| Washington | 0-20355 | 91-1223280 | ||||||||||||
| (State or other jurisdiction of incorporation) |
(Commission File No.) |
(I.R.S. Employer Identification No.) |
||||||||||||
| ☐ | Written communications pursuant to Rule 425 under the Securities Act (17 CFR 230.425) | ||||
| ☐ | Soliciting material pursuant to Rule 14a-12 under the Exchange Act (17 CFR 240.14a-12) | ||||
| ☐ | Pre-commencement communications pursuant to Rule 14d-2(b) under the Exchange Act (17 CFR 240.14d-2(b)) | ||||
| ☐ | Pre-commencement communications pursuant to Rule 13e-4(c) under the Exchange Act (17 CFR 240.13e-4(c)) | ||||
| Title of each class | Trading Symbol(s) | Name of each exchange on which registered | ||||||||||||
| Common Stock, par value $.005 per share | COST | NASDAQ | ||||||||||||
| COSTCO WHOLESALE CORPORATION | |||||||||||
| Dated: September 26, 2024 | By: | /s/ Gary Millerchip | |||||||||
| Gary Millerchip | |||||||||||
| Executive Vice President and Chief Financial Officer | |||||||||||

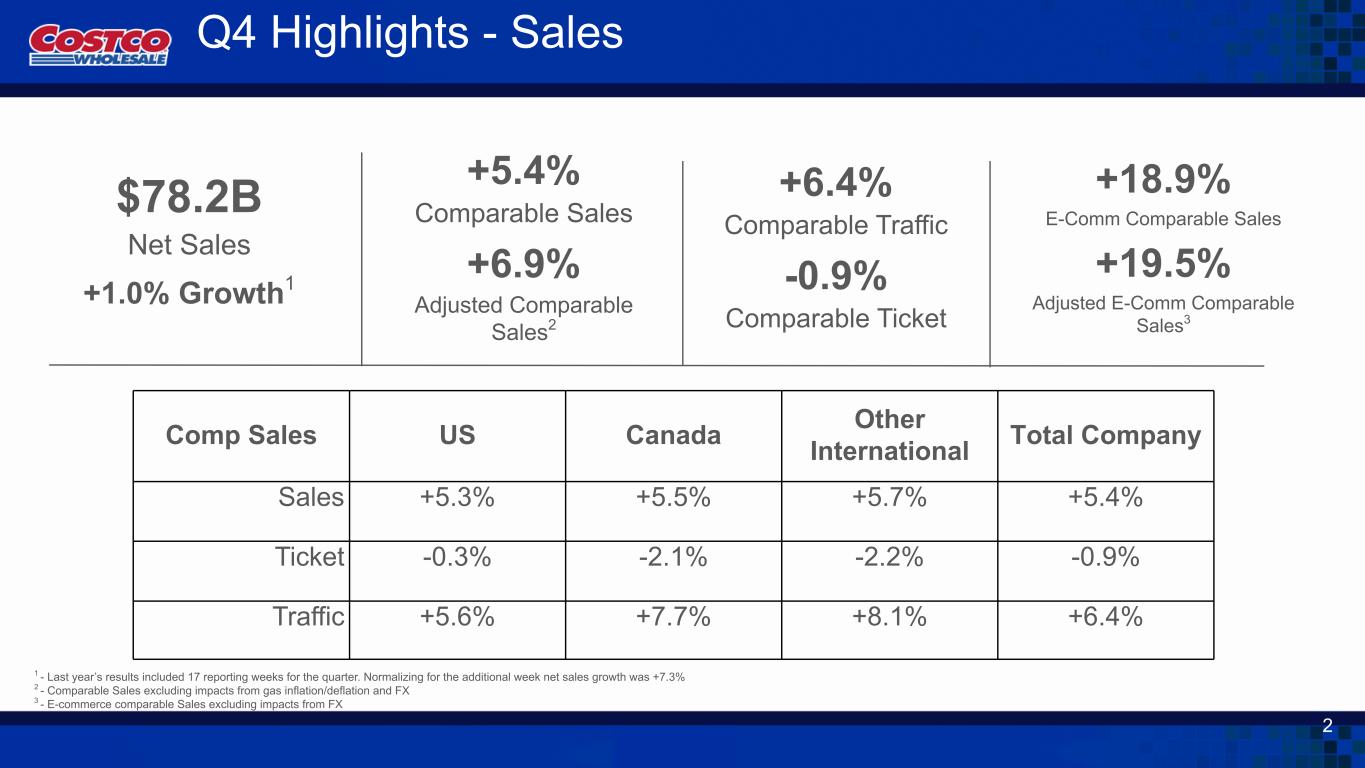
| 16 Weeks | 16 Weeks | 52 Weeks | 52 Weeks | ||||||||||||||||||||
| Adjusted* | Adjusted* | ||||||||||||||||||||||
| U.S. | 5.3% | 6.3% | 4.5% | 5.0% | |||||||||||||||||||
| Canada | 5.5% | 7.9% | 7.0% | 8.1% | |||||||||||||||||||
| Other International | 5.7% | 9.3% | 8.1% | 8.4% | |||||||||||||||||||
| Total Company | 5.4% | 6.9% | 5.3% | 5.9% | |||||||||||||||||||
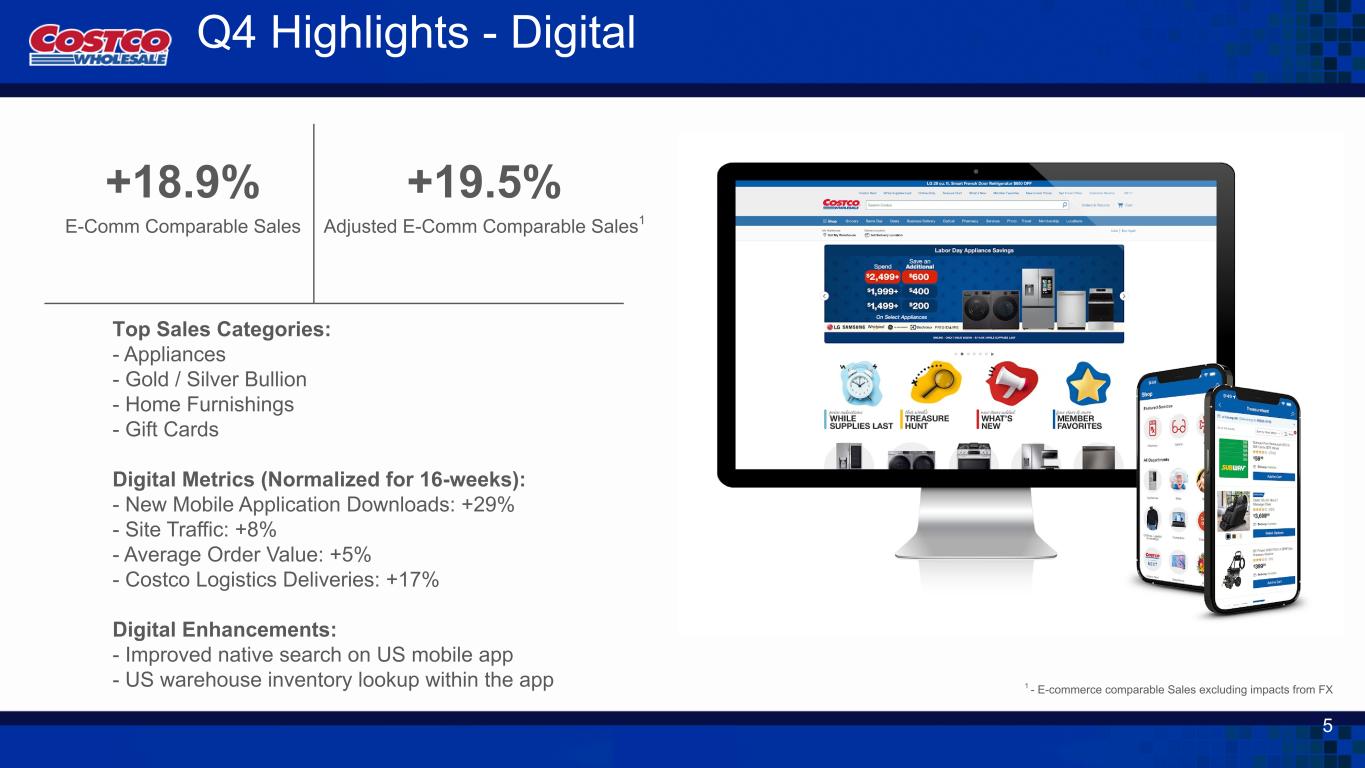
| E-commerce | 18.9% | 19.5% | 16.1% | 16.2% | |||||||||||||||||||


| 16 Weeks Ended | 17 Weeks Ended | 52 Weeks Ended | 53 Weeks Ended | ||||||||||||||||||||
| September 1, 2024 |
September 3, 2023 |
September 1, 2024 |
September 3, 2023 |
||||||||||||||||||||
| REVENUE | |||||||||||||||||||||||
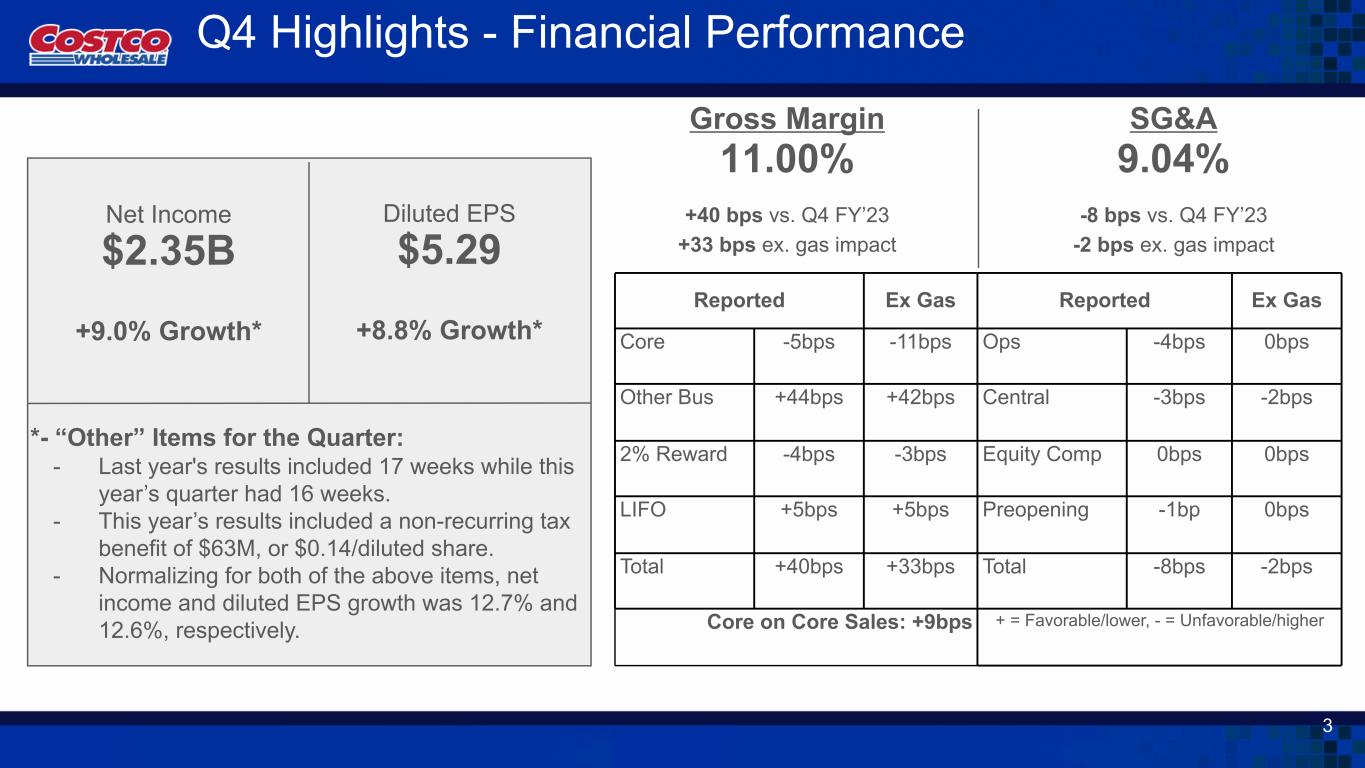
| Net sales | $ | 78,185 | $ | 77,430 | $ | 249,625 | $ | 237,710 | |||||||||||||||
| Membership fees | 1,512 | 1,509 | 4,828 | 4,580 | |||||||||||||||||||
| Total revenue | 79,697 | 78,939 | 254,453 | 242,290 | |||||||||||||||||||
| OPERATING EXPENSES | |||||||||||||||||||||||
| Merchandise costs | 69,588 | 69,219 | 222,358 | 212,586 | |||||||||||||||||||
| Selling, general and administrative | 7,067 | 6,939 | 22,810 | 21,590 | |||||||||||||||||||
| Operating income | 3,042 | 2,781 | 9,285 | 8,114 | |||||||||||||||||||
| OTHER INCOME (EXPENSE) | |||||||||||||||||||||||
| Interest expense | (49) | (56) | (169) | (160) | |||||||||||||||||||
| Interest income and other, net | 120 | 238 | 624 | 533 | |||||||||||||||||||
| INCOME BEFORE INCOME TAXES | 3,113 | 2,963 | 9,740 | 8,487 | |||||||||||||||||||
| Provision for income taxes | 759 | 803 | 2,373 | 2,195 | |||||||||||||||||||
| NET INCOME | $ | 2,354 | $ | 2,160 | $ | 7,367 | $ | 6,292 | |||||||||||||||
| NET INCOME PER COMMON SHARE: | |||||||||||||||||||||||
| Basic | $ | 5.30 | $ | 4.87 | $ | 16.59 | $ | 14.18 | |||||||||||||||
| Diluted | $ | 5.29 | $ | 4.86 | $ | 16.56 | $ | 14.16 | |||||||||||||||
| Shares used in calculation (000's): | |||||||||||||||||||||||
| Basic | 444,013 | 443,876 | 443,914 | 443,854 | |||||||||||||||||||
| Diluted | 444,977 | 444,445 | 444,759 | 444,452 | |||||||||||||||||||

| September 1, 2024 |
September 3, 2023 |
||||||||||
| ASSETS | |||||||||||
| CURRENT ASSETS | |||||||||||
| Cash and cash equivalents | $ | 9,906 | $ | 13,700 | |||||||
| Short-term investments | 1,238 | 1,534 | |||||||||
| Receivables, net | 2,721 | 2,285 | |||||||||
| Merchandise inventories | 18,647 | 16,651 | |||||||||
| Other current assets | 1,734 | 1,709 | |||||||||
| Total current assets | 34,246 | 35,879 | |||||||||
| OTHER ASSETS | |||||||||||
| Property and equipment, net | 29,032 | 26,684 | |||||||||
| Operating lease right-of-use assets | 2,617 | 2,713 | |||||||||
| Other long-term assets | 3,936 | 3,718 | |||||||||
| TOTAL ASSETS | $ | 69,831 | $ | 68,994 | |||||||
| LIABILITIES AND EQUITY | |||||||||||
| CURRENT LIABILITIES | |||||||||||
| Accounts payable | $ | 19,421 | $ | 17,483 | |||||||
| Accrued salaries and benefits | 4,794 | 4,278 | |||||||||
| Accrued member rewards | 2,435 | 2,150 | |||||||||
| Deferred membership fees | 2,501 | 2,337 | |||||||||
| Current portion of long-term debt | 103 | 1,081 | |||||||||
| Other current liabilities | 6,210 | 6,254 | |||||||||
| Total current liabilities | 35,464 | 33,583 | |||||||||
| OTHER LIABILITIES | |||||||||||
| Long-term debt, excluding current portion | 5,794 | 5,377 | |||||||||
| Long-term operating lease liabilities | 2,375 | 2,426 | |||||||||
| Other long-term liabilities | 2,576 | 2,550 | |||||||||
| TOTAL LIABILITIES | 46,209 | 43,936 | |||||||||
| COMMITMENTS AND CONTINGENCIES | |||||||||||
| EQUITY | |||||||||||
| Preferred stock $0.005 par value; 100,000,000 shares authorized; no shares issued and outstanding | — | — | |||||||||
Common stock $0.005 par value; 900,000,000 shares authorized; 443,126,000 and 442,793,000 shares issued and outstanding |
2 | 2 | |||||||||
| Additional paid-in capital | 7,829 | 7,340 | |||||||||
| Accumulated other comprehensive loss | (1,828) | (1,805) | |||||||||
| Retained earnings | 17,619 | 19,521 | |||||||||
| TOTAL EQUITY | 23,622 | 25,058 | |||||||||
| TOTAL LIABILITIES AND EQUITY | $ | 69,831 | $ | 68,994 | |||||||

| 52 Weeks Ended | 53 Weeks Ended | ||||||||||
| September 1, 2024 |
September 3, 2023 |
||||||||||
| CASH FLOWS FROM OPERATING ACTIVITIES | |||||||||||
| Net income | $ | 7,367 | $ | 6,292 | |||||||
Adjustments to reconcile net income to net cash provided by operating activities: |
|||||||||||
| Depreciation and amortization | 2,237 | 2,077 | |||||||||
| Non-cash lease expense | 315 | 412 | |||||||||
| Stock-based compensation | 818 | 774 | |||||||||
| Impairment of assets and other non-cash operating activities, net | (9) | 495 | |||||||||
Changes in working capital |
611 | 1,018 | |||||||||
| Net cash provided by operating activities | 11,339 | 11,068 | |||||||||
| CASH FLOWS FROM INVESTING ACTIVITIES | |||||||||||
| Purchases of short-term investments | (1,470) | (1,622) | |||||||||
| Maturities and sales of short-term investments | 1,790 | 937 | |||||||||
| Additions to property and equipment | (4,710) | (4,323) | |||||||||
| Other investing activities, net | (19) | 36 | |||||||||
| Net cash used in investing activities | (4,409) | (4,972) | |||||||||
| CASH FLOWS FROM FINANCING ACTIVITIES | |||||||||||
| Repayments of short-term borrowings | (920) | (935) | |||||||||
| Proceeds from short-term borrowings | 928 | 917 | |||||||||
| Repayments of long-term debt | (1,077) | (75) | |||||||||
| Proceeds from issuance of long-term debt | 498 | — | |||||||||
| Tax withholdings on stock-based awards | (315) | (303) | |||||||||
| Repurchases of common stock | (700) | (676) | |||||||||
| Cash dividend payments | (9,041) | (1,251) | |||||||||
| Financing lease payments | (136) | (291) | |||||||||
| Other financing activities, net | (1) | — | |||||||||
| Net cash used in financing activities | (10,764) | (2,614) | |||||||||
EFFECT OF EXCHANGE RATE CHANGES ON CASH AND CASH EQUIVALENTS |
40 | 15 | |||||||||
| Net change in cash and cash equivalents | (3,794) | 3,497 | |||||||||
| CASH AND CASH EQUIVALENTS BEGINNING OF YEAR | 13,700 | 10,203 | |||||||||
| CASH AND CASH EQUIVALENTS END OF YEAR | $ | 9,906 | $ | 13,700 | |||||||
