Document
Exhibit 96.2
TECHNICAL REPORT SUMMARY OF THE NUEVA VICTORIA OPERATION
YEAR 2023
Date: April 5, 2024
Summary
This report provides the methodology, procedures and classification used to obtain SQM’s Nitrate an Iodine Mineral Resources and Mineral Reserves, at the Nueva Victoria Site. The Mineral Resources and Reserves that are delivered correspond to the update as of December 31, 2023.
The results obtained are summarized in the following tables:
|
|
|
|
|
|
|
|
|
|
|
|
|
|
|
|
|
|
|
|
|
|
|
|
|
|
|
|
|
|
|
Total Inferred Resource |
Total Indicated Resource |
Total Measured Resource |
| Mining |
Tonnage
(Mt)
|
Nitrate grade
(%)
|
Iodine grade
(ppm)
|
Tonnage
(Mt)
|
Nitrate grade
(%)
|
Iodine grade
(ppm)
|
Tonnage
(Mt)
|
Nitrate grade
(%)
|
Iodine grade
(ppm)
|
| Nueva Victoria |
48.5 |
5.3 |
372 |
549 |
6.0 |
460 |
201.8 |
5.6 |
432 |
Mineral Resources 2023
|
|
|
|
|
|
|
|
|
|
|
|
|
|
|
|
Proven Reserves (1) |
Average grade Nitrate |
Average grade Iodine |
Average Cut-off |
|
|
|
|
|
|
(million metric tons) |
(Percentage by weight) |
(Parts per million) |
grade for the Mine |
|
|
|
|
|
| Mining |
|
|
|
(2) |
|
|
|
|
|
| Nueva Victoria |
201.8 |
5.6% |
432 |
Nitrate 3.0 % |
|
|
|
|
|
|
Probable Reserves |
Average grade Nitrate |
Average grade Iodine |
Average Cut-off |
|
|
|
|
|
|
(million metric tons) |
(Percentage by weight) |
(Parts per million) |
grade for the Mine (2) |
|
|
|
|
|
Sector |
|
|
|
|
|
|
|
|
|
Nueva Victoria |
529 |
5.1% |
415 |
Nitrate 3.0 % |
(1)The above tables show the Proven Reserves before losses related to the exploitation and treatment of the ore. Proven Reserves are affected by mining methods, resulting in differences between the estimated reserves that are available for exploitation in the mining plan and the recoverable material that is ultimately transferred to the leaching heaps. The average mining factor for each of our mines varies between 80% and 90%, while the average global metallurgical recovery of nitrate an iodine processes contained in the recovered material varies between 55% and 70%.
(2)The cut-off grade of the Proven and Probable Reserves vary according to the objectives required in the different mines. The assigned values correspond to the averages of the different sectors.
TABLE OF CONTENTS
TABLES
|
|
|
|
|
|
|
|
|
|
|
|
|
|
|
|
|
|
|
|
|
|
|
|
|
|
|
|
|
|
|
|
|
|
|
|
|
|
|
|
|
|
TABLE 14-8 NUEVA VICTORIA PROCESS PLANT PRODUCTION SUMMARY |
|
|
|
|
|
|
|
|
|
|
|
|
|
|
|
|
|
|
|
|
|
|
|
|
|
|
|
|
|
|
|
|
|
|
|
|
|
|
|
|
|
|
|
|
|
|
|
|
|
|
|
|
|
|
|
|
|
|
|
|
|
|
|
|
|
|
|
|
|
|
|
|
|
|
|
|
|
|
|
|
|
|
|
|
|
|
|
|
|
|
|
|
|
|
|
|
|
|
|
|
|
|
|
|
|
|
|
|
|
|
|
|
|
|
|
|
|
|
|
FIGURE 11-8. SWATH PLOTS FOR IODINE TORCAZA |
125 |
|
|
FIGURE 11-9. SWATH PLOTS FOR NITRATE TORCAZA |
126 |
|
|
|
|
|
|
|
|
|
|
|
|
|
|
|
|
|
|
|
|
|
|
|
|
|
|
1EXECUTIVE SUMMARY
1.1PROPERTY SUMMARY AND OWNERSHIP
The Nueva Victoria Property, situated 145 km southeast of the city of Iquique, covers an area of 69,793 hectares (ha) of low topographic relief terrain. The property boundary includes several nitrate and iodine deposits of economic value including Hermosa Oeste, Tente en el Aire, Pampa Hermosa, Pampa Engañadora, etc. The Nueva Victoria Property also has substantial potential for metallic mineralization, notably copper and gold, which could in the future sustain exploitation by SQM or generate royalties. Several properties adjacent to the Nueva Victoria Project host mineral deposits with geological characteristics like those at Nueva Victoria, including mining lots held by ACF Minera S.A., owned by the Urticoechea family.
1.2GEOLOGY AND MINERALIZATION
Nueva Victoria is a nitrate-iodine deposit located in the Intermediate Basin (Central Depression) of northern Chile, limited to the west by the Coastal Range (representing the Jurassic magmatic arc) and to the east by the Precordillera (associated with the Cenozoic magmatic activity which gave rise to the large Cu-Au deposits of northern Chile), generating a natural barrier for their deposition and concentration.
The regional geology in which the Nueva Victoria deposits are immersed corresponds to Paleogene clastic sedimentary rocks, over a volcanic basement, associated with lavas of intermediate composition (mainly andesites - tuffs) representing Jurassic volcanism, overlying a series of intrusive belonging to the Cretaceous, which mostly outcrops outside the property area.
The mineralization at Nueva Victoria is mantiform, with a wide areal distribution, forming deposits several kilometers in extension. The mineralization thicknesses are variable, with mantles of approximately 1.0 to 6.0 meters (m).
Because of geological activity over time (volcanism, weathering, faulting) the deposits can be found as continuous mantles, thin salt crusts and superficial caliche and “Stacked" caliche.
The mineralogical association identified corresponds mainly to soluble sulfates of Na - K, less soluble sulfates of Ca, Chlorides, Nitrates, and Iodates.
Within the mineral species of interest, for Nitrates; Nitratine Potassium Nitrate; Hectorfloresite; Lautarite, Bruggenite as Iodates.
In 2023, there was a detailed exploration program of 8,730 ha in the Hermosa Oeste, Pampa Engañadora; Franja Oeste, Tea Oeste y Cocar. Currently, drilling totals 110,313 reverse circulation (RC) drill holes (459,709 meter). All the drill holes were vertical. Drilling is carried out with wide grid in the first reconnaissance stage (1,000 x 1,000 m; 800 x 800 m; 400 x 400 m); to later reduce this spacing to define the resources in their different categories.
1.3MINERAL RESOURCE STATEMENT
This sub-section contains forward-looking information related to Mineral Resource estimates for the Nueva Victoria Project. The material factors that could cause actual results to differ materially from the conclusions, estimates, designs, forecast or projections in the forward-looking information include any significant differences form one or more of the material factors or assumptions that were set forth in this sub-section including geological a grade interpretation a controls and assumptions a forecast associated with establishing the prospects for economic extraction.
All available samples were used without compositing and no capping, or other outlier restriction, to develop a geological model in support of estimating Mineral Resources. Hard contacts were used between different geological units. Sectors with a drill hole grid of 50 x 50 m and up to 100T ~ 100 x 50 m were estimated in a three-dimensional block model using the Ordinary Kriging (KO) interpolation method in one pass. Additionally, variograms were constructed and used to support the search for ellipsoid anisotropy and linear trends observed in the data. Iodine and nitrate grade interpolation was performed using the same variograms model calculated for Iodine. In the case of sectors with drill holes grids greater than 100T m and up to 200 x 200 m were estimated in a three-dimensional block model using the Inverse Distance Weighted (IDW) interpolation method. For areas with drill holes grids from 200 x 200 m up to 400 x 400 m were estimated in two dimensional using the Polygon Method.
Mineral Resources were classified using the drill hole grid. Zones with grid of 50 x 50 m up to 100T ~ 100 x 50 m were classified as Measured. For Indicated Mineral Resources, the zone should have a 100 x100 m and 200 x 200 m drill hole grid. To define inferred Resources a 400 x 400 m drill hole grid was used.
The Mineral Resource Estimate, exclusive of Mineral Reserves, is reported in Table 1-1. Note that based on the application of modifying factors and that because the caliche deposits are at the surface, all Measured an Indicated Mineral Resources with environment permits has been converted into Mineral Reserves, as result, only Inferred Mineral Resources are
|
|
|
|
|
|
|
|
|
| SQM TRS Nueva Victoria |
|
Pag. 1 |
reported in this Technical Report Summary (TRS). As the mineral resources estimation process is reviewed and improved each year, mineral resources could change in terms of geometry, tonnage, or grades.
Table 1-1. In situ Mineral Resource Estimate, Exclusive of Mineral Reserves, effective December 31, 2023.
|
|
|
|
|
|
|
|
|
|
|
|
| Inferred Resource |
| Nueva Victoria |
Tonnage (Mt) |
Nitrate (%) |
Iodine (ppm) |
| Cocar |
5.1 |
7.3 |
302 |
| Los Angeles |
9.3 |
7.9 |
331 |
| Hermosa Oeste |
17.0 |
4.7 |
387 |
| Franja Oeste |
16.0 |
3.9 |
401 |
| TEA Oeste |
1.1 |
4.0 |
397 |
| Total |
48.5 |
5.3 |
372 |
(a)Mineral Resources are not Mineral Reserves and do not have demonstrated economic viability. There is no certainty that all or any part of the Mineral Resource will be converted into Mineral Reserves upon the application of modifying factors.
(b)Mineral Resources are reported as in-situ and exclusive of Mineral Reserves, where the estimated Mineral Reserve without processing losses during the reported Long Term was subtracted from the Mineral Resource inclusive of Mineral Reserves. All Measured an indicated Resources with environment permits has been converted into Mineral Reserves; as a result, only inferred Mineral Resources are reported in this TRS.
(c)Comparisons of values may not add due to rounding of numbers and the differences caused by use of averaging methods.
(d)The units “Mt”, “ppm” and “%” refer to million tons, parts per million, and weight percent respectively.
(e)The Mineral Resource estimate considers a nitrate cut-off grade of 3.0 %, based on accumulated cut-off grades and operational average grades, as well as caliche thickness ≥ 2.0 m and overburden thickness ≤ 3.0 m. The nitrate cut-off grade considers the cost and medium-and long-term price forecast of generating iodine as discussed in Section 11, 16 and 19 of this TRS.
(f)As the mineral resources estimation process is reviewed and improved each year, mineral resources could change in terms of geometry, tonnage or grades.
Density was assigned to all materials with a default value of 2.1 (t/m3), this value comes from several analysis made by SQM in Nueva Victoria and other operations.
Resource Estimate considers a cut-off grade of Nitrate of 3.0%, this value considers the corresponding operational, financial and planned investment costs, depreciation, profit margin, and taxes. The iodine price used was to determine reasonable prospects for economic extraction is 42,000 USD/ton the same as that used to estimate Mineral Reserves.
Marco Fazzi is the QP responsible for the Mineral Resources. The QP is not aware of any environmental, permitting, legal, title, taxation, socioeconomic, marketing, political or other relevant factors that could materially affect the Mineral Resource Estimate that are not discussed in this Technical Report.
1.4MINERAL RESERVE STATEMENT
This sub-section contains forward-looking information related to Mineral Reserve estimates for the Project. The material factors that could cause actual results to differ materially from the conclusions, estimates, designs, forecast or projections in the forward-looking information include any significant differences from one or more of the material factors or assumptions that were set forth in this sub-section including Mineral Resource model tons and grade, modifying factors including mining and recovery factors, production rate and schedule, mining equipment productivity, commodity market and prices and projected operating and capital costs.
The Measure Mineral Resources defined by drill hole grid 50 x 50 m and up to 100T; and evaluated using 3D blocks and Ordinary Kriging are considered as high level of geological confidence are qualified as Proven Mineral Reserves with unit conversion coefficient in tonnage and Iodine and Nitrates grades. (See Table 12.2)
The Indicate Mineral Resources defined by drill holes grids greater than 100T up to 200 x 200 m; and evaluated using 3D blocks model and Inverse Distance Weighted (IDW) interpolation method is considered as medium level of geological
|
|
|
|
|
|
|
|
|
| SQM TRS Nueva Victoria |
|
Pag. 2 |
confidence are qualified as Probable Mineral Reserves. Conversion factors used are less than one for iodine (0.90) and nitrate (0.85) grades.
Mineral Reserves are based on a nitrate cut-off grade of 3.0 %, Iodine price of 42.0 USD/kg; for finished fertilizer products sold at Coya Sur price of 820 USD/ton; and based on economic viability as demonstrated in an after-tax discounted cash flow (see Section 19). All Mineral Reserves are defined in sectors with environmental permits (RCA)
Based on these criteria, Proven Reserves Mineral at Nueva Victoria are estimated in to 201.8 million tons (Mt) with an estimated average nitrate grade of 5.6% and 432 ppm iodine.
Probable Mineral Reserves at the Nueva Victoria site are 529 Mt with and estimated average nitrate grade of 5.1% and 415 ppm iodine.
Mineral Reserves are stated as in-situ ore.
Table 1-2. Mineral Reserve at the Nueva Victoria Mine (Effective 31 December 2023)
|
|
|
|
|
|
|
|
|
|
|
|
|
Proven Reserves |
Probable Reserves |
Total Reserves |
| Tonnage (Mt) |
201.8 |
529 |
731 |
| Iodine Grade (ppm) |
432 |
415 |
420 |
| Nitrate Grade (%) |
5.6 |
5.1 |
5.2 |
| Iodine (kt) |
87.2 |
219.5 |
306.7 |
| Nitrate (kt) |
11,300 |
26,979 |
38,279 |
Notes:
(a)Mineral Reserves area based on Measured and Indicate Mineral Resources at an operating cutoff of 3.0 % nitrate. Operating constraints of caliche thickness ≥ 2.0 m; overburden thickness ≤ 1.0 m and waste / caliche ratio ≤ 0.5 are applied.
(b)Proven Minerals Reserves are based on Measured Mineral Resources at the criteria described in (a) above.
(c)Probable Mineral Reserves are based on Indicated Mineral Resources at the criteria described in (a) above with a grade call factor of 0.85 for Nitrate and 0.9 for Iodine confirmed by the calculation of the uncertainty of the estimated model by IDW.
(d)Mineral Reserves are stated as in-situ ore (caliche) as the point of reference.
(e)The units “Mt”, “kt”; “ppm” and “%” refer to million tons, kilotons; parts per million, and weight percent respectively.
(f)Mineral Reserves are based on an Iodine price of 42.0 USD/kg and a finished fertilizer product sold at Coya Sur of 820 USD/ton. Miner is also based on economic viability as demonstrated in an after-tax discounted cash flow (see Section 19).
(g)Marco Lema is the QP responsible for the Mineral Reserve.
(h)The QP is not aware of any environmental, permitting, legal, title, taxation, socioeconomic, marketing, political or other relevant factors that could materially affect the Mineral Reserve estimate.
(i)Comparison of values may not total due to rounding of numbers and the differences caused by use of averaging methods.
1.5MINE DESIGN AND SCHEDULING
At Nueva Victoria the total amount of Caliche extraction reached in 2023 was 43.4 million tons (Mt). Caliche production for the Long Term (LP) form 2024 through 2037 ranges between 54 Mt per year to 44 Mt per year for a total ore production of 731 Mt with an average iodine grade of 414 ppm and a nitrate grade of 5.1%. The mining procedure at Nueva Victoria involves the following processes:
⮚Removal of surface layer and overload (between 0.50 m to 1.0 m thick).
|
|
|
|
|
|
|
|
|
| SQM TRS Nueva Victoria |
|
Pag. 3 |
⮚Caliche extraction, up to a maximum depth of 6 m, through explosives (drill & blast) or surface miner (continuous miner MC).
⮚Caliche loading, using front-end loaders and/or shovels.
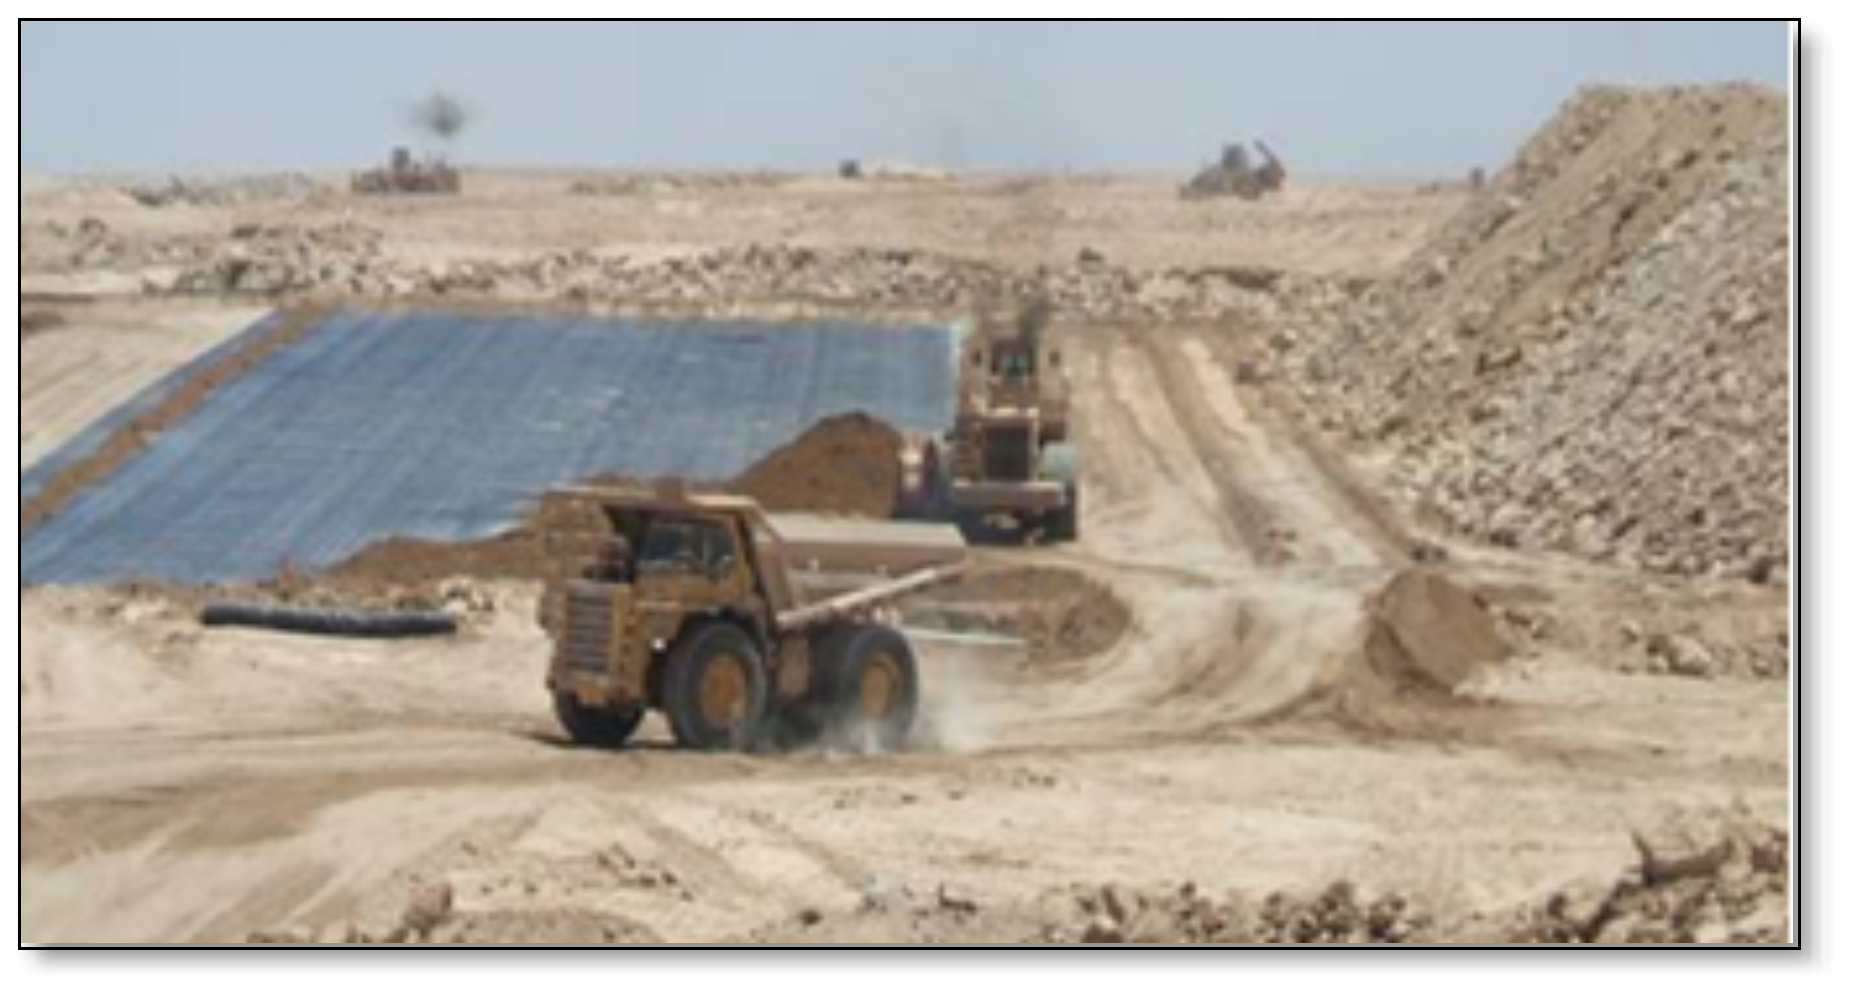
⮚Transport of the mineral to heap leach, using mining trucks (rigid hopper) of high tonnage (100 to 150 tons).
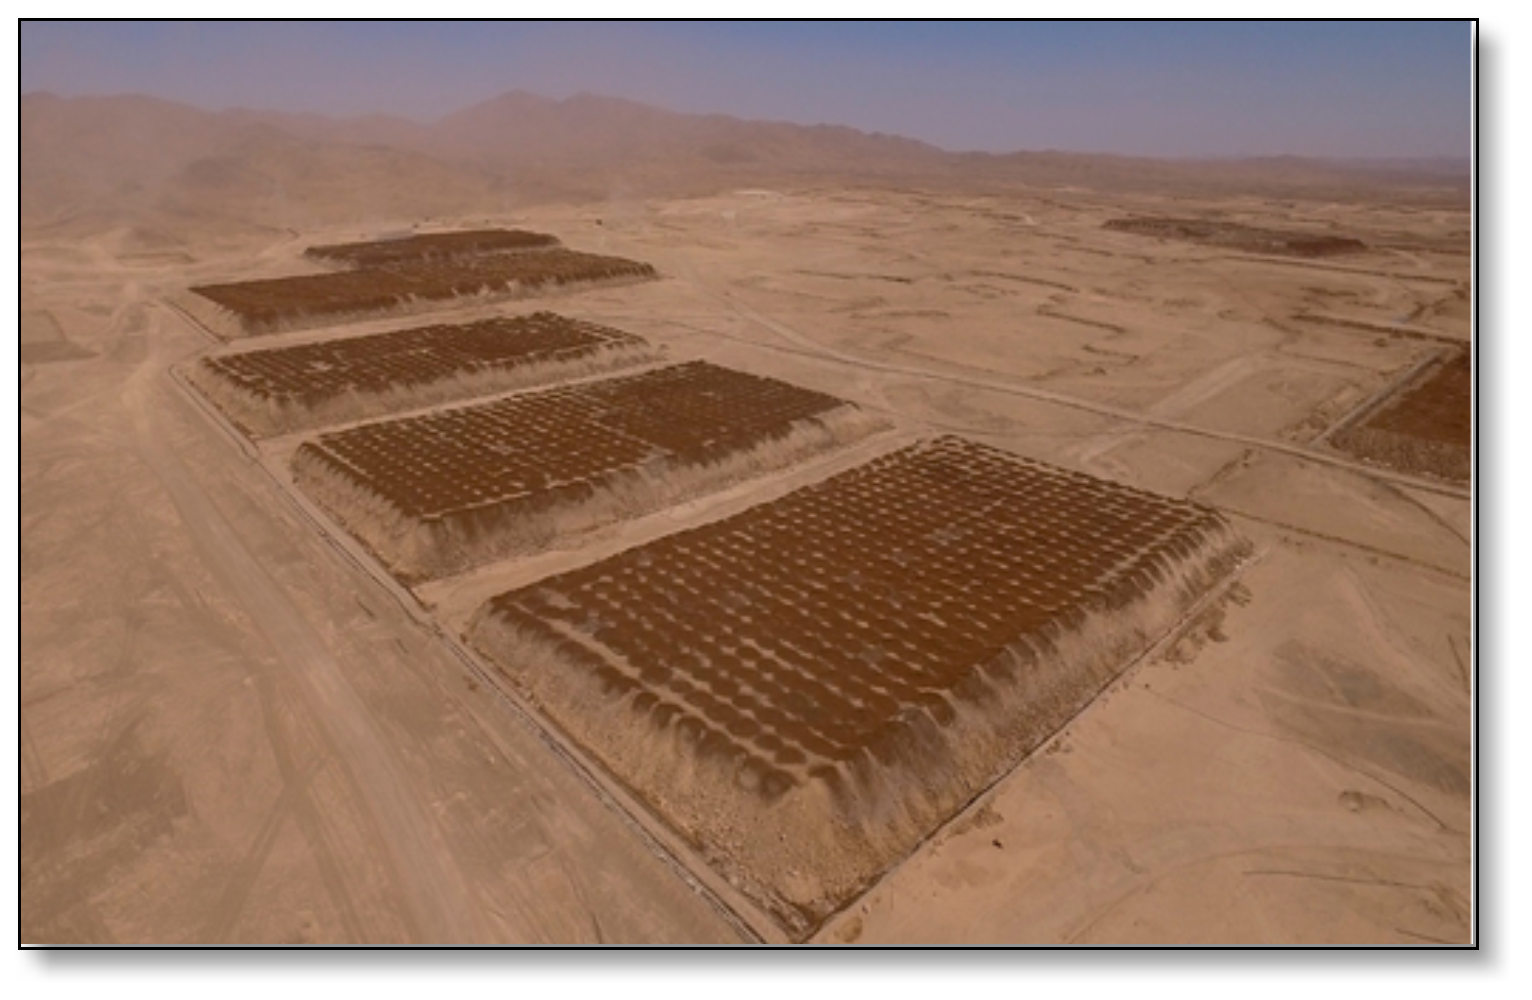
⮚Construction of heap leach to accumulate a total of 1 Mt, with heights of 7 to 15 m and a crown area of 65,000 square meters (m²).
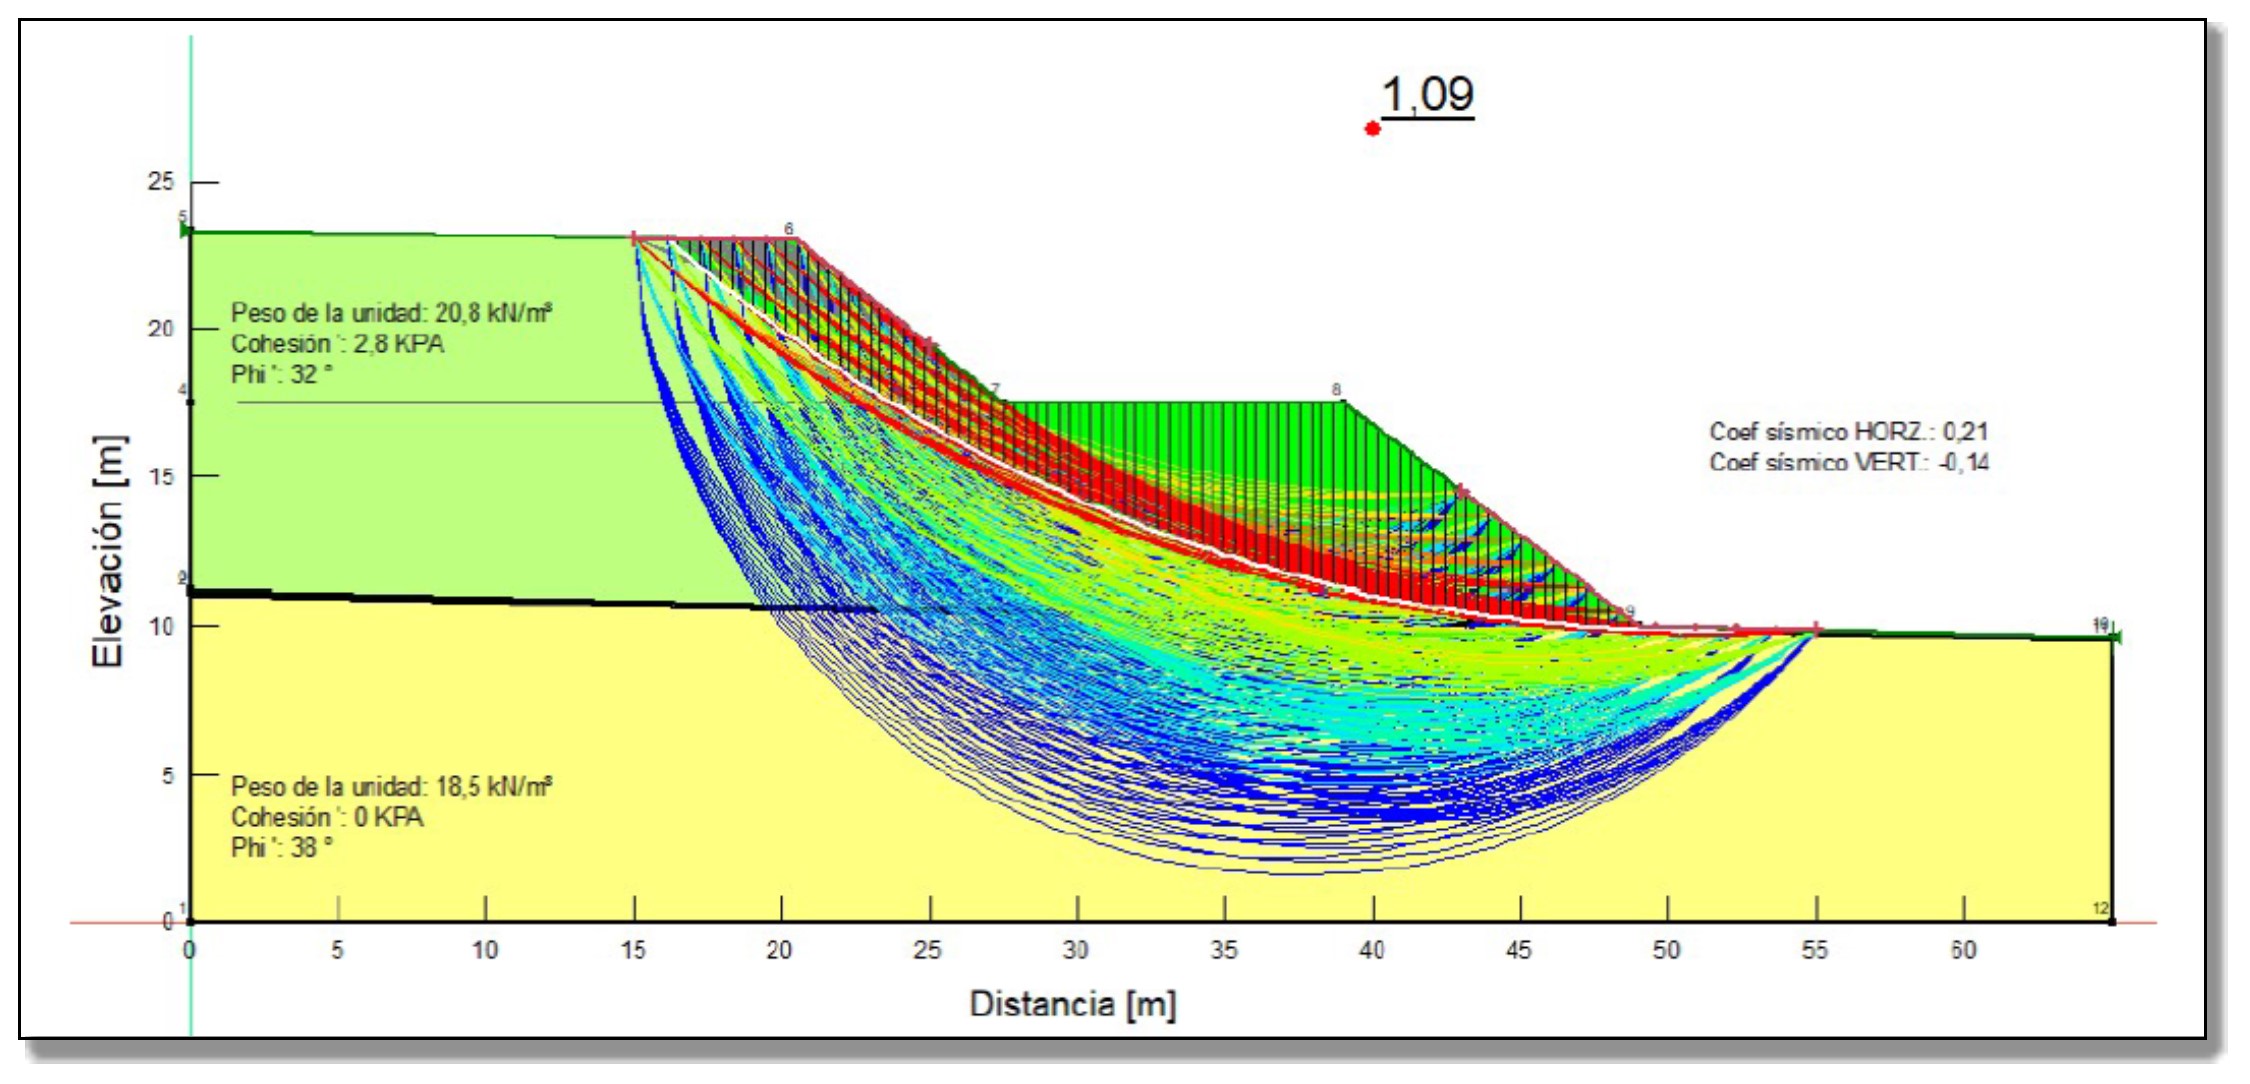
The physical stability analysis performed by SQM indicates that these heaps are stable for long-term stable, and no slope modification is required for closure.
⮚Continuous irrigation of heap leach is conducted to complete the leach cycle. The cycle of each heap lasts approximately 300 to 500 days and during this time, heap height decreases by 15% to 20%.
The criteria set by SQM to establish the mining plan correspond to the following:
⮚Caliche thickness ≥ 2.0 m
⮚Overburden thickness ≤ 1.0 m
⮚Barren / Mineral Ratio < 0.5
⮚Nitrate cut-off grades of 3.0 %.
⮚Unit sales Price for prilled Iodine 42,000 USD/ton and a unit total cost of 23.4 USD/kg (mining, leaching, seawater pipeline and plant processing).
Approximately 92% of the caliche will be extracted using the traditional methods of drill & blast while the remaining 8% will we extracted using CM (continuous miner).
In the mining processes, SQM considers an efficiency between 80% an 90% (losses of mineral and grades dilution in the integral process of mineral extraction, load, and transport; and heap leach construction).
Given the production factors set in mining and leaching processes (71.9 % for Iodine and 49.7 % for Nitrates production for leaching that are average values), a total production of 200 kt of prilled Iodine and 18,463 kt of nitrate salts is expected for this period (2024- 2038) from lixiviation process to treatment plants.
1.6METALLURGY AND MINERAL PROCESSING
1.6.1Metallurgical Testing Summary
The test work developed is aimed at determining the susceptibility of raw materials to production by means of separation and recovery methods established in the plant, evaluating deleterious elements, to establish mechanisms in the operations and optimize the process to guarantee a recovery that will be intrinsically linked to the mineralogical and chemical characterization, as well as physical and granulometric of the mineral to be treated.
Historically, SQM Nitrates, through its Research and Development area, has conducted tests at plant and/or pilot scale that have allowed improving the knowledge about the recovery process and product quality through chemical oxidation tests, solution cleaning and recently, optimization tests of leaching heap operations, through the prior categorization of the ore to be leached.
SQM's analysis laboratories located in the city of Antofagasta and the Iris Pilot Plant Laboratory (Nueva Victoria) perform physicochemical, mineralogical, and metallurgical tests. The latter allow to know the behavior of the caliche bed against water leaching and thus support future performance. In addition, the knowledge generated contributes to the selection of the best irrigation strategy to maximize profit and a and the estimation of recovery at industrial scale by means of empirical correlations between the soluble content of caliches and the metallurgical yields of the processes.
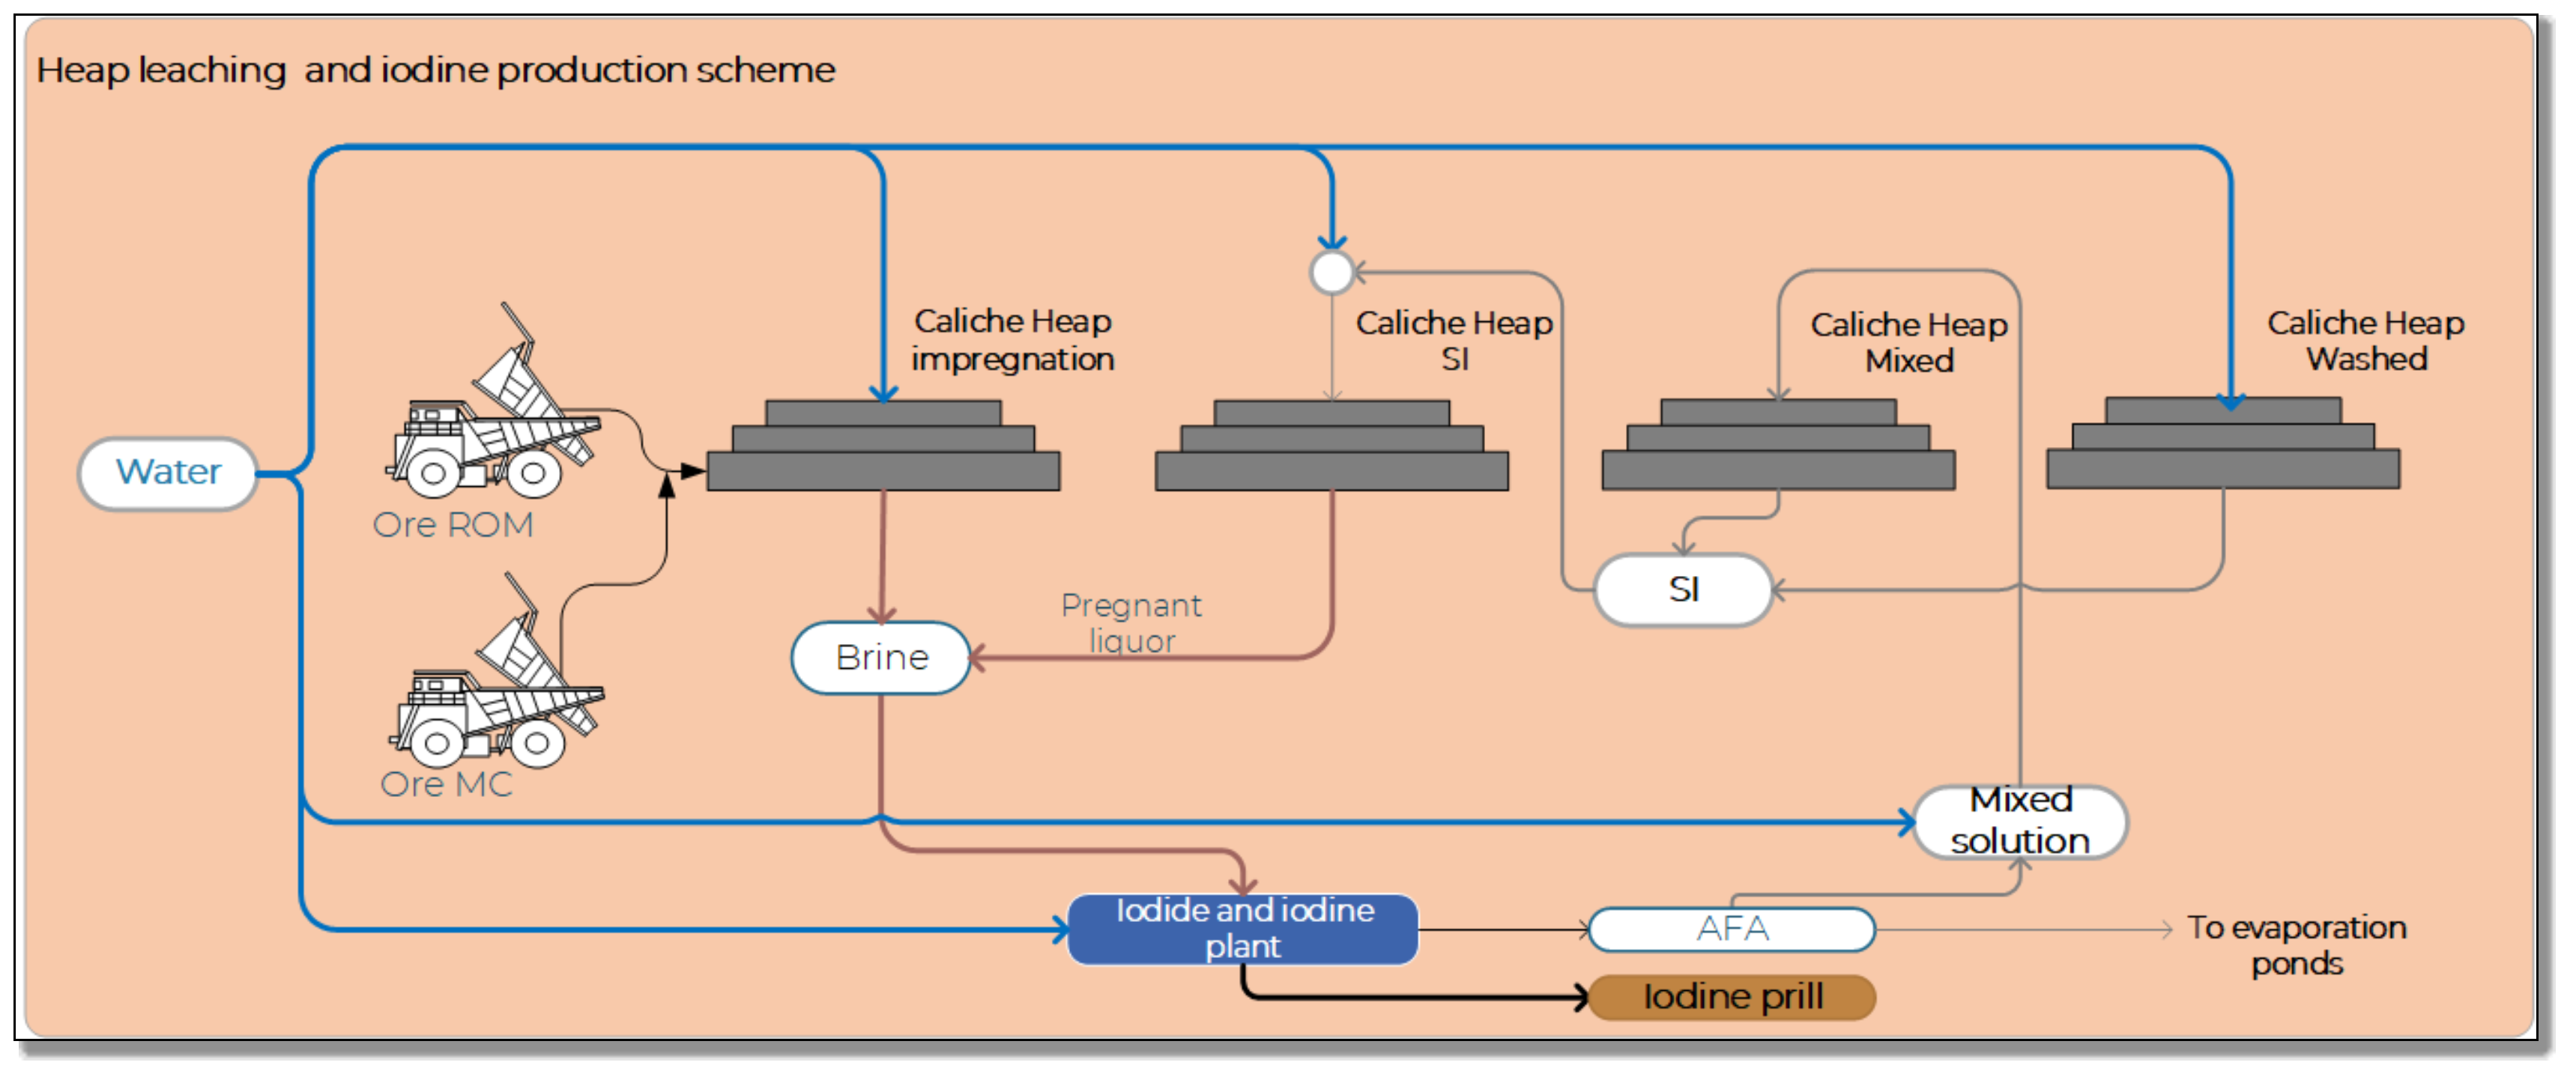
1.6.2Mining and Mineral Processing Summary
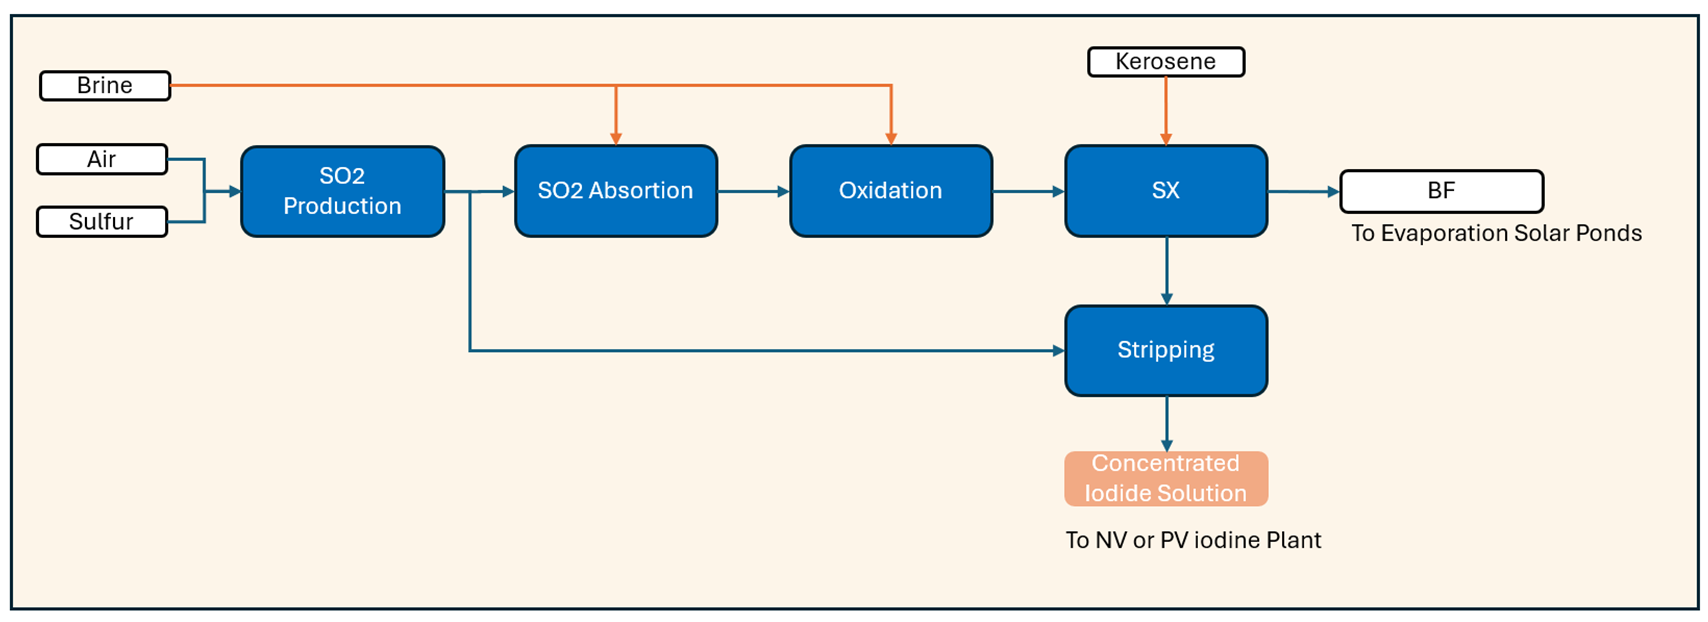
The Nueva Victoria Operation comprises the sectors of Nueva Victoria belonging to Nueva Victoria, Sur Viejo and Iris. The production process begins with mining of “Caliche “ore. The ore is heap-leached to generated iodate & nitrate rich leaching solutions referred to by SQM as “Brines”. The brines are piped to processing plants where the iodate is converted to iodide, which is them processed to obtain pelleted (“Prilled”) iodine. The iodine-depleted brine which exits the iodide plant is referred to as brine Feble (“BF”) by SQM, literally feble brine in the sense of depleted, weakened. A proportion of
|
|
|
|
|
|
|
|
|
| SQM TRS Nueva Victoria |
|
Pag. 4 |
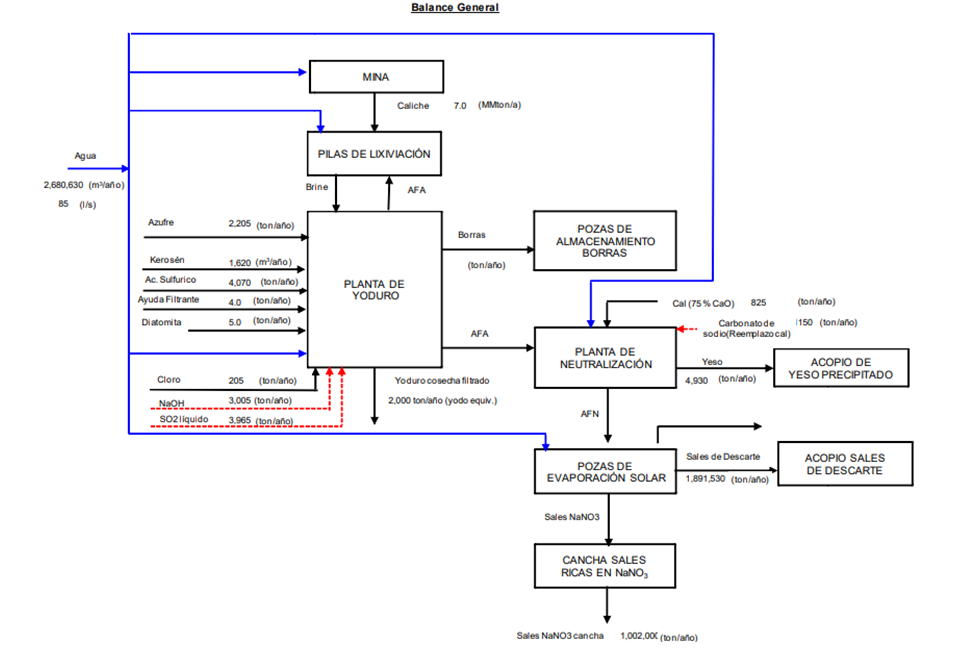
the of the BF is recirculated to the heap-leaching stage of the process; the remaining BF is routed to the evaporation ponds at Sur Viejo. The solar evaporation ponds produce salts rich in sodium nitrate and potassium nitrate. These nitrate-rich salts are sent to the SQM Coya Sur Plants (locate 160 Km to the south of Nueva Victoria, and 7 Km southeast of the town of Maria Elena in the Antofagasta Region of northern Chile) where they are refined to produce commercial sodium nitrate a potassium nitrate.
The surface area authorized for mining at Nueva Victoria is 1,299 square kilometers (km2). The surface area authorized for mining at Iris is 45.5 km2. No expansion is planned at Iris.
Caliche extraction at Nueva Victoria is 37 million tons per year (Mtpy), with an additional 6.48 Mtpy at Iris. The overall mining rate at Nueva Victoria and Iris will be increased to a total of 71.48 Mtpy with the incorporation of the TEA expansion.
1.7CAPITAL AND OPERATING COSTS
This section contains forward-looking information related to capital and operating cost estimates for the Project. The material factors that could cause actual results to differ materially from the conclusions, estimates, designs, forecast or projection in the forward-looking information include any significant differences from one or more of the materials factors or assumptions that were set forth in this section including prevailing economic conditions continue such that projected capital costs, labor and equipment productivity levels and that contingency is sufficient to account for changes in material factors or assumptions.
The annual production estimates were used to determine annual estimates of capital and operating costs. All cost estimates were in 2023 USD. Total capital costs are estimated to be about USD 798 million for seawater pipelines, new facilities for the TEA expansion project, as well as sustaining and expansion capital for current operations. Annual operating costs were based on historical operating costs, material movements and estimated unit costs provided for SQM. These including mining, leaching, iodine and nitrate production. Ore capital costs included working capital and closure costs. Annual total operating cost of 7.3 USD/ton caliche to 11.8 USD/ton of caliche, with an average total operating cost of 7.96 USD/ton of caliche over the Long Term. (Table 19.3)
1.8ECONOMIC ANALYSIS
This section contains forward-looking information related to economic analysis for the Project. The material factors that could cause actual results to differ materially from the conclusions, estimates, designs, forecast or projection in the forward-looking information include any significant differences from one or more of the materials factors or assumptions that were set forth in this sub section including estimated capital and operating costs, project schedule and approvals timing, availability of funding, projected commodities markets and prices.
All costs were assumed in 2023 USD.
For the economic analysis a Discounted Cash flow (DCF) model was development.
An iodine sales price of 42,000 USD/ton and a nitrate salt for fertilizer price of 323 USD/ton was used in the discounted cash flow. The imputed nitrate salts for fertilizer price of 323 USD/ton were estimated based on average price for finished fertilizer products sold at Coya Sur of 820 USD/ton, less 497 USD/ton for production cost at Coya Sur.
QP believes these prices reasonably reflect current market prices and are reasonable to use as sales prices for the economic analysis for this Study.
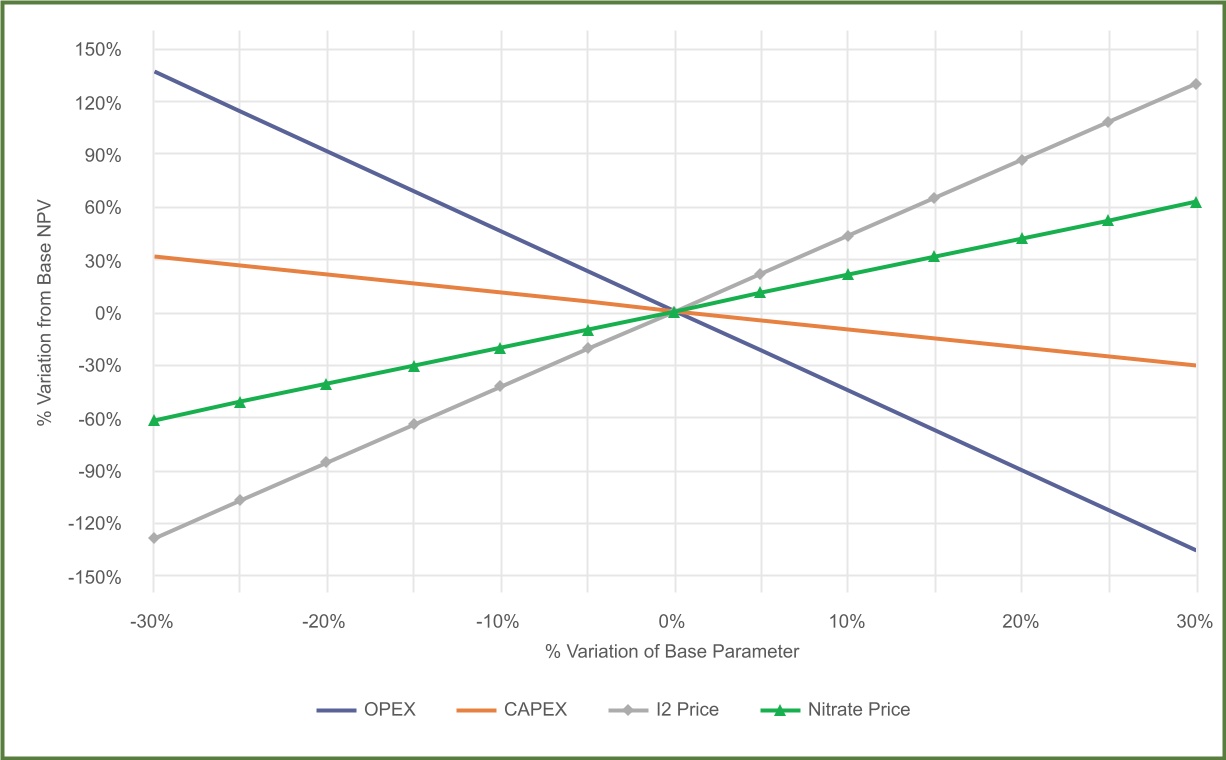
The discounted cash flow establishes that the Mineral Reserves estimate provided in this report are economically viable. The base case NPV10 is estimated to be USD 1.92 billion. The Net Present Value for this study is most sensitive to operating cost and sales prices of both iodine and nitrates. (Table 19.4) QP considers the accuracy and contingency of cost estimates to be well within a Prefeasibility Study (PFS) standard and enough for the economic analysis supporting the Mineral Reserve estimated for SQM.
1.9CONCLUSIONS AND RECOMMENDATIONS
Marco Fazzi QP of Mineral Resources and Mineral Reserves concludes that the work done in the review of this TRS includes adequate details and information to declare the Mineral Reserves. In relation to the resource treatment processes, the conclusion of the responsible QP, Gino Slanzi, is that appropriate work practices and equipment, design methods and processing equipment selection criteria have been used. In addition, the company has developed new processes that have continuously and systematically optimized its operations.
Some recommendations are given in the following areas:
|
|
|
|
|
|
|
|
|
| SQM TRS Nueva Victoria |
|
Pag. 5 |
⮚Continue with the improvements implemented during the year 2022 for the Qa-Qc program to integrate it to Acquire System manages to align with the best practices of the industry, facilitating with this a more robust quality control.
⮚With the migration of geological database to Acquire platform, traceability of drilling, geology, geochemical data is achieved in a secure base.
⮚It is considered important to evaluate the leachable material through heap leaching simulation, which allows the construction of a conceptual model of caliche leaching with a view to secondary processing of the riprap to increase the overall recovery . It is recommended to continue with the research work of the geometallurgical model to determine the real recovery to the increase of water.
⮚Environmental issues include leachate or acid water management, air emissions management, tailings dump management, and leachate riprap.
All the above recommendations are considered within the declared CAPEX/OPEX and do not imply additional costs for their execution.
|
|
|
|
|
|
|
|
|
| SQM TRS Nueva Victoria |
|
Pag. 6 |
2INTRODUCTION
This Technical Summary Report (TRS) was prepared by SQM's team of professionals and external advisors for Sociedad Química y Minera de Chile (SQM), in accordance with the requirements of Regulation SK, Subpart 1300 of the United States Securities Exchange Commission (SEC), hereinafter referred to as SK 1300.
2.1TERMS OF REFERENCE AND PURPOSE OF THE REPORT
At Nueva Victoria SQM produces nitrate salts (sodium nitrate and potassium nitrate) and iodine, by heap leaching and evaporation.
The effective date of this TRS report is December 31, 2023.
This TRS uses English spelling and Metric units of measure. Grades are presented in weight percent (wt.%). Costs are presented in constant US Dollars as of December 31, 2023.
Except where noted, coordinates in this TRS are presented in metric units using the World Geodesic Reference System (PSAD) 1956 Universal Transverse Mercator (UTM) ZONE 19 South (19S).
The purpose of this TRS is to report Mineral Resources and Mineral Reserves for SQM’s Nueva Victoria operation.
2.2SOURCE OF DATA AND INFORMATION
This TRS is based on information from SQM and public domain data. All information is cited throughout this document and is listed in the final "References" section at the end of this report. Table 2-1 provides the abbreviations (abbv.) and acronyms used in this TRS.
Table 2-1. Abbreviations and Acronyms
|
|
|
|
|
|
| Acronym/Abbv. |
Definition |
| ' |
minute |
| " |
second |
| % |
percent |
| ° |
degrees |
| °C |
degrees Celsius |
| 100T |
100 truncated grid |
| AA |
Atomic absorption |
| AAA |
Andes Analytical Assay |
| AFA |
weakly acidic water |
| AFN |
Feble Neutral Water |
| Ajay |
Ajay Chemicals Inc. |
| AS |
Auxiliary Station |
| ASG |
Ajay-SQM Group |
| BF |
Brine Feble |
| BFN |
Neutral Brine Feble |
| BWn |
abundant cloudiness |
| CIM |
Centro de Investigación Minera y Metalúrgica |
| cm |
centimeter |
| CM |
continuous miner |
| CU |
Water consumption |
| COM |
Mining Operations Center |
| CSP |
Concentrated solar power |
| CONAF |
National Forestry Development Corporation |
| DDH |
diamond drill hole |
| DGA |
General Directorate of Water |
|
|
|
|
|
|
|
|
|
| SQM TRS Nueva Victoria |
|
Pag. 7 |
|
|
|
|
|
|
| Acronym/Abbv. |
Definition |
| DTH |
down-the-hole |
| EB 1 |
Pumping Station No. 1 |
| EB2 |
Pumping Station No. 2 |
| EIA |
environmental impact statement |
| EW |
east-west |
| FC |
financial cost |
| FNW |
feble neutral water |
| g |
gram |
| G |
gravity |
| GU |
geological unit |
| g/cc |
grams per centimeter |
| g/mL |
grams per milliliter |
| g/ton |
grams per ton |
| g/L |
grams per liter |
| GPS |
global positioning system |
| h |
hour |
| ha |
hectare |
| ha/y |
hectares per year |
| HDPE |
High-density Polyethylene |
| ICH |
industrial chemicals |
| ICP |
inductively coupled plasma |
| ISO |
International Organization for Standardization |
| kg |
kilogram |
kh |
horizontal seismic coefficient |
kg/m3 |
kilogram per cubic meter |
| km |
kilometer |
kv |
vertical seismic coefficient |
kN/m3 |
kilonewton per cubic meter |
km2 |
square kilometer |
| kPa |
Kilopascal |
| kt |
kilotonne |
| ktpd |
thousand tons per day |
| ktpy |
kilotonne per year |
| kUSD |
thousand USD |
| kV |
kilovolt |
| kVa |
kilovolt-amperes |
L/h-m2 |
liters per hour square meter |
L/m2 /d |
liters per square meter per day |
| L/s |
liters per second |
| LR |
Leaching rate |
| LCD/LED |
liquid crystal displays/light-emitting diode |
| LCY |
Caliche and Iodine Laboratories |
| LdTE |
medium voltage electrical transmission line |
| LIMS |
Laboratory Information Management System |
| LOM |
life-of-mine |
|
|
|
|
|
|
|
|
|
| SQM TRS Nueva Victoria |
|
Pag. 8 |
|
|
|
|
|
|
| Acronym/Abbv. |
Definition |
| m |
meter |
| M&A |
mergers and acquisitions |
m/km2 |
meters per square kilometer |
| m/s |
meters per second |
m2 |
square meter |
m3 |
cubic meter |
m3 /d |
cubic meter per day |
m3 /h |
cubic meter per hour |
m3 /ton |
cubic meter per ton |
| masl |
meters above sea level |
| mbgl |
meter below ground level |
| mbsl |
meters below sea level |
| mm |
millimeter |
| mm/y |
millimeters per year |
| Mpa |
megapascal |
| Mt |
million ton |
| Mtpy |
million tons per year |
| MW |
megawatt |
| MWh/y |
Megawatt hour per year |
| NNE |
north-northeast |
| NNW |
north-northwest |
| NPV |
net present value |
| NS |
north south |
O3 |
ozone |
| ORP |
oxidation reduction potential |
| PLS |
pregnant leach solution |
| PMA |
particle mineral analysis |
| ppbv |
parts per billion volume |
| ppm |
parts per million |
| PVC |
Polyvinyl chloride |
| QA |
Quality assurance |
| QA/QC |
Quality Assurance/Quality Control |
| QC |
Quality control |
| QP |
Qualified Person |
| RC |
reverse circulation |
| RCA |
environmental qualification resolution |
| RMR |
Rock Mass Rating |
| ROM |
run-of-mine |
| RPM |
revolutions per minute |
| RQD |
rock quality index |
| SG |
Specific gravity |
| SEC |
Securities Exchange Commission of the United States |
| SSE |
South-southeast |
| SEIA |
Environmental Impact Assessment System |
| MMA |
Ministry of Environment |
|
|
|
|
|
|
|
|
|
| SQM TRS Nueva Victoria |
|
Pag. 9 |
|
|
|
|
|
|
| Acronym/Abbv. |
Definition |
| SMA |
Environmental Superintendency |
| SNIFA |
National Environmental Qualification Information System (SMA online System) |
| PSA |
Environmental Following Plan (Plan de Seguimiento Ambiental) |
| SEM |
Terrain Leveler Surface Excavation Machine |
| SFF |
specialty field fertilizer |
| SI |
intermediate solution |
| SING |
Norte Grande Interconnected System |
| S-K 1300 |
Subpart 1300 of the Securities Exchange Commission of the United States |
| SM |
salt matrix |
| SPM |
sedimentable particulate matter |
| Sr |
relief value, or maximum elevation difference in an area of 1 km² |
| SS |
soluble salt |
| SX |
solvent extraction |
| t |
ton |
| TR |
Irrigation rate |
| TAS |
sewage treatment plant |
| TEA project |
Tente en el Aire Project |
| tpy |
tons per year |
t/m3 |
tons per cubic meter |
| tpd |
tons per day |
| TRS |
Technical Report Summary |
ug/m3 |
microgram per cubic meter |
| USD |
United States Dollars |
| USD/kg |
United States Dollars per kilogram |
| USD/ton |
United States Dollars per ton |
| UTM |
Universal Transverse Mercator |
| UV |
ultraviolet |
| VEC |
Voluntary Environmental Commitments |
| WGS |
World Geodetic System |
| WSF |
Water soluble fertilizer |
| wt.% |
weight percent |
| XRD |
X-Ray diffraction |
| XRF |
X-ray fluorescence |
2.3DETAILS OF INSPECTION
The most recent site visit dates for each Qualified Person (QP) are listed in Table 2-2:
Table 2-2. Summary of site visits made by QPs to Nueva Victoria in support of TRS Review
|
|
|
|
|
|
|
|
|
|
|
|
| Qualified Person (QP) |
Expertis |
Date of Visit |
Details of Visit |
| Marco Fazzi |
Geology |
dic-23 |
Nueva Victoria Mine and Facilities |
| Gino Slanzi |
Metallurgy and Mineral Processing |
dic-22 |
Inspection of Iodine Plants, Mine and Leaching Piles |
| Marco Lema |
Mining |
dic-23 |
Nueva Victoria Mine and Facilities |
|
|
|
|
|
|
|
|
|
| SQM TRS Nueva Victoria |
|
Pag. 10 |
During the site visits to the Nueva Victoria Property, the QPs, accompanied by SQM technical staffs:
⮚Visited the mineral deposit (caliche) areas.
⮚Inspected drilling operations and reviewed sampling protocols.
⮚Reviewed core samples and drill holes logs.
⮚Assessed access to future drilling locations.
⮚Viewed the process though mining, heap leaching to the finished prilled iodine product.
⮚Reviewed and collated data and information with SQM personnel for inclusion in the TRS.
2.4PREVIOUS REPORTS ON PROJECT
Technical Report Summary prepared by WSP Consulting Chile (WSP), March 2022.
Technical Report Summary prepared by SQM SA; March 2023.
|
|
|
|
|
|
|
|
|
| SQM TRS Nueva Victoria |
|
Pag. 11 |
3DESCRIPTION AND LOCATION
3.1LOCATION
The Nueva Victoria Property is in the Commune of Pozo Almonte, in the Province of Tamarugal, within the Region of Tarapacá of northern Chile. The center of the property is situated 80 km south-southeast (SSE) of the City of Iquique and 70 km south of the City of Pozo Almonte.
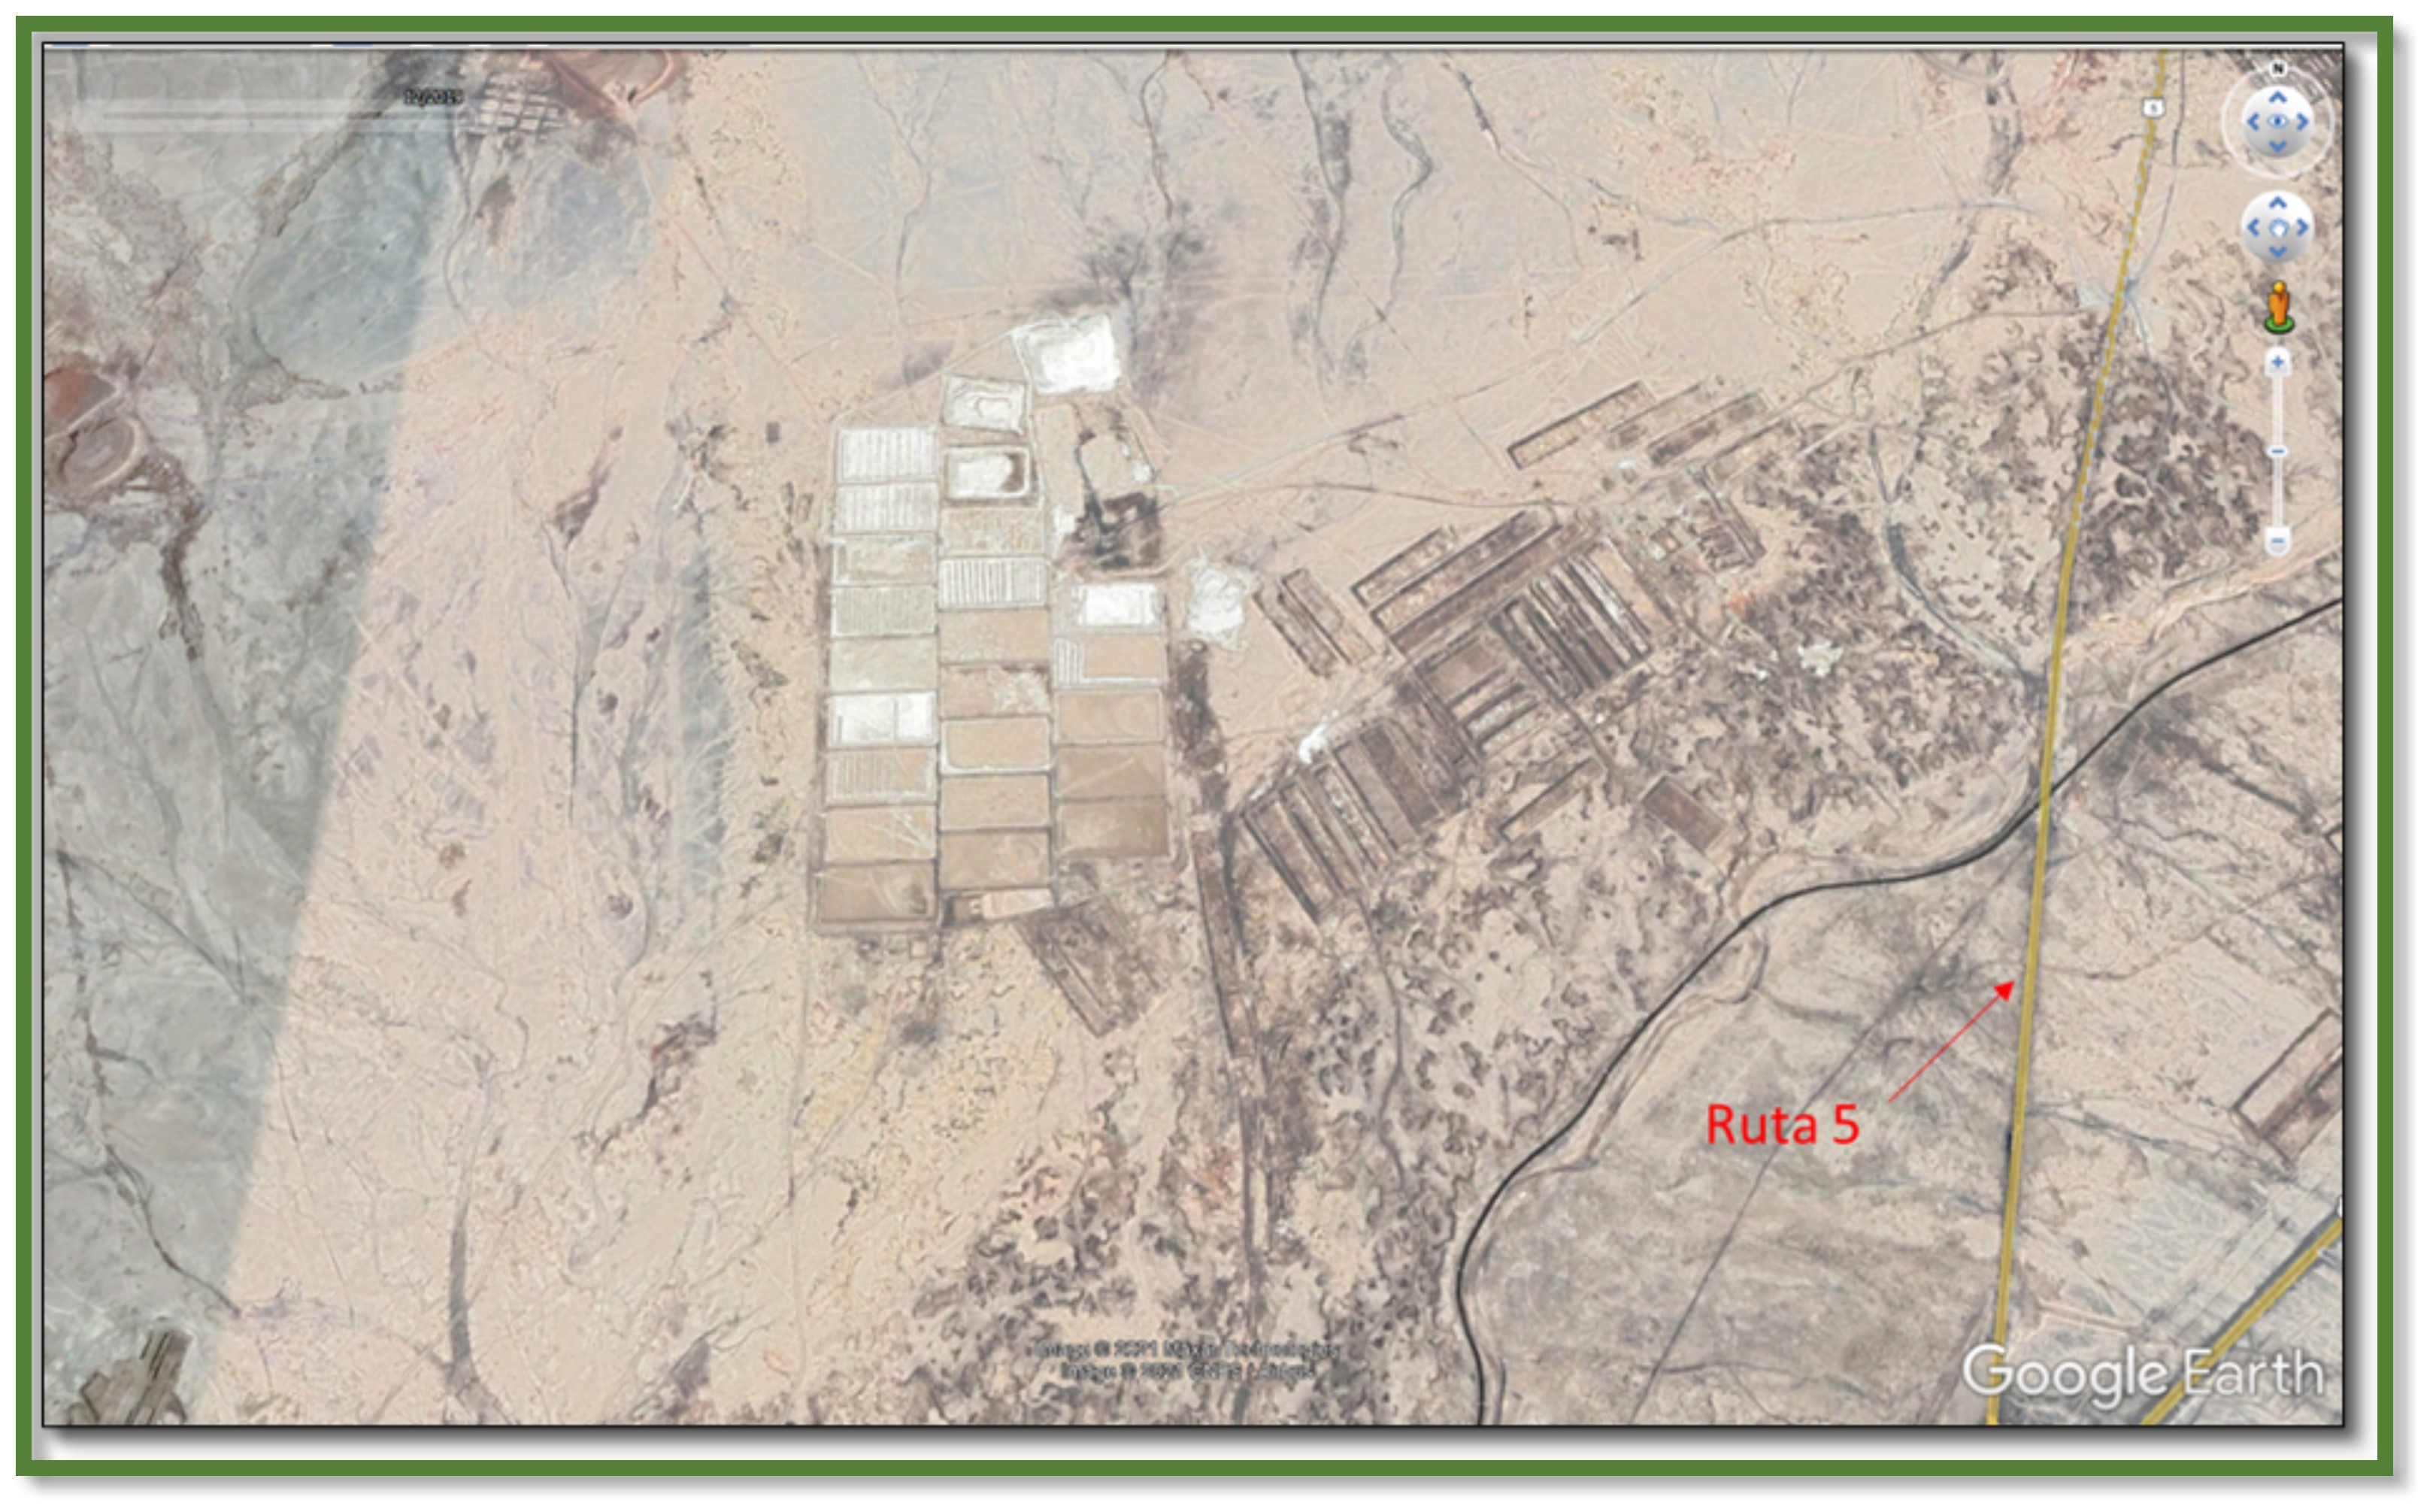
The access control checkpoint to the Property is located on the eastern side of the Ruta 5 South trunk road (the Panamericana Highway), 83 km south of the City of Pozo Almonte. The Nueva Victoria Property is approximately 55 km north-south by 40 km east-west.
|
|
|
|
|
|
|
|
|
| SQM TRS Nueva Victoria |
|
Pag. 12 |
Figure 3-1. General Location Map
|
|
|
|
|
|
|
|
|
| SQM TRS Nueva Victoria |
|
Pag. 13 |
3.2MINERAL TITLES, CLAIMS, RIGHTS, LEASES AND OPTIONS
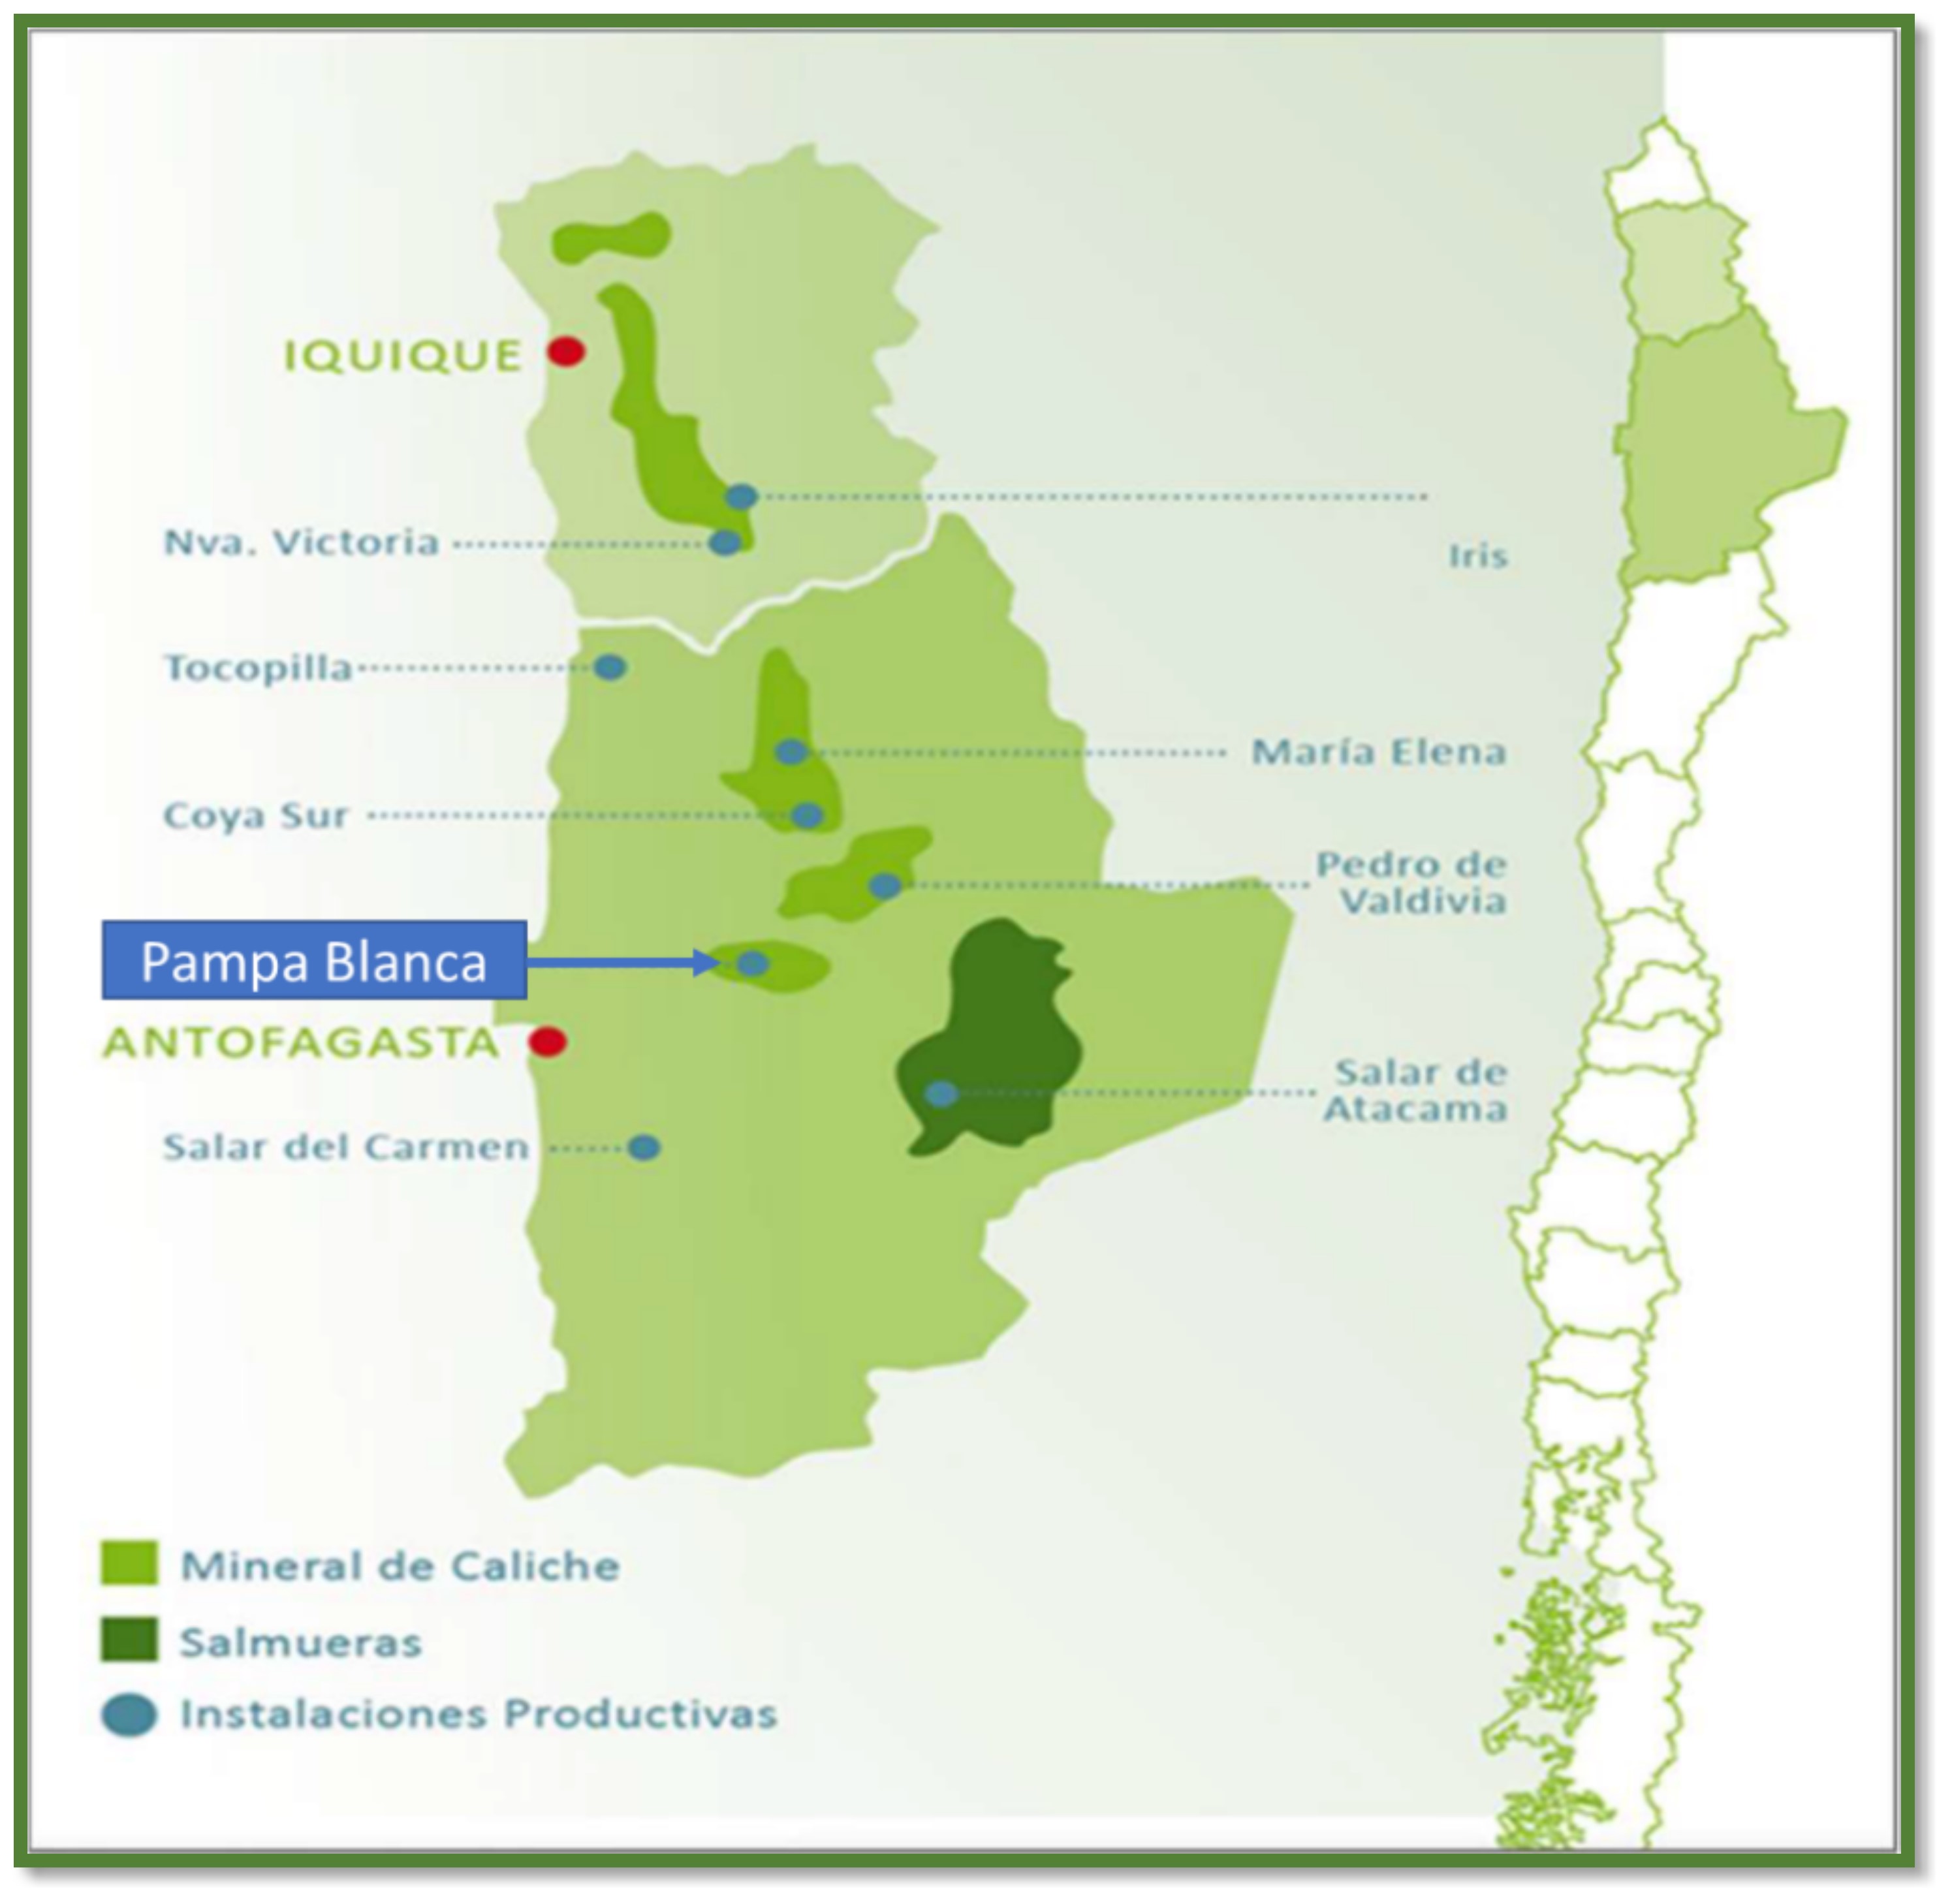
SQM currently has 5 mineral properties located in the north of Chile, in the First Region of Tarapacá (I) and Second Region of Antofagasta (II). These are the Nueva Victoria, Pampa Orcoma; María Elena, Pedro de Valdivia and Pampa Blanca properties. All properties cover a combined area of approximately 288,915 ha and has been make prospecting grid resolution of 400 x 400 m or finer.
The Nueva Victoria Property covers an area of approximately 69,800 ha.
3.3MINERAL RIGHTS
SQM owns mineral exploration rights over 1,538,919 ha of land in the I and II Regions of northern Chile and is currently exploiting the mineral resources over less of 1% of this area (as of Dec 2023).
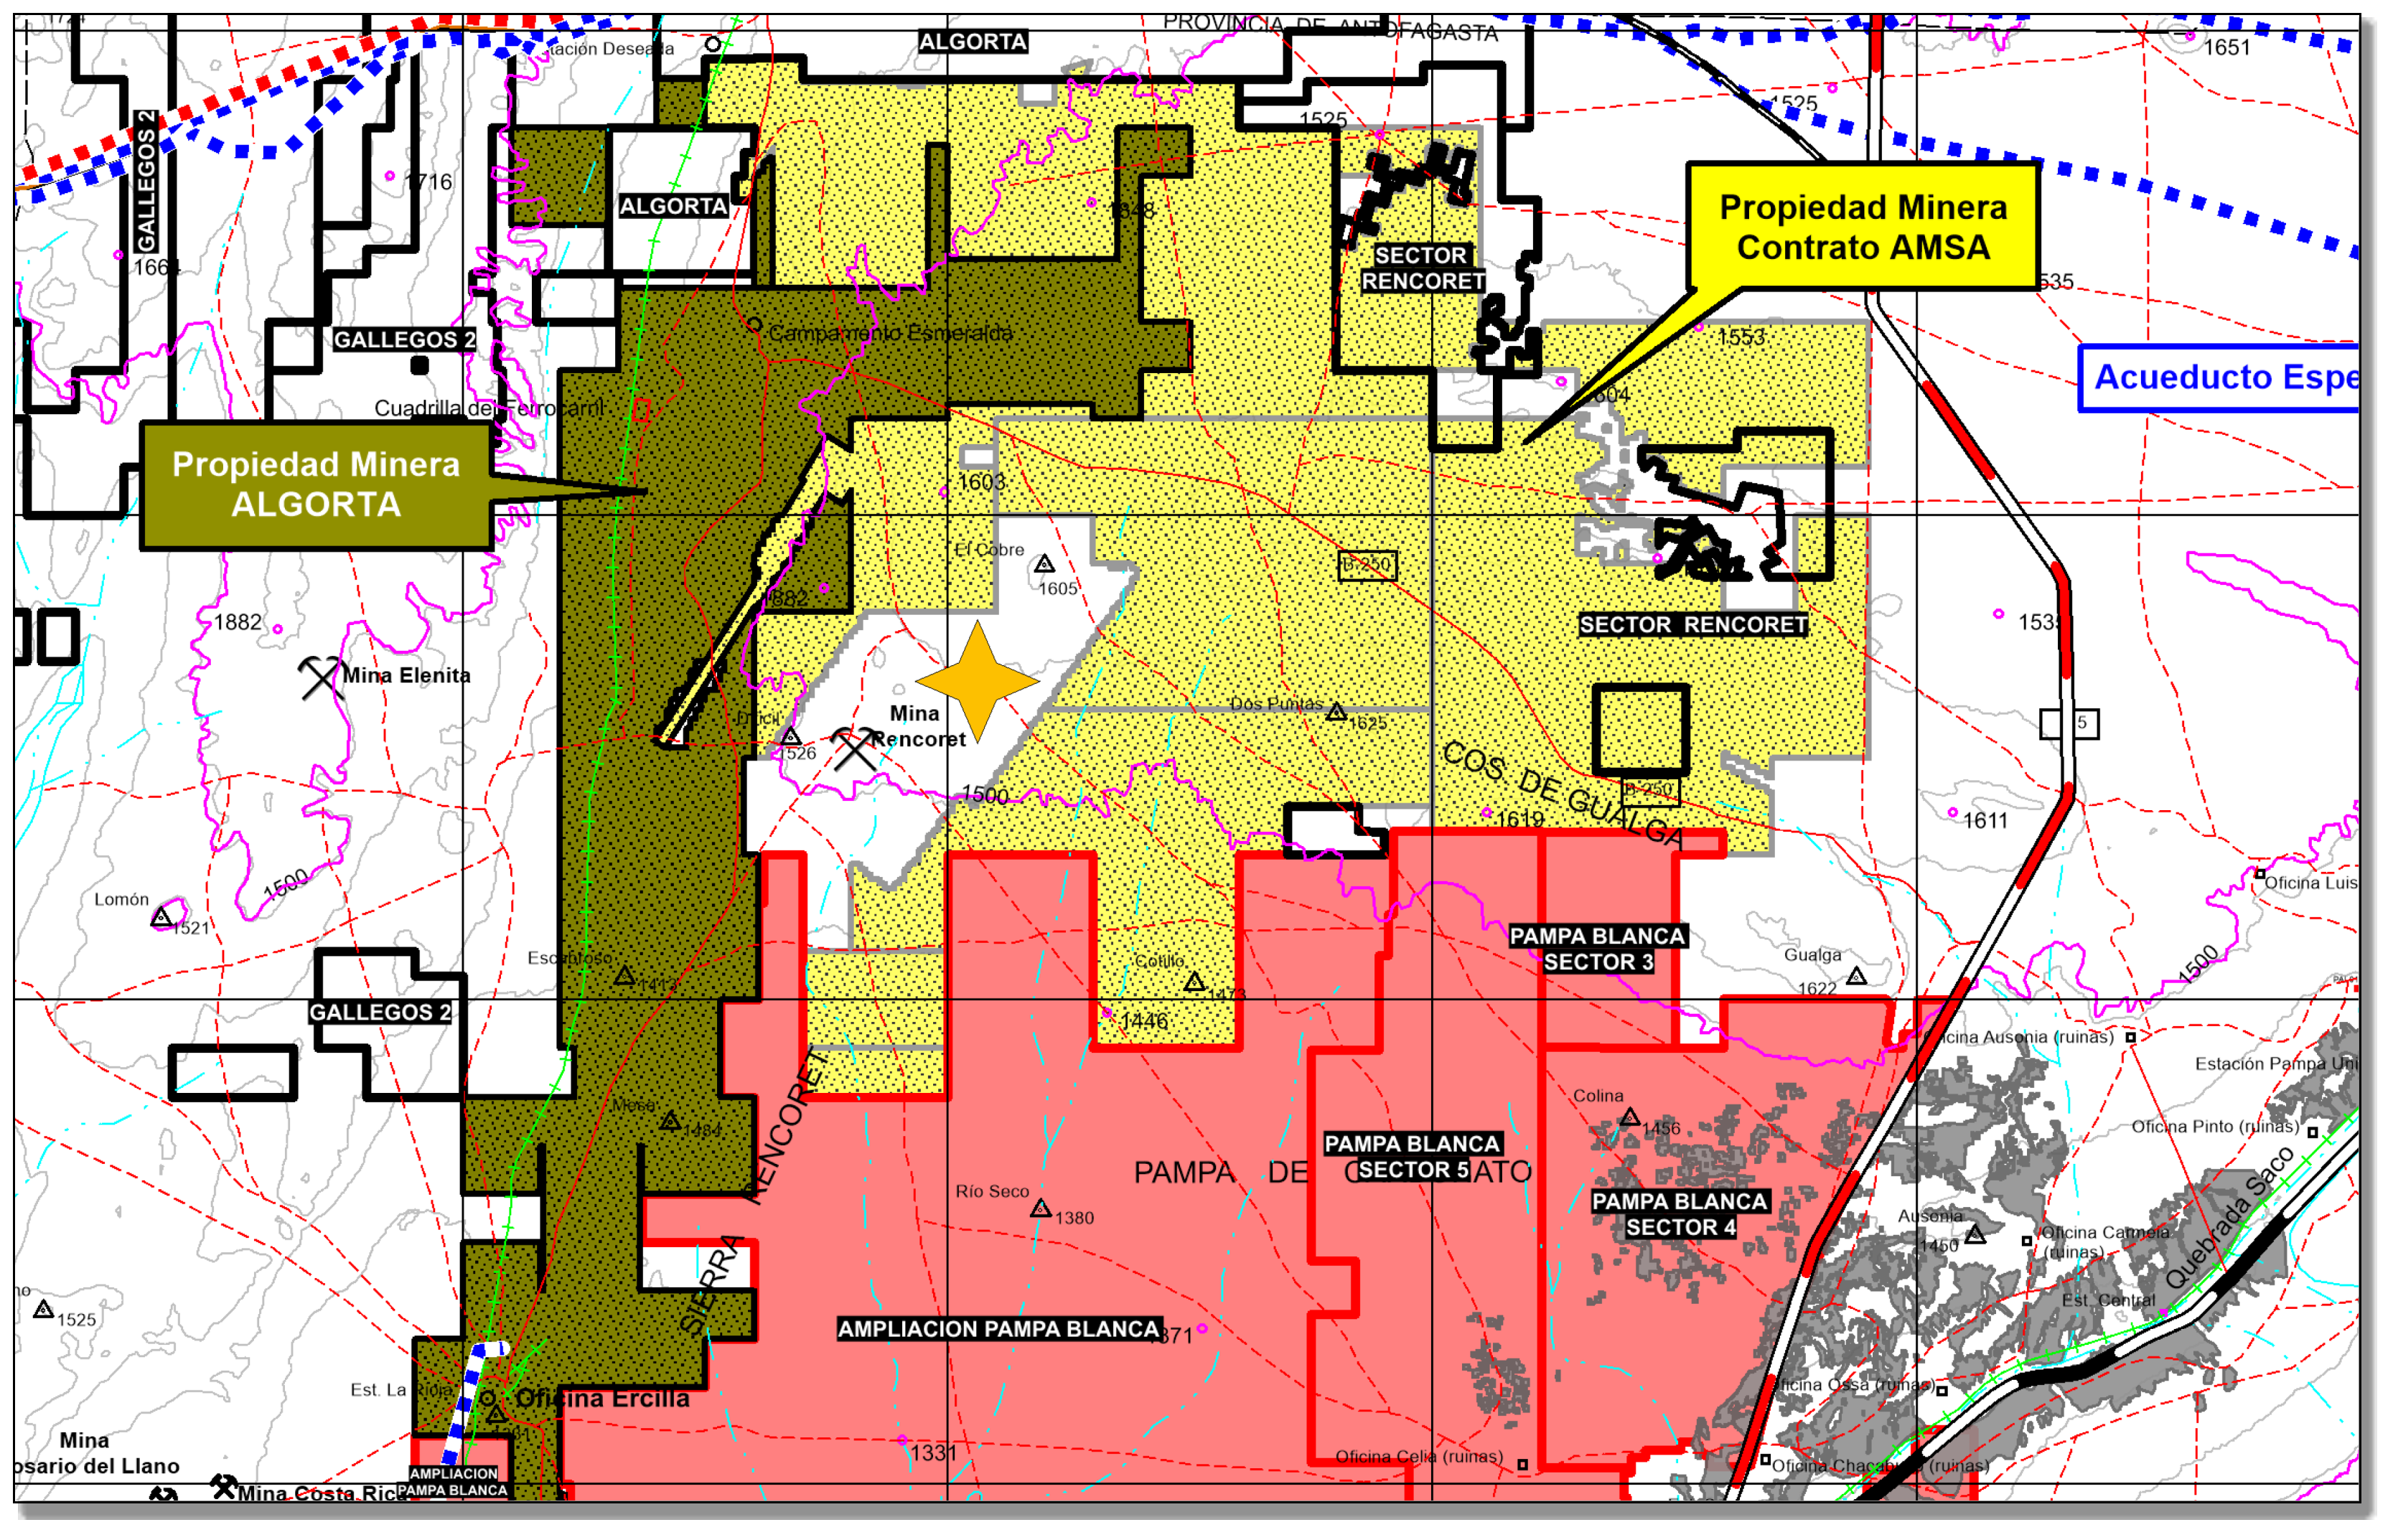
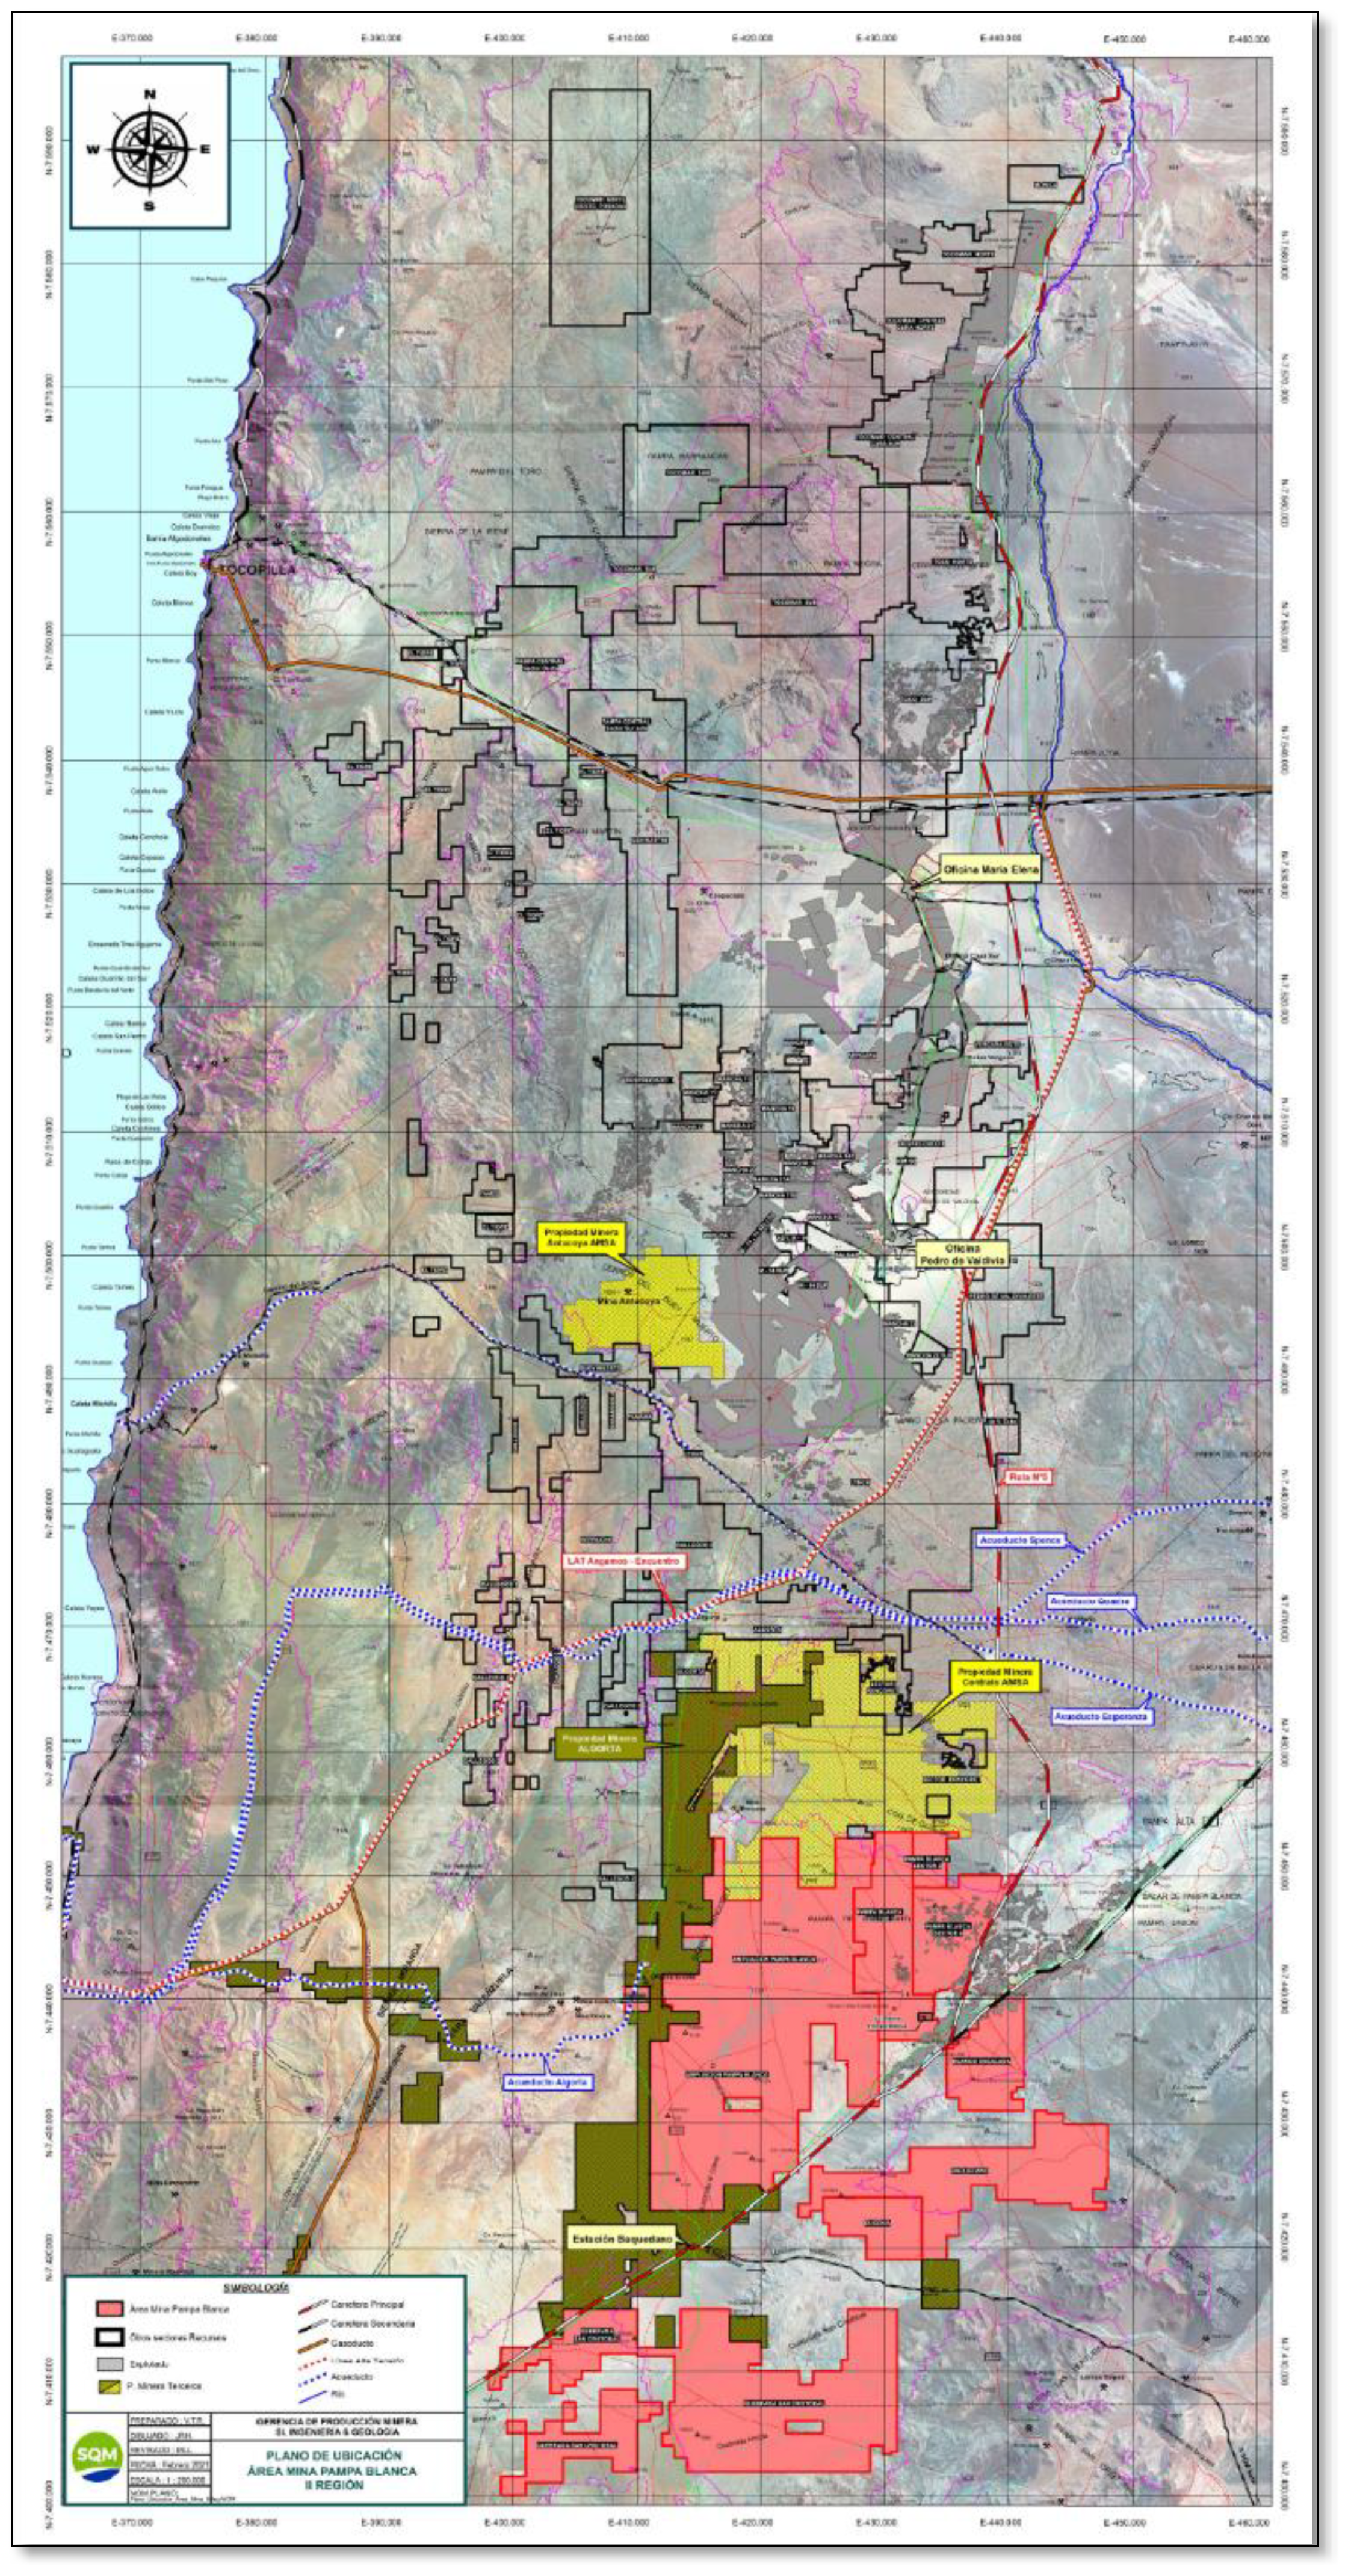
Figure 3-2. Location of Nueva Victoria Project
3.4ENVIRONMENTAL IMPACTS AND PERMITTING
Since 1997, SQM has completed numerous Environmental Impact Assessments (EIA) (Estudio de Impacto Ambiental) and Environmental Impact Statements (EIS) (Declaración de Impacto Ambiental, DIA) in support of the development and ongoing expansion of the Nueva Victoria Property (including the “Pampa Hermosa” and “TEA” Projects). These
|
|
|
|
|
|
|
|
|
| SQM TRS Nueva Victoria |
|
Pag. 14 |
environmental assessments are completed within the Chilean regulatory platform Sistema de Evaluación de Impacto Ambiental (SEIA), which is managed by the Chilean Regulatory Authority, the Servicio de Evaluación Ambiental (SEA, https://www.sea.gob.cl/).
Section 17.1 of this TRS details these environmental studies and the environmental approvals (permits), termed Resoluciones de Calificación Ambiental (RCA), issued by SEA.
3.5OTHER SIGNIFICANT FACTORS AND RISKS
SQM’s operations are subject to certain risk factors that may affect the business, financial conditions, cash flow, or SQM’s operational results. The list of potential risk factors is summarized below:
⮚Risks related to be a company based in Chile; potential political risks as well as changes to the Chilean Constitution and legislation that could conceivably affect development plans, production levels, royalties and other costs.
⮚Risks related to financial markets.
3.6ROYALTIES AND AGREEMENTS
Apart from paying standard mineral royalties to the Government of Chile, in compliance with the Chilean Royalty Law, SQM has no obligations to any third party in respect of payments related to licenses, franchises or royalties for its Nueva Victoria Property.
|
|
|
|
|
|
|
|
|
| SQM TRS Nueva Victoria |
|
Pag. 15 |
4ACCESSIBILITY, CLIMATE, LOCAL RESOURCES, INFRASTRUCTURE AND PHYSIOGRAPHY
This section of the TRS provides a summary of the physical setting of the Nueva Victoria Property, access to the property and relevant civil infrastructure.
4.1TOPOGRAPHY
The Nueva Victoria Property is located in the Intermediate Basin (Central Depression) of the Atacama Desert. The property constitutes an area of gentle topographic relief with an average elevation of 1.500 masl.
Figure 4-1 presents a topographic map developed from a digital elevation model (DEM) corresponding to a 30 m resolution ASTER satellite image. The lower part of the figure presents a topographic cross section through the DEM. The figure categorizes the topographic slope into the six categories summarized in Table 4-1.
Table 4-1. Slope Categories applied in the analysis of the ASTER DEM
|
|
|
|
|
|
|
|
|
| Slope Category |
From |
To |
| Very Low |
0° |
4.3° |
| Low |
4.3° |
9.94° |
| Moderate |
9.94° |
16.71° |
| Medium |
16.71° |
26.58° |
| High |
26.58° |
| Very High |
Slopes > 38.66° |
From inspection of Figure 4-1, it can be appreciated that the Nueva Victoria Property presents slopes that vary from very low (near flat) to moderate or medium. The steepest slopes are observed in the western sector, close to the coast, due to the coastal scarp.
|
|
|
|
|
|
|
|
|
| SQM TRS Nueva Victoria |
|
Pag. 16 |
Figure 4-1. Slope parameter map Sr and elevation profile trace AA"
4.2VEGETATION
The Nueva Victoria Property is a desert landscape devoid of vegetation cover (EIA, 2007).
4.3ACCESS TO THE PROPERTY
As detailed in Section 1 of this TRS, the Nueva Victoria Property is situated 80 km SSE the City of Iquique and 70 km south of the City of Pozo Almonte. The principal route to the property from Diego Aracena International Airport is as follows:
1.Drive 28 km north on Ruta 1 to the City of Iquique.
2.Travel northeast through the City of Iquique on primary roads to take Ruta 16 (motorway) to reach the settlement of Alto Hospicio at 44 km total distance driven.
|
|
|
|
|
|
|
|
|
| SQM TRS Nueva Victoria |
|
Pag. 17 |
3.Continue East on Ruta 16 (motorway) for 83 km to reach the deserted mining town of Humberstone. Humberstone is a Chilean National Monument and part of a UNESCO World Heritage Site where saltpeter (KNO3) was formerly mined.
4.At Humberstone, turn south on the trunk road of Ruta 5, reaching the City of Pozo Almonte at 87 km from Humberstone.
5.Continue south on the trunk road of Ruta 5, reaching the SQM access control checkpoint (garita) of the Nueva Victoria property at 171 km.
4.4CLIMATE AND LENGTH OF OPERATING SEASON
Nueva Victoria is in the Intermediate Basin (Central Depression) of the hyper arid Atacama Desert at a latitude of approximately 21°S. The topographic relief at the property is gentle and much of the area is essentially flat with an average elevation of 1,500 masl. Long-term annual rainfall is close to 0 mm, and the annual average temperature is 18° C. Relative humidity of the air is low. On very rare occasions, the convective summer rains which occur from November to February over land above 4,000 masl on the Altiplano of the Andes may extend west to bring very infrequent rain to the Intermediate Basin and Nueva Victoria.
The climate of the study area is classed as a low marginal desert climate within the Köppen climate classification (EIA, 2007).
Nueva Victoria operates all year, there are no climate constraints which would force the operations to shut down during any part of the year. However, in the event of a very rare thunderstorm, precautions must be taken to eliminate the risk to life that that lightning strikes could present.
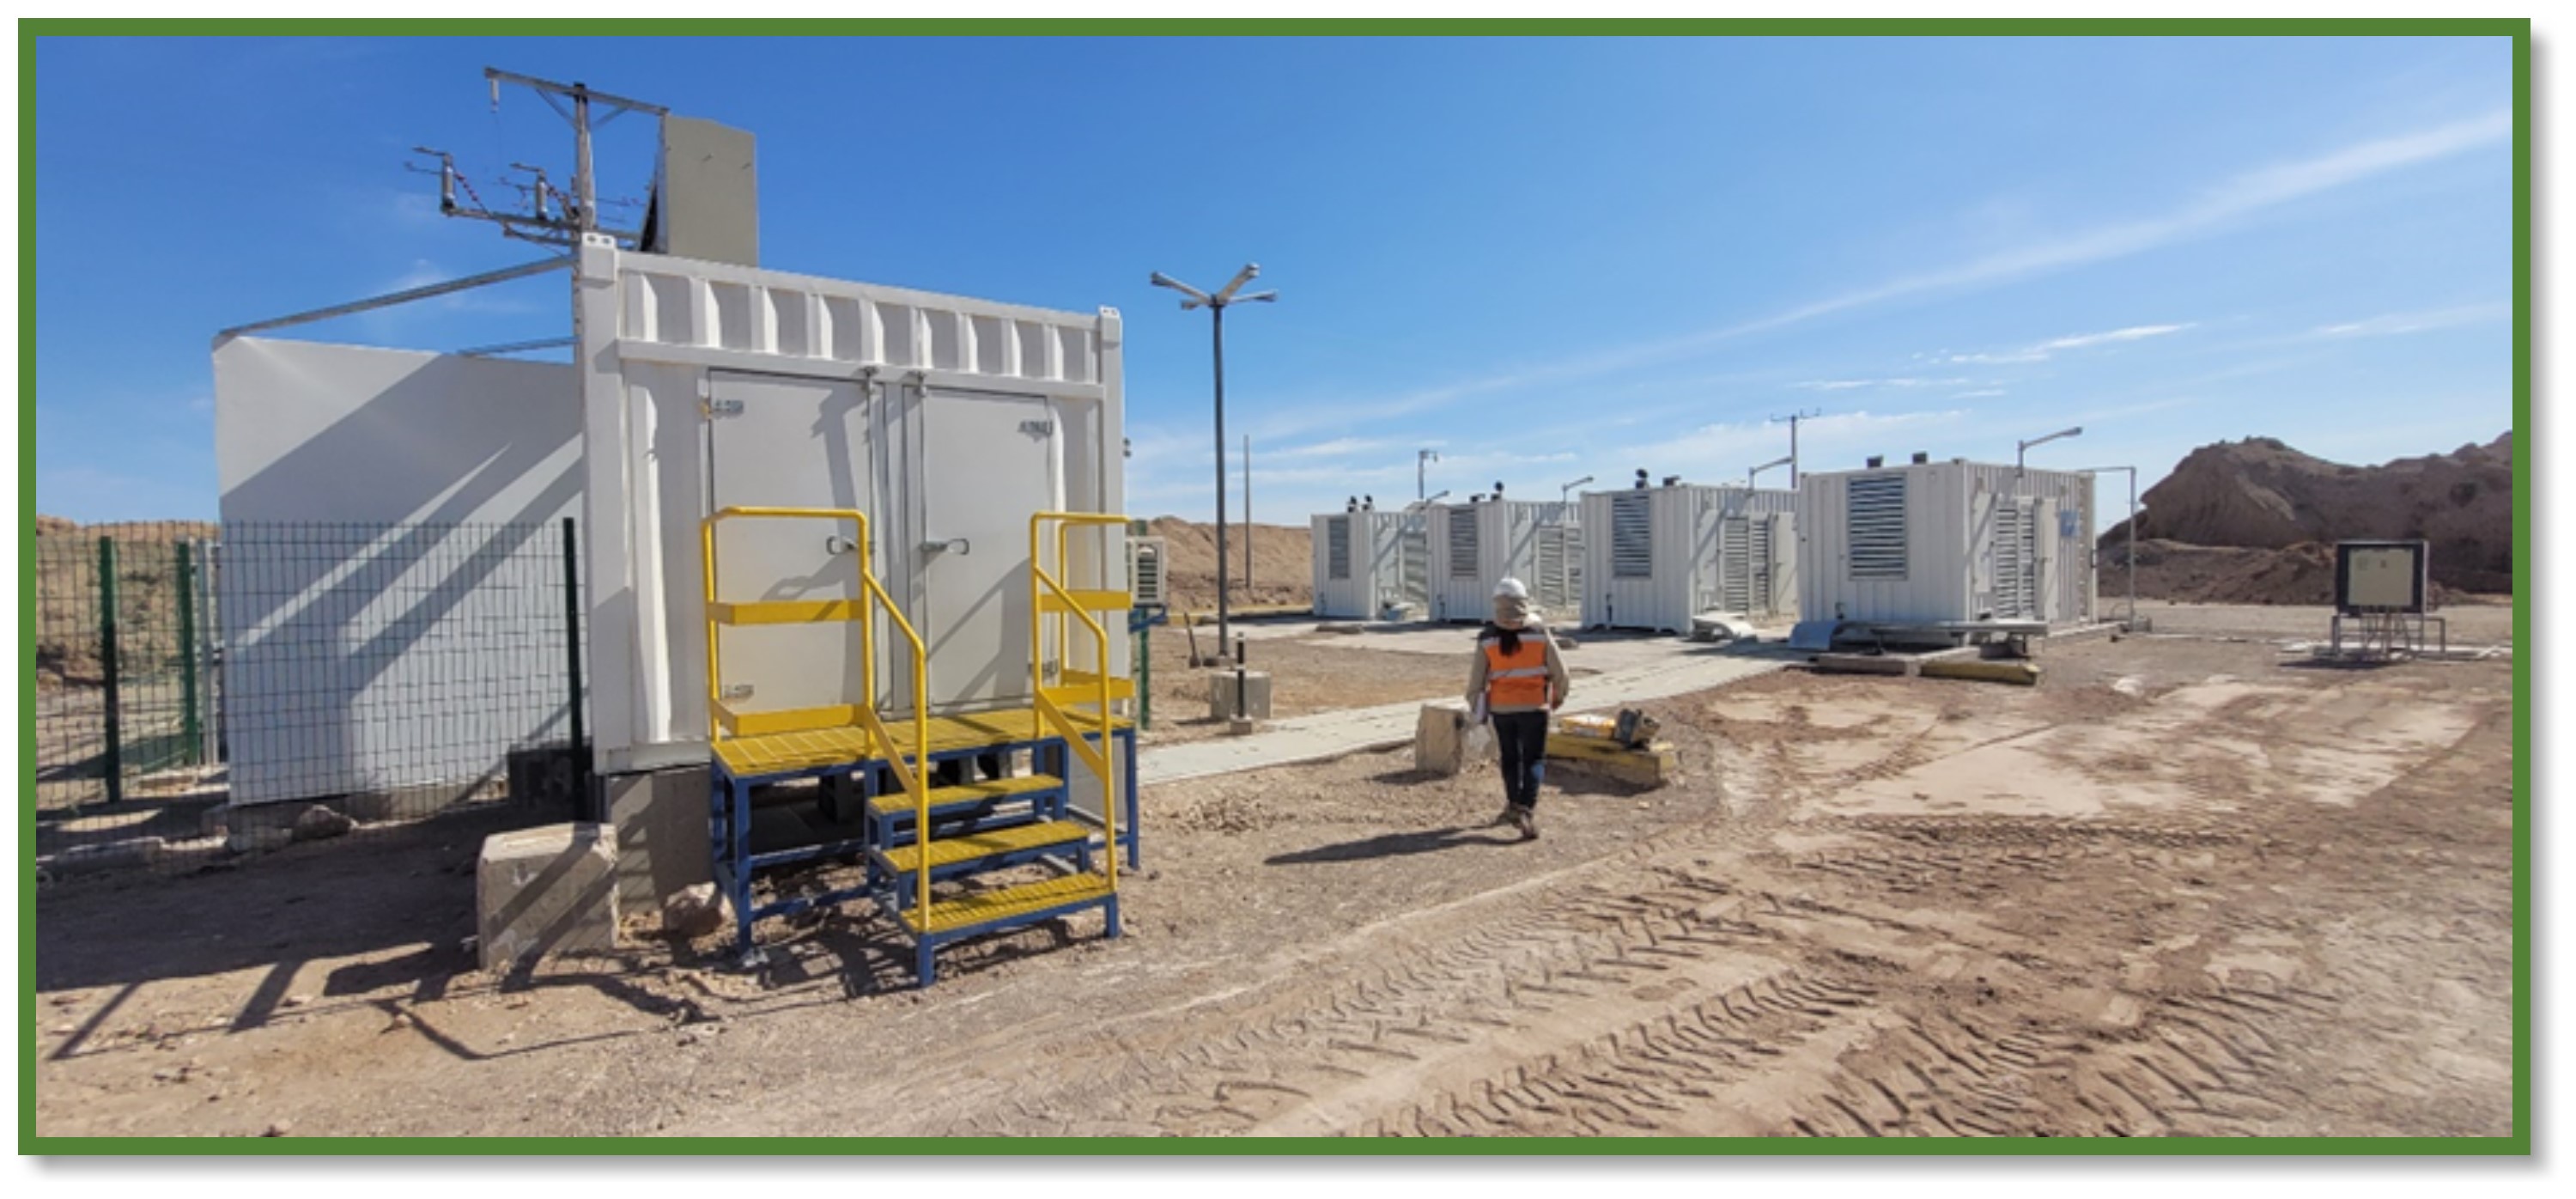
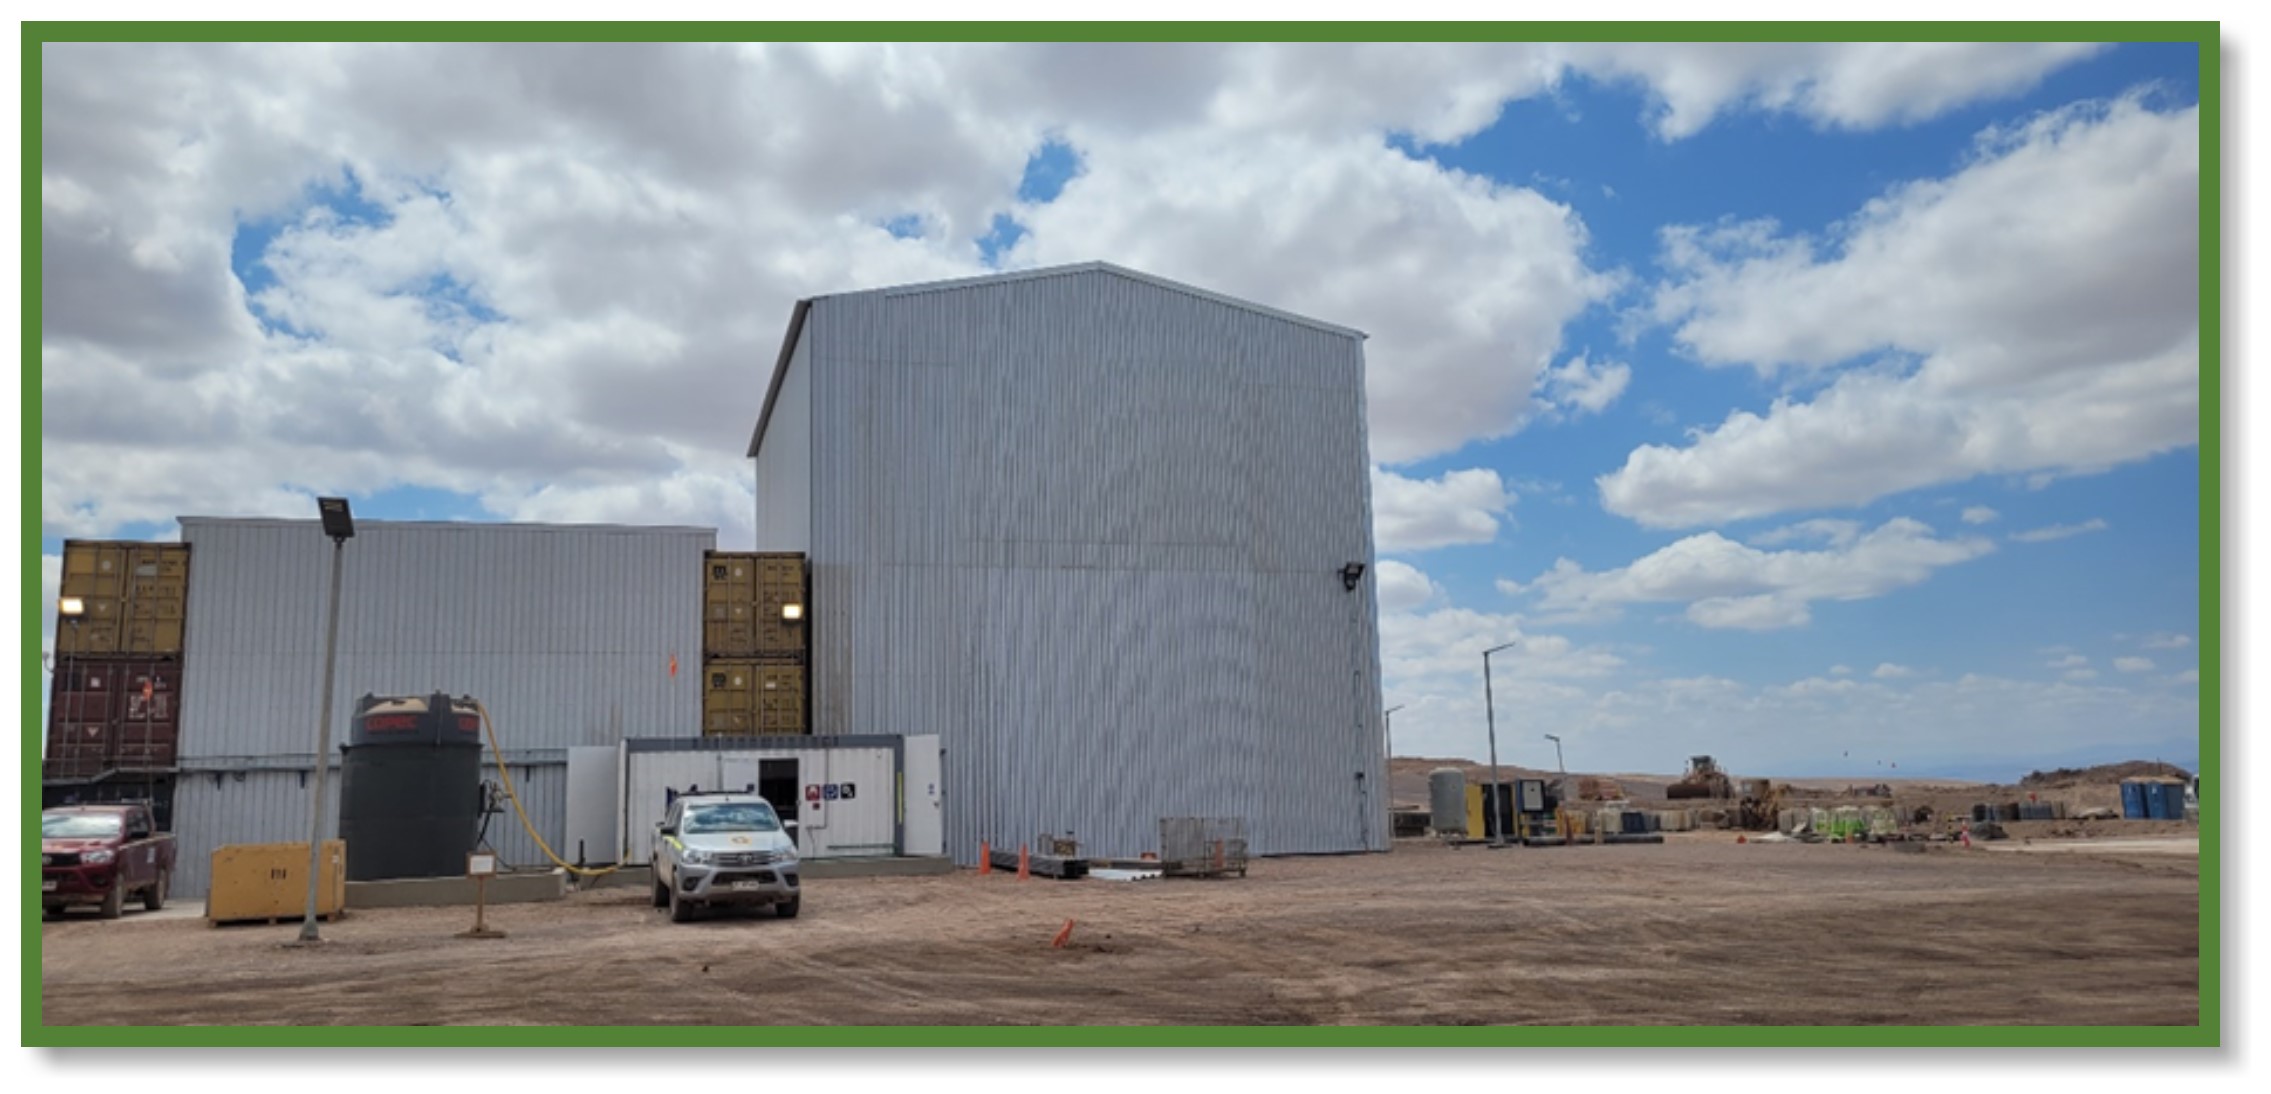
4.5INFRASTRUCTURE
In the Nueva Victoria mining area and, the following facilities and infrastructures can be found.
The main facilities at Nueva Victoria are follows:
⮚Caliche mining areas.
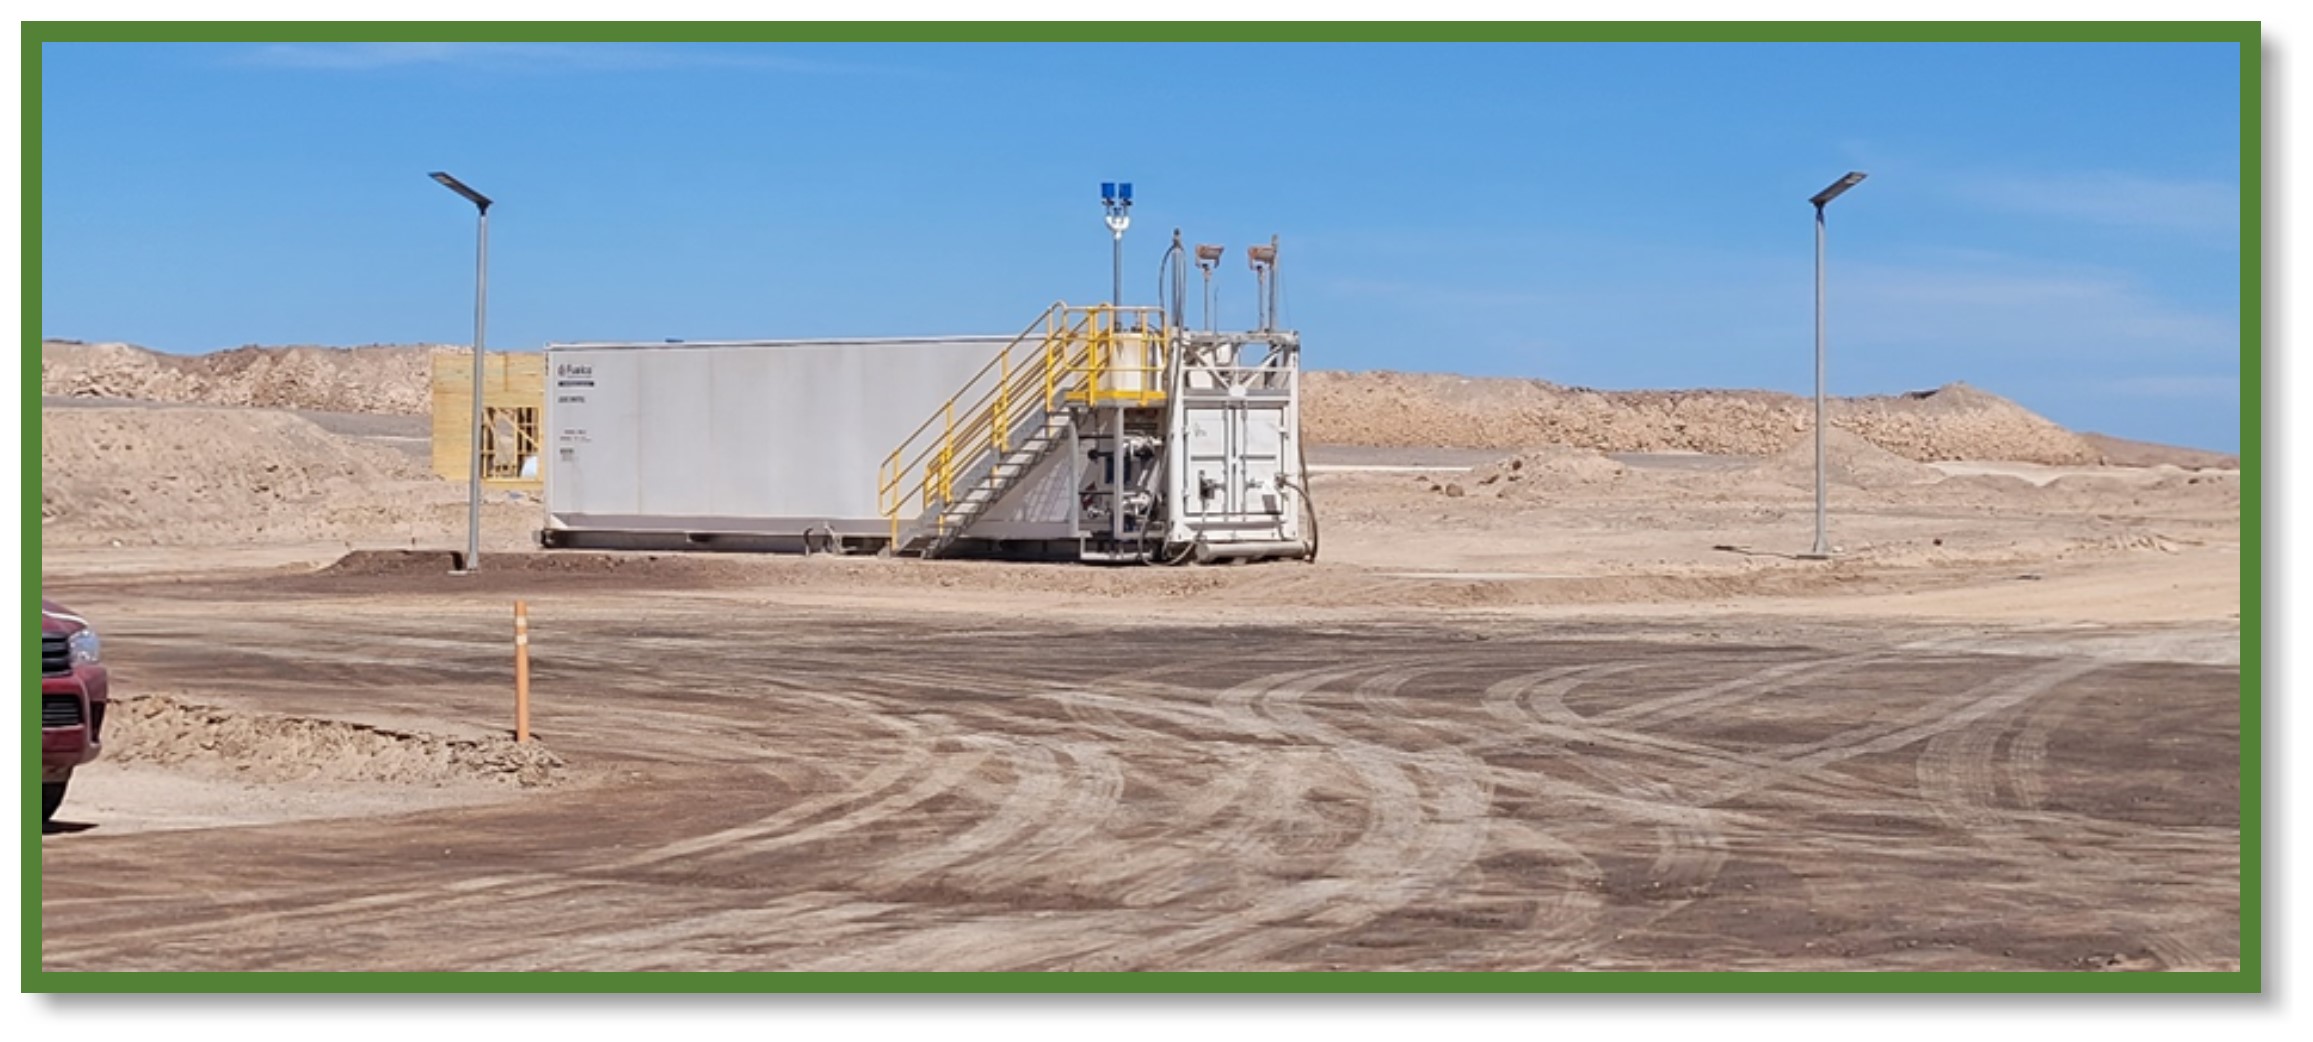
⮚Industrial water supply.
⮚Heap leaching operation.
⮚Iodine plants (Nueva Victoria and Iris properties).
⮚Evaporation ponds (Sur Viejo).
⮚Iodine production & prilling Plant NV (Nueva Victoria).
⮚Administrative and technical offices and training rooms.
⮚Medical facilities.
⮚Camp and associated facilities (gym, restaurant, etc.).
⮚Domestic waste disposal site.
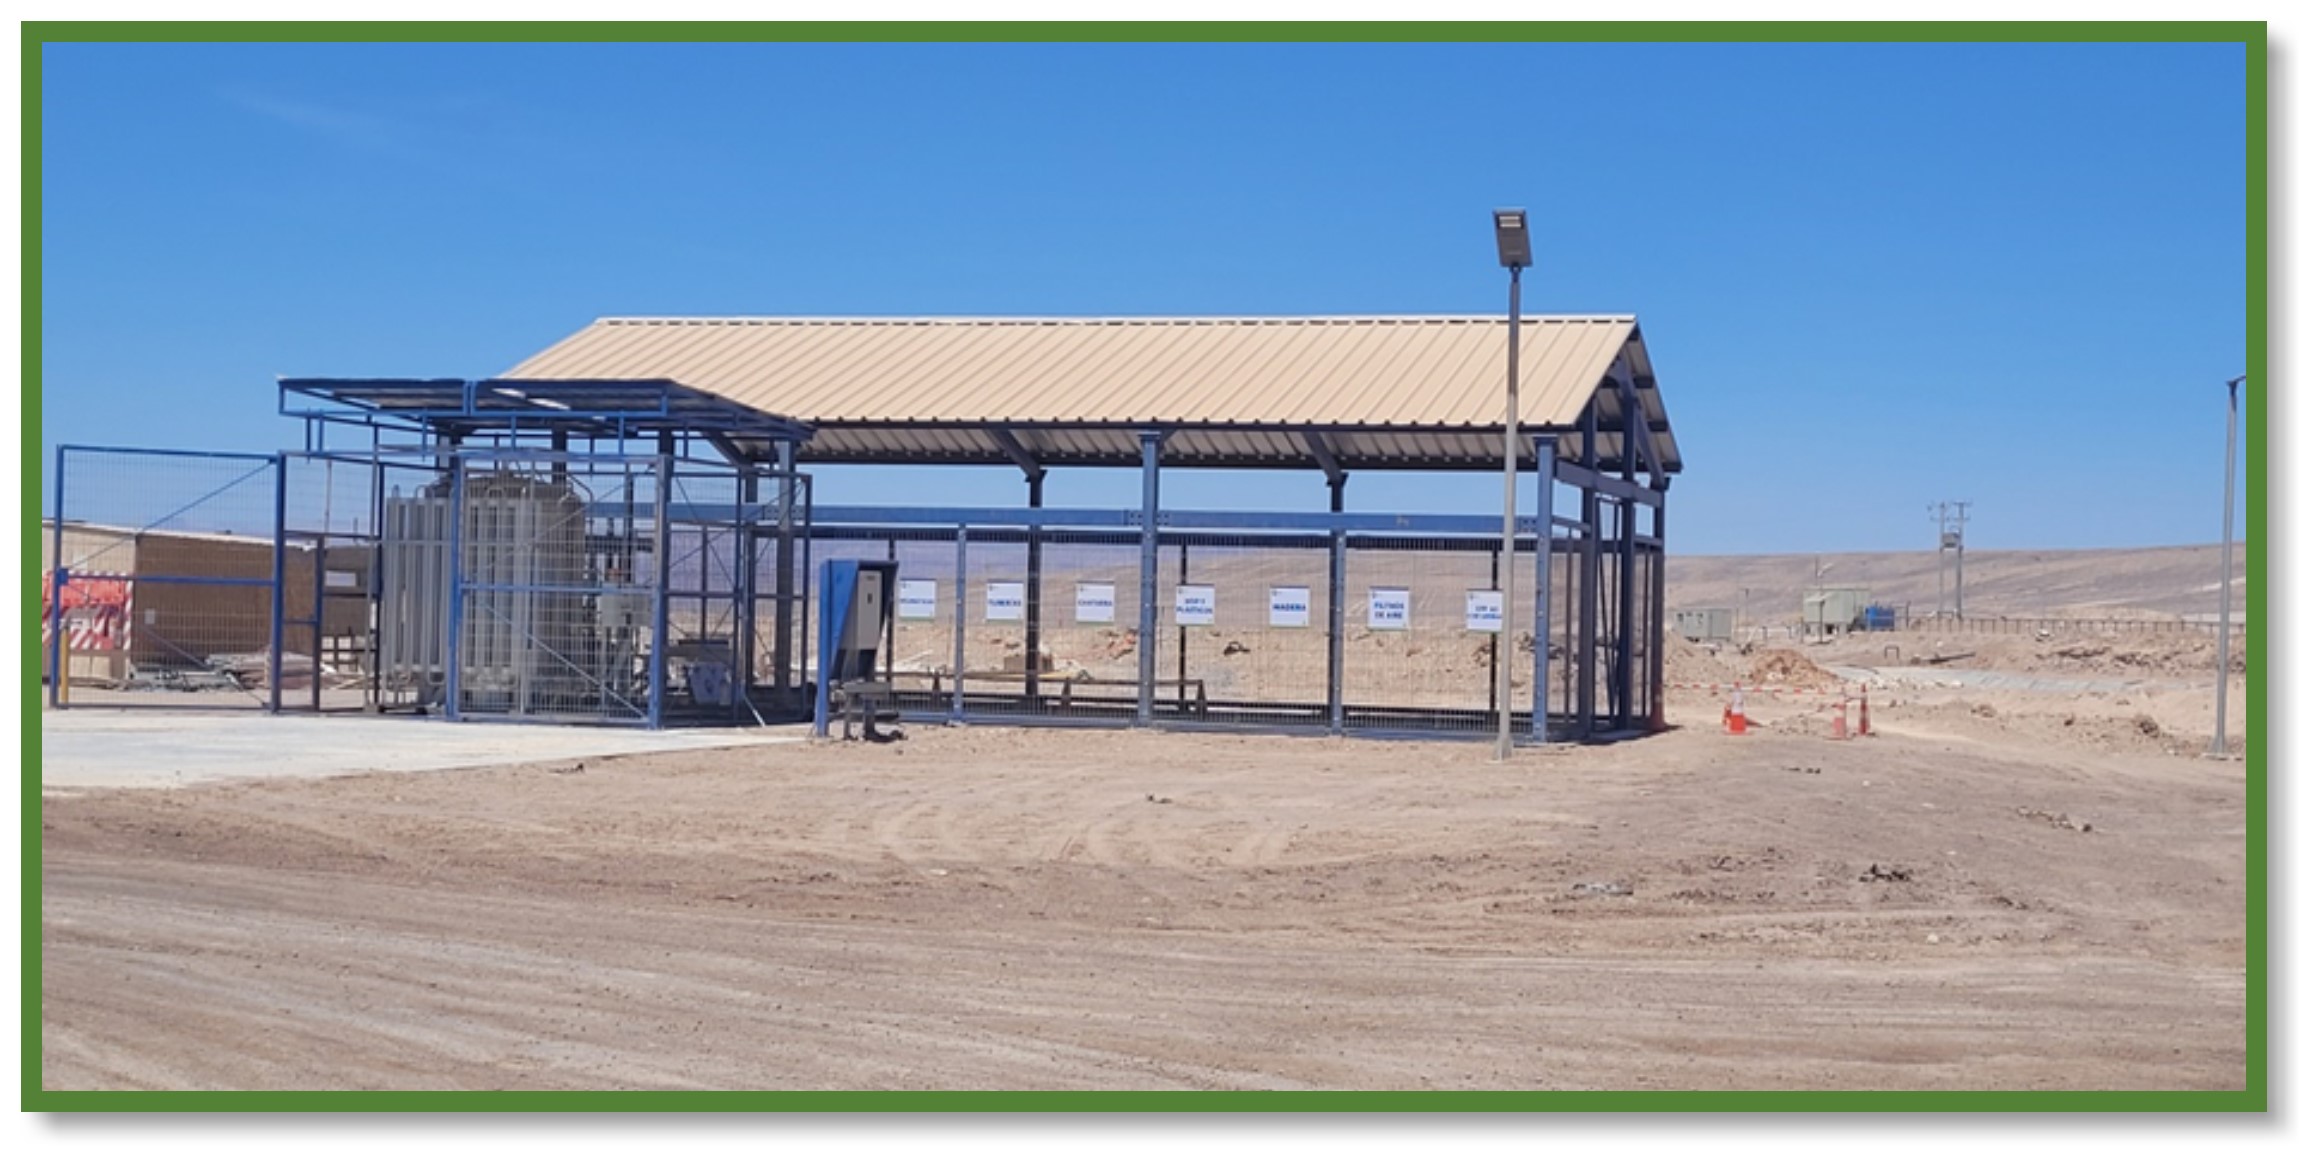
⮚Hazardous waste yard.
⮚Non-hazardous industrial waste yard.
|
|
|
|
|
|
|
|
|
| SQM TRS Nueva Victoria |
|
Pag. 18 |
5HISTORY
Commercial exploitation of caliche mineral deposits in northern Chile began in 1830s when sodium nitrate was extracted from the mineral for use in explosives and fertilizers production. By the end nineteenth century, nitrate production had become Chile's leading industry, and, with it, Chile became a world leader in nitrates production and supply. This boom brought a surge of direct foreign investment and the development of the Nitrate “Offices” or “Oficinas Salitreras” as they were called.
Synthetic nitrates' commercial development in 1920s and global economic depression in l930s caused a serious contraction of the Chilean nitrate business, which did not recover in any significant way until shortly after World War II. Post-war, widely expanded commercial production of synthetic nitrates resulted in a further contraction in Chile's natural nitrate industry, which continued to operate at depressed levels into their 1960s.
The Victoria “Office” was first established between 1941 and 1944 by the “Compañía Salitrera de Tarapacá”. At its peak, Victoria produced 150,000 metric tons of nitrates with over 2,000 employees. In 1960, CORFO, Chile´s Production Development corporation. Formed the roots of SQM. In 1971, Anglo Lautaro sold all its shares to CORFO and SQM became wholly owned by the Chilean government since SQM´s inception, nitrates and iodine have been produced from caliche deposits in northern Chile.
In late 2002, Nueva Victoria East was re-established as a mining operation. Nueva Victoria mineral is transported by trucks to heap leach facilities where iodine is produced. This site is made up of facilities located in three sectors corresponding to Nueva Victoria, Sur Viejo and Iris.
The overall site layout is shown in Figure 6-4.
In 2014, there was investment into developing new mining sectors and increased production of both nitrates and iodine at Nueva Victoria, achieving a production capacity (including Iris facility) of approximately 8,500 metric tons per year of iodine at the site.
In 2015, SQM company focused on increasing the efficiency of its operations. This included a plan to restructure our iodine and nitrates operations. To take advantage of highly efficient production facilities at Nueva Victoria, it was decided to suspend mining and nitrates operations and reduce iodine production at Pedro de Valdivia site. During 2017, production capacity for iodine was increased at Nueva Victoria, with current effective iodine capacity at approximately 14,000 metric tons per year.
|
|
|
|
|
|
|
|
|
| SQM TRS Nueva Victoria |
|
Pag. 19 |
6GEOLOGICAL SETTING, MINERALIZATION AND DEPOSIT
6.1REGIONAL GEOLOGICAL SETTING
In Chile, the nitrate-iodine deposits are in the intermediate basin, limited to the east by the Coastal Range (representing the Jurassic magmatic arc) and the Precordillera (associated to the magmatic activity originating from the mega Cu-Au deposits in northern Chile), generating a natural barrier for their deposition and concentration. (Figure 6-1)
The salt and nitrate deposits of northern Chile occur in all topographic positions from hilltops and ridges to the centers of broad valleys (Ericksen, 1981). They are hosted in rocks of different ages and present very varied lithologies; however, a distinctive feature is that they are always related in some way to a key unit known as the Saline Clastic Series (CSS à Late Oligocene to Neogene). The CSS comprises mainly siliciclastic and volcanoclastic sandstones and conglomerates produced by erosion and re-sedimentation of pre-existing rocks of the Late Cretaceous-Eocene volcanic arc. This key stratigraphic unit includes rocks deposited under a range of sedimentary environments including fluvial, eolian, lacustrine, and alluvial, but all were developed primarily under arid conditions. The upper parts of CSS include lacustrine and evaporitic rocks composed mainly of sulfates and chlorides. The outcrop of CSS always lies to the west of the ancient Late Cretaceous-Eocene volcanic arc, covering the present-day topography (Chong et al., 2007).
Figure 6-1. Geomorphological scheme of saline deposits in northern Chile.
Note: Nitrate deposits are restricted to the eastern edge of the Coastal Range and in the Central Basin (Taken from Gajardo, A & Carrasco, R. (2010). Salares del Norte de Chile: Potential Lithium Source. SERNAGEOMIN, Chile).
Most of the nitrate deposits in Chile are found in the provinces of Tarapacá and Antofagasta, with more northerly occurrences in Tarapacá largely restricted to a narrow band along the eastern side of the Coastal Range; while, to the south they extended extensively not only in the Coastal Range, but also in the Central Valley and the Andean Front (Garret, 1983). Extremely rare minerals are present in this type of deposits, among which we find nitrates, nitrate-sulphates, chlorides, perchlorates, iodates, borates, carbonates, and chromates. The mineralization occurs as veins or impregnations filling pores, cavities, desiccation polygons and fractures of unconsolidated sedimentary deposits; or as a massive deposit forming a consolidated to semi-consolidated cement as extensive uniform mantles cementing the regolith, called caliche.
The regional geology in which the Nueva Victoria nitrate-iodine deposits are situated corresponds to Paleogene clastic sedimentary rocks, over a volcanic basement, associated with lavas of intermediate composition (mainly andesites - tuffs) representing Jurassic volcanism. The area of influence of the geological component includes the coastal plain, the coastal Farellón, the coastal mountain range and the central Gran pampa. The oldest rocks outcropping in the area correspond to Upper Carboniferous Granitoids. This unit is covered by rocks of the Sierra de Lagunas Strata, which correspond to Upper
|
|
|
|
|
|
|
|
|
| SQM TRS Nueva Victoria |
|
Pag. 20 |
Triassic-Lower Jurassic volcano-sedimentary products and affected by associated hypabyssal intrusive rocks. The Sierra de Lagunas strata are covered in apparent concordance by rocks of The Oficina Viz Formation, which represent the volcanic products of the Lower and Middle Jurassic magmatic arc.
The Cerro Vetarrón Monzonite outcrops in the central sector of the Cordillera de la Costa, it is partly contemporaneous with the Oficina Viz Formation. The Oficina Viz Formation is concordantly covered by marine sedimentary rocks of the Huantajaya Group à the Lígate Cove Formation and the El Godo Formation.
Plutonic rocks originated in the arc magmatism during the Upper Jurassic-Lower Cretaceous, represented by the Patache Diorite, the Cerro Carrasco Intrusive Complex, and the Oyarbide Intrusive Complex, as well as by hypabyssal bodies associated with the latter unit. These complexes outcrop in the coastal strip and in the western edge of the Coastal Range.
The deformation processes of north-south faults associated with the Atacama Fault System caused structural basins (tensional basins and grabens) where the Cerro Rojo Formation and Punta Barranco Formation were continentally deposited. These Mesozoic units are intruded by Lower Cretaceous subvolcanic intrusive and granitoids of the Montevideo Intrusive Complex. These intrusive bodies outcrop in the easternmost portion of the Cordillera de la Costa and the second unit presents ages that decrease towards the east. On the other hand, in the eastern limit of the Coastal Range, isolated rocks of Upper Cretaceous intrusive outcrop, which represent the magmatism of that period and evidence the migration of the magmatism axis towards the east.
The Great Coastal Escarpment generated during the Pleistocene-Holocene by the combined action of eustatic, tectonic and erosive events, limits the western edge of the Coastal Range with the Coastal Strip. Attached to the Great Coastal Escarpment there are large volumes of colluvial deposits, which are also found on a smaller scale along escarpments associated with east-west faults and on the slopes of some mountain fronts. After the generation of the Great Coastal Escarpment, sedimentation of littoral deposits occurs at its foot. Massive landslide deposits caused by various gravitational displacements of material from the western edge of the Coastal Mountain Range.
In the Pleistocene-Holocene, the deposition of the Alto Hospicio Gravels and the alluvial deposits occur in the Coastal Range in the Pleistocene-Holocene, which are restricted to the bottoms of the ravines and locally form alluvial fans. These deposits have a considerably smaller extension than the Oligocene-Pliocene deposits, which shows a reduction in the contribution of alluvial clastic material. On the other hand, in the Central Basin there are large extensions of Pleistocene-Holocene alluvial deposits, whose components come from the erosion of rocks from the Precordillera. These alluvial deposits are cut and covered by active alluvial deposits, of lesser extension and made up of clays, silts, and fine sands.
6.2LOCAL GEOLOGY
The geology of the Nueva Victoria Property is presented in Figure 6-2. The geological units are described below.
6.2.1Intrusive Igneous Rocks
Granites, diorites, quartz monzonites and gabbro of Cretaceous age, intruded as sills and dikes. Denoted as Jg on the geological map.
6.2.2Volcanic and Marine Sedimentary Sequences
Jurassic age marine sedimentary rocks (sandstones, glauconitic breccias, shales and limestones) with intercalations of continental andesites and andesitic breccias. Denoted as Jm(m) on the geological map.
6.2.3Stratified Sedimentary and Volcanoclastic Rocks
This category comprises Mesozoic to Cenozoic sedimentary and volcanoclastic units comprising:
⮚Continental volcanoclastic rocks of Jurassic age comprising andesites, breccias & andesitic agglomerates with intercalations of continental sediments. Denoted as Jv (i) on the geological map.
⮚Continental clastic sedimentary rocks of Triassic age comprising conglomerates, sandstones & quartzites with intercalations of marine sedimentary rocks. Denoted as Tr on the geological map.
⮚Poorly to well consolidated sediments of Quaternary age comprising aeolian sediments, colluvial deposits, alluvial fans, terraces, and sedimentary debris flows. Denoted as Qcp on the geological map.
⮚Evaporitic salts forming salt pans, salt flats, saline & gypsiferous crusts, associated with modern and former wetlands and brackish or saline lagoons and areas of former or current shallow water tables. Denoted as Qs on the geological map.
⮚Recent alluvial sediments, sedimentary debris flows and aeolian deposits. Denoted as Qal on the map.
|
|
|
|
|
|
|
|
|
| SQM TRS Nueva Victoria |
|
Pag. 21 |
Figure 6-2. Geological map at Nueva Victoria. Internal document-SQM
|
|
|
|
|
|
|
|
|
| SQM TRS Nueva Victoria |
|
Pag. 22 |
|
|
|
|
|
|
|
|
|
| SQM TRS Nueva Victoria |
|
Pag. 23 |
6.3PROPERTY GEOLOGY
Through the collection of geological information by logging of drill holes and surface mapping, five stratified subunits have been identified within the Quaternary Unit (Qcp) (Units A to E). (Figure 6-3). These units correspond to sediments and sedimentary rocks that host the non-metallic or industrial ores of interest, i.e., iodine and nitrate. Each of the units is described below.
6.3.1Unit A
Forms the upper part of the profile. It corresponds to a sulfated soil or petrogypsic saline detrital horizon of light brown color. It has an average thickness of approximately 0.4 m. It consists mainly of sand and silt-sized grains, and to a lesser extent gravel-sized clast. It presents as a well-cemented horizon at depth, while higher in the profile, within 0.2 m of ground surface, weathering and leaching of the more soluble components have rendered it porous and friable. At ground surface it presents as loose fine sand to silt-sized sediment, referred to locally as "chuca" or "chusca" which is readily transported by the wind or lofted by dust devils. Below the chusca, the competent part of the unit may present subvertical cracks vertical cracks, which may become filled with chusca o aeolian sediments.
6.3.2Unit B
Underlies Unit A. It corresponds to a light brown detrital sulfate soil characterized by anhydrite nodules in a medium to coarse sand matrix. Its thicknesses may vary laterally. It is typically between 0.5 to 1.0 m but may become laterally impersistent.
6.3.3Unit C
Underlies Unit B. It comprises fine to medium dark brown sandstones, with intercalations of sedimentary breccias. The thickness of this unit varies between 0.5 to 2.0 m. The sandstones and breccias are well consolidated and cemented by salts comprising sulfates, chlorides & nitrates. The salts occur as envelopes around the sedimentary clast (sand and gravel grains), fill cavities between the sedimentary clast and form saline aggregates due to saline efflorescence, (the deposition of salts from the evaporation of water from the capillary fringe of shallow water tables).
6.3.4Unit D
Underlies Unit C. It comprises dark brown matrix-supported polymictic breccias. The thickness of this units varies between 1 to 5 m. The clast are angular, tending towards sub rounded with depth. They range from 2 mm (very fine gravel) to 80 mm (small cobble) in diameter. Lithologically, the clast comprise porphyritic andesites, amygdaloidal andesites, intrusive and highly altered lithics. The matrix of the breccias consists of medium to coarse sand-sized grains. The breccias is well consolidated and cemented by salts. As in the case of Unit C, the salts comprise sulfates, chlorides and nitrates, which occur as envelopes around the clast, fill cavities and present as saline aggregates resulting from saline efflorescence.
6.3.5Unit E
This unit is like Unit D, except for the sedimentary fabric and structure. It comprises dark brown clast-supported polymictic conglomerates. The clast are sub rounded, and present a wide range of sizes, with some clast exceeding 100 mm in diameter. Their composition includes porphyritic andesites, intensely epidotized and chloritized porphyritic andesites, fragments of indeterminate altered intrusive rocks and clast with abundant iron oxide. The deposit is well cemented by salts, which, as in the case of Units C & D envelope the clast, fill cavities and occur as aggregates or accumulations of salts formed by saline efflorescence.
6.3.6Unit F
Corresponds to the igneous basement of the sedimentary sequence. At Nueva Victoria this corresponds mainly to Cretaceous volcanic rocks, andesitic to dioritic lavas, and granitic bodies. The basement presents little mineralization of economic interest, this being restricted to fracture infills, where present.
|
|
|
|
|
|
|
|
|
| SQM TRS Nueva Victoria |
|
Pag. 24 |
Figure 6-3. Typical profile of the Qcp unit at Nueva Victoria.
|
|
|
|
|
|
|
Upper horizon of sulfate sediments, forming loose, readily wind-transportable "chusca" where it is weathered and leached at the ground surface. This unit varies in thickness in the range 0.5 – 0.9 m. |
|
| Anhydrite nodules in a medium to coarse sand matrix. This unit typically varies in thickness in the range 0.5 – 1.0 m, but it may become laterally impersistent. |
|
| Horizon fine to medium-grained dark brown sandstones with intercalations of sedimentary breccias. This unit hosts economic mineralization. The thickness of the unit typically varies between 1.0 – 1.5 m. |
|
| Level of fine to medium-grained breccias. As in the case of Unit C, this unit hosts economic mineralization. The thickness of the unit varies between 1.0 - 3.0 m. |
The Geology of the different sectors of Nueva Victoria corresponds mainly to sedimentary and volcano-sedimentary associations, on a Jurassic igneous crystalline Jurassic basement, related through sedimentation cycles, which could correspond to the distal facies of an alluvial fan, which vary in size from medium sand to fine gravel. In general, the facies found correspond to breccias, sandstones, andesites, intrusive, and tuffs. In the TEA and Hermosa sectors, salt crusts can be observed encasing sandstones, as well as cover of anhydrite, which is present in an irregular manner and with variable thicknesses. In the West Mine Sector, the anhydrite crust is much more frequent, reaching maximum thicknesses, of the order of metric. Figure 6-4 shows the location of the sectors that are described in detail.
|
|
|
|
|
|
|
|
|
| SQM TRS Nueva Victoria |
|
Pag. 25 |
Figure 6-4. Nueva Victoria Sectors
6.3.7Tente en el Aire (TEA)
Morphologically, this deposit area is in a flat area (pampa) crossed by a NW-SE fault system and surrounded by volcanic outcrops. The low topographic relief has protected the evaporite deposits against erosive processes, particularly in the south and northeast of TEA. The western part of TEA has been affected by surface runoff that leached the caliche, making it soft, friable and porous and reducing its nitrate content. Lithologically TEA presents a sequence of sandstones and polymictic breccias over a volcanic basement. Salt crusts and variable thicknesses of anhydrite cover the sandstones (Figure 6-5).
The occurrence of mineralization corresponds to mineralized mantles (caliche) which typically vary in thickness in the range 3.0 – 3.5 m. 70% of TEA is covered by high-nitrate content, competent caliche, cemented by a high content of soluble salts. The remaining 30% of TEA is covered by reduced nitrate leached caliche of lower geomechanically quality.
Nitrate mineralization in TEA caliche is in the range 4.5 – 6.5% NaN03 with iodine is in the range 400 - 430 ppm I2.
|
|
|
|
|
|
|
|
|
| SQM TRS Nueva Victoria |
|
Pag. 26 |
Figure 6-5. Schematic Cross section of TEA Deposit.
|
|
|
|
|
|
|
|
|
| SQM TRS Nueva Victoria |
|
Pag. 27 |
6.3.8Torcaza
The Torcaza deposit area comprises an open pampa in the southeast, limited by volcanic outcrops to the west and by fluvial deposits to the east. Its geology comprises a sequence of fine-grained sandstones and medium-grained breccias, with a tendency to an increase in clast sizes with depth. The mineralized mantles of caliche are typically 2.5 – 3.2 m in thickness. Nitrate content is spatially variable. A Nitratine (NaNO₃) horizon can be identified in the stratigraphic sequence between the sandstone and breccia subunits, deposited by mineral-rich groundwaters
(Figure 6-6).
The nitrate grade at Torcaza is in the range 4.0 – 6.0 % NaN03 and the iodine grade is in the range 350 - 430 ppm.
Figure 6-6. Stratigraphic Cross Section of Torcaza sector
|
|
|
|
|
|
|
|
|
| SQM TRS Nueva Victoria |
|
Pag. 28 |
6.3.9Hermosa
The Hermosa deposit area comprises a closed basin crossed by a system of NW-SE faults. It is and area of gently undulating relief with areas of salt accumulation. It is limited by volcanic outcrops to the west and north. The gentle topographic relief has limited erosion. The geology at Hermosa comprises a sequence of medium-grained sandstones and polymictic breccias over oligomictic breccias resting on volcanic basement (Figure 6-7).
The mineralized mantles (caliche) at Hermosa typically vary in thickness in the range 3.5 – 4.0 m. 90% of Hermosa is covered by high-nitrate content, competent caliche, cemented by a high content of soluble salts. The remaining 10% of Hermosa is covered by reduced nitrate leached caliche of lower geomechanically quality.
Nitrate mineralization in Hermosa caliche is in the range 5.5 – 7.5 % NaN03, with iodine is in the range 400 - 450 ppm I2.
|
|
|
|
|
|
|
|
|
| SQM TRS Nueva Victoria |
|
Pag. 29 |
Figure 6-7. Stratigraphic Column and Schematic cross section of Hermosa Sector.
6.3.10Mina Oeste
The Mina Oeste corresponds to an open Pampa to the southeast located in an alluvial environment, limited by volcanic outcrops to the west and by fluvial deposits to the east. Lithologically, the sector is formed by a sequence of fine sandstones and medium breccias with an increase of clast at depth. And anhydrite crust is present in this sector and is much more frequent than in other sectors, reaching the maximum thicknesses, of order metric (Figure 6-8).
|
|
|
|
|
|
|
|
|
| SQM TRS Nueva Victoria |
|
Pag. 30 |
Like the Torcaza deposit area, the Mina Oeste deposit area comprises an open pampa in the southeast, limited by volcanic outcrops to the west and by fluvial deposits to the east. Its geology comprises a sequence of fine-grained sandstones and medium-grained breccias, with a tendency to an increase in clast sizes with depth.
At Mine Oeste, the anhydrite crust is more prominent and laterally persistent than in the other deposit areas and may attain a thickness of the order of a 1 m.
The mineralized mantles of caliche are a little thinner than in TEA and Hermosa, generally attaining a thickness in the range 2.0 – 2.5 m. The caliche has been subject to leaching which has reduced its nitrate content and geomechanically competence.
The nitrate grade at West Mine is in the range 3.5 – 5.5 % NaN03 and the iodine grade is in the range 350 - 450 ppm.
6.3.11Mina Norte
The Mina Norte deposit area corresponds to a raised block, bounded to the east by the Sur Viejo salt flat.
The caliches of this sector have suffered salt remobilization and erosion, reflected in the lower nitrate content and reduced thickness of the caliche. Lithologically, the caliches correspond to sandstones and breccias with high quartz contents, which makes them highly abrasive. Figure 6-9 presents the stratigraphic column and a cross section for Mina Norte.
The caliche mantles present average thicknesses of 2.0 – 2.2 m. The geomechanically quality of the caliches in this sector is generally high, except locally where they are cut by faults which may result in significant clay content.
As for the Mina Oeste deposit area, the nitrate grade at Mina Norte is in the range 3.5 – 4.5 % NaN03 and the iodine grade is in the range 400 - 450 ppm.
|
|
|
|
|
|
|
|
|
| SQM TRS Nueva Victoria |
|
Pag. 31 |
Figure 6-8. Schematic Cross section of Mina Oeste Sector.
|
|
|
|
|
|
|
|
|
| SQM TRS Nueva Victoria |
|
Pag. 32 |
Figure 6-9. Schematic Cross Section of Mina Norte Sector.
|
|
|
|
|
|
|
|
|
| SQM TRS Nueva Victoria |
|
Pag. 33 |
6.3.12Mina Sur
The Mina Sur deposit area corresponds to a tectonically uplifted basin, bounded to the east by the Sur Viejo salt flat. The Mina Sur deposit area was enriched by surface water runoff after mineralization which favored the remobilization of soluble salts and enrichment with chlorides, sulfates, potassium, calcium, and sodium. The geology of South Mine comprises a sequence of anhydrites, sandstones and polymictic breccias over siltstones with variable clay content.
The caliche mantles reach average thicknesses of 2.0 meters. Their geomechanically quality is generally high, except locally where they are cut by faults which may result in significant clay content.
The nitrate grade at Mina Sur is lower than at Mina Norte and Mina Oeste, being in the range 2.5 – 3.5 % NaN03, although the iodine grade is a little higher at 400 - 500 ppm.
6.4MINERALIZATION
Table 6-1 presents a summary of the mineralogy of the Nueva Victoria Property. The number of samples included in the database on which the table is based are indicated by the “n = “value in the table header. TEA has by far the greatest number of samples with n = 291. An “X” indicates the presence of the mineral in the samples of the sector. In the case of TEA, the proportion of the 291 samples analyzed in which the mineral of interest was recorded are indicated as percentage. The table uses the following color coding to indicate the percentage content by mass of dry sample of each mineral of interest:
⮚Red fill indicates that the mineral accounts for 10% or greater of the mass of the dry samples.
⮚Orange fill indicates that the mineral accounts for between 5% and 10% of the mass of the dry samples.
⮚Yellow fill indicates that the mineral accounts for between 1% and 5% of the mass of the dry samples.
⮚An “X” in a cell with no color fill indicates that the mineral of interest accounts for less than 1% of the mass of the dry samples.
|
|
|
|
|
|
|
|
|
| SQM TRS Nueva Victoria |
|
Pag. 34 |
Table 6-1. Mineralogy of Nueva Victoria Caliches.
|
|
|
|
|
|
|
|
|
|
|
|
|
|
|
|
|
|
|
|
|
|
|
|
|
|
|
|
|
|
| Group |
Mineral
(Spanish name in brackets) |
Formula |
Pampa Blanca
(n = 33) |
Mina Sur
(n = 21) |
Mina Oeste
(n =75) |
Mina Norte
(n = 21) |
Mina Norte
Gravels
(n = 2) |
TEA
(n = 291) |
TEA Gravels
(n = 3) |
| Nitrates |
Nitratine (Nitratina) |
NaNO3 |
X |
X |
X |
X |
X |
X (79%) |
X |
| Darapskita (Darapskita) |
Na3(SO4)(NO3).H2O |
X |
X |
|
|
|
X (6%) |
|
| Saltpetre (Nitrato potassic) |
KNO3 |
|
X |
|
|
|
|
|
| Iodates |
Lautarite (Lautarita) |
Ca(IO3)2 |
|
X |
|
|
|
X (9%) |
X |
| Hectorfloresite (Hectorfloresita) |
Na9(IO3)(SO4)4 |
|
X |
|
|
|
X (59%) |
X |
| Fuenzalidaita |
K6(Na, K)4Na6Mg10(SO4)12(IO3)12.12H2O |
|
|
|
|
|
X (8%) |
|
| Bruggenite |
Ca(IO3)2.H2O |
|
|
|
|
|
X (25%) |
|
| Chlorides |
Halite |
NaCI |
X |
X |
X |
X |
X |
X (82%) |
X |
| Sylvite |
KCI |
|
X |
|
|
|
|
|
| Potassium-rich halite |
(K, Na)CI |
|
X |
|
|
|
|
|
| Sulfates |
Anhydrite |
CaSO4 |
X |
X |
X |
X |
|
X (76%) |
|
| Glauberite |
Na2Ca(SO4)2 |
X |
X |
X |
X |
X |
X (21%) |
X |
| Loeweite, |
Na12Mg7(SO4)13.15H2O |
X |
X |
X |
|
|
X (13%) |
|
| Polyhalite |
K2Ca2Mg(SO4)4.2H2O |
|
X |
X |
X |
X |
X (81%) |
X |
| Kieserite |
MgSO4.H2O |
X |
X |
|
|
|
X (55%) |
|
| Astrakanit |
Na2Mg(SO4)2.4H2O |
|
X |
X |
X |
X |
X (78%) |
X |
| Humberstonita |
K3Na7Mg2(SO4)6(NO3)2.6H2O |
|
X |
|
X |
X |
X (8%) |
|
| Hexahydrite |
MgSO4.6H2O |
|
X |
|
|
X |
X (55%) |
|
| Epsomite |
MgSO4.7H2O |
|
|
|
|
|
X (4%) |
|
| Gypsum |
CaSO4.2H2O |
X |
X |
|
X |
X |
X (15%) |
X |
| D'Ansite |
Na21Mg(SO4)10Cl3 |
|
|
|
|
|
X (0.4%) |
|
| Bassanite |
2(CaSO4).H2O |
|
X |
|
|
|
|
|
| Mirabilite |
Na2SO4.10H20) |
|
|
|
|
|
|
X |
| Cesanite |
Ca2Na3(OH)(SO4)3 |
|
|
|
|
|
|
X |
| Thenardite |
Na2SO4 |
|
X |
|
|
|
|
|
| Pentahydrite |
MgSO4.5H2O |
|
X |
|
|
|
|
|
| Vanthoffite |
Na6Mg(SO4)4 |
|
X |
|
|
|
|
|
| Silicates |
Silicate minerals generally |
|
X |
X |
X |
X |
X |
X |
X |
6.5DEPOSIT TYPES
6.5.1Genesis of Caliche Deposits
Wetzel (1961) postulated that nitrate deposits are enriched in salts by mudflow events. Mueller (1960) supported the theory of Singewald and Miller (1916) which cited accumulation by capillary rise and evaporation of groundwater at the margins of salt flats. Fiestas (1966) suggested that reactions between acids from volcanic gas clouds and the rocks and soils of the nitrate fields was important in the genesis of the mineral salts concentrated within the caliche deposits. Ericksen (1975) proposed that the mineral salts have a mainly atmospheric origin, the product of dry atmospheric precipitation of mineral salt aerosols carried inland from the coast; the aerosols being derived from marine spray at the ocean surface / atmosphere interface, particularly from waves in the breaker zone of the coast. In 1963, working with condensed fog samples, he demonstrated that the coastal fogs of northern Chile contain mineral salts which could be an important source of mineral salts that subsequently become concentrated over time by leaching and evaporation, forming economic caliche deposits.
Authors such as Pueyo et al. (1998) and Reich et al. (2003) describe mechanisms for the genesis of saline groundwaters and brines, which can give rise to the generation of caliche deposits in porous host rocks such as sandstones and breccias, though processes of concentration, primarily evapo-concentration, by the evaporation of water from the capillary fringe of shallow water tables. The soluble mineral salts first enter the source water via the leaching of altered rocks and pre-existing saline materials. They emphasize the role the hydrological system operating over long periods of time in the leaching and transport of the salts, including during periods of former wetter climate (hydrological paleo system).
Current thinking is that the mineral salts of most economic caliche deposits in the arid north of Chile, except for a few specific cases of marine evaporite deposits, have a dominantly volcanic origin. Chong (1991) noted that the leaching of volcanic materials would have been favored by thermal processes related to the middle Tertiary volcanic arc. Álvarez (2016) explained how groundwater leaching of iodine from iodine bearing organic-rich rocks may constitute an important origin of iodine in caliche deposits.
|
|
|
|
|
|
|
|
|
| SQM TRS Nueva Victoria |
|
Pag. 35 |
6.5.2Nueva Victoria
The mineralization at Nueva Victoria is mantiform, with distinct deposit areas of several kilometers in extension. Mineralized mantle (caliche) thicknesses vary between deposit areas, falling within the range 1.0 – 6.0 m. Because of the action of geological processes over time (weathering, erosion, faulting, volcanism) the caliche deposits can take a variety of forms, including, as detailed below.
6.5.3Continuous Mantles
Laterally continuous mineralization hosted in sandstones and breccias; presenting caliche thicknesses generally in the range 2.0 – 4.0 m, but occasionally reaching up to 6.0 m. Nitrate grades tend to be highest where the caliche is thickest. Iodine grades tend to reduce at depth. The caliche mantles may be cut by fractures filled with cemented sands (sand dikes). Secondary deposition of mineral salts may be observed along bedding plane contacts.
6.5.4Thin salt Crusts and Superficial Caliche
Evaporite deposits presenting as thin (0.5 to 1.2 m), laterally discontinuous mineralization, often developed within and over fine-grained sandstones of high competence. Nitrate grades in these thin deposits can reach 20% and iodine can attain values of 1,500 ppm.
6.5.5Stacked caliches.
This type of deposit is found in sectors with a high degree of leaching. It is particularly associated with alluvial fans. The leaching of the overlying material reduces its degree of cementation and geomechanical competence and reduces the grade of economic mineralization that it contains. Reprecipitation of the leached minerals at depth in the formation (e.g., alluvial fan) results in better-cemented, geomechanically more competent, more mineralized caliches at depth. The thickness of these mineralized caliches is variable, but is generally around 2.0 m. Generally, the mineral grades of these caliches are lower than the other caliche deposit styles.
6.5.6Other Economic Mineralization
Most of the economic nitrate and iodine mineralization associated with caliche mantles occurs as:
⮚Envelopes around the sedimentary clast (sand and gravel grains) of host sandstones, breccias and conglomerates.
⮚Filling of the pore space between the sedimentary clast.
⮚Evaporite aggregates due to saline efflorescence.
Economic mineralization may also manifest itself in the following ways:
⮚Cutting the caliche mantles as fracture infills (sand dikes).
⮚Veins of 0.5 to 1.0 m thickness associated with sediment - lava contact surfaces.
⮚As veins of 0.5 to 1.0 m thickness in volcanic rocks.
⮚As veins in altered or fractured volcanic rocks.
The nitrate deposits at Nueva Victoria are located on the western edge of the Intermediate Basin, formed mainly by surface or shallow horizontal to sub-horizontal strata of clastic sedimentary rocks (sandstones, breccias and conglomerates) which have been mineralized by solutions rich in mineral salts (nitrates, chlorides, iodates) to form caliche deposits found in large horizontal layers, ranging in thickness from 1 to 4 m, with barren material (overburden) ranging from 0.0 to 2.0 m at the top.
|
|
|
|
|
|
|
|
|
| SQM TRS Nueva Victoria |
|
Pag. 36 |
7EXPLORATION
Nueva Victoria is an active mine operation. Ongoing exploration is conducted by SQM with primary purpose of supporting mine operations and increasing estimated Mineral Resources. The exploration strategy is focused on have preliminary background information on the tonnage and grade of the ore bodies and will be the basis for decision making for the next Recategorization campaigns. Exploration work was completed by mine personnel.
7.1SURFACE SAMPLES
SQM does not collect surface samples for effect of exploration.
7.2TOPOGRAPHIC SURVEY
Detailed topographic mapping was created in the different sectors of Nueva Victoria by aerial photography, using an unmanned aircraft operated by remote control, Wingtra One (Figure 7-1); equipment with 61 Mega pixels resolution, maximum flight altitude 600 m, flight autonomy 55 minutes. The accuracy in the survey is 5 to 2 cm.
The measurement was contracted to STG since 2015.
Figure 7-1. Wingtra One Fixed-Wing Aircraft
Prior to 2015, the topography survey was done by data measurement profiles every 25 meters; these profiles were done by walking and collecting information from points as the land surveyor made the profile. With this information, the corresponding interpolations were generated to obtain sector surfaces and contour lines.
7.3DRILLING METHODS AND RESULTS
The Nueva Victoria geologic and drill hole database included 110,313 holes that represented 459,709 m of drilling. Table 7-1 summarizes the drilling by sector. Figure 7-2 shows the drill hole locations. As for the type of drilling used, it corresponds to RC holes, with a maximum depth of 7 meters. All the Nueva Victoria drilling was done with vertical holes.
|
|
|
|
|
|
|
|
|
| SQM TRS Nueva Victoria |
|
Pag. 37 |
Table 7-1. Detail of the Number of Drill Holes and Total Meters Drilled by sector in Nueva Victoria, Iris, and Soronal Properties
|
|
|
|
|
|
|
|
|
|
|
|
|
|
|
|
|
|
|
|
|
| SQM Property |
Sector |
EIA |
Grid |
N° of Drill Holes |
Total Meters |
Core Recovery (%) |
| Soronal |
Fortuna |
Hermosa |
100 |
1,021 |
5,105 |
No Data |
| Hermosa |
Hermosa |
100 - 100T |
11,655 |
58,218 |
90 |
| Tente en el Aire |
Hermosa |
100 - 100T - 200 |
7,313 |
36,565 |
89 |
| Hermosa Oeste |
TEA |
100T-200 - 400 |
4,724 |
24,779 |
87 |
| Coruña |
Hermosa |
100 |
1,038 |
6,228 |
No Data |
| TEA Oeste |
TEA |
100T-200 - 400 |
2,886 |
14,992 |
87 |
| TEA Sur |
TEA |
100T |
1,165 |
6,336 |
87 |
| Cocar |
TEA |
100T - 100 - 200 |
1,339 |
6,695 |
85 |
| Pampa Engañadora |
TEA |
100T-200 - 400 |
2,719 |
14,822 |
85 |
| Franja Oeste |
TEA |
200 - 100T |
7,113 |
35,503 |
87 |
| Nueva Victoria & Iris |
Oeste 3 |
TEA |
50 - 100 |
485 |
2,183 |
84 |
| Mina Oeste |
Nueva Victoria |
50 - 100 |
18,350 |
64,225 |
90 |
| Mina Norte |
Nueva Victoria |
50 - 100 |
21,165 |
74,078 |
83.5 |
| Mina Sur |
Nueva Victoria |
50 - 100 |
24,115 |
84,403 |
94 |
| Iris Vigia |
Nueva Victoria |
200 - 100T |
825 |
3,578 |
87 |
| Torcaza |
Torcaza |
50 - 100 - 200 |
4,400 |
22,000 |
88.1 |
|
|
|
|
110,313 |
459,709 |
|
The drilling campaigns were carried out according to the resource projection priorities of the Mineral Resources and LT Planning Management. Subsequently, this prospecting plan was presented to the respective VPs to ratify if they comply with the reserve projections to be planned, if they do not coincide, the prospecting plan is modified.
|
|
|
|
|
|
|
|
|
| SQM TRS Nueva Victoria |
|
Pag. 38 |
Figure 7-2. Drill hole location map
Drilling at Nueva Victoria was completed with prospecting grids of 400 x 400 m, 200 x 200 m, 100 x 100 m, 100 locked and 50 x 50 m.
|
|
|
|
|
|
|
|
|
| SQM TRS Nueva Victoria |
|
Pag. 39 |
7.3.1Grid > 400 m
Areas that have been recognized and that present some mineralization potentials are initially prospected in wide mesh reverse air holes, generally greater than 400 m with variable depths of 6 to 8 m depending on the depth at which the ore is encountered. In consideration of the type of grid and the fact that the estimations of tonnage and grades are affected in accuracy, this resource is defined as a Hypotheticals and Speculative Resources, exploration target grid > 400 m.
7.3.2400 m Grid
Once the Inferred sectors with expectations are identified, 400 x 400 m prospecting grids are carried out. In areas of recognized presence of caliche or areas where 400 x 400 m grid drilling is accompanied by localized closer spaced drilling that confirms the continuity of mineralization, the 400m grid drilling provides a reasonable level of confidence and therefore define dimensions, thickness, tonnages, and grades of the mineralized bodies, used for defining exploration targets and future development. The information obtained is complemented by surface geology and the definition of geological units. This area is used to estimated Inferred Resources. In other cases when there is no reasonable level of confidence the 400 x 400 m grid will be defined as a Potential Resource.
7.3.3200 m and 100 m Grid
Subsequently, the potential sectors are redefined, and the 200 x 200 m and 100 x 100 m prospecting grid is carried out, which in this case allows to delimit, with a significant level of confidence, the dimensions, power, tonnage, and grades of the mineralized bodies as well as the continuity of the mineralization. At this stage, detailed geology is initiated, the definition of geological units on surface continues to be complemented and sectors are defined to carry out geometallurgical assays. This area is used to estimated Indicated Mineral Resources
7.3.4100T and 50 m Grid
The 50 x 50 m and 100T ~ 100x50 m prospecting grid allows to delimit with a significant level of confidence (amount of information associated to the drilling grid) the dimensions, powers, tonnages, and grades of the mineralized bodies as well as the continuity of the mineralization. The definition of geological units and collect information on geometallurgical assays from the pilot plants depending on the prospecting site is then continued. This area is used to estimate Measured Mineral Resources.
The results of the drilling campaigns in the sector of Mina Norte and Mina Sur can be seen in Figure 7-3, where it is highlighted in red the sectors with nitrates greater than 5.0%, in green the nitrates between 3.0 – 5.0% and in yellow the nitrates less than 3.0%. The mineralized bodies at Mina Norte and Mina Sur are distributed in a discontinuous and irregular distribution, with a higher concentration of nitrate mineralization in the central and western portion of the Mina Norte mine, as well as in the southern and south-western part of the Mina Sur.
|
|
|
|
|
|
|
|
|
| SQM TRS Nueva Victoria |
|
Pag. 40 |
Figure 7-3. Iso-Nitrate Map Nueva Victoria of Mina Norte and Mina Sur Sector
|
|
|
|
|
|
|
|
|
| SQM TRS Nueva Victoria |
|
Pag. 41 |
The results of the drilling campaigns in the Mina Oeste sector are shown in Figure 7-4. As shown, the red highlight represents sectors with nitrates greater than 5.0%. The green highlight represents the nitrates between 3.0 – 5.0%, and the yellow highlight denotes the nitrates less than 3.0%. The mineralized bodies in Mina Oeste are distributed in a discontinuous and irregular way in almost its totality, presenting a greater mineralized volume in the central portion.
Figure 7-4. Iso-Nitrate Map Nueva Victoria Mina Oeste
|
|
|
|
|
|
|
|
|
| SQM TRS Nueva Victoria |
|
Pag. 42 |
The results of the drilling campaigns in the TEA and Hermosa sectors are shown in Figure 7-5. Sectors with nitrates greater than 5.0% are highlighted in red, nitrates between 3.0 – 5.0% in green, and nitrates less than 3.0% in yellow. The mineralized bodies in TEA and Hermosa show greater continuity in nitrate mineralization in the central, north-east, and south-east portions, being the west sector of low continuity and greater irregularity.
Figure 7-5. Iso-Iodine Map Nueva Victoria; TEA and Hermosa Sector
The results of the drilling campaigns in the Torcaza sector are shown in Figure 7-6. Sectors with nitrates greater than 5.0% are highlighted in red, nitrates between 3.0 – 5.0% in green and nitrates less than 3.0% in yellow. The mineralized bodies at Torcaza are continuous and regular in the eastern portion, while in the western portion, the mineralization is discontinuous and irregular.
|
|
|
|
|
|
|
|
|
| SQM TRS Nueva Victoria |
|
Pag. 43 |
Figure 7-6. Iso-Iodine Map Nueva Victoria TEA en Torcaza sector
|
|
|
|
|
|
|
|
|
| SQM TRS Nueva Victoria |
|
Pag. 44 |
7.3.52023 Campaigns.
SQM has an ongoing program of exploration, recategorization and resource evaluation in the areas surrounding the Nueva Victoria mine, which is currently in operation. SQM has performed reconnaissance drilling at 400 m spacing or lower in 18.7% of the area covered by its mining properties over the areas with caliche interest. (Table 7-2 and Table 7-3).
In 2023, a Mineral Resource recategorization project was carried in the TEA sector and its surroundings, to have exploitable Mineral Reserves for the development of the Five-Year Plan.
For this purpose, 13,781 drill holes representing 68,907 m were carried out, at an estimated cost of 106.5 USD/m; obtaining total salt analysis sample by sample. With this information, the Tea Oeste, Franja Oeste, Hermosa Oeste, Cocar and Pampa Engañadora will be recategorized, expecting to obtain resources for 60 Mt.
Table 7-2. Meters Drilled in Campaigns 2023
|
|
|
|
|
|
|
|
|
| Project / Area |
Holes Drilled |
Total Meters |
| Hermosa Oeste |
3,228 |
16,142 |
| Franja Oeste |
3,104 |
15,518 |
| Pampa Engañadora |
1,494 |
7,472 |
| Cocar |
324 |
1,620 |
| Hermosa |
3,305 |
16,523 |
| Tea Oeste |
2,326 |
11,632 |
| Total |
13,781 |
68,907 |
|
|
|
|
|
|
|
|
|
| SQM TRS Nueva Victoria |
|
Pag. 45 |
Table 7-3. Campaigns 2023 Average NaNO3 and I2
|
|
|
|
|
|
|
|
|
|
|
|
| Project / Area |
Holes Drilled |
Average NaNO3 (%) |
Average I2 (ppm) |
| Hermosa Oeste |
3,228 |
3.4 |
250 |
| Franja Oeste |
3,104 |
3.8 |
370 |
| Pampa Engañadora |
1,494 |
4.0 |
300 |
| Cocar |
324 |
5.3 |
400 |
| Hermosa |
3,305 |
5.7 |
370 |
| Tea Oeste |
2,326 |
3.3 |
270 |
| Total |
13,781 |
4.3 |
327 |
7.3.6Exploration Drill Sample Recovery
Core recovery has been calculated for all RC holes completed to date. In historical campaigns, the recovery was lower due to the type of drilling rig used.
Since 2015, the drilling equipment was adapted, which allowed a decrease in the loss of material and consequently an improvement in sample recoveries. It should be noted that the recoveries are above 80%, a value that fluctuates in direct relation to the degree of competence of the rock to be drilled, having for example lower recoveries in Franja Oeste and Pampa Engañadora, which present semi-soft caliches of low compaction. Sectors such as Hermosa and TEA have recoveries close to 90% as they correspond to caliche sectors with high competition and mineralization. Table 7-4 details the recovery percentages by sector in Nueva Victoria. Recoveries in sectors such as Fortuna and Cocar correspond to historical campaigns where there is no recovery information.
Table 7-4. Recovery Percentages at Nueva Victoria by Sectors
|
|
|
|
|
|
|
|
|
|
|
|
|
|
|
|
|
|
|
|
|
| SQM Property |
Sector |
EIA |
Grid |
N° of Drill Holes |
Total Meters |
Core Recovery (%) |
| Soronal |
Fortuna |
Hermosa |
100 |
1,021 |
5,105 |
No Data |
| Hermosa |
Hermosa |
100 - 100T |
11,655 |
58,218 |
90 |
| Tente en el Aire |
Hermosa |
100 - 100T - 200 |
7,313 |
36,565 |
89 |
| Hermosa Oeste |
TEA |
100T - 200 - 400 |
4,724 |
24,779 |
87 |
| Coruña |
Hermosa |
100 |
1,038 |
6,228 |
No Data |
| TEA Oeste |
TEA |
100T - 200 - 400 |
2,886 |
14,992 |
87 |
| TEA Sur |
TEA |
100T |
1,165 |
6,336 |
87 |
| Cocar |
TEA |
100T - 100 - 200 |
1,339 |
6,695 |
85 |
| Pampa Engañadora |
TEA |
100T - 200 - 400 |
2,719 |
14,822 |
85 |
| Franja Oeste |
TEA |
200 - 100T |
7,113 |
35,503 |
87 |
| Nueva Victoria & Iris |
Oeste 3 |
TEA |
50 - 100 |
485 |
2,183 |
84 |
| Mina Oeste |
Nueva Victoria |
50 - 100 |
18,350 |
64,225 |
90 |
| Mina Norte |
Nueva Victoria |
50 - 100 |
21,165 |
74,078 |
83.5 |
| Mina Sur |
Nueva Victoria |
50 - 100 |
24,115 |
84,403 |
94 |
| Iris Vigia |
Nueva Victoria |
200 - 100T |
825 |
3,578 |
87 |
| Torcaza |
Torcaza |
50 - 100 - 200 |
4,400 |
22,000 |
88.1 |
|
|
|
|
110,313 |
459,709 |
|
7.3.7Exploration Drill Hole Logging
For all the samples drill hole logging was carried out by external and internal personnel, which was done in the field. Since 2015 ARVI Mining Limited is the company in charge of logging activities in Nueva Victoria. SQM personnel validated the logs through periodic reviews. Logging procedures used documented protocols. Geology logging recorded information about rock type, mineralogy, alteration and geomechanics.
The logging process included the following steps:
⮚Measurement of the “destace” and drill hole using a tool graduated in cm.
|
|
|
|
|
|
|
|
|
| SQM TRS Nueva Victoria |
|
Pag. 46 |
⮚Mapping of cutting (RC) and/or drill hole cores (DDH), defining their color, lithology, type and intensity of alteration and/or mineralization.
⮚Determination of geomechanical units a Leached, smooth, rough and intercalations.
The information is recorded digitally with a Tablet and/or computer, using a predefined format with control system and data validation in Acquire.
The Supervisor Logging Geologist from external contractor was responsible for:
⮚Generate geological data of the highest possible quality and internal consistency, using established procedures and employing System in Acquire.
⮚Locate and verify information of work to be mapped.
⮚Execute geomechanical and lithological drill hole mapping procedures.
⮚Supervise field activities. And coordinate and report permanently to SQM personnel on the progress and execution of the work carried out according to the program.
7.3.8Exploration Drill Hole Location of Data Points
The process of measuring the coordinates of drill holes collars was performed, in 2 stages. Prior to the drilling of the drill holes, the geology area generates a plan and list with the number of drill holes by Acquire, to be marked and coordinates to the personnel of the external contractor of the STG company. A Land surveyor measured the point in the field and identifies the point with a wooden stake and an identification card with contain barcode with information of number of drill hole recommended, coordinates and elevation.
Holes are surveyed, after drilling, with GNSS equipment, for subsequent processing by specialized software with all the required information. Once the complete campaign is finished, the surveyed data was reviewed, and a list was sent with the drill id information and its coordinates.
Collar coordinates were entered into Microsoft® Excel sheets and later aggregated into a final database in Acquire by personnel from the SQM.
At the completion of drilling, the drill casing was removed, and the drill collars were marked with a permanent concrete monument with the drill hole name recorded on a metal tag on the monument.
7.3.9Qualified Person’s Statement on Exploration Drilling
The Qualified Person believes that the selection of sampling grids of gradually decreasing spacing as Mineral Resources areas are upgrades from Inferred to Measured Mineral Resources and as they are further converted to Proven, and Probable Mineral Reserves where production plans have been applied, is appropriate and consistent with good business practices for caliche mining. The level of detail in data collection is appropriate for the geology and mining method of these deposits.
|
|
|
|
|
|
|
|
|
| SQM TRS Nueva Victoria |
|
Pag. 47 |
8SAMPLE PREPARATION, ANALYSIS AND SECURITY
8.1SITE SAMPLE PREPARATION METHODS AND SECURITY
Analytical samples informing Nueva Victoria Mineral Resources were prepared and assayed at the Iris plant and Internal Laboratory located in city of Antofagasta.
All sampling was completed by the external operators. Based on review of the procedures during the site visit and subsequent review of the data, it is the opinion of the QP that the measures taken to ensure sample representativeness were reasonable for estimating Mineral Resources.
8.1.1RC Drilling
The RC drilling is focused on collecting lithological and grade data from the “Caliche mantle”. RC Drilling was carried out with a 5 ½ inch diameter by an external company "Perforations RMuñoz" under the supervision of SQM, both parties were coordinate to establish the drilling points. Once the drilling point was designated, the positioning of the drilling rig was surveyed, and the drill rig was set up on the surveyed drill hole location. (A and B).
Once set up, drilling commenced (Figure 8-1 C). At the beginning of each drill hole, the drilling point was cleaned or uncovered, eliminating the soft overburden, or chusca, with a backhoe.
Samples were collected from the cyclone at continuous 50 cm intervals in plastic bags. The samples were weighed and quartered at the platform. A cutting sample was taken and left on the floor as a control sample. The sample bag was tied, and a number card was inserted. (Figure 8-1 D).
Figure 8-1. A) Drilling Point Marking B) Drill Rig Positioning C) RC Drilling D) RC Samples at Platform
Samples were transported by truck to the plant for mechanical preparation and chemical analysis. Samples were unloaded from the truck in the correct correlative order and positioned on Pallets supplied by the plant manager. Sample loading and unloading is recorded by barcode reading and entered into Acquire. (Figure 8-2).
|
|
|
|
|
|
|
|
|
| SQM TRS Nueva Victoria |
|
Pag. 48 |
Figure 8-2. A) Transportation Truck. B) Pallets with RC Samples
8.1.2Sample Preparation
Mechanical sample preparation was carried out by Pilot Plant Iris V7 located at Nueva Victoria. Sample preparation includes (Figure 8-3)
⮚Samples of 12 to 18 kg are divided in a cone splitter, The sample obtained should weigh between 1.0 to 2.5 kg (equivalent from 10 to 14% of the initial sample mass)
⮚Drying of the sample in case of humidity.
⮚Sample size reduction using cone crushers to produce an approximately 1 to 2.5 kg sample passing a number 8 mesh (-#8).
⮚Division of the sample in a Riffle cutter of 12 slots of ½" each. The sample is separated in 2, one of them corresponds to rejection and the other sample must weigh at least 500 g.
⮚Sample pulverizing.
⮚Packaging and labeling, generating 2 bags of samples, one will be for the composites in which 250 g are required (original) and the other will be for the laboratory, in which 100 g are required. (Figure 8-4).
Insertion points for quality control samples in the sample stream were determined. Duplicated samples were incorporated every 20 samples, including the first sample. Samples were shipped in boxes containing a maximum of 63 samples (weighing approximately 15 kg) to the Caliche Iodine Internal laboratory.
|
|
|
|
|
|
|
|
|
| SQM TRS Nueva Victoria |
|
Pag. 49 |
Figure 8-3. Sample Preparation Flow Diagram
Figure 8-4. A) Sample Division B) Cone Crusher C) Riffle Cutter D) Sample Pulverizing E) Packaging
8.2LABORATORIES, ASSAYING AND ANALYTICAL PROCEDURES
Chemical analysis for NO3 an iodine was performed at the Caliche Iodine laboratory, located Antofagasta. Which is ISO 9001:2015 certified in shippable iodine, replicated in caliche and drill holes.
|
|
|
|
|
|
|
|
|
| SQM TRS Nueva Victoria |
|
Pag. 50 |
The caliche iodine laboratory has capacity to analyze 200 samples/day for nitrate and iodine analysis. Sample handling, from receipt to analysis, is performed in 3 areas:
⮚Receiving and pressing area
⮚Nitrate area
⮚Redox volumetric area
Nitrate analysis was performed by UV-Visible Molecular Absorption Spectroscopy. The minimum concentration entered the laboratory information Management System (LIMS) system was 1,0%, the result was expressed in % of NaNO3. Iodine analysis was performed by Redox volumetric. The minimum concentration reported to the LIMS system was 0,005%.
8.3RESULTS, QC PROCEDURES AND QA ACTIONS
8.3.1Laboratory Quality Control
To validate the results of the laboratory analysis, the following control measures were carried out (Figure 8-5)
Iodine:
⮚Prepare a reference standard .
⮚Use of secondary reference material.
⮚Measure the reference standard and the reagent blank to ensure the quality of the reagents used.
⮚Every 7 samples a QC prepared with a Caliche of known concentration
⮚Of the obtained result should not exceed 2% of the nominal value of the QC, otherwise the variables should be revised, and the analysis of the batch should start from the beginning.
Nitrate:
Analyze at the beginning of the sample set a standard solution.
⮚Every 5 samples a QC of 8 g/L prepared with a solution of 1 mg/L of a NaNO3 salt is measured, the variation of the obtained result should not exceed 5% of the nominal value of the QC, otherwise the variables should be revised, and the analysis of the batch should start from the beginning.
|
|
|
|
|
|
|
|
|
| SQM TRS Nueva Victoria |
|
Pag. 51 |
Figure 8-5. Flow Chart for Approval of Laboratory Chemical Analysis Results
8.3.2Quality Control and Quality Assurance Programs (Qa-Qc)
Qa/Qc programs were typically set in place to ensure the reliability and trustworthiness of the exploration data. They include written field procedures of aspects such as drilling, surveying, sampling, and assaying, data management, and database integrity.
Analytical control measures typically involved the internal laboratory control measures implemented to monitor the precision and accuracy of the sampling, preparation, and assaying. Assaying protocols typically involve regular duplicate assays and insertion of Qc samples.
SQM has a systematic QA/QC program controlled by Acquire; which included the insertion of different control samples into the sampling stream:
⮚Blank → 2% (1 every 50).
⮚Analytical duplicate → 5% (1 per 20).
⮚Standard → 5% (1 per 20).
Acquire and LIMS software managed the quality control by automatically checking the refined control samples and the Standards entered the system, generating warnings at the time of analysis.
2020 to 2023
The results of the Qa-Qc program for the Nueva Victoria Sector from 2020 to 2023 and Hermosa sectors are detailed below.
Table 8-1 details the number of samples inserted for each of the controls and the variables analyzed.
|
|
|
|
|
|
|
|
|
| SQM TRS Nueva Victoria |
|
Pag. 52 |
Table 8-1. Number of Control Samples for Campaigns from 2017 to 2020 for Nueva Victoria Sectors.
|
|
|
|
|
|
|
|
|
|
|
|
|
|
|
|
|
|
|
|
|
| Sector |
Year |
Control Type |
Variable |
| Coarse Duplicate |
Standard |
Duplicates |
Nitrate |
Iodine |
| TEA |
2017 |
298 |
|
298 |
x |
x |
| TEA |
2018-2019 |
492 |
630 |
1,815 |
x |
x |
| Hermosa |
2019-2020 |
559 |
|
559 |
x |
x |
a)TEA 2017
For the 2017 campaign, 298 coarse duplicates were inserted. Nitrate gives a good precision without bias. (Figure 8-6 and Table 8-2). Iodine presents low concentrations (ppm), so a lower precision is observed probably due to a nugget type effect, however no bias is observed (Figure 8-7 and Table 8-3).
Table 8-2. Coarse Duplicates for Nitrate TEA 2017
|
|
|
|
|
|
|
|
|
|
|
|
|
|
|
| Statisticians |
Nitrate Grade % |
Difference |
Error |
| Original |
Check |
Original - Check |
| Number |
298 |
298 |
|
|
| Mean |
4.0 |
4.2 |
0.135 |
0.091 |
| Stand. Deviation |
3.39 |
3.46 |
1.56 |
|
| % Difference |
103.35 |
| Test T |
0.137 |
| Minimum |
1.0 |
1.0 |
|
|
| Percentile 25 |
2.0 |
2.1 |
|
|
| Median |
2.9 |
3.1 |
|
|
| Percentile 75 |
4.6 |
4.8 |
|
|
| Maximum |
20.0 |
20.0 |
|
|
| Correlation Index |
|
0.90 |
|
|
|
|
|
|
|
|
|
|
|
| SQM TRS Nueva Victoria |
|
Pag. 53 |
Figure 8-6. Scatter plot for Nitrate - Coarse Duplicates- TEA 2017
Table 8-3. Coarse Duplicates for Iodine TEA 2017
|
|
|
|
|
|
|
|
|
|
|
|
|
|
|
| Statisticians |
Iodine Grade ppm |
Difference |
Error
|
| Original |
Check |
Original -
Check |
| Number |
298 |
298 |
|
|
| Mean |
285.1 |
285 |
-0.067 |
6.03 |
| Stand. Deviation |
229.86 |
213.83 |
103.94 |
|
| % Difference |
99.98 |
|
|
| Test T |
0.99 |
| Minimum |
50 |
50 |
|
|
| Percentile 25 |
140 |
130 |
|
|
| Median |
220 |
230 |
|
|
| Percentile 75 |
360 |
390 |
|
|
| Maximum |
1,660 |
1,270 |
|
|
| Correlation Index |
|
0.89 |
|
|
|
|
|
|
|
|
|
|
|
| SQM TRS Nueva Victoria |
|
Pag. 54 |
Figure 8-7. Plots for Iodine - Coarse Duplicates TEA 2017
b)TEA 2018 -2019
Coarse Duplicate:
The analysis of the drilling campaign conducted at TEA shows that for Nitrate good precision is observed with no apparent bias. Iodine shows low concentrations (ppm), with lower precision, probably due to a nugget type effect, however no bias is observed. (Figure 8-8 and Table 8-4).
Table 8-4. Coarse Duplicates for Iodine and Nitrate TEA 2018-2019
|
|
|
|
|
|
|
|
|
|
|
|
|
|
|
|
|
|
|
|
|
|
|
|
|
|
|
| Statisticians |
|
Statisticians |
| Iodine ppm |
Original |
Duplicate |
Difference |
|
Nitrate % |
Original |
Duplicate |
Difference |
| Number |
492 |
492 |
|
|
Number |
492 |
492 |
|
| Average |
3.1 |
3.1 |
0.0 |
|
Average |
277.1 |
269.5 |
7.6 |
| Median |
2.4 |
2.4 |
0.0 |
|
Median |
260 |
250 |
10 |
| Variance |
5.5 |
5.9 |
0.5 |
|
Variance |
10,967.7 |
11,821.3 |
2,968.4 |
| Max |
19.7 |
20.0 |
2.2 |
|
Max |
820 |
770 |
190 |
| Min |
1.0 |
1.0 |
-2.5 |
|
Min |
50 |
70 |
-170 |
|
|
|
|
|
|
|
|
|
| Test T |
-0.277 |
|
|
|
Test T |
-0.001 |
|
|
| Corr. Coefficient |
0.96 |
|
|
|
Corr. Coefficient |
0.87 |
|
|
|
|
|
|
|
|
|
|
|
| SQM TRS Nueva Victoria |
|
Pag. 55 |
Figure 8-8. Plots for Iodine and Nitrate - Coarse Duplicates TEA 2018-2019
Nitrate Coarse Core
Iodine Coarse Core
|
|
|
|
|
|
|
|
|
| SQM TRS Nueva Victoria |
|
Pag. 56 |
Standard:
The ranges of variation of the analyses with respect to the standards used by SQM vary in nitrate by ± 0.35 to ± 0.53 % and for iodine ± 50 to ± 60 ppm. (Table 8-5).
Table 8-5. Standards Results - TEA 2018-2019
|
|
|
|
|
|
|
|
|
|
|
|
|
|
|
|
|
|
|
|
|
| Nitrate % |
|
|
Iodine ppm |
|
|
|
|
|
|
|
|
| Date |
Rank +/- |
Data |
|
Date |
Rank +/- |
Data |
| Sept-18 |
0.35 |
87 |
|
Sept-18 |
60 |
87 |
| Oct-18 |
0.53 |
87 |
|
Oct-18 |
60 |
87 |
| Nov-18 |
0.45 |
66 |
|
Nov-18 |
50 |
66 |
| Dec-18 |
0.46 |
114 |
|
Dec-18 |
50 |
114 |
| Jan-19 |
0.46 |
163 |
|
Jan-19 |
50 |
163 |
| Fec-19 |
0.46 |
113 |
|
Fec-19 |
50 |
113 |
|
|
|
|
|
|
|
| Total Data |
630 |
|
Total Data |
630 |
Fine duplicates:
The ranges of variation of the analyses present a very good performance for nitrate and for iodine, showing no biases and with very good correlation between the original sample and the duplicate sample (Figure 8-9 and Table 8-6).
Table 8-6. Fine Duplicates for Iodine-and Nitrate TEA 2018-2019
|
|
|
|
|
|
|
|
|
|
|
|
|
|
|
|
|
|
|
|
|
|
|
|
|
|
|
| Statisticians |
|
Statisticians |
| Nitrate % |
Original |
Duplicate |
Difference |
|
Iodine ppm |
Original |
Duplicate |
Difference |
| Number |
1,815 |
1,815 |
|
|
Number |
1,815 |
1.815 |
|
| Average |
3.38 |
3.38 |
-0.01 |
|
Average |
290 |
290 |
0 |
| Median |
2.5 |
2.5 |
0 |
|
Median |
260 |
250 |
0 |
| Variance |
6.75 |
6.78 |
0.03 |
|
Variance |
33,106 |
33,968 |
1,141 |
| Max |
22.7 |
22.9 |
0.5 |
|
Max |
2,500 |
2,530 |
130 |
| Min |
1.0 |
0.2 |
-0.6 |
|
Min |
20 |
20 |
-140 |
|
|
|
|
|
|
|
|
|
| Test T |
-0.062 |
|
|
|
Test T |
-0.411 |
|
|
| Corr. Coefficient |
0.99 |
|
|
|
Corr. Coefficient |
0.98 |
|
|
|
|
|
|
|
|
|
|
|
| SQM TRS Nueva Victoria |
|
Pag. 57 |
Figure 8-9. Plots for Nitrate and Iodine Fine Duplicates TEA 2018-2019
Figure 8-10. Plot Cumulative Absolute Difference for Nitrate and Iodine Fine Duplicates TEA 2018- 2019
Nitrate Plot
Graph represents the behavior of the accumulated absolute differences of all the samples analyzed by the laboratory. Using as a decision tool what is recommended by MRDI to accept the control analysis process, that in at least 90% of cases (cumulative frequency), the accumulated absolute difference should not exceed 20%.
In the laboratory the figure is 93% for nitrate and 88% for iodine, therefore its performance from the point of view of accuracy, is acceptable.
|
|
|
|
|
|
|
|
|
| SQM TRS Nueva Victoria |
|
Pag. 58 |
c)Hermosa 2019 - 2020
Coarse Duplicate:
The analysis of the drilling campaign conducted at Hermosa shows that for Nitrate good precision is observed with no apparent bias. Iodine shows low concentrations (ppm), with lower precision, probably due to a nugget type effect, however no bias is observed. (Figure 8-11 and Table 8-7).
Table 8-7 Coarse Duplicate for Nitrate and Iodine Hermosa 2019
|
|
|
|
|
|
|
|
|
|
|
|
|
|
|
|
|
|
|
|
|
|
|
|
|
|
|
| Statisticians |
|
Statisticians |
| Nitrate % |
Original |
Duplicate |
Difference |
|
Iodine ppm |
Original |
Duplicate |
Difference |
| Number |
559 |
559 |
|
|
Number |
559 |
559 |
|
| Average |
6.842 |
6.848 |
-0.006 |
|
Average |
439.9 |
444.4 |
-4.54 |
| Median |
5.8 |
6 |
-0.2 |
|
Median |
370 |
380 |
-10 |
| Variance |
17.962 |
15.569 |
2.393 |
|
Variance |
57,900.9 |
52,344.5 |
5,556.4 |
| Max |
20 |
20 |
0 |
|
Max |
2,000 |
2,000 |
0 |
| Min |
1.0 |
1.0 |
0.0 |
|
Min |
120 |
50 |
70 |
|
|
|
|
|
|
|
|
|
| Test T |
1.96 |
|
|
|
Test T |
1.96 |
|
|
| Corr. Coefficient |
0.81 |
|
|
|
Corr. Coefficient |
0.76 |
|
|
Figure 8-11. Plot for Nitrate Coarse Duplicate Hermosa 2019
8.3.3Sample Security
SQM maintains strict control over sampling, mechanical sample preparation and chemical analysis. In each of the stages, the safety and chain of custody of the samples was safeguarded, using protocols that describe the steps to be followed for this purpose. All these controls are managed and controlled through the Acquire platform, in process of implement by SQM since Q3 2022, according to the follow sections.
This section highlights your current processes and procedures and introduces data management processes recommended for deployment in GIM Suite.
The following workflow architecture demonstrates the data flow and object requirements of GIM Suite.
8.3.3.1 Planning RC Drilling.
The drilling are planned by the geology area using modeling software, which generates an Excel file containing a previous identification of the drilling, which will later be modified for the final identification, along with the east and north coordinates and the planned depth are also indicated. This planning drilling is import task into Arena should allow the user to import the planned drill hole data from the file. Coordinates must be entered in PSAD56. The object must enter the
|
|
|
|
|
|
|
|
|
| SQM TRS Nueva Victoria |
|
Pag. 59 |
status of the drilling as Planned at the time of import, as well as store the identification of the probing planning in a virtual field. Template file for importing planned drillholes.
Task in "Arena" that will show the information of the planned drilling.
8.3.3.1.1Header:
In general, a drilling planning can take up to 30 thousand meters of drilling, where between 4 thousand and 5 thousand meters per sector is applied, each drilling equipment in general works for 1 month and a half, the contractor company executes the drilling and monthly delivers to the geology area the file with the information taken in the field, some drilling that was planned may eventually not be executed due to poor conditions of the premises.
Import Final Drills: Object of import in Acquire 4 that allows the user to import the collar data of the final drilling, also considering the import of the original samples and their respective duplicates of terrain. Due to the geology having the same stretch as the geological mapping, it is indicated to occupy the compound of blastholes for the storage of this data.
Data Capture Collar: Data Capture of Sand based on Blastholes, which will be used in the field for the capture of collar and sample data, where you must indicate the sounding that the duplicate ground sample can take, the section of the first sample will be entered manually by user, once it must consider the highlight section of the drilling, The subsequent sections may be indicated automatically by the application, considering as a protocol that the samples original is usually 50 cm in size. The correlative of the samples will continue to be controlled by the checkbooks occupied in land, the user must manually enter the correlative of the first sample taken in the field, the correlative of the subsequent samples will be entered automatically by the application. In this Data Capture, the user can also change the status of the probe as Canceled, thus identifying the drilling that was not executed in the field.
Import Final Coordinates: With this importer object of the Acquire 4, the user will enter the final coordinates data of the drilling, the importer will validate if the final coordinates contain a difference in meters greater than 10% in relation to the planned coordinates, indicating a message to the user at the time of data entry.
Consult probing collar: Task in "Arena" that will show the information of the necklace of the soundings.
Dashboard Planned vs Executed Meters: Dashboard in Sand that presents a graph and grid with information of the planned meters on the perforated meters, thus providing additional information to control the meters of the drilling campaigns. The data can be filtered by date of execution of the drilling and sector of the mine.
Choose Sample Correlates: Data Entry object in Acquire 4 that will allow the user to enter a range of correlative samples making it possible to choose which samples will be printed the labels. Occupy META IMPORTA LISES table to manage the data entered for the printing of samples. The Fields will be entered as follows: CATEGORY = TAGS; SUBCATEGORY= GENERATED, PRINTED; SOURCE VALUE = Value of the initial SAMPLE ID; ALIAS VALUE = Value of the final SAMPLE ID. The object must appear with an ERROR message if there are samples generated with some SAMPLE ID within the range indicated by the user. The object must indicate the initial SAMPLE ID to be printed, so that user error is avoided.
Sample Label Report: Report in Acquire 4 that allows the user to print sample labels in the format of the checkbook, the report will be applied on an A4 or Letter size paper, considering that the printing will be made on a cardboard paper. The
|
|
|
|
|
|
|
|
|
| SQM TRS Nueva Victoria |
|
Pag. 60 |
label will have the barcode with the identification of each sample, thus enabling the user to read the barcode with the tablet camera when entering the identification of the first sample
8.3.3.1.2Geological mapping
In the geological mapping, data on lithology, clast, clays, color, sulfate, salt crust, anhydrite crust, sulfate destace, percentage of clast and observation are captured.
Geological Mapping: Data capture in "Arena" that allows the user to perform the geological mapping of the drilling, this tool must allow the user to perform the mapping in the field so that it is not connected to the mine network. The task will occupy Blastholes as the task type.
Import Geologic Mapping: Importer in "Arena" that allows to enter the geological mapping data carried out in the field.
Geomechanics Mapping: Data capture in "Arena" where the geomechanical data of the drilling will be captured. For the data not related to the samples, this data capture must be of the Drillholes type.
Import Geomechanics Mapping: Importer in "Arena" that allows to enter the geomechanical mapping data carried out in the field.
Consult Geology of Drilling: Task in "Arena" that will show the information of the geology of the drilling.
Consult Geomechanics of Drilling: Task in "Arena" that will show the information of the geomechanics of the drilling.
8.3.3.1.3Dispatch of samples for mechanical preparation
Create dispatch order for Physical Sample Preparation: In this object the user can generate the order of dispatch of samples for physical preparation. Create a correlative and identifier for the office number. Example for identification. F2022-0001 where, F = Physical dispatch prefix, 2022 = Year of Shipment, 0001 = Correlative controller per year.
Print dispatch order for Physical Sample Preparation: Object that will allow to execute the printing of the report of shipment order to physical preparation.
Physical Office Reception: Script object in Acquire that allows the user to indicate the samples received in the pilot plant, the object must be filtered by physical dispatch number where it will make available the samples associated with this dispatch, thus enabling the user to select the samples and indicate in the system that these samples were received. The object must indicate and automatically create the pulp samples indicating the position where each one was generated.
Consult Drilling Dispatch to Preparation: Task in Sand that will show the information of the dispatch of the samples of the drilling that were sent to mechanical preparation.
Consult Pulp Samples: Task in Arena that will have the information of the pulp samples in a grid of data associated with the number of the physical dispatch received by the pilot plant.
In the drilling stage, before drilling begins, the drill rod was marked to indicate the distance for sampling. The drilling rig was equipped with a cyclone to slow down the particle velocity, under it, a bag is placed to collect the samples.
The collected sample from the cyclone is carefully stored in a plastic bag, then it was identified with a sequential card with a barcode and tied. The Supervisor oversaw requesting a revision to a determined sample of the drilling (coarse sample), originating another sample and of noting the weights obtained in the balance for each cut sample. This data collection is done through the Acquire platform.
The samples were loaded daily onto the truck that will transport them to the sample plant, the following steps are followed:
⮚SQM Supervisor delivers a dispatch guide with the drill holes and the total number of samples to be collected and mentions to the person in charge of the sample plant, the number of samples and the number of samples without recovery, if any. This dispatch guide is generated for Acquire platform.
⮚Samples are loaded sequentially according to the drilling and unloaded in the same way.
⮚Upon arrival at the plant, the corresponding permit must be requested from the area manager, who will provide an unloading guideline, which contemplates how the samples should be positioned on the pallets.
|
|
|
|
|
|
|
|
|
| SQM TRS Nueva Victoria |
|
Pag. 61 |
⮚The pallets with samples are moved to the sample preparation area from their storage place to the place where the Cone Splitter is located.
During all stages of sample preparation, special care was taken to maintain the identification of the samples and to clean the equipment after use. The samples already packed and labeled were collected following the instructions for filling boxes of “caliche” samples, respecting the correlative order of the samples, the order in which they must be deposited in the box and the quantity of samples according to the capacity of the box.
The trays were labeled indicating the corresponding information and date (Figure 8-11) are then transferred to the storage place at Testigoteca (core Warehouse) Iris and Testigoteca TEA located at Nueva Victoria (Figure 8-12), either transitory or final, after being sent to the laboratory.
Figure 8-12. A) Samples Storage B) Drill Hole and Samples Labeling
Figure 8-13. Iris – TEA Warehouse at Nueva Victoria
Assay samples were collected by appropriately qualified staff at the laboratories. The analysis results of the samples were reported by the specialty analyst to the LIMS software system, integrated to platform Acquire.
Automatically LIMS triggering an e-mail to the users and only to those who are authorized to send the information.
8.4OPINION OF ADEQUACY
The competent person considers that in what corresponds to the preparation, analysis, safety of the samples and procedures used by SQM in Nueva Victoria complies with the appropriate standard without showing relevant deficiencies that may alter the obtaining of the results derived from the procedures.
|
|
|
|
|
|
|
|
|
| SQM TRS Nueva Victoria |
|
Pag. 62 |
9DATA VERIFICATION
9.1PROCEDURES
Verification by the QP focuses on drilling, sample collection, handling and quality control procedures, geological mapping of drill cores and cuttings, and analytical and quality assurance laboratory procedures. Based on the review of SQM's procedures and standards, the protocols are considered adequate to guarantee the quality of the data obtained from the drilling campaigns and laboratory analysis.
9.2DATA MANAGEMENT
Using the drilling, the recognition of the deposit is carried out in depth and to this is used prospecting grids 400 x 400 m, 200 x 200 m, 100 x 100 m, 100T and 50 x 50 m. Depend on the size of drillhole grid, the Resources are estimated by different interpolations methods (for details see 1.3 Mineral Resources Statement).
The samples obtained from these reverse air drilling campaigns are sent to the internal laboratory of SQM who have quality control standards regarding its mechanical and chemical treatment. QA-QC analyzes are performed on control samples in all prospecting grid à (400 x 400 m, 200 x 200 m, 100 x 100; 100T and 50 x 50m). This QA-QC consists of the analysis of NaNO3 and Iodine concentrations in duplicate vs. original (or primary) samples.
9.3TECHNICAL PROCEDURES
The competent person indicates that in terms of the Chain of Custody (traceability of the place of origin of the samples), subsequent preparation and analysis and security of the samples, SQM applies procedures that ensure optimal obtaining of field and laboratory data; to ensure control and quality of results.
9.4QUALITY CONTROL PROCEDURES
The competent person indicates that in SQM Quality Control ensures the monitoring of samples accurately from the preparation of the sample and the consequent chemical analysis through a protocol that includes regular analysis of duplicates and insertion of samples for quality control.
9.5PRECISION EVALUATION
Regarding the Accuracy Assessment, the Competent Person indicates that the iodine and nitrate grades of the duplicate samples in the 400 x 400, 200 x 200, and 100 x 100 meshes have good correlation with the grades of the original samples; However, it is recommended to always maintain permanent control. In this process, to prevent and detect in time any anomaly that could happen.
9.6ACCURACY EVALUATION
A QA-QC analysis of the campaign is carried out in the Nueva Victoria Sectors for standard/pattern samples, which were carried out and analyzed by the laboratory, the results obtained show that the variation of the analyzes with respect to the standards used by SQM show acceptable margins, with a maximum of ± 0.53% of NaNO3 and 60 ppm of Iodine (Informe 20 F, 2021).
9.7QUALIFIED PERSON’S OPINION OF DATA ADEQUACY
The Competent Person indicates that the methodologies used by SQM to estimate geological resources and reserves in New Victoria are adequate.
The 400 x 400 m drilling grid may imply continuity, average grade of mineralization with a moderate confidence level since there is no certainty that all or part of these resources will become mineral reserves after the application of the modifying factors.
The 200 x 200 m and 100 x 100 drilling grids generate geological information of greater detail being possible to define geological units, continuity, grades, and power. Therefore, at this stage of exploration, sectors for geometallurgical tests can be defined.
Therefore, at this stage of exploration, sectors for geometallurgical tests can be defined. To the extent that the exploration grid is sequentially reduced with drilling 100T and 50 x 50 m, the geological information is more robust, solid which allows a characterization of the mineral deposit with a significant level of confidence. They are called Measured Resources.
|
|
|
|
|
|
|
|
|
| SQM TRS Nueva Victoria |
|
Pag. 63 |
10MINERAL PROCESSING AND METALLURGICAL TESTING
Since 2009, further research has been developed through laboratory tests to continuously improve yield estimation and valuable element recovery such as iodine and nitrate. These efforts, focused on caliche chemical and physical characterization, made it possible to develop a set of strategies that provide a better prediction and recovery projection for each caliche mining area identified, which are and will be processed at Nueva Victoria's plant.
It should be noted that, before Nueva Victoria started operations in 2002, SQM nitrates & iodine explored options to expand and/or optimize iodine production through a trial plan developed at Pedro de Valdivia's process plant to establish an oxidative treatment of the concentrate. These tests demonstrated that it is possible to avoid flotation stage in the conventional process, iodine production process works well using an external oxidizer, and it is economically viable and less costly to build and operate. As such, extensive tests were completed with different iodine brines from different resources to confirm these results, as well as considering the oxidation stages applicable at Nueva Victoria Process Plant.
In 2016, given water scarcity in the north of Chile, industry investigated new sustainable sources of water for its processes. A caliche leaching test plan was performed with seawater, to determine its technical feasibility, positive and negative impacts or metallurgical recovery and performance equivalence. A pilot plant at the plant site demonstrated its feasibility of the leaching process. The historical development of testing has made it possible to differentiate the main categories of caliche types according to their composition and physical behavior. These tests are designed to optimize the process to guarantee compliance with the customer's product specifications and, on the other hand, to ensure that harmful elements can be kept below the established limits.
More than a decade of research on multiple systems has provided a foundation for leaching process, recovery, and production of iodine. This includes a review of trials which have contributed to the development and build-up of current operating procedures.
10.1HISTORICAL DEVELOPMENT OF METALLURGICAL TESTS
In 2009, heap & ponds management created a working group that will be in charge to develop tests to continuously improve yield estimation and valuable elements recovery, such as iodine and nitrate, from heaps and evaporation ponds. In early February 2010, the first metallurgical test work program was presented at the Pilot Plant facility located at Iris sector. Its main objective is to provide, through pilot scale tests, all the necessary data to guide, simulate, strengthen, and generate enough knowledge to understand the phenomenology behind production processes in leaching heaps and evaporation ponds.
The initial work program was framed around the following topics:
⮚Reviewing constructive aspects of heaps.
⮚Study thermodynamic, kinetic, and hydraulic phenomena of the heap.
⮚Designing a configuration in terms of performance and production level.
Work program activities are divided into specializations and the objectives of each activity and methodology followed are summarized in the following table.
|
|
|
|
|
|
|
|
|
| SQM TRS Nueva Victoria |
|
Pag. 64 |
Table 10-1. Methodologies of the Test Plan Initially Developed for the Study of Caliche Behavior.
|
|
|
|
|
|
|
|
|
|
|
|
| Activity |
Objective |
Methodology |
|
Pile geometry and height |
Optimum dimensions and the effect of height on performance |
Mathematical methods and column leaching tests at different heights |
|
Granulometry |
Impact of size and determination of maximum optimum |
Leaching tests at three levels of granulometry |
| Heap physical aspects |
Loading |
Impact of loading shape and optimization of the operation |
Column percolability with different size segregation in loading |
|
Wetting requirements |
Determination of impact on yield due to wetting effect |
Column tests, dry and wet ore |
|
Caliche characterization |
Characterization by mining sector |
Chemical analysis, XRD and treatability tests |
| Hydraulics |
Impregnation rate, irrigation and irrigation system configuration |
Establish optimums |
Mathematical methods and industrial level tests |
|
Species solubilities |
Establish concentrations of interferents in iodine and nitrate leaching |
Successive leaching tests |
| Kinetics |
Effect of irrigation configuration |
Effect of type of lixiviant |
Column tests |
|
Sequestering phases |
Impact of clays on leaching |
Stirred reactor tests |
| System configuration |
Pile reworking study |
Evaluate impact on yield |
Column tests |
| Solar evaporation ponds |
AFN / brine mixture study |
Reduction of salt harvesting times |
Stirred and tray reactor tests |
|
Sample processing |
Preparation and segregation of test samples |
|
| Routine |
Treatability tests |
Data on the behavior of caliche available in heaps according to the exploited sector |
Column tests |
|
Quality control of irrigation elements and flowmeters |
Review of irrigation assurance control on a homogeneous basis |
|
This first metallurgical test work plan results in the establishment of appropriate heap dimensions, maximum ROM size and heap irrigation configuration. In addition to giving way to studies of caliche solubilities and their behavior towards leaching. Diagram of chemical, physical, mineralogical, and metallurgical characterization tests applied to all company resources.
SQM, through its Research and Development area, has carried out the following tests at plant and/or pilot scale that have allowed improving the recovery process and product quality:
⮚Iodide solution cleaning tests.
⮚Iodide oxidation tests with Hydrogen and/or Chlorine in the Iodine Plant.
The cleaning test made it possible to establish two stages prior to the oxidation of solution filtration with an adjuvant and with activated carbon. In addition, it is defined that to intensify the cleaning work of this stage, it is necessary to add traces of sulfur dioxide to the iodide solution. Meanwhile, the iodide oxidation tests allowed incorporating the use of hydrogen peroxide and/or chlorine in adequate proportions to dispense with the iodine concentration stage by flotation, obtaining a pulp with a high content of iodine crystals.
Currently, the metallurgical tests performed are related to the physicochemical properties of the material and the behavior during leaching. The procedures associated with these tests are described below.
|
|
|
|
|
|
|
|
|
| SQM TRS Nueva Victoria |
|
Pag. 65 |
10.2METALLURGICAL TESTING
The main objective of the tests developed is to be assessing different minerals' response to leaching. In the pilot plant-laboratory, test data collection for the characterization and recovery database of composites are generated. Tests detailed below have the following specific objectives:
⮚Determine whether analyzed material is sufficiently amenable to the leaching process, nitrate and iodine solution concentration for production by established separation and recovery methods in plant.
⮚Optimize this process to guarantee a recovery that will be linked intrinsically to mineralogical and chemical characterization, as well as physical and granulometry characterization of mineral to be treated.
⮚Determine deleterious elements, to establish mechanisms for operations to keep them below certain limits that guarantee a certain product quality.
SQM's analytical and pilot test laboratories perform the following chemical, mineralogical, and metallurgical tests:
⮚Microscopy and chemical composition.
⮚Physical properties: Tail Test, Borra test, Laboratory granulometry, Embedding tests, Permeability.
⮚Leaching test.
Currently, SQM is conducting plant-scale tests to optimize heap leach operations through categorization of the mineral to be leached. Metallurgical studies are conducted on mining method called continuous mining (CM), which consists of breaking and extracting the “caliche mantle” material through a tractor with a cutting drum, which allows obtaining a smaller mineral with more homogeneous size distribution.
Preliminary leaching tests of this material under identical conditions to ROM material have resulted in higher recoveries of approximately 12% of the recovery in ROM heaps.
In order develop these tests, two different CM teams have been acquired and evaluated:
⮚Rolling system availability.
⮚Cutting system design.
⮚Sensitivity to rock conditions.
⮚Productivity variability.
⮚Consumption and replacement of components.
The 2024 mining plan aims to treat 10% of mineral caliche by CM to obtain, through quarry selection, a maximum recovery estimated at +12% in iodine and +6% in nitrate. At the operational level, recoveries will be monitored to establish annual sequential exploitation levels. Through this work it is hoped to determine an optimal proportion of CM mineral to be incorporated into ROM stockpiles to increase recovery.
In the following sections, a description of sample preparation and characterization procedures, for metallurgical tests, and process and product monitoring/control activities of the operations through chemical analysis is given.
10.2.1Sample preparation
Samples for metallurgical testing are obtained through a sampling campaign. The methods used are related to the different drilling methodologies used in the different campaigns to obtain core samples for analysis through a 100T-200 grid drilling campaign and diamond drilling (more details in section 7.3 Drilling Methods and Results). With the material sorted from the trial pits (calicatas), loading faces, piles, drill holes and diamond drill, composite samples are prepared to determine iodine and nitrate grades, and to determine physicochemical properties of the material to predict its behavior during leaching.
Samples are segregated according to a mechanical preparation guide, which aims to provide an effective guideline for minimum required mass and characteristic sizes for each test, to optimize the use of available material. This allows successful metallurgical testing, ensuring validity of results and reproducibility. The method of sampling and development of metallurgical tests on samples from Nueva Victoria property, for the projection of future mineral resources, consists in summary of the stages outlined in the Figure 10.1
|
|
|
|
|
|
|
|
|
| SQM TRS Nueva Victoria |
|
Pag. 66 |
Figure 10-1. General Stages of the Sampling Methodology and Development of Metallurgical Test at Nueva Victoria.
As for the development of metallurgical, characterization, leaching and physical properties tests, these are developed by teams of specialized professionals with extensive experience in the mining-geo-metallurgical field. The work program in metallurgical tests contemplates that the samples are sent to internal laboratories to perform the analysis and test work according to the following detail:
⮚Analysis Laboratories located in Antofagasta provide chemical and mineralogical analysis.
⮚Pilot Plant Laboratory, located in Iris- Nueva Victoria, for completion of the physical and leaching response tests.
Details of the names, locations and responsibilities of each laboratory involved in the development of the metallurgical tests are reported in section 10.4 Analytical and Testing Laboratories. The reports documenting the drilling programs provide detailed descriptions of sampling and sample preparation methodologies, analytical procedures meeting current industry standards. Quality control is implemented at all stages to ensure and verify that the collection process occurs at each stage successfully and is representative. To establish the representativeness of the samples, a map of a diamond drilling campaign in the NV sector is shown below to estimate the physical and chemical properties of the caliche of the resource to be exploited (Figure 10-2).
|
|
|
|
|
|
|
|
|
| SQM TRS Nueva Victoria |
|
Pag. 67 |
Figure 10-2. Diamond Drilling Campaign Map for Composite Samples from the NV Sector for Metallurgical Testing
10.2.2Caliche Mineralogical and Chemical Characterization
As part of SQM nitrate test work, mineralogical tests were conducted on composite samples. To develop its mineralogical characteristics and its alterations, a study of the elemental composition is conducted by X-Ray Diffraction (XRD). A particle mineral analysis (PMA) to determine mineral content of the sample is carried out.
Caliche mineralogical characterization are done for the components Nitrate, Chloride, Iodate, Sulfate and Silicate.
Additionally, caliche chemical characterization in iodine, nitrate, Na2SO4 (%), Ca (%), K (%), Mg (%), KClO4 (%), NaCl (%), Na (%), Na (%), H3BO3 (%), and SO4 were obtained from chemical analyses obtained from an internal laboratory of the company. The analysis methods are shown in Table 10-2. More details on SQM's in-house and staff-operated laboratories can be found in the section 10.4 Analytical and Testing Laboratories.
|
|
|
|
|
|
|
|
|
| SQM TRS Nueva Victoria |
|
Pag. 68 |
The protocols used for each of the methods are properly documented with respect to materials, equipment, procedures, and control measures. Details of the procedure used to calculate iodine and nitrate grades are provided in Section 10.2.3
Table 10-2. Applied Methods for the Characterization of Caliche or Composite.
|
|
|
|
|
|
|
|
|
| Parameter |
Unit |
Method |
| Iodine grade |
ppm |
Volumetric redox |
| Nitrate grade |
% |
UV-Vis |
Na2SO4 |
% |
Gravimetric / ICP |
| Ca |
% |
Potentiometric / Direct Aspiration – AA or ICP Finish |
| Mg |
% |
Potentiometric / Direct Aspiration – AA or ICP Finish |
| K |
% |
Direct Aspiration – AA or ICP Finish |
SO4 |
% |
Gravimetric / ICP |
KclO4 |
% |
Potentiometric / Direct Aspiration – AA or ICP Finish |
| NaCl |
% |
Volumetric |
| Na |
% |
Direct Aspiration – AA or ICP Finish |
H3BO3 |
% |
Volumetric or ICP Finish |
In-house analytical laboratories operated by company personnel are responsible for the chemical and mineralogical analysis of samples. These laboratories are located in the city of Antofagasta and correspond to the following four sub-facilities:
⮚Caliche-Iodine Laboratory
⮚Research and Development Laboratory
⮚Quality Control Laboratory
⮚SEM and XRD Laboratory
Results of the chemical and mineralogical characterization reported by the company are conclusive on the following points:
⮚The most soluble part of the saline matrix is composed of sulfates, nitrates and chlorides.
⮚There are differences in the ion compositions present in salt matrix (SM).
⮚Anhydrite, Polyhalita and Glauberite, and less soluble minerals, have calcium sulfate associations.
⮚From a chemical-salt point of view, this deposit is favorable in terms of the extraction process, as it contains an average of 49% of soluble salts, high calcium content (>2.5%), and good concentrations of chlorides and sulfates (about 11% and 13% respectively).
⮚Being a mostly semi-soft deposit CM methods can be applied in almost all the deposit. The geomechanical characteristic of the deposit together with a low clastic content and low abrasiveness (proven by calicatas) allows low mining costs applying CM technology.
10.2.3Caliche Nitrate and Iodine Grade Determination
Composite samples (material sorted from the trial pits (calicatas), loading faces, piles, drill holes and diamond piles) are analyzed by iodine and nitrate grades. The analyses are conducted by Caliche and Iodine laboratory located in the city of Antofagasta. Facilities for iodine and nitrate analysis have qualified under ISO- 9001:2015 for which TÜV Rheinland provides quality management system certification. The latest recertification process was approved in November 2020 and is valid until March 15, 2023.
10.2.3.1Iodine determination
There are two methods to determine iodine in caliche, redox volumetry and XRF. Due to quality and accuracy in the analysis, we currently use redox volumetry to determine the iodine grade. Redox volumetry is based on titration of an exactly known concentration solution, called standard solution, which is gradually added to another solution of unknown concentration, until chemical reaction between both solutions is complete (equivalence point). Iodine determination by XRF uses XRF Spectro ASOMA equipment, in which a pressed mineral sample is placed in a reading cell. This year it was possible to replace the team with the Rigaku NEX QC, which allows to analyze six samples, A silicon drift detector (SDD)
|
|
|
|
|
|
|
|
|
| SQM TRS Nueva Victoria |
|
Pag. 69 |
affords extremely high-count rate capability with excellent spectral resolution. This enables NEX QC+ to deliver the highest precision analytical results in the shortest possible measurement times. QA controls consist of equipment status checks, sample reagent blanks, titrant concentration checks, repeat analysis for a standard with sample set to confirm its value.
Figure 10.3. Rigaku NEX QC series of EDXRF Spectrometers
10.2.3.2Nitrate determination
Nitrate grade in caliches is determined by UV-visible molecular absorption spectroscopy. This technique allows to quantify parameters in solution, based on their absorption at a certain wavelength of the UV-visible spectrum (between 100 and 800 nm).
This determination uses a Molecular Absorption Spectrophotometer POE-011-01, or POE-17-01, in which a glass test tube containing a filtered solution obtained by leaching with filtered distilled water is used. Results obtained are expressed in percent nitrate.
QA criteria and result validity are achieved through:
⮚Prior equipment verification.
⮚Performing comparative nitrate analysis once a shift, by contrasting readings of the same samples with other UV-visible equipment and checking readings in Kjeldahl method distillation equipment, for nitrogen determination.
⮚Conducting standard and QC sample input every 10 samples.
Although the certification is specific to iodine and nitrate grade determination, this laboratory is specialized in chemical and mineralogical analysis of mineral resources, with long-standing experience in this field. It is the QP’s opinion that quality control and analytical procedures used at the Antofagasta Caliches and Iodine laboratory are of high quality.
Figure 10.4 UDK 169 with AutoKjel Autosampler - Automatic Kjeldahl Nitrogen Protein Analyzer
|
|
|
|
|
|
|
|
|
| SQM TRS Nueva Victoria |
|
Pag. 70 |
10.2.4Caliche Physical Properties
To measure, identify, and describe mineral physical tests of mineral properties are developed to predict how it will react under certain treatment conditions. The tests performed are summarized in Table 10-3. During the site visit it was possible to verify the development of embedding, sedimentation, and compaction tests in the Iris Pilot Plant Laboratory, which are shown in Figure 10-3.
Table 10-3. Determination of Physical Properties of Caliche Minerals.
|
|
|
|
|
|
|
|
|
|
|
|
|
|
|
| Test |
Parameter |
Procedure |
Objective |
Impact |
| Tails Test |
Sedimentation and compaction |
Sedimentation test, measuring the clearance and riprap cake every hour for a period of about 12 hours |
Obtain the rate of sedimentation and compaction of fines |
Evidence of crown instability and mid generation. Irrigation rate |
| Borra test |
% Of fine material |
The retained material is measured between the -#35 #+100 and #-100 after a flocculation and decantation process. Flocculation and decantation of ore |
To obtain the amount of ore flocculation and decantation process |
% Of fine that could delay irrigation. Irrigation rate. Canalizations. |
| Size distribution |
% Of microfine |
Standard test of granulometry, the percentage under 200 mesh is given |
Obtain % microfine |
% Water retention and yield losses |
| Permeability |
K (cm/h) |
Using constant load permeameter and Darcy's law |
To measure the degree of permeability of ore |
Decrease in extraction kinetics of extraction |
| Embedded |
alpha |
Wettability measurement procedure of rock |
To measure the degree of wettability of the ore |
Variability in impregnation times |
Figure 10-5. Embedding, Compaction and Sedimentation Tests Performed in the Iris Pilot Plant Laboratory.
Table 10-4 provides a summary of physical test results comparing the conditions of TEA and Orcoma.
|
|
|
|
|
|
|
|
|
| SQM TRS Nueva Victoria |
|
Pag. 71 |
Table 10-4 Comparative Results of Physical Tests for Pampa Orcoma and TEA Exploitation Project.
|
|
|
|
|
|
|
|
|
|
|
|
|
|
|
|
|
|
| Sector |
Sedimentation |
Compactation |
% Fines |
#-200 |
Alpha |
| TEA |
0.024 |
7.54 |
31.86 |
10.57 |
2.37 |
| ORCOMA |
0.025 |
10.05 |
32.98 |
12.29 |
2.29 |
According to the results, it is possible to highlight the following points:
⮚Sedimentation: Both have medium sedimentation velocity, which implies the need for impregnation and prolonged resting for stabilization.
⮚Compaction: Orcoma has a good compaction, which indicates a greater uniformity in the porous bed, which allows reaching high irrigation rates and therefore better kinetics.
⮚Fines: Both sectors present high percentage of fines, this implies that the best impregnant to use should be a solution other than water. The negative impact of this condition could be increased depending on the type of fine material (e.g., clays) generating water pockets and channeling.
⮚Material #-200: Corresponds to the microfine and are the ones that give rise to channeling and exhibit very high value in both sectors.
⮚Parameter Alpha: At medium levels, these imply acceptable embedding speed which can be improved with a slow controlled impregnation.
As the physical properties measured are directly related to the irrigation strategy, the conclusion is that both caliches should be treated in a similar way considering a standard impregnation stage of mixed drip and sprinkler irrigation.
10.2.5Agitated Leaching Tests
Leaching tests are performed at the company's in-house laboratory facilities located at the Iris Pilot Plant. The following is a brief description of the agitated and successive leaching test procedure.
10.2.5.1Leaching in Stirred Reactors
Leaching experiments are conducted at atmospheric pressure and temperature in a plastic reactor without baffles. A propeller agitator at 200 RPM was used to agitate leach suspension. In short, all the experiments were executed with:
⮚Ambient conditions.
⮚Caliche sample particle size 100% mesh -65# mesh.
⮚Caliche mass 480, 320 or 200 g.
⮚L/S ratio 2:1.
⮚Leaching time 2 h.
⮚Three contact leaching including use of drainage solution.
To start up the leaching experiment, a reactor was initially filled with distilled water and then the solution is gently agitated. After a few minutes, caliche concentrate added to the solution and agitation increased to the final rate.
Once finished, the product was filtered, and the brine solution analyzed by checking the extraction of analytes and minerals by contact with the leaching agent, consumption per unit and iodine extraction response.
Successive leaching’s are complementary to stirred vessel leaching and performed in a stirred vessel with the same parameters explained above. However, it contemplates leaching three caliche samples successively with the resulting drainage solution of each stage. The objective of this test is to enrich this solution of an element of interest such as iodine and nitrates to evaluate heap performance as this solution percolates through the heap. The representative scheme of successive leaching in stirred vessel reactors is shown in Figure 10-6.
|
|
|
|
|
|
|
|
|
| SQM TRS Nueva Victoria |
|
Pag. 72 |
Figure 10-6. Successive Leach Test Development Procedure
The extraction of each analyte and minerals per contact is analyzed. These results reported by the company are conclusive on the following points:
⮚Higher quantity of soluble salts, lower is the extraction.
⮚Higher proportion of Calcium in Salt Matrix results in higher extraction.
⮚Physical and chemical quality for Leaching is determined by a Soluble Salts content of less than 50%.
For a caliche of TEA sector, the chemical characterization and leaching results show in Table 10-5, where an average salt matrix of 63.7% soluble salts and iodine yield of 56.4%.
Table 10-5 Chemical Characterization of Samples Obtained from TEA and Successive Leach Test Results.
|
|
|
|
|
|
|
|
|
|
|
|
|
|
|
|
|
|
|
|
|
|
|
|
|
|
|
|
|
|
|
|
|
|
|
|
|
|
|
|
|
|
| Sectors |
Mesh |
Recoveries Proyected |
Elements |
| Mton |
Iodine (ppm) |
NaNO3 |
Na2SO4 |
Ca |
Mg |
k |
SO4 ap |
KCIO4 |
NaCl |
Na |
H3BO3 |
| Hermosa |
100-100T |
155 |
408 |
6.7 |
17.3 |
1.82 |
0.95 |
0.84 |
10.84 |
0.04 |
12.6 |
8.13 |
0.23 |
| TEA Norte |
100T |
62 |
428 |
5.8 |
18.4 |
2.21 |
1 |
0.85 |
10.6 |
0.08 |
14.5 |
9.45 |
0.4 |
| TEA Sur |
200 |
22 |
412 |
4.7 |
21 |
3.02 |
1.1 |
0.81 |
10.57 |
0.02 |
14.2 |
7.97 |
0.39 |
| TEA Oeste |
2000 |
75 |
407 |
5.4 |
16.6 |
2.31 |
0.97 |
0.69 |
8.44 |
0.05 |
16.7 |
8.87 |
0.57 |
| Average |
|
314 |
412 |
6.1 |
17.6 |
2.1 |
0.97 |
0.8 |
10.2 |
0.05 |
14.1 |
8.56 |
0.36 |
The following graphs, included in Figure 10-7, show the results of the agitated leaching tests of two resources from TEA and Pampa Orcoma. The graphs represent the Nitrate and Iodine yield achieved as a function of soluble salt content.
In the graphs, the green line corresponds to the experimental yield result, while the orange line indicates a modeling result of the Pampa Orcoma yield factored at 90%. The yield equivalent to 90% of what the model indicates is 66.3% for Iodine and 63.4% for Nitrate. These factored yields are conservatively used for the economic evaluation of the project.
The green line, which corresponds to the experimental results, shows that an ore from Pampa Orcoma with a content of soluble salts of 46.5% has a yield of 73% in iodine and 70.5% in nitrate, while an ore from TEA, with a content of 62.9% of soluble salts, has a yield of 55.5% in iodine and 60.7% in nitrate. Both resources show a difference in Nitrate yield of 70.5% vs 60.7% and Iodine yield, 73% vs 55.5%. Nitrate and iodine yield difference is the 9% and 17%, respectively.
|
|
|
|
|
|
|
|
|
| SQM TRS Nueva Victoria |
|
Pag. 73 |
Figure 10-7. Nitrate and Iodine yield Obtained by Successive Agitated Leaching Test.
10.2.6Column Leach Test Using Sea Water
Water availability is limited, being a critical issue for the mining industries and, therefore, other leaching agents such as seawater can be a viable alternative. Therefore, experimental studies of caliche leaching in mini columns were conducted to evaluate seawater's effect.
This study aims to analyze seawater's effect on caliche leaching from different sectors of nitrate-iodine mining properties, using seawater sampled in Mejillones Bay at 100 m offshore and below 15 m deep.
The types of tests executed are in duplicate under the following impregnation-irrigation strategy and conditions:
⮚Water Impregnation - Irrigation with Water (MC 1-MC2).
⮚Water Impregnation - Irrigation with 60% v/v Water - 40% v/v with a recirculated weakly acidic water ( AFA). (MC 3-MC 4).
|
|
|
|
|
|
|
|
|
| SQM TRS Nueva Victoria |
|
Pag. 74 |
⮚Seawater Impregnation - Irrigation with Seawater (MC 5-MC 6).
⮚Seawater Impregnation - Irrigation with Mixed 60% v/v Seawater - 40% v/v AFA (MC 7-MC 8)
⮚The test development conditions are indicated in Table 10-6.
⮚Composition determined by granulometry of the material disposed in the columns.
Table 10-6 Conditions for Leaching Experiments with Seawater.
|
|
|
|
|
|
| Parameter |
Detaille |
| Mass |
3,031.3 g |
| Granulometry |
1'' - 3/4'' - 1/2'' - 1/4'' - 20'' mesh |
| Test Duration |
7 days |
| Total Impregnation |
19 hours in watering/rest schedule |
| Continuous Irrigation |
1 h/2 h-1 h/1 h/1h h-2 h/1 h |
| Irrigation Rate Flow-Flow |
5 days and 20 h |
The results of the experiments show that highly soluble minerals such as nitrate and iodate are rapidly leached with seawater without much difference with respect to the raw water method.
Regarding nitrate and iodine extraction, a higher NO3 extraction, in Figure 10-8, is observed when leaching with seawater as well as a higher IO3 extraction is observed when leaching with seawater (MC5 and MC6 curves versus MC1 and MC2 curves).
In addition to the above, when comparing the extractions achieved in iodine leaching by water/AFA and seawater/AFA, curves MC 3, and MC 4 versus MC 7 and MC 8, the seawater/AFA mixture is better (MC 7 and MC 8). While, for nitrate, there is no appreciable difference in increase when using seawater as a mixture and extraction is like that of iodine.
Figure 10-8. Results of Nitrate and Iodine Extraction by Seawater Leaching.
a)Nitrate extraction with seawater
|
|
|
|
|
|
|
|
|
| SQM TRS Nueva Victoria |
|
Pag. 75 |
b)Iodine extraction with seawater
In the future heap behavior will be studies through column leaching tests using seawater, including different irrigation rates and bed heights in the column, and analyzing the experimental concentrations of each species.
10.2.7Laboratory Control Procedures
Currently, there is a quality control system in place to monitor iodine production operations, which consists of monitoring processes starting with inlet brine characterization, followed by sampling and characterization of the cutting and oxidation brine, as well as the prill product obtained. From the product obtained from the iodine prill plant, a series of analyses are conducted to quantify purity, chloride/bromine ratio, sulfate, mercury, residues, and color index.
The analyses, on liquid and solid samples, are performed in the laboratory facilities located in the city of Antofagasta, Analysis laboratory, involving two installations:
⮚Caliche-Iodine Laboratory: Determination of iodine and nitrate in caliches.
⮚Research and Development Laboratory: Facility in charge of performing determination by AAS, ICP-OES, potentiometry, conventional titration, solution density.
More details on SQM's in-house and staff-operated laboratories can be found in the section 10.4 Analytical and Testing Laboratories.
Table 10-7 shows the basic set of analyses requested from laboratories and the methodologies used for their determination.
|
|
|
|
|
|
|
|
|
| SQM TRS Nueva Victoria |
|
Pag. 76 |
Table 10-7 List of Requested Analyses for Caliche Leach Brines and Iodine Prill
|
|
|
|
|
|
| Iodine Solutions |
| Parameter |
Method |
| Iodine grade |
Volumetric redox |
| Nitrate grade |
UV-Vis |
| PH |
Potentiometric |
| Acidity |
Volumetric acid-base |
| Alkalinity |
Volumetric acid-base |
H3BO3 |
Volumetric or ICP Finish |
Na2SO4 |
Gravimetric / ICP |
| Ca |
Potentiometric / Direct Aspiration-AA or ICP Finish |
| Mg |
Potentiometric / Direct Aspiration-AA or ICP Finish |
| K |
Direct Aspiration-AA or ICP Finish |
SO4 |
Gravimetric / ICP |
KClO4 |
Potentiometric |
| NaCl |
Volumetric |
| Na |
Direct Aspiration-AA or ICP Finish |
|
|
|
|
|
|
| Iodine Prill |
| Parameter |
Method |
| Purity or iodine count |
Potentiometric |
| Bromide and chloride |
Volumetric |
| Non-volatile material (residue) |
Gravimetric |
| Sulfate |
Turbidimetry |
| Mercury |
Spectrophotometry |
| Coloration Index |
Colorimetric |
SQM's nitrate and iodine processing plants have been in production for many years and metallurgical requirements for processing and recovering the nitrate from evaporation ponds from iodine process remaining solution are well known. Consequently, no new metallurgical studies related to evaporation studies have recently been carried out. However, once pond systems are in operation, sampling and assay procedures for evaporation tests are as follows:
⮚Brine sample collection is conducted on a periodic basis to measure brine properties, such as chemical analysis, density, brine activity, etc. Samples are taken by an internal company laboratory using the same methods and quality control procedures as those applied to other brine samples.
⮚Precipitated salts are collected from ponds for chemical analysis to evaluate evaporation pathways, brine evolution, and physical and chemical properties of the salts.
10.3SAMPLES REPRESENTATIVENESS
The company has established Quality Assurance/Quality Control (QA/QC) measures to ensure the reliability and accuracy of sampling, preparation, and assays, as well as the results obtained from assays. These measures include field procedures and checks that cover aspects such as monitoring to detect and correct any errors during drilling, prospecting, sampling, and assaying, as well as data management and database integrity. This is done to ensure that the data generated are reliable and can be used in both resource estimation and prediction of recovery estimates.
According to the sampling protocol, the samples, once logged by the technical staff in charge of the campaign, are delivered from the drilling site to a secure and private facility. Analytical samples are prepared and assayed at the in-house " Pilot Plant Laboratory" located at the Nueva Victoria site and Iris sector. The protocol ensures the correct entry in the database by tracking the samples from their sampling or collection points, identifying them with an ID, and recording what has been done for the samples delivered/received. The set of procedures and instructions for traceability corresponds to a document called "Caliche AR Sample Preparation Procedure".
|
|
|
|
|
|
|
|
|
| SQM TRS Nueva Victoria |
|
Pag. 77 |
The company applies a quality control protocol established in the laboratory to receive caliche samples from all the areas developed according to the campaign, preparing the dispatches together with the documentation for sending the samples, preparing, and inserting the quality controls, which will be the verification of the precision and accuracy of the results. The LIMS data management system is used to randomly order the standards, blank and duplicates in the corresponding request. By chemical species analysis, an insertion rate of standard or standard QA/QC samples and duplicates is established.
The following criteria are established for the handling of results:
⮚Numbers of samples that are above and below the lower detection limits.
⮚Differences of values in duplicates are evaluated. For example, when comparing duplicates of nitrate and iodine grades, a maximum difference, calculated in absolute value, of 0.4% for NaNO3 and 0.014% for iodine is accepted.
⮚For standards measured, results with a tolerance of +/- 2 standard deviations from the certified value are accepted.
In the case of any deviation, the laboratory manager reviews and requests check of the samples, in case the duplicate or standard is non-compliant.
As for physical characterization and leaching tests, all tests are developed in duplicate. Determination results are accepted with a difference of values in the duplicates of 2%.
Given the QA/QC controls and documentation described above the QP considers that the test samples are representative of the different types and styles of mineralization and of the mineral deposit. Sampling for operations control is representative of caliche as they are obtained directly from the areas being mined or scheduled for mining. The caliche analysis and characterization tests are appropriate for a good planning of operations based on a recovery estimation.
10.4ANALYTICAL AND TESTING LABORATORIES
The metallurgical testing program directs samples to be sent to internal laboratories in charge of analysis and testing:
⮚Analysis laboratory located in Antofagasta, in charge of chemical and mineralogical analysis and composed of four laboratories (see Table 10-8).
⮚Pilot Plant Laboratory located at Iris- Nueva Victoria responsible for sample reception and physical and leaching response tests.
The following table details the available facilities and the analyses performed in each one of them.
Table 10-8 List of Installations Available for Analysis.
|
|
|
|
|
|
|
|
|
| Laboratory |
Location |
Analyses |
| Caliche-Iodine Laboratory |
Antofagasta |
Determination of Iodine and Nitrate in caliches, probing |
| Research and Development Laboratory |
Antofagasta |
AAS, ICP-OES, potentiometry, conventional titration, solution density |
| Quality Control Laboratory |
Antofagasta |
Polarized light microscopy, particle size distribution |
| SEM and XRD Laboratory |
Antofagasta |
SEM and XRD |
| Pilot Plant Laboratory |
Nueva Victoria |
Physical characterization and ore leaching tests |
Iodine and nitrate testing facilities available at Caliche and Iodine Laboratories (LCY) in Antofagasta are certified under ISO-9001:2015. Certification was granted by TÜV Rheinland and is valid from 2020-2023.
It should be noted that part of the exploration efforts is focused on possible gold and copper metallic mineralization underneath the caliche. Therefore, samples are sent to external analytical laboratories that are independent from SQM and accredited and/or certified by the International Standards Organization (ISO):
⮚Andes Analytical Assay (AAA) (ISO 9001 Certification).
⮚ALS Global Chile (ISO/IEC 17025).
⮚Centro de Investigación Minera y Metalúrgica (CIMM) (ISO/IEC 17025).
|
|
|
|
|
|
|
|
|
| SQM TRS Nueva Victoria |
|
Pag. 78 |
10.5TESTING AND RELEVANT RESULTS
10.5.1Metallurgical Recovery Estimation
Caliche characterization results are contrasted with metallurgical results to formulate relationships between elemental concentrations and recovery rates of the elements of interest or valuable elements and reagent consumption.
The relationships between reported analyses and recoveries achieved are as follows:
⮚It is possible to establish an impact regarding recovery based on the type of salt matrix and the effect of salts in the leaching solution. With higher amounts of soluble salts, extraction is lower while higher calcium in SM results in higher extraction.
⮚Caliches with better recovery performance tend to decant faster (speed) and compact better.
⮚The higher presence of fines hinders bed percolation, compromising the ability to leach and ultrafine that could delay irrigation or cause areas to avoid being irrigated.
⮚The higher hydraulic conductivity or permeability coefficient, better the leachability behavior of the bed.
For metallurgical recovery estimation, the formulated model contains the following elements:
⮚Chemical-mineralogical composition.
⮚Yield.
⮚Physical characteristics: sedimentation velocity, compaction, percentage of fines and ultrafine, uniformity coefficient, and wetting.
The metallurgical analysis is focused on determining the relationships associated with these variables, since the relationships can be applied to the blocks to determine deposit results. From a chemical and yield point of view, a relationship is established between unit consumption (UC, amount of water) or total irrigation salts (salt concentration, g/L) and iodine extraction. The best subset of the regressions was used to determine the optimal linear relationships between these predictors and metallurgical results. Thus, iodine and nitrate recovery equations are represented by the following formulas and Figure 10-9:
|
|
|
|
|
|
|
|
|
| SQM TRS Nueva Victoria |
|
Pag. 79 |
Figure 10-9. Iodine Recovery as a Function of total Salts Content.
The graph of Figure 10-9 compares iodine yield results for samples from two SQM resources, TEA and Pampa Orcoma (abbreviated as ORC), as a function of total salts. The mineral samples (MS) are differentiated by their percentage soluble salt content, so that sample MS-45 (TEA), for example, corresponds to a mineral sample from the TEA sector characterized by 45% soluble salts. Following this logic, MS-45 (ORC), corresponds to a mineral sample from Pampa Orcoma, which has a soluble salt content of 45%. As can be seen, an output matrix content of 65% implies a lower recovery compared to an ore content of 45%.
In conclusion, the metallurgical tests, as previously stated, have allowed establishing baseline relationships between caliche characteristics and recovery. In the case of iodine, a relationship is established between unit consumption and soluble salt content, while for nitrate, a relationship is established depending on the grades of nitrate, unit consumption and the salt matrix. Relationships that allow estimating the yield at industrial scale.
10.5.2Irrigation Strategy Selection
In terms of physical properties, the metallurgical analysis allows to determine caliche classification as unstable, very unstable, stable, and very stable, which gives rise to an irrigation strategy in the impregnation stage. As a result, a parameter impact ranking is established in caliche classification, in the order indicated below (from higher to lower impact):
1.Compaction degree (C).
2.Sedimentation velocity (S).
3.Fines and ultrafine percentage (%f; percent passing #200) with wetting degree (α).
4.Uniformity degree (Cu).
The weighting establishes a value to be placed on a scale of selection depending on the type of impregnation for the highest yield (see Figure 10-10):
⮚Scale 1.1 to 1.9; pulse ramp 70 days of irrigation with intermediate solution.
⮚Scale 1.9 to 2.6; pulse ramp 60 days of irrigation with intermediate solution.
⮚Scale 2.6 to 3.3; pulse ramp 50 days of irrigation with water.
|
|
|
|
|
|
|
|
|
| SQM TRS Nueva Victoria |
|
Pag. 80 |
⮚Scale 3.3 to 3.9; pulse ramp 40 days of irrigation with water.
Figure 10-10. Parameter Scales and Irrigation Strategy in the Impregnation Stage.
10.5.3Industrial Scale Yield Estimation
All the knowledge generated from the metallurgical tests carried out, is translated into the execution of a procedure for the estimation of the industrial scale performance of the pile. Heap yield estimation and irrigation strategy selection procedure is as follows:
⮚A review of the actual heap Salt Matrix was compared to results obtained from diamond drill hole samples from the different mining polygons. The correlation factor between the two is obtained, which allows determining, from the tests applied to diamond drill hole samples, how the heap performs in a more precise way.
⮚With the salt matrix value, a yield per exploitation polygon is estimated and then, through a percentage contribution of each polygon's material to heap construction, a heap yield is estimated.
⮚Based on percentage physical quality results for each polygon, i.e., C m/min, compaction, % fine material, Alpha, #-200, an irrigation strategy is selected for each heap.
For example, for Pile 583, the physical test showed that the pile tends to generate mud in the crown and was unstable. A 60-day wetting was recommended to avoid generating turbidity. The recommendation was to irrigate at design rate.
The real composition for Pile 583, determined by the diamond drilling campaign by polygon is shown in the Table 10-9 in which some differences can be observed.
Table 10-9 Comparison of the Composition Determined for the 583 Heap Leaching Pile in Operation at Nueva Victoria.
|
|
|
|
|
|
|
|
|
|
|
|
|
|
|
|
|
|
|
|
|
|
|
|
|
|
|
|
|
|
|
|
|
|
|
|
| Type |
Real vs. Diamond Salts Matrix |
|
Iodine grade
(ppm)
|
Nitrate grade
(%)
|
Na2SO4 |
Ca |
Mg |
K |
KClO4 |
NaCl |
Na |
H3BO3 |
Saline Soluble |
| Sample |
400 |
4.0 |
17.9 |
2.0 |
1.3 |
0.5 |
0.1 |
10.1 |
4.3 |
0.3 |
57.8 |
| Real |
424 |
4.2 |
16.4 |
1.9 |
1.2 |
0.6 |
1.4 |
10.5 |
4.6 |
0.3 |
58.3 |
Through the established methodology, composition and physical properties, the resulting 583 pile yield estimate is 54.5%. The estimation scheme is as shown in Figure 10- .
|
|
|
|
|
|
|
|
|
| SQM TRS Nueva Victoria |
|
Pag. 81 |
Figure 10-11. Irrigation Strategy Selection
Participation of Polygon
Following the example and in relation to the observed yield values contrasted with the values predicted by the model, the following graphs shows the annual yield of Nueva Victoria plant, both for iodine and nitrate, for the period 2008-2020.
The annual industrial throughput values with the values predicted by the model are shown in the Figure 10-12 in which a good degree of correlation is observed.
The annual industrial throughput values with the values predicted by the model are shown in the following figures and in which a good degree of correlation is observed.
|
|
|
|
|
|
|
|
|
| SQM TRS Nueva Victoria |
|
Pag. 82 |
Figure 10-12. Nitrate and Iodine Yield Estimation and Industrial Correlation
The new correlation to project nitrate and iodine yield is made with data from 10 years of industrial operation. This correlation relates the availability of water (CU) to the amount of soluble salts (Caliche*SS*MS) to be dissolved present in the caliche and is directly related to the species of interest (Iodine and Nitrate).
Nueva Victoria has operated in ranges of CU 0.40 m3/t and 0.6 (m3/t). The higher the CU, the lower the CRS (Recirculating charge Salt), therefore the better the performance.
Caliches with high soluble salts (SS), the CRS increases, the increase in CU is more significant.
Caliche with low SS, less steep slope, the CU is not as significant
ST Purge to Ponds: Total salts present in Afa to evaporating solar ponds.
Unit Consumption: Corresponds to fresh water to leachate by mass of treated caliche.
MS: total salt contained in caliche
SS: soluble salts
10.6SIGNIFICANT RISK FACTORS
Elements detrimental to recovery or to the quality of the product obtained pose a risk. Insoluble material and elements such as magnesium (magnesium sulfate or Epsom salt) and perchlorate in the raw material also poses a negative impact to the process. In this regard, this report has provided information on tests carried out on the process input and output flows, such as brine and finished products of iodine, potassium nitrate and sodium nitrate, for these elements, thus showing the company's constant concern to improve the operation and obtain the best product.
|
|
|
|
|
|
|
|
|
| SQM TRS Nueva Victoria |
|
Pag. 83 |
Plant control systems analyze grades and ensure that they comply with required threshold values and will not affect the concentration of valuable species in the brine or impact plant performance. Therefore, processing factors or deleterious elements that may have a significant impact on the potential economic extraction are controlled. For example, brines are monitored and those that are loaded with 2-2.5 g/L of Epsom salt are purged to waste ponds.
Along with the above, the company is also interested in developing or incorporating a new stage, process and/or technology that can mitigate the impact of known factors. This is achieved with constant focus on continuous improvement of the processes.
10.7QUALIFIED PERSON´S OPINION
10.7.1Physical and chemical characterization
Mineralogical and chemical characterization results, as well as physical and granulometric characterization of the mineral to be treated, which are obtained from the tests performed, allow to continuously evaluate different processing routes, both in initial conceptual stages of the project and during established processes, in order to ensure that such process is valid and up to date, and/or also to review optimal alternatives to recover valuable elements based on the nature of the resource. Additionally, analytical methodologies determine deleterious elements, to establish mechanisms in operations so that these can be kept below the limits to ensure a certain product quality.
10.7.2Chemical – Metallurgical Tests
Metallurgical test work performed in laboratories and pilot plants are adequate to establish proper processing routes for caliche resources.
Testing program has evidenced adequate scalability of separation and recovery methods established in plant to produce iodine and nitrate salts. It has been possible to generate a model that can assist with an operational plan for the initial irrigation stage to improve iodine and nitrate recovery in leaching.
Samples used to generate metallurgical data are sufficiently representative to support estimates of planning performance and are suitable in terms of estimating recovery from the Mineral Resources.
10.7.3Innovation and Development
The company has a research and development team that has demonstrated important advances regarding development of new processes and products to maximize returns from exploited resources.
Research is developed by three different units covering topics, such as chemical process design, phase chemistry, chemical analysis methodologies, and physical properties of finished products. These address raw material characterization, operations traceability, and finished product.
|
|
|
|
|
|
|
|
|
| SQM TRS Nueva Victoria |
|
Pag. 84 |
11MINERAL RESOURCE ESTIMATE
11.1KEY ASSUMPTIONS, PARAMETERS AND METHODS
This sub-section contains forward-looking information related to density a grade for the Project. The material factors that could cause actual results to differ materially from the conclusions, estimates, designs, forecast or projections in the forward-looking information include any significant differences from one or more of the material factors or assumptions that were set forth in this sub-section including actual in-situ characteristics that are different from the samples collected and tested to date, equipment and operational performance that yield different results from current test work results.
The resource estimation process is different depending on the drill hole spacing grid available in each sector:
⮚Measured Mineral Resources: Sectors with a Block Model, with a drill hole spacing grid of 50 x 50 m or 100T were estimated with a full 3D block model using Ordinary Kriging, which contains variables, such as Iodine, Nitrate, soluble salts, geology, geotechnics, topography, etc. For Nueva Victoria all sectors defined Measured Resources have an available Block Model.
⮚Indicated Mineral Resources: Sectors with a Block Model; with a drill hole spacing grid of 100 x 100 m and 200 x 200 m were estimated with a full 3D block model using Inverse Distance Weighted (IDW) which contains variables, such as Iodine, Nitrate, soluble salts, geology, geotechnics, topography, etc. For Nueva Victoria all sectors defined Indicated Resources have an available Block Model.
⮚Inferred Mineral Resources: Sectors with a drill hole spacing grid greater than 200 x 200 m up to 400 x 400m were estimated in 2D using the Polygon Method. This Inferred Resources do not have block model. the output are polygons which are then transformed to tonnage by multiplying by the area, thickness, and density.
11.1.1Sample Database
The 2023 Nueva Victoria Model included the estimate of Iodine and Nitrate, and in the case of smaller grids Measured Mineral Resources includes soluble Salts, elements, lithology, and hardness parameters.
Table 11-1 summarizes the basis statistics of Iodine and Nitrate for Nueva Victoria.
Table 11-1. Basic Sample Statistics for Iodine and Nitrate in Nueva Victoria
|
|
|
|
|
|
|
|
|
|
|
|
|
|
|
|
|
|
|
|
|
|
|
|
|
|
|
| Variable |
Number of Samples |
Minimum |
Maximum |
Mean |
Std. Dev. |
Variance |
CV |
Kurtosis |
| Iodine |
67,153 |
3.0 |
2272 |
376.28 |
320.31 |
102,599.6 |
0.85 |
9.15 |
| Nitrate |
67,153 |
0.1 |
21.2 |
5.28 |
3.79 |
14.33 |
0.72 |
4.5 |
11.1.2Geological Domains and Modeling
For the estimation of each block within a geological unit (UG) only the composite grades, elements and hardness parameters found in that domain are used (Hard contact between UG). The main UG are described as:
⮚Overburden, Cover (UG 1).
⮚Mineralized mantle, Caliche (UG 2).
⮚Underlying (UG 3).
11.1.3Assay Compositing
Considering that all the sample have the same length (0.5 m) and the block height is also 0.5 m, SQM did not composite the sample database and used directly in the estimation process.
11.1.4Evaluation of Outlier Grades, Cut-offs, and Grade Capping
Definition and control of outliers is a common industry practice that is necessary and useful to prevent potential overestimation of volumes and grades. SQM has not established detection limits (upper limit) in the determined grades of Iodine and Nitrates in the analyzed samples. The distribution of grades for both Iodine and Nitrates within the deposit were such that not samples were judged to be extreme, so no sample restrictions were used in the estimation process.
|
|
|
|
|
|
|
|
|
| SQM TRS Nueva Victoria |
|
Pag. 85 |
11.1.5Specific Gravity (SG)
There are no available SG samples in the database. SQM have been using a historic value of 2.1 (g/cc) for the calculations of tonnage, SQM performed a series of analyses for different DDH drill holes measuring the specific gravity in Nueva Victoria. Table 11-2 shows the analyzed drill holes, the specific gravity, and the geological unit (UG), these results justified the historical value used by SQM.
Table 11-2. Specific Gravity Samples in Nueva Victoria
|
|
|
|
|
|
|
|
|
| Drill Hole |
Specific Gravity (g/cc) |
UG |
| 567L |
2.15 |
2 |
| 1941L |
2.22 |
2 |
| 117L |
2.28 |
2 |
| 2316L |
1.84 |
1 |
| 1684L |
2.14 |
2 |
| 2695L |
2.23 |
2 |
| CL-10 |
2.25 |
2 |
| Al-06 |
2.07 |
2 |
| 1032L |
2.23 |
2 |
| MB-18-4 |
2.12 |
2 |
| MB-12-29 |
1.96 |
1 |
| 2995L |
2.05 |
2 |
| Average |
2.13 |
11.1.6Block Model Mineral Resource Evaluation
As mentioned before, sectors with a drill hole spacing grid of 50 x 50 m or 100T m were estimated with a full 3D block model using Ordinary Kriging and the sector with a drill hole grid greater than 100T m and up to 200 x 200 m were estimated using Inverse Distance Weighted also using block model, for interpolation of Iodine, Nitrate, soluble salts, geology, geotechnics, topography, etc. For Nueva Victoria all sectors defined Measured and Indicated Resources have an available Block Model.
|
|
|
|
|
|
|
|
|
| SQM TRS Nueva Victoria |
|
Pag. 86 |
Block Model Parameters and Domaining Table 11-3 shows the definition for the block model built in Datamine Studio 3. The block size is 25 x 25 x 0.5 m in all sectors.
Table 11-3. Block Model Dimensions
|
|
|
|
|
|
|
|
|
|
|
|
|
|
|
| Sector |
Parameters |
East |
North |
Elevation |
| Norte |
Origin (m) |
428,425 |
7,689,400 |
951 |
| Range (m) |
10,700 |
5,450 |
153 |
| Final (m) |
439,125 |
7,694,850 |
1,104 |
| Block Size |
25 |
25 |
0,5 |
| N° of Blocks |
428 |
218 |
306 |
| TEA |
Origin (m) |
409,950 |
7,691,975 |
989 |
| Range (m) |
11,075 |
13,050 |
292 |
| Final (m) |
421,025 |
7,705,025 |
1,191 |
| Block Size |
25 |
25 |
0.5 |
| N° of Blocks |
443 |
522 |
404 |
| Hermosa |
Origin (m) |
414,950 |
7,704,175 |
1,066 |
| Range (m) |
9,100 |
9,050 |
179 |
| Final (m) |
424,050 |
7,713,225 |
1,245 |
| Block Size |
25 |
25 |
0.5 |
| N° of Blocks |
364 |
362 |
358 |
| Torcaza |
Origin (m) |
412,450 |
7,694,150 |
1,016 |
| Range (m) |
8,600 |
10,950 |
175 |
| Final (m) |
421,050 |
7,705,100 |
1,191 |
| Block Size |
25 |
25 |
0.5 |
| N° of Blocks |
344 |
438 |
350 |
|
|
|
|
|
|
|
|
|
| SQM TRS Nueva Victoria |
|
Pag. 87 |
Figure 11-1 illustrates a plan view of the sectors with a block model inside Nueva Victoria
Figure 11-1. Block Model Location in Nueva Victoria.
Although there are overlaps between the boundaries of the Nueva Victoria Block Models, there is no duplication of blocks for the estimation of Mineral Resources, each of these models has the boundary of the other zones given by the different databases of each zone.
11.1.6.1Variography
Experimental variogram where constructed using all the drill hole samples independent of the UG. The variogram is modeled and adjusted, obtaining parameters such as structure range and sill, nugget effect and the main direction of mineralization. Experimental variograms were calculated and modeled for Iodine and used in the estimation of both Iodine and Nitrate.
|
|
|
|
|
|
|
|
|
| SQM TRS Nueva Victoria |
|
Pag. 88 |
Table 11-4 describes the variogram models for Iodine used in each zone for the estimation of Iodine and Nitrate.
Table 11-4. Variogram Models for Iodine and Nitrate in Nueva Victoria
|
|
|
|
|
|
|
|
|
|
|
|
|
|
|
|
|
|
|
|
|
|
|
|
|
|
|
|
|
|
| Sector |
Variable |
Rotation |
Nugget Effect |
Range 1 |
Sill 1 |
| Z |
Y |
X |
Z |
Y |
X |
| Norte |
Iodine |
0 |
0 |
0 |
6,943.3 |
0.5 |
80 |
80 |
46,577.1 |
| TEA |
45 |
0 |
0 |
18,928.5 |
0.5 |
100 |
150 |
79,464.0 |
| Hermosa |
45 |
0 |
0 |
20,714.3 |
0.5 |
160 |
145 |
59,523.0 |
| Torcaza |
0 |
0 |
0 |
39,821.0 |
0.5 |
80 |
80 |
50,350.7 |
|
|
|
|
|
|
|
|
|
|
| Sector |
Variable |
Rotation |
Nugget Effect |
Range 1 |
Sill 1 |
| Z |
Y |
X |
Z |
Y |
X |
| Norte |
Nitrate |
0 |
0 |
0 |
6.4 |
0.5 |
80 |
80 |
10.2 |
| TEA |
45 |
0 |
0 |
9.0 |
0.5 |
100 |
150 |
14.0 |
| Hermosa |
45 |
0 |
0 |
9.2 |
0.5 |
160 |
145 |
14.3 |
| Torcaza |
0 |
0 |
0 |
7.2 |
0.5 |
80 |
80 |
9.8 |
The nugget effect varies between 6% and 39% of the total sill, this suggests different behavior of Iodine between each zone. The total ranges are around 80 m to a maximum of 150 m. These variogram ranges are in line with the SQM´s definition of Measured Mineral Resources, namely estimates blocks using a drill hole grid of 50 x 50 m or 100T. (Block model evaluation).
The QP performed and independent analysis to confirm the variogram models used by SQM, in general, obtains similar nugget effect, total sill and variogram ranges to those used by SQM.
Figure 11-2. Variogram Models for Iodine and Nitrate in Nueva Victoria.
11.1.6.2Interpolation and Extrapolation Parameters
The estimation of Iodine and Nitrate grades for Nueva Victoria has been conducted using Ordinary Kriging (KO) in one pass for each UG. SQM used cross-validation to determine the estimation parameters such as search radius, minimum and maximum number of samples used, etc. In the cross-validation approach, the validation is performed on the data by removing each observation and using the remaining to predict the value of remove sample. In the case of stationary processes, it would allow to diagnose whether the variogram model and other search parameter adequately describes the spatial dependence of the data.
|
|
|
|
|
|
|
|
|
| SQM TRS Nueva Victoria |
|
Pag. 89 |
The Block model is intercepted with the geological model to flag the geological units used in the estimation process.
The KO plan included the following criteria and restrictions:
⮚No capping used in the estimation process.
⮚Hard contacts have been implemented between all UG.
⮚No octant restrictions have been used for any UG.
⮚No samples per drill hole restrictions have been implemented for any UG.
Table 11-5 summarizes the orientation, radii of searches implemented and the scheme of samples selection for each GU and sector. Search ellipsoid radio were chosen based on the variogram ranges.
Table 11-5. Sample Selection for each sector.
|
|
|
|
|
|
|
|
|
|
|
|
|
|
|
|
|
|
|
|
|
|
|
|
|
|
|
|
|
|
|
|
|
| Sector |
Variable |
Rotation |
Nugget Effect |
Range 1 |
|
Samples |
| Z |
Y |
X |
Z |
Y |
X |
Minimum |
Maximum |
| Norte |
Iodine / Nitrate |
0 |
0 |
0 |
6.4 |
0.5 |
80 |
80 |
3 |
20 |
| TEA |
45 |
0 |
0 |
9.0 |
0.5 |
100 |
150 |
3 |
20 |
| Hermosa |
45 |
0 |
0 |
9.2 |
0.5 |
160 |
145 |
3 |
20 |
| Torcaza |
0 |
0 |
0 |
7.2 |
0.5 |
80 |
80 |
3 |
20 |
After the estimation is done, a vertical reblocking was performed transforming the 3D block model in a 2D grid of points (coordinates X and Y) with the mean grades of all estimated variables. When the 2D grid points are available, operational and mine planning parameters are applied to determine tonnage/grade curves according to a 300 ppm cut-off grades for Iodine. Finally, GIS software (Arcview and Mapinfo) is used to draw the polygons, limiting the estimated Mineral Resources with economic potential.
An example of this methodology is shown in Figure 11-3 for Hermosa. The black line defines polygons above the cutoff grade and that comply with several operational conditions (at least 50 x 50 m, not isolated polygons, no infrastructure nearby, etc.).
|
|
|
|
|
|
|
|
|
| SQM TRS Nueva Victoria |
|
Pag. 90 |
Figure 11-3. Plan View of the Polygons Bordering The Mineral Resources Hermosa
11.1.6.3Block Model Validation
A validation of the block model was carried out to assess the performance of the KO and the conformity of input values. The block model validation considers:
⮚Statistical comparison between estimated blocks and samples grades of drill holes.
⮚Global and local comparison between estimated blocks and samples through each direction (East, North and elevation) performing the following test: Anisotropy analysis, Search Neighborhood, Similarity analysis, Seasonality Analysis, Multivariate comparison, cumulative Distribution Function, Trend analysis Near Neighbor (NN).
⮚Visual validation to check if the lock model matches the sample data.
11.1.7Global Statistics
The QP carried out a statistical validation between sample grades and estimated blocks. Global statistics of mean grades for the samples can be influenced by several factors, such as sample density, grouping, and, to a greater extent, the presence of high grades that have been restricted in the estimation plan.
Consequently, global statistics of samples grades were calculated using the Nearest-Neighbor (NN) method with search ranges like the one used in the estimation. A summary of this comparison is shown in Table 11-6 and Table 11-7 for Iodine and Nitrate respectively, where the negative values indicate a negative difference between block mean grades in relation to composite mean grades, and vice-versa. In general, differences under 5% are satisfactory, and differences above 10% require attention. The result of the estimate shows that relative differences are found within acceptable limits.
|
|
|
|
|
|
|
|
|
| SQM TRS Nueva Victoria |
|
Pag. 91 |
Table 11-6. Global Statistics comparison for Iodine
|
|
|
|
|
|
|
|
|
|
|
|
|
|
|
|
|
|
|
|
|
|
|
|
|
|
|
|
|
|
|
|
|
|
|
|
| Sector |
# Data |
Minimun |
Maximun |
Mean |
Difference |
Std. Dev |
| Blocks |
NN |
Blocks |
NN |
Blocks |
NN |
Blocks |
NN |
Blocks |
NN |
| Norte |
437,603 |
125,226 |
50 |
50 |
2,000 |
2,000 |
363 |
360 |
-2.99 |
158 |
245 |
| TEA |
1,230,674 |
152,279 |
50 |
50 |
2,000 |
2,000 |
308 |
305 |
-2.19 |
166 |
244 |
| Hermosa |
919,383 |
93,254 |
50 |
50 |
2,000 |
2,000 |
355 |
351 |
-3.4 |
165 |
262 |
| Torcaza |
289,242 |
53,478 |
50 |
50 |
2,000 |
2,000 |
262 |
259 |
-2.9 |
161 |
249 |
Table 11-7. Global Statistics comparison for Nitrate
|
|
|
|
|
|
|
|
|
|
|
|
|
|
|
|
|
|
|
|
|
|
|
|
|
|
|
|
|
|
|
|
|
|
|
|
| Sector |
# Data |
Minimun |
Maximun |
Mean |
Difference |
Std. Dev |
| Blocks |
NN |
Blocks |
NN |
Blocks |
NN |
Blocks |
NN |
Blocks |
NN |
| Norte |
437,603 |
125,226 |
1 |
1 |
20 |
20 |
3.76 |
3.83 |
0.07 |
2.14 |
3.25 |
| TEA |
1,230,674 |
152,279 |
1 |
1 |
20 |
20 |
5.03 |
5.09 |
0.06 |
2.81 |
4.03 |
| Hermosa |
919,383 |
93,254 |
1 |
1 |
20 |
20 |
5.73 |
5.81 |
0.08 |
2.03 |
3.91 |
| Torcaza |
289,242 |
53,478 |
1 |
1 |
20 |
20 |
3.43 |
3.45 |
0.02 |
2.37 |
3.65 |
11.1.7.1Swath Plots
To evaluate how robust block grades are in relation to data, the following tests were performed to validate the robustness of the generated model (Anisotropy analysis, Search Neighborhood, Similarity analysis, Seasonality Analysis, Multivariate comparison, cumulative Distribution Function, Trend analysis Near Neighbor NN). From Figure 11-4 to Figure 11-7 provides a summary of plots for each variable for TEA. In general, results indicate that estimates reasonably follow trends found in the deposit’s grades at a local and global scale without observing an excessive degree of smoothing.
|
|
|
|
|
|
|
|
|
| SQM TRS Nueva Victoria |
|
Pag. 92 |
Figure 11-4. Swath Plots for Iodine TEA
|
|
|
|
|
|
|
|
|
Anisotropy Analysis |
|
Cross Validation Neighborhood Search |
|
|
|
|
|
|
|
|
|
|
|
|
|
|
|
| Analysis Similarity Model Data with Dendrograms |
|
Multivariate Comparison |
|
|
|
|
|
|
Seasonality Analysis
|
|
|
|
|
|
|
|
|
| Direction E-W |
Direction N-S |
Elevation |
|
|
|
|
|
|
|
|
|
|
|
|
|
|
|
| SQM TRS Nueva Victoria |
|
Pag. 93 |
|
|
|
|
|
|
| Cumulative Distribution Function |
Cross Validation Variogram Used |
|
|
|
|
|
|
|
|
|
|
|
|
|
| SQM TRS Nueva Victoria |
|
Pag. 94 |
Figure 11-5. Swath Plots for Nitrate TEA
|
|
|
|
|
|
|
|
|
| Anisotropy Analysis |
|
Cross Validation Neighborhood Search |
|
|
|
|
|
|
|
|
|
|
|
|
|
|
|
| Analysis Similarity Model Data with Dendrograms |
|
Multivariate Comparison |
|
|
|
|
|
|
Seasonality Analysis
|
|
|
|
|
|
|
|
|
| Direction E-W |
Direction N-S |
Elevation |
|
|
|
|
|
|
|
|
|
|
|
|
|
|
|
| SQM TRS Nueva Victoria |
|
Pag. 95 |
|
|
|
|
|
|
|
|
|
| Cumulative Distribution Function |
|
Cross Validation Variogram Used |
|
|
|
|
|
|
|
|
|
|
|
|
|
|
|
| SQM TRS Nueva Victoria |
|
Pag. 96 |
Commentaries
From the analysis carried out, the following is concluded:
⮚There is a slight anisotropy.
⮚Vary the search ellipse, between 120 and 300 m provides very little to cross-validation, this mainly being a spatial structure where the first structure (which is the one that contributes the most to the variance) is of short scope and the second contributes very little to the total variance of the variogram its effect is minimal.
⮚There is an improvement in search levels of the order of 160 m mainly in the effect this has on standardized error.
⮚The similarity levels of the model respect the levels of similarity present in the samples of the drilling at a high level, this happens for both Iodine and Nitrate.
⮚The correlation indices present in the original data between Iodine and Nitrate, are keep in the block model.
⮚The model presents a slight optimism and underestimates in a very uninfluential way local uncertainty, both at the data level and at the distribution function level Theoretical.
⮚The average of the analyzed region presents, at the level of samples, an average value of iodine of 305 ppm and at block level 308 ppm.
⮚The average of the analyzed region presents, at level of samples an average nitrate of 5.03% and at block level 5.09%.
⮚The cross-validation is of good quality with a high degree of robustness.
⮚The model accurately represents the grades of the deposit in blocks of 25 x 25 x 0.5 both in Iodine and Nitrate. Presenting a slight optimism and very little influential underestimation of Local uncertainty.
|
|
|
|
|
|
|
|
|
| SQM TRS Nueva Victoria |
|
Pag. 97 |
Figure 11-6. Swath Plots for Iodine Hermosa
|
|
|
|
|
|
| Anisotropy Analysis Cross |
Validation Neighborhood Search |
|
|
|
|
|
|
| Analysis Similarity Model Data with Dendrograms |
Multivariate Comparison |
|
|
|
|
Seasonality Analysis
|
|
|
|
|
|
|
|
|
| Direction E-W |
Direction N-S |
Elevation |
|
|
|
|
|
|
|
|
|
|
|
|
|
|
|
| SQM TRS Nueva Victoria |
|
Pag. 98 |
|
|
|
|
|
|
| Cumulative Distribution Function |
Cross Validation Variogram Used |
|
|
|
|
|
|
|
|
|
|
|
|
|
| SQM TRS Nueva Victoria |
|
Pag. 99 |
Figure 11-7. Swath Plots for Nitrate Hermosa
|
|
|
|
|
|
| Anisotropy Analysis |
Cross Validation Neighborhood Search |
|
|
|
|
|
|
| Analysis Similarity Model Data with Dendrograms |
Multivariate Comparison |
|
|
|
|
Seasonality Analysis
|
|
|
|
|
|
|
|
|
| Direction E-W |
Direction N-S |
Elevation |
|
|
|
|
|
|
|
|
|
|
|
|
|
|
|
| SQM TRS Nueva Victoria |
|
Pag. 100 |
|
|
|
|
|
|
| Cumulative Distribution Function |
Cross Validation Variogram Used |
|
|
|
|
|
|
|
|
|
|
|
|
|
| SQM TRS Nueva Victoria |
|
Pag. 101 |
Commentaries
From the analysis carried out, the following is concluded:
⮚There is a slight anisotropy.
⮚Vary the search ellipse, between 120 and 300 meters provides very little to cross-validation, this mainly being a spatial structure where the first structure (which is the one that contributes the most to the variance) is of short scope and the second contributes very little to the total variance of the variogram its effect is minimal.
⮚There is an improvement in search levels of the order of 160 meters mainly in the effect this has on standardized error.
⮚The similarity levels of the model respect the levels of similarity present in the samples of the drilling at a high level, this happens for both Iodine and Nitrate.
⮚The correlation indices present in the original data between Iodine and Nitrate, are keep in the block model.
⮚The model presents a slight optimism and underestimates in a very uninfluential way local uncertainty, both at the data level and at the distribution function level Theoretical.
⮚The average of the analyzed region presents, at the level of samples, an average value of iodine of 351 ppm and at block level 355 ppm.
⮚The average of the analyzed region presents, at level of samples an average nitrate of 5.81% and at block level 5.73%.
⮚The cross-validation is of good quality with a high degree of robustness.
⮚The model accurately represents the grades of the deposit in blocks of 25 x 25 x 0.5 both in Iodine and Nitrate. Presenting a slight optimism and very little influential underestimation of Local uncertainty.
|
|
|
|
|
|
|
|
|
| SQM TRS Nueva Victoria |
|
Pag. 102 |
Figure 11-8. Swath Plots for Iodine Torcaza
|
|
|
|
|
|
| Anisotropy Analysis |
Cross Validation Neighborhood Search |
|
|
|
|
|
|
| Analysis Similarity Model Data with Dendrograms |
Multivariate Comparison |
|
|
|
|
Seasonality Analysis
|
|
|
|
|
|
|
|
|
| Direction E-W |
Direction N-S |
Elevation |
|
|
|
|
|
|
|
|
|
|
|
|
|
|
|
| SQM TRS Nueva Victoria |
|
Pag. 103 |
|
|
|
|
|
|
| Cumulative Distribution Function |
Cross Validation Variogram Used |
|
|
|
|
|
|
|
|
|
|
|
|
|
| SQM TRS Nueva Victoria |
|
Pag. 104 |
Figure 11-9. Swath Plots for Nitrate Torcaza
|
|
|
|
|
|
| Anisotropy Analysis |
Cross Validation Neighborhood Search |
|
|
|
|
|
|
| Analysis Similarity Model Data with Dendrograms |
Multivariate Comparison |
|
|
|
|
Seasonality Analysis
|
|
|
|
|
|
|
|
|
| Direction E-W |
Direction N-S |
Elevation |
|
|
|
|
|
|
|
|
|
|
|
|
|
|
|
| SQM TRS Nueva Victoria |
|
Pag. 105 |
|
|
|
|
|
|
| Cumulative Distribution Function |
Cross Validation Variogram Used |
|
|
|
|
|
|
|
|
|
|
|
|
|
| SQM TRS Nueva Victoria |
|
Pag. 106 |
Commentaries
From the analysis carried out, the following is concluded:
⮚There is a slight anisotropy.
⮚Vary the search ellipse, between 120 and 300 m provides very little to cross-validation, this mainly being a spatial structure where the first structure (which is the one that contributes the most to the variance) is of short scope and the second contributes very little to the total variance of the variogram its effect is minimal.
⮚There is an improvement in search levels of the order of 160 m mainly in the effect this has on standardized error.
⮚The similarity levels of the model respect the levels of similarity present in the samples of the drilling at a high level, this happens for both Iodine and Nitrate.
⮚The correlation indices present in the original data between Iodine and Nitrate, are keep in the block model.
⮚The model presents a slight optimism and underestimates in a very uninfluential way local uncertainty, both at the data level and at the distribution function level Theoretical.
⮚The average of the analyzed region presents, at the level of samples, an average value of iodine of 259 ppm and at block level 262 ppm.
⮚The average of the analyzed region presents, at level of samples an average nitrate of 3.45% and at block level 3.43%.
⮚The cross-validation is of good quality with a high degree of robustness.
⮚The model accurately represents the grades of the deposit in blocks of 25 x 25 x 0.5 both in Iodine and Nitrate. Presenting a slight optimism and very little influential underestimation of Local uncertainty
11.1.7.2Visual Validation
To visually validate the Iodine a Nitrate estimation, the QP completed a review of a set of cross-sectional a plant view. The validation shows a suitable representation of samples in blocks. Locally, the blocks match the estimation samples both in cross-section and plant view. In general, there is an adequate match between composite data block model data for Iodine and Nitrates grades. High grades areas are suitably represented, and high-grade samples exhibit suitable control.
Figure 11- to Figure 11- present a series of horizontal plant views with the estimated model and the samples for Nitrate and Iodine in TEA, Hermosa and Torcaza.
|
|
|
|
|
|
|
|
|
| SQM TRS Nueva Victoria |
|
Pag. 107 |
Figure 11-10. Visual Validation of Nitrate Estimation, Plan View TEA
Figure 11-11. Visual Validation of Iodine a Estimation, Plan View Hermosa
|
|
|
|
|
|
|
|
|
| SQM TRS Nueva Victoria |
|
Pag. 108 |
Figure 11-12. Visual Validation of Nitrate Estimation, Plan View Torcaza
11.1.7Polygon Mineral Resource Evaluation
This sub-section contains forward-looking information related to establishing the prospects of economic extraction for Mineral Resources for the Project. The material factors that could cause actual results to differ materially from the conclusions, estimates, designs, forecasts, or projections in the forward-looking information include any significant differences from one or more of the material factors or assumptions that were set forth in this sub-section including cut-off grade assumptions, costing forecasts and product pricing forecasts.
For the sectors with a drill hole spacing grid greater than 200 x 200 m up to 400 x 400 m, the Mineral Resource evaluation was performed at the Polygon Method. Table 11-10 shows the parameters used to define the polygon with economic potential in Nueva Victoria.
Table 11-8. Economic and Operational Parameters Used to Define Economic Intervals for each Drill Hole in Nueva Victoria
|
|
|
|
|
|
| Parameter |
Value |
| Mantle thickness |
More than 2.0 m |
| Cover thickness |
Less than 3.0 m |
| Waste/Mineral Ratio |
Less than 0.5 |
| Nitrate Cut-off grade |
3.0% |
| Iodine Cut-off grade |
300 ppm |
These parameters are the inputs that calculates for each polygon the economic potential which then are converted to tonnage using the multiplication of polygon area, thickness, and density (2.1 g/cc).
|
|
|
|
|
|
|
|
|
| SQM TRS Nueva Victoria |
|
Pag. 109 |
After the calculated and selected all the economic polygons SQM used the same methodology used in the block model evaluation to define polygons with material above cut-off grade and that comply with operational conditions.
11.2.MINERAL RESOURCE ESTIMATE
This sub-section contains forward-looking information related to Mineral Resources estimates for the Project. The material factors that could cause actual results to differ materially from the conclusions, estimates, designs, forecast or projections in the forward-looking information include any significant differences from one or more of the material factors or assumptions that were set forth in this sub-section including geological a grade interpretations and controls and assumptions and forecast associated with establishing the prospect for economic extraction.
Table 11-9. summarizes The Mineral Resources estimate, exclusive of reserves, for nitrate and iodine in Nueva Victoria.
Table 11-9. Mineral Resource Estimate, Exclusive of Mineral Reserves, as December 31, 2023
|
|
|
|
|
|
|
|
|
|
|
|
| Inferred Resource |
| Nueva Victoria |
Tonnage (Mt) |
Nitrate (%) |
Iodine (ppm) |
| Cocar |
5.1 |
7.3 |
302 |
| Los Angeles |
9.3 |
7.9 |
331 |
| Hermosa Oeste |
17.0 |
4.7 |
387 |
| Franja Oeste |
16.0 |
3.9 |
401 |
| TEA Oeste |
1.1 |
4.0 |
397 |
| Total |
48.5 |
5.3 |
372 |
Notes:
(a)Mineral Resource are not Mineral Reserves and do not have demonstrated economic viability. There is no certainty that all or any part of the Mineral Resources will be converted into Mineral Reserves upon the application of modifying factors.
(b)Mineral Resources are reported as in-situ and exclusive of Mineral Reserves, where the estimated Mineral Reserve without processing losses during the reported LOM was subtracted from the Mineral Resources inclusive of Mineral Reserves.
(c)Comparisons of values may not add due to rounding of numbers and the differences caused by used of averaging methods.
(d)The units “Mt”; %, and “ppm” refer to million tons, weight percent, and parts per million respectively.
(e)The Mineral Resource estimate considers a nitrate cut-off grade of 3.0 %, based on accumulated cut-off nitrate grades and operational averages grades, as well as caliche thickness ≥ 2.0 m and overburden thickness ≤ 3.0 m. The mean iodine grade considers the cost and medium-and long-term price forecast of generating iodine as discussed in Section 11.16 and 19 of this TRS.
(f)As the mineral resources estimation process is reviewed and improved each year, mineral resources could change in terms of geometry, tonnage, or grades.
(g)Marco Fazzi is the QP responsible for the Mineral Resources.
11.3MINERAL RESOURCE CLASSIFICATION
This sub-section contains forward-looking information related to Mineral Resources classification for the Project. The material factors that could cause actual results to differ materially from the conclusions, estimates, designs, forecast or projections in the forward-looking information include any significant differences from one or more of the material factors or assumptions that were set forth in this sub-section including geological and grade continuity analysis and assumptions.
The Mineral Resources classification defined by SQM is based on drill hole spacing grid:
⮚Measured Resources were defined using the drill holes grids of 50 x 50 m and 100 T m, which allows to delimit with a significant level of confidence the dimensions, mantle thickness and grades of the mineralized bodies as well as the continuity of the mineralization. Variability and uncertain studies carried out by SQM show a relative estimation error or 4.5 and 5.5 % for both grids, respectively.
|
|
|
|
|
|
|
|
|
| SQM TRS Nueva Victoria |
|
Pag. 110 |
⮚Indicated Resources were defined using drill holes grids of 100 x 100 m and 200 x 200 m, which allows to delimit with a reasonable level of confidence the dimensions, mantle thickness, tonnage, and grades of the mineralized bodies. Variability and uncertain studies carried out by SQM show a relative estimation error or 7.6 and 8.3 % for both grids, respectively.
⮚Inferred Mineral Resources were defined using drill holes grid greater than the 200 x 200 m and up to 400 x 400 m. When prospecting is carried out in districts or areas of recognized presence of caliche, or when the drill hole grids is accompanied by some prospecting in a smaller grid, confirming the continuity of mineralization, it is possible to anticipate that such resources have a sustainable base to give them a reasonable level of confidence, and therefore, to define dimensions, mantle thickness, tonnages, and grades of the mineralized bodies. The information obtained is complemented by the surface geology the definition of UGs.
11.4MINERAL RESOURCE UNCERTAINTY DISCUSSION
Mineral Resource estimates may be materially affected by the quality of data, natural geological variability of mineralization and / or metallurgical recovery and the accuracy of the economic assumptions supporting reasonable prospects for economic extraction including metal prices, and mining and processing costs.
Inferred Mineral Resources are too speculative geologically to have economic considerations applied to them to enable them to be categorized as Mineral Reserves.
Mineral Resources may also be affected by the estimation methodology and parameters and assumptions used in the grade estimation process including top-cutting (capping) of data or search and estimation strategies although it is the QP’s opinion that there is a low likelihood of this having a material impact on the Mineral Resource estimate.
11.5ASSUMPTIONS FOR MULTIPLE COMMODITY MINERAL RESOURCE ESTIMATE
For Nueva Victoria, the cut-off grade depends on nitrate and iodine grade. Nitrate is part of Iodine process.
11.6QUALIFIED PERSON’S OPINION ON FACTORS THAT ARE LIKELY TO INFLUENCE THE PROSPECT OF ECONOMIC EXTRACTION
As Nueva Victoria is an active mine with more than 20 years of operational experience and data, it is the QP’s opinion that the relevant technical and economic factors necessary to support economic extraction of the Mineral Resource have been appropriately accounted for at the Mine.
The QP is not aware of any environmental, permitting, legal, title, taxation, socioeconomic, marketing, political or other relevant factors that could materially affect the Mineral Resource Estimate that are not discussed in this Technical Report.
|
|
|
|
|
|
|
|
|
| SQM TRS Nueva Victoria |
|
Pag. 111 |
12MINERAL RESERVE ESTIMATE
12.1ESTIMATION METHODS, PARAMETERS AND METHODS
This sub-section contains forward-looking information related to the key assumptions, parameters, and methods for the Mineral Reserve estimates for the Project. The materials factors that could cause actual results to differ materially from the conclusion, estimates, designs, forecast or projection in the forward-looking include any significant differences from one or more of the material factors or assumptions that were set forth in this sub-section including Mineral Resource model tons and grade and mine design parameters.
Mineral Reserves estimates are based on sample grades obtained from drill holes executed with reverse air drilling rigs in 200 x 200 m, 100 x 100 m, 100 T m (100 x 50 m) and 50x50 m grid spacing.
Measured Resources are evaluated from 3D blocks built by numerical interpolation techniques (Ordinary Kriging), where nitrate, iodine, and soluble salt content information available from data obtained in drill hole grids with a spacing equal to or less than 70 m (100T and 50 x 50 m).
Indicated Resources are evaluated from 3D blocks built by Inverse Distance Weighted (IDW) interpolation technique and defined by drill hole spacing of 100 x 100 m and 200 x 200 m.
Mineral Reserves considers SQM’s criteria for the mining plan which includes to the following:
⮚Caliche Thickness ≥ 2.0 m
⮚Overload thickness ≤ 1.0 m
⮚Waste / Mineral Ratio ≤ 0.5
⮚Nitrate 3.0 % cut-off grade.
⮚The average production cost for iodine prill corresponds to 23.95 USD/kg and the sales price for Iodine derivatives is 42.0 USD/kg. For nitrate concentrate brine1, the average production unit cost is 93.8 USD/ton (mining, leaching, seawater pipeline, neutralization, and pond treatment) and the Nitrate salts for fertilizer price is 323 USD/ton.
The mining sectors consider in the mining plans (see figure 12-2) are delimited in base of the environmental licenses obtained by SQM and a series of additional factors (layout of main accesses, heap and ponds locations, distance to treatment plants, etc.). Mining is executed in blocks of 25 x25 m and the volumes of caliche to be extracted are established considering an average density value applied to 2.1 t/m³ for the deposit.
Using these criteria SQM estimated volumes (caliche) to be considered as Proven Reserves based on the 3D block models built, to define Measured Mineral Resources, and applying the criteria defined above to determine the mining plan.
1 Correspond to the brine enriched in nitrate salts (AFA-Acid Water Feble) neutralized and treated in ponds (Salar Sur Viejo) that SQM transport to Coya Sur plant produce Potassium Nitrate Fertilizers mixing with KCL from Salar de Atacama.
The Indicated Resources estimated by Inverse Distance Weighted method using the Nitrate and Iodine grades and other relevant data obtained from medium density drill hole prospecting grids (100 x 100 m and 200 x 200 m) are stated as Probable Reserves using the same criteria for mineral reserves describes above, caliche and overload thickness, waste/mineral rates, and Nitrate cut-off grade.
To convert Indicated Resources in Probable Reserves, SQM use a unit conversion factor for tonnage considering the layered, shallowed, and sub-horizontal geological features of “caliches” and the mining process to extract the ore. Nevertheless, the intrinsic geological variability of the mineral deposit, perceived when comparing the results obtained from medium density drill hole spacing prospecting surveys (100 x 100 m and 200 x 200 m) with higher density surveys (100T m or 50 x 50 m), indicates using coefficient below the 1.0 for Nitrates and Iodine grades for the conversion Indicated Resources to Probable Reserves.
The historical data collected by SQM during decades of mining exploitation of caliches in Chile implies the use of different values for grade conversion depending on the mine. For Nueva Victoria mine, SQM’s mining experience indicates the use of a coefficient of 0.90 for Iodine and 0.85 for Nitrate for Probable Reserves evaluated from Indicated Resources.
Was executed and analysis using 3D model blocks built with the information derived from the database from the prospecting drill hole surveys (100 x 100 m and 200 x 200 m) in the TEA sector of Nueva Victoria mine, reviewing the base data, variograms for nitrate and iodine grades and Ordinary Kriging interpolation, to reconcile these with 3D blocks
|
|
|
|
|
|
|
|
|
| SQM TRS Nueva Victoria |
|
Pag. 112 |
models obtained from 3D Model Block with combine all the data of the prospecting surveys execute in TEA sector (100 x 100 m and 200 x 200 m and 50 x 50 m).
The purpose was to verify the criteria used to convert Indicate Resources to Probable Reserves. The results of the reconciliation exercise are as follow (Figure 12-1 and table 12-1):
⮚The average Nitrate and Iodine grades obtained by the 3D Block Model built using the 200 x 200 m database higher than the average grades obtained by the 3D Block Model built by the 100T m database.
⮚The average Nitrate and Iodine grades and tonnage obtained by the 3D Block Model built using 100T m database (100x50 m drill hole spacing grid) and the 3D Block Model built to estimate Resources (using collectively base data form 50 x 50 m, 100 x 100m and 200 x 200 m) are similar.
⮚The average Iodine and Nitrate grades obtained by the 3D Block Model built using only 200 x 200 m database are higher than the average grades obtained by the 3D Block Model built using the whole entire database (using collectively base data form 50 x 50 m, 100 x 100m and 200 x 200 m.
Based on the SQM experience and the result obtained to compare data from different grid geological investigations, justify the use of coefficients below a value of one for nitrate and iodine grades to convert Indicate Resources to Probable Reserves, as show in accounts for the variability of the caliche deposits.
Figure 12-1. Results of the 3D Block Models Conciliation
Prospecting drill hole grid – Tente en el Aire (TEA) sector Nueva Victoria Mine.
|
|
|
|
|
|
|
|
|
| SQM TRS Nueva Victoria |
|
Pag. 113 |
Table 12-1. Results of 3D Block Model Reconciliations
|
|
|
|
|
|
|
|
|
|
|
|
|
|
|
|
|
|
|
|
|
| SOURCE |
CUT-OFF
Nitrate (%) |
Nitrate (%) |
Iodine (ppm) |
Tonnage (Mt) |
Nitrate
(Mt) |
Iodine (Kt) |
| 3D Model Block SQM (MBSQM) |
3.0 |
5.9 |
448 |
324 |
1.9 |
145.3 |
| 3D Model Block 100T (MB100T) |
|
5.8 |
428 |
322 |
1.9 |
137.6 |
| 3D Model Block 200x200 m (MB200) |
|
6.6 |
460 |
319 |
2.1 |
147 |
| Difference: (MB100T - MBSQM)/ MB100T |
|
-1% |
-4% |
-1% |
-1% |
-5% |
| Difference: (MBSQM - MB200)/ MBSQM |
|
-12% |
-3% |
1% |
-10% |
-1% |
| Difference: (MB100T - MB200)/ MB100T |
|
-11% |
-7% |
1% |
-11% |
-6% |
|
|
|
|
|
|
|
|
|
| SQM TRS Nueva Victoria |
|
Pag. 114 |
Figure 12-2 Map of Reserves Sectors in Nueva Victoria
12.2CUT-OFF GRADE
SQM´s has historically used an operational cut-off grade of 300 ppm of iodine; for this year´s report has been used operational cut-off grade of 3.0% of Nitrate. The QP has reviewed the cut-off and agrees that at cut-off of 3.0% nitrate is conservative and will more than pay all mining cost and iodine production cost. Additional nitrate production profits will enhance the economics, and that the nitrate cut-off is appropriate for operations.
12.3CLASSIFICATION AND CRITERIA
This sub-section contains forward-looking information related to the Mineral Reserve classification for the Project. The material factors that could cause actual results to differ materially from the conclusions, estimate, designs, forecast or projections in the forward-looking information include any significant differences from one or more of the material factors or assumptions that were set forth in this sub-section including Mineral Resources model tons, grade, and classification.
|
|
|
|
|
|
|
|
|
| SQM TRS Nueva Victoria |
|
Pag. 115 |
The geological features of the mineral deposits (sub-horizontal, superficial, and limited thickness) allow to consider all the estimated Measured and Indicated Mineral Resources and Mineral Reserves, because, regardless, the method of mining extraction used by SQM (drill & blast, continuous miner), the entire volume/mass of Mineral Resources defined as Measured or Indicated can be extracted.
Any mining block (25x25 m) that can´t be extracted due to temporary infrastructure limitations (pond, pipes, roads, etc.), are still counted as Mineral Reserves since they may be mined once the temporary limitations are removed.
Proved Reserves have been determined based on Measured Resources, considering the rules set for tonnage and grades conversion (direct conversion of tonnage and grades). Measured Resources are classified as describe in section 11.3 with modifying factors, as described in section 12.1.
Probable Reserves has been determined from Indicated Resources, which are classified as described in section 11.3. Additional criteria as described in section 12.1 are applied in conjunctions with conversion factors for grade conversions as described in section 12.1 and summarized in table 12-2. SQM applies a conversion factor of 0.85 for nitrate and 0.90 for iodine grades.
12.4MINERAL RESERVES
This sub-section contains forward-looking information related to the Mineral Reserve estimates for the Project. The material factors that could cause actual results to differ materially from the conclusions, estimate, designs, forecast or projections in the forward-looking information include any significant differences from one or more of the material factors or assumptions that were set forth in this sub-section including Mineral Resources model tons and grade, modifying factors including mining and recovery factors, production rate and schedule, mining equipment productivity, commodity market and prices and projected operating and capital costs.
Nueva Victoria mine is divided into three sectors: Nueva Victoria, Tente en el Aire (TEA) and Hermosa. Each sector is further subdivided into exploitation sub-sectors (see Figure 12-2).
The Nueva Victoria Sector (located at the SW Sector) contains the following sub-sectors:
⮚Mina Sur, Mina Oeste, Oeste 3, Torcaza and Franja Oeste;
The Tente en el Aire (TEA) Sector (Central Sector) contains the following sub-sectors:
⮚TEA, TEA Oeste, TEA Sur, TEA Central, Fortuna, Pampa Engañadora and Cocar;
Finally, the Hermosa Sector (North and NE Sector):
⮚Hermosa, Hermosa Oeste and Coruña
SQM extracts “caliches” from these sectors within areas having environmental license currently approved by the Chilean authorities. Soon, SQM plans to obtain additional environmental licenses to extend the mining into the TEA sector.
SQM exploits caliche at a rate of up to 37,000 ktpy for Nueva Victoria plant site (Exempt Resolution N°0515/2012), and a rate of up to 28,000 ktpy for TEA Project (Exempt Resolution 0047/2022), which implies a caliche production of 65,000 ktpy of caliche extraction in Nueva Victoria.
In 2023 caliche mining production targeted 43.4 Mt of Proved Reserves2 with an iodine grade averaging 398 ppm I2 and nitrate salts of 4.7% NaNO3.
SQM's Mining Plan for 2024-2038 (Nueva Victoria-SQM Industrial Plan) sets a total extraction of 731 Mt of caliche with production ranging between 43,000 and 54,000 ktpy. 90% (658 Mt) of this material will be extracted by blasting and 10% (73 Mt) by continuous miner. Iodine average grade is 414 ppm and Nitrate average grade is 5.1% for the long term of mine (LP).
2 The Five-Year Mining Plan (5YP) in Nueva Victoria mine is defined by the exploitation of Proved Reserves. Every year SQM execute a plan to re-categorization the prospecting grid used to define indicate Resources (100 x 100 m or 200 x 200 m) to convert these to Measured Resources using a higher density drill hole spacing grid (100 T m or 50 x50 m).
The criteria for estimating Mineral Reserves are as described below:
⮚Measured Mineral Resources defined by 3D Model block and ordinary Kriging using data from high resolution drill hole spacing campaigns (100T m or 50 x 50 m) are used to establish Proven Mineral Reserves using a unit coefficient conversion for tonnage and Iodine and Nitrate grades (see Table 12-2).
|
|
|
|
|
|
|
|
|
| SQM TRS Nueva Victoria |
|
Pag. 116 |
⮚Indicated Mineral Resources defined by 3D Model Block an Inverse Distance Weighted using data from medium resolution drill hole spacing campaigns (100 x 100 m and 200 x 200 m) are converted to Probable Mineral Reserves using a coefficient equal one for tonnage conversion and coefficients lower than one for iodine and nitrate grades as consequence of natural variability of grades in the mineral deposit for coarser drill grids (see Table 12-2).
⮚All the prospected sectors at Nueva Victoria have an environmental license to operate, considering the mining method used by SQM (drill-and-blast and CM) and the treatment by heap leach structures to obtain enriched brines of iodine and nitrates.
Table 12-2 Resources to Reserves Conversion Factors at the Nueva Victoria Mine
|
|
|
|
|
|
|
|
|
|
|
|
| Measured Resources |
Proven Reserves |
| Tonnage (Mt) |
Nitrate (%) |
Iodine (ppm) |
| 100T (100 x 50 m) |
1.0 |
1.0 |
1.0 |
| 50 x 50 m |
1.0 |
1.0 |
1.0 |
|
|
|
4 |
| Indicated Resources |
Probable Reserves |
| Tonnage (Mt) |
Nitrate (%) |
Iodine (ppm) |
| 100 x 100 m |
1.0 |
0.85 |
0.90 |
| 200 x 200 m |
1.0 |
0.85 |
0.90 |
Notes:
1.Grade variability depends on the prospecting drill hole spacing.
2.Conciliation analysis using grades/tonnages obtained from 100 x 100 m or 200 x 200 m against those obtained from 100T or 50 x 50 m indicates the need to use conversion coefficients lower than 1 on grades.
Modifying Factors
The modifying factors are considered herein. All permits are current and although there are no formal agreements, the operations have longstanding relationships with the communities, some of which are company towns. Mining, processing, downstream costs, mining loss, dilution, and recoveries are accounted for in the operational cutoff grade. As the project has been in operation since 2002, the risks associated with operating costs and recoveries are considered minimal.
Based on the described rules for resources to reserves conversion and qualification, the Proven Mineral Reserves and Probable Mineral Reserves of Nueva Victoria has been estimated as shown in Table 12-3 summarizes the estimated Mineral Reserves in the different sectors investigated by SQM in the Nueva Victoria mine.
Table 12-3 Mineral Reserves at the Nueva Victoria Mine (Effective 31 December 2023)
|
|
|
|
|
|
|
|
|
|
|
|
|
Proven Reserves |
Probable Reserves |
Total Reserves |
| Tonnage (Mt) |
201.8 |
529 |
731.0 |
| Iodine Grade (ppm) |
432 |
415 |
420 |
| Nitrate Grade (%) |
5.6 |
5.1 |
5.2 |
| Iodine (kt) |
87.2 |
219.5 |
306.7 |
| Nitrate (kt) |
11,300 |
26,979 |
38,279 |
Notes:
a)Mineral Reserves are based on Measured and Indicated Mineral Resources at an operating cutoff of 3.0 % nitrate. Operating constraints of caliche thickness ≥ 2.0 m; overburden thickness ≤ 3.0 m; and waste / caliche ratio ≤ 1.5 are applied.
b)Proven Mineral Reserves are based on Measured Mineral Resources at the criteria described in (a) above.
c)Probable Mineral Reserves are based on Indicated Mineral Resources at the criteria described in (a) above with a grade call factor of 0.9 for iodine and 0.85 for nitrates confirmed by operating experience.
|
|
|
|
|
|
|
|
|
| SQM TRS Nueva Victoria |
|
Pag. 117 |
d)Mineral Reserves are declared as in-situ ore (caliche).
e)The units “Mt”, “kt”, “ppm” and % refer to million tons, kilotons, parts per million, and weight percent respectively.
f)Mineral Reserves are based on a Nitrate price of 323 USD/ton and an Iodine price of 42.0 USD/Kg. Mineral Reserves are also based on economic viability as demonstrated in an after-tax discounted cashflow (see Section 19).
g)Marco Lema is the QP responsible for the Mineral Reserves.
h)The QP is not aware of any environmental, permitting, legal, title, taxation, socioeconomic, marketing, political or other relevant factors that could materially affect the Mineral Reserve estimate that are not discussed in this TRS.
i)Comparisons of values may not total due to rounding of numbers and the differences caused by use of averaging methods.
The final estimates of Mineral Reserves by sector are summarized in the Table 12-4. The procedure used to check the estimates as follows:
⮚Verified tonnage and average grades (iodine and nitrate) as Mineral Reserves by sectors with the measured and indicated resources previously analyzed (Section 11).
⮚Checked that the sectors with estimated Mineral Reserves by SQM are in areas with environmental licenses approved by the Chilean authorities while also considering application of modifying factors.
⮚Checked that the rules and factors previously described to convert Measures Resources to Mineral Reserves (tonnage and grade) have been correctly applied.
⮚Confirmed that each sector with Mineral Reserves is considered in the Long Term mine plan (2024-2037) and the total volume of mineral ore (caliche) is economically mineable.
⮚Considered the judgment of the Qualified Person in respect of the technical and economic factors likely to influence the prospect of economic extraction.
Table 12-4 Reserves at the Nueva Victoria Mine by Sector (Effective 31 December 2022)
|
|
|
|
|
|
|
|
|
|
|
|
|
|
|
|
|
|
|
|
|
|
|
|
|
|
|
|
|
|
| Mining |
Proved |
Probable |
Reserves |
Tonnage
(MTon) |
Nitrate
(%) |
Iodine
(ppm) |
Tonnage
(MTon) |
Nitrate
(%) |
Iodine
(ppm) |
Tonnage
(MTon) |
Nitrate
(%) |
Iodine
(ppm) |
| Nueva Victoria |
20.2 |
4.5 |
405 |
104 |
4.1 |
401 |
124.2 |
4.2 |
402 |
| Tente en el Aire |
37.7 |
4.5 |
402 |
204 |
5.3 |
408 |
241.7 |
5.2 |
407 |
| Hermosa |
143.9 |
6.0 |
443 |
221 |
5.4 |
429 |
364.9 |
5.6 |
435 |
| Total |
201.8 |
5.6 |
432 |
529 |
5.1 |
415 |
730.8 |
5.2 |
420 |
Exploitation sector of Nueva Victoria comprises:
Mina Oeste, Oeste 3, Torcaza and Franja Oeste (see ubication in the Figure 12-2 (Map of Reserve Sectors in Nueva Victoria).
Exploitation sector of Tente en el Aire (TEA) includes:
TEA Oeste, TEA Sur, Fortuna, Pampa Engañadora and Cocar (see ubication in the Figure 12-2 (Map of Reserve Sectors in Nueva Victoria).
Exploitation sector of Hermosa considers:
Hermosa, Hermosa Oeste, and Coruña (see ubication in the Figure 12-2 (Map of Reserve Sectors in Nueva Victoria).
|
|
|
|
|
|
|
|
|
| SQM TRS Nueva Victoria |
|
Pag. 118 |
12.5Qualified Person’s Opinion
The estimate of mineral reserves is based on Measured and Indicated Mineral Resources. This information has been provided in reference to Nueva Victoria. The Competent Person has audited the mineral resource estimate and modifying factors to convert the measured and indicated resources into proven and probable reserves.
The Competent Person has also reconciled mineral reserves with production and indicates that such reserves are appropriate for use in mine planning.
|
|
|
|
|
|
|
|
|
| SQM TRS Nueva Victoria |
|
Pag. 119 |
13MINING METHODS
SQM provided with production forecasts for the period from 2024 to 2038 (Mining Plan MP). This Mining Plan was checked that the planned exploitation sectors had environmental licenses approved by the Chilean authorities; the total tonnage and average Iodine and Nitrate grades were consistent with estimated Mineral Reserves; the total volume of mineral ore (caliche) is economically mineable and the production of prilled Iodine and Brine Nitrate Concentrate (Brine Nitrate) set by SQM is attainable, considering the dilution and mass losses for mining and recovery factors for leaching and processing
Mining at the Nueva Victoria mine comprises soil and overload removal, mineral extraction from the surface, loading and transport of the mineral (caliche) to make heap leach pads to obtain iodine and nitrate-enriched solutions (brine leach solution).
Mineralization can be described as stratified, sub-horizontal, superficial (≤ 5.0 m), and limited thickness (3.0 m average). The extraction process of the mineral is constrained by the tabular and superficial bedding disposition of the geological formations that contain the mineral resource (caliches). This mining process has been approved by local mining authorities in Chile (SERNAGEOMIN) 3. Generally, extraction consists of a few meters’ thick excavation (one continuous bench of up to 6.0 m in height (overburden + caliche) where the mineral is extracted using traditional methods - drilling and blasting and a CM. Extracted ore is loaded by front loaders and/or shovels and transported by rigid hopper mining trucks to heap leach structures.
The concentration process starts with leaching in situ by means of heap leach pads irrigated by drip/spray to obtain an iodine and nitrate enriched solution that is sent to treatment plants to obtain the final products. The mining and extraction process is summarized in Table 13-1.
3 SERNAGEOMIN Resolution 1469/2005 of June 30, 2005 (" Ordinance for Regularization of Mine Exploitation Method and mineral treatment and expansion of Nueva Victoria mine and iodide plant"); updated by SERNAGEOMIN Resolution 0515/2012 of November 29, 2012, in accordance with Article 22 of D.S. No. 132/04, Ministry of Mining, Mining Safety Regulations).
Table 13-1. Summary of Nueva Victoria-SQM caliche mine characteristics
|
|
|
|
|
|
| Mining System |
Opencast with a single and continuous bench with a height of up to 6 m |
| Drilling |
Atlas Copco Model F9 and D7 |
| Blast Mining (Explosive) |
ANFO, detonating cord, 150 gr APD booster and non-electric detonators.
Power factor 0.365 kg/ton |
| Continuous Mining |
Surface excavator (tractor with cutting drum) |
| Loading and Transportation |
Front loaders (12 to 14 m3), 100 to 150 t trucks (60 m3 to 94 m3 capacity) |
| Topsoil Stripping (overburden removal) |
0.15 m3 of soils and overburden / ton of caliche |
| Caliche Production |
129,500 tons per day (tpd) |
| Dilution Factor |
± 10 ppm Iodine (< 2,5%) |
| Recovery Factor |
56% of Iodine and 52% of Nitrate (2008 - 2022 period) |
| Heap Leaching Water Consumption |
0.39 to 0.60 m3/ ton leached caliche (2008 - 2022 period) |
Sterile(a) / Ore Mass Ratio |
1 t: 2.36 t |
(a)This material is used by SQM to build the base of the heap pads. The final volume of waste material is negligible.
13.1GEOTECHNICAL AND HYDROLOGICAL MODELS, AND OTHER PARAMETERS RELEVANT TO MINE DESIGNS AND PLANS
This sub-section contains forward-looking information related to mine design for the Project. The material factors that could cause actual results to differ materially from the conclusions, estimates, designs, forecasts, or projections in the forward-looking information include any significant differences from one or more of the material factors or assumptions that were set forth in this sub-section.
Mining at Nueva Victoria is relatively simple, as it is only necessary to remove a surface layer of sterile material (soil + overburden) up to 1.0 m thick (sandstone, breccia, and anhydrite crusts), which is removed. Subsequently the ore (caliche) is extracted, which has a thickness of 1.50 to 6.0 m (average of 3.0 m). Caliche's geotechnical characteristics (Polymictic Sedimentary Breccia) allow a vertical mining bench face, allowing increased efficiency in the exploitation of the mining resources.
|
|
|
|
|
|
|
|
|
| SQM TRS Nueva Victoria |
|
Pag. 120 |
The mining conditions do not require physical stability analysis of the mining working face; therefore, no specific geotechnical field investigations and designs are required. One single final bench of about 4.70 m average height (1.0 m of soil + overburden and 3.2 m of caliche) is typical of the operations (Figure 13-1).
Figure 13-1. Stratigraphic Column and Schematic Profile, and Schematic Mining Process in Nueva Victoria Caliche Mine
Due to its practically non-existent surface runoff and surface infiltration (area with very low rainfall) and its shallow mining depth, the water table is not reached during excavation. Therefore, no surface water management and/or mine drainage plans are required to control groundwater and avoid problems arising from the existence of pore pressures.
Therefore, this mining operation does not require detailed geotechnical, hydrological, and hydrogeological models for its operation and/or mining designs and mining plans.
Two methods are used in the mining operation: blasting and continuous surface mining. The selection of the method to be used in each sector depends on a variable defined by the hardness of the caliche to be excavated and its proximity to infrastructure, where there may be a potential risk of blasting damage.
The hardness is established during geological surveys and exploration and relates to the following qualitative technical criteria as judged by the geologist in the field from boreholes:
⮚Caliche drilled borehole section that exhibits collapse and/or roughness in diameter is rated as Soft (Hardness 1) or Semi-Soft (Hardness 2).
⮚Borehole section drilled in caliche that exhibits a consistent and smooth borehole diameter is rated as Hard (Hardness 3).
|
|
|
|
|
|
|
|
|
| SQM TRS Nueva Victoria |
|
Pag. 121 |
⮚This parameter is included in the block model and is used in decision-making on mining and heap leach shaping.
Extracted mineral is stockpiled in heaps located in same general area of exploitation. Heap leach pads are constructed in previously mined-out areas. The pads are irrigated to leach the target components (iodine and nitrates) by aqueous dissolution (pregnant brine solution).
SQM has analyzed heap leach stability4 to verify the physical long-term stability of these mining structures under adverse conditions (maximum credible earthquake). Geomechanical conditions analyzed for heap leaching facilities that are already closed have been considered, which have the following characteristics:
⮚Wet density of 20.4 kilonewtons per cubic meter (kN/m³).
⮚Internal friction angle of 32º.
⮚Cohesion of 2.8 kPa.
A graded compacted material is used to support the liner on which the piles rest. The specification is based on experience and is generally defined by a wet density of 18.5 kN/m³, an angle of friction (𝜙) of 38° and no cohesion. Between the soil base and heap material there is an HDPE sheet that waterproofs the heap leach pad foundation. The interface between geomembrane HDPE and the drainage layer material is modelled as a 10 cm thick layer of material and a friction angle 𝜙 = 25° is adopted, which represents generated friction between the soil and the geomembrane.
Maximum acceleration value for the maximum credible earthquake is set at 0.86 G (G = 9.8

) and for the design earthquake it is set at 0.35 G.
The horizontal seismic coefficient (Kh) was set through expressions commonly used in Chile and the vertical seismic coefficient (Kv) was set according to NCh 2369 Of. 2003, as 2/3 of the horizontal coefficient. Therefore, in the stability analysis of heaps, a Kh value of 0.21 and Kv of 0.14 was used for the maximum credible earthquake; and a Kh of 0.11 and Kv of 0.07 were used for the design earthquake.
4INFORME TÉCNICO ANÁLISIS DE ESTABILIDAD DE TALUDES PILAS 300 Y 350. SQM N° 14220M-6745-800-IN-001. PROCURE Servicios de Ingeniería (21146-800-IN-001), May 2021
The stability analysis was executed using the static dowel equilibrium methodology (Morgenstern-Price Limit Equilibrium method) and GeoStudio’s Slope software, with results that comply with the minimum Factor of Safety criteria.
Based on the analysis developed in this document, it is possible to draw the following conclusions (Table 13-2 and Figure 13-2):
⮚The slopes of the heaps analyzed in their current condition are stable against sliding.
⮚None of the heaps will require slope profiling treatment after closure.
Table 13-2. Summary Results of Slope Stability Analysis of Closed Heap Leaching (Nueva Victoria)
|
|
|
|
|
|
|
|
|
|
|
|
| Heap pad Number |
Static case (FS adm = 1,4) |
Pseudo-static design earthquake
(FS adm = 1,2)
|
Pseudo-static maximum credible earthquake
(FS adm = 1,0)
|
| 300 |
1.93 |
1.42 |
1.09 |
| 350 |
1.91 |
1.42 |
1.1 |
|
|
|
|
|
|
|
|
|
| SQM TRS Nueva Victoria |
|
Pag. 122 |
Figure 13-2. Geotechnical Analysis Results: Heap #300, Hypothesis Maximum Credible Earthquake
TECHNICAL REPORT ‘’ANÁLISIS DE ESTABILIDAD DE TALUDES PILAS 300 Y 350’’. Document SQM N° 14220M-6745-800-IN-001. PROCURE Servicios de Ingeniería (21146-800-IN-001), May 2021.
13.2PRODUCTION RATES, EXPECTED MINE LIFE, MINING UNIT DIMENSIONS, AND MINING DILUTION AND RECOVERY FACTORS
The MP considers a total caliche extraction of 731 Mt, with a production growing from 44 Mtpy to 54 Mtpy, as shown in Table 13-3. For the MP total caliche to be extracted is projected to have iodine grades ranging between 380 to 430 ppm and nitrate grades between 4.6 % and 5.6%.
With an average Iodine grade of 414 ppm (0.0414%), gross iodine prill production is estimated to be at 39 tpd (14.287 tpy of iodine). Likewise, for a Nitrate average grade of 5.1 %, average Nitrate salts for fertilizer production is estimated to be at 3.505 tpd (1.279 ktpy of nitrate salts for fertilizer).
The mining area extends over an area of 40 km x 50 km (see Figure 12-2). The mining sequence is defined based on the productive thickness data established for caliche from geological investigations, approved mining licenses exist, distances to treatment plants and ensuring that mineral is not lost under areas where infrastructure is planned to be installed (heap bases, pipelines, roads, channels, trunk lines, etc.). Areas with future planned infrastructure are targeted for mining prior to establishing these elements or mined after the infrastructure is demobilized.
Mineral Reserves considers SQM's criteria for the mining plan which includes the following:
⮚Caliche Thickness ≥ 2.0 m.
⮚Overburden thickness ≤ 1.0 m.
⮚Waste / Mineral Ratio ≤ 0.5.
⮚Nitrate (3.0 %) cut-off grade.
In addition to the above-mentioned operational parameters, the following geological parameters are also considered for determining the mining areas:
⮚Lithologies.
⮚Hardness parameters.
⮚Total salts (caliche salt matrix) which impact caliche leaching.
⮚Total salts elements (majority ions) which impact caliche leaching.
GPS control over the mining area floor is executed during mining to minimize dilution of the target iodine and nitrate grades.
|
|
|
|
|
|
|
|
|
| SQM TRS Nueva Victoria |
|
Pag. 123 |
Table 13-3. Mining Plan (2024-2038)
|
|
|
|
|
|
|
|
|
|
|
|
|
|
|
|
|
|
|
|
|
|
|
|
|
|
|
|
|
|
|
|
|
|
|
|
|
|
|
|
|
|
|
|
|
|
|
|
|
|
|
|
|
|
| MATERIAL MOVEMENT |
UNITS |
2024 |
2025 |
2026 |
2027 |
2028 |
2029 |
2030 |
2031 |
2032 |
2033 |
2034 |
2035 |
2036 |
2037 |
2038 |
TOTAL |
| Nueva Victoria Sector Ore Tonnage |
Mt |
20 |
13 |
18 |
16 |
16 |
0 |
0 |
0 |
0 |
16 |
16 |
16 |
16 |
16 |
0 |
163 |
| Iodine (I2) in situ |
ppm |
390 |
375 |
382 |
410 |
385 |
0 |
0 |
0 |
0 |
400 |
400 |
395 |
390 |
385 |
0 |
391 |
| Average grade Nitrate Salts (NaNO3) |
% |
4.7% |
3.6% |
3.4% |
5.0% |
4.3% |
0.0% |
0.0% |
0.0% |
0.0% |
4.2% |
4.1% |
4.0% |
4.0% |
4.0% |
0.0% |
4.1% |
| Tente en el Aire (TEA) Sector Ore Tonnage |
Mt |
2 |
8 |
8 |
16 |
16 |
24 |
26 |
26 |
26 |
10 |
10 |
0 |
0 |
0 |
0 |
172 |
| Iodine (I2) in situ |
ppm |
492 |
420 |
430 |
413 |
400 |
413 |
413 |
410 |
410 |
405 |
390 |
0 |
0 |
0 |
0 |
411 |
| Average grade Nitrate Salts (NaNO3) |
% |
4.4% |
4.6% |
4.2% |
5.5% |
6.7% |
5.2% |
4.6% |
4.0% |
4.0% |
4.1% |
4.0% |
0.0% |
0.0% |
0.0% |
0.0% |
4.7% |
| Hermosa Sector Ore Tonnage |
Mt |
22 |
22 |
21 |
22 |
22 |
30 |
28 |
28 |
28 |
28 |
28 |
38 |
38 |
38 |
3 |
396 |
| Iodine (I2) in situ |
ppm |
458 |
470 |
468 |
455 |
460 |
440 |
430 |
440 |
430 |
420 |
400 |
390 |
372 |
395 |
411 |
425 |
| Average grade Nitrate Salts (NaNO3) |
% |
6.5% |
6.4% |
6.2% |
6.0% |
6.4% |
5.9% |
5.7% |
5.5% |
5.6% |
5.2% |
5.1% |
5.0% |
6.3% |
5.5% |
4.9% |
5.7% |
| TOTAL ORE MINED (CALICHE) |
Mt |
44 |
43 |
47 |
54 |
54 |
54 |
54 |
54 |
54 |
54 |
54 |
54 |
54 |
54 |
3 |
731 |
| Iodine (I2) in situ |
kt |
18.9 |
18.6 |
20.1 |
23.2 |
22.7 |
23.1 |
22.8 |
23.0 |
22.7 |
22.2 |
21.5 |
21.1 |
20.4 |
21.2 |
1.2 |
302.6 |
| Yield process to produce prilled Iodine |
% |
60.3% |
56.0% |
57.6% |
67.3% |
64.4% |
63.8% |
65.6% |
65.8% |
69.1% |
71.7% |
71.5% |
71.7% |
68.5% |
69.2% |
69.6% |
66.2% |
| Prilled Iodine produced |
kt |
11.4 |
10.4 |
11.6 |
15.6 |
14.6 |
14.8 |
14.9 |
15.1 |
15.7 |
15.9 |
15.4 |
15.1 |
14.0 |
14.6 |
0.9 |
200.0 |
| Nitrate Salts in situ |
kt |
2,460 |
2,244 |
2,244 |
3,000 |
3,168 |
3,022 |
2,788 |
2,590 |
2,604 |
2,538 |
2,479 |
2,540 |
3,022 |
2,714 |
147 |
37,560 |
| Yield process to produce Nitrates |
% |
42.8% |
33.4% |
37.1% |
52.3% |
45.8% |
40.8% |
47.7% |
48.5% |
49.7% |
57.8% |
57.5% |
57.9% |
55.1% |
58.4% |
57.1% |
49.7% |
| Nitrate production from Leaching |
kt |
1,052 |
750 |
833 |
1,569 |
1,450 |
1,233 |
1,329 |
1,255 |
1,295 |
1,467 |
1,425 |
1,472 |
1,665 |
1,584 |
84 |
18,463 |
| Ponds Yield to produce Nitrates Salts |
% |
60.7% |
68.5% |
64.3% |
65.9% |
64.7% |
66.3% |
63.5% |
63.5% |
63.5% |
63.5% |
63.5% |
63.5% |
63.5% |
63.5% |
63.5% |
64.1% |
| Nitrate Salts for Fertilizers |
kt |
639 |
513 |
535 |
1,034 |
939 |
818 |
844 |
798 |
823 |
932 |
905 |
935 |
1,058 |
1,006 |
53 |
11,833 |
Grade dilution from mining is estimated to be less than 2.5% (± 10 ppm iodine) and less than 2.3% for nitrate (± 0.12% nitrate). During the caliche mining process, as the mineralized thicknesses are low (≤ 5.0 m), there is a double effect on the mineralized mantle floor resulting from the blasting process: with the inclusion of underlying material as well as over-excavation. These tend to compensate, with dilution or loss of grade is minor or negligible (± 10 ppm for Iodine).
The excavation depth is controlled by GPS on the loading equipment. SQM considers a planned mining recovery of 90%, (average value for MP 2024-2038).
The processes of extraction, loading and transport of the mineral (caliche) include:
⮚Surface layer and overburden removal (between 0.5 to 1.0 m thick) that is deposited in nearby mined out or barren sectors. This material is used to build the base of the heap leaching structures.
⮚Caliche extraction, to a maximum depth of 6 m, using explosives (drill and blast), or surface excavator (CM type Terrain Leveler SEM).
Blasting is performed to achieve good fragmentation, good floor control, ore sizes suitable for the loading equipment, and to avoid further handling (20% of fragments below 5.0-6.0 cm, 80% of fragments below 37.0 cm, and maximum diameter of 100 cm).
CMs are used to mine areas that are close to infrastructure that can be damaged by blasting, to extract softer caliche areas and to obtain a more homogenous granulometry of mineral extracted, which generates better recovery rates in the iodine and nitrate leaching processes. In addition, it generates less dust emission than drill and blast. The decision to use a miner versus drill & blast is based on simple compressive strength parameters of the rock (up to 35 megapascals [MPa]), to limit material abrasiveness, as well as the presence of caliche clasts.
This equipment allows mineral fragmentation through the rotation of the cutting drum with iron tips reinforced with tungsten alloy, which crushes the mineral to obtain an average and homogeneous size of approximately 15.0 cm (20% below 3.5 cm, 80% below 15.0 cm and Dmax 45.0 cm, as average values). The drum is located at the back of the machine, which enables the cutting of mineral while the crawler tracks remain on the ground so as not to damage the crushed material.
The 2024 Mining Plan targets an annual production of 44 Mt of fresh caliche (5.6 % NaNO3, 429 ppm Iodine and 57,5 % soluble salts) of which 40 Mt will be extracted by traditional mining and 4 Mt by continuous mining.
⮚Caliche loading, using front-end loaders and/or shovels.
⮚Transport of the mineral to heap leach pads, using mining trucks (rigid hopper, 100 t to 150 t).
|
|
|
|
|
|
|
|
|
| SQM TRS Nueva Victoria |
|
Pag. 124 |
Heap leach pads (Figure 13-3) are built to accumulate a total of 1 Mt, with heights between 7 to 15 m and crown area of 65,000 m2 .
Figure 13-3. Pad Construction and Morphology in Nueva Victoria Mine (caliches)
Physical stability analysis performed by SQM reports that these heaps are stable in the long term (closed heaps) and no slope modification is required for closure.
Fragmented material from continuous surface mining comes to heaps separate from the ROM ones.
There are several stages in the heap construction process:
⮚Site preparation and construction of the heap base and perimeter parapets to facilitate collection of the enriched solutions.
The base of the heaps has an area of 84,000 m² and a maximum cross slope of 2.5% to facilitate the drainage of solutions enriched in iodine and nitrate salts.
Heap base construction material (0.4 m thick) comes from the sterile material and is roller-compacted to 95% of normal proctor (moisture and/or density is not tested on site).
An HDPE, waterproof geomembrane is laid on top of this base layer.
To protect the geomembrane, a 0.5 m thick layer of barren material is placed on top (to avoid damage to the membrane by ROM/CM fragments stored in the heap).
⮚Heap pad loading by high-tonnage trucks (100 to 150 t). The leach pads are built in two lifts each 3.25 m high, on average. The average high of a heap pad is 6.5 m.
⮚Impregnation, which consists of an initial wetting of the heap with industrial water, in alternating cycles of irrigation and rest, for a period of 60 days. During this stage the pile begins its initial solution drainage (brine)
⮚Continuous irrigation until leaching cycle is completed in the following stages:
•Irrigation Intermediate Brine: stage where first pass solutions are cycled through the oldest half of heaps to add an additional charge. It lasts up to 280 days.
•Mixing: Irrigation stage consisting of a mixture of recirculated Brine Feble5 and water. Drainage from these heaps is considered as SI and are used to irrigate other heaps. This stage lasts about 60-80 days.
•Washing: last stage of a heap's life, with a final irrigation of water, for approximately 20-30 days.
In total, there is a cycle of approximately 300 to 500 days for each heap, during which time the heap drops in height by 15-20%.
|
|
|
|
|
|
|
|
|
| SQM TRS Nueva Victoria |
|
Pag. 125 |
The irrigation system used is a mixed system with drippers and sprinklers. In the case of drippers, heaps may be covered with a plastic sheet or blanket to reduce evaporation losses and improve the efficiency of the irrigation system.
⮚Leaching solutions are collected by gravity via channels, which lead the liquids to a sump where it is recirculated by means of a portable pump and pipes to the brine reception and accumulation ponds.
⮚Once the heaps are out of operation, tailings can either be used for base construction of other heaps or remain on site as exhausted heaps.
In 2023, for the heap leaching processes, the total water demand was 582L/s (2,095 m³/h) (unit consumption of 0.42 m³/ton caliche leached), while enriched solution flow from heap leach to Nueva Victoria-Iris concentration plants was 2,031 m³/h. In the process SQM applies a recirculation system for leaching to achieve a higher brine production than fresh water used. The hydraulic efficiency of the heap leaching process in NV mine reached an average of 80%.
In the Long term (MP) for 2024-2038 period, the unit water consumptions range from 0.42 to 0.50 m³/ton of caliche leached with an average of 0.49m³/ton. The leaching process projected for 2024-2037 envisions an increase of water used (pumped groundwater and seawater) from 582 L/s in 2024 to 850 L/s in 2027. This increased water use in the leaching process results in an improvement in the extraction of Iodine and Nitrates in the heap leach structures, allowing a better performance in the metallurgical recovery process.
Leaching process yields average 71,9% for iodine and 49,7% for nitrate in ROM heap leaching (drill and blast material) for the Long Term from 2024 to 2038 period.
Homogeneous and smaller fragmentation generated by the CM allows an increase of 6% in Nitrate yield (approximately to 55,4% recovery) and 10% in Iodine yield (approximately to 81,9% recovery).
Heap leaching process performance constraints include the amount of water available, slope shaping7 (slopes cannot be irrigated), re-impregnation and resource/reserve modelling errors. This last factor most influences annual target production deviations from actuals achieved. Such deviations are typically as high as -5% for iodine and -10% for nitrate.
Other facilities besides heaps are solution ponds (brine, blending, intermediate solution) and water and back-up ponds (brine and intermediate solution). There are about seven rectangular ponds with 8,000 m³ to 36,000 m³ capacity and heights between 3.0 to 4.9 m, which have pump systems, whose function is to drive industrial water, Brine Feble (BF), and Intermediate Brine to the heap leaching, through HDPE pipes, to extract the maximum amount of iodine and nitrate from the caliche heaps (continuous irrigation process).
From brine ponds, the enriched solutions are sent to the iodide plants via HPDE pipes.
7 Heap morphology implies a natural slope of 24º (1H:0.44V).
13.3PRODUCTION AND FINAL MINE OUTLINE
SQM works with topographic control in the mining operations whereby the soil and overburden are removed (total thickness of 1.5 m on average at Nueva Victoria) and caliche is extracted (average thickness of 3.0 m).
Given that the excavations are small (4.70 m on average) in relation to the surface area involved (690 ha/y), it is not possible to correctly visualize a topographic map showing the final situation of the mine.
Figure 13-4 depicts the final mine outline for the 2023 to 2038 period (Long Term Plan).
|
|
|
|
|
|
|
|
|
| SQM TRS Nueva Victoria |
|
Pag. 126 |
Figure 13-4. Final Mine Outline - Nueva Victoria Mining Plan 2023-2037
|
|
|
|
|
|
|
|
|
| SQM TRS Nueva Victoria |
|
Pag. 127 |
Caliche production data for the 2024-2038 Long Term (MP) involves a total production of 731 Mt, with average grades of 414 ppm of Iodine and 5.1 % of Nitrates.
Based on production factors set in mining and leaching processes, a total production of 200 kt of Iodine and 11,833 kt of Nitrate salts for fertilizers is expected for this period (2024-2038), which means to produce fresh brine solution (68,300 m³/d) with average contents of 39 tpd of Iodine (0.62 g/L) and 2,316 tpd of Nitrate salts for fertilizers (104 g/l) that would be sent to the processing plants. Note that dilution factors considered herein are in addition to the indicated resource to probable reserve factors described above.
Table 13-4. Mine and Pad Leaching Production for Nueva Victoria Mine Period 2024 – 2038.
|
|
|
|
|
|
|
|
|
|
|
|
|
|
|
|
|
|
|
|
|
|
|
|
|
|
|
| LOM 2024-2038 |
|
Caliche |
|
% Ratios |
|
Iodine |
|
Nitrates |
|
|
|
|
|
|
|
|
|
| Production (kt) |
|
731 |
|
|
|
|
|
|
| Average grade (Iodine ppm / Nitrates ppm) |
|
|
|
|
|
414 |
|
5,1% |
| In-situ estimates (kt) |
|
|
|
|
|
303 |
|
37,560 |
| Traditional mining (kt) |
|
675 |
|
93.0% |
|
|
|
|
| Continuous mining (kt) |
|
56 |
|
7.0% |
|
|
|
|
| Mining yield |
|
|
|
95.0% |
|
|
|
|
| Grade Dilution Factor |
|
|
|
|
|
2.25% |
|
2.5% |
| Grade dilution |
|
|
|
|
|
9.5 |
|
0.13 |
| Mining process efficiency |
|
|
|
|
|
90.0% |
|
90.0% |
| Mineral charged in heap leach (kt) |
|
|
|
|
|
303 |
|
37,560 |
| Heap Leach ROM recovery from traditional mining |
|
|
|
|
|
71.0% |
|
48.7% |
| Heap ROM production from traditional mining heaps (kt) |
|
|
|
|
|
198 |
|
16,889 |
| Heap leach recovery from continuous mining |
|
|
|
|
|
83.0% |
|
54.7% |
| Heap production ROM continuous mining |
|
|
|
|
|
19 |
|
1,574 |
| Total Heap Leach production (kt) |
|
|
|
|
|
218 |
|
18,463 |
| Total Heap Leach production (tpd) |
|
|
|
|
|
43 |
|
3,613 |
| Total Heap Leach production (ktpa) |
|
|
|
|
|
15.5 |
|
1,319 |
| Heap Leaching recovery coefficient |
|
|
|
|
|
71.9% |
|
49.7% |
13.4REQUIREMENTS FOR STRIPPING, UNDERGROUND DEVELOPMENT, AND BACKFILLING
Initial ground preparation work requires an excavation of a surface layer of soil-type material (50 cm average thickness) and overburden or waste material above the mineral (caliche) that reaches average thicknesses of between 50 cm to 100 cm.
This is done by bulldozer type tracked tractors and Whelldozer type wheeled tractors. This waste material is deposited in nearby mined-out or barren sectors.
SQM has 8 bulldozer type tractors of 50 to 70 tons and 4 Whelldozer type tractors of 25 t to 35 t for these tasks.
Caliche mining is conducted through use of explosives and/or continuous miners to a maximum depth of 6 m (3.0 m average and 1.5 m minimum mineable thickness), with an annual caliche production rate at Nueva Victoria of 52 Mtpy.
Caliche extraction by drilling and blasting is executed by means of rectangular blasting patterns, which are drilled considering an average caliche thickness of 3.5 m.
Table 13-5 Blasting Pattern in Nueva Victoria Mine
|
|
|
|
|
|
|
|
|
|
|
|
| Diameter (Inches) |
Burden (m) |
Spacing (m) |
Subgrade (m) |
| 3.5 |
2.8 to 3.2 |
2.2 to 2.8 |
0.5 to 0.8 |
| 4.0 |
2.8 to 3.4 |
2.8 to 3.4 |
0.7 to 1.2 |
| 4.5 |
3.4 to 3.8 |
3.4 to 3.8 |
1.0 to 1.5 |
|
|
|
|
|
|
|
|
|
| SQM TRS Nueva Victoria |
|
Pag. 128 |
Usually, drilling grid used in Nueva Victoria is 2.8 x 3.0 m and 3.0 x 3.2 m, with a drill diameter of 4". Atlas Copco rigs (F9 and D7 equipment) are used for drilling (Percussion drilling with DTH hammer).
The explosive used is ANFO, which is composed of 94% ammonium nitrate and 6.0% fuel oil, which has a density of 0.82-0.84 g/cc, with a detonation velocity between 3,800 to 4,100 m/s. The charge is 24.3 kg per drill hole.
A backfill (stemming) of 0.80 m is provided with sterile material. For detonation, 150 g APD boosters and non-electric detonators are used as detonators, which start with a detonating cord. The over-excavation (subgrade) is variable from 0.5 to 1.5 m. Blasting assumes a rock density of 2.1 t/m³ of intact rock, with an explosives load factor of 365 g/ton (load factor of 0.767 kg/m³ of blasted caliche), for an extraction of 129,500 tpd of caliche. The figure 13-5 depicts a typical blast.
Figure 13-5. Typical Blast in Nueva Victoria Mine (caliches)
SQM has two Vermeer T1655; series equipment with a rotating drum and crawler tracks. Each unit can produce 3 Mtpy. It also has SEM-Wirtgen 2500SM Series equipment (Figure 13-6), with a different cutting design to Vermeer equipment, with crawler tracks and able to work with a conveyor belt stacking or loading material directly to a truck.
|
|
|
|
|
|
|
|
|
| SQM TRS Nueva Victoria |
|
Pag. 129 |
Figure 13-6. Terrain Leveler and SME equipment (Vermeer)
13.5REQUIRED MINING EQUIPMENT FLEET AND PERSONNEL
This sub-section contains forward-looking information related to equipment selection for the Project. The material factors that could cause actual results to differ materially from the conclusions, estimates, designs, forecasts or projections in the forward-looking information include any significant differences from one or more of the material factors or assumptions that were set forth in this sub-section including labor and equipment availability and productivity.
SQM has sufficient equipment at the Nueva Victoria mine to produce enough caliche as required, to mine and build heap leach pads, and to obtain enriched liquors that are sent to treatment plants to obtain Iodine and Nitrate end-products.
The equipment available to achieve Nueva Victoria's current production Mining Plan (2024-2038) of caliche is summarized in Table 13-6. The current equipment capacity has been evaluated by the QP and will meet the future production requirements.
Table 13-6 Equipment Fleet at Nueva Victoria mine
|
|
|
|
|
|
|
|
|
| Equipment |
Quantity |
Type or size |
| Front Loader |
6 |
12.5 and 15 m3 |
| Shovels |
3 |
13 to 15 m3 / 150 to 200 Ton |
| Surface Excavation Machine (SME) |
4 |
100 to 200 Ton |
| Trucks |
20 |
100 to 150 Ton |
| Bulldozer |
5 |
50 to 70 Ton |
| Whelldozer |
4 |
35 Ton |
| Drill |
7 |
Top hammer of 3.5 to 4.5 inches (diameter) |
| Grade |
3 |
5 -7 m |
| Roller |
2 |
10 - 15 Ton |
| Excavator |
3 |
Bucket capacity 1 -1.5 m3 |
The staff at Nueva Victoria's mining operation consists of 575 professionals dedicated to mining and heap leach operation.
Also, a total of 126 professionals are employed for heap leaching and ponds maintenance. No contractor mining and labor is used.
The Nueva Victoria mine operation includes some general service facilities for site personnel: offices, bathrooms, truck maintenance and washing shed, change rooms, canteens (fixed or mobile), warehouses, drinking water plant (reverse osmosis) and/or drinking water storage tank, sewage treatment plant and transformers.
|
|
|
|
|
|
|
|
|
| SQM TRS Nueva Victoria |
|
Pag. 130 |
14PROCESSING AND RECOVERY METHODS
This sub-section contains forward-looking information related to the nitrate and iodine concentrators, leaching and solvent extraction throughputs and designs, equipment characteristics, and specifications for the Project. The material factors that could cause actual results to differ materially from the conclusions, estimates, designs, forecasts or projections in the forward-looking information include any significant differences from one or more of the material factors or assumptions that were set forth in this sub-section including actual ore feed characteristics that are different from the historical operations or from samples tested to date, equipment and operational performance that yield different results from the historical operations, historical and current test work results, and metallurgical recovery factors.
The Nueva Victoria Property includes caliche mining areas, heap leaching and processing plants to produce iodine as the primary product and nitrate as a secondary product. The mine facilities are concentrated in the following three SQM property areas: Nueva Victoria, Sur Viejo, and Iris.
Nueva Victoria ore contains an average of 5.1% nitrate and 414 ppm iodine as stated in the current TRS (section 12.2 Mineral Reserves). A portion of the iodine and nitrate is water-soluble and is extracted during heap leaching. Following iodide extraction, a portion of the iodide-depleted solution is fed back to the heap leaching process. The remaining iodide-depleted solution is pumped to the evaporation ponds where nitrate salts are recovered from it.
Standard open pit mining methods are used to mine the caliche ore. Caliche mining occurs over an area of approximately 408.5 km² within the Nueva Victoria Property and 45.5 km² within the Iris Property. The nominal rate of caliche mining is currently 44 Mtpy. . Pregnant Leach Solution (PLS) from the heap leach is piped to the iodide plant, Nueva Victoria, and iris, located about 20 km from the pile site, which have a production capacity of 11 ktpy and 2 ktpy of iodine, respectively.
The 2010 environmental permit for the Pampa Hermosa Project considered the installation of a Nitrate Plant to produce sodium nitrate & potassium nitrate at Nueva Victoria. This has not yet been implemented, and currently nitrate production for Nueva Victoria and Iris is carried out at the Coya Sur (Antofagasta Region).
Nueva Victoria operations currently have the following facilities:
⮚Caliche mine and mine operation centers.
⮚Nueva Victoria Iodide Plant and Nueva Victoria Iodine Plant.
⮚Iodide - iodine Iris Plant.
⮚Neutralization Plant.
⮚Evaporation ponds.
⮚Waste salts deposit.
⮚Industrial water supply.
⮚Auxiliary installations: Camps and offices, domestic waste disposal site, hazardous waste yard, and non-hazardous industrial waste yard.
|
|
|
|
|
|
|
|
|
| SQM TRS Nueva Victoria |
|
Pag. 131 |
Figure 14-1 shows a block diagram of the main stages of caliche mineral processing to produce iodine prill and nitrate salts at Nueva Victoria. The following sections describe the operational stages and mineral processing facilities.
Figure 14-1. Simplified Nueva Victoria Process Flowsheet
|
|
|
|
|
|
|
|
|
| SQM TRS Nueva Victoria |
|
Pag. 132 |
14.1.PROCESS OVERVIEW
The Nueva Victoria Property includes caliche mining, heap leaching and processing plants to obtain iodine as the main product and nitrate as a by-product.
Figure 14-2 presents a schematic of the mineral production process of iodine and concentrated nitrate salts from caliche ore at Nueva Victoria. This diagram shows that the process can be summarized in six relevant stages: mining, leaching, extraction in iodide plant, conversion in iodine plant, neutralization, and evapo-concentration solar ponds. Each of these stages are described below.
Figure 14-2. Schematic of the Mineral Production Process at Nueva Victoria
The extraction process begins with the removal of non-mineralized soil and non-mineralized overburden and ends with the loading and transport of the caliche to the leaching heaps. More details on this operation are described in Section 13.2
Two categories of ore, defined by SQM, are processed at the site. These include Ore Category 1 (ROM ore extracted by blasting), and Ore Category 2 (ore extracted by CMs).
The batter fragmentation of the CM ore results in a higher percentage recovery of the available mineral salts in the PLS generated. As of 2023, this material represents 20% of the mineral stacked on the heap leach pads. The relative proportion of this material added to the heap leach pads will increase sequentially over the long term.
SQM extracts caliche from Nueva Victoria at a rate of 37 Mtpy in accordance with RE N°0515/2012 (Resolution Exempt, the government permit that authorizes the mineral extraction). At the neighboring Iris Property, SQM mines caliche and a rate of 6.48 Mtpy in accordance with permit RE 1447/2018. The authorized mining rate increased by an additional 28 Mtpy, reaching an authorized total of 65 Mtpy of mining at the Nueva Victoria Property. The caliche is extracted using explosives and then loaded and transferred to the heap leach pads. The caliche is leached using process water, augmented with depleted solution outflow from the iodide plant. This component of depleted (feeble) solution from the iodine process is referred to by SQM as BF that corresponds to weakly acidic water (also called agua feble ácida [AFA]).
|
|
|
|
|
|
|
|
|
| SQM TRS Nueva Victoria |
|
Pag. 133 |
The Table 14-1 summarizes the changes considered by the expansion project.
Table 14-1 Modifications to the Operation with Expansion of the TEA Project
|
|
|
|
|
|
|
|
|
|
|
|
| Installation |
Current Situation |
Modification |
Situation with TEA Project |
| Nueva Victoria surface area authorized for mining |
408.5 km² |
Increase of 436 km² |
Total mineable area of 844.5 km² at Nueva Victoria (890 km² including Iris) |
| Iris surface area authorized for mining |
45.5 km² |
No change |
No modification |
| Rate of caliche mining at Nueva Victoria |
37 Mtpy |
Increase of 28 Mtpy |
Total mining rate 71.48 Mtpy (65 Mtpy of which is at Nueva Victoria) |
| Rate of caliche mining at Iris |
6.48 Mtpy |
No modification |
No modification |
| Iodide production, Nueva Victoria |
11 Ktpy |
Increase of 12 Ktpy |
Total iodide production rate 25 Ktpy |
| Iodide production, Iris |
2 Ktpy |
No modification |
|
| Iodine production, Nueva Victoria |
11 Ktpy |
Increase of 12 Ktpy |
Total rate of iodine production 23 Ktpy |
| Iodine production, Iris |
2 Ktpy |
No modification |
|
| Salt production |
1,025 Mtpy (2,050 Mtpy with Pampa Hermosa) |
Increase of 1.95 Mtpy |
Total production rate of nitrate-rich salts 4 Mtpy |
| Evaporation ponds |
8.34 km² |
Increase of 10.17 km² |
Total evaporation ponds area 18.51 km² |
| Water use |
810.8 L/s (groundwater abstraction for industrial use) |
Increase of 900 L/s (abstraction of seawater) |
Total permitted water uses 1,710.8 L/s for industrial use |
The operations carried out to treat the ore and obtain iodine and nitrate salts are described below.
14.1.1Mine Area and COM (Operation Centers)
SQM Nueva Victoria and Iris Properties cover areas of approximately 408.5 km² (Nueva Victoria West, North, and South) and 44.5 km² (Iris). Administratively, SQM distinguishes:
⮚The mining areas (mineral deposit areas).
⮚The office and support buildings, warehouses, truck repair shops, heap leach piles, industrial water, and leaching solution (brine) storage ponds.
SQM refers to the processing plant and office area at Nueva Victoria and Iris as the Nueva Victoria Mine Operations Center (Centro de Operaciones Mina, or COM) and the Iris COM respectively.
Inside the mine areas there are the COM whose objective is the management of the different solutions. Basically, a COM is formed by the leaching heaps and accumulation ponds for the brine coming from the leaching process and the water required for the same. Thus, both COM de Nueva Victoria and Iris are facilities that have brine accumulation ponds, reception and accumulation ponds for AFA, industrial water ponds, and intermediate solution, which correspond to irrigation solutions.
All brine, industrial water and BF accumulation ponds are lined with impermeable membranes (typically HDPE or PVC) to prevent infiltration of their contents into the underlying ground.
14.1.2Heap Leaching
Leach Heaps are constructed on non-mineralized ground, so as not to cover valuable caliche resource. The land is prepared prior to construction of the heap leach pads. The soil is left with a slope profile of 1 to 4%, to promote gravity flow of the drained solution. The base is covered with an impermeable geomembrane (PVC, or HDPE) to prevent seepage of leaching solutions into the ground, allowing the solutions to be collected at the toe of the leach heap. A protective 40-50 cm thick layer of fine material (non-mineralized chusca (weathered material) or spent leached caliche) is spread over geomembrane to protect it against being damaged by the transit of mine vehicles or punctured by sharp stones.
|
|
|
|
|
|
|
|
|
| SQM TRS Nueva Victoria |
|
Pag. 134 |
The caliche to be leached is then emplaced over the protective layer. The leach piles are constructed with a rectangular base and heights between 7 to 15 m and a crown area of 65,000 m². Once the stacking of caliche is complete, heap is irrigated to dissolve the soluble mineral salts present in the caliche.
The heap leaching operation applies alternating cycles of irrigation and resting. The irrigation system used incorporates both sprinklers and drip irrigation. The heap leaching process typically takes around 425 days from start to finish (in general, the operating range is of approximately 300- 500 days for each heap). Over the leaching cycle, the removal of soluble mineral salts results in a 15% to 20% drop in height of each leach heap.
Figure 14-3 presents a schematic of the heap leaching process. The piles are organized in such a way as to reuse the solutions they deliver production heaps (the newest ones), which produce iodine rich solution to be sent to the iodine plant, and older heaps whose drainage feeds the production heaps. At the end of its irrigation cycle, an (old) pile leaves the system as inert debris, and a new heap enters at the other end, thus forming a continuous process.
Figure 14-3. Schematic of the Heap Leaching Process at Nueva Victoria
The stages in the heap leaching process (Figure 14-3) are as follows:
1)Initial irrigation of the heap with industrial water (impregnation): the “impregnation” stage corresponds to the initial irrigation of the leach pile with industrial water. During this stage the pile begins generating salt-bearing leach solution at its base, termed brine. Stage 1 lasts about 50-70 days.
2)Irrigation of the heap with Intermediate Solution: Maturing heap leach piles are irrigated with drained solutions (Pregnant leaching solution (PLS) or iodine rich Brine). This stage lasts about 190-280 days.
3)Mixed: the heap is irrigated with a mixture of recirculated AFA and referred to by SQM as BF and industrial water. The leaching solutions draining from these heaps are termed Intermediate Solution (SI). The SI is the input to Stage 3 of the heap leaching cycle. This stage lasts about 60-80 days approximately.
4)Washing of the heap: this is the last stage of a heap's life, comprising a final water irrigation of the heap with industrial water to maximize total extraction of soluble salts. This stage lasts about 20-30 days.
The PLS obtained during heap leaching process is referred to as brine by the operation. The leaching solutions (brines) which drain from the leaching heaps are piped, according to their chemical quality to poor solution, intermediate solution, and rich brine solution storage ponds (accumulation ponds) at the COM. From here they are piped to the Nueva Victoria and Iris process plants.
As part of ongoing efforts to reduce the use of continental groundwaters, SQM is currently evaluating:
⮚The integration of seawater into the industrial water feed.
⮚The reduction of evaporative water loss from leach piles by relying increasingly on drip irrigation rather than spray irrigation and covering the surface of leach piles which are undergoing irrigation with impermeable membranes.
|
|
|
|
|
|
|
|
|
| SQM TRS Nueva Victoria |
|
Pag. 135 |
⮚The reduction of evaporative water loss from industrial water accumulation ponds by covering the surface of these ponds with floating hexacovers
14.1.3Iodide-Iodine Production
The facilities are in three sectors corresponding to: Nueva Victoria, Sur Viejo, and Iris. The iodide and iodine production plants are located at Nueva Victoria.
The iodide plant is connected to the Nueva Victoria COM via a 20 km long pipeline. It converts the iodate, recovered from the caliche by the heap leaching process, into iodide. The segregation of the brines into poor, intermediate and rich in the accumulation ponds at the Nueva Victoria and Iris sites allows SQM to ensure an optimum concentration of iodate (in the range 0.5 – 1.0 g/L iodate) in the brine feedline to the iodide plant.
The iodide-rich solution output from iodide plant is then fed into the iodine plant to produce Iodine pearls (prill), SQM final product.
The other output from the iodide plant is leaching solution depleted in iodide, which SQM often refers to as BF, or AFA. The BF produced at the iodide plant can be routed via two alternative paths:
⮚It can be recirculated to the heap leach operation.
⮚It can be sent to the neutralization plant, where BF is neutralized, by adding lime or sodium carbonate (brine feble neutral [BFN, AFN]). BFN is sent to the solar evaporation ponds at Viejo Sur where nitrate-rich salts are produced and sent for processing to the nitrate production plant at the SQM Coya Sur facilities, located 160 km to the south of Nueva Victoria, and 7 km southeast of the town of María Elena in the Antofagasta Region of northern Chile.
At Iris and Nueva Victoria service plants, this process is intended to reduce sodium iodate from caliche leach solutions to free iodine by addition of sulfur dioxide, and then to separate and purify it. The required sulfur dioxide is produced by burning sulfur. There are two stages in the process of obtaining free iodine: production of iodide from iodate (iodide plant) and production of iodine from iodide (iodine plant). The iodine and iodine derivatives production facilities have qualified in accordance with ISO-9001:2015 program for which TÜV Rheinland provides quality management system certification.
Below is a description of iodate to iodine transformation processes that are performed at Nueva Victoria and Iris service plants.
14.1.3.1 Nueva Victoria Iodine Production
The Nueva Victoria Iodine Processing Plant is situated 1 km southeast of the access control (garita) to the SQM Nueva Victoria complex. It covers an area of approximately 15 ha. It includes:
⮚3 Iodate to iodide modules.
⮚3 Iodide to iodine modules.
Leaching solutions (brines) from the heap leaching of caliche ores are piped to the brine reception pond of each iodate to iodide module. This brine has an iodate content between a minimum of 0.4 g/L and an ideal working concentration of 0.7 g/L iodine equivalent.
|
|
|
|
|
|
|
|
|
| SQM TRS Nueva Victoria |
|
Pag. 136 |
Figure 14-4 presents a schematic of the iodine recovery process.
Figure 14-4. Schematic of the Iodine Recovery Process at Nueva Victoria
The first stage of the process occurs at the iodide plant. The process start when one part of the brine (iodate) is reduced to iodide using sulfur dioxide. The sulfur dioxide is obteined from sulfur burn system. Then, iodide solution is contacted with a second part of the fresh solution (iodate) to obtain Iodine (1). The reaction happen to ph 1,8-2,0 as described by the following equation:
5I −(aq)+IO3−(aq)+6H +(aq)→3I2 (s)+3H2 O (l)
This process of producing iodine by reacting iodate and iodide in acidic solution is referred to as “cutting”.
When reaction occurs the pulp is sending to the solven extraction process, using kerosene as the solvent, to purify and concentrate the iodide, SQM intermediate product. Nueva Victoria has three such SX plants (SX1, SX2, and SX3).
The outputs from the SX plant are:
⮚Iodide high concentrated solution.
⮚Iodine-depleted acidic solution, referred to by SQM as AFA (BF).
The kerosene solvent is recirculated to the start of the SX process.
One part of the afa is recycled to the heap leaching process and the second part is sent to solar evaporation ponds to Sur Viejo. Then the solution is neutraliced using lime or sodium carbonate to enter to solar evaporation system for the recovery of potassium and sodium nitrate salts, which are trucked to the SQM Property at Coya Sur for refining.
The iodide high concentrated solution from iodide plants is refined in a 2-stage process. First it is filtered, then it is passed through an activated carbon tower to remove any kerosene and heavy metal traces.
The iodide high concentrated solution is then routed through to the next stage of the process at the iodine plant where it is oxidized, using hydrogen peroxide and chlorine as the oxidizing agents. The iodine pulp thus obtained is then melted and subsequently prilled to produce spheres of iodine called “prill” which have a metallic luster.
|
|
|
|
|
|
|
|
|
| SQM TRS Nueva Victoria |
|
Pag. 137 |
Figure 14-5 presents the general layout of the iodide and iodine plant complex at Nueva Victoria, including the additional capacity which will be required once the environmental permit for the TEA expansion has been obtained.
Figure 14-5. General Arrangement Drawing. Iodide-Iodine Plants of Nueva Victoria
14.1.3.2 Iris Iodide-Iodine Production
The Iris plant has an iodide-iodine plant within its COM. The iodine production facilities are currently inoperative and so the iodide brines are used to feed the iodine plants at Nueva Victoria. Figure 14-6 presents a schematic of the production process at Iris Plant
Figure 14-6. Process Diagram of Iris Plant
The Iris Plant can process brines with iodate concentrations lower than 0,4 g/L iodine equivalent.
|
|
|
|
|
|
|
|
|
| SQM TRS Nueva Victoria |
|
Pag. 138 |
The iodide produced in the absorption towers is routed to the reactor, where it is mixed with fresh brine (Iodate) from the fresh brine storage pond at the plant. The iodate and iodide react to obtain iodine (I2)
The iodine-enriched solution is pumped to the blow-out tower (blowing tower), where it is desrob from the solution and transfer it to the air. Then the iodine/Air is sent to the stripping tower to transfer it at concentrated iodide solution.
This solution is routed to the iodide recirculation tank, creating a concentration cycle. the iodide-enriched brine is sent for refining at the Nueva Victoria iodine plant.
14.1.4Neutralization Plant
The neutralization plant at Nueva Victoria covers a surface area of approximately 59.76 ha. It includes AFA storage ponds, solids sedimentation ponds, neutralization ponds, industrial water ponds, reagent storage warehouses, pumping infrastructure and support facilities. The Neutralization Plant receives AFA solution from the iodide plants. The AFA is mixed with a lime (calcium hydroxide) slurry to neutralize it in the neutralization ponds.
14.1.5Solar Evaporation Ponds
The evaporation solar ponds (referred to by SQM as pozas), and associated transfer pumps, are located at Sur Viejo (Figure 14-7). There are 5 stages in the Evapo-concentration process. The ponds are of different types that vary in size given their function. The Sur Viejo evaporation ponds have a depth of 3.2 m and an approximate surface area of 7,600,000 m2. The pond configurations (pond types) used are detailed in Table 14-2. The mean annual rate of evaporation is approximately 5 L/m²/d (5 mm/d or 1,825 mm/y).
Table 14-2 Solar Evaporation Pond Types at Sur Viejo
|
|
|
|
|
|
| Pond Type |
Description |
| Stage 1 Pond |
AFA Alkalinization Pond |
| Stage 2 Pond |
Brine Preconcentration, Phase 1 Pond |
| Stage 3 Pond |
Brine Preconcentration, Phase 2 Pond |
| Stage 4 Pond |
Cut-off or Control Pond |
| Stage 5 Pond |
High Grade Nitrate Pond |
The 6-stage evaporation sequence is designed to progressively concentrate the evaporating brine. As this process progresses, the highly soluble nitrates (KNO3 and NaNO3) become ever more concentrated in the brine as impurities such as halite and Astrakanita progressively precipitate out from the ever-concentrating brine. Each of the 6 stages in the evapo-concentration process are described below.
Stage 1: AFA Alkalinization
Stage 1 corresponds to the AFA alkalinization (AFA neutralization) stage. Stage 1 infrastructure includes a neutralization plan, a quicklime (calcium oxide, CaO) storage silo, a slaking system to produce slaked lime (calcium hydroxide, CaOH2) and a reactor with agitator to mix the slaked lime slurry into the AFA. The slaked lime-AFA mixture (Stage 1 brine) is discharged into the Stage 1 pond. The main objective of this stage is to increase the pH of the brine from the pH 1.6 - 2.0 of the AFA to the pH 6.0-7.0 of the Stage 1 brine.
The rate of quicklime consumption (kg/m³ of AFA) varies between 0.30 and 0.60 kg/m3, depending on the acidity of the influent AFA. The Stage 1 brine can also be referred to as BFN, or Feble Neutral Water (FNW).
Stages 2 & 3: Brine Preconcentration Ponds
The brine passes through the 125,000 m² Stage 2 and 250,000 m² Stage 3 evaporation ponds in sequence. The objective of this process is to Evapo-concentration the AFN towards saturation with KNO3 and NaNO3, progressively precipitating out impurities, principally halite (NaCl) and Astrakanita (Na2Mg(SO4)2·4H2O) crystals.
Stage 4: Cut-off or Control Pond
Evapo-concentration continues during Stage 4, progressively concentrating KNO3 and NaNO3 toward saturation levels.
|
|
|
|
|
|
|
|
|
| SQM TRS Nueva Victoria |
|
Pag. 139 |
Stage 5: High Grade Nitrate Pond
KNO3 and NaNO3 crystallize out in the Stage 5 pond. The high-nitrate salts obtained include residual impurities, including NaCl, Astrakanita, KClO4, H3BO3, and MgSO4. The relative proportion of KNO3 and NaNO3 in the high-nitrate salts reflects their ratio in the AFA fed into Stage 1.
When the precipitate of the high-nitrate salt is ready, the salt is harvested, storaged and sent to SQM Coya Sur facility for further refinement prior to sale.
The Nueva Victoria Mine evaporation ponds planned for the TEA Project can be seen in Figure 14-8 and the dimensions are shown in Table -14-3.
Table 14-3 Solar Evaporation Pond Types at TEA Project
|
|
|
|
|
|
|
|
|
|
|
|
|
|
|
| Pond Type |
Description |
Length x Width (m x m) |
Surface Area ( m2) |
Surface Area (Ha) |
| Stage 1 Pond |
AFA Alkalinization Pond |
500 x 320 |
160,000 |
16 |
| Stage 2 Pond |
Brine Preconcentration, Phase 1 Pond |
500 x 250 |
125,000 |
12.5 |
| Stage 3 Pond |
Brine Preconcentration, Phase 2 Pond |
500 x 500 |
250,000 |
25 |
| Stage 4 Pond |
Cut-off or Boundary Pond |
240 x 165 |
39,600 |
3.96 |
| Stage 5 Pond |
High Grade Nitrate Pond |
280 x 250 |
70,000 |
7 |
Figure 14-7. General Arrangement of Sur Viejo Evaporation Ponds
|
|
|
|
|
|
|
|
|
| SQM TRS Nueva Victoria |
|
Pag. 140 |
Figure 14-8. General Arrangement of TEA Evaporation Ponds
14.1.6Sur Viejo Nitrate Plant (Planned)
The 2010 environmental permit (RCA 890/10), which constitutes the environmental approval for the Pampa Hermosa Project, contemplates the construction of a nitrate plant at the Sur Viejo, adjacent to the existing evaporation ponds. The nitrate plant has yet to be constructed and so the high-nitrate salt produced by the evaporation pond sequence at Sur Viejo is trucked to the SQM Coya Sur facility for refinement.
The production capacity of the Sur Viejo nitrate plant would be 1.2 Mtpy of refined NaNO3 & KNO3. It would cover an area of 8.2 ha. Of modular construction, it would comprise 4 modules, each with a 300 ktpy NaNO3 / KNO3 production capacity. The plant would receive high-nitrate brine from Stage 5 of the evaporation pond sequence, which would be routed through crystallizers, solid-liquid separators, thickeners, and centrifuges. The resulting commercial products would be sodium nitrate and wet potassium nitrate.
14.2.PRODUCTION SPECIFICATIONS AND EFFICIENCIES
|
|
|
|
|
|
|
|
|
| SQM TRS Nueva Victoria |
|
Pag. 141 |
14.2.1Process criteria
Table 14-4 contains a summary of the main criteria for the Nueva Victoria processing circuit.
Table 14-4 Summary of process criteria. Mine site caliche heap leaching and productive iodine process.
|
|
|
|
|
|
|
|
|
| Criteria |
| Mining Capacity and Grades |
| Caliche Mine Exploitation |
8.5 to 44 Mtpy |
| Caliche Exploitation at Iris Mine |
6.48 Mtpy |
| Exploitation of Future Proven Areas |
28 Mtpy |
| Average Grades |
5.9 % Nitrate ; 439 ppm Iodine |
| Cut-off Grade |
Nitrate 3.0% - Iodine 300 ppm |
| Availability / Use of Availability |
| Mining Exploitation Factor |
80 - 90 % |
| Plant Availability Factors |
96.7% |
| Caliche Iodine PO Factor |
4.2 Mt Caliche per Ton of Prilled Iodine |
| Caliche Nitrate PO Factor |
40 Tonnes Caliche / Nitrate |
| Caliche Iodine Iris Factor |
|
| Heap Leaching |
| Impregnation Stage |
300 to 500 Days for Each Heap |
| Intermediate Solution |
| Mixed Irrigation Stage |
| Washing Stage with Industrial Water |
|
|
|
|
|
|
|
|
|
| Criteria |
| Heap Leaching |
| Water + AFA Mixed Irrigation |
|
40% Dilution of AFA |
| Heap Drainage |
|
250 to 450 days |
| Iodate Brine Turbidity |
|
<150 NTU |
| Yield and Plant Capacity |
| Iodate / Iodide Yield |
|
92 - 95% |
| Iodide / Iodine Yield |
|
98% |
| Production Capacity at Nueva Victoria |
|
11 Ktpy Iodide at Nueva Victoria |
| Production Capacity at Iris |
|
2 Ktpy Iodide at Iris |
| Iodine Prill Product Purity |
|
99,8% |
| High - Nitrate Salts Production Capacity |
|
2.050 Mtpy |
The following sections summarize the Nueva Victoria productivity and forecast.
|
|
|
|
|
|
|
|
|
| SQM TRS Nueva Victoria |
|
Pag. 142 |
14.2.2Solar Pond Specifications
The specific criteria for the operation of evaporation ponds are summarize in the 14-5:
Table 14-5 Description of Inflows and Outflows of the Solar Evaporation System
|
|
|
|
|
|
|
|
|
| System Input Flows |
Unit |
Value |
| AFA Feed Flow |
m3 / h |
1,050 |
Sodium Nitrate (NaNO3) |
g/l |
124 |
| Potassium (K) |
12.5 |
Potassium Perchlorate (KClO4) |
1.2 |
| Magnesium (Mg) |
15 |
Boron w/boric acid (H3BO3) |
4.0 |
| System outflows |
Unit |
Value |
| Discard Salts |
Ton |
3,900,000 |
| Astrakanite |
% |
25 |
| Sodium Chloride |
% |
75 |
| High Nitrate Salt Production |
Ton |
2,050,000 |
Sodium Nitrate (NaNO3) |
1,050,000 |
Sodium Nitrate (NaNO3) |
% |
41.9 |
Potassium Nitrate (KNO3) |
11.4 |
Potassium Perchlorate (KClO4) |
0.32 |
| Magnesium (Mg) |
1.3 |
Boron w/boric acid (H3BO3) |
2.4 |
14.2.3Production Balance and Yields
Since 2014, SQM has been working on a plan to develop new caliche mining areas at Nueva Victoria and increase production of both nitrates and iodine at Nueva Victoria. With respect to the Iris Property, no modifications to the operation are contemplated. In recent years, investments have been made to increase the water supply capacity at the Nueva Victoria operations and to expand the capacity of the solar evaporation ponds and implement new mining and solution collection areas through expansion projects submitted to the National Environmental Commission. These projects are the Pampa Hermosa project (approved in 2010) and the TEA project, currently in process. The approval of Pampa Hermosa allowed increasing the nominal production capacity of the Nueva Victoria Operations to 11 ktpy iodine and to produce up to 1.2 Mtpy of nitrates and use new water rights of up to 665.7 L/s. This increase in capacity was achieved by adding new iodide production modules and new support facilities over an area of 34.9 hectares at the Nueva Victoria COM.
Nueva Victoria (including the Iris Operation) currently has a total production capacity of 13 ktpy of iodine, which affords SQM the flexibility to adjust production according to market conditions (iodine price). In 2019, 42,196 Mt of caliche, with a mean iodine grade of 465 ppm iodine, were processed, from which 10.70 kt of prilled iodine was produced. For the year 2023, the mean iodine grade of mined caliche was 398 ppm iodine and the 43.5 Mt of caliche processed yielded 12.2 kt of prilled iodine (11.4 kt from Nueva Victoria and 0.8 kt from PB).
|
|
|
|
|
|
|
|
|
| SQM TRS Nueva Victoria |
|
Pag. 143 |
Table 14-6 presents a summary of 2023 iodine and nitrate production at Nueva Victoria, including Iris.
Table 14-6 Summary of 2023 Iodine and Nitrate at Nueva Victoria, Including Iris
|
|
|
|
|
|
|
|
|
| Iodine Balance NV |
Unit |
Total Year 2023 |
| Caliche Processed |
Mt |
43.9 |
| Caliche Nitrate Grade |
% |
5.7% |
| Caliche Iodine Grade |
ppm |
414 |
| Iodine Heap Yield |
% |
66% |
| Brine sent to plant |
Km3 |
17,961 |
| Concentration |
gpl |
0.67 |
| Iodide Produce |
ton |
11,510 |
| Iodine Plant Yield |
% |
98.4% |
| Iodine Produced |
ton |
11,374 |
| Iodide Plant Yield |
% |
96% |
| Iodide Global Yield |
% |
55% |
| Iris Iodine Production |
Unit |
Total Year 2023 |
| Iodate Rich Brine Feed to Iodide Plant |
m3 |
129,000 |
| Iodide to Nueva Victoria Iodine Plant |
ton |
11.84 |
| Iodide Plant Yield |
% |
87% |
| Average Yield of Prilled Iodine from Iris Iodide |
98% |
| Global Iodine Yield Iris |
87% |
| Iodine Produced |
ton |
11.84 |
| Nitrate Balance NV |
Unit |
Total Year 2023 |
| AFA Sent to Sur Viejo Evaporation Ponds |
Mm3 |
10,352,031 |
| Nitrate in AFA Sent to Sur Viejo Evaporation Ponds |
Ton NaNO3 |
1,261,277 |
| Nitrate Concentration in AFA Sent to Sur Viejo Evaporation Ponds |
g/l (ppt) |
122 |
NaNO3 Grade |
% |
52% |
Yield of NaNO3 from Sur Viejo Evaporation Ponds |
53.7% |
Table 14-7 shows the production data for 2023, 2022, 2021, 2020 and 2019:
Table 14-7 Nueva Victoria Production Data for 2019 to 2022.
|
|
|
|
|
|
|
|
|
|
|
|
|
|
|
|
|
|
| Nueva Victoria (Including Iris) |
2023 |
2022 |
2021 |
2020 |
2019 |
| Mass of Caliche Ore Mined (Mt) |
43,450 |
45,400 |
41,428 |
43,420 |
42,196 |
| Iodine Grade in Caliche Ore (ppm) |
398 |
430 |
441 |
452 |
465 |
| Mass of Iodine Produced (Kt) |
12.2 |
12.4 |
8.7 |
10.6 |
10.7 |
14.2.4Production Estimation
In recent years, investments have also been made to increase water supply capacity at Nueva Victoria operations from two water sources approved by the Pampa Hermosa Environmental Study and to expand solar evaporation pond capacity and implement new mining and solution collection areas.
Due to Pampa Hermosa project, to increase nitrate production, Sur Viejo Industrial Area will have to be incorporated. In this sector, solar evaporation ponds will be expanded and there will be 2 types of ponds:
⮚Pre-concentration ponds: Four pits (500 x 250 m, depth 3.2 m) and 13 ponds (500 x 250 m, depth 2.2 m), and a total volume of 5,175,000 m3.
|
|
|
|
|
|
|
|
|
| SQM TRS Nueva Victoria |
|
Pag. 144 |
⮚Production ponds: Area 1,645,000 m2; 3,290,000 m3, 47 Ponds (140 x 250 m, depth of 2 m), and a total volume of 3,290,000 m3.
Furthermore, two additional neutralization plants will be built in addition to those already existing; a nitrate production plant will be built (with a capacity of 1.2 Mtpy of sodium nitrate and/or potassium nitrate) and new salt storage areas will be set up (final product, nitrate-rich salts, discarded salts and neutralization process residue). These facilities will involve a total surface area of 1,328 ha.
In terms of future, Nueva Victoria, and Iris' mining (see Section 13.2, see Table 13-3) and industrial plan, an economic analysis of which is discussed later in Chapter 19 (see Table 19-1) considers caliche extraction at a current rate of 44 Mtpy and estimates an increase in iodine and nitrate production to the year 2030. Projected growth is sequential and is expected to reach 10.1-11.3 ktpy of iodine production by 2029 - 2030.
Table 14-8 shows that to achieve the committed production it is required to increase water consumption to 0.48 m3/ton for the years 2028-2037 and the heap leach yield for iodine must be increased to 70%.
The indicated yield values for each year have been calculated using empirical yield ratios as a function of soluble salt content, nitrate grade and unit consumption.
Table 14-8 Nueva Victoria Process Plant Production Summary.
|
|
|
|
|
|
|
|
|
|
|
|
|
|
|
|
|
|
|
|
|
|
|
|
|
|
|
|
|
|
|
|
|
| Parameter |
2024 |
2025 |
2026 |
2027 |
2028 |
2029 |
2030 |
2031 |
Long Term
2032 -2038 |
Total |
| Mass of Caliche ore Processed (Mt) |
44 |
43 |
47 |
54 |
54 |
54 |
54 |
54 |
327 |
728 |
Water Consumption (m3 / Ton Caliche) |
0.40 |
0.42 |
0.48 |
0.48 |
0.48 |
0.48 |
0.48 |
0.48 |
0.50 |
0.46 |
Ore Grade (ppm, I2) |
429 |
432 |
429 |
429 |
420 |
428 |
422 |
426 |
399 |
414 |
| Ore Grade (Nitrate, %) |
5.59% |
5.22% |
4.77% |
5.56% |
5.87% |
5.60% |
5.16% |
4.80% |
4.91% |
5.14% |
| Soluble Salts, % |
62.4% |
60.1% |
59.5% |
65.2% |
63.5% |
59.5% |
59.4% |
62.7% |
64.3% |
62.6% |
| Yield Process to produce Iodine, % |
60.3% |
56.0% |
57.6% |
67.3% |
64.4% |
63.8% |
65.6% |
65.8% |
70.3% |
66.2% |
| Yield process to produce Nitrates, % |
26.0% |
22.9% |
23.9% |
34.5% |
29.6% |
27.1% |
30.3% |
30.8% |
35.7% |
32.18% |
| Prilled Iodine produced (kt) |
11.4 |
10.4 |
11.6 |
15.6 |
14.6 |
14.8 |
14.9 |
15.1 |
91.6 |
200 |
| Nitrate Salts for Fertilizers (kt) |
639 |
513 |
535 |
1,034 |
939 |
818 |
844 |
798 |
5,713 |
11,833 |
14.3PROCESS REQUIREMENTS
This sub-section contains forward-looking information related to the projected requirements for energy, water, process materials and personnel for the Project. The material factors that could cause actual results to differ materially from the conclusions, estimates, designs, forecasts, or projections in the forward-looking information include any significant differences from one or more of the material factors, or assumptions, that were set forth in this sub-section including actual plant requirements that yield different results from the historical operations.
Figure 14-9 shows Nueva Victoria's process diagram with TEA project incorporated, giving an overall production process balance. It is important to note that input quantities will depend on caliche chemical properties, as well as iodide plant operation (whether operating in SX or blow-out mode) but will not exceed those indicated in the diagram.
|
|
|
|
|
|
|
|
|
| SQM TRS Nueva Victoria |
|
Pag. 145 |
Figure 14-9. Projected Water and Reagent Consumption at Nueva Victoria with Implementation of the TEA Extension
The balance scenario shown corresponds to the situation of treatment of 65 Mtpy of caliche with 23 ktpy of iodine prill production.
Future energy and water needs will be satisfied by the infrastructure expansion plan considered in the TEA Project. This includes power transmission lines connected to electrical installations with new transformers to be located at mine operation centers, water supply centers, and the Nueva Victoria mining areas, as well as the Sur Viejo industrial area.
The following sections detail energy, water, staff, and process input consumption.
14.3.1Energy and Fuel Requirements
14.3.1.1Power and Energy
The power supply comes from permanent power lines to the site. Its function is to supply electricity to the industrial areas to carry out operations and to supply electricity to the adduction system, specifically through installed substations. There is
|
|
|
|
|
|
|
|
|
| SQM TRS Nueva Victoria |
|
Pag. 146 |
a control portal and power distribution center at the facility. This center has a start-up power supply for the operations, laboratory, and plant.
Nueva Victoria has one substation, with two distribution systems. One system has a capacity of 50 MW and the other has a capacity of 60 MW. Associated with the Nueva Victoria 50 MW line, the consumption declared by SQM for the 2023 is of 26,868,606 kilowatt-hours (kWh), while for the line Nueva Victoria 60 MW, the energy consumption is 119,486,398 kWh.
In terms of power consumed and considering a calendar year of 365 days and 24 hours, the indicated energy values translate into a consumption of 2.40 MW for the available 50 MW power line and 14.10 MW for the available 60 MW power line. Therefore, for the year 2022, the electric power consumption was about 16.50 MW.
There is an auxiliary electricity supply system, via 500-kilovolt-amperes (kVa) generators, considered to be installed in both process plants planned for the expansion.
14.3.1.2Fuels
The operation required 24,061 m3/y of diesel and 581 ton/y fuel oil. Fuel was supplied by duly authorized fuel trucks.
14.3.2Water Supply and Consumption
14.3.2.1Water Supply System
Water supplies are required for basic consumption, drinking water consumption (treated and available in drums, dispensed by an external supplier) and for industrial quality work. As reported, the entire sector is supplied by an industrial water supply center located in Nueva Victoria.
For industrial water supply, groundwater will be extracted at an average rate of 810.8 L/s, from wellfields at the Salar de Sur Viejo, the Salar de Llamara and the Pampa del Tamarugal.
SQM has:
⮚4 wells at Sur Viejo with consumptive rights totaling 103 L/s.
⮚5 wells at the Iris with consumptive rights totaling 60.4 L/s.
⮚Well TC-9, situated to southwest of the Salar de Bellavista.
⮚7 wells in the Salar de Llamara with consumptive rights totaling 244 L/s.
⮚7 wells in the Soronal with consumptive rights totaling 194 L/s.
⮚4 Catchment wells with consumptive rights totaling 122.8 L/s.
SQM projects the addition of the following water resource supply capacity to its water rights:
⮚113.1 L/s of groundwater extraction from new wells situated to the east of the Salar de Bellavista.
⮚Groundwater extraction from the TC-10 well located in Salar de Llamara.
⮚Surface water extraction through permanent and continuous surface consumptive rights for a maximum of 60 L/s granted in Quebrada Amarga.
Industrial water pipelines connect groundwater ponds to the mining and industrial areas of Nueva Victoria. For water extraction, pumping and transport, there is a network of pipes, pumping stations and power lines that allow extraction of the required industrial water and its transport and redistribution to the different points where it is required.
Water is supplied to an existing process water storage tank. Raw water is used for all purposes requiring clean water with low dissolved solids and salt content, mainly for reagent replenishment.
Raw water is treated in a reverse osmosis system; whose infrastructure includes tanks for water storage (industrial or potable). The potable water storage tank also supplies water for use in:
|
|
|
|
|
|
|
|
|
| SQM TRS Nueva Victoria |
|
Pag. 147 |
8 730.3 L/s (approved by the Direccion General de Aguas (DGA), The Chilean Regulator
⮚Safety showers and other similar applications:
⮚Fire-fighting – the building of the Nueva Victoria, Iris and Sur Viejo COMS are equipped with water storage tanks for firefighting which supply hydrant & sprinkler systems.
⮚Cooling water.
⮚Boilers for steam generation.
⮚In addition, the TEA project considers a seawater supply system (900 L/s design flow) to supplement the industrial process water supply. The seawater will be drawn from the coast at Puerto Patillos, 58 km northwest of the Nueva Victoria Property and 55 km SSW of the City of Iquique. The seawater will be stored in reception ponds at Nueva Victoria.
14.3.2.2Water Consumption
Table 14-9 summarizes the rate of groundwater pumping for industrial water supply by SQM, by sector, for the years 2020; 2021, 2022 & 2023
Table 14-9 Historic Rates of Groundwater Extraction for Industrial Water Supply
|
|
|
|
|
|
|
|
|
|
|
|
|
|
|
|
|
|
|
|
|
| Year |
Sur Viejo (L/s) |
Llamara (L/s) |
Iris (L/s) |
Soronal (L/s) |
Pampa Tamarugal (L/s) |
Total (L/s) |
| 2020 |
105 |
225 |
61 |
127 |
117 |
635 |
| 2021 |
107 |
221 |
61 |
128 |
120 |
637 |
| 2022 |
103 |
203.8 |
60.4 |
126 |
122.8 |
616 |
| 2023 |
101.8 |
226.2 |
59.6 |
118.6 |
110.9 |
617.1 |
Potable water will be required to cover all workers' consumption and sanitary needs. Potable water supply considers a use rate of 100 L/person/d, of which 2 L/person/d corresponds to drinking water at the work fronts and cafeterias. Commercial bottled water will be provided to staff. Sanitary water will be supplied from storage tanks located in the camp and office sectors, which will be equipped with a chlorination system. A total of 719 workers per month are required, considering the Nueva Victoria and Iris operations together, so the total amount of potable water will be 72 m3/day (0.83 L/s).
Table 14-10 provides a breakdown of the estimated annual water requirement by potable and industrial water for year 2022. The heap leaching process corresponds to the greatest water demand.
Table 14-10 Nueva Victoria Industrial and Potable Water Consumption
|
|
|
|
|
|
|
|
|
| Process |
Annual Volume (M³/Year) |
Equivalent Rate (L/s) |
|
Industrial Water |
|
| Heap Leach |
17,470,467 |
554 |
| Puquios Reinjection |
1,071,084 |
34 |
| Mine |
157,248 |
5 |
| Iodide - Iodine Plants |
247,586 |
8 |
| Neutralization Plant |
| Solar Evaporation Ponds |
458,452 |
15 |
| Camp |
62,899 |
2,0 |
| Total Industrial Water |
19,467,736 |
693 |
| Drinking Water |
26.207 |
0,83 |
|
|
|
|
|
|
|
|
|
| SQM TRS Nueva Victoria |
|
Pag. 148 |
Figure 14-10 presents the historical rate of water consumption by the heap-leaching operation at Nueva Victoria over the period 2008 – 2023. In 2023 the consumption of industrial water for heap leaching was 553 L/s.
Figure 14-10. Historical Rate of Consumption of Industrial Water by the Heap Leach Operation at Nueva Victoria (L/s)
14.3.2.3Future Process Water Requirements
Future process water requirements, due to TEA Project incorporation, will be covered by adding a 900 L/s seawater supply system. This seawater supply system extends from an intake located in Patillos Bay at a depth of 25 m and 852 m from the beach line, through to the seawater storage ponds located at the Seawater System Terminal Station at Nueva Victoria.
This system will be implemented starting in 2024, with an initial capacity of 206 L/s, which will increase to 400 L/s between 2026 - 2028 and reach the full design capacity of 900 L/s by 2030.
14.3.3Staffing Requirements
An estimated 719 workers are required during Nueva Victoria and Iris operations, while an estimated 717 workers will be required for the TEA Expansion of the Nueva Victoria Property when that project is completed. Table 14-12 summarizes current and future workforce requirements.
|
|
|
|
|
|
|
|
|
| SQM TRS Nueva Victoria |
|
Pag. 149 |
Table 14-11 Personnel Required by Operational Activity
|
|
|
|
|
|
|
|
|
| Operational Activity |
Current Personnel, Nueva Victoria & Iris Operations |
Additional Personnel, TEA Expansion Project |
| Caliche Mining |
475 |
474 |
| Maintenance (mine-plant) |
38 |
38 |
| Iodide Production |
17 |
17 |
| Iodine Production |
40 |
40 |
| Neutralization System |
2 |
2 |
| Evaporation System-Operations |
75 |
75 |
| Evaporation System, Maintenance |
72 |
71 |
| Total |
719 |
717 |
14.3.4Process Plant Consumables
Raw materials such as sulfur, chlorine, paraffin, sodium hydroxide, or sulfuric acid, are added to the plants to produce a concentrated iodide solution which is then used in iodine production. These materials are transported by trucks from different parts of the country. A-412, which connects with Route 5, is the main route for vehicular flows required for input supply and raw material shipment.
Reagent Consumption Summary
Table 14-12 summarizes the main annual materials required for Nueva Victoria's operations to the nominal production rate of 11 kt iodine prill. This table also includes a total requirement for the future expansion of TEA project. It is worth noting that some of the inputs can be replaced by an alternative compound; for example, sulfur can be replaced by liquid sulfur dioxide, kerosene can be replaced by sodium hydroxide and finally, lime can be replaced by sodium carbonate.
It is important to note that there are ranges of consumption factors that have been studied through historical operational data of plant treatment. The ranges are established according to the different qualities of brine obtained from the treated resource. These factors allow projecting the requirements of reagents and process inputs, both for annual, short- and long-term planning.
|
|
|
|
|
|
|
|
|
| SQM TRS Nueva Victoria |
|
Pag. 150 |
Table 14-12 Process Reagents and Consumption Rates per Year, NV
|
|
|
|
|
|
|
|
|
|
|
|
|
|
|
| Reagent and Consumables |
Function or Process Area |
Units |
Cosumption of Nueva Victoria (11 kton iodine prill) |
Consumption with TEA (23 kton iodine prill) |
| Sodium Hypochlorite |
Addition Of Sodium Hypochlorite Solution in The Seawater Pipeline Suction. |
Tpy |
29 |
60 |
|
Iodide And Iodine Consumption |
Tpy |
2,228 |
4,659 |
|
|
|
23,102 |
48,305 |
| Ammonium Nitrate |
Necessary for Blasting |
Tpy |
13,860 |
22,000 |
| Sulfuric Acid |
Iodide Plant |
Tpy |
16,652 |
34,464 |
| Sulfur |
Iodide And Iodine Plants |
Tpy |
9,058 |
24,699 |
|
|
|
825 |
2,990 |
| Liquid Sulfur Dioxide |
Used as an Alternative to Solid Sulfur |
Tpy |
23,626 |
49,399 |
|
|
|
2,860 |
5,980 |
| Kerosene |
At The Iodide Plant as a Solvent |
Tpy |
6,007 |
12,062 |
| Sodium Hydroxide |
At the Iodine Plants and at the Iodide Plant as Replacement of Kerosene |
Tpy |
1,935 |
34,464 |
|
|
|
166 |
690 |
| Chlorine |
Supply Chlorine to the Iodine Plants as an Oxidizer |
Tpy |
2,563 |
5,360 |
|
To The Iodide Plants |
Tpy |
247 |
517 |
| Filter Aid |
Alpha Cellulose Powder used to Iodide and Iodine Plants |
Tpy |
72 |
150 |
|
|
Tpy |
43 |
90 |
| Codium Chloride |
Iodide Plant |
Tpy |
613 |
1,281 |
|
|
Tpy |
6,353 |
13,284 |
| Hydrogen Peroxide |
Iodine Plant as an Oxidizer |
Tpy |
2,136 |
5,520 |
| Activated Carbon |
At the Iodine Plant |
Tpy |
52 |
117 |
| Sulfonitric Acid |
At the Iodine Plant |
Tpy |
72 |
150 |
| Sodium Metabisulfite |
Iodine Plant |
Tpy |
132 |
276 |
| Lime (75 % Cao) |
Neutralization Plant |
Tpy |
7,979 |
19,000 |
|
Heap |
Tpy |
2,391 |
5,000 |
| Lime (95 % Cao) |
Heap |
Tpy |
2,674 |
2,500 |
| Sodium Carbonate |
Neutralization Plant for Lime Replacement |
Tpy |
17,217 |
36,000 |
|
Heap |
Tpy |
16,483 |
34,464 |
| Others |
|
|
|
|
| Fuel Oil |
Iodine Plant |
Tpy |
399 |
1,817 |
| Barrels |
Packaging |
Pcs/Month |
15,105 |
31,584 |
| Polyethylene Bags |
Packaging |
Pcs/Month |
17,948 |
37,527 |
| Krealon Bags |
Packaging |
Pcs/Month |
16,452 |
34,399 |
| Maxi Bags |
Packaging |
Pcs/Month |
414 |
865 |
It should be noted that when the Project's Nitrate Plant is built and becomes operational, 2,050,000 tpy of nitrate salts will be processed to produce 1,000,000 tpy of potassium nitrate and 1,200,000 tpy of potassium nitrate, for which it will require the following processing inputs in addition to those detailed above (Table 14-13).
|
|
|
|
|
|
|
|
|
| SQM TRS Nueva Victoria |
|
Pag. 151 |
Table 14-13 Process Reagents and Consumption Rates per year with Nitrate Plant (Planned).
|
|
|
|
|
|
|
|
|
| Reagent and Consumables |
Units |
Consumption |
| Potassium Chloride |
Tpy |
924,000 |
| Potassium Salts |
|
3,314,000 |
| Fuel Oil |
|
33,500 |
| Diesel |
|
31,500 |
14.3.4.1Reagent handling and storage
To operate, inputs used are stored in stockpiles and tanks, facilities available in the area known as the input reception and storage area. To store the inputs used in the Nueva Victoria plants, the following infrastructure are used:
⮚Sulfur storage facilities.
⮚Paraffin tanks.
⮚Sulfuric acid tanks.
⮚Peroxide tanks.
⮚Chlorine tanks (mobile).
⮚Bunker oil tanks.
⮚Diesel oil tanks.
⮚Sulfonitric acid tank.
In the case of inputs used at Iris' iodine plant, the storage facilities include:
⮚Sulfur storage facilities.
⮚Sulfuric acid tanks.
⮚Diesel oil tank.
⮚Caustic soda tank.
⮚Calcium carbonate silo.
Each reagent storage system assembly is segregated based on compatibility and is located within curbed containment areas to prevent spill spreading and incompatible reagents from mixing. Drainage sumps and pump sumps are provided for spill control.
14.3.5Air Supply
High pressure air at 600-700 kPa is produced by compressors in place to satisfy the requirements of the plant as well as the equipment. High pressure air supply is dried and distributed through air receivers located throughout the plant. Each process plant has a compressor room to supply air to the compressors.
14.4QUALIFIED PERSON´S OPINION
According to Gino Slanzi Guerra, QP responsible for metallurgy and resource treatment:
⮚Metallurgical test data on the resources planned to be processed in the projected production plan to 2023 indicate that recovery methods are adequate. The laboratory, bench and pilot plant scale test program conducted over the last few years has determined that feedstock is reasonably suitable for production and has demonstrated that it is technically possible using plant established separation and recovery methods to produce iodine and nitrate salts. Based on this analysis, the most appropriate process route, based on test results and further economic analysis of the material, are the unit operations selected which are otherwise typical for the industry.
⮚In addition, historical process performance data demonstrates reliability of recovery estimation models based on mineralogical content. Reagent forecasting and dosing will be based on analytical processes that determine
|
|
|
|
|
|
|
|
|
| SQM TRS Nueva Victoria |
|
Pag. 152 |
mineral grades, valuable element content and impurity content to ensure that system treatment requirements are effective. Although there are known deleterious elements and processing factors that can affect operations and products, the company has incorporated proprietary methodologies for their proper control and elimination. These are supported by the high level of expertise of its professionals, which has been verified at the different sites visited.
⮚The mineralogical, chemical, physical and granulometric characterization results of the mineral to be treated, obtained from trials obtained, allow continuous evaluation of processing routes, either at the initial conceptual stages of the project or during the process already established, to ensure that the process is valid and in force, and/or to review optimal alternatives to recover valuable elements based on resource nature. Additionally, analysis methodologies determine deleterious elements, to establish mechanisms in operations so that these can be kept below the limits to ensure a certain product quality.
|
|
|
|
|
|
|
|
|
| SQM TRS Nueva Victoria |
|
Pag. 153 |
15PROJECT INFRASTRUCTURE
This section contains forward-looking information related to locations and designs of facilities comprising infrastructure for the Project. The material factors that could cause actual results to differ materially from the conclusions, estimates, designs, forecasts, or projections in the forward-looking information include any significant differences from one or more of the material factors or assumptions that were set forth in this sub-section including Project development plan and schedule, available routes and facilities sites with the characteristics described, facilities design criteria, access, and approvals timing. The analysis of the infrastructure in New Victoria has been developed considering current facilities and requirements associated with future projects. This Section describes the existing facilities and planned expansion projects.
SQM's mining sites in Tarapacá Region, Nueva Victoria, and Iris, are in Tarapacá Region, in Iquique and Tamarugal provinces, communes of Iquique and Pozo Almonte, approximately 145 km southeast from Iquique and 85 km south from Pozo Almonte, in the case of Nueva Victoria, and 120 km southeast from Iquique in the case of Iris, located close to Iris office (Figure 15-1). These works as a whole involve a surface area of approximately 92.998 ha, including the TEA Project. The geographical reference location is 7,682,276 N, 431,488E, with an average elevation of 891 masl.
In late 2002, in order to restore mining operations at Nueva Victoria East, SQM re-established mining operations at Nueva Victoria East. Mineral at Nueva Victoria is transported by truck to heap leaching facilities, where iodine is produced. This site is constituted by facilities located in three sectors corresponding to Nueva Victoria, Sur Viejo, and Iris.
Figure 15-2 shows Nueva Victoria's geographic location. It also shows, for reference purposes, other sites belonging to SQM (Coya Sur, Salar de Atacama, and Salar del Carmen), and facilities used to distribute its products (Port of Tocopilla, Port of Antofagasta, and Port of Iquique).
From caliche, this site produces iodine and nitrate-rich salts through heap leaching and evaporation ponds. The main raw material required for the production of nitrate and iodine is caliche mineral, which is obtained from SQM's surface mines. The areas that are currently mined are located approximately 20 km northwest of Nueva Victoria.
Iodine extraction from caliche is a well-established process, but variations in the iodine and other chemical content of treated mineral and other operational parameters require a high level of technical expertise to manage effectively.
Caliche mineral in northern Chile contains a unique deposit of nitrate and iodine known throughout the world and is the world's largest commercially exploited source for natural nitrate. From these caliche mineral deposits, a wide range of nitrate-based products are produced, used as specialty plant nutrients and industrial applications as well as iodine and iodine derivatives.
In NV, nothing from Truck Workshop, Operations Centers, Transfers between Cop, Plant, and Ponds is included.
|
|
|
|
|
|
|
|
|
| SQM TRS Nueva Victoria |
|
Pag. 154 |
Figure 15-1. General Location of Nueva Victoria
|
|
|
|
|
|
|
|
|
| SQM TRS Nueva Victoria |
|
Pag. 155 |
Figure 15-2. Location of Nueva Victoria Production Area
Iodine and its derivatives are used in a wide range of medical, pharmaceutical, agricultural and industrial applications, including x-ray contrast media, polarizing films for liquid crystal display (LCD/LED) screens, antiseptics, biocides and disinfectants, in pharmaceutical synthesis, electronics, pigments and dye components.
The solutions resulting from caliche mineral leaching at Nueva Victoria plant are used to produce iodine from the iodate contained inside them. Iodine is extracted from aqueous and concentrated solutions in iodide form using solvent extraction in plants at Nueva Victoria, Pedro de Valdivia and Iris. Details on the process facilities and the iodine and nitrates extraction can be found n Section14.
Prilled iodine is tested for quality control purposes, using international standard procedures it has implemented, and then packaged in 20 - 50 kg drums or 350 - 700 kg maxi bags and transported by truck to Antofagasta, Mejillones or Iquique for export.
Figure 15-3 shows Nueva Victoria's process diagram.
|
|
|
|
|
|
|
|
|
| SQM TRS Nueva Victoria |
|
Pag. 156 |
Figure 15-3. Nueva Victoria Plant Process Diagram
SQM S.A.'s surface area under Mining Concessions for Exploitation associated with caliche Mineral Resources for its mining operations as of 31 December 2022 is approximately 558,562 ha (Figure 15-4).
Figure 15-4. Nueva Victoria Site Resource Diagram
In September 2010, the National Environmental Commission (now the Environmental Assessment Service) approved Pampa Hermosa's Environmental Study in Chile's Tarapacá Region (RCA N°890/2010).
This approval allowed SQM to have a production capacity at Nueva Victoria of 11,000 t of iodine per year and to produce up to 1.2 Mt of nitrates, extract up to 37 Mt of caliche per year, and use new water rights of up to 665.7 L/s.
At Iris, SQM has approved 2,000 t of iodine production per year with annual caliche extraction of up to 6.48 Mt. In recent years SQM has invested to increase water capacity at Nueva Victoria's operations from two water sources approved by
|
|
|
|
|
|
|
|
|
| SQM TRS Nueva Victoria |
|
Pag. 157 |
Pampa Hermosa's Environmental Study and to expand the capacity of solar evaporation ponds and implement new mining areas and solution collection.
In 2011 and 2013, SQM completed iodine plant capacity expansions at Nueva Victoria.
In 2014, SQM made investments in new mining sector development and production increases for both nitrates and iodine at Nueva Victoria, achieving a production capacity (including Iris facility) of approximately 8,500 tpy of iodine at that site.
In November 2015, mining and nitrate operations at Pedro de Valdivia were suspended and iodine production at the site was reduced to take advantage in the more efficient production facilities at Nueva Victoria. Pampa Blanca's operations were suspended in 2010 and Maria Elena's operations were suspended in October 2013.
During 2017, iodine production capacity at Nueva Victoria was increased to approximately 10,000 tpy.
Currently, Nueva Victoria has a production capacity of approximately 13,000 metric tpy of iodine in an area of about 48,000 ha and 1,000,000 metric ton of nitrates per year.
Current total effective production capacity at the iodine production plants (Nueva Victoria, Iris, Pedro de Valdivia) is approximately 14,800 tpy.
Total iodine production in 2022 was 12,400 t, 10,800 ton from Nueva Victoria (with loading fronts TEA, and NV Norte), 1,250 t from Iris, and 1,600 t from Pedro de Valdivia. Nueva Victoria is also equipped to produce iodine from iodide delivered from the other plants. There is flexibility to adjust production according to market conditions.
Some of iodine produced is used to manufacture inorganic iodine derivatives, which are intermediate products used to make nutritional and agricultural applications, at facilities located near Santiago, Chile, and to produce organic and inorganic iodine derivatives in collaboration with Ajay, a company that purchases iodine. Iodine-derived products have been marketed mainly in South America, Africa, and Asia, while Ajay and its affiliates have marketed iodine derivatives mainly in North America and Europe.
During 2020, progress was made on the TEA project development and environmental processing. In November 2021, SQM's TEA project was favorably classified by Tarapacá Region's Environmental Assessment Commission.
It involves an investment of USD350 million and aims to incorporate new mine areas for iodide, iodine, and nitrate-rich salts production at Nueva Victoria mine, which will increase the total amount of caliche to be extracted and the use of the sea water for these processes.
This project consists in modifying Nueva Victoria mine, which consists of:
a)New mine areas (436 Km2), with a caliche extraction rate of 28 Mtpy, resulting in a total of 65 Mtpy.
b)Two new Iodide production plants (6,000 tpy each), for a total of 23,000 tpy.
c)One new iodine production plant (12,000 tpy) for a total of 23,000 tpy.
d)New evaporation ponds to produce nitrate-rich salts (1,950,000 tpy) for a total of 4,000,000 tpy.
e)New operational irrigation centers and distribution pipe solutions which should cover the new mine area.
f)New truck workshops and supporting infrastructure such as roads, casinos, offices, control rooms, etc.
g)A new neutralization system, a seawater conveyance (900 L/s maximum) from Patillos Bay sector to the mining area.
15.1ACCESS TO PRODUCTION, STORAGE AND PORT LOADING AREAS
The main access for vehicular traffic will be through a private existing road and A-760 Route. This private road will be accessed from Route 5. Access to Route A-760 may be from Route A-750 or from Route 5.
Additionally, the TEA Project considers two service roads - a road that connects the north-west sector (mine areas) with the coastal sector, where seawater suction works are located; and an internal road that will run from south to north, parallel to electric transmission line.
SQM's products and raw materials are transported by trucks, which are operated by third parties under long-term, dedicated contracts,
|
|
|
|
|
|
|
|
|
| SQM TRS Nueva Victoria |
|
Pag. 158 |
Iodine raw material, obtained from the same caliche used for nitrate production, is processed, packaged, and stored exclusively at Nueva Victoria and Pedro de Valdivia facilities.
Iodine is packaged in FIBC drums and maxi-bags with an inner polyethylene bag and oxygen barrier. When transported, it is consolidated in containers and sent by truck to port terminals suitable for handling, mainly in Antofagasta, Mejillones, and Iquique.
They are then shipped to the different markets by container ship, or by truck to Santiago where iodine derivatives are produced at Ajay-SQM Chile's plants.
In Nueva Victoria, nitrate raw material is produced for potassium nitrate production at Coya Sur, whose plant, also owned by SQM, is located 161 km southwest of Nueva Victoria by road.
15.2PRODUCTION AREAS AND INFRASTRUCTURE
The main facilities of the Nueva Victoria production area are as follows:
⮚Caliche extraction mine.
⮚Industrial water supply.
⮚Leaching.
⮚Iodide plants NV.
⮚Iodine and Prilling Plant NV.
⮚Evaporation ponds.
⮚Iodine Iris Plant.
⮚Camp and Offices.
⮚Domestic waste disposal site.
⮚Hazardous Waste Yard.
⮚Non-hazardous industrial waste yard.
Figure 15-5 depicts the Nueva Victoria site layout.
|
|
|
|
|
|
|
|
|
| SQM TRS Nueva Victoria |
|
Pag. 159 |
Figure 15-5. Nueva Victoria Site Layout
The Nueva Victoria mining areas and process facilities are described in more detail below.
15.2.1Caliche Mine Areas
Caliche ore is blasted and dug at Nueva Victoria and Iris. The minimum thickness of caliche ore that SQM will mine is 1.5 m. The ore deposits are mined on a 25 x 25 m grid pattern.
The surface area authorized for mining at Nueva Victoria is 844 km². The surface area authorized for mining at Iris is 45.5 km². No expansion is planned at Iris.
Caliche extraction at Nueva Victoria is 37 Mtpy, with an additional 6.48 Mtpy at Iris. The overall mining rate at Nueva Victoria and Iris is a 71.48 Mtpy with the incorporation of TEA Expansion.
15.2.2Heap Leaching
⮚Heap leaching: platforms (normally 90 x 500 m) with parapets around the perimeter and with bottom waterproofed with HDPE membranes), which are loaded with required caliche (between 400 to 1000 Mton) and are irrigated with different solutions (Industrial Water, Industrial water + BF mix or Intermediate Solution).
⮚Mine Operation Centers (COM) represent a set of heap leaching facilities, with brine accumulation ponds (poor solution, intermediate solution, and rich solution), recirculated brine ponds, industrial water ponds and their respective pumping and impulsion systems.
⮚Auxiliary infrastructure includes general service facilities destined for workers.
|
|
|
|
|
|
|
|
|
| SQM TRS Nueva Victoria |
|
Pag. 160 |
15.2.3Iodide Plants
Iodide production at the Nueva Victoria Iodide Plant totals 11 ktpy. The Iris Iodide Plant produces an additional 2 ktpy. Whit the TEA expansion the combined Nueva Victoria plus Iris iodide production will reach 25 ktpy.
The infrastructure at the iodide plants includes the following:
⮚Storage ponds to hold the brine received from the heap leaching operation.
⮚SO2 generation units.
⮚Absorption towers with their respective pick-up tanks.
⮚SX units.
⮚Stripping system.
⮚Gas scrubbing system.
⮚BF storage ponds with their respective pumps.
15.2.4Iodine Plant
The Iodine Plant at Nueva Victoria receives iodide from the iodide plants at Nueva Victoria and Iris. The current production capacity of the Nueva Victoria Iodine Plant is 11 ktpy. This increase to 23 ktpy whit the TEA expansion.
The infrastructure at the iodine plant includes the following:
⮚Iodide storage ponds (concentrated, filtered, or conditioned).
⮚Filters (perrin, or duplex plates).
⮚Activated carbon towers for iodide conditioning.
⮚Oxidizers.
⮚Reactors (for smelting, refining and prilling stages).
⮚Prilling towers.
⮚Prill grading sieving systems.
⮚Gas scrubbing system.
⮚Boiler room.
⮚Warehouse for packaging and temporary storage (product awaiting approval).
⮚Dispatch warehouse with a rack system for product storage.
15.2.5Ancillary Infrastructure at the Nueva Victoria COM
The following facilities are available for the storage of consumables used in the iodide and iodine plants:
⮚Sulfur stockpiles for the generation of sulfur dioxide.
⮚Kerosene tanks.
⮚Sulfuric acid tanks.
⮚Hydrogen peroxide storage tanks.
⮚Mobile storage tanks for chlorine.
⮚Oil storage tanks.
|
|
|
|
|
|
|
|
|
| SQM TRS Nueva Victoria |
|
Pag. 161 |
⮚Diesel storage tanks.
⮚Sulfonitric acid storage tanks.
The Nueva Victoria COM is also equipped with the following systems and infrastructure:
⮚Firefighting water system.
⮚Water storage tank with its respective pump and piping system distributed throughout the entire plant installation.
⮚Reverse osmosis system, including water storage tanks (industrial or drinking water).
⮚Generator room.
⮚Compressor room.
⮚Control room.
⮚Office building.
⮚Ponds used with intermediate process solutions.
⮚Equipment maintenance workshop.
⮚Material and replacement parts yard.
⮚Electrical control rooms.
15.2.6Evaporation Ponds
This facility, located in the industrial area of Sur Viejo, receives AFA piped 20 km from the iodide plant at Nueva Victoria.
Current production of high-nitrate salts at Nueva Victoria is 2.05 Mtpy. This is projected to increase to a total of 4 Mtpy whit the TEA expansion.
The current facility covers an area of 8.34 km², this will increase to a total of 18.51 km² with the TEA expansion.
The evaporation ponds facility includes the following infrastructure:
⮚Neutralization Plant to raise the pH of the influent AFA.
⮚Solar evaporation ponds.
⮚Auxiliary facilities.
Figure 15-6 presents an aerial view of the evaporation ponds facility at Sur Viejo.
|
|
|
|
|
|
|
|
|
| SQM TRS Nueva Victoria |
|
Pag. 162 |
Figure 15-6. General View of The Evaporation Ponds at the Sur Viejo Industrial Area
15.2.7Neutralization Plant
AFA is neutralized by mixing it with a slurry of calcium hydroxide. Neutralization takes place in mixing ponds that discharge into ponds that allow sedimentation of solids in suspension, such as gypsum.
15.2.8Solar Evaporation Ponds
Solar evaporation ponds are divided into pre-concentration ponds, production ponds and purge ponds. Figure 15-7 shows a panoramic view of a part of the solar evaporation ponds.
|
|
|
|
|
|
|
|
|
| SQM TRS Nueva Victoria |
|
Pag. 163 |
Figure 15-7. General View of Solar Evaporation Ponds in Sur Viejo
In the pre-concentration ponds, discard salts precipitate, which are harvested and placed in discard salt stockpiles that have a waterproofed base to recover the solution from the squeezing or impregnation. Nitrate-rich salts precipitate in the production ponds are harvested and stockpiled in product ponds.
These nitrate-rich salts are shipped by truck to SQM's facilities in the Antofagasta Region
15.2.9Auxiliary Facilities
These include offices, bathrooms, dressing rooms and a cafeteria for personnel working there, a reverse osmosis plant and a sewage treatment plant (TAS).
15.2.10Iris Iodine Plant
Located at the Iris COM, it includes the following infrastructure:
⮚Iodide plant
⮚Auxiliary installations
⮚Iodine plant
Figure 15-8 presents an aerial view of the Iris Iodine Plant.
|
|
|
|
|
|
|
|
|
| SQM TRS Nueva Victoria |
|
Pag. 164 |
Figure 15-8. General View of The Iris Iodine Plant Area
To produce iodine at Iris the plant that cover reception of raw materials to producing iodine prill as a final product.
The main equipment and infrastructure included in iodine plant are:
⮚SO2 generation furnaces,
⮚Iodization absorption towers, each with its respective TK pick up, cooler and TK seal,
⮚Iodine reception TK from the iodization towers,
⮚Scrubber or gas scrubber with its respective TK seal,
⮚TK for primary cutting,
⮚Blow-out modules, consisting of absorption tower, desorption tower and NaOH TK,
⮚concentrated iodide TK,
⮚Brine feble pond for blow-out modules discard solution, with their respective pumps,
⮚Crystallizers (secondary cutting),
⮚Reactors (for smelting, refining and prilling stages),
⮚Prilling tower,
⮚Dryers and sifters,
⮚Boiler room.
|
|
|
|
|
|
|
|
|
| SQM TRS Nueva Victoria |
|
Pag. 165 |
Packaging and shipment facilities include.
⮚Auxiliary facilities.
Storage facilities at the at Iris iodine plant include:
⮚Sulfur storage yard
⮚Sulfuric acid tanks,
⮚Diesel oil tank,
⮚Caustic soda tank
Other infrastructures around the plant include:
⮚Osmosis plant and water storage ponds
⮚TAS plants (sewage treatment)
⮚Generator room
⮚Compressors
⮚Control room
⮚Administrative offices
⮚Ponds used with intermediate process solutions,
⮚Maintenance workshop,
⮚Camp and Offices.
In the industrial sectors of Nueva Victoria and Iris, the following annexed facilities are available:
⮚General office facility
⮚Offices
⮚Training room,
⮚Cafeteria,
⮚Camp,
⮚Warehouse,
⮚Domestic waste disposal site,
⮚Hazardous waste yard and
⮚Non-hazardous industrial waste yard.
15.3COMMUNICATIONS
The facilities have telephone, internet, and television services via satellite link or by fiber optics supplied by an external provider.
Communication for operations staff is via communication radios with the same frequency.
Communication to the control system, CCTV, internal telephony, energy, and data monitoring is via its own fiber optics, which connects process plants and control rooms.
|
|
|
|
|
|
|
|
|
| SQM TRS Nueva Victoria |
|
Pag. 166 |
15.3.1Information Systems and IT
In addition to the facilities mentioned above, SQM operates several computer and information systems that connect its main subsidiaries to operational and administrative facilities in Chile and other parts of the world. IT and information systems are mainly used for finance, accounting, human resources, supply and inventory tracking, invoicing, quality control, research activities, as well as production and maintenance process control. The mainframe computer system is located at Santiago offices and Chilean and international subsidiaries are interconnected with each other through data links.
15.4WATER SUPPLY
Water for Nueva Victoria's facilities is obtained from ground water ponds near the production facilities. Currently, the new EIA TEA considers seawater from an aqueduct to be constructed by SQM.
For industrial water supply, there are groundwater extraction ponds in Salar de Sur Viejo, Pampa del Tamarugal and Salar de Llamara, whose water rights have been approved as shown in Table 15-1:
Table 15-1. Approved Water Rights, by Sector
|
|
|
|
|
|
| Ponds Location Sector |
Approved water right |
| Salar de Sur Viejo |
107 |
| Pampa del Tamarugal |
378.6 |
| Salar de Llamara |
244.7 |
| Total |
730.3 |
The current authorized groundwater extraction for industrial use is 810.8 L/s, increasing by an additional 900 L/s due to seawater conveyance (TEA project), reaching a total of 1,710.8 L/s for industrial use.
The average water abstraction records (L/s) during 2020 to 2022 are included in Table 15-2
Table 15-2. Average Water Extraction, by Sector
|
|
|
|
|
|
|
|
|
|
|
|
Pond location sector |
Water extraction average value 2020 (l/s) |
Water extraction average value 2021 (l/s) |
Water extraction average value 2022 (l/s) |
| Salar de Sur Viejo |
104.68 |
106.5 |
103 |
| Pampa del Tamarugal |
304.89 |
309.3 |
309.2 |
| Salar de Llamara |
225.48 |
220.62 |
203.8 |
| Total |
635.05 |
636.42 |
616 |
A network of pipelines, pumping stations, and power lines are used for water extraction, pumping, and transport to storage ponds, and from there to the different points where it is required. Average water consumption is 567 l/s.
The difference between extraction of 616 L/s compared to consumption of 567 L/s, in other words, 49 L/s (approximately 2,649,024 m³/y) is accumulated in pools and/or ponds.
15.5WATER TREATMENT
The volume of treated water at the wastewater treatment plant in 2022 was 11,738 m³.
Mining waste generated at the site correspond to depleted heap leaching, overburden, and waste salts.
15.6POWER SUPPLY
These facilities, shown in Figure 15-9, are connected to the National Electric System, Arica-Diego de Almagro area. The electrical system in the north of the country is called "Sistema Interconectado Norte Grande" or SING.
Nueva Victoria Tap-Off Substation has 220-, 66-, and 23-kV high-voltage yards in single bus configuration. It is currently connected to Circuit No. 1 of the Lagunas - Crucero 220-kV National Transmission Line, and to the line, called Lagunas - Nueva Victoria, with 220-kV voltage and 211-MVa capacity.
|
|
|
|
|
|
|
|
|
| SQM TRS Nueva Victoria |
|
Pag. 167 |
Figure 15-9. Geographical location of S/E Tap Off Nueva Victoria
|
|
|
|
|
|
|
|
|
| SQM TRS Nueva Victoria |
|
Pag. 168 |
16MARKET STUDIES
This section contains forward-looking information related to commodity demand and prices for the Project. The material factors that could cause actual results to differ materially from the conclusions, estimates, designs, forecasts, or projections in the forward-looking information include any significant differences from one or more of the material factors or assumptions that were set forth in this section including prevailing economic conditions, commodity demand and prices are as forecasted over the Long-Term period.
16.1THE COMPANY
SQM is the world’s largest producer of potassium nitrate and iodine and one of the world’s largest lithium producers. It also produces specialty plant nutrients, iodine derivatives, lithium derivatives, potassium chloride, potassium sulfate and certain industrial chemicals (including industrial nitrates and solar salts). The products are sold in more than 100 countries through SQM worldwide distribution network, with more than 98% of our sales in 2023 derived from countries outside Chile.
The business strategy is to maintain the world leadership position in the market for iodine, potassium nitrate, lithium, and salts.
The products are mainly derived from mineral deposits found in northern Chile. Mine and process caliche ore and brine deposits.
Caliche ore in northern Chile contains the only known nitrate and iodine deposits in the world and is the world's largest commercially exploited slice of natural nitrate.
From the caliche ore deposits, SQM produces a wide range of nitrate-based products used for specialty plant nutrients and industrial applications, as well as iodine and its derivatives.
The SQM´s products are divided into six categories:
⮚specialty plant nutrients,
⮚iodine and its derivatives,
⮚industrial chemicals,
⮚lithium and its derivatives,
⮚potassium chloride and potassium sulfate,
⮚other commodity fertilizers.
The following table presents the percentage breakdown of SQM's revenues for 2021, 2020, 2019 and 2018 according to the product lines:
Table 16-1 Percentage Breakdown of SQM's Revenues for 2023, 2022 and 2021
|
|
|
|
|
|
|
|
|
|
|
|
| Revenue breakdown |
2023 |
2022 |
2021 |
| Specialty Plant Nutrition |
12% |
11% |
32% |
| Lithium and derivatives |
69% |
76% |
33% |
| Iodine and derivatives |
12% |
7% |
15% |
| Potassium |
4% |
4% |
15% |
| Industrial chemicals |
2% |
2% |
5% |
| Other products and services |
—% |
—% |
1% |
| Total |
100% |
100% |
100% |
16.2IODINE AND ITS DERIVATIVES, MARKET, COMPETITION, PRODUCTS, CUSTOMERS
SQM is one of the world's leading producers of iodine and its derivatives, which are used in a wide range of medical, pharmaceutical, agricultural, and industrial applications, including x-ray contrast media, polarizing films for liquid crystal displays (LCD/LED), antiseptics, biocides, and disinfectants, in the synthesis of pharmaceuticals, electronics, pigments and dye components.
|
|
|
|
|
|
|
|
|
| SQM TRS Nueva Victoria |
|
Pag. 169 |
In 2023, the SQM’s revenues from iodine and iodine derivatives amounted to US892.2 million, representing 11.9% of our total revenues in that year. We estimate that our sales accounted for approximately 35% of global iodine sales by volume in 2023.
SQM's strategy for the iodine business is:
i.To achieve and maintain sufficient market share to optimize the use of the available production capacity.
ii.Encourage demand growth and develop new uses for iodine.
iii.Participate in the iodine recycling projects through the Ajay-SQM Group (“ASG”), a joint venture with the US company Ajay Chemicals Inc. (“Ajay”).
iv.Reduce the production costs through improved processes and increased productivity to compete more effectively.
v.Provide a product of consistent quality according to the requirements of the customers.
16.2.1Iodine Market
Iodine and iodine derivatives are used in a wide range of medical, agricultural, and industrial applications as well as in human and animal nutrition products. Iodine and iodine derivatives are used as raw materials or catalysts in the formulation of products such as X-ray contrast media, biocides, antiseptics and disinfectants, pharmaceutical intermediates, polarizing films for LCD and LED screens, chemicals, organic compounds, and pigments. Iodine is also added in the form of potassium iodate or potassium iodide to edible salt to prevent iodine deficiency disorders.
X-ray contrast media is the leading application of iodine, accounting for approximately 34% of demand. Iodine’s high atomic number and density make it ideally suited for this application, as its presence in the body can help to increase contrast between tissues, organs, and blood vessels with similar X-ray densities. Other applications include pharmaceuticals, which we believe account for 14% of demand; LCD and LED screens, 12%; iodophors and povidone-iodine, 7%; animal nutrition, 7%; fluoride derivatives, 7%; biocides, 5%; nylon, 3%; human nutrition, 3% and other applications, 8%.
In 2023, our estimations indicate that the market experienced a downturn of approximately 4% compared to the previous year. This decline can primarily be attributed to a series of key factors affecting various industries. Initially, the broader economic slowdown played a pivotal role in shaping this trend, affecting industrial production, and leading companies to adjust their stocking policies to adapt to the evolving market conditions. Following this, the introduction of new regulations emerged as another critical factor, significantly influencing the reduced demand for iodine in the fluorochemical industry. Finally, the impact of high iodine prices marked a decisive factor, prompting two main responses: substitution, with customers migrating to alternative products, and reformulation, where product compositions were adjusted to minimize iodine content. Collectively, these elements have each played a unique role in the observed decrease in demand for iodine over the course of the year.
Conversely, the demand for X-ray contrast media emerged as a primary driver of growth in the iodine market. This increase is largely due to heightened healthcare expenditures and improved accessibility to medical services in emerging economies. The growing utilization of diagnostic imaging, particularly in these regions, has significantly bolstered the demand for iodine-based contrast agents, counterbalancing some of the declines seen in other sectors.
16.2.2Iodine Products
SQM produce iodine in our Nueva Victoria plant, near Iquique, and our Pedro de Valdivia plant, close to María Elena. The total production capacity of approximately 16,100 metric tons per year of iodine, including the Iris plant, which is located close to the Nueva Victoria plant.
Through ASG, SQM produces organic and inorganic iodine derivatives. ASG was established in the mid-1990s and has production plants in the United States, Chile, and France. ASG is one of the world’s leading inorganic and organic iodine derivatives producer.
Consistent with the business strategy, SQM works on the development of new applications for iodine-based products, pursuing a continuing expansion of the businesses and maintaining the market leadership.
SQM manufactures its iodine and iodine derivatives in accordance with international quality standards and have qualified its iodine facilities and production processes under the ISO 9001:2015 program, providing third party certification of the quality management system and international quality control standards that SQM has implemented.
|
|
|
|
|
|
|
|
|
| SQM TRS Nueva Victoria |
|
Pag. 170 |
SQM’s revenues increased to US$892.2 million in 2023 from US$754.3 million in 2022. This increase was primarily attributable to higher sales volumes and higher average prices during 2023. Average iodine prices were approximately 15.2% higher in 2023 than in 2022. Our sales volumes increased 2.7% in 2023.
The following table shows the total sales volumes and revenues from iodine and iodine derivatives for 2023, 2022 and 2021:
Table 16-2 Iodine and derivatives volumes and revenues, 2021 - 2023
|
|
|
|
|
|
|
|
|
|
|
|
|
Sales volumes
(Thousands of metric tons)
|
2023 |
2022 |
2021 |
| Iodine and derivatives |
13.1 |
12.7 |
12.3 |
|
Total revenues
(In US$ millions)
|
892.2 |
754.3 |
438 |
16.2.3Iodine: Marketing and Customers
In 2023, we sold our iodine products in approximately 30 countries to 158 customers, and most of our sales were exports. One customer accounted for more than 10% of our iodine revenues in 2023, representing approximately 22.8% of iodine revenues. Our ten largest customers accounted in the aggregate for approximately 68% of revenues. No supplier accounted for more than 10% of the cost of sales of this business line.
The following table shows the geographical breakdown of the revenues:
Table 16-3 Geographical Breakdown of the Revenues
|
|
|
|
|
|
|
|
|
|
|
|
| Revenues Breakdown |
2023 |
2022 |
2021 |
| North America |
14% |
19% |
23% |
| Europe |
41% |
38% |
40% |
| Chile |
0% |
0%% |
0%% |
| Central and South America (excluding Chile) |
2% |
2% |
2% |
| Asia and Others |
42% |
41% |
34% |
SQM sells iodine through our own worldwide network of representative offices and through our sales, support and distribution affiliates. We maintain inventories of iodine at our facilities throughout the world to facilitate prompt delivery to customers. Iodine sales are made pursuant to spot purchase orders or within the framework of supply agreements. Supply agreements generally specify annual minimum and maximum purchase commitments, and prices are adjusted periodically, according to prevailing market prices.
16.2.4Iodine Competition
The world’s main iodine producers are based in Chile, Japan, and the United States. Iodine is also produced in Russia, Turkmenistan, Azerbaijan, Indonesia, and China.
Iodine is produced in Chile using a unique mineral known as caliche ore, whereas in Japan, the United States, Russia, Turkmenistan, Azerbaijan, and Indonesia, producers extract iodine from underground brines that are mainly obtained together with the extraction of natural gas and petroleum. In China, iodine is extracted from seaweed.
Five Chilean companies accounted for approximately 57% of total global sales of iodine in 2023, including SQM, with approximately 35%, and four other producers accounting for the remaining 22%. The other Chilean producers are Atacama Chemical S.A. (Cosayach), controlled by the Chilean holding company Inverraz S.A.; ACF Minera S.A., owned by the Chilean Urruticoechea family; Algorta Norte S.A., a joint venture between ACF Minera S.A. and Toyota Tsusho; and Atacama Minerals, which is owned by Chinese company Tewoo.
We estimate that eight Japanese iodine producers accounted for approximately 27% of global iodine sales in 2023, including recycled iodine. We estimate that iodine producers in the United States accounted for nearly 5% of world iodine sales in 2023.
|
|
|
|
|
|
|
|
|
| SQM TRS Nueva Victoria |
|
Pag. 171 |
Iodine recycling is a growing trend worldwide. Several producers have recycling facilities where they recover iodine and iodine derivatives from iodine waste streams.
We estimate the 17% of the iodine supply comes from iodine recycling. SQM, through ASG or alone, is also actively involved in the iodine recycling business using iodinated side streams from a variety of chemical processes in Europe and the United States.
The prices of iodine and iodine derivative products are determined by market conditions. World iodine prices vary depending upon, among other things, the relationship between supply and demand at any given time. Iodine supply varies primarily because of the production levels of the iodine producers and their respective business strategies.
Our annual average iodine sales prices increased to approximately 68 USD/kg in 2023, from the average sales prices of approximately 59 USD/kg observed in 2022.
Demand for iodine varies depending upon overall levels of economic activity and the level of demand in the medical, pharmaceutical, industrial, and other sectors that are the main users of iodine and iodine-derivative products. Certain substitutes for iodine are available for certain applications, such as antiseptics and disinfectants, which could represent a cost-effective alternative to iodine depending on prevailing prices. Demand for iodine varies depending upon overall levels of economic activity and the level of demand in the medical, pharmaceutical, industrial, and other sectors that are the main users of iodine and iodine-derivative products. Certain substitutes for iodine are available for certain applications, such as antiseptics and disinfectants, which could represent a cost-effective alternative to iodine depending on prevailing prices.
The main factors of competition in the sale of iodine and iodine derivative products are reliability, price, quality, customer service and the price and availability of substitutes. SQM has competitive advantages over other producers due to the size and quality of its mineral reserves and the production capacity available. Iodine is competitive with that produced by other manufacturers in certain advanced industrial processes. SQM also benefits from the long-term relationships it has established with its main clients.
16.3NITRATES
Nitrates are obtained in Chile from the exploitation of the fields of nitrates that are in a strip of approximately 700 km long by 30-50 km wide, which is in the north of Chile, to the east of the Cordillera de la Costa, in the regions of Tarapacá and Antofagasta. This is the only area in the world where nitrate deposits have reserves and resources with economic content, where it is feasible to obtain different products such as nitrate sodium, potassium nitrate, iodine, and sodium sulfate. Its ore, called caliche, is presented preferably as a dense, hard surface layer of salt-cemented sands and gravels, with variable thicknesses between 0.5 m to 5 m.
The caliche resources and reserves estimated by SERNAGEOMIN for the year 2007, amounted to 2,459 million tons with an average grade of 6.3% nitrates. In turn, SQM reports that its total reserves amount to 1,378 million tons of caliche with an average grade of 6.29% of nitrates, this is 56% of national total.
Nitrates, in general, are considered specialty fertilizers because they are applied in a relatively narrow range of crops where it is possible to obtain higher yields and better products in their crops compared to massive fertilizers (urea and others).
Of these, potassium nitrate is today the main nitric fertilizer due to the combination of two primary nutrients, Nitrogen (N) and Potassium (K). Other nitric fertilizers are nitrate of sodium, ammonium nitrate and calcium nitrate. Nitrates explain less than 1% of the world market for nitrogenous fertilizers.
The most relevant crops for the potassium nitrate market are fruits, vines, citrus, tobacco, cotton, and vegetables, where higher yields and specific benefits are achieved such as improvements in color, flavor, skin strength, disease resistance, etc.
Potassium nitrate competes favorably against ammoniacal fertilizers in Market niches indicated Its greatest advantage is the solubility and speed of assimilation by the plants. These properties have been keyed to gaining a solid position in the applications of drip irrigation and foliar fertilization that are applied in specialty crops and higher value, is that is, those that clearly bear the highest cost of this type of fertilizer.
In addition, sodium nitrate, historically recognized in the international market as "Salitre de Chile", fulfills functions like potassium nitrate, although the functionality of the sodium is more limited. For this reason, it has been losing importance to the benefit of potassium nitrate.
For some applications, a more balanced dose of sodium and potassium is required, therefore that "potassium-sodium" is especially elaborated, which corresponds to a mixture of 67% by weight of sodium nitrate and 33% potassium nitrate.
Additionally, nitrates can be modified by adding other functional nutrients, such as phosphorus, sulfur, boron, magnesium, silicon, etc., seeking to enhance certain fertilizer properties for more specific crops. These products fall into the range of fertilizer mixtures.
|
|
|
|
|
|
|
|
|
| SQM TRS Nueva Victoria |
|
Pag. 172 |
Sodium and potassium nitrates also have industrial applications based on their chemical properties.
The alkaline oxides of sodium and potassium (Na2O and K2O) give it properties to melt and source of sodium or potassium, required in the special glass industry. The nitrate, for its composition rich in oxygen, strengthens the oxidizing properties. Its main applications industrial are found in high-resolution glasses for TV screens and computers, ceramics, explosives, charcoal briquettes, metal treatment and various chemical processes as a powerful industrial oxidant.
It is relevant to mention the great growth potential of the application of nitrates in solar thermal installations, where it plays the role of a heat accumulator that allows capturing the solar energy in the day and release heat at night to allow almost continuous operation of power generation plants. The most efficient solar salt for this purpose is a mixture of 60% by weight of sodium nitrate and 40% of potassium nitrate.
16.3.1Specialty Plant Nutrition, Market, Competition, Products, Customers
In 2023, specialty plant nutrients revenues decreased to US$913.9 million, representing 12.2% of our total revenues for that year and a 22.0% decrease from US$1,172.3 million in specialty plant nutrients revenues in 2022. Prices decreased approximately 21.3% in 2023.
Specialty Plant Nutrients are premium fertilizers that allow farmers to improve their yields and the quality of certain crops.
SQM produces four main types of specialty plant nutrients that offer nutritional solutions for fertigation, soil, and foliar applications: potassium nitrate, sodium nitrate, sodium potassium nitrate and specialty blends.
In addition, SQM markets other specialty fertilizers including third-party products.
All these products are commercialized in solid or liquid form, for use mainly in high-value crops such as fruits, flowers, and certain vegetables.
These fertilizers are widely used in crops using modern farming techniques such as hydroponics, greenhouses, foliar-applied crops, and fertigation (in the latter case, the fertilizer is dissolved in water before irrigation).
Specialty plant nutrients have certain advantages over commodity fertilizers. Such advantages include rapid and effective absorption (no need for nitrification), higher water solubility, alkaline pH (which reduces soil acidity), and low chloride content.
One of the most important products in the field of specialty plant nutrients is potassium nitrate, which is available in crystallized and granulated (prilled) form, which allows different application methods. Crystalline potassium nitrate products are ideal for application by fertigation and foliar applications. Potassium Nitrate Granules are suitable for direct use in soil.
SQM has developed brands for marketing according to the different applications and uses of the products. The main brands are: UltrasolR (fertigation), QropR (soil application), SpeedfolR (foliar application) and AllganicR (organic agriculture).
The new needs of more sophisticated customers demand that the industry provide integrated solutions rather than individual products. The products, including customized specialty blends that meet specific needs along with the agronomic service provided, allow to create plant nutrition solutions that add value to crops through higher yields and better-quality production.
Because SQM products come from natural nitrate deposits or natural potassium brines, they have certain advantages over synthetically produced fertilizers.
One of these advantages is the presence in the products of certain beneficial micronutrients, valued by those customers who prefer products of natural origin.
As a result, specialty plant nutrients are sold at a premium price compared to commodity fertilizers.
SQM's strategy in the specialty plant nutrition business is:
i.Leverage (take) the advantages of the specialty products over commodity-type fertilizers.
ii.Selectively expanding the business by increasing sales of higher-margin specialty plant nutrients based on potassium and natural nitrates, particularly soluble potassium nitrate and specialty blends.
iii.Pursue (seek) investment opportunities in complementary businesses to enhance (improve) the product portfolio, increase production, reduce costs, and add value to the marketing of the products.
|
|
|
|
|
|
|
|
|
| SQM TRS Nueva Victoria |
|
Pag. 173 |
iv.Develop new specialty nutrient blends produced at the mixing plants that are strategically located in or near the principal markets to meet specific customer needs.
v.Focus primarily on the markets where SQM can sell plant nutrients in soluble and foliar applications to establish a leadership position.
vi.Further develop the global distribution and marketing system directly and through strategic alliances with other producers and global or local distributors.
vii.Reduce production costs through improved processes and higher labor productivity to compete more effectively.
viii.Supply a product with consistent quality according to the specific requirements of customers.
Specialty plant Nutrition: Market
Specialty plant nutrients are sold for various agricultural uses, including but not limited to fertigation in high-value crops (vegetables, fruit trees, flowers, etc.). These fertilizers must be highly soluble and free of impurities in order to be used by means of modern technical irrigation techniques (drip irrigation, micro-sprinkler). Among the specialty plant nutrients for use in fertigation, potassium nitrate is one of the most important fertilizers. Its advantage lies in being chlorine free, high solubility, adequate PH and free of impurities. These advantages allow for a premium price compared to substitute commodity fertilizers such as potassium chloride and sulfate.
Modern irrigation systems are increasingly used with protected crops and in high-value fruit plantations such as greenhouses, tunnels (berries) and shade houses (tomatoes). Specialty nutrients for foliar and granular soil applications in certain high-value niches such as potato and tobacco production.
Specialty plant nutrients have specific characteristics that increase productivity and enhance quality when used on certain crops and soils. The products have significant advantages for certain applications over commodity fertilizers based on other sources of nitrogen and potassium, such as urea and potassium chloride.
Since 1990, the international market for specialty plant nutrients has grown at a faster rate than the international market for commodity fertilizers. This is mainly due to: (i) the application of new agricultural technologies such as fertigation, hydroponics and greenhouses; (ii) the increase in the cost of land and the scarcity of water, which has forced farmers to improve their yields and reduce water use; and (iii) the increase in demand for higher quality crops.
As an exception, during 2022 and 2023 and due to the strong increase in price, adverse climate conditions and high inflation rates, the agricultural soluble potassium nitrate market had a consumption reduction of approximately 10% and 15%, respectively. These estimates do not consider potassium nitrate produced and sold locally in China, and only include net imports and exports.
Specialty plant Nutrition: Products
In 2023, specialty plant nutrients revenues decreased to US$913.9 million, representing 12.2% of our total revenues for that year and a 22.0% decrease from US$1,172.3 million in specialty plant nutrients revenues in 2022. Prices decreased approximately 21.3% in 2023.
We believe that we are the world’s largest producer of potassium nitrate. We estimate that our sales accounted for approximately 42% of global potassium nitrate sales for all agricultural uses by volume in 2023.
The following table shows our sales volumes of and revenues from specialty plant nutrients for 2023, 2022 and 2021:
|
|
|
|
|
|
|
|
|
| SQM TRS Nueva Victoria |
|
Pag. 174 |
Table 16-4 Sales Volumes and Revenue for Specialty Plant Nutrients, 2023, 2022 and 2021
|
|
|
|
|
|
|
|
|
|
|
|
|
Sales Volumes
(Thousands of Metric Tons)
|
2023 |
2022 |
2021 |
| Sales Volumes |
840.2 |
847.9 |
1,154.6 |
| Sodium Nitrate |
16.7 |
14.4 |
32.1 |
| Potassium Nitrate and Sodium Potassium Nitrate |
443.5 |
477.4 |
643.6 |
| Specialty blends |
243.0 |
218.0 |
304.0 |
Other Specialty
Plant Nutrients |
136.5 |
138.1 |
174.9 |
|
Total Revenues
(In US$ millions)
|
914 |
1,172.3 |
908.8 |
Specialty Plant Nutrition: Marketing and Customers
In 2023, we sold our specialty plant nutrients in approximately 93 countries and to more than 1,100 customers. One of our customers represented more than 10% of our specialty plant nutrition revenues during 2023, accounting for approximately 12.6% of specialty plant nutrition revenue. Our ten largest customers accounted in the aggregate for approximately 39% of revenues during that period. No supplier accounted for more than 10% of the costs of sales for this business line.
The following table shows the geographical breakdown of the sales:
Table 16-5 Geographical Breakdown of the Sales
|
|
|
|
|
|
|
|
|
|
|
|
| Sales Breakdown |
2023 |
2022 |
2021 |
| North America |
45% |
42% |
35% |
| Europe |
14% |
17% |
20% |
| Chile |
12% |
11% |
15% |
| Central and South America (excluding Chile) |
8% |
11% |
10% |
| Asia and Others |
21% |
20% |
21% |
SQM sells specialty plant nutrition products globally mainly through our own worldwide network of commercial offices and distributors.
Specialty Plant Nutrition: Competition
The principal means of competition in the sale of specialty nutrients are product quality, logistics, agronomic service expertise and price.
We believe that we are the world’s largest producer of potassium nitrate for agricultural use. Our potassium nitrate products compete indirectly with specialty and commodity substitutes, which may be used by some customers instead of potassium nitrate depending on the type of soil and crop to which the product will be applied.
Our sales accounted for approximately 42% of global agricultural potassium nitrate sales by volume during 2023. In the 100% soluble potassium nitrate market, our largest competitor is Haifa Chemicals Ltd. (“Haifa”), in Israel. We estimate that sales of agricultural potassium nitrate by Haifa accounted for approximately 20% of total world sales during 2023 (excluding sales by Chinese producers to the domestic Chinese market). Kemapco, a Jordanian producer owned by Arab Potash, produces potassium nitrate in a plant located close to the Port of Aqaba, Jordan. We estimate that sales of agricultural potassium nitrate by Kemapco accounted for approximately 11% of total world sales during 2023.
|
|
|
|
|
|
|
|
|
| SQM TRS Nueva Victoria |
|
Pag. 175 |
ACF, another Chilean producer, mainly oriented to iodine production, has produced potassium nitrate from caliche ore and potassium chloride since 2005. In addition, there are several potassium nitrate producers in China. Most of the Chinese production is consumed by the Chinese domestic market.
16.3.2Industrial Chemicals, Market, Competition, Products, Customers
In 2023, we sold potassium chloride and potassium sulfate to approximately 519 customers in 36 countries. None of the customers accounted for more than 10% of our revenues of potassium chloride in 2023. We estimate that our ten largest customers accounted in the aggregate for approximately 43% of such revenues. No supplier accounted for more than 10% of the cost of sales of this business line. We make lease payments to Corfo which are associated with the sale of different products produced in the Salar de Atacama, including lithium carbonate, lithium hydroxide and potassium chloride.
SQM produces and markets three industrial chemicals: sodium nitrate, potassium nitrate and potassium chloride.
Sodium nitrate is mainly used in the production of glass and explosives, in metal treatments, metal recycling and the production of insulating materials, among others.
Potassium nitrate is used as a raw material to produce frits for ceramic and metal surfaces, in the production of special glasses, in the enamel industry, metal treatment and pyrotechnics.
Solar salts, a combination of potassium nitrate and sodium nitrate, are used as a thermal storage medium in concentrated solar power plants.
Potassium chloride is a basic chemical used to produce potassium hydroxide, and it is also used as an additive in oil drilling as well as in food processing, among other uses.
In addition to producing sodium and potassium nitrate for agricultural applications, SQM produces different grades of these products, including prilled grades, for industrial applications. The grades differ mainly in their chemical purity.
At SQM there is some operational flexibility in the production of industrial nitrates because they are produced from the same process as their equivalent agricultural grades, needing only an additional step of purification.
SQM, with certain constraints, shift production from one grade to the other depending on market conditions. This flexibility allows to maximize yields and to reduce commercial risk.
In addition to producing industrial nitrates, SQM produces, markets, and sells industrial potassium chloride.
The strategy in industrial chemical business is to:
(i)Maintain the leadership position in the industrial nitrates market.
(ii)Encourage demand growth in different applications as well as exploring new potential applications.
(iii)Reliable supplier for the thermal storage industry, maintaining close relationships with R&D programs and industrial initiatives.
(iv)Reduce production costs through improved processes and higher productivity to compete more effectively.
(v)Supply a product with consistent quality according to the requirements of the customers.
Industrial Chemicals Market
Industrial sodium and potassium nitrate are used in a wide range of industrial applications, including the production of glass, ceramics and explosives, metal recycling, insulation materials, metal treatments, thermal solar and various chemical processes.
We completed solar salts delivery for the CSP project in the Middle East with ~105,000 metric tons of solar salts delivered during in 2023.
We are also experiencing a growing interest in using solar salts in thermal storage solutions not related to CSP technology. Due to their proven performance, solar salts are being tested in industrial heat processes and heat waste solutions. These new applications may open new opportunities for solar salts uses in the near future, such as retrofitting coal plants.
|
|
|
|
|
|
|
|
|
| SQM TRS Nueva Victoria |
|
Pag. 176 |
Industrial Chemicals Products
In 2023, our revenues from industrial chemicals were US$175.2 million, representing approximately 2.3% of our total revenues for that year and a 6.1% increase from US$165.2 million in 2022, as a result of higher sales volumes in this business line, which offset lower sales prices. Sales volumes in 2023 increased 22.8% compared to sales volumes reported last year, while average prices in the business line decreased 13.6% during 2023 compared to average prices reported during 2022.
The following table shows our sales volumes of industrial chemicals and total revenues for 2023, 2022 and 2021:
|
|
|
|
|
|
|
|
|
|
|
|
|
Sales Volumes
(Thousands of Metric Tons)
|
2023 |
2022 |
2021 |
| Industrial Chemicals |
180.4 |
147.0 |
174.5 |
|
Total Revenues
(In US$ millions)
|
175 |
165.2 |
132.0 |
Industrial Chemicals: Marketing and Customers
In 2023, we sold our industrial nitrate products in 52 countries, to approximately 297 customers. One customer accounted for more than 10% of our revenues of industrial chemicals in 2023, accounting for approximately 40.5%, and our ten largest customers accounted in the aggregate for approximately 61% of such revenues. No supplier accounted for more than 10% of the cost of sales of this business line. We make lease payments to Corfo which are associated with the sale of different products produced in the Salar de Atacama, including lithium carbonate, lithium hydroxide and potassium chloride.
The following table shows the geographical breakdown of our revenues:
Table 16-7 Geographical Breakdown of the Revenues
|
|
|
|
|
|
|
|
|
|
|
|
| Sales breakdown |
2023 |
2022 |
2021 |
| North America |
27% |
36% |
23% |
| Europe |
12% |
17% |
14% |
| Chile |
1% |
1% |
3% |
| Central and South America (excluding Chile) |
6% |
7% |
6% |
| Asia and Others |
54% |
39% |
55% |
Our industrial chemical products are marketed mainly through our own network of offices, logistic platforms, representatives and distributors. We maintain updated inventories of our stocks of sodium nitrate and potassium nitrate, classified according to graduation, to facilitate prompt dispatch from our warehouses. We provide support to our customers and continuously work with them to improve our service and quality, together with developing new products and applications for our products.
Industrial Chemicals Competition
We believe that we are one of the world’s largest producers of industrial sodium nitrate and potassium nitrate. In 2023, our estimated market share by volume for industrial potassium nitrate was 62% and for industrial sodium nitrate was 44% (excluding domestic demand in China and India).
Our competitors in sodium nitrate are mainly based in Europe and Asia, producing sodium nitrate as a by-product of other production processes. In sodium nitrate, BASF AG, a German corporation, and several producers in Eastern Europe and China are competitive since they produce industrial sodium nitrate as a by-product. Our industrial sodium nitrate grades also compete indirectly with substitute chemicals, including sodium carbonate, sodium sulfate, calcium nitrate and ammonium nitrate, which may be used in certain applications in place of sodium nitrate and are available from a large number of producers worldwide.
|
|
|
|
|
|
|
|
|
| SQM TRS Nueva Victoria |
|
Pag. 177 |
Our main competitors in the industrial potassium nitrate business are Haifa Chemicals, Kemapco and some Chinese producers, which we estimate had a market share of 8%, 4% and 7%, respectively, in 2023.
Producers of industrial sodium nitrate and industrial potassium nitrate compete in the marketplace based on attributes such as product quality, delivery reliability, price, and customer service. Our operation offers both products at high quality and with low cost.
In the industrial potassium chloride market, we are a relatively small producer, mainly focused on supplying regional needs.
Pricing Estimates
The QP has determined that using 42.0 USD/kg for iodine at the port of Tocopilla is the appropriate price for this study. Nitrates are more complicated since various products are produced based on market conditions, however the QP has determined that an appropriate average price for nitrates at Tocopilla is $US820. The derivation of a price for delivery of nitrates for refining in Coya Sur is detailed in Section 19.
|
|
|
|
|
|
|
|
|
| SQM TRS Nueva Victoria |
|
Pag. 178 |
17ENVIRONMENTAL STUDIES, PERMITTING AND SOCIAL OR COMMUNITY IMPACT
The following section details the regulatory environment of the Project. It presents the applicable laws and regulations and lists the permits that will be needed to begin the mining operations. The environmental Assessment process requires that data be gathered on many components and consultations be held to inform the Project relevant stakeholders. The main results of this inventory and consultation process are also documented in this section. The design criteria for the water and mining waste infrastructure are also outlined. Finally, the general outline of the mine’s rehabilitation plan is presented to the extent of the information available now.
17.1ENVIRONMENTAL STUDIES
The Law 19,300/1994 General Bases of the Environment (Law 19,300 or Environmental Law), its amendment by Law 20.417/2010 and Supreme Decree N°40/2012 Regulation of the Environmental Impact Assessment Service regulations (DS N°40/2012 or RSEIA)) determines how projects that generate some type of environmental impact must be developed, operated, and closed. Regarding mining projects, the art. 3.i of the Environmental Law defines that mining project must be submitted to the Environmental Impact Assessment System (SEIA) before being developed.
The Nueva Victoria project, which includes the “Pampa Hermosa” and “Tente en el Aire” projects, has been submitted to the Environmental Impact Assessment System (SEIA) a total of 15 times, on account of the following projects:
⮚Salar Sur Viejo Groundwater Extraction Project presented through DIA and approved by RCA 036/ 1997
⮚Draft loopholes submitted by EIA and approved by RCA N° 058/1997
⮚Nueva Victoria extension presented through a DIA and approved by RCA N° 004/2005)
⮚Draft Adduction Call presented through DIA and approved by RCA N° 032/ 2005)
⮚Nueva Victoria Sur Mine presented through DIA and approved by RCA N° 0173/ 2006.
⮚Modification of Nueva Victoria Yoduro Plant presented by DIA and approved by RCA N° 094/2007
⮚Incorporation of Chlorine in Nueva Victoria Iodine Plant presented by DIA and approved by RCA N°070/2008)
⮚Update Operation Nueva Victoria presented through DIA and approved by RCA N°124/2008.
⮚Nueva Victoria Mine Area submitted through an EIA and approved by RCA N°042/2008)
⮚Evaporation Iris Pipeline and Pools presented through a DIA and approved by RCA N° 061/ 2009.
⮚Pampa Hermosa Project presented through an EIA and approved by RCA N° 890/2010
⮚Expansion of Nueva Victoria South Mine Zone presented through by DIA and approved by RCA N°076/ 2012.
⮚Tente en el Aire presented by EIA and approved by RCA N° 20210100112/2021
In addition, an Environmental Impact Study (EIA), "Partial modification of the reinjection system in the Llamara Púquios", was Approved by RCA 20239900145/2023.
Recently, the Environmental Impact Statement (EIS) Project was also approved by RCA 2023010039/2023.: "Adaptation of the seawater pipeline and complementary works Nueva Victoria". The Project corresponds to a modification of the mining project "Tente en el Aire" (TEA), approved by RCA No. 20210100112/2021. To this end, the modification of the route of the seawater supply and associated works are considered, together with the incorporation of an access road from Route A-750, in the Costa area; And in the Pampa area, the incorporation of a SE Sectioning Machine and complementary works, such as an LTE 66 kV and SE 10 MVa.
The Project, which entered the Environmental Impact Assessment System (SEIA), in September 2022, is in the process of responding to its Addendum 1 and consolidated observations generated by the Citizen Participation Process (PAC) which was requested by the communities.
Given the above, and in case of having the approval and conformity by the authority of the response process and the Addendum 1 and CAP Annex documents, it is expected to have a favorable environmental qualification resolution (RCA), in 2023.
|
|
|
|
|
|
|
|
|
| SQM TRS Nueva Victoria |
|
Pag. 179 |
17.1.1Baseline studies
Each time the project has been submitted to the SEIA; baseline environmental studies have been carried out. The last Environmental Impact Study (EIA) approved is TEA.
The following is a more detailed analysis of certain components of the baseline:
Hydrology
As for the hydrology of the site, the average annual rainfall has a value of less than 2 mm in recent years, with many years with zero precipitation. The maximum 24 hour recorded in the area is less than 10 mm, with historical maximums fluctuating between 3 and 7 mm. There are no permanent surface runoff channels, with sporadic runoff associated with extreme precipitation events. It is estimated that the streams of the sectors are able to contain the runoff generated by these extreme precipitation events.
Hydrogeology
In the area of influence of the project, groundwater rights have been granted for 41 wells. All are consumptive, permanent, and continuous.
In the area of influence, there are four distinct hydrogeological units: A1, A3, C5 and D1 (IMAGE). Units A have a high hydrogeological potential to store and transmit water, C has a low potential and D has no potential.
Unit D1 corresponds to compact to slightly fractured/altered andesites, and locally fractured/altered diorites without water content. Its potential is nonexistent because it does not receive any recharge due to its position.
Unit C5 corresponds to sandy-clayey gravels intercalated with sands, clays and silts, without water content. It has a low to null recharge due to precipitation at the site.
Unit A3 corresponds to evaporite deposits hosted in the western sector of the Pampa del Tamarugal. It has a medium to high water transmissivity.
Unit A1 corresponds to sands and gravels with low consolidation, which form active deposits mainly in the central basin. It has a medium to high water transmissivity, with a maximum value of 4,280 m2/day.
According to the study, there is no evidence of the existence of water under the area of the planned works in the coastal mountain range. To the northwest and southwest of the planned works there are local basins with groundwater. To the east, groundwater belonging to the Pampa del Tamarugal aquifer can be observed. To the north of the works, in the Soronal salt flat, there is groundwater with a depth of between 0.8 and 19.6 m.
According to hydro chemical information, the water in the area corresponds to the chloride-sodium type.
|
|
|
|
|
|
|
|
|
| SQM TRS Nueva Victoria |
|
Pag. 180 |
Figure 17-1. Location of Wells with Granted Water Rights
|
|
|
|
|
|
|
|
|
| SQM TRS Nueva Victoria |
|
Pag. 181 |
Figure 17-2. Hydrogeologic Map of the Area of Background Collection
Soil
The soils presented in the area of influence show very little edaphic development, mainly due to the extremely arid conditions of the site, which have limited the intensity of soil formation processes. Four different homogeneous soil units were defined, being "Depositional plains soils" the predominant one in the sector (76.6%).
The soil in the sector has a neutral to strongly alkaline pH; it is extremely saline, and strongly to extremely sodic. Soils with loam- sandy (Fa) and sandy- loam (aF) textures predominate. All these characteristics place all the sector's soils within use capacity VIII ("soils with no agricultural, livestock or forestry value, where their use is limited to wildlife, recreation or watershed protection").
The soil resource presented in the area of influence not considered a scarce or unique resource within the region. In addition, it has a very low capacity to support biodiversity, which makes it an inhospitable habitat (absolute desert condition).
Plants
As for the vegetation in influence of the project, the predominant vegetation type is "Prosopis Tamarugo plantation", covering 96.6% of the study area. It is followed by "Distichlis Spicata Meadow", with 1.9%; and the least represented is "Tillandsia Landbeckii Meadow", with 0.1%.
|
|
|
|
|
|
|
|
|
| SQM TRS Nueva Victoria |
|
Pag. 182 |
There is a preservation native forest formation around influence (vegetation type "Prosopis Tamarugo forest"); however, it is far from the area of direct intervention of the project. Only the intervention of floristic elements in the vegetation type "Tillandsia Landbeckii Meadow" is considered, which has no endemic species or species in conservation category.
With respect to the flora, 4 species were identified within the area of influence of the project, 2 belonging to the Magnoliopsida class and 2 to the Liliopsida class. There are 2 species classified in a conservation category: Prosopis Tamarugo (tamarugo), classified as endangered; and Prosopis Alba (Algarrobo Blanco), classified as out of danger. Both species are considered native. The area of influence is dominated by native and endemic species.
With respect to environmental singularities (1, according to the document "Guide for the Description of the area of influence, description of the Soil, Flora and Fauna Components of Terrestrial Ecosystems in the SEIA" (SEA, 2015)), Native Forest formations of Prosopis Tamarugo were detected, because it is a scarce area arid due to the presence of a species classified as Endangered; however, the project does not affect the habitat of Prosopis Tamarugo.
Wild Animals
38 native species were identified: 27 birds, 7 mammals and 4 reptiles.
18 species were identified in some state of conservation:
In danger: Black tern, little tern.
Vulnerable: Garuma Seagull, Nun Seagull, Humboldt Penguin, Guanay, Stolzmann's Dragon, Chungungo (detected exclusively in the Patillos Islote sector).
Near Threatened: Northern Mouse-Eared Bat.
Rare: Teresa's Corridor
Sufficiently known: Tamarugal Sebo-Eater, Lile;
Least Concern: Four-banded Racer, Booby, Common Sea Lion, Great Northern Gecko, Chilla Fox, Culpeo Fox.
Six Exotic species were detected: Dog, Donkey, Mule, Goat, hare and Guarén.
The coastal sector had the greatest richness of species, with 20 detected. This was followed by the Pampa del Tamarugal National Reserve sector, with 14 species, and then the pampas sector, with 9 species. In particular, the lesser tern was detected in the coastal sector (Chanavayita sector), with 7 adults and 5 active nests in the incubation stage. The black tern and other species of the family Procellaridae were detected only through carcasses, and no nesting sites were found. The Garuma gull was sighted in the coastal sector and in the pampas sector, with 9 sightings of adults and detection of isolated nesting events.
Fungi and Lichens
No fungal species were detected in the study area. 36 species of lichens were detected, four of which are in a conservation category: Acarospora Altoandina and Acarospora Rhabarbarina, both in the Data Deficient category; and Acarospora Bullata and Polycauliona Ascendens in the Least Concern category.
Biological Oceanography
A marine baseline was conducted, taking as the study area (larger than the area of influence of the project) a sector of the Bay of Patillos and a sector north of Caleta Caramucho.
In the sampling period (winter 2017 to winter 2018) the number of identified phytoplankton taxa varied between 41 and 47; of Zooplankton varied between 24 and 68.
With respect to fish, 16 taxa were found, the most abundant being Burrito (C. crusma), Bilagay (C. variegatus) and Borrachilla (Scartichthys spp). The highest abundance of fish was observed in transects with rocky substrate.
Human Environment
For the definition of the area of influence of the project's human environment, the sectors that had some type of housing, productive and/or cultural use were considered. Accordingly, the settlements of Chanavayita, Caleta Cáñamo and Caramucho, corresponding to the Coast sector, and the settlements of Colonia Pintados and Victoria, corresponding to the Pampa sector, were considered.
|
|
|
|
|
|
|
|
|
| SQM TRS Nueva Victoria |
|
Pag. 183 |
Figure 17-3. Sectors of the Area of Influence
|
|
|
|
|
|
|
|
|
| SQM TRS Nueva Victoria |
|
Pag. 184 |
Cultural Heritage
In paleontological terms, the sector where the project is located has a low to medium potential. Most of the geological units of the sector did not present paleontological findings of interest during the survey; however, the Coastal Deposits Unit (PIHI) shows medium to high potential, having shown a finding of fossil pieces in the field, in addition to its characteristics.
Regarding archaeology, a survey found 3,017 heritage elements in influence of the project. They were classified into five categories: 761 point finds, 194 aerial type finds, 239 linear type finds, 71 lithic sites and 1,752 calicheros. The linear elements were mostly classified as roadways, totaling almost 410 km in length. Specific finds are divided into isolated finds, signaling structures, animal skeletons, and stone inscriptions. Regarding the time of the findings, 76% were dated as chronologically historical, with 5.5% dating from pre-Hispanic times.
17.1.2Environmental Impact Study
As for the Pampa Hermosa Project, based on the results of the EIA (Chapter 5), the activities of the project and their possible environmental impacts were analyzed. This made it possible to identify the environmental components that could be directly or indirectly affected during the different phases of the project and where they are located.
For those significant environmental impacts, management measures were designed to mitigate, repair, and compensate the relevant affected elements.
|
|
|
|
|
|
|
|
|
| SQM TRS Nueva Victoria |
|
Pag. 185 |
The following table summarizes that information.
Table 17-1. Environmental Impacts of the Pampa Hermosa Project and Committed Measures
|
|
|
|
|
|
|
|
|
|
|
|
| Impact |
Phase in
which it
occurs |
Type of measure |
Measures |
| Decrease in surface water level in the Salar de Llamara ponds (púquios) |
Operation |
Mitigation |
Implementation of a hydraulic barrier: consist of injecting water between the pumping sector and the ponds, to induce an increase in the aquifer level so as to generate a water divide that isolates the hydraulic behavior of both sectors and prevent the cone of depression from spreading and affecting the water level of the ponds. This impact is modified through the EIA "Partial modification of the reinjection system in the Llamara reservoirs" |
| An Early Warning Plan "PAT" has been designed, which should be understood as an environmental management tool complementary to the implementation of the hydraulic barrier, i.e., the PAT would be activated if the hydraulic barrier runs the risk of not being efficient enough to meet the environmental objectives defined for the Púquios and hydromorphic vegetation. This impact is modified through the EIA "Partial modification of the reinjection system in the Llamara reservoirs" |
| The alteration of the vital state of natural Tamarugo formations and of the habitat for flora species in the Salar de Llamara |
Operation |
Mitigation |
Staggered groundwater withdrawal and the exclusion of groundwater withdrawal from the 45 l/s well TC-10. |
| An Early Warning Plan has been designed that contemplates the application of warning and recovery measures aimed at maintaining population vitality values, the main measures to be implemented being a) Irrigation of tamarugos during the Warning Phase and b) Reduction of pumping flow during the Recovery Phase. |
| Tamarugo recovery irrigation program: the purpose of this program would be to recover the vitality of the Tamarugo of the Salar de Llamara that could be affected by water stress due to the pumping of the Project. For this purpose, it is considered to irrigate specimens that are in regular or bad condition, according to the amount of Tamarugo that exceeds the threshold defined for the activation of the Tamarugo alert for a certain period. This measure will be linked to the Early Warning Plan of the Llamara Tamarugo System, consequently it will be implemented together with the actions of the Tamarugo alert and recovery phase, as appropriate. |
| The alteration of the livelihood systems of tenant ranchers who use the Pampa del Tamarugal National Reserve due to water extraction. |
Construction, operation, and closure |
Mitigation |
Change of well catchment point |
| Staggered water withdrawal |
| Tamarugo plant production program |
| Tamarugo planting program |
| Program to support phytosanitary control of Tamarugo trees |
| Program for sustainable management of tamarugo trees |
| Productive development program for cattle ranchers |
| SQM commits not to affect the livelihood systems of the Quillagua Community in the Quebrada Amarga sector; to maintain monthly contact with the leadership of the Community in order to monitor the generation of any situation related to the project in the sector and, in the event that the information provided by the leadership indicates any situation attributable to the project, the respective measures will be taken in order to maintain the commitment of not affecting; and submit an annual report to the competent authority on these contacts with the Quillagua leadership, the situations detected that are attributable to the project and the actions taken for such purposes. |
| The alteration of cultural heritage |
Construction, operation, and closure |
Mitigation |
An archaeological exclusion area will be created for the geoglyphs, lithic workshops, burial sites and recorded animites, where the application of mitigation measures focused on signage and fencing is proposed, to ensure their protection and safeguarding. |
| Compensation |
Materials recovered in the different compensation activities will have a definitive destination such as the Saltpeter Museum Corporation of Humberstone |
| Plan for the study, preservation, and enhancement of the Pintados Station |
Source: own elaboration, based on information obtained from RCA N°890/2010
|
|
|
|
|
|
|
|
|
| SQM TRS Nueva Victoria |
|
Pag. 186 |
The Pampa Hermosa Project is currently in a sanctioning process (Sanctioning File D-027-2016) for the infractions detected by the authority during 2016 in relation to the breach of certain commitments established in the Environmental Assessment Resolution (RCA 890/2010) of the project, mainly associated with water resources and their impact on environmental systems (public, tamarugos). Along these lines, in 2019 SQM presented an adequate plan to address this issue: a revised and corrected Environmental Compliance Program, which incorporates the observations made by the authority, complying with the contents and criteria established and legal requirements to ensure compliance with the requirements infringed.
PDC Approved on 02.26.2019 by Res. Ex N°24/Rol D-027-2016. and amended by Res. Ex. N°27/ Rol D-027-2016, 08.11.22.
This program establishes concrete actions to improve knowledge and follow-up of the environmental systems that make up the project, recognizes the role of the communities, and provides greater transparency in the monitoring of environmental variables. The final report was submitted in 2023, and the response from the Environmental Superintendency (SMA) is awaited.
It should be noted that the EIA "Partial modification of the reinjection system in the Llamara reservoirs", mentioned above, was presented as part of the commitment of this Compliance Program that the company presented. The project corresponds to a modification of the Pampa Hermosa project (RCA N°890/2010), geographically limited to the "Púquios Sector in Salar de Llamara", and its objective is to modify the mitigation measure of recital 7.1.1 of RCA N° 890/2010, which is oriented to minimize the secondary impacts that water extraction will have on biotic systems present in the area of influence of the project, allowing to maintain the surface levels of the ponds in such a way as not to affect the aquatic and terrestrial biota surrounding them. The project also modify the Phase I Alert Llamara Aquifer of the Early Warning Plan, as well as to strengthen the monitoring plan associated with the Púquios of Llamara.
As for the Tente en el Aire project, it aims to incorporate new mine areas into the "Nueva Victoria" mine to produce salts rich in iodide, iodine, and nitrate, which implies an increase in the total amount of caliche to be extracted, in the production of salts rich in iodide, iodine and nitrate and in the use of seawater for these processes.
|
|
|
|
|
|
|
|
|
| SQM TRS Nueva Victoria |
|
Pag. 187 |
The environmental impacts of this project and the measures proposed by the company to mitigate, repair, or compensate those impacts are in the following table:
Table 17-2. Environmental Impacts of the Tente en el Aire Project and Committed Measures
|
|
|
|
|
|
|
|
|
|
|
|
| Impact |
Phase in
which it
occurs |
Type of measure |
Measures |
| Intervention of relevant nesting habitat for the nesting of the little tern Chanavayita |
Construction, operation, and closure |
Mitigation |
Construction outside the breeding season of the Little Tern and installation of an automatic noise monitoring station outside the nesting area. |
| Permanent environmental inspector during the construction phase |
| Relocation of works near the "Chanavayita" site: installation of work sites 1 and linear works. |
| Apply soundproofing measures during construction and operation: acoustic screens during construction and encapsulation of auxiliary pumping station during operation. |
| Compensation |
Management measures plan for the nesting site at the Chanavayita access: strengthen dog control at the municipal kennel; install allusive signage at the nesting site at the Chanavayita access; environmental education plan; and research program to characterize the habitat and reproductive dynamics of the little tern at the Chanavayita site. |
| Intervention of relevant nesting habitat for the nesting of sea swallows in the northern sector of the project. |
Construction, operation, and closure |
Mitigation |
Prohibition of construction during the swallow's breeding season. |
| Prohibition of mining exploitation during the operation phase |
| Prohibition of removal of facilities during the reproductive season |
| Extension of the protection buffer of the swallow nesting site "Pampa Hermosa". |
| Extension of the exclusion area and prohibition of mining activities in the "Pampa Hermosa" nesting site, because of the previous measure. |
| 20m protection buffer around potential nesting sites with nesting records, close to the route of the project's linear works. |
| Compensation |
Compensation measure MC-4 "Protection of the Exclusion Area": the owner agrees not to explore or exploit this mining property or those in his name that are not included in the project; he agrees to require the constitution of encumbrances on the surface properties. |
| Alteration of archaeological cultural heritage |
Construction and operation |
Mitigation |
MM1- Induction lectures in Paleontology |
| MM2- Rescue of elements of paleontological interest and release of area (surface) |
| MM3- Ongoing paleontological monitoring during construction in coastal sector |
|
MM4- Creation of archaeological cultural heritage protection areas |
|
MM5- Permanent archaeological monitoring during construction |
|
MM6- Induction lectures in archeology |
|
Compensation |
MC1- Improvement or fitting out of the warehouse of the Saltpeter Museum Corporation for the conservation of cultural heritage pieces. |
| Alteration of paleontological cultural heritage |
MC2- Scientific-educational publication on local and regional paleontology. |
| MC3- Intensive archaeological survey and documentation |
| MC4- Protection of the exclusion area |
Source: based on RCA N°20210100112/2021
|
|
|
|
|
|
|
|
|
| SQM TRS Nueva Victoria |
|
Pag. 188 |
17.2OPERATING AND POST CLOSURE REQUIREMENTS AND PLANS
17.2.1Waste Disposal Requirements and Plans
During mining operations, two types of waste are generated. Mineral and non-mineral waste.
Mineral wastes
Mineral waste or mining residues refer in this case to inert salts are called waste salts. These salts are transported to certain areas for deposit, piling up on the ground in the form of cakes.
For this purpose, the Nueva Victoria site has the Sectoral Permit for the Collection of Discarded Salts presented and approved by the authority in accordance with current regulations (article 339 of Supreme Decree No. 132/2002, Mining Safety Regulations of the Ministry of Mining, for the establishment of a landfill.), additionally, it has the corresponding environmental authorization.
Currently, the discarded salts are deposited in stockpiles in the industrial zone of Sur Viejo (in an area of approximately 1,328 ha that also includes storage areas for the final product). However, in the Tente en el Aire project (environmentally approved in November 2021), which expands the current operation of Nueva Victoria, a new deposit is contemplated to dispose of the discarded salts from the evaporation pools and the waste of the neutralization process. This new tank will have an area of 360 ha in which material accumulation cakes up to 50 m high will be placed, resulting in an estimated total capacity of 102,500,000 tons (4,997,000 t/y of discard salts and 110,150 t/y of gypsum), to test the project “Waste dump corresponding to deposits of discarded salts, project Tente en el Aire" la Res. Ex 424/2022. These salts are neutral and pose no health risks as declared by the authority.
Regarding the management of these deposits, it should be noted that the hygroscopic properties of the salts that compose them favor compaction and subsequent cementation.
Given these characteristics (salts that form a crust and the level of final impregnation in brine of the residue of the neutralization process is approximately 20%), no emissions of particles or gases are generated.
Regarding the management of possible effluents, the new tank will have a perimeter drainage system, which will allow, on the one hand, the collection of the solutions resulting from the runoff or runoff generated by the impregnation solutions, which will be channeled to 4 collection ponds for later pumping to the evaporation ponds and on the other hand, The function of this drainage system will be the channeling of rainwater.
The waste salt deposits are committed to being monitored annually to verify that they are in accordance with the design variables and at the closure of the mine the discard salts and residues of the brine neutralization process will be maintained.
Non-mineral waste
All types of waste can be classified as non-mineral waste, which in turn can be classified as Hazardous Waste and Non-Hazardous Waste according to the environmental and sectoral regulations in force in Chile.
Among the non-hazardous waste associated with this type of projects, we can mention solid waste assimilable to households, sludge from the wastewater treatment system, containers of non-hazardous inputs, non-hazardous discards, waste associated with maintenance and generated products of the actions carried out in contingencies, among others.
Hazardous waste (RESPEL) comes from process discards, used maintenance lubricating oil generated by changing equipment and machinery, batteries, paint residues, ink cartridges, fluorescent tubes, contaminated cleaning materials, among others.
The disposal of this type of waste has the current environmental and sectoral legal authorizations declared in section 17.3.
Additionally, the company in its 2020 Sustainable Development Plan contains a set of commitments, among which is to reduce the generation of industrial waste by 50% by 2025.
17.2.2Monitoring and Management Plan Established in the Environmental Authorization
The contents of the Environmental Monitoring Plan agreed for the implementation of the Pampa Hermosa project include: Project Phase, Environmental Components to be measured and controlled, Associated Environmental Impacts, Monitoring Plan, Measurement Methods or Procedures, Location of Monitoring Points, Parameters that are used to characterize the state and evolution of said component, Permitted or committed levels or limits, Duration and frequency of the monitoring plan according to the stage of the project, Delivery of Report with monitoring results, Indication of the competent body that would receive such documentation, and Location in the evaluation history.
|
|
|
|
|
|
|
|
|
| SQM TRS Nueva Victoria |
|
Pag. 189 |
The Hydrogeological Environmental Monitoring Plan of the "Pampa Hermosa" Project is the same Environmental Monitoring Plan (PSA) of the Aducción Llamara Project (committed by RCA No. 32/05 and modified according to Resolution No. 097/07). In this way, the commitments of the PSA Aducción Llamara will be incorporated into the PSA Pampa Hermosa.
For the implementation of the "Tente en el Aire" project, a monitoring plan for the different components was committed. This plan states the following:
⮚Regarding the cultural heritage component the follow-up plan includes induction talks on paleontology; rescue of elements of paleontological interest and release of the area (surface); permanent paleontological monitoring during construction in the coastal sector; scientific-didactic publication on local and regional paleontology; creation of areas for the protection of archaeological cultural heritage; permanent archaeological monitoring during construction; induction talks on archaeology; and intensive archaeological prospection and documentation. Likewise, improvement or adaptation of the winery of the Saltpeter Museum Corporation for the conservation of pieces of cultural heritage.
⮚Regarding the wild animal component, the monitoring plan includes the exclusion of the mining area at tern nesting sites; modification of layout and establishment of precautionary areas in linear works at tern nesting sites; Chanavayita little tern nesting site; protection of the exclusion area; study of the ecology, phenology and ethology of the tern (Procellariformes: Hydrobatidae) in the Pampa Hermosa; research program on the increase of habitat use in the nesting site "Pampa Hermosa".
17.2.3Requirements and Plans for Water Management during Operations and After Closure
The extraction of water for the Nueva Victoria industrial operation is environmentally approved and totals 810 L/s, considering the use of 570.8 L/s of water approved in RCA 890/2010, a flow that is additional to the 120 L/s contemplated by the EIA “Lagunas” (RCA 58/1997) and the 120 L/s considered in the DIA “Extraction of Groundwater from Salar de Sur Viejo” (RCA 36/1997) and DIA “Expansion Nueva Victoria” (RCA 04/2005).
It should be noted that the last environmentally approved project (EIA "Tente en el Aire" - RCA 20210100112/2021), did not increase the projected freshwater requirement despite an increased rate of exploitation and processing of caliche, by relying on the use of 900 l/s of seawater.
The extraction is carried out from the 5 locations detailed in Table 17-3, located in the Salar de Sur Viejo, Salar de Llamara and the Pampa del Tamarugal (environmental protection area), comprising principally groundwater sources with a minor component of surface waters.
Table 17-3. Monthly Average Flow Period 2022 Nueva Victoria
|
|
|
|
|
|
|
|
|
|
|
|
|
|
|
|
|
|
| Sur Viejo (l/s) |
Llamara (l/s) |
Iris (l/s) |
Soronal (l/s) |
CPC (l/s) |
Total flow (l/s) |
| 103 |
204 |
60.4 |
126 |
122.8 |
616 |
| 17% |
33% |
10% |
20% |
20% |
100% |
Table 17-4 shows how the water resources are distributed among the different sectors of the Nueva Victoria operation.
Table 17-4. Distribution of Freshwater Consumption Between the Various Components of the Nueva Victoria Operation.
|
|
|
|
|
|
|
|
|
|
|
|
|
|
|
|
|
|
| Pozas (l/s) |
Puquíos injection (l/s) |
Mine (l/s) |
Processing Plant (l/s) |
Camp (l/s) |
Leaching (l/s) |
| 2.3% |
4.6% |
0.8% |
1.3% |
0.3% |
90.7% |
Information on water extraction n from natural sources is public, being reported to the Chilean Regulatory Authority through the reporting component of the Environmental Monitoring Plan (PES).
The PES fulfills the objective of monitoring the ecosystems that may be affected by a project, thus guaranteeing their conservation and the permanence of the ecosystem services they provide. Hydrogeological reports include groundwater levels, hydro chemical quality of groundwater and surface water, and cumulative pumping rates and volumes from supply wells and surface water extraction points.
The PES also documents the mitigation measure of injecting water to generate a hydraulic barrier to protect the Púquios wetlands against the lowering of the water table associated with the extraction of groundwater from the Llamara aquifer.
|
|
|
|
|
|
|
|
|
| SQM TRS Nueva Victoria |
|
Pag. 190 |
The chemical quality of the injected water is monitored to ensure that the hydrochemistry of groundwater in the Púquios wetlands is not adversely affected.
As stablished in the update of the Closure Plan (Exempt Resolution 814/2022) of the Nueva Victoria site, the works or actions contemplated for closure in relation to water resources are the removal of metal structures, pipes, and equipment, disabling of pumping wells, removal of steel pipes, removal of power lines, removal of substations and removal of waste.
17.3ENVIRONMENTAL AND SECTORIAL PERMITS STATUS
The project has been submitted 15 times to the SEIA. In 9 cases the projects were submitted through Environmental Impact Statements (EIS) and in 4 cases through Environmental Impact Assessments (EIA) and in all cases the projects were authorized by the environmental authority. Chapter 17.1 contains the environmental authorization for each project.
Additionally, the Project required different sectorial permitting for operating. The following table shows the sectorial permits defined in each RCA as applicable to each project:
|
|
|
|
|
|
|
|
|
| SQM TRS Nueva Victoria |
|
Pag. 191 |
Table 17-5. Sectorial Permits Defined in the Environmental Resolutions
|
|
|
|
|
|
|
|
|
| Name of the Sectorial Permit (PAS) |
PAS Number |
Sectorial Approval Resolution |
| Permit to carry out research fishing |
119 |
RCA 20210100112 approved by Resolution No. 20210100112/2021. |
| Permit for archaeological excavations |
132 or Ex 76 |
RCA 042/2008.Approved by Resolution No. 5175/2012; 4531/2014; 1493/2015; 548/2020
RCA124/2008. Approved by Resolution No. 659/2009
RCA 890/2010. Approved by Resolution No. 5416/2010; 6164/2010; 568/2011; 149 0/2011; 3738/2011; 5802/2011; 6613/2011; 2974/2012; 3851/2012; 1947/2014; 3502/2015; 1950/2018; 3772/2021; 28 48/2020.
RCA 076/2012. Approved by Resolution No. 3885/2012
RCA 20210100112 Approved by Resolution No. 3395/2022 (paleontology); Resolution No. 5043/2022; 113/2023.
|
| Permit for stockpiling mining waste |
136 or EX 88 |
RCA 004/2005; RCA 173/2006; 042/2008; RCA 076/2012. Approved by Resolution No. 2552/2015, 2129/2020 (leaching piles); 2959/2016 (discarded stockpiles)
RCA 890/2010 Approved by Resolution No. 2129/2020 (lix batteries); 2959/2016; 1570/2020 (discarded stockpiles)
RCA 20210100112 approved by Resolution No. 424/2022. (discarded stock piles)
|
| Approval of the mining closing plan |
137 |
RCA 890/2010 Approved by Resolution No. 515/2012.
RCA (036/1997; 058/1997; 04/2005; 032/2005; 173/2006; 094/2007; 042/2008; 070/2008; 076/2012) Approved by Resolution No. 1858/2015.amended by Res. No. 2817/2015.
Resolution No. 814/2022, as amended by Res. No. 1511/2022 . (Update PdC. Includes ASD)
|
| Permit for the construction, modification, and expansion of any public or private work for the evacuation, treatment, or final disposal of sewage water |
138 or Ex 91 |
RCA 004/2005, Approved by Resolution No. 2543/2006
RCA 124/2008. Approved by Resolution No. 3428/2014
RCA 890/2010. Approved by Resolution No. 1970/2013; 3079/2011; 3427/2014; 339/2018.
|
| Permit for the construction, modification, and expansion of any public or private facility for the evacuation, treatment, or final disposal of industrial or mining waste |
139 |
Not requerid |
| Permit for the construction, modification and expansion of any garbage and waste treatment plant of any kind; or for the installation of any place for the accumulation, selection, industrialization, trade or final disposal of garbage and waste of any kind. |
140 or Ex 93 |
RCA 004/2005. Approved by Resolution No . 1813/2006; 2167/2014
RCA 124/2008. Approved by Resolution No. 2547/2010.
RCA 890/2010. Approved by Resolution No. 1807/2016; 758/2018; 17581/2021; 2482/2019
|
| Permit for the construction of a site for the storage of hazardous wastes |
142 |
RCA 890/2010. Approved by Resolution No. 081/2018; 753/2018. |
| Permit for the hunting or capture of specimens of animals |
146 |
RCA 20210100112 approved by Resolution No. 80/2022; -82/2022; -86/2022. |
| Permit for the construction of some hydraulic works |
155 |
RCA 20210100112 Seawater pools. Approved by Res N°: Solar evaporation ponds in process. |
| Permit for the modification of a watercourse |
156 |
RCA 20210100112. Approved by Resolution N°. 139/2022 |
| Permit to subdivide and urbanize rural land to complement an industrial activity with housing, to equip a rural sector, or to set up a spa or tourist camp; or for industrial, equipment, tourism, and population constructions outside the urban limits. |
160 or Ex 96 |
RCA 124/2008. Approved by Resolution N°. 577/2011 |
| Permit for the qualification of industrial or warehousing establishments. |
161 |
RCA 004/2005 Approved by Resolution N°. 686/2014 |
Source: Elaboration by SQM
|
|
|
|
|
|
|
|
|
| SQM TRS Nueva Victoria |
|
Pag. 192 |
Additionally, an authorization of the Exploitation Method and Processing Plants is required. These authorizations are:
⮚Res. Annex 1447/2018. Exploitation method update – Office Iris
⮚Res. Ex. 1646/2011. Approves the Project "Update of Operation Nueva Victoria ".
⮚Res. 1602/2010. Approves Project "Stockpiles of discarded salts Sur Viejo."
⮚Res. 621/2006. Increase in the exploitation of caliche in Nueva Victoria.
⮚Res. 1469/2005. Regularization of the mine Exploitation Method and treatment of minerals and expansion of the Nueva Victoria mine and iodine plant.
⮚Res.1351/2004. Regularization of the Exploitation Method and Processing Plants of the Iris office.
⮚Res. Ex. 515/2012. Update Exploitation Method, Mineral Treatment and Closure Plan.
⮚Res. Ex. 121/2022. Tea Project Benefit Plant.
17.4SOCIAL AND COMMUNITY
This sub-section contains forward-looking information related to plans, negotiations or agreements with local individuals or groups for the Project. The material factors that could cause actual results to differ materially from the conclusions, estimates, designs, forecasts, or projections in the forward-looking information include any significant differences from one or more of the material factors or assumptions that were set forth in this sub-section including that regulatory framework is unchanged for Study period; no unforeseen environmental, social or community events disrupt timely approvals.
17.4.1Plans, Negotiations or Agreements with Individuals or Local Groups
The company has established agreements with indigenous and non-indigenous organizations on different aspects that derive both from previous commitments and from programs associated with corporate policies on community relations, for example:
⮚Progress in the processing of the agroforestry project presented by CONAF for funding by the Tarapacá regional government. In turn, define short-term actions to advance towards preservation and sustainable use of lot 103, such as plantations, pruning, and cleaning of channels. For these last actions, the Aymara Community of Quillagua will provide volunteers, develop them, and have the material and economic resources for their realization.
⮚Develop an outdoor educational program for early childhood in Quillagua, considering as initial actions the realization of a diploma with the Universidad del Desarrollo so that professionals from the Quillagua kindergarten can specialize in related educational processes. Also, advance in the design of the new kindergarten and the delivery in lease or usufruct or another form of a lot for the installation of this new establishment. The financing of this educational facility will be defined jointly afterwards, complying with the steps described here and should prioritize obtaining resources from the Antofagasta regional government or similar.
⮚Continue supporting all necessary actions to maintain operational continuity in the supply of potable water in Quillagua, whose purification and distribution system is managed by the Rural Potable Water Committee of Quillagua (APR). In this sense, continue with specialized consultancy and training of APR operators, conduct an assessment of the state, and replacement or improvements of the osmosis plant, and expand the capacity of the water storage tank to advance towards the operational continuity of the plant, especially during summer periods.
Regarding contributions:
1.Acquisition of a vehicle for APR
2.Acquisition of APR batteries
3.Acquisition of a vehicle for the community
4.Repairs, community headquarters (fire)
5.Operation of Chug - Chug (6 months)
SQM will provide the Aymara community of Quillagua with 17 hectares of the Monte de Oro property for the development of the Forest Management Oasis of Quillagua project, financed by the National Fund for Regional Development, with a 15-year renewable lease.
|
|
|
|
|
|
|
|
|
| SQM TRS Nueva Victoria |
|
Pag. 193 |
SQM will carry out the channel cleaning works in a participatory manner with the related organizations of Quillagua and in accordance with the practices and traditions of the Aymara Community of Quillagua. If there are expenses associated with these tasks, they will be covered by SQM.
However, within the framework of the company's relationship policies, the following working groups are maintained:
IQUIQUE
1.Working Group of the Union of Fishermen N° 1 of Chanavayita.
2.Working Table of the Union of Fishermen N° 2 of Chanavayita.
3.Working Table of the Union of Fishermen N° 3 of Chanavayita.
4.Working Table of the Union of Fishermen N° 4 of Chanavayita.
5.Working Table of the Union of Fishermen N° 5 of Chanavayita.
6.Working Table of the Fishermen's Guild N° 6 Chanavayita.
7.Working Table social organizations at Caramucho.
8.Working Group of Coastal Unions, which brings together: Union N° 1 of Caramucho, Union of Fishermen N° 2 of Caramucho and Union of Hemp Fishermen.
9.Working Group Fishermen's Union N°3 Caramucho
10.Working Table social organizations at Cáñamo.
11.Working Table of the Fishermen's Guild N° 1 Cáñamo.
POZO ALMONTE
1.Working table of "Asociación Indígena Multiétnica Tierras de Jehová" of Colonia Pintados
2.Working Group of the "Asociación Indígena Aymara Juventud del Desierto"
3.Working table Victoria Office Neighborhood Council.
4.Working table with GHPPI Familia Choque, Bellavista Sector, RNPT
5.Working table with the Sandra Vicentelo Family, Tamentíca.
6.Working agreement with "GPHI Tamentíca".
7.Working Group Aymara Indigenous Association Campesinos Pampa del Tamarugal.
8.Working Group of Dairy Cooperatives and Dairy Producers of Tarapacá.
9.Working table "Asociación Indígena de la Huayca" at La Huayca.
10.Working table "Grupo Humano Perteneciente a Pueblo Indígenas Comunidad de la Huayca – Familia Ceballos" at La Huayca.
11.Working table with "Asociación Indígena Aymara Campesina Pampa del Tamarugal".
12.Working table " Comunidad Indígena Quechua de Huatacondo" at Huatacondo.
|
|
|
|
|
|
|
|
|
| SQM TRS Nueva Victoria |
|
Pag. 194 |
17.4.2Purchasing Commitments or Local Contracting
Notwithstanding the foregoing, as part of its community relations policy, SQM has programs aimed at hiring local labor, such as:
⮚Employability Workshops aimed at improving curriculum vitae for job interviews.
⮚More Suppliers Program of Tarapacá.
⮚Development Program of Agricultural Suppliers in the Province of Tamarugal.
⮚Channel of diffusion with Municipal Office of Information Laboral of the Municipality of Pozo Almonte of labor offer of the company.
⮚Channel of dissemination and follow-up with the organizations attached to the different instances of local collaboration (Work Tables) of labor offer of the company.
⮚Educational support program with Liceo de Pozo Almonte for labor induction and professional practices
17.4.3Social Risk Matrix
There is no specific risk matrix to assess these aspects at the corporate level. In the framework of the working meetings for the preparation of this report, it was indicated that there are initiatives to evaluate these aspects but that they lack a specific program or derive from a specific commitment or objective.
17.5MINE CLOSURE
This sub-section contains forward-looking information related to mine closure for the Project. The material factors that could cause actual results to differ materially from the conclusions, estimates, designs, forecasts or projections in the forward-looking information include any significant differences from one or more of the material factors or assumptions that were set forth in this sub-section including prevailing economic conditions continue such that unit costs are as estimated in constant (or real) dollar terms, projected labor and equipment productivity levels are appropriate at time of closure and estimated infrastructure and mining facilities are appropriate at the time of closure.
17.5.1Closure, Remediation, and Reclamation Plans
During the stage of the Project, the measures established in the "Faena Nueva Victoria" Closure Plan approved by the National Geology and Mining Service (SNGM) will be maintained, through the update of the “Nueva Victoria e Iris” Mining Slaughter Plan (RPC -57.1 585), approved on May 16, 2022, through Exempt Resolution N° 814 and modified by Exempt Resolution N°. 1511, by the National Geology and Mining Service (SERNAGEOMIN). This update includes the
|
|
|
|
|
|
|
|
|
| SQM TRS Nueva Victoria |
|
Pag. 195 |
following mining sites resolutions. Resolution N°. 1858 of 2015, as amended by Resolution N°. 2817 of 2015 implemented.
|
|
|
|
|
|
|
|
|
|
|
|
| N° |
Project Name |
Resolution |
Year |
| 1 |
Regularization of the Exploitation Method and Plants Iris Office Benefit |
1351 |
2004 |
| 2 |
Regularization of Mine and Mineral Treatment Method and Expansion of Nueva Victoria Mine and Iodide Plant |
1469 |
2005 |
| 3 |
Modify RCA N°004/2005 |
88 |
2016 |
| 4 |
Increased Caliche Exploitation in Nueva Victoria |
621 |
2006 |
| 5 |
Iris Slaughter Closure Plan |
376 |
2009 |
| 6 |
Deposit of Discarded Salts Sur Viejo |
1602 |
2010 |
| 7 |
Update Operation New Victoria |
1646 |
2011 |
| 8 |
Pampa Hermosa: Update Exploitation Method, Mineral Treatment and Closure Plan |
515 |
2012 |
| 9 |
Partial temporary shutdown of the Iris Iodine Plant |
49 |
2014 |
| 10 |
Closure Plan for Nueva Victoria Mining Site |
1858 |
2015 |
| 11 |
Modifies Exempt Resolution N°. 1858/2015 |
2817 |
2015 |
| 12 |
Update Exploitation Method – Iris Office Site |
1447 |
2018 |
| 13 |
Discard salts as sterile dumps |
424 |
2022 |
| 14 |
Approval of waste dumps corresponding to Depleted Leaching Piles "Faena Nueva Victoria" |
2129 |
2020 |
| 15 |
TEA Project Benefit Plant |
121 |
2022 |
| 16 |
Exploitation Methods TEA Project |
47 |
2022 |
Among the measures to be implemented are the removal of metal structures, equipment, materials, boards and electrical systems, de-energization of facilities, closure of accesses and installation of signaling. The activities related to the cessation of operations of the Project will be carried out in full compliance with the legal provisions in force on the date of closure of the Project, especially those related to the protection of workers and the environment.
Closing measures
The following are the closure and post-closure measures for the main or remaining facilities, i.e., those that remain on the site after the end of the mine's useful life. The remaining facilities are the leach heaps, tailings ponds and solar evaporation ponds.
In the case of the waste collection, slope stabilization measures will be carried out in the post-closure phase. For the closure of the leaching piles, the removal of structures, equipment, electrical equipment, concrete structures, support structures and pipes, as well as the closure of accesses and installation of closing signals, will be considered. For the closure of the solar evaporation pools, measures were defined for the removal of nitrate-rich salts, removal of parapets, concrete structures, and support structures.
For the rest of the complementary and auxiliary installations, the measures are also aimed at protecting the safety of people and animals, and are basically the dismantling of structures, closure of roads, signaling installation, de-energization of the facilities and perimeter closures, and leveling of the land.
All measures are of the "Personal Security" type and the means of verification corresponds to photographic reports.
Risk Analysis
SERNAGEOMIN, in consideration of Law 20,551 and Supreme Decree N°41/2012, requests owners to carry out a risk assessment that considers the impacts on the health of people and the environment in the context of the closure of the mining site at the end of its useful life. This risk assessment was carried out considering the Risk Assessment Methodology for Mine Closure currently in force. The results of the assessment indicate that the risks associated with the remaining facilities of the Nueva Victoria Mine and TEA project are Low and Not Significant (see Table 17-6).
|
|
|
|
|
|
|
|
|
| SQM TRS Nueva Victoria |
|
Pag. 196 |
Table 17-6. Risk Assessment of the Main Facilities at the Nueva Victoria and TEA Project Mine
|
|
|
|
|
|
|
|
|
|
|
|
|
|
|
|
|
|
| Register |
Risk |
Description of Risk |
Level Nueva Victoria |
Level Project Tea |
Significance |
| Solar Evaporation Ponds |
| PE1 |
PE1.P |
To people due to failure in the slope of the pool, which exceeds the exclusion zone due to an earthquake. |
LOW |
LOW |
Non- significant |
| PE1.MA |
To the Environment due to failure in the slope of the pool, which exceeds the exclusion zone because of an earthquake. |
LOW |
LOW |
Non- significant |
| PE2 |
PE2.P |
To persons for DAR infiltration |
LOW |
LOW |
Non- significant |
| PE2.MA |
To the environment by DAR infiltration |
LOW |
LOW |
Non- significant |
| Discard salt deposits |
| DE1 |
DE1.P |
To people due to groundwater contamination from rainfall (infiltration of solutions). |
LOW |
LOW |
Non- significant |
| DE1.MA |
To the environment due to groundwater contamination caused by rainfall (infiltration of solutions). |
LOW |
LOW |
Non- significant |
| DE2 |
DE2.P |
To people due to groundwater contamination from floods/floods |
LOW |
LOW |
Non- significant |
| DE2.MA |
To the environment due to groundwater contamination caused by floods/floods |
LOW |
LOW |
Non- significant |
| DE3 |
DE3.P |
To people due to particulate emissions into the atmosphere caused by wind. |
LOW |
LOW |
Non- significant |
| DE3.MA |
To the environment due to particulate emissions to the atmosphere caused by wind |
LOW |
LOW |
Non- significant |
| DE4 |
DE4.P |
To people due to surface water pollution caused by heavy rainfall |
LOW |
LOW |
Non- significant |
| DE4.MA |
To the Environment due to surface water contamination caused by heavy rainfall |
LOW |
LOW |
Non- significant |
| DE5 |
DE5.P |
To people due to surface water contamination caused by floods |
LOW |
LOW |
Non- significant |
| DE5.MA |
To the Environment due to surface water contamination caused by floods |
LOW |
LOW |
Non- significant |
| DE6 |
DE6.P |
To people as a result of slope failure due to water erosion |
LOW |
LOW |
Non- significant |
| DE6.MA |
To the Environment for slope failure due to water erosion |
LOW |
LOW |
Non- significant |
| DE7 |
DE7.P |
To people due to slope failure as a result of an earthquake |
LOW |
LOW |
Non- significant |
| DE7.MA |
To the Environment due to slope failure caused by an earthquake |
LOW |
LOW |
Non- significant |
| MINE |
| MR1 |
MR1.P |
To people due to failure of the pit slope, which exceeds the exclusion zone due to an earthquake. |
LOW |
LOW |
Non- significant |
| MR1.MA |
To the environment due to failure of the pit slope that exceeds the exclusion zone because of an earthquake. |
LOW |
LOW |
Non- significant |
| MR2 |
MR2.P |
To people due to DAR infiltration from the mine |
LOW |
LOW |
Non- significant |
| MR2.MA |
To the environment due to DAR infiltration from the mine |
LOW |
LOW |
Non- significant |
Source: Annex 10 of the Nueva Victoria and TEA project Mine Closure Plan Update (in process).
|
|
|
|
|
|
|
|
|
| SQM TRS Nueva Victoria |
|
Pag. 197 |
17.5.2Closure Costs
The total amount of the closure of the mining site of the Nueva Victoria and Iris Project, considering closure and post-closure activities, amounts to 284,507 UF (272,272 UF for closure and 12,236 UF for post-closure). The following is a summary of the costs reported to the authority in the Update of the Closure Plan of the “Nueva Victoria e Iris” Mining Site (see Table 17-7 and Table 17-8).
Table 17-7. Nueva Victoria Mine Site Closure Costs
|
|
|
|
|
|
| Item |
Total (UF) |
| Total direct closing cost |
173,333 |
| Indirect Cost |
17,333 |
| Contingencies |
38,133 |
| VAT (19%) |
43,472 |
| Total |
272,272 |
Source: Annex 5, Addendum 2 to the Closure Plan Update Nueva Victoria and TEA project mine (in process)
Table 17-8. Nueva Victoria Mining Site Post-Closure Costs
|
|
|
|
|
|
| Item |
Total (UF) |
| Direct Cost |
7,789 |
| Indirect Cost |
779 |
| Contingencies |
1,714 |
| VAT (19%) |
1,954 |
| Total |
12,236 |
Source: Annex 5, Addendum 2 to the Closure Plan Update Nueva Victoria and TEA project mine (in process)
According to the technical report Useful Life presented technical and the constitution of the guarantees was made considering the total cost of the Closure Plan, and a useful life of 21 years, whose estimated operation would be until the year 2040. The following shows the development of the constitution of guarantees.
Table 17-9. General Background of Nueva Victoria
|
|
|
|
|
|
| GENERAL BACKGROUND |
| Discount Rate Used |
1.55% |
| Certified End of Life |
2040 |
| Year of Closure of the Mining Site |
2050 |
|
|
|
|
|
|
|
|
|
| SQM TRS Nueva Victoria |
|
Pag. 198 |
Table 17-10. Warranties by Installation of the Nueva Victoria Mine Closure Plan.
|
|
|
|
|
|
|
|
|
|
|
|
|
|
|
| TABLE OF WARRANTIES BY INSTALLATION |
| Installation |
Total Cost (UF) |
Year Completion
of Operations |
Year Start
of closure |
End of
Closure Year |
| Mine (Caliche) |
13,364 |
2040 |
2041 |
2050 |
| Mine Operation Center (COM) |
35,899 |
| Evaporation Pools and Neutralization System |
11,711 |
| Sea Water Supply |
51,824 |
| ND Iodide Plant |
7,529 |
| TEA Iodide Plant |
10,253 |
| NV Iodide Plant (TEA Project) |
5,107 |
| Iodine Plant NV |
4,690 |
| Iodide Plant - Iris Iodine |
20,939 |
| Iodine Plant NV (TEA Project) |
4,697 |
| Campgrounds and Offices |
7,985 |
| Industrial Water Supply |
47,442 |
| Mitigation Works Salar Llamara |
1,290 |
| Hazardous Waste Yard |
2,345 |
| Patio de Res. Non - Hazardous Industrial |
703 |
| Roads |
8,099 |
| Desenergization |
43 |
| Signage |
969 |
| Removal of Swimming Pools and Pools |
10,701 |
| Withdrawal of inputs |
26,681 |
| Contribution to the Post Closing Fund (UF) |
282,871 |
|
|
|
|
|
|
|
|
|
|
|
|
| SQM TRS Nueva Victoria |
|
Pag. 199 |
18CAPITAL AND OPERATING COSTS
This section contains forward-looking information related to capital and operating cost estimates for the Project. The material factors that could cause actual results to differ materially from the conclusions, estimates, designs, forecasts or projections in the forward-looking information include any significant differences from one or more of the material factors or assumptions that were set forth in this section including prevailing economic conditions continue such that unit costs are as estimated in constant (or real) dollar terms, projected labor and equipment productivity levels and that contingency is sufficient to account for changes in material factors or assumptions.
The main facilities for producing iodine and nitrate salts at the Nueva Victoria Site are as follows:
⮚Caliche Mining
⮚Heap Leaching
⮚Iodide & Iodine Plants
⮚Solar Evaporation Ponds
⮚Water Resource Provision
⮚Electrical Distribution System
⮚General Facilities
18.1CAPITAL COSTS
The main facilities for the production operations of Iodine and nitrate salts, include caliche extraction, leaching, water resources, Iodide an Iodine production plants, solar evaporation ponds, as well as other minor facilities. Offices and services include, among others, the following: common areas, supply areas, powerhouse, laboratory, and warehouse.
Much of the primary capital expenditure in the Nueva Victoria Project has been completed. At the end of 2022, the capital cost invested in these facilities was reportedly about USD 920 million with the relative expenditure by major category as shown in Table 18-1
Table 18-1. Summary of Capital Expenses for the Nueva Victoria an Iris Operations
|
|
|
|
|
|
|
|
|
|
Capital Cost |
|
% Total |
MM USD |
| Category |
100% |
920,355 |
| Caliche Mining (*) |
27% |
248,824 |
| Heap Leaching |
19% |
176,441 |
| Iodide & Iodine Plant |
19% |
171,684 |
| Solar Evaporation Ponds |
19% |
172,869 |
| Water Resources Provision |
9% |
82,137 |
| Electrical Distribution System |
3% |
25,817 |
General Facilities |
5% |
42,583 |
The net book value as of January 1, 2023, was reportedly about MUSD 281.3 and according to SQM will be depreciated over the next 6 years.
18.1.1Caliche Mining
SQM produces salts rich in iodide, iodine and nitrate in Nueva Victoria and Iris, near Iquique, Chile, mineral caliche extracted from mines near Nueva Victoria.
Capital investment in the mine is primarily for the equipment including trucks, front loaders, bulldozers, drills, surface miners (Vermeer, Wirtgen), wheeldozers, motor graders. Other investment is in buildings and support facilities and associated equipment.
|
|
|
|
|
|
|
|
|
| SQM TRS Nueva Victoria |
|
Pag. 200 |
18.1.2Heap Leaching
The leach piles are made up of platforms (normally 90 x 500 m, with perimeter parapets and with a bottom waterproofed with HDPE membranes), which are loaded with the necessary caliche and are irrigated with different solutions (water, mixture, or intermediate solution of piles).
The Mine Operation Centers (COM) are a set of leaching heaps that have brine accumulation ponds, recirculated “feeble brine” ponds, industrial water ponds and their respective pumping systems.
Primary capital expenditure is in the form of piping, electrical facilities and equipment, pumps, ponds, and support equipment.
18.1.3Iodide and Iodine Plants
The main investment in the Iodide and Iodine Plants is found in tank and decanter equipment, pumps and piping, equipment and electrical facilities, buildings and well. primary investment in the Prilate Iodine Plant is found in piping and pumps, mechanical equipment (Reactor, Tank, Tower) and buildings.
18.1.4Solar Evaporation Ponds
These ponds in the industrial area of Sur Viejo and receive the “Feeble Brine” fraction (BF) generated in the process of obtaining iodide, which is transported through 3 pipelines of approximately 20 kilometers each. The current area of evaporation ponds is 8.34 km², increasing to a total of 18.51 km² with TEA project.
18.1.5Water Resources
Primary investment is in piping, pumps, buildings, and wells.
18.1.6Electrical Distribution System
Primary investment is in transformers, substations, distribution systems and associated support facilities.
18.1.7General Facilities
Investment in General Facilities include laboratories, fire detection systems, lighting, and warehouses.
18.2FUTURE INVESTMENT
During 2020, progress was made in the development and environmental processing of the Tente en el Aire Project. In November 2021, the Environmental Assessment Commission of the Tarapacá Region agreed to classify favorably the “Tente en el Aire” project, presented by SQM.
With an investment of US$333 million, the initiative aims to incorporate new mining areas to produce iodide, iodine, and salts rich in nitrates at the Nueva Victoria Site, which entails an increase in the total amount of caliche extract, and in the use of water for said processes.
The project corresponds to a modification of the Nueva Victoria Faena consisting of:
a)New mining areas (approx. 43,586 ha), with a caliche extraction rate of 28 million t/y, resulting in a total of 65 Mt/y.
b)Two new iodide production plants (6,000 t/y each), resulting in a total of 23,000 t/y.
c)A new iodine production plant (12,000 t/y), resulting in a total of 23,000 t/y.
d)New Evaporation Ponds to produce nitrate-rich salts (1,950,000 t/y), resulting in a total of 4,000,000 t/y.
e)A new neutralization system, a seawater adduction (900 L/s maximum) from the Bahía Patillos sector to the mining area.
f)A new electric transmission line from the National Electric System.
Additional capital for the Long Term is estimated to be USD 466 million including capital associated with the TEA expansion project and sustaining capital for mining and leaching operations for equipment, improving aspects of quality, performance, sustainability and increasing production capacity. The distribution of the operating cost is presented in table 18-2:
|
|
|
|
|
|
|
|
|
| SQM TRS Nueva Victoria |
|
Pag. 201 |
Table 18-2 Estimated Investment
|
|
|
|
|
|
|
|
|
|
|
|
|
|
|
|
|
|
|
|
|
|
|
|
|
|
|
|
|
|
|
|
|
|
|
|
|
|
|
|
|
|
|
|
|
|
|
|
|
|
|
Investment
(MUS$) |
2024 |
2025 |
2026 |
2027 |
2028 |
2029 |
2030 |
2031 |
2032 |
2033 |
2034 |
2035 |
2036 |
2037 |
2038 |
Total |
| Sea Water Pipeline |
66 |
134 |
134 |
|
|
|
|
|
|
|
|
|
|
|
|
333 |
| Nueva Victoria |
28 |
27 |
30 |
34 |
34 |
34 |
34 |
34 |
34 |
34 |
34 |
34 |
34 |
34 |
2 |
466 |
18.3OPERATING COST
The main costs to produce Iodine and Nitrates involve the following components: common production cost for iodine and nitrates, such as Mining, Leaching and Seawater, production cost of iodine in the plant, and the production cost of nitrate before processing at the Coya Sur site.
The production cost of nitrate at Coya Sur Plant and the processing of extra solar salt are added. To the costs indicated above, have been added the Depreciation and Others.
Estimated aggregate unit operating costs are presented in Table 18-3. These are based on historical unit operating costs for each of the sub-categories listed above.
Over the Long Term, total operating costs are expected to be almost equally apportioned amongst the three primary categories (Common; Iodine Production and Transport; Nitrate Production and Transport).
Table 18-3 Nueva Victoria Operating Cost
|
|
|
|
|
|
| Cost Category |
Estimated Unit Cost |
| Common (Mining / Leaching/ Seawater) |
4.9 US$/Ton caliche |
| Iodine Production (including transport to ports) |
23,950 US$/Ton iodine |
| Nitrates Production |
93,75 US$/Ton nitrate |
| Nitrates Transport to Coya Sur |
35,32 US$/Ton nitrate |
|
|
|
|
|
|
|
|
|
| SQM TRS Nueva Victoria |
|
Pag. 202 |
19ECONOMIC ANALYSIS
This section contains forward-looking information related to economic analysis for the Project. The material factors that could cause actual results to differ materially from the conclusions, estimates, designs, forecasts, or projections in the forward-looking information include any significant differences from one or more of the material factors or assumptions that were set forth in this sub-section including estimated capital and operating costs, project schedule and approvals timing, availability of funding, projected commodities markets, and prices.
19.1PRINCIPAL ASSUMPTIONS
Capital and operating costs used in the economic analysis are as described in Section 18. Sales prices used for Iodine and Nitrates are as described in Section 16. A 10% discount rate was used for the cashflow and is deemed reasonable to account for cost of capital and project risk. A 28% income tax rate was considerate, and all costs, prices, and values shown in this section are in 2023 US$.
19.2PRODUCTION AND SALES
The estimated production of iodine and nitrates for the period 2024 to 2038 is presented in Table 19-1. The production shown does not consider the impact of the Pampa Blanca Project which is presented in a separate TRS.
19.3PRICES AND REVENUE
An average sales price of 42.0 USD/kg (42,000 USD/ton) was used for sales of Iodine based on the market study presented in in Section 16. This price is assessed as FOB port.
As a vertically integrated company, nitrate production from the mining operations is directed to the plant at Coya Sur to produce specialty fertilizer products. An imputed sales price of 323 USD/ton was assumed for nitrates salts for fertilizer based on an average sales price of 820 USD/ton for finished fertilizer products sold at Coya Sur, less 497 USD/ton for production costs at Coya Sur.
These prices and the revenue streams derived from the sale of iodine and nitrates is shown in Table 19-2.
|
|
|
|
|
|
|
|
|
| SQM TRS Nueva Victoria |
|
Pag. 203 |
Table 19-1. Nueva Victoria Long Term of Mine Production
|
|
|
|
|
|
|
|
|
|
|
|
|
|
|
|
|
|
|
|
|
|
|
|
|
|
|
|
|
|
|
|
|
|
|
|
|
|
|
|
|
|
|
|
|
|
|
|
|
|
|
|
|
|
| MATERIAL MOVEMENT |
UNITS |
2024 |
2025 |
2026 |
2027 |
2028 |
2029 |
2030 |
2031 |
2032 |
2033 |
2034 |
2035 |
2036 |
2037 |
2038 |
TOTAL |
| Nueva Victoria Sector Ore Tonnage |
Mt |
20 |
13 |
18 |
16 |
16 |
0 |
0 |
0 |
0 |
16 |
16 |
16 |
16 |
16 |
0 |
163 |
| Iodine (I2) in situ |
ppm |
390 |
375 |
382 |
410 |
385 |
0 |
0 |
0 |
0 |
400 |
400 |
395 |
390 |
385 |
0 |
391 |
| Average grade Nitrate Salts (NaNO3) |
% |
4.7% |
3.6% |
3.4% |
5.0% |
4.3% |
0.0% |
0.0% |
0.0% |
0.0% |
4.2% |
4.1% |
4.0% |
4.0% |
4.0% |
0.0% |
4.1% |
| Tente en el Aire (TEA) Sector Ore Tonnage |
Mt |
2 |
8 |
8 |
16 |
16 |
24 |
26 |
26 |
26 |
10 |
10 |
0 |
0 |
0 |
0 |
172 |
| Iodine (I2) in situ |
ppm |
492 |
420 |
430 |
413 |
400 |
413 |
413 |
410 |
410 |
405 |
390 |
0 |
0 |
0 |
0 |
411 |
| Average grade Nitrate Salts (NaNO3) |
% |
4.4% |
4.6% |
4.2% |
5.5% |
6.7% |
5.2% |
4.6% |
4.0% |
4.0% |
4.1% |
4.0% |
0.0% |
0.0% |
0.0% |
0.0% |
4.7% |
| Hermosa Sector Ore Tonnage |
Mt |
22 |
22 |
21 |
22 |
22 |
30 |
28 |
28 |
28 |
28 |
28 |
38 |
38 |
38 |
3 |
396 |
| Iodine (I2) in situ |
ppm |
458 |
470 |
468 |
455 |
460 |
440 |
430 |
440 |
430 |
420 |
400 |
390 |
372 |
395 |
411 |
425 |
| Average grade Nitrate Salts (NaNO3) |
% |
6.5% |
6.4% |
6.2% |
6.0% |
6.4% |
5.9% |
5.7% |
5.5% |
5.6% |
5.2% |
5.1% |
5.0% |
6.3% |
5.5% |
4.9% |
5.7% |
| TOTAL ORE MINED (CALICHE) |
Mt |
44 |
43 |
47 |
54 |
54 |
54 |
54 |
54 |
54 |
54 |
54 |
54 |
54 |
54 |
3 |
731 |
| Iodine (I2) in situ |
kt |
18.9 |
18.6 |
20.1 |
23.2 |
22.7 |
23.1 |
22.8 |
23.0 |
22.7 |
22.2 |
21.5 |
21.1 |
20.4 |
21.2 |
1.2 |
302.6 |
| Yield process to produce prilled Iodine |
% |
60.3% |
56.0% |
57.6% |
67.3% |
64.4% |
63.8% |
65.6% |
65.8% |
69.1% |
71.7% |
71.5% |
71.7% |
68.5% |
69.2% |
69.6% |
66.2% |
| Prilled Iodine produced |
kt |
11.4 |
10.4 |
11.6 |
15.6 |
14.6 |
14.8 |
14.9 |
15.1 |
15.7 |
15.9 |
15.4 |
15.1 |
14.0 |
14.6 |
0.9 |
200.0 |
| Nitrate Salts in situ |
kt |
2,460 |
2,244 |
2,244 |
3,000 |
3,168 |
3,022 |
2,788 |
2,590 |
2,604 |
2,538 |
2,479 |
2,540 |
3,022 |
2,714 |
147 |
37,560 |
| Yield process to produce Nitrates |
% |
42.8% |
33.4% |
37.1% |
52.3% |
45.8% |
40.8% |
47.7% |
48.5% |
49.7% |
57.8% |
57.5% |
57.9% |
55.1% |
58.4% |
57.1% |
49.7% |
| Nitrate production from Leaching |
kt |
1,052 |
750 |
833 |
1,569 |
1,450 |
1,233 |
1,329 |
1,255 |
1,295 |
1,467 |
1,425 |
1,472 |
1,665 |
1,584 |
84 |
18,463 |
| Ponds Yield to produce Nitrates Salts |
% |
60.7% |
68.5% |
64.3% |
65.9% |
64.7% |
66.3% |
63.5% |
63.5% |
63.5% |
63.5% |
63.5% |
63.5% |
63.5% |
63.5% |
63.5% |
64.1% |
| Nitrate Salts for Fertilizers |
kt |
639 |
513 |
535 |
1,034 |
939 |
818 |
844 |
798 |
823 |
932 |
905 |
935 |
1,058 |
1,006 |
53 |
11,833 |
Table 19-2. Nueva Victoria Iodine and Nitrate Price and Revenues
|
|
|
|
|
|
|
|
|
|
|
|
|
|
|
|
|
|
|
|
|
|
|
|
|
|
|
|
|
|
|
|
|
|
|
|
|
|
|
|
|
|
|
|
|
|
|
|
|
|
|
|
|
|
| PRICES |
UNITS |
2024 |
2025 |
2026 |
2027 |
2028 |
2029 |
2030 |
2031 |
2032 |
2033 |
2034 |
2035 |
2036 |
2037 |
2038 |
TOTAL |
| Iodine |
US$/t |
42,000 |
42,000 |
42,000 |
42,000 |
42,000 |
42,000 |
42,000 |
42,000 |
42,000 |
42,000 |
42,000 |
42,000 |
42,000 |
42,000 |
42,000 |
42,000 |
| Nitrates delivered to Coya Sur |
US$/t |
323 |
323 |
323 |
323 |
323 |
323 |
323 |
323 |
323 |
323 |
323 |
323 |
323 |
323 |
323 |
323 |
| REVENUE |
UNITS |
2024 |
2025 |
2026 |
2027 |
2028 |
2029 |
2030 |
2031 |
2032 |
2033 |
2034 |
2035 |
2036 |
2037 |
2038 |
TOTAL |
| Iodine |
US$M |
478 |
437 |
487 |
655 |
614 |
620 |
627 |
635 |
659 |
669 |
645 |
636 |
587 |
615 |
36 |
8,401 |
| Nitrates delivered to Coya Sur |
US$M |
206 |
166 |
173 |
334 |
303 |
264 |
273 |
258 |
266 |
301 |
292 |
302 |
342 |
325 |
17 |
3,821 |
| Total Revenues |
US$M |
684 |
603 |
660 |
989 |
917 |
884 |
900 |
893 |
925 |
970 |
937 |
938 |
928 |
940 |
53 |
12,221 |
19.4OPERATING COSTS
Operating costs associated with the production of iodine and nitrates at Nueva Victoria are as described earlier in Section 18 and are incurred in the following primary areas:
1.Common
2.Iodine Production
3.Nitrate Production
Additional details on operating costs may be found in Section 18.3. Unit costs for each of these unit operations is shown in Table 19-3.
|
|
|
|
|
|
|
|
|
| SQM TRS Nueva Victoria |
|
Pag. 204 |
Table 19-3. Nueva Victoria Operating Costs.
|
|
|
|
|
|
|
|
|
|
|
|
|
|
|
|
|
|
|
|
|
|
|
|
|
|
|
|
|
|
|
|
|
|
|
|
|
|
|
|
|
|
|
|
|
|
|
|
|
|
|
|
|
|
| COSTS |
UNITS |
2024 |
2025 |
2026 |
2027 |
2028 |
2029 |
2030 |
2031 |
2032 |
2033 |
2034 |
2035 |
2036 |
2037 |
2038 |
TOTAL |
| COMMON |
|
|
|
|
|
|
|
|
|
|
|
|
|
|
|
|
|
| Mining |
US$M |
136 |
133 |
145 |
167 |
167 |
167 |
167 |
167 |
167 |
167 |
167 |
167 |
167 |
167 |
9 |
2,256 |
| Leaching |
US$M |
79 |
77 |
80 |
79 |
79 |
79 |
79 |
79 |
79 |
79 |
79 |
79 |
79 |
79 |
4 |
1,105 |
| Seawater |
US$M |
0 |
0 |
4 |
19 |
19 |
19 |
19 |
19 |
19 |
19 |
19 |
19 |
19 |
19 |
1 |
219 |
| Total Mining Costs |
US$M |
214 |
210 |
229 |
265 |
265 |
265 |
265 |
265 |
265 |
265 |
265 |
265 |
265 |
265 |
15 |
3,581 |
| IODINE PRODUCTION |
|
|
|
|
|
|
|
|
|
|
|
|
|
|
|
|
|
| Iodide Plant |
US$M |
38 |
35 |
39 |
52 |
49 |
49 |
50 |
51 |
52 |
53 |
51 |
51 |
47 |
49 |
3 |
669 |
| Iodine Plant |
US$M |
29 |
26 |
29 |
39 |
37 |
37 |
37 |
38 |
39 |
40 |
39 |
38 |
35 |
37 |
2 |
501 |
| Total Iodine Production Cost |
US$M |
256 |
250 |
276 |
315 |
313 |
319 |
319 |
322 |
324 |
321 |
319 |
316 |
304 |
311 |
18 |
4,281 |
| Total Iodine Production Cost |
US$/kg Iodine |
22 |
24 |
24 |
20 |
21 |
22 |
21 |
21 |
21 |
20 |
21 |
21 |
22 |
21 |
21 |
21 |
| NITRATE PRODUCTION |
|
|
|
|
|
|
|
|
|
|
|
|
|
|
|
|
|
| Ponds and preparation |
US$M |
28 |
22 |
23 |
45 |
41 |
36 |
37 |
35 |
36 |
41 |
40 |
41 |
46 |
44 |
2 |
518 |
| Harvest production |
US$M |
5 |
4 |
4 |
8 |
7 |
6 |
7 |
6 |
6 |
7 |
7 |
7 |
8 |
8 |
— |
92 |
| Others (G&A) |
US$M |
2 |
1 |
1 |
2 |
2 |
2 |
2 |
2 |
2 |
2 |
2 |
2 |
3 |
2 |
— |
28 |
| Transport to Coya Sur |
US$M |
23 |
18 |
19 |
37 |
33 |
29 |
30 |
28 |
29 |
33 |
32 |
33 |
37 |
36 |
2 |
418 |
| Total Nitrate Production Cost |
US$M |
82 |
66 |
69 |
133 |
121 |
106 |
109 |
103 |
106 |
120 |
117 |
121 |
137 |
130 |
7 |
1,527 |
| Total Nitrate Production Cost |
US$/t Nitrate |
129 |
129 |
129 |
129 |
129 |
129 |
129 |
129 |
129 |
129 |
129 |
129 |
129 |
129 |
129 |
129 |
| Closure Accretion |
US$M |
|
|
|
|
|
|
|
|
|
|
|
|
|
|
11 |
11 |
| TOTAL OPERATING COST |
US$M |
338 |
316 |
345 |
448 |
434 |
424 |
428 |
425 |
430 |
441 |
436 |
437 |
441 |
440 |
35 |
5,819 |
| TOTAL OPERATING COST |
US$/t Caliche |
7.7 |
7.4 |
7.3 |
8.3 |
8.0 |
7.9 |
7.9 |
7.9 |
8.0 |
8.2 |
8.1 |
8.1 |
8.2 |
8.2 |
11.8 |
8.0 |
19.5CAPITAL EXPENDITURE
Much of the primary capital expenditure in the Nueva Victoria Project has been completed.
The most significant proposed future capital expenditure is for the seawater pipeline to support the proposed TEA Expansion Project. This investment is expected to need USD 333 million between 2024- 2026.
Additional capital for the Long Term is estimated to be USD 465 million including capital associated with the TEA expansion project and sustaining capital for mining and leaching operations. for equipment, improving aspects of quality, performance, sustainability and increasing production capacity.
A closure costs of USD 11 million has been estimated in 2038 in the cashflow.
Additional details on capital expenditures for the Nueva Victoria Project can be found in Section 18.1 and Section 18.2. The estimated capital expenditure for the Long Term (2024 to 2038) is presented in Table 18-2.
19.6CASHFLOW FORECAST
The cashflow for the Nueva Victoria Project is presented in Table 19-4.The following is a summary of key results from the cashflow:
⮚Total Revenue: estimated to be USD 12.22 billion including sales of iodine and nitrates.
⮚Total Operating Cost: estimated to be USD 5.82 billion.
⮚EBITDA: estimated at USD 6.40 billion
⮚Tax Rate of 28% on pre-tax gross income
⮚Closure Cost: estimated at USD 11 million
⮚Capital Expenditure estimated at USD 798 million
⮚Net Change in Working Capital is based on two months of EBITDA.
⮚A discount rate of 10% was utilized to determine NPV. The QP deems this to be a reasonable discount rate to apply for this TRS which reasonable accounts for cost of capital and project risk.
⮚After-tax Cashflow: The cashflow is calculated by subtracting all operating costs, taxes, capital costs, interest payments, and closure costs from the total revenue.
⮚Net Present Value: The after tax NPV is estimated to be USD 1.91 billion at a discount rate of 10%
|
|
|
|
|
|
|
|
|
| SQM TRS Nueva Victoria |
|
Pag. 205 |
The QP considers the accuracy and contingency of cost estimates to be well within a Prefeasibility Study (PFS) standard and sufficient for the economic analysis supporting the Mineral Reserve estimate for Nueva Victoria.
Table 19-4. Estimated Net Present Value (NPV) for the Period
|
|
|
|
|
|
|
|
|
|
|
|
|
|
|
|
|
|
|
|
|
|
|
|
|
|
|
|
|
|
|
|
|
|
|
|
|
|
|
|
|
|
|
|
|
|
|
|
|
|
|
|
|
|
| REVENUE |
UNITS |
2024 |
2025 |
2026 |
2027 |
2028 |
2029 |
2030 |
2031 |
2032 |
2033 |
2034 |
2035 |
2036 |
2037 |
2038 |
TOTAL |
| Total Revenue |
US$M |
684 |
603 |
660 |
989 |
917 |
884 |
900 |
893 |
925 |
970 |
937 |
938 |
928 |
940 |
53 |
12,221 |
| COSTS |
|
|
|
|
|
|
|
|
|
|
|
|
|
|
|
|
|
| Total Mining Costs |
US$M |
214 |
210 |
229 |
265 |
265 |
265 |
265 |
265 |
265 |
265 |
265 |
265 |
265 |
265 |
15 |
3,581 |
| Total Iodine Production Cost |
US$M |
256 |
250 |
276 |
315 |
313 |
319 |
319 |
322 |
324 |
321 |
319 |
316 |
304 |
311 |
18 |
4,281 |
| Total Nitrate Production Cost |
US$M |
82 |
66 |
69 |
133 |
121 |
106 |
109 |
103 |
106 |
120 |
117 |
121 |
137 |
130 |
7 |
1,527 |
| Closure Accretion |
US$M |
|
|
|
|
|
|
|
|
|
|
|
|
|
|
|
11 |
| TOTAL OPERATING COST |
US$M |
338 |
316 |
345 |
448 |
434 |
424 |
428 |
425 |
430 |
441 |
436 |
437 |
441 |
440 |
35 |
5,819 |
| EBITDA |
US$M |
346 |
287 |
315 |
540 |
483 |
460 |
472 |
468 |
494 |
529 |
502 |
501 |
487 |
500 |
18 |
6,402 |
| Depreciation |
US$M |
28 |
27 |
30 |
62 |
62 |
62 |
62 |
62 |
62 |
62 |
62 |
62 |
62 |
62 |
30 |
798 |
| Interest Payments |
US$M |
30 |
30 |
30 |
30 |
30 |
30 |
30 |
30 |
30 |
30 |
30 |
30 |
30 |
30 |
30 |
450 |
| Pre-Tax Gross Income |
US$M |
288 |
229 |
255 |
448 |
391 |
368 |
380 |
376 |
402 |
436 |
410 |
409 |
395 |
408 |
(42) |
5,154 |
| Taxes |
28% |
81 |
64 |
71 |
125 |
109 |
103 |
106 |
105 |
113 |
122 |
115 |
115 |
111 |
114 |
(12) |
1,443 |
| Operating Income |
US$M |
208 |
165 |
184 |
323 |
281 |
265 |
274 |
271 |
290 |
314 |
295 |
295 |
284 |
293 |
(30) |
3,711 |
| Add back depreciation |
US$M |
28 |
27 |
30 |
62 |
62 |
62 |
62 |
62 |
62 |
62 |
62 |
62 |
62 |
62 |
30 |
798 |
| Add back closure accretion |
US$M |
0 |
0 |
0 |
0 |
0 |
0 |
0 |
0 |
0 |
0 |
0 |
0 |
0 |
0 |
11 |
11 |
| NET INCOME AFTER TAXES |
US$M |
236 |
192 |
214 |
385 |
343 |
327 |
336 |
333 |
352 |
376 |
357 |
357 |
347 |
356 |
11 |
4,520 |
| Total CAPEX |
US$M |
94 |
161 |
164 |
34 |
34 |
34 |
34 |
34 |
34 |
34 |
34 |
34 |
34 |
34 |
2 |
798 |
| Closure Costs |
US$M |
0 |
0 |
0 |
0 |
0 |
0 |
0 |
0 |
0 |
0 |
0 |
0 |
0 |
0 |
0 |
0 |
| Working Capital |
US$M |
2 |
-10 |
5 |
38 |
-10 |
-4 |
2 |
-1 |
4 |
6 |
(4) |
0 |
(2) |
2 |
(80) |
(53) |
| Pre-Tax Cashflow |
US$M |
251 |
136 |
147 |
468 |
458 |
429 |
436 |
434 |
456 |
489 |
472 |
467 |
455 |
463 |
96 |
5,657 |
| After-Tax Cashflow |
US$M |
140 |
41 |
45 |
313 |
319 |
296 |
299 |
299 |
313 |
336 |
327 |
322 |
315 |
319 |
89 |
3,775 |
| Pre-Tax NPV |
US$M |
2,965 |
|
|
|
|
|
|
|
|
|
|
|
|
|
|
|
| After-Tax NPV |
US$M |
1,918 |
|
|
|
|
|
|
|
|
|
|
|
|
|
|
|
| Discount Rate |
US$M |
10% |
|
|
|
|
|
|
|
|
|
|
|
|
|
|
|
19.7SENSITIVITY ANALYSIS
The sensitivity analysis was carried out by independently varying the commodity prices (Iodine, Nitrate), operating cost, and capital cost. The results of the sensitivity analysis are shown in Figure 19-1 shows the relative sensitivity of each key metric.
Figure 19-1. Sensitivity Analysis
|
|
|
|
|
|
|
|
|
| SQM TRS Nueva Victoria |
|
Pag. 206 |
As seen in the above figure, the project NPV is equally sensitive to operating cost and commodity price while being least sensitive to capital costs. This is to be expected for a mature, well-established project with much of its infrastructure already in place and no significantly large projects currently planned during the LOM discussed in this Study. Both iodine and nitrate prices have a similar impact on the NPV with nitrate prices having a slightly larger impact.
|
|
|
|
|
|
|
|
|
| SQM TRS Nueva Victoria |
|
Pag. 207 |
20ADJACENT PROPERTIES
SQM has the right to explore and/or exploit caliche mineral resources in an effective area covering more than 1,539,177 hectares in Northern Chile's Regions I and II. Prospect deposits are located on flat land or "pampas".
⮚Hermosa Oeste
⮚Tente en el Aire Oeste.
⮚Pampa Hermosa
⮚Pampa Engañadora
⮚Hermosa
⮚Fortuna
⮚Cocar
⮚Coruña
⮚Hermosa Sur
⮚Los Ángeles
⮚Tente en el aire à (Tea Sur – Tea Central – Tea Felipe – Cop 5)
⮚Franja Oeste
⮚Iris Vigía
⮚Oeste III
⮚Torcaza
⮚Sur
⮚Oeste
All prospected areas have been explored and exploration program results have indicated that these prospects reflect a mineralized trend hosting nitrate and iodine. For the year 2022, a detailed exploration program of 5,250 ha in the Hermosa Oeste and Tente en el Aire Oeste sector is underway. On the other hand, exploration efforts are focused on possible metallic mineralization found underneath caliche. There is significant potential for metallic mineralization in the area, especially copper and gold. Exploration has generated discoveries that in some cases may lead to exploitation, discovery sales and future royalty generation.
Along SQM-Nueva Victoria's boundary, as shown in Figure 20-1, there are some small-scale mining rights. In total there are two mining lots (shown in green: North-east and south-east), which are close to the property boundary.
|
|
|
|
|
|
|
|
|
| SQM TRS Nueva Victoria |
|
Pag. 208 |
Figure 20-1. Nueva Victoria Adjacent Properties.
|
|
|
|
|
|
|
|
|
| SQM TRS Nueva Victoria |
|
Pag. 209 |
21.OTHER RELEVANT DATA AND INFORMATION
The QP is not aware of any other relevant data or information to disclose in this TRS.
|
|
|
|
|
|
|
|
|
| SQM TRS Nueva Victoria |
|
Pag. 210 |
22INTERPRETATION AND CONCLUSIONS
This section contains forward-looking information related to Mineral Resources and the Long Term plan for the Project. The material factors that could cause actual results to differ materially from the conclusions, estimates, designs, forecasts or projections in the forward-looking information include any significant differences from one or more of the material factors or assumptions that were forth in this sub-section including: geological and grade interpretations and controls and assumptions and forecasts associated with establishing the prospects for economic extraction; grade continuity analysis and assumptions; Mineral Resource model Tonnes and grade and mine design parameters; actual plant feed characteristics that are different from the historical operations or from samples tested to date; equipment and operational performance that yield different results from the historical operations and historical and current test work results; mining strategy and production rates; expected mine life and mining unit dimensions; prevailing economic conditions, commodity markets and prices over the Long Term period; regulatory framework is unchanged during the Study period and no unforeseen environmental, social or community events disrupt timely approvals; estimated capital and operating costs; and project schedule and approvals timing with availability of funding.
The Nueva Victoria Mine is a proven producer of both iodine and nitrate fertilizer products. Current exploration drilling has identified Mineral Resources and Mineral Reserves sufficient to continue production until 2040. To accomplish this, certain planned strategic investments must be implemented, including a sea water intake and supply system for the operation.
To reach this conclusion, has reviewed the available data on geology, drilling, mining, and mineral processing, and has concluded that Mineral Resources, costs, and recoveries are reasonable. The largest risks for the operation will lie in changes to market conditions or to the cost of operating inputs.
The work done in this report has demonstrated that the mine, heap leach facility and the iodine and nitrate operations correspond to those of a technically feasible and economically viable project. The most appropriate process route is determined to be the selected unit operations of the existing plants, which are otherwise typical of the industry.
The current needs of the nitrate and iodine process, such as power, water, labor, and supplies, are met as this is a mature operation with many years of production supported by the current project infrastructure. As such, performance information on the valuable nitrate and iodine species consists of a significant amount of historical production data, which is useful for predicting metallurgical recoveries from the process plant. Along with this, metallurgical tests are intended to estimate the response of different caliche ores to leaching.
Marco Fazzi QP of Resources and Marco Lema QP of Reserves, concludes that the work done in the preparation of this technical report includes adequate details and information to declare the Mineral Reserves. In relation to the resource treatment processes, the conclusion of the responsible QP, Gino Slanzi, is that appropriate work practices and equipment, design methods and processing equipment selection criteria have been used. In addition, the company has developed new processes that have continuously and systematically optimized its operations.
The QP believes that mining and continued development of the Nueva Victoria project should continue and be integrated into SQM’s corporate plans.
|
|
|
|
|
|
|
|
|
| SQM TRS Nueva Victoria |
|
Pag. 211 |
22.1RESULTS
22.1.1Geology and Mineral Resources
⮚Nueva Victoria is a nitrate-iodine deposit located the intermediate depression, limited to the east by the Coastal Range (representing the Jurassic magmatic arc) and the Precordillera (associated to the magmatic activity originating from the mega Cu-Au deposits in northern Chile), generating a natural barrier for their deposition and concentration.
⮚The Nueva Victoria geology team has a clear understanding of mineralization controls and the geological and deposit related knowledge has been appropriately used to develop and guide the exploration, modeling, and estimation processes.
⮚Sampling methods, sample preparation, analysis and security were acceptable for mineral resource estimation. The collected sample data adequately reflect deposit dimensions, true widths of mineralization, and the style of the deposits. Sampling is representative of the Iodine and Nitrate Grades.
⮚As of December 31, 2023, the Inferred Resources (exclusive of Mineral Reserves) for iodine and nitrate in Nueva Victoria are 48.5 Mt with a 372 ppm mean grade of Iodine and 5.3% of nitrate. Note that because the caliche deposit is at the surface, all measured and indicated resources with environment permits has been converted into mineral reserves.
⮚The average mineral resource concentrations are above the cutoff grades of 3.0 % of Nitrate, reflecting that the potential extraction is economically viable.
⮚SQM holds a large property position with similar geology and geomorphology as the current operations. It is probable that SQM will continue to find additional mineral resources in the Nueva Victoria area.
22.1.2Mining and Mineral Reserves
⮚Nueva Victoria has been in operation since 2002 and is a stable enterprise that should continue producing into the future.
22.1.3Metallurgy and Mineral Processing
According to Gino Slanzi Guerra, the QP in charge of metallurgy and resource treatment:
⮚There is a duly documented verification plan for the cover system to limit infiltration during leaching. The document establishes installation and leak detection procedures in accordance with environmental compliance criteria.
⮚Metallurgical test work performed to date has been adequate to establish appropriate processing routes for the caliche resource. The metallurgical test results show that the recoveries are dependent on the saline matrix content and, on the other hand, the maximization of this is linked to the impregnation cycle which has been studied, establishing irrigation scales according to the classified physical nature. The derived data are suitable for the purpose of estimating recovery from mineral resources.
⮚Based on the annual, short- and long-term production program, the yield is estimated for the different types of material to be exploited according to the mining plan, according to their classification of physical and chemical properties, obtaining a projection of recoveries that is considered quite adequate for the resources.
⮚In addition to the ROM mining methodology, there is a mining method called "Continuous Mining", which, according to the tests carried out with the reaming equipment, allows obtaining a smaller size mineral and more homogeneous granulometry, which implies obtaining higher recoveries for iodine and nitrate during leaching.
⮚Reagent forecasting and dosing are based on analytical processes that determine ore grades, valuable element content and impurity content to ensure that the system's treatment requirements are effective. These are translated into consumption rate factors that are maturely studied.
⮚Since access to water can be affected by different natural and anthropogenic factors, the use of seawater is a viable alternative for future or current operations. However, this may increase operating costs, resulting in additional maintenance days.
⮚During operations, the content of impurities fed to the system and the concentration in the mother liquor is monitored to eventually detect any situation that may impact the treatment methodologies and the characteristics of its products.
|
|
|
|
|
|
|
|
|
| SQM TRS Nueva Victoria |
|
Pag. 212 |
22.2RISKS
22.2.1Mining and Mineral Reserves
⮚As mining proceeds into new areas, such as TEA, the production, dilution, and recovery factors may change based on operating factors. These factors and mining costs should be evaluated on a sector-by-sector basis.
22.2.2Metallurgy and Mineral Processing
⮚The risk that the process, as currently defined, will not produce the expected quantity and/or quality required. However, exhaustive characterization tests have been carried out on the treated material and, moreover, at all stages of the process, controls are in place to manage within certain ranges a successful operation.
⮚The risk that the degree of impurities in the natural resources may increase over time more than predicted by the model, which may result in non-compliance with certain product standards. Consequently, it may be necessary to incorporate other process stages, with the development of previous engineering studies, to comply with the standards.
22.2.3Other Risks
⮚The prices of iodine and fertilizers have been stable and increasing and though product price is a risk it is expected to be small.
⮚There is a social and political risk that derives from the current process of constitutional discussion in Chile, which may change the actual regulation of the mining industry This could impact to mining property, taxes, and future royalties.
22.3SIGNIFICANT OPPORTUNITIES
22.3.1Geology and Mineral Resources
⮚There is a big opportunity to improve the resource estimation simplicity and reproducibility using the block model approach not only in the case of smaller drill hole grids of 50 x 50 m and up to 200 x 200m, but also for larger drill hole grids to avoid separating the resource model and databases by drill hole spacing, bringing the estimation and management of the resource model to industry standards.
22.3.2Mining and Mineral Reserves
⮚Improve efficiency of mining by implementing selective mining criteria to improve produced grades. As the deposit is a single mining bench there is an opportunity to establish a smaller selective mining unit and mine irregular polygons to improve head grade delivered to the leach pads.
⮚The advantages of continuous mining machines will offer better leaching recoveries and may be optimized with evaluation of cutter head designs and operating parameters. Care should be taken to evaluate the costs on a basis of final product production price.
22.3.3Metallurgy and Mineral Processing
⮚Determine the optimal mining levels by continuous mining that maximizes recovery and minimizes costs.
⮚Improve heap slope irrigation conditions to increase iodine and nitrate recovery.
|
|
|
|
|
|
|
|
|
| SQM TRS Nueva Victoria |
|
Pag. 213 |
23RECOMMENDATIONS
23.1GEOLOGY AND MINERAL RESOURCES
⮚Confirm the accuracy and precision of SQM internal laboratory implementing an external QA/QC check with a representative number of samples as a routine procedure.
⮚Quality procedures for data maintenance should be implemented as well as a formal methodology for reviewing laboratory QA/QC information and flagging potential issues.
⮚Expand the block model approach for resource estimation to larger drill hole grids to avoid separating the resource model and databases by drill hole spacing.
23.2MINING AND MINERAL RESERVES
⮚The conversion factors from indicated mineral resources to probable mineral reserves should be continuously reviewed and updated as preproduction drilling converts the indicated resources to measured. Expansion of the use of geostatistical block models (see above) will have an impact on these factors.
⮚In cooperation with the processing group, an ore blending plan could optimize the cost and recovery balance in the future and should be studied soon to better forecast production and equipment needs for the life of mine.
23.3METALLURGY AND MINERAL PROCESSING
⮚From the point of view of the material fed to the heaps, a recovery study is necessary to establish optimal annual operating levels that maximize recovery and minimize costs. The study will allow defining the percentage of ore to be reamed during the life of the mine to increase recovery sequentially.
⮚Regarding irrigation, alternatives that allow an efficient use of water should be reviewed, considering the irrigation of the lateral areas of the piles to increase the recovery of iodine and nitrates.
⮚A relevant aspect is the incorporation of seawater in the process, a decision that is valued given the current water shortage and that ultimately is a contribution to the project, however, a study should be made of the impact of processing factors such as impurities from this source.
⮚It is advisable to carry out tests to identify the hydrogeological parameters that govern the behavior of the water inside the pile. Review the properties of the mineral bed, which acts as a protector of the binders at the base of the piles, which is currently a fine material called "chusca", which could be replaced by classified particulate material, favoring the infiltration of the solutions.
⮚It is considered important to evaluate the leachable material through heap leaching simulation, which allows the construction of a conceptual model of caliche leaching with a view to secondary processing of the riprap to increase the overall recovery.
⮚It is contributive and relevant to work on the generation of models that represent heap leaching, the decrease in particle size (ROM versus Scarious granulometry) and, therefore, of the whole heap and the simultaneous dissolution of different species at different rates of nitrate iodine extraction.
⮚With respect to generating material use options, detailed geotechnical characterization of the available clays within the mine property boundaries is suggested to assess whether there are sufficient clay materials on site to use as a low permeable soil liner bed under the leach pad.
⮚Environmental issues include leachate or acid water management, air emissions management, tailings dump management, and leachate riprap.
⮚All the above recommendations are considered within the declared CAPEX/OPEX and do not imply additional costs for their execution.
|
|
|
|
|
|
|
|
|
| SQM TRS Nueva Victoria |
|
Pag. 214 |
24REFERENCES
⮚Chong, G., Gajardo, A., Hartley, A., Moreno, T. 2007. Industrial Minerals and rocks. In Moreno, T. & Gibbons, W. (eds) The Geology of Chile 7, 201-214
⮚Ericksen, G.E. 1981. Geology and origin of the Chilean nitrate deposits. U.S. Geological Survey Professional Paper 1188-B.
⮚Fiesta, B. 1966. El origen del salitre de Chile. Sociedad Española de Historia Natural Boletín, Sección Geológica 64(1), 47-56.
⮚Mueller, G. 1960. The theory of formation of north Chilean nitrate deposits through ((capillary concentration)). International Geological Congress, 21st, Copenhagen 1960, Report 1, 76-86.
⮚Pueyo, J.J.; Chong, G.; Vega, M. 1998. Mineralogía y evolución de las salmueras madres en el yacimiento de nitratos Pedro de Valdivia, Antofagasta, Chile. Revista Geológica de Chile, Vol. 25, No. 1, p. 3-15.
⮚Reich, M., Snyder, G.T., Alvarez, F., Pérez, A., Palacios, C., Vargas, G., Cameron, E.M., Muramatsu, Y., Fehn, U. 2013. Using iodine to constrain supergen uid sources in arid regions: Insights from the Chuquicamata oxide blanket. Economic Geology 108, 163-171.
⮚Reich, M.,Bao,H. 2018. Nitrate Deposits of the Atacama Desert: A Marker of Long-Term Hyperaridity. Elements, Vol. 14, 251–256
|
|
|
|
|
|
|
|
|
| SQM TRS Nueva Victoria |
|
Pag. 215 |
25RELIANCE ON INFORMATION PROVIDED BY REGISTRANT
The qualified person has relied on information provided by the registrant in preparing its findings and conclusions regarding the following aspects of modifying factors:
1)Macroeconomic trends, data, and assumptions, and interest rates.
2)Mine and process operating costs.
3)Projected sales quantities and prices.
4)Marketing information and plans within the control of the registrant.
5)Environmental and social licenses
|
|
|
|
|
|
|
|
|
| SQM TRS Nueva Victoria |
|
Pag. 216 |


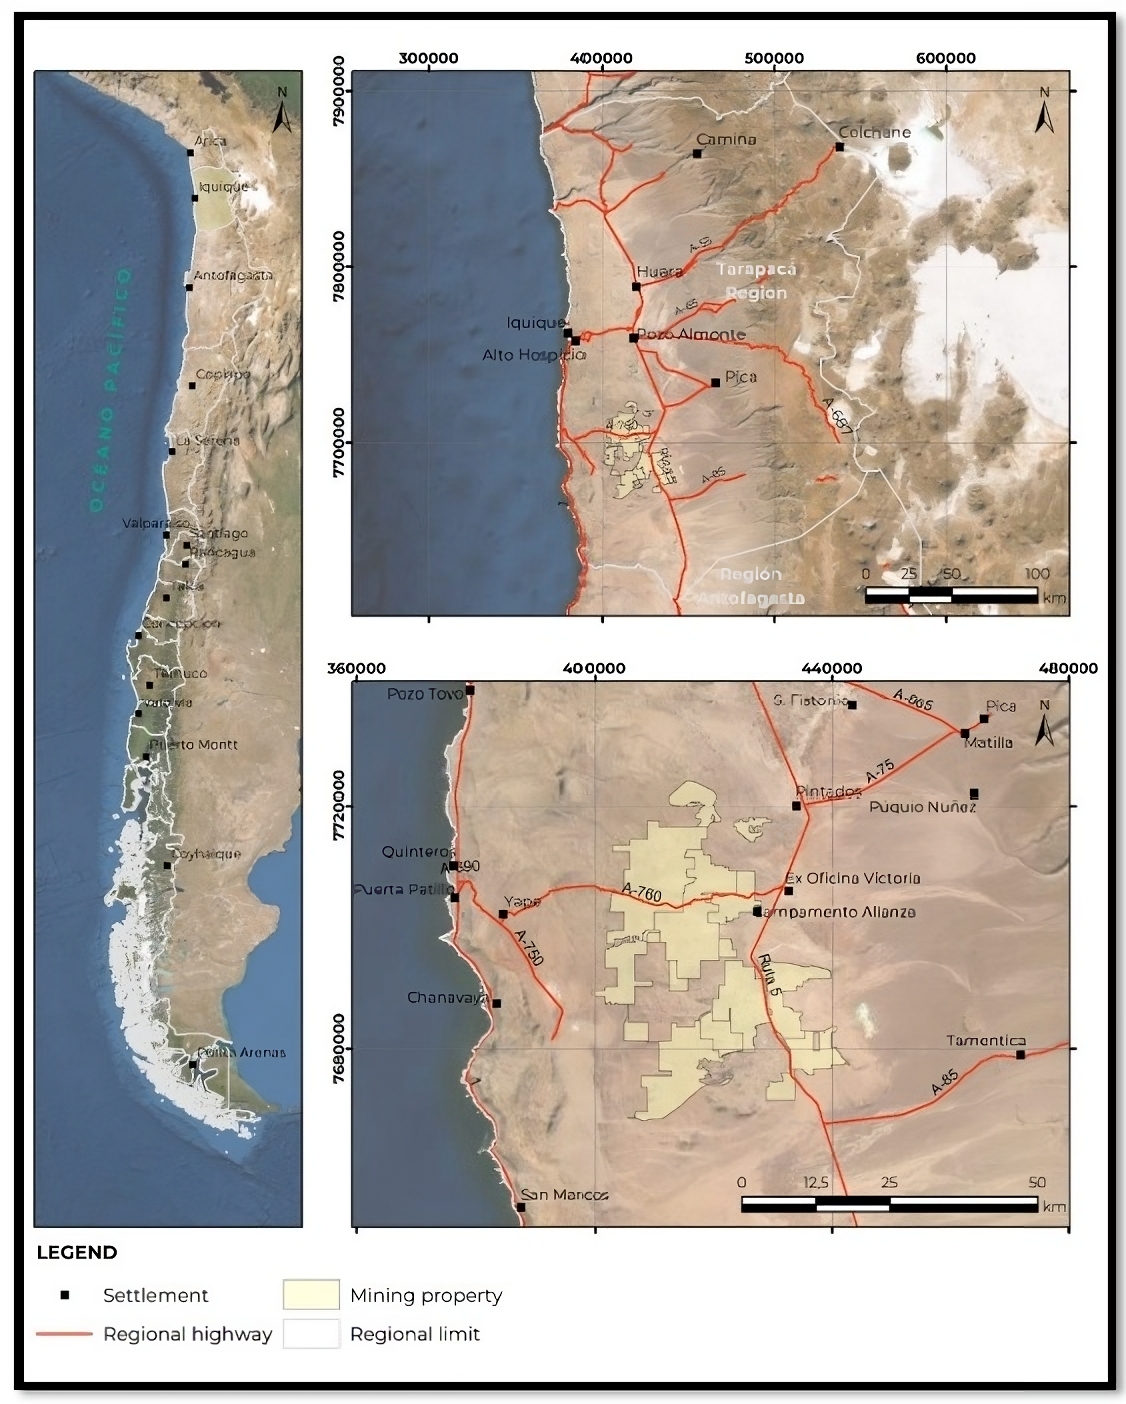
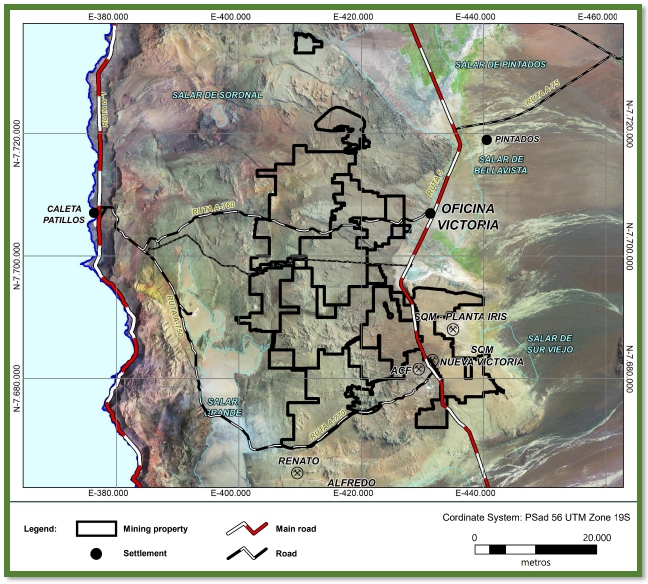
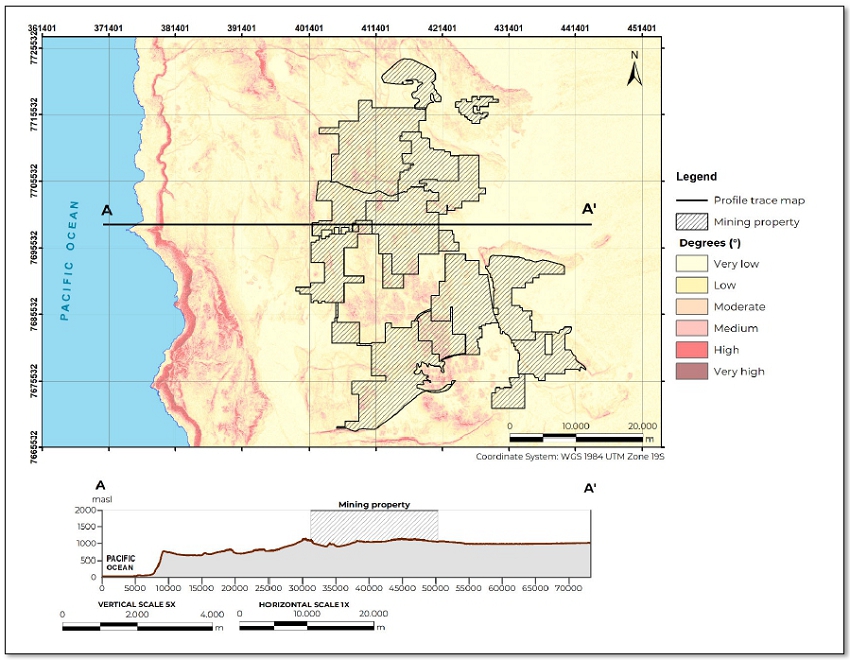
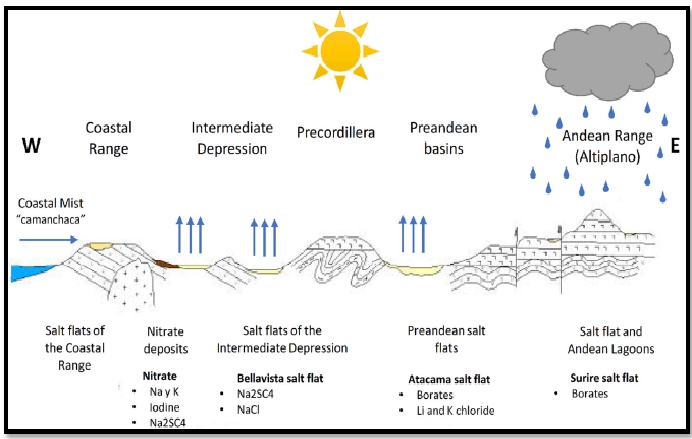
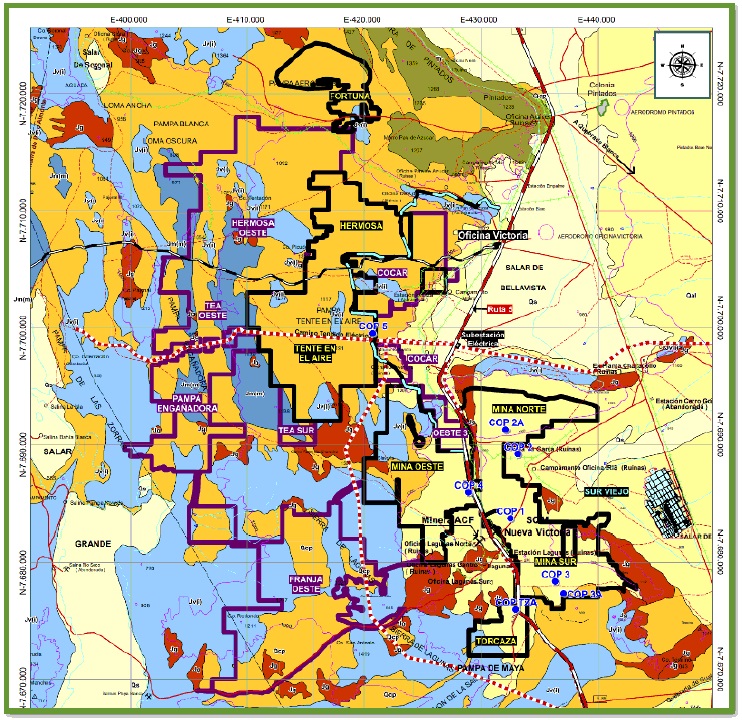
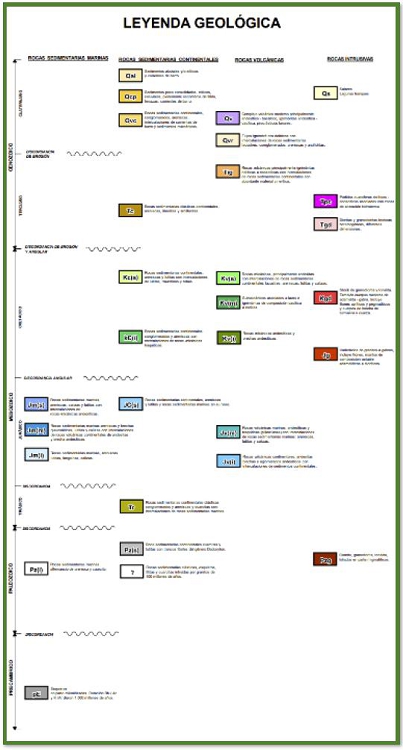
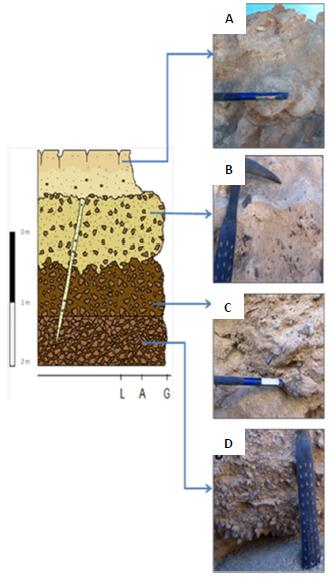
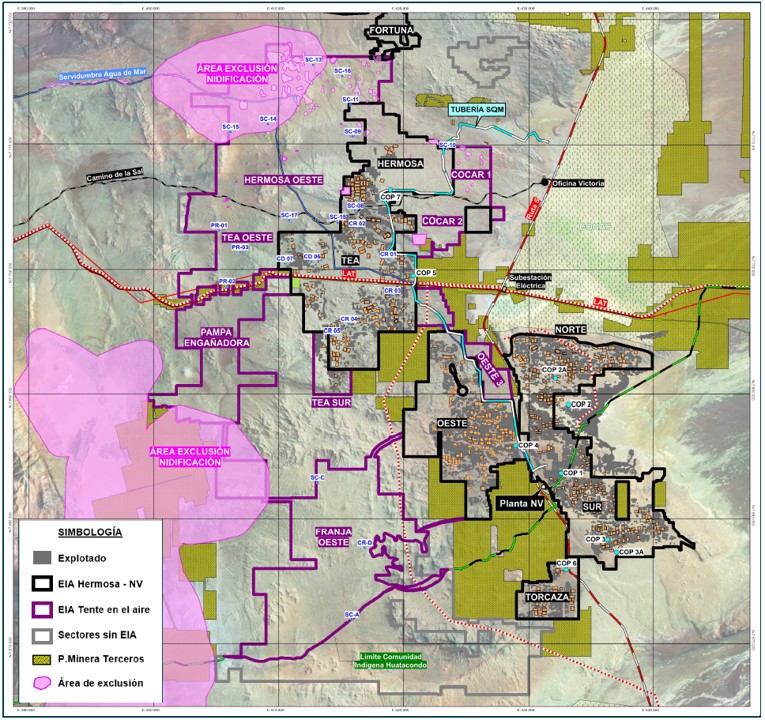
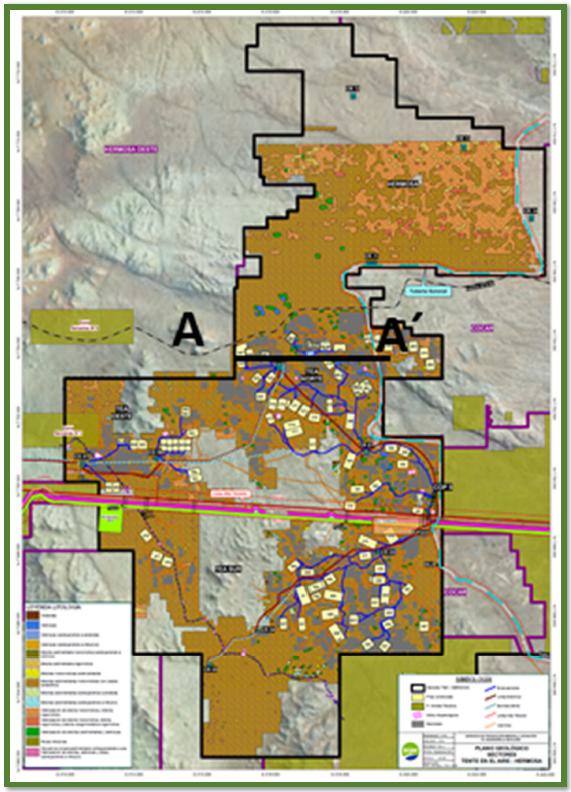
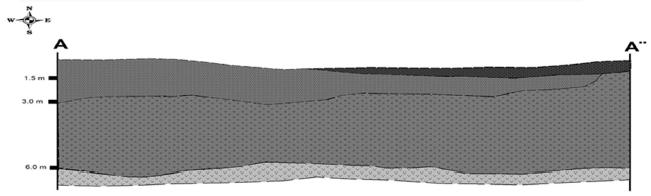
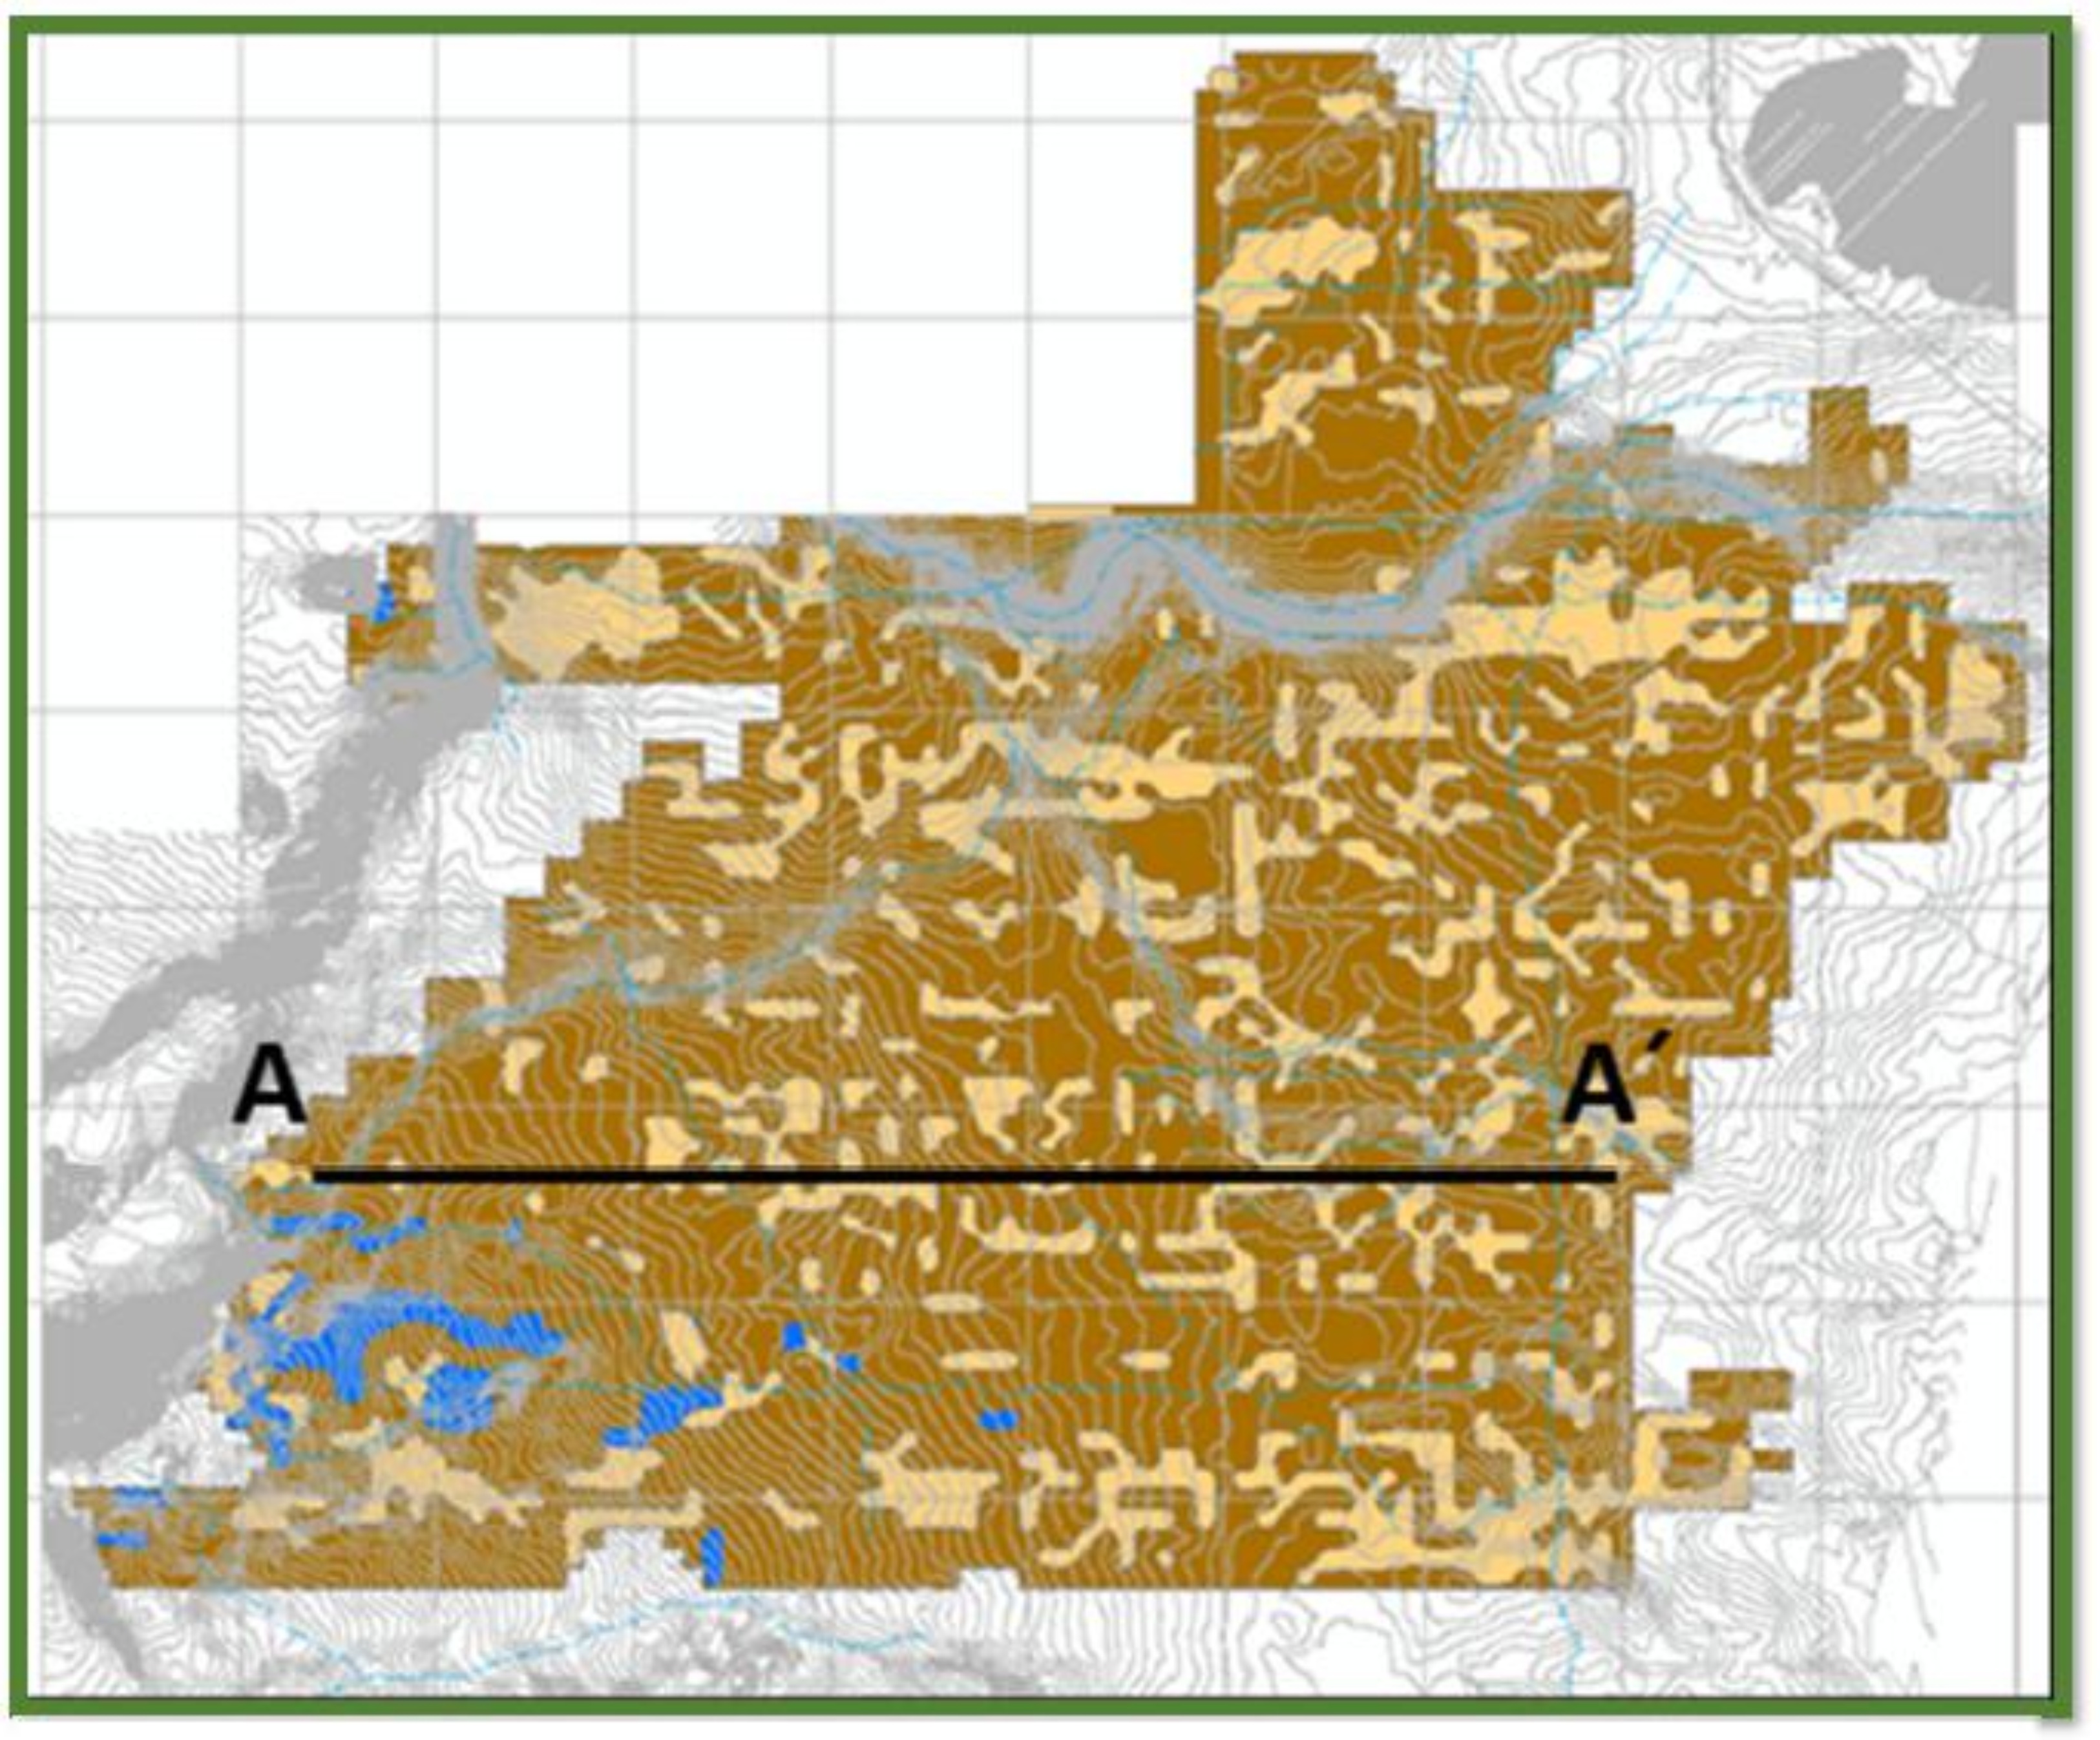
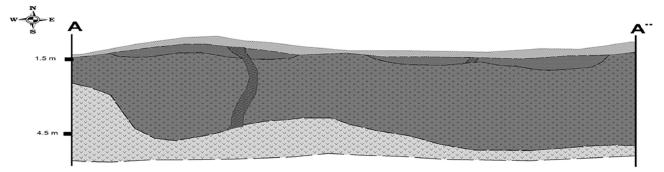
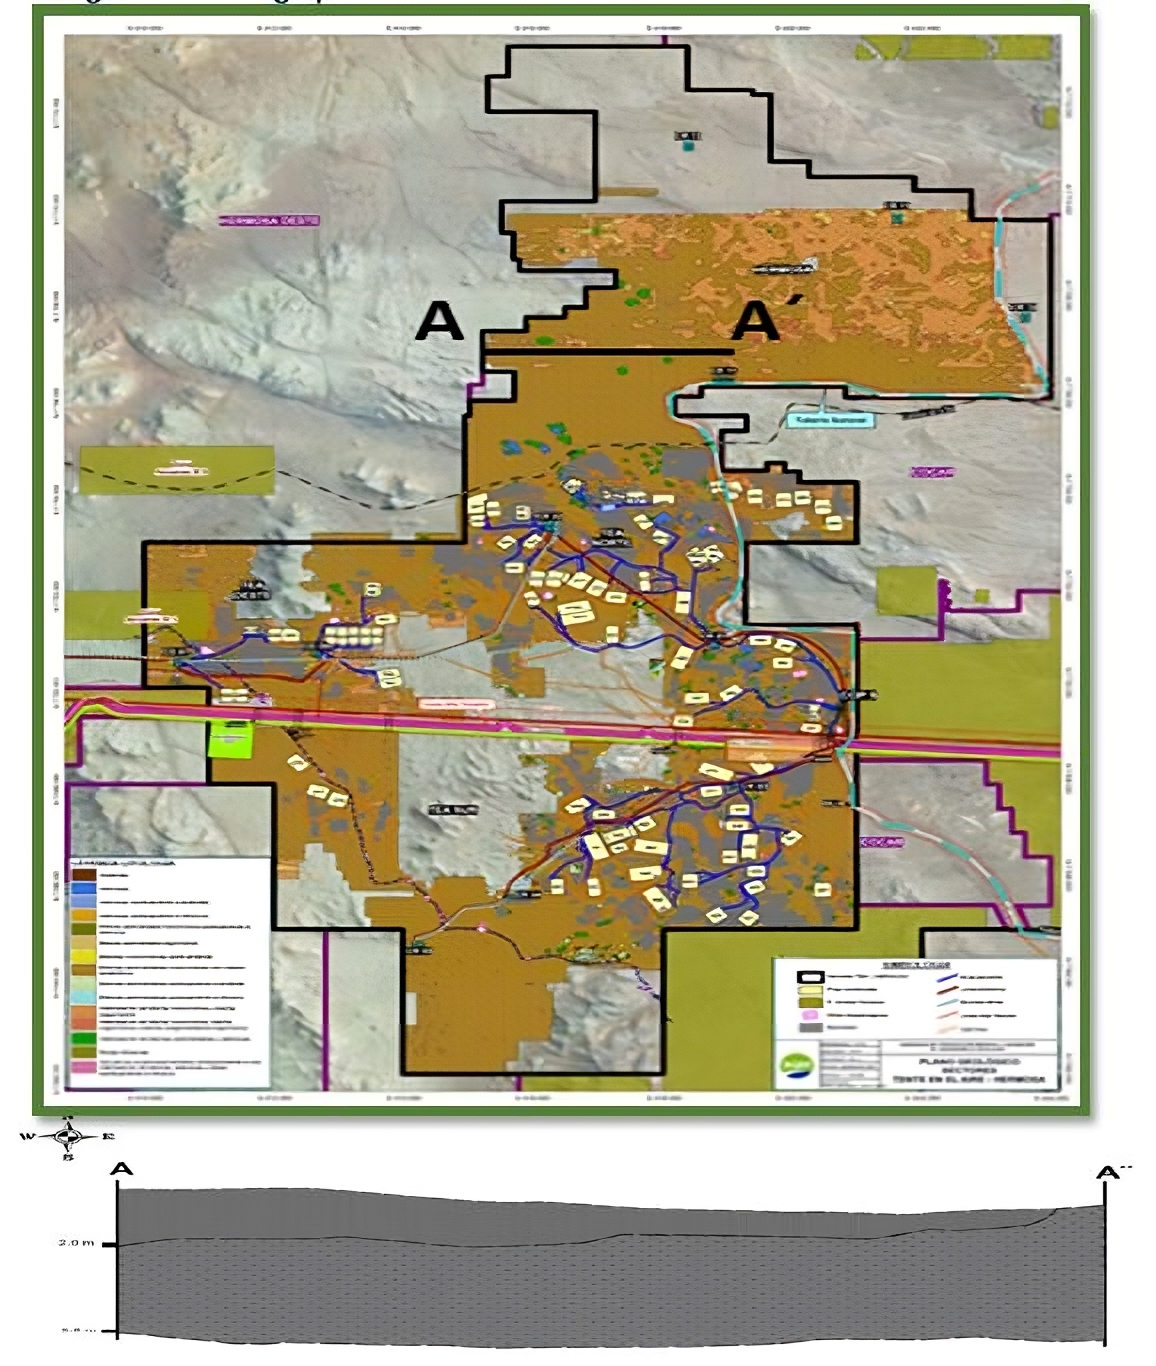
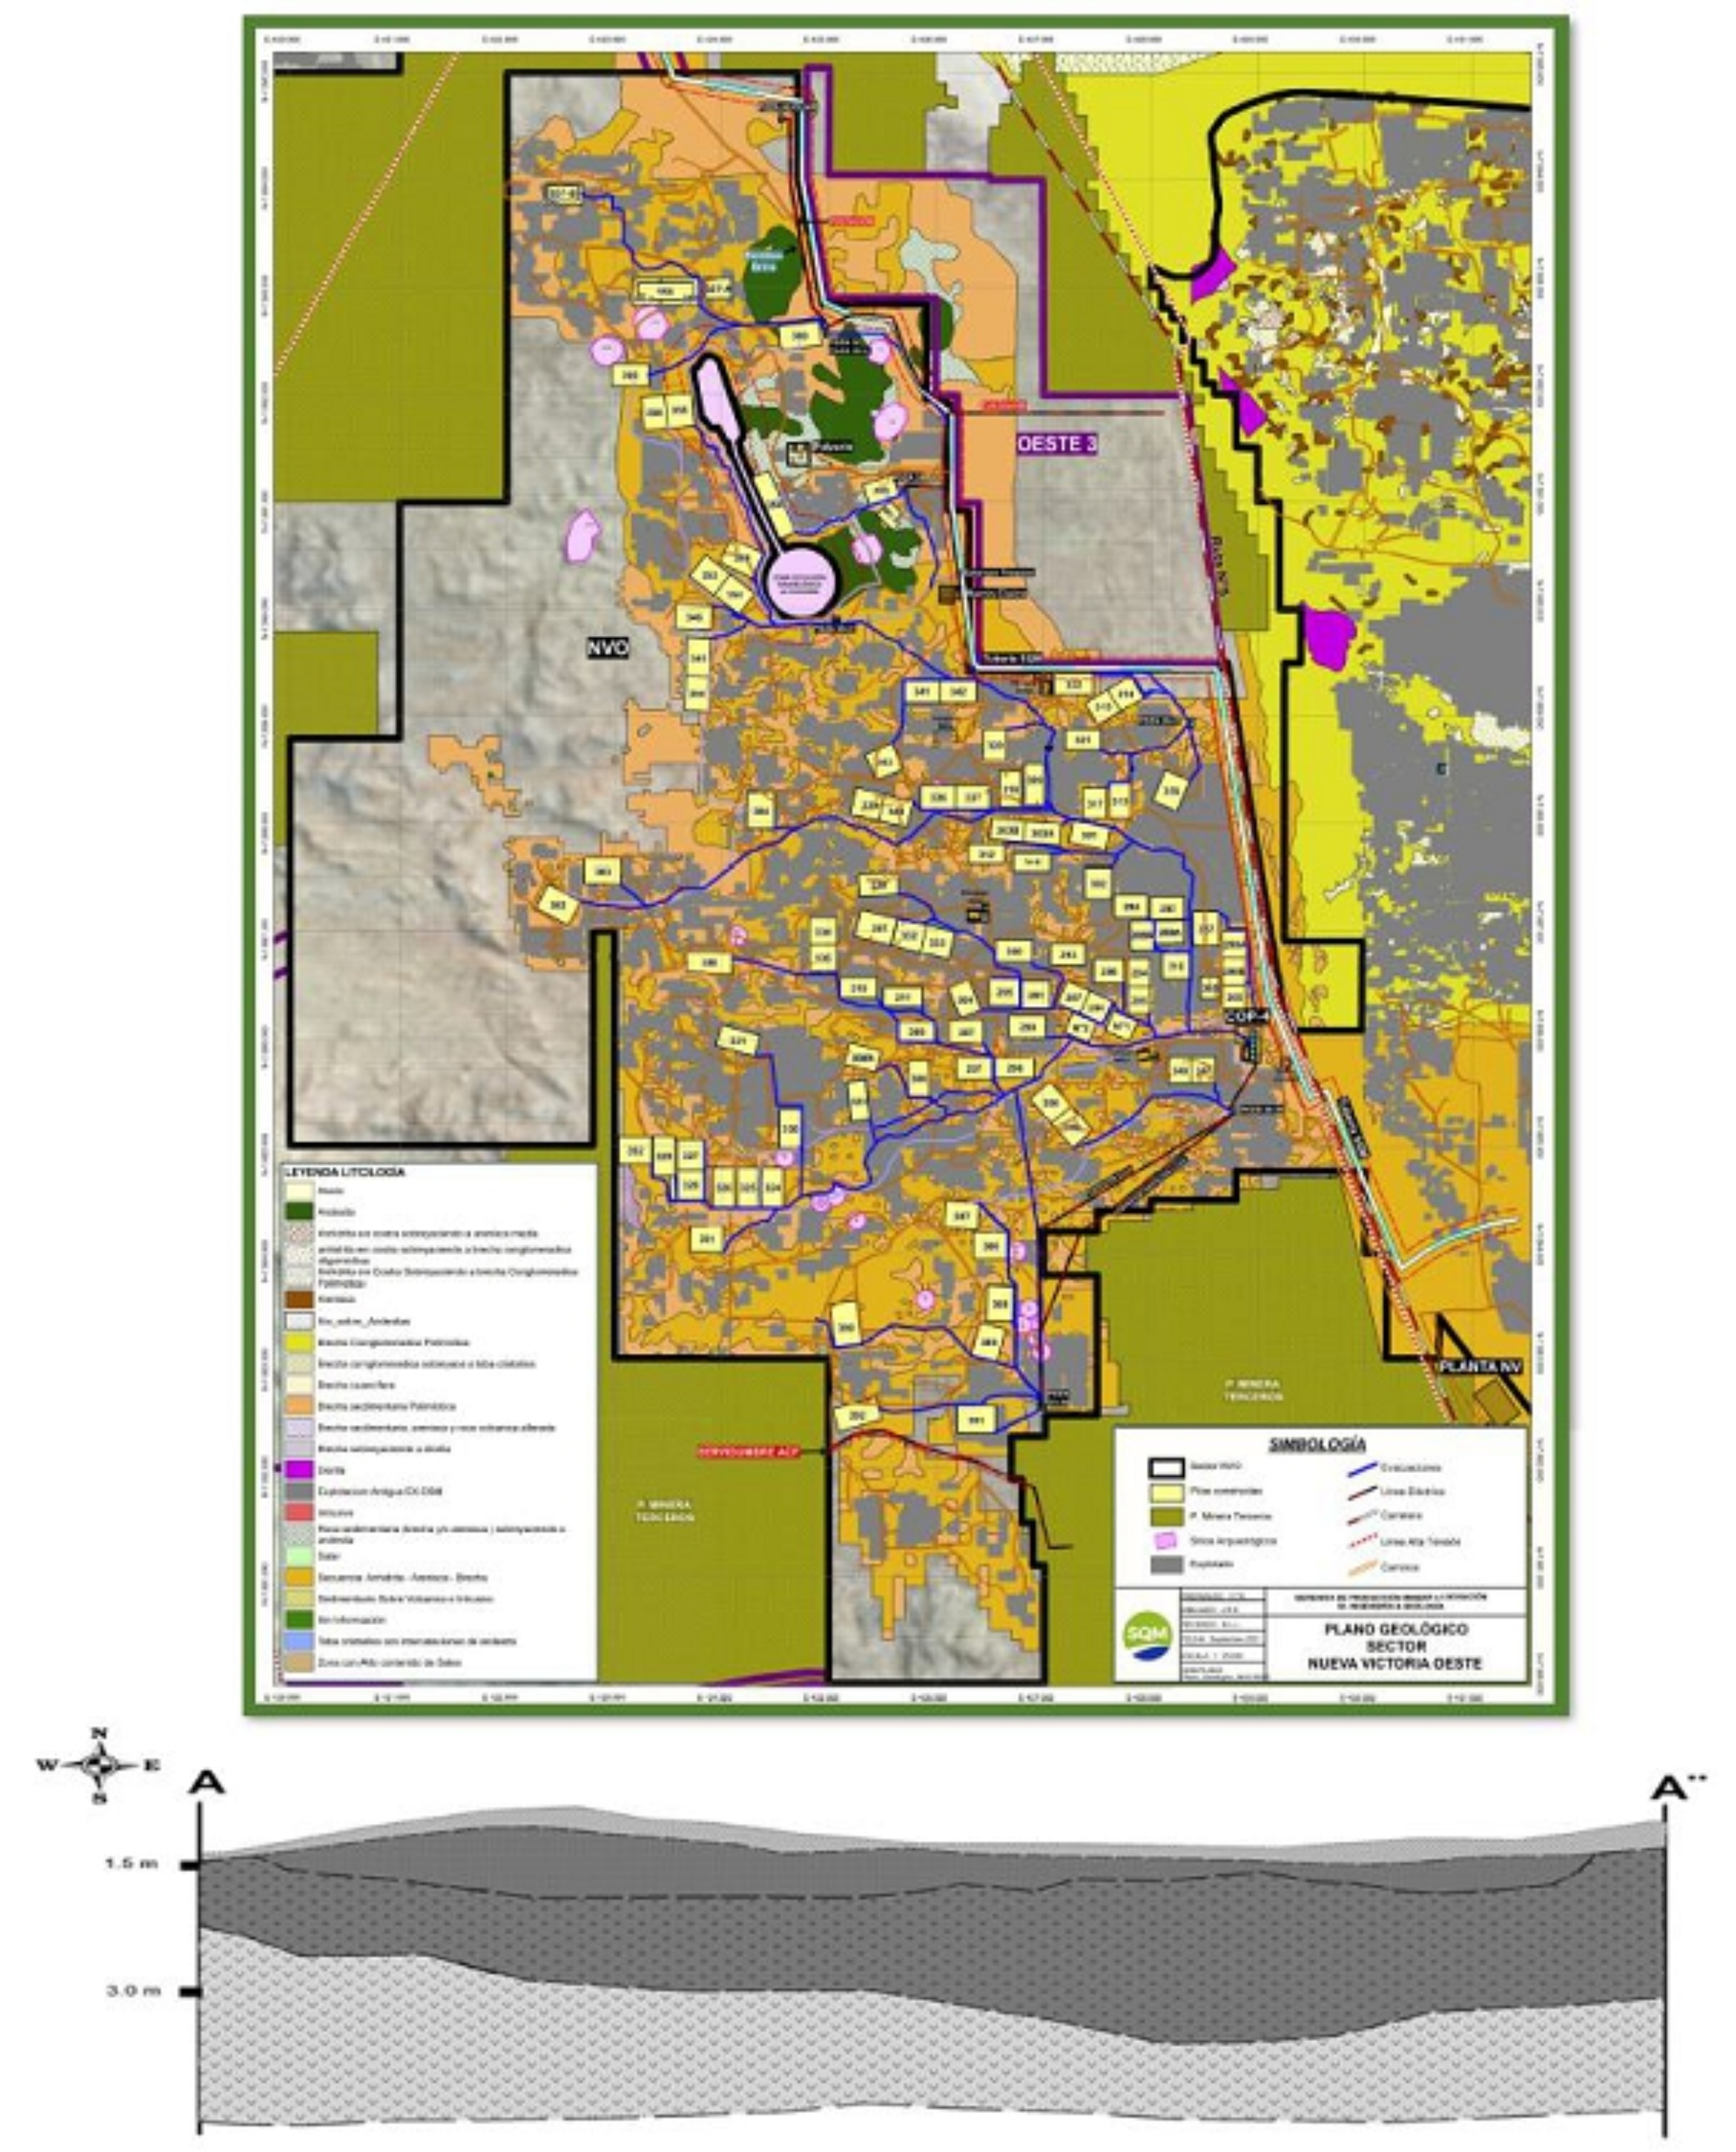
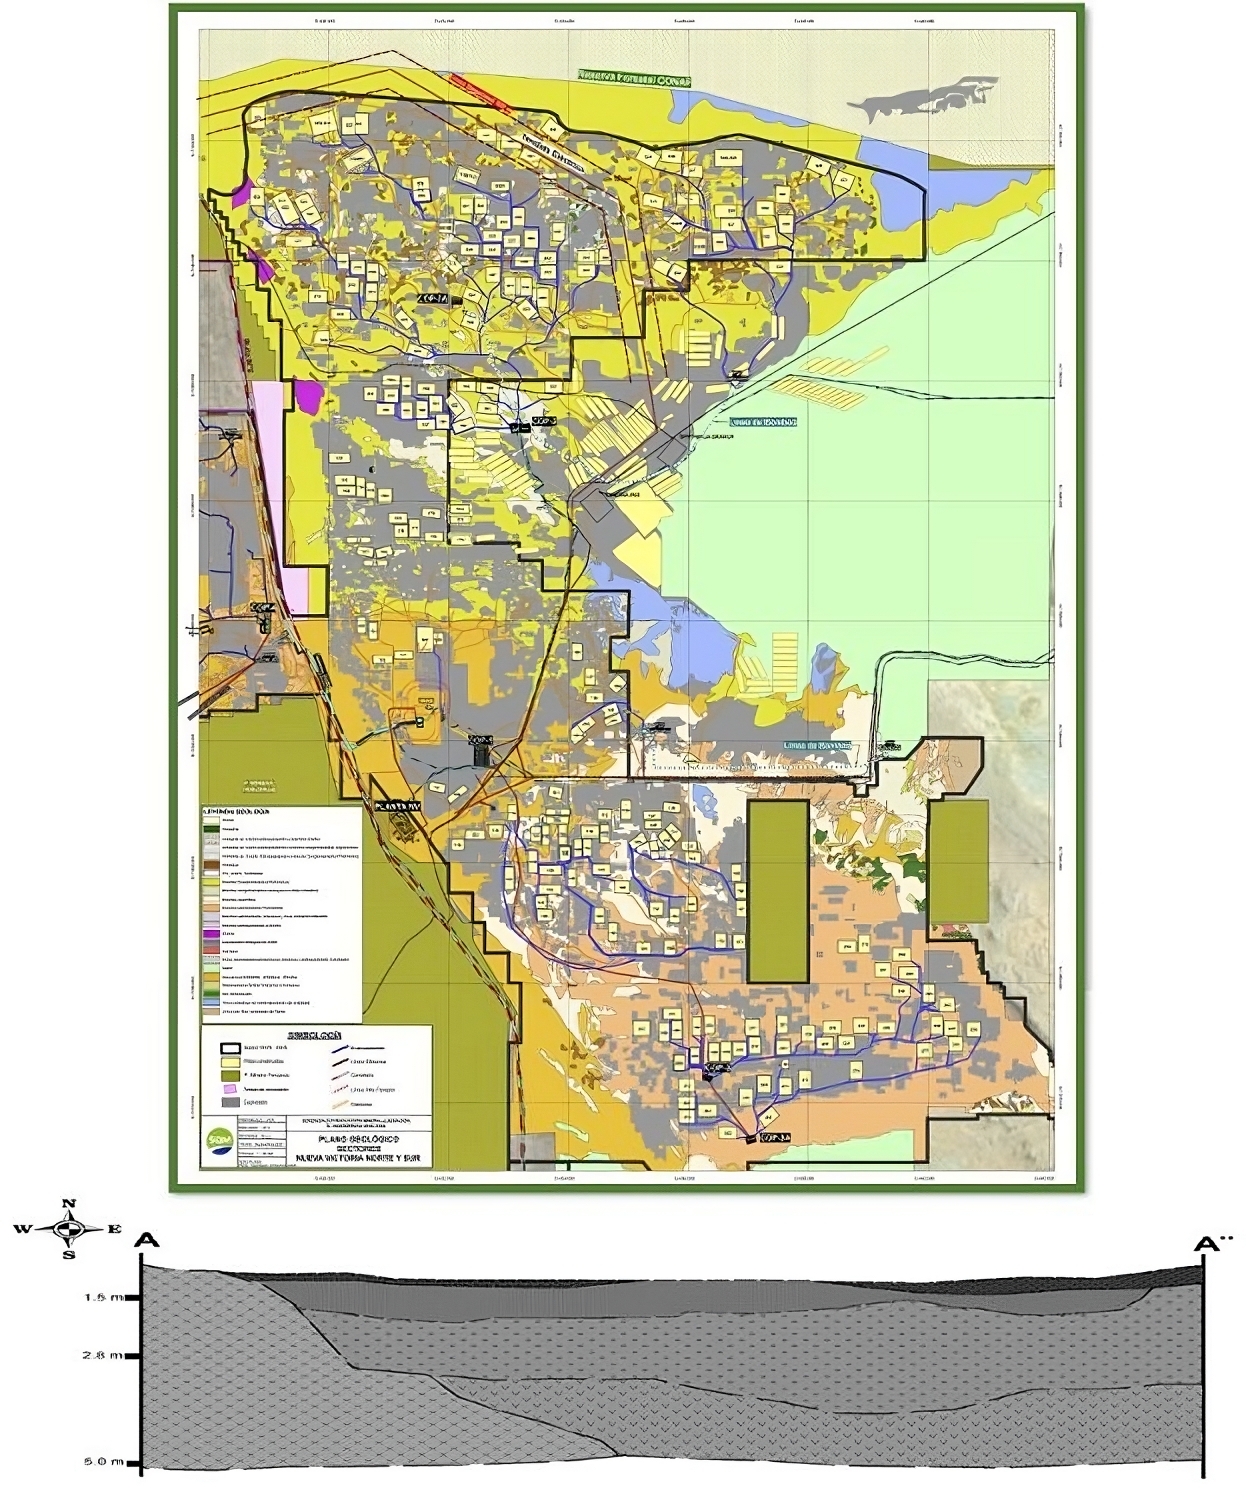
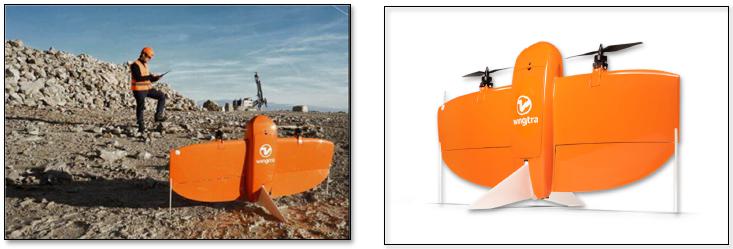
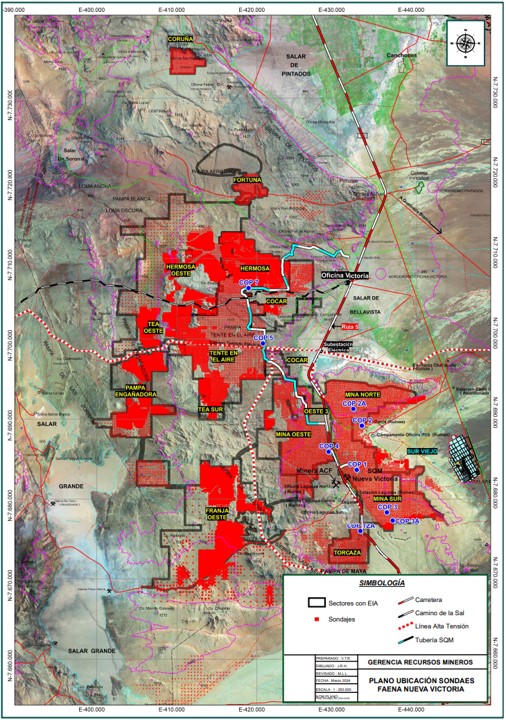
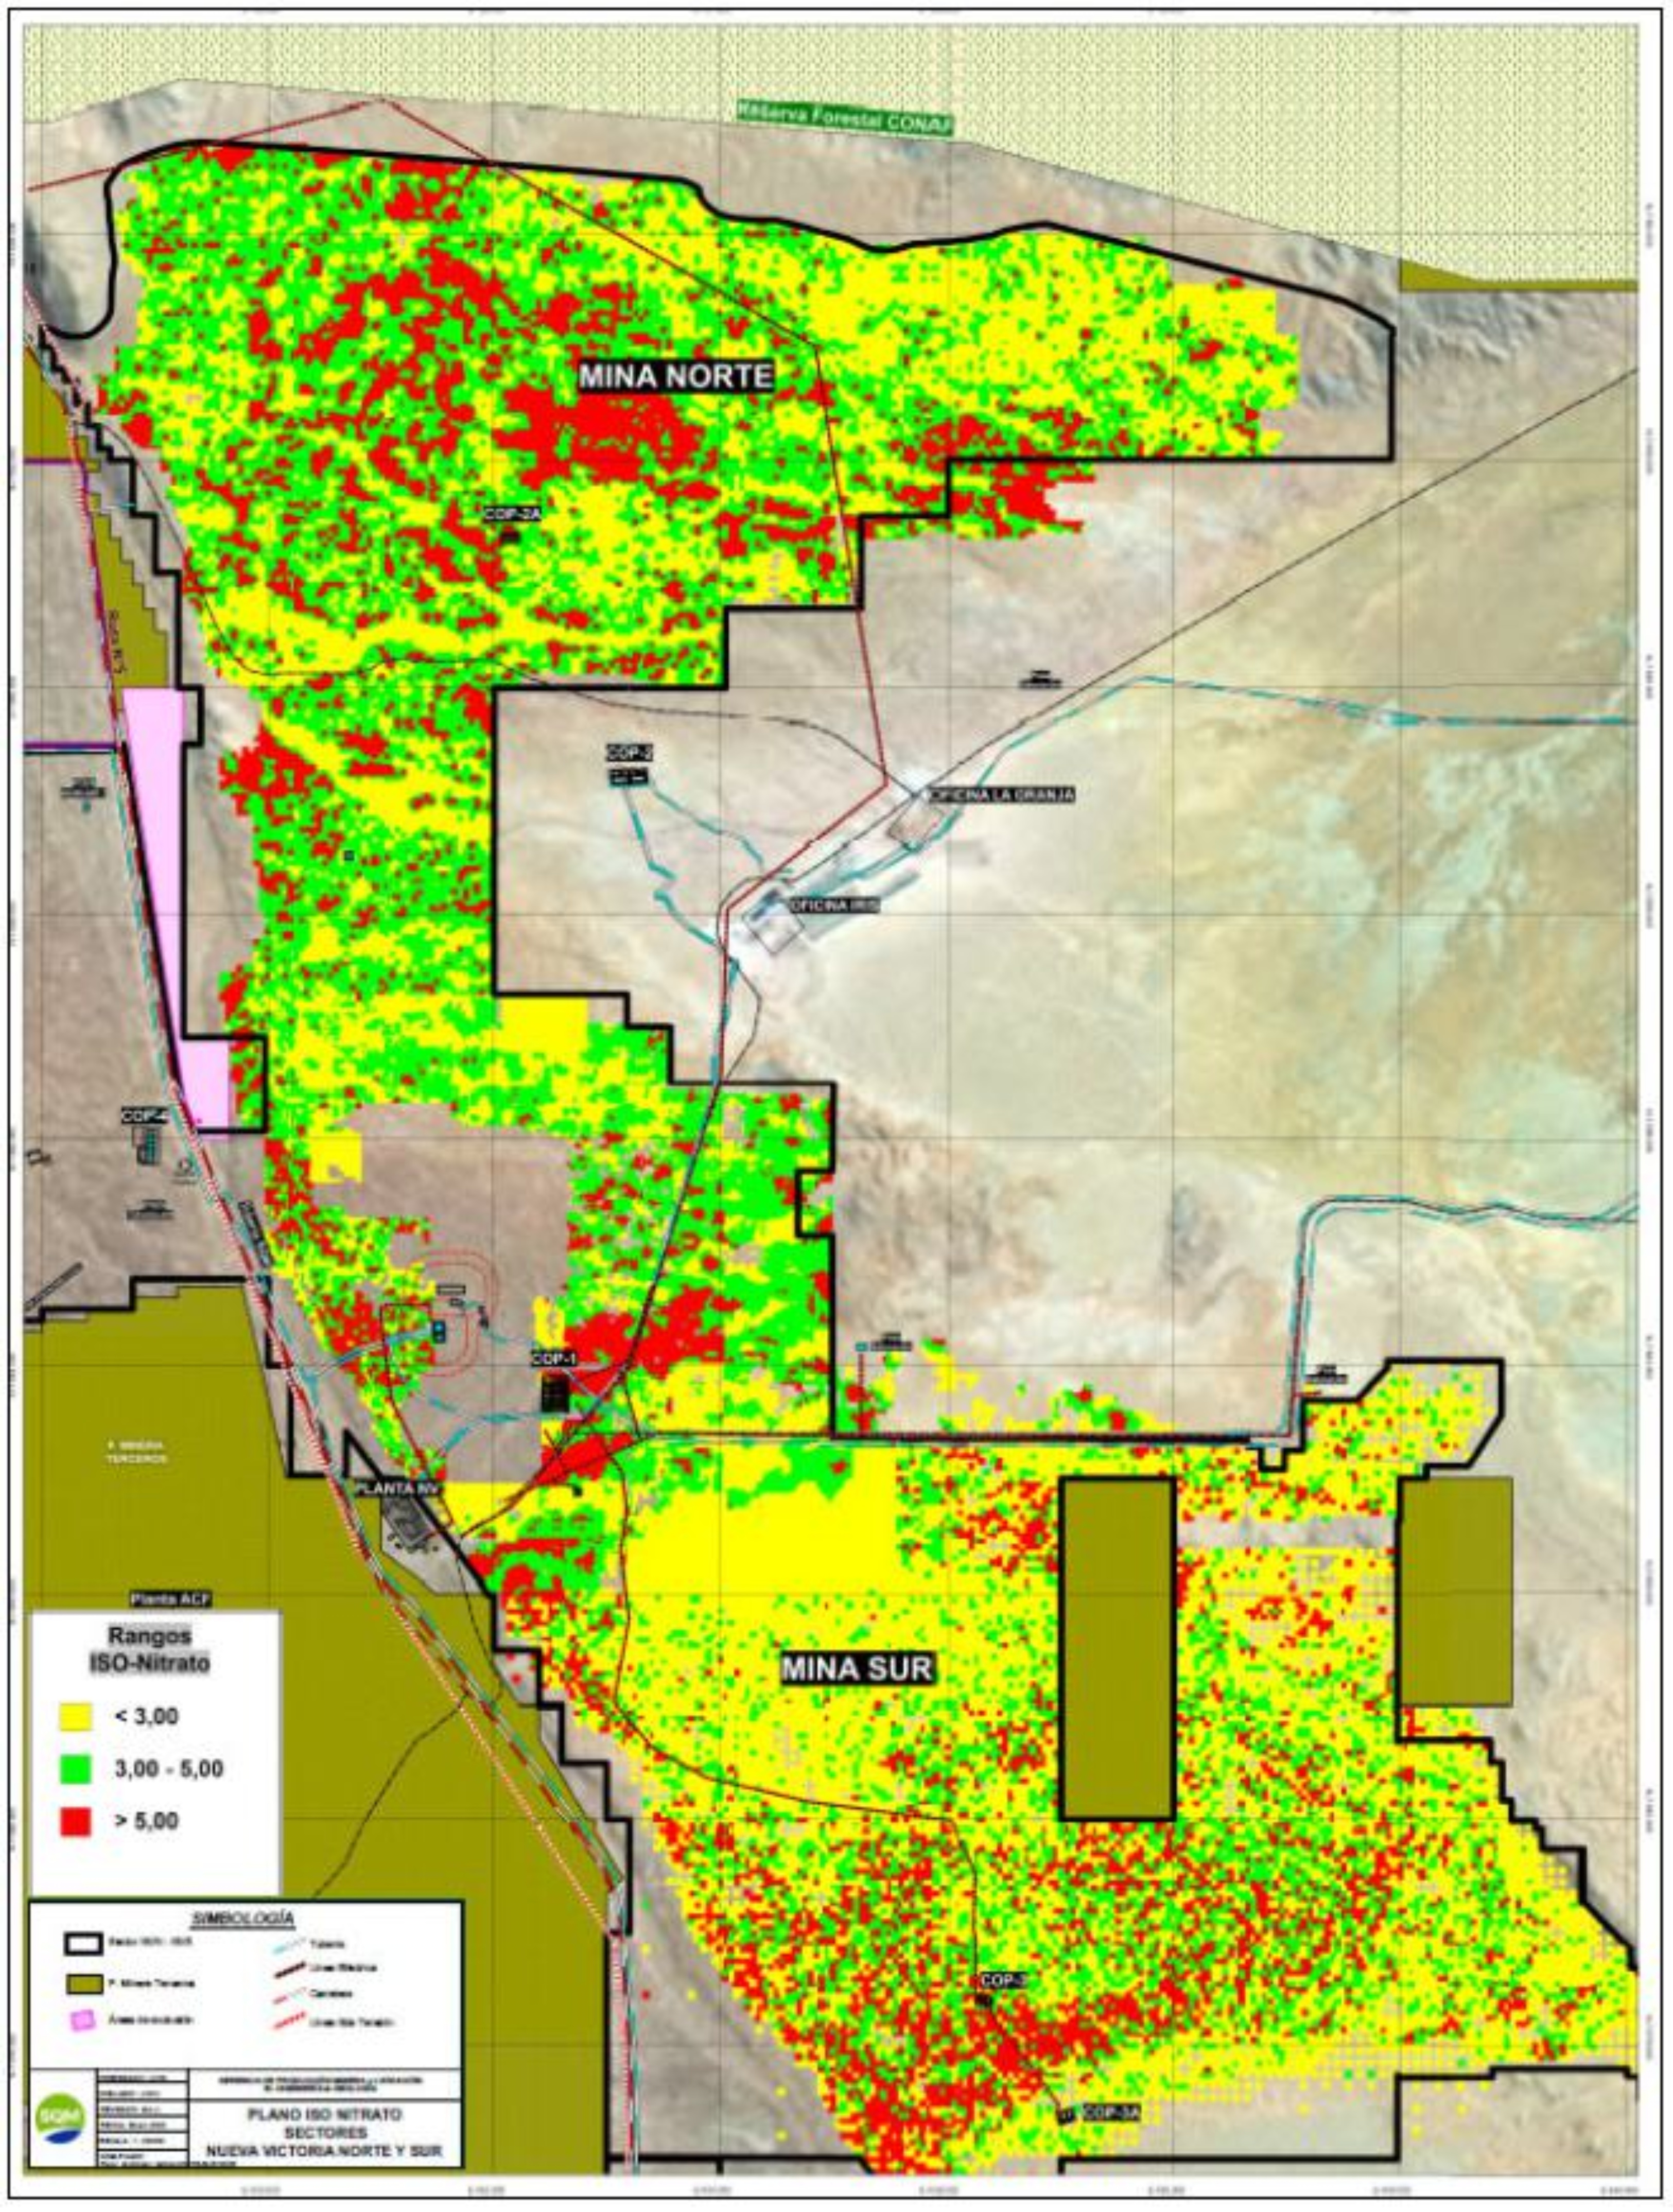
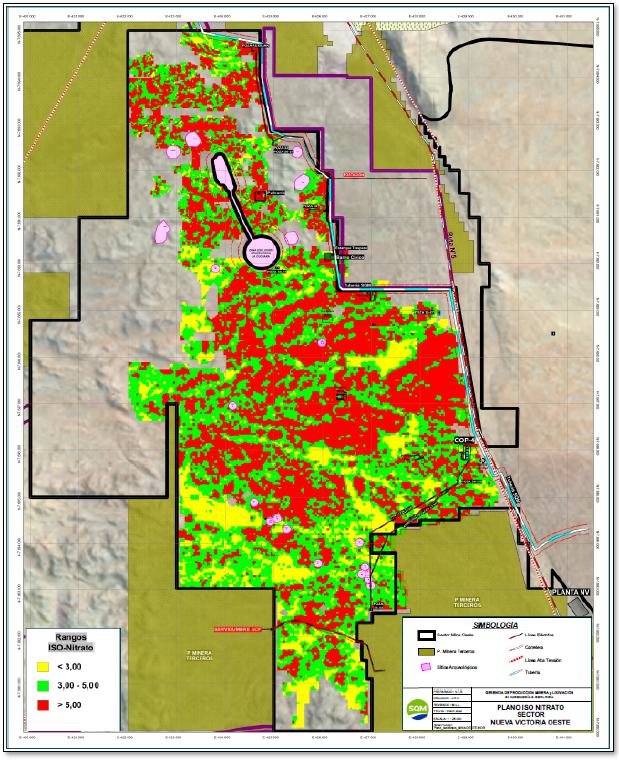
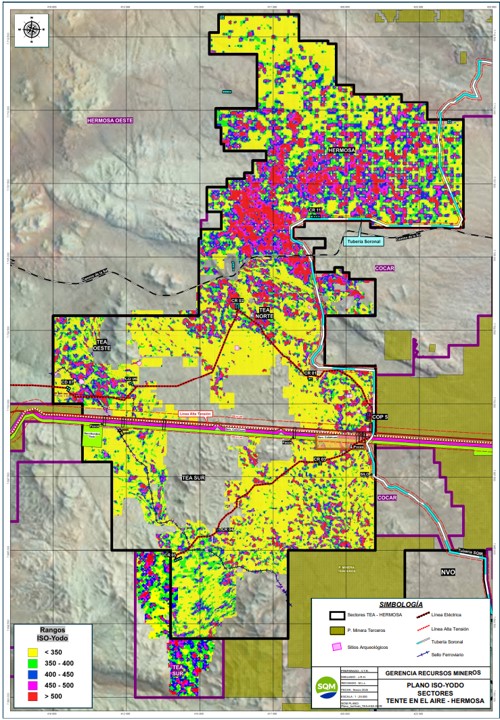
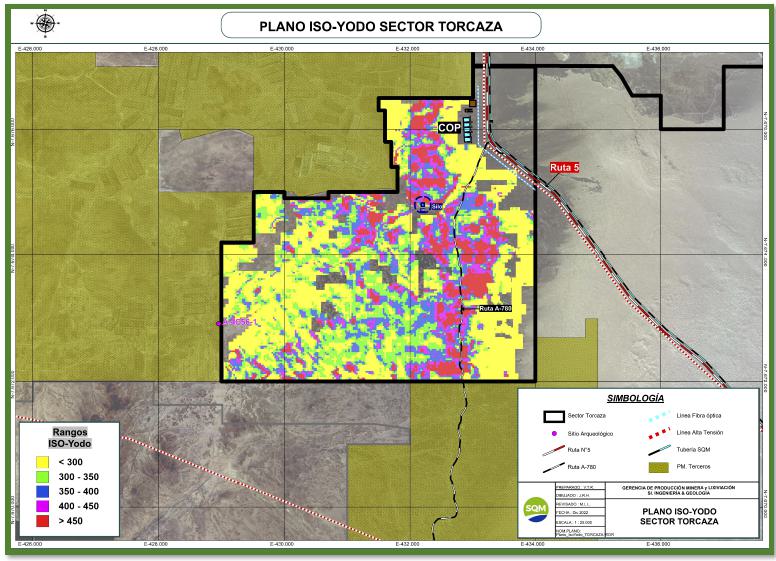

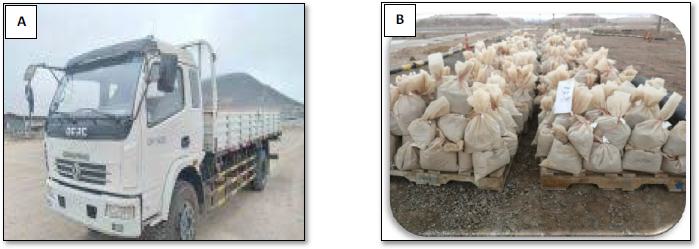


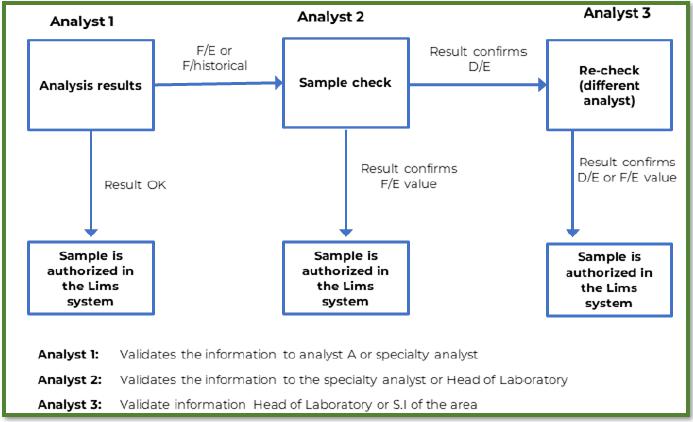
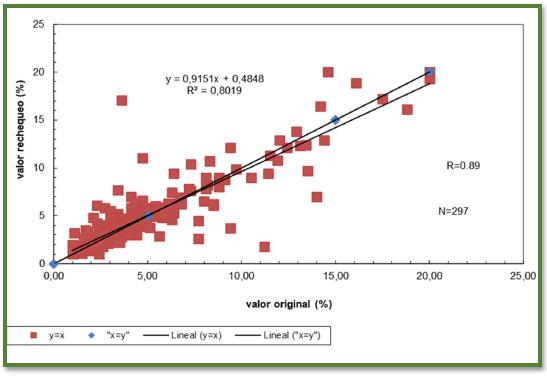
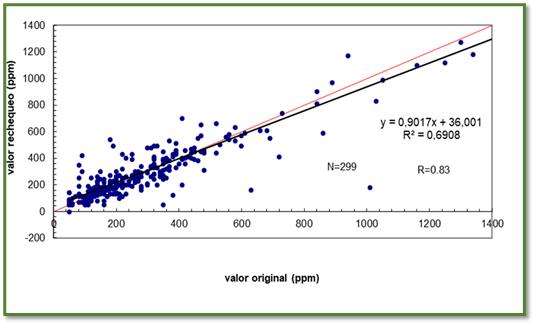
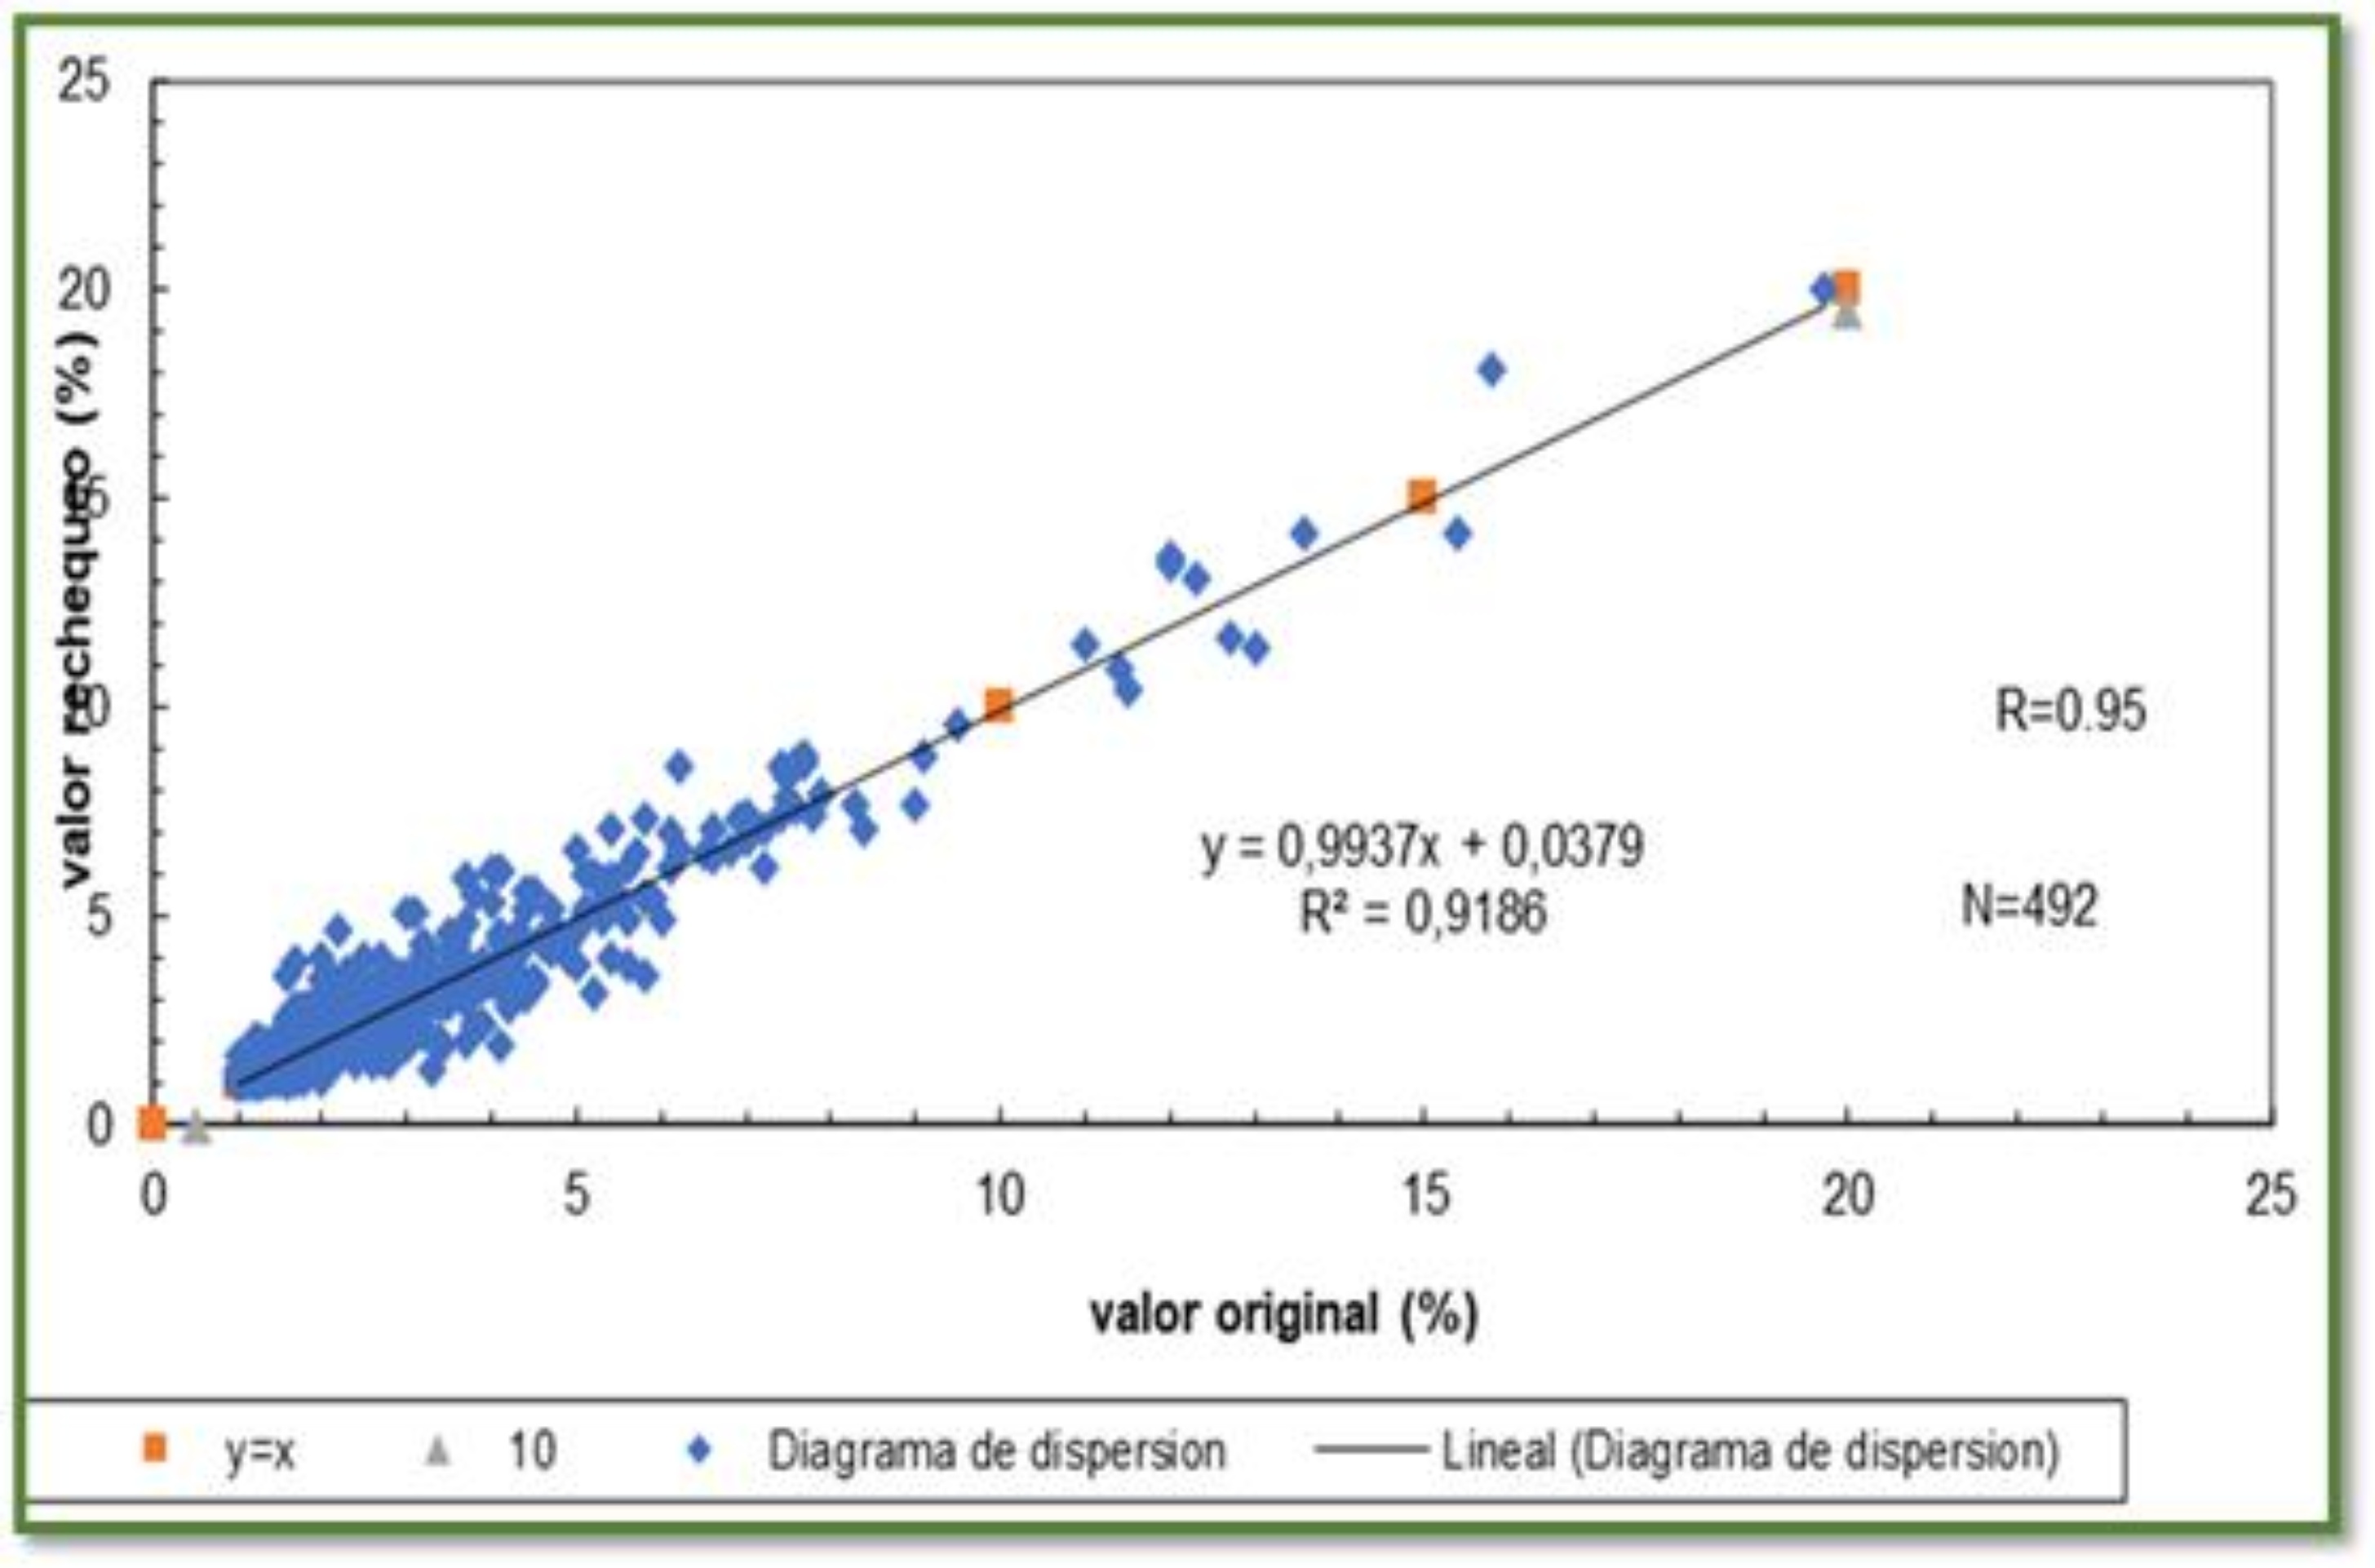
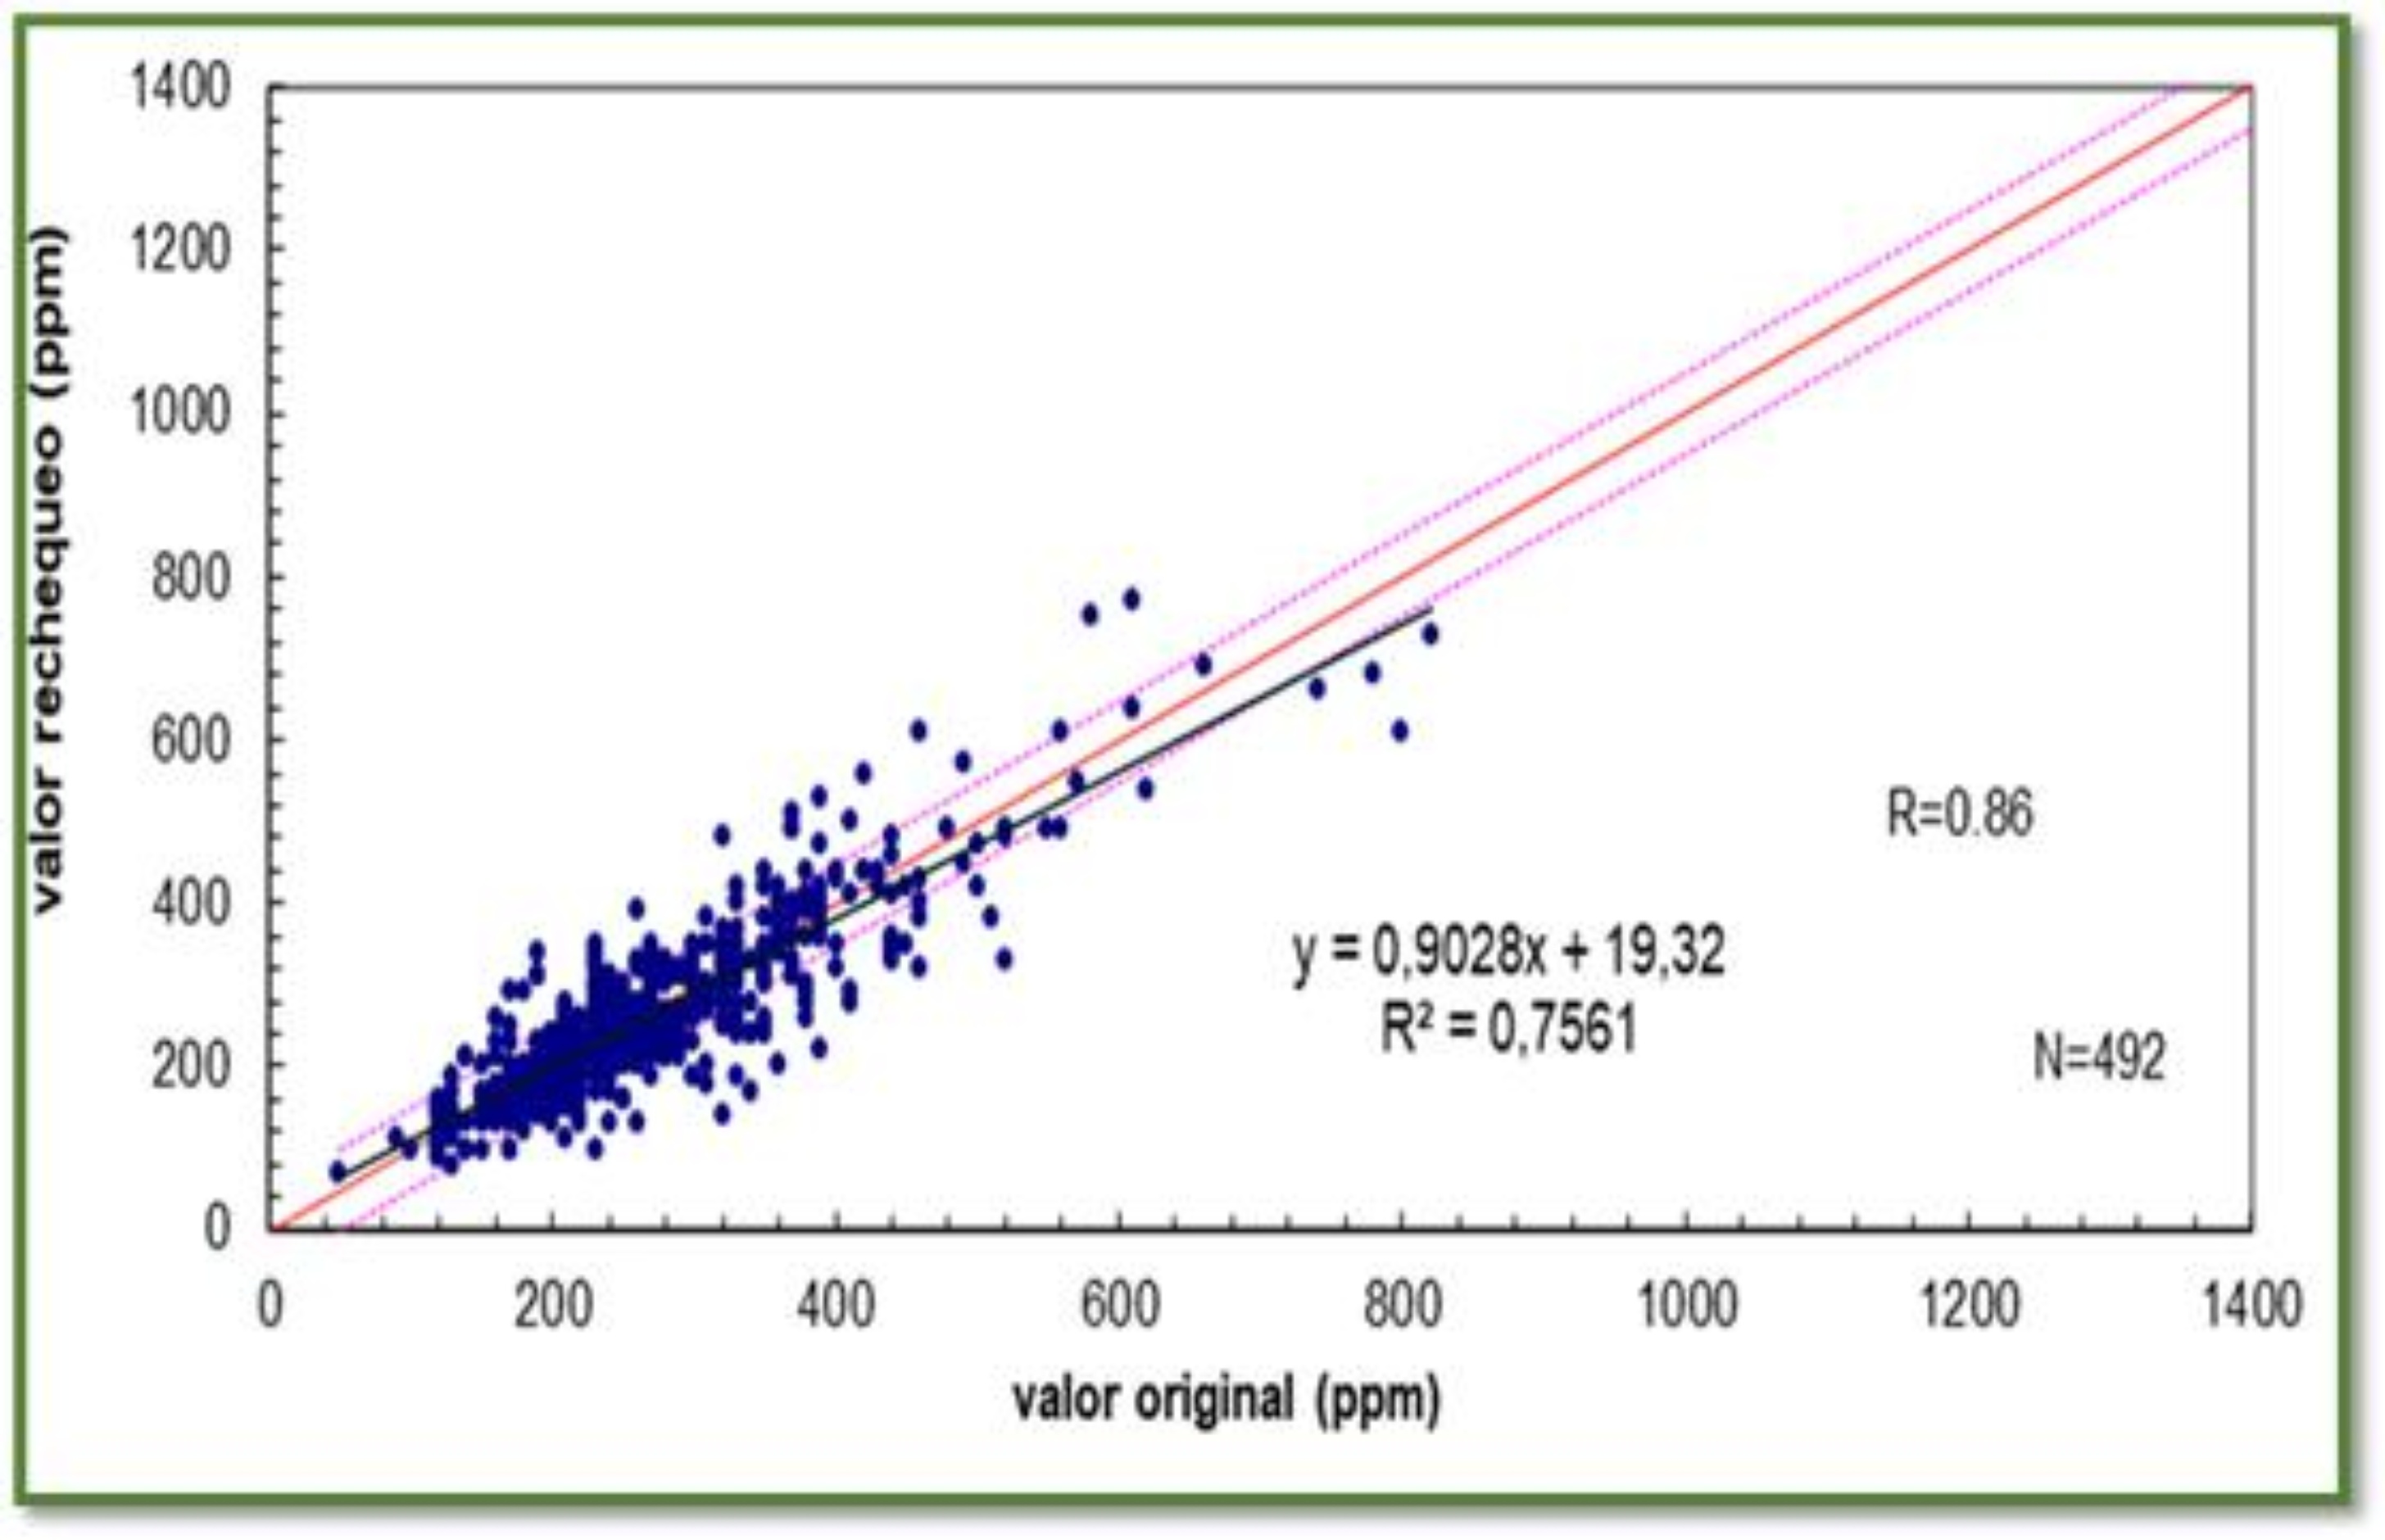
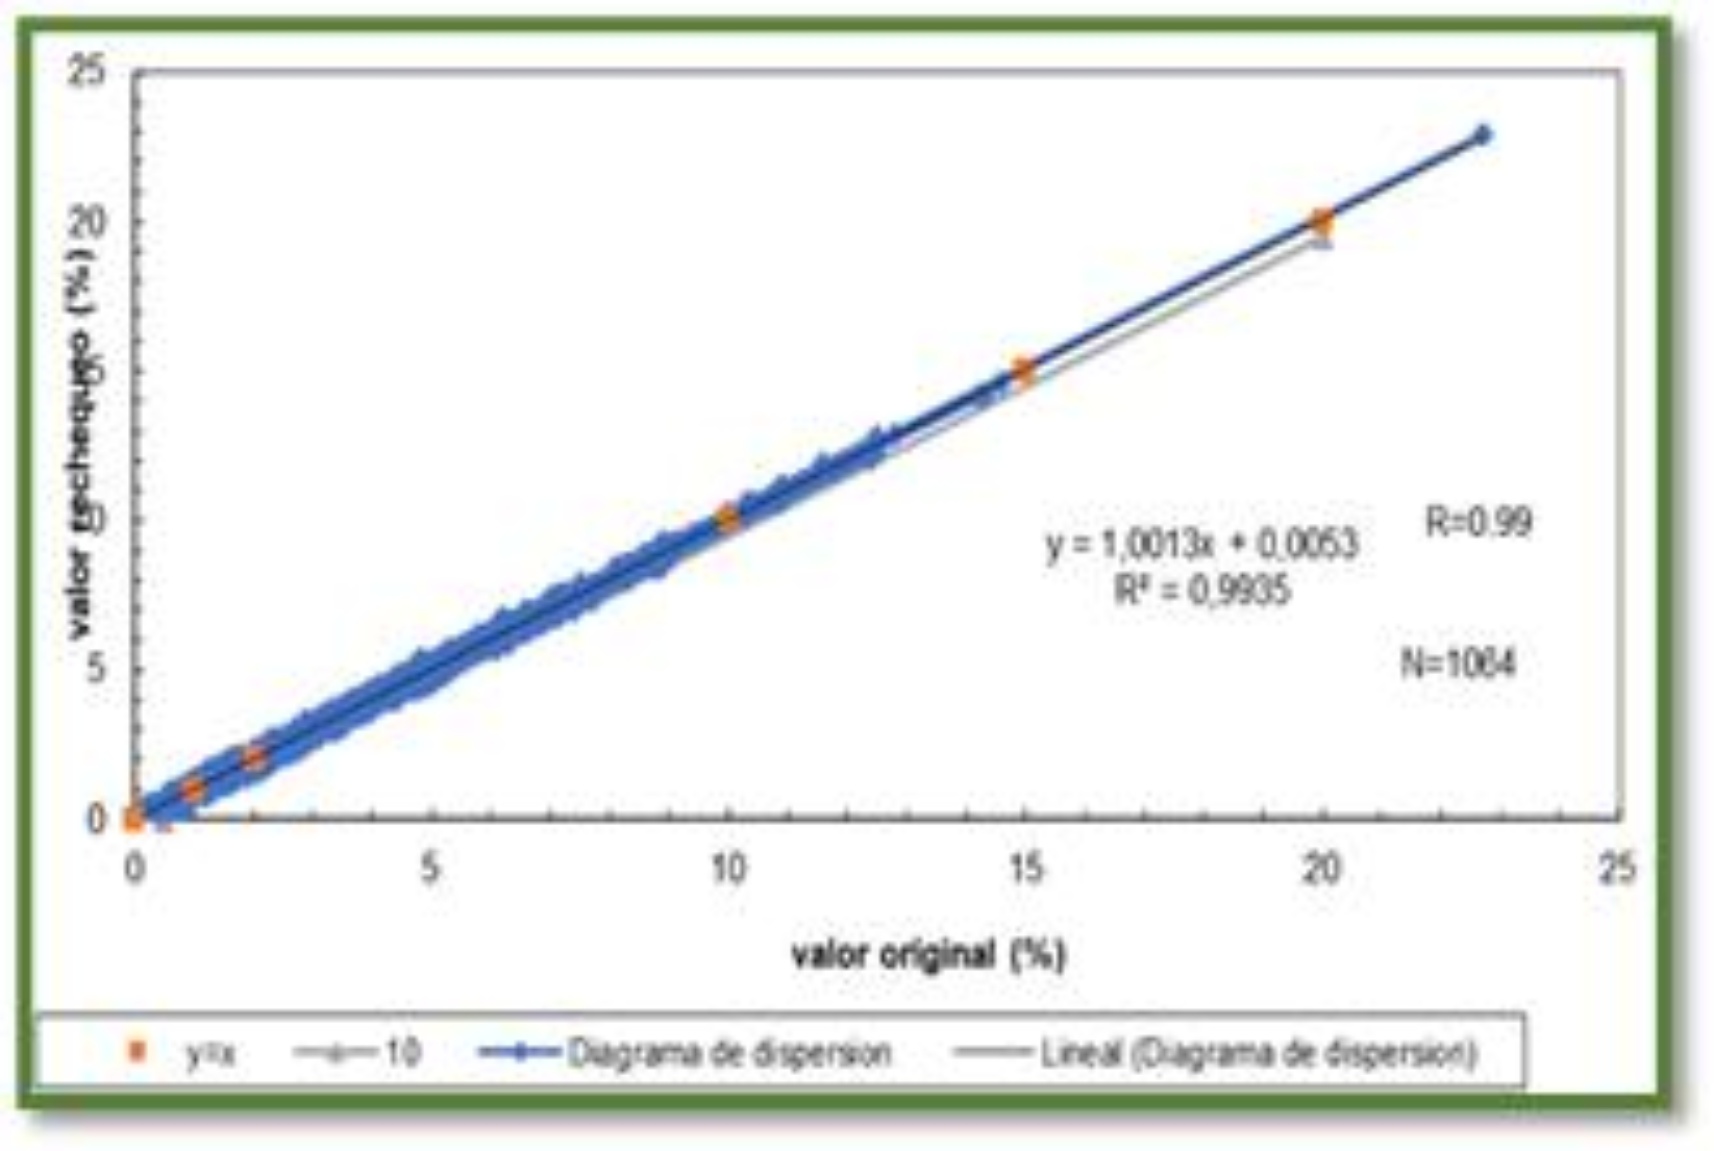
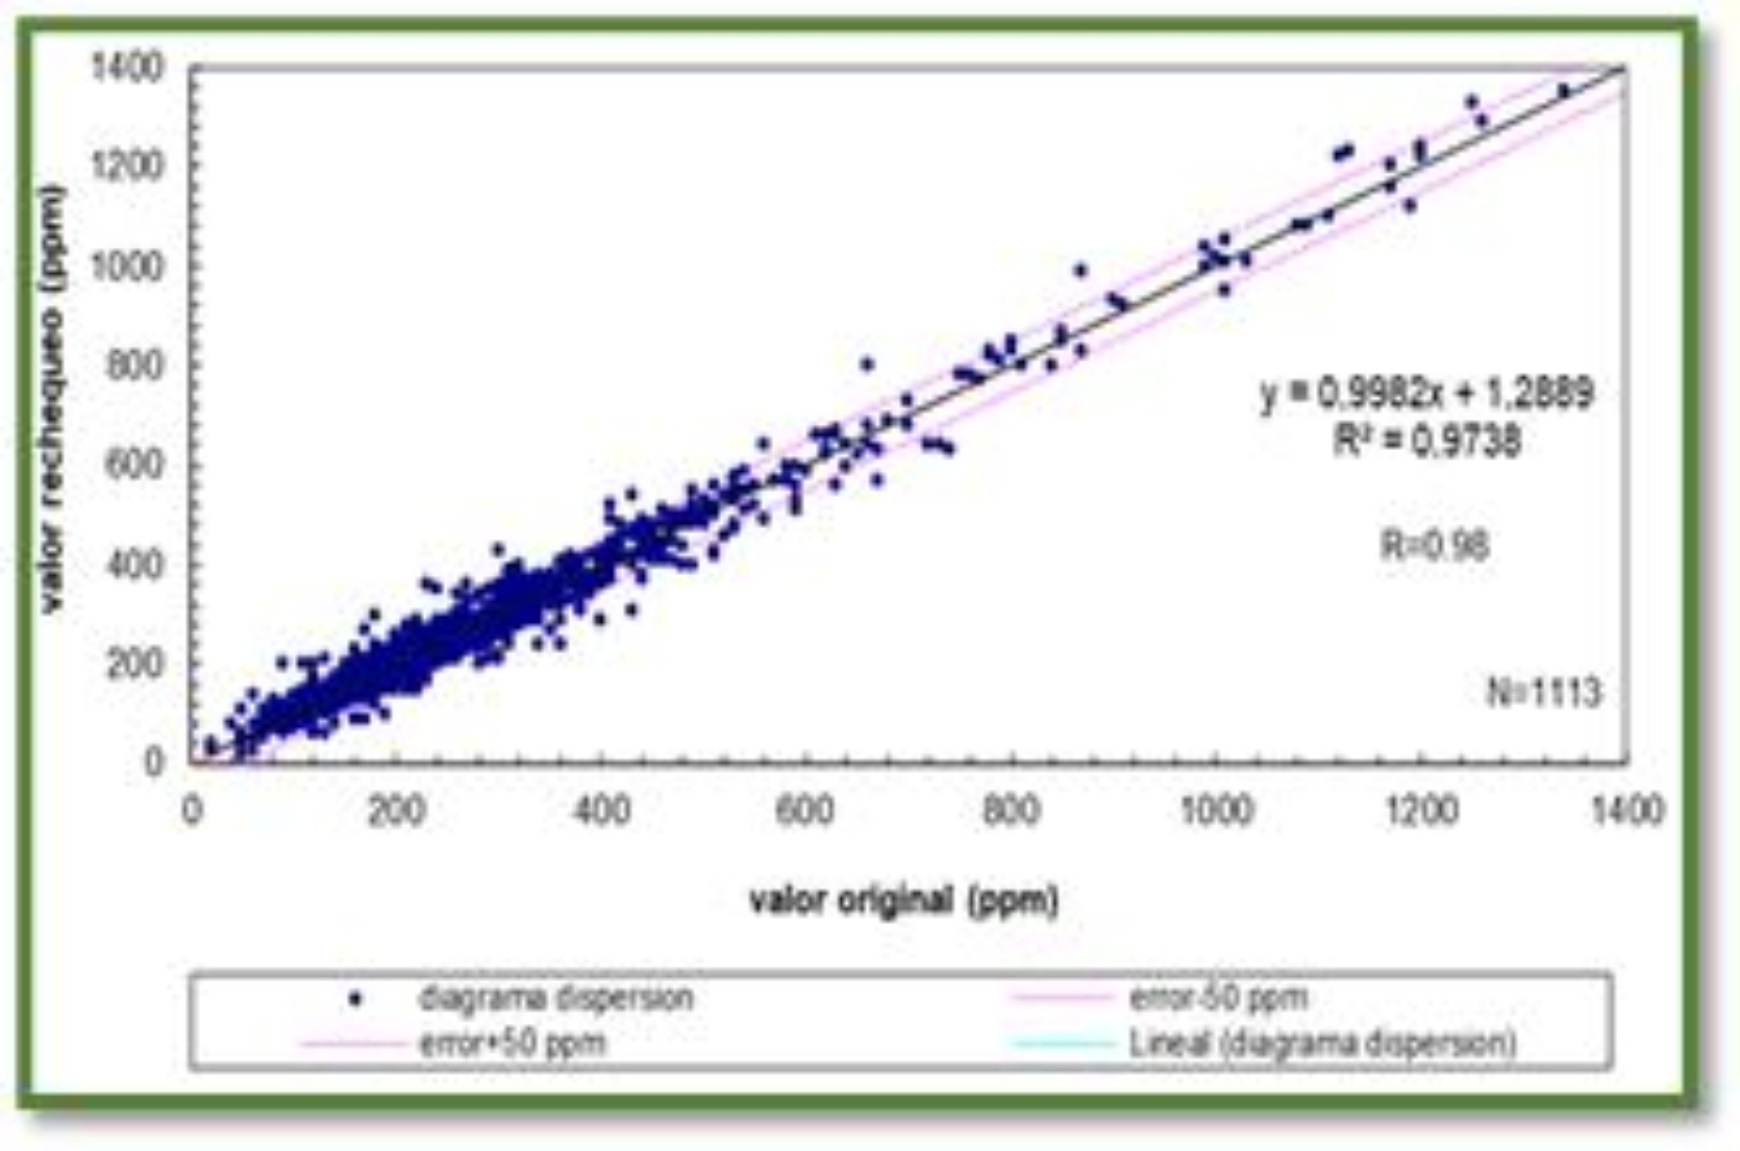
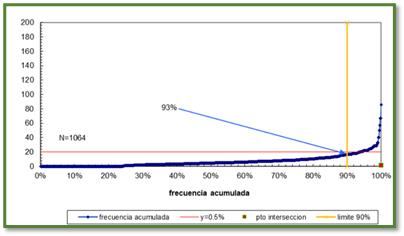
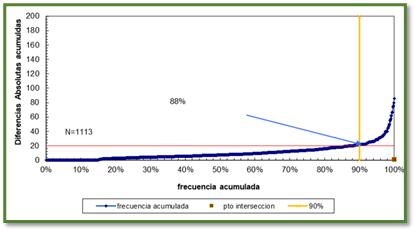
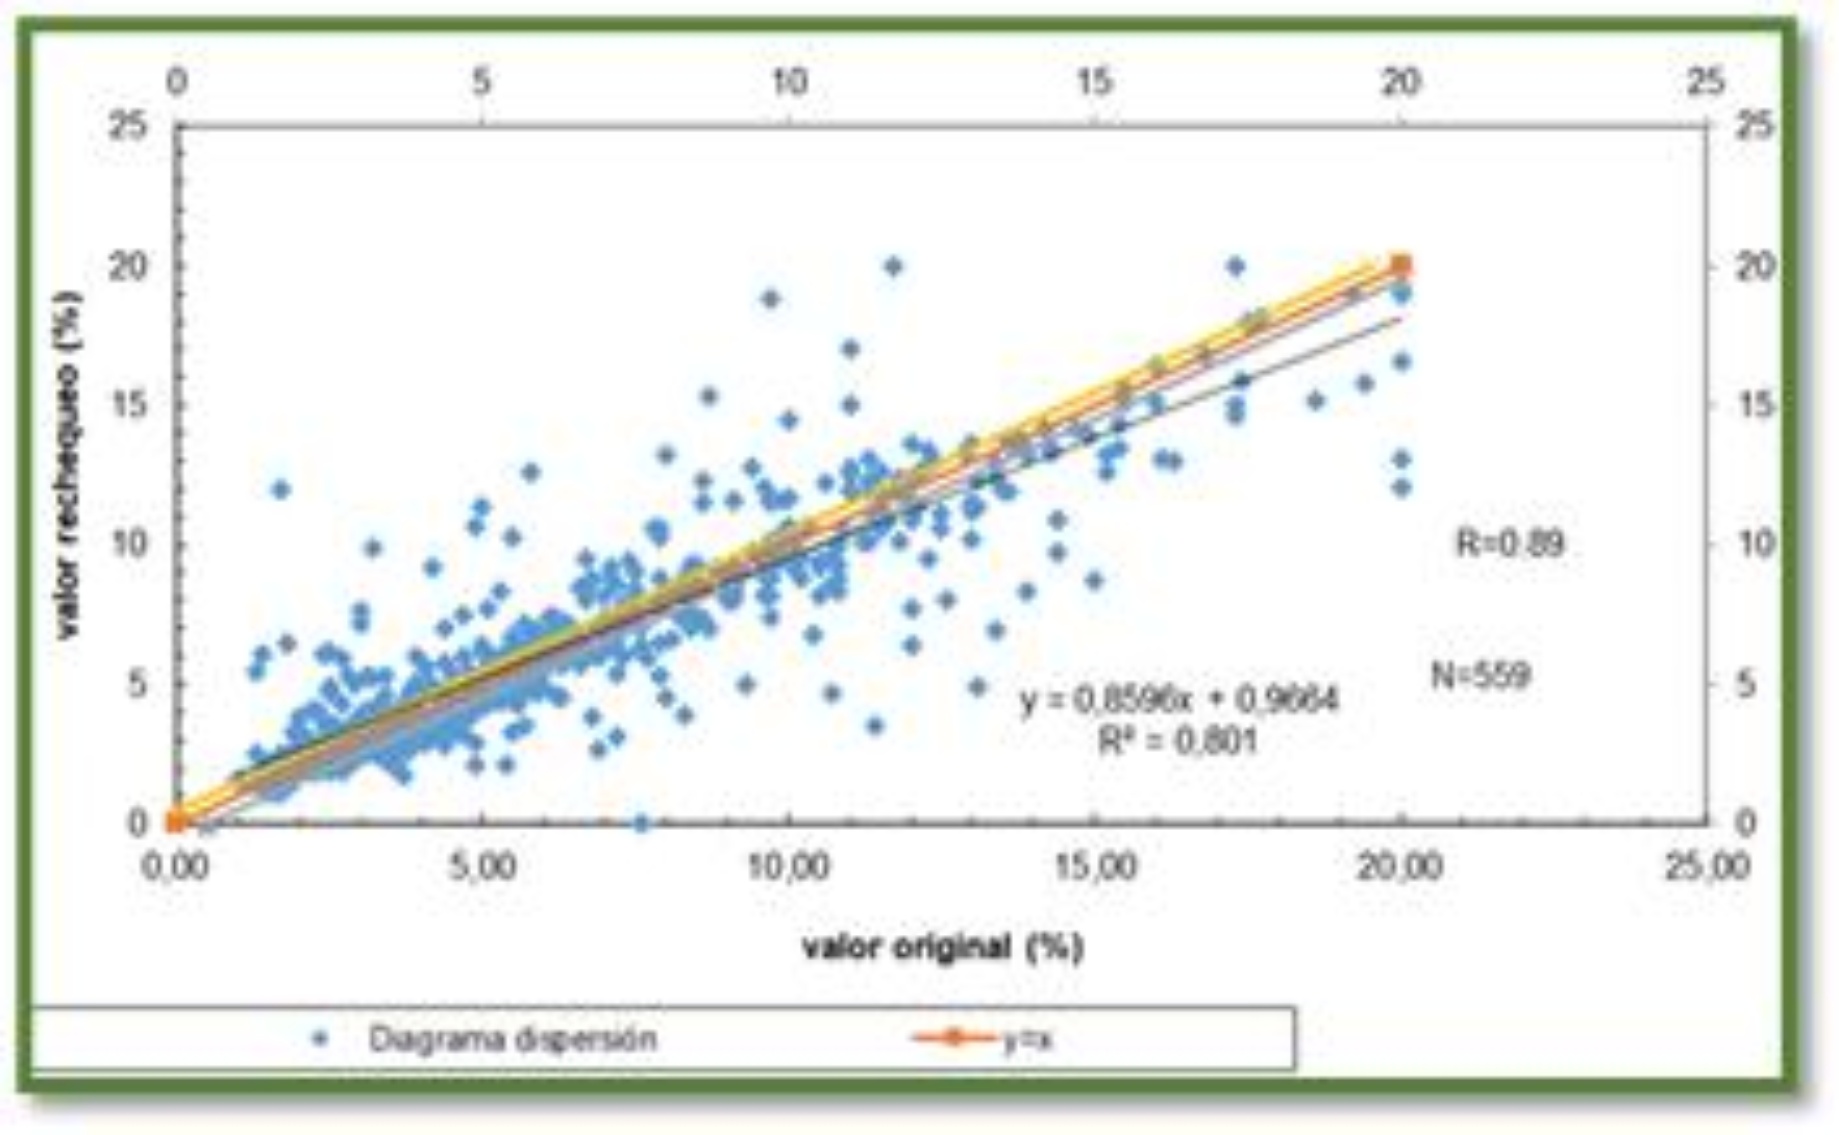
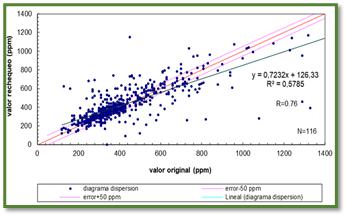
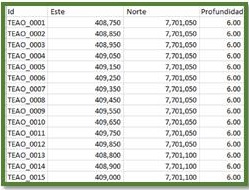
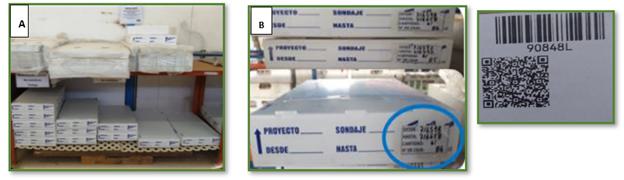
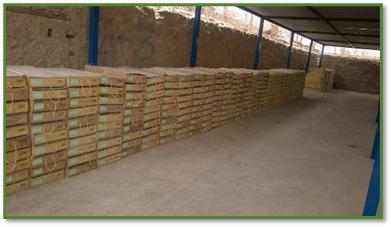
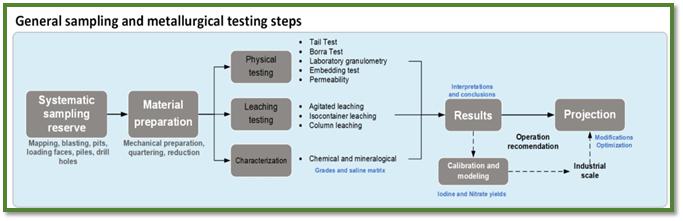
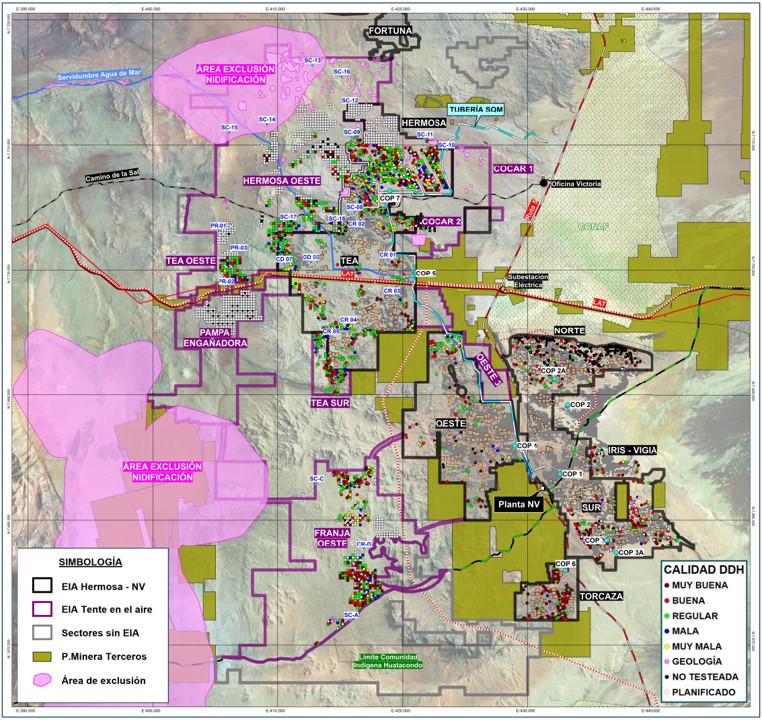
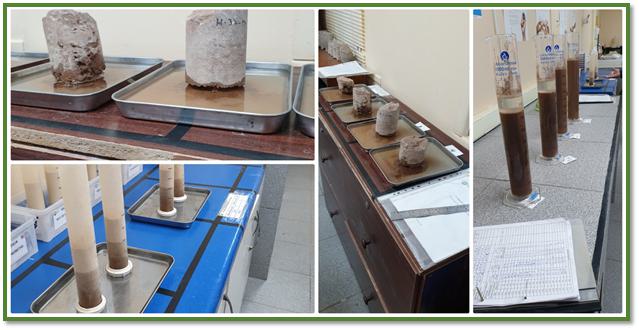
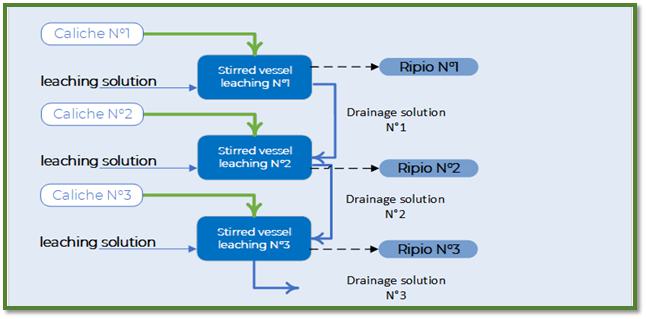
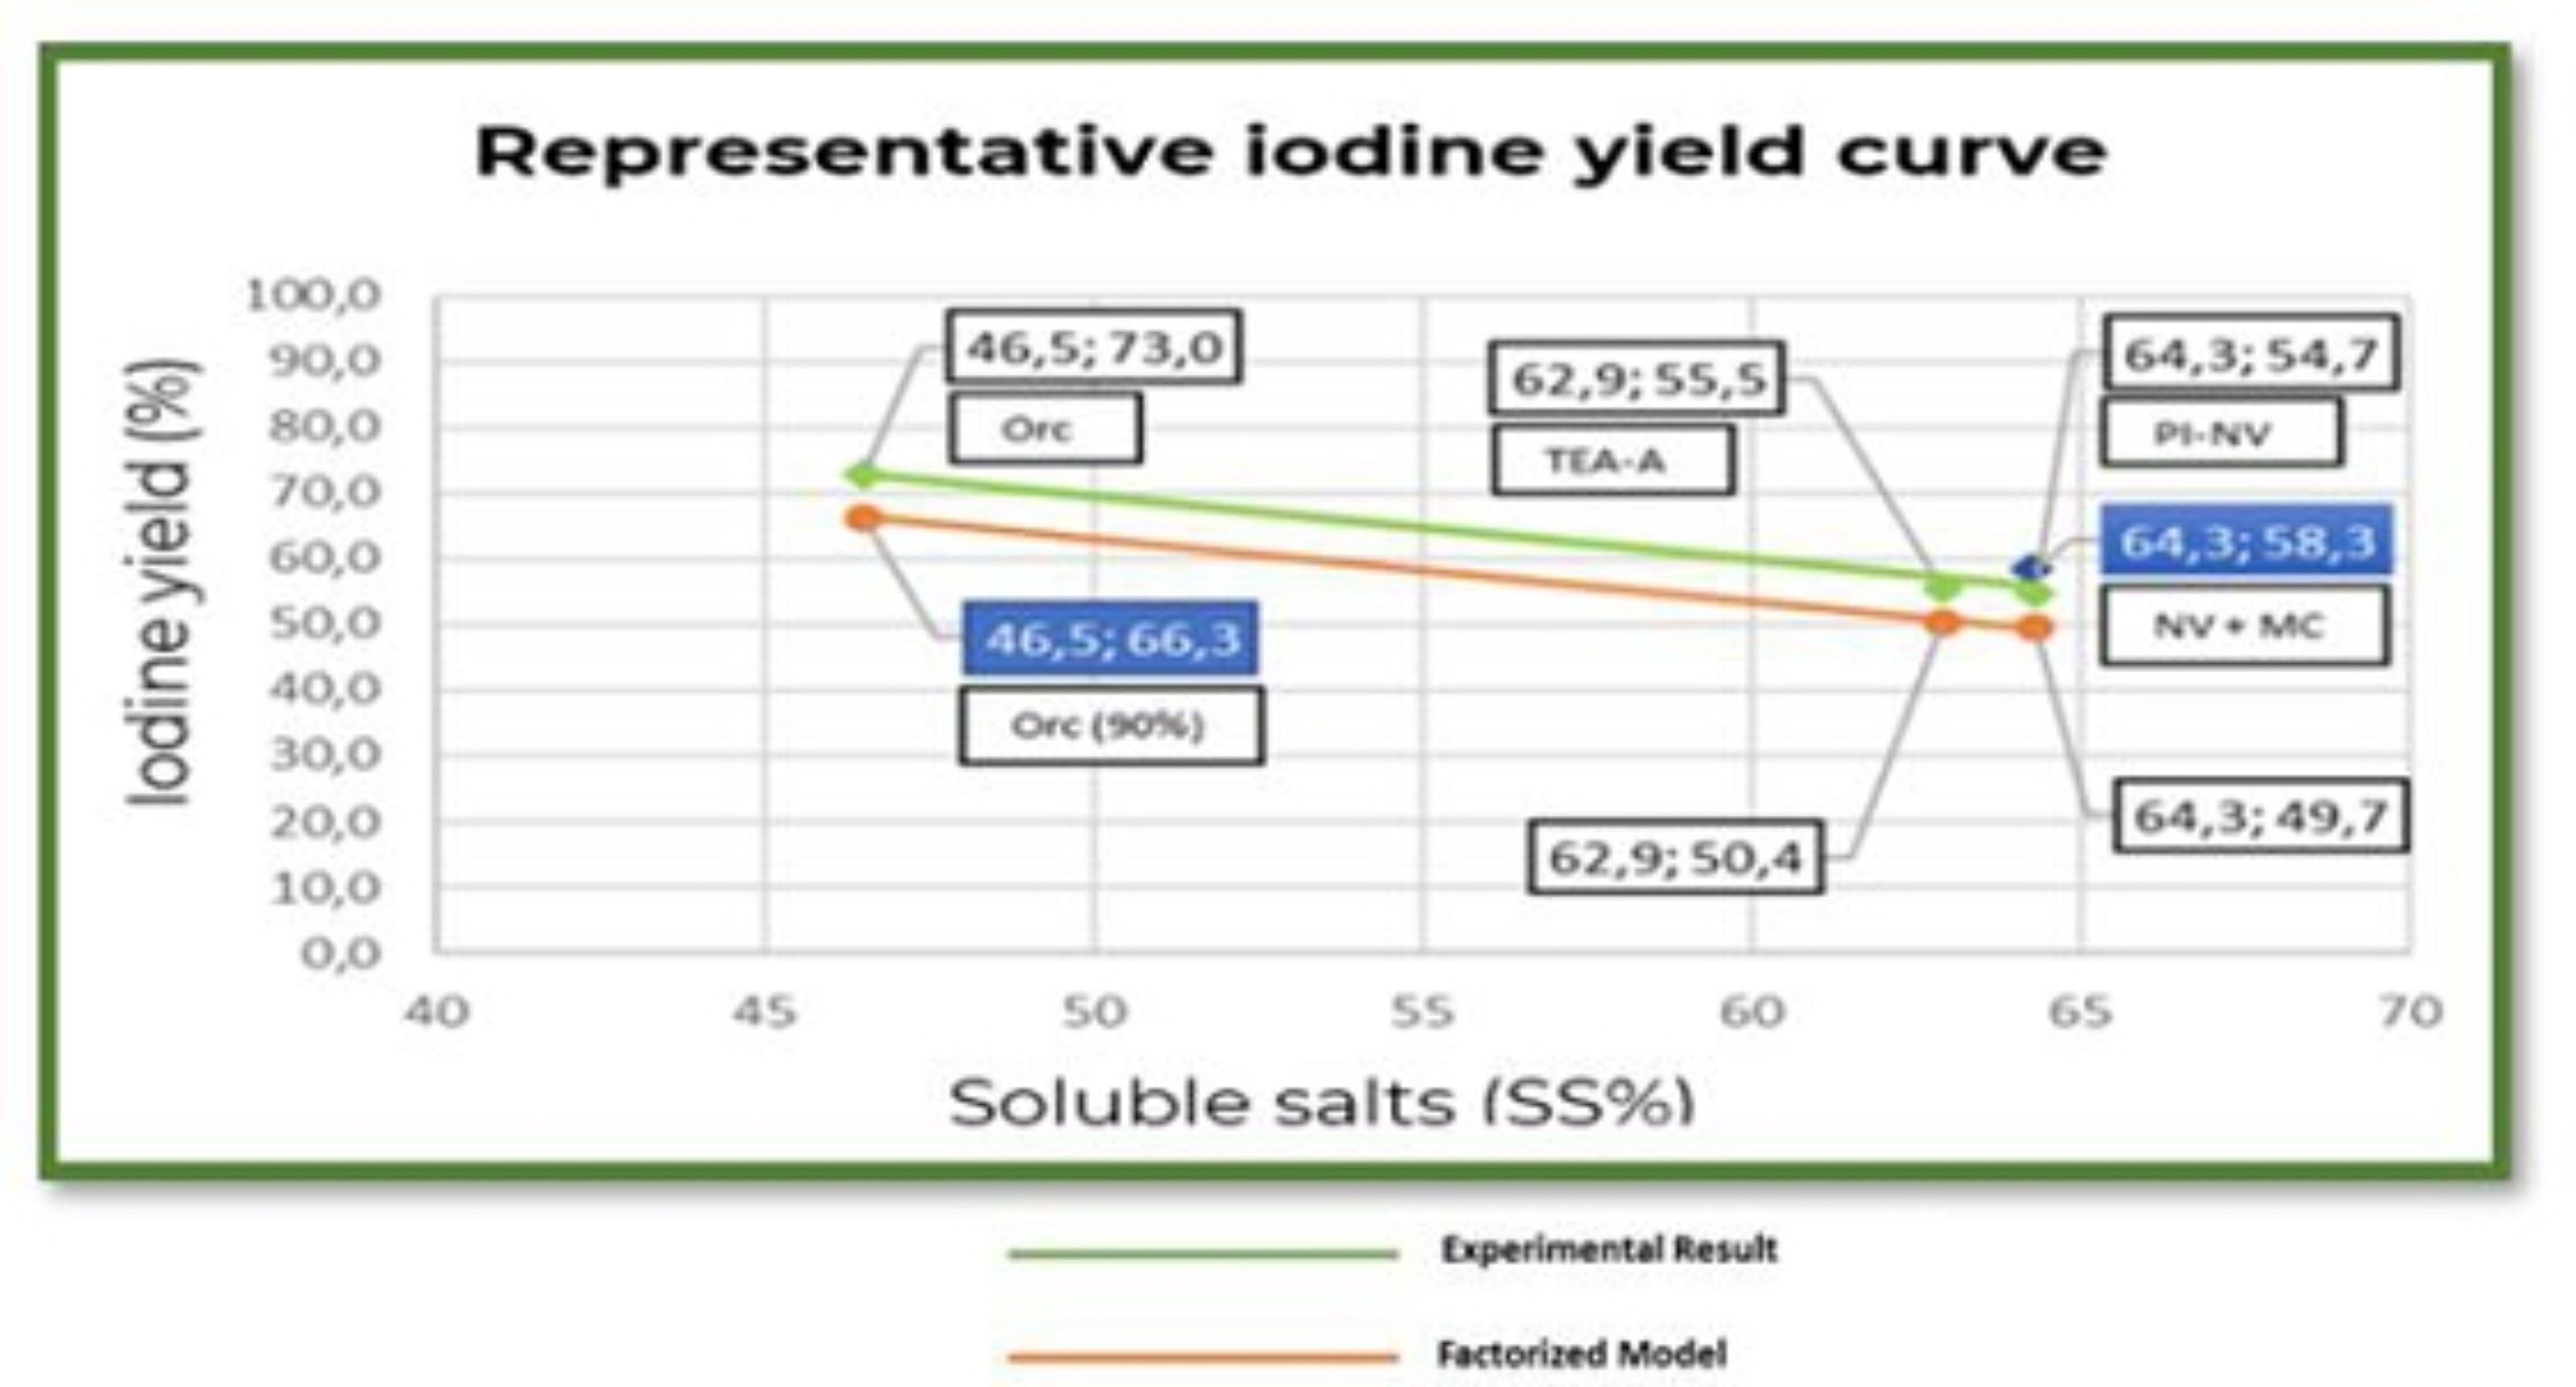
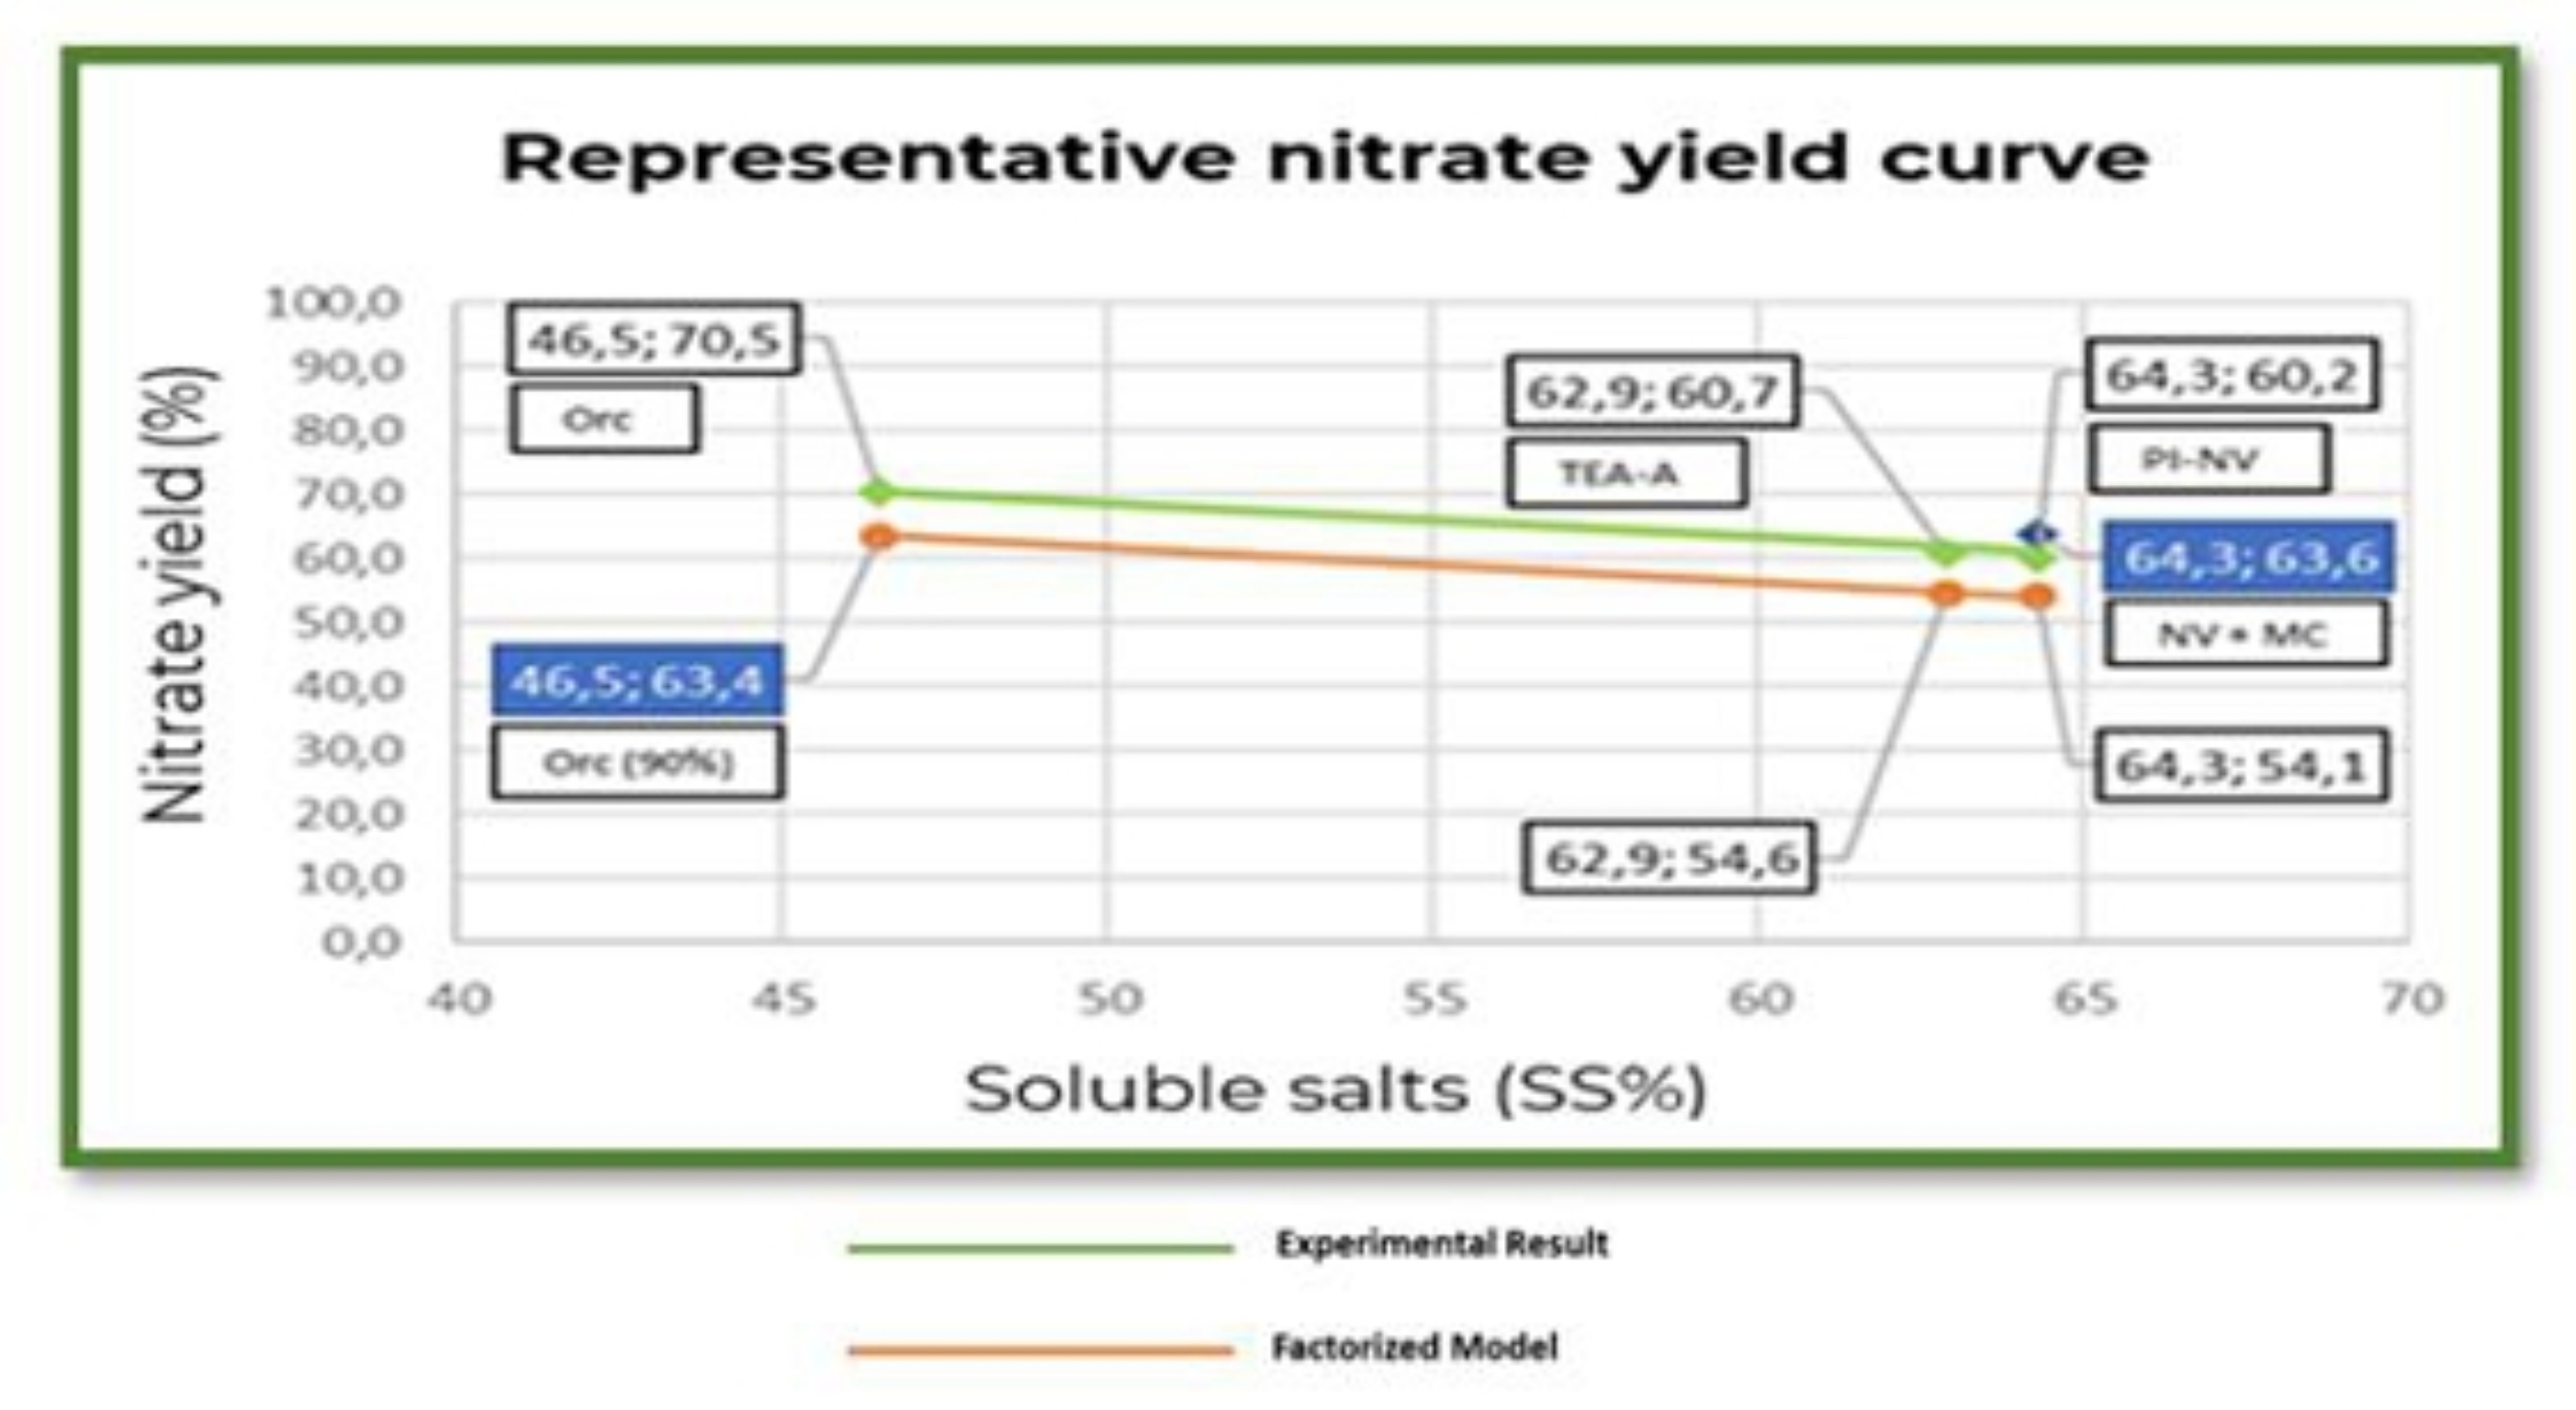
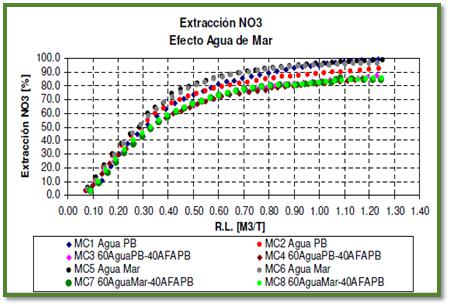
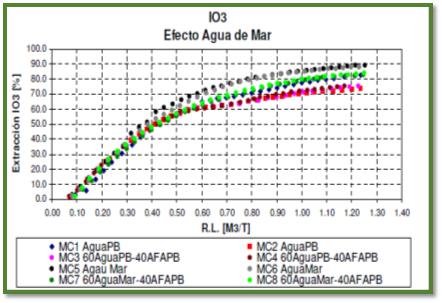


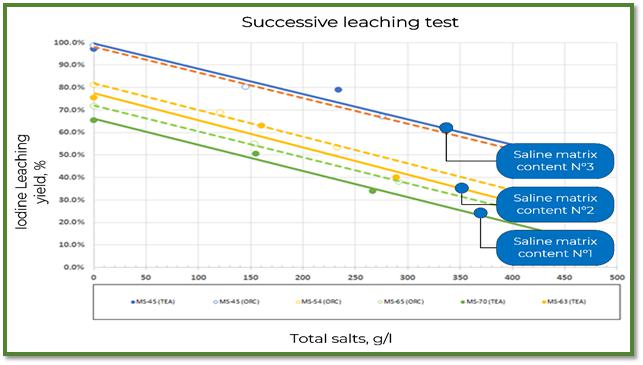

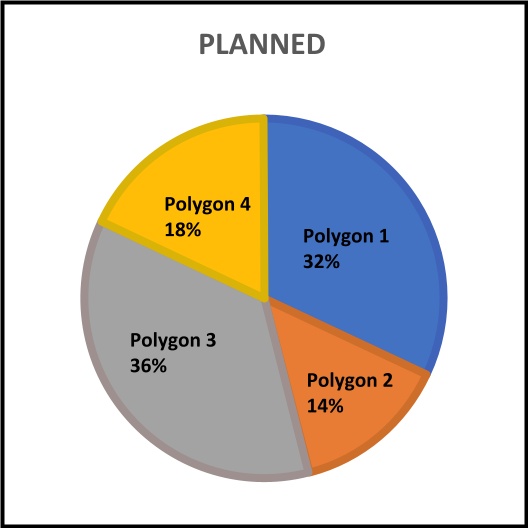

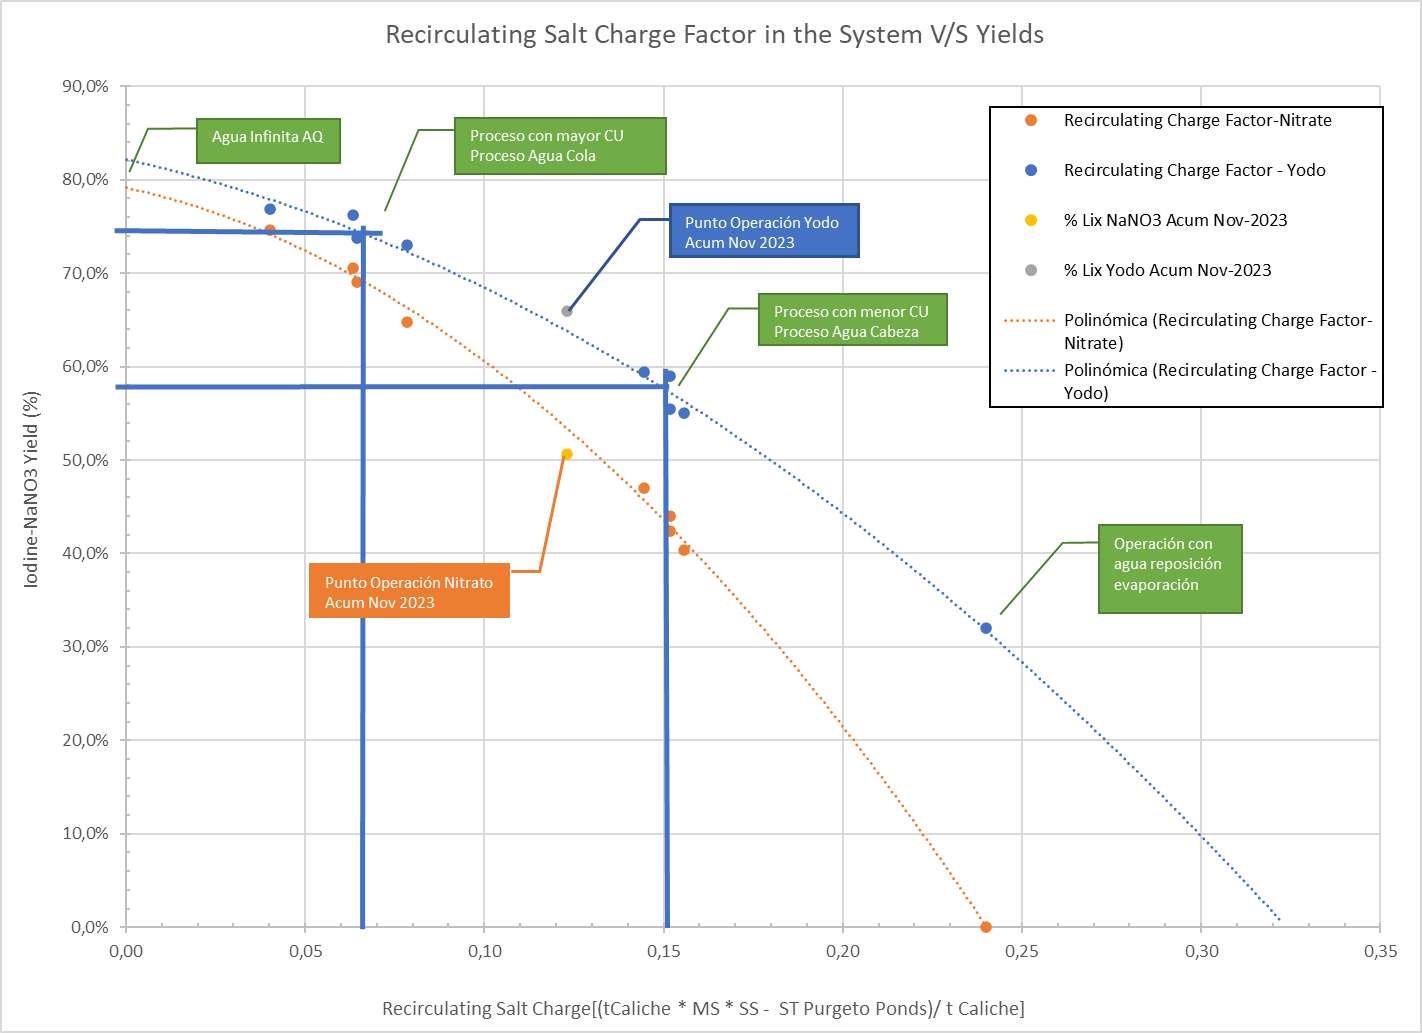
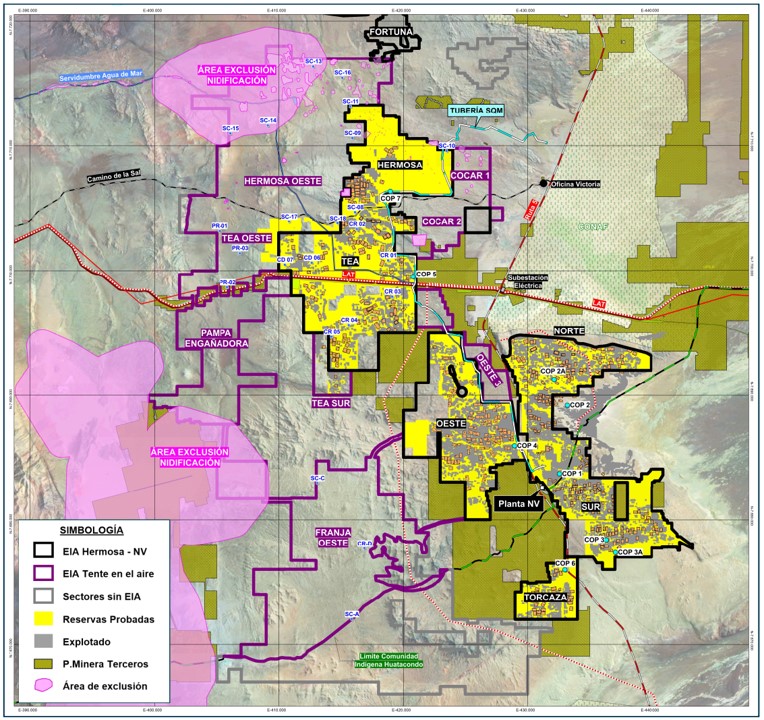
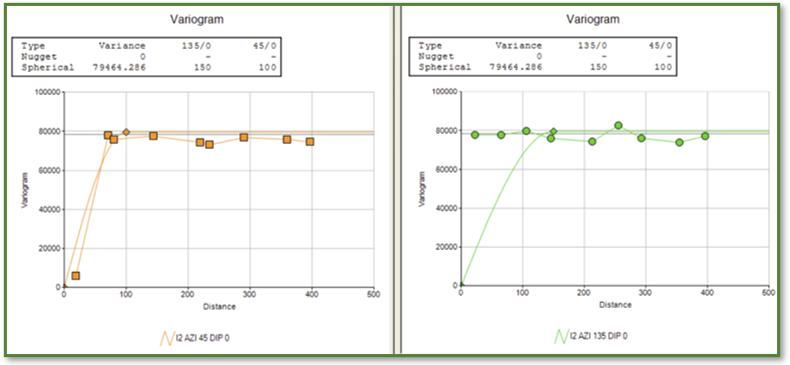
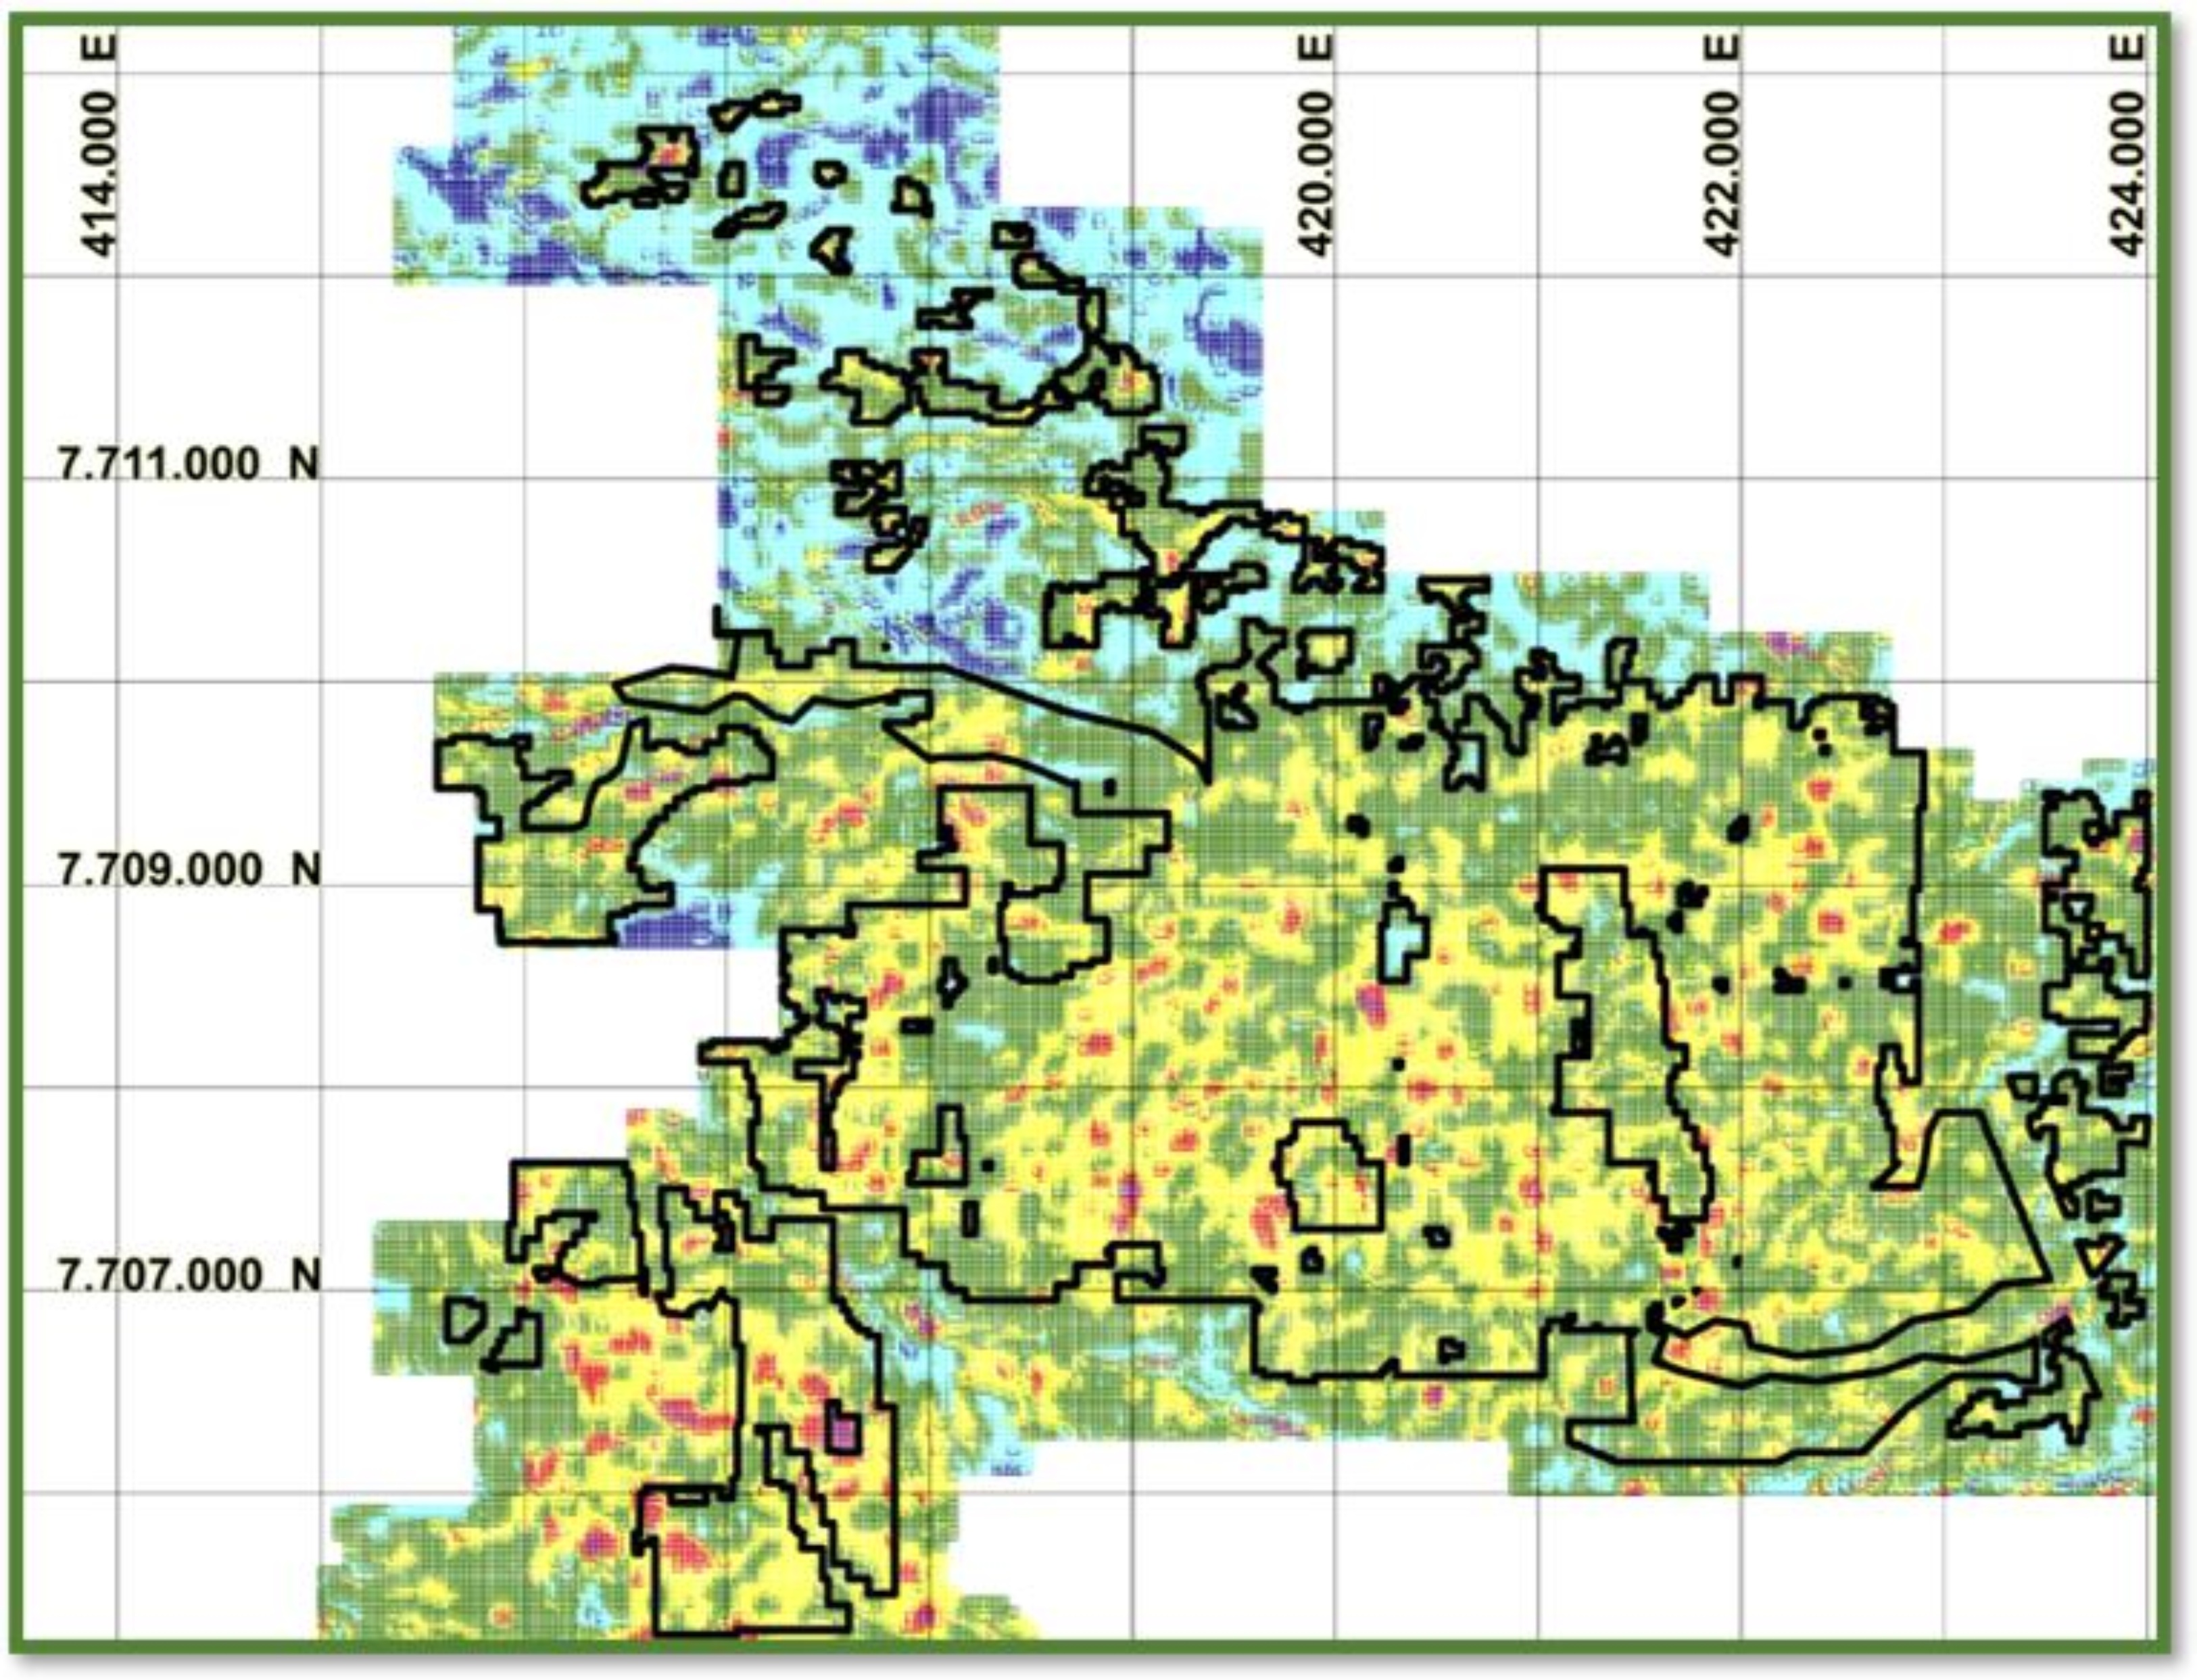
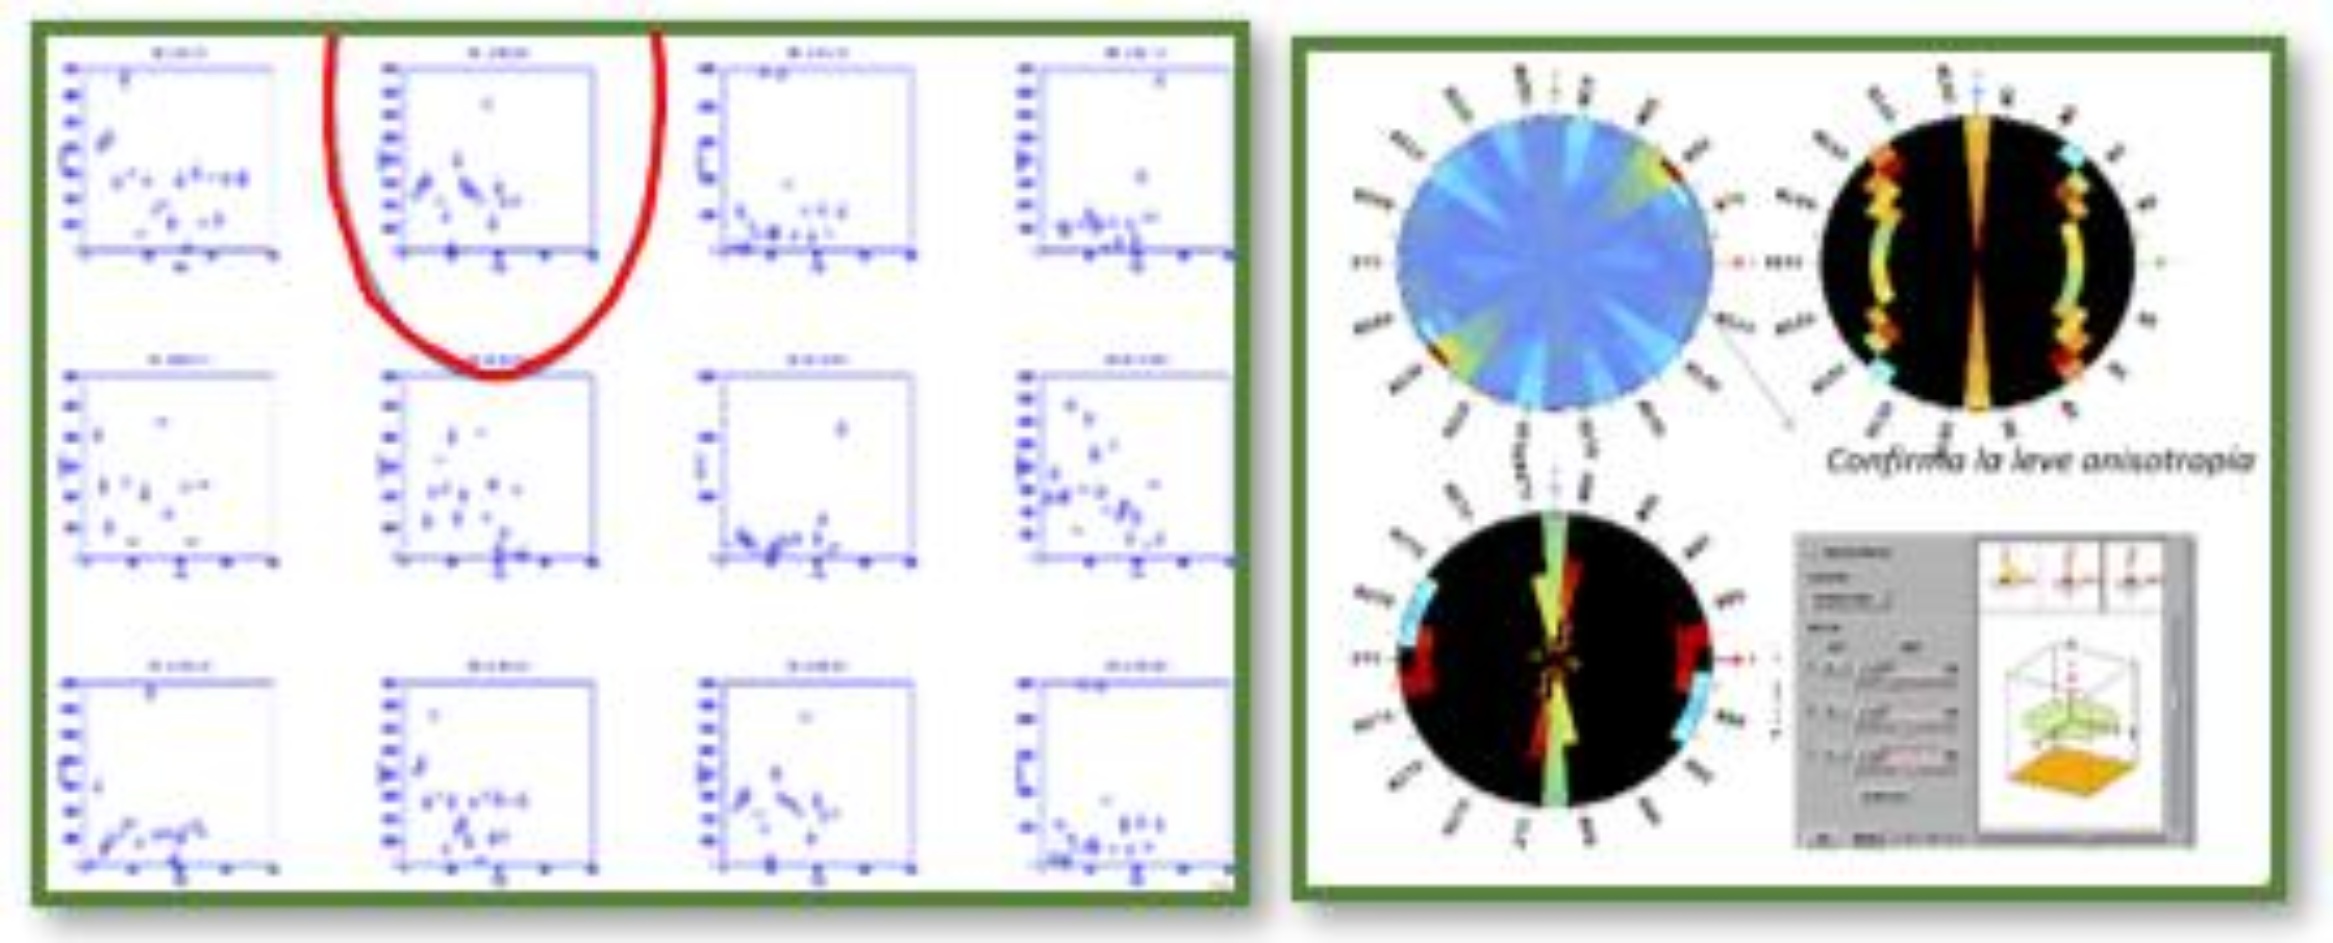
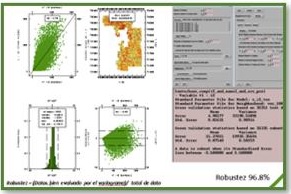
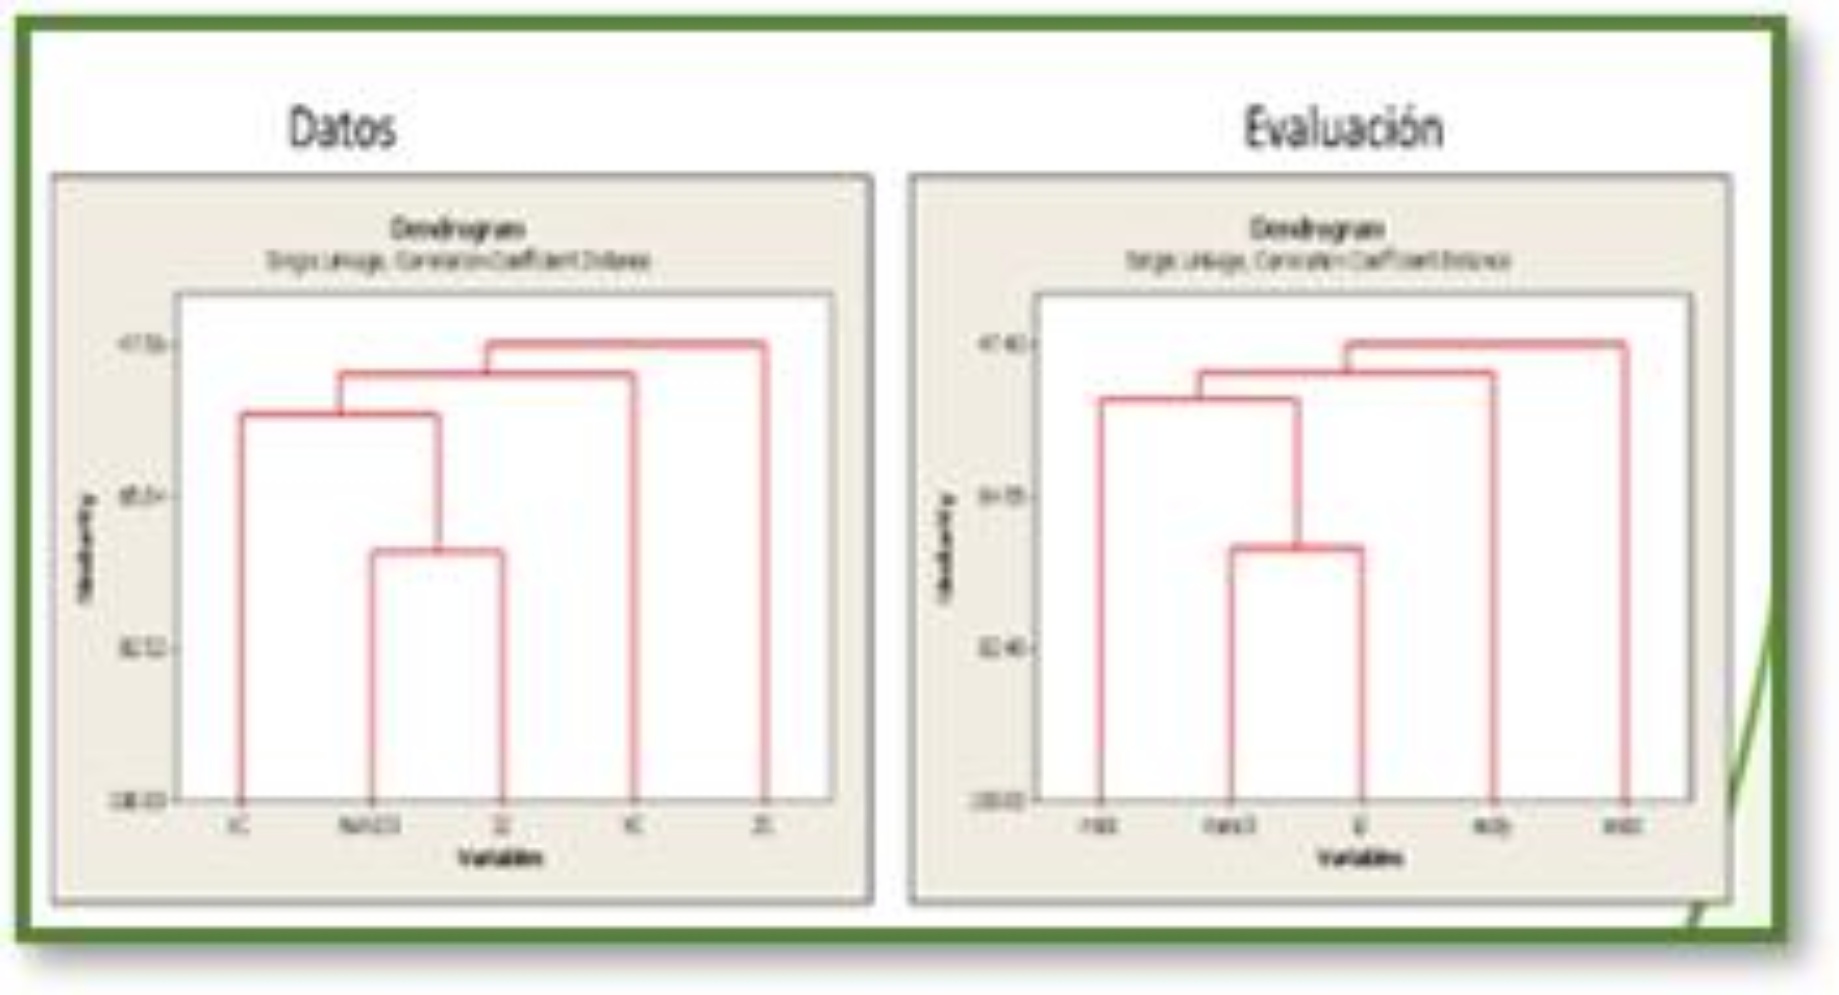
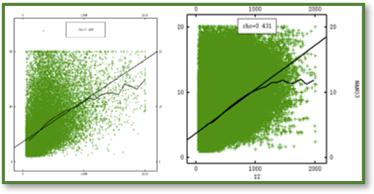
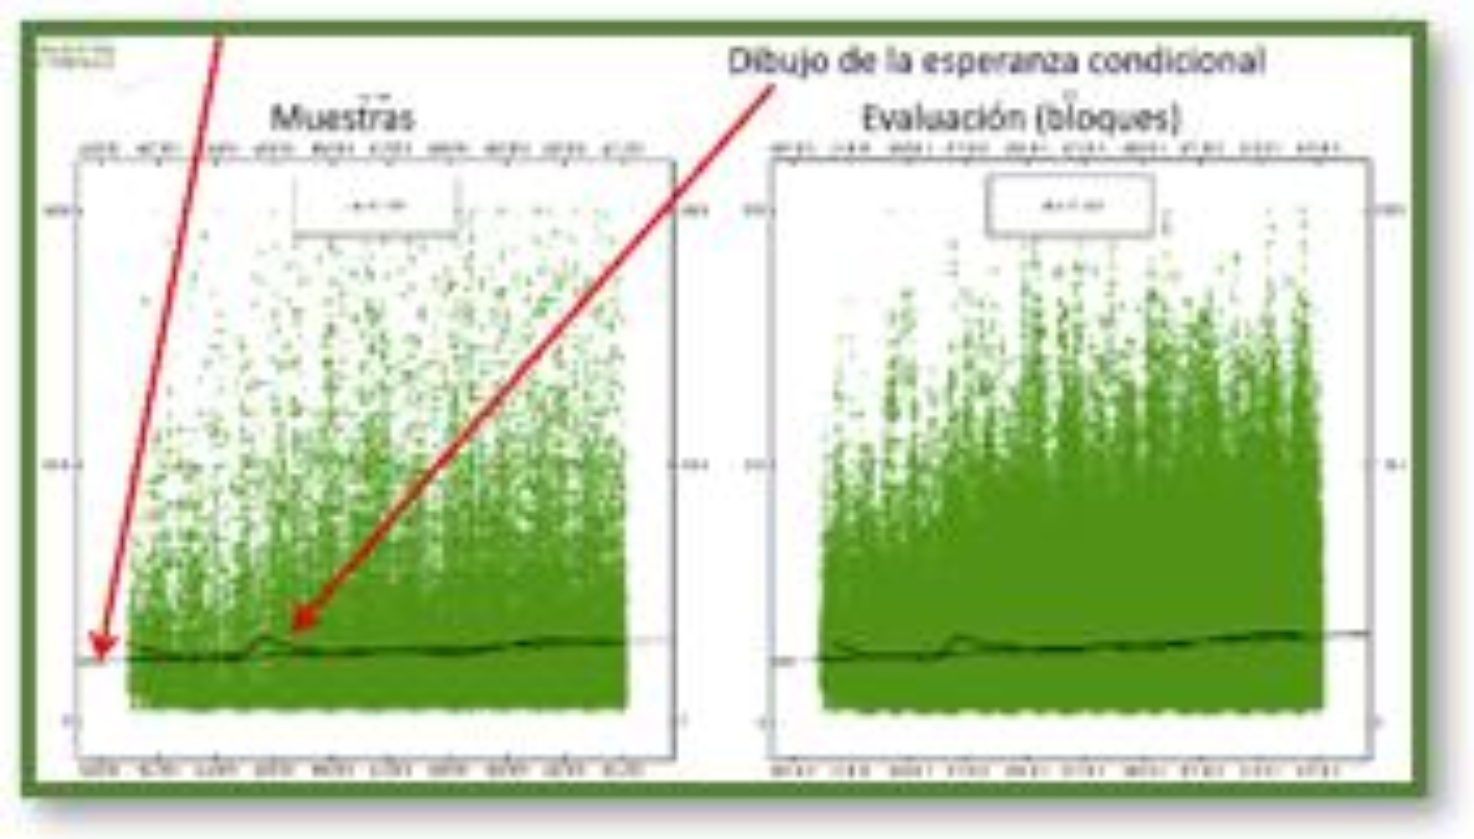
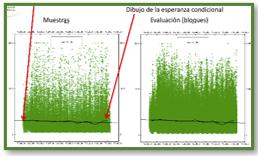
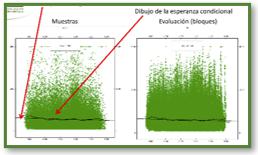
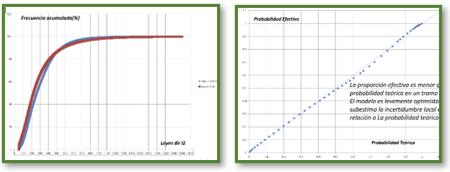

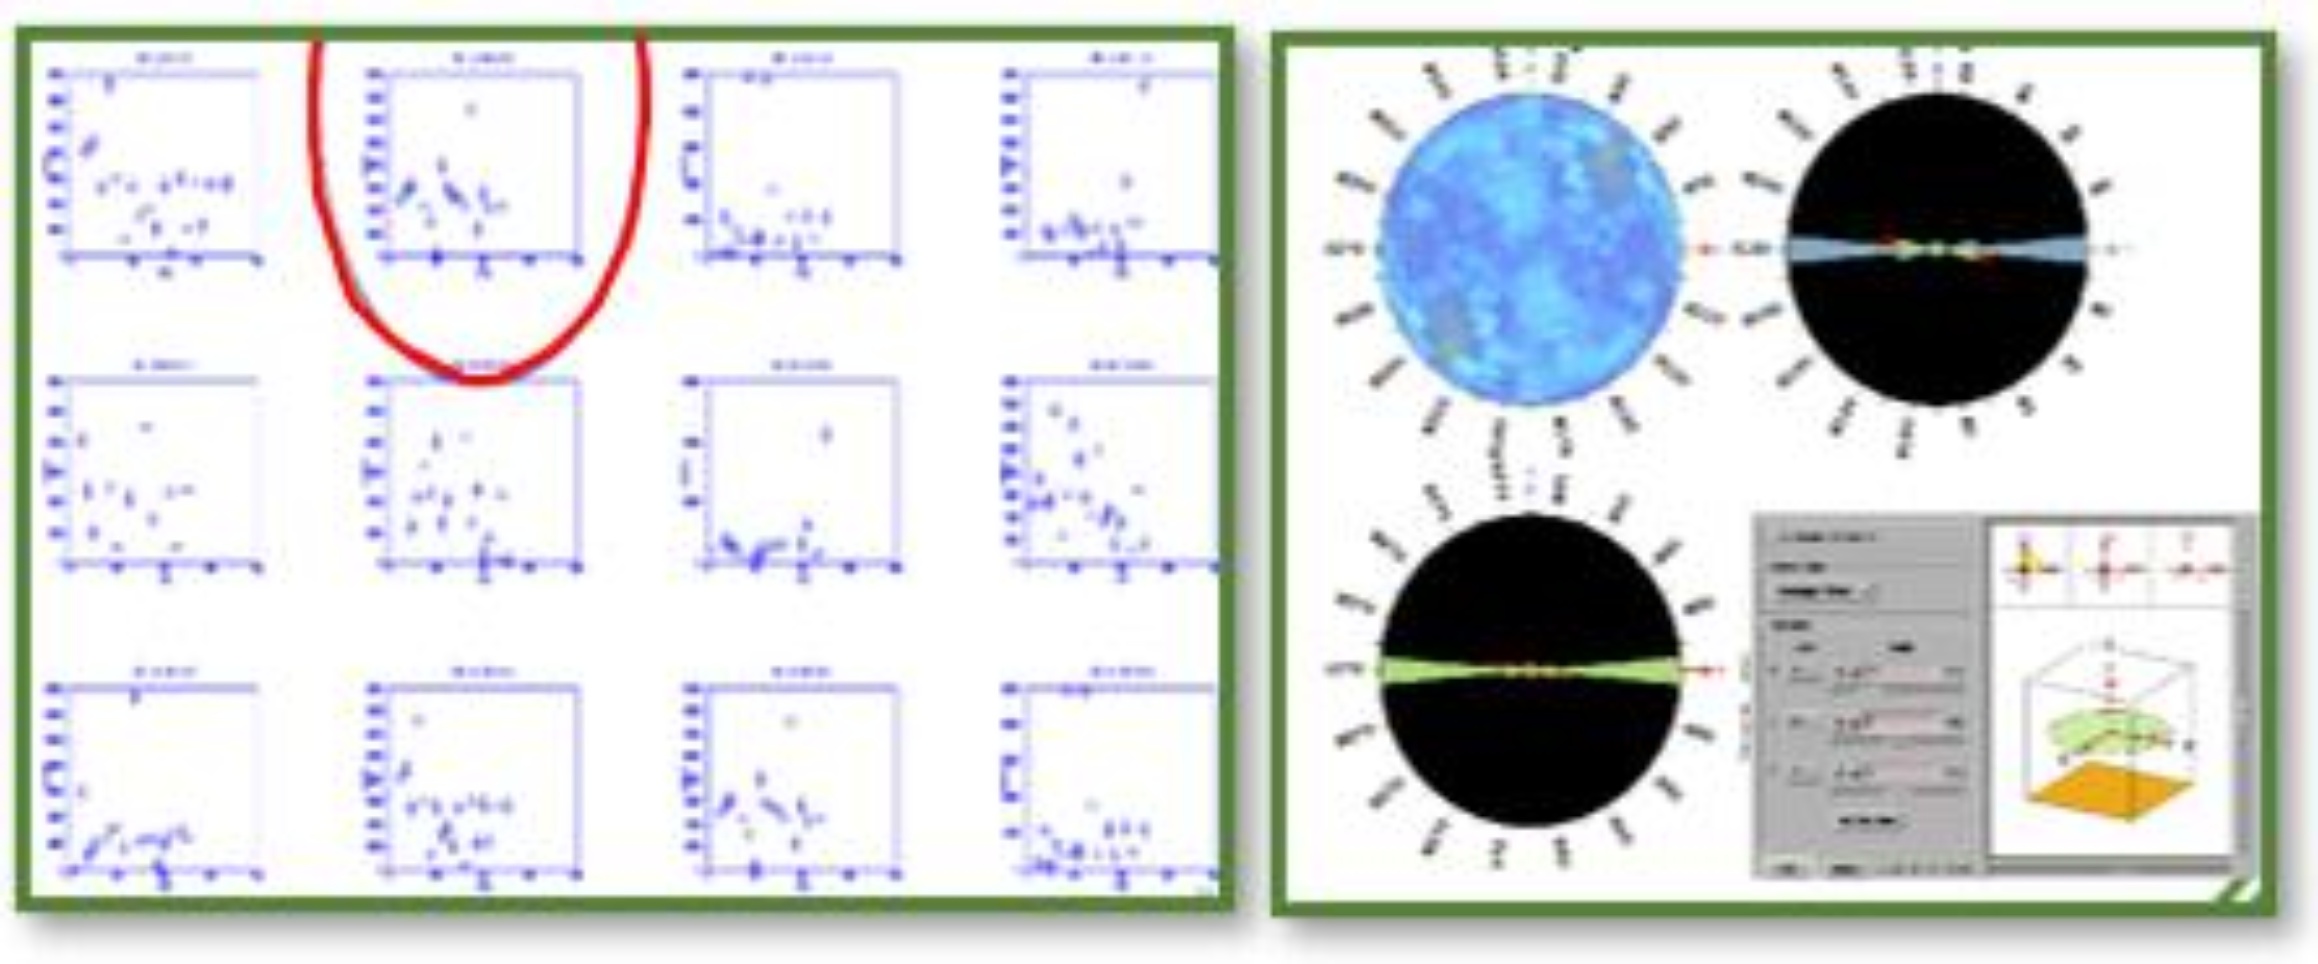
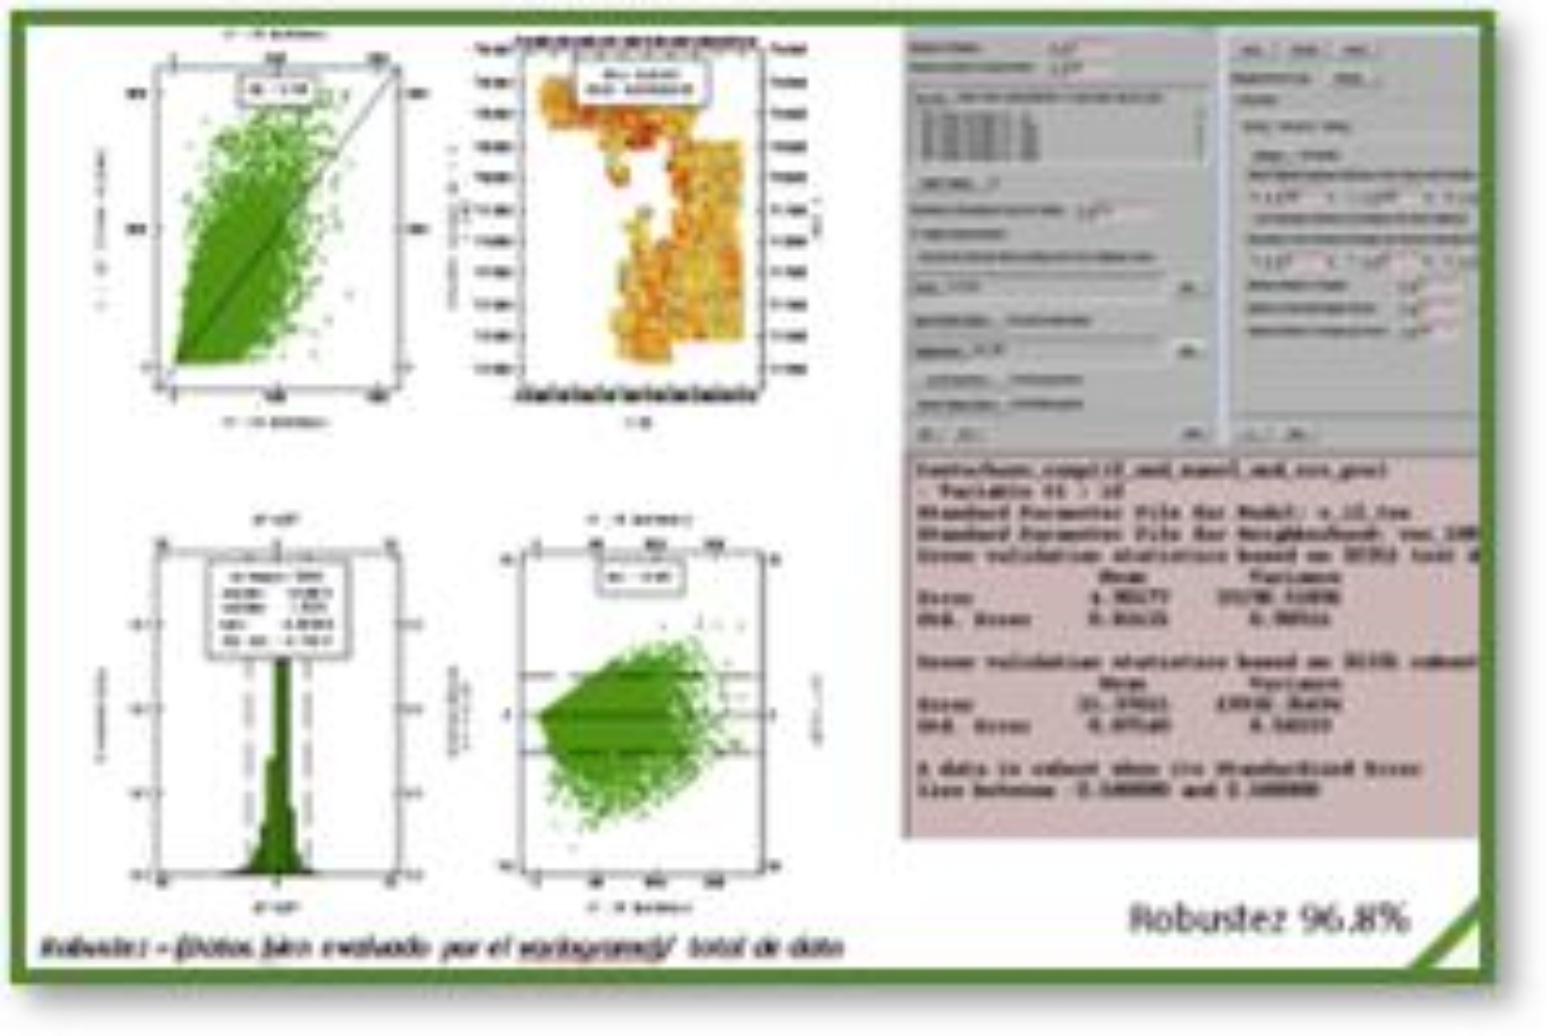
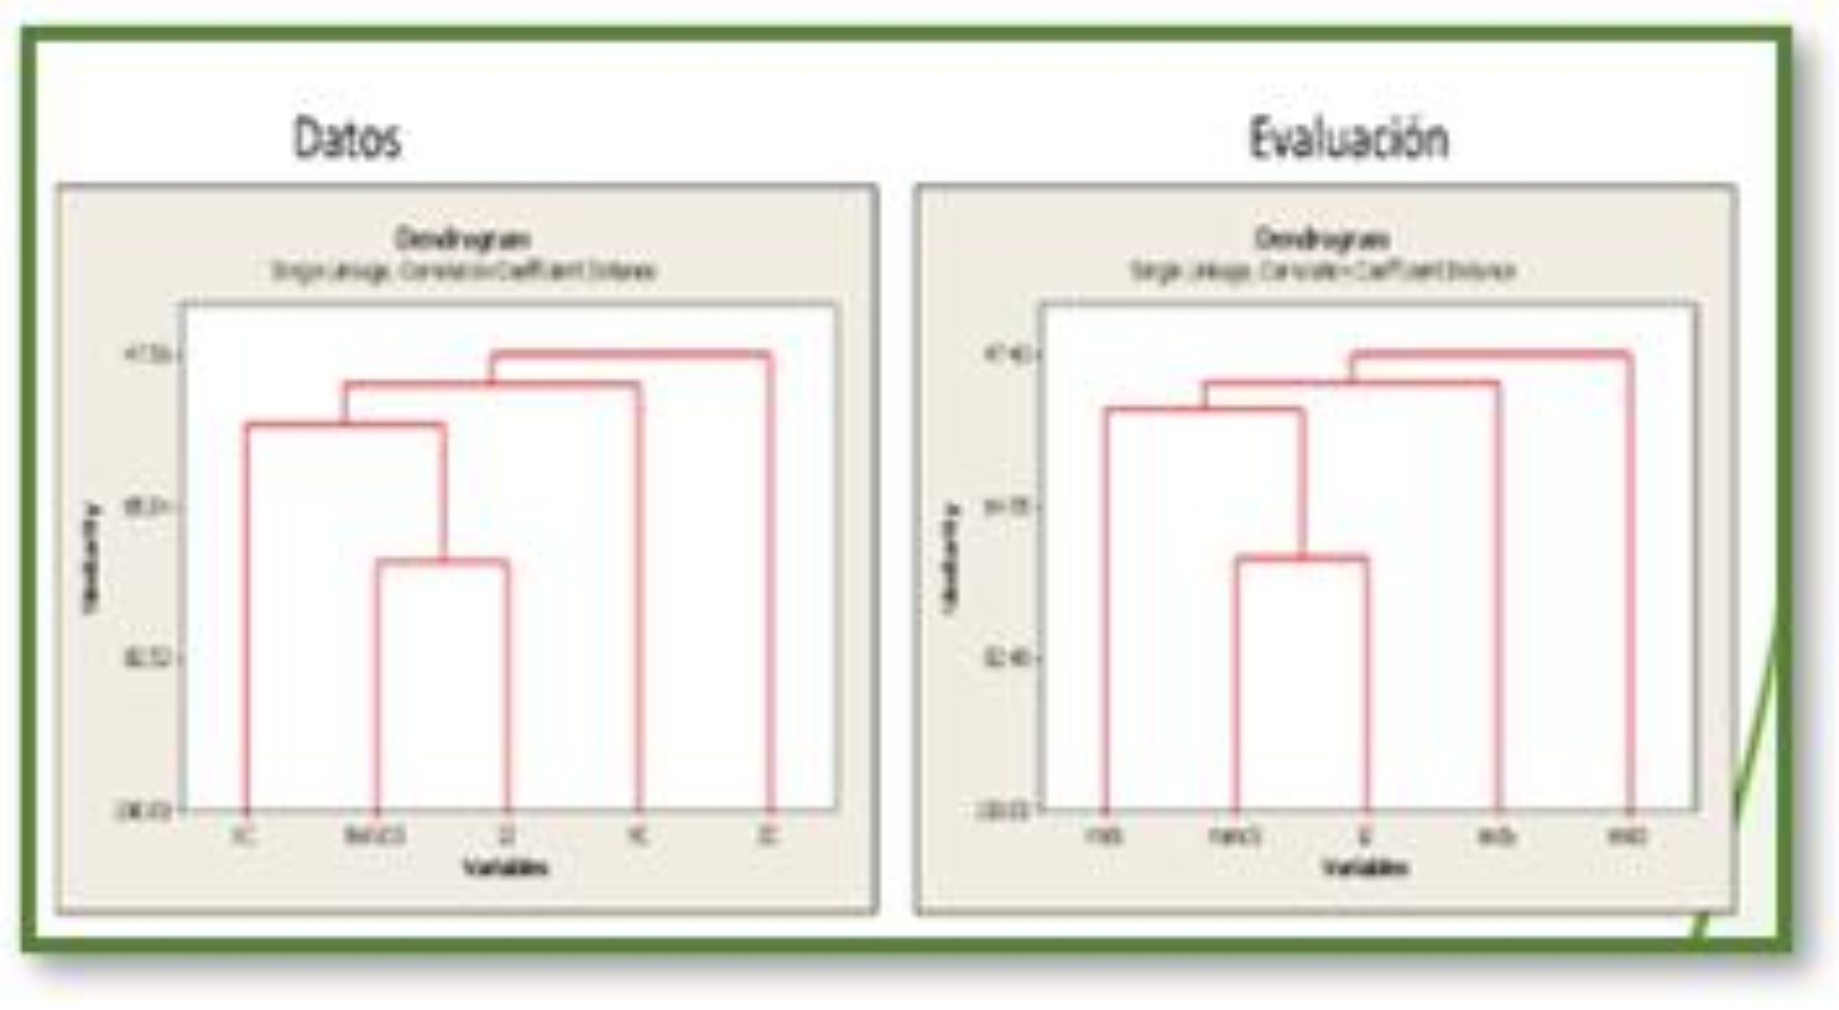
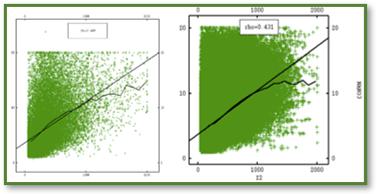
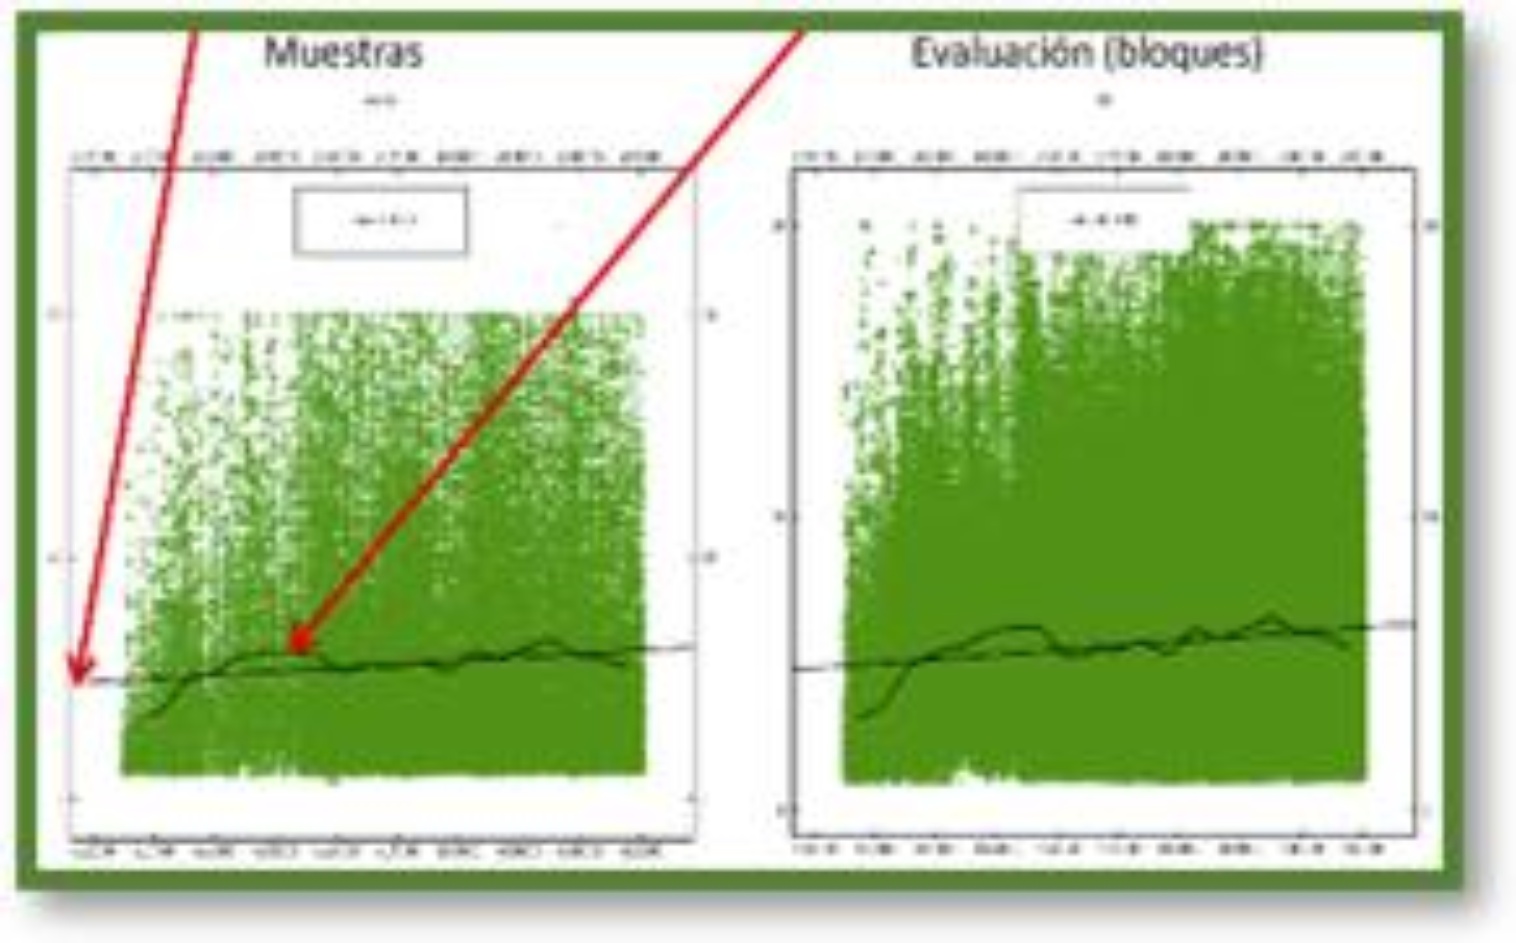
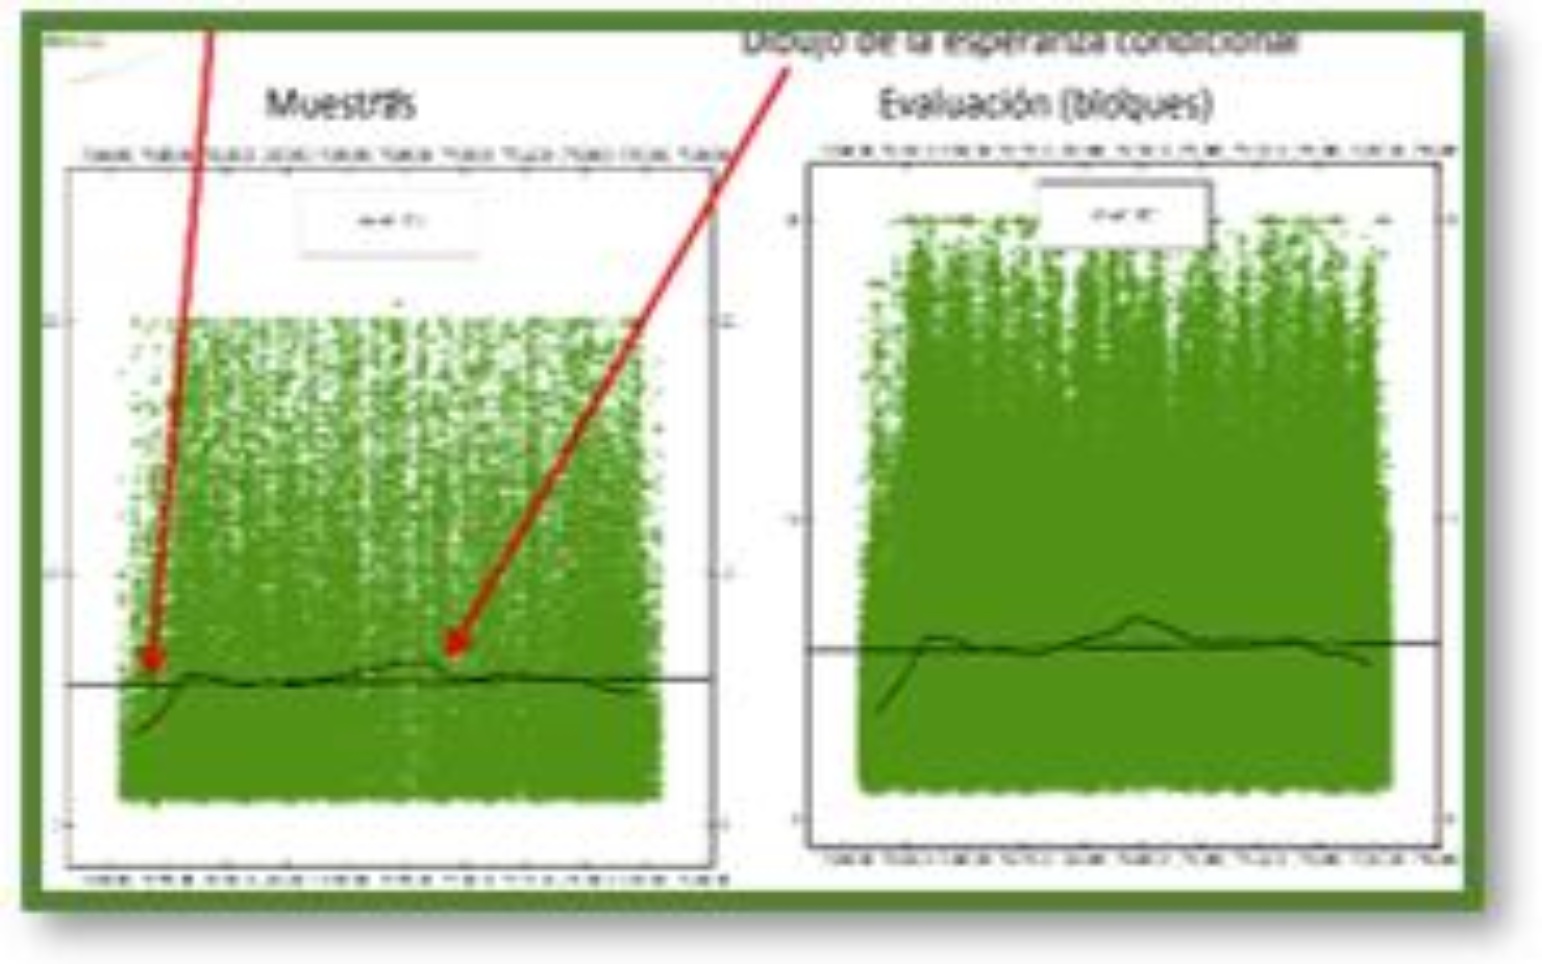
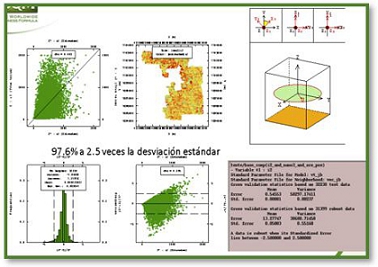

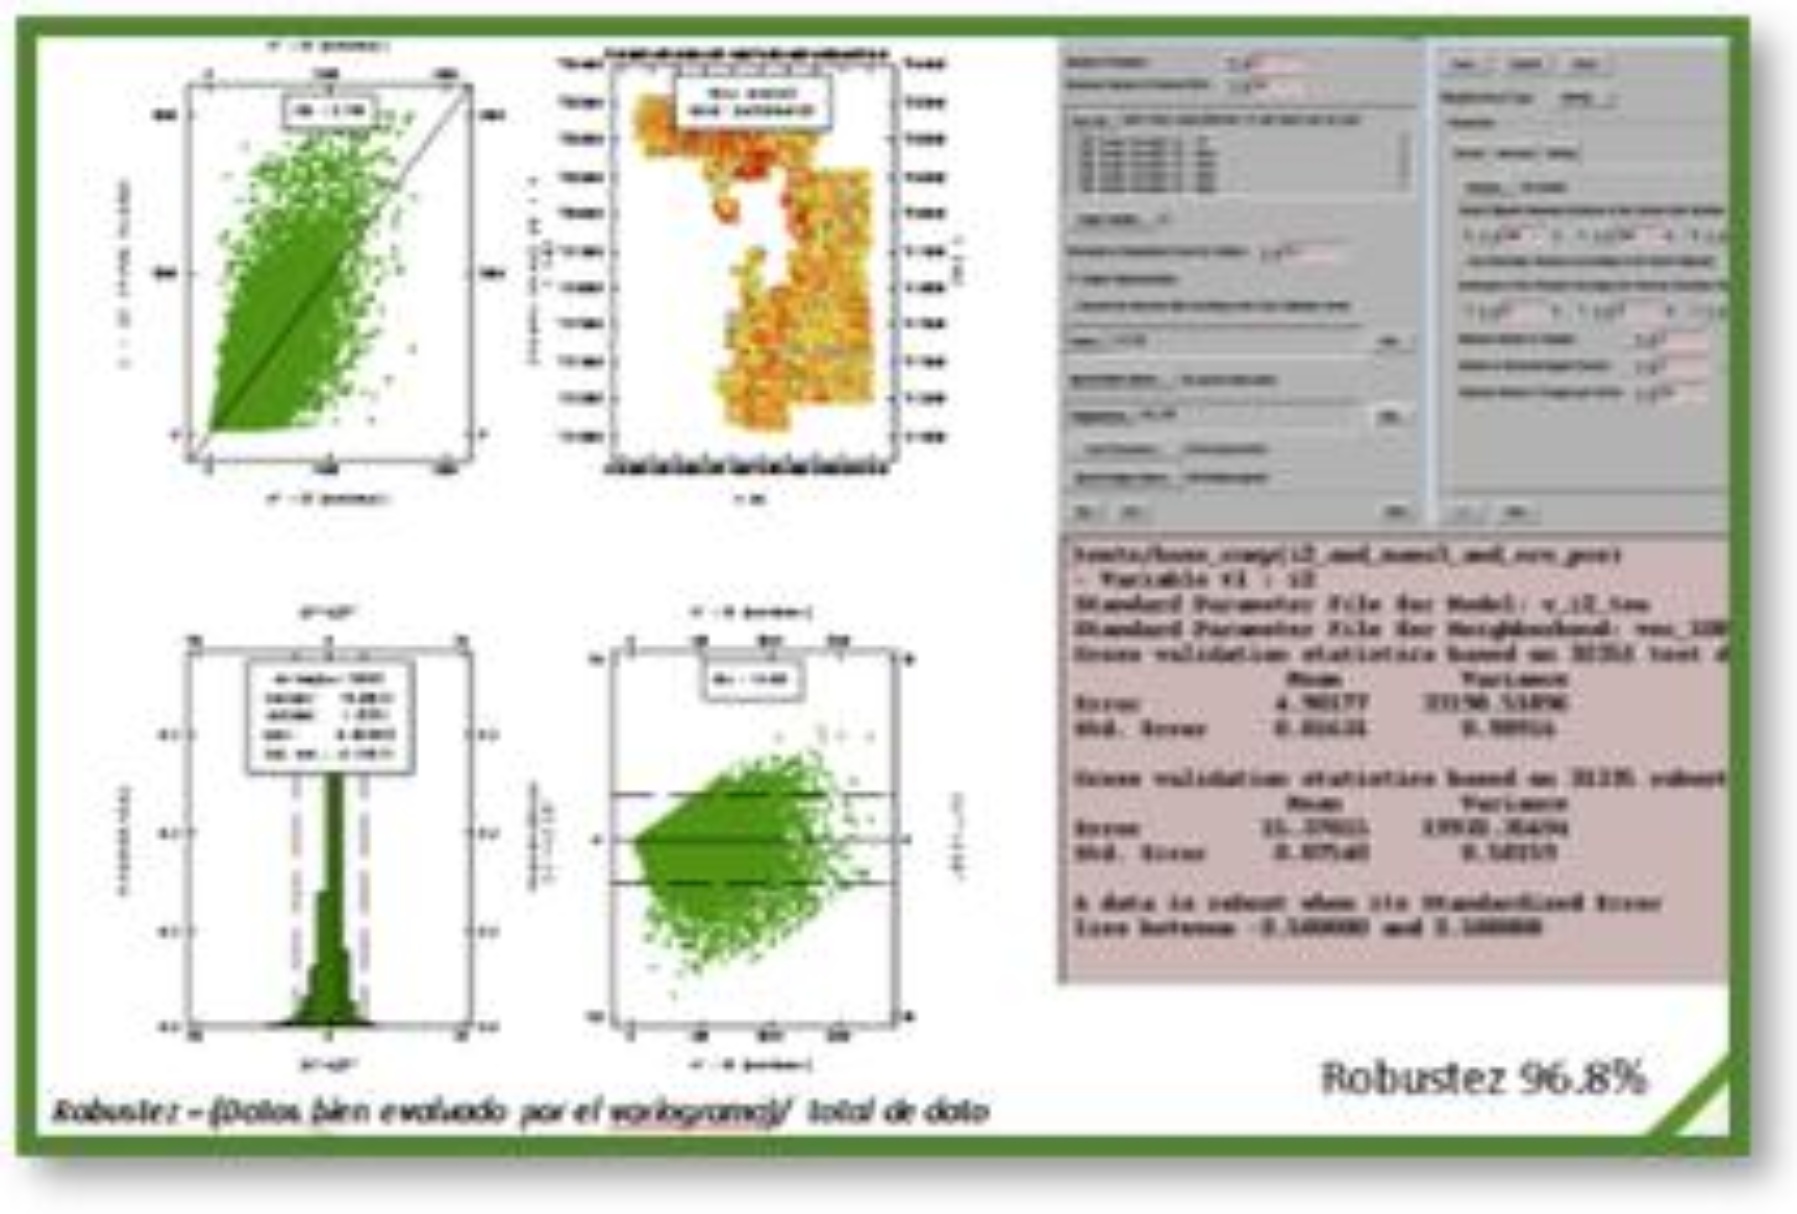
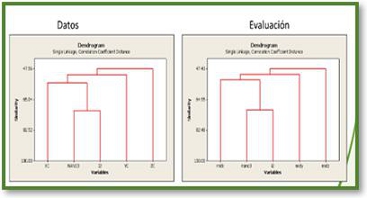
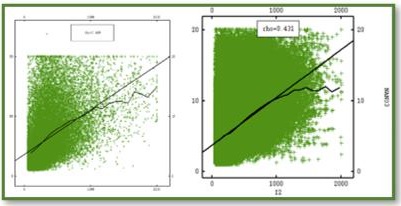
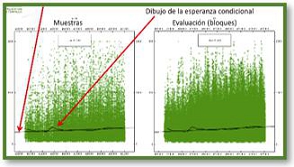
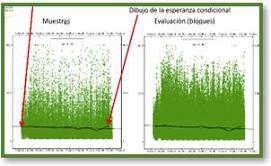
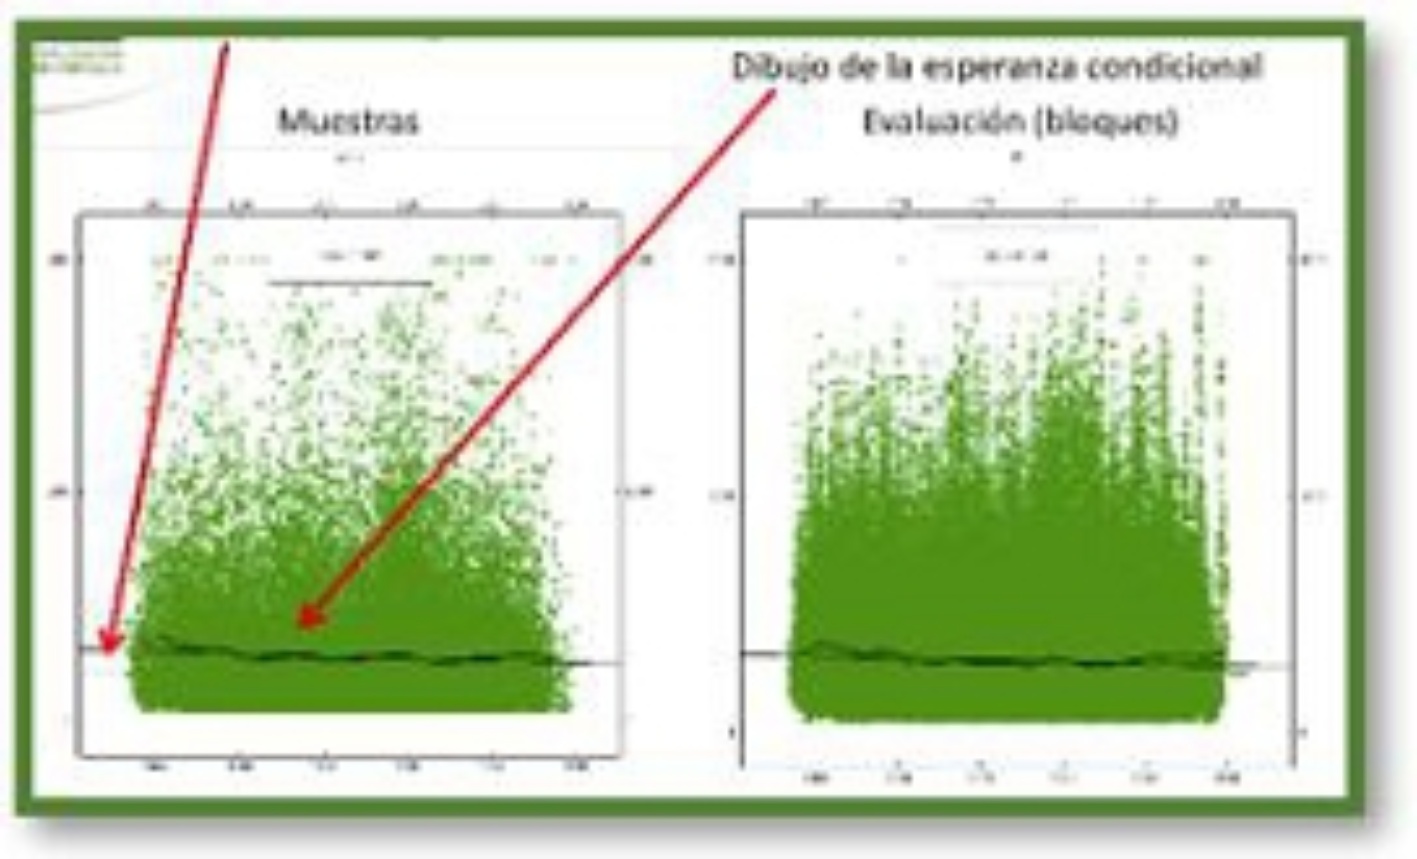
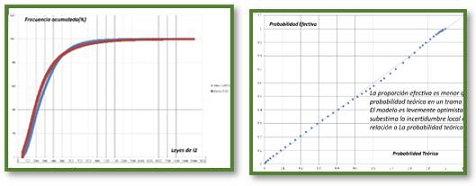
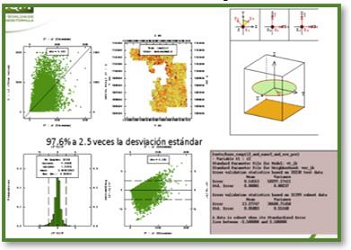
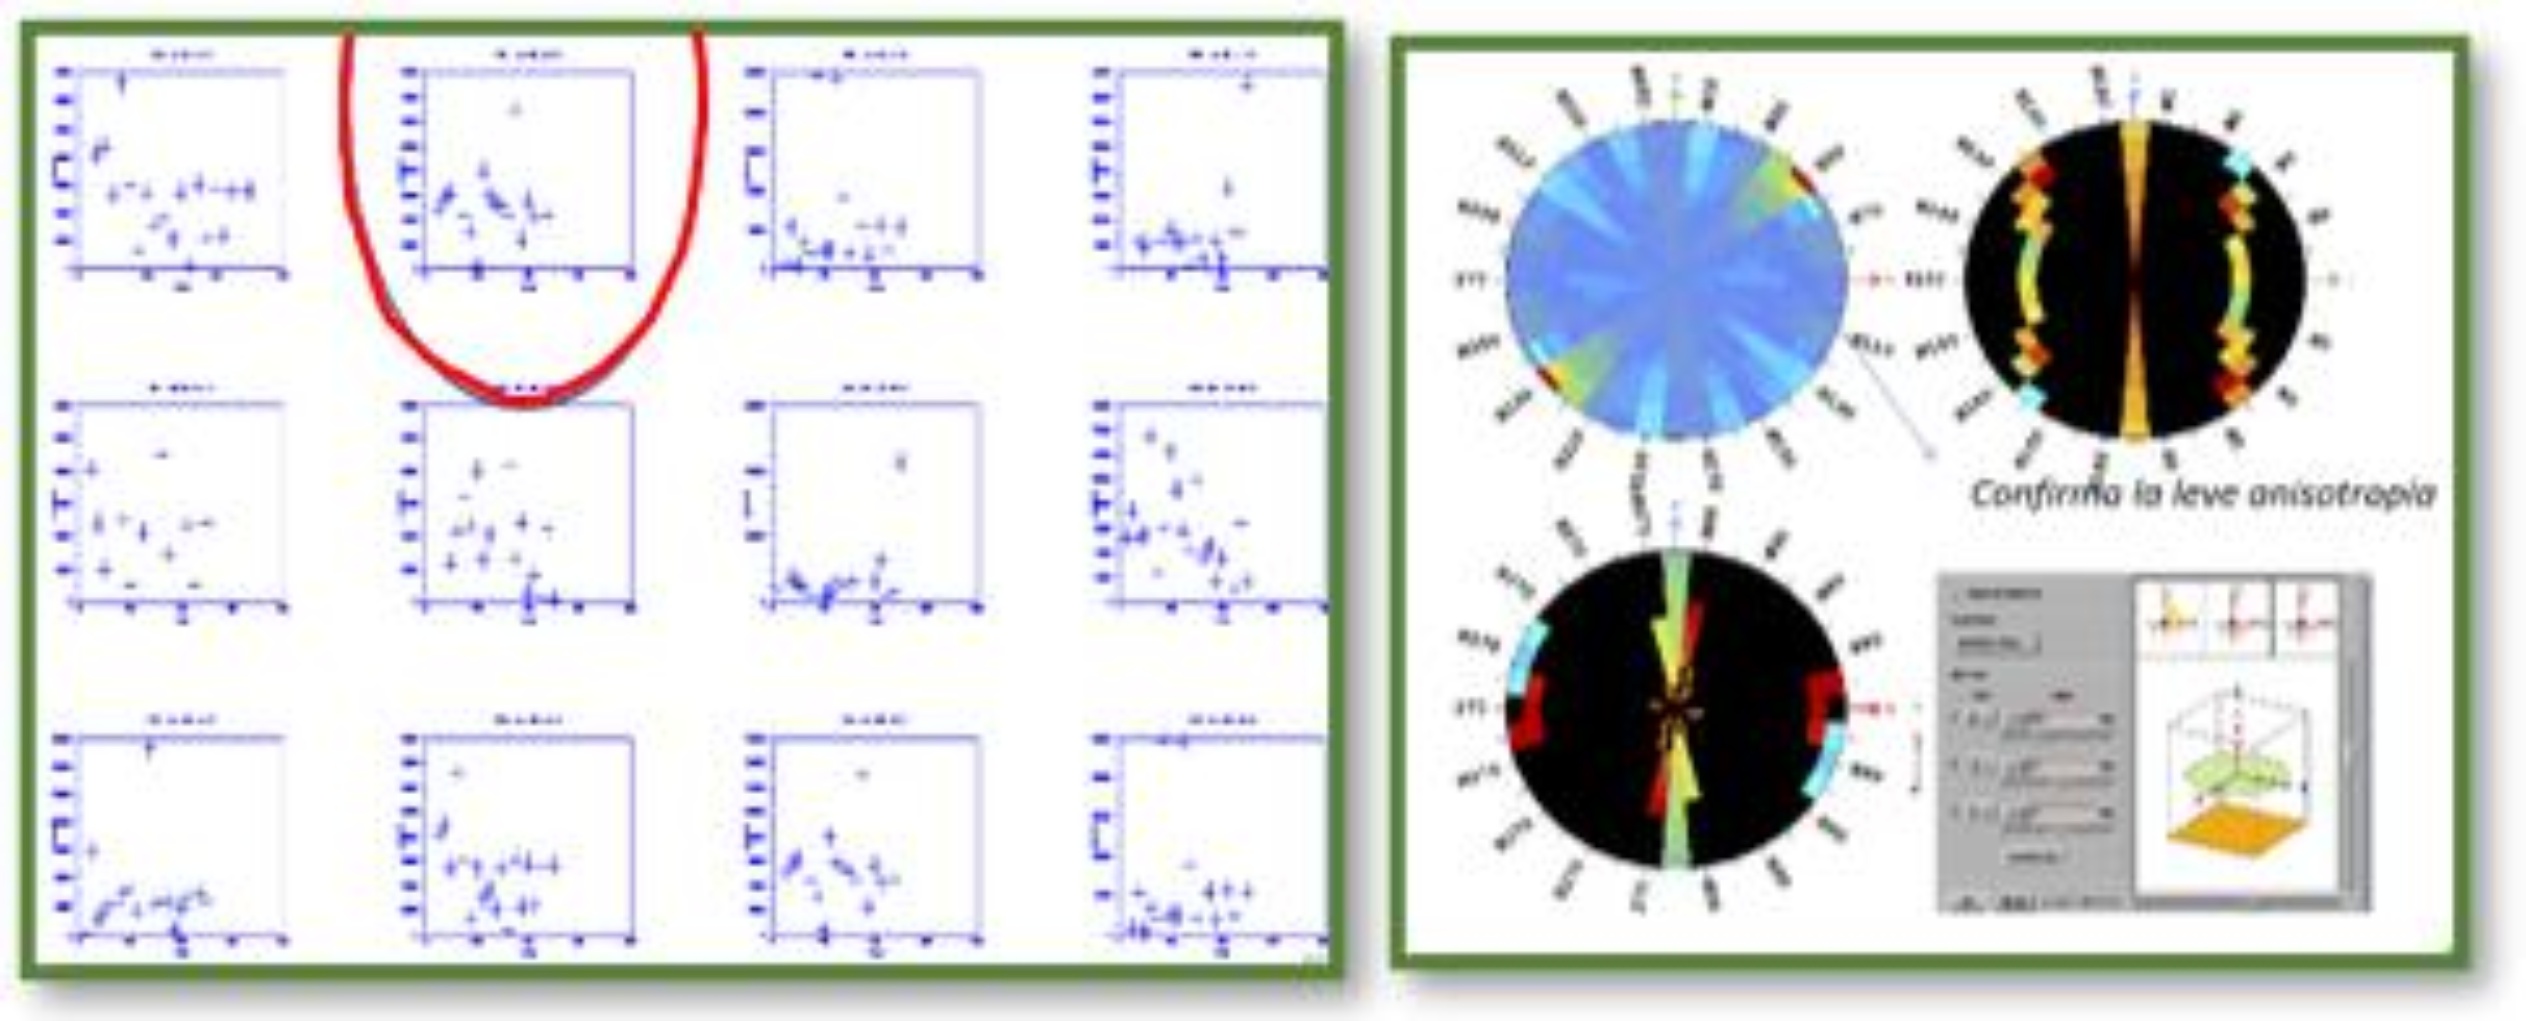
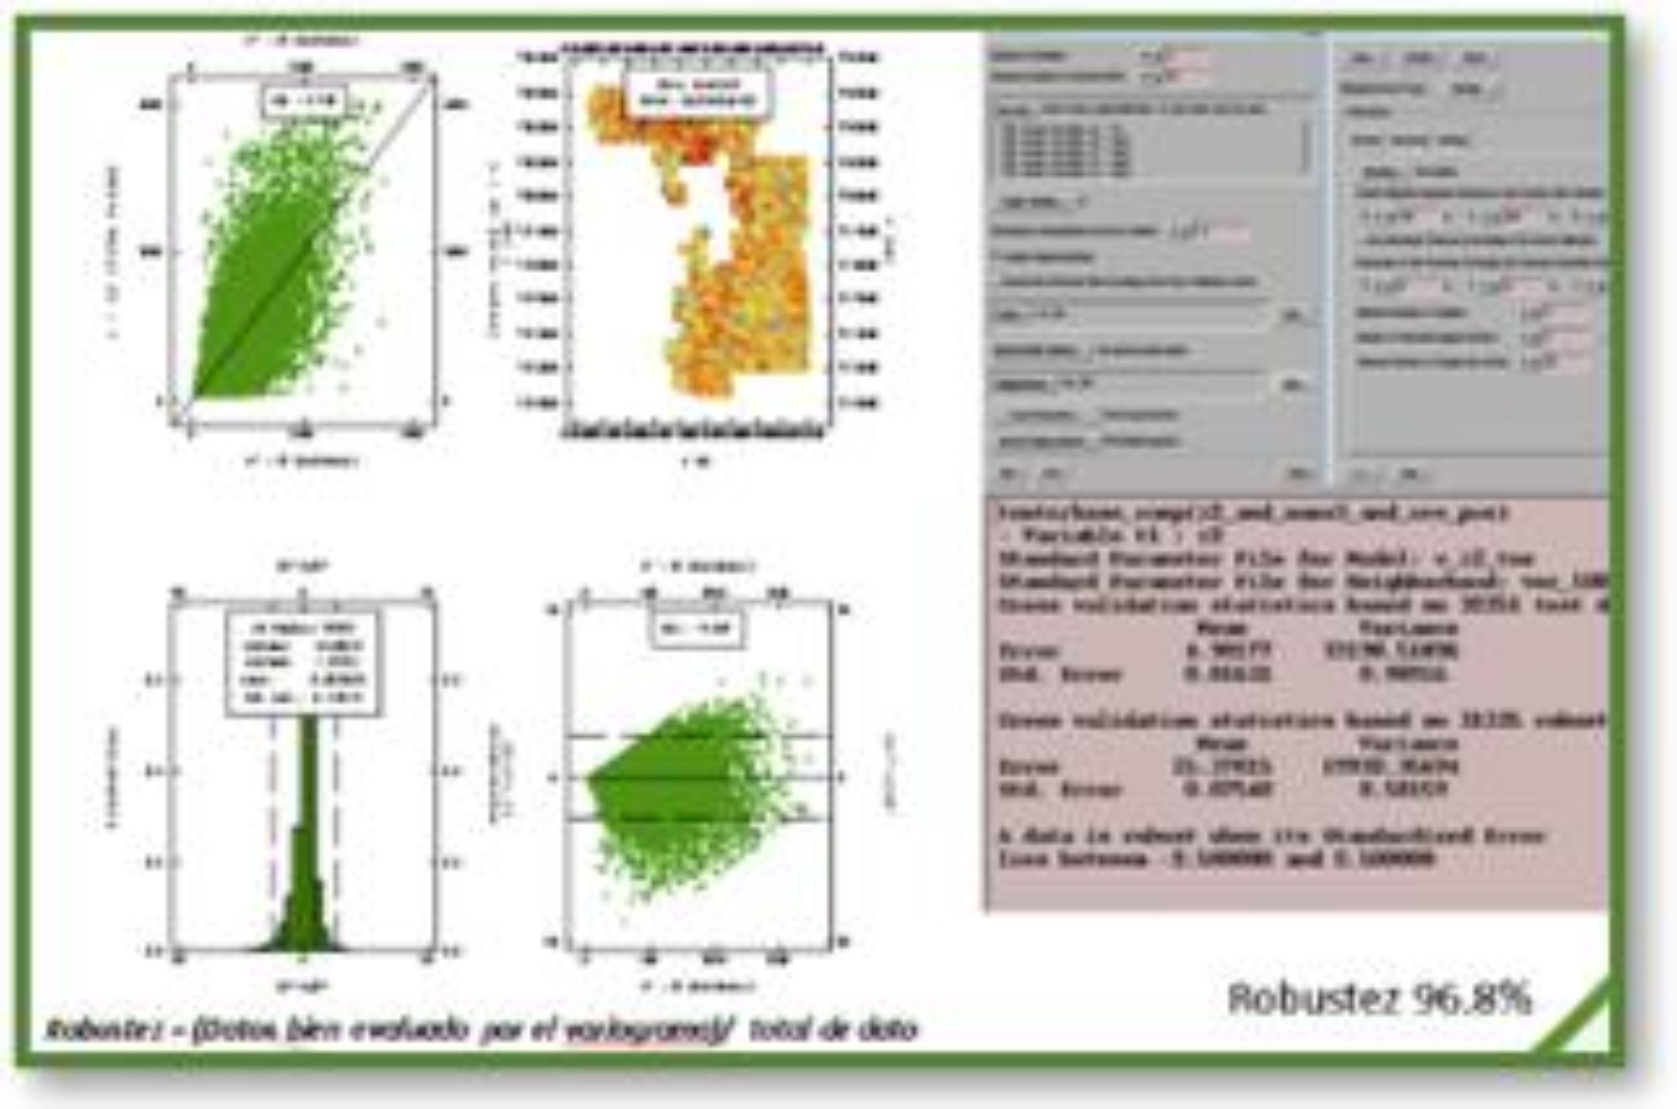
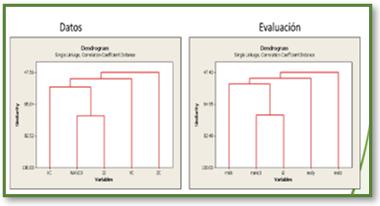

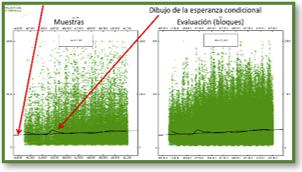

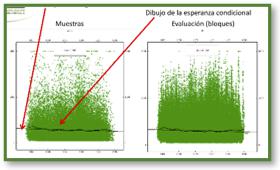
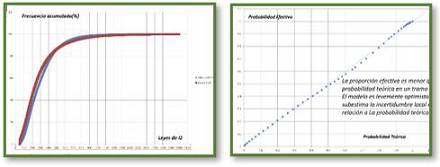
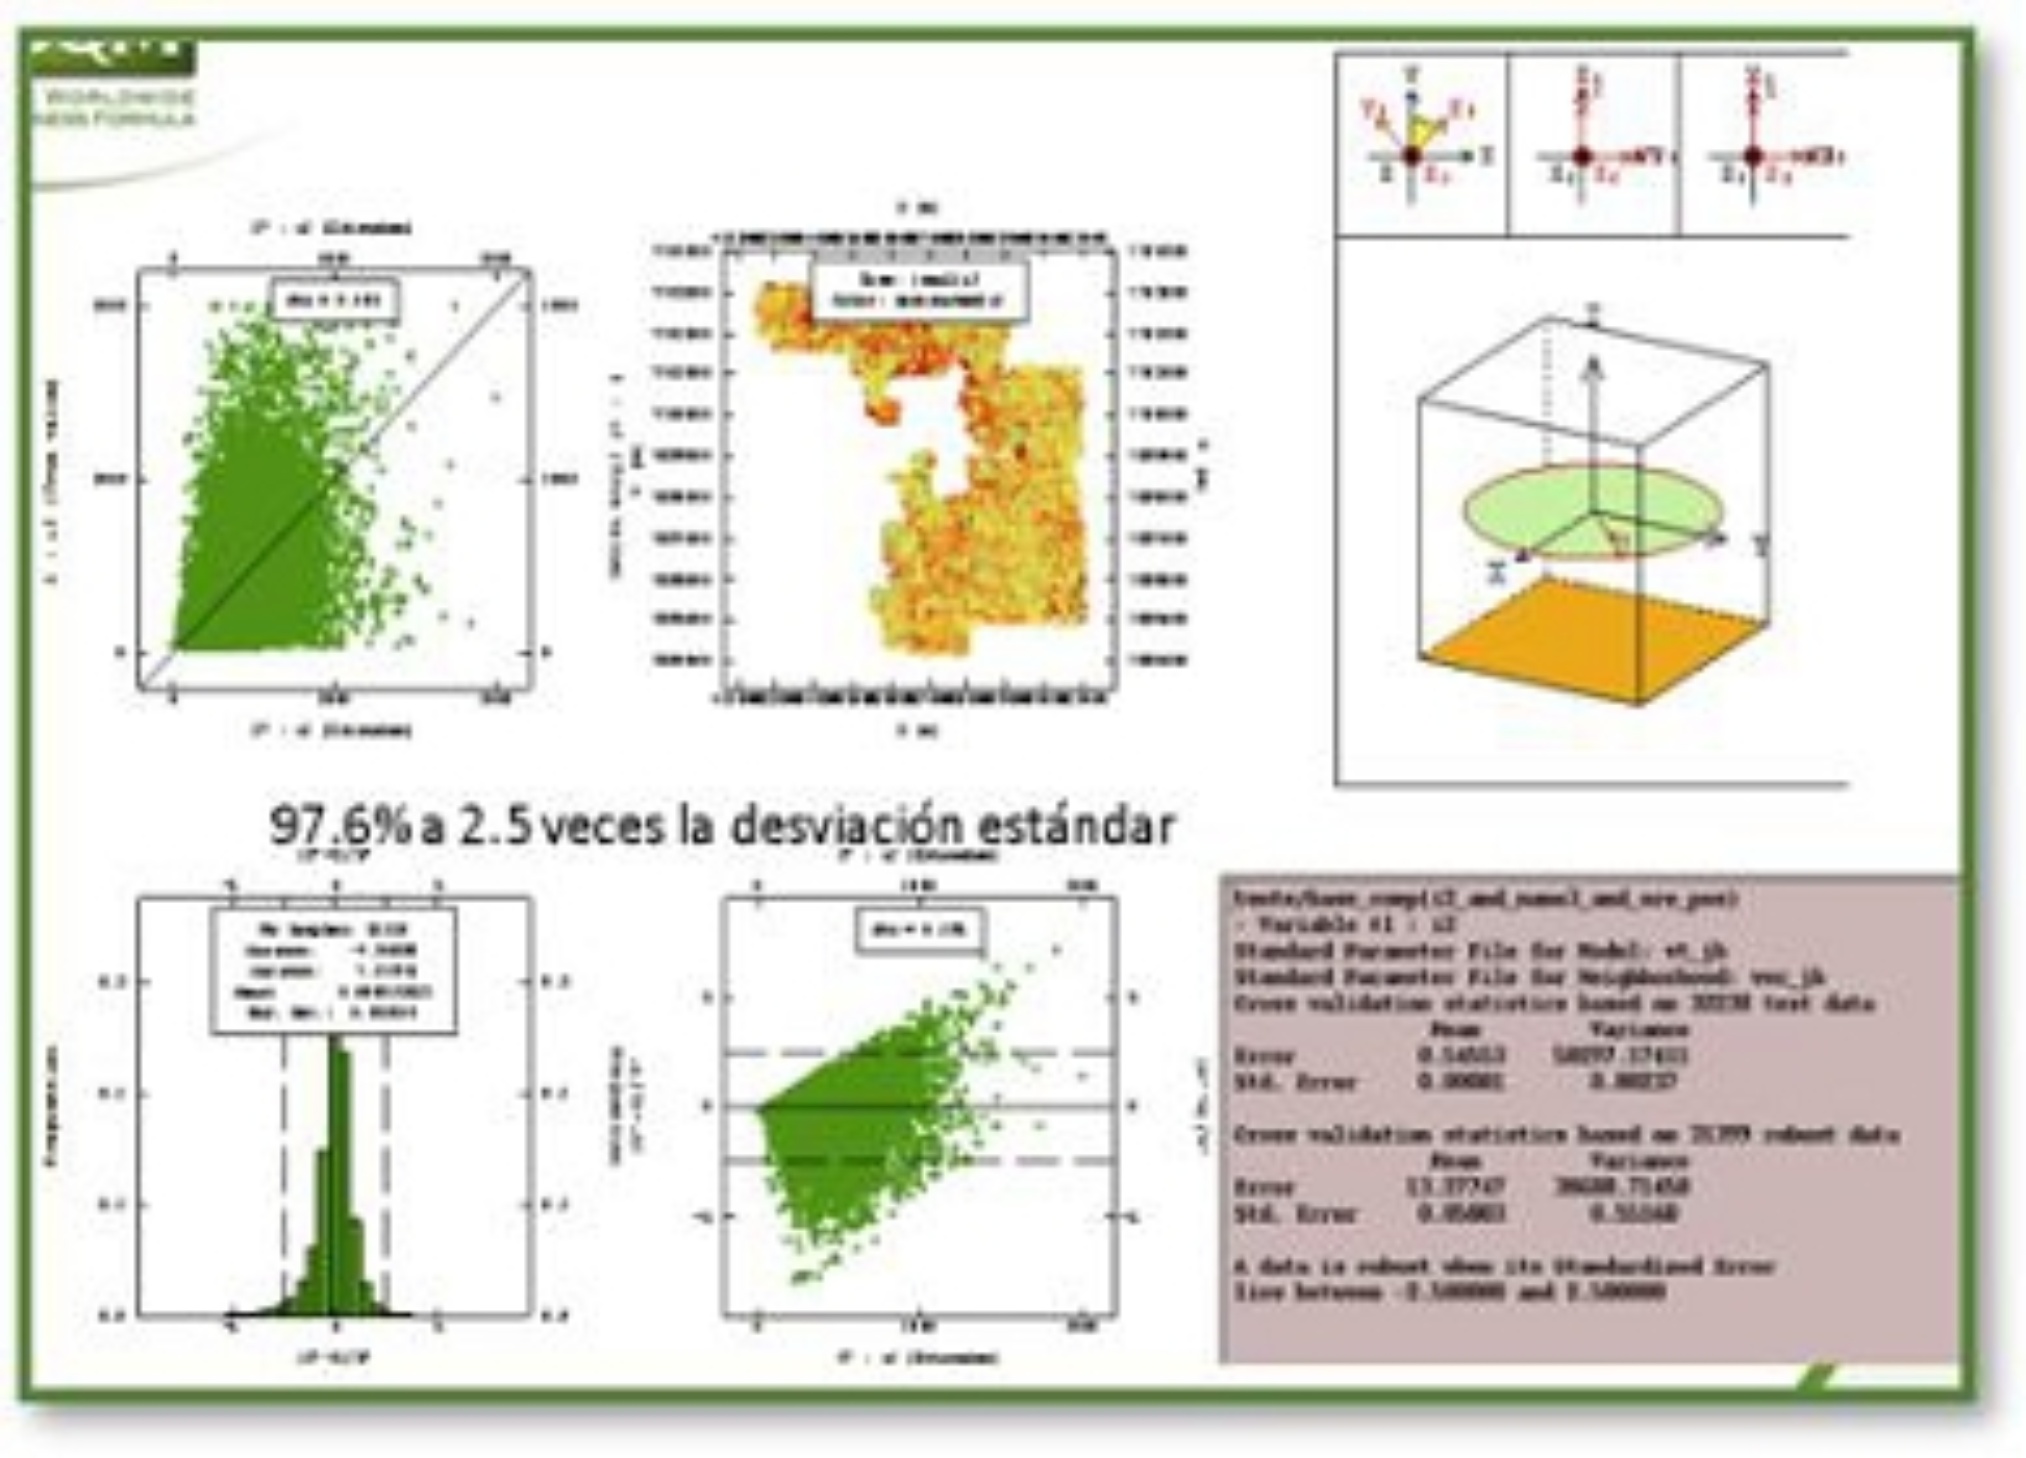
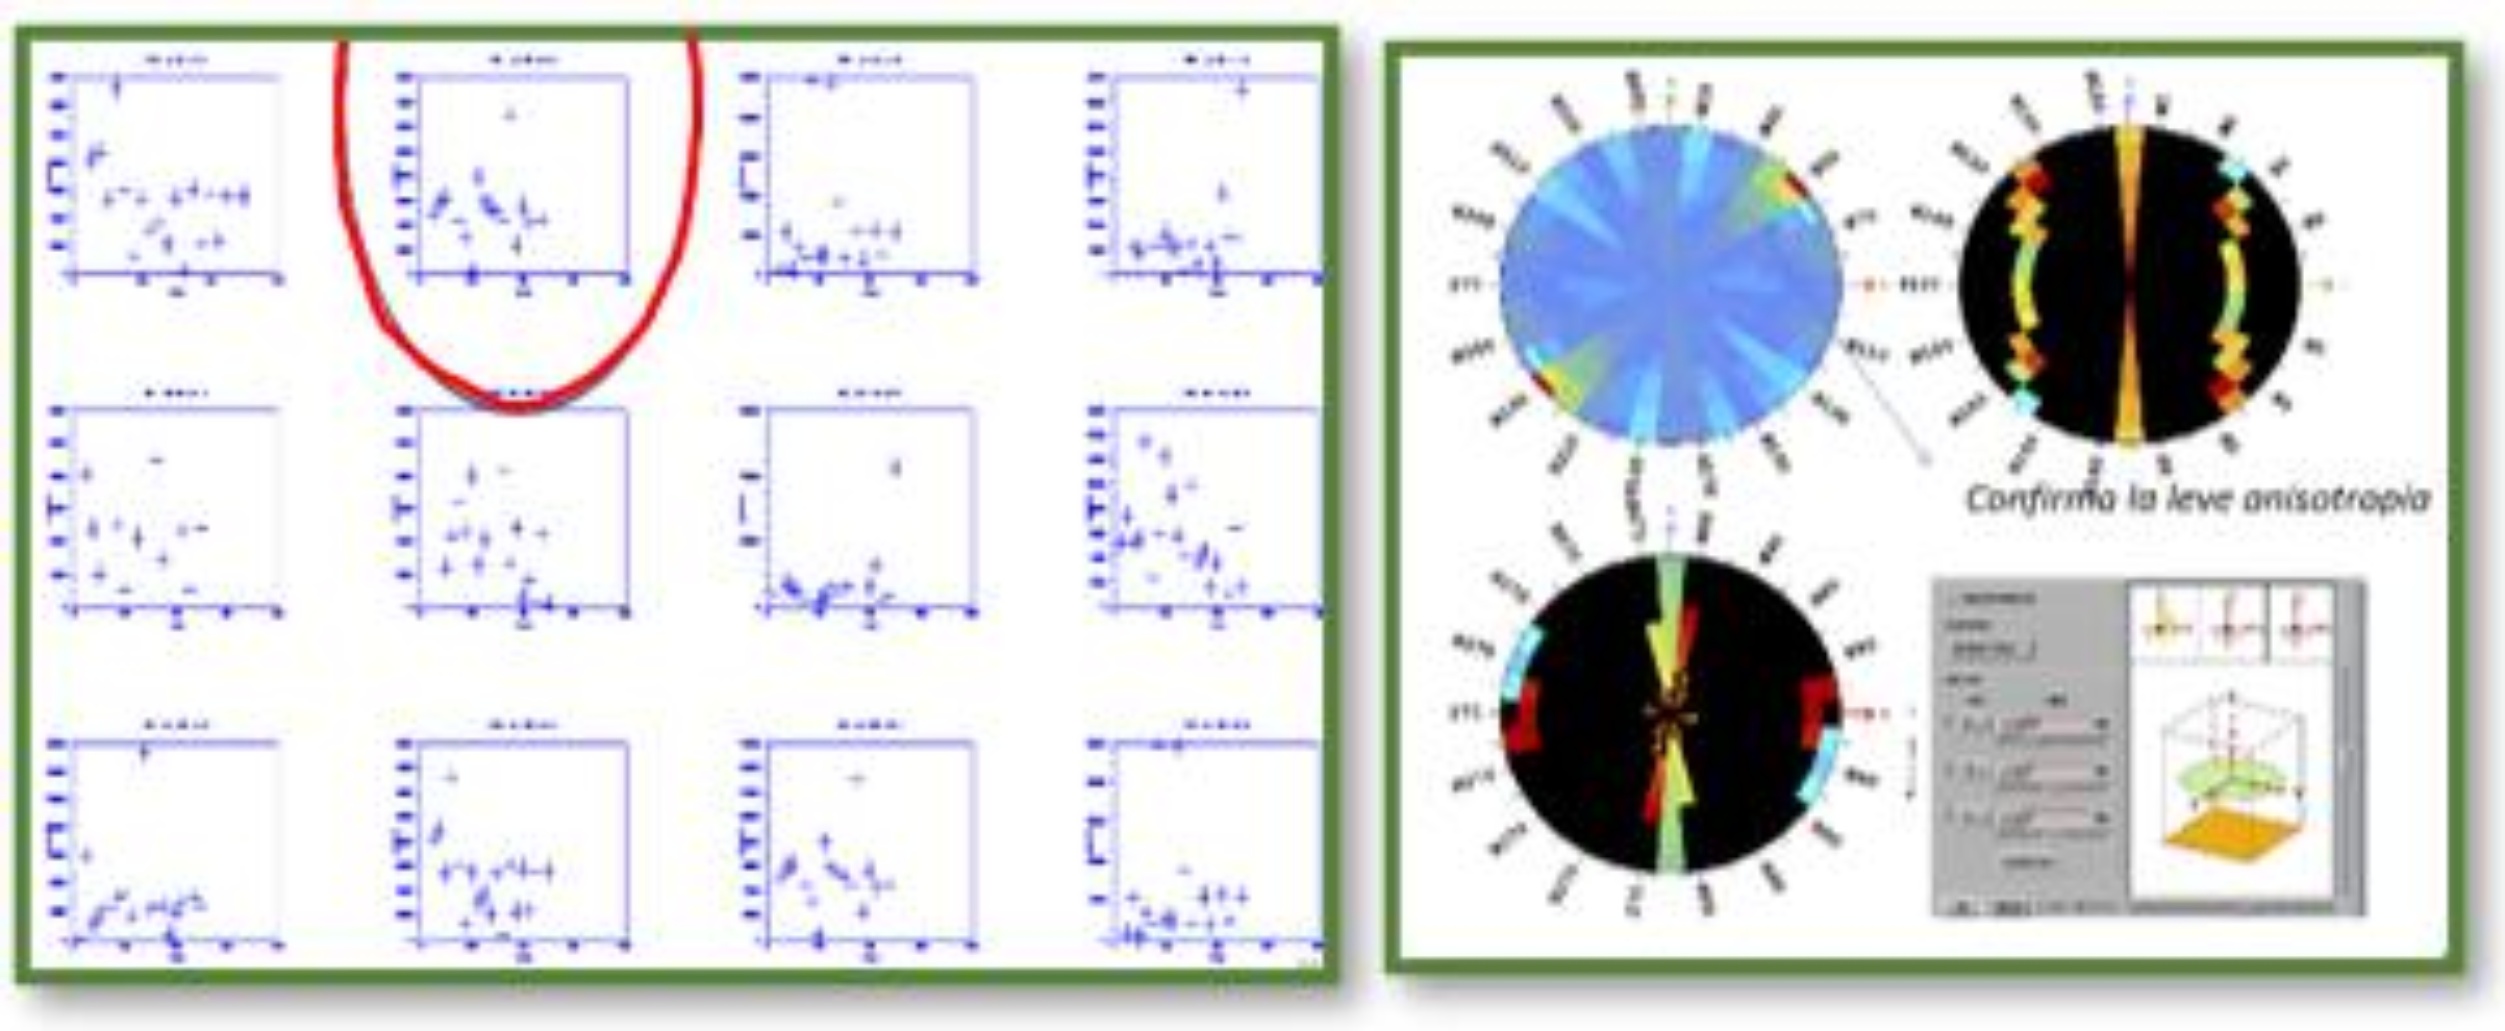
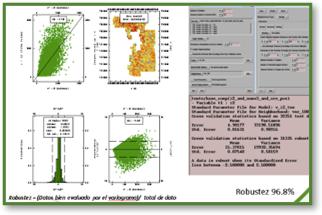
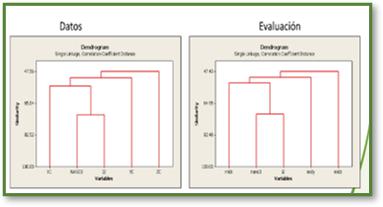

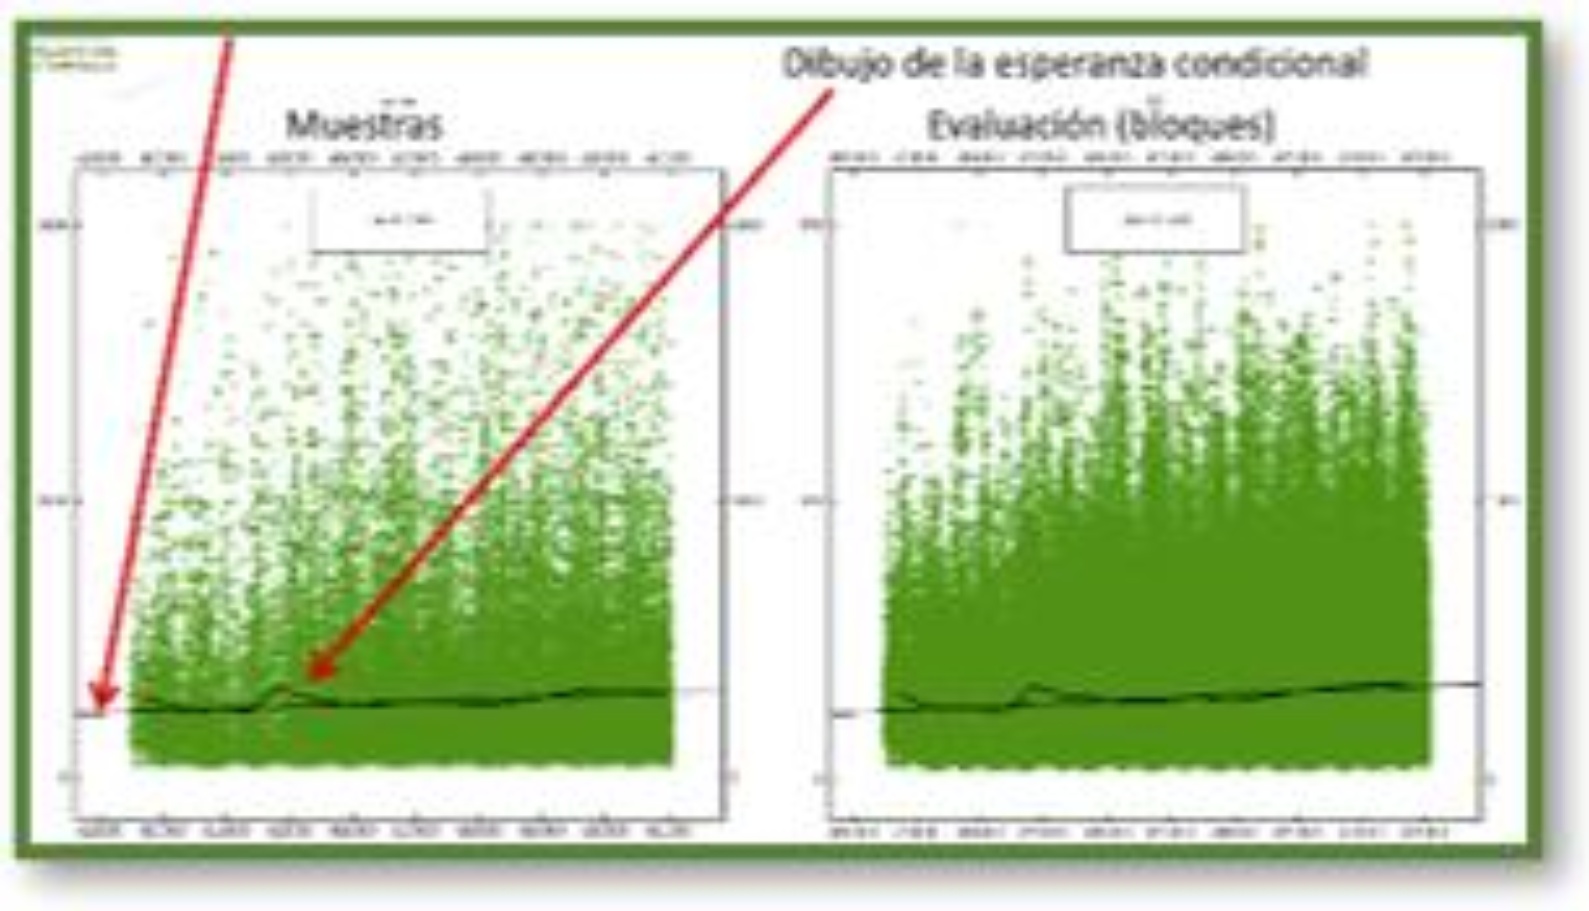
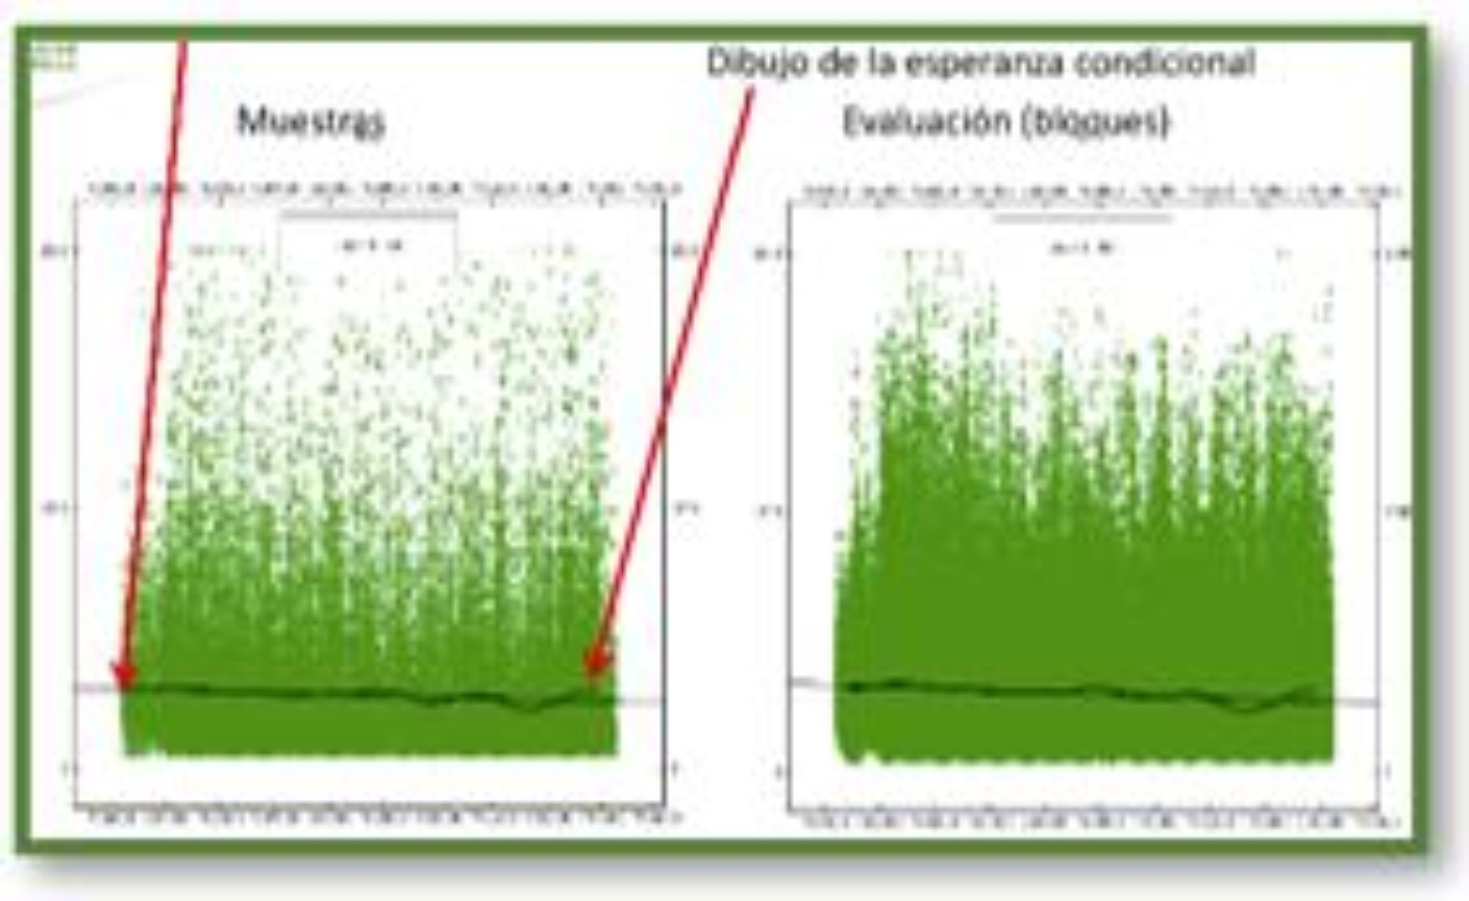
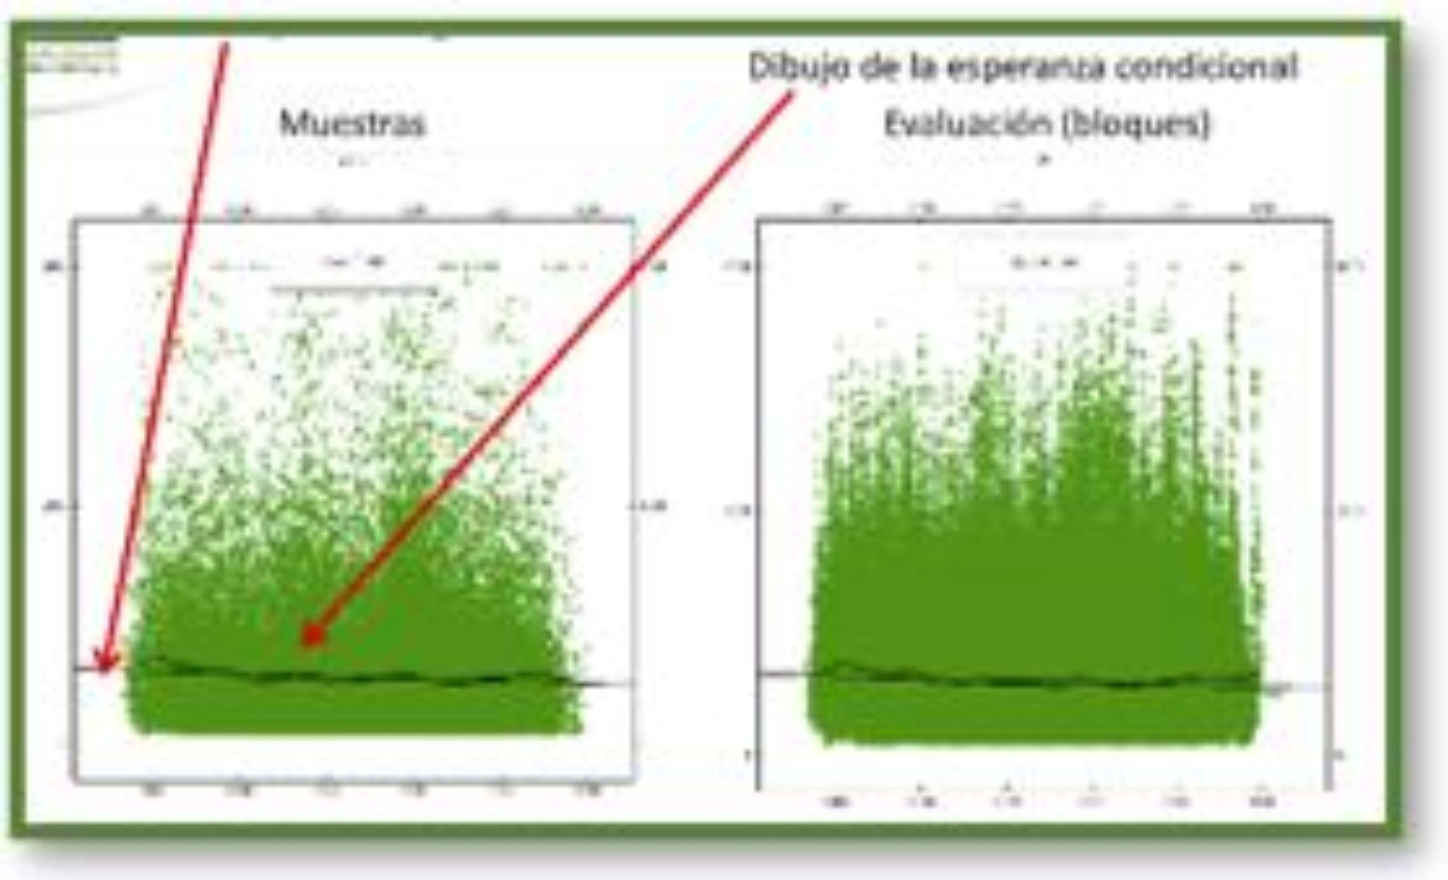
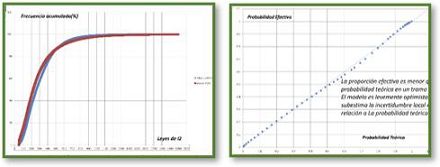

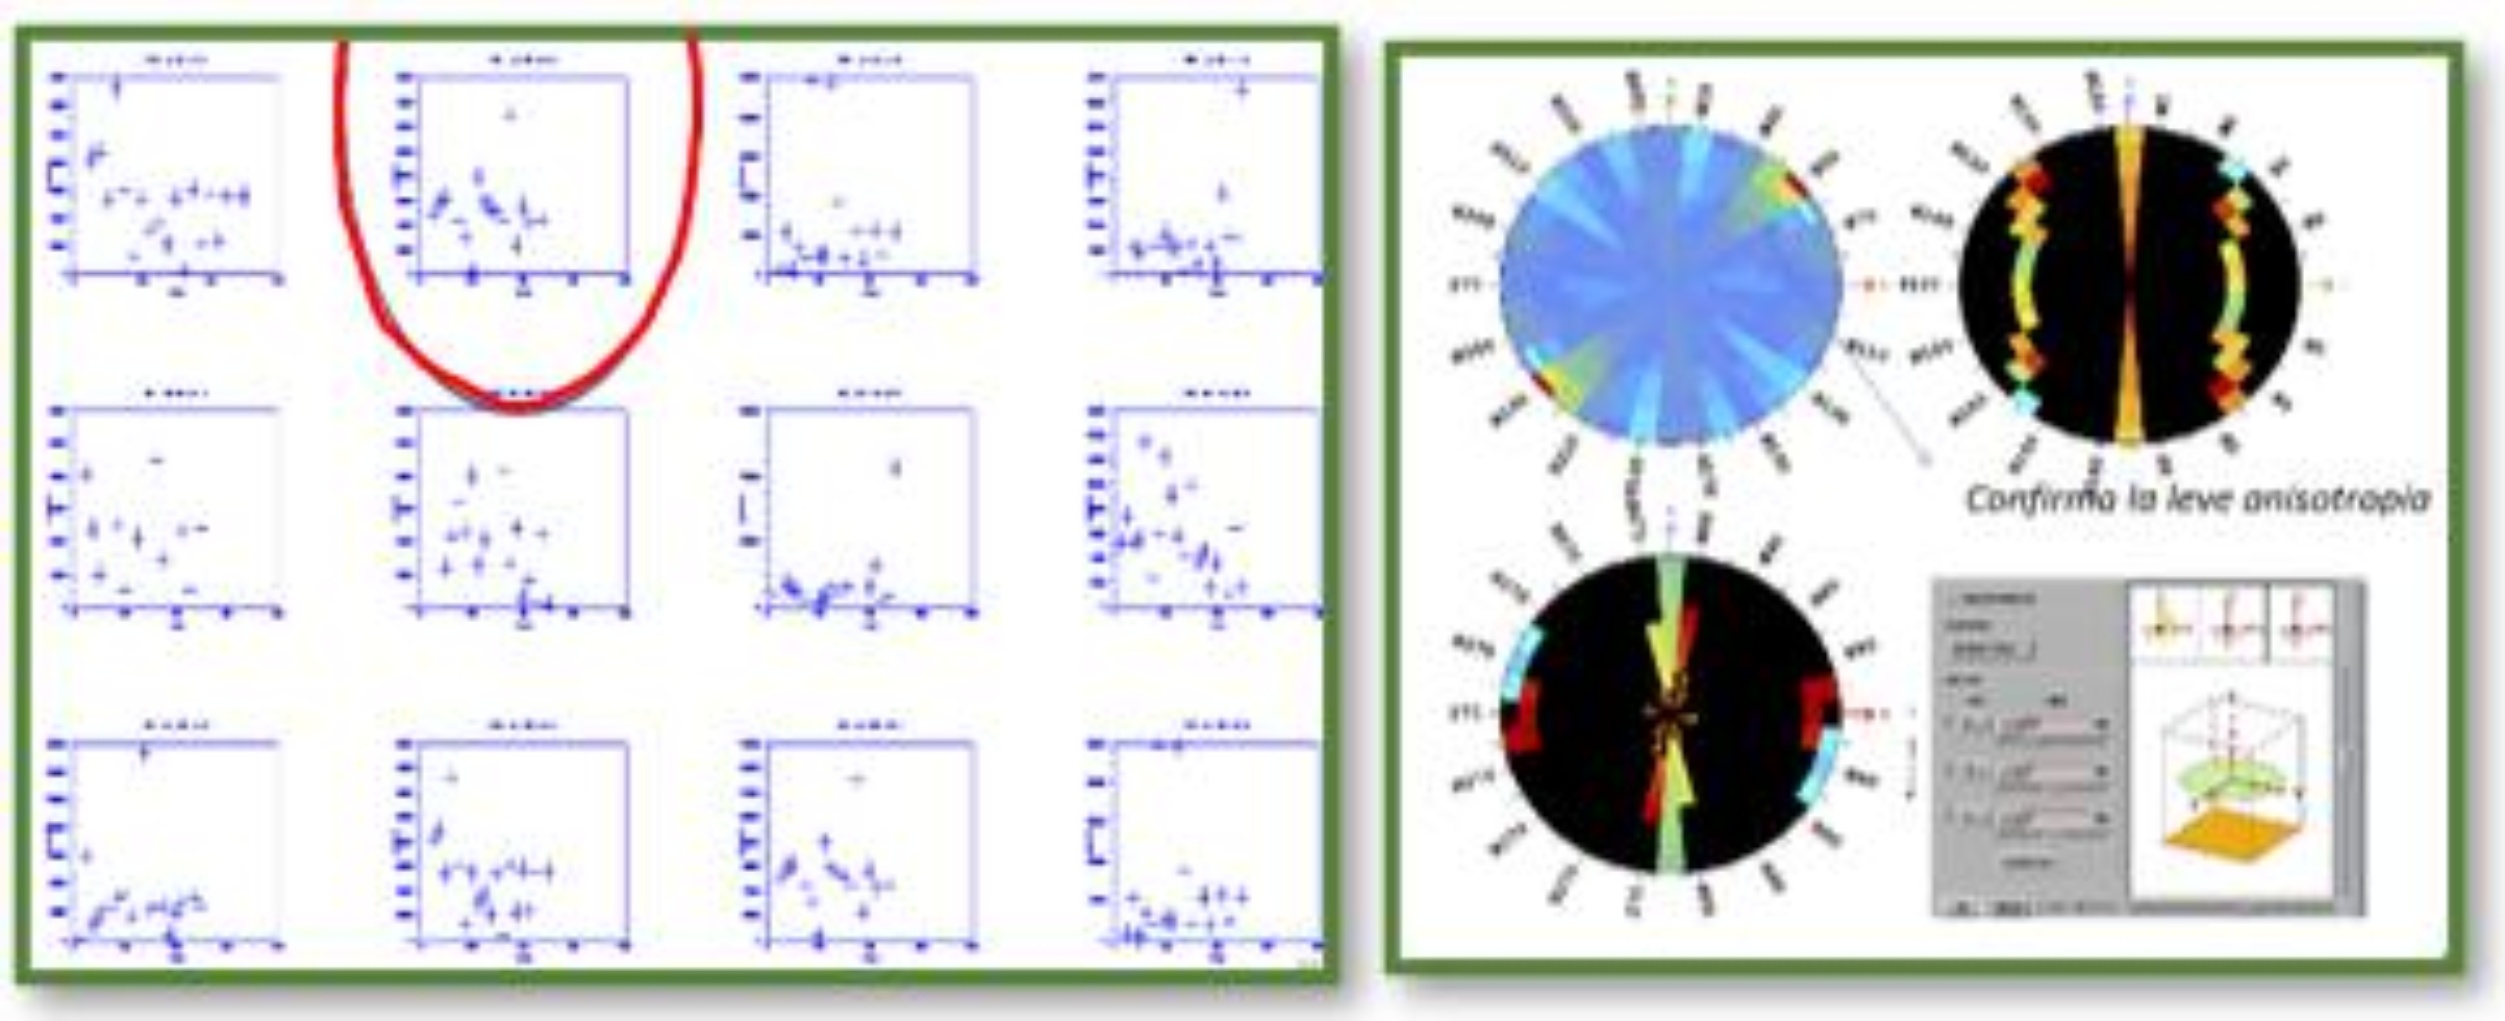
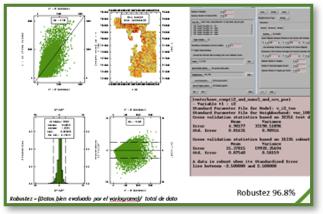
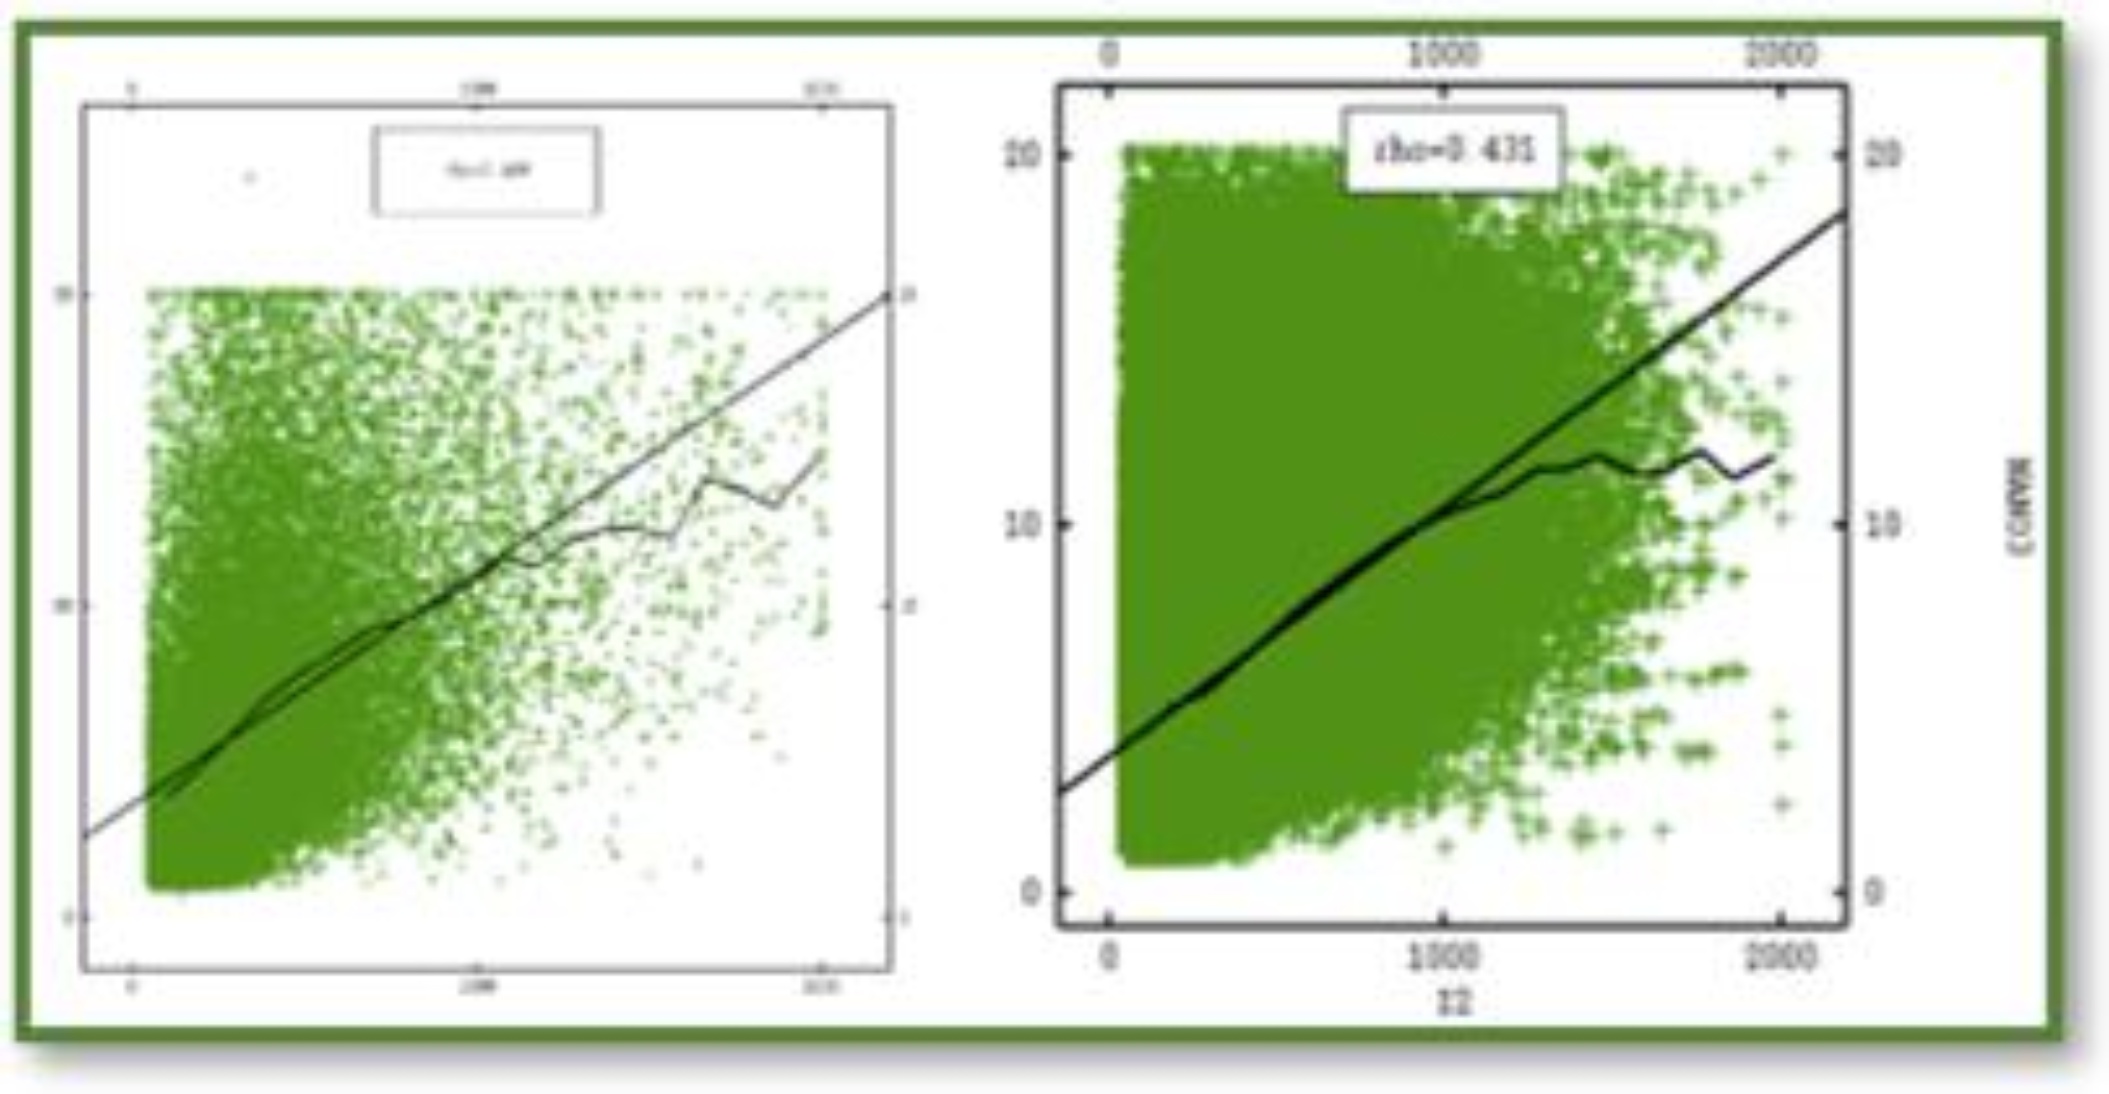

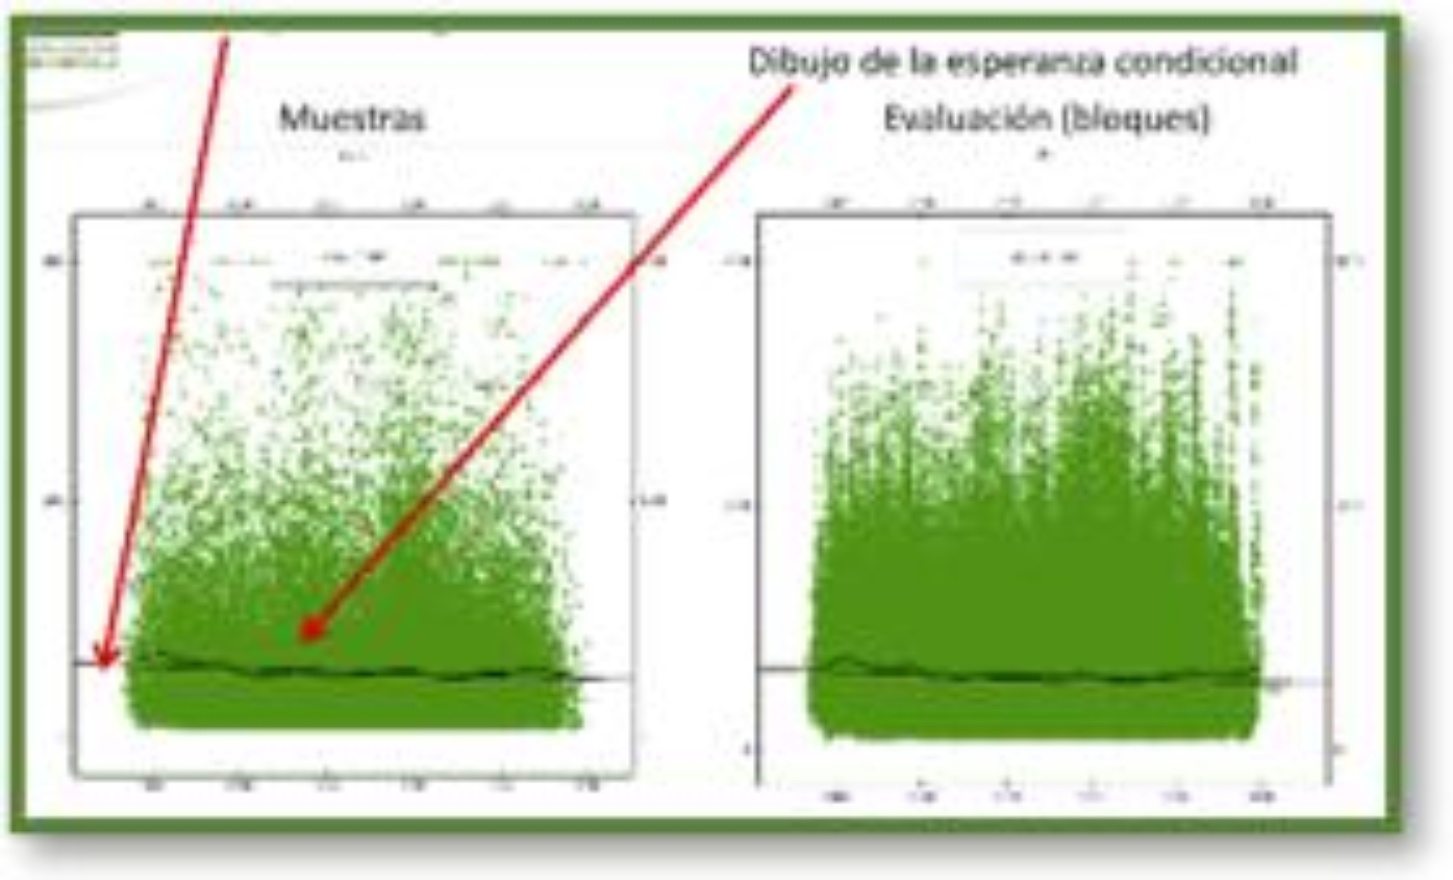
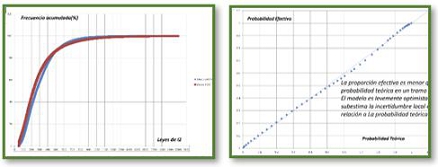
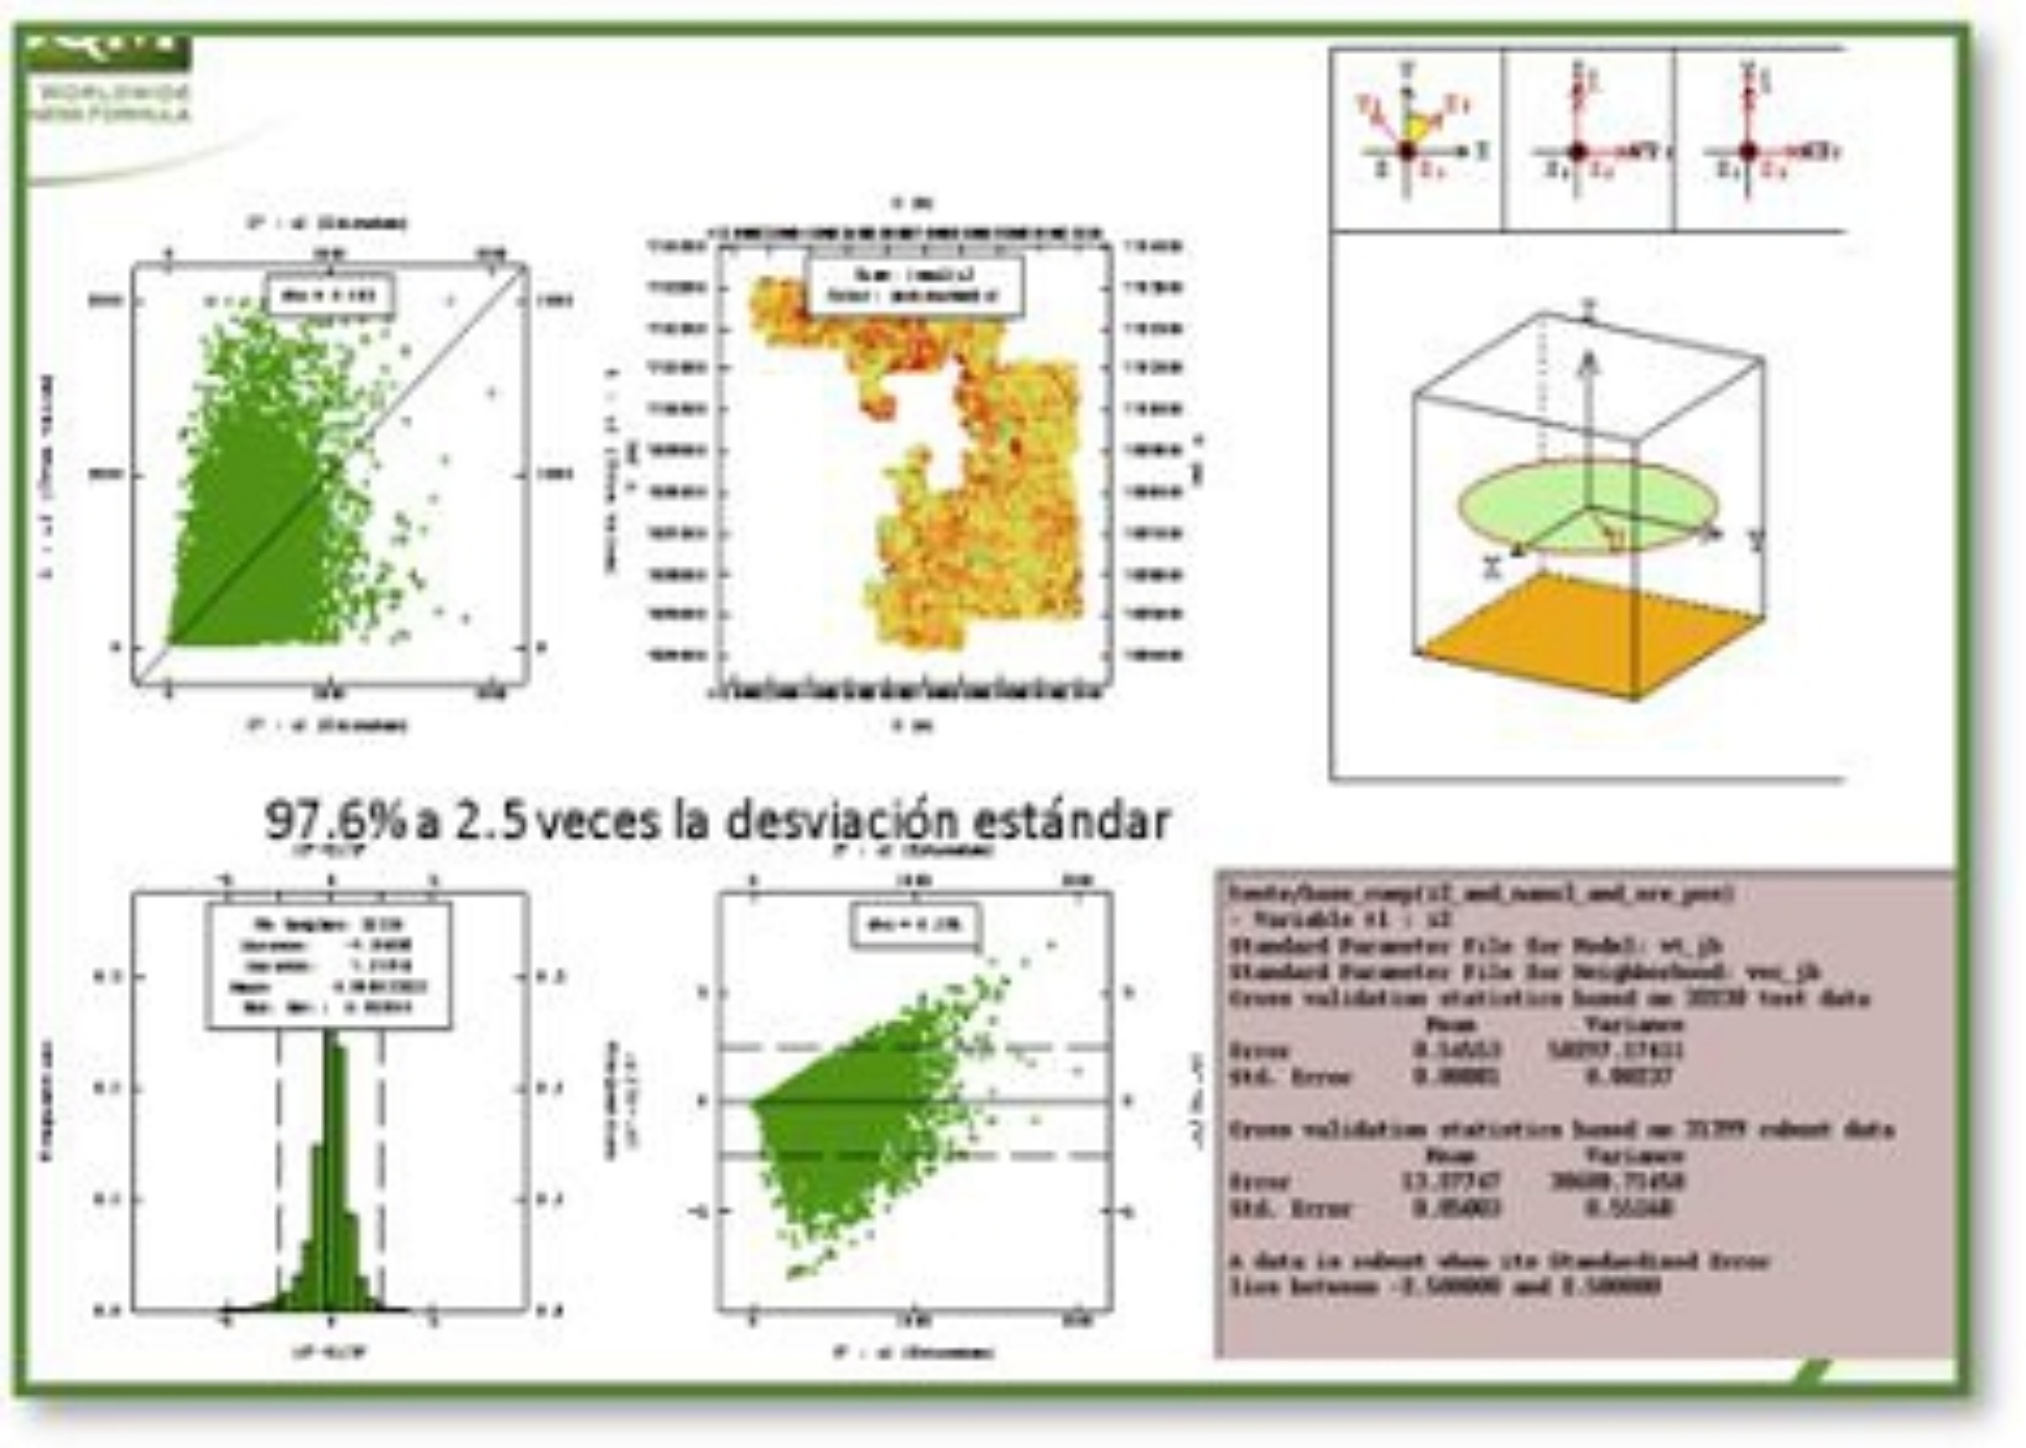
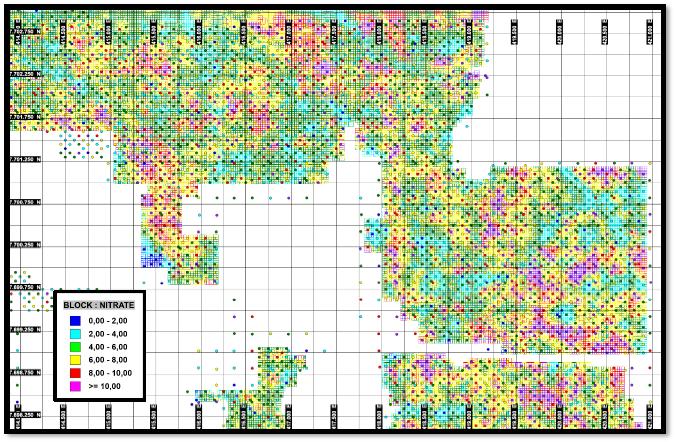
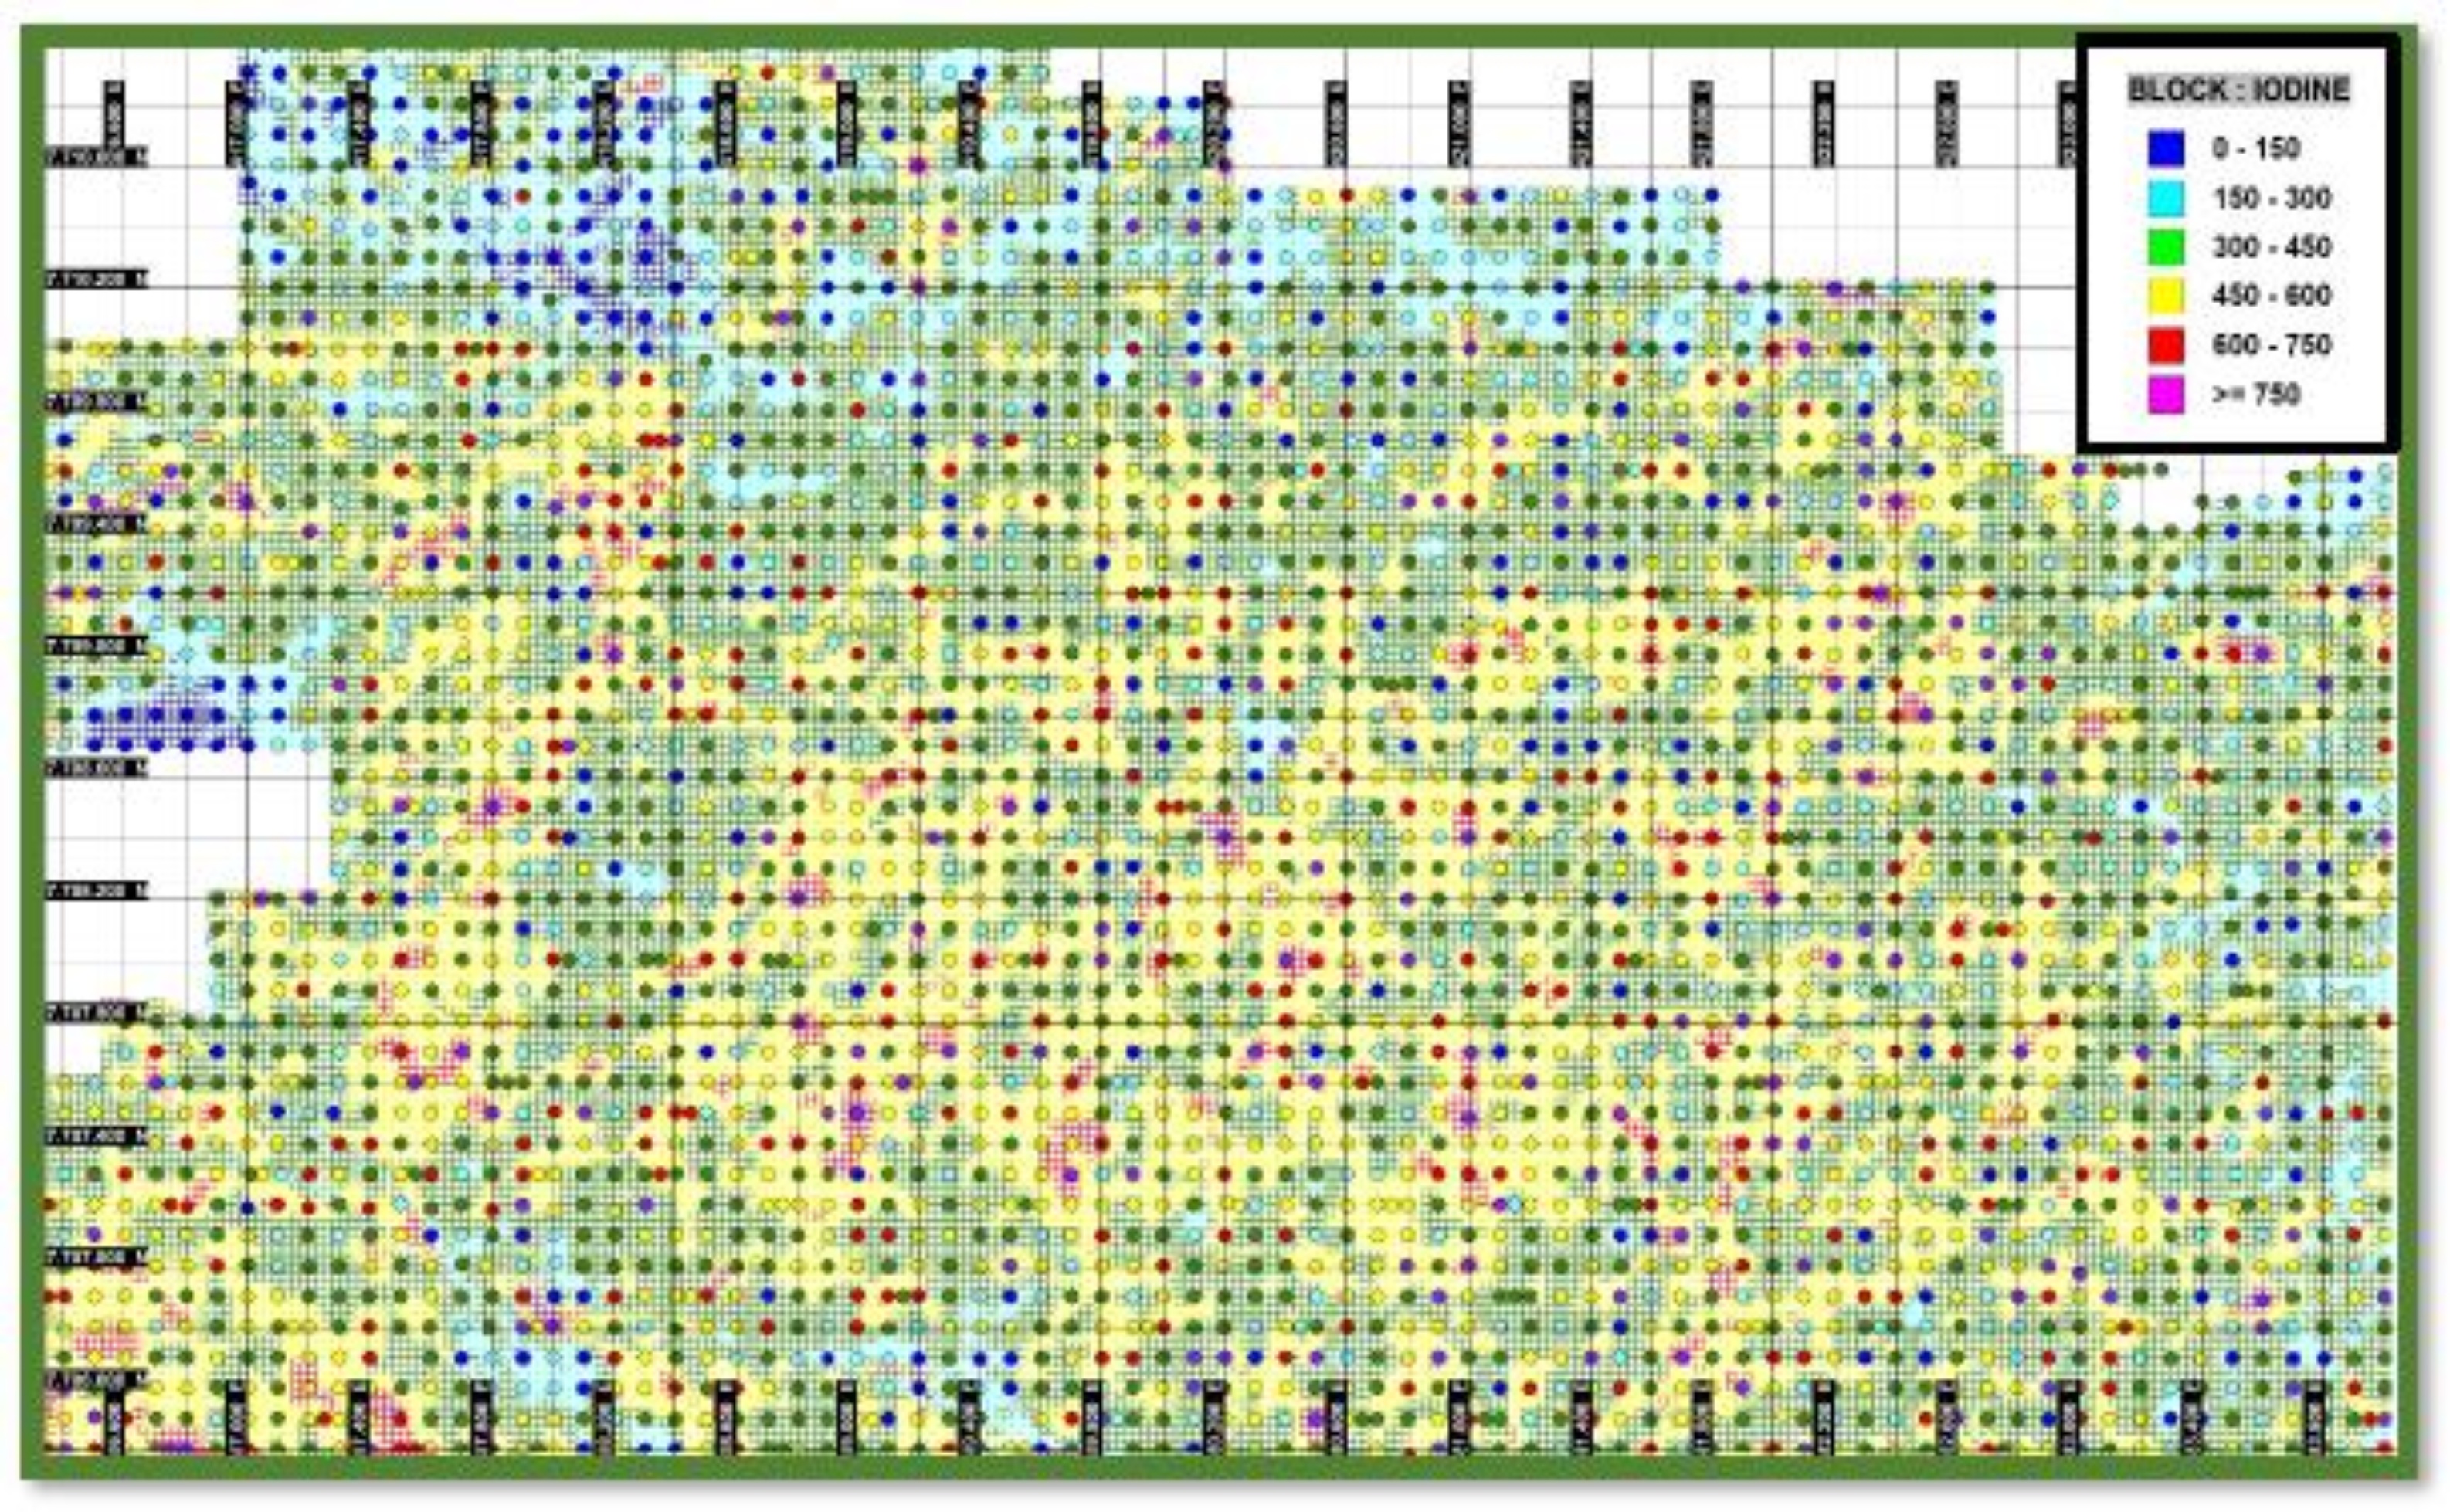
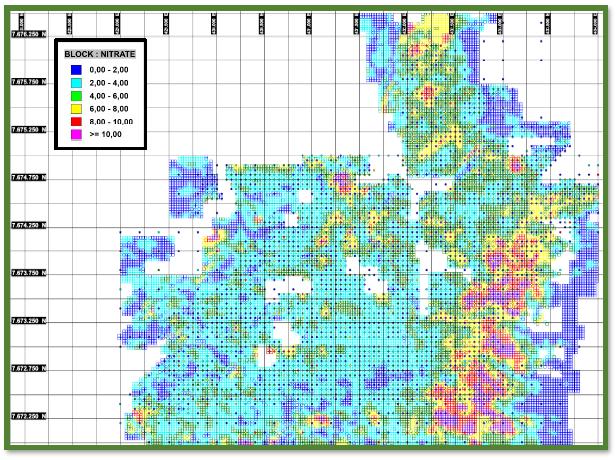
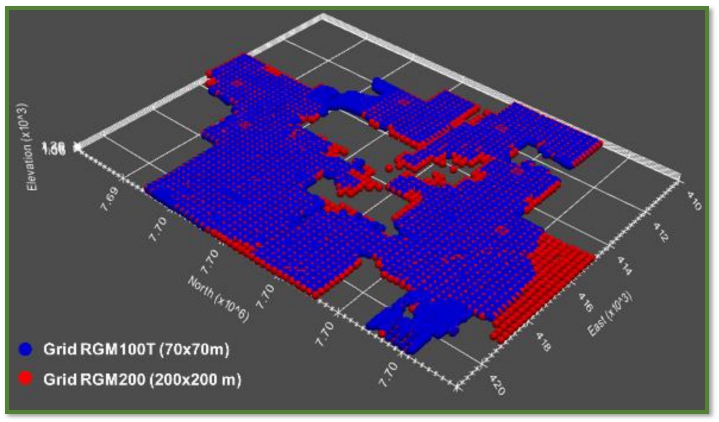
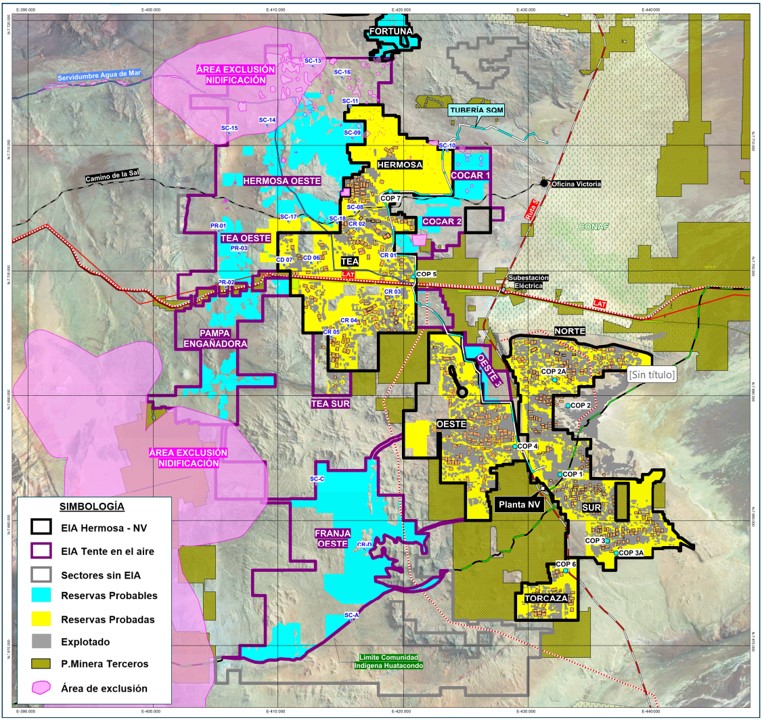
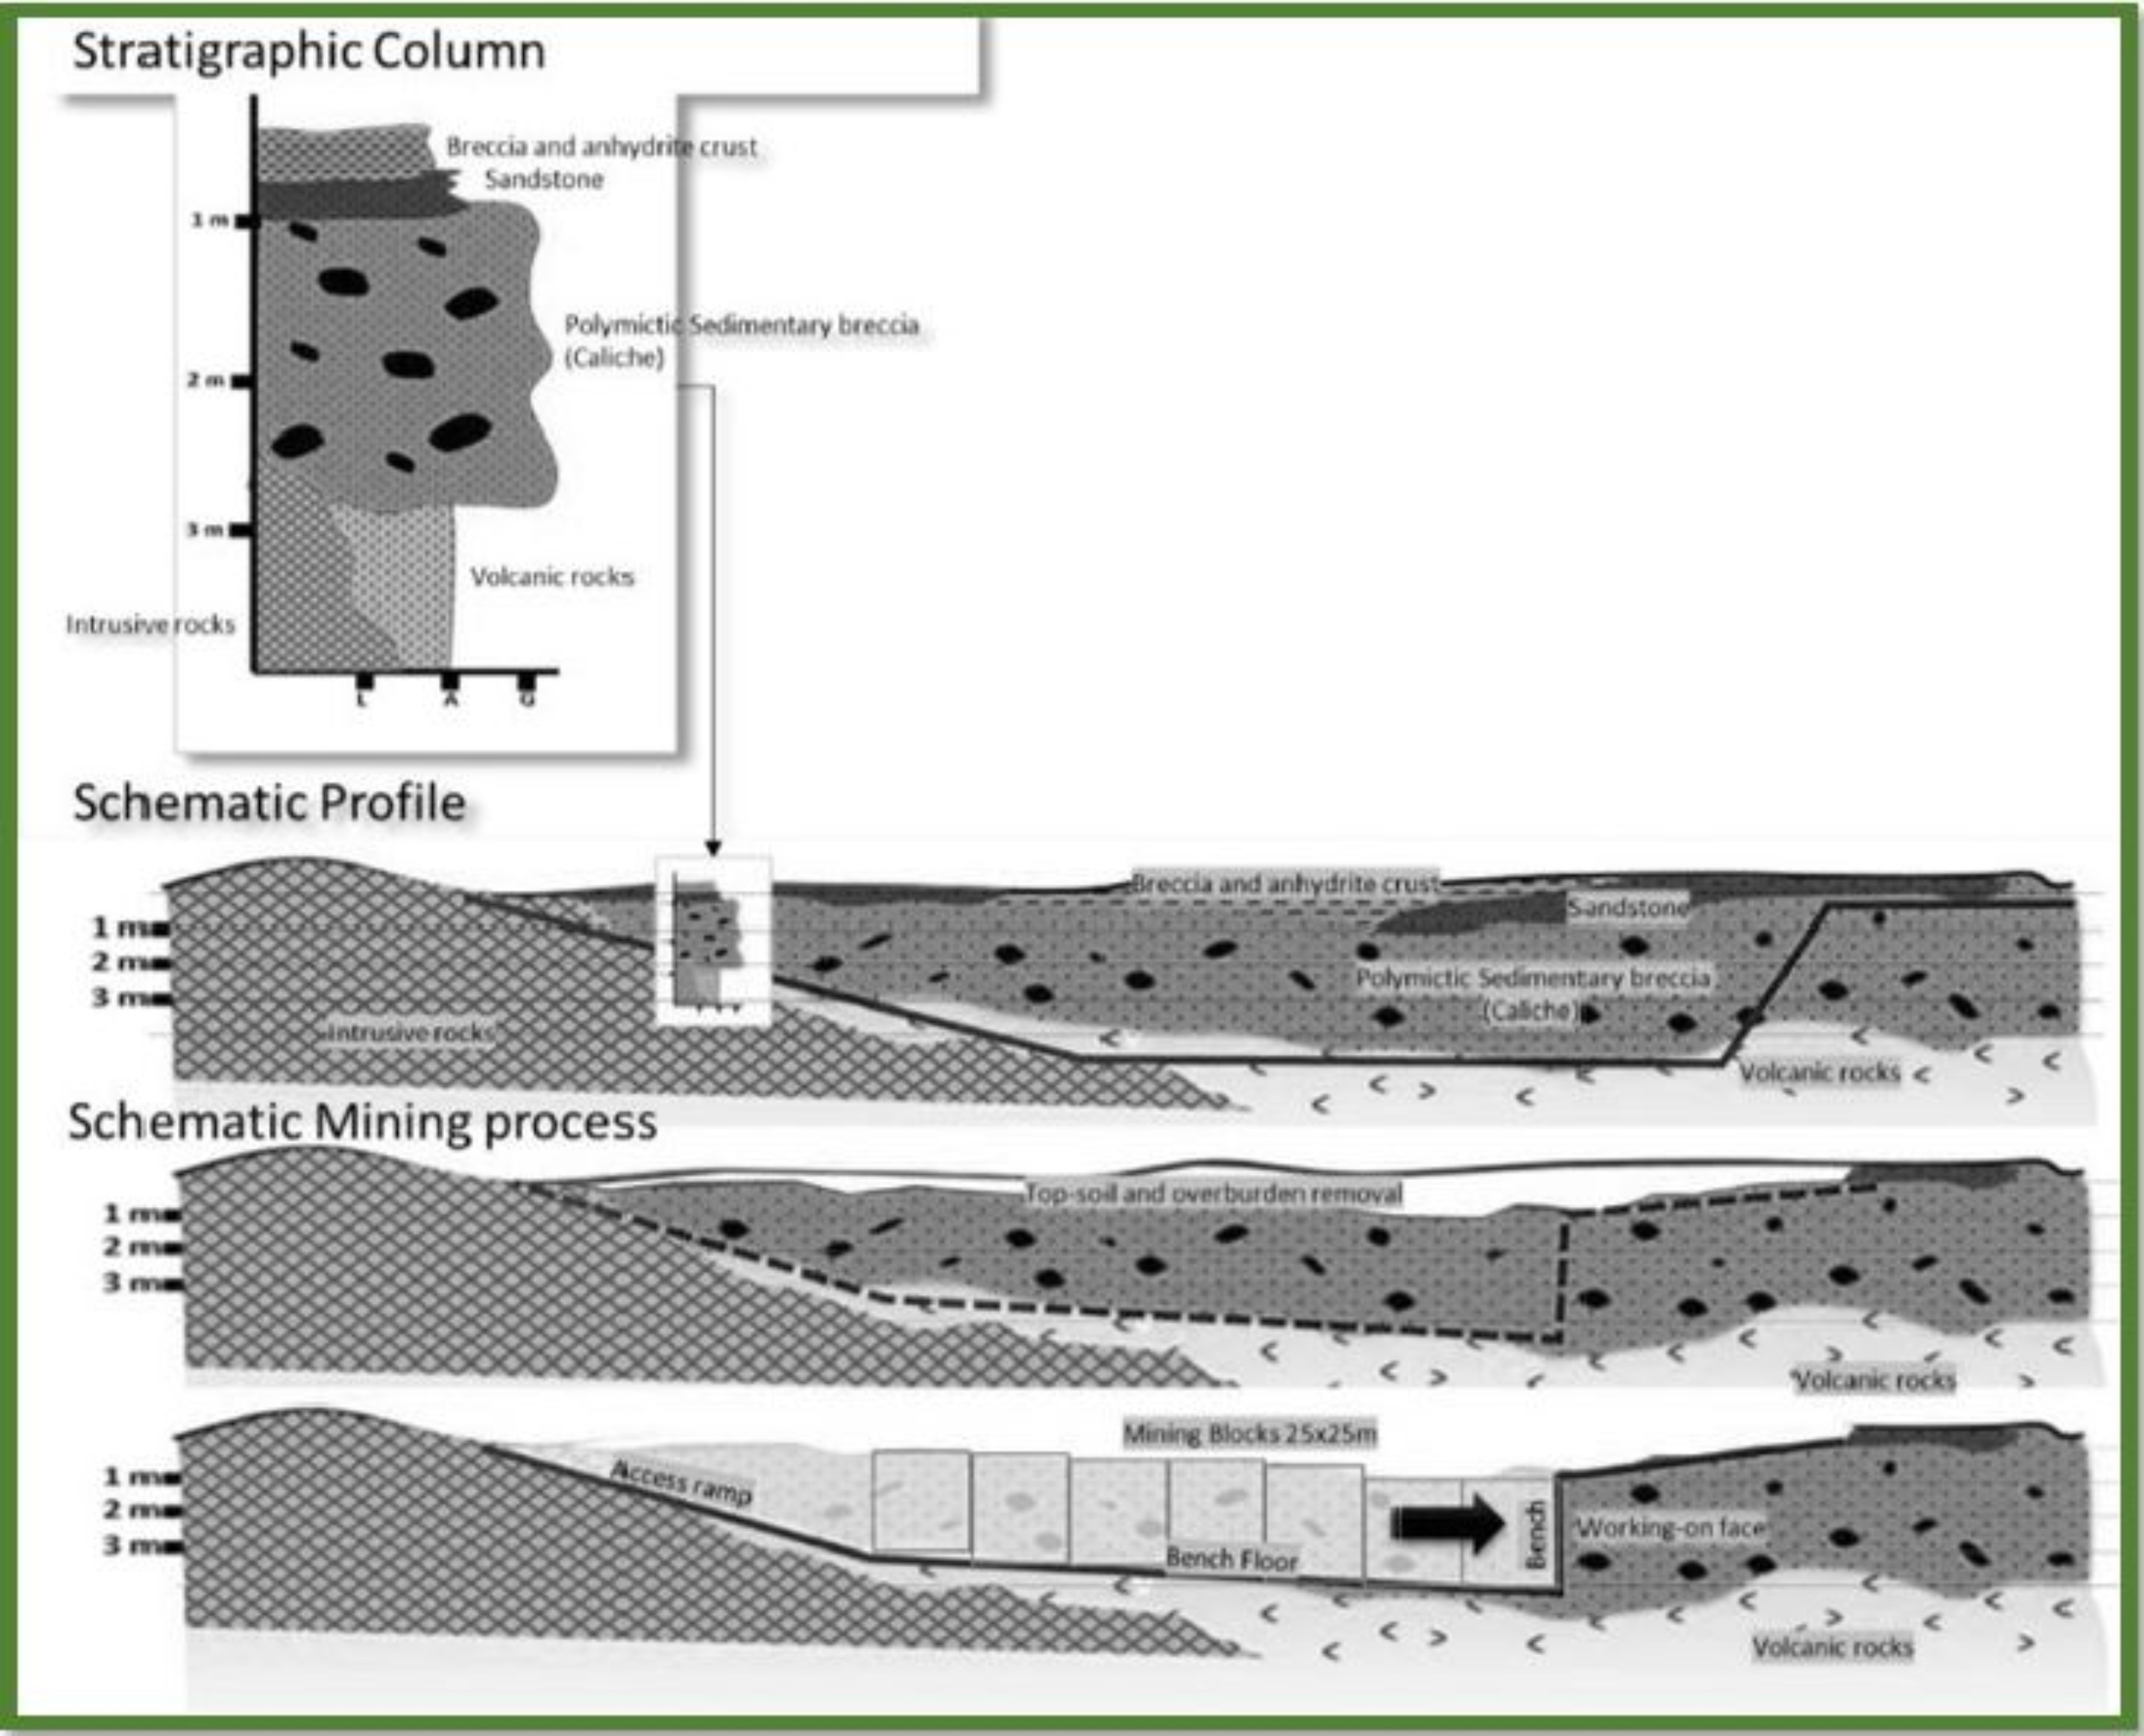
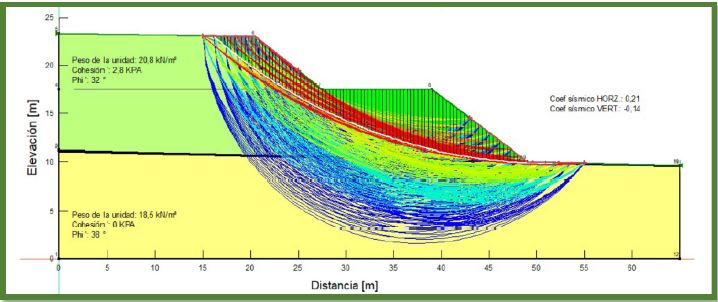
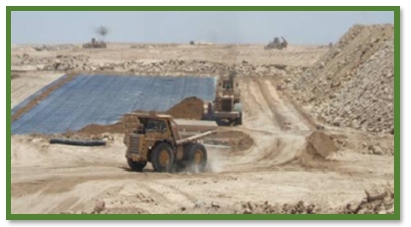
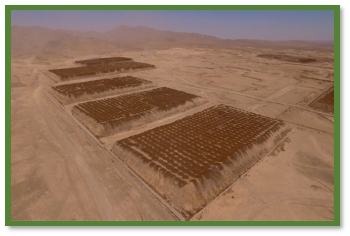
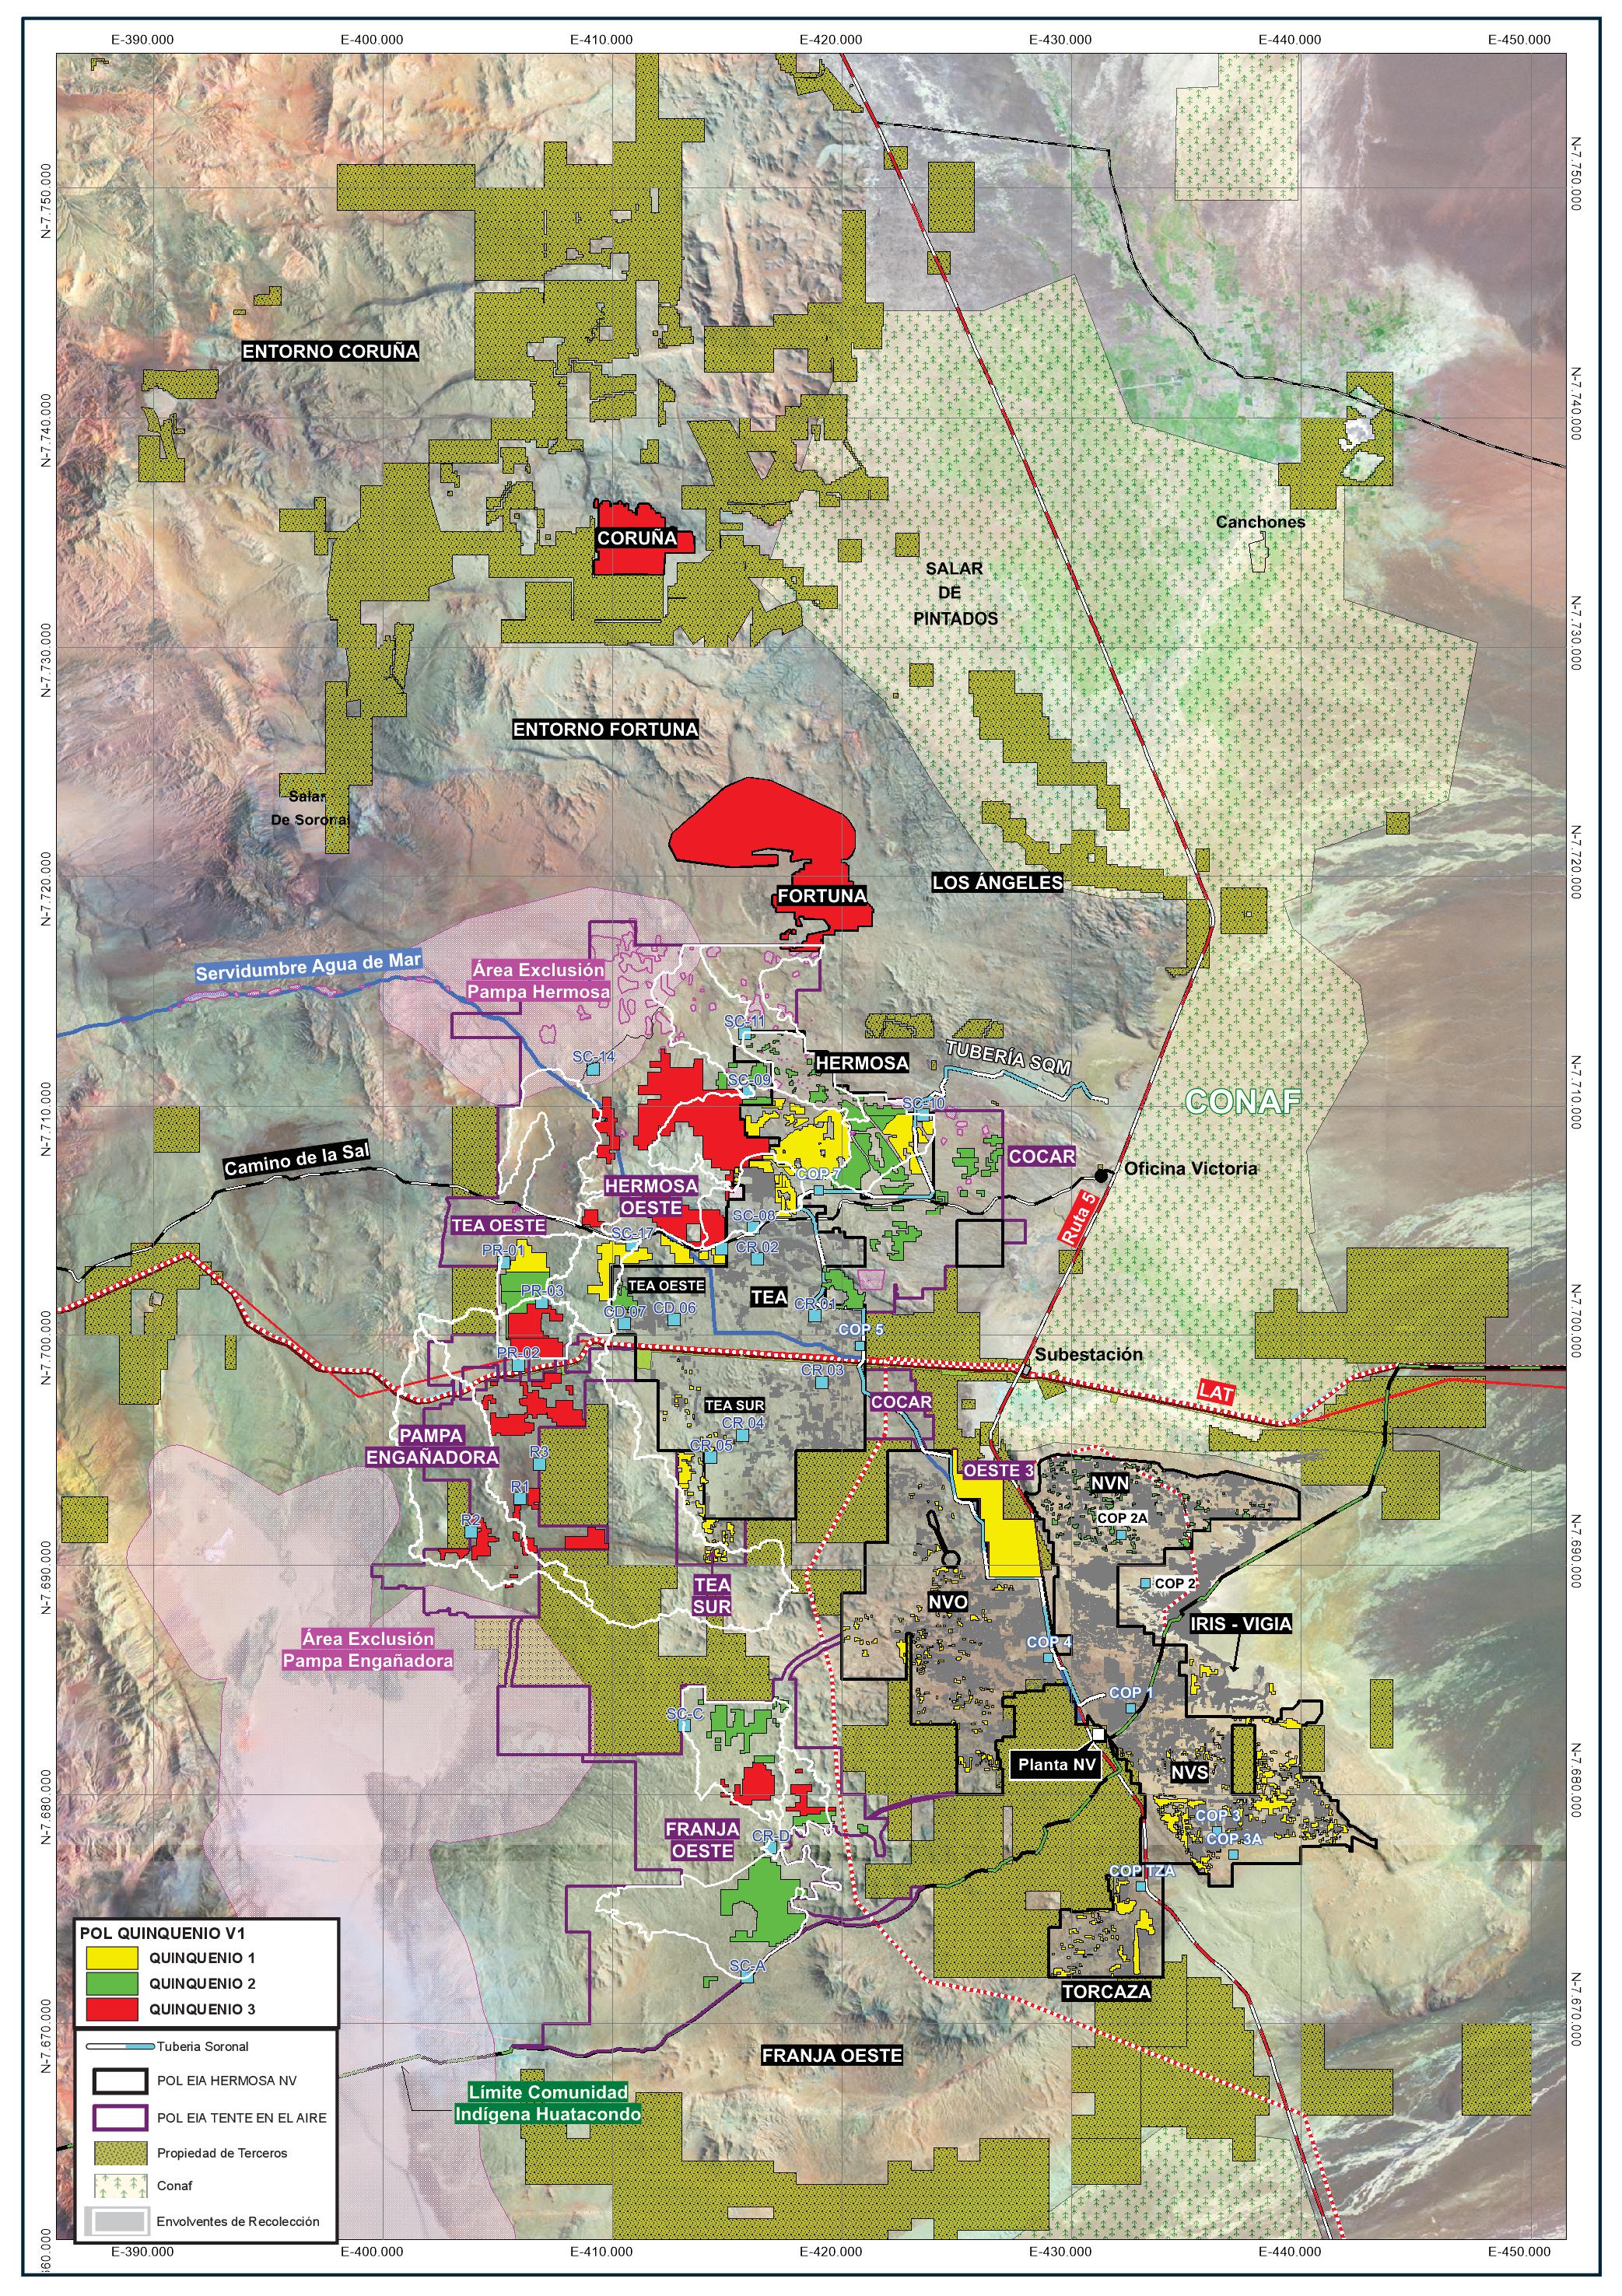
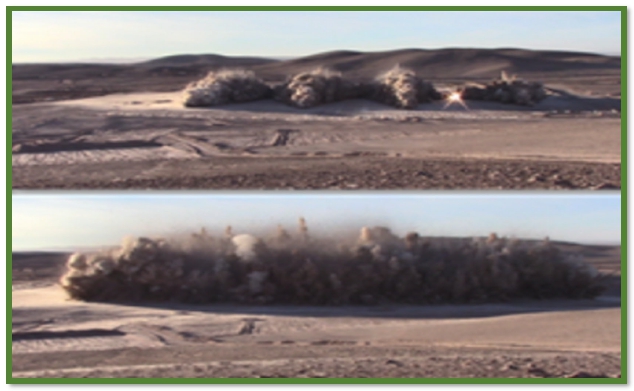
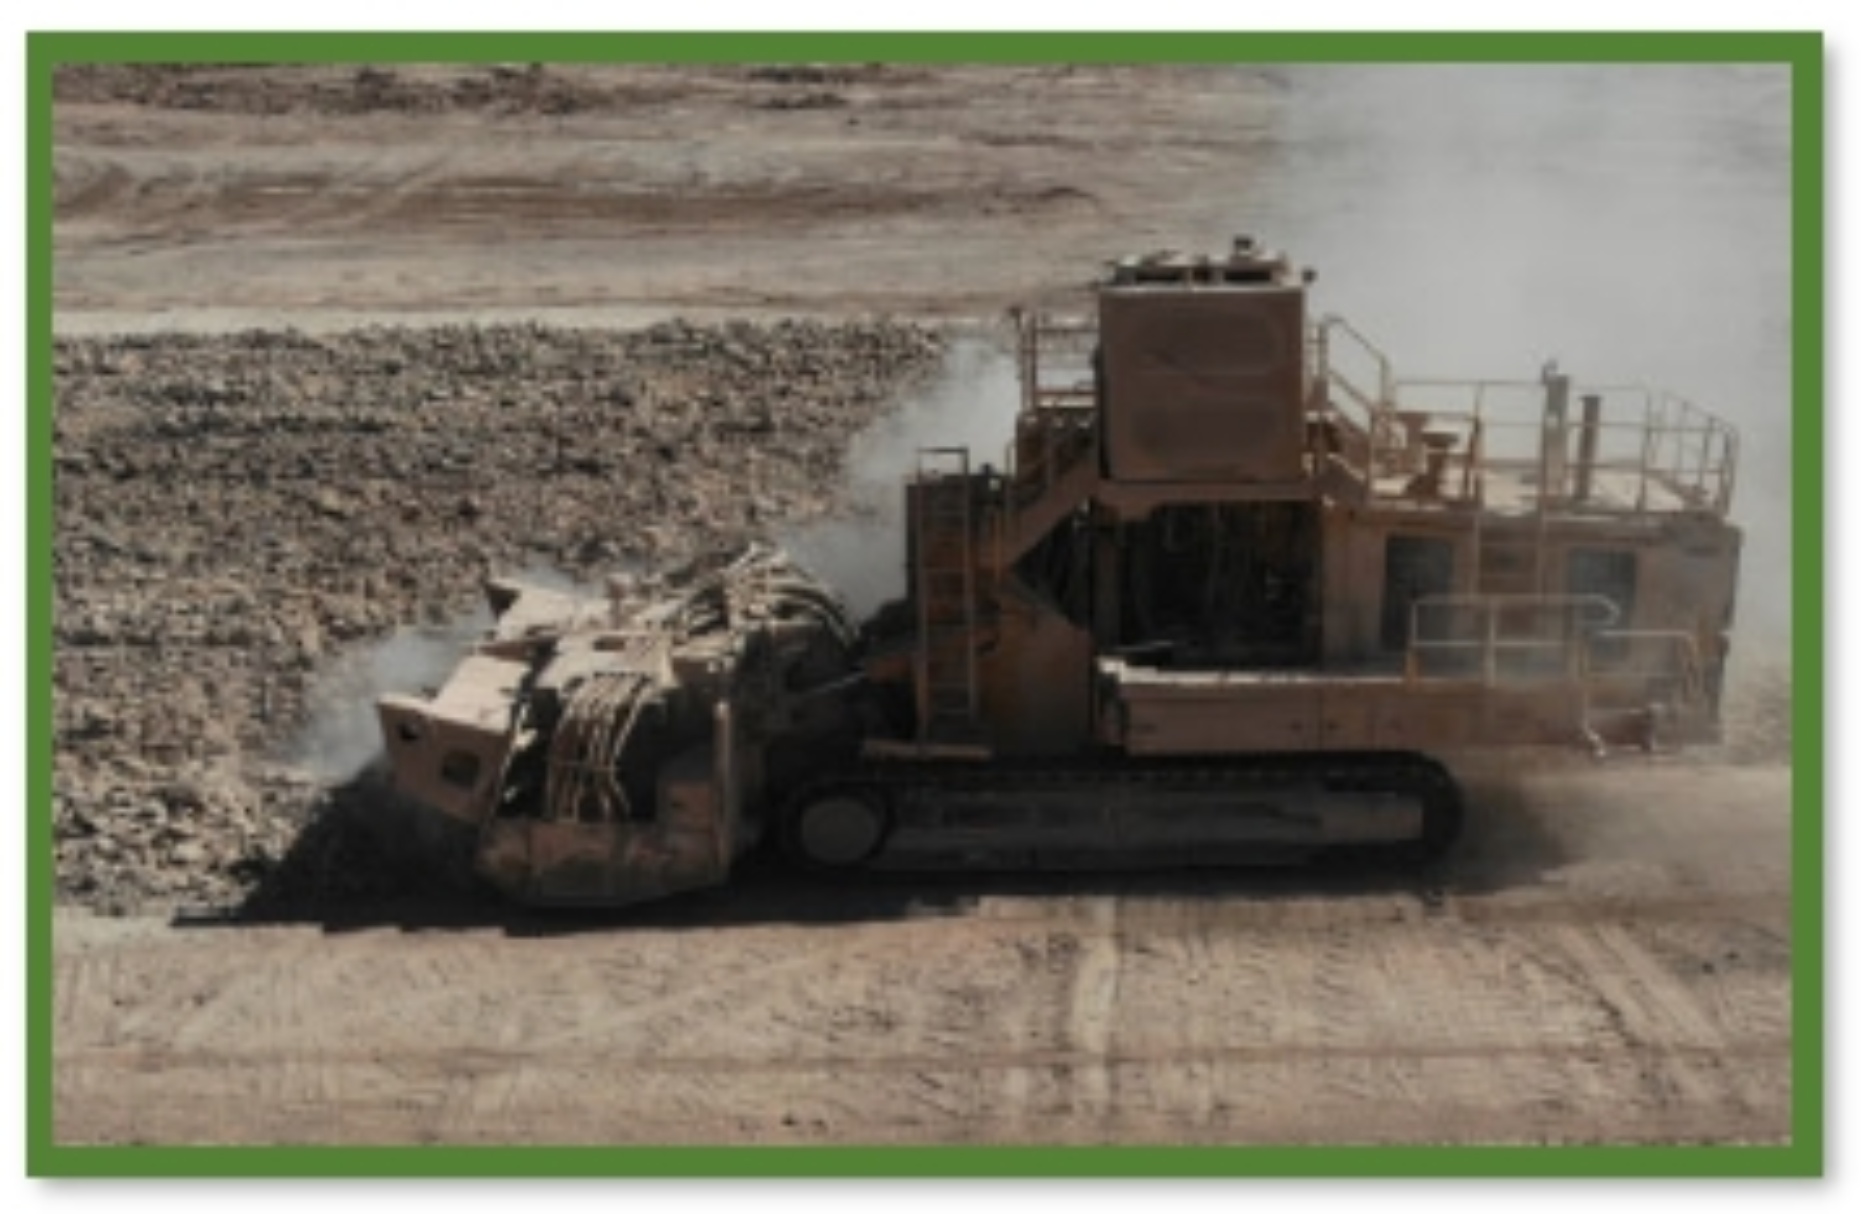
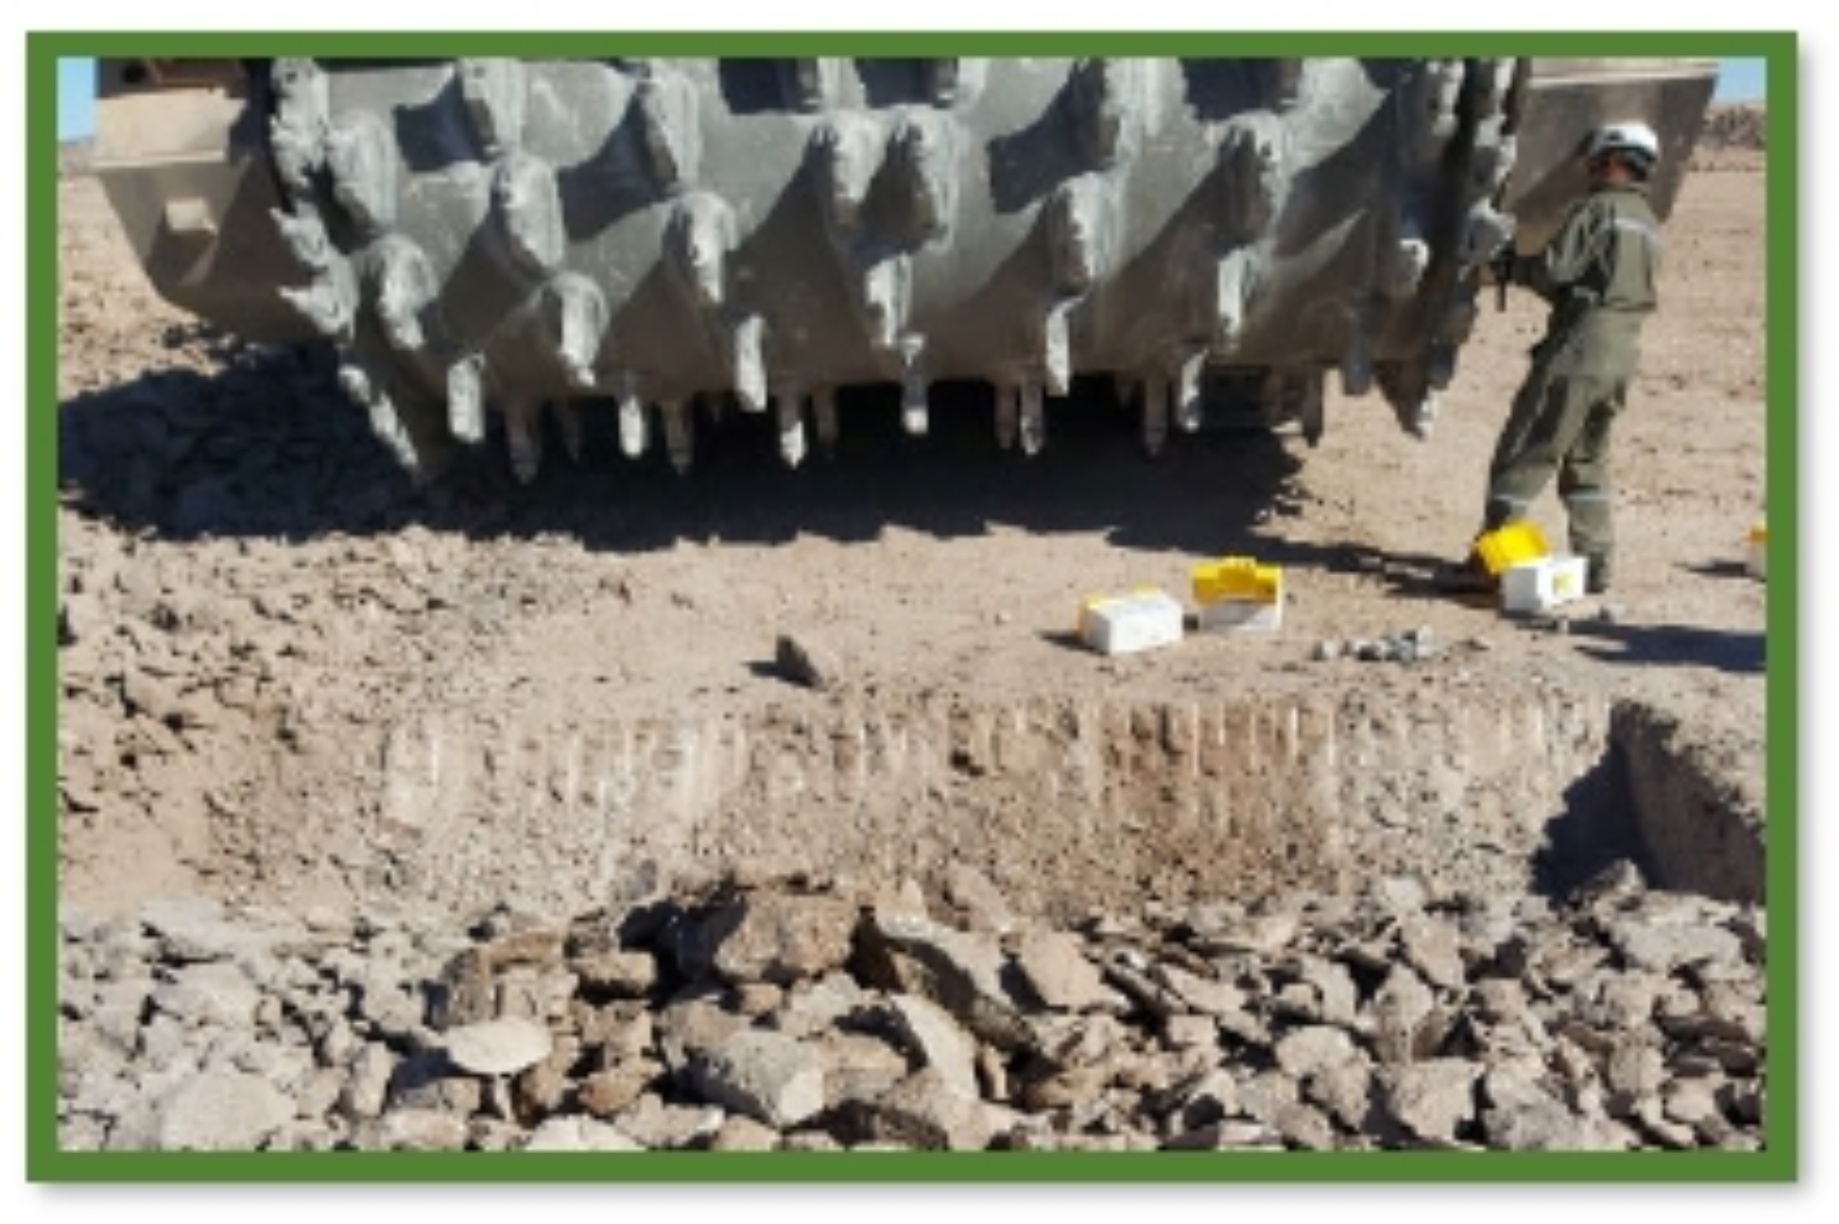
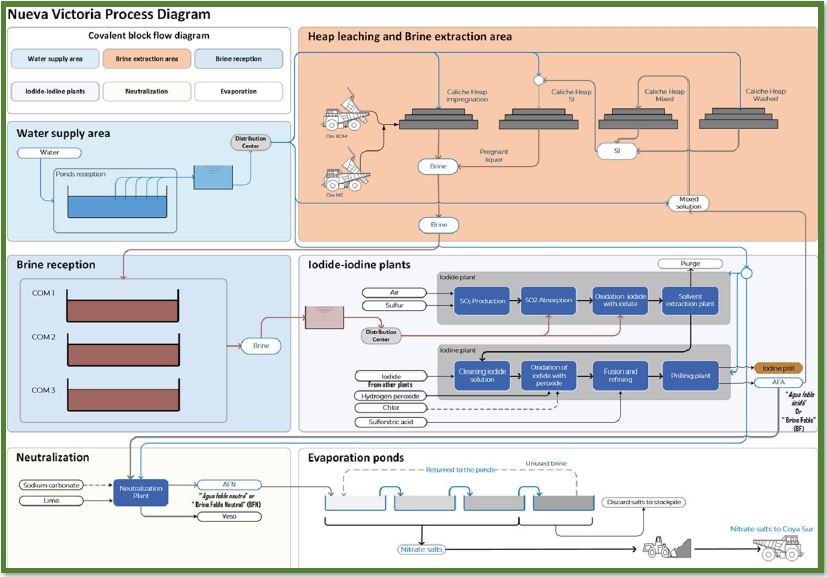
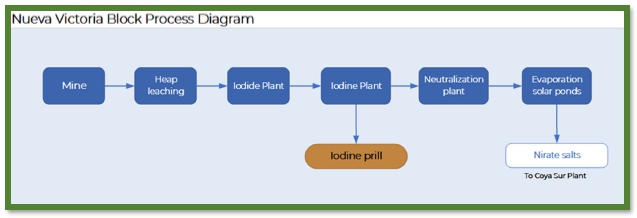
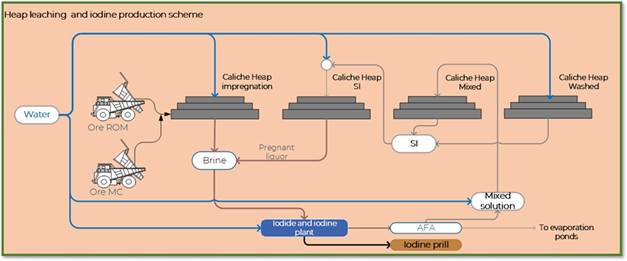
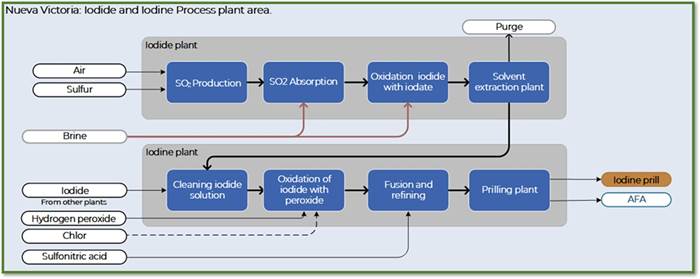
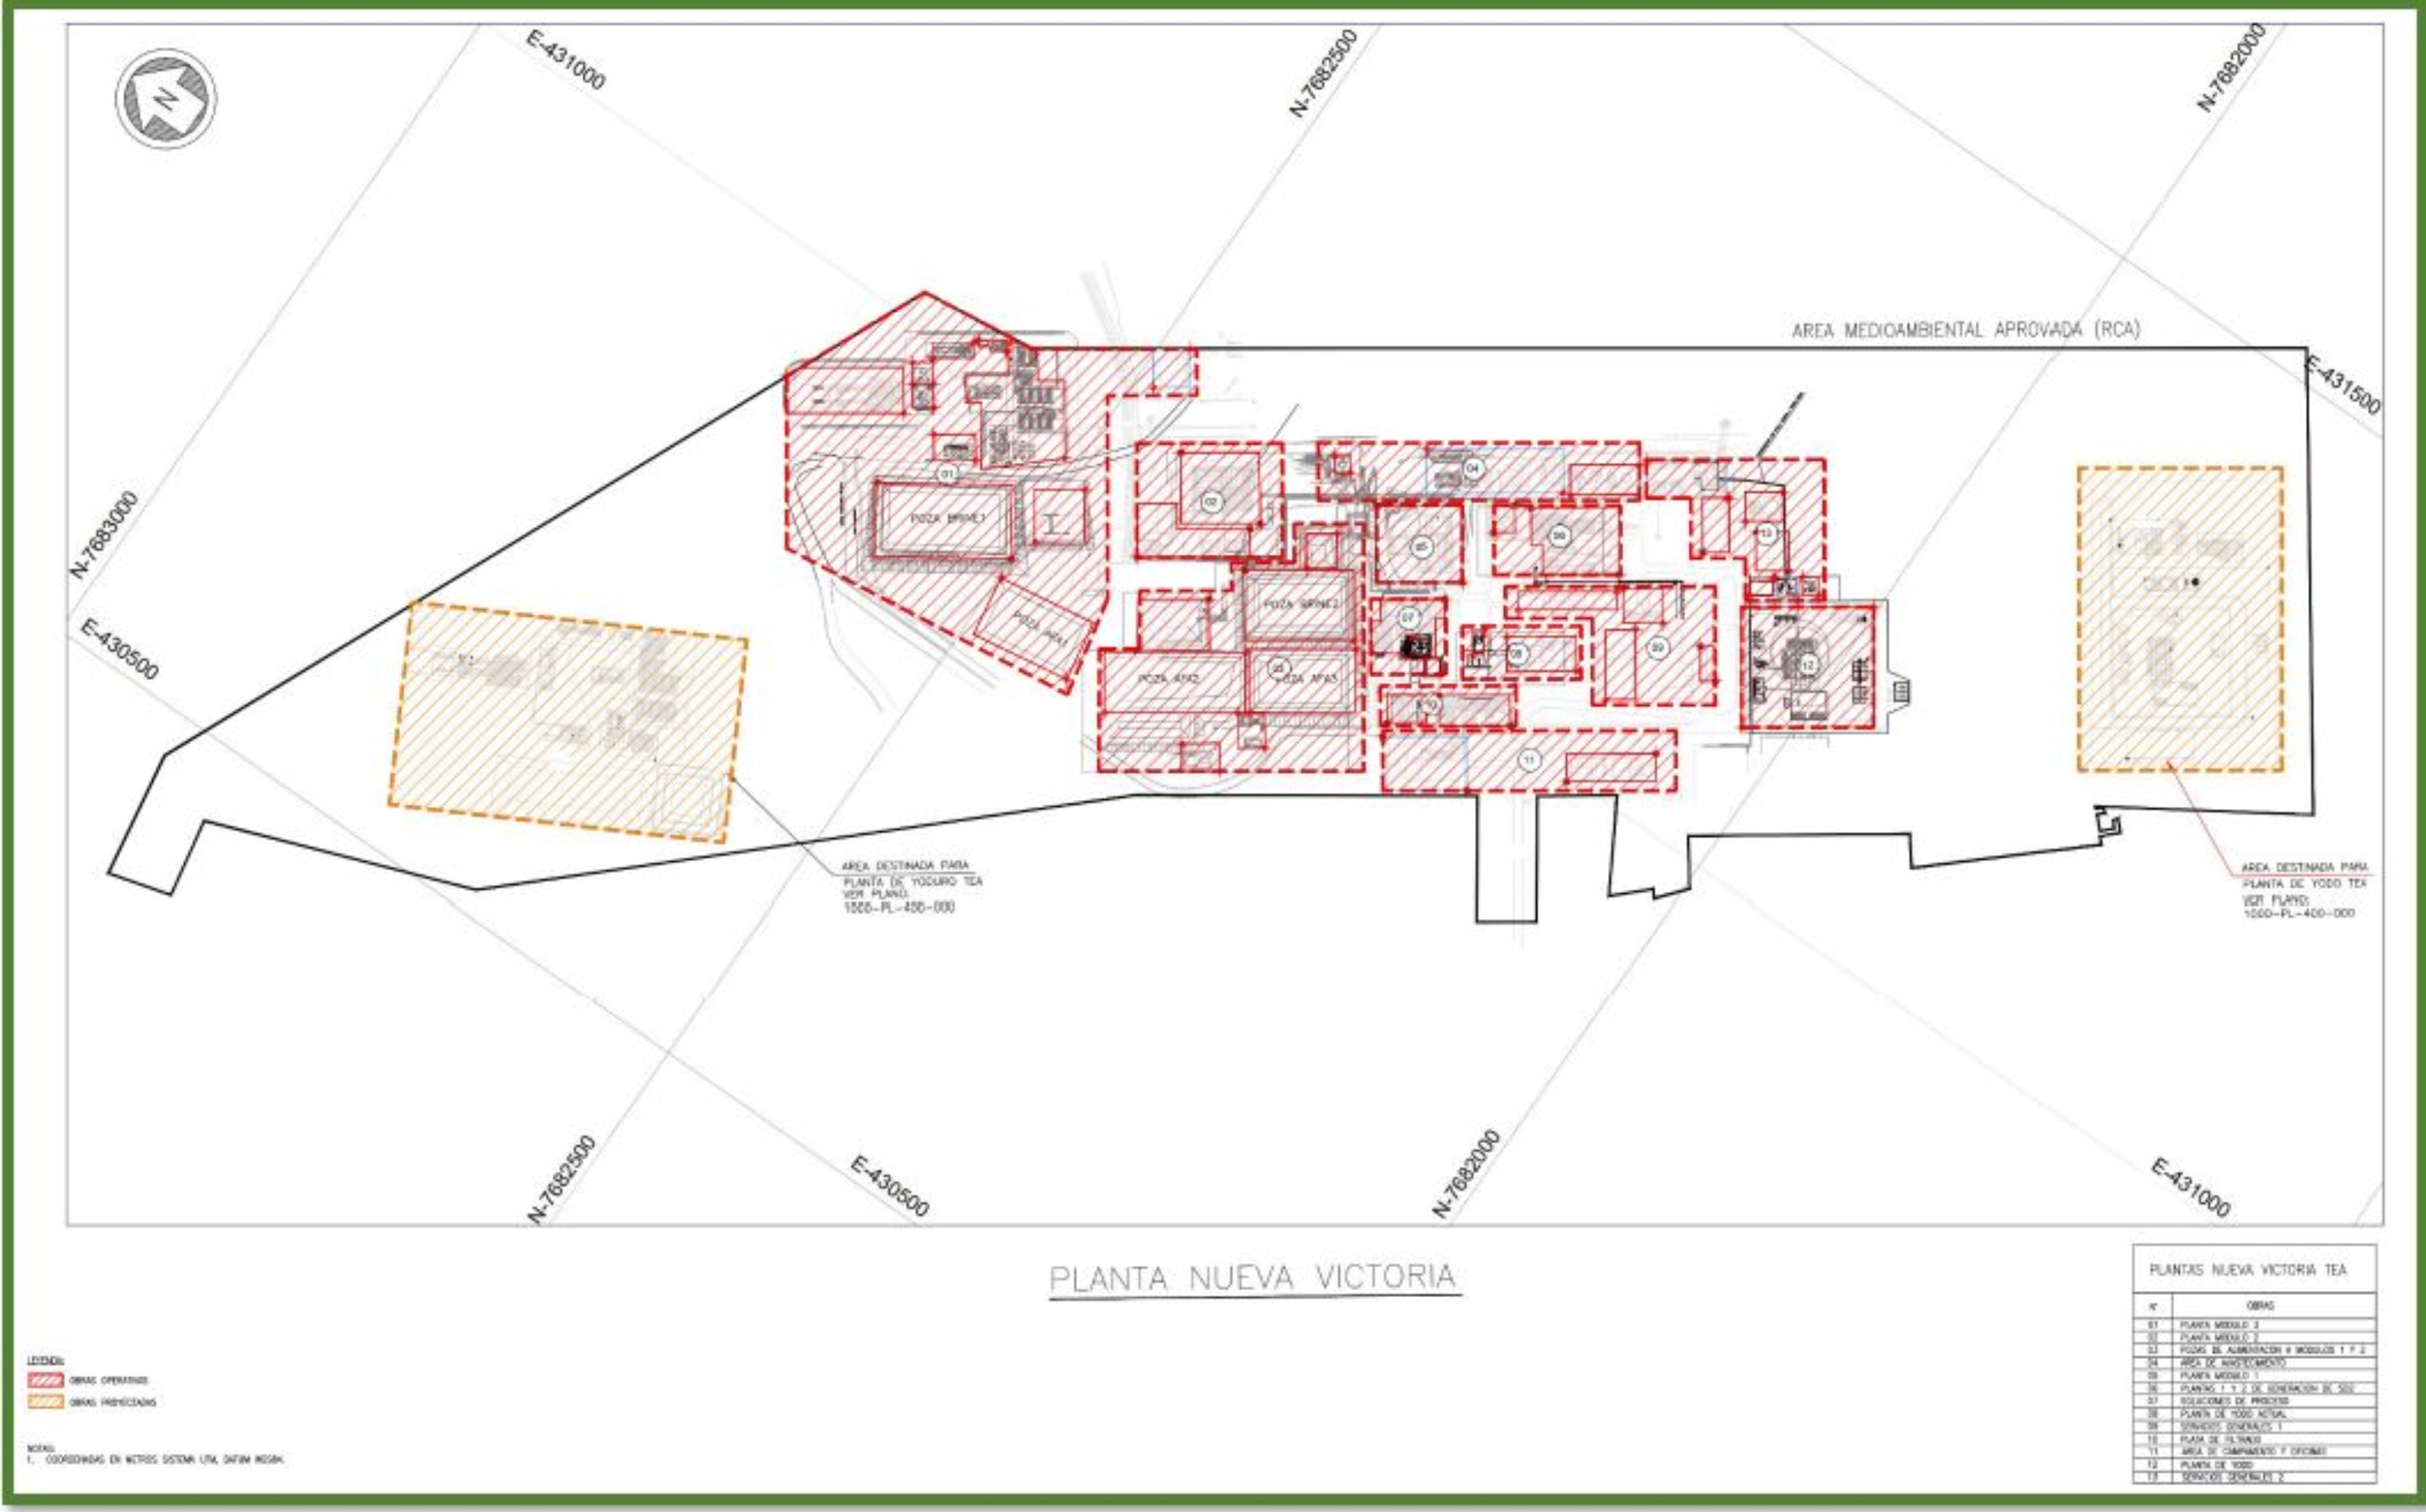
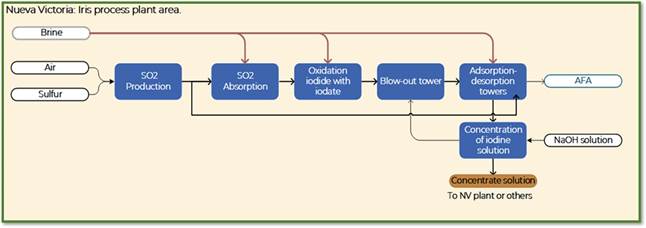
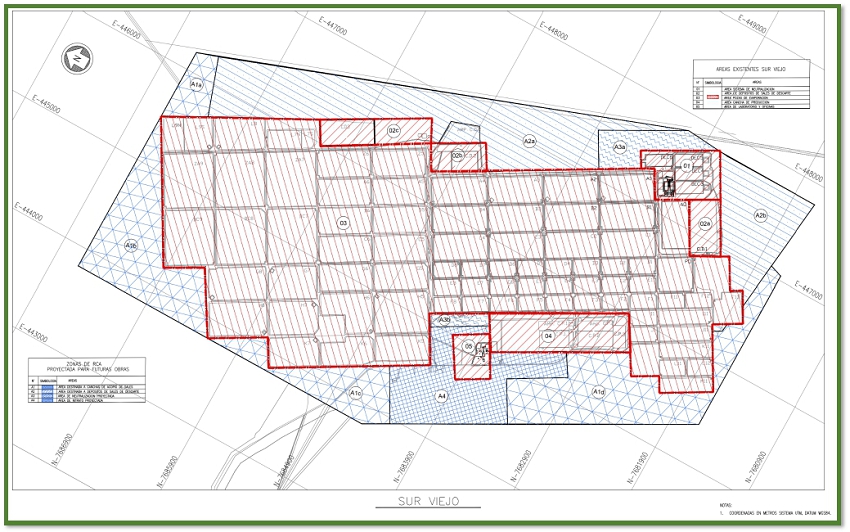
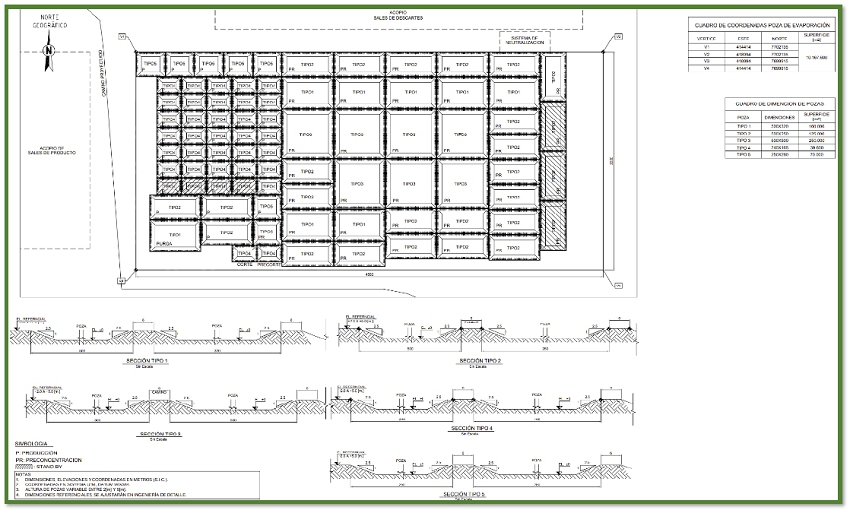
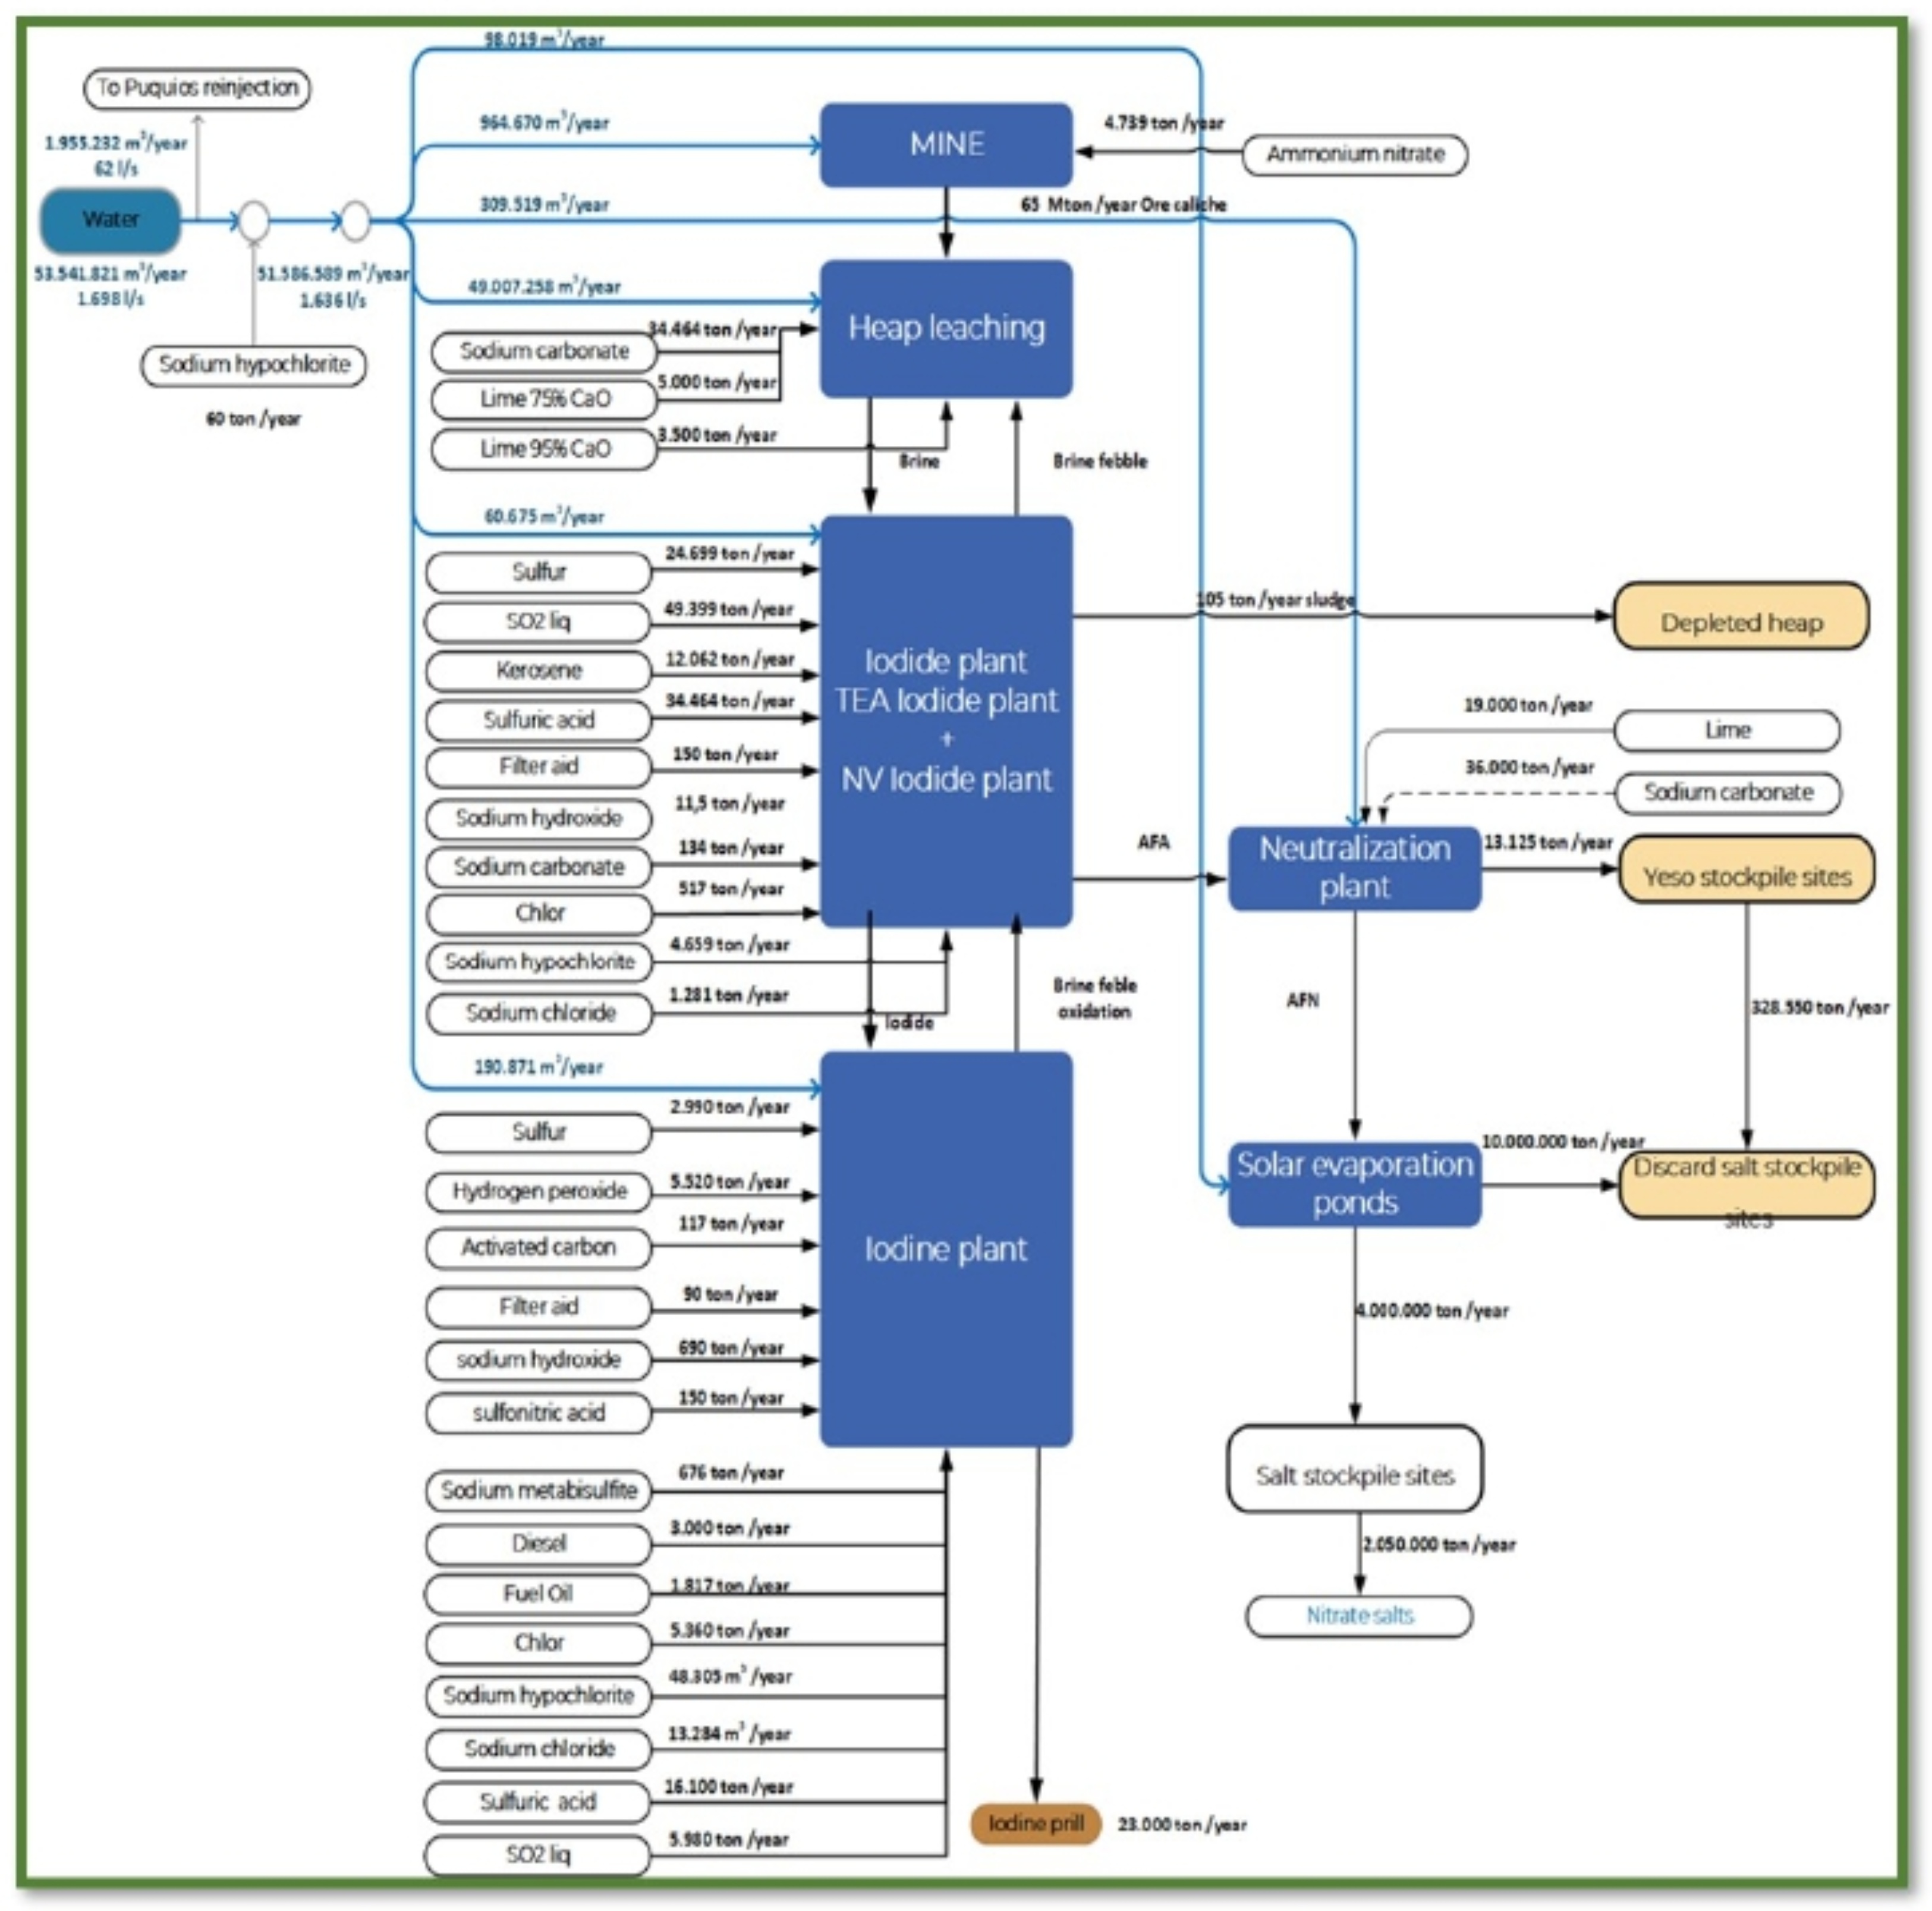
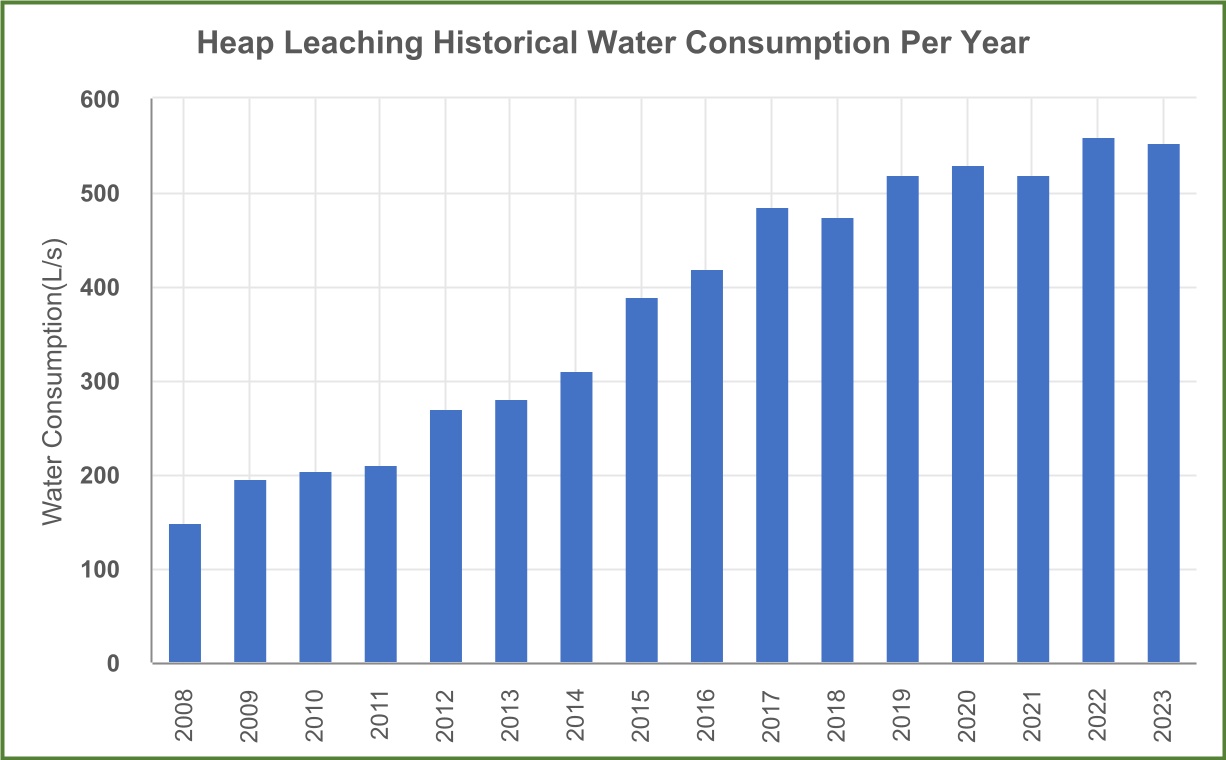
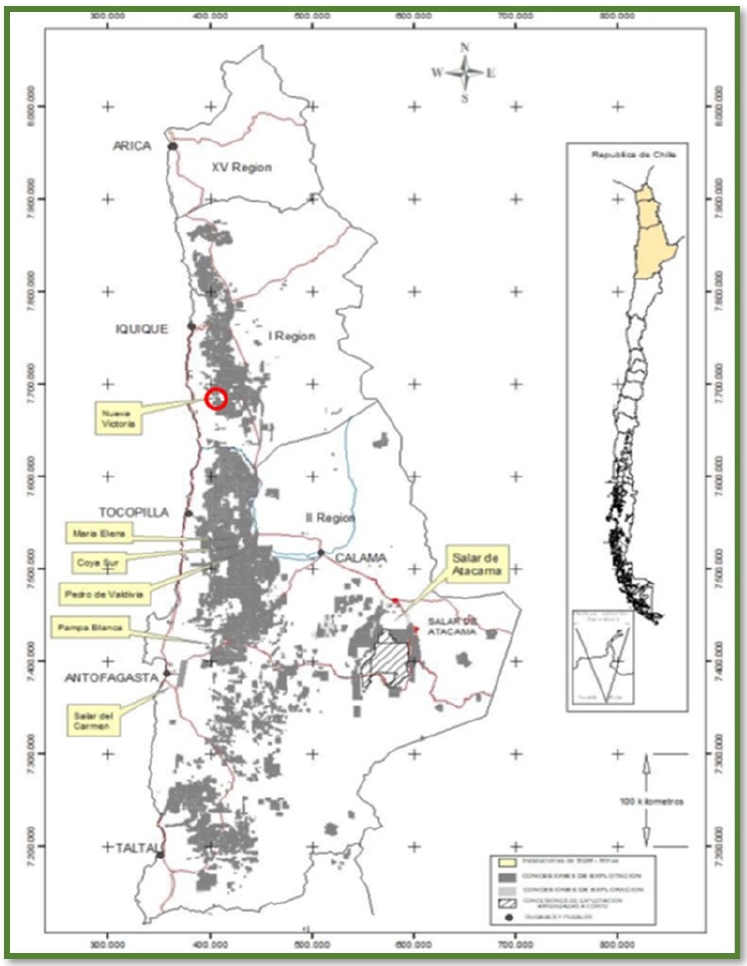
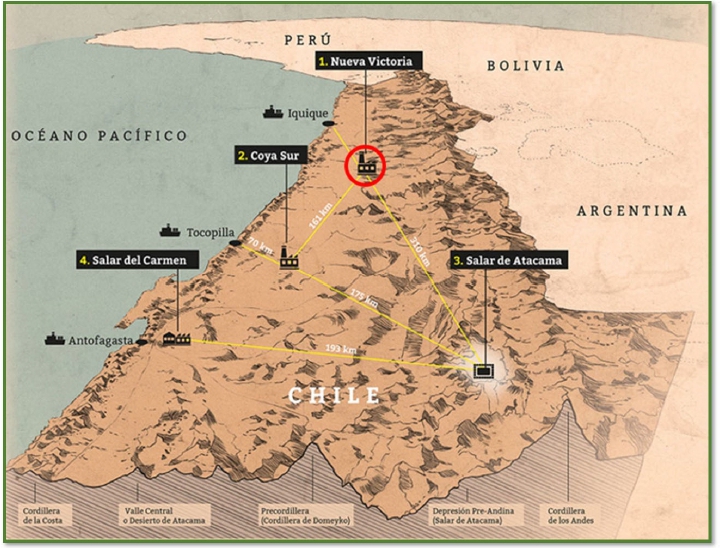
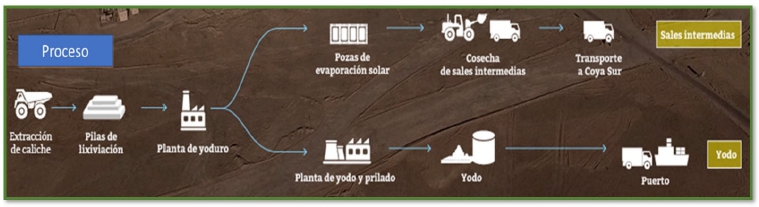
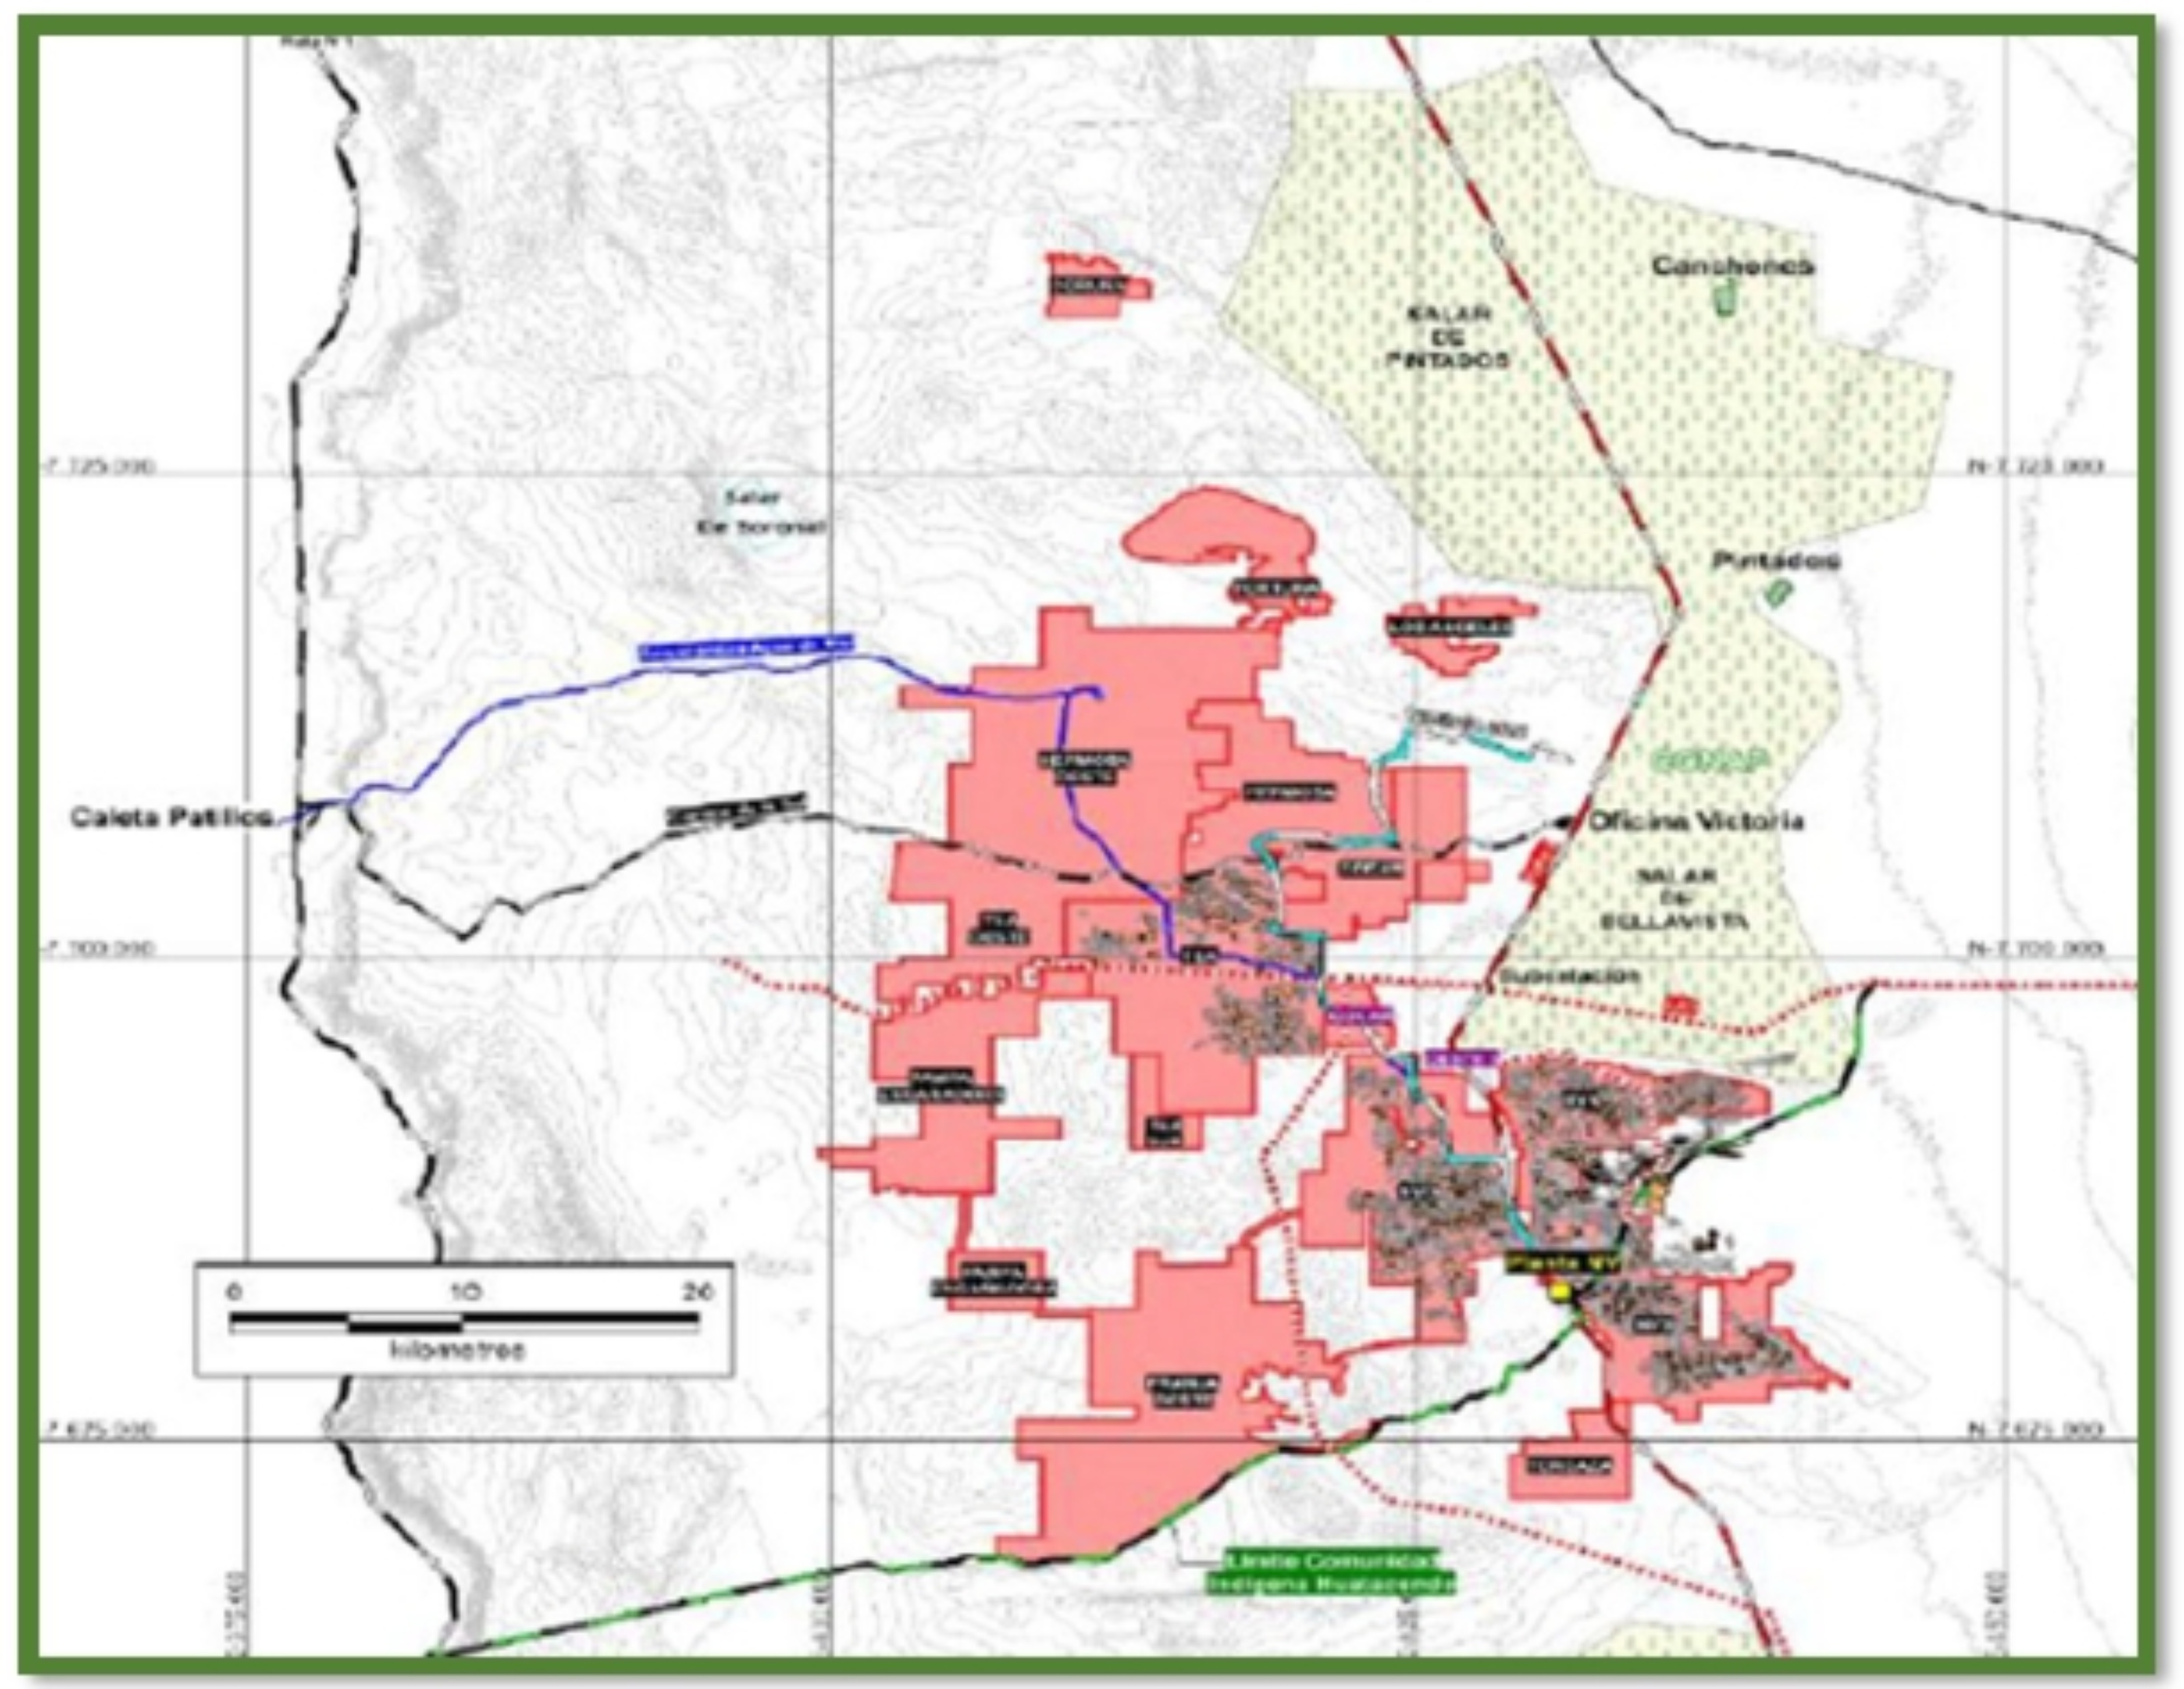
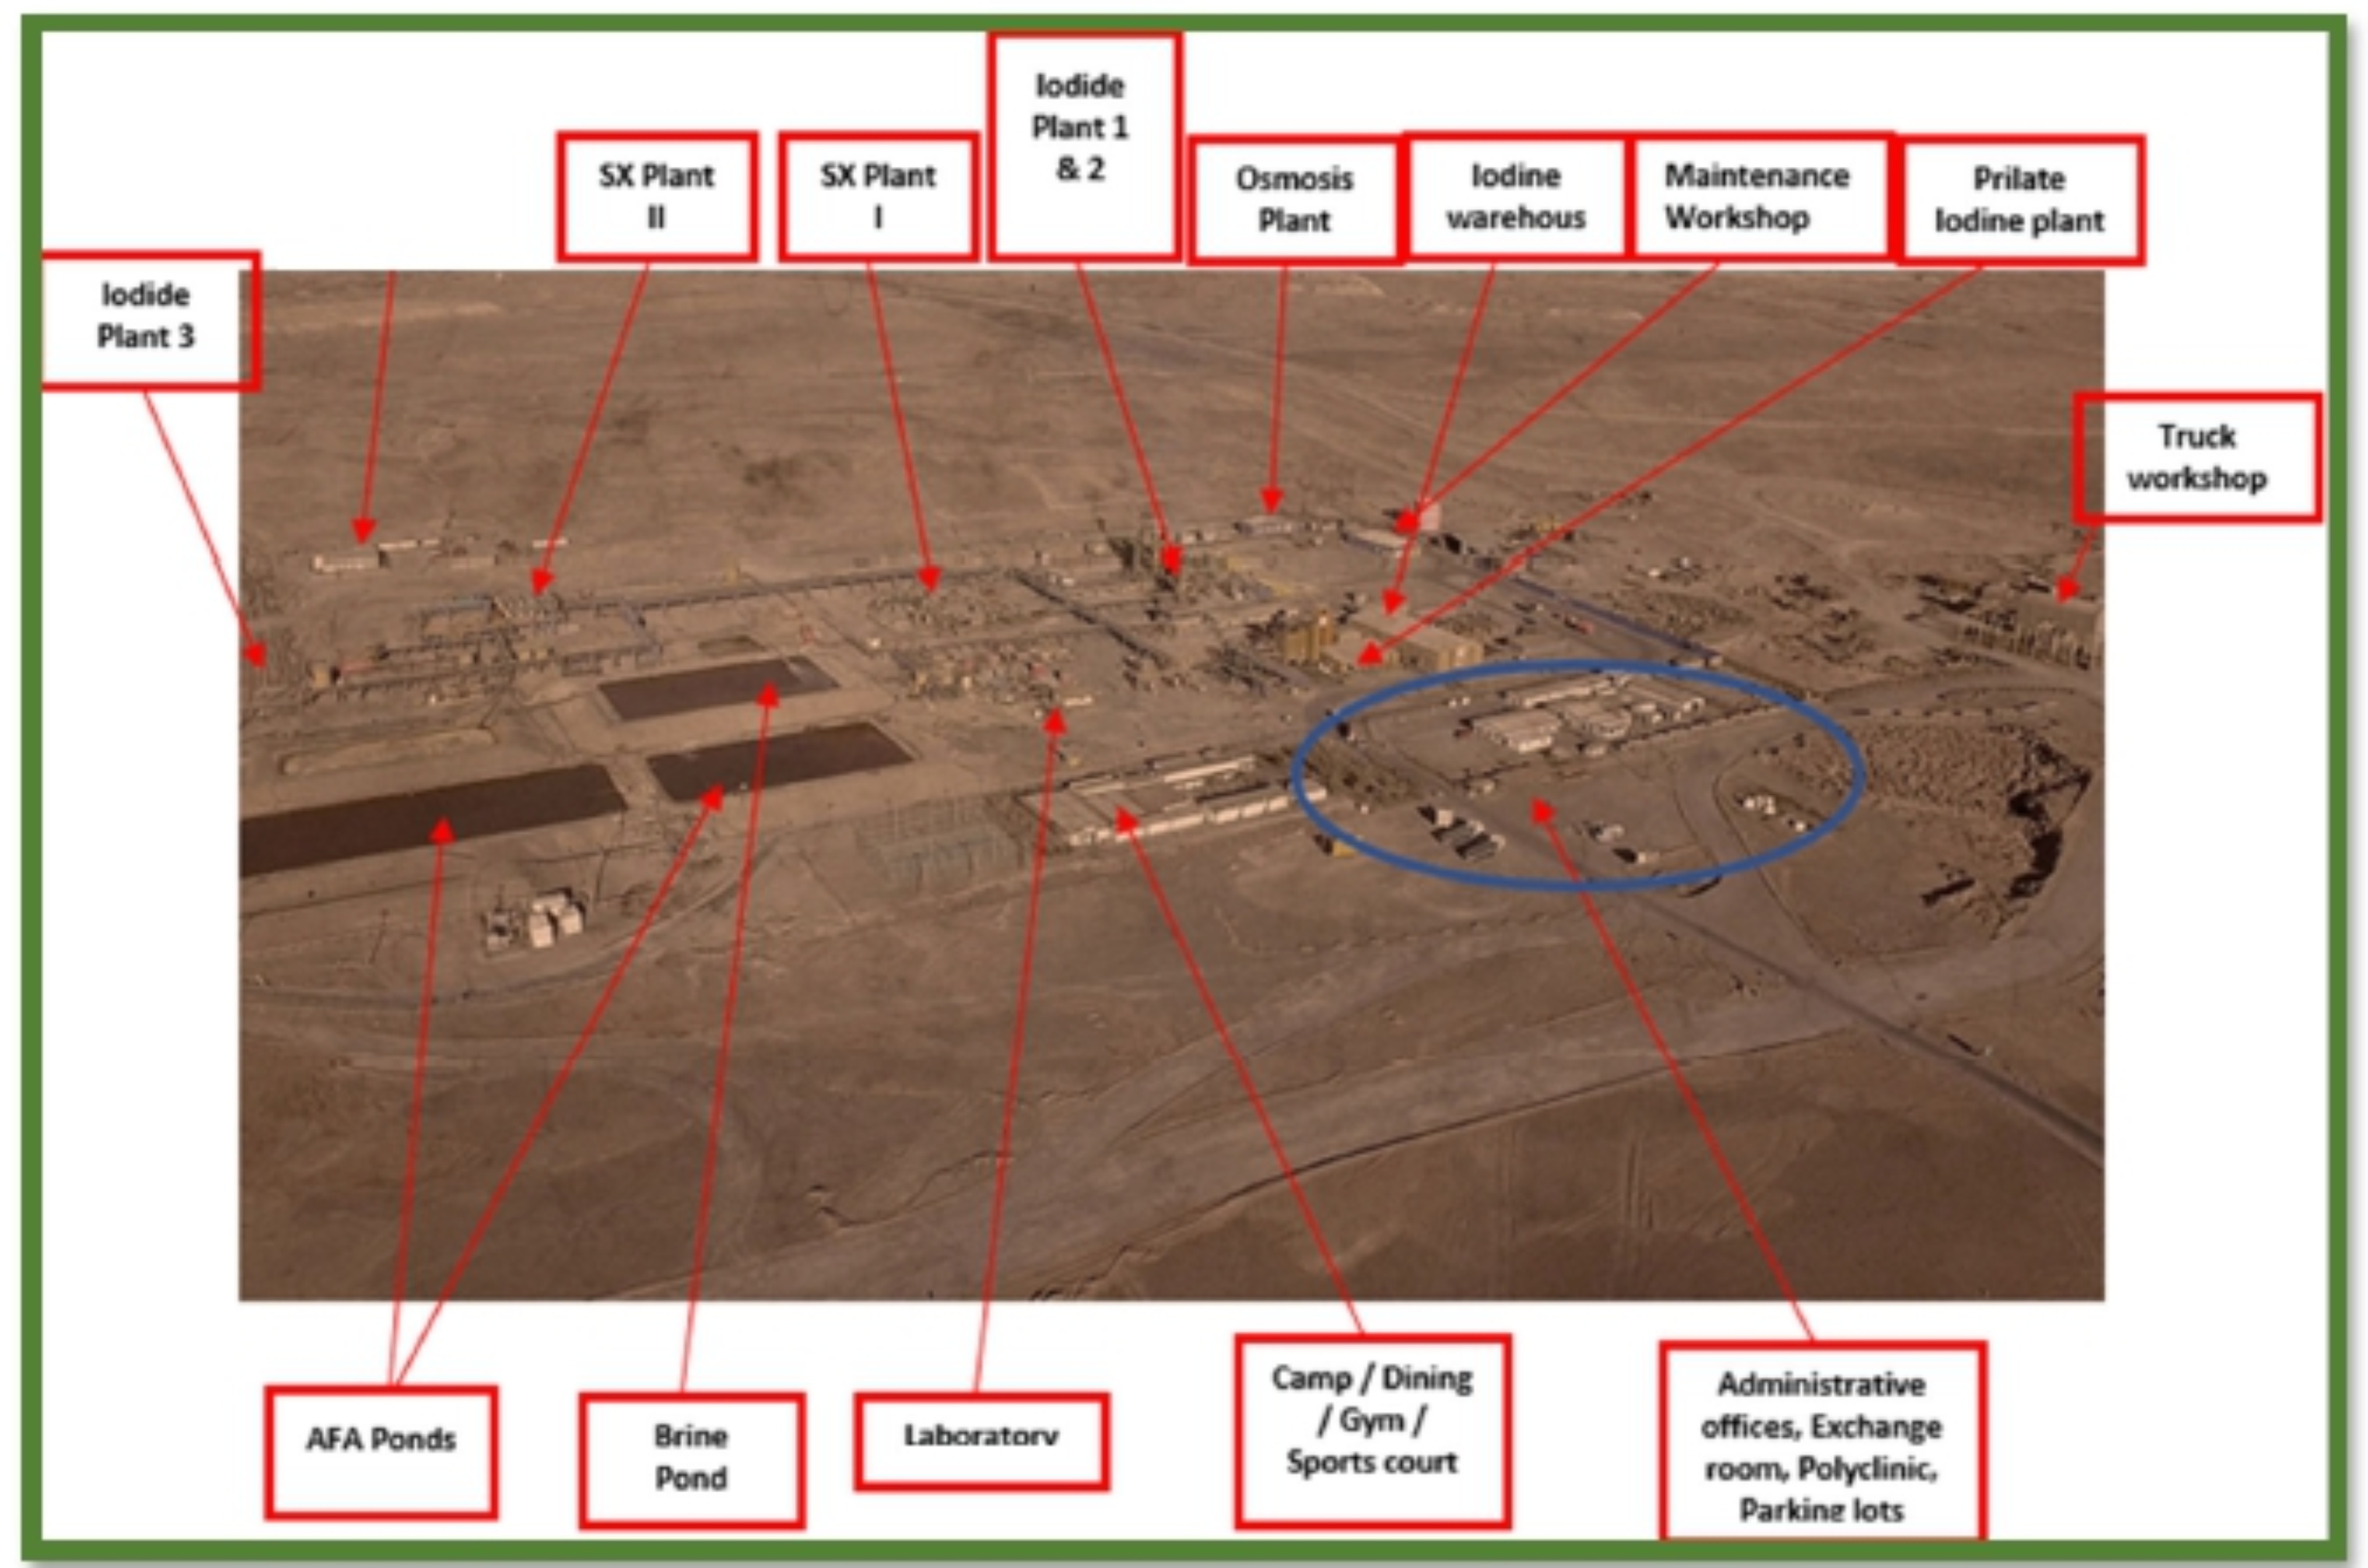
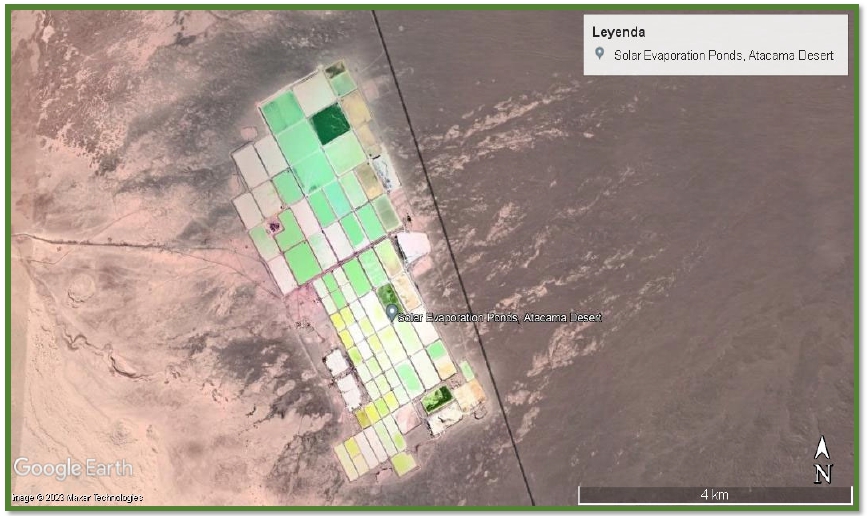
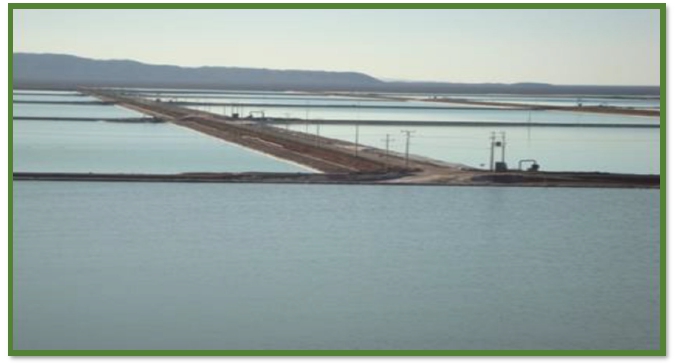
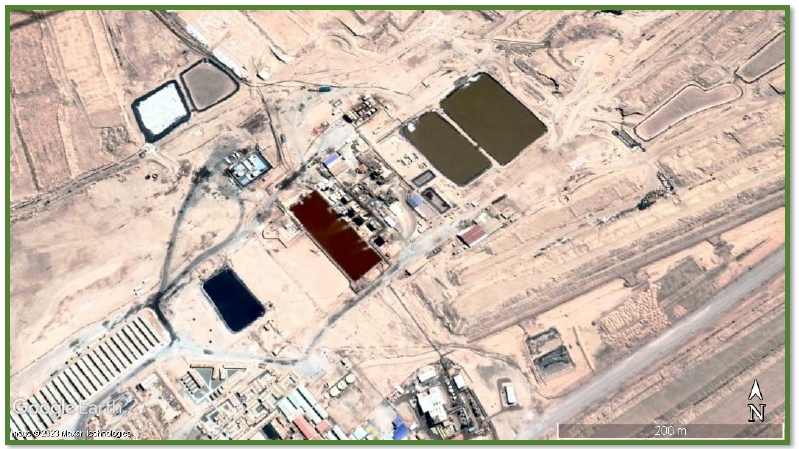
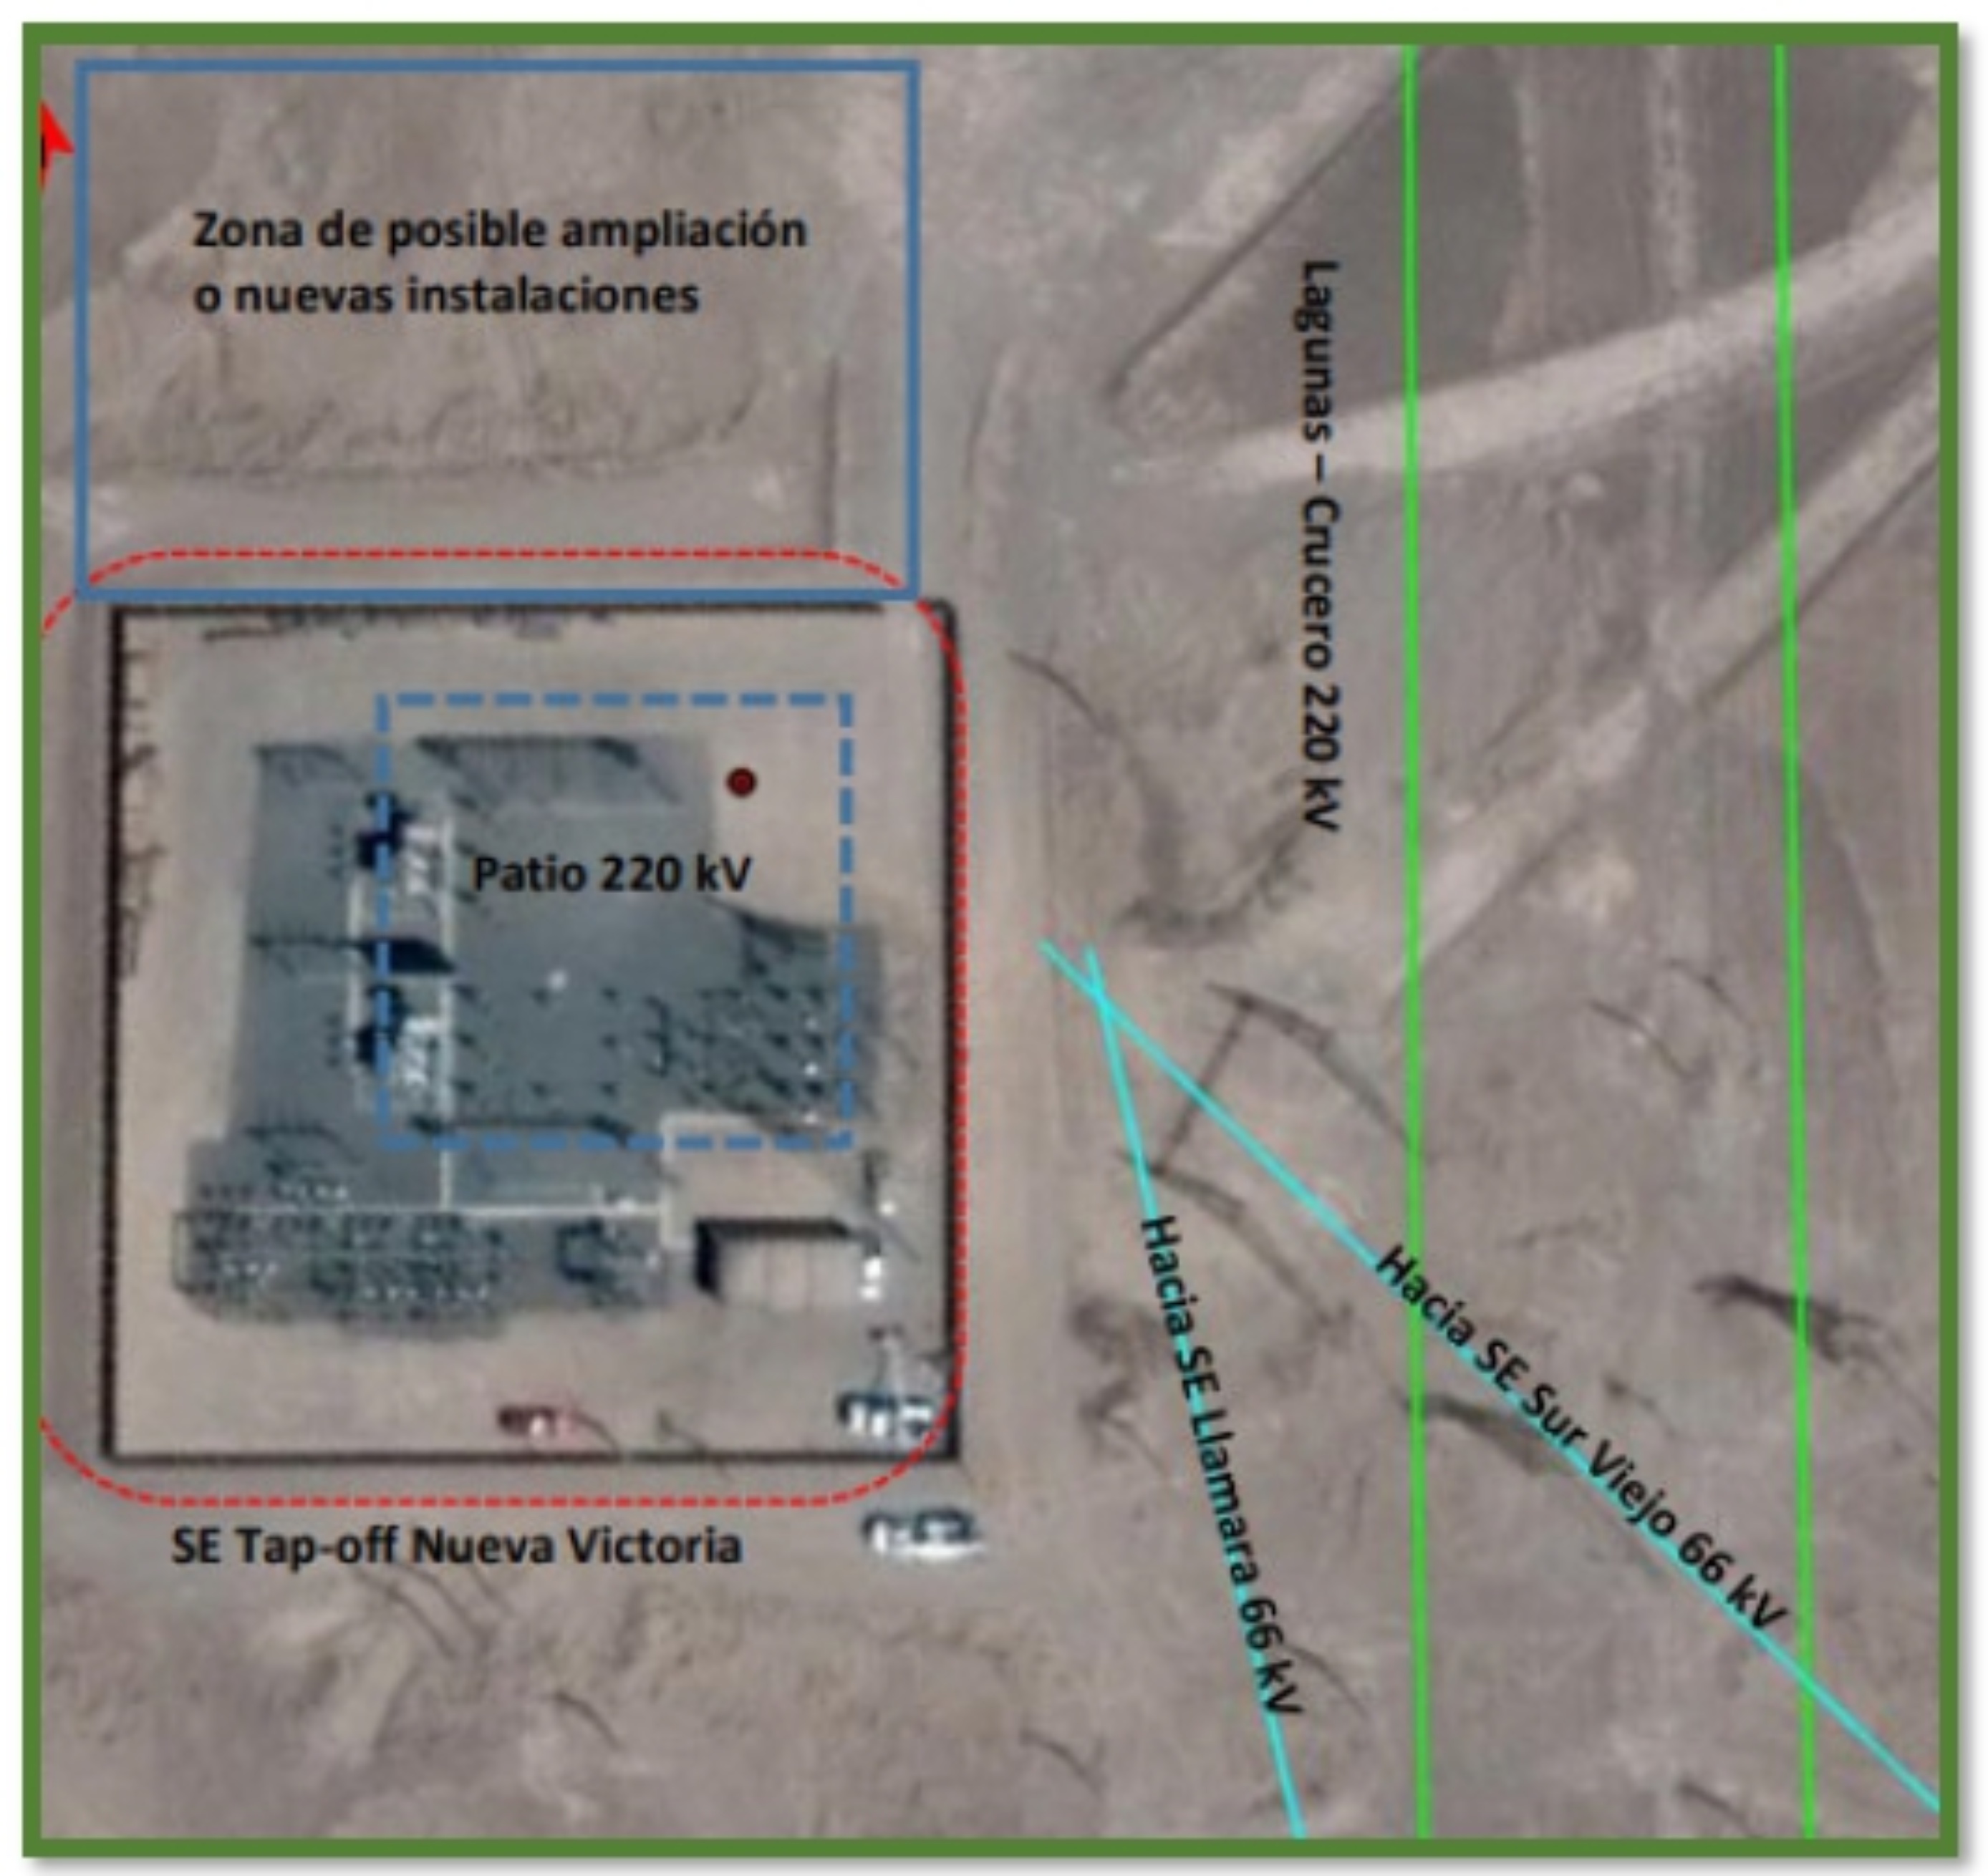
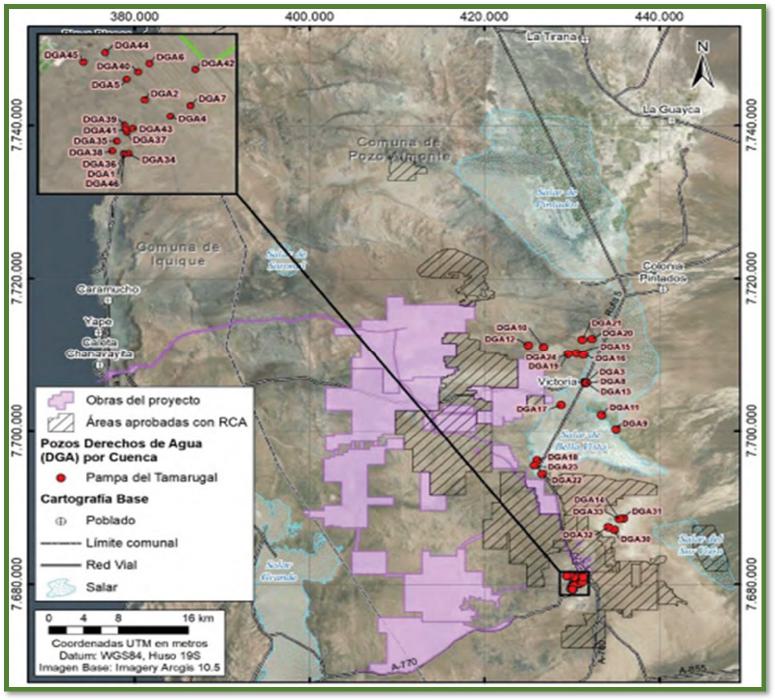
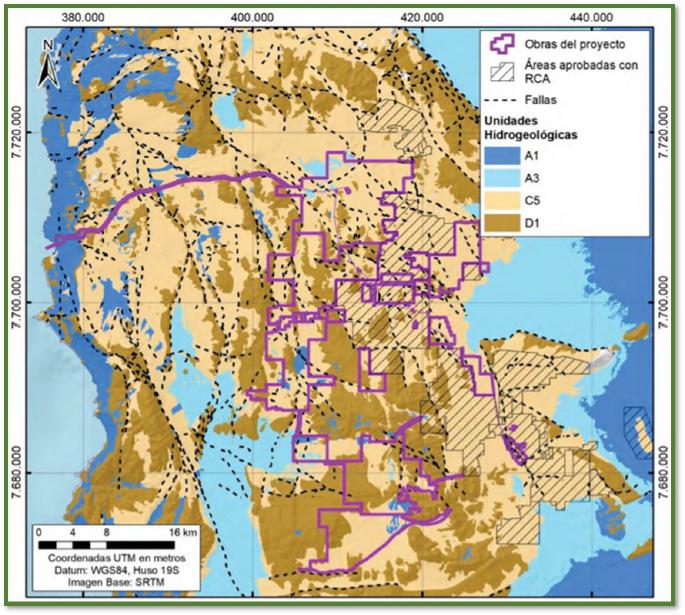
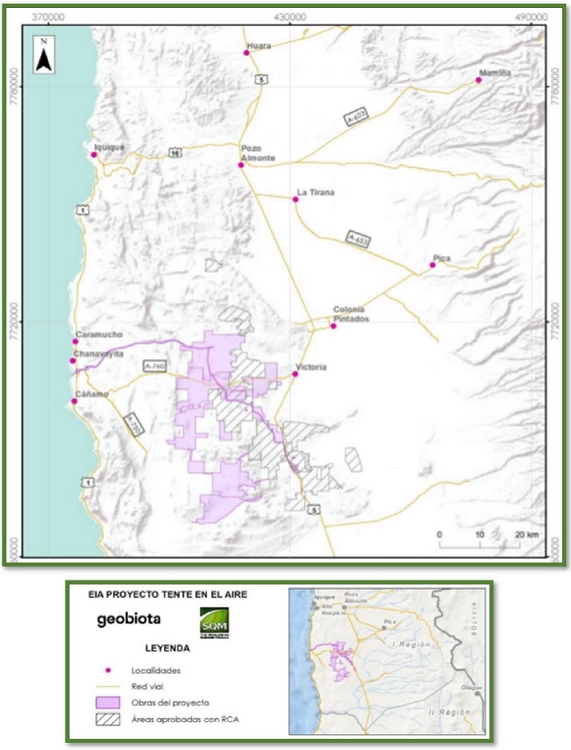
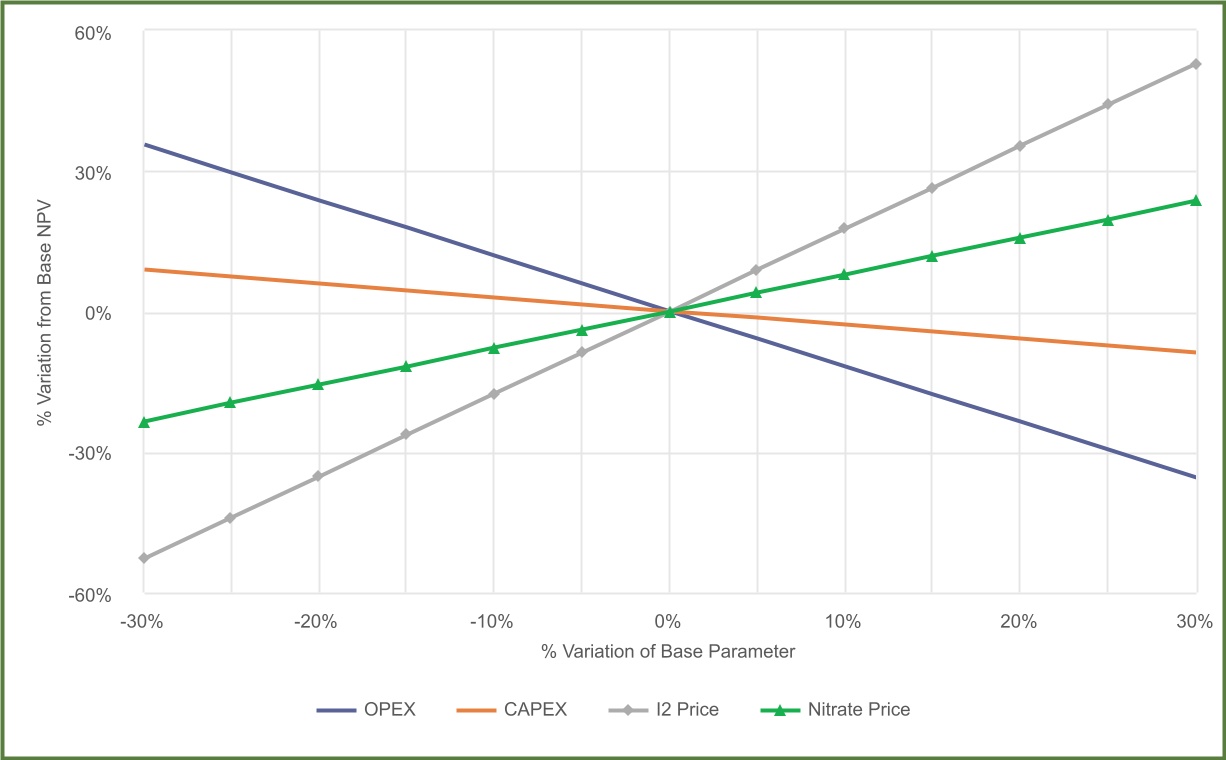
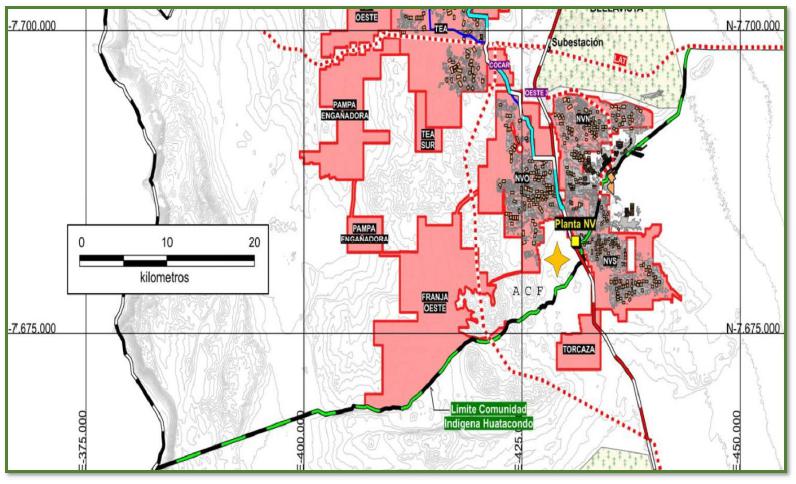

 TECHNICHAL REPORT SUMMARY OF THE PAMPA BLANCA OPERATION YEAR 2023
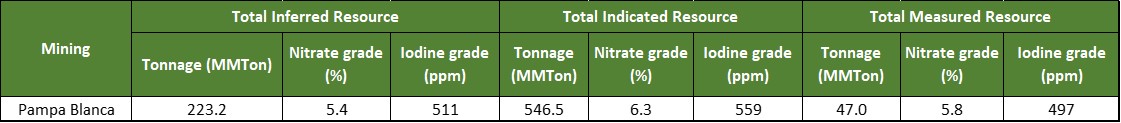

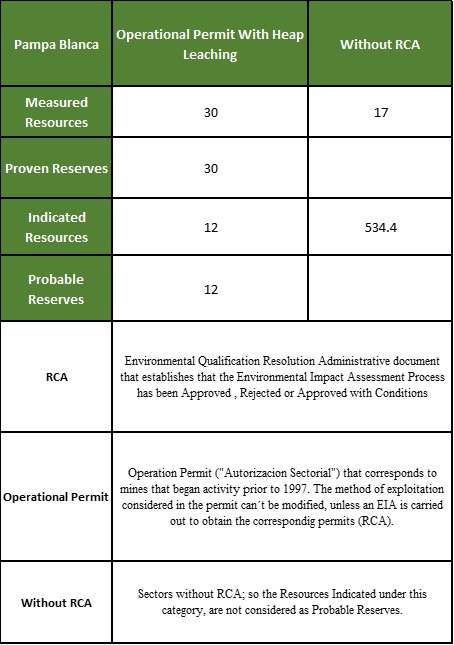
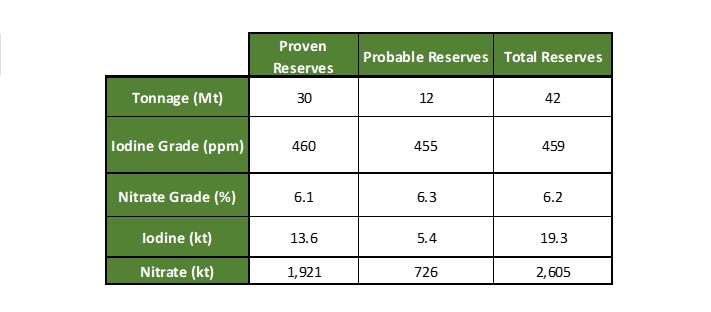
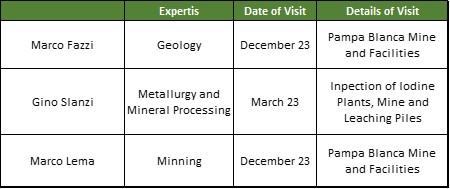
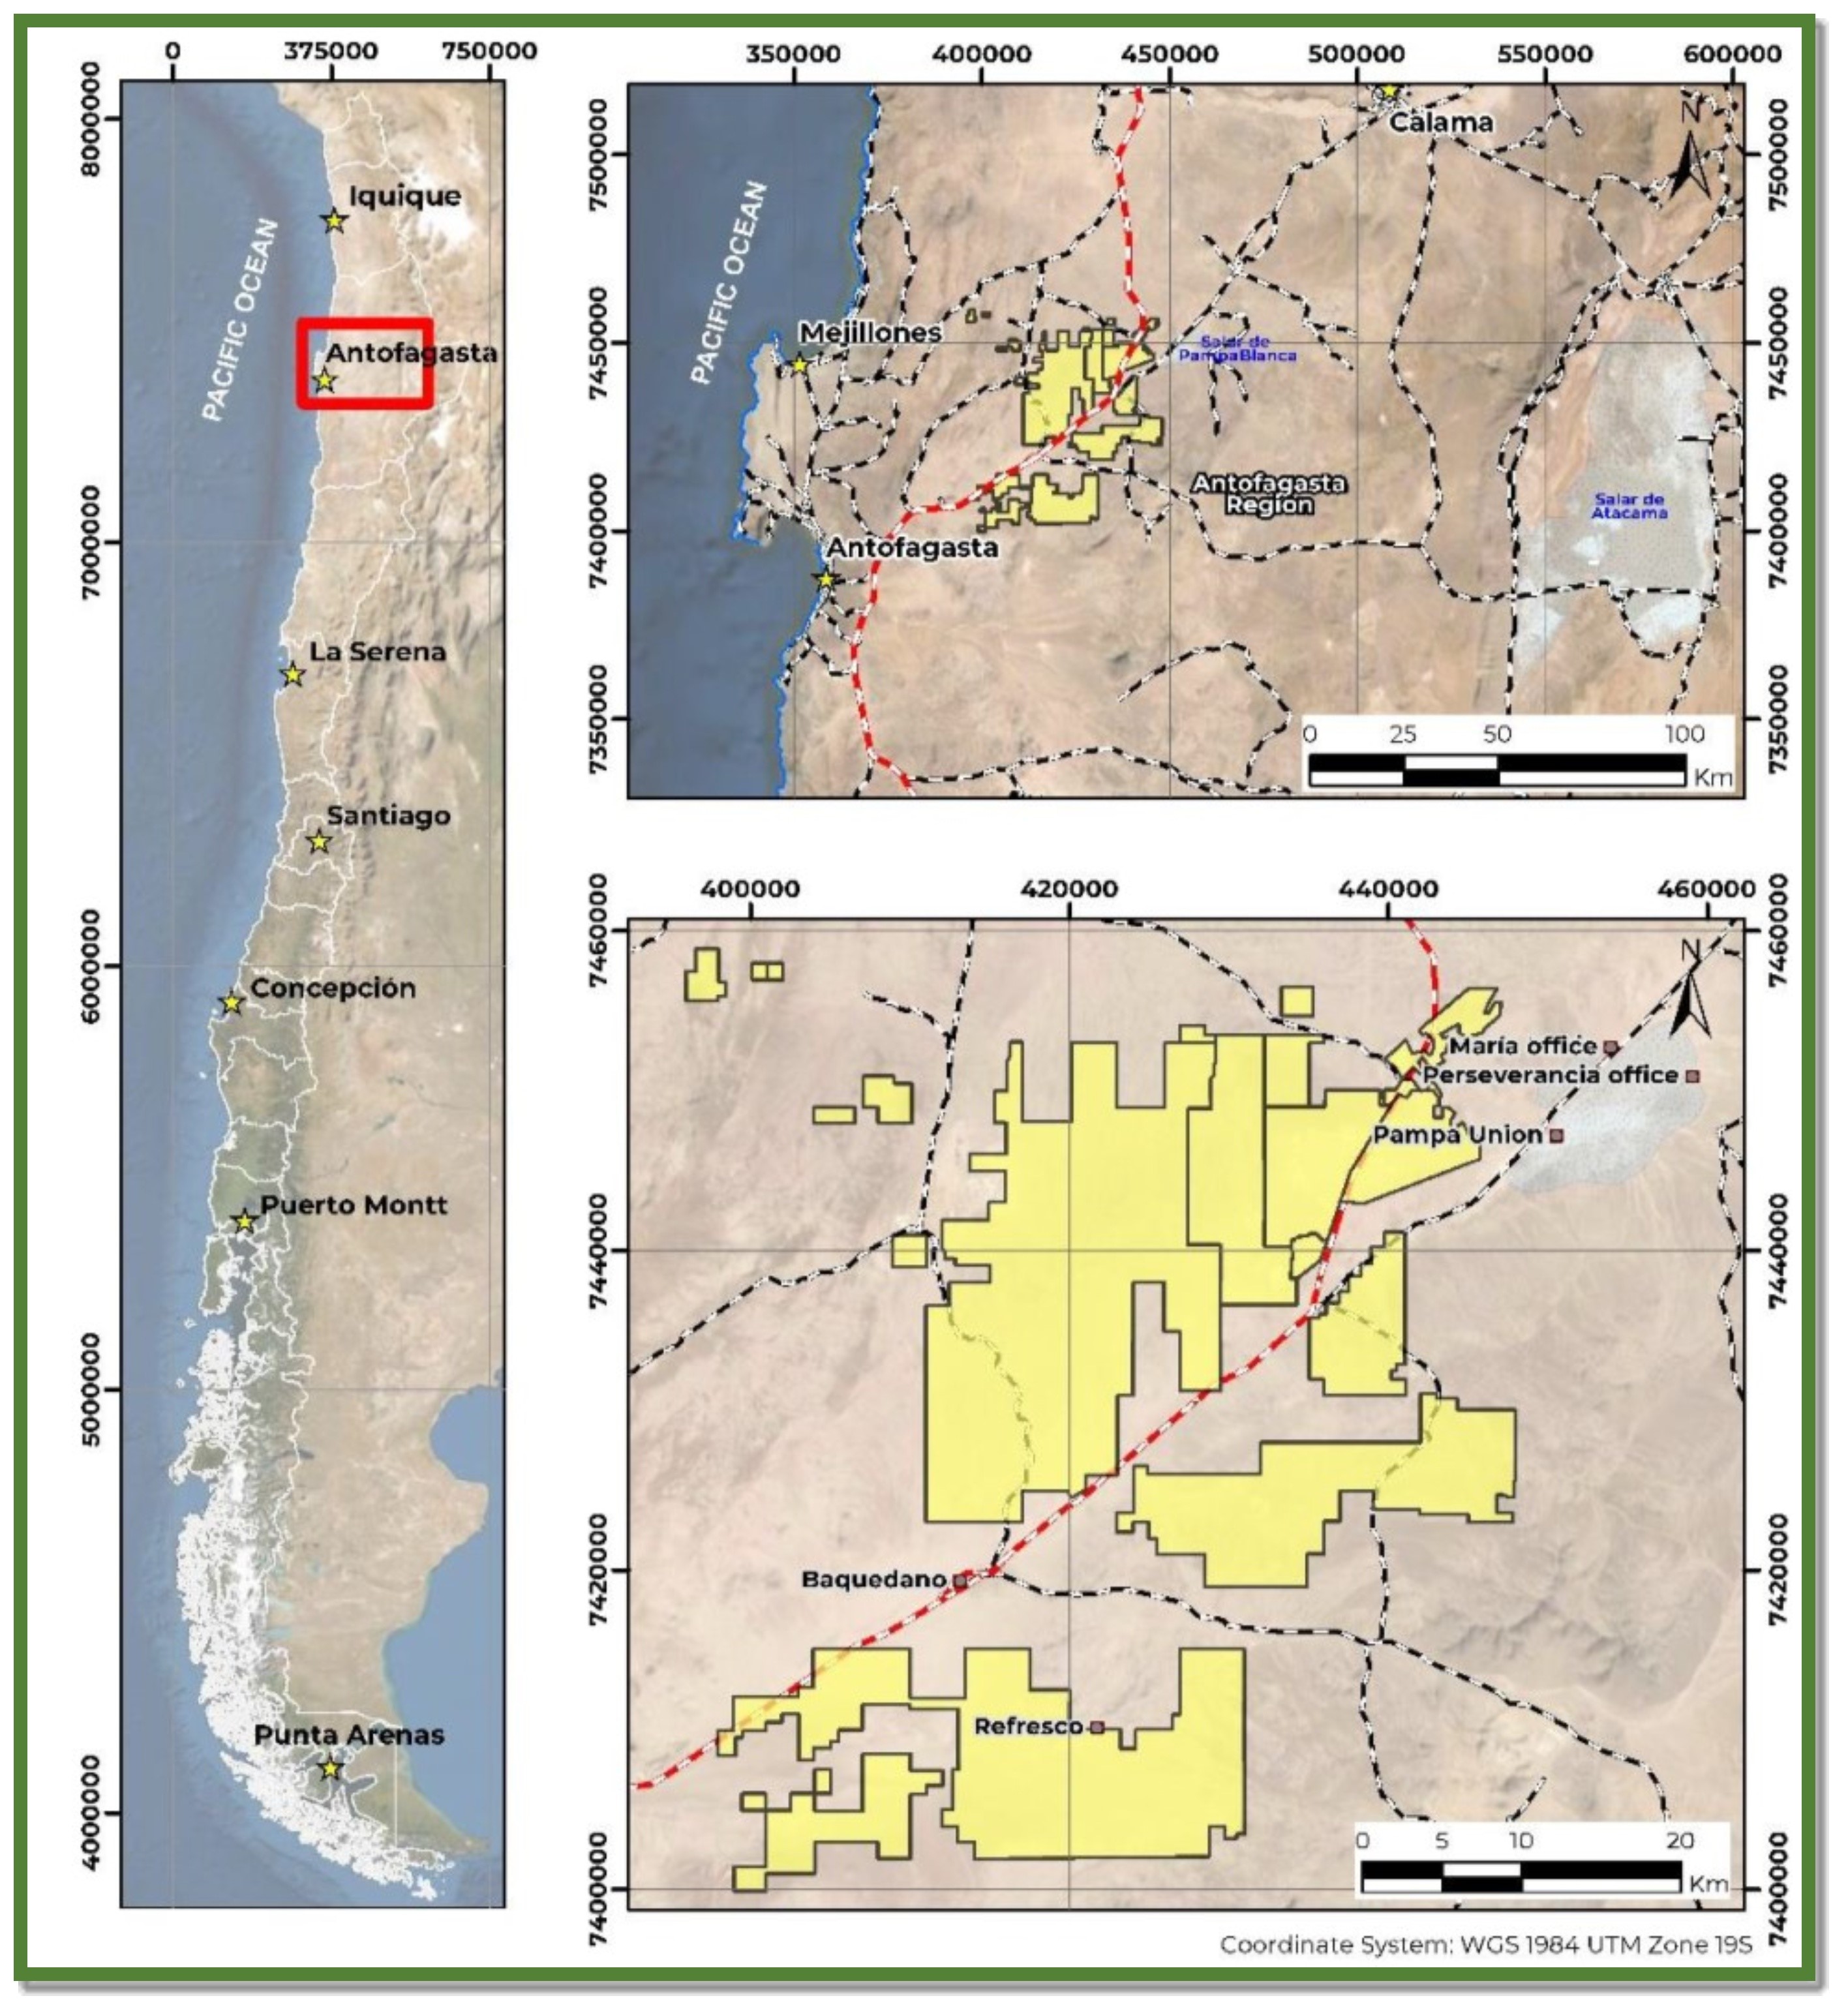

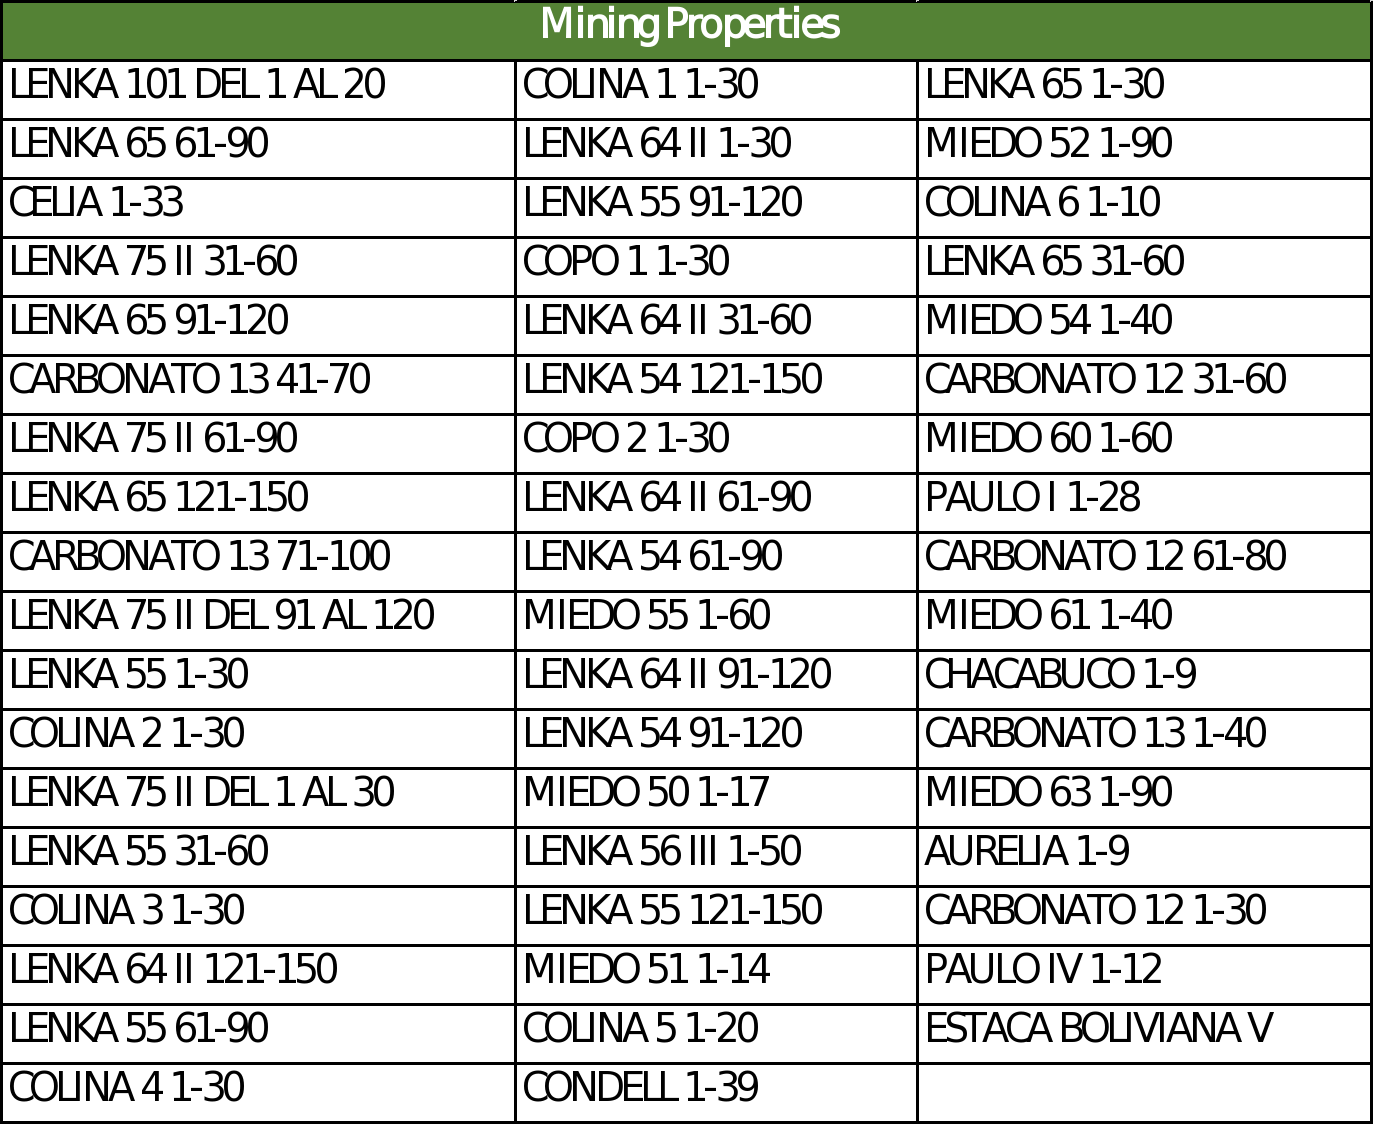
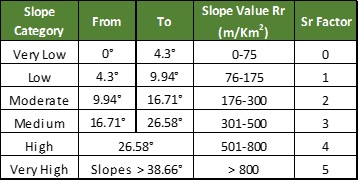
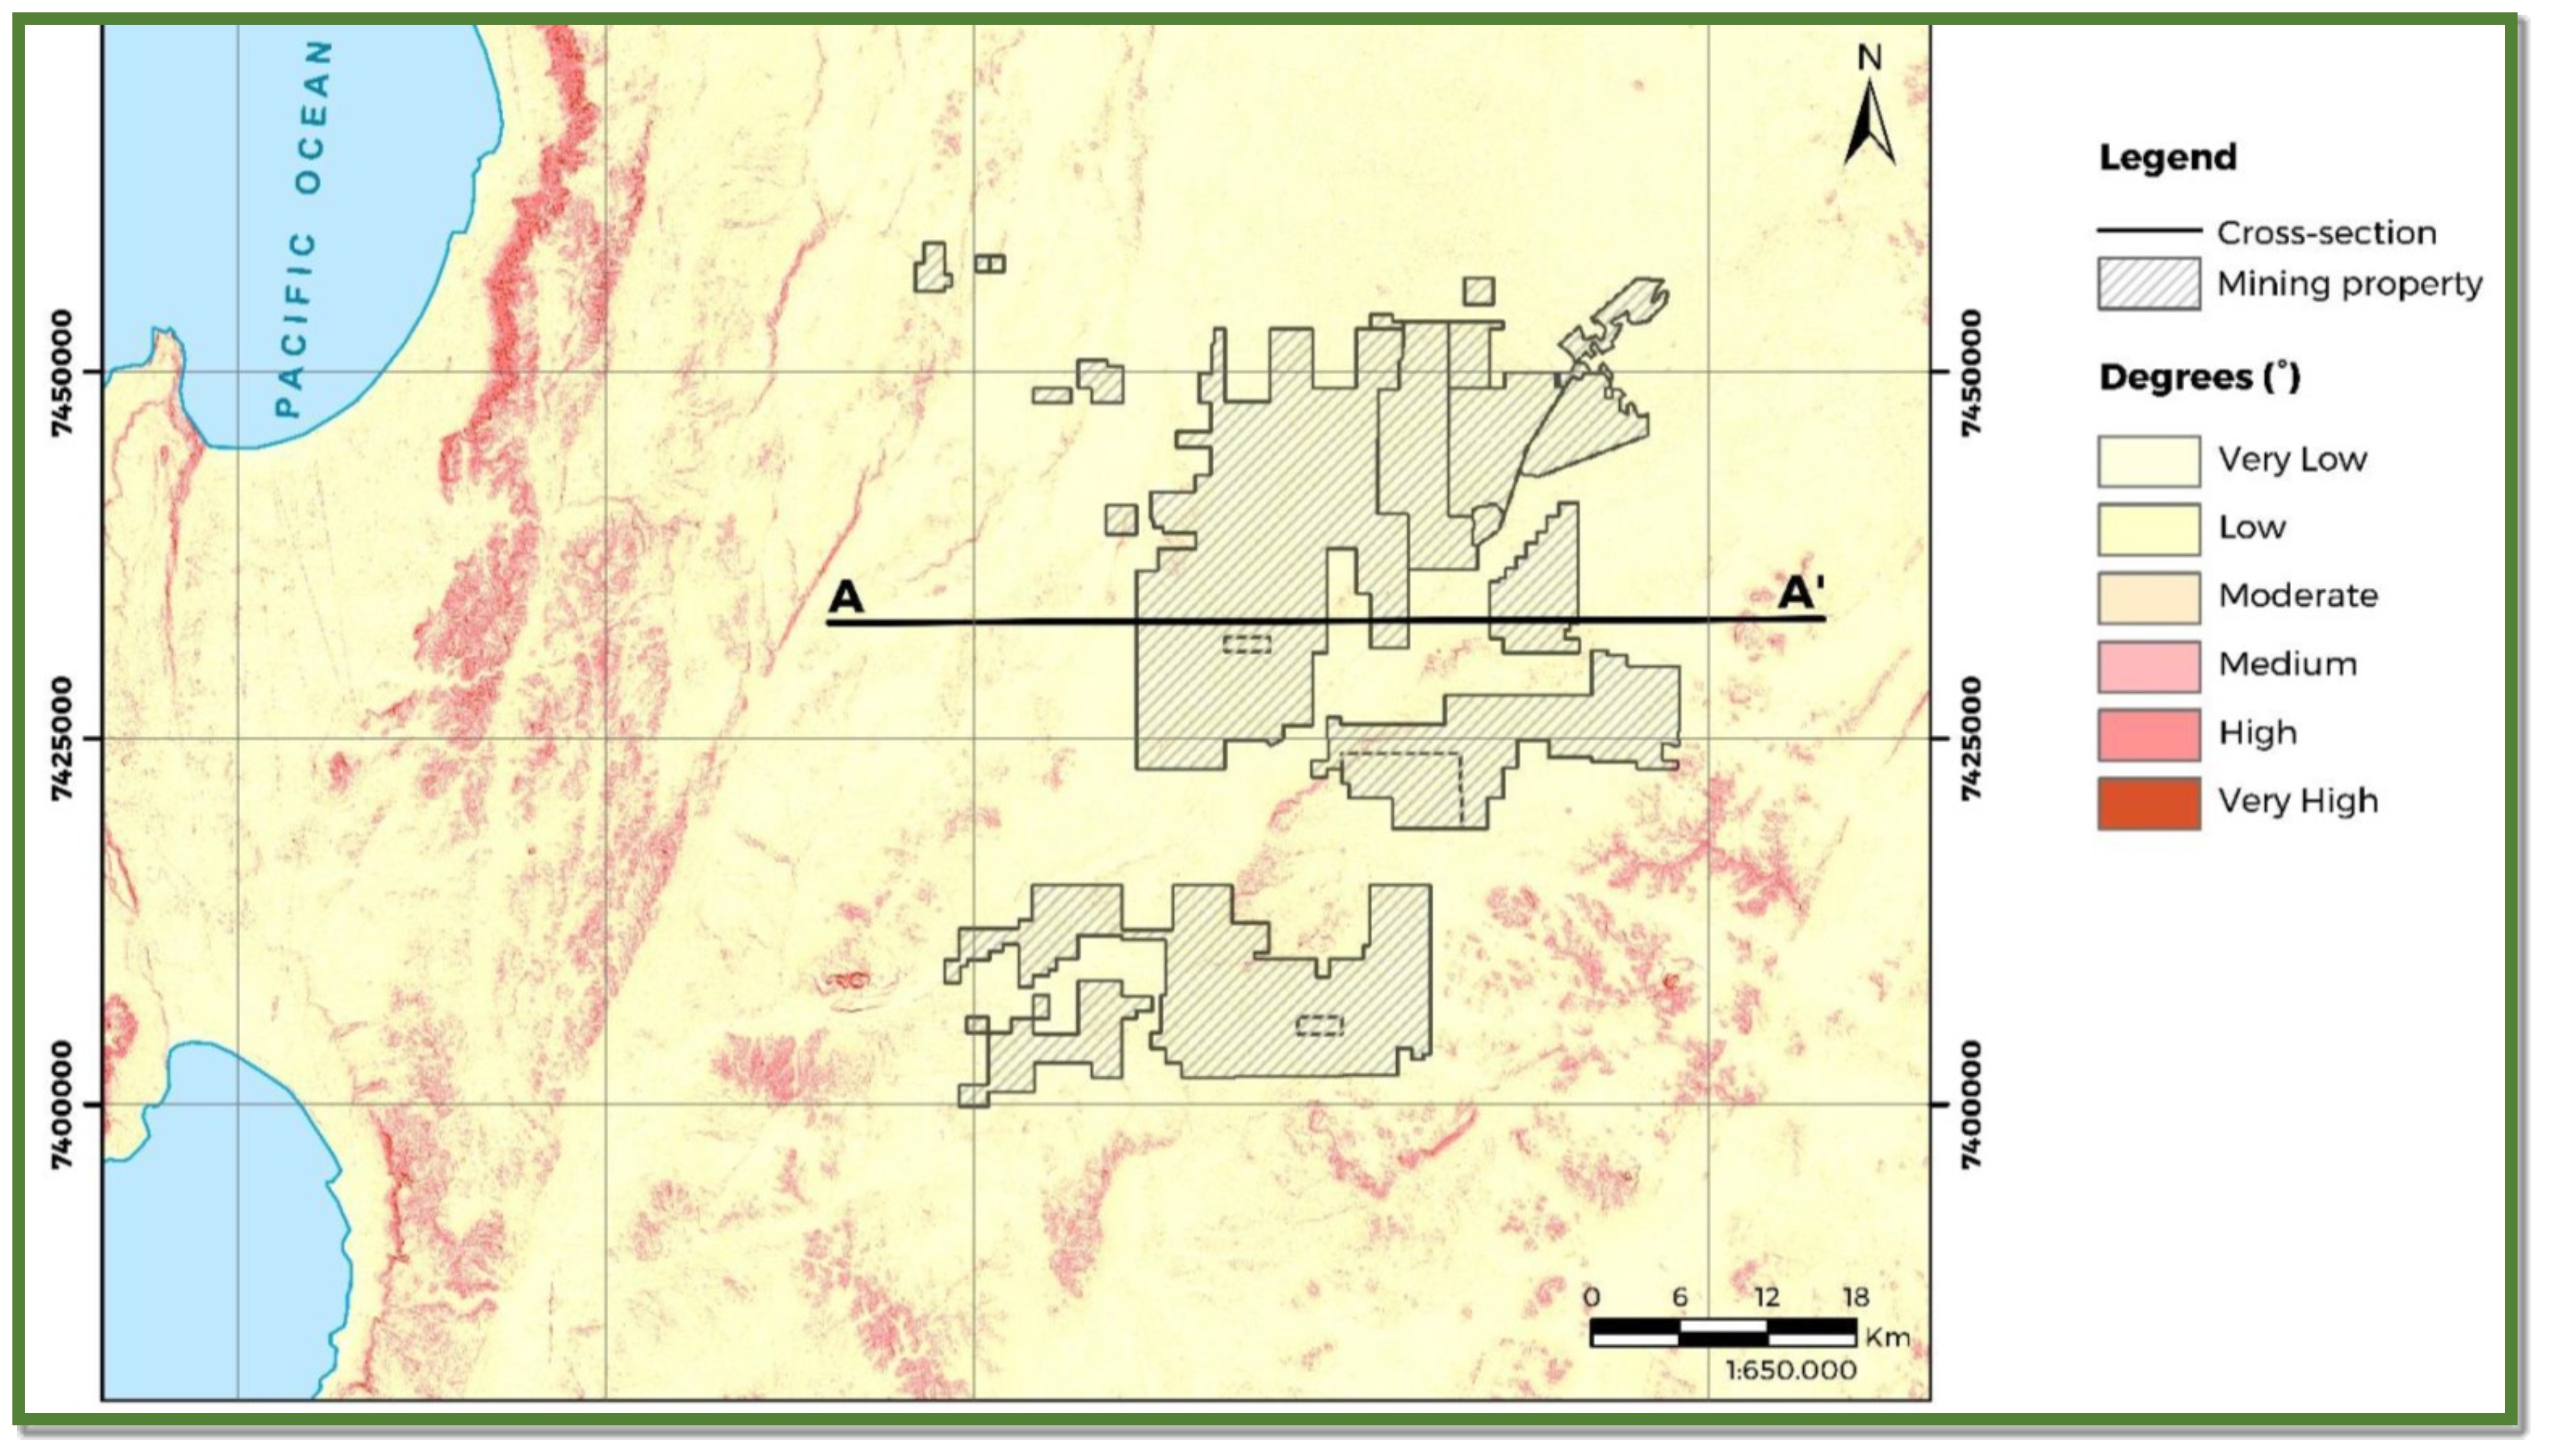
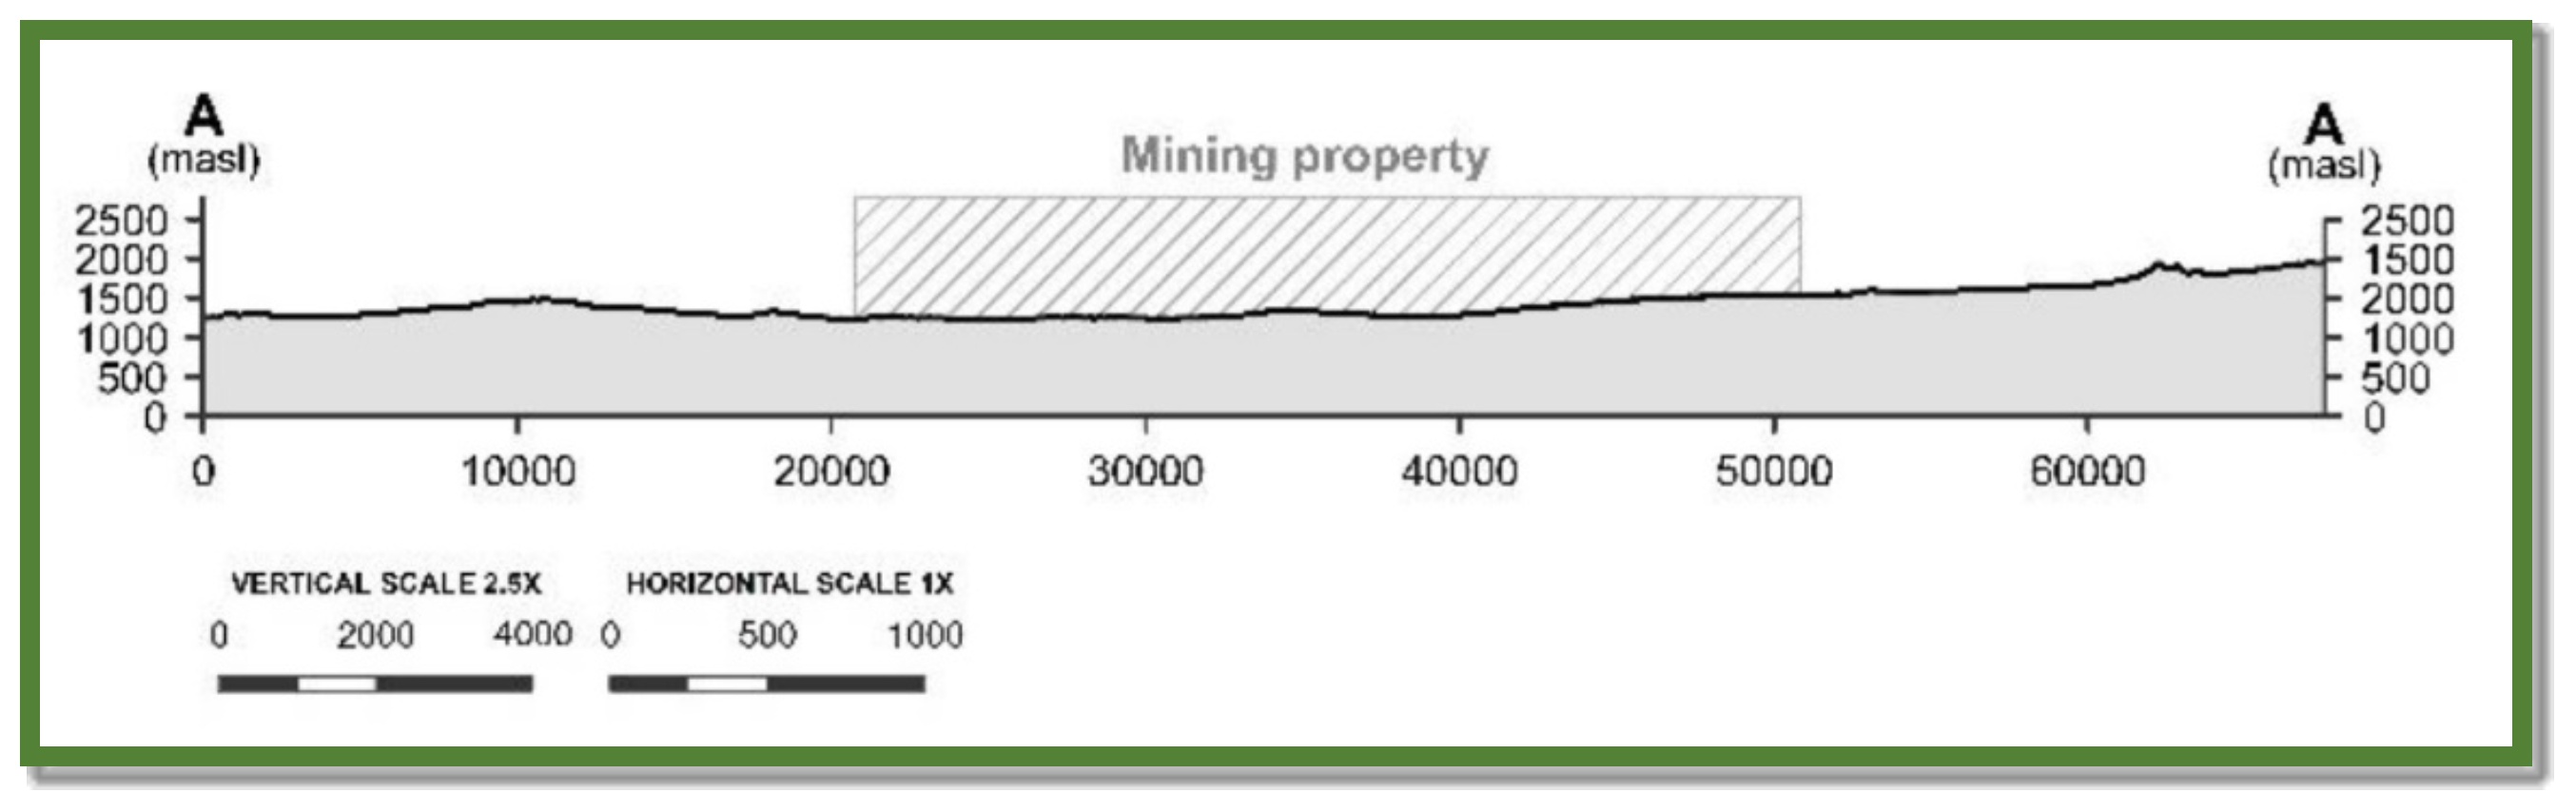
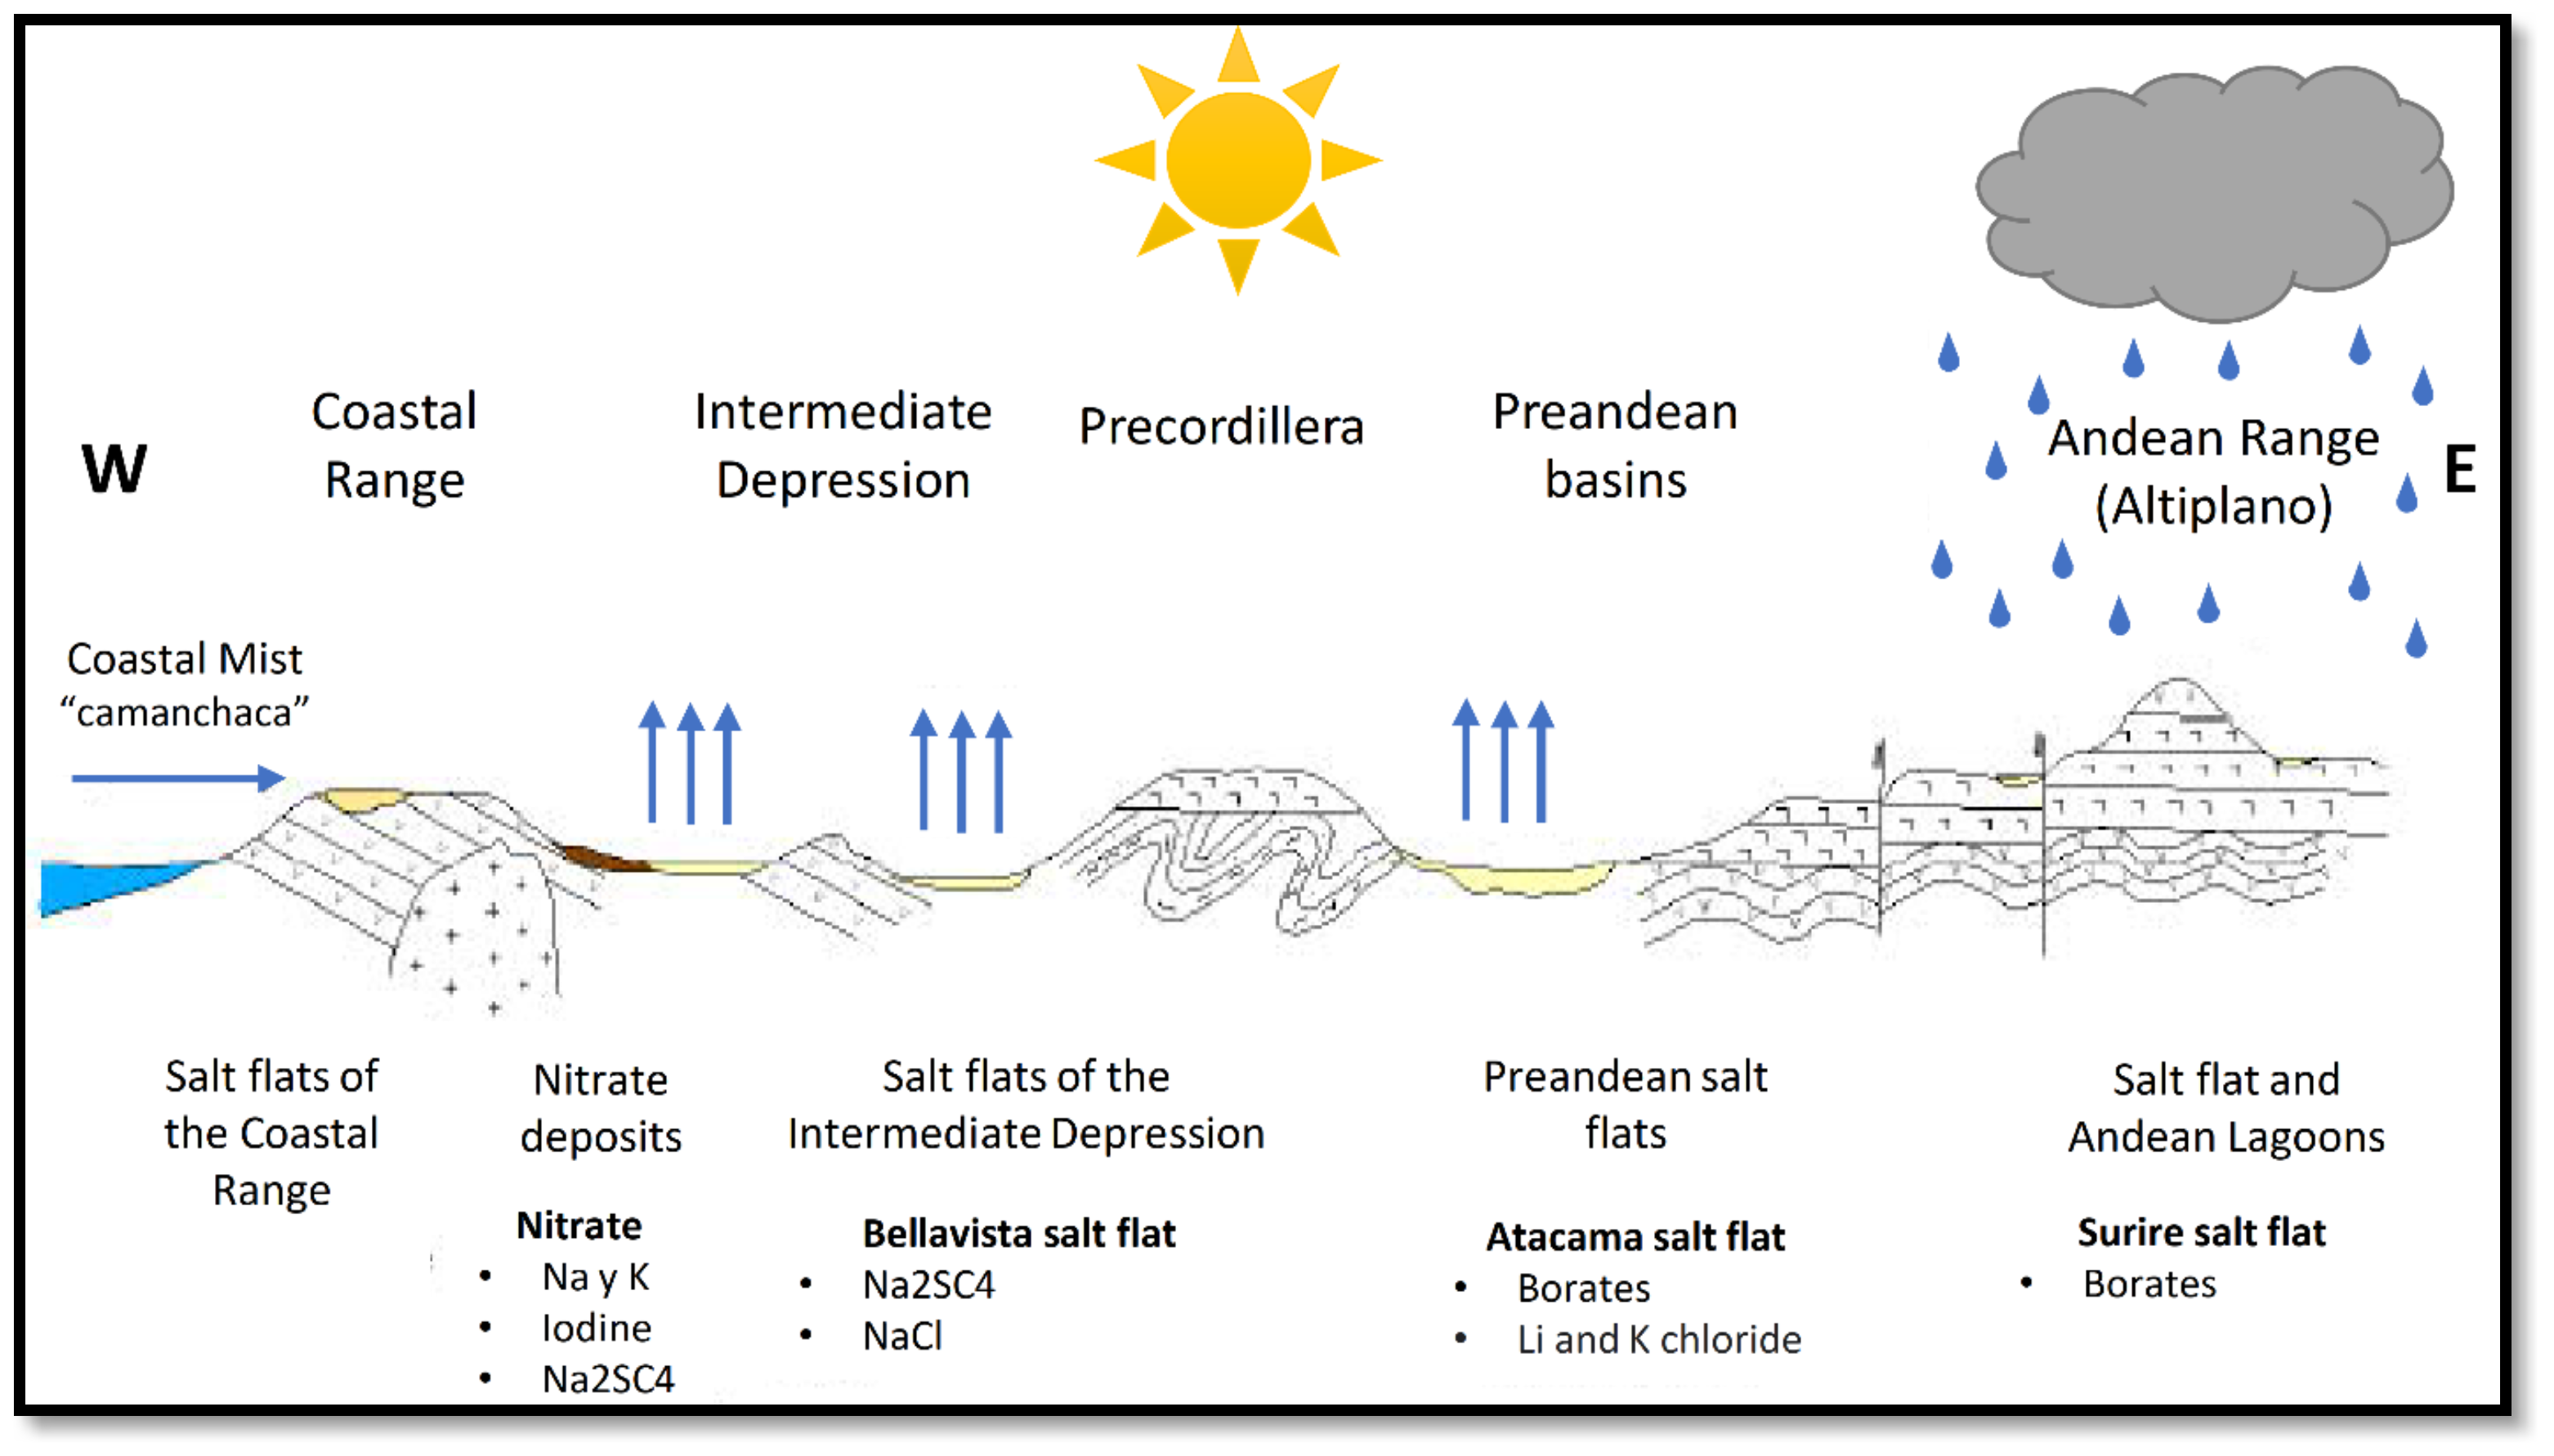
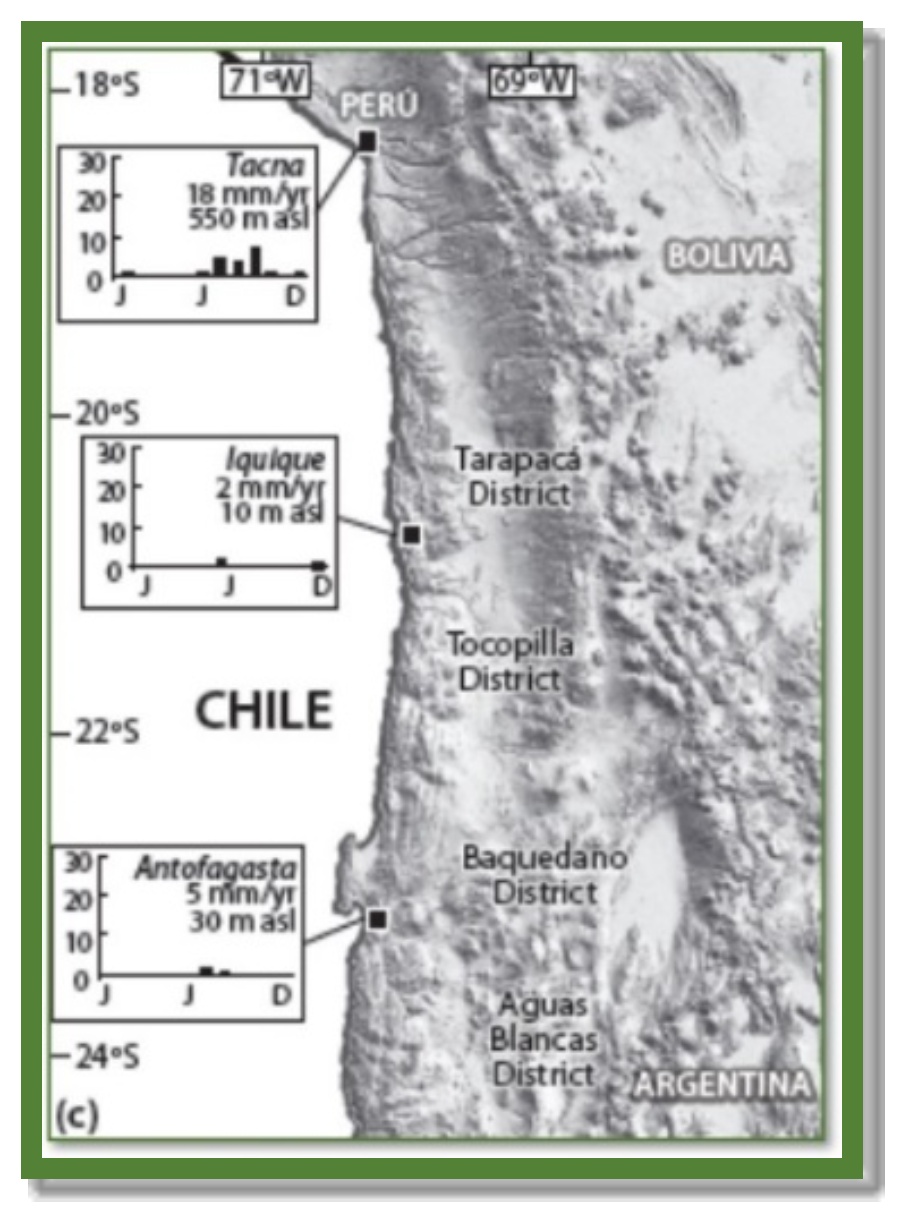
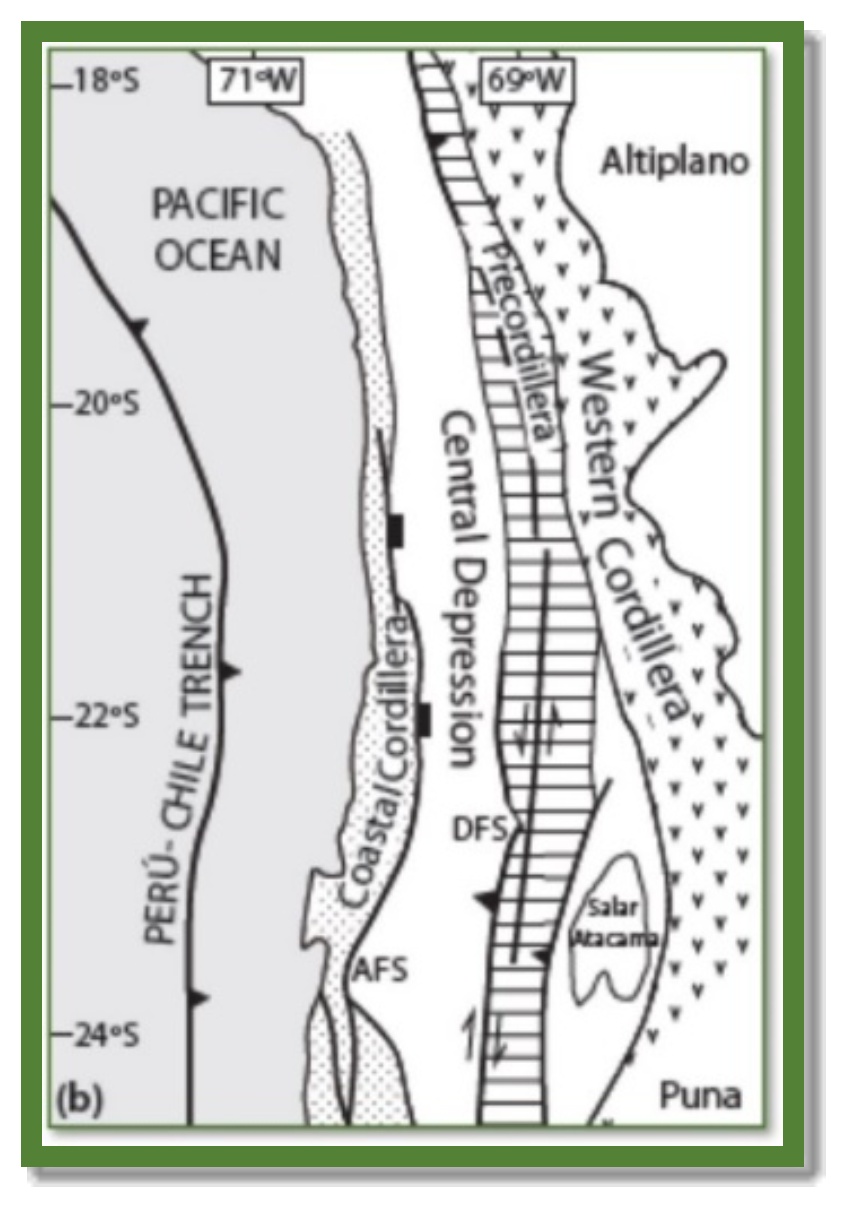
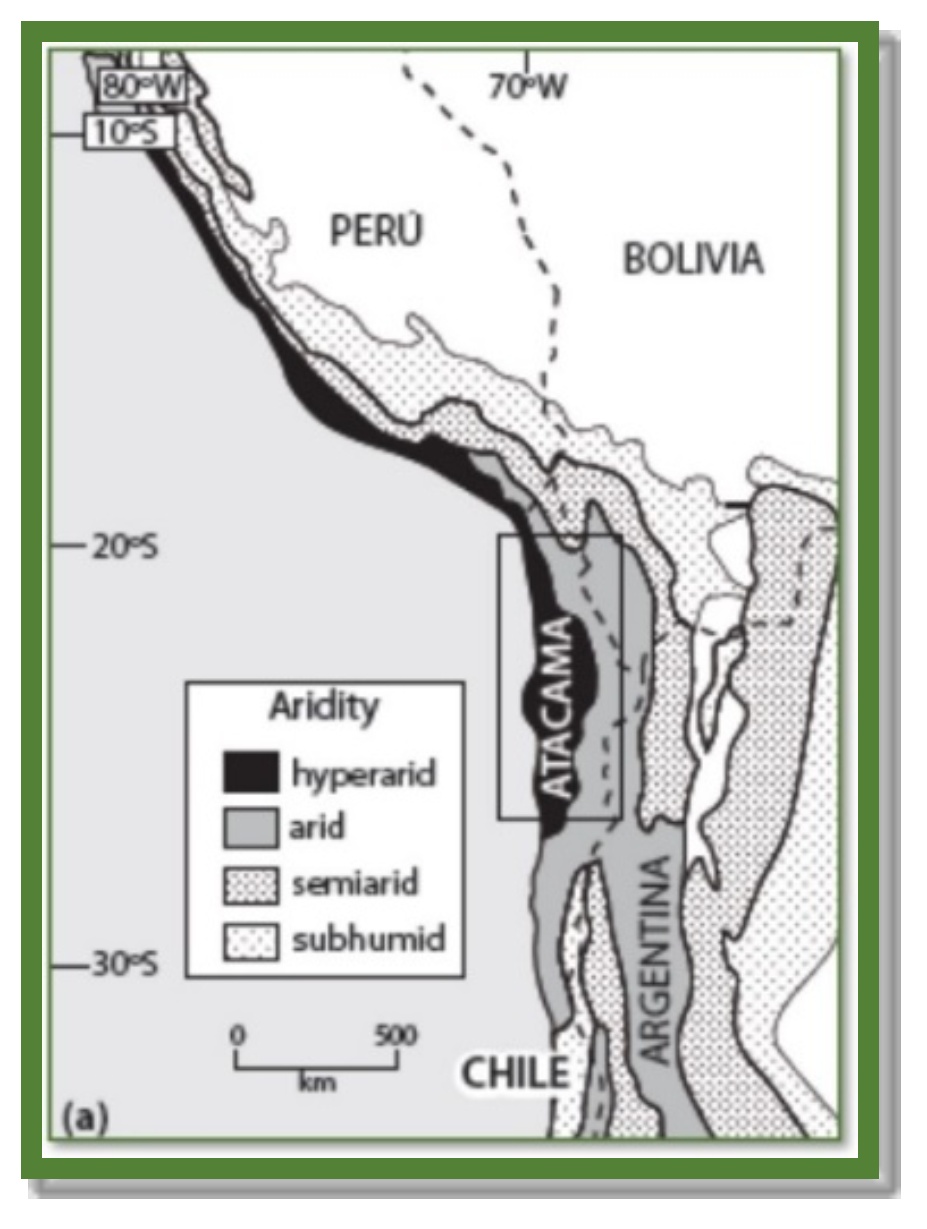
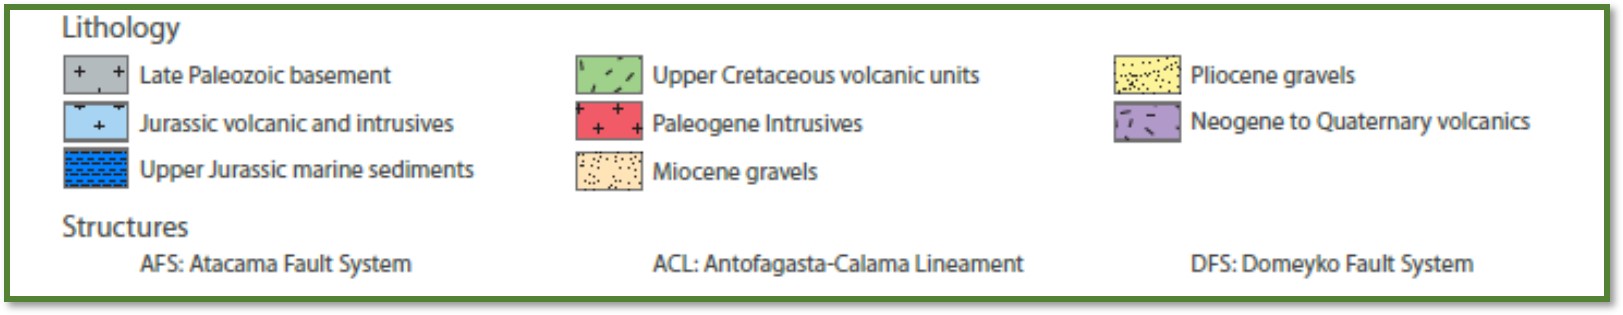
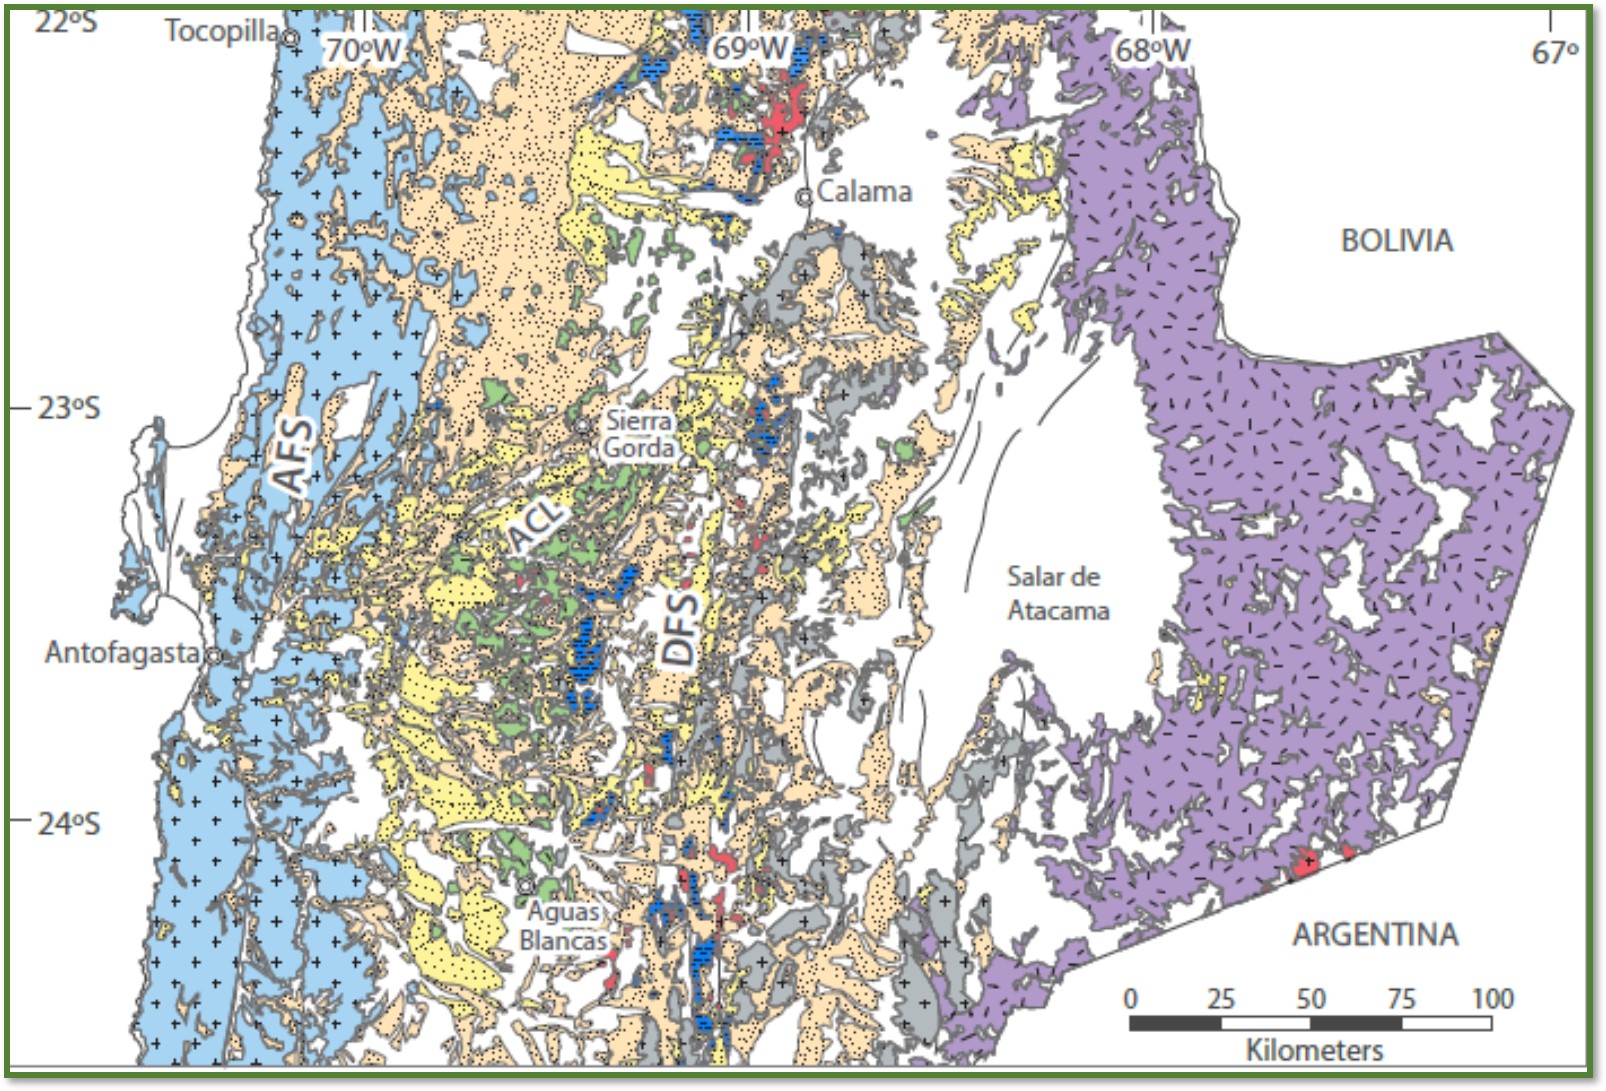
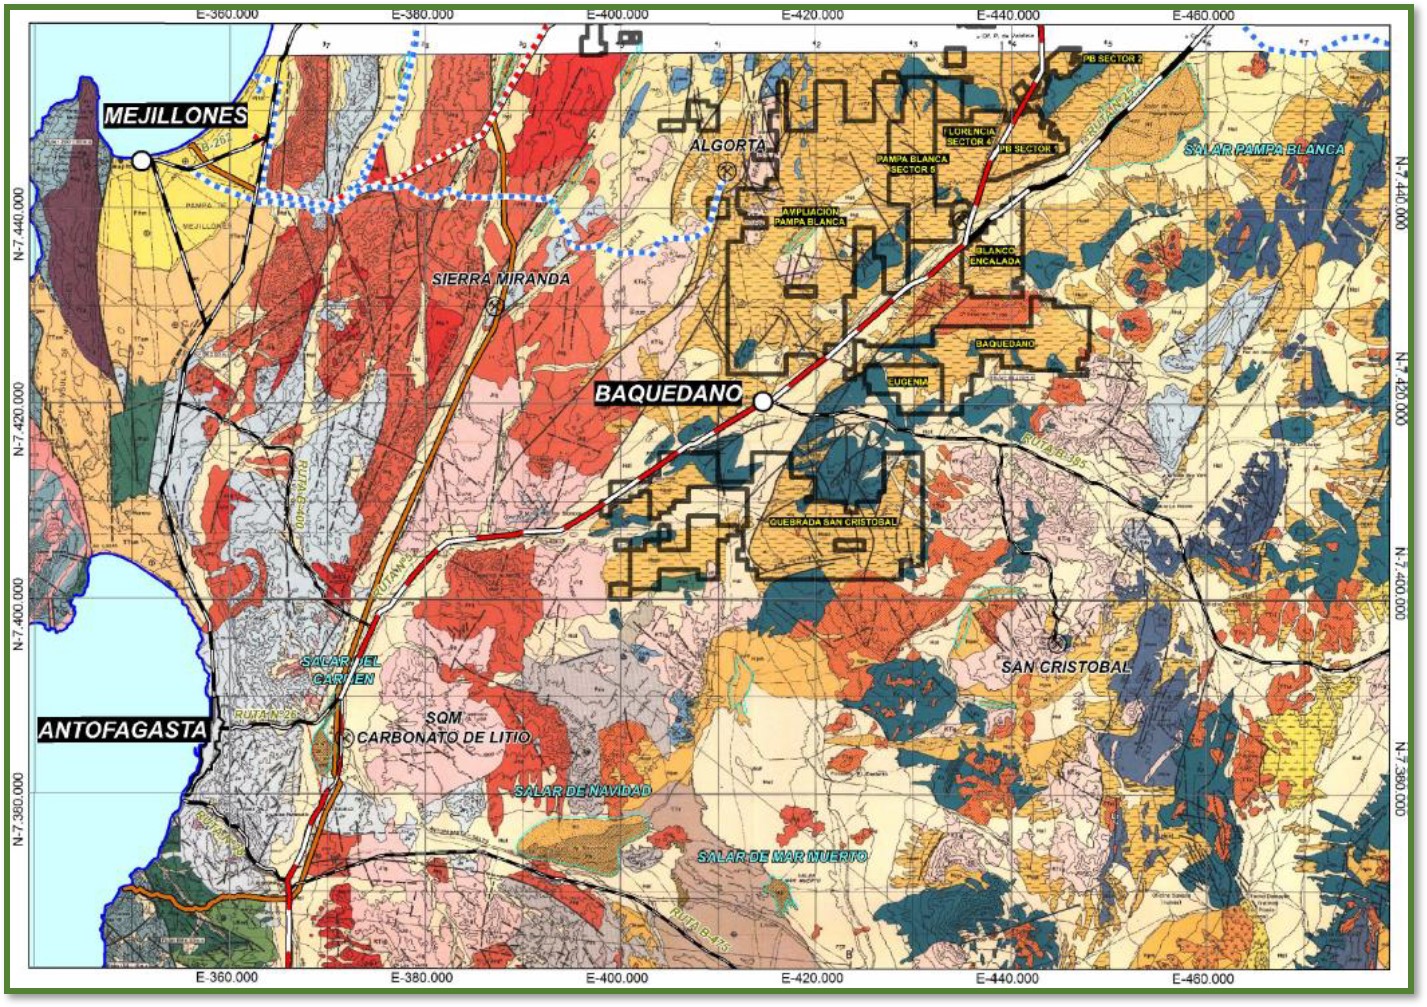
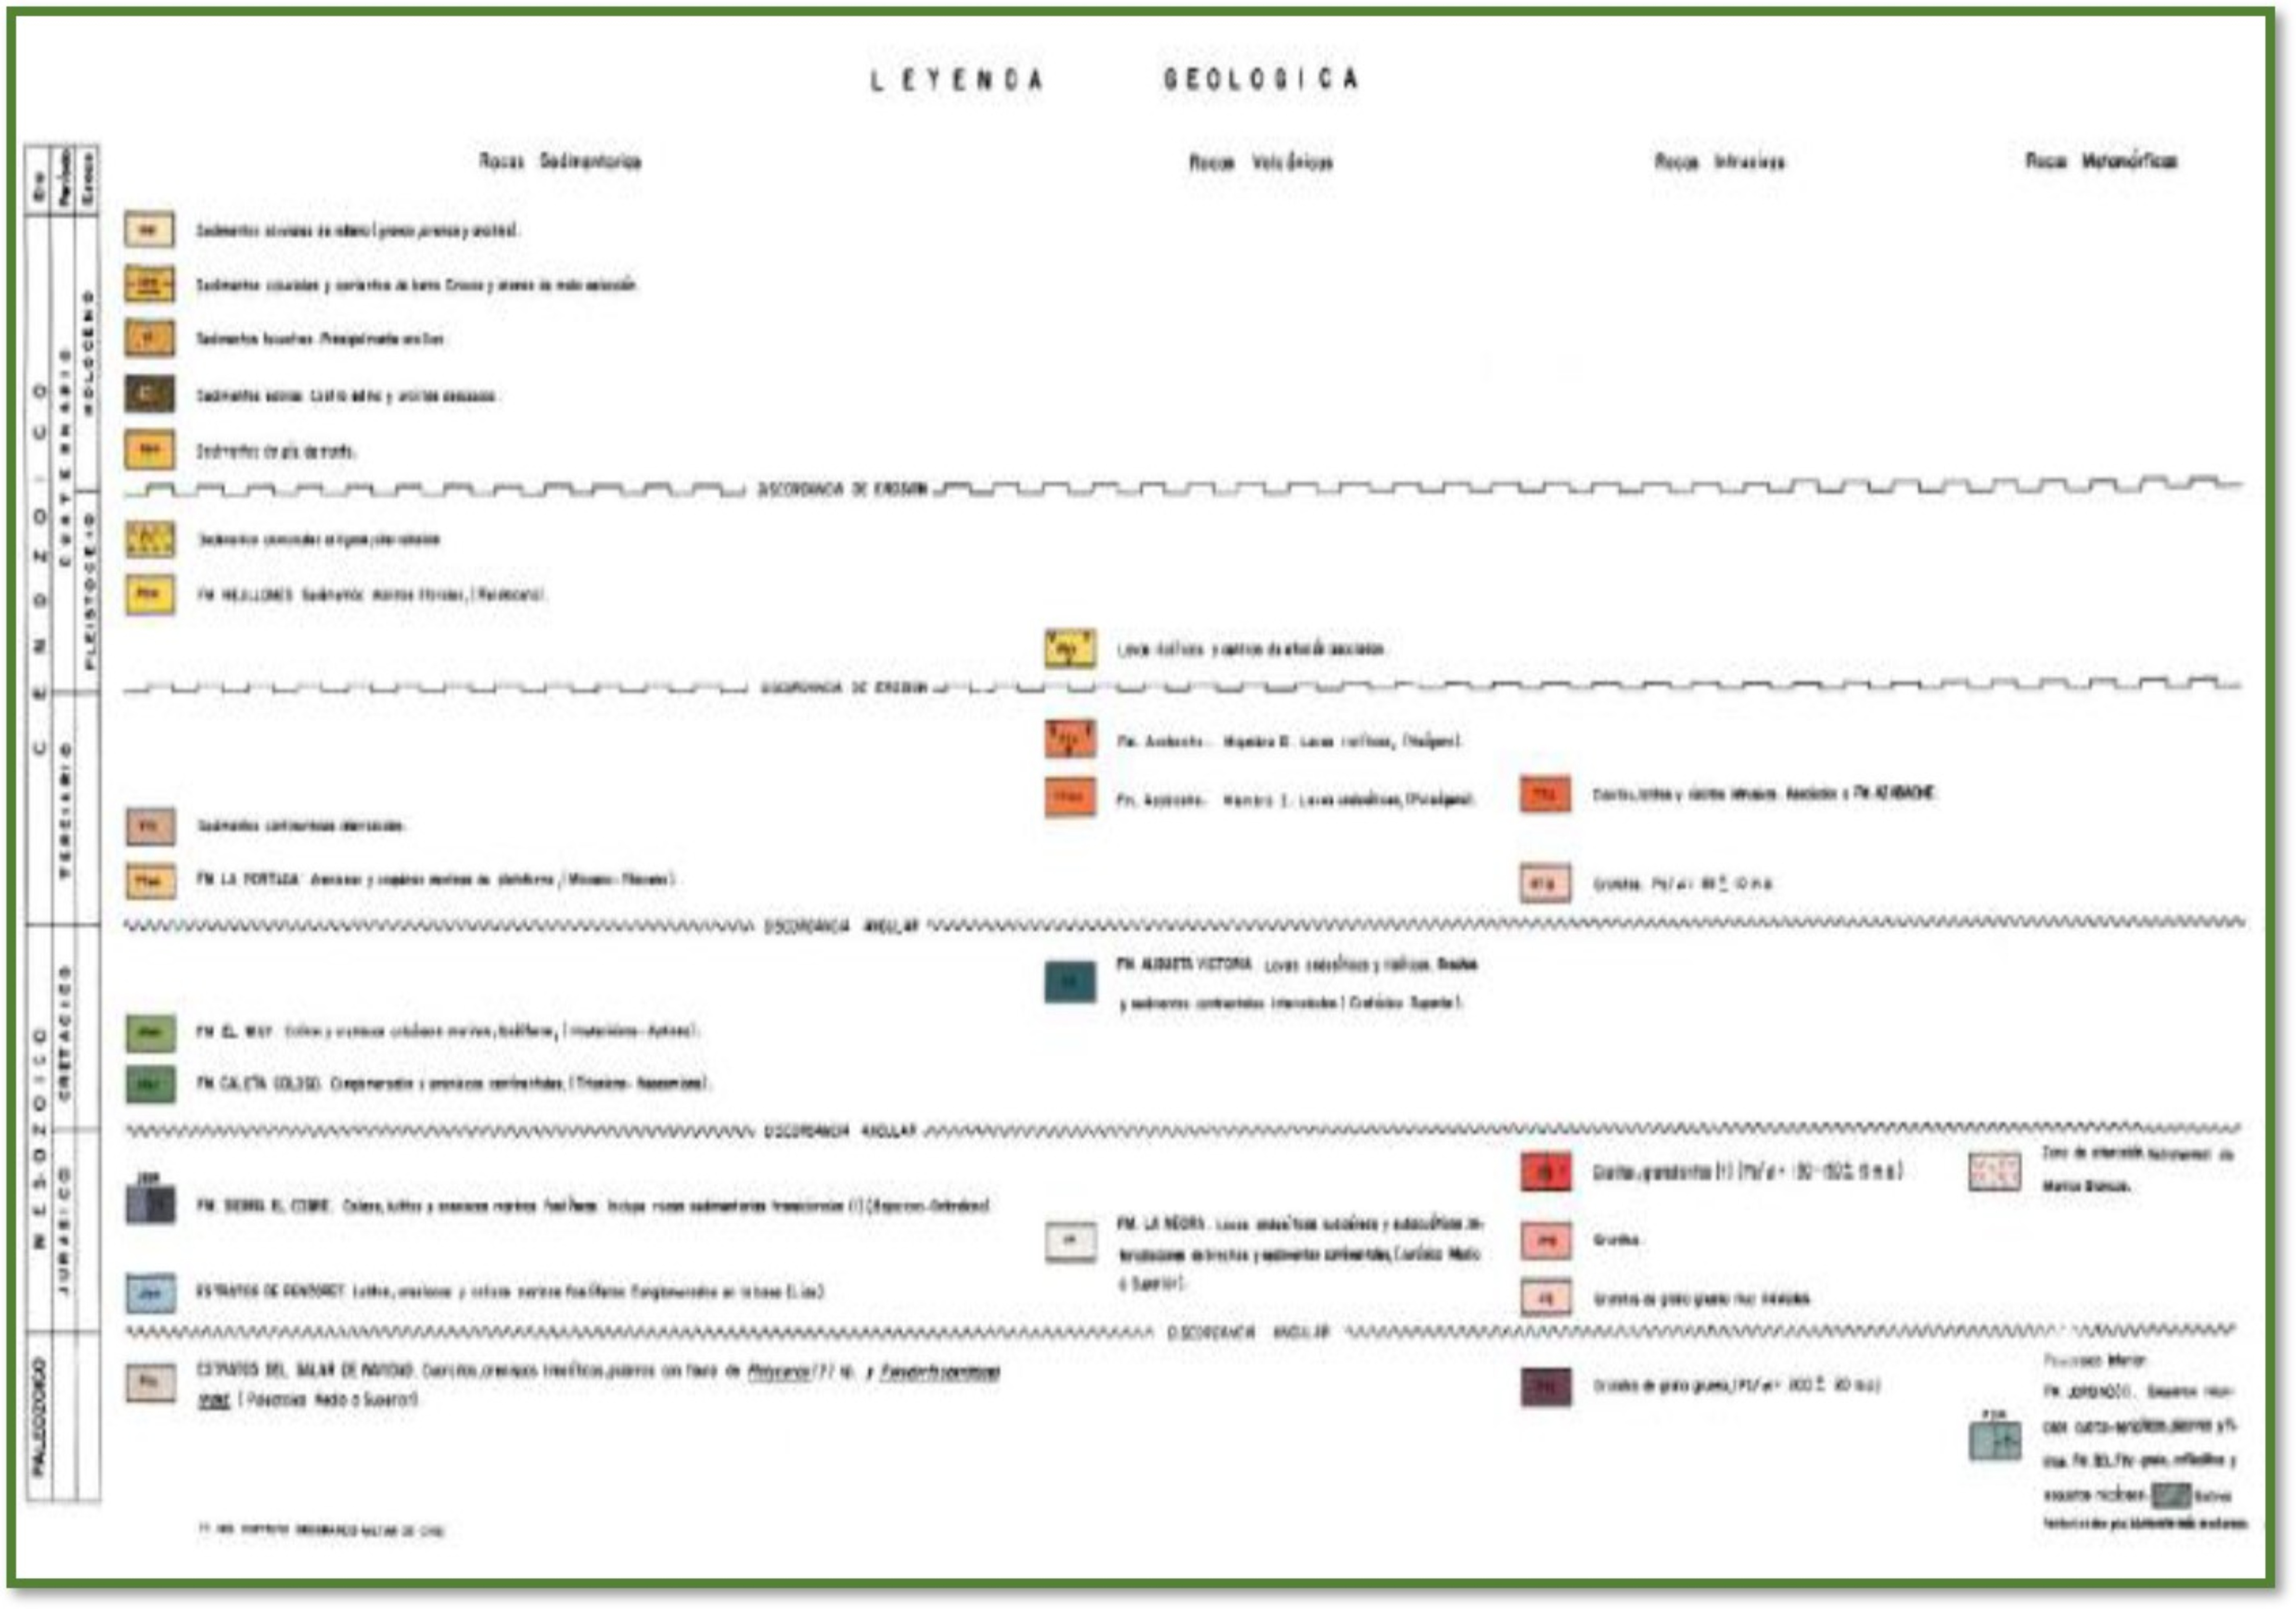
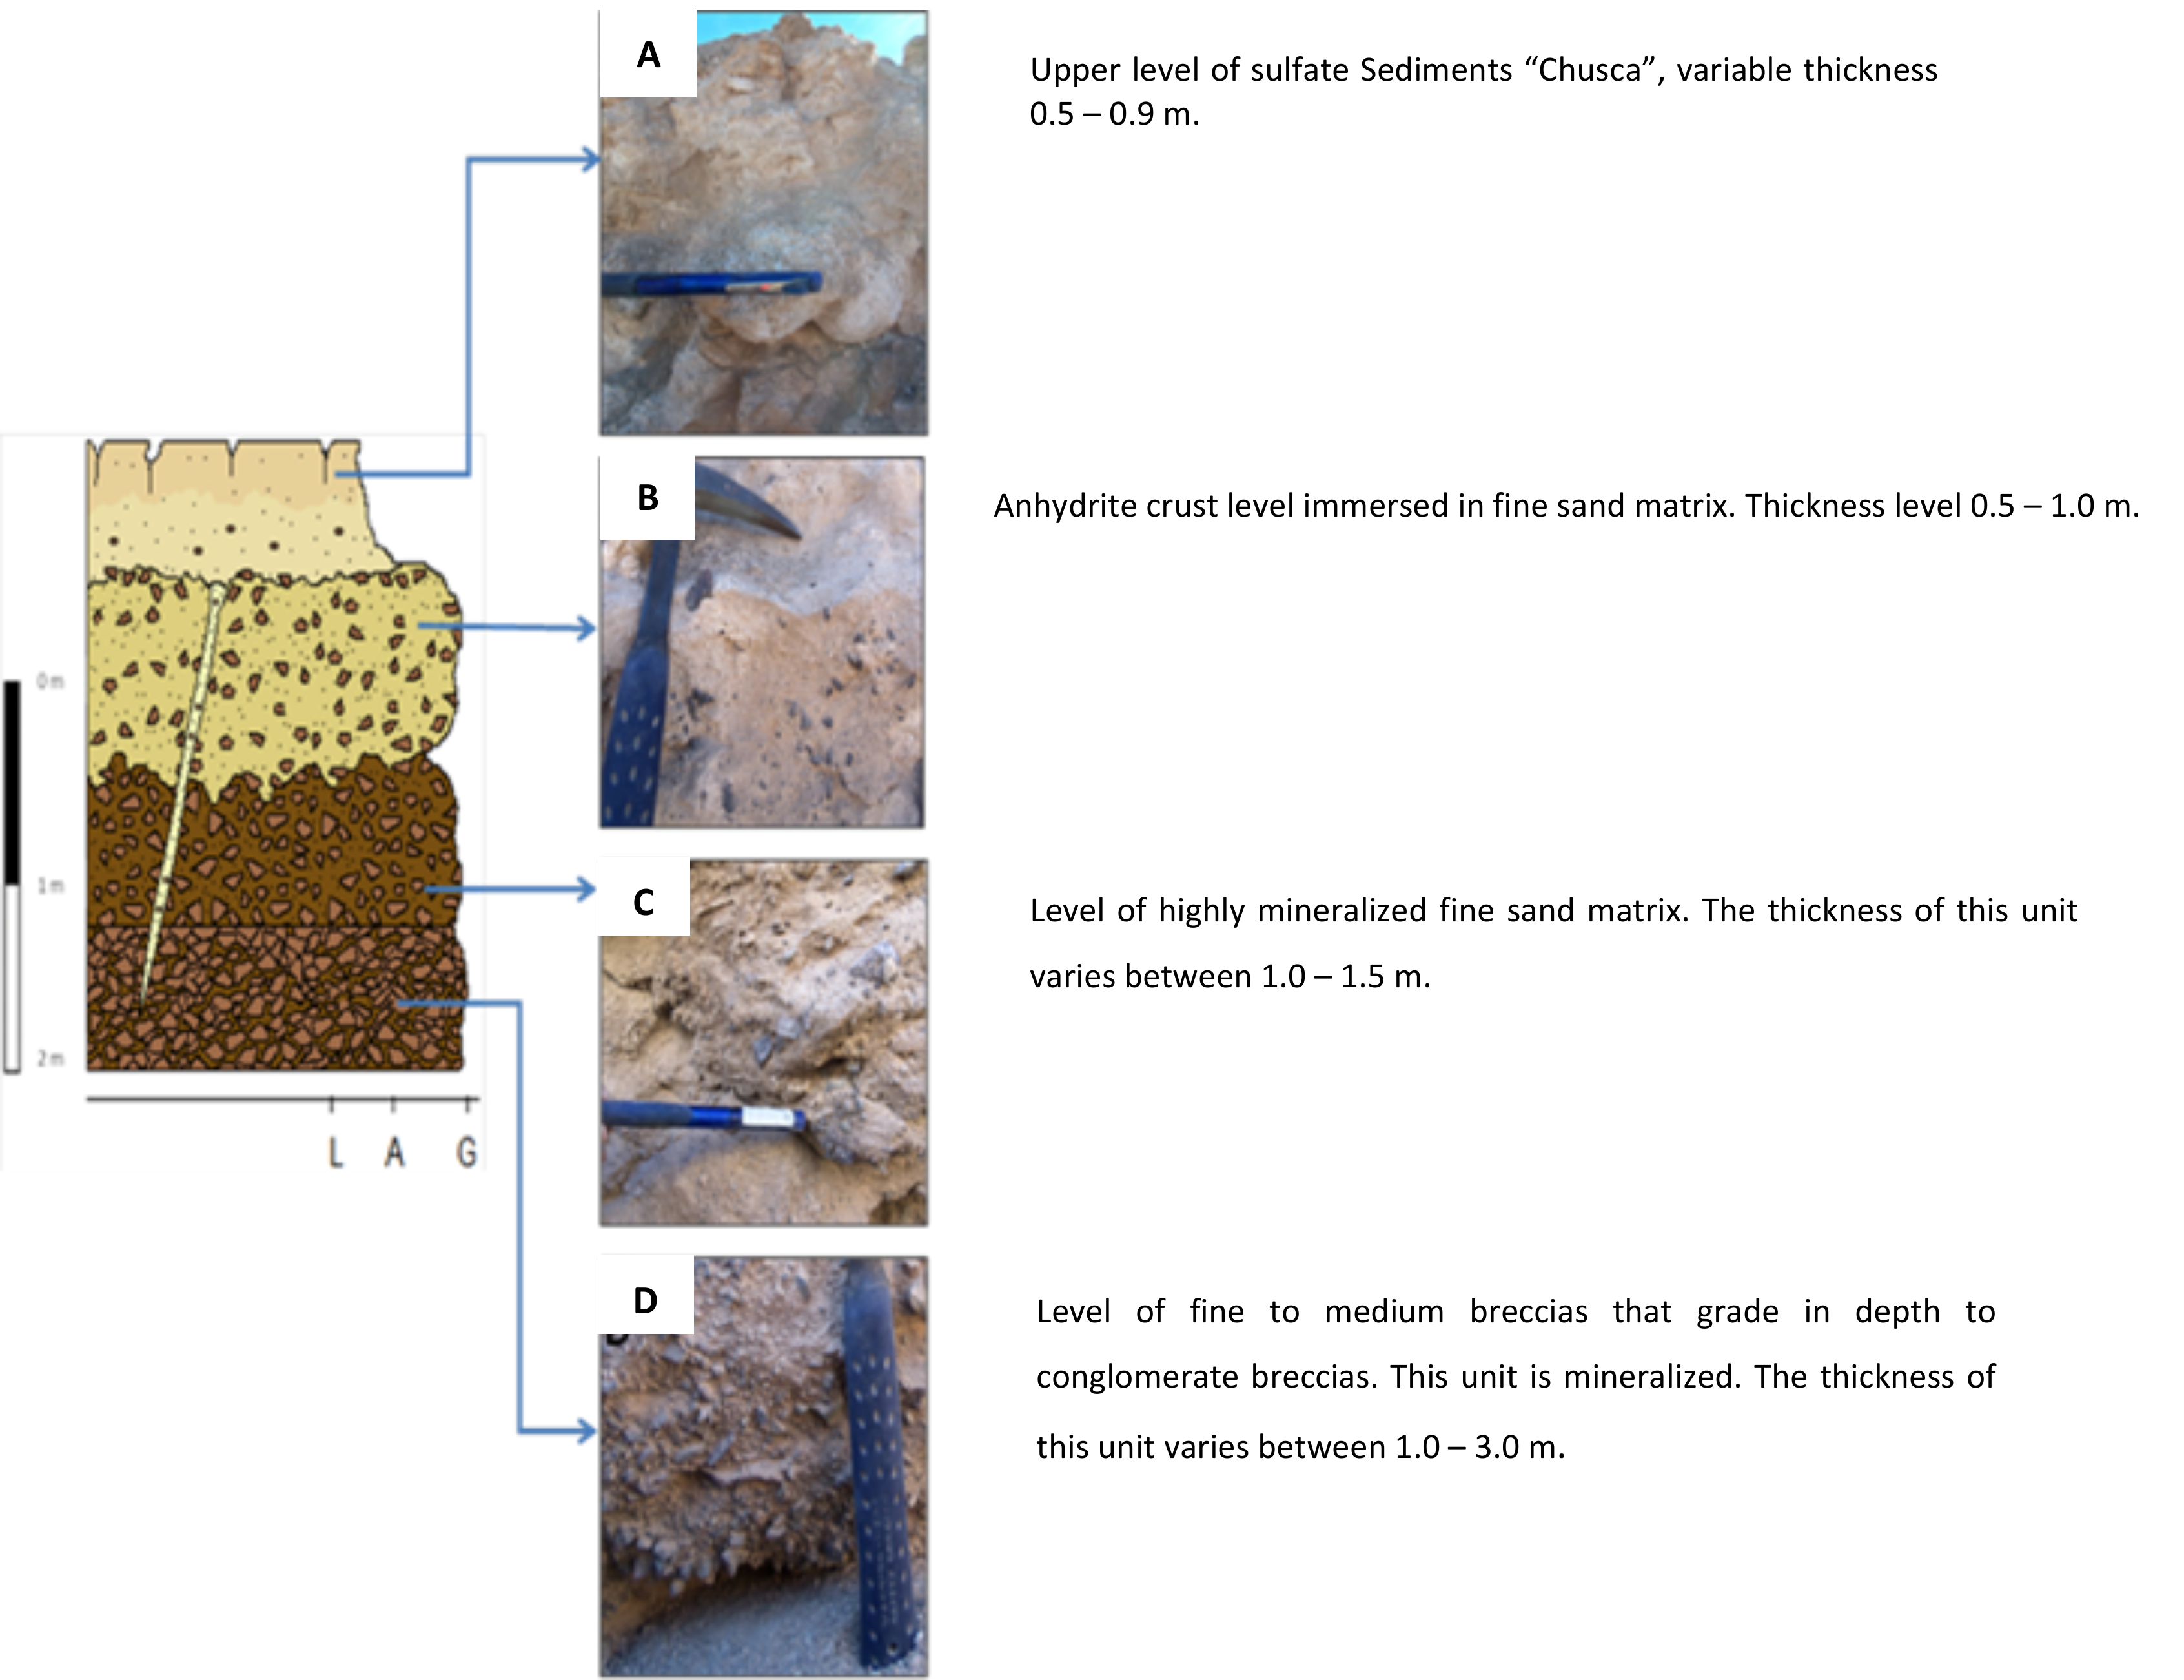
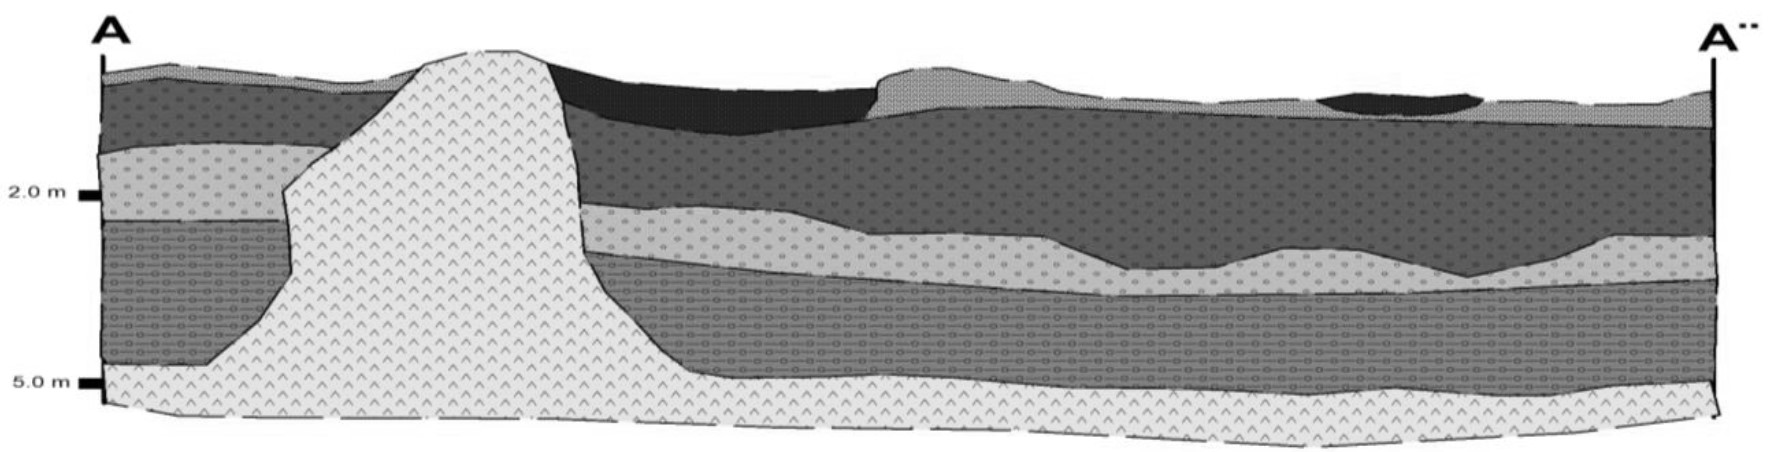
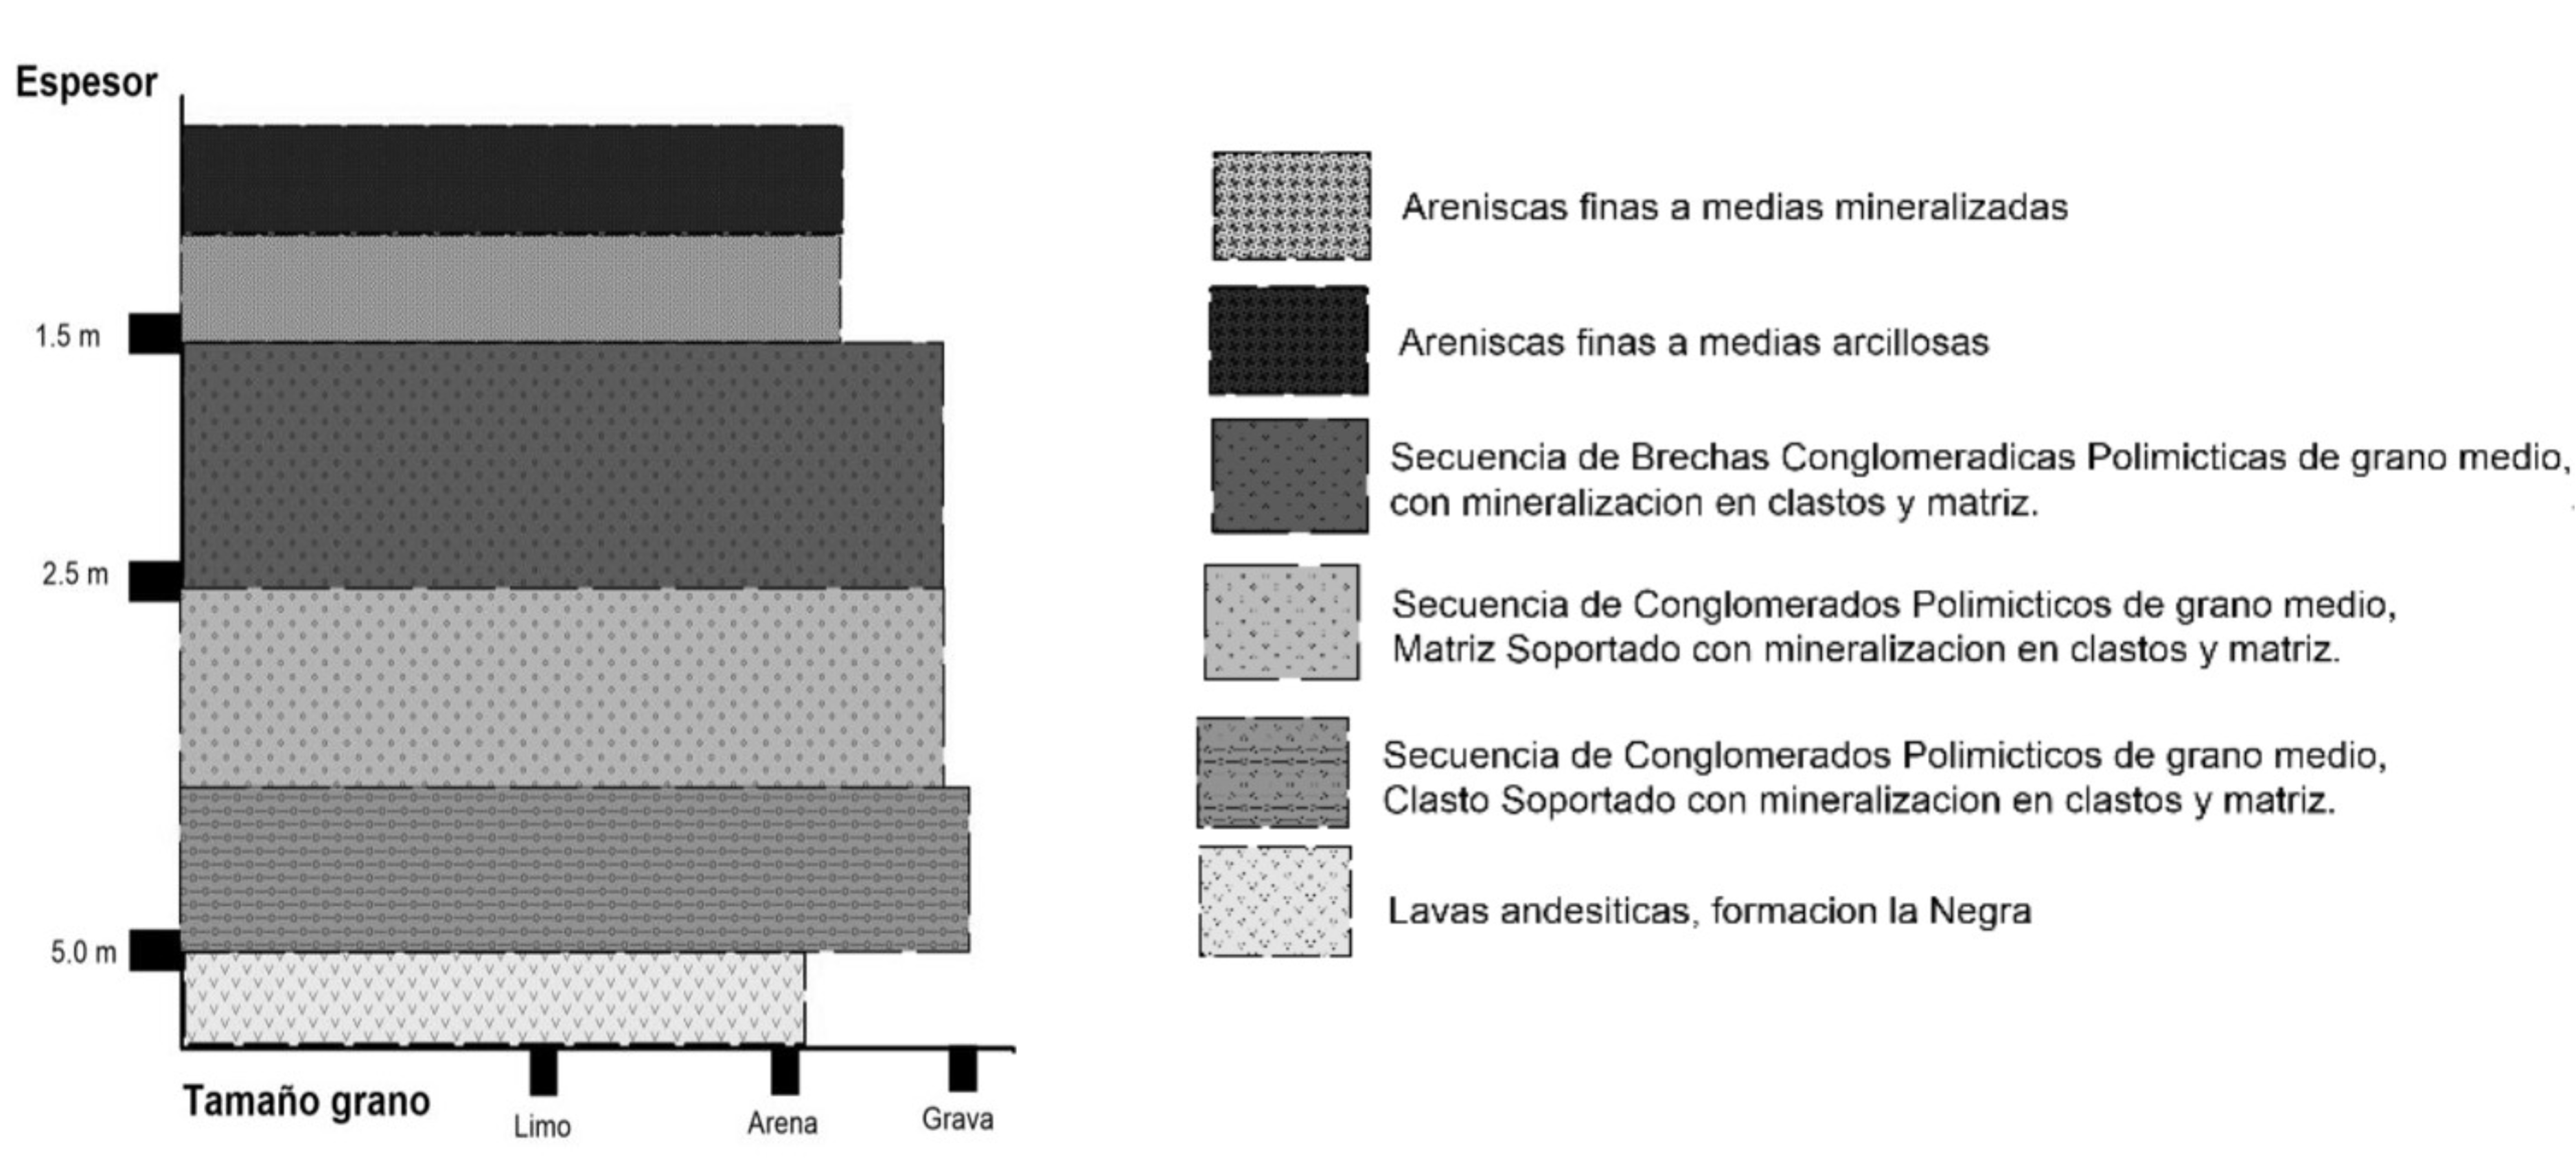
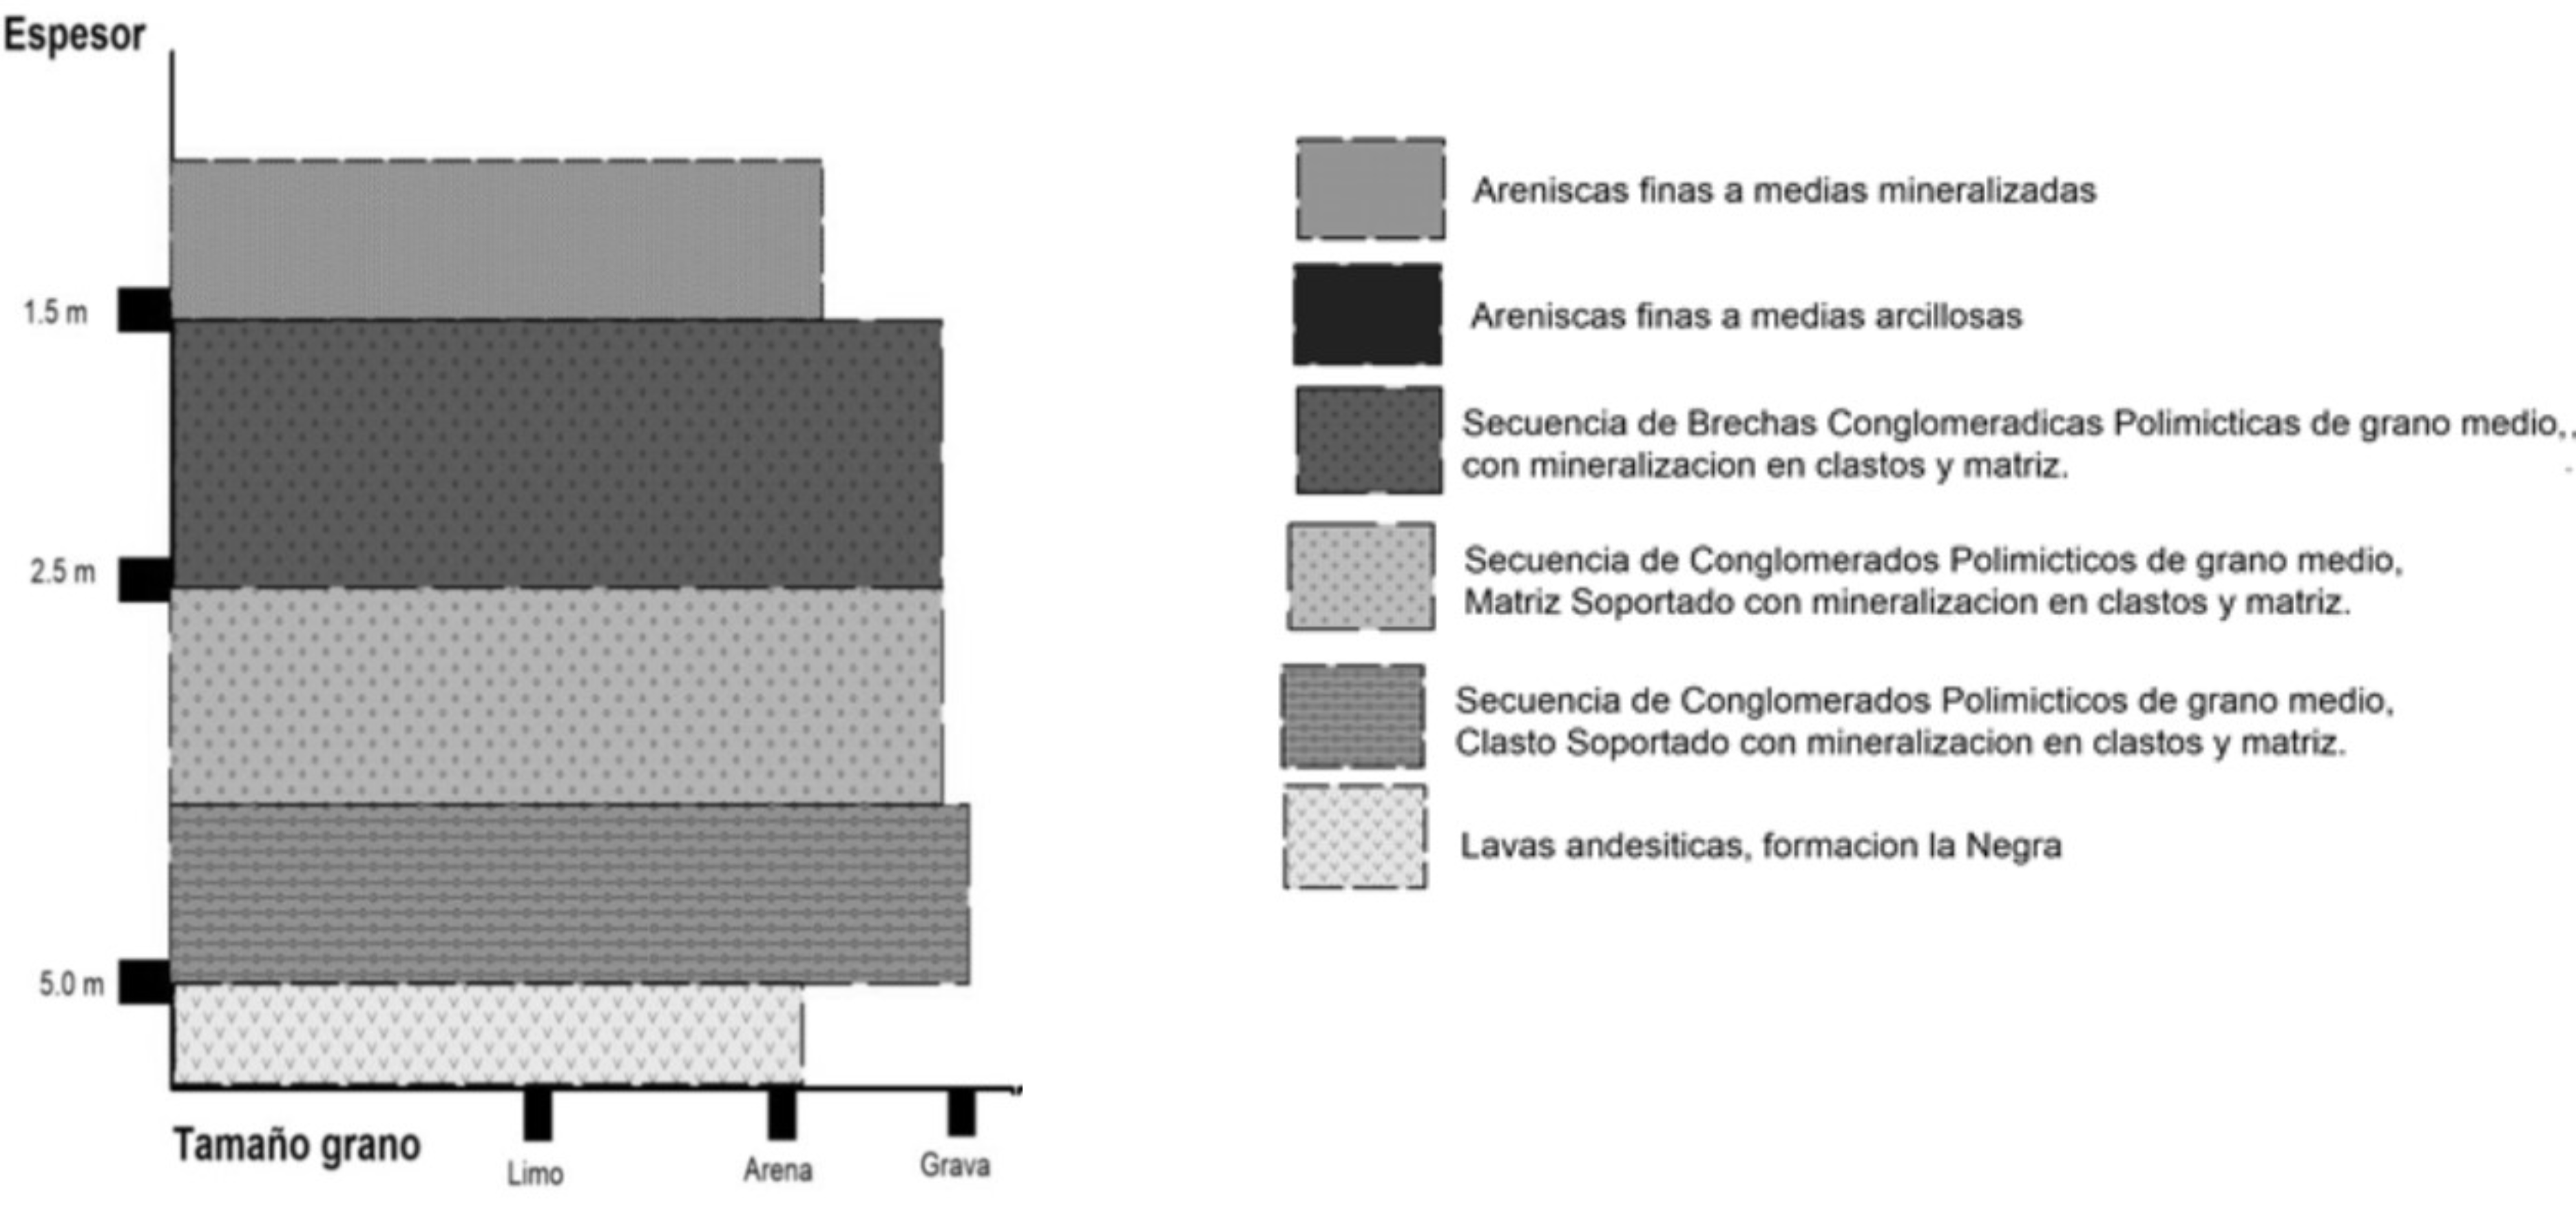 Figure 6-7. Stratigraphic Column and Stratigraphic Cross Section in the Expansion Pampa Blanca Typical Sequence , formed by a Level of Fine Sandstones, Over a Sequence of Conglomerate Breccias and Conglomerates.
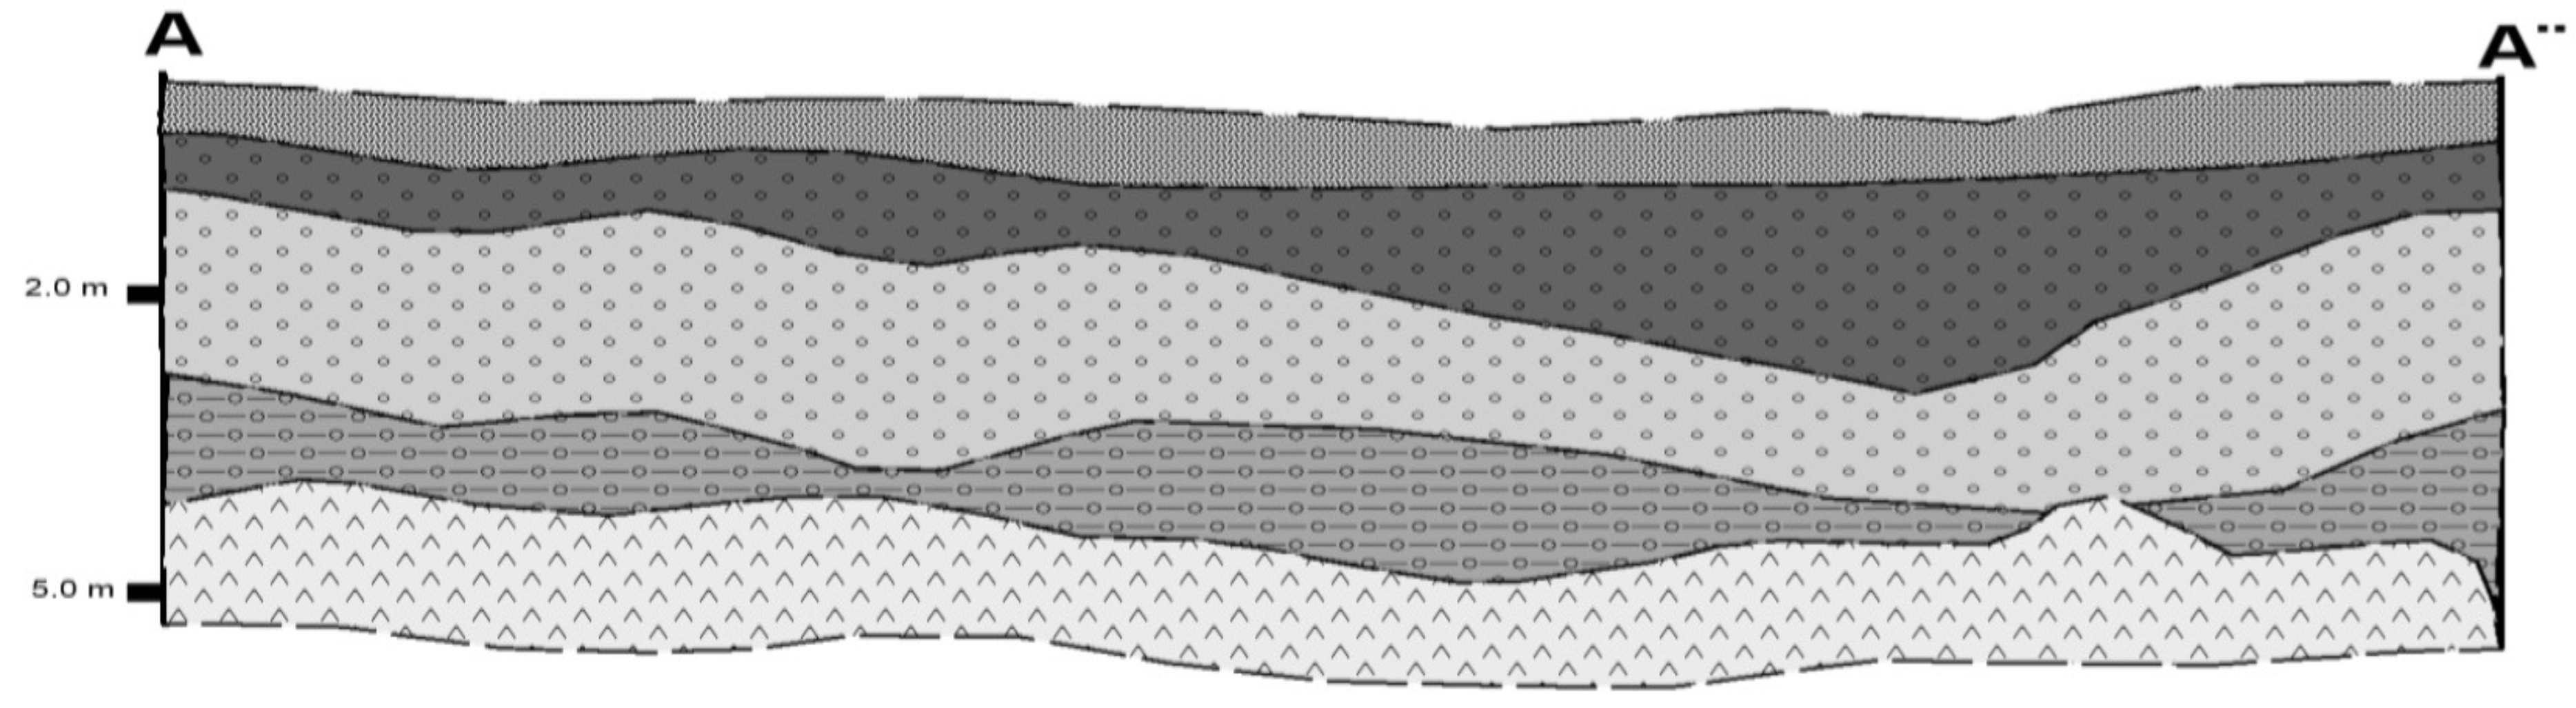
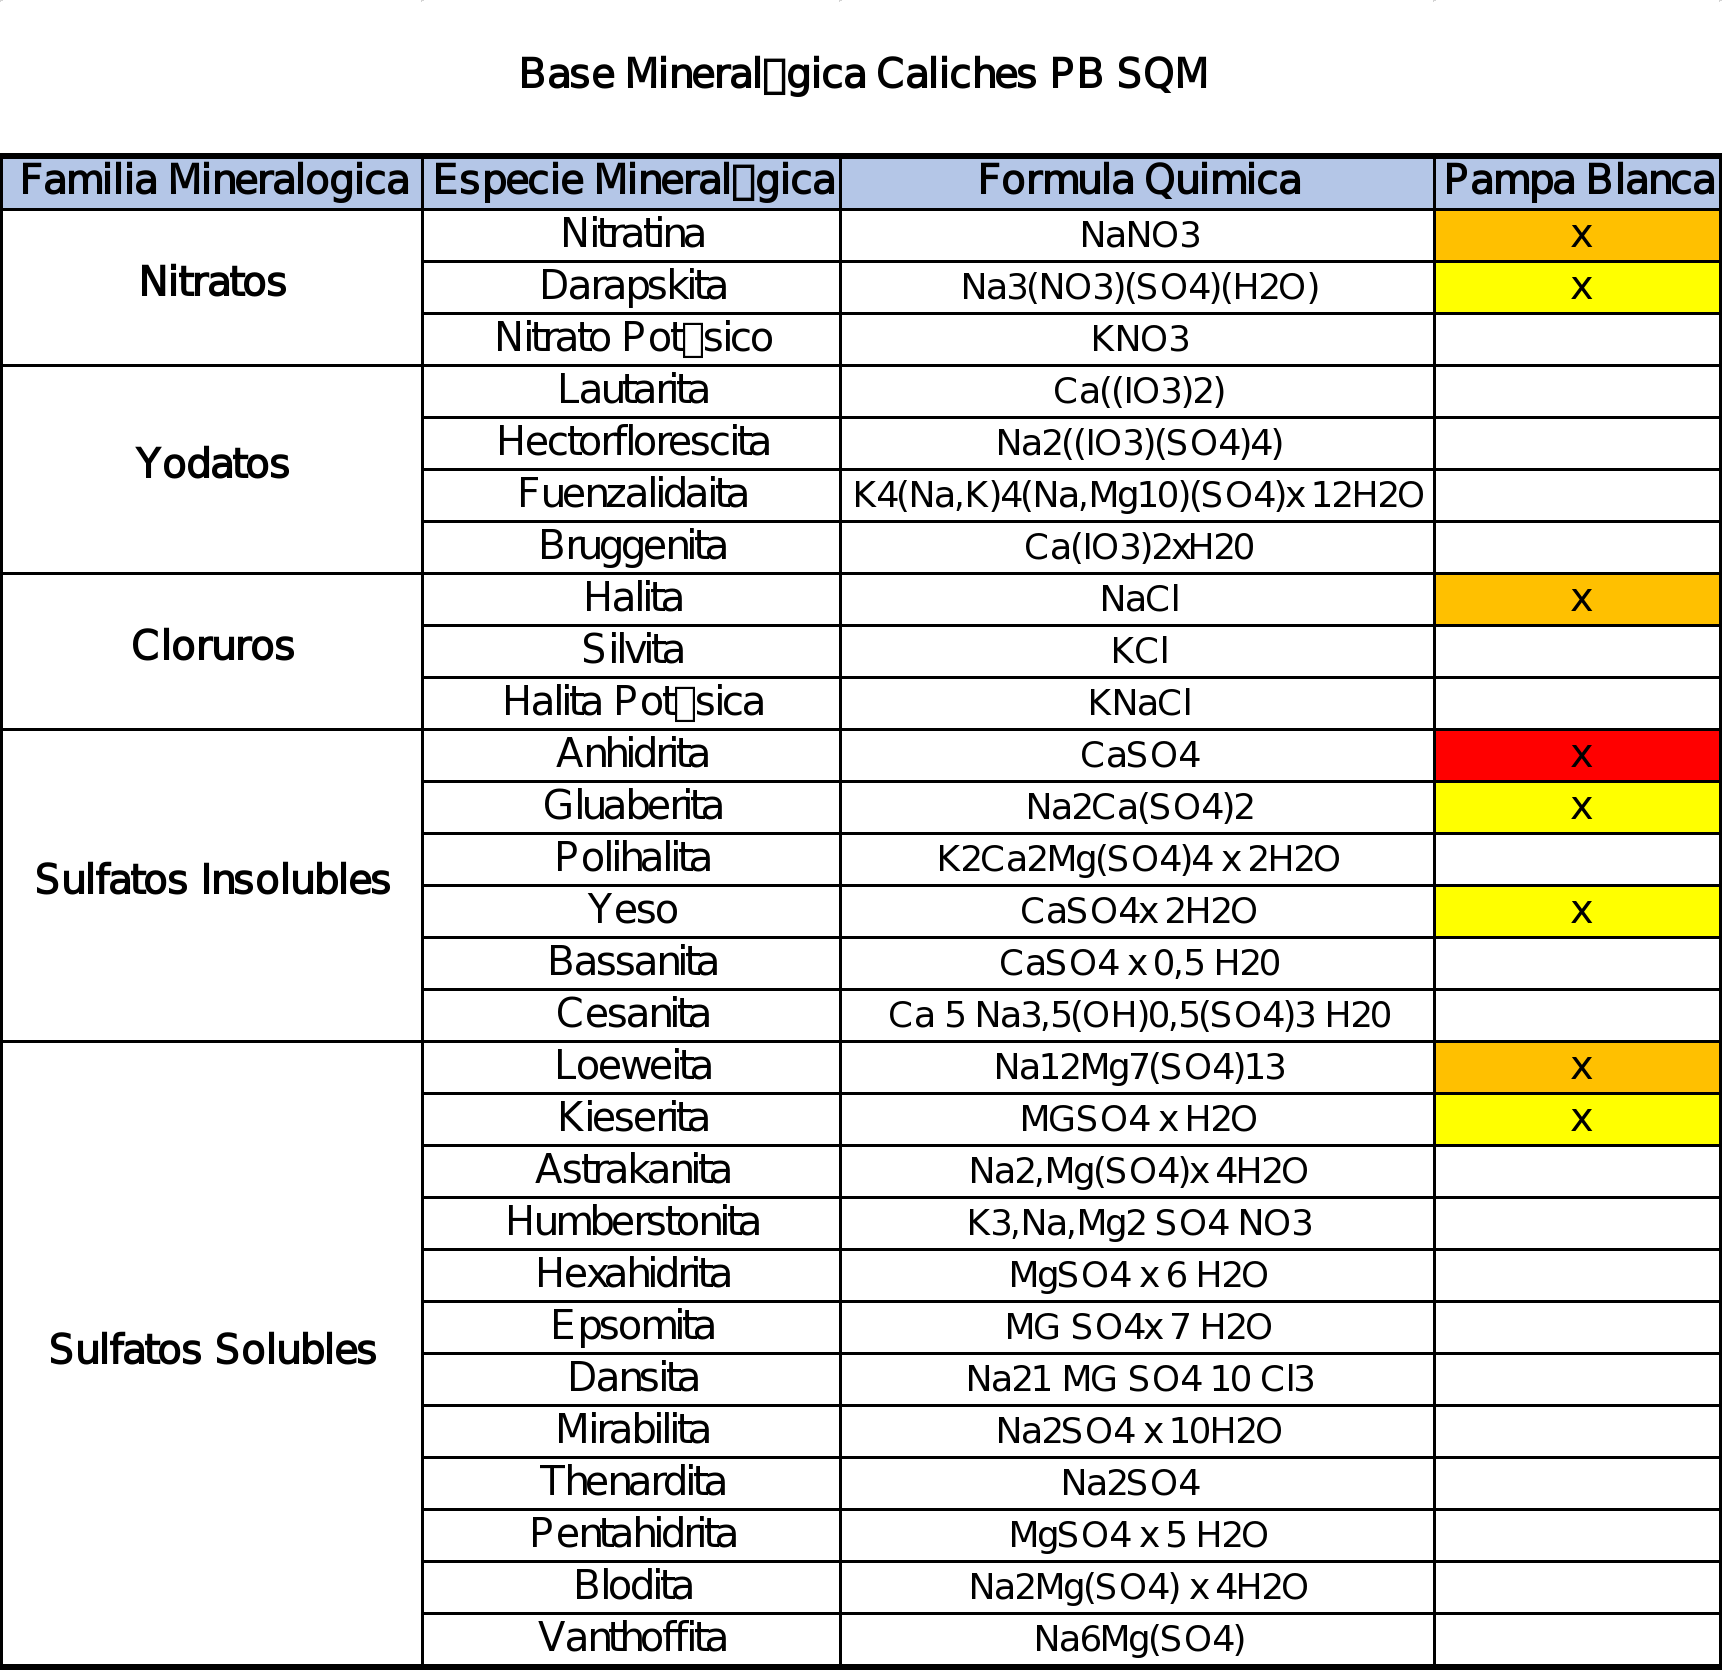
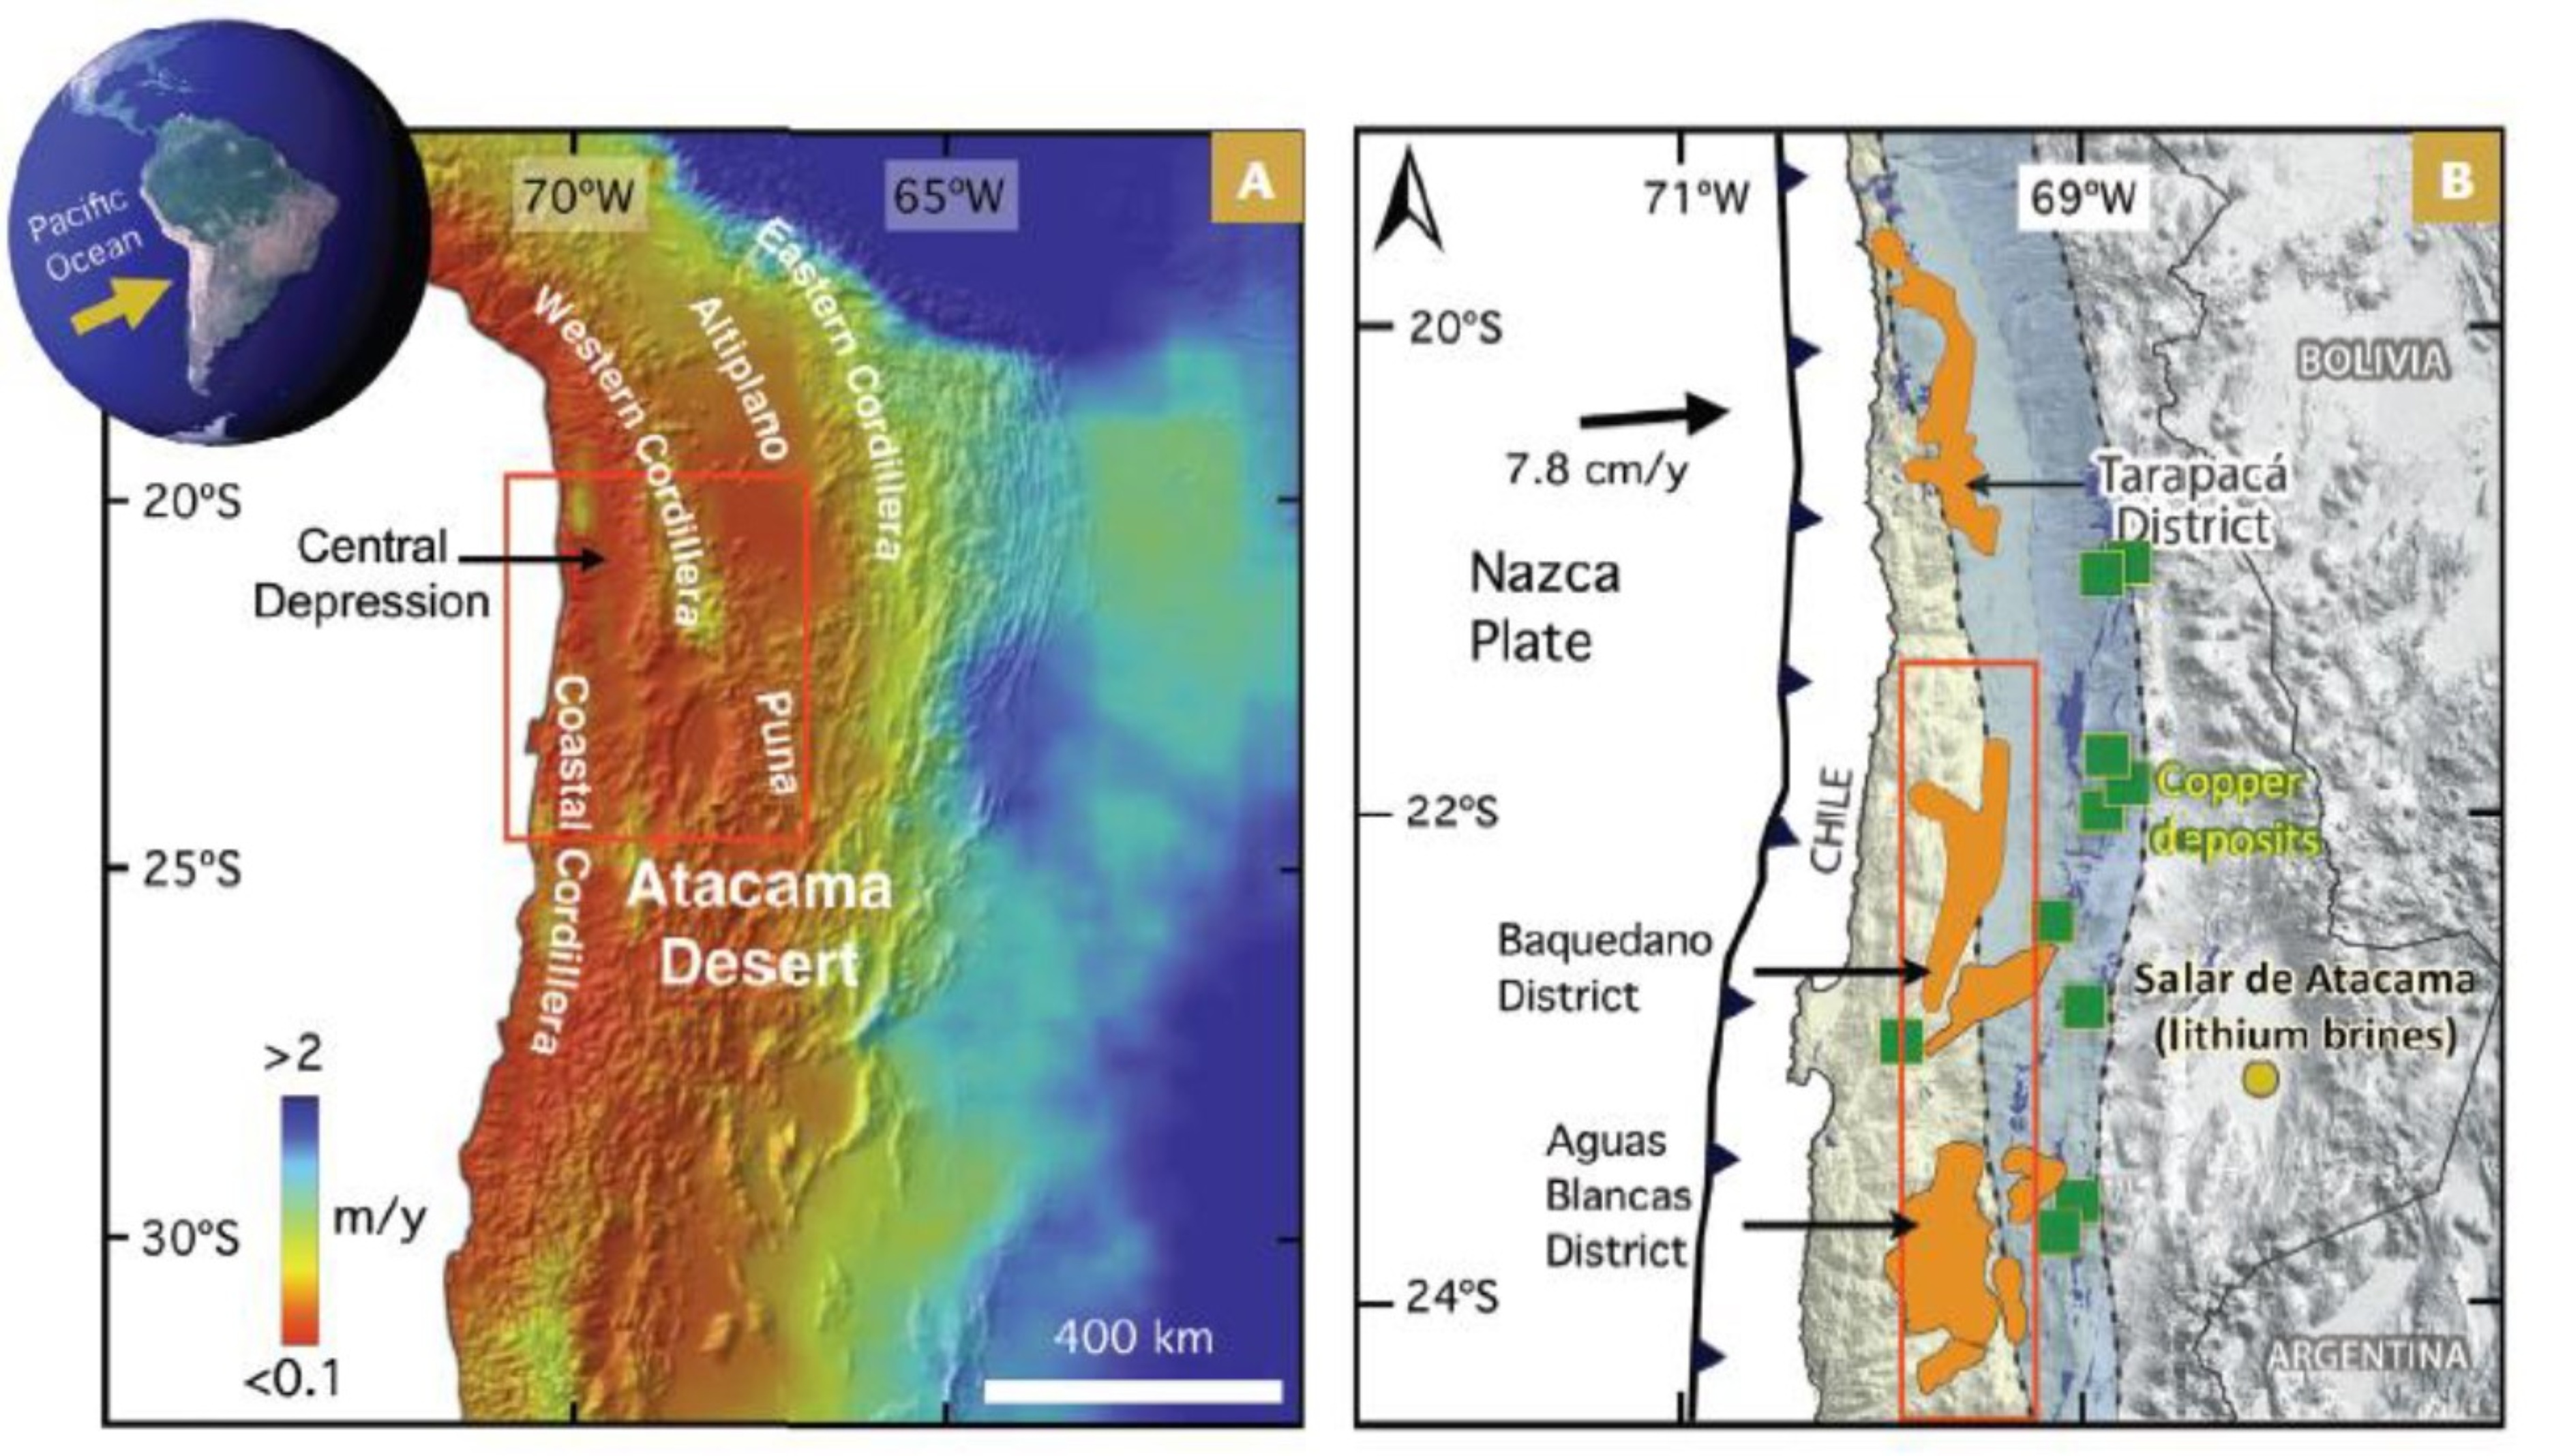

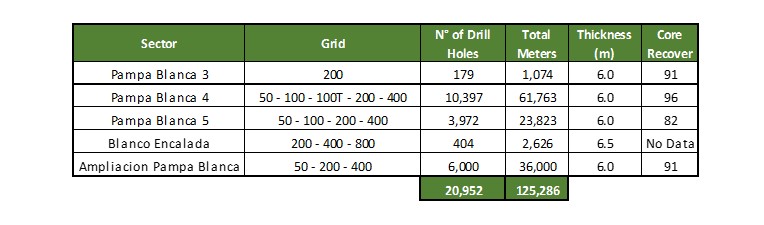
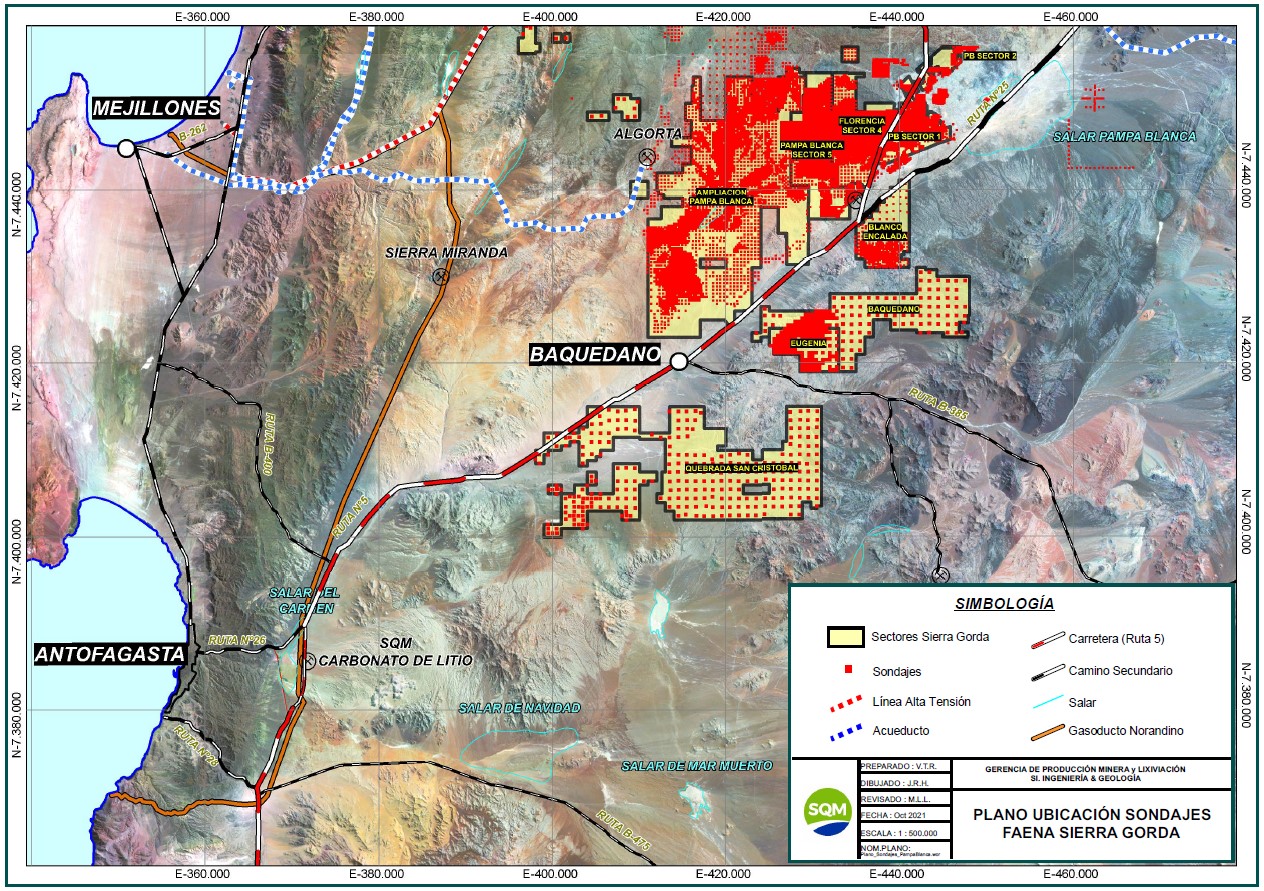
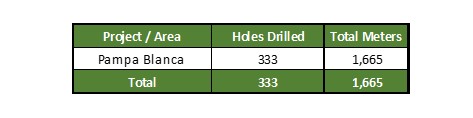
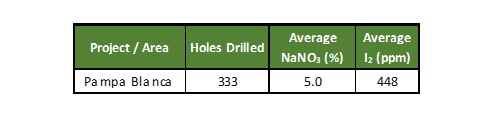
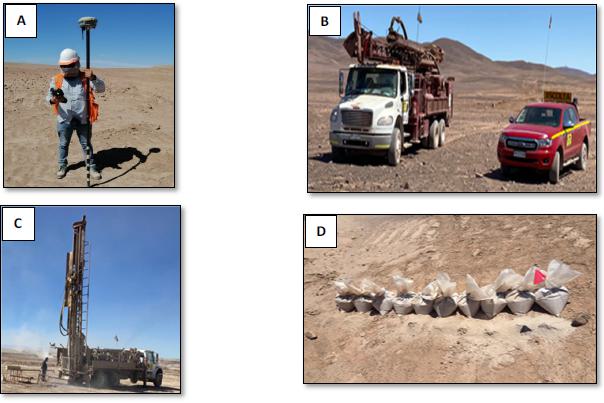
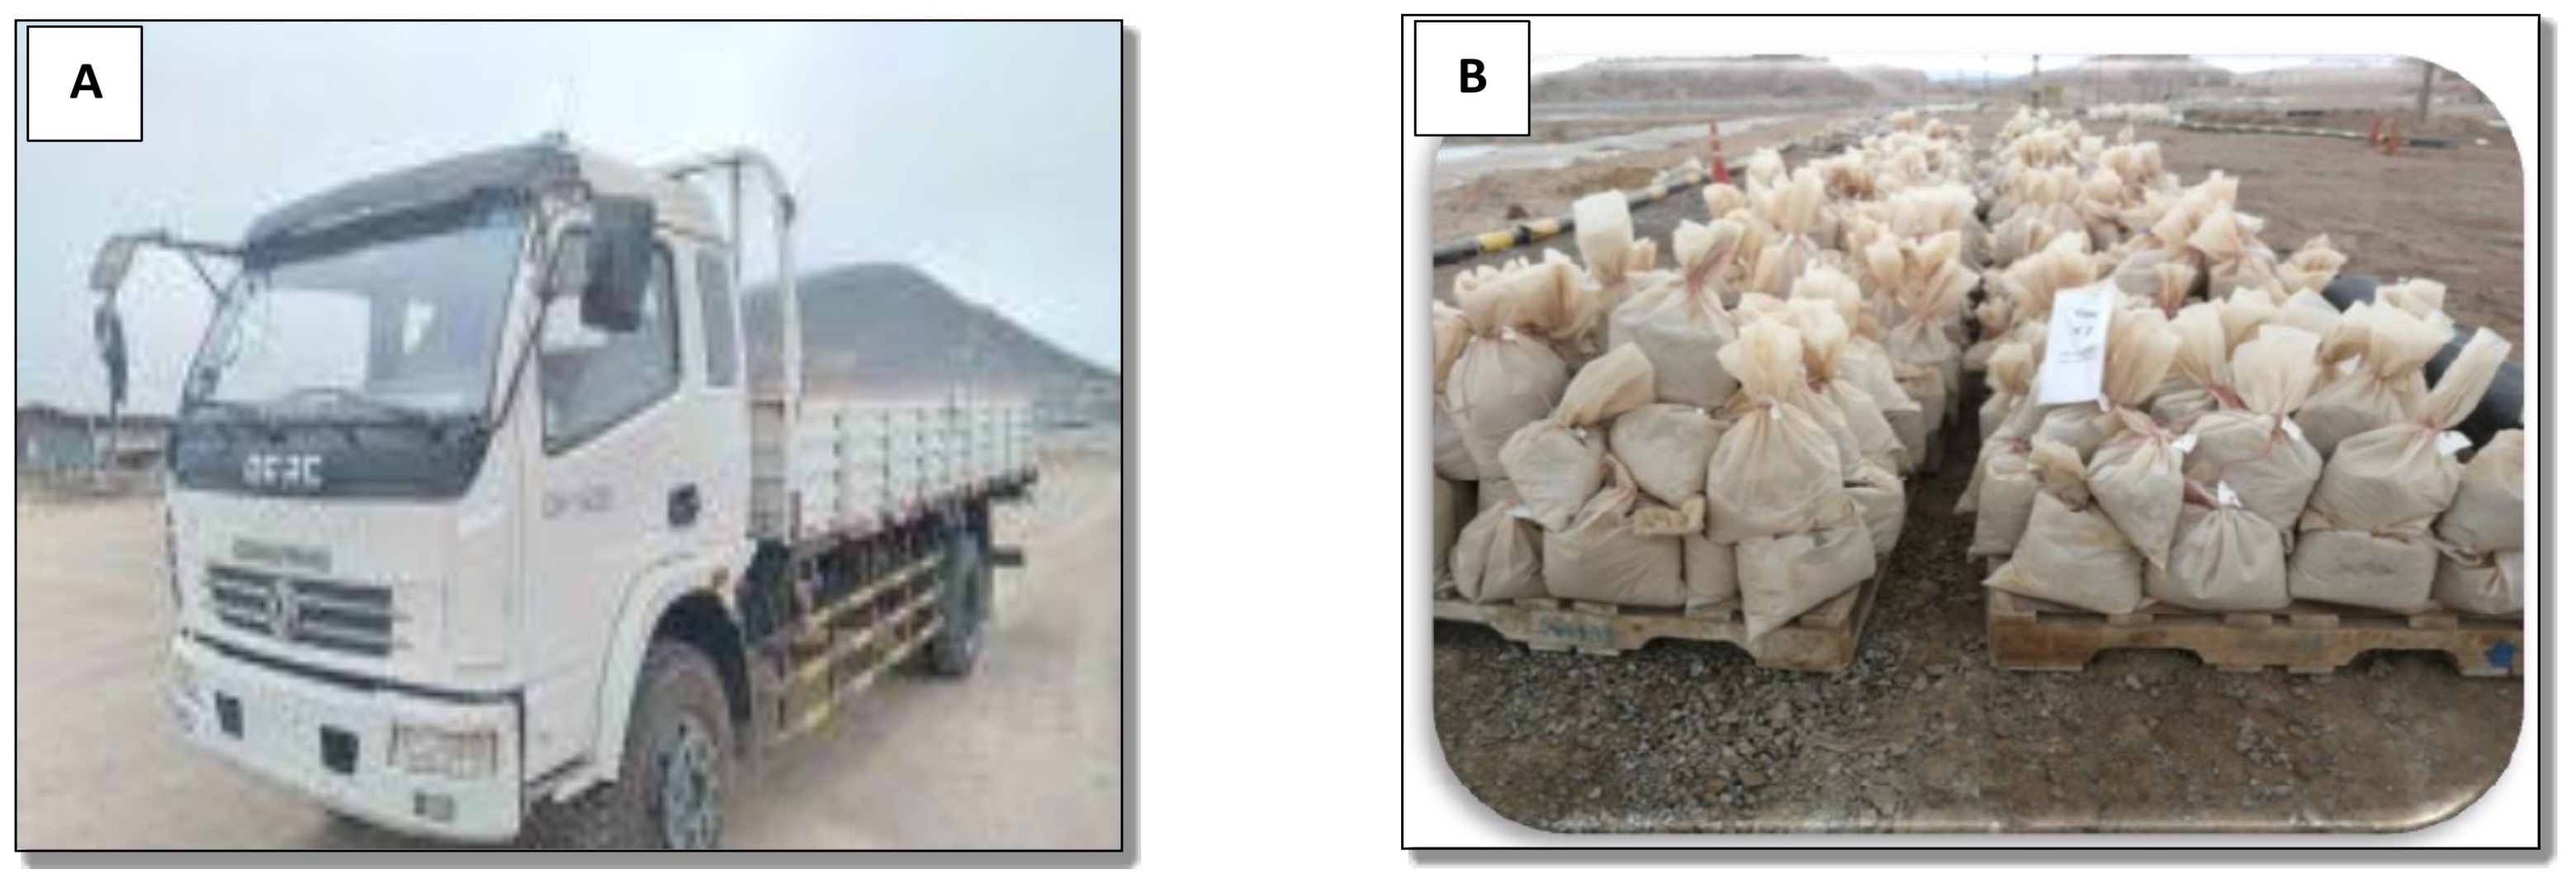
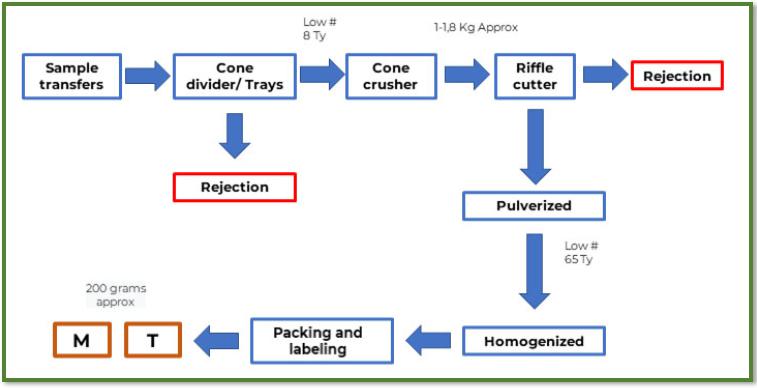
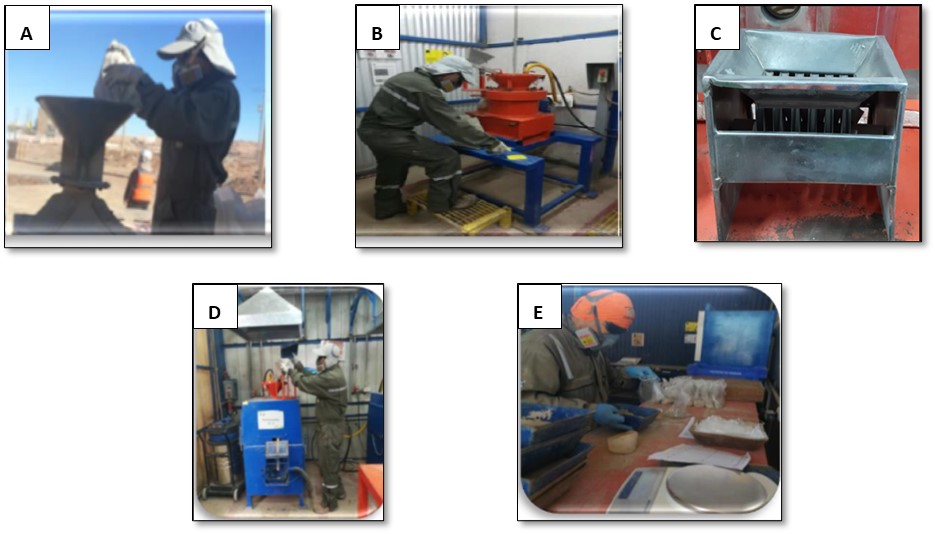
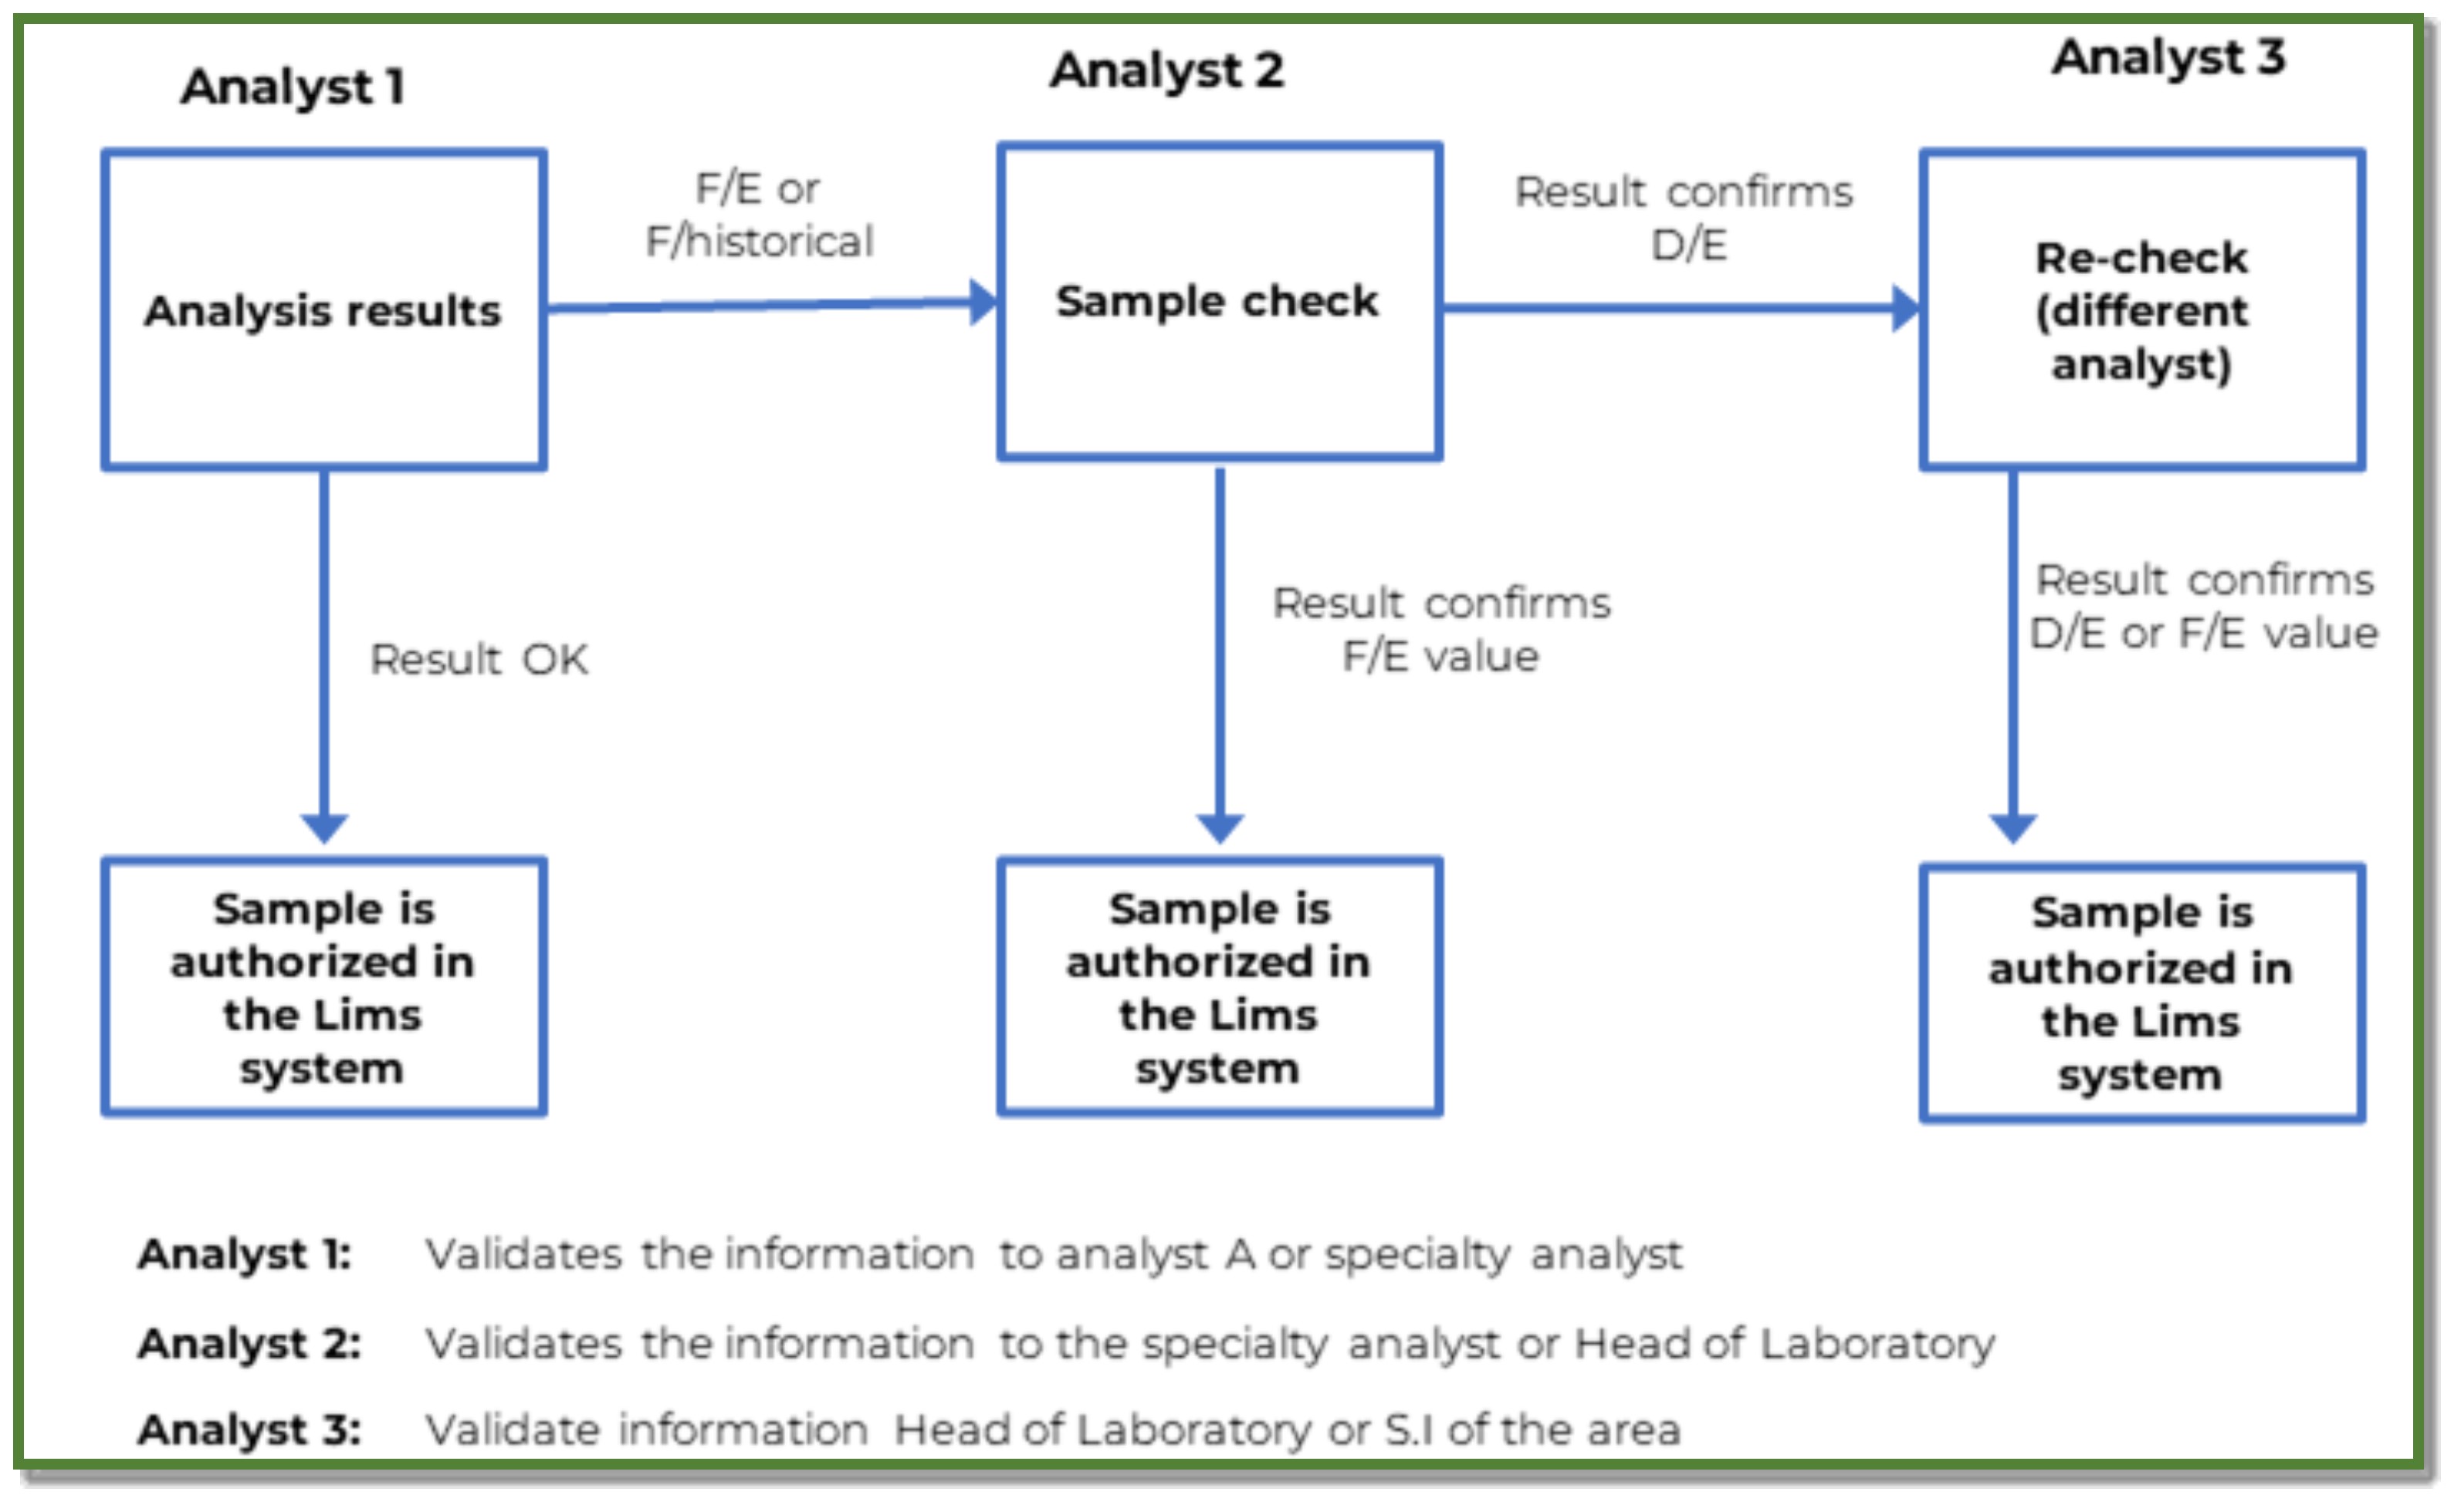
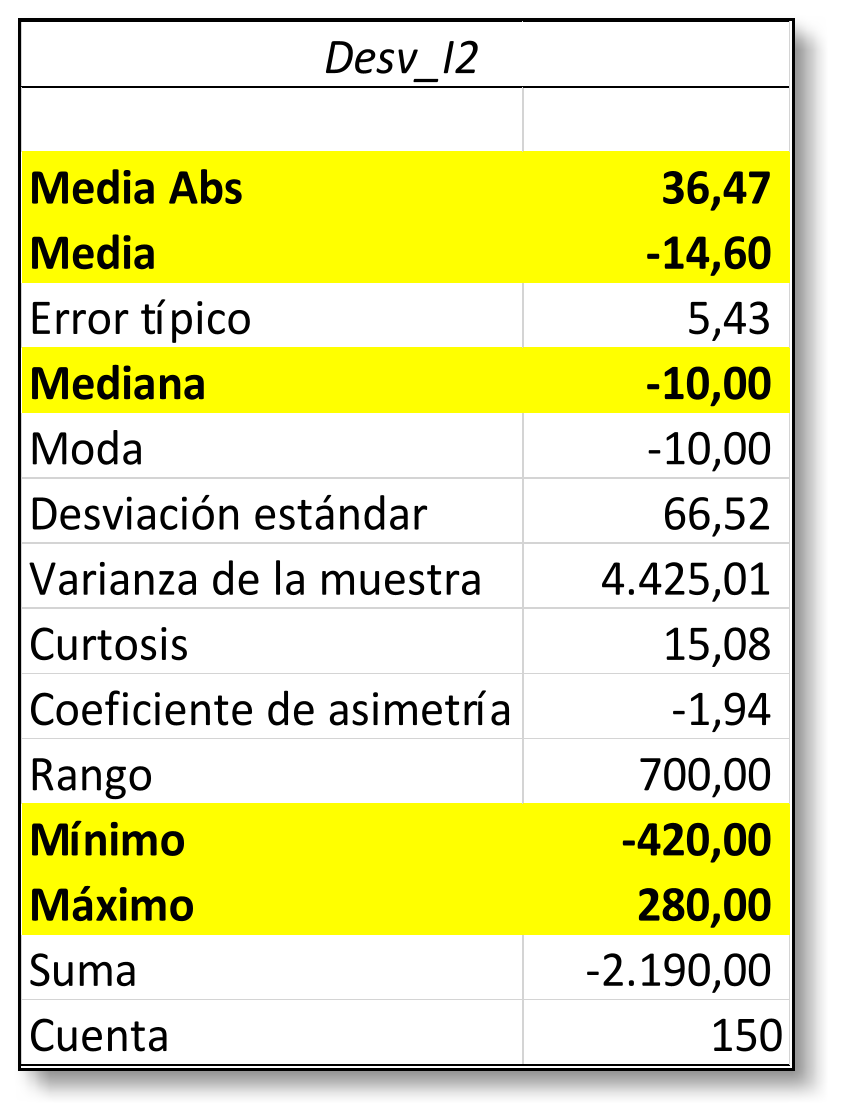
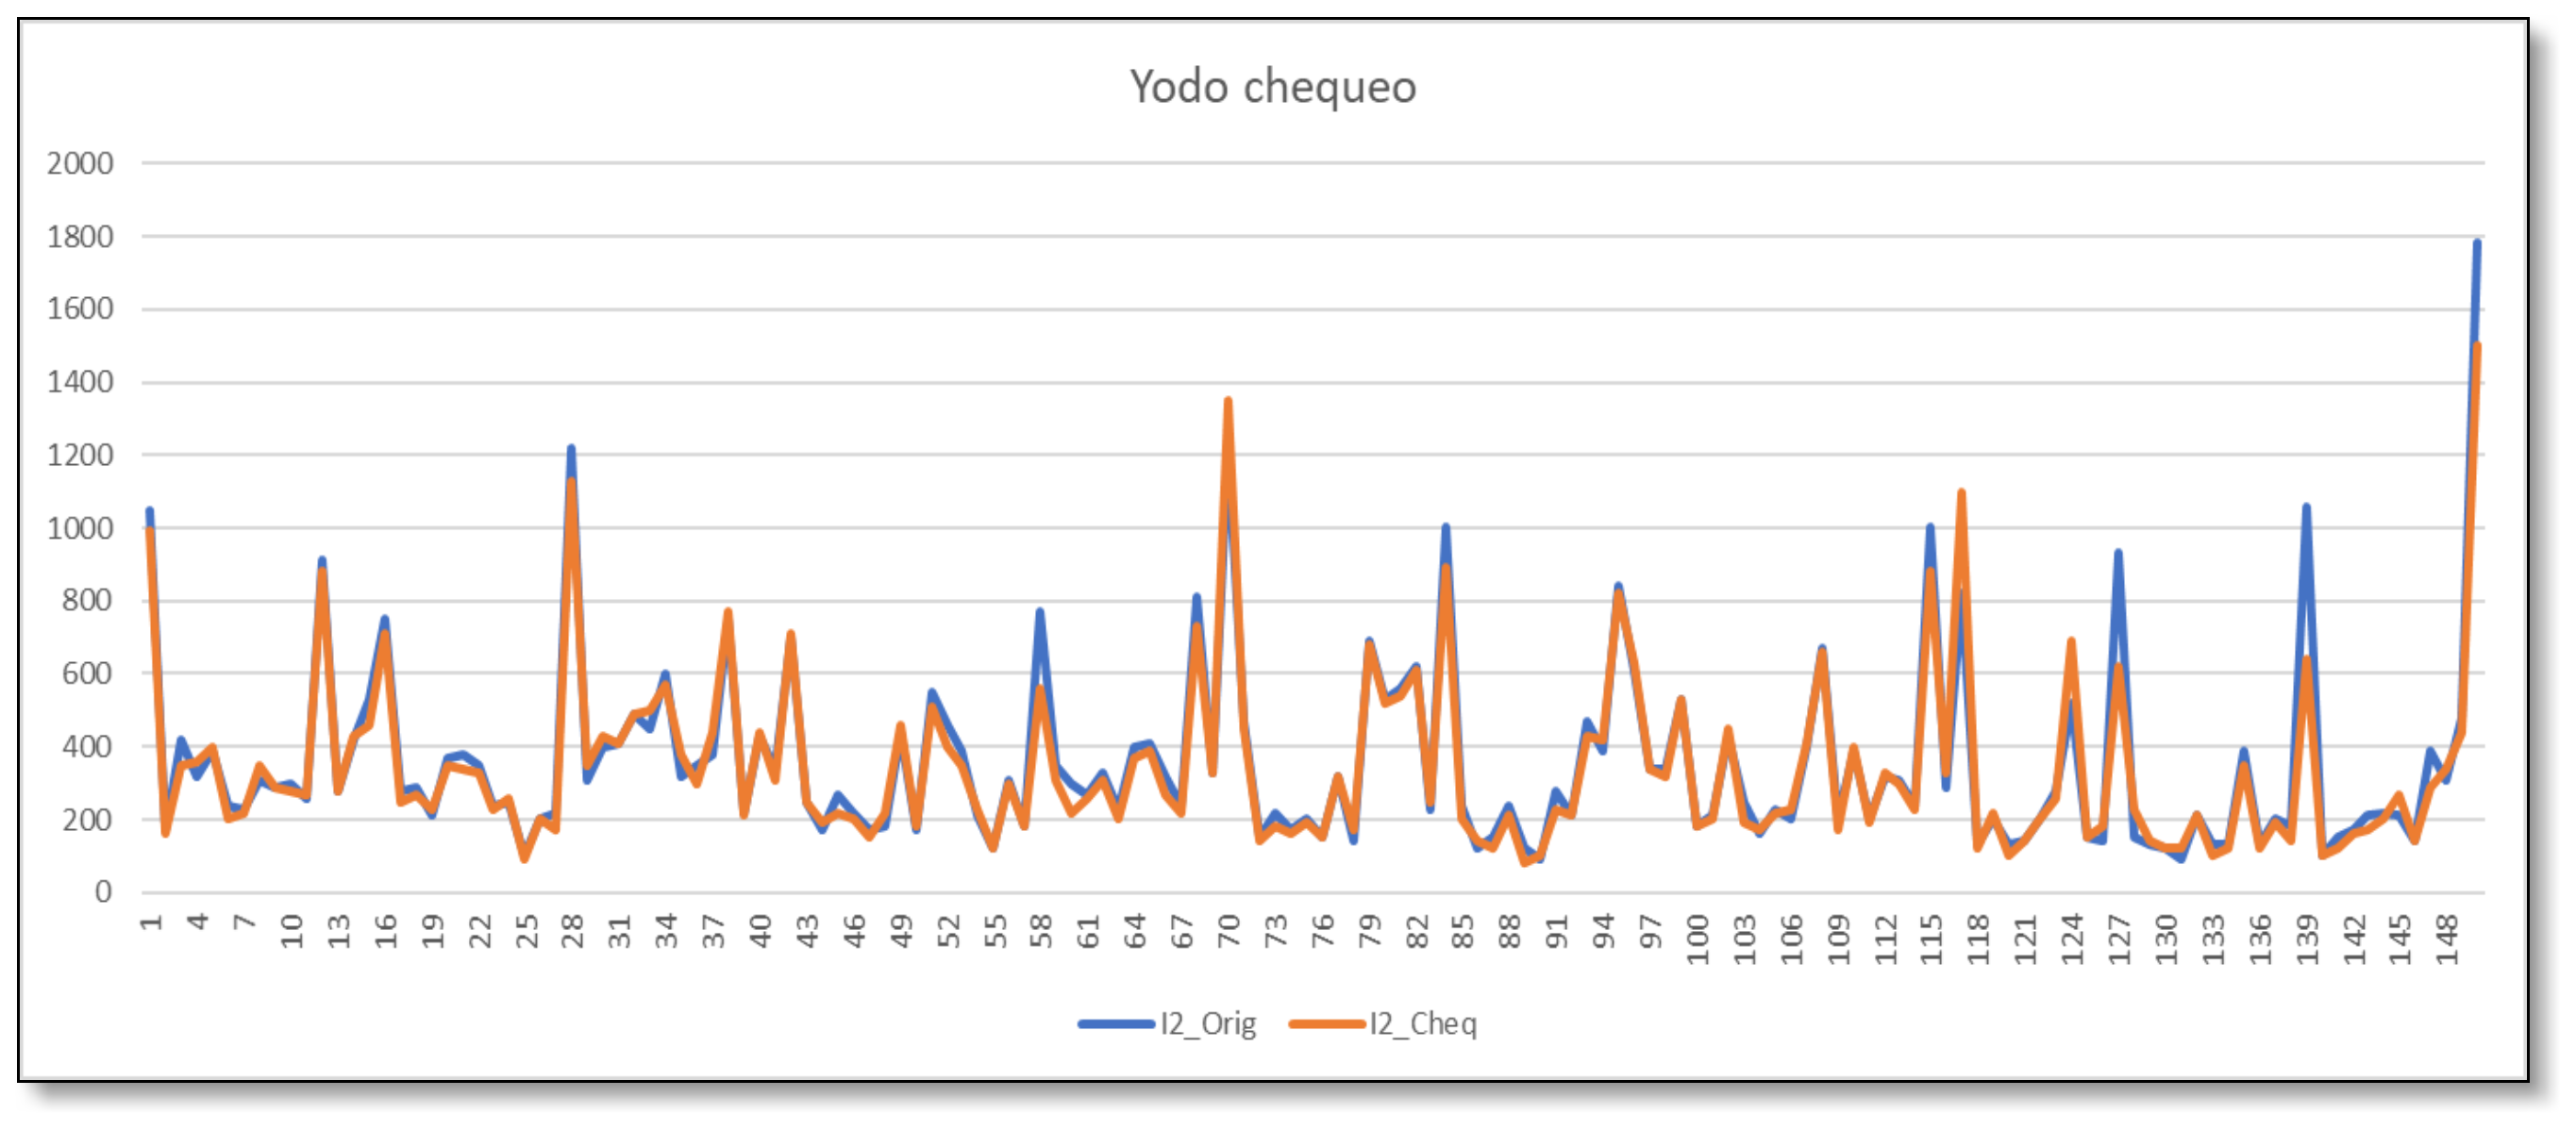
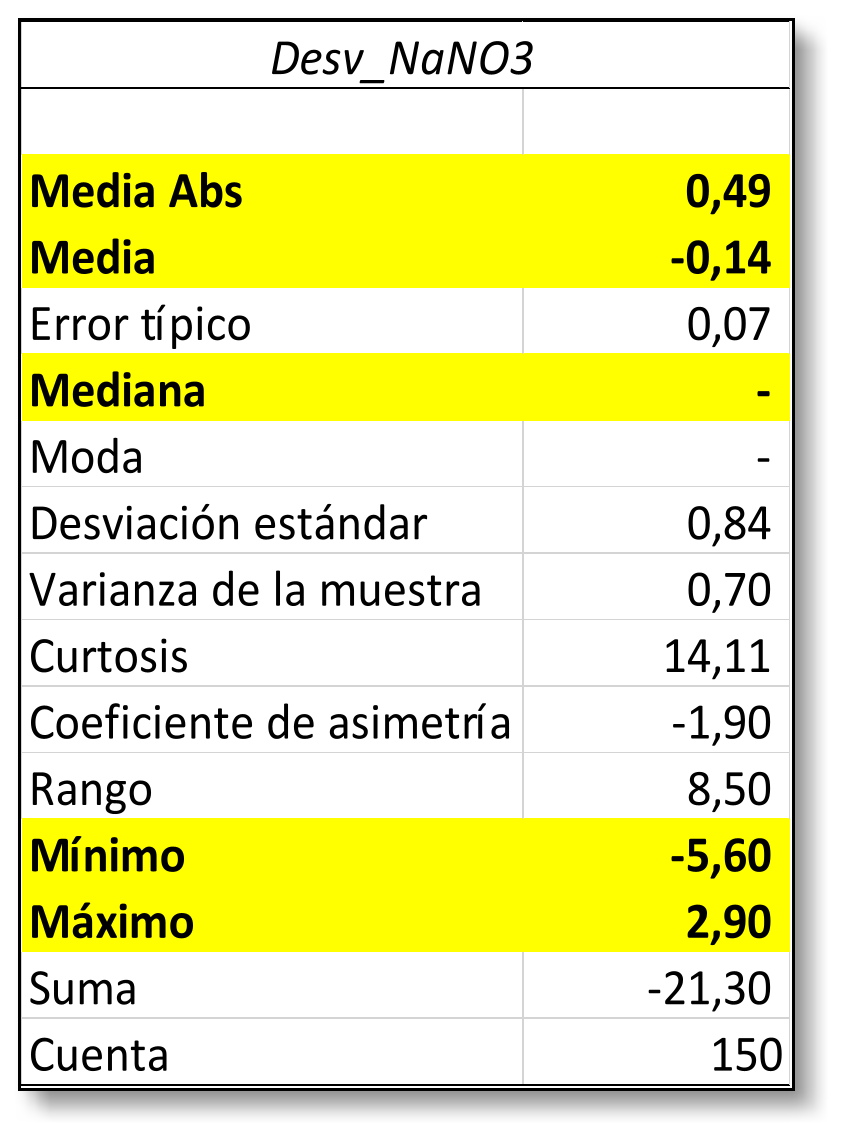
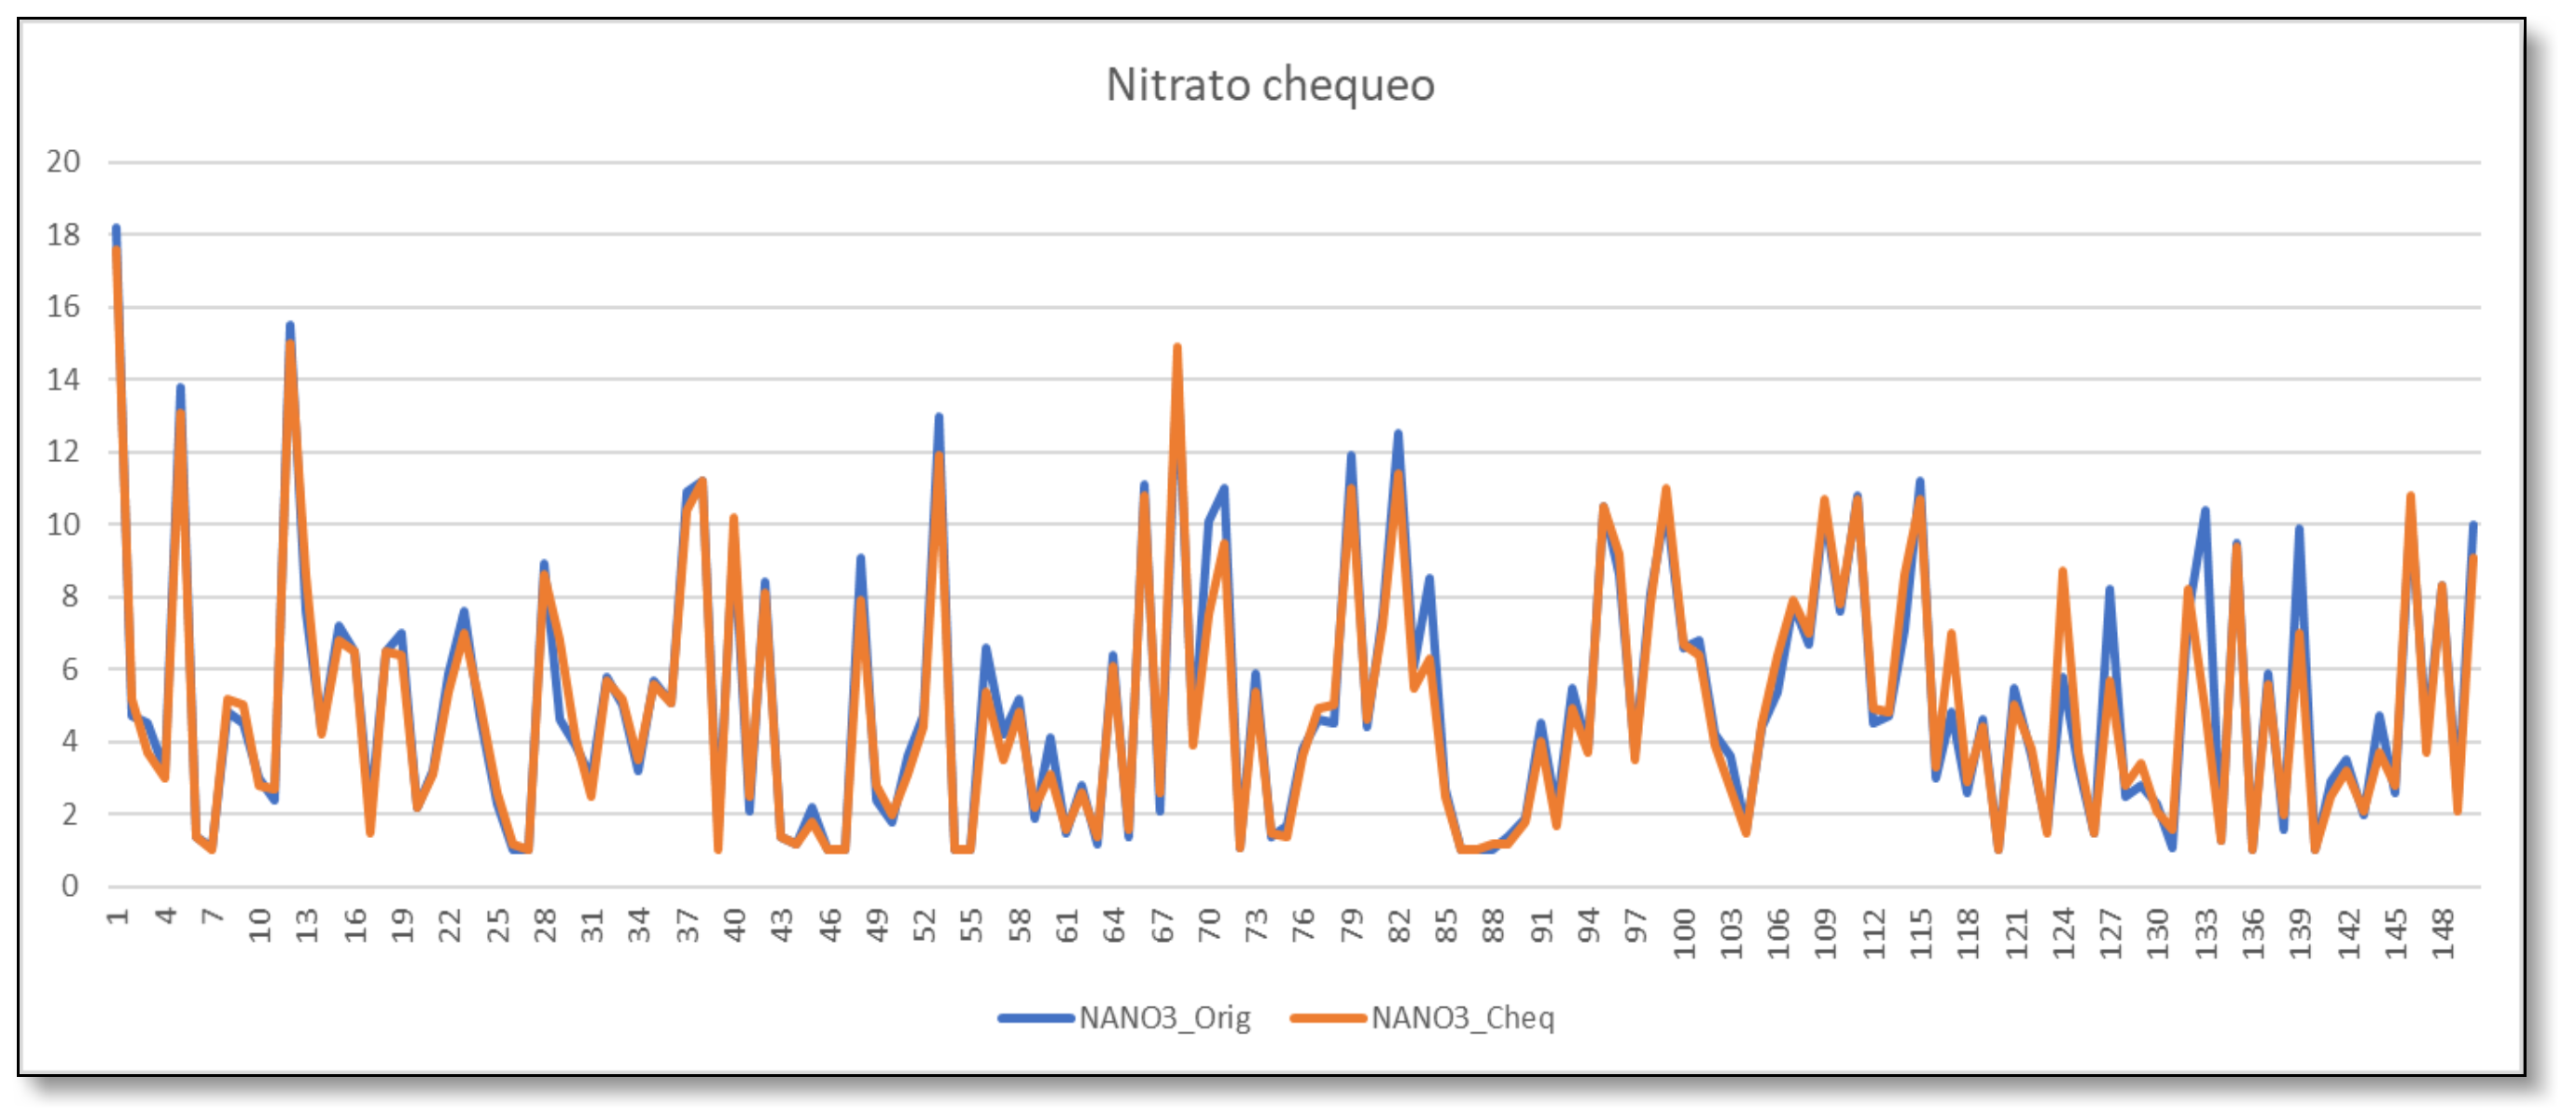
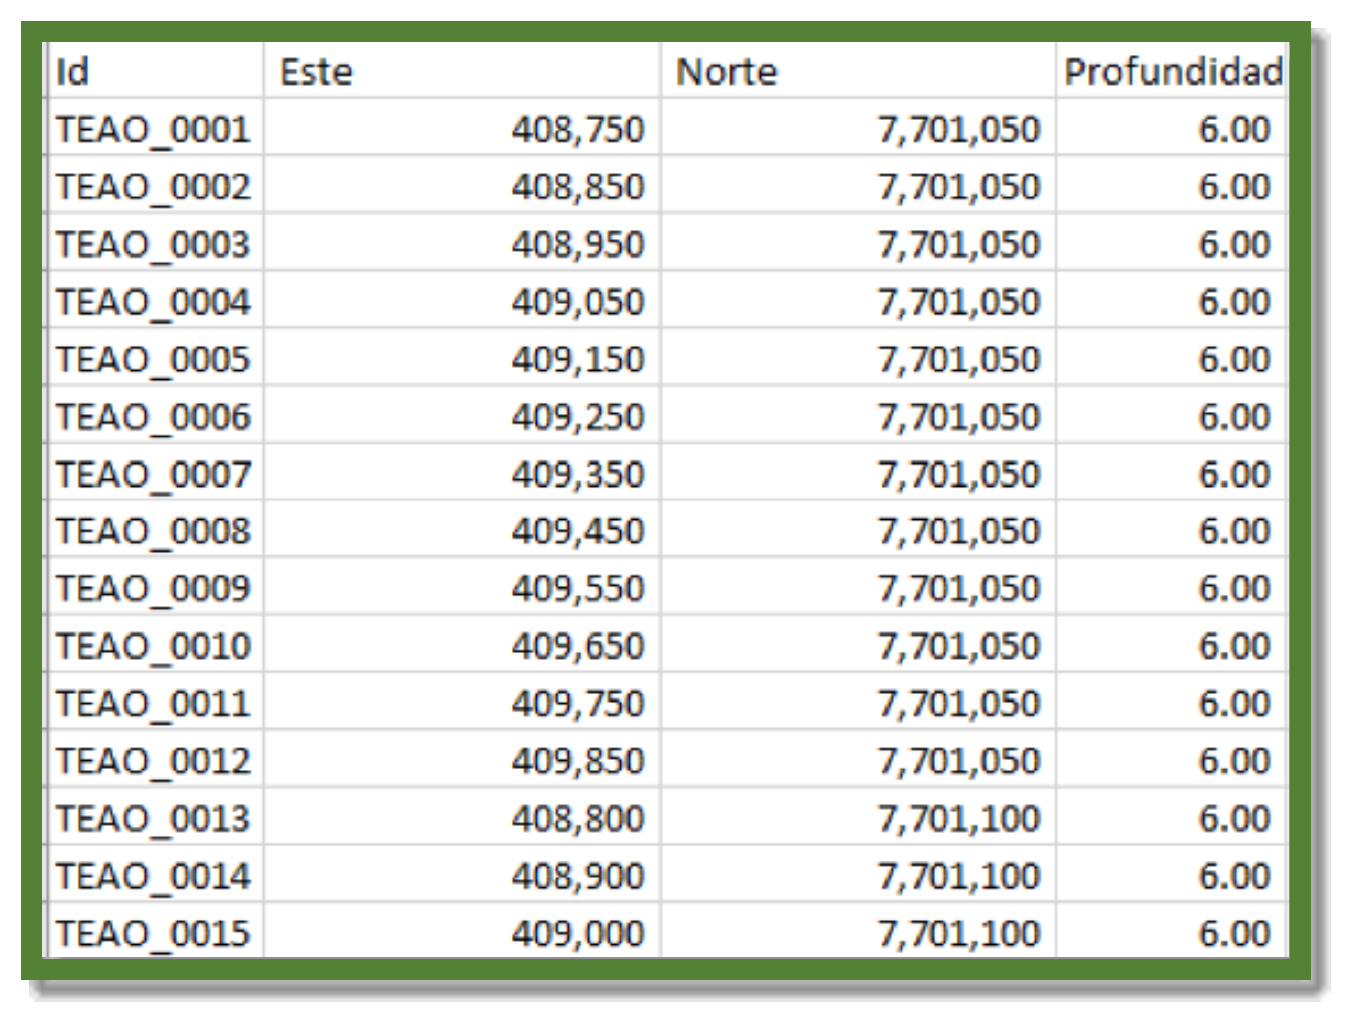

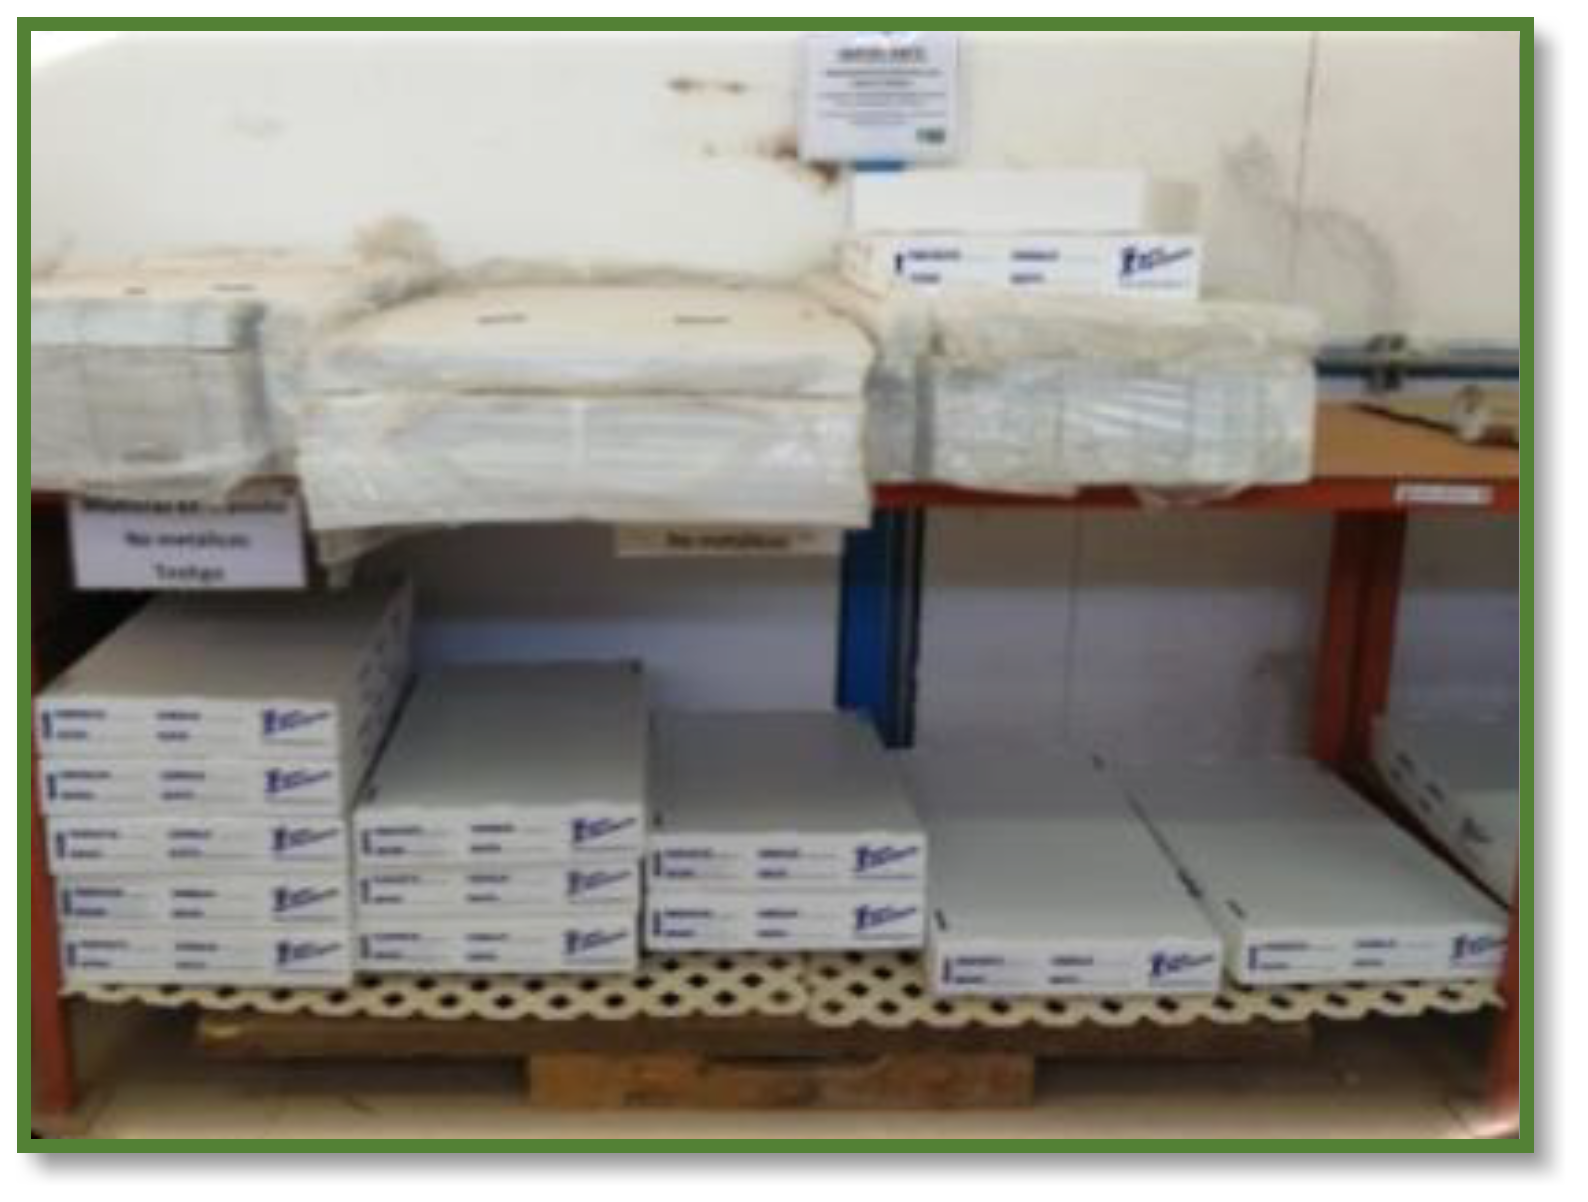

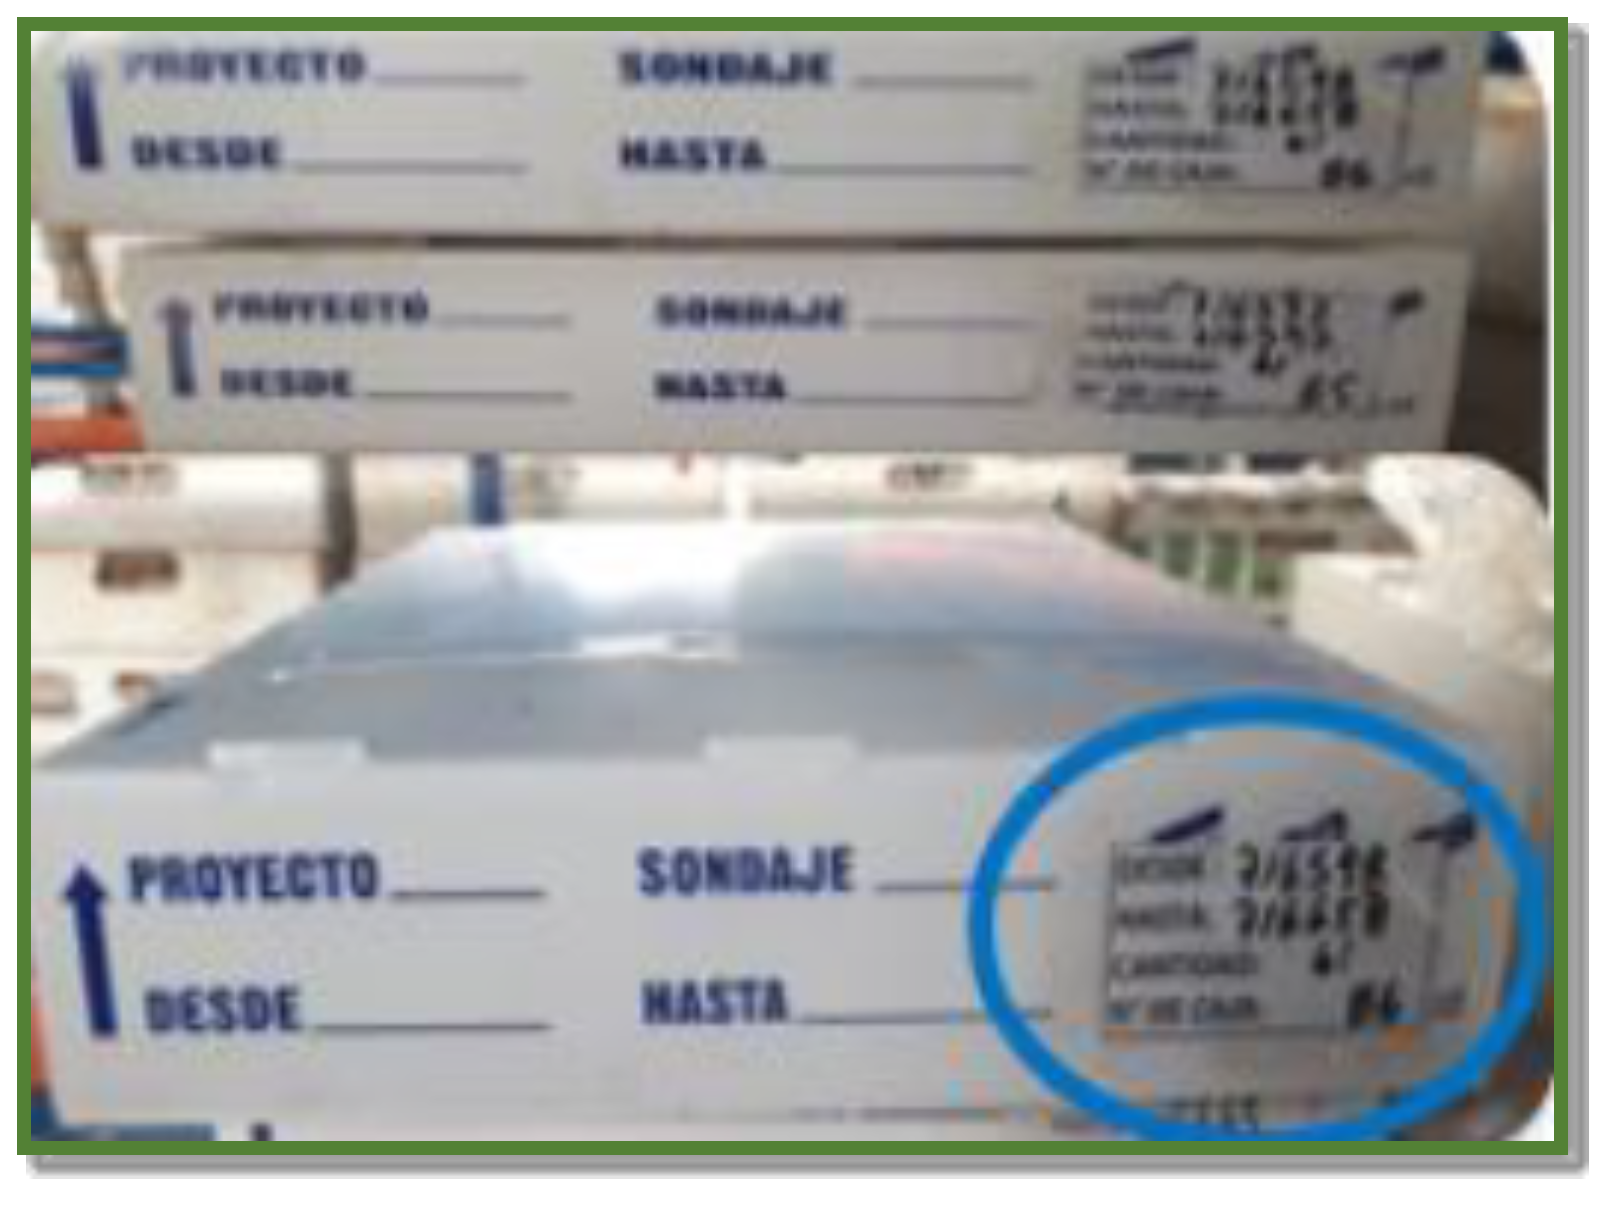


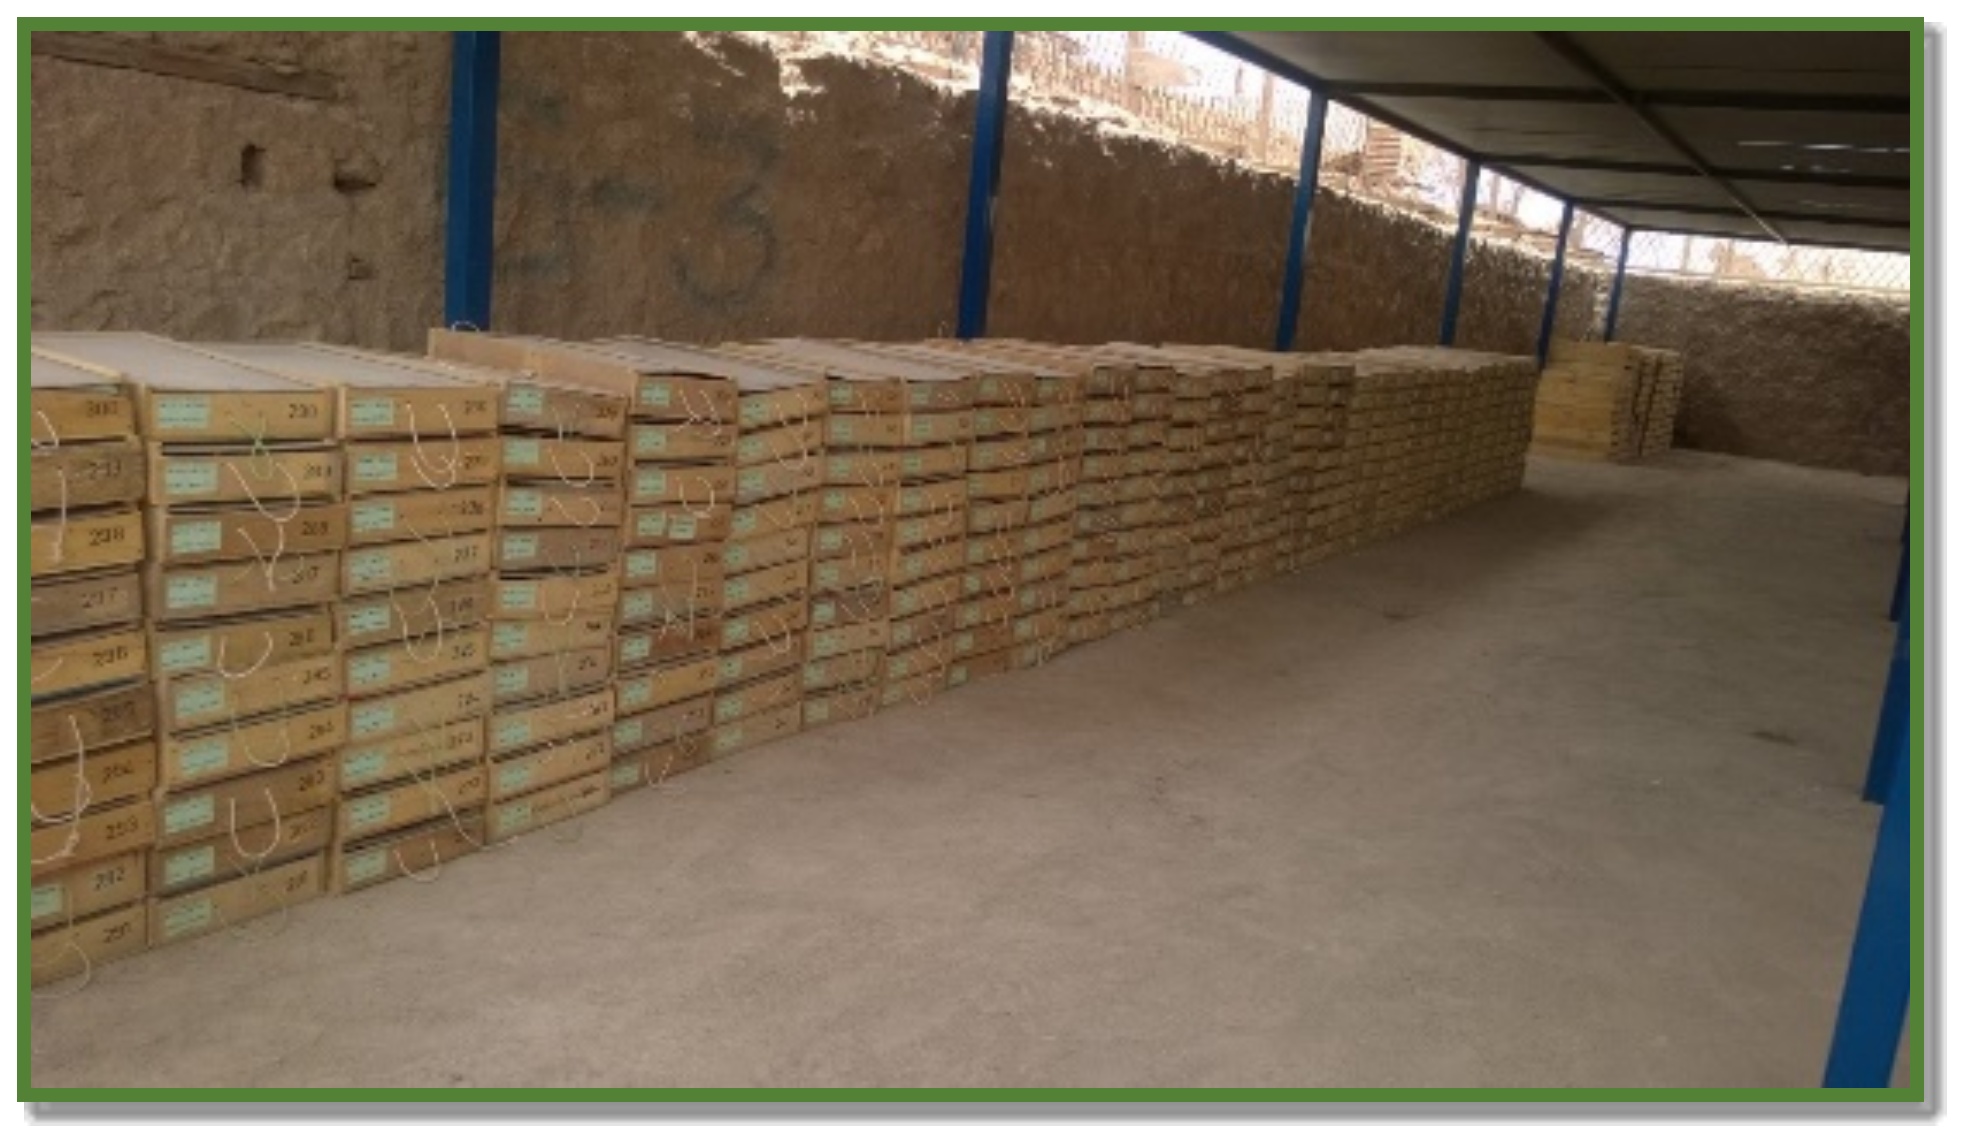
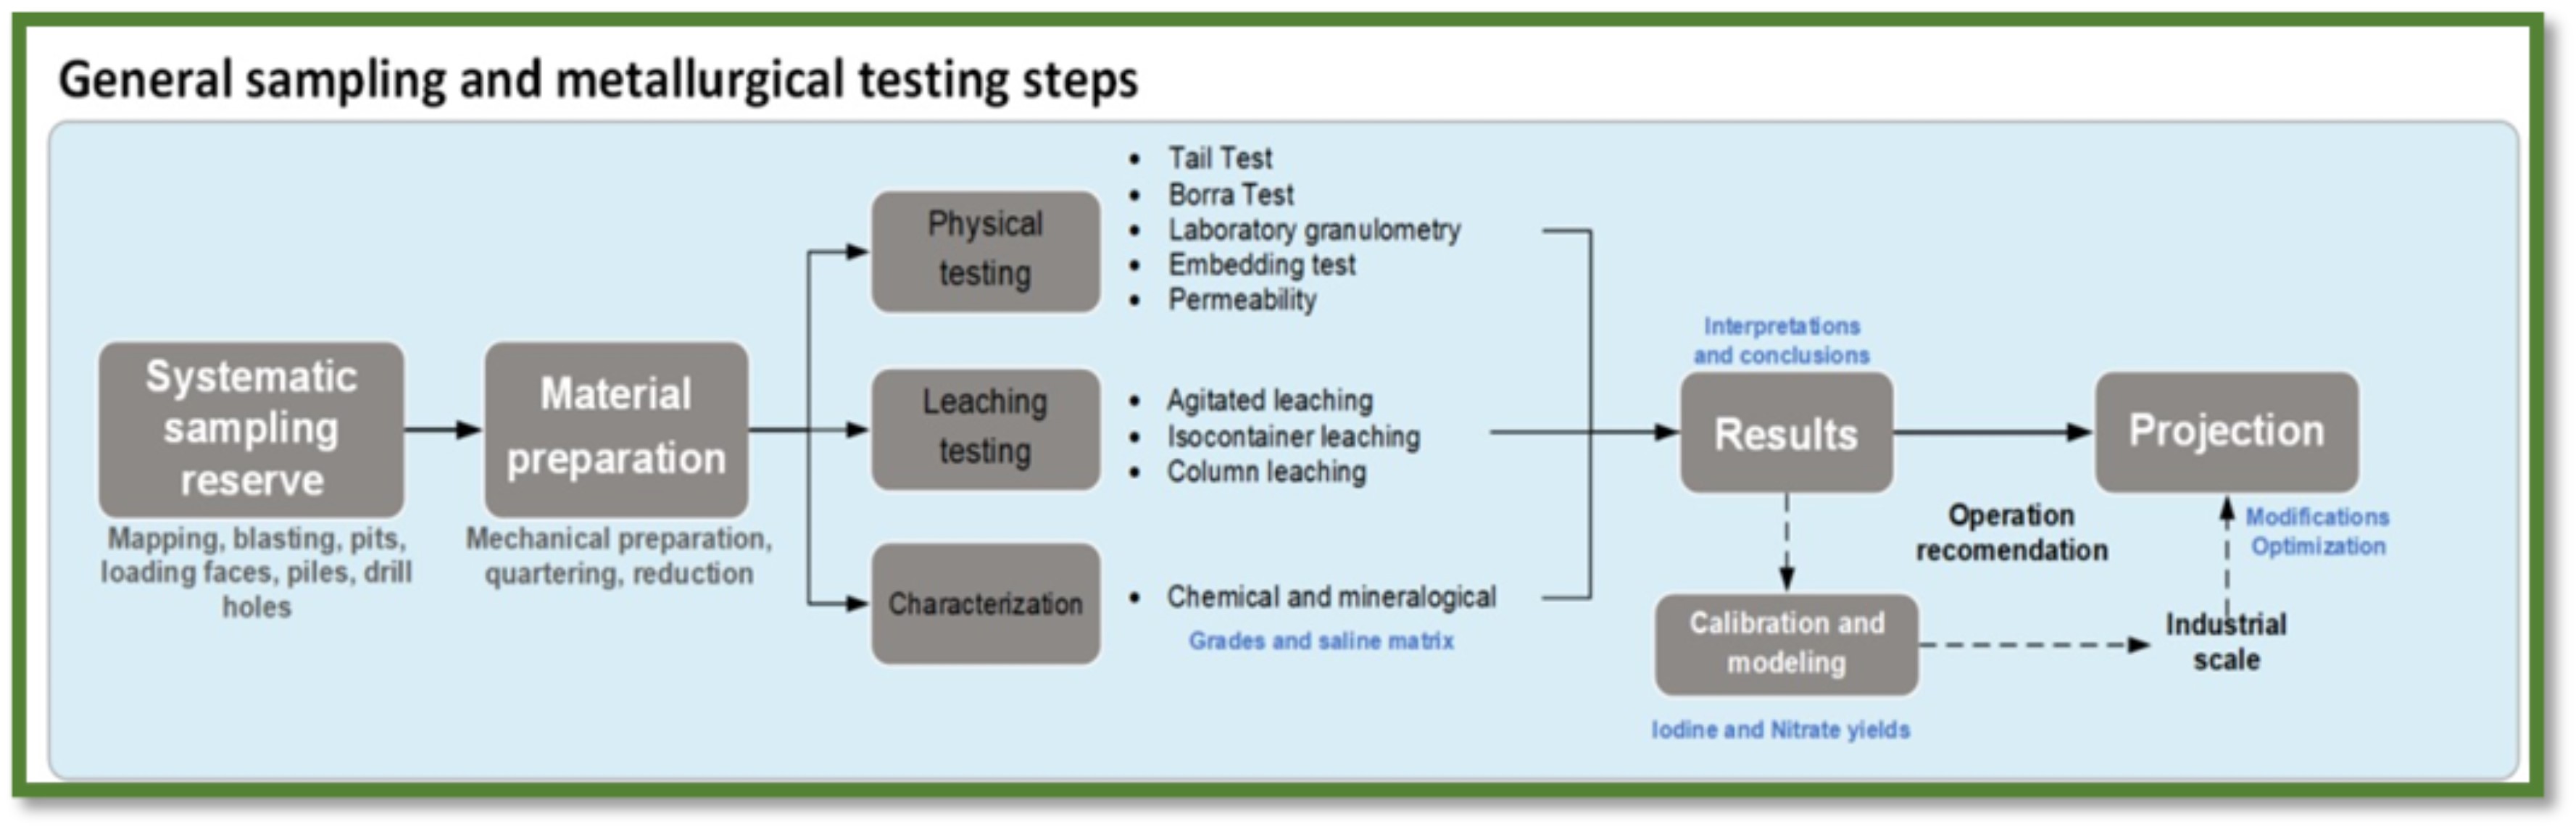
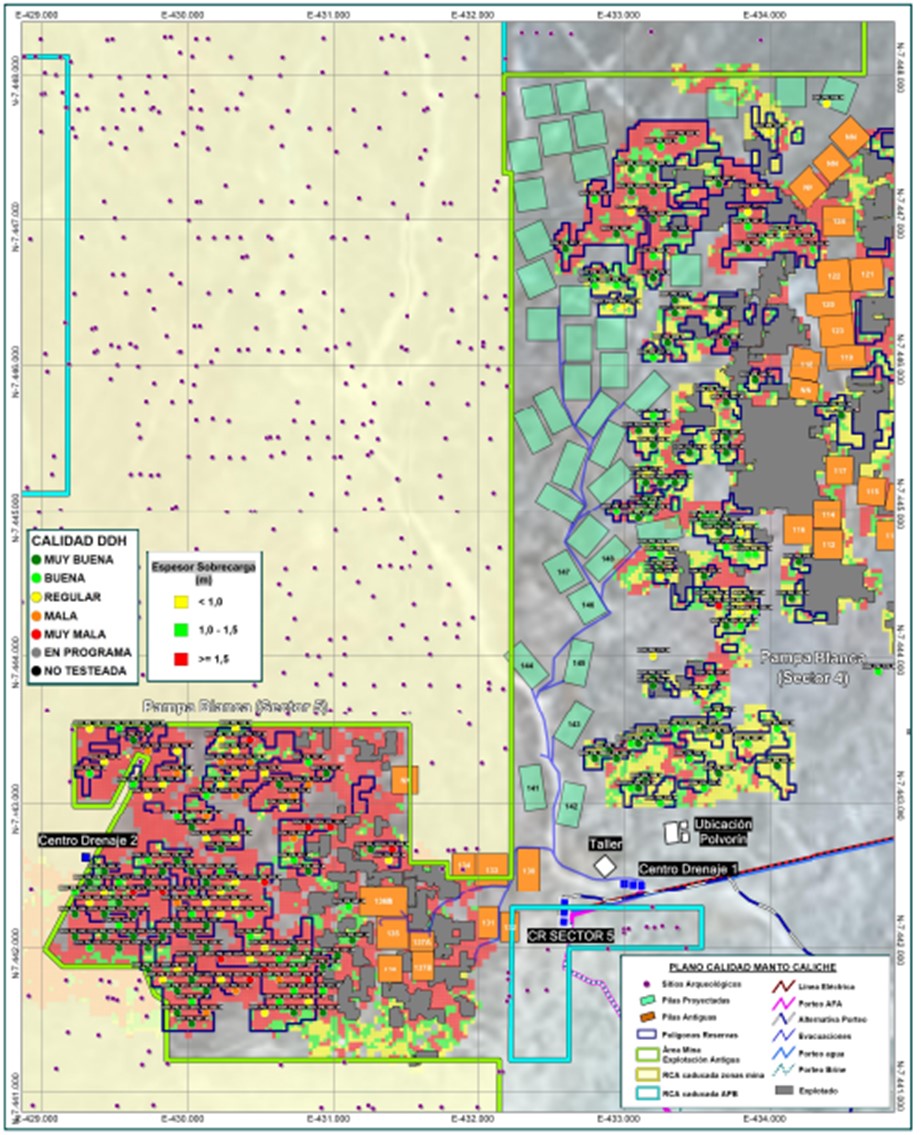
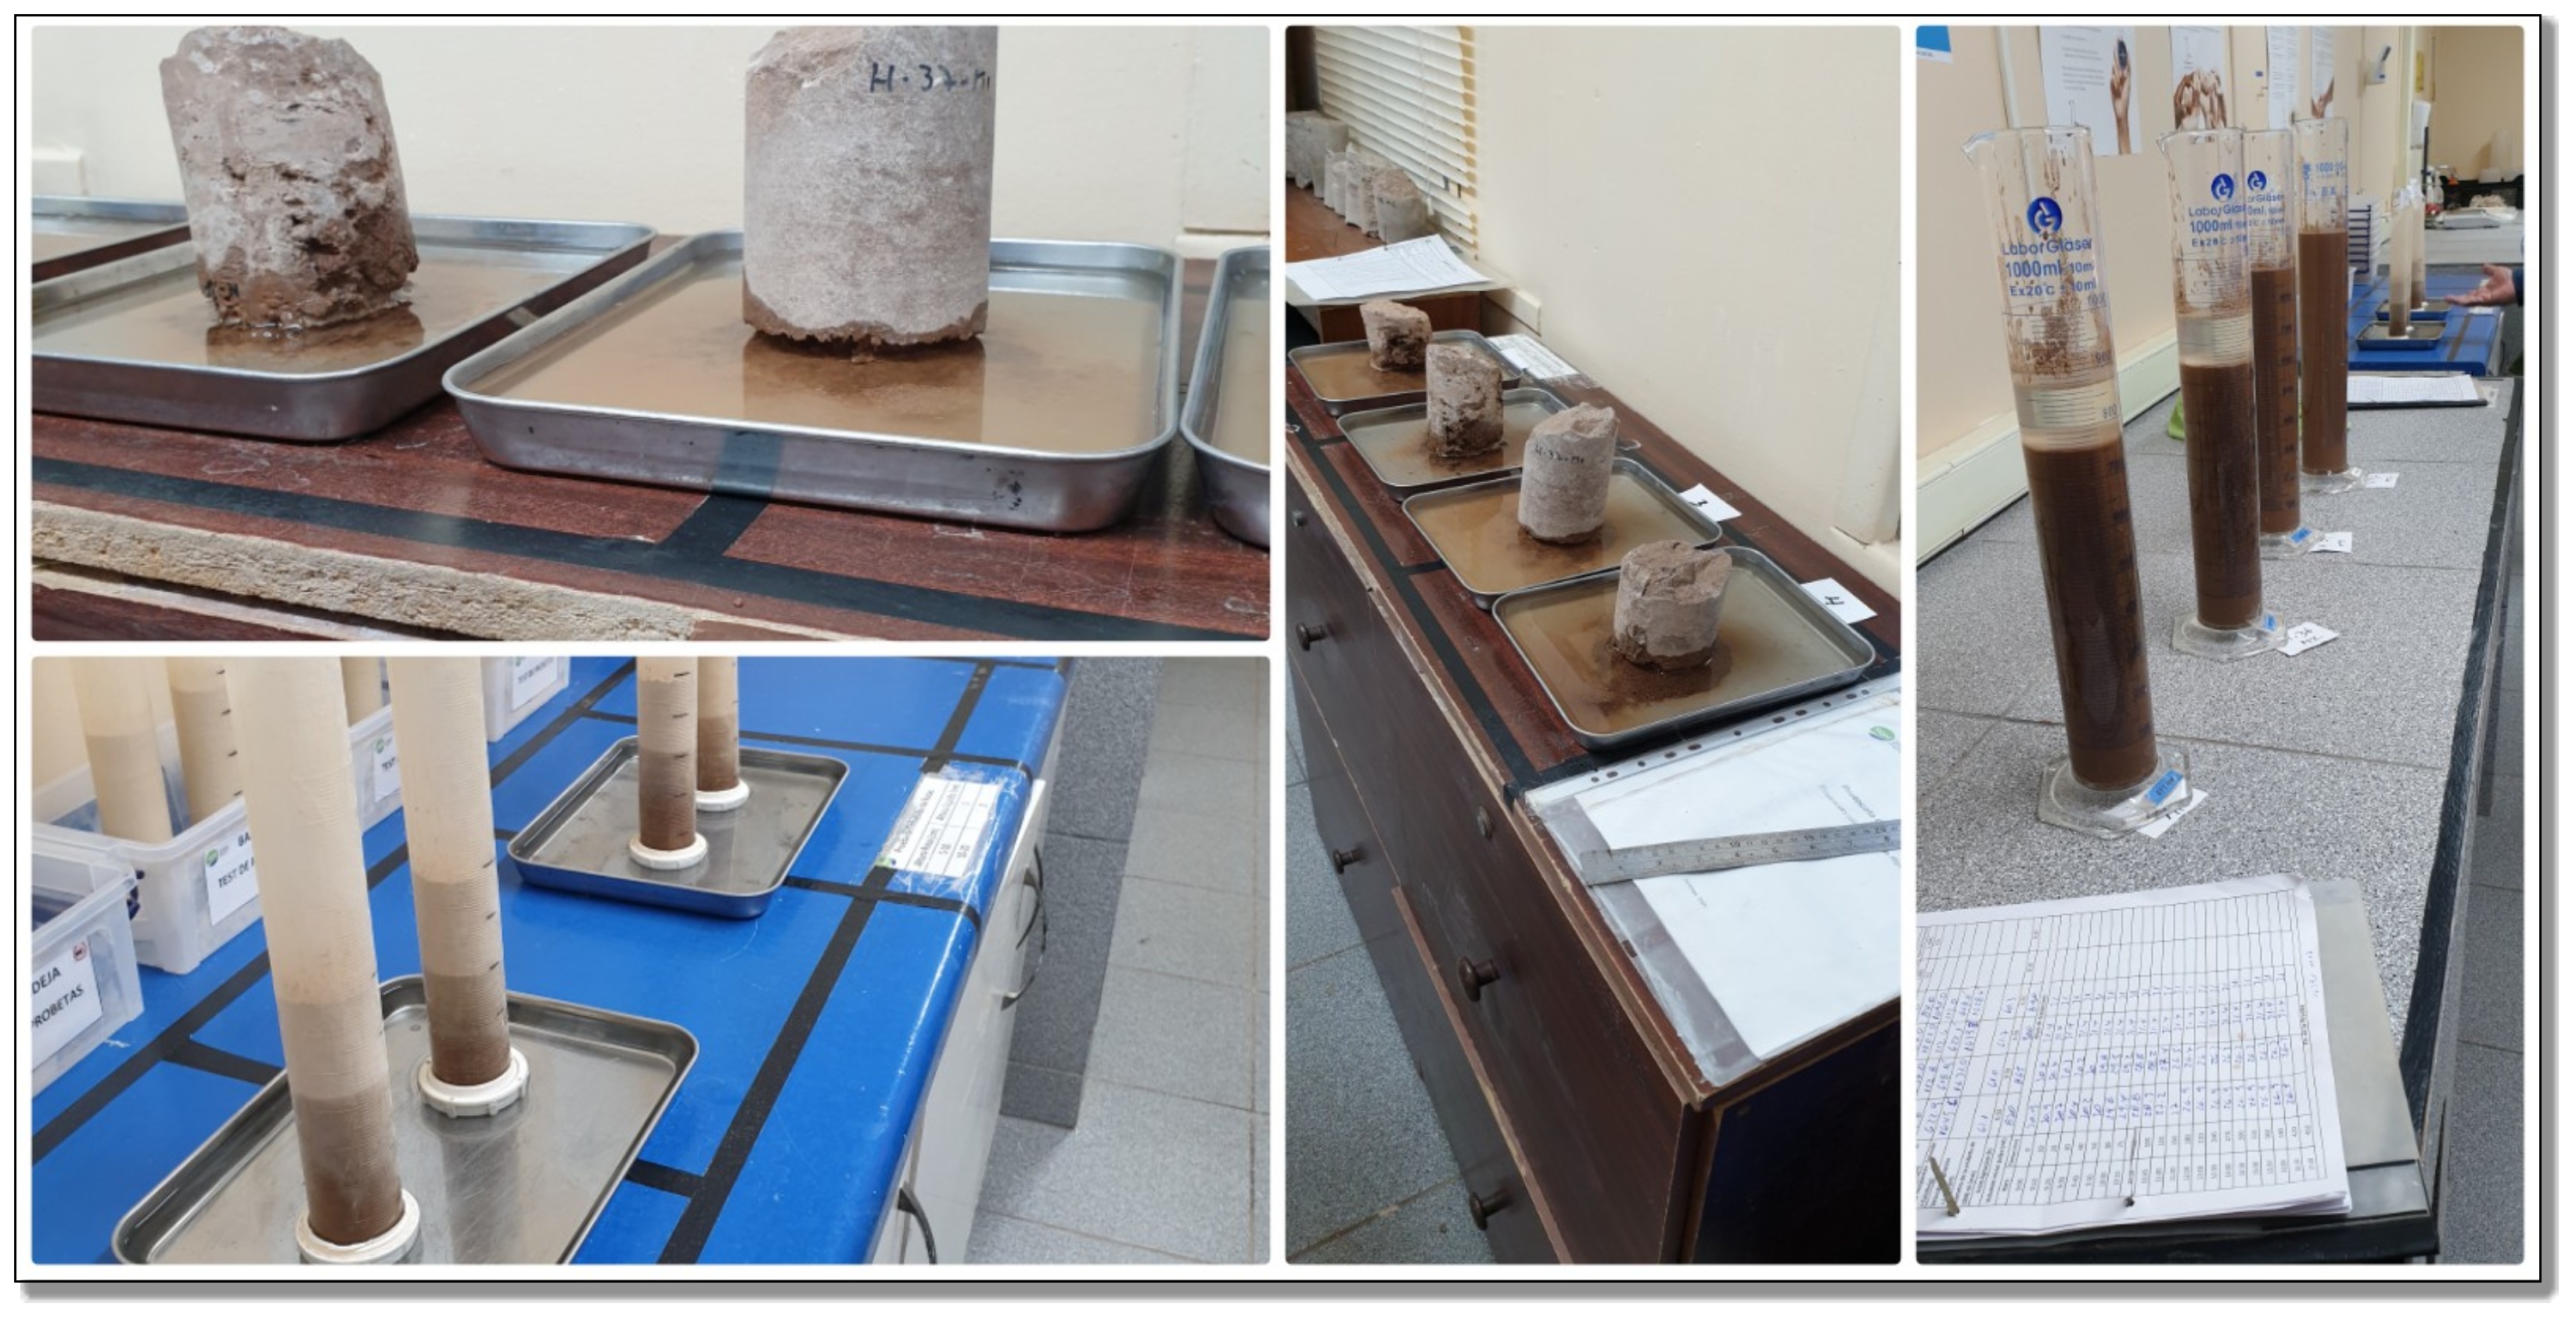
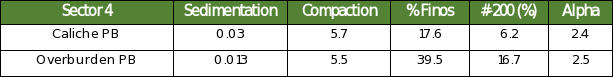
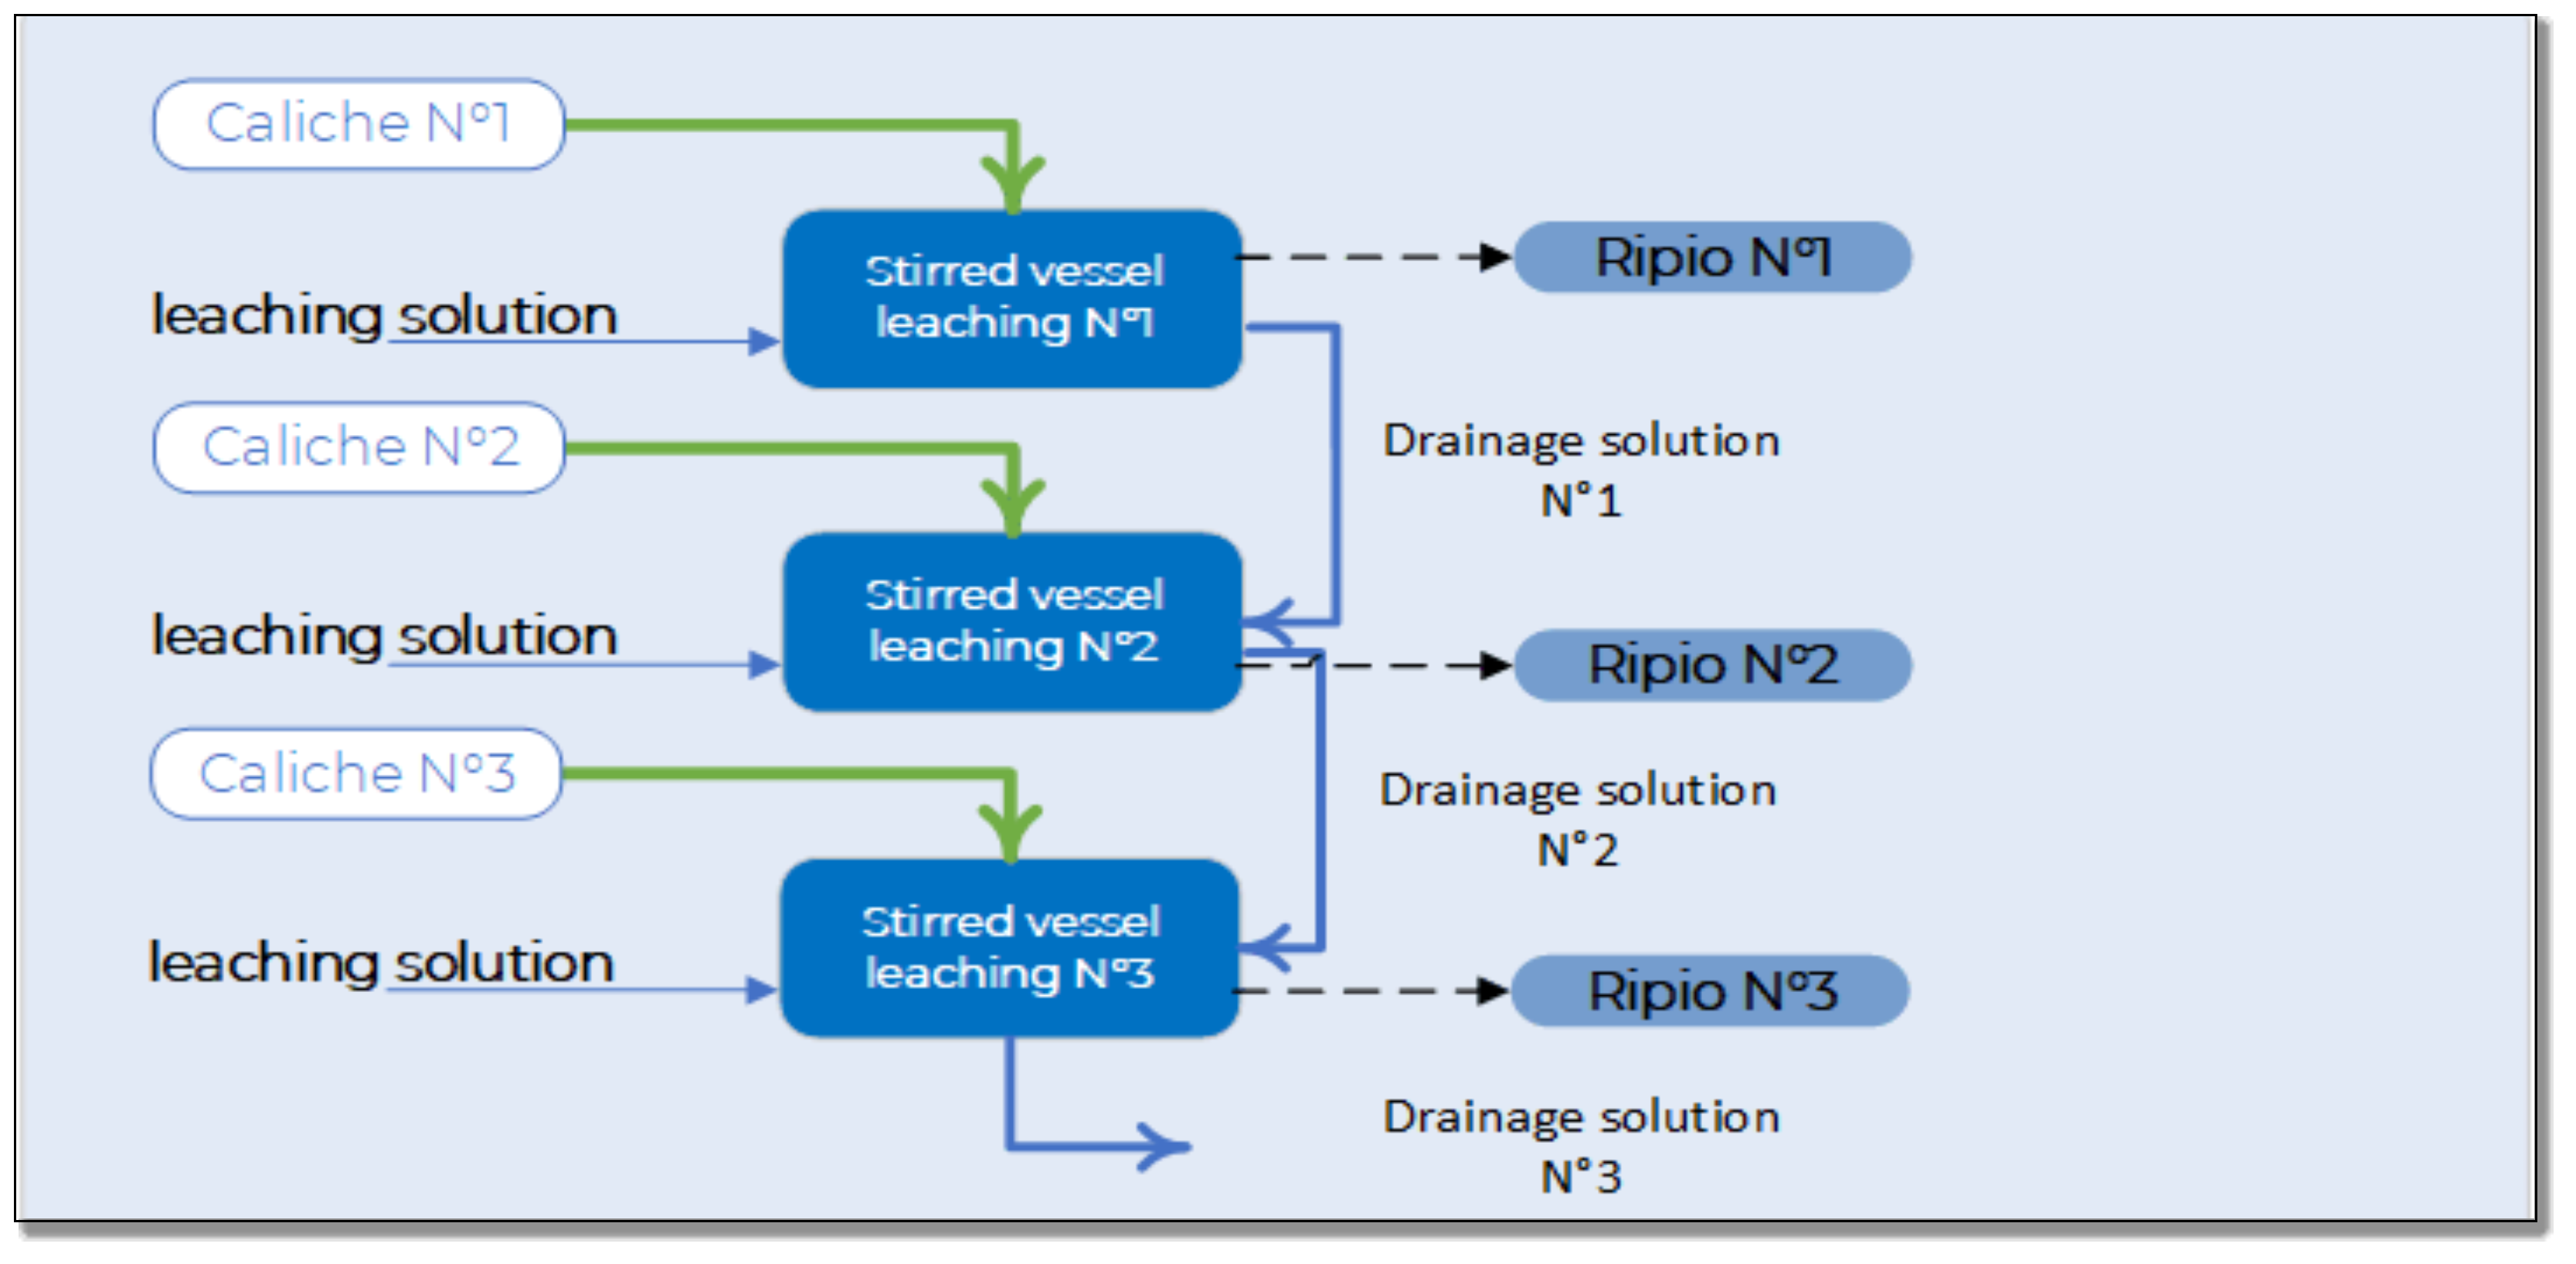
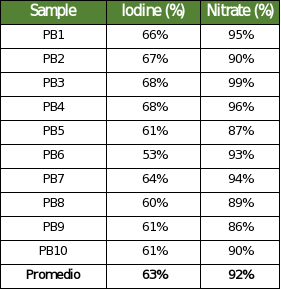
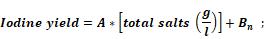

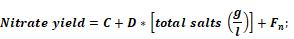


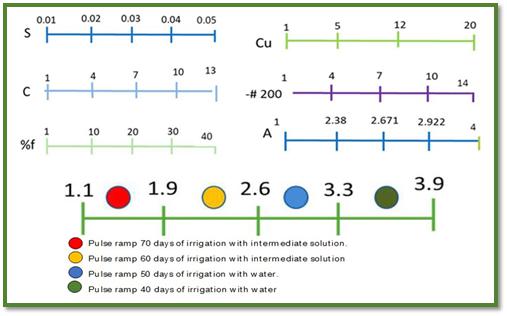

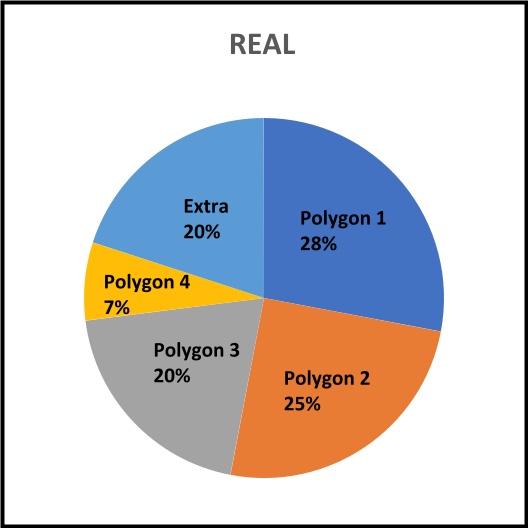

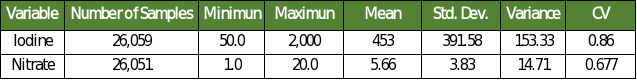
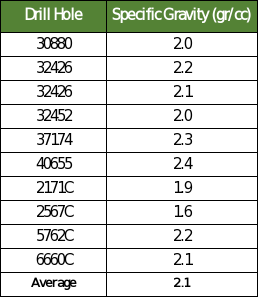
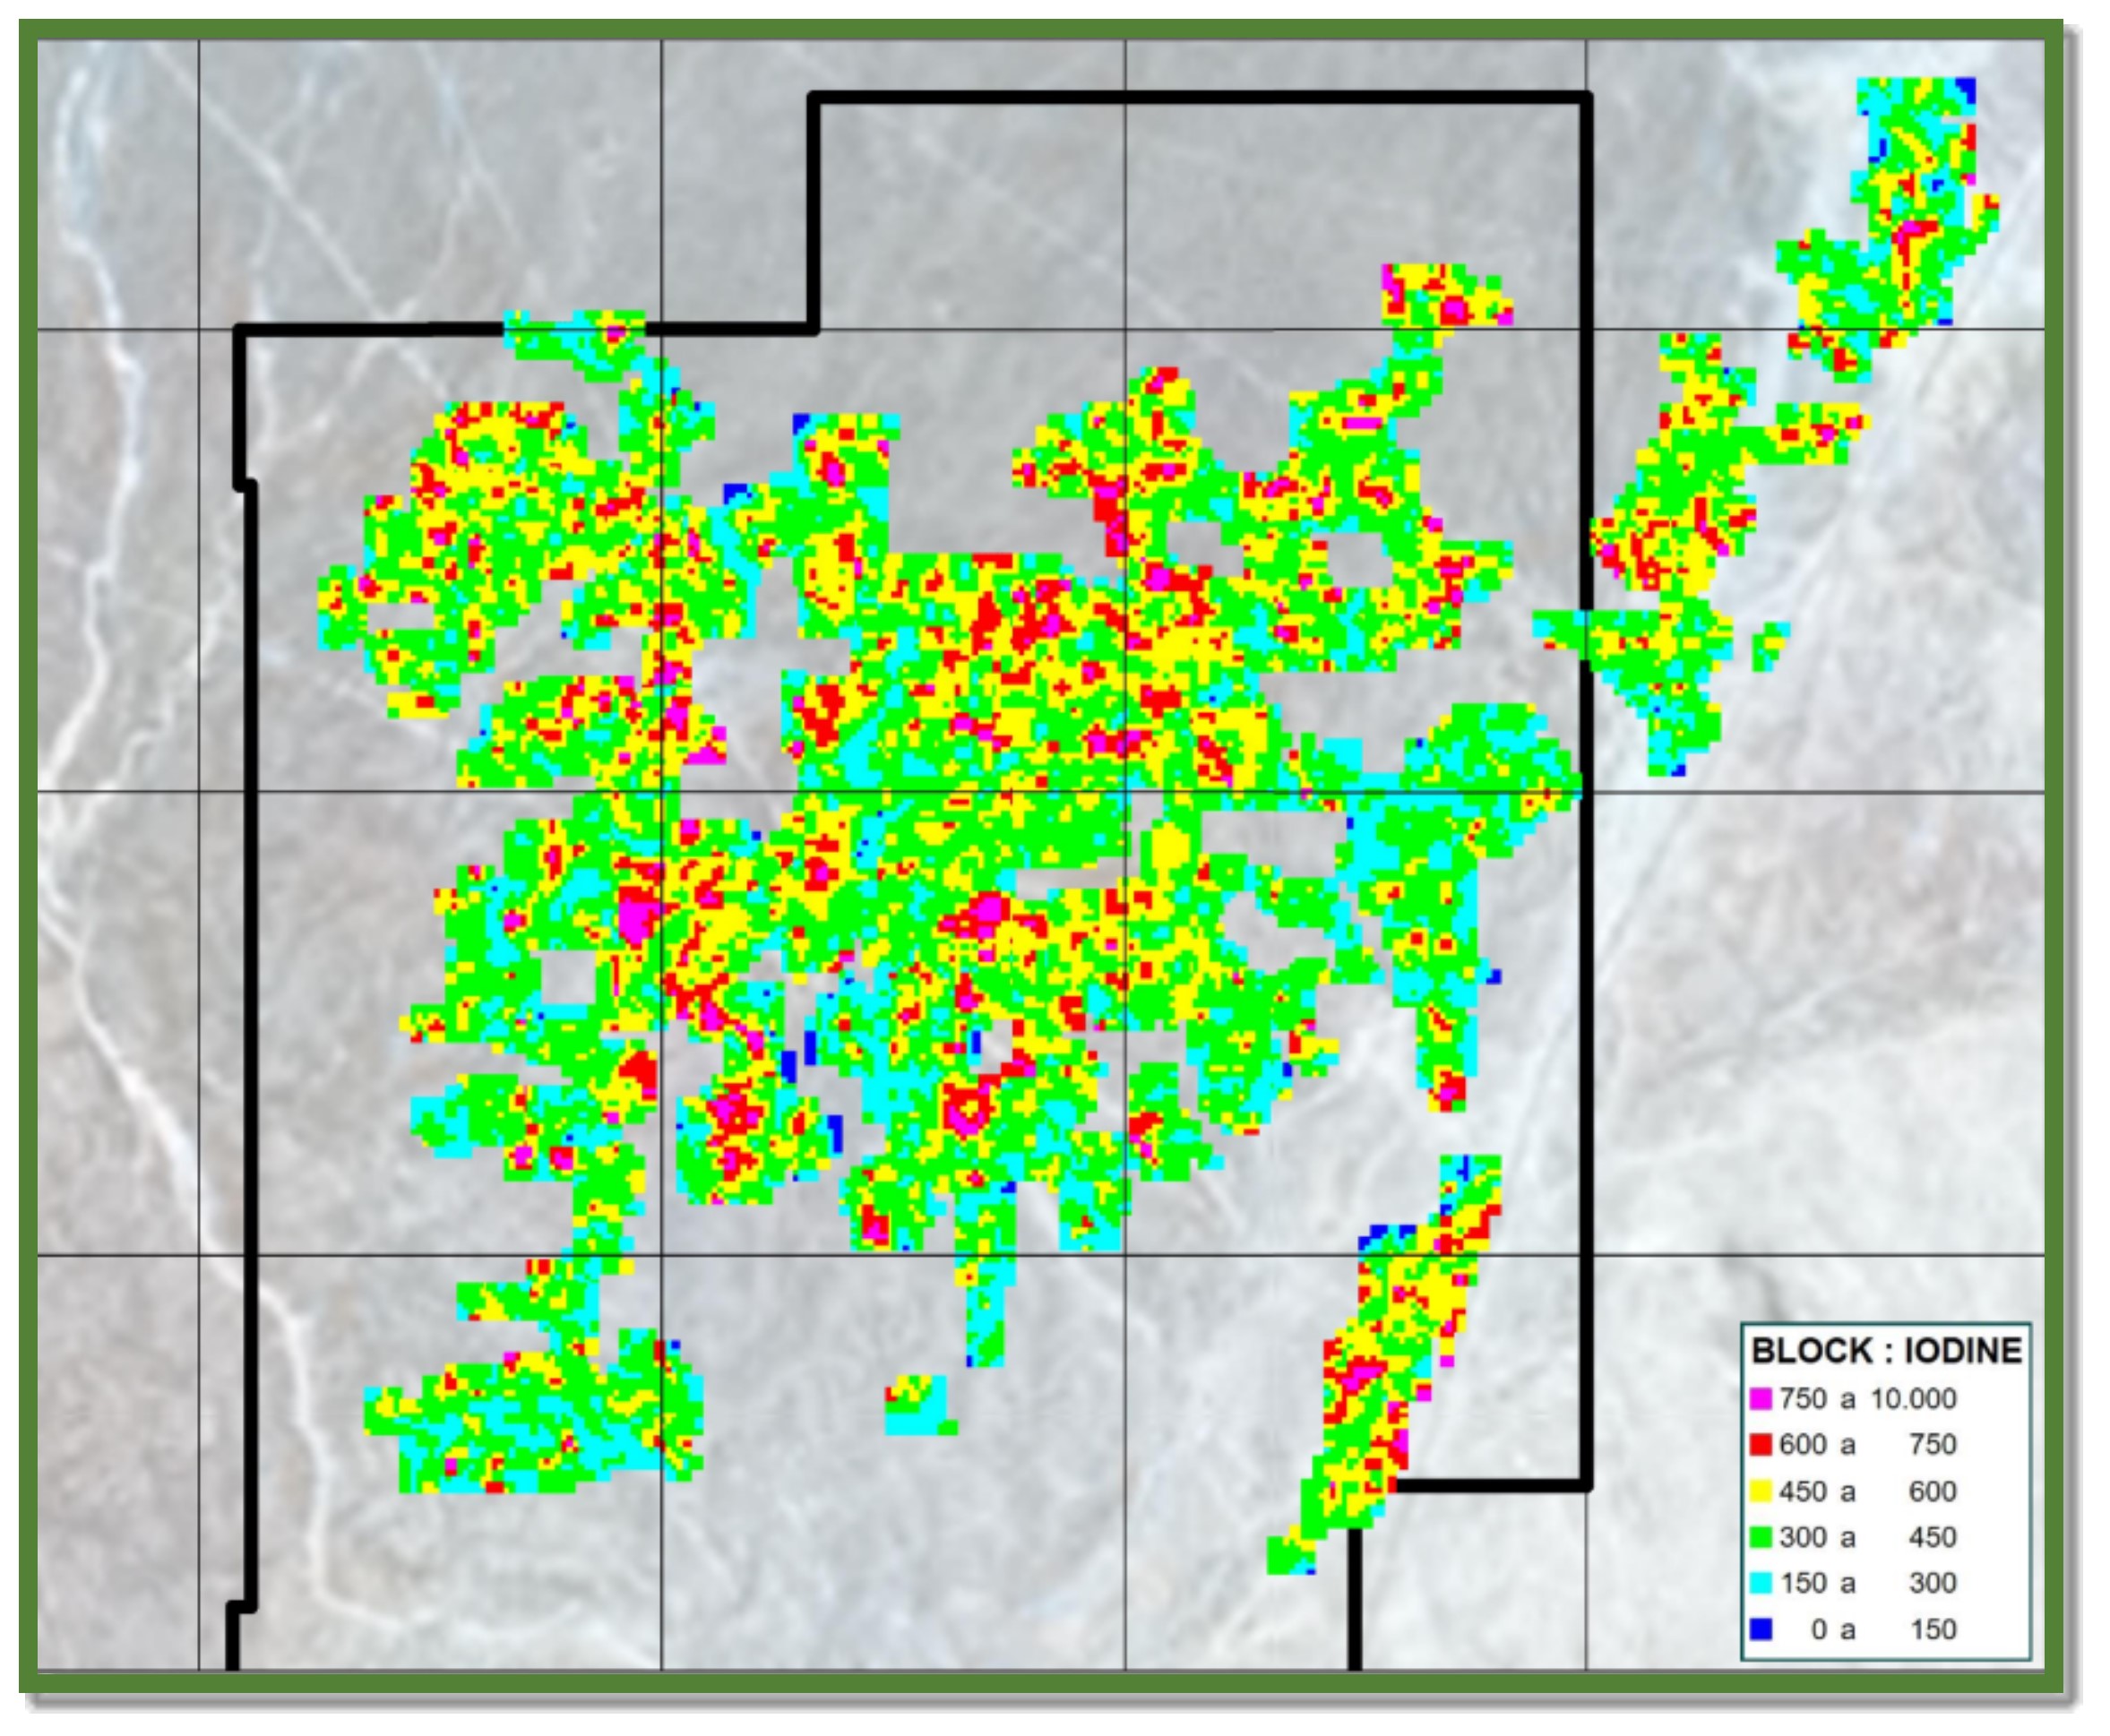
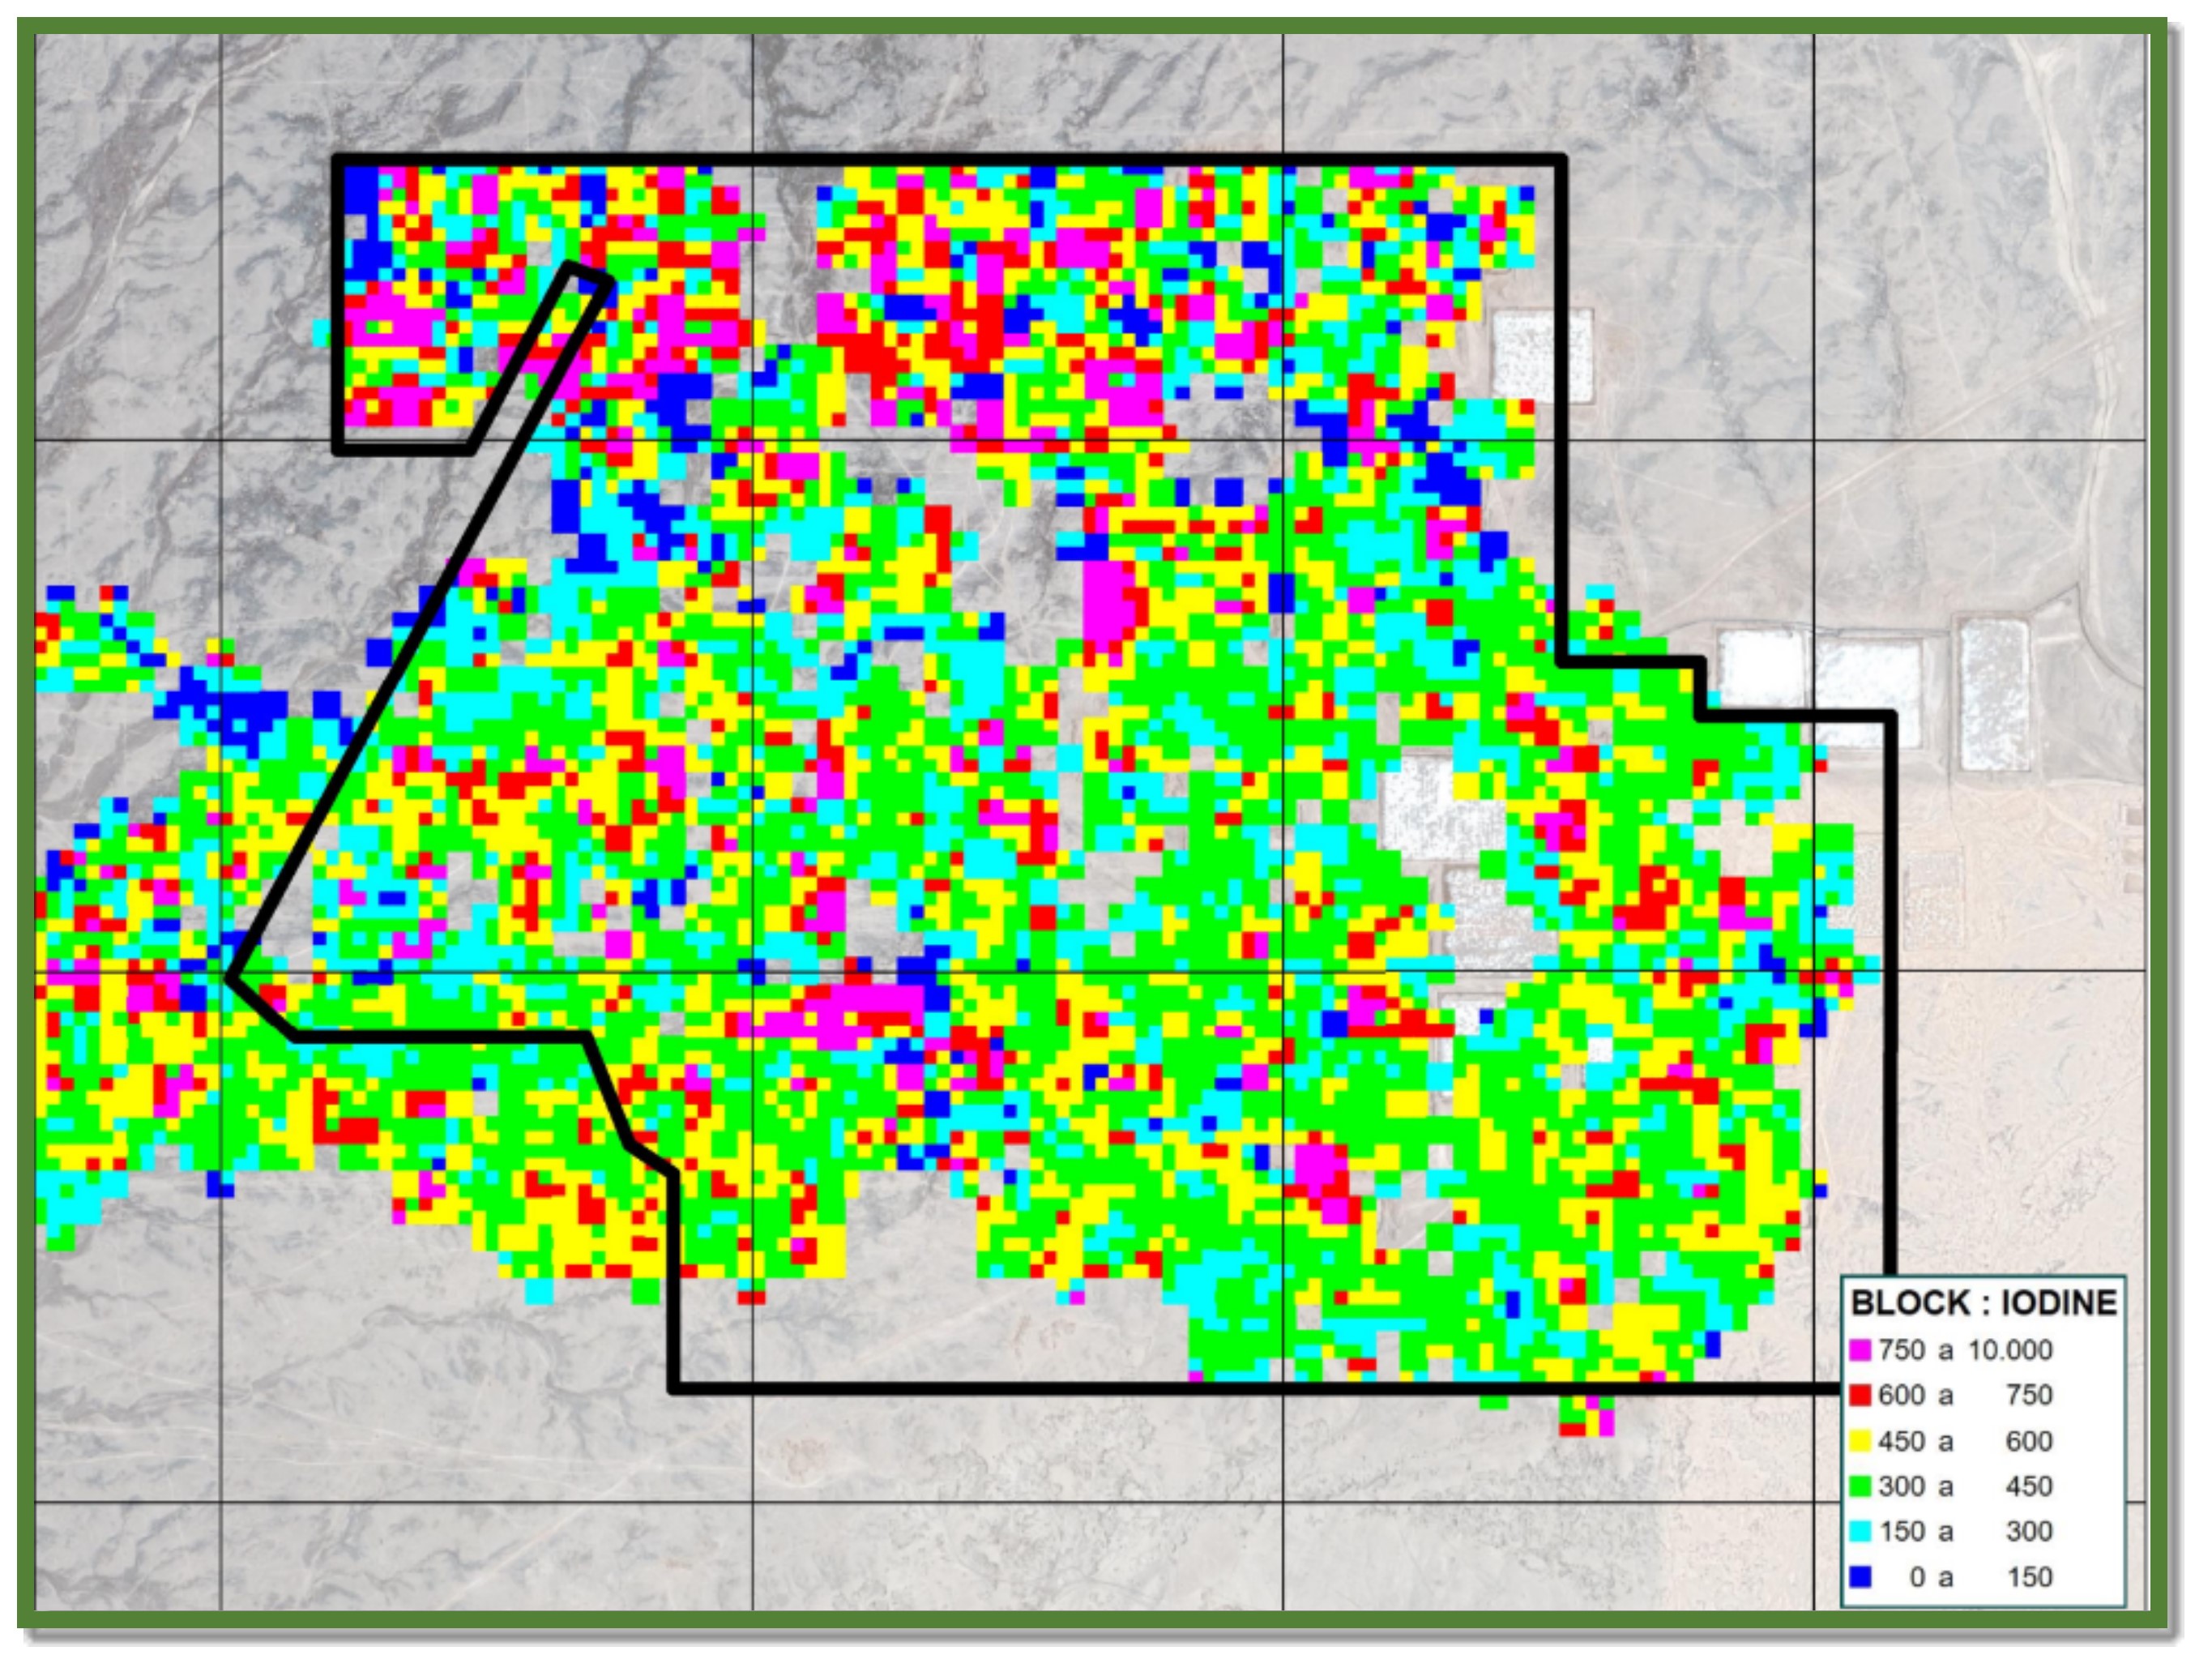
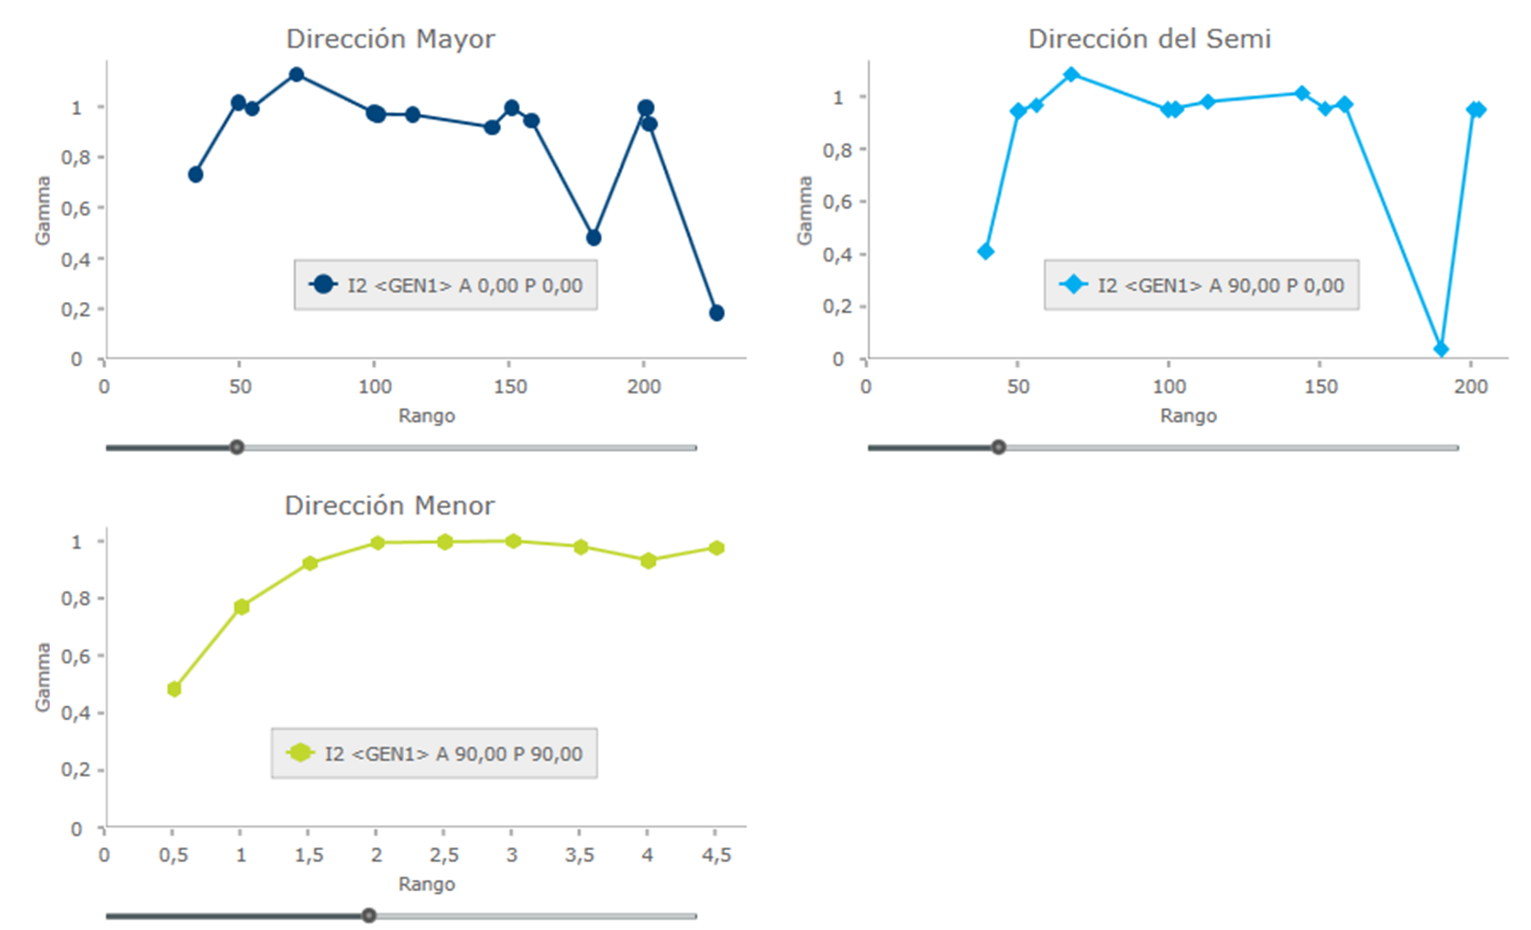
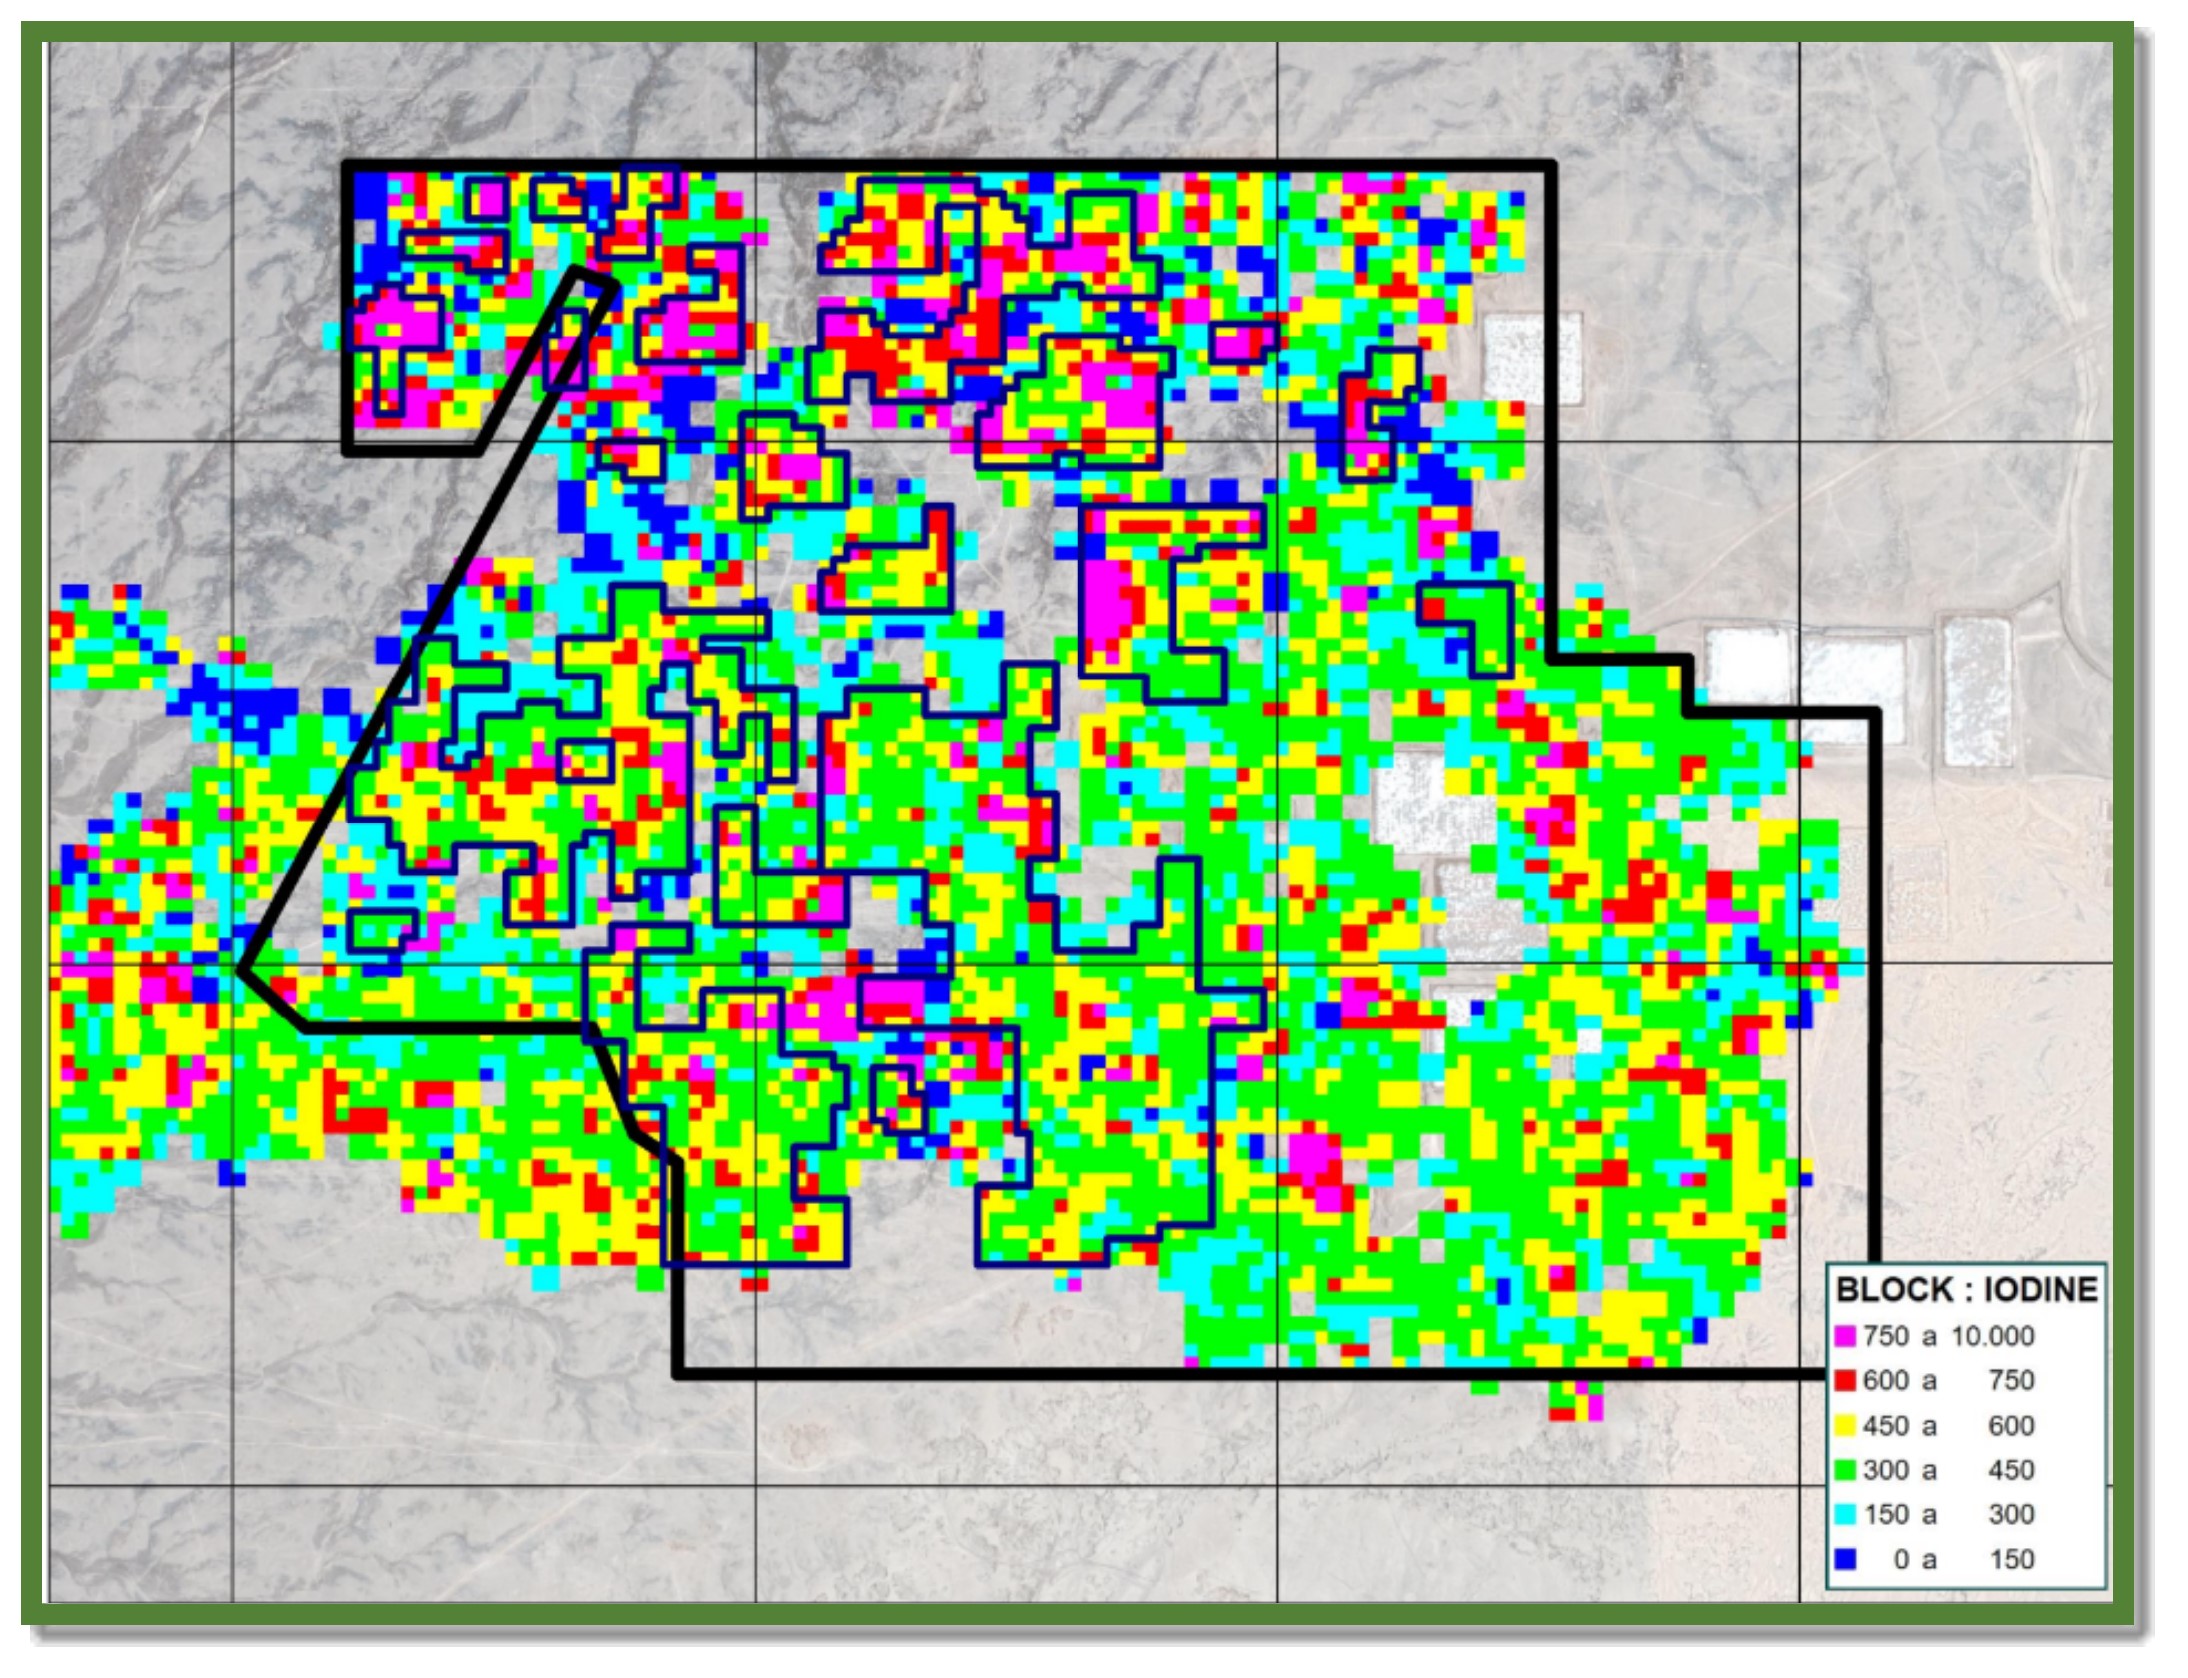


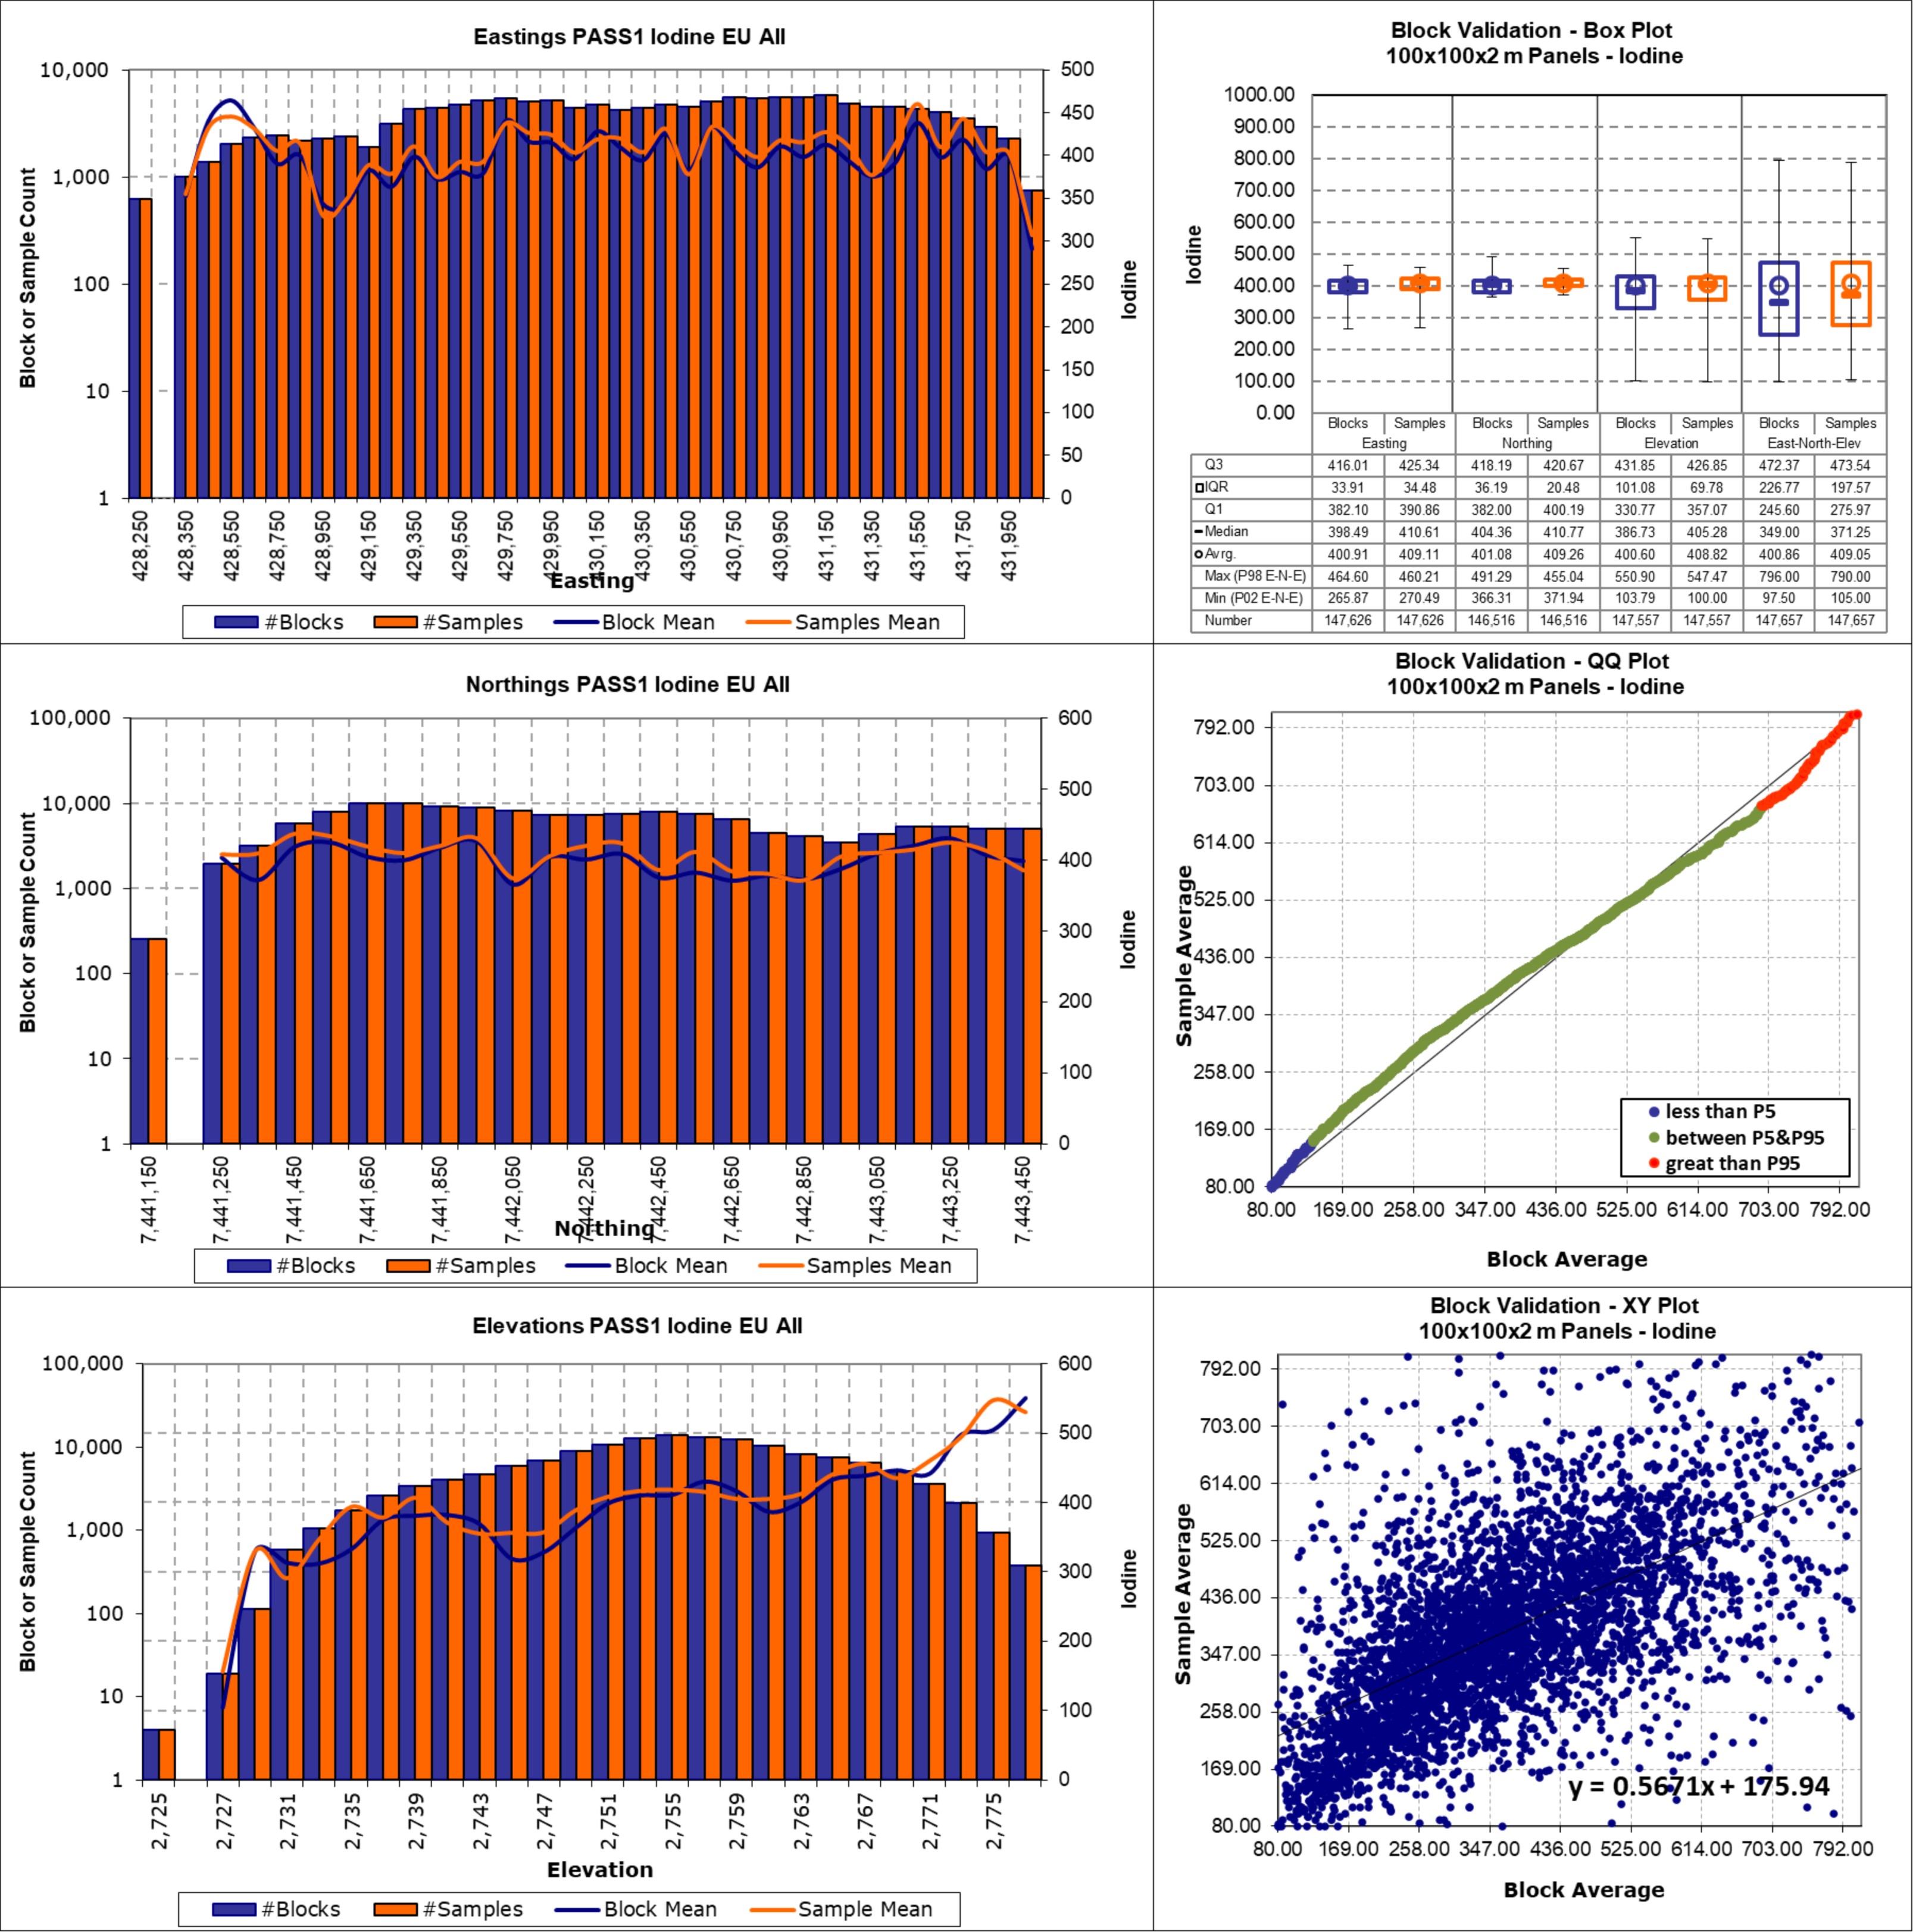
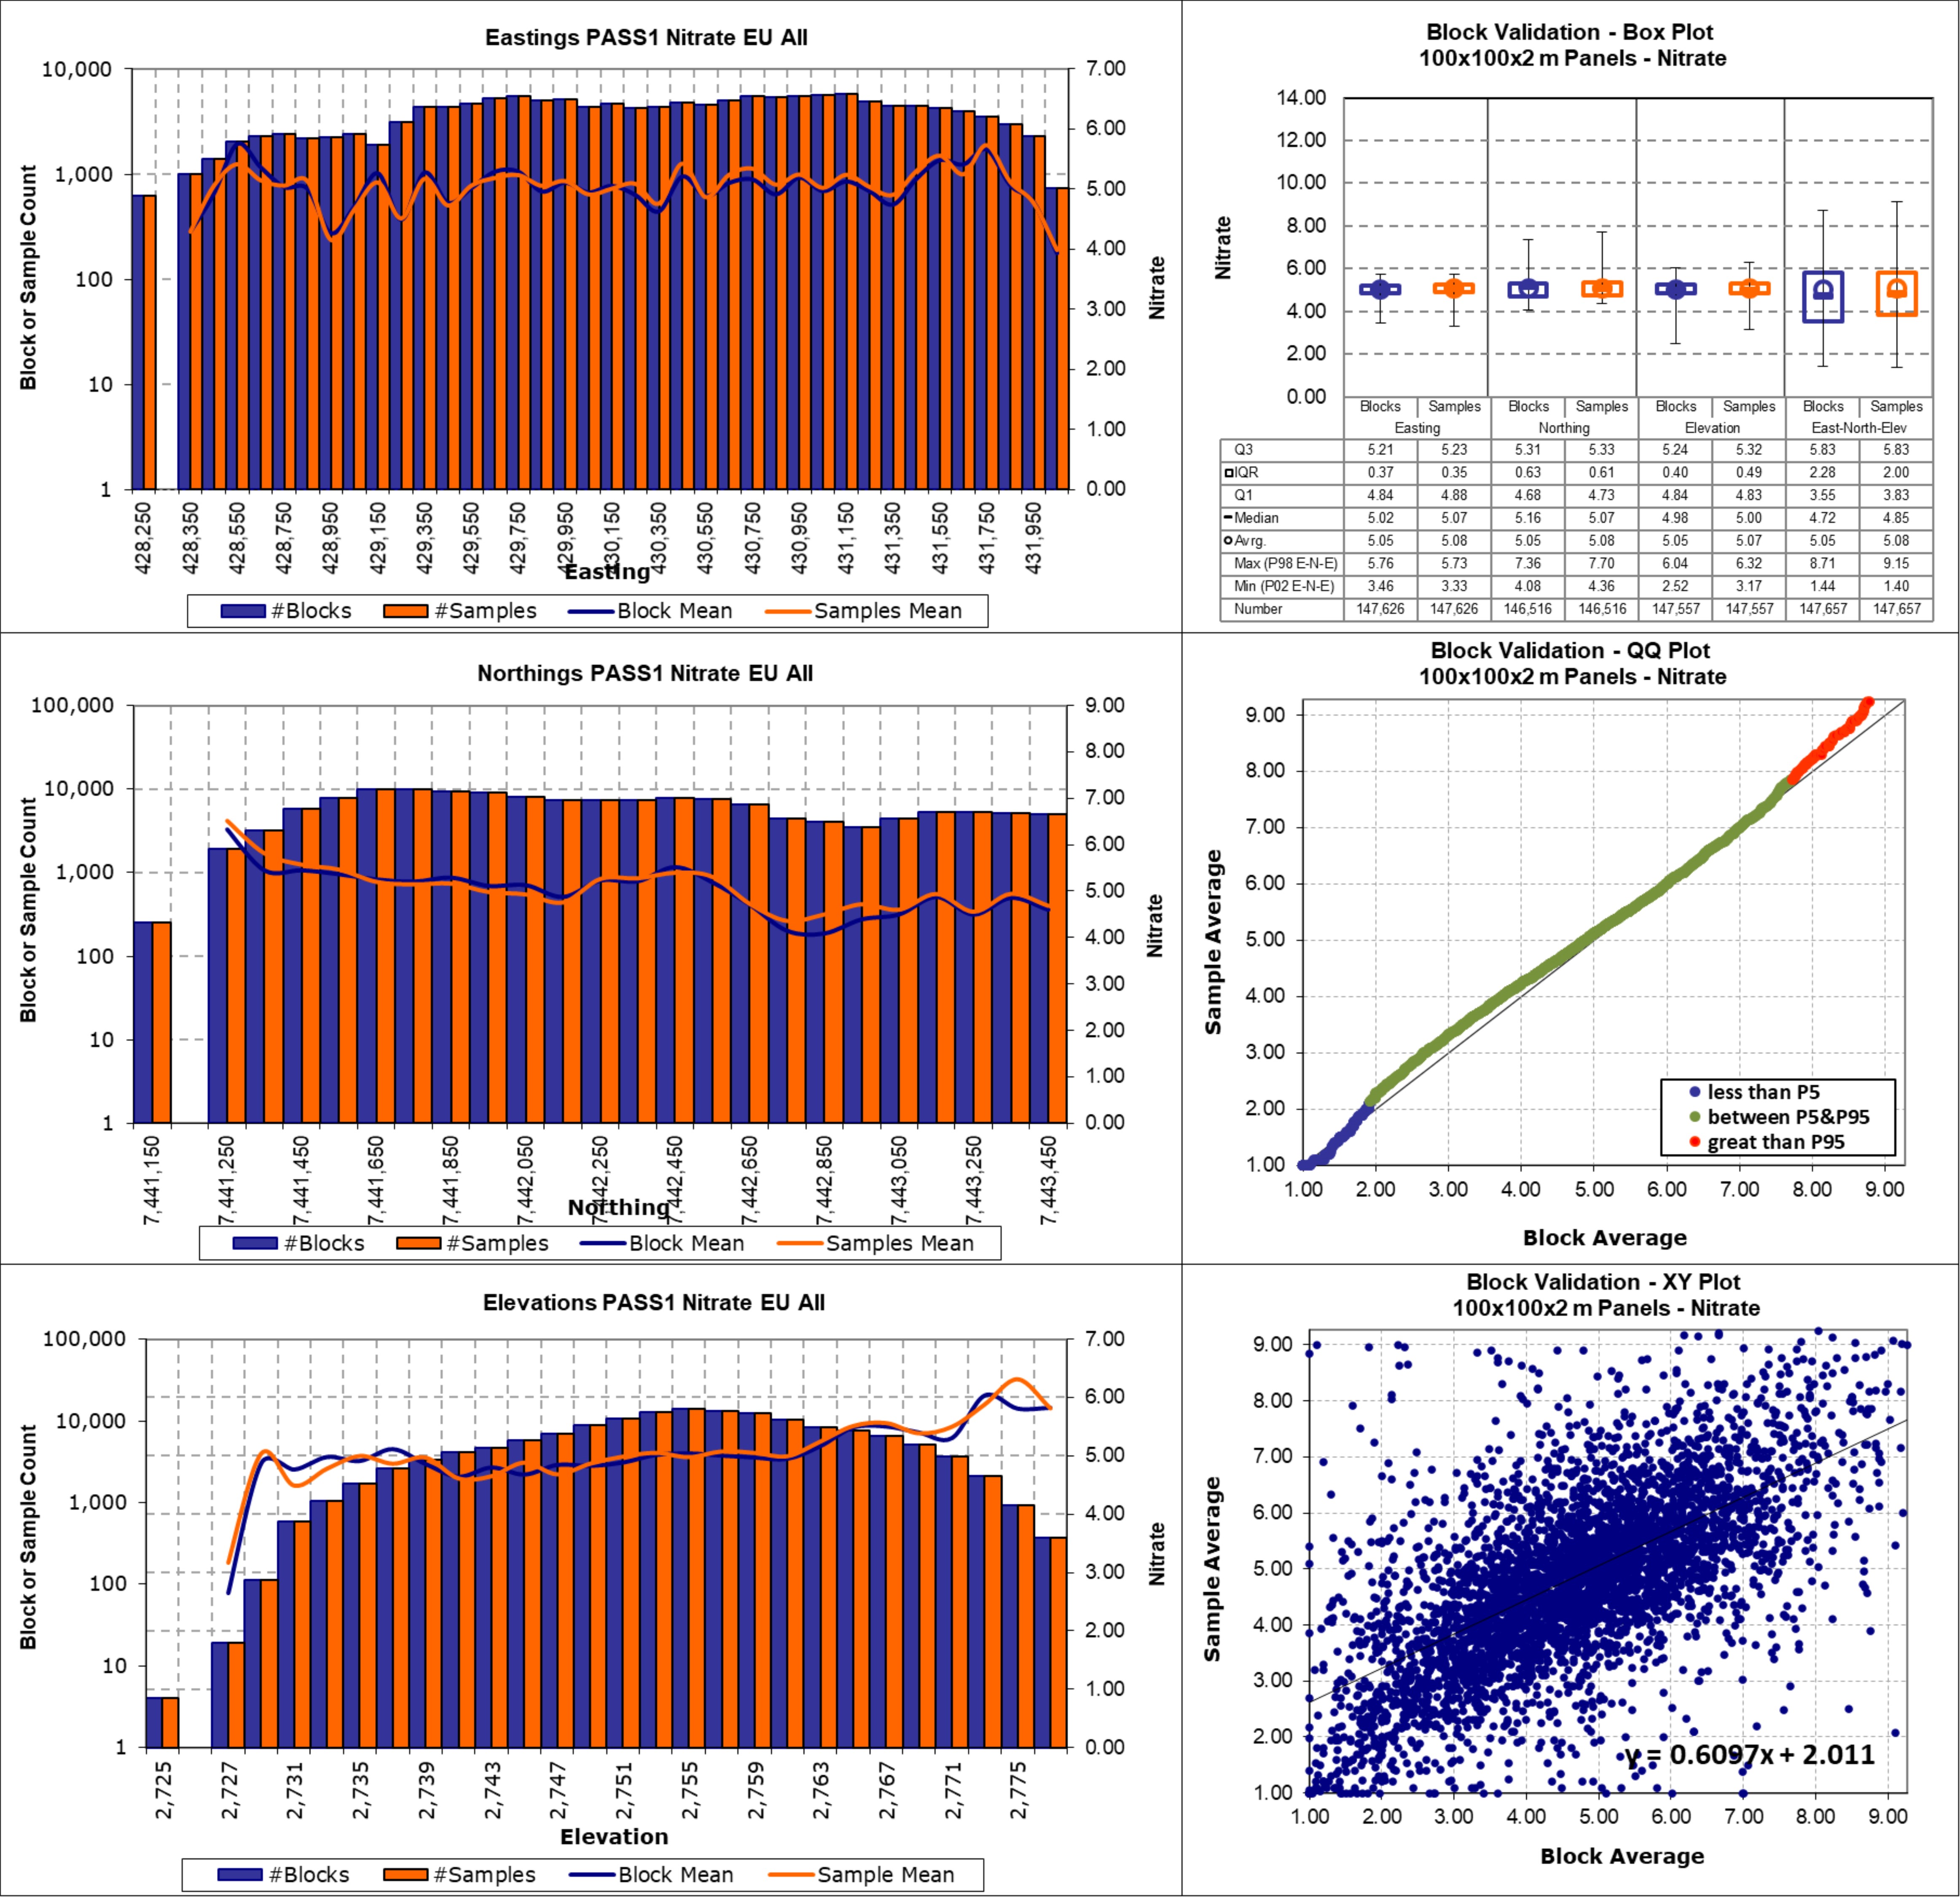
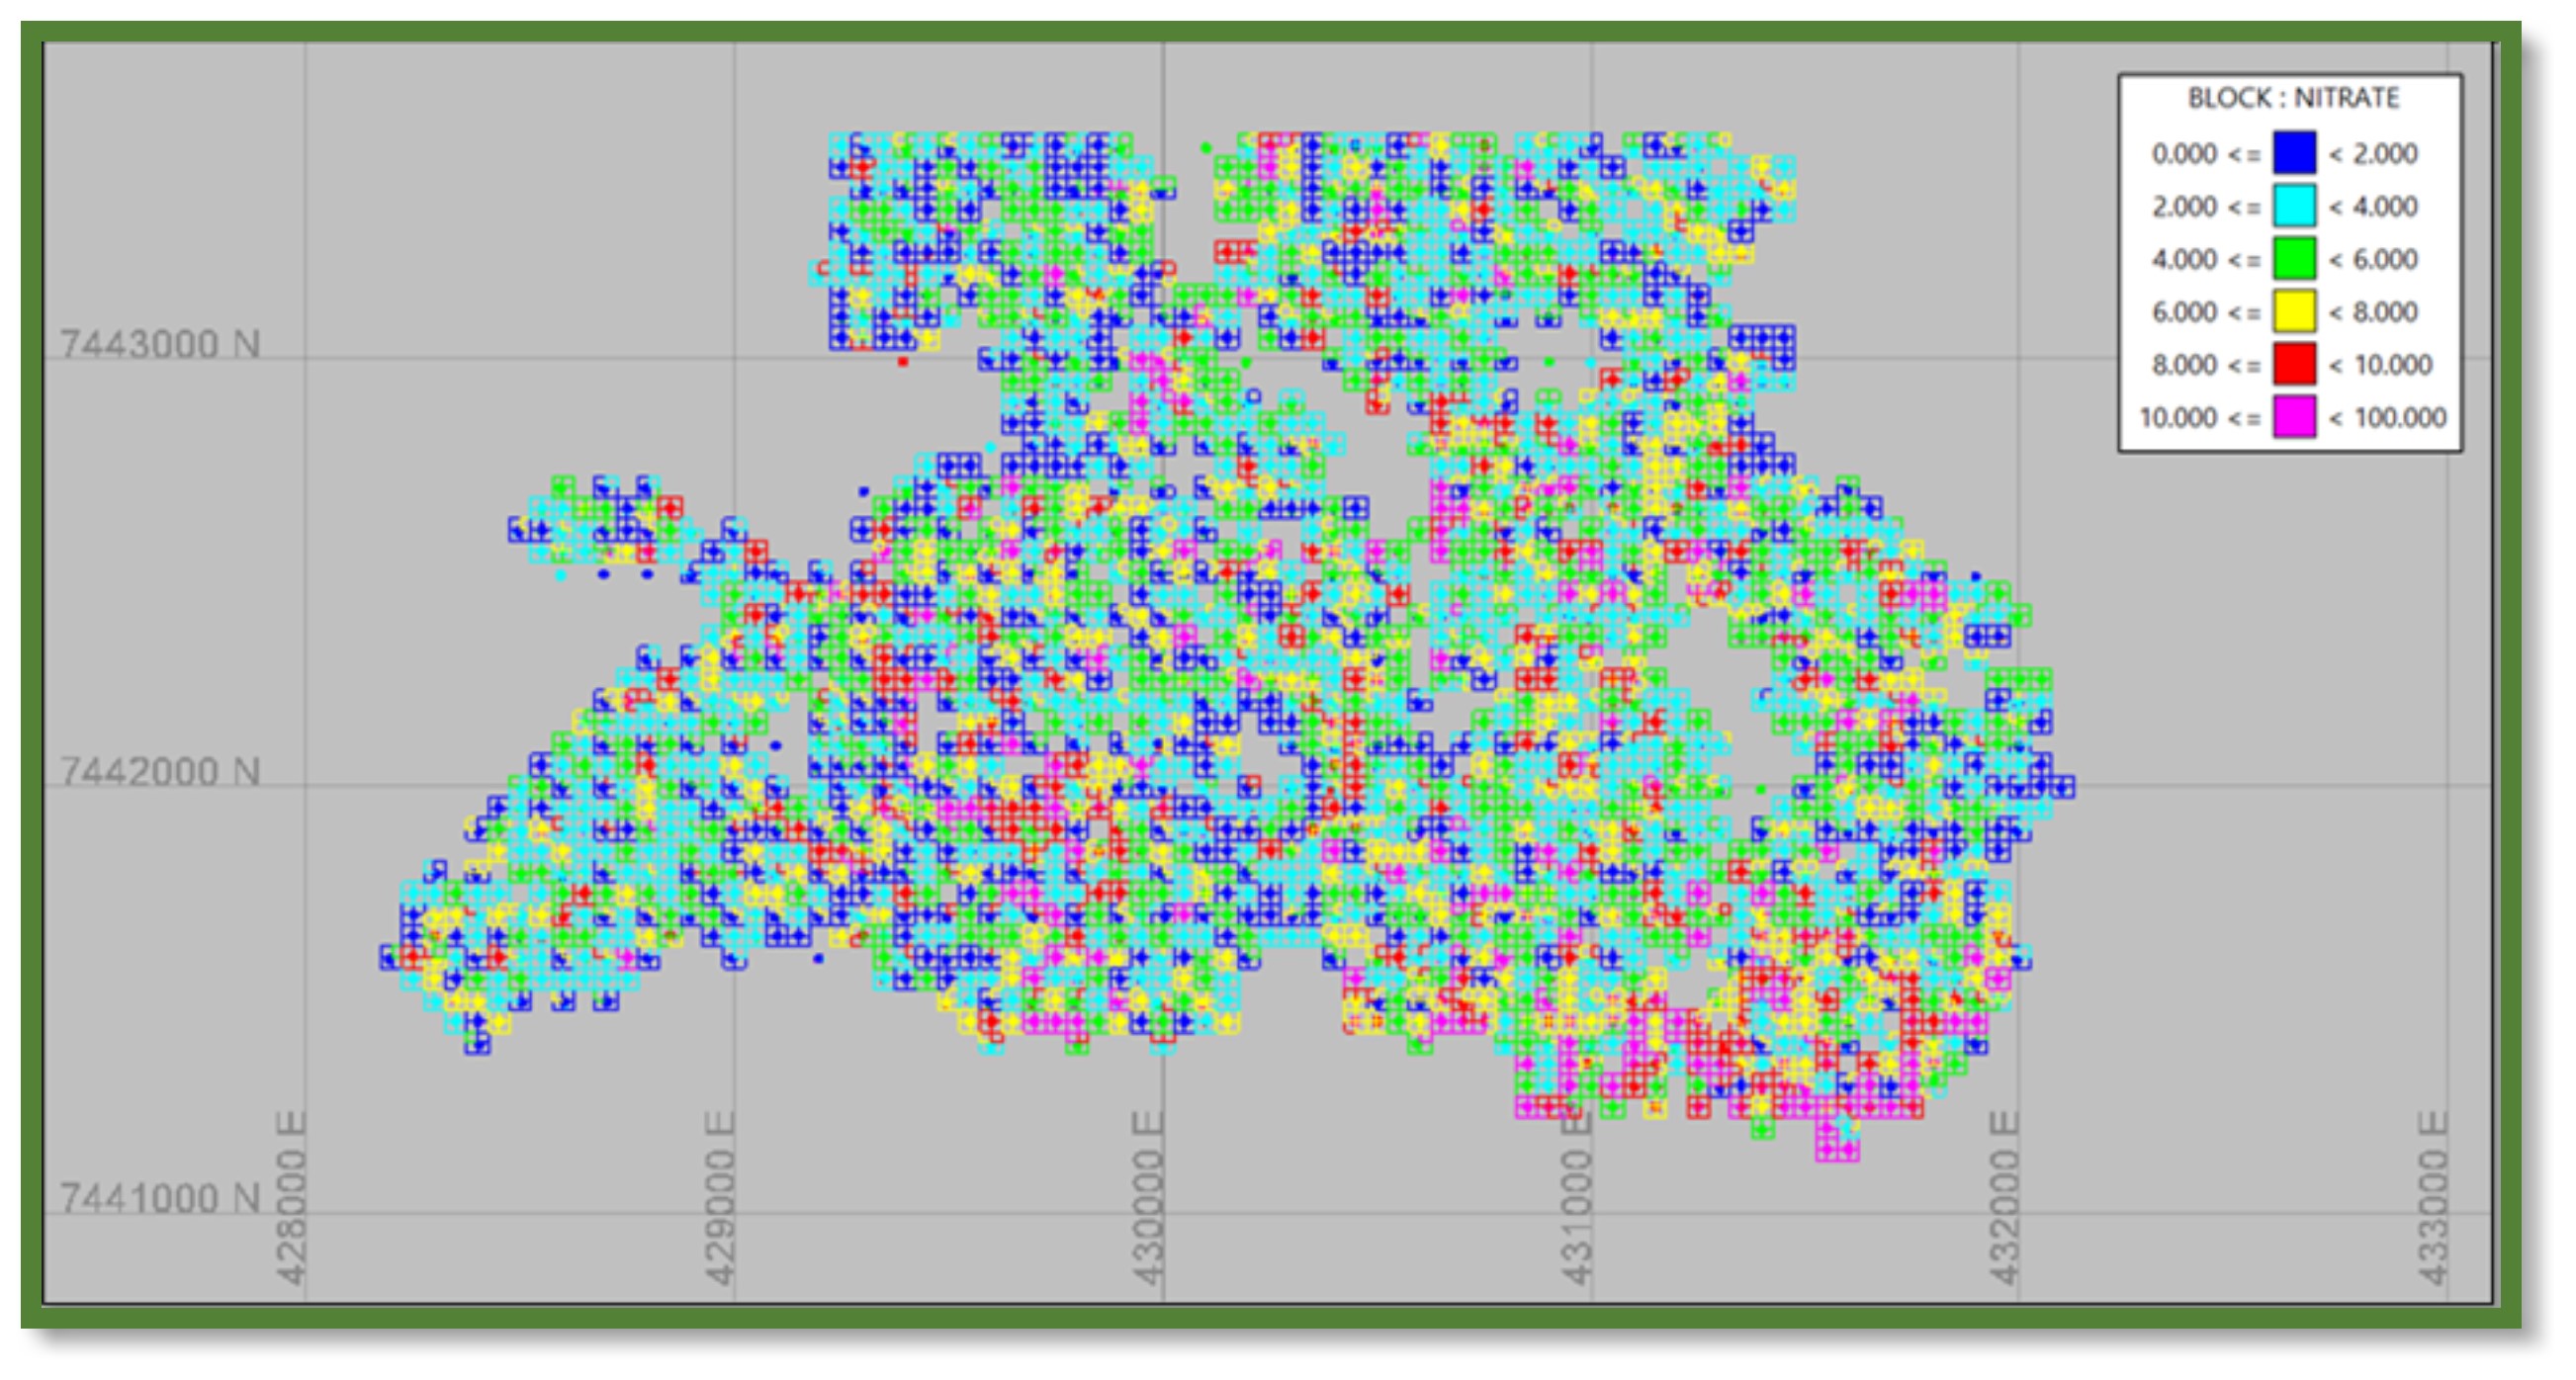
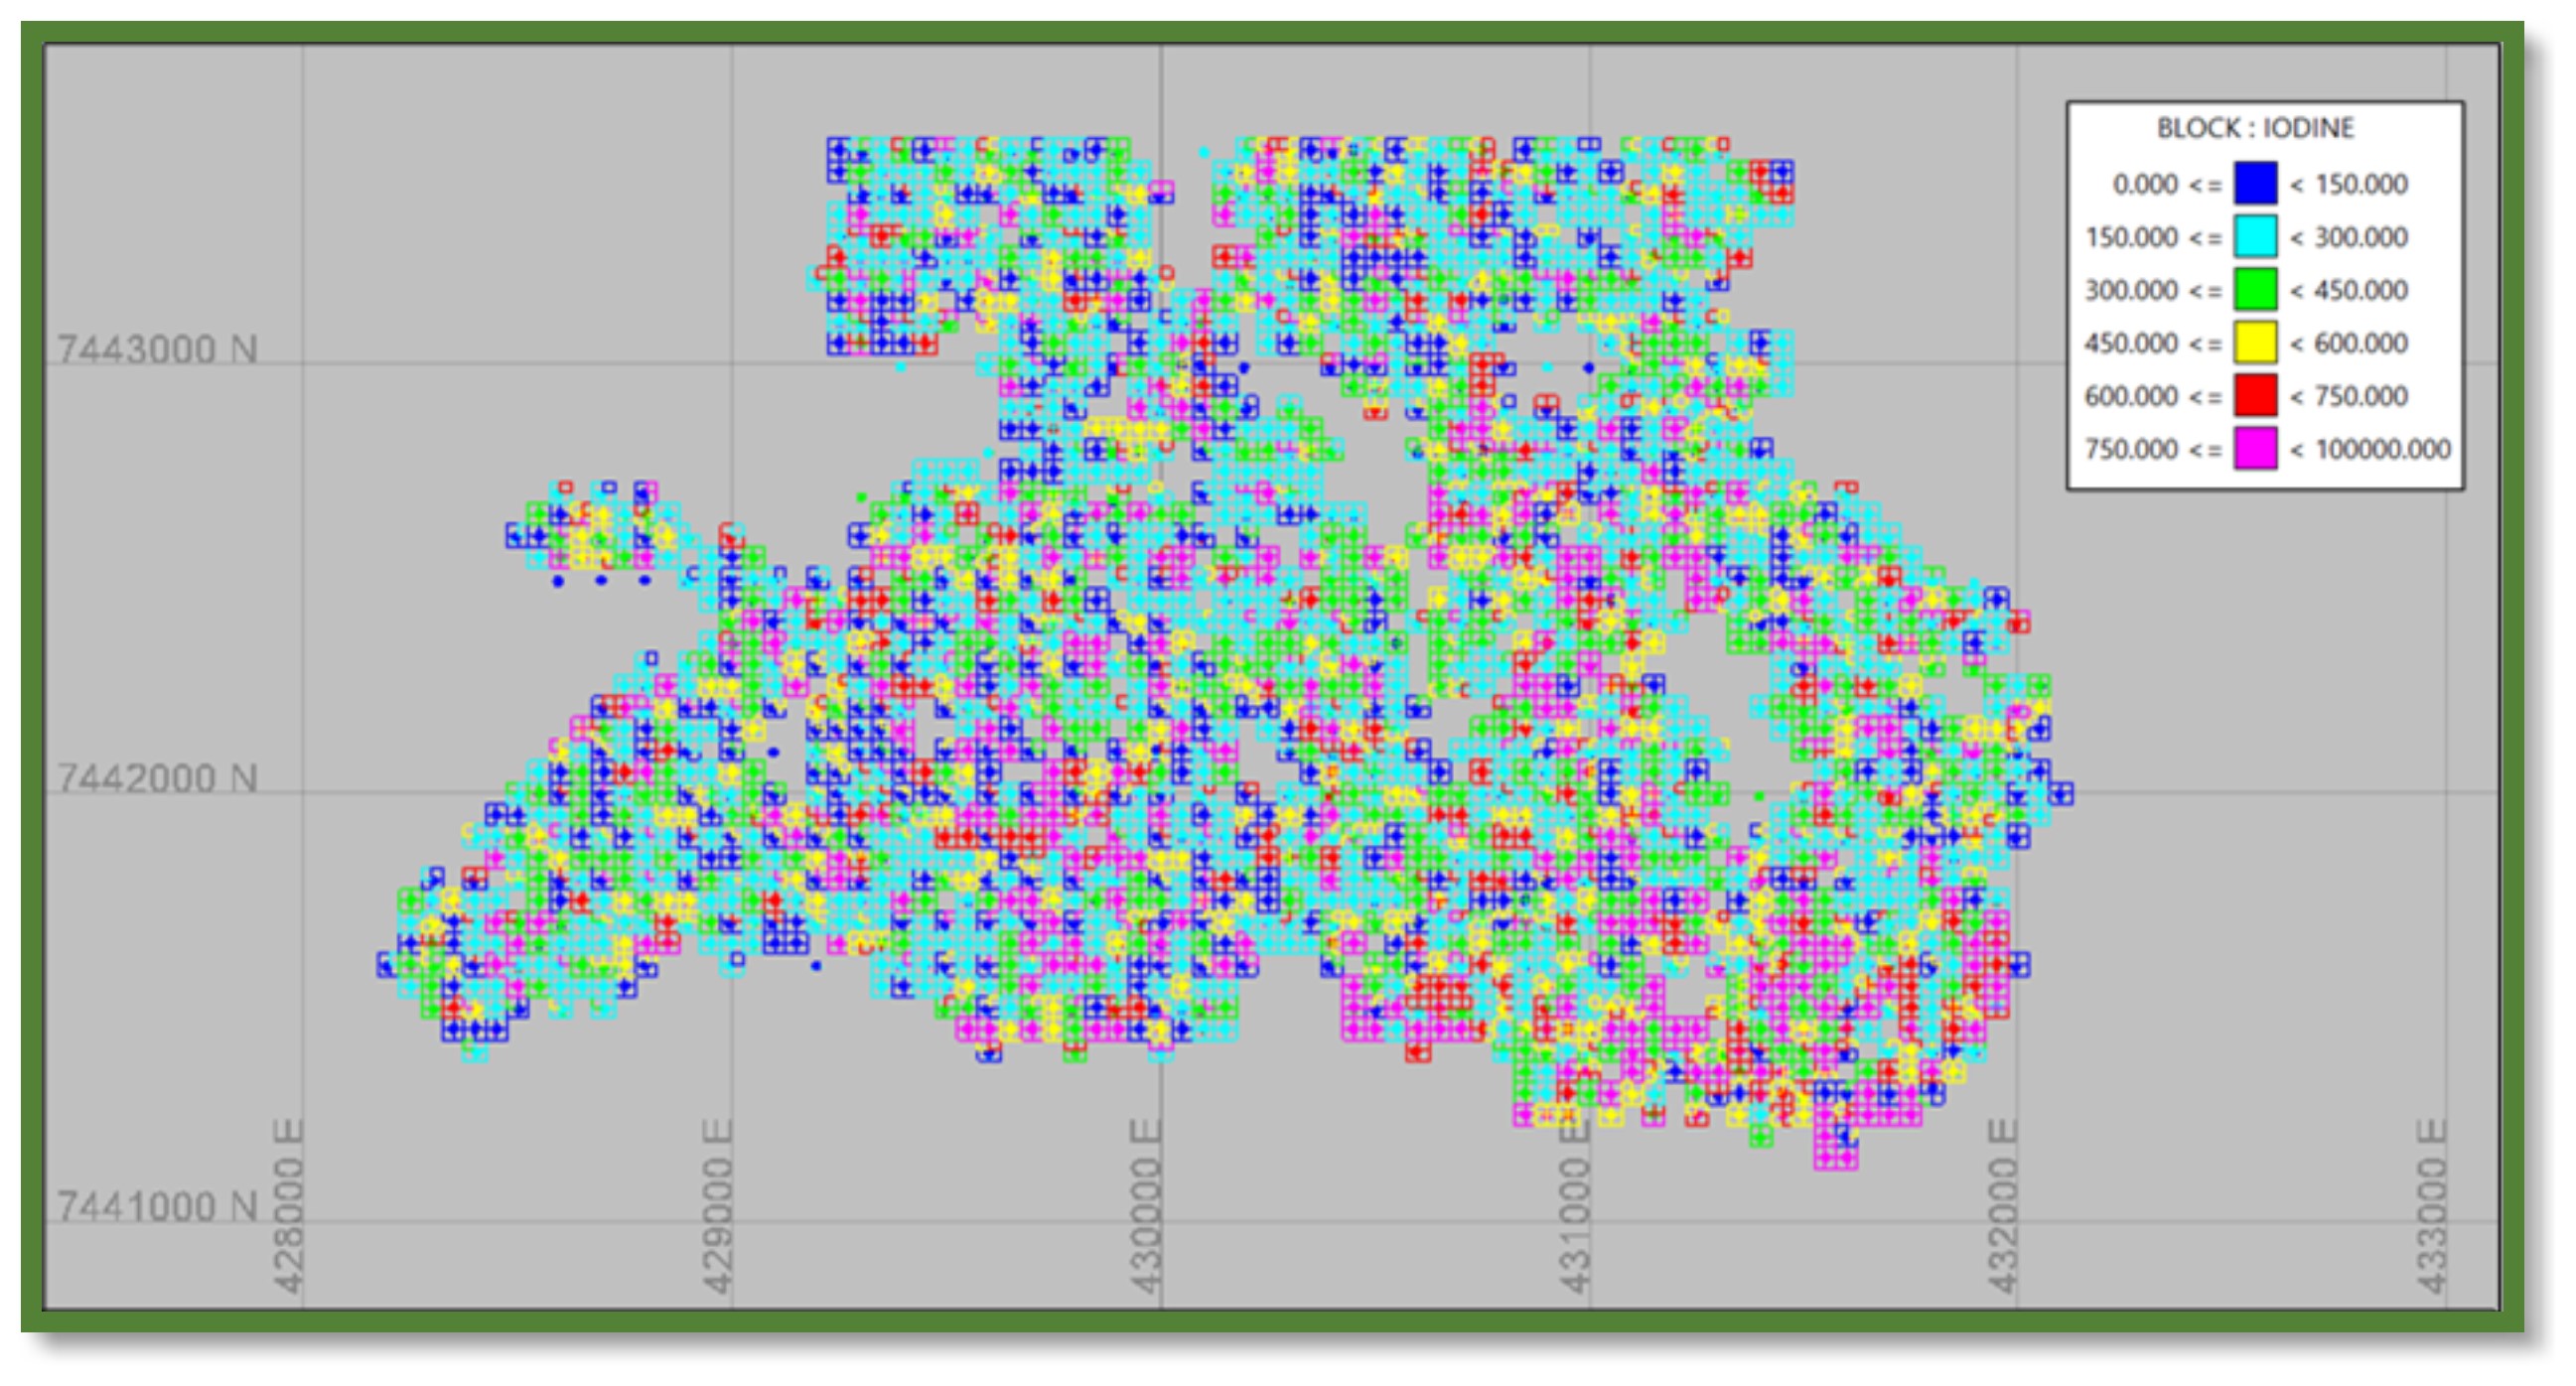
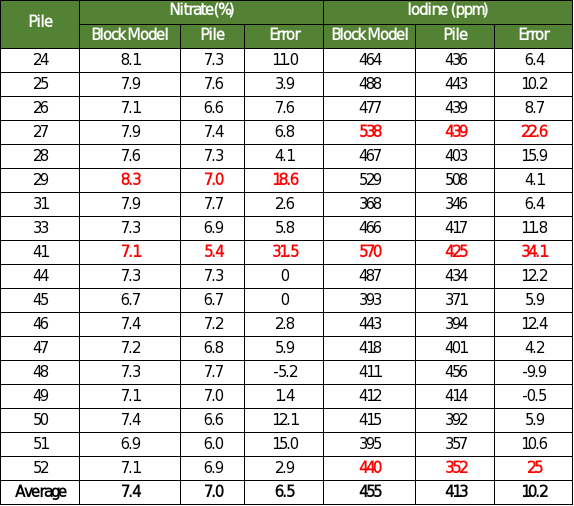
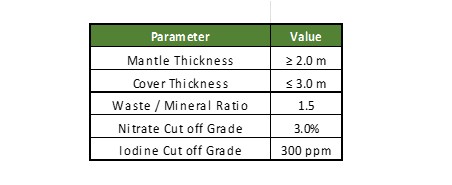
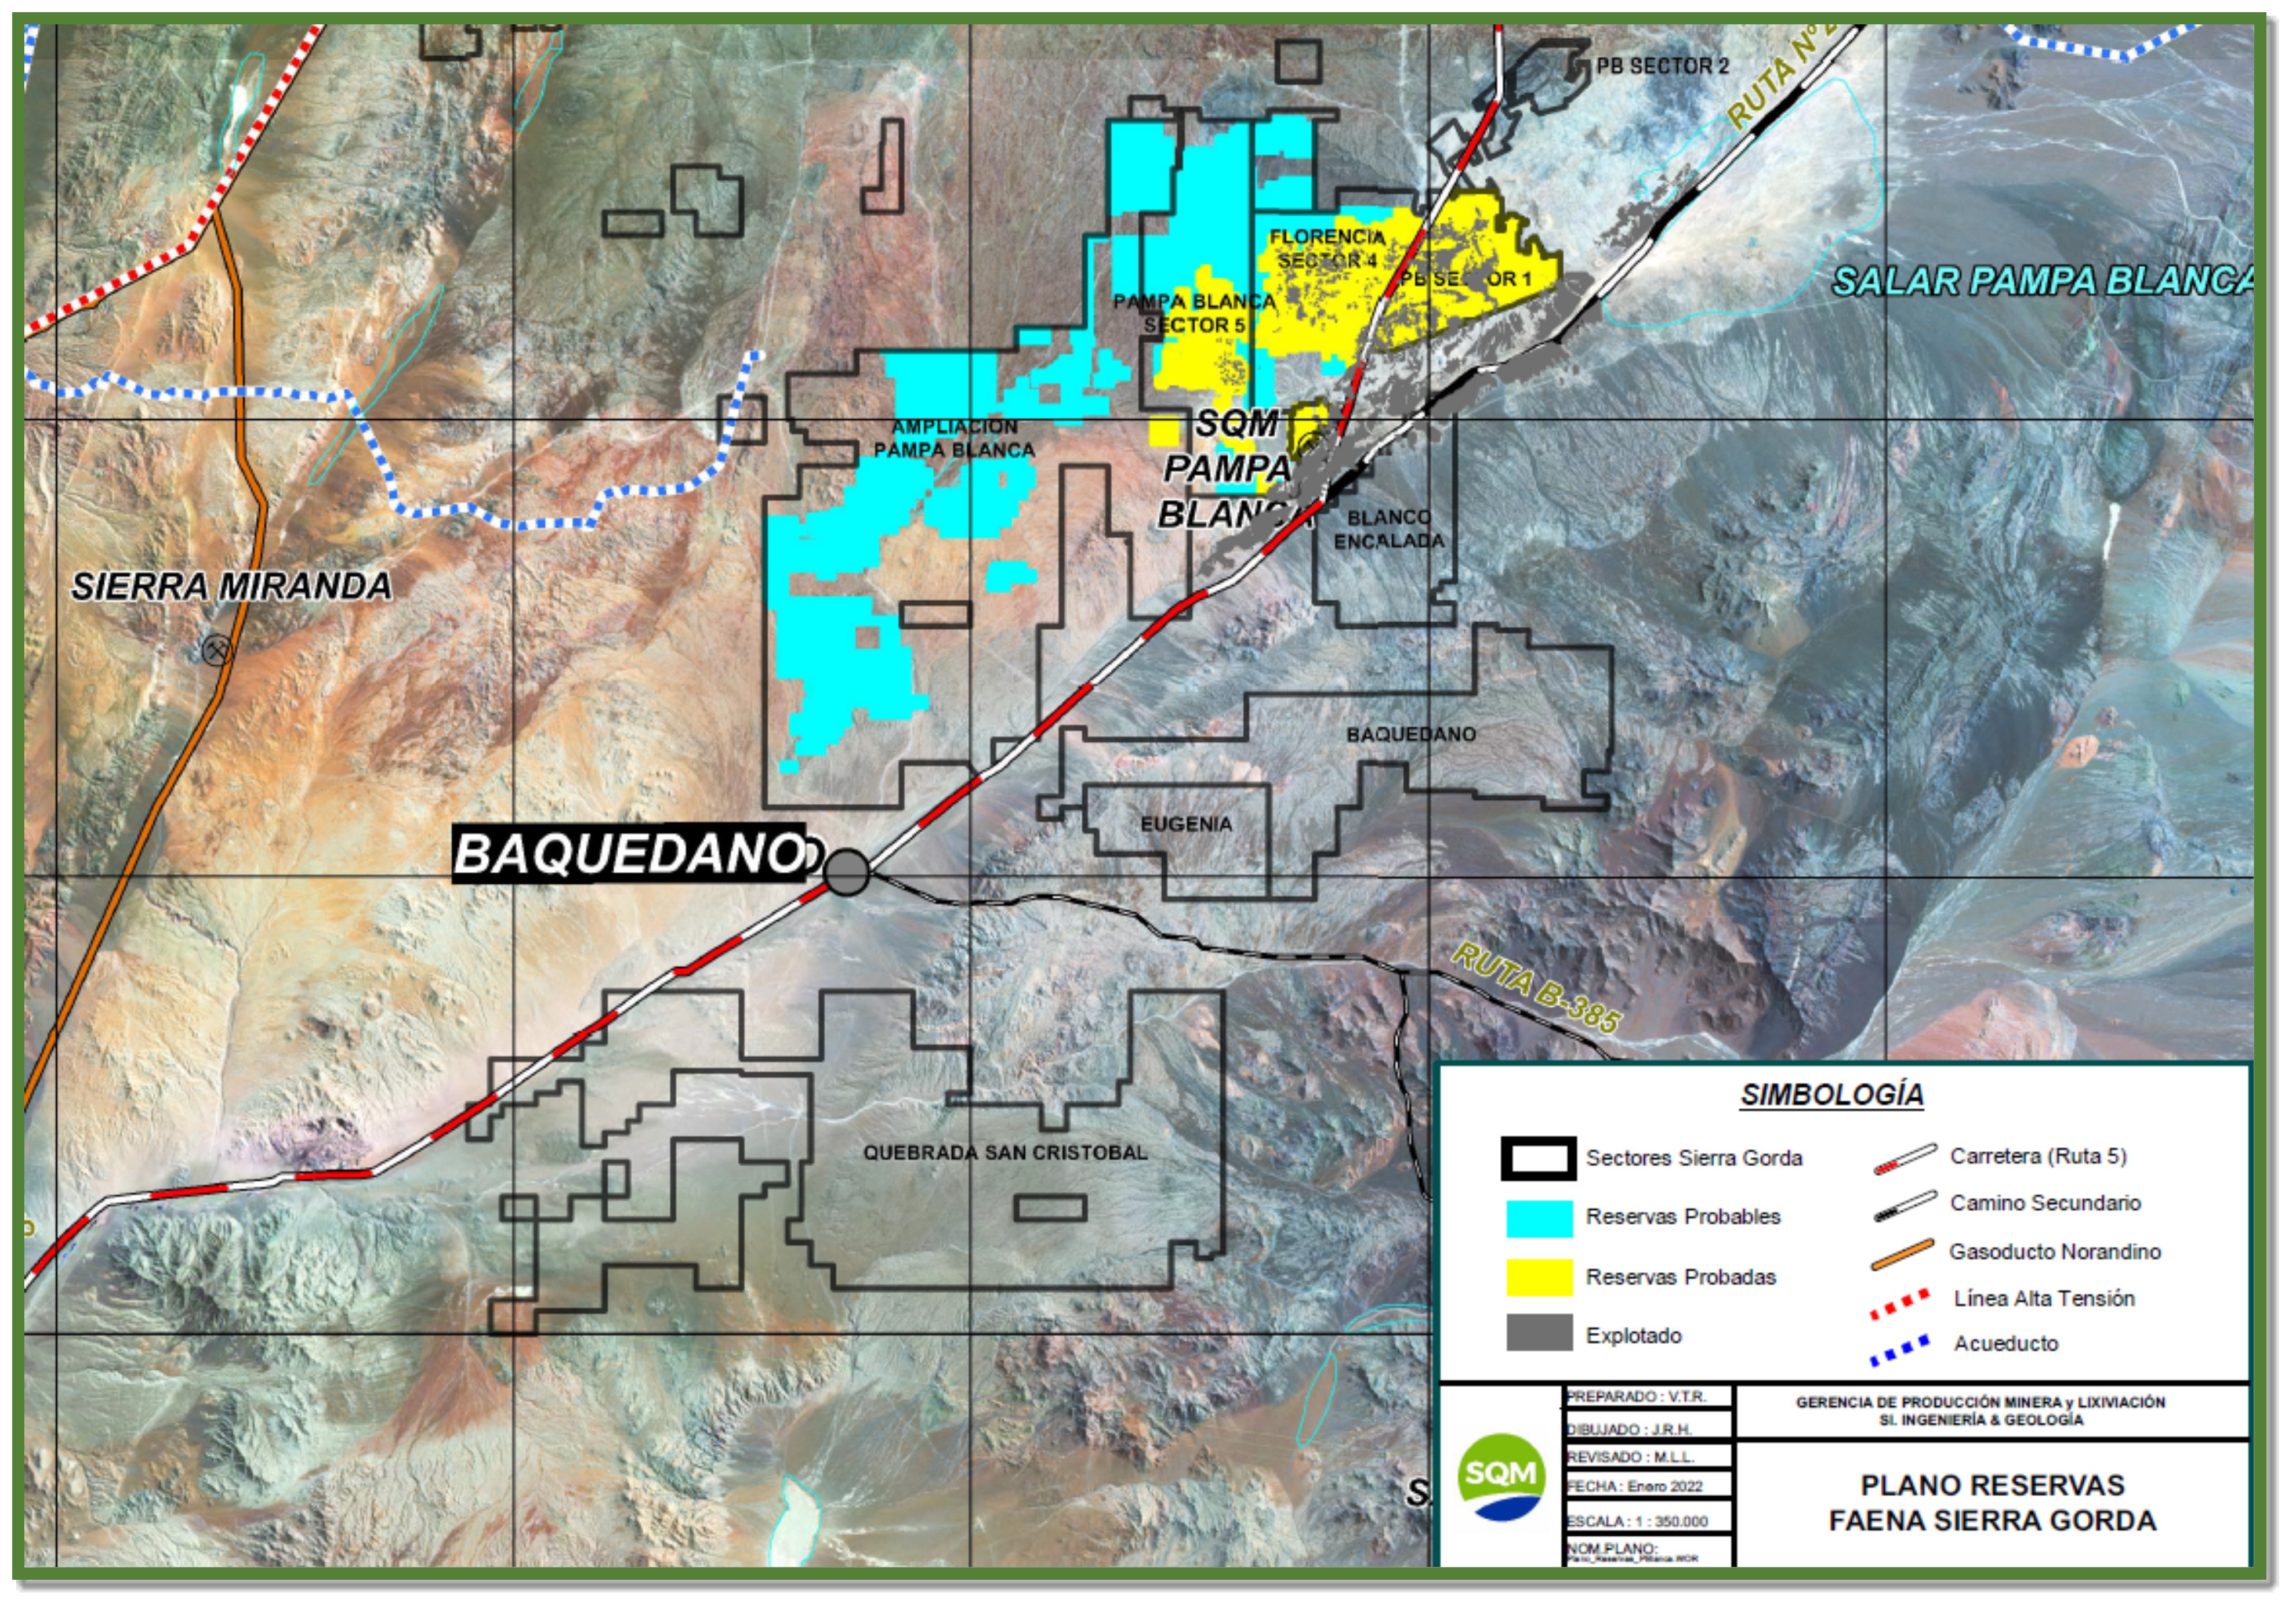
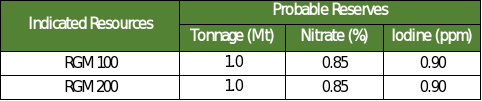
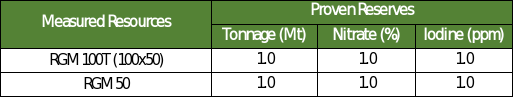
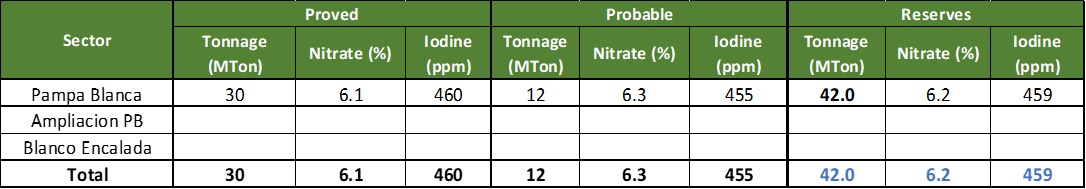
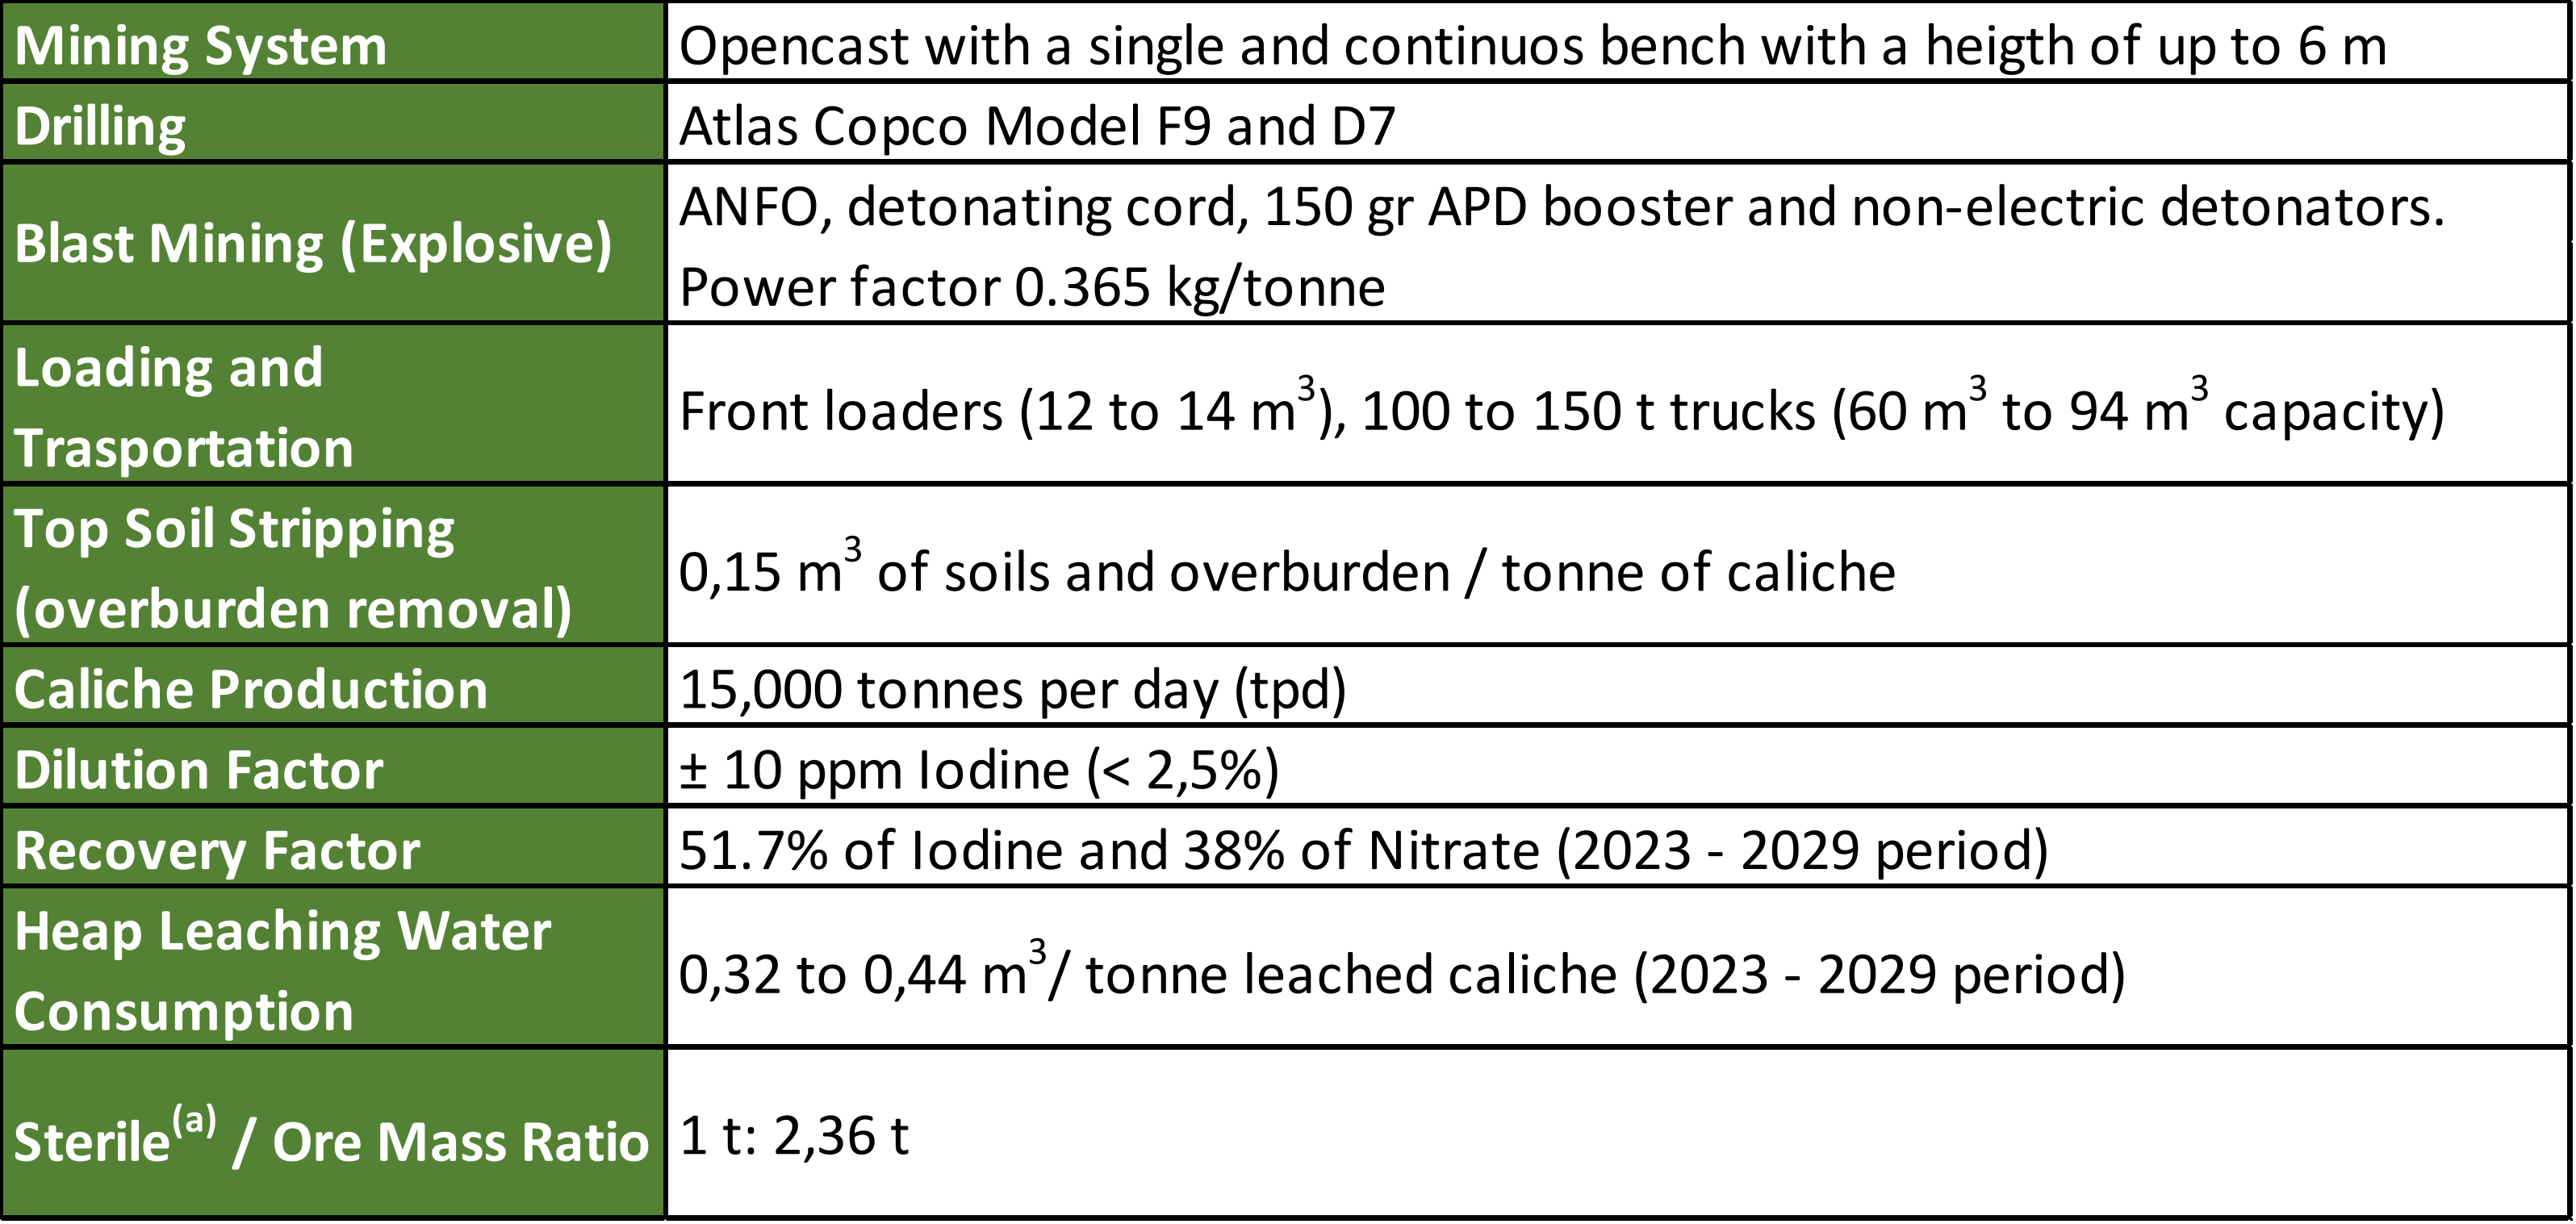 Table 13-1. Summary of Pampa Blanca-SQM caliche mine characteristics
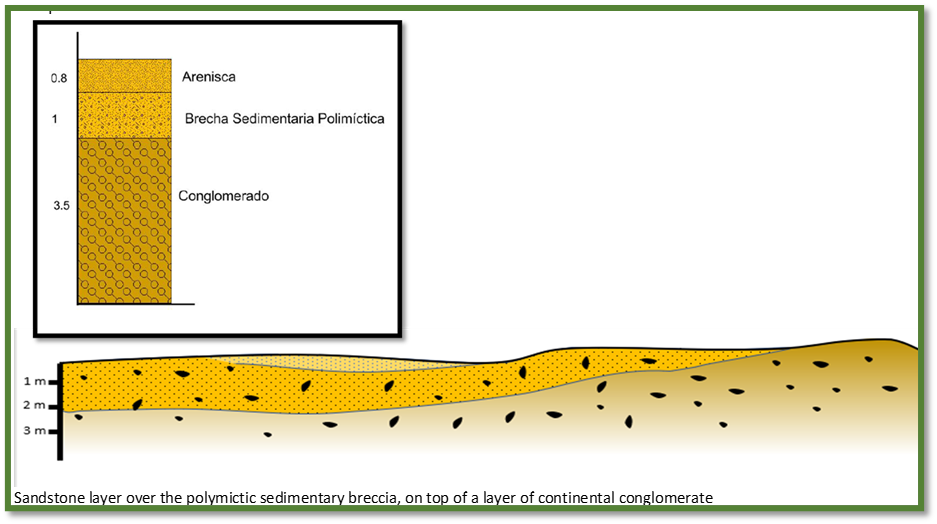
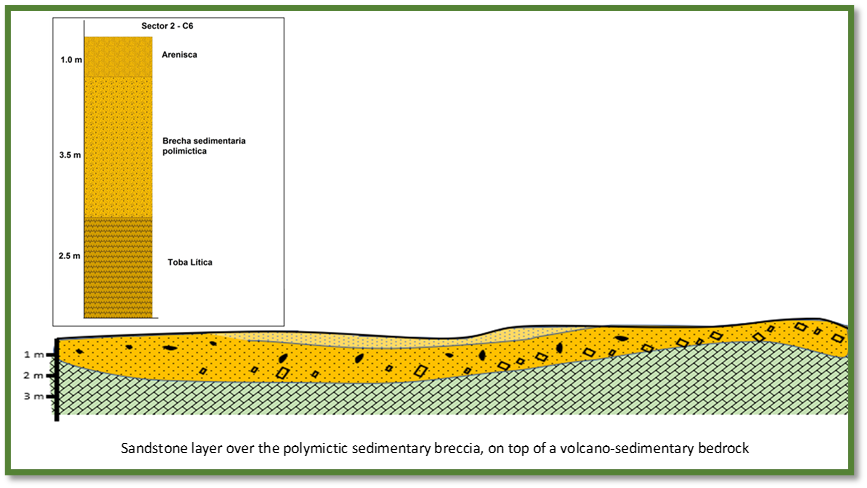
 ) and for the design earthquake it is set at 0.35 G.