UNITED STATES
SECURITIES AND EXCHANGE COMMISSION
Washington, D.C. 20549
FORM 8-K
CURRENT REPORT
Pursuant to Section 13 OR 15(d) of the Securities Exchange Act of 1934
Date of Report (Date of earliest event reported): February 4, 2026
ChoiceOne Financial Services, Inc.
(Exact Name of Registrant as
Specified in Charter)
| Michigan (State or Other Jurisdiction of Incorporation) |
000-19202 (Commission File Number) |
38-2659066 (IRS Employer Identification No.) |
|||
| 109 East Division Sparta, Michigan (Address of Principal Executive Offices) |
49345 (Zip Code) |
||||
Registrant's telephone number, including area code: (616) 887-7366
Check the appropriate box below if the Form 8-K filing is intended to simultaneously satisfy the filing obligation of the registrant under any of the following provisions (see General Instruction A.2. below):
o Written communications pursuant to Rule 425 under the Securities Act (17 CFR 230.425)
o Soliciting material pursuant to Rule 14a-12 under the Exchange Act (17 CFR 240.14a-12)
o Pre-commencement communications pursuant to Rule 14d-2(b) under the Exchange Act (17 CFR 240.14d-2(b))
o Pre-commencement communications pursuant to Rule 13e-4(c) under the Exchange Act (17 CFR 240.13e-4(c))
Securities registered pursuant to Section 12(b) of the Act:
| Title of each class | Trading symbol(s) | Name of each exchange on which registered |
| Common stock | COFS | NASDAQ Capital Market |
Indicate by check mark whether the registrant is an emerging growth company as defined in Rule 405 of the Securities Act of 1933 (§230.405 of this chapter) or Rule 12b-2 of the Securities Exchange Act of 1934 (§240.12b-2 of this chapter).
Emerging growth company o
If an emerging growth company, indicate by check mark if the registrant has elected not to use the extended transition period for complying with any new or revised financial accounting standards provided pursuant to Section 13(a) of the Exchange Act. o ChoiceOne Financial Services, Inc. ("ChoiceOne") is furnishing as Exhibit 99.1 to this Form 8-K presentation materials that are to be used by ChoiceOne management in meetings with investors beginning February 4, 2026. The information in Item 7.01 and Item 9.01 of this report, including Exhibit 99.1, is furnished to, and not filed with, the Commission.
|
|
| Item 7.01 | Regulation FD Disclosure |
| Item 9.01 | Financial Statements and Exhibits |
| Exhibit No. | Exhibit |
| 99.1 | ChoiceOne Financial Services, Inc. Investor Presentation. This Exhibit is furnished to, and not filed with, the Commission. |
***
| -2- |
SIGNATURES
Pursuant to the requirements of the Securities Exchange Act of 1934, the registrant has duly caused this report to be signed on its behalf by the undersigned hereunto duly authorized.
| Dated: | February 4, 2026 | CHOICEONE FINANCIAL SERVICES, INC. (Registrant) |
|
| By: | /s/ Adom J. Greenland | ||
| Adom J. Greenland Its Chief Financial Officer and Treasurer |
|||
-3-
EXHIBIT 99.1

INVESTOR PRESENTATION FOURTH QUARTER 2025 EXHIBIT 99.1
2 FORWARD - LOOKING STATEMENTS This presentation contains forward - looking statements that are based on management’s beliefs, assumptions, current expectations, estimates and projections about the financial services industry, the economy, and ChoiceOne . Words such as “anticipates,” “believes,” “estimates,” “expects,” “forecasts,” “intends,” “is likely,” “plans,” “predicts,” “projects,” “may,” “could,” “look forward,” “continue”, “future”, and variations of such words and similar expressions are intended to identify such forward - looking statements . All statements with references to future time periods are forward - looking . These statements are not guarantees of future performance and involve certain risks, uncertainties and assumptions (“risk factors”) that are difficult to predict with regard to timing, extent, likelihood, and degree of occurrence . Therefore, actual results and outcomes may materially differ from what may be expressed, implied or forecasted in such forward - looking statements . Furthermore, ChoiceOne undertakes no obligation to update, amend, or clarify forward - looking statements, whether as a result of new information, future events, or otherwise . Additional risk factors include, but are not limited to, the risk factors described in Item 1 A in ChoiceOne’s Annual Report on Form 10 - K for the year ended December 31 , 2024 . NON - GAAP FINANCIAL MEASURES In addition to results presented in accordance with GAAP, this presentation includes certain non - GAAP financial measures . ChoiceOne believes these non - GAAP financial measures provide additional information that is useful to investors in helping to understand underlying financial performance and condition and trends of ChoiceOne . Non - GAAP financial measures have inherent limitations . Readers should be aware of these limitations and should be cautious with respect to the use of such measures . To compensate for these limitations, we use non - GAAP financial measures as comparative tools, together with GAAP financial measures, to assist in the evaluation of our operating performance or financial condition . Also, we ensure that these measures are calculated using the appropriate GAAP or regulatory components in their entirety and that they are computed in a manner intended to facilitate consistent period - to - period comparisons . ChoiceOne’s method of calculating these non - GAAP financial measures may differ from methods used by other companies . These non - GAAP financial measures should not be considered in isolation or as a substitute for those financial measures prepared in accordance with GAAP or applicable regulatory requirements . Where non - GAAP financial measures are used, the most directly comparable GAAP or regulatory financial measure, as well as the reconciliation to the most directly comparable GAAP or regulatory financial measure, can be found in this presentation .
3 Our vision is to be the best bank in Michigan. Our mission is to provide superior service, quality advice, and show utmost respect to everyone we meet.
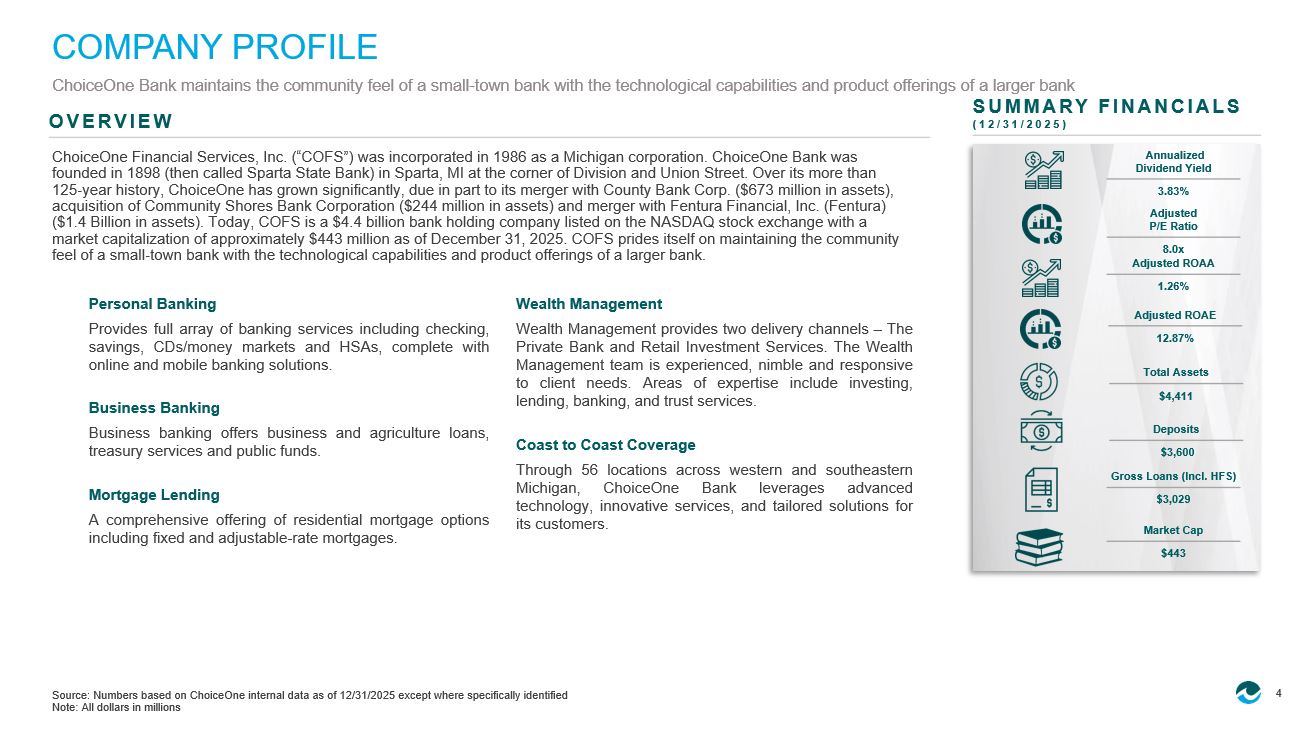
4 Source: Numbers based on ChoiceOne internal data as of 12/31/2025 except where specifically identified Note: All dollars in millions COMPANY PROFILE ChoiceOne Bank maintains the community feel of a small - town bank with the technological capabilities and product offerings of a larger bank ChoiceOne Financial Services, Inc. (“COFS”) was incorporated in 1986 as a Michigan corporation. ChoiceOne Bank was founded in 1898 (then called Sparta State Bank) in Sparta, MI at the corner of Division and Union Street. Over its more than 125 - year history, ChoiceOne has grown significantly, due in part to its merger with County Bank Corp. ($673 million in assets), acquisition of Community Shores Bank Corporation ($244 million in assets) and merger with Fentura Financial, Inc. (Fentura) ($1.4 Billion in assets). Today, COFS is a $4.4 billion bank holding company listed on the NASDAQ stock exchange with a market capitalization of approximately $443 million as of December 31, 2025. COFS prides itself on maintaining the community feel of a small - town bank with the technological capabilities and product offerings of a larger bank. Personal Banking Provides full array of banking services including checking, savings, CDs/money markets and HSAs, complete with online and mobile banking solutions . Business Banking Business banking offers business and agriculture loans, treasury services and public funds . Mortgage Lending A comprehensive offering of residential mortgage options including fixed and adjustable - rate mortgages . Wealth Management Wealth Management provides two delivery channels – The Private Bank and Retail Investment Services . The Wealth Management team is experienced, nimble and responsive to client needs . Areas of expertise include investing, lending, banking, and trust services . Coast to Coast Coverage Through 56 locations across western and southeastern Michigan, ChoiceOne Bank leverages advanced technology, innovative services, and tailored solutions for its customers . SUMMARY FINANCIALS (12/31/2025) Total Assets $4,411 Deposits $3,600 Gross Loans (Incl.
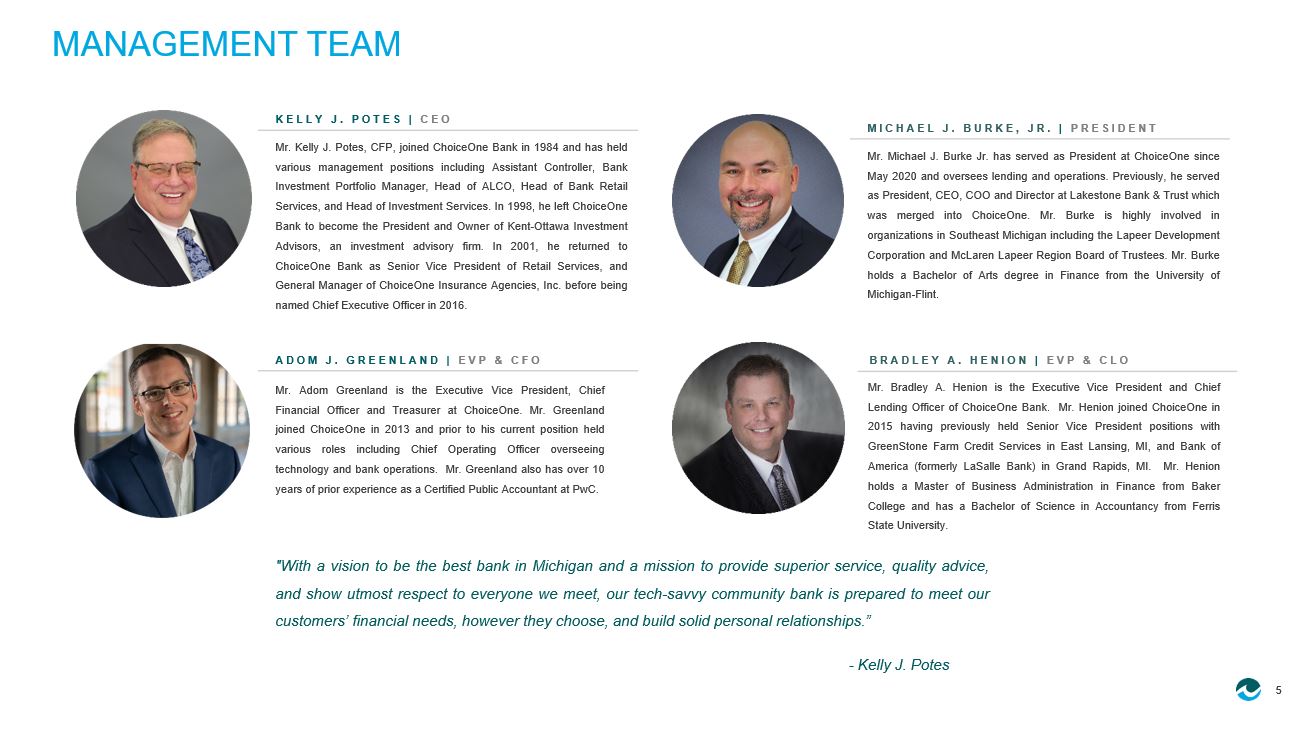
HFS) $3,029 Market Cap $443 Adjusted ROAA 1.26% Adjusted ROAE 12.87% Annualized Dividend Yield 3.83% Adjusted P/E Ratio 8.0x OVERVIEW 5 MANAGEMENT TEAM Mr . Michael J . Burke Jr . has served as President at ChoiceOne since May 2020 and oversees lending and operations . Previously, he served as President, CEO, COO and Director at Lakestone Bank & Trust which was merged into ChoiceOne . Mr . Burke is highly involved in organizations in Southeast Michigan including the Lapeer Development Corporation and McLaren Lapeer Region Board of Trustees . Mr . Burke holds a Bachelor of Arts degree in Finance from the University of Michigan - Flint . MICHAEL J. BURKE, JR. | PRESIDENT Mr . Adom Greenland is the Executive Vice President, Chief Financial Officer and Treasurer at ChoiceOne . Mr . Greenland joined ChoiceOne in 2013 and prior to his current position held various roles including Chief Operating Officer overseeing technology and bank operations . Mr . Greenland also has over 10 years of prior experience as a Certified Public Accountant at PwC . Mr . Kelly J . Potes, CFP, joined ChoiceOne Bank in 1984 and has held various management positions including Assistant Controller, Bank Investment Portfolio Manager, Head of ALCO, Head of Bank Retail Services, and Head of Investment Services . In 1998 , he left ChoiceOne Bank to become the President and Owner of Kent - Ottawa Investment Advisors, an investment advisory firm . In 2001 , he returned to ChoiceOne Bank as Senior Vice President of Retail Services, and General Manager of ChoiceOne Insurance Agencies, Inc . before being named Chief Executive Officer in 2016 . ADOM J. GREENLAND | EVP & CFO KELLY J. POTES | CEO Mr . Bradley A . Henion is the Executive Vice President and Chief Lending Officer of ChoiceOne Bank . Mr . Henion joined ChoiceOne in 2015 having previously held Senior Vice President positions with GreenStone Farm Credit Services in East Lansing, MI, and Bank of America (formerly LaSalle Bank) in Grand Rapids, MI . Mr . Henion holds a Master of Business Administration in Finance from Baker College and has a Bachelor of Science in Accountancy from Ferris State University . BRADLEY A. HENION | EVP & CLO "With a vision to be the best bank in Michigan and a mission to provide superior service, quality advice, and show utmost respect to everyone we meet, our tech - savvy community bank is prepared to meet our customers’ financial needs, however they choose, and build solid personal relationships . ” - Kelly J . Potes 6 AWARDS & ACCOMPLISHMENTS With an abundance of accolades & awards, ChoiceOne Bank has been recognized as a top - tier community bank in Michigan and in the banking industry.
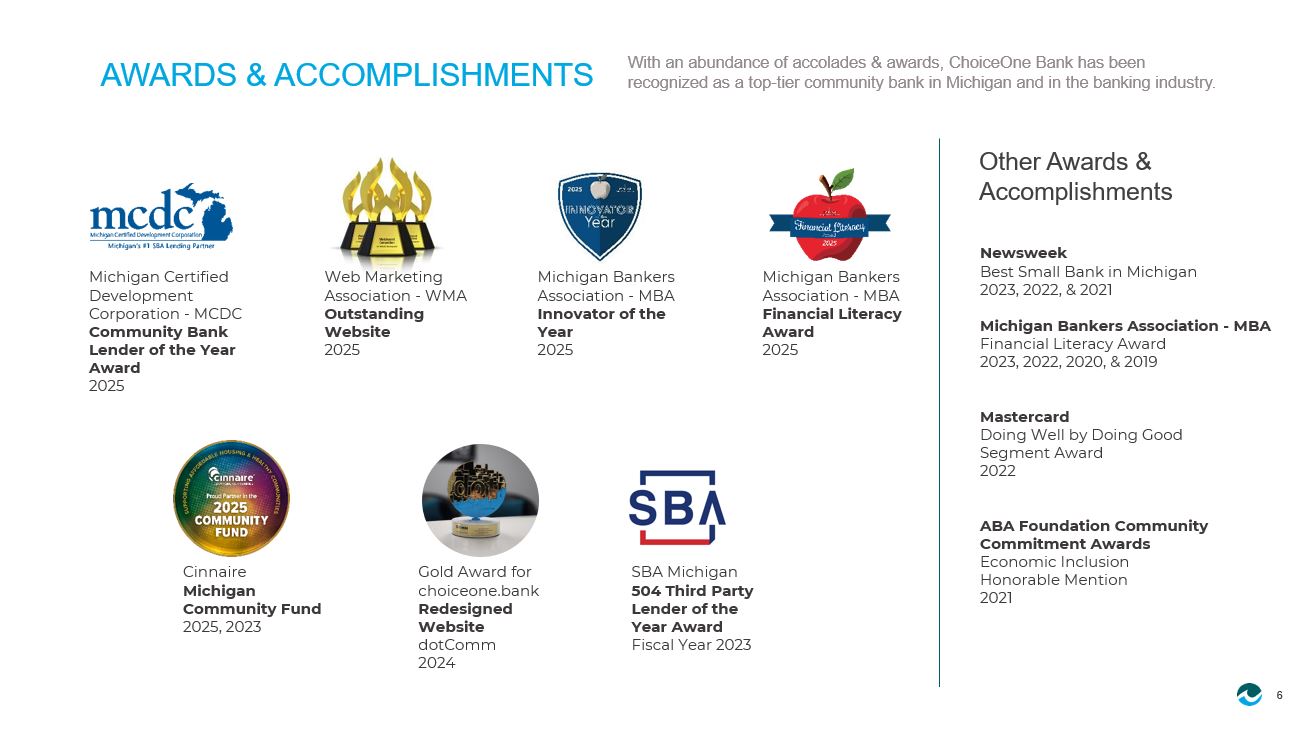
Michigan Certified Development Corporation - MCDC Community Bank Lender of the Year Award 2025 Web Marketing Association - WMA Outstanding Website 2025 Michigan Bankers Association - MBA Innovator of the Year 2025 Michigan Bankers Association - MBA Financial Literacy Award 2025 Cinnaire Michigan Community Fund 2025, 2023 Gold Award for choiceone.bank Redesigned Website dotComm 2024 SBA Michigan 504 Third Party Lender of the Year Award Fiscal Year 2023 Newsweek Best Small Bank in Michigan 2023, 2022, & 2021 Michigan Bankers Association - MBA Financial Literacy Award 2023, 2022, 2020, & 2019 Mastercard Doing Well by Doing Good Segment Award 2022 ABA Foundation Community Commitment Awards Economic Inclusion Honorable Mention 2021 Other Awards & Accomplishments 7 Source: Numbers based on ChoiceOne internal data as of 12/31/2025 except where specifically identified Note: All dollars in millions, unless otherwise noted; deals sorted by announcement date M&A HISTORY COFS has completed four whole bank M&A deals, most recently, the Merger with Fentura in March of 2025.
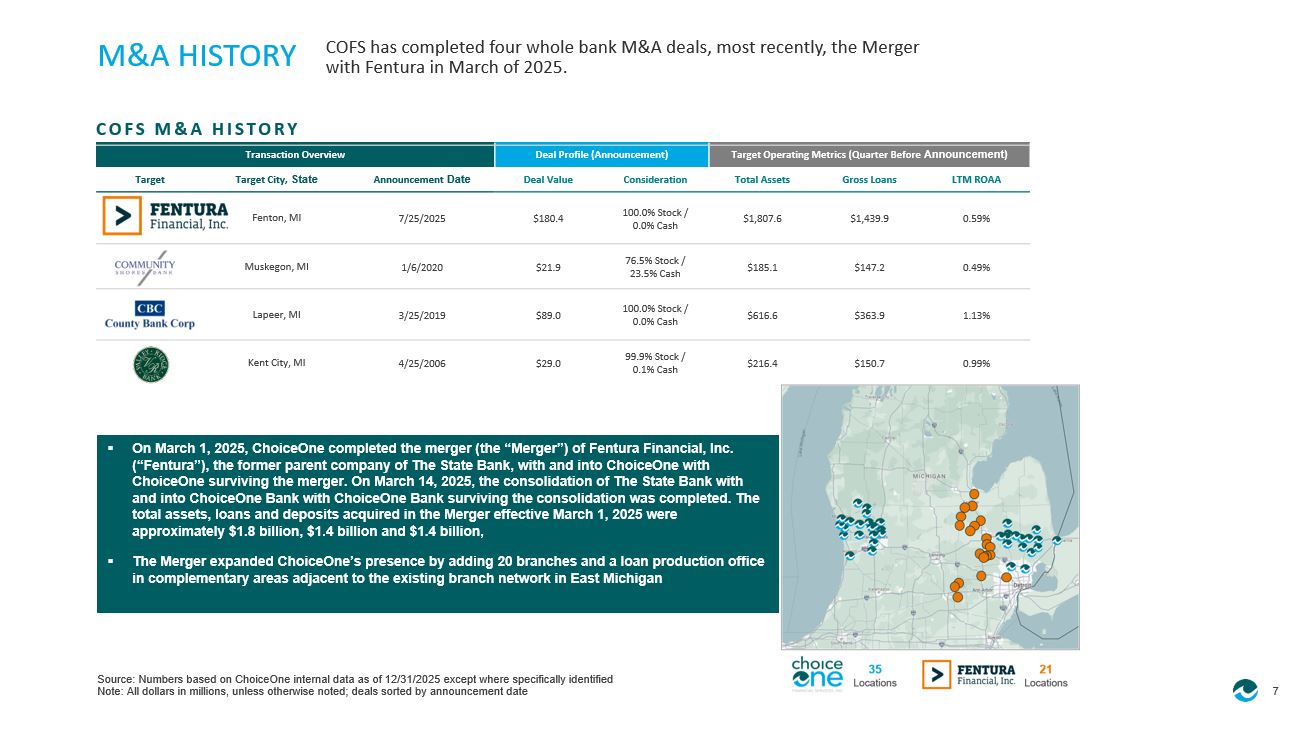
Target Operating Metrics (Quarter Before Announcement) Deal Profile (Announcement) Transaction Overview LTM ROAA Gross Loans Total Assets Consideration Deal Value Announcement Date Target City, State Target 0.59% $1,439.9 $1,807.6 100.0% Stock / 0.0% Cash $180.4 7/25/2025 Fenton, MI 0.49% $147.2 $185.1 76.5% Stock / 23.5% Cash $21.9 1/6/2020 Muskegon, MI 1.13% $363.9 $616.6 100.0% Stock / 0.0% Cash $89.0 3/25/2019 Lapeer, MI 0.99% $150.7 $216.4 99.9% Stock / 0.1% Cash $29.0 4/25/2006 Kent City, MI COFS M&A HISTORY ▪ On March 1, 2025, ChoiceOne completed the merger (the “Merger”) of Fentura Financial, Inc. (“Fentura”), the former parent company of The State Bank, with and into ChoiceOne with ChoiceOne surviving the merger. On March 14, 2025, the consolidation of The State Bank with and into ChoiceOne Bank with ChoiceOne Bank surviving the consolidation was completed. The total assets, loans and deposits acquired in the Merger effective March 1, 2025 were approximately $1.8 billion, $1.4 billion and $1.4 billion, ▪ The Merger expanded ChoiceOne’s presence by adding 20 branches and a loan production office in complementary areas adjacent to the existing branch network in East Michigan 10 Source: Numbers based on ChoiceOne internal data as of 12/31/2025 except where specifically identified; Note: All dollars in thousands 1.
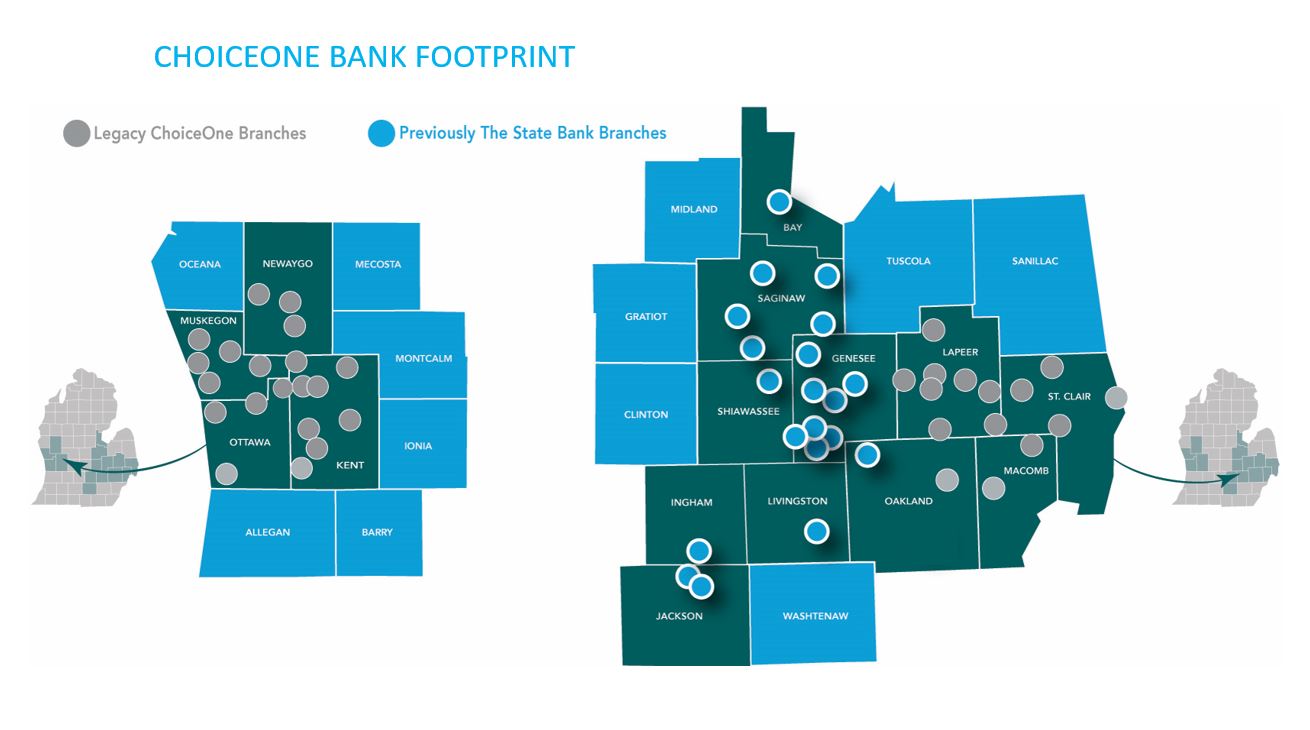
CHOICEONE BANK FOOTPRINT

FINANCIAL SUMMARY
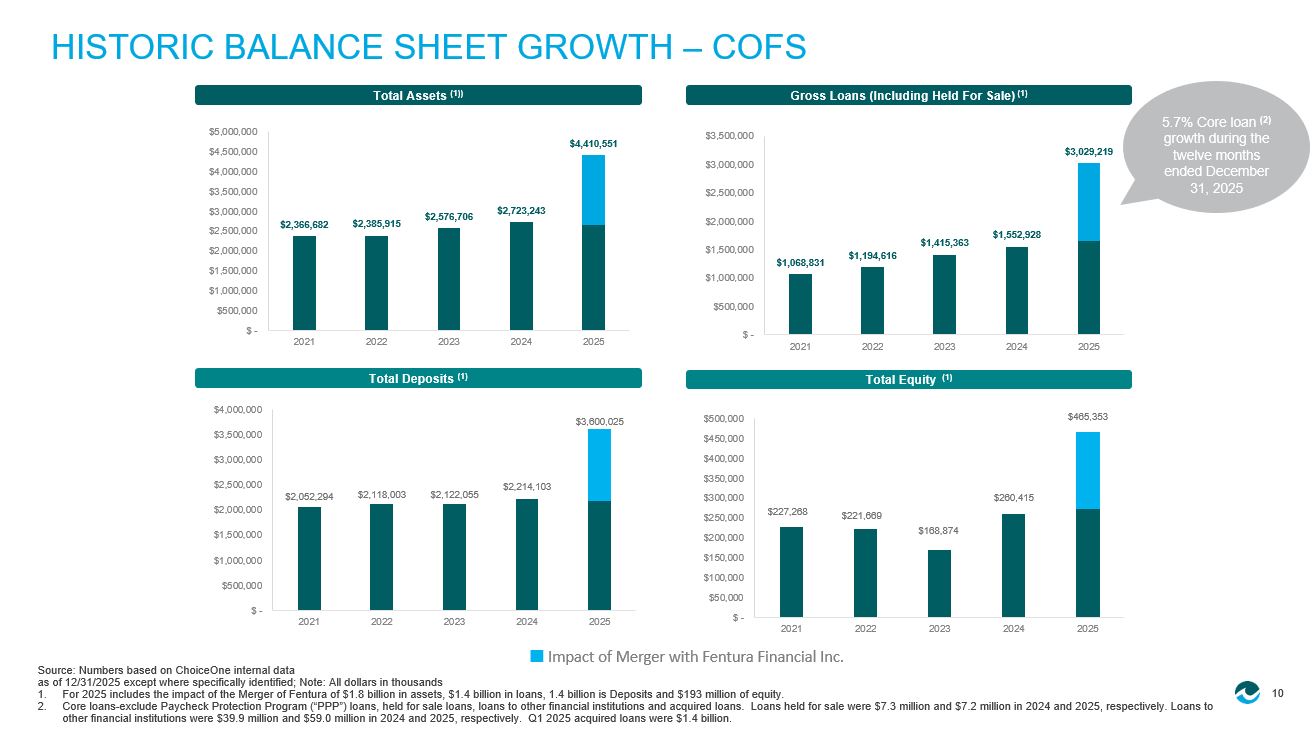
For 2025 includes the impact of the Merger of Fentura of $1.8 billion in assets, $1.4 billion in loans, 1.4 billion is Deposi ts and $193 million of equity. 2. Core loans - exclude Paycheck Protection Program (“PPP”) loans, held for sale loans, loans to other financial institutions and acq uired loans. Loans held for sale were $7.3 million and $7.2 million in 2024 and 2025, respectively. Loans to other financial institutions were $39.9 million and $59.0 million in 2024 and 2025, respectively. Q1 2025 acquired loans wer e $ 1.4 billion. HISTORIC BALANCE SHEET GROWTH – COFS Total Equity (1) Total Deposits (1) Gross Loans (Including Held For Sale) (1) Total Assets (1)) 5.7% Core loan (2) growth during the twelve months ended December 31, 2025 Impact of Merger with Fentura Financial Inc. $2,366,682 $2,385,915 $2,576,706 $2,723,243 $4,410,551 $ - $500,000 $1,000,000 $1,500,000 $2,000,000 $2,500,000 $3,000,000 $3,500,000 $4,000,000 $4,500,000 $5,000,000 2021 2022 2023 2024 2025 $1,068,831 $1,194,616 $1,415,363 $1,552,928 $3,029,219 $ - $500,000 $1,000,000 $1,500,000 $2,000,000 $2,500,000 $3,000,000 $3,500,000 2021 2022 2023 2024 2025 $2,052,294 $2,118,003 $2,122,055 $2,214,103 $3,600,025 $ - $500,000 $1,000,000 $1,500,000 $2,000,000 $2,500,000 $3,000,000 $3,500,000 $4,000,000 2021 2022 2023 2024 2025 $227,268 $221,669 $168,874 $260,415 $465,353 $ - $50,000 $100,000 $150,000 $200,000 $250,000 $300,000 $350,000 $400,000 $450,000 $500,000 2021 2022 2023 2024 2025 11 Business - Transactional 24% Business - Savings 12% Retail - Transactional 19% Retail - Savings 24% Public Funds - Transactional 10% Public Funds - Savings 11% ▪ Diverse local deposit franchise of retail, business, and municipal accounts ▪ Launched new treasury management platform in 2023 with best - in - class functionality ▪ At 12/31/2025 Non - interest - bearing deposit base of $907.0 million or 25% of deposits ▪ Diversified offerings such as Intrafi’s CDARS and ICS products that increase depositors’ FDIC coverage ▪ $1.2 billion or 33.2% of total deposits exceed the FDIC limit of $250,000, as of 12/31/2025 ▪ ChoiceOne continues to be proactive in managing its liquidity position at December 31, 2025.
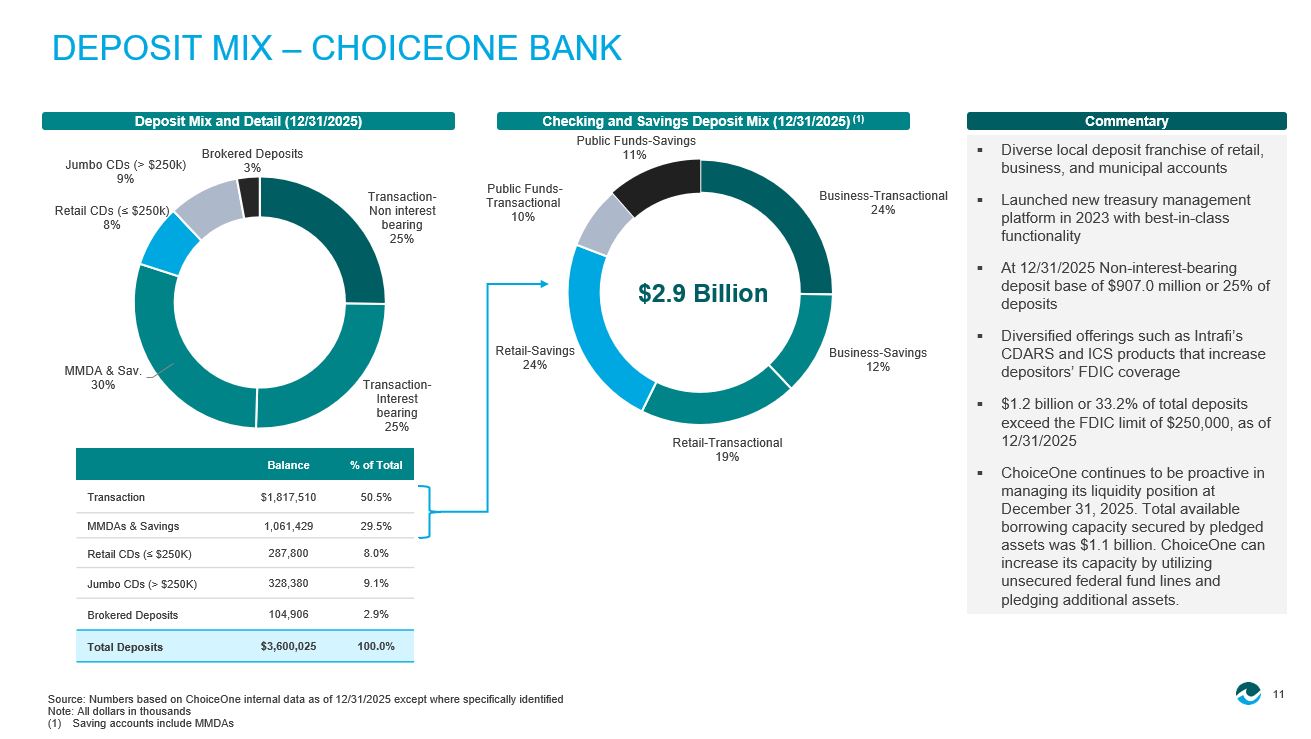
Total available borrowing capacity secured by pledged assets was $1.1 billion. ChoiceOne can increase its capacity by utilizing unsecured federal fund lines and pledging additional assets. Source: Numbers based on ChoiceOne internal data as of 12/31/2025 except where specifically identified Note: All dollars in thousands (1) Saving accounts include MMDAs DEPOSIT MIX – CHOICEONE BANK Deposit Mix and Detail (12/31/2025) Commentary Checking and Savings Deposit Mix (12/31/2025) (1) $2.9 Billion % of Total Balance 50.5% $1,817,510 Transaction 29.5% 1,061,429 MMDAs & Savings 8.0% 287,800 Retail CDs (≤ $250K) 9.1% 328,380 Jumbo CDs (> $250K) 2.9% 104,906 Brokered Deposits 100.0% $3,600,025 Total Deposits Transaction - Non interest bearing 25% Transaction - Interest bearing 25% MMDA & Sav.
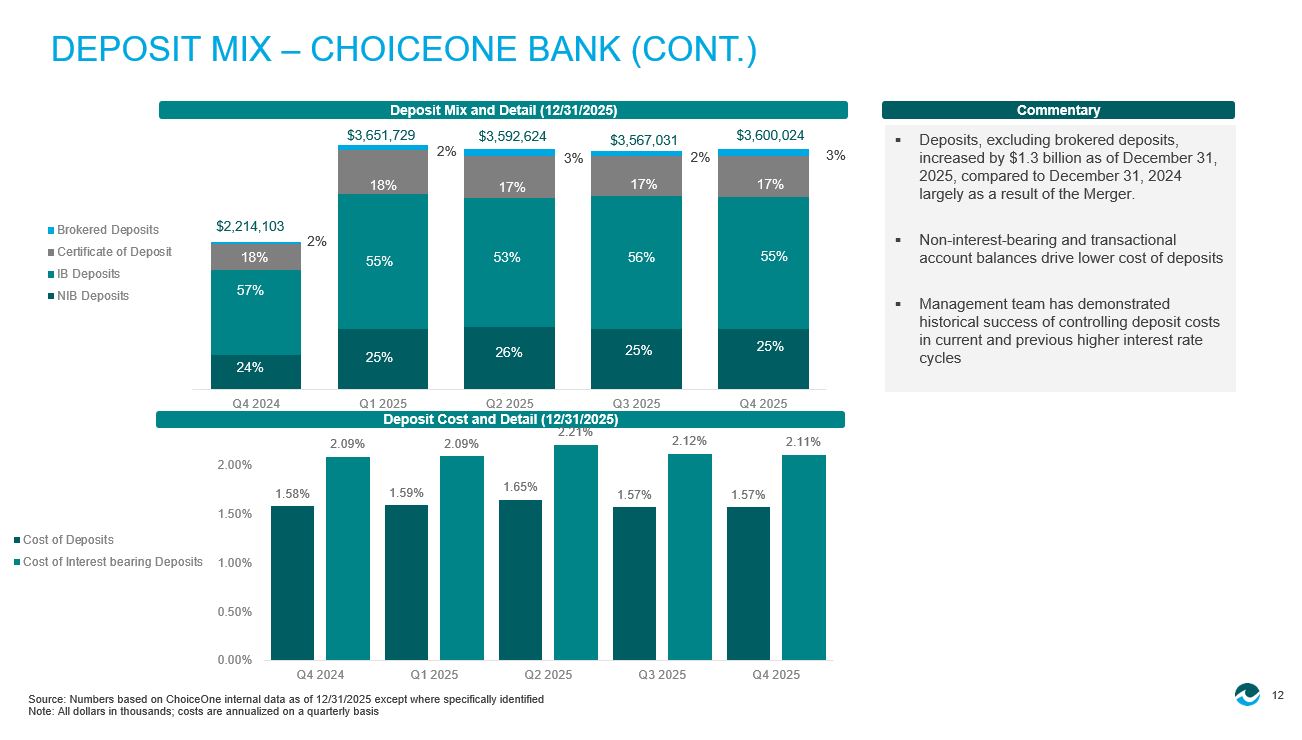
30% Retail CDs (≤ $250k) 8% Jumbo CDs (> $250k) 9% Brokered Deposits 3% 12 Q4 2024 Q1 2025 Q2 2025 Q3 2025 Q4 2025 Brokered Deposits Certificate of Deposit IB Deposits NIB Deposits Source: Numbers based on ChoiceOne internal data as of 12/31/2025 except where specifically identified Note: All dollars in thousands; costs are annualized on a quarterly basis DEPOSIT MIX – CHOICEONE BANK (CONT.) ▪ Deposits, excluding brokered deposits, increased by $1.3 billion as of December 31, 2025, compared to December 31, 2024 largely as a result of the Merger. ▪ Non - interest - bearing and transactional account balances drive lower cost of deposits ▪ Management team has demonstrated historical success of controlling deposit costs in current and previous higher interest rate cycles Deposit Mix and Detail (12/31/2025) Commentary $2,214,103 $3,651,729 $3,592,624 24% 25% 25% 53% 57% 55% 26% 55% $3,567,031 56% 25% $3,600,024 17% 17% 17% 18% 18% 2% 2% 3% 3% 2% Deposit Cost and Detail (12/31/2025) 1.58% 1.59% 1.65% 1.57% 1.57% 2.09% 2.09% 2.21% 2.12% 2.11% 0.00% 0.50% 1.00% 1.50% 2.00% Q4 2024 Q1 2025 Q2 2025 Q3 2025 Q4 2025 Cost of Deposits Cost of Interest bearing Deposits 13 Source: Numbers based on ChoiceOne internal data as of 12/31/2025 except where specifically identified Note: All dollars in thousands; yields are annualized on a quarterly basis (1) Detail by types per call report codes LOAN MIX – CHOICEONE BANK ▪ Strong commercial real estate portfolio – 37.6% of CRE loans are owner occupied at 12 - 31 - 2025.
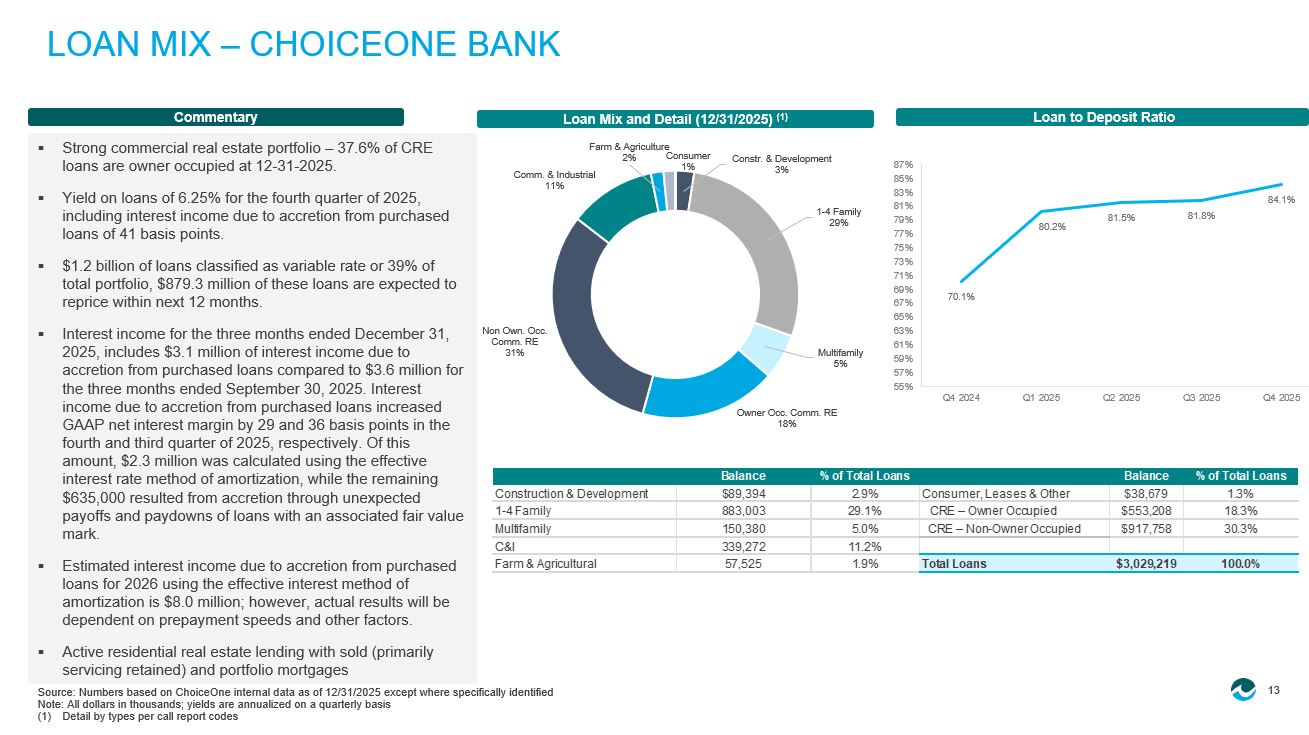
▪ Yield on loans of 6.25% for the fourth quarter of 2025, including interest income due to accretion from purchased loans of 41 basis points. ▪ $1.2 billion of loans classified as variable rate or 39% of total portfolio, $879.3 million of these loans are expected to reprice within next 12 months. ▪ Interest income for the three months ended December 31, 2025, includes $3.1 million of interest income due to accretion from purchased loans compared to $3.6 million for the three months ended September 30, 2025. Interest income due to accretion from purchased loans increased GAAP net interest margin by 29 and 36 basis points in the fourth and third quarter of 2025, respectively. Of this amount, $2.3 million was calculated using the effective interest rate method of amortization, while the remaining $635,000 resulted from accretion through unexpected payoffs and paydowns of loans with an associated fair value mark. ▪ Estimated interest income due to accretion from purchased loans for 2026 using the effective interest method of amortization is $8.0 million; however, actual results will be dependent on prepayment speeds and other factors. ▪ Active residential real estate lending with sold (primarily servicing retained) and portfolio mortgages Loan Mix and Detail (12/31/2025) (1) Commentary Loan to Deposit Ratio Constr. & Development 3% 1 - 4 Family 29% Multifamily 5% Owner Occ. Comm. RE 18% Non Own. Occ. Comm. RE 31% Comm. & Industrial 11% Farm & Agriculture 2% Consumer 1% 70.1% 80.2% 81.5% 81.8% 84.1% 55% 57% 59% 61% 63% 65% 67% 69% 71% 73% 75% 77% 79% 81% 83% 85% 87% Q4 2024 Q1 2025 Q2 2025 Q3 2025 Q4 2025 Balance % of Total Loans Balance % of Total Loans Construction & Development $89,394 2.9% Consumer, Leases & Other $38,679 1.3% 1-4 Family 883,003 29.1% CRE – Owner Occupied $553,208 18.3% Multifamily 150,380 5.0% CRE – Non-Owner Occupied $917,758 30.3% C&I 339,272 11.2% Farm & Agricultural 57,525 1.9% Total Loans $3,029,219 100.0% 14 Source: Numbers based on ChoiceOne internal data as of 12/31/2025 except where specifically identified (1) Detail by types per purpose code for call report codes 1E2, 1A1,1A2 and 1D loans (2) Construction and land development contains all 1A1 and 1A2 loans NON - OWNER OCCUPIED COMMERCIAL REAL ESTATE PER REGULATORY CALL CODES ▪ Diversified local NOO CRE portfolio with average loan size of $1.1 million.
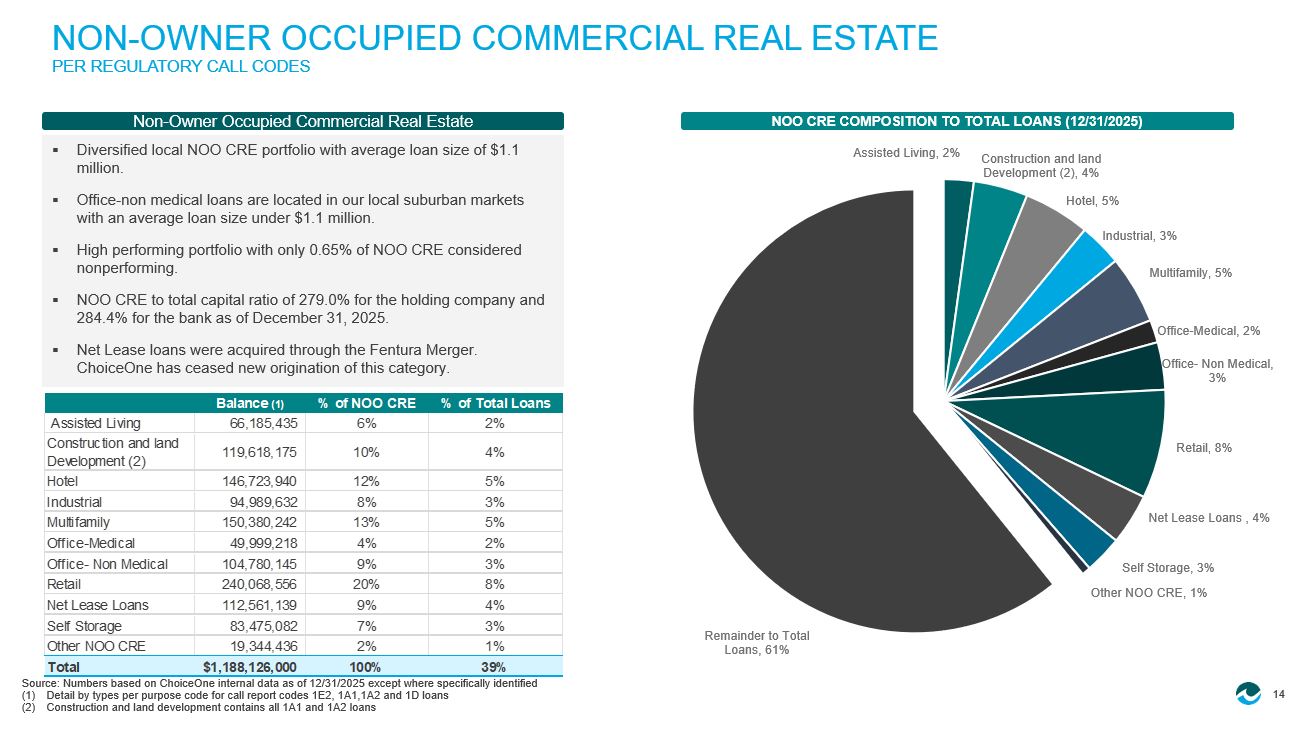
▪ Office - non medical loans are located in our local suburban markets with an average loan size under $1.1 million. ▪ High performing portfolio with only 0.65% of NOO CRE considered nonperforming. ▪ NOO CRE to total capital ratio of 279.0% for the holding company and 284.4% for the bank as of December 31, 2025. ▪ Net Lease loans were acquired through the Fentura Merger. ChoiceOne has ceased new origination of this category. NOO CRE COMPOSITION TO TOTAL LOANS (12/31/2025) Non - Owner Occupied Commercial Real Estate Balance (1) % of NOO CRE % of Total Loans Assisted Living 66,185,435 6% 2% Construction and land Development (2) 119,618,175 10% 4% Hotel 146,723,940 12% 5% Industrial 94,989,632 8% 3% Multifamily 150,380,242 13% 5% Office-Medical 49,999,218 4% 2% Office- Non Medical 104,780,145 9% 3% Retail 240,068,556 20% 8% Net Lease Loans 112,561,139 9% 4% Self Storage 83,475,082 7% 3% Other NOO CRE 19,344,436 2% 1% Total $1,188,126,000 100% 39% Assisted Living , 2% Construction and land Development (2) , 4% Hotel , 5% Industrial , 3% Multifamily , 5% Office - Medical , 2% Office - Non Medical , 3% Retail , 8% Net Lease Loans , 4% Self Storage , 3% Other NOO CRE , 1% Remainder to Total Loans , 61% 15 Commercial Mortgage Backed 23% Mortgage - Backed 18% Asset - Backed Securities 1% Corporate 2% State and MUNI - Tax Exempt 29% State and MUNI - Taxable 17% US Treasury Bonds and Agency 10% Source: Numbers based on ChoiceOne internal data as of 12/31/2025 except where specifically identified (1) Securities portfolio breakdown is by book value and excludes equity securities (2) Reported value of securities: Available for sale, at fair value and held to maturity, at amortized cost net of credit losses INVESTMENT PORTFOLIO – COFS Securities Portfolio Breakdown (1) $940 Million (2) SECURITIES PORTFOLIO HIGHLIGHTS ▪ COFS’ total securities portfolio of $940 million consists of high - quality securities to be used for liquidity and cash flow ▪ $385.2 million of the portfolio is at held to maturity status.
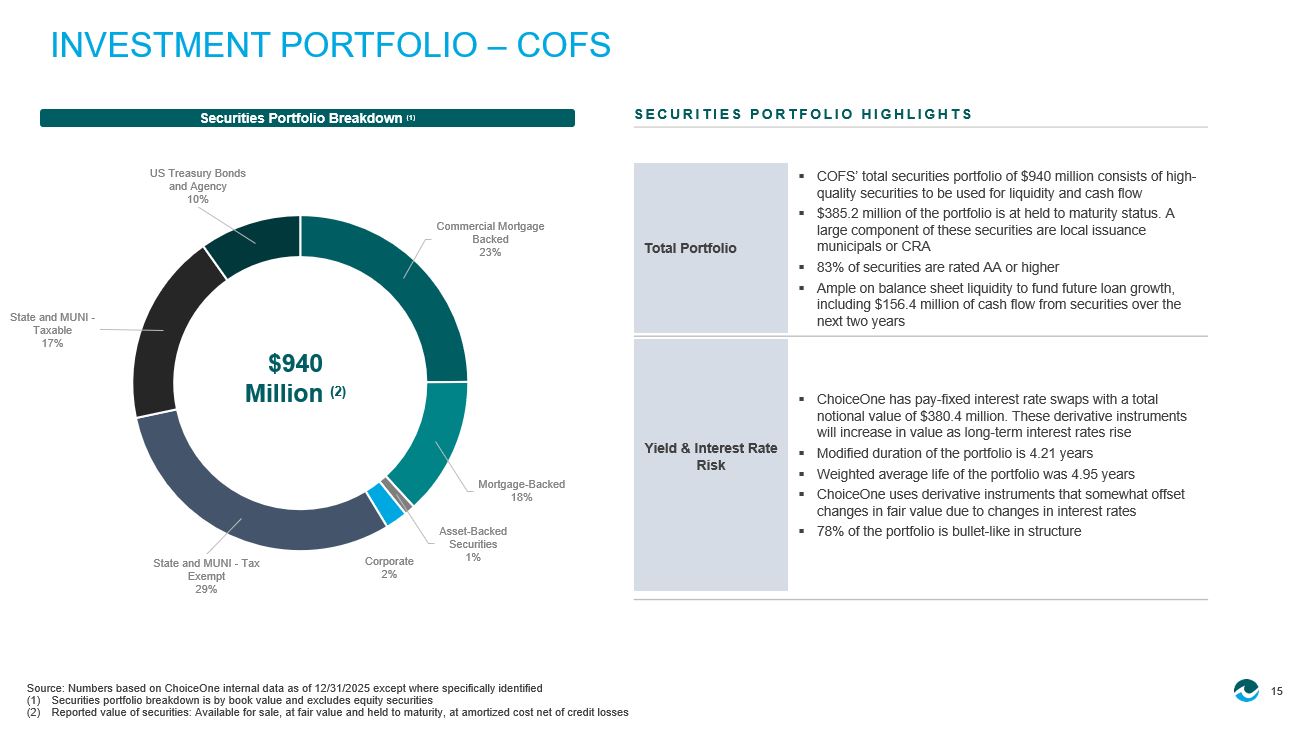
A large component of these securities are local issuance municipals or CRA ▪ 83% of securities are rated AA or higher ▪ Ample on balance sheet liquidity to fund future loan growth, including $156.4 million of cash flow from securities over the next two years Total Portfolio ▪ ChoiceOne has pay - fixed interest rate swaps with a total notional value of $380.4 million. These derivative instruments will increase in value as long - term interest rates rise ▪ Modified duration of the portfolio is 4.21 years ▪ Weighted average life of the portfolio was 4.95 years ▪ ChoiceOne uses derivative instruments that somewhat offset changes in fair value due to changes in interest rates ▪ 78% of the portfolio is bullet - like in structure Yield & Interest Rate Risk 16 Source: Numbers based on ChoiceOne internal data as of 12/31/2025 except where specifically identified Note: All dollars in thousands INTEREST RATE SWAPS ChoiceOne uses interest rate swaps as part of our interest rate risk management strategy.
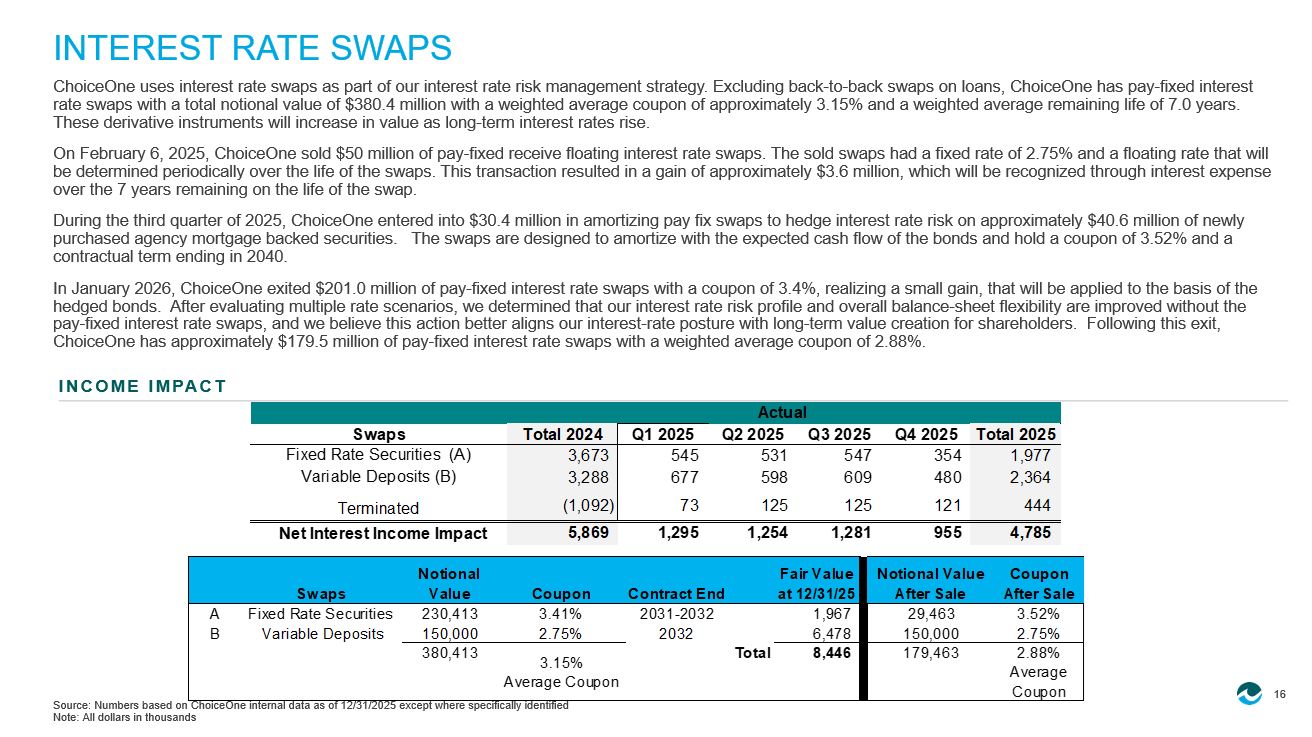
Excluding back - to - back swaps on loans, ChoiceOne has pay - fixed interest rate swaps with a total notional value of $380.4 million with a weighted average coupon of approximately 3.15% and a weighted av erage remaining life of 7.0 years. These derivative instruments will increase in value as long - term interest rates rise. On February 6, 2025, ChoiceOne sold $50 million of pay - fixed receive floating interest rate swaps. The sold swaps had a fixed ra te of 2.75% and a floating rate that will be determined periodically over the life of the swaps. This transaction resulted in a gain of approximately $3.6 million, whi ch will be recognized through interest expense over the 7 years remaining on the life of the swap. During the third quarter of 2025, ChoiceOne entered into $30.4 million in amortizing pay fix swaps to hedge interest rate ris k o n approximately $40.6 million of newly purchased agency mortgage backed securities. The swaps are designed to amortize with the expected cash flow of the bonds and h old a coupon of 3.52% and a contractual term ending in 2040. In January 2026, ChoiceOne exited $201.0 million of pay - fixed interest rate swaps with a coupon of 3.4%, realizing a small gain, that will be applied to the basis of the hedged bonds. After evaluating multiple rate scenarios, we determined that our interest rate risk profile and overall balance - s heet flexibility are improved without the pay - fixed interest rate swaps, and we believe this action better aligns our interest - rate posture with long - term value creation for shareholders. Following this exit, ChoiceOne has approximately $179.5 million of pay - fixed interest rate swaps with a weighted average coupon of 2.88%. INCOME IMPACT Swaps Total 2024 Q1 2025 Q2 2025 Q3 2025 Q4 2025 Total 2025 Fixed Rate Securities (A) 3,673 545 531 547 354 1,977 Variable Deposits (B) 3,288 677 598 609 480 2,364 Terminated (1,092) 73 125 125 121 444 Net Interest Income Impact 5,869 1,295 1,254 1,281 955 4,785 Actual Swaps Notional Value Coupon Contract End Fair Value at 12/31/25 Notional Value After Sale Coupon After Sale A Fixed Rate Securities 230,413 3.41% 2031-2032 1,967 29,463 3.52% B Variable Deposits 150,000 2.75% 2032 6,478 150,000 2.75% 380,413 3.15% Average Coupon Total 8,446 179,463 2.88% Average Coupon 17 Source: Numbers based on ChoiceOne internal data as of 12/31/2025 except where specifically identified (1) Net interest margin (tax - equivalent basis).
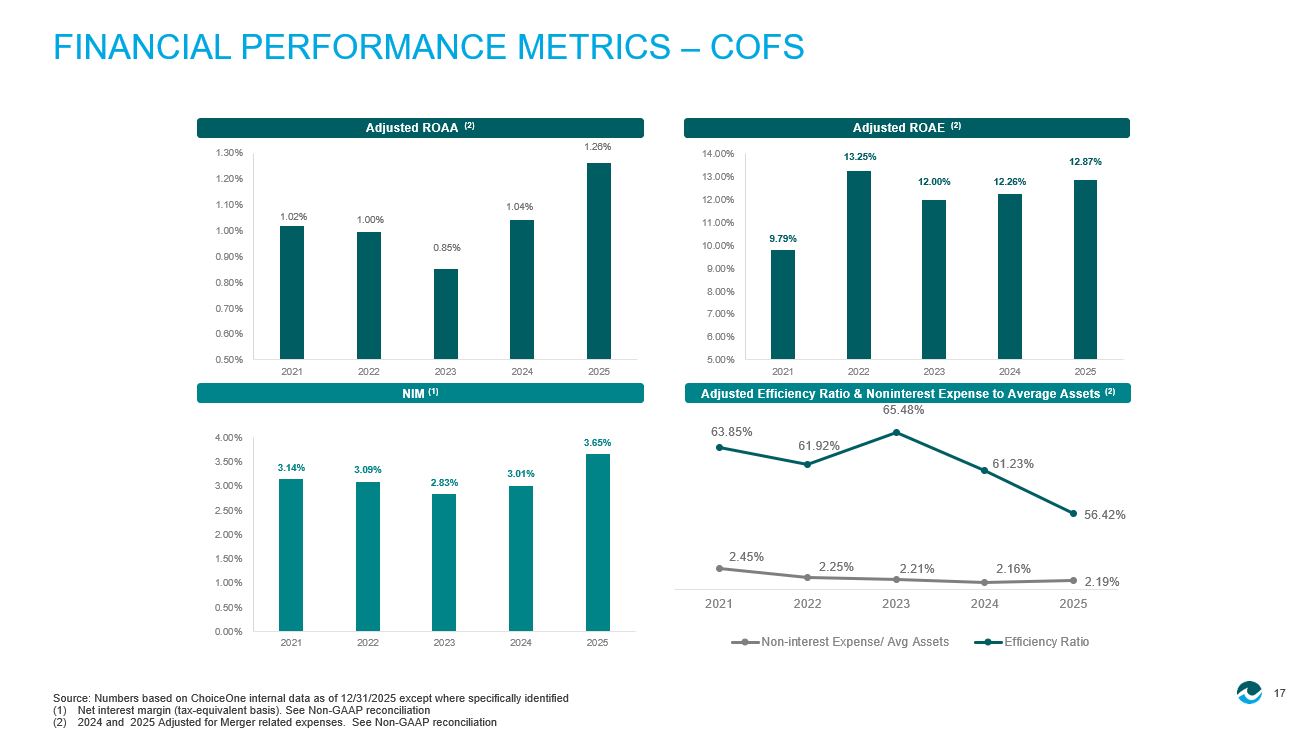
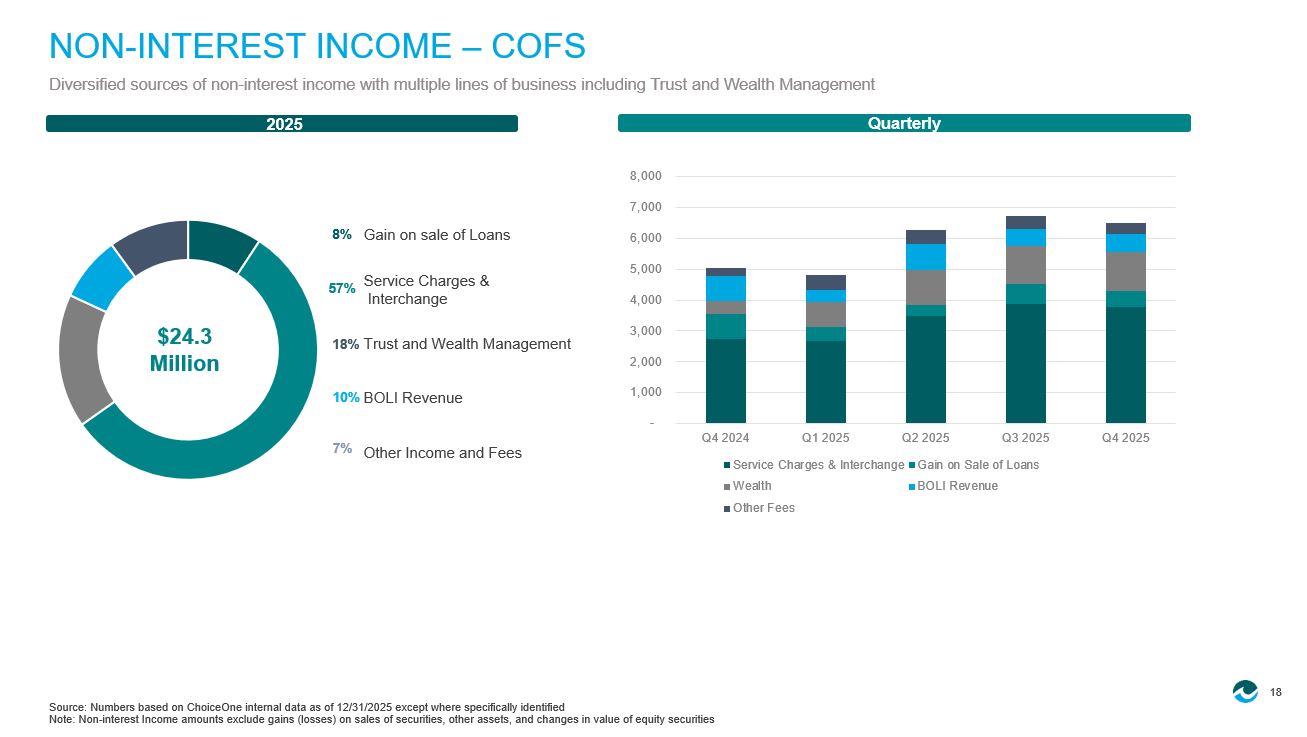
See Non - GAAP reconciliation (2) 2024 and 2025 Adjusted for Merger related expenses. See Non - GAAP reconciliation FINANCIAL PERFORMANCE METRICS – COFS Adjusted Efficiency Ratio & Noninterest Expense to Average Assets (2) NIM (1) Adjusted ROAE (2) Adjusted ROAA (2) 1.02% 1.00% 0.85% 1.04% 1.26% 0.50% 0.60% 0.70% 0.80% 0.90% 1.00% 1.10% 1.20% 1.30% 2021 2022 2023 2024 2025 9.79% 13.25% 12.00% 12.26% 12.87% 5.00% 6.00% 7.00% 8.00% 9.00% 10.00% 11.00% 12.00% 13.00% 14.00% 2021 2022 2023 2024 2025 3.14% 3.09% 2.83% 3.01% 3.65% 0.00% 0.50% 1.00% 1.50% 2.00% 2.50% 3.00% 3.50% 4.00% 2021 2022 2023 2024 2025 2.45% 2.25% 2.21% 2.16% 2.19% 63.85% 61.92% 65.48% 61.23% 56.42% 2021 2022 2023 2024 2025 Non-interest Expense/ Avg Assets Efficiency Ratio 18 Source: Numbers based on ChoiceOne internal data as of 12/31/2025 except where specifically identified Note: Non - interest Income amounts exclude gains (losses) on sales of securities, other assets, and changes in value of equity se curities NON - INTEREST INCOME – COFS Diversified sources of non - interest income with multiple lines of business including Trust and Wealth Management 2025 8% 7% 57% $24.3 Million 18% 10% Gain on sale of Loans Service Charges & Interchange Trust and Wealth Management BOLI Revenue Other Income and Fees Quarterly - 1,000 2,000 3,000 4,000 5,000 6,000 7,000 8,000 Q4 2024 Q1 2025 Q2 2025 Q3 2025 Q4 2025 Service Charges & Interchange Gain on Sale of Loans Wealth BOLI Revenue Other Fees
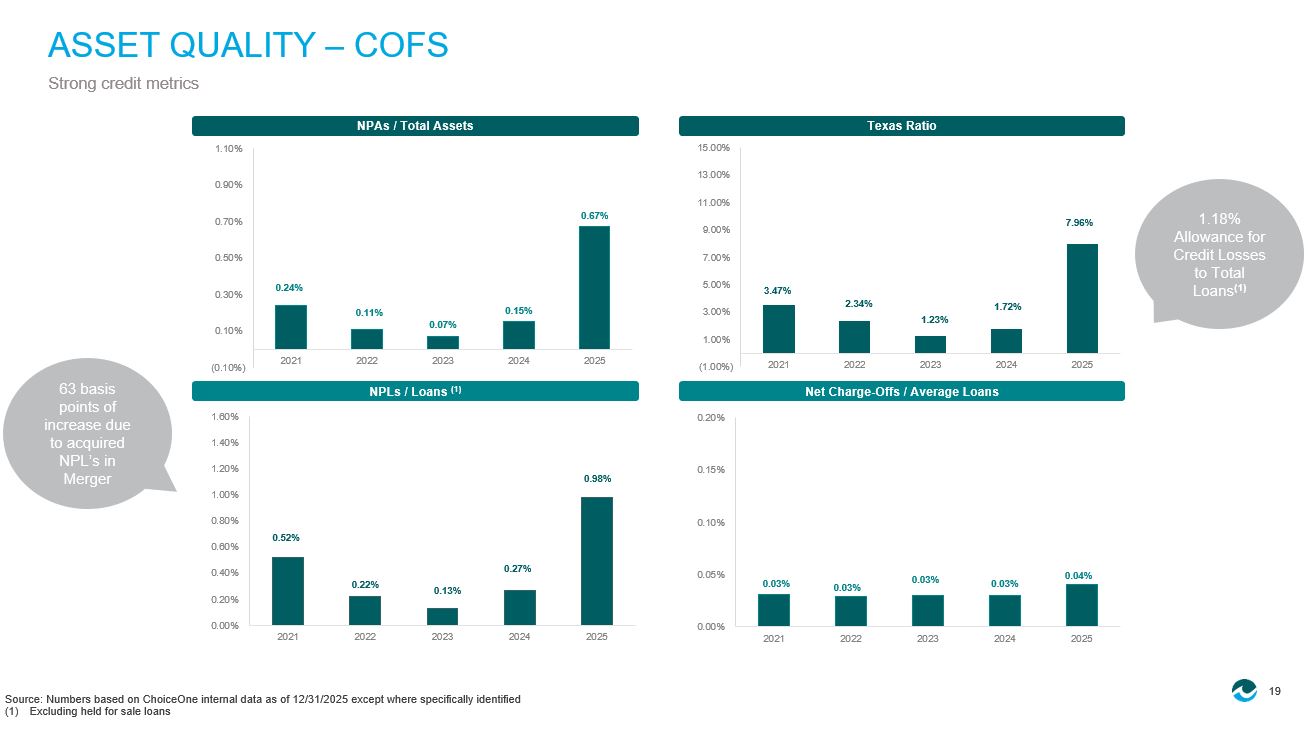
19 Source: Numbers based on ChoiceOne internal data as of 12/31/2025 except where specifically identified (1) Excluding held for sale loans ASSET QUALITY – COFS Strong credit metrics Net Charge - Offs / Average Loans NPLs / Loans (1) Texas Ratio NPAs / Total Assets 63 basis points of increase due to acquired NPL’s in Merger 1.18% Allowance for Credit Losses to Total Loans (1) 3.47% 2.34% 1.23% 1.72% 7.96% (1.00%) 1.00% 3.00% 5.00% 7.00% 9.00% 11.00% 13.00% 15.00% 2021 2022 2023 2024 2025 0.52% 0.22% 0.13% 0.27% 0.98% 0.00% 0.20% 0.40% 0.60% 0.80% 1.00% 1.20% 1.40% 1.60% 2021 2022 2023 2024 2025 0.03% 0.03% 0.03% 0.03% 0.04% 0.00% 0.05% 0.10% 0.15% 0.20% 2021 2022 2023 2024 2025 0.24% 0.11% 0.07% 0.15% 0.67% (0.10%) 0.10% 0.30% 0.50% 0.70% 0.90% 1.10% 2021 2022 2023 2024 2025 20 Source: Numbers based on ChoiceOne internal data as of 12/31/2025 except where specifically identified (1) See Non - GAAP Reconciliation CAPITAL Regulatory Ratios On July 26, 2024, ChoiceOne completed an underwritten public offering of 1,380,000 shares of its common stock at a price to the public of $25.00 per share for aggregate gross proceeds of approximately $34.5 million before deducting underwriting discounts and estimated offering expenses.
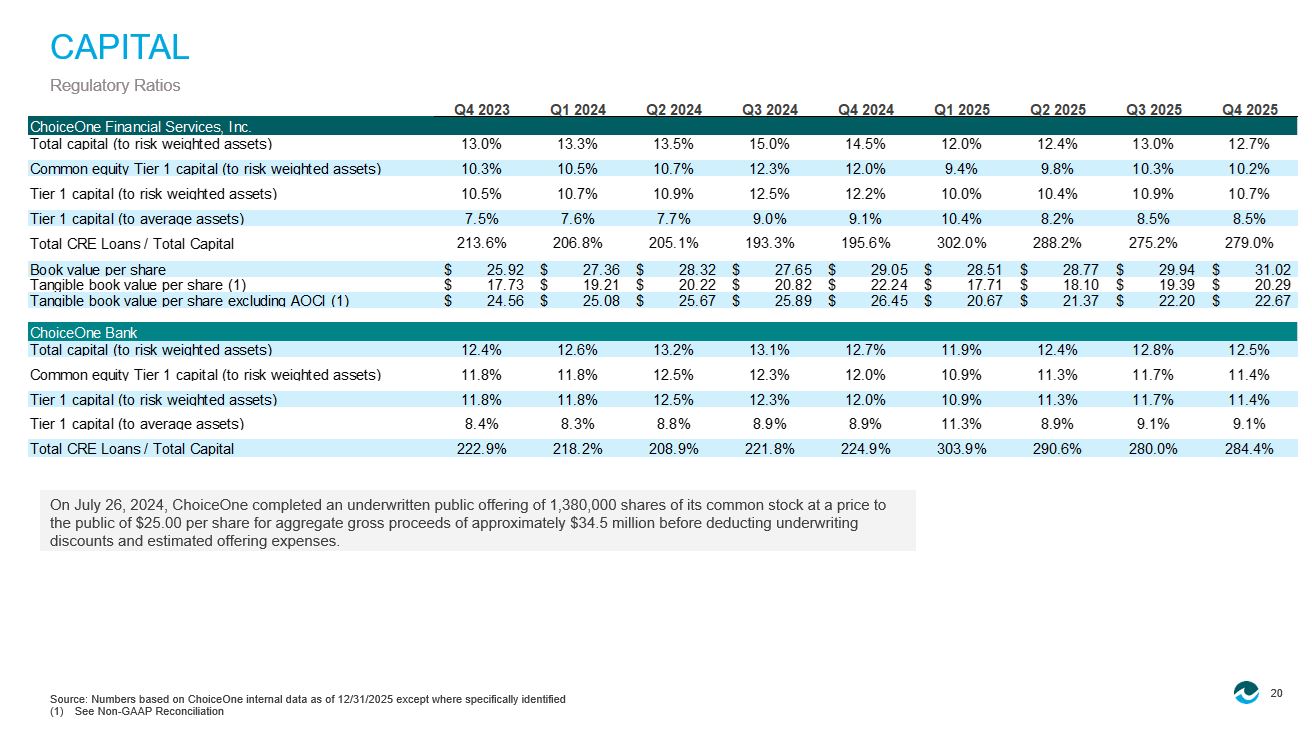
Q4 2023 Q1 2024 Q2 2024 Q3 2024 Q4 2024 Q1 2025 Q2 2025 Q3 2025 Q4 2025 ChoiceOne Financial Services, Inc. Total capital (to risk weighted assets) 13.0% 13.3% 13.5% 15.0% 14.5% 12.0% 12.4% 13.0% 12.7% Common equity Tier 1 capital (to risk weighted assets) 10.3% 10.5% 10.7% 12.3% 12.0% 9.4% 9.8% 10.3% 10.2% Tier 1 capital (to risk weighted assets) 10.5% 10.7% 10.9% 12.5% 12.2% 10.0% 10.4% 10.9% 10.7% Tier 1 capital (to average assets) 7.5% 7.6% 7.7% 9.0% 9.1% 10.4% 8.2% 8.5% 8.5% Total CRE Loans / Total Capital 213.6% 206.8% 205.1% 193.3% 195.6% 302.0% 288.2% 275.2% 279.0% Book value per share $ 25.92 $ 27.36 $ 28.32 $ 27.65 $ 29.05 $ 28.51 $ 28.77 $ 29.94 $ 31.02 Tangible book value per share (1) $ 17.73 $ 19.21 $ 20.22 $ 20.82 $ 22.24 $ 17.71 $ 18.10 $ 19.39 $ 20.29 Tangible book value per share excluding AOCI (1) $ 24.56 $ 25.08 $ 25.67 $ 25.89 $ 26.45 $ 20.67 $ 21.37 $ 22.20 $ 22.67 ChoiceOne Bank Total capital (to risk weighted assets) 12.4% 12.6% 13.2% 13.1% 12.7% 11.9% 12.4% 12.8% 12.5% Common equity Tier 1 capital (to risk weighted assets) 11.8% 11.8% 12.5% 12.3% 12.0% 10.9% 11.3% 11.7% 11.4% Tier 1 capital (to risk weighted assets) 11.8% 11.8% 12.5% 12.3% 12.0% 10.9% 11.3% 11.7% 11.4% Tier 1 capital (to average assets) 8.4% 8.3% 8.8% 8.9% 8.9% 11.3% 8.9% 9.1% 9.1% Total CRE Loans / Total Capital 222.9% 218.2% 208.9% 221.8% 224.9% 303.9% 290.6% 280.0% 284.4% 21 C OF S T R ADES ON NAS D A Q ® ChoiceOne trades on the NASDAQ S t ock E x change under its s ymbol, “COFS” Market Makers in ChoiceOne D. A. Davidson & Co. Nick Bicking 800.394.9230 Janney Montgomery Scott, LLC O 215.665.6566, M 610.766.0015 Raymond James & Associates Anthony LanFranca 312.655.2961 Stock Registrar & Transfer Agent Continental Stock Transfer & Trust Company 1 State Street Plaza, 30th Floor New York, NY 10004 - 1561 212.509.4000 Analyst Coverage of ChoiceOne D. A. Davidson & Co. Jeff Rulis jrulis@dadco.com HOVDE Group Brendan Nosal bnosal@hovdegroup.com

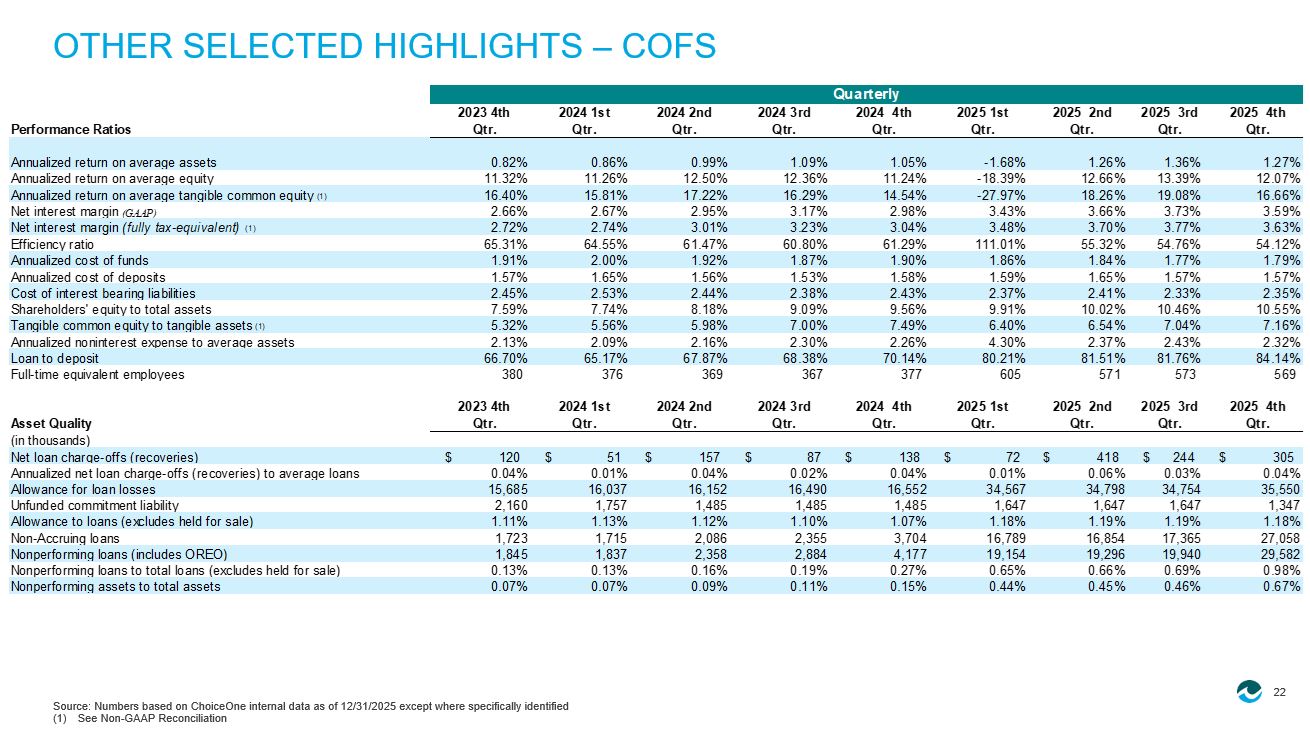
22 Source: Numbers based on ChoiceOne internal data as of 12/31/2025 except where specifically identified (1) See Non - GAAP Reconciliation OTHER SELECTED HIGHLIGHTS – COFS Performance Ratios 2023 4th Qtr. 2024 1st Qtr. 2024 2nd Qtr. 2024 3rd Qtr. 2024 4th Qtr. 2025 1st Qtr. 2025 2nd Qtr. 2025 3rd Qtr. 2025 4th Qtr. Annualized return on average assets 0.82% 0.86% 0.99% 1.09% 1.05% -1.68% 1.26% 1.36% 1.27% Annualized return on average equity 11.32% 11.26% 12.50% 12.36% 11.24% -18.39% 12.66% 13.39% 12.07% Annualized return on average tangible common equity (1) 16.40% 15.81% 17.22% 16.29% 14.54% -27.97% 18.26% 19.08% 16.66% Net interest margin (GAAP) 2.66% 2.67% 2.95% 3.17% 2.98% 3.43% 3.66% 3.73% 3.59% Net interest margin (fully tax-equivalent) (1) 2.72% 2.74% 3.01% 3.23% 3.04% 3.48% 3.70% 3.77% 3.63% Efficiency ratio 65.31% 64.55% 61.47% 60.80% 61.29% 111.01% 55.32% 54.76% 54.12% Annualized cost of funds 1.91% 2.00% 1.92% 1.87% 1.90% 1.86% 1.84% 1.77% 1.79% Annualized cost of deposits 1.57% 1.65% 1.56% 1.53% 1.58% 1.59% 1.65% 1.57% 1.57% Cost of interest bearing liabilities 2.45% 2.53% 2.44% 2.38% 2.43% 2.37% 2.41% 2.33% 2.35% Shareholders' equity to total assets 7.59% 7.74% 8.18% 9.09% 9.56% 9.91% 10.02% 10.46% 10.55% Tangible common equity to tangible assets (1) 5.32% 5.56% 5.98% 7.00% 7.49% 6.40% 6.54% 7.04% 7.16% Annualized noninterest expense to average assets 2.13% 2.09% 2.16% 2.30% 2.26% 4.30% 2.37% 2.43% 2.32% Loan to deposit 66.70% 65.17% 67.87% 68.38% 70.14% 80.21% 81.51% 81.76% 84.14% Full-time equivalent employees 380 376 369 367 377 605 571 573 569 Asset Quality 2023 4th Qtr. 2024 1st Qtr. 2024 2nd Qtr. 2024 3rd Qtr. 2024 4th Qtr. 2025 1st Qtr. 2025 2nd Qtr. 2025 3rd Qtr. 2025 4th Qtr. (in thousands) Net loan charge-offs (recoveries) $ 120 $ 51 $ 157 $ 87 $ 138 $ 72 $ 418 $ 244 $ 305 Annualized net loan charge-offs (recoveries) to average loans 0.04% 0.01% 0.04% 0.02% 0.04% 0.01% 0.06% 0.03% 0.04% Allowance for loan losses 15,685 16,037 16,152 16,490 16,552 34,567 34,798 34,754 35,550 Unfunded commitment liability 2,160 1,757 1,485 1,485 1,485 1,647 1,647 1,647 1,347 Allowance to loans (excludes held for sale) 1.11% 1.13% 1.12% 1.10% 1.07% 1.18% 1.19% 1.19% 1.18% Non-Accruing loans 1,723 1,715 2,086 2,355 3,704 16,789 16,854 17,365 27,058 Nonperforming loans (includes OREO) 1,845 1,837 2,358 2,884 4,177 19,154 19,296 19,940 29,582 Nonperforming loans to total loans (excludes held for sale) 0.13% 0.13% 0.16% 0.19% 0.27% 0.65% 0.66% 0.69% 0.98% Nonperforming assets to total assets 0.07% 0.07% 0.09% 0.11% 0.15% 0.44% 0.45% 0.46% 0.67% Quarterly 23 Source: Numbers based on ChoiceOne internal data as of 12/31/2025 except where specifically identified * Adjusted non - interest expense adjusted for certain non - cash items.

** Adjusted total income is the sum of net interest income and adjusted non - interest income adjusted for certain non - cash items. APPENDIX NON - GAAP RECONCILIATION Twelve Months Ended Twelve Months Ended Return on average assets December 31, 2024 December 31, 2025 (In Thousands) Net income $ 26,727 $ 28,176 Plus merger related expenses net of tax 1,039 23,348 Adjusted net income $ 27,766 $ 51,524 Average total assets $ 2,668,556 $ 4,079,074 Annualized return on average assets 1.00% 0.69% Plus Merger adjustment 0.04% 0.57% Adjusted Annualized return on average assets 1.04% 1.26% Twelve Months Ended Twelve Months Ended Return on average shareholders' equity December 31, 2024 December 31, 2025 (In Thousands) Net income $ 26,727 $ 28,176 Plus merger related expenses net of tax 1,039 23,348 Adjusted net income $ 27,766 $ 51,524 Average shareholders' equity $ 226,547 $ 400,271 Annualized return on average assets 11.80% 7.04% Plus Merger adjustment 0.46% 5.83% Adjusted Annualized return on average assets 12.26% 12.87% Twelve Months Ended Twelve Months Ended Non-interest expense / Average Assets December 31, 2024 December 31, 2025 (In Thousands) Non-interest expense $ 58,723 $ 112,735 Less merger related expenses 1,039 23,348 Adjusted non-interest expense $ 57,684 $ 89,387 Average total assets $ 2,668,556 $ 4,079,074 Annualized non-interest expense / Average Assets 2.20% 2.76% Less Merger adjustment 0.04% 0.57% Adjusted annualized non-interest expense / Average Assets 2.16% 2.19% Twelve Months Ended Twelve Months Ended Efficiency ratio December 31, 2024 December 31, 2025 (In Thousands) Adjusted non-interest expense* $ 57,966 $ 106,912 Less merger related expenses 1,039 23,348 Merger adjusted non-interest expense $ 56,928 $ 83,564 Adjusted total income** $ 92,975 $ 148,117 Efficiency ratio 62.35% 72.18% Less Merger adjustment 1.12% 15.76% Adjusted efficiency ratio 61.23% 56.42% 24 Source: Numbers based on ChoiceOne internal data as of 12/31/2025 except where specifically identified APPENDIX NON - GAAP RECONCILIATION (1) Adjusted to a fully tax - equivalent basis to facilitate comparison to the taxable interest - earning assets.
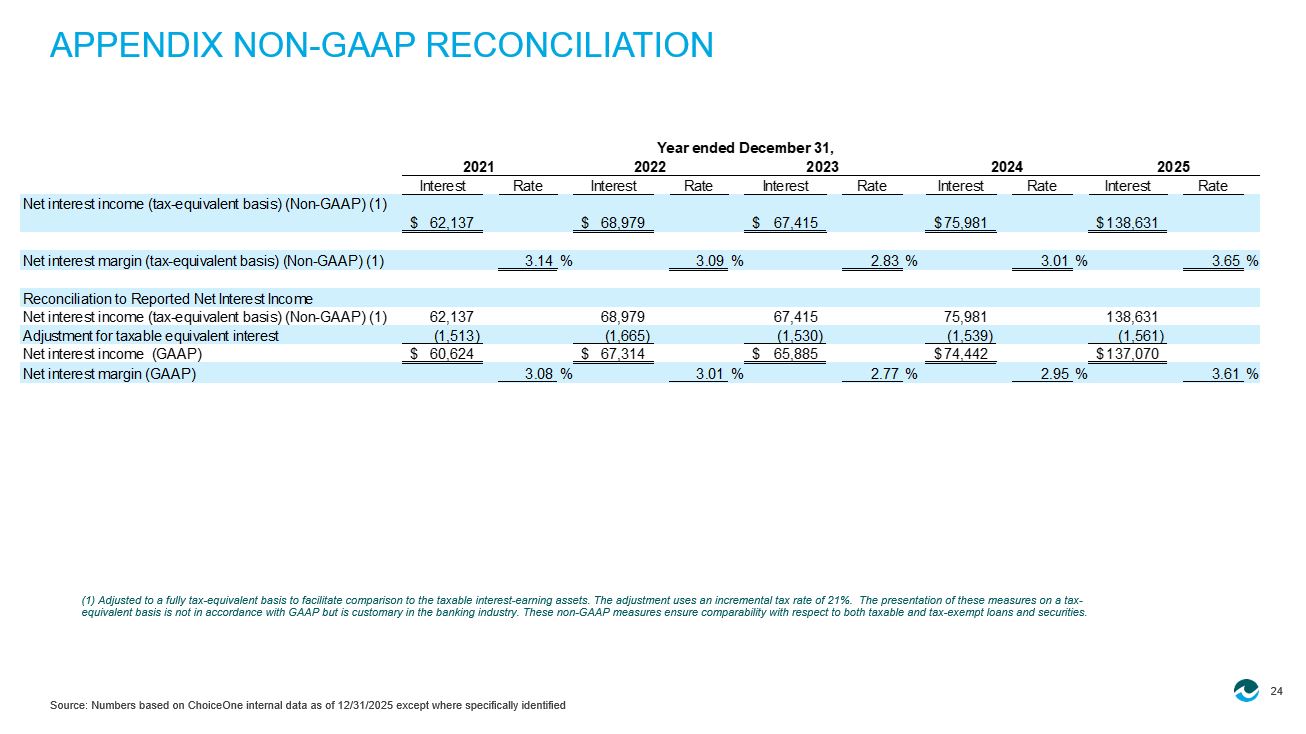
The adjustment use s an incremental tax rate of 21%. The presentation of these measures on a tax - equivalent basis is not in accordance with GAAP but is customary in the banking industry. These non - GAAP measures ensure compara bility with respect to both taxable and tax - exempt loans and securities. Interest Rate Interest Rate Interest Rate Interest Rate Interest Rate Net interest income (tax-equivalent basis) (Non-GAAP) (1) 62,137$ 68,979$ 67,415$ 75,981$ 138,631$ Net interest margin (tax-equivalent basis) (Non-GAAP) (1) 3.14% 3.09% 2.83% 3.01% 3.65% Reconciliation to Reported Net Interest Income Net interest income (tax-equivalent basis) (Non-GAAP) (1) 62,137 68,979 67,415 75,981 138,631 Adjustment for taxable equivalent interest (1,513) (1,665) (1,530) (1,539) (1,561) Net interest income (GAAP) 60,624$ 67,314$ 65,885$ 74,442$ 137,070$ Net interest margin (GAAP) 3.08% 3.01% 2.77% 2.95% 3.61% Year ended December 31, 20252021 20242022 2023 25 Source: Numbers based on ChoiceOne internal data as of 12/31/2025 except where specifically identified APPENDIX NON - GAAP RECONCILIATION (1) Adjusted to a fully tax - equivalent basis to facilitate comparison to the taxable interest - earning assets.
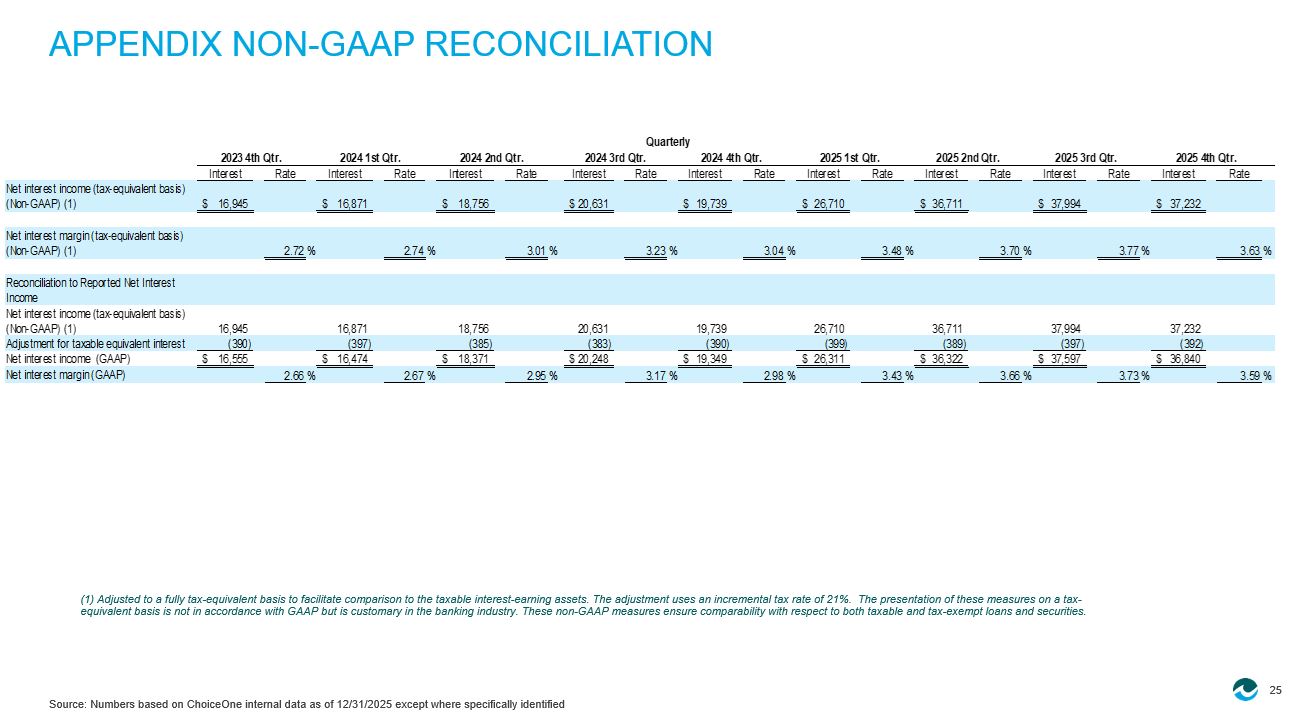
The adjustment use s an incremental tax rate of 21%. The presentation of these measures on a tax - equivalent basis is not in accordance with GAAP but is customary in the banking industry. These non - GAAP measures ensure compara bility with respect to both taxable and tax - exempt loans and securities. Interest Rate Interest Rate Interest Rate Interest Rate Interest Rate Interest Rate Interest Rate Interest Rate Interest Rate Net interest income (tax-equivalent basis) (Non-GAAP) (1) 16,945$ 16,871$ 18,756$ 20,631$ 19,739$ 26,710$ 36,711$ 37,994$ 37,232$ Net interest margin (tax-equivalent basis) (Non-GAAP) (1) 2.72% 2.74% 3.01% 3.23% 3.04% 3.48% 3.70% 3.77% 3.63% Reconciliation to Reported Net Interest Income Net interest income (tax-equivalent basis) (Non-GAAP) (1) 16,945 16,871 18,756 20,631 19,739 26,710 36,711 37,994 37,232 Adjustment for taxable equivalent interest (390) (397) (385) (383) (390) (399) (389) (397) (392) Net interest income (GAAP) 16,555$ 16,474$ 18,371$ 20,248$ 19,349$ 26,311$ 36,322$ 37,597$ 36,840$ Net interest margin (GAAP) 2.66% 2.67% 2.95% 3.17% 2.98% 3.43% 3.66% 3.73% 3.59% 2025 4th Qtr.2025 3rd Qtr. Quarterly 2025 2nd Qtr.2025 1st Qtr.2024 4th Qtr.2024 3rd Qtr.2024 2nd Qtr.2024 1st Qtr.2023 4th Qtr.
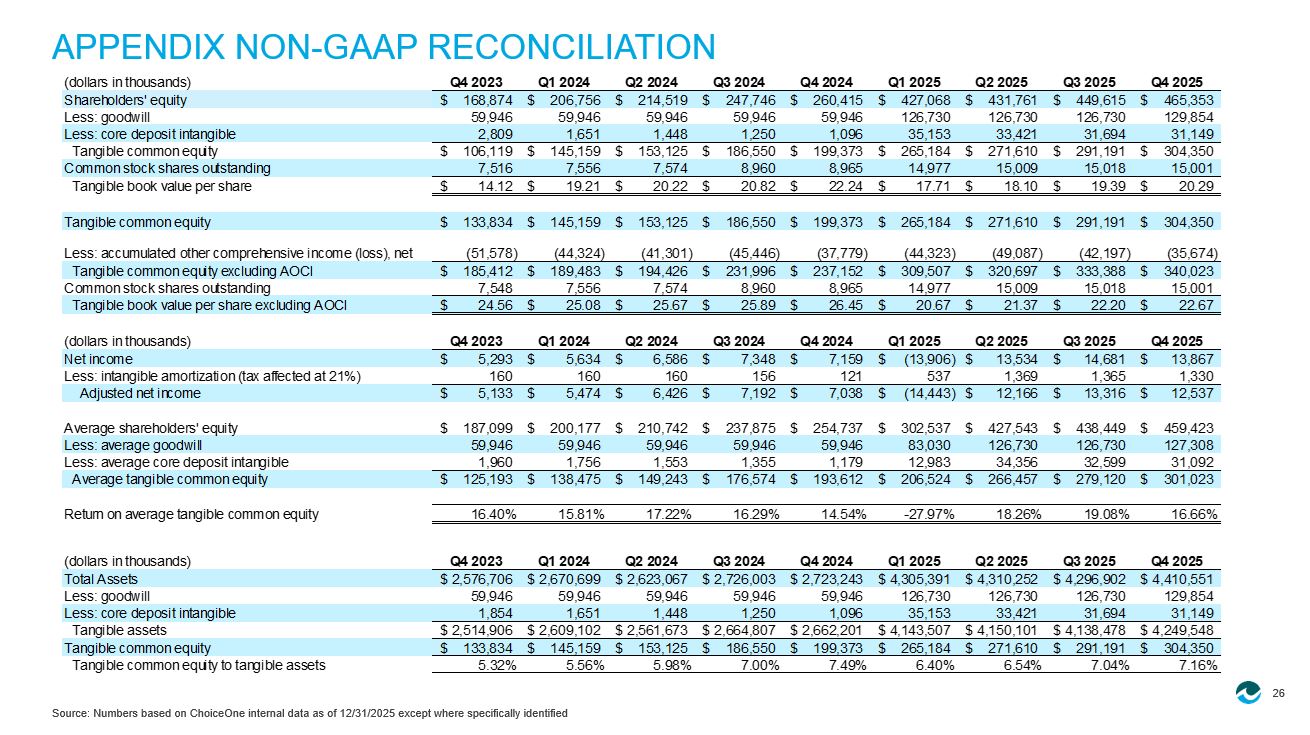
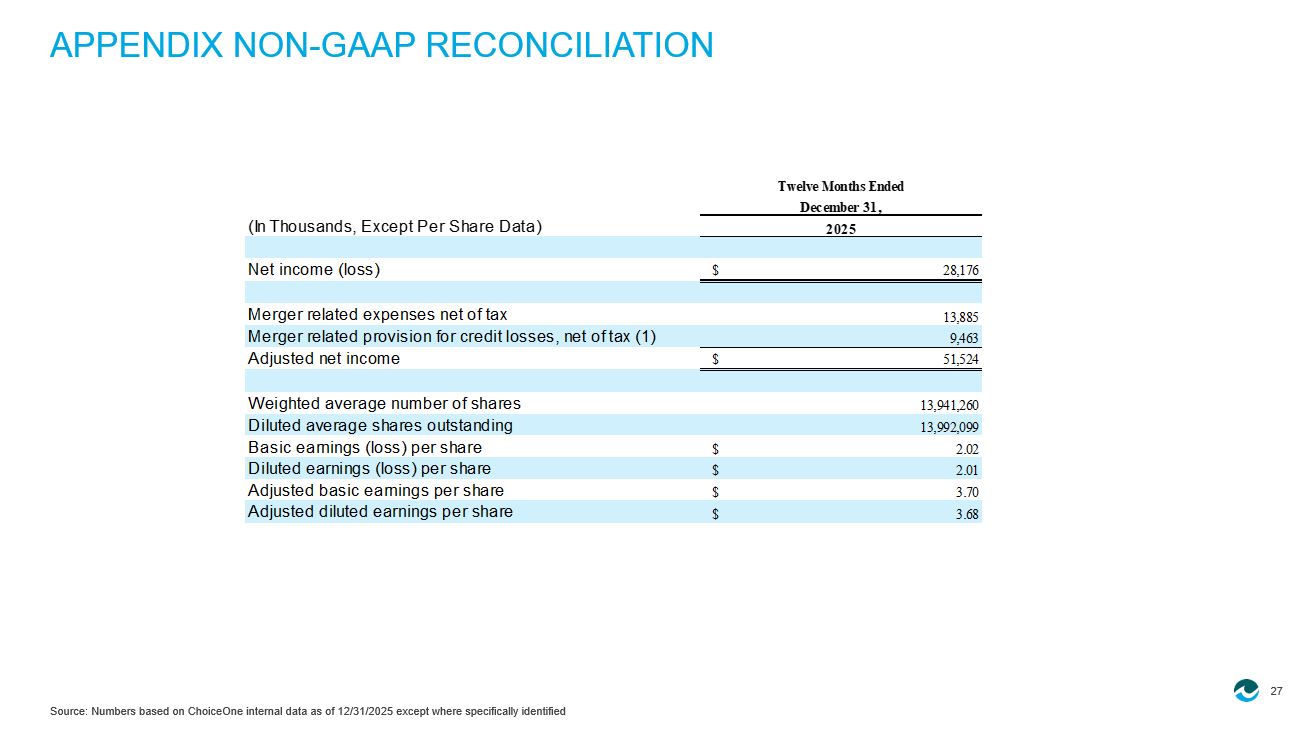
26 Source: Numbers based on ChoiceOne internal data as of 12/31/2025 except where specifically identified APPENDIX NON - GAAP RECONCILIATION (dollars in thousands) Q4 2023 Q1 2024 Q2 2024 Q3 2024 Q4 2024 Q1 2025 Q2 2025 Q3 2025 Q4 2025 Shareholders' equity 168,874$ 206,756$ 214,519$ 247,746$ 260,415$ 427,068$ 431,761$ 449,615$ 465,353$ Less: goodwill 59,946 59,946 59,946 59,946 59,946 126,730 126,730 126,730 129,854 Less: core deposit intangible 2,809 1,651 1,448 1,250 1,096 35,153 33,421 31,694 31,149 Tangible common equity 106,119$ 145,159$ 153,125$ 186,550$ 199,373$ 265,184$ 271,610$ 291,191$ 304,350$ Common stock shares outstanding 7,516 7,556 7,574 8,960 8,965 14,977 15,009 15,018 15,001 Tangible book value per share 14.12$ 19.21$ 20.22$ 20.82$ 22.24$ 17.71$ 18.10$ 19.39$ 20.29$ Tangible common equity 133,834$ 145,159$ 153,125$ 186,550$ 199,373$ 265,184$ 271,610$ 291,191$ 304,350$ Less: accumulated other comprehensive income (loss), net (51,578) (44,324) (41,301) (45,446) (37,779) (44,323) (49,087) (42,197) (35,674) Tangible common equity excluding AOCI 185,412$ 189,483$ 194,426$ 231,996$ 237,152$ 309,507$ 320,697$ 333,388$ 340,023$ Common stock shares outstanding 7,548 7,556 7,574 8,960 8,965 14,977 15,009 15,018 15,001 Tangible book value per share excluding AOCI 24.56$ 25.08$ 25.67$ 25.89$ 26.45$ 20.67$ 21.37$ 22.20$ 22.67$ (dollars in thousands) Q4 2023 Q1 2024 Q2 2024 Q3 2024 Q4 2024 Q1 2025 Q2 2025 Q3 2025 Q4 2025 Net income 5,293$ 5,634$ 6,586$ 7,348$ 7,159$ (13,906)$ 13,534$ 14,681$ 13,867$ Less: intangible amortization (tax affected at 21%) 160 160 160 156 121 537 1,369 1,365 1,330 Adjusted net income 5,133$ 5,474$ 6,426$ 7,192$ 7,038$ (14,443)$ 12,166$ 13,316$ 12,537$ Average shareholders' equity 187,099$ 200,177$ 210,742$ 237,875$ 254,737$ 302,537$ 427,543$ 438,449$ 459,423$ Less: average goodwill 59,946 59,946 59,946 59,946 59,946 83,030 126,730 126,730 127,308 Less: average core deposit intangible 1,960 1,756 1,553 1,355 1,179 12,983 34,356 32,599 31,092 Average tangible common equity 125,193$ 138,475$ 149,243$ 176,574$ 193,612$ 206,524$ 266,457$ 279,120$ 301,023$ Return on average tangible common equity 16.40% 15.81% 17.22% 16.29% 14.54% -27.97% 18.26% 19.08% 16.66% (dollars in thousands) Q4 2023 Q1 2024 Q2 2024 Q3 2024 Q4 2024 Q1 2025 Q2 2025 Q3 2025 Q4 2025 Total Assets 2,576,706$ 2,670,699$ 2,623,067$ 2,726,003$ 2,723,243$ 4,305,391$ 4,310,252$ 4,296,902$ 4,410,551$ Less: goodwill 59,946 59,946 59,946 59,946 59,946 126,730 126,730 126,730 129,854 Less: core deposit intangible 1,854 1,651 1,448 1,250 1,096 35,153 33,421 31,694 31,149 Tangible assets 2,514,906$ 2,609,102$ 2,561,673$ 2,664,807$ 2,662,201$ 4,143,507$ 4,150,101$ 4,138,478$ 4,249,548$ Tangible common equity 133,834$ 145,159$ 153,125$ 186,550$ 199,373$ 265,184$ 271,610$ 291,191$ 304,350$ Tangible common equity to tangible assets 5.32% 5.56% 5.98% 7.00% 7.49% 6.40% 6.54% 7.04% 7.16% 27 Source: Numbers based on ChoiceOne internal data as of 12/31/2025 except where specifically identified APPENDIX NON - GAAP RECONCILIATION Twelve Months Ended December 31, (In Thousands, Except Per Share Data) 2025 Net income (loss) $ 28,176 Merger related expenses net of tax 13,885 Merger related provision for credit losses, net of tax (1) 9,463 Adjusted net income $ 51,524 Weighted average number of shares 13,941,260 Diluted average shares outstanding 13,992,099 Basic earnings (loss) per share $ 2.02 Diluted earnings (loss) per share $ 2.01 Adjusted basic earnings per share $ 3.70 Adjusted diluted earnings per share $ 3.68
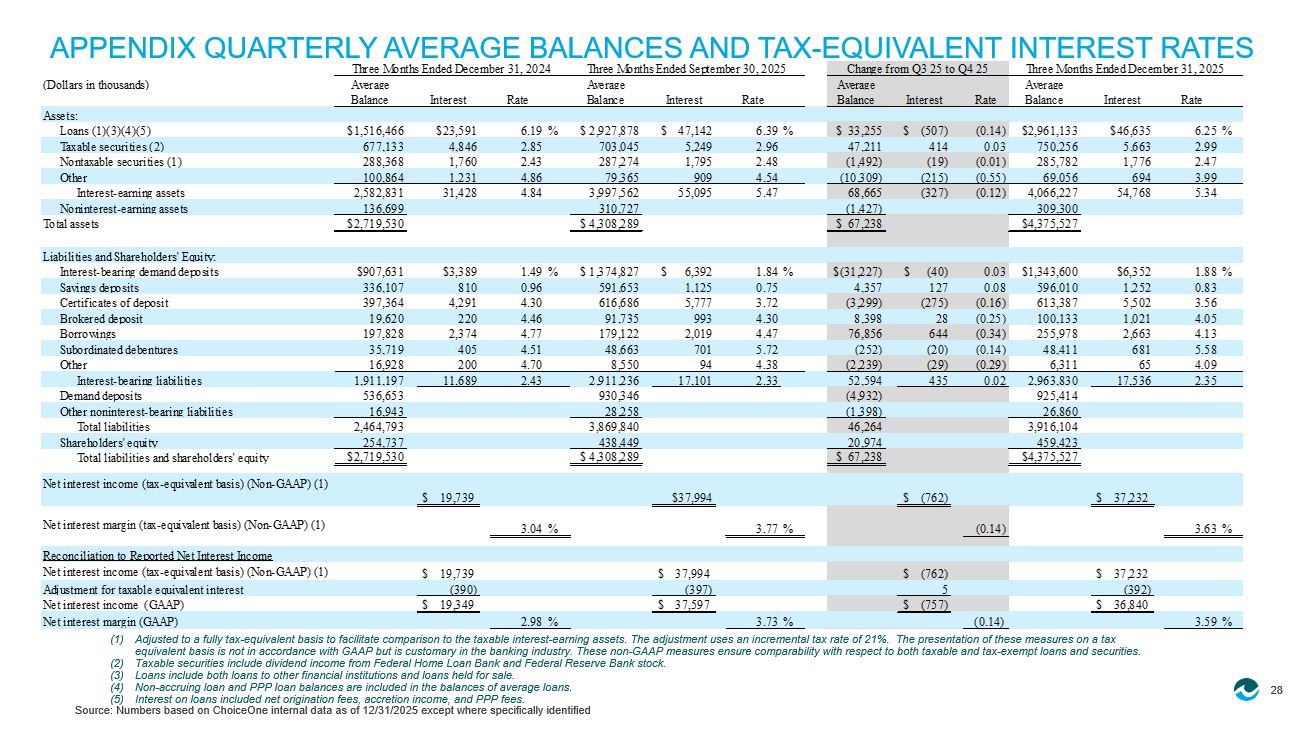
28 Source: Numbers based on ChoiceOne internal data as of 12/31/2025 except where specifically identified APPENDIX QUARTERLY AVERAGE BALANCES AND TAX - EQUIVALENT INTEREST RATES (1) Adjusted to a fully tax - equivalent basis to facilitate comparison to the taxable interest - earning assets. The adjustment uses an incremental tax rate of 21%. The presentation of these measures on a tax equivalent basis is not in accordance with GAAP but is customary in the banking industry. These non - GAAP measures ensure compara bility with respect to both taxable and tax - exempt loans and securities. (2) Taxable securities include dividend income from Federal Home Loan Bank and Federal Reserve Bank stock. (3) Loans include both loans to other financial institutions and loans held for sale. (4) Non - accruing loan and PPP loan balances are included in the balances of average loans. (5) Interest on loans included net origination fees, accretion income, and PPP fees. (Dollars in thousands) Average Average Average Average Balance Interest Rate Balance Interest Rate Balance Interest Rate Balance Interest Rate Assets: Loans (1)(3)(4)(5) $1,516,466 $23,591 6.19 % $ 2,927,878 $ 47,142 6.39 % $ 33,255 $ (507) (0.14) $2,961,133 $46,635 6.25 % Taxable securities (2) 677,133 4,846 2.85 703,045 5,249 2.96 47,211 414 0.03 750,256 5,663 2.99 Nontaxable securities (1) 288,368 1,760 2.43 287,274 1,795 2.48 (1,492) (19) (0.01) 285,782 1,776 2.47 Other 100,864 1,231 4.86 79,365 909 4.54 (10,309) (215) (0.55) 69,056 694 3.99 Interest-earning assets 2,582,831 31,428 4.84 3,997,562 55,095 5.47 68,665 (327) (0.12) 4,066,227 54,768 5.34 Noninterest-earning assets 136,699 310,727 (1,427) 309,300 Total assets $2,719,530 $ 4,308,289 $ 67,238 $4,375,527 Liabilities and Shareholders' Equity: Interest-bearing demand deposits $907,631 $3,389 1.49 % $ 1,374,827 $ 6,392 1.84 % $(31,227) $ (40) 0.03 $1,343,600 $6,352 1.88 % Savings deposits 336,107 810 0.96 591,653 1,125 0.75 4,357 127 0.08 596,010 1,252 0.83 Certificates of deposit 397,364 4,291 4.30 616,686 5,777 3.72 (3,299) (275) (0.16) 613,387 5,502 3.56 Brokered deposit 19,620 220 4.46 91,735 993 4.30 8,398 28 (0.25) 100,133 1,021 4.05 Borrowings 197,828 2,374 4.77 179,122 2,019 4.47 76,856 644 (0.34) 255,978 2,663 4.13 Subordinated debentures 35,719 405 4.51 48,663 701 5.72 (252) (20) (0.14) 48,411 681 5.58 Other 16,928 200 4.70 8,550 94 4.38 (2,239) (29) (0.29) 6,311 65 4.09 Interest-bearing liabilities 1,911,197 11,689 2.43 2,911,236 17,101 2.33 52,594 435 0.02 2,963,830 17,536 2.35 Demand deposits 536,653 930,346 (4,932) 925,414 Other noninterest-bearing liabilities 16,943 28,258 (1,398) 26,860 Total liabilities 2,464,793 3,869,840 46,264 3,916,104 Shareholders' equity 254,737 438,449 20,974 459,423 Total liabilities and shareholders' equity $2,719,530 $ 4,308,289 $ 67,238 $4,375,527 Net interest income (tax-equivalent basis) (Non-GAAP) (1) $ 19,739 $37,994 $ (762) $ 37,232 Net interest margin (tax-equivalent basis) (Non-GAAP) (1) 3.04% 3.77% (0.14) 3.63% Reconciliation to Reported Net Interest Income Net interest income (tax-equivalent basis) (Non-GAAP) (1) $ 19,739 $ 37,994 $ (762) $ 37,232 Adjustment for taxable equivalent interest (390) (397) 5 (392) Net interest income (GAAP) $ 19,349 $ 37,597 $ (757) $ 36,840 Net interest margin (GAAP) 2.98% 3.73% (0.14) 3.59% Change from Q3 25 to Q4 25Three Months Ended December 31, 2024 Three Months Ended September 30, 2025 Three Months Ended December 31, 2025 29 Source: Numbers based on ChoiceOne internal data as of 12/31/2025 except where specifically identified Note: Excludes loans held for sale APPENDIX LOANS BY LOAN CATEGORY (Dollars in thousands) Loans: Q1 2024 Q2 2024 Q3 2024 Q4 2024 Q1 2025 Q2 2025 Q3 2025 Q4 2025 Agricultural $ 41,950 $ 45,274 $ 49,147 $ 48,221 $ 48,165 $ 47,273 $ 51,183 $ 56,218 Commercial and Industrial 231,222 224,031 229,232 228,256 345,138 351,367 352,876 352,556 Consumer 34,268 32,811 30,693 29,412 30,932 29,741 27,328 26,701 Commercial Real Estate 794,705 804,213 862,773 901,130 1,757,598 1,743,541 1,728,774 1,780,396 Construction Real Estate 17,890 18,751 14,555 17,042 18,067 21,508 18,441 19,139 Residential Real Estate 268,523 275,878 279,058 281,701 722,662 724,329 728,843 728,037 Loans to Other Financial Institutions 30,032 36,569 38,492 39,878 2,393 3,033 2,483 58,987 Gross Loans 1,418,590 1,437,527 1,503,950 1,545,640 2,924,955 2,920,792 2,909,928 3,022,034 Less allowance for credit losses on loans 16,037 16,152 16,490 16,552 34,567 34,798 34,754 35,550 Loans, Net 1,402,553 1,421,375 1,487,460 1,529,088 2,890,388 2,885,994 2,875,174 2,986,484

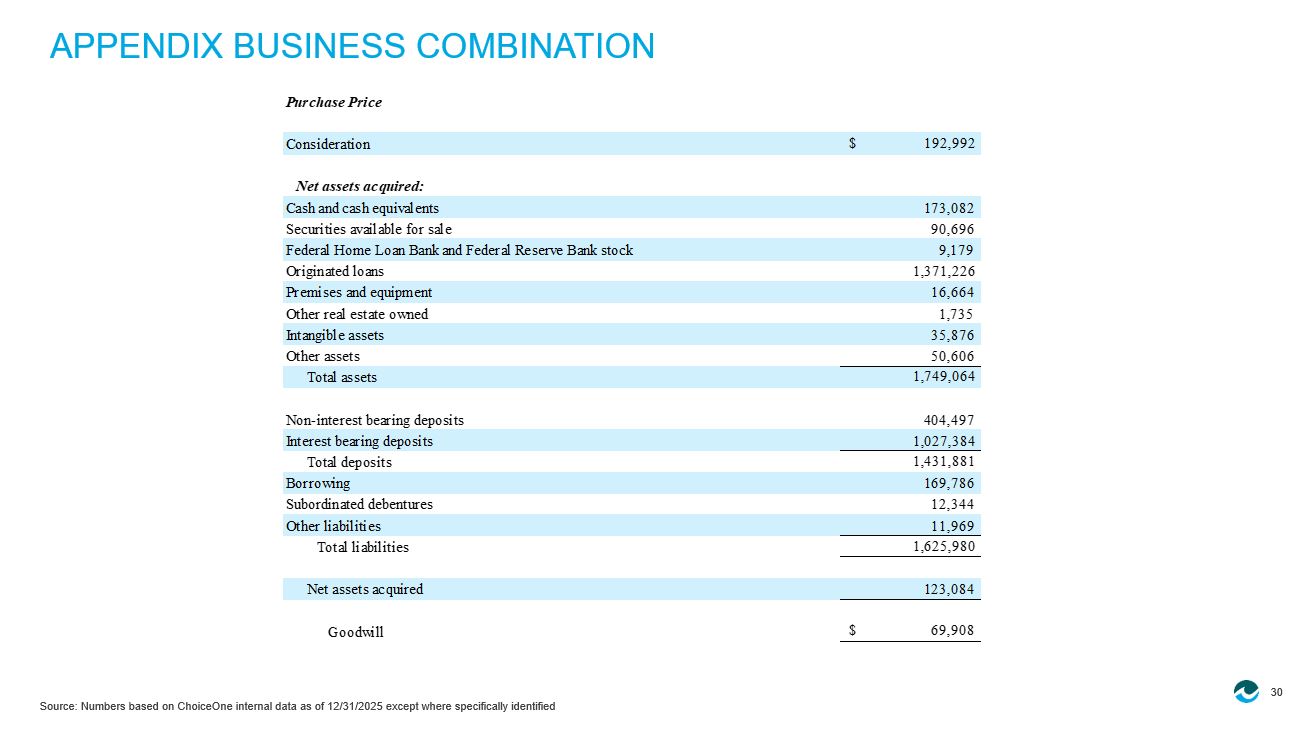
30 Source: Numbers based on ChoiceOne internal data as of 12/31/2025 except where specifically identified APPENDIX BUSINESS COMBINATION Purchase Price Consideration $ 192,992 Net assets acquired: Cash and cash equivalents 173,082 Securities available for sale 90,696 Federal Home Loan Bank and Federal Reserve Bank stock 9,179 Originated loans 1,371,226 Premises and equipment 16,664 Other real estate owned 1,735 Intangible assets 35,876 Other assets 50,606 Total assets 1,749,064 Non-interest bearing deposits 404,497 Interest bearing deposits 1,027,384 Total deposits 1,431,881 Borrowing 169,786 Subordinated debentures 12,344 Other liabilities 11,969 Total liabilities 1,625,980 Net assets acquired 123,084 Goodwill $ 69,908