UNITED STATES
SECURITIES AND EXCHANGE COMMISSION
Washington, D.C. 20549
FORM 8-K
CURRENT REPORT
Pursuant to Section 13 OR 15(d) of the Securities Exchange Act of 1934
Date of Report (Date of earliest event reported): November 2, 2023
ChoiceOne Financial Services, Inc.
(Exact Name of Registrant as
Specified in Charter)
| Michigan (State or Other Jurisdiction of Incorporation) |
000-19202 (Commission File Number) |
38-2659066 (IRS Employer Identification No.) |
|||
| 109 East Division Sparta, Michigan (Address of Principal Executive Offices) |
49345 (Zip Code) |
||||
Registrant's telephone number, including area code: (616) 887-7366
Check the appropriate box below if the Form 8-K filing is intended to simultaneously satisfy the filing obligation of the registrant under any of the following provisions (see General Instruction A.2. below):
o Written communications pursuant to Rule 425 under the Securities Act (17 CFR 230.425)
o Soliciting material pursuant to Rule 14a-12 under the Exchange Act (17 CFR 240.14a-12)
o Pre-commencement communications pursuant to Rule 14d-2(b) under the Exchange Act (17 CFR 240.14d-2(b))
o Pre-commencement communications pursuant to Rule 13e-4(c) under the Exchange Act (17 CFR 240.13e-4(c))
Securities registered pursuant to Section 12(b) of the Act:
| Title of each class | Trading symbol(s) | Name of each exchange on which registered |
| Common stock | COFS | NASDAQ Capital Market |
Indicate by check mark whether the registrant is an emerging growth company as defined in Rule 405 of the Securities Act of 1933 (§230.405 of this chapter) or Rule 12b-2 of the Securities Exchange Act of 1934 (§240.12b-2 of this chapter).
Emerging growth company o
If an emerging growth company, indicate by check mark if the registrant has elected not to use the extended transition period for complying with any new or revised financial accounting standards provided pursuant to Section 13(a) of the Exchange Act. o ChoiceOne Financial Services, Inc. ("ChoiceOne") is furnishing as Exhibit 99.1 to this Form 8-K presentation materials that are to be used by ChoiceOne management in meetings with investors beginning November 2, 2023. The information in Item 7.01 and Item 9.01 of this report, including Exhibit 99.1, is furnished to, and not filed with, the Commission.
|
|
| Item 7.01 | Regulation FD Disclosure |
| Item 9.01 | Financial Statements and Exhibits |
| Exhibit No. | Exhibit |
| 99.1 | ChoiceOne Financial Services, Inc. Investor Presentation. This Exhibit is furnished to, and not filed with, the Commission. |
***
|
|
SIGNATURES
Pursuant to the requirements of the Securities Exchange Act of 1934, the registrant has duly caused this report to be signed on its behalf by the undersigned hereunto duly authorized.
| Dated: | November 2, 2023 | CHOICEONE FINANCIAL SERVICES, INC. (Registrant) |
|
| By: | /s/ Adom J. Greenland | ||
| Adom J. Greenland Its Chief Financial Officer and Treasurer |
|||
-3-
EXHIBIT 99.1

2 2 2 FORWARD - LOOKING STATEMENTS • This presentation contains forward - looking statements that are based on management’s beliefs, assumptions, current expectations, estimates and projections about the financial services industry, the economy, and ChoiceOne. Words such as “anticipates,” “believes,” “estima tes,” “expects,” “forecasts,” “intends,” “is likely,” “plans,” “predicts,” “projects,” “may,” “could,” “look forward,” “continue”, “future”, and variations of such words and similar expressions are intended to identify such forward - looking statements. • All statements with references to future time periods are forward - looking. These statements are not guarantees of future perfor mance and involve certain risks, uncertainties and assumptions (“risk factors”) that are difficult to predict with regard to timing, extent, li kel ihood, and degree of occurrence. Therefore, actual results and outcomes may materially differ from what may be expressed, implied or forecasted in s uch forward - looking statements. Furthermore, ChoiceOne undertakes no obligation to update, amend, or clarify forward - looking statements, whether as a result of new information, future events, or otherwise. • Additional risk factors include, but are not limited to, the risk factors described in Item 1A in ChoiceOne’s Annual Report on Form 10 - K for the year ended December 31, 2022.
3 Our vision is to be the best bank in Michigan. Our mission is to provide superior service, quality advice, and show utmost respect to everyone we meet.
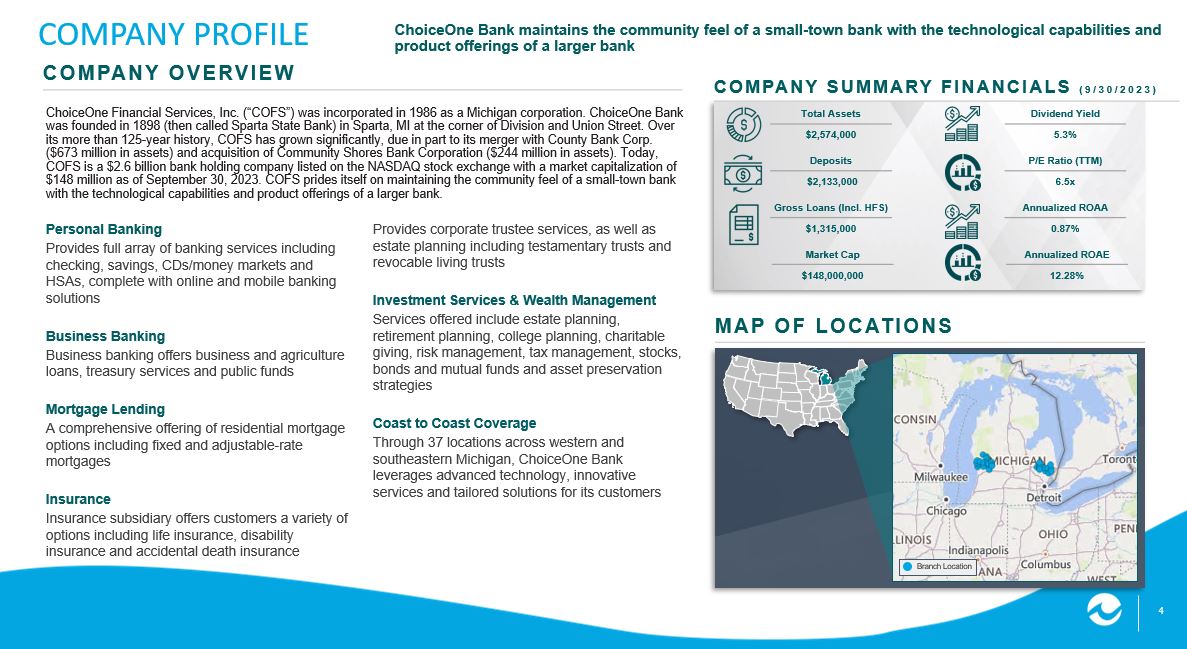
4 COMPANY PROFILE ChoiceOne Financial Services, Inc. (“COFS”) was incorporated in 1986 as a Michigan corporation. ChoiceOne Bank was founded in 1898 (then called Sparta State Bank) in Sparta, MI at the corner of Division and Union Street. Over its more than 125 - year history, COFS has grown significantly, due in part to its merger with County Bank Corp. ($673 million in assets) and acquisition of Community Shores Bank Corporation ($244 million in assets). Today, COFS is a $2.6 billion bank holding company listed on the NASDAQ stock exchange with a market capitalization of $148 million as of September 30, 2023. COFS prides itself on maintaining the community feel of a small - town bank with the technological capabilities and product offerings of a larger bank. ChoiceOne Bank maintains the community feel of a small - town bank with the technological capabilities and product offerings of a larger bank COMPANY OVERVIEW COMPANY SUMMARY FINANCIALS (9/30/2023) Total Assets $2,574,000 Deposits $2,133,000 Gross Loans (Incl. HFS) $1,315,000 Market Cap $148,000,000 Annualized ROAA 0.87% Annualized ROAE 12.28% Dividend Yield 5.3% P/E Ratio (TTM) 6.5x MAP OF LOCATIONS Branch Location Personal Banking Provides full array of banking services including checking, savings, CDs/money markets and HSAs, complete with online and mobile banking solutions Business Banking Business banking offers business and agriculture loans, treasury services and public funds Mortgage Lending A comprehensive offering of residential mortgage options including fixed and adjustable - rate mortgages Insurance Insurance subsidiary offers customers a variety of options including life insurance, disability insurance and accidental death insurance Provides corporate trustee services, as well as estate planning including testamentary trusts and revocable living trusts Investment Services & Wealth Management Services offered include estate planning, retirement planning, college planning, charitable giving, risk management, tax management, stocks, bonds and mutual funds and asset preservation strategies Coast to Coast Coverage Through 37 locations across western and southeastern Michigan, ChoiceOne Bank leverages advanced technology, innovative services and tailored solutions for its customers 5 Award Nominee ( West MI Hispanic Chamber of Commerce – 2018 ) AWARDS & ACCOMPLISHMENTS With an abundance of accolades & awards, ChoiceOne Bank has been recognized as a top - tier community bank in Michigan and in the banking industry.

Named Best Small Bank by Newsweek 3 Years in a row. 2021 – 2022 – 2023 “ChoiceOne Bank has always taken the lead in presenting our customers with the financial technology they require … Our innovative strategies allow us to offer our customers technology - based services and solutions while still maintaining our personal approach to banking with our Customer Service Center and full - service branch network.” – Kelly J. Potes National Top 20 Most Innovative Community Bank ( Independent Banker – 2018 ) Financial Literacy Award ( Michigan Bankers Association – 2023, 2022 & 2020 ) Editor’s Choice Award for Community Commitment ( Cardrates.com – 2019 ) Best Small Business Solutions Nomination ( Finovate Awards – 2019 ) Global Innovation Awards Nominee ( BAI – 2018 ) Newsmaker Finalist of the Year ( Grand Rapids Business Journal – 2019 & 2018 ) True North Community Partner Award ( True North Community Services – 2019 & 2018 ) Silver Addy ( AAF – 2019 ) Startup Innovation Finalist with Plinqit ( Bank Director Best of FinXTech – 2019 & 2018 ) Mastercard Doing Well By Doing Good ( Segment Award – 2022 ) ABA Foundation Community Commitment Awards ( Economic Inclusion Honorable Mention – 2021 )
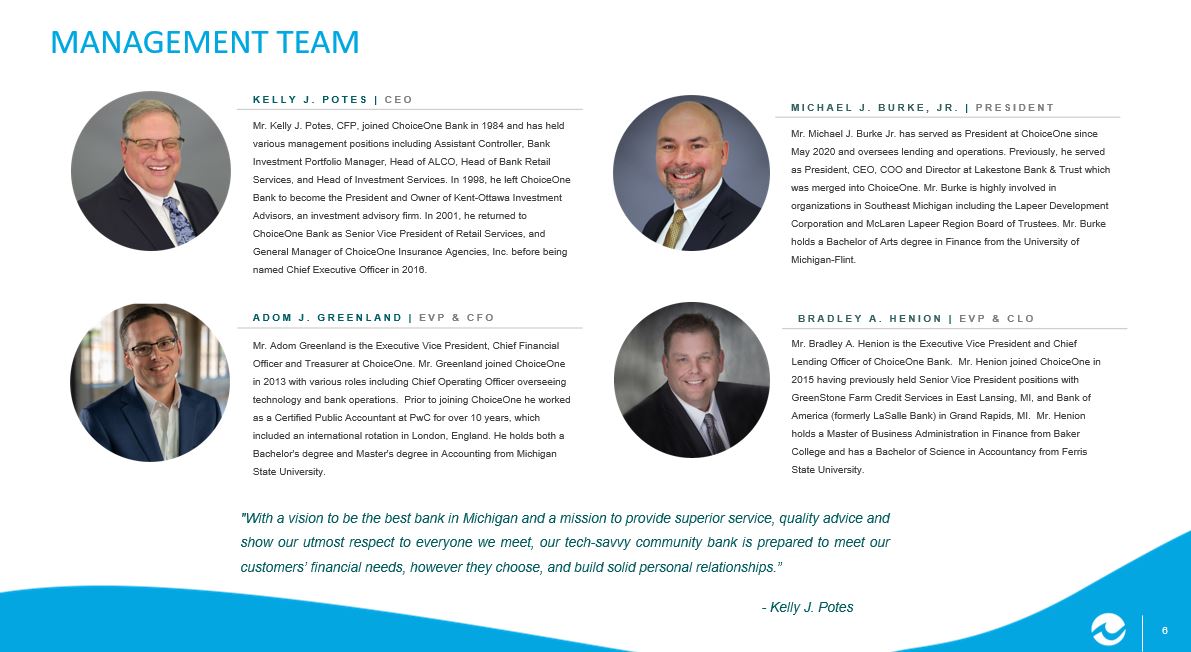
6 Mr. Michael J. Burke Jr. has served as President at ChoiceOne since May 2020 and oversees lending and operations. Previously, he served as President, CEO, COO and Director at Lakestone Bank & Trust which was merged into ChoiceOne. Mr. Burke is highly involved in organizations in Southeast Michigan including the Lapeer Development Corporation and McLaren Lapeer Region Board of Trustees. Mr. Burke holds a Bachelor of Arts degree in Finance from the University of Michigan - Flint. MICHAEL J. BURKE, JR. | PRESIDENT Mr. Adom Greenland is the Executive Vice President, Chief Financial Officer and Treasurer at ChoiceOne. Mr. Greenland joined ChoiceOne in 2013 with various roles including Chief Operating Officer overseeing technology and bank operations. Prior to joining ChoiceOne he worked as a Certified Public Accountant at PwC for over 10 years, which included an international rotation in London, England. He holds both a Bachelor's degree and Master's degree in Accounting from Michigan State University. Mr. Kelly J. Potes, CFP, joined ChoiceOne Bank in 1984 and has held various management positions including Assistant Controller, Bank Investment Portfolio Manager, Head of ALCO, Head of Bank Retail Services, and Head of Investment Services. In 1998, he left ChoiceOne Bank to become the President and Owner of Kent - Ottawa Investment Advisors, an investment advisory firm. In 2001, he returned to ChoiceOne Bank as Senior Vice President of Retail Services, and General Manager of ChoiceOne Insurance Agencies, Inc. before being named Chief Executive Officer in 2016. ADOM J. GREENLAND | EVP & CFO KELLY J. POTES | CEO MANAGEMENT TEAM Mr. Bradley A. Henion is the Executive Vice President and Chief Lending Officer of ChoiceOne Bank. Mr. Henion joined ChoiceOne in 2015 having previously held Senior Vice President positions with GreenStone Farm Credit Services in East Lansing, MI, and Bank of America (formerly LaSalle Bank) in Grand Rapids, MI. Mr. Henion holds a Master of Business Administration in Finance from Baker College and has a Bachelor of Science in Accountancy from Ferris State University. BRADLEY A. HENION | EVP & CLO "With a vision to be the best bank in Michigan and a mission to provide superior service, quality advice and show our utmost respect to everyone we meet, our tech - savvy community bank is prepared to meet our customers’ financial needs, however they choose, and build solid personal relationships . ” - Kelly J .
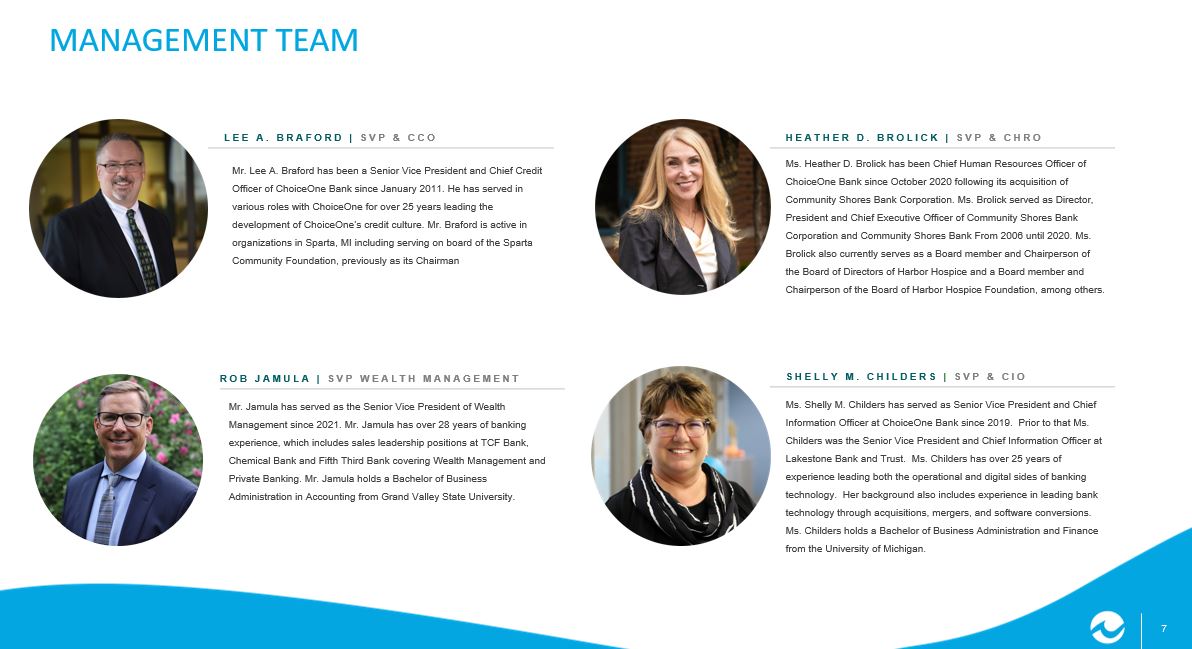
Potes 7 Ms. Shelly M. Childers has served as Senior Vice President and Chief Information Officer at ChoiceOne Bank since 2019. Prior to that Ms. Childers was the Senior Vice President and Chief Information Officer at Lakestone Bank and Trust. Ms. Childers has over 25 years of experience leading both the operational and digital sides of banking technology. Her background also includes experience in leading bank technology through acquisitions, mergers, and software conversions. Ms. Childers holds a Bachelor of Business Administration and Finance from the University of Michigan. Mr. Jamula has served as the Senior Vice President of Wealth Management since 2021. Mr. Jamula has over 28 years of banking experience, which includes sales leadership positions at TCF Bank, Chemical Bank and Fifth Third Bank covering Wealth Management and Private Banking. Mr. Jamula holds a Bachelor of Business Administration in Accounting from Grand Valley State University. Ms. Heather D. Brolick has been Chief Human Resources Officer of ChoiceOne Bank since October 2020 following its acquisition of Community Shores Bank Corporation. Ms. Brolick served as Director, President and Chief Executive Officer of Community Shores Bank Corporation and Community Shores Bank From 2006 until 2020. Ms. Brolick also currently serves as a Board member and Chairperson of the Board of Directors of Harbor Hospice and a Board member and Chairperson of the Board of Harbor Hospice Foundation, among others. SHELLY M. CHILDERS | SVP & CIO HEATHER D. BROLICK | SVP & CHRO MANAGEMENT TEAM ROB JAMULA | SVP WEALTH MANAGEMENT LEE A. BRAFORD | SVP & CCO Mr. Lee A. Braford has been a Senior Vice President and Chief Credit Officer of ChoiceOne Bank since January 2011. He has served in various roles with ChoiceOne for over 25 years leading the development of ChoiceOne’s credit culture. Mr.
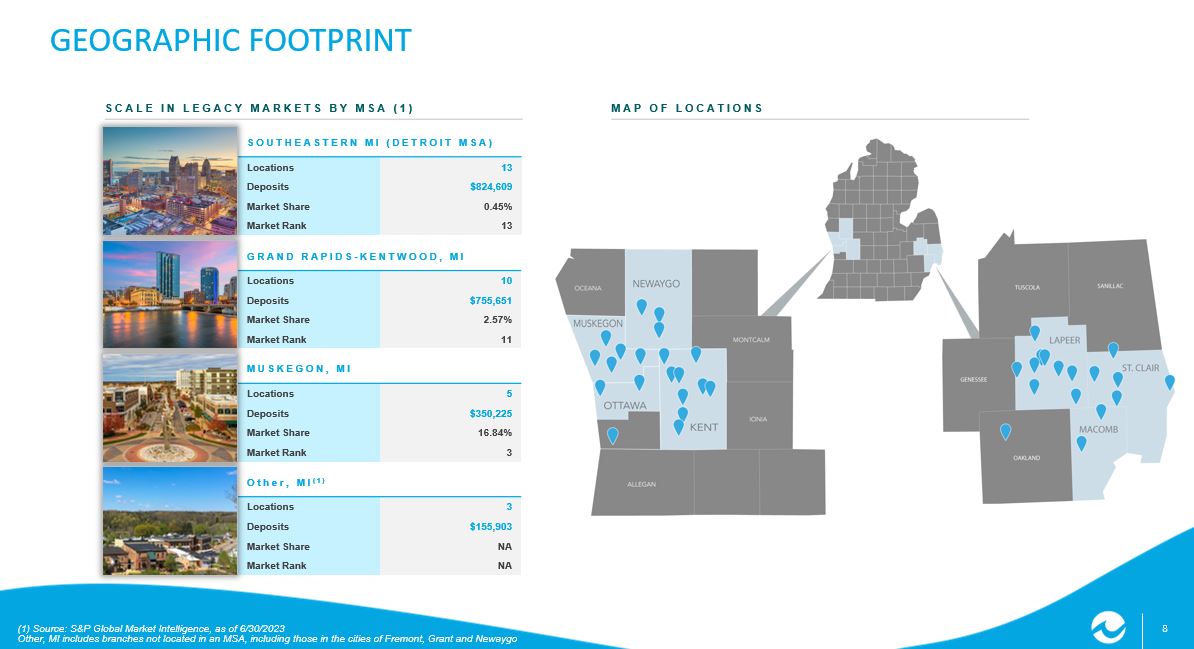
Braford is active in organizations in Sparta, MI including serving on board of the Sparta Community Foundation, previously as its Chairman 8 GRAND RAPIDS - KENTWOOD, MI Locations 10 Deposits $755,651 Market Share 2.57% Market Rank 11 SOUTHEASTERN MI (DETROIT MSA) Locations 13 Deposits $824,609 Market Share 0.45% Market Rank 13 MUSKEGON, MI Locations 5 Deposits $350,225 Market Share 16.84% Market Rank 3 Other, MI (1) Locations 3 Deposits $155,903 Market Share NA Market Rank NA GEOGRAPHIC FOOTPRINT MAP OF LOCATIONS SCALE IN LEGACY MARKETS BY MSA (1) (1) Source: S&P Global Market Intelligence, as of 6/30/2023 Other, MI includes branches not located in an MSA, including those in the cities of Fremont, Grant and Newaygo 9 Transaction Overview Deal Profile (Announcement) Target Operating Metrics (Quarter Before Announcement) Target Target City, State Announcement Date Deal Value ($M) Consideration Total Assets Gross Loans LTM ROAA Muskegon, MI 1/6/2020 $21.9 76.5% Stock / 23.5% Cash $185.1 $147.2 0.49% Lapeer, MI 3/25/2019 $89.0 100.0% Stock / 0.0% Cash $616.6 $363.9 1.13% Kent City, MI 4/25/2006 $29.0 99.9% Stock / 0.1% Cash $216.4 $150.7 0.99% Note: All dollars in millions, unless otherwise noted; deals sorted by announcement date (1) Excludes $138.0 million and $33.1 million in PPP loans in 2020, 2021 respectively M&A HISTORY COFS has completed three whole bank M&A deals, most recently, the merger of equals with County Bank Corp.
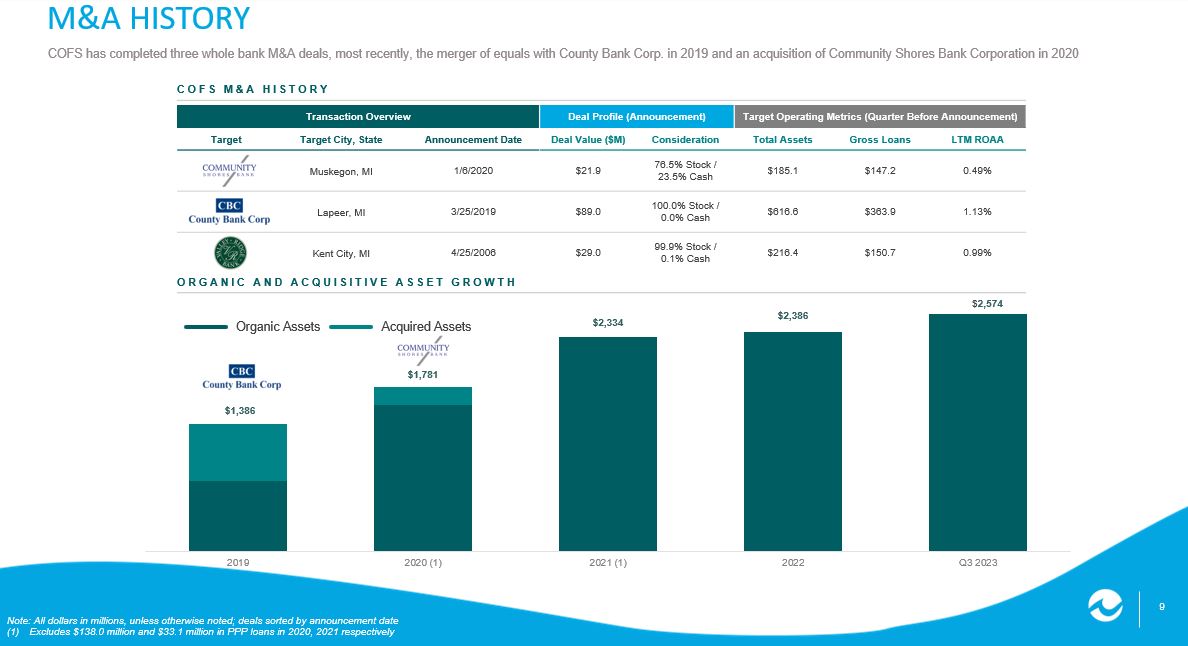
in 2019 and an acqu isi tion of Community Shores Bank Corporation in 2020 COFS M&A HISTORY ORGANIC AND ACQUISITIVE ASSET GROWTH Organic Assets Acquired Assets 1) $1,386 $1,781 $2,334 $2,386 2019 2020 (1) 2021 (1) 2022 Q3 2023 $ 2,574 11 Note: All dollars in thousands (1) Includes $138.0 million, $33.1 million and $0 million in PPP loans in 2020, 2021 and 2022, respectively.

FINANCIAL SUMMARY

All PPP loans are assumed to be deposits for "Total Deposits" graphic. (2) Core loans - exclude Paycheck Protection Program (“PPP”) loans, held for sale loans, and loans to other financial institutions. Loans held for sale were $8.8 million and $5.2 million in Q3 2022 and Q3 2023, respective ly Loans to other financial institutions were $70,000 and $23.8 million in Q3 2022 and Q3 2023, respectively HISTORIC BALANCE SHEET GROWTH – COFS Outline of COFS’ notable balance sheet growth following two M&A transactions in 2019 and 2020, both including & excluding the im pact of PPP loans Total Equity Total Deposits Gross Loans (Including Held For Sale) (1) Total Assets PPP 13.6% Core loan (2) growth for the trailing 12 months $192,139 $227,268 $221,669 $168,874 $181,161 $ - $50,000 $100,000 $150,000 $200,000 $250,000 2019 2020 2021 2022 Q3 2023 $1,386,128 $1,919,342 $2,366,682 $2,385,915 $2,574,196 $ - $500,000 $1,000,000 $1,500,000 $2,000,000 $2,500,000 $3,000,000 2019 2020 2021 2022 Q3 2023 $856,191 $1,117,798 $1,068,831 $1,194,616 $1,315,022 $ - $200,000 $400,000 $600,000 $800,000 $1,000,000 $1,200,000 $1,400,000 2019 2020 2021 2022 Q3 2023 $1,154,602 $1,674,578 $2,052,294 $2,118,003 $2,133,195 $ - $500,000 $1,000,000 $1,500,000 $2,000,000 2019 2020 2021 2022 Q3 2023 12 Deposit Commentary : ▪ Diverse local deposit franchise of retail, business, and municipal accounts ▪ Launched new treasury management platform in 2023 with best - in - class functionality ▪ At 9/30/2023 Non - interest - bearing deposit base of $532.0 million or 25.0% of deposits ▪ 34.7% of total deposits exceed the FDIC limit of $250,000, as of 9/30/2023 ▪ Diversified offerings such as Intrafi’s CDARS and ICS products that increase depositors’ FDIC coverage ▪ Ample borrowing capacity from the Federal Home Loan Bank, Federal Reserve, and other sources is available to fully cover uninsured deposits September 30, 2023 Deposit Mix and Detail (1) Saving accounts include MMDA’s ATTRACTIVE DEPOSIT MIX – CHOICEONE BANK Balance % of Total Transaction $1,124,050 52.7% MMDAs & Savings 608,125 28.5% Retail CDs (≤ $250K) 210,934 9.9% Jumbo CDs (> $250K) 190,086 8.9% Total Deposits $2,133,195 100.0% Commentary 27% 26% 72% 73% 74% September 30, 2023 Demand Deposit Mix and Detail (1) $1.7 Billion Transaction - Non interest bearing 25% Transaction - Interest bearing 28% MMDA & Sav.

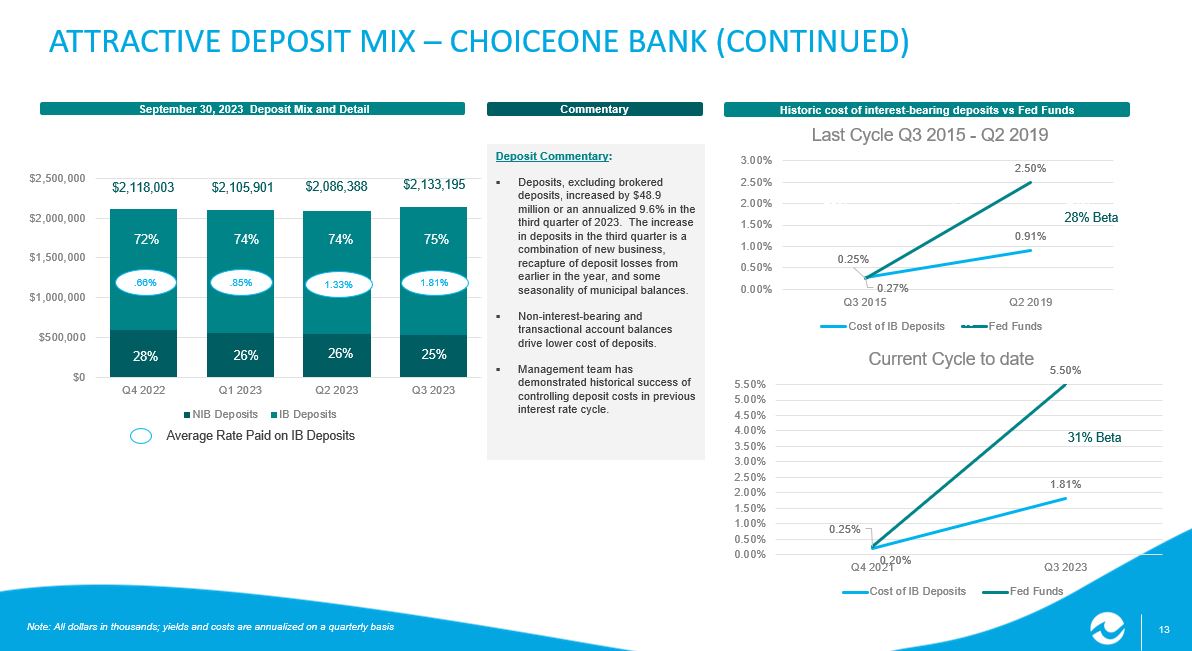
28% Retail CDs (≤ $250k) 10% Jumbo CDs (> $250k) 9% Business - Transactional 26% Business - Savings 11% Retail - Transactional 22% Retail - Savings 23% Public Funds - Transactional 12% Public Funds - Savings 6% 13 $0 $500,000 $1,000,000 $1,500,000 $2,000,000 $2,500,000 Q4 2022 Q1 2023 Q2 2023 Q3 2023 NIB Deposits IB Deposits 0.20% 1.81% 0.25% 5.50% 0.00% 0.50% 1.00% 1.50% 2.00% 2.50% 3.00% 3.50% 4.00% 4.50% 5.00% 5.50% Q4 2021 Q3 2023 Current Cycle to date Cost of IB Deposits Fed Funds 0.27% 0.91% 0.25% 2.50% 0.00% 0.50% 1.00% 1.50% 2.00% 2.50% 3.00% Q3 2015 Q2 2019 Last Cycle Q3 2015 - Q2 2019 Cost of IB Deposits Fed Funds Deposit Commentary : ▪ Deposits, excluding brokered deposits, increased by $48.9 million or an annualized 9.6% in the third quarter of 2023. The increase in deposits in the third quarter is a combination of new business, recapture of deposit losses from earlier in the year, and some seasonality of municipal balances. ▪ Non - interest - bearing and transactional account balances drive lower cost of deposits. ▪ Management team has demonstrated historical success of controlling deposit costs in previous interest rate cycle. September 30, 2023 Deposit Mix and Detail Note: All dollars in thousands; yields and costs are annualized on a quarterly basis ATTRACTIVE DEPOSIT MIX – CHOICEONE BANK (CONTINUED) Commentary 27% 26% 72% 73% 74% Historic cost of interest - bearing deposits vs Fed Funds Average Rate Paid on IB Deposits .66% .85% 1.33% $2,118,003 $2,105,901 $2,086,388 26% 28% 26% 72% 74% 74% 28% Beta 31% Beta 1.81% 25% 75% $2,133,195 14 Loan Commentary : ▪ Strong commercial real estate portfolio - 51% of CRE loans are owner occupied ▪ QTD Yield on loans of 5.5% ▪ $371 million of variable loans or 28% of portfolio ▪ Weighted average duration of loan portfolio of 2.2 years ▪ Active residential real estate lending with sold (primarily service retained) and portfolio mortgages ▪ ChoiceOne has total outstanding loans to businesses in the automotive sector of $50.2 million or 3.9% of core loans.
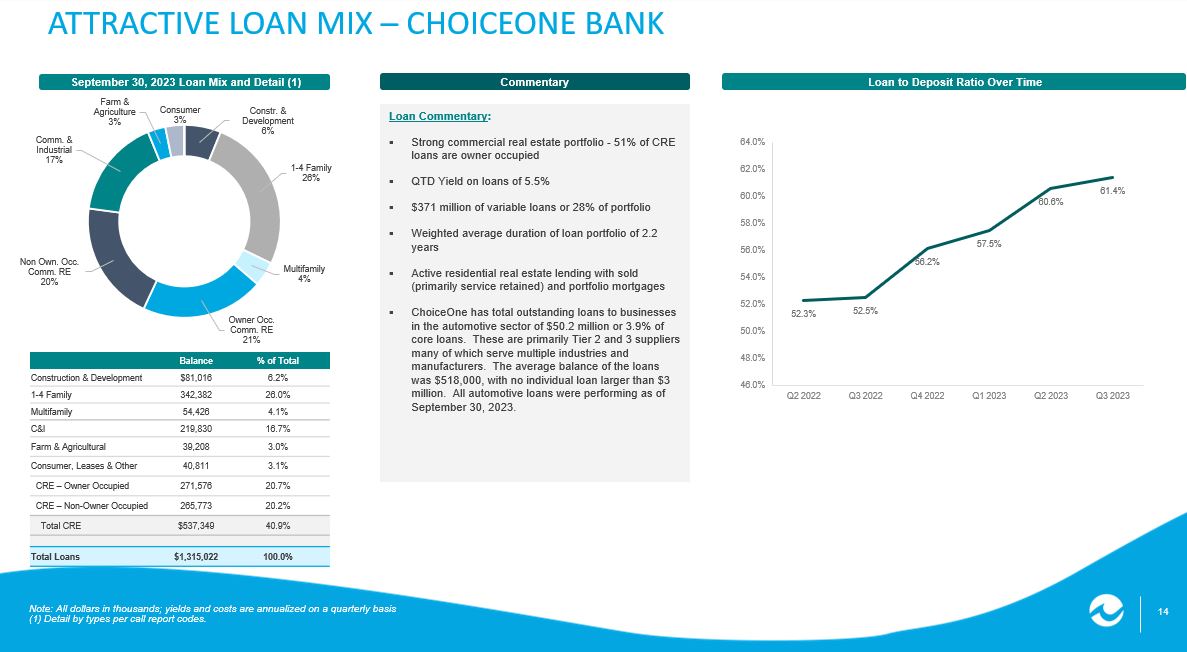
These are primarily Tier 2 and 3 suppliers many of which serve multiple industries and manufacturers. The average balance of the loans was $518,000, with no individual loan larger than $3 million. All automotive loans were performing as of September 30, 2023. September 30, 2023 Loan Mix and Detail (1) Loan to Deposit Ratio Over Time Note: All dollars in thousands; yields and costs are annualized on a quarterly basis (1) Detail by types per call report codes. ATTRACTIVE LOAN MIX – CHOICEONE BANK Commentary Constr. & Development 6% 1 - 4 Family 26% Multifamily 4% Owner Occ. Comm. RE 21% Non Own. Occ. Comm. RE 20% Comm. & Industrial 17% Farm & Agriculture 3% Consumer 3% Balance % of Total Construction & Development $81,016 6.2% 1 - 4 Family 342,382 26.0% Multifamily 54,426 4.1% C&I 219,830 16.7% Farm & Agricultural 39,208 3.0% Consumer, Leases & Other 40,811 3.1% CRE – Owner Occupied 271,576 20.7% CRE – Non - Owner Occupied 265,773 20.2% Total CRE $537,349 40.9% Total Loans $1,315,022 100.0% 52.3% 52.5% 56.2% 57.5% 60.6% 61.4% 46.0% 48.0% 50.0% 52.0% 54.0% 56.0% 58.0% 60.0% 62.0% 64.0% Q2 2022 Q3 2022 Q4 2022 Q1 2023 Q2 2023 Q3 2023 15 Commercial Mortgage Backed 25% Mortgage - Backed 16% Asset - Backed Securities 1% Corporate 2% State and MUNI - Tax Exempt 29% State and MUNI - Taxable 18% US Treasury Bonds and Agency 9% Numbers based on ChoiceOne internal data as of 9/30/2023 except where specifically identified.
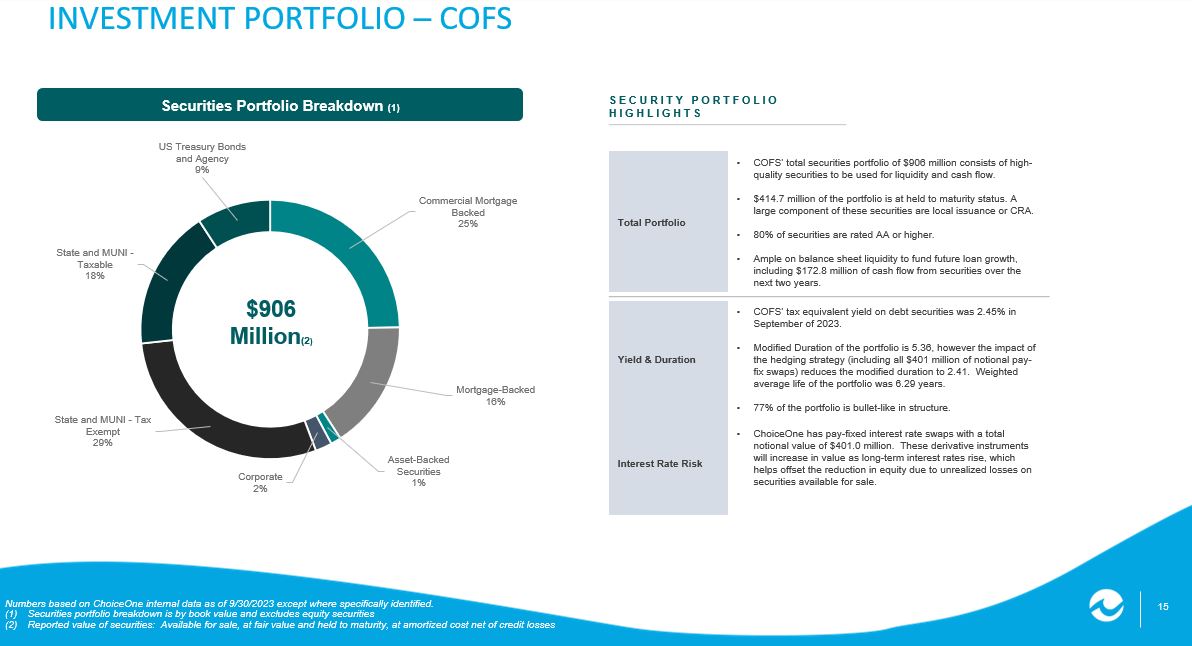
(1) Securities portfolio breakdown is by book value and excludes equity securities (2) Reported value of securities: Available for sale, at fair value and held to maturity, at amortized cost net of credit losses INVESTMENT PORTFOLIO – COFS Securities Portfolio Breakdown (1) SECURITY PORTFOLIO HIGHLIGHTS $906 Million (2 ) Total Portfolio • COFS’ total securities portfolio of $906 million consists of high - quality securities to be used for liquidity and cash flow. • $414.7 million of the portfolio is at held to maturity status. A large component of these securities are local issuance or CRA. • 80% of securities are rated AA or higher. • Ample on balance sheet liquidity to fund future loan growth, including $172.8 million of cash flow from securities over the next two years. Yield & Duration • COFS’ tax equivalent yield on debt securities was 2.45% in September of 2023. • Modified Duration of the portfolio is 5.36, however the impact of the hedging strategy (including all $401 million of notional pay - fix swaps) reduces the modified duration to 2.41. Weighted average life of the portfolio was 6.29 years. • 77% of the portfolio is bullet - like in structure. Interest Rate Risk • ChoiceOne has pay - fixed interest rate swaps with a total notional value of $401.0 million. These derivative instruments will increase in value as long - term interest rates rise, which helps offset the reduction in equity due to unrealized losses on securities available for sale.

16 Note: Dollars in thousands (1) Derivatives income impact assumes a SOFR rate of 5.31% in perpetuity INTEREST RATE SWAPS INCOME IMPACT ChoiceOne uses interest rate swaps as part of our interest rate risk management strategy. ChoiceOne has pay - fixed interest rate swaps with a total notional value of $401.0 million with a weighted average coupon of approximately 3.07%. These derivative instruments will increase in value as lon g - term interest rates rise, which helps offset the reduction in equity due to unrealized losses on securities available for sale Actual Projected (1) Swaps YTD Q3 2023 Q4 2023 Total 2023 Q1 2024 Q2 2024 Q3 2024 Q4 2024 Total 2024 Current paying (1) 2,244 960 3,204 960 960 960 960 3,840 Forward starting (2) 853 1,280 1,280 3,413 Terminated (2,794) (897) (3,691) (887) (205) (1,092) Net Interest Income Impact (550) 63 (487) 73 1,608 2,240 2,240 6,161 Swaps Notional Value Coupon Item Hedged Contract End Fair Value at 9/30/23 1 Current Paying 200,950 3.40% Fixed rate securities 2031 - 2032 12,013 2 Forward Starting 200,000 2.75% Variable Deposits 2032 17,887 Total 29,900 17 FINANCIAL PERFORMANCE TRENDS – COFS Efficiency Ratio & Noninterest Expense to Average Assets NIM (1) ROAE ROAA Numbers based on ChoiceOne internal data as of 9/30/2023 except where specifically identified.

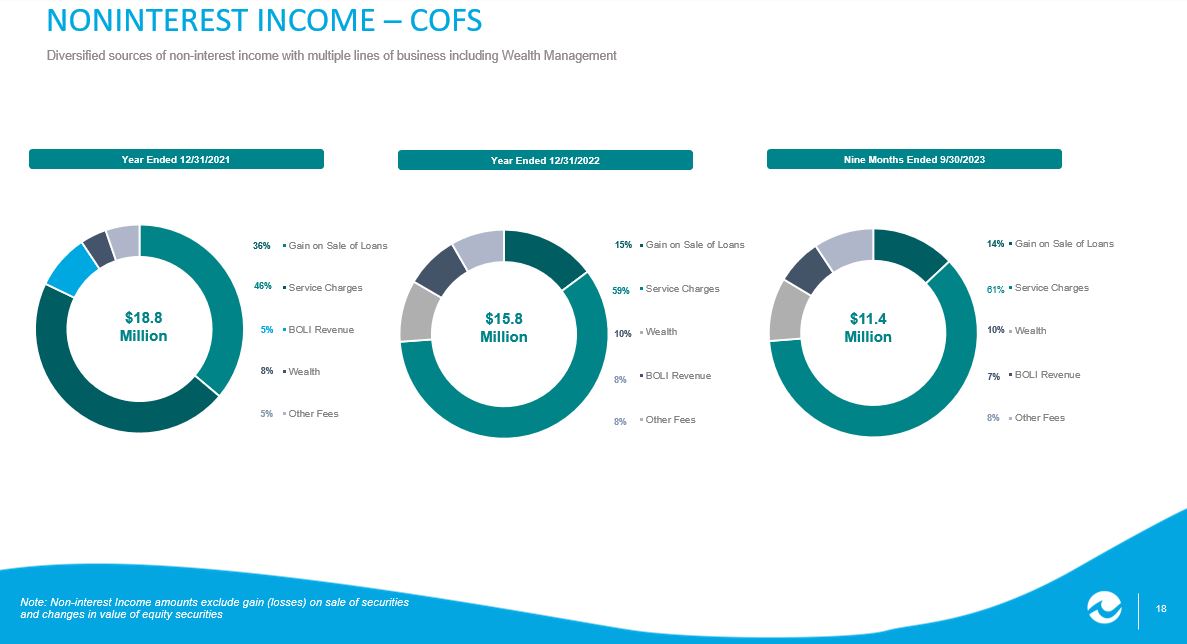
(1) Net interest margin (tax - equivalent basis) See Non - GAAP reconciliation 0.85% 0.94% 1.02% 1.00% 0.80% 0.50% 0.60% 0.70% 0.80% 0.90% 1.00% 1.10% 1.20% 1.30% 2019 2020 2021 2022 Q3 2023 6.48% 7.28% 9.79% 13.25% 11.31% 5.00% 6.00% 7.00% 8.00% 9.00% 10.00% 11.00% 12.00% 13.00% 14.00% 2019 2020 2021 2022 Q3 2023 3.71% 3.51% 3.14% 3.09% 2.70% 0.00% 0.50% 1.00% 1.50% 2.00% 2.50% 3.00% 3.50% 4.00% 2019 2020 2021 2022 Q3 2023 70.63% 62.99% 63.85% 61.92% 65.74% 3.37% 3.07% 2.45% 2.25% 2.23% 2019 2020 2021 2022 Q3 2023 Efficiency Ratio Noninterest Expense/ Avg Assets 18 Gain on Sale of Loans Service Charges Wealth BOLI Revenue Other Fees Gain on Sale of Loans Service Charges BOLI Revenue Wealth Other Fees Gain on Sale of Loans Service Charges Wealth BOLI Revenue Other Fees 36% 8% 5% 5% 46% of equ ity sec uriti es NONINTEREST INCOME – COFS Diversified sources of non - interest income with multiple lines of business including Wealth Management Year Ended 12/31/2022 $18.8 Million Year Ended 12/31/2021 Nine Months Ended 9/30/2023 $15.8 Million 15% 10% 8% 8% 59% 14% 7% 8% 61% $11.4 Million Note: Non - interest Income amounts exclude gain (losses) on sale of securities and changes in value of equity securities 10%

19 ASSET QUALITY Historically strong credit metrics Net Charge - Offs / Average Loans (2) NPLs/ Loans (1) Texas Ratio NPAs/ Total Assets Numbers based on ChoiceOne internal data as of 09/30/2023 except where specifically identified. 1. Excluding held for sale loans 2. Annualized quarter data 5.35% 5.03% 3.47% 2.34% 1.93% 0.00% 1.00% 2.00% 3.00% 4.00% 5.00% 6.00% 2019 2020 2021 2022 Q3 2023 0.53% 0.44% 0.24% 0.11% 0.07% 0.00% 0.10% 0.20% 0.30% 0.40% 0.50% 0.60% 2019 2020 2021 2022 Q3 2023 0.75% 0.74% 0.52% 0.22% 0.14% 0.00% 0.10% 0.20% 0.30% 0.40% 0.50% 0.60% 0.70% 0.80% 0.90% 2019 2020 2021 2022 Q3 2023 0.12% 0.05% 0.03% 0.03% 0.05% 0.00% 0.10% 0.20% 0.30% 0.40% 0.50% 2019 2020 2021 2022 Q3 2023 20 $14,784 $15,065 $14,582 $14,872 $3,275 $2,991 $3,156 $2,718 $ - $2,000 $4,000 $6,000 $8,000 $10,000 $12,000 $14,000 $16,000 $18,000 $20,000 Jan 1 2023 CECL Q1 2023 Q2 2023 Q3 2023 Note: All dollars in Graph are in thousands (1) Remaining yield Mark related to the mark against loans acquired in the County Bank Corp.
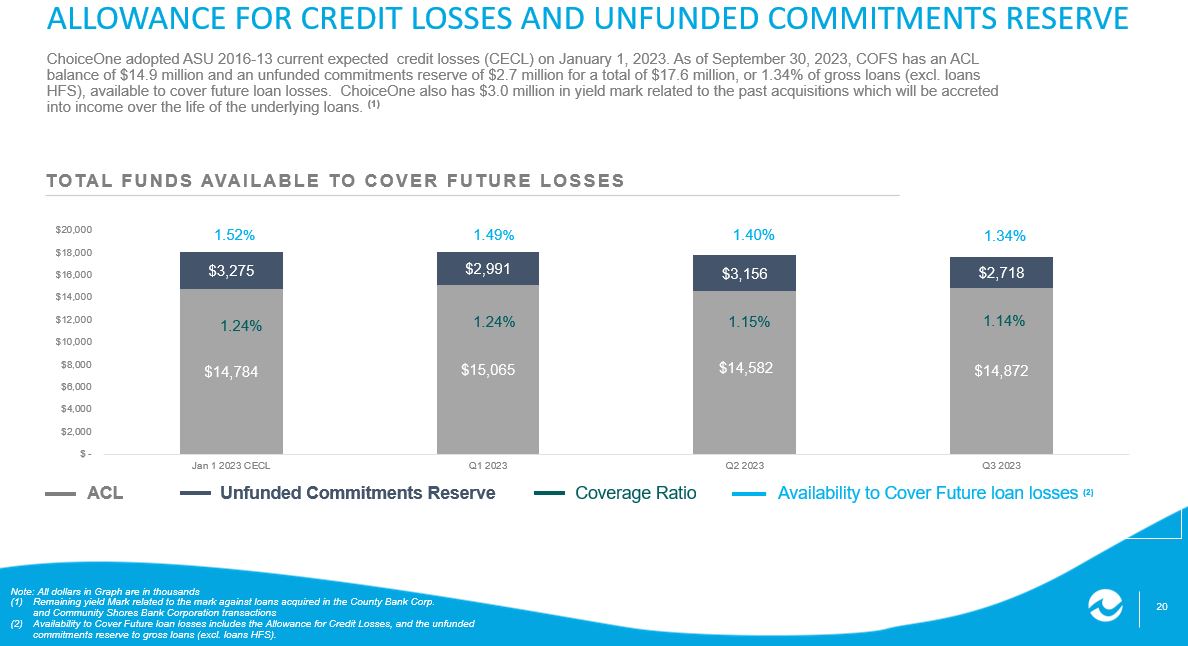
and Community Shores Bank Corporation transactions (2) Availability to Cover Future loan losses includes the Allowance for Credit Losses, and the unfunded commitments reserve to gross loans (excl. loans HFS). ALLOWANCE FOR CREDIT LOSSES AND UNFUNDED COMMITMENTS RESERVE ChoiceOne adopted ASU 2016 - 13 current expected credit losses (CECL) on January 1, 2023. As of September 30, 2023, COFS has an A CL balance of $14.9 million and an unfunded commitments reserve of $2.7 million for a total of $17.6 million, or 1.34% of gross loa ns (excl. loans HFS), available to cover future loan losses. ChoiceOne also has $3.0 million in yield mark related to the past acquisitions whi ch will be accreted into income over the life of the underlying loans. (1) TOTAL FUNDS AVAILABLE TO COVER FUTURE LOSSES ACL Unfunded Commitments Reserve Coverage Ratio Availability to Cover Future loan losses (2) 1.52 % 1.49 % 1.40% 1.24% 1.24% 1.15% 1.34% 1.14% 21 STRONG RISK MANAGEMENT Interest Rate Risk Management • ChoiceOne uses interest rate swaps as part of our interest rate risk management strategy.

ChoiceOne has pay - fixed interest rate swaps with a total notional value of $401.0 million, a fair value of $29.9 million and a weighted average coupon of approximately 3.07%. These derivative instruments will increase in value as long - term interest rates rise, which helps offset the reduction in equity due to unrealized losses on securities available for sale. • $200 million of the total notional value is a forward starting pay - fix, receive floating swap starting in April 2024 with an eight - year term set to expire in 2032. The forward starting pay fixed, receive floating swap agreements will pay a fixed coupon rate of 2.75% while receiving the SOFR Rate starting in April 2024. • In March 2023, ChoiceOne terminated all Receive - Fix, Pay Floating Swap Agreements for a cash payment of $4.2 million. The loss is being amortized with an expense of approximately $285 thousand monthly through April 2024, which was the remaining period of the agreements. • Diversified income streams with growth in our Wealth Management department. Since August 2022, over $56 million of deposits were transferred off balance sheet to ChoiceOne Wealth Management. Focus on transactional non - interest - bearing deposits and service fees with newly launched Treasury platform. PROACTIVE STEPS TO MITIGATE INTEREST RATE RISK AND INCREASE FUNC TIONAL LIQUIDITY . Numbers based on ChoiceOne internal data as of 09/30/2023 except where specifically identified. Liquidity Risk Management • Increased cash position and used a variety of funding sources including brokered CD’s to add liquidity and preserve borrowing capacity. • Borrowed $160 million from the Federal Reserve’s Bank Term Funding Program (BTFP) at a fixed rate of 4.71% for 1 year. This borrowing can be prepaid without penalty. • Pledging of eligible assets to FHLB, Fed Discount window, and BTFP to enhance operational liquidity and ease of access to reliable sources of funding. This secured a total of $796.1 million in unused available borrowings, exceeding uninsured deposits. • Proactive discussions with large deposit customers offering extended FDIC insurance through programs such as Intrafi.

22 (1) See Non - GAAP Reconciliation CAPITAL Regulatory Ratios Q1 2022 Q2 2022 Q3 2022 Q4 2022 Q1 2023 Q2 2023 Q3 2023 ChoiceOne Financial Services Inc. Total capital (to risk weighted assets) 14.6% 13.8% 13.7% 13.8% 13.5% 13.2% 13.2% Common equity Tier 1 capital (to risk weighted assets) 11.5% 11.0% 10.9% 11.1% 10.7% 10.5% 10.4% Tier 1 capital (to risk weighted assets) 11.9% 11.3% 11.2% 11.4% 11.0% 10.8% 10.7% Tier 1 capital (to average assets) 7.3% 7.5% 7.6% 7.9% 7.7% 7.7% 7.4% Book value per share $ 25.52 $ 22.19 $ 20.86 $ 22.47 $ 22.43 $ 23.79 $ 24.02 Tangible book value per share (1) $ 17.02 $ 13.75 $ 12.47 $ 14.12 $ 14.12 $ 15.53 $ 15.80 Tangible book value per share excluding AOCI (1) $ 21.88 $ 22.42 $ 22.99 $ 23.67 $ 23.14 $ 23.61 $ 24.08 ChoiceOne Bank Total capital (to risk weighted assets) 13.3% 12.7% 12.8% 13.0% 13.0% 12.7% 12.7% Common equity Tier 1 capital (to risk weighted assets) 12.8% 12.2% 12.3% 12.5% 12.5% 12.2% 12.0% Tier 1 capital (to risk weighted assets) 12.8% 12.2% 12.3% 12.5% 12.5% 12.2% 12.0% Tier 1 capital (to average assets) 7.9% 8.1% 8.3% 8.7% 8.7% 8.7% 8.3% 23 (1) See Non - GAAP Reconciliation OTHER SELECTED HIGHLIGHTS Quarterly Performance Ratios 2022 2nd Qtr.
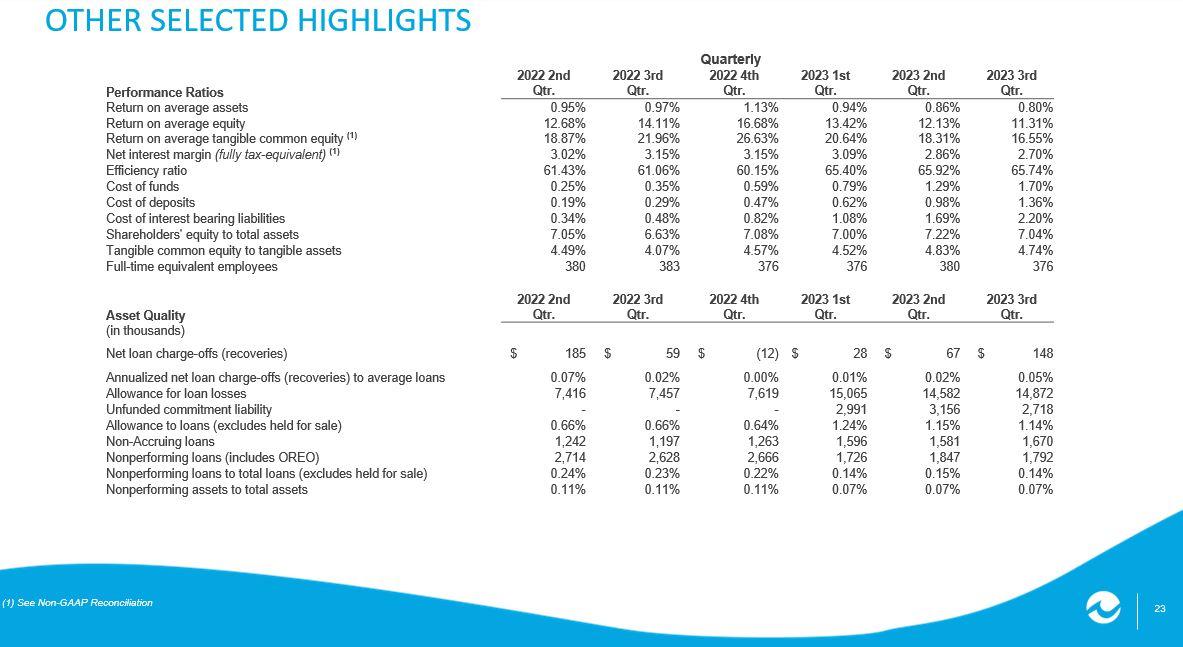
2022 3rd Qtr. 2022 4th Qtr. 2023 1st Qtr. 2023 2nd Qtr. 2023 3rd Qtr. Return on average assets 0.95% 0.97% 1.13% 0.94% 0.86% 0.80% Return on average equity 12.68% 14.11% 16.68% 13.42% 12.13% 11.31% Return on average tangible common equity (1) 18.87% 21.96% 26.63% 20.64% 18.31% 16.55% Net interest margin (fully tax - equivalent) (1) 3.02% 3.15% 3.15% 3.09% 2.86% 2.70% Efficiency ratio 61.43% 61.06% 60.15% 65.40% 65.92% 65.74% Cost of funds 0.25% 0.35% 0.59% 0.79% 1.29% 1.70% Cost of deposits 0.19% 0.29% 0.47% 0.62% 0.98% 1.36% Cost of interest bearing liabilities 0.34% 0.48% 0.82% 1.08% 1.69% 2.20% Shareholders' equity to total assets 7.05% 6.63% 7.08% 7.00% 7.22% 7.04% Tangible common equity to tangible assets 4.49% 4.07% 4.57% 4.52% 4.83% 4.74% Full - time equivalent employees 380 383 376 376 380 376 Asset Quality 2022 2nd Qtr. 2022 3rd Qtr. 2022 4th Qtr. 2023 1st Qtr. 2023 2nd Qtr. 2023 3rd Qtr. (in thousands) Net loan charge - offs (recoveries) $ 185 $ 59 $ (12) $ 28 $ 67 $ 148 Annualized net loan charge - offs (recoveries) to average loans 0.07% 0.02% 0.00% 0.01% 0.02% 0.05% Allowance for loan losses 7,416 7,457 7,619 15,065 14,582 14,872 Unfunded commitment liability - - - 2,991 3,156 2,718 Allowance to loans (excludes held for sale) 0.66% 0.66% 0.64% 1.24% 1.15% 1.14% Non - Accruing loans 1,242 1,197 1,263 1,596 1,581 1,670 Nonperforming loans (includes OREO) 2,714 2,628 2,666 1,726 1,847 1,792 Nonperforming loans to total loans (excludes held for sale) 0.24% 0.23% 0.22% 0.14% 0.15% 0.14% Nonperforming assets to total assets 0.11% 0.11% 0.11% 0.07% 0.07% 0.07% C OF S T R ADES ON TH E NAS D A Q ® Market Makers in ChoiceOne Stock D. A. Davidson & Co. Nick Bi cking 800.394.9230 Raymond James & Associates Anthony LanFranca 312.655.2961 Stock Registrar & Transfer Agent Continental Stock Transfer & Trust Company 1 State Street Plaza, 30th Floor New York, NY 10004 - 1561 212.509.4000 ChoiceOne trades on the NASDAQ S t ock E x change under its s ymbol, “COFS.”
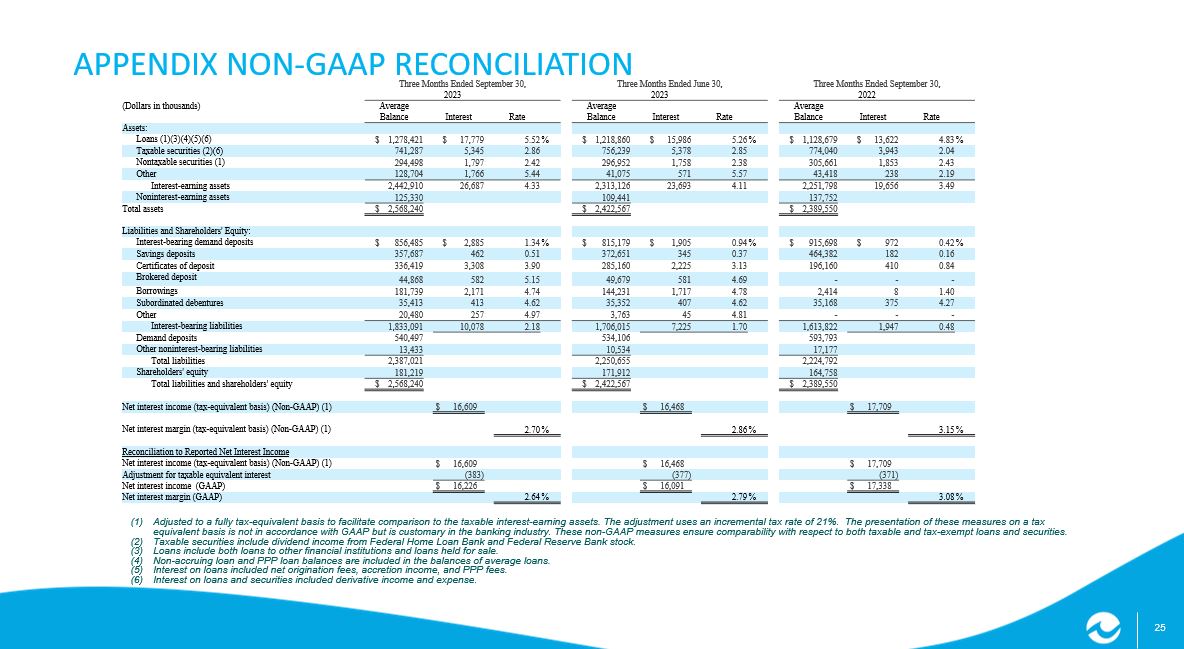
25 (1) Adjusted to a fully tax - equivalent basis to facilitate comparison to the taxable interest - earning assets. The adjustment uses an incremental tax rate of 21%. The presentation of these measures on a tax equivalent basis is not in accordance with GAAP but is customary in the banking industry. These non - GAAP measures ensure compara bility with respect to both taxable and tax - exempt loans and securities. (2) Taxable securities include dividend income from Federal Home Loan Bank and Federal Reserve Bank stock. (3) Loans include both loans to other financial institutions and loans held for sale. (4) Non - accruing loan and PPP loan balances are included in the balances of average loans. (5) Interest on loans included net origination fees, accretion income, and PPP fees. (6) Interest on loans and securities included derivative income and expense. APPENDIX NON - GAAP RECONCILIATION Three Months Ended September 30, Three Months Ended June 30, Three Months Ended September 30, 2023 2023 2022 (Dollars in thousands) Average Average Average Balance Interest Rate Balance Interest Rate Balance Interest Rate Assets: Loans (1)(3)(4)(5)(6) $ 1,278,421 $ 17,779 5.52 % $ 1,218,860 $ 15,986 5.26 % $ 1,128,679 $ 13,622 4.83 % Taxable securities (2)(6) 741,287 5,345 2.86 756,239 5,378 2.85 774,040 3,943 2.04 Nontaxable securities (1) 294,498 1,797 2.42 296,952 1,758 2.38 305,661 1,853 2.43 Other 128,704 1,766 5.44 41,075 571 5.57 43,418 238 2.19 Interest - earning assets 2,442,910 26,687 4.33 2,313,126 23,693 4.11 2,251,798 19,656 3.49 Noninterest - earning assets 125,330 109,441 137,752 Total assets $ 2,568,240 $ 2,422,567 $ 2,389,550 Liabilities and Shareholders' Equity: Interest - bearing demand deposits $ 856,485 $ 2,885 1.34 % $ 815,179 $ 1,905 0.94 % $ 915,698 $ 972 0.42 % Savings deposits 357,687 462 0.51 372,651 345 0.37 464,382 182 0.16 Certificates of deposit 336,419 3,308 3.90 285,160 2,225 3.13 196,160 410 0.84 Brokered deposit 44,868 582 5.15 49,679 581 4.69 - - - Borrowings 181,739 2,171 4.74 144,231 1,717 4.78 2,414 8 1.40 Subordinated debentures 35,413 413 4.62 35,352 407 4.62 35,168 375 4.27 Other 20,480 257 4.97 3,763 45 4.81 - - - Interest - bearing liabilities 1,833,091 10,078 2.18 1,706,015 7,225 1.70 1,613,822 1,947 0.48 Demand deposits 540,497 534,106 593,793 Other noninterest - bearing liabilities 13,433 10,534 17,177 Total liabilities 2,387,021 2,250,655 2,224,792 Shareholders' equity 181,219 171,912 164,758 Total liabilities and shareholders' equity $ 2,568,240 $ 2,422,567 $ 2,389,550 Net interest income (tax - equivalent basis) (Non - GAAP) (1) $ 16,609 $ 16,468 $ 17,709 Net interest margin (tax - equivalent basis) (Non - GAAP) (1) 2.70 % 2.86 % 3.15 % Reconciliation to Reported Net Interest Income Net interest income (tax - equivalent basis) (Non - GAAP) (1) $ 16,609 $ 16,468 $ 17,709 Adjustment for taxable equivalent interest (383) (377) (371) Net interest income (GAAP) $ 16,226 $ 16,091 $ 17,338 Net interest margin (GAAP) 2.64 % 2.79 % 3.08 % 26 (1) Adjusted to a fully tax - equivalent basis to facilitate comparison to the taxable interest - earning assets.
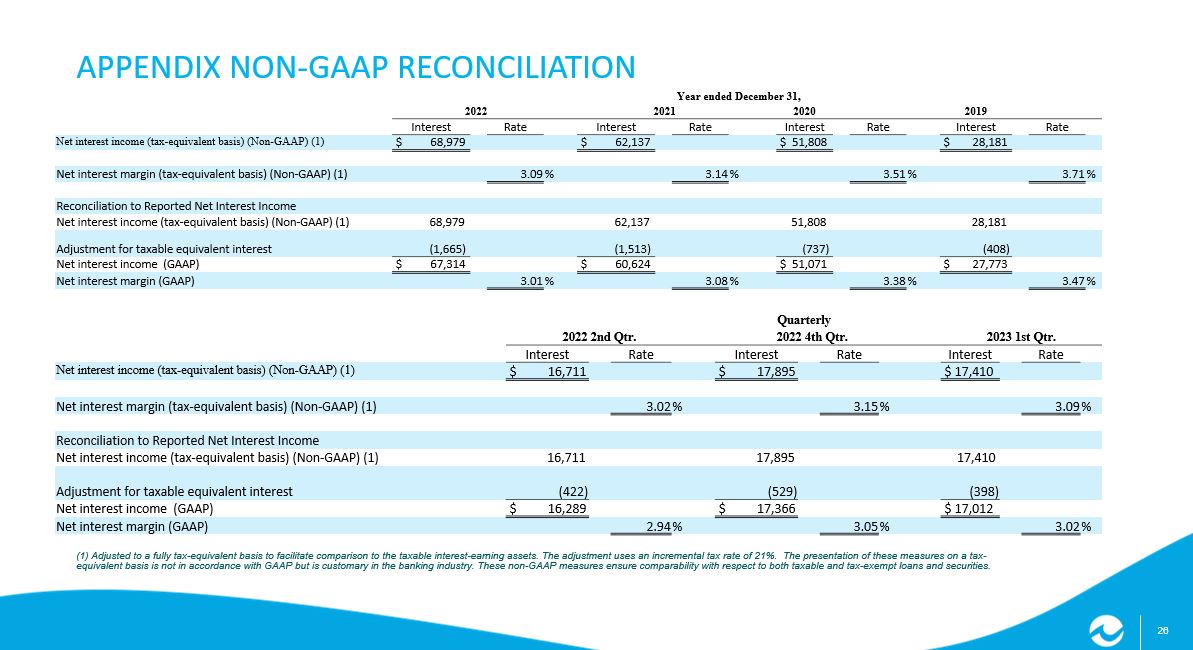
The adjustment use s an incremental tax rate of 21%. The presentation of these measures on a tax - equivalent basis is not in accordance with GAAP but is customary in the banking industry. These non - GAAP measures ensure compara bility with respect to both taxable and tax - exempt loans and securities. APPENDIX NON - GAAP RECONCILIATION Year ended December 31, 2022 2021 2020 2019 Interest Rate Interest Rate Interest Rate Interest Rate Net interest income (tax - equivalent basis) (Non - GAAP) (1) $ 68,979 $ 62,137 $ 51,808 $ 28,181 Net interest margin (tax - equivalent basis) (Non - GAAP) (1) 3.09 % 3.14 % 3.51 % 3.71 % Reconciliation to Reported Net Interest Income Net interest income (tax - equivalent basis) (Non - GAAP) (1) 68,979 62,137 51,808 28,181 Adjustment for taxable equivalent interest (1,665) (1,513) (737) (408) Net interest income (GAAP) $ 67,314 $ 60,624 $ 51,071 $ 27,773 Net interest margin (GAAP) 3.01 % 3.08 % 3.38 % 3.47 % Quarterly 2022 2nd Qtr. 2022 4th Qtr. 2023 1st Qtr.
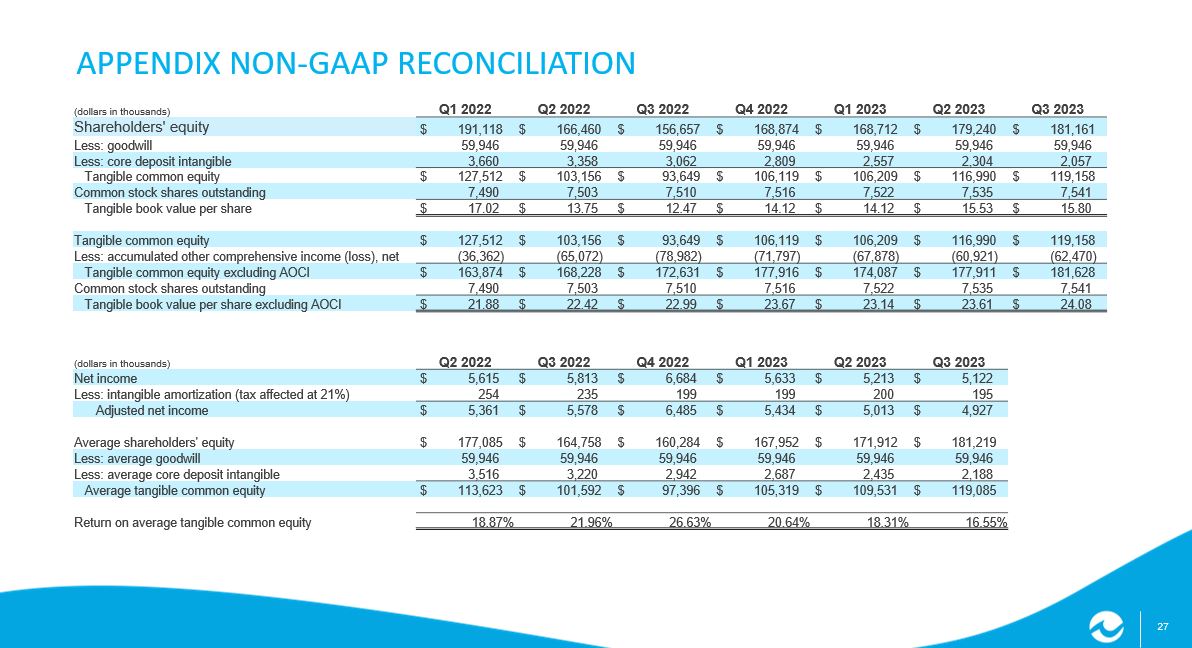
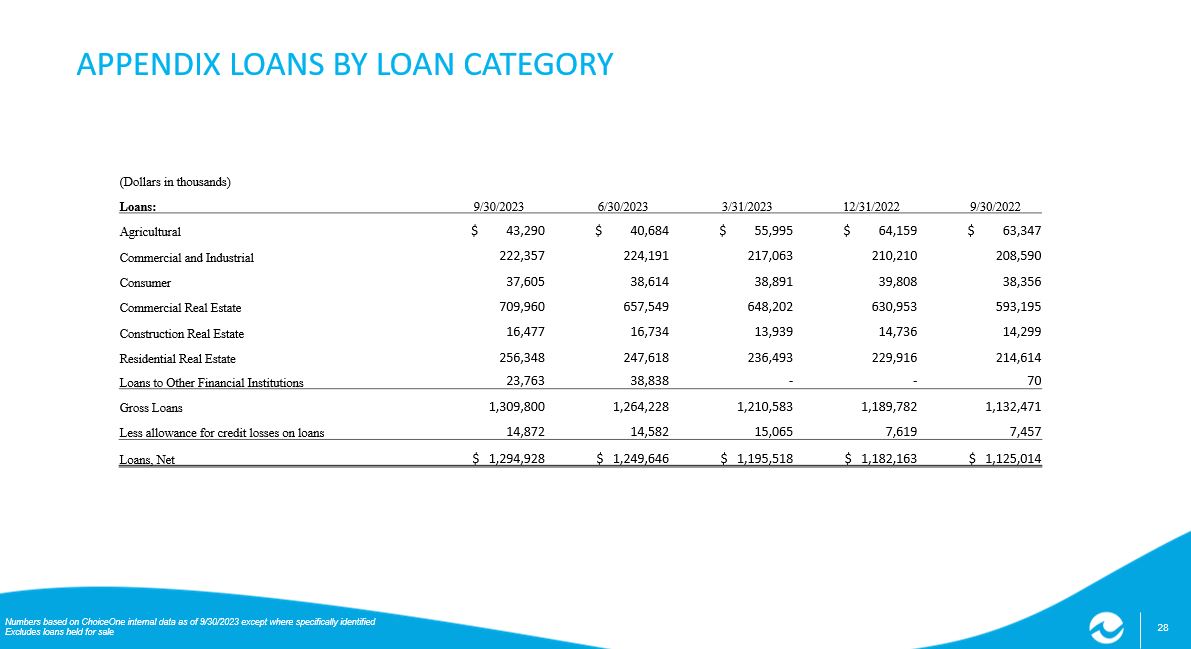
Interest Rate Interest Rate Interest Rate Net interest income (tax - equivalent basis) (Non - GAAP) (1) $ 16,711 $ 17,895 $ 17,410 Net interest margin (tax - equivalent basis) (Non - GAAP) (1) 3.02 % 3.15 % 3.09 % Reconciliation to Reported Net Interest Income Net interest income (tax - equivalent basis) (Non - GAAP) (1) 16,711 17,895 17,410 Adjustment for taxable equivalent interest (422) (529) (398) Net interest income (GAAP) $ 16,289 $ 17,366 $ 17,012 Net interest margin (GAAP) 2.94 % 3.05 % 3.02 % 27 APPENDIX NON - GAAP RECONCILIATION (dollars in thousands) Q1 2022 Q2 2022 Q3 2022 Q4 2022 Q1 2023 Q2 2023 Q3 2023 Shareholders' equity $ 191,118 $ 166,460 $ 156,657 $ 168,874 $ 168,712 $ 179,240 $ 181,161 Less: goodwill 59,946 59,946 59,946 59,946 59,946 59,946 59,946 Less: core deposit intangible 3,660 3,358 3,062 2,809 2,557 2,304 2,057 Tangible common equity $ 127,512 $ 103,156 $ 93,649 $ 106,119 $ 106,209 $ 116,990 $ 119,158 Common stock shares outstanding 7,490 7,503 7,510 7,516 7,522 7,535 7,541 Tangible book value per share $ 17.02 $ 13.75 $ 12.47 $ 14.12 $ 14.12 $ 15.53 $ 15.80 Tangible common equity $ 127,512 $ 103,156 $ 93,649 $ 106,119 $ 106,209 $ 116,990 $ 119,158 Less: accumulated other comprehensive income (loss), net (36,362) (65,072) (78,982) (71,797) (67,878) (60,921) (62,470) Tangible common equity excluding AOCI $ 163,874 $ 168,228 $ 172,631 $ 177,916 $ 174,087 $ 177,911 $ 181,628 Common stock shares outstanding 7,490 7,503 7,510 7,516 7,522 7,535 7,541 Tangible book value per share excluding AOCI $ 21.88 $ 22.42 $ 22.99 $ 23.67 $ 23.14 $ 23.61 $ 24.08 (dollars in thousands) Q2 2022 Q3 2022 Q4 2022 Q1 2023 Q2 2023 Q3 2023 Net income $ 5,615 $ 5,813 $ 6,684 $ 5,633 $ 5,213 $ 5,122 Less: intangible amortization (tax affected at 21%) 254 235 199 199 200 195 Adjusted net income $ 5,361 $ 5,578 $ 6,485 $ 5,434 $ 5,013 $ 4,927 Average shareholders' equity $ 177,085 $ 164,758 $ 160,284 $ 167,952 $ 171,912 $ 181,219 Less: average goodwill 59,946 59,946 59,946 59,946 59,946 59,946 Less: average core deposit intangible 3,516 3,220 2,942 2,687 2,435 2,188 Average tangible common equity $ 113,623 $ 101,592 $ 97,396 $ 105,319 $ 109,531 $ 119,085 Return on average tangible common equity 18.87% 21.96% 26.63% 20.64% 18.31% 16.55% 28 APPENDIX LOANS BY LOAN CATEGORY Numbers based on ChoiceOne internal data as of 9/30/2023 except where specifically identified Excludes loans held for sale (Dollars in thousands) Loans: 9/30/2023 6/30/2023 3/31/2023 12/31/2022 9/30/2022 Agricultural $ 43,290 $ 40,684 $ 55,995 $ 64,159 $ 63,347 Commercial and Industrial 222,357 224,191 217,063 210,210 208,590 Consumer 37,605 38,614 38,891 39,808 38,356 Commercial Real Estate 709,960 657,549 648,202 630,953 593,195 Construction Real Estate 16,477 16,734 13,939 14,736 14,299 Residential Real Estate 256,348 247,618 236,493 229,916 214,614 Loans to Other Financial Institutions 23,763 38,838 - - 70 Gross Loans 1,309,800 1,264,228 1,210,583 1,189,782 1,132,471 Less allowance for credit losses on loans 14,872 14,582 15,065 7,619 7,457 Loans, Net $ 1,294,928 $ 1,249,646 $ 1,195,518 $ 1,182,163 $ 1,125,014