UNITED STATES
SECURITIES AND EXCHANGE COMMISSION
Washington, D.C. 20549
FORM 8-K
CURRENT REPORT
Pursuant to Section 13 OR 15(d) of the Securities Exchange Act of 1934
Date of Report (Date of earliest event reported): May 24, 2023
ChoiceOne Financial Services, Inc.
(Exact Name of Registrant as
Specified in its Charter)
| Michigan (State or Other Jurisdiction of Incorporation) |
000-19202 (Commission File Number) |
38-2659066 (IRS Employer Identification No.) |
|||
| 109 East Division Sparta, Michigan (Address of Principal Executive Offices) |
49345 (Zip Code) |
||||
Registrant's telephone number, including area code: (616) 887-7366
Check the appropriate box below if the Form 8-K filing is intended to simultaneously satisfy the filing obligation of the registrant under any of the following provisions (see General Instruction A.2. below):
o Written communications pursuant to Rule 425 under the Securities Act (17 CFR 230.425)
o Soliciting material pursuant to Rule 14a-12 under the Exchange Act (17 CFR 240.14a-12)
o Pre-commencement communications pursuant to Rule 14d-2(b) under the Exchange Act (17 CFR 240.14d-2(b))
o Pre-commencement communications pursuant to Rule 13e-4(c) under the Exchange Act (17 CFR 240.13e-4(c))
Securities registered pursuant to Section 12(b) of the Act:
| Title of each class | Trading symbol(s) | Name of each exchange on which registered |
| Common stock | COFS | NASDAQ Capital Market |
Indicate by check mark whether the registrant is an emerging growth company as defined in Rule 405 of the Securities Act of 1933 (§230.405 of this chapter) or Rule 12b-2 of the Securities Exchange Act of 1934 (§240.12b-2 of this chapter).
Emerging growth company o
If an emerging growth company, indicate by check mark if the registrant has elected not to use the extended transition period for complying with any new or revised financial accounting standards provided pursuant to Section 13(a) of the Exchange Act. o ChoiceOne Financial Services, Inc. ("ChoiceOne") is furnishing presentation materials as Exhibit 99.1 to this Form 8-K, which are to be used by ChoiceOne in connection with ChoiceOne's annual shareholder meeting to be held on May 24, 2023.
|
|
| Item 7.01 | Regulation FD Disclosure |
| Item 9.01 | Financial Statements and Exhibits |
| Exhibit No. | Exhibit |
| 99.1 | Presentation Materials. This Exhibit is furnished to, and not filed with, the Commission. |
***
| -2- |
SIGNATURES
Pursuant to the requirements of the Securities Exchange Act of 1934, the registrant has duly caused this report to be signed on its behalf by the undersigned hereunto duly authorized.
| Dated: | May 24, 2023 | CHOICEONE FINANCIAL SERVICES, INC. (Registrant) |
|
| By: | /s/ Adom J. Greenland | ||
| Adom J. Greenland Its Chief Financial Officer, Secretary and Treasurer |
|||
-3-
EXHIBIT 99.1
| |
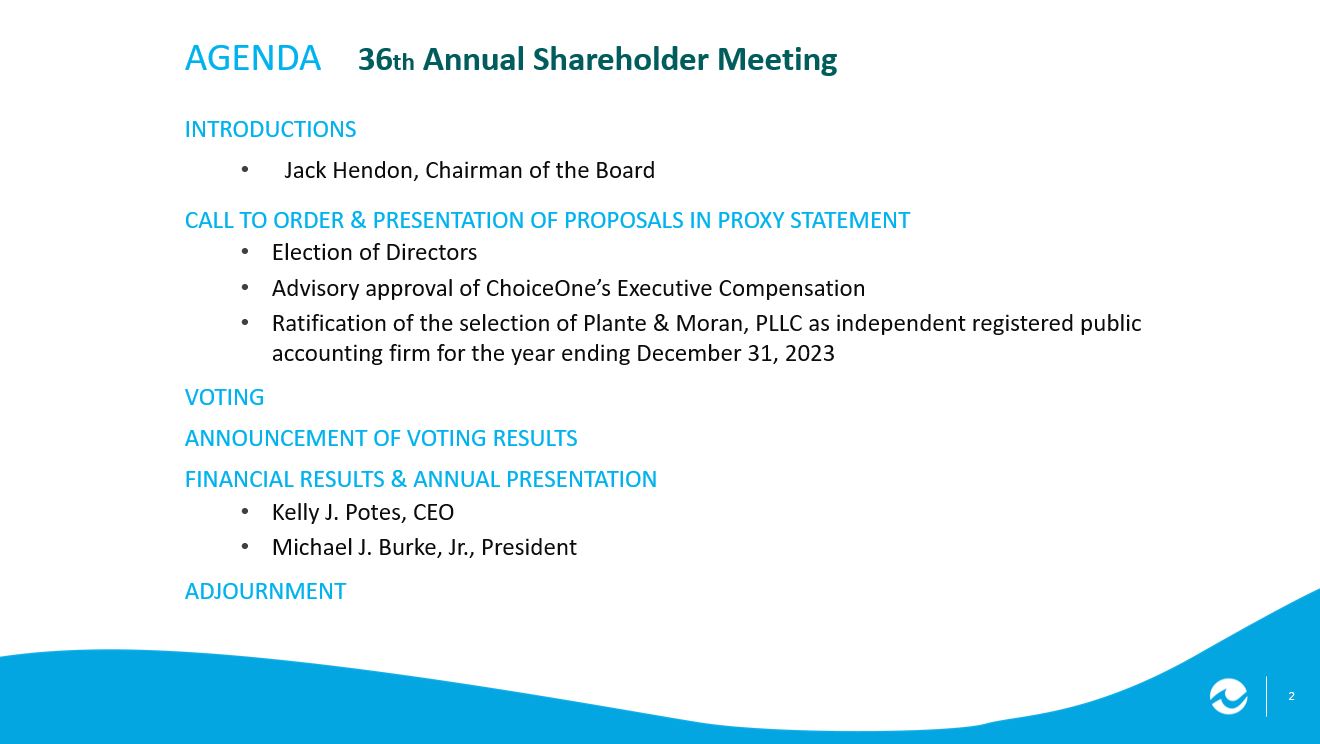
SERVICE • INNOVATION • RESPECT 2023 annual meeting 2 2 2 AGENDA 36th Annual Shareholder Meeting INTRODUCTIONS • Jack Hendon, Chairman of the Board CALL TO ORDER & PRESENTATION OF PROPOSALS IN PROXY STATEMENT • Election of Directors • Advisory approval of ChoiceOne’s Executive Compensation • Ratification of the selection of Plante & Moran, PLLC as independent registered public accounting firm for the year ending December 31, 2023 VOTING ANNOUNCEMENT OF VOTING RESULTS FINANCIAL RESULTS & ANNUAL PRESENTATION • Kelly J. Potes, CEO • Michael J.
| |
Burke, Jr., President ADJOURNMENT 3 3 3 FORWARD-LOOKING STATEMENTS • This presentation contains forward-looking statements that are based on management’s beliefs, assumptions, current expectations, estimates and projections about the financial services industry, the economy, and ChoiceOne. Words such as “anticipates,” “believes,” “estimates,” “expects,” “forecasts,” “intends,” “is likely,” “plans,” “predicts,” “projects,” “may,” “could,” “look forward,” “continue”, “future”, and variations of such words and similar expressions are intended to identify such forward-looking statements. • All statements with references to future time periods are forward-looking. These statements are not guarantees of future performance and involve certain risks, uncertainties and assumptions (“risk factors”) that are difficult to predict with regard to timing, extent, likelihood, and degree of occurrence. Therefore, actual results and outcomes may materially differ from what may be expressed, implied or forecasted in such forward-looking statements. Furthermore, ChoiceOne undertakes no obligation to update, amend, or clarify forward-looking statements, whether as a result of new information, future events, or otherwise. • Additional risk factors include, but are not limited to, the risk factors described in Item 1A in ChoiceOne’s Annual Report on Form 10 - K for the year ended December 31, 2022.
| |
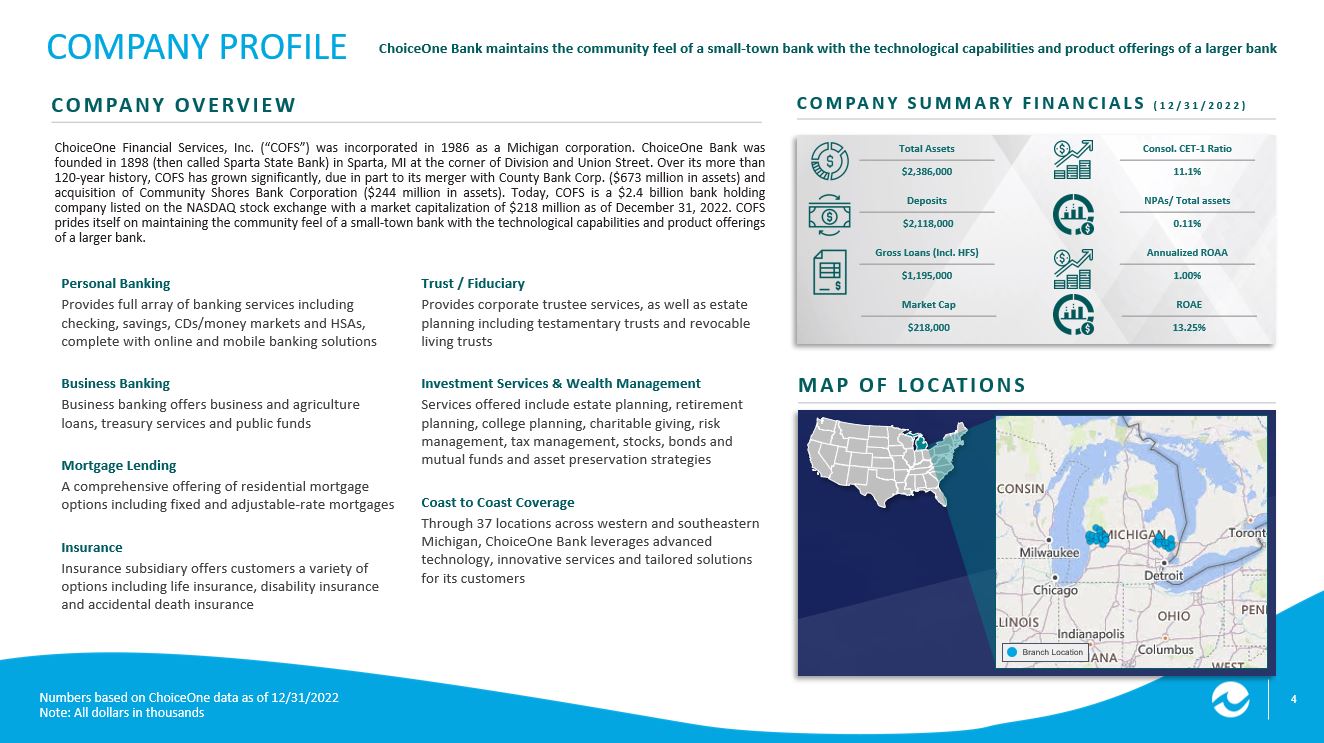
4 4 4 COMPANY PROFILE ChoiceOne Financial Services, Inc . (“COFS”) was incorporated in 1986 as a Michigan corporation . ChoiceOne Bank was founded in 1898 (then called Sparta State Bank) in Sparta, MI at the corner of Division and Union Street . Over its more than 120 - year history, COFS has grown significantly, due in part to its merger with County Bank Corp . ( $ 673 million in assets) and acquisition of Community Shores Bank Corporation ( $ 244 million in assets) . Today, COFS is a $ 2 . 4 billion bank holding company listed on the NASDAQ stock exchange with a market capitalization of $ 218 million as of December 31 , 2022 . COFS prides itself on maintaining the community feel of a small - town bank with the technological capabilities and product offerings of a larger bank . ChoiceOne Bank maintains the community feel of a small - town bank with the technological capabilities and product offerings of a larger bank Numbers based on ChoiceOne data as of 12/31/2022 Note: All dollars in thousands COMPANY OVERVIEW COMPANY SUMMARY FINANCIALS (12/31/2022) Total Assets $2,386,000 Deposits $2,118,000 Gross Loans (Incl. HFS) $1,195,000 Market Cap $218,000 Annualized ROAA 1.00% ROAE 13.25% Consol. CET - 1 Ratio 11.1% NPAs/ Total assets 0.11% MAP OF LOCATIONS Branch Location Personal Banking Provides full array of banking services including checking, savings, CDs/money markets and HSAs, complete with online and mobile banking solutions Business Banking Business banking offers business and agriculture loans, treasury services and public funds Mortgage Lending A comprehensive offering of residential mortgage options including fixed and adjustable - rate mortgages Insurance Insurance subsidiary offers customers a variety of options including life insurance, disability insurance and accidental death insurance Trust / Fiduciary Provides corporate trustee services, as well as estate planning including testamentary trusts and revocable living trusts Investment Services & Wealth Management Services offered include estate planning, retirement planning, college planning, charitable giving, risk management, tax management, stocks, bonds and mutual funds and asset preservation strategies Coast to Coast Coverage Through 37 locations across western and southeastern Michigan, ChoiceOne Bank leverages advanced technology, innovative services and tailored solutions for its customers 5 5 5 $671 $1,386 $1,781 $2,334 $2,386 2018 2019 2020 (1) 2021 (1) 2022 Transaction Overview Deal Profile (Announcement) Target Operating Metrics (Quarter Before Announcement) Target Target City, State Announcement Date Deal Value ($M) Consideration Total Assets Gross Loans LTM ROAA Muskegon, MI 1/6/2020 $21.9 76.5% Stock / 23.5% Cash $185.1 $147.2 0.49% Lapeer, MI 3/25/2019 $89.0 100.0% Stock / 0.0% Cash $616.6 $363.9 1.13% Kent City, MI 4/25/2006 $29.0 99.9% Stock / 0.1% Cash $216.4 $150.7 0.99% M&A HISTORY COFS has completed three whole bank M&A deals, most recently, the merger of equals with County Bank Corp.
| |
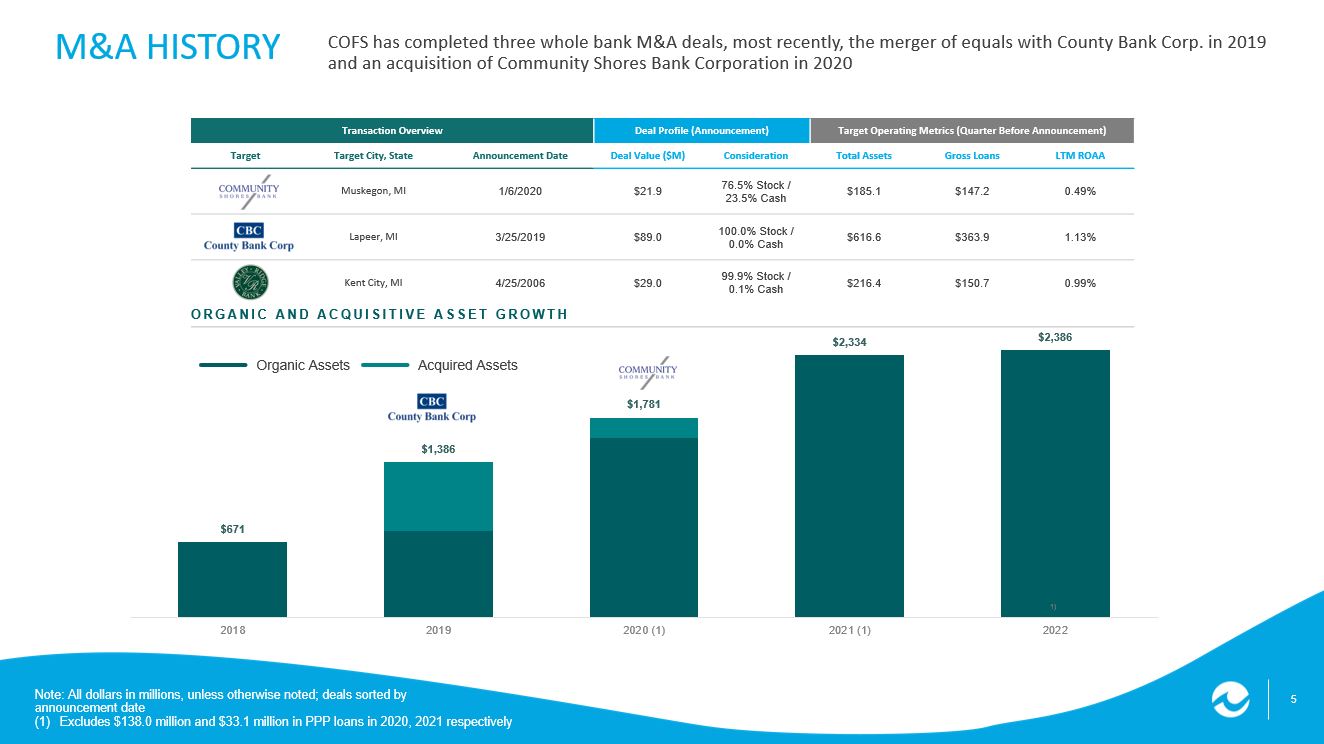
in 2019 and an acquisition of Community Shores Bank Corporation in 2020 Note: All dollars in millions, unless otherwise noted; deals sorted by announcement date (1) Excludes $138.0 million and $33.1 million in PPP loans in 2020, 2021 respectively ORGANIC AND ACQUISITIVE ASSET GROWTH Organic Assets Acquired Assets 1)
|
|
6 6 6 Our vision is to be the best bank in Michigan. Our mission is to provide superior service, quality advice, and show utmost respect to everyone we meet.
| |
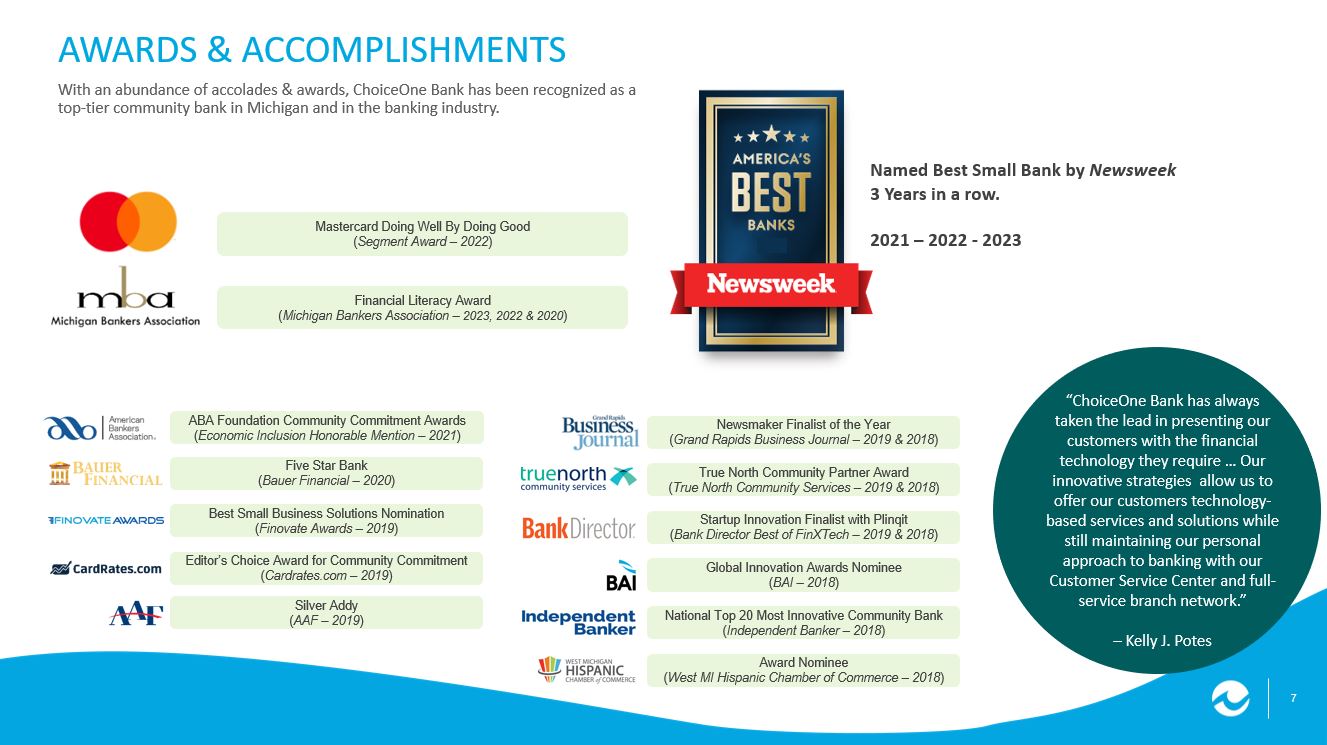
7 7 7 Five Star Bank ( Bauer Financial – 2020 ) Award Nominee ( West MI Hispanic Chamber of Commerce – 2018 ) AWARDS & ACCOMPLISHMENTS With an abundance of accolades & awards, ChoiceOne Bank has been recognized as a top - tier community bank in Michigan and in the banking industry. Named Best Small Bank by Newsweek 3 Years in a row. 2021 – 2022 - 2023 “ChoiceOne Bank has always taken the lead in presenting our customers with the financial technology they require … Our innovative strategies allow us to offer our customers technology - based services and solutions while still maintaining our personal approach to banking with our Customer Service Center and full - service branch network.” – Kelly J. Potes National Top 20 Most Innovative Community Bank ( Independent Banker – 2018 ) Financial Literacy Award ( Michigan Bankers Association – 2023, 2022 & 2020 ) Editor’s Choice Award for Community Commitment ( Cardrates.com – 2019 ) Best Small Business Solutions Nomination ( Finovate Awards – 2019 ) Global Innovation Awards Nominee ( BAI – 2018 ) Newsmaker Finalist of the Year ( Grand Rapids Business Journal – 2019 & 2018 ) True North Community Partner Award ( True North Community Services – 2019 & 2018 ) Silver Addy ( AAF – 2019 ) Startup Innovation Finalist with Plinqit ( Bank Director Best of FinXTech – 2019 & 2018 ) Mastercard Doing Well By Doing Good ( Segment Award – 2022 ) ABA Foundation Community Commitment Awards ( Economic Inclusion Honorable Mention – 2021 )
| |
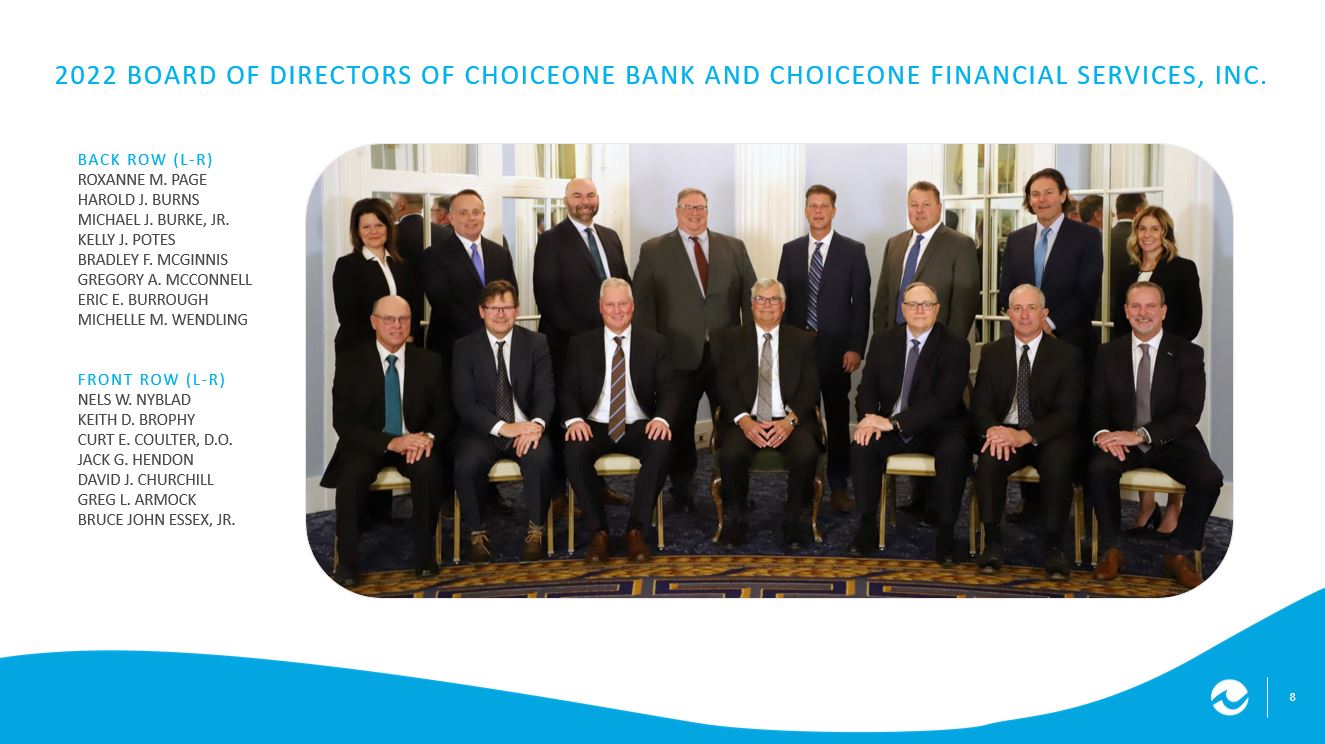
8 8 8 2022 BOARD OF DIRECTORS OF CHOICEONE BANK AND CHOICEONE FINANCIA L SERVICES, INC. BACK ROW (L - R) ROXANNE M. PAGE HAROLD J. BURNS MICHAEL J. BURKE, JR. KELLY J. POTES BRADLEY F. MCGINNIS GREGORY A. MCCONNELL ERIC E. BURROUGH MICHELLE M. WENDLING FRONT ROW (L - R) NELS W. NYBLAD KEITH D. BROPHY CURT E. COULTER, D.O. JACK G. HENDON DAVID J. CHURCHILL GREG L. ARMOCK BRUCE JOHN ESSEX, JR.
| |
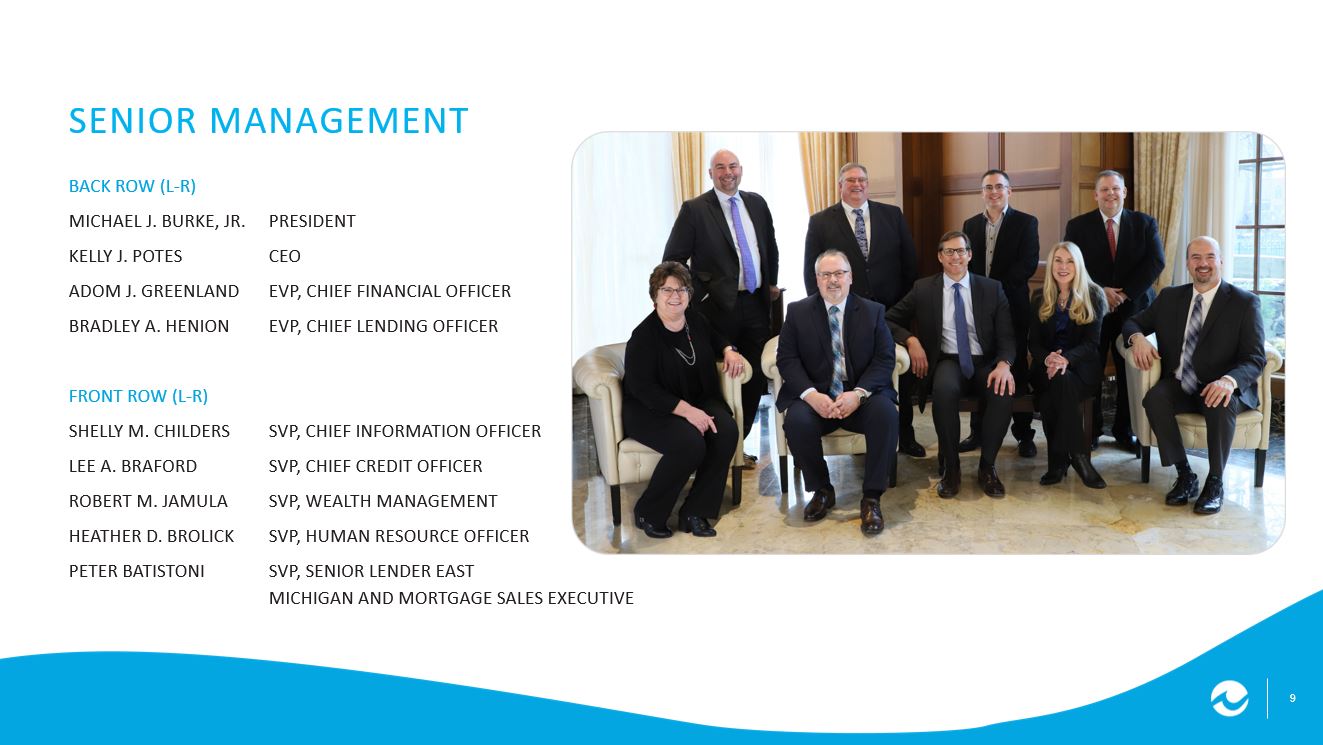
9 9 9 SENIOR MANAGEMENT BACK ROW (L - R) MICHAEL J. BURKE, JR. PRESIDENT KELLY J. POTES CEO ADOM J. GREENLAND EVP, CHIEF FINANCIAL OFFICER BRADLEY A. HENION EVP, CHIEF LENDING OFFICER FRONT ROW (L - R) SHELLY M. CHILDERS SVP, CHIEF INFORMATION OFFICER LEE A. BRAFORD SVP, CHIEF CREDIT OFFICER ROBERT M. JAMULA SVP, WEALTH MANAGEMENT HEATHER D. BROLICK SVP, HUMAN RESOURCE OFFICER PETER BATISTONI SVP, SENIOR LENDER EAST M ICHIGAN AND MORTGAGE SALES EXECUTIVE 12 12 12 5 YEARS ADJUSTED NET INCOME *Tax-effected merger expenses refers to expenses related to the merger with County Bank Corp.
| |
| |

FINANCIAL SUMMARY
| |
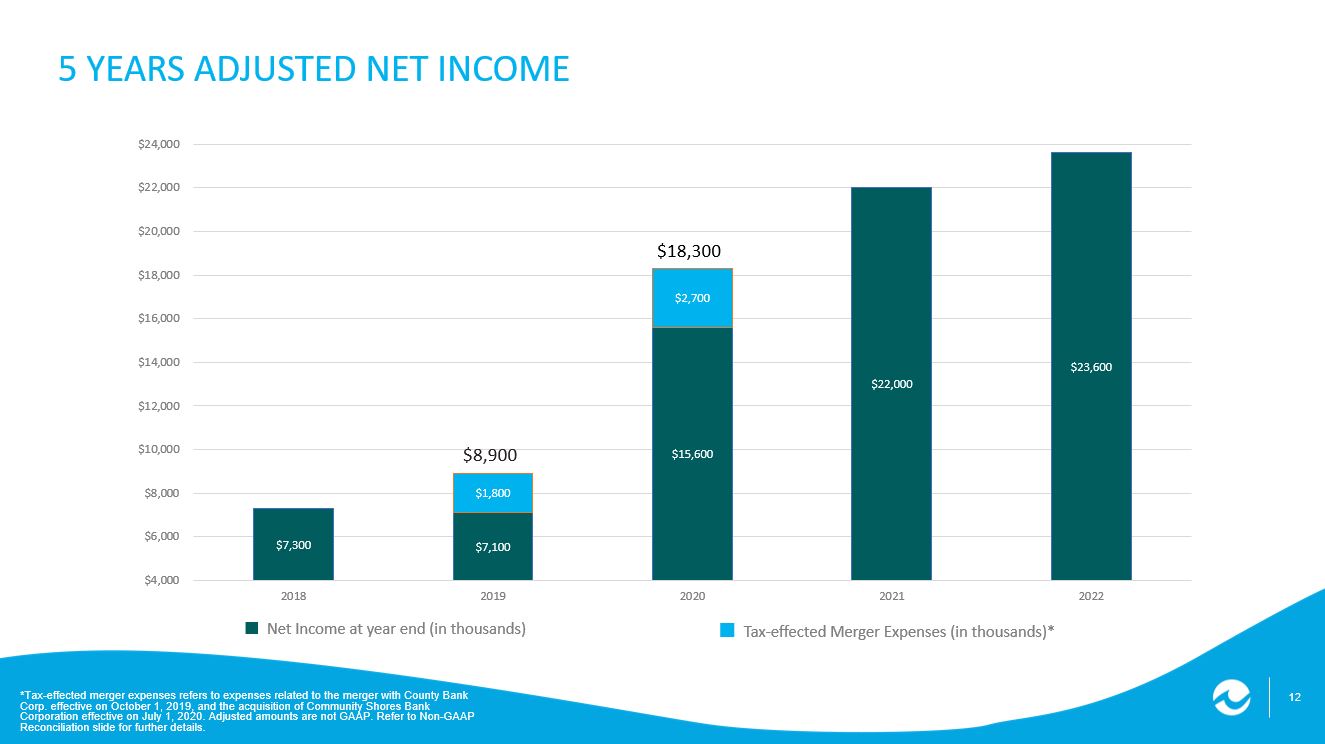
effective on October 1, 2019, and the acquisition of Community Shores Bank Corporation effective on July 1, 2020. Adjusted amounts are not GAAP. Refer to Non-GAAP Reconciliation slide for further details.
| |
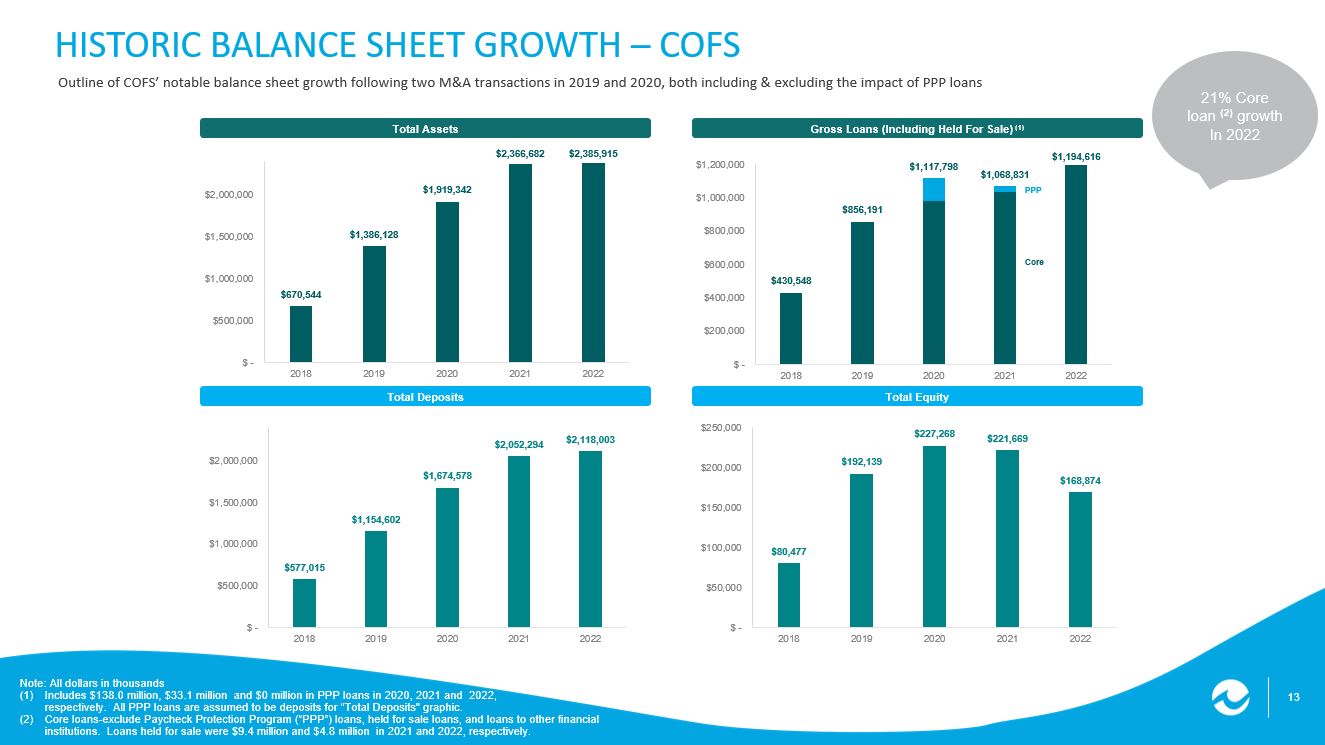
$7,300 $7,100 $15,600 $22,000 $23,600 $1,800 $2,700 $4,000 $6,000 $8,000 $10,000 $12,000 $14,000 $16,000 $18,000 $20,000 $22,000 $24,000 2018 2019 2020 2021 2022 $18,300 Net Income at year end (in thousands) Tax-effected Merger Expenses (in thousands)* $8,900 13 13 13 $577,015 $1,154,602 $1,674,578 $2,052,294 $2,118,003 $ - $500,000 $1,000,000 $1,500,000 $2,000,000 2018 2019 2020 2021 2022 $430,548 $856,191 $1,117,798 $1,068,831 $1,194,616 $ - $200,000 $400,000 $600,000 $800,000 $1,000,000 $1,200,000 2018 2019 2020 2021 2022 $670,544 $1,386,128 $1,919,342 $2,366,682 $2,385,915 $ - $500,000 $1,000,000 $1,500,000 $2,000,000 2018 2019 2020 2021 2022 HISTORIC BALANCE SHEET GROWTH – COFS Outline of COFS’ notable balance sheet growth following two M&A transactions in 2019 and 2020, both including & excluding the impact of PPP loans Note: All dollars in thousands (1) Includes $138.0 million, $33.1 million and $0 million in PPP loans in 2020, 2021 and 2022, respectively. All PPP loans are assumed to be deposits for "Total Deposits" graphic. (2) Core loans - exclude Paycheck Protection Program (“PPP”) loans, held for sale loans, and loans to other financial institutions. Loans held for sale were $9.4 million and $4.8 million in 2021 and 2022, respectively.
| |
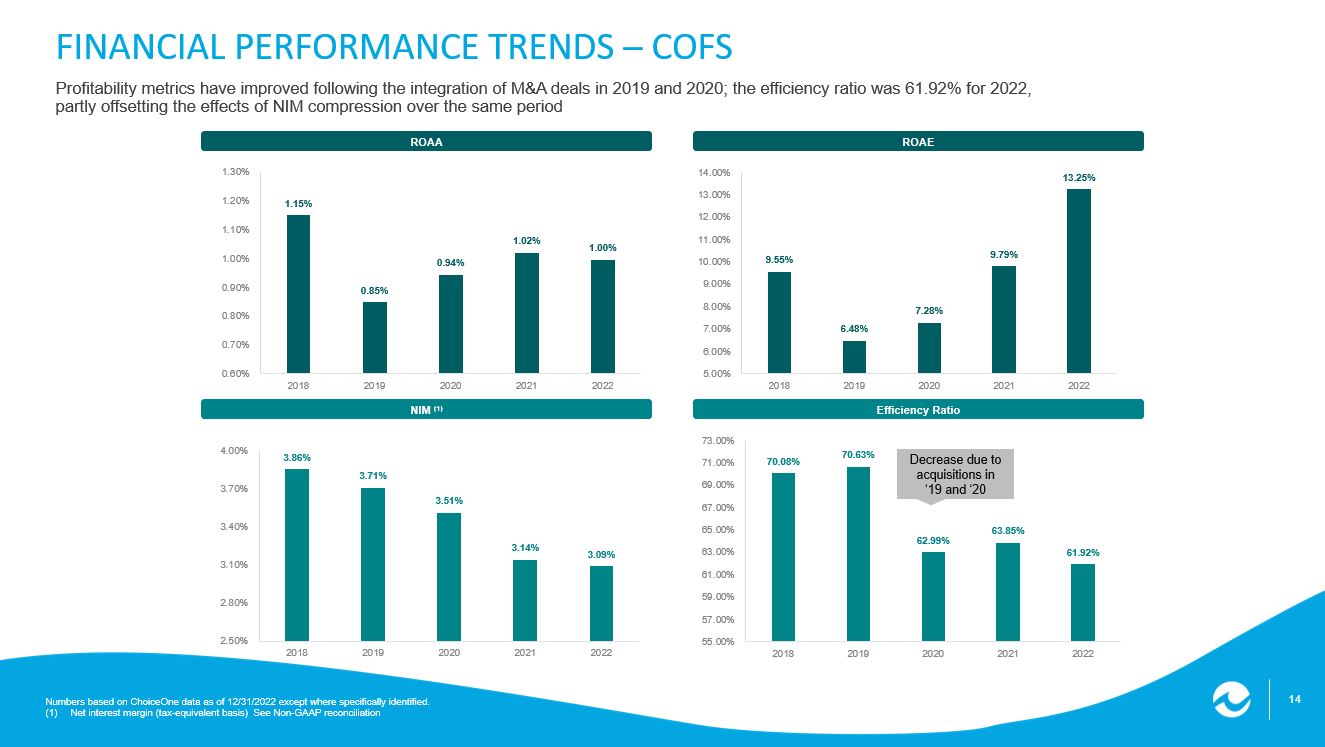
Total Equity Total Deposits Gross Loans (Including Held For Sale) (1) Total Assets PPP Core 21% Core loan (2) growth In 2022 $80,477 $192,139 $227,268 $221,669 $168,874 $ - $50,000 $100,000 $150,000 $200,000 $250,000 2018 2019 2020 2021 2022 14 14 14 70.08% 70.63% 62.99% 63.85% 61.92% 55.00% 57.00% 59.00% 61.00% 63.00% 65.00% 67.00% 69.00% 71.00% 73.00% 2018 2019 2020 2021 2022 FINANCIAL PERFORMANCE TRENDS – COFS Profitability metrics have improved following the integration of M&A deals in 2019 and 2020; the efficiency ratio was 61.92% for 2022, partly offsetting the effects of NIM compression over the same period Numbers based on ChoiceOne data as of 12/31/2022 except where specifically identified.
| |
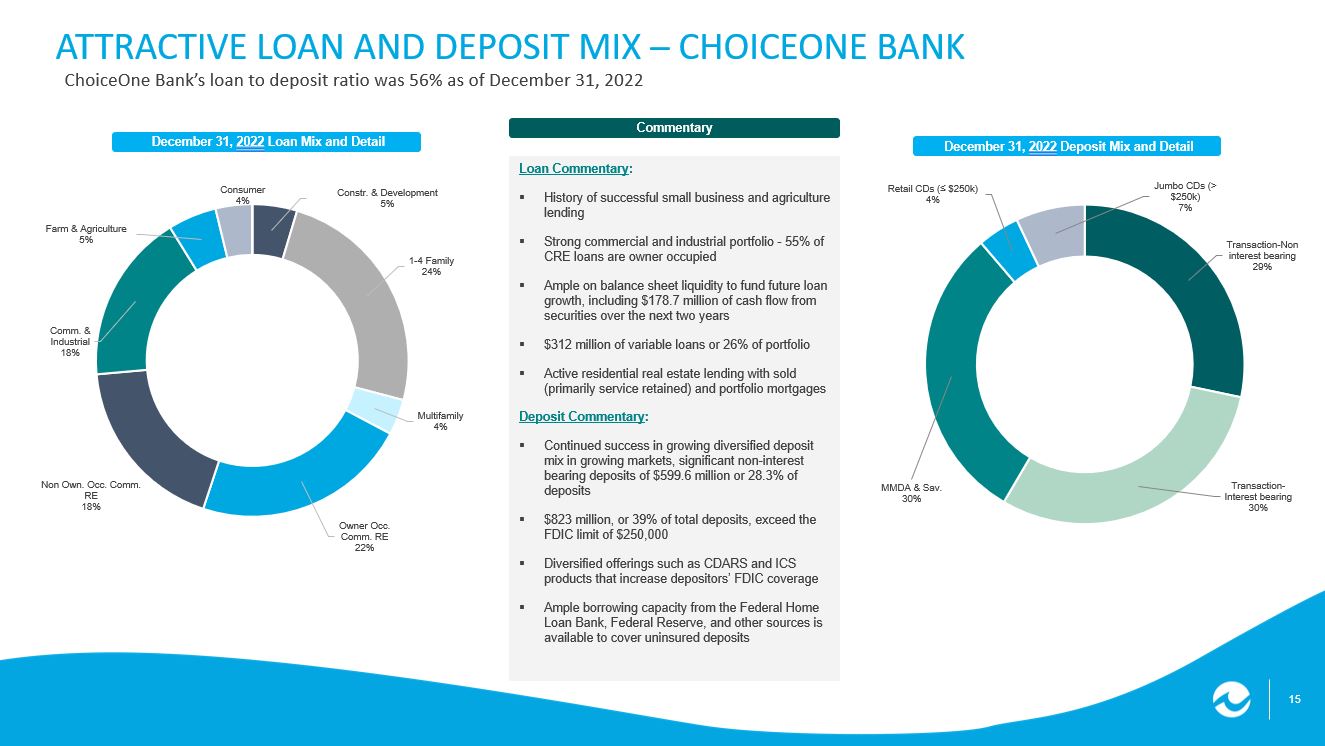
(1) Net interest margin (tax - equivalent basis) See Non - GAAP reconciliation Efficiency Ratio NIM (1) ROAE ROAA Decrease due to acquisitions in ‘19 and ‘20 1.15% 0.85% 0.94% 1.02% 1.00% 0.60% 0.70% 0.80% 0.90% 1.00% 1.10% 1.20% 1.30% 2018 2019 2020 2021 2022 9.55% 6.48% 7.28% 9.79% 13.25% 5.00% 6.00% 7.00% 8.00% 9.00% 10.00% 11.00% 12.00% 13.00% 14.00% 2018 2019 2020 2021 2022 3.86% 3.71% 3.51% 3.14% 3.09% 2.50% 2.80% 3.10% 3.40% 3.70% 4.00% 2018 2019 2020 2021 2022 15 15 15 Loan Commentary : ▪ History of successful small business and agriculture lending ▪ Strong commercial and industrial portfolio - 55% of CRE loans are owner occupied ▪ Ample on balance sheet liquidity to fund future loan growth, including $178.7 million of cash flow from securities over the next two years ▪ $312 million of variable loans or 26% of portfolio ▪ Active residential real estate lending with sold (primarily service retained) and portfolio mortgages Deposit Commentary : ▪ Continued success in growing diversified deposit mix in growing markets, significant non - interest bearing deposits of $599.6 million or 28.3% of deposits ▪ $823 million, or 39% of total deposits, exceed the FDIC limit of $250,000 ▪ Diversified offerings such as CDARS and ICS products that increase depositors’ FDIC coverage ▪ Ample borrowing capacity from the Federal Home Loan Bank, Federal Reserve, and other sources is available to cover uninsured deposits December 31, 2022 Loan Mix and Detail December 31, 2022 Deposit Mix and Detail ATTRACTIVE LOAN AND DEPOSIT MIX – CHOICEONE BANK ChoiceOne Bank’s loan to deposit ratio was 56% as of December 31, 2022 Commentary Transaction - Non interest bearing 29% Transaction - Interest bearing 30% MMDA & Sav. 30% Retail CDs (≤ $250k) 4% Jumbo CDs (> $250k) 7% Constr. & Development 5% 1 - 4 Family 24% Multifamily 4% Owner Occ. Comm. RE 22% Non Own. Occ. Comm. RE 18% Comm. & Industrial 18% Farm & Agriculture 5% Consumer 4% 16 16 16 LOAN LOSS RESERVE AND CREDIT MARK BUILD – COFS On December 31, 2022, COFS had an ALLL balance of $7.6 million and a $1.6 million accounting credit mark (1) against loans acquired from its two most recent M&A deals.
| |
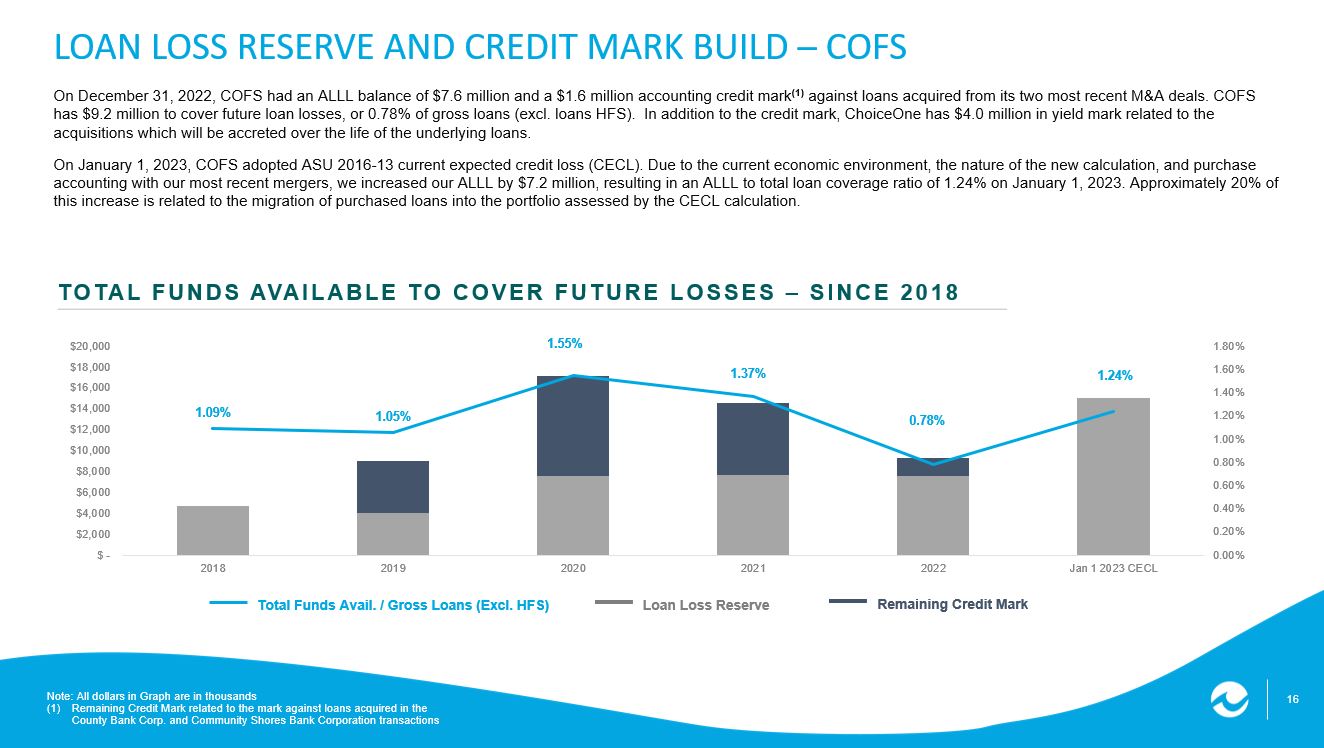
COFS has $9.2 million to cover future loan losses, or 0.78% of gross loans (excl. loans HFS). In addition to the credit mark, Cho ice One has $4.0 million in yield mark related to the acquisitions which will be accreted over the life of the underlying loans. On January 1, 2023, COFS adopted ASU 2016 - 13 current expected credit loss (CECL). Due to the current economic environment, the nature of the new calculation, and purchase accounting with our most recent mergers, we increased our ALLL by $7.2 million, resulting in an ALLL to total loan coverage ratio of 1.24% on January 1, 2023. Approximately 20% of this increase is related to the migration of purchased loans into the portfolio assessed by the CECL calculation. Note: All dollars in Graph are in thousands (1) Remaining Credit Mark related to the mark against loans acquired in the County Bank Corp. and Community Shores Bank Corporation transactions TOTAL FUNDS AVAILABLE TO COVER FUTURE LOSSES – SINCE 2018 Total Funds Avail. / Gross Loans (Excl. HFS) Loan Loss Reserve Remaining Credit Mark 1.09% 1.05% 1.55% 1.37% 0.78% 1.24% 0.00% 0.20% 0.40% 0.60% 0.80% 1.00% 1.20% 1.40% 1.60% 1.80% $ - $2,000 $4,000 $6,000 $8,000 $10,000 $12,000 $14,000 $16,000 $18,000 $20,000 2018 2019 2020 2021 2022 Jan 1 2023 CECL 17 17 17 ASSET QUALITY Historically strong credit metrics Numbers based on ChoiceOne data as of 12/31/2022 except where specifically identified.
| |
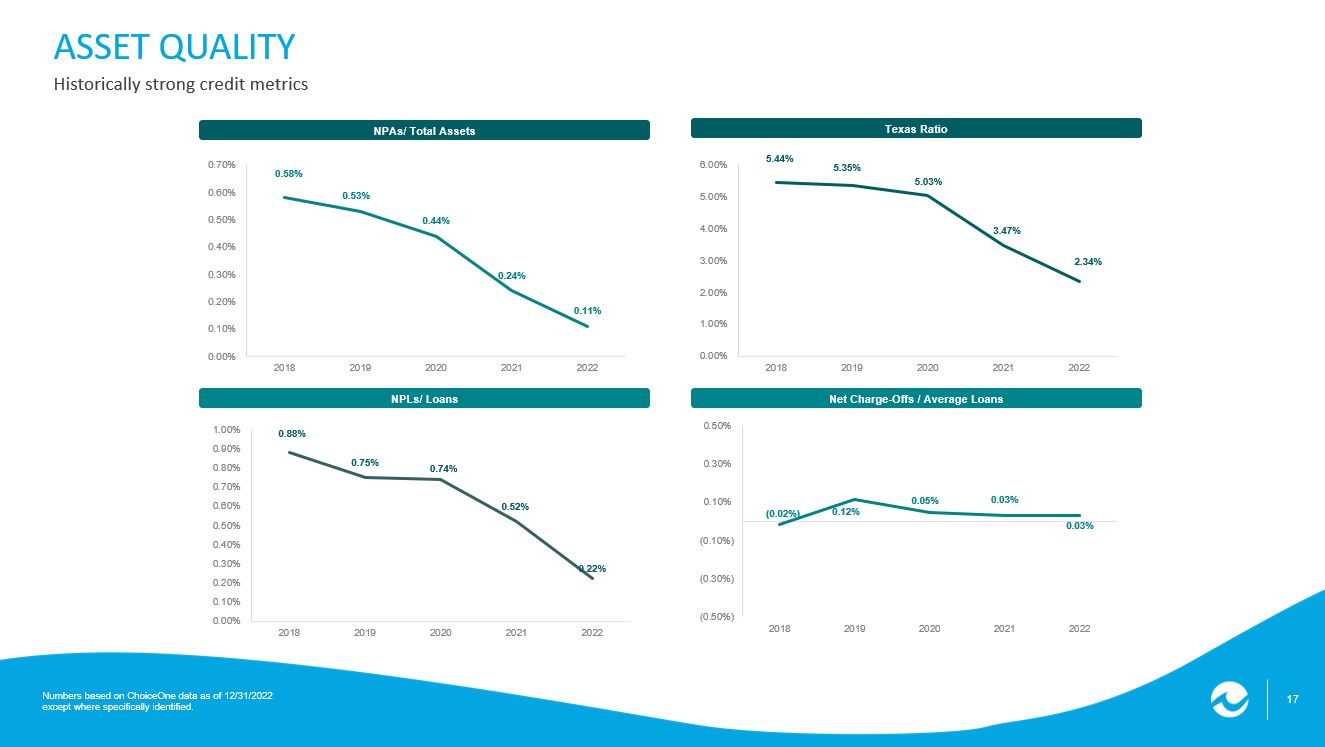
Net Charge - Offs / Average Loans NPLs/ Loans Texas Ratio NPAs/ Total Assets 0.58% 0.53% 0.44% 0.24% 0.11% 0.00% 0.10% 0.20% 0.30% 0.40% 0.50% 0.60% 0.70% 2018 2019 2020 2021 2022 5.44% 5.35% 5.03% 3.47% 2.34% 0.00% 1.00% 2.00% 3.00% 4.00% 5.00% 6.00% 2018 2019 2020 2021 2022 0.88% 0.75% 0.74% 0.52% 0.22% 0.00% 0.10% 0.20% 0.30% 0.40% 0.50% 0.60% 0.70% 0.80% 0.90% 1.00% 2018 2019 2020 2021 2022 (0.02%) 0.12% 0.05% 0.03% 0.03% (0.50%) (0.30%) (0.10%) 0.10% 0.30% 0.50% 2018 2019 2020 2021 2022 18 18 18 CAPITAL LEVELS In September 2021, ChoiceOne completed a private placement of $32.5 million in aggregate principal amount of 3.25% fixed - to - floating rate subordinated notes due 2031.
| |
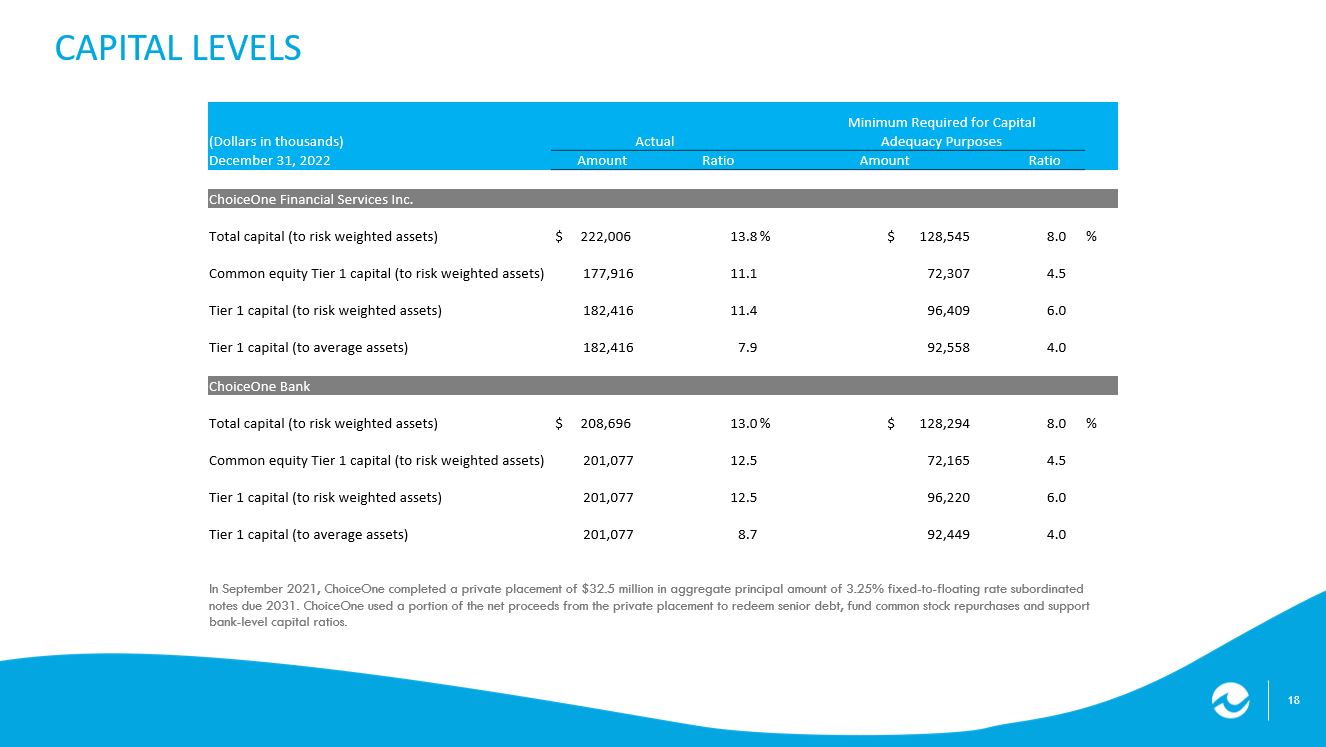
ChoiceOne used a portion of the net proceeds from the private placement to redeem senior debt, fund common stock repurchases and support bank - level capital ratios. Minimum Required for Capital (Dollars in thousands) Actual Adequacy Purposes December 31, 2022 Amount Ratio Amount Ratio ChoiceOne Financial Services Inc. Total capital (to risk weighted assets) $ 222,006 13.8 % $ 128,545 8.0 % Common equity Tier 1 capital (to risk weighted assets) 177,916 11.1 72,307 4.5 Tier 1 capital (to risk weighted assets) 182,416 11.4 96,409 6.0 Tier 1 capital (to average assets) 182,416 7.9 92,558 4.0 ChoiceOne Bank Total capital (to risk weighted assets) $ 208,696 13.0 % $ 128,294 8.0 % Common equity Tier 1 capital (to risk weighted assets) 201,077 12.5 72,165 4.5 Tier 1 capital (to risk weighted assets) 201,077 12.5 96,220 6.0 Tier 1 capital (to average assets) 201,077 8.7 92,449 4.0 19 19 19 CASH DIVIDENDS PER SHARE *Amounts have been adjusted for a 5% Stock Dividend on May 31, 2018.
|
|
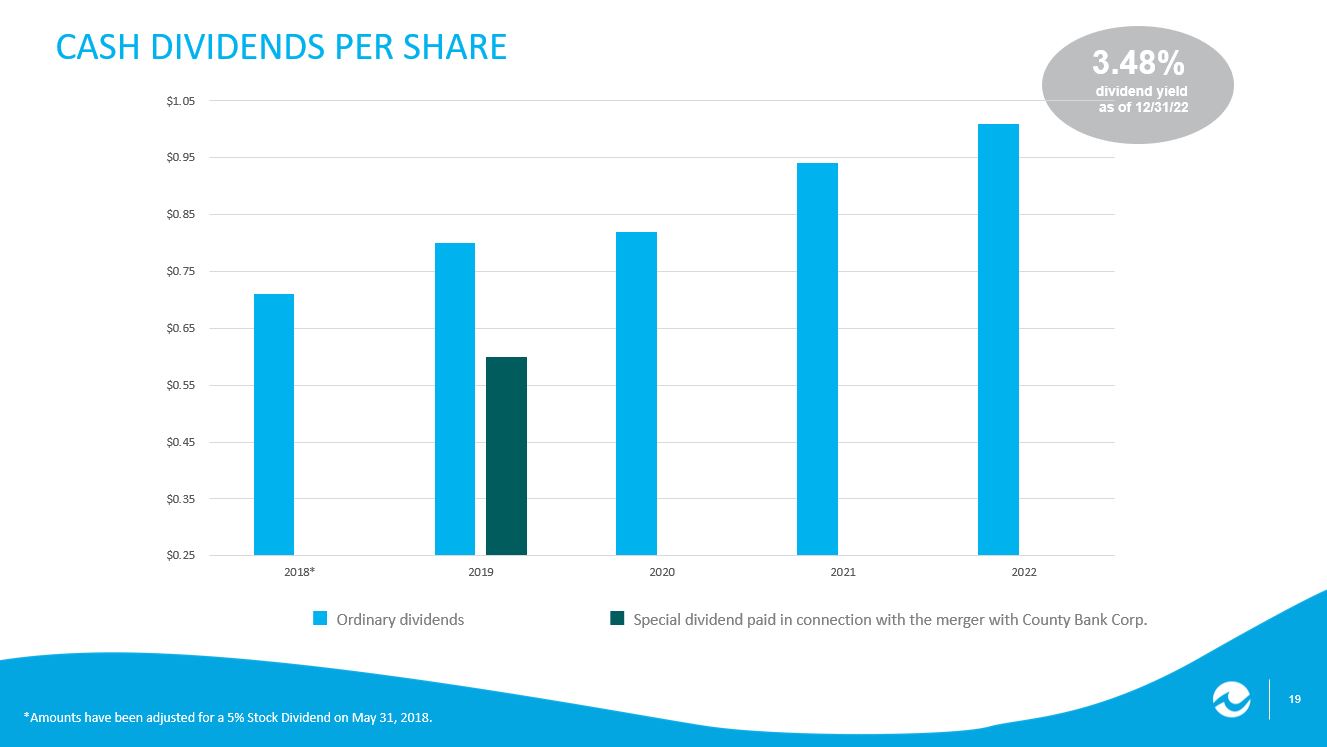
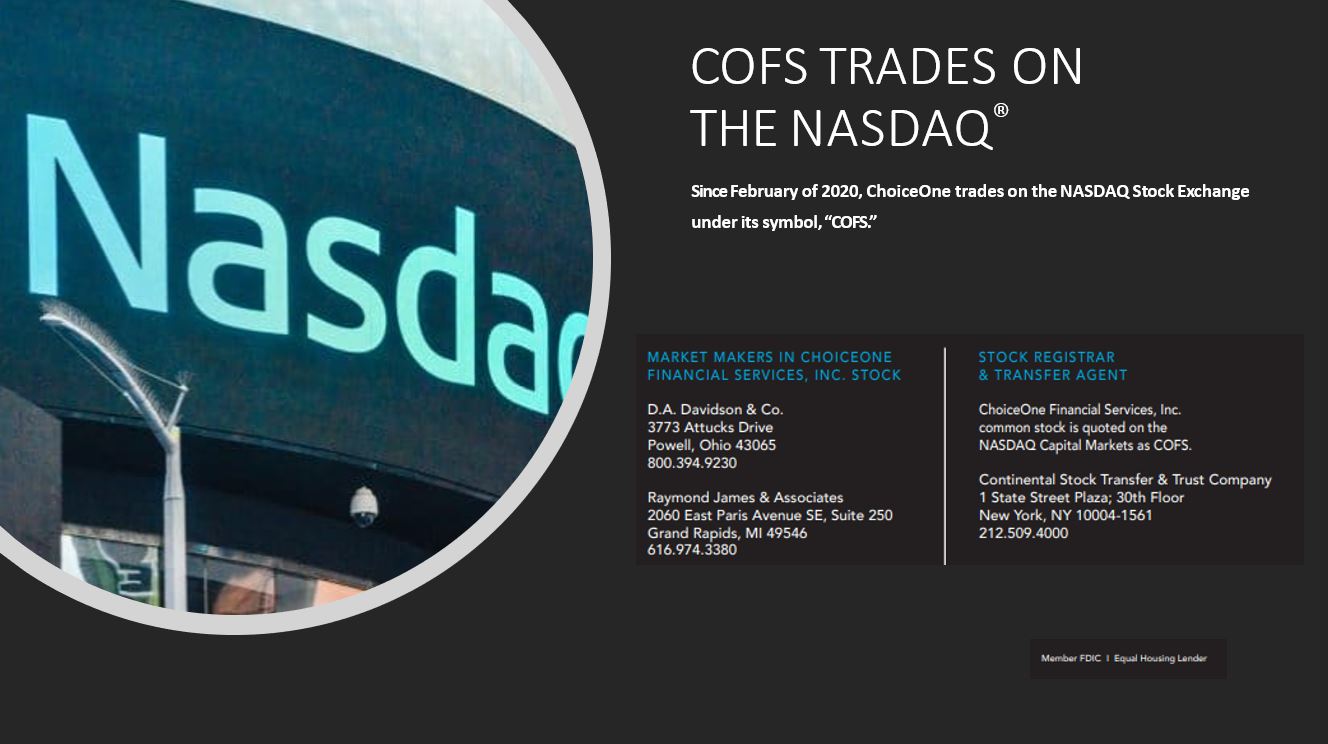
Ordinary dividends Special dividend paid in connection with the merger with County Bank Corp. $0.25 $0.35 $0.45 $0.55 $0.65 $0.75 $0.85 $0.95 $1.05 2018* 2019 2020 2021 2022 3.48% dividend yield as of 12/31/22 C OF S T R ADES ON TH E NAS D A Q ® Since February of 2020, ChoiceOne trades on the NASDAQ Stock Exchange under its symbol, “COFS.”
| |
| |
| |
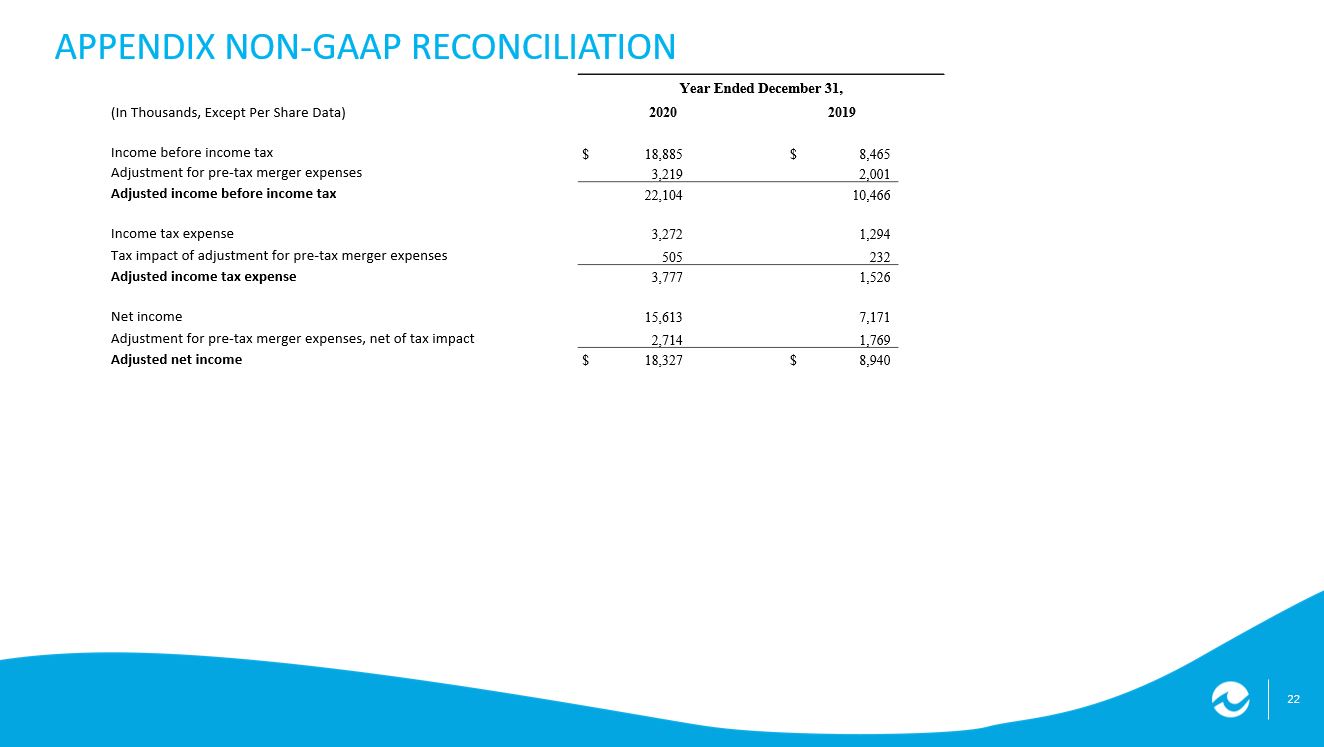
SERVICE • INNOVATION • RESPECT thank you 22 22 22 APPENDIX NON - GAAP RECONCILIATION Year Ended December 31, (In Thousands, Except Per Share Data) 2020 2019 Income before income tax $ 18,885 $ 8,465 Adjustment for pre - tax merger expenses 3,219 2,001 Adjusted income before income tax 22,104 10,466 Income tax expense 3,272 1,294 Tax impact of adjustment for pre - tax merger expenses 505 232 Adjusted income tax expense 3,777 1,526 Net income 15,613 7,171 Adjustment for pre - tax merger expenses, net of tax impact 2,714 1,769 Adjusted net income $ 18,327 $ 8,940 23 23 23 APPENDIX NON - GAAP RECONCILIATION (1) Adjusted to a fully tax - equivalent basis to facilitate comparison to the taxable interest - earning assets.
|
|
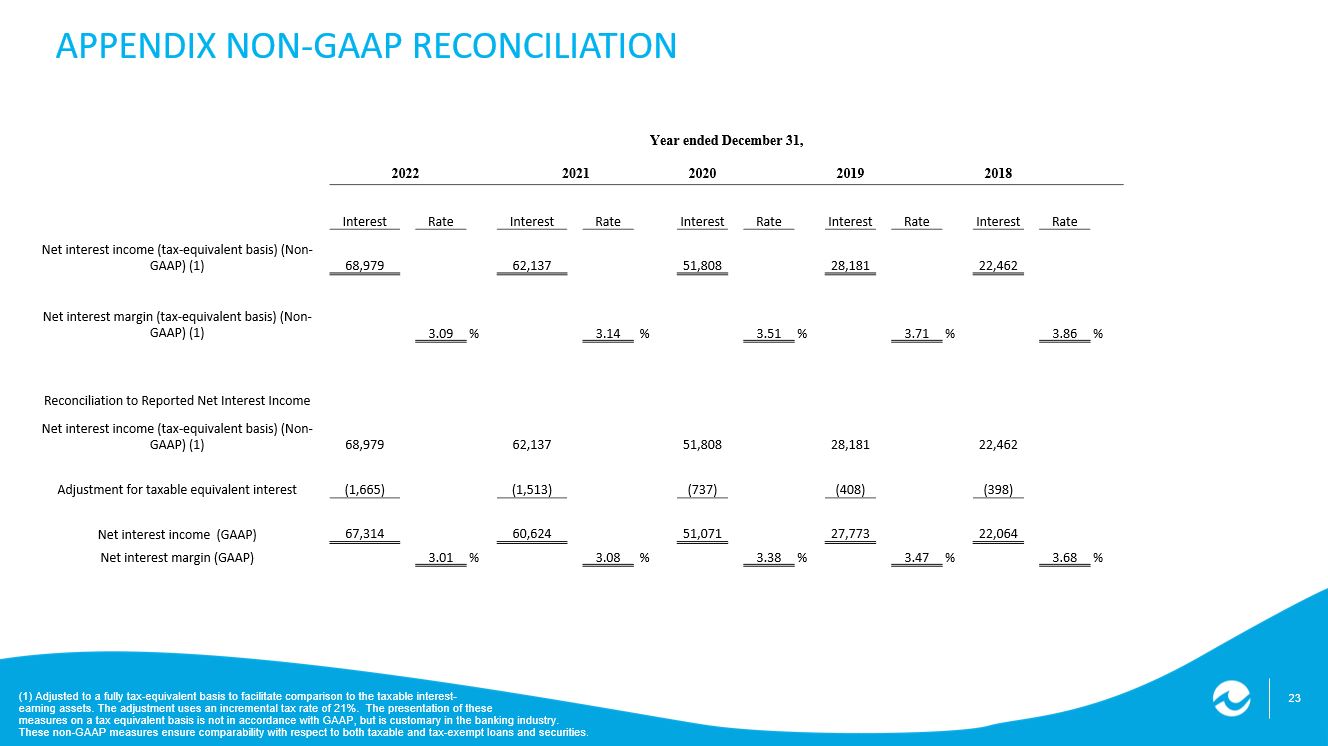
The adjustment uses an incremental tax rate of 21%. The presentation of these measures on a tax equivalent basis is not in accordance with GAAP, but is customary in the banking industry. These non - GAAP measures ensure comparability with respect to both taxable and tax - exempt loans and securities. Year ended December 31, 2022 2021 2020 2019 2018 Interest Rate Interest Rate Interest Rate Interest Rate Interest Rate Net interest income (tax - equivalent basis) (Non - GAAP) (1) 68,979 62,137 51,808 28,181 22,462 Net interest margin (tax - equivalent basis) (Non - GAAP) (1) 3.09 % 3.14 % 3.51 % 3.71 % 3.86 % Reconciliation to Reported Net Interest Income Net interest income (tax - equivalent basis) (Non - GAAP) (1) 68,979 62,137 51,808 28,181 22,462 Adjustment for taxable equivalent interest (1,665) (1,513) (737) (408) (398) Net interest income (GAAP) 67,314 60,624 51,071 27,773 22,064 Net interest margin (GAAP) 3.01 % 3.08 % 3.38 % 3.47 % 3.68 %