| Missouri | 1-11848 | 43-1627032 | ||||||||||||
| (State or Other Jurisdiction of Incorporation) |
(Commission File Number) |
(IRS Employer Identification Number) |
||||||||||||
| ☐ | Written communications pursuant to Rule 425 under the Securities Act (17 CFR 230.425) | ||||
| ☐ | Soliciting material pursuant to Rule 14a-12 under the Exchange Act (17 CFR 240.14a-12) | ||||
| ☐ | Pre-commencement communications pursuant to Rule 14d-2(b) under the Exchange Act (17 CFR 240.14d-2(b)) | ||||
| ☐ | Pre-commencement communications pursuant to Rule 13e-4(c) under the Exchange Act (17 CFR 240.13e-4(c)) | ||||
| Title of each class | Trading Symbol(s) | Name of each exchange on which registered | ||||||||||||
| Common Stock, par value $0.01 | RGA | New York Stock Exchange | ||||||||||||
| 5.75% Fixed-To-Floating Rate Subordinated Debentures due 2056 | RZB | New York Stock Exchange | ||||||||||||
| 7.125% Fixed Rate Reset Subordinated Debentures due 2052 | RZC | New York Stock Exchange | ||||||||||||
| ☐ | Emerging growth company | ||||
| ☐ | If an emerging growth company, indicate by check mark if the registrant has elected not to use the extended transition period for complying with any new or revised financial accounting standards provided pursuant to Section 13(a) of the Exchange Act. | ||||
| Item 2.02 | Results of Operations and Financial Condition. | ||||
| Item 7.01 | Regulation FD Disclosure. | ||||
| Item 9.01 | Financial Statements and Exhibits | ||||
| Exhibit No. | Exhibit | |||||||
| 104 | Cover Page Interactive Data File (formatted as Inline XBRL) | |||||||
| REINSURANCE GROUP OF AMERICA, INCORPORATED | ||||||||||||||||||||
| Date: February 2, 2023 | By: | /s/ Todd C. Larson | ||||||||||||||||||
| Todd C. Larson | ||||||||||||||||||||
| Senior Executive Vice President and Chief Financial Officer | ||||||||||||||||||||

| Quarterly Results | Full Year Results | ||||||||||||||||||||||
| ($ in millions, except per share data) | 2022 | 2021 | 2022 | 2021 | |||||||||||||||||||
| Net premiums | $ | 3,446 | $ | 3,407 | $ | 13,078 | $ | 12,513 | |||||||||||||||
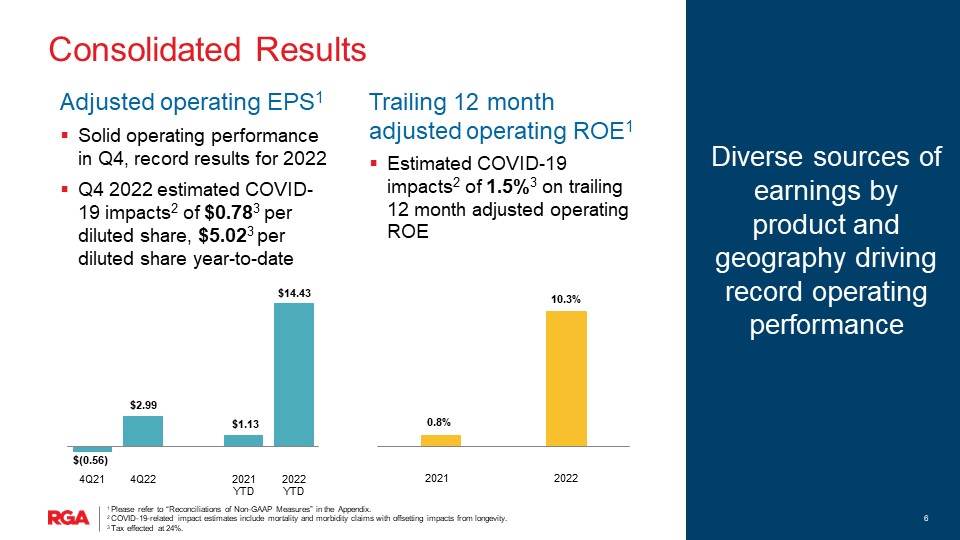
| Net income available to RGA shareholders | 204 | 156 | 623 | 617 | |||||||||||||||||||
| Net income available to RGA shareholders per diluted share | 3.02 | 2.30 | 9.21 | 9.04 | |||||||||||||||||||
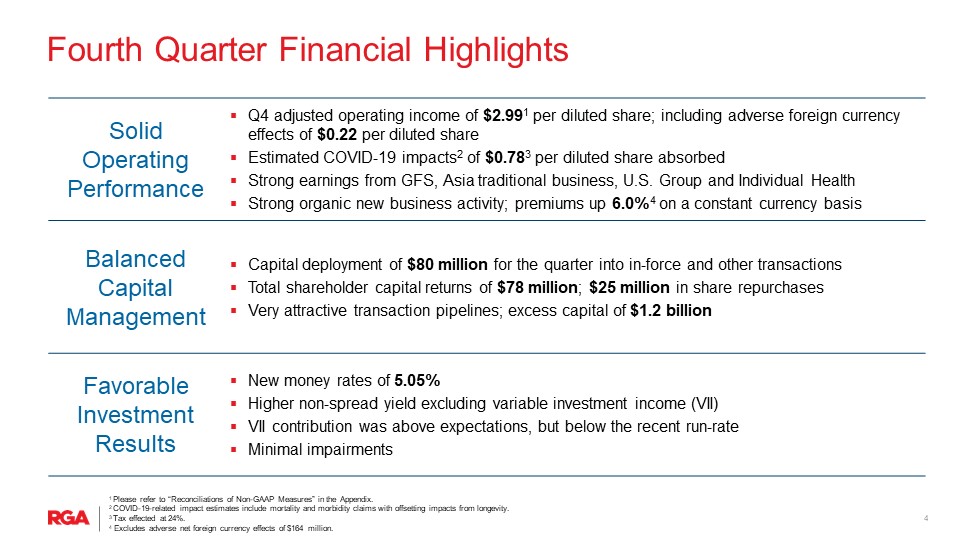
| Adjusted operating income (loss)* | 202 | (38) | 977 | 77 | |||||||||||||||||||
| Adjusted operating income (loss) per diluted share* | 2.99 | (0.56) | 14.43 | 1.13 | |||||||||||||||||||
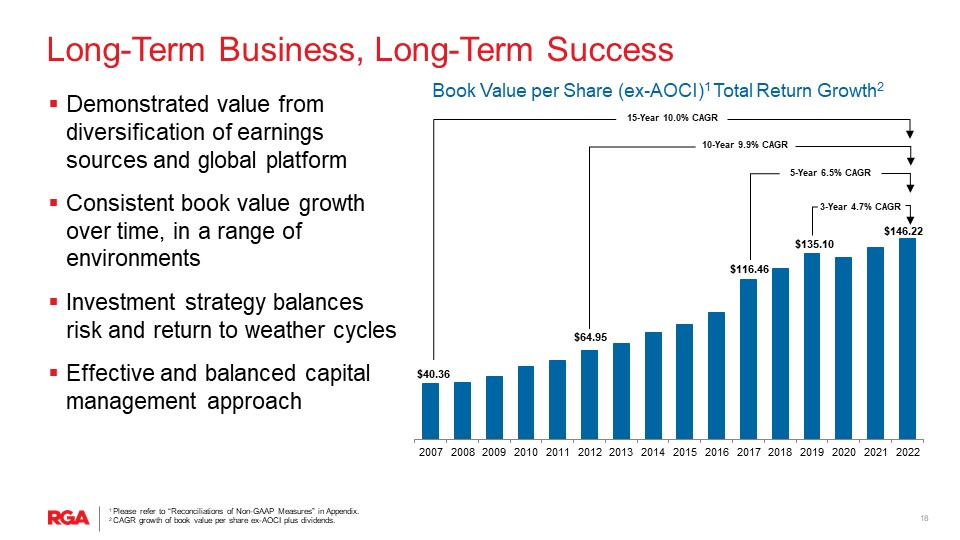
| Book value per share | 62.16 | 193.75 | |||||||||||||||||||||
| Book value per share, excluding accumulated other comprehensive income (AOCI)* | 146.22 | 139.53 | |||||||||||||||||||||
| Total assets | 84,706 | 92,175 | |||||||||||||||||||||
| * | See ‘Use of Non-GAAP Financial Measures’ below | ||||
| Quarterly Results | Full Year Results | ||||||||||||||||||||||
| ($ in millions) | 2022 | 2021 | 2022 | 2021 | |||||||||||||||||||
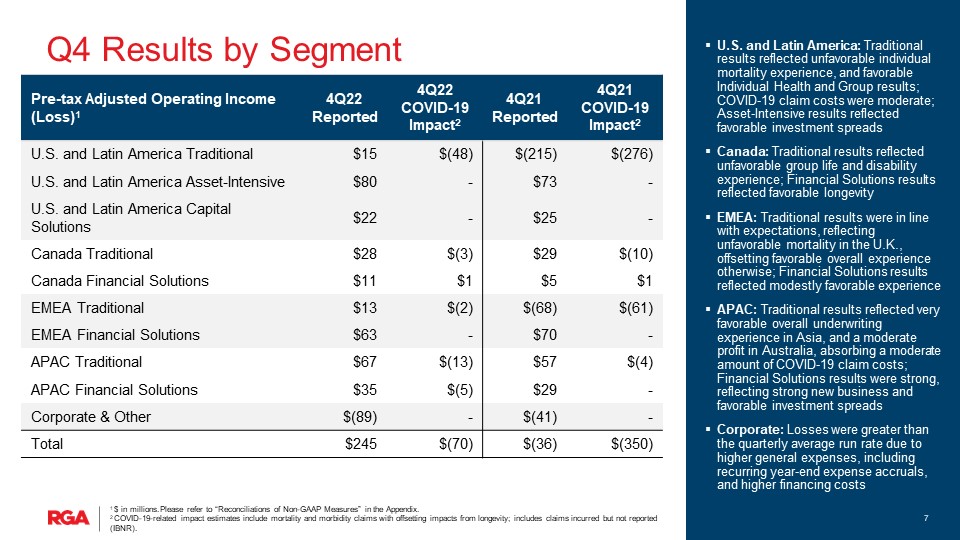
| Net premiums | $ | 1,778 | $ | 1,697 | $ | 6,590 | $ | 6,244 | |||||||||||||||
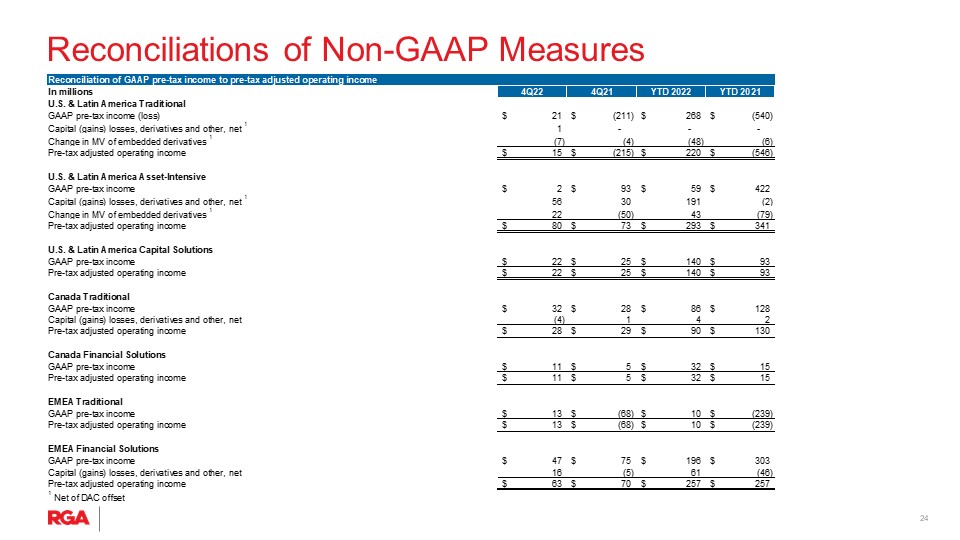
| Pre-tax income (loss) | 21 | (211) | 268 | (540) | |||||||||||||||||||
| Pre-tax adjusted operating income (loss) | 15 | (215) | 220 | (546) | |||||||||||||||||||
| Quarterly Results | Full Year Results | ||||||||||||||||||||||
| ($ in millions) | 2022 | 2021 | 2022 | 2021 | |||||||||||||||||||
| Asset-Intensive: | |||||||||||||||||||||||
| Pre-tax income | $ | 2 | $ | 93 | $ | 59 | $ | 422 | |||||||||||||||
| Pre-tax adjusted operating income | 80 | 73 | 293 | 341 | |||||||||||||||||||
| Capital Solutions: | |||||||||||||||||||||||
| Pre-tax income | 22 | 25 | 140 | 93 | |||||||||||||||||||
| Pre-tax adjusted operating income | 22 | 25 | 140 | 93 | |||||||||||||||||||
| Quarterly Results | Full Year Results | ||||||||||||||||||||||
| ($ in millions) | 2022 | 2021 | 2022 | 2021 | |||||||||||||||||||
| Net premiums | $ | 308 | $ | 324 | $ | 1,219 | $ | 1,194 | |||||||||||||||
| Pre-tax income | 32 | 28 | 86 | 128 | |||||||||||||||||||
| Pre-tax adjusted operating income | 28 | 29 | 90 | 130 | |||||||||||||||||||
| Quarterly Results | Full Year Results | ||||||||||||||||||||||
| ($ in millions) | 2022 | 2021 | 2022 | 2021 | |||||||||||||||||||
| Pre-tax income | $ | 11 | $ | 5 | $ | 32 | $ | 15 | |||||||||||||||
| Pre-tax adjusted operating income | 11 | 5 | 32 | 15 | |||||||||||||||||||
| Quarterly Results | Full Year Results | ||||||||||||||||||||||
| ($ in millions) | 2022 | 2021 | 2022 | 2021 | |||||||||||||||||||
| Net premiums | $ | 422 | $ | 435 | $ | 1,736 | $ | 1,738 | |||||||||||||||
| Pre-tax income (loss) | 13 | (68) | 10 | (239) | |||||||||||||||||||
| Pre-tax adjusted operating income (loss) | 13 | (68) | 10 | (239) | |||||||||||||||||||
| Quarterly Results | Full Year Results | ||||||||||||||||||||||
| ($ in millions) | 2022 | 2021 | 2022 | 2021 | |||||||||||||||||||
| Pre-tax income | $ | 47 | $ | 75 | $ | 196 | $ | 303 | |||||||||||||||
| Pre-tax adjusted operating income | 63 | 70 | 257 | 257 | |||||||||||||||||||
| Quarterly Results | Full Year Results | ||||||||||||||||||||||
| ($ in millions) | 2022 | 2021 | 2022 | 2021 | |||||||||||||||||||
| Net premiums | $ | 700 | $ | 773 | $ | 2,650 | $ | 2,624 | |||||||||||||||
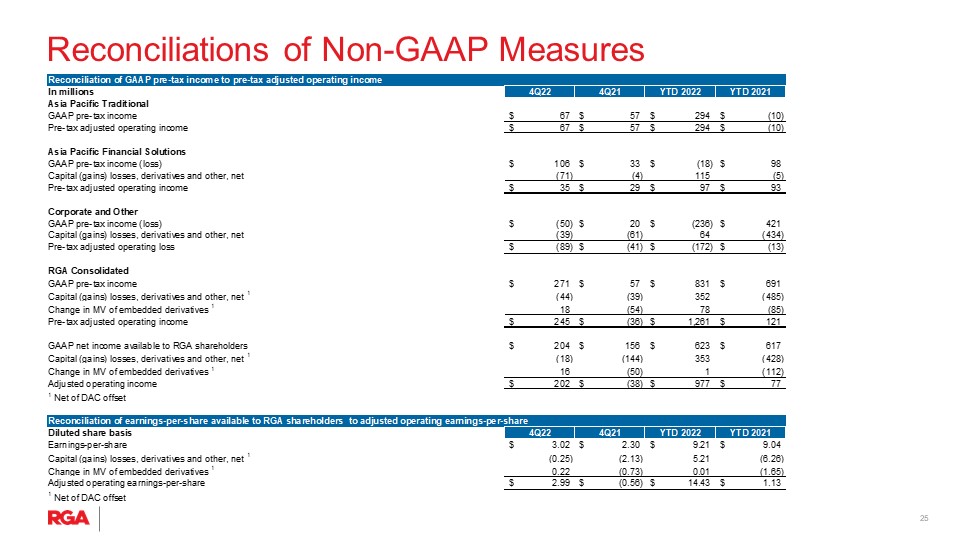
| Pre-tax income (loss) | 67 | 57 | 294 | (10) | |||||||||||||||||||
| Pre-tax adjusted operating income (loss) | 67 | 57 | 294 | (10) | |||||||||||||||||||
| Quarterly Results | Full Year Results | ||||||||||||||||||||||
| ($ in millions) | 2022 | 2021 | 2022 | 2021 | |||||||||||||||||||
| Net premiums | $ | 64 | $ | 52 | $ | 236 | $ | 218 | |||||||||||||||
| Pre-tax income (loss) | 106 | 33 | (18) | 98 | |||||||||||||||||||
| Pre-tax adjusted operating income | 35 | 29 | 97 | 93 | |||||||||||||||||||
| Quarterly Results | Full Year Results | ||||||||||||||||||||||
| ($ in millions) | 2022 | 2021 | 2022 | 2021 | |||||||||||||||||||
| Pre-tax income (loss) | $ | (50) | $ | 20 | $ | (236) | $ | 421 | |||||||||||||||
| Pre-tax adjusted operating loss | (89) | (41) | (172) | (13) | |||||||||||||||||||
| (Unaudited) | Three Months Ended December 31, | ||||||||||||||||||||||
| 2022 | 2021 | ||||||||||||||||||||||
| Diluted Earnings Per Share | Diluted Earnings Per Share | ||||||||||||||||||||||
| Net income available to RGA shareholders | $ | 204 | $ | 3.02 | $ | 156 | $ | 2.30 | |||||||||||||||
| Reconciliation to adjusted operating income: | |||||||||||||||||||||||
| Capital (gains) losses, derivatives and other, included in investment related gains/losses, net | (11) | (0.15) | (24) | (0.36) | |||||||||||||||||||
| Capital (gains) losses on funds withheld, included in investment income, net of related expenses | 1 | 0.01 | (1) | (0.01) | |||||||||||||||||||
| Embedded derivatives: | |||||||||||||||||||||||
| Included in investment related gains/losses, net | 41 | 0.60 | (39) | (0.57) | |||||||||||||||||||
| Included in interest credited | 1 | 0.01 | (8) | (0.12) | |||||||||||||||||||
| DAC offset, net | (28) | (0.41) | 21 | 0.31 | |||||||||||||||||||
| Investment (income) loss on unit-linked variable annuities | 2 | 0.03 | (4) | (0.06) | |||||||||||||||||||
| Interest credited on unit-linked variable annuities | (2) | (0.03) | 4 | 0.06 | |||||||||||||||||||
| Interest expense on uncertain tax positions | — | — | (27) | (0.40) | |||||||||||||||||||
| Non-investment derivatives and other | 1 | 0.01 | 4 | 0.06 | |||||||||||||||||||
| Uncertain tax positions and other tax related items | (9) | (0.13) | (120) | (1.77) | |||||||||||||||||||
| Net income attributable to noncontrolling interest | 2 | 0.03 | — | — | |||||||||||||||||||
| Adjusted operating income (loss) | $ | 202 | $ | 2.99 | $ | (38) | $ | (0.56) | |||||||||||||||
| (Unaudited) | Twelve Months Ended December 31, | ||||||||||||||||||||||
| 2022 | 2021 | ||||||||||||||||||||||
| Diluted Earnings Per Share | Diluted Earnings Per Share | ||||||||||||||||||||||
| Net income available to RGA shareholders | $ | 623 | $ | 9.21 | $ | 617 | $ | 9.04 | |||||||||||||||
| Reconciliation to adjusted operating income: | |||||||||||||||||||||||
| Capital (gains) losses, derivatives and other, included in investment related gains/losses, net | 354 | 5.22 | (338) | (4.94) | |||||||||||||||||||
| Capital (gains) losses on funds withheld, included in investment income, net of related expenses | 18 | 0.27 | (4) | (0.06) | |||||||||||||||||||
| Embedded derivatives: | |||||||||||||||||||||||
| Included in investment related gains/losses, net | 107 | 1.58 | (79) | (1.16) | |||||||||||||||||||
| Included in interest credited | (42) | (0.62) | (36) | (0.53) | |||||||||||||||||||
| DAC offset, net | (21) | (0.31) | 30 | 0.44 | |||||||||||||||||||
| Investment (income) loss on unit-linked variable annuities | 19 | 0.28 | (3) | (0.04) | |||||||||||||||||||
| Interest credited on unit-linked variable annuities | (19) | (0.28) | 3 | 0.04 | |||||||||||||||||||
| Interest expense on uncertain tax positions | 1 | 0.01 | (21) | (0.31) | |||||||||||||||||||
| Non-investment derivatives and other | (62) | (0.92) | (2) | (0.03) | |||||||||||||||||||
| Uncertain tax positions and other tax related items | (5) | (0.07) | (90) | (1.32) | |||||||||||||||||||
| Net income attributable to noncontrolling interest | 4 | 0.06 | — | — | |||||||||||||||||||
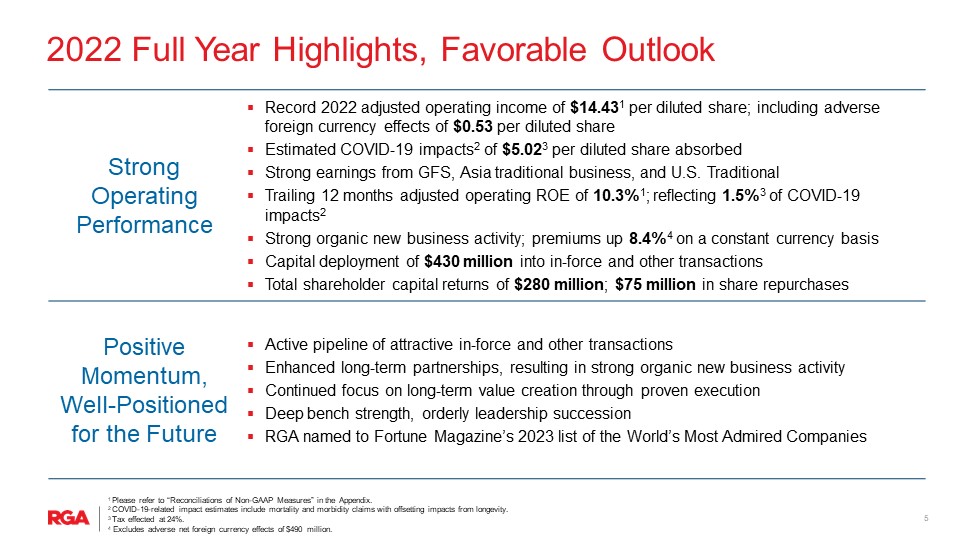
| Adjusted operating income | $ | 977 | $ | 14.43 | $ | 77 | $ | 1.13 | |||||||||||||||
| (Unaudited) | Three Months Ended December 31, 2022 | Twelve Months Ended December 31, 2022 | |||||||||||||||||||||||||||||||||
| Pre-tax Income (Loss) | Income Taxes | Effective Tax Rate (1) |
Pre-tax Income (Loss) | Income Taxes | Effective Tax Rate (1) |
||||||||||||||||||||||||||||||
| GAAP income | $ | 271 | $ | 65 | 23.9 | % | $ | 831 | $ | 204 | 24.6 | % | |||||||||||||||||||||||
| Reconciliation to adjusted operating income: | |||||||||||||||||||||||||||||||||||
| Capital (gains) losses, derivatives and other, included in investment related gains/losses, net | (45) | (34) | 430 | 76 | |||||||||||||||||||||||||||||||
| Capital (gains) losses on funds withheld, included in investment income, net of related expenses | 1 | — | 23 | 5 | |||||||||||||||||||||||||||||||
| Embedded derivatives: | |||||||||||||||||||||||||||||||||||
| Included in investment related gains/losses, net | 52 | 11 | 135 | 28 | |||||||||||||||||||||||||||||||
| Included in interest credited | 1 | — | (53) | (11) | |||||||||||||||||||||||||||||||
| DAC offset, net | (36) | (8) | (27) | (6) | |||||||||||||||||||||||||||||||
| Investment (income) loss on unit-linked variable annuities | 2 | — | 24 | 5 | |||||||||||||||||||||||||||||||
| Interest credited on unit-linked variable annuities | (2) | — | (24) | (5) | |||||||||||||||||||||||||||||||
| Interest expense on uncertain tax positions | — | — | 1 | — | |||||||||||||||||||||||||||||||
| Non-investment derivatives and other | 1 | — | (79) | (17) | |||||||||||||||||||||||||||||||
| Uncertain tax positions and other tax related items | — | 9 | — | 5 | |||||||||||||||||||||||||||||||
| Adjusted operating income | $ | 245 | $ | 43 | 17.5 | % | $ | 1,261 | $ | 284 | 22.5 | % | |||||||||||||||||||||||
| (Unaudited) | Three Months Ended December 31, | Twelve Months Ended December 31, | |||||||||||||||||||||
| 2022 | 2021 | 2022 | 2021 | ||||||||||||||||||||
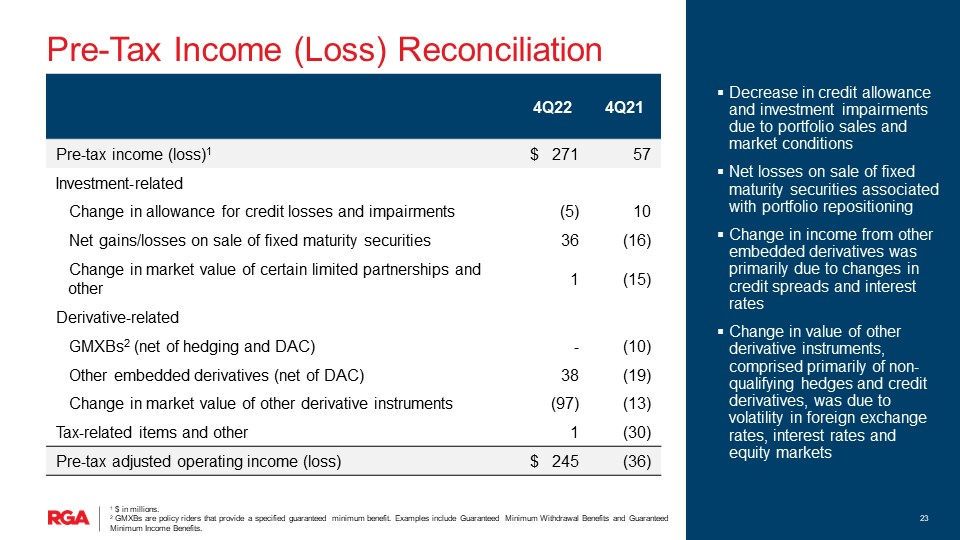
| Income before income taxes | $ | 271 | $ | 57 | $ | 831 | $ | 691 | |||||||||||||||
| Reconciliation to pre-tax adjusted operating income: | |||||||||||||||||||||||
| Capital (gains) losses, derivatives and other, included in investment related gains/losses, net | (45) | (31) | 430 | (429) | |||||||||||||||||||
| Capital (gains) losses on funds withheld, included in investment income, net of related expenses | 1 | (1) | 23 | (5) | |||||||||||||||||||
| Embedded derivatives: | |||||||||||||||||||||||
| Included in investment related gains/losses, net | 52 | (49) | 135 | (100) | |||||||||||||||||||
| Included in interest credited | 1 | (9) | (53) | (45) | |||||||||||||||||||
| DAC offset, net | (36) | 26 | (27) | 38 | |||||||||||||||||||
| Investment (income) loss on unit-linked variable annuities | 2 | (5) | 24 | (4) | |||||||||||||||||||
| Interest credited on unit-linked variable annuities | (2) | 5 | (24) | 4 | |||||||||||||||||||
| Interest expense on uncertain tax positions | — | (34) | 1 | (26) | |||||||||||||||||||
| Non-investment derivatives and other | 1 | 5 | (79) | (3) | |||||||||||||||||||
| Pre-tax adjusted operating income (loss) | $ | 245 | $ | (36) | $ | 1,261 | $ | 121 | |||||||||||||||
| (Unaudited) | Three Months Ended December 31, 2022 | ||||||||||||||||||||||
| Pre-tax income (loss) | Capital (gains) losses, derivatives and other, net |
Change in value of embedded derivatives, net |
Pre-tax adjusted operating income (loss) |
||||||||||||||||||||
| U.S. and Latin America: | |||||||||||||||||||||||
| Traditional | $ | 21 | $ | 1 | $ | (7) | $ | 15 | |||||||||||||||
| Financial Solutions: | |||||||||||||||||||||||
| Asset-Intensive | 2 | 56 | (1) | 22 | (2) | 80 | |||||||||||||||||
| Capital Solutions | 22 | — | — | 22 | |||||||||||||||||||
| Total U.S. and Latin America | 45 | 57 | 15 | 117 | |||||||||||||||||||
| Canada Traditional | 32 | (4) | — | 28 | |||||||||||||||||||
| Canada Financial Solutions | 11 | — | — | 11 | |||||||||||||||||||
| Total Canada | 43 | (4) | — | 39 | |||||||||||||||||||
| EMEA Traditional | 13 | — | — | 13 | |||||||||||||||||||
| EMEA Financial Solutions | 47 | 16 | — | 63 | |||||||||||||||||||
| Total EMEA | 60 | 16 | — | 76 | |||||||||||||||||||
| Asia Pacific Traditional | 67 | — | — | 67 | |||||||||||||||||||
| Asia Pacific Financial Solutions | 106 | (71) | — | 35 | |||||||||||||||||||
| Total Asia Pacific | 173 | (71) | — | 102 | |||||||||||||||||||
| Corporate and Other | (50) | (39) | — | (89) | |||||||||||||||||||
| Consolidated | $ | 271 | $ | (41) | $ | 15 | $ | 245 | |||||||||||||||
| (Unaudited) | Three Months Ended December 31, 2021 | ||||||||||||||||||||||
| Pre-tax income (loss) | Capital (gains) losses, derivatives and other, net |
Change in value of embedded derivatives, net |
Pre-tax adjusted operating income (loss) |
||||||||||||||||||||
| U.S. and Latin America: | |||||||||||||||||||||||
| Traditional | $ | (211) | $ | — | $ | (4) | $ | (215) | |||||||||||||||
| Financial Solutions: | |||||||||||||||||||||||
| Asset-Intensive | 93 | 30 | (1) | (50) | (2) | 73 | |||||||||||||||||
| Capital Solutions | 25 | — | — | 25 | |||||||||||||||||||
| Total U.S. and Latin America | (93) | 30 | (54) | (117) | |||||||||||||||||||
| Canada Traditional | 28 | 1 | — | 29 | |||||||||||||||||||
| Canada Financial Solutions | 5 | — | — | 5 | |||||||||||||||||||
| Total Canada | 33 | 1 | — | 34 | |||||||||||||||||||
| EMEA Traditional | (68) | — | — | (68) | |||||||||||||||||||
| EMEA Financial Solutions | 75 | (5) | — | 70 | |||||||||||||||||||
| Total EMEA | 7 | (5) | — | 2 | |||||||||||||||||||
| Asia Pacific Traditional | 57 | — | — | 57 | |||||||||||||||||||
| Asia Pacific Financial Solutions | 33 | (4) | — | 29 | |||||||||||||||||||
| Total Asia Pacific | 90 | (4) | — | 86 | |||||||||||||||||||
| Corporate and Other | 20 | (61) | — | (41) | |||||||||||||||||||
| Consolidated | $ | 57 | $ | (39) | $ | (54) | $ | (36) | |||||||||||||||
| (Unaudited) | Twelve Months Ended December 31, 2022 | ||||||||||||||||||||||
| Pre-tax income (loss) | Capital (gains) losses, derivatives and other, net |
Change in value of embedded derivatives, net |
Pre-tax adjusted operating income (loss) |
||||||||||||||||||||
| U.S. and Latin America: | |||||||||||||||||||||||
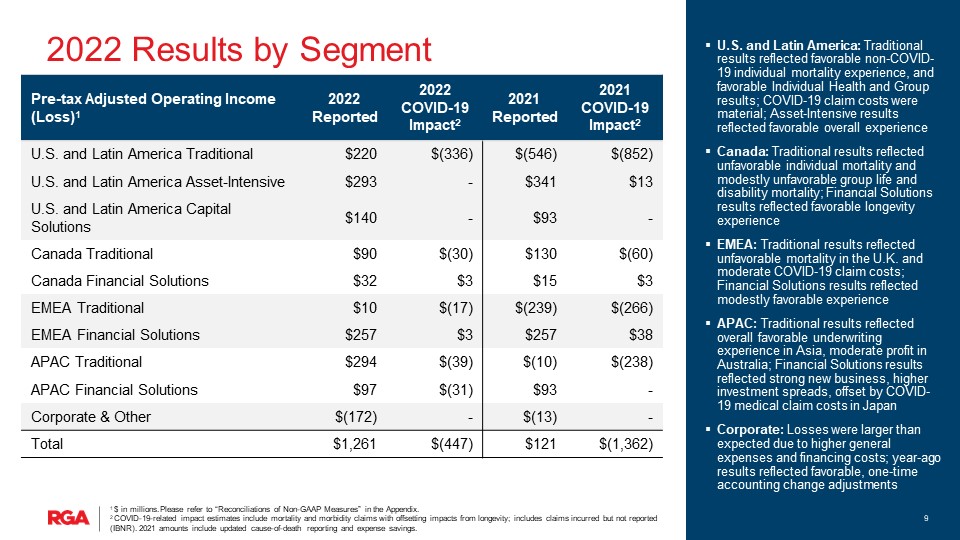
| Traditional | $ | 268 | $ | — | $ | (48) | $ | 220 | |||||||||||||||
| Financial Solutions: | |||||||||||||||||||||||
| Asset-Intensive | 59 | 191 | (1) | 43 | (2) | 293 | |||||||||||||||||
| Capital Solutions | 140 | — | — | 140 | |||||||||||||||||||
| Total U.S. and Latin America | 467 | 191 | (5) | 653 | |||||||||||||||||||
| Canada Traditional | 86 | 4 | — | 90 | |||||||||||||||||||
| Canada Financial Solutions | 32 | — | — | 32 | |||||||||||||||||||
| Total Canada | 118 | 4 | — | 122 | |||||||||||||||||||
| EMEA Traditional | 10 | — | — | 10 | |||||||||||||||||||
| EMEA Financial Solutions | 196 | 61 | — | 257 | |||||||||||||||||||
| Total EMEA | 206 | 61 | — | 267 | |||||||||||||||||||
| Asia Pacific Traditional | 294 | — | — | 294 | |||||||||||||||||||
| Asia Pacific Financial Solutions | (18) | 115 | — | 97 | |||||||||||||||||||
| Total Asia Pacific | 276 | 115 | — | 391 | |||||||||||||||||||
| Corporate and Other | (236) | 64 | — | (172) | |||||||||||||||||||
| Consolidated | $ | 831 | $ | 435 | $ | (5) | $ | 1,261 | |||||||||||||||
| (Unaudited) | Twelve Months Ended December 31, 2021 | ||||||||||||||||||||||
| Pre-tax income (loss) | Capital (gains) losses, derivatives and other, net |
Change in value of embedded derivatives, net |
Pre-tax adjusted operating income (loss) |
||||||||||||||||||||
| U.S. and Latin America: | |||||||||||||||||||||||
| Traditional | $ | (540) | $ | — | $ | (6) | $ | (546) | |||||||||||||||
| Financial Solutions: | |||||||||||||||||||||||
| Asset-Intensive | 422 | (2) | (1) | (79) | (2) | 341 | |||||||||||||||||
| Capital Solutions | 93 | — | — | 93 | |||||||||||||||||||
| Total U.S. and Latin America | (25) | (2) | (85) | (112) | |||||||||||||||||||
| Canada Traditional | 128 | 2 | — | 130 | |||||||||||||||||||
| Canada Financial Solutions | 15 | — | — | 15 | |||||||||||||||||||
| Total Canada | 143 | 2 | — | 145 | |||||||||||||||||||
| EMEA Traditional | (239) | — | — | (239) | |||||||||||||||||||
| EMEA Financial Solutions | 303 | (46) | — | 257 | |||||||||||||||||||
| Total EMEA | 64 | (46) | — | 18 | |||||||||||||||||||
| Asia Pacific Traditional | (10) | — | — | (10) | |||||||||||||||||||
| Asia Pacific Financial Solutions | 98 | (5) | — | 93 | |||||||||||||||||||
| Total Asia Pacific | 88 | (5) | — | 83 | |||||||||||||||||||
| Corporate and Other | 421 | (434) | — | (13) | |||||||||||||||||||
| Consolidated | $ | 691 | $ | (485) | $ | (85) | $ | 121 | |||||||||||||||
| (Unaudited) | Three Months Ended December 31, | Twelve Months Ended December 31, | |||||||||||||||||||||
| 2022 | 2021 | 2022 | 2021 | ||||||||||||||||||||
| Earnings per share from net income (loss): | |||||||||||||||||||||||
| Basic earnings per share | $ | 3.07 | $ | 2.32 | $ | 9.31 | $ | 9.10 | |||||||||||||||
Diluted earnings per share (1) |
$ | 3.02 | $ | 2.30 | $ | 9.21 | $ | 9.04 | |||||||||||||||
Diluted earnings per share from adjusted operating income (1) |
$ | 2.99 | $ | (0.56) | $ | 14.43 | $ | 1.13 | |||||||||||||||
| Weighted average number of common and common equivalent shares outstanding | 67,793 | 67,930 | 67,703 | 68,286 | |||||||||||||||||||
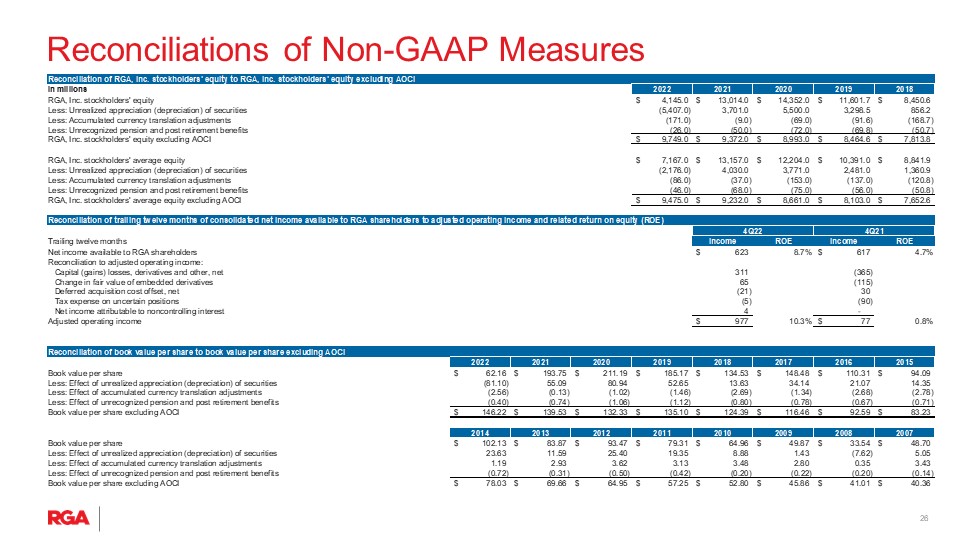
| (Unaudited) | At December 31, | ||||||||||
| 2022 | 2021 | ||||||||||
| Treasury shares | 18,635 | 18,140 | |||||||||
| Common shares outstanding | 66,676 | 67,171 | |||||||||
| Book value per share outstanding | $ | 62.16 | $ | 193.75 | |||||||
| Book value per share outstanding, before impact of AOCI | $ | 146.22 | $ | 139.53 | |||||||
| (Unaudited) | At December 31, | ||||||||||
| 2022 | 2021 | ||||||||||
| Book value per share outstanding | $ | 62.16 | $ | 193.75 | |||||||
| Less effect of AOCI: | |||||||||||
| Accumulated currency translation adjustments | (2.56) | (0.13) | |||||||||
| Unrealized appreciation (depreciation) of securities | (81.10) | 55.09 | |||||||||
| Pension and postretirement benefits | (0.40) | (0.74) | |||||||||
| Book value per share outstanding, before impact of AOCI | $ | 146.22 | $ | 139.53 | |||||||
| (Unaudited) | |||||
| Trailing Twelve Months Ended December 31, 2022: | Average Equity | ||||
| Stockholders' average equity | $ | 7,167 | |||
| Less effect of AOCI: | |||||
| Accumulated currency translation adjustments | (86) | ||||
| Unrealized depreciation of securities | (2,176) | ||||
| Pension and postretirement benefits | (46) | ||||
| Stockholders' average equity, excluding AOCI | $ | 9,475 | |||
| (Unaudited) | Return on Equity | ||||||||||
| Trailing Twelve Months Ended December 31, 2022: | Income | ||||||||||
| Net income available to RGA shareholders | $ | 623 | 8.7 | % | |||||||
| Reconciliation to adjusted operating income: | |||||||||||
| Capital (gains) losses, derivatives and other, net | 311 | ||||||||||
| Change in fair value of embedded derivatives | 65 | ||||||||||
| Deferred acquisition cost offset, net | (21) | ||||||||||
| Tax expense on uncertain tax positions | (5) | ||||||||||
| Net income attributable to noncontrolling interest | 4 | ||||||||||
| Adjusted operating income | $ | 977 | 10.3 | % | |||||||
| (Unaudited) | Three Months Ended December 31, | Twelve Months Ended December 31, | |||||||||||||||||||||
| 2022 | 2021 | 2022 | 2021 | ||||||||||||||||||||
| Revenues: | |||||||||||||||||||||||
| Net premiums | $ | 3,446 | $ | 3,407 | $ | 13,078 | $ | 12,513 | |||||||||||||||
| Investment income, net of related expenses | 828 | 771 | 3,161 | 3,138 | |||||||||||||||||||
| Investment related gains (losses), net | 8 | 88 | (506) | 560 | |||||||||||||||||||
| Other revenue | 93 | 93 | 525 | 447 | |||||||||||||||||||
| Total revenues | 4,375 | 4,359 | 16,258 | 16,658 | |||||||||||||||||||
| Benefits and expenses: | |||||||||||||||||||||||
| Claims and other policy benefits | 3,191 | 3,482 | 12,046 | 12,776 | |||||||||||||||||||
| Interest credited | 214 | 159 | 682 | 700 | |||||||||||||||||||
| Policy acquisition costs and other insurance expenses | 355 | 406 | 1,499 | 1,416 | |||||||||||||||||||
| Other operating expenses | 289 | 253 | 1,009 | 936 | |||||||||||||||||||
| Interest expense | 54 | (2) | 184 | 127 | |||||||||||||||||||
| Collateral finance and securitization expense | 1 | 4 | 7 | 12 | |||||||||||||||||||
| Total benefits and expenses | 4,104 | 4,302 | 15,427 | 15,967 | |||||||||||||||||||
| Income before income taxes | 271 | 57 | 831 | 691 | |||||||||||||||||||
| Provision for income taxes | 65 | (99) | 204 | 74 | |||||||||||||||||||
| Net income | 206 | 156 | 627 | 617 | |||||||||||||||||||
| Net income attributable to noncontrolling interest | 2 | — | 4 | — | |||||||||||||||||||
| Net income available to RGA shareholders | $ | 204 | $ | 156 | $ | 623 | $ | 617 | |||||||||||||||

| World Headquarters | Internet Address | Contacts | ||||||||||||
| 16600 Swingley Ridge Road | www.rgare.com | Todd C. Larson | ||||||||||||
| Chesterfield, Missouri 63017 U.S.A. | Senior Executive Vice President | |||||||||||||
| and Chief Financial Officer | ||||||||||||||
| Phone: (636) 736-7000 | ||||||||||||||
| e-mail: tlarson@rgare.com | ||||||||||||||
| Jeff Hopson | ||||||||||||||
| Senior Vice President, Investor Relations | ||||||||||||||
| Phone: (636) 736-2068 | ||||||||||||||
| e-mail: jhopson@rgare.com | ||||||||||||||
| Current Ratings | ||||||||||||||||||||
| Standard & Poor’s | A.M. Best | Moody’s | ||||||||||||||||||
| Financial Strength Ratings | ||||||||||||||||||||
| RGA Reinsurance Company | AA- | A+ | A1 | |||||||||||||||||
| RGA Life Reinsurance Company of Canada | AA- | A+ | ||||||||||||||||||
| RGA International Reinsurance Company dac | AA- | |||||||||||||||||||
| RGA Global Reinsurance Company, Ltd. | AA- | |||||||||||||||||||
| RGA Reinsurance Company of Australia Limited | AA- | |||||||||||||||||||
| RGA Americas Reinsurance Company, Ltd. | AA- | A+ | ||||||||||||||||||
| RGA Worldwide Reinsurance Company, Ltd. | AA- | |||||||||||||||||||
| RGA Reinsurance Company (Barbados) Ltd. | AA- | |||||||||||||||||||
| RGA Atlantic Reinsurance Company Ltd. | AA- | A+ | ||||||||||||||||||
| Omnilife Insurance Company Limited | A+ | |||||||||||||||||||
| Aurora National Life Assurance Company | A+ | |||||||||||||||||||
| Senior Debt Ratings | ||||||||||||||||||||
| Reinsurance Group of America, Incorporated | A | a- | Baa1 | |||||||||||||||||

| Page | |||||
| Non-GAAP Disclosures | |||||
| 2022 Notes | |||||
| Consolidated | |||||
| Financial Highlights | |||||
| Consolidated GAAP Income Statements (including Adjusted Operating Income Reconciliations) | |||||
| Consolidated Balance Sheets | |||||
| Segment Summaries of GAAP Income Statements and Adjusted Operating Income Statements | |||||
| U.S. and Latin America Traditional | |||||
| U.S. and Latin America Financial Solutions - Asset-Intensive | |||||
| U.S. and Latin America Financial Solutions - Capital Solutions | |||||
| Canada Traditional | |||||
| Canada Financial Solutions | |||||
| Europe, Middle East and Africa Traditional | |||||
| Europe, Middle East and Africa Financial Solutions | |||||
| Asia Pacific Traditional | |||||
| Asia Pacific Financial Solutions | |||||
| Corporate and Other | |||||
| Summary of Segment GAAP Income | |||||
| Summary of Segment Adjusted Operating Income | |||||
| Investments | |||||
| Cash and Invested Assets and Investment Income and Yield Summary | |||||
| Amortized Cost, Allowance for Credit Losses, Gross Unrealized Gains and Losses, and Estimated Fair Values of Fixed Maturity Securities | |||||
| Corporate Fixed Maturity Securities by Industry | |||||
| Ratings of Fixed Maturity Securities and Structured Fixed Maturity Securities | |||||
| Fixed Maturity Securities Below Amortized Cost | |||||
| Consolidated Investment Related Gains and Losses | |||||
| Appendix | |||||
| Reconciliations of GAAP to Non-GAAP Measures | |||||
|
Page 1
|
|||||||
|
Page 2
|
|||||||
| Reinsurance Group of America, Incorporated | ||||||||||||||||||||||||||||||||||||||||||||||||||||||||||||||
| Financial Highlights | ||||||||||||||||||||||||||||||||||||||||||||||||||||||||||||||
| Three Months Ended | Current Qtr vs. PY Quarter | Year-to-Date | ||||||||||||||||||||||||||||||||||||||||||||||||||||||||||||
| (USD millions, except in force & per share and shares data) | Dec. 31, | Sept. 30, | June 30, | March 31, | Dec. 31, | Dec. 31, | Dec. 31, | |||||||||||||||||||||||||||||||||||||||||||||||||||||||
| 2022 | 2022 | 2022 | 2022 | 2021 | 2022 | 2021 | Change | |||||||||||||||||||||||||||||||||||||||||||||||||||||||
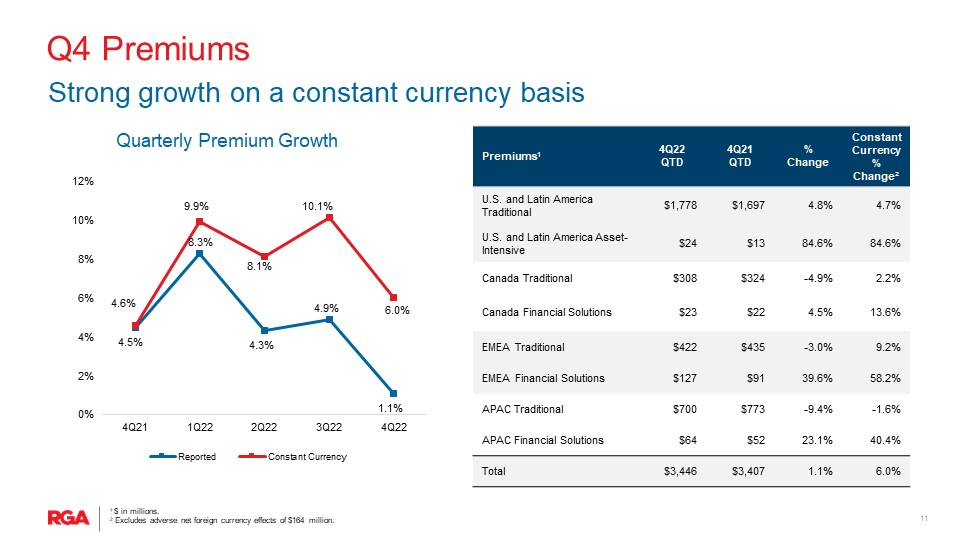
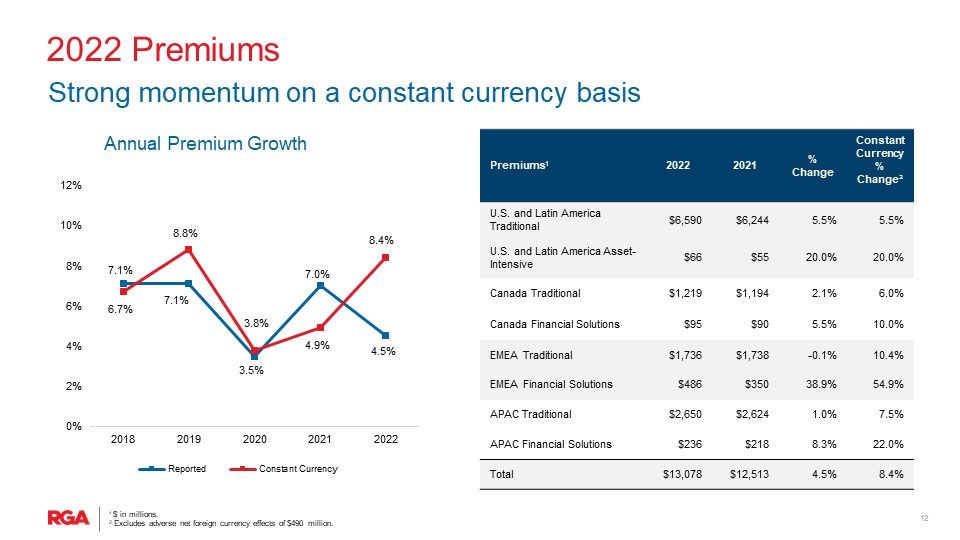
| Net premiums | $ | 3,446 | $ | 3,247 | $ | 3,230 | $ | 3,155 | $ | 3,407 | $ | 39 | $ | 13,078 | $ | 12,513 | $ | 565 | ||||||||||||||||||||||||||||||||||||||||||||
| Net income (loss) available to RGA's shareholders | 204 | 284 | 198 | (63) | 156 | 48 | 623 | 617 | 6 | |||||||||||||||||||||||||||||||||||||||||||||||||||||
| Adjusted operating income (loss) | 202 | 352 | 391 | 32 | (38) | 240 | 977 | 77 | 900 | |||||||||||||||||||||||||||||||||||||||||||||||||||||
| Return on equity - annualized | 21.0 | % | 23.9 | % | 10.6 | % | (2.3) | % | 4.8 | % | 16.2 | % | ||||||||||||||||||||||||||||||||||||||||||||||||||
| Return on equity - trailing 12 months | 8.7 | % | 6.4 | % | 2.5 | % | 3.4 | % | 4.7 | % | 4.0 | % | ||||||||||||||||||||||||||||||||||||||||||||||||||
| Adjusted operating return on equity (ex AOCI) - annualized | 8.4 | % | 14.8 | % | 16.8 | % | 1.4 | % | (1.6) | % | 10.0 | % | ||||||||||||||||||||||||||||||||||||||||||||||||||
| Adjusted operating return on equity (ex AOCI) - trailing 12 months | 10.3 | % | 7.9 | % | 3.3 | % | 2.1 | % | 0.8 | % | 9.5 | % | ||||||||||||||||||||||||||||||||||||||||||||||||||
| Total assets | $ | 84,706 | $ | 82,705 | $ | 84,609 | $ | 89,761 | $ | 92,175 | $ | (7,469) | ||||||||||||||||||||||||||||||||||||||||||||||||||
| Assumed Life Reinsurance In Force (in billions) | ||||||||||||||||||||||||||||||||||||||||||||||||||||||||||||||
| U.S. and Latin America Traditional | $ | 1,672.2 | $ | 1,662.7 | $ | 1,650.5 | $ | 1,645.1 | $ | 1,628.4 | $ | 43.8 | ||||||||||||||||||||||||||||||||||||||||||||||||||
| U.S. and Latin America Financial Solutions | 5.2 | 5.3 | 5.3 | 5.3 | 5.3 | (0.1) | ||||||||||||||||||||||||||||||||||||||||||||||||||||||||
| Canada Traditional | 463.6 | 448.7 | 477.2 | 484.5 | 472.6 | (9.0) | ||||||||||||||||||||||||||||||||||||||||||||||||||||||||
| Europe, Middle East and Africa Traditional | 735.4 | 671.3 | 756.4 | 850.7 | 861.6 | (126.2) | ||||||||||||||||||||||||||||||||||||||||||||||||||||||||
| Asia Pacific Traditional | 518.6 | 479.4 | 486.1 | 508.4 | 497.4 | 21.2 | ||||||||||||||||||||||||||||||||||||||||||||||||||||||||
| Asia Pacific Financial Solutions | 5.7 | 5.2 | 5.4 | (1) |
1.1 | 1.7 | 4.0 | |||||||||||||||||||||||||||||||||||||||||||||||||||||||
| Total assumed life reinsurance in force | $ | 3,400.7 | $ | 3,272.6 | $ | 3,380.9 | $ | 3,495.1 | $ | 3,467.0 | $ | (66.3) | ||||||||||||||||||||||||||||||||||||||||||||||||||
| Assumed New Business Production (in billions) | ||||||||||||||||||||||||||||||||||||||||||||||||||||||||||||||
| U.S. and Latin America Traditional | $ | 36.4 | $ | 37.3 | $ | 32.7 | $ | 39.5 | $ | 32.4 | $ | 4.0 | $ | 145.9 | $ | 130.5 | $ | 15.4 | ||||||||||||||||||||||||||||||||||||||||||||
| Canada Traditional | 11.9 | 10.8 | 12.8 | 12.7 | 14.6 | (2.7) | 48.2 | 48.8 | (0.6) | |||||||||||||||||||||||||||||||||||||||||||||||||||||
| Europe, Middle East and Africa Traditional | 35.6 | 38.2 | 45.1 | 50.5 | 51.0 | (15.4) | 169.4 | 198.4 | (29.0) | |||||||||||||||||||||||||||||||||||||||||||||||||||||
| Asia Pacific Traditional | 8.6 | 14.4 | 5.7 | 16.6 | 8.6 | — | 45.3 | 34.2 | 11.1 | |||||||||||||||||||||||||||||||||||||||||||||||||||||
| Asia Pacific Financial Solutions | — | — | — | 0.1 | 0.1 | (0.1) | 0.1 | 0.2 | (0.1) | |||||||||||||||||||||||||||||||||||||||||||||||||||||
| Total assumed new business production | $ | 92.5 | $ | 100.7 | $ | 96.3 | $ | 119.4 | $ | 106.7 | $ | (14.2) | $ | 408.9 | $ | 412.1 | $ | (3.2) | ||||||||||||||||||||||||||||||||||||||||||||
| Per Share and Shares Data (shares in thousands) | ||||||||||||||||||||||||||||||||||||||||||||||||||||||||||||||
| Basic earnings per share | ||||||||||||||||||||||||||||||||||||||||||||||||||||||||||||||
| Net income (loss) | $ | 3.07 | $ | 4.24 | $ | 2.95 | $ | (0.93) | $ | 2.32 | $ | 0.75 | $ | 9.31 | $ | 9.10 | $ | 0.21 | ||||||||||||||||||||||||||||||||||||||||||||
| Adjusted operating income (loss) | $ | 3.04 | $ | 5.26 | $ | 5.83 | $ | 0.48 | $ | (0.56) | $ | 3.60 | $ | 14.60 | $ | 1.14 | $ | 13.46 | ||||||||||||||||||||||||||||||||||||||||||||
Diluted earnings per share (2) |
||||||||||||||||||||||||||||||||||||||||||||||||||||||||||||||
Net income (loss) (2) |
$ | 3.02 | $ | 4.19 | $ | 2.92 | $ | (0.93) | $ | 2.30 | $ | 0.72 | $ | 9.21 | $ | 9.04 | $ | 0.17 | ||||||||||||||||||||||||||||||||||||||||||||
Adjusted operating income (loss) (2) |
$ | 2.99 | $ | 5.20 | $ | 5.78 | $ | 0.47 | $ | (0.56) | $ | 3.55 | $ | 14.43 | $ | 1.13 | $ | 13.30 | ||||||||||||||||||||||||||||||||||||||||||||
| Wgt. average common shares outstanding | ||||||||||||||||||||||||||||||||||||||||||||||||||||||||||||||
| Basic | 66,748 | 66,936 | 66,996 | 67,104 | 67,380 | (632) | 66,945 | 67,814 | (869) | |||||||||||||||||||||||||||||||||||||||||||||||||||||
| Diluted | 67,793 | 67,663 | 67,620 | 67,649 | 67,930 | (137) | 67,703 | 68,286 | (583) | |||||||||||||||||||||||||||||||||||||||||||||||||||||
| Common shares issued | 85,311 | 85,311 | 85,311 | 85,311 | 85,311 | — | 85,311 | 85,311 | — | |||||||||||||||||||||||||||||||||||||||||||||||||||||
| Treasury shares | 18,635 | 18,484 | 18,304 | 18,323 | 18,140 | 495 | 18,635 | 18,140 | 495 | |||||||||||||||||||||||||||||||||||||||||||||||||||||
| Common shares outstanding | 66,676 | 66,827 | 67,007 | 66,988 | 67,171 | (495) | 66,676 | 67,171 | (495) | |||||||||||||||||||||||||||||||||||||||||||||||||||||
| Book value per share | $ | 62.16 | $ | 54.66 | $ | 87.14 | $ | 137.08 | $ | 193.75 | $ | (131.59) | ||||||||||||||||||||||||||||||||||||||||||||||||||
| Per share effect of AOCI | $ | (84.06) | $ | (89.25) | $ | (53.12) | $ | (0.81) | $ | 54.22 | $ | (138.28) | ||||||||||||||||||||||||||||||||||||||||||||||||||
| Book value per share, excluding AOCI | $ | 146.22 | $ | 143.91 | $ | 140.26 | $ | 137.89 | $ | 139.53 | $ | 6.69 | ||||||||||||||||||||||||||||||||||||||||||||||||||
| Stockholders’ dividends paid | $ | 53 | $ | 54 | $ | 49 | $ | 49 | $ | 49 | $ | 4 | $ | 205 | $ | 194 | $ | 11 | ||||||||||||||||||||||||||||||||||||||||||||
| (1) During the quarter, the Company changed its calculation for assumed life reinsurance in force, resulting in an increase for the quarter. | ||||||||||||||||||||||||||||||||||||||||||||||||||||||||||||||
| (2) As a result of anti-dilutive impact, in periods of a loss, weighted average common shares outstanding (basic) are used in the calculation of diluted earnings per share. | ||||||||||||||||||||||||||||||||||||||||||||||||||||||||||||||
|
Page 3
|
|||||||
| Reinsurance Group of America, Incorporated | ||||||||||||||||||||||||||||||||||||||||||||||||||||||||||||||
| Consolidated GAAP Income Statements (including Adjusted Operating Income Reconciliations) | ||||||||||||||||||||||||||||||||||||||||||||||||||||||||||||||
| (USD millions) | ||||||||||||||||||||||||||||||||||||||||||||||||||||||||||||||
| Three Months Ended | Current Qtr | Year-to-Date | ||||||||||||||||||||||||||||||||||||||||||||||||||||||||||||
| Dec. 31, | Sept. 30, | June 30, | March 31, | Dec. 31, | vs. PY | Dec. 31, | Dec. 31, | |||||||||||||||||||||||||||||||||||||||||||||||||||||||
| 2022 | 2022 | 2022 | 2022 | 2021 | Quarter | 2022 | 2021 | Change | ||||||||||||||||||||||||||||||||||||||||||||||||||||||
| Revenues: | ||||||||||||||||||||||||||||||||||||||||||||||||||||||||||||||
| Net premiums | $ | 3,446 | $ | 3,247 | $ | 3,230 | $ | 3,155 | $ | 3,407 | $ | 39 | $ | 13,078 | $ | 12,513 | $ | 565 | ||||||||||||||||||||||||||||||||||||||||||||
| Net investment income | 828 | 769 | 754 | 810 | 771 | 57 | 3,161 | 3,138 | 23 | |||||||||||||||||||||||||||||||||||||||||||||||||||||
| Investment related gains (losses), net | 8 | (134) | (254) | (126) | 88 | (80) | (506) | 560 | (1,066) | |||||||||||||||||||||||||||||||||||||||||||||||||||||
| Other revenue | 93 | 184 | 157 | 91 | 93 | — | 525 | 447 | 78 | |||||||||||||||||||||||||||||||||||||||||||||||||||||
| Total revenues | 4,375 | 4,066 | 3,887 | 3,930 | 4,359 | 16 | 16,258 | 16,658 | (400) | |||||||||||||||||||||||||||||||||||||||||||||||||||||
| Benefits and expenses: | ||||||||||||||||||||||||||||||||||||||||||||||||||||||||||||||
| Claims and other policy benefits | 3,191 | 2,815 | 2,815 | 3,225 | 3,482 | (291) | 12,046 | 12,776 | (730) | |||||||||||||||||||||||||||||||||||||||||||||||||||||
| Interest credited | 214 | 189 | 138 | 141 | 159 | 55 | 682 | 700 | (18) | |||||||||||||||||||||||||||||||||||||||||||||||||||||
| Policy acquisition costs and other insurance expenses | 355 | 396 | 393 | 355 | 406 | (51) | 1,499 | 1,416 | 83 | |||||||||||||||||||||||||||||||||||||||||||||||||||||
| Other operating expenses | 289 | 251 | 243 | 226 | 253 | 36 | 1,009 | 936 | 73 | |||||||||||||||||||||||||||||||||||||||||||||||||||||
| Interest expense | 54 | 46 | 42 | 42 | (2) | 56 | 184 | 127 | 57 | |||||||||||||||||||||||||||||||||||||||||||||||||||||
| Collateral finance and securitization expense | 1 | 3 | 2 | 1 | 4 | (3) | 7 | 12 | (5) | |||||||||||||||||||||||||||||||||||||||||||||||||||||
| Total benefits and expenses | 4,104 | 3,700 | 3,633 | 3,990 | 4,302 | (198) | 15,427 | 15,967 | (540) | |||||||||||||||||||||||||||||||||||||||||||||||||||||
| Income (loss) before income taxes | 271 | 366 | 254 | (60) | 57 | 214 | 831 | 691 | 140 | |||||||||||||||||||||||||||||||||||||||||||||||||||||
| Provision for income taxes | 65 | 81 | 55 | 3 | (99) | 164 | 204 | 74 | 130 | |||||||||||||||||||||||||||||||||||||||||||||||||||||
| Net income (loss) | 206 | 285 | 199 | (63) | 156 | 50 | 627 | 617 | 10 | |||||||||||||||||||||||||||||||||||||||||||||||||||||
| Net income attributable to noncontrolling interest | 2 | 1 | 1 | — | — | 2 | 4 | — | 4 | |||||||||||||||||||||||||||||||||||||||||||||||||||||
| Net income (loss) available to RGA's shareholders | $ | 204 | $ | 284 | $ | 198 | $ | (63) | $ | 156 | $ | 48 | $ | 623 | $ | 617 | $ | 6 | ||||||||||||||||||||||||||||||||||||||||||||
| Pre-tax adjusted operating income reconciliation: | ||||||||||||||||||||||||||||||||||||||||||||||||||||||||||||||
| Income (loss) before income taxes | $ | 271 | $ | 366 | $ | 254 | $ | (60) | $ | 57 | $ | 214 | $ | 831 | $ | 691 | $ | 140 | ||||||||||||||||||||||||||||||||||||||||||||
Investment and derivative (gains) losses (1) |
(45) | 153 | 203 | 119 | (31) | (14) | 430 | (429) | 859 | |||||||||||||||||||||||||||||||||||||||||||||||||||||
Change in value of modified coinsurance and funds withheld embedded derivatives (1) |
67 | 17 | 56 | 33 | (20) | 87 | 173 | (107) | 280 | |||||||||||||||||||||||||||||||||||||||||||||||||||||
GMXB embedded derivatives (1) |
(15) | (21) | 12 | (14) | (29) | 14 | (38) | 7 | (45) | |||||||||||||||||||||||||||||||||||||||||||||||||||||
| Funds withheld (gains) losses - investment income | 1 | 5 | 9 | 8 | (1) | 2 | 23 | (5) | 28 | |||||||||||||||||||||||||||||||||||||||||||||||||||||
| EIA embedded derivatives - interest credited | 1 | (10) | (27) | (17) | (9) | 10 | (53) | (45) | (8) | |||||||||||||||||||||||||||||||||||||||||||||||||||||
| DAC offset, net | (36) | 12 | 7 | (10) | 26 | (62) | (27) | 38 | (65) | |||||||||||||||||||||||||||||||||||||||||||||||||||||
| Investment (income) loss on unit-linked variable annuities | 2 | 5 | 8 | 9 | (5) | 7 | 24 | (4) | 28 | |||||||||||||||||||||||||||||||||||||||||||||||||||||
| Interest credited on unit-linked variable annuities | (2) | (5) | (8) | (9) | 5 | (7) | (24) | 4 | (28) | |||||||||||||||||||||||||||||||||||||||||||||||||||||
| Interest expense on uncertain tax positions | — | 1 | — | — | (34) | 34 | 1 | (26) | 27 | |||||||||||||||||||||||||||||||||||||||||||||||||||||
| Non-investment derivatives and other | 1 | (71) | (9) | — | 5 | (4) | (79) | (3) | (76) | |||||||||||||||||||||||||||||||||||||||||||||||||||||
| Adjusted operating income (loss) before income taxes | $ | 245 | $ | 452 | $ | 505 | $ | 59 | $ | (36) | $ | 281 | $ | 1,261 | $ | 121 | $ | 1,140 | ||||||||||||||||||||||||||||||||||||||||||||
| (1) Included in “Investment related gains (losses), net” on Consolidated GAAP Income Statement. | ||||||||||||||||||||||||||||||||||||||||||||||||||||||||||||||
|
Page 4
|
|||||||
| Reinsurance Group of America, Incorporated | ||||||||||||||||||||||||||||||||||||||||||||||||||||||||||||||
| Consolidated GAAP Income Statements (including Adjusted Operating Income Reconciliations) | ||||||||||||||||||||||||||||||||||||||||||||||||||||||||||||||
| (USD millions) | ||||||||||||||||||||||||||||||||||||||||||||||||||||||||||||||
| Three Months Ended | Current Qtr | Year-to-Date | ||||||||||||||||||||||||||||||||||||||||||||||||||||||||||||
| Dec. 31, | Sept. 30, | June 30, | March 31, | Dec. 31, | vs. PY | Dec. 31, | Dec. 31, | |||||||||||||||||||||||||||||||||||||||||||||||||||||||
| 2022 | 2022 | 2022 | 2022 | 2021 | Quarter | 2022 | 2021 | Change | ||||||||||||||||||||||||||||||||||||||||||||||||||||||
| After-tax adjusted operating income reconciliation: | ||||||||||||||||||||||||||||||||||||||||||||||||||||||||||||||
| GAAP net income attributable to RGA | $ | 204 | $ | 284 | $ | 198 | $ | (63) | $ | 156 | $ | 48 | $ | 623 | $ | 617 | $ | 6 | ||||||||||||||||||||||||||||||||||||||||||||
Investment and derivative (gains) losses (1) |
(11) | 119 | 152 | 94 | (25) | 14 | 354 | (338) | 692 | |||||||||||||||||||||||||||||||||||||||||||||||||||||
Change in value of modified coinsurance and funds withheld embedded derivatives (1) |
53 | 14 | 44 | 26 | (16) | 69 | 137 | (85) | 222 | |||||||||||||||||||||||||||||||||||||||||||||||||||||
GMXB embedded derivatives (1) |
(12) | (16) | 9 | (11) | (22) | 10 | (30) | 6 | (36) | |||||||||||||||||||||||||||||||||||||||||||||||||||||
| Funds withheld (gains) losses - investment income | 1 | 4 | 7 | 6 | (1) | 2 | 18 | (4) | 22 | |||||||||||||||||||||||||||||||||||||||||||||||||||||
| EIA embedded derivatives - interest credited | 1 | (8) | (22) | (13) | (8) | 9 | (42) | (36) | (6) | |||||||||||||||||||||||||||||||||||||||||||||||||||||
| DAC offset, net | (28) | 9 | 6 | (8) | 21 | (49) | (21) | 30 | (51) | |||||||||||||||||||||||||||||||||||||||||||||||||||||
| Investment (income) loss on unit-linked variable annuities | 2 | 4 | 6 | 7 | (4) | 6 | 19 | (3) | 22 | |||||||||||||||||||||||||||||||||||||||||||||||||||||
| Interest credited on unit-linked variable annuities | (2) | (4) | (6) | (7) | 4 | (6) | (19) | 3 | (22) | |||||||||||||||||||||||||||||||||||||||||||||||||||||
| Interest expense on uncertain tax positions | — | 1 | — | — | (27) | 27 | 1 | (21) | 22 | |||||||||||||||||||||||||||||||||||||||||||||||||||||
| Non-investment derivatives and other | 1 | (56) | (7) | — | 4 | (3) | (62) | (2) | (60) | |||||||||||||||||||||||||||||||||||||||||||||||||||||
| Uncertain tax positions and other tax related items | (9) | — | 3 | 1 | (120) | 111 | (5) | (90) | 85 | |||||||||||||||||||||||||||||||||||||||||||||||||||||
| Net income attributable to noncontrolling interest | 2 | 1 | 1 | — | — | 2 | 4 | — | 4 | |||||||||||||||||||||||||||||||||||||||||||||||||||||
| Adjusted operating income (loss) | $ | 202 | $ | 352 | $ | 391 | $ | 32 | $ | (38) | $ | 240 | $ | 977 | $ | 77 | $ | 900 | ||||||||||||||||||||||||||||||||||||||||||||
Diluted earnings per share - adjusted operating income (loss) (2) |
$ | 2.99 | $ | 5.20 | $ | 5.78 | $ | 0.47 | $ | (0.56) | $ | 3.55 | $ | 14.43 | $ | 1.13 | $ | 13.30 | ||||||||||||||||||||||||||||||||||||||||||||
Foreign currency effect on (3): |
||||||||||||||||||||||||||||||||||||||||||||||||||||||||||||||
| Net premiums | $ | (164) | $ | (160) | $ | (119) | $ | (47) | $ | (3) | $ | (161) | $ | (490) | $ | 250 | $ | (740) | ||||||||||||||||||||||||||||||||||||||||||||
| Adjusted operating income (loss) before income taxes | $ | (19) | $ | (13) | $ | (14) | $ | (1) | $ | — | $ | (19) | $ | (47) | $ | 4 | $ | (51) | ||||||||||||||||||||||||||||||||||||||||||||
| (1) Included in “Investment related gains (losses), net” on Consolidated GAAP Income Statement. | ||||||||||||||||||||||||||||||||||||||||||||||||||||||||||||||
| (2) As a result of anti-dilutive impact, in periods of a loss, weighted average common shares outstanding (basic) are used in the calculation of diluted earnings per share. | ||||||||||||||||||||||||||||||||||||||||||||||||||||||||||||||
| (3) Compared to comparable prior year period. | ||||||||||||||||||||||||||||||||||||||||||||||||||||||||||||||
|
Page 5
|
|||||||
| Reinsurance Group of America, Incorporated | ||||||||||||||||||||||||||||||||
| Consolidated Balance Sheets | ||||||||||||||||||||||||||||||||
| (USD millions) | ||||||||||||||||||||||||||||||||
| Dec. 31, | Sept. 30, | June 30, | March 31, | Dec. 31, | ||||||||||||||||||||||||||||
| 2022 | 2022 | 2022 | 2022 | 2021 | ||||||||||||||||||||||||||||
| Assets | ||||||||||||||||||||||||||||||||
| Fixed maturity securities, available-for-sale | $ | 52,901 | $ | 50,495 | $ | 53,294 | $ | 57,922 | $ | 60,749 | ||||||||||||||||||||||
| Equity securities | 134 | 137 | 127 | 139 | 151 | |||||||||||||||||||||||||||
| Mortgage loans | 6,590 | 6,558 | 6,544 | 6,535 | 6,283 | |||||||||||||||||||||||||||
| Policy loans | 1,231 | 1,202 | 1,218 | 1,221 | 1,234 | |||||||||||||||||||||||||||
| Funds withheld at interest | 6,003 | 6,177 | 6,393 | 6,737 | 6,954 | |||||||||||||||||||||||||||
| Limited partnerships and real estate joint ventures | 2,327 | 2,197 | 2,074 | 1,943 | 1,996 | |||||||||||||||||||||||||||
| Short-term investments | 154 | 225 | 272 | 315 | 87 | |||||||||||||||||||||||||||
| Other invested assets | 1,140 | 1,049 | 1,036 | 1,090 | 1,074 | |||||||||||||||||||||||||||
| Total investments | 70,480 | 68,040 | 70,958 | 75,902 | 78,528 | |||||||||||||||||||||||||||
| Cash and cash equivalents | 2,927 | 3,512 | 2,556 | 2,709 | 2,948 | |||||||||||||||||||||||||||
| Accrued investment income | 630 | 628 | 572 | 578 | 533 | |||||||||||||||||||||||||||
| Premiums receivable and other reinsurance balances | 3,013 | 2,820 | 2,884 | 2,883 | 2,888 | |||||||||||||||||||||||||||
| Reinsurance ceded receivables | 2,462 | 2,456 | 2,558 | 2,595 | 2,580 | |||||||||||||||||||||||||||
| Deferred policy acquisition costs | 3,974 | 3,887 | 3,856 | 3,797 | 3,690 | |||||||||||||||||||||||||||
| Other assets | 1,220 | 1,362 | 1,225 | 1,297 | 1,008 | |||||||||||||||||||||||||||
| Total assets | $ | 84,706 | $ | 82,705 | $ | 84,609 | $ | 89,761 | $ | 92,175 | ||||||||||||||||||||||
| Liabilities and equity | ||||||||||||||||||||||||||||||||
| Future policy benefits | $ | 35,220 | $ | 33,715 | $ | 34,833 | $ | 35,946 | $ | 35,782 | ||||||||||||||||||||||
| Interest-sensitive contract liabilities | 30,572 | 30,286 | 29,023 | 28,083 | 26,377 | |||||||||||||||||||||||||||
| Other policy claims and benefits | 6,571 | 6,249 | 6,464 | 7,079 | 6,993 | |||||||||||||||||||||||||||
| Other reinsurance balances | 756 | 909 | 582 | 582 | 613 | |||||||||||||||||||||||||||
| Deferred income taxes | 736 | 686 | 1,060 | 1,843 | 2,886 | |||||||||||||||||||||||||||
| Other liabilities | 2,655 | 2,910 | 2,899 | 3,123 | 2,663 | |||||||||||||||||||||||||||
| Long-term debt | 3,961 | 4,207 | 3,667 | 3,667 | 3,667 | |||||||||||||||||||||||||||
| Collateral finance and securitization notes | — | — | 152 | 166 | 180 | |||||||||||||||||||||||||||
| Total liabilities | 80,471 | 78,962 | 78,680 | 80,489 | 79,161 | |||||||||||||||||||||||||||
| Equity: | ||||||||||||||||||||||||||||||||
| Common stock, at par value | 1 | 1 | 1 | 1 | 1 | |||||||||||||||||||||||||||
| Additional paid-in-capital | 2,502 | 2,493 | 2,478 | 2,465 | 2,461 | |||||||||||||||||||||||||||
| Retained earnings | 8,967 | 8,820 | 8,592 | 8,446 | 8,563 | |||||||||||||||||||||||||||
| Treasury stock | (1,720) | (1,697) | (1,673) | (1,675) | (1,653) | |||||||||||||||||||||||||||
| Accumulated other comprehensive income (AOCI): | ||||||||||||||||||||||||||||||||
| Accumulated currency translation adjustment, net of income taxes | (171) | (216) | (39) | 4 | (9) | |||||||||||||||||||||||||||
| Unrealized appreciation of securities, net of income taxes | (5,407) | (5,697) | (3,469) | (9) | 3,701 | |||||||||||||||||||||||||||
| Pension and postretirement benefits, net of income taxes | (27) | (51) | (51) | (50) | (50) | |||||||||||||||||||||||||||
| Total RGA, Inc. stockholders’ equity | 4,145 | 3,653 | 5,839 | 9,182 | 13,014 | |||||||||||||||||||||||||||
| Noncontrolling interest | 90 | 90 | 90 | 90 | — | |||||||||||||||||||||||||||
| Total equity | 4,235 | 3,743 | 5,929 | 9,272 | 13,014 | |||||||||||||||||||||||||||
| Total liabilities and equity | $ | 84,706 | $ | 82,705 | $ | 84,609 | $ | 89,761 | $ | 92,175 | ||||||||||||||||||||||
| Total RGA, Inc. stockholders’ equity, excluding AOCI | $ | 9,750 | $ | 9,617 | $ | 9,398 | $ | 9,237 | $ | 9,372 | ||||||||||||||||||||||
| See appendix for reconciliation of total stockholders' equity before and after impact of AOCI. | ||||||||||||||||||||||||||||||||
|
Page 6
|
|||||||
| Reinsurance Group of America, Incorporated | ||||||||||||||||||||||||||||||||||||||||||||||||||||||||||||||
| U.S. and Latin America Traditional | ||||||||||||||||||||||||||||||||||||||||||||||||||||||||||||||
| GAAP Income Statements | ||||||||||||||||||||||||||||||||||||||||||||||||||||||||||||||
| (USD millions) | ||||||||||||||||||||||||||||||||||||||||||||||||||||||||||||||
| Three Months Ended | Current Qtr | Year-to-Date | ||||||||||||||||||||||||||||||||||||||||||||||||||||||||||||
| Dec. 31, | Sept. 30, | June 30, | March 31, | Dec. 31, | vs. PY | Dec. 31, | Dec. 31, | |||||||||||||||||||||||||||||||||||||||||||||||||||||||
| 2022 | 2022 | 2022 | 2022 | 2021 | Quarter | 2022 | 2021 | Change | ||||||||||||||||||||||||||||||||||||||||||||||||||||||
| Revenues: | ||||||||||||||||||||||||||||||||||||||||||||||||||||||||||||||
| Net premiums | $ | 1,778 | $ | 1,640 | $ | 1,631 | $ | 1,541 | $ | 1,697 | $ | 81 | $ | 6,590 | $ | 6,244 | $ | 346 | ||||||||||||||||||||||||||||||||||||||||||||
| Net investment income | 238 | 214 | 209 | 304 | 245 | (7) | 965 | 930 | 35 | |||||||||||||||||||||||||||||||||||||||||||||||||||||
| Investment related gains (losses), net | 6 | 8 | 19 | 15 | 4 | 2 | 48 | 6 | 42 | |||||||||||||||||||||||||||||||||||||||||||||||||||||
| Other revenue | 5 | 5 | 9 | 7 | 4 | 1 | 26 | 18 | 8 | |||||||||||||||||||||||||||||||||||||||||||||||||||||
| Total revenues | 2,027 | 1,867 | 1,868 | 1,867 | 1,950 | 77 | 7,629 | 7,198 | 431 | |||||||||||||||||||||||||||||||||||||||||||||||||||||
| Benefits and expenses: | ||||||||||||||||||||||||||||||||||||||||||||||||||||||||||||||
| Claims and other policy benefits | 1,713 | 1,398 | 1,389 | 1,765 | 1,892 | (179) | 6,265 | 6,720 | (455) | |||||||||||||||||||||||||||||||||||||||||||||||||||||
| Interest credited | 18 | 18 | 17 | 17 | 18 | — | 70 | 70 | — | |||||||||||||||||||||||||||||||||||||||||||||||||||||
| Policy acquisition costs and other insurance expenses | 223 | 203 | 208 | 208 | 209 | 14 | 842 | 792 | 50 | |||||||||||||||||||||||||||||||||||||||||||||||||||||
| Other operating expenses | 52 | 44 | 45 | 43 | 42 | 10 | 184 | 156 | 28 | |||||||||||||||||||||||||||||||||||||||||||||||||||||
| Total benefits and expenses | 2,006 | 1,663 | 1,659 | 2,033 | 2,161 | (155) | 7,361 | 7,738 | (377) | |||||||||||||||||||||||||||||||||||||||||||||||||||||
| Income (loss) before income taxes | $ | 21 | $ | 204 | $ | 209 | $ | (166) | $ | (211) | $ | 232 | $ | 268 | $ | (540) | $ | 808 | ||||||||||||||||||||||||||||||||||||||||||||
| Loss and expense ratios: | ||||||||||||||||||||||||||||||||||||||||||||||||||||||||||||||
| Claims and other policy benefits | 96.3 | % | 85.2 | % | 85.2 | % | 114.5 | % | 111.5 | % | (15.2) | % | 95.1 | % | 107.6 | % | (12.5) | % | ||||||||||||||||||||||||||||||||||||||||||||
| Policy acquisition costs and other insurance expenses | 12.5 | % | 12.4 | % | 12.8 | % | 13.5 | % | 12.3 | % | 0.2 | % | 12.8 | % | 12.7 | % | 0.1 | % | ||||||||||||||||||||||||||||||||||||||||||||
| Other operating expenses | 2.9 | % | 2.7 | % | 2.8 | % | 2.8 | % | 2.5 | % | 0.4 | % | 2.8 | % | 2.5 | % | 0.3 | % | ||||||||||||||||||||||||||||||||||||||||||||
Foreign currency effect on (1): |
||||||||||||||||||||||||||||||||||||||||||||||||||||||||||||||
| Net premiums | $ | 1 | $ | — | $ | 1 | $ | — | $ | — | $ | 1 | $ | 2 | $ | 3 | $ | (1) | ||||||||||||||||||||||||||||||||||||||||||||
| Income (loss) before income taxes | $ | — | $ | — | $ | — | $ | — | $ | 1 | $ | (1) | $ | — | $ | — | $ | — | ||||||||||||||||||||||||||||||||||||||||||||
| See appendix for reconciliation of GAAP income before income taxes to adjusted operating income before income taxes. | ||||||||||||||||||||||||||||||||||||||||||||||||||||||||||||||
| (1) Compared to comparable prior year period. | ||||||||||||||||||||||||||||||||||||||||||||||||||||||||||||||
|
Page 7
|
|||||||
| Reinsurance Group of America, Incorporated | ||||||||||||||||||||||||||||||||||||||||||||||||||||||||||||||
| U.S. and Latin America Traditional | ||||||||||||||||||||||||||||||||||||||||||||||||||||||||||||||
| Adjusted Operating Income Statements | ||||||||||||||||||||||||||||||||||||||||||||||||||||||||||||||
| (USD millions) | ||||||||||||||||||||||||||||||||||||||||||||||||||||||||||||||
| Three Months Ended | Current | Year-to-Date | ||||||||||||||||||||||||||||||||||||||||||||||||||||||||||||
| Dec. 31, | Sept. 30, | June 30, | March 31, | Dec. 31, | Qtr vs. PY | Dec. 31, | Dec. 31, | |||||||||||||||||||||||||||||||||||||||||||||||||||||||
| 2022 | 2022 | 2022 | 2022 | 2021 | Quarter | 2022 | 2021 | Change | ||||||||||||||||||||||||||||||||||||||||||||||||||||||
| Revenues: | ||||||||||||||||||||||||||||||||||||||||||||||||||||||||||||||
| Net premiums | $ | 1,778 | $ | 1,640 | $ | 1,631 | $ | 1,541 | $ | 1,697 | $ | 81 | $ | 6,590 | $ | 6,244 | $ | 346 | ||||||||||||||||||||||||||||||||||||||||||||
| Net investment income | 238 | 214 | 209 | 304 | 245 | (7) | 965 | 930 | 35 | |||||||||||||||||||||||||||||||||||||||||||||||||||||
| Other revenue | 5 | 5 | 9 | 7 | 4 | 1 | 26 | 18 | 8 | |||||||||||||||||||||||||||||||||||||||||||||||||||||
| Total revenues | 2,021 | 1,859 | 1,849 | 1,852 | 1,946 | 75 | 7,581 | 7,192 | 389 | |||||||||||||||||||||||||||||||||||||||||||||||||||||
| Benefits and expenses: | ||||||||||||||||||||||||||||||||||||||||||||||||||||||||||||||
| Claims and other policy benefits | 1,713 | 1,398 | 1,389 | 1,765 | 1,892 | (179) | 6,265 | 6,720 | (455) | |||||||||||||||||||||||||||||||||||||||||||||||||||||
| Interest credited | 18 | 18 | 17 | 17 | 18 | — | 70 | 70 | — | |||||||||||||||||||||||||||||||||||||||||||||||||||||
| Policy acquisition costs and other insurance expenses | 223 | 203 | 208 | 208 | 209 | 14 | 842 | 792 | 50 | |||||||||||||||||||||||||||||||||||||||||||||||||||||
| Other operating expenses | 52 | 44 | 45 | 43 | 42 | 10 | 184 | 156 | 28 | |||||||||||||||||||||||||||||||||||||||||||||||||||||
| Total benefits and expenses | 2,006 | 1,663 | 1,659 | 2,033 | 2,161 | (155) | 7,361 | 7,738 | (377) | |||||||||||||||||||||||||||||||||||||||||||||||||||||
| Adjusted operating income (loss) before income taxes | $ | 15 | $ | 196 | $ | 190 | $ | (181) | $ | (215) | $ | 230 | $ | 220 | $ | (546) | $ | 766 | ||||||||||||||||||||||||||||||||||||||||||||
| Loss and expense ratios: | ||||||||||||||||||||||||||||||||||||||||||||||||||||||||||||||
| Claims and other policy benefits | 96.3 | % | 85.2 | % | 85.2 | % | 114.5 | % | 111.5 | % | (15.2) | % | 95.1 | % | 107.6 | % | (12.5) | % | ||||||||||||||||||||||||||||||||||||||||||||
| Policy acquisition costs and other insurance expenses | 12.5 | % | 12.4 | % | 12.8 | % | 13.5 | % | 12.3 | % | 0.2 | % | 12.8 | % | 12.7 | % | 0.1 | % | ||||||||||||||||||||||||||||||||||||||||||||
| Other operating expenses | 2.9 | % | 2.7 | % | 2.8 | % | 2.8 | % | 2.5 | % | 0.4 | % | 2.8 | % | 2.5 | % | 0.3 | % | ||||||||||||||||||||||||||||||||||||||||||||
Foreign currency effect on (1): |
||||||||||||||||||||||||||||||||||||||||||||||||||||||||||||||
| Net premiums | $ | 1 | $ | — | $ | 1 | $ | — | $ | — | $ | 1 | $ | 2 | $ | 3 | $ | (1) | ||||||||||||||||||||||||||||||||||||||||||||
| Adjusted operating income (loss) before income taxes | $ | — | $ | — | $ | — | $ | — | $ | 1 | $ | (1) | $ | — | $ | — | $ | — | ||||||||||||||||||||||||||||||||||||||||||||
| See appendix for reconciliation of GAAP income before income taxes to adjusted operating income before income taxes. | ||||||||||||||||||||||||||||||||||||||||||||||||||||||||||||||
| (1) Compared to comparable prior year period. | ||||||||||||||||||||||||||||||||||||||||||||||||||||||||||||||
|
Page 8
|
|||||||
| Reinsurance Group of America, Incorporated | ||||||||||||||||||||||||||||||||||||||||||||||||||||||||||||||
| U.S. and Latin America Financial Solutions - Asset-Intensive | ||||||||||||||||||||||||||||||||||||||||||||||||||||||||||||||
| GAAP Income Statements | ||||||||||||||||||||||||||||||||||||||||||||||||||||||||||||||
| (USD millions) | ||||||||||||||||||||||||||||||||||||||||||||||||||||||||||||||
| Three Months Ended | Current Qtr | Year-to-Date | ||||||||||||||||||||||||||||||||||||||||||||||||||||||||||||
| Dec. 31, | Sept. 30, | June 30, | March 31, | Dec. 31, | vs. PY | Dec. 31, | Dec. 31, | |||||||||||||||||||||||||||||||||||||||||||||||||||||||
| 2022 | 2022 | 2022 | 2022 | 2021 | Quarter | 2022 | 2021 | Change | ||||||||||||||||||||||||||||||||||||||||||||||||||||||
| Revenues: | ||||||||||||||||||||||||||||||||||||||||||||||||||||||||||||||
| Net premiums | $ | 24 | $ | 13 | $ | 14 | $ | 15 | $ | 13 | $ | 11 | $ | 66 | $ | 55 | $ | 11 | ||||||||||||||||||||||||||||||||||||||||||||
| Net investment income | 292 | 270 | 251 | 262 | 264 | 28 | 1,075 | 1,087 | (12) | |||||||||||||||||||||||||||||||||||||||||||||||||||||
| Investment related gains (losses), net | (114) | (22) | (93) | (80) | 36 | (150) | (309) | 72 | (381) | |||||||||||||||||||||||||||||||||||||||||||||||||||||
| Other revenue | 26 | 29 | 31 | 27 | 26 | — | 113 | 168 | (55) | |||||||||||||||||||||||||||||||||||||||||||||||||||||
| Total revenues | 228 | 290 | 203 | 224 | 339 | (111) | 945 | 1,382 | (437) | |||||||||||||||||||||||||||||||||||||||||||||||||||||
| Benefits and expenses: | ||||||||||||||||||||||||||||||||||||||||||||||||||||||||||||||
| Claims and other policy benefits | 49 | 42 | 42 | 48 | 37 | 12 | 181 | 166 | 15 | |||||||||||||||||||||||||||||||||||||||||||||||||||||
| Interest credited | 147 | 130 | 101 | 107 | 120 | 27 | 485 | 565 | (80) | |||||||||||||||||||||||||||||||||||||||||||||||||||||
| Policy acquisition costs and other insurance expenses | 17 | 58 | 59 | 40 | 79 | (62) | 174 | 192 | (18) | |||||||||||||||||||||||||||||||||||||||||||||||||||||
| Other operating expenses | 13 | 12 | 12 | 9 | 10 | 3 | 46 | 37 | 9 | |||||||||||||||||||||||||||||||||||||||||||||||||||||
| Total benefits and expenses | 226 | 242 | 214 | 204 | 246 | (20) | 886 | 960 | (74) | |||||||||||||||||||||||||||||||||||||||||||||||||||||
| Income (loss) before income taxes | $ | 2 | $ | 48 | $ | (11) | $ | 20 | $ | 93 | $ | (91) | $ | 59 | $ | 422 | $ | (363) | ||||||||||||||||||||||||||||||||||||||||||||
| See appendix for reconciliation of GAAP income before income taxes to adjusted operating income before income taxes. | ||||||||||||||||||||||||||||||||||||||||||||||||||||||||||||||
|
Page 9
|
|||||||
| Reinsurance Group of America, Incorporated | ||||||||||||||||||||||||||||||||||||||||||||||||||||||||||||||
| U.S. and Latin America Financial Solutions - Asset-Intensive | ||||||||||||||||||||||||||||||||||||||||||||||||||||||||||||||
| Adjusted Operating Income Statements | ||||||||||||||||||||||||||||||||||||||||||||||||||||||||||||||
| (USD millions) | ||||||||||||||||||||||||||||||||||||||||||||||||||||||||||||||
| Three Months Ended | Current Qtr | Year-to-Date | ||||||||||||||||||||||||||||||||||||||||||||||||||||||||||||
| Dec. 31, | Sept. 30, | June 30, | March 31, | Dec. 31, | vs. PY | Dec. 31, | Dec. 31, | |||||||||||||||||||||||||||||||||||||||||||||||||||||||
| 2022 | 2022 | 2022 | 2022 | 2021 | Quarter | 2022 | 2021 | Change | ||||||||||||||||||||||||||||||||||||||||||||||||||||||
| Revenues: | ||||||||||||||||||||||||||||||||||||||||||||||||||||||||||||||
| Net premiums | $ | 24 | $ | 13 | $ | 14 | $ | 15 | $ | 13 | $ | 11 | $ | 66 | $ | 55 | $ | 11 | ||||||||||||||||||||||||||||||||||||||||||||
| Net investment income | 291 | 270 | 254 | 264 | 264 | 27 | 1,079 | 1,086 | (7) | |||||||||||||||||||||||||||||||||||||||||||||||||||||
| Other revenue | 26 | 29 | 32 | 27 | 25 | 1 | 114 | 167 | (53) | |||||||||||||||||||||||||||||||||||||||||||||||||||||
| Total revenues | 341 | 312 | 300 | 306 | 302 | 39 | 1,259 | 1,308 | (49) | |||||||||||||||||||||||||||||||||||||||||||||||||||||
| Benefits and expenses: | ||||||||||||||||||||||||||||||||||||||||||||||||||||||||||||||
| Claims and other policy benefits | 49 | 42 | 42 | 48 | 37 | 12 | 181 | 166 | 15 | |||||||||||||||||||||||||||||||||||||||||||||||||||||
| Interest credited | 146 | 140 | 128 | 124 | 129 | 17 | 538 | 610 | (72) | |||||||||||||||||||||||||||||||||||||||||||||||||||||
| Policy acquisition costs and other insurance expenses | 53 | 46 | 52 | 50 | 53 | — | 201 | 154 | 47 | |||||||||||||||||||||||||||||||||||||||||||||||||||||
| Other operating expenses | 13 | 12 | 12 | 9 | 10 | 3 | 46 | 37 | 9 | |||||||||||||||||||||||||||||||||||||||||||||||||||||
| Total benefits and expenses | 261 | 240 | 234 | 231 | 229 | 32 | 966 | 967 | (1) | |||||||||||||||||||||||||||||||||||||||||||||||||||||
| Adjusted operating income before income taxes | $ | 80 | $ | 72 | $ | 66 | $ | 75 | $ | 73 | $ | 7 | $ | 293 | $ | 341 | $ | (48) | ||||||||||||||||||||||||||||||||||||||||||||
| See appendix for reconciliation of GAAP income before income taxes to adjusted operating income before income taxes. | ||||||||||||||||||||||||||||||||||||||||||||||||||||||||||||||
|
Page 10
|
|||||||
| Reinsurance Group of America, Incorporated | ||||||||||||||||||||||||||||||||
| U.S. and Latin America Financial Solutions - Asset-Intensive | ||||||||||||||||||||||||||||||||
| (Continued) | ||||||||||||||||||||||||||||||||
| Three Months Ended | ||||||||||||||||||||||||||||||||
| (USD millions, shown net of reinsurance ceded) | Dec. 31, | Sept. 30, | June 30, | March 31, | Dec. 31, | |||||||||||||||||||||||||||
| 2022 | 2022 | 2022 | 2022 | 2021 | ||||||||||||||||||||||||||||
| Annuity account values: | ||||||||||||||||||||||||||||||||
| Fixed annuities (deferred) | $ | 12,190 | $ | 12,408 | $ | 12,084 | $ | 11,693 | $ | 11,858 | ||||||||||||||||||||||
| Net interest spread (fixed annuities) | 1.8 | % | 1.5 | % | 1.3 | % | 2.0 | % | 1.4 | % | ||||||||||||||||||||||
| Equity-indexed annuities | $ | 2,861 | $ | 2,952 | $ | 3,017 | $ | 3,114 | $ | 3,213 | ||||||||||||||||||||||
| Variable annuities account values | ||||||||||||||||||||||||||||||||
| No riders | $ | 672 | $ | 642 | $ | 705 | $ | 786 | $ | 844 | ||||||||||||||||||||||
| GMDB only | 771 | 802 | 811 | 891 | 960 | |||||||||||||||||||||||||||
| GMIB only | 20 | 19 | 20 | 23 | 25 | |||||||||||||||||||||||||||
| GMAB only | 2 | 2 | 2 | 3 | 3 | |||||||||||||||||||||||||||
| GMWB only | 863 | 833 | 916 | 1,035 | 1,130 | |||||||||||||||||||||||||||
| GMDB / WB | 165 | 158 | 174 | 240 | 264 | |||||||||||||||||||||||||||
| Other | 15 | 15 | 16 | 18 | 19 | |||||||||||||||||||||||||||
| Total variable annuities account values | $ | 2,508 | $ | 2,471 | $ | 2,644 | $ | 2,996 | $ | 3,245 | ||||||||||||||||||||||
| Fair value of liabilities associated with living benefit riders | $ | 124 | $ | 139 | $ | 160 | $ | 148 | $ | 162 | ||||||||||||||||||||||
| Interest-sensitive contract liabilities associated with: | ||||||||||||||||||||||||||||||||
| Guaranteed investment contracts | $ | 613 | $ | 623 | $ | 712 | $ | 656 | $ | 656 | ||||||||||||||||||||||
| Bank-owned life insurance (BOLI) | $ | 2,500 | $ | 2,508 | $ | 2,505 | $ | 2,499 | $ | 2,492 | ||||||||||||||||||||||
| Other asset-intensive business | $ | 110 | $ | 111 | $ | 112 | $ | 114 | $ | 115 | ||||||||||||||||||||||
| Future policy benefits associated with: | ||||||||||||||||||||||||||||||||
| Payout annuities | $ | 4,021 | $ | 4,081 | $ | 4,160 | $ | 4,218 | $ | 4,274 | ||||||||||||||||||||||
|
Page 11
|
|||||||
| Reinsurance Group of America, Incorporated | ||||||||||||||||||||||||||||||||||||||||||||||||||||||||||||||
| U.S. and Latin America Financial Solutions - Capital Solutions | ||||||||||||||||||||||||||||||||||||||||||||||||||||||||||||||
| GAAP Income Statements | ||||||||||||||||||||||||||||||||||||||||||||||||||||||||||||||
| (USD millions) | ||||||||||||||||||||||||||||||||||||||||||||||||||||||||||||||
| Three Months Ended | Current Qtr | Year-to-Date | ||||||||||||||||||||||||||||||||||||||||||||||||||||||||||||
| Dec. 31, | Sept. 30, | June 30, | March 31, | Dec. 31, | vs. PY | Dec. 31, | Dec. 31, | |||||||||||||||||||||||||||||||||||||||||||||||||||||||
| 2022 | 2022 | 2022 | 2022 | 2021 | Quarter | 2022 | 2021 | Change | ||||||||||||||||||||||||||||||||||||||||||||||||||||||
| Revenues: | ||||||||||||||||||||||||||||||||||||||||||||||||||||||||||||||
| Net investment income | $ | 1 | $ | — | $ | 1 | $ | 1 | $ | — | $ | 1 | $ | 3 | $ | 2 | $ | 1 | ||||||||||||||||||||||||||||||||||||||||||||
| Other revenue | 26 | 25 | 74 | 27 | 28 | (2) | 152 | 108 | 44 | |||||||||||||||||||||||||||||||||||||||||||||||||||||
| Total revenues | 27 | 25 | 75 | 28 | 28 | (1) | 155 | 110 | 45 | |||||||||||||||||||||||||||||||||||||||||||||||||||||
| Benefits and expenses: | ||||||||||||||||||||||||||||||||||||||||||||||||||||||||||||||
| Policy acquisition costs and other insurance expenses | 1 | — | 1 | 1 | — | 1 | 3 | 4 | (1) | |||||||||||||||||||||||||||||||||||||||||||||||||||||
| Other operating expenses | 4 | 3 | 2 | 3 | 3 | 1 | 12 | 13 | (1) | |||||||||||||||||||||||||||||||||||||||||||||||||||||
| Total benefits and expenses | 5 | 3 | 3 | 4 | 3 | 2 | 15 | 17 | (2) | |||||||||||||||||||||||||||||||||||||||||||||||||||||
| Income before income taxes | $ | 22 | $ | 22 | $ | 72 | $ | 24 | $ | 25 | $ | (3) | $ | 140 | $ | 93 | $ | 47 | ||||||||||||||||||||||||||||||||||||||||||||
| See appendix for reconciliation of GAAP income before income taxes to adjusted operating income before income taxes. | ||||||||||||||||||||||||||||||||||||||||||||||||||||||||||||||
|
Page 12
|
|||||||
| Reinsurance Group of America, Incorporated | ||||||||||||||||||||||||||||||||||||||||||||||||||||||||||||||
| U.S. and Latin America Financial Solutions - Capital Solutions | ||||||||||||||||||||||||||||||||||||||||||||||||||||||||||||||
| Adjusted Operating Income Statements | ||||||||||||||||||||||||||||||||||||||||||||||||||||||||||||||
| (USD millions) | ||||||||||||||||||||||||||||||||||||||||||||||||||||||||||||||
| Three Months Ended | Current Qtr | Year-to-Date | ||||||||||||||||||||||||||||||||||||||||||||||||||||||||||||
| Dec. 31, | Sept. 30, | June 30, | March 31, | Dec. 31, | vs. PY | Dec. 31, | Dec. 31, | |||||||||||||||||||||||||||||||||||||||||||||||||||||||
| 2022 | 2022 | 2022 | 2022 | 2021 | Quarter | 2022 | 2021 | Change | ||||||||||||||||||||||||||||||||||||||||||||||||||||||
| Revenues: | ||||||||||||||||||||||||||||||||||||||||||||||||||||||||||||||
| Net investment income | $ | 1 | $ | — | $ | 1 | $ | 1 | $ | — | $ | 1 | $ | 3 | $ | 2 | $ | 1 | ||||||||||||||||||||||||||||||||||||||||||||
| Other revenue | 26 | 25 | 74 | 27 | 28 | (2) | 152 | 108 | 44 | |||||||||||||||||||||||||||||||||||||||||||||||||||||
| Total revenues | 27 | 25 | 75 | 28 | 28 | (1) | 155 | 110 | 45 | |||||||||||||||||||||||||||||||||||||||||||||||||||||
| Benefits and expenses: | ||||||||||||||||||||||||||||||||||||||||||||||||||||||||||||||
| Policy acquisition costs and other insurance expenses | 1 | — | 1 | 1 | — | 1 | 3 | 4 | (1) | |||||||||||||||||||||||||||||||||||||||||||||||||||||
| Other operating expenses | 4 | 3 | 2 | 3 | 3 | 1 | 12 | 13 | (1) | |||||||||||||||||||||||||||||||||||||||||||||||||||||
| Total benefits and expenses | 5 | 3 | 3 | 4 | 3 | 2 | 15 | 17 | (2) | |||||||||||||||||||||||||||||||||||||||||||||||||||||
| Adjusted operating income before income taxes | $ | 22 | $ | 22 | $ | 72 | $ | 24 | $ | 25 | $ | (3) | $ | 140 | $ | 93 | $ | 47 | ||||||||||||||||||||||||||||||||||||||||||||
| See appendix for reconciliation of GAAP income before income taxes to adjusted operating income before income taxes. | ||||||||||||||||||||||||||||||||||||||||||||||||||||||||||||||
|
Page 13
|
|||||||
| Reinsurance Group of America, Incorporated | ||||||||||||||||||||||||||||||||||||||||||||||||||||||||||||||
| Canada Traditional | ||||||||||||||||||||||||||||||||||||||||||||||||||||||||||||||
| GAAP Income Statements | ||||||||||||||||||||||||||||||||||||||||||||||||||||||||||||||
| (USD millions) | ||||||||||||||||||||||||||||||||||||||||||||||||||||||||||||||
| Three Months Ended | Current Qtr | Year-to-Date | ||||||||||||||||||||||||||||||||||||||||||||||||||||||||||||
| Dec. 31, | Sept. 30, | June 30, | March 31, | Dec. 31, | vs. PY | Dec. 31, | Dec. 31, | |||||||||||||||||||||||||||||||||||||||||||||||||||||||
| 2022 | 2022 | 2022 | 2022 | 2021 | Quarter | 2022 | 2021 | Change | ||||||||||||||||||||||||||||||||||||||||||||||||||||||
| Revenues: | ||||||||||||||||||||||||||||||||||||||||||||||||||||||||||||||
| Net premiums | $ | 308 | $ | 293 | $ | 314 | $ | 304 | $ | 324 | $ | (16) | $ | 1,219 | $ | 1,194 | $ | 25 | ||||||||||||||||||||||||||||||||||||||||||||
| Net investment income | 62 | 63 | 58 | 55 | 60 | 2 | 238 | 248 | (10) | |||||||||||||||||||||||||||||||||||||||||||||||||||||
| Investment related gains (losses), net | 5 | 2 | (6) | 1 | — | 5 | 2 | 3 | (1) | |||||||||||||||||||||||||||||||||||||||||||||||||||||
| Other revenue | 3 | — | 1 | 2 | 1 | 2 | 6 | 3 | 3 | |||||||||||||||||||||||||||||||||||||||||||||||||||||
| Total revenues | 378 | 358 | 367 | 362 | 385 | (7) | 1,465 | 1,448 | 17 | |||||||||||||||||||||||||||||||||||||||||||||||||||||
| Benefits and expenses: | ||||||||||||||||||||||||||||||||||||||||||||||||||||||||||||||
| Claims and other policy benefits | 293 | 270 | 295 | 300 | 298 | (5) | 1,158 | 1,096 | 62 | |||||||||||||||||||||||||||||||||||||||||||||||||||||
| Policy acquisition costs and other insurance expenses | 42 | 46 | 46 | 46 | 50 | (8) | 180 | 187 | (7) | |||||||||||||||||||||||||||||||||||||||||||||||||||||
| Other operating expenses | 11 | 10 | 10 | 10 | 9 | 2 | 41 | 37 | 4 | |||||||||||||||||||||||||||||||||||||||||||||||||||||
| Total benefits and expenses | 346 | 326 | 351 | 356 | 357 | (11) | 1,379 | 1,320 | 59 | |||||||||||||||||||||||||||||||||||||||||||||||||||||
| Income before income taxes | $ | 32 | $ | 32 | $ | 16 | $ | 6 | $ | 28 | $ | 4 | $ | 86 | $ | 128 | $ | (42) | ||||||||||||||||||||||||||||||||||||||||||||
| Loss and expense ratios: | ||||||||||||||||||||||||||||||||||||||||||||||||||||||||||||||
| Claims and other policy benefits | 95.1 | % | 92.2 | % | 93.9 | % | 98.7 | % | 92.0 | % | 3.1 | % | 95.0 | % | 91.8 | % | 3.2 | % | ||||||||||||||||||||||||||||||||||||||||||||
| Policy acquisition costs and other insurance expenses | 13.6 | % | 15.7 | % | 14.6 | % | 15.1 | % | 15.4 | % | (1.8) | % | 14.8 | % | 15.7 | % | (0.9) | % | ||||||||||||||||||||||||||||||||||||||||||||
| Other operating expenses | 3.6 | % | 3.4 | % | 3.2 | % | 3.3 | % | 2.8 | % | 0.8 | % | 3.4 | % | 3.1 | % | 0.3 | % | ||||||||||||||||||||||||||||||||||||||||||||
Foreign currency effect on (1): |
||||||||||||||||||||||||||||||||||||||||||||||||||||||||||||||
| Net premiums | $ | (23) | $ | (11) | $ | (13) | $ | — | $ | 10 | $ | (33) | $ | (47) | $ | 76 | $ | (123) | ||||||||||||||||||||||||||||||||||||||||||||
| Income before income taxes | $ | (2) | $ | (1) | $ | (1) | $ | — | $ | — | $ | (2) | $ | (4) | $ | 6 | $ | (10) | ||||||||||||||||||||||||||||||||||||||||||||
| Creditor reinsurance net premiums | $ | 17 | $ | 18 | $ | 20 | $ | 18 | $ | 19 | $ | (2) | $ | 73 | $ | 74 | $ | (1) | ||||||||||||||||||||||||||||||||||||||||||||
| See appendix for reconciliation of GAAP income before income taxes to adjusted operating income before income taxes. | ||||||||||||||||||||||||||||||||||||||||||||||||||||||||||||||
| (1) Compared to comparable prior year period. | ||||||||||||||||||||||||||||||||||||||||||||||||||||||||||||||
|
Page 14
|
|||||||
| Reinsurance Group of America, Incorporated | ||||||||||||||||||||||||||||||||||||||||||||||||||||||||||||||
| Canada Traditional | ||||||||||||||||||||||||||||||||||||||||||||||||||||||||||||||
| Adjusted Operating Income Statements | ||||||||||||||||||||||||||||||||||||||||||||||||||||||||||||||
| (USD millions) | ||||||||||||||||||||||||||||||||||||||||||||||||||||||||||||||
| Three Months Ended | Current Qtr | Year-to-Date | ||||||||||||||||||||||||||||||||||||||||||||||||||||||||||||
| Dec. 31, | Sept. 30, | June 30, | March 31, | Dec. 31, | vs. PY | Dec. 31, | Dec. 31, | |||||||||||||||||||||||||||||||||||||||||||||||||||||||
| 2022 | 2022 | 2022 | 2022 | 2021 | Quarter | 2022 | 2021 | Change | ||||||||||||||||||||||||||||||||||||||||||||||||||||||
| Revenues: | ||||||||||||||||||||||||||||||||||||||||||||||||||||||||||||||
| Net premiums | $ | 308 | $ | 293 | $ | 314 | $ | 304 | $ | 324 | $ | (16) | $ | 1,219 | $ | 1,194 | $ | 25 | ||||||||||||||||||||||||||||||||||||||||||||
| Net investment income | 63 | 64 | 58 | 55 | 59 | 4 | 240 | 247 | (7) | |||||||||||||||||||||||||||||||||||||||||||||||||||||
| Investment related gains, net | — | 2 | 2 | — | 2 | (2) | 4 | 6 | (2) | |||||||||||||||||||||||||||||||||||||||||||||||||||||
| Other revenue | 3 | — | 1 | 2 | 1 | 2 | 6 | 3 | 3 | |||||||||||||||||||||||||||||||||||||||||||||||||||||
| Total revenues | 374 | 359 | 375 | 361 | 386 | (12) | 1,469 | 1,450 | 19 | |||||||||||||||||||||||||||||||||||||||||||||||||||||
| Benefits and expenses: | ||||||||||||||||||||||||||||||||||||||||||||||||||||||||||||||
| Claims and other policy benefits | 293 | 270 | 295 | 300 | 298 | (5) | 1,158 | 1,096 | 62 | |||||||||||||||||||||||||||||||||||||||||||||||||||||
| Policy acquisition costs and other insurance expenses | 42 | 46 | 46 | 46 | 50 | (8) | 180 | 187 | (7) | |||||||||||||||||||||||||||||||||||||||||||||||||||||
| Other operating expenses | 11 | 10 | 10 | 10 | 9 | 2 | 41 | 37 | 4 | |||||||||||||||||||||||||||||||||||||||||||||||||||||
| Total benefits and expenses | 346 | 326 | 351 | 356 | 357 | (11) | 1,379 | 1,320 | 59 | |||||||||||||||||||||||||||||||||||||||||||||||||||||
| Adjusted operating income before income taxes | $ | 28 | $ | 33 | $ | 24 | $ | 5 | $ | 29 | $ | (1) | $ | 90 | $ | 130 | $ | (40) | ||||||||||||||||||||||||||||||||||||||||||||
| Loss and expense ratios: | ||||||||||||||||||||||||||||||||||||||||||||||||||||||||||||||
| Claims and other policy benefits | 95.1 | % | 92.2 | % | 93.9 | % | 98.7 | % | 92.0 | % | 3.1 | % | 95.0 | % | 91.8 | % | 3.2 | % | ||||||||||||||||||||||||||||||||||||||||||||
| Policy acquisition costs and other insurance expenses | 13.6 | % | 15.7 | % | 14.6 | % | 15.1 | % | 15.4 | % | (1.8) | % | 14.8 | % | 15.7 | % | (0.9) | % | ||||||||||||||||||||||||||||||||||||||||||||
| Other operating expenses | 3.6 | % | 3.4 | % | 3.2 | % | 3.3 | % | 2.8 | % | 0.8 | % | 3.4 | % | 3.1 | % | 0.3 | % | ||||||||||||||||||||||||||||||||||||||||||||
Foreign currency effect on (1): |
||||||||||||||||||||||||||||||||||||||||||||||||||||||||||||||
| Net premiums | $ | (23) | $ | (11) | $ | (13) | $ | — | $ | 10 | $ | (33) | $ | (47) | $ | 76 | $ | (123) | ||||||||||||||||||||||||||||||||||||||||||||
| Adjusted operating income before income taxes | $ | (2) | $ | (1) | $ | (1) | $ | — | $ | — | $ | (2) | $ | (4) | $ | 6 | $ | (10) | ||||||||||||||||||||||||||||||||||||||||||||
| Creditor reinsurance net premiums | $ | 17 | $ | 18 | $ | 20 | $ | 18 | $ | 19 | $ | (2) | $ | 73 | $ | 74 | $ | (1) | ||||||||||||||||||||||||||||||||||||||||||||
| See appendix for reconciliation of GAAP income before income taxes to adjusted operating income before income taxes. | ||||||||||||||||||||||||||||||||||||||||||||||||||||||||||||||
| (1) Compared to comparable prior year period. | ||||||||||||||||||||||||||||||||||||||||||||||||||||||||||||||
|
Page 15
|
|||||||
| Reinsurance Group of America, Incorporated | ||||||||||||||||||||||||||||||||||||||||||||||||||||||||||||||
Canada Financial Solutions (1) | ||||||||||||||||||||||||||||||||||||||||||||||||||||||||||||||
| GAAP Income Statements | ||||||||||||||||||||||||||||||||||||||||||||||||||||||||||||||
| (USD millions) | ||||||||||||||||||||||||||||||||||||||||||||||||||||||||||||||
| Three Months Ended | Current Qtr | Year-to-Date | ||||||||||||||||||||||||||||||||||||||||||||||||||||||||||||
| Dec. 31, | Sept. 30, | June 30, | March 31, | Dec. 31, | vs. PY | Dec. 31, | Dec. 31, | |||||||||||||||||||||||||||||||||||||||||||||||||||||||
| 2022 | 2022 | 2022 | 2022 | 2021 | Quarter | 2022 | 2021 | Change | ||||||||||||||||||||||||||||||||||||||||||||||||||||||
| Revenues: | ||||||||||||||||||||||||||||||||||||||||||||||||||||||||||||||
| Net premiums | $ | 23 | $ | 24 | $ | 25 | $ | 23 | $ | 22 | $ | 1 | $ | 95 | $ | 90 | $ | 5 | ||||||||||||||||||||||||||||||||||||||||||||
| Net investment income | — | 1 | (1) | 1 | — | — | 1 | — | 1 | |||||||||||||||||||||||||||||||||||||||||||||||||||||
| Other revenue | 3 | 2 | 3 | 1 | 2 | 1 | 9 | 11 | (2) | |||||||||||||||||||||||||||||||||||||||||||||||||||||
| Total revenues | 26 | 27 | 27 | 25 | 24 | 2 | 105 | 101 | 4 | |||||||||||||||||||||||||||||||||||||||||||||||||||||
| Benefits and expenses: | ||||||||||||||||||||||||||||||||||||||||||||||||||||||||||||||
| Claims and other policy benefits | 14 | 21 | 22 | 11 | 17 | (3) | 68 | 79 | (11) | |||||||||||||||||||||||||||||||||||||||||||||||||||||
| Policy acquisition costs and other insurance expenses | — | 1 | — | 1 | 1 | (1) | 2 | 3 | (1) | |||||||||||||||||||||||||||||||||||||||||||||||||||||
| Other operating expenses | 1 | 1 | 1 | — | 1 | — | 3 | 4 | (1) | |||||||||||||||||||||||||||||||||||||||||||||||||||||
| Total benefits and expenses | 15 | 23 | 23 | 12 | 19 | (4) | 73 | 86 | (13) | |||||||||||||||||||||||||||||||||||||||||||||||||||||
| Income before income taxes | $ | 11 | $ | 4 | $ | 4 | $ | 13 | $ | 5 | $ | 6 | $ | 32 | $ | 15 | $ | 17 | ||||||||||||||||||||||||||||||||||||||||||||
Foreign currency effect on (2): |
||||||||||||||||||||||||||||||||||||||||||||||||||||||||||||||
| Net premiums | $ | (2) | $ | (1) | $ | (1) | $ | — | $ | 1 | $ | (3) | $ | (4) | $ | 6 | $ | (10) | ||||||||||||||||||||||||||||||||||||||||||||
| Income before income taxes | $ | (1) | $ | — | $ | — | $ | — | $ | 1 | $ | (2) | $ | (1) | $ | 1 | $ | (2) | ||||||||||||||||||||||||||||||||||||||||||||
| See appendix for reconciliation of GAAP income before income taxes to adjusted operating income before income taxes. | ||||||||||||||||||||||||||||||||||||||||||||||||||||||||||||||
| (1) Canada Financial Solutions operations includes longevity and fee-based transactions. | ||||||||||||||||||||||||||||||||||||||||||||||||||||||||||||||
| (2) Compared to comparable prior year period. | ||||||||||||||||||||||||||||||||||||||||||||||||||||||||||||||
|
Page 16
|
|||||||
| Reinsurance Group of America, Incorporated | ||||||||||||||||||||||||||||||||||||||||||||||||||||||||||||||
Canada Financial Solutions (1) | ||||||||||||||||||||||||||||||||||||||||||||||||||||||||||||||
| Adjusted Operating Income Statements | ||||||||||||||||||||||||||||||||||||||||||||||||||||||||||||||
| (USD millions) | ||||||||||||||||||||||||||||||||||||||||||||||||||||||||||||||
| Three Months Ended | Current Qtr | Year-to-Date | ||||||||||||||||||||||||||||||||||||||||||||||||||||||||||||
| Dec. 31, | Sept. 30, | June 30, | March 31, | Dec. 31, | vs. PY | Dec. 31, | Dec. 31, | |||||||||||||||||||||||||||||||||||||||||||||||||||||||
| 2022 | 2022 | 2022 | 2022 | 2021 | Quarter | 2022 | 2021 | Change | ||||||||||||||||||||||||||||||||||||||||||||||||||||||
| Revenues: | ||||||||||||||||||||||||||||||||||||||||||||||||||||||||||||||
| Net premiums | $ | 23 | $ | 24 | $ | 25 | $ | 23 | $ | 22 | $ | 1 | $ | 95 | $ | 90 | $ | 5 | ||||||||||||||||||||||||||||||||||||||||||||
| Net investment income | — | 1 | (1) | 1 | — | — | 1 | — | 1 | |||||||||||||||||||||||||||||||||||||||||||||||||||||
| Other revenue | 3 | 2 | 3 | 1 | 2 | 1 | 9 | 11 | (2) | |||||||||||||||||||||||||||||||||||||||||||||||||||||
| Total revenues | 26 | 27 | 27 | 25 | 24 | 2 | 105 | 101 | 4 | |||||||||||||||||||||||||||||||||||||||||||||||||||||
| Benefits and expenses: | ||||||||||||||||||||||||||||||||||||||||||||||||||||||||||||||
| Claims and other policy benefits | 14 | 21 | 22 | 11 | 17 | (3) | 68 | 79 | (11) | |||||||||||||||||||||||||||||||||||||||||||||||||||||
| Policy acquisition costs and other insurance expenses | — | 1 | — | 1 | 1 | (1) | 2 | 3 | (1) | |||||||||||||||||||||||||||||||||||||||||||||||||||||
| Other operating expenses | 1 | 1 | 1 | — | 1 | — | 3 | 4 | (1) | |||||||||||||||||||||||||||||||||||||||||||||||||||||
| Total benefits and expenses | 15 | 23 | 23 | 12 | 19 | (4) | 73 | 86 | (13) | |||||||||||||||||||||||||||||||||||||||||||||||||||||
| Adjusted operating income before income taxes | $ | 11 | $ | 4 | $ | 4 | $ | 13 | $ | 5 | $ | 6 | $ | 32 | $ | 15 | $ | 17 | ||||||||||||||||||||||||||||||||||||||||||||
Foreign currency effect on (2): |
||||||||||||||||||||||||||||||||||||||||||||||||||||||||||||||
| Net premiums | $ | (2) | $ | (1) | $ | (1) | $ | — | $ | 1 | $ | (3) | $ | (4) | $ | 6 | $ | (10) | ||||||||||||||||||||||||||||||||||||||||||||
| Adjusted operating income before income taxes | $ | (1) | $ | — | $ | — | $ | — | $ | — | $ | (1) | $ | (1) | $ | 1 | $ | (2) | ||||||||||||||||||||||||||||||||||||||||||||
| See appendix for reconciliation of GAAP income before income taxes to adjusted operating income before income taxes. | ||||||||||||||||||||||||||||||||||||||||||||||||||||||||||||||
| (1) Canada Financial Solutions operations includes longevity and fee-based transactions. | ||||||||||||||||||||||||||||||||||||||||||||||||||||||||||||||
| (2) Compared to comparable prior year period. | ||||||||||||||||||||||||||||||||||||||||||||||||||||||||||||||
|
Page 17
|
|||||||
| Reinsurance Group of America, Incorporated | ||||||||||||||||||||||||||||||||||||||||||||||||||||||||||||||
| Europe, Middle East and Africa Traditional | ||||||||||||||||||||||||||||||||||||||||||||||||||||||||||||||
| GAAP Income Statements | ||||||||||||||||||||||||||||||||||||||||||||||||||||||||||||||
| (USD millions) | ||||||||||||||||||||||||||||||||||||||||||||||||||||||||||||||
| Three Months Ended | Current Qtr | Year-to-Date | ||||||||||||||||||||||||||||||||||||||||||||||||||||||||||||
| Dec. 31, | Sept. 30, | June 30, | March 31, | Dec. 31, | vs. PY | Dec. 31, | Dec. 31, | |||||||||||||||||||||||||||||||||||||||||||||||||||||||
| 2022 | 2022 | 2022 | 2022 | 2021 | Quarter | 2022 | 2021 | Change | ||||||||||||||||||||||||||||||||||||||||||||||||||||||
| Revenues: | ||||||||||||||||||||||||||||||||||||||||||||||||||||||||||||||
| Net premiums | $ | 422 | $ | 436 | $ | 427 | $ | 451 | $ | 435 | $ | (13) | $ | 1,736 | $ | 1,738 | $ | (2) | ||||||||||||||||||||||||||||||||||||||||||||
| Net investment income | 24 | 21 | 22 | 22 | 22 | 2 | 89 | 88 | 1 | |||||||||||||||||||||||||||||||||||||||||||||||||||||
| Other revenue | 4 | — | (2) | 3 | — | 4 | 5 | 1 | 4 | |||||||||||||||||||||||||||||||||||||||||||||||||||||
| Total revenues | 450 | 457 | 447 | 476 | 457 | (7) | 1,830 | 1,827 | 3 | |||||||||||||||||||||||||||||||||||||||||||||||||||||
| Benefits and expenses: | ||||||||||||||||||||||||||||||||||||||||||||||||||||||||||||||
| Claims and other policy benefits | 375 | 394 | 377 | 427 | 464 | (89) | 1,573 | 1,829 | (256) | |||||||||||||||||||||||||||||||||||||||||||||||||||||
| Policy acquisition costs and other insurance expenses | 29 | 32 | 37 | 25 | 34 | (5) | 123 | 125 | (2) | |||||||||||||||||||||||||||||||||||||||||||||||||||||
| Other operating expenses | 33 | 30 | 31 | 30 | 27 | 6 | 124 | 112 | 12 | |||||||||||||||||||||||||||||||||||||||||||||||||||||
| Total benefits and expenses | 437 | 456 | 445 | 482 | 525 | (88) | 1,820 | 2,066 | (246) | |||||||||||||||||||||||||||||||||||||||||||||||||||||
| Income (loss) before income taxes | $ | 13 | $ | 1 | $ | 2 | $ | (6) | $ | (68) | $ | 81 | $ | 10 | $ | (239) | $ | 249 | ||||||||||||||||||||||||||||||||||||||||||||
| Loss and expense ratios: | ||||||||||||||||||||||||||||||||||||||||||||||||||||||||||||||
| Claims and other policy benefits | 88.9 | % | 90.4 | % | 88.3 | % | 94.7 | % | 106.7 | % | (17.8) | % | 90.6 | % | 105.2 | % | (14.6) | % | ||||||||||||||||||||||||||||||||||||||||||||
| Policy acquisition costs and other insurance expenses | 6.9 | % | 7.3 | % | 8.7 | % | 5.5 | % | 7.8 | % | (0.9) | % | 7.1 | % | 7.2 | % | (0.1) | % | ||||||||||||||||||||||||||||||||||||||||||||
| Other operating expenses | 7.8 | % | 6.9 | % | 7.3 | % | 6.7 | % | 6.2 | % | 1.6 | % | 7.1 | % | 6.4 | % | 0.7 | % | ||||||||||||||||||||||||||||||||||||||||||||
Foreign currency effect on (1): |
||||||||||||||||||||||||||||||||||||||||||||||||||||||||||||||
| Net premiums | $ | (53) | $ | (68) | $ | (46) | $ | (16) | $ | — | $ | (53) | $ | (183) | $ | 95 | $ | (278) | ||||||||||||||||||||||||||||||||||||||||||||
| Income (loss) before income taxes | $ | (1) | $ | (1) | $ | (1) | $ | 1 | $ | — | $ | (1) | $ | (2) | $ | (23) | $ | 21 | ||||||||||||||||||||||||||||||||||||||||||||
| Critical illness net premiums | $ | 33 | $ | 41 | $ | 36 | $ | 39 | $ | 42 | $ | (9) | $ | 149 | $ | 174 | $ | (25) | ||||||||||||||||||||||||||||||||||||||||||||
| See appendix for reconciliation of GAAP income before income taxes to adjusted operating income before income taxes. | ||||||||||||||||||||||||||||||||||||||||||||||||||||||||||||||
| (1) Compared to comparable prior year period. | ||||||||||||||||||||||||||||||||||||||||||||||||||||||||||||||
|
Page 18
|
|||||||
| Reinsurance Group of America, Incorporated | ||||||||||||||||||||||||||||||||||||||||||||||||||||||||||||||
| Europe, Middle East and Africa Traditional | ||||||||||||||||||||||||||||||||||||||||||||||||||||||||||||||
| Adjusted Operating Income Statements | ||||||||||||||||||||||||||||||||||||||||||||||||||||||||||||||
| (USD millions) | ||||||||||||||||||||||||||||||||||||||||||||||||||||||||||||||
| Three Months Ended | Current Qtr | Year-to-Date | ||||||||||||||||||||||||||||||||||||||||||||||||||||||||||||
| Dec. 31, | Sept. 30, | June 30, | March 31, | Dec. 31, | vs. PY | Dec. 31, | Dec. 31, | |||||||||||||||||||||||||||||||||||||||||||||||||||||||
| 2022 | 2022 | 2022 | 2022 | 2021 | Quarter | 2022 | 2021 | Change | ||||||||||||||||||||||||||||||||||||||||||||||||||||||
| Revenues: | ||||||||||||||||||||||||||||||||||||||||||||||||||||||||||||||
| Net premiums | $ | 422 | $ | 436 | $ | 427 | $ | 451 | $ | 435 | $ | (13) | $ | 1,736 | $ | 1,738 | $ | (2) | ||||||||||||||||||||||||||||||||||||||||||||
| Net investment income | 24 | 21 | 22 | 22 | 22 | 2 | 89 | 88 | 1 | |||||||||||||||||||||||||||||||||||||||||||||||||||||
| Other revenue | 4 | — | (2) | 3 | — | 4 | 5 | 1 | 4 | |||||||||||||||||||||||||||||||||||||||||||||||||||||
| Total revenues | 450 | 457 | 447 | 476 | 457 | (7) | 1,830 | 1,827 | 3 | |||||||||||||||||||||||||||||||||||||||||||||||||||||
| Benefits and expenses: | ||||||||||||||||||||||||||||||||||||||||||||||||||||||||||||||
| Claims and other policy benefits | 375 | 394 | 377 | 427 | 464 | (89) | 1,573 | 1,829 | (256) | |||||||||||||||||||||||||||||||||||||||||||||||||||||
| Policy acquisition costs and other insurance expenses | 29 | 32 | 37 | 25 | 34 | (5) | 123 | 125 | (2) | |||||||||||||||||||||||||||||||||||||||||||||||||||||
| Other operating expenses | 33 | 30 | 31 | 30 | 27 | 6 | 124 | 112 | 12 | |||||||||||||||||||||||||||||||||||||||||||||||||||||
| Total benefits and expenses | 437 | 456 | 445 | 482 | 525 | (88) | 1,820 | 2,066 | (246) | |||||||||||||||||||||||||||||||||||||||||||||||||||||
| Adjusted operating income (loss) before income taxes | $ | 13 | $ | 1 | $ | 2 | $ | (6) | $ | (68) | $ | 81 | $ | 10 | $ | (239) | $ | 249 | ||||||||||||||||||||||||||||||||||||||||||||
| Loss and expense ratios: | ||||||||||||||||||||||||||||||||||||||||||||||||||||||||||||||
| Claims and other policy benefits | 88.9 | % | 90.4 | % | 88.3 | % | 94.7 | % | 106.7 | % | (17.8) | % | 90.6 | % | 105.2 | % | (14.6) | % | ||||||||||||||||||||||||||||||||||||||||||||
| Policy acquisition costs and other insurance expenses | 6.9 | % | 7.3 | % | 8.7 | % | 5.5 | % | 7.8 | % | (0.9) | % | 7.1 | % | 7.2 | % | (0.1) | % | ||||||||||||||||||||||||||||||||||||||||||||
| Other operating expenses | 7.8 | % | 6.9 | % | 7.3 | % | 6.7 | % | 6.2 | % | 1.6 | % | 7.1 | % | 6.4 | % | 0.7 | % | ||||||||||||||||||||||||||||||||||||||||||||
Foreign currency effect on (1): |
||||||||||||||||||||||||||||||||||||||||||||||||||||||||||||||
| Net premiums | $ | (53) | $ | (68) | $ | (46) | $ | (16) | $ | — | $ | (53) | $ | (183) | $ | 95 | $ | (278) | ||||||||||||||||||||||||||||||||||||||||||||
| Adjusted operating income (loss) before income taxes | $ | (1) | $ | (1) | $ | (1) | $ | 1 | $ | — | $ | (1) | $ | (2) | $ | (23) | $ | 21 | ||||||||||||||||||||||||||||||||||||||||||||
| Critical illness net premiums | $ | 33 | $ | 41 | $ | 36 | $ | 39 | $ | 42 | $ | (9) | $ | 149 | $ | 174 | $ | (25) | ||||||||||||||||||||||||||||||||||||||||||||
| See appendix for reconciliation of GAAP income before income taxes to adjusted operating income before income taxes. | ||||||||||||||||||||||||||||||||||||||||||||||||||||||||||||||
| (1) Compared to comparable prior year period. | ||||||||||||||||||||||||||||||||||||||||||||||||||||||||||||||
|
Page 19
|
|||||||
| Reinsurance Group of America, Incorporated | ||||||||||||||||||||||||||||||||||||||||||||||||||||||||||||||
Europe, Middle East and Africa Financial Solutions (1) | ||||||||||||||||||||||||||||||||||||||||||||||||||||||||||||||
| GAAP Income Statements | ||||||||||||||||||||||||||||||||||||||||||||||||||||||||||||||
| (USD millions) | ||||||||||||||||||||||||||||||||||||||||||||||||||||||||||||||
| Three Months Ended | Current Qtr | Year-to-Date | ||||||||||||||||||||||||||||||||||||||||||||||||||||||||||||
| Dec. 31, | Sept. 30, | June 30, | March 31, | Dec. 31, | vs. PY | Dec. 31, | Dec. 31, | |||||||||||||||||||||||||||||||||||||||||||||||||||||||
| 2022 | 2022 | 2022 | 2022 | 2021 | Quarter | 2022 | 2021 | Change | ||||||||||||||||||||||||||||||||||||||||||||||||||||||
| Revenues: | ||||||||||||||||||||||||||||||||||||||||||||||||||||||||||||||
| Net premiums | $ | 127 | $ | 112 | $ | 119 | $ | 128 | $ | 91 | $ | 36 | $ | 486 | $ | 350 | $ | 136 | ||||||||||||||||||||||||||||||||||||||||||||
| Net investment income | 43 | 37 | 33 | 35 | 56 | (13) | 148 | 205 | (57) | |||||||||||||||||||||||||||||||||||||||||||||||||||||
| Investment related gains (losses), net | (11) | (9) | (22) | 16 | 8 | (19) | (26) | 49 | (75) | |||||||||||||||||||||||||||||||||||||||||||||||||||||
| Other revenue | 6 | 2 | 4 | 3 | 2 | 4 | 15 | 12 | 3 | |||||||||||||||||||||||||||||||||||||||||||||||||||||
| Total revenues | 165 | 142 | 134 | 182 | 157 | 8 | 623 | 616 | 7 | |||||||||||||||||||||||||||||||||||||||||||||||||||||
| Benefits and expenses: | ||||||||||||||||||||||||||||||||||||||||||||||||||||||||||||||
| Claims and other policy benefits | 103 | 104 | 94 | 91 | 60 | 43 | 392 | 254 | 138 | |||||||||||||||||||||||||||||||||||||||||||||||||||||
| Interest credited | (2) | (5) | (8) | (9) | 5 | (7) | (24) | 4 | (28) | |||||||||||||||||||||||||||||||||||||||||||||||||||||
| Policy acquisition costs and other insurance expenses | 1 | 1 | 2 | 1 | 5 | (4) | 5 | 10 | (5) | |||||||||||||||||||||||||||||||||||||||||||||||||||||
| Other operating expenses | 16 | 11 | 13 | 14 | 12 | 4 | 54 | 45 | 9 | |||||||||||||||||||||||||||||||||||||||||||||||||||||
| Total benefits and expenses | 118 | 111 | 101 | 97 | 82 | 36 | 427 | 313 | 114 | |||||||||||||||||||||||||||||||||||||||||||||||||||||
| Income before income taxes | $ | 47 | $ | 31 | $ | 33 | $ | 85 | $ | 75 | $ | (28) | $ | 196 | $ | 303 | $ | (107) | ||||||||||||||||||||||||||||||||||||||||||||
Foreign currency effect on (2): |
||||||||||||||||||||||||||||||||||||||||||||||||||||||||||||||
| Net premiums | $ | (17) | $ | (20) | $ | (14) | $ | (5) | $ | 1 | $ | (18) | $ | (56) | $ | 21 | $ | (77) | ||||||||||||||||||||||||||||||||||||||||||||
| Income before income taxes | $ | (6) | $ | (4) | $ | (4) | $ | (3) | $ | 1 | $ | (7) | $ | (17) | $ | 21 | $ | (38) | ||||||||||||||||||||||||||||||||||||||||||||
| See appendix for reconciliation of GAAP income before income taxes to adjusted operating income before income taxes. | ||||||||||||||||||||||||||||||||||||||||||||||||||||||||||||||
| (1) Europe, Middle East and Africa Financial Solutions operations includes longevity, asset-intensive and fee-based transactions. | ||||||||||||||||||||||||||||||||||||||||||||||||||||||||||||||
| (2) Compared to comparable prior year period. | ||||||||||||||||||||||||||||||||||||||||||||||||||||||||||||||
|
Page 20
|
|||||||
| Reinsurance Group of America, Incorporated | ||||||||||||||||||||||||||||||||||||||||||||||||||||||||||||||
Europe, Middle East and Africa Financial Solutions (1) | ||||||||||||||||||||||||||||||||||||||||||||||||||||||||||||||
| Adjusted Operating Income Statements | ||||||||||||||||||||||||||||||||||||||||||||||||||||||||||||||
| (USD millions) | ||||||||||||||||||||||||||||||||||||||||||||||||||||||||||||||
| Three Months Ended | Current Qtr | Year-to-Date | ||||||||||||||||||||||||||||||||||||||||||||||||||||||||||||
| Dec. 31, | Sept. 30, | June 30, | March 31, | Dec. 31, | vs. PY | Dec. 31, | Dec. 31, | |||||||||||||||||||||||||||||||||||||||||||||||||||||||
| 2022 | 2022 | 2022 | 2022 | 2021 | Quarter | 2022 | 2021 | Change | ||||||||||||||||||||||||||||||||||||||||||||||||||||||
| Revenues: | ||||||||||||||||||||||||||||||||||||||||||||||||||||||||||||||
| Net premiums | $ | 127 | $ | 112 | $ | 119 | $ | 128 | $ | 91 | $ | 36 | $ | 486 | $ | 350 | $ | 136 | ||||||||||||||||||||||||||||||||||||||||||||
| Net investment income | 46 | 46 | 47 | 50 | 51 | (5) | 189 | 198 | (9) | |||||||||||||||||||||||||||||||||||||||||||||||||||||
| Investment related gains (losses), net | 4 | 5 | 5 | 4 | 3 | 1 | 18 | 6 | 12 | |||||||||||||||||||||||||||||||||||||||||||||||||||||
| Other revenue | 6 | 2 | 4 | 3 | 2 | 4 | 15 | 12 | 3 | |||||||||||||||||||||||||||||||||||||||||||||||||||||
| Total revenues | 183 | 165 | 175 | 185 | 147 | 36 | 708 | 566 | 142 | |||||||||||||||||||||||||||||||||||||||||||||||||||||
| Benefits and expenses: | ||||||||||||||||||||||||||||||||||||||||||||||||||||||||||||||
| Claims and other policy benefits | 103 | 104 | 94 | 91 | 60 | 43 | 392 | 254 | 138 | |||||||||||||||||||||||||||||||||||||||||||||||||||||
| Interest credited | — | — | — | — | — | — | — | — | — | |||||||||||||||||||||||||||||||||||||||||||||||||||||
| Policy acquisition costs and other insurance expenses | 1 | 1 | 2 | 1 | 5 | (4) | 5 | 10 | (5) | |||||||||||||||||||||||||||||||||||||||||||||||||||||
| Other operating expenses | 16 | 11 | 13 | 14 | 12 | 4 | 54 | 45 | 9 | |||||||||||||||||||||||||||||||||||||||||||||||||||||
| Total benefits and expenses | 120 | 116 | 109 | 106 | 77 | 43 | 451 | 309 | 142 | |||||||||||||||||||||||||||||||||||||||||||||||||||||
| Adjusted operating income before income taxes | $ | 63 | $ | 49 | $ | 66 | $ | 79 | $ | 70 | $ | (7) | $ | 257 | $ | 257 | $ | — | ||||||||||||||||||||||||||||||||||||||||||||
Foreign currency effect on (2): |
||||||||||||||||||||||||||||||||||||||||||||||||||||||||||||||
| Net premiums | $ | (17) | $ | (20) | $ | (14) | $ | (5) | $ | 1 | $ | (18) | $ | (56) | $ | 21 | $ | (77) | ||||||||||||||||||||||||||||||||||||||||||||
| Adjusted operating income before income taxes | $ | (10) | $ | (8) | $ | (7) | $ | (3) | $ | 1 | $ | (11) | $ | (28) | $ | 18 | $ | (46) | ||||||||||||||||||||||||||||||||||||||||||||
| See appendix for reconciliation of GAAP income before income taxes to adjusted operating income before income taxes. | ||||||||||||||||||||||||||||||||||||||||||||||||||||||||||||||
| (1) Europe, Middle East and Africa Financial Solutions operations includes longevity, asset-intensive and fee-based transactions. | ||||||||||||||||||||||||||||||||||||||||||||||||||||||||||||||
| (2) Compared to comparable prior year period. | ||||||||||||||||||||||||||||||||||||||||||||||||||||||||||||||
|
Page 21
|
|||||||
| Reinsurance Group of America, Incorporated | ||||||||||||||||||||||||||||||||||||||||||||||||||||||||||||||
| Asia Pacific Traditional | ||||||||||||||||||||||||||||||||||||||||||||||||||||||||||||||
| GAAP Income Statements | ||||||||||||||||||||||||||||||||||||||||||||||||||||||||||||||
| (USD millions) | ||||||||||||||||||||||||||||||||||||||||||||||||||||||||||||||
| Three Months Ended | Current Qtr | Year-to-Date | ||||||||||||||||||||||||||||||||||||||||||||||||||||||||||||
| Dec. 31, | Sept. 30, | June 30, | March 31, | Dec. 31, | vs. PY | Dec. 31, | Dec. 31, | |||||||||||||||||||||||||||||||||||||||||||||||||||||||
| 2022 | 2022 | 2022 | 2022 | 2021 | Quarter | 2022 | 2021 | Change | ||||||||||||||||||||||||||||||||||||||||||||||||||||||
| Revenues: | ||||||||||||||||||||||||||||||||||||||||||||||||||||||||||||||
| Net premiums | $ | 700 | $ | 660 | $ | 640 | $ | 650 | $ | 773 | $ | (73) | $ | 2,650 | $ | 2,624 | $ | 26 | ||||||||||||||||||||||||||||||||||||||||||||
| Net investment income | 38 | 38 | 33 | 33 | 36 | 2 | 142 | 136 | 6 | |||||||||||||||||||||||||||||||||||||||||||||||||||||
| Investment related gains (losses), net | 4 | 3 | 5 | — | — | 4 | 12 | (1) | 13 | |||||||||||||||||||||||||||||||||||||||||||||||||||||
| Other revenue | 2 | 4 | 8 | 5 | 6 | (4) | 19 | 19 | — | |||||||||||||||||||||||||||||||||||||||||||||||||||||
| Total revenues | 744 | 705 | 686 | 688 | 815 | (71) | 2,823 | 2,778 | 45 | |||||||||||||||||||||||||||||||||||||||||||||||||||||
| Benefits and expenses: | ||||||||||||||||||||||||||||||||||||||||||||||||||||||||||||||
| Claims and other policy benefits | 575 | 498 | 537 | 542 | 667 | (92) | 2,152 | 2,445 | (293) | |||||||||||||||||||||||||||||||||||||||||||||||||||||
| Policy acquisition costs and other insurance expenses | 45 | 37 | 42 | 47 | 44 | 1 | 171 | 159 | 12 | |||||||||||||||||||||||||||||||||||||||||||||||||||||
| Other operating expenses | 57 | 52 | 49 | 48 | 47 | 10 | 206 | 184 | 22 | |||||||||||||||||||||||||||||||||||||||||||||||||||||
| Total benefits and expenses | 677 | 587 | 628 | 637 | 758 | (81) | 2,529 | 2,788 | (259) | |||||||||||||||||||||||||||||||||||||||||||||||||||||
| Income (loss) before income taxes | $ | 67 | $ | 118 | $ | 58 | $ | 51 | $ | 57 | $ | 10 | $ | 294 | $ | (10) | $ | 304 | ||||||||||||||||||||||||||||||||||||||||||||
| Loss and expense ratios: | ||||||||||||||||||||||||||||||||||||||||||||||||||||||||||||||
| Claims and other policy benefits | 82.1 | % | 75.5 | % | 83.9 | % | 83.4 | % | 86.3 | % | (4.2) | % | 81.2 | % | 93.2 | % | (12.0) | % | ||||||||||||||||||||||||||||||||||||||||||||
| Policy acquisition costs and other insurance expenses | 6.4 | % | 5.6 | % | 6.6 | % | 7.2 | % | 5.7 | % | 0.7 | % | 6.5 | % | 6.1 | % | 0.4 | % | ||||||||||||||||||||||||||||||||||||||||||||
| Other operating expenses | 8.1 | % | 7.9 | % | 7.7 | % | 7.4 | % | 6.1 | % | 2.0 | % | 7.8 | % | 7.0 | % | 0.8 | % | ||||||||||||||||||||||||||||||||||||||||||||
Foreign currency effect on (1): |
||||||||||||||||||||||||||||||||||||||||||||||||||||||||||||||
| Net premiums | $ | (61) | $ | (50) | $ | (38) | $ | (23) | $ | (13) | $ | (48) | $ | (172) | $ | 52 | $ | (224) | ||||||||||||||||||||||||||||||||||||||||||||
| Income (loss) before income taxes | $ | (3) | $ | (6) | $ | (5) | $ | 2 | $ | (2) | $ | (1) | $ | (12) | $ | (2) | $ | (10) | ||||||||||||||||||||||||||||||||||||||||||||
| Critical illness net premiums | $ | 324 | $ | 296 | $ | 301 | $ | 295 | $ | 424 | $ | (100) | $ | 1,216 | $ | 1,281 | $ | (65) | ||||||||||||||||||||||||||||||||||||||||||||
| See appendix for reconciliation of GAAP income before income taxes to adjusted operating income before income taxes. | ||||||||||||||||||||||||||||||||||||||||||||||||||||||||||||||
| (1) Compared to comparable prior year period. | ||||||||||||||||||||||||||||||||||||||||||||||||||||||||||||||
|
Page 22
|
|||||||
| Reinsurance Group of America, Incorporated | ||||||||||||||||||||||||||||||||||||||||||||||||||||||||||||||
| Asia Pacific Traditional | ||||||||||||||||||||||||||||||||||||||||||||||||||||||||||||||
| Adjusted Operating Income Statements | ||||||||||||||||||||||||||||||||||||||||||||||||||||||||||||||
| (USD millions) | ||||||||||||||||||||||||||||||||||||||||||||||||||||||||||||||
| Three Months Ended | Current Qtr | Year-to-Date | ||||||||||||||||||||||||||||||||||||||||||||||||||||||||||||
| Dec. 31, | Sept. 30, | June 30, | March 31, | Dec. 31, | vs. PY | Dec. 31, | Dec. 31, | |||||||||||||||||||||||||||||||||||||||||||||||||||||||
| 2022 | 2022 | 2022 | 2022 | 2021 | Quarter | 2022 | 2021 | Change | ||||||||||||||||||||||||||||||||||||||||||||||||||||||
| Revenues: | ||||||||||||||||||||||||||||||||||||||||||||||||||||||||||||||
| Net premiums | $ | 700 | $ | 660 | $ | 640 | $ | 650 | $ | 773 | $ | (73) | $ | 2,650 | $ | 2,624 | $ | 26 | ||||||||||||||||||||||||||||||||||||||||||||
| Net investment income | 38 | 38 | 33 | 33 | 36 | 2 | 142 | 136 | 6 | |||||||||||||||||||||||||||||||||||||||||||||||||||||
| Investment related gains (losses), net | 4 | 3 | 5 | — | — | 4 | 12 | (1) | 13 | |||||||||||||||||||||||||||||||||||||||||||||||||||||
| Other revenue | 2 | 4 | 8 | 5 | 6 | (4) | 19 | 19 | — | |||||||||||||||||||||||||||||||||||||||||||||||||||||
| Total revenues | 744 | 705 | 686 | 688 | 815 | (71) | 2,823 | 2,778 | 45 | |||||||||||||||||||||||||||||||||||||||||||||||||||||
| Benefits and expenses: | ||||||||||||||||||||||||||||||||||||||||||||||||||||||||||||||
| Claims and other policy benefits | 575 | 498 | 537 | 542 | 667 | (92) | 2,152 | 2,445 | (293) | |||||||||||||||||||||||||||||||||||||||||||||||||||||
| Policy acquisition costs and other insurance expenses | 45 | 37 | 42 | 47 | 44 | 1 | 171 | 159 | 12 | |||||||||||||||||||||||||||||||||||||||||||||||||||||
| Other operating expenses | 57 | 52 | 49 | 48 | 47 | 10 | 206 | 184 | 22 | |||||||||||||||||||||||||||||||||||||||||||||||||||||
| Total benefits and expenses | 677 | 587 | 628 | 637 | 758 | (81) | 2,529 | 2,788 | (259) | |||||||||||||||||||||||||||||||||||||||||||||||||||||
| Adjusted operating income (loss) before income taxes | $ | 67 | $ | 118 | $ | 58 | $ | 51 | $ | 57 | $ | 10 | $ | 294 | $ | (10) | $ | 304 | ||||||||||||||||||||||||||||||||||||||||||||
| Loss and expense ratios: | ||||||||||||||||||||||||||||||||||||||||||||||||||||||||||||||
| Claims and other policy benefits | 82.1 | % | 75.5 | % | 83.9 | % | 83.4 | % | 86.3 | % | (4.2) | % | 81.2 | % | 93.2 | % | (12.0) | % | ||||||||||||||||||||||||||||||||||||||||||||
| Policy acquisition costs and other insurance expenses | 6.4 | % | 5.6 | % | 6.6 | % | 7.2 | % | 5.7 | % | 0.7 | % | 6.5 | % | 6.1 | % | 0.4 | % | ||||||||||||||||||||||||||||||||||||||||||||
| Other operating expenses | 8.1 | % | 7.9 | % | 7.7 | % | 7.4 | % | 6.1 | % | 2.0 | % | 7.8 | % | 7.0 | % | 0.8 | % | ||||||||||||||||||||||||||||||||||||||||||||
Foreign currency effect on (1): |
||||||||||||||||||||||||||||||||||||||||||||||||||||||||||||||
| Net premiums | $ | (61) | $ | (50) | $ | (38) | $ | (23) | $ | (13) | $ | (48) | $ | (172) | $ | 52 | $ | (224) | ||||||||||||||||||||||||||||||||||||||||||||
| Adjusted operating income (loss) before income taxes | $ | (2) | $ | (7) | $ | (4) | $ | 1 | $ | (2) | $ | — | $ | (12) | $ | (2) | $ | (10) | ||||||||||||||||||||||||||||||||||||||||||||
| Critical illness net premiums | $ | 324 | $ | 296 | $ | 301 | $ | 295 | $ | 424 | $ | (100) | $ | 1,216 | $ | 1,281 | $ | (65) | ||||||||||||||||||||||||||||||||||||||||||||
| See appendix for reconciliation of GAAP income before income taxes to adjusted operating income before income taxes. | ||||||||||||||||||||||||||||||||||||||||||||||||||||||||||||||
| (1) Compared to comparable prior year period. | ||||||||||||||||||||||||||||||||||||||||||||||||||||||||||||||
|
Page 23
|
|||||||
| Reinsurance Group of America, Incorporated | ||||||||||||||||||||||||||||||||||||||||||||||||||||||||||||||
Asia Pacific Financial Solutions (1) | ||||||||||||||||||||||||||||||||||||||||||||||||||||||||||||||
| GAAP Income Statements | ||||||||||||||||||||||||||||||||||||||||||||||||||||||||||||||
| (USD millions) | ||||||||||||||||||||||||||||||||||||||||||||||||||||||||||||||
| Three Months Ended | Current Qtr | Year-to-Date | ||||||||||||||||||||||||||||||||||||||||||||||||||||||||||||
| Dec. 31, | Sept. 30, | June 30, | March 31, | Dec. 31, | vs. PY | Dec. 31, | Dec. 31, | |||||||||||||||||||||||||||||||||||||||||||||||||||||||
| 2022 | 2022 | 2022 | 2022 | 2021 | Quarter | 2022 | 2021 | Change | ||||||||||||||||||||||||||||||||||||||||||||||||||||||
| Revenues: | ||||||||||||||||||||||||||||||||||||||||||||||||||||||||||||||
| Net premiums | $ | 64 | $ | 69 | $ | 60 | $ | 43 | $ | 52 | $ | 12 | $ | 236 | $ | 218 | $ | 18 | ||||||||||||||||||||||||||||||||||||||||||||
| Net investment income | 95 | 77 | 56 | 44 | 42 | 53 | 272 | 138 | 134 | |||||||||||||||||||||||||||||||||||||||||||||||||||||
| Investment related gains (losses), net | 82 | (93) | (113) | (81) | 7 | 75 | (205) | 19 | (224) | |||||||||||||||||||||||||||||||||||||||||||||||||||||
| Other revenue | — | 118 | 40 | 15 | 13 | (13) | 173 | 42 | 131 | |||||||||||||||||||||||||||||||||||||||||||||||||||||
| Total revenues | 241 | 171 | 43 | 21 | 114 | 127 | 476 | 417 | 59 | |||||||||||||||||||||||||||||||||||||||||||||||||||||
| Benefits and expenses: | ||||||||||||||||||||||||||||||||||||||||||||||||||||||||||||||
| Claims and other policy benefits | 69 | 88 | 59 | 41 | 47 | 22 | 257 | 187 | 70 | |||||||||||||||||||||||||||||||||||||||||||||||||||||
| Interest credited | 39 | 38 | 22 | 20 | 15 | 24 | 119 | 57 | 62 | |||||||||||||||||||||||||||||||||||||||||||||||||||||
| Policy acquisition costs and other insurance expenses | 21 | 43 | 22 | 12 | 15 | 6 | 98 | 56 | 42 | |||||||||||||||||||||||||||||||||||||||||||||||||||||
| Other operating expenses | 6 | 4 | 6 | 4 | 4 | 2 | 20 | 19 | 1 | |||||||||||||||||||||||||||||||||||||||||||||||||||||
| Total benefits and expenses | 135 | 173 | 109 | 77 | 81 | 54 | 494 | 319 | 175 | |||||||||||||||||||||||||||||||||||||||||||||||||||||
| Income (loss) before income taxes | $ | 106 | $ | (2) | $ | (66) | $ | (56) | $ | 33 | $ | 73 | $ | (18) | $ | 98 | $ | (116) | ||||||||||||||||||||||||||||||||||||||||||||
Foreign currency effect on (2): |
||||||||||||||||||||||||||||||||||||||||||||||||||||||||||||||
| Net premiums | $ | (9) | $ | (10) | $ | (8) | $ | (3) | $ | (2) | $ | (7) | $ | (30) | $ | (3) | $ | (27) | ||||||||||||||||||||||||||||||||||||||||||||
| Income (loss) before income taxes | $ | (18) | $ | 20 | $ | 16 | $ | 6 | $ | (2) | $ | (16) | $ | 24 | $ | (1) | $ | 25 | ||||||||||||||||||||||||||||||||||||||||||||
| See appendix for reconciliation of GAAP income before income taxes to adjusted operating income before income taxes. | ||||||||||||||||||||||||||||||||||||||||||||||||||||||||||||||
| (1) Asia Pacific Financial Solutions operations includes asset-intensive and fee-based transactions. | ||||||||||||||||||||||||||||||||||||||||||||||||||||||||||||||
| (2) Compared to comparable prior year period. | ||||||||||||||||||||||||||||||||||||||||||||||||||||||||||||||
|
Page 24
|
|||||||
| Reinsurance Group of America, Incorporated | ||||||||||||||||||||||||||||||||||||||||||||||||||||||||||||||
Asia Pacific Financial Solutions (1) | ||||||||||||||||||||||||||||||||||||||||||||||||||||||||||||||
| Adjusted Operating Income Statements | ||||||||||||||||||||||||||||||||||||||||||||||||||||||||||||||
| (USD millions) | ||||||||||||||||||||||||||||||||||||||||||||||||||||||||||||||
| Three Months Ended | Current Qtr | Year-to-Date | ||||||||||||||||||||||||||||||||||||||||||||||||||||||||||||
| Dec. 31, | Sept. 30, | June 30, | March 31, | Dec. 31, | vs. PY | Dec. 31, | Dec. 31, | |||||||||||||||||||||||||||||||||||||||||||||||||||||||
| 2022 | 2022 | 2022 | 2022 | 2021 | Quarter | 2022 | 2021 | Change | ||||||||||||||||||||||||||||||||||||||||||||||||||||||
| Revenues: | ||||||||||||||||||||||||||||||||||||||||||||||||||||||||||||||
| Net premiums | $ | 64 | $ | 69 | $ | 60 | $ | 43 | $ | 52 | $ | 12 | $ | 236 | $ | 218 | $ | 18 | ||||||||||||||||||||||||||||||||||||||||||||
| Net investment income | 95 | 77 | 56 | 44 | 42 | 53 | 272 | 138 | 134 | |||||||||||||||||||||||||||||||||||||||||||||||||||||
| Investment related gains, net | 4 | 4 | 5 | 4 | 3 | 1 | 17 | 14 | 3 | |||||||||||||||||||||||||||||||||||||||||||||||||||||
| Other revenue | 7 | 36 | 16 | 7 | 13 | (6) | 66 | 42 | 24 | |||||||||||||||||||||||||||||||||||||||||||||||||||||
| Total revenues | 170 | 186 | 137 | 98 | 110 | 60 | 591 | 412 | 179 | |||||||||||||||||||||||||||||||||||||||||||||||||||||
| Benefits and expenses: | ||||||||||||||||||||||||||||||||||||||||||||||||||||||||||||||
| Claims and other policy benefits | 69 | 88 | 59 | 41 | 47 | 22 | 257 | 187 | 70 | |||||||||||||||||||||||||||||||||||||||||||||||||||||
| Interest credited | 39 | 38 | 22 | 20 | 15 | 24 | 119 | 57 | 62 | |||||||||||||||||||||||||||||||||||||||||||||||||||||
| Policy acquisition costs and other insurance expenses | 21 | 43 | 22 | 12 | 15 | 6 | 98 | 56 | 42 | |||||||||||||||||||||||||||||||||||||||||||||||||||||
| Other operating expenses | 6 | 4 | 6 | 4 | 4 | 2 | 20 | 19 | 1 | |||||||||||||||||||||||||||||||||||||||||||||||||||||
| Total benefits and expenses | 135 | 173 | 109 | 77 | 81 | 54 | 494 | 319 | 175 | |||||||||||||||||||||||||||||||||||||||||||||||||||||
| Adjusted operating income before income taxes | $ | 35 | $ | 13 | $ | 28 | $ | 21 | $ | 29 | $ | 6 | $ | 97 | $ | 93 | $ | 4 | ||||||||||||||||||||||||||||||||||||||||||||
Foreign currency effect on (2): |
||||||||||||||||||||||||||||||||||||||||||||||||||||||||||||||
| Net premiums | $ | (9) | $ | (10) | $ | (8) | $ | (3) | $ | (2) | $ | (7) | $ | (30) | $ | (3) | $ | (27) | ||||||||||||||||||||||||||||||||||||||||||||
| Adjusted operating income before income taxes | $ | (3) | $ | 2 | $ | (1) | $ | (1) | $ | (2) | $ | (1) | $ | (3) | $ | (2) | $ | (1) | ||||||||||||||||||||||||||||||||||||||||||||
| See appendix for reconciliation of GAAP income before income taxes to adjusted operating income before income taxes. | ||||||||||||||||||||||||||||||||||||||||||||||||||||||||||||||
| (1) Asia Pacific Financial Solutions operations includes asset-intensive and fee-based transactions. | ||||||||||||||||||||||||||||||||||||||||||||||||||||||||||||||
| (2) Compared to comparable prior year period. | ||||||||||||||||||||||||||||||||||||||||||||||||||||||||||||||
|
Page 25
|
|||||||
| Reinsurance Group of America, Incorporated | ||||||||||||||||||||||||||||||||||||||||||||||||||||||||||||||
| Corporate and Other | ||||||||||||||||||||||||||||||||||||||||||||||||||||||||||||||
| GAAP Income Statements | ||||||||||||||||||||||||||||||||||||||||||||||||||||||||||||||
| (USD millions) | ||||||||||||||||||||||||||||||||||||||||||||||||||||||||||||||
| Three Months Ended | Current Qtr | Year-to-Date | ||||||||||||||||||||||||||||||||||||||||||||||||||||||||||||
| Dec. 31, | Sept. 30, | June 30, | March 31, | Dec. 31, | vs. PY | Dec. 31, | Dec. 31, | |||||||||||||||||||||||||||||||||||||||||||||||||||||||
| 2022 | 2022 | 2022 | 2022 | 2021 | Quarter | 2022 | 2021 | Change | ||||||||||||||||||||||||||||||||||||||||||||||||||||||
| Revenues: | ||||||||||||||||||||||||||||||||||||||||||||||||||||||||||||||
| Net investment income | $ | 35 | $ | 48 | $ | 92 | $ | 53 | $ | 46 | $ | (11) | $ | 228 | $ | 304 | $ | (76) | ||||||||||||||||||||||||||||||||||||||||||||
| Investment related gains (losses), net | 36 | (23) | (44) | 3 | 33 | 3 | (28) | 412 | (440) | |||||||||||||||||||||||||||||||||||||||||||||||||||||
| Other revenue | 18 | (1) | (11) | 1 | 11 | 7 | 7 | 65 | (58) | |||||||||||||||||||||||||||||||||||||||||||||||||||||
| Total revenues | 89 | 24 | 37 | 57 | 90 | (1) | 207 | 781 | (574) | |||||||||||||||||||||||||||||||||||||||||||||||||||||
| Benefits and expenses: | ||||||||||||||||||||||||||||||||||||||||||||||||||||||||||||||
| Interest credited | 12 | 8 | 6 | 6 | 1 | 11 | 32 | 4 | 28 | |||||||||||||||||||||||||||||||||||||||||||||||||||||
| Policy acquisition costs and other insurance income | (24) | (25) | (24) | (26) | (31) | 7 | (99) | (112) | 13 | |||||||||||||||||||||||||||||||||||||||||||||||||||||
| Other operating expenses | 96 | 84 | 74 | 65 | 98 | (2) | 319 | 329 | (10) | |||||||||||||||||||||||||||||||||||||||||||||||||||||
| Interest expense | 54 | 46 | 42 | 42 | (2) | 56 | 184 | 127 | 57 | |||||||||||||||||||||||||||||||||||||||||||||||||||||
| Collateral finance and securitization expense | 1 | 3 | 2 | 1 | 4 | (3) | 7 | 12 | (5) | |||||||||||||||||||||||||||||||||||||||||||||||||||||
| Total benefits and expenses | 139 | 116 | 100 | 88 | 70 | 69 | 443 | 360 | 83 | |||||||||||||||||||||||||||||||||||||||||||||||||||||
| Income (loss) before income taxes | $ | (50) | $ | (92) | $ | (63) | $ | (31) | $ | 20 | $ | (70) | $ | (236) | $ | 421 | $ | (657) | ||||||||||||||||||||||||||||||||||||||||||||
Foreign currency effect on (1): |
||||||||||||||||||||||||||||||||||||||||||||||||||||||||||||||
| Income (loss) before income taxes | $ | (7) | $ | 3 | $ | 2 | $ | — | $ | 1 | $ | (8) | $ | (2) | $ | 11 | $ | (13) | ||||||||||||||||||||||||||||||||||||||||||||
| See appendix for reconciliation of GAAP income before income taxes to adjusted operating income before income taxes. | ||||||||||||||||||||||||||||||||||||||||||||||||||||||||||||||
| (1) Compared to comparable prior year period. | ||||||||||||||||||||||||||||||||||||||||||||||||||||||||||||||
|
Page 26
|
|||||||
| Reinsurance Group of America, Incorporated | ||||||||||||||||||||||||||||||||||||||||||||||||||||||||||||||
| Corporate and Other | ||||||||||||||||||||||||||||||||||||||||||||||||||||||||||||||
| Adjusted Operating Income Statements | ||||||||||||||||||||||||||||||||||||||||||||||||||||||||||||||
| (USD millions) | ||||||||||||||||||||||||||||||||||||||||||||||||||||||||||||||
| Three Months Ended | Current Qtr | Year-to-Date | ||||||||||||||||||||||||||||||||||||||||||||||||||||||||||||
| Dec. 31, | Sept. 30, | June 30, | March 31, | Dec. 31, | vs. PY | Dec. 31, | Dec. 31, | |||||||||||||||||||||||||||||||||||||||||||||||||||||||
| 2022 | 2022 | 2022 | 2022 | 2021 | Quarter | 2022 | 2021 | Change | ||||||||||||||||||||||||||||||||||||||||||||||||||||||
| Revenues: | ||||||||||||||||||||||||||||||||||||||||||||||||||||||||||||||
| Net investment income | $ | 35 | $ | 48 | $ | 92 | $ | 53 | $ | 46 | $ | (11) | $ | 228 | $ | 304 | $ | (76) | ||||||||||||||||||||||||||||||||||||||||||||
| Investment related gains, net | 3 | 1 | — | 4 | — | 3 | 8 | 6 | 2 | |||||||||||||||||||||||||||||||||||||||||||||||||||||
| Other revenue | 12 | 10 | 3 | 9 | 17 | (5) | 34 | 63 | (29) | |||||||||||||||||||||||||||||||||||||||||||||||||||||
| Total revenues | 50 | 59 | 95 | 66 | 63 | (13) | 270 | 373 | (103) | |||||||||||||||||||||||||||||||||||||||||||||||||||||
| Benefits and expenses: | ||||||||||||||||||||||||||||||||||||||||||||||||||||||||||||||
| Interest credited | 12 | 8 | 6 | 6 | 1 | 11 | 32 | 4 | 28 | |||||||||||||||||||||||||||||||||||||||||||||||||||||
| Policy acquisition costs and other insurance income | (24) | (25) | (24) | (26) | (31) | 7 | (99) | (112) | 13 | |||||||||||||||||||||||||||||||||||||||||||||||||||||
| Other operating expenses | 96 | 84 | 74 | 65 | 98 | (2) | 319 | 329 | (10) | |||||||||||||||||||||||||||||||||||||||||||||||||||||
| Interest expense | 54 | 45 | 42 | 42 | 32 | 22 | 183 | 153 | 30 | |||||||||||||||||||||||||||||||||||||||||||||||||||||
| Collateral finance and securitization expense | 1 | 3 | 2 | 1 | 4 | (3) | 7 | 12 | (5) | |||||||||||||||||||||||||||||||||||||||||||||||||||||
| Total benefits and expenses | 139 | 115 | 100 | 88 | 104 | 35 | 442 | 386 | 56 | |||||||||||||||||||||||||||||||||||||||||||||||||||||
| Adjusted operating income (loss) before income taxes | $ | (89) | $ | (56) | $ | (5) | $ | (22) | $ | (41) | $ | (48) | $ | (172) | $ | (13) | $ | (159) | ||||||||||||||||||||||||||||||||||||||||||||
Foreign currency effect on (1): |
||||||||||||||||||||||||||||||||||||||||||||||||||||||||||||||
| Adjusted operating income (loss) before income taxes | $ | — | $ | 2 | $ | — | $ | 1 | $ | 2 | $ | (2) | $ | 3 | $ | 6 | $ | (3) | ||||||||||||||||||||||||||||||||||||||||||||
| See appendix for reconciliation of GAAP income before income taxes to adjusted operating income before income taxes. | ||||||||||||||||||||||||||||||||||||||||||||||||||||||||||||||
| (1) Compared to comparable prior year period. | ||||||||||||||||||||||||||||||||||||||||||||||||||||||||||||||
|
Page 27
|
|||||||
| Reinsurance Group of America, Incorporated | ||||||||||||||||||||||||||||||||||||||||||||||||||||||||||||||
| Summary of Segment GAAP Income | ||||||||||||||||||||||||||||||||||||||||||||||||||||||||||||||
| (USD millions) | ||||||||||||||||||||||||||||||||||||||||||||||||||||||||||||||
| Three Months Ended | Current Qtr | Year-to-Date | ||||||||||||||||||||||||||||||||||||||||||||||||||||||||||||
| Dec. 31, | Sept. 30, | June 30, | March 31, | Dec. 31, | vs. PY | Dec. 31, | Dec. 31, | |||||||||||||||||||||||||||||||||||||||||||||||||||||||
| 2022 | 2022 | 2022 | 2022 | 2021 | Quarter | 2022 | 2021 | Change | ||||||||||||||||||||||||||||||||||||||||||||||||||||||
| U.S. and Latin America: | ||||||||||||||||||||||||||||||||||||||||||||||||||||||||||||||
| Traditional | $ | 21 | $ | 204 | $ | 209 | $ | (166) | $ | (211) | $ | 232 | $ | 268 | $ | (540) | $ | 808 | ||||||||||||||||||||||||||||||||||||||||||||
| Financial Solutions: | ||||||||||||||||||||||||||||||||||||||||||||||||||||||||||||||
| Asset Intensive | 2 | 48 | (11) | 20 | 93 | (91) | 59 | 422 | (363) | |||||||||||||||||||||||||||||||||||||||||||||||||||||
| Capital Solutions | 22 | 22 | 72 | 24 | 25 | (3) | 140 | 93 | 47 | |||||||||||||||||||||||||||||||||||||||||||||||||||||
| Total U.S. and Latin America | 45 | 274 | 270 | (122) | (93) | 138 | 467 | (25) | 492 | |||||||||||||||||||||||||||||||||||||||||||||||||||||
| Canada: | ||||||||||||||||||||||||||||||||||||||||||||||||||||||||||||||
| Traditional | 32 | 32 | 16 | 6 | 28 | 4 | 86 | 128 | (42) | |||||||||||||||||||||||||||||||||||||||||||||||||||||
| Financial Solutions | 11 | 4 | 4 | 13 | 5 | 6 | 32 | 15 | 17 | |||||||||||||||||||||||||||||||||||||||||||||||||||||
| Total Canada | 43 | 36 | 20 | 19 | 33 | 10 | 118 | 143 | (25) | |||||||||||||||||||||||||||||||||||||||||||||||||||||
| Europe, Middle East and Africa: | ||||||||||||||||||||||||||||||||||||||||||||||||||||||||||||||
| Traditional | 13 | 1 | 2 | (6) | (68) | 81 | 10 | (239) | 249 | |||||||||||||||||||||||||||||||||||||||||||||||||||||
| Financial Solutions | 47 | 31 | 33 | 85 | 75 | (28) | 196 | 303 | (107) | |||||||||||||||||||||||||||||||||||||||||||||||||||||
| Total Europe, Middle East and Africa | 60 | 32 | 35 | 79 | 7 | 53 | 206 | 64 | 142 | |||||||||||||||||||||||||||||||||||||||||||||||||||||
| Asia Pacific: | ||||||||||||||||||||||||||||||||||||||||||||||||||||||||||||||
| Traditional | 67 | 118 | 58 | 51 | 57 | 10 | 294 | (10) | 304 | |||||||||||||||||||||||||||||||||||||||||||||||||||||
| Financial Solutions | 106 | (2) | (66) | (56) | 33 | 73 | (18) | 98 | (116) | |||||||||||||||||||||||||||||||||||||||||||||||||||||
| Total Asia Pacific | 173 | 116 | (8) | (5) | 90 | 83 | 276 | 88 | 188 | |||||||||||||||||||||||||||||||||||||||||||||||||||||
| Corporate and Other | (50) | (92) | (63) | (31) | 20 | (70) | (236) | 421 | (657) | |||||||||||||||||||||||||||||||||||||||||||||||||||||
| Consolidated income (loss) before income taxes | $ | 271 | $ | 366 | $ | 254 | $ | (60) | $ | 57 | $ | 214 | $ | 831 | $ | 691 | $ | 140 | ||||||||||||||||||||||||||||||||||||||||||||
| See appendix for reconciliation of GAAP income before income taxes to adjusted operating income before income taxes. | ||||||||||||||||||||||||||||||||||||||||||||||||||||||||||||||
|
Page 28
|
|||||||
| Reinsurance Group of America, Incorporated | ||||||||||||||||||||||||||||||||||||||||||||||||||||||||||||||
| Summary of Segment Adjusted Operating Income | ||||||||||||||||||||||||||||||||||||||||||||||||||||||||||||||
| (USD millions) | ||||||||||||||||||||||||||||||||||||||||||||||||||||||||||||||
| Three Months Ended | Current Qtr vs. PY Quarter |
Year-to-Date | ||||||||||||||||||||||||||||||||||||||||||||||||||||||||||||
| Dec. 31, | Sept. 30, | June 30, | March 31, | Dec. 31, | Dec. 31, | Dec. 31, | ||||||||||||||||||||||||||||||||||||||||||||||||||||||||
| 2022 | 2022 | 2022 | 2022 | 2021 | 2022 | 2021 | Change | |||||||||||||||||||||||||||||||||||||||||||||||||||||||
| U.S. and Latin America: | ||||||||||||||||||||||||||||||||||||||||||||||||||||||||||||||
| Traditional | $ | 15 | $ | 196 | $ | 190 | $ | (181) | $ | (215) | $ | 230 | $ | 220 | $ | (546) | $ | 766 | ||||||||||||||||||||||||||||||||||||||||||||
| Financial Solutions: | ||||||||||||||||||||||||||||||||||||||||||||||||||||||||||||||
| Asset Intensive | 80 | 72 | 66 | 75 | 73 | 7 | 293 | 341 | (48) | |||||||||||||||||||||||||||||||||||||||||||||||||||||
| Capital Solutions | 22 | 22 | 72 | 24 | 25 | (3) | 140 | 93 | 47 | |||||||||||||||||||||||||||||||||||||||||||||||||||||
| Total U.S. and Latin America | 117 | 290 | 328 | (82) | (117) | 234 | 653 | (112) | 765 | |||||||||||||||||||||||||||||||||||||||||||||||||||||
| Canada: | ||||||||||||||||||||||||||||||||||||||||||||||||||||||||||||||
| Traditional | 28 | 33 | 24 | 5 | 29 | (1) | 90 | 130 | (40) | |||||||||||||||||||||||||||||||||||||||||||||||||||||
| Financial Solutions | 11 | 4 | 4 | 13 | 5 | 6 | 32 | 15 | 17 | |||||||||||||||||||||||||||||||||||||||||||||||||||||
| Total Canada | 39 | 37 | 28 | 18 | 34 | 5 | 122 | 145 | (23) | |||||||||||||||||||||||||||||||||||||||||||||||||||||
| Europe, Middle East and Africa: | ||||||||||||||||||||||||||||||||||||||||||||||||||||||||||||||
| Traditional | 13 | 1 | 2 | (6) | (68) | 81 | 10 | (239) | 249 | |||||||||||||||||||||||||||||||||||||||||||||||||||||
| Financial Solutions | 63 | 49 | 66 | 79 | 70 | (7) | 257 | 257 | — | |||||||||||||||||||||||||||||||||||||||||||||||||||||
| Total Europe, Middle East and Africa | 76 | 50 | 68 | 73 | 2 | 74 | 267 | 18 | 249 | |||||||||||||||||||||||||||||||||||||||||||||||||||||
| Asia Pacific: | ||||||||||||||||||||||||||||||||||||||||||||||||||||||||||||||
| Traditional | 67 | 118 | 58 | 51 | 57 | 10 | 294 | (10) | 304 | |||||||||||||||||||||||||||||||||||||||||||||||||||||
| Financial Solutions | 35 | 13 | 28 | 21 | 29 | 6 | 97 | 93 | 4 | |||||||||||||||||||||||||||||||||||||||||||||||||||||
| Total Asia Pacific | 102 | 131 | 86 | 72 | 86 | 16 | 391 | 83 | 308 | |||||||||||||||||||||||||||||||||||||||||||||||||||||
| Corporate and Other | (89) | (56) | (5) | (22) | (41) | (48) | (172) | (13) | (159) | |||||||||||||||||||||||||||||||||||||||||||||||||||||
| Consolidated adjusted operating income (loss) before income taxes | $ | 245 | $ | 452 | $ | 505 | $ | 59 | $ | (36) | $ | 281 | $ | 1,261 | $ | 121 | $ | 1,140 | ||||||||||||||||||||||||||||||||||||||||||||
| See appendix for reconciliation of GAAP income before income taxes to adjusted operating income before income taxes. | ||||||||||||||||||||||||||||||||||||||||||||||||||||||||||||||
|
Page 29
|
|||||||
| Reinsurance Group of America, Incorporated | ||||||||||||||||||||||||||||||||
| Investments | ||||||||||||||||||||||||||||||||
| (USD millions) | ||||||||||||||||||||||||||||||||
| Cash and Invested Assets | ||||||||||||||||||||||||||||||||
| Dec. 31, | Sept. 30, | June 30, | March 31, | Dec. 31, | ||||||||||||||||||||||||||||
| 2022 | 2022 | 2022 | 2022 | 2021 | ||||||||||||||||||||||||||||
Fixed maturity securities, available-for-sale (1) |
$ | 52,901 | $ | 50,495 | $ | 53,294 | $ | 57,922 | $ | 60,749 | ||||||||||||||||||||||
| Equity securities | 134 | 137 | 127 | 139 | 151 | |||||||||||||||||||||||||||
| Mortgage loans | 6,590 | 6,558 | 6,544 | 6,535 | 6,283 | |||||||||||||||||||||||||||
| Policy loans | 1,231 | 1,202 | 1,218 | 1,221 | 1,234 | |||||||||||||||||||||||||||
| Limited partnerships and real estate joint ventures | 2,327 | 2,197 | 2,074 | 1,943 | 1,996 | |||||||||||||||||||||||||||
| Funds withheld at interest | 6,003 | 6,177 | 6,393 | 6,737 | 6,954 | |||||||||||||||||||||||||||
| Short-term investments | 154 | 225 | 272 | 315 | 87 | |||||||||||||||||||||||||||
| Other invested assets | 1,140 | 1,049 | 1,036 | 1,090 | 1,074 | |||||||||||||||||||||||||||
| Cash and cash equivalents | 2,927 | 3,512 | 2,556 | 2,709 | 2,948 | |||||||||||||||||||||||||||
| Total cash and invested assets | $ | 73,407 | $ | 71,552 | $ | 73,514 | $ | 78,611 | $ | 81,476 | ||||||||||||||||||||||
| (1) The Company holds various types of fixed maturity securities available-for-sale and classifies them as corporate securities (“Corporate”), Canadian and Canadian provincial government securities (“Canadian government”), residential mortgage-backed securities (“RMBS”), asset-backed securities (“ABS”), commercial mortgage-backed securities (“CMBS”), U.S. government and agencies (“U.S. government”), state and political subdivisions, and other foreign government, supernational and foreign government-sponsored enterprises (“Other foreign government”). | ||||||||||||||||||||||||||||||||
| Investment Income and Yield Summary | ||||||||||||||||||||||||||||||||||||||||||||||||||||||||||||||
| Three Months Ended | Current Qtr vs. PY Quarter |
Year-to-Date | ||||||||||||||||||||||||||||||||||||||||||||||||||||||||||||
| Dec. 31, | Sept. 30, | June 30, | March 31, | Dec. 31, | Dec. 31, | Dec. 31, | ||||||||||||||||||||||||||||||||||||||||||||||||||||||||
| 2022 | 2022 | 2022 | 2022 | 2021 | 2022 | 2021 | Change | |||||||||||||||||||||||||||||||||||||||||||||||||||||||
Average invested assets at amortized cost (1) |
$ | 35,300 | $ | 34,579 | $ | 34,859 | $ | 35,271 | $ | 34,325 | $ | 975 | $ | 34,398 | $ | 33,040 | $ | 1,358 | ||||||||||||||||||||||||||||||||||||||||||||
Net investment income (1) |
$ | 386 | $ | 374 | $ | 397 | $ | 457 | $ | 397 | $ | (11) | $ | 1,614 | $ | 1,648 | $ | (34) | ||||||||||||||||||||||||||||||||||||||||||||
Annualized investment yield (ratio of net investment income to average invested assets at amortized cost) (1) |
4.45 | % | 4.40 | % | 4.63 | % | 5.29 | % | 4.70 | % | (25) bps | 4.69 | % | 4.99 | % | (30) bps | ||||||||||||||||||||||||||||||||||||||||||||||
Variable investment income ("VII") (included in net investment income) (1) |
$ | 42 | $ | 38 | $ | 70 | $ | 141 | $ | 91 | $ | (49) | $ | 291 | $ | 433 | $ | (142) | ||||||||||||||||||||||||||||||||||||||||||||
Annualized investment yield excluding VII (ratio of net investment income, excluding VII, to average invested assets, excluding assets with only VII, at amortized cost) (1) |
4.14 | % | 4.12 | % | 3.96 | % | 3.80 | % | 3.78 | % | 36 bps | 4.00 | % | 3.81 | % | 19 bps | ||||||||||||||||||||||||||||||||||||||||||||||
| (1) Excludes spread related business (e.g. coinsurance of annuities). | ||||||||||||||||||||||||||||||||||||||||||||||||||||||||||||||
|
Page 30
|
|||||||
| Reinsurance Group of America, Incorporated | ||||||||||||||||||||||||||||||||||||||
| Investments | ||||||||||||||||||||||||||||||||||||||
| (USD millions) | ||||||||||||||||||||||||||||||||||||||
| Amortized Cost, Allowance for Credit Losses, Gross Unrealized Gains and Losses, and Estimated Fair Values of Fixed Maturity Securities | ||||||||||||||||||||||||||||||||||||||
| December 31, 2022 | ||||||||||||||||||||||||||||||||||||||
| Amortized Cost |
Allowance for Credit Losses | Unrealized Gains |
Unrealized Losses |
Estimated Fair Value |
% of Total |
|||||||||||||||||||||||||||||||||
| Available-for-sale: | ||||||||||||||||||||||||||||||||||||||
| Corporate | $ | 38,963 | $ | 27 | $ | 168 | $ | 5,135 | $ | 33,969 | 64.2 | % | ||||||||||||||||||||||||||
| Canadian government | 3,311 | — | 381 | 66 | 3,626 | 6.9 | % | |||||||||||||||||||||||||||||||
| RMBS | 1,054 | — | 1 | 114 | 941 | 1.8 | % | |||||||||||||||||||||||||||||||
| ABS | 4,324 | 10 | 4 | 440 | 3,878 | 7.3 | % | |||||||||||||||||||||||||||||||
| CMBS | 1,835 | — | — | 212 | 1,623 | 3.1 | % | |||||||||||||||||||||||||||||||
| U.S. government | 1,690 | — | 4 | 212 | 1,482 | 2.8 | % | |||||||||||||||||||||||||||||||
| State and political subdivisions | 1,282 | — | 10 | 173 | 1,119 | 2.1 | % | |||||||||||||||||||||||||||||||
| Other foreign government | 7,204 | — | 26 | 967 | 6,263 | 11.8 | % | |||||||||||||||||||||||||||||||
| Total fixed maturity securities | $ | 59,663 | $ | 37 | $ | 594 | $ | 7,319 | $ | 52,901 | 100.0 | % | ||||||||||||||||||||||||||
| December 31, 2021 | ||||||||||||||||||||||||||||||||||||||
| Amortized Cost |
Allowance for Credit Losses | Unrealized Gains |
Unrealized Losses |
Estimated Fair Value |
% of Total |
|||||||||||||||||||||||||||||||||
| Available-for-sale: | ||||||||||||||||||||||||||||||||||||||
| Corporate | $ | 35,239 | $ | 26 | $ | 3,084 | $ | 194 | $ | 38,103 | 62.8 | % | ||||||||||||||||||||||||||
| Canadian government | 3,339 | — | 1,606 | 1 | 4,944 | 8.1 | % | |||||||||||||||||||||||||||||||
| RMBS | 1,020 | — | 37 | 7 | 1,050 | 1.7 | % | |||||||||||||||||||||||||||||||
| ABS | 4,024 | — | 22 | 41 | 4,005 | 6.6 | % | |||||||||||||||||||||||||||||||
| CMBS | 1,790 | 1 | 66 | 6 | 1,849 | 3.0 | % | |||||||||||||||||||||||||||||||
| U.S. government | 2,082 | — | 31 | 8 | 2,105 | 3.5 | % | |||||||||||||||||||||||||||||||
| State and political subdivisions | 1,191 | — | 137 | 5 | 1,323 | 2.2 | % | |||||||||||||||||||||||||||||||
| Other foreign government | 7,188 | 4 | 273 | 87 | 7,370 | 12.1 | % | |||||||||||||||||||||||||||||||
| Total fixed maturity securities | $ | 55,873 | $ | 31 | $ | 5,256 | $ | 349 | $ | 60,749 | 100.0 | % | ||||||||||||||||||||||||||
|
Page 31
|
|||||||
| Reinsurance Group of America, Incorporated | ||||||||||||||||||||||||||||||||||||||||||||||||||
| Investments | ||||||||||||||||||||||||||||||||||||||||||||||||||
| (USD millions) | ||||||||||||||||||||||||||||||||||||||||||||||||||
| Corporate Fixed Maturity Securities by Industry | ||||||||||||||||||||||||||||||||||||||||||||||||||
| December 31, 2022 | December 31, 2021 | |||||||||||||||||||||||||||||||||||||||||||||||||
| Amortized Cost | Estimated Fair Value | % of Total | Average Credit Ratings (1) |
Amortized Cost | Estimated Fair Value | % of Total | Average Credit Ratings (1) |
|||||||||||||||||||||||||||||||||||||||||||
| Financial institutions | ||||||||||||||||||||||||||||||||||||||||||||||||||
| Banking | $ | 6,281 | $ | 5,672 | 16.7 | % | A- | $ | 5,792 | $ | 6,163 | 16.2 | % | A- | ||||||||||||||||||||||||||||||||||||
| Brokerage/asset managers/exchanges | 1,302 | 1,115 | 3.3 | % | A- | 1,073 | 1,145 | 3.0 | % | A- | ||||||||||||||||||||||||||||||||||||||||
| Finance companies | 410 | 350 | 1.0 | % | BBB | 306 | 316 | 0.8 | % | BBB+ | ||||||||||||||||||||||||||||||||||||||||
| Insurance | 4,452 | 3,851 | 11.3 | % | A- | 3,987 | 4,383 | 11.5 | % | A- | ||||||||||||||||||||||||||||||||||||||||
| REITs | 1,205 | 1,013 | 3.0 | % | BBB+ | 987 | 1,022 | 2.7 | % | BBB+ | ||||||||||||||||||||||||||||||||||||||||
| Other finance | 901 | 679 | 2.0 | % | A- | 956 | 1,016 | 2.7 | % | A- | ||||||||||||||||||||||||||||||||||||||||
| Total financial institutions | $ | 14,551 | $ | 12,680 | 37.3 | % | $ | 13,101 | $ | 14,045 | 36.9 | % | ||||||||||||||||||||||||||||||||||||||
| Industrials | ||||||||||||||||||||||||||||||||||||||||||||||||||
| Basic | $ | 1,921 | $ | 1,690 | 5.0 | % | BBB | $ | 1,972 | $ | 2,210 | 5.8 | % | BBB | ||||||||||||||||||||||||||||||||||||
| Capital goods | 1,734 | 1,550 | 4.6 | % | BBB | 1,542 | 1,649 | 4.3 | % | BBB | ||||||||||||||||||||||||||||||||||||||||
| Communications | 2,517 | 2,136 | 6.3 | % | BBB | 2,330 | 2,592 | 6.8 | % | BBB | ||||||||||||||||||||||||||||||||||||||||
| Consumer cyclical | 1,997 | 1,748 | 5.1 | % | BBB+ | 1,758 | 1,885 | 4.9 | % | BBB+ | ||||||||||||||||||||||||||||||||||||||||
| Consumer noncyclical | 4,625 | 4,052 | 11.9 | % | BBB+ | 3,952 | 4,315 | 11.3 | % | BBB+ | ||||||||||||||||||||||||||||||||||||||||
| Energy | 2,050 | 1,801 | 5.3 | % | BBB+ | 1,967 | 2,159 | 5.7 | % | BBB+ | ||||||||||||||||||||||||||||||||||||||||
| Technology | 1,617 | 1,461 | 4.3 | % | BBB+ | 1,436 | 1,486 | 3.9 | % | BBB+ | ||||||||||||||||||||||||||||||||||||||||
| Transportation | 2,160 | 1,859 | 5.5 | % | BBB+ | 2,050 | 2,192 | 5.8 | % | BBB+ | ||||||||||||||||||||||||||||||||||||||||
| Other industrial | 1,003 | 960 | 2.8 | % | BBB | 850 | 887 | 2.3 | % | BBB | ||||||||||||||||||||||||||||||||||||||||
| Total industrials | $ | 19,624 | $ | 17,257 | 50.8 | % | $ | 17,857 | $ | 19,375 | 50.8 | % | ||||||||||||||||||||||||||||||||||||||
| Utilities | ||||||||||||||||||||||||||||||||||||||||||||||||||
| Electric | $ | 3,779 | $ | 3,200 | 9.4 | % | A- | $ | 3,256 | $ | 3,561 | 9.4 | % | A- | ||||||||||||||||||||||||||||||||||||
| Natural gas | 664 | 553 | 1.7 | % | A- | 566 | 614 | 1.6 | % | BBB+ | ||||||||||||||||||||||||||||||||||||||||
| Other utility | 345 | 279 | 0.8 | % | BBB+ | 459 | 508 | 1.3 | % | BBB+ | ||||||||||||||||||||||||||||||||||||||||
| Total utilities | $ | 4,788 | $ | 4,032 | 11.9 | % | $ | 4,281 | $ | 4,683 | 12.3 | % | ||||||||||||||||||||||||||||||||||||||
| Total | $ | 38,963 | $ | 33,969 | 100.0 | % | BBB+ | $ | 35,239 | $ | 38,103 | 100.0 | % | BBB+ | ||||||||||||||||||||||||||||||||||||
| (1) The Average Credit Rating designations are based on the ratings from nationally recognized statistical rating organizations (NRSRO), primarily those assigned by Moody’s, S&P and Fitch. | ||||||||||||||||||||||||||||||||||||||||||||||||||
|
Page 32
|
|||||||
| Ratings of Fixed Maturity Securities | ||||||||||||||||||||||||||||||||||||||||||||||||||||||||||||||||||||||||||||||||||||||||||||||||||
| December 31, 2022 | September 30, 2022 | June 30, 2022 | March 31, 2022 | December 31, 2021 | ||||||||||||||||||||||||||||||||||||||||||||||||||||||||||||||||||||||||||||||||||||||||||||||
NAIC Designation (1) |
Rating Agency Designation (2) |
Amortized Cost | Estimated Fair Value | % of Total | Amortized Cost | Estimated Fair Value | % of Total | Amortized Cost | Estimated Fair Value | % of Total | Amortized Cost | Estimated Fair Value | % of Total | Amortized Cost | Estimated Fair Value | % of Total | ||||||||||||||||||||||||||||||||||||||||||||||||||||||||||||||||||||||||||||||||||
| 1 | AAA/AA/A | $ | 36,217 | $ | 32,295 | 61.1 | % | $ | 33,881 | $ | 30,062 | 59.6 | % | $ | 33,989 | $ | 31,782 | 59.6 | % | $ | 34,434 | $ | 34,741 | 60.0 | % | $ | 33,540 | $ | 36,725 | 60.5 | % | |||||||||||||||||||||||||||||||||||||||||||||||||||||||||||||||||||
| 2 | BBB | 20,188 | 17,580 | 33.2 | % | 19,931 | 16,924 | 33.5 | % | 19,851 | 18,011 | 33.8 | % | 19,691 | 19,574 | 33.8 | % | 18,684 | 20,379 | 33.5 | % | |||||||||||||||||||||||||||||||||||||||||||||||||||||||||||||||||||||||||||||
| 3 | BB | 2,734 | 2,607 | 5.0 | % | 3,044 | 2,843 | 5.6 | % | 2,940 | 2,774 | 5.2 | % | 2,821 | 2,769 | 4.8 | % | 2,620 | 2,668 | 4.4 | % | |||||||||||||||||||||||||||||||||||||||||||||||||||||||||||||||||||||||||||||
| 4 | B | 397 | 331 | 0.6 | % | 625 | 583 | 1.2 | % | 658 | 619 | 1.2 | % | 730 | 720 | 1.2 | % | 876 | 863 | 1.4 | % | |||||||||||||||||||||||||||||||||||||||||||||||||||||||||||||||||||||||||||||
| 5 | CCC | 103 | 71 | 0.1 | % | 107 | 62 | 0.1 | % | 124 | 84 | 0.2 | % | 127 | 92 | 0.2 | % | 96 | 79 | 0.1 | % | |||||||||||||||||||||||||||||||||||||||||||||||||||||||||||||||||||||||||||||
| 6 | In or near default | 24 | 17 | — | % | 42 | 21 | — | % | 46 | 24 | — | % | 46 | 26 | — | % | 57 | 35 | 0.1 | % | |||||||||||||||||||||||||||||||||||||||||||||||||||||||||||||||||||||||||||||
| Total | $ | 59,663 | $ | 52,901 | 100.0 | % | $ | 57,630 | $ | 50,495 | 100.0 | % | $ | 57,608 | $ | 53,294 | 100.0 | % | $ | 57,849 | $ | 57,922 | 100.0 | % | $ | 55,873 | $ | 60,749 | 100.0 | % | ||||||||||||||||||||||||||||||||||||||||||||||||||||||||||||||||||||
| (1) Structured securities held by the Company’s insurance subsidiaries that maintain the NAIC statutory basis of accounting utilize the NAIC rating methodology. | ||||||||||||||||||||||||||||||||||||||||||||||||||||||||||||||||||||||||||||||||||||||||||||||||||
| (2) The Rating Agency Designation includes all “+” or “-” at that rating level (e. g. “BBB” includes “BBB+”, “BBB”, and “BBB-”). | ||||||||||||||||||||||||||||||||||||||||||||||||||||||||||||||||||||||||||||||||||||||||||||||||||
| Structured Fixed Maturity Securities | ||||||||||||||||||||||||||||||||||||||||||||||||||||||||||||||||||||||||||||||||||||||||||||
| December 31, 2022 | September 30, 2022 | June 30, 2022 | March 31, 2022 | December 31, 2021 | ||||||||||||||||||||||||||||||||||||||||||||||||||||||||||||||||||||||||||||||||||||||||
| Amortized Cost | Estimated Fair Value | % of Total | Amortized Cost | Estimated Fair Value | % of Total | Amortized Cost | Estimated Fair Value | % of Total | Amortized Cost | Estimated Fair Value | % of Total | Amortized Cost | Estimated Fair Value | % of Total | ||||||||||||||||||||||||||||||||||||||||||||||||||||||||||||||||||||||||||||||
| RMBS | ||||||||||||||||||||||||||||||||||||||||||||||||||||||||||||||||||||||||||||||||||||||||||||
| Agency | $ | 476 | $ | 427 | 6.6 | % | $ | 489 | $ | 442 | 7.0 | % | $ | 519 | $ | 498 | 7.7 | % | $ | 538 | $ | 537 | 8.3 | % | $ | 551 | $ | 582 | 8.4 | % | ||||||||||||||||||||||||||||||||||||||||||||||||||||||||||||||
| Non-agency | 578 | 514 | 8.0 | % | 565 | 511 | 8.1 | % | 485 | 452 | 7.0 | % | 445 | 429 | 6.6 | % | 469 | 468 | 6.8 | % | ||||||||||||||||||||||||||||||||||||||||||||||||||||||||||||||||||||||||
| Total RMBS | 1,054 | 941 | 14.6 | % | 1,054 | 953 | 15.1 | % | 1,004 | 950 | 14.7 | % | 983 | 966 | 14.9 | % | 1,020 | 1,050 | 15.2 | % | ||||||||||||||||||||||||||||||||||||||||||||||||||||||||||||||||||||||||
| ABS: | ||||||||||||||||||||||||||||||||||||||||||||||||||||||||||||||||||||||||||||||||||||||||||||
| Collateralized loan obligations ("CLOs") | 1,825 | 1,702 | 26.4 | % | 1,788 | 1,650 | 26.0 | % | 1,714 | 1,622 | 25.1 | % | 1,659 | 1,630 | 25.1 | % | 1,761 | 1,752 | 25.4 | % | ||||||||||||||||||||||||||||||||||||||||||||||||||||||||||||||||||||||||
| ABS, excluding CLOs | 2,499 | 2,176 | 33.8 | % | 2,377 | 2,073 | 32.6 | % | 2,377 | 2,160 | 33.4 | % | 2,256 | 2,116 | 32.5 | % | 2,263 | 2,253 | 32.6 | % | ||||||||||||||||||||||||||||||||||||||||||||||||||||||||||||||||||||||||
| Total ABS | 4,324 | 3,878 | 60.2 | % | 4,165 | 3,723 | 58.6 | % | 4,091 | 3,782 | 58.5 | % | 3,915 | 3,746 | 57.6 | % | 4,024 | 4,005 | 58.0 | % | ||||||||||||||||||||||||||||||||||||||||||||||||||||||||||||||||||||||||
| CMBS | 1,835 | 1,623 | 25.2 | % | 1,843 | 1,670 | 26.3 | % | 1,856 | 1,735 | 26.8 | % | 1,829 | 1,786 | 27.5 | % | 1,790 | 1,849 | 26.8 | % | ||||||||||||||||||||||||||||||||||||||||||||||||||||||||||||||||||||||||
| Total | $ | 7,213 | $ | 6,442 | 100.0 | % | $ | 7,062 | $ | 6,346 | 100.0 | % | $ | 6,951 | $ | 6,467 | 100.0 | % | $ | 6,727 | $ | 6,498 | 100.0 | % | $ | 6,834 | $ | 6,904 | 100.0 | % | ||||||||||||||||||||||||||||||||||||||||||||||||||||||||||||||
|
Page 33
|
|||||||
| Reinsurance Group of America, Incorporated | ||||||||||||||||||||||||||||||||||||||
| Investments | ||||||||||||||||||||||||||||||||||||||
| (USD millions) | ||||||||||||||||||||||||||||||||||||||
Fixed Maturity Securities Below Amortized Cost (1) | ||||||||||||||||||||||||||||||||||||||
| As of December 31, 2022 | ||||||||||||||||||||||||||||||||||||||
| Less than 12 months | Equal to or greater than 12 months | Total | ||||||||||||||||||||||||||||||||||||
| Estimated Fair Value | Gross Unrealized Losses | Estimated Fair Value | Gross Unrealized Losses | Estimated Fair Value | Gross Unrealized Losses | |||||||||||||||||||||||||||||||||
| Investment grade securities: | ||||||||||||||||||||||||||||||||||||||
| Corporate | $ | 21,867 | $ | 2,756 | $ | 6,840 | $ | 2,225 | $ | 28,707 | $ | 4,981 | ||||||||||||||||||||||||||
| Canadian government | 554 | 42 | 71 | 23 | 625 | 65 | ||||||||||||||||||||||||||||||||
| RMBS | 664 | 62 | 181 | 53 | 845 | 115 | ||||||||||||||||||||||||||||||||
| ABS | 1,596 | 153 | 1,931 | 269 | 3,527 | 422 | ||||||||||||||||||||||||||||||||
| CMBS | 1,314 | 144 | 281 | 65 | 1,595 | 209 | ||||||||||||||||||||||||||||||||
| U.S. government | 1,202 | 64 | 253 | 148 | 1,455 | 212 | ||||||||||||||||||||||||||||||||
| State and political subdivisions | 819 | 124 | 131 | 50 | 950 | 174 | ||||||||||||||||||||||||||||||||
| Other foreign government | 2,757 | 253 | 2,720 | 652 | 5,477 | 905 | ||||||||||||||||||||||||||||||||
| Total investment grade securities | $ | 30,773 | $ | 3,598 | $ | 12,408 | $ | 3,485 | $ | 43,181 | $ | 7,083 | ||||||||||||||||||||||||||
| Below investment grade securities: | ||||||||||||||||||||||||||||||||||||||
| Corporate | $ | 767 | $ | 87 | $ | 305 | $ | 61 | $ | 1,072 | $ | 148 | ||||||||||||||||||||||||||
| ABS | 52 | 6 | 38 | 9 | 90 | 15 | ||||||||||||||||||||||||||||||||
| Other foreign government | 39 | 2 | 164 | 60 | 203 | 62 | ||||||||||||||||||||||||||||||||
| Total below investment grade securities | $ | 858 | $ | 95 | $ | 507 | $ | 130 | $ | 1,365 | $ | 225 | ||||||||||||||||||||||||||
| Total fixed maturity securities | $ | 31,631 | $ | 3,693 | $ | 12,915 | $ | 3,615 | $ | 44,546 | $ | 7,308 | ||||||||||||||||||||||||||
| (1) Included in the table above are securities for which an allowance for credit loss has not been recorded. | ||||||||||||||||||||||||||||||||||||||
|
Page 34
|
|||||||
| Reinsurance Group of America, Incorporated | ||||||||||||||||||||||||||||||||||||||
| Investments | ||||||||||||||||||||||||||||||||||||||
| (USD millions) | ||||||||||||||||||||||||||||||||||||||
Fixed Maturity Securities Below Amortized Cost (1) | ||||||||||||||||||||||||||||||||||||||
| As of December 31, 2021 | ||||||||||||||||||||||||||||||||||||||
| Less than 12 months | Equal to or greater than 12 months | Total | ||||||||||||||||||||||||||||||||||||
| Estimated Fair Value | Gross Unrealized Losses | Estimated Fair Value | Gross Unrealized Losses | Estimated Fair Value | Gross Unrealized Losses | |||||||||||||||||||||||||||||||||
| Investment grade securities: | ||||||||||||||||||||||||||||||||||||||
| Corporate | $ | 4,135 | $ | 86 | $ | 946 | $ | 51 | $ | 5,081 | $ | 137 | ||||||||||||||||||||||||||
| Canadian government | 20 | 1 | — | — | 20 | 1 | ||||||||||||||||||||||||||||||||
| RMBS | 132 | 3 | 102 | 4 | 234 | 7 | ||||||||||||||||||||||||||||||||
| ABS | 1,747 | 22 | 589 | 6 | 2,336 | 28 | ||||||||||||||||||||||||||||||||
| CMBS | 152 | 2 | 35 | 2 | 187 | 4 | ||||||||||||||||||||||||||||||||
| U.S. government | 1,513 | 6 | 31 | 2 | 1,544 | 8 | ||||||||||||||||||||||||||||||||
| State and political subdivisions | 109 | 3 | 28 | 2 | 137 | 5 | ||||||||||||||||||||||||||||||||
| Other foreign government | 2,237 | 33 | 724 | 37 | 2,961 | 70 | ||||||||||||||||||||||||||||||||
| Total investment grade securities | $ | 10,045 | $ | 156 | $ | 2,455 | $ | 104 | $ | 12,500 | $ | 260 | ||||||||||||||||||||||||||
| Below investment grade securities: | ||||||||||||||||||||||||||||||||||||||
| Corporate | $ | 463 | $ | 13 | $ | 97 | $ | 44 | $ | 560 | $ | 57 | ||||||||||||||||||||||||||
| ABS | — | — | 13 | 13 | 13 | 13 | ||||||||||||||||||||||||||||||||
| Other foreign government | 136 | 7 | 75 | 10 | 211 | 17 | ||||||||||||||||||||||||||||||||
| Total below investment grade securities | $ | 599 | $ | 20 | $ | 185 | $ | 67 | $ | 784 | $ | 87 | ||||||||||||||||||||||||||
| Total fixed maturity securities | $ | 10,644 | $ | 176 | $ | 2,640 | $ | 171 | $ | 13,284 | $ | 347 | ||||||||||||||||||||||||||
| (1) Included in the table above are securities for which an allowance for credit loss has not been recorded. | ||||||||||||||||||||||||||||||||||||||
|
Page 35
|
|||||||
| Reinsurance Group of America, Incorporated | ||||||||||||||||||||||||||||||||||||||||||||||||||||||||||||||
| Investments | ||||||||||||||||||||||||||||||||||||||||||||||||||||||||||||||
| (USD millions) | ||||||||||||||||||||||||||||||||||||||||||||||||||||||||||||||
| Consolidated Investment Related Gains and Losses | ||||||||||||||||||||||||||||||||||||||||||||||||||||||||||||||
| Three Months Ended | Current Qtr vs. PY Quarter |
Year-to-Date | ||||||||||||||||||||||||||||||||||||||||||||||||||||||||||||
| Dec. 31, | Sept. 30, | June 30, | March 31, | Dec. 31, | Dec. 31, | Dec. 31, | ||||||||||||||||||||||||||||||||||||||||||||||||||||||||
| 2022 | 2022 | 2022 | 2022 | 2021 | 2022 | 2021 | Change | |||||||||||||||||||||||||||||||||||||||||||||||||||||||
| Fixed maturity securities available-for-sale: | ||||||||||||||||||||||||||||||||||||||||||||||||||||||||||||||
| Change in allowance for credit losses and impairments | $ | 13 | $ | (9) | $ | (15) | $ | (12) | $ | (14) | $ | 27 | $ | (23) | $ | (12) | $ | (11) | ||||||||||||||||||||||||||||||||||||||||||||
| Realized gains on investment activity | 127 | 20 | 34 | 11 | 34 | 93 | 192 | 299 | (107) | |||||||||||||||||||||||||||||||||||||||||||||||||||||
| Realized losses on investment activity | (160) | (106) | (94) | (36) | (13) | (147) | (396) | (65) | (331) | |||||||||||||||||||||||||||||||||||||||||||||||||||||
| Net gains (losses) on fixed maturity securities available-for-sale | (20) | (95) | (75) | (37) | 7 | (27) | (227) | 222 | (449) | |||||||||||||||||||||||||||||||||||||||||||||||||||||
| Net gains (losses) on equity securities | (5) | 7 | (15) | (8) | (6) | 1 | (21) | 25 | (46) | |||||||||||||||||||||||||||||||||||||||||||||||||||||
| Change in mortgage loan allowance for credit losses | (8) | (5) | (1) | (2) | 4 | (12) | (16) | 29 | (45) | |||||||||||||||||||||||||||||||||||||||||||||||||||||
| Change in fair value of certain limited partnership investments | 9 | — | 10 | 19 | 13 | (4) | 38 | 169 | (131) | |||||||||||||||||||||||||||||||||||||||||||||||||||||
| Other, net | (1) | 6 | 9 | 7 | 11 | (12) | 21 | 25 | (4) | |||||||||||||||||||||||||||||||||||||||||||||||||||||
Free-standing derivatives (1): |
||||||||||||||||||||||||||||||||||||||||||||||||||||||||||||||
| Interest rate swaps | (2) | (33) | (44) | (52) | 7 | (9) | (131) | (34) | (97) | |||||||||||||||||||||||||||||||||||||||||||||||||||||
| Interest rate options | (9) | 18 | (6) | — | — | (9) | 3 | — | 3 | |||||||||||||||||||||||||||||||||||||||||||||||||||||
| Total return swaps | 22 | (1) | — | — | — | 22 | 21 | — | 21 | |||||||||||||||||||||||||||||||||||||||||||||||||||||
| Financial futures | (10) | 7 | 24 | 7 | (5) | (5) | 28 | (24) | 52 | |||||||||||||||||||||||||||||||||||||||||||||||||||||
| Foreign currency swaps | (6) | 9 | 11 | 7 | 5 | (11) | 21 | 20 | 1 | |||||||||||||||||||||||||||||||||||||||||||||||||||||
| Foreign currency swaps - hedged | 1 | 1 | — | 4 | 1 | — | 6 | 2 | 4 | |||||||||||||||||||||||||||||||||||||||||||||||||||||
| Foreign currency forwards | 61 | (55) | (76) | (23) | (9) | 70 | (93) | (20) | (73) | |||||||||||||||||||||||||||||||||||||||||||||||||||||
| CPI swaps | 6 | 7 | (11) | 29 | 13 | (7) | 31 | 46 | (15) | |||||||||||||||||||||||||||||||||||||||||||||||||||||
| Credit default swaps | 37 | (12) | (33) | (58) | 13 | 24 | (66) | 33 | (99) | |||||||||||||||||||||||||||||||||||||||||||||||||||||
| Equity options | (15) | 8 | 21 | — | (15) | — | 14 | (33) | 47 | |||||||||||||||||||||||||||||||||||||||||||||||||||||
| Total free-standing derivatives | 85 | (51) | (114) | (86) | 10 | 75 | (166) | (10) | (156) | |||||||||||||||||||||||||||||||||||||||||||||||||||||
| Embedded derivatives: | ||||||||||||||||||||||||||||||||||||||||||||||||||||||||||||||
| Modified coinsurance and funds withheld treaties | (67) | (17) | (56) | (33) | 20 | (87) | (173) | 107 | (280) | |||||||||||||||||||||||||||||||||||||||||||||||||||||
| GMXB | 15 | 21 | (12) | 14 | 29 | (14) | 38 | (7) | 45 | |||||||||||||||||||||||||||||||||||||||||||||||||||||
| Total embedded derivatives | (52) | 4 | (68) | (19) | 49 | (101) | (135) | 100 | (235) | |||||||||||||||||||||||||||||||||||||||||||||||||||||
| Net gains (losses) on total derivatives | 33 | (47) | (182) | (105) | 59 | (26) | (301) | 90 | (391) | |||||||||||||||||||||||||||||||||||||||||||||||||||||
| Total investment related gains (losses), net | $ | 8 | $ | (134) | $ | (254) | $ | (126) | $ | 88 | $ | (80) | $ | (506) | $ | 560 | $ | (1,066) | ||||||||||||||||||||||||||||||||||||||||||||
| (1) Free-standing derivatives are non-hedged unless specified. | ||||||||||||||||||||||||||||||||||||||||||||||||||||||||||||||
|
Page 36
|
|||||||
| Reconciliations of GAAP to Non-GAAP Measures | ||||||||||||||
|
Page 37
|
|||||||
| Reinsurance Group of America, Incorporated | ||||||||||||||||||||||||||||||||||||||||||||||||||||||||||||||
| Reconciliations of GAAP Income to Adjusted Operating Income | ||||||||||||||||||||||||||||||||||||||||||||||||||||||||||||||
| (USD millions) | ||||||||||||||||||||||||||||||||||||||||||||||||||||||||||||||
| Three Months Ended | Current Qtr | Year-to-Date | ||||||||||||||||||||||||||||||||||||||||||||||||||||||||||||
| Dec. 31, | Sept. 30, | June 30, | March 31, | Dec. 31, | vs. PY | Dec. 31, | Dec. 31, | |||||||||||||||||||||||||||||||||||||||||||||||||||||||
| 2022 | 2022 | 2022 | 2022 | 2021 | Quarter | 2022 | 2021 | Change | ||||||||||||||||||||||||||||||||||||||||||||||||||||||
| U.S. & Latin America Traditional | ||||||||||||||||||||||||||||||||||||||||||||||||||||||||||||||
| Income (loss) before income taxes | $ | 21 | $ | 204 | $ | 209 | $ | (166) | $ | (211) | $ | 232 | $ | 268 | $ | (540) | $ | 808 | ||||||||||||||||||||||||||||||||||||||||||||
| Investment and derivative losses (1) | 1 | (1) | — | — | — | 1 | — | — | — | |||||||||||||||||||||||||||||||||||||||||||||||||||||
| Change in value of modified coinsurance and | ||||||||||||||||||||||||||||||||||||||||||||||||||||||||||||||
funds withheld embedded derivatives (1) |
(7) | (7) | (19) | (15) | (4) | (3) | (48) | (6) | (42) | |||||||||||||||||||||||||||||||||||||||||||||||||||||
| Adjusted operating income (loss) before income taxes | $ | 15 | $ | 196 | $ | 190 | $ | (181) | $ | (215) | $ | 230 | $ | 220 | $ | (546) | $ | 766 | ||||||||||||||||||||||||||||||||||||||||||||
| U.S. & Latin America Asset-Intensive | ||||||||||||||||||||||||||||||||||||||||||||||||||||||||||||||
| Income (loss) before income taxes | $ | 2 | $ | 48 | $ | (11) | $ | 20 | $ | 93 | $ | (91) | $ | 59 | $ | 422 | $ | (363) | ||||||||||||||||||||||||||||||||||||||||||||
Investment and derivative (gains) losses (1) |
55 | 19 | 6 | 46 | 9 | 46 | 126 | 22 | 104 | |||||||||||||||||||||||||||||||||||||||||||||||||||||
| Change in value of modified coinsurance and | ||||||||||||||||||||||||||||||||||||||||||||||||||||||||||||||
funds withheld embedded derivatives (1) |
74 | 24 | 75 | 48 | (16) | 90 | 221 | (101) | 322 | |||||||||||||||||||||||||||||||||||||||||||||||||||||
GMXB embedded derivatives (1) |
(15) | (21) | 12 | (14) | (29) | 14 | (38) | 7 | (45) | |||||||||||||||||||||||||||||||||||||||||||||||||||||
| Funds withheld (gains) losses - investment income | (1) | — | 3 | 2 | — | (1) | 4 | (1) | 5 | |||||||||||||||||||||||||||||||||||||||||||||||||||||
| EIA embedded derivatives - interest credited | 1 | (10) | (27) | (17) | (9) | 10 | (53) | (45) | (8) | |||||||||||||||||||||||||||||||||||||||||||||||||||||
| DAC offset, net | (36) | 12 | 7 | (10) | 26 | (62) | (27) | 38 | (65) | |||||||||||||||||||||||||||||||||||||||||||||||||||||
| Non-investment derivatives and other | — | — | 1 | — | (1) | 1 | 1 | (1) | 2 | |||||||||||||||||||||||||||||||||||||||||||||||||||||
| Adjusted operating income before income taxes | $ | 80 | $ | 72 | $ | 66 | $ | 75 | $ | 73 | $ | 7 | $ | 293 | $ | 341 | $ | (48) | ||||||||||||||||||||||||||||||||||||||||||||
| U.S. & Latin America Capital Solutions | ||||||||||||||||||||||||||||||||||||||||||||||||||||||||||||||
| Income before income taxes | $ | 22 | $ | 22 | $ | 72 | $ | 24 | $ | 25 | $ | (3) | $ | 140 | $ | 93 | $ | 47 | ||||||||||||||||||||||||||||||||||||||||||||
| Adjusted operating income before income taxes | $ | 22 | $ | 22 | $ | 72 | $ | 24 | $ | 25 | $ | (3) | $ | 140 | $ | 93 | $ | 47 | ||||||||||||||||||||||||||||||||||||||||||||
| Canada Traditional | ||||||||||||||||||||||||||||||||||||||||||||||||||||||||||||||
| Income before income taxes | $ | 32 | $ | 32 | $ | 16 | $ | 6 | $ | 28 | $ | 4 | $ | 86 | $ | 128 | $ | (42) | ||||||||||||||||||||||||||||||||||||||||||||
Investment and derivative (gains) losses (1) |
(5) | — | 8 | (1) | 2 | (7) | 2 | 3 | (1) | |||||||||||||||||||||||||||||||||||||||||||||||||||||
| Investment income - non-operating FWAI | 1 | 1 | — | — | (1) | 2 | 2 | (1) | 3 | |||||||||||||||||||||||||||||||||||||||||||||||||||||
| Adjusted operating income before income taxes | $ | 28 | $ | 33 | $ | 24 | $ | 5 | $ | 29 | $ | (1) | $ | 90 | $ | 130 | $ | (40) | ||||||||||||||||||||||||||||||||||||||||||||
| Canada Financial Solutions | ||||||||||||||||||||||||||||||||||||||||||||||||||||||||||||||
| Income before income taxes | $ | 11 | $ | 4 | $ | 4 | $ | 13 | $ | 5 | $ | 6 | $ | 32 | $ | 15 | $ | 17 | ||||||||||||||||||||||||||||||||||||||||||||
| Adjusted operating income before income taxes | $ | 11 | $ | 4 | $ | 4 | $ | 13 | $ | 5 | $ | 6 | $ | 32 | $ | 15 | $ | 17 | ||||||||||||||||||||||||||||||||||||||||||||
| (1) Included in “Investment related gains (losses), net” on Consolidated GAAP Income Statement. | ||||||||||||||||||||||||||||||||||||||||||||||||||||||||||||||
|
Page 38
|
|||||||
| Reinsurance Group of America, Incorporated | ||||||||||||||||||||||||||||||||||||||||||||||||||||||||||||||
| Reconciliations of GAAP Income to Adjusted Operating Income | ||||||||||||||||||||||||||||||||||||||||||||||||||||||||||||||
| (USD millions) | ||||||||||||||||||||||||||||||||||||||||||||||||||||||||||||||
| Three Months Ended | Current Qtr | Year-to-Date | ||||||||||||||||||||||||||||||||||||||||||||||||||||||||||||
| Dec. 31, | Sept. 30, | June 30, | March 31, | Dec. 31, | vs. PY | Dec. 31, | Dec. 31, | |||||||||||||||||||||||||||||||||||||||||||||||||||||||
| 2022 | 2022 | 2022 | 2022 | 2021 | Quarter | 2022 | 2021 | Change | ||||||||||||||||||||||||||||||||||||||||||||||||||||||
| Europe, Middle East and Africa Traditional | ||||||||||||||||||||||||||||||||||||||||||||||||||||||||||||||
| Income (loss) before income taxes | $ | 13 | $ | 1 | $ | 2 | $ | (6) | $ | (68) | $ | 81 | $ | 10 | $ | (239) | $ | 249 | ||||||||||||||||||||||||||||||||||||||||||||
| Adjusted operating income (loss) before income taxes | $ | 13 | $ | 1 | $ | 2 | $ | (6) | $ | (68) | $ | 81 | $ | 10 | $ | (239) | $ | 249 | ||||||||||||||||||||||||||||||||||||||||||||
| Europe, Middle East and Africa Financial Solutions | ||||||||||||||||||||||||||||||||||||||||||||||||||||||||||||||
| Income before income taxes | $ | 47 | $ | 31 | $ | 33 | $ | 85 | $ | 75 | $ | (28) | $ | 196 | $ | 303 | $ | (107) | ||||||||||||||||||||||||||||||||||||||||||||
Investment and derivative (gains) losses (1) |
15 | 14 | 27 | (12) | (5) | 20 | 44 | (43) | 87 | |||||||||||||||||||||||||||||||||||||||||||||||||||||
| Investment income - non-operating FWAI | 1 | 4 | 6 | 6 | — | 1 | 17 | (3) | 20 | |||||||||||||||||||||||||||||||||||||||||||||||||||||
| Investment (income) loss on unit-linked variable annuities | 2 | 5 | 8 | 9 | (5) | 7 | 24 | (4) | 28 | |||||||||||||||||||||||||||||||||||||||||||||||||||||
| Interest credited on unit-linked variable annuities | (2) | (5) | (8) | (9) | 5 | (7) | (24) | 4 | (28) | |||||||||||||||||||||||||||||||||||||||||||||||||||||
| Adjusted operating income before income taxes | $ | 63 | $ | 49 | $ | 66 | $ | 79 | $ | 70 | $ | (7) | $ | 257 | $ | 257 | $ | — | ||||||||||||||||||||||||||||||||||||||||||||
| Asia Pacific Traditional | ||||||||||||||||||||||||||||||||||||||||||||||||||||||||||||||
| Income (loss) before income taxes | $ | 67 | $ | 118 | $ | 58 | $ | 51 | $ | 57 | $ | 10 | $ | 294 | $ | (10) | $ | 304 | ||||||||||||||||||||||||||||||||||||||||||||
| Adjusted operating income (loss) before income taxes | $ | 67 | $ | 118 | $ | 58 | $ | 51 | $ | 57 | $ | 10 | $ | 294 | $ | (10) | $ | 304 | ||||||||||||||||||||||||||||||||||||||||||||
| Asia Pacific Financial Solutions | ||||||||||||||||||||||||||||||||||||||||||||||||||||||||||||||
| Income (loss) before income taxes | $ | 106 | $ | (2) | $ | (66) | $ | (56) | $ | 33 | $ | 73 | $ | (18) | $ | 98 | $ | (116) | ||||||||||||||||||||||||||||||||||||||||||||
Investment and derivative (gains) losses (1) |
(78) | 97 | 118 | 85 | (4) | (74) | 222 | (5) | 227 | |||||||||||||||||||||||||||||||||||||||||||||||||||||
| Non-investment derivatives and other | 7 | (82) | (24) | (8) | — | 7 | (107) | — | (107) | |||||||||||||||||||||||||||||||||||||||||||||||||||||
| Adjusted operating income before income taxes | $ | 35 | $ | 13 | $ | 28 | $ | 21 | $ | 29 | $ | 6 | $ | 97 | $ | 93 | $ | 4 | ||||||||||||||||||||||||||||||||||||||||||||
| Corporate and Other | ||||||||||||||||||||||||||||||||||||||||||||||||||||||||||||||
| Income (loss) before income taxes | $ | (50) | $ | (92) | $ | (63) | $ | (31) | $ | 20 | $ | (70) | $ | (236) | $ | 421 | $ | (657) | ||||||||||||||||||||||||||||||||||||||||||||
Investment and derivative (gains) losses (1) |
(33) | 24 | 44 | 1 | (33) | — | 36 | (406) | 442 | |||||||||||||||||||||||||||||||||||||||||||||||||||||
| Interest expense on uncertain tax positions | — | 1 | — | — | (34) | 34 | 1 | (26) | 27 | |||||||||||||||||||||||||||||||||||||||||||||||||||||
| Non-investment derivatives and other | (6) | 11 | 14 | 8 | 6 | (12) | 27 | (2) | 29 | |||||||||||||||||||||||||||||||||||||||||||||||||||||
| Adjusted operating income (loss) before income taxes | $ | (89) | $ | (56) | $ | (5) | $ | (22) | $ | (41) | $ | (48) | $ | (172) | $ | (13) | $ | (159) | ||||||||||||||||||||||||||||||||||||||||||||
| (1) Included in “Investment related gains (losses), net” on Consolidated GAAP Income Statement. | ||||||||||||||||||||||||||||||||||||||||||||||||||||||||||||||
|
Page 39
|
|||||||
| Reinsurance Group of America, Incorporated | |||||||||||||||||||||||||||||||||||
| Reconciliations of Stockholders’ Equity to Stockholders’ Equity Excluding AOCI | |||||||||||||||||||||||||||||||||||
| (USD millions except per share data) | |||||||||||||||||||||||||||||||||||
| Dec. 31, | Sept. 30, | June 30, | March 31, | Dec. 31, | |||||||||||||||||||||||||||||||
| 2022 | 2022 | 2022 | 2022 | 2021 | |||||||||||||||||||||||||||||||
| RGA, Inc. stockholders’ equity | $ | 4,145 | $ | 3,653 | $ | 5,839 | $ | 9,182 | $ | 13,014 | |||||||||||||||||||||||||
| Less effect of AOCI: | |||||||||||||||||||||||||||||||||||
| Accumulated currency translation adjustments | (171) | (216) | (39) | 4 | (9) | ||||||||||||||||||||||||||||||
| Unrealized appreciation (depreciation) of securities | (5,407) | (5,697) | (3,469) | (9) | 3,701 | ||||||||||||||||||||||||||||||
| Pension and postretirement benefits | (27) | (51) | (51) | (50) | (50) | ||||||||||||||||||||||||||||||
| RGA, Inc. stockholders’ equity, excluding AOCI | $ | 9,750 | $ | 9,617 | $ | 9,398 | $ | 9,237 | $ | 9,372 | |||||||||||||||||||||||||
| Reconciliations of Book Value Per Share to Book Value Per Share Excluding AOCI | |||||||||||||||||||||||||||||||||||
| Dec. 31, | Sept. 30, | June 30, | March 31, | Dec. 31, | |||||||||||||||||||||||||||||||
| 2022 | 2022 | 2022 | 2022 | 2021 | |||||||||||||||||||||||||||||||
| Book value per share | $ | 62.16 | $ | 54.66 | $ | 87.14 | $ | 137.08 | $ | 193.75 | |||||||||||||||||||||||||
| Less effect of AOCI: | |||||||||||||||||||||||||||||||||||
| Accumulated currency translation adjustments | (2.56) | (3.24) | (0.58) | 0.06 | (0.13) | ||||||||||||||||||||||||||||||
| Unrealized appreciation (depreciation) of securities | (81.10) | (85.25) | (51.78) | (0.13) | 55.09 | ||||||||||||||||||||||||||||||
| Pension and postretirement benefits | (0.40) | (0.76) | (0.76) | (0.74) | (0.74) | ||||||||||||||||||||||||||||||
| Book value per share, excluding AOCI | $ | 146.22 | $ | 143.91 | $ | 140.26 | $ | 137.89 | $ | 139.53 | |||||||||||||||||||||||||
|
Page 40
|
|||||||