Delaware |
11-3131700 |
|||||||
|
(State or other jurisdiction of
incorporation or organization)
|
(I.R.S. Employer
Identification No.)
|
|||||||
| ☐ | Written communications pursuant to Rule 425 under the Securities Act (17 CFR 230.425) |
||||
| ☐ | Soliciting material pursuant to Rule 14a-12 under the Exchange Act (17 CFR 240.14a-12) |
||||
| ☐ | Pre-commencement communications pursuant to Rule 14d-2(b) under the Exchange Act (17 CFR 240.14d-2(b)) |
||||
| ☐ | Pre-commencement communications pursuant to Rule 13e-4(c) under the Exchange Act (17 CFR 240.13e-4(c)) |
||||
| Title of each class | Trading Symbol(s) | Name of each exchange on which registered | ||||||||||||
| Common Stock, par value $0.001 per share | AMED | The NASDAQ Global Select Market | ||||||||||||
| Indicate by check mark whether the registrant is an emerging growth company as defined in Rule 405 of the Securities Act of 1933 (§230.405 of this chapter) or Rule 12b-2 of the Securities Exchange Act of 1934 (§240.12b-2 of this chapter). | |||||||||||
Emerging growth company |
☐ | ||||||||||
If an emerging growth company, indicate by check mark if the registrant has elected not to use the extended transition period for complying with any new or revised financial accounting standards provided pursuant to Section 13(a) of the Exchange Act. ¨ | |||||||||||
| 99.1 | ||||||||||||||
| 99.2 | ||||||||||||||
| 104 | Cover Page Interactive Data File (embedded within the Inline XBRL document) | |||||||||||||

| For the Three-Month Periods Ended September 30, |
For the Nine-Month Periods Ended September 30, |
||||||||||||||||||||||
| 2023 | 2022 | 2023 | 2022 | ||||||||||||||||||||
| Net service revenue | $ | 556,237 | $ | 557,988 | $ | 1,665,594 | $ | 1,661,135 | |||||||||||||||
| Operating expenses: | |||||||||||||||||||||||
| Cost of service, inclusive of depreciation | 311,628 | 322,227 | 924,093 | 943,258 | |||||||||||||||||||
| General and administrative expenses: | |||||||||||||||||||||||
| Salaries and benefits | 129,083 | 125,550 | 380,926 | 376,788 | |||||||||||||||||||
| Non-cash compensation | 6,612 | 3,495 | 18,968 | 15,990 | |||||||||||||||||||
| Merger-related expenses | 4,980 | — | 25,151 | — | |||||||||||||||||||
| Depreciation and amortization | 4,436 | 5,477 | 13,604 | 19,705 | |||||||||||||||||||
| Investment impairment | — | 3,009 | — | 3,009 | |||||||||||||||||||
| Other | 57,287 | 59,299 | 180,467 | 167,851 | |||||||||||||||||||
| Total operating expenses | 514,026 | 519,057 | 1,543,209 | 1,526,601 | |||||||||||||||||||
| Operating income | 42,211 | 38,931 | 122,385 | 134,534 | |||||||||||||||||||
| Other income (expense): | |||||||||||||||||||||||
| Interest income | 1,304 | 59 | 2,452 | 108 | |||||||||||||||||||
| Interest expense | (8,021) | (4,963) | (23,040) | (16,447) | |||||||||||||||||||
| Equity in earnings (loss) from equity method investments | 1,252 | 302 | 9,366 | (442) | |||||||||||||||||||
| Merger termination fee | — | — | (106,000) | — | |||||||||||||||||||
| Miscellaneous, net | 1,201 | 491 | 5,262 | 1,155 | |||||||||||||||||||
| Total other expense, net | (4,264) | (4,111) | (111,960) | (15,626) | |||||||||||||||||||
| Income before income taxes | 37,947 | 34,820 | 10,425 | 118,908 | |||||||||||||||||||
| Income tax expense | (12,331) | (9,417) | (40,381) | (32,755) | |||||||||||||||||||
| Net income (loss) | 25,616 | 25,403 | (29,956) | 86,153 | |||||||||||||||||||
| Net loss attributable to noncontrolling interests | 344 | 239 | 887 | 739 | |||||||||||||||||||
| Net income (loss) attributable to Amedisys, Inc. | $ | 25,960 | $ | 25,642 | $ | (29,069) | $ | 86,892 | |||||||||||||||
| Basic earnings per common share: | |||||||||||||||||||||||
| Net income (loss) attributable to Amedisys, Inc. common stockholders | $ | 0.80 | $ | 0.79 | $ | (0.89) | $ | 2.67 | |||||||||||||||
| Weighted average shares outstanding | 32,624 | 32,482 | 32,587 | 32,519 | |||||||||||||||||||
| Diluted earnings per common share: | |||||||||||||||||||||||
| Net income (loss) attributable to Amedisys, Inc. common stockholders | $ | 0.79 | $ | 0.79 | $ | (0.89) | $ | 2.66 | |||||||||||||||
| Weighted average shares outstanding | 32,831 | 32,616 | 32,587 | 32,680 | |||||||||||||||||||
| September 30, 2023 (unaudited) |
December 31, 2022 | ||||||||||
| ASSETS | |||||||||||
| Current assets: | |||||||||||
| Cash and cash equivalents | $ | 78,112 | $ | 40,540 | |||||||
| Restricted cash | 15,904 | 13,593 | |||||||||
| Patient accounts receivable | 319,580 | 296,785 | |||||||||
| Prepaid expenses | 20,534 | 11,628 | |||||||||
| Other current assets | 33,097 | 26,415 | |||||||||
| Total current assets | 467,227 | 388,961 | |||||||||
| Property and equipment, net of accumulated depreciation of $93,909 and $101,364 | 39,631 | 16,026 | |||||||||
| Operating lease right of use assets | 87,834 | 102,856 | |||||||||
| Goodwill | 1,244,679 | 1,287,399 | |||||||||
| Intangible assets, net of accumulated amortization of $12,838 and $14,604 | 103,634 | 101,167 | |||||||||
| Other assets | 84,412 | 79,836 | |||||||||
| Total assets | $ | 2,027,417 | $ | 1,976,245 | |||||||
| LIABILITIES AND EQUITY | |||||||||||
| Current liabilities: | |||||||||||
| Accounts payable | $ | 34,555 | $ | 43,735 | |||||||
| Payroll and employee benefits | 126,989 | 125,387 | |||||||||
| Accrued expenses | 139,100 | 137,390 | |||||||||
| Termination fee paid by UnitedHealth Group | 106,000 | — | |||||||||
| Current portion of long-term obligations | 35,364 | 15,496 | |||||||||
| Current portion of operating lease liabilities | 26,111 | 33,521 | |||||||||
| Total current liabilities | 468,119 | 355,529 | |||||||||
| Long-term obligations, less current portion | 366,853 | 419,420 | |||||||||
| Operating lease liabilities, less current portion | 61,878 | 69,504 | |||||||||
| Deferred income tax liabilities | 35,398 | 20,411 | |||||||||
| Other long-term obligations | 1,651 | 4,808 | |||||||||
| Total liabilities | 933,899 | 869,672 | |||||||||
| Equity: | |||||||||||
| Preferred stock, $0.001 par value, 5,000,000 shares authorized; none issued or outstanding | — | — | |||||||||
| Common stock, $0.001 par value, 60,000,000 shares authorized; 38,065,853 and 37,891,186 shares issued; 32,633,599 and 32,511,465 shares outstanding | 38 | 38 | |||||||||
Additional paid-in capital |
776,880 | 755,063 | |||||||||
| Treasury stock, at cost, 5,432,254 and 5,379,721 shares of common stock | (465,613) | (461,200) | |||||||||
| Retained earnings | 728,603 | 757,672 | |||||||||
| Total Amedisys, Inc. stockholders’ equity | 1,039,908 | 1,051,573 | |||||||||
| Noncontrolling interests | 53,610 | 55,000 | |||||||||
| Total equity | 1,093,518 | 1,106,573 | |||||||||
| Total liabilities and equity | $ | 2,027,417 | $ | 1,976,245 | |||||||
| For the Three-Month Periods Ended September 30, |
For the Nine-Month Periods Ended September 30, |
||||||||||||||||||||||
| 2023 | 2022 | 2023 | 2022 | ||||||||||||||||||||
| Cash Flows from Operating Activities: | |||||||||||||||||||||||
| Net income (loss) | $ | 25,616 | $ | 25,403 | $ | (29,956) | $ | 86,153 | |||||||||||||||
| Adjustments to reconcile net income (loss) to net cash (used in) provided by operating activities: | |||||||||||||||||||||||
| Depreciation and amortization (inclusive of depreciation included in cost of service) | 6,063 | 5,477 | 17,956 | 19,705 | |||||||||||||||||||
| Non-cash compensation | 7,243 | 3,495 | 19,624 | 15,990 | |||||||||||||||||||
| Amortization and impairment of operating lease right of use assets | 8,456 | 12,319 | 25,427 | 34,782 | |||||||||||||||||||
| (Gain) loss on disposal of property and equipment | (10) | (24) | 346 | 507 | |||||||||||||||||||
| Loss on personal care divestiture | — | — | 2,186 | — | |||||||||||||||||||
| Merger termination fee | — | — | 106,000 | — | |||||||||||||||||||
| Deferred income taxes | 7,313 | 13,028 | 15,417 | 19,031 | |||||||||||||||||||
| Equity in (earnings) loss from equity method investments | (1,252) | (302) | (9,366) | 442 | |||||||||||||||||||
| Amortization of deferred debt issuance costs | 248 | 248 | 743 | 743 | |||||||||||||||||||
| Return on equity method investments | 1,556 | 1,370 | 4,309 | 3,798 | |||||||||||||||||||
| Investment impairment | — | 3,009 | — | 3,009 | |||||||||||||||||||
| Changes in operating assets and liabilities, net of impact of acquisitions: | |||||||||||||||||||||||
| Patient accounts receivable | (40,796) | 3,078 | (32,934) | (18,266) | |||||||||||||||||||
| Other current assets | (17,123) | (15,461) | (15,434) | (19,929) | |||||||||||||||||||
| Operating lease right of use assets | (866) | (661) | (2,803) | (2,323) | |||||||||||||||||||
| Other assets | 29 | 63 | 273 | 283 | |||||||||||||||||||
| Accounts payable | (4,108) | 1,388 | (8,839) | 5,886 | |||||||||||||||||||
| Accrued expenses | 5,565 | (56,319) | 10,340 | (26,790) | |||||||||||||||||||
| Other long-term obligations | 23 | 466 | (3,156) | 243 | |||||||||||||||||||
| Operating lease liabilities | (7,800) | (10,207) | (23,256) | (30,864) | |||||||||||||||||||
| Net cash (used in) provided by operating activities | (9,843) | (13,630) | 76,877 | 92,400 | |||||||||||||||||||
| Cash Flows from Investing Activities: | |||||||||||||||||||||||
| Proceeds from the sale of deferred compensation plan assets | — | 61 | 25 | 89 | |||||||||||||||||||
| Proceeds from the sale of property and equipment | — | 29 | 100 | 66 | |||||||||||||||||||
| Purchases of property and equipment | (984) | (1,556) | (3,728) | (4,338) | |||||||||||||||||||
| Investments in technology assets | (214) | (289) | (6,881) | (848) | |||||||||||||||||||
| Investment in equity method investee | — | (637) | — | (637) | |||||||||||||||||||
| Purchase of cost method investment | — | — | — | (15,000) | |||||||||||||||||||
| Return of investment | 150 | — | 150 | — | |||||||||||||||||||
| Proceeds from personal care divestiture | — | — | 47,787 | — | |||||||||||||||||||
| Acquisitions of businesses, net of cash acquired | — | 1,359 | (350) | (71,952) | |||||||||||||||||||
| Net cash (used in) provided by investing activities | (1,048) | (1,033) | 37,103 | (92,620) | |||||||||||||||||||
| Cash Flows from Financing Activities: | |||||||||||||||||||||||
| Proceeds from issuance of stock upon exercise of stock options | 25 | 306 | 100 | 1,078 | |||||||||||||||||||
| Proceeds from issuance of stock under employee stock purchase plan | 848 | 966 | 2,602 | 2,857 | |||||||||||||||||||
| Shares withheld to pay taxes on non-cash compensation | (925) | (3,187) | (4,413) | (7,949) | |||||||||||||||||||
| Noncontrolling interest contributions | 856 | 1,148 | 1,232 | 2,100 | |||||||||||||||||||
| Noncontrolling interest distributions | (902) | (450) | (1,614) | (1,425) | |||||||||||||||||||
| Proceeds from sale of noncontrolling interest | — | 3,941 | — | 3,941 | |||||||||||||||||||
| Proceeds from borrowings under revolving line of credit | — | 185,500 | 23,000 | 484,000 | |||||||||||||||||||
| Repayments of borrowings under revolving line of credit | — | (182,000) | (23,000) | (465,500) | |||||||||||||||||||
| Principal payments of long-term obligations | (6,120) | (3,151) | (67,113) | (10,126) | |||||||||||||||||||
| Purchase of company stock | — | — | — | (17,351) | |||||||||||||||||||
| Payment of accrued contingent consideration | (36) | (5,714) | (4,091) | (5,714) | |||||||||||||||||||
| Purchase of noncontrolling interest | — | — | (800) | — | |||||||||||||||||||
| Net cash used in financing activities | (6,254) | (2,641) | (74,097) | (14,089) | |||||||||||||||||||
| Net (decrease) increase in cash, cash equivalents and restricted cash | (17,145) | (17,304) | 39,883 | (14,309) | |||||||||||||||||||
| Cash, cash equivalents and restricted cash at beginning of period | 111,161 | 48,764 | 54,133 | 45,769 | |||||||||||||||||||
| Cash, cash equivalents and restricted cash at end of period | $ | 94,016 | $ | 31,460 | $ | 94,016 | $ | 31,460 | |||||||||||||||
| For the Three-Month Periods Ended September 30, |
For the Nine-Month Periods Ended September 30, |
||||||||||||||||||||||
| 2023 | 2022 | 2023 | 2022 | ||||||||||||||||||||
| Supplemental Disclosures of Cash Flow Information: | |||||||||||||||||||||||
| Cash paid for interest | $ | 6,756 | $ | 4,664 | $ | 19,787 | $ | 9,153 | |||||||||||||||
| Cash paid for Infinity ZPIC interest | $ | — | $ | 11,544 | $ | — | $ | 11,544 | |||||||||||||||
| Cash paid for income taxes, net of refunds received | $ | 8,498 | $ | 605 | $ | 24,318 | $ | 23,582 | |||||||||||||||
| Cash paid for operating lease liabilities | $ | 8,665 | $ | 10,868 | $ | 26,059 | $ | 33,187 | |||||||||||||||
| Cash paid for finance lease liabilities | $ | 3,141 | $ | 339 | $ | 8,462 | $ | 1,074 | |||||||||||||||
| Supplemental Disclosures of Non-Cash Activity: | |||||||||||||||||||||||
| Right of use assets obtained in exchange for operating lease liabilities | $ | 10,459 | $ | 10,390 | $ | 25,261 | $ | 36,980 | |||||||||||||||
| Right of use assets obtained in exchange for finance lease liabilities | $ | 7,020 | $ | 530 | $ | 34,964 | $ | 1,846 | |||||||||||||||
| Reductions to right of use assets resulting from reductions to operating lease liabilities | $ | — | $ | 624 | $ | 15,135 | $ | 3,387 | |||||||||||||||
| Reductions to right of use assets resulting from reductions to finance lease liabilities | $ | 315 | $ | 564 | $ | 1,209 | $ | 564 | |||||||||||||||
| Accrued contingent consideration | $ | — | $ | — | $ | — | $ | 19,195 | |||||||||||||||
| Noncontrolling interest contribution | $ | — | $ | — | $ | — | $ | 8,900 | |||||||||||||||
| Days revenue outstanding (1) | 49.8 | 47.3 | 49.8 | 47.3 | |||||||||||||||||||
| For the Three-Month Periods Ended September 30, |
|||||||||||
| 2023 | 2022 | ||||||||||
Financial Information (in millions) (6): |
|||||||||||
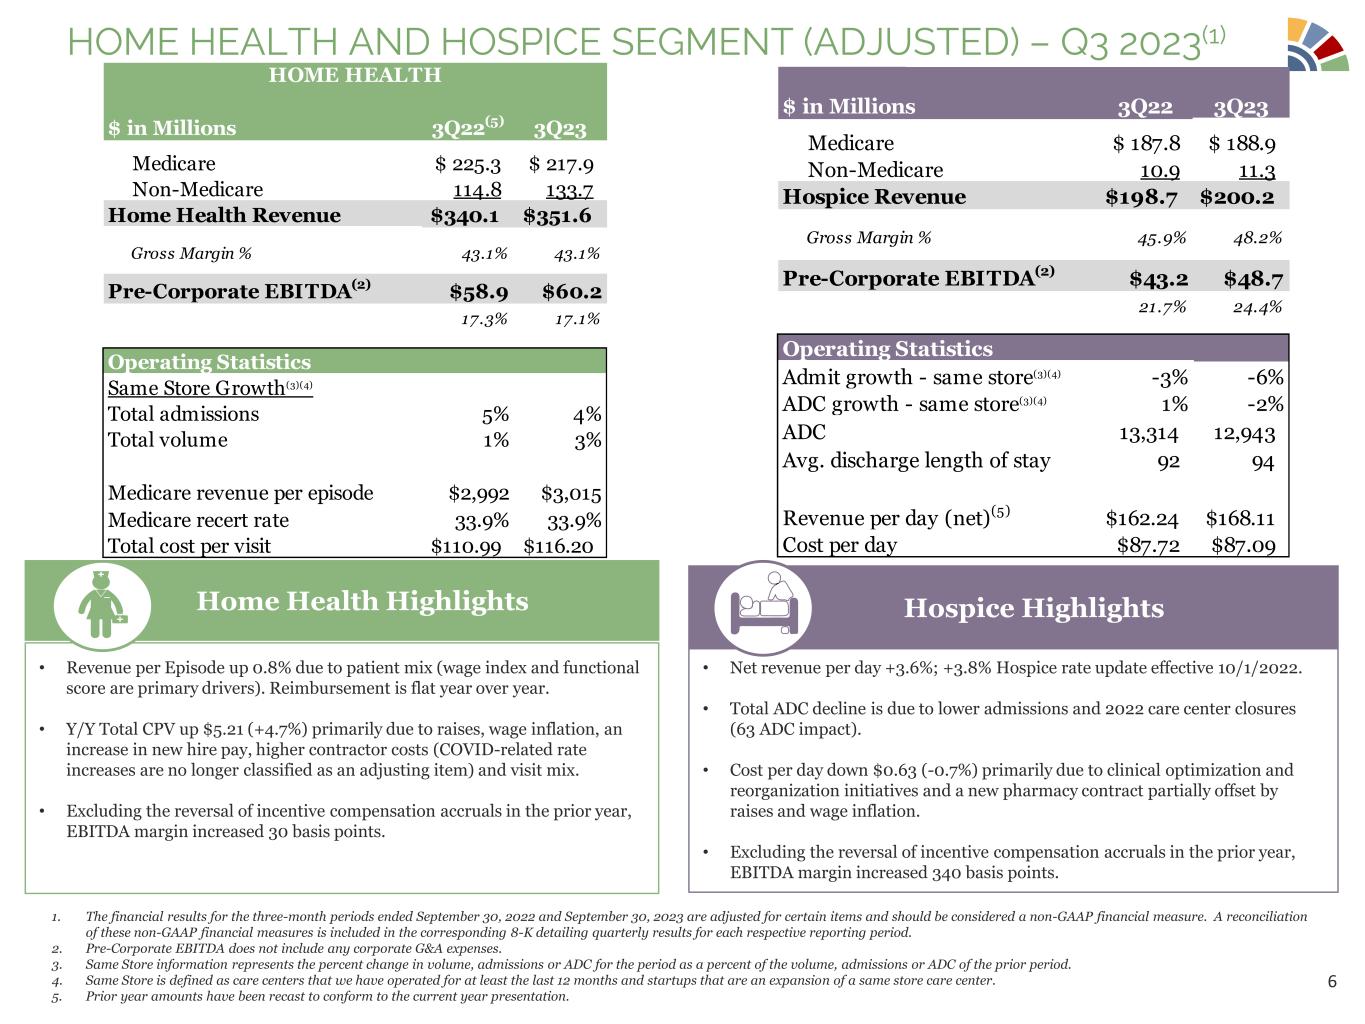
| Medicare | $ | 217.9 | $ | 225.6 | |||||||
| Non-Medicare | 133.7 | 113.6 | |||||||||
| Net service revenue | 351.6 | 339.2 | |||||||||
| Cost of service, inclusive of depreciation | 201.6 | 196.7 | |||||||||
| Gross margin | 150.0 | 142.5 | |||||||||
| General and administrative expenses | 91.4 | 89.1 | |||||||||
| Depreciation and amortization | 1.8 | 0.9 | |||||||||
| Operating income | $ | 56.8 | $ | 52.5 | |||||||
Same Store Growth(1): |
|||||||||||
| Medicare revenue | (2 | %) | (6 | %) | |||||||
| Non-Medicare revenue | 17 | % | (1 | %) | |||||||
| Total admissions | 4 | % | 5 | % | |||||||
Total volume(2) |
3 | % | 1 | % | |||||||
Key Statistical Data - Total(3)(6): |
|||||||||||
| Admissions | 98,527 | 95,566 | |||||||||
| Recertifications | 45,693 | 45,098 | |||||||||
| Total volume | 144,220 | 140,664 | |||||||||
| Medicare completed episodes | 72,714 | 76,334 | |||||||||
Average Medicare revenue per completed episode(4) |
$ | 3,015 | $ | 2,992 | |||||||
Medicare visits per completed episode(5) |
12.4 | 12.7 | |||||||||
| Visiting clinician cost per visit | $ | 105.06 | $ | 101.33 | |||||||
| Clinical manager cost per visit | 11.98 | 11.44 | |||||||||
| Total cost per visit | $ | 117.04 | $ | 112.77 | |||||||
| Visits | 1,723,289 | 1,744,385 | |||||||||
| For the Nine-Month Periods Ended September 30, |
|||||||||||
| 2023 | 2022 | ||||||||||
Financial Information (in millions) (6): |
|||||||||||
| Medicare | $ | 653.1 | $ | 671.7 | |||||||
| Non-Medicare | 391.6 | 345.1 | |||||||||
| Net service revenue | 1,044.7 | 1,016.8 | |||||||||
| Cost of service, inclusive of depreciation | 593.1 | 576.6 | |||||||||
| Gross margin | 451.6 | 440.2 | |||||||||
| General and administrative expenses | 270.5 | 261.1 | |||||||||
| Depreciation and amortization | 4.3 | 3.3 | |||||||||
| Operating income | $ | 176.8 | $ | 175.8 | |||||||
Same Store Growth(1): |
|||||||||||
| Medicare revenue | (3 | %) | (5 | %) | |||||||
| Non-Medicare revenue | 13 | % | — | % | |||||||
| Total admissions | 5 | % | 2 | % | |||||||
Total volume(2) |
3 | % | — | % | |||||||
Key Statistical Data - Total(3)(6): |
|||||||||||
| Admissions | 297,943 | 281,393 | |||||||||
| Recertifications | 134,826 | 133,775 | |||||||||
| Total volume | 432,769 | 415,168 | |||||||||
| Medicare completed episodes | 221,125 | 229,098 | |||||||||
Average Medicare revenue per completed episode(4) |
$ | 2,998 | $ | 3,019 | |||||||
Medicare visits per completed episode(5) |
12.4 | 13.0 | |||||||||
| Visiting clinician cost per visit | $ | 101.55 | $ | 98.72 | |||||||
| Clinical manager cost per visit | 11.41 | 10.99 | |||||||||
| Total cost per visit | $ | 112.96 | $ | 109.71 | |||||||
| Visits | 5,250,944 | 5,256,207 | |||||||||
| For the Three-Month Periods Ended September 30, |
|||||||||||
| 2023 | 2022 | ||||||||||
Financial Information (in millions): |
|||||||||||
| Medicare | $ | 188.9 | $ | 187.8 | |||||||
| Non-Medicare | 11.3 | 10.9 | |||||||||
| Net service revenue | 200.2 | 198.7 | |||||||||
| Cost of service, inclusive of depreciation | 104.2 | 109.4 | |||||||||
| Gross margin | 96.0 | 89.3 | |||||||||
| General and administrative expenses | 48.4 | 49.1 | |||||||||
| Depreciation and amortization | 0.8 | 0.5 | |||||||||
| Operating income | $ | 46.8 | $ | 39.7 | |||||||
Same Store Growth(1): |
|||||||||||
| Medicare revenue | 1 | % | — | % | |||||||
| Hospice admissions | (6 | %) | (3 | %) | |||||||
| Average daily census | (2 | %) | 1 | % | |||||||
Key Statistical Data - Total(2): |
|||||||||||
| Hospice admissions | 11,968 | 12,782 | |||||||||
| Average daily census | 12,943 | 13,314 | |||||||||
| Revenue per day, net | $ | 168.11 | $ | 162.24 | |||||||
| Cost of service per day | $ | 87.48 | $ | 89.36 | |||||||
| Average discharge length of stay | 94 | 92 | |||||||||
| For the Nine-Month Periods Ended September 30, |
|||||||||||
| 2023 | 2022 | ||||||||||
Financial Information (in millions): |
|||||||||||
| Medicare | $ | 559.8 | $ | 557.8 | |||||||
| Non-Medicare | 33.0 | 32.4 | |||||||||
| Net service revenue | 592.8 | 590.2 | |||||||||
| Cost of service, inclusive of depreciation | 304.4 | 323.2 | |||||||||
| Gross margin | 288.4 | 267.0 | |||||||||
| General and administrative expenses | 144.1 | 152.1 | |||||||||
| Depreciation and amortization | 2.2 | 1.7 | |||||||||
| Operating income | $ | 142.1 | $ | 113.2 | |||||||
Same Store Growth(1): |
|||||||||||
| Medicare revenue | — | % | — | % | |||||||
| Hospice admissions | (6 | %) | 1 | % | |||||||
| Average daily census | (2 | %) | (1 | %) | |||||||
Key Statistical Data - Total(2): |
|||||||||||
| Hospice admissions | 37,361 | 40,027 | |||||||||
| Average daily census | 12,864 | 13,163 | |||||||||
| Revenue per day, net | $ | 168.80 | $ | 164.24 | |||||||
| Cost of service per day | $ | 86.66 | $ | 89.94 | |||||||
| Average discharge length of stay | 91 | 90 | |||||||||
| For the Three-Month Periods Ended September 30, |
|||||||||||
| 2023 | 2022 | ||||||||||
Financial Information (in millions): |
|||||||||||
| Medicare | $ | — | $ | — | |||||||
| Non-Medicare | — | 16.6 | |||||||||
| Net service revenue | — | 16.6 | |||||||||
| Cost of service, inclusive of depreciation | — | 12.2 | |||||||||
| Gross margin | — | 4.4 | |||||||||
| General and administrative expenses | — | 2.4 | |||||||||
| Depreciation and amortization | — | — | |||||||||
| Operating income | $ | — | $ | 2.0 | |||||||
| Key Statistical Data - Total: | |||||||||||
| Billable hours | — | 474,365 | |||||||||
| Clients served | — | 7,771 | |||||||||
| Shifts | — | 202,638 | |||||||||
| Revenue per hour | $ | — | $ | 34.98 | |||||||
| Revenue per shift | $ | — | $ | 81.89 | |||||||
| Hours per shift | — | 2.3 | |||||||||
| For the Nine-Month Periods Ended September 30, |
|||||||||||
| 2023 | 2022 | ||||||||||
Financial Information (in millions): |
|||||||||||
| Medicare | $ | — | $ | — | |||||||
| Non-Medicare | 15.0 | 45.5 | |||||||||
| Net service revenue | 15.0 | 45.5 | |||||||||
| Cost of service, inclusive of depreciation | 11.1 | 34.5 | |||||||||
| Gross margin | 3.9 | 11.0 | |||||||||
| General and administrative expenses | 2.3 | 6.8 | |||||||||
| Depreciation and amortization | — | 0.1 | |||||||||
| Operating income | $ | 1.6 | $ | 4.1 | |||||||
| Key Statistical Data - Total: | |||||||||||
| Billable hours | 440,464 | 1,397,919 | |||||||||
| Clients served | 7,892 | 9,530 | |||||||||
| Shifts | 191,379 | 598,376 | |||||||||
| Revenue per hour | $ | 33.97 | $ | 32.53 | |||||||
| Revenue per shift | $ | 78.19 | $ | 76.00 | |||||||
| Hours per shift | 2.3 | 2.3 | |||||||||
| For the Three-Month Periods Ended September 30, |
|||||||||||
| 2023 | 2022 | ||||||||||
Financial Information (in millions) (1): |
|||||||||||
| Medicare | $ | — | $ | — | |||||||
| Non-Medicare | 4.4 | 3.5 | |||||||||
| Net service revenue | 4.4 | 3.5 | |||||||||
| Cost of service, inclusive of depreciation | 5.8 | 3.9 | |||||||||
| Gross margin | (1.4) | (0.4) | |||||||||
| General and administrative expenses | 5.3 | 5.2 | |||||||||
| Depreciation and amortization | 0.7 | 0.8 | |||||||||
| Investment impairment | — | 3.0 | |||||||||
| Operating loss | $ | (7.4) | $ | (9.4) | |||||||
| Key Statistical Data - Total: | |||||||||||
| Full risk admissions | 150 | 130 | |||||||||
| Limited risk admissions | 430 | 300 | |||||||||
| Total admissions | 580 | 430 | |||||||||
| Full risk revenue per episode | $ | 10,168 | $ | 11,615 | |||||||
| Limited risk revenue per episode | $ | 6,242 | $ | 5,580 | |||||||
| Number of admitting joint venture markets | 11 | 8 | |||||||||
| For the Nine-Month Periods Ended September 30, |
|||||||||||
| 2023 | 2022 | ||||||||||
Financial Information (in millions) (1): |
|||||||||||
| Medicare | $ | — | $ | — | |||||||
| Non-Medicare | 13.1 | 8.6 | |||||||||
| Net service revenue | 13.1 | 8.6 | |||||||||
| Cost of service, inclusive of depreciation | 15.5 | 9.0 | |||||||||
| Gross margin | (2.4) | (0.4) | |||||||||
| General and administrative expenses | 15.0 | 14.6 | |||||||||
| Depreciation and amortization | 2.3 | 2.4 | |||||||||
| Investment impairment | — | 3.0 | |||||||||
| Operating loss | $ | (19.7) | $ | (20.4) | |||||||
| Key Statistical Data - Total: | |||||||||||
| Full risk admissions | 468 | 339 | |||||||||
| Limited risk admissions | 1,263 | 768 | |||||||||
| Total admissions | 1,731 | 1,107 | |||||||||
| Full risk revenue per episode | $ | 10,783 | $ | 11,018 | |||||||
| Limited risk revenue per episode | $ | 5,881 | $ | 5,556 | |||||||
| Number of admitting joint venture markets | 11 | 8 | |||||||||
| For the Three-Month Periods Ended September 30, |
|||||||||||
| 2023 | 2022 | ||||||||||
Financial Information (in millions) (1): |
|||||||||||
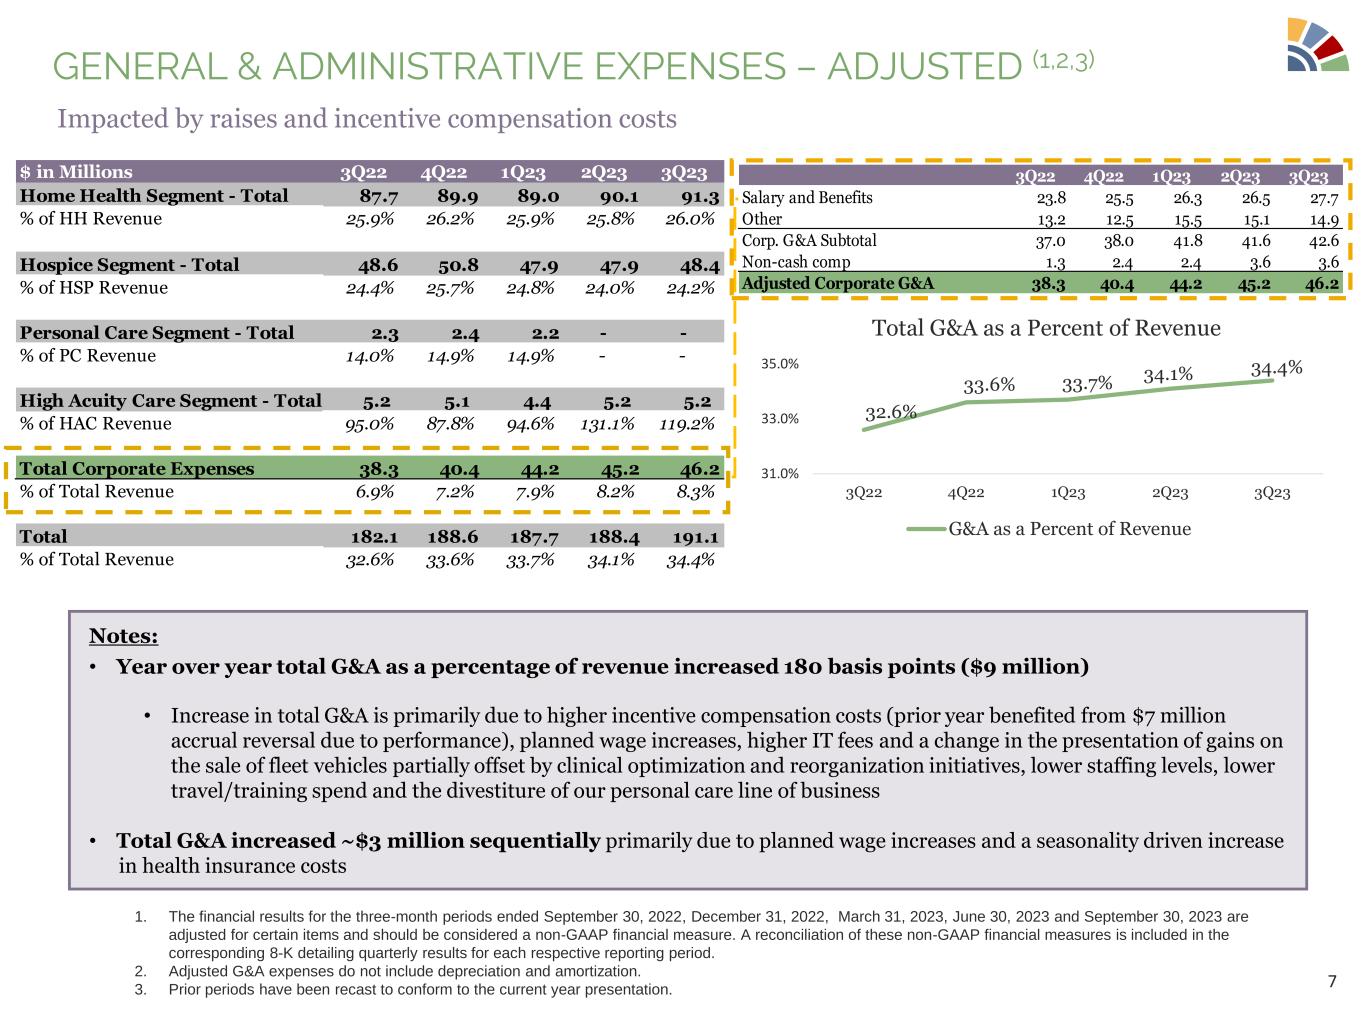
| General and administrative expenses | $ | 52.9 | $ | 42.6 | |||||||
| Depreciation and amortization | 1.1 | 3.3 | |||||||||
| Total operating expenses | $ | 54.0 | $ | 45.9 | |||||||
| For the Nine-Month Periods Ended September 30, |
|||||||||||
| 2023 | 2022 | ||||||||||
Financial Information (in millions) (1): |
|||||||||||
| General and administrative expenses | $ | 173.6 | $ | 126.0 | |||||||
| Depreciation and amortization | 4.8 | 12.2 | |||||||||
| Total operating expenses | $ | 178.4 | $ | 138.2 | |||||||
| For the Three-Month Periods Ended September 30, |
For the Nine-Month Periods Ended September 30, |
||||||||||||||||||||||
| 2023 | 2022 | 2023 | 2022 | ||||||||||||||||||||
| Net income (loss) attributable to Amedisys, Inc. | $ | 25,960 | $ | 25,642 | $ | (29,069) | $ | 86,892 | |||||||||||||||
| Add: | |||||||||||||||||||||||
| Income tax expense | 12,331 | 9,417 | 40,381 | 32,755 | |||||||||||||||||||
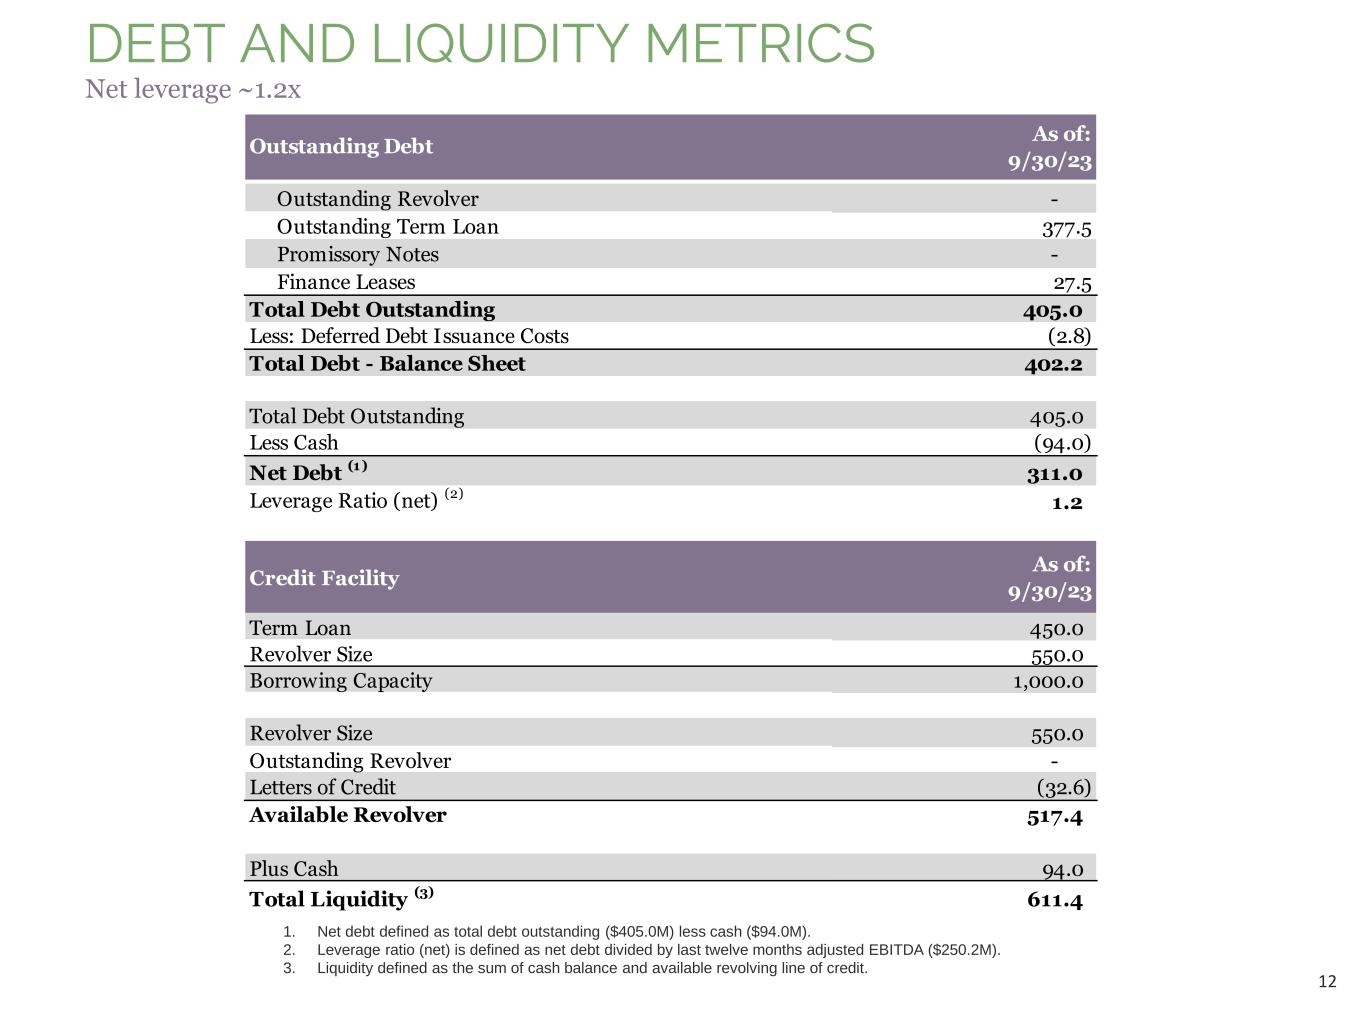
| Interest expense, net | 6,717 | 4,904 | 20,588 | 16,339 | |||||||||||||||||||
| Depreciation and amortization | 6,063 | 5,477 | 17,956 | 19,705 | |||||||||||||||||||
Certain items(1) |
6,807 | 15,861 | 140,498 | 50,920 | |||||||||||||||||||
Interest component of certain items(1) |
— | 207 | — | (4,445) | |||||||||||||||||||
Adjusted EBITDA(2)(6) |
$ | 57,878 | $ | 61,508 | $ | 190,354 | $ | 202,166 | |||||||||||||||
| For the Three-Month Periods Ended September 30, |
For the Nine-Month Periods Ended September 30, |
||||||||||||||||||||||
| 2023 | 2022 | 2023 | 2022 | ||||||||||||||||||||
| Net service revenue | $ | 556,237 | $ | 557,988 | $ | 1,665,594 | $ | 1,661,135 | |||||||||||||||
| Add: | |||||||||||||||||||||||
Certain items(1) |
— | 931 | — | 9,305 | |||||||||||||||||||
Adjusted net service revenue(3) (6) |
$ | 556,237 | $ | 558,919 | $ | 1,665,594 | $ | 1,670,440 | |||||||||||||||
| For the Three-Month Periods Ended September 30, |
For the Nine-Month Periods Ended September 30, |
||||||||||||||||||||||
| 2023 | 2022 | 2023 | 2022 | ||||||||||||||||||||
| Net income (loss) attributable to Amedisys, Inc. | $ | 25,960 | $ | 25,642 | $ | (29,069) | $ | 86,892 | |||||||||||||||
| Add: | |||||||||||||||||||||||
Certain items(1) |
6,242 | 11,740 | 138,884 | 38,587 | |||||||||||||||||||
Adjusted net income attributable to Amedisys, Inc.(4)(6) |
$ | 32,202 | $ | 37,382 | $ | 109,815 | $ | 125,479 | |||||||||||||||
| For the Three-Month Periods Ended September 30, |
For the Nine-Month Periods Ended September 30, |
||||||||||||||||||||||
| 2023 | 2022 | 2023 | 2022 | ||||||||||||||||||||
| Net income (loss) attributable to Amedisys, Inc. common stockholders per diluted share | $ | 0.79 | $ | 0.79 | $ | (0.89) | $ | 2.66 | |||||||||||||||
| Add: | |||||||||||||||||||||||
Certain items(1) |
0.19 | 0.36 | 4.25 | 1.18 | |||||||||||||||||||
Adjusted net income attributable to Amedisys, Inc. common stockholders per diluted share(5)(6) |
$ | 0.98 | $ | 1.15 | $ | 3.36 | $ | 3.84 | |||||||||||||||
| For the Three-Month Periods Ended September 30, 2023 |
For the Nine-Month Periods Ended September 30, 2023 |
||||||||||
| (Income) Expense | (Income) Expense | ||||||||||
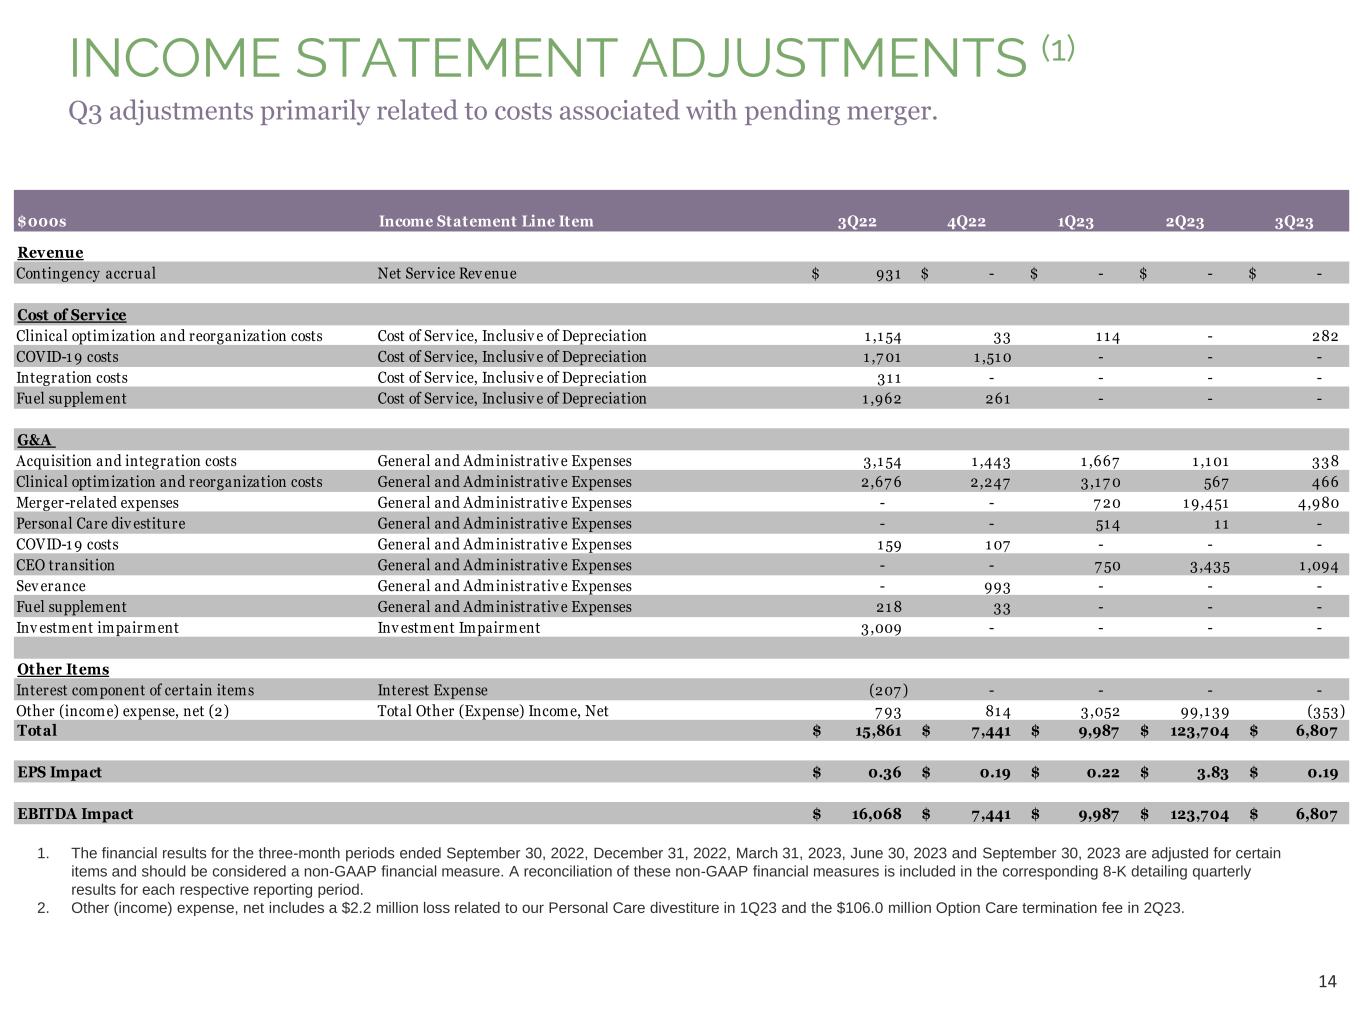
| Certain Items Impacting Cost of Service, Inclusive of Depreciation: | |||||||||||
| Clinical optimization and reorganization costs | $ | 282 | $ | 396 | |||||||
| Certain Items Impacting General and Administrative Expenses: | |||||||||||
| Acquisition and integration costs | 338 | 3,106 | |||||||||
| CEO transition | 1,094 | 5,279 | |||||||||
| Merger-related expenses | 4,980 | 25,151 | |||||||||
| Clinical optimization and reorganization costs | 466 | 4,203 | |||||||||
| Personal care divestiture | — | 525 | |||||||||
| Certain Items Impacting Total Other Income (Expense): | |||||||||||
| Other (income) expense, net (includes $106,000 merger termination fee) | (353) | 101,838 | |||||||||
| Total | $ | 6,807 | $ | 140,498 | |||||||
| Net of tax | $ | 6,242 | $ | 138,884 | |||||||
| Diluted EPS | $ | 0.19 | $ | 4.25 | |||||||
| For the Three-Month Periods Ended September 30, 2022 |
For the Nine-Month Periods Ended September 30, 2022 |
||||||||||
| (Income) Expense | (Income) Expense | ||||||||||
| Certain Items Impacting Net Service Revenue: | |||||||||||
| Contingency accrual | $ | 931 | $ | 9,305 | |||||||
| Certain Items Impacting Cost of Service: | |||||||||||
| COVID-19 costs | 1,701 | 7,237 | |||||||||
| Clinical optimization and reorganization costs | 1,154 | 1,349 | |||||||||
| Fuel supplement | 1,962 | 3,315 | |||||||||
| Integration costs | 311 | 1,712 | |||||||||
| Certain Items Impacting General and Administrative Expenses: | |||||||||||
| Acquisition and integration costs | 3,154 | 9,855 | |||||||||
| COVID-19 costs | 159 | 396 | |||||||||
| CEO transition | — | 3,500 | |||||||||
| Legal fees - non-routine | — | 241 | |||||||||
| Clinical optimization and reorganization costs | 2,676 | 3,545 | |||||||||
| Legal settlement | — | (1,058) | |||||||||
| Fuel supplement | 218 | 218 | |||||||||
| Investment impairment | 3,009 | 3,009 | |||||||||
| Certain Items Impacting Total Other Income (Expense): | |||||||||||
| Interest component of certain items | (207) | 4,445 | |||||||||
| Other expense, net | 793 | 3,851 | |||||||||
| Total | $ | 15,861 | $ | 50,920 | |||||||
| Net of tax | $ | 11,740 | $ | 38,587 | |||||||
| Diluted EPS | $ | 0.36 | $ | 1.18 | |||||||

