Document
FORM 6-K
SECURITIES AND EXCHANGE COMMISSION
Washington, D.C. 20549
Report of Foreign Issuer
Pursuant to Rule 13a-16 or 15d-16
of the Securities Exchange Act of 1934
For the month of October, 2025
Commission File Number: 001-12518
Banco Santander, S.A.
(Exact name of registrant as specified in its charter)
Ciudad Grupo Santander
28660 Boadilla del Monte (Madrid) Spain
(Address of principal executive office)
Indicate by check mark whether the registrant files or will file annual reports under cover of Form 20-F or Form 40-F:
Form 20-F ☒ Form 40-F ☐
BANCO SANTANDER, S.A.
________________________
TABLE OF CONTENTS
|
|
|
|
|
|
|
|
|
|
|
Item 1. January - September 2025 Financial Report |
|
Index
This report was approved by the board of directors on 28 October 2025, following a favourable report from the audit committee. Important information regarding this report can be found on pages 93 and 94.
SIGNIFICANT EVENTS IN THE PERIOD
In Q2 2025, Santander announced the entry into an agreement with Erste Group Bank AG (Erste) to sell approximately 49% of its stake in Santander Bank Polska S.A. and the 50% of the asset management company (TFI) which was not integrated within Santander Polska to Erste, for a total cash amount of approximately EUR 7 billion. In addition, Santander announced its intention to acquire 100% of Santander Consumer Bank Polska by purchasing the 60% stake currently held by Santander Bank Polska S.A. (approximately EUR 0.7 billion), thereby bringing the business fully within the perimeter of Grupo Santander and excluding it from the scope of the sale. Santander and Erste also announced a strategic collaboration to leverage the strengths and international presence of both institutions in Corporate & Investment Banking (CIB) and to enable Erste to benefit from Santander’s global payments platforms. The transaction is subject to customary closing conditions, including regulatory approvals, such as that of the Polish Financial Supervision Authority (KNF). Completion is expected in the next few months. The abovementioned transaction will hereinafter be referred to as the 'Poland disposal', based on the assumption that it will be completed under the terms described above.
In accordance with IFRS 5 requirements, the business subject to the Poland disposal has been classified as 'non-current assets/liabilities held for sale' and the related results have been reported under 'discontinued operations'. Accordingly:
•In the Group’s consolidated balance sheet, the assets associated with the Poland disposal are classified under the 'non-current assets held for sale' line item and the related liabilities under 'liabilities associated with non-current assets held for sale'. This classification applies solely to the balance sheet as at 30 June 2025 and does not affect balance sheets for prior periods.
•In the statutory income statement, the results associated with the business subject to the Poland disposal are reported under a single line in the consolidated income statement — 'profit/(loss) after tax from discontinued operations' — for results corresponding to both 2025 and 2024. Consequently, the results from the Poland disposal perimeter are excluded line by line from the breakdown of continuing operations in both periods.
However:
•In the underlying income statement, both at the Group and the primary and secondary segment levels (which are presented on an underlying basis only), the results from Poland continue to be reported line by line and disaggregated, as they were in previous quarterly disclosures given the fact that the management of Santander Polska remains unchanged until the Poland disposal is completed. This reporting approach is consistent with the information used internally in management reporting, as well as with other public Group disclosures.
•For the same reason, all management metrics included in this report have been calculated including Poland, i.e. maintaining the same perimeter that existed at the time of the announcement of the Poland disposal. However, if we were to exclude Poland, the Group's main management ratios would not be materially affected.
Additionally, in Q3 2025, Santander announced it has reached an agreement to acquire 100% of TSB Banking Group plc's (TSB) share capital from Banco de Sabadell, S.A. (Sabadell) with a valuation of GBP 2.65 billion (approximately EUR 3.1 billion) in an all-cash transaction. This agreement does not impact the information presented is this report nor is it expected to affect future publications until the transaction is completed. The transaction is subject to the corresponding regulatory approvals.
Finally, after the close of Q3 2025, Santander announced the merger of Openbank and Santander Consumer Finance (SCF) into a single legal entity. This is expected to result in all our European consumer finance businesses progressively operating under the Openbank brand.
|
|
|
|
|
|
|
|
|
| January - September 2025 |
|
3 |
KEY CONSOLIDATED DATA
|
|
|
|
|
|
|
|
|
|
|
|
|
|
|
|
|
|
|
|
|
|
|
|
| BALANCE SHEET (EUR million) |
Sep-25 |
Jun-25 |
% |
Sep-25 |
Sep-24 |
% |
Dec-24 |
| Total assets |
1,840,668 |
|
1,815,888 |
|
1.4 |
|
1,840,668 |
|
1,802,259 |
|
2.1 |
|
1,837,081 |
|
| Loans and advances to customers |
1,027,209 |
|
1,010,727 |
|
1.6 |
|
1,027,209 |
|
1,067,419 |
|
(3.8) |
|
1,054,069 |
|
| Customer deposits |
1,026,130 |
|
1,008,229 |
|
1.8 |
|
1,026,130 |
|
1,045,911 |
|
(1.9) |
|
1,055,936 |
|
| Total funds |
1,339,096 |
|
1,307,359 |
|
2.4 |
|
1,339,096 |
|
1,327,308 |
|
0.9 |
|
1,348,422 |
|
| Total equity |
109,914 |
|
108,985 |
|
0.9 |
|
109,914 |
|
105,063 |
|
4.6 |
|
107,327 |
|
|
Note: total funds includes customer deposits, mutual funds, pension funds and managed portfolios.
If we include loans, deposits and funds associated with the Poland disposal, as at 30 September 2025 loans and advances to customers would have been EUR 1,065,294 million; customer deposits EUR 1,077,885 million and total funds EUR 1,398,767 million.
|
|
|
|
|
|
|
|
|
|
|
|
|
|
|
|
|
|
|
|
|
|
|
|
|
| INCOME STATEMENT (EUR million) |
Q3'25 |
Q2'25 |
% |
9M'25 |
9M'24 |
% |
2024 |
| Net interest income |
10,348 |
|
10,590 |
|
(2.3) |
|
31,559 |
|
32,543 |
|
(3.0) |
|
43,787 |
|
| Total income |
14,325 |
|
14,503 |
|
(1.2) |
|
43,507 |
|
43,259 |
|
0.6 |
|
58,380 |
|
|
|
|
|
|
|
|
|
| Net operating income |
8,310 |
|
8,395 |
|
(1.0) |
|
25,128 |
|
24,659 |
|
1.9 |
|
33,231 |
|
|
|
|
|
|
|
|
|
| Profit before tax |
4,657 |
|
4,415 |
|
5.5 |
|
13,761 |
|
13,121 |
|
4.9 |
|
17,347 |
|
| Profit attributable to the parent |
3,504 |
|
3,431 |
|
2.1 |
|
10,337 |
|
9,309 |
|
11.0 |
|
12,574 |
|
|
|
|
|
|
|
|
|
|
|
Note: net operating income as total income minus operating expenses.
|
|
|
|
|
|
|
|
|
|
|
|
|
|
|
|
|
|
|
|
|
|
|
|
EPS, PROFITABILITY AND EFFICIENCY (%) 1 |
Q3'25 |
Q2'25 |
% |
9M'25 |
9M'24 |
% |
2024 |
| EPS (euros) |
0.23 |
|
0.22 |
|
2.7 |
|
0.66 |
|
0.57 |
|
16.3 |
|
0.77 |
|
| RoE |
13.8 |
|
13.7 |
|
|
13.7 |
|
12.9 |
|
|
13.0 |
|
| RoTE |
16.9 |
|
16.9 |
|
|
16.8 |
|
16.2 |
|
|
16.3 |
|
| RoTE (post-AT1) |
16.2 |
|
16.2 |
|
|
16.1 |
|
15.4 |
|
|
15.5 |
|
| RoA |
0.85 |
|
0.82 |
|
|
0.83 |
|
0.76 |
|
|
0.76 |
|
| RoRWA |
2.46 |
|
2.37 |
|
|
2.39 |
|
2.15 |
|
|
2.18 |
|
Efficiency ratio 2 |
41.1 |
|
41.2 |
|
|
41.3 |
|
41.7 |
|
|
41.8 |
|
|
|
|
|
|
|
|
|
|
|
|
|
|
|
|
|
|
|
|
|
|
|
|
|
UNDERLYING INCOME STATEMENT 2 (EUR million) |
Q3'25 |
Q2'25 |
% |
9M'25 |
9M'24 |
% |
2024 |
| Net interest income |
11,100 |
|
11,338 |
|
(2.1) |
|
33,816 |
|
34,682 |
|
(2.5) |
|
46,668 |
|
| Total income |
15,267 |
|
15,473 |
|
(1.3) |
|
46,277 |
|
46,185 |
|
0.2 |
|
62,211 |
|
|
|
|
|
|
|
|
|
| Net operating income |
8,999 |
|
9,097 |
|
(1.1) |
|
27,144 |
|
26,923 |
|
0.8 |
|
36,177 |
|
|
|
|
|
|
|
|
|
| Profit before tax |
5,197 |
|
5,116 |
|
1.6 |
|
15,500 |
|
14,427 |
|
7.4 |
|
19,027 |
|
| Underlying profit attributable to the parent |
3,504 |
|
3,431 |
|
2.1 |
|
10,337 |
|
9,309 |
|
11.0 |
|
12,574 |
|
| Changes in constant euros: |
|
|
|
|
|
| Q3'25 / Q2'25: NII: -1.6%; Total income: -0.9%; Net operating income: -0.7%; Profit before tax: +2.0%; Attributable profit: +2.7%. |
| 9M'25 / 9M'24: NII: +1.5%; Total income: +4.4%; Net operating income: +5.3%; Profit before tax: +11.7%; Attributable profit: +15.7%. |
|
|
|
|
|
|
|
|
|
4 |
|
January - September 2025 |
|
|
|
|
|
|
|
|
|
|
|
|
|
|
|
|
|
|
|
|
|
|
|
|
| SOLVENCY (%) |
Sep-25 |
Jun-25 |
|
Sep-25 |
Sep-24 |
|
Dec-24 |
| Phased-in CET1 ratio |
13.1 |
|
13.0 |
|
|
13.1 |
|
12.5 |
|
|
12.8 |
|
| Phased-in total capital ratio |
17.4 |
|
17.2 |
|
|
17.4 |
|
17.1 |
|
|
17.4 |
|
|
|
|
|
|
|
|
|
|
|
|
|
|
|
|
|
|
|
|
|
|
|
|
|
|
|
|
|
|
|
|
|
|
|
|
|
|
|
|
|
CREDIT QUALITY (%) 1 |
Sep-25 |
Jun-25 |
|
Sep-25 |
Sep-24 |
|
Dec-24 |
Cost of risk 2, 3 |
1.13 |
|
1.14 |
|
|
1.13 |
|
1.18 |
|
|
1.15 |
|
| NPL ratio |
2.92 |
|
2.91 |
|
|
2.92 |
|
3.06 |
|
|
3.05 |
|
| NPL coverage ratio |
67 |
|
67 |
|
|
67 |
|
64 |
|
|
65 |
|
|
|
|
|
|
|
|
|
|
|
|
|
|
|
|
|
|
|
|
|
|
|
|
|
|
| MARKET CAPITALIZATION AND SHARES |
Sep-25 |
Jun-25 |
% |
Sep-25 |
Sep-24 |
% |
Dec-24 |
| Shares (millions) |
14,885 |
|
14,885 |
|
0.0 |
|
14,885 |
|
15,494 |
|
(3.9) |
|
15,152 |
|
| Number of shareholders |
3,520,788 |
|
3,508,261 |
|
0.4 |
|
3,520,788 |
|
3,501,621 |
|
0.5 |
3,485,134 |
|
| Share price (euros) |
8.874 |
|
7.027 |
|
26.3 |
|
8.874 |
|
4.601 |
|
92.9 |
|
4.465 |
|
| Market capitalization (EUR million) |
132,092 |
|
104,599 |
|
26.3 |
|
132,092 |
|
71,281 |
|
85.3 |
|
67,648 |
|
| Tangible book value per share (euros) |
5.56 |
|
5.50 |
|
|
5.56 |
|
5.04 |
|
|
5.24 |
|
| Price / Tangible book value per share (X) |
1.60 |
|
1.28 |
|
|
1.60 |
|
0.91 |
|
|
0.85 |
|
|
|
|
|
|
|
|
|
|
|
|
|
|
|
|
|
|
|
|
|
|
|
|
|
|
|
|
|
|
|
|
|
CUSTOMERS (thousands) 4 |
Sep-25 |
Jun-25 |
% |
Sep-25 |
Sep-24 |
% |
Dec-24 |
| Total customers |
178,374 |
|
176,431 |
|
1.1 |
|
178,374 |
|
170,944 |
|
4.3 |
172,537 |
|
| Active customers |
105,528 |
|
104,733 |
|
0.8 |
|
105,528 |
|
102,313 |
|
3.1 |
|
103,262 |
|
|
|
|
|
|
|
|
|
|
|
|
|
|
|
|
|
|
|
|
|
|
|
|
|
| Digital customers |
62,258 |
|
61,100 |
|
1.9 |
|
62,258 |
|
57,801 |
|
7.7 |
59,317 |
|
|
|
|
|
|
|
|
|
|
|
|
|
|
|
|
|
|
|
|
|
|
|
|
|
|
|
|
|
|
|
|
|
OTHER DATA 4 |
Sep-25 |
Jun-25 |
% |
Sep-25 |
Sep-24 |
% |
Dec-24 |
|
|
|
|
|
|
|
|
| Number of employees |
201,304 |
|
204,330 |
|
(1.5) |
|
201,304 |
|
208,080 |
|
(3.3) |
|
206,753 |
|
| Number of branches |
7,389 |
|
7,683 |
|
(3.8) |
|
7,389 |
|
8,206 |
|
(10.0) |
|
8,086 |
|
|
|
|
|
|
|
|
Note: for Argentina and any grouping which includes it, the variations in constant euros have been calculated considering the Argentine peso exchange rate on the last working day for each of the periods presented. For further information, see the 'Alternative performance measures' section in the appendix to this report. Certain figures contained in this report, have been subject to rounding to enhance their presentation. Accordingly, in certain instances, the sum of the numbers in a column or a row in tables contained in this report may not conform exactly to the total figure given for that column or row.
|
|
|
|
|
|
|
| 1. |
|
| 2. |
In addition to financial information prepared in accordance with International Financial Reporting Standards (IFRS) and derived from our consolidated financial statements, this report contains certain financial measures that constitute alternative performance measures (APMs) as defined in the Guidelines on Alternative Performance Measures issued by the European Securities and Markets Authority (ESMA) on 5 October 2015, and other non-IFRS measures, including the figures related to “underlying” results, which do not include factors that are outside the ordinary course of our business, or have been reclassified within the underlying income statement. Further details are provided in the ' Alternative performance measures' section of the appendix to this report. For further details on the APMs and non-IFRS measures used, including their definition or a reconciliation between any applicable management indicators and the financial data presented in the annual consolidated financial statements prepared under IFRS, please see our 2024 Annual Financial Report, published in the CNMV on 28 February 2025, our 20-F report for the year ending 31 December 2024 filed with the SEC in the United States on 28 February 2025 as well as the ' Alternative performance measures' section of the appendix to this report.
|
|
|
|
|
| 3. |
Allowances for loan-loss provisions over the last 12 months / Average loans and advances to customers over the last 12 months. |
| 4. |
Customers, employees and branches include Poland. |
|
|
|
|
|
|
|
|
|
|
|
January - September 2025 |
|
5 |
OUR BUSINESS MODEL
|
|
|
|
|
|
|
|
|
|
|
|
|
|
|
|
|
|
|
|
|
|
|
|
|
|
|
| CUSTOMER FOCUS |
Building a digital bank with branches |
|
|
|
|
|
|
|
|
|
|
|
|
|
|
|
|
|
|
→ We continue to build a digital bank with branches, with a multichannel offering to fulfil all our customers' financial needs. |
|
|
178 mn |
|
106 mn |
|
|
|
total customers |
|
active customers |
|
|
|
|
|
|
|
|
|
|
| SCALE |
Global and in-market scale |
|
|
|
|
|
|
|
|
|
|
→ Our global and in-market scale helps us to improve our local banks' profitability, adding value and network benefits.
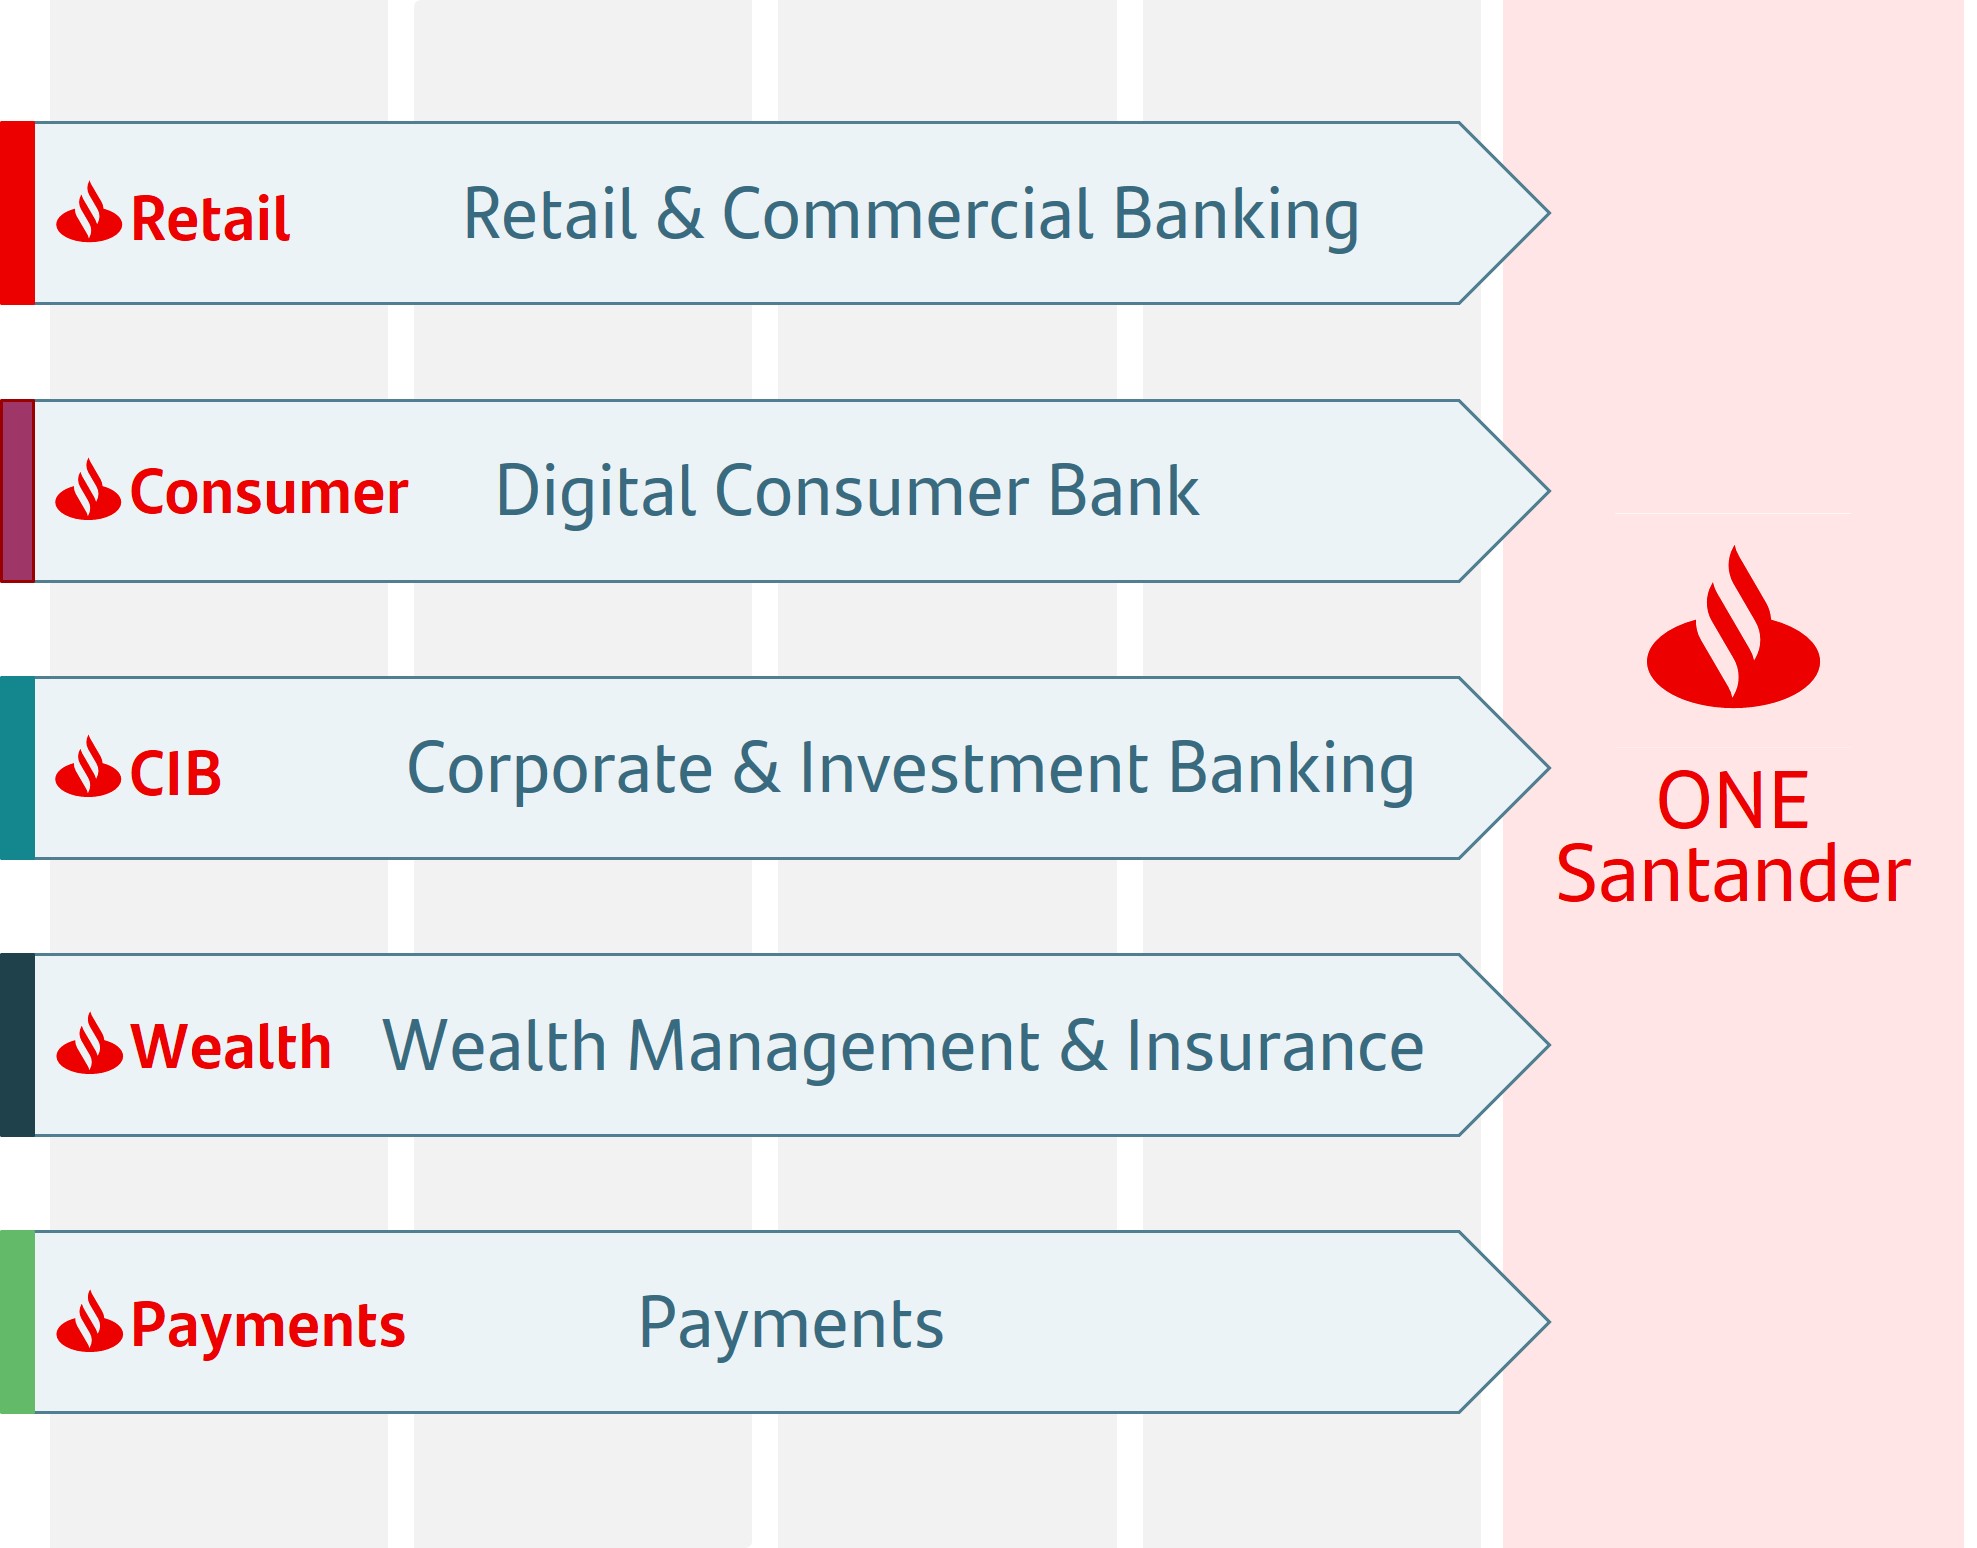
→ Our activities are organized under five global businesses: Retail & Commercial Banking (Retail), Digital Consumer Bank (Consumer), Corporate & Investment Banking (CIB), Wealth Management & Insurance (Wealth) and Payments.
→ Our five global businesses support value creation based on the profitable growth and operational leverage that ONE Santander provides.
|
|
|
|
|
|
|
|
|
|
|
|
| DIVERSIFICATION |
Business, geographical and balance sheet |
|
|
|
|
|
|
|
|
|
→ Well-balanced diversification between businesses and markets with a solid and simple balance sheet that gives us recurrent net operating income with low volatility and more predictable results. |
Our corporate culture
The Santander Way remains unchanged to continue to deliver for all our stakeholders.
|
|
|
|
|
|
|
|
|
|
|
|
|
Our purpose |
|
|
|
|
|
|
To help people and businesses prosper |
|
|
|
|
|
Our aim |
|
|
|
|
|
To be the best open financial services platform, by acting responsibly and earning the lasting loyalty of our people, customers, shareholders and communities |
|
|
|
|
|
Our how |
|
|
|
|
|
Everything we do should be Simple, Personal and Fair |
|
|
|
|
|
|
|
|
|
|
|
|
|
6 |
|
January - September 2025 |
|
|
|
|
|
|
|
|
|
|
|
|
|
|
|
|
|
|
|
|
|
|
|
|
|
|
|
|
|
|
|
|
|
|
|
|
|
Significant events
|
|
|
|
|
|
|
|
|
|
|
|
|
|
General background |
|
|
|
|
|
|
|
|
GROUP FINANCIAL INFORMATION
General background
Grupo Santander's operating environment in Q3 2025 was characterized by a moderate global economic slowdown, with falling interest rates and a decline in inflation across most of our footprint. Labour markets continued to have relatively low unemployment rates across most of our countries. Geopolitical and commercial tensions remained, however though easing slightly compared to previous quarters. We expect the main macroeconomic trends to continue during the rest of the year.
|
|
|
|
|
|
|
|
|
|
|
|
Country |
GDP Change1 |
Economic performance |
|
Eurozone |
+1.5% |
GDP growth slowed in Q2 2025, due to the decline in exports to the US. The labour market was resilient, with unemployment rate at historic lows (6.2% in July). Inflation is close to the 2% target. Since cutting interest rates to 2% in June, the ECB has since held rates, signalling that is comfortable with the current degree of monetary policy easing. |
|
Spain |
+3.1% |
Indicators in Q3 2025 point to solid growth, albeit more moderate in the year as a whole, mainly driven by domestic demand. The labour market remained strong, with the number of people enrolled in social security at record levels, though growth decelerated slightly in Q3 2025. Inflation rebounded year-on-year to 3% in September, driven by energy prices, but we expect a decline over the rest of the year. We expect core inflation (2.4% in September) to fall more gradually due to the stickiness of services prices. |
|
United Kingdom |
+1.2% |
The economy was more resilient than expected in Q2 2025, with growth driven by public spending and inventories. The labour market is stabilizing following the corporate tax hike and minimum wage increase in April, with the unemployment rate at 4.8% in July and stable wage growth, Though it remained elevated at +5% year-on-year. In August, headline inflation stabilized (3.8% in September) and core inflation eased to 3.5%, but both remain elevated. In this context, the Bank of England cut interest rates to 4% in August. |
|
Portugal |
+1.8% |
The economy returned to growth in Q2 2025, driven by private consumption. The labour market remained strong with the unemployment rate falling to 5.9% in August, reflecting full employment, and real wages grew 3.7%. Headline inflation declined to 2.4% in September, boosted by lower prices in the leisure, culture and hospitality component, and core inflation fell to 2.0% amid continued rigidity in service prices. Public finances were solid, with a fiscal surplus, debt reduction and an improved sovereign credit rating. |
|
Poland |
+3.4% |
GDP growth accelerated in Q2 2025 on the back of stronger consumption, although investment declined following a very strong Q1 2025. The labour market, while still solid, is weakening. The unemployment rate rose to 5.6% in September and wage growth slowed to 7.1% in August. Inflation continued to ease, reaching 2.9% in September which led the central bank to cut interest rates to 4.5% in October. |
|
United States |
+2.1% |
Leaving aside the volatility caused by bringing forward imports, the economy slowed down in the first half of the year, although by less than expected. Labour market cooling became more evident, with the unemployment rate at 4.3% in August. Even though inflation remained elevated (3.0% in September), increased risks to employment led the Fed to resume interest rate cuts in September, lowering rates by 25 bps and setting the federal funds target range at 4.0%-4.25%. |
|
Mexico |
0.0% |
The economy surprised to the upside in Q2 2025, with 0.6% quarterly growth, driven by expansion in industry and services. The labour market remained resilient, with low unemployment (2.7%). The annual headline inflation rate was below 4% (3.8% in September) but core inflation remained sticky at 4.3%. The central bank continued to cut the official interest rate, albeit at a more moderate rate, -25 bps per meeting, reaching 7.5% in September. |
|
Brazil |
+2.2% |
The economy slowed in Q2 2025, with weakness in manufacturing and agriculture but strong momentum in mining and services, with the unemployment rate at historic lows (5.6% in August). The annual inflation rate remained elevated (5.2% in September) and medium-term expectations are above target. After raising the interest rate to 15% in June, the central bank held rates in Q3 2025 and reaffirmed the message that rates will remain high for an extended period. |
|
Chile |
+3.1% |
The economy performed well in Q2 2025, boosted by private consumption and especially by investment. Inflation rebounded, with headline inflation up to 4.4% and core inflation to 3.9% in September. Although we expect inflation will converge towards the 3% inflation target in 2026, the central bank expressed concern about the persistence of core inflation. As such, following a 25 bp cut in July to 4.75%, it decided to hold rates in the following months, signalling that it would continue to cautiously move towards the neutral interest rate. |
|
Argentina |
+6.3% |
Economic growth increased year-on-year in Q2 2025, though it decreased slightly in the quarter (-0.1%). Monthly inflation remained around 2%, unaffected by the increased exchange rate volatility in recent months. The central bank adopted a monetary aggregates framework, enabling the policy rate to be determined by market conditions, rather than setting it through monetary policy decisions. |
1.Year-on-year changes for Q2 2025.
|
|
|
|
|
|
|
|
|
January - September 2025 |
|
7 |
|
|
|
|
|
|
|
|
|
|
|
|
|
|
|
|
|
|
|
|
|
|
|
|
|
|
|
|
|
|
|
|
|
|
|
|
|
Significant events
|
|
|
|
|
|
|
|
|
|
|
|
|
|
Highlights of the period |
|
|
|
|
|
|
|
|
|
|
|
|
|
|
|
|
|
|
|
|
| Highlights of the period: Main figures |
|
|
|
|
|
|
|
|
|
|
|
|
|
|
|
|
|
|
|
|
|
|
|
|
|
Q3'25 ATTRIBUTABLE PROFIT |
|
|
EUR 3,504 mn |
|
|
|
|
|
|
|
|
+2% in euros |
/Q2'25 |
|
|
+3% in constant euros |
|
|
|
|
|
|
|
|
9M'25 ATTRIBUTABLE PROFIT |
|
|
EUR 10,337 mn |
|
|
|
|
|
|
|
|
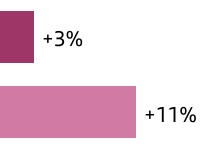
+11% in euros |
/9M'24 |
|
|
+16% in constant euros |
|
|
|
|
|
|
|
|
|
|
|
|
|
|
|
|
|
|
|
|
RoTE (post-AT1) |
|
|
|
|
|
|
|
|
16.1% |
|
|
+0.7 pp |
/9M'24 |
|
|
|
|
|
|
|
|
|
|
|
|
|
|
|
|
|
|
|
|
|
|
|
|
|
|
|
|
|
|
|
|
|
|
|
|
|
|
|
|
|
|
|
|
|
|
|
|
|
|
|
|
VOLUMES AND REVENUE |
|
|
Loan and advances to customers |
Customer
funds |
|
|
+2% |
+7% |
|
|
Net interest income |
Net fee
income |
|
|
+2% |
+8% |
|
|
Note: YoY changes in constant euros and Argentina in current euros. |
|
|
|
|
|
|
|
|
EFFICIENCY |
|
|
41.3% |
|
|
-0.4 pp /9M'24 |
|
|
|
|
|
|
|
|
COST OF RISK |
|
|
1.13% |
|
|
-5 bps /Sep-24 |
|
|
|
|
|
|
|
|
|
|
|
|
|
|
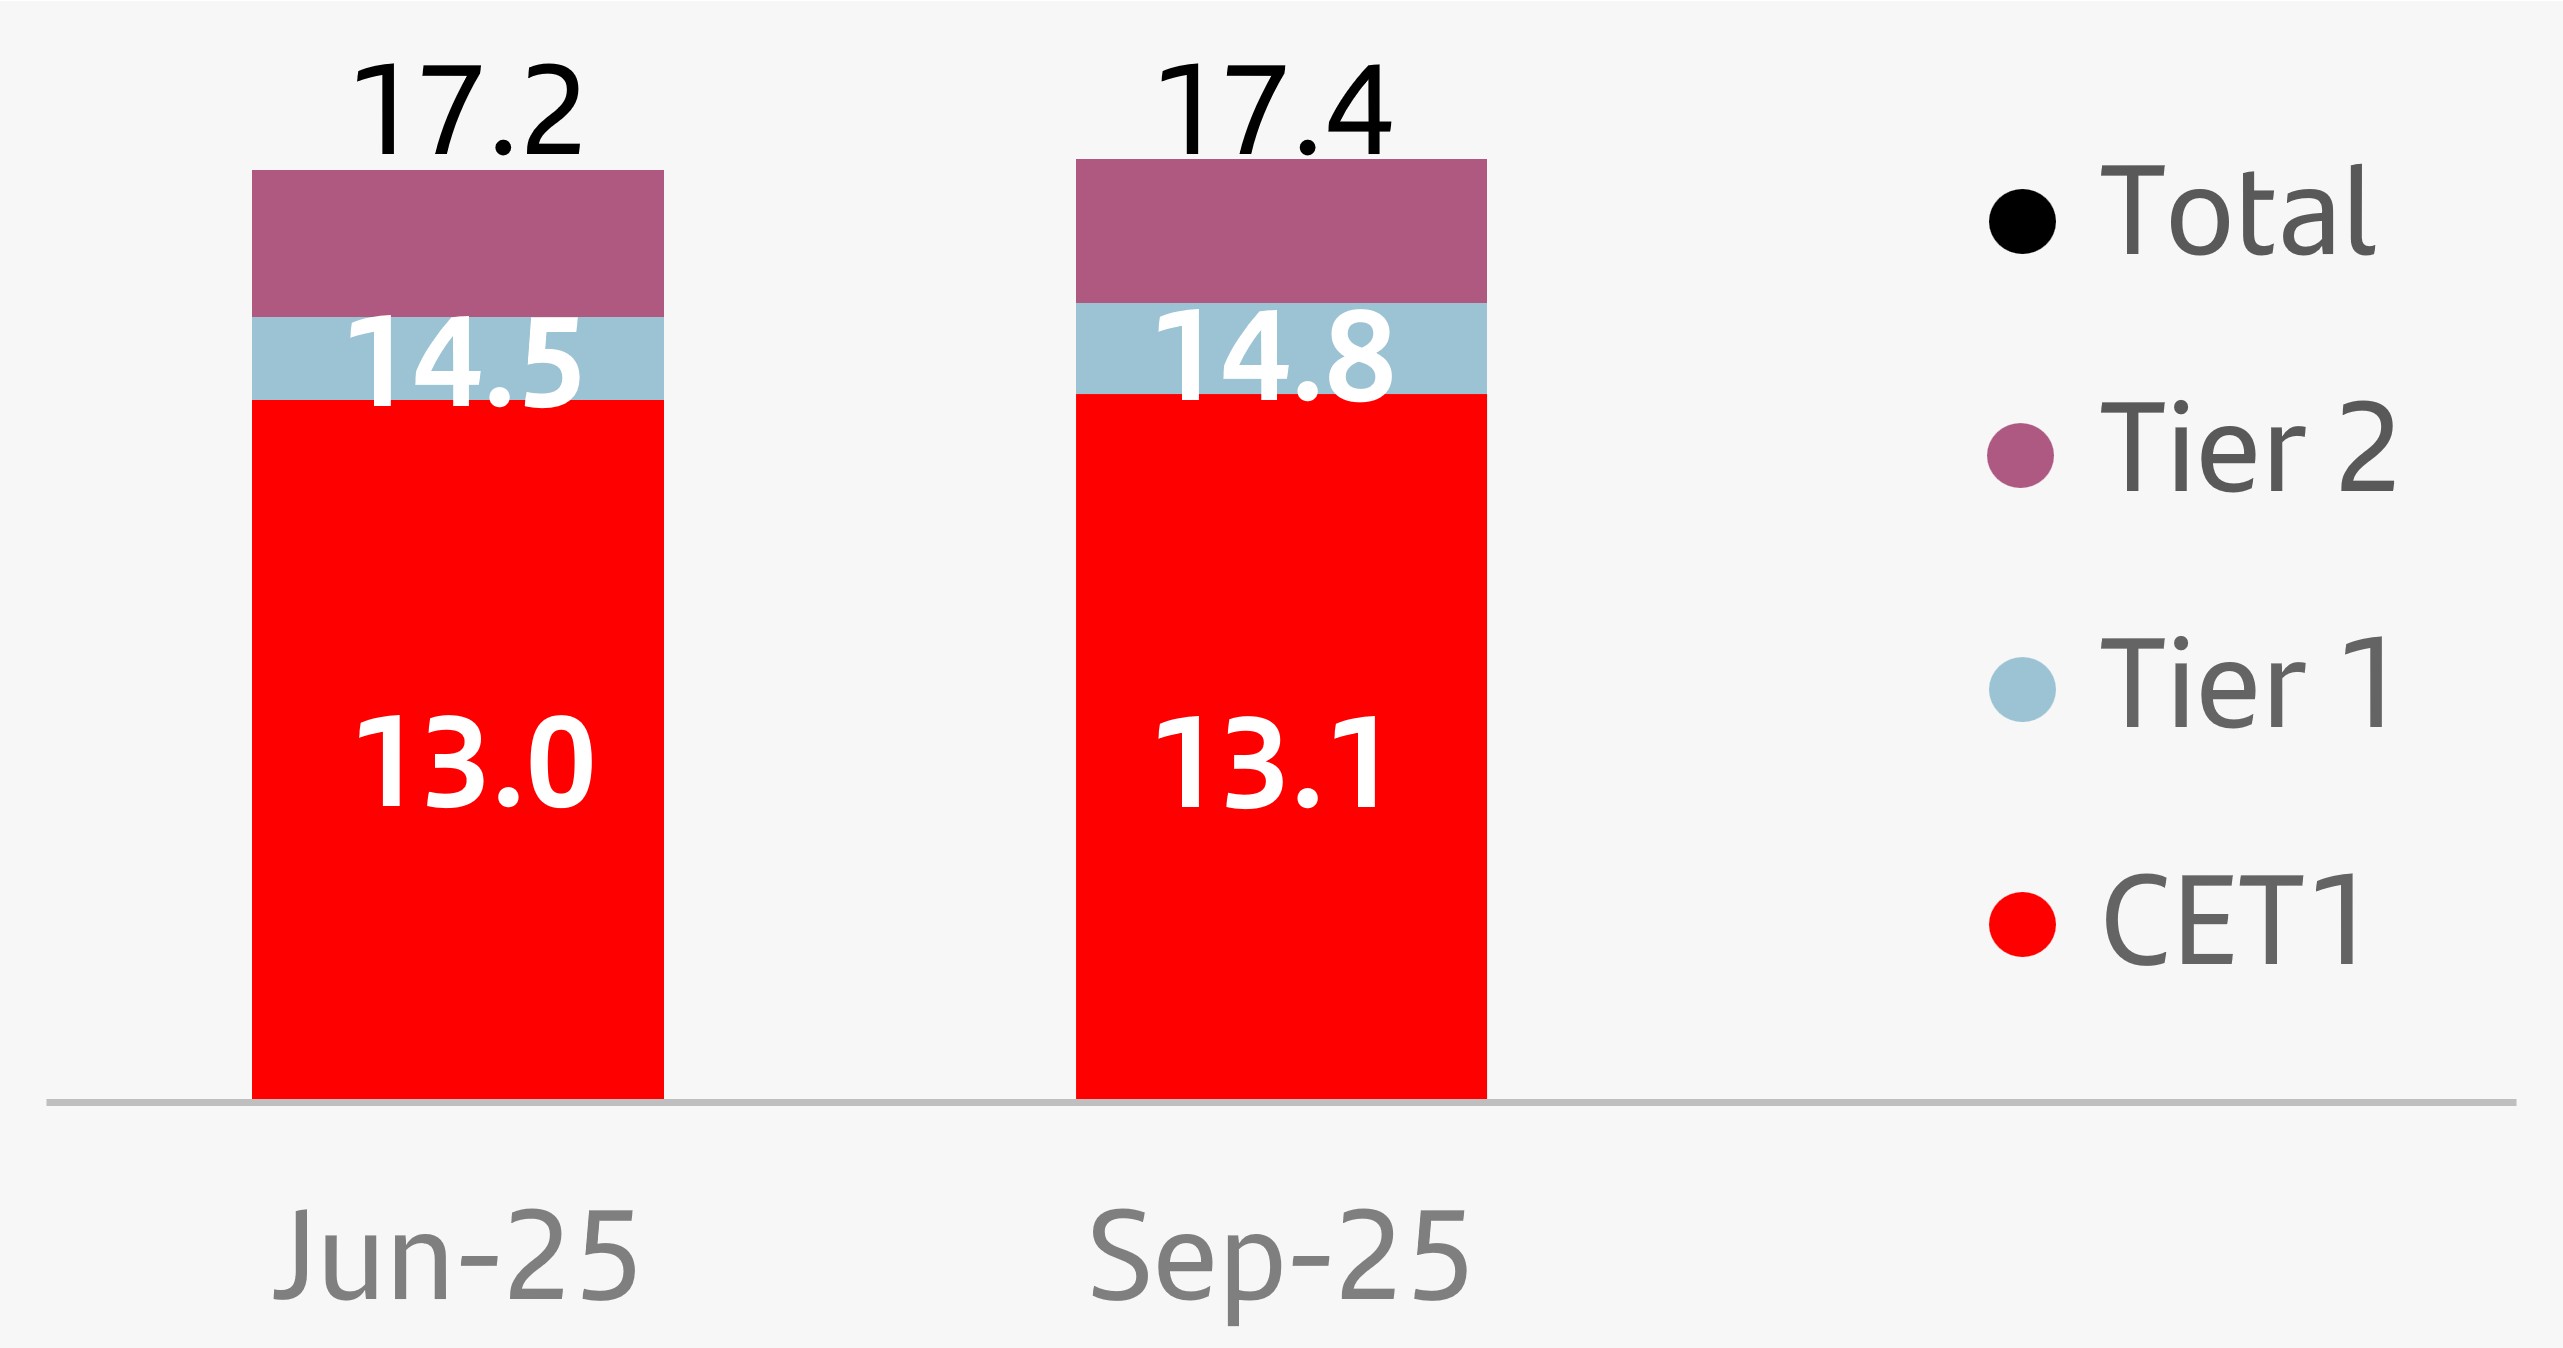
CET11 |
|
|
13.1% |
|
|
+0.1 pp /Jun-25 |
|
uIn Q3 2025, profit attributable to the parent was EUR 3,504 million, a sixth consecutive quarterly record, up 2% compared to Q2 2025. In constant euros, profit rose 3% quarter-on-quarter, despite the impact of Argentina. Excluding it, profit grew 4%, driven by a resilient NII even in a less favourable interest rate environment, solid net fee income and lower provisions, with controlled costs.
uIn 9M 2025, attributable profit increased 11% year-on-year to EUR 10,337 million, also an all-time-high. In constant euros, profit rose 16% backed by solid performances across all revenue lines, especially in net fee income, with costs flat in real terms and better cost of risk.
In addition, the year-on-year comparison was favoured by the charges in Q2 2024 following the discontinuation of the merchant platform in Germany and Superdigital in Latin America.
uStrong profit growth across our global businesses, most of them at or close to double digits year-on-year, supported by the solid increase in revenue.
uThese results in 9M 2025 put us on track to meet our 2025 targets.
uProfitability improved significantly year-on-year with RoTE (post-AT1) increasing 0.7 pp to 16.1% in 9M 2025, compared to 15.4% in the same period of 2024, advancing toward our c.16.5% target for 2025.
uWe continue to record sustained earnings per share growth, increasing 16% year-on-year to EUR 66.1 cents in 9M 2025, boosted by the positive profit trends and the share buybacks executed over the last 12 months.
uIn terms of business volumes, growth of customer funds outpaced loans and advances to customers as we continued to focus on active capital management, disciplined capital allocation and profitable growth.
Gross loans and advances to customers (excluding reverse repos) rose 2% year-on-year in constant euros, supported by increases in all businesses except in Retail, where they were flat.
Customer funds (customer deposits excluding repos plus mutual funds) grew 7% year-on-year in constant euros, increasing across all global businesses, underpinned by a rise in both demand and time deposits, and double-digit growth in mutual funds.
uIn a less favourable environment than initially expected, shaped by geopolitical and trade tensions and lower interest rates, total income was flat year-on-year, remaining on track to meet our target. In constant euros, it was 4% up, underpinned by the solid net interest income performance, which rose 2%, and positive net fee income performance (+8%), boosted by higher customer activity and network benefits in all businesses except in Consumer, which was impacted by new regulation in Germany and weaker trends in new car registrations in Europe, particularly in H1 2025.
uThe structural changes we have implemented to move towards a simpler and more integrated model through ONE Transformation continue to contribute to better costs, efficiency gains and profitable growth. Costs decreased in current euros, in line with our 2025 year-end target. The efficiency ratio improved to 41.3%, the best efficiency ratio we have reported in more than 15 years, with notable improvements in Payments and Wealth.
uCredit quality remains robust, supported by our good risk management and low unemployment levels across our footprint. The NPL ratio improved 14 bps year-on-year to 2.92%. Total loan-loss reserves reached EUR 22,850 million, resulting in an NPL coverage ratio of 67% (+3 pp year-on-year).
uThe Group's cost of risk improved 5 bps year-on-year to 1.13%, in line with our target for 2025. Cost of risk in Retail and Consumer, which accounted for approximately 80% of the Group's net loan-loss provisions, improved to 0.89% and 2.06%, respectively, compared to the same period in 2024.
uThe CET1 ratio ended September 2025 at 13.1%, having increased 0.1 pp in the quarter, and is slightly above the top end of our operating range of 12–13% and our 2025 target. A solid contribution from attributable profit growth in the quarter more than offset charges related to capital distributions2, net RWA growth and other negative effects. Profitable growth in RWAs, which are being originated with RoRWAs above back book profitability, is strengthening our future organic capital generation and improving the Group's profitability and value creation.
Note: in this section, results are presented on an underlying basis and loans and advances to customers, customer funds and other metrics include Poland, in line with previously published quarterly information, i.e. maintaining the same perimeter that existed at the time of the announcement of the Poland disposal. For further information, see the '
Significant events in the period' and '
Alternative performance measures' sections in this report.
1.CET1 ratio on a phased-in basis, calculated in accordance with the transitory treatment of the CRR.
2.In line with our current ordinary shareholder remuneration policy of approximately 50% of the Group's reported profit (excluding non-cash, non-capital ratios impact items), divided approximately equally between cash dividends and share buybacks. The implementation of the shareholder remuneration policy is subject to future corporate and regulatory decisions and approvals.
|
|
|
|
|
|
|
|
|
8 |
|
January - September 2025 |
|
|
|
|
|
|
|
|
|
|
|
|
|
|
|
|
|
|
|
|
|
|
|
|
|
|
|
|
|
|
|
|
|
|
|
|
|
Significant events
|
|
|
|
|
|
|
|
|
|
|
|
|
|
Highlights of the period |
|
|
|
|
|
|
|
|
|
|
|
|
|
|
|
|
|
|
|
|
|
|
|
|
|
|
|
|
|
|
|
|
|
SHAREHOLDER REMUNERATION* |
|
|
EUR billion |
|
|
|
|
|
|
|
|
|
|
|
|
|
|
|
|
|
|
|
+15% |
higher than 2024 interim cash dividend |
|
|
*Remuneration based on the results of
the first half of each period |
|
|
|
|
|
|
|
|
TNAVps + CASH DPS |
|
|
|
|
|
|
|
|
n Cash DPS: €22.5 cents |
|
|
+15% |
|
|
|
/ Sep-24 |
|
|
|
|
|
|
|
|
|
|
|
|
|
|
|
|
|
|
|
|
|
|
|
|
|
|
|
|
|
|
|
|
|
|
|
|
|
|
|
|
|
|
|
uIn application of the current shareholder remuneration policy, the board of directors approved an interim payment charged against 2025 results, which will be made in two parts:
i)an interim cash dividend against 2025 results of EUR 11.50 cents per share approved by the board of directors on 30 September 2025, equivalent to c.25% of the Group's underlying profit in H1 2025, 15% higher than its 2024 equivalent, which will be paid from 3 November 2025. Including the EUR 11.00 cent dividend per share paid in May 2025, the cash dividend per share paid during 2025 will also be 15% higher than that paid in 2024.
ii)a share buyback programme against 2025 results of up to EUR 1.7 billion, which commenced on 31 July 2025 once the applicable regulatory approval had been obtained, as announced during the Q2 2025 results presentation and in the Inside Information disclosed on 30 July 2025.
This programme puts us on track to reach our goal to distribute at least EUR 10 billion through share buybacks charged against 2025 and 2026 results and against expected capital excess1.
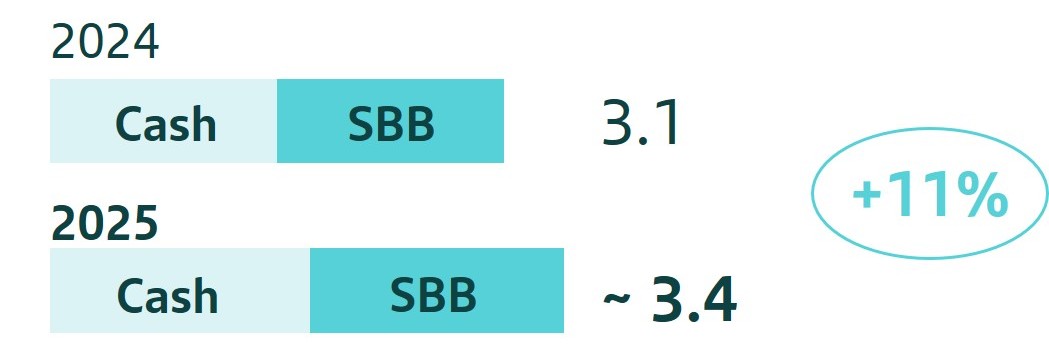
uTotal shareholder remuneration charged against H1 2025 results will be approximately EUR 3,400 million, 11% higher than the remuneration charged against H1 2024 results. The amount is approximately 50% of H1 2025 attributable profit (around 25% through cash dividend payments and around 25% through share buybacks).
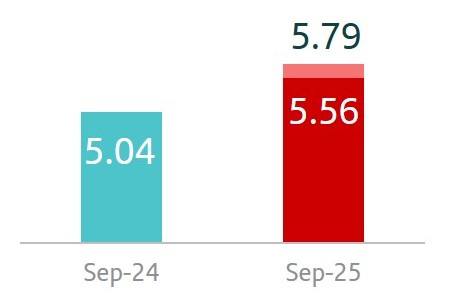
uAt the end of the quarter, TNAV per share was EUR 5.56. Including the final cash dividend against 2024 results and the interim cash dividend charged against 2025 results, TNAV per share increased 15% year-on-year.
|
|
|
|
|
|
|
|
|
|
|
|
|
|
|
|
|
|
|
|
|
|
|
|
|
# OF CUSTOMERS (Sep-25) |
|
|
Total customers: |
178 |
mn |
|
|
|
|
|
|
|
Active customers: |
106 |
mn |
|
|
|
|
|
|
|
|
|
|
|
|
|
|
|
|
|
|
|
|
|
|
|
|
|
|
|
|
|
|
|
|
|
|
|
|
|
|
|
|
|
|
|
uWe continue to implement our global platforms across our businesses. For example, Gravity, our technology which enhances customer experience through digital channels, reduces transaction costs and improves response times, is already fully implemented in Spain, the US and Chile, and we are in the process of rolling it out in Mexico in Q4 2025.
uThese developments, along with other initiatives focused on delivering a great customer experience and improving service quality, enable us to rank in the top 3 for NPS2 in most of our markets and to continue growing the Group’s customer base.
uAs a result, we had 178 million total customers, with a year-on-year increase of more than 7 million, and active customers grew more than 3 million, reaching 106 million.
|
|
|
|
|
|
|
|
|
|
|
|
|
|
|
|
|
|
|
|
|
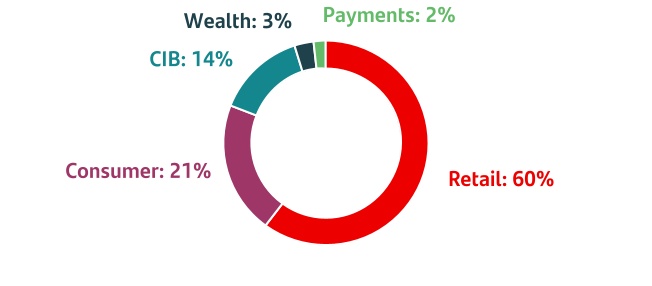
Contribution to Group revenue 3 |
|
|
|
|
|
|
|
|
|
|
|
|
|
|
|
|
|
Retail |
|
50% |
|
|
|
|
|
|
|
|
|
|
|
|
|
|
|
|
|
|
|
|
|
|
|
|
|
|
|
|
|
|
|
|
|
|
|
|
|
|
|
Consumer |
|
21% |
|
|
|
|
|
|
|
|
|
|
|
|
|
|
|
|
|
|
|
|
|
|
|
|
|
|
|
|
|
|
|
|
|
|
|
|
|
|
|
CIB |
|
14% |
|
|
|
|
|
|
|
|
|
|
|
|
|
|
|
|
|
|
|
|
|
|
|
|
|
|
|
|
|
|
|
|
|
|
|
|
|
|
|
Wealth |
|
6% |
|
|
|
|
|
|
|
|
|
|
|
|
|
|
|
|
|
|
|
|
|
|
|
|
|
|
|
|
|
|
|
|
|
|
|
|
|
|
|
Payments |
|
9% |
|
|
|
|
|
|
|
|
|
|
|
|
|
|
|
9M 2025 data. Year-on-year changes in constant euros.
uIn Retail, attributable profit grew 9% to EUR 5,670 million, backed by better net fee income and provisions, with good performance in net interest income and costs declining in real terms.
uThe efficiency ratio stood at 39.2% and cost of risk improved to 0.89%. RoTE (post-AT1) was 17.6%.
uIn Consumer, attributable profit was EUR 1,561 million (+6%), driven by improvements in net interest income, provisions and other results and provisions, which more than offset weaker trends in other revenue and the impact of lower fiscal benefits following reduced electric vehicle demand.
uThe efficiency ratio stood at 40.9%, cost of risk improved to 2.06% and RoTE (post-AT1) was 10.4%.
uIn CIB, attributable profit increased double digits to EUR 2,168 million, driven by higher revenue, supported by a rise in net interest income in Global Markets and a higher net fee income across business lines.
uThe efficiency ratio stood at 44.9%. RoTE (post-AT1) improved 2.3 pp to 19.7%.
uIn Wealth, attributable profit amounted to EUR 1,439 million, also rising double-digits, driven by net fee income, the good performance of our joint ventures in Insurance and our Portfolio Investments business.
uThe efficiency ratio improved 1.3 pp to 35.9% and RoTE (post-AT1) was 66.0%.
uIn Payments, attributable profit reached EUR 558 million, boosted by double-digit growth in net interest income and net fee income, with costs falling 1% in real terms, more than offsetting higher provisions in part due to higher activity.
uCost of risk was 7.73%. In PagoNxt, EBITDA margin reached 31.6% (+8.9 pp year-on-year).
1.As previously announced, Santander intends to allocate at least EUR 10 billion to shareholders through share buybacks charged against 2025 and 2026 results and against the expected capital excess. This share buyback target includes i) buybacks that are part of the existing shareholder remuneration policy; and ii) additional buybacks following the publication of annual results to distribute year-end excesses of CET1 capital. The implementation of the shareholder remuneration policy and additional buybacks are subject to future corporate and regulatory decisions and approvals.
2.Net Promoter Score, internal benchmark of individual customers' satisfaction audited by Stiga/Deloitte in H1 2025.
3.As % of total operating areas, excluding the Corporate Centre.
|
|
|
|
|
|
|
|
|
January - September 2025 |
|
9 |
|
|
|
|
|
|
|
|
|
|
|
|
|
|
|
|
|
|
|
|
|
|
|
|
|
|
|
|
|
|
|
|
|
|
|
|
|
Significant events
|
|
|
|
|
|
|
|
|
|
|
|
|
|
Statutory income statement |
|
|
|
|
|
|
|
|
Grupo Santander results
As a result of the announcement of the Poland disposal and in accordance with IFRS 5 requirements, in the statutory income statement, results associated with the business subject to the Poland disposal are reported under a single line in the consolidated income statement — 'profit/(loss) after tax from discontinued operations' — for results corresponding to both 2025 and 2024. Consequently, the results from the Poland disposal perimeter are excluded line by line from the breakdown of continuing operations in both periods. For further information, see the
'Significant events in the period' section of this report.
|
|
|
|
|
|
|
|
|
|
|
|
|
|
|
|
|
|
|
|
|
|
|
| Grupo Santander. Summarized income statement |
| EUR million |
|
|
|
|
|
|
|
|
|
|
|
Change |
|
|
Change |
|
Q3'25 |
Q2'25 |
% |
|
9M'25 |
9M'24 |
% |
|
| Net interest income |
10,348 |
|
10,590 |
|
(2.3) |
|
|
31,559 |
|
32,543 |
|
(3.0) |
|
|
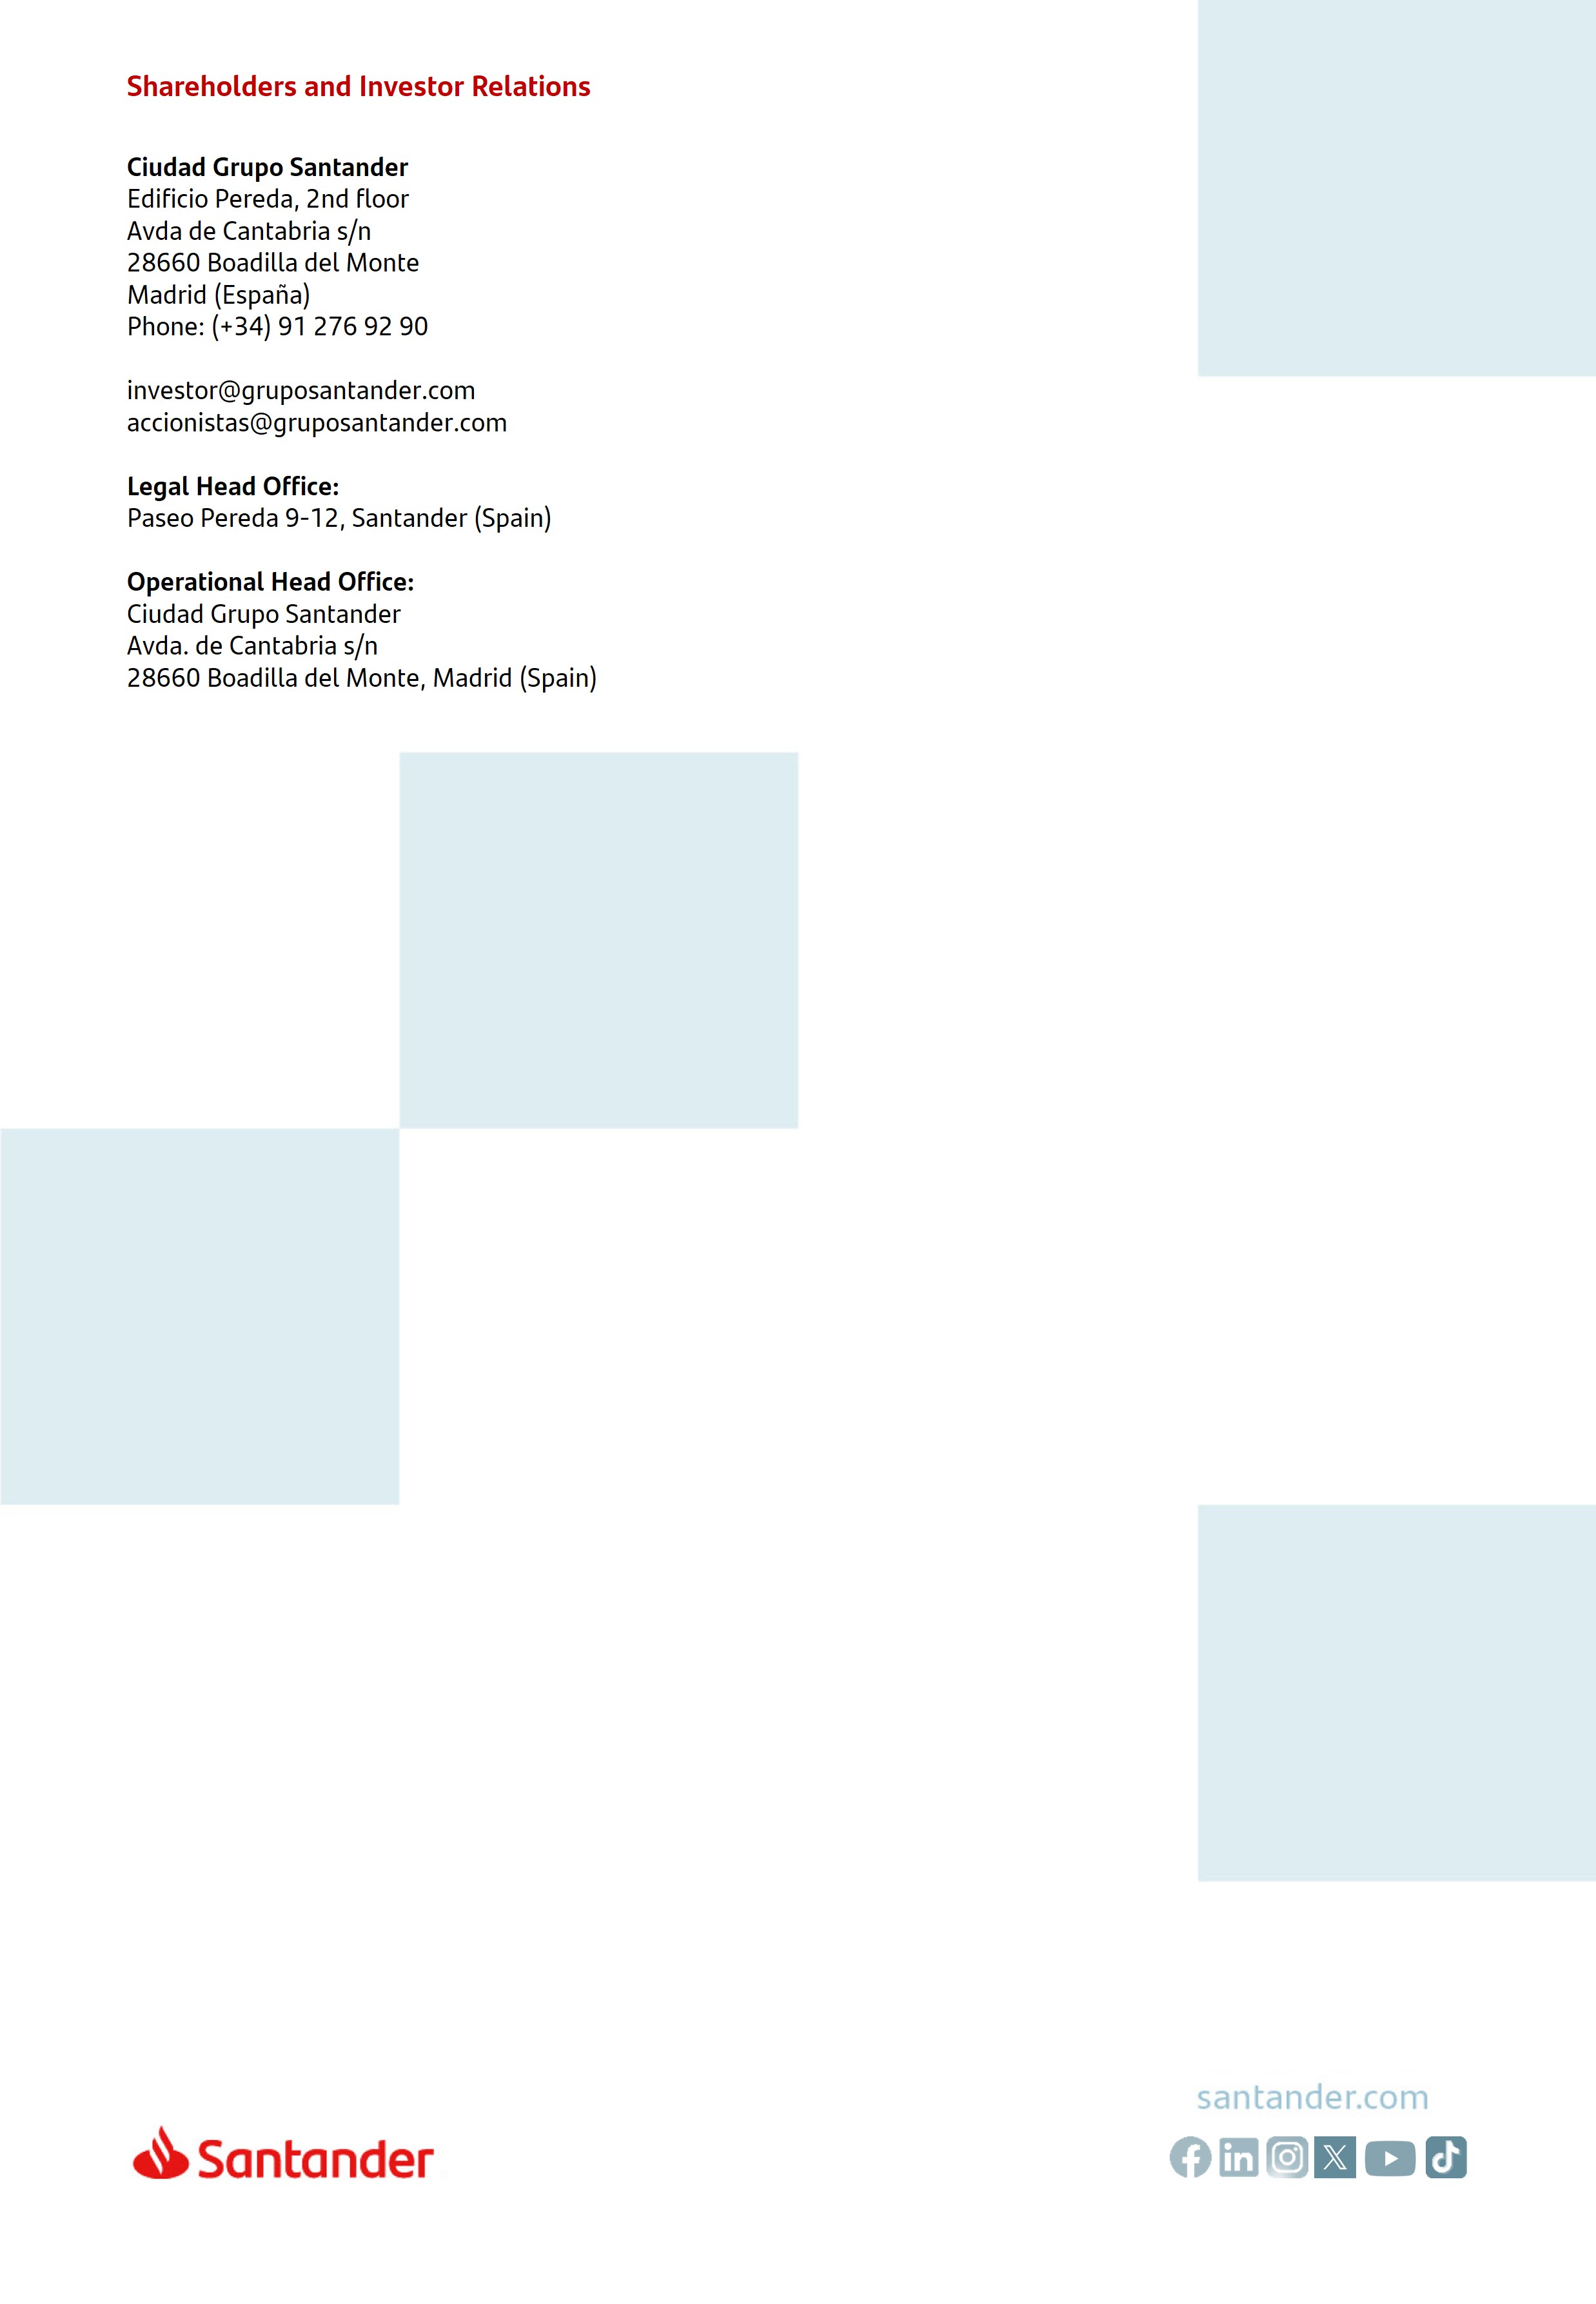
Net fee income1 |
3,159 |
|
3,143 |
|
0.5 |
|
|
9,501 |
|
9,191 |
|
3.4 |
|
|
Gains or losses on financial assets and liabilities and exchange differences2 |
621 |
|
364 |
|
70.6 |
|
|
1,653 |
|
1,444 |
|
14.5 |
|
|
| Dividend income |
88 |
|
383 |
|
(77.0) |
|
|
559 |
|
581 |
|
(3.8) |
|
|
| Share of results of entities accounted for using the equity method |
148 |
|
171 |
|
(13.5) |
|
|
480 |
|
480 |
|
— |
|
|
Other operating income/expenses (net)3 |
(39) |
|
(148) |
|
(73.6) |
|
|
(245) |
|
(980) |
|
(75.0) |
|
|
| Total income |
14,325 |
|
14,503 |
|
(1.2) |
|
|
43,507 |
|
43,259 |
|
0.6 |
|
|
| Operating expenses |
(6,015) |
|
(6,108) |
|
(1.5) |
|
|
(18,379) |
|
(18,600) |
|
(1.2) |
|
|
| Administrative expenses |
(5,219) |
|
(5,304) |
|
(1.6) |
|
|
(15,957) |
|
(16,215) |
|
(1.6) |
|
|
| Staff costs |
(3,322) |
|
(3,320) |
|
0.1 |
|
|
(10,045) |
|
(10,187) |
|
(1.4) |
|
|
| Other general administrative expenses |
(1,897) |
|
(1,984) |
|
(4.4) |
|
|
(5,912) |
|
(6,028) |
|
(1.9) |
|
|
| Depreciation and amortization |
(796) |
|
(804) |
|
(1.0) |
|
|
(2,422) |
|
(2,385) |
|
1.6 |
|
|
| Provisions or reversal of provisions |
(769) |
|
(677) |
|
13.6 |
|
|
(2,019) |
|
(2,292) |
|
(11.9) |
|
|
| Impairment or reversal of impairment of financial assets not measured at fair value through profit or loss (net) |
(2,848) |
|
(3,447) |
|
(17.4) |
|
|
(9,372) |
|
(9,131) |
|
2.6 |
|
|
|
|
|
|
|
|
|
|
|
| Impairment on other assets (net) |
(41) |
|
(45) |
|
(8.9) |
|
|
(188) |
|
(435) |
|
(56.8) |
|
|
| Gains or losses on non-financial assets and investments, net |
10 |
|
(34) |
|
— |
|
|
(22) |
|
371 |
|
— |
|
|
| Negative goodwill recognized in results |
— |
|
(1) |
|
(100.0) |
|
|
22 |
|
— |
|
— |
|
|
| Gains or losses on non-current assets held for sale not classified as discontinued operations |
(5) |
|
224 |
|
— |
|
|
212 |
|
(51) |
|
— |
|
|
| Profit or loss before tax from continuing operations |
4,657 |
|
4,415 |
|
5.5 |
|
|
13,761 |
|
13,121 |
|
4.9 |
|
|
| Tax expense or income from continuing operations |
(1,193) |
|
(1,043) |
|
14.4 |
|
|
(3,560) |
|
(3,919) |
|
(9.2) |
|
|
| Profit from the period from continuing operations |
3,464 |
|
3,372 |
|
2.7 |
|
|
10,201 |
|
9,202 |
|
10.9 |
|
|
| Profit or loss after tax from discontinued operations |
426 |
|
350 |
|
21.7 |
|
|
1,152 |
|
979 |
|
17.7 |
|
|
| Profit for the period |
3,890 |
|
3,722 |
|
4.5 |
|
|
11,353 |
|
10,181 |
|
11.5 |
|
|
| Profit attributable to non-controlling interests |
(386) |
|
(291) |
|
32.6 |
|
|
(1,016) |
|
(872) |
|
16.5 |
|
|
| Profit attributable to the parent |
3,504 |
|
3,431 |
|
2.1 |
|
|
10,337 |
|
9,309 |
|
11.0 |
|
|
|
|
|
|
|
|
|
|
|
| EPS (euros) |
0.23 |
|
0.22 |
|
2.7 |
|
|
0.66 |
|
0.57 |
|
16.3 |
|
|
| Diluted EPS (euros) |
0.22 |
|
0.22 |
|
2.7 |
|
|
0.66 |
|
0.57 |
|
16.2 |
|
|
|
|
|
|
|
|
|
|
|
| Memorandum items: |
|
|
|
|
|
|
|
|
| Average total assets |
1,833,163 |
|
1,815,203 |
|
1.0 |
|
|
1,834,698 |
|
1,792,871 |
|
2.3 |
|
|
| Average stockholders' equity |
101,598 |
|
99,904 |
|
1.7 |
|
|
101,001 |
|
96,341 |
|
4.8 |
|
|
|
|
|
|
|
|
| Note: the summarized income statement groups some lines of the consolidated statutory income statement on page 91 as follows: |
1.‘Commission income’ and ‘Commission expense’. |
2.‘Gain or losses on financial assets and liabilities not measured at fair value through profit or loss, net’; ‘Gain or losses on financial assets and liabilities held for trading, net’; ‘Gains or losses on non-trading financial assets and liabilities mandatorily at fair value through profit or loss’; ‘Gain or losses on financial assets and liabilities measured at fair value through profit or loss, net’; ‘Gain or losses from hedge accounting, net’; and ‘Exchange differences, net’. |
3.‘Other operating income’; ‘Other operating expenses’; ’Income from insurance and reinsurance contracts’; and ‘Expenses from insurance and reinsurance contracts’. |
|
|
|
|
|
|
|
|
|
10 |
|
January - September 2025 |
|
|
|
|
|
|
|
|
|
|
|
|
|
|
|
|
|
|
|
|
|
|
|
|
|
|
|
|
|
|
|
|
|
|
|
|
|
Significant events
|
|
|
|
|
|
|
|
|
|
|
|
|
|
Statutory income statement |
|
|
|
|
|
|
|
|
|
|
|
|
|
|
|
|
|
|
|
|
|
STATUTORY INCOME STATEMENT |
|
|
|
|
|
In accordance with IFRS 5 requirements, results associated with the business subject to the Poland disposal are reported under a single line in the consolidated income statement — 'profit/(loss) after tax from discontinued operations' — for results in both 2025 and 2024. For further information, see the
'Significant events in the period' section of this report.
Results performance compared to 9M 2024
In Q3 2025, profit attributable to the parent totalled EUR 3,504 million, reaching a new quarterly record for the sixth quarter in a row, supported by good performances in our global businesses. In 9M 2025, profit totalled EUR 10,337 million, 11% higher compared to 9M 2024.
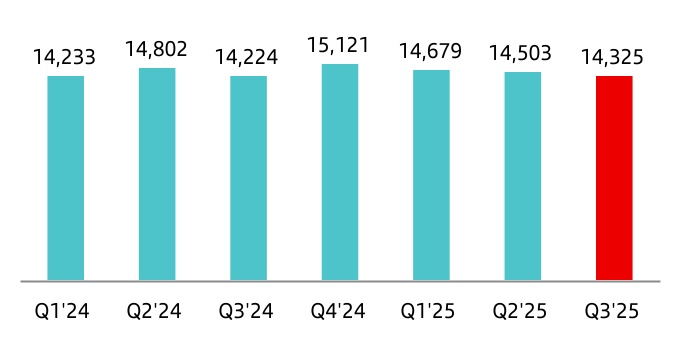
Total income
Total income amounted to EUR 43,507 million, 1% up year-on-year. By line:
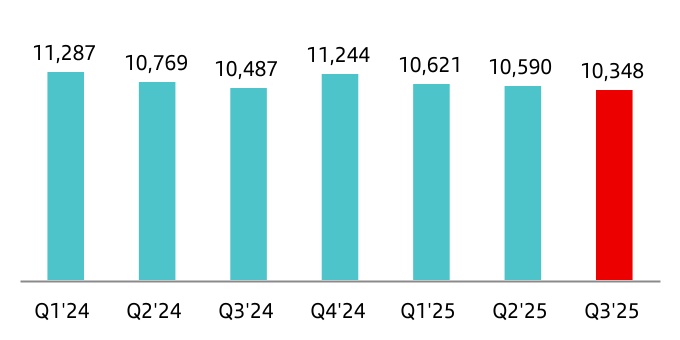
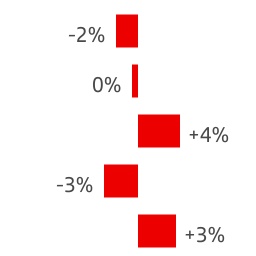
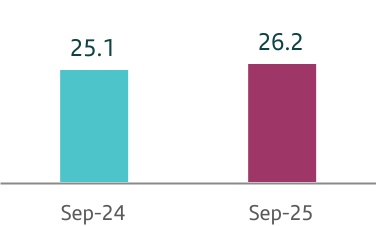
•Net interest income (NII) totalled EUR 31,559 million, 3% lower than 9M 2024, mainly due to the impact from the sharp fall in interest rates in Argentina, especially Retail, and a decline in Wealth.
This decrease was partially offset by the good performances in Consumer, driven by active margin management and higher volumes, and in Payments, supported by increased activity levels.
|
|
|
|
|
|
| Net interest income |
| EUR million |
•Net fee income amounted to EUR 9,501 million, up 3% compared to 9M 2024, with solid performances across most global businesses. Notably, there were increases in CIB, mainly driven by Global Banking and Global Transaction Banking, in Wealth, due to strong performances in Private Banking and Santander Asset Management (SAM), and in Payments, due to higher activity levels.
|
|
|
|
|
|
| Net fee income |
| EUR million |
•Gains or losses on financial assets and liabilities and exchange differences reached EUR 1,653 million (EUR 1,444 million in 9M 2024) mainly due to lower impacts from foreign exchange hedges in Corporate Centre and results in Portfolio Investments in Wealth.
•Dividend income was EUR 559 million (EUR 581 million in 9M 2024).
•Income from companies accounted for by the equity method reached EUR 480 million, compared to EUR 480 million in 9M 2024, and mainly included results from Insurance in Wealth and Consumer.
•Other operating income recorded a loss of EUR 245 million, compared to a EUR 980 million loss in 9M 2024, which was impacted by a larger hyperinflation adjustment in Argentina and the temporary levy on revenue earned in Spain, which was recorded in full in Q1 2024 (EUR 335 million), whereas in 9M 2025, the expected tax on income obtained in Spain for the year is accrued under 'Tax expense or income from continuing operations'.
In summary, we saw a resilient performance in total income, reflecting our diversification and global scale, even in the current interest rate environment.
|
|
|
|
|
|
|
|
|
January - September 2025 |
|
11 |
|
|
|
|
|
|
|
|
|
|
|
|
|
|
|
|
|
|
|
|
|
|
|
|
|
|
|
|
|
|
|
|
|
|
|
|
|
Significant events
|
|
|
|
|
|
|
|
|
|
|
|
|
|
Statutory income statement |
|
|
|
|
|
|
|
|
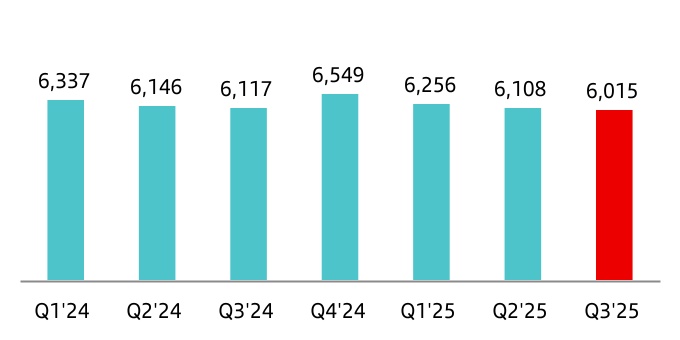
Operating expenses
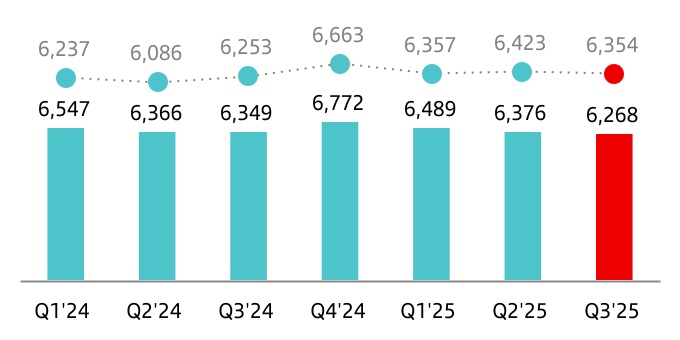
Operating expenses in 9M 2025 amounted to EUR 18,379 million, 1% lower year-on-year, reflecting our progress in transformation.
Our cost management continued to focus on further improving our structural efficiency and, as a result, we remain one of the most efficient banks in the world.
We continued to drive our business model transformation plan, ONE Transformation, across our footprint, reflected in greater operational leverage and better commercial dynamics.
|
|
|
|
|
|
| Operating expenses |
| EUR million |
Provisions or reversal of provisions
Provisions (net of provisions reversals) amounted to EUR 2,019 million. In 9M 2024, this line totalled EUR 2,292 million, affected by the charge in PagoNxt following the discontinuation of our Superdigital platform in Latin America in Q2 2024.
Impairment or reversal of impairment of financial assets not measured at fair value through profit or loss (net)
Impairment of financial assets not measured at fair value through profit or loss (net) was EUR 9,372 million and included provisions in Q2 2025 which strengthen the balance sheet after having updated macroeconomic parameters in Brazil’s credit provisioning models. In 9M 2024, the impairment was EUR 9,131 million.
Impairment on other assets (net)
The impairment on other assets (net) was EUR 188 million. In 9M 2024, the impairment on other assets totalled EUR 435 million, including the charges in PagoNxt following the discontinuation of our merchant platform in Germany in Q2 2024.
Gains or losses on non-financial assets and investments (net)
This line recorded a loss of EUR 22 million in 9M 2025. In the same period in 2024, net gains were EUR 371 million, which included a capital gain of EUR 352 million generated upon closing the agreement with Sodexo in Brazil in Q2 2024.
Negative goodwill recognized in results
In 9M 2025, negative goodwill recognized in results was EUR 22 million relating to the acquisition of CrediScotia Financiera from Scotiabank which expands Consumer's presence in Peru. There was no negative goodwill recorded in 9M 2024.
Gains or losses on non-current assets held for sale not classified as discontinued operations
This item, which mainly includes impairments of foreclosed assets, recorded a EUR 212 million gain in 9M 2025 which included a capital gain of EUR 231 million in Q2 2025 from the sale of Santander’s remaining 30.5% stake in CACEIS. In 9M 2024, this line recorded a loss of EUR 51 million.
Profit or loss before tax from continuing operations
Profit before tax was EUR 13,761 million in 9M 2025, up 5% year-on-year, supported by the solid net fee income performance, lower costs, the impact of the full recognition of the temporary levy on revenue earned in Spain in Q1 2024 in the other operating income line and the charge in Q2 2024 following the aforementioned discontinuation of platforms in PagoNxt.
Tax expense or income from continuing operations
Total tax expense in 9M 2025 amounted to EUR 3,560 million which includes EUR 263 million corresponding to the quarterly accrual of the expected tax on income obtained in Spain for the year. In 9M 2024, tax expense was EUR 3,919 million.
Profit or loss after tax from discontinued operations
Profit from discontinued operations totalled EUR 1,152 million in 9M 2025 compared to EUR 979 million in 9M 2024. This line includes the results associated with the Poland disposal, which increased year-on-year driven by a good revenue performance and lower provisions.
Profit attributable to non-controlling interests
Profit attributable to non-controlling interests amounted to EUR 1,016 million in 9M 2025 compared to EUR 872 million in 9M 2024.
Profit attributable to the parent
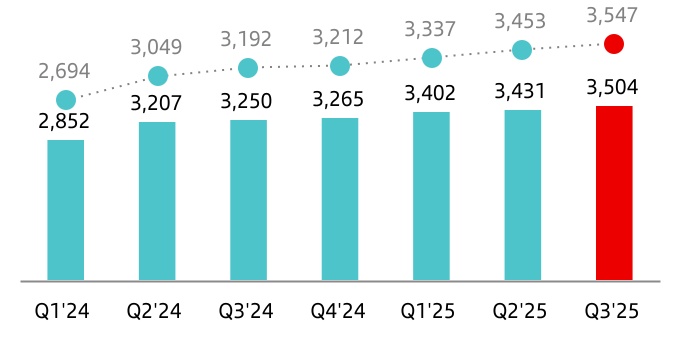
Profit attributable to the parent rose to a new record of EUR 10,337 million in 9M 2025, compared to EUR 9,309 million in 9M 2024. This 11% increase year-on-year was driven by a strong net fee income increase and better costs and provisions.
|
|
|
|
|
|
|
|
|
12 |
|
January - September 2025 |
|
|
|
|
|
|
|
|
|
|
|
|
|
|
|
|
|
|
|
|
|
|
|
|
|
|
|
|
|
|
|
|
|
|
|
|
|
Significant events
|
|
|
|
|
|
|
|
|
|
|
|
|
|
Underlying income statement |
|
|
|
|
|
|
|
|
|
|
|
|
|
|
|
|
|
|
|
|
|
|
|
|
|
|
|
|
|
|
|
|
|
|
|
|
|
|
|
UNDERLYING INCOME STATEMENT |
|
|
|
|
|
|
|
|
|
|
|
|
|
→ Sixth consecutive quarter of record profit, boosted by solid performances across our global businesses.
→ We continue to drive profitable growth and solid efficiency, through an execution of ONE Transformation.
→ Risk indicators were robust, supported by good risk management and low unemployment rates.
|
|
|
|
|
|
|
|
|
|
|
|
|
|
Attributable profit |
|
RoTE (post-AT1) |
RoRWA |
|
|
|
EUR 10,337 million |
+11% in euros |
|
16.1% |
2.39% |
|
|
|
+16% in constant euros |
|
+0.7 pp |
+0.2 pp |
|
|
|
|
|
|
|
|
|
|
|
|
|
Note: changes vs. 9M 2024. |
|
|
|
|
|
|
|
|
|
|
|
Since Q2 2025, in contrast to the statutory income statement, in the underlying income statement, results obtained in Poland continue to be reported line by line and disaggregated, as they were in previous quarterly disclosures given that the management of Santander Polska remains unchanged until the Poland disposal is completed.
For the same reason, all management metrics included in this report have been calculated including Poland, i.e. maintaining the same perimeter that existed at the time of the announcement of the Poland disposal. For further information, see the '
Significant events in the period' and
'Alternative performance measures' sections in this report.
Results performance compared to 9M 2024
The Group presents, both at the total Group level and for each of the business units, the changes in euros registered in the income statement, as well as variations excluding the exchange rate effect (i.e. in constant euros, except for Argentina and any grouping which includes it), understanding that the latter provide a better analysis of the Group’s management. For further information, see the
'Alternative performance measures' section in this report.
At the Group level, exchange rates had an unfavourable year-on-year impact of 4.2 pp on total income and a favourable impact of 3.7 pp on administrative expenses and amortizations, mainly due to the depreciation of the Brazilian real and the Mexican peso.
To better understand the business trends, we reclassified certain items under some headings of the underlying income statement.
These reclassifications between the statutory and underlying income statements include:
In 9M 2025:
•As previously explained, in the statutory income statement, the results associated with the business subject to the Poland disposal are reported in the 'profit/(loss) after tax from discontinued operations' line.
However, in the underlying income statement, the results from Poland are disaggregated across the corresponding line items as they were in previous quarterly disclosures.
In 9M 2024:
•In the statutory income statement, the results associated with the business subject to the Poland disposal are reported in the 'profit/(loss) after tax from discontinued operations' line.
However, in the underlying income statement, the results from Poland are disaggregated across the corresponding line items as they were in previous quarterly disclosures.
•The temporary levy on revenue earned in Spain amounted to EUR 335 million in Q1 2024, which was reclassified from total income to other gains (losses) and provisions.
•The recognition of provisions to strengthen the balance sheet in Brazil, amounted to EUR 352 million gross in Q2 2024 (EUR 174 million net of tax and non-controlling interests).
|
|
|
|
|
|
|
|
|
|
|
|
|
|
|
|
|
|
|
|
|
|
|
|
|
|
|
Summarized underlying income statement (EUR million) |
|
|
|
|
|
|
|
|
|
|
|
|
Change |
|
|
Change |
|
Q3'25 |
Q2'25 |
% |
% excl. FX |
9M'25 |
9M'24 |
% |
% excl. FX |
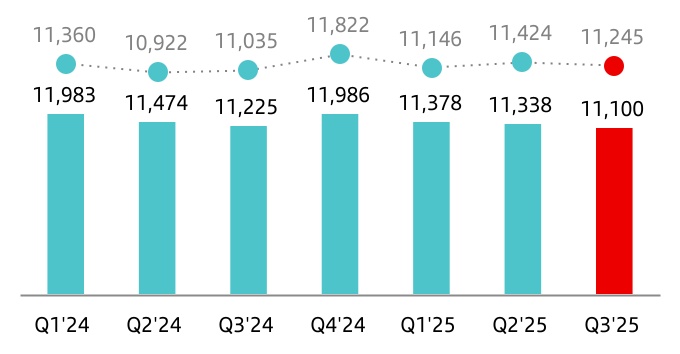
| Net interest income |
11,100 |
|
11,338 |
|
(2.1) |
(1.6) |
33,816 |
|
34,682 |
|
(2.5) |
1.5 |
| Net fee income |
3,327 |
|
3,315 |
|
0.4 |
0.6 |
10,011 |
|
9,666 |
|
3.6 |
8.4 |
Gains (losses) on financial transactions 1 |
639 |
|
391 |
|
63.4 |
62.9 |
1,708 |
|
1,493 |
|
14.4 |
18.1 |
| Other operating income |
201 |
|
429 |
|
(53.1) |
(52.1) |
742 |
|
344 |
|
115.7 |
115.5 |
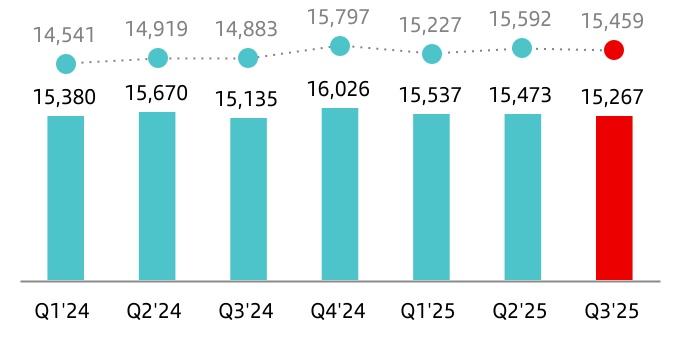
| Total income |
15,267 |
|
15,473 |
|
(1.3) |
(0.9) |
46,277 |
|
46,185 |
|
0.2 |
4.4 |
| Administrative expenses and amortizations |
(6,268) |
|
(6,376) |
|
(1.7) |
(1.1) |
(19,133) |
|
(19,262) |
|
(0.7) |
3.0 |
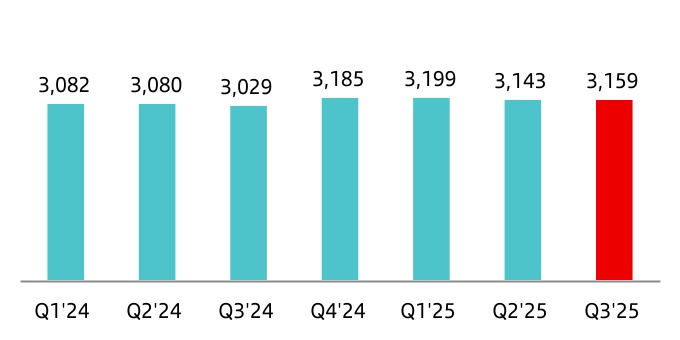
| Net operating income |
8,999 |
|
9,097 |
|
(1.1) |
(0.7) |
27,144 |
|
26,923 |
|
0.8 |
5.3 |
| Net loan-loss provisions |
(2,931) |
|
(3,017) |
|
(2.9) |
(2.6) |
(9,109) |
|
(9,219) |
|
(1.2) |
4.9 |
| Other gains (losses) and provisions |
(871) |
|
(964) |
|
(9.6) |
(9.4) |
(2,535) |
|
(3,277) |
|
(22.6) |
(20.9) |
| Profit before tax |
5,197 |
|
5,116 |
|
1.6 |
2.0 |
15,500 |
|
14,427 |
|
7.4 |
11.7 |
| Tax on profit |
(1,307) |
|
(1,368) |
|
(4.5) |
(4.4) |
(4,121) |
|
(4,246) |
|
(2.9) |
0.7 |
| Profit from continuing operations |
3,890 |
|
3,748 |
|
3.8 |
4.4 |
11,379 |
|
10,181 |
|
11.8 |
16.3 |
| Net profit from discontinued operations |
— |
|
— |
|
— |
— |
— |
|
— |
|
— |
— |
| Consolidated profit |
3,890 |
|
3,748 |
|
3.8 |
4.4 |
11,379 |
|
10,181 |
|
11.8 |
16.3 |
| Non-controlling interests |
(386) |
|
(317) |
|
21.8 |
22.7 |
(1,042) |
|
(872) |
|
19.5 |
22.7 |
| Net capital gains and provisions |
— |
|
— |
|
— |
— |
— |
|
— |
|
— |
— |
| Profit attributable to the parent |
3,504 |
|
3,431 |
|
2.1 |
2.7 |
10,337 |
|
9,309 |
|
11.0 |
15.7 |
Underlying profit attributable to the parent 2 |
3,504 |
|
3,431 |
|
2.1 |
2.7 |
10,337 |
|
9,309 |
|
11.0 |
15.7 |
|
|
|
|
|
|
|
|
|
1. Includes exchange differences.
2. Excludes net capital gains and provisions.
|
|
|
|
|
|
|
|
|
January - September 2025 |
|
13 |
|
|
|
|
|
|
|
|
|
|
|
|
|
|
|
|
|
|
|
|
|
|
|
|
|
|
|
|
|
|
|
|
|
|
|
|
|
Significant events
|
|
|
|
|
|
|
|
|
|
|
|
|
|
Underlying income statement |
|
|
|
|
|
|
|
|
Additionally, regarding results that fall outside the ordinary course of our business and are therefore excluded from underlying income statement:
In 9M 2025:
•The ‘net capital gains and provisions’ line includes the following two events of the same value but opposite signs:
•A capital gain in Q2 2025 of EUR 231 million from the sale of Santander’s remaining 30.5% stake in CACEIS.
•A one-off charge of EUR 467 million in Q2 2025 (EUR 231 million, net of tax and minority interests), which strengthens the balance sheet after having updated macroeconomic parameters in Brazil’s credit provisioning models, in accordance with IFRS 9 regulations, which resulted in increased provisions, reflecting expectations of a more complex economic environment.
In 9M 2024:
•There were no impacts outside the ordinary course of our business and therefore no amount was recorded under the ‘net capital gains and provisions’ line.
For further information on the reconciliation between the statutory and underlying income statements, see the '
Alternative performance measures' section in this report.
All in all, profit attributable to the parent and underlying profit attributable to the parent were the same, EUR 10,337 million in 9M 2025 and EUR 9,309 million in 9M 2024. This represents an 11% year-on-year increase in euros, +16% in constant euros.
This year-on-year comparison was favoured by the recognition in Q2 2024 of the impacts in PagoNxt following the discontinuation of our merchant platforms in Germany and Superdigital in Latin America.
Total income amounted to EUR 46,277 million in 9M 2025, flat compared to 9M 2024. In constant euros, total income rose 4% year-on-year, as follows:
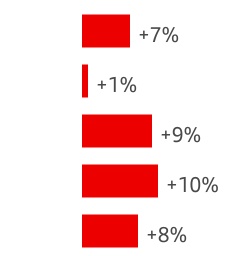
•Net interest income (NII) performed well, with a 2% increase year-on-year despite a less favourable interest rate environment, particularly in Argentina. Excluding Argentina, NII rose 3%. By business:
•In Retail, NII decreased 1%. Excluding Argentina, it rose 1%, due to good performances in Chile (lower cost of deposits), Mexico (volumes and lower cost of deposits) and the UK (higher mortgage lending profitability and lower cost of deposits).
•In Consumer, NII rose 6% supported by our good margin management across our main markets and also by higher volumes in DCB Europe and Latin America in addition to the CrediScotia acquisition in Peru.
•In CIB, NII also increased 7%, even with a negative impact from Argentina. Excluding it, NII grew 16% driven by a strong increase in activity and lower funding costs in Global Markets.
•In Wealth, NII declined 15%, affected by some deposit cost inelasticity to interest rate declines and by the lower yield on assets, despite higher volumes in Private Banking.
•In Payments, NII rose 23%, with doubled-digit growth in both PagoNxt and Cards, boosted by higher activity.
|
|
|
|
|
|
| Net interest income |
| EUR million |
|
constant euros |
•Net fee income grew 8% year-on-year driven by widespread growth across all businesses, except Consumer. By business:
•In Retail, net fee income increased 5%, supported mainly by mutual funds, foreign exchange fees and insurance.
•In Consumer, net fee income fell 2%, despite strong growth in the US and positive trends across Latin America, mainly due to DCB Europe, which was impacted by new insurance regulation in Germany and weaker trends in new car registrations, especially in H1 2025.
•In CIB, it increased 7%, driven by Global Transaction Banking (GTB) and Global Banking (GB) in the US, boosted by our US Banking Build-Out (US BBO) initiative.
•In Wealth, net fee income rose 19%, with strong growth in Private Banking and SAM driven by solid commercial activity, a positive market performance and our focus on promoting fee-generating products.
•In Payments, net fee income rose 16% boosted by higher activity (both PagoNxt and Cards).
This net fee income growth was higher than our mid- to high-single digit growth target for 2025.
|
|
|
|
|
|
| Net fee income |
| EUR million |
|
constant euros |

•Gains on financial transactions rose 18%, boosted by an increase in the Corporate Centre due to lower impacts from foreign exchange hedges, and better results from the performance of the stakes managed by our Portfolio Investments business line.
|
|
|
|
|
|
|
|
|
14 |
|
January - September 2025 |
|
|
|
|
|
|
|
|
|
|
|
|
|
|
|
|
|
|
|
|
|
|
|
|
|
|
|
|
|
|
|
|
|
|
|
|
|
Significant events
|
|
|
|
|
|
|
|
|
|
|
|
|
|
Underlying income statement |
|
|
|
|
|
|
|
|
•Other operating income in 9M 2025 improved compared to the same period in 2024, mainly driven by a less negative impact from the hyperinflation adjustment in Argentina.
This positive revenue performance keeps us on track to achieve our 2025 target of reaching a revenue level of around EUR 62 billion in the year, similar to the revenue recorded in 2024.
|
|
|
|
|
|
| Total income |
| EUR million |
|
constant euros |
Administrative expenses and amortizations in 9M 2025 amounted to EUR 19,133 million, down 1% compared to 9M 2024 (+3% in constant euros). In real terms (excluding the impact of average inflation and in constant euros), they were flat year-on-year.
As a result, the efficiency ratio stood at 41.3%, improving 36 bps year-on-year.
Our cost management remained focused on structurally improving our efficiency and maintaining our position as one of the most efficient global banks. We continued to make progress in our business model transformation plan, ONE Transformation, which provides greater operational leverage, improving business dynamics and promoting leaner and more agile structures.
Costs by business and in constant euros were as follows:
•In Retail, costs rose 1%. In real terms, they fell 2%, reflecting our transformation efforts through the simplification and the implementation of our global platform. The efficiency ratio stood at 39.2%.
•In Consumer, costs increased 3% year-on-year. In real terms, they rose just 1% as our transformation savings largely offset our investments in leasing and check-out lending platforms, as well as in Openbank, and CrediScotia's integration costs. The efficiency ratio stood at 40.9%.
•In CIB, costs rose 6%, +3% in real terms, due to investments in new products and capabilities to drive growth. We maintained a leading position among peers with an efficiency ratio of 44.9%.
•In Wealth, costs grew 9%. In real terms, they increased 6%, reflecting our investments to reinforce Private Banking teams and new capabilities to address the increase in commercial activity. The efficiency ratio improved 1.3 pp year-on-year to 35.9%.
•In Payments, costs rose 3% but decreased 1% in real terms, due to the savings generated from the use of our platforms. The efficiency ratio stood at 40.8%, a 5.2 pp improvement year-on-year.
|
|
|
|
|
|
| Operating expenses |
| EUR million |
|
constant euros |
Net operating income in 9M 2025 amounted to EUR 27,144 million, up 1% compared to 9M 2024. In constant euros, it rose 5%, underpinned by the good performance across all revenue lines and the positive impact on costs from our transformation efforts.
|
|
|
|
|
|
| Net operating income |
| EUR million |
|
constant euros |
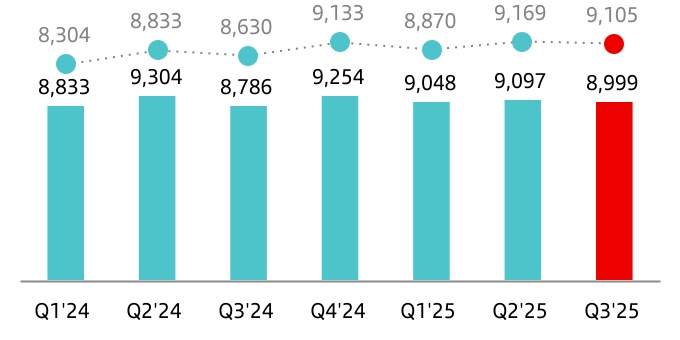
Net loan-loss provisions in 9M 2025 amounted to EUR 9,109 million, a 1% decrease year-on-year.
In constant euros, they increased 5%, mainly due to: i) higher provisions in Payments, mainly in Cards, due to strong loan growth in general and by model changes and updates, in a less favourable macro environment in some of our countries; and ii) the increase in Corporate Centre due to provisions in H1 2025 related to our plan to accelerate NPL ratio reductions, improving the Group's credit quality.
As a result, the cost of risk improved 5 bps year-on-year to 1.13%, in line with the Group’s 2025 target.
|
|
|
|
|
|
|
|
|
January - September 2025 |
|
15 |
|
|
|
|
|
|
|
|
|
|
|
|
|
|
|
|
|
|
|
|
|
|
|
|
|
|
|
|
|
|
|
|
|
|
|
|
|
Significant events
|
|
|
|
|
|
|
|
|
|
|
|
|
|
Underlying income statement |
|
|
|
|
|
|
|
|
|
|
|
|
|
|
| Net loan-loss provisions |
| EUR million |
|
constant euros |

Other gains (losses) and provisions registered a EUR 2,535 million loss compared to a EUR 3,277 million loss in 9M 2024. This comparison is mainly impacted by the charge in 9M 2024 following the discontinuation of the aforementioned platforms in PagoNxt and the full recognition of the temporary levy on revenue earned in Spain in Q1 2024, compared to its quarterly accrual in 2025, now in the ‘Tax on profit' line.
Tax on profit amounted to EUR 4,121 million, 3% lower than in 9M 2024. In constant euros, it rose 1%, as a lower tax burden in some countries, mainly in Brazil, practically offset lower benefits from fiscal incentives for electric vehicles in the US and a EUR 263 million charge in 9M 2025 corresponding to the aforementioned quarterly accrual of the tax on revenue expected in Spain for the year.
Profit attributable to the parent in 9M 2025 was EUR 10,337 million, 11% more than in 9M 2024 (+16% in constant euros).
|
|
|
|
|
|
| Profit attributable to the parent |
| EUR million |
|
constant euros |
RoTE (post-AT1) in 9M 2025 stood at 16.1% (15.4% in 9M 2024), on track to achieve our 2025 target of approximately 16.5%. RoRWA was 2.39% (2.15% in 9M 2024) and earnings per share stood at EUR 0.66 (EUR 0.57 in 9M 2024).
Underlying results performance compared to the previous quarter
In Q3 2025, no impacts outside the ordinary course of our business occurred and, therefore, no amount was recorded under the ‘net capital gains and provisions’ line.
In contrast, in Q2 2025 the two aforementioned events that fall outside the ordinary course of our business and are therefore excluded from underlying income statement were recorded. As they were the same value but opposite signs, the amount in line ‘net capital gains and provisions’ was zero.
As a result, underlying profit attributable to the parent and profit attributable to the parent were the same in both Q3 2025, at EUR 3,504 million, and Q2 2025, at EUR 3,431 million.
Compared to Q2 2025, profit in Q3 2025 increased 2%. In constant euros it increased 3%, including a 1 pp impact from the depreciation of the Argentine peso observed during the quarter. For further information, see the
'Alternative performance measures' section in this report. By line and in constant euros:
•Total income remained above EUR 15 billion, but declined 1%, due to the impact of Argentina (excluding it, total income was flat), with the following breakdown by line:
•Net interest income decreased 2%, strongly impacted by the exchange rate in Argentina. Excluding it, the NII was flat, as the good performance in Consumer (driven by good margin management) and CIB offset lower results in Retail (affected by negative sensitivity in Brazil and changes in inflation in Chile).
•Net fee income increased 1% quarter-on-quarter, supported by good performances mainly in Consumer and Payments which more than offset the decrease in Retail (affected by the macroeconomic environment in Brazil and seasonality in Spain).
•Gains on financial transactions grew 63%, mainly boosted by a positive performance in CIB and the Corporate Centre.
•Operating expenses in Q3 2025 improved 1% quarter-on-quarter due to good results in Retail in most countries and favoured in part by the impact of the Argentine peso depreciation.
•Net loan-loss provisions improved 3% driven by good performances in Retail and in the Corporate Centre, due to provisions recorded in Q2 2025 related to our plan to accelerate NPL ratio reductions.
•Other gains (losses) and provisions recorded a EUR 871 million loss in Q3 2025, compared to a EUR 964 million loss in Q2 2025, due to lower provisions related to CHF mortgage portfolio in Poland.
|
|
|
|
|
|
|
|
|
16 |
|
January - September 2025 |
|
|
|
|
|
|
|
|
|
|
|
|
|
|
|
|
|
|
|
|
|
|
|
|
|
|
|
|
|
|
|
|
|
|
|
|
|
Significant events
|
|
|
|
|
|
|
|
|
|
|
|
|
|
Balance sheet |
|
|
|
|
|
|
|
|
Grupo Santander's balance sheet
Since Q2 2025, as a result of the announcement of the Poland disposal and in accordance with IFRS 5 requirements, in the Group’s consolidated balance sheet the assets associated with the Poland disposal are classified under the 'non-current assets held for sale' line item and the related liabilities under 'liabilities associated with non-current assets held for sale'. This classification applies solely to balance sheets from 30 June 2025 onwards and does not affect prior periods, which therefore limits the comparability of the balance sheets presented below.
|
|
|
|
|
|
|
|
|
|
|
|
|
|
|
|
|
|
| Grupo Santander. Condensed balance sheet |
| EUR million |
|
|
|
|
|
|
|
|
Change |
|
| Assets |
Sep-25 |
Sep-24 |
Absolute |
% |
Dec-24 |
| Cash, cash balances at central banks and other demand deposits |
161,899 |
|
169,377 |
|
(7,478) |
|
(4.4) |
|
192,208 |
|
| Financial assets held for trading |
248,856 |
|
232,039 |
|
16,817 |
|
7.2 |
|
230,253 |
|
| Debt securities |
91,891 |
|
74,202 |
|
17,689 |
|
23.8 |
|
82,646 |
|
| Equity instruments |
17,998 |
|
16,008 |
|
1,990 |
|
12.4 |
|
16,636 |
|
| Loans and advances to customers |
35,988 |
|
31,482 |
|
4,506 |
|
14.3 |
|
26,591 |
|
| Loans and advances to central banks and credit institutions |
44,151 |
|
54,100 |
|
(9,949) |
|
(18.4) |
|
40,280 |
|
| Derivatives |
58,828 |
|
56,247 |
|
2,581 |
|
4.6 |
|
64,100 |
|
Financial assets designated at fair value through profit or loss1 |
15,585 |
|
15,460 |
|
125 |
|
0.8 |
|
14,045 |
|
| Loans and advances to customers |
6,550 |
|
7,033 |
|
(483) |
|
(6.9) |
|
5,652 |
|
| Loans and advances to central banks and credit institutions |
457 |
|
435 |
|
22 |
|
5.1 |
|
408 |
|
| Other (debt securities an equity instruments) |
8,578 |
|
7,992 |
|
586 |
|
7.3 |
|
7,985 |
|
| Financial assets at fair value through other comprehensive income |
74,037 |
|
80,171 |
|
(6,134) |
|
(7.7) |
|
89,898 |
|
| Debt securities |
59,903 |
|
68,850 |
|
(8,947) |
|
(13.0) |
|
76,558 |
|
| Equity instruments |
2,185 |
|
1,942 |
|
243 |
|
12.5 |
|
2,193 |
|
| Loans and advances to customers |
11,635 |
|
9,036 |
|
2,599 |
|
28.8 |
|
10,784 |
|
| Loans and advances to central banks and credit institutions |
314 |
|
343 |
|
(29) |
|
(8.5) |
|
363 |
|
| Financial assets measured at amortized cost |
1,175,701 |
|
1,198,673 |
|
(22,972) |
|
(1.9) |
|
1,203,707 |
|
| Debt securities |
128,115 |
|
111,107 |
|
17,008 |
|
15.3 |
|
120,949 |
|
| Loans and advances to customers |
973,036 |
|
1,019,868 |
|
(46,832) |
|
(4.6) |
|
1,011,042 |
|
| Loans and advances to central banks and credit institutions |
74,550 |
|
67,698 |
|
6,852 |
|
10.1 |
|
71,716 |
|
| Investments in subsidiaries, joint ventures and associates |
7,352 |
|
8,640 |
|
(1,288) |
|
(14.9) |
|
7,277 |
|
| Tangible assets |
28,408 |
|
32,536 |
|
(4,128) |
|
(12.7) |
|
32,087 |
|
| Intangible assets |
17,287 |
|
19,077 |
|
(1,790) |
|
(9.4) |
|
19,259 |
|
| Goodwill |
12,025 |
|
13,487 |
|
(1,462) |
|
(10.8) |
|
13,438 |
|
| Other intangible assets |
5,262 |
|
5,590 |
|
(328) |
|
(5.9) |
|
5,821 |
|
| Non-current asset held for sale |
69,369 |
|
2,939 |
|
66,430 |
|
— |
|
4,002 |
|
Other assets2 |
42,174 |
|
43,347 |
|
(1,173) |
|
(2.7) |
|
44,345 |
|
| Total assets |
1,840,668 |
|
1,802,259 |
|
38,409 |
|
2.1 |
|
1,837,081 |
|
|
|
|
|
|
|
| Liabilities and shareholders' equity |
|
|
|
|
|
| Financial liabilities held for trading |
164,608 |
|
143,559 |
|
21,049 |
|
14.7 |
|
152,151 |
|
| Customer deposits |
42,926 |
|
33,043 |
|
9,883 |
|
29.9 |
|
18,984 |
|
| Debt securities issued |
— |
|
— |
|
— |
|
— |
|
— |
|
| Deposits by central banks and credit institutions |
31,415 |
|
28,646 |
|
2,769 |
|
9.7 |
|
39,584 |
|
| Derivatives |
51,712 |
|
50,697 |
|
1,015 |
|
2.0 |
|
57,753 |
|
| Other |
38,555 |
|
31,173 |
|
7,382 |
|
23.7 |
|
35,830 |
|
| Financial liabilities designated at fair value through profit or loss |
37,079 |
|
34,503 |
|
2,576 |
|
7.5 |
|
36,360 |
|
| Customer deposits |
23,938 |
|
24,962 |
|
(1,024) |
|
(4.1) |
|
25,407 |
|
| Debt securities issued |
10,608 |
|
7,487 |
|
3,121 |
|
41.7 |
|
7,554 |
|
| Deposits by central banks and credit institutions |
2,508 |
|
2,038 |
|
470 |
|
23.1 |
|
3,399 |
|
| Other |
25 |
|
16 |
|
9 |
|
56.3 |
|
— |
|
| Financial liabilities measured at amortized cost |
1,414,964 |
|
1,459,778 |
|
(44,814) |
|
(3.1) |
|
1,484,322 |
|
| Customer deposits |
959,266 |
|
987,906 |
|
(28,640) |
|
(2.9) |
|
1,011,545 |
|
| Debt securities issued |
306,015 |
|
314,446 |
|
(8,431) |
|
(2.7) |
|
317,967 |
|
| Deposits by central banks and credit institutions |
106,617 |
|
115,657 |
|
(9,040) |
|
(7.8) |
|
114,894 |
|
| Other |
43,066 |
|
41,769 |
|
1,297 |
|
3.1 |
|
39,916 |
|
| Liabilities under insurance contracts |
18,620 |
|
18,037 |
|
583 |
|
3.2 |
|
17,829 |
|
| Provisions |
7,744 |
|
8,571 |
|
(827) |
|
(9.6) |
|
8,407 |
|
| Liabilities associated with non-current assets held for sale |
59,058 |
|
— |
|
59,058 |
|
— |
|
— |
|
Other liabilities3 |
28,681 |
|
32,748 |
|
(4,067) |
|
(12.4) |
|
30,685 |
|
| Total liabilities |
1,730,754 |
|
1,697,196 |
|
33,558 |
|
2.0 |
1,729,754 |
|
| Shareholders' equity |
139,081 |
|
134,070 |
|
5,011 |
|
3.7 |
|
135,196 |
|
| Capital stock |
7,443 |
|
7,747 |
|
(304) |
|
(3.9) |
|
7,576 |
|
Reserves (including treasury stock)4 |
123,005 |
|
118,539 |
|
4,466 |
|
3.8 |
|
116,578 |
|
| Profit attributable to the Group |
10,337 |
|
9,309 |
|
1,028 |
|
11.0 |
|
12,574 |
|
| Less: dividends |
(1,704) |
|
(1,525) |
|
(179) |
|
11.7 |
|
(1,532) |
|
| Other comprehensive income |
(38,004) |
|
(37,471) |
|
(533) |
|
1.4 |
|
(36,595) |
|
| Minority interests |
8,837 |
|
8,464 |
|
373 |
|
4.4 |
|
8,726 |
|
| Total equity |
109,914 |
|
105,063 |
|
4,851 |
|
4.6 |
|
107,327 |
|
| Total liabilities and equity |
1,840,668 |
|
1,802,259 |
|
38,409 |
|
2.1 |
|
1,837,081 |
|
|
|
|
| Note: the condensed balance sheet groups some lines of the consolidated balance sheet on pages 89 and 90 as follows: |
1.'Non-trading financial assets mandatorily at fair value through profit or loss' and 'Financial assets designated at fair value through profit or loss'. |
2.‘Hedging derivatives’; ‘Changes in the fair value of hedged items in portfolio hedges of interest risk’; 'Assets under reinsurance contracts'; ‘Tax assets’; and ‘Other assets’. |
3.‘Hedging derivatives’; ‘Changes in the fair value of hedged items in portfolio hedges of interest rate risk’; ‘Tax liabilities’; and ‘Other liabilities‘. |
4.‘Share premium’; ‘Equity instruments issued other than capital’; ‘Other equity’; ‘Accumulated retained earnings’; ‘Revaluation reserves’; ‘Other reserves’; and ‘Own shares (-)’. |
|
|
|
|
|
|
|
|
|
January - September 2025 |
|
17 |
|
|
|
|
|
|
|
|
|
|
|
|
|
|
|
|
|
|
|
|
|
|
|
|
|
|
|
|
|
|
|
|
|
|
|
|
|
Significant events
|
|
|
|
|
|
|
|
|
|
|
|
|
|
Balance sheet |
|
|
|
|
|
|
|
|
|
|
|
|
|
|
|
|
|
|
|
|
|
|
|
|
|
|
|
|
|
|
|
|
|
|
|
|
|
|
|
|
|
|
|
|
|
|
|
|
|
|
|
|
|
|
Gross loans and advances to customers (excl. reverse repos) |
|
Customer funds (deposits excl. repos + mutual funds) |
|
|
Loans rose 2% year-on-year and 1% quarter-on-quarter. |
|
Customer funds continued to increase, +2% quarter-on-quarter and +7% year-on-year. |
|
|
EUR 1,007 billion |
+1% QoQ |
|
EUR 1,230 billion |
+2% QoQ |
|
|
+2% YoY |
|
+7% YoY |
|
|
|
|
|
|
|
|
|
|
|
By business: |
|
By product: |
|
|
Year-on-year growth across all businesses except in Retail, where they were flat. |
|
Strong year-on-year increase in mutual funds, with widespread growth across businesses and countries, and higher deposits (both demand and time deposits). |
|
|
Retail |
Consumer |
CIB |
|
Demand |
Time |
Mutual funds |
|
|
0% |
+2% |
+5% |
|
+4% |
+6% |
+16% |
|
|
|
|
|
|
|
|
|
|
|
Note: changes in constant euros. Includes Poland. |
|
|
|
|
|
|
|
|
|
|
|
|
|
|
|
Loans and advances to customers
Loans and advances to customers stood at EUR 1,027,209 million as at end September 2025, reflecting a 2% increase quarter-on-quarter and 4% decrease year-on-year. This year-on-year comparison was affected by the Poland disposal as, in accordance with IFRS 5 requirements and only from 30 June 2025 onwards, the assets related to the Poland disposal are aggregated under the 'non-current assets held for sale' line.
For the purpose of analysing traditional banking loans, the Group uses gross loans and advances to customers excluding reverse repos. We continue to analyse gross loans and advances to customers excluding reverse repos including Poland, i.e. maintaining the same perimeter that existed at the time of the announcement of the Poland disposal. As at end September 2025, gross loans and advances to customers excluding reverse repos, including Poland, totalled EUR 1,006,978 million.
Additionally, the comments below do not include the exchange rate impact (i.e. in constant euros) except for Argentina and any grouping which includes it. For further information, see the
'Alternative performance measures' section in this report.
Compared to June 2025, gross loans and advances to customers (excluding reverse repos and including Poland), increased 1% in constant euros with the following detail:
•In Retail, they were flat, as the increase in mortgages offset the decline in SMEs in Spain and the UK.
•In Consumer, they were also flat as higher balances mainly in the US, Mexico and Brazil, offset lower volumes in DCB Europe (due to portfolio sales).
|
|
|
|
|
|
| Gross loans and advances to customers (excl. reverse repos) |
| EUR billion. Including Poland |

1. In constant euros: +2%.
•In CIB, loans increased 4%, particularly due to Spain and the US.
•Loans in Wealth grew 2%, mainly due to Private Banking, and in Payments they were flat.
Compared to September 2024, gross loans and advances to customers (excluding reverse repos and including Poland) grew 2% in constant euros, as follows:
•In Retail, they were flat, as growth in individuals (driven by the mortgage portfolio, especially in Portugal, Brazil and Mexico) offset the decline in SME balances.
•In Consumer, they rose 2% boosted by the good performance in auto business, mainly in DCB Europe and Latin America.
•In CIB, they increased 5% due to Global Banking (Latin America and the US) and Global Markets (mainly in Spain).
•They increased 13% in Wealth, particularly in Spain and the US, and were up 14% in Payments, driven by strong volumes growth in Cards, especially in Brazil.
As at end September 2025, gross loans and advances to customers (excluding reverse repos and including Poland) maintained a diversified mix across our footprint, with presence in different countries in Europe (69% of Group's total loans), Latin America (20%) and the US (11%).
|
|
|
| Gross loans and advances to customers (excl. reverse repos) |
| % operating areas. September 2025. Including Poland |
|
|
|
|
|
|
|
|
|
18 |
|
January - September 2025 |
|
|
|
|
|
|
|
|
|
|
|
|
|
|
|
|
|
|
|
|
|
|
|
|
|
|
|
|
|
|
|
|
|
|
|
|
|
Significant events
|
|
|
|
|
|
|
|
|
|
|
|
|
|
Balance sheet |
|
|
|
|
|
|
|
|
Customer funds
Customer deposits amounted to EUR 1,026,130 million as at end September 2025, up 2% quarter-on-quarter and down 2% year-on-year. This year-on-year comparison was affected by the Poland disposal as, in accordance with IFRS 5 requirements and only from 30 June 2025 onwards, the liabilities related to the Poland disposal are aggregated under the 'liabilities associated with non-current assets held for sale' line.
The Group uses customer funds (customer deposits excluding repos, plus mutual funds) for the purpose of analysing traditional retail banking funds. We continue to analyse customer funds including Poland, i.e. maintaining the same perimeter that existed at the time of the announcement of the Poland disposal. As at end September 2025, they amounted to EUR 1,230,211 million.
The comments below do not include the exchange rate impact (i.e. in constant euros), except for Argentina and any grouping which includes it. For further information, see the '
Alternative performance measures' section in this report.
Compared to June 2025, customer funds including Poland increased 2% in constant euros, with the following detail:
•By product, customer deposits excluding repos rose 1%, with growth in time deposits (+5%) while demand deposits were flat. Positive momentum continued in mutual funds (+4%).
•By business, customer funds grew in Retail (+2%), CIB (+5%), Wealth (+4%) and Payments (+11%), which more than offset the decreases in Consumer (-2%).
Compared to September 2024, customer funds were 7% higher in constant euros:
•By product, deposits excluding repos rose 5%, with growth in both demand (+4%) and time deposits (+6%). Widespread growth in mutual funds, increasing 16%.
•By business, they rose 6% in Retail, driven by double-digit growth in mutual funds and a 9% increase in time deposits. They grew considerably in Consumer (+6%), in line with our deposit gathering strategy. They rose 9% in CIB and in Wealth, they were up 11% mainly driven by mutual funds (+14%). Mutual funds grew across all countries.
As at end September 2025, customer funds (including Poland) maintained a diversified mix across our footprint, with presence in different countries in Europe (70% of Group's total customer funds), Latin America (22%) and the US (8%). The weight of demand deposits as a percentage of total customer funds was 54%, while time deposits accounted for 25% of the total and mutual funds for 21%.
In addition to capturing customer deposits, the Group, for strategic reasons, maintains a selective policy of issuing securities in the international fixed income markets and strives to adapt the frequency
|
|
|
|
|
|
| Customer funds |
| EUR billion. Including Poland |
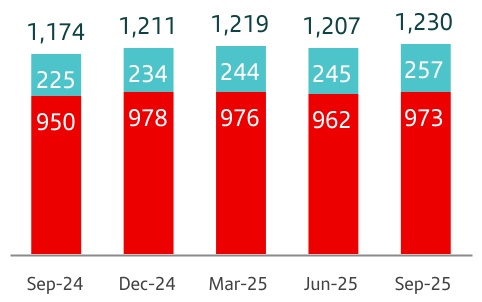
|
|
|
|
|
|
|
|
|
|
|
|
| +5% ¹ |
|
|
|
|
|
| +14% |
|
|
|
|
|
| +2% |
|
|
|
|
|
|
|
|
•Total |
•Mutual funds |
•Deposits excl. repos |
|
|
|
| Sep-25 / Sep-24 |
|
|
|
1. In constant euros: +7%.
and volume of its market operations to the structural liquidity needs of each unit, as well as to the receptiveness of each market
In 9M 2025, the Group's issuances were as follows:
•Medium- and long-term senior debt totalling EUR 14,116 million and covered bonds placed in the market for EUR 6,801 million.
•TLAC eligible instruments issued amounted to EUR 11,208 million, of which EUR 9,364 million was senior non-preferred, EUR 344 million was subordinated debt and EUR 1,500 million was contingent convertible AT1 debt.
•Maturities of medium- and long-term debt totalled EUR 29,974 million.
The net loan-to-deposit ratio was 99% (102% in September 2024), and the ratio of deposits plus medium- and long-term funding to the Group’s loans was 127%, showing a comfortable funding structure. The Group liquidity coverage ratio (LCR) was an estimated 160% in September 2025 (see the '
Risk management' chapter of this report).
The Group's access to wholesale funding markets, as well as the cost of issuances depends, in part, on the ratings granted by the rating agencies.
|
|
|
|
|
|
|
|
|
|
|
|
| Rating agencies |
|
Long term |
Short term |
Outlook |
| Fitch Ratings |
A (Senior A+) |
F1 (Senior F1) |
Stable |
| Moody's |
A1 |
P-1 |
Stable |
| S&P Global Ratings |
A+ |
A-1 |
Stable |
| DBRS |
A (High) |
R-1 (Middle) |
Stable |
Following the upgrade of the Kingdom of Spain's rating in September 2025, Moody's raised Santander's long-term rating to A1 and maintained the short-term rating at P-1 in October.
Fitch upgraded Santander's long-term senior rating to A+ in Q1 2025.
In Q3 2024, S&P Global Ratings confirmed Santander's credit rating at A+ for long-term and A-1 for short-term debt. Since Q2 2024, S&P has maintained our BBB- (investment grade) rating for AT1 instruments.
Lastly, all four agencies view the outlook as stable, in line with their respective ratings for the sovereign.
Sometimes the methodology applied by the rating agencies limits a bank's rating to the sovereign rating of the country where it is headquartered. Banco Santander, S.A. is still rated above the sovereign debt rating of the Kingdom of Spain in long-term senior debt by Moody's and Fitch, and rated at the same level by S&P and DBRS. These ratings above the sovereign demonstrate our financial strength and the benefits derived from our diversification.
|
|
|
| Customer funds |
| % operating areas. September 2025. Including Poland |
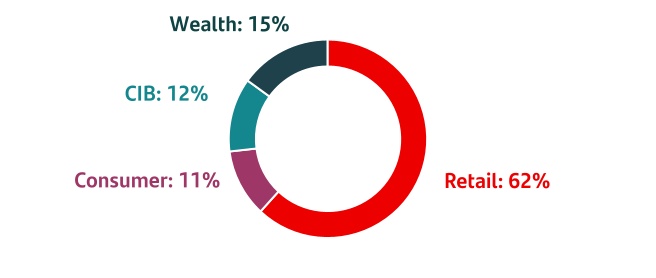
|
|
|
|
|
|
|
|
|
January - September 2025 |
|
19 |
|
|
|
|
|
|
|
|
|
|
|
|
|
|
|
|
|
|
|
|
|
|
|
|
|
|
|
|
|
|
|
|
|
|
|
|
|
Significant events
|
|
|
|
|
|
|
|
|
|
|
|
|
|
Solvency ratios |
|
|
|
|
|
|
|
|
Solvency ratios
|
|
|
|
|
|
|
|
|
|
|
|
|
|
|
|
|
|
|
|
|
|
|
|
|
|
|
|
|
|
|
|
|
|
|
|
|
|
|
|
|
|
|
|
|
|
Phased-in capital ratio |
|
CET1 ratio |
|
|
The phased-in CET1 ratio stood at 13.1%, slightly above the Group's operating range of 12-13%. |
|
We continued to generate capital organically in the quarter, strongly backed by good profit growth. |
|
|
|
|
Attributable profit |
+56 bps |
|
|
|
Capital distribution1 |
-30 bps |
|
|
|
|
|
|
|
|
|
|
|
|
|
|
|
Value creation |
|
|
|
TNAVps |
€5.56 |
|
|
|
TNAVps + Cash DPS |
+15% YoY |
|
|
|
|
|
|
|
Note: Phased-in ratios are calculated in accordance with the transitory treatment of the CRR. |
|
|
|
|
|
|
|
|
|
|
|
As at end September 2025, the total phased-in capital ratio (applying the CRR transitional arrangements) stood at 17.4% and the phased-in CET1 ratio at 13.1%, slightly ahead of the 13% target for 2025 that we announced in Q4 2024.
We comfortably meet the levels required by the ECB on a consolidated basis, estimated at 14.0% for the total capital ratio and at 9.7% for the CET1 ratio2. This resulted in a distance to the maximum distributable amount (MDA) of 324 bps and a CET1 management buffer of 338 bps.
In the quarter, the CET1 ratio improved 0.1 pp to 13.1% as +56 bps of capital generation from attributable profit more than offset a -30 bp impact related to capital distributions, including the deduction for the accrual of shareholder remuneration against profit earned in Q3 2025 (in line with our 50% payout target3) and AT1 costs, and higher RWAs (risk transfer initiatives partly compensated organic RWA growth). Additionally, we recorded -2 bps related to regulatory headwinds and -5 bps in markets and others (mostly HTC&S portfolio and hedge valuations).
Although the CRR3 fully-loaded criteria are not yet fully defined, our current estimate for the fully-loaded CET1 ratio is comfortably above our >12% Investor Day target for 2025 year end.
TNAV per share ended the quarter at EUR 5.56. Including the final cash dividend against 2024 results paid in May 2025 (EUR 11.00 cents per share) and the interim cash dividend charged against 2025 results announced in September that will be paid from 3 November 2025 (EUR 11.50 cents per share), TNAV plus cash dividend per share increased 14.9% in the last twelve months (+3.2% in the quarter).
Lastly, the leverage ratio was 4.92%.
|
|
|
|
|
|
|
Eligible capital. September 2025 |
| EUR million |
|
|
|
|
Phased-in |
| CET1 |
|
82,593 |
|
| Basic capital |
|
93,222 |
|
| Eligible capital |
|
109,941 |
|
| Risk-weighted assets |
|
630,753 |
|
|
|
|
|
|
% |
| CET1 capital ratio |
|
13.1 |
|
| Tier 1 capital ratio |
|
14.8 |
|
| Total capital ratio |
|
17.4 |
|
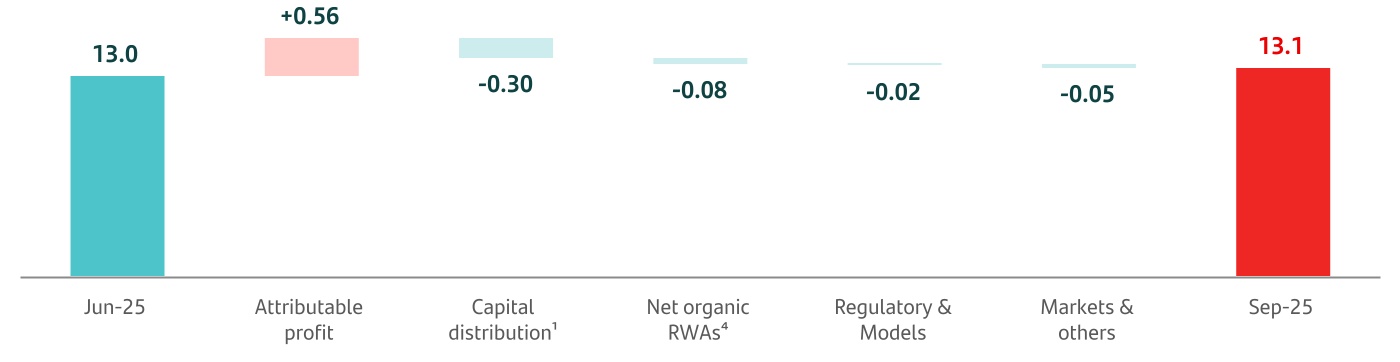
Note: Phased-in ratios are calculated in accordance with the transitory treatment of the CRR. Does not include any expected impacts from the recently announced inorganic transactions.
1.Capital distribution includes deduction for the accrual of shareholder remuneration and AT1 costs.
2.According to a resolution from Banco de España in October 2024, from 1 October 2025 a countercyclical buffer of 0.50% over the exposures located in Spain will be activated. The impact at the Group level is +12 bps to the countercyclical buffer requirement.
3.Our current ordinary shareholder remuneration policy is to distribute approximately 50% of Group reported profit (excluding non-cash, non-capital ratios impact items), distributed approximately 50% in cash dividend and 50% in share buybacks. Execution of the shareholder remuneration policy is subject to future corporate and regulatory decisions and approvals.
4.Business RWA change net of risk transfer initiatives.
|
|
|
|
|
|
|
|
|
20 |
|
January - September 2025 |
|
|
|
|
|
|
|
|
|
|
|
|
|
|
|
|
|
|
|
|
|
|
|
|
|
|
|
|
|
|
|
|
|
|
|
|
|
Significant events
|
|
|
|
|
|
|
|
|
|
|
|
|
|
Solvency ratios |
|
|
|
|
|
|
|
|
Stress test
In August, the European Banking Authority (EBA) published the results of its 2025 EU-wide stress test, which involved the major European banks, in coordination with the European Central Bank (ECB) and the European Systemic Risk Board (ESRB).
This exercise assesses the resilience of these banks' main balance sheet and income statement items under two different macroeconomic scenarios (baseline and adverse).
The balance sheets at the end of 2024 were taken as a starting point and the expected behaviours of business models of each of the banks were compared in order to gauge the expected losses and the ability of the balance sheet to withstand such losses without requiring external support.
On this occasion, as with previous exercises, there was no minimum capital threshold to meet. Instead, results will be taken into account when determining the SREP requirements.
The baseline scenario assumes the most likely economic performance according to the models used by the supervisor. The very unlikely adverse scenario assumes a severe deterioration in both macroeconomic and global financial market conditions. This year's adverse scenario assumes a severe global downturn caused by a hypothetical escalation in geopolitical tensions leading to a contraction in GDP, sustained inflation and a rise in unemployment.
The GDP scenarios used to project the evolution of the Group's main countries were as follows:
|
|
|
|
|
|
|
|
|
|
|
|
|
|
|
|
|
|
|
|
|
|
|
|
|
|
|
|
|
|
|
|
|
|
|
|
|
|
|
|
|
|
|
|
|
|
|
|
|
|
|
|
|
|
| Gross Domestic Product (GDP) |
| Change (%) |
|
|
|
|
|
|
|
|
|
|
|
|
|
|
|
|
|
|
|
|
|
|
|
|
|
|
|
|
|
|
|
|
|
|
Spain |
|
UK |
|
US |
|
Mexico |
|
Brazil |
|
Chile |
|
2025 |
2025-27 |
|
2025 |
2025-27 |
|
2025 |
2025-27 |
|
2025 |
2025-27 |
|
2025 |
2025-27 |
|
2025 |
2025-27 |
| Baseline scenario |
2.5 |
6.1 |
|
1.5 |
4.5 |
|
2.2 |
6.3 |
|
1.3 |
5.6 |
|
2.2 |
6.9 |
|
2.4 |
7.3 |
| Adverse scenario |
-2.5 |
-4.0 |
|
-4.5 |
-10.3 |
|
-5.1 |
-3.3 |
|
-4.7 |
-7.0 |
|
-3.3 |
-2.9 |
|
-5.1 |
-3.2 |
|
|
|
|
|
|
|
Santander: resilience of our income statement was reflected in greater capital strength |
Since 2008, the Group has undergone 10 stress tests and demonstrated in all of them the strength of its business model and, consequently, that its solvency levels are sufficient to face the most severe macroeconomic scenarios.
Our business and geographic diversification provides us with more stable and non-interrelated sources of income, so that even if the macroeconomic situation were to deteriorate globally, we would be capable of generating profit for our shareholders while satisfying the most demanding regulatory requirements, and thereby ensure an adequate capital position in line with regulatory requirements.
|
|
|
|
|
|
| Fully-loaded CET1 ratio 2027 vs. 2024 |
| Adverse scenario. Basis points |
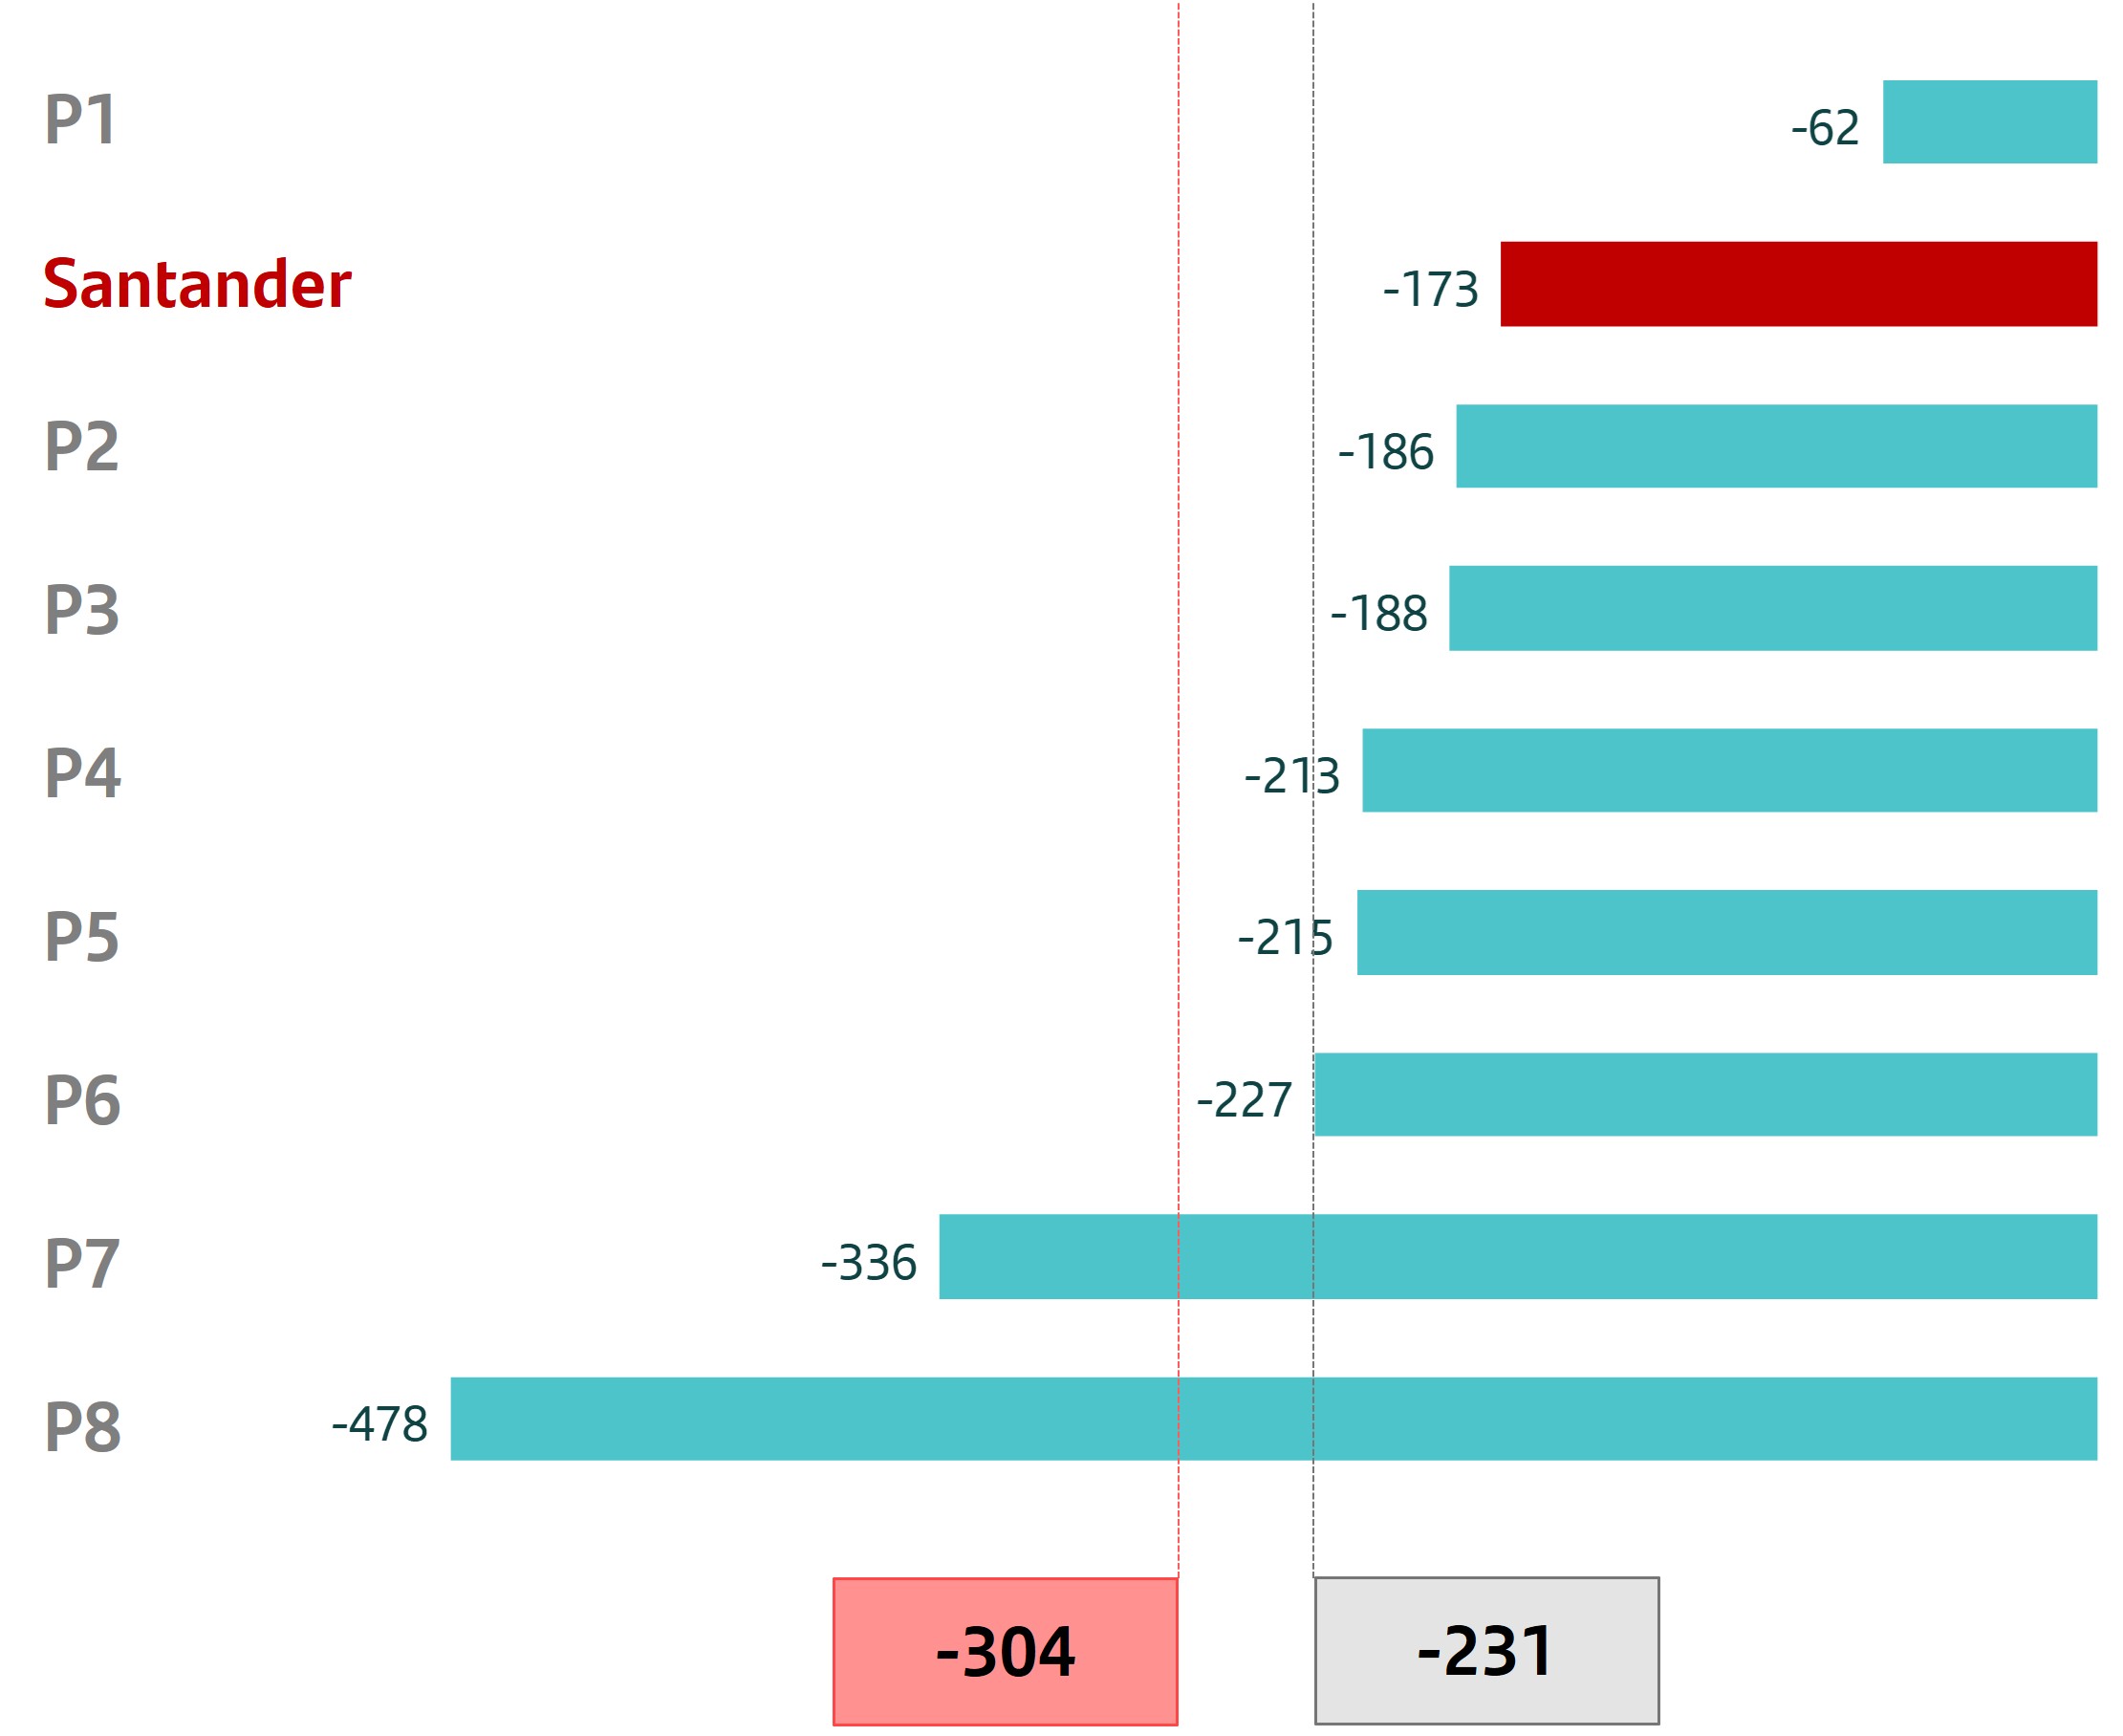
According to the results obtained from this stress test, under the adverse scenario, Santander would destroy just 173 bps of fully-loaded capital. This compares to a peer average of 231 bps and the average of European banking system of more than 300 bps.
This implies that, in absolute terms, the Group at the end of the stressed horizon in the adverse scenario, would have a fully-loaded CET1 ratio that is 50 bps better than the average of its European peers.
Even in the adverse scenario, Santander was forecasted to generate a cumulative profit of EUR 10,769 million, well above its peers (average projected profit of EUR 805 million) and the system (averaging a projected loss of EUR 278 million).
|
|
|
|
|
|
| Profit after tax (2025-2027) |
| Adverse scenario. EUR million |
|
|
|
|
|
|
|
|
|
January - September 2025 |
|
21 |
|
|
|
|
|
|
|
|
|
|
|
|
|
|
|
|
|
|
|
|
|
|
|
|
|
|
|
|
|
|
|
|
|
|
|
|
|
Significant events
|
|
|
|
|
|
|
|
|
|
|
|
|
|
Risk management |
|
|
|
|
|
|
|
|
Risk management
|
|
|
|
|
|
|
|
|
|
|
|
|
|
|
|
|
|
|
|
|
|
|
|
|
|
|
|
|
|
|
|
|
|
|
|
|
|
|
|
|
|
|
|
|
|
Credit risk |
|
Market risk |
|
|
Credit quality indicators remained contained, within expected levels. |
|
Average VaR declined in the quarter, positively impacted by agreements reached between the US and some of its trade partners. |
|
|
Cost of risk |
NPL ratio |
NPL coverage ratio |
|
Average VaR |
|
|
1.13% |
2.92% |
67% |
|
Q3'25 |
EUR 15 million |
-EUR 2 mn vs. Q2'25 |
|
|
-1 bp vs. Jun-25 |
+1 bps vs. Jun-25 |
0 pp vs. Jun-25 |
|
|
|
|
|
|
|
|
|
|
|
|
Structural and liquidity risk |
|
Operational risk |
|
|
Robust and diversified liquidity buffer, with ratios well above regulatory requirements. |
|
In Q3 2025, our operational risk profile remained stable, focusing on risks associated with suppliers, technology and cyberrisk. Operational losses decreased compared to the previous quarter. |
|
|
Liquidity Coverage Ratio (LCR) |
|
|
|
160%1 |
+1 pp vs. Jun-25 |
|
|
|
|
|
|
|
|
|
|
|
|
|
|
|
|
|
|
|
In accordance with IFRS 5 requirements, business subject to the Poland disposal has been classified as 'non-current assets/liabilities held for sale' and the results have been reported under 'discontinued operations' since June 2025.
However, given that until the Poland disposal is completed, the management of Santander Polska remains unchanged, all management metrics included in this report have been calculated including Poland, i.e. maintaining the same perimeter that existed at the time of the announcement of the Poland disposal. This reporting approach is consistent with the information used internally in management reporting, as well as with other public Group disclosures.
Credit risk2
During Q3 2025, US trade agreements helped to soften the impact of trade tensions and consequently mitigated uncertainty regarding global growth and limited inflationary pressures. However, geopolitical tensions continued to generate uncertainty regarding the outlook for the global economy.
In the eurozone, inflation was stable during the quarter, confirming an environment characterized by contained prices. In the UK, lower interest rates, stable housing price, and support measures from the Bank of England boosted activity. In the US, weak labour market data led the Federal Reserve to cut interest rates. In Latin America, after a good first half of the year, activity indicators and external demand performance showed signs of deceleration at the beginning of Q3 2025.
In this context, our global and diversified business model, with our strong local presence, provides us with a resilient structure which, together with our prudent risk management, enables us to maintain a medium-low risk profile, even in a more complex, macroeconomic and geopolitical environment.
In terms of credit quality:
•The NPL ratio was relatively stable quarter-on-quarter at 2.92%. Credit impaired loans rose 2% to EUR 34,048 million, mainly due to less favourable exchange rate movements and increases in Consumer and Payments. This trend was offset by a 2% increase in gross credit risk with customers (total risk), which reached EUR 1,168 billion, on the back of positive trends across all global businesses, especially in CIB.
Year-on-year, the NPL ratio improved 14 bps, underpinned by lower credit impaired loans, mainly in Retail (supported by the NPL reduction plan) and CIB, while total risk was flat.
•Net loan-loss provisions totalled EUR 9,109 million in 9M 2025, growing 5% year-on-year in constant euros, mainly in Payments and the Corporate Centre due to provisions related to our plan to accelerate NPL ratio reductions, improving the Group's credit quality.
|
|
|
|
|
|
|
|
|
|
|
|
|
|
|
|
|
|
|
|
|
|
|
|
|
|
|
|
|
|
|
|
|
|
|
|
|
|
|
|
|
|
|
|
|
|
|
|
|
|
|
|
|
Key risk metrics |
|
|
|
|
|
|
|
|
|
|
|
|
|
|
|
|
|
|
|
|
|
|
|
|
|
|
|
|
|
|
|
|
|
|
|
|
|
|
Net loan-loss provisions 3 |
|
Cost of risk (%) 4 |
|
NPL ratio (%) |
|
NPL coverage ratio (%) |
|
|
Q3'25 |
9M'25 |
Chg (%)
/ 9M'24 |
Chg (%)
/ Q2'25 |
|
Sep-25 |
Chg (bps)
/ Sep-24 |
Chg (bps)
/ Jun-25 |
|
Sep-25 |
Chg (bps)
/ Sep-24 |
Chg (bps)
/ Jun-25 |
|
Sep-25 |
Chg (pp)
/ Sep-24 |
Chg (pp)
/ Jun-25 |
|
Retail |
1,275 |
4,105 |
(1.2) |
(8.9) |
|
0.89 |
(9) |
(1) |
|
3.00 |
(27) |
(6) |
|
62 |
4 |
2 |
|
Consumer |
1,069 |
3,144 |
(1.9) |
13.0 |
|
2.06 |
(6) |
(2) |
|
5.29 |
39 |
32 |
|
73 |
(2) |
(4) |
|
CIB |
81 |
167 |
9.2 |
13.9 |
|
0.10 |
(11) |
1 |
|
0.70 |
(16) |
(1) |
|
45 |
10 |
0 |
|
Wealth |
(10) |
11 |
(56.8) |
— |
|
0.12 |
3 |
(8) |
|
0.91 |
(9) |
(5) |
|
68 |
5 |
(2) |
|
Payments |
514 |
1,485 |
29.5 |
6.7 |
|
7.73 |
73 |
19 |
|
5.54 |
(15) |
43 |
|
136 |
7 |
5 |
|
|
|
|
|
|
|
|
|
|
|
|
|
|
|
|
|
|
|
|
|
|
|
|
|
|
|
|
|
|
|
|
|
|
|
|
|
|
|
|
|
|
|
|
|
|
|
|
|
|
|
|
|
|
|
TOTAL GROUP |
2,931 |
9,109 |
4.9 |
(2.6) |
|
1.13 |
(5) |
(1) |
|
2.92 |
(14) |
1 |
|
67 |
3 |
0 |
|
|
|
|
|
|
|
|
|
|
|
|
|
|
|
|
|
|
|
|
|
|
|
|
|
|
|
|
|
|
|
|
|
|
|
|
|
|
|
|
|
|
|
|
|
|
|
|
|
|
|
|
|
|
|
|
|
|
|
|
|
|
|
|
|
|
|
|
|
|
|
|
|
|
|
|
|
|
|
|
|
|
|
|
|
|
|
|
|
|
|
|
|
|
|
|
|
|
|
|
|
|
|
|
|
|
|
|
|
|
|
|
|
|
|
|
|
|
|
|
|
|
|
|
|
|
|
|
|
|
|
|
|
|
|
|
|
|
|
|
|
|
|
|
|
|
|
|
|
|
|
|
|
|
|
|
|
|
|
|
|
|
|
|
|
|
|
|
|
|
|
|
|
|
|
|
|
|
|
|
|
|
|
|
|
|
|
|
|
|
|
|
|
|
|
|
|
|
|
|
|
|
|
|
|
|
|
|
|
|
|
|
|
|
|
|
|
|
|
|
|
|
|
|
|
|
|
|
|
|
|
|
|
|
|
|
|
|
|
|
|
|
|
|
|
|
|
|
|
|
|
|
|
|
|
|
|
|
|
|
|
|
|
|
|
|
|
|
|
|
|
|
|
|
|
|
|
|
|
|
|
|
|
|
|
|
|
|
|
|
|
|
|
|
|
|
|
|
|
|
|
|
|
|
|
|
|
|
|
|
|
|
|
|
|
|
|
|
|
|
|
|
|
|
1.Group LCR. See the 'Structural and liquidity risk' section of this chapter. Provisional data.
2.Changes in constant euros, unless otherwise indicated.
3.EUR million and % change in constant euros.
4.Provisions to cover losses due to impairment of loans in the last 12 months / average customer loans and advances of the last 12 months.
|
|
|
|
|
|
|
|
|
22 |
|
January - September 2025 |
|
|
|
|
|
|
|
|
|
|
|
|
|
|
|
|
|
|
|
|
|
|
|
|
|
|
|
|
|
|
|
|
|
|
|
|
|
Significant events
|
|
|
|
|
|
|
|
|
|
|
|
|
|
Risk management |
|
|
|
|
|
|
|
|
Quarter-on-quarter, provisions decreased 3% in constant euros, especially supported by a good performance in Retail (mainly in Brazil and the UK) and in the Corporate Centre.
•Cost of risk reached 1.13%, improving 5 bps compared to September 2024 and 1 bp compared to June 2025.
•The NPL coverage ratio stood at 67%, flat quarter-on-quarter, with loan-loss allowances of EUR 22,850 million. The coverage ratio remained at comfortable levels considering that more than 65% of the Group’s portfolio is backed by quality collateral.
Regarding the IFRS 9 stages, the distribution of the portfolio was stable in the quarter in percentage terms.
|
|
|
|
|
|
|
|
|
|
|
|
|
|
|
|
|
|
|
|
|
|
|
|
| NPL coverage ratio by stage |
|
| EUR billion |
|
Exposure1 |
|
NPL coverage2 |
|
Sep-25 |
Jun-25 |
Sep-24 |
|
Sep-25 |
Jun-25 |
Sep-24 |
| Stage 1 |
1,005 |
989 |
1,008 |
|
0.3 |
% |
0.3 |
% |
0.4 |
% |
| Stage 2 |
86 |
85 |
87 |
|
4.9 |
% |
5.7 |
% |
5.7 |
% |
| Stage 3 |
34 |
33 |
36 |
|
42.4 |
% |
42.7 |
% |
40.1 |
% |
1. Exposure subject to impairment. Additionally, in September 2025 there were EUR 43 billion in loans and advances to customers not subject to impairment recorded at mark to market with changes through P&L (EUR 41 billion in June 2025 and EUR 39 billion in September 2024).
Stage 1: financial instruments for which no significant increase in credit risk has been identified since its initial recognition.
Stage 2: if there has been a significant increase in credit risk since the date of initial recognition but the impairment event has not materialized, the financial instrument is classified in Stage 2.
Stage 3: a financial instrument is catalogued in this stage when it shows effective signs of impairment as a result of one or more events that have already occurred resulting in a loss.
2. Total loan-loss reserves in each stage / exposure subject to impairment in each stage.
|
|
|
|
|
|
|
|
|
|
|
|
| Credit impaired loans and loan-loss allowances |
| EUR million |
|
|
|
|
Change (%) |
|
Q3'25 |
QoQ |
YoY |
| Balance at beginning of period |
33,395 |
|
(4.6) |
|
(4.8) |
|
| Net additions |
3,538 |
|
19.0 |
|
(21.5) |
|
| Increase in scope of consolidation |
— |
|
— |
|
(100.0) |
|
| Exchange rate differences and other |
103 |
|
— |
|
— |
|
| Write-offs |
(2,988) |
|
(16.0) |
|
(11.6) |
|
| Balance at period-end |
34,048 |
|
2.0 |
|
(4.7) |
|
|
|
|
|
| Loan-loss allowances |
22,850 |
|
1.8 |
|
0.5 |
|
| For impaired assets |
14,426 |
|
1.2 |
|
1.3 |
|
| For other assets |
8,424 |
|
2.9 |
|
(0.8) |
|
Our Retail, Consumer, CIB and Payments businesses account for around 97% of the Group's total credit portfolio. Our Wealth business focuses on asset management, investment funds and insurance and has little credit risk exposure. Therefore, the following explanations are focused on the most relevant businesses from a credit risk management point of view:
|
|
|
|
|
|
|
|
|
|
|
|
|
|
Retail & Commercial Banking |
Credit risk exposure |
|
54% of total Group |
Retail's portfolio mainly comprises high quality mortgage loans, where 90% of loans have an LTV lower than 80%, and a corporate portfolio in which more than 50% has property collateral or other collateral.
The NPL ratio improved 6 bps in the quarter to 3.00%, driven by lower credit impaired loans, mainly in Europe, with a notable improvement in the UK, favoured by portfolio sales, and in Spain, supported by the execution of our NPL reduction plan. Total risk was stable, as a decline in Spain and Chile offset growth in Brazil, México and the UK.
The cost of risk improved 9 bps compared to September 2024 to 0.89%, mainly supported by lower provisions, particularly: i) in Spain, due to a good performance in mortgages, favoured by lower interest rates and a robust labour market; ii) in Poland, as our CHF mortgage portfolio required lower provisions than in the same period last year; iii) in Mexico driven by our prudent risk management, lower provisions in mortgages and corporates and a significant impact from exchange rates; and iv) in Brazil, also affected by exchange rate depreciation. Compared to the previous quarter, cost of risk improved 1 bp, backed by lower provisions mainly in Brazil, reflecting our focus on risk management in a less favourable environment, and, to a lesser extent, in the UK (releases due to portfolio sales),
The NPL coverage ratio improved 2 pp in the quarter, reaching 62%. Given the Retail portfolio includes the mortgage portfolios in Spain and the UK, which have high-quality collateral, we consider that coverage is at appropriate levels for the risk of the portfolio.
|
|
|
|
|
|
|
|
|
|
|
|
|
|
Digital Consumer Bank |
Credit risk exposure |
|
18% of total Group |
The Consumer portfolio mainly comprises auto loans and leasing, which together account for more than 80% of the portfolio. This business is characterized by a good risk profile and short-term and geographically diversified portfolios.
The NPL ratio stood at 5.29%, 32 bps higher quarter-on-quarter, underpinned by an increase in credit impaired loans, mainly in the US (due to lower write-offs in a context of high car prices, which has boosted payment rates, regulatory impacts and seasonal effects) and DCB Europe (Germany). Total risk was flat in the quarter.
The cost of risk stood at 2.06%, improving 2 bps compared to June 2025 and 6 bps compared to September 2024, on the back of an excellent performance in provisions in the US (driven by resilient customer behaviour, used car prices stable at high levels and capital relief measures) and, to a lesser extent, in Brazil (provision model updates).
The NPL coverage ratio fell 4 pp quarter-on-quarter, reaching 73%, a level we are comfortable with considering more than 80% of the portfolio is auto loans.
|
|
|
|
|
|
|
|
|
January - September 2025 |
|
23 |
|
|
|
|
|
|
|
|
|
|
|
|
|
|
|
|
|
|
|
|
|
|
|
|
|
|
|
|
|
|
|
|
|
|
|
|
|
Significant events
|
|
|
|
|
|
|
|
|
|
|
|
|
|
Risk management |
|
|
|
|
|
|
|
|
|
|
|
|
|
|
|
|
|
|
|
|
|
|
Corporate & Investment Banking |
Credit risk exposure |
|
22% of total Group |
CIB's business consists of wholesale customers, around 85% of whom have a rating above investment grade. It is a business with a strong advisory component and high value-added solutions and is less intensive in terms of balance sheet activity.
The NPL ratio improved 1 bp in the quarter to 0.70%, backed by a 7% increase in total risk (mainly driven by the US, Brazil and Spain), which amply offset higher credit impaired loans.
The cost of risk improved 11 bps compared to September 2024, reaching 0.10%, on the back of almost inexistent provisions in Q4 2024 and Q1 2025. Cost of risk was practically stable quarter-on-quarter (+1 bp).
The NPL coverage ratio stood at 45%, relatively stable compared to June 2025.
|
|
|
|
|
|
|
|
|
|
|
|
|
|
Payments |
Credit risk exposure |
|
2% of total Group |
The Payments portfolio encompasses both the exposure associated with payments and transfer processing activities (PagoNxt) as well as the Cards businesses, which are characterized by rapid turnover and returns in line with their level of risk.
The NPL ratio reached 5.54%, 43 bps higher than the previous quarter, driven by an increase in credit impaired loans, especially in Brazil, while total risk posted a slight increase quarter-on-quarter.
The cost of risk rose 73 bps year-on-year, to 7.73%, on the back of higher provisions (mainly concentrated in Cards), due to strong loan growth in general and model changes and updates, in a less favourable macro environment in some of our countries. In the quarter, cost of risk registered a 19 bp increase.
The NPL coverage ratio improved 5 pp in the quarter, reaching 136%.
Market risk
Despite the persistent uncertainty regarding the final economic impacts from the new trade policies in the US, markets saw less volatility in the quarter, due to the agreements reached with some of the US's commercial partners (such as the agreement reached with EU or the temporary tariff suspension with China). Geopolitical tensions, including the war in Ukraine and the conflict in Israel, continued to add to market uncertainty.
Trading activity in CIB is focused on meeting the needs of our clients. Its risk is measured in terms of daily VaR at 99% and originates from possible movements in interest rates.
In Q3 2025, average VaR was EUR 15 million, below the previous quarter, in a slightly less volatile environment. Daily VaR registered a slight pick up at the end of the period, impacted by market volatility derived from the results from the legislative elections in Buenos Aires.
By market risk factor, VaR continued to be primarily driven by interest rate risk. The VaR figures remain low compared to the size of the balance sheet and the Group's activity.
|
|
|
|
|
|
|
|
|
|
|
|
|
|
|
Trading portfolios1. VaR by region |
| EUR million |
|
|
|
|
|
2025 |
|
2024 |
| Q3 |
Average |
Last |
|
Average |
|
|
|
|
|
| Total |
15.0 |
|
18.1 |
|
|
16.4 |
|
| Europe |
12.9 |
|
13.8 |
|
|
11.7 |
|
| North America |
4.8 |
|
5.2 |
|
|
7.0 |
|
| South America |
6.7 |
|
11.4 |
|
|
9.7 |
|
1. Activity in Santander Corporate & Investment Banking markets.
|
|
|
|
|
|
|
|
|
|
|
|
|
|
|
Trading portfolios1. VaR by market factor |
| EUR million |
|
|
|
|
| Q3 2025 |
Min. |
Avg. |
Max. |
Last |
| VaR total |
9.6 |
|
15.0 |
|
19.8 |
|
18.1 |
|
| Diversification effect |
(13.8) |
|
(16.9) |
|
(25.9) |
|
(17.0) |
|
| Interest rate VaR |
12.0 |
|
15.0 |
|
19.7 |
|
17.2 |
|
| Equity VaR |
2.4 |
|
4.1 |
|
5.3 |
|
5.0 |
|
| FX VaR |
3.7 |
|
5.5 |
|
8.7 |
|
4.5 |
|
| Credit spreads VaR |
4.3 |
|
5.7 |
|
8.3 |
|
5.2 |
|
| Commodities VaR |
1.0 |
|
1.6 |
|
3.7 |
|
3.2 |
|
1.Activity in Santander Corporate & Investment Banking markets.
Note: in the North America, South America and Asia portfolios, VaR corresponding to the credit spreads factor other than sovereign risk is not relevant and is included in the interest rate factor.
|
|
|
|
Trading portfolios1. VaR performance
|
| EUR million |
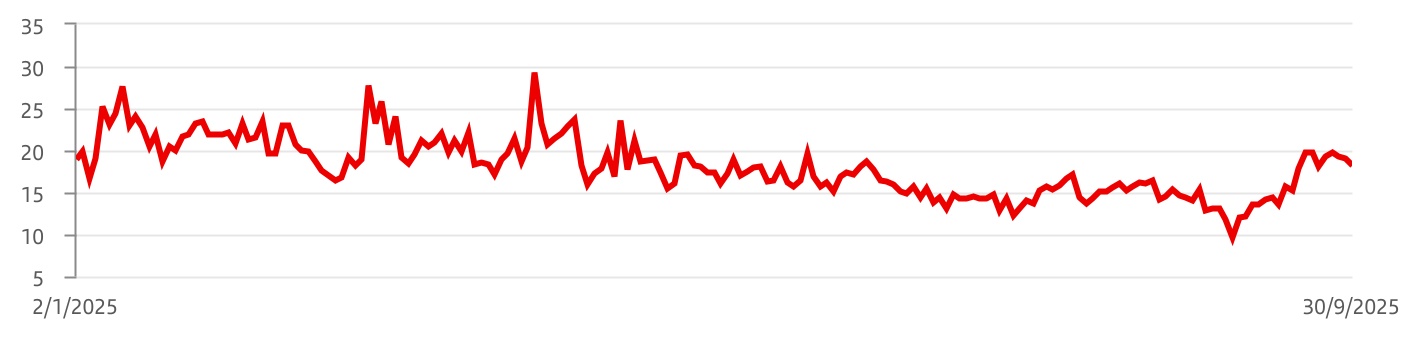
1. Activity in Santander Corporate & Investment Banking markets.
|
|
|
|
|
|
|
|
|
24 |
|
January - September 2025 |
|
|
|
|
|
|
|
|
|
|
|
|
|
|
|
|
|
|
|
|
|
|
|
|
|
|
|
|
|
|
|
|
|
|
|
|
|
Significant events
|
|
|
|
|
|
|
|
|
|
|
|
|
|
Risk management |
|
|
|
|
|
|
|
|
Structural and liquidity risk
Structural exchange rate risk
Grupo Santander's structural exchange rate risk mainly arises from foreign currency transactions related to permanent financial investments, their results and associated hedges.
During Q3 2025, the performance against the euro of the main currencies in which the Group operates was, in general, less volatile than during the first half of the year. Of note was the Argentine peso, which posted a significant depreciation, reflecting high market volatility following the results of the legislative elections in Buenos Aires.
Our dynamic management of this risk aims to limit the impact on the CET1 capital ratio from exchange rate movements. In the quarter, the coverage of the different currencies impacting this ratio remained close to 100%.
Regarding financial results, the exchange rate hedging strategy is tactical and dynamic, depending on our expectations of the evolution of the different currencies in the various countries where the Group operates.
Structural interest rate risk
Interest rate risk management aims to mitigate potential negative impacts on Santander, both in terms of net interest income and economic value of its equity, due to adverse fluctuations in interest rate curves in the various currencies in which the Group operates.
The Group measures interest rate risk through statistical models based on structural risk mitigation strategies using interest rate instruments, such as fixed-income bond portfolios and derivative instruments, to keep the risk profile within the risk appetite.
In Q3 2025, market interest rates continued to reflect the monetary policy adjustments carried out by the major central banks (with the US, the UK and Mexico cutting interest rates, while there were no changes in the eurozone and Brazil).
The Group’s structural interest rate risk remained at comfortable levels during the period. However, structural debt portfolios recorded a negative performance, reflecting the persistent uncertainty regarding the final impact of US tariff policies and ongoing geopolitical tensions.
At an aggregate level, Santander maintains positive net interest income sensitivity to interest rate hikes and negative sensitivity in the same scenario for the economic value of its equity.
Liquidity risk
Liquidity risk is the risk of not having the necessary liquid financial resources available to meet our obligations as they come due. Losses can be caused by forced asset sales or margin impacts due to the mismatch between expected cash inflows and outflows.
Our strong liquidity position is based on a decentralized model, where each subsidiary is managed autonomously.
In Q3 2025, the Group maintained a comfortable position, with ratios well above regulatory limits, supported by a robust and diversified liquidity buffer.
The Group liquidity coverage ratio (LCR1) ended the quarter at 160%, 1 pp higher than the previous quarter.
Operational risk
The Group constantly monitors the evolution of operational risks in general and, particularly, those arising from transformation plans (including the use of new technologies), external fraud and the most significant legal processes.
Our operational risk profile was stable in Q3 2025 compared to the previous quarter. There was a decrease in operational risk losses quarter-on-quarter. Legal processes continue to be the main cause of these losses, which are concentrated in the Group's Retail business.
Additionally, we maintained our focus on risks associated with suppliers, technology and cyberrisk, especially considering the potential impact of geopolitical risks on these areas.
1. The Consolidated LCR ratio as at end September 2025 was 147%, comfortably exceeding internal and regulatory requirements. For more information on the calculation of both the Group LCR and the Consolidated LCR, see the “Liquidity and funding management” section of the “Economic and financial review” chapter in the Annual report 2024 published on 28 February 2025.
|
|
|
|
|
|
|
|
|
January - September 2025 |
|
25 |
|
|
|
|
|
|
|
|
|
|
|
|
|
|
|
|
|
|
|
|
|
|
|
|
|
|
|
|
|
|
|
|
|
|
|
|
|
Significant events
|
|
|
|
|
|
|
|
|
|
|
|
|
|
Santander share |
|
|
|
|
|
|
|
|
The Santander share
Dividends and shareholder remuneration
In application of the shareholder remuneration policy for 2025, on 29 July 2025 the board approved a first share buyback programme against 2025 results of up to EUR 1.7 billion, which was communicated in the Inside Information disclosed on 30 July 2025. The programme commenced on 31 July 2025, once the applicable regulatory approval was obtained.
On 30 September 2025, the board of directors approved an interim cash dividend of EUR 11.50 cents per share charged against 2025 results to be paid from 3 November 2025. This represents a 15% increase compared to the equivalent cash dividend payment in 2024. Accordingly, the last trading day of the share with entitlement to the interim cash dividend will be 29 October 2025, the share will trade ex-dividend on 30 October 2025 and the record date will be 31 October 2025.
As a result, the total remuneration of this interim distribution charged against 2025 results will be approximately EUR 3.4 billion (+11% compared to its equivalent of 2024) and represents approximately 50% of the H1 2025 attributable profit (around 25% through cash dividends and around 25% through share buybacks).
Share price performance
Santander's shares are listed on five markets: on four exchanges in Spain (Madrid, Barcelona, Bilbao and Valencia), in the US (as an ADR), in the UK (as a CDI), in Mexico (Sistema Internacional de Cotizaciones) and in Poland.
Q3 2025 was characterized by a moderate global economic slowdown. Financial markets are reaching new all-time highs, supported by several factors such as expectations of further interest
rate cuts, declining inflation in most of the countries where Santander operates, and optimism around productivity gains from the use of artificial intelligence. However, concerns persist over geopolitical and trade tensions, though easing slightly compared to previous quarters, and over the sustainability of fiscal policies in certain countries.
In this context, equity markets performed well with widespread gains. As at 30 September 2025, Santander’s share price had increased by 98.8%, significantly outperforming the performance of both the sector and the broader European market.
In the banking sector, the Eurostoxx Banks, the eurozone's main index, increased 59.9% year to date, while the DJ Stoxx Banks rose 46.5% and the MSCI World Banks increased 34.9%. The other main indices also closed up in the quarter, but rose by less (Ibex 35 +33.5% and DJ Stoxx 50 +7.5%).
|
|
|
|
|
|
|
|
|
|
|
|
|
|
|
| Share price |
|
|
|
|
|
|
START 31/12/2024 |
|
END 30/09/2025 |
| €4.465 |
|
€8.874 |
|
|
|
|
|
|
|
|
Maximum 30/09/2025 |
|
Minimum 02/01/2025 |
| €8.882 |
|
€4.255 |
|
|
|
| Comparative share performance |
|
|
|
|
|
|
|
|
|
|
26 |
|
January - September 2025 |
|
|
|
|
|
|
|
|
|
|
|
|
|
|
|
|
|
|
|
|
|
|
|
|
|
|
|
|
|
|
|
|
|
|
|
|
|
Significant events
|
|
|
|
|
|
|
|
|
|
|
|
|
|
Santander share |
|
|
|
|
|
|
|
|
Market capitalization and trading
As at 30 September 2025, Santander’s market capitalization of EUR 132,092 million was the largest in the eurozone and the 16th largest in the world among financial institutions.
The share’s weighting in the Stoxx Europe 600 Banks index was 8.5% and 13.5% in the Euro Stoxx Banks. In the domestic market, its weight in the Ibex 35 was 16.7% as at 30 September 2025.
A total of 5,961 million shares were traded in the quarter for an effective value of EUR 38,759 million and an annualized liquidity ratio of 53%.
The average daily trading volume was 31.2 million shares with an effective value of EUR 203 million.
Shareholder base
The total number of Santander shareholders as at 30 September 2025 was 3,520,788, of which 2,939,643 were European (70.70% of the capital stock) and 568,826 from the Americas (27.88% of the capital stock).
Excluding the board, which holds 1.32% of the bank’s capital stock, retail shareholders accounted for 34.96% and institutional shareholders accounted for 63.72%.
|
|
|
|
|
|
|
|
|
| Share capital distribution by geographic area |
| 30 September 2025 |
| The Americas |
Europe |
Other |
|
|
|
| 27.88% |
70.70% |
1.42% |
|
Source: data obtained from the aggregation of Banco Santander, S.A. Shareholder Register.
|
|
|
|
|
|
|
|
|
|
|
|
|
1st |
Bank in the eurozone by market capitalization |
| EUR |
132,092 |
million |
|
|
|
|
|
|
|
|
|
| The Santander share |
| 30 September 2025 |
|
|
|
| Shares and trading data |
|
| Shares (number) |
14,885,325,372 |
|
| Average daily turnover (number of shares) |
31,214,467 |
|
| Share liquidity (%) |
53 |
| (Annualized number of shares traded during the period / number of shares) |
|
|
| Stock market indicators |
| Price / Tangible book value (X) |
1.60 |
|
|
|
| Free float (%) |
99.55 |
.
|
|
|
|
|
|
| Share capital distribution by type of shareholder |
| 30 September 2025 |
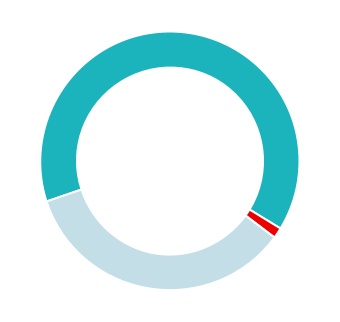
|
|
|
|
|
Institutions |
|
63.72% |
|
|
|
Board * |
|
1.32% |
|
|
|
Retail |
|
34.96% |
|
|
* Shares owned or represented by directors.
|
|
|
|
|
|
|
|
|
January - September 2025 |
|
27 |
FINANCIAL INFORMATION BY SEGMENT
Description of segments
We base segment reporting on financial information presented to the chief operating decision maker, which excludes certain statutory results items that distort year-on-year comparisons and are not considered for management reporting. This financial information (underlying basis) is computed by adjusting reported results for the effects of certain gains and losses (e.g. capital gains, write-downs, impairment of goodwill, etc.). These gains and losses are items that management and investors ordinarily identify and consider separately to better understand the underlying trends in the business.
The Group has aligned the information in this chapter with the underlying information used internally for management reporting and with that presented in the Group's other public documents.
Santander's executive committee has been selected to be its chief operating decision maker. The Group's operating segments reflect its organizational and managerial structures. The Group's executive committee reviews internal reporting based on these segments to assess performance and allocate resources.
The segments are split by global business and by country in which profits are earned. We prepare the financial information by aggregating the figures for Santander’s global businesses and countries, relating it to both the accounting data of the business units integrated in each segment and that provided by management information systems. The same general principles as those used in the Group are applied.
Main changes to the composition of Santander's segments in 2025
The main changes, which we announced in the Q1 2025 results publications and that we are applying to the management information for all periods included in these consolidated financial statements, are as follows:
•To better align reporting with the changes to the management structure in Wealth Management & Insurance, investment platforms (Investment Platforms Unit) and certain stakes in companies, mainly in the real estate sector, that were previously recorded in Retail & Commercial Banking or Corporate & Investment Banking have been incorporated into Wealth Management & Insurance. We have therefore incorporated a new vertical, Portfolio Investments, focusing on the management of said investment platforms and stakes that complement Wealth's traditional business, enhancing the product and service offering for our clients.
•Some profit sharing criteria between Retail & Commercial Banking and Cards have been improved, aligning criteria across the Group.
•Additionally, we completed the usual annual adjustment of the perimeter of the Global Customer Relationship Model between Retail & Commercial Banking and Corporate & Investment Banking and between Retail & Commercial Banking and Wealth Management & Insurance.
•In secondary segments, as part of our transformation strategy and after a year with our five global businesses in full operation, the board of directors approved the dissolution of the regional structures, having fulfilled their mission to support the transition to the global operating model. As a result, we no longer report regional information and the secondary segments are structured into the 10 main units (nine countries and DCB Europe), the Corporate Centre and ‘Rest of the Group’, which includes everything that is not already included in the mentioned units.
None of the changes described above impact the Group's reported global figures in the consolidated financial statements.
Composition of Santander's segments
Primary segments
This primary level of segmentation, comprises six reportable segments: five global businesses plus the Corporate Centre. The global businesses are:
Retail & Commercial Banking (Retail): area that integrates the retail banking and commercial banking businesses (individuals, SMEs and corporates), except private banking clients and business originated in the consumer finance and the cards businesses. Detailed financial information is provided on Spain (Retail Spain), the UK (Retail UK), Mexico (Retail Mexico) and Brazil (Retail Brazil), which represent most of the total Retail business.
Digital Consumer Bank (Consumer): comprises all business originated in the consumer finance companies, plus Openbank, Open Digital Services (ODS) and SBNA Consumer. Detailed financial information is provided on Europe (DCB Europe) and the US (DCB US).
Corporate & Investment Banking (CIB): this business, which includes Global Transaction Banking, Global Banking (Global Debt Financing and Corporate Finance) and Global Markets, offers products and services on a global scale to corporate and institutional customers, and collaborates with other global businesses to better serve our broad customer base.
Wealth Management & Insurance (Wealth): includes the corporate unit of Private Banking and International Private Banking in Miami and Switzerland (Santander Private Banking), the asset management business (Santander Asset Management), the insurance business (Santander Insurance) and the unit that manages the investment platforms and stakes that complement Wealth's traditional business (the new vertical, Portfolio Investments).
Payments: comprises the Group's digital payments solutions, providing global technological solutions for our banks and new customers in the open market. It is structured in two businesses: PagoNxt (Getnet, Ebury and PagoNxt Payments) and Cards (cards platform and business in the countries where we operate).
|
|
|
|
|
|
|
|
|
28 |
|
January - September 2025 |
Secondary segments
Following the dissolution of the regional management structures at the beginning of 2025, this secondary level includes our main geographical units. Detailed financial information is provided on Spain, the UK, Portugal, Poland, DCB Europe, which includes Santander Consumer Finance (the entire consumer finance business in Europe), Openbank in Europe and ODS, the US, which includes the holding company (SHUSA) and the businesses of Santander Bank (SBNA), Santander Consumer USA (SC USA), the specialized business unit Banco Santander International, the New York branch and Santander US Capital Markets (SanCap), Mexico, Brazil, Chile and Argentina. Information is also provided on the Corporate Centre and ‘Rest of the Group’, which brings together everything that is not included in the aforementioned geographical units or the Corporate Centre.
The Corporate Centre includes the centralized activities relating to equity stakes in financial companies, financial management of the structural exchange rate position, assumed within the sphere of the Group’s asset and liability committee, as well as management of liquidity and of shareholders’ equity via issuances.
As the Group’s holding entity, this area manages all capital and reserves and allocations of capital and liquidity with the other businesses. It also incorporates goodwill impairments but not the costs related to the Group’s central services (charged to the areas), except for corporate and institutional expenses related to the Group’s functioning.
|
|
|
|
The businesses included in each of the segments in this report and the accounting principles under which their results are presented here may differ from the businesses included and accounting principles applied in the financial information separately prepared and disclosed by our subsidiaries (some of which are publicly listed) which in name or geographical description may seem to correspond to the business areas covered in this report. Accordingly, the results of operations and trends shown for our business areas in this document may differ materially from those of such subsidiaries.
The results of our segments included in this section are presented only on an underlying basis in accordance with IFRS 8. Therefore, the following information, at both the Group and the primary and secondary segment levels (which are only presented on an underlying basis), includes Poland's results reported line by line as they were in previous quarterly disclosures, given that the management of Santander Polska remains unchanged until the Poland disposal is completed. This reporting approach is consistent with the information used internally in management reporting, as well as with other public Group disclosures. For the same reason, all management metrics included in this report have been calculated including Poland, i.e. maintaining the same perimeter that existed at the time of the announcement of the Poland disposal. For further information, see the ' Alternative performance measures' section in the appendix to this report. The results of our segments presented below are provided on the basis of underlying results only and include the impact of foreign exchange rate fluctuations. However, for a better understanding of the changes in the performance of our business areas, we also provide and discuss the year-on-year changes to our results excluding such exchange rate impacts (i.e. in constant euros), except for Argentina, and any grouping which includes it, where the variations in constant euros have been calculated considering the Argentine peso exchange rate on the last working day for each of the periods presented. For further information, see methodology in the ' Alternative performance measures' section in the appendix to this report. Certain figures contained in this report, have been subject to rounding to enhance their presentation. Accordingly, in certain instances, the sum of the numbers in a column or a row in tables contained in this report may not conform exactly to the total figure given for that column or row.
|
|
|
|
|
|
|
|
|
|
January - September 2025 |
|
29 |
|
|
|
|
|
|
|
|
|
|
|
|
|
|
|
|
|
|
|
|
|
| January-September 2025 |
| Main items of the underlying income statement |
| EUR million |
|
|
|
|
|
|
| Primary segments |
Net interest
income |
Net fee
income |
Total
income |
Net operating
income |
Profit
before tax |
Underlying profit attributable to the parent |
| Retail & Commercial Banking |
19,770 |
|
3,529 |
|
23,337 |
|
14,178 |
|
8,356 |
|
5,670 |
|
| Digital Consumer Bank |
8,267 |
|
1,060 |
|
9,667 |
|
5,717 |
|
2,251 |
|
1,561 |
|
| Corporate & Investment Banking |
2,948 |
|
1,977 |
|
6,374 |
|
3,514 |
|
3,237 |
|
2,168 |
|
| Wealth Management & Insurance |
1,079 |
|
1,257 |
|
3,046 |
|
1,952 |
|
1,925 |
|
1,439 |
|
| Payments |
2,116 |
|
2,209 |
|
4,370 |
|
2,586 |
|
985 |
|
558 |
|
| PagoNxt |
122 |
|
777 |
|
994 |
|
138 |
|
57 |
|
35 |
|
| Cards |
1,994 |
|
1,432 |
|
3,376 |
|
2,448 |
|
928 |
|
523 |
|
| Corporate Centre |
(364) |
|
(22) |
|
(517) |
|
(802) |
|
(1,254) |
|
(1,059) |
|
| TOTAL GROUP |
33,816 |
|
10,011 |
|
46,277 |
|
27,144 |
|
15,500 |
|
10,337 |
|
|
|
|
|
|
|
|
| Secondary segments |
|
|
|
|
|
|
|
|
|
|
|
|
|
| Spain |
5,414 |
|
2,212 |
|
9,056 |
|
5,886 |
|
4,639 |
|
3,233 |
|
| UK |
3,763 |
|
259 |
|
3,939 |
|
1,844 |
|
1,306 |
|
958 |
|
| Portugal |
1,013 |
|
378 |
|
1,474 |
|
1,070 |
|
1,071 |
|
765 |
|
| Poland |
2,217 |
|
549 |
|
2,776 |
|
2,005 |
|
1,490 |
|
713 |
|
|
|
|
|
|
|
|
| DCB Europe |
3,473 |
|
571 |
|
4,330 |
|
2,352 |
|
1,212 |
|
685 |
|
|
|
|
|
|
|
|
| US |
4,412 |
|
1,014 |
|
5,856 |
|
3,004 |
|
1,328 |
|
1,194 |
|
| Mexico |
3,364 |
|
1,031 |
|
4,566 |
|
2,682 |
|
1,667 |
|
1,211 |
|
|
|
|
|
|
|
|
|
|
|
|
|
|
|
| Brazil |
7,049 |
|
2,350 |
|
9,405 |
|
6,343 |
|
2,403 |
|
1,589 |
|
| Chile |
1,438 |
|
431 |
|
2,040 |
|
1,344 |
|
907 |
|
534 |
|
| Argentina |
1,257 |
|
581 |
|
1,654 |
|
947 |
|
507 |
|
348 |
|
|
|
|
|
|
|
|
|
|
|
|
|
|
|
| Corporate Centre |
(364) |
|
(22) |
|
(517) |
|
(802) |
|
(1,254) |
|
(1,059) |
|
| Rest of the Group |
780 |
|
658 |
|
1,697 |
|
468 |
|
223 |
|
166 |
|
| TOTAL GROUP |
33,816 |
|
10,011 |
|
46,277 |
|
27,144 |
|
15,500 |
|
10,337 |
|
|
|
|
Underlying profit attributable to the parent distribution1 |
| 9M 2025 |
1. As a % of operating areas. Excluding the Corporate Centre.
|
|
|
Underlying profit attributable to the parent. 9M 2025 |
| EUR million. % change YoY |

|
|
|
|
|
|
| Var |
Var2 |
| +5 |
% |
+9 |
% |
| +4 |
% |
+6 |
% |
| +6 |
% |
+10 |
% |
| +17 |
% |
+21 |
% |
| +269% |
+446% |
|
|
|
|
|
|
|
|
|
|
|
|
|
|
2. Changes in constant euros.
|
|
|
|
|
|
|
|
|
30 |
|
January - September 2025 |
|
|
|
|
|
|
|
|
|
|
|
|
|
|
|
|
|
|
|
|
|
| January-September 2024 |
| Main items of the underlying income statement |
| EUR million |
|
|
|
|
|
|
| Primary segments |
Net interest
income |
Net fee
income |
Total
income |
Net operating
income |
Profit
before tax |
Underlying profit attributable to the parent |
| Retail & Commercial Banking |
20,803 |
|
3,543 |
|
24,216 |
|
14,751 |
|
8,249 |
|
5,385 |
|
| Digital Consumer Bank |
7,980 |
|
1,115 |
|
9,582 |
|
5,686 |
|
1,963 |
|
1,506 |
|
| Corporate & Investment Banking |
2,909 |
|
1,892 |
|
6,266 |
|
3,493 |
|
3,115 |
|
2,052 |
|
| Wealth Management & Insurance |
1,298 |
|
1,090 |
|
2,777 |
|
1,742 |
|
1,678 |
|
1,227 |
|
| Payments |
1,887 |
|
2,035 |
|
3,948 |
|
2,129 |
|
541 |
|
151 |
|
| PagoNxt |
97 |
|
697 |
|
894 |
|
5 |
|
(281) |
|
(326) |
|
| Cards |
1,790 |
|
1,337 |
|
3,054 |
|
2,124 |
|
823 |
|
477 |
|
| Corporate Centre |
(195) |
|
(7) |
|
(604) |
|
(879) |
|
(1,120) |
|
(1,012) |
|
| TOTAL GROUP |
34,682 |
|
9,666 |
|
46,185 |
|
26,923 |
|
14,427 |
|
9,309 |
|
|
|
|
|
|
|
|
| Secondary segments |
|
|
|
|
|
|
|
|
|
|
|
|
|
| Spain |
5,454 |
|
2,191 |
|
9,048 |
|
5,910 |
|
4,193 |
|
2,837 |
|
| UK |
3,637 |
|
222 |
|
3,860 |
|
1,699 |
|
1,338 |
|
975 |
|
| Portugal |
1,216 |
|
357 |
|
1,642 |
|
1,238 |
|
1,185 |
|
792 |
|
| Poland |
2,111 |
|
508 |
|
2,634 |
|
1,915 |
|
1,284 |
|
643 |
|
|
|
|
|
|
|
|
| DCB Europe |
3,256 |
|
680 |
|
4,252 |
|
2,276 |
|
1,159 |
|
696 |
|
|
|
|
|
|
|
|
| US |
4,235 |
|
835 |
|
5,639 |
|
2,796 |
|
830 |
|
880 |
|
| Mexico |
3,534 |
|
1,062 |
|
4,721 |
|
2,744 |
|
1,685 |
|
1,234 |
|
|
|
|
|
|
|
|
|
|
|
|
|
|
|
| Brazil |
7,709 |
|
2,567 |
|
10,266 |
|
6,977 |
|
2,904 |
|
1,771 |
|
| Chile |
1,306 |
|
411 |
|
1,878 |
|
1,176 |
|
767 |
|
433 |
|
| Argentina |
1,812 |
|
315 |
|
1,441 |
|
834 |
|
475 |
|
382 |
|
|
|
|
|
|
|
|
|
|
|
|
|
|
|
|
|
|
|
|
|
|
| Corporate Centre |
(195) |
|
(7) |
|
(604) |
|
(879) |
|
(1,120) |
|
(1,012) |
|
| Rest of the Group |
607 |
|
523 |
|
1,409 |
|
237 |
|
(273) |
|
(320) |
|
| TOTAL GROUP |
34,682 |
|
9,666 |
|
46,185 |
|
26,923 |
|
14,427 |
|
9,309 |
|
|
|
|
|
|
|
|
|
|
January - September 2025 |
|
31 |
|
|
|
|
|
|
|
|
|
|
|
|
|
|
|
|
|
|
|
RETAIL |
|
Underlying attributable profit |
EUR 5,670 mn |
|
|
|
|
|
→ We continued to drive our ONE Transformation programme to support our vision of becoming a digital bank with branches, through the implementation of a common operating model and the rollout of our global technological platform.
→ Loans were stable in constant euros year-on-year, as an increase in mortgage portfolio offset a decline in SMEs. Deposits rose 4% in constant euros, with widespread positive dynamics, and mutual funds grew 19%.
→ Attributable profit reached EUR 5,670 million, up 5% year-on-year and +9% in constant euros, driven by positive net fee income due to good commercial dynamics, lower net loan-loss provisions in line with our prudent credit risk management and cost control, supported by efficiencies from our common operating model.
|
|
|
|
|
|
|
|
Strategy
In Q3 2025, we continued consolidating our vision of being a digital bank with branches, leveraging our unique model that combines the Group's global scale and local presence.
We are successfully executing on our strategic business priorities:
•Transformation of our operating model based on three pillars:
•Customer experience. We continued to drive product digitalization and optimize customer journeys, resulting in double-digit year-on-year growth in digital sales. Notable initiatives include the launch of the new app in Brazil and we are preparing its roll out across more countries, driving an enhanced experience through digital channels and global consistency. In addition, we continued to implement the new branch and WorkCafé model, with new openings in the UK and Brazil, strengthening our omnichannel offering.
•Operational leverage. We continued to simplify and automate processes at scale while promoting leaner and more agile structures. This enabled us to reduce non-commercial FTEs per million customers by 17% year-on-year, freeing up capacity for commercial tasks and higher value-added customer service. Artificial intelligence (AI) is gaining prominence. We are using AI in the development of software, which is accelerating delivery cycles, reducing maintenance costs and boosting the scalability of solutions across the Group.
•Global Technology Platform. During the year, we have accelerated the convergence towards a common platform. Gravity, our back-end technology, has already been fully implemented in Spain and Chile, and in the process of being rolled out in Mexico in Q4 2025, enabling us to reduce transaction costs and improve response times. In addition, our assisted channels solution is already being used in more than
half of our branches and in our contact centres in Mexico, enhancing productivity and sales. Our new customer interaction platform, which is fully available in Brazil, the UK and Argentina, enables effective hyper-personalization across all channels and segments, increasing sales conversion and strengthening our relationships with customers.
•Transformation of the business model. We remain focused on value creation and positioning the customer at the centre of our management:
•We provide a better customer experience, a simpler offering tailored to our key segments and advanced hyper-personalized tools which enable us to build stronger relationships with our customers. For example, in Portugal, we launched a new loyalty programme where customers can earn points for their banking activity and for purchases at a number of retailers, which they can later redeem for exclusive benefits.
•We differentiate ourselves by promoting the network effect to better serve our customers. By taking advantage of Group's capabilities, we offer our customers a complete value proposition. A good example was the incorporation of Ebury and Tresmares products and services into our corporate offering. Moreover, our business with multinationals is another example of how our scale enables us to offer integrated and differentiated solutions, reflected in the continued growth in total income.
•Structural efficiency improvement. The transformation of our operating and business model continued to drive structural efficiency improvements based on operational leverage and common technology and through enhanced commercial strength, focused on hyper-personalization and value-added services.
|
|
|
|
|
|
|
|
|
|
|
|
|
|
|
|
|
|
|
|
|
|
|
|
|
|
|
|
|
|
|
|
|
Retail. Customers. September 2025 |
| Thousands and year-on-year change |
|
|
|
|
|
|
|
|
|
|
|
|
|
|
|
|
|
|
|
|
|
|
|
|
|
|
|
|
|
|
Total Retail |
|
|
|
|
|
|
|
|
|
|
|
|
|
|
|
|
|
|
|
|
|
|
|
|
| Total customers |
|
|
151,824 |
|
15,221 |
22,609 |
|
21,696 |
|
72,185 |
|
|
|
|
|
+4% |
|
+1% |
+1% |
|
+2% |
|
+7% |
|
|
|
|
|
|
|
|
|
|
|
|
|
|
|
|
|
|
|
|
|
|
|
|
|
|
|
|
|
|
|
| Active customers |
|
|
80,614 |
|
8,956 |
13,519 |
|
11,211 |
|
33,133 |
|
|
|
|
|
+3% |
|
+4% |
-1% |
|
+5% |
|
+4% |
|
|
|
|
|
|
|
|
|
|
|
|
32 |
|
January - September 2025 |
Business performance
Gross loans and advances to customers, excluding reverse repos and in constant euros, were stable year-on-year, as the increase in individuals due to mortgages offset the decrease in SMEs.
In individuals, the mortgage portfolio grew in most countries, particularly in Portugal, Brazil and Mexico. Personal loans also increased in most countries, especially in Argentina, Spain, Chile and Poland, which amply offset the decrease in Brazil, which reflects our capital optimization strategy and macro environment in the country.
SME loans were affected by lower volumes in Spain, the UK and Chile, with positive dynamics across the rest of our footprint. Corporate loans were stable as the increases in most countries, offset declines, especially in Spain, in line with our active risk management and our focus on profitability, and in the US, due to the run-off of non-core portfolios.
Customer deposits, excluding repos and in constant euros, grew 4% year-on-year, driven by good performances in most countries. By product, there was a 9% increase in time deposits with positive performances across Europe and South America. Demand deposits rose 2%, increasing across the board except in the UK, Brazil and Argentina. Mutual funds grew 19% year-on-year in constant euros, rising across most countries. Overall, customer funds increased 6% year-on-year in constant euros.
|
|
|
|
|
|
|
|
|
|
|
|
|
|
|
|
|
|
|
|
|
|
|
|
|
Retail. Business performance. September 2025 |
|
|
EUR billion and YoY % change in constant euros |
|
|
|
|
|
|
|
|
|
|
|
|
597 |
0% |
|
759 |
+6% |
|
|
|
|
|
|
|
|
|
|
|
|
|
|
|
|
|
|
|
|
|
|
|
|
|
|
|
|
|
|
|
|
|
|
|
|
|
|
|
|
| Gross loans and advances to customers excl. reverse repos |
|
Customer deposits excl.
repos + mutual funds |
Results
Attributable profit in 9M 2025 was EUR 5,670 million, 5% higher year-on-year. In constant euros, profit rose 9% year-on-year, by line:
•Total income increased 1% driven by positive net fee income and a lower hyperinflation adjustment in Argentina more than offset lower gains on financial transactions and a slight decrease net interest income.
Net interest income decreased 1% year-on-year due to Argentina, where interest rates were strongly down in the previous twelve months. However, if we exclude Argentina, net interest income increased 1%, growing in most countries, even in a less favourable interest rate environment. Of note were Chile, supported by a lower cost of deposits, Mexico due to volumes and a lower cost of deposits and the UK driven by higher mortgage profitability and a lower cost of deposits, as well as higher activity in Poland.
Our more targeted products and services offering and hyper-personalization contributed to 5% net fee income growth, mainly driven by mutual funds, FX and insurance. By country, net fee income increased particularly in Argentina, Mexico and the UK.
|
|
|
|
|
|
|
|
|
|
|
|
|
|
|
|
|
|
|
|
|
|
|
|
|
|
|
|
|
|
|
|
|
Retail. Total income. 9M 2025 |
| EUR million and YoY % change in constant euros |
|
•Costs increased 1% year-on-year. In real terms, they declined 2%, reflecting our transformation efforts through organizational simplification, process automation and the roll out of our global platform.
•Net loan-loss provisions continued to perform well, decreasing 1% year-on-year, mainly in Poland, Spain and Mexico, which more than offset the rise in Argentina due to higher volumes and normalization in Chile and the UK.
Cost of risk was 0.89% (9 bps lower year-on-year) and the NPL ratio improved to 3.00% (3.27% in September 2024).
RoTE (post-AT1) in 9M 2025 was 17.6%.
Compared to Q2 2025, attributable profit increased 11% in constant euros, driven by the overall improvement in costs, supported by our transformation programme, the good performance of net loan-loss provisions and lower provisions related to the CHF mortgage portfolio in Poland.
|
|
|
|
|
|
|
|
|
|
|
|
|
|
|
|
|
|
|
|
|
|
|
|
|
|
Retail. Underlying income statement |
|
EUR million and % change |
|
|
|
|
|
|
|
|
|
|
|
|
|
|
|
|
|
|
|
|
|
/ |
Q2'25 |
|
|
/ |
9M'24 |
|
|
Q3'25 |
% |
excl. FX |
|
9M'25 |
% |
excl. FX |
|
|
|
|
|
|
|
|
|
|
Total income |
7,627 |
-2 |
-2 |
|
23,337 |
-4 |
+1 |
|
Expenses |
-2,971 |
-3 |
-3 |
|
-9,159 |
-3 |
+1 |
|
Net operating income |
4,655 |
-2 |
-2 |
|
14,178 |
-4 |
0 |
|
LLPs |
-1,275 |
-9 |
-9 |
|
-4,105 |
-8 |
-1 |
|
PBT |
2,888 |
+9 |
+9 |
|
8,356 |
+1 |
+4 |
|
Underlying attrib. profit |
1,984 |
+11 |
+11 |
|
5,670 |
+5 |
+9 |
|
|
|
|
|
|
|
|
|
|
|
January - September 2025 |
|
33 |
|
|
|
|
|
|
|
|
|
|
RETAIL SPAIN |
Profit before tax |
| EUR 2,447 mn |
Commercial activity and business performance
Commercial activity remained strong, supported by customer growth and improving engagement and digital adoption. We continued to gain market share in payrolls and pensions and use of Bizum increased.
Gross loans and advances to customers, excluding reverse repos, decreased 2% year-on-year affected by the decrease in SMEs, due to ICO maturities and corporates, in line with our focus on active risk management and balance sheet optimization. This was partially offset by an improvement in personal loans, reflecting our engagement strategy.
Customer deposits, excluding repos, increased 5% year-on-year mainly due to demand deposits driven by our new value proposition for Select customers, supporting customer acquisition and improving our deposit mix. Mutual funds improved 14%. As a result, customer funds rose 7%.
Results
Profit before tax in 9M 2025 reached EUR 2,447 million, 10% higher than in 9M 2024, partially driven by impact of the temporary levy on revenue earned in Spain, which was recorded in full in Q1 2024 in other gains (losses) and provisions (accrued quarterly in taxes in 2025). By line:
•Total income was 2% lower, in line with the decrease in the portfolio, mainly due to the decline in net interest income in a lower interest rate environment. Net fee income fell 1%, impacted by securitizations and partially offset by mutual funds and insurance fees.
•Costs were stable. In real terms, costs declined, benefitting from process automation and greater digitalization. The efficiency ratio was 32.0%.
•Net loan-loss provisions dropped 4%, declining faster than the portfolio, driven by our proactive risk management which contributed to a credit quality improvement.
In the quarter, of note the favourable cost performance, driven by digitalization and automation initiatives, the credit quality improvement and resilient net interest income, in the current interest rate environment. However, this was not reflected in profit before tax (-4%) which was affected by the decline in fees due to seasonality and charges related to transformation in the quarter.
|
|
|
|
|
|
|
|
|
|
|
|
|
|
|
|
|
|
|
|
Retail Spain. Underlying income statement |
|
EUR million and % change |
|
|
|
|
|
|
|
|
|
|
|
|
|
|
|
|
Q3'25 |
/ Q2'25 |
|
9M'25 |
/ 9M'24 |
|
|
|
|
|
|
|
|
Total income |
1,739 |
|
-2 |
|
5,299 |
|
-2 |
|
Expenses |
-558 |
|
-2 |
|
-1,696 |
|
0 |
|
Net operating income |
1,181 |
|
-2 |
|
3,603 |
|
-3 |
|
LLPs |
-230 |
|
-6 |
|
-765 |
|
-4 |
|
PBT |
801 |
|
-4 |
|
2,447 |
|
+10 |
|
|
|
|
|
|
|
|
|
|
|
|
|
|
|
|
|
|
|
RETAIL UK |
Profit before tax |
| EUR 1,166 mn |
Commercial activity and business performance
We continue to make progress in our transformation programme through digitalization, business simplification and process automation, which continue to improve efficiency.
Gross loans and advances to customers, excluding reverse repos and in constant euros, were stable year-on-year, as the increase of corporates was more than offset by lower volumes in mortgages, in line with our balance sheet optimization strategy, and SMEs. However, the trend in mortgages has been positive since the beginning of the year, with a progressive recovery in new business volumes.
Customer deposits, excluding repos and in constant euros, increased 1% year-on-year, as the strong growth in time deposits in individuals, offset the decrease in demand deposits. Mutual funds rose 1% year-on-year in constant euros. As a result, customer funds improved 1% in constant euros.
Results
Profit before tax in 9M 2025 reached EUR 1,166 million, 4% lower than in 9M 2024. In constant euros, profit before tax also decreased 4%, by line:
•Total income rose 2%, mainly due to a good net interest income performance, driven by higher mortgage yields and a lower cost of deposits.
•Costs fell 4%, boosted by process automation and our simplification efforts. Overall, net operating income grew 9% and the efficiency ratio improved 3 pp to 53.4%.
•Net loan-loss provisions increased but remained at very low levels, due to LLP normalization.
•Other gains (losses) and provisions recorded higher losses, due to impacts related to transformation charges.
Compared to Q2 2025, profit before tax increased 50% in constant euros, on the back of the strong net operating income, driven by both revenue and costs, net loan-loss releases due to portfolio sales and lower regulatory charges.
|
|
|
|
|
|
|
|
|
|
|
|
|
|
|
|
|
|
|
|
|
|
|
|
|
|
Retail United Kingdom. Underlying income statement |
|
EUR million and % change |
|
|
|
|
|
|
|
|
|
|
|
|
|
|
|
|
|
|
|
|
|
/ |
Q2'25 |
|
|
/ |
9M'24 |
|
|
Q3'25 |
% |
excl. FX |
|
9M'25 |
% |
excl. FX |
|
|
|
|
|
|
|
|
|
|
Total income |
1,146 |
|
0 |
+2 |
|
3,485 |
|
+2 |
+2 |
|
Expenses |
-593 |
|
-6 |
-3 |
|
-1,860 |
|
-3 |
-4 |
|
Net operating income |
553 |
|
+6 |
+8 |
|
1,625 |
|
+9 |
+9 |
|
LLPs |
5 |
|
— |
— |
|
-76 |
|
+107 |
+107 |
|
PBT |
488 |
|
+48 |
+50 |
|
1,166 |
|
-4 |
-4 |
|
|
|
|
|
|
|
|
|
|
|
|
|
|
|
|
|
|
|
|
34 |
|
January - September 2025 |
|
|
|
|
|
|
|
|
|
|
RETAIL MEXICO |
Profit before tax |
| EUR 1,016 mn |
Commercial activity and business performance
We continue to make a great strides in the transformation of our operating model. 74% of our active customers use digital channels and, at the same time, the number of digital customers increased 7% year-on-year.
Gross loans and advances to customers, excluding reverse repos and in constant euros, increased 4% year-on-year, driven by generalized increases across products, especially in the mortgage portfolio (+7%), where we have a market share of 17%, well above our total loan market share (12%).
Customer deposits, excluding repos and in constant euros, rose 5% year-on-year, increasing both in time and demand deposits. We are targeting mutual fund growth, resulting in a 20% increase in constant euros. As a result, customer funds rose 9% in constant euros.
Results
Profit before tax in 9M 2025 reached EUR 1,016 million, 2% higher than in 9M 2024. In constant euros, it increased 15%, as follows:
•Total income increased 7%, mainly driven by a good net interest income performance, supported by higher activity and a lower cost of deposits, and by higher net fee income, particularly from mutual funds.
•Costs rose 5%, impacted by inflation and higher salary costs, partially offset by savings obtained from our simplification and automation initiatives. As a result, net operating income grew 9% and the efficiency ratio improved 1.1 pp to 43.8%.
•Net loan-loss provisions fell 6% despite higher activity, due to lower provisions in mortgages and corporates and sound risk management.
Compared to Q2 2025, net operating income increased 4% in constant euros, driven by higher net interest income, supported by business growth and capital gains from the sale of a stake. However, this was not reflected in profit before tax (-1% in constant euros), which was affected by higher provisions (due to SMEs and model updates in the payroll portfolio).
|
|
|
|
|
|
|
|
|
|
|
|
|
|
|
|
|
|
|
|
|
|
|
|
|
|
Retail Mexico. Underlying income statement |
|
EUR million and % change |
|
|
|
|
|
|
|
|
|
|
|
|
|
|
|
|
|
|
|
|
|
|
|
/ |
Q2'25 |
|
|
/ |
9M'24 |
|
|
Q3'25 |
% |
excl. FX |
|
9M'25 |
% |
excl. FX |
|
|
|
|
|
|
|
|
|
|
Total income |
932 |
|
+5 |
+3 |
|
2,719 |
|
-5 |
+7 |
|
Expenses |
-405 |
|
+4 |
+2 |
|
-1,191 |
|
-8 |
+5 |
|
Net operating income |
528 |
|
+5 |
+4 |
|
1,528 |
|
-4 |
+9 |
|
LLPs |
-176 |
|
+17 |
+15 |
|
-461 |
|
-17 |
-6 |
|
PBT |
338 |
|
+1 |
-1 |
|
1,016 |
|
+2 |
+15 |
|
|
|
|
|
|
|
|
|
|
|
|
|
|
|
|
|
|
|
|
|
RETAIL BRAZIL |
Profit before tax |
| EUR 633 mn |
Commercial activity and business performance
Our business strategy remains focused on: i) expanding the high-net worth and corporate segments by offering a personalized and global experience; and ii) providing an integrated multi-channel experience and a simplified product offering to the mass market. Additionally, in corporates, we are working to build a closer relationship with our customers, with tailored offerings and an enhanced multi-channel approach.
Gross loans and advances to customers, excluding reverse repos and in constant euros, fell 3% year-on-year as increases in mortgages, corporates and SMEs did not offset declines in personal loans, in line with our strategy to focus on profitable growth and capital optimization.
Customer deposits, excluding repos and in constant euros, increased 9% year-on-year, on the back of double-digit growth in time deposits especially from individuals. Mutual funds grew 15% year-on-year in constant euros. As a result, customer funds rose 10% in constant euros.
Results
Profit before tax in 9M 2025 reached EUR 633 million, 41% less than in 9M 2024. In constant euros, it fell 34%, by line:
•Total income declined 5%, impacted by the negative sensitivity of the balance sheet to higher interest rates, lower net fee income and gains on financial transactions, in an environment with lower activity.
•Costs increased 2%, below inflation, reflecting our transformation efforts in simplification, automation and digitalization.
•Net loan-loss provisions increased 1% reflecting our prudent risk management and the shift in the portfolio mix to increase balance sheet resilience. This more than offset higher provisions in the corporate and agro business segments, both heavily impacted by the macroeconomic and regulatory environment.
Compared to Q2 2025, profit before tax increased 54% in constant euros, mainly driven by lower net loan-loss provisions (reflecting our focus on risk management in a less favourable environment) and good cost management (-3%), which more than offset the negative impact of the macro environment on revenue.
|
|
|
|
|
|
|
|
|
|
|
|
|
|
|
|
|
|
|
|
|
|
|
|
|
|
Retail Brazil. Underlying income statement |
|
EUR million and % change |
|
|
|
|
|
|
|
|
|
|
|
|
|
|
|
|
|
|
|
|
|
/ |
Q2'25 |
|
|
/ |
9M'24 |
|
|
Q3'25 |
% |
excl. FX |
|
9M'25 |
% |
excl. FX |
|
|
|
|
|
|
|
|
|
|
Total income |
1,719 |
|
-3 |
-4 |
|
5,376 |
|
-14 |
-5 |
|
Expenses |
-709 |
|
-2 |
-3 |
|
-2,193 |
|
-8 |
+2 |
|
Net operating income |
1,011 |
|
-4 |
-5 |
|
3,183 |
|
-18 |
-9 |
|
LLPs |
-603 |
|
-15 |
-16 |
|
-2,034 |
|
-9 |
+1 |
|
PBT |
244 |
|
+57 |
+54 |
|
633 |
|
-41 |
-34 |
|
|
|
|
|
|
|
|
|
|
|
|
|
|
|
|
|
|
|
|
January - September 2025 |
|
35 |
|
|
|
|
|
|
|
|
|
|
|
|
|
|
|
|
|
|
|
CONSUMER |
|
Underlying attributable profit |
EUR 1,561 mn |
|
|
|
|
|
|
|
|
|
|
|
→ We continue to advance in our priority to become the preferred choice of our partners and end customers and maximize profitability, while being the most cost competitive player in the industry.
→ Loans grew 2% year-on-year in constant euros, +4% in auto, especially in Europe and Latin America. Deposits rose 5% in constant euros, with solid growth in both Europe and the Americas, supported by Openbank, in line with our strategy to lower funding costs and reduce net interest income volatility across the cycle.
→ Attributable profit was EUR 1,561 million in 9M 2025, up 4% year-on-year and 6% in constant euros, supported by the improvements in net interest income across almost all of our footprint, net loan-loss provisions and other results and provisions, which more than offset weaker trends in other income and the impact of lower fiscal benefits as a result of reduced electric vehicle demand.
|
|
|
|
|
|
|
|
Strategy
Digital Consumer Bank (Consumer) is a leading consumer finance company globally, with operations spanning auto financing, consumer lending and digital banking services (Openbank). It operates in 26 countries in Europe and the Americas and serves the financing needs at the point of sale (both physical and digital) of 26 million customers.
Our vision is to become the preferred choice of our partners and end customers and offer greater profitability and value creation to our shareholders, while being the most cost competitive player in the industry.
To respond to the constantly evolving customer needs and the increasingly competitive mobility and consumer finance ecosystem while delivering on our vision, we are transforming our operating model from a primarily monoline lending-based model to a full service digital consumer banking model with customers at the heart of our management, by focusing on our strategic priorities:
•Converge towards global platforms. We continue to expand the functionalities of our auto leasing platform and foster growth in Zinia, our check-out lending technology, by embracing new technologies, pursuing new agreements and extending existing ones across regions.
•Grow and consolidate partnerships and acquisitions. To retain and consolidate our leadership in mobility financing, we offer global and best-in-class solutions, integrated into our partners' (OEMs, importers and retailers) processes. We continue to work on improving cross-regional partnerships and consolidating new ones, by leveraging existing agreements across our consumer finance and auto businesses and in Openbank.
•Promote the network effect. We are aligning the business with the Group’s operating model and becoming more agile, by leveraging AI-driven tools to simplify and automate processes and boost productivity, in order to reduce time to market, increase scalability and improve customer experience.
In Q3 2025, we made progress in these strategic priorities, as we advanced in the following initiatives:
•In mobility finance, we continued to enhance our digital sales and post-sales capabilities and further developed our leasing platform, now available in Spain, Italy and Germany, with features such as an online direct sales channel. At the same time, we continued to pursue commercial opportunities and manage agreements globally, including partnerships with new entrants in Europe.
In the US, we remained focused on our pricing discipline and capital stewardship to drive profitable growth across the full credit spectrum.
In Latin America, we remained #1 in new vehicle financing across our footprint as we continued to focus on developing strategic alliances and new products to further strengthen our franchise.
•In consumer lending, Zinia continued to leverage strong partnerships. We achieved record volumes during Amazon Prime Days and introduced instalment payments as an alternative for Amazon customers in Spain, further expanding our embedded finance offering. We also furthered the integration of CrediScotia in Peru.
•As part of our profitable growth strategy we continued to: i) boost customer deposits, with more than EUR 4 billion captured year-on-year, on the back of targeted campaigns and the recent successful Openbank launches in the US, Mexico and Germany; and ii) actively manage our balance sheet to optimize capital.
In Openbank, we continued to upgrade our customer proposition, fund asset growth and capture synergies. As a result: i) in the US, we maintained solid trends in both new customers and deposits captured, with a strong performance from our partnership with Verizon; ii) in Mexico, we delivered outstanding results, reaching more than 300,000 new customers since its launch in Q1 2025, reflecting our focus on digital acquisition and a more attractive product offering; and iii) in Germany, we have been delivering a secure, seamless and mobile-first experience since going live in January and we are now expanding our digital product offering. A good example of this is the recent launch of a broker platform supported by AI-enhanced tools.
|
|
|
| Consumer. Total customers |
| Millions |
|
|
|
|
|
|
|
|
|
36 |
|
January - September 2025 |
Business performance
Gross loans and advances to customers, excluding reverse repos and in constant euros, rose 2% year-on-year, supported by auto (+4%), which saw continuous growth in Europe, in a market which has picked up from a weak start at the beginning of the year, and double-digit increases across Latin America.
The new lending performance (-9% year-on-year in constant euros) continues to reflect our strategy to prioritize profitability over volumes as we remain prudent in terms of originations in an environment marked by volatility and geopolitical uncertainty.
Our EUR 14.2 billion leasing portfolio decreased 12% year-on-year in constant euros, as growth in Europe was more than offset by a decrease in the US, due to the wind down of business through our relationship with Stellantis, lower demand for electric vehicles and our strategy to prioritize profitability over growth.
In terms of liabilities, our access to wholesale funding markets remained strong and diversified. Customer deposits, excluding repos and in constant euros, grew 5% year-on-year (+10% in the US and +2% in Europe), reflecting our focus on deposit gathering, supported by Openbank. They now account for 60% of Consumer's total funding (1.7 pp more than a year ago). Including mutual funds, customer funds increased 6% in constant euros.
|
|
|
|
|
|
|
|
|
|
|
|
|
|
|
|
|
|
|
|
|
|
|
|
|
|
|
|
|
|
Consumer. Business. September 2025 |
| EUR billion and YoY % change in constant euros |
|
|
|
|
|
|
|
|
|
|
|
|
211 |
+2% |
|
|
|
|
136 |
+6% |
|
|
|
|
|
|
|
|
|
|
|
|
|
|
|
|
|
|
|
|
|
|
|
|
|
|
|
|
|
|
|
|
|
|
|
|
|
|
|
| Gross loans and advances to customers excl. reverse repos |
|
Customer deposits excl.
repos + mutual funds |
|
|
|
|
|
|
|
|
|
|
|
|
Consumer. Leasing portfolio. September 2025 |
| EUR billion and YoY % change in constant euros |
| Total leasing |
14 |
-12% |
|
|
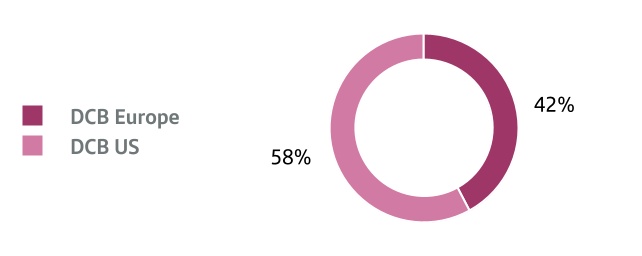
Results
In 9M 2025, attributable profit reached EUR 1,561 million, 4% higher than the same period in 2024. In constant euros, profit increased 6% year-on-year, by line:
•Total income rose 3%, driven by positive trends in net interest income, which amply offset a weaker performance in the other income lines.
Net interest income grew 6%, backed by notable increases across almost all our footprint, with Europe and Latin America supported by our active margin management, higher volumes and
CrediScotia's integration in Peru. In the US, higher yields more than offset weaker volumes.
Net fee income declined 2%, despite double-digit growth in the US and positive trends across Latin America, mainly due to DCB Europe, which was impacted by new insurance regulation in Germany and weaker car registration trends, especially in H1 2025.
Gains on financial transactions fell, mainly driven by Europe. Leasing income also decreased, particularly in the US.
|
|
|
|
|
|
|
|
|
|
|
|
|
|
|
|
|
|
|
|
|
|
|
|
|
|
|
|
|
|
|
|
|
Consumer. Total income. 9M 2025 |
| EUR million and YoY % change in constant euros |
|
•Costs increased 3% year-on-year. In real terms, they rose just 1%, supported by savings from our efficiency and transformation efforts, particularly in Europe and the US, as we continued to invest in our platforms, Openbank and CrediScotia's integration.
•Net loan-loss provisions improved 2%, mainly driven by an excellent performance in auto in the US, which amply offset increases, mainly in Europe, and the impact of CrediScotia's integration. Credit quality remained controlled, with the cost of risk improving to 2.06%.
•Other gains (losses) and provisions posted a lower loss in 9M 2025 compared to 9M 2024, mainly due to the temporary levy on revenue earned in Spain recorded in Q1 2024 and lower charges related to the CHF mortgage portfolio in Poland.
•The effective tax rate normalized, due to lower benefits from fiscal incentives for electric vehicles, following a decline in leasing volumes in the US this year.
As a result of the aforementioned performance, RoTE (post-AT1) stood at 10.4% in 9M 2025.
Compared to Q2 2025, attributable profit fell 4% in constant euros. Continued strength in net interest income (driven by good margin management), better net fee income (mainly insurance in Brazil and DCB Europe), controlled costs and lower charges related to the CHF mortgage portfolio in Poland were more than offset by higher net loan-loss provisions (mostly due to seasonality in the US) and increased minority interests.
|
|
|
|
|
|
|
|
|
|
|
|
|
|
|
|
|
|
|
|
|
|
|
|
|
|
Consumer. Underlying income statement |
|
EUR million and % change |
|
|
|
|
|
|
|
|
|
|
|
|
|
|
|
|
|
|
|
|
|
/ |
Q2'25 |
|
|
/ |
9M'24 |
|
|
Q3'25 |
% |
excl. FX |
|
9M'25 |
% |
excl. FX |
|
|
|
|
|
|
|
|
|
|
Total income |
3,242 |
|
+2 |
+3 |
|
9,667 |
|
+1 |
+3 |
|
Expenses |
-1,285 |
|
-2 |
0 |
|
-3,950 |
|
+1 |
+3 |
|
Net operating income |
1,957 |
|
+4 |
+5 |
|
5,717 |
|
+1 |
+3 |
|
LLPs |
-1,069 |
|
+12 |
+13 |
|
-3,144 |
|
-5 |
-2 |
|
PBT |
796 |
|
+2 |
+3 |
|
2,251 |
|
+15 |
+17 |
|
Underlying attrib. profit |
518 |
|
-6 |
-4 |
|
1,561 |
|
+4 |
+6 |
|
|
|
|
|
|
|
|
|
|
|
January - September 2025 |
|
37 |
|
|
|
|
|
|
|
|
|
| DCBE |
DCB EUROPE |
Profit before tax |
| EUR 1,212 mn |
Commercial activity and business performance
Weaker car registration trends, especially in the first half of the year, and our focus on prioritizing profitability over volumes are reflected in a 5% year-on-year drop in new business volumes in constant euros.
However, the stock of gross loans and advances to customers, excluding reverse repos and in constant euros, continued to rise (+3% year-on-year), mainly driven by auto balances.
Customer deposits, excluding repos and in constant euros, grew 2%, particularly driven by demand deposits, in line with our strategy to increase the concentration of retail funding. Mutual funds, which represent a small amount, rose 16% in constant euros. Our access to wholesale funding markets remained strong and diversified.
Results
In 9M 2025, profit before tax was 5% higher year-on-year, reaching EUR 1,212 million. In constant euros, profit before tax also increased 5%, as follows:
•Total income grew 2%, mainly driven by strong net interest income (+7%), underpinned by our focus on margin management, as well as volumes growth, which more than offset the impact on net fee income from new insurance regulation in Germany and weaker car registration trends, particularly in the first half of the year, and the impact on gains on financial transactions from our hedging strategy, which reduces net interest income volatility.
•Costs were flat, -2% in real terms, supported by the benefits from the transformation, simplification and centralization of our operating model, which compensated our strategic investments in platforms and business growth.
•Net loan-loss provisions rose 7%, mainly in Germany, driven by the macro environment and worse credit quality in corporates.
•Other gains (losses) and provisions recorded a lower loss in the period, due to the temporary levy on revenue earned in Spain recorded in Q1 2024 and lower charges linked to the CHF mortgage portfolio in Poland.
Compared to Q2 2025, profit before tax increased 31% in constant euros, driven by better net interest income (margin management), net fee income (insurance) and leasing income, together with lower costs and charges related to the CHF mortgage portfolio in Poland. This was partially offset by higher net loan-loss provisions (lower base in Q2 due to portfolio sales in the Nordic countries).
|
|
|
|
|
|
|
|
|
|
|
|
|
|
|
|
|
|
|
|
|
|
|
|
|
|
DCB Europe. Underlying income statement |
|
EUR million and % change |
|
|
|
|
|
|
|
|
|
|
|
|
|
|
|
|
|
|
|
|
|
/ |
Q2'25 |
|
|
/ |
9M'24 |
|
|
Q3'25 |
% |
excl. FX |
|
9M'25 |
% |
excl. FX |
|
|
|
|
|
|
|
|
|
|
Total income |
1,504 |
|
+6 |
+6 |
|
4,330 |
|
+2 |
+2 |
|
Expenses |
-652 |
|
-1 |
-1 |
|
-1,978 |
|
0 |
0 |
|
Net operating income |
852 |
|
+11 |
+12 |
|
2,352 |
|
+3 |
+3 |
|
LLPs |
-307 |
|
+8 |
+8 |
|
-926 |
|
+7 |
+7 |
|
PBT |
485 |
|
+31 |
+31 |
|
1,212 |
|
+5 |
+5 |
|
|
|
|
|
|
|
|
|
|
|
|
|
|
|
|
|
|
|
|
|
DCB US |
Profit before tax |
| EUR 669 mn |
Commercial activity and business performance
Almost one year after its launch, Openbank has welcomed around 160,000 new customers and captured USD 5.8 billion in deposit balances. Our partnership with Verizon also continued to deliver strong results, with more than 21,000 accounts opened and approximately USD 520 million in balances gathered since its launch in April.
Gross loans and advances to customers, excluding reverse repos and in constant euros, posted a 5% drop year-on-year, mainly impacted by our asset rotation initiatives (in line with our capital light strategy), reduced new business volumes in a market with lower activity and our continued focus on profitability.
Customer deposits, excluding repos and in constant euros, rose 10% year-on-year, backed by the aforementioned growth in Openbank. Mutual funds also grew, contributing to an 11% increase in customer funds.
Results
In 9M 2025, profit before tax increased 52% year-on-year, reaching EUR 669 million. In constant euros, it grew 56%, as follows:
•Total income rose 1%, as stronger net interest income (higher auto loan yields) and net fee income (auto servicing fees), compensated a decline in leasing income, particularly due to lower volumes and residual values.
•Costs increased slightly (+2%), as savings from our transformation initiatives partially compensated our investments in Openbank.
•Net loan-loss provisions improved 12%, driven by resilient customer behaviour, used car prices stable at high levels and capital relief measures. As a result, cost of risk improved 42 bps to 4.16%.
Compared to Q2 2025, profit before tax fell 33% in constant euros, as solid net interest income growth, backed by our efforts in margin management and balance sheet optimization, was more than offset by higher net loan-loss provisions (affected by seasonality in Q3) and lower leasing income, with stable costs.
|
|
|
|
|
|
|
|
|
|
|
|
|
|
|
|
|
|
|
|
|
|
|
|
|
|
DCB US. Underlying income statement |
|
EUR million and % change |
|
|
|
|
|
|
|
|
|
|
|
|
|
|
|
|
|
|
|
|
|
/ |
Q2'25 |
|
|
/ |
9M'24 |
|
|
Q3'25 |
% |
excl. FX |
|
9M'25 |
% |
excl. FX |
|
|
|
|
|
|
|
|
|
|
Total income |
1,232 |
|
-3 |
0 |
|
3,864 |
|
-2 |
+1 |
|
Expenses |
-504 |
|
-3 |
0 |
|
-1,598 |
|
-1 |
+2 |
|
Net operating income |
728 |
|
-3 |
0 |
|
2,265 |
|
-2 |
0 |
|
LLPs |
-541 |
|
+16 |
+19 |
|
-1,531 |
|
-14 |
-12 |
|
PBT |
168 |
|
-37 |
-33 |
|
669 |
|
+52 |
+56 |
|
|
|
|
|
|
|
|
|
|
|
|
|
|
|
|
|
|
|
|
38 |
|
January - September 2025 |
|
|
|
|
|
|
|
|
|
|
|
|
|
|
|
|
|
|
|
CIB |
|
Underlying attributable profit |
EUR 2,168 mn |
|
|
|
|
|
|
|
|
|
|
|
→ Our enhanced centres of expertise and Global Markets and US Banking Build-Out (US BBO) initiatives are helping to improve client penetration, reflected in the types of deals we are participating in and the roles we are currently winning.
→ Strong activity year-on-year, with Global Markets and Global Banking driving growth on the back of market volatility in the first half of the year and transformation initiatives. Good performances across regions and products, benefitting from our diversified global model.
→ Attributable profit reached EUR 2,168 million, a 6% increase year-on-year (+10% in constant euros), driven by a good revenue performance, (+6% in constant euros), supported by strong NII and by net fee income, which rose across all business lines. We maintained a leading position in efficiency and profitability.
|
|
|
|
|
|
|
|
Strategy
Our Corporate & Investment Banking (CIB) business is a global franchise that is well diversified by business line, country and client type, which helps reduce the potential impacts from risks in any specific market or sector and better support our clients. This is especially important in the current environment, characterized by geopolitical tensions and market volatility, which enables us to continue delivering sustainable and profitable growth.
In 2025, we keep progressing in our core initiatives in Global Markets (GM) and Global Banking (GB) to deliver an enhanced value proposition and drive profitable growth by:
•Fully leveraging our centres of expertise and expanded coverage to strengthen our positioning in our core markets, fostering collaboration between our businesses to increase connectivity and gain market share in the new areas we have invested in.
This is driving significant growth, particularly in our institutional franchise in Global Markets. A good example is our US CMO (collateralized mortgage obligations) desk, which achieved a 10% market share in July 2025.
•Continuing to advance in the execution of our automation and digitalization initiatives, while exploring tangible opportunities afforded by AI, both for business and support functions, to increase productivity, improve efficiency and enhance controls, such as the significant operational risk reduction due to AI-revised reconciliations or automated tasks on pre- and post-trade services.
•Deepening our client relationships by fostering and expanding our advisory and value-added businesses on the back of our transformation initiatives, with a particular focus on the US, and capital-light and fee businesses.
In the US, we are executing our growth plan, selectively broadening coverage and our product platform. We are increasing core client penetration and, as a result, gaining market share and more important roles in Investment Banking in a challenging and very competitive market.
•Maximizing the impact of our US BBO initiative on the global CIB franchise by leveraging the newly developed capabilities and coverage, which are providing new opportunities in other Group businesses and countries.
As a key driver of Santander’s growth, we continue to foster collaboration with other global businesses to generate additional value for the Group. From CIB, for example, we are providing FX solutions to Retail, a full suite of products to Commercial, product development and structuring to Wealth, and capital markets solutions and advisory to Consumer, among others.
•Further evolving CIB's global operating model, in line with the Group’s initiatives to expand our global platforms and strengthen the support functions to foster business growth and increase team specialization and synergies, while investing in transformational growth initiatives.
We continued to improve our Originate-to-Share (OtS) model, with a focus on capital efficiency, active management and profitability.
|
|
|
|
|
|
|
|
|
|
|
|
|
|
|
|
|
|
|
|
|
|
|
|
| Recent awards |
|
Ranking in League Tables 9M 2025 |
|
| Euromoney |
Global Capital |
|
Structured Finance |
Debt Capital Markets |
Latin America’s Best FX Bank |
Americas Derivatives Risk Solutions House of the Year |
|
|
|
| Global Trade Review |
Latin Finance |
|
Equity Capital Markets |
M&A |
ECAs* |
|
Best Export Finance Bank
Best Supply Chain Finance Bank
|
Infrastructure Bank of the Year: Latin America |
|
|
|
|
|
|
|
* ECAs as of H1 2025. |
|
|
|
|
|
|
|
|
|
January - September 2025 |
|
39 |
Business performance
We remain focused on capital-light activity and actively managing our balance sheet. As a result, our total revenue to risk-weighted assets ratio improved 1 pp year-on-year up to 7.9%.
Gross customer loans and advances, excluding reverse repos and in constant euros, were up 5% year-on-year, driven by GB, GM and Trade Finance (GTB). Customer deposits, excluding repos and in constant euros, were up 8% year-on-year, as growth in Cash Management (GTB) amply offset the reduction in GM, in line with our funding strategy.
Global Transaction Banking recorded good activity levels year-on-year in a challenging environment.
•In Trade & Working Capital Solutions, activity increased year-on-year, after a strong first half of the year, driven by: i) new solutions to mitigate the impact of tariffs; and ii) expansion into new segments and diversification of client portfolios through partnerships, such as Invensa, to provide mid- and large-sized corporates with supply chain inventory solutions.
•In Export Finance, activity recovered in Europe and North America in Q3 2025, after a weaker first half compared to a particularly strong H1 2024. We closed ECA-covered transactions across various countries and sectors, with public and private borrowers in the US, the UK, Indonesia, the UAE and Morocco. Most notably, we executed deals exceeding USD 1 billion in Saudi Arabia and Turkey.
•In Cash Management, activity remained at good levels, on the back of new value-added solutions that make the business less subject to interest rate cycles and support our ambition to consolidate our position as an important player in Europe, while we maintain a leading position in Spain, Portugal and Latin America.
In Global Banking, activity continued to grow, especially due to our US BBO initiative.
•In Corporate Finance (CF), strong activity growth driven mainly by M&A and Leveraged Finance, on the back of better market conditions, particularly in the energy sector. Notably, we advised Blackstone on the acquisition of Hill Top Energy Center in the US. In ECM, international activity picked-up materially. The US had a particularly good quarter across all products, including IPOs, follow-ons and convertibles. Similarly, positive trends continued in Europe, while activity in Latin America remained muted.
•In Debt Finance, DCM performed well supported by strong investor demand while Syndicated Loans decreased. In Europe, we saw particularly strong activity in corporate issuances. We acted as active bookrunner for Danone, IAG, Orange and Air France, among others. In Latin America, we led the primary market as active bookrunner, in sovereign and corporate transactions. In the US, we continue to grow in the corporate hybrid capital market.
•In Structured Finance, activity was better year-on-year, supported by a better quarter, mainly in the US in the telecommunications and power sectors. We maintained a leading position globally in energy transition, renewables and infrastructure and debt advisory.
In Global Markets, positive activity year-on-year, albeit with some normalization in Q3 2025 after a strong start to the year in H1 2025, which benefitted from high volatility, mainly in Europe and South America. We continue to deliver solid performances across most products, especially Securities Financing and Securitized Products, particularly in the US as a result of our strategic focus on institutional clients and effective risk management across countries and asset classes.
Results
Attributable profit in 9M 2025 rose 6% year-on-year to EUR 2,168 million. In constant euros, it grew 10%, with the following detail:
•Total income rose 6%, supported by net interest income, which rose 7%, mainly due to GM boosted by lower cost of funding, and higher activity in Europe and the US, and by net fee income (+7%), which grew in all businesses. Other income was relatively stable year-on-year.
By country, of note were double-digit increases in the US, Mexico, Brazil and in our branches in Asia and the UK.
By business, we saw double-digit revenue growth in GM, in fixed income, currencies & commodities (FICC) and equity products. In GB, there was double-digit growth in CF, particularly in the US, and a strong quarter in Structured Finance. GTB decreased slightly, as growth in Trade & Working Capital Solutions was offset by lower results in Cash Management and Export Finance.
|
|
|
|
|
|
|
|
|
|
|
|
|
|
|
|
|
|
|
|
|
|
|
|
|
|
|
|
|
|
|
|
|
CIB. Total income by business. 9M 2025 |
| EUR million and % change in constant euros |
|
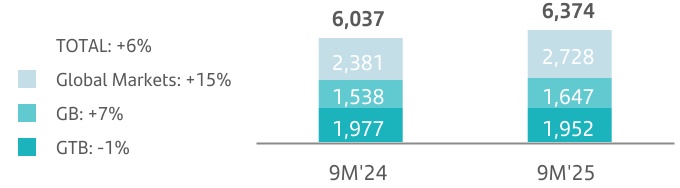
|
|
|
|
|
|
|
|
|
|
|
|
Note: total income includes revenue from other activities which are less material (EUR 141 million in 9M'24 and EUR 47 million in 9M'25). |
•Costs increased 6% due to the investments made in new products and capabilities to drive growth. The efficiency ratio was 44.9%, one of the best in the sector.
•Net loan-loss provisions have a limited impact on CIB results due to the nature of the business and to the high quality of our credit portfolio. In 9M 2025 net loan-loss provisions increased, partly due to credit portfolio growth.
As a result, this good business performance delivered a 19.7% RoTE (post-AT1) in 9M 2025 compared to 17.4% in 9M 2024, reflecting our focus on active capital management, efficiency and profitability.
Compared to Q2 2025, attributable profit decreased 13% in constant euros, affected by seasonality in GM and lower results in Trade & Working Capital Solutions following a strong Q2, partially offset by the good quarter in Global Banking. Additionally, there was a negative impact from the depreciation of the exchange rate in Argentina.
|
|
|
|
|
|
|
|
|
|
|
|
|
|
|
|
|
|
|
|
|
|
|
|
|
|
CIB. Underlying income statement |
|
EUR million and % change |
|
|
|
|
|
|
|
|
|
|
|
|
|
|
|
|
|
|
|
|
|
/ |
Q2'25 |
|
|
/ |
9M'24 |
|
|
Q3'25 |
% |
excl. FX |
|
9M'25 |
% |
excl. FX |
|
|
|
|
|
|
|
|
|
|
Total income |
2,020 |
|
-5 |
-5 |
|
6,374 |
|
+2 |
+6 |
|
Expenses |
-957 |
|
+1 |
+2 |
|
-2,860 |
|
+3 |
+6 |
|
Net operating income |
1,062 |
|
-10 |
-10 |
|
3,514 |
|
+1 |
+5 |
|
LLPs |
-81 |
|
+12 |
+14 |
|
-167 |
|
+8 |
+9 |
|
PBT |
919 |
|
-15 |
-15 |
|
3,237 |
|
+4 |
+9 |
|
Underlying attrib. profit |
634 |
|
-13 |
-13 |
|
2,168 |
|
+6 |
+10 |
|
|
|
|
|
|
|
|
|
|
|
40 |
|
January - September 2025 |
|
|
|
|
|
|
|
|
|
|
|
|
|
|
|
|
|
|
|
WEALTH |
|
Underlying attributable profit |
EUR 1,439 mn |
|
|
|
|
|
|
|
|
|
|
|
→ We continue building the best wealth and insurance manager in Europe and the Americas, supported by our leading global private banking platform and our best-in-class funds and insurance factories that leverage our scale and global capabilities to offer the best value proposition to our customers.
→ Total assets under management reached new record levels of EUR 536 billion, +11% year-on-year in constant euros, on the back of solid commercial dynamics in both Private Banking and Santander Asset Management, and a good market performance. In Insurance, gross written premiums reached EUR 8.3 billion, +5% year-on-year in constant euros.
→ Attributable profit amounted to EUR 1,439 million, 17% higher year-on-year (+21% in constant euros), with revenue increasing across all business lines and RoTE (post-AT1) at 66.0%.
|
|
|
|
|
|
|
|
Strategy
We aim to enhance our Wealth Management & Insurance service model and value proposition through a common global platform that leverages Santander's scale and capabilities. Wealth is an important driver for the Group, delivering consistent double-digit profit growth and generating around one third of the Group's total net fee income, including fees ceded to the commercial network.
In recent years, we have been working on building a leading global private banking platform with best-in-class funds and insurance product factories that leverage our global scale and capabilities.
We continue to focus on the following strategic initiatives:
•In Private Banking (PB), we continued to consolidate our global position during the quarter, by reinforcing our value proposition through greater specialization. We also remain focused on accelerating the transition to a fee-based model, driving sustainable growth and greater client alignment.
In Q3 2025, we continued to progress in Beyond Wealth, our new Global Family Office service, which has further consolidated its brand recognition and client adoption with two major milestones: launch and initial team set up in Spain, having already onboarded our first clients, and the launch of the first phase in the US, integrating it as an additional advisory platform within our value proposition.
We are also making progress in adopting AI, which has, for example, helped us to deliver market reports in half the time. This enabled us to reduce time-to-market and broaden multilingual distribution.
Additionally, in this quarter we launched Active Advisory in Spain, a specialized team that provides expert advice and access to financial markets, enhancing our advisory offering and fee-based services.
|
|
|
| Private Banking clients |
| Thousands |
|
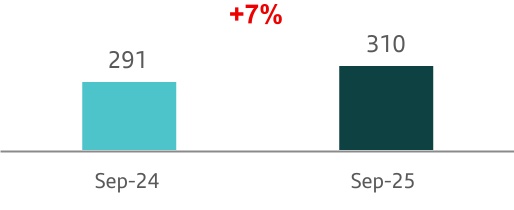
•In Santander Asset Management (SAM), we operate as a global asset manager leveraging our scale, global investment capabilities and product distribution hubs. We continue on our journey to become a leaner, more scalable and digital organization, delivering sustained volumes growth. We have advanced in
globalizing the investment function, simplification of legal structures and product range optimization.
We reinforced distribution and investment capabilities in Alternatives, with strategic hires and tailored product offerings. As a result, we are attracting strong interest from Latin American and European institutional investors and family offices.
This transformation is backed by our efforts to redesign procedures and actively integrate the use of AI. We have made strategic hires to boost digital sales, enabling us to deliver a best-in-class customer experience. At the same time, a dedicated process reengineering team is accelerating automation using AI to drive tangible productivity gains.
•In Insurance, our bancassurance operation is present in more than 20 countries through the Group's global businesses. We are accelerating the execution of our strategy and transformation plans around two verticals, Life & Pensions and Property & Casualty, to deliver more value to our customers:
•In Life & Pensions, we are developing a new retirement business line, offering an integrated value proposition focused on both savings and retirement income products, along with other services. This quarter, we launched a new life product for senior customers in Brazil and, a new annuities product for the private banking and affluent segments in Spain.
•In terms of Property & Casualty, we are expanding into high growth verticals such as: i) Health, where we launched a new complementary health insurance with Bupa Group in Chile; and ii) SMEs, where we are expanding our value offering with new protection business products in collaboration with Getnet. We launched Ingreso Empresarial in Mexico and Facturación Protegida in Argentina, to protect business revenue against contingencies (damage due to external causes, failure to open, death, disability and hospitalization, among others).
We are working to further enhance the value we offer to our customers to drive long-lasting relationships by integrating personalized financial advice at the core of our strategy in every country.
Since 2023, Insurance has operated under a single holding company, which has enabled us to centralize management, governance, risk and control across all insurance entities. This has improved the integration of the Insurance business within the Group’s model.
•Portfolio Investments was incorporated as a fourth vertical that combines the investment platforms unit and stakes in other companies. We have integrated this business line into Wealth to capture synergies and enhance our value proposition and the service provided to our customers.
|
|
|
|
|
|
|
|
|
January - September 2025 |
|
41 |
Business performance
Total assets under management (AuMs) reached a new record of EUR 536 billion, up 11% year-on-year in constant euros, driven by solid commercial activity and a positive market performance.
By business and in constant euros, volumes performed as follows:
•In PB, customer assets and liabilities reached a record of EUR 354 billion (+11% year-on-year), with all product categories growing, especially funds as we focus on offering products with greater added value, such as alternative products and discretionary portfolio management. Net new money totalled EUR 16.7 billion, increasing 29% year-on-year, with relevant growth in commitments in private assets.
We remain focused on offering our customers the benefits of our scale and international presence. This resulted in 7% year-on-year growth in our customer base to c.310,000.
•In SAM, total assets under management reached an all-time high of EUR 255 billion, +12% year-on-year, on the back of solid commercial activity in most countries. Net sales in 9M 2025 totalled EUR 7.0 billion.
•In Insurance, gross written premiums reached EUR 8.3 billion in 9M 2025, increasing 5% year-on-year, driven by the life savings business.
|
|
|
|
|
|
|
|
|
|
|
|
|
|
|
|
|
|
|
|
|
Wealth. Business performance. September 2025 |
| EUR billion and % change in constant euros |
|
|
|
|
| Total AuMs |
| Funds and investment* |
| - SAM |
| - Private Banking |
| Custody |
| Customer deposits |
| Customer loans |
|
| GWPs |
|
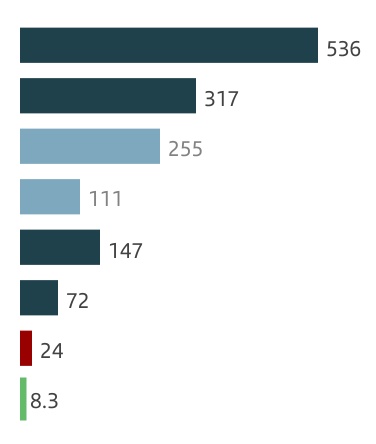
|
|
|
|
|
|
|
|
| / Jun-25 |
/ Sep-24 |
| +4 |
% |
+11 |
% |
| +3 |
% |
+13 |
% |
| +3 |
% |
+12 |
% |
| +4 |
% |
+19 |
% |
| +7 |
% |
+8 |
% |
| +2 |
% |
+5 |
% |
| +2 |
% |
+12 |
% |
|
|
| -8 |
% |
+5 |
% |
|
|
Note: total products marketed, advised, under custody and/or managed.
*Excluding overlaps between PB and SAM (PB clients with investment funds managed by SAM).
Results
Attributable profit in 9M 2025 amounted to EUR 1,439 million, 17% higher year-on-year. In constant euros, it grew 21%, with the following performance by line:
•Total income increased 13% year-on-year as a result of our focus on value-added solutions to expand our fee businesses and improve revenue recurrency.
Net interest income decreased 15% affected by some deposit cost inelasticity to interest rate declines and by the lower yield on assets, despite higher volumes in Private Banking, in a lower interest rates environment in most of our main units.
Net fee income rose 19% year-on-year, with good performances across businesses in general. Of note were the performances in Private Banking and SAM, driven by solid commercial activity, a positive market performance and supported by our focus on promoting fee-generating activities and products.
Other income almost doubled year-on-year, boosted by the good performances of our joint ventures in Insurance and of the stakes managed by our Portfolio Investments business line.
•Costs increased 9% year-on-year, less than total income, reflecting investments made to strengthen PB teams and to develop new capabilities to address the increase in commercial activity.
Including the fees ceded to our commercial network, total revenue reached EUR 4,880 million, up 10%, on the back of higher activity with customers in PB, higher volumes in SAM and the good performance of insurance related businesses.
|
|
|
|
|
|
|
|
|
|
|
|
|
|
|
|
|
|
|
|
|
|
|
|
|
|
|
|
|
|
|
|
|
Wealth. Total income. 9M 2025 |
| EUR million and YoY % change in constant euros |
|
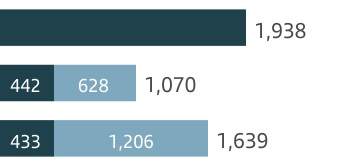
|
|
|
|
|
|
| Total income |
Total income + ceded fees |
| +2% |
+2% |
| +20% |
+16% |
| +22% |
+6% |
|
|
|
|
|
|
|
|
|
|
|
|
|
|
|
Total income |
|
Fees ceded to the commercial network |
Note: Additionally, Wealth's total income included EUR 78 million in 9M'24 and EUR 233 million in 9M'25 corresponding to Portfolio Investments. Information excludes overlaps between Wealth businesses and also Insurance fees recorded in Consumer (EUR 685 million).
When considering these ceded fees along with our PAT, the total contribution to Group profit (PAT+Fees) reached EUR 2,695 million, up 14% year-on-year both in euros and in constant euros.
Our RoTE (post-AT1) in 9M 2025 was 66.0%.
Compared to Q2 2025, attributable profit increased 3% in constant euros, boosted by the good performance of both total income and bottom line. This more than offset higher costs from investments related to our transformation and expansion into new markets.
|
|
|
|
|
|
|
|
|
|
|
|
|
|
|
|
|
|
|
|
|
|
|
|
|
|
Wealth. Underlying income statement |
|
EUR million and % change |
|
|
|
|
|
|
|
|
|
|
|
|
|
|
|
|
|
|
|
|
|
/ |
Q2'25 |
|
|
/ |
9M'24 |
|
|
Q3'25 |
% |
excl. FX |
|
9M'25 |
% |
excl. FX |
|
|
|
|
|
|
|
|
|
|
Total income |
1,014 |
|
0 |
+1 |
|
3,046 |
|
+10 |
+13 |
|
Expenses |
-369 |
|
+4 |
+5 |
|
-1,094 |
|
+6 |
+9 |
|
Net operating income |
646 |
|
-2 |
-1 |
|
1,952 |
|
+12 |
+15 |
|
LLPs |
10 |
|
— |
— |
|
-11 |
|
-58 |
-57 |
|
PBT |
651 |
|
+3 |
+3 |
|
1,925 |
|
+15 |
+18 |
|
Underlying attrib. profit |
491 |
|
+3 |
+3 |
|
1,439 |
|
+17 |
+21 |
|
|
|
|
|
|
|
|
|
|
|
42 |
|
January - September 2025 |
|
|
|
|
|
|
|
|
|
|
|
|
|
|
|
|
|
|
|
PAYMENTS |
|
Underlying attributable profit |
EUR 558 mn |
|
|
|
|
|
→ PagoNxt and Cards bring a unique position in the payments industry to the Group, covering both sides of the value chain of card payments (issuing and acquiring businesses) and account-to-account (A2A) payments.
→ Activity increased in both businesses, while we develop our global platforms, which enables further scale gains. In PagoNxt, Getnet's Total Payments Volume (TPV) rose 15% year-on-year in constant euros and the number of transactions improved 8%. In Cards, spending increased 8% year-on-year in constant euros and transactions rose 5%.
→ Attributable profit was EUR 558 million, up 62% year-on-year in constant euros excluding the charges in Q2 2024 after discontinuing some platforms, driven by a good revenue performance boosted by higher activity. PagoNxt's EBITDA margin improved 8.9 pp year-on-year to 31.6% in 9M 2025.
|
|
|
|
|
|
|
|
PagoNxt and Cards strategy
In PagoNxt, we continued to make progress in our strategic priorities:
•In Getnet, our focus is on fostering business expansion by investing in innovation and creating effective commercial channels.
We are working to expand our regional API capabilities, which is now live in Uruguay, in addition to Brazil, Argentina, Chile and Mexico, reinforcing Getnet's positioning in Latin America.
Our strength and commitment to excellence in payments across regions was recognized in The Nilson Report where Getnet was the leading acquirer in Latin America by TPV in 2024, and the second by number of transactions.
Our focus on innovation and development of tailored solutions for global and local merchants is also clear in Spain, where Getnet used its Tap on Phone technology to turn a large company's delivery drivers' mobile phones in the country into payment terminals, eliminating hardware, minimizing errors and streamlining logistics. In Portugal, we partnered with Elecctro to offer electric vehicle drivers a seamless payment experience at charging points.
•In Ebury, we remain focused on: i) growing customers by expanding our product offering and online capabilities; ii) expanding geographically with a focus on developing markets; iii) introducing tailored products to capture verticals such as mass payments; and iv) increasing collaboration revenue with other global businesses.
•In PagoNxt Payments, we continued to develop our solution for A2A payments processing, foreign exchange, fraud detection and value-added services, leveraging the best technology to build tailored solutions for customers.
In Cards, we remained focused on the following priorities:
•Expand the business to continue growing and offering the best products to our customers.
We further implemented Cards Data Lab, which continued to expand its functionalities to improve credit card experience in the different life cycle phases. This quarter, we launched it in Brazil.
This quarter, we continued to expand our joint value proposition with Getnet (cards and PoS), by launching it in Brazil. It is already available in Spain, Chile, Portugal and Argentina.
As part of our strategy to promote the use of credit cards (debit-to-credit strategy), we launched Pay Smarter, an initiative aimed at enhancing the security, control and benefits of credit card usage. We launched it in the UK, Argentina, Mexico, Chile and Portugal (having already launched it in Spain in Q2), and we expect to reach all our markets this year.
•Improve customer satisfaction, offering global solutions to facilitate the use of our cards, increase the security of our products and handle all transactions digitally. For example, the centralized management of tokenized payments, roll out of Click to Pay across some of our markets, incident management from digital channels and enrolment in Apple Pay, now available in all our countries after implementing it in Uruguay this quarter.
•Implement our global card platform (Plard), which currently manage more than 20 million debit cards in Brazil, and is capturing new debit card sales to individuals in Chile. In Mexico, the new authorizer processes more than 170 million transactions per month and we are testing its implementation in Spain and the UK.
Business performance
Gross loans and advances to customers, excluding reverse repos and in constant euros, rose 14% driven mainly by higher volumes in Cards, especially in Brazil, Argentina, the UK and Spain.
Payments has a very small amount of deposits, concentrated in PagoNxt. These deposits (excluding repos) amounted to EUR 1,162 million, +15% year-on-year in constant euros.
Results
Attributable profit was EUR 558 million in 9M 2025, compared with a profit of EUR 151 million in 9M 2024. This year-on-year comparison was favoured by charges recorded in Q2 2024 related to the discontinuation of some platforms. Excluding them, profit rose 62% year-on-year in constant euros, by line:
•Total income grew 19%, boosted by double-digit growth in net interest income and net fee income driven by increased activity.
•Costs rose 3% but they decreased 1% in real terms, supported by the savings generated from the use of our platforms in PagoNxt.
•Net loan-loss provisions, mainly related to Cards, rose 29%, due to strong generalized loan growth and model changes and updates, in a less favourable macro environment in some of our countries.
Compared to Q2 2025, profit grew 7% in constant euros as the good performances in fees and gains on financial transactions and lower costs, due to the savings generated from the use of our platforms, more than offset a net interest income decline and higher LLPs, both affected by Argentina's exchange rate (excluding Argentina both improved 2%).
|
|
|
|
|
|
|
|
|
|
|
|
|
|
|
|
|
|
|
|
|
|
|
|
|
|
Payments. Underlying income statement |
|
EUR million and % change |
|
|
|
|
|
|
|
|
|
|
|
|
|
|
|
|
|
|
|
|
|
/ |
Q2'25 |
|
|
/ |
9M'24 |
|
|
Q3'25 |
% |
excl. FX |
|
9M'25 |
% |
excl. FX |
|
|
|
|
|
|
|
|
|
|
Total income |
1,530 |
|
+5 |
+5 |
|
4,370 |
|
+11 |
+19 |
|
Expenses |
-585 |
|
-1 |
-1 |
|
-1,785 |
|
-2 |
+3 |
|
Net operating income |
945 |
|
+9 |
+9 |
|
2,586 |
|
+21 |
+34 |
|
LLPs |
-514 |
|
+7 |
+7 |
|
-1,485 |
|
+17 |
+29 |
|
PBT |
391 |
|
+13 |
+13 |
|
985 |
|
+82 |
+116 |
|
Underlying attrib. profit |
223 |
|
+7 |
+7 |
|
558 |
|
+269 |
+446 |
|
|
|
|
|
|
|
|
|
|
|
January - September 2025 |
|
43 |
PagoNxt
Business performance
In 9M 2025, the total number of transactions in Getnet reached 7.8 billion, 8% higher year-on-year, mainly boosted by growth in Mexico, Chile and Europe. The total payments volume (TPV) was EUR 174 billion, 15% higher than in 9M 2024 in constant euros.
In PagoNxt Payments, A2A payments activity on our global Payments Hub platform continued ramping up. The migration of transactions from legacy systems to our new global platform is accelerating faster than planned, driven by the ongoing migration of Pix transactions in Brazil.
|
|
|
|
|
| PagoNxt. Activity |
|
|
|
| TPV (Getnet) |
|
|
| EUR billion and changes in constant euros |
|
|
Results
In 9M 2025, attributable profit reached EUR 35 million, compared to a EUR 326 million loss in the same period of 2024 (EUR 83 million loss if we exclude the charges related to the discontinuation of our merchant platform in Germany and Superdigital in Latin America). In constant euros:
•Total income rose 18% year-on-year, with double-digit growth in net interest income and net fee income, driven by higher activity. All three business lines recorded double-digit growth in total income, of note, Getnet in Mexico, Brazil and Chile.
•Costs were flat, due to the savings generated from the use of our platforms.
EBITDA margin increased to 31.6% (22.7% in 9M 2024).
Compared to previous quarter, attributable profit rose to EUR 19 million from EUR 11 million in Q2 2025, +69% in constant euros, driven by cost savings generated from the use of our platforms and the recovery of gains on financial transactions from very low levels in Q2 2025.
|
|
|
|
|
|
|
|
|
|
|
|
|
|
|
|
|
|
|
|
|
|
|
|
|
|
|
|
|
PagoNxt. Underlying income statement |
|
EUR million and % change |
|
|
|
|
|
|
|
|
|
|
|
|
|
|
|
|
|
|
|
|
|
|
|
/ |
Q2'25 |
|
|
|
/ |
9M'24 |
|
|
Q3'25 |
% |
excl. FX |
|
9M'25 |
9M'24 |
% |
excl. FX |
|
|
|
|
|
|
|
|
|
|
|
Total income |
353 |
+9 |
+8 |
|
994 |
894 |
+11 |
+18 |
|
Expenses |
-280 |
-3 |
-4 |
|
-856 |
-889 |
-4 |
0 |
|
Net operating income |
73 |
+109 |
+106 |
|
138 |
5 |
— |
— |
|
LLPs |
-8 |
+68 |
+68 |
|
-19 |
-13 |
+50 |
+59 |
|
PBT |
35 |
+299 |
+272 |
|
57 |
-281 |
— |
— |
|
Underlying attrib. profit |
19 |
+73 |
+69 |
|
35 |
-326 |
— |
— |
|
|
Cards
Business performance
Our customers' card activity continued to increase across all types of payments. The number of transactions grew 5% year-on-year, reaching EUR 11.3 billion. Spending rose 8% year-on-year in constant euros, mainly driven by credit cards (+13% year-on-year), increasing across countries. This growth is accompanied by an improvement in the quality of service, resulting in increases in our share of wallet.
Gross loans and advances to customers, excluding reverse repos and in constant euros, rose 14%, with double-digit growth in most of our countries.
|
|
|
|
|
| Cards. Activity |
|
|
|
| Spending |
|
|
| EUR billion and changes in constant euros |
|
|
Results
In 9M 2025, attributable profit was EUR 523 million, 10% higher year-on-year. In constant euros, profit rose 19%, by line:
•Total income increased 20% year-on-year, supported by higher activity. There was notable growth in net interest income (+22%, with double-digit growth in most of our countries) and net fee income (+14%), driven by greater activity in credit cards resulting from our debit-to-credit strategy and in commercial cards which have a higher interchange fee.
•Costs rose 6%, well below revenue, despite our investment in platforms and business growth. As a result, net operating income increased 26%.
•Net loan-loss provisions increased 29%, driven by strong generalized loan growth and by model changes and updates, in a less favourable macro environment in some of our countries.
In 9M 2025, RoTE (post-AT1) in Cards was 27.3%.
Compared to Q2 2025, attributable profit rose 3% in constant euros, driven by record revenue, boosted by net fee income (mainly in Brazil and Argentina, which includes a positive one-off fee in Q3), and despite the impact of Argentine peso depreciation in net interest income and LLPs (excluding Argentina, both improved 2%).
|
|
|
|
|
|
|
|
|
|
|
|
|
|
|
|
|
|
|
|
|
|
|
|
|
|
Cards. Underlying income statement |
|
EUR million and % change |
|
|
|
|
|
|
|
|
|
|
|
|
|
|
|
|
|
|
|
|
|
/ |
Q2'25 |
|
|
/ |
9M'24 |
|
|
Q3'25 |
% |
excl. FX |
|
9M'25 |
% |
excl. FX |
|
|
|
|
|
|
|
|
|
|
Total income |
1,178 |
+4 |
+4 |
|
3,376 |
+11 |
+20 |
|
Expenses |
-305 |
+1 |
+1 |
|
-929 |
0 |
+6 |
|
Net operating income |
872 |
+5 |
+5 |
|
2,448 |
+15 |
+26 |
|
LLPs |
-506 |
+7 |
+6 |
|
-1,466 |
+17 |
+29 |
|
PBT |
356 |
+6 |
+6 |
|
928 |
+13 |
+22 |
|
Underlying attrib. profit |
204 |
+3 |
+3 |
|
523 |
+10 |
+19 |
|
|
|
|
|
|
|
|
|
|
|
44 |
|
January - September 2025 |
|
|
|
|
|
|
|
|
|
|
|
|
|
|
|
|
|
|
|
CORPORATE CENTRE |
|
Underlying attributable profit |
-EUR 1,059 mn |
|
|
|
|
|
|
|
|
|
|
|
→ The Corporate Centre continued to support the Group, defining, developing and coordinating the Group's strategy, as well as aiding the operating units, adding value.
→ It carries out the corporate oversight and control function, coordinates interactions with the Group's supervisors and regulators and also carries out functions related to financial and capital management.
→ Attributable loss of EUR 1,059 million in 9M 2025, a greater loss year-on-year (+5%), impacted by lower interest rates and higher net loan-loss provisions, partially offset by lower losses on financial transactions driven by a smaller impact from currency hedges.
|
|
|
|
|
|
|
|
Strategy and functions
The Corporate Centre contributes value to the Group, through the following functions, among others:
•Global control frameworks and supervision.
•Fostering the exchange of best practices in cost management, which enables us to be one of the most efficient banks.
•Collaborating in the definition and execution of the global strategy, competitive development operations and projects that ensure we meet the business plan.
•Contributing to the launch of projects that will be developed by our global businesses, aimed at leveraging our worldwide presence to generate economies of scale.
•Ensuring open and constructive communication with shareholders, analysts, investors, bondholders, rating agencies and other market players.
•Adding value to our businesses, countries and divisions by encouraging the exchange of best practices, driving and managing innovative global initiatives and defining corporate policies to improve process efficiency and customer service quality.
It also coordinates the relationship with European regulators and supervisors and carries out functions related to financial management and capital, as follows:
•Financial Management functions:
•Structural management of liquidity risk associated with funding the Group’s recurring activity and stakes of a financial nature. At the end of September 2025, the liquidity buffer was EUR 343 billion (provisional data).
This is done ensuring the diversification of funding sources (issuances and others), maintaining an adequate profile in volumes, maturities and costs.
The price of these transactions with other Group units is the market rate that includes all liquidity concepts (which the Group supports by immobilizing funds during the term of the transaction) and regulatory requirements (TLAC/MREL).
•We also actively manage interest rate risk to dampen the impact of interest rate changes on net interest income, conducted via high credit quality, very liquid and low capital consumption derivatives.
•Strategic management of exposure to exchange rates in equity and dynamic management of the FX hedges related to the units’ next twelve months results in euros. The net investments in equity currently hedged totalled EUR 18,102 million (mainly in the UK, Mexico and Chile) with different FX instruments (spots and forwards).
•Management of total capital and reserves: capital analysis, adequacy and management of the Group including: coordination with subsidiaries, monitoring profitability to maximize shareholder returns, setting solvency targets and capital contributions, and monitoring the capital ratio in both regulatory and economic terms, and efficient capital allocation to the units.
Results
In 9M 2025, the attributable loss was EUR 1,059 million, a 5% greater loss than in 9M 2024 (EUR 1,012 million loss), with the following performance by line:
•Net interest income declined EUR 169 million as lower interest rates impacted the balance sheet which has positive sensitivity to rate rises.
•Losses on financial transactions improved EUR 294 million, due to a lower impact from foreign currency hedges.
•Costs were 4% higher year-on-year, impacted by higher IT expenses.
•Net loan-loss provisions increased EUR 196 million year-on-year due to LLPs recorded in the first half of the year related to our plan to accelerate NPL ratio reductions, improving the Group's credit quality.
•Other results and provisions line was EUR 15 million more negative year-on-year.
|
|
|
|
|
|
|
|
|
|
|
|
|
|
|
|
|
|
|
|
|
|
|
|
|
|
Corporate Centre. Underlying income statement |
|
EUR million and % change |
|
|
|
|
|
|
|
|
|
|
|
Q3'25 |
Q2'25 |
% chg. |
|
9M'25 |
9M'24 |
% chg. |
|
|
|
|
|
|
|
|
|
|
Total income |
-166 |
|
-135 |
|
+23 |
|
-517 |
|
-604 |
|
-14 |
|
Net operating income |
-267 |
|
-232 |
|
+15 |
|
-802 |
|
-879 |
|
-9 |
|
PBT |
-447 |
|
-375 |
|
+19 |
|
-1,254 |
|
-1,120 |
|
+12 |
|
Underlying attrib. profit |
-346 |
|
-319 |
|
+8 |
|
-1,059 |
|
-1,012 |
|
+5 |
|
|
|
|
|
|
|
|
|
|
|
January - September 2025 |
|
45 |
SUSTAINABILITY
STRATEGY
|
|
|
|
|
|
|
|
|
| 1 |
|
Support our customers in meeting their goals in their transition to a low-carbon economy while also managing climate-related risks and impacts. |
|
|
|
| 2 |
|
Encourage employee growth, fostering an inclusive culture and promoting skill development, while providing fair working conditions. |
|
|
|
| 3 |
|
Contribute to the economic, financial and social development of our communities, with a special focus on education, employability and entrepreneurship. |
|
|
|
| 4 |
|
Be a trusted partner to our customers, with products and services that adapt to their needs, while applying responsible practices, supporting their financial inclusion and protecting their information. |
|
|
|
| 5 |
|
Act responsibly through a strong culture, governance and conduct. |
|
|
|
|
|
|
|
|
|
|
|
|
|
|
|
|
|
|
|
|
|
|
|
|
|
|
|
|
|
Green finance |
|
Socially Responsible Investments (SRI) AuMs |
|
Financial inclusion |
|
|
EUR 165.4
billion
|
|
EUR 118.8
billion
|
|
5.7
million people
|
|
|
Target 1: EUR 120 bn 2025 |
|
Target: EUR 100 bn 2025 |
|
Target: 5 mn 2025 |
|
|
Target 2: EUR 220 bn 2030 |
|
|
|
|
|
|
Note: targets were set in 2019 and 2021, before the publication of the European taxonomy in Q2 2023. Therefore, target definitions are not fully aligned with the taxonomy. For further information, see the 'Alternative performance measures' section in the appendix to this report. |
|
KEY HIGHLIGHTS
→ Having achieved our three 2023 Investor Day targets earlier than expected, in Q3 2025:
–We raised or facilitated EUR 8.2 billion in green finance, reaching EUR 165.4 billion to date towards our target of EUR 220 billion in green finance raised or facilitated by 2030. Through CIB, we stood out in green financing by participating in a EUR 4.1 billion deal for East Anglia Three and through our advisory role in Iberdrola's sale of 49% of Windanker. In Poland, we took part in the country's largest renewable financing deal (more than EUR 6 billion) for two offshore wind projects, Equinor and Polenergia. In DCM, we acted as joint lead manager in Poland's green bond issuance (EUR 1.3 billion) and as joint bookrunner in Terna’s debut in Italy with a bond 100% aligned with the EU Taxonomy. In Latin America, we participated in the sustainable bond issuances by Colbún and Empresas CMPC as well as CAF's first sustainable issuance.
–Our SRI assets reached EUR 118.8 billion, of which EUR 68 billion were SAM AuMs and EUR 51 billion from third party funds in PB. We strengthened our sustainability offering by adding five new ESG portfolios, through which we have incorporated independent ESG advisory services.
–Financially included people reached 5.7 million to date and as we continue to support unbanked and underbanked individuals to enter into or remain within the formal financial system through access solutions — such as Correos Cash in Spain, partnerships with merchants in Mexico, Life account in Chile, or financial inclusion branches in Argentina — and financing solutions — such as support for entrepreneurs through our microfinance businesses in Brazil, Mexico, Colombia and Peru. In addition, we complement our financial inclusion efforts with financial education programmes and financial health solutions for customers.
→ In Retail, we partnered with MatHolding to transform farms in Spain, enabling them to produce high value crops. The partnership will promote modernization of Spanish agriculture with improved technological solutions, specialized financing and a firm commitment to sustainability.
→ Santander X Global Challenge, launched together with Norrsken and centred around circular economy, unveiled the six best and most innovative startups and scaleups from 11 countries in this field.
→ Finally, our commitment to inclusive growth was recognized by Euromoney, receiving awards for Best ESG in Argentina and Spain, Sustainable Finance in Brazil, and Corporate Responsibility in Poland and Portugal.
|
|
|
|
|
|
|
|
|
46 |
|
January - September 2025 |
CORPORATE GOVERNANCE
Changes to the Group's Senior Management
The board of directors of Banco Santander appointed Juan Olaizola as the new Group Chief Operating & Technology Officer, effective 1 September 2025. The appointment has received the required regulatory approval. Mr Olaizola joined the Group in 2005 as Chief Operating Officer at Santander UK, responsible for T&O among other functions. From 2017 to 2022, he served as Head of T&O of Santander Spain and Europe and, since 2022, he was the CEO of PagoNxt Payments Hub. He succeeds Dirk Marzluf, who remains in the Group as senior advisor to the Executive Chair.
Changes to the international advisory board
José Fernández da Ponte joined as a member of the international advisory board. Mr Fernández da Ponte is the President and Chief Growth Officer of the Stellar Development Foundation and has a deep understanding of blockchain, as well as cryptocurrencies, stablecoins and central bank digital currencies. Andreas Dombret ceased being a member of said advisory board.
|
|
|
|
|
|
|
|
|
January - September 2025 |
|
47 |
APPENDIX
|
|
|
|
|
|
|
|
|
48 |
|
January - September 2025 |
|
|
|
|
|
|
|
|
|
|
|
|
|
|
|
|
|
|
|
|
|
|
|
|
|
|
|
|
|
|
|
|
|
|
|
|
|
Significant events
|
|
|
|
|
|
|
|
|
|
|
|
|
|
|
|
|
|
|
|
Group information |
|
|
Financial information
Group information
As a result of the Poland disposal and in accordance with IFRS 5 requirements, the business subject to the Poland disposal has been classified as 'non-current assets/liabilities held for sale' and the related results have been reported under 'discontinued operations'. Accordingly:
•In the Group’s consolidated balance sheet, the assets associated with the Poland disposal are classified under the 'non-current assets held for sale' line item and the related liabilities under 'liabilities associated with non-current assets held for sale'. This classification applies solely to balance sheets from 30 June 2025 onwards and does not affect balance sheets for prior periods. In the statutory income statement, the results associated with the business subject to the Poland disposal are reported under a single line in the consolidated income statement — 'profit/(loss) after tax from discontinued operations' — for results corresponding to both 2025 and 2024. Consequently, the results from the Poland disposal perimeter are excluded line by line from the breakdown of continuing operations in both periods.
•However, in the underlying income statement, both at the Group and the primary and secondary segment levels (which are presented on an underlying basis only), the results from Poland continue to be reported line by line and disaggregated, as they were in previous quarterly disclosures given the fact that the management of Santander Polska remains unchanged until the Poland disposal is completed. This reporting approach is consistent with the information used internally in management reporting, as well as with other public Group disclosures. For the same reason, all management metrics included in this report have been calculated including Poland, i.e. maintaining the same perimeter that existed at the time of the announcement of the Poland disposal.
•In this appendix, results are presented on an underlying basis and the balance sheet figures, ratios and other metrics include Poland, as they were in previous quarterly disclosures, i.e. maintaining the same perimeter as prior to the announcement of the Poland disposal. However, if we were to exclude Poland, the Group's main management ratios would not be materially affected.
For Argentina and any grouping which includes it, the variations in constant euros have been calculated considering the Argentine peso exchange rate on the last working day for each of the periods presented. For more information, see the calculation method detailed in the ‘
Alternative performance measures’ section in this appendix.
|
|
|
|
|
|
|
|
|
|
|
|
|
|
|
|
|
|
|
|
|
Underlying net fee income. Consolidated |
| EUR million |
|
|
|
|
|
|
|
Q3'25 |
Q2'25 |
Change (%) |
9M'25 |
9M'24 |
Change (%) |
| Fees from services |
1,914 |
|
1,908 |
|
0.3 |
5,694 |
|
5,368 |
|
6.1 |
| Wealth management and marketing of customer funds |
1,116 |
|
1,082 |
|
3.1 |
3,306 |
|
3,305 |
|
— |
| Securities and custody |
297 |
|
325 |
|
(8.6) |
1,011 |
|
993 |
|
1.8 |
| Net fee income |
3,327 |
|
3,315 |
|
0.4 |
10,011 |
|
9,666 |
|
3.6 |
|
|
|
|
|
|
|
|
|
|
|
|
|
|
|
|
|
|
|
|
|
Underlying operating expenses. Consolidated |
| EUR million |
|
|
|
|
|
|
|
Q3'25 |
Q2'25 |
Change (%) |
9M'25 |
9M'24 |
Change (%) |
| Staff costs |
3,461 |
|
3,449 |
|
0.3 |
10,442 |
|
10,558 |
|
(1.1) |
| Other general administrative expenses |
1,978 |
|
2,090 |
|
(5.4) |
6,171 |
|
6,234 |
|
(1.0) |
| Information technology |
675 |
|
556 |
|
21.4 |
1,849 |
|
1,931 |
|
(4.2) |
| Communications |
96 |
|
93 |
|
3.2 |
280 |
|
296 |
|
(5.4) |
| Advertising |
123 |
|
145 |
|
(15.2) |
404 |
|
400 |
|
1.0 |
| Buildings and premises |
138 |
|
232 |
|
(40.5) |
549 |
|
571 |
|
(3.9) |
| Printed and office material |
18 |
|
24 |
|
(25.0) |
61 |
|
65 |
|
(6.2) |
| Taxes (other than tax on profits) |
128 |
|
114 |
|
12.3 |
408 |
|
391 |
|
4.3 |
| Other expenses |
800 |
|
926 |
|
(13.6) |
2,620 |
|
2,580 |
|
1.6 |
| Administrative expenses |
5,439 |
|
5,539 |
|
(1.8) |
16,613 |
|
16,792 |
|
(1.1) |
| Depreciation and amortization |
829 |
|
837 |
|
(1.0) |
2,520 |
|
2,470 |
|
2.0 |
| Operating expenses |
6,268 |
|
6,376 |
|
(1.7) |
19,133 |
|
19,262 |
|
(0.7) |
|
|
|
|
|
|
|
|
|
January - September 2025 |
|
49 |
|
|
|
|
|
|
|
|
|
|
|
|
|
|
|
|
|
|
|
|
|
|
|
|
|
|
|
|
|
|
|
|
|
|
|
|
|
Significant events
|
|
|
|
|
|
|
|
|
|
|
|
|
|
|
|
|
|
|
|
Group information |
|
|
|
|
|
|
|
|
|
|
|
|
|
|
|
|
|
|
|
|
|
|
|
|
|
|
|
|
|
Operating means. Consolidated |
|
Employees |
|
|
Branches |
|
Sep-25 |
Dec-24 |
Change |
|
|
Sep-25 |
Sep-24 |
Change |
| Retail & Commercial Banking |
125,615 |
|
131,653 |
|
(6,038) |
|
|
Spain |
1,684 |
|
1,832 |
|
(148) |
|
| Digital Consumer Bank |
31,463 |
|
29,903 |
|
1,560 |
|
|
United Kingdom |
368 |
|
444 |
|
(76) |
|
| Corporate & Investment Banking |
13,724 |
|
13,385 |
|
339 |
|
|
Portugal |
373 |
|
375 |
|
(2) |
|
| Wealth Management & Insurance |
7,606 |
|
7,707 |
|
(101) |
|
|
Poland |
360 |
|
374 |
|
(14) |
|
| Payments |
21,004 |
|
22,280 |
|
(1,276) |
|
|
DCB Europe |
299 |
|
326 |
|
(27) |
|
| Corporate Centre |
1,892 |
|
1,825 |
|
67 |
|
|
US |
384 |
|
408 |
|
(24) |
|
| Total Group |
201,304 |
206,753 |
(5,449) |
|
Mexico |
1,329 |
|
1,354 |
|
(25) |
|
|
|
|
|
|
Brazil |
1,724 |
|
2,313 |
|
(589) |
|
|
|
|
|
|
Chile |
231 |
|
235 |
|
(4) |
|
|
|
|
|
|
Argentina |
396 |
|
407 |
|
(11) |
|
|
|
|
|
|
Rest of the Group |
241 |
|
138 |
|
103 |
|
|
|
|
|
|
Total Group |
7,389 |
8,206 |
(817) |
|
|
|
|
|
|
|
|
|
|
|
|
|
|
|
|
|
|
|
|
|
|
|
|
|
|
|
Underlying net loan-loss provisions. Consolidated |
| EUR million |
|
|
|
|
|
|
|
Q3'25 |
Q2'25 |
Change (%) |
9M'25 |
9M'24 |
Change (%) |
|
|
|
|
|
|
|
| Non-performing loans |
3,389 |
|
3,496 |
|
(3.1) |
10,416 |
|
10,415 |
|
— |
| Country-risk |
0 |
|
(1) |
|
(70.0) |
|
(2) |
|
(1) |
|
130.0 |
|
| Recovery of written-off assets |
(458) |
|
(478) |
|
(4.2) |
(1,305) |
|
(1,195) |
|
9.2 |
|
|
|
|
|
|
|
| Net loan-loss provisions |
2,931 |
|
3,017 |
|
(2.9) |
9,109 |
|
9,219 |
|
(1.2) |
|
|
|
|
|
|
|
|
|
|
|
|
|
|
|
|
|
|
Loans and advances to customers. Consolidated |
| EUR million |
|
|
|
|
|
|
|
|
Change |
|
|
Sep-25 |
Sep-24 |
Absolute |
% |
Dec-24 |
| Commercial bills |
48,757 |
|
50,448 |
|
(1,691) |
|
(3.4) |
53,209 |
|
| Secured loans |
549,079 |
|
557,728 |
|
(8,649) |
|
(1.6) |
557,463 |
|
| Other term loans |
299,229 |
|
297,421 |
|
1,808 |
|
0.6 |
296,339 |
|
| Finance leases |
40,891 |
|
39,926 |
|
965 |
|
2.4 |
40,120 |
|
| Receivable on demand |
11,185 |
|
10,401 |
|
784 |
|
7.5 |
10,756 |
|
| Credit cards receivable |
25,316 |
|
23,100 |
|
2,216 |
|
9.6 |
24,928 |
|
| Impaired assets |
32,521 |
|
34,121 |
|
(1,600) |
|
(4.7) |
33,731 |
|
| Gross loans and advances to customers (excl. reverse repos) |
1,006,978 |
|
1,013,145 |
|
(6,167) |
|
(0.6) |
1,016,546 |
|
| Reverse repos |
80,495 |
|
76,296 |
|
4,199 |
|
5.5 |
59,648 |
|
| Gross loans and advances to customers |
1,087,473 |
|
1,089,441 |
|
(1,968) |
|
(0.2) |
1,076,194 |
|
| Loan-loss allowances |
22,179 |
|
22,022 |
|
157 |
|
0.7 |
22,125 |
|
| Loans and advances to customers |
1,065,294 |
|
1,067,419 |
|
(2,125) |
|
(0.2) |
1,054,069 |
|
|
|
|
|
|
|
|
|
|
50 |
|
January - September 2025 |
|
|
|
|
|
|
|
|
|
|
|
|
|
|
|
|
|
|
|
|
|
|
|
|
|
|
|
|
|
|
|
|
|
|
|
|
|
Significant events
|
|
|
|
|
|
|
|
|
|
|
|
|
|
|
|
|
|
|
|
Group information |
|
|
|
|
|
|
|
|
|
|
|
|
|
|
|
|
|
|
|
|
Total funds. Consolidated |
| EUR million |
|
|
|
|
|
|
|
|
Change |
|
|
Sep-25 |
Sep-24 |
Absolute |
% |
Dec-24 |
| Demand deposits |
667,027 |
|
653,640 |
|
13,387 |
|
2.0 |
677,818 |
|
| Time deposits |
306,121 |
|
295,969 |
|
10,152 |
|
3.4 |
299,801 |
|
| Mutual funds |
257,063 |
|
224,602 |
|
32,461 |
|
14.5 |
233,722 |
|
| Customer funds |
1,230,211 |
|
1,174,211 |
|
56,000 |
|
4.8 |
1,211,341 |
|
| Pension funds |
15,927 |
|
15,502 |
|
425 |
|
2.7 |
15,646 |
|
| Managed portfolios |
47,892 |
|
41,293 |
|
6,599 |
|
16.0 |
43,118 |
|
| Repos |
104,737 |
|
96,302 |
|
8,435 |
|
8.8 |
78,317 |
|
| Total funds |
1,398,767 |
|
1,327,308 |
|
71,459 |
|
5.4 |
1,348,422 |
|
|
|
|
|
|
|
|
|
|
|
|
|
|
|
|
|
|
|
Eligible capital (phased-in)1. Consolidated |
| EUR million |
|
|
|
|
|
|
|
|
Change |
|
|
Sep-25 |
Sep-24 |
Absolute |
% |
Dec-24 |
| Capital stock and reserves |
130,941 |
|
126,083 |
|
4,858 |
|
3.9 |
124,263 |
|
| Attributable profit |
10,337 |
|
9,309 |
|
1,028 |
|
11.0 |
12,574 |
|
| Dividends |
(2,584) |
|
(2,327) |
|
(257) |
|
11.0 |
(3,144) |
|
| Other retained earnings |
(40,381) |
|
(39,349) |
|
(1,032) |
|
2.6 |
(38,323) |
|
| Minority interests |
8,589 |
|
7,940 |
|
648 |
|
8.2 |
8,479 |
|
| Goodwill and intangible assets |
(15,522) |
|
(16,595) |
|
1,073 |
|
(6.5) |
(15,957) |
|
| Other deductions |
(8,787) |
|
(6,909) |
|
(1,878) |
|
27.2 |
(8,092) |
|
| CET1 |
82,593 |
|
78,152 |
|
4,441 |
|
5.7 |
79,800 |
|
| Preferred shares and other eligible tier 1 |
10,630 |
|
10,091 |
|
539 |
|
5.3 |
10,371 |
|
| Tier 1 |
93,222 |
|
88,242 |
|
4,980 |
|
5.6 |
90,170 |
|
| Generic funds and eligible tier 2 instruments |
16,719 |
|
18,542 |
|
(1,823) |
|
(9.8) |
18,418 |
|
| Eligible capital |
109,941 |
|
106,784 |
|
3,157 |
|
3.0 |
108,589 |
|
| Risk-weighted assets |
630,753 |
|
626,099 |
|
4,654 |
|
0.7 |
624,503 |
|
|
|
|
|
|
|
| CET1 capital ratio |
13.1 |
12.5 |
0.6 |
|
12.8 |
| Tier 1 capital ratio |
14.8 |
14.1 |
0.7 |
|
14.4 |
| Total capital ratio |
17.4 |
17.1 |
0.4 |
|
17.4 |
1. Phased-in ratios are calculated in accordance with the transitory treatment of the CRR. For 2024 data, the transitional treatment of IFRS 9 also applies.
|
|
|
|
|
|
|
|
|
January - September 2025 |
|
51 |
|
|
|
|
|
|
|
|
|
|
|
|
|
|
|
|
|
|
|
|
|
|
|
|
|
|
|
|
|
|
|
|
|
|
|
|
|
Significant events
|
|
|
|
|
|
|
|
|
|
|
|
|
|
|
|
|
|
|
|
Information by segment |
|
|
Segments information
|
|
|
|
|
|
|
|
|
|
|
|
|
|
|
|
|
|
|
|
|
|
|
|
| RETAIL & COMMERCIAL BANKING |
|
| EUR million |
|
|
|
|
|
|
|
|
/ |
Q2'25 |
|
|
/ |
9M'24 |
| Underlying income statement |
Q3'25 |
% |
% excl. FX |
|
9M'25 |
% |
% excl. FX |
| Net interest income |
6,431 |
|
(2.8) |
|
(2.5) |
|
|
19,770 |
|
(5.0) |
|
(1.0) |
|
| Net fee income |
1,133 |
|
(4.6) |
|
(4.7) |
|
|
3,529 |
|
(0.4) |
|
5.4 |
|
Gains (losses) on financial transactions 1 |
172 |
|
34.2 |
|
33.3 |
|
|
472 |
|
(11.7) |
|
(10.4) |
|
| Other operating income |
(108) |
|
(7.8) |
|
(9.0) |
|
|
(434) |
|
(34.6) |
|
(32.7) |
|
| Total income |
7,627 |
|
(2.4) |
|
(2.2) |
|
|
23,337 |
|
(3.6) |
|
0.6 |
|
| Administrative expenses and amortizations |
(2,971) |
|
(3.4) |
|
(3.0) |
|
|
(9,159) |
|
(3.2) |
|
1.3 |
|
| Net operating income |
4,655 |
|
(1.8) |
|
(1.6) |
|
|
14,178 |
|
(3.9) |
|
0.1 |
|
| Net loan-loss provisions |
(1,275) |
|
(8.8) |
|
(8.9) |
|
|
(4,105) |
|
(7.9) |
|
(1.2) |
|
| Other gains (losses) and provisions |
(492) |
|
(29.4) |
|
(28.8) |
|
|
(1,717) |
|
(16.0) |
|
(13.5) |
|
| Profit before tax |
2,888 |
|
9.2 |
|
9.4 |
|
|
8,356 |
|
1.3 |
|
4.2 |
|
| Tax on profit |
(717) |
|
1.9 |
|
1.8 |
|
|
(2,179) |
|
(11.9) |
|
(9.6) |
|
| Profit from continuing operations |
2,171 |
|
11.8 |
|
12.1 |
|
|
6,176 |
|
6.9 |
|
10.2 |
|
| Net profit from discontinued operations |
— |
|
— |
|
— |
|
|
— |
|
— |
|
— |
|
| Consolidated profit |
2,171 |
|
11.8 |
|
12.1 |
|
|
6,176 |
|
6.9 |
|
10.2 |
|
| Non-controlling interests |
(187) |
|
20.1 |
|
21.2 |
|
|
(506) |
|
29.4 |
|
31.7 |
|
| Underlying attributable profit to the parent |
1,984 |
|
11.1 |
|
11.3 |
|
|
5,670 |
|
5.3 |
|
8.6 |
|
|
| Balance sheet and activity metrics |
|
|
|
|
|
|
|
| Loans and advances to customers |
601,039 |
|
0.2 |
|
0.7 |
|
|
601,039 |
|
(3.0) |
|
(0.2) |
|
| Customer deposits |
657,109 |
|
0.5 |
|
0.8 |
|
|
657,109 |
|
1.0 |
|
3.3 |
|
|
|
|
|
|
|
|
|
| Memorandum items: |
|
|
|
|
|
|
|
| Gross loans and advances to customers ² |
596,855 |
|
(0.4) |
|
0.0 |
|
|
596,855 |
|
(2.8) |
|
0.0 |
|
| Customer funds |
759,201 |
|
1.5 |
|
1.7 |
|
|
759,201 |
|
3.5 |
|
5.7 |
|
| Customer deposits ³ |
647,291 |
|
0.7 |
|
1.0 |
|
|
647,291 |
|
1.5 |
|
3.7 |
|
| Mutual funds |
111,910 |
|
6.2 |
|
5.7 |
|
|
111,910 |
|
17.0 |
|
19.0 |
|
| Risk-weighted assets |
296,255 |
|
0.1 |
|
|
|
296,255 |
|
1.4 |
|
|
|
| Ratios (%) and customers |
|
|
|
|
|
|
|
| RoTE |
19.1 |
|
1.6 |
|
|
|
18.3 |
|
(0.5) |
|
|
| RoTE (post-AT1) |
18.4 |
|
1.6 |
|
|
|
17.6 |
|
(0.5) |
|
|
| Efficiency ratio |
39.0 |
|
(0.4) |
|
|
|
39.2 |
|
0.2 |
|
|
| NPL ratio |
3.00 |
|
(0.06) |
|
|
|
3.00 |
|
(0.27) |
|
|
| NPL coverage ratio |
62 |
|
2 |
|
|
|
62 |
|
4 |
|
|
| Number of employees |
125,615 |
|
(2.2) |
|
|
|
125,615 |
|
|
|
|
|
|
|
|
|
|
|
| Number of total customers (thousands) |
151,824 |
|
1.1 |
|
|
|
151,824 |
|
4.4 |
|
|
| Number of active customers (thousands) |
80,614 |
|
0.8 |
|
|
|
80,614 |
|
3.2 |
|
|
|
|
|
| 1. Includes exchange differences. |
| 2. Excluding reverse repos. |
| 3. Excluding repos. |
|
|
|
|
|
|
|
|
|
|
|
52 |
|
January - September 2025 |
|
|
|
|
|
|
|
|
|
|
|
|
|
|
|
|
|
|
|
|
|
|
|
|
|
|
|
|
|
|
|
|
|
|
|
|
|
Significant events
|
|
|
|
|
|
|
|
|
|
|
|
|
|
|
|
|
|
|
|
Information by segment |
|
|
|
|
|
|
|
|
|
|
|
|
|
|
|
|
|
|
|
|
| Retail Spain |
|
|
|
|
|
| EUR million |
|
|
|
|
|
|
/ Q2'25 |
|
|
/ 9M'24 |
| Underlying income statement |
Q3'25 |
% |
|
9M'25 |
% |
| Net interest income |
1,443 |
|
(0.4) |
|
|
4,357 |
|
(1.8) |
|
| Net fee income |
259 |
|
(3.8) |
|
|
819 |
|
(1.3) |
|
|
|
|
|
|
|
|
|
|
|
|
|
| Total income |
1,739 |
|
(1.6) |
|
|
5,299 |
|
(1.8) |
|
| Administrative expenses and amortizations |
(558) |
|
(1.6) |
|
|
(1,696) |
|
0.5 |
|
| Net operating income |
1,181 |
|
(1.6) |
|
|
3,603 |
|
(2.9) |
|
| Net loan-loss provisions |
(230) |
|
(5.7) |
|
|
(765) |
|
(4.4) |
|
|
|
|
|
|
|
| Profit before tax |
801 |
|
(4.3) |
|
|
2,447 |
|
10.0 |
|
|
|
|
|
|
|
|
|
|
|
|
|
|
|
|
|
|
|
|
|
|
|
|
|
|
|
|
|
|
|
|
|
|
|
|
|
|
| Balance sheet and activity metrics |
|
|
|
|
|
| Loans and advances to customers |
152,424 |
|
(2.1) |
|
|
152,424 |
|
(1.5) |
|
| Customer deposits |
228,019 |
|
1.6 |
|
|
228,019 |
|
5.0 |
|
|
|
|
|
|
|
| Memorandum items: |
|
|
|
|
|
Gross loans and advances to customers 1 |
155,248 |
|
(2.1) |
|
|
155,248 |
|
(1.9) |
|
| Customer funds |
276,741 |
|
2.0 |
|
|
276,741 |
|
6.5 |
|
Customer deposits 2 |
228,019 |
|
1.6 |
|
|
228,019 |
|
5.0 |
|
| Mutual funds |
48,722 |
|
3.9 |
|
|
48,722 |
|
14.2 |
|
|
|
|
|
|
|
|
|
|
|
|
|
|
|
|
|
|
|
|
|
|
|
|
|
|
|
|
|
|
|
|
|
|
|
|
|
|
|
|
|
|
|
|
|
|
|
|
|
|
|
|
|
|
|
|
|
|
|
|
|
|
|
|
|
|
| 1. Excluding reverse repos. |
| 2. Excluding repos. |
|
|
|
|
|
|
|
|
|
|
|
January - September 2025 |
|
53 |
|
|
|
|
|
|
|
|
|
|
|
|
|
|
|
|
|
|
|
|
|
|
|
|
|
|
|
|
|
|
|
|
|
|
|
|
|
Significant events
|
|
|
|
|
|
|
|
|
|
|
|
|
|
|
|
|
|
|
|
Information by segment |
|
|
|
|
|
|
|
|
|
|
|
|
|
|
|
|
|
|
|
|
|
|
|
|
|
|
| Retail UK |
|
| EUR million |
|
|
|
|
|
|
|
|
/ |
Q2'25 |
|
|
/ |
9M'24 |
| Underlying income statement |
Q3'25 |
% |
% excl. FX |
|
9M'25 |
% |
% excl. FX |
| Net interest income |
1,152 |
|
(1.9) |
|
0.2 |
|
|
3,550 |
|
3.3 |
|
3.2 |
|
| Net fee income |
9 |
|
293.1 |
|
293.1 |
|
|
16 |
|
— |
|
— |
|
|
|
|
|
|
|
|
|
|
|
|
|
|
|
|
|
| Total income |
1,146 |
|
(0.3) |
|
1.8 |
|
|
3,485 |
|
2.0 |
|
1.9 |
|
| Administrative expenses and amortizations |
(593) |
|
(5.6) |
|
(3.5) |
|
|
(1,860) |
|
(3.5) |
|
(3.5) |
|
| Net operating income |
553 |
|
6.1 |
|
8.2 |
|
|
1,625 |
|
9.0 |
|
8.9 |
|
| Net loan-loss provisions |
5 |
|
— |
|
— |
|
|
(76) |
|
106.8 |
|
106.6 |
|
|
|
|
|
|
|
|
|
| Profit before tax |
488 |
|
48.0 |
|
50.2 |
|
|
1,166 |
|
(4.2) |
|
(4.3) |
|
|
|
|
|
|
|
|
|
|
|
|
|
|
|
|
|
|
|
|
|
|
|
|
|
|
|
|
|
|
|
|
|
|
|
|
|
|
|
|
|
|
|
|
|
|
|
|
|
|
| Balance sheet and activity metrics |
|
|
|
|
|
|
|
| Loans and advances to customers |
234,666 |
|
0.6 |
|
2.4 |
|
|
234,666 |
|
(5.5) |
|
(0.9) |
|
| Customer deposits |
211,062 |
|
(0.7) |
|
1.0 |
|
|
211,062 |
|
(5.4) |
|
(0.8) |
|
|
|
|
|
|
|
|
|
| Memorandum items: |
|
|
|
|
|
|
|
Gross loans and advances to customers 1 |
219,930 |
|
(1.2) |
|
0.6 |
|
|
219,930 |
|
(5.1) |
|
(0.4) |
|
| Customer funds |
211,793 |
|
(0.2) |
|
1.6 |
|
|
211,793 |
|
(3.7) |
|
1.0 |
|
Customer deposits 2 |
205,873 |
|
(0.2) |
|
1.6 |
|
|
205,873 |
|
(3.7) |
|
1.0 |
|
| Mutual funds |
5,920 |
|
0.5 |
|
2.3 |
|
|
5,920 |
|
(3.4) |
|
1.3 |
|
|
|
|
|
|
|
|
|
|
|
|
|
|
|
|
|
|
|
|
|
|
|
|
|
|
|
|
|
|
|
|
|
|
|
|
|
|
|
|
|
|
|
|
|
|
|
|
|
|
|
|
|
|
|
|
|
|
|
|
|
|
|
|
|
|
|
|
|
|
|
|
|
|
|
|
|
|
|
|
|
|
|
|
|
|
| 1. Excluding reverse repos. |
| 2. Excluding repos. |
|
|
|
|
|
|
|
|
|
|
|
54 |
|
January - September 2025 |
|
|
|
|
|
|
|
|
|
|
|
|
|
|
|
|
|
|
|
|
|
|
|
|
|
|
|
|
|
|
|
|
|
|
|
|
|
Significant events
|
|
|
|
|
|
|
|
|
|
|
|
|
|
|
|
|
|
|
|
Information by segment |
|
|
|
|
|
|
|
|
|
|
|
|
|
|
|
|
|
|
|
|
|
|
|
|
|
|
| Retail Mexico |
|
| EUR million |
|
|
|
|
|
|
|
|
/ |
Q2'25 |
|
|
/ |
9M'24 |
| Underlying income statement |
Q3'25 |
% |
% excl. FX |
|
9M'25 |
% |
% excl. FX |
| Net interest income |
762 |
|
3.6 |
|
2.0 |
|
|
2,253 |
|
(4.9) |
|
7.9 |
|
| Net fee income |
179 |
|
1.1 |
|
(0.4) |
|
|
527 |
|
(3.1) |
|
9.9 |
|
|
|
|
|
|
|
|
|
|
|
|
|
|
|
|
|
| Total income |
932 |
|
4.6 |
|
3.0 |
|
|
2,719 |
|
(5.5) |
|
7.2 |
|
| Administrative expenses and amortizations |
(405) |
|
3.9 |
|
2.3 |
|
|
(1,191) |
|
(7.7) |
|
4.7 |
|
| Net operating income |
528 |
|
5.2 |
|
3.6 |
|
|
1,528 |
|
(3.6) |
|
9.3 |
|
| Net loan-loss provisions |
(176) |
|
17.0 |
|
15.4 |
|
|
(461) |
|
(17.5) |
|
(6.4) |
|
|
|
|
|
|
|
|
|
| Profit before tax |
338 |
|
1.1 |
|
(0.5) |
|
|
1,016 |
|
1.8 |
|
15.5 |
|
|
|
|
|
|
|
|
|
|
|
|
|
|
|
|
|
|
|
|
|
|
|
|
|
|
|
|
|
|
|
|
|
|
|
|
|
|
|
|
|
|
|
|
|
|
|
|
|
|
| Balance sheet and activity metrics |
|
|
|
|
|
|
|
| Loans and advances to customers |
31,738 |
|
4.3 |
|
1.3 |
|
|
31,738 |
|
5.4 |
|
3.7 |
|
| Customer deposits |
38,129 |
|
1.1 |
|
(1.8) |
|
|
38,129 |
|
9.7 |
|
7.9 |
|
|
|
|
|
|
|
|
|
| Memorandum items: |
|
|
|
|
|
|
|
Gross loans and advances to customers 1 |
32,546 |
|
4.4 |
|
1.4 |
|
|
32,546 |
|
5.3 |
|
3.6 |
|
| Customer funds |
51,142 |
|
4.2 |
|
1.2 |
|
|
51,142 |
|
11.3 |
|
9.5 |
|
Customer deposits 2 |
35,905 |
|
2.5 |
|
(0.4) |
|
|
35,905 |
|
7.2 |
|
5.4 |
|
| Mutual funds |
15,237 |
|
8.4 |
|
5.3 |
|
|
15,237 |
|
22.4 |
|
20.4 |
|
|
|
|
|
|
|
|
|
|
|
|
|
|
|
|
|
|
|
|
|
|
|
|
|
|
|
|
|
|
|
|
|
|
|
|
|
|
|
|
|
|
|
|
|
|
|
|
|
|
|
|
|
|
|
|
|
|
|
|
|
|
|
|
|
|
|
|
|
|
|
|
|
|
|
|
|
|
|
|
|
|
|
|
|
|
| 1. Excluding reverse repos. |
| 2. Excluding repos. |
|
|
|
|
|
|
|
|
|
|
|
January - September 2025 |
|
55 |
|
|
|
|
|
|
|
|
|
|
|
|
|
|
|
|
|
|
|
|
|
|
|
|
|
|
|
|
|
|
|
|
|
|
|
|
|
Significant events
|
|
|
|
|
|
|
|
|
|
|
|
|
|
|
|
|
|
|
|
Information by segment |
|
|
|
|
|
|
|
|
|
|
|
|
|
|
|
|
|
|
|
|
|
|
|
|
|
|
| Retail Brazil |
|
| EUR million |
|
|
|
|
|
|
|
|
/ |
Q2'25 |
|
|
/ |
9M'24 |
| Underlying income statement |
Q3'25 |
% |
% excl. FX |
|
9M'25 |
% |
% excl. FX |
| Net interest income |
1,452 |
|
(3.3) |
|
(4.1) |
|
|
4,489 |
|
(13.6) |
|
(4.0) |
|
| Net fee income |
314 |
|
(5.6) |
|
(6.4) |
|
|
1,006 |
|
(14.9) |
|
(5.5) |
|
|
|
|
|
|
|
|
|
|
|
|
|
|
|
|
|
| Total income |
1,719 |
|
(3.3) |
|
(4.2) |
|
|
5,376 |
|
(14.3) |
|
(4.8) |
|
| Administrative expenses and amortizations |
(709) |
|
(2.1) |
|
(3.0) |
|
|
(2,193) |
|
(8.2) |
|
2.0 |
|
| Net operating income |
1,011 |
|
(4.2) |
|
(5.0) |
|
|
3,183 |
|
(18.0) |
|
(8.9) |
|
| Net loan-loss provisions |
(603) |
|
(15.4) |
|
(15.9) |
|
|
(2,034) |
|
(9.3) |
|
0.7 |
|
|
|
|
|
|
|
|
|
| Profit before tax |
244 |
|
57.1 |
|
54.0 |
|
|
633 |
|
(40.5) |
|
(33.9) |
|
|
|
|
|
|
|
|
|
|
|
|
|
|
|
|
|
|
|
|
|
|
|
|
|
|
|
|
|
|
|
|
|
|
|
|
|
|
|
|
|
|
|
|
|
|
|
|
|
|
| Balance sheet and activity metrics |
|
|
|
|
|
|
|
| Loans and advances to customers |
51,998 |
|
5.1 |
|
2.6 |
|
|
51,998 |
|
(6.4) |
|
(3.7) |
|
| Customer deposits |
59,182 |
|
5.2 |
|
2.7 |
|
|
59,182 |
|
4.9 |
|
8.0 |
|
|
|
|
|
|
|
|
|
| Memorandum items: |
|
|
|
|
|
|
|
Gross loans and advances to customers 1 |
55,853 |
|
5.0 |
|
2.5 |
|
|
55,853 |
|
(5.6) |
|
(2.9) |
|
| Customer funds |
80,842 |
|
7.3 |
|
4.7 |
|
|
80,842 |
|
7.3 |
|
10.5 |
|
Customer deposits 2 |
58,012 |
|
5.0 |
|
2.5 |
|
|
58,012 |
|
5.7 |
|
8.8 |
|
| Mutual funds |
22,831 |
|
13.7 |
|
11.0 |
|
|
22,831 |
|
11.7 |
|
14.9 |
|
|
|
|
|
|
|
|
|
|
|
|
|
|
|
|
|
|
|
|
|
|
|
|
|
|
|
|
|
|
|
|
|
|
|
|
|
|
|
|
|
|
|
|
|
|
|
|
|
|
|
|
|
|
|
|
|
|
|
|
|
|
|
|
|
|
|
|
|
|
|
|
|
|
|
|
|
|
|
|
|
|
|
|
|
|
| 1. Excluding reverse repos. |
| 2. Excluding repos. |
|
|
|
|
|
|
|
|
|
|
|
56 |
|
January - September 2025 |
|
|
|
|
|
|
|
|
|
|
|
|
|
|
|
|
|
|
|
|
|
|
|
|
|
|
|
|
|
|
|
|
|
|
|
|
|
Significant events
|
|
|
|
|
|
|
|
|
|
|
|
|
|
|
|
|
|
|
|
Information by segment |
|
|
|
|
|
|
|
|
|
|
|
|
|
|
|
|
|
|
|
|
|
|
|
|
|
|
| DIGITAL CONSUMER BANK |
|
| EUR million |
|
|
|
|
|
|
|
|
/ |
Q2'25 |
|
|
/ |
9M'24 |
| Underlying income statement |
Q3'25 |
% |
% excl. FX |
|
9M'25 |
% |
% excl. FX |
| Net interest income |
2,763 |
|
0.6 |
|
1.9 |
|
|
8,267 |
|
3.6 |
|
6.2 |
|
| Net fee income |
380 |
|
11.3 |
|
12.0 |
|
|
1,060 |
|
(4.9) |
|
(2.4) |
|
Gains (losses) on financial transactions 1 |
(19) |
|
8.0 |
|
8.3 |
|
|
(43) |
|
— |
|
— |
|
| Other operating income |
118 |
|
(1.9) |
|
(0.1) |
|
|
382 |
|
(18.4) |
|
(17.4) |
|
| Total income |
3,242 |
|
1.6 |
|
2.9 |
|
|
9,667 |
|
0.9 |
|
3.4 |
|
| Administrative expenses and amortizations |
(1,285) |
|
(1.7) |
|
(0.4) |
|
|
(3,950) |
|
1.4 |
|
3.2 |
|
| Net operating income |
1,957 |
|
3.9 |
|
5.2 |
|
|
5,717 |
|
0.5 |
|
3.5 |
|
| Net loan-loss provisions |
(1,069) |
|
11.8 |
|
13.0 |
|
|
(3,144) |
|
(5.1) |
|
(1.9) |
|
| Other gains (losses) and provisions |
(91) |
|
(37.2) |
|
(36.5) |
|
|
(321) |
|
(21.5) |
|
(20.0) |
|
| Profit before tax |
796 |
|
1.9 |
|
3.3 |
|
|
2,251 |
|
14.7 |
|
17.4 |
|
| Tax on profit |
(176) |
|
9.0 |
|
9.5 |
|
|
(454) |
|
80.5 |
|
85.4 |
|
| Profit from continuing operations |
620 |
|
— |
|
1.7 |
|
|
1,797 |
|
5.0 |
|
7.4 |
|
| Net profit from discontinued operations |
— |
|
— |
|
— |
|
|
— |
|
— |
|
— |
|
| Consolidated profit |
620 |
|
— |
|
1.7 |
|
|
1,797 |
|
5.0 |
|
7.4 |
|
| Non-controlling interests |
(101) |
|
47.1 |
|
47.3 |
|
|
(237) |
|
15.0 |
|
16.1 |
|
| Underlying attributable profit to the parent |
518 |
|
(5.9) |
|
(4.0) |
|
|
1,561 |
|
3.6 |
|
6.2 |
|
|
| Balance sheet and activity metrics |
|
|
|
|
|
|
|
| Loans and advances to customers |
203,017 |
|
0.0 |
|
(0.2) |
|
|
203,017 |
|
0.3 |
|
2.0 |
|
| Customer deposits |
127,161 |
|
(2.2) |
|
(2.3) |
|
|
127,161 |
|
3.5 |
|
5.3 |
|
|
|
|
|
|
|
|
|
| Memorandum items: |
|
|
|
|
|
|
|
| Gross loans and advances to customers ² |
211,130 |
|
0.0 |
|
(0.2) |
|
|
211,130 |
|
0.5 |
|
2.3 |
|
| Customer funds |
136,078 |
|
(1.6) |
|
(1.7) |
|
|
136,078 |
|
4.2 |
|
6.0 |
|
| Customer deposits ³ |
127,123 |
|
(2.2) |
|
(2.3) |
|
|
127,123 |
|
3.5 |
|
5.3 |
|
| Mutual funds |
8,955 |
|
7.2 |
|
7.1 |
|
|
8,955 |
|
14.6 |
|
17.1 |
|
| Risk-weighted assets |
156,565 |
|
0.5 |
|
|
|
156,565 |
|
3.0 |
|
|
|
| Ratios (%) and customers |
|
|
|
|
|
|
|
| RoTE |
11.1 |
|
(0.8) |
|
|
|
11.2 |
|
(0.8) |
|
|
| RoTE (post-AT1) |
10.3 |
|
(0.8) |
|
|
|
10.4 |
|
(0.7) |
|
|
| Efficiency ratio |
39.6 |
|
(1.3) |
|
|
|
40.9 |
|
0.2 |
|
|
| NPL ratio |
5.29 |
|
0.32 |
|
|
|
5.29 |
|
0.39 |
|
|
| NPL coverage ratio |
73 |
|
(4) |
|
|
|
73 |
|
(2) |
|
|
| Number of employees |
31,463 |
|
0.4 |
|
|
|
31,463 |
|
|
|
| Number of total customers (thousands) |
26,179 |
|
1.2 |
|
|
|
26,179 |
|
4.2 |
|
|
|
|
|
|
|
|
|
|
|
|
|
|
|
|
|
|
|
|
|
| 1. Includes exchange differences. |
| 2. Excluding reverse repos. |
| 3. Excluding repos. |
|
|
|
|
|
|
|
|
|
|
January - September 2025 |
|
57 |
|
|
|
|
|
|
|
|
|
|
|
|
|
|
|
|
|
|
|
|
|
|
|
|
|
|
|
|
|
|
|
|
|
|
|
|
|
Significant events
|
|
|
|
|
|
|
|
|
|
|
|
|
|
|
|
|
|
|
|
Information by segment |
|
|
|
|
|
|
|
|
|
|
|
|
|
|
|
|
|
|
|
|
|
|
|
|
|
|
|
| DCB EUROPE |
|
|
| EUR million |
|
|
|
|
|
|
|
|
|
/ |
Q2'25 |
|
|
/ |
9M'24 |
|
| Underlying income statement |
Q3'25 |
% |
% excl. FX |
|
9M'25 |
% |
% excl. FX |
|
| Net interest income |
1,207 |
|
4.5 |
|
4.7 |
|
|
3,473 |
|
6.7 |
|
6.8 |
|
|
| Net fee income |
198 |
|
7.3 |
|
7.4 |
|
|
571 |
|
(16.1) |
|
(16.1) |
|
|
|
|
|
|
|
|
|
|
|
|
|
|
|
|
|
|
|
|
| Total income |
1,504 |
|
5.6 |
|
5.8 |
|
|
4,330 |
|
1.8 |
|
1.9 |
|
|
| Administrative expenses and amortizations |
(652) |
|
(1.2) |
|
(1.0) |
|
|
(1,978) |
|
0.1 |
|
0.2 |
|
|
| Net operating income |
852 |
|
11.4 |
|
11.6 |
|
|
2,352 |
|
3.3 |
|
3.4 |
|
|
| Net loan-loss provisions |
(307) |
|
8.4 |
|
8.5 |
|
|
(926) |
|
7.3 |
|
7.4 |
|
|
|
|
|
|
|
|
|
|
|
| Profit before tax |
485 |
|
30.9 |
|
31.3 |
|
|
1,212 |
|
4.6 |
|
4.8 |
|
|
|
|
|
|
|
|
|
|
|
|
|
|
|
|
|
|
|
|
|
|
|
|
|
|
|
|
|
|
|
|
|
|
|
|
|
|
|
|
|
|
|
|
|
|
|
|
|
|
|
|
|
|
|
|
|
|
|
|
|
|
|
|
|
| Balance sheet and activity metrics |
|
|
|
|
|
|
|
|
| Loans and advances to customers |
138,021 |
|
(0.9) |
|
(0.9) |
|
|
138,021 |
|
1.9 |
|
2.3 |
|
|
|
|
|
|
|
|
|
|
|
|
|
|
|
|
|
|
|
|
|
|
|
|
|
|
|
|
|
|
|
|
|
|
|
|
|
|
|
|
|
|
|
|
|
|
|
| Customer deposits |
81,558 |
|
(2.9) |
|
(3.0) |
|
|
81,558 |
|
2.0 |
|
2.0 |
|
|
|
|
|
|
|
|
|
|
|
|
|
|
|
|
|
|
|
|
|
|
|
|
|
|
|
|
|
|
|
|
|
|
|
|
|
|
|
|
|
|
|
|
|
|
|
|
|
|
|
|
|
|
|
|
|
|
|
|
|
|
|
|
|
| Memorandum items: |
|
|
|
|
|
|
|
|
Gross loans and advances to customers 1 |
141,162 |
|
(0.8) |
|
(0.8) |
|
|
141,162 |
|
2.1 |
|
2.5 |
|
|
| Customer funds |
86,657 |
|
(2.4) |
|
(2.5) |
|
|
86,657 |
|
2.7 |
|
2.7 |
|
|
Customer deposits 2 |
81,558 |
|
(2.9) |
|
(3.0) |
|
|
81,558 |
|
2.0 |
|
2.0 |
|
|
| Mutual funds |
5,099 |
|
6.9 |
|
6.9 |
|
|
5,099 |
|
16.0 |
|
16.0 |
|
|
|
|
|
|
|
|
|
|
|
|
|
|
|
|
|
|
|
|
|
|
|
|
|
|
|
|
|
|
|
|
|
|
|
|
|
|
|
|
|
|
|
|
|
|
|
|
|
|
|
|
|
|
|
|
|
|
|
|
|
|
|
|
|
|
|
|
|
|
|
|
|
|
|
|
|
|
|
|
|
|
|
|
|
|
|
|
|
|
|
|
|
|
|
|
|
|
|
|
|
1. Excluding reverse repos.
2. Excluding repos.
|
|
|
|
|
|
|
|
|
58 |
|
January - September 2025 |
|
|
|
|
|
|
|
|
|
|
|
|
|
|
|
|
|
|
|
|
|
|
|
|
|
|
|
|
|
|
|
|
|
|
|
|
|
Significant events
|
|
|
|
|
|
|
|
|
|
|
|
|
|
|
|
|
|
|
|
Information by segment |
|
|
|
|
|
|
|
|
|
|
|
|
|
|
|
|
|
|
|
|
|
|
|
|
|
|
| DCB US |
|
| EUR million |
|
|
|
|
|
|
|
|
/ |
Q2'25 |
|
|
/ |
9M'24 |
| Underlying income statement |
Q3'25 |
% |
% excl. FX |
|
9M'25 |
% |
% excl. FX |
| Net interest income |
1,132 |
|
0.2 |
|
3.3 |
|
|
3,482 |
|
0.6 |
|
3.4 |
|
| Net fee income |
86 |
|
(4.3) |
|
(1.0) |
|
|
261 |
|
26.3 |
|
29.8 |
|
|
|
|
|
|
|
|
|
|
|
|
|
|
|
|
|
| Total income |
1,232 |
|
(3.0) |
|
0.2 |
|
|
3,864 |
|
(1.8) |
|
0.9 |
|
| Administrative expenses and amortizations |
(504) |
|
(3.1) |
|
— |
|
|
(1,598) |
|
(1.2) |
|
1.6 |
|
| Net operating income |
728 |
|
(2.9) |
|
0.3 |
|
|
2,265 |
|
(2.3) |
|
0.4 |
|
| Net loan-loss provisions |
(541) |
|
16.2 |
|
19.0 |
|
|
(1,531) |
|
(14.4) |
|
(12.1) |
|
|
|
|
|
|
|
|
|
| Profit before tax |
168 |
|
(36.8) |
|
(33.1) |
|
|
669 |
|
51.8 |
|
56.1 |
|
|
|
|
|
|
|
|
|
|
|
|
|
|
|
|
|
|
|
|
|
|
|
|
|
|
|
|
|
|
|
|
|
|
|
|
|
|
|
|
|
|
|
|
|
|
|
|
|
|
| Balance sheet and activity metrics |
|
|
|
|
|
|
|
| Loans and advances to customers |
45,106 |
|
0.6 |
|
0.5 |
|
|
45,106 |
|
(9.7) |
|
(5.1) |
|
| Customer deposits |
44,925 |
|
(1.5) |
|
(1.6) |
|
|
44,925 |
|
4.8 |
|
10.2 |
|
|
|
|
|
|
|
|
|
| Memorandum items: |
|
|
|
|
|
|
|
Gross loans and advances to customers 1 |
48,665 |
|
0.6 |
|
0.4 |
|
|
48,665 |
|
(9.4) |
|
(4.7) |
|
| Customer funds |
48,743 |
|
(0.8) |
|
(1.0) |
|
|
48,743 |
|
5.4 |
|
10.8 |
|
Customer deposits 2 |
44,887 |
|
(1.5) |
|
(1.6) |
|
|
44,887 |
|
4.8 |
|
10.2 |
|
| Mutual funds |
3,855 |
|
7.5 |
|
7.3 |
|
|
3,855 |
|
12.8 |
|
18.6 |
|
|
|
|
|
|
|
|
|
|
|
|
|
|
|
|
|
|
|
|
|
|
|
|
|
|
|
|
|
|
|
|
|
|
|
|
|
|
|
|
|
|
|
|
|
|
|
|
|
|
|
|
|
|
|
|
|
|
|
|
|
|
|
|
|
|
|
|
|
|
|
|
|
|
|
|
|
|
|
|
|
|
|
|
|
| 1. Excluding reverse repos. |
| 2. Excluding repos. |
|
|
|
|
|
|
|
|
|
|
January - September 2025 |
|
59 |
|
|
|
|
|
|
|
|
|
|
|
|
|
|
|
|
|
|
|
|
|
|
|
|
|
|
|
|
|
|
|
|
|
|
|
|
|
Significant events
|
|
|
|
|
|
|
|
|
|
|
|
|
|
|
|
|
|
|
|
Information by segment |
|
|
|
|
|
|
|
|
|
|
|
|
|
|
|
|
|
|
|
|
|
|
|
|
|
|
| CORPORATE & INVESTMENT BANKING |
|
| EUR million |
|
|
|
|
|
|
|
|
/ |
Q2'25 |
|
|
/ |
9M'24 |
| Underlying income statement |
Q3'25 |
% |
% excl. FX |
|
9M'25 |
% |
% excl. FX |
| Net interest income |
982 |
|
(3.1) |
|
(2.6) |
|
|
2,948 |
|
1.3 |
|
6.7 |
|
| Net fee income |
624 |
|
(2.0) |
|
(1.4) |
|
|
1,977 |
|
4.5 |
|
7.4 |
|
Gains (losses) on financial transactions 1 |
357 |
|
41.7 |
|
42.4 |
|
|
1,135 |
|
(7.0) |
|
(4.3) |
|
| Other operating income |
56 |
|
(75.9) |
|
(75.8) |
|
|
314 |
|
28.3 |
|
27.0 |
|
| Total income |
2,020 |
|
(5.3) |
|
(4.7) |
|
|
6,374 |
|
1.7 |
|
5.6 |
|
| Administrative expenses and amortizations |
(957) |
|
0.7 |
|
1.7 |
|
|
(2,860) |
|
3.1 |
|
6.4 |
|
| Net operating income |
1,062 |
|
(10.2) |
|
(9.9) |
|
|
3,514 |
|
0.6 |
|
5.0 |
|
| Net loan-loss provisions |
(81) |
|
12.1 |
|
13.9 |
|
|
(167) |
|
7.9 |
|
9.2 |
|
| Other gains (losses) and provisions |
(62) |
|
133.6 |
|
132.3 |
|
|
(110) |
|
(50.8) |
|
(50.0) |
|
| Profit before tax |
919 |
|
(15.2) |
|
(14.9) |
|
|
3,237 |
|
3.9 |
|
8.8 |
|
| Tax on profit |
(241) |
|
(21.7) |
|
(21.5) |
|
|
(918) |
|
0.5 |
|
5.7 |
|
| Profit from continuing operations |
678 |
|
(12.6) |
|
(12.3) |
|
|
2,319 |
|
5.4 |
|
10.1 |
|
| Net profit from discontinued operations |
— |
|
— |
|
— |
|
|
— |
|
— |
|
— |
|
| Consolidated profit |
678 |
|
(12.6) |
|
(12.3) |
|
|
2,319 |
|
5.4 |
|
10.1 |
|
| Non-controlling interests |
(44) |
|
(8.3) |
|
(7.4) |
|
|
(151) |
|
1.0 |
|
6.2 |
|
| Underlying attributable profit to the parent |
634 |
|
(12.9) |
|
(12.6) |
|
|
2,168 |
|
5.7 |
|
10.3 |
|
|
| Balance sheet and activity metrics |
|
|
|
|
|
|
|
| Loans and advances to customers |
206,106 |
|
7.7 |
|
7.4 |
|
|
206,106 |
|
5.6 |
|
7.6 |
|
| Customer deposits |
227,689 |
|
7.8 |
|
7.3 |
|
|
227,689 |
|
8.9 |
|
11.3 |
|
|
|
|
|
|
|
|
|
| Memorandum items: |
|
|
|
|
|
|
|
| Gross loans and advances to customers ² |
141,716 |
|
4.8 |
|
4.4 |
|
|
141,716 |
|
3.5 |
|
5.4 |
|
| Customer funds |
148,551 |
|
5.4 |
|
4.7 |
|
|
148,551 |
|
6.6 |
|
9.0 |
|
| Customer deposits ³ |
133,784 |
|
6.8 |
|
6.3 |
|
|
133,784 |
|
5.7 |
|
8.0 |
|
| Mutual funds |
14,767 |
|
(6.1) |
|
(7.9) |
|
|
14,767 |
|
14.9 |
|
18.3 |
|
| Risk-weighted assets |
108,146 |
|
3.2 |
|
|
|
108,146 |
|
(13.7) |
|
|
|
| Ratios (%) |
|
|
|
|
|
|
|
| RoTE |
18.0 |
|
(2.7) |
|
|
|
20.4 |
|
2.2 |
|
|
| RoTE (post-AT1) |
17.3 |
|
(2.6) |
|
|
|
19.7 |
|
2.3 |
|
|
| Efficiency ratio |
47.4 |
|
2.8 |
|
|
|
44.9 |
|
0.6 |
|
|
| NPL ratio |
0.70 |
|
(0.01) |
|
|
|
0.70 |
|
(0.16) |
|
|
| NPL coverage ratio |
45 |
|
0 |
|
|
|
45 |
|
10 |
|
|
| Number of employees |
13,724 |
|
1.8 |
|
|
|
13,724 |
|
|
|
|
|
|
| 1. Includes exchange differences. |
| 2. Excluding reverse repos. |
| 3. Excluding repos. |
|
|
|
|
|
|
|
|
|
|
60 |
|
January - September 2025 |
|
|
|
|
|
|
|
|
|
|
|
|
|
|
|
|
|
|
|
|
|
|
|
|
|
|
|
|
|
|
|
|
|
|
|
|
|
Significant events
|
|
|
|
|
|
|
|
|
|
|
|
|
|
|
|
|
|
|
|
Information by segment |
|
|
|
|
|
|
|
|
|
|
|
|
|
|
|
|
|
|
|
|
|
|
|
|
|
|
| WEALTH MANAGEMENT & INSURANCE |
|
| EUR million |
|
|
|
|
|
|
|
|
/ |
Q2'25 |
|
|
/ |
9M'24 |
| Underlying income statement |
Q3'25 |
% |
% excl. FX |
|
9M'25 |
% |
% excl. FX |
| Net interest income |
350 |
|
(0.9) |
|
(0.1) |
|
|
1,079 |
|
(16.9) |
|
(15.4) |
|
| Net fee income |
415 |
|
(2.0) |
|
(1.2) |
|
|
1,257 |
|
15.4 |
|
18.7 |
|
Gains (losses) on financial transactions 1 |
101 |
|
1.8 |
|
2.4 |
|
|
283 |
|
90.7 |
|
97.2 |
|
| Other operating income |
148 |
|
8.9 |
|
8.6 |
|
|
427 |
|
77.2 |
|
92.5 |
|
| Total income |
1,014 |
|
0.2 |
|
0.8 |
|
|
3,046 |
|
9.7 |
|
12.8 |
|
| Administrative expenses and amortizations |
(369) |
|
4.2 |
|
5.1 |
|
|
(1,094) |
|
5.7 |
|
8.7 |
|
| Net operating income |
646 |
|
(1.9) |
|
(1.5) |
|
|
1,952 |
|
12.1 |
|
15.3 |
|
| Net loan-loss provisions |
10 |
|
— |
|
— |
|
|
(11) |
|
(57.6) |
|
(56.8) |
|
| Other gains (losses) and provisions |
(5) |
|
(55.9) |
|
(57.4) |
|
|
(16) |
|
(58.3) |
|
(58.2) |
|
| Profit before tax |
651 |
|
2.5 |
|
3.0 |
|
|
1,925 |
|
14.7 |
|
18.1 |
|
| Tax on profit |
(137) |
|
1.6 |
|
2.0 |
|
|
(414) |
|
5.6 |
|
7.8 |
|
| Profit from continuing operations |
514 |
|
2.8 |
|
3.3 |
|
|
1,511 |
|
17.5 |
|
21.3 |
|
| Net profit from discontinued operations |
— |
|
— |
|
— |
|
|
— |
|
— |
|
— |
|
| Consolidated profit |
514 |
|
2.8 |
|
3.3 |
|
|
1,511 |
|
17.5 |
|
21.3 |
|
| Non-controlling interests |
(23) |
|
(1.5) |
|
(0.7) |
|
|
(72) |
|
22.4 |
|
25.8 |
|
| Underlying attributable profit to the parent |
491 |
|
3.0 |
|
3.4 |
|
|
1,439 |
|
17.3 |
|
21.1 |
|
|
| Balance sheet and activity metrics |
|
|
|
|
|
|
|
| Loans and advances to customers |
25,609 |
|
2.2 |
|
2.3 |
|
|
25,609 |
|
10.3 |
|
13.3 |
|
| Customer deposits |
63,498 |
|
1.7 |
|
2.0 |
|
|
63,498 |
|
4.3 |
|
6.4 |
|
|
|
|
|
|
|
|
|
| Memorandum items: |
|
|
|
|
|
|
|
| Gross loans and advances to customers ² |
25,769 |
|
2.2 |
|
2.3 |
|
|
25,769 |
|
10.3 |
|
13.2 |
|
| Customer funds |
183,953 |
|
3.9 |
|
3.7 |
|
|
183,953 |
|
9.3 |
|
11.2 |
|
| Customer deposits ³ |
62,522 |
|
1.6 |
|
1.9 |
|
|
62,522 |
|
4.3 |
|
6.4 |
|
| Mutual funds |
121,431 |
|
5.2 |
|
4.7 |
|
|
121,431 |
|
12.1 |
|
13.8 |
|
| Risk-weighted assets |
17,633 |
|
4.4 |
|
|
|
17,633 |
|
59.5 |
|
|
| Assets under management |
536,036 |
|
4.3 |
|
3.8 |
|
|
536,036 |
|
9.0 |
|
10.7 |
|
| Gross written premiums |
2,685 |
|
(8.4) |
|
(8.4) |
|
|
8,285 |
|
(2.0) |
|
4.9 |
|
|
| Ratios (%) and customers |
|
|
|
|
|
|
|
| RoTE |
64.2 |
|
(3.1) |
|
|
|
66.7 |
|
(9.9) |
|
|
| RoTE (post-AT1) |
63.5 |
|
(3.1) |
|
|
|
66.0 |
|
(9.9) |
|
|
| Efficiency ratio |
36.3 |
|
1.4 |
|
|
|
35.9 |
|
(1.3) |
|
|
| NPL ratio |
0.91 |
|
(0.05) |
|
|
|
0.91 |
|
(0.09) |
|
|
| NPL coverage ratio |
68 |
|
(2) |
|
|
|
68 |
|
5 |
|
|
| Number of employees |
7,606 |
|
(0.8) |
|
|
|
7,606 |
|
|
|
| Number of Private Banking customers (thousands) |
310 |
|
1.4 |
|
|
|
310 |
|
6.5 |
|
|
|
|
|
| 1. Includes exchange differences. |
| 2. Excluding reverse repos. |
| 3. Excluding repos. |
|
|
|
|
|
|
|
|
|
|
January - September 2025 |
|
61 |
|
|
|
|
|
|
|
|
|
|
|
|
|
|
|
|
|
|
|
|
|
|
|
|
|
|
|
|
|
|
|
|
|
|
|
|
|
Significant events
|
|
|
|
|
|
|
|
|
|
|
|
|
|
|
|
|
|
|
|
Information by segment |
|
|
|
|
|
|
|
|
|
|
|
|
|
|
|
|
|
|
|
|
|
|
|
|
|
|
| PAYMENTS |
|
| EUR million |
|
|
|
|
|
|
|
|
/ |
Q2'25 |
|
|
/ |
9M'24 |
| Underlying income statement |
Q3'25 |
% |
% excl. FX |
|
9M'25 |
% |
% excl. FX |
| Net interest income |
705 |
|
(2.9) |
|
(3.3) |
|
|
2,116 |
|
12.1 |
|
22.9 |
|
| Net fee income |
781 |
|
6.4 |
|
6.3 |
|
|
2,209 |
|
8.6 |
|
15.8 |
|
Gains (losses) on financial transactions 1 |
19 |
|
— |
|
— |
|
|
(4) |
|
— |
|
— |
|
| Other operating income |
25 |
|
76.5 |
|
77.3 |
|
|
50 |
|
94.6 |
|
64.8 |
|
| Total income |
1,530 |
|
5.0 |
|
4.8 |
|
|
4,370 |
|
10.7 |
|
19.4 |
|
| Administrative expenses and amortizations |
(585) |
|
(1.2) |
|
(1.3) |
|
|
(1,785) |
|
(1.9) |
|
2.7 |
|
| Net operating income |
945 |
|
9.3 |
|
8.9 |
|
|
2,586 |
|
21.4 |
|
34.5 |
|
| Net loan-loss provisions |
(514) |
|
7.5 |
|
6.7 |
|
|
(1,485) |
|
17.3 |
|
29.5 |
|
| Other gains (losses) and provisions |
(39) |
|
(2.5) |
|
(2.3) |
|
|
(116) |
|
(64.1) |
|
(63.8) |
|
| Profit before tax |
391 |
|
13.2 |
|
13.2 |
|
|
985 |
|
82.0 |
|
115.9 |
|
| Tax on profit |
(137) |
|
18.0 |
|
17.7 |
|
|
(351) |
|
8.5 |
|
20.3 |
|
| Profit from continuing operations |
255 |
|
10.7 |
|
11.0 |
|
|
635 |
|
190.8 |
|
284.8 |
|
| Net profit from discontinued operations |
— |
|
— |
|
— |
|
|
— |
|
— |
|
— |
|
| Consolidated profit |
255 |
|
10.7 |
|
11.0 |
|
|
635 |
|
190.8 |
|
284.8 |
|
| Non-controlling interests |
(31) |
|
47.5 |
|
49.2 |
|
|
(77) |
|
14.0 |
|
22.0 |
|
| Underlying attributable profit to the parent |
223 |
|
7.0 |
|
7.1 |
|
|
558 |
|
269.4 |
|
446.4 |
|
|
|
|
|
|
|
|
|
| Balance sheet and activity metrics |
|
|
|
|
|
|
|
| Loans and advances to customers |
23,400 |
|
0.2 |
|
(0.8) |
|
|
23,400 |
|
10.5 |
|
13.5 |
|
| Customer deposits |
1,162 |
|
11.3 |
|
11.3 |
|
|
1,162 |
|
15.3 |
|
15.3 |
|
|
|
|
|
|
|
|
|
| Memorandum items: |
|
|
|
|
|
|
|
| Gross loans and advances to customers ² |
25,309 |
|
1.1 |
|
— |
|
|
25,309 |
|
10.8 |
|
13.7 |
|
| Customer funds |
1,162 |
|
11.3 |
|
11.3 |
|
|
1,162 |
|
15.3 |
|
15.3 |
|
| Customer deposits ³ |
1,162 |
|
11.3 |
|
11.3 |
|
|
1,162 |
|
15.3 |
|
15.3 |
|
| Mutual funds |
— |
|
— |
|
— |
|
|
— |
|
— |
|
— |
|
| Risk-weighted assets |
23,601 |
2.3 |
|
|
|
23,601 |
13.7 |
|
|
|
|
|
|
|
|
|
|
| Ratios (%) |
|
|
|
|
|
|
|
| RoTE |
28.1 |
|
(0.8) |
|
|
|
24.9 |
|
17.5 |
|
|
| RoTE (post-AT1) |
27.4 |
|
(0.7) |
|
|
|
24.2 |
|
17.5 |
|
|
| NPL ratio |
5.54 |
|
0.43 |
|
|
|
5.54 |
|
(0.15) |
|
|
| NPL coverage ratio |
136 |
5 |
|
|
|
136 |
7 |
|
|
| Number of employees |
21,004 |
(3.0) |
|
|
|
21,004 |
|
|
|
|
|
| 1. Includes exchange differences. |
| 2. Excluding reverse repos. |
| 3. Excluding repos. |
|
|
|
|
|
|
|
|
|
|
62 |
|
January - September 2025 |
|
|
|
|
|
|
|
|
|
|
|
|
|
|
|
|
|
|
|
|
|
|
|
|
|
|
|
|
|
|
|
|
|
|
|
|
|
Significant events
|
|
|
|
|
|
|
|
|
|
|
|
|
|
|
|
|
|
|
|
Information by segment |
|
|
|
|
|
|
|
|
|
|
|
|
|
|
|
|
|
|
|
|
|
|
|
|
|
|
|
|
|
| PagoNxt |
|
|
| EUR million |
|
|
|
|
|
|
|
|
|
/ |
Q2'25 |
|
|
|
/ |
9M'24 |
| Underlying income statement |
Q3'25 |
% |
% excl. FX |
|
9M'25 |
9M'24 |
% |
% excl. FX |
| Net interest income |
41 |
|
(2.4) |
|
(2.8) |
|
|
122 |
|
97 |
|
25.7 |
|
36.9 |
|
| Net fee income |
267 |
|
0.8 |
|
0.7 |
|
|
777 |
|
697 |
|
11.4 |
|
19.1 |
|
Gains (losses) on financial transactions 1 |
3 |
|
— |
|
— |
|
|
(26) |
|
(1) |
|
— |
|
— |
|
| Other operating income |
41 |
|
7.2 |
|
7.2 |
|
|
121 |
|
101 |
|
19.9 |
|
21.0 |
|
| Total income |
353 |
|
8.5 |
|
8.3 |
|
|
994 |
|
894 |
|
11.2 |
|
18.3 |
|
| Administrative expenses and amortizations |
(280) |
|
(3.5) |
|
(3.6) |
|
|
(856) |
|
(889) |
|
(3.7) |
|
(0.3) |
|
| Net operating income |
73 |
|
108.9 |
|
105.7 |
|
|
138 |
|
5 |
|
— |
|
— |
|
| Net loan-loss provisions |
(8) |
|
68.0 |
|
67.6 |
|
|
(19) |
|
(13) |
|
50.1 |
|
59.4 |
|
| Other gains (losses) and provisions |
(29) |
|
38.3 |
|
37.9 |
|
|
(62) |
|
(274) |
|
(77.3) |
|
(77.2) |
|
| Profit before tax |
35 |
|
298.9 |
|
272.3 |
|
|
57 |
|
(281) |
|
— |
|
— |
|
| Tax on profit |
(9) |
|
— |
|
— |
|
|
(10) |
|
(37) |
|
(73.1) |
|
(66.4) |
|
| Profit from continuing operations |
27 |
|
135.8 |
|
130.3 |
|
|
47 |
|
(318) |
|
— |
|
— |
|
| Net profit from discontinued operations |
— |
|
— |
|
— |
|
|
— |
|
— |
|
— |
|
— |
|
| Consolidated profit |
27 |
|
135.8 |
|
130.3 |
|
|
47 |
|
(318) |
|
— |
|
— |
|
| Non-controlling interests |
(7) |
|
— |
|
— |
|
|
(12) |
|
(7) |
|
65.2 |
|
80.8 |
|
| Underlying attributable profit to the parent |
19 |
|
73.1 |
|
69.4 |
|
|
35 |
|
(326) |
|
— |
|
— |
|
|
|
|
|
|
|
|
|
|
| Balance sheet and activity metrics |
|
|
|
|
|
|
|
|
| Loans and advances to customers |
952 |
|
(22.5) |
|
(24.3) |
|
|
952 |
|
933 |
|
2.1 |
|
3.7 |
|
| Customer deposits |
1,145 |
|
14.7 |
|
14.7 |
|
|
1,145 |
|
982 |
|
16.7 |
|
16.7 |
|
|
|
|
|
|
|
|
|
|
| Memorandum items: |
|
|
|
|
|
|
|
|
| Gross loans and advances to customers ² |
976 |
|
(21.9) |
|
(23.6) |
|
|
976 |
|
955 |
|
2.1 |
|
3.7 |
|
| Customer funds |
1,145 |
|
14.7 |
|
14.7 |
|
|
1,145 |
|
982 |
|
16.7 |
|
16.7 |
|
| Customer deposits ³ |
1,145 |
|
14.7 |
|
14.7 |
|
|
1,145 |
|
982 |
|
16.7 |
|
16.7 |
|
| Mutual funds |
— |
|
— |
|
— |
|
|
— |
|
— |
|
— |
|
— |
|
| Risk-weighted assets |
6,158 |
|
(0.5) |
|
|
|
6,158 |
|
4,437 |
|
38.8 |
|
|
| Total transactions (Getnet, million) |
2,672 |
|
2.9 |
|
|
|
7,774 |
|
7,209 |
|
7.8 |
|
|
| Total payments volume (Getnet) |
60,970 |
|
6.5 |
|
6.3 |
|
|
174,007 |
|
162,767 |
|
6.9 |
|
15.1 |
|
|
|
|
|
|
|
|
|
|
| Ratios (%) |
|
|
|
|
|
|
|
|
| EBITDA margin |
36.7 |
|
7.8 |
|
|
|
31.6 |
|
22.7 |
|
8.9 |
|
|
| Efficiency ratio |
79.4 |
(9.9) |
|
|
86.1 |
99.4 |
(13.3) |
|
|
|
|
|
|
|
|
|
|
|
|
|
|
|
|
|
|
|
|
|
|
|
|
|
|
|
|
|
|
|
|
| 1. Includes exchange differences. |
| 2. Excluding reverse repos. |
| 3. Excluding repos. |
|
|
|
|
|
|
|
|
|
January - September 2025 |
|
63 |
|
|
|
|
|
|
|
|
|
|
|
|
|
|
|
|
|
|
|
|
|
|
|
|
|
|
|
|
|
|
|
|
|
|
|
|
|
Significant events
|
|
|
|
|
|
|
|
|
|
|
|
|
|
|
|
|
|
|
|
Information by segment |
|
|
|
|
|
|
|
|
|
|
|
|
|
|
|
|
|
|
|
|
|
|
|
|
|
|
| Cards |
|
|
|
|
|
|
|
| EUR million |
|
|
|
|
|
|
|
|
/ |
Q2'25 |
|
|
/ |
9M'24 |
| Underlying income statement |
Q3'25 |
% |
% excl. FX |
|
9M'25 |
% |
% excl. FX |
| Net interest income |
663 |
|
(2.9) |
|
(3.3) |
|
|
1,994 |
|
11.4 |
|
22.1 |
|
| Net fee income |
514 |
|
9.5 |
|
9.5 |
|
|
1,432 |
|
7.1 |
|
14.1 |
|
Gains (losses) on financial transactions 1 |
16 |
|
372.9 |
|
381.2 |
|
|
22 |
|
— |
|
— |
|
| Other operating income |
(16) |
|
(34.5) |
|
(34.3) |
|
|
(71) |
|
(5.4) |
|
2.1 |
|
| Total income |
1,178 |
|
4.0 |
|
3.8 |
|
|
3,376 |
|
10.6 |
|
19.8 |
|
| Administrative expenses and amortizations |
(305) |
|
1.1 |
|
1.0 |
|
|
(929) |
|
(0.1) |
|
5.7 |
|
| Net operating income |
872 |
|
5.1 |
|
4.8 |
|
|
2,448 |
|
15.2 |
|
26.1 |
|
| Net loan-loss provisions |
(506) |
|
6.8 |
|
6.1 |
|
|
(1,466) |
|
16.9 |
|
29.2 |
|
| Other gains (losses) and provisions |
(10) |
|
(46.9) |
|
(46.0) |
|
|
(53) |
|
11.4 |
|
13.0 |
|
| Profit before tax |
356 |
|
5.7 |
|
5.8 |
|
|
928 |
|
12.9 |
|
22.4 |
|
| Tax on profit |
(128) |
|
8.3 |
|
8.2 |
|
|
(341) |
|
19.1 |
|
30.1 |
|
| Profit from continuing operations |
228 |
|
4.2 |
|
4.5 |
|
|
588 |
|
9.5 |
|
18.3 |
|
| Net profit from discontinued operations |
— |
|
— |
|
— |
|
|
— |
|
— |
|
— |
|
| Consolidated profit |
228 |
|
4.2 |
|
4.5 |
|
|
588 |
|
9.5 |
|
18.3 |
|
| Non-controlling interests |
(24) |
|
13.1 |
|
14.5 |
|
|
(65) |
|
7.8 |
|
15.0 |
|
| Underlying attributable profit to the parent |
204 |
|
3.3 |
|
3.4 |
|
|
523 |
|
9.8 |
|
18.7 |
|
|
|
|
|
|
|
|
|
| Balance sheet and activity metrics |
|
|
|
|
|
|
|
| Loans and advances to customers |
22,448 |
|
1.4 |
|
0.5 |
|
|
22,448 |
|
10.9 |
|
14.0 |
|
| Customer deposits |
16 |
|
(63.2) |
|
(63.2) |
|
|
16 |
|
(36.6) |
|
(36.6) |
|
|
|
|
|
|
|
|
|
| Memorandum items: |
|
|
|
|
|
|
|
| Gross loans and advances to customers ² |
24,333 |
|
2.3 |
|
1.3 |
|
|
24,333 |
|
11.2 |
|
14.2 |
|
| Customer funds |
16 |
|
(63.2) |
|
(63.2) |
|
|
16 |
|
(36.6) |
|
(36.6) |
|
| Customer deposits ³ |
16 |
|
(63.2) |
|
(63.2) |
|
|
16 |
|
(36.6) |
|
(36.6) |
|
| Mutual funds |
— |
|
— |
|
— |
|
|
— |
|
— |
|
— |
|
| Risk-weighted assets |
17,444 |
|
3.3 |
|
|
|
17,444 |
|
6.9 |
|
|
Number of cards (million)4 |
107 |
|
1.4 |
|
|
|
107 |
|
2.1 |
|
|
|
|
|
|
|
|
|
|
| Ratios (%) |
|
|
|
|
|
|
|
| RoTE |
31.6 |
|
(0.3) |
|
|
|
27.9 |
|
1.1 |
|
|
| RoTE (post-AT1) |
31.0 |
(0.3) |
|
|
27.3 |
1.1 |
|
|
| Efficiency ratio |
25.9 |
(0.8) |
|
|
27.5 |
(2.9) |
|
|
| NPL ratio |
5.59 |
0.37 |
|
|
5.59 |
(0.21) |
|
|
| NPL coverage ratio |
138 |
|
5 |
|
|
|
138 |
|
9 |
|
|
|
|
|
|
|
|
|
|
|
|
|
| 1. Includes exchange differences. |
| 2. Excluding reverse repos. |
| 3. Excluding repos. |
| 4. Total number of Cards in the Group, including those managed within Consumer's perimeter. |
|
|
|
|
|
|
|
|
|
64 |
|
January - September 2025 |
|
|
|
|
|
|
|
|
|
|
|
|
|
|
|
|
|
|
|
|
|
|
|
|
|
|
|
|
|
|
|
|
|
|
|
|
|
Significant events
|
|
|
|
|
|
|
|
|
|
|
|
|
|
|
|
|
|
|
|
Information by segment |
|
|
|
|
|
|
|
|
|
|
|
|
|
|
|
|
|
|
|
|
|
|
|
|
|
|
| CORPORATE CENTRE |
|
|
|
|
|
|
|
| EUR million |
|
|
|
|
|
|
|
|
|
/ Q2'25 |
|
|
|
/ 9M'24 |
| Underlying income statement |
Q3'25 |
Q2'25 |
% |
|
9M'25 |
9M'24 |
% |
| Net interest income |
(132) |
|
(120) |
|
9.6 |
|
|
(364) |
|
(195) |
|
86.7 |
|
| Net fee income |
(6) |
|
(7) |
|
(17.3) |
|
|
(22) |
|
(7) |
|
195.4 |
|
Gains (losses) on financial transactions 1 |
8 |
|
(53) |
|
— |
|
|
(135) |
|
(429) |
|
(68.6) |
|
| Other operating income |
(37) |
|
45 |
|
— |
|
|
4 |
|
28 |
|
(85.9) |
|
| Total income |
(166) |
|
(135) |
|
22.6 |
|
|
(517) |
|
(604) |
|
(14.4) |
|
| Administrative expenses and amortizations |
(101) |
|
(97) |
|
4.0 |
|
|
(285) |
|
(275) |
|
3.9 |
|
| Net operating income |
(267) |
|
(232) |
|
14.9 |
|
|
(802) |
|
(879) |
|
(8.7) |
|
| Net loan-loss provisions |
0 |
|
(98) |
|
— |
|
|
(197) |
|
(1) |
|
— |
|
| Other gains (losses) and provisions |
(181) |
|
(45) |
|
305.0 |
|
|
(255) |
|
(240) |
|
6.3 |
|
| Profit before tax |
(447) |
|
(375) |
|
19.2 |
|
|
(1,254) |
|
(1,120) |
|
12.0 |
|
| Tax on profit |
102 |
|
56 |
|
81.2 |
|
|
195 |
|
108 |
|
81.6 |
|
| Profit from continuing operations |
(346) |
|
(319) |
|
8.3 |
|
|
(1,059) |
|
(1,012) |
|
4.6 |
|
| Net profit from discontinued operations |
— |
|
— |
|
— |
|
|
— |
|
— |
|
— |
|
| Consolidated profit |
(346) |
|
(319) |
|
8.3 |
|
|
(1,059) |
|
(1,012) |
|
4.6 |
|
| Non-controlling interests |
0 |
|
0 |
|
(93.7) |
|
|
0 |
|
0 |
|
— |
|
| Underlying attributable profit to the parent |
(346) |
|
(319) |
|
8.3 |
|
|
(1,059) |
|
(1,012) |
|
4.7 |
|
|
|
|
|
|
|
|
|
| Balance sheet |
|
|
|
|
|
|
|
| Loans and advances to customers |
6,123 |
|
6,052 |
|
1.2 |
|
|
6,123 |
|
5,896 |
|
3.9 |
|
| Cash, central banks and credit institutions |
93,831 |
|
94,853 |
|
(1.1) |
|
|
93,831 |
|
100,528 |
|
(6.7) |
|
| Debt instruments |
10,191 |
|
10,556 |
|
(3.5) |
|
|
10,191 |
|
8,939 |
|
14.0 |
|
| Other financial assets |
1,504 |
|
1,784 |
|
(15.7) |
|
|
1,504 |
|
1,413 |
|
6.5 |
|
| Other asset accounts |
118,021 |
|
118,888 |
|
(0.7) |
|
|
118,021 |
|
121,371 |
|
(2.8) |
|
| Total assets |
229,670 |
|
232,133 |
|
(1.1) |
|
|
229,670 |
|
238,147 |
|
(3.6) |
|
| Customer deposits |
1,267 |
|
1,841 |
|
(31.2) |
|
|
1,267 |
|
1,612 |
|
(21.4) |
|
| Central banks and credit institutions |
20,301 |
|
17,048 |
|
19.1 |
|
|
20,301 |
|
22,000 |
|
(7.7) |
|
| Marketable debt securities |
106,123 |
|
109,719 |
|
(3.3) |
|
|
106,123 |
|
115,124 |
|
(7.8) |
|
| Other financial liabilities |
2,298 |
|
14 |
|
— |
|
|
2,298 |
|
1,375 |
|
67.2 |
|
| Other liabilities accounts |
6,519 |
|
7,338 |
|
(11.2) |
|
|
6,519 |
|
7,575 |
|
(13.9) |
|
| Total liabilities |
136,507 |
|
135,960 |
|
0.4 |
|
|
136,507 |
|
147,685 |
|
(7.6) |
|
| Total equity |
93,163 |
|
96,173 |
|
(3.1) |
|
|
93,163 |
|
90,461 |
|
3.0 |
|
|
|
|
|
|
|
|
|
| Memorandum items: |
|
|
|
|
|
|
|
Gross loans and advances to customers 2 |
6,198 |
|
6,199 |
|
0.0 |
|
|
6,198 |
|
5,945 |
|
4.3 |
|
| Customer funds |
1,267 |
|
1,841 |
|
(31.2) |
|
|
1,267 |
|
1,478 |
|
(14.3) |
|
Customer deposits 3 |
1,267 |
|
1,841 |
|
(31.2) |
|
|
1,267 |
|
1,478 |
|
(14.3) |
|
| Mutual funds |
— |
|
— |
|
— |
|
|
— |
|
— |
|
— |
|
|
|
|
|
|
|
|
|
| Resources |
|
|
|
|
|
|
|
| Number of employees |
1,892 |
|
1,812 |
|
4.4 |
|
|
1,892 |
|
|
|
1. Includes exchange differences.
2. Excluding reverse repos.
3. Excluding repos.
|
|
|
|
|
|
|
|
|
January - September 2025 |
|
65 |
|
|
|
|
|
|
|
|
|
|
|
|
|
|
|
|
|
|
|
|
|
|
|
|
|
|
|
|
|
|
|
|
|
|
|
|
|
Significant events
|
|
|
|
|
|
|
|
|
|
|
|
|
|
|
|
|
|
|
|
Information by segment |
|
|
|
|
|
|
|
|
|
|
|
|
|
|
|
|
|
|
|
|
| Spain |
|
|
|
|
|
| EUR million |
|
|
|
|
|
|
|
/ Q2'25 |
|
|
/ 9M'24 |
| Underlying income statement |
Q3'25 |
% |
|
9M'25 |
% |
| Net interest income |
1,829 |
|
1.3 |
|
|
5,414 |
|
(0.7) |
|
| Net fee income |
710 |
|
(3.5) |
|
|
2,212 |
|
1.0 |
|
Gains (losses) on financial transactions 1 |
205 |
|
66.1 |
|
|
777 |
|
(2.6) |
|
| Other operating income |
145 |
|
(61.0) |
|
|
652 |
|
7.8 |
|
| Total income |
2,889 |
|
(4.8) |
|
|
9,056 |
|
0.1 |
|
| Administrative expenses and amortizations |
(1,070) |
|
1.9 |
|
|
(3,170) |
|
1.0 |
|
| Net operating income |
1,819 |
|
(8.4) |
|
|
5,886 |
|
(0.4) |
|
| Net loan-loss provisions |
(242) |
|
(18.2) |
|
|
(841) |
|
(10.3) |
|
| Other gains (losses) and provisions |
(171) |
|
66.3 |
|
|
(407) |
|
(47.8) |
|
| Profit before tax |
1,406 |
|
(11.4) |
|
|
4,639 |
|
10.6 |
|
| Tax on profit |
(431) |
|
(9.6) |
|
|
(1,405) |
|
3.6 |
|
| Profit from continuing operations |
976 |
|
(12.2) |
|
|
3,234 |
|
14.0 |
|
| Net profit from discontinued operations |
— |
|
— |
|
|
— |
|
— |
|
| Consolidated profit |
976 |
|
(12.2) |
|
|
3,234 |
|
14.0 |
|
| Non-controlling interests |
0 |
|
117.6 |
|
|
0 |
|
163.5 |
|
| Underlying attributable profit to the parent |
975 |
|
(12.2) |
|
|
3,233 |
|
14.0 |
|
|
|
|
|
|
|
| Balance sheet |
|
|
|
|
|
| Loans and advances to customers |
264,693 |
|
0.2 |
|
|
264,693 |
|
3.0 |
|
| Cash, central banks and credit institutions |
97,387 |
|
(1.7) |
|
|
97,387 |
|
10.7 |
|
| Debt instruments |
105,335 |
|
9.8 |
|
|
105,335 |
|
26.4 |
|
| Other financial assets |
48,940 |
|
0.6 |
|
|
48,940 |
|
11.8 |
|
| Other asset accounts |
16,146 |
|
(1.8) |
|
|
16,146 |
|
(9.1) |
|
| Total assets |
532,502 |
|
1.6 |
|
|
532,502 |
|
8.7 |
|
| Customer deposits |
355,275 |
|
2.6 |
|
|
355,275 |
|
9.9 |
|
| Central banks and credit institutions |
49,226 |
|
(1.2) |
|
|
49,226 |
|
12.7 |
|
| Marketable debt securities |
29,717 |
|
12.7 |
|
|
29,717 |
|
5.4 |
|
| Other financial liabilities |
58,906 |
|
(6.1) |
|
|
58,906 |
|
7.9 |
|
| Other liabilities accounts |
22,009 |
|
2.2 |
|
|
22,009 |
|
0.4 |
|
| Total liabilities |
515,133 |
|
1.6 |
|
|
515,133 |
|
9.2 |
|
| Total equity |
17,368 |
|
0.3 |
|
|
17,368 |
|
(5.4) |
|
|
|
|
|
|
|
| Memorandum items: |
|
|
|
|
|
Gross loans and advances to customers 2 |
233,236 |
|
0.3 |
|
|
233,236 |
|
1.5 |
|
| Customer funds |
416,402 |
|
2.8 |
|
|
416,402 |
|
8.1 |
|
Customer deposits 3 |
313,534 |
|
2.5 |
|
|
313,534 |
|
5.9 |
|
| Mutual funds |
102,868 |
|
3.9 |
|
|
102,868 |
|
15.3 |
|
|
|
|
|
|
|
| Ratios (%), operating means and customers |
|
|
|
|
|
| RoTE |
23.2 |
|
(2.8) |
|
|
25.2 |
|
3.4 |
|
| RoTE (post-AT1) |
22.4 |
|
(2.8) |
|
|
24.4 |
|
3.3 |
|
| Efficiency ratio |
37.0 |
|
2.4 |
|
|
35.0 |
|
0.3 |
|
| NPL ratio |
2.08 |
|
(0.06) |
|
|
2.08 |
|
(0.72) |
|
| NPL coverage ratio |
54 |
|
1 |
|
|
54 |
|
4 |
|
|
|
|
|
|
|
| Number of branches |
1,684 |
|
(2.3) |
|
|
1,684 |
|
(8.1) |
|
| Number of total customers (thousands) |
15,404 |
|
0.2 |
|
|
15,404 |
|
1.1 |
|
| Number of active customers (thousands) |
9,124 |
|
0.9 |
|
|
9,124 |
|
4.5 |
|
1. Includes exchange differences.
2. Excluding reverse repos.
3. Excluding repos.
|
|
|
|
|
|
|
|
|
66 |
|
January - September 2025 |
|
|
|
|
|
|
|
|
|
|
|
|
|
|
|
|
|
|
|
|
|
|
|
|
|
|
|
|
|
|
|
|
|
|
|
|
|
Significant events
|
|
|
|
|
|
|
|
|
|
|
|
|
|
|
|
|
|
|
|
Information by segment |
|
|
|
|
|
|
|
|
|
|
|
|
|
|
|
|
|
|
|
|
|
|
|
|
|
|
| United Kingdom |
|
| EUR million |
|
|
|
|
|
|
|
|
|
/ |
Q2'25 |
|
|
/ |
9M'24 |
| Underlying income statement |
Q3'25 |
% |
% excl. FX |
|
9M'25 |
% |
% excl. FX |
| Net interest income |
1,220 |
|
(1.9) |
|
0.2 |
|
|
3,763 |
|
3.5 |
|
3.4 |
|
| Net fee income |
92 |
|
10.0 |
|
12.1 |
|
|
259 |
|
16.3 |
|
16.2 |
|
Gains (losses) on financial transactions 1 |
(16) |
|
(38.9) |
|
(36.7) |
|
|
(84) |
|
— |
|
— |
|
| Other operating income |
1 |
|
81.1 |
|
82.9 |
|
|
2 |
|
57.2 |
|
57.0 |
|
| Total income |
1,297 |
|
(0.4) |
|
1.7 |
|
|
3,939 |
|
2.0 |
|
2.0 |
|
| Administrative expenses and amortizations |
(667) |
|
(5.7) |
|
(3.6) |
|
|
(2,095) |
|
(3.1) |
|
(3.2) |
|
| Net operating income |
629 |
|
5.9 |
|
8.1 |
|
|
1,844 |
|
8.6 |
|
8.5 |
|
| Net loan-loss provisions |
(6) |
|
(89.6) |
|
(87.7) |
|
|
(119) |
|
21.3 |
|
21.2 |
|
| Other gains (losses) and provisions |
(79) |
|
(48.7) |
|
(46.6) |
|
|
(419) |
|
59.5 |
|
59.3 |
|
| Profit before tax |
544 |
|
43.1 |
|
45.3 |
|
|
1,306 |
|
(2.4) |
|
(2.4) |
|
| Tax on profit |
(146) |
|
39.6 |
|
41.7 |
|
|
(348) |
|
(3.9) |
|
(4.0) |
|
| Profit from continuing operations |
398 |
|
44.4 |
|
46.6 |
|
|
958 |
|
(1.8) |
|
(1.9) |
|
| Net profit from discontinued operations |
— |
|
— |
|
— |
|
|
— |
|
— |
|
— |
|
| Consolidated profit |
398 |
|
44.4 |
|
46.6 |
|
|
958 |
|
(1.8) |
|
(1.9) |
|
| Non-controlling interests |
— |
|
— |
|
— |
|
|
— |
|
— |
|
— |
|
| Underlying attributable profit to the parent |
398 |
|
44.4 |
|
46.6 |
|
|
958 |
|
(1.8) |
|
(1.9) |
|
|
|
|
|
|
|
|
|
| Balance sheet |
|
|
|
|
|
|
|
| Loans and advances to customers |
241,224 |
|
0.5 |
|
2.3 |
|
|
241,224 |
|
(5.3) |
|
(0.7) |
|
| Cash, central banks and credit institutions |
56,063 |
|
(5.1) |
|
(3.4) |
|
|
56,063 |
|
(0.5) |
|
4.3 |
|
| Debt instruments |
12,436 |
|
(4.7) |
|
(3.0) |
|
|
12,436 |
|
(6.4) |
|
(1.9) |
|
| Other financial assets |
255 |
|
(12.2) |
|
(10.6) |
|
|
255 |
|
(8.9) |
|
(4.4) |
|
| Other asset accounts |
3,781 |
|
(16.5) |
|
(15.0) |
|
|
3,781 |
|
2.5 |
|
7.5 |
|
| Total assets |
313,759 |
|
(1.0) |
|
0.8 |
|
|
313,759 |
|
(4.4) |
|
0.2 |
|
| Customer deposits |
221,173 |
|
(0.7) |
|
1.0 |
|
|
221,173 |
|
(5.5) |
|
(0.9) |
|
| Central banks and credit institutions |
20,675 |
|
(12.2) |
|
(10.6) |
|
|
20,675 |
|
(26.2) |
|
(22.6) |
|
| Marketable debt securities |
54,376 |
|
1.9 |
|
3.7 |
|
|
54,376 |
|
11.0 |
|
16.4 |
|
| Other financial liabilities |
2,615 |
|
(4.7) |
|
(2.9) |
|
|
2,615 |
|
(12.7) |
|
(8.5) |
|
| Other liabilities accounts |
1,653 |
|
(15.7) |
|
(14.2) |
|
|
1,653 |
|
(6.9) |
|
(2.4) |
|
| Total liabilities |
300,491 |
|
(1.3) |
|
0.5 |
|
|
300,491 |
|
(4.8) |
|
(0.2) |
|
| Total equity |
13,267 |
|
6.6 |
|
8.5 |
|
|
13,267 |
|
5.3 |
|
10.5 |
|
|
|
|
|
|
|
|
|
| Memorandum items: |
|
|
|
|
|
|
|
Gross loans and advances to customers 2 |
226,671 |
|
(1.2) |
|
0.6 |
|
|
226,671 |
|
(4.9) |
|
(0.2) |
|
| Customer funds |
223,539 |
|
(0.2) |
|
1.6 |
|
|
223,539 |
|
(3.8) |
|
0.9 |
|
Customer deposits 3 |
215,984 |
|
(0.2) |
|
1.6 |
|
|
215,984 |
|
(3.9) |
|
0.8 |
|
| Mutual funds |
7,555 |
|
0.5 |
|
2.3 |
|
|
7,555 |
|
(2.1) |
|
2.6 |
|
|
|
|
|
|
|
|
|
| Ratios (%), operating means and customers |
|
|
|
|
|
|
|
| RoTE |
12.8 |
|
3.7 |
|
|
|
10.6 |
|
(0.5) |
|
|
| RoTE (post-AT1) |
12.3 |
|
3.7 |
|
|
|
10.1 |
|
(0.5) |
|
|
| Efficiency ratio |
51.5 |
|
(2.9) |
|
|
|
53.2 |
|
(2.8) |
|
|
| NPL ratio |
1.09 |
|
(0.17) |
|
|
|
1.09 |
|
(0.36) |
|
|
| NPL coverage ratio |
34 |
|
3 |
|
|
|
34 |
|
6 |
|
|
|
|
|
|
|
|
|
|
| Number of branches |
368 |
|
(12.4) |
|
|
|
368 |
|
(17.1) |
|
|
| Number of total customers (thousands) |
22,653 |
|
0.4 |
|
|
|
22,653 |
|
0.5 |
|
|
| Number of active customers (thousands) |
13,555 |
|
— |
|
|
|
13,555 |
|
(1.0) |
|
|
1. Includes exchange differences.
2. Excluding reverse repos.
3. Excluding repos.
|
|
|
|
|
|
|
|
|
January - September 2025 |
|
67 |
|
|
|
|
|
|
|
|
|
|
|
|
|
|
|
|
|
|
|
|
|
|
|
|
|
|
|
|
|
|
|
|
|
|
|
|
|
Significant events
|
|
|
|
|
|
|
|
|
|
|
|
|
|
|
|
|
|
|
|
Information by segment |
|
|
|
|
|
|
|
|
|
|
|
|
|
|
|
|
|
|
|
|
| Portugal |
|
|
|
|
|
| EUR million |
|
|
|
|
|
|
|
/ Q2'25 |
|
|
/ 9M'24 |
| Underlying income statement |
Q3'25 |
% |
|
9M'25 |
% |
| Net interest income |
328 |
|
(2.4) |
|
|
1,013 |
|
(16.7) |
|
| Net fee income |
123 |
|
(4.4) |
|
|
378 |
|
5.9 |
|
Gains (losses) on financial transactions 1 |
20 |
|
3.8 |
|
|
59 |
|
58.6 |
|
| Other operating income |
10 |
|
113.0 |
|
|
23 |
|
(25.2) |
|
| Total income |
481 |
|
(1.6) |
|
|
1,474 |
|
(10.3) |
|
| Administrative expenses and amortizations |
(134) |
|
0.5 |
|
|
(404) |
|
(0.2) |
|
| Net operating income |
347 |
|
(2.4) |
|
|
1,070 |
|
(13.5) |
|
| Net loan-loss provisions |
(7) |
|
41.5 |
|
|
1 |
|
— |
|
| Other gains (losses) and provisions |
1 |
|
— |
|
|
— |
|
(98.9) |
|
| Profit before tax |
341 |
|
(2.8) |
|
|
1,071 |
|
(9.6) |
|
| Tax on profit |
(100) |
|
(3.2) |
|
|
(304) |
|
(22.2) |
|
| Profit from continuing operations |
241 |
|
(2.6) |
|
|
767 |
|
(3.4) |
|
| Net profit from discontinued operations |
— |
|
— |
|
|
— |
|
— |
|
| Consolidated profit |
241 |
|
(2.6) |
|
|
767 |
|
(3.4) |
|
| Non-controlling interests |
0 |
|
(8.2) |
|
|
(2) |
|
(11.1) |
|
| Underlying attributable profit to the parent |
240 |
|
(2.6) |
|
|
765 |
|
(3.4) |
|
|
|
|
|
|
|
| Balance sheet |
|
|
|
|
|
| Loans and advances to customers |
40,188 |
|
1.3 |
|
|
40,188 |
|
5.7 |
|
| Cash, central banks and credit institutions |
3,191 |
|
(20.3) |
|
|
3,191 |
|
(51.6) |
|
| Debt instruments |
15,224 |
|
0.4 |
|
|
15,224 |
|
17.4 |
|
| Other financial assets |
1,212 |
|
3.1 |
|
|
1,212 |
|
7.6 |
|
| Other asset accounts |
1,003 |
|
(3.7) |
|
|
1,003 |
|
(7.8) |
|
| Total assets |
60,818 |
|
(0.4) |
|
|
60,818 |
|
1.7 |
|
| Customer deposits |
40,199 |
|
1.3 |
|
|
40,199 |
|
5.7 |
|
| Central banks and credit institutions |
8,478 |
|
(4.3) |
|
|
8,478 |
|
(8.1) |
|
| Marketable debt securities |
5,514 |
|
(1.2) |
|
|
5,514 |
|
9.1 |
|
| Other financial liabilities |
301 |
|
(12.4) |
|
|
301 |
|
2.5 |
|
| Other liabilities accounts |
3,177 |
|
(6.9) |
|
|
3,177 |
|
(4.5) |
|
| Total liabilities |
57,669 |
|
(0.4) |
|
|
57,669 |
|
3.1 |
|
| Total equity |
3,149 |
|
(1.5) |
|
|
3,149 |
|
(18.9) |
|
|
|
|
|
|
|
| Memorandum items: |
|
|
|
|
|
Gross loans and advances to customers 2 |
40,916 |
|
1.2 |
|
|
40,916 |
|
5.5 |
|
| Customer funds |
45,657 |
|
1.7 |
|
|
45,657 |
|
6.9 |
|
Customer deposits 3 |
40,199 |
|
1.3 |
|
|
40,199 |
|
5.7 |
|
| Mutual funds |
5,458 |
|
4.9 |
|
|
5,458 |
|
16.8 |
|
|
|
|
|
|
|
| Ratios (%), operating means and customers |
|
|
|
|
|
| RoTE |
29.9 |
|
(2.2) |
|
|
31.0 |
|
4.2 |
|
| RoTE (post-AT1) |
29.4 |
|
(2.1) |
|
|
30.5 |
|
4.1 |
|
| Efficiency ratio |
27.9 |
|
0.6 |
|
|
27.4 |
|
2.8 |
|
| NPL ratio |
2.09 |
|
(0.16) |
|
|
2.09 |
|
(0.38) |
|
| NPL coverage ratio |
86 |
|
4 |
|
|
86 |
|
8 |
|
|
|
|
|
|
|
| Number of branches |
373 |
|
— |
|
|
373 |
|
(0.5) |
|
| Number of total customers (thousands) |
2,971 |
|
0.2 |
|
|
2,971 |
|
0.2 |
|
| Number of active customers (thousands) |
1,936 |
|
0.8 |
|
|
1,936 |
|
3.0 |
|
1. Includes exchange differences.
2. Excluding reverse repos.
3. Excluding repos.
|
|
|
|
|
|
|
|
|
68 |
|
January - September 2025 |
|
|
|
|
|
|
|
|
|
|
|
|
|
|
|
|
|
|
|
|
|
|
|
|
|
|
|
|
|
|
|
|
|
|
|
|
|
Significant events
|
|
|
|
|
|
|
|
|
|
|
|
|
|
|
|
|
|
|
|
Information by segment |
|
|
|
|
|
|
|
|
|
|
|
|
|
|
|
|
|
|
|
|
|
|
|
|
|
|
| Poland |
Q |
| EUR million |
|
|
|
|
|
|
|
|
|
/ |
Q2'25 |
|
|
/ |
9M'24 |
| Underlying income statement |
Q3'25 |
% |
% excl. FX |
|
9M'25 |
% |
% excl. FX |
| Net interest income |
737 |
|
0.2 |
|
0.2 |
|
|
2,217 |
|
5.0 |
|
3.5 |
|
| Net fee income |
176 |
|
(4.2) |
|
(4.3) |
|
|
549 |
|
8.0 |
|
6.3 |
|
Gains (losses) on financial transactions 1 |
17 |
|
(46.3) |
|
(46.0) |
|
|
62 |
|
41.0 |
|
38.8 |
|
| Other operating income |
4 |
|
(47.3) |
|
(45.6) |
|
|
(52) |
|
76.8 |
|
74.1 |
|
| Total income |
934 |
|
(2.5) |
|
(2.5) |
|
|
2,776 |
|
5.4 |
|
3.8 |
|
| Administrative expenses and amortizations |
(259) |
|
1.2 |
|
1.2 |
|
|
(771) |
|
7.3 |
|
5.7 |
|
| Net operating income |
675 |
|
(3.9) |
|
(3.9) |
|
|
2,005 |
|
4.7 |
|
3.1 |
|
| Net loan-loss provisions |
(81) |
|
89.8 |
|
88.5 |
|
|
(201) |
|
(49.7) |
|
(50.5) |
|
| Other gains (losses) and provisions |
(69) |
|
(64.5) |
|
(64.2) |
|
|
(314) |
|
35.2 |
|
33.2 |
|
| Profit before tax |
525 |
|
13.0 |
|
12.9 |
|
|
1,490 |
|
16.1 |
|
14.3 |
|
| Tax on profit |
(109) |
|
(5.1) |
|
(5.1) |
|
|
(346) |
|
8.3 |
|
6.6 |
|
| Profit from continuing operations |
416 |
|
18.9 |
|
18.8 |
|
|
1,144 |
|
18.7 |
|
16.9 |
|
| Net profit from discontinued operations |
— |
|
— |
|
— |
|
|
— |
|
— |
|
— |
|
| Consolidated profit |
416 |
|
18.9 |
|
18.8 |
|
|
1,144 |
|
18.7 |
|
16.9 |
|
| Non-controlling interests |
(159) |
|
21.8 |
|
21.6 |
|
|
(431) |
|
34.1 |
|
32.1 |
|
| Underlying attributable profit to the parent |
257 |
|
17.2 |
|
17.1 |
|
|
713 |
|
11.0 |
|
9.3 |
|
|
|
|
|
|
|
|
|
| Balance sheet |
|
|
|
|
|
|
|
| Loans and advances to customers |
39,102 |
|
(0.7) |
|
(0.2) |
|
|
39,102 |
|
4.8 |
|
4.4 |
|
| Cash, central banks and credit institutions |
10,712 |
|
8.4 |
|
9.0 |
|
|
10,712 |
|
16.3 |
|
15.8 |
|
| Debt instruments |
18,363 |
|
(1.7) |
|
(1.2) |
|
|
18,363 |
|
20.8 |
|
20.3 |
|
| Other financial assets |
662 |
|
(22.3) |
|
(21.9) |
|
|
662 |
|
13.9 |
|
13.5 |
|
| Other asset accounts |
2,298 |
|
2.5 |
|
3.0 |
|
|
2,298 |
|
4.7 |
|
4.3 |
|
| Total assets |
71,137 |
|
0.1 |
|
0.7 |
|
|
71,137 |
|
10.3 |
|
9.8 |
|
| Customer deposits |
51,755 |
|
(0.4) |
|
0.1 |
|
|
51,755 |
|
9.2 |
|
8.7 |
|
| Central banks and credit institutions |
5,866 |
|
(3.0) |
|
(2.5) |
|
|
5,866 |
|
23.5 |
|
23.0 |
|
| Marketable debt securities |
3,064 |
|
7.2 |
|
7.7 |
|
|
3,064 |
|
16.6 |
|
16.2 |
|
| Other financial liabilities |
1,656 |
|
(4.6) |
|
(4.1) |
|
|
1,656 |
|
6.8 |
|
6.4 |
|
| Other liabilities accounts |
1,914 |
|
(2.0) |
|
(1.5) |
|
|
1,914 |
|
27.3 |
|
26.7 |
|
| Total liabilities |
64,254 |
|
(0.5) |
|
— |
|
|
64,254 |
|
11.1 |
|
10.6 |
|
| Total equity |
6,883 |
|
6.4 |
|
7.0 |
|
|
6,883 |
|
3.5 |
|
3.0 |
|
|
|
|
|
|
|
|
|
| Memorandum items: |
|
|
|
|
|
|
|
Gross loans and advances to customers 2 |
39,813 |
|
(0.4) |
|
0.1 |
|
|
39,813 |
|
4.8 |
|
4.3 |
|
| Customer funds |
59,060 |
|
0.4 |
|
0.9 |
|
|
59,060 |
|
11.7 |
|
11.3 |
|
Customer deposits 3 |
51,291 |
|
(0.6) |
|
0.0 |
|
|
51,291 |
|
10.0 |
|
9.5 |
|
| Mutual funds |
7,770 |
|
7.2 |
|
7.8 |
|
|
7,770 |
|
24.9 |
|
24.4 |
|
|
|
|
|
|
|
|
|
| Ratios (%), operating means and customers |
|
|
|
|
|
|
|
| RoTE |
26.5 |
|
2.8 |
|
|
|
24.3 |
|
2.7 |
|
|
| RoTE (post-AT1) |
25.8 |
|
2.8 |
|
|
|
23.6 |
|
2.6 |
|
|
| Efficiency ratio |
27.7 |
|
1.0 |
|
|
|
27.8 |
|
0.5 |
|
|
| NPL ratio |
3.51 |
|
0.12 |
|
|
|
3.51 |
|
(0.40) |
|
|
| NPL coverage ratio |
64 |
|
0 |
|
|
|
64 |
|
(2) |
|
|
|
|
|
|
|
|
|
|
| Number of branches |
360 |
|
(0.3) |
|
|
|
360 |
|
(3.7) |
|
|
| Number of total customers (thousands) |
6,076 |
|
0.9 |
|
|
|
6,076 |
|
1.4 |
|
|
| Number of active customers (thousands) |
4,731 |
|
0.5 |
|
|
|
4,731 |
|
3.1 |
|
|
1. Includes exchange differences.
2. Excluding reverse repos.
3. Excluding repos.
|
|
|
|
|
|
|
|
|
January - September 2025 |
|
69 |
|
|
|
|
|
|
|
|
|
|
|
|
|
|
|
|
|
|
|
|
|
|
|
|
|
|
|
|
|
|
|
|
|
|
|
|
|
Significant events
|
|
|
|
|
|
|
|
|
|
|
|
|
|
|
|
|
|
|
|
Information by segment |
|
|
|
|
|
|
|
|
|
|
|
|
|
|
|
|
|
|
|
|
|
|
|
|
|
|
|
| DCB EUROPE |
|
|
| EUR million |
|
|
|
|
|
|
|
|
|
/ |
Q2'25 |
|
|
/ |
9M'24 |
|
| Underlying income statement |
Q3'25 |
% |
% excl. FX |
|
9M'25 |
% |
% excl. FX |
|
| Net interest income |
1,207 |
|
4.5 |
|
4.7 |
|
|
3,473 |
|
6.7 |
|
6.8 |
|
|
| Net fee income |
198 |
|
7.3 |
|
7.4 |
|
|
571 |
|
(16.1) |
|
(16.1) |
|
|
Gains (losses) on financial transactions 1 |
(25) |
|
55.3 |
|
55.5 |
|
|
(45) |
|
— |
|
— |
|
|
| Other operating income |
124 |
|
22.3 |
|
23.0 |
|
|
332 |
|
7.6 |
|
7.7 |
|
|
| Total income |
1,504 |
|
5.6 |
|
5.8 |
|
|
4,330 |
|
1.8 |
|
1.9 |
|
|
| Administrative expenses and amortizations |
(652) |
|
(1.2) |
|
(1.0) |
|
|
(1,978) |
|
0.1 |
|
0.2 |
|
|
| Net operating income |
852 |
|
11.4 |
|
11.6 |
|
|
2,352 |
|
3.3 |
|
3.4 |
|
|
| Net loan-loss provisions |
(307) |
|
8.4 |
|
8.5 |
|
|
(926) |
|
7.3 |
|
7.4 |
|
|
| Other gains (losses) and provisions |
(59) |
|
(46.2) |
|
(46.0) |
|
|
(213) |
|
(15.9) |
|
(16.3) |
|
|
| Profit before tax |
485 |
|
30.9 |
|
31.3 |
|
|
1,212 |
|
4.6 |
|
4.8 |
|
|
| Tax on profit |
(104) |
|
(3.6) |
|
(3.4) |
|
|
(313) |
|
11.6 |
|
11.6 |
|
|
| Profit from continuing operations |
380 |
|
45.1 |
|
45.6 |
|
|
899 |
|
2.4 |
|
2.6 |
|
|
| Net profit from discontinued operations |
— |
|
— |
|
— |
|
|
— |
|
— |
|
— |
|
|
| Consolidated profit |
380 |
|
45.1 |
|
45.6 |
|
|
899 |
|
2.4 |
|
2.6 |
|
|
| Non-controlling interests |
(92) |
|
54.2 |
|
54.1 |
|
|
(214) |
|
17.6 |
|
17.6 |
|
|
| Underlying attributable profit to the parent |
289 |
|
42.4 |
|
43.1 |
|
|
685 |
|
(1.6) |
|
(1.3) |
|
|
|
|
|
|
|
|
|
|
|
| Balance sheet |
|
|
|
|
|
|
|
|
| Loans and advances to customers |
138,021 |
|
(0.9) |
|
(0.9) |
|
|
138,021 |
|
1.9 |
|
2.3 |
|
|
| Cash, central banks and credit institutions |
17,566 |
|
(0.7) |
|
(0.5) |
|
|
17,566 |
|
(17.4) |
|
(16.9) |
|
|
| Debt instruments |
8,280 |
|
2.0 |
|
2.0 |
|
|
8,280 |
|
34.8 |
|
34.7 |
|
|
| Other financial assets |
106 |
|
0.5 |
|
0.6 |
|
|
106 |
|
(21.4) |
|
(21.4) |
|
|
| Other asset accounts |
11,879 |
|
1.1 |
|
1.2 |
|
|
11,879 |
|
5.1 |
|
5.7 |
|
|
| Total assets |
175,851 |
|
(0.6) |
|
(0.5) |
|
|
175,851 |
|
0.9 |
|
1.3 |
|
|
| Customer deposits |
81,558 |
|
(2.9) |
|
(3.0) |
|
|
81,558 |
|
2.0 |
|
2.0 |
|
|
| Central banks and credit institutions |
29,662 |
|
(4.9) |
|
(4.2) |
|
|
29,662 |
|
(0.8) |
|
1.1 |
|
|
| Marketable debt securities |
42,618 |
|
7.1 |
|
7.1 |
|
|
42,618 |
|
(2.3) |
|
(2.2) |
|
|
| Other financial liabilities |
2,180 |
|
(15.7) |
|
(15.6) |
|
|
2,180 |
|
2.5 |
|
2.7 |
|
|
| Other liabilities accounts |
5,770 |
|
1.5 |
|
1.5 |
|
|
5,770 |
|
9.4 |
|
9.5 |
|
|
| Total liabilities |
161,787 |
|
(0.9) |
|
(0.8) |
|
|
161,787 |
|
0.5 |
|
1.0 |
|
|
| Total equity |
14,063 |
|
2.4 |
|
2.4 |
|
|
14,063 |
|
5.4 |
|
5.9 |
|
|
|
|
|
|
|
|
|
|
|
| Memorandum items: |
|
|
|
|
|
|
|
|
Gross loans and advances to customers 2 |
141,162 |
|
(0.8) |
|
(0.8) |
|
|
141,162 |
|
2.1 |
|
2.5 |
|
|
| Customer funds |
86,657 |
|
(2.4) |
|
(2.5) |
|
|
86,657 |
|
2.7 |
|
2.7 |
|
|
Customer deposits 3 |
81,558 |
|
(2.9) |
|
(3.0) |
|
|
81,558 |
|
2.0 |
|
2.0 |
|
|
| Mutual funds |
5,099 |
|
6.9 |
|
6.9 |
|
|
5,099 |
|
16.0 |
|
16.0 |
|
|
|
|
|
|
|
|
|
|
|
| Ratios (%), operating means and customers |
|
|
|
|
|
|
|
|
| RoTE |
11.1 |
|
3.2 |
|
|
|
8.9 |
|
(0.3) |
|
|
|
| RoTE (post-AT1) |
10.2 |
|
3.2 |
|
|
|
8.0 |
|
(0.3) |
|
|
|
| Efficiency ratio |
43.4 |
|
(3.0) |
|
|
|
45.7 |
|
(0.8) |
|
|
|
| NPL ratio |
2.70 |
|
0.08 |
|
|
|
2.70 |
|
0.26 |
|
|
|
| NPL coverage ratio |
82 |
|
0 |
|
|
|
82 |
|
(1) |
|
|
|
|
|
|
|
|
|
|
|
|
| Number of branches |
299 |
|
0.7 |
|
|
|
299 |
|
(8.3) |
|
|
|
| Number of total customers (thousands) |
19,633 |
|
0.3 |
|
|
|
19,633 |
|
0.1 |
|
|
|
|
|
|
|
|
|
|
|
|
|
|
|
|
|
|
|
|
|
1. Includes exchange differences.
2. Excluding reverse repos.
3. Excluding repos.
|
|
|
|
|
|
|
|
|
70 |
|
January - September 2025 |
|
|
|
|
|
|
|
|
|
|
|
|
|
|
|
|
|
|
|
|
|
|
|
|
|
|
|
|
|
|
|
|
|
|
|
|
|
Significant events
|
|
|
|
|
|
|
|
|
|
|
|
|
|
|
|
|
|
|
|
Information by segment |
|
|
|
|
|
|
|
|
|
|
|
|
|
|
|
|
|
|
|
|
|
|
|
|
|
|
| United States |
|
| EUR million |
|
|
|
|
|
|
|
|
|
/ |
Q2'25 |
|
|
/ |
9M'24 |
| Underlying income statement |
Q3'25 |
% |
% excl. FX |
|
9M'25 |
% |
% excl. FX |
| Net interest income |
1,463 |
|
0.9 |
|
4.1 |
|
|
4,412 |
|
4.2 |
|
7.1 |
|
| Net fee income |
335 |
|
3.7 |
|
6.7 |
|
|
1,014 |
|
21.4 |
|
24.7 |
|
Gains (losses) on financial transactions 1 |
111 |
|
46.9 |
|
48.7 |
|
|
283 |
|
(2.6) |
|
0.2 |
|
| Other operating income |
20 |
|
(68.4) |
|
(64.4) |
|
|
148 |
|
(46.8) |
|
(45.4) |
|
| Total income |
1,930 |
|
0.9 |
|
4.0 |
|
|
5,856 |
|
3.9 |
|
6.7 |
|
| Administrative expenses and amortizations |
(908) |
|
(3.1) |
|
0.1 |
|
|
(2,852) |
|
0.3 |
|
3.1 |
|
| Net operating income |
1,022 |
|
4.7 |
|
7.8 |
|
|
3,004 |
|
7.5 |
|
10.4 |
|
| Net loan-loss provisions |
(569) |
|
15.3 |
|
18.1 |
|
|
(1,597) |
|
(12.3) |
|
(9.9) |
|
| Other gains (losses) and provisions |
(28) |
|
7.4 |
|
10.6 |
|
|
(79) |
|
(45.5) |
|
(44.0) |
|
| Profit before tax |
425 |
|
(7.0) |
|
(3.7) |
|
|
1,328 |
|
60.1 |
|
64.5 |
|
| Tax on profit |
(70) |
|
101.4 |
|
103.9 |
|
|
(135) |
|
— |
|
— |
|
| Profit from continuing operations |
355 |
|
(15.9) |
|
(12.5) |
|
|
1,194 |
|
35.7 |
|
39.4 |
|
| Net profit from discontinued operations |
— |
|
— |
|
— |
|
|
— |
|
— |
|
— |
|
| Consolidated profit |
355 |
|
(15.9) |
|
(12.5) |
|
|
1,194 |
|
35.7 |
|
39.4 |
|
| Non-controlling interests |
— |
|
— |
|
— |
|
|
— |
|
— |
|
— |
|
| Underlying attributable profit to the parent |
355 |
|
(15.9) |
|
(12.5) |
|
|
1,194 |
|
35.7 |
|
39.4 |
|
|
|
|
|
|
|
|
|
| Balance sheet |
|
|
|
|
|
|
|
| Loans and advances to customers |
132,562 |
|
8.1 |
|
8.0 |
|
|
132,562 |
|
(1.0) |
|
4.1 |
|
| Cash, central banks and credit institutions |
23,269 |
|
(17.1) |
|
(17.2) |
|
|
23,269 |
|
(5.5) |
|
(0.6) |
|
| Debt instruments |
38,855 |
|
1.8 |
|
1.7 |
|
|
38,855 |
|
49.3 |
|
57.0 |
|
| Other financial assets |
2,878 |
|
26.0 |
|
25.8 |
|
|
2,878 |
|
26.8 |
|
33.4 |
|
| Other asset accounts |
12,123 |
|
(6.3) |
|
(6.5) |
|
|
12,123 |
|
(21.5) |
|
(17.5) |
|
| Total assets |
209,686 |
|
2.8 |
|
2.6 |
|
|
209,686 |
|
3.6 |
|
9.0 |
|
| Customer deposits |
117,535 |
|
3.2 |
|
3.0 |
|
|
117,535 |
|
(1.2) |
|
3.9 |
|
| Central banks and credit institutions |
40,084 |
|
6.2 |
|
6.1 |
|
|
40,084 |
|
41.8 |
|
49.1 |
|
| Marketable debt securities |
27,402 |
|
(4.4) |
|
(4.5) |
|
|
27,402 |
|
(12.7) |
|
(8.2) |
|
| Other financial liabilities |
6,895 |
|
18.4 |
|
18.2 |
|
|
6,895 |
|
36.2 |
|
43.2 |
|
| Other liabilities accounts |
3,002 |
|
(2.3) |
|
(2.5) |
|
|
3,002 |
|
0.8 |
|
6.1 |
|
| Total liabilities |
194,919 |
|
3.0 |
|
2.9 |
|
|
194,919 |
|
4.4 |
|
9.8 |
|
| Total equity |
14,767 |
|
(0.5) |
|
(0.6) |
|
|
14,767 |
|
(5.7) |
|
(0.9) |
|
|
|
|
|
|
|
|
|
| Memorandum items: |
|
|
|
|
|
|
|
Gross loans and advances to customers 2 |
106,850 |
|
0.8 |
0.7 |
|
106,850 |
|
(5.5) |
(0.6) |
| Customer funds |
98,087 |
|
1.1 |
1.0 |
|
98,087 |
|
(0.4) |
4.7 |
Customer deposits 3 |
82,874 |
|
0.1 |
(0.1) |
|
82,874 |
|
(2.3) |
2.7 |
| Mutual funds |
15,213 |
|
7.4 |
7.2 |
|
15,213 |
|
11.1 |
16.9 |
|
|
|
|
|
|
|
|
| Ratios (%), operating means and customers |
|
|
|
|
|
|
|
| RoTE |
10.0 |
|
(1.8) |
|
|
|
11.0 |
|
3.0 |
|
|
| RoTE (post-AT1) |
9.5 |
|
(1.8) |
|
|
|
10.5 |
|
2.9 |
|
|
| Efficiency ratio |
47.1 |
|
(1.9) |
|
|
|
48.7 |
|
(1.7) |
|
|
| NPL ratio |
4.71 |
|
0.07 |
|
|
|
4.71 |
|
0.31 |
|
|
| NPL coverage ratio |
58 |
|
(5) |
|
|
|
58 |
|
(7) |
|
|
|
|
|
|
|
|
|
|
| Number of branches |
384 |
|
(4.7) |
|
|
|
384 |
|
(5.9) |
|
|
| Number of total customers (thousands) |
4,426 |
|
(1.1) |
|
|
|
4,426 |
|
(1.2) |
|
|
| Number of active customers (thousands) |
4,222 |
|
(1.3) |
|
|
|
4,222 |
|
(2.5) |
|
|
1. Includes exchange differences.
2. Excluding reverse repos.
3. Excluding repos.
|
|
|
|
|
|
|
|
|
January - September 2025 |
|
71 |
|
|
|
|
|
|
|
|
|
|
|
|
|
|
|
|
|
|
|
|
|
|
|
|
|
|
|
|
|
|
|
|
|
|
|
|
|
Significant events
|
|
|
|
|
|
|
|
|
|
|
|
|
|
|
|
|
|
|
|
Information by segment |
|
|
|
|
|
|
|
|
|
|
|
|
|
|
|
|
|
|
|
|
|
|
|
|
|
|
| Mexico |
|
| EUR million |
|
|
|
|
|
|
|
|
|
/ |
Q2'25 |
|
|
/ |
9M'24 |
| Underlying income statement |
Q3'25 |
% |
% excl. FX |
|
9M'25 |
% |
% excl. FX |
| Net interest income |
1,126 |
|
1.6 |
|
0.0 |
|
|
3,364 |
|
(4.8) |
|
8.0 |
|
| Net fee income |
341 |
|
0.6 |
|
(1.0) |
|
|
1,031 |
|
(3.0) |
|
10.0 |
|
Gains (losses) on financial transactions 1 |
118 |
|
62.5 |
|
60.3 |
|
|
255 |
|
16.1 |
|
31.7 |
|
| Other operating income |
(30) |
|
84.8 |
|
78.6 |
|
|
(84) |
|
(12.3) |
|
(0.6) |
|
| Total income |
1,556 |
|
3.4 |
|
1.8 |
|
|
4,566 |
|
(3.3) |
|
9.7 |
|
| Administrative expenses and amortizations |
(639) |
|
3.5 |
|
1.9 |
|
|
(1,884) |
|
(4.7) |
|
8.1 |
|
| Net operating income |
917 |
|
3.4 |
|
1.8 |
|
|
2,682 |
|
(2.3) |
|
10.8 |
|
| Net loan-loss provisions |
(324) |
|
7.3 |
|
5.7 |
|
|
(931) |
|
(8.2) |
|
4.1 |
|
| Other gains (losses) and provisions |
(19) |
|
(44.7) |
|
(45.6) |
|
|
(84) |
|
85.7 |
|
110.7 |
|
| Profit before tax |
574 |
|
4.2 |
|
2.6 |
|
|
1,667 |
|
(1.1) |
|
12.2 |
|
| Tax on profit |
(157) |
|
4.6 |
|
3.0 |
|
|
(454) |
|
1.3 |
|
14.9 |
|
| Profit from continuing operations |
417 |
|
4.0 |
|
2.4 |
|
|
1,214 |
|
(1.9) |
|
11.3 |
|
| Net profit from discontinued operations |
— |
|
— |
|
— |
|
|
— |
|
— |
|
— |
|
| Consolidated profit |
417 |
|
4.0 |
|
2.4 |
|
|
1,214 |
|
(1.9) |
|
11.3 |
|
| Non-controlling interests |
(1) |
|
(7.2) |
|
(8.8) |
|
|
(3) |
|
(8.4) |
|
3.9 |
|
| Underlying attributable profit to the parent |
416 |
|
4.0 |
|
2.5 |
|
|
1,211 |
|
(1.9) |
|
11.3 |
|
|
|
|
|
|
|
|
|
| Balance sheet |
|
|
|
|
|
|
|
| Loans and advances to customers |
44,589 |
|
3.7 |
|
0.8 |
|
|
44,589 |
|
1.0 |
|
(0.6) |
|
| Cash, central banks and credit institutions |
14,310 |
|
33.3 |
|
29.4 |
|
|
14,310 |
|
28.6 |
|
26.6 |
|
| Debt instruments |
29,021 |
|
8.7 |
|
5.6 |
|
|
29,021 |
|
14.3 |
|
12.5 |
|
| Other financial assets |
4,469 |
|
8.4 |
|
5.3 |
|
|
4,469 |
|
(23.6) |
|
(24.9) |
|
| Other asset accounts |
5,171 |
|
(3.8) |
|
(6.6) |
|
|
5,171 |
|
(3.9) |
|
(5.5) |
|
| Total assets |
97,561 |
|
8.5 |
|
5.4 |
|
|
97,561 |
|
6.2 |
|
4.5 |
|
| Customer deposits |
50,839 |
|
5.1 |
|
2.0 |
|
|
50,839 |
|
6.0 |
|
4.3 |
|
| Central banks and credit institutions |
16,744 |
|
17.3 |
|
13.9 |
|
|
16,744 |
|
16.2 |
|
14.3 |
|
| Marketable debt securities |
9,480 |
|
2.4 |
|
(0.6) |
|
|
9,480 |
|
6.6 |
|
4.8 |
|
| Other financial liabilities |
9,080 |
|
23.4 |
|
19.9 |
|
|
9,080 |
|
(0.4) |
|
(2.0) |
|
| Other liabilities accounts |
2,905 |
|
6.1 |
|
3.1 |
|
|
2,905 |
|
(1.3) |
|
(2.9) |
|
| Total liabilities |
89,047 |
|
8.6 |
|
5.4 |
|
|
89,047 |
|
6.8 |
|
5.1 |
|
| Total equity |
8,513 |
|
8.0 |
|
4.9 |
|
|
8,513 |
|
(0.3) |
|
(1.9) |
|
|
|
|
|
|
|
|
|
| Memorandum items: |
|
|
|
|
|
|
|
Gross loans and advances to customers 2 |
45,997 |
|
3.8 |
|
0.8 |
|
|
45,997 |
|
6.0 |
|
4.3 |
|
| Customer funds |
64,610 |
|
3.7 |
|
0.7 |
|
|
64,610 |
|
11.8 |
|
10.0 |
|
Customer deposits 3 |
42,135 |
|
2.1 |
|
(0.8) |
|
|
42,135 |
|
7.5 |
|
5.8 |
|
| Mutual funds |
22,475 |
|
6.7 |
|
3.6 |
|
|
22,475 |
|
20.9 |
|
18.9 |
|
|
|
|
|
|
|
|
|
| Ratios (%), operating means and customers |
|
|
|
|
|
|
|
| RoTE |
21.9 |
|
0.1 |
|
|
|
21.6 |
|
2.2 |
|
|
| RoTE (post-AT1) |
21.5 |
|
0.1 |
|
|
|
21.2 |
|
2.2 |
|
|
| Efficiency ratio |
41.1 |
|
0.0 |
|
|
|
41.3 |
|
(0.6) |
|
|
| NPL ratio |
2.95 |
|
0.02 |
|
|
|
2.95 |
|
0.25 |
|
|
| NPL coverage ratio |
101 |
|
1 |
|
|
|
101 |
|
(3) |
|
|
|
|
|
|
|
|
|
|
| Number of branches |
1,329 |
|
(0.2) |
|
|
|
1,329 |
|
(1.8) |
|
|
| Number of total customers (thousands) |
22,126 |
|
2.0 |
|
|
|
22,126 |
|
4.4 |
|
|
| Number of active customers (thousands) |
11,641 |
|
3.8 |
|
|
|
11,641 |
|
8.3 |
|
|
1. Includes exchange differences.
2. Excluding reverse repos.
3. Excluding repos.
|
|
|
|
|
|
|
|
|
72 |
|
January - September 2025 |
|
|
|
|
|
|
|
|
|
|
|
|
|
|
|
|
|
|
|
|
|
|
|
|
|
|
|
|
|
|
|
|
|
|
|
|
|
Significant events
|
|
|
|
|
|
|
|
|
|
|
|
|
|
|
|
|
|
|
|
Information by segment |
|
|
|
|
|
|
|
|
|
|
|
|
|
|
|
|
|
|
|
|
|
|
|
|
|
|
| Brazil |
|
| EUR million |
|
|
|
|
|
|
|
|
|
/ |
Q2'25 |
|
|
/ |
9M'24 |
| Underlying income statement |
Q3'25 |
% |
% excl. FX |
|
9M'25 |
% |
% excl. FX |
| Net interest income |
2,309 |
|
(1.2) |
|
(2.1) |
|
|
7,049 |
|
(8.6) |
|
1.6 |
|
| Net fee income |
801 |
|
5.8 |
|
4.9 |
|
|
2,350 |
|
(8.5) |
|
1.7 |
|
Gains (losses) on financial transactions 1 |
(34) |
|
(8.0) |
|
(6.2) |
|
|
(47) |
|
26.8 |
|
40.9 |
|
| Other operating income |
20 |
|
(25.2) |
|
(24.7) |
|
|
54 |
|
92.2 |
|
113.6 |
|
| Total income |
3,096 |
|
0.4 |
|
(0.5) |
|
|
9,405 |
|
(8.4) |
|
1.8 |
|
| Administrative expenses and amortizations |
(1,002) |
|
— |
|
(0.9) |
|
|
(3,062) |
|
(6.9) |
|
3.5 |
|
| Net operating income |
2,095 |
|
0.5 |
|
(0.3) |
|
|
6,343 |
|
(9.1) |
|
1.0 |
|
| Net loan-loss provisions |
(1,035) |
|
(7.9) |
|
(8.6) |
|
|
(3,325) |
|
(2.5) |
|
8.4 |
|
| Other gains (losses) and provisions |
(208) |
|
(2.1) |
|
(2.7) |
|
|
(615) |
|
(7.3) |
|
3.0 |
|
| Profit before tax |
851 |
|
14.0 |
|
12.8 |
|
|
2,403 |
|
(17.3) |
|
(8.1) |
|
| Tax on profit |
(198) |
|
(5.7) |
|
(6.7) |
|
|
(653) |
|
(31.3) |
|
(23.7) |
|
| Profit from continuing operations |
654 |
|
21.7 |
|
20.4 |
|
|
1,749 |
|
(10.4) |
|
(0.5) |
|
| Net profit from discontinued operations |
— |
|
— |
|
— |
|
|
— |
|
— |
|
— |
|
| Consolidated profit |
654 |
|
21.7 |
|
20.4 |
|
|
1,749 |
|
(10.4) |
|
(0.5) |
|
| Non-controlling interests |
(61) |
|
21.0 |
|
19.9 |
|
|
(160) |
|
(12.3) |
|
(2.5) |
|
| Underlying attributable profit to the parent |
593 |
|
21.7 |
|
20.5 |
|
|
1,589 |
|
(10.3) |
|
(0.3) |
|
|
|
|
|
|
|
|
|
| Balance sheet |
|
|
|
|
|
|
|
| Loans and advances to customers |
88,221 |
|
4.2 |
|
1.7 |
|
|
88,221 |
|
(2.8) |
|
0.1 |
|
| Cash, central banks and credit institutions |
54,071 |
|
4.7 |
|
2.2 |
|
|
54,071 |
|
(2.9) |
|
— |
|
| Debt instruments |
47,554 |
|
5.8 |
|
3.3 |
|
|
47,554 |
|
6.3 |
|
9.5 |
|
| Other financial assets |
11,839 |
|
28.3 |
|
25.3 |
|
|
11,839 |
|
49.3 |
|
53.6 |
|
| Other asset accounts |
14,585 |
|
(2.3) |
|
(4.7) |
|
|
14,585 |
|
5.3 |
|
8.4 |
|
| Total assets |
216,270 |
|
5.3 |
|
2.8 |
|
|
216,270 |
|
1.6 |
|
4.6 |
|
| Customer deposits |
95,907 |
|
5.7 |
|
3.1 |
|
|
95,907 |
|
(2.8) |
|
0.1 |
|
| Central banks and credit institutions |
33,691 |
|
(0.3) |
|
(2.6) |
|
|
33,691 |
|
0.9 |
|
3.9 |
|
| Marketable debt securities |
28,480 |
|
7.1 |
|
4.5 |
|
|
28,480 |
|
7.3 |
|
10.5 |
|
| Other financial liabilities |
35,578 |
|
9.8 |
|
7.2 |
|
|
35,578 |
|
17.8 |
|
21.3 |
|
| Other liabilities accounts |
6,288 |
|
1.9 |
|
(0.6) |
|
|
6,288 |
|
(23.4) |
|
(21.2) |
|
| Total liabilities |
199,943 |
|
5.4 |
|
2.9 |
|
|
199,943 |
|
1.5 |
|
4.5 |
|
| Total equity |
16,327 |
|
3.8 |
|
1.3 |
|
|
16,327 |
|
2.4 |
|
5.4 |
|
|
|
|
|
|
|
|
|
| Memorandum items: |
|
|
|
|
|
|
|
Gross loans and advances to customers 2 |
93,616 |
|
4.8 |
|
2.3 |
|
|
93,616 |
|
(2.6) |
|
0.3 |
|
| Customer funds |
137,559 |
|
5.4 |
|
2.9 |
|
|
137,559 |
|
2.2 |
|
5.2 |
|
Customer deposits 3 |
82,967 |
|
4.7 |
|
2.2 |
|
|
82,967 |
|
(0.5) |
|
2.5 |
|
| Mutual funds |
54,592 |
|
6.5 |
|
4.0 |
|
|
54,592 |
|
6.5 |
|
9.6 |
|
|
|
|
|
|
|
|
|
| Ratios (%), operating means and customers |
|
|
|
|
|
|
|
| RoTE |
17.4 |
|
2.7 |
|
|
|
15.8 |
|
(1.0) |
|
|
| RoTE (post-AT1) |
16.8 |
|
2.7 |
|
|
|
15.1 |
|
(1.0) |
|
|
| Efficiency ratio |
32.4 |
|
(0.1) |
|
|
|
32.6 |
|
0.5 |
|
|
| NPL ratio |
6.58 |
|
(0.03) |
|
|
|
6.58 |
|
0.32 |
|
|
| NPL coverage ratio |
86 |
|
1 |
|
|
|
86 |
|
4 |
|
|
|
|
|
|
|
|
|
|
| Number of branches |
1,724 |
|
(8.7) |
|
|
|
1,724 |
|
(25.5) |
|
|
| Number of total customers (thousands) |
72,788 |
|
1.5 |
|
|
|
72,788 |
|
6.8 |
|
|
| Number of active customers (thousands) |
33,733 |
|
0.5 |
|
|
|
33,733 |
|
3.8 |
|
|
1. Includes exchange differences.
2. Excluding reverse repos.
3. Excluding repos.
|
|
|
|
|
|
|
|
|
January - September 2025 |
|
73 |
|
|
|
|
|
|
|
|
|
|
|
|
|
|
|
|
|
|
|
|
|
|
|
|
|
|
|
|
|
|
|
|
|
|
|
|
|
Significant events
|
|
|
|
|
|
|
|
|
|
|
|
|
|
|
|
|
|
|
|
Information by segment |
|
|
|
|
|
|
|
|
|
|
|
|
|
|
|
|
|
|
|
|
|
|
|
|
|
|
| Chile |
|
|
|
|
|
|
|
| EUR million |
|
|
|
|
|
|
|
|
|
/ |
Q2'25 |
|
|
/ |
9M'24 |
| Underlying income statement |
Q3'25 |
% |
% excl. FX |
|
9M'25 |
% |
% excl. FX |
| Net interest income |
436 |
|
(11.1) |
|
(6.5) |
|
|
1,438 |
|
10.2 |
|
15.6 |
|
| Net fee income |
135 |
|
(7.4) |
|
(2.8) |
|
|
431 |
|
4.9 |
|
10.1 |
|
Gains (losses) on financial transactions 1 |
64 |
|
12.6 |
|
17.0 |
|
|
184 |
|
6.4 |
|
11.7 |
|
| Other operating income |
(4) |
|
(3.2) |
|
1.3 |
|
|
(13) |
|
10.5 |
|
16.0 |
|
| Total income |
630 |
|
(8.4) |
|
(3.9) |
|
|
2,040 |
|
8.7 |
|
14.1 |
|
| Administrative expenses and amortizations |
(212) |
|
(9.7) |
|
(5.2) |
|
|
(696) |
|
(0.8) |
|
4.2 |
|
| Net operating income |
418 |
|
(7.7) |
|
(3.2) |
|
|
1,344 |
|
14.3 |
|
20.0 |
|
| Net loan-loss provisions |
(122) |
|
(11.3) |
|
(6.8) |
|
|
(416) |
|
9.9 |
|
15.3 |
|
| Other gains (losses) and provisions |
(11) |
|
59.2 |
|
64.8 |
|
|
(21) |
|
(30.4) |
|
(26.9) |
|
| Profit before tax |
285 |
|
(7.6) |
|
(3.1) |
|
|
907 |
|
18.2 |
|
24.1 |
|
| Tax on profit |
(50) |
|
10.8 |
|
15.2 |
|
|
(142) |
|
(7.2) |
|
(2.6) |
|
| Profit from continuing operations |
234 |
|
(10.8) |
|
(6.3) |
|
|
766 |
|
24.6 |
|
30.7 |
|
| Net profit from discontinued operations |
— |
|
— |
|
— |
|
|
— |
|
— |
|
— |
|
| Consolidated profit |
234 |
|
(10.8) |
|
(6.3) |
|
|
766 |
|
24.6 |
|
30.7 |
|
| Non-controlling interests |
(70) |
|
(11.3) |
|
(6.8) |
|
|
(232) |
|
27.5 |
|
33.9 |
|
| Underlying attributable profit to the parent |
165 |
|
(10.6) |
|
(6.0) |
|
|
534 |
|
23.3 |
|
29.4 |
|
|
|
|
|
|
|
|
|
| Balance sheet |
|
|
|
|
|
|
|
| Loans and advances to customers |
37,416 |
|
(2.4) |
|
0.4 |
|
|
37,416 |
|
(8.2) |
|
3.4 |
|
| Cash, central banks and credit institutions |
5,446 |
|
21.7 |
|
25.1 |
|
|
5,446 |
|
1.3 |
|
14.1 |
|
| Debt instruments |
8,534 |
|
2.9 |
|
5.9 |
|
|
8,534 |
|
(1.6) |
|
10.7 |
|
| Other financial assets |
10,821 |
|
(3.6) |
|
(0.9) |
|
|
10,821 |
|
(14.7) |
|
(4.0) |
|
| Other asset accounts |
2,022 |
|
0.2 |
|
3.0 |
|
|
2,022 |
|
(21.0) |
|
(11.1) |
|
| Total assets |
64,239 |
|
(0.2) |
|
2.7 |
|
|
64,239 |
|
(8.3) |
|
3.3 |
|
| Customer deposits |
26,440 |
|
(3.1) |
|
(0.4) |
|
|
26,440 |
|
(9.3) |
|
2.2 |
|
| Central banks and credit institutions |
9,463 |
|
9.7 |
|
12.8 |
|
|
9,463 |
|
5.3 |
|
18.5 |
|
| Marketable debt securities |
9,281 |
|
(4.8) |
|
(2.1) |
|
|
9,281 |
|
(12.3) |
|
(1.3) |
|
| Other financial liabilities |
11,984 |
|
2.2 |
|
5.1 |
|
|
11,984 |
|
(11.8) |
|
(0.6) |
|
| Other liabilities accounts |
2,037 |
|
1.2 |
|
4.0 |
|
|
2,037 |
|
(6.5) |
|
5.3 |
|
| Total liabilities |
59,205 |
|
(0.3) |
|
2.5 |
|
|
59,205 |
|
(8.2) |
|
3.4 |
|
| Total equity |
5,034 |
|
2.0 |
|
4.9 |
|
|
5,034 |
|
(9.6) |
|
1.8 |
|
|
|
|
|
|
|
|
|
| Memorandum items: |
|
|
|
|
|
|
|
Gross loans and advances to customers 2 |
38,438 |
|
(1.3) |
|
1.5 |
|
|
38,438 |
|
(8.2) |
|
3.4 |
|
| Customer funds |
38,221 |
|
(2.1) |
|
0.6 |
|
|
38,221 |
|
(6.8) |
|
5.0 |
|
Customer deposits 3 |
25,530 |
|
(4.1) |
|
(1.3) |
|
|
25,530 |
|
(11.8) |
|
(0.7) |
|
| Mutual funds |
12,691 |
|
2.0 |
|
4.9 |
|
|
12,691 |
|
5.4 |
|
18.7 |
|
|
|
|
|
|
|
|
|
| Ratios (%), operating means and customers |
|
|
|
|
|
|
|
| RoTE |
19.8 |
|
(1.8) |
|
|
|
20.1 |
|
4.5 |
|
|
| RoTE (post-AT1) |
19.1 |
|
(1.7) |
|
|
|
19.3 |
|
4.4 |
|
|
| Efficiency ratio |
33.6 |
|
(0.5) |
|
|
|
34.1 |
|
(3.2) |
|
|
| NPL ratio |
5.54 |
|
0.11 |
|
|
|
5.54 |
|
0.22 |
|
|
| NPL coverage ratio |
49 |
|
(1) |
|
|
|
49 |
|
(2) |
|
|
|
|
|
|
|
|
|
|
| Number of branches |
231 |
|
— |
|
|
|
231 |
|
(1.7) |
|
|
| Number of total customers (thousands) |
4,580 |
|
1.4 |
|
|
|
4,580 |
|
8.7 |
|
|
| Number of active customers (thousands) |
2,680 |
|
0.9 |
|
|
|
2,680 |
|
5.4 |
|
|
1. Includes exchange differences.
2. Excluding reverse repos.
3. Excluding repos.
|
|
|
|
|
|
|
|
|
74 |
|
January - September 2025 |
|
|
|
|
|
|
|
|
|
|
|
|
|
|
|
|
|
|
|
|
|
|
|
|
|
|
|
|
|
|
|
|
|
|
|
|
|
Significant events
|
|
|
|
|
|
|
|
|
|
|
|
|
|
|
|
|
|
|
|
Information by segment |
|
|
|
|
|
|
|
|
|
|
|
|
|
|
|
|
|
|
|
|
|
|
|
|
| Argentina |
|
| EUR million |
|
|
|
|
|
|
|
|
|
/ Q2'25 |
|
|
/ 9M'24 |
|
| Underlying income statement |
Q3'25 |
Q2'25 |
% |
|
9M'25 |
% |
|
| Net interest income |
318 |
|
523 |
|
(39.2) |
|
|
1,257 |
|
(30.7) |
|
|
| Net fee income |
192 |
|
217 |
|
(11.8) |
|
|
581 |
|
84.2 |
|
|
Gains (losses) on financial transactions 1 |
55 |
|
83 |
|
(33.8) |
|
|
177 |
|
38.2 |
|
|
| Other operating income |
(56) |
|
(183) |
|
(69.6) |
|
|
(361) |
|
(55.8) |
|
|
| Total income |
509 |
|
641 |
|
(20.5) |
|
|
1,654 |
|
14.8 |
|
|
| Administrative expenses and amortizations |
(209) |
|
(275) |
|
(24.0) |
|
|
(707) |
|
16.5 |
|
|
| Net operating income |
300 |
|
366 |
|
(17.9) |
|
|
947 |
|
13.6 |
|
|
| Net loan-loss provisions |
(172) |
|
(133) |
|
29.3 |
|
|
(381) |
|
196.3 |
|
|
| Other gains (losses) and provisions |
(13) |
|
(37) |
|
(65.3) |
|
|
(58) |
|
(74.7) |
|
|
| Profit before tax |
115 |
|
195 |
|
(41.2) |
|
|
507 |
|
6.8 |
|
|
| Tax on profit |
(29) |
|
(61) |
|
(53.3) |
|
|
(159) |
|
71.3 |
|
|
| Profit from continuing operations |
86 |
|
134 |
|
(35.6) |
|
|
349 |
|
(8.8) |
|
|
| Net profit from discontinued operations |
— |
|
— |
|
— |
|
|
— |
|
— |
|
|
| Consolidated profit |
86 |
|
134 |
|
(35.6) |
|
|
349 |
|
(8.8) |
|
|
| Non-controlling interests |
0 |
|
0 |
|
(57.4) |
|
|
(1) |
|
(24.1) |
|
|
| Underlying attributable profit to the parent |
86 |
|
134 |
|
(35.6) |
|
|
348 |
|
(8.7) |
|
|
|
|
|
|
|
|
|
|
| Balance sheet |
|
|
|
|
|
|
|
| Loans and advances to customers |
8,945 |
|
8,607 |
|
3.9 |
|
|
8,945 |
|
65.7 |
|
|
| Cash, central banks and credit institutions |
3,522 |
|
4,090 |
|
(13.9) |
|
|
3,522 |
|
(26.3) |
|
|
| Debt instruments |
2,388 |
|
2,821 |
|
(15.3) |
|
|
2,388 |
|
35.1 |
|
|
| Other financial assets |
71 |
|
68 |
|
5.8 |
|
|
71 |
|
6.9 |
|
|
| Other asset accounts |
987 |
|
962 |
|
2.5 |
|
|
987 |
|
55.5 |
|
|
| Total assets |
15,914 |
|
16,548 |
|
(3.8) |
|
|
15,914 |
|
25.9 |
|
|
| Customer deposits |
10,190 |
|
11,476 |
|
(11.2) |
|
|
10,190 |
|
15.2 |
|
|
| Central banks and credit institutions |
1,316 |
|
595 |
|
121.4 |
|
|
1,316 |
|
39.8 |
|
|
| Marketable debt securities |
280 |
|
299 |
|
(6.4) |
|
|
280 |
|
93.2 |
|
|
| Other financial liabilities |
1,228 |
|
1,087 |
|
13.0 |
|
|
1,228 |
|
73.6 |
|
|
| Other liabilities accounts |
465 |
|
513 |
|
(9.5) |
|
|
465 |
|
52.4 |
|
|
| Total liabilities |
13,478 |
|
13,969 |
|
(3.5) |
|
|
13,478 |
|
23.2 |
|
|
| Total equity |
2,436 |
|
2,579 |
|
(5.5) |
|
|
2,436 |
|
43.1 |
|
|
|
|
|
|
|
|
|
|
| Memorandum items: |
|
|
|
|
|
|
|
Gross loans and advances to customers 2 |
9,424 |
|
8,989 |
|
4.8 |
|
|
9,424 |
|
69.8 |
|
|
| Customer funds |
16,205 |
|
17,761 |
|
(8.8) |
|
|
16,205 |
|
31.0 |
|
|
Customer deposits 3 |
10,190 |
|
11,476 |
|
(11.2) |
|
|
10,190 |
|
15.2 |
|
|
| Mutual funds |
6,015 |
|
6,285 |
|
(4.3) |
|
|
6,015 |
|
70.6 |
|
|
|
|
|
|
|
|
|
|
| Ratios (%), operating means and customers |
|
|
|
|
|
|
|
| RoTE |
21.5 |
|
|
(0.7) |
|
22.1 |
(15.3) |
|
| RoTE (post-AT1) |
20.9 |
|
|
(0.7) |
|
21.4 |
(15.6) |
|
| Efficiency ratio |
41.0 |
|
|
(1.9) |
|
42.7 |
0.6 |
|
| NPL ratio |
4.95 |
|
|
1.19 |
|
4.95 |
3.16 |
|
| NPL coverage ratio |
109 |
|
|
(12) |
|
109 |
(52) |
|
|
|
|
|
|
|
|
|
| Number of branches |
396 |
|
|
(2.2) |
|
396 |
(2.7) |
|
| Number of total customers (thousands) |
5,406 |
|
|
1.6 |
|
5,406 |
7.1 |
|
| Number of active customers (thousands) |
3,752 |
|
|
2.3 |
|
3,752 |
3.5 |
|
1. Includes exchange differences.
2. Excluding reverse repos.
3. Excluding repos.
|
|
|
|
|
|
|
|
|
January - September 2025 |
|
75 |
|
|
|
|
|
|
|
|
|
|
|
|
|
|
|
|
|
|
|
|
|
|
|
|
|
|
|
|
|
|
|
|
|
|
|
|
|
Significant events
|
|
|
|
|
|
|
|
|
|
|
|
|
|
|
|
|
|
|
|
Information by segment |
|
|
|
|
|
|
|
|
|
|
|
|
|
|
|
|
|
|
|
|
|
|
|
|
|
|
| Rest of the Group |
|
| EUR million |
|
|
|
|
|
|
|
|
|
/ |
Q2'25 |
|
|
/ |
9M'24 |
| Underlying income statement |
Q3'25 |
% |
% excl. FX |
|
9M'25 |
% |
% excl. FX |
| Net interest income |
258 |
|
(5.1) |
|
(5.1) |
|
|
780 |
|
28.5 |
|
35.8 |
|
| Net fee income |
230 |
|
2.7 |
|
3.0 |
|
|
658 |
|
25.7 |
|
28.9 |
|
Gains (losses) on financial transactions 1 |
114 |
|
94.0 |
|
89.2 |
|
|
223 |
|
(15.2) |
|
(12.3) |
|
| Other operating income |
5 |
|
(61.6) |
|
(53.7) |
|
|
36 |
|
125.5 |
|
132.9 |
|
| Total income |
606 |
|
7.0 |
|
7.1 |
|
|
1,697 |
|
20.4 |
|
25.3 |
|
| Administrative expenses and amortizations |
(414) |
|
2.2 |
|
2.7 |
|
|
(1,228) |
|
4.8 |
|
7.0 |
|
| Net operating income |
192 |
|
19.1 |
|
17.9 |
|
|
468 |
|
97.7 |
|
127.4 |
|
| Net loan-loss provisions |
(65) |
|
57.7 |
|
52.5 |
|
|
(177) |
|
11.4 |
|
18.1 |
|
| Other gains (losses) and provisions |
(32) |
|
(17.3) |
|
(19.9) |
|
|
(69) |
|
(80.5) |
|
(80.4) |
|
| Profit before tax |
94 |
|
17.1 |
|
18.0 |
|
|
223 |
|
— |
|
— |
|
| Tax on profit |
(16) |
|
(2.0) |
|
(8.5) |
|
|
(58) |
|
16.5 |
|
28.5 |
|
| Profit from continuing operations |
78 |
|
21.8 |
|
25.2 |
|
|
165 |
|
— |
|
— |
|
| Net profit from discontinued operations |
— |
|
— |
|
— |
|
|
— |
|
— |
|
— |
|
| Consolidated profit |
78 |
|
21.8 |
|
25.2 |
|
|
165 |
|
— |
|
— |
|
| Non-controlling interests |
(3) |
|
— |
|
— |
|
|
1 |
|
(42.1) |
|
(48.2) |
|
| Underlying attributable profit to the parent |
75 |
|
10.6 |
|
13.4 |
|
|
166 |
|
— |
|
— |
|
|
|
|
|
|
|
|
|
| Balance sheet |
|
|
|
|
|
|
|
| Loans and advances to customers |
24,209 |
|
3.8 |
|
2.8 |
|
|
24,209 |
|
1.1 |
|
3.3 |
|
| Cash, central banks and credit institutions |
9,481 |
|
40.2 |
|
39.2 |
|
|
9,481 |
|
41.0 |
|
42.4 |
|
| Debt instruments |
5,267 |
|
(0.3) |
|
(0.8) |
|
|
5,267 |
|
(52.6) |
|
(52.3) |
|
| Other financial assets |
2,319 |
|
(10.6) |
|
(11.6) |
|
|
2,319 |
|
(11.9) |
|
(9.9) |
|
| Other asset accounts |
2,815 |
|
(10.6) |
|
(11.0) |
|
|
2,815 |
|
(20.5) |
|
(19.8) |
|
| Total assets |
44,091 |
|
7.3 |
|
6.4 |
|
|
44,091 |
|
(8.1) |
|
(6.6) |
|
| Customer deposits |
25,747 |
|
18.8 |
|
18.0 |
|
|
25,747 |
|
43.0 |
|
45.7 |
|
| Central banks and credit institutions |
7,230 |
|
(20.3) |
|
(21.5) |
|
|
7,230 |
|
(65.7) |
|
(65.2) |
|
| Marketable debt securities |
3,354 |
|
30.8 |
|
30.4 |
|
|
3,354 |
|
333.9 |
|
334.1 |
|
| Other financial liabilities |
2,293 |
|
(1.0) |
|
(1.6) |
|
|
2,293 |
|
11.0 |
|
14.2 |
|
| Other liabilities accounts |
1,219 |
|
(3.7) |
|
(4.3) |
|
|
1,219 |
|
(11.4) |
|
(11.3) |
|
| Total liabilities |
39,844 |
|
8.0 |
|
7.1 |
|
|
39,844 |
|
(8.0) |
|
(6.5) |
|
| Total equity |
4,247 |
|
1.0 |
|
0.3 |
|
|
4,247 |
|
(8.9) |
|
(7.3) |
|
|
|
|
|
|
|
|
|
| Memorandum items: |
|
|
|
|
|
|
|
Gross loans and advances to customers 2 |
24,657 |
|
3.8 |
|
2.8 |
|
|
24,657 |
|
1.8 |
|
4.0 |
|
| Customer funds |
42,946 |
|
15.0 |
|
14.5 |
|
|
42,946 |
|
39.2 |
|
41.7 |
|
Customer deposits 3 |
25,621 |
|
19.4 |
|
18.6 |
|
|
25,621 |
|
45.7 |
|
48.5 |
|
| Mutual funds |
17,326 |
|
9.0 |
|
8.9 |
|
|
17,326 |
|
30.7 |
|
32.8 |
|
|
|
|
|
|
|
|
|
|
|
|
|
|
|
|
|
|
|
|
|
|
|
|
|
|
|
|
|
|
|
|
|
|
|
|
|
|
|
|
|
|
|
|
|
|
|
|
|
|
|
|
|
|
|
|
|
1. Includes exchange differences.
2. Excluding reverse repos.
3. Excluding repos.
|
|
|
|
|
|
|
|
|
76 |
|
January - September 2025 |
Alternative performance measures (APMs)
In addition to the financial information prepared under IFRS, this consolidated directors’ report contains financial measures that constitute alternative performance measures (APMs) to comply with the guidelines on alternative performance measures issued by the European Securities and Markets Authority on 5 October 2015 and non-IFRS measures.
The financial measures contained in this consolidated directors’ report that qualify as APMs and non-IFRS measures have been calculated using our financial information but are not defined or detailed in the applicable financial information framework or under IFRS and therefore have neither been audited nor are susceptible to being fully audited.
We use these APMs and non-IFRS measures when planning, monitoring and evaluating our performance. We consider these APMs and non-IFRS financial measures to be useful metrics for management and investors to facilitate operating performance comparisons from period to period. While we believe that these APMs and non-IFRS financial measures are useful in evaluating our business, this information should be considered as supplemental in nature and is not meant as a substitute of IFRS measures. In addition, the way in which Santander defines and calculates these APMs and non-IFRS measures may differ from the calculations used by other companies with similar measures and, therefore, may not be comparable.
The APMs and non-IFRS measures we use in this document can be categorized as follows:
Underlying results
In addition to IFRS results measures, we present some results measures which are non-IFRS and which we refer to as underlying measures. These measures allow in our view a better year-on-year comparability given that they exclude items outside the ordinary performance of our business (e.g. capital gains, write-downs, impairment of goodwill) or certain line items have been reclassified in the underlying ("adjusted") income statement, as their impact on profit is zero, to facilitate comparisons with prior quarters and better understand the trends in the business.
In addition, in the "Financial information by segment" section, covering the primary and secondary segments, results are presented only on an underlying basis in accordance with IFRS 8, and reconciled on an aggregate basis to our IFRS consolidated results to the consolidated financial statements, which are set out below.
As a result of the Poland disposal and in accordance with IFRS 5 requirements, in the statutory income statement, the results associated with the business subject to the Poland disposal are reported under a single line in the consolidated income statement — 'profit/(loss) after tax from discontinued operations' — for results corresponding to both 2025 and 2024.
However, in the underlying income statement, the results from Poland continue to be reported line by line and disaggregated, as they were in previous quarterly disclosures, given the management of Santander Polska remains unchanged until the Poland disposal is completed. This reporting approach is consistent with the information used internally in management reporting, as well as with other public Group disclosures.
|
|
|
|
|
|
|
|
|
|
|
|
|
|
|
| Reconciliation of underlying results to statutory results |
| EUR million |
|
|
|
January-September 2025 |
|
Statutory results |
Adjustments related to the Poland disposal |
Other adjustments |
Underlying results |
| Net interest income |
31,559 |
|
2,257 |
|
— |
|
33,816 |
|
| Net fee income |
9,501 |
|
510 |
|
— |
|
10,011 |
|
Gains (losses) on financial transactions 1 |
1,653 |
|
55 |
|
— |
|
1,708 |
|
| Other operating income |
794 |
|
(52) |
|
— |
|
742 |
|
| Total income |
43,507 |
|
2,770 |
|
— |
|
46,277 |
|
| Administrative expenses and amortizations |
(18,379) |
|
(754) |
|
— |
|
(19,133) |
|
| Net operating income |
25,128 |
|
2,016 |
|
— |
|
27,144 |
|
| Net loan-loss provisions |
(9,372) |
|
(204) |
|
467 |
|
(9,109) |
|
| Other gains (losses) and provisions |
(1,995) |
|
(309) |
|
(231) |
|
(2,535) |
|
| Profit before tax |
13,761 |
|
1,503 |
|
236 |
|
15,500 |
|
| Tax on profit |
(3,560) |
|
(351) |
|
(210) |
|
(4,121) |
|
| Profit from continuing operations |
10,201 |
|
1,152 |
|
26 |
|
11,379 |
|
| Net profit from discontinued operations |
1,152 |
|
(1,152) |
|
— |
|
— |
|
| Consolidated profit |
11,353 |
|
— |
|
26 |
|
11,379 |
|
| Non-controlling interests |
(1,016) |
|
— |
|
(26) |
|
(1,042) |
|
| Profit attributable to the parent |
10,337 |
|
— |
|
— |
|
10,337 |
|
1. Includes exchange differences.
|
|
|
|
|
|
|
|
|
January - September 2025 |
|
77 |
Explanation of adjustments:
•In accordance with IFRS 5 requirements, in the statutory income statement in 9M 2025, results subject to the Poland disposal have been reported under 'discontinued operations'. However, in the underlying income statement the results from Poland have been reclassified so that they are reported line by line and disaggregated in each of the corresponding line items.
•A capital gain, that falls outside the ordinary course of our business, in Q2 2025 of EUR 231 million from the sale of Santander’s remaining 30.5% stake in CACEIS.
•A one-off charge of EUR 467 million in Q2 2025 (EUR 231 million net of tax and minority interests), which strengthens the balance sheet after having updated macroeconomic parameters in Brazil’s credit provisioning models.
|
|
|
|
|
|
|
|
|
|
|
|
|
|
|
| Reconciliation of underlying results to statutory results |
| EUR million |
|
|
|
|
|
January-September 2024 |
|
Statutory results |
Adjustments related to the Poland disposal |
Other adjustments |
Underlying results |
| Net interest income |
32,543 |
|
2,139 |
|
— |
|
34,682 |
|
| Net fee income |
9,191 |
|
475 |
|
— |
|
9,666 |
|
Gains (losses) on financial transactions 1 |
1,444 |
|
49 |
|
— |
|
1,493 |
|
| Other operating income |
81 |
|
(72) |
|
335 |
|
344 |
|
| Total income |
43,259 |
|
2,591 |
|
335 |
|
46,185 |
|
| Administrative expenses and amortizations |
(18,600) |
|
(662) |
|
— |
|
(19,262) |
|
| Net operating income |
24,659 |
|
1,929 |
|
335 |
|
26,923 |
|
| Net loan-loss provisions |
(9,178) |
|
(393) |
|
352 |
|
(9,219) |
|
| Other gains (losses) and provisions |
(2,360) |
|
(230) |
|
(687) |
|
(3,277) |
|
| Profit before tax |
13,121 |
|
1,306 |
|
— |
|
14,427 |
|
| Tax on profit |
(3,919) |
|
(327) |
|
— |
|
(4,246) |
|
| Profit from continuing operations |
9,202 |
|
979 |
|
— |
|
10,181 |
|
| Net profit from discontinued operations |
979 |
|
(979) |
|
— |
|
— |
|
| Consolidated profit |
10,181 |
|
— |
|
— |
|
10,181 |
|
| Non-controlling interests |
(872) |
|
— |
|
— |
|
(872) |
|
| Profit attributable to the parent |
9,309 |
|
— |
|
— |
|
9,309 |
|
1. Includes exchange differences.
Explanation of adjustments:
•In accordance with IFRS 5 requirements, in the statutory income statement in 9M 2024, results subject to the Poland disposal have been reported under 'discontinued operations'. However, in the underlying income statement the results from Poland have been reclassified so that they are reported line by line and disaggregated in each of the corresponding line items.
•Temporary levy on revenue in Spain in Q1 2024, totalling EUR 335 million, which was reclassified from total income to other gains (losses) and provisions.
•Provisions which strengthen the balance sheet in Brazil of EUR 352 million in Q2 2024 (EUR 174 million net of tax and minority interests).
|
|
|
|
|
|
|
|
|
|
Note: regarding the Group’s consolidated balance sheet, in accordance with IFRS 5 requirements and solely in the balance sheets starting from 30 June 2025, the assets associated with the Poland disposal are classified under 'non-current assets held for sale'. This consolidates the following line items (data as of 30 September 2025): cash, cash balances at central banks and other deposits on demand: EUR 3,308 million; financial assets held for trading: EUR 1,505 million; financial assets designated at fair value through other comprehensive income: EUR 6,700 million; financial assets at amortized cost: EUR 51,552 million; intangible assets: EUR 1,368 million; tax assets: EUR 850 million; and other assets: EUR 1,260 million.
Likewise, the related liabilities are aggregated under 'liabilities associated with non-current assets held for sale'. This consolidates the following line items (data as of 30 September 2025): financial liabilities held for trading: EUR 1,002 million; financial liabilities at amortized cost: EUR 56,142 million; provisions: EUR 537 million; tax liabilities: EUR 918 million; and other liabilities: EUR 459 million.
|
|
|
|
|
|
|
|
|
|
|
78 |
|
January - September 2025 |
Ratios
|
|
|
|
|
|
|
|
|
|
All profitability, efficiency, credit quality and other metrics included in this 'Alternative performance measures' section have been calculated including Poland, as they were in quarterly disclosures prior to the announcement of the operation given the management of Santander Polska remains unchanged until the Poland disposal is completed. This reporting approach is consistent with the information used internally in management reporting, as well as with other public Group disclosures. However, if we were to exclude Poland, the Group's main management ratios would not be materially affected. |
|
Profitability and efficiency ratios
The purpose of the profitability ratios is to measure the ratio of profit to equity, to tangible equity, to assets and to risk-weighted assets, while the efficiency ratio measures how much general administrative expenses (personnel and other) and amortization costs are needed to generate revenue.
Additionally, goodwill adjustments have been removed from the RoTE numerator as, since they are not considered in the denominator, we believe this calculation is more correct.
|
|
|
|
|
|
|
|
|
|
|
|
|
|
|
| Ratio |
|
Formula |
|
Relevance of the metric |
| RoE |
|
Profit attributable to the parent (annualized) |
|
This ratio measures the return that shareholders obtain on the funds invested in the bank and as such measures the company's ability to pay shareholders. |
| (Return on equity) |
|
Average stockholders’ equity 1 (excl. minority interests) |
|
|
|
|
|
|
|
|
|
|
| RoTE |
|
Profit attributable to the parent (annualized)2 |
|
This indicator is used to evaluate the profitability of the company as a percentage of its tangible equity. It's measured as the return that shareholders receive as a percentage of the funds invested in the entity less intangible assets. |
| (Return on tangible equity) |
|
Average stockholders' equity 1 (excl. minority interests) - intangible assets |
|
| RoTE (post-AT1) |
|
Profit attributable to the parent minus AT1 costs (annualized)2 |
|
As with RoTE, this indicator is used to assess the profitability of a company as a percentage of its tangible equity, but the cost of AT1 issuances is deduced from the numerator. This is the definition of RoTE that is commonly used as a measure of profitability over tangible equity. |
| (Return on tangible equity) |
|
Average stockholders' equity 1 (excl. minority interests) - intangible assets |
|
|
|
|
|
|
|
|
|
|
| RoA |
|
Consolidated profit (annualized) |
|
This metric measures the profitability of a company as a percentage of its total assets. It is an indicator that reflects the efficiency of the bank's total assets in generating profit over a given period. |
| (Return on assets) |
|
Average total assets |
|
|
|
|
|
|
|
|
|
|
| RoRWA |
|
Consolidated profit (annualized) |
|
The return adjusted for risk is a derivative of the RoA metric. The difference is that RoRWA measures profit in relation to the bank's risk-weighted assets. |
| (Return on risk-weighted assets) |
|
Average risk-weighted assets |
|
|
|
|
|
|
|
|
|
|
| Efficiency ratio |
|
Operating expenses 3 |
|
One of the most commonly used indicators when comparing productivity of different financial entities. It measures the amount of resources used to generate the bank's total income. |
|
|
Total income |
|
1. Stockholders’ equity = Capital and Reserves + Accumulated other comprehensive income + Profit attributable to the parent + Dividends.
2. Excluding the adjustment to the valuation of goodwill.
3. Operating expenses = Administrative expenses + amortizations.
|
|
|
|
|
|
|
|
|
January - September 2025 |
|
79 |
|
|
|
|
|
|
|
|
|
|
|
|
|
|
|
Profitability and efficiency 1, 2 , 3(EUR million and %) |
Q3'25 |
Q2'25 |
9M'25 |
9M'24 |
|
|
|
|
|
| RoE |
13.8 |
% |
13.7 |
% |
13.6 |
% |
12.9 |
% |
| Profit attributable to the parent (annualized) |
14,019 |
13,720 |
13,783 |
12,412 |
| Average stockholders' equity (excluding minority interests) |
101,598 |
99,904 |
101,001 |
96,341 |
|
|
|
|
|
|
|
|
|
|
|
|
|
|
|
|
|
|
|
|
|
|
|
|
|
|
|
|
|
|
|
|
|
|
|
| RoTE |
16.9 |
% |
16.9 |
% |
16.8 |
% |
16.2 |
% |
| Profit attributable to the parent (annualized) |
14,019 |
13,720 |
13,783 |
12,412 |
| (-) Goodwill impairment |
-3 |
-1 |
-4 |
-4 |
| Profit attributable to the parent excluding goodwill impairment (annualized) |
14,022 |
13,722 |
13,787 |
12,416 |
| Average stockholders' equity (excluding minority interests) |
101,598 |
99,904 |
101,001 |
96,341 |
| (-) Average intangible assets |
18,629 |
18,700 |
18,896 |
19,518 |
| Average stockholders' equity (excl. minority interests) - intangible assets |
82,969 |
81,204 |
82,105 |
76,823 |
|
|
|
|
|
| RoTE post-AT1 |
16.2 |
% |
16.2 |
% |
16.1 |
% |
15.4 |
% |
| Profit attributable to the parent (annualized) |
14,019 |
13,720 |
13,783 |
12,412 |
| (-) AT1 costs (annualized) |
587 |
602 |
609 |
595 |
| Profit attributable to the parent excluding AT1 costs (annualized) |
13,432 |
13,118 |
13,174 |
11,816 |
| (-) Goodwill impairment |
-3 |
-1 |
-4 |
-4 |
| Profit attributable to the parent minus AT1 costs (annualized; excluding goodwill impairment) |
13,435 |
13,120 |
13,178 |
11,820 |
| Average stockholders' equity (excluding minority interests) |
101,598 |
99,904 |
101,001 |
96,341 |
| (-) Average intangible assets |
18,629 |
18,700 |
18,896 |
19,518 |
| Average stockholders' equity (excl. minority interests) - intangible assets |
82,969 |
81,204 |
82,105 |
76,823 |
|
|
|
|
|
|
|
|
|
|
|
|
|
|
|
|
|
|
|
|
|
|
|
|
|
|
|
|
|
|
|
|
|
|
|
| RoA |
0.85 |
% |
0.82 |
% |
0.83 |
% |
0.76 |
% |
| Consolidated profit (annualized) |
15,564 |
14,962 |
15,146 |
13,574 |
| Average total assets |
1,833,163 |
1,815,203 |
1,834,698 |
1,792,871 |
|
|
|
|
|
|
|
|
|
|
|
|
|
|
|
|
|
|
|
|
|
|
|
|
|
|
|
|
|
|
|
|
|
|
|
| RoRWA |
2.46 |
% |
2.37 |
% |
2.39 |
% |
2.15 |
% |
| Consolidated profit (annualized) |
15,564 |
14,962 |
15,146 |
13,574 |
| Average risk-weighted assets |
631,713 |
630,054 |
634,201 |
631,547 |
|
|
|
|
|
|
|
|
|
|
|
|
|
|
|
|
|
|
|
|
|
|
|
|
|
|
|
|
|
|
|
|
|
|
|
| Efficiency ratio |
41.1 |
% |
41.2 |
% |
41.3 |
% |
41.7 |
% |
| Underlying operating expenses |
6,268 |
6,376 |
19,133 |
19,262 |
| Operating expenses |
6,015 |
6,108 |
18,379 |
18,600 |
| Adjustments to operating expenses for items outside ordinary course of businesses |
253 |
268 |
754 |
662 |
| Underlying total income |
15,267 |
15,473 |
46,277 |
46,185 |
| Total income |
14,325 |
14,503 |
43,507 |
43,259 |
| Adjustments to total income for items outside ordinary course of businesses |
942 |
970 |
2,770 |
2,926 |
1.Averages included in the RoE, RoTE, RoTE (post-AT1), RoA and RoRWA denominators are calculated using the monthly average over the period, which we believe should not differ materially from using daily balances. |
|
|
2.The risk-weighted assets included in the denominator of the RoRWA metric are calculated in line with the criteria laid out in the CRR (Capital Requirements Regulation). |
3.For periods less than one year, and if there are results outside the ordinary course of our business, the profit used to calculate RoA and RoRWA is the annualized underlying consolidated profit, to which said results are added without annualizing. |
|
|
|
|
|
|
|
|
|
80 |
|
January - September 2025 |
|
|
|
|
|
|
|
|
|
|
|
|
|
|
|
| Ratio |
|
Formula |
|
Relevance of the metric |
| Global business RoTE |
|
Profit attributable to the parent excluding goodwill impairment (annualized) |
|
This indicator is used to evaluate the profitability of the company as a percentage of its tangible equity. It's measured as the return that shareholders receive as a percentage of the funds invested in the entity less intangible assets. |
|
Average stockholders' equity (excl. minority interests) - intangible assets 1 |
|
| Global business and country RoTE (post-AT1) |
|
Profit attributable to the parent minus AT1 costs2 (annualized; excluding goodwill impairment) |
|
As with RoTE, this indicator is used to assess the profitability of a company as a percentage of its tangible equity, but the cost of AT1 issuances is deduced from the numerator. This is the definition of RoTE that is commonly used as a measure of profitability over tangible equity. |
|
Average stockholders' equity (excl. minority interests) - intangible assets 1 |
|
1.For global businesses, tangible equity is allocated according to RWA consumption.
2.For both global businesses and countries, AT1 costs are allocated according to RWA consumption.
|
|
|
|
|
|
|
|
|
|
|
|
|
|
|
|
|
|
|
|
|
|
|
|
RoTE (EUR million and %) |
|
|
|
|
|
|
|
9M'25 |
|
9M'24 |
|
% |
Numerator |
Denominator |
|
% |
Numerator |
Denominator |
| Retail & Commercial Banking |
18.3 |
|
7,565 |
|
41,308 |
|
|
18.8 |
|
7,182 |
|
38,200 |
|
| Digital Consumer Bank |
11.2 |
|
2,081 |
|
18,620 |
|
|
12.0 |
|
2,008 |
|
16,773 |
|
| Corporate & Investment Banking |
20.4 |
|
2,891 |
|
14,170 |
|
|
18.2 |
|
2,736 |
|
15,070 |
|
| Wealth Management & Insurance |
66.7 |
|
1,919 |
|
2,877 |
|
|
76.6 |
|
1,636 |
|
2,135 |
|
| Payments |
24.9 |
|
744 |
|
2,983 |
|
|
7.4 |
|
204 |
|
2,749 |
|
| PagoNxt |
|
|
|
|
|
|
|
| Cards |
27.9 |
|
698 |
|
2,499 |
|
|
26.9 |
|
636 |
|
2,366 |
|
|
|
|
|
|
|
|
|
|
|
|
|
|
|
|
|
| Spain |
25.2 |
|
4,311 |
|
17,121 |
|
|
21.8 |
|
3,783 |
|
17,335 |
|
| UK |
10.6 |
|
1,278 |
|
12,105 |
|
|
11.1 |
|
1,301 |
|
11,714 |
|
| Portugal |
31.0 |
|
1,020 |
|
3,290 |
|
|
26.8 |
|
1,056 |
|
3,944 |
|
| Poland |
24.3 |
|
951 |
|
3,914 |
|
|
21.6 |
|
857 |
|
3,971 |
|
| DCB Europe |
8.9 |
|
913 |
|
10,294 |
|
|
9.2 |
|
927 |
|
10,102 |
|
|
|
|
|
|
|
|
|
| US |
11.0 |
|
1,591 |
|
14,410 |
|
|
8.1 |
|
1,173 |
|
14,540 |
|
| Mexico |
21.6 |
|
1,614 |
|
7,489 |
|
|
19.3 |
|
1,645 |
|
8,520 |
|
|
|
|
|
|
|
|
|
| Brazil |
15.8 |
|
2,120 |
|
13,421 |
|
|
16.8 |
|
2,363 |
|
14,051 |
|
| Chile |
20.1 |
|
712 |
|
3,544 |
|
|
15.6 |
|
577 |
|
3,702 |
|
| Argentina |
22.1 |
|
464 |
|
2,101 |
|
|
37.4 |
|
509 |
|
1,360 |
|
|
|
|
|
|
|
|
|
Numerator: profit attributable to the parent excluding goodwill impairment annualized (Excluding the adjustment to the valuation of goodwill).
Denominator: average stockholders' equity (excluding minority interests) - intangible assets.
PagoNxt's RoTE is not provided as we do not consider it a relevant metric to measure performance in this type of business.
|
|
|
|
|
|
|
|
|
|
|
|
|
|
|
|
|
|
|
|
|
|
|
|
RoTE (post-AT1) (EUR million and %) |
|
|
|
|
|
|
|
9M'25 |
|
9M'24 |
|
% |
Numerator |
Denominator |
|
% |
Numerator |
Denominator |
| Retail & Commercial Banking |
17.6 |
|
7,275 |
|
41,308 |
|
|
18.1 |
|
6,903 |
|
38,200 |
|
| Digital Consumer Bank |
10.4 |
|
1,928 |
|
18,620 |
|
|
11.1 |
|
1,861 |
|
16,773 |
|
| Corporate & Investment Banking |
19.7 |
|
2,787 |
|
14,170 |
|
|
17.4 |
|
2,622 |
|
15,070 |
|
| Wealth Management & Insurance |
66.0 |
|
1,898 |
|
2,877 |
|
|
75.9 |
|
1,620 |
|
2,135 |
|
| Payments |
24.2 |
|
722 |
|
2,983 |
|
|
6.7 |
|
184 |
|
2,749 |
|
| PagoNxt |
|
|
|
|
|
|
|
| Cards |
27.3 |
|
681 |
|
2,499 |
|
|
26.2 |
|
620 |
|
2,366 |
|
|
|
|
|
|
|
|
|
|
|
|
|
|
|
|
|
| Spain |
24.4 |
|
4,175 |
|
17,121 |
|
|
21.0 |
|
3,646 |
|
17,335 |
|
| UK |
10.1 |
|
1,219 |
|
12,105 |
|
|
10.6 |
|
1,244 |
|
11,714 |
|
| Portugal |
30.5 |
|
1,004 |
|
3,290 |
|
|
26.4 |
|
1,041 |
|
3,944 |
|
| Poland |
23.6 |
|
924 |
|
3,914 |
|
|
21.0 |
|
832 |
|
3,971 |
|
| DCB Europe |
8.0 |
|
828 |
|
10,294 |
|
|
8.4 |
|
845 |
|
10,102 |
|
|
|
|
|
|
|
|
|
| US |
10.5 |
|
1,507 |
|
14,410 |
|
|
7.5 |
|
1,092 |
|
14,540 |
|
| Mexico |
21.2 |
|
1,584 |
|
7,489 |
|
|
18.9 |
|
1,612 |
|
8,520 |
|
|
|
|
|
|
|
|
|
| Brazil |
15.1 |
|
2,027 |
|
13,421 |
|
|
16.1 |
|
2,265 |
|
14,051 |
|
| Chile |
19.3 |
|
686 |
|
3,544 |
|
|
14.9 |
|
552 |
|
3,702 |
|
| Argentina |
21.4 |
|
450 |
|
2,101 |
|
|
37.0 |
|
503 |
|
1,360 |
|
|
|
|
|
|
|
|
|
Numerator: profit attributable to the parent excluding goodwill impairment minus AT1 costs (annualized; excluding goodwill impairment).
Denominator: average stockholders' equity (excluding minority interests) - intangible assets.
PagoNxt's RoTE is not provided as we do not consider it a relevant metric to measure performance in this type of business.
|
|
|
|
|
|
|
|
|
January - September 2025 |
|
81 |
|
|
|
|
|
|
|
|
|
|
|
|
|
|
|
|
|
|
|
|
|
|
|
|
Efficiency ratio (EUR million and %) |
|
|
|
|
|
|
|
9M'25 |
|
9M'24 |
|
% |
Numerator |
Denominator |
|
% |
Numerator |
Denominator |
| Retail & Commercial Banking |
39.2 |
|
9,159 |
|
23,337 |
|
|
39.1 |
|
9,465 |
|
24,216 |
|
| Digital Consumer Bank |
40.9 |
|
3,950 |
|
9,667 |
|
|
40.7 |
|
3,896 |
|
9,582 |
|
| Corporate & Investment Banking |
44.9 |
|
2,860 |
|
6,374 |
|
|
44.3 |
|
2,773 |
|
6,266 |
|
| Wealth Management & Insurance |
35.9 |
|
1,094 |
|
3,046 |
|
|
37.3 |
|
1,035 |
|
2,777 |
|
| Payments |
40.8 |
|
1,785 |
|
4,370 |
|
|
46.1 |
|
1,818 |
|
3,948 |
|
| PagoNxt |
86.1 |
|
856 |
|
994 |
|
|
99.4 |
|
889 |
|
894 |
|
| Cards |
27.5 |
|
929 |
|
3,376 |
|
|
30.4 |
|
930 |
|
3,054 |
|
|
|
|
|
|
|
|
|
|
|
|
|
|
|
|
|
| Spain |
35.0 |
|
3,170 |
|
9,056 |
|
|
34.7 |
|
3,138 |
|
9,048 |
|
| UK |
53.2 |
|
2,095 |
|
3,939 |
|
|
56.0 |
|
2,161 |
|
3,860 |
|
| Portugal |
27.4 |
|
404 |
|
1,474 |
|
|
24.6 |
|
404 |
|
1,642 |
|
| Poland |
27.8 |
|
771 |
|
2,776 |
|
|
27.3 |
|
719 |
|
2,634 |
|
| DCB Europe |
45.7 |
|
1,978 |
|
4,330 |
|
|
46.5 |
|
1,976 |
|
4,252 |
|
|
|
|
|
|
|
|
|
| US |
48.7 |
|
2,852 |
|
5,856 |
|
|
50.4 |
|
2,843 |
|
5,639 |
|
| Mexico |
41.3 |
|
1,884 |
|
4,566 |
|
|
41.9 |
|
1,976 |
|
4,721 |
|
|
|
|
|
|
|
|
|
| Brazil |
32.6 |
|
3,062 |
|
9,405 |
|
|
32.0 |
|
3,289 |
|
10,266 |
|
| Chile |
34.1 |
|
696 |
|
2,040 |
|
|
37.4 |
|
701 |
|
1,878 |
|
| Argentina |
42.7 |
|
707 |
|
1,654 |
|
|
42.1 |
|
607 |
|
1,441 |
|
|
|
|
|
|
|
|
|
Numerator: underlying operating expenses.
Denominator: underlying total income.
Credit risk indicators
The credit risk indicators measure the quality of the credit portfolio and the percentage of non-performing loans covered by provisions.
|
|
|
|
|
|
|
|
|
|
|
|
|
|
|
| Ratio |
|
Formula |
|
Relevance of the metric |
NPL ratio
(Non-performing loans ratio) |
|
Credit impaired customer loans and advances, guarantees and undrawn balances |
|
The NPL ratio is an important variable regarding financial institutions' activity since it gives an indication of the level of risk the entities are exposed to. It calculates risks that are, in accounting terms, declared to be credit impaired as a percentage of the total outstanding amount of customer credit and contingent liabilities. |
|
|
Total Risk 1 |
|
|
|
|
|
|
| NPL coverage ratio |
|
Total allowances to cover impairment losses on customer loans and advances, guarantees and undrawn balances |
|
The NPL coverage ratio is a fundamental metric in the financial sector. It reflects the level of provisions as a percentage of the credit impaired assets. Therefore, it is a good indicator of the entity's solvency against customer defaults both present and future. |
|
|
Credit impaired customer loans and advances, guarantees and undrawn balances |
|
|
|
|
|
|
| Cost of risk |
|
Allowances for loan-loss provisions over the last 12 months |
|
This ratio quantifies loan-loss provisions arising from credit risk over a defined period of time for a given loan portfolio. As such, it acts as an indicator of credit quality. |
|
|
Average loans and advances to customers over the last 12 months |
|
1. Total risk = non-impaired and impaired customer loans and advances and guarantees + impaired undrawn customer balances.
|
|
|
|
|
|
|
|
|
82 |
|
January - September 2025 |
|
|
|
|
|
|
|
|
|
|
|
|
|
Credit risk (I) (EUR million and %) |
|
|
|
|
|
Sep-25 |
Jun-25 |
|
Sep-24 |
|
|
|
|
|
| NPL ratio |
2.92 |
% |
2.91 |
% |
|
3.06 |
% |
| Credit impaired customer loans and advances, guarantees and undrawn balances |
34,048 |
33,395 |
|
35,723 |
| Gross loans and advances to customers registered under the headings 'financial assets measured at amortized cost' and 'financial assets designated at fair value through profit or loss' classified in stage 3 (OCI), excluding POCI (Purchased or Originated Credit Impaired) |
32,378 |
31,681 |
|
33,890 |
| POCI exposure (Purchased or Originated Credit Impaired) that is additionally impaired |
143 |
178 |
|
231 |
| Customer guarantees and undrawn balances classified in stage 3 |
1,507 |
1,514 |
|
1,593 |
| Doubtful exposure of loans and advances to customers at fair value through profit or loss |
20 |
22 |
|
9 |
| Total risk |
1,167,714 |
1,148,243 |
|
1,168,574 |
| Impaired and non-impaired gross loans and advances to customers |
1,087,473 |
1,070,722 |
|
1,089,441 |
| Impaired and non-impaired customer guarantees and impaired undrawn customer balances |
80,241 |
77,521 |
|
79,133 |
|
|
|
|
|
|
|
|
|
|
|
|
|
Credit risk (II) (EUR million and %) |
|
|
|
|
|
Sep-25 |
Jun-25 |
|
Sep-24 |
|
|
|
|
|
| NPL coverage ratio |
67 |
% |
67 |
% |
|
64 |
% |
| Total allowances to cover impairment losses on customer loans and advances, guarantees and undrawn balances |
22,850 |
22,441 |
|
22,735 |
| Total allowances to cover impairment losses on loans and advances to customers measured at amortized cost and designated at fair value through OCI |
22,179 |
21,771 |
|
22,022 |
| Total allowances to cover impairment losses on customer guarantees and undrawn balances |
671 |
670 |
|
713 |
| Credit impaired customer loans and advances, guarantees and undrawn balances |
34,048 |
33,395 |
|
35,723 |
| Gross loans and advances to customers registered under the headings 'financial assets measured at amortized cost' and 'financial assets designated at fair value through profit or loss' classified in stage 3 (OCI), excluding POCI (Purchased or Originated Credit Impaired) |
32,378 |
31,681 |
|
33,890 |
| POCI exposure (Purchased or Originated Credit Impaired) that is additionally impaired |
143 |
178 |
|
231 |
| Customer guarantees and undrawn balances classified in stage 3 |
1,507 |
1,514 |
|
1,593 |
| Doubtful exposure of loans and advances to customers at fair value through profit or loss |
20 |
22 |
|
9 |
|
|
|
|
|
| Cost of risk |
1.13 |
% |
1.14 |
% |
|
1.18 |
% |
| Underlying allowances for loan-loss provisions over the last 12 months |
12,223 |
12,268 |
|
12,640 |
| Allowances for loan-loss provisions over the last 12 months |
12,371 |
12,408 |
|
12,599 |
| Adjustments to loan-loss provisions for items outside ordinary course of businesses |
(148) |
(140) |
|
41 |
| Average loans and advances to customers over the last 12 months |
1,078,288 |
1,079,967 |
|
1,070,585 |
|
|
|
|
|
|
|
|
|
January - September 2025 |
|
83 |
|
|
|
|
|
|
|
|
|
|
|
|
|
|
|
|
|
|
|
|
|
|
|
|
NPL ratio (EUR million and %) |
|
|
|
|
|
|
|
|
|
|
|
|
|
Sep-25 |
|
Sep-24 |
|
% |
Numerator |
Denominator |
|
% |
Numerator |
Denominator |
| Retail & Commercial Banking |
3.00 |
|
19,066 |
|
635,909 |
|
|
3.27 |
|
21,383 |
|
654,159 |
|
| Digital Consumer Bank |
5.29 |
|
11,232 |
|
212,493 |
|
|
4.89 |
|
10,344 |
|
211,376 |
|
| Corporate & Investment Banking |
0.70 |
|
1,830 |
|
261,308 |
|
|
0.86 |
|
2,148 |
|
250,046 |
|
| Wealth Management & Insurance |
0.91 |
|
241 |
|
26,413 |
|
|
1.01 |
|
242 |
|
23,993 |
|
| Payments |
5.54 |
|
1,407 |
|
25,386 |
|
|
5.70 |
|
1,304 |
|
22,887 |
|
| PagoNxt |
|
|
|
|
|
|
|
| Cards |
5.59 |
|
1,364 |
|
24,410 |
|
|
5.80 |
|
1,272 |
|
21,931 |
|
|
|
|
|
|
|
|
|
|
|
|
|
|
|
|
|
| Spain |
2.08 |
|
6,299 |
|
302,175 |
|
|
2.80 |
|
8,313 |
|
296,731 |
|
| United Kingdom |
1.09 |
|
2,638 |
|
242,934 |
|
|
1.44 |
|
3,696 |
|
256,374 |
|
| Portugal |
2.09 |
|
905 |
|
43,255 |
|
|
2.47 |
|
1,013 |
|
41,035 |
|
| Poland |
3.51 |
|
1,595 |
|
45,478 |
|
|
3.91 |
|
1,687 |
|
43,151 |
|
| DCB Europe |
2.70 |
|
3,843 |
|
142,511 |
|
|
2.44 |
|
3,405 |
|
139,508 |
|
|
|
|
|
|
|
|
|
| US |
4.71 |
|
6,842 |
|
145,169 |
|
|
4.40 |
|
6,426 |
|
146,029 |
|
| Mexico |
2.95 |
|
1,476 |
|
50,086 |
|
|
2.70 |
|
1,324 |
|
49,076 |
|
|
|
|
|
|
|
|
|
| Brazil |
6.58 |
|
6,974 |
|
106,068 |
|
|
6.25 |
|
6,701 |
|
107,180 |
|
| Chile |
5.54 |
|
2,282 |
|
41,160 |
|
|
5.33 |
|
2,367 |
|
44,430 |
|
| Argentina |
4.95 |
|
478 |
|
9,657 |
|
|
1.79 |
|
108 |
|
6,019 |
|
|
|
|
|
|
|
|
|
Numerator: credit impaired customer loans and advances, guarantees and undrawn balances.
Denominator: total risk.
PagoNxt's NPL ratio is not provided as we do not consider it a relevant metric for this type of business.
|
|
|
|
|
|
|
|
|
|
|
|
|
|
|
|
|
|
|
|
|
|
|
|
NPL coverage ratio (EUR million and %) |
|
|
|
|
|
|
|
|
|
|
|
|
|
|
|
Sep-25 |
|
Sep-24 |
|
% |
Numerator |
Denominator |
|
% |
Numerator |
Denominator |
| Retail & Commercial Banking |
62 |
|
11,736 |
|
19,066 |
|
|
58 |
|
12,386 |
|
21,383 |
|
| Digital Consumer Bank |
73 |
|
8,147 |
|
11,232 |
|
|
74 |
|
7,699 |
|
10,344 |
|
| Corporate & Investment Banking |
45 |
|
832 |
|
1,830 |
|
|
36 |
|
763 |
|
2,148 |
|
| Wealth Management & Insurance |
68 |
|
165 |
|
241 |
|
|
64 |
|
154 |
|
242 |
|
| Payments |
136 |
|
1,910 |
|
1,407 |
|
|
128 |
|
1,672 |
|
1,304 |
|
| PagoNxt |
|
|
|
|
|
|
|
| Cards |
138 |
|
1,886 |
|
1,364 |
|
|
130 |
|
1,648 |
|
1,272 |
|
|
|
|
|
|
|
|
|
|
|
|
|
|
|
|
|
| Spain |
54 |
|
3,392 |
|
6,299 |
|
|
50 |
|
4,160 |
|
8,313 |
|
| United Kingdom |
34 |
|
903 |
|
2,638 |
|
|
28 |
|
1,050 |
|
3,696 |
|
| Portugal |
86 |
|
779 |
|
905 |
|
|
78 |
|
791 |
|
1,013 |
|
| Poland |
64 |
|
1,021 |
|
1,595 |
|
|
66 |
|
1,118 |
|
1,687 |
|
| DCB Europe |
82 |
|
3,164 |
|
3,843 |
|
|
83 |
|
2,838 |
|
3,405 |
|
|
|
|
|
|
|
|
|
| US |
58 |
|
3,957 |
|
6,842 |
|
|
65 |
|
4,146 |
|
6,426 |
|
| Mexico |
101 |
|
1,485 |
|
1,476 |
|
|
104 |
|
1,377 |
|
1,324 |
|
|
|
|
|
|
|
|
|
| Brazil |
86 |
|
5,978 |
|
6,974 |
|
|
82 |
|
5,502 |
|
6,701 |
|
| Chile |
49 |
|
1,125 |
|
2,282 |
|
|
52 |
|
1,226 |
|
2,367 |
|
| Argentina |
109 |
|
522 |
|
478 |
|
|
161 |
|
174 |
|
108 |
|
|
|
|
|
|
|
|
|
Numerator: total allowances to cover impairment losses on customer loans and advances, guarantees and undrawn balances.
Denominator: credit impaired customer loans and advances, guarantees and undrawn balances.
PagoNxt's coverage ratio is not provided as we do not consider it a relevant metric for this type of business.
|
|
|
|
|
|
|
|
|
84 |
|
January - September 2025 |
|
|
|
|
|
|
|
|
|
|
|
|
|
|
|
|
|
|
|
|
|
|
|
|
Cost of risk (EUR million and %) |
|
|
|
|
|
|
|
|
|
|
|
|
|
|
|
Sep-25 |
|
Sep-24 |
|
% |
Numerator |
Denominator |
|
% |
Numerator |
Denominator |
| Retail & Commercial Banking |
0.89 |
|
5,493 |
|
619,266 |
|
|
0.98 |
|
6,188 |
|
634,093 |
|
| Digital Consumer Bank |
2.06 |
|
4,392 |
|
212,804 |
|
|
2.12 |
|
4,440 |
|
209,091 |
|
| Corporate & Investment Banking |
0.10 |
|
183 |
|
190,471 |
|
|
0.21 |
|
361 |
|
175,324 |
|
| Wealth Management & Insurance |
0.12 |
|
29 |
|
24,886 |
|
|
0.09 |
|
21 |
|
22,952 |
|
| Payments |
7.73 |
|
1,933 |
|
25,016 |
|
|
6.99 |
|
1,629 |
|
23,293 |
|
| PagoNxt |
|
|
|
|
|
|
|
| Cards |
8.04 |
|
1,910 |
|
23,772 |
|
|
7.22 |
|
1,615 |
|
22,357 |
|
|
|
|
|
|
|
|
|
|
|
|
|
|
|
|
|
| Spain |
0.45 |
1,162 |
|
256,668 |
|
|
0.52 |
|
1,280 |
|
247,399 |
|
| United Kingdom |
0.03 |
85 |
|
246,340 |
|
|
0.05 |
|
116 |
|
251,285 |
|
| Portugal |
0.00 |
0 |
|
39,739 |
|
|
0.07 |
|
28 |
|
38,132 |
|
| Poland |
0.79 |
313 |
|
39,464 |
|
|
1.67 |
|
599 |
|
35,876 |
|
| DCB Europe |
0.91 |
1,272 |
|
139,887 |
|
|
0.75 |
|
1,016 |
|
135,675 |
|
|
|
|
|
|
|
|
|
| US |
1.65 |
2,283 |
|
138,440 |
|
|
1.94 |
|
2,645 |
|
136,013 |
|
| Mexico |
2.62 |
1,194 |
|
45,520 |
|
|
2.69 |
|
1,315 |
|
48,952 |
|
|
|
|
|
|
|
|
|
| Brazil |
4.71 |
4,402 |
|
93,387 |
|
|
4.78 |
|
4,827 |
|
101,059 |
|
| Chile |
1.32 |
534 |
|
40,473 |
|
|
1.09 |
|
456 |
|
41,953 |
|
| Argentina |
6.24 |
537 |
|
8,600 |
|
|
4.88 |
|
136 |
|
2,775 |
|
|
|
|
|
|
|
|
|
Numerator: underlying allowances for loan-loss provisions over the last 12 months.
Denominator: average loans and advances to customers over the last 12 months.
PagoNxt's cost of risk is not provided as we do not consider it a relevant metric for this type of business.
Other indicators
The Group has a series of additional financial metrics which facilitate analysis of the underlying business trends and performance. It also has another set of Sustainability indicators which enables us to track the progress of our objectives.
|
|
|
|
|
|
|
|
|
|
|
|
|
|
|
| Ratio |
|
Formula |
|
Relevance of the metric |
| TNAV per share |
|
Tangible book value 1 |
|
This is a very commonly used ratio used to measure the company's accounting value per share having deducted the intangible assets. It is useful in evaluating the amount each shareholder would receive if the company were to enter into liquidation and had to sell all the company's tangible assets. |
| (Tangible net asset value per share) |
|
Number of shares excluding treasury stock |
|
|
|
|
|
|
| Price / tangible book value per share (X) |
|
Share price |
|
This is one of the most commonly used ratios by market participants for the valuation of listed companies both in absolute terms and relative to other entities. This ratio measures the relationship between the price paid for a company and its accounting equity value. |
|
|
TNAV per share |
|
|
|
|
|
|
LTD ratio2 |
|
Net loans and advances to customers |
|
This is an indicator of the bank's liquidity. It measures the total loans and advances to customers net of loan-loss provisions as a percentage of customer deposits. |
| (Loan-to-deposit) |
|
Customer deposits |
|
|
|
|
|
|
Loans and advances (excl. reverse repos)2 |
|
Gross loans and advances to customers excluding reverse repos |
|
In order to aid analysis of the commercial banking activity, reverse repos are excluded as they are highly volatile treasury products. |
|
|
|
|
|
Deposits (excl. repos)2 |
|
Customer deposits excluding repos |
|
In order to aid analysis of the commercial banking activity, repos are excluded as they are highly volatile treasury products. |
|
|
|
|
|
| PAT + fees paid to SAN (in Wealth Management & Insurance) |
|
Net profit + fees ceded by Santander Asset Management and Santander Insurance to the branch network, net of taxes, excluding Private Banking customers |
|
Metric to assess Wealth Management & Insurance's total contribution to the Group's profit. |
|
|
|
|
|
|
|
|
|
|
|
|
|
|
|
|
|
|
|
|
|
|
|
|
|
|
|
|
|
|
|
|
|
|
1.Tangible book value = Stockholders' equity (excl. minority interests) - intangible assets.
2.Includes Poland.
|
|
|
|
|
|
|
|
|
January - September 2025 |
|
85 |
|
|
|
|
|
|
|
|
|
|
|
|
|
|
|
Others (EUR million and %) |
|
|
|
|
|
Sep-25 |
Jun-25 |
|
Sep-24 |
|
|
|
|
|
| TNAV (tangible book value) per share |
5.56 |
5.50 |
|
5.04 |
| Tangible book value |
82,422 |
81,878 |
|
77,522 |
| Number of shares excl. treasury stock (million) |
14,818 |
14,884 |
|
15,390 |
|
|
|
|
|
| Price / Tangible book value per share (X) |
1.60 |
1.28 |
|
0.91 |
| Share price (euros) |
8.874 |
7.027 |
|
4.601 |
| TNAV (tangible book value) per share |
5.56 |
5.50 |
|
5.04 |
|
|
|
|
|
| Loan-to-deposit ratio |
99 |
% |
99 |
% |
|
102 |
% |
| Net loans and advances to customers |
1,065,294 |
1,048,951 |
|
1,067,419 |
| Customer deposits |
1,077,885 |
1,060,208 |
|
1,045,911 |
|
|
|
|
|
|
Q3'25 |
Q2'25 |
9M'25 |
9M'24 |
| PAT + After tax fees paid to SAN (in Wealth) (Constant EUR million) |
920 |
891 |
2,695 |
2,369 |
| Profit after tax |
519 |
503 |
1,511 |
1,245 |
| Net fee income net of tax |
401 |
388 |
1,185 |
1,124 |
|
|
|
|
|
|
|
|
|
|
|
|
|
|
|
|
|
|
|
|
|
|
|
|
|
|
|
|
|
|
|
|
|
|
|
|
|
|
|
|
|
|
|
|
|
|
|
|
|
|
|
|
|
|
|
|
|
|
|
|
|
|
|
|
|
|
|
|
|
|
|
|
|
|
|
|
|
|
|
|
|
|
|
|
|
|
|
|
|
|
|
|
|
|
|
|
|
|
|
|
Sustainability indicators |
|
|
|
|
|
|
|
|
|
|
|
|
|
|
|
Metric |
|
|
Definition |
|
Sep-25 |
|
|
|
|
|
|
|
|
Green finance raised and facilitated accumulated from 2019-2025 (EUR billion) |
|
|
Nominal amount of project finance, financial advisory, project bonds, green bonds (DCM), export finance (ECA), mergers and acquisitions (M&A), and equity capital markets (ECM) transactions ranked by the SCFS panel and reported in the League Tables of Dealogic, Inframation News, TXF and Mergermarket since 2019. |
|
165.4 |
|
Socially responsible investment assets under management (SRI AuMs) (EUR billion) |
|
|
Value corresponding to total volume of assets under management registered as article 8 - promoting ESG characteristics - and 9 - with explicit sustainability objectives - of the Sustainable Finance Disclosure Regulation (SFDR, EU Reg. 2019/2088) except for illiquid investments in Private Banking which are reported in terms of committed capital. It includes: i) assets managed or advised by Santander Asset Management (SAM) and other Group asset managers in the EU and, using equivalent criteria, in countries where SFDR does not apply; and ii) third party funds and assets advised deemed sustainable investments according to SFDR (Article 2.17) or using internal criteria as per SFICS (Sustainable Finance & Investment Classification System). |
|
118.8 |
|
|
|
|
|
|
|
|
|
|
|
|
|
|
|
|
|
|
|
|
|
|
|
|
|
|
|
|
|
|
|
|
|
|
|
Note: targets were set before the publication of the European taxonomy in Q2 2023. Therefore, target definitions are not fully aligned with the taxonomy.
|
|
|
|
|
|
|
|
|
86 |
|
January - September 2025 |
Local currency measures
We make use of certain financial measures in local currency to help in the assessment of our ongoing operating performance. These non-IFRS financial measures include the results of operations of our subsidiary banks located outside the eurozone, excluding the impact of foreign exchange. Because changes in foreign currency exchange rates do not have an operating impact on the results, we believe that evaluating their performance on a local currency basis provides an additional and meaningful assessment of performance to both management and the company’s investors.
The Group presents, at both the Group level as well as the business unit level, the changes in the income statement as well as the changes excluding the exchange rate effect ("excluding FX" or "constant euros"), as it considers the latter facilitates analysis, since it enables business movements to be identified without taking into account the impact of converting each local currency into euros.
Said variations, excluding the impact of exchange rate movements, are calculated by converting income statement lines for the different business units comprising the Group into our presentation currency, the euro, applying the average exchange rate for 9M 2025 to all periods contemplated in the analysis. We use this method for all countries with the exception of Argentina, where we use the exchange rate on the last working day of each period presented, given it is a hyperinflationary economy, to mitigate the distortions caused by the hyperinflation.
We present, at both the Group level as well as the business unit level, the changes in euros as well as the changes excluding the exchange rate effect ("excluding FX" or "constant euros") for loans and advances to customers excluding reverse repurchase agreements (repos) and customer funds (which comprise deposits and mutual funds) excluding repos. Additionally, we present changes in the main balance sheet lines of the Group's countries both in euros as well as the changes excluding the exchange rate effect. As with the income statement, the reason is to facilitate analysis by isolating the changes in the balance sheet that are not caused by converting each local currency into euros.
These changes excluding the impact of exchange rate movements are calculated by converting the balances into our presentation currency, the euro, applying the closing exchange rate on the last working day of September 2025 to all periods contemplated in the analysis. We use this method to calculate the variations for all countries with the exception of Argentina, where we use the exchange rate on the last working day of each period presented, given it is a hyperinflationary economy, to mitigate the distortions caused by the hyperinflation.
In Q2 2024, due to the significant divergence between the official exchange rate and other macroeconomic magnitudes in Argentina, mainly inflation, we began to apply an alternative exchange rate for the Argentine peso which reflected the exchange rate observed in transactions ordered between market participants under the prevailing economic conditions, such as the repatriation of dividends from businesses in Argentina.
Given the stabilization and improved macroeconomic outlook in the country, in Q4 2024 and Q1 2025 we used the dollar contado con liquidación rate (CCL) as a reference for this alternative exchange rate, which is the exchange rate resulting from the sale of local bonds denominated in Argentine pesos in US dollars (dual denomination peso/dollar bonds).
From Q2 2025, we once again began to apply the official exchange rate given that the value of the dollar CCL exchange rate did not significantly differ from other market rates or the official exchange rate following the lifting of currency controls and the removal of restrictions on the purchase of foreign currency for individuals in Argentina.
The average and period-end exchange rates for the main currencies in which the Group operates are set out in the table below.
|
|
|
|
|
|
|
|
|
|
|
|
|
|
|
|
|
|
|
|
|
| Exchange rates: 1 euro / currency parity |
|
|
|
|
|
|
|
|
Average (income statement) |
|
Period-end (balance sheet) |
|
9M'25 |
9M'24 |
|
Sep-25 |
Jun-25 |
Sep-24 |
| US dollar |
1.117 |
|
1.087 |
|
|
1.173 |
|
1.175 |
|
1.116 |
|
| Pound sterling |
0.851 |
|
0.851 |
|
|
0.873 |
|
0.857 |
|
0.832 |
|
| Brazilian real |
6.313 |
|
5.682 |
|
|
6.252 |
|
6.405 |
|
6.074 |
|
| Mexican peso |
21.787 |
|
19.208 |
|
|
21.523 |
|
22.158 |
|
21.874 |
|
| Chilean peso |
1,068.408 |
|
1,017.949 |
|
|
1,127.108 |
|
1,095.928 |
|
1,001.107 |
|
Argentine peso1 |
|
|
|
1,609.836 |
|
1,401.188 |
|
1,617.838 |
|
| Polish zloty |
4.240 |
|
4.305 |
|
|
4.265 |
|
4.242 |
|
4.282 |
|
1. Average exchange rates for the Argentine peso are not included since we use the exchange rate on the last working day of each period presented given it is a hyperinflationary economy. We apply the official ARS exchange rate except in the periods between Q2 2024 and Q1 2025 when we applied an alternative exchange rate for the Argentine peso that better reflects the evolution of inflation.
|
|
|
|
|
|
|
|
|
January - September 2025 |
|
87 |
Impact of inflation rate on the variations of operating expenses
Santander presents, for both the Group and the business units included in the primary and secondary segments: i) the changes in operating expenses in euros; ii) the changes excluding the exchange rate effect with the exception of Argentina which is calculated as described above in "Local currency measures"; and iii) the changes excluding the exchange rate effect minus the effect of average inflation over the last twelve months except for Argentina as cost growth in euros should already largely reflect the effect of hyperinflation on exchange rates. The reason is that the two latter facilitate analysis for management purposes.
Inflation is calculated as the arithmetic average of the last twelve months for each country and, for the global businesses, as the weighted average the inflation rate of each country comprising the global business, weighted by each country's operating expenses. For the Group and the global businesses, we exclude the impact of inflation in Argentina from the calculation as cost growth in euros should already largely reflect the effect of hyperinflation on exchange rates.
The table below shows the average inflation rates calculated as indicated.
|
|
|
|
|
|
|
|
|
|
|
Average inflation |
|
|
|
|
|
|
|
|
% |
|
Average inflation last 12 months |
|
|
|
Retail & Commercial Banking1 |
|
3.6 |
|
|
|
Digital Consumer Bank1 |
|
2.6 |
|
|
|
Corporate & Investment Banking1 |
|
3.0 |
|
|
|
Wealth Management & Insurance1 |
|
3.0 |
|
|
|
Payments1 |
|
3.3 |
|
|
|
|
|
|
|
|
|
|
|
|
|
|
|
Spain |
|
2.5 |
|
|
|
UK |
|
3.1 |
|
|
|
Portugal |
|
2.4 |
|
|
|
Poland |
|
4.2 |
|
|
|
DCB Europe |
|
2.2 |
|
|
|
|
|
|
|
|
|
US2 |
|
2.7 |
|
|
|
Mexico |
|
4.0 |
|
|
|
|
|
|
|
|
|
Brazil |
|
5.1 |
|
|
|
Chile |
|
4.5 |
|
|
|
|
|
|
|
|
|
|
|
|
|
|
|
Total Group1 |
|
3.3 |
|
|
1.Excluding the impact of inflation in Argentina.
2.Based on latest available data.
|
|
|
|
|
|
|
|
|
88 |
|
January - September 2025 |
|
|
|
|
|
|
|
|
|
|
|
|
|
|
|
|
|
|
|
|
|
|
|
|
|
|
|
|
|
|
|
|
|
|
|
|
|
Significant events
|
|
|
|
|
|
|
|
|
|
|
|
|
|
|
|
|
|
|
|
Condensed consolidated financial statements |
|
|
Interim condensed consolidated financial statements
Condensed consolidated balance sheet
Condensed consolidated income statement
|
|
|
|
|
|
| NOTE: |
The following financial information for the first nine months of 2025 and 2024 (attached herewith) corresponds to the condensed consolidated financial statements prepared in accordance with the International Financial Reporting Standards. |
|
|
|
|
|
|
|
|
|
|
|
|
|
| Interim condensed consolidated balance sheet |
|
|
|
|
| EUR million |
|
|
|
|
|
|
|
|
|
| ASSETS |
Sep-25 |
Dec-24 |
Sep-24 |
|
| Cash, cash balances at central banks and other deposits on demand |
161,899 |
|
192,208 |
|
169,377 |
|
|
| Financial assets held for trading |
248,856 |
|
230,253 |
|
232,039 |
|
|
| Non-trading financial assets mandatorily at fair value through profit or loss |
7,499 |
|
6,130 |
|
6,347 |
|
|
| Financial assets designated at fair value through profit or loss |
8,086 |
|
7,915 |
|
9,113 |
|
|
| Financial assets at fair value through other comprehensive income |
74,037 |
|
89,898 |
|
80,171 |
|
|
| Financial assets at amortised cost |
1,175,701 |
|
1,203,707 |
|
1,198,673 |
|
|
| Hedging derivatives |
4,246 |
|
5,672 |
|
5,637 |
|
|
| Changes in the fair value of hedged items in portfolio hedges of interest risk |
(156) |
|
(704) |
|
(313) |
|
|
| Investments |
7,352 |
|
7,277 |
|
8,640 |
|
|
| Joint ventures entities |
1,993 |
|
2,061 |
|
2,060 |
|
|
| Associated entities |
5,359 |
|
5,216 |
|
6,580 |
|
|
| Assets under reinsurance contracts |
227 |
|
222 |
|
217 |
|
|
| Tangible assets |
28,408 |
|
32,087 |
|
32,536 |
|
|
| Property, plant and equipment |
27,608 |
|
31,212 |
|
31,612 |
|
|
| For own-use |
11,953 |
|
12,636 |
|
12,469 |
|
|
| Leased out under an operating lease |
15,655 |
|
18,576 |
|
19,143 |
|
|
| Investment property |
800 |
|
875 |
|
924 |
|
|
| Of which : Leased out under an operating lease |
640 |
|
749 |
|
768 |
|
|
| Intangible assets |
17,287 |
|
19,259 |
|
19,077 |
|
|
| Goodwill |
12,025 |
|
13,438 |
|
13,487 |
|
|
| Other intangible assets |
5,262 |
|
5,821 |
|
5,590 |
|
|
| Tax assets |
28,812 |
|
30,596 |
|
28,589 |
|
|
| Current tax assets |
9,897 |
|
11,426 |
|
9,471 |
|
|
| Deferred tax assets |
18,915 |
|
19,170 |
|
19,118 |
|
|
| Other assets |
9,045 |
|
8,559 |
|
9,217 |
|
|
| Insurance contracts linked to pensions |
71 |
|
81 |
|
95 |
|
|
| Inventories |
5 |
|
6 |
|
6 |
|
|
| Other |
8,969 |
|
8,472 |
|
9,116 |
|
|
| Non-current assets held for sale |
69,369 |
|
4,002 |
|
2,939 |
|
|
| TOTAL ASSETS |
1,840,668 |
|
1,837,081 |
|
1,802,259 |
|
|
|
|
|
|
|
|
|
|
|
|
|
|
|
|
January - September 2025 |
|
89 |
|
|
|
|
|
|
|
|
|
|
|
|
|
|
|
|
|
|
|
|
|
|
|
|
|
|
|
|
|
|
|
|
|
|
|
|
|
Significant events
|
|
|
|
|
|
|
|
|
|
|
|
|
|
|
|
|
|
|
|
Condensed consolidated financial statements |
|
|
|
|
|
|
|
|
|
|
|
|
|
|
|
| Interim condensed consolidated balance sheet |
|
|
| EUR million |
|
|
|
|
|
|
|
|
|
| LIABILITIES |
Sep-25 |
Dec-24 |
Sep-24 |
|
| Financial liabilities held for trading |
164,608 |
|
152,151 |
|
143,559 |
|
|
| Financial liabilities designated at fair value through profit or loss |
37,079 |
|
36,360 |
|
34,503 |
|
|
| Financial liabilities at amortized cost |
1,414,964 |
|
1,484,322 |
|
1,459,778 |
|
|
| Hedging derivatives |
4,188 |
|
4,752 |
|
5,000 |
|
|
| Changes in the fair value of hedged items in portfolio hedges of interest rate risk |
28 |
|
(9) |
|
50 |
|
|
| Liabilities under insurance contracts |
18,620 |
|
17,829 |
|
18,037 |
|
|
| Provisions |
7,744 |
|
8,407 |
|
8,571 |
|
|
| Pensions and other post-retirement obligations |
1,663 |
1,731 |
2,318 |
|
| Other long term employee benefits |
918 |
915 |
833 |
|
| Taxes and other legal contingencies |
2,786 |
2,717 |
2,604 |
|
| Contingent liabilities and commitments |
653 |
710 |
713 |
|
| Other provisions |
1,724 |
2,334 |
2,103 |
|
| Tax liabilities |
9,457 |
|
9,598 |
|
9,177 |
|
|
| Current tax liabilities |
3,537 |
3,322 |
3,040 |
|
| Deferred tax liabilities |
5,920 |
6,276 |
6,137 |
|
| Other liabilities |
15,008 |
|
16,344 |
|
18,521 |
|
|
| Liabilities associated with non-current assets held for sale |
59,058 |
|
— |
|
— |
|
|
| TOTAL LIABILITIES |
1,730,754 |
|
1,729,754 |
|
1,697,196 |
|
|
|
|
|
|
|
| EQUITY |
|
|
|
|
| Shareholders' equity |
139,081 |
|
135,196 |
|
134,070 |
|
|
| Capital |
7,443 |
|
7,576 |
|
7,747 |
|
|
| Called up paid capital |
7,443 |
|
7,576 |
|
7,747 |
|
|
| Unpaid capital which has been called up |
— |
|
— |
|
— |
|
|
| Share premium |
38,492 |
|
40,079 |
|
41,604 |
|
|
| Equity instruments issued other than capital |
— |
|
— |
|
744 |
|
|
| Equity component of the compound financial instrument |
— |
|
— |
|
— |
|
|
| Other equity instruments issued |
— |
|
— |
|
744 |
|
|
| Other equity |
271 |
|
217 |
|
213 |
|
|
| Accumulated retained earnings |
91,954 |
|
82,326 |
|
82,324 |
|
|
| Revaluation reserves |
— |
|
— |
|
— |
|
|
| Other reserves |
(7,180) |
|
(5,976) |
|
(5,887) |
|
|
| (-) Own shares |
(532) |
|
(68) |
|
(459) |
|
|
| Profit attributable to shareholders of the parent |
10,337 |
|
12,574 |
|
9,309 |
|
|
| (-) Interim dividends |
(1,704) |
|
(1,532) |
|
(1,525) |
|
|
| Other comprehensive income (loss) |
(38,004) |
|
(36,595) |
|
(37,471) |
|
|
| Items not reclassified to profit or loss |
(4,248) |
|
(4,757) |
|
(5,256) |
|
|
| Items that may be reclassified to profit or loss |
(33,756) |
|
(31,838) |
|
(32,215) |
|
|
| Non-controlling interest |
8,837 |
|
8,726 |
|
8,464 |
|
|
| Other comprehensive income |
(2,048) |
|
(2,020) |
|
(1,852) |
|
|
| Other items |
10,885 |
|
10,746 |
|
10,316 |
|
|
| TOTAL EQUITY |
109,914 |
|
107,327 |
|
105,063 |
|
|
| TOTAL LIABILITIES AND EQUITY |
1,840,668 |
|
1,837,081 |
|
1,802,259 |
|
|
|
|
|
|
|
| MEMORANDUM ITEMS: OFF BALANCE SHEET AMOUNTS |
|
|
|
|
| Loan commitments granted |
310,866 |
|
302,861 |
|
291,385 |
|
|
| Financial guarantees granted |
16,819 |
|
16,901 |
|
15,780 |
|
|
| Other commitments granted |
158,744 |
|
134,493 |
|
138,136 |
|
|
|
|
|
|
|
|
|
|
|
90 |
|
January - September 2025 |
|
|
|
|
|
|
|
|
|
|
|
|
|
|
|
|
|
|
|
|
|
|
|
|
|
|
|
|
|
|
|
|
|
|
|
|
|
Significant events
|
|
|
|
|
|
|
|
|
|
|
|
|
|
|
|
|
|
|
|
Condensed consolidated financial statements |
|
|
|
|
|
|
|
|
|
|
|
| Interim condensed consolidated income statement |
|
|
|
|
|
|
| EUR million |
9M'25 |
9M'24 |
| Interest income |
76,325 |
|
81,638 |
|
| Financial assets at fair value through other comprehensive income |
4,140 |
|
4,880 |
|
| Financial assets at amortized cost |
58,116 |
|
60,431 |
|
| Other interest income |
14,069 |
|
16,327 |
|
| Interest expense |
(44,766) |
|
(49,095) |
|
| Interest income/ (charges) |
31,559 |
|
32,543 |
|
| Dividend income |
559 |
|
581 |
|
| Income from companies accounted for using the equity method |
480 |
|
480 |
|
| Commission income |
12,790 |
|
12,465 |
|
| Commission expense |
(3,289) |
|
(3,274) |
|
| Gain or losses on financial assets and liabilities not measured at fair value through profit or loss, net |
162 |
|
16 |
|
| Financial assets at amortized cost |
(26) |
|
(40) |
|
| Other financial assets and liabilities |
188 |
|
56 |
|
| Gain or losses on financial assets and liabilities held for trading, net |
1,040 |
|
712 |
|
| Reclassification of financial assets at fair value through other comprehensive income |
— |
|
— |
|
| Reclassification of financial assets from amortized cost |
— |
|
— |
|
| Other gains (losses) |
1,040 |
|
712 |
|
| Gains or losses on non-trading financial assets and liabilities mandatorily at fair value through profit or loss |
672 |
|
627 |
|
| Reclassification of financial assets at fair value through other comprehensive income |
— |
|
— |
|
| Reclassification of financial assets from amortized cost |
— |
|
— |
|
| Other gains (losses) |
672 |
|
627 |
|
| Gain or losses on financial assets and liabilities measured at fair value through profit or loss, net |
(419) |
|
41 |
|
| Gain or losses from hedge accounting, net |
(6) |
|
26 |
|
| Exchange differences, net |
204 |
|
22 |
|
| Other operating income (*) |
1,221 |
|
731 |
|
| Other operating expenses |
(1,531) |
|
(1,728) |
|
| Income from insurance and reinsurance contracts |
351 |
|
348 |
|
| Expenses from insurance and reinsurance contracts |
(286) |
|
(331) |
|
| Total income |
43,507 |
|
43,259 |
|
| Administrative expenses |
(15,957) |
|
(16,215) |
|
| Staff costs |
(10,045) |
|
(10,187) |
|
| Other general and administrative expenses |
(5,912) |
|
(6,028) |
|
| Depreciation and amortization |
(2,422) |
|
(2,385) |
|
| Provisions or reversal of provisions, net |
(2,019) |
|
(2,292) |
|
Impairment or reversal of impairment of financial assets not measured at fair value
through profit or loss and net gains and losses from modifications |
(9,372) |
|
(9,131) |
|
| Financial assets at fair value through other comprehensive income |
(52) |
|
(4) |
|
| Financial assets at amortized cost |
(9,320) |
|
(9,127) |
|
| Impairment of investments in subsidiaries, joint ventures and associates, net |
— |
|
— |
|
| Impairment on non-financial assets, net |
(188) |
|
(435) |
|
| Tangible assets |
(128) |
|
(248) |
|
| Intangible assets |
(53) |
|
(184) |
|
| Others |
(7) |
|
(3) |
|
| Gain or losses on non-financial assets and investments, net |
(22) |
|
371 |
|
| Negative goodwill recognized in results |
22 |
|
— |
|
| Gains or losses on non-current assets held for sale not classified as discontinued operations |
212 |
|
(51) |
|
| Operating profit/(loss) before tax |
13,761 |
|
13,121 |
|
| Tax expense or income from continuing operations |
(3,560) |
|
(3,919) |
|
| Profit/(loss) for the period from continuing operations |
10,201 |
|
9,202 |
|
| Profit/( loss) after tax from discontinued operations |
1,152 |
|
979 |
|
| Profit/(loss) for the period |
11,353 |
|
10,181 |
|
| Profit attributable to non-controlling interests |
1,016 |
|
872 |
|
| Profit/(loss) attributable to the parent |
10,337 |
|
9,309 |
|
|
|
|
| Earnings/(losses) per share |
|
|
| Basic |
0.66 |
|
0.57 |
|
| Diluted |
0.66 |
|
0.57 |
|
(*) Includes -EUR 348 million at 30 September 2025 (-EUR 796 million at 30 September 2024) derived from the net monetary loss generated in Argentina as a result of the application of IAS 29 Financial reporting in hyperinflationary economies.
|
|
|
|
|
|
|
|
|
January - September 2025 |
|
91 |
|
|
|
|
|
|
|
|
|
|
|
|
|
|
|
|
|
|
|
|
|
|
|
|
|
|
|
|
|
|
|
|
|
|
|
|
|
Significant events
|
|
|
|
|
|
|
|
|
|
|
|
|
|
|
|
|
|
|
|
Glossary |
|
|
Glossary
•A2A: Account-to-account
•Active customer: Those customers who comply with the minimum balance, income and/or transactionality requirements as defined according to the business area
•ADR: American Depositary Receipt
•AI: Artificial intelligence
•APM: Alternative Performance Measures
•AuMs: Assets under management
•bn: Billion
•bps: basis points
•CDI: CREST Depository Interest
•CET1: Common Equity Tier 1
•CF: Corporate Finance
•CHF: Swiss francs
•CIB: Corporate & Investment Banking
•CNMV: Spanish National Securities Market Commission (Comisión Nacional del Mercado de Valores)
•Consumer: Digital Consumer Bank
•Costs in real terms: variations excluding the effect of average inflation over the last twelve months
•CRR: Capital Requirements Regulation
•DCBE: Digital Consumer Bank Europe
•DCB US: Digital Consumer Bank US
•Digital customers: Every consumer of a commercial bank’s services who has logged on to their personal online banking and/or mobile banking in the last 30 days
•ECAs: Export Credit Agencies, government-backed financial institutions that support domestic companies' international trade
•ECB: European Central Bank
•EPS: Earnings per share
•ESMA: European Securities and Markets Authority
•Fed: Federal Reserve
•Free float: total number of shares in circulation minus treasury shares as a % the total number of shares in circulation
•Financial inclusion: Number of people who are unbanked, underbanked, in financial difficulty, with difficulties in accessing credit who, through the Group's products and services, are able to access the financial system or receive tailored finance. Financially underserved groups are defined as people who do not have a current account, or who have an account but obtained alternative (non-bank) financial services in the last 12 months. Beneficiaries of various programmes are included in the quantification process only once in the entire period. Only new empowered people are counted, taking as a base year those existing since 2019.
•FX: Foreign Exchange
•GB: Global Banking
•GDP: Gross Domestic Product
•GM: Global Markets
•GTB: Global Transaction Banking
•IFRS 5: International Financial Reporting Standard 5, regarding non-current Assets Held for Sale and Discontinued Operations
•IFRS 8: International Financial Reporting Standard 8, regarding operating segments
•IFRS 9: International Financial Reporting Standard 9, regarding financial instruments
•IPO: Initial public offering
•IT: Information technology
•LCR: Liquidity Coverage Ratio
•LLPs: Loan-loss provisions
•MDA: Maximum Distributable Amount
•mn: Million
•MREL: Minimum Requirement for own funds and eligible liabilities)
•NII: Net interest income
•NPS: Net promoter score
•ODS: Open Digital Services
•P2R: Pillar 2 requirement
•Payments: PagoNxt (Getnet, Ebury and PagoNxt) and Cards
•PB: Private Banking
•PBT: Profit before tax
•PoS: Point of sale
•pp: percentage points
•QoQ: quarter-on-quarter
•Retail: Retail & Commercial Banking
•Repos: Repurchase agreements
•RoA: Return on assets
•RoE: Return on equity
•RoRWA: Return on risk-weighted assets
•RoTE: Return on tangible equity
•RoTE (post-AT1): Return on tangible equity excluding the cost of AT1issuances from the numerator.
•RWAs: Risk-weighted assets
•Sales conversion: Indicator that measures the effectiveness of a commercial process in converting opportunities into actual sales
•SAM: Santander Asset Management
•SBNA: Santander Bank N.A.
•SC USA: Santander Consumer USA
•SEC: Securities and Exchanges Commission
•Share of wallet: how much (on average) a consumer spends on a company's product or service as compared to how much they spend on competing products or services
•SHUSA: Santander Holdings USA, Inc.
•SMEs: Small and medium enterprises
•Time-to-market: The length of time it takes for a product or service to being available for purchase
•TLAC: The total loss-absorbing capacity requirement which is required to be met under the CRD V package
•TNAV: Tangible net asset value
•Token: Digital unit that represents a value, right, or asset within a technological system, typically based on blockchain
•Tokenization: Process by which a tangible or intangible asset is digitally represented through a token on a blockchain network or other secure technological infrastructure
•TPV: Total payments volume
•VaR: Value at Risk
•Wealth: Wealth Management & Insurance
•YoY: Year-on-year
|
|
|
|
|
|
|
|
|
92 |
|
January - September 2025 |
|
|
|
|
|
|
|
|
|
|
|
|
|
|
|
|
|
|
|
|
|
|
|
|
|
|
|
|
|
|
|
|
|
|
|
|
|
Significant events
|
|
|
|
|
|
|
|
|
|
|
|
|
|
|
|
|
|
|
|
Important information |
|
|
Important information
Non-IFRS and alternative performance measures
Banco Santander, S.A. (“Santander”) cautions that this report may contain financial information prepared according to International Financial Reporting Standards (IFRS) and taken from our consolidated financial statements, as well as alternative performance measures (APMs) as defined in the Guidelines on Alternative Performance Measures issued by the European Securities and Markets Authority (ESMA) on 5 October 2015, and other non-IFRS measures. The APMs and non-IFRS measures were calculated with information from Grupo Santander; however, they are neither defined or detailed in the applicable financial reporting framework nor audited or reviewed by our auditors. We use the APMs and non-IFRS measures when planning, monitoring and evaluating our performance. We consider them to be useful metrics for our management and investors to compare operating performance between accounting periods.
Nonetheless, the APMs and non-IFRS measures are supplemental information; their purpose is not to substitute the IFRS measures. Furthermore, companies in our industry and others may calculate or use APMs and non-IFRS measures differently, thus making them less useful for comparison purposes. APMs using environmental, social and governance labels have not been calculated in accordance with the Taxonomy Regulation or with the indicators for principal adverse impact in SFDR.
For more details on APMs and non-IFRS measures, please see the 2024 Annual Report on Form 20-F filed with the U.S. Securities and Exchange Commission (the SEC) on 28 February 2025 (https://www.santander.com/content/dam/santander-com/en/documentos/informacion-sobre-resultados-semestrales-y-anuales-suministrada-a-la-sec/2025/sec-2024-annual-20-f-2024-en.pdf), as well as the section “Alternative performance measures” of Banco Santander, S.A. (Santander) Q3 2025 Financial Report, published on 29 October 2025 (https://www.santander.com/en/shareholders-and-investors/financial-and-economic-information#quarterly-results).
Sustainability information
This report may contain, in addition to financial information, sustainability-related information, including environmental, social and governance-related metrics, statements, goals, targets, commitments and opinions. Sustainability information is not audited nor, save as expressly indicated under section ‘Auditors’ reviews’ of the 2024 Annual Financial Report, reviewed by an external auditor. Sustainability information is prepared following various external and internal frameworks, reporting guidelines and measurement, collection and verification methods and practices, which may materially differ from those applicable to financial information and are in many cases emerging and evolving. Sustainability information is based on various materiality thresholds, estimates, assumptions, judgments and underlying data derived internally and from third parties. Sustainability information is thus subject to significant measurement uncertainties, may not be comparable to sustainability information of other companies or over time or across periods and its use is not meant to imply that the information is fit for any particular purpose or that it is material to us under mandatory reporting standards. The sustainability information is for informational purposes only, without any liability being accepted in connection with it except where such liability cannot be limited under overriding provisions of applicable law.
Forward-looking statements
Santander hereby warns that this report may contain 'forward-looking statements', as defined by the US Private Securities Litigation Reform Act of 1995. Such statements can be understood through words and expressions like 'expect', 'project', 'anticipate', 'should', 'intend', 'probability', 'risk', 'VaR', 'RoRAC', 'RoRWA', 'TNAV', 'target', 'goal', 'objective', 'estimate', 'future', 'ambition', 'aspiration', 'commitment', 'commit', 'focus', 'pledge' and similar expressions. They include (but are not limited to) statements on future business development, shareholder remuneration policy and NFI. However, risks, uncertainties and other important factors may lead to developments and results that differ materially from those anticipated, expected, projected or assumed in forward-looking statements. The important factors below (and others mentioned in this report), as well as other unknown or unpredictable factors, could affect our future development and results and could lead to outcomes materially different from what our forward-looking statements anticipate, expect, project or assume:
•general economic or industry conditions (e.g., an economic downturn; higher volatility in the capital markets; inflation; deflation; changes in demographics, consumer spending, investment or saving habits; and the effects of the wars in Ukraine and the Middle East or the outbreak of public health emergencies in the global economy) in areas where we have significant operations or investments;
•exposure to market risks (e.g., risks from interest rates, foreign exchange rates, equity prices and new benchmark indices);
•potential losses from early loan repayment, collateral depreciation or counterparty risk;
•political instability in Spain, the UK, other European countries, Latin America and the US;
•changes in monetary, fiscal and immigration policies and trade tensions, including the imposition of tariffs and retaliatory responses;
•legislative, regulatory or tax changes (including regulatory capital and liquidity requirements) and greater regulation prompted by financial crises;
•acquisitions, integrations, divestitures and challenges arising from deviating management’s resources and attention from other strategic opportunities and operational matters;
•climate-related conditions, regulations, targets and weather events;
•uncertainty over the scope of actions that may be required by us, governments and other to achieve goals relating to climate, environmental and social matters, as well as the evolving nature of underlying science and potential conflicts and inconsistencies among governmental standards and regulations. Important factors affecting sustainability information may materially differ from those applicable to financial information. Sustainability information is based on various materiality thresholds, estimates, assumptions, judgments and underlying data derived internally and from third parties. Sustainability information is thus subject to significant measurement uncertainties, may not be
|
|
|
|
|
|
|
|
|
January - September 2025 |
|
93 |
|
|
|
|
|
|
|
|
|
|
|
|
|
|
|
|
|
|
|
|
|
|
|
|
|
|
|
|
|
|
|
|
|
|
|
|
|
Significant events
|
|
|
|
|
|
|
|
|
|
|
|
|
|
|
|
|
|
|
|
Important information |
|
|
comparable to sustainability information of other companies or over time or across periods and its inclusion is not meant to imply that the information is fit for any particular purpose or that it is material to us under mandatory reporting standards. The sustainability information is for informational purposes only, without any liability being accepted in connection with it except where such liability cannot be limited under overriding provisions of applicable law;
•our own decisions and actions, including those affecting or changing our practices, operations, priorities, strategies, policies or procedures;
•changes affecting our access to liquidity and funding on acceptable terms, especially due to credit spread shifts or credit rating downgrade for the entire group or core subsidiaries;
•our exposure to operational losses; and
•potential losses associated with cyberattacks, data breaches, data losses and other security incidents.
Forward looking statements are based on current expectations and future estimates about Santander’s and third-parties’ operations and businesses and address matters that are uncertain to varying degrees, including, but not limited to developing standards that may change in the future; plans, projections, expectations, targets, objectives, strategies and goals relating to environmental, social, safety and governance performance, including expectations regarding future execution of Santander’s and third parties’ energy and climate strategies, and the underlying assumptions and estimated impacts on Santander’s and third-parties’ businesses related thereto; Santander’s and third-parties’ approach, plans and expectations in relation to carbon use and targeted reductions of emissions; changes in operations or investments under existing or future environmental laws and regulations; and changes in government regulations and regulatory requirements, including those related to climate-related initiatives.
Forward-looking statements are aspirational, should be regarded as indicative, preliminary and for illustrative purposes only, speak only as of the date of this report and are informed by the knowledge, information and views available on such date and are subject to change without notice. Banco Santander is not required to update or revise any forward-looking statements, regardless of new information, future events or otherwise, except as required by applicable law.
Past performance does not indicate future outcomes
Statements about historical performance or growth rates must not be construed as suggesting that future performance, share price or earnings (including earnings per share) will necessarily be the same or higher than in a previous period. Nothing mentioned in this report should be taken as a profit and loss forecast.
Not a securities offer
This report and the information it contains does not constitute an offer to sell nor the solicitation of an offer to buy any securities.
Third Party Information
In particular, regarding the data provided by third parties, neither Santander, nor any of its directors, managers or employees, either explicitly or implicitly, guarantees that these contents are exact, accurate, comprehensive or complete, nor are they obliged to keep them updated, nor to correct them in the case that any deficiency, error or omission were to be detected. Moreover, in reproducing these contents in by any means, Santander may introduce any changes it deems suitable, and may omit, partially or completely, any of the elements of this report, and in case of any deviation, Santander assumes no liability for any discrepancy.
Sale of 49% stake in Santander Bank Polska to Erste Group
All figures, including P&L, loans and advances to customers, customer funds and other metrics are presented on an underlying basis and include Santander Bank Polska, in line with previously published quarterly information, i.e. maintaining the same perimeter that existed at the time of the announcement of the sale of 49% stake in Santander Bank Polska to Erste Group (https://www.santander.com/content/dam/santander-com/en/documentos/informacion-privilegiada/2025/05/hr-2025-05-05-santander-announces-the-sale-of-49-per-cent-of-santander-polska-to-erste-group-bank-and-agrees-strategic-cooperation-across-cib-and-payments-en.pdf). For further information, see the 'Alternative performance measures' section of Banco Santander, S.A. (Santander) Q3 2025 Financial Report, published on 29 October 2025 (https://www.santander.com/en/shareholders-and-investors/financial-and-economic-information#quarterly-results).
|
|
|
This document is a translation of a document originally issued in Spanish. Should there be any discrepancies between the English and the Spanish versions, only the original Spanish version should be binding. |
|
|
|
|
|
|
|
|
|
94 |
|
January - September 2025 |
SIGNATURE
Pursuant to the requirements of the Securities Exchange Act of 1934, the registrant has duly caused this report to be signed on its behalf by the undersigned, thereunto duly authorized.
|
|
|
|
|
|
|
|
|
|
|
|
|
Banco Santander, S.A. |
|
|
|
|
| Date: 29 October 2025 |
By: |
/s/ José García Cantera |
|
Name: |
José García Cantera |
|
Title: |
Chief Financial Officer |