Document
FORM 6-K
SECURITIES AND EXCHANGE COMMISSION
Washington, D.C. 20549
Report of Foreign Issuer
Pursuant to Rule 13a-16 or 15d-16
of the Securities Exchange Act of 1934
For the month of April, 2025
Commission File Number: 001-12518
Banco Santander, S.A.
(Exact name of registrant as specified in its charter)
Ciudad Grupo Santander
28660 Boadilla del Monte (Madrid) Spain
(Address of principal executive office)
Indicate by check mark whether the registrant files or will file annual reports under cover of Form 20-F or Form 40-F:
Form 20-F ☒ Form 40-F ☐
BANCO SANTANDER, S.A.
________________________
TABLE OF CONTENTS
|
|
|
|
|
|
|
|
|
|
|
Item 1. January - March 2025 Financial Report |
|
Index
This report was approved by the board of directors on 29 April 2025, following a favourable report from the audit committee. Important information regarding this report can be found on pages 90 and 91.
Key consolidated data
|
|
|
|
|
|
|
|
|
|
|
|
|
|
|
|
|
|
|
|
|
|
| BALANCE SHEET (EUR million) |
Mar-25 |
Dec-24 |
% |
|
Mar-24 |
% |
Dec-24 |
| Total assets |
1,845,177 |
|
1,837,081 |
|
0.4 |
|
|
1,800,006 |
|
2.5 |
|
1,837,081 |
|
| Loans and advances to customers |
1,064,416 |
|
1,054,069 |
|
1.0 |
|
|
1,049,533 |
|
1.4 |
|
1,054,069 |
|
| Customer deposits |
1,081,894 |
|
1,055,936 |
|
2.5 |
|
|
1,044,453 |
|
3.6 |
|
1,055,936 |
|
| Total funds |
1,386,326 |
|
1,348,422 |
|
2.8 |
|
|
1,315,779 |
|
5.4 |
|
1,348,422 |
|
| Total equity |
110,514 |
|
107,327 |
|
3.0 |
|
|
105,025 |
|
5.2 |
|
107,327 |
|
| Note: total funds includes customer deposits, mutual funds, pension funds and managed portfolios. |
|
|
|
|
|
|
|
|
|
|
|
|
|
|
|
|
|
|
|
|
|
|
| INCOME STATEMENT (EUR million) |
Q1'25 |
Q4'24 |
% |
|
Q1'24 |
% |
2024 |
| Net interest income |
11,378 |
|
11,986 |
|
(5.1) |
|
|
11,983 |
|
(5.0) |
|
46,668 |
|
| Total income |
15,537 |
|
16,026 |
|
(3.1) |
|
|
15,045 |
|
3.3 |
|
61,876 |
|
|
|
|
|
|
|
|
|
| Net operating income |
9,048 |
|
9,254 |
|
(2.2) |
|
|
8,498 |
|
6.5 |
|
35,842 |
|
|
|
|
|
|
|
|
|
| Profit before tax |
5,187 |
|
4,600 |
|
12.8 |
|
|
4,583 |
|
13.2 |
|
19,027 |
|
| Profit attributable to the parent |
3,402 |
|
3,265 |
|
4.2 |
|
|
2,852 |
|
19.3 |
|
12,574 |
|
|
|
|
|
|
|
|
|
|
|
|
|
|
|
|
|
|
|
|
|
|
|
|
|
|
|
|
|
|
|
|
|
EPS, PROFITABILITY AND EFFICIENCY (%) 1 |
Q1'25 |
Q4'24 |
% |
|
Q1'24 |
% |
2024 |
| EPS (euros) |
0.21 |
|
0.20 |
|
5.8 |
|
|
0.17 |
|
26.1 |
|
0.77 |
|
| RoE |
13.4 |
|
13.3 |
|
|
|
11.9 |
|
|
13.0 |
|
| RoTE |
16.6 |
|
16.6 |
|
|
|
14.9 |
|
|
16.3 |
|
| RoTE (post-AT1) |
15.8 |
|
15.7 |
|
|
|
14.1 |
|
|
15.5 |
|
| RoA |
0.81 |
|
0.78 |
|
|
|
0.69 |
|
|
0.76 |
|
| RoRWA |
2.34 |
|
2.27 |
|
|
|
1.96 |
|
|
2.18 |
|
Efficiency ratio 2 |
41.8 |
|
42.3 |
|
|
|
42.6 |
|
|
41.8 |
|
|
|
|
|
|
|
|
|
|
|
|
|
|
|
|
|
|
|
|
|
|
|
UNDERLYING INCOME STATEMENT 2 (EUR million) |
Q1'25 |
Q4'24 |
% |
|
Q1'24 |
% |
2024 |
| Net interest income |
11,378 |
|
11,986 |
|
(5.1) |
|
|
11,983 |
|
(5.0) |
|
46,668 |
|
| Total income |
15,537 |
|
16,026 |
|
(3.1) |
|
|
15,380 |
|
1.0 |
|
62,211 |
|
|
|
|
|
|
|
|
|
| Net operating income |
9,048 |
|
9,254 |
|
(2.2) |
|
|
8,833 |
|
2.4 |
|
36,177 |
|
|
|
|
|
|
|
|
|
| Profit before tax |
5,187 |
|
4,600 |
|
12.8 |
|
|
4,583 |
|
13.2 |
|
19,027 |
|
| Profit attributable to the parent |
3,402 |
|
3,265 |
|
4.2 |
|
|
2,852 |
|
19.3 |
|
12,574 |
|
| Changes in constant euros: |
|
|
|
|
|
| Q1'25 / Q4'24: NII: -5.6%; Total income: -3.5%; Net operating income: -2.8%; Profit before tax: +12.4%; Attributable profit: +4.2%. |
| Q1'25 / Q1'24: NII: -1.7%; Total income: +4.8%; Net operating income: +6.9%; Profit before tax: +17.5%; Attributable profit: +23.9%. |
|
|
|
Note: for Argentina and any grouping which includes it, the variations in constant euros have been calculated considering the Argentine peso exchange rate on the last working day for each of the periods presented. Additionally, from Q2 2024 onwards for the Argentine peso, we apply an alternative exchange rate that better reflects the evolution of inflation (we continue to apply the official ARS exchange rate to all prior periods). For further information, see the 'Alternative performance measures' section in the appendix to this report. Certain figures contained in this report, have been subject to rounding to enhance their presentation. Accordingly, in certain instances, the sum of the numbers in a column or a row in tables contained in this report may not conform exactly to the total figure given for that column or row.
|
|
|
|
|
|
|
|
|
|
|
|
|
|
|
|
|
|
|
|
|
|
|
| SOLVENCY (%) |
Mar-25 |
Dec-24 |
|
|
Mar-24 |
|
Dec-24 |
| Phased-in CET1 ratio |
12.9 |
|
12.8 |
|
|
|
12.3 |
|
|
12.8 |
|
| Phased-in total capital ratio |
17.2 |
|
17.4 |
|
|
|
16.6 |
|
|
17.4 |
|
|
|
|
|
|
|
|
|
|
|
|
|
|
|
|
|
|
|
|
|
|
|
|
|
|
|
|
|
|
|
|
|
|
|
|
|
|
|
CREDIT QUALITY (%)1 |
Q1'25 |
Q4'24 |
|
|
Q1'24 |
|
2024 |
Cost of risk 2, 3 |
1.14 |
|
1.15 |
|
|
|
1.20 |
|
|
1.15 |
|
| NPL ratio |
2.99 |
|
3.05 |
|
|
|
3.10 |
|
|
3.05 |
|
| NPL coverage ratio |
65.7 |
|
64.8 |
|
|
|
66.1 |
|
|
64.8 |
|
|
|
|
|
|
|
|
|
|
|
|
|
|
|
|
|
|
|
|
|
|
|
| MARKET CAPITALIZATION AND SHARES |
Mar-25 |
Dec-24 |
% |
|
Mar-24 |
% |
Dec-24 |
| Shares (millions) |
15,152 |
|
15,152 |
|
0.0 |
|
|
15,826 |
|
(4.3) |
|
15,152 |
|
| Number of shareholders |
3,435,876 |
|
3,485,134 |
|
(1.4) |
|
|
3,584,294 |
|
(4.1) |
3,485,134 |
|
| Share price (euros) |
6.196 |
|
4.465 |
|
38.8 |
|
|
4.522 |
|
37.0 |
|
4.465 |
|
| Market capitalization (EUR million) |
93,885 |
|
67,648 |
|
38.8 |
|
|
71,555 |
|
31.2 |
|
67,648 |
|
| Tangible book value per share (euros) |
5.46 |
|
5.24 |
|
|
|
4.86 |
|
|
5.24 |
|
| Price / Tangible book value per share (X) |
1.13 |
|
0.85 |
|
|
|
0.93 |
|
|
0.85 |
|
|
|
|
|
|
|
|
|
|
|
|
|
|
|
|
|
|
|
|
|
|
|
|
|
|
|
|
|
|
|
| CUSTOMERS (thousands) |
Mar-25 |
Dec-24 |
% |
|
Mar-24 |
% |
Dec-24 |
| Total customers |
174,769 |
|
172,537 |
|
1.3 |
|
|
165,752 |
|
5.4 |
172,537 |
|
| Active customers |
104,179 |
|
103,262 |
|
0.9 |
|
|
100,092 |
|
4.1 |
|
103,262 |
|
|
|
|
|
|
|
|
|
|
|
|
|
|
|
|
|
|
|
|
|
|
|
|
|
| Digital customers |
60,651 |
|
59,317 |
|
2.2 |
|
|
55,305 |
|
9.7 |
59,317 |
|
|
|
|
|
|
|
|
|
|
|
|
|
|
|
|
|
|
|
|
|
|
|
|
|
|
|
|
|
|
|
| OTHER DATA |
Mar-25 |
Dec-24 |
% |
|
Mar-24 |
% |
Dec-24 |
|
|
|
|
|
|
|
|
| Number of employees |
207,137 |
|
206,753 |
|
0.2 |
|
|
211,141 |
|
(1.9) |
|
206,753 |
|
| Number of branches |
7,910 |
|
8,011 |
|
(1.3) |
|
|
8,405 |
|
(5.9) |
|
8,011 |
|
|
|
|
|
|
|
| 1. |
|
| 2. |
In addition to financial information prepared in accordance with International Financial Reporting Standards (IFRS) and derived from our consolidated financial statements, this report contains certain financial measures that constitute alternative performance measures (APMs) as defined in the Guidelines on Alternative Performance Measures issued by the European Securities and Markets Authority (ESMA) on 5 October 2015, and other non-IFRS measures, including the figures related to “underlying” results, which do not include factors that are outside the ordinary course of our business, or have been reclassified within the underlying income statement. Further details are provided in the 'Alternative performance measures' section of the appendix to this report. For further details on the APMs and non-IFRS measures used, including their definition or a reconciliation between any applicable management indicators and the financial data presented in the annual consolidated financial statements prepared under IFRS, please see our 2024 Annual Financial Report, published in the CNMV on 28 February 2025, our 20-F report for the year ending 31 December 2024 filed with the SEC in the United States on 28 February 2025 as well as the 'Alternative performance measures' section of the appendix to this report.
|
|
|
|
|
| 3. |
Allowances for loan-loss provisions over the last 12 months / Average loans and advances to customers over the last 12 months. |
OUR BUSINESS MODEL
|
|
|
|
|
|
|
|
|
|
|
|
|
|
|
|
|
|
|
|
|
|
|
|
|
|
|
| CUSTOMER FOCUS |
Building a digital bank with branches |
|
|
|
|
|
|
|
|
|
|
|
|
|
|
|
|
|
|
→ We continue to build a digital bank with branches, with a multichannel offering to fulfil all our customers' financial needs. |
|
|
175 mn |
|
104 mn |
|
|
|
total customers |
|
active customers |
|
|
|
|
|
|
|
|
|
|
| SCALE |
Global and in-market scale |
|
|
|
|
|
|
|
|
|
|
→ Our global and in-market scale helps us to improve our local banks' profitability, adding value and network benefits.
→ Our activities are organized under five global businesses: Retail & Commercial Banking (Retail), Digital Consumer Bank (Consumer), Corporate & Investment Banking (CIB), Wealth Management & Insurance (Wealth) and Payments.
→ Our five global businesses support value creation based on the profitable growth and operational leverage that ONE Santander provides.
|
|
|
|
|
|
|
|
|
|
|
|
| DIVERSIFICATION |
Business, geographical and balance sheet |
|
|
|
|
|
|
|
|
|
→ Well-balanced diversification between businesses and markets with a solid and simple balance sheet that gives us recurrent net operating income with low volatility and more predictable results. |
Our corporate culture
The Santander Way remains unchanged to continue to deliver for all our stakeholders.
|
|
|
|
|
|
|
|
|
|
|
|
|
Our purpose |
|
|
|
|
|
|
To help people and businesses prosper |
|
|
|
|
|
Our aim |
|
|
|
|
|
To be the best open financial services platform, by acting responsibly and earning the lasting loyalty of our people, customers, shareholders and communities |
|
|
|
|
|
Our how |
|
|
|
|
|
Everything we do should be Simple, Personal and Fair |
|
|
|
|
GROUP FINANCIAL INFORMATION
General background
Grupo Santander's operating environment in Q1 2025 was characterized by a moderate global economic slowdown, with falling interest rates and a decline in inflation across most of our footprint. Labour markets continued to have relatively low unemployment rates across most of our countries. Geopolitical and commercial tensions have increased and there has been greater volatility in global financial markets. Looking ahead, and with the information available to date on the events that have occurred in the second quarter (trade tensions and market volatility), these trends could intensify.
|
|
|
|
|
|
|
|
|
|
|
|
Country |
GDP Change1 |
Economic performance |
|
Eurozone |
+1.2% |
Economic activity was weak in Q1 2025, reflected in confidence indicators which remained at low levels. Inflation fell to 2.2% in March. Although it seemed in March that the ECB would pause interest rate cuts, in April it reduced rates again to 2.25% due to the greater uncertainty regarding global trade and concerns over economic growth. |
|
Spain |
+3.4% |
The Spanish economy has begun 2025 positively, albeit less so than in previous quarters. This points to solid growth, though more contained in the year as a whole, driven by internal demand. The labour market remains strong, with the number of people enrolled in social security at record levels. Inflation fell to 2.3% in March, with a moderation in services prices. |
|
United Kingdom |
+1.5% |
Economic indicators up to March suggest a generalized improvement in activity before the change in US trade policy and the impact of the new taxes in early April. The labour market cooled, although the unemployment rate remains at very low levels (4.4% in January), and wage pressures remain (5.9% year-on-year growth in February). The annual inflation rate fell to 2.6% in March and core inflation declined to 3.5%. Despite expected pressure on inflation, we expect the Bank of England will cut rates from 4.50% to 4.25% in May. |
|
Portugal |
+2.9% |
Strong GDP growth in Q4 2024 has given the economy a boost for 2025. Consumption remained robust during the first quarter of the year. Employment increased and the unemployment rate remained low (6.4% in February). Headline and core inflation moderated to 1.9% in March, but a rebound is expected during the year due to increased activity and consumption. |
|
Poland |
+3.4% |
The outlook for 2025 is for growth around 3.5%, supported by internal demand which should offset weakness in the external sector, having registered average growth of 3% in 2024. The labour market remained strong, with unemployment at record lows (5.3% in March). The slowdown in wages improved inflation expectations for 2025 and annual inflation was stable at 4.9% in March. The central bank, having held interest rates at 5.75% in April, could start a cycle of interest rate cuts from May. |
|
United States |
+2.5% |
After strong growth in the second half of 2024, economic growth slowed in Q1 2025. The labour market remained relatively strong and inflation remained around 3%. Uncertainty regarding tariff policies is affecting the market expectations. The Fed held interest rates due to the risk of higher inflation and lower economic growth. |
|
Mexico |
+0.5% |
The economy weakened further between late 2024 and early 2025, affected by global uncertainty which is delaying investment and consumption decisions. The labour market remained resilient, albeit with signs of softening. The annual inflation rate moderated to 3.8% in March and core inflation stood at 3.6%. The central bank has continued to cut the official rate, by 50 bps per meeting, to 9% in March and suggested further cuts in the future. |
|
Brazil |
+3.6% |
Significant economic momentum continued in Q1 2025, with growth exceeding 3.5% driven by private consumption and a very low unemployment rate (below 7%). The annual inflation rate rebounded to 5.5% in March and medium-term expectations remained above target. In Q1 2025, the central bank continued the cycle of interest rate hikes it began in September 2024, with two 100 bp increases to 14.25%, and suggested that there will be more, albeit smaller, increases. |
|
Chile |
+4.0% |
After a strong Q4 2024, the economy slowed in Q1 2025, driven by temporary factors which should dissipate as the year goes on. Inflation remains high (4.9% in March) it is expected to moderate rapidly in the second half of the year and converge to the 3% target in early 2026. The central bank paused the rate-cutting cycle it had been implementing in the past two years and left the official interest rate at 5% in Q1 2025, while setting a cautious tone for the future that suggests rate stability in the coming months. |
|
Argentina |
+2.1% |
The economy consolidated its recovery in Q1 2025 and inflation, although elevated, fell further with monthly rates below 3%. The IMF approved a new USD 20 billion plan with the country in April. The funds will serve to recapitalize the central bank and should help Argentina re-establish access to international capital markets. The central bank lifted the fixed exchange rate regime, allowing it to float freely between 1,000-1,400 ARS/USD. |
1.Year-on-year changes for Q4 2024.
|
|
|
|
|
|
|
|
|
|
|
|
| Highlights of the period: Main figures |
|
|
|
|
|
|
|
|
|
|
|
|
|
|
|
|
|
|
|
|
|
|
|
|
|
Q1'25 ATTRIBUTABLE PROFIT |
|
|
EUR 3,402 mn |
|
|
|
|
|
|
|
|
+4% in euros |
/Q4'24 |
|
|
+4% in constant euros |
|
|
|
|
|
|
|
|
+19% in euros |
/Q1'24 |
|
|
+24% in constant euros |
|
|
|
|
|
|
|
|
|
|
|
|
|
|
|
|
|
|
|
|
RoTE (post-AT1) |
|
|
|
|
|
|
|
|
15.8% |
|
|
+172 bps |
/ Q1 2024 |
|
|
Note: RoTE (pre-AT1): 16.6% (+164 bps / Q1'24). |
|
|
|
|
|
|
|
|
|
|
|
|
|
|
|
|
|
|
|
|
|
|
|
|
|
|
|
|
|
|
|
|
|
|
|
|
|
|
|
|
|
|
|
|
|
|
|
|
|
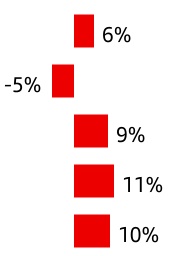
VOLUMES AND INCOME |
|
|
Loan and advances to customers |
Customer funds |
|
|
+1% |
+5% |
|
|
Net interest income |
Net fee income |
|
|
-2% |
+9% |
|
|
Note: YoY changes in constant euros and Argentina in current euros. |
|
|
|
|
|
|
|
|
EFFICIENCY |
|
|
-0.8pp |
|
|
|
|
|
|
|
|
|
|
COST OF RISK |
|
|
-6bps |
|
|
|
|
|
|
|
|
|
|
CET11 |
|
| +0.3pp |
+0.1pp |
|
|
|
uIn Q1 2025, profit attributable to the parent was EUR 3,402 million, a new record for the fourth consecutive quarter, having increased 4% compared to Q4 2024. In constant euros, profit also rose 4%, driven by lower costs. Positive net fee income performance and resilient net interest income in the current interest rate environment, excluding Argentina.
uAttributable profit increased 19% compared to Q1 2024. In constant euros, profit rose 24% boosted by the positive total income performance, with a solid contribution from net fee income, and costs, which grew by less than revenue and declined in real terms.
Additionally, the year-on-year comparison was favoured by the temporary levy on revenue earned in Spain which was recorded in full in Q1 2024 compared to the quarterly accrual of the banking tax expected for 2025. If we accrue the 2024 temporary levy, distributing the charge in line with the treatment of the tax in 2025, profit would increase by 13% year-on-year in constant euros.
uBy business, strong year-on-year profit growth across all global businesses, with most of them rising double digits.
uThese results reflect an excellent start to the year and put us on track to meet our 2025 targets.
uProfitability improved strongly year-on-year. RoTE (post-AT1) stood at 15.8% in Q1 2025, compared to 14.1% in the same period of 2024.
uSustained earnings per share growth, increasing 26% year-on-year to EUR 21.5 cents, boosted by the positive trends in profit and the share buybacks executed in the last 12 months.
uIn terms of business volumes, growth of customer funds continued to outpace loans and advances to customers as we continued to focus on active capital management, disciplined capital allocation and profitable growth.
Gross loans and advances to customers (excluding reverse repos) rose 1% year-on-year in constant euros, supported by increases in all global businesses' portfolios except Retail, where they fell slightly.
Customer funds (customer deposits excluding repos plus mutual funds) increased 5% year-on-year in constant euros, underpinned by double-digit growth in mutual funds and a rise in deposits (supported by increases in most global businesses), mainly due to demand deposits.
uIn the new interest rate environment, total income increased 1% in euros (+5% in constant euros) in line with the target we established for 2025. Of note was the positive net interest income performance, as excluding Argentina (strongly impacted by the sharp fall in interest rates) net interest income increased 4% in constant euros, with most global businesses growing. Higher customer activity and network benefits were reflected in net fee income (+4%, +9% in constant euros), growing in most global businesses except Consumer.
uThe structural changes we have implemented to move towards a simpler and more integrated model through ONE Transformation continued to contribute to better costs, efficiency gains and profitable growth. Costs decreased 1% in current euros, in line with our 2025 year-end target. The efficiency ratio improved 0.8 pp year-on-year to 41.8% driven mainly by Retail and Payments.
uCredit quality remains robust, supported by the positive overall macroeconomic environment and employment across our footprint. The NPL ratio improved 10 bps year-on-year to 2.99%. Total loan-loss reserves reached EUR 22,980 million, resulting in an NPL coverage ratio of 66%.
uThe Group's cost of risk improved 6 bps year-on-year to 1.14%, in line with our target for 2025. In Retail, the cost of risk improved to 0.91%, and in Consumer, the ratio was practically stable at controlled levels (2.14%). Retail and Consumer accounted for more than 80% of the Group's net loan-loss provisions.
uAs at end March 2025, the CET1 ratio stood at 12.9%, having increased 0.1 pp quarter-on-quarter, supported by +33 bps of organic generation, mainly resulting from gross profit generation (+53 bps) which amply offset RWA growth in the quarter, and +12 bps in markets and others. The ratio was impacted by a 27 bp deduction for the accrual of shareholder remuneration against profit earned in Q1 2025, in line with our 50% payout target2, and 8 bps in regulatory charges.
1.Dec-24 ratio on a fully-loaded basis (as published in the Q4 2024 Financial Report), excluding the transitory treatment of IFRS 9 and the CRR2. Mar-25 ratio on phased-in basis, calculated in accordance with the transitory treatment of the CRR.
2.In line with our current ordinary shareholder remuneration policy of approximately 50% of the Group's reported profit (excluding non-cash, non-capital ratios impact items), divided approximately equally between cash dividends and share buybacks. The implementation of the shareholder remuneration policy is subject to future corporate and regulatory decisions and approvals.
|
|
|
|
|
|
|
|
|
|
|
|
|
|
|
|
|
|
|
|
|
|
|
|
|
SHAREHOLDER REMUNERATION |
|
|
EUR million |
|
|
|
|
|
|
|
|
|
|
|
|
|
|
|
|
|
|
|
+19% |
higher than cash dividends against 2023 results |
|
|
|
|
|
|
|
|
|
|
|
|
|
|
TNAVps + CASH DPS |
|
|
|
|
|
|
|
|
n Cash DPS: €10.0 cents |
|
|
+14.5% |
|
|
|
/ Mar-24 |
|
|
|
|
|
|
|
|
|
|
|
|
|
|
|
|
|
|
|
|
|
|
|
|
|
|
|
|
|
|
|
|
|
|
|
|
|
|
|
|
|
|
|
uOn 4 April 2025, the ordinary general shareholders’ meeting approved a final cash dividend charged against 2024 results in the gross amount of EUR 11.00 cents per share entitled to dividends cash that will be paid from 2 May 2025. Including the interim cash dividend paid in November 2024 (EUR 10.00 cents), the total cash dividend per share paid against 2024 results will be EUR 21.00 cents, around 19% more than the dividends paid against 2023 results.
uThese dividends are complemented by two share buyback programmes. The first has already been completed for a total of EUR 1,525 million, and the second started on 6 February 2025 after having been approved by the board of directors and having obtained the required regulatory authorization, for a maximum amount of EUR 1,587 million. Following the completion of this second programme, the Group will have repurchased 14% of its outstanding shares since we began our buybacks in 2021.
uAfter both actions have been carried out, total shareholder remuneration against 2024 results is therefore expected to be around EUR 6.3 billion, 13% higher than the remuneration against 2023 results, distributed approximately equally between cash dividends and share buybacks. On 5 February 2025, we announced that the board of directors intends to return up to EUR 10 billion to our shareholders through share buybacks corresponding to 2025 and 2026 results as well as to distribute excesses of our capital1.
uAs at March 2025, TNAV was EUR 5.46, +4.2% quarter-on-quarter. Including the first dividend charged against 2024 results, TNAV per share + dividend per share increased 14.5% year-on-year.
|
|
|
|
|
|
|
|
|
|
|
|
|
|
|
|
|
|
|
|
|
|
|
|
|
# OF CUSTOMERS (Mar-25) |
|
|
Total customers: |
175 |
mn |
|
|
|
|
|
|
|
Active customers: |
104 |
mn |
|
|
|
|
|
|
|
|
|
|
|
|
|
|
|
|
|
|
|
|
|
|
|
|
|
|
|
|
|
|
|
|
|
|
|
|
|
|
|
|
|
|
|
uOur efforts to simplify and improve our product offering and service quality are reflected in an increase of 9 million customers year-on-year, bringing our total customers to 175 million. We have 104 million active customers, up 4 million year-on-year.
uThe volume of transactions per active customer rose 6% year-on-year in Q1 2025.
uWe continue to focus on delivering great customer experience and improving our service quality, ranking in the top 3 in NPS2 in seven of our markets.
|
|
|
|
|
|
|
|
|
|
|
|
|
|
|
|
|
|
|
|
|
Contribution to Group revenue 3 |
|
|
|
|
|
|
|
|
|
|
|
|
|
|
|
|
|
Retail |
|
50% |
|
|
|
|
|
|
|
|
|
|
|
|
|
|
|
|
|
|
|
|
|
|
|
|
|
|
|
|
|
|
|
|
|
|
|
|
|
|
|
Consumer |
|
21% |
|
|
|
|
|
|
|
|
|
|
|
|
|
|
|
|
|
|
|
|
|
|
|
|
|
|
|
|
|
|
|
|
|
|
|
|
|
|
|
CIB |
|
14% |
|
|
|
|
|
|
|
|
|
|
|
|
|
|
|
|
|
|
|
|
|
|
|
|
|
|
|
|
|
|
|
|
|
|
|
|
|
|
|
Wealth |
|
6% |
|
|
|
|
|
|
|
|
|
|
|
|
|
|
|
|
|
|
|
|
|
|
|
|
|
|
|
|
|
|
|
|
|
|
|
|
|
|
|
Payments |
|
9% |
|
|
|
|
|
|
|
|
|
|
|
|
|
|
|
Q1 2025 data. Year-on-year changes in constant euros
uIn Retail, double-digit attributable profit growth to EUR 1,902 million, driven by a 2% rise in total income, boosted by the positive trends in net fee income and by the structural cost improvements (-1%) stemming from our transformation efforts, with controlled provisions (+2%).
uThe efficiency improved 1.3 pp to 39.4% and cost of risk also improved to 0.91%. RoTE (post-AT1) increased to 17.6%.
uIn Consumer, attributable profit grew to EUR 492 million, with a good performance in total income (+2%), supported by net interest income and by lower provisions (-1%) due to DCB US.
uThe efficiency ratio stood at 41.9%, cost of risk was stable at controlled levels (2.14%) and RoTE (post-AT1) was 9.7%.
uIn CIB, attributable profit reached a new quarterly record of EUR 806 million, with double-digit growth driven by total income, supported by net fee income, especially in Global Transaction Banking.
uThe efficiency ratio stood at 42.9%. RoTE (post-AT1) improved 3.1 pp to 21.6%.
uIn Wealth, attributable profit amounted to EUR 471 million, also rising double-digits, driven by net fee income (greater activity) and higher revenue from our joint ventures in Insurance, more than offsetting the impact of interest rates on net interest income and higher costs, reflecting our investments in key initiatives such as reinforcing Private Banking teams.
uThe efficiency ratio improved 1.4 pp to 36.5% and RoTE (post-AT1) was 68.0%.
uIn Payments, attributable profit reached EUR 126 million, boosted by double-digit growth in net interest income and fees, with costs flat, partially offset by higher provisions in Cards in Brazil and Mexico, in part due to portfolio growth.
uCost of risk was 7.52%. In PagoNxt, EBITDA margin reached 28.6% (+11.6 pp year-on-year).
1.This share buyback target includes i) buybacks that are part of the existing shareholder remuneration policy, and ii) additional buybacks following the publication of annual results to distribute year-end excesses of CET1 capital.
2.Net Promoter Score, internal benchmark of individual customers' satisfaction audited by Stiga/Deloitte in H2 2024.
3.As % of total operating areas, excluding the Corporate Centre.
|
|
|
|
|
|
|
|
|
|
|
|
|
|
|
|
|
|
|
|
|
|
|
|
|
|
|
|
|
|
|
|
|
|
|
|
|
|
|
|
|
|
|
|
|
|
|
|
|
|
|
Statutory income statement |
|
|
|
|
|
|
|
|
Grupo Santander results
|
|
|
|
|
|
|
|
|
|
|
|
|
|
|
|
|
|
|
|
|
| Grupo Santander. Summarized income statement |
| EUR million |
|
|
|
|
|
|
|
|
|
|
|
Change |
|
|
Change |
|
Q1'25 |
Q4'24 |
% |
|
|
Q1'24 |
% |
|
| Net interest income |
11,378 |
|
11,986 |
|
(5.1) |
|
|
|
11,983 |
|
(5.0) |
|
|
Net fee income1 |
3,369 |
|
3,344 |
|
0.7 |
|
|
|
3,240 |
|
4.0 |
|
|
Gains or losses on financial assets and liabilities and exchange differences2 |
678 |
|
780 |
|
(13.1) |
|
|
|
623 |
|
8.8 |
|
|
| Dividend income |
88 |
|
130 |
|
(32.3) |
|
|
|
93 |
|
(5.4) |
|
|
| Share of results of entities accounted for using the equity method |
168 |
|
214 |
|
(21.5) |
|
|
|
123 |
|
36.6 |
|
|
Other operating income/expenses (net)3 |
(144) |
|
(428) |
|
(66.4) |
|
|
|
(1,017) |
|
(85.8) |
|
|
| Total income |
15,537 |
|
16,026 |
|
(3.1) |
|
|
|
15,045 |
|
3.3 |
|
|
| Operating expenses |
(6,489) |
|
(6,772) |
|
(4.2) |
|
|
|
(6,547) |
|
(0.9) |
|
|
| Administrative expenses |
(5,635) |
|
(5,948) |
|
(5.3) |
|
|
|
(5,719) |
|
(1.5) |
|
|
| Staff costs |
(3,532) |
|
(3,770) |
|
(6.3) |
|
|
|
(3,594) |
|
(1.7) |
|
|
| Other general administrative expenses |
(2,103) |
|
(2,178) |
|
(3.4) |
|
|
|
(2,125) |
|
(1.0) |
|
|
| Depreciation and amortization |
(854) |
|
(824) |
|
3.6 |
|
|
|
(828) |
|
3.1 |
|
|
| Provisions or reversal of provisions |
(621) |
|
(1,362) |
|
(54.4) |
|
|
|
(633) |
|
(1.9) |
|
|
| Impairment or reversal of impairment of financial assets not measured at fair value through profit or loss (net) |
(3,156) |
|
(3,120) |
|
1.2 |
|
|
|
(3,134) |
|
0.7 |
|
|
|
|
|
|
|
|
|
|
|
| Impairment on other assets (net) |
(102) |
|
(192) |
|
(46.9) |
|
|
|
(129) |
|
(20.9) |
|
|
| Gains or losses on non-financial assets and investments, net |
2 |
|
(4) |
|
— |
|
|
|
2 |
|
— |
|
|
| Negative goodwill recognized in results |
23 |
|
— |
|
— |
|
|
|
— |
|
— |
|
|
| Gains or losses on non-current assets held for sale not classified as discontinued operations |
(7) |
|
24 |
|
— |
|
|
|
(21) |
|
(66.7) |
|
|
| Profit or loss before tax from continuing operations |
5,187 |
|
4,600 |
|
12.8 |
|
|
|
4,583 |
|
13.2 |
|
|
| Tax expense or income from continuing operations |
(1,446) |
|
(1,037) |
|
39.4 |
|
|
|
(1,468) |
|
(1.5) |
|
|
| Profit from the period from continuing operations |
3,741 |
|
3,563 |
|
5.0 |
|
|
|
3,115 |
|
20.1 |
|
|
| Profit or loss after tax from discontinued operations |
— |
|
— |
|
— |
|
|
|
— |
|
— |
|
|
| Profit for the period |
3,741 |
|
3,563 |
|
5.0 |
|
|
|
3,115 |
|
20.1 |
|
|
| Profit attributable to non-controlling interests |
(339) |
|
(298) |
|
13.8 |
|
|
|
(263) |
|
28.9 |
|
|
| Profit attributable to the parent |
3,402 |
|
3,265 |
|
4.2 |
|
|
|
2,852 |
|
19.3 |
|
|
|
|
|
|
|
|
|
|
|
| EPS (euros) |
0.21 |
|
0.20 |
|
5.8 |
|
|
|
0.17 |
|
26.1 |
|
|
| Diluted EPS (euros) |
0.21 |
|
0.20 |
|
5.8 |
|
|
|
0.17 |
|
26.0 |
|
|
|
|
|
|
|
|
|
|
|
| Memorandum items: |
|
|
|
|
|
|
|
|
| Average total assets |
1,855,729 |
|
1,834,476 |
|
1.2 |
|
|
|
1,804,334 |
|
2.8 |
|
|
| Average stockholders' equity |
101,501 |
|
97,952 |
|
3.6 |
|
|
|
96,308 |
|
5.4 |
|
|
|
|
|
|
|
|
| Note: the summarized income statement groups some lines of the consolidated statutory income statement on page 88 as follows: |
1.‘Commission income’ and ‘Commission expense’. |
2.‘Gain or losses on financial assets and liabilities not measured at fair value through profit or loss, net’; ‘Gain or losses on financial assets and liabilities held for trading, net’; ‘Gains or losses on non-trading financial assets and liabilities mandatorily at fair value through profit or loss’; ‘Gain or losses on financial assets and liabilities measured at fair value through profit or loss, net’; ‘Gain or losses from hedge accounting, net’; and ‘Exchange differences, net’. |
3.‘Other operating income’; ‘Other operating expenses’; ’Income from insurance and reinsurance contracts’; and ‘Expenses from insurance and reinsurance contracts’. |
|
|
|
|
|
|
|
|
|
|
|
|
|
|
|
|
|
|
|
|
|
|
|
|
|
|
|
|
|
|
|
|
|
|
|
|
|
|
|
|
|
|
|
|
|
|
|
|
|
|
|
Statutory income statement |
|
|
|
|
|
|
|
|
|
|
|
|
|
|
|
|
|
|
|
|
|
STATUTORY INCOME STATEMENT |
|
|
|
|
|
Results performance compared to Q1 2024
In Q1 2025, profit attributable to the parent totalled EUR 3,402 million, reaching a new quarterly record for the fourth quarter in a row, supported by the good performance of our global businesses.
Compared to the EUR 2,852 million recorded in Q1 2024, profit attributable to the parent in Q1 2025 was 19% higher year-on-year.
This year-on-year comparison is favoured by the temporary levy on revenue earned in Spain (EUR 335 million) which was recorded in full in Q1 2024. This compares to EUR 87 million in Q1 2025, corresponding to the quarterly accrual of the tax on revenue expected in Spain for the year.
If we accrue the 2024 temporary levy, distributing the charge equally between the four quarters of the year in line with the treatment of the tax in 2025, profit would increase 10% year-on-year. This growth was supported by the good performance in total income, mainly in net fee income, and lower operating expenses, reflecting our progress in transformation, with a slight increase in provisions in line with credit portfolio growth.
Total income
Total income amounted to EUR 15,537 million, up 3% year-on-year.
•Net interest income (NII) totalled EUR 11,378 million, 5% lower than Q1 2024, mainly due to the impact from the sharp fall in interest rates in Argentina (which are at the lowest levels since 2018) on all businesses, especially Retail and CIB.
Excluding Argentina, net interest income was flat as the good performance in Consumer, due to good margin management and higher volumes, and in CIB and Payments, due to increased activity, offset the slight fall in Retail, as well as declines in Wealth and the Corporate Centre, impacted by the new interest rate environment.
|
|
|
|
|
|
| Net interest income |
| EUR million |
•Net fee income amounted to EUR 3,369 million, up 4% compared to Q1 2024, due to the good performance in all businesses. Of particular note were the increases in CIB, supported by Global Transaction Banking and Global Banking, boosted by our US Banking Build-Out (US BBO) initiative, in Wealth, due to the good performances in Private Banking and Santander Asset Management, and in Payments, boosted by higher activity. On the other hand, net fee income in Consumer fell slightly, as DCB Europe was impacted by new insurance regulation in Germany.
|
|
|
|
|
|
| Net fee income |
| EUR million |

•Gains or losses on financial assets and liabilities and exchange differences reached EUR 678 million (EUR 623 million in Q1 2024) due to the higher results in Retail and the Corporate Centre due to a lower impact from currency hedges.
•Dividend income was EUR 88 million (EUR 93 million in Q1 2024).
•Income from companies accounted for by the equity method reached EUR 168 million, compared to EUR 123 million in Q1 2024.
•Other operating income recorded a loss of EUR 144 million, compared to a EUR 1,017 million loss in Q1 2024, which was strongly affected by the larger hyperinflation adjustment in Argentina and the temporary levy on revenue earned in Spain, which was recorded in full in Q1 2024 (EUR 335 million).
In summary, a resilient performance in total income, which exceeded EUR 15 billion for the fifth consecutive quarter, reflecting our diversification and global scale, despite the impact of the new interest rate environment on net interest income.
|
|
|
|
|
|
|
|
|
|
|
|
|
|
|
|
|
|
|
|
|
|
|
|
|
|
|
|
|
|
|
|
|
|
|
|
|
|
|
|
|
|
|
|
|
|
|
|
|
|
|
Statutory income statement |
|
|
|
|
|
|
|
|
Operating expenses
Operating expenses in Q1 2025 amounted to EUR 6,489 million, 1% lower year-on-year, reflecting our progress in transformation.
Our cost management continued to focus on structurally improving our efficiency and, as a result, we remain as one of the most efficient banks in the world.
We continued to drive our business transformation plan, ONE Transformation, across our footprint, reflected in greater operational leverage and better commercial dynamics.
|
|
|
|
|
|
| Operating expenses |
| EUR million |
Provisions or reversal of provisions
Provisions (net of provisions reversals) amounted to EUR 621 million. In Q1 2024, this line totalled EUR 633 million.
Impairment or reversal of impairment of financial assets not measured at fair value through profit or loss (net)
Impairment or reversal of impairment on financial assets not measured at fair value through profit or loss (net) was EUR 3,156 million, relatively stable year-on-year (EUR 3,134 million in Q1 2024).
Credit quality indicators remained robust, supported by our risk management and the resilience of the labour markets across our footprint.
Impairment on other assets (net)
The impairment on other assets (net) was EUR 102 million. In Q1 2024, the impairment on other assets totalled EUR 129 million.
Gains or losses on non-financial assets and investments (net)
Net gains on non-financial assets and investments were EUR 2 million in Q1 2025. In Q1 2024, net gains were also EUR 2 million.
Negative goodwill recognized in results
In Q1 2025, negative goodwill recognized in results was EUR 23 million relating to the acquisition of CrediScotia Financiera from Scotiabank to expand Consumer's presence in Peru. There was no negative goodwill recorded in Q1 2024.
Gains or losses on non-current assets held for sale not classified as discontinued operations
This item, which mainly includes impairment of foreclosed assets recorded and the sale of properties acquired upon foreclosure, recorded a EUR 7 million loss in Q1 2025 (EUR 21 million loss in Q1 2024).
Profit before tax
Profit before tax was EUR 5,187 million in Q1 2025, up 13% year-on-year, supported by the solid performance in net fee income, our cost discipline and the impact of recording the temporary levy on revenue earned in Spain in full in Q1 2024 (EUR 335 million) in the other operating income line.
Income tax
Total income tax amounted to EUR 1,446 million which includes EUR 87 million corresponding to the quarterly accrual of the tax on revenue expected in Spain for the year. In Q1 2024, income tax was EUR 1,468 million.
Profit attributable to non-controlling interests
Profit attributable to non-controlling interests amounted to EUR 339 million (EUR 263 million in Q1 2024).
Profit attributable to the parent
Profit attributable to the parent rose to a new record at EUR 3,402 million in Q1 2025, compared to EUR 2,852 million in the same period in 2024, 19% higher year-on-year.
These results do not fully reflect the underlying business performance due to the different accounting of the aforementioned temporary levy in 2024 and tax in 2025.
|
|
|
|
|
|
|
|
|
|
|
|
|
|
|
|
|
|
|
|
|
|
|
|
|
|
|
|
|
|
|
|
|
|
|
|
|
|
|
|
|
|
|
|
|
|
|
|
|
|
|
Underlying income statement |
|
|
|
|
|
|
|
|
|
|
|
|
|
|
|
|
|
|
|
|
|
|
|
|
|
|
|
|
|
|
|
|
|
|
|
|
|
|
|
UNDERLYING INCOME STATEMENT |
|
|
|
|
|
|
|
|
|
|
|
|
|
→ Fourth consecutive quarter of record profit boosted by solid performance in our global businesses.
→ Efficiency improvement and profitable growth, supported by the operational leverage resulting from ONE Transformation.
→ Risk indicators were robust, supported by good risk management and low unemployment.
|
|
|
|
|
|
|
|
|
|
|
|
|
|
Attributable profit |
|
RoTE (post-AT1) |
RoRWA |
|
|
|
EUR 3,402 million |
+19% in euros |
|
15.8% |
2.34% |
|
|
|
+24% in constant euros |
|
+1.7 pp |
+0.4 pp |
|
|
|
|
|
|
|
|
|
|
|
|
|
Note: changes vs. Q1 2024. |
|
|
|
|
|
|
|
|
|
|
|
|
|
|
|
Results performance compared to Q1 2024
The Group presents, both at the total Group level and for each of the business units, the changes in euros registered in the income statement, as well as variations excluding the exchange rate effect (i.e. in constant euros, except for Argentina and any grouping which includes it), understanding that the latter provide a better analysis of the Group’s management. For further information, see the
'Alternative performance measures' section in the appendix to this report.
At the Group level, exchange rates had a negative impact of 3.8 pp on total income and a positive impact of 2.9 pp on administrative expenses and amortizations, mainly due to the depreciation of the Brazilian real and the Mexican peso.
To better understand the business trends, we reclassified certain items under some headings of the underlying income statement. These items explain the differences between the statutory and underlying income statements. There was only one reclassification in Q1 2024:
•The impact of the temporary levy on revenue earned in Spain totalling EUR 335 million in Q1 2024, which was reclassified from total income to other gains (losses) and provisions.
As profit was not affected by results that fell outside the ordinary course of our business, no amount was recorded in the net capital gains and provisions line in Q1 2025 or in Q1 2024 and so both profit attributable to the parent and underlying profit attributable to the parent were the same; EUR 3,402 million in Q1 2025 and EUR 2,852 million in Q1 2024. This represents a 19% year-on-year increase,+24% in constant euros.
This year-on-year comparison is favoured by the temporary levy on revenue earned in Spain (EUR 335 million) which was recorded in full in Q1 2024. This compares to EUR 87 million in Q1 2025, corresponding to the quarterly accrual of the tax on revenue expected in Spain for the year. If we accrue the 2024 temporary levy, distributing the charge equally between the four quarters of the year in line with the treatment of the tax in 2025, profit increases 10% year-on-year (+13% in constant euros). This growth was supported by the good performance in net fee income, and our effort to reduce administrative expenses and amortizations, with net loan-loss provisions and cost of risk at controlled levels.
|
|
|
|
|
|
|
|
|
|
|
|
|
|
|
|
|
|
|
|
|
|
|
|
|
| Summarized underlying income statement |
| EUR million |
|
|
|
|
|
|
|
|
|
|
|
Change |
|
|
Change |
|
Q1'25 |
Q4'24 |
% |
% excl. FX |
|
Q1'24 |
% |
% excl. FX |
| Net interest income |
11,378 |
|
11,986 |
|
(5.1) |
(5.6) |
|
11,983 |
|
(5.0) |
(1.7) |
| Net fee income |
3,369 |
|
3,344 |
|
0.7 |
0.3 |
|
3,240 |
|
4.0 |
8.7 |
Gains (losses) on financial transactions 1 |
678 |
|
780 |
|
(13.1) |
(12.3) |
|
623 |
|
8.8 |
10.8 |
| Other operating income |
112 |
|
(84) |
|
— |
— |
|
(466) |
|
— |
— |
| Total income |
15,537 |
|
16,026 |
|
(3.1) |
(3.5) |
|
15,380 |
|
1.0 |
4.8 |
| Administrative expenses and amortizations |
(6,489) |
|
(6,772) |
|
(4.2) |
(4.5) |
|
(6,547) |
|
(0.9) |
2.0 |
| Net operating income |
9,048 |
|
9,254 |
|
(2.2) |
(2.8) |
|
8,833 |
|
2.4 |
6.9 |
| Net loan-loss provisions |
(3,161) |
|
(3,114) |
|
1.5 |
0.6 |
|
(3,125) |
|
1.2 |
7.2 |
| Other gains (losses) and provisions |
(700) |
|
(1,540) |
|
(54.5) |
(55.0) |
|
(1,125) |
|
(37.8) |
(36.5) |
| Profit before tax |
5,187 |
|
4,600 |
|
12.8 |
12.4 |
|
4,583 |
|
13.2 |
17.5 |
| Tax on profit |
(1,446) |
|
(1,037) |
|
39.4 |
38.0 |
|
(1,468) |
|
(1.5) |
2.7 |
| Profit from continuing operations |
3,741 |
|
3,563 |
|
5.0 |
4.9 |
|
3,115 |
|
20.1 |
24.5 |
| Net profit from discontinued operations |
— |
|
— |
|
— |
|
— |
|
|
— |
|
— |
|
— |
|
| Consolidated profit |
3,741 |
|
3,563 |
|
5.0 |
4.9 |
|
3,115 |
|
20.1 |
24.5 |
| Non-controlling interests |
(339) |
|
(298) |
|
13.8 |
12.4 |
|
(263) |
|
28.9 |
30.6 |
| Net capital gains and provisions |
— |
|
— |
|
— |
— |
|
— |
|
— |
— |
| Profit attributable to the parent |
3,402 |
|
3,265 |
|
4.2 |
4.2 |
|
2,852 |
|
19.3 |
23.9 |
Underlying profit attributable to the parent 2 |
3,402 |
|
3,265 |
|
4.2 |
4.2 |
|
2,852 |
|
19.3 |
23.9 |
|
|
|
|
|
|
|
|
|
1. Includes exchange differences.
2. Excludes net capital gains and provisions.
|
|
|
|
|
|
|
|
|
|
|
|
|
|
|
|
|
|
|
|
|
|
|
|
|
|
|
|
|
|
|
|
|
|
|
|
|
|
|
|
|
|
|
|
|
|
|
|
|
|
|
Underlying income statement |
|
|
|
|
|
|
|
|
Total income amounted to EUR 15,537 million, up slightly compared to Q1 2024 (+1% year-on-year). In constant euros, total income rose 5% year-on-year, as follows:
•Net interest income (NII) performed well, considering the current interest rate environment, but fell 2% year-on-year mainly due to the strong impact of the interest rate decline in Argentina. Excluding Argentina, NII rose 4%.
By business:
•In Retail (-2%), NII performance reflected the impact of Argentina, where interest rates reached their lowest levels since 2018. Excluding it, NII rose 4%, due to good performances in Chile, the UK, Mexico and Poland.
•In Consumer, NII rose 2% supported by our good margin management and also by volumes growth in DCB Europe.
•In CIB, NII decreased 5%, mainly due to the impact from Argentina. Excluding it, NII grew 12% driven by the strong increase in Global Markets.
•In Wealth, NII declined 16%, especially in Private Banking, impacted by the less favourable interest rate environment, despite higher volumes.
•In Payments, NII rose 15%, with growth in both Cards, mainly in Mexico and Brazil due to volumes increase, and PagoNxt, due to higher activity.
|
|
|
|
|
|
| Net interest income |
| EUR million |
|
constant euros |
•Net fee income grew 9% year-on-year driven by widespread growth across all businesses except Consumer. By business:
•In Retail, net fee income increased 7%, supported by insurance, mutual funds and transactional fees.
•In Consumer, net fee income fell 3%, despite strong growth in the US (auto fees), mainly due to DCB Europe, which was impacted by new insurance regulation in Germany.
•In CIB, it increased 11%, driven by the three business lines, especially due to Global Transaction Banking (GTB) and Global Banking, backed by our US Banking Build-Out (US BBO) initiative.
•In Wealth, net fee income rose 16%, with strong growth in Private Banking and Asset Management due to good commercial activity.
•In Payments, net fee income rose 13% boosted by both PagoNxt (Ebury and Getnet) and Cards (driven by interchange fees in Latin America).
This positive net fee income performance keeps us on track to achieve our mid-high single digit growth target for 2025.
|
|
|
|
|
|
| Net fee income |
| EUR million |
|
constant euros |

•Gains on financial transactions rose 11%, boosted by higher results in Retail, mainly due to Brazil and Spain, and the Corporate Centre, due to a lower impact from foreign currency hedges. This good performance more than offset lower results in CIB, despite higher activity in Global Markets, as this activity was concentrated in more NII and fee based products.
•Other operating income in Q1 2025 registered a positive result compared to a negative result in Q1 2024, driven by a less negative impact from the hyperinflation adjustment in Argentina.
This positive revenue performance keeps us on track to achieve our 2025 target of reaching a revenue level of EUR 62 billion in the year, similar to the revenue recorded in 2024.
|
|
|
|
|
|
| Total income |
| EUR million |
|
constant euros |
Administrative expenses and amortizations in Q1 2025 totalled EUR 6,489 million, down 1% year-on-year, reflecting our transformation progress and in line with our 2025 target to reduce costs in euro terms. In real terms (excluding the impact of average inflation, and in constant euros), they were also 1% lower year-on-year.
Our cost management continued to focus on structurally improving our efficiency. As a result, we remain one of the most efficient banks in the world with an efficiency ratio of 41.8%, having improved 80 bps year-on-year.
We continued to progress with our business transformation plan, ONE Transformation, reflected in greater operational leverage and better business dynamics. We continued to create simpler and leaner structures. As part of our simplification, in Q1 2025 we announced the
|
|
|
|
|
|
|
|
|
|
|
|
|
|
|
|
|
|
|
|
|
|
|
|
|
|
|
|
|
|
|
|
|
|
|
|
|
|
|
|
|
|
|
|
|
|
|
|
|
|
|
Underlying income statement |
|
|
|
|
|
|
|
|
dissolution of the regional structures, having fulfilled their mission to support the transition to the global operating model.
By business and in constant euros:
•In Retail, costs were down 1%, -4% in real terms (i.e. excluding inflation), reflecting our transformation efforts through the simplification and the implementation of our global platform. The efficiency ratio improved 1.3 pp year-on-year to 39.4%.
•In Consumer, costs rose 3% year-on-year. In real terms, they were flat as our transformation savings offset our investments in leasing and check-out lending platforms and in Openbank. The efficiency ratio stood at 41.9% (+0.8 pp year-on-year).
•In CIB, costs increased 9%, +6% in real terms, due to our investments in our transformation initiatives. The efficiency ratio was 42.9%, maintaining a leading position among peers.
•In Wealth, costs rose 10%. In real terms, they increased 7%, reflecting our investments to reinforce Private Banking teams and new capabilities to address the increase in commercial activity. The efficiency ratio improved 1.4 pp year-on-year to 36.5%.
•In Payments, costs were stable, declining 3% in real terms, supported by our efforts to control costs, with good performances in both PagoNxt and Cards. The efficiency ratio stood at 43.9%, an improvement of 4.5 pp year-on-year.
|
|
|
|
|
|
| Operating expenses |
| EUR million |
|
constant euros |
Net operating income in Q1 2025 grew 2% year-on-year (+7% in constant euros), reaching EUR 9,048 million.
|
|
|
|
|
|
| Net operating income |
| EUR million |
|
constant euros |

Net loan-loss provisions in Q1 2025 amounted to EUR 3,161 million, up 1% year-on-year. In constant euros, they increased 7% due to higher provisions in Payments (impacted by strong credit portfolio growth in Cards, macro outlook and regulatory changes in models in Brazil and model updates in Mexico due to the macro environment) and higher provisions in the Corporate Centre to accelerate NPL ratio reductions, improving the Group's credit quality.
The cost of risk stood at 1.14%, in line with the Group’s 2025 target.
|
|
|
|
|
|
| Net loan-loss provisions |
| EUR million |
|
constant euros |

Other gains (losses) and provisions had a loss of EUR 700 million, versus a EUR 1,125 million loss in Q1 2024. This reduction was mainly explained by the temporary levy on revenue earned in Spain (EUR 335 million) which was recorded in full in Q1 2024 but also due to the good performance in most global businesses.
Total income tax amounted EUR 1,446 million, 1% lower than in Q1 2024 (+3% in constant euros). Included in Q1 2025 is the EUR 87 million charge corresponding to the quarterly accrual of the tax on revenue expected in Spain for the year.
Profit attributable to the parent in Q1 2025 was EUR 3,402 million, 19% more than in Q1 2024 (+24% in constant euros).
|
|
|
|
|
|
| Profit attributable to the parent |
| EUR million |
|
constant euros |
RoTE (post-AT1) in Q1 2025 stood at 15.8% (14.1% in Q1 2024), on track to achieve our 2025 target of 16.5%. RoRWA was 2.34% (1.96% in Q1 2024) and earnings per share stood at EUR 0.21 (EUR 0.17 in Q1 2024).
|
|
|
|
|
|
|
|
|
|
|
|
|
|
|
|
|
|
|
|
|
|
|
|
|
|
|
|
|
|
|
|
|
|
|
|
|
|
|
|
|
|
|
|
|
|
|
|
|
|
|
Underlying income statement |
|
|
|
|
|
|
|
|
Underlying results performance compared to the previous quarter
Underlying profit attributable to the parent and profit attributable to the parent were both the same in Q1 2025, at EUR 3,402 million, and in Q4 2024, at EUR 3,265 million, as profit in neither period was affected by results outside the ordinary course of our business.
Compared to Q4 2024, profit in Q1 2025 increased 4%, driven by good performances in operating expenses and provisions.
The quarter-on-quarter comparison was greatly affected by the impact of the exchange rate on Argentina's results in Q4 2024. For further information, see the
'Alternative performance measures' section in the appendix to this report. Additionally, profit in Q4 2024 was impacted by the provision for potential complaints related to motor finance dealer commissions in the UK.
In constant euros, profit increased 4%, by line:
•Total income remained above EUR 15 billion. However, it decreased 4%, heavily affected by the impact of the exchange rate on Argentina's results in Q4 2024. By line:
•Net interest income decreased 6%, strongly affected by the exchange rate effect on Argentina's results in Q4 2024. Excluding Argentina, NII was stable, as increases in CIB (+8%) and Payments (+6%) from higher activity, offset a worse performance in Retail (-1%), mainly in Brazil due to the negative sensitivity of its balance sheet to interest rate hikes.
•Net fee income was stable quarter-on-quarter. Excluding Argentina, it increased 4%, driven by growth in most countries in Retail and the good performance in CIB and Wealth, which offset the decline in Consumer (new insurance regulation in Germany) and Payments, affected by the seasonality of the last quarter in the year in both PagoNxt and Cards.
•Gains on financial transactions fell 12%, mainly affected by worse performance in the Corporate Centre related to FX hedges, partially offset by higher results in CIB, driven by Global Markets.
•Operating expenses in Q1 2025 declined 5% quarter-on-quarter (-2% excluding Argentina), underpinned by the good performance in all global businesses except Consumer, where costs were strongly affected by the new Openbank launches, and Payments, due to PagoNxt's platform investments.
•Net loan-loss provisions were fairly stable, supported by the significant improvement in DCB US, due to a good underlying performance and some seasonality in Q4, offsetting higher provisions mainly in the Corporate Centre to accelerate NPL ratio reductions, improving the Group's credit quality.
•Other gains (losses) and provisions recorded a EUR 700 million loss in Q1 2025, compared to a EUR 1,540 million loss in Q4 2024, which was impacted by the aforementioned provision for potential complaints related to motor finance dealer commissions in the UK.
Grupo Santander balance sheet
|
|
|
|
|
|
|
|
|
|
|
|
|
|
|
|
|
|
| Grupo Santander. Condensed balance sheet |
| EUR million |
|
|
|
|
|
|
|
|
Change |
|
| Assets |
Mar-25 |
Mar-24 |
Absolute |
% |
Dec-24 |
| Cash, cash balances at central banks and other demand deposits |
166,948 |
|
174,161 |
|
(7,213) |
|
(4.1) |
|
192,208 |
|
| Financial assets held for trading |
243,348 |
|
209,589 |
|
33,759 |
|
16.1 |
|
230,253 |
|
| Debt securities |
91,215 |
|
71,983 |
|
19,232 |
|
26.7 |
|
82,646 |
|
| Equity instruments |
16,739 |
|
19,805 |
|
(3,066) |
|
(15.5) |
|
16,636 |
|
| Loans and advances to customers |
28,979 |
|
18,722 |
|
10,257 |
|
54.8 |
|
26,591 |
|
| Loans and advances to central banks and credit institutions |
50,440 |
|
39,146 |
|
11,294 |
|
28.9 |
|
40,280 |
|
| Derivatives |
55,975 |
|
59,933 |
|
(3,958) |
|
(6.6) |
|
64,100 |
|
Financial assets designated at fair value through profit or loss1 |
13,647 |
|
14,919 |
|
(1,272) |
|
(8.5) |
|
14,045 |
|
| Loans and advances to customers |
5,513 |
|
6,474 |
|
(961) |
|
(14.8) |
|
5,652 |
|
| Loans and advances to central banks and credit institutions |
407 |
|
455 |
|
(48) |
|
(10.5) |
|
408 |
|
| Other (debt securities an equity instruments) |
7,727 |
|
7,990 |
|
(263) |
|
(3.3) |
|
7,985 |
|
| Financial assets at fair value through other comprehensive income |
94,873 |
|
84,183 |
|
10,690 |
|
12.7 |
|
89,898 |
|
| Debt securities |
81,279 |
|
73,638 |
|
7,641 |
|
10.4 |
|
76,558 |
|
| Equity instruments |
2,401 |
|
1,916 |
|
485 |
|
25.3 |
|
2,193 |
|
| Loans and advances to customers |
10,848 |
|
8,282 |
|
2,566 |
|
31.0 |
|
10,784 |
|
| Loans and advances to central banks and credit institutions |
345 |
|
347 |
|
(2) |
|
(0.6) |
|
363 |
|
| Financial assets measured at amortized cost |
1,221,296 |
|
1,207,699 |
|
13,597 |
|
1.1 |
|
1,203,707 |
|
| Debt securities |
127,891 |
|
112,589 |
|
15,302 |
|
13.6 |
|
120,949 |
|
| Loans and advances to customers |
1,019,076 |
|
1,016,055 |
|
3,021 |
|
0.3 |
|
1,011,042 |
|
| Loans and advances to central banks and credit institutions |
74,329 |
|
79,055 |
|
(4,726) |
|
(6.0) |
|
71,716 |
|
| Investments in subsidiaries, joint ventures and associates |
7,460 |
|
7,685 |
|
(225) |
|
(2.9) |
|
7,277 |
|
| Tangible assets |
30,822 |
|
34,229 |
|
(3,407) |
|
(10.0) |
|
32,087 |
|
| Intangible assets |
19,150 |
|
19,910 |
|
(760) |
|
(3.8) |
|
19,259 |
|
| Goodwill |
13,510 |
|
14,028 |
|
(518) |
|
(3.7) |
|
13,438 |
|
| Other intangible assets |
5,640 |
|
5,882 |
|
(242) |
|
(4.1) |
|
5,821 |
|
Other assets2 |
47,633 |
|
47,631 |
|
2 |
|
— |
|
48,347 |
|
| Total assets |
1,845,177 |
|
1,800,006 |
|
45,171 |
|
2.5 |
|
1,837,081 |
|
|
|
|
|
|
|
| Liabilities and shareholders' equity |
|
|
|
|
|
| Financial liabilities held for trading |
164,971 |
|
130,466 |
|
34,505 |
|
26.4 |
|
152,151 |
|
| Customer deposits |
45,422 |
|
24,338 |
|
21,084 |
|
86.6 |
|
18,984 |
|
| Debt securities issued |
— |
|
— |
|
— |
|
— |
|
— |
|
| Deposits by central banks and credit institutions |
29,756 |
|
21,095 |
|
8,661 |
|
41.1 |
|
39,584 |
|
| Derivatives |
50,197 |
|
54,454 |
|
(4,257) |
|
(7.8) |
|
57,753 |
|
| Other |
39,596 |
|
30,579 |
|
9,017 |
|
29.5 |
|
35,830 |
|
| Financial liabilities designated at fair value through profit or loss |
35,920 |
|
38,583 |
|
(2,663) |
|
(6.9) |
|
36,360 |
|
| Customer deposits |
24,711 |
|
29,532 |
|
(4,821) |
|
(16.3) |
|
25,407 |
|
| Debt securities issued |
8,661 |
|
5,933 |
|
2,728 |
|
46.0 |
|
7,554 |
|
| Deposits by central banks and credit institutions |
2,548 |
|
3,100 |
|
(552) |
|
(17.8) |
|
3,399 |
|
| Other |
— |
|
18 |
|
(18) |
|
(100.0) |
|
— |
|
| Financial liabilities measured at amortized cost |
1,477,629 |
|
1,465,644 |
|
11,985 |
|
0.8 |
|
1,484,322 |
|
| Customer deposits |
1,011,761 |
|
990,583 |
|
21,178 |
|
2.1 |
|
1,011,545 |
|
| Debt securities issued |
309,555 |
|
310,627 |
|
(1,072) |
|
(0.3) |
|
317,967 |
|
| Deposits by central banks and credit institutions |
111,734 |
|
121,424 |
|
(9,690) |
|
(8.0) |
|
114,894 |
|
| Other |
44,579 |
|
43,010 |
|
1,569 |
|
3.6 |
|
39,916 |
|
| Liabilities under insurance contracts |
17,777 |
|
17,738 |
|
39 |
|
0.2 |
|
17,829 |
|
| Provisions |
8,353 |
|
8,387 |
|
(34) |
|
(0.4) |
|
8,407 |
|
Other liabilities3 |
30,013 |
|
34,163 |
|
(4,150) |
|
(12.1) |
|
30,685 |
|
| Total liabilities |
1,734,663 |
|
1,694,981 |
|
39,682 |
|
2.3 |
1,729,754 |
|
| Shareholders' equity |
137,564 |
|
130,876 |
|
6,688 |
|
5.1 |
|
135,196 |
|
| Capital stock |
7,576 |
|
7,913 |
|
(337) |
|
(4.3) |
|
7,576 |
|
Reserves (including treasury stock)4 |
128,118 |
|
120,111 |
|
8,007 |
|
6.7 |
|
116,578 |
|
| Profit attributable to the Group |
3,402 |
|
2,852 |
|
550 |
|
19.3 |
|
12,574 |
|
| Less: dividends |
(1,532) |
|
— |
|
(1,532) |
|
— |
|
(1,532) |
|
| Other comprehensive income |
(36,179) |
|
(34,620) |
|
(1,559) |
|
4.5 |
|
(36,595) |
|
| Minority interests |
9,129 |
|
8,769 |
|
360 |
|
4.1 |
|
8,726 |
|
| Total equity |
110,514 |
|
105,025 |
|
5,489 |
|
5.2 |
|
107,327 |
|
| Total liabilities and equity |
1,845,177 |
|
1,800,006 |
|
45,171 |
|
2.5 |
|
1,837,081 |
|
|
|
|
| Note: The condensed balance sheet groups some lines of the consolidated balance sheet on pages 86 and 87 as follows: |
1.'Non-trading financial assets mandatorily at fair value through profit or loss' and 'Financial assets designated at fair value through profit or loss'. |
2.‘Hedging derivatives’; ‘Changes in the fair value of hedged items in portfolio hedges of interest risk’; 'Assets under reinsurance contracts'; ‘Tax assets’; ‘Other assets’; and 'Non-current assets held for sale’. |
3.‘Hedging derivatives’; ‘Changes in the fair value of hedged items in portfolio hedges of interest rate risk’; ‘Tax liabilities’; ‘Other liabilities’; and ‘Liabilities associated with non-current assets held for sale‘. |
4.‘Share premium’; ‘Equity instruments issued other than capital’; ‘Other equity’; ‘Accumulated retained earnings’; ‘Revaluation reserves’; ‘Other reserves’; and ‘Own shares (-)’. |
|
|
|
|
|
|
|
|
|
|
|
|
|
|
|
|
|
|
|
|
|
|
|
|
|
|
|
|
|
|
|
|
|
|
|
|
|
|
|
|
|
|
|
|
|
|
Gross loans and advances to customers (excl. reverse repos) |
|
Customer funds (deposits excl. repos + mutual funds) |
|
|
Loans rose 1% both year-on-year and quarter-on-quarter. |
|
Customer funds continued to increase, with growth both year-on-year and quarter-on-quarter. |
|
|
EUR 1,019 billion |
+1% QoQ |
|
EUR 1,219 billion |
+1% QoQ |
|
|
+1% YoY |
|
+5% YoY |
|
|
|
|
|
|
|
|
|
|
|
By business: |
|
By product: |
|
|
Solid growth year-on-year across our global businesses except Retail, still affected by prepayments and due to our focus on profitable growth and capital optimization. |
|
Strong year-on-year increase in mutual funds, with widespread growth across businesses and countries, and higher deposits (both demand and time deposits). |
|
|
Retail |
Consumer |
CIB |
|
Demand |
Time |
Mutual funds |
|
|
-1% |
+4% |
+4% |
|
+3% |
+2% |
+17% |
|
|
|
|
|
|
|
|
|
|
|
Note: changes in constant euros. |
|
|
|
|
|
|
|
|
|
|
|
|
|
|
|
Loans and advances to customers
Loans and advances to customers stood at EUR 1,064,416 million as at end March 2025, a 1% increase both year-on-year and quarter-on-quarter.
For the purpose of analysing traditional banking loans, the Group uses gross loans and advances to customers excluding reverse repos, which as at end March 2025 totalled EUR 1,019,077 million. Additionally, the comments below do not include the exchange rate impact (i.e. in constant euros) except for Argentina and any grouping which includes it. For further information, see the
'Alternative performance measures' section in the appendix of this report.
Compared to December 2024, gross loans and advances to customers excluding reverse repos rose 1% in constant euros, with the following detail:
•In Retail, they were flat, as growth in most countries offset the decline in personal loans in Brazil and corporates in the US, in line with our strategy of profitable growth and capital optimization.
•In Consumer, they were also fairly stable, as greater volumes in Latin America offset the decline in DCB Europe.
•In CIB, loans rose 4%, due to the increase in the US, in line with our strategy to develop new products and capabilities (US BBO) and, to a lesser extent, in Spain.
•In Wealth, they increased 2% and +1% in Payments.
|
|
|
|
|
|
| Gross loans and advances to customers (excl. reverse repos) |
| EUR billion |

1. In constant euros: +1%.
Compared to March 2024, gross loans and advances to customers (excluding reverse repos and in constant euros) grew 1% in constant euros, as follows:
•In Retail, they declined 1%, as the positive performances across products in most countries did not fully offset: i) lower mortgage and SME portfolios in the UK (in line with our strategy) and Spain (still affected by early repayments); and ii) lower personal loans in Brazil and the decline in commercial loans in the US (both in line with our strategy to focus on profitable growth and capital optimization).
•In Consumer, they rose 4% boosted by the good performance in auto in Europe and double-digit loan growth across our Latin American countries.
•In CIB, they grew 4% driven by strong growth in the US, supported by our US BBO initiative, and solid growth in Spain.
•They increased 9% in Wealth, with widespread growth across most countries and were up 15% in Payments, driven by strong growth in Cards in all countries in Latin America and Europe, especially in Brazil and Mexico.
At the end of the quarter, gross loans and advances to customers excluding reverse repos maintained a diversified mix across our footprint, with presence in different countries in Europe (69% of Group's total loans), Latin America (20%) and in the US (11%).
|
|
|
| Gross loans and advances to customers (excl. reverse repos) |
| % operating areas. March 2025 |
Customer funds
Customer deposits amounted to EUR 1,081,894 million as at end March 2025, up 2% quarter-on-quarter and +4% year-on-year.
The Group uses customer funds (customer deposits excluding repos, plus mutual funds) for the purpose of analysing traditional retail banking funds, which amounted to EUR 1,219,260 million as at end March 2025. The comments below do not include the exchange rate impact (i.e. in constant euros), except for Argentina and any grouping which includes it. For further information, see the
'Alternative performance measures' section in the appendix to this report.
Compared to December 2024, customer funds grew 1% in constant euros, with the following detail:
•By product, customer deposits excluding repos were fairly flat, with time deposits rising slightly (+1%) and demand deposits were stable. Positive momentum continued in mutual funds (+4%).
•By business, customer funds grew 4% in Consumer, Wealth and Payments. They were flat in CIB and fell slightly in Retail (-1%).
Compared to March 2024, customer funds were 5% higher in constant euros, with the following detail:
•By product, deposits excluding repos rose 3%, with growth in both demand deposits (+3%) and time deposits (+2%). Mutual funds increased 17%, with widespread good performances.
•By business, there were generalized increases across most businesses. They rose 4% in Retail, boosted by time deposits and mutual funds and grew strongly in Consumer (+12%), in line with our deposit gathering strategy. They remained flat in CIB, as growth in demand deposits and mutual funds offset a decline in time deposits. In Wealth, they were up 12% due to mutual funds (+16%).
As at end March 2025, customer funds maintained a diversified mix across our footprint, with presence in different countries in Europe (69% of Group's total customer funds), Latin America (22%) and the US (9%). The weight of demand deposits as a percentage of total customer funds was 55%, while time deposits accounted for 25% of the total and mutual funds for 20%.
In addition to capturing customer deposits, the Group, for strategic reasons, maintains a selective policy of issuing securities in the international fixed income markets and strives to adapt the frequency and volume of its market operations to the structural liquidity needs of each unit, as well as to the receptiveness of each market.
|
|
|
|
|
|
| Customer funds |
| EUR billion |

|
|
|
|
|
|
|
|
|
|
|
|
| +3 ¹ |
|
|
|
|
|
| +12% |
|
|
|
|
|
| +1% |
|
|
|
|
|
|
|
|
•Total |
•Mutual funds |
•Deposits exc. repos |
|
|
|
| Mar-25 / Mar-24 |
|
|
|
1. In constant euros: +5%.
In Q1 2025, Group's issuances were as follows:
•Medium- and long-term senior debt totalling EUR 8,744 million and covered bonds placed in the market for EUR 2,878 million.
•TLAC eligible instruments issued amounted to EUR 5,688 million, of which EUR 5,330 million was senior non-preferred and EUR 358 million was subordinated debt.
•Maturities of medium- and long-term debt totalled EUR 14,823 million.
The net loan-to-deposit ratio was 98% (100% in March 2024), and the ratio of deposits plus medium- and long-term funding to the Group’s loans was 128%, showing a comfortable funding structure. The Group liquidity coverage ratio (LCR) was an estimated 157% in March 2025 (see the '
Risk management' chapter of this report).
The Group's access to wholesale funding markets, as well as the cost of issuances depends, in part, on the ratings granted by the rating agencies.
|
|
|
|
|
|
|
|
|
|
|
|
| Rating agencies |
|
Long term |
Short term |
Outlook |
| Fitch Ratings |
A (Senior A+) |
F1 (Senior F1) |
Stable |
| Moody's |
A2 |
P-1 |
Positive |
| S&P Global Ratings |
A+ |
A-1 |
Stable |
| DBRS |
A (High) |
R-1 (Middle) |
Stable |
Moody's confirmed its A2 long-term and P-1 short-term ratings in October 2024 and maintained the positive outlook they had previously improved in April 2024, following the same movement in the rating of the Kingdom of Spain, and maintaining it two notches above the sovereign.
In September 2024, S&P Global confirmed Santander's credit rating at A+ for long-term and A1 for short-term debt. In April 2024, S&P rated our AT1 instruments as BBB- (investment grade). They maintained Santander's outlook as stable, in line with the sovereign.
Fitch upgraded Santander's long-term senior rating to A+ in February 2025.
Fitch and DBRS maintained their stable outlooks, above the sovereign.
Sometimes the methodology applied by the rating agencies limits a bank's rating to the sovereign rating of the country where it is headquartered. Banco Santander, S.A. is still rated above the sovereign debt rating of the Kingdom of Spain by Moody’s, DBRS and S&P and rated at the same level by Fitch, which demonstrates our financial strength and the benefits from our diversification.
|
|
|
| Customer funds |
| % operating areas. March 2025 |

Solvency ratios
|
|
|
|
|
|
|
|
|
|
|
|
|
|
|
|
|
|
|
|
|
|
|
|
|
|
|
|
|
|
|
|
|
|
|
|
|
|
|
|
|
|
|
|
|
|
Phased-in capital ratio |
|
CET1 ratio |
|
|
The phased-in CET1 ratio stood at 12.9% at the end of March, at the top end of the Group's operating range of 12-13%. |
|
We continued to generate capital organically in the quarter, backed by profit growth. |
|
|
 c |
|
Organic generation |
+33 bps |
|
|
|
Accrual for shareholder remuneration1 |
-27 bps |
|
|
|
|
|
|
|
|
|
|
|
|
|
|
|
TNAV per share |
|
|
|
TNAV per share was EUR 5.46, increasing 14.5% year-on-year including the cash dividend paid in November 2024. |
|
|
Note: Phased-in ratios are calculated in accordance with the transitory treatment of the CRR. |
|
|
|
|
|
|
|
|
|
|
|
As at end March 2025, the total phased-in capital ratio (applying the CRR transitional arrangements) stood at 17.2% and the phased-in CET1 ratio at 12.9%, on track to meet the 13% target for 2025 that we announced in Q4 2024.
We comfortably meet the levels required by the ECB on a consolidated basis (estimated 13.9% for the total capital ratio and 9.6% for the CET1 ratio). This resulted in a distance to the maximum distributable amount (MDA) of 295 bps and a CET1 management buffer of 321 bps.
In the quarter, the CET1 ratio increased by 10 bps. We generated 33 bps organically in the period, the net result of 53 bps of gross profit generation and the impact from RWA growth.
We also recorded a 27 bp deduction for the accrual of shareholder remuneration profit earned in Q1 2025, in line with our 50% payout target1, and 8 bps of regulatory charges, mostly relating to capital model changes.
Additionally, there were positive impacts in Markets & others, mainly relating to HTC&S portfolio valuations and tax credits.
Although the CRR3 fully-loaded criteria are not yet fully defined, our current estimate for the fully-loaded CET1 ratio is comfortably above our >12% Investor Day target for 2025 year end.
TNAV per share ended the quarter at EUR 5.46. Including the interim cash dividend charged against 2024 results paid in November 2024 (EUR 10.00 cents per share), TNAV plus cash dividend per share increased 14.5% in the last twelve months (+4.2% in the quarter).
The EUR 11.00 cent per share dividend approved in the Annual General Meeting on 4 April 2025 will be paid from 2 May 2025 and recorded in Q2 2025 results.
Lastly, the leverage ratio was 4.84%.
|
|
|
|
|
|
|
| Eligible capital. March 2025 |
| EUR million |
|
|
|
|
Phased-in |
| CET1 |
|
82,163 |
|
| Basic capital |
|
92,170 |
|
| Eligible capital |
|
110,201 |
|
| Risk-weighted assets |
|
639,124 |
|
|
|
|
|
|
% |
| CET1 capital ratio |
|
12.9 |
|
| Tier 1 capital ratio |
|
14.4 |
|
| Total capital ratio |
|
17.2 |
|

Note: Phased-in ratios are calculated in accordance with the transitory treatment of the CRR.
1.Our current ordinary shareholder remuneration policy is to distribute approximately 50% of Group reported profit (excluding non-cash, non-capital ratios impact items), divided approximately equally between cash dividends and share buybacks. The implementation of the shareholder remuneration policy is subject to future corporate and regulatory decisions and approvals.
2.Dec-24 data on a fully-loaded basis (as published in the Q4 2024 Financial Report), excluding the transitory treatment of IFRS 9 and the CRR.
Risk management
|
|
|
|
|
|
|
|
|
|
|
|
|
|
|
|
|
|
|
|
|
|
|
|
|
|
|
|
|
|
|
|
|
|
|
|
|
|
|
|
|
|
|
|
|
|
Credit risk |
|
Market risk |
|
|
Credit quality indicators remained contained, within expected levels. |
|
VaR remained at moderate levels in an environment of increased volatility. |
|
|
Cost of risk |
NPL ratio |
NPL coverage ratio |
|
Average VaR |
|
|
1.14% |
2.99% |
66% |
|
Q1'25 |
EUR 21 million |
+EUR 2.6 mn vs. Q4'24 |
|
|
-1 bp vs. Dec-24 |
-5 bps vs. Dec-24 |
+1 pp vs. Dec-24 |
|
|
|
|
|
|
|
|
|
|
|
|
Structural and liquidity risk |
|
Operational risk |
|
|
Robust and diversified liquidity buffer, with ratios well above regulatory requirements. |
|
In Q1 2025, our operational risk profile remained stable, focusing on risks associated with suppliers, technology and cyber risk. We registered a decrease in operational losses compared to the previous quarter. |
|
|
Liquidity Coverage Ratio (LCR) |
|
|
|
157%1 |
-11 pp vs. Dec-24 |
|
|
|
|
|
|
|
|
|
|
|
|
|
|
|
|
|
|
|
Credit risk2
The environment in the first three months of the year was characterized by the growing uncertainty caused by certain geopolitical tensions, with two main focus points: tariff policies in the US and spending on infrastructure and defense in Europe.
Regarding the credit market, successive interest rate cuts in mature markets have marked the end of active deleveraging in these regions, starting a new credit cycle with positive growth. The reduction in early repayments could support an increase in mortgage portfolio balances, while consumer credit, which is less sensitive to interest rate changes, is expected to show positive trends. Companies, which are in an expansive credit phase, could be affected by tariff policies.
Our global and diversified business model, with our strong local presence, provides us with a resilient structure which, together with our conservative risk management, enables us to maintain a medium-low risk profile, even in a more complex macroeconomic and geopolitical environment.
In terms of credit quality, in the first quarter:
•The NPL ratio improved 5 bps quarter-on-quarter to 2.99%. Credit impaired loans decreased 1% to EUR 34,992 million as the
improvements in Retail and CIB were partially offset by a deterioration in Payments, affected by higher interest rates and inflation in Brazil, negatively impacting delinquency indicators. Gross credit risk with customers (total risk), reached EUR 1,168 billion, driven by growth in all global businesses, but especially of note was CIB.
Year-on-year, the NPL ratio improved 10 bps, driven by lower credit impaired loan volumes, mainly in Retail and CIB, as well as by higher gross credit risk with customers (total risk), which increased 2% compared to Q1 2024.
•Net loan-loss provisions totalled EUR 3,161 million in Q1 2025, growing 7% year-on-year in constant euros, mainly due to the increase in Payments and the Corporate Centre.
Quarter-on-quarter, provisions were relatively stable in constant euros, supported by DCB US, driven by the good underlying performance and some seasonality in Q4 (tax season).
•Cost of risk stood at 1.14%, 1 bp lower than December 2024, driven by lower provisions in Consumer and CIB.
|
|
|
|
|
|
|
|
|
|
|
|
|
|
|
|
|
|
|
|
|
|
|
|
|
|
|
|
|
|
|
|
|
|
|
|
|
|
|
|
|
|
|
|
|
|
|
|
|
|
|
Key risk metrics |
|
|
|
|
|
|
|
|
|
|
|
|
|
|
|
|
|
|
|
|
|
|
|
|
|
|
|
|
|
|
|
|
|
|
|
|
|
|
Net loan-loss provisions 3 |
|
Cost of risk (%) 4 |
|
NPL ratio (%) |
|
NPL coverage ratio (%) |
|
|
Q1'25 |
|
Chg (%)
/ Q1'24 |
Chg (%)
/ Q4'24 |
|
Mar-25 |
Chg (bps)
/ Mar-24 |
Chg (bps)
/ Dec-24 |
|
Mar-25 |
Chg (bps)
/ Mar-24 |
Chg (bps)
/ Dec-24 |
|
Mar-25 |
Chg (pp)
/ Mar-24 |
Chg (pp)
/ Dec-24 |
|
Retail |
1,431 |
|
1.9 |
2.0 |
|
0.91 |
(12) |
(1) |
|
3.12 |
(9) |
(6) |
|
59.0 |
(1.7) |
0.6 |
|
Consumer |
1,119 |
|
(0.9) |
(11.3) |
|
2.14 |
1 |
(3) |
|
5.09 |
23 |
1 |
|
75.0 |
(1.1) |
1.4 |
|
CIB |
13 |
|
(67.0) |
(26.9) |
|
0.08 |
(6) |
(2) |
|
0.75 |
(44) |
(8) |
|
39.3 |
(3.8) |
0.3 |
|
Wealth |
8 |
|
97.3 |
(58.4) |
|
0.20 |
26 |
1 |
|
0.98 |
5 |
4 |
|
66.4 |
10.2 |
(4.7) |
|
Payments |
492 |
|
32.9 |
10.1 |
|
7.52 |
64 |
16 |
|
5.88 |
89 |
68 |
|
126.0 |
(13.8) |
(11.5) |
|
|
|
|
|
|
|
|
|
|
|
|
|
|
|
|
|
|
|
|
|
|
|
|
|
|
|
|
|
|
|
|
|
|
|
|
|
|
|
|
|
|
|
|
|
|
|
|
|
|
|
|
|
|
|
TOTAL GROUP |
3,161 |
|
7.2 |
0.6 |
|
1.14 |
(6) |
(1) |
|
2.99 |
(10) |
(5) |
|
65.7 |
(0.4) |
0.9 |
|
|
|
|
|
|
|
|
|
|
|
|
|
|
|
|
|
|
|
|
|
|
|
|
|
|
|
|
|
|
|
|
|
|
|
|
|
|
|
|
|
|
|
|
|
|
|
|
|
|
|
|
|
|
|
|
|
|
|
|
|
|
|
|
|
|
|
|
|
|
|
|
|
|
|
|
|
|
|
|
|
|
|
|
|
|
|
|
|
|
|
|
|
|
|
|
|
|
|
|
|
|
|
|
|
|
|
|
|
|
|
|
|
|
|
|
|
|
|
|
|
|
|
|
|
|
|
|
|
|
|
|
|
|
|
|
|
|
|
|
|
|
|
|
|
|
|
|
|
|
|
|
|
|
|
|
|
|
|
|
|
|
|
|
|
|
|
|
|
|
|
|
|
|
|
|
|
|
|
|
|
|
|
|
|
|
|
|
|
|
|
|
|
|
|
|
|
|
|
|
|
|
|
|
|
|
|
|
|
|
|
|
|
|
|
|
|
|
|
|
|
|
|
|
|
|
|
|
|
|
|
|
|
|
|
|
|
|
|
|
|
|
|
|
|
|
|
|
|
|
|
|
|
|
|
|
|
|
|
|
|
|
|
|
|
|
|
|
|
|
|
|
|
|
|
|
|
|
|
|
|
|
|
|
|
|
|
|
|
|
|
|
|
|
|
|
|
|
|
|
|
|
|
|
|
|
|
|
|
|
|
|
|
|
|
|
|
|
|
|
|
|
|
|
1.Group LCR. See the 'Structural and liquidity risk' section of this chapter. Provisional data.
2.Changes in constant euros, unless otherwise indicated.
3.EUR million and % change in constant euros.
4.Provisions to cover losses due to impairment of loans in the last 12 months / average customer loans and advances of the last 12 months.
•The NPL coverage ratio increased slightly compared to December 2024, reaching 66%, with loan-loss allowances of EUR 22,980 million. The coverage ratio remained at comfortable levels considering that 68% of the Group’s portfolio is backed by quality collateral.
Regarding the IFRS 9 stages, the distribution of the portfolio was stable in the quarter in percentage terms.
|
|
|
|
|
|
|
|
|
|
|
|
|
|
|
|
|
|
|
|
|
|
|
|
| NPL coverage ratio by stage |
|
| EUR billion |
|
Exposure1 |
|
NPL coverage |
|
Mar-25 |
Dec-24 |
Mar-24 |
|
Mar-25 |
Dec-24 |
Mar-24 |
| Stage 1 |
1,012 |
1,002 |
1,007 |
|
0.4 |
% |
0.4 |
% |
0.4 |
% |
| Stage 2 |
87 |
88 |
83 |
|
5.6 |
% |
5.6 |
% |
6.3 |
% |
| Stage 3 |
35 |
35 |
36 |
|
41.3 |
% |
40.6 |
% |
40.5 |
% |
1. Exposure subject to impairment. Additionally, in March 2025 there were EUR 34 billion in loans and advances to customers not subject to impairment recorded at mark to market with changes through P&L (EUR 32 billion in December 2024 and EUR 25 billion in March 2024).
Stage 1: financial instruments for which no significant increase in credit risk has been identified since its initial recognition.
Stage 2: if there has been a significant increase in credit risk since the date of initial recognition but the impairment event has not materialized, the financial instrument is classified in Stage 2.
Stage 3: a financial instrument is catalogued in this stage when it shows effective signs of impairment as a result of one or more events that have already occurred resulting in a loss.
|
|
|
|
|
|
|
|
|
|
|
|
| Credit impaired loans and loan-loss allowances |
| EUR million |
|
|
|
|
Change (%) |
|
Q1'25 |
QoQ |
YoY |
| Balance at beginning of period |
35,265 |
|
(1.3) |
|
(1.0) |
|
| Net additions |
3,119 |
|
10.6 |
|
(1.5) |
|
| Increase in scope of consolidation |
— |
|
— |
|
— |
|
| Exchange rate differences and other |
(95) |
|
— |
|
— |
|
| Write-offs |
(3,297) |
|
(2.8) |
|
3.2 |
|
| Balance at period-end |
34,992 |
|
(0.8) |
|
(1.8) |
|
|
|
|
|
| Loan-loss allowances |
22,980 |
|
0.6 |
|
(2.4) |
|
| For impaired assets |
14,445 |
|
1.0 |
|
— |
|
| For other assets |
8,535 |
|
— |
|
(6.2) |
|
Our Retail, Consumer, CIB and Payments businesses account for more than 95% of the Group's total credit portfolio. Our Wealth business focuses mainly on asset management, investment funds and insurance and has little credit risk exposure. Therefore, the following explanations are focused on the most relevant businesses from a credit risk management point of view:
|
|
|
|
|
|
|
|
|
|
|
|
|
|
Retail & Commercial Banking |
Credit risk exposure |
|
55% of total Group |
Retail's portfolio mainly comprises high quality mortgage loans, where 90% of loans have an LTV lower than 80%, and a corporate portfolio in which more than 50% has property collateral or other collateral.
The NPL ratio improved 6 bps in the quarter to 3.12%, driven by lower credit impaired loans in all European units, in Spain's case, favoured by the write-offs and portfolio sales within the NPL ratio reduction plan.
The cost of risk decreased 12 bps compared to March 2024, reaching 0.91%, mainly supported by the good performance in provisions in European portfolios, particularly mortgages in the UK and Spain, favoured by lower inflationary pressures and lower interest rates, and the personal loan portfolio in Mexico, supported by more selective admission policies. Compared to the previous quarter, it improved 1 bp due to lower provisions in Portugal, Poland and Argentina, offsetting Brazil and Mexico.
The NPL coverage ratio rose slightly in the quarter to 59%. Given the Retail portfolio includes the mortgage portfolios in Spain and the UK, which have high-quality collateral, we consider that coverage is at appropriate levels for the risk of the portfolio.
|
|
|
|
|
|
|
|
|
|
|
|
|
|
Digital Consumer Bank |
Credit risk exposure |
|
18% of total Group |
The Consumer portfolio mainly comprises auto loans and leasing business, which together account for more than 80% of the portfolio.
The NPL ratio stood at 5.09%, 1 bp more than in December 2024, explained by a slight decrease in gross credit risk with customers (total risk). Credit impaired loans were stable, supported by the good performance in the US (tax season).
The cost of risk at 2.14% was practically flat (+1 bp) compared to March 2024, as the good performance in DCB US, which offset the normalization of provisions in Europe, the increased coverage of our CHF mortgage portfolio, lower portfolio sales, and regulatory charges in DCB Europe. Compared to December 2024, cost of risk improved 3 bps, driven by lower LLPs in DCB US due to the good underlying performance and some seasonality in Q4 of net loan-loss provisions.
The NPL coverage ratio was stable in the quarter at 75%, a level we are comfortable with considering more than 80% of the portfolio is auto loans.
|
|
|
|
|
|
|
|
|
|
|
|
|
|
Corporate & Investment Banking |
Credit risk exposure |
|
21% of total Group |
CIB's business consists of wholesale customers, more than 85% of whom have a rating above investment grade. It is a business with a strong advisory component and high value-added solutions and is less intensive in terms of balance sheet activity.
The NPL ratio improved 8 bps in the quarter to 0.75%, due to a generalized decline in credit impaired loans in all units, but especially in the European countries and the US. Moreover, gross credit risk with customers (total risk) increased significantly, mainly due to the US, Spain and Argentina. This positive performance was supported by the good results obtained by large corporates at the end of the year and by the pick-up in credit demand in Argentina.
The cost of risk improved 6 bps compared to March 2024, to 0.08%, and 2 bps since December 2024, due to the almost inexistent provisions in Q1 2025.
The NPL coverage ratio decreased 4 pp quarter-on-quarter to 39%.
|
|
|
|
|
|
|
|
|
|
|
|
|
|
Payments |
Credit risk exposure |
|
2% of total Group |
The Payments portfolio encompasses both the exposure associated with payments and transfer processing activities (PagoNxt) as well as the Cards businesses, which are characterized by rapid turnover and returns in line with their level of risk.
The NPL ratio stood at 5.88%, 68 bps above December 2024, driven by the increase in credit impaired loans, especially in Brazil, due to higher interest rates and inflation in the country. Gross credit risk with customers (total risk) increased slightly in the quarter.
The cost of risk rose 64 bps year-on-year to 7.52% due to the increase in provisions (mainly concentrated in Cards). The increase is primarily due to portfolio growth and regulatory model changes and macroeconomic outlook in Brazil, and, to a lesser extent, to the update of models in Mexico in response to a change in macroeconomic environment. In the quarter, CoR registered a 16 bp increase.
The NPL coverage ratio fell 11 pp in the quarter to 126%.
Market risk
Markets were mainly influenced by the potential negative impact on global economic growth as a consequence of the new trade policies in the US, as well as by geopolitical tensions stemming from the ongoing war in Ukraine and the conflict in the Middle East.
The trading activity of CIB is focused on meeting the needs of our clients. Its risk is measured in terms of daily VaR at 99% and originates from possible movements in interest rates.
In the first quarter of the year, the average VaR was EUR 21 million (slightly increasing compared to the previous quarter in interest rate and exchange rate risk), remaining stable during the quarter despite the uncertainty of the current environment, which was reflected in spikes in market volatility.
By market risk factor, VaR continued to be primarily driven by interest rate risk. The VaR figures remain low compared to the size of the balance sheet and the Group's activity.
|
|
|
|
|
|
|
|
|
|
|
|
|
|
|
Trading portfolios1. VaR by region |
| EUR million |
|
|
|
|
|
2025 |
|
2024 |
| Q1 |
Average |
Last |
|
Average |
|
|
|
|
|
| Total |
21.0 |
|
18.3 |
|
|
17.3 |
|
| Europe |
17.2 |
|
17.7 |
|
|
12.7 |
|
| North America |
7.0 |
|
6.2 |
|
|
6.6 |
|
| South America |
9.4 |
|
14.7 |
|
|
9.3 |
|
1. Activity in Santander Corporate & Investment Banking markets.
|
|
|
|
|
|
|
|
|
|
|
|
|
|
|
Trading portfolios1. VaR by market factor |
| EUR million |
|
|
|
|
| Q1 2025 |
Min. |
Avg. |
Max. |
Last |
| VaR total |
16.3 |
|
21.0 |
|
27.7 |
|
18.3 |
|
| Diversification effect |
(16.3) |
|
(23.3) |
|
(55.7) |
|
(28.9) |
|
| Interest rate VaR |
16.1 |
|
18.9 |
|
22.6 |
|
18.4 |
|
| Equity VaR |
5.1 |
|
7.4 |
|
10.8 |
|
7.6 |
|
| FX VaR |
5.7 |
|
9.4 |
|
37.5 |
|
12.9 |
|
| Credit spreads VaR |
3.2 |
|
4.4 |
|
6.3 |
|
4.5 |
|
| Commodities VaR |
2.5 |
|
4.2 |
|
6.2 |
|
3.8 |
|
1.Activity in Santander Corporate & Investment Banking markets.
Note: in the North America, South America and Asia portfolios, VaR corresponding to the credit spreads factor other than sovereign risk is not relevant and is included in the interest rate factor.
|
|
|
|
Trading portfolios1. VaR performance
|
| EUR million |
1. Activity in Santander Corporate & Investment Banking markets.
Structural and liquidity risk
Structural exchange rate risk
Grupo Santander's structural exchange rate risk mainly arises from foreign currency transactions related to permanent financial investments, their results and associated hedges.
During Q1 2025, the performance against the euro of the main currencies in which the Group operates was mixed. Of note were the Brazilian real, which appreciated 4% supported by the official interest rate hikes by the central bank (+200 bps), and the 4% depreciation of the US dollar, due to the potential negative impact on its economy from tariff policies.
Our dynamic management of this risk aims to limit the impact on the CET1 capital ratio from exchange rate movements. In the quarter, the coverage of the different currencies impacting this ratio remained close to 100%.
Regarding financial results, the exchange rate hedging strategy is tactical and dynamic, depending on our expectations of the evolution of the different currencies in the various countries where the Group operates.
Structural interest rate risk
Interest rate risk management aims to mitigate potential negative impacts on Santander, both in terms of net interest income and economic value of its equity, due to adverse fluctuations in interest rate curves in the various currencies in which the Group operates.
The Group measures interest rate risk through statistical models based on structural risk mitigation strategies using interest rate instruments, such as fixed-income bond portfolios and derivative instruments, to keep the risk profile within the risk appetite.
In the quarter, market interest rates recorded high levels of volatility mainly due to the potential increase in inflation levels globally, as a consequence of the new tariff policies in the US and their corresponding impacts on central bank monetary policies.
Despite this volatile environment, our structural debt portfolios continued to perform positively, and structural interest rate risk remained at comfortable levels during the period.
At an aggregate level, Santander maintains positive net interest income sensitivity to interest rate hikes and negative sensitivity in the same scenario for the economic value of its equity.
Liquidity risk
Liquidity risk is the risk of not having the necessary liquid financial resources available to meet our obligations as they come due. Losses can be caused by forced asset sales or margin impacts due to the mismatch between expected cash inflows and outflows.
Our strong liquidity position is based on a decentralized model, where each subsidiary is managed autonomously.
In Q1 2025, the Group maintained a comfortable position, with ratios well above regulatory limits, supported by a robust and diversified liquidity buffer.
The Group liquidity coverage ratio (LCR1) ended the quarter at 157%, 11 pp lower than the previous quarter.
Operational risk
Our operational risk profile was stable in Q1 2025 compared to the previous quarter, with a focus on risks associated with suppliers, technology and cyber risk, especially considering the potential impact of geopolitical risks on these areas. Regarding operational risk losses, there was a decrease quarter-on-quarter. Legal processes continue to be the main cause of these losses, which are concentrated in the Group's Retail business.
The Group constantly monitors the evolution of operational risks in general and, particularly, those arising from transformation plans, external fraud and the most significant legal processes.
1. The Consolidated LCR ratio as at end March 2025 was 145%, comfortably exceeding internal and regulatory requirements. For more information on the calculation of both the Group LCR and the Consolidated LCR, see the “Liquidity and funding management” section of the “Economic and financial review” chapter in the Annual Report 2024 published on 28 February 2025.
Santander Share
Dividends and shareholder remuneration
In application of the shareholder remuneration policy for 2024, on 4 February 2025, the board resolved to execute the Second 2024 Buyback Programme against 2024 results worth a maximum amount of EUR 1,587 million, for which the appropriate regulatory authorization has been obtained, and the execution of which began on 6 February 2025 and is currently ongoing. As of the date of this report, 81% of the second programme has been executed. Once completed, the Group will have repurchased 14% of its outstanding shares as of November 2021.
On 4 April 2025, the AGM approved a final cash dividend in the gross amount of EUR 11.00 cents per share entitled to dividends that will be paid from 2 May 2025. Including the interim cash dividend paid in November 2024 (EUR 10.00 cents), the total cash dividend per share paid against 2024 results will be EUR 21.00 cents, around 19% more than the dividends paid against 2023 results.
Once both actions have been carried out, total shareholder remuneration against 2024 results is therefore expected to be EUR 6.3 billion (approximately 50% of the Group reported profit -excluding non-cash, non-capital ratios impact items- in 2024), distributed approximately 50% in cash dividends and 50% in share buybacks.
As announced on 5 February 2025, the board intends to allocate up to EUR 10 billion to shareholder remuneration in the form of share buybacks, corresponding to 2025 and 2026 results, as well as to the expected excess capital. This share buyback target includes: i) buybacks that are part of the existing shareholder remuneration policy outlined below, and ii) additional buybacks following the publication of annual results to distribute year-end excesses of CET1 capital.
The ordinary remuneration policy for 2025 results which the board intends to apply will remain the same as for the 2024 results, consisting of a total shareholder remuneration of approximately 50% of the Group's reported profit (excluding non-cash and non-capital ratios impact items), distributed in approximately equal parts between cash dividends and share buybacks. The execution of the shareholder remuneration policy and share buybacks to distribute the excess CET1 capital is subject to future corporate and regulatory approvals.
Share price performance
Santander's shares are listed on five markets: on four exchanges in Spain (Madrid, Barcelona, Bilbao and Valencia), in the US (as an ADR), in the UK (as a CDI), in Mexico (Sistema Internacional de Cotizaciones) and in Poland.
During Q1 2025, markets showed volatility, driven by geopolitical tensions and growing uncertainty regarding US trade policy, particularly in the implementation of tariffs in various regions.
On the monetary side, major central banks took different paths: the ECB and the Bank of England cut interest rates during the quarter (50 bps and 25 bps, respectively), while the Federal Reserve held rates. In Latin America, Brazil's central bank raised rates by 200 bps during the period (100 bps at each of its meetings), while the Mexico's central bank made two rate cuts of 50 bps each.
In this environment, equity markets performed well, showing widespread growth. Santander's share ended March 2025 with a positive return of 38.8%, above both the sector and the European market.
In the banking sector, the Eurostoxx Banks, the eurozone's main index, increased 27.5%, while the DJ Stoxx Banks rose 21.5% and the MSCI World Banks increased 6.6%. The other main indices also closed up in the quarter, but rose by slightly less (Ibex 35 +13.3% and DJ Stoxx 50 +5.5%).
|
|
|
|
|
|
|
|
|
|
|
|
|
|
|
| Share price |
|
|
|
|
|
|
START 31/12/2024 |
|
END 31/03/2025 |
| €4.465 |
|
€6.196 |
|
|
|
|
|
|
|
|
Maximum 26/03/2025 |
|
Minimum 02/01/2025 |
| €6.661 |
|
€4.255 |
|
|
|
| Comparative share performance |
|

Market capitalization and trading
As at 31 March 2025, Santander’s market capitalization of EUR 93,885 million was the largest in the eurozone and the 21st largest in the world among financial institutions.
The share’s weighting in the Stoxx Europe 600 Banks index was 7.2% and 11.9% in the Euro Stoxx Banks. In the domestic market, its weight in the Ibex 35 was 11.4% as at end March 2025.
A total of 2,261 million shares were traded in the period for an effective value of EUR 12,846 million and an annualized liquidity ratio of 60%.
The average daily trading volume was 35.9 million shares with an effective value of EUR 204 million.
Shareholder base
The total number of Santander shareholders at the end of March 2025 was 3,435,876, of which 3,050,665 were European (71.57% of the capital stock) and 372,809 from the Americas (26.96% of the capital stock).
Excluding the board, which holds 1.29% of the bank’s capital stock, retail shareholders accounted for 36.77% and institutional shareholders accounted for 61.94%.
|
|
|
|
|
|
|
|
|
| Share capital distribution by geographic area |
| 31 March 2025 |
| The Americas |
Europe |
Other |
|
|
|
| 26.96% |
71.57% |
1.47% |
|
Source: Banco Santander, S.A. Shareholder Register.
|
|
|
|
|
|
|
|
|
|
|
|
|
1st |
Bank in the eurozone by market capitalization |
| EUR |
93,885 |
million |
|
|
|
|
|
|
|
|
|
| The Santander share |
| 31 March 2025 |
|
|
|
| Shares and trading data |
|
| Shares (number) |
15,152,492,322 |
|
| Average daily turnover (number of shares) |
35,893,232 |
|
| Share liquidity (%) |
60 |
| (Annualized number of shares traded during the period / number of shares) |
|
|
| Stock market indicators |
| Price / Tangible book value (X) |
1.13 |
|
|
|
| Free float (%) |
99.34 |
.
|
|
|
|
|
|
| Share capital distribution by type of shareholder |
| 31 March 2025 |

|
|
|
|
|
Institutions |
|
61.94% |
|
|
|
Board * |
|
1.29% |
|
|
|
Retail |
|
36.77% |
|
|
* Shares owned or represented by directors.
FINANCIAL INFORMATION BY SEGMENT
Description of segments
We base segment reporting on financial information presented to the chief operating decision maker, which excludes certain statutory results items that distort year-on-year comparisons and are not considered for management reporting. This financial information (underlying basis) is computed by adjusting reported results for the effects of certain gains and losses (e.g. capital gains, write-downs, impairment of goodwill, etc.). These gains and losses are items that management and investors ordinarily identify and consider separately to better understand the underlying trends in the business.
The Group has aligned the information in this chapter with the underlying information used internally for management reporting and with that presented in the Group's other public documents.
Santander's executive committee has been selected to be its chief operating decision maker. The Group's operating segments reflect its organizational and managerial structures. The Group's executive committee reviews internal reporting based on these segments to assess performance and allocate resources.
The segments are split by global business and by country in which profits are earned. We prepare the financial information by aggregating the figures for Santander’s global businesses and countries, relating it to both the accounting data of the business units integrated in each segment and that provided by management information systems. The same general principles as those used in the Group are applied.
Main changes to the composition of Santander's segments in 2025
The main changes, which we are applying to the management information for all periods included in these consolidated financial statements, are as follows:
•To better align reporting with the changes to the management structure in Wealth Management & Insurance, investment platforms (Investment Platforms Unit) and certain stakes in companies, mainly in the real estate sector, that were previously recorded in Retail & Commercial Banking or Corporate & Investment Banking have been incorporated into Wealth Management & Insurance. We have therefore incorporated a new vertical, Portfolio Investments, focusing on said investment platforms and stakes that complement Wealth's traditional business, enhancing the product and service offering for our clients.
•Some profit sharing criteria between Retail & Commercial Banking and Cards have been improved, aligning criteria across the Group.
•Additionally, we completed the usual annual adjustment of the perimeter of the Global Customer Relationship Model between Retail & Commercial Banking and Corporate & Investment Banking and between Retail & Commercial Banking and Wealth Management & Insurance.
•In secondary segments, as part of our transformation strategy and after a year with our five global businesses in full operation, the board of directors approved the dissolution of the regional structures, having fulfilled their mission to support the transition to the global operating model. As a result, we will no longer report regional information and the secondary segments are structured into the ten main units (nine countries and DCB Europe), the Corporate Centre and ‘Rest of the Group’, which includes everything that is not already included in the mentioned units.
None of the changes described above impact the Group's reported global figures in the consolidated financial statements.
Composition of Santander's segments
Primary segments
This primary level of segmentation, comprises six reportable segments: five global businesses plus the Corporate Centre. The global businesses are:
Retail & Commercial Banking (Retail): area that integrates the retail banking and commercial banking businesses (individuals, SMEs and corporates), except private banking clients and business originated in the consumer finance and the cards businesses. Detailed financial information is provided on Spain (Retail Spain), the UK (Retail UK), Mexico (Retail Mexico) and Brazil (Retail Brazil), which represent most of the total Retail business.
Digital Consumer Bank (Consumer): comprises all business originated in the consumer finance companies, plus Openbank, Open Digital Services (ODS) and SBNA Consumer. Detailed financial information is provided on Europe (DCB Europe) and the US (DCB US).
Corporate & Investment Banking (CIB): this business, which includes Global Transaction Banking, Global Banking (Global Debt Financing and Corporate Finance) and Global Markets, offers products and services on a global scale to corporate and institutional customers, and collaborates with other global businesses to better serve our broad customer base.
Wealth Management & Insurance (Wealth): includes the corporate unit of Private Banking and International Private Banking in Miami and Switzerland (Santander Private Banking), the asset management business (Santander Asset Management), the insurance business (Santander Insurance) and investment platforms (the new vertical, Portfolio Investments).
Payments: comprises the Group's digital payments solutions, providing global technological solutions for our banks and new customers in the open market. It is structured in two businesses: PagoNxt (Getnet, Ebury and PagoNxt Payments) and Cards (cards platform and business in the countries where we operate).
Secondary segments
Following the dissolution of the regional management structures at the beginning of 2025, this secondary level includes our main geographical units. Detailed financial information is provided on Spain, the UK, Portugal, Poland, DCB Europe, which includes Santander Consumer Finance (the entire consumer finance business in Europe), Openbank in Europe and ODS, the US, which includes the holding company (SHUSA) and the businesses of Santander Bank (SBNA), Santander Consumer USA (SC USA), the specialized business unit Banco Santander International, the New York branch and Santander US Capital Markets (SanCap), Mexico, Brazil, Chile and Argentina. Information is also provided on the Corporate Centre and ‘Rest of the Group’, which brings together everything that is not included in the aforementioned geographical units or the Corporate Centre.
The Corporate Centre includes the centralized activities relating to equity stakes in financial companies, financial management of the structural exchange rate position, assumed within the sphere of the Group’s assets and liabilities committee, as well as management of liquidity and of shareholders’ equity via issuances.
As the Group’s holding entity, this area manages all capital and reserves and allocations of capital and liquidity with the other businesses. It also incorporates goodwill impairment but not the costs related to the Group’s central services (charged to the areas), except for corporate and institutional expenses related to the Group’s functioning.
|
|
|
|
The businesses included in each of the segments in this report and the accounting principles under which their results are presented here may differ from the businesses included and accounting principles applied in the financial information separately prepared and disclosed by our subsidiaries (some of which are publicly listed) which in name or geographical description may seem to correspond to the business areas covered in this report. Accordingly, the results of operations and trends shown for our business areas in this document may differ materially from those of such subsidiaries.
The results of our segments presented below are provided on the basis of underlying results only and include the impact of foreign exchange rate fluctuations. However, for a better understanding of the changes in the performance of our business areas, we also provide and discuss the year-on-year changes to our results excluding such exchange rate impacts (i.e. in constant euros), except for Argentina, and any grouping which includes it, where the variations in constant euros have been calculated considering the Argentine peso exchange rate on the last working day for each of the periods presented. Additionally, from Q2 2024 onwards for the Argentine peso, we apply an alternative exchange rate that better reflects the evolution of inflation (we continue to apply the official ARS exchange rate to all prior periods). For further information, see methodology in the ' Alternative performance measures' section in the appendix to this report. Certain figures contained in this report, have been subject to rounding to enhance their presentation. Accordingly, in certain instances, the sum of the numbers in a column or a row in tables contained in this report may not conform exactly to the total figure given for that column or row.
|
|
|
|
|
|
|
|
|
|
|
|
|
|
|
|
|
|
|
|
|
|
| January-March 2025 |
| Main items of the underlying income statement |
| EUR million |
|
|
|
|
|
|
| Primary segments |
Net interest
income |
Net fee
income |
Total
income |
Net operating
income |
Profit
before tax |
Profit attributable to the parent |
| Retail & Commercial Banking |
6,721 |
|
1,210 |
|
7,895 |
|
4,782 |
|
2,823 |
|
1,902 |
|
| Digital Consumer Bank |
2,756 |
|
339 |
|
3,234 |
|
1,878 |
|
674 |
|
492 |
|
| Corporate & Investment Banking |
953 |
|
716 |
|
2,220 |
|
1,268 |
|
1,234 |
|
806 |
|
| Wealth Management & Insurance |
375 |
|
419 |
|
1,019 |
|
647 |
|
639 |
|
471 |
|
| Payments |
685 |
|
693 |
|
1,383 |
|
776 |
|
248 |
|
126 |
|
| PagoNxt |
38 |
|
245 |
|
317 |
|
31 |
|
13 |
|
4 |
|
| Cards |
647 |
|
449 |
|
1,067 |
|
745 |
|
235 |
|
121 |
|
| Corporate Centre |
(112) |
|
(9) |
|
(215) |
|
(303) |
|
(431) |
|
(394) |
|
| TOTAL GROUP |
11,378 |
|
3,369 |
|
15,537 |
|
9,048 |
|
5,187 |
|
3,402 |
|
|
|
|
|
|
|
|
| Secondary segments |
|
|
|
|
|
|
|
|
|
|
|
|
|
| Spain |
1,779 |
|
767 |
|
3,130 |
|
2,081 |
|
1,645 |
|
1,147 |
|
| United Kingdom |
1,298 |
|
82 |
|
1,341 |
|
621 |
|
382 |
|
285 |
|
| Portugal |
348 |
|
126 |
|
503 |
|
367 |
|
380 |
|
278 |
|
| Poland |
744 |
|
189 |
|
883 |
|
627 |
|
500 |
|
237 |
|
|
|
|
|
|
|
|
| DCB Europe |
1,112 |
|
188 |
|
1,402 |
|
736 |
|
357 |
|
193 |
|
|
|
|
|
|
|
|
| US |
1,499 |
|
355 |
|
2,014 |
|
1,006 |
|
447 |
|
417 |
|
| Mexico |
1,129 |
|
350 |
|
1,506 |
|
878 |
|
542 |
|
394 |
|
|
|
|
|
|
|
|
|
|
|
|
|
|
|
| Brazil |
2,402 |
|
793 |
|
3,223 |
|
2,165 |
|
805 |
|
509 |
|
| Chile |
512 |
|
151 |
|
722 |
|
473 |
|
315 |
|
185 |
|
| Argentina |
416 |
|
172 |
|
504 |
|
281 |
|
197 |
|
129 |
|
|
|
|
|
|
|
|
|
|
|
|
|
|
|
| Corporate Centre |
(112) |
|
(9) |
|
(215) |
|
(303) |
|
(431) |
|
(394) |
|
| Rest of the Group |
250 |
|
205 |
|
525 |
|
116 |
|
49 |
|
23 |
|
| TOTAL GROUP |
11,378 |
|
3,369 |
|
15,537 |
|
9,048 |
|
5,187 |
|
3,402 |
|
|
|
|
Profit attributable to the parent distribution1 |
| Q1 2025 |
1. As a % of operating areas. Excluding the Corporate Centre.
|
|
|
Profit attributable to the parent. Q1 2025 |
| EUR million. % change YoY |

|
|
|
|
|
|
| Var |
Var2 |
| +24 |
% |
+28 |
% |
| +6 |
% |
+6 |
% |
| +13 |
% |
+18 |
% |
| +25 |
% |
+28 |
% |
| +9 |
% |
+30 |
% |
|
|
|
|
|
|
|
|
|
|
|
|
|
|
2. Changes in constant euros.
|
|
|
|
|
|
|
|
|
|
|
|
|
|
|
|
|
|
|
|
|
| January-March 2024 |
| Main items of the underlying income statement |
| EUR million |
|
|
|
|
|
|
| Primary segments |
Net interest
income |
Net fee
income |
Total
income |
Net operating
income |
Profit
before tax |
Profit attributable to the parent |
| Retail & Commercial Banking |
7,139 |
|
1,205 |
|
8,061 |
|
4,776 |
|
2,414 |
|
1,539 |
|
| Digital Consumer Bank |
2,710 |
|
354 |
|
3,184 |
|
1,873 |
|
618 |
|
463 |
|
| Corporate & Investment Banking |
1,053 |
|
654 |
|
2,123 |
|
1,240 |
|
1,121 |
|
716 |
|
| Wealth Management & Insurance |
449 |
|
365 |
|
905 |
|
562 |
|
531 |
|
376 |
|
| Payments |
662 |
|
662 |
|
1,318 |
|
679 |
|
238 |
|
115 |
|
| PagoNxt |
31 |
|
224 |
|
283 |
|
(21) |
|
(27) |
|
(39) |
|
| Cards |
632 |
|
438 |
|
1,035 |
|
701 |
|
266 |
|
155 |
|
| Corporate Centre |
(31) |
|
(1) |
|
(210) |
|
(297) |
|
(340) |
|
(357) |
|
| TOTAL GROUP |
11,983 |
|
3,240 |
|
15,380 |
|
8,833 |
|
4,583 |
|
2,852 |
|
|
|
|
|
|
|
|
| Secondary segments |
|
|
|
|
|
|
|
|
|
|
|
|
|
| Spain |
1,816 |
|
746 |
|
3,016 |
|
1,984 |
|
1,236 |
|
772 |
|
| United Kingdom |
1,185 |
|
79 |
|
1,257 |
|
523 |
|
415 |
|
305 |
|
| Portugal |
431 |
|
127 |
|
584 |
|
450 |
|
440 |
|
303 |
|
| Poland |
686 |
|
176 |
|
834 |
|
605 |
|
412 |
|
213 |
|
|
|
|
|
|
|
|
| DCB Europe |
1,095 |
|
220 |
|
1,410 |
|
745 |
|
401 |
|
229 |
|
|
|
|
|
|
|
|
| US |
1,396 |
|
267 |
|
1,869 |
|
929 |
|
274 |
|
279 |
|
| Mexico |
1,214 |
|
359 |
|
1,608 |
|
943 |
|
558 |
|
411 |
|
|
|
|
|
|
|
|
|
|
|
|
|
|
|
| Brazil |
2,630 |
|
846 |
|
3,507 |
|
2,351 |
|
977 |
|
561 |
|
| Chile |
352 |
|
129 |
|
527 |
|
303 |
|
160 |
|
90 |
|
| Argentina |
1,025 |
|
131 |
|
555 |
|
270 |
|
104 |
|
101 |
|
|
|
|
|
|
|
|
|
|
|
|
|
|
|
|
|
|
|
|
|
|
| Corporate Centre |
(31) |
|
(1) |
|
(210) |
|
(297) |
|
(340) |
|
(357) |
|
| Rest of the Group |
183 |
|
162 |
|
424 |
|
29 |
|
(54) |
|
(56) |
|
| TOTAL GROUP |
11,983 |
|
3,240 |
|
15,380 |
|
8,833 |
|
4,583 |
|
2,852 |
|
|
|
|
|
|
|
|
|
|
|
|
|
|
|
|
|
|
|
|
RETAIL |
|
Underlying attributable profit |
EUR 1,902 mn |
|
|
|
|
|
→ We continued to drive our ONE Transformation programme to support our vision of becoming a digital bank with branches, through the implementation of a common operating model and the rollout of our global technological platform.
→ Loans decreased 1% year-on-year in constant euros due to lower volumes in the UK and Spain (mortgages and SMEs), in the US and Brazil, partially offset by increases in corporates in most countries. Deposits rose 2% in constant euros.
→ Attributable profit reached EUR 1,902 million, increasing 24% year-on-year in euros and +28% in constant euros, driven by good revenue performance, lower costs and the impact of recording the temporary levy on revenue earned in Spain in full in Q1 2024.
|
|
|
|
|
|
|
|
Strategy
In the first quarter of the year, we continued to make progress in the execution of our strategic priorities for 2025, consolidating our vision of being a digital bank with branches, leveraging a common operating model and a global technology platform.
We are successfully executing our strategic business priorities:
•Transformation of our operating model, which uniquely leverages the Group's global scale and our local presence, based on three pillars:
•Customer experience. We continued to drive the digitalization of products and optimize customer journeys, resulting in double-digit growth in digital sales. We advanced the implementation of the new branch and WorkCafé model. In Spain, for example, we have now deployed new commercial tools to nearly 85% of the network, improving agent productivity and product sales.
•Operational leverage. We continued to simplify and digitalize processes while promoting leaner and more agile structures. This enabled us to reduce non-commercial FTEs per million customers by 13% year-on-year. Artificial intelligence is gaining prominence in automation, enabling more efficient processes and lower operational burden, thanks to solutions such as Zenith, our proprietary AI-based tool that eliminates manual back-office tasks.
•Global Technology Platform. All of our units accelerated their convergence towards a common platform, generating synergies across the Group. Gravity, our back-end technology, continued to increase the volume of processed transactions, while through
ODS, our cloud-based front-end solution, we enhanced digital experience, activated global products, and significantly reduced time-to-market. In Chile, we completed the integration of Gravity Q1 2025 which doubled the performance of our digital channels, driven by faster response times. Meanwhile, in Brazil we completed the first integration of our new customer interaction platform, improving digital conversion and reducing abandoned cart rate in new journeys.
•Transformation of the business model. We are deepening value creation and positioning the customer at the centre of our management:
•We provide our key segments an increasingly tailored offering, enabling us to build stronger relationships. Customer base growth (+6% year-on-year), combined with transactionality and positive performances in value-added products, reflect our progress as a trusted financial partner.
•The network effect resulting from our global structure is a key asset which enables us to better serve our customers. Business growth with multinational corporates (8% increase year-on-year in revenue) is a clear example of how this scale allows us to offer integrated and differentiated solutions.
•Structural efficiency improvement. The transformation of our operating and business model continued to drive structural efficiency improvements through greater commercial power, focusing on expanding value-added services, together with operational leverage and common technology.
|
|
|
|
|
|
|
|
|
|
|
|
|
|
|
|
|
|
|
|
|
|
|
|
|
|
|
|
|
|
|
|
|
Retail. Customers. March 2025 |
| Thousands and year-on-year change |
|
|
|
|
|
|
|
|
|
|
|
|
|
|
|
|
|
|
|
|
|
|
|
|
|
|
|
|
|
|
|
|
|
|
|
|
|
|
|
|
|
|
|
|
|
|
|
|
|
|
|
|
|
|
|
| Total customers |
|
|
148,701 |
|
15,129 |
22,493 |
|
21,380 |
|
70,133 |
|
|
|
|
|
+6% |
|
+1% |
0% |
|
+4% |
|
+10% |
|
|
|
|
|
|
|
|
|
|
|
|
|
|
|
|
|
|
|
|
|
|
|
|
|
|
|
|
|
|
|
| Active customers |
|
|
79,479 |
|
8,781 |
13,542 |
|
10,909 |
|
32,788 |
|
|
|
|
|
+5% |
|
+5% |
-2% |
|
+5% |
|
+7% |
|
|
|
Business performance
Loans and advances to customers decreased 2% year-on-year. In gross terms, excluding reverse repos and in constant euros, they decreased 1%, as the decline in individuals and SMEs was practically offset by increases in corporates.
In individuals, there were reductions in mortgage portfolios in the UK, in line with our strategy, and in Spain still impacted by early prepayments. These declines were partially offset by good performances in the other countries. Personal loans showed positive trends, especially in Spain, Argentina and Poland.
Loans to SMEs were affected by lower volumes in Spain and the UK, with positive dynamics across the rest of our footprint. Corporate loans increased, driven by most countries but especially by Poland, Mexico, the UK and Spain, which more than offset the decrease in the US, due to the run-off of non-core portfolios, and in Brazil.
Customer deposits increased 1% year-on-year. Excluding repos and in constant euros, they grew 2%, driven by Spain, Poland, Brazil and Argentina. By product, there was a 10% increase in time deposits with good performances in most countries in Europe and South America. Demand deposits recorded positive trends in most countries, offsetting the fall in the UK. Mutual funds, rose 15% in constant euros, with positive performances in the most countries. Overall, customer funds increased 4% in constant euros.
|
|
|
|
|
|
|
|
|
|
|
|
|
|
|
|
|
|
|
|
|
|
|
|
|
Retail. Business performance. March 2025 |
|
|
EUR billion and YoY % change in constant euros |
|
|
|
|
|
|
|
|
|
|
|
|
608 |
-1% |
|
745 |
+4% |
|
|
|
|
|
|
|
|
|
|
|
|
|
|
|
|
|
|
|
|
|
|
|
|
|
|
|
|
|
|
|
|
|
|
|
|
|
|
|
|
| Gross loans and advances to customers excl. reverse repos |
|
Customer deposits excl.
repos + mutual funds |
Results
Attributable profit in Q1 2025 was EUR 1,902 million, 24% higher year-on-year. In constant euros, profit rose 28% year-on-year.
This year-on-year comparison is favoured by the temporary levy on revenue earned in Spain which was recorded in full in Q1 2024 while the new tax in Spain in 2025 is accrued quarterly. On a like-for-like basis (i.e. accruing the 2024 temporary levy), profit increases 13% year-on-year in constant euros, by line:
•Total income increased 2%, driven by generalized positive performances in net fee income and by gains on financial transactions which increased 24% year-on-year, mainly in Brazil and Spain.
Good net interest income performance in most countries, though it decreased 2%, affected by the impact of Argentina, where the interest rates reached their lowest levels since 2018. Excluding Argentina, net interest income increased 4%, driven by Chile (lower cost of deposits and higher credit spreads and inflation), the UK (lower cost of deposits) and Mexico and Poland, both due to higher activity.
Our more targeted products and services offering contributed to 7% net fee income growth, mainly related to transactionality, investment funds and insurance.
|
|
|
|
|
|
|
|
|
|
|
|
|
|
|
|
|
|
|
|
|
|
|
|
|
|
|
|
|
|
|
|
|
Retail. Total income. Q1 2025 |
| EUR million and YoY % change in constant euros |
|
•Costs decreased 1% year-on-year (-4% in real terms), reflecting transformation efforts through organizational simplification, process automation and global platform implementation. This transformation, together with strong revenue growth, contributed to a 1.3 pp efficiency ratio improvement year-on-year to 39.4%.
•Net loan-loss provisions showed a solid performance, increasing 2%, affected by rises in Brazil, mainly due to individuals, and the normalization of the cost of risk in the UK and Chile.
Cost of risk was 0.91% (12 bps lower year-on-year) and the NPL ratio improved to 3.12% (3.21% in March 2024).
RoTE (post-AT1) in Q1 2025 was 17.6%, a 2.3 pp improvement year-on-year.
Compared to Q4 2024, attributable profit increased 2% in constant euros, driven by net fee income and lower costs, reflecting our transformation efforts and some seasonality. This more than offset the impact of interest rates on net interest income (mainly in Argentina, Brazil and Chile) and higher net loan-loss provisions in Mexico (increasing from low levels) and the UK and Chile (cost of risk normalization).
|
|
|
|
|
|
|
|
|
|
|
|
|
|
|
|
|
|
|
|
|
|
|
|
Retail. Underlying income statement |
|
EUR million and % change |
|
|
|
|
|
|
|
|
|
|
|
|
|
|
|
|
|
|
|
|
|
/ |
Q4'24 |
|
|
/ |
Q1'24 |
|
|
Q1'25 |
% |
excl. FX |
|
|
% |
excl. FX |
|
|
|
|
|
|
|
|
|
|
Total income |
7,895 |
-3 |
-4 |
|
|
-2 |
+2 |
|
Expenses |
-3,113 |
-7 |
-7 |
|
|
-5 |
-1 |
|
Net operating income |
4,782 |
-1 |
-2 |
|
|
0 |
+5 |
|
LLPs |
-1,431 |
+3 |
+2 |
|
|
-6 |
+2 |
|
PBT |
2,823 |
+8 |
+8 |
|
|
+17 |
+21 |
|
Attributable profit |
1,902 |
+2 |
+2 |
|
|
+24 |
+28 |
|
|
|
|
|
|
|
|
|
|
|
|
RETAIL SPAIN |
Profit before tax |
| EUR 810 mn |
Commercial activity and business performance
In the first quarter, the above-market increase in transactionality supported strong growth in our market share in payrolls and pension funds. This, together with the increase in customers using Bizum, reflects our progress in our business transformation.
In terms of new business, there were good dynamics in personal loans and insurance, as well as in mortgages, driven by business with developers. However, this is not yet reflected in the stock of loans and advances to customers as they decreased 2% year-on-year both in net and gross terms excluding reverse repurchase agreements, still impacted by prepayments in mortgages and SMEs, partially offset by an improvement in corporates and personal loans.
Customer deposits increased 4% year-on-year, both including and excluding repos, with all products contributing positively. Mutual funds increased 14%. As a result, customer funds rose 6%.
Results
Profit before tax in Q1 2025 reached EUR 810 million, 40% higher than in Q1 2024.
This year-on-year comparison is favoured by the temporary levy on revenue earned in Spain which was recorded in full in Q1 2024 in other results and provisions. By line:
•Total income increased 1% as net fee income (mutual funds) and gains on financial transactions more than offset the impact of lower interest rates on net interest income.
•Costs were almost flat (+1%) driven by process automatization and greater digital adoption, with an efficiency ratio of 31.8%.
•Net loan-loss provisions increased 3%, mainly due to balance sheet clean up exercises and active risk management, improving credit quality.
In the quarter, profit before tax grew 41%, due to good performance across all P&L lines: net interest income increased 3% driven by good margin management and higher volumes even in a lower interest rate environment, net fee income (+19% boosted by mutual funds and insurance), lower costs (seasonality and transformation) and controlled provisions.
|
|
|
|
|
|
|
|
|
|
|
|
|
|
|
|
|
|
Retail Spain. Underlying income statement |
|
EUR million and % change |
|
|
|
|
|
|
|
|
|
|
|
|
|
|
|
|
Q1'25 |
/ Q4'24 |
|
|
/ Q1'24 |
|
|
|
|
|
|
|
|
Total income |
1,794 |
|
+7 |
|
|
+1 |
|
Expenses |
-571 |
|
-5 |
|
|
+1 |
|
Net operating income |
1,223 |
|
+14 |
|
|
+1 |
|
LLPs |
-291 |
|
0 |
|
|
+3 |
|
PBT |
810 |
|
+41 |
|
|
+40 |
|
|
|
|
|
|
|
|
|
|
|
|
|
|
|
|
|
|
|
RETAIL UK |
Profit before tax |
| EUR 348 mn |
Commercial activity and business performance
In the first quarter, we made progress in our transformation programme through digitalization and automation, which helped simplify the business and improve efficiency.
We prioritized profitability through price discipline and planned balance sheet optimization. As a result, loans and advances to customers decreased 1% year-on-year. In gross terms, excluding repos and in constant euros, they fell 3%, due to mortgages and SMEs.
Customer deposits decreased 4% year-on-year. Excluding repos and in constant euros, they fell 5%, mainly due to demand deposits. Mutual funds decreased 4% in constant euros. As a result, customer funds declined 5% in constant euros.
Results
Profit before tax in Q1 2025 reached EUR 348 million, 5% lower than in the same period of 2024. In constant euros, profit before tax decreased 8%, by line:
•Total income increased 4%, mainly due to good net interest income performance, driven by higher yields in mortgages and lower cost of deposits.
•Costs fell 4%, boosted by our efforts to simplify in the operating model and process automation. Overall, net operating income grew 17% and the efficiency ratio improved 4.9 pp to 53.6%.
•Net loan-loss provisions increased but remained at low levels, due to cost of risk normalization.
•Other gains (losses) and provisions recorded more negative results, due to impacts related to transformation charges.
In the quarter, net operating income rose 5% in constant euros, supported by lower costs, reflecting our transformation efforts and seasonality. However, this good performance is not reflected in profit before tax due to the higher provisions mentioned.
|
|
|
|
|
|
|
|
|
|
|
|
|
|
|
|
|
|
|
|
|
|
|
|
Retail United Kingdom. Underlying income statement |
|
EUR million and % change |
|
|
|
|
|
|
|
|
|
|
|
|
|
|
|
|
|
|
|
|
|
/ |
Q4'24 |
|
|
/ |
Q1'24 |
|
|
Q1'25 |
% |
excl. FX |
|
|
% |
excl. FX |
|
|
|
|
|
|
|
|
|
|
Total income |
1,190 |
|
-1 |
-1 |
|
|
+7 |
+4 |
|
Expenses |
-638 |
|
-5 |
-5 |
|
|
-2 |
-4 |
|
Net operating income |
552 |
|
+5 |
+5 |
|
|
+20 |
+17 |
|
LLPs |
-36 |
|
— |
— |
|
|
+310 |
+300 |
|
PBT |
348 |
|
-9 |
-8 |
|
|
-5 |
-8 |
|
|
|
|
|
|
|
|
|
|
|
|
|
|
|
|
|
|
|
|
|
RETAIL MEXICO |
Profit before tax |
| EUR 343 mn |
Commercial activity and business performance
We made great strides in our transformation, optimizing digital onboarding times (digital account), cash withdrawals at ATMs (contactless and QR) and we improved the customer experience through simplification, with an innovative centralized checking account (Cuenta Única).
Loans and advances to customers decreased 13% year-on-year, heavily impacted by currency depreciation. In gross terms, excluding reverse repos and in constant euros, they increased 8% year-on-year, driven by mortgages, with a 17% market share, well above our total loan market share (12%). Also of note was the growth in payroll, corporate and SME loans.
Customer deposits decreased 10% year-on-year. Excluding repos and in constant euros, deposits rose 2%, driven by an increase in demand deposits from Commercial, while time deposits decreased 1%, in line with our strategy to optimize funding costs. Mutual funds rose 37% in constant euros. As a result, customer funds rose 9% in constant euros.
Results
Profit before tax in Q1 2025 reached EUR 343 million, 6% higher than in the same period of 2024. In constant euros, it increased 23%, as follow:
•Total income increased 8%, mainly driven by good performances in net interest income, supported by higher activity and lower cost of deposits, and net fee income, particularly from mutual funds and insurance.
•Costs increased 7% impacted by inflation. Net operating income grew 8% and the efficiency ratio improved 27 bps to 44.3%.
•Net loan-loss provisions decreased 23% due to credit quality improvement in corporates and mortgages, despite a pick up in activity.
In the quarter, profit before tax increased 8% in constant euros, driven by the good net fee income performance, mainly due to mutual funds, and lower costs, which more than offset higher provisions (increasing from low levels in Q4 2024).
|
|
|
|
|
|
|
|
|
|
|
|
|
|
|
|
|
|
|
|
|
|
|
|
Retail Mexico. Underlying income statement |
|
EUR million and % change |
|
|
|
|
|
|
|
|
|
|
|
|
|
|
|
|
|
|
|
|
|
|
|
/ |
Q4'24 |
|
|
/ |
Q1'24 |
|
|
Q1'25 |
% |
excl. FX |
|
|
% |
excl. FX |
|
|
|
|
|
|
|
|
|
|
Total income |
896 |
|
0 |
+1 |
|
|
-8 |
+8 |
|
Expenses |
-397 |
|
-15 |
-14 |
|
|
-8 |
+7 |
|
Net operating income |
499 |
|
+17 |
+16 |
|
|
-7 |
+8 |
|
LLPs |
-135 |
|
+40 |
+33 |
|
|
-34 |
-23 |
|
PBT |
343 |
|
+7 |
+8 |
|
|
+6 |
+23 |
|
|
|
|
|
|
|
|
|
|
|
|
|
|
|
|
|
|
|
|
|
RETAIL BRAZIL |
Profit before tax |
| EUR 233 mn |
Commercial activity and business performance
Our business strategy focused on: i) expanding the high-net worth and corporate segments by offering a personalized and global experience; and ii) providing a more integrated multi-channel experience and a more simplified product offering in the mass segment, thereby driving double-digit growth in digital sales. Additionally, in corporates, we are working to build a closer relationship with our customers, with tailored offers and enhancing the multi-channel approach.
Loans and advances to customers decreased 15% year-on-year. In gross terms, excluding reverse repos and in constant euros they fell 2% as increases in mortgages and SMEs did not offset declines in personal loans and corporates, in line with our strategy to focus on profitable growth and capital optimization.
Customer deposits decreased 3% year-on-year. Excluding repos and in constant euros, they increased 9%, mainly due to time deposits in line with the market. Mutual funds grew 16% year-on-year in constant euros. As a result customer funds rose 11% in constant euros.
Results
Profit before tax in Q1 2025 reached EUR 233 million, 31% less than in the same period of 2024. In constant euros, it fell 21%, by line:
•Total income increased 2%, driven by higher gains on financial transactions and net fee income (+3%), mainly in insurance and funds, with net interest income flat despite the impact of negative sensitivity of the balance sheet to higher interest rates.
•Costs increased 3%, less than inflation, reflecting our transformation efforts. As a result, net operating income was flat and the efficiency ratio improved by 68 bps to 40.5%.
•Net loan-loss provisions rose 9%, though remaining at controlled levels, mainly due to the increase in individuals, impacted by the macroeconomic environment, balance sheet clean up exercises and active risk management.
In the quarter, profit before tax fell 21% in constant euros, as the improvement in costs and provisions, as well as higher net fee income, did not offset the decline in net interest income due to a less favourable interest rate environment.
|
|
|
|
|
|
|
|
|
|
|
|
|
|
|
|
|
|
|
|
|
|
|
|
Retail Brazil. Underlying income statement |
|
EUR million and % change |
|
|
|
|
|
|
|
|
|
|
|
|
|
|
|
|
|
|
|
|
|
/ |
Q4'24 |
|
|
/ |
Q1'24 |
|
|
Q1'25 |
% |
excl. FX |
|
|
% |
excl. FX |
|
|
|
|
|
|
|
|
|
|
Total income |
1,878 |
|
-4 |
-5 |
|
|
-11 |
+2 |
|
Expenses |
-761 |
|
0 |
-1 |
|
|
-10 |
+3 |
|
Net operating income |
1,117 |
|
-6 |
-7 |
|
|
-12 |
0 |
|
LLPs |
-718 |
|
-2 |
-2 |
|
|
-5 |
+9 |
|
PBT |
233 |
|
-19 |
-21 |
|
|
-31 |
-21 |
|
|
|
|
|
|
|
|
|
|
|
|
|
|
|
|
|
|
|
|
|
|
|
|
|
|
|
|
|
|
CONSUMER |
|
Underlying attributable profit |
EUR 492 mn |
|
|
|
|
|
|
|
|
|
|
|
→ We continue to advance in our priority to become the preferred choice of our partners and end customers, and offer greater profitability, while being the most competitive player in the industry.
→ Loans increased 4% year-on-year in constant euros, +6% in auto, in a market that is picking up from a weak start in January 2025. Deposits rose 12% in constant euros, supported by Openbank and in line with our strategy aimed at lowering funding costs and reducing net interest income volatility across the cycle.
→ Attributable profit reached EUR 492 million in Q1 2025, a 6% increase year-on-year in euros (+6% also in constant euros), supported by a solid performance in net interest income and good cost control.
|
|
|
|
|
|
|
|
Strategy
Digital Consumer Bank (Consumer) is a leading consumer finance company globally. It operates in 26 countries in Europe and the Americas and serves the financing needs at the point of sale (both physical and digital) of 26 million customers. It combines three interconnected businesses: auto financing, consumer lending and Openbank.
Our vision for Consumer is to become the preferred choice of our partners and end customers and offer greater profitability and value creation to our shareholders, while being the most cost competitive player in the industry.
To respond to the changing mobility and consumer finance ecosystem and deliver on our vision, we are transforming our operating model by focusing on our strategic priorities:
•Converge towards global platforms. We continue to expand the functionalities of our auto leasing platform and foster growth in Zinia, our check-out lending technology, for example through new agreements with Amazon and Apple. Additionally, in Europe, we have moved from one platform per country to three in total, progressing in our final goal of having one common platform.
•Grow and consolidate partnerships. We offer global and best-in-class solutions, integrated into our partners' (OEMs, importers and retailers) processes, accompanying them as their increasingly digital business models evolve. We are improving cross-regional partnerships and consolidating new ones, by leveraging existing agreements in our consumer finance business and in Openbank.
•Promote the network effect. We are aligning the business with the Group’s operating model and becoming more agile through the simplification and automatization of processes to improve customer experience and increase scalability.
In Q1 2025, we made progress in our strategic priorities:
•In Auto, we continued to improve our sales and post-sales digital capabilities, further developed our leasing platform, pursued commercial opportunities and continued to manage agreements globally, having recently signed partnerships with new entrants in Europe. In the US, we remained disciplined in our pricing and capital stewardship to drive growth, diversify originations channels and optimize profitability across the full credit spectrum while balancing cost of risk. In Latin America, we remained #1 in new vehicle financing across our footprint as we continued to focus on developing strategic alliances.
•In the consumer lending business (non-auto), Zinia continued progressing with strong partnerships. For example, we launched the Amazon co-branded card in Austria. In Peru, we finalized the acquisition of CrediScotia.
•As part of our profitable growth strategy, we continued to boost customer deposit gathering (more than EUR 2 billion of deposits captured in Europe since the end of 2024), as a result of our focus on managing deposit remuneration, since it has a significant impact on our competitiveness and is a more stable source of funding. We also actively managed our balance sheet to make it more capital light.
In addition to the successful launch in the US in Q4 2024, this quarter we launched Openbank in Mexico with a full value proposition to compete with other neobanks and we opened a new branch in Germany. The purpose of this expansion is to fund asset growth and capture synergies, while we continue to upgrade our customer proposition and experience.
In the US, Openbank had a solid performance in the quarter, both in terms of customers captured and in terms of deposit volumes, and we announced a multi-year partnership with Verizon, starting in April, to offer its customers high-yield savings accounts.
|
|
|
| Consumer. Total customers |
| Millions |
Business performance
The new lending performance (-6% year-on-year) reflects our strategy to prioritize profitability over growth, in an environment of some volatility and geopolitical uncertainty.
The stock of loans and advances to customers rose 3% year-on-year. In gross terms, excluding reverse repos and in constant euros, they were 4% up year-on-year (driven by auto), with good performances in DCB Europe and Brazil, in a market that is picking up from a weak start in January 2025.
We have a EUR 16 billion leasing portfolio, which decreased 8% year-on-year in constant euros, as growth in Europe was more than offset by a decline in the US, which was affected by the wind down of business through our relationship with Stellantis, lower demand for electric vehicles and our strategy to prioritize profitability over volumes.
Customer deposits increased 12% year-on-year, and now account for 62% of Consumer's total funding, 5 pp more than a year ago. Excluding repos and in constant euros, they were up 12% (+14% in DCB Europe and +7% in the US), reflecting our focus on deposit gathering, supported by Openbank. Mutual funds rose 16% in constant euros, up from very low levels. Our access to wholesale funding markets remained strong and diversified.
|
|
|
|
|
|
|
|
|
|
|
|
|
|
|
|
|
|
|
|
|
|
|
|
|
|
|
|
|
|
Consumer. Business. March 2025 |
| EUR billion and YoY % change in constant euros |
|
|
|
|
|
|
|
|
|
|
|
|
214 |
+4% |
|
|
|
|
141 |
+12% |
|
|
|
|
|
|
|
|
|
|
|
|
|
|
|
|
|
|
|
|
|
|
|
|
|
|
|
|
|
|
|
|
|
|
|
|
|
|
|
| Gross loans and advances to customers excl. reverse repos |
|
Customer deposits excl.
repos + mutual funds |
|
|
|
|
|
|
|
|
|
|
|
|
Consumer. Leasing portfolio. March 2025 |
| EUR billion and YoY % change in constant euros |
| Total leasing |
16 |
-8% |
|
|

Results
In Q1 2025, attributable profit reached EUR 492 million, 6% higher than the same period in 2024. In constant euros, profit was also up 6%, as follows:
•Total income rose 2%, mainly due to net interest income, which also grew 2%, supported by our efforts in margin management and volumes growth in Europe. Net interest income in the US rose as the increase from higher yields more than offset lower credit volumes.
Net fee income declined (-3%), despite strong growth in the US (auto fees), mainly due to DCB Europe, which was impacted by new insurance regulation in Germany.
Leasing income fell, due to lower residual values, lower volumes and lower gains on sales in the US.
|
|
|
|
|
|
|
|
|
|
|
|
|
|
|
|
|
|
|
|
|
|
|
|
|
|
|
|
|
|
|
|
|
Consumer. Total income. Q1 2025 |
| EUR million and YoY % change in constant euros |
|
•Costs increased 3% (flat in real terms), due to our investment in leasing and check-out lending platforms and in Openbank. Costs were flat in DCB Europe, reflecting our transformation efforts, and increased in the US. The efficiency ratio increased 0.8 pp to 41.9%.
•Net loan-loss provisions fell 1%, supported by a good performance in the US (mainly in auto), and despite the normalization in Europe (mainly due to the macro environment and corporates in Germany). Credit quality remained controlled with the cost of risk at 2.14% and the NPL ratio at 5.09%.
•Other gains (losses) and provisions registered a loss of EUR 84 million in Q1 2025, compared to a EUR 118 million loss in Q1 2024, due to the temporary levy on revenue earned in Spain recorded in Q1 2024.
RoTE (post-AT1) in Q1 2025 stood at 9.7%.
Compared to Q4 2024, attributable profit rose significantly, with a good performance in net loan-loss provisions, especially in DCB US, and lower Swiss franc mortgage provisions in Poland. Additionally, the quarterly comparison was favoured by the provision for potential complaints related to motor finance dealer commissions in the UK recorded in Q4 2024.
|
|
|
|
|
|
|
|
|
|
|
|
|
|
|
|
|
|
|
|
|
|
|
|
Consumer. Underlying income statement |
|
EUR million and % change |
|
|
|
|
|
|
|
|
|
|
|
|
|
|
|
|
|
|
|
|
|
/ |
Q4'24 |
|
|
/ |
Q1'24 |
|
|
Q1'25 |
% |
excl. FX |
|
|
% |
excl. FX |
|
|
|
|
|
|
|
|
|
|
Total income |
3,234 |
|
-3 |
-4 |
|
|
+2 |
+2 |
|
Expenses |
-1,357 |
|
+5 |
+5 |
|
|
+3 |
+3 |
|
Net operating income |
1,878 |
|
-8 |
-9 |
|
|
0 |
+1 |
|
LLPs |
-1,119 |
|
-10 |
-11 |
|
|
-2 |
-1 |
|
PBT |
674 |
|
+155 |
+159 |
|
|
+9 |
+10 |
|
Attributable profit |
492 |
|
+221 |
+230 |
|
|
+6 |
+6 |
|
|
|
|
|
|
|
|
|
|
|
| DCBE |
DCB EUROPE |
Profit before tax |
| EUR 357 mn |
Commercial activity and business performance
Due to our focus on profitability and declining trends of new car registrations in the EU, new business volumes were down 5% year-on-year in constant euros, mainly driven by new auto.
The stock of loans and advances to customers rose 3% year-on-year. In gross terms, excluding reverse repos and in constant euros, it also increased 3% year-on-year, mainly driven by auto balances.
In line with our strategy to increase retail funding, customer deposits increased 15% year-on-year. Excluding repos and in constant euros, they grew 14%. Mutual funds increased 20% in constant euros, up from very low levels. Our access to wholesale funding markets remained strong and diversified.
Results
Profit before tax in Q1 2025 was EUR 357 million, an 11% decline year-on-year. In constant euros, profit before tax also fell 11%, by line:
•Total income was fairly flat, as the good performance in net interest income, driven by our good margin management, was offset by the impact of the new insurance regulation in Germany and lower new business volumes on net fee income.
•Costs were flat (-2% in real terms) on the back of the benefits from the transformation, simplification and centralization of our operating model.
•Net loan-loss provisions (+22%) were impacted by the macro outlook and worse credit quality in corporates in Germany.
•Other gains (losses) and provisions recorded less negative results, due to the temporary levy on revenue earned in Spain which was recorded in Q1 2024.
Compared to Q4 2024, profit before tax increased significantly with a resilient net interest income performance, supported by a lower cost of deposits and better net loan-loss provisions. Net fee income was affected by the new insurance regulation in Germany and costs rose, reflecting our investments in platforms. The quarterly comparison was favoured by the provision for potential complaints related to motor finance dealer commissions in the UK recorded in Q4 2024.
|
|
|
|
|
|
|
|
|
|
|
|
|
|
|
|
|
|
|
|
|
|
|
|
DCB Europe. Underlying income statement |
|
EUR million and % change |
|
|
|
|
|
|
|
|
|
|
|
|
|
|
|
|
|
|
|
|
|
/ |
Q4'24 |
|
|
/ |
Q1'24 |
|
|
Q1'25 |
% |
excl. FX |
|
|
% |
excl. FX |
|
|
|
|
|
|
|
|
|
|
Total income |
1,402 |
|
-2 |
-2 |
|
|
-1 |
-1 |
|
Expenses |
-667 |
|
+6 |
+6 |
|
|
0 |
0 |
|
Net operating income |
736 |
|
-8 |
-8 |
|
|
-1 |
-1 |
|
LLPs |
-336 |
|
-3 |
-3 |
|
|
+22 |
+22 |
|
PBT |
357 |
|
— |
— |
|
|
-11 |
-11 |
|
|
|
|
|
|
|
|
|
|
|
|
|
|
|
|
|
|
|
|
|
DCB US |
Profit before tax |
| EUR 236 mn |
Commercial activity and business performance
During the first quarter of the year, we exceeded our expectations for Openbank with the incorporation of over 90 thousand new customers and approximately USD 3.5 billion in deposit balances since its launch. We announced a new multi-year partnership with Verizon, which will start in April and enable us to offer our service to a significant number of potential customers, thereby reinforcing our presence in the US.
Loans and advances to customers were 2% lower compared to March 2024. In gross terms, excluding reverse repos and in constant euros, they were 2% down year-on-year, impacted by our asset rotation initiatives in non-auto balances.
Customer deposits rose 7% year-on-year. Excluding repos and in constant euros, they also increased 7%, driven by the successful launch of Openbank and a solid performance in our branch based deposits. Mutual funds increased 11% in constant euros.
Results
Profit before tax in Q1 2025 increased 95% year-on-year to EUR 236 million. In constant euros, it rose 89%, as follows:
•Total income increased 1%, driven by greater net interest income (higher auto loan yields) and net fee income (servicing in auto), which offset lower leasing income, mainly due to lower residual values, volumes and gains on sales.
•Costs were 2% up, mainly driven by our investments in the Openbank platform, partially offset by savings from our transformation initiatives.
•Net loan-loss provisions improved 17%, driven by favourable customer payment rates, improved used car prices and lower unemployment, which more than offset the NPL ratio normalization. Cost of risk improved 20 bps to 4.27%.
Compared to Q4 2024, profit before tax grew strongly, supported by the good underlying performance and some seasonality in Q4 of net loan-loss provisions.
|
|
|
|
|
|
|
|
|
|
|
|
|
|
|
|
|
|
|
|
|
|
|
|
DCB US. Underlying income statement |
|
EUR million and % change |
|
|
|
|
|
|
|
|
|
|
|
|
|
|
|
|
|
|
|
|
|
/ |
Q4'24 |
|
|
/ |
Q1'24 |
|
|
Q1'25 |
% |
excl. FX |
|
|
% |
excl. FX |
|
|
|
|
|
|
|
|
|
|
Total income |
1,362 |
|
0 |
-1 |
|
|
+4 |
+1 |
|
Expenses |
-574 |
|
+6 |
+4 |
|
|
+5 |
+2 |
|
Net operating income |
788 |
|
-4 |
-5 |
|
|
+4 |
+1 |
|
LLPs |
-524 |
|
-23 |
-24 |
|
|
-14 |
-17 |
|
PBT |
236 |
|
+113 |
+111 |
|
|
+95 |
+89 |
|
|
|
|
|
|
|
|
|
|
|
|
|
|
|
|
|
|
|
|
|
|
|
|
|
|
|
|
|
|
CIB |
|
Underlying attributable profit |
EUR 806 mn |
|
|
|
|
|
|
|
|
|
|
|
→ Our enhanced centres of expertise and the Global Markets and US Banking Build-Out (US BBO) initiatives are resulting in increased client penetration, reflected in the types of deals and roles we are currently winning.
→ Strong activity year-on-year, driven by our growth initiatives in Global Markets, with good performance in all geographic areas, and by Corporate Finance in Global Banking, mainly due to the US.
→ Attributable profit reached EUR 806 million, a 13% increase year-on-year (+18% in constant euros). We had a good revenue performance, growing 8% in constant euros, and lower provisions, reflecting the high quality of our credit portfolio. We maintained a leading position in efficiency and profitability.
|
|
|
|
|
|
|
|
Strategy
Our Corporate & Investment Banking (CIB) business is well diversified both by business line and geographically which helps reduce the potential impacts from risks in any specific market or sector. This is especially important in the current operating environment characterized by continuing geopolitical tensions and market volatility.
Our focus for 2025 is to continue to develop our core initiatives in Global Markets (GM) and Global Banking (GB) to deliver an enhanced value proposition to drive profitable growth by:
•Fully leveraging our centres of expertise in Global Banking to strengthen our positioning in our core markets, fostering collaboration between our businesses to increase connectivity around the client agenda.
Additionally, our enhanced capabilities are providing important opportunities between Global Banking, Global Transactional Banking (GTB) and Global Markets. This is driving significant growth, particularly in our Global Markets franchise, which is also supported by the investments we have made.
•Continuing to advance in the execution of our automation and digitalization initiatives, while exploring tangible opportunities afforded by artificial intelligence (AI), both for business and support functions. We are developing solutions in digital assets and tokenization to streamline processes, increase efficiency and enhance controls.
•Deepening our client relationships by fostering and expanding our advisory and value-added businesses on the back of our transformation initiatives, with a particular focus on the US and fee businesses.
In the US, we are executing our growth plan, evolving our specialized investment banking footprint by selectively broadening coverage and our product platform, showing significant progress within a short timeframe of just 18 months.
We increased core client penetration, which is reflected in the type of deals and roles we are currently winning. In Q1 2025 we successfully executed, either as global Coordinator or bookrunner, six IPOs raising approximately USD 4 billion, ranking #7 for IPOs globally and #2 in the US, according to Dealogic data.
•Maximizing the impact of our US BBO initiative on the global CIB franchise by leveraging the newly developed capabilities and coverage, which is providing new business opportunities in other areas and countries.
As a key driver of Santander’s growth, we continue to foster collaboration with other divisions to generate additional value for the Group, providing FX solutions to Retail, a full suite of products to Commercial, product development and structuring to Wealth, and capital markets solutions and advisory to auto finance in Consumer, among others.
•Further evolving CIB's global operating model, in line with Group’s initiative to expand our global platforms and strengthen the support functions to foster business growth, team specialization and synergies.
We are improving our Originate-to-Share (OtS) model, with focus on capital efficiency, active management and profitability.
|
|
|
|
|
|
|
|
|
|
|
|
|
|
|
|
|
|
|
|
|
|
|
|
| Recent awards |
|
Ranking in League Tables Q1 2025 |
|
| Latin Finance |
Global Capital |
|
Structured Finance |
Debt Capital Markets |
|
Bond House of the Year
|
SRT Bank of the Year Europe
Best Arranger of Project Finance Loans
|
|
|
|
| IJGlobal |
Global Finance |
|
Equity Capital Markets |
M&A |
ECAs (2024) |
|
Market Impact Award in Latam
Power Deal of the Year in Europe
|
World’s Best Customer Implementation for 2025 in Supply Chain |
|
|
|
|
Business performance
We remain focused on our capital-light activity and actively managing our balance sheet. As a result, our total revenue to risk-weighted assets ratio improved 1 pp year-on-year up to 8.1%.
Customer loans, although concentrated in our Global Transaction Banking (GTB) and GB businesses, increased 10% year-on-year, supported by the good performance in Global Markets (GM). In gross terms, excluding reverse repos and in constant euros, they increased 4%. Customer deposits rose 7% year-on-year. Excluding repos and in constant euros, they decreased 4%, in line with our strategy to reduce excess corporate deposits.
By business line, we had the following performance:
•Global Transaction Banking recorded good activity levels in a challenging business environment:
In Trade & Working Capital Solutions, activity continued accelerating through the expansion into new segments and developing partnerships with major private equity and private credit funds as well as asset managers (e.g. with Pemberton).
In Export Finance, activity was lower compared to the strong Q1 2024. We continued to leverage our strong capabilities in the coordination of important financing operations, especially in the shipping, defense and power sectors.
Cash Management was impacted by the lower interest rate environment, however there was a good performance in the US.
•In Global Banking, activity had a mixed performance across products.
In debt finance products, DCM experienced strong activity growth, mainly in Latin America (specifically Brazil), while Syndicated Loans & Acquisition Finance decreased in North America and Europe, affected by subdued demand due to the uncertain geopolitical and trade environment.
In Corporate Finance (CF), the good trends seen in 2024 continued, achieving strong growth despite a challenging environment. In ECM, we successfully executed, either as global coordinator or bookrunner, six initial public offerings (IPOs) and in M&A of note was our role as sole financial and debt advisor to PSP and AviAlliance for the AGS Airports acquisition.
Activity in Structured Finance declined after a record Q1 2024. Lower activity levels in renewables in the US were offset by new midstream projects in the energy sector and a recovery in digital infrastructure globally. Fund Finance activity also rebounded, with several core infrastructure funds raising capital and the consolidation of growing activity on the private credit side.
•Global Markets had an excellent quarter, with record activity levels in January on the back of higher volatility and the continuous growth of the institutional franchise, in line with our strategy, especially in rates, securitized products and securities finance.
Results
Attributable profit in Q1 2025 increased 13% year-on-year to EUR 806 million. In constant euros, it grew 18%, with the following detail:
•Total income rose 8% year-on-year, supported by the good net fee income performance in all businesses, which grew +11%, primarily in GTB and GB, favoured by the US BBO initiative, and by net interest income, growing double digits if we exclude Argentina. Gains on financial transactions fell year-on-year, with increased activity in more NII and fee based products in Global Markets.
By country, there were good performances in the US, Brazil and Argentina, with European units continuing to grow but at a slower pace.
By business, revenue growth in GM (+23%) was well balanced between fixed income business and equity products, both up double digits. In GTB, revenue increased slightly on the back of a strong quarter in Trade & Working Capital Solutions. In GB, revenue decreased 5%, as the net fee income growth in CF was more than offset by lower net interest income from Debt and Structured Finance, partially due to portfolio sales.
|
|
|
|
|
|
|
|
|
|
|
|
|
|
|
|
|
|
|
|
|
|
|
|
|
|
|
|
|
|
|
|
|
CIB. Total income by business. Q1 2025 |
| EUR million and % change in constant euros |
|

|
|
|
|
|
|
|
|
|
|
|
|
Note: total income includes revenue from other activities which are less material (-EUR 21 million in Q1'24 and -EUR 17 million in Q1'25). |
•Costs increased 9% due to investments in our transformation initiatives. The efficiency ratio was 42.9%, one of the best in the sector.
•Due to the nature of the business and the high quality of our credit portfolio, net loan-loss provisions have a limited impact on results. In Q1 2025, net loan-loss provisions declined, driven by European and South American countries.
As a result, the good performance delivered a 21.6% RoTE (post-AT1) in Q1 2025 compared to 18.5% in Q1 2024, reflecting our focus on capital efficiency, active management and profitability.
Compared to Q4 2024, attributable profit grew 15% in constant euros, supported by a good total revenue performance (+6%), and decreasing costs, as a result of some seasonal effects in Q4 2024.
|
|
|
|
|
|
|
|
|
|
|
|
|
|
|
|
|
|
|
|
|
|
|
|
CIB. Underlying income statement |
|
EUR million and % change |
|
|
|
|
|
|
|
|
|
|
|
|
|
|
|
|
|
|
|
|
|
/ |
Q4'24 |
|
|
/ |
Q1'24 |
|
|
Q1'25 |
% |
excl. FX |
|
|
% |
excl. FX |
|
|
|
|
|
|
|
|
|
|
Total income |
2,220 |
|
+7 |
+6 |
|
|
+5 |
+8 |
|
Expenses |
-952 |
|
-7 |
-7 |
|
|
+8 |
+9 |
|
Net operating income |
1,268 |
|
+21 |
+20 |
|
|
+2 |
+7 |
|
LLPs |
-13 |
|
-21 |
-27 |
|
|
-68 |
-67 |
|
PBT |
1,234 |
|
+36 |
+35 |
|
|
+10 |
+15 |
|
Attributable profit |
806 |
|
+16 |
+15 |
|
|
+13 |
+18 |
|
|
|
|
|
|
|
|
|
|
|
|
|
|
|
|
|
|
|
|
|
WEALTH |
|
Underlying attributable profit |
EUR 471 mn |
|
|
|
|
|
|
|
|
|
|
|
→ We continue building the best wealth and insurance manager in Europe and the Americas, supported by our leading global private banking platform and our best-in-class funds and insurance factories that leverage our scale and global capabilities to offer the best value proposition to our customers.
→ Total assets under management reached new record levels of EUR 511 billion, +11% year-on-year in constant euros, due to solid commercial dynamics in both Private Banking and Santander Asset Management and good market performance. In Insurance, gross written premiums reached EUR 2.7 billion, +4% year-on-year in constant euros.
→ Attributable profit amounted to EUR 471 million, +25% higher year-on-year (+28% in constant euros), with a good revenue performance in all business lines and an RoTE (post-AT1) of 68%.
|
|
|
|
|
|
|
|
Strategy
We aim to enhance our Wealth Management & Insurance service model and value proposition through a common global platform that leverages Santander's scale and capabilities. Wealth is an important driver for the Group, delivering consistent double-digit profit growth and generating around one third of the Group's total net fee income, including fees ceded to the commercial network.
In recent years, we have been working to build a leading global private banking platform complemented with best-in-class funds and insurance product factories that leverage our global scale and capabilities.
We continue to focus on the following strategic initiatives:
•In Private Banking (PB), we are developing key growth opportunities to expand our footprint, such as in the Middle East, where we are working to strengthen partnerships, driving growth. As a result, we have achieved our first key milestones in terms of business volumes and expanding our client base.
We continue to increase our specialization, creating a new global Family Office team that provides multi-booking capabilities to clients in Miami, Switzerland, Spain, Brazil and Mexico. We are expanding our Ultra-High Net Worth (UHNW) global team.
Regarding our products and services, we continue to focus on value-added solutions, providing the best advice to increase our net fee income. In this regard, we launched a new private assets strategy, supported by a global team that will drive top-tier global and local opportunities tailored to our clients’ investment profiles and preferences. We also launched Strategic Solutions, a new initiative to deliver tailored investment banking capabilities to our UHNW clients.
During the quarter, we were named World’s Best Private Bank for International Latin American Clients, Best International Private Bank in Latin America and Best International Private Bank in six of our countries by Euromoney.
|
|
|
| Private Banking clients |
| Thousands |
|

•In SAM, we operate as a global asset manager leveraging our scale, global investment capabilities and product distribution hubs. We continue transforming, globalizing and simplifying our operating model, governance and value proposition to continue to improve our efficiency ratio even further.
In terms of retail distribution, we progressed in the implementation of an advisory model across all countries, supported by a global investments platform that provides a better customer experience.
Regarding our alternatives business, we recently acquired a majority stake in Tresmares Capital, an alternative financing and private equity platform, showing our strategic focus on private markets. We continue growing on our institutional/third party partnership investments, reinforcing our distribution capabilities.
•In Insurance, we reorganized our business around Life & Pensions and Property & Casualty verticals to accelerate the execution of our strategy and transformation plans while we continue evolving our product offering:
•In terms of Life & Pensions, we are developing a new retirement business line, offering an integrated value proposition and unlocking synergies with Asset Management, aiming to support our long-term vision for growth in this business.
•In terms of Property & Casualty, we are expanding high growth verticals such as: i) Health, where we are developing targeted solutions for our customers, as we have done in Chile in agreement with UC Christus, and ii) Motor, where we have closed new deals with OEMs in Mexico through Autocompara, our insurance comparison web operating mainly in Latin America.
We remain focused on increasing the use of data to offer personalized solutions while embedding our products into key customer journeys. During the quarter, we made progress delivering fully-digital servicing and claims capabilities in Portugal, Chile and Brazil.
Since 2023, Insurance has operated under a single holding company enabling us to unify management, governance, risk and control across all insurance entities, and improving the integration of the Insurance business into the Group’s model. This quarter, there were key additions to the board of directors of Santander Insurance Holding, strengthening it to ensure strategic focus and expert oversight.
•Portfolio Investments is incorporated as a fourth vertical that integrates the investment platforms unit as well as other corporate investments. We have integrated this business line into Wealth to capture synergies and enhance our value proposition and the service provided to our customers.
Business performance
Total assets under management (AuMs) reached new record levels of EUR 511 billion, +11% year-on-year in constant euros, driven by solid commercial activity and positive market performance.
By business and in constant euros, volumes performed as follows:
•In PB, customer assets and liabilities reached a new record of EUR 335 billion (+9% year-on-year), with all product categories growing, especially funds and custody. Net new money totalled EUR 5.7 billion in the quarter, increasing year-on-year.
We continued to focus on offering our customers the benefits of our scale and international presence. This resulted in 9% year-on-year growth in our customer base to 301,000.
•In SAM, total assets under management reached EUR 244 billion, +14% year-on-year, on the back of solid commercial activity in most countries. Net sales in Q1 2025 reached EUR 4.8 billion, well above Q1 2024 levels.
•In Insurance, gross written premiums reached EUR 2.7 billion in the first three months of 2025, increasing 4% year-on-year, driven by life savings business.
|
|
|
|
|
|
|
|
|
|
|
|
|
|
|
|
|
|
|
|
|
Wealth. Business performance. March 2025 |
| EUR billion and % change in constant euros |
|
|
|
|
| Total AuMs |
| Funds and investment* |
| - SAM |
| - Private Banking |
| Custody |
| Customer deposits |
| Customer loans |
|
| GWPs |
|

|
|
|
|
|
|
|
|
| / Dec-24 |
/ Mar-24 |
| +3 |
% |
+11 |
% |
| +3 |
% |
+15 |
% |
| +3 |
% |
+14 |
% |
| +4 |
% |
+19 |
% |
| +2 |
% |
+5 |
% |
| +3 |
% |
+5 |
% |
| +2 |
% |
+8 |
% |
|
|
| +9 |
% |
+4 |
% |
|
|
Note: total products marketed, advised, under custody and/or managed.
*Excluding overlaps between PB and SAM (PB clients with investment funds managed by SAM).
Results
Attributable profit in Q1 2025 amounted to EUR 471 million, 25% higher year-on-year. In constant euros, it grew 28%, with the following performance by line:
•Total income was EUR 1,019 million, 14% higher year-on-year as a result of our focus on value-added solutions to expand our fee businesses.
Net interest income decreased 16% in a lower interest rate environment in some of our main units, despite higher volumes in Private Banking.
Net fee income rose 16% year-on-year to EUR 419 million, with good overall performance across businesses. Of note were the performances in Private Banking and SAM, on the back of our increased focus on fee generating activities and products and the positive commercial activity and market performance.
Other income increased, boosted by the good performance of joint ventures in Insurance and also due to Portfolio Investments vertical.
•Costs increased 10% year-on-year, growing less than total income, reflecting our investments to reinforce PB teams and new capabilities to address the increase in commercial activity.
Including the fees ceded to our commercial network, total revenue reached EUR 1,639 million, up 12%, on the back of a more recurrent activity in Private Banking, higher volumes in SAM and the good performance of the insurance related businesses.
|
|
|
|
|
|
|
|
|
|
|
|
|
|
|
|
|
|
|
|
|
|
|
|
|
|
|
|
|
|
|
|
|
Wealth. Total income. Q1 2025 |
| EUR million and YoY % change in constant euros |
|

|
|
|
|
|
|
| Total income |
Total income + ceded fees |
| +2% |
+2% |
| +15% |
+20% |
| +30% |
+8% |
|
|
|
|
|
|
|
|
|
|
|
|
|
|
|
Total income |
|
Fees ceded to the commercial network |
Note: Additionally, Wealth's total income included EUR 10 million in Q1'24 and EUR 72 million in Q1'25 corresponding to Portfolio Investments. Information excludes overlaps between Wealth businesses and also Insurance fees recorded in Consumer.
When considering these ceded fees along with our PAT, the total contribution to Group profit (PAT+Fees) reached EUR 897 million, up 19% year-on-year in euros and in constant euros.
Our RoTE (post-AT1) for Q1 2025 was 68.0%.
Compared to Q4 2024, attributable profit increased 6% in constant euros due to higher volumes, cost savings, the good start to the year in Insurance joint ventures and higher fees in Private Banking, more than offsetting lower net interest income, mainly in PB.
|
|
|
|
|
|
|
|
|
|
|
|
|
|
|
|
|
|
|
|
|
|
|
|
Wealth. Underlying income statement |
|
EUR million and % change |
|
|
|
|
|
|
|
|
|
|
|
|
|
|
|
|
|
|
|
|
|
/ |
Q4'24 |
|
|
/ |
Q1'24 |
|
|
Q1'25 |
% |
excl. FX |
|
|
% |
excl. FX |
|
|
|
|
|
|
|
|
|
|
Total income |
1,019 |
|
-1 |
-1 |
|
|
+13 |
+14 |
|
Expenses |
-372 |
|
-11 |
-11 |
|
|
+9 |
+10 |
|
Net operating income |
647 |
|
+6 |
+6 |
|
|
+15 |
+17 |
|
LLPs |
-8 |
|
-58 |
-58 |
|
|
+100 |
+97 |
|
PBT |
639 |
|
+5 |
+5 |
|
|
+20 |
+23 |
|
Attributable profit |
471 |
|
+6 |
+6 |
|
|
+25 |
+28 |
|
|
|
|
|
|
|
|
|
|
|
|
|
|
|
|
|
|
|
|
|
PAYMENTS |
|
Underlying attributable profit |
EUR 126 mn |
|
|
|
|
|
→ PagoNxt and Cards bring a unique position in the payments industry to the Group, covering both sides of the value chain of card payments (issuing and acquiring businesses) and account-to-account payments.
→ Activity increased in both businesses, supported by global platform development, enabling further scale gains. In PagoNxt, Getnet's Total Payments Volume (TPV) rose 14% year-on-year in constant euros and the number of transactions improved 4%. In Cards, turnover increased 7% year-on-year in constant euros and transactions rose 5%.
→ Attributable profit was EUR 126 million, 9% higher year-on-year, +30% in constant euros. The EBITDA margin in PagoNxt improved 11.6 pp to 28.6%.
|
|
|
|
|
|
|
|
PagoNxt and Cards strategy
In PagoNxt, we started the year making progress in our strategic priorities:
•In Getnet, we focused on driving profitable growth and increasing market share. We continued investing in commercial capabilities while further expanding business across the Group and developing open market opportunities.
We remain focused on globalizing products and technology. We launched G-Tap in Mexico, the Tap on Phone solution that is already available in Spain, Portugal and Brazil.
In Chile, we are migrating our customer base to our cloud-native global acquiring platform. We have more than 280,000 active PoS and we are creating new opportunities for businesses, supported by the new functionalities incorporated in our Get Smart PoS (such as bill payments and mobile top-ups).
In Brazil, the Dynamic Currency Conversion (DCC) tool is now available, designed for foreign customers who want to make payments (online or in person) directly in their local currencies (over 30 currencies available), in a simple and practical way, thereby enhancing the purchase experience.
•In Ebury, we focused on: i) growing customers by expanding our product offering and online capabilities; ii) expanding geographically with a focus on developing markets; iii) introducing tailored products to capture verticals such as mass payments; and iv) increasing collaboration revenue with other Group units.
•PagoNxt Payments, our solution to transfer money providing superior experience, leverages the best technology to build tailored solutions for our customer and deliver A2A payments processing, foreign exchange, fraud detection and value-added services.
In Cards, we started 2025 with a focus on the following priorities:
•Expand the business to continue the good dynamics from 2024.
We made progress implementing Cards Risk Data Lab in seven of our countries, with new functionalities to improve the credit card experience in the different phases of its life cycle.
We continued to combine our business card issuance capabilities with Getnet to offer greater added value. Our priority for this year is to launch a joint value proposition (cards and PoS) in the Group's countries where we have the issuing and acquiring businesses, as we did in Chile and Spain in 2024.
•Improve customer satisfaction. We are working to offer global solutions to facilitate the use of our cards, increase the security of our products and handle all transactions digitally. For instance, centralized management of tokenized payments, enrolment in Apple Pay and Google Pay from our app, launch Click to Pay across some of our markets and incident management from digital channels.
•Implement our global card platform (Plard), which already manages more than 16 million debit cards in Brazil, and in 2025 we will start issuing debit cards for new customers in Chile.
In Mexico, the new authorizer continued to process more than 160 million transactions per month.
Business performance
Loans and advances to customers rose 4% year-on-year. In gross terms, excluding reverse repos and in constant euros, loans rose 15%, driven mainly by higher volumes in Cards in all our countries, mainly in South American countries.
Payments has a very small amount of deposits, concentrated in PagoNxt. These deposits (excluding repos) rose 33% year-on-year in euros and in constant euros.
Results
Attributable profit was EUR 126 million in Q1 2025, 9% up year-on-year. In constant euros, profit rose 30%, by line:
•Total income grew 15%, boosted by double-digit growth in net interest income and net fee income in both businesses driven by increased activity.
•Costs were flat, decreasing 3% in real terms, supported by our cost discipline, even after our investments in platforms both in Cards and PagoNxt.
•Net loan-loss provisions, mainly related to Cards, rose 33%, in part due to the double-digit loan growth, especially in Brazil and Mexico, and the impact related to changes in models.
Compared to Q4 2024, profit fell 49% in constant euros due to lower revenue, affected by seasonality and higher provisions (+10%), mainly in the UK and Brazil, while costs improved slightly (-1%).
|
|
|
|
|
|
|
|
|
|
|
|
|
|
|
|
|
|
|
|
|
|
|
|
Payments. Underlying income statement |
|
EUR million and % change |
|
|
|
|
|
|
|
|
|
|
|
|
|
|
|
|
|
|
|
|
|
/ |
Q4'24 |
|
|
/ |
Q1'24 |
|
|
Q1'25 |
% |
excl. FX |
|
|
% |
excl. FX |
|
|
|
|
|
|
|
|
|
|
Total income |
1,383 |
|
-9 |
-8 |
|
|
+5 |
+15 |
|
Expenses |
-608 |
|
-1 |
-1 |
|
|
-5 |
0 |
|
Net operating income |
776 |
|
-14 |
-13 |
|
|
+14 |
+30 |
|
LLPs |
-492 |
|
+10 |
+10 |
|
|
+18 |
+33 |
|
PBT |
248 |
|
-40 |
-39 |
|
|
+4 |
+20 |
|
Attributable profit |
126 |
|
-50 |
-49 |
|
|
+9 |
+30 |
|
|
PagoNxt
Business performance
In Q1 2025, the total number of transactions in Getnet reached 2.5 billion, 4% higher year-on-year, and the total payments volume (TPV) was EUR 55.8 billion, 14% more than in Q1 2024 in constant euros.
In PagoNxt Payments, A2A payments activity on our Payments Hub platform continued ramping up. In Q1 2025, the number of transactions processed was 454 million, triple the volume in Q1 2024 (159 million).
|
|
|
|
|
| PagoNxt. Activity |
|
|
|
| TPV (Getnet) |
|
|
| EUR billion and changes in constant euros |
|
|
Results
In Q1 2025, attributable profit of EUR 4 million, compared to a EUR 39 million loss in the same period of 2024. There was no material impact from exchange rates in the period. In constant euros:
•Total income up 21% year-on-year, with double-digit growth in net interest income and net fee income, driven by higher activity. There were good revenue performances across business lines, especially in Ebury and in Getnet in Mexico, Chile and Europe.
•Costs decreased 2% year-on-year, reflecting our cost discipline, with a good performance in Getnet, while continuing to invest in global payments platforms.
EBITDA margin increased to 28.6%, 11.6 pp higher than in Q1 2024.
Compared to Q4 2024, attributable profit was EUR 4 million, down from EUR 26 million profit in Q4 2024 due to the usual revenue seasonality in the last quarter of the year.
|
|
|
|
|
|
|
|
|
|
|
|
|
|
|
|
|
|
|
|
|
|
|
|
|
|
|
PagoNxt. Underlying income statement |
|
EUR million and % change |
|
|
|
|
|
|
|
|
|
|
|
|
|
|
|
|
|
|
|
|
|
|
|
|
/ |
Q4'24 |
|
|
/ |
Q1'24 |
|
|
Q1'25 |
Q1'24 |
% |
excl. FX |
|
|
% |
excl. FX |
|
|
|
|
|
|
|
|
|
|
|
Total income |
317 |
283 |
-8 |
-8 |
|
|
+12 |
+21 |
|
Expenses |
-286 |
-304 |
+6 |
+5 |
|
|
-6 |
-2 |
|
Net operating income |
31 |
-21 |
-59 |
-58 |
|
|
— |
— |
|
LLPs |
-6 |
-4 |
+59 |
+56 |
|
|
+50 |
+69 |
|
PBT |
13 |
-27 |
-73 |
-73 |
|
|
— |
— |
|
Attributable profit |
4 |
-39 |
-83 |
-82 |
|
|
— |
— |
|
|
Cards
Business performance
Our customer spending on cards increased 7% year-on-year in constant euros. The number of cards increased year-on-year, especially credit cards, in line with our strategy to increase the weight of credit cards in our countries.
The number of transactions rose 5% year-on-year, boosted by increased card usage for all types of payments.
Gross loans and advances to customers, excluding reverse repos and in constant euros rose 15%, driven by good performances across our countries, of note was the double-digit growth in our South American countries.
|
|
|
|
|
| Cards. Activity |
|
|
|
| Spending |
|
|
| EUR billion and changes in constant euros |
|
|
Results
In Q1 2025, attributable profit amounted to EUR 121 million, 22% less than in the same period of 2024. In constant euros, profit decreased 14%, by line:
•Total income increased 13% year-on-year, driven by strong growth in net interest income (+14%) due to higher volumes, and net fee income (+10%), driven by interchange fees in Latin America.
•Costs rose 2%, as a result of our focus on cost management and despite our investment in platforms.
•Net loan-loss provisions increased 33%, mainly driven by strong credit portfolio growth across the portfolio in general, macro outlook and regulatory changes in models in Brazil and model updates in Mexico due to the macro environment.
In Q1 2025, RoTE (post-AT1) in Cards was 19.2%.
Compared to Q4 2024, attributable profit was affected by the effect of the exchange rate in Argentina in Q4 and seasonality in revenue, characterized by high spending Q4 each year while Q1 usually has the lowest transactionality, and by higher provisions. Of note, net interest income rose 6% excluding Argentina.
|
|
|
|
|
|
|
|
|
|
|
|
|
|
|
|
|
|
|
|
|
|
|
|
Cards. Underlying income statement |
|
EUR million and % change |
|
|
|
|
|
|
|
|
|
|
|
|
|
|
|
|
|
|
|
|
|
/ |
Q4'24 |
|
|
/ |
Q1'24 |
|
|
Q1'25 |
% |
excl. FX |
|
|
% |
excl. FX |
|
|
|
|
|
|
|
|
|
|
Total income |
1,067 |
-9 |
-8 |
|
|
+3 |
+13 |
|
Expenses |
-322 |
-6 |
-6 |
|
|
-4 |
+2 |
|
Net operating income |
745 |
-10 |
-9 |
|
|
+6 |
+19 |
|
LLPs |
-486 |
+9 |
+10 |
|
|
+17 |
+33 |
|
PBT |
235 |
-36 |
-35 |
|
|
-12 |
-3 |
|
Attributable profit |
121 |
-46 |
-46 |
|
|
-22 |
-14 |
|
|
|
|
|
|
|
|
|
|
|
|
|
|
|
|
|
|
|
|
|
CORPORATE CENTRE |
|
Underlying attributable profit |
-EUR 394 mn |
|
|
|
|
|
|
|
|
|
|
|
→ The Corporate Centre continued to support the Group, defining, developing and coordinating the Group's strategy, as well as aiding the operating units, adding value.
→ It carries out the corporate oversight and control function, coordinates interactions with the Group's supervisors and regulators and also carries out functions related to financial and capital management.
→ Attributable loss of EUR 394 million in Q1 2025, a 10% greater loss year-on-year, impacted by a weaker performance in net interest income and higher net loan-loss provisions to accelerate the Group's NPL ratio reductions, partially offset by lower losses on financial transactions driven by a lower impact from currency hedges.
|
|
|
|
|
|
|
|
Strategy and functions
The Corporate Centre contributes value to the Group, through the following functions, among others:
•Global control frameworks and supervision.
•Fostering the exchange of best practices in cost management, which enables us to be one of the most efficient banks.
•Collaborating in the definition and execution of the global strategy, competitive development operations and projects that ensure we meet the business plan.
•Contributing to the launch of projects that will be developed by our global businesses, aimed at leveraging our worldwide presence to generate economies of scale.
•Ensuring open and constructive communication with shareholders, analysts, investors, bondholders, rating agencies and other market players.
•Adding value to our businesses, countries and divisions by encouraging the exchange of best practices, driving and managing innovative global initiatives and defining corporate policies to improve efficiency in our processes and service quality for our customers.
It also coordinates the relationship with European regulators and supervisors and carries out functions related to financial and capital management, as follows:
•Financial Management functions:
•Structural management of liquidity risk associated with funding the Group’s recurring activity and stakes of a financial nature. At the end of March 2025, the liquidity buffer was EUR 329 billion (provisional data).
This is done ensuring the diversification of funding sources (issuances and others), maintaining an adequate profile in volumes, maturities and costs.
The price of these transactions with other Group units is the market rate that includes all liquidity concepts (which the Group supports by immobilizing funds during the term of the transaction) and regulatory requirements (TLAC/MREL).
•We also actively manage interest rate risk to dampen the impact of interest rate changes on net interest income, conducted via high credit quality, very liquid and low capital consumption derivatives.
•Strategic management of exposure to exchange rates in equity and dynamic management of the FX hedges related to the units’ next twelve months results in euros. The net investments in equity currently hedged totalled EUR 20,089 million (mainly in the UK, Poland, Mexico and Chile) with different FX instruments (spots and forwards).
•Management of total capital and reserves: capital analysis, adequacy and management of the Group including: coordination with subsidiaries, monitoring profitability to maximize shareholder returns, setting solvency targets and capital contributions, and monitoring the capital ratio in both regulatory and economic terms, and efficient capital allocation to the units.
Results
In Q1 2025, the attributable loss was EUR 394 million, 10% higher than in Q1 2024 (EUR 357 million loss), with the following performance by line:
•Net interest income declined EUR 81 million as lower interest rates impacted the balance sheet which has positive sensitivity to rate rises.
•Losses on financial transactions improved EUR 71 million, due to a lower impact from foreign currency hedges.
•Costs were flat compared to Q1 2024, driven by ongoing simplification measures.
•Net loan-loss provisions increased year-on-year reflecting our strategy to accelerate NPL ratio reductions, improving the Group's credit quality.
•Other results and provisions was 27% less negative year-on-year.
|
|
|
|
|
|
|
|
|
|
|
|
|
|
|
|
|
|
|
|
|
|
|
|
Corporate Centre. Underlying income statement |
|
EUR million and % change |
|
|
|
|
|
|
|
|
|
|
|
Q1'25 |
Q4'24 |
% chg. |
|
|
Q1'24 |
% chg. |
|
|
|
|
|
|
|
|
|
|
Total income |
-215 |
|
-72 |
|
+200 |
|
|
-210 |
|
+3% |
|
Net operating income |
-303 |
|
-176 |
|
+72 |
|
|
-297 |
|
+2% |
|
PBT |
-431 |
|
-197 |
|
+119 |
|
|
-340 |
|
+27% |
|
Attributable profit |
-394 |
|
-142 |
|
+177 |
|
|
-357 |
|
+10% |
|
|
SUSTAINABILITY
STRATEGY
|
|
|
|
|
|
|
|
|
| 1 |
|
Help our customers in meeting their goals in their transition to a low-carbon economy while also managing climate-related risks and impacts. |
|
|
|
| 2 |
|
Help our employees develop by promoting an inclusive culture and learning and by providing fair working conditions. |
|
|
|
| 3 |
|
Contribute to the economic, financial and social development of our communities, with a special focus on education, employability and entrepreneurship. |
|
|
|
| 4 |
|
Be a trusted partner to our customers, with products and services that adapt to their needs, while applying responsible practices, supporting their financial inclusion and protecting their information. |
|
|
|
| 5 |
|
Act responsibly through a strong culture, governance and conduct. |
|
|
|
|
|
|
|
|
|
|
|
|
|
|
|
|
|
|
|
|
|
|
|
|
|
|
|
|
|
Green finance |
|
Socially Responsible Investments (SRI) AuMs |
|
Financial inclusion |
|
|
EUR 144.9
billion
|
|
EUR 108.0
billion
|
|
4.8
million people
|
|
|
Target 1: EUR 120 bn 2025 |
|
Target: EUR 100 bn 2025 |
|
Target: 5 mn 2025 |
|
|
Target 2: EUR 220 bn 2030 |
|
|
|
|
|
|
Note: targets were set in 2019 and 2021, before the publication of the European taxonomy in Q2 2023. Therefore, target definitions are not fully aligned with the taxonomy. For further information, see the 'Alternative performance measures' section in the appendix to this report. |
|
KEY HIGHLIGHTS
→ In February, we published the 2024 Annual Report in which the Sustainability chapter responds to the European Corporate Sustainability Reporting Directive (CSDR). We report the management of material impacts, risks and opportunities derived from Santander's activity separated into five areas: climate change, own workforce, supporting communities, customers, and employees and business conduct. We also published sustainability reports in the UK, Poland, Mexico and our unit in the Nordic region.
→ In 2024, we maintained or increased our ESG rating positions: MSCI (AA), CDP (leadership, improved from A- to A), Sustainalytics (low risk, improving our performance) and in ISS, we improved to C+ from C.
→ On 4 April 2025, the annual general meeting approved the long-term incentive scheme (2025-2027), where ESG metrics account for 20% of the total. The remuneration of employees at the global and subsidiary corporate centres also include a qualitative adjustment based on their performance on sustainability goals.
→ Regarding our three Investor Day targets:
–In 2024, we exceeded our target of EUR 120 billion in green finance raised or facilitated 18 months early.
–This quarter, we achieved our target of EUR 100 billion in Socially Responsible Investments (SRI) AuMs nine months early. Our SRI assets were EUR 108 billion, of which EUR 63.7 billion were in SAM and EUR 44.2 billion from third party funds in Private Banking.
–We continued making progress in our target to financially include 5 million people between 2023 and 2025.
→ With the aim of facilitating financing for agricultural producers who want to implement deforestation and ecological regeneration projects, Banco Santander Argentina signed an agreement with Nativas, a company that addresses the challenge of sustainability through technology.
→ The Santander X Global Challenge | New Era of Customer Experience initiative, launched together with Telefónica, presented its awards to the best startups and scaleups in integrating technology and new digital approaches to transform the relationship with customers with more than 900 participating companies from 11 countries. Santander Open Academy announced the 550 female managers from 11 countries that won the Santander W50 women’s leadership programme.
CORPORATE GOVERNANCE
|
|
|
|
|
|
|
|
|
|
|
|
|
|
|
|
u |
The 2025 ordinary general shareholders’ meeting was held by virtual means |
|
|
|
|
u |
This format ensures equal treatment of all our shareholders |
|
|
|
|
|
|
|
2025 ordinary general shareholders’ meeting. |
|
|
|
|
2025 ordinary general shareholders’ meeting
Banco Santander held its 2025 ordinary general shareholders’ meeting on 4 April, on second call and exclusively by remote means. The meeting was broadcast live from the corporate headquarters in Boadilla del Monte, where the Presiding Committee (Mesa de la Junta) of the general shareholders’ meeting was gathered.
This meeting format is possible thanks to the ability by the law and the amendment of the Bylaws approved in 2021 under majority support of the shareholders and is consistent with Grupo Santander’s digitalization policy. The General Shareholders’ Meeting Platform, through which shareholders attended the meeting, provides sufficient guarantees and encourages their participation and full exercise of their rights, regardless of their location.
559,938 shareholders, owning 68.507% of the share capital, attended the general meeting on their own behalf or by proxy. This quorum is the second highest in the Bank's shareholders' meetings.
The proposed resolutions submitted by the board passed with an average of 98.7% votes in favour. 99.56% of voting shareholders approved the Bank’s management for the 2024 financial year.
Detailed information on the resolutions that passed at the general meeting can be found published on our corporate website (www.santander.com).
APPENDIX
Financial information
Group information
Note: from Q2 2024, we have begun to apply a new theoretical exchange rate for the Argentine peso which better reflects inflation in the country. For more information, see the calculation method detailed in the ‘
Alternative Performance Measures’ section in this appendix.
|
|
|
|
|
|
|
|
|
|
|
|
|
|
|
|
|
|
|
Net fee income. Consolidated |
| EUR million |
|
|
|
|
|
|
|
Q1'25 |
Q4'24 |
Change (%) |
|
Q1'24 |
Change (%) |
| Fees from services |
1,872 |
|
1,979 |
|
(5.4) |
|
1,821 |
|
2.8 |
| Wealth management and marketing of customer funds |
1,108 |
|
1,069 |
|
3.6 |
|
1,076 |
|
3.0 |
| Securities and custody |
389 |
|
296 |
|
31.4 |
|
343 |
|
13.4 |
| Net fee income |
3,369 |
|
3,344 |
|
0.7 |
|
3,240 |
|
4.0 |
|
|
|
|
|
|
|
|
|
|
|
|
|
|
|
|
|
|
|
Underlying operating expenses. Consolidated |
| EUR million |
|
|
|
|
|
|
|
Q1'25 |
Q4'24 |
Change (%) |
|
Q1'24 |
Change (%) |
| Staff costs |
3,532 |
|
3,770 |
|
(6.3) |
|
3,594 |
|
(1.7) |
| Other general administrative expenses |
2,103 |
|
2,178 |
|
(3.4) |
|
2,125 |
|
(1.0) |
| Information technology |
618 |
|
691 |
|
(10.6) |
|
645 |
|
(4.2) |
| Communications |
91 |
|
108 |
|
(15.7) |
|
104 |
|
(12.5) |
| Advertising |
136 |
|
140 |
|
(2.9) |
|
139 |
|
(2.2) |
| Buildings and premises |
179 |
|
186 |
|
(3.8) |
|
192 |
|
(6.8) |
| Printed and office material |
19 |
|
24 |
|
(20.8) |
|
23 |
|
(17.4) |
| Taxes (other than tax on profits) |
166 |
|
165 |
|
0.6 |
|
150 |
|
10.7 |
| Other expenses |
894 |
|
864 |
|
3.5 |
|
872 |
|
2.5 |
| Administrative expenses |
5,635 |
|
5,948 |
|
(5.3) |
|
5,719 |
|
(1.5) |
| Depreciation and amortization |
854 |
|
824 |
|
3.6 |
|
828 |
|
3.1 |
| Operating expenses |
6,489 |
|
6,772 |
|
(4.2) |
|
6,547 |
|
(0.9) |
|
|
|
|
|
|
|
|
|
|
|
|
|
|
|
|
|
|
|
|
|
|
|
|
|
|
|
Operating means. Consolidated |
|
Employees |
|
|
Branches |
|
Mar-25 |
Dec-24 |
Change |
|
|
Mar-25 |
Mar-24 |
Change |
| Retail & Commercial Banking |
130,869 |
|
131,653 |
|
(784) |
|
|
Spain |
1,792 |
|
1,864 |
|
(72) |
|
| Digital Consumer Bank |
31,547 |
|
29,903 |
|
1,644 |
|
|
United Kingdom |
444 |
|
444 |
|
0 |
|
| Corporate & Investment Banking |
13,538 |
|
13,385 |
|
153 |
|
|
Portugal |
373 |
|
375 |
|
(2) |
|
| Wealth Management & Insurance |
7,690 |
|
7,707 |
|
(17) |
|
|
Poland |
362 |
|
377 |
|
(15) |
|
| Payments |
21,700 |
|
22,280 |
|
(580) |
|
|
DCB Europe |
324 |
|
340 |
|
(16) |
|
| Corporate Centre |
1,793 |
|
1,825 |
|
(32) |
|
|
US |
404 |
|
413 |
|
(9) |
|
| Total Group |
207,137 |
206,753 |
384 |
|
Mexico |
1,342 |
|
1,370 |
|
(28) |
|
|
|
|
|
|
Brazil |
2,055 |
|
2,492 |
|
(437) |
|
|
|
|
|
|
Chile |
238 |
|
245 |
|
(7) |
|
|
|
|
|
|
Argentina |
301 |
|
318 |
|
(17) |
|
|
|
|
|
|
Rest of the Group |
275 |
|
167 |
|
108 |
|
|
|
|
|
|
Total Group |
7,910 |
8,405 |
(495) |
|
|
|
|
|
|
|
|
|
|
|
|
|
|
|
|
|
|
|
Underlying net loan-loss provisions. Consolidated |
| EUR million |
|
|
|
|
|
|
|
Q1'25 |
Q4'24 |
Change (%) |
|
Q1'24 |
Change (%) |
|
|
|
|
|
|
|
| Non-performing loans |
3,531 |
|
3,526 |
|
0.1 |
|
3,464 |
|
1.9 |
| Country-risk |
(1) |
|
(1) |
|
— |
|
|
— |
|
— |
|
| Recovery of written-off assets |
(369) |
|
(411) |
|
(10.2) |
|
(339) |
|
8.8 |
|
|
|
|
|
|
|
| Net loan-loss provisions |
3,161 |
|
3,114 |
|
1.5 |
|
3,125 |
|
1.2 |
|
|
|
|
|
|
|
|
|
|
|
|
|
|
|
|
|
|
Loans and advances to customers. Consolidated |
| EUR million |
|
|
|
|
|
|
|
|
Change |
|
|
Mar-25 |
Mar-24 |
Absolute |
% |
Dec-24 |
| Commercial bills |
52,987 |
|
50,959 |
|
2,028 |
|
4.0 |
53,209 |
|
| Secured loans |
556,458 |
|
557,047 |
|
(589) |
|
(0.1) |
557,463 |
|
| Other term loans |
299,063 |
|
301,931 |
|
(2,868) |
|
(0.9) |
296,339 |
|
| Finance leases |
40,203 |
|
38,786 |
|
1,417 |
|
3.7 |
40,120 |
|
| Receivable on demand |
11,649 |
|
13,452 |
|
(1,803) |
|
(13.4) |
10,756 |
|
| Credit cards receivable |
25,166 |
|
24,082 |
|
1,084 |
|
4.5 |
24,928 |
|
| Impaired assets |
33,551 |
|
34,147 |
|
(596) |
|
(1.7) |
33,731 |
|
| Gross loans and advances to customers (excl. reverse repos) |
1,019,077 |
|
1,020,404 |
|
(1,327) |
|
(0.1) |
1,016,546 |
|
| Reverse repos |
67,610 |
|
51,973 |
|
15,637 |
|
30.1 |
59,648 |
|
| Gross loans and advances to customers |
1,086,687 |
|
1,072,377 |
|
14,310 |
|
1.3 |
1,076,194 |
|
| Loan-loss allowances |
22,271 |
|
22,844 |
|
(573) |
|
(2.5) |
22,125 |
|
| Loans and advances to customers |
1,064,416 |
|
1,049,533 |
|
14,883 |
|
1.4 |
1,054,069 |
|
|
|
|
|
|
|
|
|
|
|
|
|
|
|
|
|
|
|
Total funds. Consolidated |
| EUR million |
|
|
|
|
|
|
|
|
Change |
|
|
Mar-25 |
Mar-24 |
Absolute |
% |
Dec-24 |
| Demand deposits |
673,560 |
|
658,749 |
|
14,811 |
|
2.2 |
677,818 |
|
| Time deposits |
302,136 |
|
306,491 |
|
(4,355) |
|
(1.4) |
299,801 |
|
| Mutual funds |
243,564 |
|
218,354 |
|
25,210 |
|
11.5 |
233,722 |
|
| Customer funds |
1,219,260 |
|
1,183,594 |
|
35,666 |
|
3.0 |
1,211,341 |
|
| Pension funds |
15,368 |
|
15,215 |
|
153 |
|
1.0 |
15,646 |
|
| Managed portfolios |
45,500 |
|
37,757 |
|
7,743 |
|
20.5 |
43,118 |
|
| Repos |
106,198 |
|
79,213 |
|
26,985 |
|
34.1 |
78,317 |
|
| Total funds |
1,386,326 |
|
1,315,779 |
|
70,547 |
|
5.4 |
1,348,422 |
|
|
|
|
|
|
|
|
|
|
|
|
|
|
|
|
|
|
|
Eligible capital (phased-in) 1. Consolidated |
| EUR million |
|
|
|
|
|
|
|
|
Change |
|
|
Mar-25 |
Mar-24 |
Absolute |
% |
Dec-24 |
| Capital stock and reserves |
133,128 |
|
127,857 |
|
5,272 |
|
4.1 |
124,263 |
|
| Attributable profit |
3,402 |
|
2,852 |
|
550 |
|
19.3 |
12,574 |
|
| Dividends |
(851) |
|
(713) |
|
(138) |
|
19.3 |
(3,144) |
|
| Other retained earnings |
(38,062) |
|
(35,527) |
|
(2,535) |
|
7.1 |
(38,323) |
|
| Minority interests |
8,746 |
|
7,550 |
|
1,196 |
|
15.8 |
8,479 |
|
| Goodwill and intangible assets |
(15,680) |
|
(16,889) |
|
1,209 |
|
(7.2) |
(15,957) |
|
| Other deductions |
(8,520) |
|
(6,497) |
|
(2,023) |
|
31.1 |
(8,092) |
|
| CET1 |
82,163 |
|
78,632 |
|
3,531 |
|
4.5 |
79,800 |
|
| Preferred shares and other eligible tier 1 |
10,006 |
|
9,104 |
|
902 |
|
9.9 |
10,371 |
|
| Tier 1 |
92,170 |
|
87,736 |
|
4,433 |
|
5.1 |
90,170 |
|
| Generic funds and eligible tier 2 instruments |
18,032 |
|
18,493 |
|
(461) |
|
(2.5) |
18,418 |
|
| Eligible capital |
110,201 |
|
106,229 |
|
3,972 |
|
3.7 |
108,589 |
|
| Risk-weighted assets |
639,124 |
|
640,382 |
|
(1,258) |
|
(0.2) |
624,503 |
|
|
|
|
|
|
|
| CET1 capital ratio |
12.9 |
12.3 |
0.6 |
|
12.8 |
| Tier 1 capital ratio |
14.4 |
13.7 |
0.7 |
|
14.4 |
| Total capital ratio |
17.2 |
16.6 |
0.7 |
|
17.4 |
1. Phased-in ratios are calculated in accordance with the transitory treatment of the CRR. For 2024 data, the transitional treatment of IFRS 9 also applies.
Segments information
|
|
|
|
|
|
|
|
|
|
|
|
|
|
|
|
|
|
|
|
|
|
| RETAIL & COMMERCIAL BANKING |
|
| EUR million |
|
|
|
|
|
|
|
|
/ |
Q4'24 |
|
|
/ |
Q1'24 |
| Underlying income statement |
Q1'25 |
% |
% excl. FX |
|
|
% |
% excl. FX |
| Net interest income |
6,721 |
|
(5.8) |
|
(6.2) |
|
|
|
(5.9) |
|
(1.9) |
|
| Net fee income |
1,210 |
|
3.9 |
|
3.1 |
|
|
|
0.4 |
|
6.7 |
|
Gains (losses) on financial transactions 1 |
172 |
|
(15.5) |
|
(14.4) |
|
|
|
22.9 |
|
24.0 |
|
| Other operating income |
(208) |
|
(39.5) |
|
(39.2) |
|
|
|
(50.9) |
|
(49.9) |
|
| Total income |
7,895 |
|
(3.2) |
|
(3.7) |
|
|
|
(2.1) |
|
2.4 |
|
| Administrative expenses and amortizations |
(3,113) |
|
(6.6) |
|
(6.7) |
|
|
|
(5.2) |
|
(0.9) |
|
| Net operating income |
4,782 |
|
(0.9) |
|
(1.6) |
|
|
|
0.1 |
|
4.7 |
|
| Net loan-loss provisions |
(1,431) |
|
3.1 |
|
2.0 |
|
|
|
(6.1) |
|
1.9 |
|
| Other gains (losses) and provisions |
(528) |
|
(36.5) |
|
(37.1) |
|
|
|
(37.0) |
|
(35.4) |
|
| Profit before tax |
2,823 |
|
8.2 |
|
7.8 |
|
|
|
16.9 |
|
20.5 |
|
| Tax on profit |
(758) |
|
23.3 |
|
22.4 |
|
|
|
(2.9) |
|
0.3 |
|
| Profit from continuing operations |
2,065 |
|
3.6 |
|
3.2 |
|
|
|
26.4 |
|
30.2 |
|
| Net profit from discontinued operations |
— |
|
— |
|
— |
|
|
|
— |
|
— |
|
| Consolidated profit |
2,065 |
|
3.6 |
|
3.2 |
|
|
|
26.4 |
|
30.2 |
|
| Non-controlling interests |
(163) |
|
24.7 |
|
21.3 |
|
|
|
72.0 |
|
71.7 |
|
| Profit attributable to the parent |
1,902 |
|
2.1 |
|
1.9 |
|
|
|
23.6 |
|
27.5 |
|
|
| Balance sheet and activity metrics |
|
|
|
|
|
|
|
| Loans and advances to customers |
611,531 |
|
0.4 |
|
0.7 |
|
|
|
(1.8) |
|
(0.5) |
|
| Customer deposits |
655,503 |
|
(0.8) |
|
(0.7) |
|
|
|
0.7 |
|
2.3 |
|
|
|
|
|
|
|
|
|
| Memorandum items: |
|
|
|
|
|
|
|
| Gross loans and advances to customers ² |
608,049 |
|
(0.2) |
|
0.0 |
|
|
|
(2.1) |
|
(0.6) |
|
| Customer funds |
744,648 |
|
(0.6) |
|
(0.5) |
|
|
|
1.5 |
|
3.6 |
|
| Customer deposits ³ |
644,088 |
|
(0.8) |
|
(0.7) |
|
|
|
0.4 |
|
2.0 |
|
| Mutual funds |
100,560 |
|
0.9 |
|
0.6 |
|
|
|
9.3 |
|
15.1 |
|
| Risk-weighted assets |
305,300 |
|
5.7 |
|
|
|
|
2.1 |
|
|
|
| Ratios (%) and customers |
|
|
|
|
|
|
|
| RoTE |
18.3 |
|
(1.0) |
|
|
|
|
2.2 |
|
|
| RoTE (post-AT1) |
17.6 |
|
(0.9) |
|
|
|
|
2.3 |
|
|
| Efficiency ratio |
39.4 |
|
(1.4) |
|
|
|
|
(1.3) |
|
|
| NPL ratio |
3.12 |
|
(0.06) |
|
|
|
|
(0.09) |
|
|
| NPL coverage ratio |
59.0 |
|
0.6 |
|
|
|
|
(1.7) |
|
|
| Number of employees |
130,869 |
|
(0.6) |
|
|
|
|
|
|
|
|
|
|
|
|
|
|
| Number of total customers (thousands) |
148,701 |
|
1.1 |
|
|
|
|
5.9 |
|
|
| Number of active customers (thousands) |
79,479 |
|
0.5 |
|
|
|
|
4.6 |
|
|
|
|
|
| 1. Includes exchange differences. |
| 2. Excluding reverse repos. |
| 3. Excluding repos. |
|
|
|
|
|
|
|
|
|
|
|
|
|
|
|
|
|
|
| Retail Spain |
|
|
|
|
|
| EUR million |
|
|
|
|
|
|
/ Q4'24 |
|
|
/ Q1'24 |
| Underlying income statement |
Q1'25 |
% |
|
|
% |
| Net interest income |
1,467 |
|
2.6 |
|
|
|
(0.4) |
|
| Net fee income |
291 |
|
19.0 |
|
|
|
2.9 |
|
|
|
|
|
|
|
|
|
|
|
|
|
| Total income |
1,794 |
|
7.2 |
|
|
|
0.8 |
|
| Administrative expenses and amortizations |
(571) |
|
(5.0) |
|
|
|
0.7 |
|
| Net operating income |
1,223 |
|
14.1 |
|
|
|
0.8 |
|
| Net loan-loss provisions |
(291) |
|
(0.2) |
|
|
|
2.8 |
|
|
|
|
|
|
|
| Profit before tax |
810 |
|
41.3 |
|
|
|
39.7 |
|
|
|
|
|
|
|
|
|
|
|
|
|
|
|
|
|
|
|
|
|
|
|
|
|
|
|
|
|
|
|
|
|
|
|
|
|
|
| Balance sheet and activity metrics |
|
|
|
|
|
| Loans and advances to customers |
152,432 |
|
0.9 |
|
|
|
(2.2) |
|
| Customer deposits |
218,201 |
|
(1.8) |
|
|
|
3.9 |
|
|
|
|
|
|
|
| Memorandum items: |
|
|
|
|
|
Gross loans and advances to customers 1 |
155,833 |
|
0.8 |
|
|
|
(2.3) |
|
| Customer funds |
263,958 |
|
(0.9) |
|
|
|
5.5 |
|
Customer deposits 2 |
218,201 |
|
(1.8) |
|
|
|
3.9 |
|
| Mutual funds |
45,757 |
|
3.7 |
|
|
|
14.3 |
|
|
|
|
|
|
|
|
|
|
|
|
|
|
|
|
|
|
|
|
|
|
|
|
|
|
|
|
|
|
|
|
|
|
|
|
|
|
|
|
|
|
|
|
|
|
|
|
|
|
|
|
|
|
|
|
|
|
|
|
|
|
|
|
|
|
| 1. Excluding reverse repos. |
| 2. Excluding repos. |
|
|
|
|
|
|
|
|
|
|
|
|
|
|
|
|
|
|
|
|
|
|
|
|
| Retail UK |
|
| EUR million |
|
|
|
|
|
|
|
|
/ |
Q4'24 |
|
|
/ |
Q1'24 |
| Underlying income statement |
Q1'25 |
% |
% excl. FX |
|
|
% |
% excl. FX |
| Net interest income |
1,224 |
|
(1.0) |
|
(0.6) |
|
|
|
9.4 |
|
6.8 |
|
| Net fee income |
5 |
|
— |
|
— |
|
|
|
699.3 |
|
680.2 |
|
|
|
|
|
|
|
|
|
|
|
|
|
|
|
|
|
| Total income |
1,190 |
|
(0.9) |
|
(0.5) |
|
|
|
7.0 |
|
4.4 |
|
| Administrative expenses and amortizations |
(638) |
|
(5.4) |
|
(5.0) |
|
|
|
(1.9) |
|
(4.3) |
|
| Net operating income |
552 |
|
4.9 |
|
5.3 |
|
|
|
19.6 |
|
16.7 |
|
| Net loan-loss provisions |
(36) |
|
— |
|
— |
|
|
|
310.2 |
|
300.4 |
|
|
|
|
|
|
|
|
|
| Profit before tax |
348 |
|
(8.9) |
|
(8.4) |
|
|
|
(5.4) |
|
(7.7) |
|
|
|
|
|
|
|
|
|
|
|
|
|
|
|
|
|
|
|
|
|
|
|
|
|
|
|
|
|
|
|
|
|
|
|
|
|
|
|
|
|
|
|
|
|
|
|
|
|
|
| Balance sheet and activity metrics |
|
|
|
|
|
|
|
| Loans and advances to customers |
241,616 |
|
0.8 |
|
1.7 |
|
|
|
(0.5) |
|
(2.6) |
|
| Customer deposits |
215,993 |
|
(1.5) |
|
(0.6) |
|
|
|
(4.2) |
|
(6.1) |
|
|
|
|
|
|
|
|
|
| Memorandum items: |
|
|
|
|
|
|
|
Gross loans and advances to customers 1 |
227,609 |
|
(0.9) |
|
0.0 |
|
|
|
(1.1) |
|
(3.1) |
|
| Customer funds |
215,293 |
|
(1.1) |
|
(0.2) |
|
|
|
(3.4) |
|
(5.4) |
|
Customer deposits 2 |
209,383 |
|
(1.1) |
|
(0.2) |
|
|
|
(3.5) |
|
(5.5) |
|
| Mutual funds |
5,910 |
|
(2.2) |
|
(1.3) |
|
|
|
(1.6) |
|
(3.6) |
|
|
|
|
|
|
|
|
|
|
|
|
|
|
|
|
|
|
|
|
|
|
|
|
|
|
|
|
|
|
|
|
|
|
|
|
|
|
|
|
|
|
|
|
|
|
|
|
|
|
|
|
|
|
|
|
|
|
|
|
|
|
|
|
|
|
|
|
|
|
|
|
|
|
|
|
|
|
|
|
|
|
|
|
|
|
| 1. Excluding reverse repos. |
| 2. Excluding repos. |
|
|
|
|
|
|
|
|
|
|
|
|
|
|
|
|
|
|
|
|
|
|
|
|
| Retail Mexico |
|
| EUR million |
|
|
|
|
|
|
|
|
/ |
Q4'24 |
|
|
/ |
Q1'24 |
| Underlying income statement |
Q1'25 |
% |
% excl. FX |
|
|
% |
% excl. FX |
| Net interest income |
756 |
|
(1.1) |
|
(0.4) |
|
|
|
(7.6) |
|
7.6 |
|
| Net fee income |
171 |
|
10.2 |
|
10.0 |
|
|
|
(2.2) |
|
13.9 |
|
|
|
|
|
|
|
|
|
|
|
|
|
|
|
|
|
| Total income |
896 |
|
0.4 |
|
0.9 |
|
|
|
(7.5) |
|
7.7 |
|
| Administrative expenses and amortizations |
(397) |
|
(14.9) |
|
(13.6) |
|
|
|
(8.1) |
|
7.1 |
|
| Net operating income |
499 |
|
17.2 |
|
16.3 |
|
|
|
(7.1) |
|
8.2 |
|
| Net loan-loss provisions |
(135) |
|
40.4 |
|
32.7 |
|
|
|
(34.3) |
|
(23.5) |
|
|
|
|
|
|
|
|
|
| Profit before tax |
343 |
|
7.2 |
|
8.0 |
|
|
|
6.0 |
|
23.5 |
|
|
|
|
|
|
|
|
|
|
|
|
|
|
|
|
|
|
|
|
|
|
|
|
|
|
|
|
|
|
|
|
|
|
|
|
|
|
|
|
|
|
|
|
|
|
|
|
|
|
| Balance sheet and activity metrics |
|
|
|
|
|
|
|
| Loans and advances to customers |
30,518 |
|
(1.5) |
|
1.0 |
|
|
|
(12.6) |
|
7.6 |
|
| Customer deposits |
38,562 |
|
1.4 |
|
4.0 |
|
|
|
(9.8) |
|
11.2 |
|
|
|
|
|
|
|
|
|
| Memorandum items: |
|
|
|
|
|
|
|
Gross loans and advances to customers 1 |
31,256 |
|
(1.5) |
|
1.0 |
|
|
|
(12.8) |
|
7.5 |
|
| Customer funds |
48,607 |
|
0.8 |
|
3.4 |
|
|
|
(11.2) |
|
9.5 |
|
Customer deposits 2 |
35,139 |
|
(0.3) |
|
2.2 |
|
|
|
(17.6) |
|
1.6 |
|
| Mutual funds |
13,468 |
|
3.8 |
|
6.5 |
|
|
|
11.5 |
|
37.3 |
|
|
|
|
|
|
|
|
|
|
|
|
|
|
|
|
|
|
|
|
|
|
|
|
|
|
|
|
|
|
|
|
|
|
|
|
|
|
|
|
|
|
|
|
|
|
|
|
|
|
|
|
|
|
|
|
|
|
|
|
|
|
|
|
|
|
|
|
|
|
|
|
|
|
|
|
|
|
|
|
|
|
|
|
|
|
| 1. Excluding reverse repos. |
| 2. Excluding repos. |
|
|
|
|
|
|
|
|
|
|
|
|
|
|
|
|
|
|
|
|
|
|
|
|
| Retail Brazil |
|
| EUR million |
|
|
|
|
|
|
|
|
/ |
Q4'24 |
|
|
/ |
Q1'24 |
| Underlying income statement |
Q1'25 |
% |
% excl. FX |
|
|
% |
% excl. FX |
| Net interest income |
1,534 |
|
(4.2) |
|
(5.2) |
|
|
|
(12.8) |
|
(0.2) |
|
| Net fee income |
359 |
|
3.1 |
|
1.6 |
|
|
|
(9.6) |
|
3.5 |
|
|
|
|
|
|
|
|
|
|
|
|
|
|
|
|
|
| Total income |
1,878 |
|
(3.6) |
|
(4.6) |
|
|
|
(11.3) |
|
1.6 |
|
| Administrative expenses and amortizations |
(761) |
|
(0.3) |
|
(1.2) |
|
|
|
(9.8) |
|
3.3 |
|
| Net operating income |
1,117 |
|
(5.7) |
|
(6.8) |
|
|
|
(12.3) |
|
0.4 |
|
| Net loan-loss provisions |
(718) |
|
(1.6) |
|
(2.4) |
|
|
|
(4.7) |
|
9.1 |
|
|
|
|
|
|
|
|
|
| Profit before tax |
233 |
|
(19.2) |
|
(20.9) |
|
|
|
(30.8) |
|
(20.8) |
|
|
|
|
|
|
|
|
|
|
|
|
|
|
|
|
|
|
|
|
|
|
|
|
|
|
|
|
|
|
|
|
|
|
|
|
|
|
|
|
|
|
|
|
|
|
|
|
|
|
| Balance sheet and activity metrics |
|
|
|
|
|
|
|
| Loans and advances to customers |
52,449 |
|
(1.5) |
|
(5.0) |
|
|
|
(15.3) |
|
(2.9) |
|
| Customer deposits |
56,662 |
|
3.7 |
|
(0.1) |
|
|
|
(3.1) |
|
11.1 |
|
|
|
|
|
|
|
|
|
| Memorandum items: |
|
|
|
|
|
|
|
Gross loans and advances to customers 1 |
55,815 |
|
(1.5) |
|
(5.0) |
|
|
|
(14.6) |
|
(2.0) |
|
| Customer funds |
77,079 |
|
5.6 |
|
1.8 |
|
|
|
(3.2) |
|
11.0 |
|
Customer deposits 2 |
55,587 |
|
3.2 |
|
(0.5) |
|
|
|
(5.0) |
|
9.0 |
|
| Mutual funds |
21,492 |
|
12.4 |
|
8.3 |
|
|
|
1.6 |
|
16.5 |
|
|
|
|
|
|
|
|
|
|
|
|
|
|
|
|
|
|
|
|
|
|
|
|
|
|
|
|
|
|
|
|
|
|
|
|
|
|
|
|
|
|
|
|
|
|
|
|
|
|
|
|
|
|
|
|
|
|
|
|
|
|
|
|
|
|
|
|
|
|
|
|
|
|
|
|
|
|
|
|
|
|
|
|
|
|
| 1. Excluding reverse repos. |
| 2. Excluding repos. |
|
|
|
|
|
|
|
|
|
|
|
|
|
|
|
|
|
|
|
|
|
|
|
|
| DIGITAL CONSUMER BANK |
|
| EUR million |
|
|
|
|
|
|
|
|
/ |
Q4'24 |
|
|
/ |
Q1'24 |
| Underlying income statement |
Q1'25 |
% |
% excl. FX |
|
|
% |
% excl. FX |
| Net interest income |
2,756 |
|
(1.5) |
|
(2.2) |
|
|
|
1.7 |
|
1.8 |
|
| Net fee income |
339 |
|
(13.8) |
|
(14.3) |
|
|
|
(4.2) |
|
(2.7) |
|
Gains (losses) on financial transactions 1 |
(6) |
|
(75.6) |
|
(76.7) |
|
|
|
— |
|
— |
|
| Other operating income |
144 |
|
(11.3) |
|
(11.7) |
|
|
|
28.8 |
|
24.3 |
|
| Total income |
3,234 |
|
(2.9) |
|
(3.6) |
|
|
|
1.6 |
|
1.7 |
|
| Administrative expenses and amortizations |
(1,357) |
|
5.4 |
|
4.6 |
|
|
|
3.5 |
|
2.8 |
|
| Net operating income |
1,878 |
|
(8.1) |
|
(8.8) |
|
|
|
0.2 |
|
1.0 |
|
| Net loan-loss provisions |
(1,119) |
|
(10.3) |
|
(11.3) |
|
|
|
(1.6) |
|
(0.9) |
|
| Other gains (losses) and provisions |
(84) |
|
(84.1) |
|
(84.3) |
|
|
|
(28.4) |
|
(27.9) |
|
| Profit before tax |
674 |
|
154.6 |
|
158.9 |
|
|
|
9.1 |
|
9.9 |
|
| Tax on profit |
(116) |
|
173.1 |
|
171.6 |
|
|
|
41.8 |
|
48.7 |
|
| Profit from continuing operations |
558 |
|
151.1 |
|
156.4 |
|
|
|
4.1 |
|
4.3 |
|
| Net profit from discontinued operations |
— |
|
— |
|
— |
|
|
|
— |
|
— |
|
| Consolidated profit |
558 |
|
151.1 |
|
156.4 |
|
|
|
4.1 |
|
4.3 |
|
| Non-controlling interests |
(66) |
|
(3.8) |
|
(3.1) |
|
|
|
(8.7) |
|
(8.4) |
|
| Profit attributable to the parent |
492 |
|
220.8 |
|
229.7 |
|
|
|
6.1 |
|
6.3 |
|
|
| Balance sheet and activity metrics |
|
|
|
|
|
|
|
| Loans and advances to customers |
205,400 |
|
(0.8) |
|
(0.2) |
|
|
|
2.7 |
|
3.4 |
|
| Customer deposits |
133,110 |
|
3.2 |
|
4.4 |
|
|
|
12.2 |
|
11.9 |
|
|
|
|
|
|
|
|
|
| Memorandum items: |
|
|
|
|
|
|
|
| Gross loans and advances to customers ² |
213,573 |
|
(0.7) |
|
(0.1) |
|
|
|
2.9 |
|
3.6 |
|
| Customer funds |
141,314 |
|
3.1 |
|
4.3 |
|
|
|
12.4 |
|
12.1 |
|
| Customer deposits ³ |
133,070 |
|
3.2 |
|
4.4 |
|
|
|
12.2 |
|
11.9 |
|
| Mutual funds |
8,244 |
|
0.7 |
|
2.5 |
|
|
|
15.9 |
|
16.0 |
|
| Risk-weighted assets |
158,488 |
|
4.9 |
|
|
|
|
1.6 |
|
|
|
| Ratios (%) and customers |
|
|
|
|
|
|
|
| RoTE |
10.6 |
|
7.0 |
|
|
|
|
(0.7) |
|
|
| RoTE (post-AT1) |
9.7 |
|
7.2 |
|
|
|
|
(0.6) |
|
|
| Efficiency ratio |
41.9 |
|
3.3 |
|
|
|
|
0.8 |
|
|
| NPL ratio |
5.09 |
|
0.01 |
|
|
|
|
0.23 |
|
|
| NPL coverage ratio |
75.0 |
|
1.4 |
|
|
|
|
(1.1) |
|
|
| Number of employees |
31,547 |
|
5.5 |
|
|
|
|
|
|
| Number of total customers (thousands) |
25,709 |
|
2.7 |
|
|
|
|
2.7 |
|
|
|
|
|
|
|
|
|
|
|
|
|
|
|
|
|
|
|
|
|
| 1. Includes exchange differences. |
| 2. Excluding reverse repos. |
| 3. Excluding repos. |
|
|
|
|
|
|
|
|
|
|
|
|
|
|
|
|
|
|
|
|
|
|
|
|
| DCB EUROPE |
|
|
| EUR million |
|
|
|
|
|
|
|
|
|
/ |
Q4'24 |
|
|
/ |
Q1'24 |
|
| Underlying income statement |
Q1'25 |
% |
% excl. FX |
|
|
% |
% excl. FX |
|
| Net interest income |
1,112 |
|
0.6 |
|
0.3 |
|
|
|
1.6 |
|
1.5 |
|
|
| Net fee income |
188 |
|
(15.6) |
|
(15.6) |
|
|
|
(14.6) |
|
(14.7) |
|
|
|
|
|
|
|
|
|
|
|
|
|
|
|
|
|
|
|
|
| Total income |
1,402 |
|
(1.7) |
|
(2.0) |
|
|
|
(0.5) |
|
(0.6) |
|
|
| Administrative expenses and amortizations |
(667) |
|
6.0 |
|
5.8 |
|
|
|
0.3 |
|
0.3 |
|
|
| Net operating income |
736 |
|
(7.9) |
|
(8.2) |
|
|
|
(1.3) |
|
(1.3) |
|
|
| Net loan-loss provisions |
(336) |
|
(2.8) |
|
(2.9) |
|
|
|
21.7 |
|
21.8 |
|
|
|
|
|
|
|
|
|
|
|
| Profit before tax |
357 |
|
— |
|
— |
|
|
|
(11.0) |
|
(11.0) |
|
|
|
|
|
|
|
|
|
|
|
|
|
|
|
|
|
|
|
|
|
|
|
|
|
|
|
|
|
|
|
|
|
|
|
|
|
|
|
|
|
|
|
|
|
|
|
|
|
|
|
|
|
|
|
|
|
|
|
|
|
|
|
|
|
| Balance sheet and activity metrics |
|
|
|
|
|
|
|
|
| Loans and advances to customers |
136,500 |
|
(0.4) |
|
(0.7) |
|
|
|
3.3 |
|
2.7 |
|
|
|
|
|
|
|
|
|
|
|
|
|
|
|
|
|
|
|
|
|
|
|
|
|
|
|
|
|
|
|
|
|
|
|
|
|
|
|
|
|
|
|
|
|
|
|
| Customer deposits |
84,067 |
|
3.3 |
|
2.8 |
|
|
|
14.7 |
|
14.2 |
|
|
|
|
|
|
|
|
|
|
|
|
|
|
|
|
|
|
|
|
|
|
|
|
|
|
|
|
|
|
|
|
|
|
|
|
|
|
|
|
|
|
|
|
|
|
|
|
|
|
|
|
|
|
|
|
|
|
|
|
|
|
|
|
|
| Memorandum items: |
|
|
|
|
|
|
|
|
Gross loans and advances to customers 1 |
139,511 |
|
(0.3) |
|
(0.6) |
|
|
|
3.5 |
|
3.0 |
|
|
| Customer funds |
88,729 |
|
3.3 |
|
2.9 |
|
|
|
15.0 |
|
14.5 |
|
|
Customer deposits 2 |
84,067 |
|
3.3 |
|
2.8 |
|
|
|
14.7 |
|
14.2 |
|
|
| Mutual funds |
4,662 |
|
3.6 |
|
3.6 |
|
|
|
20.1 |
|
20.1 |
|
|
|
|
|
|
|
|
|
|
|
|
|
|
|
|
|
|
|
|
|
|
|
|
|
|
|
|
|
|
|
|
|
|
|
|
|
|
|
|
|
|
|
|
|
|
|
|
|
|
|
|
|
|
|
|
|
|
|
|
|
|
|
|
|
|
|
|
|
|
|
|
|
|
|
|
|
|
|
|
|
|
|
|
|
|
|
|
|
|
|
|
|
|
|
|
|
|
|
|
|
1. Excluding reverse repos.
2. Excluding repos.
|
|
|
|
|
|
|
|
|
|
|
|
|
|
|
|
|
|
|
|
|
|
| DCB US |
|
| EUR million |
|
|
|
|
|
|
|
|
/ |
Q4'24 |
|
|
/ |
Q1'24 |
| Underlying income statement |
Q1'25 |
% |
% excl. FX |
|
|
% |
% excl. FX |
| Net interest income |
1,221 |
|
2.5 |
|
1.1 |
|
|
|
6.8 |
|
3.6 |
|
| Net fee income |
84 |
|
(12.5) |
|
(14.0) |
|
|
|
31.2 |
|
27.2 |
|
|
|
|
|
|
|
|
|
|
|
|
|
|
|
|
|
| Total income |
1,362 |
|
0.0 |
|
(1.3) |
|
|
|
4.4 |
|
1.2 |
|
| Administrative expenses and amortizations |
(574) |
|
5.9 |
|
4.5 |
|
|
|
5.3 |
|
2.1 |
|
| Net operating income |
788 |
|
(3.8) |
|
(5.2) |
|
|
|
3.8 |
|
0.6 |
|
| Net loan-loss provisions |
(524) |
|
(22.6) |
|
(23.7) |
|
|
|
(14.2) |
|
(16.8) |
|
|
|
|
|
|
|
|
|
| Profit before tax |
236 |
|
113.2 |
|
111.4 |
|
|
|
95.3 |
|
89.4 |
|
|
|
|
|
|
|
|
|
|
|
|
|
|
|
|
|
|
|
|
|
|
|
|
|
|
|
|
|
|
|
|
|
|
|
|
|
|
|
|
|
|
|
|
|
|
|
|
|
|
| Balance sheet and activity metrics |
|
|
|
|
|
|
|
| Loans and advances to customers |
50,300 |
|
(3.7) |
|
0.1 |
|
|
|
(2.2) |
|
(2.1) |
|
| Customer deposits |
48,662 |
|
2.3 |
|
6.4 |
|
|
|
7.3 |
|
7.4 |
|
|
|
|
|
|
|
|
|
| Memorandum items: |
|
|
|
|
|
|
|
Gross loans and advances to customers 1 |
54,129 |
|
(3.8) |
|
0.1 |
|
|
|
(2.2) |
|
(2.1) |
|
| Customer funds |
52,204 |
|
1.9 |
|
6.0 |
|
|
|
7.5 |
|
7.7 |
|
Customer deposits 2 |
48,623 |
|
2.3 |
|
6.4 |
|
|
|
7.3 |
|
7.4 |
|
| Mutual funds |
3,582 |
|
(2.9) |
|
1.0 |
|
|
|
10.8 |
|
11.0 |
|
|
|
|
|
|
|
|
|
|
|
|
|
|
|
|
|
|
|
|
|
|
|
|
|
|
|
|
|
|
|
|
|
|
|
|
|
|
|
|
|
|
|
|
|
|
|
|
|
|
|
|
|
|
|
|
|
|
|
|
|
|
|
|
|
|
|
|
|
|
|
|
|
|
|
|
|
|
|
|
|
|
|
|
|
| 1. Excluding reverse repos. |
| 2. Excluding repos. |
|
|
|
|
|
|
|
|
|
|
|
|
|
|
|
|
|
|
|
|
|
|
|
| CORPORATE & INVESTMENT BANKING |
|
| EUR million |
|
|
|
|
|
|
|
|
/ |
Q4'24 |
|
|
/ |
Q1'24 |
| Underlying income statement |
Q1'25 |
% |
% excl. FX |
|
|
% |
% excl. FX |
| Net interest income |
953 |
|
(11.7) |
|
(12.6) |
|
|
|
(9.5) |
|
(5.2) |
|
| Net fee income |
716 |
|
9.1 |
|
8.5 |
|
|
|
9.4 |
|
11.2 |
|
Gains (losses) on financial transactions 1 |
525 |
|
28.4 |
|
28.0 |
|
|
|
(8.7) |
|
(7.4) |
|
| Other operating income |
26 |
|
— |
|
— |
|
|
|
— |
|
— |
|
| Total income |
2,220 |
|
7.2 |
|
6.3 |
|
|
|
4.6 |
|
7.9 |
|
| Administrative expenses and amortizations |
(952) |
|
(6.7) |
|
(7.3) |
|
|
|
7.8 |
|
9.4 |
|
| Net operating income |
1,268 |
|
20.7 |
|
19.6 |
|
|
|
2.3 |
|
6.8 |
|
| Net loan-loss provisions |
(13) |
|
(21.3) |
|
(26.9) |
|
|
|
(68.0) |
|
(67.0) |
|
| Other gains (losses) and provisions |
(22) |
|
(83.3) |
|
(83.3) |
|
|
|
(72.2) |
|
(72.1) |
|
| Profit before tax |
1,234 |
|
36.4 |
|
35.1 |
|
|
|
10.0 |
|
15.2 |
|
| Tax on profit |
(368) |
|
138.1 |
|
129.7 |
|
|
|
4.9 |
|
10.6 |
|
| Profit from continuing operations |
865 |
|
15.4 |
|
14.9 |
|
|
|
12.3 |
|
17.4 |
|
| Net profit from discontinued operations |
— |
|
— |
|
— |
|
|
|
— |
|
— |
|
| Consolidated profit |
865 |
|
15.4 |
|
14.9 |
|
|
|
12.3 |
|
17.4 |
|
| Non-controlling interests |
(59) |
|
8.3 |
|
7.9 |
|
|
|
8.3 |
|
12.5 |
|
| Profit attributable to the parent |
806 |
|
16.0 |
|
15.5 |
|
|
|
12.6 |
|
17.7 |
|
|
| Balance sheet and activity metrics |
|
|
|
|
|
|
|
| Loans and advances to customers |
193,724 |
|
4.8 |
|
5.9 |
|
|
|
9.9 |
|
12.0 |
|
| Customer deposits |
227,927 |
|
12.6 |
|
13.3 |
|
|
|
7.1 |
|
11.2 |
|
|
|
|
|
|
|
|
|
| Memorandum items: |
|
|
|
|
|
|
|
| Gross loans and advances to customers ² |
141,573 |
|
3.6 |
|
4.4 |
|
|
|
1.6 |
|
4.1 |
|
| Customer funds |
151,366 |
|
0.4 |
|
0.2 |
|
|
|
(4.1) |
|
(0.2) |
|
| Customer deposits ³ |
134,015 |
|
(1.9) |
|
(1.8) |
|
|
|
(6.7) |
|
(3.7) |
|
| Mutual funds |
17,351 |
|
23.4 |
|
19.4 |
|
|
|
21.9 |
|
39.5 |
|
| Risk-weighted assets |
107,870 |
|
(12.1) |
|
|
|
|
(10.3) |
|
|
|
| Ratios (%) |
|
|
|
|
|
|
|
| RoTE |
22.4 |
|
4.7 |
|
|
|
|
3.0 |
|
|
| RoTE (post-AT1) |
21.6 |
|
4.8 |
|
|
|
|
3.1 |
|
|
| Efficiency ratio |
42.9 |
|
(6.4) |
|
|
|
|
1.3 |
|
|
| NPL ratio |
0.75 |
|
(0.08) |
|
|
|
|
(0.44) |
|
|
| NPL coverage ratio |
39.3 |
|
0.3 |
|
|
|
|
(3.8) |
|
|
| Number of employees |
13,538 |
|
1.1 |
|
|
|
|
|
|
|
|
|
| 1. Includes exchange differences. |
| 2. Excluding reverse repos. |
| 3. Excluding repos. |
|
|
|
|
|
|
|
|
|
|
|
|
|
|
|
|
|
|
|
|
|
|
|
| WEALTH MANAGEMENT & INSURANCE |
|
| EUR million |
|
|
|
|
|
|
|
|
/ |
Q4'24 |
|
|
/ |
Q1'24 |
| Underlying income statement |
Q1'25 |
% |
% excl. FX |
|
|
% |
% excl. FX |
| Net interest income |
375 |
|
(8.2) |
|
(8.5) |
|
|
|
(16.3) |
|
(16.1) |
|
| Net fee income |
419 |
|
2.9 |
|
2.5 |
|
|
|
14.8 |
|
16.5 |
|
Gains (losses) on financial transactions 1 |
82 |
|
(24.7) |
|
(24.9) |
|
|
|
35.7 |
|
38.4 |
|
| Other operating income |
144 |
|
40.3 |
|
39.4 |
|
|
|
359.9 |
|
482.8 |
|
| Total income |
1,019 |
|
(0.7) |
|
(1.1) |
|
|
|
12.6 |
|
14.5 |
|
| Administrative expenses and amortizations |
(372) |
|
(10.8) |
|
(11.0) |
|
|
|
8.5 |
|
9.9 |
|
| Net operating income |
647 |
|
6.2 |
|
5.7 |
|
|
|
15.2 |
|
17.3 |
|
| Net loan-loss provisions |
(8) |
|
(57.7) |
|
(58.4) |
|
|
|
99.7 |
|
97.3 |
|
| Other gains (losses) and provisions |
(1) |
|
— |
|
— |
|
|
|
(97.3) |
|
(97.3) |
|
| Profit before tax |
639 |
|
5.4 |
|
5.0 |
|
|
|
20.3 |
|
22.7 |
|
| Tax on profit |
(142) |
|
0.7 |
|
0.2 |
|
|
|
5.5 |
|
6.8 |
|
| Profit from continuing operations |
497 |
|
6.8 |
|
6.5 |
|
|
|
25.4 |
|
28.1 |
|
| Net profit from discontinued operations |
— |
|
— |
|
— |
|
|
|
— |
|
— |
|
| Consolidated profit |
497 |
|
6.8 |
|
6.5 |
|
|
|
25.4 |
|
28.1 |
|
| Non-controlling interests |
(26) |
|
26.1 |
|
24.6 |
|
|
|
28.9 |
|
31.0 |
|
| Profit attributable to the parent |
471 |
|
6.0 |
|
5.7 |
|
|
|
25.2 |
|
28.0 |
|
|
| Balance sheet and activity metrics |
|
|
|
|
|
|
|
| Loans and advances to customers |
24,602 |
|
0.3 |
|
1.6 |
|
|
|
7.6 |
|
9.0 |
|
| Customer deposits |
62,885 |
|
2.5 |
|
2.9 |
|
|
|
4.8 |
|
5.5 |
|
|
|
|
|
|
|
|
|
| Memorandum items: |
|
|
|
|
|
|
|
| Gross loans and advances to customers ² |
24,762 |
|
0.3 |
|
1.6 |
|
|
|
7.8 |
|
9.1 |
|
| Customer funds |
179,464 |
|
4.2 |
|
4.3 |
|
|
|
9.3 |
|
12.0 |
|
| Customer deposits ³ |
62,055 |
|
2.7 |
|
3.1 |
|
|
|
4.8 |
|
5.3 |
|
| Mutual funds |
117,409 |
|
5.0 |
|
5.0 |
|
|
|
11.8 |
|
16.0 |
|
| Risk-weighted assets |
16,218 |
|
33.8 |
|
|
|
|
(2.9) |
|
|
| Assets under management |
511,198 |
|
2.8 |
|
2.7 |
|
|
|
6.5 |
|
10.8 |
|
| Gross written premiums |
2,666 |
|
9.8 |
|
8.9 |
|
|
|
(3.2) |
|
3.6 |
|
|
| Ratios (%) and customers |
|
|
|
|
|
|
|
| RoTE |
68.8 |
|
(11.7) |
|
|
|
|
(2.2) |
|
|
| RoTE (post-AT1) |
68.0 |
|
(11.7) |
|
|
|
|
(2.1) |
|
|
| Efficiency ratio |
36.5 |
|
(4.1) |
|
|
|
|
(1.4) |
|
|
| NPL ratio |
0.98 |
|
0.04 |
|
|
|
|
0.05 |
|
|
| NPL coverage ratio |
66.4 |
|
(4.7) |
|
|
|
|
10.2 |
|
|
| Number of employees |
7,690 |
|
(0.2) |
|
|
|
|
|
|
| Number of Private Banking customers (thousands) |
301 |
|
0.9 |
|
|
|
|
9.0 |
|
|
|
|
|
| 1. Includes exchange differences. |
| 2. Excluding reverse repos. |
| 3. Excluding repos. |
|
|
|
|
|
|
|
|
|
|
|
|
|
|
|
|
|
|
|
|
|
|
|
| PAYMENTS |
|
| EUR million |
|
|
|
|
|
|
|
|
/ |
Q4'24 |
|
|
/ |
Q1'24 |
| Underlying income statement |
Q1'25 |
% |
% excl. FX |
|
|
% |
% excl. FX |
| Net interest income |
685 |
|
0.7 |
|
0.7 |
|
|
|
3.4 |
|
15.0 |
|
| Net fee income |
693 |
|
(4.4) |
|
(4.4) |
|
|
|
4.7 |
|
12.9 |
|
Gains (losses) on financial transactions 1 |
(5) |
|
— |
|
— |
|
|
|
— |
|
— |
|
| Other operating income |
10 |
|
(79.2) |
|
(78.6) |
|
|
|
— |
|
— |
|
| Total income |
1,383 |
|
(8.5) |
|
(8.2) |
|
|
|
5.0 |
|
14.8 |
|
| Administrative expenses and amortizations |
(608) |
|
(0.6) |
|
(0.9) |
|
|
|
(4.8) |
|
0.1 |
|
| Net operating income |
776 |
|
(13.9) |
|
(13.2) |
|
|
|
14.2 |
|
29.7 |
|
| Net loan-loss provisions |
(492) |
|
9.7 |
|
10.1 |
|
|
|
17.6 |
|
32.9 |
|
| Other gains (losses) and provisions |
(36) |
|
(7.3) |
|
(6.4) |
|
|
|
58.2 |
|
62.4 |
|
| Profit before tax |
248 |
|
(40.1) |
|
(39.3) |
|
|
|
4.0 |
|
20.5 |
|
| Tax on profit |
(98) |
|
(29.5) |
|
(28.9) |
|
|
|
(4.3) |
|
9.0 |
|
| Profit from continuing operations |
150 |
|
(45.4) |
|
(44.6) |
|
|
|
10.3 |
|
29.3 |
|
| Net profit from discontinued operations |
— |
|
— |
|
— |
|
|
|
— |
|
— |
|
| Consolidated profit |
150 |
|
(45.4) |
|
(44.6) |
|
|
|
10.3 |
|
29.3 |
|
| Non-controlling interests |
(24) |
|
7.6 |
|
6.2 |
|
|
|
17.5 |
|
24.6 |
|
| Profit attributable to the parent |
126 |
|
(50.1) |
|
(49.3) |
|
|
|
9.0 |
|
30.3 |
|
|
|
|
|
|
|
|
|
| Balance sheet and activity metrics |
|
|
|
|
|
|
|
| Loans and advances to customers |
23,315 |
|
1.4 |
|
0.3 |
|
|
|
4.0 |
|
14.3 |
|
| Customer deposits |
1,129 |
|
3.9 |
|
3.9 |
|
|
|
33.4 |
|
33.4 |
|
|
|
|
|
|
|
|
|
| Memorandum items: |
|
|
|
|
|
|
|
| Gross loans and advances to customers ² |
25,186 |
|
1.7 |
|
0.6 |
|
|
|
4.5 |
|
15.0 |
|
| Customer funds |
1,129 |
|
3.9 |
|
3.9 |
|
|
|
33.4 |
|
33.4 |
|
| Customer deposits ³ |
1,129 |
|
3.9 |
|
3.9 |
|
|
|
33.4 |
|
33.4 |
|
| Mutual funds |
— |
|
— |
|
— |
|
|
|
— |
|
— |
|
| Risk-weighted assets |
22,943 |
0.6 |
|
|
|
|
4.0 |
|
|
|
|
|
|
|
|
|
|
| Ratios (%) |
|
|
|
|
|
|
|
| RoTE |
17.4 |
|
(13.3) |
|
|
|
|
0.9 |
|
|
| RoTE (post-AT1) |
16.6 |
|
(13.4) |
|
|
|
|
0.9 |
|
|
| NPL ratio |
5.88 |
|
0.68 |
|
|
|
|
0.89 |
|
|
| NPL coverage ratio |
126.0 |
(11.5) |
|
|
|
|
(13.8) |
|
|
| Number of employees |
21,700 |
(2.6) |
|
|
|
|
|
|
|
|
|
| 1. Includes exchange differences. |
| 2. Excluding reverse repos. |
| 3. Excluding repos. |
|
|
|
|
|
|
|
|
|
|
|
|
|
|
|
|
|
|
|
|
|
|
|
|
|
|
| PagoNxt |
|
| EUR million |
|
|
|
|
|
|
|
|
|
|
/ |
Q4'24 |
|
|
/ |
Q1'24 |
| Underlying income statement |
Q1'25 |
Q1'24 |
% |
% excl. FX |
|
|
% |
% excl. FX |
| Net interest income |
38 |
|
31 |
|
9.7 |
|
9.8 |
|
|
|
23.9 |
|
39.3 |
|
| Net fee income |
245 |
|
224 |
|
(6.3) |
|
(6.1) |
|
|
|
9.3 |
|
18.8 |
|
Gains (losses) on financial transactions 1 |
(7) |
|
(2) |
|
— |
|
— |
|
|
|
345.5 |
|
329.1 |
|
| Other operating income |
41 |
|
30 |
|
(16.3) |
|
(16.3) |
|
|
|
35.3 |
|
36.4 |
|
| Total income |
317 |
|
283 |
|
(8.4) |
|
(8.2) |
|
|
|
11.8 |
|
21.0 |
|
| Administrative expenses and amortizations |
(286) |
|
(304) |
|
5.6 |
|
5.3 |
|
|
|
(6.1) |
|
(2.1) |
|
| Net operating income |
31 |
|
(21) |
|
(59.0) |
|
(58.1) |
|
|
|
— |
|
— |
|
| Net loan-loss provisions |
(6) |
|
(4) |
|
58.7 |
|
55.6 |
|
|
|
50.1 |
|
69.4 |
|
| Other gains (losses) and provisions |
(12) |
|
(2) |
|
(47.4) |
|
(46.4) |
|
|
|
403.5 |
|
488.0 |
|
| Profit before tax |
13 |
|
(27) |
|
(73.5) |
|
(72.8) |
|
|
|
— |
|
— |
|
| Tax on profit |
(4) |
|
(10) |
|
(80.2) |
|
(79.9) |
|
|
|
(59.5) |
|
(42.5) |
|
| Profit from continuing operations |
9 |
|
(37) |
|
(68.8) |
|
(67.8) |
|
|
|
— |
|
— |
|
| Net profit from discontinued operations |
— |
|
— |
|
— |
|
— |
|
|
|
— |
|
— |
|
| Consolidated profit |
9 |
|
(37) |
|
(68.8) |
|
(67.8) |
|
|
|
— |
|
— |
|
| Non-controlling interests |
(4) |
|
(2) |
|
107.7 |
|
107.6 |
|
|
|
94.9 |
|
105.0 |
|
| Profit attributable to the parent |
4 |
|
(39) |
|
(83.1) |
|
(82.4) |
|
|
|
— |
|
— |
|
|
|
|
|
|
|
|
|
|
| Balance sheet and activity metrics |
|
|
|
|
|
|
|
|
| Loans and advances to customers |
1,315 |
|
1,415 |
|
23.3 |
|
21.1 |
|
|
|
(7.1) |
|
9.1 |
|
| Customer deposits |
1,090 |
|
790 |
|
5.1 |
|
5.1 |
|
|
|
37.9 |
|
37.9 |
|
|
|
|
|
|
|
|
|
|
| Memorandum items: |
|
|
|
|
|
|
|
|
| Gross loans and advances to customers ² |
1,337 |
|
1,443 |
|
23.0 |
|
20.7 |
|
|
|
(7.3) |
|
8.5 |
|
| Customer funds |
1,090 |
|
790 |
|
5.1 |
|
5.1 |
|
|
|
37.9 |
|
37.9 |
|
| Customer deposits ³ |
1,090 |
|
790 |
|
5.1 |
|
5.1 |
|
|
|
37.9 |
|
37.9 |
|
| Mutual funds |
— |
|
— |
|
— |
|
— |
|
|
|
— |
|
— |
|
| Risk-weighted assets |
6,062 |
|
5,107 |
|
23.8 |
|
|
|
|
18.7 |
|
|
| Total transactions (Getnet, million) |
2,505 |
|
2,413 |
|
(4.7) |
|
|
|
|
3.8 |
|
|
| Total payments volume (Getnet) |
55,776 |
|
53,743 |
|
(5.5) |
|
(5.0) |
|
|
|
3.8 |
|
14.1 |
|
|
|
|
|
|
|
|
|
|
| Ratios (%) |
|
|
|
|
|
|
|
|
| EBITDA margin |
28.6 |
|
|
(11.4) |
|
|
|
|
11.6 |
|
|
| Efficiency ratio |
90.3 |
|
12.0 |
|
|
|
(17.1) |
|
|
|
|
|
|
|
|
|
|
|
|
|
|
|
|
|
|
|
|
|
|
|
|
|
|
|
|
|
|
|
|
| 1. Includes exchange differences. |
| 2. Excluding reverse repos. |
| 3. Excluding repos. |
|
|
|
|
|
|
|
|
|
|
|
|
|
|
|
|
|
|
|
|
|
|
| Cards |
|
|
|
|
|
|
|
| EUR million |
|
|
|
|
|
|
|
|
/ |
Q4'24 |
|
|
/ |
Q1'24 |
| Underlying income statement |
Q1'25 |
% |
% excl. FX |
|
|
% |
% excl. FX |
| Net interest income |
647 |
|
0.3 |
|
0.2 |
|
|
|
2.4 |
|
13.8 |
|
| Net fee income |
449 |
|
(3.2) |
|
(3.5) |
|
|
|
2.4 |
|
9.9 |
|
Gains (losses) on financial transactions 1 |
3 |
|
(95.8) |
|
(95.4) |
|
|
|
(11.8) |
|
(16.1) |
|
| Other operating income |
(31) |
|
— |
|
720.6 |
|
|
|
(17.1) |
|
(13.5) |
|
| Total income |
1,067 |
|
(8.5) |
|
(8.2) |
|
|
|
3.1 |
|
13.1 |
|
| Administrative expenses and amortizations |
(322) |
|
(5.5) |
|
(5.9) |
|
|
|
(3.7) |
|
2.2 |
|
| Net operating income |
745 |
|
(9.8) |
|
(9.2) |
|
|
|
6.4 |
|
18.6 |
|
| Net loan-loss provisions |
(486) |
|
9.3 |
|
9.7 |
|
|
|
17.3 |
|
32.6 |
|
| Other gains (losses) and provisions |
(24) |
|
50.4 |
|
49.8 |
|
|
|
17.7 |
|
19.1 |
|
| Profit before tax |
235 |
|
(35.6) |
|
(35.0) |
|
|
|
(11.5) |
|
(2.7) |
|
| Tax on profit |
(94) |
|
(21.1) |
|
(20.4) |
|
|
|
1.5 |
|
13.2 |
|
| Profit from continuing operations |
141 |
|
(42.7) |
|
(42.0) |
|
|
|
(18.4) |
|
(11.0) |
|
| Net profit from discontinued operations |
— |
|
— |
|
— |
|
|
|
— |
|
— |
|
| Consolidated profit |
141 |
|
(42.7) |
|
(42.0) |
|
|
|
(18.4) |
|
(11.0) |
|
| Non-controlling interests |
(20) |
|
(2.7) |
|
(4.1) |
|
|
|
8.0 |
|
14.7 |
|
| Profit attributable to the parent |
121 |
|
(46.3) |
|
(45.5) |
|
|
|
(21.6) |
|
(14.2) |
|
|
|
|
|
|
|
|
|
| Balance sheet and activity metrics |
|
|
|
|
|
|
|
| Loans and advances to customers |
22,000 |
|
0.3 |
|
(0.7) |
|
|
|
4.7 |
|
14.6 |
|
| Customer deposits |
39 |
|
(19.8) |
|
(19.8) |
|
|
|
(30.4) |
|
(30.4) |
|
|
|
|
|
|
|
|
|
| Memorandum items: |
|
|
|
|
|
|
|
| Gross loans and advances to customers ² |
23,849 |
|
0.7 |
|
(0.3) |
|
|
|
5.2 |
|
15.4 |
|
| Customer funds |
39 |
|
(19.8) |
|
(19.8) |
|
|
|
(30.4) |
|
(30.4) |
|
| Customer deposits ³ |
39 |
|
(19.8) |
|
(19.8) |
|
|
|
(30.4) |
|
(30.4) |
|
| Mutual funds |
— |
|
— |
|
— |
|
|
|
— |
|
— |
|
| Risk-weighted assets |
16,880 |
|
(5.7) |
|
|
|
|
(0.4) |
|
|
Number of cards (million)4 |
106 |
|
0.2 |
|
|
|
|
2.8 |
|
|
|
|
|
|
|
|
|
|
| Ratios (%) |
|
|
|
|
|
|
|
| RoTE |
19.9 |
|
(16.0) |
|
|
|
|
(6.2) |
|
|
| RoTE (post-AT1) |
19.2 |
(15.9) |
|
|
|
(6.2) |
|
|
| Efficiency ratio |
30.2 |
1.0 |
|
|
|
(2.1) |
|
|
| NPL ratio |
6.11 |
0.80 |
|
|
|
0.97 |
|
|
| NPL coverage ratio |
126.7 |
|
(12.5) |
|
|
|
|
(15.5) |
|
|
|
|
|
|
|
|
|
|
|
|
|
| 1. Includes exchange differences. |
| 2. Excluding reverse repos. |
| 3. Excluding repos. |
| 4. Total number of Cards in the Group, including those managed within Consumer's perimeter. |
|
|
|
|
|
|
|
|
|
|
|
|
|
|
|
|
|
|
|
|
|
|
| CORPORATE CENTRE |
|
|
|
|
|
|
|
| EUR million |
|
|
|
|
|
|
|
|
|
/ Q4'24 |
|
|
|
/ Q1'24 |
| Underlying income statement |
Q1'25 |
Q4'24 |
% |
|
|
Q1'24 |
% |
| Net interest income |
(112) |
|
(113) |
|
(1.4) |
|
|
|
(31) |
|
262.3 |
|
| Net fee income |
(9) |
|
(3) |
|
199.4 |
|
|
|
(1) |
|
540.6 |
|
Gains (losses) on financial transactions 1 |
(91) |
|
22 |
|
— |
|
|
|
(162) |
|
(44.0) |
|
| Other operating income |
(4) |
|
23 |
|
— |
|
|
|
(16) |
|
(74.9) |
|
| Total income |
(215) |
|
(72) |
|
199.7 |
|
|
|
(210) |
|
2.6 |
|
| Administrative expenses and amortizations |
(87) |
|
(104) |
|
(15.8) |
|
|
|
(87) |
|
(0.1) |
|
| Net operating income |
(303) |
|
(176) |
|
72.3 |
|
|
|
(297) |
|
1.8 |
|
| Net loan-loss provisions |
(99) |
|
3 |
|
— |
|
|
|
(2) |
|
— |
|
| Other gains (losses) and provisions |
(30) |
|
(25) |
|
21.1 |
|
|
|
(41) |
|
(26.8) |
|
| Profit before tax |
(431) |
|
(197) |
|
119.2 |
|
|
|
(340) |
|
26.9 |
|
| Tax on profit |
37 |
|
55 |
|
(31.8) |
|
|
|
(18) |
|
— |
|
| Profit from continuing operations |
(394) |
|
(142) |
|
177.1 |
|
|
|
(357) |
|
10.3 |
|
| Net profit from discontinued operations |
— |
|
— |
|
— |
|
|
|
— |
|
— |
|
| Consolidated profit |
(394) |
|
(142) |
|
177.1 |
|
|
|
(357) |
|
10.3 |
|
| Non-controlling interests |
0 |
|
0 |
|
(74.3) |
|
|
|
0 |
|
— |
|
| Profit attributable to the parent |
(394) |
|
(142) |
|
177.5 |
|
|
|
(357) |
|
10.2 |
|
|
|
|
|
|
|
|
|
| Balance sheet |
|
|
|
|
|
|
|
| Loans and advances to customers |
5,845 |
|
5,778 |
|
1.2 |
|
|
|
5,580 |
|
4.7 |
|
| Cash, central banks and credit institutions |
105,926 |
|
104,379 |
|
1.5 |
|
|
|
100,663 |
|
5.2 |
|
| Debt instruments |
11,158 |
|
10,923 |
|
2.2 |
|
|
|
8,388 |
|
33.0 |
|
| Other financial assets |
1,609 |
|
1,444 |
|
11.4 |
|
|
|
820 |
|
96.2 |
|
| Other asset accounts |
124,957 |
|
118,425 |
|
5.5 |
|
|
|
130,691 |
|
(4.4) |
|
| Total assets |
249,496 |
|
240,948 |
|
3.5 |
|
|
|
246,142 |
|
1.4 |
|
| Customer deposits |
1,341 |
|
1,430 |
|
(6.3) |
|
|
|
1,428 |
|
(6.1) |
|
| Central banks and credit institutions |
27,844 |
|
21,730 |
|
28.1 |
|
|
|
21,970 |
|
26.7 |
|
| Marketable debt securities |
111,631 |
|
121,122 |
|
(7.8) |
|
|
|
115,063 |
|
(3.0) |
|
| Other financial liabilities |
145 |
|
48 |
|
203.5 |
|
|
|
1,774 |
|
(91.8) |
|
| Other liabilities accounts |
7,056 |
|
7,256 |
|
(2.8) |
|
|
|
8,001 |
|
(11.8) |
|
| Total liabilities |
148,017 |
|
151,585 |
|
(2.4) |
|
|
|
148,236 |
|
(0.1) |
|
| Total equity |
101,479 |
|
89,363 |
|
13.6 |
|
|
|
97,907 |
|
3.6 |
|
|
|
|
|
|
|
|
|
| Memorandum items: |
|
|
|
|
|
|
|
Gross loans and advances to customers 2 |
5,932 |
|
5,853 |
|
1.4 |
|
|
|
5,651 |
|
5.0 |
|
| Customer funds |
1,341 |
|
1,299 |
|
3.2 |
|
|
|
1,428 |
|
(6.1) |
|
Customer deposits 3 |
1,341 |
|
1,299 |
|
3.2 |
|
|
|
1,428 |
|
(6.1) |
|
| Mutual funds |
— |
|
— |
|
— |
|
|
|
— |
|
— |
|
|
|
|
|
|
|
|
|
| Resources |
|
|
|
|
|
|
|
| Number of employees |
1,793 |
|
1,825 |
|
(1.8) |
|
|
|
|
|
1. Includes exchange differences.
2. Excluding reverse repos.
3. Excluding repos.
|
|
|
|
|
|
|
|
|
|
|
|
|
|
|
|
| Spain |
|
|
|
|
|
| EUR million |
|
|
|
|
|
|
|
/ Q4'24 |
|
|
/ Q1'24 |
| Underlying income statement |
Q1'25 |
% |
|
|
% |
| Net interest income |
1,779 |
|
(1.2) |
|
|
|
(2.0) |
|
| Net fee income |
767 |
|
13.4 |
|
|
|
2.9 |
|
Gains (losses) on financial transactions 1 |
448 |
|
48.5 |
|
|
|
24.0 |
|
| Other operating income |
136 |
|
(7.1) |
|
|
|
45.5 |
|
| Total income |
3,130 |
|
7.0 |
|
|
|
3.8 |
|
| Administrative expenses and amortizations |
(1,049) |
|
(7.5) |
|
|
|
1.6 |
|
| Net operating income |
2,081 |
|
16.1 |
|
|
|
4.9 |
|
| Net loan-loss provisions |
(304) |
|
(5.6) |
|
|
|
(8.3) |
|
| Other gains (losses) and provisions |
(133) |
|
(40.5) |
|
|
|
(68.1) |
|
| Profit before tax |
1,645 |
|
31.9 |
|
|
|
33.1 |
|
| Tax on profit |
(498) |
|
54.7 |
|
|
|
7.3 |
|
| Profit from continuing operations |
1,147 |
|
24.0 |
|
|
|
48.6 |
|
| Net profit from discontinued operations |
— |
|
— |
|
|
|
— |
|
| Consolidated profit |
1,147 |
|
24.0 |
|
|
|
48.6 |
|
| Non-controlling interests |
0 |
|
135.0 |
|
|
|
— |
|
| Profit attributable to the parent |
1,147 |
|
23.9 |
|
|
|
48.6 |
|
|
|
|
|
|
|
| Balance sheet |
|
|
|
|
|
| Loans and advances to customers |
254,067 |
|
2.9 |
|
|
|
3.6 |
|
| Cash, central banks and credit institutions |
95,311 |
|
(4.4) |
|
|
|
22.6 |
|
| Debt instruments |
105,220 |
|
11.3 |
|
|
|
34.6 |
|
| Other financial assets |
45,391 |
|
(5.7) |
|
|
|
(10.4) |
|
| Other asset accounts |
16,921 |
|
(3.4) |
|
|
|
(0.3) |
|
| Total assets |
516,910 |
|
2.0 |
|
|
|
10.3 |
|
| Customer deposits |
343,753 |
|
6.3 |
|
|
|
7.6 |
|
| Central banks and credit institutions |
45,363 |
|
(20.7) |
|
|
|
34.4 |
|
| Marketable debt securities |
26,361 |
|
(3.7) |
|
|
|
(0.8) |
|
| Other financial liabilities |
62,830 |
|
4.8 |
|
|
|
26.4 |
|
| Other liabilities accounts |
20,715 |
|
(2.1) |
|
|
|
(3.9) |
|
| Total liabilities |
499,023 |
|
2.0 |
|
|
|
10.6 |
|
| Total equity |
17,888 |
|
1.9 |
|
|
|
0.5 |
|
|
|
|
|
|
|
| Memorandum items: |
|
|
|
|
|
Gross loans and advances to customers 2 |
229,140 |
|
1.5 |
|
|
|
0.3 |
|
| Customer funds |
395,842 |
|
(1.0) |
|
|
|
3.8 |
|
Customer deposits 3 |
299,063 |
|
(2.4) |
|
|
|
0.1 |
|
| Mutual funds |
96,779 |
|
3.4 |
|
|
|
17.2 |
|
|
|
|
|
|
|
| Ratios (%), operating means and customers |
|
|
|
|
|
| RoTE |
26.3 |
|
5.0 |
|
|
|
8.3 |
|
| RoTE (post-AT1) |
25.5 |
|
5.1 |
|
|
|
8.3 |
|
| Efficiency ratio |
33.5 |
|
(5.2) |
|
|
|
(0.7) |
|
| NPL ratio |
2.56 |
|
(0.13) |
|
|
|
(0.44) |
|
| NPL coverage ratio |
52.8 |
|
0.2 |
|
|
|
3.0 |
|
|
|
|
|
|
|
| Number of branches |
1,792 |
|
(1.9) |
|
|
|
(3.9) |
|
| Number of total customers (thousands) |
15,299 |
|
(0.1) |
|
|
|
1.1 |
|
| Number of active customers (thousands) |
8,937 |
|
1.1 |
|
|
|
5.2 |
|
1. Includes exchange differences.
2. Excluding reverse repos.
3. Excluding repos.
|
|
|
|
|
|
|
|
|
|
|
|
|
|
|
|
|
|
|
|
|
|
| United Kingdom |
|
| EUR million |
|
|
|
|
|
|
|
|
|
/ |
Q4'24 |
|
|
/ |
Q1'24 |
| Underlying income statement |
Q1'25 |
% |
% excl. FX |
|
|
% |
% excl. FX |
| Net interest income |
1,298 |
|
(1.1) |
|
(0.8) |
|
|
|
9.5 |
|
6.9 |
|
| Net fee income |
82 |
|
34.4 |
|
35.5 |
|
|
|
4.5 |
|
2.0 |
|
Gains (losses) on financial transactions 1 |
(41) |
|
127.3 |
|
124.5 |
|
|
|
450.6 |
|
437.5 |
|
| Other operating income |
1 |
|
21.0 |
|
20.7 |
|
|
|
307.3 |
|
297.5 |
|
| Total income |
1,341 |
|
(1.2) |
|
(0.8) |
|
|
|
6.7 |
|
4.1 |
|
| Administrative expenses and amortizations |
(720) |
|
(4.8) |
|
(4.4) |
|
|
|
(1.9) |
|
(4.3) |
|
| Net operating income |
621 |
|
3.4 |
|
3.8 |
|
|
|
18.7 |
|
15.9 |
|
| Net loan-loss provisions |
(52) |
|
— |
|
— |
|
|
|
202.4 |
|
195.2 |
|
| Other gains (losses) and provisions |
(186) |
|
4.5 |
|
4.0 |
|
|
|
105.3 |
|
100.4 |
|
| Profit before tax |
382 |
|
(16.3) |
|
(15.9) |
|
|
|
(7.9) |
|
(10.1) |
|
| Tax on profit |
(97) |
|
(22.4) |
|
(22.1) |
|
|
|
(11.3) |
|
(13.4) |
|
| Profit from continuing operations |
285 |
|
(13.9) |
|
(13.6) |
|
|
|
(6.7) |
|
(9.0) |
|
| Net profit from discontinued operations |
— |
|
— |
|
— |
|
|
|
— |
|
— |
|
| Consolidated profit |
285 |
|
(13.9) |
|
(13.6) |
|
|
|
(6.7) |
|
(9.0) |
|
| Non-controlling interests |
— |
|
— |
|
— |
|
|
|
— |
|
— |
|
| Profit attributable to the parent |
285 |
|
(13.9) |
|
(13.6) |
|
|
|
(6.7) |
|
(9.0) |
|
|
|
|
|
|
|
|
|
| Balance sheet |
|
|
|
|
|
|
|
| Loans and advances to customers |
248,283 |
|
0.7 |
|
1.7 |
|
|
|
(0.3) |
|
(2.4) |
|
| Cash, central banks and credit institutions |
53,294 |
|
(2.7) |
|
(1.8) |
|
|
|
(16.9) |
|
(18.6) |
|
| Debt instruments |
14,636 |
|
(3.2) |
|
(2.3) |
|
|
|
42.3 |
|
39.3 |
|
| Other financial assets |
254 |
|
(34.7) |
|
(34.1) |
|
|
|
(20.0) |
|
(21.7) |
|
| Other asset accounts |
3,899 |
|
15.3 |
|
16.4 |
|
|
|
(18.5) |
|
(20.2) |
|
| Total assets |
320,366 |
|
0.1 |
|
1.0 |
|
|
|
(2.5) |
|
(4.5) |
|
| Customer deposits |
226,962 |
|
(1.5) |
|
(0.6) |
|
|
|
(3.9) |
|
(5.9) |
|
| Central banks and credit institutions |
23,511 |
|
(8.4) |
|
(7.5) |
|
|
|
(14.4) |
|
(16.2) |
|
| Marketable debt securities |
52,764 |
|
10.1 |
|
11.1 |
|
|
|
16.7 |
|
14.3 |
|
| Other financial liabilities |
3,266 |
|
30.7 |
|
31.9 |
|
|
|
(39.5) |
|
(40.8) |
|
| Other liabilities accounts |
1,622 |
|
(6.4) |
|
(5.5) |
|
|
|
2.7 |
|
0.6 |
|
| Total liabilities |
308,126 |
|
0.0 |
|
0.9 |
|
|
|
(2.4) |
|
(4.4) |
|
| Total equity |
12,241 |
|
2.9 |
|
3.9 |
|
|
|
(4.3) |
|
(6.2) |
|
|
|
|
|
|
|
|
|
| Memorandum items: |
|
|
|
|
|
|
|
Gross loans and advances to customers 2 |
234,462 |
|
(0.9) |
|
0.1 |
|
|
|
(0.9) |
|
(2.9) |
|
| Customer funds |
227,841 |
|
(1.1) |
|
(0.2) |
|
|
|
(3.1) |
|
(5.1) |
|
Customer deposits 3 |
220,353 |
|
(1.1) |
|
(0.2) |
|
|
|
(3.2) |
|
(5.2) |
|
| Mutual funds |
7,488 |
|
(2.0) |
|
(1.1) |
|
|
|
0.0 |
|
(2.1) |
|
|
|
|
|
|
|
|
|
| Ratios (%), operating means and customers |
|
|
|
|
|
|
|
| RoTE |
9.7 |
|
(1.4) |
|
|
|
|
(0.7) |
|
|
| RoTE (post-AT1) |
9.2 |
|
(1.3) |
|
|
|
|
(0.7) |
|
|
| Efficiency ratio |
53.7 |
|
(2.0) |
|
|
|
|
(4.7) |
|
|
| NPL ratio |
1.25 |
|
(0.08) |
|
|
|
|
(0.23) |
|
|
| NPL coverage ratio |
30.8 |
|
1.5 |
|
|
|
|
2.5 |
|
|
|
|
|
|
|
|
|
|
| Number of branches |
444 |
|
0.0 |
|
|
|
|
0.0 |
|
|
| Number of total customers (thousands) |
22,541 |
|
0.0 |
|
|
|
|
0.2 |
|
|
| Number of active customers (thousands) |
13,584 |
|
(0.5) |
|
|
|
|
(1.6) |
|
|
1. Includes exchange differences.
2. Excluding reverse repos.
3. Excluding repos.
|
|
|
|
|
|
|
|
|
|
|
|
|
|
|
|
| Portugal |
|
|
|
|
|
| EUR million |
|
|
|
|
|
|
|
/ Q4'24 |
|
|
/ Q1'24 |
| Underlying income statement |
Q1'25 |
% |
|
|
% |
| Net interest income |
348 |
|
4.8 |
|
|
|
(19.2) |
|
| Net fee income |
126 |
|
13.9 |
|
|
|
(1.2) |
|
Gains (losses) on financial transactions 1 |
20 |
|
175.7 |
|
|
|
14.4 |
|
| Other operating income |
9 |
|
9.9 |
|
|
|
8.5 |
|
| Total income |
503 |
|
9.7 |
|
|
|
(13.9) |
|
| Administrative expenses and amortizations |
(136) |
|
(5.2) |
|
|
|
1.4 |
|
| Net operating income |
367 |
|
16.5 |
|
|
|
(18.4) |
|
| Net loan-loss provisions |
14 |
|
— |
|
|
|
— |
|
| Other gains (losses) and provisions |
(1) |
|
(95.0) |
|
|
|
(67.6) |
|
| Profit before tax |
380 |
|
28.4 |
|
|
|
(13.6) |
|
| Tax on profit |
(101) |
|
17.3 |
|
|
|
(25.8) |
|
| Profit from continuing operations |
279 |
|
32.9 |
|
|
|
(8.2) |
|
| Net profit from discontinued operations |
— |
|
— |
|
|
|
— |
|
| Consolidated profit |
279 |
|
32.9 |
|
|
|
(8.2) |
|
| Non-controlling interests |
(1) |
|
8.7 |
|
|
|
(1.8) |
|
| Profit attributable to the parent |
278 |
|
33.0 |
|
|
|
(8.2) |
|
|
|
|
|
|
|
| Balance sheet |
|
|
|
|
|
| Loans and advances to customers |
38,913 |
|
1.3 |
|
|
|
4.3 |
|
| Cash, central banks and credit institutions |
4,239 |
|
9.5 |
|
|
|
(38.3) |
|
| Debt instruments |
14,959 |
|
(0.3) |
|
|
|
20.4 |
|
| Other financial assets |
1,092 |
|
(3.3) |
|
|
|
(2.5) |
|
| Other asset accounts |
976 |
|
(12.0) |
|
|
|
(6.9) |
|
| Total assets |
60,180 |
|
1.1 |
|
|
|
2.4 |
|
| Customer deposits |
39,034 |
|
1.9 |
|
|
|
6.9 |
|
| Central banks and credit institutions |
8,800 |
|
(0.2) |
|
|
|
(0.3) |
|
| Marketable debt securities |
5,757 |
|
15.8 |
|
|
|
(1.0) |
|
| Other financial liabilities |
347 |
|
2.3 |
|
|
|
6.3 |
|
| Other liabilities accounts |
3,304 |
|
8.1 |
|
|
|
(4.4) |
|
| Total liabilities |
57,241 |
|
3.2 |
|
|
|
4.2 |
|
| Total equity |
2,938 |
|
(27.4) |
|
|
|
(23.6) |
|
|
|
|
|
|
|
| Memorandum items: |
|
|
|
|
|
Gross loans and advances to customers 2 |
39,631 |
|
1.2 |
|
|
|
4.0 |
|
| Customer funds |
44,040 |
|
2.0 |
|
|
|
7.8 |
|
Customer deposits 3 |
39,034 |
|
1.9 |
|
|
|
6.9 |
|
| Mutual funds |
5,005 |
|
2.5 |
|
|
|
14.8 |
|
|
|
|
|
|
|
| Ratios (%), operating means and customers |
|
|
|
|
|
| RoTE |
31.1 |
|
9.9 |
|
|
|
(0.1) |
|
| RoTE (post-AT1) |
30.6 |
|
9.9 |
|
|
|
(0.1) |
|
| Efficiency ratio |
27.0 |
|
(4.2) |
|
|
|
4.1 |
|
| NPL ratio |
2.25 |
|
(0.15) |
|
|
|
(0.38) |
|
| NPL coverage ratio |
81.7 |
|
2.3 |
|
|
|
0.8 |
|
|
|
|
|
|
|
| Number of branches |
373 |
|
(0.3) |
|
|
|
(0.5) |
|
| Number of total customers (thousands) |
2,980 |
|
(0.3) |
|
|
|
1.7 |
|
| Number of active customers (thousands) |
1,913 |
|
0.4 |
|
|
|
3.8 |
|
1. Includes exchange differences.
2. Excluding reverse repos.
3. Excluding repos.
|
|
|
|
|
|
|
|
|
|
|
|
|
|
|
|
|
|
|
|
|
|
| Poland |
Q |
| EUR million |
|
|
|
|
|
|
|
|
|
/ |
Q4'24 |
|
|
/ |
Q1'24 |
| Underlying income statement |
Q1'25 |
% |
% excl. FX |
|
|
% |
% excl. FX |
| Net interest income |
744 |
|
1.5 |
|
(1.0) |
|
|
|
8.5 |
|
5.2 |
|
| Net fee income |
189 |
|
14.2 |
|
11.4 |
|
|
|
7.8 |
|
4.5 |
|
Gains (losses) on financial transactions 1 |
12 |
|
(10.4) |
|
(12.6) |
|
|
|
151.1 |
|
143.4 |
|
| Other operating income |
(62) |
|
— |
|
— |
|
|
|
89.3 |
|
83.6 |
|
| Total income |
883 |
|
(4.2) |
|
(6.5) |
|
|
|
5.9 |
|
2.7 |
|
| Administrative expenses and amortizations |
(256) |
|
3.9 |
|
1.4 |
|
|
|
11.7 |
|
8.3 |
|
| Net operating income |
627 |
|
(7.1) |
|
(9.4) |
|
|
|
3.8 |
|
0.6 |
|
| Net loan-loss provisions |
(78) |
|
(30.7) |
|
(32.4) |
|
|
|
(40.5) |
|
(42.3) |
|
| Other gains (losses) and provisions |
(49) |
|
(75.0) |
|
(75.6) |
|
|
|
(20.6) |
|
(23.0) |
|
| Profit before tax |
500 |
|
36.6 |
|
33.2 |
|
|
|
21.4 |
|
17.7 |
|
| Tax on profit |
(122) |
|
9.8 |
|
7.1 |
|
|
|
23.9 |
|
20.1 |
|
| Profit from continuing operations |
378 |
|
48.2 |
|
44.6 |
|
|
|
20.6 |
|
16.9 |
|
| Net profit from discontinued operations |
— |
|
— |
|
— |
|
|
|
— |
|
— |
|
| Consolidated profit |
378 |
|
48.2 |
|
44.6 |
|
|
|
20.6 |
|
16.9 |
|
| Non-controlling interests |
(141) |
|
44.4 |
|
40.9 |
|
|
|
40.1 |
|
35.8 |
|
| Profit attributable to the parent |
237 |
|
50.6 |
|
46.9 |
|
|
|
11.4 |
|
8.0 |
|
|
|
|
|
|
|
|
|
| Balance sheet |
|
|
|
|
|
|
|
| Loans and advances to customers |
38,994 |
|
2.5 |
|
0.4 |
|
|
|
12.2 |
|
9.2 |
|
| Cash, central banks and credit institutions |
9,714 |
|
(5.5) |
|
(7.4) |
|
|
|
7.8 |
|
4.9 |
|
| Debt instruments |
20,507 |
|
17.3 |
|
14.9 |
|
|
|
29.5 |
|
26.0 |
|
| Other financial assets |
616 |
|
24.8 |
|
22.3 |
|
|
|
18.5 |
|
15.2 |
|
| Other asset accounts |
2,063 |
|
5.2 |
|
3.1 |
|
|
|
7.3 |
|
4.4 |
|
| Total assets |
71,894 |
|
5.3 |
|
3.2 |
|
|
|
15.9 |
|
12.7 |
|
| Customer deposits |
53,204 |
|
5.7 |
|
3.6 |
|
|
|
15.9 |
|
12.8 |
|
| Central banks and credit institutions |
5,332 |
|
6.2 |
|
4.1 |
|
|
|
27.8 |
|
24.4 |
|
| Marketable debt securities |
2,734 |
|
(0.4) |
|
(2.4) |
|
|
|
30.6 |
|
27.0 |
|
| Other financial liabilities |
1,718 |
|
3.8 |
|
1.7 |
|
|
|
21.3 |
|
18.0 |
|
| Other liabilities accounts |
1,553 |
|
(8.0) |
|
(9.8) |
|
|
|
(5.9) |
|
(8.4) |
|
| Total liabilities |
64,542 |
|
5.1 |
|
2.9 |
|
|
|
16.9 |
|
13.7 |
|
| Total equity |
7,352 |
|
7.6 |
|
5.5 |
|
|
|
8.0 |
|
5.1 |
|
|
|
|
|
|
|
|
|
| Memorandum items: |
|
|
|
|
|
|
|
Gross loans and advances to customers 2 |
39,796 |
|
2.8 |
|
0.7 |
|
|
|
11.5 |
|
8.5 |
|
| Customer funds |
59,269 |
|
4.7 |
|
2.6 |
|
|
|
16.5 |
|
13.3 |
|
Customer deposits 3 |
52,354 |
|
4.5 |
|
2.4 |
|
|
|
15.5 |
|
12.4 |
|
| Mutual funds |
6,915 |
|
6.5 |
|
4.3 |
|
|
|
24.2 |
|
20.9 |
|
|
|
|
|
|
|
|
|
| Ratios (%), operating means and customers |
|
|
|
|
|
|
|
| RoTE |
22.8 |
|
6.7 |
|
|
|
|
2.7 |
|
|
| RoTE (post-AT1) |
22.1 |
|
6.7 |
|
|
|
|
2.6 |
|
|
| Efficiency ratio |
29.0 |
|
2.3 |
|
|
|
|
1.5 |
|
|
| NPL ratio |
3.52 |
|
(0.14) |
|
|
|
|
(0.04) |
|
|
| NPL coverage ratio |
63.7 |
|
1.8 |
|
|
|
|
(11.2) |
|
|
|
|
|
|
|
|
|
|
| Number of branches |
362 |
|
(1.6) |
|
|
|
|
(4.0) |
|
|
| Number of total customers (thousands) |
6,042 |
|
1.1 |
|
|
|
|
3.1 |
|
|
| Number of active customers (thousands) |
4,670 |
|
0.8 |
|
|
|
|
4.0 |
|
|
1. Includes exchange differences.
2. Excluding reverse repos.
3. Excluding repos.
|
|
|
|
|
|
|
|
|
|
|
|
|
|
|
|
|
|
|
|
|
|
|
| DCB EUROPE |
|
|
| EUR million |
|
|
|
|
|
|
|
|
|
/ |
Q4'24 |
|
|
/ |
Q1'24 |
|
| Underlying income statement |
Q1'25 |
% |
% excl. FX |
|
|
% |
% excl. FX |
|
| Net interest income |
1,112 |
|
0.6 |
|
0.3 |
|
|
|
1.6 |
|
1.5 |
|
|
| Net fee income |
188 |
|
(15.6) |
|
(15.6) |
|
|
|
(14.6) |
|
(14.7) |
|
|
Gains (losses) on financial transactions 1 |
(4) |
|
(85.9) |
|
(85.9) |
|
|
|
— |
|
— |
|
|
| Other operating income |
107 |
|
(18.4) |
|
(18.5) |
|
|
|
17.5 |
|
17.2 |
|
|
| Total income |
1,402 |
|
(1.7) |
|
(2.0) |
|
|
|
(0.5) |
|
(0.6) |
|
|
| Administrative expenses and amortizations |
(667) |
|
6.0 |
|
5.8 |
|
|
|
0.3 |
|
0.3 |
|
|
| Net operating income |
736 |
|
(7.9) |
|
(8.2) |
|
|
|
(1.3) |
|
(1.3) |
|
|
| Net loan-loss provisions |
(336) |
|
(2.8) |
|
(2.9) |
|
|
|
21.7 |
|
21.8 |
|
|
| Other gains (losses) and provisions |
(43) |
|
(91.0) |
|
(91.1) |
|
|
|
(36.8) |
|
(37.4) |
|
|
| Profit before tax |
357 |
|
— |
|
— |
|
|
|
(11.0) |
|
(11.0) |
|
|
| Tax on profit |
(100) |
|
— |
|
— |
|
|
|
(2.7) |
|
(2.8) |
|
|
| Profit from continuing operations |
256 |
|
— |
|
— |
|
|
|
(13.9) |
|
(13.9) |
|
|
| Net profit from discontinued operations |
— |
|
— |
|
— |
|
|
|
— |
|
— |
|
|
| Consolidated profit |
256 |
|
— |
|
— |
|
|
|
(13.9) |
|
(13.9) |
|
|
| Non-controlling interests |
(63) |
|
22.9 |
|
22.9 |
|
|
|
(8.2) |
|
(8.3) |
|
|
| Profit attributable to the parent |
193 |
|
— |
|
— |
|
|
|
(15.5) |
|
(15.5) |
|
|
|
|
|
|
|
|
|
|
|
| Balance sheet |
|
|
|
|
|
|
|
|
| Loans and advances to customers |
136,500 |
|
(0.4) |
|
(0.7) |
|
|
|
3.3 |
|
2.7 |
|
|
| Cash, central banks and credit institutions |
17,042 |
|
(11.2) |
|
(11.4) |
|
|
|
(11.0) |
|
(11.6) |
|
|
| Debt instruments |
8,023 |
|
27.2 |
|
26.2 |
|
|
|
15.3 |
|
14.5 |
|
|
| Other financial assets |
101 |
|
(21.4) |
|
(21.5) |
|
|
|
(7.5) |
|
(7.7) |
|
|
| Other asset accounts |
11,399 |
|
2.6 |
|
2.5 |
|
|
|
12.1 |
|
11.7 |
|
|
| Total assets |
173,065 |
|
(0.4) |
|
(0.7) |
|
|
|
2.7 |
|
2.1 |
|
|
| Customer deposits |
84,067 |
|
3.3 |
|
2.8 |
|
|
|
14.7 |
|
14.2 |
|
|
| Central banks and credit institutions |
28,446 |
|
1.2 |
|
1.2 |
|
|
|
(5.7) |
|
(6.6) |
|
|
| Marketable debt securities |
39,132 |
|
(9.3) |
|
(9.5) |
|
|
|
(11.2) |
|
(11.4) |
|
|
| Other financial liabilities |
2,201 |
|
14.8 |
|
14.5 |
|
|
|
(3.7) |
|
(4.0) |
|
|
| Other liabilities accounts |
5,392 |
|
(5.6) |
|
(5.9) |
|
|
|
6.0 |
|
5.6 |
|
|
| Total liabilities |
159,238 |
|
(0.6) |
|
(0.9) |
|
|
|
2.8 |
|
2.3 |
|
|
| Total equity |
13,828 |
|
2.3 |
|
1.8 |
|
|
|
1.1 |
|
0.4 |
|
|
|
|
|
|
|
|
|
|
|
| Memorandum items: |
|
|
|
|
|
|
|
|
Gross loans and advances to customers 2 |
139,511 |
|
(0.3) |
|
(0.6) |
|
|
|
3.5 |
|
3.0 |
|
|
| Customer funds |
88,729 |
|
3.3 |
|
2.9 |
|
|
|
15.0 |
|
14.5 |
|
|
Customer deposits 3 |
84,067 |
|
3.3 |
|
2.8 |
|
|
|
14.7 |
|
14.2 |
|
|
| Mutual funds |
4,662 |
|
3.6 |
|
3.6 |
|
|
|
20.1 |
|
20.1 |
|
|
|
|
|
|
|
|
|
|
|
| Ratios (%), operating means and customers |
|
|
|
|
|
|
|
|
| RoTE |
7.6 |
|
9.7 |
|
|
|
|
(1.3) |
|
|
|
| RoTE (post-AT1) |
6.7 |
|
9.8 |
|
|
|
|
(1.3) |
|
|
|
| Efficiency ratio |
47.5 |
|
3.5 |
|
|
|
|
0.4 |
|
|
|
| NPL ratio |
2.62 |
|
0.12 |
|
|
|
|
0.35 |
|
|
|
| NPL coverage ratio |
82.3 |
|
(0.3) |
|
|
|
|
(3.8) |
|
|
|
|
|
|
|
|
|
|
|
|
| Number of branches |
324 |
|
(0.6) |
|
|
|
|
(4.7) |
|
|
|
| Number of total customers (thousands) |
19,626 |
|
0.4 |
|
|
|
|
0.1 |
|
|
|
|
|
|
|
|
|
|
|
|
|
|
|
|
|
|
|
|
|
1. Includes exchange differences.
2. Excluding reverse repos.
3. Excluding repos.
|
|
|
|
|
|
|
|
|
|
|
|
|
|
|
|
|
|
|
|
|
|
| United States |
|
| EUR million |
|
|
|
|
|
|
|
|
|
/ |
Q4'24 |
|
|
/ |
Q1'24 |
| Underlying income statement |
Q1'25 |
% |
% excl. FX |
|
|
% |
% excl. FX |
| Net interest income |
1,499 |
|
2.8 |
|
1.4 |
|
|
|
7.3 |
|
4.1 |
|
| Net fee income |
355 |
|
12.0 |
|
10.4 |
|
|
|
33.0 |
|
29.0 |
|
Gains (losses) on financial transactions 1 |
96 |
|
20.3 |
|
19.1 |
|
|
|
(4.6) |
|
(7.5) |
|
| Other operating income |
64 |
|
(26.5) |
|
(27.4) |
|
|
|
(39.2) |
|
(41.0) |
|
| Total income |
2,014 |
|
3.7 |
|
2.3 |
|
|
|
7.8 |
|
4.5 |
|
| Administrative expenses and amortizations |
(1,007) |
|
2.0 |
|
0.6 |
|
|
|
7.2 |
|
3.9 |
|
| Net operating income |
1,006 |
|
5.5 |
|
4.1 |
|
|
|
8.4 |
|
5.1 |
|
| Net loan-loss provisions |
(535) |
|
(22.0) |
|
(23.2) |
|
|
|
(13.0) |
|
(15.7) |
|
| Other gains (losses) and provisions |
(25) |
|
(44.8) |
|
(45.5) |
|
|
|
(38.6) |
|
(40.5) |
|
| Profit before tax |
447 |
|
100.1 |
|
98.2 |
|
|
|
63.3 |
|
58.3 |
|
| Tax on profit |
(30) |
|
— |
|
— |
|
|
|
— |
|
— |
|
| Profit from continuing operations |
417 |
|
82.0 |
|
80.4 |
|
|
|
49.1 |
|
44.6 |
|
| Net profit from discontinued operations |
— |
|
— |
|
— |
|
|
|
— |
|
— |
|
| Consolidated profit |
417 |
|
82.0 |
|
80.4 |
|
|
|
49.1 |
|
44.6 |
|
| Non-controlling interests |
— |
|
— |
|
— |
|
|
|
— |
|
— |
|
| Profit attributable to the parent |
417 |
|
82.0 |
|
80.4 |
|
|
|
49.1 |
|
44.6 |
|
|
|
|
|
|
|
|
|
| Balance sheet |
|
|
|
|
|
|
|
| Loans and advances to customers |
136,552 |
|
1.3 |
|
5.4 |
|
|
|
7.4 |
|
7.5 |
|
| Cash, central banks and credit institutions |
28,481 |
|
1.0 |
|
5.1 |
|
|
|
13.3 |
|
13.5 |
|
| Debt instruments |
30,349 |
|
12.2 |
|
16.8 |
|
|
|
23.6 |
|
23.8 |
|
| Other financial assets |
2,299 |
|
(18.5) |
|
(15.2) |
|
|
|
14.7 |
|
14.8 |
|
| Other asset accounts |
15,089 |
|
(6.0) |
|
(2.2) |
|
|
|
(10.2) |
|
(10.1) |
|
| Total assets |
212,771 |
|
1.8 |
|
5.9 |
|
|
|
8.8 |
|
8.9 |
|
| Customer deposits |
122,635 |
|
(2.2) |
|
1.7 |
|
|
|
3.0 |
|
3.1 |
|
| Central banks and credit institutions |
31,140 |
|
16.2 |
|
20.9 |
|
|
|
35.4 |
|
35.5 |
|
| Marketable debt securities |
33,795 |
|
6.3 |
|
10.6 |
|
|
|
15.0 |
|
15.1 |
|
| Other financial liabilities |
6,567 |
|
25.7 |
|
30.8 |
|
|
|
12.3 |
|
12.4 |
|
| Other liabilities accounts |
3,315 |
|
(10.0) |
|
(6.3) |
|
|
|
3.8 |
|
3.9 |
|
| Total liabilities |
197,452 |
|
2.4 |
|
6.5 |
|
|
|
9.4 |
|
9.5 |
|
| Total equity |
15,318 |
|
(4.8) |
|
(1.0) |
|
|
|
1.4 |
|
1.5 |
|
|
|
|
|
|
|
|
|
| Memorandum items: |
|
|
|
|
|
|
|
Gross loans and advances to customers 2 |
117,108 |
|
(0.3) |
3.7 |
|
|
1.8 |
1.9 |
| Customer funds |
105,476 |
|
(2.6) |
1.4 |
|
|
(1.6) |
(1.5) |
Customer deposits 3 |
91,034 |
|
(2.7) |
1.3 |
|
|
(3.2) |
(3.1) |
| Mutual funds |
14,442 |
|
(1.8) |
2.2 |
|
|
9.9 |
10.0 |
|
|
|
|
|
|
|
|
| Ratios (%), operating means and customers |
|
|
|
|
|
|
|
| RoTE |
11.3 |
|
5.4 |
|
|
|
|
3.4 |
|
|
| RoTE (post-AT1) |
10.7 |
|
5.4 |
|
|
|
|
3.4 |
|
|
| Efficiency ratio |
50.0 |
|
(0.8) |
|
|
|
|
(0.3) |
|
|
| NPL ratio |
4.45 |
|
(0.27) |
|
|
|
|
(0.15) |
|
|
| NPL coverage ratio |
63.8 |
|
0.0 |
|
|
|
|
(4.0) |
|
|
|
|
|
|
|
|
|
|
| Number of branches |
404 |
|
(0.2) |
|
|
|
|
(2.2) |
|
|
| Number of total customers (thousands) |
4,495 |
|
0.5 |
|
|
|
|
0.0 |
|
|
| Number of active customers (thousands) |
4,306 |
|
0.0 |
|
|
|
|
(0.8) |
|
|
1. Includes exchange differences.
2. Excluding reverse repos.
3. Excluding repos.
|
|
|
|
|
|
|
|
|
|
|
|
|
|
|
|
|
|
|
|
|
|
| Mexico |
|
| EUR million |
|
|
|
|
|
|
|
|
|
/ |
Q4'24 |
|
|
/ |
Q1'24 |
| Underlying income statement |
Q1'25 |
% |
% excl. FX |
|
|
% |
% excl. FX |
| Net interest income |
1,129 |
|
3.0 |
|
3.5 |
|
|
|
(7.0) |
|
8.4 |
|
| Net fee income |
350 |
|
8.6 |
|
8.9 |
|
|
|
(2.5) |
|
13.6 |
|
Gains (losses) on financial transactions 1 |
64 |
|
(64.0) |
|
(62.0) |
|
|
|
(8.6) |
|
6.4 |
|
| Other operating income |
(38) |
|
(1.4) |
|
0.8 |
|
|
|
6.6 |
|
24.2 |
|
| Total income |
1,506 |
|
(3.3) |
|
(2.4) |
|
|
|
(6.3) |
|
9.1 |
|
| Administrative expenses and amortizations |
(628) |
|
(8.8) |
|
(7.6) |
|
|
|
(5.6) |
|
10.0 |
|
| Net operating income |
878 |
|
1.0 |
|
1.6 |
|
|
|
(6.9) |
|
8.5 |
|
| Net loan-loss provisions |
(304) |
|
15.7 |
|
14.5 |
|
|
|
(17.7) |
|
(4.1) |
|
| Other gains (losses) and provisions |
(31) |
|
86.2 |
|
89.4 |
|
|
|
112.8 |
|
147.8 |
|
| Profit before tax |
542 |
|
(7.9) |
|
(6.7) |
|
|
|
(2.8) |
|
13.2 |
|
| Tax on profit |
(147) |
|
(1.9) |
|
(0.9) |
|
|
|
1.0 |
|
17.6 |
|
| Profit from continuing operations |
395 |
|
(10.0) |
|
(8.7) |
|
|
|
(4.2) |
|
11.6 |
|
| Net profit from discontinued operations |
— |
|
— |
|
— |
|
|
|
— |
|
— |
|
| Consolidated profit |
395 |
|
(10.0) |
|
(8.7) |
|
|
|
(4.2) |
|
11.6 |
|
| Non-controlling interests |
(1) |
|
(20.4) |
|
(18.3) |
|
|
|
(3.2) |
|
12.7 |
|
| Profit attributable to the parent |
394 |
|
(10.0) |
|
(8.7) |
|
|
|
(4.2) |
|
11.6 |
|
|
|
|
|
|
|
|
|
| Balance sheet |
|
|
|
|
|
|
|
| Loans and advances to customers |
43,335 |
|
(3.8) |
|
(1.4) |
|
|
|
(14.5) |
|
5.4 |
|
| Cash, central banks and credit institutions |
10,972 |
|
0.3 |
|
2.8 |
|
|
|
10.3 |
|
35.9 |
|
| Debt instruments |
27,326 |
|
(9.2) |
|
(6.9) |
|
|
|
(12.0) |
|
8.4 |
|
| Other financial assets |
4,412 |
|
(23.7) |
|
(21.8) |
|
|
|
(31.2) |
|
(15.3) |
|
| Other asset accounts |
5,385 |
|
(6.3) |
|
(3.9) |
|
|
|
(18.9) |
|
(0.1) |
|
| Total assets |
91,430 |
|
(6.3) |
|
(3.9) |
|
|
|
(12.7) |
|
7.6 |
|
| Customer deposits |
48,942 |
|
(1.8) |
|
0.7 |
|
|
|
(13.3) |
|
6.8 |
|
| Central banks and credit institutions |
14,856 |
|
(13.9) |
|
(11.7) |
|
|
|
2.0 |
|
25.7 |
|
| Marketable debt securities |
8,294 |
|
(13.9) |
|
(11.7) |
|
|
|
(8.0) |
|
13.3 |
|
| Other financial liabilities |
8,248 |
|
(14.4) |
|
(12.3) |
|
|
|
(26.4) |
|
(9.3) |
|
| Other liabilities accounts |
3,007 |
|
(3.5) |
|
(1.0) |
|
|
|
(16.7) |
|
2.6 |
|
| Total liabilities |
83,348 |
|
(6.9) |
|
(4.5) |
|
|
|
(12.1) |
|
8.3 |
|
| Total equity |
8,082 |
|
(0.7) |
|
1.9 |
|
|
|
(18.1) |
|
0.9 |
|
|
|
|
|
|
|
|
|
| Memorandum items: |
|
|
|
|
|
|
|
Gross loans and advances to customers 2 |
44,517 |
|
(0.4) |
|
2.1 |
|
|
|
(13.5) |
|
6.6 |
|
| Customer funds |
61,373 |
|
0.3 |
|
2.9 |
|
|
|
(10.5) |
|
10.3 |
|
Customer deposits 3 |
41,145 |
|
(0.9) |
|
1.6 |
|
|
|
(16.6) |
|
2.8 |
|
| Mutual funds |
20,228 |
|
3.0 |
|
5.7 |
|
|
|
5.0 |
|
29.4 |
|
|
|
|
|
|
|
|
|
| Ratios (%), operating means and customers |
|
|
|
|
|
|
|
| RoTE |
21.1 |
|
(1.1) |
|
|
|
|
2.3 |
|
|
| RoTE (post-AT1) |
20.6 |
|
(1.1) |
|
|
|
|
2.3 |
|
|
| Efficiency ratio |
41.7 |
|
(2.5) |
|
|
|
|
0.3 |
|
|
| NPL ratio |
2.79 |
|
0.08 |
|
|
|
|
0.04 |
|
|
| NPL coverage ratio |
101.8 |
|
1.4 |
|
|
|
|
1.1 |
|
|
|
|
|
|
|
|
|
|
| Number of branches |
1,342 |
|
(1.0) |
|
|
|
|
(2.0) |
|
|
| Number of total customers (thousands) |
21,406 |
|
0.6 |
|
|
|
|
3.8 |
|
|
| Number of active customers (thousands) |
10,935 |
|
0.6 |
|
|
|
|
5.5 |
|
|
1. Includes exchange differences.
2. Excluding reverse repos.
3. Excluding repos.
|
|
|
|
|
|
|
|
|
|
|
|
|
|
|
|
|
|
|
|
|
|
| Brazil |
|
| EUR million |
|
|
|
|
|
|
|
|
|
/ |
Q4'24 |
|
|
/ |
Q1'24 |
| Underlying income statement |
Q1'25 |
% |
% excl. FX |
|
|
% |
% excl. FX |
| Net interest income |
2,402 |
|
(0.4) |
|
(1.5) |
|
|
|
(8.7) |
|
4.5 |
|
| Net fee income |
793 |
|
(6.3) |
|
(7.0) |
|
|
|
(6.3) |
|
7.2 |
|
Gains (losses) on financial transactions 1 |
23 |
|
— |
|
— |
|
|
|
(36.8) |
|
(27.6) |
|
| Other operating income |
6 |
|
(42.6) |
|
(42.5) |
|
|
|
— |
|
— |
|
| Total income |
3,223 |
|
(1.4) |
|
(2.3) |
|
|
|
(8.1) |
|
5.2 |
|
| Administrative expenses and amortizations |
(1,059) |
|
(0.4) |
|
(1.2) |
|
|
|
(8.4) |
|
4.8 |
|
| Net operating income |
2,165 |
|
(1.9) |
|
(2.9) |
|
|
|
(7.9) |
|
5.4 |
|
| Net loan-loss provisions |
(1,166) |
|
8.2 |
|
7.2 |
|
|
|
0.2 |
|
14.8 |
|
| Other gains (losses) and provisions |
(194) |
|
(4.7) |
|
(5.8) |
|
|
|
(8.0) |
|
5.3 |
|
| Profit before tax |
805 |
|
(13.1) |
|
(13.9) |
|
|
|
(17.6) |
|
(5.7) |
|
| Tax on profit |
(246) |
|
15.0 |
|
10.9 |
|
|
|
(31.4) |
|
(21.5) |
|
| Profit from continuing operations |
559 |
|
(21.6) |
|
(21.6) |
|
|
|
(9.6) |
|
3.5 |
|
| Net profit from discontinued operations |
— |
|
— |
|
— |
|
|
|
— |
|
— |
|
| Consolidated profit |
559 |
|
(21.6) |
|
(21.6) |
|
|
|
(9.6) |
|
3.5 |
|
| Non-controlling interests |
(49) |
|
(18.3) |
|
(18.9) |
|
|
|
(12.8) |
|
(0.2) |
|
| Profit attributable to the parent |
509 |
|
(21.9) |
|
(21.9) |
|
|
|
(9.3) |
|
3.8 |
|
|
|
|
|
|
|
|
|
| Balance sheet |
|
|
|
|
|
|
|
| Loans and advances to customers |
88,407 |
|
(0.2) |
|
(3.8) |
|
|
|
(10.3) |
|
2.9 |
|
| Cash, central banks and credit institutions |
54,999 |
|
17.7 |
|
13.4 |
|
|
|
5.7 |
|
21.2 |
|
| Debt instruments |
47,101 |
|
3.1 |
|
(0.6) |
|
|
|
(2.3) |
|
12.0 |
|
| Other financial assets |
9,120 |
|
(14.2) |
|
(17.3) |
|
|
|
19.4 |
|
36.9 |
|
| Other asset accounts |
14,837 |
|
7.2 |
|
3.3 |
|
|
|
3.0 |
|
18.1 |
|
| Total assets |
214,464 |
|
4.4 |
|
0.6 |
|
|
|
(2.9) |
|
11.4 |
|
| Customer deposits |
98,563 |
|
4.9 |
|
1.1 |
|
|
|
(7.1) |
|
6.6 |
|
| Central banks and credit institutions |
34,709 |
|
12.4 |
|
8.4 |
|
|
|
17.2 |
|
34.4 |
|
| Marketable debt securities |
26,583 |
|
4.9 |
|
1.1 |
|
|
|
(5.6) |
|
8.2 |
|
| Other financial liabilities |
32,633 |
|
(4.6) |
|
(8.1) |
|
|
|
0.9 |
|
15.7 |
|
| Other liabilities accounts |
6,095 |
|
9.2 |
|
5.2 |
|
|
|
(17.4) |
|
(5.3) |
|
| Total liabilities |
198,583 |
|
4.5 |
|
0.7 |
|
|
|
(2.5) |
|
11.9 |
|
| Total equity |
15,881 |
|
2.5 |
|
(1.2) |
|
|
|
(7.8) |
|
5.7 |
|
|
|
|
|
|
|
|
|
| Memorandum items: |
|
|
|
|
|
|
|
Gross loans and advances to customers 2 |
93,607 |
|
(0.2) |
|
(3.8) |
|
|
|
(10.1) |
|
3.1 |
|
| Customer funds |
138,313 |
|
6.5 |
|
2.7 |
|
|
|
(4.3) |
|
9.8 |
|
Customer deposits 3 |
84,267 |
|
3.6 |
|
(0.2) |
|
|
|
(5.5) |
|
8.3 |
|
| Mutual funds |
54,045 |
|
11.4 |
|
7.4 |
|
|
|
(2.2) |
|
12.1 |
|
|
|
|
|
|
|
|
|
| Ratios (%), operating means and customers |
|
|
|
|
|
|
|
| RoTE |
15.1 |
|
(4.4) |
|
|
|
|
(0.3) |
|
|
| RoTE (post-AT1) |
14.4 |
|
(4.3) |
|
|
|
|
(0.3) |
|
|
| Efficiency ratio |
32.8 |
|
0.3 |
|
|
|
|
(0.1) |
|
|
| NPL ratio |
6.33 |
|
0.19 |
|
|
|
|
0.27 |
|
|
| NPL coverage ratio |
82.0 |
|
(0.7) |
|
|
|
|
(4.8) |
|
|
|
|
|
|
|
|
|
|
| Number of branches |
2,055 |
|
(6.7) |
|
|
|
|
(17.5) |
|
|
| Number of total customers (thousands) |
70,720 |
|
1.8 |
|
|
|
|
9.8 |
|
|
| Number of active customers (thousands) |
33,373 |
|
0.8 |
|
|
|
|
7.2 |
|
|
1. Includes exchange differences.
2. Excluding reverse repos.
3. Excluding repos.
|
|
|
|
|
|
|
|
|
|
|
|
|
|
|
|
|
|
|
|
|
|
| Chile |
|
|
|
|
|
|
|
| EUR million |
|
|
|
|
|
|
|
|
|
/ |
Q4'24 |
|
|
/ |
Q1'24 |
| Underlying income statement |
Q1'25 |
% |
% excl. FX |
|
|
% |
% excl. FX |
| Net interest income |
512 |
|
(0.7) |
|
(2.0) |
|
|
|
45.6 |
|
43.5 |
|
| Net fee income |
151 |
|
8.5 |
|
6.9 |
|
|
|
17.6 |
|
16.0 |
|
Gains (losses) on financial transactions 1 |
63 |
|
(3.0) |
|
(4.3) |
|
|
|
19.0 |
|
17.3 |
|
| Other operating income |
(4) |
|
(24.9) |
|
(25.8) |
|
|
|
(27.3) |
|
(28.3) |
|
| Total income |
722 |
|
1.1 |
|
(0.3) |
|
|
|
36.9 |
|
35.0 |
|
| Administrative expenses and amortizations |
(249) |
|
7.3 |
|
5.8 |
|
|
|
11.0 |
|
9.5 |
|
| Net operating income |
473 |
|
(1.9) |
|
(3.2) |
|
|
|
56.1 |
|
53.9 |
|
| Net loan-loss provisions |
(156) |
|
32.0 |
|
30.0 |
|
|
|
24.5 |
|
22.7 |
|
| Other gains (losses) and provisions |
(3) |
|
(87.7) |
|
(87.8) |
|
|
|
(85.8) |
|
(86.0) |
|
| Profit before tax |
315 |
|
(8.3) |
|
(9.5) |
|
|
|
97.0 |
|
94.3 |
|
| Tax on profit |
(46) |
|
(21.2) |
|
(22.2) |
|
|
|
35.5 |
|
33.6 |
|
| Profit from continuing operations |
268 |
|
(5.7) |
|
(6.8) |
|
|
|
113.8 |
|
110.8 |
|
| Net profit from discontinued operations |
— |
|
— |
|
— |
|
|
|
— |
|
— |
|
| Consolidated profit |
268 |
|
(5.7) |
|
(6.8) |
|
|
|
113.8 |
|
110.8 |
|
| Non-controlling interests |
(84) |
|
(5.5) |
|
(6.6) |
|
|
|
138.7 |
|
135.4 |
|
| Profit attributable to the parent |
185 |
|
(5.8) |
|
(6.9) |
|
|
|
104.1 |
|
101.3 |
|
|
|
|
|
|
|
|
|
| Balance sheet |
|
|
|
|
|
|
|
| Loans and advances to customers |
40,482 |
|
0.4 |
|
0.1 |
|
|
|
3.3 |
|
0.4 |
|
| Cash, central banks and credit institutions |
5,101 |
|
(11.4) |
|
(11.7) |
|
|
|
(17.8) |
|
(20.1) |
|
| Debt instruments |
8,750 |
|
9.5 |
|
9.2 |
|
|
|
(28.0) |
|
(30.1) |
|
| Other financial assets |
12,268 |
|
(9.5) |
|
(9.7) |
|
|
|
(13.4) |
|
(15.9) |
|
| Other asset accounts |
2,467 |
|
(11.8) |
|
(12.0) |
|
|
|
(14.8) |
|
(17.3) |
|
| Total assets |
69,068 |
|
(1.9) |
|
(2.2) |
|
|
|
(7.4) |
|
(10.1) |
|
| Customer deposits |
29,623 |
|
(1.8) |
|
(2.1) |
|
|
|
6.4 |
|
3.3 |
|
| Central banks and credit institutions |
8,535 |
|
4.9 |
|
4.7 |
|
|
|
(37.7) |
|
(39.5) |
|
| Marketable debt securities |
9,948 |
|
(4.4) |
|
(4.6) |
|
|
|
(2.3) |
|
(5.1) |
|
| Other financial liabilities |
13,055 |
|
(8.9) |
|
(9.1) |
|
|
|
(12.2) |
|
(14.7) |
|
| Other liabilities accounts |
2,174 |
|
11.9 |
|
11.6 |
|
|
|
(22.1) |
|
(24.4) |
|
| Total liabilities |
63,335 |
|
(2.5) |
|
(2.8) |
|
|
|
(8.7) |
|
(11.4) |
|
| Total equity |
5,733 |
|
5.2 |
|
4.9 |
|
|
|
10.4 |
|
7.2 |
|
|
|
|
|
|
|
|
|
| Memorandum items: |
|
|
|
|
|
|
|
Gross loans and advances to customers 2 |
41,579 |
|
0.4 |
|
0.1 |
|
|
|
3.2 |
|
0.2 |
|
| Customer funds |
42,115 |
|
(2.9) |
|
(3.2) |
|
|
|
10.7 |
|
7.5 |
|
Customer deposits 3 |
29,507 |
|
(1.8) |
|
(2.1) |
|
|
|
6.3 |
|
3.2 |
|
| Mutual funds |
12,608 |
|
(5.4) |
|
(5.6) |
|
|
|
22.8 |
|
19.3 |
|
|
|
|
|
|
|
|
|
| Ratios (%), operating means and customers |
|
|
|
|
|
|
|
| RoTE |
19.0 |
|
(2.4) |
|
|
|
|
9.2 |
|
|
| RoTE (post-AT1) |
18.2 |
|
(2.3) |
|
|
|
|
9.2 |
|
|
| Efficiency ratio |
34.5 |
|
2.0 |
|
|
|
|
(8.0) |
|
|
| NPL ratio |
5.60 |
|
0.23 |
|
|
|
|
0.64 |
|
|
| NPL coverage ratio |
49.6 |
|
(0.4) |
|
|
|
|
(4.6) |
|
|
|
|
|
|
|
|
|
|
| Number of branches |
238 |
|
0.4 |
|
|
|
|
(2.9) |
|
|
| Number of total customers (thousands) |
4,337 |
|
0.6 |
|
|
|
|
9.4 |
|
|
| Number of active customers (thousands) |
2,604 |
|
1.9 |
|
|
|
|
7.0 |
|
|
1. Includes exchange differences.
2. Excluding reverse repos.
3. Excluding repos.
|
|
|
|
|
|
|
|
|
|
|
|
|
|
|
|
|
|
|
|
| Argentina |
|
| EUR million |
|
|
|
|
|
|
|
|
|
/ Q4'24 |
|
|
/ Q1'24 |
|
| Underlying income statement |
Q1'25 |
Q4'24 |
% |
|
|
% |
|
| Net interest income |
416 |
|
1,107 |
|
(62.4) |
|
|
|
(59.4) |
|
|
| Net fee income |
172 |
|
287 |
|
(39.9) |
|
|
|
31.4 |
|
|
Gains (losses) on financial transactions 1 |
38 |
|
101 |
|
(62.3) |
|
|
|
(49.6) |
|
|
| Other operating income |
(122) |
|
(448) |
|
(72.7) |
|
|
|
(81.9) |
|
|
| Total income |
504 |
|
1,047 |
|
(51.9) |
|
|
|
(9.3) |
|
|
| Administrative expenses and amortizations |
(223) |
|
(416) |
|
(46.3) |
|
|
|
(21.9) |
|
|
| Net operating income |
281 |
|
631 |
|
(55.5) |
|
|
|
4.1 |
|
|
| Net loan-loss provisions |
(76) |
|
(156) |
|
(51.4) |
|
|
|
117.4 |
|
|
| Other gains (losses) and provisions |
(8) |
|
(123) |
|
(93.6) |
|
|
|
(93.9) |
|
|
| Profit before tax |
197 |
|
352 |
|
(44.0) |
|
|
|
89.4 |
|
|
| Tax on profit |
(69) |
|
(68) |
|
0.4 |
|
|
|
— |
|
|
| Profit from continuing operations |
129 |
|
284 |
|
(54.6) |
|
|
|
26.6 |
|
|
| Net profit from discontinued operations |
— |
|
— |
|
— |
|
|
|
— |
|
|
| Consolidated profit |
129 |
|
284 |
|
(54.6) |
|
|
|
26.6 |
|
|
| Non-controlling interests |
0 |
|
(1) |
|
(53.6) |
|
|
|
(9.0) |
|
|
| Profit attributable to the parent |
129 |
|
283 |
|
(54.6) |
|
|
|
26.7 |
|
|
|
|
|
|
|
|
|
|
| Balance sheet |
|
|
|
|
|
|
|
| Loans and advances to customers |
8,367 |
|
7,684 |
|
8.9 |
|
|
|
60.0 |
|
|
| Cash, central banks and credit institutions |
3,833 |
|
4,901 |
|
(21.8) |
|
|
|
0.1 |
|
|
| Debt instruments |
2,815 |
|
2,654 |
|
6.1 |
|
|
|
60.5 |
|
|
| Other financial assets |
86 |
|
23 |
|
281.2 |
|
|
|
76.1 |
|
|
| Other asset accounts |
874 |
|
978 |
|
(10.7) |
|
|
|
(22.0) |
|
|
| Total assets |
15,976 |
|
16,240 |
|
(1.6) |
|
|
|
33.3 |
|
|
| Customer deposits |
10,978 |
|
11,293 |
|
(2.8) |
|
|
|
73.0 |
|
|
| Central banks and credit institutions |
842 |
|
852 |
|
(1.1) |
|
|
|
(49.4) |
|
|
| Marketable debt securities |
242 |
|
158 |
|
53.5 |
|
|
|
28.3 |
|
|
| Other financial liabilities |
1,007 |
|
968 |
|
4.0 |
|
|
|
20.3 |
|
|
| Other liabilities accounts |
422 |
|
476 |
|
(11.5) |
|
|
|
(27.2) |
|
|
| Total liabilities |
13,491 |
|
13,746 |
|
(1.9) |
|
|
|
40.3 |
|
|
| Total equity |
2,485 |
|
2,494 |
|
(0.4) |
|
|
|
5.1 |
|
|
|
|
|
|
|
|
|
|
| Memorandum items: |
|
|
|
|
|
|
|
Gross loans and advances to customers 2 |
8,642 |
|
7,938 |
|
8.9 |
|
|
|
61.3 |
|
|
| Customer funds |
17,006 |
|
17,047 |
|
(0.2) |
|
|
|
63.6 |
|
|
Customer deposits 3 |
10,978 |
|
11,293 |
|
(2.8) |
|
|
|
73.0 |
|
|
| Mutual funds |
6,028 |
|
5,754 |
|
4.8 |
|
|
|
49.0 |
|
|
|
|
|
|
|
|
|
|
| Ratios (%), operating means and customers |
|
|
|
|
|
|
|
| RoTE |
22.7 |
|
|
(6.1) |
|
|
2.2 |
|
| RoTE (post-AT1) |
22.0 |
|
|
(6.4) |
|
|
1.9 |
|
| Efficiency ratio |
44.3 |
|
|
4.5 |
|
|
(7.2) |
|
| NPL ratio |
2.32 |
|
|
0.26 |
|
|
0.48 |
|
| NPL coverage ratio |
155.4 |
|
|
(21.7) |
|
|
8.1 |
|
|
|
|
|
|
|
|
|
| Number of branches |
301 |
|
|
0.0 |
|
|
(5.3) |
|
| Number of total customers (thousands) |
5,214 |
|
|
1.9 |
|
|
8.2 |
|
| Number of active customers (thousands) |
3,645 |
|
|
(0.8) |
|
|
1.9 |
|
1. Includes exchange differences.
2. Excluding reverse repos.
3. Excluding repos.
|
|
|
|
|
|
|
|
|
|
|
|
|
|
|
|
|
|
|
|
|
|
| Rest of the Group |
|
| EUR million |
|
|
|
|
|
|
|
|
|
/ |
Q4'24 |
|
|
/ |
Q1'24 |
| Underlying income statement |
Q1'25 |
% |
% excl. FX |
|
|
% |
% excl. FX |
| Net interest income |
250 |
|
11.1 |
|
10.1 |
|
|
|
36.3 |
|
40.2 |
|
| Net fee income |
205 |
|
2.6 |
|
2.3 |
|
|
|
26.2 |
|
26.7 |
|
Gains (losses) on financial transactions 1 |
50 |
|
(20.0) |
|
(21.4) |
|
|
|
(28.1) |
|
(27.4) |
|
| Other operating income |
20 |
|
— |
|
— |
|
|
|
141.9 |
|
111.2 |
|
| Total income |
524 |
|
9.5 |
|
8.2 |
|
|
|
23.8 |
|
25.3 |
|
| Administrative expenses and amortizations |
(409) |
|
9.1 |
|
8.5 |
|
|
|
3.6 |
|
4.0 |
|
| Net operating income |
116 |
|
10.8 |
|
7.5 |
|
|
|
298.8 |
|
354.9 |
|
| Net loan-loss provisions |
(70) |
|
(1.3) |
|
(1.9) |
|
|
|
30.6 |
|
35.5 |
|
| Other gains (losses) and provisions |
3 |
|
— |
|
— |
|
|
|
— |
|
— |
|
| Profit before tax |
49 |
|
96.1 |
|
76.5 |
|
|
|
— |
|
— |
|
| Tax on profit |
(26) |
|
— |
|
— |
|
|
|
875.3 |
|
— |
|
| Profit from continuing operations |
23 |
|
(40.2) |
|
(42.1) |
|
|
|
0.0 |
|
— |
|
| Net profit from discontinued operations |
— |
|
— |
|
— |
|
|
|
— |
|
— |
|
| Consolidated profit |
23 |
|
(40.2) |
|
(42.1) |
|
|
|
0.0 |
|
— |
|
| Non-controlling interests |
0 |
|
— |
|
— |
|
|
|
(55.9) |
|
(67.0) |
|
| Profit attributable to the parent |
23 |
|
(43.6) |
|
(45.8) |
|
|
|
— |
|
— |
|
|
|
|
|
|
|
|
|
| Balance sheet |
|
|
|
|
|
|
|
| Loans and advances to customers |
24,668 |
|
(1.0) |
|
1.2 |
|
|
|
0.1 |
|
3.0 |
|
| Cash, central banks and credit institutions |
6,508 |
|
(20.4) |
|
(19.2) |
|
|
|
21.9 |
|
25.2 |
|
| Debt instruments |
12,665 |
|
18.6 |
|
19.1 |
|
|
|
5.2 |
|
7.5 |
|
| Other financial assets |
2,470 |
|
(18.8) |
|
(17.3) |
|
|
|
14.4 |
|
15.9 |
|
| Other asset accounts |
2,909 |
|
(0.7) |
|
(0.5) |
|
|
|
(28.0) |
|
(27.3) |
|
| Total assets |
49,220 |
|
(1.0) |
|
0.5 |
|
|
|
2.1 |
|
4.6 |
|
| Customer deposits |
22,792 |
|
14.2 |
|
16.4 |
|
|
|
43.1 |
|
50.6 |
|
| Central banks and credit institutions |
17,611 |
|
(8.8) |
|
(7.6) |
|
|
|
(25.3) |
|
(24.9) |
|
| Marketable debt securities |
973 |
|
8.3 |
|
9.0 |
|
|
|
23.9 |
|
36.3 |
|
| Other financial liabilities |
2,355 |
|
(12.6) |
|
(10.6) |
|
|
|
15.8 |
|
17.3 |
|
| Other liabilities accounts |
1,489 |
|
(1.7) |
|
(1.4) |
|
|
|
5.4 |
|
8.8 |
|
| Total liabilities |
45,220 |
|
1.9 |
|
3.5 |
|
|
|
3.4 |
|
5.9 |
|
| Total equity |
4,000 |
|
(25.4) |
|
(24.3) |
|
|
|
(10.8) |
|
(8.5) |
|
|
|
|
|
|
|
|
|
| Memorandum items: |
|
|
|
|
|
|
|
Gross loans and advances to customers 2 |
25,151 |
|
(0.5) |
|
1.6 |
|
|
|
1.0 |
|
3.9 |
|
| Customer funds |
37,918 |
|
10.9 |
|
12.7 |
|
|
|
34.3 |
|
38.8 |
|
Customer deposits 3 |
22,554 |
|
15.5 |
|
17.7 |
|
|
|
43.2 |
|
50.8 |
|
| Mutual funds |
15,364 |
|
4.7 |
|
6.0 |
|
|
|
23.1 |
|
24.4 |
|
|
|
|
|
|
|
|
|
|
|
|
|
|
|
|
|
|
|
|
|
|
|
|
|
|
|
|
|
|
|
|
|
|
|
|
|
|
|
|
|
|
|
|
|
|
|
|
|
|
|
|
|
|
|
|
|
1. Includes exchange differences.
2. Excluding reverse repos.
3. Excluding repos.
Alternative performance measures (APMs)
In addition to the financial information prepared under IFRS, this consolidated directors’ report contains financial measures that constitute alternative performance measures (APMs) to comply with the guidelines on alternative performance measures issued by the European Securities and Markets Authority on 5 October 2015 and non-IFRS measures.
The financial measures contained in this consolidated directors’ report that qualify as APMs and non-IFRS measures have been calculated using our financial information but are not defined or detailed in the applicable financial information framework or under IFRS and therefore have neither been audited nor are susceptible to being fully audited.
We use these APMs and non-IFRS measures when planning, monitoring and evaluating our performance. We consider these APMs and non-IFRS financial measures to be useful metrics for management and investors to facilitate operating performance comparisons from period to period. While we believe that these APMs and non-IFRS financial measures are useful in evaluating our business, this information should be considered as supplemental in nature and is not meant as a substitute of IFRS measures. In addition, the way in which Santander defines and
calculates these APMs and non-IFRS measures may differ from the calculations used by other companies with similar measures and, therefore, may not be comparable.
The APMs and non-IFRS measures we use in this document can be categorized as follows:
Underlying results
In addition to IFRS results measures, we present some results measures which are non-IFRS and which we refer to as underlying measures. These measures allow in our view a better year-on-year comparability given that they exclude items outside the ordinary performance of our business (e.g. capital gains, write-downs, impairment of goodwill) or certain line items have been reclassified in the underlying ("adjusted") income statement, as their impact on profit is zero, to facilitate comparisons with prior quarters and better understand the trends in the business.
In addition, in the section "Financial information by segment", covering the primary and secondary segments, results are presented only on an underlying basis in accordance with IFRS 8, and reconciled on an aggregate basis to our IFRS consolidated results to the consolidated financial statements, which are set out below.
|
|
|
|
|
|
|
|
|
|
|
|
| Reconciliation of underlying results to statutory results |
| EUR million |
|
|
|
|
January-March 2025 |
|
Statutory results |
Adjustments |
Underlying results |
| Net interest income |
11,378 |
|
— |
|
11,378 |
|
| Net fee income |
3,369 |
|
— |
|
3,369 |
|
Gains (losses) on financial transactions 1 |
678 |
|
— |
|
678 |
|
| Other operating income |
112 |
|
— |
|
112 |
|
| Total income |
15,537 |
|
— |
|
15,537 |
|
| Administrative expenses and amortizations |
(6,489) |
|
— |
|
(6,489) |
|
| Net operating income |
9,048 |
|
— |
|
9,048 |
|
| Net loan-loss provisions |
(3,161) |
|
— |
|
(3,161) |
|
| Other gains (losses) and provisions |
(700) |
|
— |
|
(700) |
|
| Profit before tax |
5,187 |
|
— |
|
5,187 |
|
| Tax on profit |
(1,446) |
|
— |
|
(1,446) |
|
| Profit from continuing operations |
3,741 |
|
— |
|
3,741 |
|
| Net profit from discontinued operations |
— |
|
— |
|
— |
|
| Consolidated profit |
3,741 |
|
— |
|
3,741 |
|
| Non-controlling interests |
(339) |
|
— |
|
(339) |
|
| Profit attributable to the parent |
3,402 |
|
— |
|
3,402 |
|
1. Includes exchange differences.
|
|
|
|
|
|
|
|
|
|
|
|
| Reconciliation of underlying results to statutory results |
| EUR million |
|
|
|
|
January-March 2024 |
|
Statutory results |
Adjustments |
Underlying results |
| Net interest income |
11,983 |
|
— |
|
11,983 |
|
| Net fee income |
3,240 |
|
— |
|
3,240 |
|
Gains (losses) on financial transactions 1 |
623 |
|
— |
|
623 |
|
| Other operating income |
(801) |
|
335 |
|
(466) |
|
| Total income |
15,045 |
|
335 |
|
15,380 |
|
| Administrative expenses and amortizations |
(6,547) |
|
— |
|
(6,547) |
|
| Net operating income |
8,498 |
|
335 |
|
8,833 |
|
| Net loan-loss provisions |
(3,125) |
|
— |
|
(3,125) |
|
| Other gains (losses) and provisions |
(790) |
|
(335) |
|
(1,125) |
|
| Profit before tax |
4,583 |
|
— |
|
4,583 |
|
| Tax on profit |
(1,468) |
|
— |
|
(1,468) |
|
| Profit from continuing operations |
3,115 |
|
— |
|
3,115 |
|
| Net profit from discontinued operations |
— |
|
— |
|
— |
|
| Consolidated profit |
3,115 |
|
— |
|
3,115 |
|
| Non-controlling interests |
(263) |
|
— |
|
(263) |
|
| Profit attributable to the parent |
2,852 |
|
— |
|
2,852 |
|
1. Includes exchange differences.
|
|
|
|
|
|
| Explanation of adjustments: |
| 1. |
Temporary levy on revenue in Spain in Q1 2024, totalling EUR 335 million, which was reclassified from total income to other gains (losses) and provisions. |
|
|
Profitability and efficiency ratios
The purpose of the profitability ratios is to measure the ratio of profit to equity, to tangible equity, to assets and to risk-weighted assets, while the efficiency ratio measures how much general administrative expenses (personnel and other) and amortization costs are needed to generate revenue.
Additionally, goodwill adjustments have been removed from the RoTE numerator as, since they are not considered in the denominator, we believe this calculation is more correct.
|
|
|
|
|
|
|
|
|
|
|
|
|
|
|
| Ratio |
|
Formula |
|
Relevance of the metric |
| RoE |
|
Profit attributable to the parent (annualized) |
|
This ratio measures the return that shareholders obtain on the funds invested in the bank and as such measures the company's ability to pay shareholders. |
| (Return on equity) |
|
Average stockholders’ equity 1 (excl. minority interests) |
|
|
|
|
|
|
|
|
|
|
| RoTE |
|
Profit attributable to the parent (annualized)2 |
|
This indicator is used to evaluate the profitability of the company as a percentage of its tangible equity. It's measured as the return that shareholders receive as a percentage of the funds invested in the entity less intangible assets. |
| (Return on tangible equity) |
|
Average stockholders' equity 1 (excl. minority interests) - intangible assets |
|
| RoTE (post-AT1) |
|
Profit attributable to the parent minus AT1 costs (annualized)2 |
|
As with RoTE, this indicator is used to assess the profitability of a company as a percentage of its tangible equity, but the cost of AT1 issuances is deduced from the numerator. This is the definition of RoTE that is commonly used as a measure of profitability over tangible equity. |
| (Return on tangible equity) |
|
Average stockholders' equity 1 (excl. minority interests) - intangible assets |
|
|
|
|
|
|
|
|
|
|
| RoA |
|
Consolidated profit (annualized) |
|
This metric measures the profitability of a company as a percentage of its total assets. It is an indicator that reflects the efficiency of the bank's total assets in generating profit over a given period. |
| (Return on assets) |
|
Average total assets |
|
|
|
|
|
|
|
|
|
|
| RoRWA |
|
Consolidated profit (annualized) |
|
The return adjusted for risk is a derivative of the RoA metric. The difference is that RoRWA measures profit in relation to the bank's risk-weighted assets. |
| (Return on risk-weighted assets) |
|
Average risk-weighted assets |
|
|
|
|
|
|
|
|
|
|
| Efficiency ratio |
|
Operating expenses 3 |
|
One of the most commonly used indicators when comparing productivity of different financial entities. It measures the amount of resources used to generate the bank's total income. |
|
|
Total income |
|
1. Stockholders’ equity = Capital and Reserves + Accumulated other comprehensive income + Profit attributable to the parent + Dividends.
2. Excluding the adjustment to the valuation of goodwill.
3. Operating expenses = Administrative expenses + amortizations.
|
|
|
|
|
|
|
|
|
|
|
|
|
Profitability and efficiency 1, 2 (EUR million and %) |
Q1'25 |
Q4'24 |
|
Q1'24 |
|
|
|
|
|
| RoE |
13.4 |
% |
13.3 |
% |
|
11.8 |
% |
| Profit attributable to the parent (annualized) |
13,610 |
13,061 |
|
11,409 |
| Average stockholders' equity (excluding minority interests) |
101,501 |
97,952 |
|
96,308 |
|
|
|
|
|
|
|
|
|
|
|
|
|
|
|
|
|
|
|
|
|
|
|
|
|
|
|
|
|
|
|
|
|
|
|
| RoTE |
16.6 |
% |
16.6 |
% |
|
14.9 |
% |
| Profit attributable to the parent (annualized) |
13,610 |
13,061 |
|
11,409 |
| (-) Goodwill impairment |
— |
0 |
|
— |
| Profit attributable to the parent excluding goodwill impairment (annualized) |
13,610 |
13,061 |
|
11,409 |
| Average stockholders' equity (excluding minority interests) |
101,501 |
97,952 |
|
96,308 |
| (-) Average intangible assets |
19,359 |
19,158 |
|
19,888 |
| Average stockholders' equity (excl. minority interests) - intangible assets |
82,142 |
78,794 |
|
76,420 |
|
|
|
|
|
| RoTE (post-AT1) |
15.8 |
% |
15.7 |
% |
|
14.1 |
% |
| Profit attributable to the parent |
3,402 |
3,265 |
|
2,852 |
| (-) AT1 costs |
160 |
173 |
|
164 |
| Profit attributable to the parent excluding AT1 costs (annualized) |
12,971 |
12,369 |
|
10,751 |
| (-) Goodwill impairment |
— |
0 |
|
— |
| Profit attributable to the parent minus AT1 costs (annualized; excluding goodwill impairment) |
12,971 |
12,369 |
|
10,751 |
| Average stockholders' equity (excluding minority interests) |
101,501 |
97,952 |
|
96,308 |
| (-) Average intangible assets |
19,359 |
19,158 |
|
19,888 |
| Average stockholders' equity (excl. minority interests) - intangible assets |
82,142 |
78,794 |
|
76,420 |
|
|
|
|
|
|
|
|
|
|
|
|
|
|
|
|
|
|
|
|
|
|
|
|
|
|
|
|
|
|
|
|
|
|
|
| RoA |
0.81 |
% |
0.78 |
% |
|
0.69 |
% |
| Consolidated profit (annualized) |
14,966 |
14,252 |
|
12,461 |
| Average total assets |
1,855,729 |
1,834,476 |
|
1,804,334 |
|
|
|
|
|
|
|
|
|
|
|
|
|
|
|
|
|
|
|
|
|
|
|
|
|
|
|
|
|
|
|
|
|
|
|
| RoRWA |
2.34 |
% |
2.27 |
% |
|
1.96 |
% |
| Consolidated profit (annualized) |
14,966 |
14,252 |
|
12,461 |
| Average risk-weighted assets |
640,837 |
627,333 |
|
635,673 |
|
|
|
|
|
|
|
|
|
|
|
|
|
|
|
|
|
|
|
|
|
|
|
|
|
|
|
|
|
|
|
|
|
|
|
| Efficiency ratio |
41.8 |
% |
42.3 |
% |
|
42.6 |
% |
| Underlying operating expenses |
6,489 |
6,772 |
|
6,547 |
| Operating expenses |
6,489 |
6,772 |
|
6,547 |
| Adjustments to operating expenses for items outside ordinary course of businesses |
— |
— |
|
— |
| Underlying total income |
15,537 |
16,026 |
|
15,380 |
| Total income |
15,537 |
16,026 |
|
15,045 |
| Adjustments to total income for items outside ordinary course of businesses |
— |
— |
|
335 |
1.Averages included in the RoE, RoTE, RoTE (post-AT1), RoA and RoRWA denominators are calculated using the monthly average over the period, which we believe should not differ materially from using daily balances. |
|
|
2.The risk-weighted assets included in the denominator of the RoRWA metric are calculated in line with the criteria laid out in the CRR (Capital Requirements Regulation). |
|
|
|
|
|
|
|
|
|
|
|
|
|
|
|
| Ratio |
|
Formula |
|
Relevance of the metric |
| Global business RoTE |
|
Profit attributable to the parent excluding goodwill impairment (annualized) |
|
This indicator is used to evaluate the profitability of the company as a percentage of its tangible equity. It's measured as the return that shareholders receive as a percentage of the funds invested in the entity less intangible assets. |
|
Average stockholders' equity (excl. minority interests) - intangible assets 1 |
|
| Global business and country RoTE (post-AT1) |
|
Profit attributable to the parent minus AT1 costs2 (annualized; excluding goodwill impairment) |
|
As with RoTE, this indicator is used to assess the profitability of a company as a percentage of its tangible equity, but the cost of AT1 issuances is deduced from the numerator. This is the definition of RoTE that is commonly used as a measure of profitability over tangible equity. |
|
Average stockholders' equity (excl. minority interests) - intangible assets 1 |
|
1.For global businesses, tangible equity is allocated according to RWA consumption.
2.For both global businesses and countries, AT1 costs are allocated according to RWA consumption.
|
|
|
|
|
|
|
|
|
|
|
|
|
|
|
|
|
|
|
|
|
|
|
|
RoTE (EUR million and %) |
|
|
|
|
|
|
|
Q1'25 |
|
Q1'24 |
|
% |
Numerator |
Denominator |
|
% |
Numerator |
Denominator |
| Retail & Commercial Banking |
18.3 |
|
7,606 |
|
41,523 |
|
|
16.1 |
|
6,154 |
|
38,217 |
|
| Digital Consumer Bank |
10.6 |
|
1,967 |
|
18,627 |
|
|
11.3 |
|
1,854 |
|
16,438 |
|
| Corporate & Investment Banking |
22.4 |
|
3,225 |
|
14,394 |
|
|
19.4 |
|
2,863 |
|
14,774 |
|
| Wealth Management & Insurance |
68.8 |
|
1,884 |
|
2,738 |
|
|
71.0 |
|
1,505 |
|
2,120 |
|
| Payments |
17.4 |
|
503 |
|
2,885 |
|
|
16.5 |
|
462 |
|
2,795 |
|
| PagoNxt |
|
|
|
|
|
|
|
| Cards |
19.9 |
|
485 |
|
2,443 |
|
|
26.1 |
|
619 |
|
2,371 |
|
|
|
|
|
|
|
|
|
|
|
|
|
|
|
|
|
| Spain |
26.3 |
|
4,588 |
|
17,427 |
|
|
18.0 |
|
3,088 |
|
17,132 |
|
| United Kingdom |
9.7 |
|
1,138 |
|
11,755 |
|
|
10.4 |
|
1,220 |
|
11,698 |
|
| Portugal |
31.1 |
|
1,113 |
|
3,583 |
|
|
31.1 |
|
1,212 |
|
3,893 |
|
| Poland |
22.8 |
|
950 |
|
4,167 |
|
|
20.1 |
|
853 |
|
4,238 |
|
| DCB Europe |
7.6 |
|
773 |
|
10,197 |
|
|
8.9 |
|
915 |
|
10,296 |
|
|
|
|
|
|
|
|
|
| US |
11.3 |
|
1,667 |
|
14,704 |
|
|
8.0 |
|
1,118 |
|
14,016 |
|
| Mexico |
21.1 |
|
1,576 |
|
7,485 |
|
|
18.8 |
|
1,645 |
|
8,771 |
|
|
|
|
|
|
|
|
|
| Brazil |
15.1 |
|
2,037 |
|
13,478 |
|
|
15.4 |
|
2,245 |
|
14,575 |
|
| Chile |
19.0 |
|
739 |
|
3,896 |
|
|
9.7 |
|
362 |
|
3,719 |
|
| Argentina |
22.7 |
|
514 |
|
2,267 |
|
|
20.5 |
|
406 |
|
1,984 |
|
|
|
|
|
|
|
|
|
Numerator: profit attributable to the parent excluding goodwill impairment annualized (Excluding the adjustment to the valuation of goodwill).
Denominator: average stockholders' equity (excluding minority interests) - intangible assets.
PagoNxt's RoTE is not provided as we do not consider it a relevant metric to measure performance in this type of business.
|
|
|
|
|
|
|
|
|
|
|
|
|
|
|
|
|
|
|
|
|
|
|
|
RoTE (post-AT1) (EUR million and %) |
|
|
|
|
|
|
|
Q1'25 |
|
Q1'24 |
|
% |
Numerator |
Denominator |
|
% |
Numerator |
Denominator |
| Retail & Commercial Banking |
17.6 |
|
7,301 |
|
41,523 |
|
|
15.3 |
|
5,846 |
|
38,217 |
|
| Digital Consumer Bank |
9.7 |
|
1,808 |
|
18,627 |
|
|
10.3 |
|
1,693 |
|
16,438 |
|
| Corporate & Investment Banking |
21.6 |
|
3,115 |
|
14,394 |
|
|
18.5 |
|
2,739 |
|
14,774 |
|
| Wealth Management & Insurance |
68.0 |
|
1,863 |
|
2,738 |
|
|
70.2 |
|
1,487 |
|
2,120 |
|
| Payments |
16.6 |
|
480 |
|
2,885 |
|
|
15.7 |
|
440 |
|
2,795 |
|
| PagoNxt |
|
|
|
|
|
|
|
| Cards |
19.2 |
|
468 |
|
2,443 |
|
|
25.4 |
|
602 |
|
2,371 |
|
|
|
|
|
|
|
|
|
|
|
|
|
|
|
|
|
| Spain |
25.5 |
|
4,444 |
|
17,427 |
|
|
17.2 |
|
2,941 |
|
17,132 |
|
| United Kingdom |
9.2 |
|
1,077 |
|
11,755 |
|
|
9.9 |
|
1,158 |
|
11,698 |
|
| Portugal |
30.6 |
|
1,097 |
|
3,583 |
|
|
30.7 |
|
1,195 |
|
3,893 |
|
| Poland |
22.1 |
|
922 |
|
4,167 |
|
|
19.5 |
|
826 |
|
4,238 |
|
| DCB Europe |
6.7 |
|
686 |
|
10,197 |
|
|
8.0 |
|
825 |
|
10,296 |
|
|
|
|
|
|
|
|
|
| US |
10.7 |
|
1,577 |
|
14,704 |
|
|
7.3 |
|
1,029 |
|
14,016 |
|
| Mexico |
20.6 |
|
1,545 |
|
7,485 |
|
|
18.3 |
|
1,608 |
|
8,771 |
|
|
|
|
|
|
|
|
|
| Brazil |
14.4 |
|
1,937 |
|
13,478 |
|
|
14.6 |
|
2,134 |
|
14,575 |
|
| Chile |
18.2 |
|
711 |
|
3,896 |
|
|
9.0 |
|
334 |
|
3,719 |
|
| Argentina |
22.0 |
|
500 |
|
2,267 |
|
|
20.1 |
|
399 |
|
1,984 |
|
|
|
|
|
|
|
|
|
Numerator: profit attributable to the parent excluding goodwill impairment minus AT1 costs (annualized; excluding goodwill impairment).
Denominator: average stockholders' equity (excluding minority interests) - intangible assets.
PagoNxt's RoTE is not provided as we do not consider it a relevant metric to measure performance in this type of business.
|
|
|
|
|
|
|
|
|
|
|
|
|
|
|
|
|
|
|
|
|
|
|
|
Efficiency ratio (EUR million and %) |
|
|
|
|
|
|
|
Q1'25 |
|
Q1'24 |
|
% |
Numerator |
Denominator |
|
% |
Numerator |
Denominator |
| Retail & Commercial Banking |
39.4 |
|
3,113 |
|
7,895 |
|
|
40.7 |
|
3,285 |
|
8,061 |
|
| Digital Consumer Bank |
41.9 |
|
1,357 |
|
3,234 |
|
|
41.2 |
|
1,311 |
|
3,184 |
|
| Corporate & Investment Banking |
42.9 |
|
952 |
|
2,220 |
|
|
41.6 |
|
883 |
|
2,123 |
|
| Wealth Management & Insurance |
36.5 |
|
372 |
|
1,019 |
|
|
37.9 |
|
343 |
|
905 |
|
| Payments |
43.9 |
|
608 |
|
1,383 |
|
|
48.4 |
|
639 |
|
1,318 |
|
| PagoNxt |
90.3 |
|
286 |
|
317 |
|
|
107.5 |
|
304 |
|
283 |
|
| Cards |
30.2 |
|
322 |
|
1,067 |
|
|
32.3 |
|
334 |
|
1,035 |
|
|
|
|
|
|
|
|
|
|
|
|
|
|
|
|
|
| Spain |
33.5 |
|
1,049 |
|
3,130 |
|
|
34.2 |
|
1,032 |
|
3,016 |
|
| United Kingdom |
53.7 |
|
720 |
|
1,341 |
|
|
58.4 |
|
734 |
|
1,257 |
|
| Portugal |
27.0 |
|
136 |
|
503 |
|
|
22.9 |
|
134 |
|
584 |
|
| Poland |
29.0 |
|
256 |
|
883 |
|
|
27.5 |
|
229 |
|
834 |
|
| DCB Europe |
47.5 |
|
667 |
|
1,402 |
|
|
47.1 |
|
665 |
|
1,410 |
|
|
|
|
|
|
|
|
|
| US |
50.0 |
|
1,007 |
|
2,014 |
|
|
50.3 |
|
940 |
|
1,869 |
|
| Mexico |
41.7 |
|
628 |
|
1,506 |
|
|
41.4 |
|
665 |
|
1,608 |
|
|
|
|
|
|
|
|
|
| Brazil |
32.8 |
|
1,059 |
|
3,223 |
|
|
33.0 |
|
1,156 |
|
3,507 |
|
| Chile |
34.5 |
|
249 |
|
722 |
|
|
42.5 |
|
224 |
|
527 |
|
| Argentina |
44.3 |
|
223 |
|
504 |
|
|
51.4 |
|
286 |
|
555 |
|
|
|
|
|
|
|
|
|
Numerator: underlying operating expenses.
Denominator: underlying total income.
Credit risk indicators
The credit risk indicators measure the quality of the credit portfolio and the percentage of non-performing loans covered by provisions.
|
|
|
|
|
|
|
|
|
|
|
|
|
|
|
| Ratio |
|
Formula |
|
Relevance of the metric |
NPL ratio
(Non-performing loans ratio) |
|
Credit impaired customer loans and advances, guarantees and undrawn balances |
|
The NPL ratio is an important variable regarding financial institutions' activity since it gives an indication of the level of risk the entities are exposed to. It calculates risks that are, in accounting terms, declared to be credit impaired as a percentage of the total outstanding amount of customer credit and contingent liabilities. |
|
|
Total Risk 1 |
|
|
|
|
|
|
| NPL coverage ratio |
|
Total allowances to cover impairment losses on customer loans and advances, guarantees and undrawn balances |
|
The NPL coverage ratio is a fundamental metric in the financial sector. It reflects the level of provisions as a percentage of the credit impaired assets. Therefore, it is a good indicator of the entity's solvency against customer defaults both present and future. |
|
|
Credit impaired customer loans and advances, guarantees and undrawn balances |
|
|
|
|
|
|
| Cost of risk |
|
Allowances for loan-loss provisions over the last 12 months |
|
This ratio quantifies loan-loss provisions arising from credit risk over a defined period of time for a given loan portfolio. As such, it acts as an indicator of credit quality. |
|
|
Average loans and advances to customers over the last 12 months |
|
1. Total risk = non-impaired and impaired customer loans and advances and guarantees + impaired undrawn customer balances.
|
|
|
|
|
|
|
|
|
|
|
|
|
Credit risk (I) (EUR million and %) |
|
|
|
|
|
Mar-25 |
Dec-24 |
|
Mar-24 |
|
|
|
|
|
| NPL ratio |
2.99 |
% |
3.05 |
% |
|
3.10 |
% |
| Credit impaired customer loans and advances, guarantees and undrawn balances |
34,992 |
35,265 |
|
35,637 |
| Gross loans and advances to customers registered under the headings 'financial assets measured at amortized cost' and 'financial assets designated at fair value through profit or loss' classified in stage 3 (OCI), excluding POCI (Purchased or Originated Credit Impaired) |
33,400 |
33,568 |
|
33,885 |
| POCI exposure (Purchased or Originated Credit Impaired) that is additionally impaired |
151 |
163 |
|
262 |
| Customer guarantees and undrawn balances classified in stage 3 |
1,435 |
1,521 |
|
1,481 |
| Doubtful exposure of loans and advances to customers at fair value through profit or loss |
6 |
13 |
|
9 |
| Total risk |
1,168,468 |
1,157,274 |
|
1,150,459 |
| Impaired and non-impaired gross loans and advances to customers |
1,086,686 |
1,076,195 |
|
1,072,377 |
| Impaired and non-impaired customer guarantees and impaired undrawn customer balances |
81,782 |
81,079 |
|
78,082 |
|
|
|
|
|
|
|
|
|
|
|
|
|
Credit risk (II) (EUR million and %) |
|
|
|
|
|
Mar-25 |
Dec-24 |
|
Mar-24 |
|
|
|
|
|
| NPL coverage ratio |
65.7 |
% |
64.8 |
% |
|
66.1 |
% |
| Total allowances to cover impairment losses on customer loans and advances, guarantees and undrawn balances |
22,980 |
22,835 |
|
23,542 |
| Total allowances to cover impairment losses on loans and advances to customers measured at amortized cost and designated at fair value through OCI |
22,271 |
22,125 |
|
22,844 |
| Total allowances to cover impairment losses on customer guarantees and undrawn balances |
709 |
710 |
|
698 |
| Credit impaired customer loans and advances, guarantees and undrawn balances |
34,992 |
35,265 |
|
35,637 |
| Gross loans and advances to customers registered under the headings 'financial assets measured at amortized cost' and 'financial assets designated at fair value through profit or loss' classified in stage 3 (OCI), excluding POCI (Purchased or Originated Credit Impaired) |
33,400 |
33,568 |
|
33,885 |
| POCI exposure (Purchased or Originated Credit Impaired) that is additionally impaired |
151 |
163 |
|
262 |
| Customer guarantees and undrawn balances classified in stage 3 |
1,435 |
1,521 |
|
1,481 |
| Doubtful exposure of loans and advances to customers at fair value through profit or loss |
6 |
13 |
|
9 |
|
|
|
|
|
| Cost of risk |
1.14 |
% |
1.15 |
% |
|
1.20 |
% |
| Underlying allowances for loan-loss provisions over the last 12 months |
12,369 |
12,333 |
|
12,710 |
| Allowances for loan-loss provisions over the last 12 months |
12,369 |
12,685 |
|
12,710 |
| Adjustments to loan-loss provisions for items outside ordinary course of businesses |
— |
(352) |
|
— |
| Average loans and advances to customers over the last 12 months |
1,082,207 |
1,075,821 |
|
1,060,024 |
|
|
|
|
|
|
|
|
|
|
|
|
|
|
|
|
|
|
|
|
|
|
|
|
NPL ratio (EUR million and %) |
|
|
|
|
|
|
|
|
|
|
|
|
|
|
Mar-25 |
|
Mar-24 |
|
% |
Numerator |
Denominator |
|
% |
Numerator |
Denominator |
| Retail & Commercial Banking |
3.12 |
|
20,172 |
|
646,693 |
|
|
3.21 |
|
21,008 |
|
655,284 |
|
| Digital Consumer Bank |
5.09 |
|
10,941 |
|
214,986 |
|
|
4.86 |
|
10,115 |
|
208,001 |
|
| Corporate & Investment Banking |
0.75 |
|
1,874 |
|
250,098 |
|
|
1.19 |
|
2,791 |
|
233,665 |
|
| Wealth Management & Insurance |
0.98 |
|
248 |
|
25,400 |
|
|
0.93 |
|
219 |
|
23,540 |
|
| Payments |
5.88 |
|
1,486 |
|
25,254 |
|
|
4.99 |
|
1,205 |
|
24,145 |
|
| PagoNxt |
|
|
|
|
|
|
|
| Cards |
6.11 |
|
1,460 |
|
23,916 |
|
|
5.13 |
|
1,166 |
|
22,702 |
|
|
|
|
|
|
|
|
|
|
|
|
|
|
|
|
|
| Spain |
2.56 |
|
7,501 |
|
293,385 |
|
|
3.00 |
|
8,549 |
|
284,897 |
|
| United Kingdom |
1.25 |
|
3,114 |
|
249,857 |
|
|
1.48 |
|
3,712 |
|
250,765 |
|
| Portugal |
2.25 |
|
942 |
|
41,948 |
|
|
2.63 |
|
1,060 |
|
40,329 |
|
| Poland |
3.52 |
|
1,609 |
|
45,664 |
|
|
3.57 |
|
1,432 |
|
40,166 |
|
| DCB Europe |
2.62 |
|
3,684 |
|
140,881 |
|
|
2.27 |
|
3,063 |
|
135,130 |
|
|
|
|
|
|
|
|
|
| US |
4.45 |
|
6,631 |
|
149,045 |
|
|
4.60 |
|
6,394 |
|
139,022 |
|
| Mexico |
2.79 |
|
1,348 |
|
48,394 |
|
|
2.74 |
|
1,535 |
|
55,945 |
|
|
|
|
|
|
|
|
|
| Brazil |
6.33 |
|
6,677 |
|
105,467 |
|
|
6.06 |
|
7,041 |
|
116,231 |
|
| Chile |
5.60 |
|
2,499 |
|
44,669 |
|
|
4.95 |
|
2,121 |
|
42,828 |
|
| Argentina |
2.32 |
|
207 |
|
8,903 |
|
|
1.84 |
|
99 |
|
5,374 |
|
|
|
|
|
|
|
|
|
Numerator: credit impaired customer loans and advances, guarantees and undrawn balances.
Denominator: total risk.
PagoNxt's NPL ratio is not provided as we do not consider it a relevant metric for this type of business.
|
|
|
|
|
|
|
|
|
|
|
|
|
|
|
|
|
|
|
|
|
|
|
|
NPL coverage ratio (EUR million and %) |
|
|
|
|
|
|
|
|
|
|
|
|
|
|
|
|
Mar-25 |
|
Mar-24 |
|
% |
Numerator |
Denominator |
|
% |
Numerator |
Denominator |
| Retail & Commercial Banking |
59.0 |
|
11,909 |
|
20,172 |
|
|
60.7 |
|
12,754 |
|
21,008 |
|
| Digital Consumer Bank |
75.0 |
|
8,204 |
|
10,941 |
|
|
76.1 |
|
7,694 |
|
10,115 |
|
| Corporate & Investment Banking |
39.3 |
|
736 |
|
1,874 |
|
|
43.0 |
|
1,201 |
|
2,791 |
|
| Wealth Management & Insurance |
66.4 |
|
165 |
|
248 |
|
|
56.2 |
|
123 |
|
219 |
|
| Payments |
126.0 |
|
1,872 |
|
1,486 |
|
|
139.8 |
|
1,685 |
|
1,205 |
|
| PagoNxt |
|
|
|
|
|
|
|
| Cards |
126.7 |
|
1,850 |
|
1,460 |
|
|
142.2 |
|
1,657 |
|
1,166 |
|
|
|
|
|
|
|
|
|
|
|
|
|
|
|
|
|
| Spain |
52.8 |
|
3,961 |
|
7,501 |
|
|
49.8 |
|
4,258 |
|
8,549 |
|
| United Kingdom |
30.8 |
|
960 |
|
3,114 |
|
|
28.3 |
|
1,050 |
|
3,712 |
|
| Portugal |
81.7 |
|
770 |
|
942 |
|
|
80.9 |
|
857 |
|
1,060 |
|
| Poland |
63.7 |
|
1,025 |
|
1,609 |
|
|
74.9 |
|
1,073 |
|
1,432 |
|
| DCB Europe |
82.3 |
|
3,031 |
|
3,684 |
|
|
86.1 |
|
2,636 |
|
3,063 |
|
|
|
|
|
|
|
|
|
| US |
63.8 |
|
4,230 |
|
6,631 |
|
|
67.8 |
|
4,334 |
|
6,394 |
|
| Mexico |
101.8 |
|
1,373 |
|
1,348 |
|
|
100.7 |
|
1,546 |
|
1,535 |
|
|
|
|
|
|
|
|
|
| Brazil |
82.0 |
|
5,477 |
|
6,677 |
|
|
86.8 |
|
6,113 |
|
7,041 |
|
| Chile |
49.6 |
|
1,239 |
|
2,499 |
|
|
54.2 |
|
1,149 |
|
2,121 |
|
| Argentina |
155.4 |
|
321 |
|
207 |
|
|
147.3 |
|
146 |
|
99 |
|
|
|
|
|
|
|
|
|
Numerator: total allowances to cover impairment losses on customer loans and advances, guarantees and undrawn balances.
Denominator: credit impaired customer loans and advances, guarantees and undrawn balances.
PagoNxt's coverage ratio is not provided as we do not consider it a relevant metric for this type of business.
|
|
|
|
|
|
|
|
|
|
|
|
|
|
|
|
|
|
|
|
|
|
|
|
Cost of risk (EUR million and %) |
|
|
|
|
|
|
|
|
|
|
|
|
|
|
|
Mar-25 |
|
Mar-24 |
|
% |
Numerator |
Denominator |
|
% |
Numerator |
Denominator |
| Retail & Commercial Banking |
0.91 |
|
5,753 |
|
630,284 |
|
|
1.03 |
|
6,551 |
|
636,647 |
|
| Digital Consumer Bank |
2.14 |
|
4,543 |
|
212,767 |
|
|
2.12 |
|
4,327 |
|
203,789 |
|
| Corporate & Investment Banking |
0.08 |
|
143 |
|
185,805 |
|
|
0.14 |
|
229 |
|
167,580 |
|
| Wealth Management & Insurance |
0.20 |
|
48 |
|
23,821 |
|
|
(0.06) |
|
(13) |
|
22,575 |
|
| Payments |
7.52 |
|
1,788 |
|
23,771 |
|
|
6.88 |
|
1,613 |
|
23,426 |
|
| PagoNxt |
|
|
|
|
|
|
|
| Cards |
7.79 |
|
1,769 |
|
22,714 |
|
|
7.10 |
|
1,591 |
|
22,424 |
|
|
|
|
|
|
|
|
|
|
|
|
|
|
|
|
|
| Spain |
0.49 |
1,231 |
|
252,202 |
|
|
0.59 |
|
1,439 |
|
244,734 |
|
| United Kingdom |
0.04 |
99 |
|
251,791 |
|
|
0.08 |
|
205 |
|
250,009 |
|
| Portugal |
-0.03 |
-10 |
|
38,831 |
|
|
0.19 |
|
71 |
|
38,125 |
|
| Poland |
1.20 |
458 |
|
38,152 |
|
|
1.95 |
|
653 |
|
33,440 |
|
| DCB Europe |
0.92 |
1,269 |
|
138,260 |
|
|
0.67 |
|
875 |
|
130,791 |
|
|
|
|
|
|
|
|
|
| US |
1.73 |
2,427 |
|
140,561 |
|
|
1.98 |
|
2,640 |
|
133,566 |
|
| Mexico |
2.55 |
1,212 |
|
47,499 |
|
|
2.63 |
|
1,266 |
|
48,160 |
|
|
|
|
|
|
|
|
|
| Brazil |
4.61 |
4,490 |
|
97,418 |
|
|
4.79 |
|
4,830 |
|
100,792 |
|
| Chile |
1.26 |
527 |
|
41,783 |
|
|
0.85 |
|
372 |
|
43,616 |
|
| Argentina |
4.58 |
325 |
|
7,096 |
|
|
5.43 |
|
142 |
|
2,620 |
|
|
|
|
|
|
|
|
|
Numerator: underlying allowances for loan-loss provisions over the last 12 months.
Denominator: average loans and advances to customers over the last 12 months.
PagoNxt's cost of risk is not provided as we do not consider it a relevant metric for this type of business.
Other indicators
The Group has a series of additional financial metrics which facilitate analysis of the underlying business trends and performance. It also has another set of sustainability indicators which enables us to track the progress of our Sustainability objectives.
|
|
|
|
|
|
|
|
|
|
|
|
|
|
|
| Ratio |
|
Formula |
|
Relevance of the metric |
| TNAV per share |
|
Tangible book value 1 |
|
This is a very commonly used ratio used to measure the company's accounting value per share having deducted the intangible assets. It is useful in evaluating the amount each shareholder would receive if the company were to enter into liquidation and had to sell all the company's tangible assets. |
| (Tangible net asset value per share) |
|
Number of shares excluding treasury stock |
|
|
|
|
|
|
| Price / tangible book value per share (X) |
|
Share price |
|
This is one of the most commonly used ratios by market participants for the valuation of listed companies both in absolute terms and relative to other entities. This ratio measures the relationship between the price paid for a company and its accounting equity value. |
|
|
TNAV per share |
|
|
|
|
|
|
| LTD ratio |
|
Net loans and advances to customers |
|
This is an indicator of the bank's liquidity. It measures the total loans and advances to customers net of loan-loss provisions as a percentage of customer deposits. |
| (Loan-to-deposit) |
|
Customer deposits |
|
|
|
|
|
|
| Loans and advances (excl. reverse repos) |
|
Gross loans and advances to customers excluding reverse repos |
|
In order to aid analysis of the commercial banking activity, reverse repos are excluded as they are highly volatile treasury products. |
|
|
|
|
|
| Deposits (excl. repos) |
|
Customer deposits excluding repos |
|
In order to aid analysis of the commercial banking activity, repos are excluded as they are highly volatile treasury products. |
|
|
|
|
|
| PAT + fees paid to SAN (in Wealth Management & Insurance) |
|
Net profit + fees ceded by Santander Asset Management and Santander Insurance to the branch network, net of taxes, excluding Private Banking customers |
|
Metric to assess Wealth Management & Insurance's total contribution to the Group's profit. |
|
|
|
|
|
|
|
|
|
|
|
|
|
|
|
|
|
|
|
|
|
|
|
|
|
|
|
|
|
|
|
|
|
|
1. Tangible book value = Stockholders' equity (excl. minority interests) - intangible assets.
|
|
|
|
|
|
|
|
|
|
|
|
|
Others (EUR million and %) |
Mar-25 |
Dec-24 |
|
Mar-24 |
|
|
|
|
|
| TNAV (tangible book value) per share |
5.46 |
5.24 |
|
4.86 |
| Tangible book value |
82,235 |
79,342 |
|
76,346 |
| Number of shares excl. treasury stock (million) |
15,052 |
15,137 |
|
15,715 |
|
|
|
|
|
| Price / Tangible book value per share (X) |
1.13 |
0.85 |
|
0.93 |
| Share price (euros) |
6.196 |
4.465 |
|
4.522 |
| TNAV (tangible book value) per share |
5.46 |
5.24 |
|
4.86 |
|
|
|
|
|
| Loan-to-deposit ratio |
98 |
% |
100 |
% |
|
100 |
% |
| Net loans and advances to customers |
1,064,416 |
1,054,069 |
|
1,049,533 |
| Customer deposits |
1,081,894 |
1,055,936 |
|
1,044,453 |
|
|
|
|
|
|
Q1'25 |
Q4'24 |
|
Q1'24 |
| PAT + After tax fees paid to SAN (in Wealth) (Constant EUR million) |
897 |
837 |
|
756 |
| Profit after tax |
497 |
466 |
|
388 |
| Net fee income net of tax |
400 |
370 |
|
368 |
|
|
|
|
|
|
|
|
|
|
|
|
|
|
|
|
|
|
|
|
|
|
|
|
|
|
|
|
|
|
|
|
|
|
|
|
|
|
|
|
|
|
|
|
|
|
|
|
|
|
|
|
|
|
|
|
|
|
|
|
|
|
|
|
|
|
|
|
|
|
|
|
|
|
|
|
|
|
|
|
|
|
|
|
|
|
|
|
|
|
|
|
|
|
|
|
|
|
|
|
Sustainability indicators |
|
|
|
|
|
|
|
|
|
|
|
|
|
|
|
Metric |
|
|
Definition |
|
Mar-25 |
|
|
|
|
|
|
|
|
Green finance raised and facilitated accumulated from 2019-2025 (EUR billion) |
|
|
Nominal amount of project finance, financial advisory, project bonds, green bonds (DCM), export finance (ECA), mergers and acquisitions (M&A), and equity capital markets (ECM) transactions ranked by the SCFS panel and reported in the League Tables of Dealogic, Inframation News, TXF and Mergermarket since 2019. |
|
144.9 |
|
Socially responsible investment assets under management (SRI AuMs) (EUR billion) |
|
|
Value corresponding to total volume of assets under management registered as article 8 - promoting ESG characteristics - and 9 - with explicit sustainability objectives - of the Sustainable Finance Disclosure Regulation (SFDR, EU Reg. 2019/2088) except for illiquid investments in Private Banking which are reported in terms of committed capital. It includes: i) assets managed or advised by Santander Asset Management (SAM) and other Group asset managers in the EU and, using equivalent criteria, in countries where SFDR does not apply; and ii) third party funds and assets advised deemed sustainable investments according to SFDR (Article 2.17) or using internal criteria as per SFICS (Sustainable Finance & Investment Classification System). |
|
108.0 |
|
|
|
|
|
|
|
|
|
|
|
|
|
|
|
|
|
|
|
|
|
|
|
|
|
|
|
|
|
|
|
|
|
|
|
Note: targets were set before the publication of the European taxonomy in Q2 2023. Therefore, target definitions are not fully aligned with the taxonomy.
Local currency measures
We make use of certain financial measures in local currency to help in the assessment of our ongoing operating performance. These non-IFRS financial measures include the results of operations of our subsidiary banks located outside the eurozone, excluding the impact of foreign exchange. Because changes in foreign currency exchange rates do not have an operating impact on the results, we believe that evaluating their performance on a local currency basis provides an additional and meaningful assessment of performance to both management and the company’s investors.
The Group presents, at both the Group level as well as the business unit level, the changes in the income statement as well as the changes excluding the exchange rate effect ("excluding FX" or "constant euros"), as it considers the latter facilitates analysis, since it enables business movements to be identified without taking into account the impact of converting each local currency into euros.
Said variations, excluding the impact of exchange rate movements, are calculated by converting income statement lines for the different business units comprising the Group into our presentation currency, the euro, applying the average exchange rate for Q1 2025 to all periods contemplated in the analysis. We use this method for all countries with the exception of Argentina, where we use the exchange rate on the last working day of each period presented, given it is a hyperinflationary economy, to mitigate the distortions caused by the hyperinflation.
We present, at both the Group level as well as the business unit level, the changes in euros as well as the changes excluding the exchange rate effect ("excluding FX" or "constant euros") for loans and advances to customers excluding reverse repurchase agreements (repos) and customer funds (which comprise deposits and mutual funds) excluding repos. Additionally, we present changes in the main balance sheet lines of the Group's countries both in euros as well as the changes excluding the exchange rate
effect. As with the income statement, the reason is to facilitate analysis by isolating the changes in the balance sheet that are not caused by converting each local currency into euros.
These changes excluding the impact of exchange rate movements are calculated by converting the balances, into our presentation currency, the euro, applying the closing exchange rate on the last working day of March 2025 to all periods contemplated in the analysis. We use this method to calculate the variations for all countries with the exception of Argentina, where we use the exchange rate on the last working day of each period presented, given it is a hyperinflationary economy, to mitigate the distortions caused by the hyperinflation.
In Q2 2024, due to the significant divergence between the official exchange rate and other macroeconomic magnitudes in Argentina, mainly inflation, we began to apply an alternative exchange rate for the Argentine peso which reflects the exchange rate observed in transactions ordered between market participants under the prevailing economic conditions, such as the repatriation of dividends from businesses in Argentina. This exchange rate was modelled by our Economic Research Team primarily taking into account the inflation differential of Argentina with respect to the US.
Given the stabilization and improved macroeconomic outlook in the country, from Q4 2024 we take the dollar contado con liquidación rate (CCL) as a reference for this alternative exchange rate, which is the exchange rate resulting from the sale of local bonds denominated in Argentine pesos in US dollars (dual denomination peso/dollar bonds). At the end of the year, the value of this exchange rate did not significantly differ from other market rates or the official exchange rate.
The average and period-end exchange rates for the main currencies in which the Group operates are set out in the table below.
|
|
|
|
|
|
|
|
|
|
|
|
|
|
|
|
|
|
|
|
|
| Exchange rates: 1 euro / currency parity |
|
|
|
|
|
|
|
|
Average (income statement) |
|
Period-end (balance sheet) |
|
Q1'25 |
Q1'24 |
|
Mar-25 |
Dec-24 |
Mar-24 |
| US dollar |
1.052 |
|
1.085 |
|
|
1.081 |
|
1.039 |
|
1.080 |
|
| Pound sterling |
0.836 |
|
0.856 |
|
|
0.837 |
|
0.829 |
|
0.855 |
|
| Brazilian real |
6.152 |
|
5.374 |
|
|
6.196 |
|
6.427 |
|
5.402 |
|
| Mexican peso |
21.480 |
|
18.443 |
|
|
22.105 |
|
21.554 |
|
17.939 |
|
| Chilean peso |
1,013.425 |
|
1,027.842 |
|
|
1,029.745 |
|
1,032.560 |
|
1,060.256 |
|
Argentine peso1 |
|
|
|
1,426.270 |
|
1,232.389 |
|
925.934 |
|
| Polish zloty |
4.200 |
|
4.333 |
|
|
4.189 |
|
4.275 |
|
4.307 |
|
1. Average exchange rates for the Argentine peso are not included since we use the exchange rate on the last working day of each period presented given it is a hyperinflationary economy. From Q2 2024 onwards for the Argentine peso, we apply an alternative exchange rate that better reflects the evolution of inflation (we continue to apply the official ARS exchange rate to all prior periods).
Impact of inflation rate on the variations of operating expenses
Santander presents, for both the Group and the business units included in the primary and secondary segments: i) the changes in operating expenses in euros, ii) the changes excluding the exchange rate effect with the exception of Argentina which is calculated as described above in "Local currency measures", and iii) the changes excluding the exchange rate effect minus the effect of average inflation over the last twelve months except for Argentina as cost growth in euros should already largely reflect the effect of hyperinflation on exchange rates. The reason is that the two latter facilitate analysis for management purposes.
Inflation is calculated as the arithmetic average of the last twelve months for each country and, for the global businesses, as the weighted average the inflation rate of each country comprising the global business, weighted by each country's operating expenses. For the Group and the global businesses, we exclude the impact of inflation in Argentina from the calculation as cost growth in euros should already largely reflect the effect of hyperinflation on exchange rates.
The table below shows the average inflation rates calculated as indicated.
|
|
|
|
|
|
|
|
|
|
|
Average inflation |
|
|
|
|
|
|
|
|
% |
|
Average inflation last 12 months |
|
|
|
Retail & Commercial Banking1 |
|
3.4 |
|
|
|
Digital Consumer Bank1 |
|
2.7 |
|
|
|
Corporate & Investment Banking1 |
|
3.1 |
|
|
|
Wealth Management & Insurance1 |
|
3.0 |
|
|
|
Payments1 |
|
3.2 |
|
|
|
|
|
|
|
|
|
|
|
|
|
|
|
Spain |
|
2.7 |
|
|
|
United Kingdom |
|
2.4 |
|
|
|
Portugal |
|
2.4 |
|
|
|
Poland |
|
4.2 |
|
|
|
DCB Europe |
|
2.3 |
|
|
|
|
|
|
|
|
|
US |
|
2.8 |
|
|
|
Mexico |
|
4.5 |
|
|
|
|
|
|
|
|
|
Brazil |
|
4.5 |
|
|
|
Chile |
|
4.5 |
|
|
|
|
|
|
|
|
|
|
|
|
|
|
|
Total Group1 |
|
3.2 |
|
|
1. Excluding the impact of inflation in Argentina.
|
|
|
|
|
|
|
|
|
|
|
|
|
|
|
|
|
|
|
|
|
|
|
|
|
|
|
|
|
|
|
|
|
|
|
|
|
|
|
|
|
|
|
|
|
|
|
|
|
|
|
|
|
|
|
|
|
Condensed consolidated financial statements |
|
|
Interim condensed consolidated financial statements
•Condensed consolidated balance sheet
•Condensed consolidated income statement
|
|
|
|
|
|
| NOTE: |
The following financial information for the first three months of 2025 and 2024 (attached herewith) corresponds to the condensed consolidated financial statements prepared in accordance with the International Financial Reporting Standards. |
|
|
|
|
|
|
|
|
|
|
|
|
|
| Interim condensed consolidated balance sheet |
|
|
|
|
| EUR million |
|
|
|
|
|
|
|
|
|
| ASSETS |
Mar-25 |
Dec-24 |
Mar-24 |
|
| Cash, cash balances at central banks and other deposits on demand |
166,948 |
|
192,208 |
|
174,161 |
|
|
| Financial assets held for trading |
243,348 |
|
230,253 |
|
209,589 |
|
|
| Non-trading financial assets mandatorily at fair value through profit or loss |
5,678 |
|
6,130 |
|
6,233 |
|
|
| Financial assets designated at fair value through profit or loss |
7,969 |
|
7,915 |
|
8,686 |
|
|
| Financial assets at fair value through other comprehensive income |
94,873 |
|
89,898 |
|
84,183 |
|
|
| Financial assets at amortised cost |
1,221,296 |
|
1,203,707 |
|
1,207,699 |
|
|
| Hedging derivatives |
4,665 |
|
5,672 |
|
5,388 |
|
|
| Changes in the fair value of hedged items in portfolio hedges of interest risk |
(384) |
|
(704) |
|
(1,203) |
|
|
| Investments |
7,460 |
|
7,277 |
|
7,685 |
|
|
| Joint ventures entities |
2,080 |
|
2,061 |
|
1,985 |
|
|
| Associated entities |
5,380 |
|
5,216 |
|
5,700 |
|
|
| Assets under reinsurance contracts |
239 |
|
222 |
|
228 |
|
|
| Tangible assets |
30,822 |
|
32,087 |
|
34,229 |
|
|
| Property, plant and equipment |
29,987 |
|
31,212 |
|
33,263 |
|
|
| For own-use |
12,408 |
|
12,636 |
|
13,323 |
|
|
| Leased out under an operating lease |
17,579 |
|
18,576 |
|
19,940 |
|
|
| Investment property |
835 |
|
875 |
|
966 |
|
|
| Of which : Leased out under an operating lease |
743 |
|
749 |
|
831 |
|
|
| Intangible assets |
19,150 |
|
19,259 |
|
19,910 |
|
|
| Goodwill |
13,510 |
|
13,438 |
|
14,028 |
|
|
| Other intangible assets |
5,640 |
|
5,821 |
|
5,882 |
|
|
| Tax assets |
29,171 |
|
30,596 |
|
30,042 |
|
|
| Current tax assets |
9,878 |
|
11,426 |
|
9,227 |
|
|
| Deferred tax assets |
19,293 |
|
19,170 |
|
20,815 |
|
|
| Other assets |
9,973 |
|
8,559 |
|
10,191 |
|
|
| Insurance contracts linked to pensions |
56 |
|
81 |
|
90 |
|
|
| Inventories |
5 |
|
6 |
|
7 |
|
|
| Other |
9,912 |
|
8,472 |
|
10,094 |
|
|
| Non-current assets held for sale |
3,969 |
|
4,002 |
|
2,985 |
|
|
| TOTAL ASSETS |
1,845,177 |
|
1,837,081 |
|
1,800,006 |
|
|
|
|
|
|
|
|
|
|
|
|
|
|
|
|
|
|
|
|
|
|
|
|
|
|
|
|
|
|
|
|
|
|
|
|
|
|
|
|
|
|
|
|
|
|
|
|
|
|
|
|
|
|
|
|
|
|
|
|
|
|
|
|
Condensed consolidated financial statements |
|
|
|
|
|
|
|
|
|
|
|
|
|
|
|
| Interim condensed consolidated balance sheet |
|
|
| EUR million |
|
|
|
|
|
|
|
|
|
| LIABILITIES |
Mar-25 |
Dic-24 |
Mar-24 |
|
| Financial liabilities held for trading |
164,971 |
|
152,151 |
|
130,466 |
|
|
| Financial liabilities designated at fair value through profit or loss |
35,920 |
|
36,360 |
|
38,583 |
|
|
| Financial liabilities at amortized cost |
1,477,629 |
|
1,484,322 |
|
1,465,644 |
|
|
| Hedging derivatives |
4,505 |
|
4,752 |
|
6,620 |
|
|
| Changes in the fair value of hedged items in portfolio hedges of interest rate risk |
49 |
|
(9) |
|
(2) |
|
|
| Liabilities under insurance contracts |
17,777 |
|
17,829 |
|
17,738 |
|
|
| Provisions |
8,353 |
|
8,407 |
|
8,387 |
|
|
| Pensions and other post-retirement obligations |
1,627 |
1,731 |
2,131 |
|
| Other long term employee benefits |
865 |
915 |
818 |
|
| Taxes and other legal contingencies |
2,720 |
2,717 |
2,765 |
|
| Contingent liabilities and commitments |
709 |
710 |
698 |
|
| Other provisions |
2,432 |
2,334 |
1,975 |
|
| Tax liabilities |
10,099 |
|
9,598 |
|
10,070 |
|
|
| Current tax liabilities |
3,716 |
3,322 |
3,909 |
|
| Deferred tax liabilities |
6,383 |
6,276 |
6,161 |
|
| Other liabilities |
15,360 |
|
16,344 |
|
17,475 |
|
|
| Liabilities associated with non-current assets held for sale |
— |
|
— |
|
— |
|
|
| TOTAL LIABILITIES |
1,734,663 |
|
1,729,754 |
|
1,694,981 |
|
|
|
|
|
|
|
| EQUITY |
|
|
|
|
| Shareholders' equity |
137,564 |
|
135,196 |
|
130,876 |
|
|
| Capital |
7,576 |
|
7,576 |
|
7,913 |
|
|
| Called up paid capital |
7,576 |
|
7,576 |
|
7,913 |
|
|
| Unpaid capital which has been called up |
— |
|
— |
|
— |
|
|
| Share premium |
40,079 |
|
40,079 |
|
43,063 |
|
|
| Equity instruments issued other than capital |
— |
|
— |
|
728 |
|
|
| Equity component of the compound financial instrument |
— |
|
— |
|
— |
|
|
| Other equity instruments issued |
— |
|
— |
|
728 |
|
|
| Other equity |
215 |
|
217 |
|
189 |
|
|
| Accumulated retained earnings |
94,871 |
|
82,326 |
|
82,339 |
|
|
| Revaluation reserves |
— |
|
— |
|
— |
|
|
| Other reserves |
(6,450) |
|
(5,976) |
|
(5,774) |
|
|
| (-) Own shares |
(597) |
|
(68) |
|
(434) |
|
|
| Profit attributable to shareholders of the parent |
3,402 |
|
12,574 |
|
2,852 |
|
|
| (-) Interim dividends |
(1,532) |
|
(1,532) |
|
— |
|
|
| Other comprehensive income (loss) |
(36,179) |
|
(36,595) |
|
(34,620) |
|
|
| Items not reclassified to profit or loss |
(4,232) |
|
(4,757) |
|
(5,038) |
|
|
| Items that may be reclassified to profit or loss |
(31,947) |
|
(31,838) |
|
(29,582) |
|
|
| Non-controlling interest |
9,129 |
|
8,726 |
|
8,769 |
|
|
| Other comprehensive income |
(1,888) |
|
(2,020) |
|
(1,777) |
|
|
| Other items |
11,017 |
|
10,746 |
|
10,546 |
|
|
| TOTAL EQUITY |
110,514 |
|
107,327 |
|
105,025 |
|
|
| TOTAL LIABILITIES AND EQUITY |
1,845,177 |
|
1,837,081 |
|
1,800,006 |
|
|
|
|
|
|
|
| MEMORANDUM ITEMS: OFF BALANCE SHEET AMOUNTS |
|
|
|
|
| Loan commitments granted |
306,977 |
|
302,861 |
|
291,805 |
|
|
| Financial guarantees granted |
17,548 |
|
16,901 |
|
15,884 |
|
|
| Other commitments granted |
163,316 |
|
134,493 |
|
121,909 |
|
|
|
|
|
|
|
|
|
|
|
|
|
|
|
|
|
|
|
|
|
|
|
|
|
|
|
|
|
|
|
|
|
|
|
|
|
|
|
|
|
|
|
|
|
|
|
|
|
|
|
|
|
|
|
|
|
|
|
Condensed consolidated financial statements |
|
|
|
|
|
|
|
|
|
|
|
| Interim condensed consolidated income statement |
| EUR million |
|
|
|
|
|
|
Q1'25 |
Q1'24 |
| Interest income |
26,903 |
|
29,243 |
|
| Financial assets at fair value through other comprehensive income |
1,543 |
|
1,845 |
|
| Financial assets at amortized cost |
20,377 |
|
21,374 |
|
| Other interest income |
4,983 |
|
6,024 |
|
| Interest expense |
(15,525) |
|
(17,260) |
|
| Interest income/ (charges) |
11,378 |
|
11,983 |
|
| Dividend income |
88 |
|
93 |
|
| Income from companies accounted for using the equity method |
168 |
|
123 |
|
| Commission income |
4,519 |
|
4,390 |
|
| Commission expense |
(1,150) |
|
(1,150) |
|
| Gain or losses on financial assets and liabilities not measured at fair value through profit or loss, net |
(4) |
|
24 |
|
| Financial assets at amortized cost |
(5) |
|
(21) |
|
| Other financial assets and liabilities |
1 |
|
45 |
|
| Gain or losses on financial assets and liabilities held for trading, net |
389 |
|
364 |
|
| Reclassification of financial assets at fair value through other comprehensive income |
— |
|
— |
|
| Reclassification of financial assets from amortized cost |
— |
|
— |
|
| Other gains (losses) |
389 |
|
364 |
|
| Gains or losses on non-trading financial assets and liabilities mandatorily at fair value through profit or loss |
495 |
|
253 |
|
| Reclassification of financial assets at fair value through other comprehensive income |
— |
|
— |
|
| Reclassification of financial assets from amortized cost |
— |
|
— |
|
| Other gains (losses) |
495 |
|
253 |
|
| Gain or losses on financial assets and liabilities measured at fair value through profit or loss, net |
(33) |
|
264 |
|
| Gain or losses from hedge accounting, net |
(44) |
|
52 |
|
| Exchange differences, net |
(125) |
|
(334) |
|
| Other operating income (*) |
438 |
|
(121) |
|
| Other operating expenses |
(591) |
|
(896) |
|
| Income from insurance and reinsurance contracts |
123 |
|
100 |
|
| Expenses from insurance and reinsurance contracts |
(114) |
|
(100) |
|
| Total income |
15,537 |
|
15,045 |
|
| Administrative expenses |
(5,635) |
|
(5,719) |
|
| Staff costs |
(3,532) |
|
(3,594) |
|
| Other general and administrative expenses |
(2,103) |
|
(2,125) |
|
| Depreciation and amortization |
(854) |
|
(828) |
|
| Provisions or reversal of provisions, net |
(621) |
|
(633) |
|
Impairment or reversal of impairment of financial assets not measured at fair value
through profit or loss and net gains and losses from modifications |
(3,156) |
|
(3,134) |
|
| Financial assets at fair value through other comprehensive income |
(33) |
|
(9) |
|
| Financial assets at amortized cost |
(3,123) |
|
(3,125) |
|
| Impairment of investments in subsidiaries, joint ventures and associates, net |
— |
|
— |
|
| Impairment on non-financial assets, net |
(102) |
|
(129) |
|
| Tangible assets |
(80) |
|
(122) |
|
| Intangible assets |
(19) |
|
(4) |
|
| Others |
(3) |
|
(3) |
|
| Gain or losses on non-financial assets and investments, net |
2 |
|
2 |
|
| Negative goodwill recognized in results |
23 |
|
— |
|
| Gains or losses on non-current assets held for sale not classified as discontinued operations |
(7) |
|
(21) |
|
| Operating profit/(loss) before tax |
5,187 |
|
4,583 |
|
| Tax expense or income from continuing operations |
(1,446) |
|
(1,468) |
|
| Profit/(loss) for the period from continuing operations |
3,741 |
|
3,115 |
|
| Profit/( loss) after tax from discontinued operations |
— |
|
— |
|
| Profit/(loss) for the period |
3,741 |
|
3,115 |
|
| Profit attributable to non-controlling interests |
339 |
|
263 |
|
| Profit/(loss) attributable to the parent |
3,402 |
|
2,852 |
|
|
|
|
| Earnings/(losses) per share |
|
|
| Basic |
0.21 |
|
0.17 |
|
| Diluted |
0.21 |
|
0.17 |
|
(*) Includes -EUR 125 million at 31 March 2025 (-EUR 672 million at 31 March 2024) derived from the net monetary loss generated in Argentina as a result of the application of IAS 29 Financial reporting in hyperinflationary economies.
Glossary
•A2A: account-to-account
•Active customer: Those customers who comply with the minimum balance, income and/or transactionality requirements as defined according to the business area
•ADR: American Depositary Receipt
•APM: Alternative Performance Measures
•AuMs: Assets under management
•bn: Billion
•BNPL: Buy now, pay later
•bps: basis points
•CDI: CREST Depository Interest
•CET1: Common Equity Tier 1
•CF: Corporate Finance
•CHF: Swiss francs
•CIB: Corporate & Investment Banking
•CNMV: Spanish National Securities Market Commission (Comisión Nacional del Mercado de Valores)
•Consumer: Digital Consumer Bank
•Costs in real terms: variations excluding the effect of average inflation over the last twelve months
•CRR: Capital Requirements Regulation
•DCBE: Digital Consumer Bank Europe
•DCB US: Digital Consumer Bank US
•Digital customers: Every consumer of a commercial bank’s services who has logged on to their personal online banking and/or mobile banking in the last 30 days
•ECB: European Central Bank
•EPS: Earnings per share
•ESMA: European Securities and Markets Authority
•Fed: Federal Reserve
•Free float: total number of shares in circulation minus treasury shares as a % the total number of shares in circulation
•Financial inclusion: Number of people who are unbanked, underbanked, in financial difficulty, with difficulties in accessing credit who, through the Group's products and services, are able to access the financial system or receive tailored finance. Financially underserved groups are defined as people who do not have a current account, or who have an account but obtained alternative (non-bank) financial services in the last 12 months. Beneficiaries of various programmes are included in the quantification process only once in the entire period. Only new empowered people are counted, taking as a base year those existing since 2019.
•FX: Foreign Exchange
•GB: Global Banking
•GDF: Global Debt Financing
•GDP: Gross Domestic Product
•GTB: Global Transaction Banking
•IA: Artificial intelligence
•IFRS 9: International Financial Reporting Standard 9, regarding financial instruments
•IFRS 17: International Financial Reporting Standard 9, regarding insurance contracts
•IT: Information technology
•LCR: Liquidity Coverage Ratio
•LLPs: Loan-loss provisions
•MDA: Maximum Distributable Amount
•mn: Million
•MREL: Minimum Requirement for own funds and eligible liabilities)
•NII: Net Interest Income
•NPS: Net Promoter Score
•ODS: Open Digital Services
•PBT: Profit before tax
•pp: percentage points
•QoQ: quarter-on-quarter
•P2R: Pillar 2 requirement
•Payments: PagoNxt (Getnet, Ebury y PagoNxt Payments) y Cards
•PB: Private Banking
•PoS: Point of sale
•Retail: Retail & Commercial Banking
•Repos: Repurchase agreements
•RoA: Return on assets
•RoE: Return on equity
•RoRWA: Return on risk-weighted assets
•RoTE: Return on tangible equity
•RoTE (post AT1): Return on tangible equity excluding the cost of AT1issuances from the numerator.
•RWAs: Risk-weighted assets
•SAM: Santander Asset Management
•SBNA: Santander Bank N.A.
•SC USA: Santander Consumer USA
•SEC: Securities and Exchanges Commission
•SHUSA: Santander Holdings USA, Inc.
•SMEs: Small and medium enterprises
•TLAC: The total loss-absorbing capacity requirement which is required to be met under the CRD V package
•TNAV: Tangible net asset value
•TPV: Total payments volume
•VaR: Value at Risk
•Wealth: Wealth Management & Insurance
•YoY: year-on-year
Important information
Non-IFRS and alternative performance measures
Banco Santander, S.A. (“Santander”) cautions that this report may contain financial information prepared according to International Financial Reporting Standards (IFRS) and taken from our consolidated financial statements, as well as alternative performance measures (APMs) as defined in the Guidelines on Alternative Performance Measures issued by the European Securities and Markets Authority (ESMA) on 5 October 2015, and other non-IFRS measures. The APMs and non-IFRS measures were calculated with information from Grupo Santander; however, they are neither defined or detailed in the applicable financial reporting framework nor audited or reviewed by our auditors. We use the APMs and non-IFRS measures when planning, monitoring and evaluating our performance. We consider them to be useful metrics for our management and investors to compare operating performance between accounting periods.
Nonetheless, the APMs and non-IFRS measures are supplemental information; their purpose is not to substitute the IFRS measures. Furthermore, companies in our industry and others may calculate or use APMs and non-IFRS measures differently, thus making them less useful for comparison purposes. APMs using environmental, social and governance labels have not been calculated in accordance with the Taxonomy Regulation or with the indicators for principal adverse impact in SFDR.
For more details on APMs and non-IFRS measures, please see the 2024 Annual Report on Form 20-F filed with the U.S. Securities and Exchange Commission (the SEC) on 28 February 2025 (https://www.santander.com/content/dam/santander-com/en/documentos/informacion-sobre-resultados-semestrales-y-anuales-suministrada-a-la-sec/2025/sec-2024-annual-20-f-2024-en.pdf), as well as the section “Alternative performance measures” of Banco Santander, S.A. (Santander) Q1 2025 Financial Report, published on 30 April 2025 (https://www.santander.com/en/shareholders-and-investors/financial-and-economic-information#quarterly-results).
Sustainability information
This report may contain, in addition to financial information, sustainability-related information, including environmental, social and governance-related metrics, statements, goals, targets, commitments and opinions. Sustainability information is not audited nor, save as expressly indicated under section ‘Auditors’ reviews’ of the 2024 Annual Financial Report, reviewed by an external auditor. Sustainability information is prepared following various external and internal frameworks, reporting guidelines and measurement, collection and verification methods and practices, which may materially differ from those applicable to financial information and are in many cases emerging and evolving. Sustainability information is based on various materiality thresholds, estimates, assumptions, judgments and underlying data derived internally and from third parties. Sustainability information is thus subject to significant measurement uncertainties, may not be comparable to sustainability information of other companies or over time or across periods and its use is not meant to imply that the information is fit for any particular purpose or that it is material to us under mandatory reporting standards. The sustainability information is for informational purposes only, without any liability being accepted in connection with it except where such liability cannot be limited under overriding provisions of applicable law.
Forward-looking statements
Santander hereby warns that this report may contain 'forward-looking statements', as defined by the US Private Securities Litigation Reform Act of 1995. Such statements can be understood through words and expressions like 'expect', 'project', 'anticipate', 'should', 'intend', 'probability', 'risk', 'VaR', 'RoRAC', 'RoRWA', 'TNAV', 'target', 'goal', 'objective', 'estimate', 'future', 'ambition', 'aspiration', 'commitment', 'commit', 'focus', 'pledge' and similar expressions. They include (but are not limited to) statements on future business development, shareholder remuneration policy and NFI. However, risks, uncertainties and other important factors may lead to developments and results that differ materially from those anticipated, expected, projected or assumed in forward-looking statements. The important factors below (and others mentioned in this report), as well as other unknown or unpredictable factors, could affect our future development and results and could lead to outcomes materially different from what our forward-looking statements anticipate, expect, project or assume:
•general economic or industry conditions (e.g., an economic downturn; higher volatility in the capital markets; inflation; deflation; changes in demographics, consumer spending, investment or saving habits; and the effects of the wars in Ukraine and the Middle East or the outbreak of public health emergencies in the global economy) in areas where we have significant operations or investments;
•climate-related conditions, regulations, targets and weather events;
•exposure to market risks (e.g., risks from interest rates, foreign exchange rates, equity prices and new benchmark indices);
•potential losses from early loan repayment, collateral depreciation or counterparty risk;
•political instability in Spain, the UK, other European countries, Latin America and the US;
•legislative, regulatory or tax changes (including regulatory capital and liquidity requirements), especially in view of the UK's exit from the European Union and greater regulation prompted by financial crises;
•acquisition integration and challenges arising from deviating management’s resources and attention from other strategic opportunities and operational matters;
•uncertainty over the scope of actions that may be required by us, governments and other to achieve goals relating to climate, environmental and social matters, as well as the evolving nature of underlying science and industry and governmental standards and regulations;
•our own decisions and actions, including those affecting or changing our practices, operations, priorities, strategies, policies or procedures; and
•changes affecting our access to liquidity and funding on acceptable terms, especially due to credit spread shifts or credit rating downgrade for the entire group or core subsidiaries.
Forward looking statements are based on current expectations and future estimates about Santander’s and third-parties’ operations and businesses and address matters that are uncertain to varying degrees, including, but not limited to developing standards that may change in the future; plans, projections, expectations, targets, objectives, strategies and goals relating to environmental, social, safety and governance performance, including expectations regarding future execution of Santander’s and third parties’ energy and climate strategies, and the underlying assumptions and estimated impacts on Santander’s and third-parties’ businesses related thereto; Santander’s and third-parties’ approach, plans and expectations in relation to carbon use and targeted reductions of emissions; changes in operations or investments under existing or future environmental laws and regulations; and changes in government regulations and regulatory requirements, including those related to climate-related initiatives.
Forward-looking statements are aspirational, should be regarded as indicative, preliminary and for illustrative purposes only, speak only as of the date of this report and are informed by the knowledge, information and views available on such date and are subject to change without notice. Banco Santander is not required to update or revise any forward-looking statements, regardless of new information, future events or otherwise, except as required by applicable law.
Past performance does not indicate future outcomes
Statements about historical performance or growth rates must not be construed as suggesting that future performance, share price or earnings (including earnings per share) will necessarily be the same or higher than in a previous period. Nothing mentioned in this report should be taken as a profit and loss forecast.
Not a securities offer
This report and the information it contains does not constitute an offer to sell nor the solicitation of an offer to buy any securities.
Third Party Information
In particular, regarding the data provided by third parties, neither Santander, nor any of its directors, managers or employees, either explicitly or implicitly, guarantees that these contents are exact, accurate, comprehensive or complete, nor are they obliged to keep them updated, nor to correct them in the case that any deficiency, error or omission were to be detected. Moreover, in reproducing these contents in by any means, Santander may introduce any changes it deems suitable, and may omit, partially or completely, any of the elements of this report, and in case of any deviation, Santander assumes no liability for any discrepancy.
|
|
|
This document is a translation of a document originally issued in Spanish. Should there be any discrepancies between the English and the Spanish versions, only the original Spanish version should be binding. |
SIGNATURE
Pursuant to the requirements of the Securities Exchange Act of 1934, the registrant has duly caused this report to be signed on its behalf by the undersigned, thereunto duly authorized.
|
|
|
|
|
|
|
|
|
|
|
|
|
Banco Santander, S.A. |
|
|
|
|
| Date: 30 April 2025 |
By: |
/s/ José García Cantera |
|
Name: |
José García Cantera |
|
Title: |
Chief Financial Officer |