Document
FORM 6-K
SECURITIES AND EXCHANGE COMMISSION
Washington, D.C. 20549
Report of Foreign Issuer
Pursuant to Rule 13a-16 or 15d-16
of the Securities Exchange Act of 1934
For the month of March, 2025
Commission File Number: 001-12518
Banco Santander, S.A.
(Exact name of registrant as specified in its charter)
Ciudad Grupo Santander
28660 Boadilla del Monte (Madrid) Spain
(Address of principal executive office)
Indicate by check mark whether the registrant files or will file annual reports under cover of Form 20-F or Form 40-F:
Form 20-F ☒ Form 40-F ☐
Banco Santander, S.A.
TABLE OF CONTENTS
|
|
|
|
|
|
|
|
| Item |
|
| 1 |
2024 Pillar III Disclosures |

a
Profitable growth and value creation
Index
|
|
|
|
|
|
Risks (Ch. 3, 4, 5, 6, 7, 8, 9, 10 and 11) |
|
|
|
|
|
|
|
|
|
|
|
|
|
|
|
|
|
|
|
|
|
|
|
|
|
|
|
|
|
|
|
|
|
|
| Other appendices available on the Santander website. |
|
|
Access 2024 Pillar 3 Disclosures Report available on the Santander Group website |
|
|
Note: Document translated from Spanish. In the event of a discrepancy, the Spanish version prevails.
4 2024 Pillar 3 Disclosures Report

2024 Pillar 3 Disclosures Report 5
1.Introduction
1.1. Santander overview
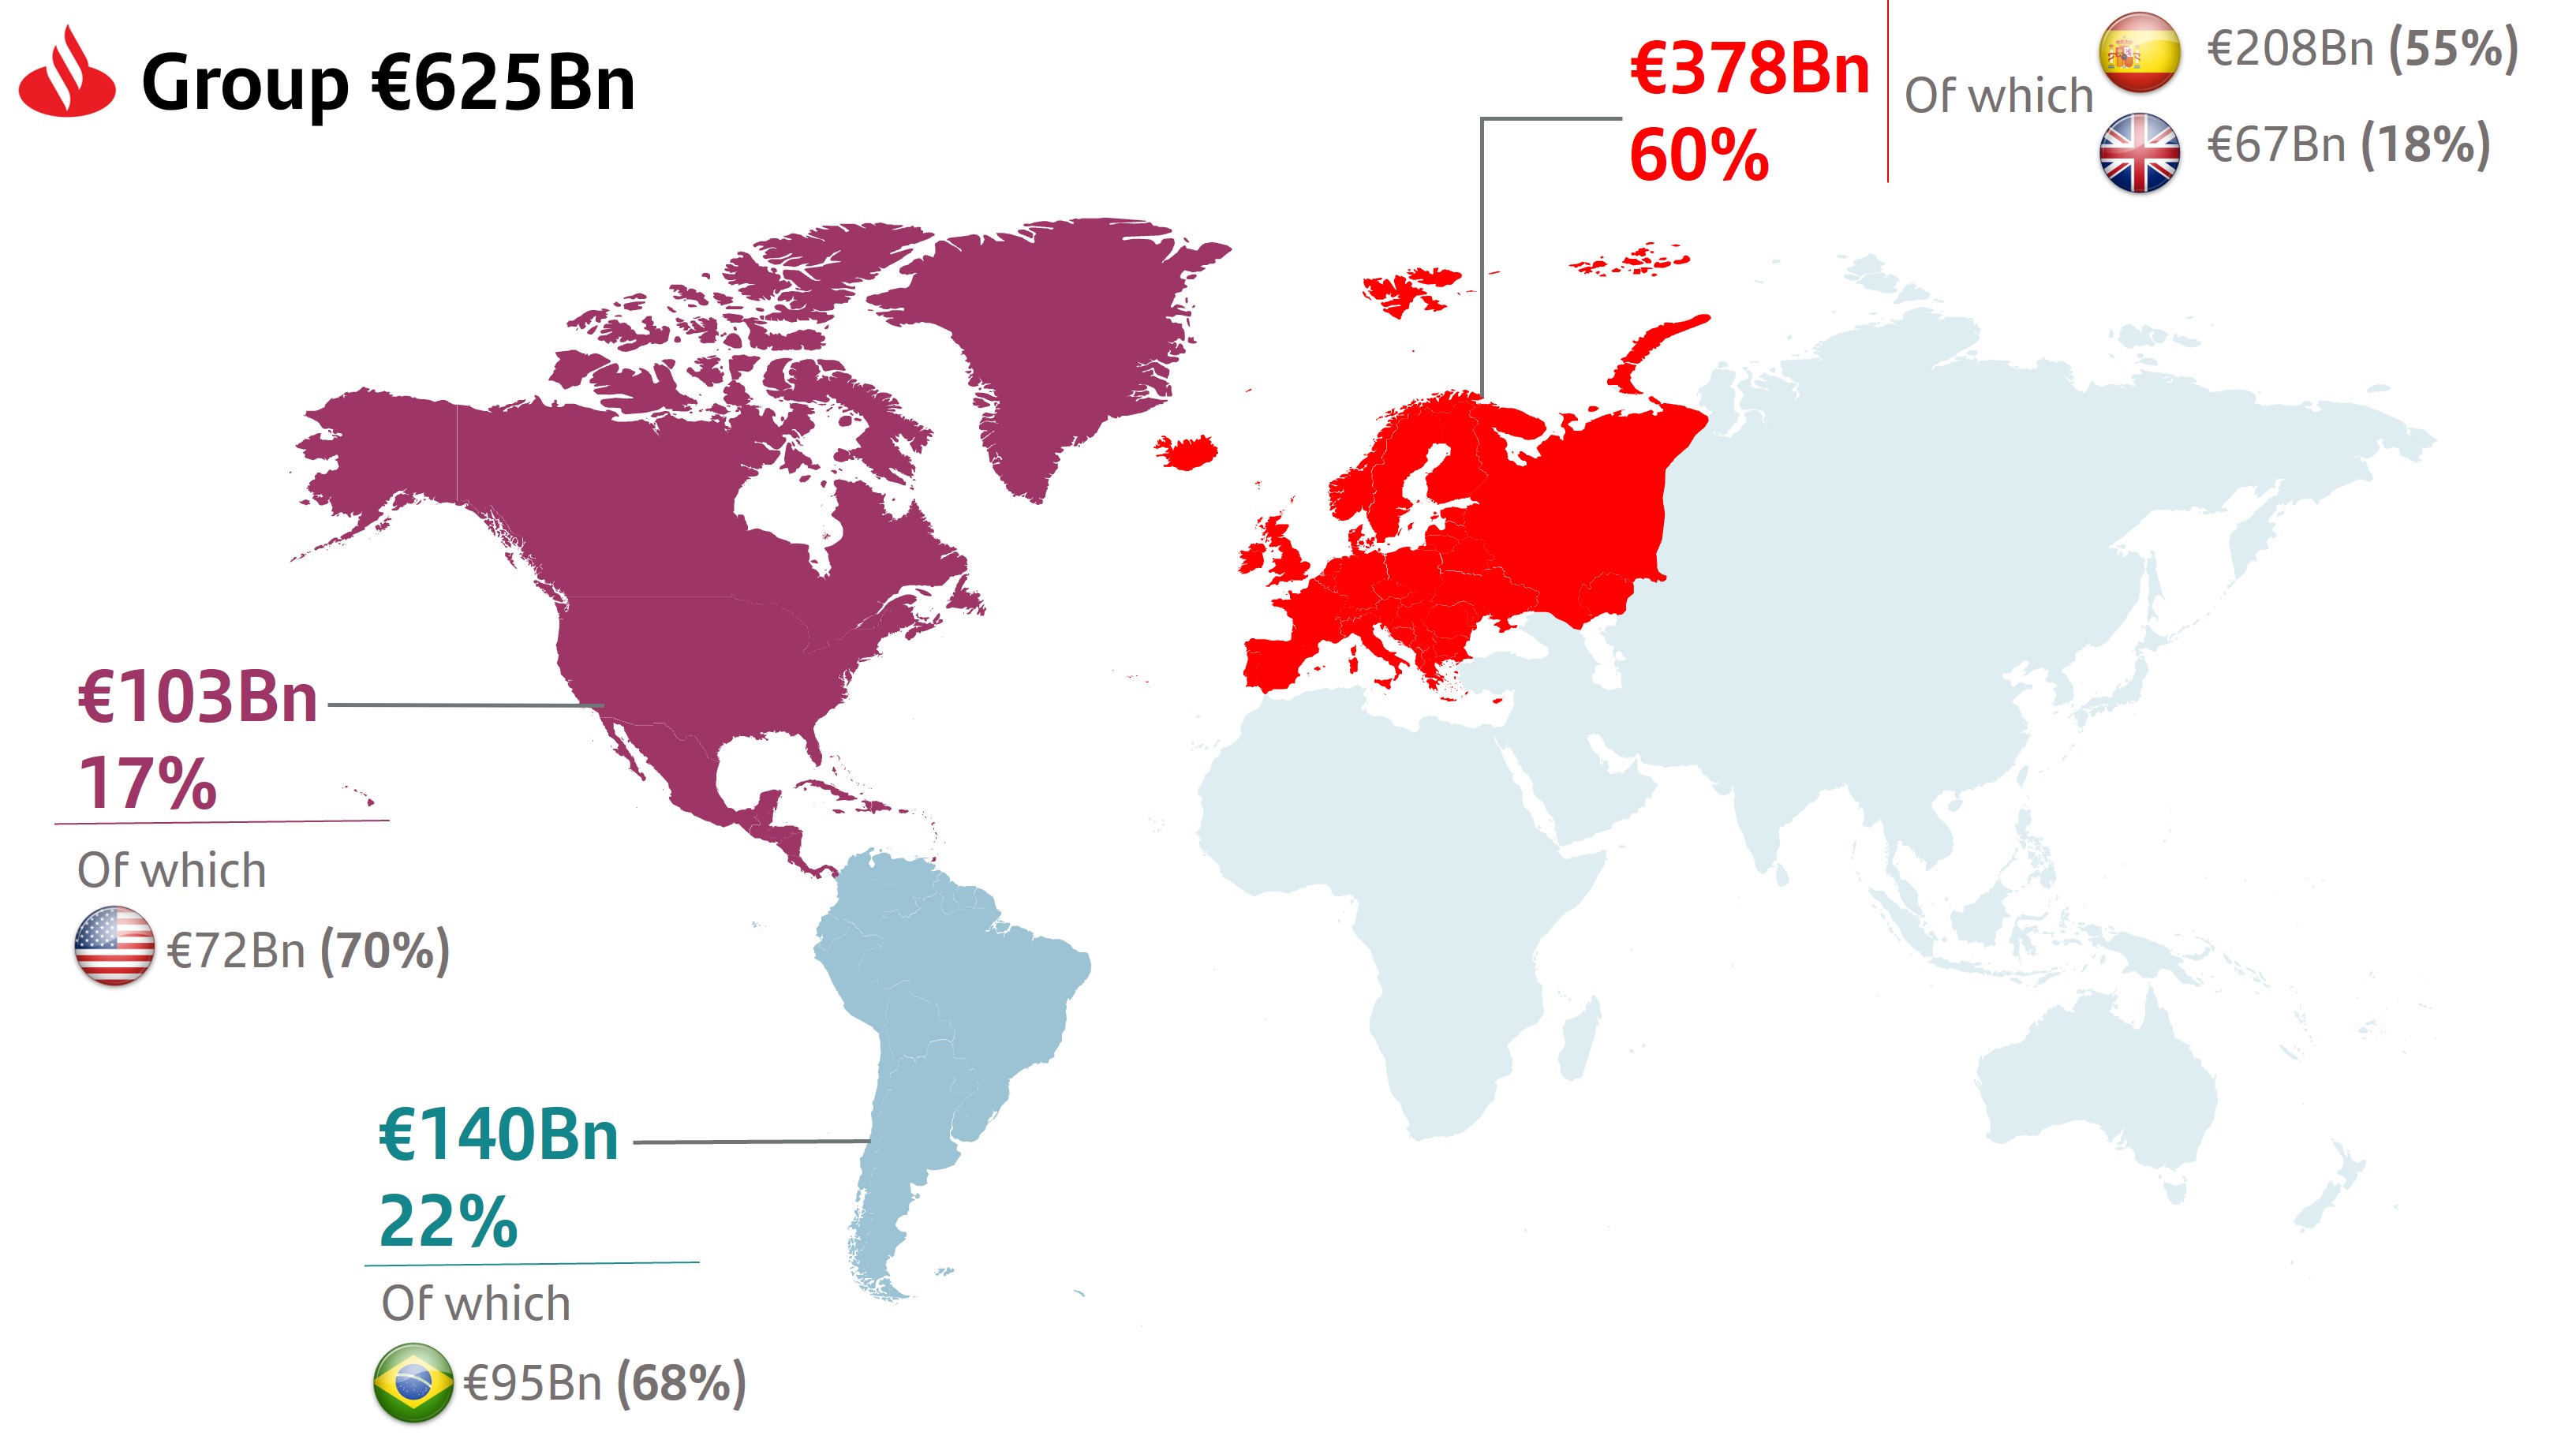
Santander is a commercial bank, founded in 1857 and headquartered in Spain. We are a global bank organised around 5 global businesses, with a meaningful presence in 10 core markets in Europe and America. We are one of the largest banks in the world by market capitalization, listed on stock exchanges of Spain, Mexico, Poland, the United States and the United Kingdom.
We provide service through our 8,011 branches and online channels that offer banking products, operations and services to individuals, SMEs, and corporates. We have 173 million customers, 206,753 employees and close to 3,5 million shareholders around the world.
As a responsible bank, we focus on areas where our activity can have the greatest impact and support an inclusive and sustainable growth.
|
|
|
|
|
|
|
|
|
|
|
|
|
|
|
|
|
|
|
|
|
|
|
|
Our business model |
|
Based on 3 pillars: |
|
Customer focus |
|
|
|
|
|
|
|
Building a digital bank with branches |
|
|
|
|
173 mn |
103 mn |
|
|
à |
We continue to build a digital bank with
branches, with a multichannel offer to fulfil all our customers' financial needs
|
|
|
|
|
total customers |
active customers |
|
|
|
|
|
Scale |
|
|
|
Global and in-market scale |
|
|
|
|
|
|
|
|
à |
Santander has a unique combination of global scale and local leadership (top 3 in lending, deposits and mutual funds in most of our markets). |
|
|
|
à |
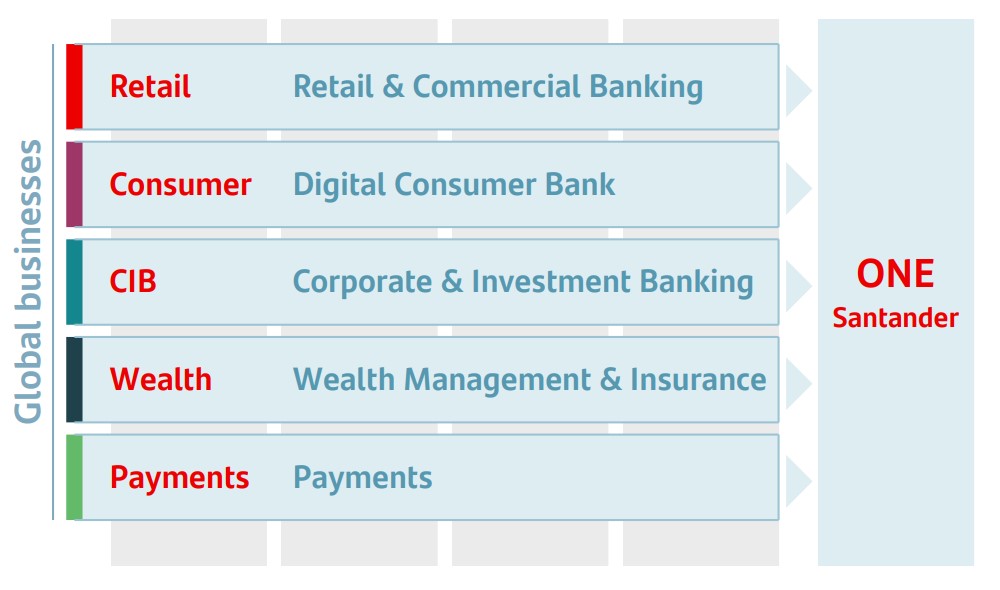
Our activities are organized under five global businesses: Retail & Commercial Banking, Digital Consumer Bank, Corporate & Investment Banking, Wealth Management & Insurance and Payments. |
|
|
à |
These five global businesses support value creation based on the profitable growth and operational leverage that ONE Santander provides.
|
|
|
|
|
|
|
|
|
Diversification |
|
|
|
Business, geographical and balance sheet |
|
|
|
|
|
|
|
|
à |
Well-balanced diversification between businesses and markets with a solid and simple balance sheet that gives us recurrent net operating income with low volatility and more predictable results |
6 2024 Pillar 3 Disclosures Report
|
|
|
|
|
|
|
|
|
|
|
|
|
|
|
| Economic and regulatory context |
In 2024, Santander operated in an environment characterized by:
|
|
|
|
|
|
| 1 |
Gradual reductions in interest rates by central banks, as a result of the decline in inflation. |
| 2 |
Geopolitical tensions arising from ongoing conflicts. |
| 3 |
While activity levels cooled, they did so slowly, labor markets were robust, with unemployment rates at or near full employment in two out of three economies in which Santander operates. |
In 2024 the banking sector continued with a solid revenue performance while portfolio quality deterioration was contained. The process of easing monetary policies is expected to have an impact on net interest income which is expected to be offset by an increase in credit volumes in an environment where a significant increase in non-performing loans is not expected.
Banks have maintained high solvency levels and have absorbed the impact of the gradual withdrawal of liquidity being carried out by major central banks, which has been observed in stress tests conducted by supervisors and multilateral agencies.
The sector's outlook for 2025 is positive, with returns slightly lower than those recorded in 2024 but well above those observed in the last decade. In the short term, the main risks facing the sector are essentially exogenous, derived mainly from the potential impact of geopolitical risks on the macroeconomic environment.
The 2024 regulatory agenda is similar to that of 2023, with the focus on issues relating to supervision, sustainability, digitalization and retail banking.
With regard to capital requirements, an agreement on Basel 3 was reached during the year, meaning that the reform will apply in Europe from January 1, 2025. However, the implementation of the Fundamental Review of the Trading Book (FRTB) was postponed to January 2026 in order to eliminate the differences between the criteria of the individual countries and to take into account the different effects in the individual countries. Intense debates in the US and the UK have also delayed implementation. In addition, the Basel Committee continued to work on the new regulatory framework for crypto assets.
In Europe, discussions were also centred on the capital buffer framework (potential revision under consideration), and on securitisations, which are expected to be relaunched in a scenario marked by a boost in competitiveness.
Public policy
We have a strong commitment to our clients to conduct our business in a simple, personal and fair way. We are also committed to regulators and supervisors, both with regard to the regulation and frameworks that affect our business, as well as to the interests of our customers.
Promote regulation that allows banks to finance the economy and be profitable and investable
Banks must continue to play their fundamental role of financing the economy and promoting growth in a competitive way, with profitability as their first line of defence:
|
|
|
|
|
|
|
It is important that, when designing regulation and supervision, policymakers and regulators consider the need for a balance between preserving financial stability and supporting economic growth. |
|
Lack of growth is the biggest threat to financial stability. As such, it is crucial to promote growth in order to finance the current challenges: decarbonization, the demographic challenge and the digital transformation, among others. |
|
Predictability and transparency in capital, regulatory and supervisory requirements are key to preserve banks' ability to finance the economy and its transformation, as well as their ability to invest. |
|
For European banks to be competitive and do more for their customers, businesses and society as a whole, it is necessary to guarantee consistent regulation and a single market. To do so, the EU needs a new Capital Markets Union (now, Savings and Investment Union) as well as a Banking Union. |
|
It is essential for the European regulation to recognise third countries, so that global European companies can continue to invest in other jurisdictions, improving their competitiveness and contributing to growth in other regions. |
2024 Pillar 3 Disclosures Report 7
|
|
|
| Record results for the third consecutive year, creating value for shareholders |
|
|
|
|
|
|
|
|
|
|
FY’24 Attributable Profit |
FY’24 Revenue |
| Record profit on the back of 8mn new customers YoY and strong revenue growth |
€12.6 Bn
+14%
|
€62.2 Bn
+8%
|
|
Efficiency |
RoTE |
| Second year of ONE Transformation driving profitable growth and structural efficiency improvement |
41.8%
-226 bps
|
16.3%
+121 bps
|
|
CoR |
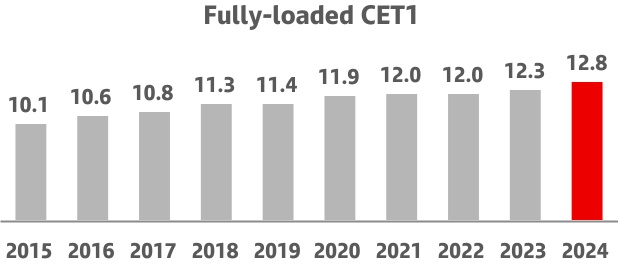
CET1 fully loaded |
Strong balance sheet, with solid credit quality
metrics and a higher capital ratio |
1.15%
-3 bps
|
12.8%
+51 bps
|
|
TNAVps + DPS |
EPS |
| Delivering double digit value creation and higher shareholder remuneration |
+14% YoY |
+18% YoY |
Note: YoY changes. In constant euros: FY'24 attributable profit +15% vs. FY’23.
(A) TNAVps + Cash DPS includes the €9.50 cent cash dividend per share paid in May 2024 and the €10.00 cent interim cash dividend per share paid in November 2024. Implementation of 2024 shareholder remuneration policy is subject to future corporate and regulatory decisions and approvals. For more details, see section 3.3 ‘Dividends and shareholder remuneration’ in the ‘Corporate Governance’ chapter in Annual Report 2024. |
|
|
|
We are only scratching the surface of our potential as a group with our strong
performance in 2024 |
|
|
|
|
|
|
|
|
|
|
2024 targetsA |
2024 achievement |
RevenueB |
Mid-single digit growth |
+10% |
| Efficiency |
<43% |
41.8% |
| Cost of risk |
c.1.2% |
1.15% |
| RoTE |
16% |
16.3% |
fully-loaded CET1 |
>12.0% |
12.8% |
|
A Some targets were upgraded in Q2'24: i) revenue from mid-single digit growth to high-single digit growth; ii) efficiency ratio from <43% to c.42%; iii) RoTE from 16%
to >16%. FL CET1 target >12% after FL Basel III implementation, FL definition as of 1 January 2025.
|
B YoY change in constant euros, except Argentina in current euros. |
8 2024 Pillar 3 Disclosures Report
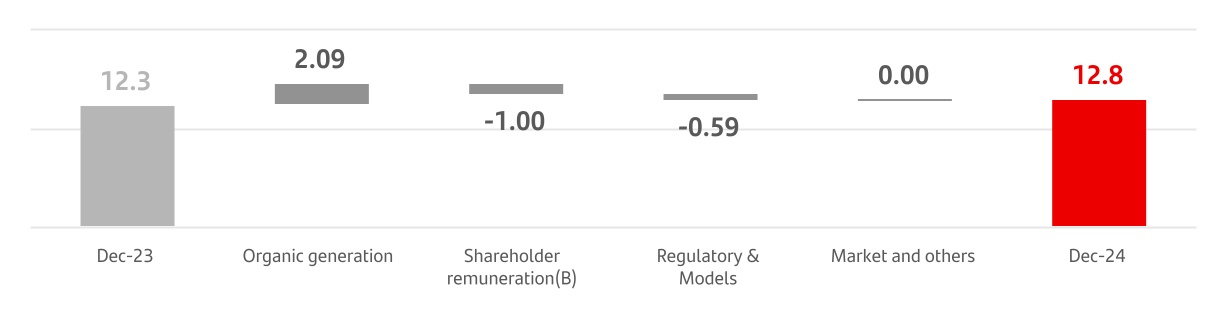
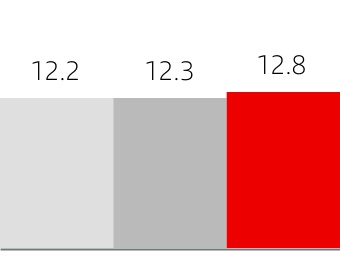
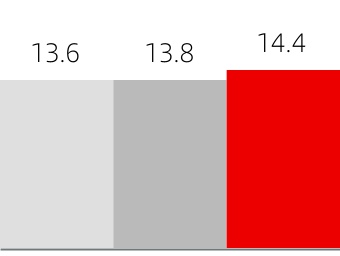
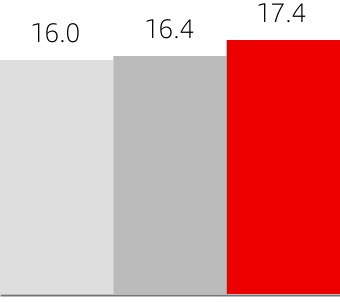
The evolution of the CET1 ratio and fully-loaded CET1 was positive...
|
|
|
|
|
|
|
|
|
|
|
|
|
|
|
| 2022 |
|
2023 |
|
2024 |
| 12.0% |
|
12.3% |
|
12.8% |
|
|
| +22 bps |
+51 bps |
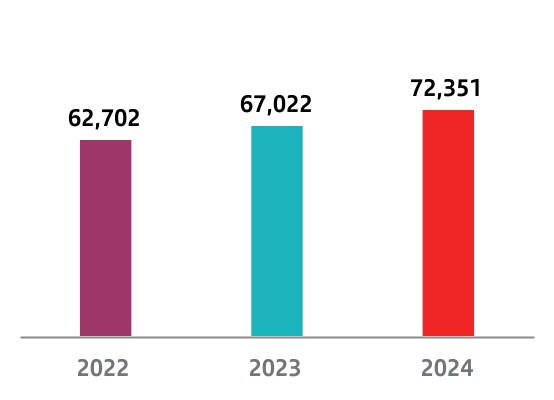
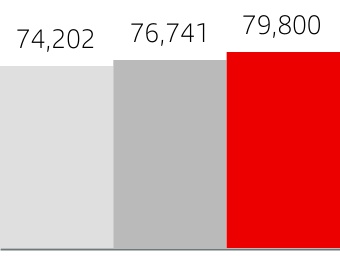
| 73.4 Bn |
|
76.4 Bn |
|
79.7 Bn |
|
|
| +3,0 Bn |
+3,3 Bn |
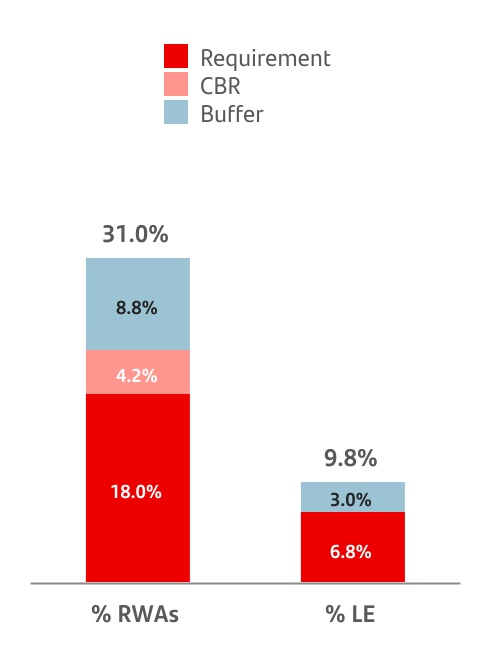
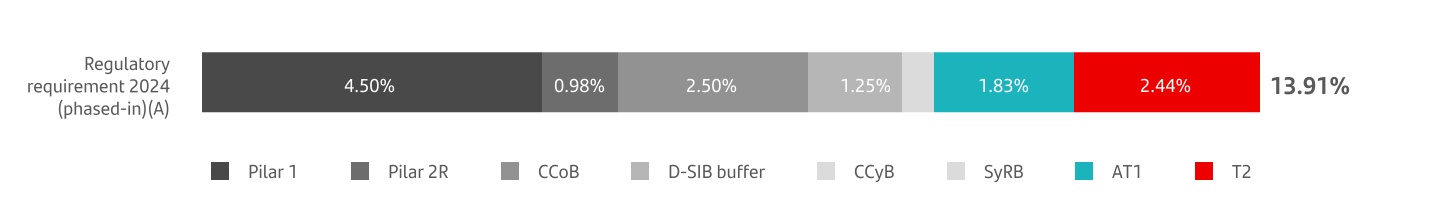
… and Santander's capital levels exceed the required regulatory minimums
We enter the last year of our third strategic cycle well ahead in all our key Investor Day targets for 2025
|
|
|
|
|
|
|
|
|
|
|
|
|
|
|
| CET1 |
RWA with RoRWA > COE |
Profitability (RoTE) |
Shareholder remuneration |
TNAVps |
| 12.8% |
87% |
16.3% |
50% |
14% |
| 2025 target: >12.0% |
2025 target: 85% |
2025 target: 15-17% |
2025 target: Cash dividend + SBB
50% annually |
2025 target: Double-digit growth |
A: The phased-in ratio includes the transitional treatment of IFRS 9, calculated in accordance with article 473a of the Capital Requirements Regulation (CRR) and the subsequent amendments introduced by EU Regulation 2020/873. In addition, the total phased-in capital ratio includes the transitional treatment in accordance with Chapter 4, Title 1, Part 10 of CRR.
Strong performance drove higher gross organic capital generation
B: Deduction for expected shareholder remuneration. Our target payout is approximately 50% of Group reported profit (excluding non-cash, non-capital ratios impact items), divided approximately equally between cash dividends and share buybacks. The implementation of the shareholder remuneration policy is subject to future corporate and regulatory decisions and approvals.
2024 Pillar 3 Disclosures Report 9
|
|
|
|
|
|
| Evolution of the main capital ratios (phased-in) |
| In % |
|
|
|
|
|
|
|
|
|
|
|
|
|
|
CET1 |
Tier 1 |
Total Capital |
|
|
|
|
|
|
| Evolution of the capital base (phased-in) |
| EUR million € |
|

|
|
|
|
|
|
|
|
|
|
|
|
|
CET1 |
Tier 1 |
Total Capital |
Evolution of another key indicators:
|
|
|
|
|
|
|
|
|
|
|
|
|
|
|
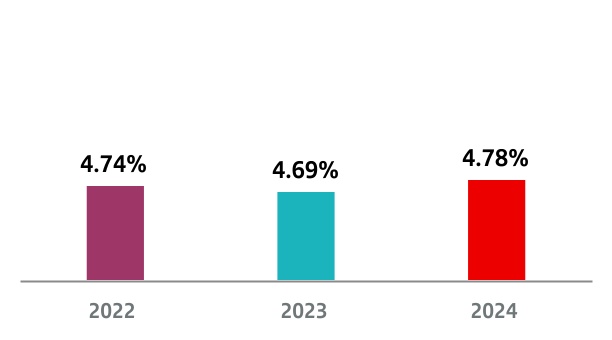
Leverage ratio (CRR and IFRS9 Phased-in) |
|
TLAC ratio |
| 4.78% |
|
30.99% |
| 2023: 4.69 % |
|
2023: 26.69 % |
|
|
|
|
|
Liquidity coverage ratio (LCR)1 |
|
NSFR ratio |
| 158% |
|
126% |
| 2023: 159 % |
|
2023: 123 % |
1 Liquidity coverage ratios are calculated following the regulatory guidelines required by the ECB.
10 2024 Pillar 3 Disclosures Report
RWA distribution by type of risk(A)
bn€

Credit risk RWAs by type of approach(A)(B)
bn€

A CRR Phased-in, IFRS9 Phased-in
B Securitisation and others are excluded. For more information, see Table 10. OV1
RWA distribution by risk type and geographic area(A)(B)
|
|
|
|
|
|
|
|
|
|
|
|
|
Credit |
Market |
Operational |
A Others is excluded. For more information, see Table 11. RWA by geographical region
B CRR Phased-in, Phased-in IFRS 9
2024 Pillar 3 Disclosures Report 11
|
|
|
|
|
|
|
|
|
|
|
|
|
|
|
|
|
|
|
|
|
| Table 1.KM1 - Key metrics template |
|
EUR million |
|
|
|
|
|
|
|
a |
b |
c |
d |
e |
|
|
Dec'24 |
Sep'24 |
Jun'24 |
Mar'24 |
Dec'23 |
|
Available own funds (amounts) |
| 1 |
Common Equity Tier 1 (CET 1) capital |
79,800 |
78,151 |
77,974 |
78,632 |
76,741 |
| 2 |
Tier 1 capital |
90,170 |
88,242 |
86,808 |
87,736 |
85,742 |
| 3 |
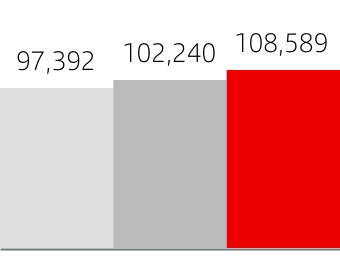
Total capital |
108,589 |
106,784 |
104,419 |
106,229 |
102,240 |
|
Risk-weighted exposure amounts |
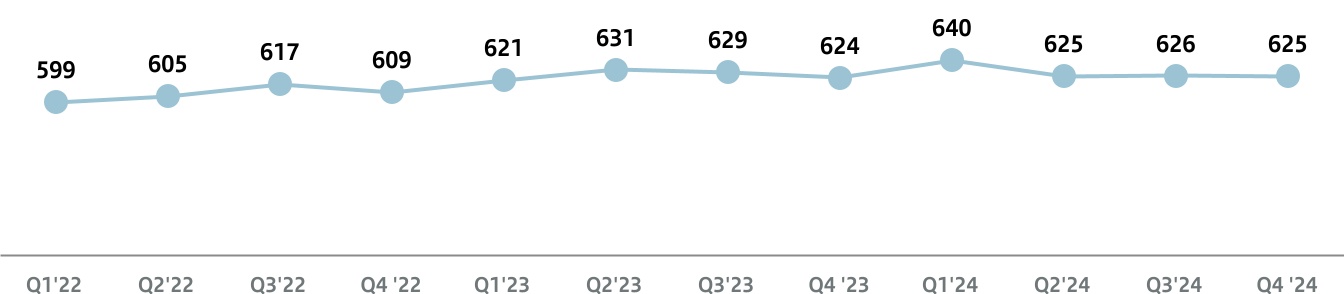
| 4 |
Total risk-weighted exposure amount |
624,503 |
626,099 |
624,831 |
640,382 |
623,731 |
|
Capital ratios (as a percentage of risk-weighted exposure amount) |
| 5 |
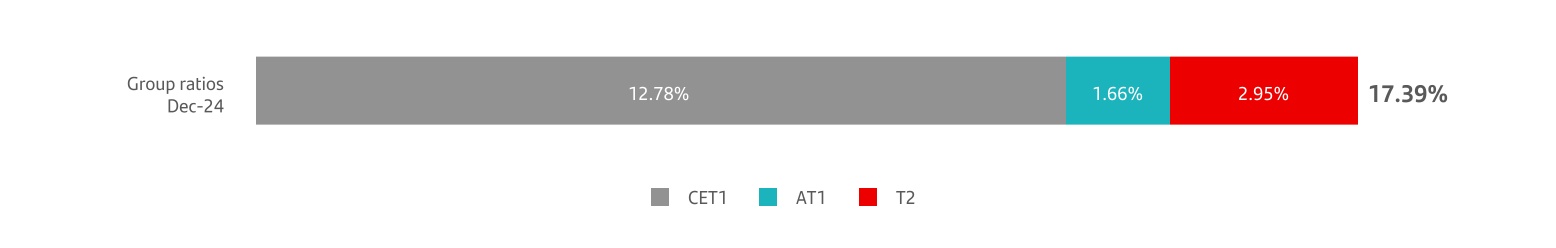
Common Equity Tier 1 ratio (%) |
12.78 |
% |
12.48 |
% |
12.48 |
% |
12.28 |
% |
12.30 |
% |
| 6 |
Tier 1 ratio (%) |
14.44 |
% |
14.09 |
% |
13.89 |
% |
13.70 |
% |
13.75 |
% |
| 7 |
Total capital ratio (%) |
17.39 |
% |
17.06 |
% |
16.71 |
% |
16.59 |
% |
16.39 |
% |
|
Additional own funds requirements to address risks other than the risk of excessive leverage (as a percentage of risk-weighted exposure amount) |
| EU 7a |
Additional own funds requirements to address risks other than the risk of excessive leverage (%) |
1.74 |
% |
1.74 |
% |
1.74 |
% |
1.74 |
% |
1.58 |
% |
| EU 7b |
of which: to be made up of CET1 capital (percentage points) |
0.98 |
% |
0.98 |
% |
0.98 |
% |
0.98 |
% |
0.89 |
% |
| EU 7c |
of which: to be made up of Tier 1 capital (percentage points) |
1.31 |
% |
1.31 |
% |
1.31 |
% |
1.31 |
% |
1.19 |
% |
| EU 7d |
Total SREP own funds requirements (%) |
9.74 |
% |
9.74 |
% |
9.74 |
% |
9.74 |
% |
9.58 |
% |
|
Combined buffer requirement (as a percentage of risk-weighted exposure amount) |
| 8 |
Capital conservation buffer (%) |
2.50 |
% |
2.50 |
% |
2.50 |
% |
2.50 |
% |
2.50 |
% |
| EU 8a |
Conservation buffer due to macro-prudential or systemic risk identified at the level of a Member State (%) |
— |
% |
— |
% |
— |
% |
— |
% |
— |
% |
| 9 |
Institution specific countercyclical capital buffer (%) |
0.39 |
% |
0.40 |
% |
0.40 |
% |
0.38 |
% |
0.37 |
% |
| EU 9a |
Systemic risk buffer (%) |
0.03 |
% |
— |
% |
— |
% |
— |
% |
— |
% |
| 10 |
Global Systemically Important Institution buffer (%) |
1.00 |
% |
1.00 |
% |
1.00 |
% |
1.00 |
% |
1.00 |
% |
| EU 10a |
Other Systemically Important Institution buffer |
1.25 |
% |
1.25 |
% |
1.25 |
% |
1.25 |
% |
1.00 |
% |
| 11 |
Combined buffer requirement (%) |
4.17 |
% |
4.15 |
% |
4.15 |
% |
4.13 |
% |
3.87 |
% |
| EU 11a |
Overall capital requirements (%) |
13.91 |
% |
13.89 |
% |
13.89 |
% |
13.87 |
% |
13.45 |
% |
| 12 |
CET1 available after meeting the total SREP own funds requirements (%) |
7.13 |
% |
6.79 |
% |
6.59 |
% |
6.40 |
% |
6.56 |
% |
|
Leverage ratio |
| 13 |
Total exposure measure |
1,885,572 |
1,853,699 |
1,827,284 |
1,849,428 |
1,826,922 |
| 14 |
Leverage ratio (%) |
4.78 |
% |
4.76 |
% |
4.75 |
% |
4.74 |
% |
4.69 |
% |
|
Additional own funds requirements to address risks of excessive leverage (as a percentage of leverage ratio total exposure amount) |
| EU 14a |
Additional own funds requirements to address the risk of excessive leverage (%) |
— |
% |
— |
% |
— |
% |
— |
% |
— |
% |
| EU 14b |
of which: to be made up of CET1 capital (percentage points) |
— |
% |
— |
% |
— |
% |
— |
% |
— |
% |
| EU 14c |
Total SREP leverage ratio requirements (%) |
3.00 |
% |
3.00 |
% |
3.00 |
% |
3.00 |
% |
3.00 |
% |
|
Leverage ratio buffer and overall leverage ratio requirement (as a percentage of total exposure measure) |
| EU 14d |
Leverage ratio buffer requirement (%) |
0.50 |
% |
0.50 |
% |
0.50 |
% |
0.50 |
% |
0.50 |
% |
| EU 14e |
Overall leverage ratio requirements (%) |
3.50 |
% |
3.50 |
% |
3.50 |
% |
3.50 |
% |
3.50 |
% |
|
Liquidity Coverage Ratio |
| 15 |
Total high-quality liquid assets (HQLA) (Weighted value - average) |
330,492 |
327,674 |
330,818 |
332,445 |
323,188 |
| EU 16a |
Cash outflows - Total weighted value |
275,509 |
277,175 |
277,721 |
277,890 |
274,162 |
| EU 16b |
Cash inflows - Total weighted value |
73,682 |
74,095 |
72,420 |
71,666 |
70,643 |
| 16 |
Total net cash outflows (adjusted value) |
201,827 |
203,080 |
205,301 |
206,224 |
203,519 |
| 17 |
Liquidity coverage ratio (%)* |
158.39 |
% |
161.30 |
% |
161.10 |
% |
161.14 |
% |
158.75 |
% |
|
Net Stable Funding Ratio |
| 18 |
Total available stable funding |
1,198,180 |
1,175,288 |
1,142,775 |
1,154,509 |
1,139,711 |
| 19 |
Total required stable funding |
954,260 |
952,387 |
934,229 |
935,685 |
924,843 |
| 20 |
NSFR ratio (%) |
125.56 |
% |
123.40 |
% |
122.32 |
% |
123.39 |
% |
123.23 |
% |
|
CRR Phased-in, Phased-in IFRS9 |
|
|
|
|
|
|
* Liquidity coverage ratio is the average of 12 months |
|
|
|
|
|
|
* Liquidity coverage ratios are calculated following the regulatory guidelines required by the ECB. |
|
|
|
12 2024 Pillar 3 Disclosures Report
|
|
|
|
|
| 1.2. GRUPO SANTANDER PILLAR 3 REPORT OVERVIEW |
This section looks at general aspects applicable to Grupo Santander and describes the governance for approval and publication of the Pillar 3 report, in addition to the disclosure criteria used in the report.
|
|
|
|
|
|
|
|
|
|
|
|
| è |
This section covers the requirements of Articles 432, 433, 433bis, 434, 436a and 437bis of the CRR on the requirements and scope of disclosure of information by the Group. |
|
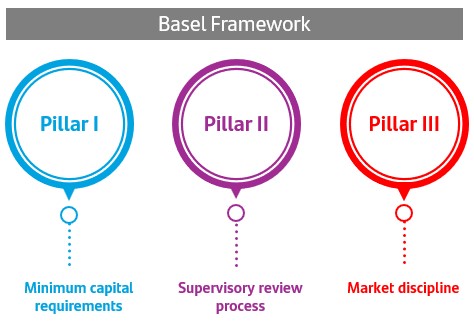
The Basel framework consists of 3 pillars:
•Minimum Capital requirements (Pillar 1)
•Supervisory review (Pillar 2)
•Market discipline (Pillar 3).
The Santander Pillar 3 Disclosure report is a public document that is published on the Group's corporate website in order to fulfil the regulatory requirements within the scope of Basel. Specifically, the reporting standards are set by Part Eight of the Capital Requirements Regulation (CRR) 575/2013 and complementary European Banking Authority (EBA) Guidelines. In addition, the report considers the Regulation (CRR II) 2019/876 amending Regulation 575/2013.
The Pillar 3 report includes a set of disclosure requirements which are intended to provide analysts, investors, shareholders and other market agents with KPIs and risk information to improve their ability of assessing the banks risk profile and capital adequacy.
The timely publication of this information is considered as a booster of transparency within financial institutions and contributes to the adequate functioning of financial markets.
This document should be read in conjunction with the Annexes of Pillar 3 and the Annual report, which have been published on the website (www.santander.com).
On 27 June 2023, an agreement was reached between the Council of the European Union and the European Parliament on the proposal put forward by the European Commission on 27 October 2021 on the banking package. The banking package includes amendments to the Capital Requirements Regulation (CRR III) and to the Capital Requirements Directive (CRD VI).
The banking package implement the latest Basel III reforms, which underpin a robust regulatory framework, efficient supervision and enhanced risk control by credit institutions. Following the CRDVI/CRR III, the EBA was asked to work on the layer of the regulatory products that ensures a technical implementation of the prudential framework, including amendments to the disclosure requirements.
On November 2024, the Regulation 2024/3172 was approved by Commission laying down implementing technical standards for the application of Regulation (EU) No 575/2013 of the European Parliament and of the Council with regard to public disclosures by institutions of the information referred to in Part Eight, Titles II and III, of that Regulation, that will apply from 1 January 2025.
In addition, in February 2025 the EBA published its Implementing Technical Standards (ITS) on the Pillar 3 data hub (P3DH), which will centralise prudential disclosures by institutions through a single electronic access point on the EBA website from June 25.
1.2.1. Governance: policy, review and approval
Grupo Santander has a formal policy on the Pillar 3 disclosures which defines the requirements, the development process, the frequency and the associated governance in accordance with the Directive 2013/36/EU, Regulation (EU) no. 2019/876 of 20 May 2019 (the EU Regulation or CRR II) amending Regulation (EU) no. 575/2013, as well as the law on supervision and capital requirements (10/2014) of the Banco de España.
This policy has been prepared in compliance with the criteria established in the Guidelines on Materiality, Proprietary, Confidentiality and Frequency of the Information by the European Banking Authority in accordance with Article 432, sections 1 and 2 and Article 433 of Regulation (EU) 575/2013.
The Pillar 3 disclosures report relies on a range of defined processes relating to the internal control framework, with duties and responsibilities for review and certification of the information contained in the report at several levels of the organisation.
Additional information regarding Grupo Santander's system of internal control over financial reporting (SCI) can be found in the 'Corporate governance' chapter of the 2024 Annual report.
|
|
|
|
|
|
|
Access 2024 Pillar 3 Disclosures Report available on the Santander Group website |
2024 Pillar 3 Disclosures Report 13
The information contained in this report has been subject to an ex-ante review by the External Auditor, who in their report have not declared any findings regarding the reasonableness of the information detailed and the compliance with the information requirements established in the European Capital Directive and Regulation.
The conclusions are presented to the audit committee prior to its approval. In addition, this report is included in the recurring annual plan review of internal audit.
Approval by governing bodies
The report has been reviewed by the capital committee and the audit committee at their meeting on 13 February 2024, as well as by the board of directors' meeting on 15 February, prior to its final approval at the board of directors' meeting on 19 February 2024.
The board of directors of Santander certifies that the publication of the Pillar 3 disclosures report is compliant with the guidelines in Part Eight of Regulation (EU) 575/2013 and consistent with the “Pillar 3 Disclosures Policy” adopted by the board of directors.
No exceptions have been applied for the publication of information considered proprietary or confidential.
Furthermore, a quarterly report is published which includes a set of information complying with the internal policy and criteria established in the European Banking Authority guidelines about disclosure frequency.
The Pillar 3 disclosures report is available in the Shareholders and Investors section of the Santander website (www.santander.com), under "Financial and economic information".
|
|
|
|
|
|
|
Access 2024 Pillar 3 Disclosures Report available on the Santander Group website |
|
|
|
|
|
|
|
|
|
|
|
|
|
|
|
|
|
|
|
|
|
|
|
|
|
|
|
|
|
|
|
|
|
|
|
|
|
|
José García Cantera |
José Doncel |
Mahesh Aditya |
|
|
Group Chief Financial Officer |
Group Chief Accounting Officer |
Group Chief Risk Officer |
|
|
|
|
|
|
|
|
|
| " |
We confirm that 2024' Santander’s Pillar 3 disclosures, to the best of our knowledge, comply with updated Pillar 3 framework within Capital Requirements Regulation (CRR) 575/2013 (Part Eight) and have been prepared in compliance with Santander’s policies, internal processes, systems and controls. |
|
|
|
|
|
|
|
|
" |
|
|
|
|
|
|
|
|
|
|
|
14 2024 Pillar 3 Disclosures Report
1.2.2. Background information on Santander
Banco Santander, S.A. is a legal entity subject to the rules and regulations applicable to banks operating in Spain. In addition to its direct operations, Banco Santander, S.A. is the holding company of a group of banking subsidiaries engaged in a range of business activities. The European Central Bank (ECB) is the supervisor of the Grupo Santander on a consolidated basis.
The Capital Requirements Regulation (CRR) and its modifications (hereinafter referred to as CRR), Capital Requirements Directive (CRD) and its modifications, and its transposition through Banco de España Circular 2/2016, on supervision and capital adequacy, are applicable at a consolidated level to the entire Grupo Santander.
Refer to Appendix III, CRR Mapping, for all aspects for which disclosure is required under Part Eight of the CRR, as amended but that are not applicable to Santander. These are reported as “N/A” (not applicable).
Notes on basis of preparation
This report has been prepared in accordance with current 31.12.2024 European regulations on capital requirements (CRR2).
The ratios presented in this report have been calculated using the transitional CRR2 and IFRS 9 implementation schedules.
There are differences regarding some metrics between the regulatory information in this report and the information in the annual report:
•The credit risk exposure measurements used for calculating regulatory capital requirements include:
◦Current and future risk exposures arising from future commitments (contingent liabilities and commitments) and changes in market risk factors (derivative instruments).
◦The mitigating factors for these exposures (netting agreements and collateral agreements for derivative exposures, and collateral and personal guarantees for on-balance-sheet exposures).
•The criteria used in classifying non-performing exposures in portfolios subject to advanced models for calculating regulatory capital are more conservative than those used for calculations for the segregated view provided in the annual report.
•ESG disclosure in Pillar 3 follows the Implementing Technical Standards (ITS) defined by the EBA for this purpose and it is not necessarily aligned with the management criteria reported in other Group’s ESG reports.
On 19 June 2024, the final update of the banking package was published in the Official Journal of the European Union Regulation (EU) 2024/1623 (CRR3) amending the CRR2
Finally, Appendix III shows the compliance with the various applied ITS which are in force and Appendix IV refers to the regulatory framework and the according articles on which the disclosed information is based.
In the Financial and economic information / Pillar 3 section of the Group's website, all tables including the Appendix, which are published in this document, are available in an editable format.
1.2.3. Disclosures by Santander subsidiaries
In addition to the consolidated information presented in this report and ECB requirements, (following article 13 of the CRR, Application of disclosure requirements on a consolidated basis) Santander large subsidiaries that meet at least one of the following criteria publish information at solo basis on their websites.
•The institution is a global systemically important entity (G-SIB);
•The institution has been identified as a systemically important entity (O-SII) in accordance with Article 131(1) and (3) of Directive 2013/36 EU;
•The institution is one of the three largest entities in terms of total value of assets in the Member State in which it is established;
•The institutions total assets on a solo or sub-consolidated basis is equal to or greater than EUR 30 billion.
Based on the criteria above, each subsidiaries in the European Economic Area (EEA) such as Portugal, Poland and Santander Consumer Germany or subsidiaries outside EEA such as Argentina, Brazil, Mexico, the UK and Uruguay publish their Pillar 3 reports.
Santander Consumer Finance (subconsolidated basis) discloses information related to articles 437, 438, 440, 442, 450, 451, 451a y 453 available in their website.
The additional disclosures for the large subsidiaries (in accordance with Article 4 No. 146 and 147 CRR) can be found within the Pillar 3 reports of the respective subsidiary as published on the corresponding website.
Each banking subsidiary is directly regulated by their local banking supervisors, who set and monitor their local capital and liquidity adequacy requirements. In most jurisdictions non-banking financial subsidiaries are also subject to the supervision and capital requirements of local regulatory authorities.
The regulators of the Group’s banking entities outside the EEA are at varying stages of implementation of the Basel framework. Local regulation in 2024 may have been implemented on the basis of Basel I, II or III.
For more information about the international Group structure see Appendix II.
2024 Pillar 3 Disclosures Report 15
1.3. Regulatory framework
1.3.1. Prudential framework 2024: highlights of solvency and resolutions
Credit institutions must meet a series of minimum capital and liquidity requirements. These minimum requirements are regulated by the European Capital Requirements Regulation (CRR) directly applicable under the Spanish legal system, and by the Capital Requirements Directive (CRD).
On 19 June 2024, the final update of the banking package was published in the Official Journal of the European Union Regulation (EU) 2024/1623 (CRR3) amending the CRR as regards requirements for credit risk, credit valuation adjustment risk, operational risk, market risk and the output floor and also Directive (EU) 2024/1619 (CRD6), amending the CRD as regards requirements for supervisory powers, sanctions, third-country branches, and environmental, social and governance risks.
The update of the banking package aims firstly to implement Basel III final reforms and, secondly, to enhance the standardisation of banking supervision in the European Union (EU).
The CRR3 introduces greater sensitivity to standardised metrics, to reduce the variability of risk-weighted assets between institutions using internal models for capital requirement calculation and facilitate the comparability among banks. The main changes introduced are as follows:
•Output floor: A risk-weighted assets floor is introduced, consisting of 72.5% of the total risk exposure amount calculated using standardised methods. The aim is to limit variability and excessive reduction in capital consumption in institutions that apply internal models. The regulation includes a transitory period to give institutions sufficient time to adapt.
•Standardised credit risk method: The CRR3 introduces greater risk sensitivity by creating specific exposure classes, and greater granularity in the range of applicable RWs, such as the new treatment of exposures guaranteed by immovable property. In addition, the minimum CCF is increased from 0% to 10%, with a transitional arrangement for the necessary accumulation of capital.
•IRB credit risk approach: The escalation factor is eliminated from the Risk Weight Asset (RWA) calculation formula and opens the possibility for an entity to use this approach for some exposure classes instead of requiring the implementation of IRB in all portfolios. Also, the F-IRB approach is made obligatory for low-default exposure classes (institutions and companies with revenue greater than €500 million). In addition new floors are introduced for the PD and LGD parameters to limit their variability.
•Credit risk mitigation: Clarity in the recognition of personal guarantees if exposures towards the guarantor and debtor are treated using different credit risk approaches (standard approach, F-IRB, A-IRB or slotting).
•Operational risk: The methods existing up until the 31 December 2024 have been replaced by a single Standardised Measurement Approach based on the business indicator. The new approach (SMA) consists of the Business Indicator Component (BIC), which multiplies the Business Indicator (BI) with an escalation factor (between
12% and 18%) depending on the institution's BI volume. The BI has 3 components: ILDC, SC and FC. The loss component (ILM) in the Basel Framework has been disregarded in the new Regulation, as the European regulatory authority made use of the discretion permitted by the Basel Framework. The CRR3 also includes: (i) the possibility of calculating a separated ILDC, for which a supervisory approval is required; and (ii) a transitional period where institutions can continue applying the current ASA until the separated ILDC calculation is granted by the ECB.
The goal of achieving more robust supervision and protection of financial stability in the CRD6 is expressed in a series of provisions concerning: fit-and-proper requirements, extending the scope by revising certain definitions and additions on the establishment of third-country branches in the EU in order to achieve greater regulatory harmonisation and better supervision of this type of entities.
The CRR3 and CRD6 came into force on 9 July 2024. Although early implementation was established for certain provisions, such as certain definitions that may affect the scope of consolidation or the capital requirements for crypto assets exposures, most of the changes were not applicable until 1 January 2025. At the same time the regulatory authority has imposed a delay for certain changes, due to issues resulting from difficulty in their implementation by institutions or to level the playing field with respect to other comparable jurisdictions. Specifically, the new regulation for the market risk capital calculation approach (FRTB), linked to the standards already published by the Basel Committee on Banking Supervision (BCBS) in 2017, will be delayed to 1 of January 2026 at the earliest. The Commission and the Council, without opposition from the Parliament, have issued a delegated act stipulating a delay of 12 months for the application of this standard, which is generating uncertainty regarding the form, content and date of implementation of this approach in other comparable jurisdictions, such as the UK and US.
This delay, which was published in July 2024, is accompanied by a delay in the rules regulating the Trading and Banking Book Boundary allocating instruments between investment and trading books for prudential purposes, the definition of trading and investment desks, the rules regarding the prudential recognition of internal risk transfers between investment and trading books, the treatment of structural FX and newest market risk reporting and disclosure framework.
For the calculation of the output floor banks have to use the FRTB SA model for calculating the market share of the output floor and compare it with the results from the internal model or CRR2 market standardised model, depending on the use by each institution. Therefore, this is the only metric in which FRTB SA is, as today official and binding.
Other provisions, such as the new regulation on calculating capital by Credit Valuation Adjustment (CVA) risk, which significantly impact the capital requirements, are not affected by this delay and have come into force as of 1 of January 2025.
The changes regarding the CVA mainly affect the methodological modifications for capital calculation and establish a new standard model based on sensitivities aligned with the new standard model for calculating capital requirements for market risk.
16 2024 Pillar 3 Disclosures Report
The new Regulation contains several mandates to the EBA to prepare level 2 or 3 standards (regulatory technical standards, implementing technical standards and guidelines) which give further details on particular aspects of the regulation. In this regard, at the end of 2023 the EBA published the EBA Roadmap, segmented into four stages, in which the changes of the banking package have to be implemented. The EBA will address legal deadlines for the according changes (up to four years after the implementation of the CRR3 and CRD6). Additionally, at the end of 2024 the EBA published its timeline for 2025, defining the guidelines for the implementation of the mandate in this year. The EBA will also be revising and updating the SREP guidelines.
In addition to the publications resulting from the implementation of the banking package in June 2024, the EBA published an update of the report on monitoring of AT1, T2, MREL and TLAC, which provides guidance on the prudential assessment of the instruments other than CET1 instruments and other aspects regarding the eligibility criteria and the terms and conditions of those issuances.
In terms of resolution regulation, Institutions must have an adequate funding structure to ensure that, in the event of financial distress, the institution has sufficient liabilities to absorb losses in order to recover or resolve its positions, while ensuring the protection of depositors and financial stability. For this purpose global systemically important institutions must therefore meet several minimum loss-absorbing requirements, e.g. Total Loss-Absorbing Capacity (TLAC), Minimum Requirement for own funds and Eligible Liabilities (MREL), which are regulated by the CRR and by the Bank Recovery and Resolution Directive (BRRD).
The regulation on the prudential treatment for global systemically important banks was published on 25 October 2022. This modified both the CRR and the BRRD regarding the prudential treatment of global systemically important banks (G-SIBs) with a multiple point of entry (MPE) resolution strategy, as well as the methods for indirect subscription of eligible instruments (Daisy Chains) to meet the minimum requirement for own funds and eligible liabilities. This regulation, known as the 'Quick Fix', covers the following two objectives:
•The inclusion in BRRD and CRR of references to third country subsidiaries to adjust the deduction for the holding of TLAC instruments issued from subsidiaries in third countries based on the excess TLAC/MREL existing in those subsidiaries, as well as the adjustment where the sum of the requirements for own funds and eligible liabilities of G-SIBs under an MPE strategy is higher than the theoretical requirement for the same group under a single point of entry (SPE) strategy. The latter adjustment is based on a comparison between the two possible resolution strategies.
Additionally, for the subsidiaries in jurisdictions without a resolution regime in place, the Regulation provides a transitional period until 31 December 2024. During this transitional period the institutions may adjust the deductions based on the excesses above the capital requirements in subsidiaries in third countries, if they meet certain requirements.
•Inclusion of a deduction scheme for MREL instrument holdings through entities of the same resolution group other than the resolution entity. This regulation sets a deduction for the intermediate entity (Daisy Chains) that repurchases instruments, and, if there is such a deduction,
the intermediate entity is obliged to issue the same amount as it is repurchasing, transferring the internal MREL needs to the resolution entity, which will cover it with external MREL.
This Regulation is applicable from the 14 November 2022, except for the provisions relating to Daisy Chains, which applies from the 1 January 2024.
In April 2024 Directive (EU) 2024/1174 was published, which amends the Daisy Chain Act to exclude daisy chain requirements in some cases, e.g. institutions that would prefer liquidation rather than resolution.
Additionally, in 2024 the SRB amended the MREL policy to adapt it to the latest amendments involving daisy chains, among other aspects.
The Deposit Guarantee Schemes (DGSs) are regulated by the Deposit Guarantee Schemes Directive (DGSD), which has not undergone any significant changes since its publication in 2014. The Directive aims to harmonise the DGSs of the Member States, thus ensuring stability and balance in the various different countries. The Directive creates an appropriate framework for depositors to have improved access to DGS through the establishment of a clear scope of coverage, shorter repayment periods, the requirement of a reliable information and robust funding requirements of the DGS. This Directive is transposed into Spanish law by Royal Decree 2606/1996, with additional amendments set forth in Royal Decree 1041/2021.
To guarantee customers' deposits, the DGS collect available financial means in the form of contributions that members institutions have to make at least once a year. These annual contributions are established depending on the total covered deposits and the risk profile faced by the institutions involved in the DGS. The method for calculation contributions is set out in the EBA Guidelines (EBA/GL/2023/02). After the target level of 0.8% of the amount of covered deposits was reached, with the contributions raised until 2023, the Spanish DGS has not required the additional contribution to its institution's deposits compartment (however, it will require a contribution to its securities compartment in February 2025 according to institution's data as of December 2024).
Lastly, on 18 April 2023, the European Commission published its proposal to review the Crisis Management and Deposit Insurance (CMDI) framework. Specifically, several proposals have been submitted:
•Early intervention measures, conditions for resolution and funding for the resolution measure;
•The scope of deposit coverage, prelation order of the loss absorbency of the deposits, use of funds of the deposit guarantee schemes, cross-border cooperation and transparency; and
•Certain aspects of the minimum requirement for own funds and eligible liabilities.
These proposals imply amending regulations such as:
•CRR;
•BRRD;
•Single Resolution Mechanism Regulation (SRMR), which establishes uniform rules and a uniform procedure for the resolution of credit institutions and certain investment firms in the framework of a Single Resolution Mechanism (SMR) and a Single Resolution Fund;
2024 Pillar 3 Disclosures Report 17
•DGSD.
The Council agreed on 19 June 2024 on its position on the revision of the CMDI, which includes a broad set of measures aiming to strengthen the current EU crisis management framework. The trialogue process was initiated in December 2024.
1.3.2. Sustainability
Since the publication of the European Commission's action plan supporting EU climate and sustainable development goals for 2030, several different regulatory measures have been drawn up with the aim of generating an optimum framework for the development of sustainable finance.
In 2024 the Commission Delegated Regulation (EU) 2023/2486 was implemented, which establishes technical criteria for determining the conditions under which an economic activity qualifies as contributing substantially to the four environmental objectives that were pending development (sustainability and protection of water and marine resources, transition to a circular economy, pollution prevention and control, and protection and restoration of biodiversity and ecosystems). Also the Commission Delegated Regulation (EU) 2023/2485 was implemented, which incorporates regulations under which a series of new economic activities (not previously included in the 2020 Taxonomy Regulation) qualify as contributing substantially to the two Taxonomy climate objectives (climate change mitigation and climate change adaptation).
In addition to developing the classification of sustainable activities listed in the Taxonomy, from a prudential perspective, the CRR3 has introduced new requirements for integrating ESG risks in this framework, in particular including definitions, a "more ecological" infrastructure supporting factor, climate considerations in guarantee assessments and additional mandates to assess whether the prudential treatment of exposures related to assets or liabilities subject to the impact of environmental or social factors should be adjusted. To assess precisely whether specific prudential treatment is required, the CRR3 provides three mandates for creating the reports that assess data availability for the exposure classes, evaluating the actual risk situation of exposures that affect environmental factors compared with the risk situation of other exposures and the potential effects of prudential treatment on financial stability. If considered necessary after publication of these reports, a legislative proposal to amend the current prudential framework may be submitted to the Commission by 31 December 2026 to ensure a prudential framework which will continue supporting financial stability and a sustainable transition.
Furthermore, the CRR3/CRD6 regulatory package contains additional disclosure obligations concerning ESG, obligations on reporting to competent authorities and the obligation to establish specific plans for addressing short-, medium- and long-term financial risks derived from ESG factors, including generated risks as a consequence of the transition period.
In 2024 the EBA held a consultation on the Guidelines on the management of ESG risks. As result several points have been concluded: reference methodology for the identification and measurement of ESG risks, minimum standards and reference methodology for the management and monitoring of ESG risks, and transition plans addressing the key aspects included in the new CRD6.
At the international level and particularly regarding reporting obligations on climate risks, it is important to note that the Basel Committee published a consultation paper at the end of 2023 proposing a series of qualitative and quantitative requirements which should be disclosed in the entities' Pillar 3 reports. In this document the Committee acknowledges that precise, consistent and quality climate data is still evolving. However the Committee believes that the disclosure requirements will expedite the availability of said information and will facilitate banks' prospective risk assessments.
Other regulatory initiatives approved in 2024 or that are in the final stage of being approved by European institutions include the following:
•The Review of the Energy Performance of Buildings Directive, which targets to expedite the transition of Member States' real estate portfolio and seeks greater standardisation in Energy Performance Certificates, and will be transposed in May 2026.
•The proposal on ESG ratings to regulate the transparency and integrity of environmental, social and governance (ESG) rating activities, which was adopted in the Regulation on the transparency and integrity of ESG rating activities. This regulation was published in November 2024 and is expected to be implemented in the third quarter of 2026.
•Publication of the Regulation (2023/2631) on European green bonds that sets forth uniform requirements (use of funds, disclosure requirements etc.) for bond issuers to use the name "European Green Bond" or "EuGB" and will apply from 21 December 2024.
•The proposed Regulation establishing the European Single Access Point (ESAP), which will help investors and other stakeholders access information about companies. This Single Access Point will offer centralised digital access to financial and sustainability information that has been published by European companies.
•In response to the European Commission's request in 2022 concerning the greenwashing risk and supervision of sustainable finance policies, in September 2024 the EBA published the final report on greenwashing monitoring and supervision. This report contains bests practices and recommendations to mitigate the risk of greenwashing and to ensure that information on sustainability is comprehensive and clear. Institutions must also take a proactive approach to incorporating ESG risks in their comprehensive risk management framework.
•The ESMA published in May 2024 Guidelines on funds' names using ESG or sustainability-related terms. The aim is to specify the circumstances under which funds' names that use terms related to ESG or sustainability comply with the requirements established therein.
1.3.3. Digital
The aim of laying the foundations for the creation of a competitive digital future in the European Union has continued to drive the creation of a regulatory framework to that end. Regarding the extending of the use of technologies promoting innovation and competitiveness, new developments can be highlighted (initiatives which should have been initiated in 2024 or were published during this year) and grouped according to subjects:
18 2024 Pillar 3 Disclosures Report
Cryptoassets
For Markets in cryptoassets the (MiCA) establishes a common framework in Europe for the issue, custody and exchange of these assets. This regulation, although it has been in force since June 2023, is effectively implemented from December 2024, except for the rules on asset-reference tokens and e-money tokens which were applicable from June 2024.
Due to the increase in international crypto assets activities, significant adjustments have also been made to the prudential framework. Following the publication of the Basel standards, the European regulation needs to be adapted to incorporate them. Therefore, the CRR3 includes the mandate to the Commission to issue a legislative proposal by 30th June 2025 that incorporates international standards on the prudential regulation applicable in Europe. Until that framework is fully integrated, the CRR3 has set out a transitional framework for calculating own funds that will be applied until the Basel standards are incorporated. The implementation of this temporary treatment is pending more comprehensive elaboration in a technical standard to be issued by the EBA.
Apart from the treatment of exposures to this type of assets, the regulation also covers obligations concerning reporting to the competent authorities and disclosure to preserve transparency and market discipline. All these provisions have to be implemented before the enforcement date of the CRR3, and compliance is obligatory from 9 July 2024.
Central Bank Digital Currencies (CBDCs)
The preparation of a potential digital euro continued during 2024 and will go on until October 2025. The following milestones are included: finalisation of the operating rules for the digital euro framework and selection of suppliers that would be able to develop the necessary platform, the infrastructure and also multiple trials aimed at introducing a digital euro in the future. The decision, as to whether to issue a digital euro, will be assessed in November 2025. A regulation from 2023 is currently proposed by the European Commission which would permit and regulate the launch of the digital euro.
Artificial Intelligence
The European Artificial Intelligence (AI) Act, which regulates the use of AI technology in both the public and private sectors, was approved in 2024. It will be implemented two years after its entry into force, i.e. 2 August 2026, except for the following specific provisions, which will be implemented early: prohibition of AI systems that pose unacceptable risks, 6 months after approval; code of practice, 9 months after approval; governance and applications relating to general-purpose AI, 12 months after approval and, finally, high-risk AI systems must comply with the requirements and obligations 36 months after entry into force.
Operational resilience
The Digital Operational Resilience Act (DORA), which is in force but will not be implemented until 17 January 2025, establishes a risk management framework for technology service providers that provide services to financial institutions and also imposes common cybersecurity requirements. This regulation comprises five key pillars: Information and Communication Technologies (ICT) risk management; classification and reporting of incidents relating to ICT; digital
operational resilience tests; third-party risk management and information exchange between financial institutions.
The RTS and ITS (regulatory and implementation technical standards), which develop the DORA Regulation, have been finalized in 2024 and published in two batches. The first batch of the RTS covers the ICT risk management framework, the criteria for ICT incident classification, specification of the policy on ICT services which support essential functions(*) and the draft ITS on the register of information. The second batch covers the criteria for specifying threat-led penetration testing (TLPT)(*), the templates, content, format, deadlines and procedures for major ICT incident reports, criteria for determining the composition of the joint examination team (JET), harmonisation of the conditions for performing supervision activities, and guidelines on both cooperation on supervision and estimation of the costs generated by major ICT incidents. All these rules implementing the DORA Regulation have been published as Delegated Acts of the European Commission except for the two marked with (*), which are expected to be published in early 2025.
Payments
The regulatory framework, that reinforces payment services, has continued to make progress with the introduction of additional requirements for payment institutions in 2024, to strengthen the legal framework already established by the PSD2 and to adapt to users' requirements in recent years, with a growing trend for electronic payments.
The legislative package contains two proposals: an update to the Payment Services Directive (PSD3) and a Payment Services Regulation (PSR), which introduce changes in the foundational framework of the European payments market. The proposed directive (PSD3) addresses rules on authorisation, licensing and supervision of payment institutions (including those for electronic money), while the proposed regulation (PSR) focuses on rules on the provision of payment services by payment service providers (PSPs). Their approval is expected in the first half of 2025.
The Instant Payments Regulation came into force on 8 April 2024. It establishes measures to facilitate and universalise instant transfers in euro within the EU. The target of this regulation is for instant payments to be more accessible, secure and affordable for consumers and companies, allowing funds to be transferred within less than 10 seconds at any time of day between Member States. This regulation establishes a precise calendar for compliance with obligations. Specifically, payment service providers that are located in a Member State with the euro as currency must provide the instant transfer receipt service from 9 January 2025 and the transfer sending service from 9 October 2025. Service providers that are located in a Member State not using the euro must provide the instant transfer receipt service from 9th January 2027 and the transfer sending service from 9 July 2027. An addition to the main amendments introduced by the regulation is the obligation to provide the payer, free of charge, as of 9th October 2025, with the service of verifying the IBAN of the beneficiary's account and the name of the beneficiary given by the payer is correct or shows any discrepancies.
Data
The payment services have changed considerably over the last few years due to the increase in electronic payments in the European Union and the entry of new providers in the
2024 Pillar 3 Disclosures Report 19
market. Thanks to digital technologies, but also to the paradigm shift, a data economy in increasingly digital environments has been promoted. New regulations have been developed to address these advances. In June 2023, the European Commission published a legislative proposal introducing a new regulation on the creation of a framework for Financial Data Access (FiDA). This framework aims to establish rules on accessing, sharing, regulating and using particular categories of customer data in the financial sector, to define rules for the authorisation and operation of financial information suppliers and to determine the rights and obligations of users, data subjects and also financial information service providers. Its scope of application will be all the categories of data covered by the regulation and the types of institutions when they act as data managers or users. This proposal, which will continue to be negotiated by European co-legislators, will serve as a specific, standardised framework for Union-wide access to financial data, establishing regulations on the access, exchange and use of certain categories of customers' data in financial services, among other such matters.
Another significant development regarding data is the Data Act, which is a regulation designed to improve the EU data economy and boost a competitive data market by making data (especially industrial data) more accessible and usable, encouraging data-driven innovation and increasing data availability. This regulation gives users of connected products (companies or persons who own, lease or rent a product of this type) greater control over the data they generate, while maintaining incentives for those who invest in data technologies. This regulation will be applicable from 12 September 2025.
Digital identity
The European Digital Identity (EUDI) Regulation has been in force since 20th May 2024. This regulation provides a unique and secure digital wallet that can contain national digital identities and other certificates, provide access to a secure and reliable electronic identification and also share the stored electronic documentation.
20 2024 Pillar 3 Disclosures Report
1.3.4. AML/FT
The Official Journal of the European Union published on 19 June 2024 the regulatory package on Anti-Money Laundering and Countering the Financing of Terrorism (AML/CFT), which strengthens the existing EU anti-money laundering framework, improves the detection of suspicious transactions and activities and closes loopholes in the current regulatory framework. The new features include an extension of anti-money laundering rules to new regulated entities, such as the majority of the crypto assets sector, luxury goods merchants, and football clubs and agents. In addition, stricter due diligence requirements are established, beneficial ownership is regulated and a limit of €10,000 is set for cash payments, among other matters.
This regulatory package consists of:
•the Regulation (EU) 2024/1620 establishing a new European AML/CFT authority known as AMLA, which will be responsible for direct and indirect supervision of regulated entities in the financial sector. The creation of AMLA will ensure effective and adequate supervision of regulated entities that pose a high risk with regard to money laundering and terrorism financing, strengthen common supervisory approaches for all other regulated entities, and support and coordinate Financial Intelligence Units (FIUs). This regulation will be applicable from 1st July 2025, and AMLA is expected to be fully operational and initiate its direct supervision duties on 1 January 2028.
•The Regulation (EU) 2024/1624, which will be directly applicable, introduces changes to achieve better harmonisation and convergence in the application of regulations on anti-money laundering and countering the financing of terrorism throughout the EU. Thus, EU requirements are harmonised in areas such as customer due diligence, transparency requirements regarding beneficial ownership, information obligations and internal control measures for regulated entities, and the list of regulated entities is extended, among other aspects. This regulation will be applicable from 10 July 2027, although for exceptions it will be applicable from 10 July 2029.
•The Directive (EU) 2024/1640 (known as AMLD 6), a mechanisms to be put in place by Member States for the prevention of money laundering or terrorist financing. Specific rules are established on access to beneficial ownership registers, a framework for FIUs and national supervision of anti-money laundering, and rules on cooperation on AML/CFT and on the treatment of certain personal data categories (data protection), among other aspects. The Member States must transpose this Directive by 10 July 2027, bar some exceptions.
2024 Pillar 3 Disclosures Report 21
1.4. Scope of consolidation
This section covers the qualitative requirements LIA - Explanations of differences between accounting and regulatory exposure amounts and LIB - Other qualitative information on the scope of application.
1.4.1. Acquisitions and disposals
The following information is a summary of the main acquisitions and disposals of ownership interests in the share capital of other entities and other significant corporate transactions performed in the last three years or pending to be completed:
•Tender offer for shares of Banco Santander México, S.A., Institución de Banca Múltiple, Grupo Financiero Santander México.
•Agreement for the acquisition of a significant stake in Ebury Partners Limited.
•Purchase by SHUSA for shares of Santander Consumer USA.
•Acquisition of Amherst Pierpont Securities LLC, a U.S. fixed-income broker dealer
•Agreement for the sale of the stake in Caceis (2024)
•Accelerated placement of ordinary shares of Santander Bank Polska (2024)
For more information on the main acquisitions and disposals of holdings in other companies and other major corporate transactions by Santander last year, refer to the 'Auditor´s report' section of the 2024 Annual Report.
|
|
|
|
|
|
|
Access 2024 Annual Report available on the Santander Group website |
1.4.2. Differences between the consolidation methods
Santander entities are consolidated using a different method for accounting consolidation.
For the purposes of calculating the capital adequacy ratio based on the nature of their business activities, the Group companies included in the prudential scope of consolidation are consolidated using the full consolidation method, with the exception of jointly controlled entities, which use proportionate consolidation. All companies that cannot be consolidated based on their business activities are accounted for using the equity method and are treated as equity exposures.
The basis of the information used for accounting purposes differs from that used for calculating regulatory capital requirements. Risk exposure measurements may differ depending on the purpose of the calculation, such as financial reporting, regulatory capital reporting and management information. The exposure data included in the quantitative disclosures in this document is used for calculating regulatory capital or leverage ratio.
The companies using a different consolidation method, depending on the regulations applied (table LI3), are listed in Appendix VI of this document.
22 2024 Pillar 3 Disclosures Report
The following table shows the relationship between the categories in the financial statements and the risk categories in accordance with prudential requirements.
|
|
|
|
|
|
|
|
|
|
|
|
|
|
|
|
|
|
|
|
|
|
|
|
|
|
|
|
Table 2.LI1 - Differences between accounting and regulatory scopes of consolidation and mapping of financial statement categories with regulatory risk categories |
|
|
EUR million |
|
|
|
|
|
|
|
|
|
|
|
|
|
|
2024 |
|
|
a |
b |
c |
d |
e |
f |
g |
|
|
Carrying values as reported in published financial statements |
Carrying values under scope of regulatory consolidation |
Carrying values of items: |
|
|
Subject to credit risk framework |
Subject to the CCR framework |
Subject to securitisation framework |
Subject to market risk framework |
Not subject to capital requirements or subject to deduction from capital |
|
Assets |
|
|
|
|
|
|
|
| 1 |
Cash and cash balances at central banks |
192,208 |
192,367 |
192,367 |
— |
— |
— |
— |
| 2 |
Financial assets held for trading |
230,253 |
230,185 |
— |
116,350 |
455 |
229,730 |
— |
| 3 |
Non-trading financial assets mandatorily measured at fair value through profit or loss |
6,130 |
4,482 |
1,158 |
— |
232 |
3,093 |
(1) |
| 4 |
Financial assets not held for trading valued mandatorily at fair value through profit or loss |
7,915 |
5,307 |
— |
— |
— |
5,307 |
— |
| 5 |
Financial assets designated at fair value through profit or loss |
89,898 |
75,312 |
67,986 |
— |
7,326 |
— |
— |
| 6 |
Financial assets at amortised cost |
1,203,707 |
1,208,317 |
1,137,318 |
56,312 |
14,588 |
— |
99 |
| 7 |
Derivatives - Hedge accounting |
5,672 |
5,772 |
— |
5,772 |
— |
— |
— |
| 8 |
Fair value changes of the hedged items in portfolio hedge of interest rate risk |
(704) |
(704) |
— |
— |
— |
— |
(704) |
| 9 |
Investments in subsidiaries, joint ventures and associates |
7,277 |
7,276 |
— |
— |
— |
— |
7,276 |
| 10 |
Reinsurance assets |
222 |
— |
— |
— |
— |
— |
— |
| 11 |
Tangible assets |
32,087 |
29,334 |
29,334 |
— |
— |
— |
— |
| 12 |
Intangible assets |
19,259 |
19,261 |
3,422 |
— |
— |
— |
15,840 |
| 13 |
Tax assets |
30,596 |
30,414 |
28,040 |
— |
— |
— |
2,374 |
| 14 |
Other assets |
8,559 |
8,850 |
8,173 |
— |
— |
— |
678 |
| 15 |
Non-current assets and disposal groups classified as held for sale |
4,002 |
4,114 |
4,114 |
— |
— |
— |
— |
| 16 |
Total assets |
1,837,081 |
1,820,287 |
1,471,911 |
178,434 |
22,601 |
238,131 |
25,562 |
|
Liabilities |
|
|
|
|
|
|
|
| 1 |
Financial liabilities held for trading |
(152,151) |
(152,093) |
— |
(116,263) |
— |
(152,093) |
— |
| 2 |
Financial liabilities designated at fair value through profit or loss |
(36,360) |
(35,778) |
— |
— |
— |
(35,778) |
— |
| 3 |
Financial liabilities measured at amortised cost |
(1,484,322) |
(1,486,381) |
— |
— |
— |
(995) |
(1,485,385) |
| 4 |
Derivatives - Hedge accounting |
(4,752) |
(4,769) |
— |
(4,769) |
— |
— |
— |
| 5 |
Fair value changes of the hedged items in portfolio hedge of interest rate risk |
9 |
9 |
— |
— |
— |
— |
9 |
| 6 |
Liabilities under insurance contracts |
(17,829) |
— |
— |
— |
— |
— |
— |
| 7 |
Provisions |
(8,407) |
(8,407) |
(710) |
— |
— |
— |
(7,698) |
| 8 |
Tax liabilities |
(9,598) |
(9,332) |
— |
— |
— |
— |
(9,332) |
| 9 |
Other liabilities |
(16,344) |
(16,255) |
— |
— |
— |
— |
(16,255) |
| 10 |
Total liabilities |
(1,729,754) |
(1,713,006) |
(710) |
(121,032) |
— |
(188,865) |
(1,518,661) |
2024 Pillar 3 Disclosures Report 23
The difference in total assets between the public and the reserved scopes is not material (-EUR 16,794 Bn) and corresponds to the exclusion of non financial institutions (-EUR 26,088 Bn) and the inclusion of jointly controlled (+EUR 13,572 Bn) and intra/group entities (-EUR 4,278 Bn).
In addition, the sum of the carrying amounts of certain items is greater than the carrying amounts under the scope of prudential consolidation, as the financial assets held for trading and the financial assets at fair value through profit or
loss are subject to the capital requirements of more than one risk category under the regulatory scope.
The main differences between the carrying amounts in the financial statements and the exposures for prudential purposes are shown below:
|
|
|
|
|
|
|
|
|
|
|
|
|
|
|
|
|
|
|
|
|
| Table 3.LI2 - Main sources of differences between regulatory exposure amounts and carrying values in financial statements |
| EUR million |
|
|
|
|
|
|
2024 |
|
|
a |
b |
c |
d |
e |
|
|
Total |
Items subject to: |
|
|
Credit risk framework |
CCR framework |
Securitisation framework |
Market risk framework |
| 1 |
Asset carrying value amount under scope of regulatory consolidation (as per template EU LI1) |
1,911,077 |
1,471,911 |
178,434 |
22,601 |
238,131 |
| 2 |
Liabilities carrying value amount under regulatory scope of consolidation (as per template EU LI1) |
(310,607) |
(710) |
(121,032) |
— |
(188,865) |
| 3 |
Total net amount under regulatory scope of consolidation |
1,600,469 |
1,471,201 |
57,402 |
22,601 |
49,265 |
| 4 |
Off-balance sheet amounts |
394,490 |
394,490 |
|
— |
— |
|
Regulatory Add-on |
59,567 |
|
59,567 |
|
— |
| 5 |
Differences in valuations |
— |
|
|
|
— |
| 6 |
Differences due to different netting rules, other than those already included in row 2 |
(63,839) |
|
(14,574) |
|
(49,265) |
|
Non-eligibility of the balances corresponding to accounting hedges (derivatives) |
(5,772) |
|
(5,772) |
|
— |
| 10 |
Securitisations with risk transfer |
21,343 |
17,555 |
|
3,788 |
— |
| 11 |
Other |
(27,388) |
(101,688) |
|
74,300 |
— |
| 7 |
Differences due to consideration of provisions |
(16,633) |
(15,950) |
— |
(684) |
— |
| 8 |
Differences due to CRMs |
(66,991) |
(20,054) |
(46,853) |
(84) |
— |
| 9 |
Differences due to CCFs |
(310,530) |
(310,530) |
— |
— |
— |
| 12 |
Exposure amounts considered for regulatory purposes (EAD) |
1,584,716 |
1,435,025 |
49,770 |
99,921 |
— |
This table shows a breakdown of the differences between the amounts of exposures for prudential purposes and the carrying amounts according to various parameters.
As shown in the table, the main cause for the deviation is the amount from the off-balance sheet items (+EUR 394.490 billion) and the application of CCFs (-EUR 310.530 billion).
Further the regulatory add-on (+EUR 59.567 billion) and the differences resulting from the various offsetting rules (-EUR 63.839 billion) are also applied.
The reconciliation of the public and non-public balance sheets (table CC2) is shown in table 4.
24 2024 Pillar 3 Disclosures Report
|
|
|
|
|
|
|
|
|
|
|
|
|
|
|
|
Table 4.CC2 - reconciliation of regulatory own funds to balance sheet in the audited financial statements |
|
|
EUR million |
|
|
|
|
|
|
|
|
|
(A)
ASSETS |
(B)
Balance under accounting consolidation |
(C)
Balance under regulatory consolidation |
(D)
Reference to transitional disclosure template (Table 2) |
|
|
a |
b |
c |
| 1 |
Cash and cash balances at central banks (010) |
192,208 |
192,367 |
|
| 2 |
Financial assets held for trading (050) |
230,253 |
230,185 |
|
| 3 |
Non-trading financial assets mandatorily measured at fair value through profit or loss (096) |
6,130 |
4,482 |
|
| 4 |
Financial assets designated at fair value through profit or loss (100) |
7,915 |
5,307 |
|
| 5 |
Financial assets at fair value through other comprehensive income (141) |
89,898 |
75,312 |
|
| 6 |
Held-to-maturity investments (181) |
1,203,707 |
1,208,317 |
|
| 7 |
Derivatives - Hedge accounting (240) |
5,672 |
5,772 |
|
| 8 |
Fair value changes of the hedged items in portfolio hedge of interest rate risk (250) |
(704) |
(704) |
|
| 9 |
Investments in subsidiaries, joint ventures and associates (260) |
7,277 |
7,276 |
|
| 10 |
Reinsurance assets (265) |
222 |
— |
|
| 11 |
Tangible assets (270) |
32,087 |
29,334 |
|
| 12 |
Intangible assets (300) |
19,259 |
19,261 |
|
| 13 |
Tax assets (330) |
30,596 |
30,414 |
|
| 14 |
Deferred tax assets (350) |
19,170 |
19,032 |
|
| 15 |
Other assets (360) |
8,559 |
8,850 |
|
| 16 |
Non-current assets and disposal groups classified as held for sale (370) |
4,002 |
4,114 |
|
|
|
|
|
|
| 17 |
TOTAL ASSETS (380) |
1,837,081 |
1,820,287 |
|
|
|
|
|
|
|
(A)
LIABILITIES |
(B)
Balance under accounting consolidation |
(C)
Balance under regulatory consolidation |
(D)
Reference to
transitional disclosure template
(Table 2) |
| 1 |
Financial liabilities held for trading (010) |
152,151 |
152,093 |
|
| 2 |
Financial liabilities designated at fair value through profit or loss (070) |
36,360 |
35,778 |
|
| 3 |
Financial liabilities measured at amortised cost (110) |
1,484,322 |
1,486,381 |
|
| 4 |
Subordinated liabilities (149) |
35,813 |
35,892 |
|
| 5 |
Derivatives - Hedge accounting (150) |
4,752 |
4,769 |
|
| 6 |
Fair value changes of the hedged items in portfolio hedge of interest rate risk (160) |
(9) |
(9) |
|
| 7 |
Liabilities under insurance contracts (165) |
17,829 |
— |
|
| 8 |
Provisions (170) |
8,407 |
8,407 |
|
| 9 |
Tax liabilities (240) |
9,598 |
9,332 |
|
| 10 |
Deferred tax liabilities (260) |
6,276 |
6,047 |
|
| 11 |
Share capital repayable on demand (270) |
— |
— |
|
| 12 |
Other liabilities (280) |
16,344 |
16,255 |
|
|
|
|
|
|
| 13 |
TOTAL LIABILITIES (300) |
1,729,754 |
1,713,006 |
|
|
|
|
|
|
|
(A)
EQUITY |
(B)
Balance under accounting consolidation |
(C)
Balance under regulatory consolidation |
(D)
Reference to transitional disclosure template (Table 2) |
| 1 |
Capital (010) |
7,576 |
7,576 |
|
| 2 |
Share premium (040) |
40,079 |
40,079 |
|
| 3 |
Equity instruments issued other than capital (050) |
— |
— |
|
| 4 |
Other equity (080) |
217 |
217 |
|
| 5 |
Retained earnings (190) |
82,326 |
82,010 |
|
| 6 |
Revaluation reserves (200) |
— |
— |
|
2024 Pillar 3 Disclosures Report 25
|
|
|
|
|
|
|
|
|
|
|
|
|
|
|
| 7 |
Other reserves (210) |
(5,976) |
(5,659) |
|
| 8 |
(-) Treasury shares (240) |
(68) |
(68) |
|
| 9 |
Profit or loss attributable to Owners of the parent (250) |
12,574 |
12,574 |
|
| 10 |
(-) Interim dividends (260) |
(1,532) |
(1,532) |
|
| 11 |
Accumulated other comprehensive income (090) |
(36,595) |
(36,596) |
|
| 12 |
Minority interests [Non-controlling interests] (270) |
8,726 |
8,680 |
|
| 13 |
Of Which other global accumulated result (280) |
(2,020) |
(2,021) |
|
|
|
|
|
|
| 14 |
TOTAL EQUITY (300) |
107,327 |
107,281 |
|
26 2024 Pillar 3 Disclosures Report
[THIS PAGE INTENTIONALLY LEFT BLANK]
2024 Pillar 3 Disclosures Report 27
28 2024 Pillar 3 Disclosures Report
|
|
|
|
|
|
|
|
|
|
|
|
|
|
|
|
|
|
|
|
|
|
|
|
|
|
|
|
|
|
|
|
|
|
|
|
|
|
|
|
|
|
|
|
|
|
|
|
|
|
2.2.2. Capital governance |
|
|
|
|
|
|
|
|
|
|
|
|
|
|
|
|
|
|
|
|
|
|
|
2.4. Regulatory capital - Pillar 1 |
|
|
|
|
|
|
|
|
|
|
|
|
|
|
|
2.4.3.1 Capital Buffers |
|
|
|
2.4.3.2 Eligible capital requirements |
|
|
|
|
|
|
|
|
|
|
|
|
|
|
|
|
|
|
|
|
|
|
|
|
|
|
|
|
|
|
|
|
|
|
|
|
|
|
|
|
|
|
|
2. CAPITAL |
2024 Pillar 3 Disclosures Report 29
This chapter analyses the relevant aspects of capital management and capital adequacy in Grupo Santander, as well as the main capital figures and solvency ratios, including aspects of Pillar 2. For further details on capital requirements by type of risk, see the specific chapters on each of the risks.
Strong organic capital generation, with profitable front-book growth and significant RWA mobilization
|
|
|
|
|
|
|
|
|
|
|
|
|
|
|
|
|
|
|
|
|
|
|
|
|
|
|
|
|
|
|
|
|
|
|
|
| Table 5.Main capital figures and capital adequacy ratios (IFRS 9 Fully loaded). |
|
| EUR million |
CRR Fully loaded |
|
CRR Phased-in |
|
Dec'24 |
Sep'24 |
Jun'24 |
Mar'24 |
Dec'23 |
|
Dec'24 |
Sep'24 |
Jun'24 |
Mar'24 |
Dec'23 |
| Common Equity (CET1) |
79,705 |
78,058 |
77,846 |
78,516 |
76,448 |
|
79,705 |
78,058 |
77,846 |
78,516 |
76,448 |
| Tier 1 |
90,076 |
88,148 |
86,680 |
87,620 |
85,450 |
|
90,076 |
88,148 |
86,680 |
87,620 |
85,450 |
| Total capital |
107,106 |
105,080 |
102,418 |
105,909 |
101,747 |
|
108,494 |
106,690 |
104,292 |
106,113 |
101,947 |
| Risk weighted assets |
624,477 |
626,288 |
625,017 |
640,507 |
623,652 |
|
624,477 |
626,288 |
625,017 |
640,507 |
623,652 |
| CET1 Ratio |
12.76 |
% |
12.46 |
% |
12.46 |
% |
12.26 |
% |
12.26 |
% |
|
12.76 |
% |
12.46 |
% |
12.46 |
% |
12.26 |
% |
12.26 |
% |
| Tier 1 Ratio |
14.42 |
% |
14.07 |
% |
13.87 |
% |
13.68 |
% |
13.70 |
% |
|
14.42 |
% |
14.07 |
% |
13.87 |
% |
13.68 |
% |
13.70 |
% |
| Total capital ratio |
17.15 |
% |
16.78 |
% |
16.39 |
% |
16.54 |
% |
16.31 |
% |
|
17.37 |
% |
17.04 |
% |
16.69 |
% |
16.57 |
% |
16.35 |
% |

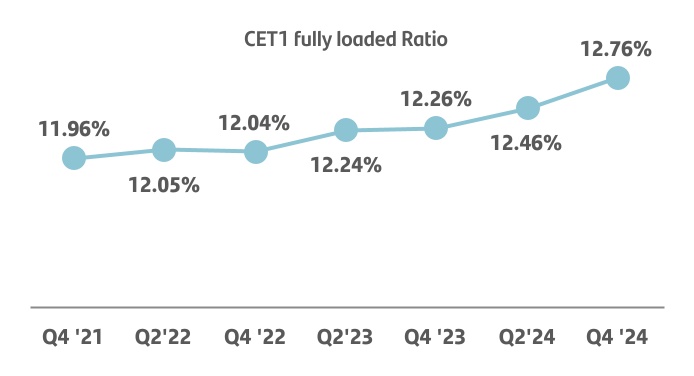
|
|
|
|
|
|
|
|
|
|
|
|
|
|
|
| RWA distribution by type of risk |
|
Calculating RWAs credit method(ex. SEC and Others) |
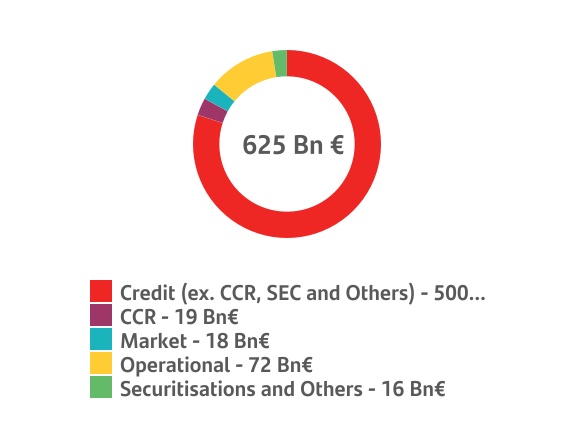
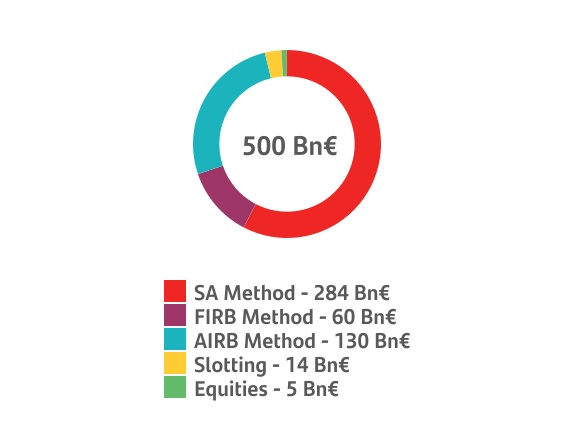
30 2024 Pillar 3 Disclosures Report
d2.1. Introduction
Capital management and capital adequacy in Grupo Santander is carried out in an integral manner, seeking to guarantee the entity's solvency, comply with regulatory requirements and maximize its profitability.
It is determined by the strategic objectives and risk appetite set by the board of directors. In order to achieve this, the following principles have been defined, which determine the Group's approach to capital management:
•Establish adequate capital planning to cover current necessities and provide the necessary equity to meet the demands of the business plans, regulatory requirements and associated risks in the short and medium term, while maintaining the risk profile approved by the board of directors.
•Ensure adequate capital to cover the needs of the group and its subsidiaries resulting from increased risks due to deteriorating macroeconomic conditions under stress scenarios.
•Optimise capital use through appropriate allocation among businesses, based on the relative return on regulatory and economic capital and taking into account risk appetite, growth and strategic objectives.
Grupo Santander manages capital and its value creation through six main blocks, placing profitability and capital at the forefront of its decisions, with the aim of improving the CET1 ratio and reinvesting freed up capital in profitable growth, shareholder remuneration and strategic investments. These blocks are:
•Capital strategy that defines an ambitious Group-wide target including a capital buffer above the requirements and incorporates a holistic market perspective compared to competitors and the supervisory authority.
•Increasing risk-adjusted returns through better allocation, analysing the performance of portfolios and carrying out both the organic (front-book) and inorganic capital allocation process.
•The detailed tracking and monitoring of performance across all countries is reviewed and evaluated at regular meetings to generate profitability-improvements.
•Portfolio management by identifying, prioritising and executing risk sharing and risk transfer across countries.
•Precise capital calculation identifying opportunities to optimise the numerator (CET1) and denominator (RWA), as well as greater industrialisation and standardisation of the Group's processes. In addition, the Group is working towards the overall optimisation of capital requirements (SREP framework, stress tests, MREL, TLAC).
•Existence of technological infrastructure and systems, capital tools and other optimisers are cross-cutting elements and factors that allow for proper capital management.
At 31 December 2024, the fully-loaded CET1 ratio (without applying the IFRS 9 or CRR transitional arrangements) stood at 12.76% and the phased-in CET1 ratio was 12.78%. Only applying the IFRS 9 transitional arrangements (CRR fully-loaded), the ratio remains at 12.78%. The following table shows the impact of the CRR transitional arrangements under a IFRS 9 phased-in scenario:
|
|
|
|
|
|
|
|
|
|
|
|
|
|
|
|
|
|
|
|
|
|
|
|
|
|
|
|
|
|
|
|
|
|
|
|
| Table 5 bis. Main capital figures and capital adequacy ratios (Phased-in IFRS 9 ). |
|
|
| EUR million |
|
|
|
Fully-loaded CRR |
|
Phased-in CRR |
|
Dec'24 |
Sep'24 |
Jun'24 |
Mar'24 |
Dec'23 |
|
Dec'24 |
Sep'24 |
Jun'24 |
Mar'24 |
Dec'23 |
| Common Equity (CET1) |
79,800 |
78,151 |
77,974 |
78,632 |
76,741 |
|
79,800 |
78,151 |
77,974 |
78,632 |
76,741 |
| Tier 1 |
90,170 |
88,242 |
86,808 |
87,736 |
85,742 |
|
90,170 |
88,242 |
86,808 |
87,736 |
85,742 |
| Total capital |
107,200 |
105,174 |
102,545 |
106,025 |
102,040 |
|
108,589 |
106,784 |
104,419 |
106,229 |
102,240 |
| Risk weighted assets |
624,503 |
626,099 |
624,831 |
640,382 |
623,731 |
|
624,503 |
626,099 |
624,831 |
640,382 |
623,731 |
| CET1 Ratio |
12.78 |
% |
12.48 |
% |
12.48 |
% |
12.28 |
% |
12.30 |
% |
|
12.78 |
% |
12.48 |
% |
12.48 |
% |
12.28 |
% |
12.30 |
% |
| Tier 1 Ratio |
14.44 |
% |
14.09 |
% |
13.89 |
% |
13.70 |
% |
13.75 |
% |
|
14.44 |
% |
14.09 |
% |
13.89 |
% |
13.70 |
% |
13.75 |
% |
| Total capital ratio |
17.17 |
% |
16.80 |
% |
16.41 |
% |
16.56 |
% |
16.36 |
% |
|
17.39 |
% |
17.06 |
% |
16.71 |
% |
16.59 |
% |
16.39 |
% |
| Leverage Ratio |
4.78 |
% |
4.76 |
% |
4.75 |
% |
4.74 |
% |
4.69 |
% |
|
4.78 |
% |
4.76 |
% |
4.75 |
% |
4.74 |
% |
4.69 |
% |
2024 Pillar 3 Disclosures Report 31
2.2. Capital function
Core principles establish the underlying guidelines governing the actions of Santander entities in capital management, monitoring and control processes.
2.2.1. Organisation
The organizational structure was established with the purpose of ensuring compliance with the basic principles relating to capital and ensuring that the relationships between the subsidiaries and the Group headquarters are maintained. Two objectives can be achieved with this function: comply with the subsidiary’s financial autonomy while at the same time retaining coordinated monitoring at group level.
2.2.2. Capital governance
Santander developed a structure of agile and efficient governing bodies, ensuring that the Capital function operates properly when it comes to decision-making and supervision and control. This ensures involvement of all relevant business areas and involvement of senior management as necessary.
Santander's characteristic subsidiary-based structure has a strong capital governance with various committees with not only responsibilities at local level but also responsibility for coordination at Group level. The local committees have to report to the corporate committees in due time and proper form on any relevant aspects of their activity that may affect capital, to ensure proper coordination between the subsidiaries and the Corporate Centre.
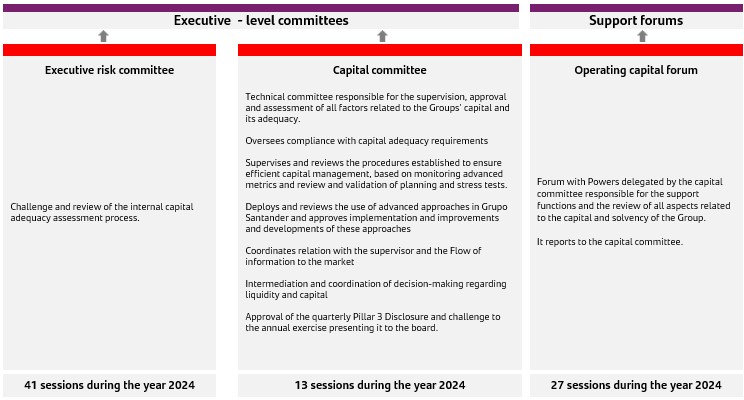
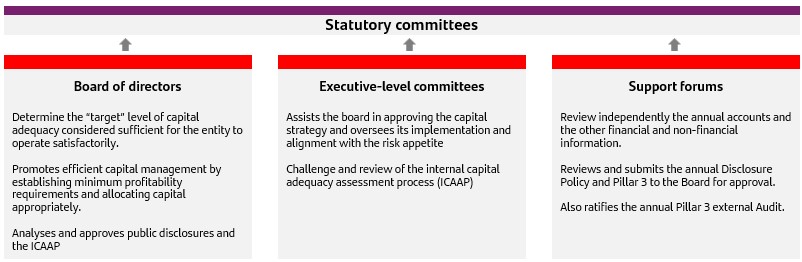
2.2.3. Capital targets
32 2024 Pillar 3 Disclosures Report The bank is pursuing a return on tangible equity (RoTE) of 15-17% in the current 3-year strategic plan (2023-2025), while delivering double-digit growth through the cycle in tangible net asset value per share plus dividend per share through the cycle. The group’s key financial and commercial goals include:
•Increasing the shareholder payout policy (the proportion of profit distributed to shareholders) from c.40% to c.50% in
2023-2025 through both cash dividends and share buybacks.
•Achieving a return on tangible equity of 15-17% in 2023-2025 and an efficiency ratio of c.42% by 2025.
•Maintaining a fully-loaded CET1 above 12%.
•Delivering double-digit average growth through the cycle in tangible net asset value (TNAV) per share plus dividend per share through the cycle - a key measure of value creation.
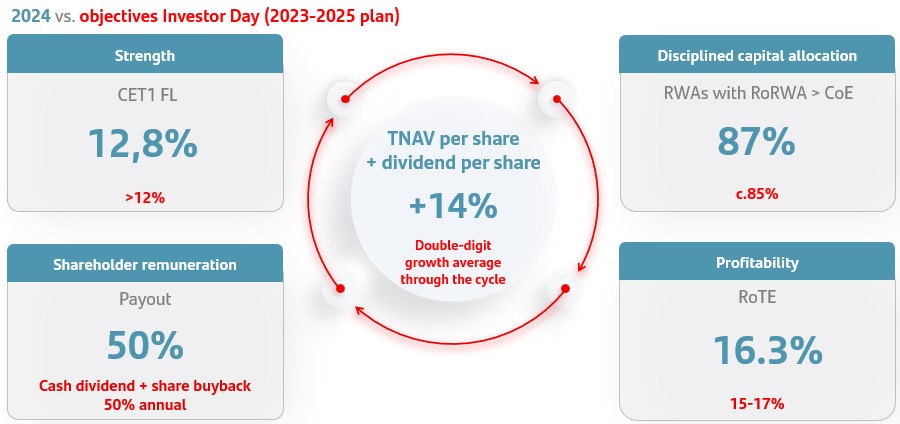
We continue to focus on disciplined capital allocation and shareholder remuneration after achieving our 2024 fully-loaded CET1 target of remaining above 12%.
Continuous improvement of our capital ratios reflects our profitable growth strategy and a culture of active capital management at all levels.
The Capital and Profitability Management team is in charge of our capital analysis, adequacy and management, coordination with subsidiaries on all matters related to capital and monitoring and measuring returns.
Every country and business unit has drawn up individual capital plans that focus on maximizing return on equity.
Santander places high value on its long-term sustainability and the efficient use of capital in the incentives of the Group's main executives. We considered certain aspects relating to capital management and returns when setting senior managers' 2024 variable remuneration including return on tangible equity (RoTE) and other relevant capital metrics (capital generation or CET1).
2025 Objectives
Santander is in a new era of value creation. Our scale, diversification and the impact of our transformation will enable us to increase profitability again in 2025.
Santander is targeting among solvency objectives to reach a CET1 of 13% (operating range of 12-13%). On day one, CRR31 has no impact to Santander’s CET1. For more details, see note e) Capital management, i) Regulatory and economic capital, in the 'Notes to the consolidated financial statements' chapter of the 2024 Annual report.
Action plans
An action plan is developed by Santander for the continuous improvement of infrastructures, processes and methodologies, supporting all aspects related to capital, with the target of further enhancing active capital management, responding more agile to the numerous and increasing regulatory requirements and efficiently carrying out all associated activities.
1 Zero day-one impact from Basel III under the final texts published in June 2024 of Regulation 2024/1623 (CRR3) and Directive 2024/1619 (CRD6). However, during 2025 the publication of ECB guides on options and discretions and EBA mandates could result in additional impacts on CET1 ratios across the industry.
2024 Pillar 3 Disclosures Report 33
2.3. Capital management, adequacy and profitability
Capital management and adequacy at Santander aims to guarantee solvency and maximize profitability, while complying with regulatory requirements and internal capital targets.
Capital management is a key strategic tool for decision-making at both the subsidiary and corporate levels.
We have a common framework that covers capital management actions, criteria, policies, functions, metrics and processes. We have a team in charge of our capital analysis, adequacy and management that coordinates with subsidiaries on all matters related to capital and monitors and measures shareholder returns.
Our most notable capital management activities are:
•Establishing capital adequacy and capital contribution targets that align with minimum regulatory requirements, internal policies and the budget, to guarantee robust capital levels consistent with our risk profile and efficient use of capital.
•Drawing up a capital plan to meet our strategic plan objectives.
•Monitoring the capital ratio in both regulatory and economic terms and the efficient capital allocation to country units and global businesses. Assessing capital adequacy to ensure the capital plan is consistent with our risk profile and risk appetite framework in baseline and stress scenarios.
•Integrating capital metrics into businesses' management ensuring alignment with the Group’s objectives. Continuously monitoring stock and new business profitability as well as new business pricing at the country unit, global business, segment and customer levels. Tracking businesses, portfolios and customers with profitability below the minimum target.
•Coordinating and promoting the bank’s asset mobilization plan (e.g. securitizations, guarantees, sales).
•Preparing internal capital reports, and reports for the supervisory authorities and the market (ICAAP, Pillar 3 reports and stress tests).
•Planning and managing other loss-absorbing instruments other than regulatory capital instruments.
|
|
|
|
|
|
|
|
|
| Santander's capital function target: |
| Capital allocation |
Maximize profitability in the economic cycle |
Shift towards a fee-based,
capital-light model |
|
|
|
Capital allocation based on shareholder value creation by measuring profitability on a full cost allocation basis |
Sustain profitability improvements in a changing macro-economic environment |
Embrace a fee-based, capital-light model, given intense competition from peers operating with lighter capital models with more competitive pricing
|
|
34 2024 Pillar 3 Disclosures Report
2.3.1. Santander Global Asset Desk
|
|
|
|
|
|
| Santander has shifted to a capital-light model to improve its ability to generate free capital. In this regard, it is key to actively manage not only the capital allocated to new origination but also the stock to improve capital management of less profitable assets. |
In addition, the Global Asset Desk analyses the balance sheets of the Group's entities, together with the different units, identifying those risk transfer opportunities that may be attractive to investors, and assists the units in their execution through different strategies such as securitizations, asset sales, guarantees and other products. |
| By mid-2023, Banco Santander's board of directors approved the creation of the “Global Asset Desk” at Group level. The Global Asset Desk is responsible for coordinating measures aimed at rotating balance sheet assets, playing a key role in achieving a more efficient use of capital, in line with the solvency and profitability strategy. |
|
| “ |
| “By proactively rotating our assets, we not only strengthen our financial position, but also generate capital for additional profitable growth. This approach is fundamental to our strategy of sustainable growth and value creation for our shareholders”. |
|
Jose García Cantera,
Group Chief Financial Officer
|
|
|
|
|
|
|
|
|
|
|
|
|
Our efforts are focused on refining the capital model to drive growth while utilizing less capital and maximizes capital productivity by…
|
|
From… |
...To |
|
Focusing on value generation & profitability |
Focusing on balance sheet growth and generation of market share |
Prioritizing value generation and profitability, while enhancing management of low yielding assets |
|
Ensuring capital efficiency at origination |
Emphasizing lifetime return optimization over credit exposures |
Implementing a systematic approach to capital efficiency at origination to enhance profitability of the new book |
|
Increasing balance sheet velocity and risk transfer |
Maintaining position in the balance sheet and pursue targeted risk distribution initiatives within each unit |
Enhancing portfolio management with dynamic reallocation and operationalization of distribution opportunities across the entire balance sheet, to achieve higher asset rotation and risk transfer |
|
|
|
|
|
|
| As part of capital management strategies, significant risk transfer securitization transactions (SRTs) have allowed the bank to free up capital used to support loans by paying investors to assume part of the associated risk. Other strategies might be linked to when part of the portfolio is guaranteed through an insurance company that assumes potential losses and the bank pays a premium for the coverage in return. The bank remains the lender of record, but the risk-weighted assets (RWA) percentage is significantly reduced. Finally, when a certain pool of assets is sold to an investor, transferring the ownership and thereby releasing all associated capital requirements. |
|
| “ |
|
“The banking model is changing and becoming much more profitable and less dependent on capital”
“I think capital generation will improve, and we will be able to accumulate capital organically in the future”
“If we continue to apply the model of using less capital to actually become much more profitable, we might be able to accumulate much more capital than we do today”.
Héctor Grisi,
Chief Executive Officer
|
|
|
2024 Pillar 3 Disclosures Report 35
|
|
|
|
|
|
|
|
|
|
|
|
|
|
|
|
|
|
|
|
|
| Risk Transfer is used by banks for various purposes, ultimately enabling them to generate capital headroom that can be reinvested in the business |
| Risk Transfer is typically used for three purposes … |
|
|
|
… with relieved Capital being used in different ways |
|
1. Risk and loss mitigation
Risk Transfer allows the bank to mitigate potential future losses by transferring the risk to a third party (often out of the banking system), thus reducing overall risk of the balance sheet
|
|
|
|
|
Continue building solid capital base
Leverage mobilized capital and headroom generated to strengthen the bank’s capital structure, effectively improving the CET1 ratio
|
|
|
|
2. Capital headroom
Risk Transfer provides the bank with additional capital headroom that can enable further business growth
|
|
|
|
|
Distribute to shareholders
Distribute generated capital headroom back to shareholders effectively maintaining the CET1 ratio constant
|
|
|
|
3. Funding and liquidity
Risk Transfer transactions can provide the bank with additional liquidity and funding, especially through traditional securitization structures
|
|
|
|
|
Reinvest in the business
Reinvest mobilized capital in the business to increase the bank’s net profit through several identified income levers
|
|
|
|
| Under a stable and predictable regulatory framework |
36 2024 Pillar 3 Disclosures Report
2.3.2. Profitability and pricing
|
|
|
|
|
|
|
|
|
A disciplined execution of our capital allocation strategy…
|
|
capital active growth
|
higher return on risk-weighted assets |
portfolio profitability management
|
| ... leads to growth, profitability and strength… |
|
|
Focused on businesses that generate high RoTE and high capital generation, along with significant potential for growth.
|
Focused on maintaining high and sustainable levels by scaling the markets leading to efficiency and the possibility to provide value to our customers and high returns to our shareholders. |
After years of regulatory capital accumulation, we are focused on maintaining capital levels above >12% on a fully-loaded basis.
|
One of the Group's primary priorities is to manage capital by ensuring that we make a profitable allocation of capital in all our activities.
Our strategy includes investing capital in markets, country units, global businesses and portfolios with the highest returns on capital, ensuring strong and sustainable shareholder value creation. Metrics such as RoTE, RoRWA and RoRAC are part of approvals and monitoring policies. These metrics help us compare the return on operations, customers, portfolios and businesses on a like-for-like basis. We can identify what is obtaining a risk-adjusted return higher than its cost of capital and thus align risk and business management to maximize economic value added (EVA).
We regularly assess the level and progression of EVA across the Group's country units and global businesses, both from a regulatory and economic capital point of view. EVA is the profit generated above the cost of capital employed.
The minimum return on capital a transaction must obtain is determined by the cost of capital (i.e. the minimum compensation required by shareholders). We calculate it by adding the premium shareholders demand to invest in Santander to the risk-free return. The premium depends essentially on the degree of volatility in our share price with respect to market performance. Santander's cost of capital in 2024 was 12.0% (versus 11.2% in 2023).
On top of reviewing the cost of capital every year, we also estimate a cost of capital for each business unit based on its features (under the philosophy that subsidiaries manage capital and liquidity autonomously) to determine whether each business is capable of creating value on a standalone basis.
Identifying and managing businesses with low profitability is part of the Group's capital optimization process. We dynamically target and actively monitor customers, portfolios, global businesses and markets with attractive returns on capital.
To ensure improved profitability and maximize capital productivity, we must focus on capital efficiency from origination. Pricing is an objective process based on the characteristics of the transaction, product, borrower, segment and market. Furthermore, it should ensure that the price exceeds a minimum threshold covering at least funding, operating, credit and capital costs, as well as an additional spread that takes into account demand sensitivity to prices and value generation. Therefore, pricing should aim to maximize profitability, with positive EVA for every transaction, customer, portfolio and/or global business, and ensure compliance with minimum return on capital targets.
Santander has granular approvals tools for the CIB and corporate segments which it uses to calculate the return on both regulatory and economic capital (RoRWA and RoRAC) and determine appropriate pricing. For retail segments, tools are locally developed by the units, tailoring them to the individual characteristics of each market. We also employ a granular tool to track returns on capital on a like-for-like basis between units.
Our approvals tools enable us to identify and justify any new loans with a pricing below the minimum threshold and our monitoring tools enable us to identify operations with profitability below the cost of capital, thereby recurrently destroying value. To try to ensure that all customer relationships add value, we regularly monitor and actively manage low performing customers through specific action plans.
Both approvals and profitability monitoring have a robust approval and review governance which i) ensures the consideration of minimum pricing thresholds are properly integrated into capital processes, ii) establishes a timely scaling/authorizing process and iii) that detailed follow-ups are carried out for operations approved below the minimum threshold.
2024 Pillar 3 Disclosures Report 37
2.3.3. Other activities in capital management
The most significant actions taken this year are as follows:
Issuances of capital hybrid and other loss-absorbing instruments
In 2024, Banco Santander, S.A. issued around EUR 5.7 billion in hybrid instruments, of which approximately EUR 2.8 billion was Tier 2 subordinated debt and approximately EUR 2.9 billion was contingently convertible preferred shares (CoCos). One EUR 1.5 billion CoCo issuance was to replace an AT1 issuance of the same amount that was called in a tender offer. The other CoCo, a USD 1.5 billion issuance, was to cover regulatory requirements.
Additionally, Banco Santander, S.A. issued around EUR 9.0 billion in senior non-preferred debt.
Dividends and shareholder remuneration
For the 2024 results, the board continued to apply the same policy as in 2023, with total shareholder remuneration of approximately 50% of the Group reported profit (excluding non-cash, non-capital ratios impact items), distributed in approximately equal parts in cash dividend and share buybacks.
•Interim remuneration.
◦On 26 August 2024, the board resolved to execute the First 2024 Buyback Programme worth up to EUR 1,525 million (equivalent to approximately 25% of said Group reported profit in H1’24). See 'First 2024 Buyback Programme' in the 'Corporate Governance' chapter of the 2024 Annual Report.
◦On 24 September 2024, the board resolved to pay an interim cash dividend against the 2024 results of 10 euro cents per share entitled to the dividend (equivalent to approximately 25% of said Group reported profit in H1’24); it was paid from 1 November 2024.
•Final remuneration. Under the 2024 shareholder remuneration policy:
◦On 4 February 2025 the board of directors resolved to implement the Second 2024 Buyback Programme worth a maximum amount of EUR 1,587 million, for which the appropriate regulatory authorization has been obtained, and the execution of which began on 6 February 2025. For more details, see 'Second 2024 Buyback Programme' in the 'Corporate Governance' chapter of the 2024 Annual Report.
◦On 25 February 2025 the board of directors resolved to submit a resolution at the 2025 AGM to approve a final cash dividend in the gross amount of 11 euro cents per share entitled to dividends. If approved at the AGM, the dividend would be payable from 2 May 2025.
Once the above-mentioned actions are completed, total shareholder remuneration for 2024 will total EUR 6,293 million (approximately 50% of the Group reported profit -excluding non cash, non-capital ratios impact items- in 2024), distributed as approximately 50% in cash dividends (EUR 3,181 million) and 50% in share buybacks (EUR 3,112 million). For more details, see section 3.3 'Dividends and shareholder remuneration' in the 'Corporate governance' chapter of the 2024 Annual Report.
Finally, for locations outside of the ECB jurisdiction, the local regulators, as a general rule, did not impose restrictions on dividend distribution, although, KNF Polish supervisor is recommending to set a limit of 75% on the pay out of dividends, but during 2024 no impediments were found.
For more details, see section 3.3 'Dividends and shareholder remuneration' in the 'Corporate Governance' chapter of the 2024 Annual Report.
|
|
|
|
|
|
|
Access 2024 Annual Report available on the Santander Group website |
38 2024 Pillar 3 Disclosures Report The current regulatory framework for capital calculation is based on three pillars:
2.4. Regulatory capital - Pillar 1
•Pillar 1 sets the minimum capital requirements for credit risk, market risk and operational risk, allowing internal ratings and models to be used. The target is to make regulatory requirements more sensitive to the risks actually incurred by financial institutions in their business activities.
•Pillar 2 establishes a system of supervisory review, aimed at improving banks' internal risk management and capital adequacy assessment in line with their risk profile.
•Pillar 3 is intended to enhance market discipline by developing a set of disclosure requirements that enable market agents to evaluate key information relating to the application of Basel II: capital, risk exposures, risk assessment processes and, by extension, the bank's capital adequacy.
|
|
|
|
|
|
|
|
|
| Eligible capital. December 2024 |
| EUR million |
|
|
|
Fully-loaded |
Phased-in |
| CET1 |
79,705 |
79,800 |
| Basic capital |
90,076 |
90,170 |
| Eligible capital |
107,106 |
108,589 |
| Risk-weighted assets |
624,477 |
624,503 |
|
|
|
| CET1 capital ratio |
12.76 |
% |
12.78 |
% |
| Tier 1 capital ratio |
14.42 |
% |
14.44 |
% |
| Total capital ratio |
17.15 |
% |
17.39 |
% |
Note: The phased-in ratio includes the transitory treatment of IFRS9
2.4.1. Eligible capital
Equity at 31 December 2024 stood at EUR 107,327 million, up EUR 3,086 million from the year before.
The reconciliation between equity and capital eligible as Tier 1 is set out below.
|
|
|
|
|
|
|
|
|
| Table 6.Reconciliation of accounting capital with regulatory capital |
| EUR million |
|
|
|
2024 |
2023 |
| Subscribed capital |
7,576 |
|
8,092 |
|
| Share premium account |
40,079 |
|
44,373 |
|
| Reserves |
76,568 |
|
69,278 |
|
| Treasury shares |
(68) |
|
(1,078) |
|
| Attributable profit |
12,574 |
|
11,076 |
|
| Approved dividend |
(1,532) |
|
(1,298) |
|
| Shareholders' equity on public balance sheet |
135,197 |
|
130,443 |
|
| Valuation adjustments |
(36,596) |
|
(35,020) |
|
| Non-controlling interests |
8,726 |
|
8,818 |
|
| Total equity on public balance sheet |
107,327 |
|
104,241 |
|
| Goodwill and intangible assets |
(16,098) |
|
(17,313) |
|
| Eligible preference shares and participating securities |
10,371 |
|
9,002 |
|
| Accrued dividend |
(1,611) |
|
(1,471) |
|
| Other adjustments |
(9,817) |
|
(8,717) |
|
| Tier 1 (Phased-in) |
90,170 |
|
85,742 |
|
|
|
|
| CRR Phased-in, IFRS 9 Phased-in. |
|
|
2024 Pillar 3 Disclosures Report 39
The following table provides a breakdown of the Group’s eligible capital and a comparison with the previous year:
|
|
|
|
|
|
|
|
|
| Table 7.Eligible capital |
| EUR million |
|
|
|
2024 |
2023 |
| Eligible capital |
|
|
| Common Equity Tier 1 (CET1) |
79,800 |
76,741 |
| Capital |
7,576 |
8,092 |
| (-) Treasury shares and own shares financed |
(1,694) |
(2,847) |
| Share premium |
40,079 |
44,373 |
| Reserves |
76,608 |
68,721 |
| Other retained earnings |
(38,617) |
(35,038) |
| Minority interests |
8,479 |
6,899 |
| Attributable profit net of dividends |
9,431 |
8,307 |
| Deductions |
(22,061) |
(21,766) |
| Goodwill and intangible assets |
(15,957) |
(17,220) |
| Others |
(6,104) |
(4,546) |
| Additional Tier 1 (AT1) |
10,371 |
9,002 |
| Eligible instruments AT1 |
9,725 |
8,461 |
| T1 excesses - subsidiaries |
645 |
541 |
| Residual value of intangibles |
— |
— |
| Deductions |
— |
— |
| Tier 2 (T2) |
18,418 |
16,497 |
| Eligible instruments T2 |
18,869 |
17,101 |
| Gen. funds and surplus loan loss prov. IRB |
— |
76 |
| T2 excesses - subsidiaries |
(450) |
(680) |
| Others |
— |
— |
| Total eligible capital |
108,589 |
102,240 |
|
|
|
| CRR Phased-in, IFRS 9 Phased-in. |
|
|
Common equity Tier 1 capital (CET1) comprises the elements of Tier 1 capital (after applying prudential filters) and CET1 deductions after applying the threshold exemptions specified in the CRR.
CET1 consists of:
•Subscribed share capital, which stood at EUR 7,576 million in December 2024.
•Other tier 1 capital items: (i) paid-up share premiums; (ii) effective and disclosed reserves generated against profits and amounts that are not taken to the income statement but are recorded under “Other reserves” (any item); (iii) other retained earnings, including certain valuation adjustments, primarily for exchange differences and for hedges of net investments in foreign operations.
•The paid-up portion of any non-controlling interests arising from the issue of ordinary shares by consolidated subsidiaries, subject to the limits set in the CRR.
•The Group's attributable net profit of cash dividends, which was €9,431 million in December 20242.
•The prudential filters exclude any positive or negative valuation adjustments from cash flow hedges. They also exclude gains or losses on liabilities and derivative liabilities measured at fair value resulting from changes in the institution’s own credit quality. The prudential filters include the additional valuation adjustments applied pursuant to article 34 of the CRR.
•Deductions from CET1 items mainly include: treasury shares; current-year losses; goodwill and other intangible assets recognised in the balance sheet; deferred tax assets that rely on future earnings (subject to the limits set in the CRR); the valuation adjustments due to prudent valuation requirements; and defined benefit pension fund assets shown on the balance sheet.
In addition to the movements in net book equity, for changes in regulatory capital, the undistributed dividend in cash for 2024 was considered to be €3,144 million, so the net attributable profit net of dividends calculated is €9,431 million.
2 The cash dividend represents c.25% of profit, see note 4.a of the Consolidated Financial Statements for the proposed result distribution.
40 2024 Pillar 3 Disclosures Report
|
|
|
|
|
|
| Table 8.Regulatory capital. Flow statement |
| EUR million |
|
|
2024 |
| Common Equity Tier 1 (CET1) |
|
| Ending figure (31/12/2023) |
76,741 |
| Shares issued during the year and share premium account |
(4,810) |
| Treasury shares and own shares financed |
1,153 |
| Reserves |
(419) |
| Attributable profit net of dividends |
9,431 |
| Other retained earnings |
(3,579) |
| Minority interests |
1,580 |
| Decrease/(increase) in goodwill and other intangibles |
1,263 |
| Other deductions |
(1,559) |
| Ending figure (31/12/2024) |
79,800 |
|
|
| Additional Tier 1 (AT1) |
|
| Ending figure (31/12/2023) |
9,002 |
| Eligible instruments AT1 |
1,264 |
| AT1 excesses - subsidiaries |
105 |
| Residual value of intangibles |
— |
| Deductions |
— |
| Ending figure (31/12/2024) |
10,371 |
|
|
| Tier 2 (T2) |
|
| Ending figure (31/12/2023) |
16,497 |
| Eligible instruments T2 |
1,767 |
| Gen. funds and surplus loan loss prov. IRB |
(76) |
| T2 excesses - subsidiaries |
230 |
| Deductions |
— |
| Ending figure (31/12/2024) |
18,418 |
| Deductions from total capital |
— |
| Final figure for total capital (31/12/2024) |
108,589 |
|
|
| CRR Phased-in, IFRS 9 Phased-in. |
|
|
|
|
|
|
|
| Eligible capital over time |
| EUR million |
|
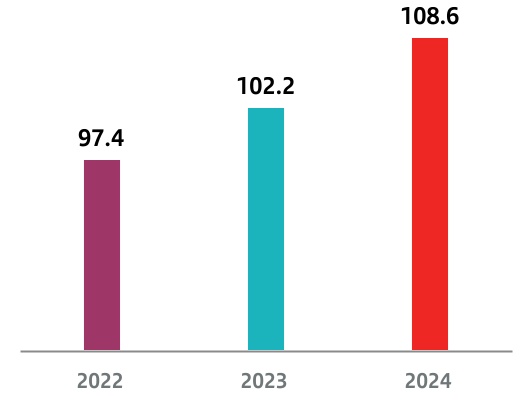
Tier 1 Capital comprises CET1 Capital plus Additional Tier 1 Capital (AT1) including preferred issuances and CoCos issued by Grupo Santander.
Total capital comprises Tier 1 capital plus Tier 2 capital (T2) and includes, among other items, equity instruments and subordinated loans where the conditions laid down in the CRR are met.
The movement of issued shares and issue premiums is mainly due to the amortisation of shares acquired through the share buyback programme, contributing to the shareholder remuneration by increasing earnings per share, which is inherent to the reduction in the number of shares. On the other hand, the remaining variation corresponds to other retained income, deductions and prudential filters.
The increase in Tier 1 capital is mainly due to new issuances in Spain net of redemptions during the year.
The increase in Tier 2 capital is due to new issuances in Spain and Brazil which is partly offset by the loss of eligibility for capital purposes of certain issuances.
For further detail on regulatory own funds (Table CC1) see Appendix VII of this document.
On 31 December 2024, none of the financial institutions consolidated in the Group had less than the minimum capital required under applicable regulations.
Under Article 7 and 9 of the CRR, the subsidiaries Santander Leasing S.A. EFC and Santander Factoring y Confirming S.A. EFC are exempt from the minimum capital requirements, the limit on large exposures and the internal corporate governance obligations. None of the exemptions under applicable regulations have been used for any other Santander subsidiaries.
Santander maintains a very comfortable capital adequacy position, well above the levels required by applicable regulations and by the European Central Bank.
IFRS 9 became effective on 1 January 2018, implying changes in accounting that affect capital ratios. Santander decided to apply the transitional arrangements, which means a seven-year transitional period.
If the transitional provisions of IFRS 9 and CRR had not been applied, the total impact on the fully loaded CET1 ratio at December would be -2bps.
The phased-in CET1 increased by 47bps during the year and stood at 12.78% in December. The fully-loaded CET1 ratio stood at 12.76% in December.
2024 Pillar 3 Disclosures Report 41
|
|
|
|
|
|
|
|
|
|
|
|
|
|
|
|
|
|
|
Table 9.IFRS 9-FL - Comparison of institutions’ own funds and capital and leverage ratios with and without the application of transitional arrangements for IFRS 9 or analogous ECLs (IFRS 9-FL) |
|
EUR million |
a |
b |
c |
d |
|
|
Dec24 |
Sep'24 |
Jun'24 |
Mar'24 |
|
Available capital (amounts) |
|
|
|
|
| 1 |
Common Equity Tier 1 (CET1) capital |
79,800 |
78,151 |
77,974 |
78,632 |
| 2 |
Common Equity Tier 1 (CET1) capital as if IFRS 9 or analogous ECLs transitional arrangements had not been applied |
79,705 |
78,058 |
77,846 |
78,516 |
| 3 |
Tier 1 capital |
90,170 |
88,242 |
86,808 |
87,736 |
| 4 |
Tier 1 capital as if IFRS 9 or analogous ECLs transitional arrangements had not been applied |
90,076 |
88,148 |
86,680 |
87,620 |
| 5 |
Total capital |
108,589 |
106,784 |
104,419 |
106,229 |
| 6 |
Total capital as if IFRS 9 or analogous ECLs transitional arrangements had not been applied |
108,494 |
106,690 |
104,292 |
106,113 |
|
Risk-weighted assets (amounts) |
|
|
|
|
| 7 |
Total risk-weighted assets |
624,503 |
626,099 |
624,831 |
640,382 |
| 8 |
Total risk-weighted assets as if IFRS 9 or analogous ECLs transitional arrangements had not been applied |
624,477 |
626,288 |
625,017 |
640,507 |
|
Capital ratios |
|
|
|
|
| 9 |
Common Equity Tier 1 (as a percentage of risk exposure amount) |
12.78 |
% |
12.48 |
% |
12.48 |
% |
12.28 |
% |
| 10 |
Common Equity Tier 1 (as a percentage of risk exposure amount) as if IFRS 9 or analogous ECLs transitional arrangements had not been applied |
12.76 |
% |
12.46 |
% |
12.46 |
% |
12.26 |
% |
| 11 |
Tier 1 (as a percentage of risk exposure amount) |
14.44 |
% |
14.09 |
% |
13.89 |
% |
13.70 |
% |
| 12 |
Tier 1 (as a percentage of risk exposure amount) as if IFRS 9 or analogous ECLs transitional arrangements had not been applied |
14.42 |
% |
14.07 |
% |
13.87 |
% |
13.68 |
% |
| 13 |
Total capital (as a percentage of risk exposure amount) |
17.39 |
% |
17.06 |
% |
16.71 |
% |
16.59 |
% |
| 14 |
Total capital (as a percentage of risk exposure amount) as if IFRS 9 or analogous ECLs transitional arrangements had not been applied |
17.37 |
% |
17.04 |
% |
16.69 |
% |
16.57 |
% |
|
Leverage ratio |
|
|
|
|
| 15 |
Leverage ratio total exposure measure |
1,885,572 |
1,853,699 |
1,827,284 |
1,849,428 |
| 16 |
Leverage ratio |
4.78 |
% |
4.76 |
% |
4.75 |
% |
4.74 |
% |
| 17 |
Leverage ratio as if IFRS 9 or analogous ECLs transitional arrangements had not been applied |
4.78 |
% |
4.76 |
% |
4.74 |
% |
4.74 |
% |
2.4.2. Capital requirements
The capital requirements maintaining a similar distribution by risks under Pillar 1 as last year: credit 85%, market 3% and operational 12%. Risk-weighted assets increased 0.1% to EUR 624,503 million, due to an increase of EUR 5,329 million in operational risk and 1,492 million in market risk. Credit risk decreased by EUR -6,049 million.
|
|
|
|
|
|
| RWA Evolution (Phased-in) |
|
|
42 2024 Pillar 3 Disclosures Report
Below is a general evolution of RWA by risk, and then also by geography:
|
|
|
|
|
|
|
|
|
|
|
|
|
|
|
|
|
|
|
|
|
| Table 10.OV1 - Overview of risk weighted exposure amounts |
|
|
EUR million |
RWA |
Min. Capital Requirements |
|
|
|
a |
b |
|
c |
|
|
|
Dec'24 |
Sep'24 |
Jun'24 |
Dec'24 |
|
| 1 |
Credit risk (excluding CCR)1 |
499,560 |
514,048 |
511,983 |
39,965 |
|
| 2 |
Of which, standardised approach (SA) |
283,612 |
279,867 |
282,308 |
22,689 |
| 3 |
Of which, the foundation IRB (FIRB) approach |
59,981 |
66,465 |
62,777 |
4,798 |
| 4 |
Of which, slotting approach2 |
13,840 |
13,289 |
13,145 |
1,107 |
| EU 4a |
Of which, equities under the simple risk weighted approach |
4,724 |
5,086 |
5,115 |
378 |
| 5 |
Of which, the advanced IRB (AIRB) approach |
129,919 |
141,350 |
141,017 |
10,394 |
| 6 |
Counterparty credit risk - CCR |
18,768 |
18,371 |
17,216 |
1,501 |
|
| 7 |
Of which, the standardised approach |
15,035 |
14,295 |
13,407 |
1,203 |
| 8 |
Of which, internal model method (IMM) |
— |
— |
— |
— |
| EU 8a |
Of which, exposures to a CCP |
294 |
329 |
292 |
24 |
| EU 8b |
Of which, credit valuation adjustment - CVA |
679 |
692 |
764 |
54 |
| 9 |
Of which, other CCR |
2,761 |
3,055 |
2,753 |
221 |
| 15 |
Settlement risk |
173 |
120 |
126 |
14 |
|
| 16 |
Securitisation exposures in the banking book (after the cap) |
15,705 |
12,567 |
12,846 |
1,256 |
|
| 17 |
Of which, SEC-IRBA approach |
7,285 |
4,880 |
5,156 |
583 |
| 18 |
Of which, SEC-ERBA approach |
2,484 |
2,197 |
2,463 |
199 |
| 19 |
Of which, SEC-SA approach3 |
5,935 |
5,489 |
5,227 |
475 |
| EU 19a |
Of which, 1250%4 |
— |
— |
— |
— |
| 20 |
Position, foreign exchange and commodities risks (Market risk) |
17,946 |
16,221 |
16,821 |
1,436 |
|
| 21 |
Of which, standardised approach |
10,693 |
9,737 |
9,538 |
855 |
| 22 |
Of which, IMA |
7,253 |
6,484 |
7,283 |
580 |
| EU 22a |
Large exposures |
— |
— |
— |
— |
|
| 23 |
Operational risk |
72,351 |
64,772 |
65,839 |
5,788 |
|
| EU 23a |
Of which, basic indicator approach |
— |
— |
— |
— |
| EU 23b |
Of which, standardised approach |
72,351 |
64,772 |
65,839 |
5,788 |
| EU 23c |
Of which advanced measurement approach |
— |
— |
— |
— |
| 24 |
Amounts below the thresholds for deduction (subject to 250% risk weight) |
22,656 |
19,147 |
19,838 |
1,812 |
|
| 29 |
Total |
624,503 |
626,099 |
624,831 |
49,960 |
|
|
CRR Phased-in, IFRS9 Phased-in. |
|
1It includes equities under the PD/LGD approach. |
|
2Correction from the mapping indicated by supervisor to {C 08.01, r0020, c0260, s0010} + {C 08.01, r0030, c0260, s0010}. |
|
3Correction from the mapping to the one appearing in tables SEC3+SEC4. |
|
4Information prepared following the recent update of the EBA (24.05.22,"ITS on institutions’ Pillar 3 public disclosures"). Banco Santander S.A. deducts from capital those securitisations that meet the deduction requirements, and therefore does not apply a 1,250% weighting to these exposures. This row does not include the EUR 8,367 million that would result from applying this weighting to these exposures. |
|
|
|
RWA distribution by type of risk |
RWA distribution by type of risk |
|
|
|
|
| Total |
|
|
Credit1 |
|
| Of which SA |
|
| Of which IRB |
|
| Counterparty credit |
| Securitisation |
| Operational |
|
| Market |
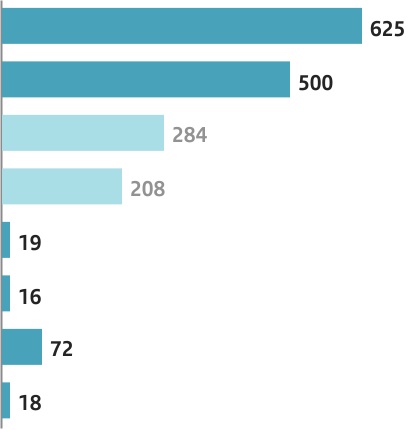
|
|
|
|
|
|
|
|
|
| vs Dec-23 |
|
|
|
| 624,503 |
623,731 |
—% |
|
|
|
| 499,560 |
515,238 |
|
|
|
-3% |
|
|
|
| 283,612 |
285,728 |
|
|
|
-1% |
|
|
|
| Workiva_Grafica |
212,842 |
|
| 208464.2947344 |
212,842 |
-2% |
| 18,768 |
13,593 |
|
|
|
+28% |
| 15,705 |
11,419 |
|
|
|
+27% |
| 72,351 |
67,022 |
|
|
|
+7% |
| 17,946 |
16,454 |
|
|
|
+8% |
|
|
|
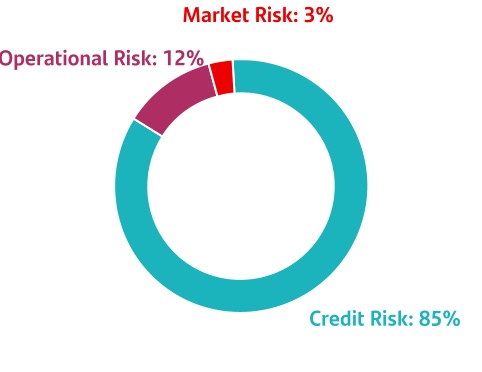
1 Excluding securitisations and CRR
2024 Pillar 3 Disclosures Report 43
|
|
|
|
|
|
|
|
|
|
|
|
|
|
|
|
|
|
|
|
|
|
|
|
|
|
|
|
|
|
| Table 11.RWAs by geographical region |
|
|
|
|
|
|
|
|
|
|
|
|
2024 |
|
|
|
|
|
|
|
|
|
|
| EUR Bn |
Total |
Europe |
Of which, Spain |
Of which, UK |
North America |
Of which, US |
South America |
Of which, Brazil |
Others |
| Credit risk |
535 |
330 |
180 |
58 |
85 |
58 |
120 |
84 |
0 |
| Of which, standardised approach (SA) |
284 |
117 |
41 |
18 |
73 |
56 |
94 |
61 |
0 |
| Of which, internal rating-based (IRB) approach |
203 |
174 |
107 |
37 |
8 |
0 |
21 |
19 |
0 |
| Of which, Securitizations* |
16 |
13 |
9 |
2 |
2 |
2 |
1 |
1 |
0 |
| Of which, the rest |
33 |
27 |
22 |
1 |
1 |
1 |
4 |
3 |
0 |
| Market risk |
18 |
13 |
13 |
0 |
1 |
1 |
4 |
2 |
0 |
| Operational risk |
72 |
34 |
16 |
8 |
17 |
12 |
16 |
9 |
5 |
| Total** |
625 |
378 |
208 |
67 |
103 |
72 |
140 |
95 |
5 |
| The amounts shown in the table are presented in billions of euros, therefore, the amounts have been rounded; consequently, some amounts may not be the exact arithmetic sum of the preceding figures. |
| *It does not include 1250% deductions. |
|
|
|
|
|
|
| ** Breakdown according to debtor’s residency, except operational risk (management criteria). |
|
|
|
|
|
|
|
|
| Note: €5 Bn belongs to Other countries (1%) |
44 2024 Pillar 3 Disclosures Report From 2016 on, Grupo Santander must comply with the combined buffer capital requirement, which is defined as the total CET1 capital necessary to meet the following obligations:
2.4.3. Eligible capital requirements and Capital buffers
2.4.3.1 Capital Buffers
•Capital conservation buffer (CCoB): this buffer was introduced to ensure that banks have additional own funds that can be used in the event of loss occurrence. The surcharge is 2.5% and is directly applicable and mandatory for all EU banks.
•Buffers for systemically important banks (G-SIB and D-SIB): There are two types of buffers, with their own methodologies, that classify financial institutions into (global and domestic) systemicity buckets. These buckets determine their systemic risk level and their respective applicable capital surcharge. The two types are:
◦G-SIB (Global Systemically Important Banks) buffer: World-wide homogeneous methodology, following the framework and levels established by the BCBS. Applicable only at consolidated level. This surcharge is quantified by comparing the systematic nature of banking groups. There is an additional methodology that considers the eurozone as a single jurisdiction for calculation purposes and allows the competent authority to classify a G-SIB in a lower bucket, reducing the applicable G-SIB buffer surcharge accordingly.
◦D-SIB (Domestic Systemically Important Banks) buffer: EU homogenous methodology following the EBA Guidelines for the calculation of the institutions score. In this case, the banking groups against which the systemicity of a D-SIB is measured are the peers of the Member State in which the bank in question is located. The National authorities define the capital surcharges that correspond to each systemicity bucket, with EU authorities having to comply with the floor methodology published by the ECB. It can be applicable at consolidated, sub-consolidated or individual level. The ECB recently issued an additional methodology that considers the eurozone as a single jurisdiction for calculation purposes and will allow, from 2027, the competent authority to apply the higher of the two outcomes (national and EU scopes), which could increment the applicable D-SIB buffer surcharge accordingly.
In the case of banking groups that are G-SIBs and are also categorised as D-SIBs, the higher of the two surcharges will apply at consolidated level.
•Countercyclical capital buffer (CCyB): Applied when National authorities consider that credit is growing excessively in a certain jurisdiction with the aim of slowing it down. Designed to be built up in periods of excessive credit growth and released in times of crisis and is therefore one of the few (apart from the SyRB) capital buffers that can be released in a discretionary manner if considered appropriate by the national authority. The CET1 surcharge implied by this capital buffer is calculated specifically for each institution or group and consists of the weighted average of the countercyclical buffer rates applied in the territories in which the entity's relevant lending exposures are located. The surcharges imposed by national authorities
in the several locations of the institution's exposures are generally applicable at a consolidated level. In line with the recommendations of the Basel Committee and the European Central Bank, national authorities in the EU are implementing the positive neutral countercyclical buffer, which activates the buffer at a minimum level greater that 0% in each jurisdiction, to give room to National authorities to perform an eventual reduction in institution's capital requirements in the event of a crisis.
•Systemic risk buffer (SyRB): National authorities may require this buffer to address macroprudential or systemic risks that are not covered by other buffers and that could trigger a disturbance in the financial system with serious consequences for both the system itself and the real economy. Its application by the authorities is discretionary and may be required either for all institutions or for a subsets of institutions, for all exposures or a subset of exposures (domestic, third countries, mortgage sector etc.). The surcharges imposed by the National authorities on the different exposures or institutions of a country require the endorsement of the Spanish macroprudential authority to be applicable at consolidated level in Santander.
The table below summarises the regulation that sets the buffer surcharge rates on the different capital buffers to be applied and the situation of Banco Santander in 2024:
|
|
|
|
|
|
|
|
|
Application |
Buffers (% RWA) |
2024 |
| All institutions |
(CCoB) |
2.5 |
% |
| Designated institutions |
G-SIB (1) |
100% of the buffer |
D-SIB (2) |
100% of the buffer |
| At the discretion of competent national authority |
(SyRB)4 |
0% -> 5% |
(CCyB) (3) |
0% - 2.5% |
|
| Combined buffer |
CCoB+CCyB+SyRB+Max (G-SIB, D-SIB) |
1) This requirement is 1% for Grupo Santander.
2) Bank of Spain requires a 1.25% buffer to Santander Group for 2025.
3) % CCyB applicable in January 2025 for exposures to customers residing in:
|
|
|
|
|
|
|
|
|
| Germany: 0.75% |
Slovenia: 1% |
Norway: 2.5% |
| Australia: 1% |
Estonia: 1.5% |
Netherlands: 2% |
| Belgium: 1% |
France: 1% |
Czech Republic: 1,25% |
| Bulgaria: 2% |
Hong Kong: 0.5% |
United Kingdom: 2% |
| Cyprus: 1% |
Ireland: 1.5% |
Romania: 1% |
| Croatia: 1.5% |
Iceland: 2.5% |
Sweden: 2% |
| Denmark: 2.5% |
Lithuania: 1% |
|
| Slovakia: 1.5% |
Luxembourg: 0.5% |
|
|
|
|
Due to its relevance for the Group, as of September 2025 Poland's CCyBr will be 1%, as of October 2025 Spain's will be 0.5% and as of January 2026 Portugal's will be 0.75%.
4) Portugal and Italy have activated their SyRB in their jurisdictions and the Banco de España has activated the reciprocity of this measure at a consolidated level, which increases in 0.04% its requirements.
2024 Pillar 3 Disclosures Report 45
The geographic breakdown of relevant exposures for calculating the CCyB (table CCyB1) is available in Appendix IX on Santander's website. The amount of institution-specific CCyB surcharged (table CCyB2) is available in table 12.
|
|
|
|
|
|
|
Access the Pillar 3 2024 file available on Grupo Santander's web site |
|
|
|
|
|
|
|
|
|
|
Table 12.CCyB2 - Amount of institution-specific countercyclical capital buffer |
|
|
EUR million |
|
|
2024 |
|
|
a |
| 1 |
Total risk exposure amount |
624,503 |
| 2 |
Institution specific countercyclical capital buffer rate |
0.39% |
| 3 |
Institution specific countercyclical capital buffer requirement |
2,422 |
|
CRR Fully Phased-in IFRS 9. |
|
Global Systemically Important Institutions
The Group is one of 29 entities designated as global systemically important banks (G-SIB) in 2024.
Systemically important banks may pose a risk to financial stability.
The insolvency or even the assumption of a systemically important bank becoming insolvent, could generate unpredictable negative effects for the financial system and the real economy.
This situation warrants special prudential treatment. This has led to the introduction of a specific capital buffer requirement for both global (G-SIB) and domestic (D-SIB) systemically important banks.
This designation requires Santander to meet additional requirements mainly relating to the following:
•Its capital buffer (Santander is in the group of banks with the lowest capital buffer, 1.25%).
•TLAC (total loss-absorbing capacity) requirements.
•The requirement to publish relevant information more frequent than other banks.
•Stricter regulatory requirements for internal control bodies.
•Special supervision.
•Requirements to submit special reports to supervisory authorities.
The designation as a globally systemically important entity is made by the Basel Committee, jointly with the Financial Stability Board, using a methodology based on five indicators: size, cross-jurisdictional activity, interconnectedness with other financial entities, substitutability of financial services/financial infrastructure and complexity (weighted at 20% for each of the above categories). The methodology was revised in December 2021 incorporating, among other things, an additional score considering the SRM Member States as a single jurisdiction.
The information necessary to evaluate the indicators is requested yearly from banks with leverage exposure exceeding €200 billion or from any other bank at the supervisor's discretion: 77 banks were considered in December 2023. These institutions are then required to publish the information before 30 April of the following year.
With this information, a global indicator is created. The score obtained by each bank determines the size of the capital
buffer required of it, which is based on a set of buckets defined by the regulators (CET1 surcharge ranging from 1% to 3.5%).
The Financial Stability Board (FSB) published in November 2024 its list of global systemically important banks based on the December 2023 data. This will be fully applicable in 2025. Meeting these requirements makes the Group a more robust bank than its domestic rivals. Santander is currently subject to a systemic capital surcharge of 1%, which will become fully effective in 2025. For more details regarding Quantitative indicators, access file "G-SIBs indicators quantitative", under sections Shareholders and Investors / Other presentations on the Grupo Santander website.
|
|
|
|
|
|
|
Access 2024 Annual Report available on the Santander Group website |
46 2024 Pillar 3 Disclosures Report
|
|
|
|
|
|
|
|
|
| Indicators for global systemically important institutions |
| Category |
Individual Indicator |
Supervisor's justification |
| Size |
Exposure used for the leverage ratio calculation |
An indicator of the weight of the bank in the financial system |
| Cross-jurisdictional activity |
Cross-jurisdictional assets |
Snapshot of a bank’s global footprint |
| Cross-jurisdictional liabilities |
| Interconnection |
Intra-financial system assets |
Measures a bank’s interconnectedness with other financial institutions |
| Intra-financial system liabilities |
| Securities outstanding |
| Substitutability/financial infrastructure |
Assets under custody |
Measures whether the bank’s activity can be replaced with other banks |
| Payments activity |
| Transactions subscribed in debt and equity markets |
| Trading Volume |
| Complexity |
Notional amount of over-the-counter (OTC) derivatives |
Measures the complexity of a financial entity |
| Level 3 assets |
| Held for trading and available-for-sale securities |
|
|
|
|
|
|
| Global systemically important institutions |
|
|
Capital buffer |
Entity |
| 5 (3.50%) |
(Empty) |
| 4 (2.50%) |
JP Morgan Chase |
| 3 (2.00%) |
Citigroup
HSBC |
| 2 (1.50%) |
Agricultural Bank of China
Bank of America
Bank of China
Barclays
BNP Paribas
China Construction Bank
Deutsche Bank
Goldman Sachs
Groupe Crédit Agricole
Industrial and Commercial Bank of China Limited
Mitsubishi UFJ FG UBS |
| 1 (1.00%) |
Bank of Communications
Bank of New York Mellon
Group BPCE
ING Bank
Mizuho FG
Morgan Stanley
Royal Bank of Canada
Santander
Société Générale
Standard Chartered
State Street
Sumitomo Mitsui FG
Toronto Dominion
Wells Fargo
|
Domestic Systemically Important Institutions
When identifying domestic systemically important banks (DSIBs), Banco de España, using the methodology established in rule 14 of Circular 2/2016, applies a mix of guidelines based on size, importance, complexity (cross-jurisdiction activity) and the degree of interconnectedness between the institutions and the financial system. Banco de España conducts an annual review of this classification. The following institutions are included on its 2025 list:
|
|
|
|
|
|
|
|
|
| Domestic systemically important institutions |
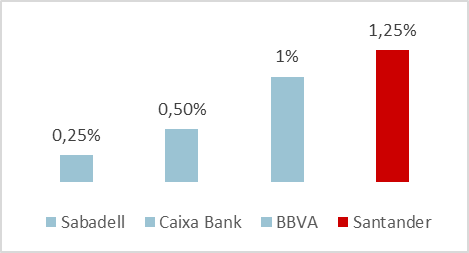
The Group is on the lists of both global and domestic systemically important banks. Banco de España requires the higher of the two buffers to be applied, under rule 23 of Circular 2/2016. The applicable surcharge in 2024 will be 1.25%, in accordance with the domestic buffer.
2024 Pillar 3 Disclosures Report 47
2.4.3.2 Eligible capital requirements
|
|
|
|
|
|
|
|
|
| The capital decision resulting from the Supervisory Review and Evaluation Process (SREP) under the European Central Bank’s (ECB) Single Supervisory Mechanism comprises a Pillar 2 Requirement (Pillar 2R) and Pillar 2 Guidance (Pillar 2G). While Pillar 2R is binding and failure to comply may have direct consequences for banks, Pillar 2G is not directly |
|
binding, and failure to comply is irrelevant for the purposes of calculating the Maximum Distributable Amount (MDA). However, the ECB expects compliance with Pillar 2G at all times. If a bank is not compliant with Pillar 2G, the ECB will carefully evaluate the reasons and circumstances and may define additional supervisory control measures. |
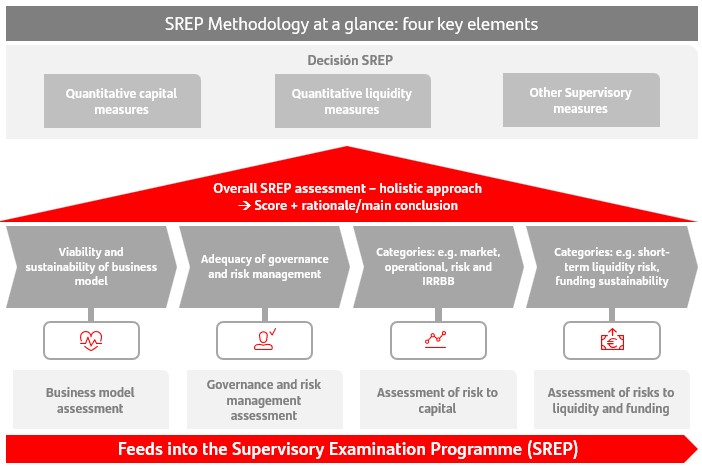
On a consolidated basis, the minimum levels required by the European Central Bank in 2024 were 9.6% for the CET1 ratio and 13.9% for the total capital ratio.
Our capital requirements increased in 2024 due to:
•A higher D-SIB requirement driving an increase in the D-SIB/G-SIB requirement from 1% to 1.25% due to: i) a methodological change by the ECB which was later adopted by Banco de España and ii) because institutions must hold capital at the consolidated level for the higher of the G-SIB (currently at 1%) and D-SIB requirements.
•The ECB's revision of Banco Santander, S.A.'s P2R requirement from 1.58% to 1.74% (mainly due to a change in the ECB's methodology).
•Higher countercyclical buffer requirements by the competent authorities in the countries in which we operate (+0.02 pp).
•A new systemic risk buffer (0.03 pp).
At year-end, the phased-in CET1 ratio was 12.8%, resulting in a CET1 management buffer of 313 bps. This shows our ability to generate capital organically, our solid position to be able to pay dividends and our strong capital management.
The total phased-in capital ratio was 17.4%. Taking into account the shortfall in AT1, Santander exceeded the 2024 minimum regulatory requirements (i.e. distance to the maximum distributable amount - MDA) by 297 bps.
48 2024 Pillar 3 Disclosures Report
|
|
|
|
|
|
| Regulatory Capital vs Regulatory requirement (Phased-in IFRS9) |

|
|
|
|
|
|
|
|
|
|
|
|
|
|
|
|
|
|
|
|
|
|
|
|
| Regulatory requirements |
|
Regulatory Ratios 2024 (phased-in) |
|
| n |
T2 |
2.44% |
n |
T2 |
2.95% |
| n |
AT 1 |
1.83% |
n |
AT 1 |
1.66% |
| n |
CET 1: |
9.65% |
n |
CET 1 |
12.78% |
|
n |
Min. Pillar 1 |
4.50% |
|
|
|
|
n |
Pillar 2 R |
0.98% |
|
|
|
|
n |
CCoBA |
2.50% |
A. Capital conservation buffer. |
|
n |
G-SIBB |
1.25% |
B. Global systemically important banks (G-SIB) buffer |
|
n |
CCyBC |
0.39% |
C. Countercyclical buffer |
|
n |
SyRBD |
0.03% |
D. Systemic risk buffer |
|
|
|
|
|
|
|
2024 Pillar 3 Disclosures Report 49
2.5. Leverage ratio
This section covers the qualitative requirement LRA - Free format text boxes for disclosure on qualitative items.
Basel III established the leverage ratio as a non-risk-sensitive measure to limit excessive growth of the balance sheet relative to available capital.
The ratio is calculated as the ratio of Tier 1 divided by the leverage exposure. This exposure is calculated as the sum of the following components:
•Asset value, without derivatives and without elements considered as deductions in Tier 1 (for example, the loan balance is included but not goodwill), also excluding the exposures referred to in section 1 of article 429.a of the standard.
|
|
|
|
|
|
| Leverage ratio (CRR fully-loaded, fully-loaded IFRS 9) |

With the publication of CRR II the definitive calibration of the leverage ratio was set at 3% for all institutions, with G-SIBs being subject to an additional surcharge of 50% of the ratio of the buffer applicable to the global systemically important institution (G-SII) from January 2023 on. Adjustments to its calculation are also included, notably the exclusion of certain exposures from the measure of total exposure: exposures to central banks in exceptional circumstances, public loans, transfer loans and officially guarantees export credits.
•Off-balance-sheet accounts (mainly: guarantees, undrawn credit limits, letters of credit) weighted by the conversion factors of the standardised approach to credit risk.
•Inclusion of the net value of derivatives (gains and losses against a single counterparty are netted, minus collateral – provided certain criteria are met) plus a surcharge for potential future exposure.
•A surcharge for the potential risk of financing securities transactions.
•Lastly, a surcharge is included for risk relating to unhedged credit derivatives (CDS).
The following tables illustrate the ratios published by Santander as of December 2024.
|
|
|
|
|
|
|
|
Leverage ratio (CRR fully loaded, phased-in IFRS9) |
All figures have been calculated applying the transitional provisions of IFRS 9.
The Group's leverage ratio at 31st December 2024 was as follows:
|
|
|
|
|
|
|
|
|
| Table 13.Leverage ratio |
| EUR million |
|
|
|
2024 |
|
CRR Fully/IFRS9 Fully |
CRR Fully/ IFRS9 Phased in |
| Tier 1 |
90,076 |
90,170 |
| Exposure |
1,885,437 |
1,885,572 |
| Leverage Ratio |
4.78 |
% |
4.78 |
% |
50 2024 Pillar 3 Disclosures Report
The following table gives a breakdown of the ratio calculation:
|
|
|
|
|
|
|
|
|
|
|
|
|
|
|
|
|
|
| Table 14.Leverage ratio details |
| EUR million |
|
2024 |
| Item |
Amounts Consol.
Balance Sheet |
To be
eliminated |
To be
included |
Leverage
exposure |
Comment |
| Derivatives |
69,835 |
69,835 |
43,824 |
43,824 |
Accounting value replaced by EAD netted from collateral |
| Securities financing transactions |
121,566 |
|
3,839 |
125,404 |
An add-on is included over these operations |
| Assets deducted in Tier 1 |
20,931 |
20,931 |
|
— |
Removed to avoid duplication |
| DTAs |
— |
— |
|
— |
|
| Rest of Assets |
1,607,954 |
24,792 |
|
1,583,162 |
Excluded: the offsetting of cash receivable from sales of regular way contracts with cash payable from purchases of regular way contracts at the trading date, securitizations and certain exposures in central banks
|
| Total Assets |
1,820,285 |
115,558 |
47,663 |
1,752,391 |
|
| Total Off-Balance-Sheet items |
454,775 |
321,593 |
|
133,182 |
Balances are weighted according to their risk and the offsetting of cash receivable from sales of regular way contracts with cash payable from purchases of regular way contracts on the settlement date is excluded.
|
| Total Exposure (denominator) |
|
|
|
1,885,572 |
|
| Tier 1 (numerator) |
|
|
|
90,170 |
|
| Leverage ratio |
1,704,727 |
|
|
4.78 |
% |
Minimum recommended 3,5% |
The leverage ratio is calculated every month and reported to the capital committee and other governing bodies, thus ensuring adequate monitoring of the risk of excessive leverage at its most restrictive measurement: fully loaded.
The leverage ratio is a primary metric in Santander's Risk Appetite Framework, as part of its commitment to preserving robust capital adequacy ratios. It is regularly monitored to ensure that the ratio comfortably exceeds the minimum regulatory requirements. The bank's Risk Appetite Framework includes a "stressed" leverage ratio as an additional metric, to manage the risk of excessive leverage in a forward-looking way, identifying how it will perform in a crisis scenario.
The Group has established the necessary limits and alerts within its framework to ensure that leverage is kept at tolerable risk levels, consistent with sustainable growth in the group's balance sheet and well above the minimum levels that could be considered to be a risk. Any significant changes in any of the main drivers of this indicator are therefore analysed and reported to senior management.
Additional quantitative indicators are monitored as part of the Group's active management of leverage risk, to complement the management and monitoring of the risk of excessive leverage, so as to understand the maturities, types of charges and movements of collateralised assets. These metrics include asset encumbrance and the Net Stable Funding Ratio (NSFR).
|
|
|
|
|
|
|
For more information, see section 9.1.2. |
As part of its capital planning, the Group estimates the leverage ratio over a three-year horizon under a range of macroeconomic scenarios, including recession.
For further information on the leverage ratio, see tables: LR1(LRSum)-summary reconciliation of accounting assets and leverage ratio exposures, LR2(LRCom)-leverage ratio common disclosure and LR3 (LRSpl)- breakdown of on balance sheet exposures (excluding derivatives, SFTs and exempted exposures) below.
2024 Pillar 3 Disclosures Report 51
The following table presents information corresponding to the reconciliation of accounting assets and leverage ratio exposures:
|
|
|
|
|
|
|
|
|
| Table 15.LR1 - LRSum: Summary reconciliation of accounting assets and leverage ratio exposures |
|
EUR million |
a |
|
2024 |
| 1 |
Total assets as per published financial statements |
1,837,079 |
| 2 |
Adjustment for entities which are consolidated for accounting purposes but are outside the scope of prudential consolidation |
(16,794) |
| 3 |
(Adjustment for securitised exposures that meet the operational requirements for the recognition of risk transference) |
(21,084) |
| 4 |
(Adjustment for temporary exemption of exposures to central banks (if applicable)) |
— |
| 5 |
(Adjustment for fiduciary assets recognised on the balance sheet pursuant to the applicable accounting framework but excluded from the total exposure measure in accordance with point (i) of Article 429a(1) CRR) |
— |
| 6 |
Adjustment for regular-way purchases and sales of financial assets subject to trade date accounting |
(3,708) |
| 7 |
Adjustment for eligible cash pooling transactions |
— |
| 8 |
Adjustments for derivative financial instruments |
(14,056) |
| 9 |
Adjustment for securities financing transactions (SFTs) |
3,839 |
| 10 |
Adjustment for off-balance sheet items (ie conversion to credit equivalent amounts of off-balance sheet exposures) |
133,182 |
| 11 |
(Adjustment for prudent valuation adjustments and specific and general provisions which have reduced Tier 1 capital) |
— |
| EU-11a |
(Adjustment for exposures excluded from total exposure measure in accordance with point (c ) of Article 429a(1) CRR) |
— |
| EU-11b |
(Adjustment for exposures excluded from total exposure measure in accordance with point (j) of Article 429a(1) CRR) |
— |
| 12 |
Other adjustments |
(32,885) |
| 13 |
Total exposure measure |
1,885,572 |
|
|
CRR Phased-in, IFRS 9 Phased-in. |
|
Information regarding the leverage ratio is shown below:
|
|
|
|
|
|
|
|
|
|
|
|
| Table 16.LR2 - LRCom: Leverage ratio common disclosure |
|
EUR million |
|
|
|
a |
b |
|
Dec'24 |
Jun'24 |
|
On-balance sheet exposures (excluding derivatives and SFTs) |
|
|
| 1 |
On-balance sheet items (excluding derivatives, SFTs, but including collateral)* |
1,631,124 |
1,582,841 |
| 2 |
Gross-up for derivatives collateral provided where deducted from the balance sheet assets pursuant to the applicable accounting framework |
— |
— |
| 3 |
(Deductions of receivables assets for cash variation margin provided in derivatives transactions) |
(11,954) |
(14,180) |
| 4 |
(Adjustment for securities received under securities financing transactions that are recognised as an asset) |
— |
— |
| 5 |
(General credit risk adjustments to on-balance sheet items) |
— |
— |
| 6 |
(Asset amounts deducted in determining Tier 1 capital) |
(20,931) |
|
(19,542) |
| 7 |
Total on-balance sheet exposures (excluding derivatives and SFTs) |
1,598,239 |
|
1,549,119 |
|
|
Derivative exposures |
|
|
| 8 |
Replacement cost associated with SA-CCR derivatives transactions (ie net of eligible cash variation margin) |
21,665 |
20,497 |
| EU-8a |
Derogation for derivatives: replacement costs contribution under the simplified standardised approach |
— |
— |
| 9 |
Add-on amounts for potential future exposure associated with SA-CCR derivatives transactions |
21,676 |
21,873 |
| EU-9a |
Derogation for derivatives: Potential future exposure contribution under the simplified standardised approach |
— |
— |
| EU-9b |
Exposure determined under Original Exposure Method |
— |
— |
| 10 |
(Exempted CCP leg of client-cleared trade exposures) (SA-CCR) |
— |
— |
| EU-10a |
(Exempted CCP leg of client-cleared trade exposures) (simplified standardised approach) |
— |
— |
| EU-10b |
(Exempted CCP leg of client-cleared trade exposures) (original exposure method) |
— |
— |
| 11 |
Adjusted effective notional amount of written credit derivatives |
16,582 |
14,404 |
| 12 |
(Adjusted effective notional offsets and add-on deductions for written credit derivatives) |
(4,144) |
(2,899) |
| 13 |
Total derivatives exposures |
55,778 |
|
53,874 |
|
|
Securities financing transaction (SFT) exposures |
|
|
52 2024 Pillar 3 Disclosures Report
|
|
|
|
|
|
|
|
|
|
|
|
| Table 16.LR2 - LRCom: Leverage ratio common disclosure |
|
EUR million |
|
|
|
a |
b |
|
Dec'24 |
Jun'24 |
| 14 |
Gross SFT assets (with no recognition of netting), after adjustment for sales accounting transactions |
121,566 |
124,656 |
| 15 |
(Netted amounts of cash payables and cash receivables of gross SFT assets) |
— |
— |
| 16 |
Counterparty credit risk exposure for SFT assets |
3,839 |
3,652 |
| EU-16a |
Derogation for SFTs: Counterparty credit risk exposure in accordance with Articles 429e(5) and 222 CRR |
— |
— |
| 17 |
Agent transaction exposures |
— |
— |
| EU-17a |
(Exempted CCP leg of client-cleared SFT exposure) |
— |
— |
| 18 |
Total securities financing transaction exposures |
125,404 |
|
128,309 |
|
|
Other off-balance sheet exposures |
|
|
| 19 |
Off-balance sheet exposures at gross notional amount |
415,525 |
400,615 |
| 20 |
(Adjustments for conversion to credit equivalent amounts) |
(309,373) |
(304,633) |
| 21 |
(General provisions deducted in determining Tier 1 capital and specific provisions associated with off-balance sheet exposures) |
— |
— |
| 22 |
Off-balance sheet exposures |
106,151 |
|
95,982 |
|
|
Excluded exposures |
|
|
| EU-22a |
(Exposures excluded from the leverage ratio total exposure measure in accordance with point (c ) of Article 429a(1) CRR) |
— |
— |
| EU-22b |
(Exposures exempted in accordance with point (j) of Article 429a (1) CRR (on and off balance sheet)) |
— |
— |
| EU-22c |
(-) Excluded exposures of public development banks - Public sector investments |
— |
— |
| EU-22d |
(Excluded exposures of public development banks (or units) - Promotional loans) |
— |
— |
| EU-22e |
( Excluded passing-through promotional loan exposures by non-public development banks (or units) |
— |
— |
| EU-22f |
(Excluded guaranteed parts of exposures arising from export credits ) |
— |
— |
| EU-22g |
(Excluded excess collateral deposited at triparty agents ) |
— |
— |
| EU-22h |
(Excluded CSD related services of CSD/institutions in accordance with point (o) of Article 429a(1) CRR) |
— |
— |
| EU-22i |
(Excluded CSD related services of designated institutions in accordance with point (p) of Article 429a(1) CRR) |
— |
— |
| EU-22j |
(Reduction of the exposure value of pre-financing or intermediate loans ) |
— |
— |
| EU-22k |
(Total exempted exposures) |
— |
— |
|
Capital and total exposure measure |
|
|
| 23 |
Tier 1 capital |
90,170 |
|
86,808 |
|
| 24 |
Total exposure measure |
1,885,572 |
|
1,827,284 |
|
|
Leverage ratio |
|
|
| 25 |
Leverage ratio |
4.78% |
0.05 |
| EU-25 |
Leverage ratio (excluding the impact of the exemption of public sector investments and promotional loans) (%) |
4.78% |
0.05 |
| 25a |
Leverage ratio (excluding the impact of any applicable temporary exemption of
central bank reserves) |
4.78% |
0.05 |
| 26 |
Regulatory minimum leverage ratio requirement (%)** |
3.00% |
0.03 |
| EU-26a |
Additional own funds requirements to address the risk of excessive leverage (%) |
—% |
— |
| EU-26b |
of which: to be made up of CET1 capital (percentage points) |
—% |
— |
| 27 |
Leverage ratio buffer requirement (%) |
0.50% |
0.01 |
| EU-27a |
Overall leverage ratio requirement (%) |
3.50% |
0.04 |
|
Choice on transitional arrangements and relevant exposures |
|
|
| EU-27b |
Choice on transitional arrangements for the definition of the capital measure |
Transitional |
Transitional |
|
Disclosure of mean values |
|
|
| 28 |
Mean value of gross SFT assets, after adjustment for sale accounting transactions and netted of amounts of associated cash payables and cash receivables |
136,365.00 |
108,928.00 |
| 29 |
Quarter-end value of gross SFT assets, after adjustment for sale accounting transactions and netted of amounts of associated cash payables and cash receivables |
121,566.00 |
124,656.00 |
| 30 |
Total exposure measure(including the impact of any applicable temporary exemption of central bank reserves) incorporating mean values from row 28 of gross SFT assets (after adjustment for sale accounting transactions and netted of amounts of associated cash payables and cash receivables) |
1,900,372.00 |
1,811,556.00 |
2024 Pillar 3 Disclosures Report 53
|
|
|
|
|
|
|
|
|
|
|
|
| Table 16.LR2 - LRCom: Leverage ratio common disclosure |
|
EUR million |
|
|
|
a |
b |
|
Dec'24 |
Jun'24 |
| 30a |
Total exposure measure (excluding the impact of any applicable temporary exemption of central bank reserves) incorporating mean values from row 28 of gross SFT assets (after adjustment for sale accounting transactions and netted of amounts of associated cash payables and cash receivables) |
1,900,372.00 |
1,811,556.00 |
| 31 |
Leverage ratio (including the impact of any applicable temporary exemption of central bank reserves) incorporating mean values from row 28 of gross SFT assets (after adjustment for sale accounting transactions and netted of amounts of associated cash payables and cash receivables) |
4.74% |
4.79% |
| 31a |
Leverage ratio (excluding the impact of any applicable temporary exemption of central bank reserves) incorporating mean values from row 28 of gross SFT assets (after adjustment for sale accounting transactions and netted of amounts of associated cash payables and cash receivables) |
4.74% |
4.79% |
|
CRR Phased-in, IFRS 9 Phased-in |
|
Tier 1 Capital - transitional definition |
|
Total Leverage Ratio exposure - using a transitional definition of Tier 1 capital |
Below is a breakdown of the different on-balance sheet exposures:
|
|
|
|
|
|
|
|
|
| Table 17.LR3 - LRSpl: Split-up of on balance sheet exposures (excluding derivatives, SFTs and exempted exposures) |
|
EUR million |
a |
|
2024 |
|
CRR leverage ratio exposures |
| EU-1 |
Total on-balance sheet exposures (excluding derivatives, SFTs, and exempted exposures), of which: |
1,619,170 |
| EU-2 |
Trading book exposures |
100,869 |
| EU-3 |
Banking book exposures, of which: |
1,518,301 |
| EU-4 |
Covered bonds |
3,371 |
| EU-5 |
Exposures treated as sovereigns |
390,899 |
| EU-6 |
Exposures to regional governments, MDB, international organisations and PSE not treated as sovereigns |
4,626 |
| EU-7 |
Institutions |
35,695 |
| EU-8 |
Secured by mortgages of immovable properties |
387,402 |
| EU-9 |
Retail exposures |
202,355 |
| EU-10 |
Corporate |
205,514 |
| EU-11 |
Exposures in default |
22,919 |
| EU-12 |
Other exposures (eg equity, securitisations, and other non-credit obligation assets) |
265,522 |
|
CRR Phased-in, IFRS 9 Phased-in. |
|
54 2024 Pillar 3 Disclosures Report
2.6. Economic capital – Pillar 2
Economic capital is the capital required to cover risks from our activity with a certain level of solvency. We measure it using an internal model. To calculate the required capital, we determine our solvency level based on our long-term rating target of 'A' (in line with the Kingdom of Spain); this represents a confidence level of 99.95% (above the regulatory level of 99.90%).
Our economic capital model measurements cover all significant risks incurred in our activity (concentration risk, structural interest rate risk (ALM), business risk, pensions risk, deferred tax assets (DTAs), goodwill and others that are beyond the scope of regulatory Pillar 1). It also considers diversification, which is key to determining and understanding our risk profile and solvency in view of our multinational operations and businesses.
Our total risk and related economic capital are less than the sum of the risk and capital of all individual units combined. Because our business spans several countries in a structure of separate legal entities with different customer and product segments and risk types, our earnings are less vulnerable to adverse situations for any given market, portfolio, customer type or risk. Despite increasing economic globalization, economic cycles and their impact differ by country. Groups with a global presence tend to have more stable results and are more resistant to market or portfolio crises, which translates into lower risk.
In contrast to regulatory criteria, we consider such intangible assets as DTAs and goodwill to retain value (even in a hypothetical resolution), owing to the geographic structure of our subsidiaries. Thus, we can value assets and estimate their unexpected loss and capital impact.
Economic capital is an essential internal management tool that helps us develop our strategy, assess solvency and manage portfolio and business risk. As such, it is a key part of the Supervisory Review and Evaluation Process (SREP).
Regarding Basel Pillar 2, we use our economic model for the internal capital adequacy assessment process (ICAAP). We plan business progression and capital needs under a baseline scenario and alternative stress scenarios to make sure we meet our solvency objectives, even in adverse scenarios.
Economic capital-derived metrics help us assess risk-return objectives, price operations based on risk, determine how economically viable projects are, and value country units and business lines to fulfil our overriding objective of maximizing shareholder value.
As a homogeneous risk measure, we can use economic capital to explain how we distribute risk throughout Santander, bringing together several activities and risk types under a single metric.
Given its relevance to internal management, Santander includes several economic capital-derived metrics from both a capital needs and a risk-return point of view, within a conservative risk appetite framework established at both Group and subsidiary level.
Required economic capital in December 2024 amounted to EUR 69,984 million. Compared to the available economic capital base of EUR 96,342 million, this implies a capital surplus of EUR 26,358 million.
For more information on economic capital, please refer to the capital management chapter of the 'Economic and Financial Review' in the 2024 Annual report.
|
|
|
|
|
|
|
Access 2024 Annual Report available on the Santander Group website |
2.7. Capital planning and stress tests
This section covers the qualitative requirement OVC - ICAAP information.
Capital stress test exercises are a key tool in banks' dynamic assessments of their risks and solvency. These forward-looking reviews are based on unlikely-but-plausible macroeconomic and idiosyncratic scenarios. They require robust planning models that can translate the effects defined in the projected scenarios to elements that affect solvency.
The ultimate aim of these exercises is to assess risks and solvency thoroughly to determine capital requirements if a bank fails to meet its regulatory and internal capital objectives.
Santander has an internal capital stress and planning process to respond to various regulatory exercises and is a key tool integrated within management and strategy. They aim to ensure sufficient current and future capital, even in unlikely-but-plausible economic scenarios. We estimate results in various business environments (including severe recessions as well as expected macroeconomic environments), based on our initial situation (financial statements, capital base, risk parameters and regulatory and economic ratios) to determine our solvency ratios, usually for a three-year period.
Planning offers a comprehensive view of our capital for the analysed period and in each of the defined scenarios based on regulatory capital and economic capital metrics.
Further information on capital planning and stress exercises can be found in the 'Economic and Financial' chapter in the 2024 Annual report.
|
|
|
|
|
|
|
Access 2024 Annual Report available on the Santander Group website |
2024 Pillar 3 Disclosures Report 55
2.8. TLAC and MREL
In November 2015, the FSB published the TLAC term sheet based on the previously published principles for crisis management frameworks. It aims to ensure global systemically important banks (G-SIBs) will have the capacity to absorb losses and recapitalize as required to maintain critical functions during and immediately after resolution proceedings without compromising public funds or financial stability.
From 1 January 2022, the TLAC term sheet requires each G-SIB to have an individually set minimum TLAC level that is the greater of 18% of risk-weighted assets and 6.75% of the Basel III Tier 1 leverage ratio exposure.
Some jurisdictions have already transposed the TLAC term sheet into law (as is the case in Europe, in the US and in Mexico as of 1 January 2023); however, other jurisdictions where we operate (e.g. Brazil) have yet to do so.
In Europe, the final texts of CRR 2 and BRRD 2, which amend the resolution framework, were published in June 2019. One of the main objectives of this revision was to implement the TLAC requirement in Europe.
The CRR 2, which came into force in June 2019, dictates the 18% minimum requirement for G-SIBs as set in the TLAC term sheet. It must be made up of subordinated liabilities (with the exception of a percentage of senior debt of maximum of 3.5%, with the resolution authority's authorization)
As of 31 December 2024, the TLAC of the resolution group headed by Banco Santander, S.A. stood at 31.0% of risk-weighted assets and 9.8% of the leverage ratio exposure.
The BRRD 2 was transposed into law in Spain in 2021.
G-SIBs also have a Pillar 2 requirement in addition to the minimum CRR TLAC requirement, owing to the MREL methodology in the BRRD 2.
In June 2024, Banco de España formally communicated the (binding) MREL requirement for the Banco Santander, S.A. Resolution Group (sub-consolidated):
•Until 31 December 2024, the Group needed to meet the minimum requirement set at the highest of 29.69% of the Resolution Group’s RWAs and 11.51% of the Resolution Group’s leverage ratio exposure. Of the total MREL requirement, a minimum subordination level was fixed as the highest of 10.27% of RWAs and 6.13% of the leverage ratio exposure. However, the Resolution Group headed by Banco Santander, S.A.'s minimum subordination is determined by TLAC, not by MREL, as the TLAC subordination requirement is greater. This MREL requirement was based on December 2021 data.
As of 31 December 2024, Banco Santander, S.A.'s MREL was 42.1% of RWAs and 16.5% of the leverage ratio exposure and subordinated MREL was 35.2% or RWAs and 13.8% of the leverage ratio exposure. As a result, it met its MREL requirements.
•From 1 January 2025 until 24 June 2025, the Group must meet the minimum requirement set at the highest of 32.39% of the Resolution Group’s RWAs and 12.23% of the Resolution Group’s leverage ratio exposure. Of the total MREL requirement, a minimum subordination level was fixed as the highest of 11.30% of RWAs and 6.22% of the leverage ratio exposure. This MREL requirement is based on December 2022 data.
•From 24 June 2025, until otherwise communicated by Banco de España, the Group will need to meet a minimum requirement set at the highest of 33.59% of the Resolution Group’s RWAs and 12.93% of the Resolution Group’s leverage ratio exposure. Of the total MREL requirement, a minimum subordination level was fixed as the highest of 11.30% of RWAs and 6.22% of the leverage ratio exposure. This MREL requirement is based on December 2022 data.
56 2024 Pillar 3 Disclosures Report
A: CBR: Combined Buffer Requirement, comprising a Capital Conservation Buffer (2.5%), a G-SII buffer (1.25%), a countercyclical capital buffer (0.37%) and a systemic risk buffer (0.04%).
2024 Pillar 3 Disclosures Report 57
The requirement for own funds and eligible liabilities are shown below:
|
|
|
|
|
|
|
|
|
|
|
|
|
|
|
|
|
|
|
|
|
|
|
|
| Table 18.EU KM2: Key metrics - G-SII requirement for own funds and eligible liabilities (TLAC) |
|
|
|
|
|
|
|
|
|
|
Minimum requirement
for own funds
and eligible liabilities (MREL) |
G-SII Requirement for own funds and eligible liabilities (TLAC) |
|
|
a |
b |
c |
d |
e |
f |
|
|
Dec'24 |
Dec'24 |
Sep'24 |
Jun'24 |
Mar'24 |
Dec'23 |
|
Own funds and eligible liabilities, ratios and components |
| 1 |
Own funds and eligible liabilities |
171,808 |
96,205 |
91,398 |
90,714 |
87,930 |
84,086 |
| EU-1a |
Of which own funds and subordinated liabilities |
143,458 |
|
|
|
|
|
| 2 |
Total risk exposure amount of the resolution group (TREA) |
408,109 |
310,413 |
320,418 |
314,369 |
319,277 |
315,015 |
| 3 |
Own funds and eligible liabilities as a percentage of TREA (row1/row2) |
42.10% |
30.99% |
28.52% |
28.86% |
27.54% |
26.69% |
| EU-3a |
Of which own funds and subordinated liabilities |
35.15% |
|
|
|
|
|
| 4 |
Total exposure measure (TEM) of the resolution group |
1,039,963 |
981,845 |
950,424 |
929,223 |
928,306 |
912,014 |
| 5 |
Own funds and eligible liabilities as percentage of the TEM |
16.52% |
9.80% |
9.62% |
9.76% |
9.47% |
9.22% |
| EU-5a |
Of which own funds or subordinated liabilities |
13.79% |
|
|
|
|
|
| 6a |
Does the subordination exemption in Article 72b(4) of Regulation (EU) No 575/2013 apply? (5 % exemption |
|
No |
No |
No |
No |
No |
| 6b |
Aggregate amount of permitted non-subordinated eligible liabilities instruments if the subordination discretion in accordance with Article 72b(3) of Regulation (EU) No 575/2013 is applied (max 3,5 % exemption) |
|
10,864 |
11,215 |
11,003 |
11,175 |
11,026 |
| 6c |
If a capped subordination exemption applies in accordance with Article 72b (3) of Regulation (EU) No 575/2013, the amount of funding issued that ranks pari passu with excluded liabilities and that is recognised under row 1, divided by funding issued that ranks pari passu with excluded liabilities and that would be recognised under row 1 if no cap was applied (%) |
|
38.32% |
40.81% |
44.05% |
45.30% |
45.50% |
|
Minimum requirement for own funds and eligible liabilities (MREL) |
| EU-7 |
MREL requirement expressed as percentage of the total risk exposure amount |
29.69% |
|
|
|
|
|
| EU-8 |
Of which to be met with own funds or subordinated liabilities |
10.27% |
|
|
|
|
|
| EU-9 |
MREL requirement expressed as percentage of the total exposure measure |
11.51% |
|
|
|
|
|
| EU-10 |
Of which to be met with own funds or subordinated liabilities |
6.13% |
|
|
|
|
|
58 2024 Pillar 3 Disclosures Report
|
|
|
|
|
|
|
|
|
|
|
|
|
|
|
| Table 19.EU TLAC1 - Composition - G-SII Requirement for own funds and eligible liabilities |
|
|
|
|
|
|
|
|
a |
b |
c |
|
|
Minimum requirement for own funds and eligible liabilities (MREL) |
G-SII requirement for own funds and eligible liabilities (TLAC) |
Memo item: Amounts eligible for the purposes of MREL, but not TLAC |
|
Own funds and eligible liabilities and adjustments |
|
| 1 |
Common Equity Tier 1 capital (CET1) |
82,473 |
82,473 |
— |
| 2 |
Additional Tier 1 capital (AT1) |
9,986 |
9,986 |
— |
| 6 |
Tier 2 capital (T2) |
13,587 |
13,587 |
— |
| 11 |
Own funds for the purpose of Articles 92a CRR and 45 BRRD |
106,046 |
106,046 |
— |
|
Own funds and eligible liabilities: Non-regulatory capital elements |
|
|
|
| 12 |
Eligible liabilities instruments issued directly by the resolution entity that are subordinated to excluded liabilities (not grandfathered) |
34,724 |
34,724 |
— |
| EU-12a |
Eligible liabilities instruments issued by other entities within the resolution group that are subordinated to excluded liabilities (not grandfathered) |
— |
— |
— |
| EU-12b |
Eligible liabilities instruments that are subordinated to excluded liabilities, issued prior to 27 June 2019 (subordinated grandfathered) |
— |
— |
— |
| EU-12c |
Tier 2 instruments with a residual maturity of at least one year to the extent they do not qualify as Tier 2 items |
2,693 |
2,693 |
— |
| 13 |
Eligible liabilities that are not subordinated to excluded liabilities (not grandfathered pre cap) |
28,466 |
28,466 |
— |
| EU-13a |
Eligible liabilities that are not subordinated to excluded liabilities issued prior to 27 June 2019 (pre-cap) |
— |
— |
— |
| 14 |
Amount of non subordinated instruments eligible, where applicable after application of Article 72b (3) CRR |
28,466 |
10,864 |
17,602 |
| 17 |
Eligible liabilities items before adjustments |
65,883 |
48,281 |
17,602 |
| EU-17a |
Of which subordinated liabilities items |
37,417 |
37,417 |
— |
|
Own funds and eligible liabilities: Adjustments to non-regulatory capital elements |
|
|
|
| 18 |
Own funds and eligible liabilities items before adjustments |
171,929 |
154,327 |
17,602 |
| 19 |
(Deduction of exposures between multiple point of entry (MPE) resolution groups) |
|
58,118 |
|
| 20 |
(Deduction of investments in other eligible liabilities instruments) |
121 |
121 |
|
| 22 |
Own funds and eligible liabilities after adjustments |
171,808 |
96,205 |
75,604 |
| EU-22a |
Of which: own funds and subordinated liabilities |
143,458 |
|
|
|
Risk-weighted exposure amount and leverage exposure measure of the resolution group |
|
|
|
| 23 |
Total risk exposure amount (TREA) |
408,109 |
310,413 |
97,697 |
| 24 |
Total exposure measure (TEM) |
1,039,963 |
981,845 |
58,118 |
2024 Pillar 3 Disclosures Report 59
|
|
|
|
|
|
|
|
|
|
|
|
|
|
|
| Table 19.EU TLAC1 - Composition - G-SII Requirement for own funds and eligible liabilities |
|
|
|
|
|
|
|
|
a |
b |
c |
|
|
Minimum requirement for own funds and eligible liabilities (MREL) |
G-SII requirement for own funds and eligible liabilities (TLAC) |
Memo item: Amounts eligible for the purposes of MREL, but not TLAC |
|
Ratio of own funds and eligible liabilities |
|
|
|
| 25 |
Own funds and eligible liabilities as a percentage of TREA |
42.10 |
% |
30.99 |
% |
11.11 |
% |
| EU-25a |
Of which own funds and subordinated liabilities |
35.15 |
% |
|
|
| 26 |
Own funds and eligible liabilities as a percentage of TEM |
16.52 |
% |
9.80 |
% |
6.72 |
% |
| EU-26a |
Of which own funds and subordinated liabilities |
13.79 |
% |
|
|
| 27 |
CET1 (as a percentage of TREA) available after meeting the resolution group’s requirements |
12.99 |
% |
12.99 |
% |
|
| 28 |
Institution-specific combined buffer requirement |
|
4.16 |
% |
|
| 29 |
of which: capital conservation buffer requirement |
|
2.50 |
% |
|
| 30 |
of which: countercyclical buffer requirement |
|
0.37 |
% |
|
| 31 |
of which: systemic risk buffer requirement |
|
0.05 |
% |
|
| EU-31a |
of which: Global Systemically Important Institution (G-SII) or Other Systemically Important Institution (O-SII) buffer |
|
1.25 |
% |
|
|
Memorandum items |
|
|
|
| EU-32 |
Total amount of excluded liabilities referred to in Article 72a(2) of Regulation (EU) No 575/2013 |
|
527,819 |
|
60 2024 Pillar 3 Disclosures Report
The creditor ranking is shown below:
|
|
|
|
|
|
|
|
|
|
|
|
|
|
|
|
|
|
|
|
|
|
|
|
|
|
|
|
|
|
|
|
|
|
|
|
| Table 20.EU TLAC3a: creditor ranking - resolution entity |
|
|
|
|
|
|
|
|
|
|
|
|
|
|
Insolvency ranking |
|
|
|
1 |
2 |
3 |
4 |
5 |
6 |
7 |
8 |
9 |
|
|
|
(most junior) |
|
|
|
|
|
|
|
(most senior) |
| 1 |
Description of insolvency ranking |
CET1 |
AT1 |
Tier 2 |
Claims from persons specially related to the debtor (including Intragroup liabilities) |
Claims from fines |
Rest of accrued interests |
Rest of contractually subordinated claims |
Senior non preferred claims |
Ordinary claims |
|
| 2 |
Liabilities and own funds |
71,032 |
9,734 |
18,713 |
22,083 |
— |
3,195 |
— |
39,236 |
247,141 |
411,133 |
| 3 |
of which excluded liabilities |
— |
— |
— |
— |
— |
— |
— |
— |
157,055 |
157,055 |
| 4 |
Liabilities and own funds less excluded liabilities |
71,032 |
9,734 |
18,713 |
22,083 |
— |
3,195 |
— |
39,236 |
90,085 |
254,077 |
| 5 |
Subset of liabilities and own funds less excluded liabilities that are own funds and liabilities potentially eligible for meeting TLAC |
71,032 |
9,734 |
15,743 |
— |
— |
— |
— |
34,720 |
28,350 |
159,578 |
| 6 |
of which residual maturity ≥ 1 year < 2 years |
— |
— |
2,260 |
— |
— |
— |
— |
4,260 |
4,216 |
10,736 |
| 7 |
of which residual maturity ≥ 2 year < 5 years |
— |
— |
2,388 |
— |
— |
— |
— |
20,235 |
13,433 |
36,056 |
| 8 |
of which residual maturity ≥ 5 years < 10 years |
— |
— |
10,626 |
— |
— |
— |
— |
9,887 |
10,254 |
30,768 |
| 9 |
of which residual maturity ≥ 10 years, but excluding perpetual securities |
— |
— |
— |
— |
— |
— |
— |
338 |
446 |
784 |
| 10 |
of which perpetual securities |
71,032 |
9,734 |
144 |
— |
— |
— |
— |
— |
— |
80,910 |
For further information on capital and TLAC instruments main features - Own Funds and Eligible liabilities, see Appendix X and Appendix XI.
|
|
|
|
|
|
|
Access the Pillar 3 2024 file available on Grupo Santander's web site |
2024 Pillar 3 Disclosures Report 61
62 2024 Pillar 3 Disclosures Report
|
|
|
|
|
|
|
|
|
|
|
|
|
|
|
|
|
|
|
|
|
|
|
|
|
|
|
|
|
|
|
|
|
|
|
|
|
|
|
|
|
|
|
|
|
|
|
|
|
|
|
|
|
|
|
|
|
|
|
|
|
|
|
|
|
|
3.2.1.2. Board committees |
|
|
|
|
|
|
|
|
|
|
|
|
|
|
|
|
|
|
|
|
|
|
|
|
|
|
|
|
|
|
|
|
|
|
|
|
|
|
|
|
|
|
|
|
|
|
|
|
|
|
|
|
|
|
|
|
|
|
|
|
|
|
|
|
|
|
|
|
|
|
|
3. GLOBAL RISK VISION |
2024 Pillar 3 Disclosures Report 63
|
|
|
|
|
|
|
|
|
|
|
|
|
|
|
|
|
|
|
|
|
|
|
|
|
|
|
|
|
|
|
|
|
This chapter will focus on three main sections: |
|
|
|
|
|
|
|
|
|
|
|
|
|
| 1 |
|
Risk management and control model. This section covers the qualitative requirements OVA - Entity's risk management approach and OVB - Information on governance arrangements. |
|
2 |
|
Governance. This section covers the qualitative requirements OVA - Entity's approach to risk management and OVB - Information on governance arrangements. |
|
3 |
|
Lines of defence. This section covers paragraphs (b), (c) and (d) of the qualitative requirement SRA - Qualitative disclosure requirements related to the IRB approach. |
|
|
|
|
|
|
|
|
|
|
|
|
|
|
|
|
|
|
|
|
3.1. Risk management and control model
This section covers the qualitative requirements OVA - Institution risk management approach and OVB - Disclosure on governance arrangements.
Our risk management and control model is underpinned by common principles, a solid risk culture, robust governance and advanced management processes on risk types.
3.1.1. Risk principles and culture
Grupo Santander's risk management and control comply to the mandatory principles and in addition, our risk culture (Risk Pro), which considers regulatory requirements and best market practices:
•All employees are risk managers understand the risks that their work can create and avoid risks which will exceed the Group’s risk appetite or have an unknown impact.
•Senior managers are involved in risk management and control risk through their conduct, action and communications, as well as reviewing our risk culture and upholding our risk profile within risk appetite.
•Independence of risk management and control functions, according to our three lines of defence model and with clearly defined roles and responsibilities.
•We take a forward-looking, comprehensive approach for all businesses and risk types, which should be proactive and analyse trends over different time periods and under different scenarios.
•Effective information management to identify, assess, manage and disclose risks at appropriate levels.
Risk culture - Risk Pro
The Group's risk culture, which is called Risk Pro (or 'I AM RISK' in the US), is a core element of both our corporate culture, The Santander Way and our purpose of helping people and businesses prosper.
Risk Pro is each employee’s accountability for the risks taken in their day to day activity and their individual contribution to identifying, assessing and managing risks properly and responsibly.
Risk Pro is part of all stages of the employee life cycle: recruitment, growth and development (training), day to day activity, remuneration and recognition.
Due to communication being the most important tool in embedding our risk culture, the communication networks of each unit were enhanced over the last year.
The global Risk Pro Week contributed to our risk culture and raised employees’ awareness of the importance of managing risk in their day to day activity.
For more details about Group's risk culture, see the section '6.1. Corporate culture' of the 'Sustainability, Statement' chapter.
|
|
|
|
|
|
|
Access 2024 Annual Report available on the Santander Group website |
64 2024 Pillar 3 Disclosures Report
3.1.2. Types of risk
Grupo Santander has measures and procedures in place to identify, measure, manage, control and report the risks that occur in our day-to-day activities and also for operations in special circumstances.
The Risk and Compliance functions follow internal regulation for each risk type that sets out the processes, tools, roles, responsibilities and governance requirements to establish a robust control environment.
The Grupo Santander´s risk classification is based on our corporate risk framework and includes:
|
|
|
|
|
|
|
|
|
| 1 |
Credit risk is the risk of financial loss arising from the default or credit quality deterioration of a customer or counterparty, to which the Grupo Santander has either directly provided credit or for which it has assumed a contractual obligation. |
| 2 |
Market risk is the risk incurred as a result of the effect of changes in market factors interest rates, exchange rates, equities and commodities, among others, may have on profits or capital. |
| 3 |
Liquidity risk occurs if liquid financial resources are insufficient or too costly to obtain in order to meet liabilities when they fall due. |
| 4 |
Structural risk is the risk of changes in the value or margin generation of the assets or liabilities in the banking book resulting from changes in market factors and balance sheet behaviour. It also includes risks associated with insurance and pension activities, as well as the risk of the Grupo Santander not having an adequate amount or quality of capital to meet its internal business objectives, regulatory requirements, or market expectations. |
| 5 |
Operational risk is the risk of loss resulting from inadequate or failed internal processes, people, and systems or from external events, including legal risk and the regulatory compliance and conduct risks. |
| 6 |
Financial crime risk is the risk arising from actions or the use of the Group's means, products, and services in criminal or illegal activities. These activities include, among others, money laundering, terrorist financing, violation of international sanctions programs, corruption, bribes, and tax evasion. |
| 7 |
Model risk is the risk of potential negative consequences arising from decisions based on poorly developed, poorly implemented or incorrectly used models, which could lead to financial losses, inadequate commercial or strategic decisions or damage to the Group's operations. |
| 8 |
Reputational risk is the risk of current or potential negative economic impact to the bank due to damage to the perception of the bank on the part of employees, customers, shareholders/investors, and the wider community. |
| 9 |
Strategic risk is the risk of loss or damage arising from strategic decisions or their poor implementation, that impact the medium and long term interests of our key stakeholders, or from an inability to adapt to external developments. |
Given the cross-cutting impact that ESG (environmental, social and governance) risk factors can have on the different types of risks that exist in different time horizons, our ESG risk management requires a comprehensive view to be able to manage and control these risks correctly, align with the Group’s sustainability strategy and meet regulatory requirements and supervisory expectations.
3.1.3. Risk management processes and tools
Grupo Santander has the following processes and tools to carry out an effective risk management :
A. Risk appetite and structure of limits
Risk appetite is the aggregate level and types of risk we deem prudent for our business strategy, even in unforeseen circumstances.
The risk appetite is expressed through qualitative statements and quantitative limits and metrics representative of the bank’s risk profile. Those metrics cover all key risk types according to our corporate risk framework. We articulate them in five axes that provide us with a holistic view of all risks we incur in the development of our business model.
The risk appetite framework (RAF) establishes its key elements, which define Santander's business model. These are:
•A medium-low, predictable target risk profile, customer focus, internationally diversified operations and a significant market share.
•Stable, recurrent earnings and shareholder remuneration, sustained by a sound base of capital, liquidity and sources of funding.
•Autonomous subsidiaries that are self-sufficient in terms of capital and liquidity to safeguard their risk profiles against compromising the Group’s profile.
•An independent risk function and a senior management actively engaged in supporting a robust control environment and risk culture.
•A conduct model that protects our customers and our Simple, Personal and Fair culture.
|
|
|
|
|
|
|
Access 2024 Annual Report available on the Santander Group website |
Risk appetite is governed throughout the Group by the following principles:
•Risk appetite is part of the board's duties. It prepares the risk appetite statement (RAS) for the whole Group every year. In a cascading down process, each subsidiary's board also sets its own risk appetite.
•Comprehensiveness and forward-looking approach. Our appetite includes of all material risks that we are exposed to and defines our target risk profile for the current and medium term with a forward-looking view considering stress scenarios.
To promote that all material risks are adequately represented, we use corporate methodologies to identify and assess the risk to which we are exposed to and are inherent to our activities (emerging risks and risk control self-assessment — RCSA— among others).
•Common standards embedded in the day-to-day risk management. The Group shares the same risk appetite model, which sets common requirements for processes, metrics, governance bodies, controls and standards. It also facilitates an effective and traceable embedding of our appetite into more granular management policies and limits across our subsidiaries.
2024 Pillar 3 Disclosures Report 65
•Continuous adaptation to market best practices, regulatory requirements and supervisors’ expectations.
•Aligning with business plans and strategy. The risk appetite is a key point of reference for strategic and business planning. We verify that the three-year strategic plans, the annual budget, and capital and liquidity planning are within the limits set in the RAS before we approve them.
The strategic and business plans are aligned with our risk appetite by:
•considering the risk appetite, long-term strategic view and the risk culture when drafting strategic and business plans.
•challenging business and strategic plans against the risk appetite. Misalignments trigger a review of either the three-year strategic plan (to make sure we stay within RAS limits) or risk appetite limits, with independent governance.
•control through the three lines of defence model that the risk appetite limits are subject to periodic oversight and that the specialized control functions report on risk profile and compliance with limits to the board and its committees every month.
B. Risk profile assessment (RPA)
Risk identification and assessment activities, and risk profile calculation extend to all types of risks arising from the entity's activities. The risk framework, reviewed annually, defines the key risk types resulting from the Group's main risk identification and assessment exercises.
Risk identification encompasses all processes aimed at detecting risks and vulnerabilities, both internal and external, to which the Group is exposed. These processes enable the responsible functions to become aware of these risks and form the starting point for effective management and control.
Risk assessment includes processes through which the relevance of identified risks is determined, quantitatively and/or qualitatively, considering both inherent risk (before considering the effects of associated mitigant and controls) and residual risk levels.
The responsible function systematically evaluates the Group's risk profile and its subsidiaries using a unique RPA methodology, based on the fundamental principles of the risk identification and assessment model: responsibility of all functions, efficiency, common methodologies, completeness in covering all risks, materiality, and orientation towards corrective and mitigation actions.
The calculation of the risk profile according to this methodology generates results through a scoring system composed of four materiality categories: low, medium-low, medium-high and high. This allows for monitoring the risk appetite approved by the board. Additionally, it provides a holistic view of all risks at a given point in time, enabling the identification of management weaknesses and potential deviations from the business plan, on which corrective actions can be taken. It provides evidence of prudent risk management, confirming strong solvency ratios and comfortable liquidity levels.
The Group objective is to maintain a medium-low risk profile, stable in an environment dominated by market volatility, a gradual decline in inflation, and ongoing geopolitical tensions. The prudent and anticipatory risk management translates into good profitability and credit quality indicators by year-end, maintaining a good liquidity risk profile.
|
|
|
|
|
|
|
Access 2024 Annual Report available on the Santander Group website |
66 2024 Pillar 3 Disclosures Report
3.2. Governance
This section covers the qualitative requirements OVA - Institution risk management approach and OVB - Disclosure on governance arrangements.
Except for matters discussed by the general shareholders meeting, the board of directors is the highest decision-making body of Banco Santander, performing its duties with unity of purpose and independence of judgement. The board's policy is to delegate day-to-day management and the execution of strategy to the executive bodies and the management team, focusing on the performance of its general supervisory function.
3.2.1. Board of Directors
As at 31 December 2024, the ´board of directors consists of 15 members, whose profiles and track records are listed in section 4.1 "Our directors" of the corporate governance chapter of the 2024 Annual report. The Bylaws allow it to have between 12 and 17 members.
Composition by type of director
The composition of the board of directors is balanced between executive and non-executive directors, most of whom are independent. Each director’s status has been verified by the nomination committee.
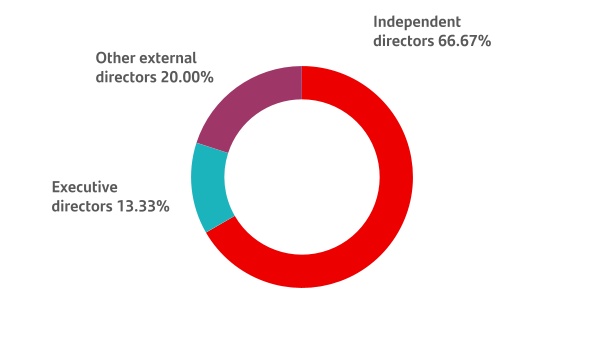
For more details on the actual knowledge, skills and experience of the members of the board of directors, as well as on the appointment, renewal and succession of directors, see chapter 'Corporate governance' of the 2024 Annual report.
|
|
|
|
|
|
|
Access 2024 Annual Report available on the Santander Group website |
3.2.1.1. Diversity
A diverse board of directors is essential to its effectiveness. A pluralistic composition incorporating a broad range of qualities, experiences and points of view promotes the contribution of independent opinions, encourages constructive debate and ensures soundness and quality in decision-making. Thus, we seek to achieve a sound balance of technical skills, expertise and a broad diversity in the composition of the board.
Our policy for the selection, suitability assessment and succession of directors favours diversity on the board, not only in terms of gender, but also in terms of age, geographical origin, experience and expertise. In addition, the policy ensures that selection procedures for directors are free from implicit biases that could lead to discrimination of any kind, e.g. on the basis of race, disability or ethnic origin.
In the past year we have continued to renew and strengthen the composition of the board to ensure a balanced representation of skills and diversity. The board is composed of 40% women (meeting the internally set target of a balanced representation of 40-60% of both genders), and also complying in advance with the provisions of Organic Law 2/2024, of 1 August, on equal representation and balanced presence of women and men, which requires a minimum presence of 40% of the underrepresented sex on the board of directors of the 35 companies with the largest market capitalization as of June 2026. In addition, two thirds of the directors are independent.
For more information on board diversity at Banco Santander, see 'Corporate governance' chapter of the 2024 Annual report.
|
|
|
|
|
|
|
Access 2024 Annual Report available on the Santander Group website |
3.2.1.2. Board committees
Banco Santander has a structure of seven committees that support the board in three main areas:
•In the management of the Group, exercising decision-making powers, through the executive committee.
•In defining strategy in key areas, through the responsible banking, sustainability and culture committee and the innovation and technology committee.
•In its functions of supervision and adoption of relevant decisions, through the audit, appointments, remuneration and risk supervision, regulation and compliance committees.
For more details see the 'Corporate governance' chapter of the 2024 Annual report.
|
|
|
|
|
|
|
Access 2024 Annual Report available on the Santander Group website |
2024 Pillar 3 Disclosures Report 67
3.2.2. Risk governance structure
The board of directors is ultimately responsible for risk and compliance management and control.
It revises and approves the bank's risk frameworks and appetite while promoting a strong risk culture across the Group. The board relies on its risk supervision, regulation and compliance committee for risk control and on the Group’s executive committee for risk approval.
For more details on board committees, see the 'Corporate governance' chapter and 'Risk and compliance management' chapter of the 2024 Annual report.
|
|
|
|
|
|
|
Access 2024 Annual Report available on the Santander Group website |
3.3. Lines of defence
In this section, the provisions of letters (b), (c) and (d) of the CRE - Qualitative disclosure requirements related to IRB approach requirement -Institution risk management approach, are complied with.
Our model of three lines of defence effectively manages and controls risks:
•First line: formed by the business units and support functions that take or originate exposure to risk, it detects, measures, controls, monitors and reports on risks it originates according to internal risk management regulation. Risk management has to be consistent with the approved risk appetite and related limits. The first line of defence executes the mitigation plans for the risks where we have identified shortcomings in their control environment.
•Second line: formed by the risk and compliance functions. It independently oversees and challenges the first line’s risk management.
•Third line: the internal audit function, which is independent to ensure the board of directors and senior managers with high quality and efficient internal controls, governance and risk management systems, helping to safeguard our value, solvency and reputation.
The Risk, Compliance and Internal Audit functions are separate and independent. Each has direct access to the board of directors and its committees.
3.3.1. Second line of defence
Its duties include ensuring that risks are managed according to the risk appetite defined by senior management and strengthening our risk culture throughout Grupo Santander. The second line of defence has to supervise and challenge the control environment implemented by the first line.
3.3.2. Third line of defence
The Internal Audit applies the definition of the Institute of Internal Auditors. It is a permanent function and is independent of all other functions and units. Its mission is to provide the board of directors and senior management with independent assurance with regard to the quality and efficacy of the systems and internal control, risk (current and emerging) management and governance processes, helping to safeguard the organisation's value, capital adequacy and reputation. It evaluates:
•The efficacy and efficiency of the processes and systems referred to above.
•Compliance with applicable legislation and the requirements of supervisory bodies.
•The reliability and integrity of financial and operating information.
•The integrity of capital.
Internal Audit is the third line of defence, acting independently.
Its scope of work encompasses:
68 2024 Pillar 3 Disclosures Report
•All group entities over which the group exercises effective control.
•Separate asset pools (for example, investment funds) managed by the entities mentioned in the previous section.
•All entities (or separate asset pools) not included in the previous points for which there is an agreement for the group to provide internal audit functions.
The Internal Audit is guided by the following principles in this work: (i) Independence, objectivity and impartiality, (ii) Integrity, ethical behaviour and confidentiality of the information handled and its findings, (iii) Competence and professional qualifications of the auditors, (iv) Quality of the work, (v) Value creation, (vi) Adequate collaboration with other control functions in the group and with the external auditors and other assurance providers working within the organisation, (vii) A smooth relationship with the supervisory bodies and (viii) Compliance with international standards for the function.
The Internal Audit's authority comes directly from the Board of Directors. Internal Audit reports to the Board Audit Committee and complies with the reporting requirements it receives from the committee in the discharge of its duties. However, as an independent unit, it reports regularly to the Board of Directors, at least twice a year and when it deems it necessary, direct access to the board is enabled.
In addition, it organises its activities with the flexibility necessary to adapt to the Group's current structure and circumstances and to achieve its objectives with maximum effectiveness and efficiency.
The Group Chief Audit Executive is responsible for submitting a corporate framework for the Internal Audit to the Board of Directors for approval and subsequent implementation. This corporate framework sets out the global function and the way in which it is to be performed, as well as any changes which arise from its regular reviews.
A plan based on an assessment of the risks to which the group is exposed is provided by the Internal Audit and submitted to the audit committee. Further it is submitted to the Board of Directors, which needs to approve it. In terms of solvency, this plan is defined, between others, in accordance with supervisory and regulatory requirements, the risk assessment process and the cycle of capital audits, taking into account the results of engagements in previous years and other criteria, such as the ratio of implementation of recommendations issued, the results of regulatory inspections, requests made by supervisory authorities and changes in mandatory regulations.
The scope of Santander´s Group capital functions includes, mainly, the capital measurement and reporting processes, as well as, the adequacy, planning and management. It also performs other tasks focusing on transversal issues with significant impact on the Group's solvency, such as analysis of credit portfolios and accounting provisions, risk management processes and other Group strategic exercises.
Regarding the models used for capital calculation, in accordance with the "ECB Guide to Internal Models" of February 2024 (General Aspects, point 5), the Internal Audit performs a risk assessment exercise on the models used to calculate capital, identifying main focus of review over the "rating system" and the greatest risks in the following major lines of action:
•Reviewing compliance with the Group's internal governance model and supervisory requirements for the approval and maintenance of advanced models.
•Managing models and their adequacy and integration.
•Analysing the accuracy of risk measurement. Checking, through analysis and tests on the quality, consistency and integrity of the Basel databases, that the methodology used in constructing the risk parameter models is consistent with their intended uses and complies with corporate standards and regulatory requirements as well as, the adequacy of internal validation function.
•Review of the regulatory capital calculation and reporting process, verifying compliance with existing regulations.
•Analysing the technical aspects and applications of the technological environment.
The key processes of the internal audit function are the activities that allow to develop the function according to the following detail:
2024 Pillar 3 Disclosures Report 69
3.3.3. Internal Audit - Key processes
70 2024 Pillar 3 Disclosures Report
[THIS PAGE INTENTIONALLY LEFT BLANK]
2024 Pillar 3 Disclosures Report 71
72 2024 Pillar 3 Disclosures Report
|
|
|
|
|
|
|
|
|
|
|
|
|
|
|
|
|
|
|
|
|
|
|
|
|
|
|
|
|
|
|
|
|
|
|
|
|
|
|
|
|
|
|
|
|
|
4.2.1. IRB roll-out plan and supervisory approval |
|
|
|
4.2.2. Internal ratings-based approach (IRB) |
|
|
|
4.2.3. Equity investments and instruments not included in the held-for-trading book |
|
|
|
4.2.4. Standardised approach |
|
|
|
|
|
|
|
|
|
|
|
|
|
|
|
|
|
|
|
|
|
|
|
|
|
|
|
|
|
|
|
|
|
|
|
|
|
|
|
|
|
|
|
|
|
|
|
|
|
|
|
|
|
|
|
|
|
|
|
|
|
|
|
|
|
|
|
|
|
|
|
|
|
|
|
4. CREDIT RISK |
2024 Pillar 3 Disclosures Report 73
|
|
|
|
|
|
|
Credit occurs from the potential financial loss caused by the default or deterioration in the credit quality of a customer or third party provided with credit or from a contractual obligation.
This chapter provides a detailed analysis of Grupo Santander´s credit risk profile from several perspectives: region, activity sector, residual maturity, etc with a focus on regulatory indicators (EAD and RWA).
|
|
|
|
|
| RWA by geography |
| Excludes Counterparty Credit risk |
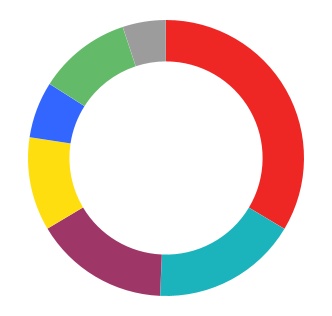
|
|
|
|
|
|
|
|
|
| n |
Spain |
34% |
| n |
Rest of Europe |
17% |
| n |
Brazil |
16% |
| n |
UK |
11% |
| n |
Rest of South America |
7% |
| n |
USA |
11% |
| n |
Rest of North America |
5% |
|
|
|
|
|
|
|
|
|
|
|
|
|
|
|
|
|
|
| Main figures |
| EUR million |
RWA |
Min. Capital Requirements |
|
2024 |
2023 |
2024 |
2023 |
Credit risk (excluding CCR)1 |
499,560 |
515,238 |
39,965 |
41,219 |
| Of which, standardised approach (SA) |
283,612 |
285,728 |
22,689 |
22,858 |
| Of which, the foundation IRB (FIRB) approach |
59,981 |
56,913 |
4,798 |
4,553 |
Of which, slotting approach2 |
13,840 |
14,123 |
1,107 |
1,130 |
| Of which, equities under the simple risk weighted approach |
4,724 |
3,603 |
378 |
288 |
| Of which, the advanced IRB (AIRB) approach |
129,919 |
138,204 |
10,394 |
11,056 |
| Counterparty credit risk - CCR |
18,768 |
13,593 |
1,501 |
1,087 |
| Of which, the standardised approach |
15,035 |
10,150 |
1,203 |
812 |
| Of which, internal model method (IMM) |
— |
— |
— |
— |
| Of which, exposures to a CCP |
294 |
324 |
24 |
26 |
| Of which, credit valuation adjustment - CVA |
679 |
680 |
54 |
54 |
| Of which, other CCR |
2,761 |
2,439 |
221 |
195 |
| Settlement risk |
173 |
4 |
14 |
0 |
| Securitisation exposures in the banking book (after the cap) |
15,705 |
11,419 |
1,256 |
914 |
1It includes equities under the PD/LGD approach. |
2Correction from the mapping indicated by supervisor to {C 08.01, r0020, c0260, s0010} + {C 08.01, r0030, c0260, s0010}. |
|
|
|
| RWA variation |
EUR million |
4.1. General aspects
This section covers the CRA - General qualitative information about credit risk. It also complies with (d), (e), (f) and (g) of the OVA Requirement - Institution risk management approach.
The credit risk management process involves identification, assessment, control and decision-making in relation to the credit risk incurred in the group's operations.
It incorporates operational, customer and portfolio factors, together with a comprehensive view of the credit risk cycle. The business areas, risk areas and senior management are involved in the process. The Group's profile is mainly retail, with diversification of credit risk between mature and emerging markets.
74 2024 Pillar 3 Disclosures Report
4.2. Capital requirements for credit risk
The following table shows the main changes in capital requirements for credit risk in the year:
|
|
|
|
|
|
|
|
|
| Table 21.Credit risk capital requirements movements |
| EUR million |
|
|
|
RWAs |
Capital requirements |
| Starting amount (31/12/2023) |
539,247 |
43,140 |
| Asset size |
(17,322) |
(1,386) |
| Asset quality |
(2,584) |
(207) |
| Model updates |
8,307 |
665 |
| Methodology and policy |
14,308 |
1,145 |
| Acquisitions and disposals |
|
— |
| Foreign exchange movements |
(8,897) |
(712) |
| Other |
|
— |
| Ending amount (31/12/2024) |
533,060 |
42,645 |
| Includes capital requirements from equity, securitizations and counterparty risk (excluding CVA and CCP) |
Credit risk RWAs decreased EUR 6,187 million in 2024. If we isolate the exchange rate effect (due to the depreciation of the Brazilian real, the Mexican peso and the Chilean peso, partially offset by the appreciation of the US dollar and the pound sterling), RWAs increased EUR 2,709 million. This is mainly due to 'Methodology and policy' from calculating maturity models in CIB (+EUR 11,556 million) and a review of the application of the SME factor on some operations with self-employed customers (+EUR 2,752 million). Additionally, 'Model updates' contributed +EUR 8,307 million, mainly relating to capital model changes associated with large exposures in some portfolios. This growth was compensated by the decrease in RWAs related to 'Asset quality' (-EUR 2,584 million) and 'Asset size' (-EUR 17,322 million), as securitizations during the year (-EUR 29,499 million) more than offset widespread business growth.
|
|
|
| RWA Evolution of Credit risk (excluding counterparty credit risk, securitisations and others) |
| Million euros |
2024 Pillar 3 Disclosures Report 75
4.2.1. IRB roll-out plan and supervisory approval
This section covers the letter (a) of the qualitative requirement CRE - Qualitative disclosure requirements related to IRB approach.
Santander has supervisory approval to use advanced approaches for calculating regulatory capital for credit risk for the parent and its main subsidiaries in Spain, the United Kingdom and Portugal and for some portfolios in Germany, Mexico, Brazil, Chile, Nordic countries (Sweden, Finland and Norway), France and the United States.
In order to incorporate the requirements of the EBA Repair Program, updated versions of IRB rating systems have been submitted to the ECB and implemented during 2023 and 2024. Additionally, Grupo Santander is expecting the ECB resolution about the mid-long term IRB strategy to the different portfolios following the simplification criteria discussed with the supervisor previously to its implementation.
The following table shows the geographical scope of the internal models for credit risk (AIRB or FIRB) in the various portfolios:
|
|
|
|
|
|
|
|
|
| List of authorised IRB models by legal entity |
|
|
|
| Country |
Legal Entity |
IRB portfolio (AIRB or FIRB) |
| UK |
Santander UK PLC |
Institutions, Corporates Project Finance, Mortgages, Qualifying Revolving, Other Retail. |
| Abbey National Treasury Services |
Institutions, Corporates Project Finance. |
| Abbey Covered Bonds LLP |
Institutions |
| Spain |
Banco Santander, S.A. |
Institutions, Corporates, Corporates SMEs, Corporates Project Finance, Mortgages, Qualifying Revolving, Retail SMEs, Other Retail |
| Santander Factoring y Confirming S.A. |
Institutions, Corporates, Corporates SMEs, Corporates Project Finance, Mortgages, Retail SMEs, Other Retail |
| Santander Lease, S.A. E.F.C. |
Institutions, Corporates, Corporates SMEs, Mortgages, Retail SMEs, Other Retail |
| Santander Consumer EFC, S.A. |
Corporates, Corporates SMEs, Qualifying Revolving, Other Retail. |
| Santander Consumer Finance, S.A. |
Corporates, Corporates SMEs, Qualifying Revolving, Other Retail. |
| Portugal |
Banco Santander Totta |
Institutions, Corporates, Corporates SMEs, Corporates Project Finance, Mortgages, Qualifying Revolving, Retail SMEs, Other Retail. |
| Brazil |
Banco Santander Brasil |
Corporates |
| Santander Brasil EFC |
Corporates |
| Germany |
Santander Consumer Bank AG |
Corporates, Corporates SMEs, Mortgages, Revolving and Other Retail |
| Mexico |
Banco Santander México |
Institutions, Corporates, Corporates SMEs, Corporates Project Finance |
| USA |
Santander Bank, National Association |
Corporates |
| France |
Société Financiére de Banque - SOFIB |
Corporates, Corporates SMEs, Retail SMEs, Other Retail |
| Nordics |
Santander Consumer Bank A.S. |
Other Retail |
| Santander Consumer Finance OY |
Other Retail |
| Chile |
Banco Santander - Chile |
Institutions and Corporates |
76 2024 Pillar 3 Disclosures Report
The following table shows the extent of use of the IRB and standard methods for each exposure category as of December 31, 2024:
|
|
|
|
|
|
|
|
|
|
|
|
|
|
|
|
|
|
|
|
|
| Table 22.CR6-A - Scope of the use of IRB and SA approaches |
|
|
|
|
|
|
|
|
|
|
2024 |
|
EUR million |
Exposure value as defined in Article 166 CRR for exposures subject to IRB approach |
Total exposure value for exposures subject to the Standardised approach and to the IRB approach |
Percentage of total exposure value subject to the permanent partial use of the SA (%) |
Percentage of total exposure value subject to a roll-out plan (%) |
Percentage of total exposure value subject to IRB Approach (%) |
|
a |
b |
c |
d |
e |
| 1 |
Central governments or central banks |
— |
433,456 |
100.00% |
—% |
— |
| 1.1 |
Of which Regional governments or local authorities |
|
20,819 |
100.00% |
—% |
— |
| 1.2 |
Of which Public sector entities |
|
3,519 |
100.00% |
— |
— |
| 2 |
Institutions |
22,055 |
69,601 |
41.95% |
26.37% |
31.69% |
| 3 |
Corporates |
202,441 |
426,319 |
26.81% |
25.71% |
47.49% |
| 3.1 |
Of which Corporates - Specialised lending, excluding slotting approach |
|
— |
—% |
—% |
—% |
| 3.2 |
Of which Corporates - Specialised lending under slotting approach |
|
34,705 |
9.20% |
29.22% |
61.58% |
| 4 |
Retail |
359,595 |
840,937 |
21.88% |
35.36% |
42.76% |
| 4.1 |
of which Retail - Secured by real estate SMEs |
|
29,121 |
4.65% |
88.13% |
7.22% |
| 4.2 |
of which Retail - Secured by real estate non-SMEs |
|
477,799 |
8.59% |
31.40% |
60.01% |
| 4.3 |
of which Retail - Qualifying revolving |
|
63,444 |
10.12% |
68.53% |
21.35% |
| 4.4 |
of which Retail - Other SMEs |
|
71,111 |
22.91% |
55.66% |
21.43% |
| 4.5 |
of which Retail - Other non-SMEs |
|
199,461 |
50.99% |
27.97% |
21.04% |
| 5 |
Equity |
7,527 |
7,580 |
0.71% |
— |
99.29% |
| 6 |
Other non-credit obligation assets |
1,086 |
107,679 |
94.31% |
4.68% |
1.01% |
| 7 |
Total |
592,704 |
1,885,572 |
45.74% |
22.82% |
31.43% |
|
Leverage exposure |
|
Phased-in CRR, Phased-in IFRS 9 |
|
|
2024 Pillar 3 Disclosures Report 77
The following table shows the geographical scope of portfolios using the internal models approach (IMA) for market risk:
|
|
|
|
|
|
|
|
|
| List of authorised IMA models by legal entity |
|
|
|
Country |
Legal entity |
IMA portfolio (product) |
| Spain |
Banco Santander, S.A. |
Trading book |
| Santander London Branch |
Trading book |
| Chile |
Banco Santander - Chile |
Trading book |
| Santander Investment Chile Limited |
Trading book |
| Santander Corridors de Bolsa Limited |
Trading book |
| Mexico |
Banco Santander México |
Trading book |
| Casa de Bolsa Santander, S.A. de C.V. |
Trading book |
|
|
|
|
|
|
|
For further information on the market risk, see chapter 7. |
The Group currently uses the standardised approach for calculating regulatory capital for operational risk, as provided in the CRR. In 2017 the European Central Bank granted authorisation for the Alternative Standardised Approach to be used to calculate consolidated capital requirements at Banco Santander México, following the approval granted in 2016 for Brazil.
|
|
|
|
|
|
|
For further information on the operational risk, see chapter 8. |
78 2024 Pillar 3 Disclosures Report
4.2.2. Internal ratings-based approach (IRB)
The following table shows the main variations in IRB credit risk RWA:
|
|
|
|
|
|
|
|
|
|
|
|
|
|
|
|
|
|
| Table 23.CR8 - RWEA flow statements of credit risk exposures under the IRB approach |
|
|
|
EUR million |
|
|
|
|
|
|
Three months ended Dec'24 |
Twelve months ended Dec'24 |
Three months ended Dec'23 |
Twelve months ended Dec'23 |
|
|
a |
|
|
|
|
|
RWA |
RWA |
RWA |
RWA |
| 1 |
Risk weighted exposure amount as at the end of the previous reporting period |
231,597 |
217,701 |
221,907 |
222,926 |
| 2 |
Asset size |
(20,313) |
(22,867) |
(2,369) |
(5,032) |
| 3 |
Asset quality |
(965) |
(2,584) |
(630) |
(2,091) |
| 4 |
Model updates |
— |
8,307 |
304 |
442 |
| 5 |
Methodology and policy |
858 |
12,414 |
— |
— |
| 6 |
Acquisitions and disposals |
— |
— |
— |
— |
| 7 |
Foreign exchange movements |
2,164 |
369 |
(1,510) |
1,457 |
| 8 |
Other |
— |
— |
— |
— |
| 9 |
Risk weighted exposure amount as at the end of the reporting period |
213,341 |
213,341 |
217,701 |
217,701 |
|
It includes capital requirements of equity. |
|
|
|
|
|
Fully-loaded CRR, Phased-in IFRS 9. |
|
|
|
|
IRB credit risk assets decreased by EUR -4,361 Bn in 2024. This is mainly explained by the evolution of asset size (EUR -22,867 Bn) due to the net effect of the business increase and initiatives carried out mainly through securitizations, and by the improvement in asset quality by EUR -2,584 Bn. Risk assets by methodology and policy increased by EUR 12,414 Bn mainly due to the measurement of maturities in the CIB models (EUR 11,556 Bn) and the update of the models by EUR 8,307 Bn.
The distribution of exposures and average parameters by segments and geographies in IRBs without default, equities or specialized financing is shown below:
|
|
|
|
|
|
|
|
|
|
|
|
|
|
|
|
|
|
|
|
|
|
|
|
| Table 24.IRB Exposures and parameters by segment and geography |
| EUR million |
|
|
|
|
|
|
|
|
|
|
|
|
|
|
2024 |
|
Institutions |
Corporates |
Retail Mortgages |
Retail SME |
Retail Other |
Retail Qualifying Revolving |
Total |
| Santander Group |
|
|
|
|
|
|
|
| EAD |
46,122 |
188,144 |
283,829 |
15,563 |
39,495 |
13,348 |
586,501 |
| Average LGD in % |
42.53 |
% |
44.07 |
% |
14.76 |
% |
47.85 |
% |
41.64 |
% |
70.06 |
% |
30.29 |
% |
| Average PD in % |
0.19 |
% |
1.01 |
% |
1.30 |
% |
3.19 |
% |
3.27 |
% |
2.30 |
% |
1.33 |
% |
| Europe |
|
|
|
|
|
|
|
| EAD |
40,789 |
143,747 |
283,829 |
15,563 |
39,495 |
13,348 |
536,771 |
| Average LGD in % |
43.97 |
% |
45.11 |
% |
14.76 |
% |
47.85 |
% |
41.64 |
% |
70.06 |
% |
29.42 |
% |
| Average PD in % |
0.15 |
% |
0.94 |
% |
1.30 |
% |
3.19 |
% |
3.27 |
% |
2.30 |
% |
1.34 |
% |
| North America |
|
|
|
|
|
|
|
| EAD |
3,816 |
13,626 |
|
|
|
|
17,442 |
| Average LGD in % |
26.07 |
% |
39.53 |
% |
|
|
|
|
36.59 |
% |
| Average PD in % |
0.60 |
% |
0.93 |
% |
|
|
|
|
0.86 |
% |
| South America |
|
|
|
|
|
|
|
| EAD |
1,517 |
30,771 |
|
|
|
|
32,288 |
| Average LGD in % |
44.99 |
% |
41.22 |
% |
|
|
|
|
41.40 |
% |
| Average PD in % |
0.10 |
% |
1.35 |
% |
|
|
|
|
1.29 |
% |
| EAD and parameters without default. |
| EAD including counterparty credit risk, does not include neither equities nor specialised lending. |
|
2024 Pillar 3 Disclosures Report 79
The tables in this section show, for each business segment and credit rating (internal and Standard & Poor’s) the value of exposures, credit risk parameters and capital under the IRB approach distinguishing between foundation IRB (FIRB) and advanced IRB (AIRB).
|
|
|
|
|
|
|
|
|
|
|
|
|
|
|
|
|
|
|
|
|
|
|
|
|
|
|
|
|
|
|
|
|
|
|
|
|
|
|
| Table 25.Credit risk exposures by exposure class |
| AIRB |
|
|
|
|
|
|
|
|
|
|
|
|
|
|
|
|
|
|
|
|
|
|
|
|
|
| EUR million |
|
|
|
|
|
|
|
|
|
|
|
2024 |
| Exposure class |
Original on-balance-sheet gross exposures |
Off-balance-sheet exposures pre-CCF |
Average CCF |
EAD post CRM and post CCF |
Average PD |
Number of obligors |
Average LGD |
Average maturity |
RWA |
RW |
EL |
Value adjustments and provisions |
| Institutions |
3,014 |
252 |
43.79 |
% |
2,548 |
1.02 |
% |
198 |
15.80 |
% |
4.07 |
904 |
35.48 |
% |
4 |
(7) |
| Corporates - Other |
42,679 |
19,050 |
32.36 |
% |
43,316 |
4.01 |
% |
37,893 |
44.88 |
% |
1.73 |
35,293 |
81.48 |
% |
977 |
(950) |
| Corporates - SMEs |
25,071 |
8,170 |
25.07 |
% |
25,168 |
7.68 |
% |
72,187 |
42.53 |
% |
1.90 |
15,365 |
61.05 |
% |
806 |
(1,053) |
| Retail - Mortgages SMEs |
2,542 |
70 |
19.79 |
% |
2,437 |
14.23 |
% |
33,062 |
26.94 |
% |
— |
819 |
33.61 |
% |
102 |
(152) |
| Retail - Mortgages no SMEs |
281,338 |
13,830 |
35.85 |
% |
286,297 |
2.89 |
% |
2,254,341 |
15.11 |
% |
— |
45,643 |
15.94 |
% |
1,402 |
(885) |
| Qualifying Revolving |
3,173 |
17,781 |
57.76 |
% |
13,543 |
3.71 |
% |
19,522,298 |
70.04 |
% |
— |
4,630 |
34.19 |
% |
332 |
(219) |
| Retail - Other non SMEs |
39,946 |
1,682 |
62.02 |
% |
40,915 |
6.63 |
% |
7,853,753 |
42.48 |
% |
— |
19,241 |
47.03 |
% |
1,506 |
(1,279) |
| Retail - SMEs |
20,232 |
4,572 |
47.46 |
% |
16,500 |
8.69 |
% |
1,641,896 |
49.34 |
% |
— |
8,024 |
48.63 |
% |
904 |
(782) |
| Total |
417,993 |
65,408 |
40.94 |
% |
430,724 |
3.94 |
% |
31,415,628 |
25.41 |
% |
0.31 |
129,919 |
30.16 |
% |
6,034 |
(5,326) |
|
|
|
|
|
|
|
|
|
|
|
|
|
|
|
|
|
|
|
|
|
|
|
|
|
|
|
|
|
|
|
|
|
|
|
|
|
|
|
| Table 25.Credit risk exposures by exposure class |
| FIRB |
|
|
|
|
|
|
|
|
|
|
|
|
|
|
|
|
|
|
|
|
|
|
|
|
|
| EUR million |
|
|
|
|
|
|
|
|
|
|
|
2024 |
| Exposure class |
Original on-balance-sheet gross exposures |
Off-balance-sheet exposures pre-CCF |
Average CCF |
EAD post CRM and post CCF |
Average PD |
Number of obligors |
Average LGD |
Average maturity |
RWA |
RW |
EL |
Value adjustments and provisions |
| Institutions |
15,336 |
17,629 |
25.67 |
% |
22,596 |
0.13 |
% |
1,976 |
43.71 |
% |
2.41 |
8,848 |
39.16 |
% |
10 |
(7) |
| Corporates - Other |
89,826 |
131,430 |
28.49 |
% |
109,097 |
1.28 |
% |
15,271 |
40.98 |
% |
2.47 |
49,470 |
45.35 |
% |
582 |
(562) |
| Corporates - SMEs |
1,087 |
235 |
75.00 |
% |
1,221 |
2.34 |
% |
1,338 |
40.64 |
% |
2.50 |
562 |
46.03 |
% |
13 |
(8) |
| Total |
106,249 |
149,294 |
28.23 |
% |
132,914 |
1.09 |
% |
18,585 |
41.44 |
% |
2.46 |
58,880 |
44.30 |
% |
606 |
(577) |
|
|
|
|
|
|
|
|
|
|
|
|
|
80 2024 Pillar 3 Disclosures Report
|
|
|
|
|
|
|
|
|
|
|
|
|
|
|
|
|
|
|
|
|
|
|
|
|
|
|
|
|
|
|
|
|
|
|
|
|
|
|
| Table 26.CR6 - AIRB approach - Credit risk exposures by exposure class and PD range |
| EUR million |
|
|
|
|
|
|
|
|
|
|
|
|
|
|
|
|
|
|
|
|
|
|
|
|
2024 |
| PD range |
Original on-balance-sheet gross exposures |
Off-balance-sheet exposures pre-CCF |
Average CCF |
EAD post CRM and post CCF |
Average PD |
Number of obligors |
Average LGD |
Average maturity |
RWA |
RW |
EL |
Value adjustments and provisions |
| a |
b |
c |
d |
e |
f |
g |
h |
i |
j |
k |
l |
m |
| Institutions |
|
|
|
|
|
|
|
|
|
|
|
|
| 0.00 < 0.15 |
|
|
|
|
|
|
|
|
|
|
|
|
| 0.00 to < 0.10 |
|
|
|
|
|
|
|
|
|
|
|
|
| 0.10 to < 0.15 |
|
|
|
|
|
|
|
|
|
|
|
|
| 0.15 < 0.25 |
|
|
|
|
|
|
|
|
|
|
|
|
| 0.25 < 0.50 |
|
|
|
|
|
|
|
|
|
|
|
|
| 0.50 < 0.75 |
1,257 |
7 |
5.62 |
% |
1,216 |
0.69 |
% |
27 |
10.22 |
% |
5 |
316 |
26 |
% |
1 |
(0.19) |
| 0.75 < 2.50 |
1,574 |
239 |
45.96 |
% |
1,149 |
0.97 |
% |
90 |
21.80 |
% |
3 |
498 |
43 |
% |
2 |
(6.26) |
| 0.75 to < 1.75 |
1,574 |
239 |
45.96 |
% |
1,149 |
0.97 |
% |
90 |
21.80 |
% |
3 |
498 |
43 |
% |
2 |
(6.26) |
| 1.75 to < 2.50 |
— |
— |
|
— |
|
|
|
|
0 |
|
— |
— |
| 2.50 < 10.00 |
179 |
4 |
1.71 |
% |
180 |
2.75 |
% |
71 |
15.16 |
% |
4 |
87 |
48 |
% |
1 |
(0.33) |
| 2.50 to <5 |
179 |
3 |
2.37 |
% |
179 |
2.74 |
% |
65 |
15.15 |
% |
4 |
87 |
48 |
% |
1 |
(0.33) |
| 5 to <10 |
— |
1 |
0.18 |
% |
— |
6.14 |
% |
6 |
19.24 |
% |
3 |
0 |
76 |
% |
— |
— |
| 10.00 < 100.00 |
3 |
2 |
1.08 |
% |
3 |
43.86 |
% |
10 |
19.24 |
% |
— |
3 |
99 |
% |
— |
— |
| 10 to < 20 |
— |
— |
|
— |
|
|
|
|
|
0 |
|
— |
— |
| 20 to < 30 |
— |
— |
|
— |
|
|
|
|
|
0 |
|
— |
— |
| 30 to < 100 |
3 |
2 |
1.08 |
% |
3 |
43.86 |
% |
10 |
19.24 |
% |
— |
3 |
99 |
% |
— |
— |
| 100.00 (Default) |
— |
— |
|
— |
|
|
|
|
0 |
|
— |
— |
| Subtotal (exposure class) |
3,014 |
252 |
43.79 |
% |
2,548 |
1.02 |
% |
198 |
15.80 |
% |
4 |
904 |
35 |
% |
4 |
(6.79) |
| Total (all exposures classes AIRB) |
417,993 |
65,408 |
40.94 |
% |
430,724 |
3.94 |
% |
31,415,628 |
25.41 |
% |
0 |
129,919 |
30 |
% |
6,034 |
(5,325.92) |
|
|
|
|
|
|
|
|
|
|
|
|
|
|
|
|
|
|
|
|
|
|
|
|
|
|
|
|
|
|
|
|
|
|
|
|
|
|
|
|
|
|
|
|
|
|
|
|
|
|
|
|
| Table 26.CR6 - AIRB approach - Credit risk exposures by exposure class and PD range |
| EUR million |
|
|
|
|
|
|
|
|
|
|
|
|
|
|
|
|
|
|
|
|
|
|
|
|
2024 |
| PD range |
Original on-balance-sheet gross exposures |
Off-balance-sheet exposures pre-CCF |
Average CCF |
EAD post CRM and post CCF |
Average PD |
Number of obligors |
Average LGD |
Average maturity |
RWA |
RW |
EL |
Value adjustments and provisions |
| a |
b |
c |
d |
e |
f |
g |
h |
i |
j |
k |
l |
m |
| Corporates - Other |
|
|
|
|
|
|
|
|
|
|
|
|
| 0.00 < 0.15 |
180 |
187 |
34.36 |
% |
384 |
0.11 |
% |
94 |
45.72 |
% |
2 |
125 |
32 |
% |
— |
(0.04) |
| 0.00 to < 0.10 |
— |
— |
58.86 |
% |
— |
0.06 |
% |
10 |
56.04 |
% |
2 |
0 |
37 |
% |
— |
— |
| 0.10 to < 0.15 |
180 |
187 |
34.35 |
% |
384 |
0.11 |
% |
84 |
45.72 |
% |
2 |
125 |
32 |
% |
— |
(0.04) |
| 0.15 < 0.25 |
3,165 |
1,426 |
35.20 |
% |
4,172 |
0.21 |
% |
1,027 |
40.60 |
% |
2 |
1,454 |
35 |
% |
3 |
(2.55) |
| 0.25 < 0.50 |
9,327 |
5,858 |
37.00 |
% |
12,318 |
0.38 |
% |
5,654 |
48.16 |
% |
2 |
7,868 |
64 |
% |
20 |
(4.99) |
| 0.50 < 0.75 |
8,653 |
3,535 |
27.01 |
% |
7,566 |
0.59 |
% |
6,182 |
47.10 |
% |
2 |
5,726 |
76 |
% |
23 |
(11.90) |
| 0.75 < 2.50 |
14,184 |
4,852 |
35.88 |
% |
13,224 |
1.49 |
% |
13,827 |
41.73 |
% |
2 |
12,617 |
95 |
% |
85 |
(29.90) |
| 0.75 to < 1.75 |
9,798 |
3,177 |
36.44 |
% |
9,186 |
1.19 |
% |
8,763 |
41.03 |
% |
2 |
8,110 |
88 |
% |
47 |
(17.51) |
| 1.75 to < 2.50 |
4,386 |
1,675 |
34.83 |
% |
4,038 |
2.17 |
% |
5,064 |
43.31 |
% |
1 |
4,507 |
112 |
% |
38 |
(12.39) |
| 2.50 < 10.00 |
4,704 |
2,705 |
22.02 |
% |
3,833 |
4.34 |
% |
6,161 |
40.14 |
% |
1 |
5,296 |
138 |
% |
73 |
(45.56) |
| 2.50 to <5 |
3,173 |
1,863 |
20.83 |
% |
2,654 |
3.61 |
% |
3,794 |
39.78 |
% |
1 |
3,440 |
130 |
% |
43 |
(19.70) |
| 5 to <10 |
1,531 |
842 |
24.64 |
% |
1,179 |
6.00 |
% |
2,367 |
40.94 |
% |
1 |
1,856 |
157 |
% |
31 |
(25.86) |
| 10.00 < 100.00 |
765 |
213 |
32.43 |
% |
719 |
24.43 |
% |
2,574 |
43.43 |
% |
2 |
1,650 |
229 |
% |
72 |
(29.79) |
| 10 to < 20 |
439 |
114 |
24.61 |
% |
405 |
13.22 |
% |
955 |
44.16 |
% |
1 |
878 |
217 |
% |
22 |
(8.49) |
| 20 to < 30 |
40 |
14 |
40.61 |
% |
49 |
23.12 |
% |
196 |
35.39 |
% |
2 |
113 |
228 |
% |
3 |
(5.89) |
| 30 to < 100 |
286 |
85 |
41.61 |
% |
265 |
41.78 |
% |
1,423 |
43.81 |
% |
2 |
660 |
249 |
% |
48 |
(15.42) |
| 100.00 (Default) |
1,700 |
273 |
25.51 |
% |
1,099 |
100.00 |
% |
2,374 |
64.37 |
% |
2 |
557 |
51 |
% |
701 |
(824.99) |
| Subtotal (exposure class) |
42,679 |
19,050 |
32.36 |
% |
43,316 |
4.01 |
% |
37,893 |
44.88 |
% |
2 |
35,293 |
81 |
% |
977 |
(950) |
| Total (all exposures classes AIRB) |
417,993 |
65,408 |
40.94 |
% |
430,724 |
3.94 |
% |
31,415,628 |
25.41 |
% |
— |
129,919 |
30 |
% |
6,034 |
(5,326) |
|
82 2024 Pillar 3 Disclosures Report
|
|
|
|
|
|
|
|
|
|
|
|
|
|
|
|
|
|
|
|
|
|
|
|
|
|
|
|
|
|
|
|
|
|
|
|
|
|
|
| Table 26.CR6 - AIRB approach - Credit risk exposures by exposure class and PD range |
| EUR million |
|
|
|
|
|
|
|
|
|
|
|
|
|
|
|
|
|
|
|
|
|
|
|
|
2024 |
| PD range |
Original on-balance-sheet gross exposures |
Off-balance-sheet exposures pre-CCF |
Average CCF |
EAD post CRM and post CCF |
Average PD |
Number of obligors |
Average LGD |
Average maturity |
RWA |
RW |
EL |
Value adjustments and provisions |
| a |
b |
c |
d |
e |
f |
g |
h |
i |
j |
k |
l |
m |
| Corporates - SMEs |
|
|
|
|
|
|
|
|
|
|
|
|
| 0.00 < 0.15 |
7 |
1 |
50.02 |
% |
8 |
0.11 |
% |
141 |
33.29 |
% |
3 |
2 |
23 |
% |
— |
— |
| 0.00 to < 0.10 |
— |
— |
53.59 |
% |
— |
0.06 |
% |
64 |
56.77 |
% |
1 |
0 |
15 |
% |
— |
— |
| 0.10 to < 0.15 |
7 |
1 |
49.00 |
% |
8 |
0.12 |
% |
77 |
32.32 |
% |
3 |
2 |
23 |
% |
— |
— |
| 0.15 < 0.25 |
652 |
75 |
17.33 |
% |
1,705 |
0.21 |
% |
1,450 |
35.52 |
% |
2 |
388 |
23 |
% |
1 |
(0.27) |
| 0.25 < 0.50 |
2,552 |
1,338 |
30.68 |
% |
3,293 |
0.37 |
% |
8,197 |
43.27 |
% |
2 |
1,381 |
42 |
% |
4 |
(7.78) |
| 0.50 < 0.75 |
5,002 |
1,384 |
31.07 |
% |
6,458 |
0.61 |
% |
13,267 |
43.51 |
% |
2 |
3,168 |
49 |
% |
13 |
(5.36) |
| 0.75 < 2.50 |
8,632 |
2,720 |
26.97 |
% |
7,631 |
1.54 |
% |
26,063 |
43.71 |
% |
2 |
5,226 |
68 |
% |
49 |
(20.58) |
| 0.75 to < 1.75 |
6,181 |
1,676 |
27.40 |
% |
5,572 |
1.31 |
% |
17,207 |
42.94 |
% |
2 |
3,576 |
64 |
% |
29 |
(13.09) |
| 1.75 to < 2.50 |
2,451 |
1,043 |
26.29 |
% |
2,059 |
2.15 |
% |
8,856 |
45.80 |
% |
2 |
1,649 |
80 |
% |
20 |
(7.49) |
| 2.50 < 10.00 |
5,256 |
2,402 |
16.30 |
% |
4,032 |
4.54 |
% |
15,019 |
39.29 |
% |
2 |
3,666 |
91 |
% |
72 |
(127.53) |
| 2.50 to <5 |
3,124 |
1,824 |
15.14 |
% |
2,500 |
3.50 |
% |
8,193 |
37.96 |
% |
2 |
2,084 |
83 |
% |
33 |
(18.28) |
| 5 to <10 |
2,132 |
578 |
19.96 |
% |
1,532 |
6.23 |
% |
6,826 |
41.44 |
% |
2 |
1,581 |
103 |
% |
39 |
(109.26) |
| 10.00 < 100.00 |
724 |
117 |
29.44 |
% |
622 |
25.50 |
% |
2,845 |
41.18 |
% |
2 |
985 |
158 |
% |
54 |
(54.39) |
| 10 to < 20 |
409 |
69 |
26.40 |
% |
329 |
13.08 |
% |
1,450 |
39.40 |
% |
2 |
455 |
138 |
% |
16 |
(19.36) |
| 20 to < 30 |
58 |
11 |
24.05 |
% |
43 |
23.29 |
% |
413 |
44.40 |
% |
2 |
73 |
169 |
% |
5 |
(7.02) |
| 30 to < 100 |
257 |
37 |
36.72 |
% |
250 |
42.23 |
% |
982 |
42.97 |
% |
2 |
457 |
183 |
% |
34 |
(28.02) |
| 100.00 (Default) |
2,245 |
132 |
25.61 |
% |
1,420 |
100.00 |
% |
5,205 |
48.18 |
% |
3 |
550 |
39 |
% |
613 |
(836.84) |
| Subtotal (exposure class) |
25,071 |
8,170 |
25.07 |
% |
25,168 |
7.68 |
% |
72,187 |
42.53 |
% |
2 |
15,365 |
61 |
% |
806 |
(1,053) |
| Total (all exposures classes AIRB) |
417,993 |
65,408 |
40.94 |
% |
430,724 |
3.94 |
% |
31,415,628 |
25.41 |
% |
— |
129,919 |
30 |
% |
6,034 |
(5,326) |
2024 Pillar 3 Disclosures Report 83
|
|
|
|
|
|
|
|
|
|
|
|
|
|
|
|
|
|
|
|
|
|
|
|
|
|
|
|
|
|
|
|
|
|
|
|
|
|
|
| CR6 - AIRB approach - Credit risk exposures by exposure class and PD range (31.12.2023) |
| EUR million |
|
|
|
|
|
|
|
|
|
|
|
|
|
|
|
|
|
|
|
|
|
|
|
|
2023 |
| PD range |
Original on-balance-sheet gross exposures |
Off-balance-sheet exposures pre-CCF |
Average CCF |
EAD post CRM and post CCF |
Average PD |
Number of obligors |
Average LGD |
Average maturity |
RWA |
RW |
EL |
Value adjustments and provisions |
| a |
b |
c |
d |
e |
f |
g |
h |
i |
j |
k |
l |
m |
| Institutions |
|
|
|
|
|
|
|
|
|
|
|
|
| 0.00 < 0.15 |
|
|
|
|
|
|
|
|
|
|
|
|
| 0.00 to < 0.10 |
|
|
|
|
|
|
|
|
|
|
|
|
| 0.10 to < 0.15 |
|
|
|
|
|
|
|
|
|
|
|
|
| 0.15 < 0.25 |
|
|
|
|
|
|
|
|
|
|
|
|
| 0.25 < 0.50 |
|
|
|
— |
|
|
|
|
|
|
|
|
| 0.50 < 0.75 |
1,094 |
49 |
68.78 |
% |
1,128 |
0.63 |
% |
19 |
10.13 |
% |
5 |
283 |
25 |
% |
1 |
(0.37) |
| 0.75 < 2.50 |
1,946 |
133 |
16.22 |
% |
1,400 |
0.93 |
% |
82 |
17.32 |
% |
4 |
513 |
37 |
% |
2 |
(2.99) |
| 0.75 to < 1.75 |
1,946 |
133 |
16.22 |
% |
1,400 |
0.93 |
% |
82 |
17.32 |
% |
4 |
513 |
37 |
% |
2 |
(2.99) |
| 1.75 to < 2.50 |
— |
— |
|
— |
|
|
|
|
0 |
|
— |
— |
| 2.50 < 10.00 |
218 |
6 |
19.47 |
% |
220 |
2.61 |
% |
71 |
16.90 |
% |
4 |
112 |
51 |
% |
1 |
(0.50) |
| 2.50 to <5 |
217 |
6 |
19.47 |
% |
219 |
2.59 |
% |
70 |
16.90 |
% |
4 |
112 |
51 |
% |
1 |
(0.49) |
| 5 to <10 |
1 |
— |
|
1 |
6.14 |
% |
1 |
18.32 |
% |
5 |
1 |
82 |
% |
— |
(0.01) |
| 10.00 < 100.00 |
— |
— |
0.47 |
% |
— |
43.86 |
% |
9 |
18.32 |
% |
1 |
0 |
96 |
% |
— |
— |
| 10 to < 20 |
— |
— |
|
— |
|
|
|
|
0 |
|
— |
— |
| 20 to < 30 |
— |
— |
|
— |
|
|
|
|
0 |
|
— |
— |
| 30 to < 100 |
— |
— |
0.47 |
% |
— |
43.86 |
% |
9 |
18.32 |
% |
1 |
0 |
96 |
% |
— |
— |
| 100.00 (Default) |
— |
— |
|
— |
100.00 |
% |
1 |
18.32 |
% |
1 |
0 |
196 |
% |
— |
— |
| Subtotal (exposure class) |
3,258 |
188 |
29.93 |
% |
2,748 |
0.94 |
% |
182 |
14.34 |
% |
4 |
908 |
33 |
% |
4 |
(4) |
| Total (all exposures classes AIRB) |
435,331 |
62,878 |
41.11 |
% |
442,013 |
4.04 |
% |
30,550,441 |
26.20 |
% |
— |
138,204 |
31 |
% |
6,039 |
(5,542) |
84 2024 Pillar 3 Disclosures Report
|
|
|
|
|
|
|
|
|
|
|
|
|
|
|
|
|
|
|
|
|
|
|
|
|
|
|
|
|
|
|
|
|
|
|
|
|
|
|
|
|
|
|
|
|
|
|
|
|
|
|
|
| CR6 - AIRB approach - Credit risk exposures by exposure class and PD range (31.12.2023) |
| EUR million |
|
|
|
|
|
|
|
|
|
|
|
|
|
|
|
|
|
|
|
|
|
|
|
|
2023 |
| PD range |
Original on-balance-sheet gross exposures |
Off-balance-sheet exposures pre-CCF |
Average CCF |
EAD post CRM and post CCF |
Average PD |
Number of obligors |
Average LGD |
Average maturity |
RWA |
RW |
EL |
Value adjustments and provisions |
| a |
b |
c |
d |
e |
f |
g |
h |
i |
j |
k |
l |
m |
| Corporates - Other |
|
|
|
|
|
|
|
|
|
|
|
|
| 0.00 < 0.15 |
4 |
— |
48.29 |
% |
4 |
0.11 |
% |
61 |
24.94 |
% |
3 |
1 |
23 |
% |
— |
— |
| 0.00 to < 0.10 |
— |
— |
55.41 |
% |
— |
0.05 |
% |
39 |
57.52 |
% |
1 |
0 |
18 |
% |
— |
— |
| 0.10 to < 0.15 |
4 |
— |
31.86 |
% |
4 |
0.11 |
% |
22 |
23.64 |
% |
4 |
1 |
23 |
% |
— |
— |
| 0.15 < 0.25 |
3,731 |
1,479 |
29.55 |
% |
3,795 |
0.21 |
% |
1,544 |
39.95 |
% |
2 |
1,308 |
34 |
% |
3 |
(3) |
| 0.25 < 0.50 |
7,483 |
5,137 |
30.85 |
% |
8,557 |
0.37 |
% |
4,997 |
50.22 |
% |
2 |
5,528 |
65 |
% |
15 |
(7) |
| 0.50 < 0.75 |
16,422 |
4,592 |
39.32 |
% |
16,778 |
0.59 |
% |
8,288 |
46.23 |
% |
2 |
12,341 |
74 |
% |
46 |
(23) |
| 0.75 < 2.50 |
10,712 |
4,084 |
28.56 |
% |
8,794 |
1.64 |
% |
10,568 |
44.68 |
% |
1 |
9,398 |
107 |
% |
67 |
(35) |
| 0.75 to < 1.75 |
5,672 |
2,537 |
22.32 |
% |
3,891 |
1.31 |
% |
5,486 |
46.29 |
% |
2 |
4,106 |
106 |
% |
27 |
(18) |
| 1.75 to < 2.50 |
5,040 |
1,547 |
38.79 |
% |
4,903 |
1.90 |
% |
5,082 |
43.40 |
% |
1 |
5,291 |
108 |
% |
40 |
(17) |
| 2.50 < 10.00 |
4,356 |
2,113 |
25.06 |
% |
3,923 |
3.96 |
% |
6,136 |
42.51 |
% |
1 |
5,532 |
141 |
% |
69 |
(55) |
| 2.50 to <5 |
3,415 |
1,640 |
26.88 |
% |
3,323 |
3.52 |
% |
4,859 |
42.05 |
% |
1 |
4,432 |
133 |
% |
49 |
(24) |
| 5 to <10 |
942 |
473 |
18.72 |
% |
599 |
6.36 |
% |
1,277 |
45.07 |
% |
2 |
1,100 |
184 |
% |
19 |
(31) |
| 10.00 < 100.00 |
707 |
275 |
29.43 |
% |
638 |
22.31 |
% |
1,346 |
43.68 |
% |
2 |
1,567 |
246 |
% |
56 |
(20) |
| 10 to < 20 |
373 |
163 |
31.58 |
% |
367 |
14.46 |
% |
645 |
45.24 |
% |
1 |
877 |
239 |
% |
23 |
(8) |
| 20 to < 30 |
143 |
15 |
19.64 |
% |
156 |
26.20 |
% |
341 |
40.18 |
% |
2 |
385 |
248 |
% |
14 |
(4) |
| 30 to < 100 |
190 |
97 |
27.32 |
% |
116 |
41.97 |
% |
360 |
43.41 |
% |
2 |
305 |
264 |
% |
19 |
(8) |
| 100.00 (Default) |
1,889 |
350 |
26.50 |
% |
1,231 |
100.00 |
% |
2,200 |
56.89 |
% |
2 |
576 |
47 |
% |
681 |
(798) |
| Subtotal (exposure class) |
45,303 |
18,030 |
31.60 |
% |
43,719 |
4.14 |
% |
35,140 |
46.08 |
% |
2 |
36,250 |
83 |
% |
937 |
(940) |
| Total (all exposures classes AIRB) |
435,331 |
62,878 |
41.11 |
% |
442,013 |
4.04 |
% |
30,550,441 |
26.20 |
% |
— |
138,204 |
31 |
% |
6,039 |
(5,542) |
2024 Pillar 3 Disclosures Report 85
|
|
|
|
|
|
|
|
|
|
|
|
|
|
|
|
|
|
|
|
|
|
|
|
|
|
|
|
|
|
|
|
|
|
|
|
|
|
|
|
| CR6 - AIRB approach - Credit risk exposures by exposure class and PD range (31.12.2023) |
| EUR million |
|
|
|
|
|
|
|
|
|
|
|
|
|
|
|
|
|
|
|
|
|
|
|
|
2023 |
| PD range |
Original on-balance-sheet gross exposures |
Off-balance-sheet exposures pre-CCF |
Average CCF |
EAD post CRM and post CCF |
Average PD |
Number of obligors |
Average LGD |
Average maturity |
RWA |
RW |
EL |
Value adjustments and provisions |
| a |
b |
c |
d |
e |
f |
g |
h |
i |
j |
k |
l |
m |
| Corporates - SMEs |
| 0.00 < 0.15 |
11 |
2 |
48.55 |
% |
12 |
0.11 |
% |
380 |
28.10 |
% |
3 |
2 |
18 |
% |
— |
— |
| 0.00 to < 0.10 |
— |
1 |
51.85 |
% |
1 |
0.06 |
% |
205 |
56.46 |
% |
2 |
0 |
23 |
% |
— |
— |
| 0.10 to < 0.15 |
11 |
1 |
44.67 |
% |
11 |
0.11 |
% |
175 |
25.79 |
% |
3 |
2 |
18 |
% |
— |
— |
| 0.15 < 0.25 |
1,191 |
128 |
24.64 |
% |
3,001 |
0.21 |
% |
2,263 |
37.85 |
% |
1 |
727 |
24 |
% |
1 |
(2) |
| 0.25 < 0.50 |
3,280 |
1,375 |
30.71 |
% |
3,645 |
0.37 |
% |
8,748 |
45.69 |
% |
2 |
1,635 |
45 |
% |
5 |
(7) |
| 0.50 < 0.75 |
5,918 |
1,709 |
33.92 |
% |
6,810 |
0.62 |
% |
13,636 |
43.99 |
% |
2 |
3,584 |
53 |
% |
15 |
(10) |
| 0.75 < 2.50 |
10,098 |
2,659 |
28.31 |
% |
8,380 |
1.55 |
% |
27,851 |
44.09 |
% |
2 |
5,956 |
71 |
% |
54 |
(40) |
| 0.75 to < 1.75 |
7,143 |
1,762 |
28.76 |
% |
5,755 |
1.31 |
% |
18,236 |
44.35 |
% |
2 |
3,931 |
68 |
% |
32 |
(24) |
| 1.75 to < 2.50 |
2,954 |
896 |
27.43 |
% |
2,625 |
2.10 |
% |
9,615 |
43.52 |
% |
2 |
2,025 |
77 |
% |
22 |
(16) |
| 2.50 < 10.00 |
5,711 |
2,521 |
18.23 |
% |
4,691 |
4.50 |
% |
16,563 |
39.23 |
% |
2 |
4,436 |
95 |
% |
79 |
(129) |
| 2.50 to <5 |
3,635 |
1,882 |
18.18 |
% |
2,944 |
3.42 |
% |
9,735 |
37.84 |
% |
2 |
2,507 |
85 |
% |
38 |
(40) |
| 5 to <10 |
2,076 |
639 |
18.36 |
% |
1,747 |
6.32 |
% |
6,828 |
41.57 |
% |
2 |
1,928 |
110 |
% |
41 |
(89) |
| 10.00 < 100.00 |
712 |
175 |
35.19 |
% |
586 |
25.56 |
% |
2,324 |
43.06 |
% |
2 |
1,006 |
172 |
% |
58 |
(58) |
| 10 to < 20 |
299 |
51 |
19.98 |
% |
293 |
13.25 |
% |
1,284 |
40.26 |
% |
2 |
424 |
145 |
% |
14 |
(14) |
| 20 to < 30 |
76 |
16 |
13.81 |
% |
66 |
24.14 |
% |
372 |
45.89 |
% |
3 |
123 |
187 |
% |
7 |
(15) |
| 30 to < 100 |
338 |
108 |
45.45 |
% |
227 |
41.84 |
% |
668 |
45.83 |
% |
2 |
459 |
202 |
% |
37 |
(28) |
| 100.00 (Default) |
2,669 |
119 |
24.03 |
% |
1,771 |
100.00 |
% |
3,465 |
44.27 |
% |
3 |
657 |
37 |
% |
711 |
(934) |
| Subtotal (exposure class) |
29,590 |
8,686 |
26.90 |
% |
28,896 |
8.04 |
% |
75,230 |
42.81 |
% |
2 |
18,002 |
62 |
% |
922 |
(1,181) |
| Total (all exposures classes AIRB) |
435,331 |
62,878 |
41.11 |
% |
442,013 |
4.04 |
% |
30,550,441 |
26.20 |
% |
— |
138,204 |
31 |
% |
6,039 |
(5,542) |
86 2024 Pillar 3 Disclosures Report
|
|
|
|
|
|
|
|
|
|
|
|
|
|
|
|
|
|
|
|
|
|
|
|
|
|
|
|
|
|
|
|
|
|
|
|
|
|
|
| Table 27.CR6 - AIRB approach Retail - Credit risk exposures by exposure class and PD range |
| EUR million |
|
|
|
|
|
|
|
|
|
|
|
|
|
|
|
|
|
|
|
|
|
|
|
|
2024 |
| PD range |
Original on-balance-sheet gross exposures |
Off-balance-sheet exposures pre-CCF |
Average CCF |
EAD post CRM and post CCF |
Average PD |
Number of obligors |
Average LGD |
Average maturity |
RWA |
RW |
EL |
Value adjustments and provisions |
| a |
b |
c |
d |
e |
f |
g |
h |
i |
j |
k |
l |
m |
| Retail - Mortgages SMEs |
|
|
|
|
|
|
|
|
|
|
|
| 0.00 < 0.15 |
337 |
— |
100.00 |
% |
338 |
0.10 |
% |
5,023 |
25.71 |
% |
|
20 |
6 |
% |
— |
— |
| 0.00 to < 0.10 |
115 |
— |
100.00 |
% |
115 |
0.07 |
% |
2,054 |
26.56 |
% |
|
5 |
4 |
% |
— |
— |
| 0.10 to < 0.15 |
222 |
— |
100.00 |
% |
222 |
0.11 |
% |
2,969 |
25.27 |
% |
|
16 |
7 |
% |
— |
— |
| 0.15 < 0.25 |
233 |
1 |
58.73 |
% |
234 |
0.20 |
% |
3,594 |
26.25 |
% |
|
26 |
11 |
% |
— |
— |
| 0.25 < 0.50 |
440 |
6 |
34.85 |
% |
439 |
0.41 |
% |
6,186 |
27.29 |
% |
|
85 |
19 |
% |
— |
(2) |
| 0.50 < 0.75 |
122 |
8 |
33.04 |
% |
122 |
0.61 |
% |
1,808 |
28.08 |
% |
|
28 |
23 |
% |
— |
— |
| 0.75 < 2.50 |
696 |
36 |
7.39 |
% |
695 |
1.39 |
% |
8,098 |
25.60 |
% |
|
285 |
41 |
% |
2 |
(3) |
| 0.75 to < 1.75 |
557 |
28 |
7.54 |
% |
557 |
1.19 |
% |
6,713 |
25.76 |
% |
|
213 |
38 |
% |
2 |
(2) |
| 1.75 to < 2.50 |
139 |
7 |
6.81 |
% |
138 |
2.21 |
% |
1,385 |
24.92 |
% |
|
72 |
52 |
% |
1 |
(1) |
| 2.50 < 10.00 |
271 |
16 |
29.20 |
% |
214 |
4.78 |
% |
2,916 |
26.88 |
% |
|
169 |
79 |
% |
3 |
(8) |
| 2.50 to <5 |
135 |
13 |
30.75 |
% |
122 |
3.42 |
% |
1,779 |
27.16 |
% |
|
82 |
67 |
% |
1 |
(2) |
| 5 to <10 |
136 |
3 |
22.41 |
% |
92 |
6.58 |
% |
1,137 |
26.50 |
% |
|
87 |
95 |
% |
2 |
(6) |
| 10.00 < 100.00 |
148 |
1 |
24.15 |
% |
104 |
30.02 |
% |
1,496 |
26.48 |
% |
|
142 |
137 |
% |
9 |
(10) |
| 10 to < 20 |
71 |
— |
44.59 |
% |
49 |
13.41 |
% |
818 |
25.92 |
% |
|
66 |
134 |
% |
2 |
(5) |
| 20 to < 30 |
33 |
1 |
20.47 |
% |
10 |
25.74 |
% |
170 |
30.44 |
% |
|
17 |
162 |
% |
1 |
(1) |
| 30 to < 100 |
45 |
— |
22.36 |
% |
44 |
49.41 |
% |
508 |
26.15 |
% |
|
60 |
134 |
% |
6 |
(4) |
| 100.00 (Default) |
295 |
2 |
37.17 |
% |
292 |
100.00 |
% |
3,941 |
31.30 |
% |
|
63 |
22 |
% |
87 |
(129) |
| Subtotal (exposure class) |
2,542 |
70 |
19.79 |
% |
2,437 |
14.23 |
% |
33,062 |
26.94 |
% |
— |
819 |
34 |
% |
102 |
(152) |
| Total (all exposures classes AIRB) |
417,993 |
65,408 |
40.94 |
% |
430,724 |
3.94 |
% |
31,415,628 |
25.41 |
% |
— |
129,919 |
30 |
% |
6,034 |
(5,326) |
|
2024 Pillar 3 Disclosures Report 87
|
|
|
|
|
|
|
|
|
|
|
|
|
|
|
|
|
|
|
|
|
|
|
|
|
|
|
|
|
|
|
|
|
|
|
|
|
|
|
| Table 27.CR6 - AIRB approach Retail - Credit risk exposures by exposure class and PD range |
| EUR million |
|
|
|
|
|
|
|
|
|
|
|
|
|
|
|
|
|
|
|
|
|
|
|
|
2024 |
| PD range |
Original on-balance-sheet gross exposures |
Off-balance-sheet exposures pre-CCF |
Average CCF |
EAD post CRM and post CCF |
Average PD |
Number of obligors |
Average LGD |
Average maturity |
RWA |
RW |
EL |
Value adjustments and provisions |
| a |
b |
c |
d |
e |
f |
g |
h |
i |
j |
k |
l |
m |
| Retail - Mortgages no SMEs |
| 0.00 < 0.15 |
32,992 |
447 |
100.00 |
% |
33,439 |
0.09 |
% |
475,911 |
25.87 |
% |
|
1,975 |
6 |
% |
8 |
(6.41) |
| 0.00 to < 0.10 |
22,097 |
247 |
100.00 |
% |
22,343 |
0.07 |
% |
345,612 |
26.72 |
% |
|
1,166 |
5 |
% |
4 |
(2.61) |
| 0.10 to < 0.15 |
10,896 |
200 |
100.00 |
% |
11,096 |
0.13 |
% |
130,299 |
24.14 |
% |
|
809 |
7 |
% |
3 |
(3.81) |
| 0.15 < 0.25 |
21,210 |
678 |
59.71 |
% |
21,615 |
0.22 |
% |
198,609 |
22.59 |
% |
|
2,240 |
10 |
% |
11 |
(4.67) |
| 0.25 < 0.50 |
73,407 |
5,710 |
31.46 |
% |
75,204 |
0.36 |
% |
473,939 |
12.58 |
% |
|
6,250 |
8 |
% |
35 |
(20.34) |
| 0.50 < 0.75 |
83,782 |
5,059 |
34.00 |
% |
85,502 |
0.61 |
% |
560,711 |
11.21 |
% |
|
9,156 |
11 |
% |
59 |
(20.39) |
| 0.75 < 2.50 |
46,940 |
1,499 |
30.12 |
% |
47,392 |
1.36 |
% |
323,490 |
13.85 |
% |
|
10,404 |
22 |
% |
88 |
(59.70) |
| 0.75 to < 1.75 |
35,906 |
455 |
48.38 |
% |
36,126 |
1.16 |
% |
245,473 |
14.19 |
% |
|
7,400 |
20 |
% |
58 |
(45.01) |
| 1.75 to < 2.50 |
11,034 |
1,044 |
22.16 |
% |
11,266 |
2.01 |
% |
78,017 |
12.77 |
% |
|
3,004 |
27 |
% |
29 |
(14.70) |
| 2.50 < 10.00 |
13,430 |
262 |
29.23 |
% |
13,507 |
4.16 |
% |
126,487 |
15.10 |
% |
|
6,402 |
47 |
% |
87 |
(60.22) |
| 2.50 to <5 |
9,977 |
109 |
42.75 |
% |
10,023 |
3.40 |
% |
80,176 |
13.97 |
% |
|
3,931 |
39 |
% |
47 |
(29.38) |
| 5 to <10 |
3,453 |
153 |
19.63 |
% |
3,484 |
6.35 |
% |
46,311 |
18.38 |
% |
|
2,471 |
71 |
% |
40 |
(30.84) |
| 10.00 < 100.00 |
4,966 |
145 |
41.12 |
% |
5,025 |
31.41 |
% |
52,287 |
15.57 |
% |
|
4,187 |
83 |
% |
239 |
(108.12) |
| 10 to < 20 |
1,709 |
72 |
33.22 |
% |
1,733 |
13.80 |
% |
24,763 |
17.08 |
% |
|
1,593 |
92 |
% |
41 |
(31.97) |
| 20 to < 30 |
1,565 |
27 |
65.07 |
% |
1,582 |
24.66 |
% |
10,747 |
15.47 |
% |
|
1,497 |
95 |
% |
59 |
(26.52) |
| 30 to < 100 |
1,692 |
46 |
39.52 |
% |
1,710 |
55.49 |
% |
16,777 |
14.15 |
% |
|
1,097 |
64 |
% |
139 |
(49.64) |
| 100.00 (Default) |
4,610 |
30 |
8.69 |
% |
4,613 |
100.00 |
% |
42,907 |
27.71 |
% |
|
5,027 |
109 |
% |
876 |
(604.92) |
| Subtotal (exposure class) |
281,338 |
13,830 |
35.85 |
% |
286,297 |
2.89 |
% |
2,254,341 |
15.11 |
% |
— |
45,643 |
16 |
% |
1,402 |
(885) |
| Total (all exposures classes AIRB) |
417,993 |
65,408 |
40.94 |
% |
430,724 |
3.94 |
% |
31,415,628 |
25.41 |
% |
— |
129,919 |
30 |
% |
6,034 |
(5,326) |
|
|
|
|
|
|
|
|
|
|
|
|
|
88 2024 Pillar 3 Disclosures Report
|
|
|
|
|
|
|
|
|
|
|
|
|
|
|
|
|
|
|
|
|
|
|
|
|
|
|
|
|
|
|
|
|
|
|
|
|
|
|
| Table 27.CR6 - AIRB approach Retail - Credit risk exposures by exposure class and PD range |
| EUR million |
|
|
|
|
|
|
|
|
|
|
|
|
|
|
|
|
|
|
|
|
|
|
|
|
2024 |
| PD range |
Original on-balance-sheet gross exposures |
Off-balance-sheet exposures pre-CCF |
Average CCF |
EAD post CRM and post CCF |
Average PD |
Number of obligors |
Average LGD |
Average maturity |
RWA |
RW |
EL |
Value adjustments and provisions |
| a |
b |
c |
d |
e |
f |
g |
h |
i |
j |
k |
l |
m |
| Qualifying Revolving |
| 0.00 < 0.15 |
572 |
8,423 |
33.12 |
% |
3,364 |
0.08 |
% |
4,736,826 |
72.49 |
% |
|
131 |
4 |
% |
2 |
(1.28) |
| 0.00 to < 0.10 |
504 |
5,321 |
36.83 |
% |
2,465 |
0.07 |
% |
3,365,934 |
79.24 |
% |
|
95 |
4 |
% |
1 |
(1.06) |
| 0.10 to < 0.15 |
69 |
3,102 |
26.76 |
% |
899 |
0.12 |
% |
1,370,892 |
53.97 |
% |
|
37 |
4 |
% |
1 |
(0.22) |
| 0.15 < 0.25 |
261 |
1,498 |
34.89 |
% |
788 |
0.21 |
% |
875,168 |
73.38 |
% |
|
71 |
9 |
% |
1 |
(1.85) |
| 0.25 < 0.50 |
87 |
4,169 |
98.10 |
% |
4,177 |
0.31 |
% |
6,250,365 |
67.64 |
% |
|
518 |
12 |
% |
9 |
(2.67) |
| 0.50 < 0.75 |
192 |
686 |
35.61 |
% |
439 |
0.63 |
% |
699,074 |
76.26 |
% |
|
97 |
22 |
% |
2 |
(1.84) |
| 0.75 < 2.50 |
739 |
1,687 |
82.65 |
% |
2,146 |
1.38 |
% |
3,222,369 |
70.61 |
% |
|
841 |
39 |
% |
21 |
(13.69) |
| 0.75 to < 1.75 |
591 |
1,489 |
79.16 |
% |
1,780 |
1.23 |
% |
2,609,700 |
70.57 |
% |
|
640 |
36 |
% |
16 |
(10.60) |
| 1.75 to < 2.50 |
148 |
198 |
108.81 |
% |
366 |
2.13 |
% |
612,669 |
70.81 |
% |
|
201 |
55 |
% |
6 |
(3.09) |
| 2.50 < 10.00 |
733 |
1,095 |
86.79 |
% |
1,704 |
4.72 |
% |
2,528,238 |
69.31 |
% |
|
1,555 |
91 |
% |
55 |
(32.83) |
| 2.50 to <5 |
440 |
734 |
81.34 |
% |
1,051 |
3.44 |
% |
1,555,597 |
70.19 |
% |
|
794 |
76 |
% |
25 |
(18.30) |
| 5 to <10 |
293 |
361 |
97.88 |
% |
653 |
6.76 |
% |
972,641 |
67.91 |
% |
|
761 |
116 |
% |
30 |
(14.54) |
| 10.00 < 100.00 |
424 |
189 |
134.58 |
% |
730 |
24.31 |
% |
1,019,606 |
65.55 |
% |
|
1,335 |
183 |
% |
114 |
(53.27) |
| 10 to < 20 |
220 |
129 |
128.68 |
% |
397 |
13.14 |
% |
562,437 |
68.08 |
% |
|
676 |
170 |
% |
35 |
(17.04) |
| 20 to < 30 |
90 |
33 |
208.39 |
% |
173 |
23.39 |
% |
268,528 |
62.36 |
% |
|
357 |
206 |
% |
25 |
(11.23) |
| 30 to < 100 |
114 |
26 |
69.95 |
% |
160 |
53.02 |
% |
188,641 |
62.70 |
% |
|
302 |
189 |
% |
53 |
(25.00) |
| 100.00 (Default) |
165 |
34 |
71.49 |
% |
195 |
100.00 |
% |
190,652 |
68.60 |
% |
|
83 |
42 |
% |
128 |
(111.45) |
| Subtotal (exposure class) |
3,173 |
17,781 |
57.76 |
% |
13,543 |
3.71 |
% |
19,522,298 |
70.04 |
% |
— |
4,630 |
34 |
% |
332 |
(219) |
| Total (all exposures classes AIRB) |
417,993 |
65,408 |
40.94 |
% |
430,724 |
3.94 |
% |
31,415,628 |
25.41 |
% |
— |
129,919 |
30 |
% |
6,034 |
(5,326) |
|
2024 Pillar 3 Disclosures Report 89
|
|
|
|
|
|
|
|
|
|
|
|
|
|
|
|
|
|
|
|
|
|
|
|
|
|
|
|
|
|
|
|
|
|
|
|
|
|
|
| Table 27.CR6 - AIRB approach Retail - Credit risk exposures by exposure class and PD range |
| EUR million |
|
|
|
|
|
|
|
|
|
|
|
|
|
|
|
|
|
|
|
|
|
|
|
|
2024 |
| PD range |
Original on-balance-sheet gross exposures |
Off-balance-sheet exposures pre-CCF |
Average CCF |
EAD post CRM and post CCF |
Average PD |
Number of obligors |
Average LGD |
Average maturity |
RWA |
RW |
EL |
Value adjustments and provisions |
| a |
b |
c |
d |
e |
f |
g |
h |
i |
j |
k |
l |
m |
| Retail - Other non SMEs |
|
|
|
|
|
|
|
|
|
|
|
|
| 0.00 < 0.15 |
1,600 |
605 |
75.39 |
% |
2,057 |
0.08 |
% |
2,249,943 |
41.16 |
% |
|
191 |
9 |
% |
1 |
(1.01) |
| 0.00 to < 0.10 |
436 |
491 |
74.02 |
% |
799 |
0.05 |
% |
1,647,373 |
56.91 |
% |
|
73 |
9 |
% |
— |
(0.23) |
| 0.10 to < 0.15 |
1,165 |
115 |
81.22 |
% |
1,259 |
0.10 |
% |
602,570 |
31.17 |
% |
|
118 |
9 |
% |
— |
(0.78) |
| 0.15 < 0.25 |
3,954 |
88 |
91.09 |
% |
4,034 |
0.21 |
% |
561,049 |
28.48 |
% |
|
569 |
14 |
% |
2 |
(1.42) |
| 0.25 < 0.50 |
6,273 |
204 |
63.10 |
% |
6,388 |
0.36 |
% |
915,983 |
39.50 |
% |
|
1,732 |
27 |
% |
9 |
(35.56) |
| 0.50 < 0.75 |
6,749 |
265 |
37.64 |
% |
6,847 |
0.64 |
% |
863,887 |
36.96 |
% |
|
2,432 |
36 |
% |
16 |
(20.37) |
| 0.75 < 2.50 |
12,191 |
353 |
55.92 |
% |
12,362 |
1.38 |
% |
1,639,023 |
43.76 |
% |
|
6,748 |
55 |
% |
74 |
(62.87) |
| 0.75 to < 1.75 |
9,853 |
289 |
53.56 |
% |
9,984 |
1.19 |
% |
1,255,981 |
43.31 |
% |
|
5,178 |
52 |
% |
51 |
(40.15) |
| 1.75 to < 2.50 |
2,339 |
64 |
66.63 |
% |
2,378 |
2.15 |
% |
383,042 |
45.65 |
% |
|
1,570 |
66 |
% |
23 |
(22.72) |
| 2.50 < 10.00 |
5,431 |
149 |
49.79 |
% |
5,488 |
4.69 |
% |
972,552 |
52.45 |
% |
|
4,584 |
84 |
% |
134 |
(107.33) |
| 2.50 to <5 |
3,333 |
49 |
76.98 |
% |
3,361 |
3.43 |
% |
456,688 |
52.37 |
% |
|
2,713 |
81 |
% |
60 |
(42.84) |
| 5 to <10 |
2,098 |
100 |
36.50 |
% |
2,127 |
6.69 |
% |
515,864 |
52.57 |
% |
|
1,871 |
88 |
% |
74 |
(64.49) |
| 10.00 < 100.00 |
2,318 |
15 |
39.63 |
% |
2,317 |
33.94 |
% |
365,349 |
47.73 |
% |
|
2,434 |
105 |
% |
376 |
(189.46) |
| 10 to < 20 |
850 |
5 |
45.80 |
% |
851 |
14.36 |
% |
128,360 |
52.80 |
% |
|
949 |
112 |
% |
64 |
(38.41) |
| 20 to < 30 |
639 |
6 |
39.06 |
% |
640 |
22.49 |
% |
95,585 |
42.92 |
% |
|
721 |
113 |
% |
62 |
(21.41) |
| 30 to < 100 |
829 |
4 |
31.98 |
% |
827 |
62.92 |
% |
141,404 |
46.24 |
% |
|
765 |
92 |
% |
250 |
(129.65) |
| 100.00 (Default) |
1,430 |
3 |
30.49 |
% |
1,421 |
100.00 |
% |
285,967 |
65.85 |
% |
|
551 |
39 |
% |
893 |
(861.43) |
| Subtotal (exposure class) |
39,946 |
1,682 |
62.02 |
% |
40,915 |
6.63 |
% |
7,853,753 |
42.48 |
% |
— |
19,241 |
47 |
% |
1,506 |
(1,279) |
| Total (all exposures classes AIRB) |
417,993 |
65,408 |
40.94 |
% |
430,724 |
3.94 |
% |
31,415,628 |
25.41 |
% |
— |
129,919 |
30 |
% |
6,034 |
(5,326) |
|
|
|
|
|
|
|
|
|
|
|
|
|
90 2024 Pillar 3 Disclosures Report
|
|
|
|
|
|
|
|
|
|
|
|
|
|
|
|
|
|
|
|
|
|
|
|
|
|
|
|
|
|
|
|
|
|
|
|
|
|
|
| Table 27.CR6 - AIRB approach Retail - Credit risk exposures by exposure class and PD range |
| EUR million |
|
|
|
|
|
|
|
|
|
|
|
|
|
|
|
|
|
|
|
|
|
|
|
|
2024 |
| PD range |
Original on-balance-sheet gross exposures |
Off-balance-sheet exposures pre-CCF |
Average CCF |
EAD post CRM and post CCF |
Average PD |
Number of obligors |
Average LGD |
Average maturity |
RWA |
RW |
EL |
Value adjustments and provisions |
| a |
b |
c |
d |
e |
f |
g |
h |
i |
j |
k |
l |
m |
| Retail - SMEs |
|
|
|
|
|
|
|
|
|
|
|
|
| 0.00 < 0.15 |
446 |
279 |
50.40 |
% |
586 |
0.09 |
% |
100,771 |
38.12 |
% |
|
52 |
9 |
% |
— |
(0.32) |
| 0.00 to < 0.10 |
80 |
184 |
53.62 |
% |
178 |
0.06 |
% |
65,385 |
48.01 |
% |
|
14 |
8 |
% |
— |
(0.17) |
| 0.10 to < 0.15 |
366 |
95 |
44.17 |
% |
408 |
0.11 |
% |
35,386 |
33.81 |
% |
|
38 |
9 |
% |
— |
(0.15) |
| 0.15 < 0.25 |
1,512 |
291 |
60.53 |
% |
1,368 |
0.21 |
% |
137,260 |
36.03 |
% |
|
210 |
15 |
% |
1 |
(2.96) |
| 0.25 < 0.50 |
1,275 |
578 |
52.83 |
% |
1,226 |
0.38 |
% |
135,812 |
42.56 |
% |
|
309 |
25 |
% |
2 |
(1.46) |
| 0.50 < 0.75 |
2,860 |
921 |
42.53 |
% |
2,435 |
0.63 |
% |
188,442 |
51.16 |
% |
|
1,001 |
41 |
% |
7 |
(6.04) |
| 0.75 < 2.50 |
6,716 |
1,734 |
47.38 |
% |
5,678 |
1.47 |
% |
536,816 |
49.99 |
% |
|
2,977 |
52 |
% |
40 |
(32.69) |
| 0.75 to < 1.75 |
4,397 |
1,316 |
48.63 |
% |
3,973 |
1.18 |
% |
383,993 |
50.32 |
% |
|
1,998 |
50 |
% |
22 |
(19.65) |
| 1.75 to < 2.50 |
2,319 |
418 |
43.47 |
% |
1,705 |
2.14 |
% |
152,823 |
49.20 |
% |
|
978 |
57 |
% |
18 |
(13.04) |
| 2.50 < 10.00 |
4,607 |
610 |
46.38 |
% |
3,557 |
4.50 |
% |
328,727 |
50.46 |
% |
|
2,442 |
69 |
% |
77 |
(68.10) |
| 2.50 to <5 |
2,975 |
404 |
47.95 |
% |
2,443 |
3.55 |
% |
218,319 |
49.99 |
% |
|
1,640 |
67 |
% |
40 |
(32.14) |
| 5 to <10 |
1,631 |
207 |
43.31 |
% |
1,114 |
6.56 |
% |
110,408 |
51.48 |
% |
|
802 |
72 |
% |
37 |
(35.96) |
| 10.00 < 100.00 |
1,018 |
77 |
39.25 |
% |
712 |
32.24 |
% |
89,841 |
46.30 |
% |
|
660 |
93 |
% |
103 |
(71.48) |
| 10 to < 20 |
425 |
33 |
37.15 |
% |
269 |
14.41 |
% |
32,388 |
48.79 |
% |
|
229 |
85 |
% |
19 |
(22.12) |
| 20 to < 30 |
179 |
22 |
39.68 |
% |
141 |
24.10 |
% |
18,346 |
45.07 |
% |
|
140 |
99 |
% |
16 |
(10.70) |
| 30 to < 100 |
415 |
22 |
41.95 |
% |
302 |
51.98 |
% |
39,107 |
44.66 |
% |
|
290 |
96 |
% |
69 |
(38.66) |
| 100.00 (Default) |
1,798 |
82 |
25.77 |
% |
937 |
100.00 |
% |
124,227 |
74.13 |
% |
|
375 |
40 |
% |
674 |
(598.68) |
| Subtotal (exposure class) |
20,232 |
4,572 |
47.46 |
% |
16,500 |
8.69 |
% |
1,641,896 |
49.34 |
% |
— |
8,024 |
49 |
% |
904 |
(782) |
| Total (all exposures classes AIRB) |
417,993 |
65,408 |
40.94 |
% |
430,724 |
3.94 |
% |
31,415,628 |
25.41 |
% |
— |
129,919 |
30 |
% |
6,034 |
(5,326) |
2024 Pillar 3 Disclosures Report 91
|
|
|
|
|
|
|
|
|
|
|
|
|
|
|
|
|
|
|
|
|
|
|
|
|
|
|
|
|
|
|
|
|
|
|
|
|
|
|
| CR6 - AIRB approach Retail - Credit risk exposures by exposure class and PD range (31.12.2023) |
| EUR million |
|
|
|
|
|
|
|
|
|
|
|
2023 |
| PD range |
Original on-balance-sheet gross exposures |
Off-balance-sheet exposures pre-CCF |
Average CCF |
EAD post CRM and post CCF |
Average PD |
Number of obligors |
Average LGD |
Average maturity |
RWA |
RW |
EL |
Value adjustments and provisions |
| a |
b |
c |
d |
e |
f |
g |
h |
i |
j |
k |
l |
m |
| Retail - Mortgages SMEs |
| 0.00 < 0.15 |
3,674 |
38 |
97.74 |
% |
3,711 |
0.08 |
% |
53,555 |
27.88 |
% |
|
175 |
5 |
% |
1 |
(1.15) |
| 0.00 to < 0.10 |
2,955 |
31 |
100.00 |
% |
2,987 |
0.07 |
% |
42,588 |
28.25 |
% |
|
126 |
4 |
% |
1 |
(0.56) |
| 0.10 to < 0.15 |
718 |
7 |
87.49 |
% |
725 |
0.13 |
% |
10,967 |
26.36 |
% |
|
49 |
7 |
% |
— |
(0.60) |
| 0.15 < 0.25 |
2,258 |
11 |
78.44 |
% |
2,267 |
0.21 |
% |
27,002 |
32.05 |
% |
|
258 |
11 |
% |
2 |
(1.95) |
| 0.25 < 0.50 |
2,332 |
16 |
87.31 |
% |
2,345 |
0.37 |
% |
30,242 |
29.14 |
% |
|
376 |
16 |
% |
3 |
(5.04) |
| 0.50 < 0.75 |
1,194 |
8 |
73.50 |
% |
1,200 |
0.61 |
% |
14,919 |
32.29 |
% |
|
288 |
24 |
% |
2 |
(2.22) |
| 0.75 < 2.50 |
2,438 |
34 |
33.18 |
% |
2,436 |
1.30 |
% |
29,912 |
29.00 |
% |
|
904 |
37 |
% |
9 |
(12.75) |
| 0.75 to < 1.75 |
1,949 |
27 |
37.96 |
% |
1,955 |
1.09 |
% |
24,172 |
29.62 |
% |
|
676 |
35 |
% |
6 |
(8.34) |
| 1.75 to < 2.50 |
489 |
6 |
12.37 |
% |
480 |
2.17 |
% |
5,740 |
26.49 |
% |
|
229 |
48 |
% |
3 |
(4.41) |
| 2.50 < 10.00 |
1,218 |
13 |
66.03 |
% |
1,153 |
4.41 |
% |
16,754 |
30.93 |
% |
|
905 |
78 |
% |
16 |
(21.50) |
| 2.50 to <5 |
698 |
9 |
82.73 |
% |
678 |
3.20 |
% |
10,582 |
30.60 |
% |
|
451 |
66 |
% |
7 |
(7.37) |
| 5 to <10 |
520 |
4 |
25.81 |
% |
475 |
6.13 |
% |
6,172 |
31.40 |
% |
|
454 |
96 |
% |
9 |
(14.13) |
| 10.00 < 100.00 |
656 |
13 |
48.06 |
% |
629 |
28.76 |
% |
8,074 |
29.83 |
% |
|
815 |
130 |
% |
55 |
(44.55) |
| 10 to < 20 |
313 |
9 |
42.20 |
% |
285 |
13.58 |
% |
4,132 |
29.36 |
% |
|
363 |
128 |
% |
12 |
(14.02) |
| 20 to < 30 |
145 |
— |
28.39 |
% |
144 |
23.95 |
% |
1,605 |
32.95 |
% |
|
225 |
156 |
% |
11 |
(8.37) |
| 30 to < 100 |
198 |
4 |
64.37 |
% |
200 |
53.86 |
% |
2,337 |
28.25 |
% |
|
227 |
114 |
% |
32 |
(22.16) |
| 100.00 (Default) |
809 |
3 |
23.06 |
% |
807 |
100.00 |
% |
10,537 |
42.57 |
% |
|
436 |
54 |
% |
309 |
(269.59) |
| Subtotal (exposure class) |
14,579 |
137 |
68.24 |
% |
14,548 |
7.52 |
% |
190,995 |
30.43 |
% |
— |
4,157 |
29 |
% |
397 |
(359) |
| Total (all exposures classes AIRB) |
435,331 |
62,878 |
41.11 |
% |
442,013 |
4.04 |
% |
30,550,441 |
26.20 |
% |
— |
138,204 |
31 |
% |
6,039 |
(5,542) |
|
92 2024 Pillar 3 Disclosures Report
|
|
|
|
|
|
|
|
|
|
|
|
|
|
|
|
|
|
|
|
|
|
|
|
|
|
|
|
|
|
|
|
|
|
|
|
|
|
|
| CR6 - AIRB approach Retail - Credit risk exposures by exposure class and PD range (31.12.2023) |
| EUR million |
|
|
|
|
|
|
|
|
|
|
|
2023 |
| PD range |
Original on-balance-sheet gross exposures |
Off-balance-sheet exposures pre-CCF |
Average CCF |
EAD post CRM and post CCF |
Average PD |
Number of obligors |
Average LGD |
Average maturity |
RWA |
RW |
EL |
Value adjustments and provisions |
| a |
b |
c |
d |
e |
f |
g |
h |
i |
j |
k |
l |
m |
| Retail - Mortgages no SMEs |
|
|
|
|
|
|
|
|
|
|
|
| 0.00 < 0.15 |
29,523 |
386 |
100.00 |
% |
29,908 |
0.09 |
% |
436,417 |
26.14 |
% |
|
1,788 |
6 |
% |
7 |
(44.82) |
| 0.00 to < 0.10 |
19,469 |
247 |
100.00 |
% |
19,716 |
0.07 |
% |
315,016 |
27.05 |
% |
|
1,038 |
5 |
% |
4 |
(3.20) |
| 0.10 to < 0.15 |
10,054 |
139 |
100.00 |
% |
10,193 |
0.13 |
% |
121,401 |
24.37 |
% |
|
750 |
7 |
% |
3 |
(41.63) |
| 0.15 < 0.25 |
19,274 |
739 |
58.64 |
% |
19,708 |
0.22 |
% |
178,618 |
22.63 |
% |
|
2,053 |
10 |
% |
10 |
(6.10) |
| 0.25 < 0.50 |
73,459 |
4,021 |
37.68 |
% |
74,974 |
0.37 |
% |
471,278 |
12.31 |
% |
|
6,114 |
8 |
% |
34 |
(23.58) |
| 0.50 < 0.75 |
83,618 |
3,760 |
36.60 |
% |
84,994 |
0.61 |
% |
575,590 |
11.30 |
% |
|
9,169 |
11 |
% |
59 |
(33.63) |
| 0.75 < 2.50 |
45,174 |
1,057 |
34.67 |
% |
45,540 |
1.36 |
% |
314,292 |
13.82 |
% |
|
10,010 |
22 |
% |
84 |
(66.88) |
| 0.75 to < 1.75 |
34,750 |
442 |
49.40 |
% |
34,968 |
1.16 |
% |
239,637 |
14.13 |
% |
|
7,185 |
21 |
% |
57 |
(48.98) |
| 1.75 to < 2.50 |
10,424 |
615 |
24.10 |
% |
10,572 |
2.02 |
% |
74,655 |
12.79 |
% |
|
2,825 |
27 |
% |
27 |
(17.90) |
| 2.50 < 10.00 |
13,222 |
176 |
29.66 |
% |
13,274 |
4.22 |
% |
123,180 |
14.89 |
% |
|
6,244 |
47 |
% |
85 |
(79.90) |
| 2.50 to <5 |
9,635 |
95 |
38.54 |
% |
9,672 |
3.42 |
% |
77,143 |
13.70 |
% |
|
3,728 |
39 |
% |
45 |
(39.06) |
| 5 to <10 |
3,587 |
80 |
19.10 |
% |
3,602 |
6.35 |
% |
46,037 |
18.08 |
% |
|
2,516 |
70 |
% |
40 |
(40.84) |
| 10.00 < 100.00 |
5,020 |
146 |
36.34 |
% |
5,073 |
30.21 |
% |
52,809 |
15.30 |
% |
|
4,217 |
83 |
% |
220 |
(133.26) |
| 10 to < 20 |
1,833 |
69 |
28.38 |
% |
1,852 |
13.69 |
% |
25,842 |
16.96 |
% |
|
1,686 |
91 |
% |
43 |
(39.89) |
| 20 to < 30 |
1,592 |
32 |
50.89 |
% |
1,609 |
24.41 |
% |
10,071 |
15.50 |
% |
|
1,523 |
95 |
% |
59 |
(31.36) |
| 30 to < 100 |
1,594 |
45 |
38.21 |
% |
1,612 |
54.98 |
% |
16,896 |
13.18 |
% |
|
1,008 |
63 |
% |
117 |
(62.00) |
| 100.00 (Default) |
4,666 |
30 |
14.26 |
% |
4,670 |
100.00 |
% |
44,113 |
25.95 |
% |
|
4,988 |
107 |
% |
813 |
(499.63) |
| Subtotal (exposure class) |
273,955 |
10,315 |
40.59 |
% |
278,141 |
2.96 |
% |
2,196,297 |
14.87 |
% |
— |
44,584 |
16 |
% |
1,312 |
(888) |
| Total (all exposures classes AIRB) |
435,331 |
62,878 |
41.11 |
% |
442,013 |
4.04 |
% |
30,550,441 |
26.20 |
% |
— |
138,204 |
31 |
% |
6,039 |
(5,542) |
|
|
|
|
|
|
|
|
|
|
|
|
|
2024 Pillar 3 Disclosures Report 93
|
|
|
|
|
|
|
|
|
|
|
|
|
|
|
|
|
|
|
|
|
|
|
|
|
|
|
|
|
|
|
|
|
|
|
|
|
|
|
| CR6 - AIRB approach Retail - Credit risk exposures by exposure class and PD range (31.12.2023) |
| EUR million |
|
|
|
|
|
|
|
|
|
|
|
2023 |
| PD range |
Original on-balance-sheet gross exposures |
Off-balance-sheet exposures pre-CCF |
Average CCF |
EAD post CRM and post CCF |
Average PD |
Number of obligors |
Average LGD |
Average maturity |
RWA |
RW |
EL |
Value adjustments and provisions |
| a |
b |
c |
d |
e |
f |
g |
h |
i |
j |
k |
l |
m |
| Qualifying Revolving |
|
|
|
|
|
|
|
|
|
|
|
|
| 0.00 < 0.15 |
481 |
8,421 |
32.07 |
% |
3,183 |
0.08 |
% |
4,518,774 |
72.74 |
% |
|
123 |
4 |
% |
2 |
(1.89) |
| 0.00 to < 0.10 |
412 |
5,517 |
35.07 |
% |
2,348 |
0.07 |
% |
3,228,063 |
79.22 |
% |
|
89 |
4 |
% |
1 |
(1.20) |
| 0.10 to < 0.15 |
69 |
2,904 |
26.37 |
% |
835 |
0.12 |
% |
1,290,711 |
54.52 |
% |
|
34 |
4 |
% |
1 |
(0.69) |
| 0.15 < 0.25 |
244 |
1,499 |
34.00 |
% |
757 |
0.21 |
% |
870,182 |
73.11 |
% |
|
67 |
9 |
% |
1 |
(1.54) |
| 0.25 < 0.50 |
100 |
4,606 |
83.73 |
% |
3,957 |
0.31 |
% |
6,226,334 |
67.26 |
% |
|
487 |
12 |
% |
8 |
(3.01) |
| 0.50 < 0.75 |
190 |
730 |
33.88 |
% |
439 |
0.64 |
% |
692,089 |
75.44 |
% |
|
95 |
22 |
% |
2 |
(1.47) |
| 0.75 < 2.50 |
726 |
2,104 |
64.24 |
% |
2,091 |
1.37 |
% |
3,179,702 |
70.16 |
% |
|
808 |
39 |
% |
20 |
(11.50) |
| 0.75 to < 1.75 |
579 |
1,826 |
62.94 |
% |
1,738 |
1.23 |
% |
2,602,277 |
69.94 |
% |
|
615 |
35 |
% |
15 |
(8.50) |
| 1.75 to < 2.50 |
147 |
279 |
72.74 |
% |
352 |
2.11 |
% |
577,425 |
71.26 |
% |
|
192 |
55 |
% |
5 |
(2.99) |
| 2.50 < 10.00 |
745 |
1,462 |
67.11 |
% |
1,746 |
4.73 |
% |
2,643,538 |
68.94 |
% |
|
1,571 |
90 |
% |
57 |
(41.43) |
| 2.50 to <5 |
441 |
975 |
63.32 |
% |
1,071 |
3.46 |
% |
1,617,403 |
69.88 |
% |
|
798 |
74 |
% |
26 |
(21.77) |
| 5 to <10 |
303 |
488 |
74.68 |
% |
675 |
6.75 |
% |
1,026,135 |
67.45 |
% |
|
774 |
115 |
% |
31 |
(19.66) |
| 10.00 < 100.00 |
429 |
326 |
82.39 |
% |
732 |
23.69 |
% |
999,680 |
65.67 |
% |
|
1,309 |
179 |
% |
112 |
(75.56) |
| 10 to < 20 |
229 |
197 |
85.07 |
% |
409 |
12.97 |
% |
570,788 |
68.12 |
% |
|
680 |
166 |
% |
36 |
(26.82) |
| 20 to < 30 |
92 |
83 |
90.16 |
% |
178 |
23.39 |
% |
273,888 |
62.35 |
% |
|
365 |
205 |
% |
26 |
(17.49) |
| 30 to < 100 |
107 |
46 |
56.97 |
% |
146 |
54.14 |
% |
155,004 |
62.84 |
% |
|
264 |
181 |
% |
50 |
(31.24) |
| 100.00 (Default) |
143 |
48 |
53.01 |
% |
169 |
100.00 |
% |
160,495 |
67.90 |
% |
|
67 |
40 |
% |
109 |
(99.18) |
| Subtotal (exposure class) |
3,056 |
19,197 |
51.79 |
% |
13,074 |
3.62 |
% |
19,290,794 |
69.82 |
% |
— |
4,528 |
35 |
% |
312 |
(236) |
| Total (all exposures classes AIRB) |
435,331 |
62,878 |
41.11 |
% |
442,013 |
4.04 |
% |
30,550,441 |
26.20 |
% |
— |
138,204 |
31 |
% |
6,039 |
(5,542) |
|
94 2024 Pillar 3 Disclosures Report
|
|
|
|
|
|
|
|
|
|
|
|
|
|
|
|
|
|
|
|
|
|
|
|
|
|
|
|
|
|
|
|
|
|
|
|
|
|
|
| CR6 - AIRB approach Retail - Credit risk exposures by exposure class and PD range (31.12.2023) |
| EUR million |
|
|
|
|
|
|
|
|
|
|
|
2023 |
| PD range |
Original on-balance-sheet gross exposures |
Off-balance-sheet exposures pre-CCF |
Average CCF |
EAD post CRM and post CCF |
Average PD |
Number of obligors |
Average LGD |
Average maturity |
RWA |
RW |
EL |
Value adjustments and provisions |
| a |
b |
c |
d |
e |
f |
g |
h |
i |
j |
k |
l |
m |
| Retail - Other non SMEs |
|
|
|
|
|
|
|
|
|
|
|
|
| 0.00 < 0.15 |
1,506 |
546 |
75.65 |
% |
1,920 |
0.08 |
% |
1,879,132 |
40.74 |
% |
|
178 |
9 |
% |
1 |
(0.99) |
| 0.00 to < 0.10 |
431 |
431 |
74.12 |
% |
751 |
0.05 |
% |
1,430,493 |
55.19 |
% |
|
67 |
9 |
% |
— |
(0.22) |
| 0.10 to < 0.15 |
1,075 |
115 |
81.41 |
% |
1,169 |
0.10 |
% |
448,639 |
31.46 |
% |
|
111 |
9 |
% |
— |
(0.77) |
| 0.15 < 0.25 |
3,749 |
94 |
86.46 |
% |
3,830 |
0.21 |
% |
499,078 |
29.70 |
% |
|
558 |
15 |
% |
2 |
(3.63) |
| 0.25 < 0.50 |
6,669 |
180 |
72.18 |
% |
6,782 |
0.37 |
% |
887,489 |
44.46 |
% |
— |
2,039 |
30 |
% |
12 |
(13.86) |
| 0.50 < 0.75 |
5,998 |
89 |
66.83 |
% |
6,053 |
0.64 |
% |
660,566 |
35.99 |
% |
— |
1,971 |
33 |
% |
14 |
(17.09) |
| 0.75 < 2.50 |
13,849 |
312 |
64.91 |
% |
14,027 |
1.34 |
% |
1,508,569 |
46.39 |
% |
— |
7,779 |
55 |
% |
86 |
(80.33) |
| 0.75 to < 1.75 |
11,431 |
226 |
68.50 |
% |
11,570 |
1.16 |
% |
1,197,227 |
46.29 |
% |
— |
6,133 |
53 |
% |
61 |
(55.45) |
| 1.75 to < 2.50 |
2,418 |
87 |
55.60 |
% |
2,457 |
2.17 |
% |
311,342 |
46.86 |
% |
— |
1,646 |
67 |
% |
25 |
(24.88) |
| 2.50 < 10.00 |
6,048 |
167 |
50.08 |
% |
6,127 |
4.61 |
% |
853,159 |
54.04 |
% |
— |
5,175 |
84 |
% |
150 |
(122.76) |
| 2.50 to <5 |
3,744 |
63 |
69.41 |
% |
3,785 |
3.36 |
% |
435,097 |
54.45 |
% |
— |
3,112 |
82 |
% |
68 |
(52.93) |
| 5 to <10 |
2,303 |
104 |
38.26 |
% |
2,341 |
6.62 |
% |
418,062 |
53.38 |
% |
|
2,063 |
88 |
% |
82 |
(69.83) |
| 10.00 < 100.00 |
2,324 |
226 |
96.42 |
% |
2,536 |
29.51 |
% |
368,250 |
45.32 |
% |
— |
2,571 |
101 |
% |
336 |
(191.33) |
| 10 to < 20 |
909 |
21 |
91.95 |
% |
927 |
14.52 |
% |
123,885 |
50.97 |
% |
— |
981 |
106 |
% |
68 |
(40.63) |
| 20 to < 30 |
718 |
201 |
98.04 |
% |
915 |
22.34 |
% |
99,325 |
40.42 |
% |
— |
922 |
101 |
% |
83 |
(26.74) |
| 30 to < 100 |
697 |
3 |
22.78 |
% |
694 |
58.96 |
% |
145,040 |
44.22 |
% |
|
668 |
96 |
% |
185 |
(123.96) |
| 100.00 (Default) |
1,120 |
3 |
28.55 |
% |
1,115 |
100.00 |
% |
179,906 |
62.60 |
% |
— |
423 |
38 |
% |
664 |
(615.29) |
| Subtotal (exposure class) |
41,263 |
1,617 |
73.51 |
% |
42,389 |
5.68 |
% |
6,836,149 |
44.30 |
% |
— |
20,693 |
49 |
% |
1,265 |
(1,045) |
| Total (all exposures classes AIRB) |
435,331 |
62,878 |
41.11 |
% |
442,013 |
4.04 |
% |
30,550,441 |
26.20 |
% |
— |
138,204 |
31 |
% |
6,039 |
(5,542) |
|
|
|
|
|
|
|
|
|
|
|
|
|
2024 Pillar 3 Disclosures Report 95
|
|
|
|
|
|
|
|
|
|
|
|
|
|
|
|
|
|
|
|
|
|
|
|
|
|
|
|
|
|
|
|
|
|
|
|
|
|
|
| CR6 - AIRB approach Retail - Credit risk exposures by exposure class and PD range (31.12.2023) |
| EUR million |
|
|
|
|
|
|
|
|
|
|
|
2023 |
| PD range |
Original on-balance-sheet gross exposures |
Off-balance-sheet exposures pre-CCF |
Average CCF |
EAD post CRM and post CCF |
Average PD |
Number of obligors |
Average LGD |
Average maturity |
RWA |
RW |
EL |
Value adjustments and provisions |
| a |
b |
c |
d |
e |
f |
g |
h |
i |
j |
k |
l |
m |
| Retail - SMEs |
| 0.00 < 0.15 |
453 |
268 |
49.54 |
% |
585 |
0.09 |
% |
260,378 |
39.50 |
% |
|
52 |
9 |
% |
— |
(0.70) |
| 0.00 to < 0.10 |
111 |
168 |
52.35 |
% |
198 |
0.06 |
% |
162,981 |
53.06 |
% |
|
18 |
9 |
% |
— |
(0.21) |
| 0.10 to < 0.15 |
342 |
100 |
44.83 |
% |
387 |
0.11 |
% |
97,397 |
32.54 |
% |
|
34 |
9 |
% |
— |
(0.49) |
| 0.15 < 0.25 |
1,633 |
298 |
60.96 |
% |
1,387 |
0.21 |
% |
142,341 |
36.13 |
% |
|
211 |
15 |
% |
1 |
(1.84) |
| 0.25 < 0.50 |
1,764 |
663 |
52.47 |
% |
1,456 |
0.39 |
% |
167,180 |
45.06 |
% |
— |
381 |
26 |
% |
2 |
(3.40) |
| 0.50 < 0.75 |
3,601 |
969 |
46.95 |
% |
2,670 |
0.62 |
% |
229,063 |
50.88 |
% |
— |
1,077 |
40 |
% |
7 |
(11.53) |
| 0.75 < 2.50 |
8,321 |
1,722 |
49.43 |
% |
6,485 |
1.47 |
% |
538,694 |
50.64 |
% |
— |
3,434 |
53 |
% |
45 |
(49.74) |
| 0.75 to < 1.75 |
5,673 |
1,342 |
49.70 |
% |
4,563 |
1.18 |
% |
374,990 |
50.94 |
% |
— |
2,317 |
51 |
% |
25 |
(30.04) |
| 1.75 to < 2.50 |
2,648 |
380 |
48.48 |
% |
1,922 |
2.15 |
% |
163,704 |
49.92 |
% |
— |
1,117 |
58 |
% |
19 |
(19.70) |
| 2.50 < 10.00 |
5,458 |
615 |
53.39 |
% |
4,128 |
4.63 |
% |
362,709 |
50.57 |
% |
— |
2,756 |
67 |
% |
96 |
(121.81) |
| 2.50 to <5 |
3,574 |
426 |
55.26 |
% |
2,714 |
3.57 |
% |
217,351 |
50.03 |
% |
— |
1,751 |
65 |
% |
48 |
(57.04) |
| 5 to <10 |
1,884 |
189 |
49.17 |
% |
1,414 |
6.67 |
% |
145,358 |
51.60 |
% |
— |
1,005 |
71 |
% |
48 |
(64.77) |
| 10.00 < 100.00 |
1,315 |
88 |
39.98 |
% |
918 |
32.12 |
% |
130,864 |
49.01 |
% |
— |
866 |
94 |
% |
144 |
(122.15) |
| 10 to < 20 |
526 |
36 |
40.73 |
% |
371 |
14.55 |
% |
43,197 |
50.21 |
% |
— |
323 |
87 |
% |
27 |
(35.63) |
| 20 to < 30 |
243 |
22 |
39.26 |
% |
178 |
24.21 |
% |
26,230 |
47.65 |
% |
— |
183 |
103 |
% |
21 |
(18.15) |
| 30 to < 100 |
546 |
30 |
39.62 |
% |
369 |
53.61 |
% |
61,437 |
48.46 |
% |
— |
360 |
98 |
% |
97 |
(68.37) |
| 100.00 (Default) |
1,781 |
86 |
24.30 |
% |
868 |
100.00 |
% |
94,425 |
70.41 |
% |
— |
304 |
35 |
% |
594 |
(578.91) |
| Subtotal (exposure class) |
24,326 |
4,709 |
49.97 |
% |
18,498 |
7.97 |
% |
1,925,654 |
49.62 |
% |
— |
9,082 |
49 |
% |
889 |
(890) |
| Total (all exposures classes AIRB) |
435,331 |
62,878 |
41.11 |
% |
442,013 |
4.04 |
% |
30,550,441 |
26.20 |
% |
— |
138,204 |
31 |
% |
6,039 |
(5,542) |
96 2024 Pillar 3 Disclosures Report
|
|
|
|
|
|
|
|
|
|
|
|
|
|
|
|
|
|
|
|
|
|
|
|
|
|
|
|
|
|
|
|
|
|
|
|
|
|
|
| Table 28.CR6 - FIRB approach - Credit risk exposures by exposure class and PD range |
| EUR million |
|
|
|
|
|
|
|
|
|
|
|
2024 |
| PD range |
Original on-balance-sheet gross exposures |
Off-balance-sheet exposures pre-CCF |
Average CCF |
EAD post CRM and post CCF |
Exposure weighted average PD (%) |
Number of obligors |
Average LGD |
Average maturity |
RWA |
RW |
EL |
Value adjustments and provisions |
| a |
b |
c |
d |
e |
f |
g |
h |
i |
j |
k |
l |
m |
| Institutions |
| 0.00 < 0.15 |
11,554 |
13,195 |
23.66 |
% |
17,679 |
0.06 |
% |
1,405 |
44.09 |
% |
2 |
5,613 |
32 |
% |
4 |
(2.81) |
| 0.00 to < 0.10 |
10,645 |
12,601 |
23.75 |
% |
16,403 |
0.05 |
% |
1,265 |
44.20 |
% |
2 |
4,962 |
30 |
% |
3 |
(2.61) |
| 0.10 to < 0.15 |
909 |
594 |
21.68 |
% |
1,276 |
0.13 |
% |
140 |
42.64 |
% |
2 |
651 |
51 |
% |
1 |
(0.20) |
| 0.15 < 0.25 |
2,425 |
2,888 |
43.71 |
% |
3,623 |
0.16 |
% |
258 |
45.00 |
% |
2 |
2,156 |
60 |
% |
3 |
(1.47) |
| 0.25 < 0.50 |
858 |
787 |
5.09 |
% |
834 |
0.32 |
% |
153 |
41.70 |
% |
2 |
686 |
82 |
% |
1 |
(1.70) |
| 0.50 < 0.75 |
223 |
155 |
0.65 |
% |
158 |
0.67 |
% |
45 |
39.97 |
% |
3 |
177 |
112 |
% |
1 |
(0.38) |
| 0.75 < 2.50 |
170 |
566 |
16.94 |
% |
205 |
1.38 |
% |
33 |
4.78 |
% |
3 |
36 |
17 |
% |
— |
(0.37) |
| 0.75 to < 1.75 |
170 |
559 |
16.83 |
% |
203 |
1.37 |
% |
31 |
4.45 |
% |
3 |
32 |
16 |
% |
— |
(0.37) |
| 1.75 to < 2.50 |
— |
7 |
25.28 |
% |
2 |
2.46 |
% |
2 |
45.00 |
% |
3 |
4 |
207 |
% |
— |
— |
| 2.50 < 10.00 |
9 |
22 |
19.92 |
% |
82 |
3.81 |
% |
46 |
31.26 |
% |
3 |
124 |
151 |
% |
— |
(0.01) |
| 2.50 to <5 |
1 |
4 |
20.06 |
% |
71 |
2.89 |
% |
3 |
29.06 |
% |
3 |
90 |
126 |
% |
— |
(0.01) |
| 5 to <10 |
8 |
18 |
19.90 |
% |
11 |
9.53 |
% |
43 |
45.00 |
% |
3 |
35 |
306 |
% |
— |
(0.01) |
| 10.00 < 100.00 |
98 |
16 |
0.05 |
% |
15 |
15.71 |
% |
34 |
45.00 |
% |
3 |
56 |
372 |
% |
2 |
(0.09) |
| 10 to < 20 |
84 |
— |
|
14 |
12.65 |
% |
4 |
45.00 |
% |
3 |
51 |
374 |
% |
1 |
(0.09) |
| 20 to < 30 |
— |
— |
|
— |
|
|
|
|
— |
|
— |
— |
| 30 to < 100 |
14 |
16 |
0.05 |
% |
1 |
45.00 |
% |
30 |
45.00 |
% |
3 |
5 |
355 |
% |
— |
(0.01) |
| 100.00 (Default) |
— |
— |
|
— |
100.00 |
% |
2 |
45.00 |
% |
3 |
— |
— |
% |
— |
— |
| Subtotal (exposure class) |
15,336 |
17,629 |
25.67 |
% |
22,596 |
0.13 |
% |
1,976 |
43.71 |
% |
2 |
8,848 |
39 |
% |
10 |
(7) |
| Total (all exposures classes FIRB) |
106,249 |
149,294 |
28.23 |
% |
132,914 |
1.09 |
% |
18,585 |
41.44 |
% |
2 |
58,880 |
44 |
% |
606 |
(577) |
|
|
|
|
|
|
|
|
|
|
|
|
|
2024 Pillar 3 Disclosures Report 97
|
|
|
|
|
|
|
|
|
|
|
|
|
|
|
|
|
|
|
|
|
|
|
|
|
|
|
|
|
|
|
|
|
|
|
|
|
|
|
| Table 28.CR6 - FIRB approach - Credit risk exposures by exposure class and PD range |
| EUR million |
|
|
|
|
|
|
|
|
|
|
|
2024 |
| PD range |
Original on-balance-sheet gross exposures |
Off-balance-sheet exposures pre-CCF |
Average CCF |
EAD post CRM and post CCF |
Exposure weighted average PD (%) |
Number of obligors |
Average LGD |
Average maturity |
RWA |
RW |
EL |
Value adjustments and provisions |
| a |
b |
c |
d |
e |
f |
g |
h |
i |
j |
k |
l |
m |
| Corporates - Other |
| 0.00 < 0.15 |
27,936 |
60,181 |
37.51 |
% |
56,234 |
0.07 |
% |
1,434 |
42.12 |
% |
2 |
13,004 |
23 |
% |
13 |
(18.94) |
| 0.00 to < 0.10 |
20,389 |
40,474 |
42.06 |
% |
47,277 |
0.06 |
% |
877 |
41.70 |
% |
2 |
9,768 |
21 |
% |
8 |
(16.57) |
| 0.10 to < 0.15 |
7,547 |
19,707 |
28.18 |
% |
8,956 |
0.13 |
% |
557 |
44.34 |
% |
3 |
3,237 |
36 |
% |
5 |
(2.37) |
| 0.15 < 0.25 |
9,267 |
17,039 |
25.56 |
% |
11,945 |
0.21 |
% |
1,143 |
43.02 |
% |
2 |
5,458 |
46 |
% |
10 |
(5.70) |
| 0.25 < 0.50 |
18,916 |
21,856 |
15.72 |
% |
16,834 |
0.37 |
% |
2,779 |
37.57 |
% |
3 |
9,009 |
54 |
% |
22 |
(29.29) |
| 0.50 < 0.75 |
11,672 |
11,984 |
19.19 |
% |
9,763 |
0.59 |
% |
2,166 |
38.69 |
% |
2 |
6,661 |
68 |
% |
21 |
(9.88) |
| 0.75 < 2.50 |
13,751 |
10,825 |
21.85 |
% |
8,528 |
1.17 |
% |
3,646 |
39.33 |
% |
3 |
7,613 |
89 |
% |
42 |
(23.51) |
| 0.75 to < 1.75 |
13,737 |
10,824 |
21.84 |
% |
8,514 |
1.17 |
% |
3,358 |
39.32 |
% |
3 |
7,595 |
89 |
% |
42 |
(23.44) |
| 1.75 to < 2.50 |
14 |
1 |
75.00 |
% |
15 |
2.09 |
% |
288 |
45.00 |
% |
3 |
18 |
123 |
% |
— |
(0.07) |
| 2.50 < 10.00 |
5,599 |
7,001 |
28.10 |
% |
4,366 |
4.52 |
% |
2,091 |
42.10 |
% |
3 |
6,241 |
143 |
% |
86 |
(79.43) |
| 2.50 to <5 |
4,330 |
4,729 |
27.21 |
% |
2,835 |
3.44 |
% |
961 |
40.72 |
% |
3 |
3,592 |
127 |
% |
41 |
(25.56) |
| 5 to <10 |
1,269 |
2,272 |
29.96 |
% |
1,530 |
6.53 |
% |
1,130 |
44.66 |
% |
3 |
2,649 |
173 |
% |
45 |
(53.86) |
| 10.00 < 100.00 |
1,945 |
2,018 |
15.47 |
% |
684 |
25.24 |
% |
1,779 |
38.85 |
% |
3 |
1,484 |
217 |
% |
68 |
(39.37) |
| 10 to < 20 |
519 |
732 |
29.01 |
% |
293 |
15.76 |
% |
145 |
38.61 |
% |
3 |
595 |
203 |
% |
18 |
(23.28) |
| 20 to < 30 |
22 |
— |
75.00 |
% |
22 |
22.10 |
% |
265 |
45.00 |
% |
3 |
57 |
257 |
% |
2 |
(0.11) |
| 30 to < 100 |
1,404 |
1,285 |
7.74 |
% |
369 |
32.96 |
% |
1,369 |
38.67 |
% |
3 |
832 |
225 |
% |
48 |
(15.98) |
| 100.00 (Default) |
739 |
526 |
26.45 |
% |
743 |
100.00 |
% |
233 |
43.09 |
% |
3 |
— |
— |
% |
320 |
(355.91) |
| Subtotal (exposure class) |
89,826 |
131,430 |
28.49 |
% |
109,097 |
1.28 |
% |
15,271 |
40.98 |
% |
2 |
49,470 |
45 |
% |
582 |
(562) |
| Total (all exposures classes FIRB) |
106,249 |
149,294 |
28.23 |
% |
132,914 |
1.09 |
% |
18,585 |
41.44 |
% |
2 |
58,880 |
44 |
% |
606 |
(577) |
|
98 2024 Pillar 3 Disclosures Report
|
|
|
|
|
|
|
|
|
|
|
|
|
|
|
|
|
|
|
|
|
|
|
|
|
|
|
|
|
|
|
|
|
|
|
|
|
|
|
| Table 28.CR6 - FIRB approach - Credit risk exposures by exposure class and PD range |
| EUR million |
|
|
|
|
|
|
|
|
|
|
|
2024 |
| PD range |
Original on-balance-sheet gross exposures |
Off-balance-sheet exposures pre-CCF |
Average CCF |
EAD post CRM and post CCF |
Exposure weighted average PD (%) |
Number of obligors |
Average LGD |
Average maturity |
RWA |
RW |
EL |
Value adjustments and provisions |
| a |
b |
c |
d |
e |
f |
g |
h |
i |
j |
k |
l |
m |
| Corporates - SMEs |
| 0.00 < 0.15 |
281 |
154 |
75.00 |
% |
397 |
0.08 |
% |
18 |
36.16 |
% |
3 |
61 |
15 |
% |
— |
(0.04) |
| 0.00 to < 0.10 |
281 |
154 |
75.00 |
% |
397 |
0.08 |
% |
18 |
36.16 |
% |
3 |
61 |
15 |
% |
— |
(0.04) |
| 0.10 to < 0.15 |
— |
— |
|
— |
|
|
|
|
— |
|
— |
— |
| 0.15 < 0.25 |
133 |
71 |
75.00 |
% |
186 |
0.16 |
% |
7 |
35.21 |
% |
3 |
40 |
22 |
% |
— |
(0.05) |
| 0.25 < 0.50 |
258 |
— |
75.00 |
% |
258 |
0.43 |
% |
145 |
45.00 |
% |
3 |
125 |
49 |
% |
— |
(0.61) |
| 0.50 < 0.75 |
19 |
— |
75.00 |
% |
19 |
0.55 |
% |
55 |
45.00 |
% |
3 |
10 |
50 |
% |
— |
(0.04) |
| 0.75 < 2.50 |
216 |
5 |
75.00 |
% |
177 |
1.46 |
% |
438 |
45.00 |
% |
3 |
126 |
71 |
% |
1 |
(0.42) |
| 0.75 to < 1.75 |
216 |
5 |
75.00 |
% |
177 |
1.46 |
% |
438 |
45.00 |
% |
3 |
126 |
71 |
% |
1 |
(0.42) |
| 1.75 to < 2.50 |
— |
— |
|
— |
|
|
|
|
0 |
|
— |
— |
| 2.50 < 10.00 |
144 |
4 |
75.00 |
% |
147 |
5.60 |
% |
442 |
45.00 |
% |
3 |
152 |
103 |
% |
4 |
(0.35) |
| 2.50 to <5 |
— |
— |
|
— |
|
|
|
|
0 |
|
— |
— |
| 5 to <10 |
144 |
4 |
75.00 |
% |
147 |
5.60 |
% |
442 |
45.00 |
% |
3 |
152 |
103 |
% |
4 |
(0.35) |
| 10.00 < 100.00 |
26 |
1 |
75.00 |
% |
27 |
20.95 |
% |
170 |
45.00 |
% |
3 |
48 |
178 |
% |
3 |
(0.06) |
| 10 to < 20 |
14 |
— |
75.00 |
% |
14 |
17.12 |
% |
5 |
45.00 |
% |
3 |
26 |
192 |
% |
1 |
(0.03) |
| 20 to < 30 |
10 |
1 |
75.00 |
% |
10 |
22.07 |
% |
111 |
45.00 |
% |
3 |
17 |
165 |
% |
1 |
(0.02) |
| 30 to < 100 |
3 |
— |
75.00 |
% |
3 |
34.20 |
% |
54 |
45.00 |
% |
3 |
5 |
165 |
% |
— |
(0.01) |
| 100.00 (Default) |
10 |
— |
|
10 |
100.00 |
% |
63 |
45.00 |
% |
3 |
0 |
— |
% |
5 |
(6.50) |
| Subtotal (exposure class) |
1,087 |
235 |
75.00 |
% |
1,221 |
2.34 |
% |
1,338 |
40.64 |
% |
3 |
562 |
46 |
% |
13 |
(8) |
| Total (all exposures classes FIRB) |
106,249 |
149,294 |
28.23 |
% |
132,914 |
1.09 |
% |
18,585 |
41.44 |
% |
2 |
58,880 |
44 |
% |
606 |
(577) |
2024 Pillar 3 Disclosures Report 99
|
|
|
|
|
|
|
|
|
|
|
|
|
|
|
|
|
|
|
|
|
|
|
|
|
|
|
|
|
|
|
|
|
|
|
|
|
|
|
| CR6 - FIRB approach - Credit risk exposures by exposure class and PD range (31.12.2023) |
| EUR million |
|
|
|
|
|
|
|
|
|
|
|
2023 |
| PD range |
Original on-balance-sheet gross exposures |
Off-balance-sheet exposures pre-CCF |
Average CCF |
EAD post CRM and post CCF |
Exposure weighted average PD (%) |
Number of obligors |
Average LGD |
Average maturity |
RWA |
RW |
EL |
Value adjustments and provisions |
| a |
b |
c |
d |
e |
f |
g |
h |
i |
j |
k |
l |
m |
| Institutions |
| 0.00 < 0.15 |
11,362 |
13,815 |
26.22 |
% |
17,138 |
0.06 |
% |
1,126 |
43.49 |
% |
1 |
3,777 |
22 |
% |
4 |
(4) |
| 0.00 to < 0.10 |
10,300 |
12,891 |
26.90 |
% |
16,020 |
0.05 |
% |
989 |
43.39 |
% |
1 |
3,379 |
21 |
% |
3 |
(4) |
| 0.10 to < 0.15 |
1,062 |
924 |
16.73 |
% |
1,119 |
0.13 |
% |
137 |
44.89 |
% |
1 |
397 |
36 |
% |
1 |
(1) |
| 0.15 < 0.25 |
1,990 |
2,056 |
32.68 |
% |
2,494 |
0.16 |
% |
168 |
44.99 |
% |
2 |
1,384 |
56 |
% |
2 |
(2) |
| 0.25 < 0.50 |
987 |
727 |
8.87 |
% |
971 |
0.31 |
% |
138 |
44.75 |
% |
2 |
826 |
85 |
% |
1 |
(1) |
| 0.50 < 0.75 |
72 |
96 |
8.51 |
% |
80 |
0.66 |
% |
43 |
45.00 |
% |
2 |
105 |
131 |
% |
— |
— |
| 0.75 < 2.50 |
49 |
451 |
20.54 |
% |
141 |
1.69 |
% |
34 |
40.54 |
% |
2 |
219 |
155 |
% |
1 |
— |
| 0.75 to < 1.75 |
49 |
182 |
21.34 |
% |
88 |
1.22 |
% |
31 |
37.82 |
% |
2 |
114 |
130 |
% |
— |
— |
| 1.75 to < 2.50 |
— |
268 |
20.00 |
% |
54 |
2.46 |
% |
3 |
45.00 |
% |
2 |
105 |
196 |
% |
1 |
— |
| 2.50 < 10.00 |
27 |
209 |
6.46 |
% |
20 |
8.43 |
% |
37 |
36.21 |
% |
2 |
42 |
205 |
% |
1 |
(1) |
| 2.50 to <5 |
23 |
162 |
0.01 |
% |
2 |
2.89 |
% |
5 |
45.00 |
% |
3 |
5 |
191 |
% |
— |
— |
| 5 to <10 |
4 |
47 |
28.76 |
% |
18 |
9.19 |
% |
32 |
34.99 |
% |
1 |
37 |
207 |
% |
1 |
— |
| 10.00 < 100.00 |
44 |
48 |
0.33 |
% |
26 |
44.96 |
% |
44 |
44.97 |
% |
2 |
94 |
360 |
% |
5 |
(1) |
| 10 to < 20 |
— |
— |
52.18 |
% |
— |
12.65 |
% |
2 |
21.90 |
% |
3 |
— |
154 |
% |
— |
— |
| 20 to < 30 |
— |
— |
|
— |
|
|
|
|
— |
|
— |
— |
| 30 to < 100 |
44 |
47 |
0.26 |
% |
26 |
45.00 |
% |
42 |
45.00 |
% |
2 |
94 |
360 |
% |
5 |
(1) |
| 100.00 (Default) |
— |
— |
|
— |
100.00 |
% |
2 |
45.00 |
% |
3 |
— |
— |
% |
— |
— |
| Subtotal (exposure class) |
14,531 |
17,402 |
25.70 |
% |
20,871 |
0.16 |
% |
1,592 |
43.71 |
% |
2 |
6,447 |
31 |
% |
14 |
(9) |
| Total (all exposures classes FIRB) |
119,537 |
144,183 |
32.37 |
% |
155,115 |
1.37 |
% |
16,829 |
42.74 |
% |
2 |
55,597 |
36 |
% |
912 |
(1,268) |
|
|
|
|
|
|
|
|
|
|
|
|
|
100 2024 Pillar 3 Disclosures Report
|
|
|
|
|
|
|
|
|
|
|
|
|
|
|
|
|
|
|
|
|
|
|
|
|
|
|
|
|
|
|
|
|
|
|
|
|
|
|
| CR6 - FIRB approach - Credit risk exposures by exposure class and PD range (31.12.2023) |
| EUR million |
|
|
|
|
|
|
|
|
|
|
|
2023 |
| PD range |
Original on-balance-sheet gross exposures |
Off-balance-sheet exposures pre-CCF |
Average CCF |
EAD post CRM and post CCF |
Exposure weighted average PD (%) |
Number of obligors |
Average LGD |
Average maturity |
RWA |
RW |
EL |
Value adjustments and provisions |
| a |
b |
c |
d |
e |
f |
g |
h |
i |
j |
k |
l |
m |
| Corporates - Other |
| 0.00 < 0.15 |
43,789 |
78,481 |
39.44 |
% |
82,242 |
0.07 |
% |
2,094 |
43.71 |
% |
2 |
17,389 |
21 |
% |
22 |
(35.19) |
| 0.00 to < 0.10 |
29,040 |
58,477 |
41.21 |
% |
61,454 |
0.05 |
% |
1,199 |
43.68 |
% |
2 |
10,201 |
17 |
% |
11 |
(20.44) |
| 0.10 to < 0.15 |
14,749 |
20,003 |
34.25 |
% |
20,788 |
0.14 |
% |
895 |
43.78 |
% |
2 |
7,189 |
35 |
% |
11 |
(14.76) |
| 0.15 < 0.25 |
17,870 |
20,642 |
20.63 |
% |
18,695 |
0.22 |
% |
1,572 |
39.83 |
% |
2 |
7,330 |
39 |
% |
15 |
(21.03) |
| 0.25 < 0.50 |
16,738 |
10,352 |
24.33 |
% |
15,378 |
0.38 |
% |
2,610 |
41.03 |
% |
2 |
8,733 |
57 |
% |
23 |
(28.88) |
| 0.50 < 0.75 |
6,618 |
5,341 |
19.56 |
% |
5,346 |
0.61 |
% |
1,633 |
41.07 |
% |
2 |
3,881 |
73 |
% |
14 |
(17.47) |
| 0.75 < 2.50 |
9,527 |
4,253 |
27.71 |
% |
6,317 |
1.21 |
% |
2,809 |
43.36 |
% |
2 |
6,408 |
101 |
% |
35 |
(42.94) |
| 0.75 to < 1.75 |
9,512 |
4,253 |
27.71 |
% |
6,302 |
1.21 |
% |
2,512 |
43.36 |
% |
2 |
6,388 |
101 |
% |
35 |
(42.90) |
| 1.75 to < 2.50 |
15 |
— |
75.00 |
% |
15 |
2.14 |
% |
297 |
45.00 |
% |
3 |
20 |
135 |
% |
— |
(0.05) |
| 2.50 < 10.00 |
4,383 |
3,616 |
29.22 |
% |
2,762 |
3.94 |
% |
1,607 |
37.42 |
% |
2 |
3,562 |
129 |
% |
50 |
(71.18) |
| 2.50 to <5 |
3,428 |
3,315 |
28.54 |
% |
2,082 |
3.23 |
% |
549 |
35.81 |
% |
2 |
2,434 |
117 |
% |
26 |
(59.00) |
| 5 to <10 |
956 |
301 |
36.67 |
% |
680 |
6.12 |
% |
1,058 |
42.37 |
% |
2 |
1,128 |
166 |
% |
24 |
(12.18) |
| 10.00 < 100.00 |
3,380 |
2,813 |
20.41 |
% |
515 |
18.46 |
% |
1,351 |
41.40 |
% |
2 |
1,240 |
241 |
% |
42 |
(32.33) |
| 10 to < 20 |
3,337 |
2,812 |
20.38 |
% |
471 |
17.63 |
% |
993 |
41.06 |
% |
2 |
1,120 |
238 |
% |
36 |
(32.13) |
| 20 to < 30 |
29 |
— |
75.00 |
% |
29 |
22.09 |
% |
281 |
45.00 |
% |
3 |
83 |
281 |
% |
3 |
(0.13) |
| 30 to < 100 |
14 |
1 |
60.15 |
% |
15 |
38.09 |
% |
77 |
45.00 |
% |
3 |
38 |
257 |
% |
2 |
(0.07) |
| 100.00 (Default) |
1,744 |
690 |
25.24 |
% |
1,588 |
100.00 |
% |
217 |
42.97 |
% |
2 |
— |
— |
% |
683 |
(999.15) |
| Subtotal (exposure class) |
104,048 |
126,190 |
33.09 |
% |
132,843 |
1.55 |
% |
13,893 |
42.58 |
% |
2 |
48,544 |
37 |
% |
884 |
(1,248) |
| Total (all exposures classes FIRB) |
119,537 |
144,183 |
32.37 |
% |
155,115 |
1.37 |
% |
16,829 |
42.74 |
% |
2 |
55,597 |
36 |
% |
912 |
(1,268) |
|
2024 Pillar 3 Disclosures Report 101
|
|
|
|
|
|
|
|
|
|
|
|
|
|
|
|
|
|
|
|
|
|
|
|
|
|
|
|
|
|
|
|
|
|
|
|
|
|
|
| CR6 - FIRB approach - Credit risk exposures by exposure class and PD range (31.12.2023) |
| EUR million |
|
|
|
|
|
|
|
|
|
|
|
2023 |
| PD range |
Original on-balance-sheet gross exposures |
Off-balance-sheet exposures pre-CCF |
Average CCF |
EAD post CRM and post CCF |
Exposure weighted average PD (%) |
Number of obligors |
Average LGD |
Average maturity |
RWA |
RW |
EL |
Value adjustments and provisions |
| a |
b |
c |
d |
e |
f |
g |
h |
i |
j |
k |
l |
m |
| Corporates - SMEs |
| 0.00 < 0.15 |
276 |
587 |
75.00 |
% |
716 |
0.04 |
% |
27 |
42.54 |
% |
3 |
97 |
14 |
% |
— |
— |
| 0.00 to < 0.10 |
276 |
558 |
75.00 |
% |
695 |
0.04 |
% |
26 |
42.77 |
% |
3 |
92 |
13 |
% |
— |
— |
| 0.10 to < 0.15 |
— |
29 |
75.00 |
% |
22 |
0.13 |
% |
1 |
35.00 |
% |
3 |
5 |
22 |
% |
— |
— |
| 0.15 < 0.25 |
— |
— |
|
— |
|
|
|
|
— |
|
— |
— |
| 0.25 < 0.50 |
254 |
— |
75.00 |
% |
254 |
0.43 |
% |
144 |
45.00 |
% |
— |
125 |
48.97 |
% |
— |
(0.74) |
| 0.50 < 0.75 |
37 |
— |
75.00 |
% |
38 |
0.55 |
% |
95 |
45.00 |
% |
— |
21 |
54.33 |
% |
— |
(0.11) |
| 0.75 < 2.50 |
219 |
2 |
75.00 |
% |
221 |
1.57 |
% |
426 |
45.00 |
% |
— |
173 |
78.41 |
% |
2 |
(0.64) |
| 0.75 to < 1.75 |
219 |
2 |
75.00 |
% |
221 |
1.57 |
% |
426 |
45.00 |
% |
— |
173 |
78.41 |
% |
2 |
(0.64) |
| 1.75 to < 2.50 |
— |
— |
|
— |
|
|
|
|
0 |
|
— |
— |
| 2.50 < 10.00 |
144 |
1 |
75.00 |
% |
145 |
5.70 |
% |
448 |
45.00 |
% |
— |
164 |
113.08 |
% |
4 |
(0.49) |
| 2.50 to <5 |
— |
— |
|
— |
|
|
|
|
0 |
|
— |
— |
| 5 to <10 |
144 |
1 |
75.00 |
% |
145 |
5.70 |
% |
448 |
45.00 |
% |
— |
164 |
113.08 |
% |
4 |
(0.49) |
| 10.00 < 100.00 |
15 |
— |
75.00 |
% |
15 |
24.23 |
% |
147 |
45.00 |
% |
— |
27 |
175.32 |
% |
2 |
(0.04) |
| 10 to < 20 |
— |
— |
|
— |
|
|
|
|
0 |
|
— |
— |
| 20 to < 30 |
13 |
— |
75.00 |
% |
13 |
22.07 |
% |
99 |
45.00 |
% |
— |
23 |
177.64 |
% |
1 |
(0.04) |
| 30 to < 100 |
3 |
— |
75.00 |
% |
3 |
34.20 |
% |
48 |
45.00 |
% |
— |
5 |
164.58 |
% |
— |
(0.01) |
| 100.00 (Default) |
11 |
— |
|
11 |
100.00 |
% |
57 |
45.00 |
% |
— |
0 |
— |
% |
5 |
(7.97) |
| Subtotal (exposure class) |
958 |
591 |
75.00 |
% |
1,401 |
2.02 |
% |
1,344 |
43.74 |
% |
1 |
606 |
43.28 |
% |
14 |
(10) |
| Total (all exposures classes FIRB) |
119,537 |
144,183 |
32.37 |
% |
155,115 |
1.37 |
% |
16,829 |
42.74 |
% |
2 |
55,597 |
35.84 |
% |
912 |
(1,268) |
102 2024 Pillar 3 Disclosures Report
The following tables show the specialized financing exposures:
|
|
|
|
|
|
|
|
|
|
|
|
|
|
|
|
|
|
|
|
|
|
|
|
| Table 29.CR10.1 - Specialised lending and equity exposures under the simple riskweighted approach. Project financing |
| EUR million |
|
|
|
|
|
|
2024 |
|
Specialised lending : Project finance (Slotting approach) |
| Regulatory Categories |
Remaining maturity |
On-balance-sheet amount |
Off-balance-sheet amount |
RW |
EAD |
RWA |
Expected loss |
|
|
a |
b |
c |
d |
e |
f |
| Category 1 |
< 2.5 years |
802 |
697 |
50 |
% |
1,067 |
402 |
0 |
| >= 2.5 years |
2,985 |
1,749 |
70 |
% |
3,422 |
1,856 |
14 |
| Category 2 |
< 2.5 years |
2,828 |
2,192 |
70 |
% |
3,357 |
2,057 |
13 |
| >= 2.5 years |
5,676 |
4,946 |
90 |
% |
6,695 |
4,913 |
54 |
| Category 3 |
< 2.5 years |
158 |
96 |
115 |
% |
214 |
209 |
6 |
| >= 2.5 years |
628 |
63 |
115 |
% |
642 |
717 |
18 |
| Category 4 |
< 2.5 years |
— |
|
3 |
250 |
% |
1 |
1 |
— |
|
| >= 2.5 years |
— |
|
— |
|
250 |
% |
— |
|
— |
|
— |
|
| Category 5 |
< 2.5 years |
51 |
3 |
— |
% |
52 |
— |
|
26 |
| >= 2.5 years |
241 |
6 |
— |
% |
247 |
— |
|
123 |
| Total |
< 2.5 years |
3,840 |
2,991 |
— |
% |
4,691 |
2,670 |
45 |
| >= 2.5 years |
9,530 |
6,765 |
— |
% |
11,006 |
7,486 |
209 |
| Including counterparty credit risk |
2024 Pillar 3 Disclosures Report 103
|
|
|
|
|
|
|
|
|
|
|
|
|
|
|
|
|
|
|
|
|
|
|
|
| Table 30.CR10.2 - Specialised lending and equity exposures under the simple riskweighted approach. Income-earning real estate and highly volatile commercial real estate |
| EUR million |
|
|
|
|
|
|
2024 |
|
Specialised lending:Income-producing real estate and high volatility commercial real estate (Slotting approach) |
| Regulatory Categories |
Remaining maturity |
On-balance-sheet amount |
Off-balance-sheet amount |
RW |
EAD |
RWA |
Expected loss |
|
|
a |
b |
c |
d |
e |
f |
| Category 1 |
< 2.5 years |
953 |
43 |
50 |
% |
954 |
436 |
— |
| >= 2.5 years |
1,550 |
96 |
70 |
% |
1,576 |
1,004 |
6 |
| Category 2 |
< 2.5 years |
2,159 |
113 |
70 |
% |
2,190 |
1,343 |
9 |
| >= 2.5 years |
2,044 |
136 |
90 |
% |
2,072 |
1,658 |
17 |
| Category 3 |
< 2.5 years |
242 |
1 |
115 |
% |
242 |
259 |
7 |
| >= 2.5 years |
111 |
14 |
115 |
% |
122 |
120 |
3 |
| Category 4 |
< 2.5 years |
5 |
— |
250 |
% |
5 |
13 |
— |
| >= 2.5 years |
— |
— |
250 |
% |
— |
1 |
— |
| Category 5 |
< 2.5 years |
178 |
— |
— |
% |
178 |
— |
89 |
| >= 2.5 years |
28 |
— |
— |
% |
28 |
— |
14 |
| Total |
< 2.5 years |
3,536 |
157 |
— |
% |
3,568 |
2,051 |
105 |
| >= 2.5 years |
3,733 |
246 |
— |
% |
3,799 |
2,782 |
40 |
104 2024 Pillar 3 Disclosures Report
|
|
|
|
|
|
|
|
|
|
|
|
|
|
|
|
|
|
|
|
|
|
|
|
| Table 31.CR10.3 - Specialised lending and equity exposures under the simple riskweighted approach. Financing of assets |
| EUR million |
|
|
|
|
|
|
2024 |
|
Specialised lending : Project finance (Slotting approach) |
| Regulatory Categories |
Remaining maturity |
On-balance-sheet amount |
Off-balance-sheet amount |
RW |
EAD |
RWA |
Expected loss |
|
|
a |
b |
c |
d |
e |
f |
| Category 1 |
< 2.5 years |
21 |
92 |
50 |
% |
74 |
31 |
— |
| >= 2.5 years |
49 |
92 |
70 |
% |
103 |
70 |
— |
| Category 2 |
< 2.5 years |
19 |
— |
70 |
% |
19 |
12 |
— |
| >= 2.5 years |
37 |
4 |
90 |
% |
39 |
33 |
— |
| Category 3 |
< 2.5 years |
— |
— |
115 |
% |
— |
— |
— |
| >= 2.5 years |
5 |
14 |
115 |
% |
5 |
6 |
— |
| Category 4 |
< 2.5 years |
— |
— |
250 |
% |
— |
— |
— |
| >= 2.5 years |
— |
— |
250 |
% |
— |
— |
— |
| Category 5 |
< 2.5 years |
— |
— |
— |
% |
— |
— |
— |
| >= 2.5 years |
137 |
— |
— |
% |
137 |
— |
62 |
| Total |
< 2.5 years |
40 |
92 |
— |
% |
93 |
43 |
— |
| >= 2.5 years |
228 |
110 |
— |
% |
285 |
108 |
63 |
2024 Pillar 3 Disclosures Report 105
|
|
|
|
|
|
|
|
|
|
|
|
|
|
|
|
|
|
|
|
|
|
|
|
| Table 32.CR10.4 - Specialised lending and equity exposures under the simple riskweighted approach. Financing of raw materials |
| EUR million |
|
|
|
|
|
|
2024 |
|
Commodities finance slotting approach |
| Regulatory Categories |
Remaining maturity |
On-balance-sheet amount |
Off-balance-sheet amount |
RW |
EAD |
RWA |
Expected loss |
|
|
a |
b |
c |
d |
e |
f |
| Category 1 |
< 2.5 years |
— |
— |
50 |
% |
— |
— |
— |
| >= 2.5 years |
— |
— |
70 |
% |
— |
— |
— |
| Category 2 |
< 2.5 years |
— |
— |
70 |
% |
— |
— |
— |
| >= 2.5 years |
10 |
— |
90 |
% |
10 |
9 |
— |
| Category 3 |
< 2.5 years |
— |
— |
115 |
% |
— |
— |
— |
| >= 2.5 years |
— |
— |
115 |
% |
— |
— |
— |
| Category 4 |
< 2.5 years |
— |
— |
250 |
% |
— |
— |
— |
| >= 2.5 years |
— |
— |
250 |
% |
— |
— |
— |
| Category 5 |
< 2.5 years |
— |
— |
— |
% |
— |
— |
— |
| >= 2.5 years |
— |
— |
— |
% |
— |
— |
— |
| Total |
< 2.5 years |
— |
— |
— |
% |
— |
— |
— |
| >= 2.5 years |
10 |
— |
— |
% |
10 |
9 |
— |
106 2024 Pillar 3 Disclosures Report
4.2.3. Equity investments and instruments not included in the held-for-trading book
This section provides definitions for investments in associates, equity instruments classified as other financial assets at fair value through other comprehensive income and financial assets with mandatory classification at fair value through profit or loss. Also, the accounting policies and measurement methods applied are defined. Information is also provided on the amounts of the equity instruments not included in the held-for-trading portfolio.
Investments in associates are defined by shares allowing the Group to influence, but not to control or joint control the respective associates. For such cases usually 20% or more of the voting power is allocated to the group.
Equity instruments not held for trading issued by entities other than subsidiaries, jointly controlled entities and associates are required to be classified at fair value through profit or loss, unless the entity opts to classify them as financial assets at fair value through other comprehensive income, irrevocably, on initial recognition.
Investments in associates are recognised at cost and the Group periodically tests for their impairment.
Equity instruments classified as other financial assets at fair value through other comprehensive income are recognised and measured at fair value with a corresponding entry in equity, under valuation adjustments, irrevocably. Instruments classified as financial assets with mandatory recognition at fair value through profit or loss are recognised and measured at fair value with a corresponding entry in profit or loss.
|
|
|
|
|
|
|
|
|
|
|
|
|
|
|
|
|
|
|
|
|
| Table 33.CR10.5 - Equity exposures under the simple risk-weighted approach |
| EUR million |
|
|
|
|
|
|
|
|
|
|
2024 |
| Categories |
On-balance sheet exposure |
Off-balance sheet exposure |
Risk weight |
Exposure value |
Risk weighted exposure amount |
Expected loss amount |
|
a |
b |
c |
d |
e |
f |
| Private equity exposures |
2,483 |
|
190 |
% |
2,483 |
4,717 |
20 |
| Exchange-traded equity exposures |
2 |
|
290 |
% |
2 |
7 |
0.018 |
| Other equity exposures |
— |
|
370 |
% |
— |
— |
— |
| Total |
2,485 |
|
|
2,485 |
4,724 |
20 |
Equity exposures under the simple risk-weighted approach represent in Santander 2,485 million euros in exposure with a risk weighted exposure amount of 4,724 million.
|
|
|
|
|
|
|
|
|
|
|
|
| Table 34.Equity instruments through other comprehensive income |
|
| EUR million |
|
|
|
|
|
|
2024 |
|
Carrying value |
Fair value |
Valuation adjustment |
| Quoted |
1,780 |
1,780 |
741 |
| Unquoted |
413 |
413 |
(1,106) |
| Total |
2,193 |
2,193 |
(365) |
|
|
|
|
|
|
| Table 35.Equity instruments mandatory at fair value through profit and loss |
|
| EUR million |
|
|
2024 |
|
Fair Value |
| Quoted |
337 |
| Investment funds |
1,489 |
| Unquoted |
1,267 |
| Total |
3,093 |
2024 Pillar 3 Disclosures Report 107
|
|
|
|
|
|
| Table 36.Equity instruments through other comprehensive income. Consolidated gross valuation adjustments |
|
| EUR million |
2024 |
|
Fair Value |
|
| Prior-year balance |
(732) |
| Revaluation gains and losses |
367 |
| Current-year balance |
(365) |
Refer to the Auditor's report and consolidated financial statements in the Annual report for further information on the portfolio of equity instruments classified as other financial assets at fair value through other comprehensive income.
|
|
|
|
|
|
|
Access 2024 Annual Report available on the Santander Group website |
With respect to holdings accounted for using the equity method at year-end 2024, the amounts for associates and jointly controlled entities were EUR 5,216 million and EUR 613 million, respectively.
There are also investments in group entities totalling 1,447 million, which are accounted for using the full consolidation method in the public perimeter.
The group tests these investments for impairment on a regular basis. No such impairment was found in 2024.
108 2024 Pillar 3 Disclosures Report
The following table summarises and describes EU CRE requirements on qualitative disclosure requirements related to the IRB approach:
|
|
|
|
|
|
|
|
|
|
|
|
IRB parameter models (CRE) |
|
| Article 452 |
|
Description of the article |
Comments |
|
| Article 452(a) |
|
When disclosing information on the extent of the authorization of the method by the competent authority or its approval of the transition process in accordance with Article 452(a) of the CRR, entities shall describe the main characteristics of the qualification systems used under the IRB method for which authorization has been granted by the competent authority, as well as the types of exposures covered by those rating systems. Institutions shall also describe the types of exposures for which they are permitted to permanently partially use the standardized approach in accordance with Article 150 of the CRR and which form part of their plans to deploy the IRB approach in accordance with Article 148 of the CRR. . The description will be provided at the group level. |
See Appendix XII and section 2.4.2.1 |
| Article 452(b) |
|
For each exposure category referred to in Article 147, the percentage of the total exposure value of each exposure category subject to the standard method established in part three, title II, chapter 2 or the IRB method established in part three, title II, chapter 3, as well as the part of each exposure category subject to an implementation plan; Where authorized to use their own loss given default (LGD) estimates and conversion factors for the calculation of risk-weighted amounts of exposures, institutions shall separately disclose the percentage of the total exposure value of each category of exhibition subject to said authorization; |
See table CR6 |
| Article 452(c) |
|
The description of the control mechanisms of the rating systems will cover the estimation of risk parameters, including the development and calibration of internal models, as well as controls on the application of the models and changes to the rating systems. In accordance with Article 452(c)(i) to iv) of the CRR, the role description of the functions mentioned above will also include: i) the relationships between the risk management function and the internal audit function ii) processes and methods for the review of rating systems, including periodic reviews of estimates in accordance with Article 179(1)(c) CRR and validations, iii) organizational procedures and modalities to ensure the independence of the function responsible for reviewing the models (validation function) with respect to the functions responsible for the development and calibration of the models, iv) and the procedure to ensure that the functions responsible for developing and reviewing the models have the obligation to render accounts. |
See sections 3.3 and 4.5 |
| Article 452(d) |
|
The entities will specify the role of the functions involved in the model development, calibration, approval and subsequent changes of the credit risk models. |
See Appendix XII and section 2.4.2.1 |
| Article 452(e) |
|
Entities will disclose the scope and main content of the management reports related to the IRB models referred to in Article 189 of the CRR, as well as the recipients and frequency of such reports. |
See Appendix XII and section 2.4.2.1 |
| Article 452(f) |
|
Disclosure of information on internal rating systems by exposure class will include the number of key models used in each exposure class with respect different types of exposures, with a brief description of the main differences among the models within the same exposure class. It will also include a description of the main characteristics of the key approved models, in particular: i) the definitions, methods and data used for the estimation and validation of the probability of default (PD), including the estimation and validation of the PD for low-default portfolios, any applicable regulatory floors and the drivers for differences observed between PD estimates and actual default rates at least for the last three years; ii) where applicable, the definitions, methods and data for the estimation and validation of LGD, including estimation and validation of downturn LGD, information on how LGDs are estimated for low default portfolios, and the average time lapse between the default event and the closure of the exposure; iii) where applicable, the definitions, methods and data used to estimate and validate the conversion factors, including assumptions employed in the derivation of those estimates |
See Appendix XII and section 4.5. |
|
| Article 452(g) |
|
As applicable, the following information in relation to quantitative information on the use of the IRB approach covered by Article 147 [...] |
See table 24, CR6 and CR4 |
2024 Pillar 3 Disclosures Report 109
4.2.4. Standardised approach
This section covers the CRD requirement - Qualitative disclosure requirements related to standardised approach
For the calculation of regulatory capital under the standardised approach, Santander uses the external rating agencies designated as eligible by the ECB (European Central Bank). The agencies used for the capital calculation at 31 December 2024 are Fitch, Moody's, DBRS, Standard & Poor's, Japan Credit Rating Agency, Inbonis Rating and HR Ratings de México.
For the central government and central banks category, if the requirements of article 137 of the CRR are met, the Group uses the OECD's Country Risk Classification of the Participants to the Arrangement on Officially Supported Export Credits.
Different risk weights are applied to credit exposures depending on the rating assigned by the credit rating agencies (e.g. Fitch, Moody's, Standard & Poor's and Inbonis Rating for the segments approved under Part III, Title II, Chapter II of the CRR) or the minimum export insurance premium rating (e.g. OECD for the central government and central bank segment, as explained above). Japan Credit Rating Agency and HR Ratings de México are used for credit exposures in the Sovereign segment.
Grupo Santander does not currently transfer the issuer and issue credit ratings onto items not included in the trading book for exposures treated under the standard method
The assignment of weights according to credit ratings complies with the regulatory requirements, aligning the alphanumeric scale of each agency used with the credit quality steps set down in Chapter II, Section II of the CRR, as follows:
|
|
|
|
|
|
|
|
|
|
|
|
|
|
|
|
|
|
|
|
|
| Credit quality step |
S&P / Inbonis |
Moody's |
Fitch |
DBRS |
Japan Credit Rating Agency |
HR Ratings Mexico |
| 1 |
AAA a AA- |
AAA to AA3 |
AAA a AA- |
AAA to AAL |
AAA to AA |
HR AAA to HR AA |
| 2 |
A+ to A- |
A1 to A3 |
A+ to A- |
AH to AL |
A |
HR A |
| 3 |
BB+ to BBB- |
BAA1 to BAA3 |
BB+ to BBB- |
BBBH to BBBL |
BBB |
HR BBB |
| 4 |
BB+ to BB- |
BA1 to BA3 |
BB+ to BB- |
BBH to BBL |
BB |
HR BB |
| 5 |
B+ to B- |
B1 to B3 |
B+ to B- |
BH to BL |
B |
HR B |
| 6 |
Lower than B- |
Lower than B3 |
Lower than B- |
CCCH to lower |
CCC to lower |
HR CCC to lower |
|
|
|
|
|
|
|
|
|
|
|
|
|
|
|
|
|
|
|
|
|
| Credit quality step |
Central governments and central banks |
Public sector entities |
Institutions ≤ 3 months rated |
Institutions > 3 months rated |
Institutions not rated |
Corporates |
| 1 |
0% |
20% |
20% |
20% |
20% |
20% |
| 2 |
20% |
50% |
20% |
50% |
50% |
50% |
| 3 |
50% |
100% |
20% |
50% |
100% |
100% |
| 4 |
100% |
100% |
50% |
100% |
100% |
100% |
| 5 |
100% |
100% |
50% |
100% |
100% |
150% |
| 6 |
150% |
150% |
150% |
150% |
150% |
150% |
In accordance with article 150 of the CRR, Santander always uses the standardised approach for sovereign exposures denominated and funded in the Member State’s local currency, applying a 0% risk weighting.
Guarantees are applied by reallocating exposures to the corresponding asset categories and risk weightings.
When credit institutions use some of their qualifying financial collateral as a credit risk mitigation technique, the valuation of this collateral for the calculation of risk-weighted exposure amounts can either follow the financial collateral simple method under Article 222 of the CRR or the financial collateral comprehensive method under Article 223 of the CRR.
110 2024 Pillar 3 Disclosures Report
|
|
|
|
|
|
|
|
|
|
|
|
|
|
|
|
|
|
|
|
|
|
|
|
|
|
|
|
|
|
|
Table 37.CR4 - standardised approach - Credit risk exposure and CRM effects |
|
EUR million |
|
|
|
|
|
|
2024 |
|
|
Exposures before CCF and CRM |
|
Exposures post CCF and CRM |
|
RWAs and RW |
|
Exposure classes |
On-balance-sheet amount |
Off-balance-sheet amount |
|
On-balance-sheet amount |
Off-balance-sheet amount |
|
RWAs |
RW |
|
|
a |
b |
|
c |
d |
|
e |
f |
| 1 |
Central governments or central banks |
366,596 |
4,359 |
|
393,423 |
2,114 |
|
27,211 |
7 |
% |
| 2 |
Regional governments or local authorities |
15,428 |
2,115 |
|
14,956 |
758 |
|
357 |
2 |
% |
| 3 |
Public sector entities |
3,564 |
926 |
|
4,212 |
235 |
|
359 |
8 |
% |
| 4 |
Multilateral Development Banks |
2,860 |
4 |
|
8,104 |
127 |
|
— |
— |
% |
| 5 |
International Organisations |
1,721 |
— |
|
1,721 |
— |
|
— |
— |
% |
| 6 |
Institutions |
21,107 |
2,991 |
|
21,526 |
3,348 |
|
5,555 |
22 |
% |
| 7 |
Corporates |
64,205 |
37,248 |
|
55,032 |
3,558 |
|
53,269 |
91 |
% |
| 8 |
Retail |
147,730 |
92,337 |
|
133,178 |
1,022 |
|
94,258 |
70 |
% |
| 9 |
Secured by mortgages on immovable property |
94,387 |
7,334 |
|
90,655 |
304 |
|
33,494 |
37 |
% |
| 10 |
Exposures in default |
15,119 |
537 |
|
14,467 |
170 |
|
15,872 |
108 |
% |
| 11 |
Items associated with particularly high risk |
561 |
342 |
|
553 |
21 |
|
861 |
150 |
% |
| 12 |
Covered bonds |
3,019 |
— |
|
3,019 |
— |
|
496 |
16 |
% |
| 13 |
Claims on institutions and corporates with a short-term credit assessment |
307 |
184 |
|
901 |
96 |
|
365 |
37 |
% |
| 14 |
Collective investments undertakings (CIU) |
345 |
— |
|
345 |
— |
|
303 |
88 |
% |
| 15 |
Equity |
53 |
— |
|
53 |
— |
|
53 |
100 |
% |
| 16 |
Other items |
82,705 |
20,757 |
|
87,173 |
233 |
|
51,158 |
59 |
% |
| 17 |
TOTAL |
819,705 |
169,135 |
|
829,317 |
11,987 |
|
283,612 |
34 |
% |
|
Securitisations not included |
|
|
|
|
|
|
|
|
|
CRR Fully-loaded, Phased-in IFRS 9 |
|
|
|
|
|
|
|
|
|
|
|
|
|
|
|
|
|
|
|
|
|
|
|
|
|
|
|
|
|
|
|
|
|
|
|
|
|
|
|
CR4 - standardised approach - Credit risk exposure and CRM effects (31.12.2023) |
|
EUR million |
|
|
|
|
|
|
2023 |
|
|
Exposures before CCF and CRM |
|
Exposures post CCF and CRM |
|
RWAs and RW |
|
Exposure classes |
On-balance-sheet amount |
Off-balance-sheet amount |
|
On-balance-sheet amount |
Off-balance-sheet amount |
|
RWAs |
RW |
|
|
a |
b |
|
c |
d |
|
e |
f |
| 1 |
Central governments or central banks |
380,526 |
4,367 |
|
415,326 |
2,607 |
|
26,949 |
6 |
% |
| 2 |
Regional governments or local authorities |
13,720 |
2,335 |
|
13,450 |
652 |
|
531 |
4 |
% |
| 3 |
Public sector entities |
5,005 |
639 |
|
5,216 |
243 |
|
360 |
7 |
% |
| 4 |
Multilateral Development Banks |
2,179 |
— |
|
5,212 |
71 |
|
— |
— |
% |
| 5 |
International Organisations |
1,924 |
— |
|
1,924 |
— |
|
— |
— |
% |
| 6 |
Institutions |
18,910 |
3,431 |
|
19,003 |
1,013 |
|
5,526 |
28 |
% |
| 7 |
Corporates |
67,043 |
31,416 |
|
57,565 |
3,382 |
|
55,811 |
92 |
% |
| 8 |
Retail |
153,984 |
90,361 |
|
140,414 |
1,717 |
|
99,635 |
70 |
% |
| 9 |
Secured by mortgages on immovable property |
96,438 |
8,078 |
|
92,582 |
243 |
|
33,382 |
36 |
% |
| 10 |
Exposures in default |
14,020 |
466 |
|
13,576 |
84 |
|
14,523 |
106 |
% |
| 11 |
Items associated with particularly high risk |
712 |
67 |
|
680 |
— |
|
1,021 |
150 |
% |
| 12 |
Covered bonds |
2,620 |
— |
|
2,620 |
— |
|
424 |
16 |
% |
| 13 |
Claims on institutions and corporates with a short-term credit assessment |
232 |
26 |
|
316 |
8 |
|
109 |
34 |
% |
| 14 |
Collective investments undertakings (CIU) |
262 |
— |
|
262 |
— |
|
248 |
95 |
% |
| 15 |
Equity |
30 |
— |
|
30 |
— |
|
30 |
100 |
% |
| 16 |
Other items |
81,438 |
20,617 |
|
84,495 |
4,283 |
|
47,181 |
53 |
% |
| 17 |
TOTAL |
839,042 |
161,803 |
|
852,670 |
14,304 |
|
285,728 |
33 |
% |
|
Securitisations not included. |
|
|
|
|
|
|
|
|
|
CRR Fully-loaded, Phased-in IFRS 9 |
|
|
|
|
|
|
|
|
2024 Pillar 3 Disclosures Report 111
|
|
|
|
|
|
|
|
|
|
|
|
|
|
|
|
|
|
|
|
|
|
|
|
|
|
|
|
|
|
|
|
|
|
|
|
|
|
|
|
|
|
|
|
|
|
|
|
|
|
|
|
|
|
|
|
|
|
Table 38.CR5 - standardised approach |
|
|
|
|
EUR million |
|
|
|
|
|
|
|
|
|
|
|
|
|
|
|
|
|
|
|
|
|
|
|
|
|
|
|
|
|
|
|
|
|
|
|
2024 |
|
|
Risk Weight |
Total |
Of which unrated |
|
|
0% |
2% |
4% |
10% |
20% |
35% |
50% |
70% |
75% |
100% |
150% |
250% |
370% |
1250% |
Others |
|
|
a |
b |
c |
d |
e |
f |
g |
h |
i |
j |
k |
l |
m |
n |
o |
p |
q |
| 1 |
Central governments or central banks |
378,030 |
— |
— |
— |
2,562 |
— |
945 |
— |
— |
5,833 |
19 |
8,147 |
— |
— |
— |
395,536 |
395,449 |
| 2 |
Regional government or local authorities |
14,944 |
— |
— |
— |
497 |
— |
30 |
— |
— |
243 |
— |
— |
— |
— |
— |
15,714 |
15,412 |
| 3 |
Public sector entities |
3,143 |
— |
— |
— |
1,112 |
— |
111 |
— |
— |
81 |
— |
— |
— |
— |
— |
4,447 |
3,218 |
| 4 |
Multilateral development banks |
8,231 |
— |
— |
— |
— |
— |
— |
— |
— |
— |
— |
— |
— |
— |
— |
8,231 |
8,231 |
| 5 |
International organisations |
1,721 |
— |
— |
— |
— |
— |
— |
— |
— |
— |
— |
— |
— |
— |
— |
1,721 |
1,721 |
| 6 |
Institutions |
— |
4,979 |
— |
— |
15,899 |
— |
3,486 |
— |
— |
454 |
56 |
— |
— |
— |
— |
24,874 |
17,255 |
| 7 |
Corporates |
— |
— |
— |
— |
1,779 |
— |
1,255 |
— |
— |
54,661 |
895 |
— |
— |
— |
— |
58,589 |
56,721 |
| 8 |
Retail |
— |
— |
— |
— |
— |
4,019 |
— |
— |
130,181 |
— |
— |
— |
— |
— |
— |
134,200 |
134,200 |
| 9 |
Secured by mortgages on immovable property |
— |
— |
— |
— |
— |
76,033 |
12,876 |
— |
— |
1,676 |
374 |
— |
— |
— |
— |
90,959 |
90,959 |
| 10 |
Exposures in default |
— |
— |
— |
— |
— |
— |
— |
— |
— |
12,166 |
2,471 |
— |
— |
— |
— |
14,637 |
14,637 |
| 11 |
Exposures associated with particularly high risk |
— |
— |
— |
— |
— |
— |
— |
— |
— |
— |
574 |
— |
— |
— |
— |
574 |
574 |
| 12 |
Covered bonds |
— |
— |
— |
1,075 |
1,944 |
— |
— |
— |
— |
— |
— |
— |
— |
— |
— |
3,019 |
2,775 |
| 13 |
Institutions and corporates with a short-term credit assessment |
— |
— |
— |
— |
612 |
— |
296 |
— |
— |
75 |
15 |
— |
— |
— |
— |
997 |
6 |
| 14 |
Collective investment undertakings |
22 |
— |
— |
— |
34 |
— |
— |
— |
— |
276 |
13 |
— |
— |
— |
— |
345 |
345 |
| 15 |
Equity |
— |
— |
— |
— |
— |
— |
— |
— |
— |
53 |
— |
— |
— |
— |
— |
53 |
53 |
| 16 |
Other items |
22,125 |
210 |
— |
— |
17,381 |
— |
15 |
— |
20 |
47,655 |
— |
— |
— |
— |
— |
87,407 |
87,407 |
| 17 |
Total |
428,216 |
5,189 |
— |
1,075 |
41,819 |
80,052 |
19,014 |
— |
130,201 |
123,173 |
4,417 |
8,147 |
— |
— |
— |
841,303 |
828,963 |
|
Securitisations not included. Including counterparty credit risk |
|
112 2024 Pillar 3 Disclosures Report
|
|
|
|
|
|
|
|
|
|
|
|
|
|
|
|
|
|
|
|
|
|
|
|
|
|
|
|
|
|
|
|
|
|
|
|
|
|
|
|
|
|
|
|
|
|
|
|
|
|
|
|
|
|
|
|
|
|
CR5 - standardised approach (31.12.2023) |
|
|
|
|
EUR million |
|
|
|
|
|
|
|
|
|
|
|
|
|
|
|
|
|
|
|
|
|
|
|
|
|
|
|
|
|
|
|
|
|
|
|
2023 |
|
|
Risk Weight |
Total |
Of which unrated |
|
|
0% |
2% |
4% |
10% |
20% |
35% |
50% |
70% |
75% |
100% |
150% |
250% |
370% |
1250% |
Others |
|
|
a |
b |
c |
d |
e |
f |
g |
h |
i |
j |
k |
l |
m |
n |
o |
p |
q |
| 1 |
Central governments or central banks |
397,622 |
— |
668 |
30 |
3,947 |
— |
531 |
— |
— |
7,980 |
2 |
7,154 |
— |
— |
— |
417,933 |
415,890 |
| 2 |
Regional government or local authorities |
13,183 |
— |
— |
— |
442 |
— |
69 |
— |
— |
408 |
— |
— |
— |
— |
— |
14,102 |
13,613 |
| 3 |
Public sector entities |
4,177 |
— |
52 |
— |
1,036 |
— |
90 |
— |
— |
101 |
3 |
— |
— |
— |
— |
5,459 |
4,333 |
| 4 |
Multilateral development banks |
5,283 |
— |
— |
— |
— |
— |
— |
— |
— |
— |
— |
— |
— |
— |
— |
5,283 |
5,283 |
| 5 |
International organisations |
1,924 |
— |
— |
— |
— |
— |
— |
— |
— |
— |
— |
— |
— |
— |
— |
1,924 |
1,924 |
| 6 |
Institutions |
— |
1,045 |
— |
— |
14,950 |
— |
3,050 |
— |
— |
910 |
61 |
— |
— |
— |
— |
20,016 |
10,816 |
| 7 |
Corporates |
— |
— |
— |
— |
1,047 |
— |
1,100 |
— |
— |
58,459 |
341 |
— |
— |
— |
— |
60,947 |
59,904 |
| 8 |
Retail |
— |
— |
— |
— |
— |
1,650 |
— |
— |
140,481 |
— |
— |
— |
— |
— |
— |
142,132 |
142,132 |
| 9 |
Secured by mortgages on immovable property |
— |
— |
— |
— |
— |
77,621 |
12,985 |
— |
— |
1,488 |
730 |
— |
— |
— |
— |
92,825 |
92,825 |
| 10 |
Exposures in default |
— |
— |
— |
— |
— |
— |
— |
— |
— |
11,932 |
1,727 |
— |
— |
— |
— |
13,660 |
13,660 |
| 11 |
Exposures associated with particularly high risk |
— |
— |
— |
— |
— |
— |
— |
— |
— |
— |
681 |
— |
— |
— |
— |
681 |
681 |
| 12 |
Covered bonds |
— |
— |
— |
996 |
1,624 |
— |
— |
— |
— |
— |
— |
— |
— |
— |
— |
2,620 |
1 |
| 13 |
Institutions and corporates with a short-term credit assessment |
— |
— |
— |
— |
198 |
— |
114 |
— |
— |
10 |
2 |
— |
— |
— |
— |
324 |
4 |
| 14 |
Collective investment undertakings |
23 |
— |
— |
— |
— |
— |
— |
— |
— |
220 |
18 |
— |
— |
— |
— |
262 |
262 |
| 15 |
Equity |
— |
— |
— |
— |
— |
— |
— |
— |
— |
30 |
— |
— |
— |
— |
— |
30 |
30 |
| 16 |
Other items |
26,507 |
141 |
— |
— |
18,634 |
— |
18 |
— |
176 |
43,289 |
14 |
— |
— |
— |
— |
88,778 |
88,778 |
| 17 |
Total |
448,719 |
1,185 |
719 |
1,027 |
41,877 |
79,271 |
17,957 |
— |
140,657 |
124,829 |
3,579 |
7,154 |
— |
— |
— |
866,974 |
850,133 |
|
Securitisations not included. Including counterparty credit risk |
|
|
|
|
2024 Pillar 3 Disclosures Report 113
4.3. Distribution of exposures
This section covers the CRB requirement - Additional disclosure concerning the credit quality of assets.
The tables below give a breakdown of the exposures to credit and dilution risk of the Group:
•Exposure category
•Business sector
•Geographical area
•Residual maturity
The information is also presented for non-performing exposures, impairment loss allowances and provisions for contingent liabilities and commitments.
In this section the numbers include the amounts for counterparty and credit risk excluding securitisations.
The distribution by geographic in standard portfolios is mainly concentrated in Brazil, Spain and the United States. The most prominent segments continue to be central administrations (with a strong presence in Spain, Brazil and UK) and retailers and companies with a prominent presence in Brazil, the United States and UK.
In terms of IRB portfolios most of the exposure is concentrated in the corporate and retail segments in Spain and the UK.
|
|
|
| Exposures by geographic area |
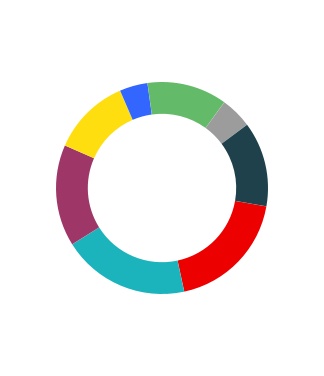
|
|
|
|
|
|
|
|
|
| n |
Spain |
19% |
| n |
United Kingdom |
19% |
| n |
Rest of Europe |
15% |
| n |
Brazil |
12% |
| n |
Rest of South America |
4% |
| n |
United States |
12% |
| n |
Rest of North America |
5% |
| n |
Other |
13% |
|
|
|
|
|
|
|
|
|
|
|
|
|
|
|
|
|
|
|
|
|
|
|
|
|
|
|
|
|
|
| Table 39.CR1-A: Maturity of exposures |
|
EUR million |
2024 |
|
|
a |
b |
c |
d |
e |
f |
|
|
Net exposure value |
|
|
On demand |
<= 1 year |
r > 1 year <= 5 years |
> 5 years |
No stated maturity |
Total |
| 1 |
Loans and advances |
42,078 |
357,047 |
363,047 |
342,159 |
— |
1,104,331 |
| 2 |
Debt securities |
— |
40,375 |
65,854 |
77,575 |
— |
183,804 |
| 3 |
Total |
42,078 |
397,422 |
428,901 |
419,734 |
— |
1,288,135 |
|
|
|
|
|
|
|
|
|
|
|
|
|
|
|
|
|
|
|
|
|
|
|
|
| CR1-A: Maturity of exposures (31.12.2023) |
|
EUR million |
2023 |
|
|
a |
b |
c |
d |
e |
f |
|
|
Net exposure value |
|
|
On demand |
<= 1 year |
r > 1 year <= 5 years |
> 5 years |
No stated maturity |
Total |
| 1 |
Loans and advances |
41,742 |
350,656 |
365,667 |
349,983 |
— |
1,108,048 |
| 2 |
Debt securities |
— |
45,170 |
57,816 |
60,642 |
— |
163,628 |
| 3 |
Total |
41,742 |
395,826 |
423,483 |
410,625 |
— |
1,271,676 |
The following table shows the stock of loans classified as non-performing between the close of the previous year and the end of current year.
|
|
|
|
|
|
|
|
|
| Table 40.CR2 - Changes in the stock of non-performing loans and advances |
|
|
EUR million |
2024 |
|
|
a |
|
|
Gross carrying amount |
| 10 |
Opening balance |
38,909 |
| 20 |
Inflows to non-performing portfolios |
24,131 |
| 30 |
Outflows from non-performing portfolios |
(11,832) |
| 40 |
Outflows due to write-offs |
(12,950) |
| 50 |
Outflow due to other situations |
— |
| 60 |
Closing balance |
38,258 |
|
|
|
114 2024 Pillar 3 Disclosures Report
The following table displays performing and non-performing exposures including provisions by stage:
|
|
|
|
|
|
|
|
|
|
|
|
|
|
|
|
|
|
|
|
|
|
|
|
|
|
|
|
|
|
|
|
|
|
|
|
|
|
|
|
|
|
|
|
|
|
|
|
|
|
|
|
Table 41.CR1 - Performing and non-performing exposures and related provisions |
|
EUR million |
2024 |
|
|
a |
b |
c |
d |
e |
f |
g |
h |
i |
j |
k |
l |
m |
n |
o |
|
|
Gross carrying amount/nominal amount |
Accumulated impairment, accumulated negative changes in fair value due to credit risk and provisions |
Accumulated partial write-off |
Collateral and financial guarantees received |
|
Performing exposures |
Non-performing exposures |
Performing exposures - accumulated impairment and provisions |
Non-performing exposures - accumulated impairment, accumulated negative changes in fair value due to credit risk and provisions |
On performing exposures |
On non-performing exposures |
|
|
Of which, stage 1 |
Of which, stage 2 |
|
Of which, stage 2 |
Of which, stage 3 |
|
Of which, stage 1 |
Of which, stage 2 |
|
Of which, stage 2 |
Of which, stage 3 |
| 5 |
Cash balances at central banks and other demand deposits |
183,115 |
183,115 |
— |
— |
— |
— |
— |
— |
— |
— |
— |
— |
— |
— |
— |
| 10 |
Loans and advances |
1,088,446 |
1,000,062 |
82,269 |
38,259 |
3,422 |
33,993 |
(7,538) |
(3,314) |
(4,224) |
(14,836) |
(587) |
(14,046) |
(215) |
726,561 |
17,610 |
| 20 |
Central banks |
16,200 |
16,200 |
— |
— |
— |
— |
— |
— |
— |
— |
— |
— |
— |
— |
— |
| 30 |
General governments |
28,569 |
27,180 |
337 |
104 |
1 |
103 |
(22) |
(17) |
(5) |
(10) |
— |
(10) |
— |
3,345 |
79 |
| 40 |
Credit institutions |
55,938 |
55,513 |
18 |
1 |
— |
1 |
(5) |
(5) |
— |
— |
— |
— |
— |
23,194 |
— |
| 50 |
Other financial corporations |
92,515 |
88,321 |
1,150 |
313 |
1 |
302 |
(139) |
(105) |
(34) |
(137) |
— |
(131) |
— |
49,878 |
118 |
| 60 |
Non-financial corporations |
311,617 |
282,453 |
27,615 |
11,778 |
407 |
10,921 |
(1,802) |
(713) |
(1,089) |
(4,992) |
(59) |
(4,760) |
(42) |
199,927 |
4,874 |
| 70 |
Of which SMEs |
117,006 |
103,230 |
13,399 |
7,269 |
222 |
6,846 |
(1,040) |
(382) |
(658) |
(3,317) |
(35) |
(3,198) |
(18) |
81,172 |
3,160 |
| 80 |
Households |
583,607 |
530,395 |
53,149 |
26,063 |
3,013 |
22,666 |
(5,570) |
(2,474) |
(3,096) |
(9,697) |
(528) |
(9,145) |
(173) |
450,217 |
12,539 |
| 90 |
Debt securities |
185,226 |
184,018 |
597 |
748 |
— |
701 |
(48) |
(39) |
(9) |
(301) |
— |
(301) |
— |
1,988 |
19 |
| 100 |
Central banks |
6,187 |
6,187 |
— |
— |
— |
— |
— |
— |
— |
— |
— |
— |
— |
— |
— |
| 110 |
General governments |
135,098 |
134,987 |
41 |
— |
— |
— |
(4) |
(4) |
— |
— |
— |
— |
— |
471 |
— |
| 120 |
Credit institutions |
10,854 |
10,854 |
— |
— |
— |
— |
— |
— |
— |
— |
— |
— |
— |
— |
— |
| 130 |
Other financial corporations |
19,821 |
19,544 |
49 |
4 |
— |
4 |
(10) |
(10) |
— |
(2) |
— |
(2) |
— |
672 |
— |
| 140 |
Non-financial corporations |
13,266 |
12,446 |
507 |
744 |
— |
697 |
(34) |
(25) |
(9) |
(299) |
— |
(299) |
— |
845 |
19 |
| 150 |
Off-balance-sheet exposures |
453,115 |
435,548 |
17,565 |
1,661 |
111 |
1,509 |
494 |
305 |
189 |
218 |
5 |
208 |
— |
17,034 |
125 |
| 160 |
Central banks |
536 |
536 |
— |
— |
— |
— |
— |
— |
— |
— |
— |
— |
— |
— |
— |
| 170 |
General governments |
5,474 |
5,256 |
218 |
17 |
— |
17 |
2 |
1 |
1 |
— |
— |
— |
— |
357 |
— |
| 180 |
Credit institutions |
66,092 |
65,984 |
108 |
— |
— |
— |
1 |
1 |
— |
— |
— |
— |
— |
614 |
— |
| 190 |
Other financial corporations |
43,261 |
41,609 |
1,653 |
92 |
— |
85 |
94 |
62 |
32 |
15 |
— |
15 |
— |
1,784 |
— |
| 200 |
Non-financial corporations |
218,031 |
209,775 |
8,254 |
1,360 |
101 |
1,226 |
212 |
128 |
84 |
196 |
4 |
187 |
— |
13,269 |
121 |
| 210 |
Households |
119,721 |
112,388 |
7,332 |
192 |
10 |
181 |
185 |
113 |
72 |
7 |
1 |
6 |
— |
1,010 |
4 |
| 220 |
Total |
1,909,902 |
1,802,743 |
100,431 |
40,668 |
3,533 |
36,203 |
(8,080) |
(3,658) |
(4,422) |
(15,355) |
(592) |
(14,555) |
(215) |
745,583 |
17,754 |
2024 Pillar 3 Disclosures Report 115
|
|
|
|
|
|
|
|
|
|
|
|
|
|
|
|
|
|
|
|
|
|
|
|
|
|
|
|
|
|
|
|
|
|
|
|
|
|
|
|
|
|
|
|
|
|
|
|
|
|
|
|
CR1 - Performing and non-performing exposures and related provisions (31.12.2023) |
|
EUR million |
2023 |
|
|
a |
b |
c |
d |
e |
f |
g |
h |
i |
j |
k |
l |
m |
n |
o |
|
|
Gross carrying amount/nominal amount |
Accumulated impairment, accumulated negative changes in fair value due to credit risk and provisions |
Accumulated partial write-off |
Collateral and financial guarantees received |
|
Performing exposures |
Non-performing exposures |
Performing exposures - accumulated impairment and provisions |
Non-performing exposures - accumulated impairment, accumulated negative changes in fair value due to credit risk and provisions |
On performing exposures |
On non-performing exposures |
|
|
Of which, stage 1 |
Of which, stage 2 |
|
Of which, stage 2 |
Of which, stage 3 |
|
Of which, stage 1 |
Of which, stage 2 |
|
Of which, stage 2 |
Of which, stage 3 |
| 5 |
Cash balances at central banks and other demand deposits |
211,879 |
211,774 |
105 |
— |
— |
— |
— |
— |
— |
— |
— |
— |
— |
— |
— |
| 10 |
Loans and advances |
1,092,226 |
1,010,085 |
74,350 |
38,906 |
3,363 |
34,425 |
(8,087) |
(3,653) |
(4,434) |
(14,997) |
(545) |
(14,233) |
(218) |
724,079 |
18,389 |
| 20 |
Central banks |
20,106 |
20,106 |
— |
— |
— |
— |
— |
— |
— |
— |
— |
— |
— |
2,330 |
— |
| 30 |
General governments |
27,024 |
25,758 |
122 |
47 |
6 |
42 |
(19) |
(13) |
(6) |
(10) |
(1) |
(9) |
— |
2,603 |
26 |
| 40 |
Credit institutions |
58,300 |
57,841 |
— |
1 |
— |
1 |
(9) |
(9) |
— |
— |
— |
— |
— |
22,970 |
— |
| 50 |
Other financial corporations |
80,469 |
75,176 |
1,086 |
263 |
1 |
256 |
(145) |
(117) |
(28) |
(65) |
— |
(58) |
— |
47,385 |
169 |
| 60 |
Non-financial corporations |
324,572 |
296,889 |
25,772 |
13,103 |
371 |
12,120 |
(2,087) |
(935) |
(1,152) |
(5,586) |
(76) |
(5,355) |
(79) |
199,171 |
5,377 |
| 70 |
Of which SMEs |
119,752 |
104,364 |
14,832 |
7,267 |
282 |
6,766 |
(1,165) |
(414) |
(751) |
(3,305) |
(61) |
(3,170) |
— |
85,160 |
3,138 |
| 80 |
Households |
581,755 |
534,315 |
47,370 |
25,492 |
2,985 |
22,006 |
(5,827) |
(2,579) |
(3,248) |
(9,336) |
(468) |
(8,811) |
(139) |
449,620 |
12,817 |
| 90 |
Debt securities |
164,792 |
163,374 |
203 |
510 |
— |
461 |
(37) |
(29) |
(8) |
(249) |
— |
(249) |
— |
620 |
— |
| 100 |
Central banks |
10,761 |
10,761 |
— |
— |
— |
— |
(1) |
(1) |
— |
— |
— |
— |
— |
— |
— |
| 110 |
General governments |
111,616 |
111,418 |
— |
— |
— |
— |
(4) |
(4) |
— |
— |
— |
— |
— |
444 |
— |
| 120 |
Credit institutions |
9,585 |
9,585 |
— |
— |
— |
— |
(1) |
(1) |
— |
— |
— |
— |
— |
— |
— |
| 130 |
Other financial corporations |
18,421 |
17,817 |
— |
11 |
— |
11 |
(5) |
(5) |
— |
(6) |
— |
(6) |
— |
4 |
— |
| 140 |
Non-financial corporations |
14,409 |
13,793 |
203 |
499 |
— |
450 |
(26) |
(18) |
(8) |
(243) |
— |
(243) |
— |
172 |
— |
| 150 |
Off-balance-sheet exposures |
407,592 |
399,099 |
8,490 |
1,715 |
104 |
1,519 |
462 |
292 |
170 |
241 |
4 |
221 |
— |
9,280 |
208 |
| 160 |
Central banks |
190 |
190 |
— |
— |
— |
— |
— |
— |
— |
— |
— |
— |
— |
— |
— |
| 170 |
General governments |
6,120 |
6,093 |
28 |
16 |
— |
16 |
— |
— |
— |
— |
— |
— |
— |
44 |
— |
| 180 |
Credit institutions |
49,602 |
49,601 |
— |
16 |
— |
16 |
1 |
1 |
— |
— |
— |
— |
— |
629 |
— |
| 190 |
Other financial corporations |
38,462 |
38,181 |
281 |
11 |
— |
11 |
89 |
63 |
26 |
1 |
— |
1 |
— |
1,149 |
— |
| 200 |
Non-financial corporations |
201,844 |
195,729 |
6,113 |
1,463 |
91 |
1,283 |
214 |
114 |
100 |
232 |
3 |
214 |
— |
6,965 |
206 |
| 210 |
Households |
111,374 |
109,305 |
2,068 |
209 |
13 |
193 |
158 |
114 |
44 |
8 |
1 |
6 |
— |
493 |
2 |
| 220 |
Total |
1,876,489 |
1,784,332 |
83,148 |
41,131 |
3,467 |
36,405 |
(8,586) |
(3,974) |
(4,612) |
(15,487) |
(549) |
(14,703) |
(218) |
733,979 |
18,597 |
116 2024 Pillar 3 Disclosures Report
The following table breaks down performing and non-performing exposures according to the number of days past due:
|
|
|
|
|
|
|
|
|
|
|
|
|
|
|
|
|
|
|
|
|
|
|
|
|
|
|
|
|
|
|
|
|
|
|
|
|
|
|
|
|
|
|
Table 42.CQ3 - Credit quality of performing and non-performing exposures by past due days |
|
EUR million |
|
|
|
|
|
|
|
|
|
2024 |
|
|
a |
b |
c |
d |
e |
f |
g |
h |
i |
j |
k |
l |
|
|
Gross carrying amount/nominal amount |
|
Performing exposures |
Non-performing exposures |
|
|
Not past due or past due ≤ 30 days |
Past due > 30 days ≤ 90 days |
|
Unlikely to pay that are not past due or are past due ≤ 90 days |
Past due > 90 days ≤ 180 days
|
Past due > 180 days ≤ 1 year
|
Past due > 1 year ≤ 2 years
|
Past due > 2 years ≤ 5 years
|
Past due > 5 years ≤ 7 years
|
Past due > 7 years |
Of which defaulted |
| 5 |
Cash balances at central banks and other demand deposits |
183,115 |
183,115 |
— |
— |
— |
— |
— |
— |
— |
— |
— |
— |
| 10 |
Loans and advances |
1,088,446 |
1,083,192 |
5,254 |
38,259 |
22,922 |
4,722 |
4,573 |
3,802 |
1,568 |
285 |
387 |
37,961 |
| 20 |
Central banks |
16,200 |
16,200 |
— |
— |
— |
— |
— |
— |
— |
— |
— |
— |
| 30 |
General governments |
28,569 |
28,567 |
2 |
104 |
44 |
43 |
1 |
15 |
1 |
— |
— |
104 |
| 40 |
Credit institutions |
55,938 |
55,938 |
— |
1 |
1 |
— |
— |
— |
— |
— |
— |
1 |
| 50 |
Other financial corporations |
92,515 |
92,504 |
11 |
313 |
262 |
8 |
8 |
7 |
19 |
9 |
— |
312 |
| 60 |
Non-financial corporations |
311,617 |
310,716 |
901 |
11,778 |
7,241 |
1,094 |
1,350 |
1,168 |
578 |
119 |
228 |
11,698 |
| 70 |
Of which SMEs |
117,006 |
116,396 |
610 |
7,269 |
3,758 |
846 |
1,110 |
800 |
463 |
105 |
187 |
7,210 |
| 80 |
Households |
583,607 |
579,267 |
4,340 |
26,063 |
15,374 |
3,577 |
3,214 |
2,612 |
970 |
157 |
159 |
25,846 |
| 90 |
Debt securities |
185,226 |
185,203 |
23 |
748 |
320 |
75 |
223 |
45 |
28 |
57 |
— |
746 |
| 100 |
Central banks |
6,187 |
6,187 |
— |
— |
— |
— |
— |
— |
— |
— |
— |
— |
| 110 |
General governments |
135,098 |
135,098 |
— |
— |
— |
— |
— |
— |
— |
— |
— |
— |
| 120 |
Credit institutions |
10,854 |
10,854 |
— |
— |
— |
— |
— |
— |
— |
— |
— |
— |
| 130 |
Other financial corporations |
19,821 |
19,820 |
1 |
4 |
4 |
— |
— |
— |
— |
— |
— |
2 |
| 140 |
Non-financial corporations |
13,266 |
13,244 |
22 |
744 |
316 |
75 |
223 |
45 |
28 |
57 |
— |
744 |
| 150 |
Off-balance-sheet exposures |
453,115 |
— |
— |
1,661 |
— |
— |
— |
— |
— |
— |
— |
1,573 |
| 160 |
Central banks |
536 |
— |
— |
— |
— |
— |
— |
— |
— |
— |
— |
— |
| 170 |
General governments |
5,474 |
— |
— |
17 |
— |
— |
— |
— |
— |
— |
— |
17 |
| 180 |
Credit institutions |
66,092 |
— |
— |
— |
— |
— |
— |
— |
— |
— |
— |
— |
| 190 |
Other financial corporations |
43,261 |
— |
— |
92 |
— |
— |
— |
— |
— |
— |
— |
85 |
| 200 |
Non-financial corporations |
218,031 |
— |
— |
1,360 |
— |
— |
— |
— |
— |
— |
— |
1,284 |
| 210 |
Households |
119,721 |
— |
— |
192 |
— |
— |
— |
— |
— |
— |
— |
187 |
| 220 |
Total |
1,909,902 |
1,451,510 |
5,277 |
40,668 |
23,242 |
4,797 |
4,796 |
3,847 |
1,596 |
342 |
387 |
40,280 |
2024 Pillar 3 Disclosures Report 117
|
|
|
|
|
|
|
|
|
|
|
|
|
|
|
|
|
|
|
|
|
|
|
|
|
|
|
|
Table 43.CQ4 - Quality of non-performing exposures by geography |
|
|
EUR million |
|
|
2024 |
|
|
a |
b |
c |
d |
e |
f |
g |
|
|
Gross carrying/Nominal amount |
|
|
Accumulated impairment |
Provisions on off-balance sheet commitments and financial guarantee given |
Accumulated negative changes in fair value due to credit risk on non-performing exposures |
|
|
|
of which: non-performing |
of which: subject to impairment |
|
|
of which: defaulted |
| 10 |
On balance sheet exposures |
1,312,679 |
|
39,007 |
|
38,706 |
|
1,308,150 |
|
(22,698) |
|
|
(25) |
|
| 20 |
GB |
281,553 |
|
3,997 |
|
3,995 |
|
281,033 |
|
(996) |
|
|
— |
|
| 30 |
ES |
237,261 |
|
8,121 |
|
8,030 |
|
233,114 |
|
(4,420) |
|
|
(24) |
|
| 40 |
US |
165,483 |
|
8,037 |
|
8,034 |
|
165,304 |
|
(4,423) |
|
|
— |
|
| 50 |
BR |
147,328 |
|
7,663 |
|
7,663 |
|
146,297 |
|
(5,509) |
|
|
— |
|
| 60 |
MX |
62,188 |
|
1,603 |
|
1,468 |
|
62,211 |
|
(1,293) |
|
|
— |
|
| 70 |
PL |
61,829 |
|
1,777 |
|
1,776 |
|
61,922 |
|
(1,278) |
|
|
(1) |
|
|
IT |
41,407 |
|
445 |
|
445 |
|
41,377 |
|
(318) |
|
|
— |
|
|
DE |
51,298 |
|
1,205 |
|
1,205 |
|
51,282 |
|
(803) |
|
|
— |
|
|
FR |
34,754 |
|
413 |
|
412 |
|
34,754 |
|
(302) |
|
|
— |
|
|
CL |
49,085 |
|
2,556 |
|
2,556 |
|
49,086 |
|
(1,180) |
|
|
— |
|
| 70 |
Other countries |
180,493 |
|
3,190 |
|
3,122 |
|
181,770 |
|
(2,176) |
|
|
— |
|
| 80 |
Off balance sheet exposures |
454,775 |
|
1,660 |
|
1,572 |
|
|
|
712 |
|
|
| 90 |
ES |
89,613 |
|
611 |
|
567 |
|
|
|
110 |
|
|
| 100 |
US |
65,838 |
|
78 |
|
59 |
|
|
|
61 |
|
|
| 110 |
GB |
61,878 |
|
164 |
|
164 |
|
|
|
117 |
|
|
| 120 |
FR |
48,095 |
|
5 |
|
5 |
|
|
|
7 |
|
|
| 130 |
BR |
42,560 |
|
413 |
|
413 |
|
|
|
146 |
|
|
|
PL |
19,131 |
|
83 |
|
83 |
|
|
|
23 |
|
|
|
MX |
18,193 |
|
18 |
|
18 |
|
|
|
78 |
|
|
|
DE |
15,896 |
|
14 |
|
13 |
|
|
|
10 |
|
|
|
CL |
13,880 |
|
17 |
|
17 |
|
|
|
18 |
|
|
|
AR |
10,411 |
|
1 |
|
— |
|
|
|
53 |
|
|
| 140 |
Other countries |
69,280 |
|
256 |
|
233 |
|
|
|
89 |
|
|
| 150 |
Total |
1,767,454 |
|
40,667 |
|
40,278 |
|
1,308,150 |
|
(22,698) |
|
712 |
|
(25) |
|
118 2024 Pillar 3 Disclosures Report
The following two tables show all exposures by industry and geographical area:
|
|
|
|
|
|
|
|
|
|
|
|
|
|
|
|
|
|
|
|
|
|
|
|
|
Table 44.CQ5 - Credit quality of loans and advances by industry |
|
|
EUR million |
|
|
2024 |
|
|
a |
b |
c |
d |
e |
f |
|
|
Gross carrying amount |
|
|
Accumulated impairment |
Accumulated negative changes in fair value due to credit risk on non-performing exposures |
|
|
|
of which: non-performing |
of which: loans and advances subject to impairment |
|
|
of which: defaulted |
| 10 |
Agriculture, forestry and fishing |
8,036 |
|
481 |
|
480 |
|
8,020 |
|
(252) |
|
(1) |
|
| 20 |
Mining and quarrying |
10,923 |
|
101 |
|
100 |
|
10,885 |
|
(61) |
|
— |
|
| 30 |
Manufacturing |
52,249 |
|
1,963 |
|
1,960 |
|
52,161 |
|
(1,026) |
|
(1) |
|
| 40 |
Electricity, gas, steam and air conditioning supply |
13,455 |
|
256 |
|
250 |
|
13,449 |
|
(152) |
|
— |
|
| 50 |
Water supply |
1,599 |
|
48 |
|
48 |
|
1,586 |
|
(28) |
|
— |
|
| 60 |
Construction |
18,665 |
|
794 |
|
792 |
|
18,652 |
|
(545) |
|
(15) |
|
| 70 |
Wholesale and retail trade |
74,970 |
|
2,873 |
|
2,874 |
|
74,915 |
|
(1,862) |
|
(1) |
|
| 80 |
Transport and storage |
16,578 |
|
756 |
|
755 |
|
16,515 |
|
(375) |
|
(3) |
|
| 90 |
Accommodation and food service activities |
11,176 |
|
854 |
|
853 |
|
11,090 |
|
(461) |
|
(1) |
|
| 100 |
Information and communication |
13,801 |
|
252 |
|
251 |
|
13,790 |
|
(132) |
|
— |
|
| 110 |
Financial and insurance activities |
— |
|
— |
|
— |
|
— |
|
— |
|
— |
|
| 120 |
Real estate activities |
45,625 |
|
1,229 |
|
1,226 |
|
45,328 |
|
(648) |
|
(2) |
|
| 130 |
Professional, scientific and technical activities |
15,923 |
|
618 |
|
611 |
|
15,875 |
|
(343) |
|
— |
|
| 140 |
Administrative and support service activities |
14,302 |
|
565 |
|
564 |
|
14,291 |
|
(303) |
|
— |
|
| 150 |
Public administration and defense, compulsory social security |
334 |
|
— |
|
— |
|
334 |
|
(1) |
|
— |
|
| 160 |
Education |
1,757 |
|
62 |
|
62 |
|
1,741 |
|
(47) |
|
— |
|
| 170 |
Human health services and social work activities |
4,356 |
|
259 |
|
257 |
|
4,346 |
|
(116) |
|
— |
|
| 180 |
Arts, entertainment and recreation |
1,474 |
|
78 |
|
77 |
|
1,474 |
|
(38) |
|
— |
|
| 190 |
Other services |
18,172 |
|
589 |
|
538 |
|
17,360 |
|
(379) |
|
— |
|
| 200 |
Total |
323,395 |
|
11,778 |
|
11,698 |
|
321,812 |
|
(6,769) |
|
(24) |
|
2024 Pillar 3 Disclosures Report 119
The following table shows the credit quality of the restructured or forborne exposures:
|
|
|
|
|
|
|
|
|
|
|
|
|
|
|
|
|
|
|
|
|
|
|
|
|
|
|
|
|
|
| Table 45.CQ1 - Credit quality of forborne exposures |
|
EUR million |
|
|
2024 |
|
|
a |
b |
c |
d |
e |
f |
g |
h |
|
|
Gross carrying amount/nominal amount of exposures with forbearance measures |
Accumulated impairment, accumulated negative changes in fair value due to credit risk and provisions |
Collateral received and financial guarantees received on forborne exposures |
|
|
Performing forborne |
Non-performing forborne |
On performing forborne exposures |
On non-performing forborne exposures |
|
Of which collateral and financial guarantees received on non-performing exposures with forbearance measures |
|
|
|
Of which defaulted |
Of which impaired |
| — |
Cash balances at central banks and other demand deposits |
— |
|
— |
|
— |
|
— |
|
— |
|
— |
|
— |
|
— |
|
| 10 |
Loans and advances |
12,289 |
|
14,980 |
|
14,977 |
|
14,707 |
|
(1,169) |
|
(5,899) |
|
16,034 |
|
7,556 |
|
| 20 |
Central banks |
— |
|
— |
|
— |
|
— |
|
— |
|
— |
|
— |
|
— |
|
| 30 |
General governments |
7 |
|
4 |
|
4 |
|
4 |
|
— |
|
(3) |
|
1 |
|
— |
|
| 40 |
Credit institutions |
— |
|
— |
|
— |
|
— |
|
— |
|
— |
|
— |
|
— |
|
| 50 |
Other financial corporations |
228 |
|
144 |
|
144 |
|
144 |
|
(3) |
|
(83) |
|
264 |
|
50 |
|
| 60 |
Non-financial corporations |
5,374 |
|
5,123 |
|
5,122 |
|
4,990 |
|
(369) |
|
(2,151) |
|
6,603 |
|
2,561 |
|
| 70 |
Households |
6,680 |
|
9,709 |
|
9,707 |
|
9,569 |
|
(797) |
|
(3,662) |
|
9,166 |
|
4,945 |
|
| 80 |
Debt Securities |
184 |
|
434 |
|
434 |
|
434 |
|
(3) |
|
(168) |
|
— |
|
— |
|
| 90 |
Loan commitments given |
386 |
|
51 |
|
51 |
|
50 |
|
2 |
|
6 |
|
317 |
|
34 |
|
| 100 |
Total |
12,859 |
|
15,465 |
|
15,462 |
|
15,191 |
|
(1,174) |
|
(6,073) |
|
16,351 |
|
7,590 |
|
The following table shows the collateral obtained through repossession and foreclosure processes:
|
|
|
|
|
|
|
|
|
|
|
|
| Table 46.CQ7 - Collateral obtained by taking possession and execution processes |
|
EUR million |
2024 |
|
|
a |
b |
|
|
Collateral obtained by taking possession |
|
|
Value at initial recognition |
Accumulated negative changes |
| 10 |
Property, plant and equipment (PP&E) |
— |
— |
| 20 |
Other than PP&E |
5,145 |
2,180 |
| 30 |
Residential immovable property |
749 |
174 |
| 40 |
Commercial Immovable property |
4,076 |
1,990 |
| 50 |
Movable property (auto, shipping, etc.) |
306 |
16 |
| 60 |
Equity and debt instruments |
14 |
— |
| 70 |
Other collateral |
— |
— |
| 80 |
Total |
5,145 |
2,180 |
Requirements CQ2, CQ6, CQ8 and CR2A of the EBA Disclosure ITS are not published because THE NPL ratio does not exceed 5%.
120 2024 Pillar 3 Disclosures Report
4.4. Internal rating systems
Santander has been using its own internal rating and scoring models to measure the credit quality of customers and transactions since 1993. Each rating or score indicates a probability of default, measured on the basis of the bank’s historical default experience (except in the case of low default portfolios).
More than 400 internal rating models are used in the Group’s credit approval and risk monitoring process.
The global rating tools are used for certain CIB segments: corporates, financial institutions, sovereigns and specialised funding, which are managed centrally in Santander, in terms of both allocating the rating and risk monitoring. The rating these tools assign to each customer is obtained using a model which relies on an analyst’s judgement, supported by a quantitative or automatic module based on balance sheet ratios or macroeconomic variables. This quantitative module is created by applying a structured technique for dealing with complex decisions based on two-by-two comparisons to evaluate priorities. Starting from an expert selection of variables/ratios to be considered in the model, this method yields the relative weight of each variable in the overall model. The analyst considers information as a reference for the decision, but has the ability adjusts it, to obtain the final rating, which is therefore heavily based on expert judgement. Occasionally, ratings are also adjusted in case of the company belonging to a group receiving explicit support, as in the case of Corporate CIB.
For the Corporate and Institutional segment (including SMEs with the highest turnover), Grupo Santander's parent company has defined a single methodology for the construction of a rating in each country. The aim is to incorporate all available information (internal behaviour, external sources, etc.) in a structured way, statistically weighting the weight of the objective (automatic) assessment and the subjective (expert) assessment according to the client's characteristics. The analyst can modify the resulting score by a limited number of rating points.
Customer ratings are reviewed regularly to take into account new information. Ratings are reviewed more frequently when certain automatic alerts are triggered and for customers placed on special watch. The rating tools are also reviewed in order to refine the ratings they generate.
Santander has scoring tools that automatically assign a score to transactions submitted for approval for the retail segment (individuals and SMEs).
These credit approval systems are supplemented by behavioural rating models, which provide greater predictability of the assumed risk. These modes are used not only when accepting new risks, but also when monitoring and setting limits.
For each portfolio in the Group PD models are developed where the rating and/or scoring models are an essential input. In the case of SCIB portfolios, the aforementioned models establish the following list of internal ratings and probabilities of default:
|
|
|
|
|
|
|
|
|
|
|
|
|
|
|
|
|
|
| Mapping of internal ratings and PD |
| Corporate |
Banks |
Financial institutions non banks |
| Rating |
PD |
Rating |
PD |
Rating |
PD |
| 9.3 |
|
0.01% |
9.3 |
0.01% |
9.3 |
0.001% |
| 9.2 |
|
0.01% |
9.2 |
0.01% |
9.2 |
0.002% |
| 9.0 |
|
0.01% |
9.0 |
0.02% |
9.0 |
0.002% |
| 8.5 |
|
0.02% |
8.5 |
0.02% |
8.5 |
0.01% |
| 8.0 |
|
0.03% |
8.0 |
0.04% |
8.0 |
0.01% |
| 7.5 |
|
0.05% |
7.5 |
0.05% |
7.5 |
0.02% |
| 7.0 |
|
0.08% |
7.0 |
0.08% |
7.0 |
0.04% |
| 6.5 |
|
0.13% |
6.5 |
0.13% |
6.5 |
0.09% |
| 6.0 |
|
0.22% |
6.0 |
0.19% |
6.0 |
0.19% |
| 5.5 |
|
0.36% |
5.5 |
0.30% |
5.5 |
0.41% |
| 5.0 |
|
0.60% |
5.0 |
0.45% |
5.0 |
0.85% |
| 4.5 |
|
0.98% |
4.5 |
0.69% |
4.5 |
1.78% |
| 4.0 |
|
1.62% |
4.0 |
1.05% |
4.0 |
3.72% |
| 3.5 |
|
2.65% |
3.5 |
1.60% |
3.5 |
7.79% |
| 3.0 |
|
4.30% |
3.0 |
2.43% |
3.0 |
16.29% |
| 2.5 |
|
6.92% |
2.5 |
3.67% |
2.5 |
34.07% |
| 2.0 |
|
10.95% |
2.0 |
5.51% |
2.0 |
45.00% |
| 1.5 |
|
16.91% |
1.5 |
8.20% |
1.5 |
45.00% |
| 1.0 |
|
25.18% |
1.0 |
12.02% |
1.0 |
45.00% |
These PDs are applied uniformly across Santander and are consistent with the global management of the portfolios. As can be seen, the PD assigned to any given internal rating is not exactly the same in every portfolio. In these cases regulatory requirements require differentiated calibration.
4.5. Rating assignment process and parameter estimation
The credit risk classification policy establishes criteria for the proper classification of transactions with customers, depending on the credit risk to which the bank is exposed. This classification is based on two regulations comprising:
•Accounting principles: pursuant to International Financial reporting Standard 9 (IFRS 9), which is used for internal management, reporting and accounting purposes.
•Prudential requirements: pursuant to Article 178 of Regulation (EU) no. 575/2013 of the European Parliament and of the Council of 26th June 2013, on prudential requirements for credit institutions and investment firms, as well as the EBA Guidelines on the application of the definition of default.
Due to accounting reasons the classification is broken down into the following categories: Phase 1, Phase 2, Phase 3 and Write-off. Furthermore, for prudential purposes, the classification is separated into: Non-Default and Default.
As a result of consistency between the classification for prudential and accounting purposes, the transactions are classified by credit risk:
2024 Pillar 3 Disclosures Report 121
•Stage 1/No-default risk: This includes all transactions that do not meet the requirements to be classified in other categories.
•Stage 2/No-default risk: This category contains all the transactions, which, without meeting the criteria for individual classification as Phase 3/Default or write-off, show significant increases in credit risk since initial recognition. Transactions are classified as Phase 2 based on the total value of the risk.
•Stage 3/Default risk: This includes all transactions, whether or not past due, for which the circumstances for classification as write-offs have not arisen, however, there are reasonable doubts with regarding to their total repayment (principal and interest) by the obligor as set out in the contract. It also includes off-balance-sheet exposures where payment by the entity is likely, but recovery is doubtful. Transactions are classified as Phase 3/Default based on the total value of the risk.
•Write-off risk: This includes debt instruments, whether or not past due, in relation to which an individual analysis considers that recovery is unlikely, due to severe or irretrievable impairment of the solvency of the transaction or the obligor. This is an accounting classification only, hence there is no equivalent in the prudential criteria.
The accounting and prudential definitions were aligned Since 2022 by incorporating core regulation aspects that better capture the economic downturn, such as day count and materiality thresholds. Only certain criteria that capture an exclusively prudential assessment have been excluded from the definition, thus avoiding excessive conservatism in the accounting perspective.
Additionally, the Group's Customer Forborne Loans Debt Policy defines forbearance as the modification of the payment conditions of a transaction, which allows a customer experiencing financial difficulties (current or foreseeable) to fulfil his/her payment obligations, on the basis that if this modification were not made, it would be reasonably certain that the customer would not be able to meet his/her financial obligations.
The modification may be made to the original transaction or through a new transaction which replaces it and is accompanied with concessions by the bank.
The modification may be made to the original transaction or through a new transaction which replaces it and is accompanied with concessions by the bank.
Measuring the credit risk of a transaction involves calculating both the expected and the unexpected loss on the transaction. Unexpected loss is the basis for the calculation of both regulatory and economic capital. It refers to a very high, though improbable, level of loss that is not considered a recurring cost and has to be absorbed by capital. Measuring risk involves two separate steps: estimating the risk and then assigning the credit risk parameters: PD, LGD and EAD.
The PD (probability of default) estimates the likelihood of a customer or a contract to default within 12 months. The PD is used for regulatory capital in the long run, or TTC (through-the-cycle) PD, not dependent on a specific point in the cycle.
The default event being modelled is based on the definition in article 178 of the European Central Bank Solvency Regulation3, which considers defaults to be defined for a customer/contract when at least one of the following circumstances arises:
•The entity considers reasonable doubts regarding the obligors ability to fulfil their credit obligations in full.
•The customer/contract is past due by more than 90 days on any material credit obligation.
The definition of default has been adopted recently in accordance with the “Guidelines on the application of the definition of default” and the materiality thresholds set by the competent authorities.
For either portfolios managed at the customer level or portfolios managed on the contract level, in both cases the probability of the customer defaults has to be modelled.
The calculation of the PD is based on the institution's internal experience, i.e. historical observations of defaults by rating or scoring level. The level at which it is estimated (contract or customer) is agreed with the management.
The LGD (loss given default) is the mathematical expectation of the percentage loss in the event of a default event. The LGD is calculated using internal data on the income and expenses incurred by the institution during the recovery process once the default event has arisen, discounted to the start date of the default.
The LGD is calculated to determine the regulatory capital for the case of a “downturn”, i.e. considered for a worst-case scenario in the economic cycle.
In addition to the estimation of the downturn LGD that will be used for normal operations, a specific loss estimate is made for operations in default. This is determined using LGD and ELBE (expected loss best estimate) parameters. The ELBE attempts to provide the best estimate of economic loss at a particular time based mainly on the time during which the operation has been at default, with due regard to the prevailing economic situation, while the LGD for transactions in default is increased by any further unexpected losses that may be reported during the recovery period.
Finally, the EAD (exposure at default) is calculated. It is defined as the value of the debt at the time of default. For lending products or any product with no off-balance-sheet amount, the EAD equals the balance of the transaction plus any interest accrued but not yet paid. For products providing facilities it is necessary to estimate any future drawings that will be made between the present time and any possible future default event. The CCF (credit conversion factor) is calculated, in order to show the percentage of the balance not currently utilised (off-balance-sheet amount) which would be utilised at the time of default.
Past information on portfolios is essential for estimating regulatory parameters, as established in EU regulations (Regulation No 575/2013). The minimum data periods to be used in estimates are between five and seven years, depending on the parameter and the portfolio. However, the period used in the estimate can be longer, depending on the historical information available. The Bank has an internal data model containing historical information on portfolios, which is
3 Regulation (EU) No 575/2013 of the European Parliament and Council of 26 June 2013 on prudential requirements for credit institutions and investment firms.
122 2024 Pillar 3 Disclosures Report
subject to review by the internal supervisory divisions (Validation and Audit) and by the supervisory authorities.
The methodology used to estimate the credit risk parameters was updated under the new regulatory guidelines, mainly established in the “Guidelines on PD estimation, LGD estimation and the treatment of defaulted assets", to incorporate the requirements and interpretations deriving from these regulatory provisions.
For regulatory purposes, observations of frequency of default and associated losses has to be averaged out over an entire economic cycle in the case of the PD, or represent a downturn situation in the case of the LGD or EAD, or represent the current economic cycle in the case of the ELBE for non-performing transactions.
For this reason, recent observations are not directly comparable with the regulatory parameters and backtesting exercises should be treated with caution and placed in the context of the current economic environment. As explained in section 4.9, recent observed default frequencies (ODFs) are below the regulatory PDs in geographic locations with economic growth rates above the average for the cycle. Conversely, in regions where economic growth is below average, the ODFs may exceed the regulatory PDs.
The risk parameters must be estimated separately for each entity, country and segment and has to be reviewed at least once a year.
The parameters are then assigned to the transactions recorded on each unit’s balance sheet, in order to calculate the expected losses and capital requirements associated with the unit’s exposure.
In certain portfolios there is only a limited amount of default experience, that alternative approaches to parameter estimation have to be used. These are known as low default portfolios.
Low default portfolio: corporates; banks; non-bank financial institutions and central governments.
Estimates of PD and LGD in low default portfolios rely chiefly on studies performed by external rating agencies, which reflect the pooled experience of the large numbers of entities and countries rated by the agencies. These databases contain in-depth historical information to help identify complete economic cycles and analyse downturn situations.
The definition of default employed by the agencies is compared in detail with the regulatory requirements. Even though this does not produce a perfect match, there are sufficient points in common to enable this approach to be used.
For the PD, the agencies do not directly report long run (through the cycle, TTC) estimates, but rather the annual observed default frequency. The observations are averaged over an economic cycle by external rating levels to obtain the long run (TTC) PD. This long run PD is assigned to all counterparties with external ratings, which later helps to calibrate the internal rating. Therefore, the PD will not depend on the counterparty’s external rating, but on its internal rating and may also be applied to customers with no external rating.
The parameters estimated for global portfolios are the same for all the Group units. Thus, a financial institution with a rating of 8.5 will have the same PD, regardless of the unit in which the exposure is recognised.
Corporates (including SMEs, specialised lending and receivables)
The estimation is based on the entity’s own internal experience for portfolios of customers that have an account manager assigned to them with sufficient experience of internal defaults. The PD is calculated for customers by observing new NPLs in the portfolio and relating these to the ratings assigned to the customers concerned. To this end, long-run observed default frequencies (LR ODFs) are calculated for a rating or group of ratings and are adjusted to the average PD observed for each portfolio over a complete economic cycle.
Compared to low default portfolios, corporates portfolios have specific rating systems in each the Group unit, requiring specific PD calibrations in each case.
The LGD in Corporates portfolios is calculated on the basis of observed recoveries of defaulted transactions. This calculation takes into account not only the cash inflows and outflows associated with the recovery process but also the timing of these flows, to calculate their present value and direct and indirect recovery costs. For regulatory use, LGD estimates must be associated with a period of economic crisis or a downturn. The existence of major variables (known as “drivers”) is modelled to explain the emergence of various LGDs for different groups of transactions. The main drivers used are the age of the transactions, the existence or absence of guarantees, the type of guarantee, the Loan to Value, etc. Statistical significance and business relevance are required for these explanatory variables. Estimated ELBE and LGD are also calculated for operations in default.
Finally, the EAD is estimated by comparing the percentage use of off-balance sheet operations at the time of default and in normal circumstances, to estimate the extent to which customers make more use of their credit facilities as they approach default. To estimate the CCF, information on past defaults is gathered from databases and balances (on and off the balance sheet) are compared between the time of default and earlier periods before the downturn in the customer’s credit quality had yet to be observed.
Retail
In portfolios where customers do not have an account manager assigned to them but are treated on a pooled or standardised basis, PDs are estimated based on the entity’s internal experience, although the unit of information for assigning PD is the transaction, not the customer.
The PDs are calculated by observing new NPLs and relating each new NPL to the score assigned to the transaction at the time of approval or, for transactions beyond a certain age, to the customer's rating. As with the corporates portfolios, the LGD is calculated on the basis of an observed recovery process, adjusted to downturn conditions. Estimated ELBE and LGD are also calculated for transactions in default. The EAD estimation is also similar to that for corporates.
2024 Pillar 3 Disclosures Report 123
For further details, see Appendix XII, which contains several tables summarising the parameter models used in the geographies, complying with the requirement (e) of CRE in relation to the article 452 (f) of the CRR.
|
|
|
|
|
|
|
Access the Pillar 3 2024 file available on Grupo Santander's web site |
4.6. Uses of internal parameter estimates
One major application of the PD, LGD and EAD credit risk parameters is to determine minimum capital requirements within the CRR framework.
The CRR states that these parameters and their associated metrics, including expected and unexpected loss, are to be used not only for regulatory purposes but also for internal credit risk management.
The Group has adapted its projection methodology to IFRS 9, resulting in an impact on the estimation of expected loss and the other relevant credit risk metrics arising from the parameters obtained, thus making full use of the risk parameters (PD, LGD and EAD) in its management through the calculation of provisions and allowances.
The internal credit risk parameter estimates are also used in a variety of management tools, including pre-classifications, economic capital allocation, the RoRAC (return on risk-adjusted capital) calculation, the RoRWA (return on risk-weighted assets), stress testing and scenario analyses. These results are reported to senior management through various internal committees.
The pre-classification tool is used to assign limits to customers based on their risk characteristics. For the Corporate Investment Banking (SCIB) segment, limits are established for capital at risk (CaR) and nominal CAP.4 Limits for financial institutions are managed using credit risk equivalent (CRE) models.
Through the calculation and allocation of economic capital, all the various types of risks arising from the lending business are integrated in a single measurement, combining measurement of credit risk with that of other risks, including market, operational, business and on-balance-sheet interest rate risk. The economic capital allocation at the business unit level provides a view of the distribution of risk by business activity and geographical area, taking the benefits of diversification into account. By linking economic capital to financial results, it is possible to calculate the risk-adjusted return (RoRAC) to be compared to the cost of capital to determine each units contributing to value creation in the Group.
The use of economic capital figures in determining management compensation and setting capital and RoRAC-related targets for the business units reinforces the integration of economic capital in management.
In scenario analyses, the credit risk parameters (including provisions under IFRS 9) are related to macroeconomic variables, such as the unemployment rate, GDP growth and interest rates, using statistical models. This allows credit risk to be quantified under different macroeconomic scenarios, and in particular, to assess potential risk levels in stress situations.
For further details on IFRS 9, see the Risk management chapter (section 3.4) of the 2024 Annual report.
4 Maximum nominal amount of a risk transaction, excluding market transactions and with maximum terms according to the type of transaction.
124 2024 Pillar 3 Disclosures Report
4.7. Credit risk mitigation techniques
This section covers the CRC requirements - Qualitative disclosure requirements related to credit risk mitigation techniques.
Among other factors Santander applies various credit risk mitigation techniques based on customer and product type.
Some are inherent to specific operations (such as real estate collateral) while others apply to a series of transactions (such as netting or collateral).
Risk approval is generally determined by the borrowers' ability to make payment due, irrespective of any additional collateral or personal guarantees that may be required to modulate the exposure. To determine repayment capacity, Grupo Santander reviews funds or net cash flows from its businesses or revenues without guarantors or assets pledged as collateral. When approving a loan, the Group always considers guarantors and guarantees as a secondary means of recourse if the first channel fails.
In general, guarantees are to reinforce a credit transaction and mitigate a loss if the borrower defaults on its payment obligation. Grupo Santander's techniques for mitigating credit risk cover various types of customers and products. Some are for specific transactions (e.g. property) or a series of transactions (e.g. clearing derivatives and guarantees). They are grouped by personal guarantees (with a solvent guarantor), guarantees (mainly on primary residence mortgages) and credit derivative hedges.
Grupo Santander ensures that mitigation techniques are duly accepted for legal compliance in all jurisdictions. Internal oversight and effective control of the value of the collateral is maintained throughout the process, especially for mortgage guarantees.
Second and subsequent mortgages
As a general rule and also from a risk acceptance perspective, lending criteria are linked to the borrower's capacity to fulfil all of their financial obligations in due time and proper form. Although this is no impediment to seeking the highest level of collateral or personal guarantees.
Payment capacity is assessed on the basis of the funds or net cash flows from their businesses or usual sources of income, without depending on guarantors or assets delivered as collateral. These must always be taken into account when considering approval of the transaction as a second and exceptional method of recovery when the first method has failed. As a general rule, security is defined as a reinforcement that is added to a credit operation for the purpose of mitigating any loss arising from default on the payment obligation.
Effective guarantees, for these purposes, are collateral and personal guarantees whose validity is demonstrated as mitigating the credit risk and whose valuation is compliant with the internal policies and procedures in place. The analysis of the effectiveness of the guarantee must consider, among other things, the time necessary for the execution of the security and the capacity to make the guarantees effective.
For the calculation of regulatory capital, only those which meet the requirements described both in the CRR and in the EBA's guide on credit risk reduction are taken into consideration.
Implementation of mitigation techniques follows the minimum requirements established in the guarantee management policy: legal certainty (possibility of legally requiring the settlement of guarantees at all times); the lack of a substantial positive correlation between the counterparty and the value of the collateral; the correct documentation of all guarantees; the availability of the documented methodologies used for each mitigation technique; and appropriate monitoring, traceability and regular monitoring of the items or assets used for the guarantee.
The mitigation techniques can be grouped into the following categories:
Personal guarantees
This type of guarantee grants the creditor a personal right or entitlement affecting the equity of the guarantor. Examples include bonds, guarantees and stand-by letters of credit. Only personal guarantees provided by persons who meet the minimum requirements established by the supervisory authority can be recognised in capital calculations.
Hedging through credit derivatives
Credit derivatives are financial instruments that are mainly used to hedge credit risk. By buying protection from a third party, Banco Santander transfers the risk of the issuer of the underlying instrument. Credit derivatives are over-the-counter (OTC) instruments that are traded on non-organised markets. Hedging with credit derivatives is contracted with leading financial institutions, mainly using credit default swaps.
The distribution of personal guarantees and credit derivatives for the corporates, banks, non-financial institutions and sovereigns segments by rating grade is shown below, in compliance with one of the transparency recommendations originally issued by the Basel Committee:
2024 Pillar 3 Disclosures Report 125
|
|
|
|
|
|
|
|
|
| Table 47.Guarantees by external rating |
| EUR million |
|
2024 |
| Corporates |
| External Rating |
Exposures in default |
Exposures not in default |
| AAA/AA |
— |
1,152 |
| A |
— |
9,081 |
| BBB |
— |
17,466 |
| BB |
21 |
3,380 |
| B |
— |
952 |
| Rest |
— |
273 |
| Unrated |
— |
42 |
| Total |
21 |
32,347 |
|
|
|
| Banks |
| External Rating |
Exposures in default |
Exposures not in default |
| AAA/AA |
— |
4,935 |
| A |
— |
9,222 |
| BBB |
— |
990 |
| BB |
— |
— |
| B |
— |
— |
| Rest |
— |
— |
| Unrated |
— |
— |
| Total |
— |
15,147 |
|
|
|
| Other financial institutions |
| External Rating |
Exposures in default |
Exposures not in default |
| AAA/AA |
— |
15,717 |
| A |
— |
9,614 |
| BBB |
— |
2,234 |
| BB |
— |
180 |
| B |
— |
101 |
| Rest |
— |
— |
| Unrated |
— |
225 |
| Total |
— |
28,071 |
|
|
|
| Sovereign |
| External Rating |
Exposures in default |
Exposures not in default |
| AAA/AA |
— |
20,607 |
| A |
— |
21,819 |
| BBB |
— |
10,451 |
| BB |
— |
120 |
| B |
— |
11 |
| Rest |
— |
— |
| Unrated |
— |
— |
| Total |
— |
53,007 |
Collateral
This is collateral pledged on assets (movable or immovable) or rights that are specific and determinate. These are rights that secure performance of the main obligation for the creditor via the attachment of an asset. As a result of this attachment, in the event of default on the secured obligation, the creditor may realise the economic value of the asset through a regulated procedure and collect the proceeds; preference over other creditors may be upheld in this collection method. Collateral may also be classified as follows:
•Real estate guarantees implemented as first charge real estate mortgages. The property can be buildings and parts of finished buildings (homes, offices, commercial premises, multi-purpose buildings, non multi-purpose buildings and
hotels), urban land and land for urban development, and other property (buildings under construction, developments in progress, etc.).
•Pledges on financial instruments (cash deposits, debt instruments).
A very important example of financial collateral is that which is used for the purpose (as with the netting technique) of reducing counterparty credit risk. Collateral consists of instruments with certain economic value and high liquidity that are deposited/transferred by one party in favour of another to guarantee or reduce any counterparty credit risk arising from portfolios of risk-bearing transactions between the two. Transactions backed by collateral are marked to market periodically (usually daily) and the parameters defined in the collateral agreement are applied, obtaining an amount of collateral (usually cash or securities) to be called from, or returned to, the counterparty.
From an estimation standpoint, the collateral adjudication flows are reduced on the basis of a haircut, which reflects the difference between the sale value of the asset and the adjudication value, as well as other aspects such as indirect costs or the effect of the discount factor.
Netting
The concept of netting involves offsetting gains and losses on multiple transactions of the same type under the umbrella of a master agreement such as an ISDA or similar (CSA, OSLA, ISMA, GMRA, etc.).
Market gains and losses on derivative transactions between Santander and a counterparty are offset against one another, so if the counterparty defaults, it owes (or Santander owes, if the net amount is negative) a single net amount, rather than a large number of positive and negative amounts relating to the individual transactions entered into with that counterparty.
An important feature of a master netting agreement is that it entails a single legal obligation, encompassing all the transactions covered by the agreement. This is what makes it possible to offset the risks of all the transactions covered by the agreement with a counterparty.
There are two methodologies for the measurement of exposure: a mark-to-market (MtM) methodology, involving replacement cost in the case of derivatives, plus an add-on for potential future exposure; and a methodology including calculation of exposure using Monte Carlo simulation, which is used in certain regions and for some products. We also calculate capital at risk or unexpected loss, i.e. the loss in economic capital once expected loss is subtracted, net of guarantees and recoveries.
Exposures are recalculated at market close, adjusting all transactions to their new time horizon. Potential future exposure is adjusted and mitigation measures (netting, collateral, etc.) are applied, so that exposures can be checked on a daily basis against the limits approved by senior management. Risk control is performed through an integrated system in real time, enabling the exposure limit available with any counterparty to be known at any time.
126 2024 Pillar 3 Disclosures Report
|
|
|
|
|
|
|
|
|
|
|
|
|
|
|
|
|
|
|
|
|
| Table 48.Credit risk mitigation techniques - IRB and SA |
|
|
|
|
|
|
|
|
|
Million euros |
|
|
|
|
|
|
|
Exposures unsecured |
Exposures secured |
Exposures secured by personal guarantees |
Exposures secured by collateral pledged |
Exposures secured by mortgage collateral |
|
Total IRB exposures (after CCFs) |
344,939 |
417,024 |
84,823 |
33,424 |
298,777 |
|
Total STD exposures |
846,735 |
142,104 |
17,887 |
26,376 |
97,841 |
|
|
|
|
|
|
|
|
Type of guarantee applied in credit risk mitigation evaluated under standard methodology |
|
|
|
|
|
|
Central governments or central banks |
367,082 |
3,873 |
3,559 |
314 |
|
|
Regional government or local authorities |
17,031 |
512 |
389 |
123 |
|
|
Public sector entities |
4,463 |
27 |
— |
27 |
|
|
Multilateral development banks |
2,863 |
— |
— |
— |
|
|
International organisations |
1,721 |
— |
— |
— |
|
|
Institutions |
21,387 |
2,711 |
2,325 |
386 |
|
|
Corporates |
89,307 |
12,146 |
6,293 |
5,853 |
|
|
Retail |
219,643 |
20,424 |
3,158 |
17,266 |
|
|
Exposures covered by residential mortgages |
— |
101,721 |
1,584 |
2,296 |
97,841 |
|
Exposures in default |
14,984 |
672 |
567 |
104 |
|
|
Higer-risk categories |
894 |
8 |
1 |
7 |
|
|
Covered bonds |
3,019 |
— |
— |
— |
|
|
Institutions and corporates with a short-term credit assessment |
491 |
— |
— |
— |
|
|
Collective investment under takings (CIU) |
345 |
— |
— |
— |
|
|
Equity |
53 |
— |
— |
— |
|
|
Other items |
103,452 |
10 |
10 |
1 |
|
|
|
|
|
|
|
|
|
Type of guarantee applied in credit risk mitigation evaluated under IRB methodology |
|
|
|
|
|
|
IRB methods when neither proprietary LGD estimates nor conversion factors are used |
|
|
|
|
|
|
Specialised lending |
28,904 |
— |
— |
— |
— |
|
Institutions |
30,704 |
2,270 |
1,851 |
407 |
11 |
|
Corporates - SMESs |
729 |
584 |
42 |
— |
542 |
|
Corporates - Other |
151,405 |
69,289 |
53,554 |
8,857 |
6,878 |
|
IRB approach when proprietary LGD estimates and/ or conversion factors are used |
|
|
|
|
|
|
Institutions |
1,090 |
2,169 |
579 |
1,590 |
— |
|
Corporates - SMESs |
14,383 |
17,805 |
8,577 |
2,812 |
6,416 |
|
Corporates - Other |
40,646 |
20,134 |
12,757 |
2,974 |
4,403 |
|
Retail exposures - guaranteed by real estate, SMEs |
144 |
2,317 |
127 |
11 |
2,178 |
|
Retail exposures - guaranteed by real estate, not SMEs |
16,073 |
278,211 |
— |
— |
278,211 |
|
Qualifying revolving retail exposures |
20,735 |
— |
— |
— |
— |
|
Retail exposures - other, SME |
14,076 |
9,947 |
7,234 |
2,689 |
25 |
|
Retail exposures - other, not SME |
26,050 |
14,298 |
103 |
14,084 |
112 |
2024 Pillar 3 Disclosures Report 127
4.7.1. Recognition of credit risk mitigation
Valuation and control processes
The valuation of collateral should always use conservative criteria appropriate to the time horizon of the secured transaction, using the most appropriate processes for each type of collateral to minimise the risk of overvaluation. The time value of the collateral offered, as well as its possible change in nature, especially in the case of rights, or risks of reduction in value, amortisation or disappearance, must be appropriate to the maturity and payment flow of the main transaction. From the point of view of parameter estimation, the collateral allotment flows are discounted on the basis of a haircut, which reflects the difference between the sale value of the asset and the allotment value, as well as other aspects such as indirect costs or the effect of the discount factor.
For collateral, the value of the collateral established at the time of grant must be updated in accordance with minimum frequencies, either by individual valuation or by automated methods. In any case, the following frequency criteria shall be observed depending on the type of collateral:
•Financial collateral shall be valued at least quarterly, taking its fair value as a reference value.
•For movable and immovable collateral, the existence of indications of significant falls in their reference valuations must be verified at least annually or when the thresholds established by the unit are exceeded, which in this case could trigger an individualised update. In determining whether there are indications of significant falls, factors such as the development of published mortgage market price indices or the opinion of an independent valuator will be taken into account. For transactions classified as doubtful risk, the minimum frequency must be annual..
•More specific review periods, with a higher frequency than normal, may be established for: real estate under construction, collateral securing transactions with a high LTV ratio, or when securing loans with a low credit quality, as defined in the relevant customer monitoring governance for each segment.
In any case, individualised updates of the value of collateral shall be made in the following cases:
•If the monitoring of the customer's performance reveals any negative symptoms that make it necessary to take urgent measures to secure the customer's credit operations.
•If a decision is taken to initiate a legal claim, or to negotiate a restructuring, with or without granting new credits.
•If it is intended to adjust the credits in an amending way, altering essential elements of the same (amount and term).
•If partial release or substitution of collateral associated with a transaction is sought.
•In guarantees granted through financial securities, where daily value updates and immediate requirement of additional coverage must be made when the thresholds established in the corresponding contract are exceeded. In this type of guarantees, the inclusion of a clause for replenishment or the provision of additional collateral in the event of variations in value below a certain threshold is considered to be an eligibility policy.
•If market conditions or extraordinary events make it advisable for certain types of transactions or when there is a specific regulation that makes it compulsory to do so.
•If transactions that have been in the doubtful risk category for more than 3 years.
•If its required to evaluate the type and complexity of the collateral, e.g. aircraft, ships, factories, machinery, etc.
For loans exceeding EUR 3 million or 5% of an institution's own funds, the valuation on the real estate must be reviewed by an expert valuer at least every 3 years.
128 2024 Pillar 3 Disclosures Report
|
|
|
|
|
|
|
|
|
|
|
|
|
|
|
|
|
|
|
|
|
|
|
|
| Table 49.CR3 - CRM techniques overview: Disclosure of the use of credit risk mitigation techniques |
|
EUR million |
|
|
|
|
|
|
|
|
|
|
|
|
|
2024 |
|
|
Unsecured carrying amount |
|
Secured carrying amount |
|
|
|
|
Of which secured by collateral |
Of which secured by financial guarantees |
|
|
|
|
Of which secured by credit derivatives |
|
|
a |
|
b |
c |
d |
e |
| 1 |
Loans and advances |
543,272 |
|
744,171 |
644,793 |
99,378 |
2,391 |
| 2 |
Debt securities |
183,967 |
|
2,007 |
30 |
1,977 |
— |
| 3 |
Total |
727,239 |
|
746,178 |
644,823 |
101,355 |
2,391 |
| 4 |
Of which non-performing exposures* |
21,377 |
|
17,629 |
15,863 |
1,766 |
— |
| EU-5 |
Of which defaulted** |
20,058 |
|
5,562 |
5,372 |
189 |
— |
|
*Correction of the mapping {F 18.00, r0070+r0191+r0221, c0060} - {F 18.00, r0070+r0191+r0221, c0200+c0210} + ({F 18.00, r0010+r0181+r0211, c0060} - {F 18.00, r0010+r0181+r0211, c0200+c0210}) |
|
**Defaulted information net of provisions |
|
|
|
|
|
|
|
|
|
|
|
|
|
|
|
|
|
|
|
|
|
|
|
|
| CR3 - CRM techniques overview: Disclosure of the use of credit risk mitigation techniques (31.12.2023) |
|
EUR million |
|
|
|
|
|
|
|
|
|
|
|
|
|
2023 |
|
|
Unsecured carrying amount |
|
Secured carrying amount |
|
|
|
|
Of which secured by collateral |
Of which secured by financial guarantees |
|
|
|
|
Of which secured by credit derivatives |
|
|
a |
|
b |
c |
d |
e |
| 1 |
Loans and advances |
577,459 |
|
742,469 |
643,337 |
99,132 |
3,131 |
| 2 |
Debt securities |
164,682 |
|
620 |
— |
620 |
— |
| 3 |
Total |
742,141 |
|
743,089 |
643,337 |
99,752 |
3,131 |
| 4 |
Of which non-performing exposures |
21,029 |
|
18,390 |
16,132 |
2,258 |
— |
| EU-5 |
Of which defaulted* |
19,761 |
|
6,094 |
5,922 |
174 |
— |
|
*Defaulted information net of provisions |
|
|
|
|
|
|
|
|
|
|
|
|
|
|
|
| Table 50.IRB approach. Credit risk mitigation techniques: credit derivatives and personal guarantees |
|
| EUR million |
|
|
|
|
|
2024 |
2023 |
| Original hedged exposure by collateral type and exposure category |
Financial guarantees |
Personal guarantees |
Financial Guarantees |
Personal guarantees |
| IRB Approach |
|
|
|
|
| Central administrations and banks |
— |
— |
— |
— |
| Institutions |
85 |
2,345 |
— |
3,249 |
| Corporates |
8,223 |
67,509 |
364 |
66,519 |
| Retail |
— |
7,463 |
— |
9,824 |
| Total |
8,308 |
77,317 |
364 |
79,591 |
2024 Pillar 3 Disclosures Report 129
The following table shows the impact of the credit derivatives used as credit mitigation techniques in RWA.
|
|
|
|
|
|
|
|
|
|
|
|
| Table 51.CR7 - IRB approach - Effect on the RWEAs of credit derivatives used as CRM techniques |
|
|
EUR million |
|
|
|
|
|
2024 |
|
|
Pre-credit derivatives RWAs |
Actual RWAs |
|
|
a |
b |
| 1 |
Exposures under FIRB |
72,956 |
72,735 |
| 2 |
Central governments and central banks |
— |
— |
| 3 |
Institutions |
9,048 |
8,863 |
| 4 |
Corporates |
63,908 |
63,872 |
| 4.1 |
of which Corporates - SMEs |
597 |
562 |
| 4.2 |
of which Corporates - Specialised lending |
13,840 |
13,840 |
| 5 |
Exposures under AIRB |
129,919 |
129,919 |
| 6 |
Central governments and central banks |
— |
— |
| 7 |
Institutions |
904 |
904 |
| 8 |
Corporates |
50,658 |
50,658 |
| 8.1 |
of Corporates - which SMEs |
15,365 |
15,365 |
| 8.2 |
of which Corporates - Specialised lending |
— |
— |
| 9 |
Retail |
78,358 |
78,358 |
| 9.1 |
of which Retail - SMEs - Secured by immovable property collateral |
819 |
819 |
| 9.2 |
of which Retail - non-SMEs - Secured by immovable property collateral |
45,643 |
45,643 |
| 9.3 |
of which Retail - Qualifying revolving |
4,630 |
4,630 |
| 9.4 |
of which Retail - SMEs - Other |
8,024 |
8,024 |
| 9.5 |
of which Retail - Non-SMEs- Other |
19,241 |
19,241 |
| 10 |
Total |
202,875 |
202,654 |
|
|
|
|
|
Does not include CCPs |
|
|
In the calculation of regulatory capital for exposures under the AIRB approach, the effects of credit risk mitigation of hedges are recognised through the credit risk parameters, depending on the technique to be used depending on the type of collateral involved, real or personal. This mitigation process will be carried out provided that the collateral has been tested for validity and is considered eligible for application.
In relation to personal guarantees, the substitution method is applied so that, for the exposure covered by the personal guarantee, the PD and LGD of the holder are substituted for those of the guarantor, provided that the resulting risk-weighted assets and the expected loss are lower than those estimated with the PD and LGD of the holder. Similarly, if the guarantor belongs to a standardised portfolio, the risk-weighted assets are directly substituted for those of the guarantor calculated under the standardized approach.
In relation to collateral, in general, its effect is reflected in the final value of the estimated LGD. For this purpose, potentially significant factors such as the type of collateral, the type of product or, in the case of mortgage collateral, the LTV. This will be done provided that the warranties have been checked for validity and are deemed to be enforceable.
130 2024 Pillar 3 Disclosures Report
|
|
|
|
|
|
|
|
|
|
|
|
|
|
|
|
|
|
|
|
|
|
|
|
|
|
|
|
|
|
|
|
|
|
|
|
|
|
|
|
|
|
|
|
|
|
|
|
|
|
|
|
|
|
|
|
|
| Table 52.CR7-A - IRB approach - Disclosure of the extent of the use of CRM techniques |
|
|
EUR million |
|
|
|
|
|
|
|
|
|
|
|
|
|
|
|
|
|
|
|
2024 |
|
|
|
|
Credit risk Mitigation techniques |
|
Credit risk Mitigation methods in the calculation of RWEAs |
|
|
|
|
Funded credit Protection (FCP) |
|
Unfunded credit Protection (UFCP) |
|
RWEA without substitution effects
(reduction effects only)
|
RWEA with substitution effects
(both reduction and substitution effects)
|
|
A-IRB |
Total exposures
|
|
Part of exposures covered by Financial Collaterals (%) |
Part of exposures covered by Other eligible collaterals (%) |
Part of exposures covered by Other funded credit protection (%) |
|
Part of exposures covered by Guarantees (%) |
Part of exposures covered by Credit Derivatives (%) |
|
|
|
|
Part of exposures covered by Immovable property Collaterals (%) |
Part of exposures covered by Receivables (%) |
Part of exposures covered by Other physical collateral (%) |
|
Part of exposures covered by Cash on deposit (%) |
Part of exposures covered by Life insurance policies (%) |
Part of exposures covered by Instruments held by a third party (%) |
|
|
|
|
a |
|
b |
c |
d |
e |
f |
g |
h |
i |
j |
|
k |
l |
|
m |
n |
| 1 |
Central governments and central banks |
|
|
|
|
|
|
|
|
|
|
|
|
|
|
|
|
|
| 2 |
Institutions |
2,548 |
|
— |
% |
62.40 |
% |
— |
% |
— |
% |
62.40 |
% |
— |
% |
— |
% |
— |
% |
— |
% |
|
— |
% |
— |
% |
|
967 |
904 |
| 3 |
Corporates |
68,484 |
|
4.45 |
% |
19.79 |
% |
15.80 |
% |
0.12 |
% |
3.87 |
% |
— |
% |
— |
% |
— |
% |
— |
% |
|
— |
% |
— |
% |
|
51,922 |
50,658 |
| 3.1 |
Of which Corporates - SMEs |
25,168 |
|
4.34 |
% |
32.32 |
% |
25.49 |
% |
0.26 |
% |
6.56 |
% |
— |
% |
— |
% |
— |
% |
— |
% |
|
— |
% |
— |
% |
|
14,447 |
15,365 |
| 3.2 |
Of which Corporates - Specialised lending |
|
|
|
|
|
|
|
|
|
|
|
|
|
|
|
— |
|
| 3.3 |
Of which Corporates - Other |
43,316 |
|
4.52 |
% |
12.51 |
% |
10.17 |
% |
0.04 |
% |
2.31 |
% |
— |
% |
— |
% |
— |
% |
— |
% |
|
— |
% |
— |
% |
|
37,475 |
35,293 |
| 4 |
Retail |
359,692 |
|
0.20 |
% |
82.46 |
% |
77.99 |
% |
0.01 |
% |
4.46 |
% |
— |
% |
— |
% |
— |
% |
— |
% |
|
— |
% |
— |
% |
|
78,092 |
78,358 |
| 4.1 |
Of which Retail - Immovable property SMEs |
2,437 |
|
0.39 |
% |
89.43 |
% |
89.38 |
% |
0.06 |
% |
— |
% |
0.01 |
% |
— |
% |
0.01 |
% |
— |
% |
|
— |
% |
— |
% |
|
896 |
819 |
| 4.2 |
Of which Retail - Immovable property non-SMEs |
286,297 |
|
— |
% |
97.18 |
% |
97.18 |
% |
— |
% |
— |
% |
— |
% |
— |
% |
— |
% |
— |
% |
|
— |
% |
— |
% |
|
45,643 |
45,643 |
| 4.3 |
Of which Retail - Qualifying revolving |
13,543 |
|
— |
% |
— |
% |
— |
% |
— |
% |
— |
% |
— |
% |
— |
% |
— |
% |
— |
% |
|
— |
% |
— |
% |
|
4,630 |
4,630 |
| 4.4 |
Of which Retail - Other SMEs |
16,500 |
|
1.23 |
% |
15.30 |
% |
0.15 |
% |
0.10 |
% |
15.05 |
% |
0.01 |
% |
— |
% |
0.01 |
% |
— |
% |
|
— |
% |
— |
% |
|
7,681 |
8,024 |
| 4.5 |
Of which Retail - Other non-SMEs |
40,915 |
|
1.25 |
% |
33.43 |
% |
0.27 |
% |
0.01 |
% |
33.14 |
% |
0.03 |
% |
— |
% |
0.03 |
% |
— |
% |
|
— |
% |
— |
% |
|
19,243 |
19,241 |
| 5 |
Total |
430,724 |
|
0.88 |
% |
72.38 |
% |
67.64 |
% |
0.02 |
% |
4.71 |
% |
— |
% |
— |
% |
— |
% |
— |
% |
|
— |
% |
— |
% |
|
130,981 |
129,919 |
|
Phased-in IFRS9 |
|
|
|
|
|
|
|
|
|
|
|
|
|
|
|
|
|
2024 Pillar 3 Disclosures Report 131
|
|
|
|
|
|
|
|
|
|
|
|
|
|
|
|
|
|
|
|
|
|
|
|
|
|
|
|
|
|
|
|
|
|
|
|
|
|
|
|
|
|
|
|
|
|
|
|
|
|
|
|
|
|
|
|
|
| Table 52.CR7-A - IRB approach - Disclosure of the extent of the use of CRM techniques |
|
EUR million |
|
|
|
|
|
|
|
|
|
|
|
|
|
|
|
|
|
|
|
2024 |
|
|
|
|
Credit risk Mitigation techniques |
|
Credit risk Mitigation methods in the calculation of RWEAs |
|
|
|
|
Funded credit Protection (FCP) |
|
Unfunded credit Protection (UFCP) |
|
RWEA without substitution effects
(reduction effects only)
|
RWEA with substitution effects
(both reduction and sustitution effects)
|
|
F-IRB |
Total exposures
|
|
Part of exposures covered by Financial Collaterals (%) |
Part of exposures covered by Other eligible collaterals (%) |
Part of exposures covered by Other funded credit protection (%) |
|
Part of exposures covered by Guarantees (%) |
Part of exposures covered by Credit Derivatives (%) |
|
|
|
|
Part of exposures covered by Immovable property Collaterals (%) |
Part of exposures covered by Receivables (%) |
Part of exposures covered by Other physical collateral (%) |
|
Part of exposures covered by Cash on deposit (%) |
Part of exposures covered by Life insurance policies (%) |
Part of exposures covered by Instruments held by a third party (%) |
|
|
|
|
a |
|
b |
c |
d |
e |
f |
g |
h |
i |
j |
|
k |
l |
|
m |
n |
| 1 |
Central governments and central banks |
|
|
|
|
|
|
|
|
|
|
|
|
|
|
|
|
|
| 2 |
Institutions |
22,612 |
|
1.80 |
% |
0.05 |
% |
0.05 |
% |
— |
% |
— |
% |
— |
% |
— |
% |
— |
% |
— |
% |
|
— |
% |
— |
% |
|
14,711 |
8,863 |
| 3 |
Corporates |
131,687 |
|
6.22 |
% |
6.14 |
% |
5.63 |
% |
0.51 |
% |
— |
% |
— |
% |
— |
% |
— |
% |
— |
% |
|
— |
% |
— |
% |
|
67,618 |
63,872 |
| 3.1 |
Of which Corporates - SMEs |
1,221 |
|
— |
% |
44.44 |
% |
44.44 |
% |
— |
% |
— |
% |
— |
% |
— |
% |
— |
% |
— |
% |
|
— |
% |
— |
% |
|
562 |
562 |
| 3.2 |
Of which Corporates - Specialised lending |
21,370 |
|
— |
% |
— |
% |
— |
% |
— |
% |
— |
% |
— |
% |
— |
% |
— |
% |
— |
% |
|
— |
% |
— |
% |
|
13,228 |
13,840 |
| 3.3 |
Of which Corporates - Other |
109,097 |
|
7.50 |
% |
6.92 |
% |
6.30 |
% |
0.61 |
% |
— |
% |
— |
% |
— |
% |
— |
% |
— |
% |
|
— |
% |
— |
% |
|
53,828 |
49,470 |
| 4 |
Total |
154,299 |
|
5.57 |
% |
5.25 |
% |
4.82 |
% |
0.43 |
% |
— |
% |
— |
% |
— |
% |
— |
% |
— |
% |
|
— |
% |
— |
% |
|
82,328 |
72,735 |
|
|
|
|
|
|
|
|
|
|
|
|
|
|
|
|
|
|
|
|
Phased-in IFRS9 |
|
|
|
|
|
|
|
|
|
|
|
|
|
|
|
|
|
132 2024 Pillar 3 Disclosures Report
4.8. Asset impairment losses: influencing factors and comparative analysis
In addition to the advanced models described (which are detailed in the economic capital section), other metrics are used to ensure prudent and effective credit risk management based on an assessment of losses on the portfolios.
Credit risk is monitored continuously and comprehensively, to ensure the early identification of incidents involving risk that could affect customers' credit ratings. This monitoring is carried out through the periodic review of all customers, the allocation of a monitoring score, the establishment of pre-defined actions associated with each category and the implementation of specific measures (predefined or ad-hoc) to correct potential deviations that could have negative impact on the entity.
The analysis of credit risk involves continuous and systematic comparison to budgets, limits and standards, assessing the effects of future external events and strategic decisions, to establish measures that ensure the risk profile and volume are within the established parameters and aligned with the appetite established by the group.
The main metric used to measure and control the credit risk at the Group is the cost of credit. This ratio quantifies loan-loss provisions arising from credit risk over a defined period of time for a given loan portfolio. As such, it acts as an indicator of the group's credit quality.
The loan-loss provisions are calculated under the IFRS 9 standards.
The basic structure for the impairment recognition phases is as follows, from lower to higher credit quality impairment (Stage 1 to 3):
•Stage 1: expected credit losses over the next twelve months.
•Stage 2: forecasting of expected credit losses over the life of the instrument.
•Stage 3: materialization of expected credit losses over the entire life of the instrument.
In this stage, the calculation considers that the loss events have already occurred and therefore, the only possible scenario is materialization in losses.
A significant increase in credit risk determines the transition from the first phase to the second phase.
For further details on the key credit risk figures, see the Risk management and control chapter of the 2024 Annual report.
|
|
|
|
|
|
|
Access 2024 Annual Report available on the Santander Group website |
4.9. Backtesting of IRB parameters
4.9.1. Backtesting of PD
The backtesting of the PD accesses the suitability of regulatory the PDs by comparing them with the Observed Default Frequencies (ODFs) during the most recent period.
This comparison complies with the quantitative approach required by the European Banking Authority (EBA) in its Guidelines on disclosure requirements under part eight of the capital requirements regulation (EU) No 575/2013, of August 2017.
This proposes reporting information for backtesting the PD in accordance with Template 24: - Internal ratings-based approach (IRB) - Back-testing of PD per exposure class.
For further details on PD backtesting (in accordance with the format of table CR9), see tables 53 to 56. A summary of the conclusions from the results obtained can be found below:
Regulatory PDs are consistent with observed historical default rates, although the following relevant facts can be highlighted:
•In general, the PDs are higher than observed default rates, both in the last year and from a historical perspective. This is a reflection of: 1) the conservatism adopted in the estimation of the parameters and 2) the progressive reflection of a better economic situation once the recession in 2008 has been overcome. These combined tend to reduce the observed default frequencies. There are only a few exceptions which are generally due to idiosyncratic factors of the portfolios, not dependent on the economic environment, such as the integration processes of acquired entities.
•Noteworthy is the good performance of the retail portfolios of non-SME mortgages and cards, where the differences between the model's PDs and levels of NPLs are more notable.
•In the case of the portfolios of Large Corporates and Financial Institutions, where point (f) of article 180 (1) of the CRR is being applied for the estimation of PD, it is also noted a good performance with regulatory PDs higher than the observed default rates, except in some ranges where low volumes affect the observed values.
For more information on PD backtesting results, see table 53, table 54, table 55 and table 56.
2024 Pillar 3 Disclosures Report 133
4.9.2. Backtesting of EAD
In order to compare the suitability of the estimated credit conversion factors (CCFs), the estimated parameters are compared with the actual CCFs in the most recent period. Given the downturn nature of the regulatory parameter, the estimated conversion factors are expected to exceed those observed. For this reason, the comparison has to be made in the context of the economic circumstances in which the contrast is made, although EAD is not a parameter that is particularly sensitive to the economic cycle.
Additionally, calculations of the so-called “coverage ratios” are performed, where the assigned EAD is compared with the default balance or observed EAD. Values above 100% are indicative of a suitable degree conservatism.
4.9.3. Backtesting of LGD
As for the rest of the parameters, the LGD estimates are compared with the LGD realised in the most recent period. Given the downturn nature of the regulatory parameter, the estimated LGDs are expected to exceed those observed. For this reason, the comparison has to be placed in the context of the economic circumstances in which the contrast is made, particularly taking into account the typical sensitivity to the cycle of the parameter, especially in portfolios where the collateral is sensitive to the economic cycle.
|
|
|
|
|
|
|
|
|
|
|
|
|
|
|
|
|
|
|
|
|
|
|
|
| Table 53.CR9 - AIRB approach - Back-testing of PD per exposure class (fixed PD scale) |
| EUR million |
|
|
|
|
|
|
|
|
2024 |
| Exposure class |
PD scale |
Number of obligors at the end of the year |
Observed average default rate (%) |
Exposures weighted average PD (%) |
Average PD (%) |
Average historical annual default rate (%) |
|
of which: number of obligors which defaulted during the year |
| a |
b |
c |
d |
e |
f |
g |
h |
| Institutions |
|
0.00 to <0.15 |
1 |
— |
— |
% |
|
0.05 |
% |
— |
% |
|
0.00 to <0.10 |
1 |
— |
— |
% |
|
0.05 |
% |
— |
% |
|
0.10 to <0.15 |
— |
— |
— |
% |
|
— |
% |
— |
% |
|
0.15 to <0.25 |
— |
— |
— |
% |
|
— |
% |
— |
% |
|
0.25 to <0.50 |
— |
— |
— |
% |
|
— |
% |
— |
% |
|
0.50 to <0.75 |
24 |
— |
— |
% |
0.69 |
% |
0.68 |
% |
— |
% |
|
0.75 to <2.50 |
73 |
— |
— |
% |
0.97 |
% |
1.29 |
% |
0.21 |
% |
|
0.75 to <1.75 |
73 |
— |
— |
% |
0.97 |
% |
1.29 |
% |
0.23 |
% |
|
1.75 to <2.5 |
— |
— |
— |
% |
|
— |
% |
— |
% |
|
2.50 to <10.00 |
74 |
— |
— |
% |
2.75 |
% |
3.06 |
% |
— |
% |
|
2.5 to <5 |
73 |
— |
— |
% |
2.74 |
% |
3.02 |
% |
— |
% |
|
5 to <10 |
1 |
— |
— |
% |
6.14 |
% |
6.14 |
% |
— |
% |
|
10.00 to <100.00 |
11 |
— |
— |
% |
43.86 |
% |
43.86 |
% |
2.56 |
% |
|
10 to <20 |
— |
— |
— |
% |
|
— |
% |
— |
% |
|
20 to <30 |
— |
— |
— |
% |
|
— |
% |
— |
% |
|
30.00 to <100.00 |
11 |
— |
— |
% |
43.86 |
% |
43.86 |
% |
3.85 |
% |
|
100.00 (Default) |
1 |
1 |
100.00 |
% |
|
100.00 |
% |
100.00 |
% |
134 2024 Pillar 3 Disclosures Report
|
|
|
|
|
|
|
|
|
|
|
|
|
|
|
|
|
|
|
|
|
|
|
|
| Table 53.CR9 - AIRB approach - Back-testing of PD per exposure class (fixed PD scale) |
| EUR million |
|
|
|
|
|
|
|
|
2024 |
| Exposure class |
PD scale |
Number of obligors at the end of the year |
Observed average default rate (%) |
Exposures weighted average PD (%) |
Average PD (%) |
Average historical annual default rate (%) |
|
of which: number of obligors which defaulted during the year |
| a |
b |
c |
d |
e |
f |
g |
h |
| Corporates - Other |
|
0.00 to <0.15 |
33 |
— |
— |
% |
0.11 |
% |
0.09 |
% |
0.15 |
% |
|
0.00 to <0.10 |
18 |
— |
— |
% |
0.06 |
% |
0.06 |
% |
0.20 |
% |
|
0.10 to <0.15 |
15 |
— |
— |
% |
0.11 |
% |
0.13 |
% |
— |
% |
|
0.15 to <0.25 |
968 |
3 |
0.31 |
% |
0.21 |
% |
0.21 |
% |
0.33 |
% |
|
0.25 to <0.50 |
3,302 |
2 |
0.06 |
% |
0.38 |
% |
0.38 |
% |
0.40 |
% |
|
0.50 to <0.75 |
3,952 |
16 |
0.40 |
% |
0.59 |
% |
0.59 |
% |
0.40 |
% |
|
0.75 to <2.50 |
6,192 |
43 |
0.69 |
% |
1.49 |
% |
1.60 |
% |
0.85 |
% |
|
0.75 to <1.75 |
3,259 |
20 |
0.61 |
% |
1.19 |
% |
1.30 |
% |
0.67 |
% |
|
1.75 to <2.5 |
2,933 |
23 |
0.78 |
% |
2.17 |
% |
1.93 |
% |
1.10 |
% |
|
2.50 to <10.00 |
3,858 |
126 |
3.27 |
% |
4.34 |
% |
4.40 |
% |
3.36 |
% |
|
2.5 to <5 |
3,071 |
75 |
2.44 |
% |
3.61 |
% |
3.80 |
% |
2.24 |
% |
|
5 to <10 |
787 |
51 |
6.48 |
% |
6.00 |
% |
6.74 |
% |
7.27 |
% |
|
10.00 to <100.00 |
1,432 |
119 |
8.31 |
% |
24.43 |
% |
24.70 |
% |
15.17 |
% |
|
10 to <20 |
683 |
61 |
8.93 |
% |
13.22 |
% |
14.59 |
% |
15.18 |
% |
|
20 to <30 |
339 |
28 |
8.26 |
% |
23.12 |
% |
26.04 |
% |
11.01 |
% |
|
30.00 to <100.00 |
410 |
30 |
7.32 |
% |
41.78 |
% |
40.42 |
% |
21.02 |
% |
|
100.00 (Default) |
2,395 |
2,395 |
100.00 |
% |
100.00 |
% |
100.00 |
% |
100.00 |
% |
|
|
|
|
|
|
|
|
| Corporates - SMEs |
|
0.00 to <0.15 |
145 |
— |
— |
% |
0.1 |
% |
0.1 |
% |
0.47 |
% |
|
0.00 to <0.10 |
70 |
— |
— |
% |
0.1 |
% |
— |
% |
0.57 |
% |
|
0.10 to <0.15 |
75 |
— |
— |
% |
0.1 |
% |
0.1 |
% |
0.54 |
% |
|
0.15 to <0.25 |
1,704 |
2 |
0.12 |
% |
0.2 |
% |
0.2 |
% |
0.40 |
% |
|
0.25 to <0.50 |
7,052 |
10 |
0.14 |
% |
0.4 |
% |
0.4 |
% |
0.35 |
% |
|
0.50 to <0.75 |
4,251 |
28 |
0.66 |
% |
0.6 |
% |
0.6 |
% |
0.65 |
% |
|
0.75 to <2.50 |
15,082 |
263 |
1.74 |
% |
1.5 |
% |
1.6 |
% |
1.15 |
% |
|
0.75 to <1.75 |
10,148 |
140 |
1.38 |
% |
1.3 |
% |
1.3 |
% |
0.99 |
% |
|
1.75 to <2.5 |
4,934 |
123 |
2.49 |
% |
2.2 |
% |
2.2 |
% |
1.41 |
% |
|
2.50 to <10.00 |
5,894 |
460 |
7.80 |
% |
4.5 |
% |
5.1 |
% |
6.68 |
% |
|
2.5 to <5 |
2,529 |
89 |
3.52 |
% |
3.5 |
% |
3.4 |
% |
3.55 |
% |
|
5 to <10 |
3,365 |
371 |
11.03 |
% |
6.2 |
% |
6.5 |
% |
10.07 |
% |
|
10.00 to <100.00 |
1,631 |
273 |
16.74 |
% |
25.5 |
% |
24.3 |
% |
23.58 |
% |
|
10 to <20 |
868 |
170 |
19.59 |
% |
13.1 |
% |
13.7 |
% |
23.24 |
% |
|
20 to <30 |
289 |
34 |
11.76 |
% |
23.3 |
% |
24.9 |
% |
26.09 |
% |
|
30.00 to <100.00 |
474 |
69 |
14.56 |
% |
42.2 |
% |
43.3 |
% |
24.07 |
% |
|
100.00 (Default) |
2,830 |
2,830 |
100.00 |
% |
100.0 |
% |
100.0 |
% |
100.00 |
% |
2024 Pillar 3 Disclosures Report 135
|
|
|
|
|
|
|
|
|
|
|
|
|
|
|
|
|
|
|
|
|
|
|
|
| Table 54.CR9 - AIRB approach Retail - Back-testing of PD per exposure class (fixed PD scale) |
| EUR million |
|
|
|
|
|
|
|
|
2024 |
| Exposure class |
PD scale |
Number of obligors at the end of the year |
Observed average default rate (%) |
Exposures weighted average PD (%) |
Average PD (%) |
Average
historical
annual
default rate (%) |
|
of which: number of obligors which defaulted during the year |
| a |
b |
c |
d |
e |
f |
g |
h |
| Retail - Mortgages SMEs |
|
0.00 to <0.15 |
1,272 |
1 |
0.08 |
% |
0.10 |
% |
0.11 |
% |
0.14 |
% |
|
0.00 to <0.10 |
3 |
0 |
— |
% |
0.07 |
% |
0.07 |
% |
— |
% |
|
0.10 to <0.15 |
1,269 |
1 |
0.08 |
% |
0.11 |
% |
0.11 |
% |
0.14 |
% |
|
0.15 to <0.25 |
1,290 |
2 |
0.16 |
% |
0.20 |
% |
0.20 |
% |
0.17 |
% |
|
0.25 to <0.50 |
2,394 |
19 |
0.79 |
% |
0.41 |
% |
0.41 |
% |
0.60 |
% |
|
0.50 to <0.75 |
180 |
2 |
1.11 |
% |
0.61 |
% |
0.67 |
% |
0.85 |
% |
|
0.75 to <2.50 |
2,496 |
50 |
2.00 |
% |
1.39 |
% |
1.23 |
% |
1.96 |
% |
|
0.75 to <1.75 |
2,242 |
35 |
1.56 |
% |
1.19 |
% |
1.11 |
% |
1.55 |
% |
|
1.75 to <2.5 |
254 |
15 |
5.91 |
% |
2.21 |
% |
2.27 |
% |
4.95 |
% |
|
2.50 to <10.00 |
578 |
59 |
10.21 |
% |
4.78 |
% |
5.00 |
% |
9.42 |
% |
|
2.5 to <5 |
296 |
25 |
8.45 |
% |
3.42 |
% |
3.47 |
% |
6.84 |
% |
|
5 to <10 |
282 |
34 |
12.06 |
% |
6.58 |
% |
6.60 |
% |
12.97 |
% |
|
10.00 to <100.00 |
544 |
118 |
21.69 |
% |
30.02 |
% |
32.74 |
% |
25.24 |
% |
|
10 to <20 |
212 |
59 |
27.83 |
% |
13.41 |
% |
13.01 |
% |
26.62 |
% |
|
20 to <30 |
12 |
3 |
25.00 |
% |
25.74 |
% |
24.18 |
% |
26.55 |
% |
|
30.00 to <100.00 |
320 |
56 |
17.50 |
% |
49.41 |
% |
46.13 |
% |
25.25 |
% |
|
100.00 (Default) |
2,002 |
2,002 |
100.00 |
% |
100.00 |
% |
100.00 |
% |
100.00 |
% |
|
|
|
|
|
|
|
|
| Retail - Mortgages no SMEs |
|
0.00 to <0.15 |
477,438 |
276 |
0.06 |
% |
0.09 |
% |
0.09 |
% |
0.07 |
% |
|
0.00 to <0.10 |
350,081 |
155 |
0.04 |
% |
0.07 |
% |
0.07 |
% |
0.06 |
% |
|
0.10 to <0.15 |
127,357 |
121 |
0.10 |
% |
0.13 |
% |
0.13 |
% |
0.10 |
% |
|
0.15 to <0.25 |
196,267 |
275 |
0.14 |
% |
0.22 |
% |
0.22 |
% |
0.13 |
% |
|
0.25 to <0.50 |
476,006 |
723 |
0.15 |
% |
0.36 |
% |
0.36 |
% |
0.17 |
% |
|
0.50 to <0.75 |
574,149 |
1,140 |
0.20 |
% |
0.61 |
% |
0.60 |
% |
0.27 |
% |
|
0.75 to <2.50 |
326,082 |
2,187 |
0.67 |
% |
1.36 |
% |
1.36 |
% |
0.44 |
% |
|
0.75 to <1.75 |
249,040 |
1,434 |
0.58 |
% |
1.16 |
% |
1.14 |
% |
0.40 |
% |
|
1.75 to <2.5 |
77,042 |
753 |
0.98 |
% |
2.01 |
% |
2.04 |
% |
0.58 |
% |
|
2.50 to <10.00 |
133,971 |
3,088 |
2.30 |
% |
4.16 |
% |
4.47 |
% |
1.35 |
% |
|
2.5 to <5 |
83,781 |
1,582 |
1.89 |
% |
3.40 |
% |
3.35 |
% |
1.07 |
% |
|
5 to <10 |
50,190 |
1,506 |
3.00 |
% |
6.35 |
% |
6.35 |
% |
1.82 |
% |
|
10.00 to <100.00 |
56,336 |
9,711 |
17.24 |
% |
31.41 |
% |
28.24 |
% |
11.99 |
% |
|
10 to <20 |
27,383 |
2,363 |
8.63 |
% |
13.80 |
% |
13.43 |
% |
5.36 |
% |
|
20 to <30 |
11,165 |
1,782 |
15.96 |
% |
24.66 |
% |
25.36 |
% |
11.38 |
% |
|
30.00 to <100.00 |
17,788 |
5,566 |
31.29 |
% |
55.49 |
% |
52.84 |
% |
22.98 |
% |
|
100.00 (Default) |
49,198 |
49,198 |
100.00 |
% |
100.00 |
% |
100.00 |
% |
100.00 |
% |
136 2024 Pillar 3 Disclosures Report
|
|
|
|
|
|
|
|
|
|
|
|
|
|
|
|
|
|
|
|
|
|
|
|
| Table 54.CR9 - AIRB approach Retail - Back-testing of PD per exposure class (fixed PD scale) |
| EUR million |
|
|
|
|
|
|
|
|
2024 |
| Exposure class |
PD scale |
Number of obligors at the end of the year |
Observed average default rate (%) |
Exposures weighted average PD (%) |
Average PD (%) |
Average
historical
annual
default rate (%) |
|
of which: number of obligors which defaulted during the year |
| a |
b |
c |
d |
e |
f |
g |
h |
| Qualifying Revolving |
|
0.00 to <0.15 |
3,712,100 |
1,637 |
0.04 |
% |
0.08 |
% |
0.09 |
% |
0.04 |
% |
|
0.00 to <0.10 |
2,576,197 |
504 |
0.02 |
% |
0.07 |
% |
0.08 |
% |
0.03 |
% |
|
0.10 to <0.15 |
1,135,903 |
1,133 |
0.10 |
% |
0.12 |
% |
0.12 |
% |
0.06 |
% |
|
0.15 to <0.25 |
609,180 |
770 |
0.13 |
% |
0.21 |
% |
0.21 |
% |
0.07 |
% |
|
0.25 to <0.50 |
5,876,478 |
4,724 |
0.08 |
% |
0.31 |
% |
0.31 |
% |
0.09 |
% |
|
0.50 to <0.75 |
478,603 |
1,435 |
0.30 |
% |
0.63 |
% |
0.64 |
% |
0.23 |
% |
|
0.75 to <2.50 |
2,548,759 |
14,280 |
0.56 |
% |
1.38 |
% |
1.33 |
% |
0.39 |
% |
|
0.75 to <1.75 |
2,087,963 |
9,781 |
0.47 |
% |
1.23 |
% |
1.16 |
% |
0.31 |
% |
|
1.75 to <2.5 |
460,796 |
4,499 |
0.98 |
% |
2.13 |
% |
2.07 |
% |
0.68 |
% |
|
2.50 to <10.00 |
2,084,203 |
35,570 |
1.71 |
% |
4.72 |
% |
4.79 |
% |
1.57 |
% |
|
2.5 to <5 |
1,273,828 |
16,699 |
1.31 |
% |
3.44 |
% |
3.49 |
% |
1.11 |
% |
|
5 to <10 |
810,375 |
18,871 |
2.33 |
% |
6.76 |
% |
6.85 |
% |
2.19 |
% |
|
10.00 to <100.00 |
793,541 |
89,638 |
11.30 |
% |
24.31 |
% |
21.80 |
% |
10.57 |
% |
|
10 to <20 |
441,380 |
26,627 |
6.03 |
% |
13.14 |
% |
12.94 |
% |
5.12 |
% |
|
20 to <30 |
227,983 |
24,506 |
10.75 |
% |
23.39 |
% |
22.81 |
% |
9.26 |
% |
|
30.00 to <100.00 |
124,178 |
38,505 |
31.01 |
% |
53.02 |
% |
51.46 |
% |
28.10 |
% |
|
100.00 (Default) |
156,931 |
156,931 |
100.00 |
% |
100.00 |
% |
100.00 |
% |
100.00 |
% |
|
|
|
|
|
|
|
|
| Retail - Other non SMEs |
|
0.00 to <0.15 |
2,182,349 |
8,448 |
0.39 |
% |
0.08 |
% |
0.09 |
% |
0.14 |
% |
|
0.00 to <0.10 |
1,624,291 |
271 |
0.02 |
% |
0.05 |
% |
0.07 |
% |
0.07 |
% |
|
0.10 to <0.15 |
558,058 |
8,177 |
1.47 |
% |
0.10 |
% |
0.13 |
% |
0.34 |
% |
|
0.15 to <0.25 |
535,567 |
784 |
0.15 |
% |
0.21 |
% |
0.20 |
% |
0.11 |
% |
|
0.25 to <0.50 |
929,542 |
2,375 |
0.26 |
% |
0.36 |
% |
0.38 |
% |
0.23 |
% |
|
0.50 to <0.75 |
779,811 |
3,708 |
0.48 |
% |
0.64 |
% |
0.60 |
% |
0.36 |
% |
|
0.75 to <2.50 |
1,809,132 |
18,803 |
1.04 |
% |
1.38 |
% |
1.35 |
% |
0.82 |
% |
|
0.75 to <1.75 |
1,414,328 |
11,091 |
0.78 |
% |
1.19 |
% |
1.13 |
% |
0.65 |
% |
|
1.75 to <2.5 |
394,804 |
7,712 |
1.95 |
% |
2.15 |
% |
2.16 |
% |
1.44 |
% |
|
2.50 to <10.00 |
1,103,207 |
42,063 |
3.81 |
% |
4.69 |
% |
5.03 |
% |
3.01 |
% |
|
2.5 to <5 |
567,324 |
15,699 |
2.77 |
% |
3.43 |
% |
3.37 |
% |
2.17 |
% |
|
5 to <10 |
535,883 |
26,364 |
4.92 |
% |
6.69 |
% |
6.78 |
% |
5.11 |
% |
|
10.00 to <100.00 |
474,215 |
98,634 |
20.80 |
% |
33.94 |
% |
36.60 |
% |
22.19 |
% |
|
10 to <20 |
165,527 |
17,496 |
10.57 |
% |
14.36 |
% |
14.52 |
% |
10.53 |
% |
|
20 to <30 |
117,445 |
25,818 |
21.98 |
% |
22.49 |
% |
23.50 |
% |
23.50 |
% |
|
30.00 to <100.00 |
191,243 |
55,320 |
28.93 |
% |
62.92 |
% |
63.75 |
% |
33.29 |
% |
|
100.00 (Default) |
226,749 |
226,749 |
100.00 |
% |
100.00 |
% |
100.00 |
% |
100.00 |
% |
2024 Pillar 3 Disclosures Report 137
|
|
|
|
|
|
|
|
|
|
|
|
|
|
|
|
|
|
|
|
|
|
|
|
| Table 54.CR9 - AIRB approach Retail - Back-testing of PD per exposure class (fixed PD scale) |
| EUR million |
|
|
|
|
|
|
|
|
2024 |
| Exposure class |
PD scale |
Number of obligors at the end of the year |
Observed average default rate (%) |
Exposures weighted average PD (%) |
Average PD (%) |
Average
historical
annual
default rate (%) |
|
of which: number of obligors which defaulted during the year |
| a |
b |
c |
d |
e |
f |
g |
h |
| Retail - SMEs |
|
0.00 to <0.15 |
84,107 |
209 |
0.25 |
% |
0.09 |
% |
0.08 |
% |
0.18 |
% |
|
0.00 to <0.10 |
46,342 |
25 |
0.05 |
% |
0.06 |
% |
0.05 |
% |
0.08 |
% |
|
0.10 to <0.15 |
37,765 |
184 |
0.49 |
% |
0.11 |
% |
0.12 |
% |
0.42 |
% |
|
0.15 to <0.25 |
111,708 |
279 |
0.25 |
% |
0.21 |
% |
0.20 |
% |
0.24 |
% |
|
0.25 to <0.50 |
78,509 |
521 |
0.66 |
% |
0.38 |
% |
0.40 |
% |
0.52 |
% |
|
0.50 to <0.75 |
89,752 |
970 |
1.08 |
% |
0.63 |
% |
0.65 |
% |
0.80 |
% |
|
0.75 to <2.50 |
270,063 |
4,626 |
1.71 |
% |
1.47 |
% |
1.41 |
% |
1.35 |
% |
|
0.75 to <1.75 |
192,107 |
2,775 |
1.44 |
% |
1.18 |
% |
1.12 |
% |
1.16 |
% |
|
1.75 to <2.5 |
77,956 |
1,851 |
2.37 |
% |
2.14 |
% |
2.14 |
% |
1.80 |
% |
|
2.50 to <10.00 |
199,041 |
9,450 |
4.75 |
% |
4.50 |
% |
4.49 |
% |
4.32 |
% |
|
2.5 to <5 |
141,205 |
5,082 |
3.60 |
% |
3.55 |
% |
3.55 |
% |
3.09 |
% |
|
5 to <10 |
57,836 |
4,368 |
7.55 |
% |
6.56 |
% |
6.79 |
% |
8.06 |
% |
|
10.00 to <100.00 |
60,488 |
17,101 |
28.27 |
% |
32.24 |
% |
33.08 |
% |
21.89 |
% |
|
10 to <20 |
17,620 |
3,232 |
18.34 |
% |
14.41 |
% |
14.46 |
% |
10.82 |
% |
|
20 to <30 |
15,923 |
4,176 |
26.23 |
% |
24.10 |
% |
23.65 |
% |
25.15 |
% |
|
30.00 to <100.00 |
26,945 |
9,693 |
35.97 |
% |
51.98 |
% |
50.83 |
% |
42.15 |
% |
|
100.00 (Default) |
55,630 |
55,630 |
100.00 |
% |
100.00 |
% |
100.00 |
% |
100.00 |
% |
138 2024 Pillar 3 Disclosures Report
|
|
|
|
|
|
|
|
|
|
|
|
|
|
|
|
|
|
|
|
|
|
|
|
| Table 55.CR9 - FIRB approach - Back-testing of PD per exposure class (fixed PD scale) |
| EUR million |
|
|
|
|
|
|
|
|
2024 |
| Exposure class |
PD scale |
Number of obligors at the end of the year |
Observed average default rate (%) |
Exposures weighted average PD (%) |
Average PD (%) |
Average
historical
annual
default rate (%) |
|
of which: number of obligors which defaulted during the year |
| a |
b |
c |
d |
e |
f |
g |
h |
| Corporates - Other |
|
0.00 to <0.15 |
116 |
— |
— |
% |
0.07 |
% |
0.06 |
% |
— |
% |
|
0.00 to <0.10 |
107 |
— |
— |
% |
0.06 |
% |
0.05 |
% |
— |
% |
|
0.10 to <0.15 |
9 |
— |
— |
% |
0.13 |
% |
0.13 |
% |
— |
% |
|
0.15 to <0.25 |
4 |
— |
— |
% |
0.21 |
% |
0.21 |
% |
— |
% |
|
0.25 to <0.50 |
1,124 |
— |
— |
% |
0.37 |
% |
0.44 |
% |
— |
% |
|
0.50 to <0.75 |
442 |
— |
— |
% |
0.59 |
% |
0.55 |
% |
— |
% |
|
0.75 to <2.50 |
1,796 |
1 |
0.06 |
% |
1.17 |
% |
1.52 |
% |
0.02 |
% |
|
0.75 to <1.75 |
1,499 |
1 |
0.07 |
% |
1.17 |
% |
1.41 |
% |
0.03 |
% |
|
1.75 to <2.5 |
297 |
— |
— |
% |
2.09 |
% |
2.08 |
% |
— |
% |
|
2.50 to <10.00 |
1,202 |
4 |
0.33 |
% |
4.52 |
% |
5.65 |
% |
0.83 |
% |
|
2.5 to <5 |
193 |
— |
— |
% |
3.44 |
% |
4.16 |
% |
0.62 |
% |
|
5 to <10 |
1,009 |
4 |
0.40 |
% |
6.53 |
% |
5.93 |
% |
0.35 |
% |
|
10.00 to <100.00 |
381 |
3 |
0.79 |
% |
25.24 |
% |
25.10 |
% |
3.58 |
% |
|
10 to <20 |
46 |
— |
— |
% |
15.76 |
% |
17.92 |
% |
3.66 |
% |
|
20 to <30 |
281 |
3 |
1.07 |
% |
22.10 |
% |
22.15 |
% |
0.37 |
% |
|
30.00 to <100.00 |
54 |
— |
— |
% |
32.96 |
% |
46.57 |
% |
— |
% |
|
100.00 (Default) |
87 |
87 |
100.00 |
% |
100.00 |
% |
100.00 |
% |
100.00 |
% |
|
|
|
|
|
|
|
|
| Corporates - SMEs |
|
0.00 to <0.15 |
0 |
— |
— |
% |
0.08 |
% |
— |
% |
— |
% |
|
0.00 to <0.10 |
0 |
— |
— |
% |
0.08 |
% |
— |
% |
— |
% |
|
0.10 to <0.15 |
0 |
— |
— |
% |
|
— |
% |
— |
% |
|
0.15 to <0.25 |
0 |
— |
— |
% |
0.16 |
% |
— |
% |
— |
% |
|
0.25 to <0.50 |
144 |
— |
— |
% |
0.43 |
% |
0.43 |
% |
— |
% |
|
0.50 to <0.75 |
95 |
— |
— |
% |
0.55 |
% |
0.55 |
% |
0.25 |
% |
|
0.75 to <2.50 |
426 |
— |
— |
% |
1.46 |
% |
1.70 |
% |
0.76 |
% |
|
0.75 to <1.75 |
426 |
— |
— |
% |
1.46 |
% |
1.70 |
% |
0.76 |
% |
|
1.75 to <2.5 |
0 |
— |
— |
% |
|
— |
% |
— |
% |
|
2.50 to <10.00 |
448 |
14 |
3.13 |
% |
5.60 |
% |
5.70 |
% |
1.89 |
% |
|
2.5 to <5 |
0 |
— |
— |
% |
|
— |
% |
1.10 |
% |
|
5 to <10 |
448 |
14 |
3.13 |
% |
5.60 |
% |
5.70 |
% |
3.07 |
% |
|
10.00 to <100.00 |
147 |
7 |
4.76 |
% |
20.95 |
% |
26.03 |
% |
3.65 |
% |
|
10 to <20 |
0 |
— |
— |
% |
17.12 |
% |
— |
% |
2.84 |
% |
|
20 to <30 |
99 |
7 |
7.07 |
% |
22.07 |
% |
22.07 |
% |
2.86 |
% |
|
30.00 to <100.00 |
48 |
— |
— |
% |
34.20 |
% |
34.20 |
% |
0.91 |
% |
|
100.00 (Default) |
57 |
57 |
100.00 |
% |
100.00 |
% |
100.00 |
% |
100.00 |
% |
2024 Pillar 3 Disclosures Report 139
|
|
|
|
|
|
|
|
|
|
|
|
|
|
|
|
|
|
|
|
|
|
|
|
| Table 56.CR9.1 - FIRB approach - Back-testing of PD per exposure class (only for PD estimates according to point (f) of Article 180(1) CRR) |
| EUR million |
|
|
|
|
|
|
|
|
2024 |
| Exposure class |
PD range |
External rating
equivalent |
Number of obligors at the end of previous year |
Observed average default rate (%) |
Average PD (%) |
Average
historical
annual
default rate (%) |
|
Of which number of
obligors which defaulted in the year |
| a |
b |
c |
d |
e |
f |
g |
h |
| Institutions |
|
0.000%-0.030% |
AA |
164 |
— |
— |
% |
0.03 |
% |
— |
% |
|
0.030%-0.038% |
AA- |
382 |
— |
— |
% |
0.03 |
% |
— |
% |
|
0.038%-0.061% |
AA- |
419 |
— |
— |
% |
0.05 |
% |
— |
% |
|
0.061%-0.097% |
A |
565 |
— |
— |
% |
0.07 |
% |
— |
% |
|
0.097%-0.158% |
BBB+ |
528 |
— |
— |
% |
0.12 |
% |
— |
% |
|
0.158%-0.262% |
BBB |
251 |
— |
— |
% |
0.20 |
% |
— |
% |
|
0.262%-0.443% |
BBB- |
158 |
— |
— |
% |
0.33 |
% |
— |
% |
|
0.443%-0.766% |
BB+ |
90 |
— |
— |
% |
0.56 |
% |
— |
% |
|
0.766%-1.354% |
BB |
19 |
— |
— |
% |
0.99 |
% |
— |
% |
|
1.354%-2.453% |
BB- |
8 |
— |
— |
% |
1.76 |
% |
— |
% |
|
2.453%-4.548% |
B+ |
3 |
— |
— |
% |
3.23 |
% |
4.17 |
% |
|
4.548%-8.621% |
B+ |
0 |
— |
— |
% |
6.06 |
% |
— |
% |
|
8.621%-14.668% |
B |
0 |
— |
— |
% |
11.60 |
% |
— |
% |
|
14.668%-16.409% |
B |
0 |
— |
— |
% |
15.34 |
% |
— |
% |
|
16.409%-99.999% |
B- |
0 |
— |
— |
% |
18.32 |
% |
— |
% |
|
16.409%-99.999% |
NR |
88 |
— |
— |
% |
18.32 |
% |
0.25 |
% |
|
100.00 |
% |
D |
6 |
6 |
100.00 |
% |
100.00 |
% |
100.00 |
% |
|
|
|
|
|
|
|
|
| Corporates - Other |
|
0,000% - 0,030% |
AA |
58 |
— |
— |
% |
0.03 |
% |
— |
% |
|
0,030% - 0,040% |
AA |
95 |
— |
— |
% |
0.03 |
% |
— |
% |
|
0,040% - 0,066% |
AA- |
253 |
— |
— |
% |
0.05 |
% |
0.11 |
% |
|
0,066% - 0,108% |
A |
385 |
— |
— |
% |
0.08 |
% |
— |
% |
|
0,108% - 0,179% |
BBB+ |
700 |
3 |
0.43 |
% |
0.14 |
% |
0.09 |
% |
|
0,179% - 0,296% |
BBB |
1,150 |
— |
— |
% |
0.22 |
% |
0.06 |
% |
|
0,296% - 0,489% |
BB+ |
1,130 |
— |
— |
% |
0.37 |
% |
0.07 |
% |
|
0,489% - 0,806% |
BB |
891 |
2 |
0.22 |
% |
0.61 |
% |
0.33 |
% |
|
0,806% - 1,326% |
BB- |
496 |
— |
— |
% |
1.00 |
% |
0.53 |
% |
|
1,326% - 2,174% |
B+ |
283 |
6 |
2.12 |
% |
1.65 |
% |
1.47 |
% |
|
2,174% - 3,546% |
B+ |
186 |
4 |
2.15 |
% |
2.70 |
% |
3.53 |
% |
|
3,546% - 5,733% |
B |
75 |
3 |
4.00 |
% |
4.38 |
% |
7.65 |
% |
|
5,733% - 9,139% |
B- |
35 |
2 |
5.71 |
% |
7.04 |
% |
9.81 |
% |
|
9,139% - 14,264% |
B- |
13 |
— |
— |
% |
11.13 |
% |
23.05 |
% |
|
14,264% - 99,999% |
CCC |
6 |
— |
— |
% |
19.91 |
% |
19.73 |
% |
|
14,264% - 99,999% |
NR |
986 |
2 |
0.20 |
% |
19.91 |
% |
1.17 |
% |
|
100.00 |
% |
D |
137 |
137 |
100.00 |
% |
100.00 |
% |
100.00 |
% |
140 2024 Pillar 3 Disclosures Report
[THIS PAGE INTENTIONALLY LEFT BLANK]
2024 Pillar 3 Disclosures Report 141
142 2024 Pillar 3 Disclosures Report
|
|
|
|
|
|
|
|
|
|
|
|
|
|
|
|
|
|
|
|
|
|
|
|
|
|
|
|
|
|
|
|
|
|
|
|
|
|
|
|
|
|
|
|
|
|
|
|
|
|
|
|
|
|
|
|
|
|
5.6. Central counterparties |
|
|
|
|
|
|
|
|
|
|
|
|
|
|
|
|
|
|
|
|
|
|
|
|
|
|
|
|
|
|
|
|
|
|
|
|
|
|
|
|
|
|
|
|
|
|
|
|
|
|
|
|
|
|
|
|
|
|
|
|
|
|
|
|
|
|
|
|
|
|
|
|
|
|
|
|
|
|
|
5. COUNTERPARTY CREDIT RISK |
2024 Pillar 3 Disclosures Report 143
|
|
|
|
|
| 5. COUNTERPARTY CREDIT RISK |
Counterparty credit risk is the risk that a customer will default before the final settlement of a transaction’s cash flows. It creates a bilateral credit risk due to its possible effect on both parties of a transaction. Additional uncertainty arises due to market factors, which can be volatile.
This chapter analyses Grupo Santander's counterparty credit risk profile from several approaches: country, type of financial contract, calculation method and notional value. It also focuses on regulatory indicators (EAD and RWA).
|
|
|
|
|
|
|
|
|
|
|
|
|
|
|
|
|
|
| Main figures |
|
|
|
|
|
EUR million |
|
|
|
|
|
|
EAD |
|
RWA |
|
2024 |
2023 |
|
2024 |
2023 |
| Counterparty credit risk* |
61,906 |
55,120 |
|
18,564 |
13,343 |
| Of which the standardised approach |
49,770 |
44,642 |
|
17,885 |
12,663 |
| Of which internal model method (IMM) |
— |
— |
|
— |
— |
| Of which exposures to a CCPs** |
4,453 |
3,653 |
|
89 |
73 |
| Of which credit valuation adjustment - CVA |
12,136 |
10,478 |
|
679 |
680 |
|
|
|
|
|
|
|
| *Includes counterparty credit risk + CVA |
| **Does not include CCPs exposures corresponding to pre-funded default fund contributions and unfunded default fund contributions. |
|
|
|
|
|
|
|
|
|
| EAD variation |
|
RWA variation |
EUR million |
|
EUR million |
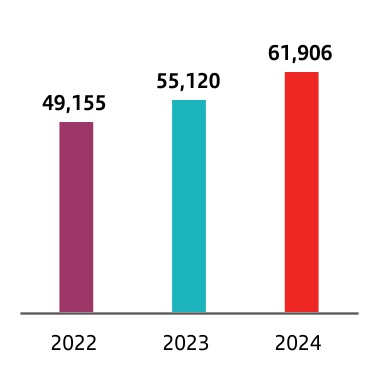
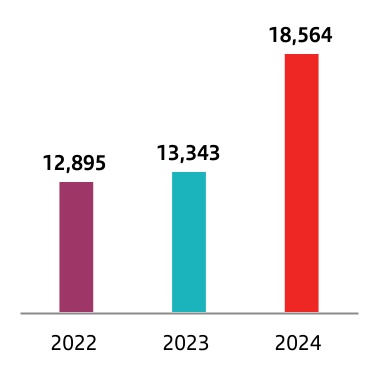
5.1 Counterparty credit risk definition and framework
This section covers the qualitative requirement CCRA - Qualitative disclosure related to CCR. It also complies with (d), (e), (f) and (g) of the OVA Requirement - Institution risk management approach.
Chapter 6 of the CRR (Regulation (EU) No 575/2013) describes counterparty credit risk as the risk a counterparty to a transaction could default before the final settlement of the transaction's cash flows. It includes the following transaction types: derivatives contracts, repurchase agreements, securities and commodities lending, long settlements and margin lending transactions.
Santander includes counterparty credit risk in its Credit Risk Framework.
For management purposes, it also has a specific counterparty credit risk model, policy and procedures.
This risk is controlled using an integrated system that provides real-time information so that exposures can be checked on a daily basis against the limits approved by senior management for any counterparty, product or maturity, in any the Group unit.
Specific counterparty credit risk limits are included in the overall credit risk limits and counterparty credit risk is independently monitored and controlled. These limits are set and reviewed in accordance with the appetite set by the board. The definition of limits and appetite metrics are reviewed and updated every year.
144 2024 Pillar 3 Disclosures Report
There are two methodologies for the measurement of counterparty credit risk management exposure: a mark-to-market (MtM, replacement cost in the case of derivatives) methodology with an add-on for potential future exposure; and a methodology including calculation of exposure using Monte Carlo simulation, which is used in certain geographies and for some products.
In addition, monthly and quarterly management exposure stress tests are conducted and the results are reported to senior management.
Credit risk equivalent is used to calculate capital at risk or unexpected loss, i.e. the loss in economic capital once expected loss is subtracted, net of guarantees and recoveries.
The risk teams reports every quarter to senior management on the main risk metrics (exposure, MtM, notional amounts) of the group's Counterparty Credit Risk portfolio broken down by geography and segment.
5.2. Collateral agreements and guarantees
A policy is applied to regulate eligibility criteria for eligible collaterals and applicable haircuts complying with the Variation and Initial Margin regulatory requirements. The policy applies to derivatives, repo and securities lending transactions.
Transactions subject to collateral agreements are valued daily and on that valuation, the parameters agreed in the collateral agreement are applied, giving an amount of collateral to be called from, or returned to, the counterparty.
The counterparty that receives the margin call checks the valuation, at which point discrepancies may arise.
A monitoring committee (discrepancies committee) meets weekly to analyse transactions in which significant discrepancies have been detected and manages them with Risk teams to ensure they are valued correctly.
5.3. Wrong-way risk
Wrong-way risk occurs if the potential exposure of a transaction with a counterparty is highly and positively (adversely) correlated with the credit rating of the counterparty, i.e. if the counterparty's credit rating deteriorates, potential exposure increases.
The criterion used by the Group for calculating the credit exposure of derivatives with specific wrong way risk (WWR) is very conservative, as exposure to derivatives with WWR resembles exposure to basic financing.
Santander has defined criteria to identify transactions subject to specific wrong way risk on the basis of the legal connection between the counterparty and the issuer of the underlying instrument. Additionally, a method for measuring general wrong way risk has also been defined.
Most of the collateral is in cash so only a small risk of adverse effects arises from specific correlations between the collateral and the collateral provider. Any adverse effects arising from correlations in non-cash collateral are immaterial since issuances from the same counterparty and its subsidiaries are excluded from collateral eligibility policies.
5.4. Credit rating downgrade
It is estimated that if our credit rating was downgraded and it was required to post additional collateral, the impact of collateral would be relatively limited. This is due to the Group's credit rating having effect only a small percentage of its current collateral agreements. In the event of a hypothetical one-notch downgrade in the group's credit rating, it is estimated that the resulting impact of the collateral would have to post would be €226 million.
5.5. Credit Value Adjustment (CVA)
The team responsible for managing counterparty credit risk in each geographic location charges the corresponding treasury desk a credit premium at the start of each transaction, in exchange for assuming the credit risk involved.
The team can then cover the CVA sensitivities through a combination of credit derivatives, interest rate derivatives, currency derivatives and other instruments.
The CVA regulatory capital is also calculated. The purpose of this charge is to improve the resilience of banks to potential losses of market value associated with a reduction in the solvency of counterparties in derivatives transactions that are not settled through clearing houses.
2024 Pillar 3 Disclosures Report 145
The following table shows the credit valuation adjustment (CVA) for the counterparty credit risk.
|
|
|
|
|
|
|
|
|
|
|
|
| Table 57.CCR2 - Transactions subject to own funds requirements for CVA risk |
|
|
|
|
|
EUR million |
|
|
|
2024 |
|
|
a |
b |
|
|
Exposure value |
RWA |
| 1 |
Total transactions subject to the Advanced method |
|
|
| 2 |
(i) VaR component (including the 3× multiplier) |
|
|
| 3 |
(ii) stressed VaR component (including the 3× multiplier) |
|
|
| 4 |
Transactions subject to the Standardised method |
12,136 |
679 |
| EU4 |
Transactions subject to the Alternative approach (Based on the Original Exposure Method) |
|
|
| 5 |
Total transactions subject to own funds requirements for CVA risk |
12,136 |
679 |
5.6. Central counterparties
The clearing of transactions through central counterparties is a common market practice for Santander. As a member of the clearing houses with which it operates, the bank contributes to their risk management framework through payments into the default fund, in addition to daily margin calls.
|
|
|
|
|
|
|
|
|
|
|
|
| Table 58.CCR8 - Exposures to CCPs |
|
EUR million |
|
|
|
2024 |
|
|
a |
b |
|
|
EAD (post CRM) |
RWA |
| 1 |
Exposures to QCCPs (total) |
|
294 |
| 2 |
Exposures for trades at QCCPs (excluding initial margin and default fund contributions); of which |
4,453 |
89 |
| 3 |
(i) OTC derivatives |
2,416 |
48 |
| 4 |
(ii) Exchange-traded derivatives |
837 |
17 |
| 5 |
(iii) Securities financing transactions |
1,199 |
24 |
| 6 |
(iv) Netting sets where cross-product netting has been approved |
|
|
| 7 |
Segregated initial margin |
|
|
| 8 |
Non-segregated initial margin |
|
|
| 9 |
Pre-funded default fund contributions |
1,269 |
205 |
| 10 |
Unfunded default fund contributions |
1,607 |
— |
| 11 |
Exposures to non-QCCPs (total) |
|
|
| 12 |
Exposures for trades at CCPs non-qualified (excluding initial margin and fund contributions); of which |
|
|
| 13 |
(i) OTC derivatives |
|
|
| 14 |
(ii) Exchange-traded derivatives |
|
|
| 15 |
(iii) Securities financing transactions |
|
|
| 16 |
(iv) Netting sets where cross-product netting has been approved |
|
|
| 17 |
Segregated initial margin |
|
|
| 18 |
Non-segregated initial margin |
|
|
| 19 |
Pre-funded default fund contributions |
|
|
| 20 |
Unfunded default fund contributions |
|
|
The risk associated with this type of counterparty is managed through the credit risk framework.
The following tables show central counterparty (CCP) exposure following risk mitigation techniques.
146 2024 Pillar 3 Disclosures Report
5.7. Credit counterparty credit risk indicators
The following table shows a breakdown of derivatives exposure by the type of product, category, geographical area and rating of the counterparty:
|
|
|
|
|
|
|
|
|
| Derivatives exposure by product |
|
Derivatives exposure by category |
| % |
|
% |
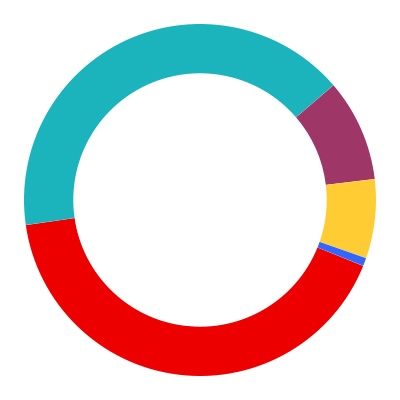
|
|
|
|
|
|
|
|
|
| n |
Interest rate |
42% |
| n |
Exchange rate |
41% |
| n |
Equity |
9% |
| n |
Raw materials |
7% |
| n |
Credit |
1% |
|
|
|
|
|
|
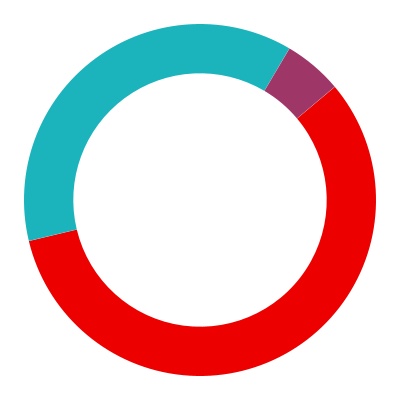
|
|
|
|
|
|
|
|
|
| n |
Corporates |
57% |
| n |
Institutions |
37% |
| n |
Sovereign |
5% |
|
|
|
|
|
|
|
|
|
|
|
|
| Derivatives exposure by geography |
|
Derivatives exposure by rating |
| % |
|
% |

|
|
|
|
|
|
|
|
|
| n |
Spain |
9% |
| n |
UK |
19% |
| n |
Rest of Europe |
31% |
| n |
South America |
24% |
| n |
USA |
10% |
| n |
Others |
7% |
|
|
|
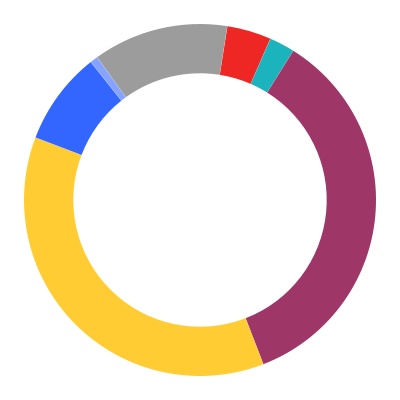
|
|
|
|
|
|
|
|
|
| n |
AAA |
4% |
| n |
AA |
2% |
| n |
A |
35% |
| n |
BBB |
37% |
| n |
BB |
9% |
| n |
B |
1% |
| n |
Rest |
12% |
|
|
|
The exposure to counterparty credit risk in 2024 from derivative transactions was concentrated in counterparties with high credit quality, so that 41% of the exposure was with counterparties rated A or higher. The distribution by type of counterparty was 37% Institutions, 5% in Sovereigns and 57% Corporates.
As regards geographic distribution, 19% of the exposure was accounted for by UK counterparties with the remainder being accounted for by Spain (9%), the rest of Europe (31%), South America (24%), the United States (10%) and the rest of the world (7%).
2024 Pillar 3 Disclosures Report 147
The following table shows exposure to counterparty credit risk depending on the calculation methodology used.
|
|
|
|
|
|
|
|
|
|
|
|
|
|
|
|
|
|
|
|
|
|
|
|
|
|
|
|
|
|
| Table 59.CCR1 - Analysis of CCR exposure by approach |
|
EUR million |
|
2024 |
|
|
a |
b |
c |
d |
e |
f |
g |
h |
|
|
Replacement cost (RC) |
Potential future exposure (PFE) |
EEPE |
Alpha used for computing regulatory exposure value |
Exposure value pre-CRM |
Exposure value-post CRM |
Exposure Value |
RWEA |
| EU1 |
EU - Original Exposure Method (for derivatives) |
|
|
|
|
|
|
|
|
| EU2 |
EU - Simplified SA-CCR (for derivatives) |
|
|
|
|
|
|
|
|
| 1 |
SA-CCR (for derivatives) |
10,442 |
11,513 |
|
1.4 |
59,399 |
32,129 |
31,949 |
15,035 |
| 2 |
IMM (for derivatives and SFTs) |
|
|
|
|
|
|
|
|
| 2a |
Of which securities financing transactions netting sets |
|
|
|
|
|
|
|
|
| 2b |
Of which derivatives and long settlement transactions netting sets |
|
|
|
|
|
|
|
|
| 2c |
Of which from contractual cross-product netting sets |
|
|
|
|
|
|
|
|
| 3 |
Financial collateral simple method (for SFTs) |
|
|
|
|
|
|
|
|
| 4 |
Financial collateral comprehensive method (for SFTs) |
|
|
|
|
183,809 |
13,368 |
13,368 |
2,761 |
| 5 |
VaR for SFTs |
|
|
|
|
|
|
|
|
| 6 |
Total |
|
|
|
|
243,208 |
45,497 |
45,317 |
17,796 |
|
|
|
|
|
|
|
|
|
|
|
|
|
|
|
|
|
|
|
|
148 2024 Pillar 3 Disclosures Report
After the new European Capital Requirement Regulation (CRR) was enforced in June 2021, the Group implemented the standard SA-CCR methodology for calculating the regulatory exposure of the derivatives portfolio.
The following table details the breakdown of counterparty credit risk exposures calculated using the standardised approach, by portfolio (counterparty type) and risk weighting (degree of risk resulting from the standardised approach):
|
|
|
|
|
|
|
|
|
|
|
|
|
|
|
|
|
|
|
|
|
|
|
|
|
|
|
|
|
|
|
|
|
|
|
|
|
|
|
|
|
|
| Table 60.CCR3 - Standardised approach - CCR exposures by regulatory exposure class and risk weights |
|
EUR million |
|
2024 |
|
|
Risk Weight |
|
|
a |
b |
c |
d |
e |
f |
g |
h |
i |
j |
k |
l |
|
|
0 |
% |
2 |
% |
4 |
% |
10 |
% |
20 |
% |
50 |
% |
70 |
% |
75 |
% |
100 |
% |
150 |
% |
Others |
Total |
| 1 |
Central governments or central banks |
3,198 |
— |
— |
— |
10 |
35 |
— |
— |
— |
— |
— |
3,243 |
| 2 |
Regional government or local authorities |
100 |
— |
— |
— |
68 |
— |
— |
— |
2 |
— |
— |
171 |
| 3 |
Public sector entities |
36 |
— |
— |
— |
11 |
1 |
— |
— |
— |
— |
— |
48 |
| 4 |
Multilateral development banks |
1,042 |
— |
— |
— |
— |
— |
— |
— |
— |
— |
— |
1,042 |
| 5 |
International organisations |
10 |
— |
— |
— |
— |
— |
— |
— |
— |
— |
— |
10 |
| 6 |
Institutions |
— |
4,453 |
— |
— |
424 |
582 |
— |
— |
125 |
— |
— |
5,584 |
| 7 |
Corporates |
— |
— |
— |
— |
— |
61 |
— |
— |
3,635 |
2 |
— |
3,698 |
| 8 |
Retail |
— |
— |
— |
— |
— |
— |
— |
73 |
— |
— |
— |
73 |
| 9 |
Institutions and corporates with a short-term credit assessment |
— |
— |
— |
— |
3 |
3 |
— |
— |
6 |
— |
— |
12 |
| 10 |
Other items |
— |
— |
— |
— |
— |
— |
— |
— |
5 |
12 |
— |
17 |
| 11 |
Total |
4,385 |
4,453 |
— |
— |
518 |
682 |
— |
73 |
3,773 |
14 |
— |
13,898 |
|
|
|
|
|
|
|
|
|
|
|
|
|
|
|
|
|
|
|
|
|
|
|
|
|
|
|
|
|
|
|
|
|
|
|
|
|
|
|
|
|
|
| CCR3 - Standardised approach - CCR exposures by regulatory exposure class and risk weights (31.12.2023) |
|
EUR million |
|
2023 |
|
|
Risk Weight |
|
|
a |
b |
c |
d |
e |
f |
g |
h |
i |
j |
k |
l |
|
|
0 |
% |
2 |
% |
4 |
% |
10 |
% |
20 |
% |
50 |
% |
70 |
% |
75 |
% |
100 |
% |
150 |
% |
Others |
Total |
| 1 |
Central governments or central banks |
3,487 |
— |
46 |
— |
20 |
— |
— |
— |
— |
— |
|
3,553 |
| 2 |
Regional government or local authorities |
102 |
— |
— |
— |
152 |
— |
— |
— |
— |
— |
|
254 |
| 3 |
Public sector entities |
14 |
— |
— |
— |
13 |
57 |
— |
— |
— |
— |
|
85 |
| 4 |
Multilateral development banks |
1,174 |
— |
— |
— |
— |
— |
— |
— |
— |
— |
|
1,174 |
| 5 |
International organisations |
4 |
— |
— |
— |
— |
— |
— |
— |
— |
— |
|
4 |
| 6 |
Institutions |
— |
3,783 |
— |
— |
757 |
611 |
— |
— |
114 |
— |
|
5,264 |
| 7 |
Corporates |
— |
— |
— |
— |
28 |
27 |
— |
— |
3,572 |
10 |
|
3,637 |
| 8 |
Retail |
— |
— |
— |
— |
— |
— |
— |
104 |
— |
— |
|
104 |
| 9 |
Institutions and corporates with a short-term credit assessment |
|
|
|
|
|
1 |
— |
— |
5 |
— |
|
6 |
| 10 |
Other items |
— |
— |
— |
— |
— |
— |
— |
— |
7 |
|
— |
7 |
| 11 |
Total |
4,781 |
3,783 |
46 |
— |
970 |
695 |
— |
104 |
3,698 |
11 |
— |
14,088 |
2024 Pillar 3 Disclosures Report 149
The following table shows a breakdown of counterparty credit risk exposure by portfolio and PD scale (excluding CCPs and specialised lending).
|
|
|
|
|
|
|
|
|
|
|
|
|
|
|
|
|
|
|
|
|
|
|
|
|
|
|
| Table 61.CCR4 - AIRB approach - CCR exposures by exposure class and PD scale |
|
EUR million |
|
|
|
2024 |
|
a |
b |
c |
d |
e |
f |
g |
h |
|
PD scale |
Exposure value |
Exposure weighted average PD (%) |
Number of obligors |
Exposure weighted average LGD (%) |
Exposure weighted average maturity (years) |
RWEA |
Density of risk weighted exposure amount |
|
|
|
|
|
|
|
|
|
|
Institutions |
| 1 |
0.00 < 0.15 |
— |
— |
% |
— |
— |
% |
— |
— |
— |
% |
| 2 |
0.15 < 0.25 |
— |
— |
% |
— |
— |
% |
— |
— |
— |
% |
| 3 |
0.25 < 0.50 |
— |
— |
% |
— |
— |
% |
— |
— |
— |
% |
| 4 |
0.50 < 0.75 |
4 |
0.69 |
% |
4 |
21.74 |
% |
2 |
2 |
42.51 |
% |
| 5 |
0.75 < 2.50 |
85 |
1.01 |
% |
9 |
26.24 |
% |
5 |
62 |
73.00 |
% |
| 6 |
2.50 < 10.00 |
1 |
2.70 |
% |
2 |
45.00 |
% |
1 |
1 |
117.13 |
% |
| 7 |
10.00 < 100.00 |
0 |
— |
% |
0 |
— |
% |
0 |
— |
— |
% |
| 8 |
100.00 (Default) |
0 |
— |
% |
0 |
— |
% |
0 |
— |
— |
% |
| 9 |
Sub-total |
89 |
1.01 |
% |
15 |
26.19 |
% |
5 |
64 |
72.08 |
% |
|
|
|
|
|
|
|
|
|
Institutions |
| 1 |
0.00 < 0.15 |
110 |
0.11 |
% |
7 |
39.74 |
% |
5 |
50 |
45.25 |
% |
| 2 |
0.15 < 0.25 |
54 |
0.21 |
% |
202 |
43.43 |
% |
1 |
17 |
30.51 |
% |
| 3 |
0.25 < 0.50 |
245 |
0.43 |
% |
142 |
39.90 |
% |
3 |
150 |
61.20 |
% |
| 4 |
0.50 < 0.75 |
20 |
0.63 |
% |
451 |
45.11 |
% |
3 |
16 |
80.90 |
% |
| 5 |
0.75 < 2.50 |
521 |
1.45 |
% |
825 |
39.85 |
% |
1 |
444 |
85.20 |
% |
| 6 |
2.50 < 10.00 |
120 |
4.29 |
% |
324 |
40.06 |
% |
2 |
165 |
137.81 |
% |
| 7 |
10.00 < 100.00 |
26 |
30.32 |
% |
92 |
39.76 |
% |
1 |
58 |
223.82 |
% |
| 8 |
100.00 (Default) |
7 |
100.00 |
% |
22 |
76.65 |
% |
4 |
4 |
59.44 |
% |
| 9 |
Sub-total |
1,103 |
2.60 |
% |
2,065 |
40.36 |
% |
2 |
904 |
81.96 |
% |
|
|
|
|
|
|
|
|
|
|
Retail |
| 1 |
0.00 < 0.15 |
1 |
0.10 |
% |
67,382 |
88.17 |
% |
|
— |
22.99 |
% |
| 2 |
0.15 < 0.25 |
— |
0.20 |
% |
2,898 |
87.59 |
% |
|
— |
37.32 |
% |
| 3 |
0.25 < 0.50 |
|
|
|
|
|
|
|
| 4 |
0.50 < 0.75 |
— |
0.54 |
% |
3,430 |
87.59 |
% |
— |
— |
69.39 |
% |
| 5 |
0.75 < 2.50 |
1 |
1.58 |
% |
3,027 |
67.54 |
% |
— |
1 |
85.17 |
% |
| 6 |
2.50 < 10.00 |
— |
7.28 |
% |
3,359 |
87.59 |
% |
— |
— |
143.89 |
% |
| 7 |
10.00 < 100.00 |
— |
32.07 |
% |
30 |
87.59 |
% |
— |
— |
207.16 |
% |
| 8 |
100.00 (Default) |
— |
100.00 |
% |
151 |
65.05 |
% |
— |
— |
91.02 |
% |
| 9 |
Sub-total |
2 |
2.46 |
% |
80,277 |
81.87 |
% |
— |
1 |
63.98 |
% |
150 2024 Pillar 3 Disclosures Report
|
|
|
|
|
|
|
|
|
|
|
|
|
|
|
|
|
|
|
|
|
|
|
|
|
|
|
| CCR4 - AIRB approach - CCR exposures by exposure class and PD scale (31.12.2023) |
|
EUR million |
|
|
|
2023 |
|
a |
b |
c |
d |
e |
f |
g |
h |
|
PD scale |
Exposure value |
Exposure weighted average PD (%) |
Number of obligors |
Exposure weighted average LGD (%) |
Exposure weighted average maturity (years) |
RWEA |
Density of risk weighted exposure amount |
|
|
|
|
|
|
|
|
|
|
Institutions |
| 1 |
0.00 < 0.15 |
0 |
— |
% |
0 |
— |
% |
0 |
— |
— |
% |
| 2 |
0.15 < 0.25 |
0 |
— |
% |
0 |
— |
% |
0 |
— |
— |
% |
| 3 |
0.25 < 0.50 |
0 |
— |
% |
0 |
— |
% |
0 |
— |
— |
% |
| 4 |
0.50 < 0.75 |
5 |
0.62 |
% |
3 |
10.56 |
% |
3 |
1 |
20.93 |
% |
| 5 |
0.75 < 2.50 |
75 |
1.02 |
% |
7 |
21.46 |
% |
5 |
46 |
60.87 |
% |
| 6 |
2.50 < 10.00 |
1 |
2.53 |
% |
1 |
45.00 |
% |
2 |
1 |
128.64 |
% |
| 7 |
10.00 < 100.00 |
— |
— |
% |
— |
— |
% |
— |
— |
— |
% |
| 8 |
100.00 (Default) |
0 |
— |
% |
0 |
— |
% |
0 |
— |
— |
% |
| 9 |
Sub-total |
82 |
1.02 |
% |
11 |
21.08 |
% |
5 |
48 |
59.23 |
% |
|
|
|
|
|
|
|
|
|
Corporates |
| 1 |
0.00 < 0.15 |
0 |
— |
% |
0 |
— |
% |
0 |
— |
— |
% |
| 2 |
0.15 < 0.25 |
21 |
0.21 |
% |
342 |
43.43 |
% |
2 |
9 |
42.82 |
% |
| 3 |
0.25 < 0.50 |
46 |
0.44 |
% |
51 |
43.72 |
% |
0 |
18 |
39.75 |
% |
| 4 |
0.50 < 0.75 |
372 |
0.58 |
% |
776 |
40.19 |
% |
2 |
258 |
69.26 |
% |
| 5 |
0.75 < 2.50 |
88 |
1.73 |
% |
480 |
40.40 |
% |
2 |
85 |
97.32 |
% |
| 6 |
2.50 < 10.00 |
63 |
3.64 |
% |
273 |
39.85 |
% |
2 |
79 |
124.59 |
% |
| 7 |
10.00 < 100.00 |
4 |
16.87 |
% |
54 |
39.88 |
% |
1 |
9 |
207.27 |
% |
| 8 |
100.00 (Default) |
8 |
100.00 |
% |
26 |
76.24 |
% |
1 |
5 |
59.48 |
% |
| 9 |
Sub-total |
602 |
2.46 |
% |
2,002 |
41.04 |
% |
2 |
462 |
76.81 |
% |
|
|
|
|
|
|
|
|
|
|
Retail |
| 1 |
0.00 < 0.15 |
7 |
0.13 |
% |
51,266 |
87.60 |
% |
|
2 |
28.18 |
% |
| 2 |
0.15 < 0.25 |
— |
0.20 |
% |
1,838 |
87.59 |
% |
|
— |
37.27 |
% |
| 3 |
0.25 < 0.50 |
|
|
|
|
|
|
|
| 4 |
0.50 < 0.75 |
— |
0.54 |
% |
2,241 |
87.59 |
% |
0 |
— |
69.42 |
% |
| 5 |
0.75 < 2.50 |
— |
1.58 |
% |
3,070 |
74.40 |
% |
0 |
— |
92.10 |
% |
| 6 |
2.50 < 10.00 |
— |
6.90 |
% |
2,388 |
87.59 |
% |
0 |
— |
142.52 |
% |
| 7 |
10.00 < 100.00 |
— |
19.97 |
% |
34 |
87.59 |
% |
0 |
— |
200.00 |
% |
| 8 |
100.00 (Default) |
— |
100.00 |
% |
210 |
67.12 |
% |
0 |
— |
80.55 |
% |
| 9 |
Sub-total |
8 |
0.87 |
% |
61,047 |
87.00 |
% |
0 |
3 |
33.62 |
% |
2024 Pillar 3 Disclosures Report 151
|
|
|
|
|
|
|
|
|
|
|
|
|
|
|
|
|
|
|
|
|
|
|
|
|
|
|
| Table 62.CCR4 - FIRB approach - CCR exposures by exposure class and PD scale |
|
EUR million |
|
|
|
2024 |
|
a |
b |
c |
d |
e |
f |
g |
h |
|
PD scale |
Exposure value |
Exposure weighted average PD (%) |
Number of obligors |
Exposure weighted average LGD (%) |
Exposure weighted average maturity (years) |
RWEA |
Density of risk weighted exposure amount |
|
|
|
|
|
|
|
|
|
|
Institutions |
| 1 |
0.00 < 0.15 |
17,739 |
0.06 |
% |
1,604 |
44.55 |
% |
1 |
4,506 |
25 |
% |
| 2 |
0.15 < 0.25 |
1,922 |
0.16 |
% |
160 |
45.00 |
% |
2 |
1,063 |
55 |
% |
| 3 |
0.25 < 0.50 |
706 |
0.33 |
% |
186 |
45.00 |
% |
1 |
493 |
70 |
% |
| 4 |
0.50 < 0.75 |
420 |
0.66 |
% |
56 |
45.00 |
% |
1 |
366 |
87 |
% |
| 5 |
0.75 < 2.50 |
71 |
1.39 |
% |
22 |
45.00 |
% |
1 |
86 |
121 |
% |
| 6 |
2.50 < 10.00 |
7 |
4.27 |
% |
24 |
45.00 |
% |
1 |
14 |
196 |
% |
| 7 |
10.00 < 100.00 |
24 |
45.00 |
% |
86 |
45.00 |
% |
2 |
84 |
354 |
% |
| 8 |
100.00 (Default) |
0 |
— |
% |
0 |
— |
% |
0 |
0 |
— |
% |
| 9 |
Sub-total |
20,889 |
0.15 |
% |
2,138 |
44.62 |
% |
1 |
6,612 |
32 |
% |
|
|
|
|
|
|
|
|
|
Corporates |
| 1 |
0.00 < 0.15 |
7,120 |
0.08 |
% |
383 |
45.00 |
% |
2 |
1,801 |
25 |
% |
| 2 |
0.15 < 0.25 |
2,053 |
0.21 |
% |
192 |
45.00 |
% |
3 |
1,012 |
49 |
% |
| 3 |
0.25 < 0.50 |
1,173 |
0.36 |
% |
207 |
45.00 |
% |
3 |
744 |
63 |
% |
| 4 |
0.50 < 0.75 |
673 |
0.59 |
% |
177 |
44.99 |
% |
3 |
526 |
78 |
% |
| 5 |
0.75 < 2.50 |
303 |
1.16 |
% |
150 |
44.96 |
% |
3 |
308 |
102 |
% |
| 6 |
2.50 < 10.00 |
130 |
4.36 |
% |
51 |
45.00 |
% |
3 |
196 |
151 |
% |
| 7 |
10.00 < 100.00 |
66 |
31.68 |
% |
77 |
45.00 |
% |
2 |
174 |
263 |
% |
| 8 |
100.00 (Default) |
190 |
100.00 |
% |
3 |
45.00 |
% |
3 |
— |
— |
% |
| 9 |
Sub-total |
11,708 |
2.04 |
% |
1,240 |
45.00 |
% |
2 |
4,762 |
41 |
% |
|
|
|
|
|
|
|
|
|
|
|
|
|
|
|
|
|
|
|
|
|
|
|
|
|
|
|
| CCR4 - FIRB approach - CCR exposures by exposure class and PD scale (31.12.2023) |
|
EUR million |
|
|
|
2023 |
|
a |
b |
c |
d |
e |
f |
g |
h |
|
PD scale |
Exposure value |
Exposure weighted average PD (%) |
Number of obligors |
Exposure weighted average LGD (%) |
Exposure weighted average maturity (years) |
RWEA |
Density of risk weighted exposure amount |
|
|
|
|
|
|
|
|
|
|
Institutions |
| 1 |
0.00 < 0.15 |
14,123 |
0.06 |
% |
1,214 |
44.21 |
% |
0 |
2,041 |
14.45 |
% |
| 2 |
0.15 < 0.25 |
824 |
0.18 |
% |
122 |
45.00 |
% |
0 |
290 |
35.16 |
% |
| 3 |
0.25 < 0.50 |
392 |
0.34 |
% |
159 |
45.00 |
% |
1 |
233 |
59.30 |
% |
| 4 |
0.50 < 0.75 |
66 |
0.66 |
% |
38 |
45.00 |
% |
1 |
61 |
93.18 |
% |
| 5 |
0.75 < 2.50 |
47 |
1.73 |
% |
28 |
45.00 |
% |
0 |
56 |
120.05 |
% |
| 6 |
2.50 < 10.00 |
6 |
2.89 |
% |
23 |
45.00 |
% |
0 |
10 |
149.89 |
% |
| 7 |
10.00 < 100.00 |
58 |
45.00 |
% |
53 |
45.00 |
% |
0 |
191 |
327.67 |
% |
| 8 |
100.00 (Default) |
1 |
100.00 |
% |
2 |
45.00 |
% |
0 |
0 |
— |
% |
| 9 |
Sub-total |
15,517 |
0.25 |
% |
1,639 |
44.28 |
% |
0 |
2,881 |
18.56 |
% |
|
|
|
|
|
|
|
|
|
Corporates |
| 1 |
0.00 < 0.15 |
10,038 |
0.08 |
% |
498 |
45.00 |
% |
2 |
2,275 |
22.67 |
% |
| 2 |
0.15 < 0.25 |
1,055 |
0.22 |
% |
217 |
45.00 |
% |
2 |
514 |
48.74 |
% |
| 3 |
0.25 < 0.50 |
559 |
0.36 |
% |
198 |
45.00 |
% |
2 |
338 |
60.35 |
% |
| 4 |
0.50 < 0.75 |
507 |
0.61 |
% |
99 |
45.00 |
% |
2 |
393 |
77.61 |
% |
| 5 |
0.75 < 2.50 |
138 |
1.30 |
% |
78 |
45.00 |
% |
2 |
161 |
116.63 |
% |
| 6 |
2.50 < 10.00 |
8 |
3.73 |
% |
17 |
45.00 |
% |
2 |
13 |
158.71 |
% |
| 7 |
10.00 < 100.00 |
13 |
18.50 |
% |
68 |
45.00 |
% |
2 |
36 |
273.28 |
% |
| 8 |
100.00 (Default) |
0 |
100.00 |
% |
6 |
45.00 |
% |
3 |
0 |
— |
% |
| 9 |
Sub-total |
12,319 |
0.16 |
% |
1,181 |
45.00 |
% |
2 |
3,731 |
30.29 |
% |
152 2024 Pillar 3 Disclosures Report
The following table shows a summary of the effects of netting agreements and collateral for exposure to counterparty credit risk, in addition to the type of collateral exchanges in derivatives transactions and securities financing transactions (SFTs).
|
|
|
|
|
|
|
|
|
|
|
|
|
|
|
|
|
|
|
|
|
|
|
|
|
|
|
|
|
|
| Table 63.CCR5 - Composition of collateral for CCR exposures |
|
EUR million |
|
|
|
|
2024 |
|
|
a |
b |
c |
d |
e |
f |
g |
h |
|
|
Collateral used in derivative transactions |
Collateral used in SFTs |
|
|
Fair value of collateral received |
Fair value of posted collateral |
Fair value of collateral received |
Fair value of posted collateral |
|
|
Segregated |
Unsegregated |
Segregated |
Unsegregated |
Segregated |
Unsegregated |
Segregated |
Unsegregated |
| 1 |
Cash - domestic currency |
323 |
10,466 |
870 |
5,766 |
— |
142,872 |
— |
117,033 |
| 2 |
Cash - other currencies |
156 |
7,928 |
1,730 |
6,136 |
— |
58,436 |
— |
55,498 |
| 3 |
Domestic sovereign debt |
1,043 |
1,445 |
7,849 |
182 |
674 |
81,736 |
5,238 |
67,628 |
| 4 |
Other sovereign debt |
1,797 |
1,234 |
2,443 |
41 |
1,875 |
66,127 |
2,088 |
47,898 |
| 5 |
Government agency debt |
7 |
15 |
69 |
— |
2 |
295 |
345 |
287 |
| 6 |
Corporate bonds |
2,023 |
118 |
153 |
24 |
1,291 |
68,919 |
3,571 |
84,747 |
| 7 |
Shares |
510 |
192 |
1,976 |
— |
6,690 |
6,302 |
11,282 |
4,328 |
| 8 |
Other collateral |
— |
— |
— |
— |
— |
3 |
— |
— |
| 9 |
Total |
5,857 |
21,400 |
15,092 |
12,150 |
10,532 |
424,691 |
22,525 |
377,419 |
r
|
|
|
|
|
|
|
|
|
|
|
|
| Table 64.CCR6 - Credit derivatives exposures |
|
EUR million |
|
|
|
2024 |
|
|
a |
b |
|
|
Credit derivatives hedges |
|
|
Protection bought |
Protection sold |
|
Notionals |
|
|
| 1 |
Single-name credit default swaps |
16,872 |
13,981 |
| 2 |
Index credit default swaps |
11,401 |
3,255 |
| 3 |
Total return swaps |
118 |
|
| 4 |
Credit options |
|
|
| 5 |
Other credit derivatives |
|
|
| 6 |
Total notionals |
28,391 |
17,237 |
|
Fair values |
|
|
| 7 |
Positive fair value (asset) |
230.109322 |
618 |
| 8 |
Negative fair value (liability) |
(1,211) |
(236) |
|
*Bought credit derivatives do include loan coverage |
|
|
2024 Pillar 3 Disclosures Report 153
|
|
|
|
|
|
|
|
|
|
|
|
| CCR6 - Credit derivatives exposures (31.12.2023) |
|
EUR million |
|
|
|
2023 |
|
|
a |
b |
|
|
Credit derivatives hedges |
|
|
Protection bought |
Protection sold |
|
Notionals |
— |
— |
| 1 |
Single-name credit default swaps |
7,972 |
6,549 |
| 2 |
Index credit default swaps |
7,100 |
2,241 |
| 3 |
Total return swaps |
467 |
|
| 4 |
Credit options |
|
|
| 5 |
Other credit derivatives |
|
|
| 6 |
Total notionals |
15,539 |
8,790 |
|
Fair values |
|
|
| 7 |
Positive fair value (asset) |
197 |
298 |
| 8 |
Negative fair value (liability) |
(596) |
(74) |
|
*Bought credit derivatives do include loan coverage |
|
|
|
|
|
|
Table CCR7- Statement of flows of risk-weighted amounts of counterparty exposures subject to IMM is not included as Santander does not have an internal model to calculate counterparty risk EAD.
For more information, see the 'Risk compliance & conduct management' chapter of the 2024 Annual report.
|
|
|
|
|
|
|
Access 2024 Annual Report available on the Santander Group website |
154 2024 Pillar 3 Disclosures Report
[THIS PAGE INTENTIONALLY LEFT BLANK]
2024 Pillar 3 Disclosures Report 155
156 2024 Pillar 3 Disclosures Report
|
|
|
|
|
|
|
|
|
|
|
|
|
|
|
|
|
|
|
|
|
|
|
|
|
|
|
|
|
|
|
|
|
|
|
|
|
|
|
|
|
|
|
|
|
|
|
|
|
|
|
|
|
|
6.2.3. Risk inherent to the securitisation activity |
|
|
|
|
|
|
|
|
|
|
|
|
|
|
|
|
|
|
|
6.3.4. As sponsor |
|
|
|
|
|
|
|
|
|
|
|
|
|
|
|
|
|
|
|
|
|
|
|
|
|
|
|
|
|
|
|
|
|
|
|
|
|
|
|
|
|
|
|
|
|
|
|
|
|
|
|
|
|
|
|
|
|
|
|
|
|
|
|
|
|
|
|
6. CREDIT RISK - SECURITISATIONS |
2024 Pillar 3 Disclosures Report 157
|
|
|
|
|
| 6. CREDIT RISK - SECURITISATIONS |
This chapter provides details of Grupo Santander's securitisation activity. It also describes the basic concepts in securitisations and summarises the objectives and functions that Grupo Santander performs in the management of securitisation activity.
|
|
|
Number of securitisations (2024)1 |
1 Originated SRT
|
|
|
|
|
|
|
|
|
|
|
|
|
|
|
|
|
|
| Main figures |
| EUR million |
|
|
|
|
|
|
|
EAD |
|
|
RWA* |
|
2024 |
2023 |
|
2024 |
2023 |
| Originator |
73,536 |
|
47,490 |
|
|
11,417 |
|
7,621 |
|
| Investor |
26,384 |
|
21,194 |
|
|
4,227 |
|
3,799 |
|
| Sponsor |
403 |
— |
|
60 |
— |
|
| Total |
100,323 |
|
68,684 |
|
|
15,704 |
|
11,420 |
|
*The EAD considered is before deductions (exposures RW 1.250%) |
6.1 Introduction
Historically, banks used deposits to fund loans that they kept on their balance sheets until maturity. Over time, however, this model of banking started to change. Banks began expanding their funding sources to include bonds financing, commercial paper financing, and repurchase agreement (repo) funding.
Bank credit has shifted from traditional originate-to-hold to “originate-to-distribute” business model. In the originate to distribute “OTD” business model, adopted by most banks to a different extend, the originator of a loan sells it to third parties through a securitization process or using other risk transfer strategies.
|
|
|
|
|
|
|
|
|
|
|
|
| "OTD" structures: originate-to-distribute |
|
|
|
| Please note that this overview is a reference to the paper from the ESRB (European Systemic Risk Board): The European significant risk transfer securitisation market pp.7 |
better risk sharing, reducing concentration of credit risk, minimizing overall funding cost and, under certain conditions, reducing regulatory capital.
Furthermore, the process frees up capital for new lending, provides income from the sale of the loans and generates fees from continuing servicing of the underlying loans (collecting interest and principal repayments and passing them on the holders of securities).
In summary, the originate-to-distribute model has many advantages, such as, capital efficiency, optimization of the balance sheet, increased returns and the capacity to enhance financial system stability.
158 2024 Pillar 3 Disclosures Report
6.2. Management of the securitisation activity
This section covers the qualitative requirement SECA - Qualitative disclosure requirements related to securitisation exposures. Letters (d), (e), (f) e (i) are not applicable to Santander. Also the provisions of letters (d), (e), (f) and (g) of the OVA requirement -Institution risk management approach, are complied with.
6.2.1. Securitisation objectives and management
Santander pursues various objectives through its securitisation activity:
•Management and diversification of credit risk: the group mitigates risk that arises naturally from growth in its commercial activity through securitisation of transactions and the subsequent transfer of credit risk to third parties. The effective transfer of risk achieved through these transactions enables the group to optimise its credit risk exposure and contributes to value creation by reducing Banco Santander's need to retain own funds.
•Optimization of capital consumption: significantly transferring risk allows for reductions in capital consumption contributing to this objective. 43 new transactions, which benefit from the new securitization framework, were issued in 2024.
•Obtaining liquidity: securitisation enables Santander to mobilise its balance sheet by transforming illiquid assets into liquid assets and obtain wholesale funding by selling the transformed assets or using them as collateral. Retained securitisation positions can also be used as collateral for ECB and Bank of England.
•Diversifying funding sources: the liquidity obtained from securitisation allows the Group to diversify its funding sources, in terms of maturity and product type.
The Financial Management division draws up the issuances and securitisations plan for each Santander subsidiary/global business annually, on the basis of the financial plan and considering certain prudential limits on raising short-term market funding.
Grupo Santander also has a robust governance process for all securitisations intended to transfer risk. The review assesses transactions from a risk, capital, regulatory and economic approach.
6.2.2. Securitisation functions
Santander's role in the securitization process is mainly that of an originator – i.e. the entity that creates the exposures (underlying assets) subsequently traditionally or synthetically securitized. Apart from being the originator, Santander also generally manages the underlying portfolio (servicing).
Santander usually also acts as the facilitator for credit enhancements (subordinated loan, credit facilities or interest-rate swaps or caps) in traditional securitizations, necessary for the securitisation fund and will subsequently issue the notes that typically have an external rating.
The structuring and placing of its own securitizations, as for third parties, are also done by Santander, initiating and promoting new structures in various jurisdictions for both funding and risk transfer purposes. This activity is carried out against a backdrop of securitization revival as a tool for channelling credit to the real economy, with a special focus on the SMEs and consumer loans.
Conversely, Santander also acts as an investor, acquiring securitization positions originated by non-Santander entities.
Finally, Grupo Santander is sponsor of a securitisation whose underlying is the short-term receivables on individual debtors issued by a corporate client in the energy sector.
2024 Pillar 3 Disclosures Report 159
The distribution of Grupo Santander's exposure according to its activity as of December 31st, 2024 is shown below:
As indicated in the graph, originator activity accounts for more than 79% of Santander securitisation activity, while investment activity accounts for 21%. 67% of the volume of securitisations originated by Santander is concentrated in Spain and the United States. On the investment side, 92% of acquisitions of investment positions are concentrated in Spain and 2% in the United States, as shown in the graph on the right.
|
|
|
| EAD variation |
| Million euros |
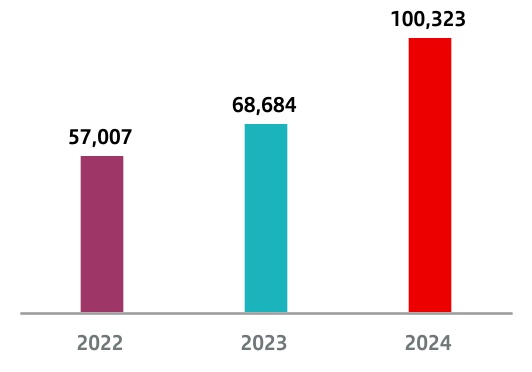
|
|
|
| RWA variation |
| Million euros |
|
|
|
|
|
|
|
|
|
|
|
|
| Distribution of the Group’s securitisation function (EAD) |
|
|
|
|
|
| Overview |
Originator Activity |
Investor Activity |
|
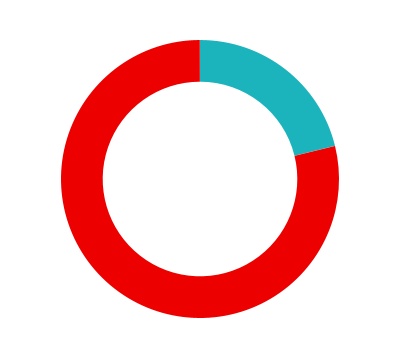
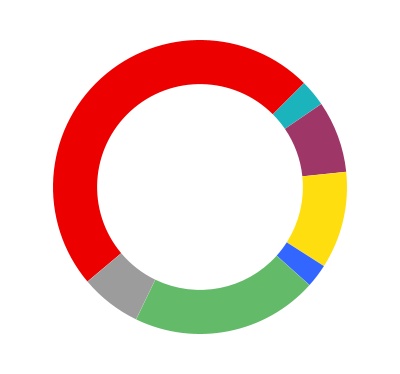

|
|
|
|
|
|
|
|
|
|
|
|
|
|
|
|
|
|
|
|
|
|
|
|
|
|
|
|
|
|
|
|
|
|
|
|
| n |
Originator - |
79% |
n |
Spain |
47% |
n |
Poland |
3% |
n |
Spain |
92% |
| n |
Investor - |
21% |
n |
USA |
20% |
n |
Brasil |
2% |
n |
USA |
2% |
|
|
|
n |
Others |
6% |
n |
UK |
10% |
n |
UK |
1% |
|
|
|
n |
Portugal |
8% |
|
|
|
n |
Brazil |
2% |
|
|
|
|
|
|
|
|
|
n |
Others |
3% |
The information on the securitisation positions of the investment and trading portfolio of Santander is included.
160 2024 Pillar 3 Disclosures Report
The following table gives a breakdown of the distribution of the activity carried out by Grupo Santander at 31 December 2024:
|
|
|
|
|
|
|
|
|
|
|
|
|
|
|
|
|
|
|
|
|
|
|
|
|
|
|
|
|
|
|
|
|
|
|
|
|
|
|
|
|
|
| Table 65.Securitisation positions purchased and retained with risk transfer by exposure type in the banking book |
| EUR million |
|
2024 |
|
2023 |
|
Exposure |
RWA |
|
EAD |
RWA |
|
Originator |
Investor |
Sponsor |
Originator |
Investor |
Sponsor |
|
Originator |
Investor |
Sponsor |
Originator |
Investor |
Sponsor |
| Traditional securitisations |
533 |
26,384 |
403 |
61 |
4,227 |
60 |
|
350 |
21,194 |
— |
35 |
3,799 |
— |
| Residential mortgages |
— |
3,117 |
— |
— |
448 |
— |
|
— |
3,278 |
— |
— |
517 |
— |
| Commercial mortgages |
— |
— |
— |
— |
— |
— |
|
— |
— |
— |
— |
— |
— |
| Credit cards |
— |
675 |
— |
— |
94 |
— |
|
— |
250 |
— |
— |
89 |
— |
| Leasing |
— |
— |
— |
— |
1 |
— |
|
— |
30 |
— |
— |
140 |
— |
| Loans to corporates or to SMEs treated as corporates |
— |
4,888 |
— |
— |
980 |
— |
|
— |
4,641 |
— |
— |
958 |
— |
| Consumer loans |
426 |
8,070 |
— |
46 |
1,180 |
— |
|
309 |
6,254 |
— |
29 |
938 |
— |
| Receivables |
— |
1,485 |
— |
— |
223 |
— |
|
— |
947 |
— |
— |
192 |
— |
| Others |
107 |
8,149 |
403 |
14 |
1,302 |
60 |
|
41 |
5,794 |
— |
6 |
967 |
— |
| Resecuritisations |
— |
— |
— |
— |
— |
— |
|
— |
— |
— |
— |
— |
— |
| Securitisation positions |
— |
— |
— |
— |
— |
— |
|
— |
— |
— |
— |
— |
— |
| Synthetic securitisations |
73,003 |
— |
— |
11,356 |
— |
— |
|
47,140 |
— |
— |
7,586 |
— |
— |
| Residential mortgages |
11,569 |
— |
— |
1,812 |
— |
— |
|
8,025 |
— |
— |
1,246 |
— |
— |
| Commercial mortgages |
5,156 |
— |
— |
960 |
— |
— |
|
3,200 |
— |
— |
431 |
— |
— |
| Credit cards |
— |
— |
— |
— |
— |
— |
|
— |
— |
— |
— |
— |
— |
| Leasing |
274 |
— |
— |
27 |
— |
— |
|
418 |
— |
— |
41 |
— |
— |
| Loans to corporates or to SMEs treated as corporates |
34,172 |
— |
— |
5,140 |
— |
— |
|
19,532 |
— |
— |
3,039 |
— |
— |
| Consumer loans |
14,736 |
— |
— |
2,483 |
— |
— |
|
10,228 |
— |
— |
1,924 |
— |
— |
| Receivables |
2,032 |
— |
— |
300 |
— |
— |
|
1,459 |
— |
— |
217 |
— |
— |
| Others |
5,065 |
— |
— |
635 |
— |
— |
|
4,278 |
— |
— |
687 |
— |
— |
| Total |
73,536 |
26,384 |
403 |
11,417 |
4,227 |
60 |
|
47,490 |
21,194 |
— |
7,621 |
3,799 |
— |
2024 Pillar 3 Disclosures Report 161
6.2.3. Risk inherent to the securitisation activity
Securitization offers advantages in terms of diversified funding sources and better risk management. However, it exposes investors to certain inherent risks, which are defined below. Santander is not exposed to any additional risk by acting as the originator or sole investor in a securitization. In fact, doing so it reduces liquidity risk by transforming illiquid assets (the loans originated) into liquid assets (securitization bonds).
•Credit risk: the risk that borrowers will fail to meet their contractual obligations in due time and proper form, with the consequent impairment of the underlying assets backing the securitisation positions. Credit risk is assessed by external credit rating agencies, which assign ratings to the securitisation positions. For third-party positions Grupo Santander invests in, this credit risk is firstly assessed by external credit rating agencies, who assign ratings to the securitisation positions. At the Group, the maximum exposure in the banking book is limited by rating (AAA, AA, A, BBB) and by type of underlying. In addition, the group continuously monitors published data on default of the underlying, the credit quality of the originator and mandatory minimum ratios and ratings in the structure, as well as data on granularity, geographical distribution and type of underlying.
•Prepayment risk: the risk of early repayment of some or all of the assets underlying the securitization, so that the securitization positions mature faster than expected and therefore fewer coupons are received than expected. Calculations of the average life, return and duration of securitisation positions is subject, among other aspects, to assumptions about the rate at which the underlying assets will be prepaid, which may vary.
•Interest rate risk: This risk arises in case of a mismatch between the interest rates of the securitized assets and those of the securitization positions. At Santander, and for any traditional securitizations that arise, this risk is usually hedged with swaps (Interest Rate Swaps — IRS).
•Exchange rate risk: This exists in securitizations where the securitized assets and the securitization positions are denominated in different currencies. Traditional securitizations issued by Santander are issued in the same currency as the underlying asset, so this risk is therefore absent. However, this risk will only be partially present in a small portion of synthetic securitizations.
•Liquidity risk: this risk is diminished through the securitisation process, whereby naturally illiquid assets are transformed into debt securities that can be traded on organised financial markets. In some securitisations, however, such as those which issue commercial paper, liquidity risk is still significant and is manifested in the need to cover potential timing mismatches between interest payments on the underlying assets and payments of interest on the securities. At Santander, this risk tends to be very small and is mitigated by liquidity facilities included in the structure (excluding synthetic securitisations). The liquidity risk associated with investing in bond positions is managed by establishing maximum holding periods.
•Counterparty risk: This risk is not present in traditional securitizations issued by Santander due to the notes/bonds being actually sold in exchange for cash. This translates to no counterparty risk. However, there is risk present in synthetic securitizations if the hedging/protection obtained is not anchored. Synthetic transactions originated by Santander can be structured through a SPV (Special Purpose Vehicle), which hedges the portfolio and issues CLNs (Credit Link Notes), or the financial guarantee can be issued directly. If the financial guarantees are funded, there will be no counterparty risk. However, if hedged and if they are not funded, this risk will not be present (the counterparty risk). Lastly, a synthetic transaction can be structured without an SPV and without issuing notes. These types of guarantees are financial in nature and will tend not to be anchored. In this case, counterparty risk will indeed be present. Finally, this type of risk will be present only if the synthetic guarantee received is not anchored. Santander will therefore have to reclaim losses generated by the hedged portfolio from the investor, whenever such losses reach their tranche. In synthetic securitisations, there is no right of credit risk transfer nor sale of the underlying portfolio. The financial guarantees received can be funded or unfunded. In the latter case, Banco Santander has to reclaim the losses from the investor, which generates counterparty risk.
Santander analyses annually the evolution of the securitisations originated with the release of capital, assessing the different parameters from a risks and capital perspective (backtesting). These reviews are submitted to the relevant management bodies.
162 2024 Pillar 3 Disclosures Report
6.3. Santander securitisation activity
The list of SPPEs is listed in Appendix XIV of the 2024 Pillar 3 report file available on the Santander website.
|
|
|
|
|
|
|
Access the Pillar 3 2024 file available on Grupo Santander's web site |
6.3.1. As asset manager
Grupo Santander has Santander de Titulización S.G.F.T., S.A. (Sociedad Gestora de Fondos de Titulización) and Gamma, STC. (Sociedade de Titularização de Créditos), in order to set up, manage and legally represent the securitisation funds originated in Spain and Portugal, respectively.
6.3.2. As originator
Grupo Santander originated in 2024 43 securitisations mainly for risk transfer purposes.
Grupo Santander has a total of 118 securitisations that transfer risk and free up capital (38 traditional transactions and 80 synthetic). The main underlying portfolios are consumer loans (primarily for cars) and loans to businesses.
A general target is to achieve and maintain the STS (Simple, Transparent and Standardised Securitisations) certification for all newly originated securitisations (both synthetic and traditional) whenever possible. Currently 62 securitisations have this certification.
|
|
|
|
|
|
|
|
|
|
|
|
|
|
|
| The key components of an STS (Simple, Transparent and Standardised Securitisations) |
|
|
| STS |
|
|
|
|
|
|
|
|
|
|
|
Simplicity
•Homogeneous underlying assets
•Clear and well documented structure
•Exclusion of derivatives or complex features
|
|
Transparent
•Full disclosure of all necessary transaction information to all investors
•Asset-level data availability in standardized formats
•Clear reporting mechanisms to monitor the transaction
|
|
Standardization
• Adherence to establish market standards for legal, documentation, and procedural practices
•Consistent and predictable cashflows characteristics
•Proper risk retention by the originator
|
Monitoring process for changes in associated risk:
•Securitisation positions originated: periodic monitoring is the responsibility of the different securitisation fund managers (trustees/management companies) or of the originators directly no fund is created. In any of the cases that prepare regular reports containing an update of the rating performance of the bonds' underlying portfolios of the securitisation positions generated.
Of the 80 synthetic securitisation funds, 30 were originated in 2024.
Santander also originates and holds positions in traditional securitisation funds whose underlying portfolios mainly comprise consumer and corporate loans.
An external rating has been given to Santander by one or more of the following external rating agencies for each of these traditional structures and for some synthetic securitisations, regardless of the underlying product: Standard & Poors, Moody's, Fitch, DBRS, Arc, Scope and KROLL. The group obtains ratings from at least two of these agencies when a traditional securitisation is placed on the market in Europe.
Grupo Santander does not provide implicit support in synthetic securitizations, where there is significant risk transfer at the regulatory level.
6.3.3. As investor
With regard to investment activity, Santander holds positions in securitisation funds originated by entities outside the Group whose underlying assets mainly comprise receivables, credit cards, corporate, SME and mortgage loans. As Santander limits its maximum exposure by rating (AAA, AA, A, BBB), it does not usually employ hedging techniques to mitigate the risk.
6.3.4. As sponsor
As of 31 of December 2024, Santander Group participates as a sponsor in a securitization structure where Santander maintains investor positions in mezzanine and senior tranches, additionally participating in 5% of the junior tranche to comply with the regulatory requirements for retention of economic interest.
•Securitisation positions invested in: published NPL metrics (90+, default, recoveries) and prepayments are monitored regularly using specialised software, which also checks whether the established rating-based limits are being met.
The processes mentioned above serve to monitor changes in credit and market risk for securitisation exposures.
2024 Pillar 3 Disclosures Report 163
This overview below displays the provided information regarding Santander securitisation activity, broken down by each table in the Pillar 3 disclosure report:
|
|
|
|
|
|
|
|
|
Overview of tables provided in the Pillar 3 Report
|
| Table |
Positions |
Information |
| SEC 1 |
Retained and invested positions in SEC in banking book
|
EAD broken down by type of securitization (synthetic, traditional), and role of the institution (originator/investor)
|
| SEC 2 |
Retained and invested positions in SEC in trading book
|
| SEC 3 |
Retained positions from originator/sponsor in banking book |
EAD & RWA broken down by regulatory approach of RW calculation
|
| SEC 4 |
Institutions acting as investor. Banking book |
| SEC 5 |
All exposures securitized by the institutions |
Underlying on-balance broken down by asset class |
A typical SRT is structured in at least in one senior and one junior tranche depending on the risk level, where the junior tranche is the one absorbing the first losses of the underlying portfolio.
|
|
|
|
|
|
|
|
|
|
|
|
|
|
|
| Disclosure of information in the Pillar 3 Report |
|
However, in most cases additional tranches are included, such as a mezzanine (covering the unexpected loss) tranche as shown in the example below.
Depending on the specific structure of the SRT, the investors risk preference and the bank´s capital strategy, several tranches may be sold to investors while others are retained by the bank. In the exemplary overview below, the mezzanine tranche is sold to investors while the senior and junior tranche are retained by Santander.
Please note that tranches which are sold to investors are not hold on the balance sheet of the Bank and therefore are not shown in the provided tables included in the Pillar 3 report. Only tranches, which are owned by the Santander and are included on its banking book, are represented by the according EAD and RWA metric. Information regarding EAD and RWA of the portions held by investors are not shown in this report and cannot be deducted by the presented information.
164 2024 Pillar 3 Disclosures Report
The following tables show the distribution, by type of underlying asset, of the securitisation positions issued and repurchased by the Group as an originator, investor and sponsor at 31st December 2024, in both the banking book and trading book.
|
|
|
|
|
|
|
|
|
|
|
|
|
|
|
|
|
|
|
|
|
|
|
|
|
|
|
|
|
|
|
|
|
|
|
|
|
|
|
|
|
|
|
|
|
|
|
|
|
|
|
|
|
|
|
|
|
| Table 66.SEC1 - Securitisation exposures in the non-trading book |
|
EUR million |
|
|
|
|
|
|
|
|
|
|
|
|
|
|
|
|
|
|
|
|
|
|
|
|
|
|
|
2024 |
|
|
a |
b |
c |
d |
e |
f |
g |
h |
i |
j |
k |
l |
m |
n |
o |
n |
o |
|
|
Bank acting as originator |
|
Bank acting as sponsor |
|
Bank acting as investor |
|
|
Traditional |
Synthetic |
Sub-total |
|
Traditional |
Synthetic |
Sub-total |
|
Traditional |
Synthetic |
Sub-total |
|
|
STS |
Non-STS |
|
of which SRT |
|
STS |
Non-STS |
|
STS |
Non-STS |
|
|
|
of which SRT |
|
of which SRT |
|
|
| 1 |
Total exposures |
2,350 |
500 |
22,829 |
34 |
73,049 |
73,003 |
98,228 |
|
— |
403 |
— |
403 |
|
3,723 |
22,662 |
— |
26,384 |
| 2 |
Retail (total) |
2,350 |
500 |
20,009 |
34 |
29,389 |
29,389 |
51,748 |
|
— |
403 |
— |
403 |
|
3,723 |
13,322 |
— |
17,044 |
| 3 |
Residential mortgages |
— |
— |
10,043 |
— |
11,569 |
11,569 |
21,612 |
|
— |
— |
— |
— |
|
517 |
2,600 |
— |
3,117 |
| 4 |
Credit card |
— |
— |
— |
— |
— |
— |
— |
|
— |
— |
— |
— |
|
267 |
407 |
— |
675 |
| 5 |
Other retail exposures |
2,350 |
500 |
9,966 |
34 |
17,820 |
17,820 |
30,136 |
|
— |
403 |
— |
403 |
|
2,938 |
10,314 |
— |
13,253 |
| 6 |
Resecuritisation |
— |
— |
— |
— |
— |
— |
— |
|
— |
— |
— |
— |
|
— |
— |
— |
— |
| 7 |
Wholesales (total) |
— |
— |
2,820 |
— |
43,660 |
43,615 |
46,480 |
|
— |
— |
— |
— |
|
— |
9,340 |
— |
9,340 |
| 8 |
Loans to corporates |
— |
— |
1,410 |
— |
34,218 |
34,172 |
35,628 |
|
— |
— |
— |
— |
|
— |
4,888 |
— |
4,888 |
| 9 |
Commercial mortgage |
— |
— |
— |
— |
5,156 |
5,156 |
5,156 |
|
— |
— |
— |
— |
|
— |
— |
— |
— |
| 10 |
Finance leases and receivables |
— |
— |
— |
— |
2,306 |
2,306 |
2,306 |
|
— |
— |
— |
— |
|
— |
1,486 |
— |
1,486 |
| 11 |
Other wholesale exposures |
— |
— |
1,409 |
— |
1,981 |
1,981 |
3,390 |
|
— |
— |
— |
— |
|
— |
2,967 |
— |
2,967 |
| 12 |
Resecuritisation |
— |
— |
— |
— |
— |
— |
— |
|
— |
— |
— |
— |
|
— |
— |
— |
— |
|
The securitisation portfolio has been considered as a whole (positions bought and retained) |
|
CRR Fully-loaded, Phased-in IFRS 9. |
2024 Pillar 3 Disclosures Report 165
|
|
|
|
|
|
|
|
|
|
|
|
|
|
|
|
|
|
|
|
|
|
|
|
|
|
|
|
|
|
|
|
|
|
|
|
|
|
|
|
|
|
| Table 67.SEC2 - Securitisation exposures in the trading book |
|
EUR million |
|
|
|
2024 |
|
|
a |
b |
c |
d |
e |
f |
g |
h |
i |
j |
k |
l |
|
|
Bank acting as originator |
Bank acting as sponsor |
Bank acting as investor |
|
|
Traditional |
Synthetic |
Subtotal |
Traditional |
Synthetic |
Subtotal |
Traditional |
Synthetic |
Subtotal |
|
|
STS |
Non-STS |
STS |
Non-STS |
STS |
Non-STS |
| 1 |
Total |
|
|
|
|
|
|
|
|
105 |
529 |
|
634 |
| 2 |
Retail (total) |
|
|
|
|
|
|
|
|
105 |
150 |
|
255 |
| 3 |
Residential mortgages |
|
|
|
|
|
|
|
|
26 |
91 |
|
117 |
| 4 |
Credit card |
|
|
|
|
|
|
|
|
|
|
|
— |
| 5 |
Other retail exposures |
|
|
|
|
|
|
|
|
79 |
60 |
|
138 |
| 6 |
Resecuritisation |
|
|
|
|
|
|
|
|
|
|
|
— |
| 7 |
Wholesales (total) |
|
|
|
|
|
|
|
|
— |
378 |
|
378 |
| 8 |
Loans to corporates |
|
|
|
|
|
|
|
|
|
|
|
— |
| 9 |
Commercial mortgage |
|
|
|
|
|
|
|
|
|
113 |
|
113 |
| 10 |
Finance leases and receivables |
|
|
|
|
|
|
|
|
|
|
|
— |
| 11 |
Other wholesale exposures |
|
|
|
|
|
|
|
|
|
265 |
|
265 |
| 12 |
Resecuritisation |
|
|
|
|
|
|
|
|
|
0.11 |
|
0.11 |
166 2024 Pillar 3 Disclosures Report
Finally, in its role as originator and investment entity for securitisations, Santander complies with the requirements relating to the net retention of economic interest and requirements established in procedure and control policies for all securitisation funds issued since 1 January 2011. We have to distinguish between the requirements for originators and for investment positions:
Securitisations originated:
•Santander always retains a minimum of 5% of the net economic interest.
•Santander meets all the due diligence requirements, making available to investors all the information needed to ensure the risks of the investment are fully known before purchase and to enable regular monitoring of the performance of the investment. This information includes
details of the risk criteria applied to the securitised exposures, which in all cases are the same as for the non-securitised exposures in the originator's balance sheet.
Investment positions in securitisations:
•The Group performs due diligence to ensure that the investment risks are understood before purchase and to be able to monitor the performance of the investment on a regular basis.
•The Group verifies that the originators of the securitisations in which it invests retain a 5% net economic interest.
|
|
|
|
|
|
|
|
|
|
|
|
|
|
|
|
|
|
|
|
|
|
|
|
|
|
|
|
|
|
|
|
|
| The positions in securitizations with risk transfer and in investment and sponsoring positions in the banking book are presented below on the basis of the approach used to calculate regulatory capital: |
|
| Table 68.Breakdown of repurchased positions in SSPEs with risk transfer, distributed by function and approach used |
| EUR million |
|
2024 |
2023 |
|
On-balance
sheet amount
exposures |
Off-balance
sheet amount
exposures |
EAD |
EAD after
capital
reductions |
RWA* |
On-balance
sheet amount
exposures |
Off-balance
sheet amount
exposures |
EAD |
EAD after
capital
reductions |
RWA* |
| Originator - standardised approach |
— |
— |
— |
— |
— |
— |
— |
— |
— |
— |
| Originator - SEC standardised approach |
14,275 |
18 |
14,049 |
13,656 |
2,100 |
10,302 |
— |
10,184 |
9,959 |
1,763 |
| Originator - SEC ERB approach |
10,088 |
116 |
10,204 |
10,204 |
2,142 |
7,819 |
18 |
7,824 |
7,824 |
1,589 |
| Originator - RB approach |
— |
— |
— |
— |
— |
— |
— |
— |
— |
— |
| Originator - SF approach |
— |
— |
— |
— |
— |
— |
— |
— |
— |
— |
| Originator - IRB approach |
49,377 |
158 |
49,246 |
49,008 |
7,285 |
29,530 |
85 |
29,445 |
29,270 |
4,275 |
| Originator - 1250% |
265 |
2 |
37 |
— |
— |
384 |
76 |
37 |
— |
— |
| Total originator |
74,006 |
294 |
73,536 |
72,868 |
11,527 |
48,035 |
179 |
47,490 |
47,053 |
7,627 |
| Investor - standardised approach |
— |
— |
— |
— |
— |
— |
— |
— |
— |
— |
| Investor - SEC standardised approach |
24,583 |
227 |
24,806 |
24,805 |
3,885 |
18,219 |
288 |
18,503 |
18,502 |
3,716 |
| Investor - SEC ERB approach |
1,473 |
106 |
1,579 |
1,579 |
342 |
2,443 |
251 |
2,691 |
2,691 |
668 |
| Investor - RB approach |
— |
— |
— |
— |
— |
— |
— |
— |
— |
— |
| Investor - SF approach |
— |
— |
— |
— |
— |
— |
— |
— |
— |
— |
| Investor - IRB approach |
— |
— |
— |
— |
— |
— |
— |
— |
— |
— |
| Investor - 1250% |
0.439 |
— |
0.439 |
— |
— |
0.439 |
— |
0.439 |
— |
— |
| Total investor |
26,056 |
332 |
26,384 |
26,384 |
4,227 |
20,663 |
539 |
21,194 |
21,193 |
4,384 |
| Sponsor - standardised approach |
— |
— |
— |
— |
— |
— |
— |
— |
— |
— |
| Sponsor - SEC standardised approach |
403 |
— |
403 |
402 |
60 |
— |
— |
— |
— |
— |
| Sponsor - SEC ERB approach |
— |
— |
— |
— |
— |
— |
— |
— |
— |
— |
| Sponsor - RB approach |
— |
— |
— |
— |
— |
— |
— |
— |
— |
— |
| Sponsor - SF approach |
— |
— |
— |
— |
— |
— |
— |
— |
— |
— |
| Sponsor - IRB approach |
— |
— |
— |
— |
— |
— |
— |
— |
— |
— |
| Sponsor - 1250% |
— |
— |
— |
— |
— |
— |
— |
— |
— |
— |
| Total sponsor |
403 |
— |
403 |
402 |
60 |
— |
— |
— |
— |
— |
| Total |
100,465 |
627 |
100,323 |
99,654 |
15,815 |
68,698 |
718 |
68,684 |
68,246 |
12,012 |
| Of which: traditional securitisations |
27,110 |
627 |
27,320 |
27,257 |
4,348 |
21,329 |
718 |
21,544 |
21,477 |
4,419 |
| Of which: synthetic securitisations |
73,355 |
— |
73,003 |
72,397 |
11,466 |
47,369 |
— |
47,140 |
46,769 |
7,592 |
| EAD IRB (RBA & SFA): exposures net of collateral, before provisions and deductions and after outflows to other regulatory reports |
| EAD STD: exposures net of collateral, before deductions and after provisions and outflows to other regulatory reports. |
| RWA IRB (RBA & SFA): after provisions, deductions and outflows to other regulatory reports and before application of the limit. |
| *RWA: after provisions, deductions and outflows to other regulatory reports and before application of the limit |
2024 Pillar 3 Disclosures Report 167
It should be noted that for all securitizations that qualify for a weighting of 1250%, the company deducts this exposure from equity.
As shown in Table 68, exposure has increased by 46.0%, due to the increase in exposures in securitisations originated by the Group. This year, 26 new securitisations with significant risk transfer were originated, with the main goal of transferring credit risk and optimising capital consumption.
Securitisation positions in the trading portfolio are eliminated from the regulatory capital calculation based on an internal market risk model and are included in the calculation of capital for specific risk, in accordance with article 335 of the CRR. The correlation trading portfolio is also included among these positions. This book consists of securitisation positions and nth-to-default derivatives that meet all the criteria in article 338.1 of the CRR. Therefore, none of these positions are considered in the VaR spread and IRC calculation, although they are included in the interest rate VaR calculation (general risk).
For these positions, capital is treated as for securitisation positions in the banking book, so that capital requirements are calculated taking into account the new approaches considered in the new Regulation (EU) 2017/2401 on securitisations.
Finally, Regulation (EU) 2017/2402 on securitisations came into force on the 1st January 2019. This regulation changed the prudential requirements for credit institutions and investment firms, establishing new treatment for securitisation positions. One of the most significant changes is that positions in preferential securitisation tranches may not consume more capital than the loan portfolio. It also provides for a more favourable treatment for senior tranches of STS (simple, transparent and standardised) securitisations which was updated on 31st March 2021 Regulation (EU) 2021/558 amending Regulation (EU) No 575/2013 regards adjustments to the securitisation framework to support the economic recovery in response to the covid-19 crisis.
The following table shows the aggregate value of securitisation positions purchased and retained in the trading portfolio.
|
|
|
|
|
|
|
|
|
|
|
|
|
|
|
|
|
|
|
|
|
| Table 69.Aggregate amount of securitisation positions purchased and retained. Trading book |
| EUR million |
|
|
|
|
|
|
|
2024 |
|
Investor positions |
Originator positions |
Sponsor positions |
| ABS PORTFOLIO |
Mark to market |
RWA |
Mark to market |
RWA |
Mark to market |
RWA |
| SEC - ERBA approach |
|
|
|
|
|
|
| 10 -12% |
80 |
2 |
|
|
|
|
| 12-20% |
255 |
26 |
|
|
|
|
| 20-40% |
17 |
4 |
|
|
|
|
| 40-100% |
135 |
93 |
|
|
|
|
| 1,250% |
1 |
10 |
|
|
|
|
| ABS PORTFOLIO |
|
|
|
|
|
|
| 10 -12% |
17 |
— |
|
|
|
|
| 12-20% |
57 |
1 |
|
|
|
|
| 20-40% |
|
|
|
|
|
|
| 40-100% |
|
|
|
|
|
|
| 1,250% |
|
|
|
|
|
|
| Total ABS Portfolio |
|
|
|
|
|
|
|
|
|
|
|
|
|
| CORRELATION PORTFOLIO |
|
|
|
|
|
|
| SEC - ERBA approach |
|
|
|
|
|
|
| 40-75 % |
|
|
|
|
|
|
| 100% |
|
|
|
|
|
|
| 250% |
|
|
|
|
|
|
| Supervisory formula method |
|
|
|
|
|
|
| FS |
|
|
|
|
|
|
| Total correlation portfolio |
|
|
|
|
|
|
| Total |
|
|
|
|
|
|
|
|
|
|
|
|
|
| The table does not include the RWA of short position correlation, since it does not consume capital. |
|
|
|
168 2024 Pillar 3 Disclosures Report
The following table shows the current situation of the underlying portfolio for originated securitisations with risk transfer and the changes compared to 2023.
|
|
|
|
|
|
|
|
|
|
|
|
|
|
|
|
|
|
|
|
|
|
|
|
|
|
|
| Table 70.Securitisation structures with risk transfer |
| EUR million |
|
|
|
|
|
|
|
|
|
2024 |
2023 |
| Traditional SPVs |
Outstanding balance |
Of which, in default |
Value adjustments in the period |
RWA |
Outstanding balance |
Of which, in default |
Value adjustments in the period |
RWA |
| Residential mortgages |
— |
— |
— |
— |
— |
— |
— |
— |
| Commercial mortgages |
— |
— |
— |
— |
— |
— |
— |
— |
| Loans to corporates or to SMEs treated as corporates |
— |
— |
— |
— |
— |
— |
— |
— |
| Consumer loans |
16,488 |
432 |
87 |
46 |
11,105 |
290 |
83 |
29 |
| Others |
4,655 |
87 |
29 |
14 |
2,395 |
55 |
11 |
6 |
| Resecuritisations |
|
|
|
|
|
|
|
|
| Securitisation positions |
— |
— |
— |
— |
— |
— |
— |
— |
| Total traditional SPVs |
21,142 |
519 |
115 |
61 |
13,500 |
345 |
94 |
35 |
| Synthetic securitisation SPVs |
|
|
|
|
|
|
|
|
| Residential mortgages |
13,014 |
56 |
7 |
1,812 |
9,106 |
12 |
7 |
1,246 |
| Commercial mortgages |
5,326 |
42 |
5 |
960 |
3,365 |
7 |
7 |
431 |
| Loans to corporates or to SMEs treated as corporates |
36,168 |
178 |
21 |
5,140 |
20,832 |
153 |
27 |
3,039 |
| Consumer loans |
16,696 |
269 |
144 |
2,593 |
11,814 |
182 |
38 |
1,931 |
| Others |
9,341 |
30 |
8 |
962 |
7,350 |
81 |
17 |
945 |
| Total synthetic securitisation SPVs |
80,546 |
575 |
184 |
11,466 |
52,467 |
435 |
96 |
7,592 |
| Total |
101,688 |
1,093 |
299 |
11,527 |
65,967 |
780 |
190 |
7,627 |
|
|
|
|
|
|
|
|
|
| The value adjustments in the period include the value adjustments by asset and provision (generic and specific) deterioration. |
43 new significant risk transfer securitizations have been issued this year, with the main objective of transferring credit risk and optimizing capital consumption
Regarding securitization funds without risk transfer, Grupo Santander retains the majority of the positions of the originated securitization funds, so they do not meet the
regulatory conditions that would allow the significant transfer of risk.
For these funds, capital is calculated for the securitized exposures as if they had not been securitized.The underlying assets securitized in the funds launched by Grupo Santander consist of mainly mortgages and consumer loans.
2024 Pillar 3 Disclosures Report 169
6.3.5. Significant Risk Transfer (SRT)
Significant Risk Transfer (SRT) is a mechanism by which a financial institution transfers a substantial portion of the credit risk associated with a portfolio of assets to external investors, generally through securitization transactions or structured credit instruments.
|
|
|
|
|
|
|
|
|
|
|
|
| Significant risk transfer (SRT) overview |
| Banks use SRTs as a de-risking strategy, purchasing credit protection on credit portfolios. |
Investors see SRTs as an attractive risk-return investment for their stakeholders |
|
|
Unique platform of assets:
SRT investors benefit from obtaining access to banks’ wide range of portfolios, ranging across product categories (e.g. mortgages, auto loans, SMEs, etc), segments (e.g. retail), stages (e.g. NPLs) and more
|
|
Optimal risk-return:
Banks’ wide portfolio offerings enable SRT investors to invest in assets that are core business to the bank, through securitization technology to achieve investors´ expected risk-return (e.g.; senior, mezzanine, junior / synthetic vs cash / funded vs unfunded)
|
|
Highly-supervised transactions:
SRT transactions are heavily supervised by the regulator, with a wide range of regulations and mechanisms that provide investors with a high degree of standardization, transparency and protection
|
This transfer allows the institution to optimize its regulatory capital management, in line with the requirements of the Basel framework, by reducing its exposure to credit risk and improving its ability to grant new financing.
The assessment of an SRT by regulators is based on specific criteria to ensure that the risk transfer is effective and complies with applicable prudential requirements.
170 2024 Pillar 3 Disclosures Report
6.3.6. Overview of the securitisation process
The following graphic details the process of a securitisation from inception to the monitoring phase after the deal is closed. Finance department starts through CFO mandate considering suitable underlying to be managed through different strategies, such as an asset sale, a single risk guarantee or securitisation. In this phase data screening is performed and suitable portfolios are analysed until a specific pool of assets is identified. Afterwards, still under the pre-deal phase, the transactions are structured and tranched based on investors risk appetite. This is also performed considering cost of capital and the economic value.
|
|
|
|
|
|
|
|
|
|
|
|
|
|
|
| Overview of the securitisation process |
|
|
|
|
|
|
Finance department coordinates the entire process with several internal and external parties involved. Transactions are only presented to investors once the relevant portfolio data has been created and the transaction structured. Individual solutions may be discussed with investors at certain stages. The regulatory pre-notification has to be submitted to the joint supervisory team from the ECB several weeks in advance. Before the final regulatory approval, Investors can propose non-binding bids. After the closure of the transaction and the disbursement, the portfolio is monitored until the end of the transactions.
2024 Pillar 3 Disclosures Report 171
6.3.7. SRT Regulation and approval process
Several factors after the financial crisis have helped to consolidate the standing of the SRT market as a resilient and dependable capital management tool for European significant institutions, as well as a reliable source of investment opportunities for investors.
As more banks adapt their risk management, IT, accounting, legal and capital management infrastructure to the new technology, supply is set to increase. Once these investments have been made, banks have an incentive to continue using SRT and expand their offering.
The SRT securitisation market in the EU has developed significantly since the introduction of new regulation. Policy makers reacted to the financial crisis by bringing in new regulatory requirements (the Dodd Frank Act in the US and Basel III internationally). In response to the failings in the securitisation intermediation chain, regulators attempted to realign incentives and address structural weaknesses as a way of reviving the securitisation markets. At a high level, these regulatory initiatives aimed to increase disclosure, mandate risk retention, restructure ratings agencies and impose capital requirements. In Europe this was complemented with securitisations labelled simple, transparent and standardised (STS) as part of a Capital Markets Union (CMU) Action Plan.
Regulation and adequate supervisory attention and capacity have been enabling factors for the growth of the SRT market. Since the introduction of the CRR and the various clarifications issued by the EBA and the SSM, banks can expect predictability when issuing transactions.
The EBA discussion paper on SRT, was taken by the Joint Supervisory Teams (JSTs) at the SSM responsible as the basis for their assessments and helped make the regulatory process for SRT clearer.
Banking supervisors assess SRT transactions to evaluate the degree of risk transfer from banks to investors, allowing institutions to achieve capital relief when this is considered sufficient. SRT transactions are assessed following a comprehensive review to ensure they comply with the CRR rules and authorities’ expectations.
Large European banks are expected to provide information on their SRT transactions to the competent authority as a condition of recognition. Entities should notify the ECB of their intentions at least three months in advance of the expected closing date of the transaction, in accordance with the ECB Public Guidance on the recognition of significant credit risk transfer.
Originator institutions should also provide the final version of the documentation no later than 15 days after the closing date of the transaction. Based on the documentation provided by the institution, the JST will assess the transaction and the credit risk that has been transferred to third parties. The JST may also ask the institution to provide any other information necessary to perform its assessment of the transaction, e.g. the specific features of an individual transaction. As the conditions for SRT have to be met on a continuous basis over the life of the securitisation transaction, the ECB also continuously reviews the securitization transactions to which originator institutions apply an SRT for the determination of their capital requirements.
|
|
|
|
|
|
|
|
|
|
|
|
|
|
|
| Table 71.SEC5 - Exposures securitised by the institution - Exposures in default and specific credit risk adjustments |
|
EUR million |
|
|
2024 |
|
a |
b |
c |
|
Exposures securitised by the institution - Institution acts as originator or as sponsor |
|
Total outstanding nominal amount |
Total amount of specific credit risk adjustments made during the period |
|
|
Of which exposures in default |
| 1 |
Total exposures |
173,276 |
3,230 |
914 |
| 2 |
Retail (total) |
122,865 |
2,971 |
898 |
| 3 |
residential mortgage |
33,890 |
538 |
22 |
| 4 |
credit card |
— |
— |
— |
| 5 |
other retail exposures |
88,975 |
2,433 |
876 |
| 6 |
re-securitisation |
— |
— |
— |
| 7 |
Wholesale (total) |
50,411 |
258 |
16 |
| 8 |
loans to corporates |
38,509 |
211 |
11 |
| 9 |
commercial mortgage |
5,326 |
42 |
5 |
| 10 |
lease and receivables |
2,617 |
5.037 |
— |
| 11 |
other wholesale |
3,958 |
1 |
— |
| 12 |
re-securitisation |
— |
— |
— |
|
|
|
|
|
|
CRR Fully Phased-in IFRS 9. |
|
|
|
172 2024 Pillar 3 Disclosures Report
6.4. Securitisation accounting policies
This section covers letter (g) of the qualitative requirement SECA - Qualitative disclosure requirements related to securitisation exposures.
According to IFRS 9, the initial recording, classification and subsequent measurement of financial assets is influenced by the company's business model and by the nature of the cash flows that financial assets. Specifically, to allow them to be measured at amortized cost or at fair value with changes in OCI, the Standard requires that contractual cash flows meet the criteria of a basic loan agreement (SPPI [Solely Payments of Principal and Interest] flows).
The criterion for derecognising securitised assets is that set by IFRS 9 in section 3.2. The accounting treatment of transfers of financial assets depends on the form and extent to which the cash flows, risks and rewards are transferred to third parties, as well as with the control of the assets transferred:
•Where substantially all the risks and rewards are transferred to third parties, e.g. in asset securitisations in which the transferor neither retains subordinated debt nor grants any credit enhancement to the new holders, the transferred financial assets are derecognised. Any right or obligation retained or created in the transfer is recognised. The difference between the carrying amount recorded prior to the transfer and the fair value of the retained rights or obligations is recognised in profits or losses for the year.
•Where substantially all the risks and rewards associated with the transferred financial asset are retained (as in securitisations in which subordinated debt or some other type of credit enhancements are retained that absorb substantially all of the expected credit losses for the transferred asset or the probable variation of its future net cash flows), the transferred financial asset is not derecognised and continues to be measured using the same criteria as before the transfer. Additionally, it should be recognized:
◦An associated financial liability, which is recognised for an amount equal to the consideration received and is subsequently measured at amortised cost, unless it meets the requirements for classification at fair value through profit or loss.
◦The income from the financial asset that has been transferred but not derecognised and any expense incurred on the new financial liability are presented on the profit and losses without netting.
•The following distinction is made when substantially all the risks and rewards associated with the transferred financial asset are neither transferred nor retained, e.g. in securitisations in which the transferor takes on subordinated debt or some other type of credit enhancement for a portion of the transferred asset and thus significantly, but not substantially, reduces its exposure to variations in the present value of future net cash flows:
a
•Where the transferor does not retain control of the transferred financial asset: the transferred financial asset is derecognised and any right or obligation retained or created in the transfer is recognised.
•Where the transferor retains control of the transferred financial asset: it continues to recognise the transferred financial asset on its balance sheet for an amount equal to its exposure to possible changes in value and recognises a financial liability associated with the transferred financial asset. The net amount of the transferred asset and the associated liability is:
•The amortised cost of the rights and obligations retained, if the transferred asset is measured at amortised cost, or
•The fair value of the rights and obligations retained, if the transferred asset is measured at fair value.
Accordingly, financial assets are only derecognised when any of the following circumstances occur:
•The rights to the future cash flows generated have been extinguished.
•The risks and benefits have been substantially transferred to third parties.
•If not all risks and benefits are retained or transferred, when control has been transferred.
There have been no changes with respect to the previous year in the methods, assumptions and key data used to assess the securitised exposures or re-securitisation exposures (i.e. securitisations in which at least one of the underlying exposures is a securitisation exposure).
There is no specific accounting treatment for synthetic securitisations or assets awaiting securitisation.
2024 Pillar 3 Disclosures Report 173
6.5. Capital requirements - Securitisations
Grupo Santander calculates regulatory capital under the securitization approach for positions held in originated securitizations only if the regulatory conditions established in the Capital Requirements Regulation (CRR) for significant risk transfer are met. Otherwise, capital is calculated for the securitized exposures as if they had never been securitized. Capital is also calculated for investment positions in securitization funds originated by third parties.
Regulation 2017/2401 modified the CRR in those areas related to the calculation methods for capital requirements for securitizations. Within this framework, with the objective of reducing the dependence on external ratings, the entity has to use its own calculation of regulatory capital requirements so long as it is authorized, in order to apply the internal ratings-based approach for securitized exposures: the Securities and Exchange Commission Internal ratings-based approach (SEC-IRBA). Entities that cannot use the SEC-IRBA must apply the standardized approach (SEC-SA) to securitizations. The SEC-SA is based on the capital requirements calculated under the standardized approach for credit risk. When neither of these two approaches are available, entities must adopt the external ratings-based approach for securitizations (SEC-ERBA). In accordance with SEC-ERBA, capital requirements must be assigned to securitization tranches on the basis of their external rating.
Capital requirements for securitization positions are calculated by applying the appropriate risk weight to the exposure value of each position, depending on the approach used by the entity to calculate the risk-weighted exposure amounts of the securitized portfolio.
In November 2020, the Basel Committee published a technical amendment establishing the prudential treatment for securitizations of non-performing loans. In 2021, this technical amendment was transposed into an EU regulation as part of the "quick fix" for securitizations implemented through two EU regulations, as explained below.
•Regulation (EU) 2021/557, amending Regulation (EU) 2017/2402 (Securitization Regulation) to aid recovery from the covid-19 crisis. In addition to establishing a framework for securitizations of non-performing exposures, this regulation also aimed to extend the benefits of STS (simple, transparent and standardized) securitization to synthetic securitizations. To this end, the framework was created so that institutions could trade their non-performing exposures in the market by securitizing such exposures.
•Regulation 2021/558, amending Regulation 575/2013 (CRR) to specify the capital requirements applicable to the changes introduced by Regulation 2021/557, such as securitizations of NPLs, senior tranches of STS synthetic securitizations, etc.
The European Banking Authority (EBA) published in February 2023 its final Regulatory Technical Standards (RTS) amending the regulatory technical standards established in Delegated Regulation (EU) 2019/1851 with regard to the assessment of the consistency of underlying exposure in simple, transparent and standardized (STS) on-balance-sheet securitization.
Lastly, in October 2023, Delegated Regulation (EU) 2023/2175 was published, specifying in greater detail the risk retention requirements for originators, sponsors, original lenders and servicers. Among other aspects, this Delegated Regulation sets forth the requirements concerning the types of risk retention, prohibits selling or hedging the retained economic interest, establishes the conditions of retention on a consolidated basis, as well as the types of risk retention in the case of the traditional securitization of non-performing exposures.
174 2024 Pillar 3 Disclosures Report
A breakdown of all securitisations in the banking book is provided below, together with the corresponding capital consumption arranged by RW (risk weighting) interval and the calculation method employed when the Group acts as originator or sponsor.
|
|
|
|
|
|
|
|
|
|
|
|
|
|
|
|
|
|
|
|
|
|
|
|
|
|
|
|
|
|
|
|
|
|
|
|
| Table 72.SEC3 - Securitisation exposures in the non-trading book and associated regulatory capital requirements - institution acting as originator or as sponsor |
|
EUR million |
|
|
2024 |
|
|
a |
b |
c |
d |
e |
|
f |
g |
h |
i |
|
|
Exposure values (by RW bands/deductions) |
|
Exposure values (by regulatory approach) |
|
|
<= 20% |
> 20% to 50% |
> 50% to 100% |
> 100% to 1250% |
1250% RW/ deductions |
|
SEC-IRBA |
SEC-ERBA
(including IAA) |
SEC-SA |
1250%/ deductions |
| 1 |
Total exposure |
67,586 |
5,297 |
62 |
326 |
668 |
|
49,008 |
10,204 |
14,058 |
668 |
| 2 |
Traditional securitisation |
866 |
6 |
— |
— |
63 |
|
337 |
116 |
421 |
63 |
| 3 |
Securitisation |
866 |
6 |
— |
— |
63 |
|
337 |
116 |
421 |
63 |
| 4 |
Retail underlying |
866 |
6 |
— |
— |
63 |
|
337 |
116 |
421 |
63 |
| 5 |
Of which STS |
437 |
6 |
— |
— |
56 |
|
321 |
116 |
6 |
56 |
| 6 |
Wholesale |
— |
— |
— |
— |
— |
|
— |
— |
— |
— |
| 7 |
Of which STS |
— |
— |
— |
— |
— |
|
— |
— |
— |
— |
| 8 |
Re-securitisation |
— |
— |
— |
— |
— |
|
— |
— |
— |
— |
| 9 |
Synthetic securitisation |
66,719 |
5,290 |
62 |
326 |
606 |
|
48,672 |
10,088 |
13,638 |
606 |
| 10 |
Securitisation |
66,719 |
5,290 |
62 |
326 |
606 |
|
48,672 |
10,088 |
13,638 |
606 |
| 11 |
Of which, retail underlying |
25,624 |
3,378 |
5 |
5 |
377 |
|
12,673 |
9,710 |
6,629 |
377 |
| 12 |
Of which, wholesale underlying |
41,095 |
1,912 |
57 |
321 |
229 |
|
35,998 |
378 |
7,009 |
229 |
| 13 |
Of which, resecuritisation |
— |
— |
— |
— |
— |
|
— |
— |
— |
— |
|
|
|
|
|
|
|
|
|
|
|
|
|
|
|
|
|
|
|
|
|
|
|
|
|
|
|
|
|
|
|
|
|
| Table 72.SEC3 - Securitisation exposures in the non-trading book and associated regulatory capital requirements - institution acting as originator or as sponsor |
|
EUR million |
|
|
|
2024 |
|
|
j |
k |
l |
m |
|
n |
o |
EU-p |
EU-q |
|
|
RWEA (by regulatory approach)* |
|
RWEA (by regulatory approach) |
|
|
SEC-IRBA |
SEC-ERBA
(including IAA) |
SEC-SA |
1250% RW |
|
SEC-IRBA |
SEC-ERBA
(including IAA) |
SEC-SA |
1250% RW |
| 1 |
Total exposure |
7,285 |
2,142 |
2,160 |
— |
|
583 |
171 |
164 |
— |
| 2 |
Traditional securitisation |
38 |
20 |
64 |
— |
|
3 |
1.6 |
5 |
— |
| 3 |
Securitisation |
38 |
20 |
64 |
— |
|
3 |
1.6 |
5 |
— |
| 4 |
Retail underlying |
38 |
20 |
64 |
— |
|
3 |
1.6 |
5 |
— |
| 5 |
Of which STS |
35 |
20 |
1 |
— |
|
3 |
1.6 |
— |
— |
| 6 |
Wholesale |
— |
— |
— |
— |
|
— |
— |
— |
— |
| 7 |
Of which STS |
— |
— |
— |
— |
|
— |
— |
— |
— |
| 8 |
Re-securitisation |
— |
— |
— |
— |
|
— |
— |
— |
— |
| 9 |
Synthetic securitisation |
7,248 |
2,123 |
2,096 |
— |
|
580 |
170 |
159 |
— |
| 10 |
Securitisation |
7,248 |
2,123 |
2,096 |
— |
|
580 |
170 |
159 |
— |
| 11 |
Of which, retail underlying |
1,953 |
1,665 |
1,104 |
— |
|
156 |
133 |
80 |
— |
| 12 |
Of which, wholesale underlying |
5,295 |
457 |
992 |
— |
|
424 |
37 |
79 |
— |
| 13 |
Of which, resecuritisation |
— |
— |
— |
— |
|
— |
— |
— |
— |
|
|
|
|
|
|
|
|
|
|
|
|
*RWA do not include tranches that have a risk weight of 1250% due to they are deducted from Common Equity Tier 1. |
|
Fully CRR Phased-in IFRS 9. |
|
|
|
|
|
|
|
|
|
|
Following Mapping tool defined by the EBA, RWAs are before CAP adjustment, capital requirements after |
2024 Pillar 3 Disclosures Report 175
|
|
|
|
|
|
|
|
|
|
|
|
|
|
|
|
|
|
|
|
|
|
|
|
|
|
|
|
|
|
|
|
|
|
|
|
| Table 73.SEC4 - Securitisation exposures in the non-trading book and associated regulatory capital requirements - institution acting as investor |
|
|
|
|
2024 |
|
|
a |
b |
c |
d |
e |
|
f |
g |
h |
i |
|
EUR million |
Exposure values (by RW bands/deductions) |
|
Exposure values (by regulatory approach) |
|
|
<= 20% |
> 20% to 50% |
> 50% to 100% |
> 100% to 1250% |
1250 |
% |
|
SEC-IRBA |
SEC-ERBA
(including IAA) |
SEC-SA |
1250 |
% |
| 1 |
Total exposure |
23,480 |
2,811 |
76 |
16 |
0.84 |
|
— |
1,579 |
24,805 |
0.84 |
| 2 |
Traditional securitisation |
23,480 |
2,811 |
76 |
16 |
0.84 |
|
— |
1,579 |
24,805 |
0.84 |
| 3 |
Securitisation |
23,480 |
2,811 |
76 |
16 |
0.84 |
|
— |
1,579 |
24,805 |
0.84 |
| 4 |
Retail underlying |
16,934 |
80 |
14 |
15 |
0.79 |
|
— |
1,037 |
16,007 |
0.79 |
| 5 |
Of which STS |
3,656 |
62 |
3 |
2 |
— |
|
— |
389 |
3,334 |
— |
| 6 |
Wholesale |
6,546 |
2,731 |
63 |
— |
0.05 |
|
— |
542 |
8,798 |
0.05 |
| 7 |
Of which STS |
— |
— |
— |
— |
— |
|
— |
— |
— |
— |
| 8 |
Re-securitisation |
— |
— |
— |
— |
— |
|
— |
— |
— |
— |
| 9 |
Synthetic securitisation |
— |
— |
— |
— |
— |
|
— |
— |
— |
— |
| 10 |
Securitisation |
— |
— |
— |
— |
— |
|
— |
— |
— |
— |
| 11 |
Of which, retail underlying |
— |
— |
— |
— |
— |
|
— |
— |
— |
— |
| 12 |
Of which, wholesale underlying |
— |
— |
— |
— |
— |
|
— |
— |
— |
— |
| 13 |
Of which, resecuritisation |
— |
— |
— |
— |
— |
|
— |
— |
— |
— |
|
|
|
|
|
|
|
|
|
|
|
|
|
|
|
|
|
|
|
|
|
|
|
|
|
|
|
|
|
|
|
|
|
| Table 73.SEC4 - Securitisation exposures in the non-trading book and associated regulatory capital requirements - institution acting as investor |
|
|
|
|
|
|
|
|
|
|
|
|
|
2024 |
|
|
j |
k |
l |
m |
|
n |
o |
EU-p |
EU-q |
|
EUR million |
RWEA (by regulatory approach) |
|
RWEA (by regulatory approach) |
|
|
SEC-IRBA |
SEC-ERBA
(including IAA) |
SEC-SA |
1250% RW |
|
SEC-IRBA |
SEC-ERBA
(including IAA) |
SEC-SA |
1250% RW |
| 1 |
Total exposure |
— |
342 |
3,885 |
— |
|
— |
27 |
311 |
— |
| 2 |
Traditional securitisation |
— |
342 |
3,885 |
— |
|
— |
27 |
311 |
— |
| 3 |
Securitisation |
— |
342 |
3,885 |
— |
|
— |
27 |
311 |
— |
| 4 |
Retail underlying |
— |
212 |
2,272 |
— |
|
— |
17 |
182 |
— |
| 5 |
Of which STS |
— |
69 |
346 |
— |
|
— |
6 |
28 |
— |
| 6 |
Wholesale |
— |
130 |
1,613 |
— |
|
— |
10 |
129 |
— |
| 7 |
Of which STS |
— |
— |
— |
— |
|
— |
— |
— |
— |
| 8 |
Re-securitisation |
— |
— |
— |
— |
|
— |
— |
— |
— |
| 9 |
Synthetic securitisation |
— |
— |
— |
— |
|
— |
— |
— |
— |
| 10 |
Securitisation |
— |
— |
— |
— |
|
— |
— |
— |
— |
| 11 |
Of which, retail underlying |
— |
— |
— |
— |
|
— |
— |
— |
— |
| 12 |
Of which, wholesale underlying |
— |
— |
— |
— |
|
— |
— |
— |
— |
| 13 |
Of which, resecuritisation |
— |
— |
— |
— |
|
— |
— |
— |
— |
|
|
|
|
|
|
|
|
|
|
|
|
Fully loaded CRR, Phased-in IFRS 9. |
|
|
|
|
|
|
|
|
|
176 2024 Pillar 3 Disclosures Report
[THIS PAGE INTENTIONALLY LEFT BLANK]
2024 Pillar 3 Disclosures Report 177
178 2024 Pillar 3 Disclosures Report
|
|
|
|
|
|
|
|
|
|
|
|
|
|
|
|
|
|
|
|
|
|
|
|
|
|
|
|
|
|
|
|
|
|
|
|
|
|
|
|
|
|
|
|
|
|
7.2.1. Internal initiatives on methods for calculating market risk |
|
|
|
|
|
|
|
|
|
|
|
|
|
|
|
7.3.3. Incremental Risk Charge |
|
|
|
7.3.4. Analysis of scenarios and stress testing |
|
|
|
|
|
|
|
|
|
|
|
|
|
|
|
|
|
|
|
|
|
|
|
|
|
|
|
|
|
|
|
|
|
|
|
|
|
|
|
|
|
|
|
|
|
|
|
|
|
|
|
|
|
|
|
|
|
|
|
|
|
|
|
|
|
|
|
7. MARKET RISK |
2024 Pillar 3 Disclosures Report 179
Market risk is the risk of value reduction of financial instruments arising from changes in market parameters, volatility of these parameters and the correlations between them.
The following chapter provides information on the activities subject to market risk and market outcomes in 2024, distinguishing trading activity from structural risks. It also describes the methodologies and different metrics used in Grupo Santander.
|
|
|
|
|
|
|
|
|
|
|
|
| Main figures |
| Million euros |
|
|
|
| RWA |
| 2024 |
|
2023 |
| Market risk |
17,946 |
|
16,454 |
| Of which, standardised approach |
10,693 |
|
9,166 |
| Of which, IMA |
7,253 |
|
7,288 |
|
|
|
|
|
|
|
|
|
|
| RWA by calculation approach |
RWA by geography |
| % |
% |

|
|
|
|
|
|
|
|
|
| n |
SA approach |
60 |
% |
| n |
IMA approach |
40 |
% |
|
|
|
|
|
|
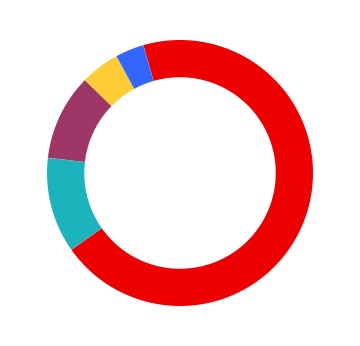
|
|
|
|
|
|
|
|
|
| n |
Spain |
70% |
| n |
Rest of Europe |
3% |
| n |
Brasil |
12% |
| n |
Rest of South America |
10% |
| n |
United States |
5% |
|
|
|
|
|
|
7.1. Activities subject to market risk
This section covers the qualitative requirement MRA - Qualitative disclosure requirements related to market risk and
MRB - Qualitative disclosure requirements for institutions using the internal Market Risk Models.
Also the provisions of letters (d), (e), (f) and (g) of the OVA requirement -Institution risk management approach, are complied with.
The measurement, control and monitoring perimeter of the Market Risk area includes all transactions where risk arises due to changes in market factors. This risk arises from changes in risk factors (interest rate, exchange rate, equities, credit spreads, commodity prices and the volatility of each of these) which may impact earnings or capital, and from the liquidity risk of the products and markets in which Santander operates.
The activities are segmented according to the purpose of the risk, as follows:
180 2024 Pillar 3 Disclosures Report
•Trading: the trading book includes all financial instruments that a bank holds for short-term resale in order to profit from short-term price movements, to make arbitrage profits or to hedge risks arising from the positions or instruments in this portfolio. This includes the provision of financial services in the markets to customers where the bank is the counterparty, as well as proprietary trading and positioning primarily in fixed income, equities, currencies and commodities. It should be noted that a corporate policy transposed by the different units delimits the Boundary between the Trading Book and the Banking Book.
See chapter 'Risk, compliance & conduct management', of the Group Annual report, for further information about the different risks of this activity.
|
|
|
|
|
|
|
Access 2024 Annual Report available on the Santander Group website |
•Structural risks: these are composed of the market risks inherent to the balance sheet, excluding the trading book. Namely:
◦Structural interest rate risk: this risk arises from timing mismatches in maturities and repricing of all balance sheet assets and liabilities.
◦Structural foreign exchange risk (hedging of results): foreign currency risk arising from the currency in which investments in consolidated and non-consolidated companies are made (structural exchange rate). This category also includes the positions taken to hedge the foreign currency risk on future results generated in currencies other than the euro (hedging of results).
◦Structural equity risk: this includes equity investments in non-consolidated financial and non-financial companies, and the available-for-sale portfolios of equity positions.
7.2. Capital requirements for market risk
This section provides more detailed information on changes in capital requirements for market risk through both internal and standardised models. The Group's consumption of regulatory capital for market risk at the end of December 2024 breaks down as follows.
|
|
|
|
|
|
|
|
|
| Table 74.Regulatory capital requirements for market risk |
| EUR million |
|
|
|
2024 |
2023 |
| Position risk - Trading book* - Standardised approach |
420 |
438 |
| Commodity Risk - Standardised approach |
30 |
27 |
| Specific risk in the correlation trading risk portfolio |
— |
— |
| Currency risk - standardised approach |
406 |
268 |
| Position and currency risk - Trading book - Internal models |
580 |
583 |
| Spain & SLB |
440 |
442 |
| Chile |
64 |
84 |
| Mexico |
76 |
57 |
| Total |
1,436 |
1,316 |
|
|
|
| *Includes structural equity considered as business. |
Grupo Santander has an internal market risk model in Spain, Chile and Mexico.
2024 Pillar 3 Disclosures Report 181
At the end of the 2024 financial year, Grupo Santander had authorization to use the internal market risk model for calculating regulatory capital in the trading books of the Spain, Chile and Mexico units. From October 2021 on, the market risk capital of the internal model for Spain and SLB will be reported in a single entity, following regulatory approval of the diversification between the two units. The other geographical units calculate capital consumption by market risk through the standardized approach. This calculation methodology is also used by entities that have approved internal models for only some of their portfolios. The standardized approach is applied to portfolios for which the internal model is not approved.
Consolidated regulatory capital under the internal market risk model for Santander is computed as the sum of the regulatory capital of the units that have the necessary approval from the European Central Bank. This is a conservative criterion when consolidating the Group's capital, as it takes no account of the capital savings arising from the geographical diversification effect.
The regulatory capital of the trading activity for the perimeter concerned is calculated with advanced approaches, using VaR, Stressed VaR and incremental risk charge (IRC) as the core metrics, in line with the new bank capital requirements under the Basel Accords and, specifically, the CRR.
The capital resulting from the VaR and SVaR metrics is adjusted through a Kr coefficient, derived from the number of backtesting overshootings existing for each unit in its local internal model and by a qualitative coefficient Kc determined by the European Supervisor. At the end of 2023, due to improvements made by the Bank to align with the supervisory expectations of the TRIM guidance the multiplier was reduced to zero.
In 2024 new not-in-model risks were added to the calculation of capital by market risk, for those risk factors not included in the current regulatory capital metrics (VaR, SVaR, etc.).
182 2024 Pillar 3 Disclosures Report
A breakdown of capital requirements in the units that use the internal model is shown below, by geography and component, at year-end:
|
|
|
|
|
|
|
|
|
|
|
|
|
|
|
|
|
|
|
|
|
| Table 75.Capital requirements for market risk. Internal model |
| EUR million |
|
|
|
|
|
|
|
2024 |
|
CR (VaR) |
CR (SVaR) |
IRC |
Risk Not in VaR |
Add-On |
Total |
| Spain & SLB |
129 |
|
279 |
|
30 |
|
3 |
|
|
440 |
|
| Chile |
21 |
|
40 |
|
3 |
|
— |
|
|
64 |
|
| México |
29 |
|
42 |
|
6 |
|
— |
|
|
76 |
|
| Total |
179 |
|
360 |
|
38 |
|
3 |
|
— |
|
580 |
|
Below is a breakdown of capital requirements and RWA for market risk and calculation component with internal model approval at 2024 year-end:
|
|
|
|
|
|
|
|
|
|
|
|
| Table 76.MR2-A - Market risk under the internal Model Approach (IMA) |
|
EUR million |
|
|
|
|
|
2024 |
|
|
a |
b |
|
|
RWA |
Capital requirements |
| 1 |
VaR (higher of values a and b) |
2,237 |
|
179 |
|
| (a) |
(a) Previous day’s VaR (Article 365(1) of the CRR (VaRt-1)) |
818 |
|
65 |
|
| (b) |
(b) Average of the daily VaR (Article 365(1)) of the CRR on each of the preceding 60 business days (VaRavg) x multiplication factor (mc) in accordance with Article 366 of the CRR |
2,237 |
|
179 |
|
| 2 |
SVaR (higher of values a and b) |
4,501 |
|
360 |
|
| (a) |
(a) Latest SVaR (Article 365(2) of the CRR (SVaRt-1)) |
1,861 |
|
149 |
|
| (b) |
(b) Average of the SVaR (Article 365(2) of the CRR) during the preceding 60 business days (SVaRavg) x multiplication factor (ms) (Article 366 of the CRR) |
4,501 |
|
360 |
|
| 3 |
IRC (higher of values a and b) |
478 |
|
38 |
|
| (a) |
(a) Most recent IRC value (incremental default and migration risks calculated in accordance with Article 370 and Article 371 of the CRR) |
348 |
|
28 |
|
| (b) |
(b) Average of the IRC number over the preceding 12 weeks |
478 |
|
38 |
|
| 4 |
Comprehensive risk measure (higher of values a, b and c) |
— |
|
— |
|
| (a) |
(a) Most recent risk number for the correlation trading portfolio (Article 377 of the CRR) |
|
|
| (b) |
(b) Average of the risk number for the correlation trading portfolio over the preceding 12 weeks |
|
|
| (c) |
(c) 8% of the own funds requirement in the standardised approach on the most recent risk number for the correlation trading portfolio (Article 338(4) of the CRR) |
|
|
| 5 |
Other* |
38 |
|
3 |
|
| 6 |
Total |
7,253 |
|
580 |
|
|
|
|
|
|
* Other includes Risks not in Model not included in Var or Svar |
|
|
2024 Pillar 3 Disclosures Report 183
|
|
|
|
|
|
|
|
|
|
|
|
|
|
|
|
|
|
|
|
|
|
|
|
|
|
|
| Table 77.MR2-B - RWA flow statements of market risk exposures under the IMA |
|
EUR million |
|
|
|
|
|
|
|
|
|
|
2024 |
|
|
a |
b |
c |
d |
e |
f |
g |
|
|
VaR |
SVaR |
IRC |
Comprehensive risk measure |
Other* |
Total RWA |
Total capital requirements |
| 1 |
RWEAs at previous period end |
1,964 |
|
3,842 |
|
678 |
|
|
— |
|
6,484 |
|
519 |
|
| 1a |
Regulatory adjustment |
1,158 |
|
2,498 |
|
69 |
|
|
— |
|
3,724 |
|
298 |
|
| 1b |
RWEAs at the previous quarter-end (end of the day) |
807 |
|
1,344 |
|
610 |
|
|
— |
|
2,760 |
|
221 |
|
| 2 |
Movement in risk levels |
(600) |
|
(1,769) |
|
(201) |
|
|
38 |
|
(2,532) |
|
(203) |
|
| 3 |
Model updates/changes |
|
|
|
|
|
|
|
| 4 |
Methodology and policy |
|
|
|
|
|
|
|
| 5 |
Acquisitions and disposals |
|
|
|
|
|
|
|
| 6 |
Foreign exchange movements |
872 |
|
2,428 |
|
|
|
|
3,300 |
|
264 |
|
| 7 |
Other |
|
|
|
|
|
|
|
| 8a |
RWEAs at the end of the reporting period (end of the day) |
818 |
|
1,861 |
|
348 |
|
|
38 |
|
3,064 |
|
245 |
|
| 8b |
Regulatory adjustment |
1,419 |
|
2,639 |
|
130 |
|
|
— |
|
4,188 |
|
335 |
|
| 8 |
RWEAs at the end of the reporting period |
2,237 |
|
4,501 |
|
478 |
|
|
38 |
|
7,253 |
|
580 |
|
|
|
|
|
|
* Other includes Risks not in Model not included in Var or Svar |
ESP & SLB: Capital consumption has rose during the quarter driven by the increase in the SVaR consumption. This SVaR increase is explained due to a higher CR sensitivity.
CHILE: Capital consumption has decreased mainly due to the reduction in VaR. This VaR decrease is mostly explained by a lower IR sensitivity during the period.
MEXICO: Capital consumption has decreased due to the reduction in SVaR. This SVaR decrease is a result of a lower volatility and IR sensitivity during the period.
IRC multiplier of 2.25 would be in effect for Mexico and Chile.
|
|
|
|
|
|
|
|
|
| Table 78.MR1 - Market risk under the standardised approach |
|
EUR million |
|
|
|
2024 |
|
|
a |
|
|
RWEAs |
|
Outright products |
10,007 |
| 1 |
Interest rate risk (general and specific) |
4,604 |
| 2 |
Equity risk (general and specific) |
219 |
| 3 |
Foreign exchange risk |
4,808 |
| 4 |
Commodity risk |
376 |
|
Options |
687 |
| 5 |
Simplified approach |
— |
| 6 |
Delta-plus method |
382 |
| 7 |
Scenario approach |
— |
| 8 |
Securitisation (specific risk) |
304 |
| 9 |
Total |
10,693 |
184 2024 Pillar 3 Disclosures Report
Below is a breakdown of capital requirements and RWA for market risk with standardised model approval from 2023 to 2024.
|
|
|
|
|
|
|
|
|
| Table 79.Capital requirements for market risk. Standardised approach |
| EUR million |
|
|
|
|
|
Capital |
RWA |
| Starting figure (31 Dec. 2023) |
733 |
9,166 |
| Changes in business |
122 |
1,527 |
| Ending figure (31 Dec. 2024) |
855 |
10,693 |
Prudent Valuation Adjustments (PVA)
In addition, table 80 provides a breakdown of the constituent elements of Banco Santander's PVA for all assets measured at fair value (at market or model prices) and for which PVA is required.
The amount of prudent valuation adjustments increased in the second half of the year. The main reason for this increase was the rise in the number of positions subject to prudential valuation adjustments, which did not offset the reduction due to the improvements in their calculation methodologies that were implemented during the year.
The details of the prudent valuation adjustments (table PV1) can be found in table 80.
7.2.1. Internal initiatives on methods for calculating market risk
Grupo Santander has dedicated great efforts in recent years to improve the internal Market Risk models, under the global initiative called Market Risk Advanced Platform (MRAP), with the double objective of transforming and strengthening them in line with the new requirements of market risk regulatory framework published by Basel (“Fundamental Review of Trading Book” - FRTB) and to adapt them to the guidelines of the ECB's TRIM exercise (“Targeted Review of Internal Model”) and supervisor expectations.
This program adopted a multidisciplinary and multi-geographic approach, with the participation of all entities that carry out activities with market risk and all relevant interest groups, including market risk, technology, Front Office and Regulatory Affairs and Compliance. It has introduced significant improvements in terms of functional and IT architecture and operating models, which entails a change in the culture established in the Group and the generation of synergies between all initiatives and resources.
Within this program, during the years 2019 and 2020, intense work was done on improving and adapting the IRC model in order to comply with the findings previously raised by the supervisor. Finally, in October 2021, after the improvements and developments executed for this purpose, the new model was approved by the ECB for the calculation of capital requirements for market risk for Spain and SLB, along with other material changes (improvement in the treatment of credit VaR and VaR percentiles), after the corresponding inspection (IMI 4313). Additionally, during 2023 work continued on improving all components of the internal model (VaR/SVaR, RNIMs and IRC) in order to respond to the obligations raised by the supervisor in the TRIM and in the aforementioned IMI. As a result of all this, the ECB closed all obligations at the end of 2023 and eliminated the corresponding capital surcharges.
Currently, the Group's focus is on strengthening the regulatory calculation model for the future implementation of FRTB/CRR III in January 2026, improving the quality of sensitivity metrics, making technological implementation more efficient and filling certain gaps in monitoring and the “end-to-end” validation exercise.
See the Group Annual report, for further information about the IBOR initiative.
|
|
|
|
|
|
|
Access 2024 Annual Report available on the Santander Group website |
2024 Pillar 3 Disclosures Report 185
|
|
|
|
|
|
|
|
|
|
|
|
|
|
|
|
|
|
|
|
|
|
|
|
|
|
|
|
|
|
|
|
|
|
|
|
| Table 80.PV1 - Prudent valuation adjustments (PVA) |
|
|
|
|
|
|
|
|
|
|
|
|
|
|
|
2024 |
|
|
a |
b |
c |
d |
e |
EU e1 |
EU e2 |
f |
g |
h |
|
|
Risk category |
Category level AVA - Valuation uncertainty |
Total category level post-diversification |
|
Category level AVA |
Equity |
Interest Rates |
Foreign exchange |
Credit |
Commodities |
Unearned credit spreads AVA |
Investment and funding costs AVA |
|
Of which: Total core approach in the trading book |
Of which: Total core approach in the banking book |
| 1 |
Market price uncertainty |
268,660,396 |
120,655,587 |
5,042,391 |
69,088,039 |
241 |
4,817,821 |
6,720,657 |
237,492,566 |
65,137,485 |
172,355,081 |
| 2 |
Set not applicable in the EU |
|
|
|
|
|
|
|
|
|
|
| 3 |
Close-out cost |
29,223,418 |
85,162,847 |
7,741,131 |
25,619,792 |
4,924 |
27,744,621 |
7,092,285 |
91,294,509 |
61,772,814 |
29,521,695 |
| 4 |
Concentrated positions |
133,233,531 |
234,843 |
|
16,316,002 |
|
|
|
149,784,376 |
6,498,224 |
143,286,152 |
| 5 |
Early termination |
|
|
|
|
|
|
|
— |
|
— |
| 6 |
Model risk |
13,209,638 |
81,946,594 |
1,737,868 |
3,242 |
4,761,916 |
63,074,885 |
1,956,123 |
83,345,132 |
81,881,821 |
1,463,311 |
| 7 |
Operational risk |
15,356,944 |
11,965,409 |
445,344 |
5,110,247 |
763 |
|
|
32,878,708 |
12,691,030 |
20,187,678 |
| 8 |
Set not applicable in the EU |
|
|
|
|
|
|
|
|
|
|
| 9 |
Set not applicable in the EU |
|
|
|
|
|
|
|
|
|
|
| 10 |
Future administrative costs |
88,537 |
18,479,339 |
85,964 |
2,755,054 |
1,561 |
|
|
21,410,455 |
19,382,444 |
2,028,011 |
| 11 |
Set not applicable in the EU |
|
|
|
|
|
|
|
|
|
|
| 12 |
Total Additional Valuation Adjustments (AVAs) |
459,772,464 |
318,444,619 |
15,052,698 |
118,892,377 |
4,769,404 |
95,637,327 |
15,769,064 |
616,205,746 |
247,363,818 |
368,841,928 |
186 2024 Pillar 3 Disclosures Report
7.3. Trading activity
The goal of daily market risk function monitoring is to ensure that market risk positions remain within approved limits and to assess performance and significant deviations in risk metrics.
Trading activity at Santander is monitored by the local market risk units, under the principle of independence of business units, monitoring market risk positions on a daily basis and analysing the value of a set of metrics identified and approved by the group, the changes in them, any material changes that may occur and compliance with the approved limits on these metrics.
Regular reports are prepared and distributed on the basis of this analysis. These reports ensure the appropriate monitoring of market risk activities within the group and are distributed to senior management and other internal and external stakeholders, so that market risk activities may be properly monitored.
The corporate Market Risk functions also monitor positions daily, both locally at the level of the individual unit and globally, through exhaustive checking of changes in the portfolios to detect any incidents and to adjust them immediately.
The local Market Risk functions are also responsible for the daily calculation and analysis of the results of the trading books. Preparing and analysing a daily income statement is an excellent risk indicator, helping to identify the impact of changes in financial variables on the portfolios.
The main market risk metrics are:
•VaR and Stressed VaR
•Equivalent and/or nominal positions
•Sensitivities of the various market risk factors to underlying factors (delta, vega, gamma and theta)
•Delivery risk for short positions in securities (fixed income and equities)
•The volume of effective and relative losses resulting from the monitoring of results during a period:
◦Loss trigger
◦Stop loss
•Credit metrics:
◦Total exposure and exposure by sector/geography/rating
◦Jump to default by issuer, product, currency and seniority
◦Sensitivity to credit risk
•Volume of origination transactions
•P&L of each desk and/or portfolio
These metrics are used to establish limits and sub-limits, in order to provide a sufficiently granular limit structure to enable effective control of the various types of market risk factors to which the group's portfolios are exposed in its trading activities.
The establishment of market risk limits for trading is a dynamic process that responds to the level of risk appetite established by the group. This process is part of an annual limits plan defined by the group's senior management, involving all of the group's subsidiaries.
For more information on the process of setting limits please refer to the chapter 'Risk, compliance & conduct management', of the Group Annual report.
|
|
|
|
|
|
|
Access 2024 Annual Report available on the Santander Group website |
A Scenario analysis is also performed as a risk management tool, to control the potential impact of extreme or unexpected movements in market risk factors on trading books. These scenarios can replicate past events (historical scenarios), identify plausible alternatives that do not correspond to past events (hypothetical scenarios) or look for market movements that cause a particular impact on results (reverse scenarios).
7.3.1. Value at Risk
Santander's VaR calculation methodology consists of a historical simulation at a 99% confidence level, with a one-day horizon for internal risk management and a ten-day horizon when calculating own funds for market risk.
Statistical adjustments are applied in VaR to enable swift and efficient incorporation of the most recent events affecting the levels of risk assumed. Currently, all units use historical simulation with full revaluation, except for Market Risk Spain, which, while using this methodology for certain portfolios, applies historical simulation using a Taylor series approximation for the bulk of its portfolios.
The group uses a two-year window, or 520 daily readings, backwards in time from the VaR calculation reference date. Two figures are calculated every day: one applying an exponential decay factor that accords less weight to the observations furthest away in time and another with the same weight for all observations. The reported VaR is the higher of these two figures.Additionally, it should be noted that VaR is calculated with a one-day horizon and scaled using the square root of time rule. Periodically, a comparison is made between this method and the direct calculation with 10-day performance.
To calibrate the VaR model, the risk factors use different calculation methodologies (relative, absolute or mixed approaches), based on observable data. The criteria for assigning these methodologies to the different groups of risk factors are set out in standards defined by Methodology and independently validated by Internal Validation (2nd Line of Defence). In addition, the corporate VaR guidance requires an annual review of the selection criteria for performance models.
At the same time as the VaR is calculated, the value at earnings (VaE) is also calculated, which measures the maximum potential gain at a certain level of confidence and time horizon, applying the same methodology as for VaR.
The VaR by historical simulation has many advantages as a risk metric: it sums up the market risk of the portfolio in a single number and is based on observed market movements without the need for assumptions about functional forms or correlations between market factors.
2024 Pillar 3 Disclosures Report 187
In relation to the VaR, the Expected Shortfall (ES) is also calculated by estimating the expected value of the potential loss when this is greater than the level set by the VaR.
Unlike VaR, the ES has the advantage of being able at capturing the risk of large losses with low probability (tail risk) and of being a sub-additive metric. The BCBS considers that a 97.5% confidence interval delivers a similar level of risk to VaR at a 99% confidence interval. ES is calculated by applying uniform weightings to all observations.
Santander had authorisation from the European Central Bank to use the internal market risk model for calculating regulatory capital in the trading portfolios of the Spain, Santander London Branch, Chile and Mexico units at the end of December 2024.
The total regulatory capital figures based on the internal model are calculated as the linear sum of the individual regulatory capital of the units that have received internal model approval; i.e. without considering diversification.
Moreover, for those Grupo Santander entities without approval for calculating regulatory capital based on the internal model, capital will be calculated based on the standard model. This calculation methodology is also used by entities that have approved internal models for only some of their portfolios. The standardised approach is applied to portfolios for which the internal model is not approved.
During the year the strategy for Santander trading activity was to remain focused on customer business, minimising any exposure to directional risk as much as possible and maintaining geographic and risk factor diversification. The level of risk in the trading portfolio remained low, despite the war in Ukraine, and its impact in the energy price and inflation. Additionally, during 2024, there have been interest rate cuts by some of the major central banks.
This is reflected in the VaR of the trading portfolio, which, despite market volatility, especially in relation to interest rates and exchange rates, mostly stayed below the trend of the last four years, and closed December at EUR 69 million. This has meant that trading risk has contributed to capital less than in previous years.
Santander also continues to have very limited exposure to complex structured instruments or vehicles, reflecting a risk culture in which prudent risk management is one of the key features.
Our exposure to hedge funds at the end of December 2024 was 111 million euros, being indirect acting as counterparty in derivative transactions. We analyse the risk related to this type of counterparty on a case-by-case basis, establishing collateralization percentages according to the characteristics and assets of each fund.
The group's policy for approving new transactions related to these products remains very prudent and conservative, and is subject to strict supervision by the group's senior management.
The bank's derivatives activity is mainly focused on the sale of investment products and on hedging risks for our customers. Risk management is focused on ensuring that net open risk is as low as possible.
These transactions include options on equities, fixed income and exchange rates. The units where this activity mainly takes place are: Spain, Brazil, the UK and Mexico.
In comparison with other similar financial groups, the Group's trading risk profile can be classified as low. Dynamic management of risk enables Santander to adopt changes in strategy to unlock opportunities in an uncertain environment.
For more information, see the 'Risk, compliance & conduct management' chapter of the 2024 Annual report.
|
|
|
|
|
|
|
Access 2024 Annual Report available on the Santander Group website |
188 2024 Pillar 3 Disclosures Report
At year-end 2024, VaR by geography was as follows:
|
|
|
|
|
|
|
|
|
|
|
|
|
|
|
| Table 81.MR3 - IMA values for trading portfolios |
| EUR million |
|
|
a |
|
|
| Total |
2024 |
2023 |
Variation |
| Var (10 days - 99%) |
| 1 |
Maximum |
92 |
87 |
6 |
% |
| 2 |
Average |
56 |
50 |
11 |
% |
| 3 |
Minimum |
38 |
31 |
22 |
% |
| 4 |
End of period |
65 |
65 |
1 |
% |
| Stressed VaR (10 days - 99%) |
| 5 |
Maximum |
188 |
155 |
21 |
% |
| 6 |
Average |
110 |
98 |
12 |
% |
| 7 |
Minimum |
63 |
56 |
11 |
% |
| 8 |
End of period |
149 |
121 |
23 |
% |
| Incremental Risk Charge (99.9%) |
| 9 |
Maximum |
204 |
131 |
55 |
% |
| 10 |
Average |
53 |
72 |
(26) |
% |
| 11 |
Minimum |
23 |
24 |
(3) |
% |
| 12 |
End of period |
31 |
119 |
(74) |
% |
| Comprehensive risk measure (99.9%) |
| 13 |
Maximum |
|
|
|
| 14 |
Average |
|
|
|
| 15 |
Minimum |
|
|
|
| 16 |
End of period |
|
|
|
| Figures do not include Risks not in model |
|
|
|
|
|
|
|
|
|
|
|
|
|
|
|
|
|
|
a |
|
|
| Spain |
2024 |
2023 |
Variation |
| Var (10 days - 99%) |
| 1 |
Maximum |
53 |
49 |
9 |
% |
| 2 |
Average |
38 |
29 |
32 |
% |
| 3 |
Minimum |
28 |
20 |
41 |
% |
| 4 |
End of period |
46 |
40 |
15 |
% |
| Stressed VaR (10 days - 99%) |
| 5 |
Maximum |
124 |
92 |
35 |
% |
| 6 |
Average |
78 |
60 |
29 |
% |
| 7 |
Minimum |
46 |
40 |
15 |
% |
| 8 |
End of period |
120 |
92 |
30 |
% |
| Incremental Risk Charge (99.9%) |
| 9 |
Maximum |
134 |
118 |
14 |
% |
| 10 |
Average |
48 |
70 |
(31) |
% |
| 11 |
Minimum |
23 |
24 |
(3) |
% |
| 12 |
End of period |
28 |
118 |
(76) |
% |
| Comprehensive risk measure (99.9%) |
| 13 |
Maximum |
|
|
|
| 14 |
Average |
|
|
|
| 15 |
Minimum |
|
|
|
| 16 |
End of period |
|
|
|
| Figures do not include Risks not in model |
|
|
|
|
|
|
|
|
|
|
|
|
|
|
|
|
|
|
a |
|
|
| Chile |
2024 |
2023 |
Variation |
| Var (10 days - 99%) |
| 1 |
Maximum |
17 |
24 |
(27 |
%) |
| 2 |
Average |
9 |
15 |
(36 |
%) |
| 3 |
Minimum |
4 |
8 |
(42 |
%) |
| 4 |
End of period |
6 |
18 |
(68 |
%) |
| Stressed VaR (10 days - 99%) |
| 5 |
Maximum |
24 |
37 |
(34) |
% |
| 6 |
Average |
14 |
22 |
(38) |
% |
| 7 |
Minimum |
7 |
11 |
(33) |
% |
| 8 |
End of period |
10 |
15 |
(30) |
% |
| Incremental Risk Charge (99.9%) |
| 9 |
Maximum |
7 |
11 |
(34) |
% |
| 10 |
Average |
2 |
1 |
56 |
% |
| 11 |
Minimum |
— |
— |
38 |
% |
| 12 |
End of period |
1 |
— |
47 |
% |
| Comprehensive risk measure (99.9%) |
| 13 |
Maximum |
|
|
|
| 14 |
Average |
|
|
|
| 15 |
Minimum |
|
|
|
| 16 |
End of period |
|
|
|
| Figures do not include Risks not in model |
|
|
|
|
|
|
|
|
|
|
|
|
|
|
|
|
|
|
a |
|
|
| Mexico |
2024 |
2023 |
Variation |
| Var (10 days - 99%) |
| 1 |
Maximum |
21 |
14 |
52 |
% |
| 2 |
Average |
9 |
7 |
23 |
% |
| 3 |
Minimum |
6 |
4 |
53 |
% |
| 4 |
End of period |
14 |
7 |
100 |
% |
| Stressed VaR (10 days - 99%) |
| 5 |
Maximum |
40 |
26 |
50 |
% |
| 6 |
Average |
19 |
16 |
17 |
% |
| 7 |
Minimum |
10 |
6 |
64 |
% |
| 8 |
End of period |
19 |
14 |
32 |
% |
| Incremental Risk Charge (99.9%) |
| 9 |
Maximum |
63 |
2 |
2862 |
% |
| 10 |
Average |
3 |
1 |
390 |
% |
| 11 |
Minimum |
— |
— |
(11) |
% |
| 12 |
End of period |
3 |
1 |
251 |
% |
| Comprehensive risk measure (99.9%) |
| 13 |
Maximum |
|
|
|
| 14 |
Average |
|
|
|
| 15 |
Minimum |
|
|
|
| 16 |
End of period |
|
|
|
| Figures do not include Risks not in model |
|
2024 Pillar 3 Disclosures Report 189
7.3.2. Stressed VaR
In addition to standard VaR, Stressed VaR is also calculated daily for the main portfolios. The methodology for calculating Stressed VaR is the same as that used to calculate VaR, apart from two differences:
•Historical window for observing factors: in the stressed VaR calculation a window of 260 data readings is used, instead of the 520 used for computing the ordinary VaR measurement.
•Unlike the method used for the ordinary VaR calculation: stressed VaR is not obtained as the higher of the uniformly weighted percentile and the exponentially weighted percentile; instead, the uniformly weighted percentile is used directly.
All other aspects of the methodology and inputs for calculating the stressed VaR are the same as for the VaR.
The Market Risk functions periodically define the window used to calculate SVaR (the observation period), using the most severe at any given time, depending on the positions in the portfolio. The scope considered comprises the Treasuries for which approval has been obtained for the use of the internal model at 31 December 2024: Spain + SLB, Chile and Mexico.
The windows currently used to calculate Stressed VaR are:
|
|
|
|
|
|
| Stress Window |
|
Period |
| Spain & SLB |
26/02/2008 – 05/03/2009 |
| Chile |
18/01/2008 – 30/01/2009 |
| Mexico |
11/05/2016 – 22/05/2017 |
The Market Risk functions review these stress windows every quarter. The SVaR figures are also checked daily, comparing them to the VaR figures. If this analysis reveals that the current window used to calculate daily VaR covers a period with greater volatility than the period used to calculate SVaR, the stress timeframe is reviewed on an extraordinary basis.
7.3.3. Incremental risk charge
Following the recommendations of the Basel Committee on Banking Supervision and applicable regulations, an additional metric is calculated in relation to the credit risk inherent to the trading portfolios: the incremental risk charge (IRC).
The IRC is intended to measure both rating migration risk and any incremental default risk that is not captured by VaR, through changes in the corresponding credit spreads. To this end, transition matrices are used, which represent the probabilities of migrating from one rating to another over a certain time horizon. The matrices are extracted from reports published by one of the leading ECAIs for the various sectors. The above-mentioned reports are produced annually by the ECAI, analysing more than thirty years of default data and one-year rating migrations for various types of debt. Some modifications are made to the transition matrices extracted from the reports in order to guarantee their consistency and that they can be used in the defined model.
The IRC metric is calculated for public and private fixed-income bonds, bond derivatives and credit derivatives in the trading portfolio. In addition, the new IRC model approved for Spain (including the SLB) uses correlations that are
determined by the relationship between each issuer and the systemic factors. These ratios are calibrated to a one-year time frame using historical price series representing each issuer and the systemic factors. The price series used are at least ten years long and include at least one stress period in accordance with regulatory requirements.
In the previous IRC model which applies for the Mexican and Chilean units, the current calculation of correlations utilizes the single-factor formula proposed by the Basel regulation.
The method used to calculate the IRC, which is essentially similar to that applied to the credit risk of non-trading portfolio exposures, is based on the Merton structural model, which dictates that the default event occurs when the assets of a company fall below a certain level of its debts. This internally developed model comprises direct measurements on the distribution queues of losses caused by the different credit events it provides for, i.e. default risk and migration of credit quality subject to a confidence interval of 99.9% and a capital horizon of one year for all positions. The assumed liquidity horizon coincides with the one-year capital horizon and using the Montecarlo simulation approach.
During 2019 and 2020 a new CRI model was developed in response to the deficiencies and findings that had been raised by the regulator in the previous IMI. The new CRI model incorporated various improvements in fundamental aspects of the model and following IMI 4313 carried out during 2020, obtained the regulator's approval for Spain, including VMS, as well as the consequent elimination of the multiplier that had previously been imposed for this geographic location. In addition, along with this approval, a series of Obligations were established for the resolution of which improvements have been made during 2022 and 2023. As of the end of December 2024 a large part of the lifted Obligations have already been considered as implemented by the supervisor.
As approval of the new model was only granted for Spain, the geographies of Chile and Mexico will continue to calculate their regulatory capital for market risk using the previous IRC model.
190 2024 Pillar 3 Disclosures Report
7.3.4. Analysis of scenarios and stress testing
The risk measures described above are based on assumptions that underpin day-to-day risk management and decision-making, including normal market conditions, continuous pricing and adequate liquidity, although they do not fully predict extreme movements or unforeseen market turbulence.
Stress testing is an important risk management tool that identifies unexpected outcomes related to a wide range of risks, telling us how much capital would be needed to absorb losses if these unexpected events were to occur.
Stress tests play a particularly important role in: estimating future risk; overcoming the inherent constraints of models and the use of historical data; the communication of internal and external risks; supporting liquidity and capital plans; reporting the establishment of risk tolerance levels; and designing risk mitigation and contingency plans for stressed conditions.
The group's stress test programme includes the following scenarios:
•Historical Scenarios: study the behaviour of trading books under crisis conditions or significant market events relevant to portfolio positions that have occurred in the past, seeking to estimate maximum losses under the hypothesis that such events may occur again.
•Hypothetical Scenarios – Abrupt Crisis: combines movements in risk factors and their respective volatilities, based on the application of the market shocks defined in the new regulatory framework for the calculation of market risk capital requirements. For each risk factor (Interest Rates, FX, Equity, Credit and Commodities), positive and negative shocks are applied in both linear and non-linear products, identifying the most unfavourable scenarios.
•EBA adverse scenario: based on the adverse macroeconomic scenario to be applied to market risk factors, as proposed by the EBA for the "EU-wide stress test 2023" exercise.
•Forward-looking scenario: a plausible scenario defined by the Market Risk functions, based on the portfolio positions and their expert judgement regarding short-term changes in market variables that can have a negative impact on such positions.
Other quarterly scenarios:
•Reverse Stress Test Scenarios: exercise that seeks to identify those market scenarios that, affecting positions in trading portfolios, may jeopardize the viability of the institution. For this purpose, the official capital requirements calculated according to the regulation in force at the time of calculation will be considered.
•IRC Scenarios: designed to stress the default risk and rating migration risk of credit positions in the trading portfolio, with a view to identifying credit events that could impact regulatory capital and measure how reasonable the assumptions of the IRC model are.
•Use of Proxies Scenarios: defined to analyse what impact incorrect estimates of proxies could have on determining the time horizons used to calculate VaR.
•Valuation Adjustments Stress scenario: aims to estimate the potential increase in valuation adjustments of fair valued instruments in market stress conditions. It includes both Fair Value Adjustments (FVAs) with P&L impact and Additional Valuation Adjustments (AVAs), with impact on capital.
The Market Risk functions regularly calculate and analyse all these scenarios. A consolidated stress test report is prepared every month, based on the results of each of the scenarios and for all the group's units with trading activities. There are also alerts on the stress results which, when exceeded, trigger communication and joint analysis by Risk and Business functions.
The table below shows the results as at 31 December 2024, broken down by risk factor (interest rate, equities, foreign currency, credit spread, commodities and the volatility for each), in a scenario based on the application of the market shocks defined in the new regulatory framework for the calculation of market risk capital requirements.
The scenario is defined by taking the change that produces the highest potential loss in the global portfolio for each risk factor, discarding the most improbable combinations in economic and financial terms.
2024 Pillar 3 Disclosures Report 191
|
|
|
|
|
|
|
|
|
|
|
|
|
|
|
|
|
|
|
|
|
|
|
|
|
|
|
|
|
|
|
|
|
|
|
|
|
|
|
|
|
|
| Table 82.Stress scenario: Maximum volatility (worst case) |
| EUR million |
|
2024 |
|
2023 |
|
Interest rate |
Equities |
Foreign currency |
Credit spread |
Commodities |
Total |
|
Interest rate |
Equities |
Foreign currency |
Credit spread |
Commodities |
Total |
| Total Trading |
(275.8) |
26.3 |
(83.2) |
(69.2) |
— |
(401.9) |
|
(37.5) |
(10.4) |
(32.3) |
(0.5) |
— |
(80.7) |
| Europe |
(118.4) |
27.6 |
(80.3) |
(69.2) |
— |
(240.3) |
|
(10.1) |
(4.9) |
(21.4) |
(0.5) |
— |
(36.8) |
| South America |
(5.5) |
(1.1) |
(1.0) |
— |
— |
(7.6) |
|
(26.8) |
(5.4) |
(9.9) |
— |
— |
(42.1) |
| USA |
(151.9) |
(0.2) |
(1.9) |
— |
— |
(154.0) |
|
(0.6) |
(0.1) |
(1.0) |
— |
— |
(1.8) |
| Global Activities |
— |
— |
— |
— |
— |
— |
|
— |
— |
— |
— |
— |
— |
| Asia |
— |
— |
— |
— |
— |
— |
|
— |
— |
— |
— |
— |
— |
The result of the analysis is that the economic impact on Grupo Santander's trading portfolios, in terms of market price, would be EUR 401.9 million if the worst-case stress movements were to materialise in the market.
7.3.5. Backtesting (MR4)
The backtesting exercise consists of comparing the VaR forecasts, given a certain confidence level and time horizon, with the actual losses incurred over a time horizon equal to the VaR time horizon.
The general aim of backtesting is to verify the accuracy of the Value at Risk (VaR) calculation model. In other words, whether to accept or reject the model used to estimate the maximum loss on a portfolio with a given level of confidence, over a certain period of time.
Backtesting is analysed at local level by the local market risk control units. The market risk consolidation unit is responsible for backtest reporting at consolidated level. It is important to note that the backtesting methodology is applied identically to all the sub-portfolios covered by the internal market risk model. The analysis of regulatory backtesting is conducted daily at portfolio and sub-portfolio level.
Four types of backtesting are defined, depending on the kind of P&L used:
•The economic P&L (dirty P&L): refers to the daily P&L calculated on the basis of mark-to-market or mark-to-model securities (depending on the instruments) of the books and records of Banco Santander at the end of the day. It is calculated using Front Office systems (data on positions, pricing models, valuation methods, price parameters and end-of-day market data)
•Actual P&L (dirty P&L without mark-ups): refers to the daily P&L calculated by comparing the portfolio's closing value and its actual value at the end of the following day, including losses and gains derived from intraday activities, excluding fees, commission and net interest income. Santander, as considered acceptable in paragraph 63 of the TRIM guidance ("ECB Guide to Internal Models", Oct 2019), has established that net interest income is equal to zero in the trading portfolio. The "actual P&L" includes all time effects (theta). This P&L is used for the regulatory backtesting in accordance with article 366 (3) of the CRR in order to compute the number of overshootings. The additional aspects included in the TRIM guidance are also considered.
•The Hypothetical P&L (clean P&L due to subtractions): this refers to the daily P&L calculated by comparing the portfolio's closing value and its actual value at the end of the following day assuming unchanged positions. In this case, time effects are not considered in order to be
consistent with the VaR. Similarly, the additional aspects included in the TRIM guidance are also considered. Specifically, any valuation adjustment made in actual P&L that is not included in VaR is also not included in the hypothetical P&L. The hypothetical P&L is obtained from the Front Office platforms by the Market Risk function, without considering intraday results or changes in portfolio positions. This P&L, like actual P&L, is used for the regulatory backtesting in accordance with article 366 (3) of the CRR in order to calculate the number of overshootings.
•The Risk-theoretical P&L (clean P&L due to change of factors): this hypothetical P&L is similar to the previous measure but is calculated using the Market Risk calculation engine (AIRE), without considering intraday results, changes in portfolio positions or time effects (theta). This P&L is exclusively used to verify the quality of the internal VaR model.
Of these four backtesting methods, only the backtesting on actual P&L (dirty P&L without mark-ups) and the hypothetical P&L (clean P&L due to subtractions) are used to measure and report the accuracy of the model, for regulatory purposes.
In order to calibrate and control the effectiveness of the internal systems for measuring and managing market risks, in 2024 Grupo Santander regularly carried out the necessary analyses and tests, obtaining conclusions that confirm the reliability of the model.
Number of overshootings
Overshooting occurs whenever the losses or gains observed in a day exceed the VaR estimate. The number (or percentage) of overshootings recorded is one of the most intuitive indicators of a model's accuracy.
When the P&L exceeds the previous day's VaR it is considered to be an overshooting (or exception). The number (or percentage) of overshootings recorded is one of the most intuitive indicators of the models accuracy. A regulatory coefficient "K" is calculated on the basis of the number of overshootings in the regulatory backtesting. This affects the calculation of regulatory capital in accordance with the following table:
192 2024 Pillar 3 Disclosures Report
|
|
|
|
|
|
|
|
|
|
|
|
| Backtesting overshootings |
KR value |
| 0 |
— |
| 1 |
— |
| 2 |
— |
| 3 |
— |
| 4 |
— |
| 5 |
0.40 |
| 6 |
0.50 |
| 7 |
0.65 |
| 8 |
0.75 |
| 9 |
0.85 |
| 10 |
1.00 |
The confidence level for the VaR calculation is a measure of the number of overshootings expected to occur in a given time frame. For example, if the daily VaR is calculated with a confidence level of 99%, the percentiles of interest are the 1st and the 99th percentiles of the P&L distribution. The expectation would be 2% of overshootings during the days studied (1% due to excess profits and 1% due to excess losses).
If there are significantly more (or fewer) overshootings, this might be a sign of problems in the VaR model employed. The observed P&L and estimated VaR data can be used to construct a hypothesis test to check the validity of the VaR/P&L relationship.
Time between overshootings
The confidence level for the VaR calculation is also an indicative measure of the number of days that can be expected to elapse between two successive overshootings. For instance, if the daily VaR is calculated at 99% confidence (1st and 99th percentiles), we may expect an average time of approximately 50 days between overshootings.
Similarly to the frequency of overshootings, hypothesis-testing can be done based on the time between overshootings, as a means of validating the VaR model.
Distance between overshootings
Whereas the VaR predicts the risk that is assumed with a certain probability, average overshooting (expected shortfall) is a predictor for that probability of the average loss once VaR is exceeded. This testing should be included when analysing the backtesting report to obtain the size of the potential losses that exceed the VaR level.
Daily VaR/P&L relationship
To validate the VaR model it is not sufficient to analyse the number and type of overshootings that occur in a time window. Other indicators must be observed to ensure the model's consistency. One such indicator is the daily VaR/P&L relationship. This relationship is defined as:
•The P&L figure, as a percentage of VaR, on all the days on which there are no overshootings (losses or gains).
•Calculation of its arithmetic mean.
The percentage should be close to a value determined by the VaR confidence level. The higher the chosen confidence level, the higher the VaR estimate (and the smaller the P&L results as a percentage of that estimate).
If the percentage observed is above the expectation, the risk is being underestimated and the model should be reviewed. Conversely, if the percentage is significantly smaller, then the risk is being overestimated and the VaR model should be adjusted. The latter outcome may, however, be desirable if the target is to maintain conservative risk estimates.
The following diagram shows the annual backtest (MR4) at the end of December 2024 for each unit with internal model approval (see table 80).
|
|
|
|
|
|
|
Access the Pillar 3 2024 file available on Grupo Santander's web site |
The number of overshootings at 31 December 2024 for the units with internal model approval are shown below.
|
|
|
|
|
|
|
|
|
| Table 83.Exceptions at units with internal model |
|
|
|
2024 |
|
Exceptions |
Model Status |
| Spain & SLB |
0 |
OK |
| Chile |
1 |
OK |
| Mexico |
3 |
OK |
During 2024, there have been three exceptions in Mexico and one in Chile.
Such exceptions were mainly driven by the volatility in the interest rates as long as movements in the FX market.
The fair value of a financial instrument is calculated using quoted market prices or appropriate valuation models, duly validated and approved. This may cause a degree of uncertainty in the valuation of less liquid financial instruments, which are not traded on a regular basis or which use valuation models. These uncertainty factors are incorporated into the fair value of positions through valuation adjustments.
Valuation adjustments are designed to ensure the fair valuation of positions, by including variables in the market value that are not considered in the valuation models or for which there is sufficient uncertainty to significantly affect the valuation.
The valuation adjustment categories used at the Group include:
•Market liquidity valuation adjustments (close out cost): adjustments arising from the use of average prices when valuing portfolio positions, where accounting rules require valuation based on the exit price.
•Valuation adjustments are included due to the existence of spreads between buy and sell prices.
•These adjustments are calculated taking into account the spread between market buy and sell prices and are estimated independently for each risk factor, distinguishing between: interest rate curves, prices, dividends, volatilities and correlation.
2024 Pillar 3 Disclosures Report 193
•Valuation adjustments due to uncertainty in market prices (market price uncertainty): these are warranted because of considerable uncertainty in the market data used for the calculation of fair value, distinguishing between:
◦Observable market data
◦Unobservable market data
•Valuation adjustments due to model risk: these are warranted when there is a high degree of uncertainty in the valuation models or in the parameters used by these models. This uncertainty may be caused by: adding certain assumptions that may be erroneous, models whose results cannot be calibrated because there are no alternatives or because of dependence on parameters that are subject to possible estimation errors.
•Other valuation adjustments: adjustments for limitations in valuation systems, for exotic items not captured in the payoffs configured in the systems, uncertainty in the financing/investment costs used in estimating the exit price, profit reserves for specific or one-off transactions (generally associated with the first-day profit or loss of instruments classified as Level 3 in the fair value hierarchy) and credit risk adjustments (CVA/DVA).
7.3.6. Internal validation of the models
Market, counterparty and other non-financial risk models
In 2024, in accordance with the model risk policies, the Internal Validation team performed independent review exercises for the main models used in the group's various geographies. The areas covered are counterparty risk (maximum and expected exposures, CVA/DVA), issuer risk (incremental risk charge), valuation (interest rates, FX, equity, credit and commodities), valuation adjustments (AVA, FVA), market risk (VaR/SVaR), structural interest rate and liquidity risk (prepayments, accounts with no specified maturity, mortgages, calculation of EVE/NIM) and other non-financial risks (operational risk, macroeconomic scenarios).
The group also continued to monitor on a quarterly basis the VaR & SVaR models used to calculate regulatory capital for market risk, based on key indicators of the quality of the models, in order to proactively and independently monitor the operation of these models.
194 2024 Pillar 3 Disclosures Report
|
|
|
|
|
|
| Table 84.MR4 - Comparison of VaR estimates with gains/losses |
2024 Pillar 3 Disclosures Report 195
196 2024 Pillar 3 Disclosures Report
7.4. Structural balance sheet risks
This section covers the requirement IRRBBA - IIRRBB qualitative information.
Structural risk is inherent in banking business and arises as a result of changes in a number of factors, including market or balance sheet behaviour variables, that affect the profit or loss or economic value of balance sheet items (banking book). This risk includes both the potential losses from price changes for assets recognised at fair value and economic losses arising from management of assets and liabilities carried at amortised cost in the banking book positions.
Within structural risk, interest rate risk in the banking book (IRRBB) is considered the main source of balance sheet risk. There are three sources of IRRBB: mismatch risk (or gap risk), basis risk and option risk (automatic and behavioural).
The management of IRRBB measures aims to ensure the stability of net interest margin and the economic value within the Group's defined risk appetite.
Additionally, within the structural risks is the credit spread risk in the banking book (hereinafter CSRBB), which measures the risk of changes in the market price due to credit risk, liquidity or other characteristics of the instruments with credit risk, which is not captured by other existing risk frameworks such as IRRBB or the expected default risk.
These activities are based on the following principles, which take into account internal policy, regulatory and market best practice requirements:
•Independence of risk management and control functions following the group's established lines of defence model.
•Involvement of senior management, ensuring that it has the necessary relevant information on these risks.
• Holistic approach to risk: IRRBB and CSRBB control and monitoring must take into account all potential sources of risk and the fact that risks can arise due to factors related to subsidiaries or for reasons not related to them, such that local risk events may have an impact on the Group. Furthermore, the approach should be forward-looking and analyse trends over different time periods and scenarios.
• Robust systems and high-quality internal data, with adequate traceability of information.
• Use of methodologies and models that are standardised and documented ensuring consistency in risk measurement.
• Establishment and adaptability of limits for adequate control of these risks.
For more information, see the 'Compliance and conduct risk' management chapter of the 2024 Annual report.
|
|
|
|
|
|
|
Access 2024 Annual Report available on the Santander Group website |
The financial area of each group subsidiary manages interest rate risk originated by retail and commercial banking and is responsible for management of the structural risk generated by interest rate fluctuations. Mitigation strategies are used to manage the IRRBB risk profile by using interest rate instruments such as fixed income bond portfolios (usually government bonds) or derivative instruments with high credit quality, high liquidity and low capital consumption that complement the natural hedges provided by the balance sheet itself. They are always carried out taking into account the market environment.
For more information, see the Risk compliance & conduct chapter of the 2024 Annual report.
|
|
|
|
|
|
|
Access 2024 Annual Report available on the Santander Group website |
7.4.1. Main interest rate risk in the banking book (IRRBB) metrics
The management, measurement and control of IRRBB risk and metrics are performed independently in each subsidiary. The set of metrics used in the Group is standardised to ensure consistent measurement. However, the specific metrics implemented in each subsidiary depend on the dimensions and risk factors identified as relevant by each subsidiary in its IRRBB self-assessment, based on the individual features and nature of its business, its balance sheet structure and the complexity of the markets in which it operates.
IRRBB metrics are calculated under various scenarios and provide a static and/or dynamic overview of balance sheet exposure and net interest margin in response to adverse interest rate movements and/or on the main behavioural parameters and assumptions under which optionality is modelled. The main metrics are as follows:
•Repricing gap: it measures the difference between the volume of sensitive assets and liabilities, on and off the balance sheet, that re-price (i.e. that mature or are subject to rate revisions) at certain times.
•Economic value and its sensitivity: Economic value of equity (EVE) is the difference between the present value of assets less the present value of liabilities of the banking book, excluding own equity and other instruments that are not interest rate sensitive. The present value is calculated by discounting projected cash flows of assets and liabilities with the appropriate discount curve. The EVE sensitivity is calculated as the difference between the EVE in a selected interest rates scenario and the EVE calculated in the baseline scenario. Therefore, the EVE can have as many sensitivities as scenarios considered. This metric enables the identification of long-term risks and supplements the sensitivity of the net interest margin.
2024 Pillar 3 Disclosures Report 197
• Net interest income and its sensitivity: Net interest income (NII) is calculated as the difference between the interest income of assets and the interest cost of liabilities of the banking book in a determined time horizon (typically from one to three years, with the Group's standard being one year). Its sensitivity reflects the impact of changes in interest rates on net interest income in the given time horizon. Net interest margin sensitivity is calculated as the difference between the net interest margin in a selected scenario and the net interest income in the baseline scenario. Therefore, the net interest margin can have as many sensitivities as scenarios considered. This metric enables the identification of short-term risks, and supplements economic value of equity sensitivity.
• Earnings metric: Measures the change in expected future profitability within a given time horizon (e.g. three months) as a result of changes in interest rates and credit spreads as risk factors. This metric takes into account both the impact of net interest income and the instruments whose value could be affected by changes in interest rates and which can be sold in the short term (mainly the instruments assigned to the Held to Collect and Sale (HTC&S) model and reported in the Fair Value Through Other Comprehensive Income category).
•Economic P&L of the ALCO portfolio: to estimate losses from price changes of assets recognised at fair value, an economic P&L is calculated under stress for fixed-income instruments managed by the ALCO (ALCO portfolios). The impact this market stress could have on the portfolio is then measured. A change in the value of this portfolio would reduce the group's equity and therefore have a negative effect on its capital ratio. The stress has a statistical component as it is calibrated according to past observed performance in the market and a forward-looking component. It also uses stress scenarios generated by the group based on macro-economic analysis.
•Value at risk (VaR and EaR) for the purpose of calculating economic capital: the economic capital model by IRRBB in the group is based on a value-at-risk model that assesses the potential impact of movements in market variables, interest rates and credit spreads (the latter limited to the FV positions managed by ALCO) on both the economic value of equity and earnings. The VaR and EaR represent the maximum amount of estimated losses on the economic value of equity and earnings calculated over a two-year period, which are expected to be exceeded only in a small percentage of cases (confidence level 0.05%) and over a time horizon that varies for each subsidiary depending on its balance sheet structure.
System for controlling limits
The measurement, analysis and control of IRRBB metrics guarantees that the level of risk is aligned with the group's policies, approved management limits and risk appetite.
As a general rule the metrics are measured and controlled on a monthly basis, using the previous month's closing data.
IRRBB limits are set independently for each subsidiary in accordance with the individualised management and control per subsidiary. The main limits set in all subsidiaries are:
•Net interest income sensitivity limit at one year.
•Market value of equity sensitivity limit.
•Limit of the market value of banking book portfolios used for on-balance-sheet interest rate management that could have an impact on equity due to their accounting classification (fair value through equity).
The limits are reviewed regularly and have flexible modification mechanisms that can adapt to extreme or unfavourable market situations, but also to market opportunities.
If one of these limits or their sub-limits is exceeded (by currency or IRRBB risk type), the heads of risk management have to justify the reasons and facilitate an action plan.
IRRBB information is reported to the group's senior management collectively on a subsidiary-by-subsidiary basis. In this way, the Group's management can assess and control the risk profile in the subsidiaries, while at the same time obtaining a comprehensive overview of the risk so it can be analysed and controlled from a global perspective.
The internal metrics used in the group to monitor IRRBB, based on the direct application of shocks to interest rate curves, are the economic value and the net interest margin sensitivities. The most commonly used interest rate scenarios are:
•Parallel scenarios with shocks of +/-100 bps.
•Regulatory scenarios defined by the EBA5 for calculating EVE and NII sensitivity.
In addition, each subsidiary of the Group uses a variety of scenarios sufficient to ensure appropriate measurement and control of its IRRBB profile. The use of these scenarios plays an important role in providing supplementary future risk estimates. These scenarios are defined annually and are based on the IRRBB self-assessment carried out by each entity in the Group. They can be of different types, e.g. historical, forward-looking, probabilistic or based on expert judgement.
Grupo Santander measures structural risks using models to support decision-making processes, obtain predictive information and generate metrics that are adapted to the economic environment of each subsidiary and its balance sheet structure. These models must be consistent with the methodological standards defined in the Group. If possible, the Group aligns all methodologies and models used for the calculation of regulatory and internal metrics. Currently there are no relevant differences.
The general IRRBB management strategies are transactions with fixed-income instruments or derivatives. Hedging carried out through fixed-income instruments is generally recorded at fair value through equity to a lesser the extent of amortised cost. For hedging through derivatives the Group's general policy to reduce asymmetries in accounting treatment is to use fair value or cash flow hedges depending on the exposure of the underlying asset.
Fair value hedges hedge portfolio risks (fixed rate) and are therefore exposed to changes in the fair value of the portfolios due to changes in interest rates.
Cash flow hedges hedge the exposure of future flows subject to changes in interest rates. The purpose of these hedges is to actively manage the interest rate risk of variable rate balance
5 EBA/GL/ 2018/02.
198 2024 Pillar 3 Disclosures Report
sheet items by using interest rate derivatives the bank swaps variable rate flows for fixed rate flows.
Both types of hedging are used in the Group. The financial management divisions of each subsidiary are responsible for designing and implementing the transactions according to their balance sheet structure, risk exposure and markets. These hedges are usually carried out through interest rate derivatives.
Derivatives that do not meet the conditions for consideration as hedging instruments are treated as trading derivatives for accounting purposes.
For further details, see the 'Risk, compliance & conduct' management chapter of the 2024 Annual report.
|
|
|
|
|
|
|
Access 2024 Annual Report available on the Santander Group website |
Methodologies
There are three elements necessary to calculate the IRRBB metrics in Santander:
•Yield curves for capitalisation and discounting.
•Behavioural models that enable the cash flows of certain instruments to be determined.
•Assumptions about future changes in the entity's balance sheet and its various items.
Of these three elements, the behavioural element is the main one subject to modelling.
The Group develops methodological standards that establish best practises and criteria to be followed for the successful development and implementation of IRRBB models. Models may be based on quantitative approaches and methods using statistical or other mathematical techniques or on assumptions and hypotheses assessed by experts. All models are managed within the framework of the Model Risk framework, which defines the principles and processes (including planning, development, validation, etc.) required to ensure adequate control of the models used in the group.
The main models used in the management and control of IRRBB are described below, by product type:
a. Treatment of non-maturity deposits (NMD)
Accounts with no contractual maturity are subject to two types of optionality. The customer's option to withdraw their money without prior notice and/or the bank's option to review the interest paid. The NMD corporate model models the product as a synthetic bond, with callable nominal and a periodic coupon. The callable nominal is determined by the stable balance and the estimated run-off for these flows. The coupon can be fixed, variable or subject to an elasticity with respect to market interest rates or a more complex function depending on different variables.
The model is based on the following sub-models and variables:
•Beta model: this sub-model defines the relationship between benchmark interest rates in the market and the
remuneration paid to customers. The model can use a single beta or multi betas for the same account.
•Stable and unstable balance: A statistical model is used to estimate the stable balance based on the historical distribution of aggregated balances at the segment level and the observed outflows in relation to the trend of the series. The stable balance is determined on the basis of a certain confidence level, which is usually above 95%. For the unstable balance, an outflow is assumed in the first time bucket (typically one day).
• Run-off model: This sub-model attempts to estimate customer behaviour on the basis of historical data (evolution of accounts created on the same date). The estimate can be made using a statistical model that depends on several variables (interest rates, spread with other products, macro variables) or it can be calculated using an optimisation process that assumes a certain function, e.g. assuming an exponential function and calibrating the decay rate6, defining a maximum maturity horizon.
The average repricing maturity is not a parameter used directly in the NMD corporate model, however, duration as a parameter is used. Following regulatory criteria, the group ensures that the average repricing maturity of NMDs for each currency does not exceed the thresholds set out in the EBA guidelines. This is calculated using the average maturity of the expected cash flows of the entire NMD balance (stable and unstable) adjusted by the betas of the model. For segments with fixed coupons or a beta of zero, the average maturity of the repricing dates matches the average maturity of the cash flows and as the unstable balance (repricing balance) or betas increase, the gap between them opens (causing the average repricing maturity to decrease).
This model requires a variety of inputs:
•Parameters inherent to the product.
•Customer and/or bank behavioural parameters (in this case, analysis of historical data is combined with expert judgement on the business).
•Market data.
•Historical data for the portfolio.
b. Treatment of non-maturity assets (NMA)
The model used on the asset side for products such as credit cards can be modelled in a similar way to the NMD model, sharing some of the same methodology and assumptions. The difference between the two models is that for assets without a fixed maturity, the fixed credit limit, which serves as a ceiling for future drawdowns, has to be taken into account.
c. Treatment of prepayment of certain assets.
The prepayment option is defined as the possibility offered to customers to repay their loans before the contractual maturity date, without this involving a significant additional cost for them. Prepayment can be total or partial and mainly affects fixed-rate products, such as fixed-rate mortgages in markets where the yield curves for these loans are at low levels and there is an incentive for customers to prepay when the market interest rate is below the product's reference interest rate. However, prepayment does not only depend on
6 An exponential function implies assuming higher outflows in the short/medium term followed by long-term stability; i.e. the empirically observed behaviour of most units with positive interest rates.
2024 Pillar 3 Disclosures Report 199
the level of interest rates, it also depends on other more complex factors resulting from macroeconomic and cultural situations in the market. This means that the normal techniques used to value options cannot be applied directly and have to be combined with empirical statistical models that aim to model customer behaviour.
Prepayment can also occur with variable rate products and variable rate mortgages are also modelled in the Group. In these cases prepayment is usually due to factors other than the level of interest rates and the impact in terms of IRRBB risk is lower due to having variable repricing.
The prepayments model assumes that these balances naturally decline as customers gradually repay. Prepayment parameters can be constant values or a function dependent on several variables. The model creates a function that produces a fall in flows until the maturity for the transaction.
d. Non-Performing Exposures Treatment
The Group includes and models NPEs in the IRRBB measurement. The definition of the parameters used in the model (e.g. estimated recovery period) is based on expert judgement and/or credit risk model parameters (probability of default and loss given default).
The use of additional behavioural models in the Group (e.g. early termination of time deposits or pipelines) depends on the structure and complexity of each subsidiary's balance sheet. The rationale for these models is based on those described above.
The published sensitivity to economic value in the IRRBB1 table follows all methodologies and criteria defined within the group and is adjusted (if necessary) by the principles set out in the EBA guidelines.
The published sensitivity to net interest income is calculated for the interest rate shocks established in the EBA guidelines in all currencies and following all methodologies and principles defined for internal metrics.
The average and maximum repricing maturity of NMDs in the group is calculated by each subsidiary based on its historical data and statistical techniques. The data for the group are:
|
|
|
|
|
|
|
|
|
|
|
|
|
|
|
|
|
|
|
|
|
|
|
Average repricing maturity |
|
Longest repricing maturity |
|
|
Total volume |
Core Volume |
|
Total Volume |
Core volume |
| Retail |
|
2.5 |
3.4 |
|
20 |
20 |
| Non-financial Wholesale |
|
2.6 |
3.8 |
|
20 |
20 |
For further details, see the 'Risk, compliance & conduct management' chapter of the 2024 Annual report.
|
|
|
|
|
|
|
Access 2024 Annual Report available on the Santander Group website |
The following tables show changes in the bank's economic value of equity (EVE) and net interest income (NII) for every prescribed interest rate scenario and for every currency:
|
|
|
|
|
|
|
|
|
|
|
|
|
|
|
|
|
|
|
|
|
| Table 85.IRRBB1 - Interest rate risks of non-trading book activities |
|
EUR million |
|
2024 |
|
|
a |
b |
c |
|
d |
|
Total |
Changes of the economic value of equity |
Changes of the net interest income |
|
Supervisory shock scenarios |
Current period |
Last period |
Current period |
requirement |
Last period |
| 1 |
Parallel up |
(5,122) |
(8,522) |
832 |
|
745 |
| 2 |
Parallel down |
1,720 |
4,466 |
(2,596) |
|
(2,350) |
| 3 |
Steepener |
285 |
(1,102) |
|
|
|
| 4 |
Flattener |
(2,172) |
(1,207) |
|
|
|
| 5 |
Short rates up |
(3,649) |
(3,495) |
|
|
|
| 6 |
Short rates down |
1,643 |
1,978 |
|
|
|
|
Metrics reported as of December 24 vs June 24 |
200 2024 Pillar 3 Disclosures Report
|
|
|
|
|
|
|
|
|
|
|
|
|
|
|
|
|
|
|
|
|
|
|
a |
b |
c |
|
d |
|
EUR |
Changes of the economic value of equity |
Changes of the net interest income |
|
Supervisory shock scenarios |
Current period |
Last period |
Current period |
requirement |
Last period |
| 1 |
Parallel up |
(1) |
(2,885) |
1,609 |
|
1,516 |
| 2 |
Parallel down |
19 |
3,643 |
(1,562) |
|
(1,482) |
| 3 |
Steepener |
(137) |
(1,282) |
|
|
|
| 4 |
Flattener |
142 |
1,063 |
|
|
|
| 5 |
Short rates up |
150 |
117 |
|
|
|
| 6 |
Short rates down |
(235) |
(11) |
|
|
|
|
Metrics reported as of December 24 vs June 24 |
|
|
|
|
|
|
|
|
|
|
|
|
|
|
|
|
|
|
|
|
|
|
|
|
|
|
|
|
|
|
a |
b |
c |
|
d |
|
USD |
Changes of the economic value of equity |
Changes of the net interest income |
|
Supervisory shock scenarios |
Current period |
Last period |
Current period |
requirement |
Last period |
| 1 |
Parallel up |
(617) |
(674) |
415 |
|
548 |
| 2 |
Parallel down |
(512) |
178 |
(440) |
|
(568) |
| 3 |
Steepener |
(210) |
(181) |
|
|
|
| 4 |
Flattener |
(321) |
(187) |
|
|
|
| 5 |
Short rates up |
(355) |
(337) |
|
|
|
| 6 |
Short rates down |
96 |
299 |
|
|
|
|
Metrics reported as of December 24 vs June 24 |
|
|
|
|
|
|
|
|
|
|
|
|
|
|
|
|
|
|
|
|
|
|
|
a |
b |
c |
|
d |
|
GBP |
Changes of the economic value of equity |
Changes of the net interest income |
|
Supervisory shock scenarios |
Current period |
Last period |
Current period |
requirement |
Last period |
| 1 |
Parallel up |
(1,458) |
(1,442) |
323 |
|
250 |
| 2 |
Parallel down |
959 |
1,247 |
(479) |
|
(291) |
| 3 |
Steepener |
421 |
78 |
|
|
|
| 4 |
Flattener |
(760) |
(353) |
|
|
|
| 5 |
Short rates up |
(1,153) |
(783) |
|
|
|
| 6 |
Short rates down |
872 |
704 |
|
|
|
|
Metrics reported as of December 24 vs June 24 |
|
|
|
|
|
|
|
|
|
|
|
|
|
|
|
|
|
|
|
|
|
|
|
|
|
|
|
|
|
|
a |
b |
c |
|
d |
|
BRL |
Changes of the economic value of equity |
Changes of the net interest income |
|
Supervisory shock scenarios |
Current period |
Last period |
Current period |
requirement |
Last period |
| 1 |
Parallel up |
(1,597) |
(2,120) |
(483) |
|
(537) |
| 2 |
Parallel down |
1,550 |
2,045 |
471 |
|
608 |
| 3 |
Steepener |
150 |
230 |
|
|
|
| 4 |
Flattener |
(520) |
(663) |
|
|
|
| 5 |
Short rates up |
(1,037) |
(1,394) |
|
|
|
| 6 |
Short rates down |
1,091 |
1,507 |
|
|
|
|
Metrics reported as of December 24 vs June 24 |
2024 Pillar 3 Disclosures Report 201
202 2024 Pillar 3 Disclosures Report
2024 Pillar 3 Disclosures Report 203
Operational risk is the risk of losses resulting from the deficiencies or failures in processes, personnel, information systems or external events outside Grupo Santander.
This chapter details the objectives of Grupo Santander in terms of control and management of operational risk, presenting the main capital figures and their evolution.
|
|
|
|
|
|
|
|
|
| Main figures |
|
|
Million euros |
|
|
|
RWA |
|
2024 |
2023 |
| Operational risk |
72,351 |
67,022 |
| Of which, standardised approach |
61,459 |
54,018 |
| Of which, alternative standardised approach |
10,892 |
13,005 |

|
|
|
|
|
|
|
|
|
| n |
Spain |
22% |
| n |
Rest of Europe |
25% |
| n |
USA |
17% |
| n |
South America |
22% |
| n |
Rest of North America |
6% |
| n |
Others |
7% |
|
|
|
|
|
|
| RWA variation |
EUR million |
204 2024 Pillar 3 Disclosures Report
8.1. Definition and objectives
This section covers the letter (a) of the qualitative requirement ORA - Qualitative information on operational risk. Also the provisions of letters (d), (e), (f) and (g) of the OVA requirement -Institution risk management approach, are complied with.
Paragraphs (c) and (d) of the qualitative requirement ORA are not applicable as Banco Santander does not use the AMA approach to calculate minimum capital requirements.
Our operational risk management and control model establishes the necessary elements to identify, evaluate, manage and report this risk in accordance with regulatory standards and industry best practices. The application of the model promotes that management priorities are properly established and updated, and that internal controls are defined and executed to mitigate risk throughout the organization. Santander expressly recognises that while a certain volume of operational losses can be expected, severe unexpected losses resulting from failures in business controls are unacceptable.
The group applied new developments and enhancements to the operational risk management model in 2024 in the risk assessment and control tools, operational risk appetite, operational resilience, as well as the integration and reporting of new risks (such as transformation risk, data risk or climate risk) into the non-financial risk monitoring and control model.
In terms of key risks, the business opportunities arising from digital transformation include new risks, such as technology risks, cyber risks and increasing dependence on suppliers, which increases potential exposure to events that could affect the delivery of services to our customers. The group has taken numerous initiatives to mitigate these risks and adapt to changes in the regulatory framework, the focus being on strengthening its ability to recover from disruptive events affecting its core operations.
For more information, see the 'Risk, compliance & conduct management' chapter of the 2024 Annual report.
|
|
|
|
|
|
|
Access 2024 Annual Report available on the Santander Group website |
Operational risk reporting should cover the following objectives:
•Provide the heads of business units and support functions with the data they need to manage their risks and meet their objectives and strategies.
•Provide senior management with the information it needs to establish, review and where appropriate, modify business strategies and risk profiles.
•Provide the operational risk function with the information necessary to efficiently discharge its duties.
•Comply with the information requests of supervisory and regulatory bodies.
The business and support functions of all group entities are responsible for identifying, assessing and communicating their operational risks. The Operational Risk function in each Group unit collects information from all business and support functions and reports on it in established local forums.
Subsequently, the corporate Operational Risk function consolidates the information available from each unit in order to provide a comprehensive and complete overview of the group's operational risk profile.
At the group level, the process of consolidating and reporting operational risk information is divided into the following phases:
•Reception of information: the local operational risk functions submit various types of information to the corporate operational risk function with the frequency that is specified in the related procedures and guidelines. Although information can be sent via various channels, the Heracles corporate tool is the primary tool for collecting and recording information.
•Consolidation and processing of the information: once all the information has been received, the corporate operational risk function conducts a qualitative analysis, checking the suitability and consistency of the data and the main deviations.
•Use of information: the consolidated information is used for reporting to external parties as well as to the group's senior management. The reports' content is updated and developed in response to the needs of the governing bodies.
Heracles is the Golden Source of the operational risk data of the Group. One of its main components is the database of events and losses for this risk, which is used in internal and regulatory reporting and in the calculation of economic capital. In addition, Heracles contains all the necessary tools for operational risk analysis and management: controls, risks, metrics, scenarios and mitigation measures. Its functionality integrates all these programs through the use of common taxonomies applied in the different control communities and common methodologies for assessing risks and the effectiveness of controls. Heracles is also the tool used to perform certifications related to various regulations such as SOX, Volcker and FATCA.
Risk mitigation is one of the core elements of the operational risk framework and consists of continuous monitoring of risks exposure to identify risks above established levels, implement control procedures, provide training and reduce the occurrence of events and losses. This information is shared on a regular basis with the governing bodies in order to ensure proper monitoring and control.
For Santander, insurance is also a key element in operational risk management. The Corporate Insurance function is responsible for the use of risk transfer formulas to optimize and safeguard the bank´s financial results. The group constantly monitors the appropriate implementation of policies and procedures for managing insurable risks, in collaboration with the relevant group areas that contribute to their correct execution in the various units.
2024 Pillar 3 Disclosures Report 205
For further information on the specific management of the principal operational risks, as well as global insurance programs, please refer to the 'Risk, compliance & conduct management' of the 2024 Annual report.
|
|
|
|
|
|
|
Access 2024 Annual Report available on the Santander Group website |
The following are the key operational risk management and control processes:
•Strategic planning: covers the activities necessary to define the Group's objective operational risk profile, including setting the risk appetite, estimating losses annually and reviewing the management perimeter.
•Identification and assessment of operational risk: aims to identify the risks and factors that may cause operational risk in the organisation and assess their potential impact quantitatively or qualitatively. The first lines of defence, which include all organisational units of the group, are responsible for identifying and assessing the operational risks in their activities.
•Continuous monitoring of the OR profile: this process aims to regularly analyse available information on the nature and extent of the risks incurred in the development of the group's activities through an adequate alerts system, based on available tools such as indicators and escalation processes.
•Risk response decisions including risk mitigation and risk transfer measures: once the operational risk assessment has been carried out, it is important to identify risk mitigation measures to prevent risks from occurring and, if necessary, to take corrective measures to minimise the economic impact of the risks that have occurred. The identification and implementation of such risk mitigating measures is an ongoing process and particularly important for adequate risk management.
•Information: information includes obtaining, disseminating and making available the information necessary for decision-making to the relevant persons. The information processes are carried out in accordance with the standards and criteria established in each case. See the OVA and OVB tables for more information about this process.
The group has defined an organisational model with three lines of defence for the structure and organisation of operational risk management in order to meet regulatory requirements and in to be in line with best practises in the banking sector:
•The first line of defence includes all business units and support functions. The first line of defence is responsible for managing the operational risk generated in its area. Its main function within the operational risk management and control model is to identify, assess, monitor, mitigate and communicate the risks.
•The second line of defence comprises the operational risk control function within the Risk division. Its functions include: designing, maintaining and developing the operational management and control model, while promoting the development of a risk culture throughout the Group; encouraging business units and support functions to monitor and effectively manage identified risks in accordance with established limits; and ensuring that the management bodies receive adequate information on all relevant risks for decision-making.
•At Santander, the Internal Audit is the independent body that performs the functions of the third line of defence. Its functions include: verifying that the risks associated with the group's activities are adequately covered; monitoring the compliance, effectiveness and efficiency of the internal control systems of operational risk; assessing the state of implementation of the operational risk management and control model in the group; and making recommendations for continuous improvement to all functions involved in OR management.
For more information on risk measurement and control tools and reporting of operational risk, please refer to the EU OVA table of this document, and the 'Risk compliance & conduct management' of the 2024 Annual report.
|
|
|
|
|
|
|
Access 2024 Annual Report available on the Santander Group website |
206 2024 Pillar 3 Disclosures Report
8.2. Capital requirements for Operational Risk
This section covers the letter (b) of the qualitative requirement ORA - Qualitative information on operational risk.
Santander uses the standardised approach to calculate the capital requirements for operational risk, as established in the CRR.
The resolution was taken by the Board of Directors on 22nd June 2007 and reported to Banco de España's general supervisory department by the second vice chairman and chief executive officer on 29th June 2007.
Under the standardised approach, capital requirements are calculated on the basis of relevant income, which is defined as the sum of the following components of the income statement:
•Interest and similar income
•Interest expense and similar charges
•Income from equity instruments
•Fee and commission income
•Fee and commission expense
•Trading gains (net)
•Exchange differences (net)
•Other operating income (earnings)
The CRR also defines the following segmentation of business lines for this method:
•Corporate finance
•Trading and sales
•Retail brokerage
•Commercial banking
•Retail banking
•Payment and settlement
•Agency services
•Asset management
Relevant income
Under the standardised approach, capital requirements are calculated as the simple average over the last three years of the aggregation, for each year, of the greater of zero or the sum of relevant income across each of the business lines, multiplied by the weight assigned to each business line.
The mathematical expression of these requirements is as follows:
Where:
RI1-8 = Relevant income of each business line, with the appropriate sign, in accordance with the CRR.
ß1-8 = Weight applicable to each business line, in accordance with the CRR.
The Financial Accounting and Control division is responsible for obtaining data on relevant income, allocating it to the various business lines and calculating the capital requirements.
Santander obtains the figure for relevant income from the consolidated management information by business line. This information is generated from accounting information.
Consolidated management information is published quarterly in aggregate form and is the basis on which the budgetary compliance of the businesses is measured. This is prepared by the Management Control area, which regulates the business lines of all the group's units based on corporate criteria, which all units must apply when drawing up their management information.
The following chart shows the distribution of capital by business line at 31st of December 2024.
|
|
|
|
|
|
| Capital distribution by business line |
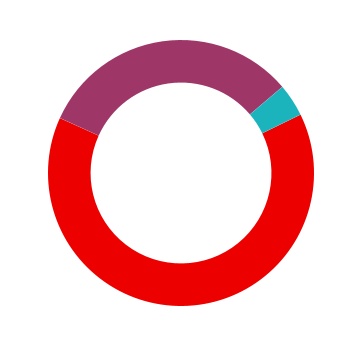
|
|
|
|
|
|
|
|
|
|
|
|
| n |
Retail Banking |
64% |
| n |
Commercial Banking |
32% |
| n |
Others |
4% |
|
|
|
|
|
|
|
|
|
|
|
|
2024 Pillar 3 Disclosures Report 207
Changes in capital requirements and RWA for operational risk from 2023 to 2024 are shown below:
|
|
|
|
|
|
|
|
|
| Table 86.Changes in capital requirements for operational risk |
|
| EUR million |
|
|
|
|
|
|
2024 |
|
Capital |
RWA |
| Starting figure (31/12/2023) |
5,362 |
67,022 |
| Perimeter |
— |
— |
| Exchange rate effect |
(174) |
(2,177) |
| Change in business |
601 |
7,507 |
| Ending figure (31/12/2024) |
5,788 |
72,351 |
The standardised approach imposes higher capital requirements for financial institutions operating in jurisdictions with high net interest income, which are often associated with a high risk premium but not necessarily greater operational risk. To avoid this undesired effect, EU legislation (Regulation 575/2013/EU) provides for the use of the alternative standardised approach by businesses that meet certain conditions, subject to the supervisor's approval. This approach uses a standardised indicator calculated by multiplying certain balances by 3.5%, thereby providing an average which is more in line with the unit's operational risk.
The European Central Bank issued on 3rd February 2016 the authorisation for the alternative standardised approach to be used to calculate consolidated capital requirements for operational risk at Banco Santander Brasil, S.A.
The European Central Bank also issued authorisation for the alternative standardised approach to be used to calculate consolidated capital requirements for operational risk at Banco Santander México S.A., on 12 July 2017.
|
|
|
|
|
|
|
|
|
|
|
|
|
|
|
|
|
|
|
|
|
| Table 87.OR1 - Operational risk own funds requirements and risk-weighted exposure amounts |
|
EUR million |
|
|
|
|
|
|
|
|
|
|
|
|
|
|
|
|
|
2024 |
|
|
a |
b |
c |
d |
e |
|
|
Relevant indicator |
Own funds requirements |
Risk weighted exposure amount |
|
|
Year-3 |
Year-2 |
Last year |
|
|
| 1 |
Banking activities subject to basic indicator approach (BIA) |
|
|
|
|
|
| 2 |
Banking activities subject to standardised (TSA) / alternative standardised (ASA) approaches |
40,076 |
45,047 |
49,035 |
5,788 |
72,351 |
| 3 |
Subject to TSA: |
33,440 |
38,690 |
42,875 |
|
|
| 4 |
Subject to ASA: |
6,637 |
6,357 |
6,160 |
|
|
| 5 |
Banking activities subject to advanced measurement approaches AMA |
|
|
|
|
|
208 2024 Pillar 3 Disclosures Report
[THIS PAGE INTENTIONALLY LEFT BLANK]
2024 Pillar 3 Disclosures Report 209
210 2024 Pillar 3 Disclosures Report
|
|
|
|
|
|
|
|
|
|
|
|
|
|
|
|
|
|
|
|
|
|
|
|
|
|
|
|
|
|
|
|
|
|
|
|
|
|
9.1. Liquidity and funding risk |
|
|
|
|
|
|
|
|
|
|
|
|
|
|
|
|
|
|
|
|
|
|
|
|
|
|
|
|
|
|
|
|
|
|
|
|
|
|
|
|
|
|
|
|
|
|
|
|
|
|
|
|
|
|
|
|
|
|
|
|
|
|
|
|
|
|
|
|
|
|
|
|
|
|
|
|
|
|
|
|
|
|
|
|
|
|
|
|
|
|
|
|
|
|
|
|
|
|
|
9. LIQUIDITY RISK |
2024 Pillar 3 Disclosures Report 211
Liquidity risk entails the potential losses that may be incurred by an entity as a result of its inability to secure funding on the market and/or the higher borrowing costs of new sources of finance.
This section covers the LIQA – Liquidity risk management and LIQB – Qualitative information on LCR requirements, which complements template EU LIQ1. It also complies with sections (d), (e), (f) and (g) of OVA – Institution risk management approach.
|
|
|
|
|
|
|
|
|
| Main figures |
|
|
| Million euros |
|
|
|
2024 |
2023 |
| Liquidity Coverage Ratio |
|
|
| Total high-quality liquid assets (HQLA) (Weighted value - average) |
330,492 |
|
323,188 |
|
| Cash outflows - Total weighted value |
275,509 |
|
274,162 |
|
| Cash inflows - Total weighted value |
73,682 |
|
70,643 |
|
| Total net cash outflows (adjusted value) |
201,827 |
|
203,519 |
|
| Liquidity coverage ratio (%) |
158% |
159% |
| Net Stable Funding Ratio |
|
|
| Total available stable funding |
1,198,180 |
|
1,139,711 |
|
| Total required stable funding |
954,260 |
|
924,843 |
|
| NSFR ratio (%) |
126% |
123% |
9.1. Liquidity and funding risk
Our structural liquidity management aims to optimize maturities and costs and to avoid undesired liquidity risks in funding Santander’s operations.
It follows these principles:
•Decentralized liquidity model.
•Medium- and long-term (M/LT) funding needs must be covered by medium- and long-term instruments.
•High contribution from customer deposits due to the retail nature of the balance sheet.
•Wholesale funding sources diversified by instrument, investor, market, currency and maturity.
•Limited use of short-term funding.
•Sufficient liquidity reserves (including standing facilities/discount windows at central banks) to be used in adverse situations.
•Group and subsidiary compliance with regulatory liquidity requirements.
The requirements of the EU LIQA table are addressed in the 'Economic and financial review' chapter of the 2024 Annual report.
|
|
|
|
|
|
|
Access 2024 Annual Report available on the Santander Group website |
9.1.1. Liquidity Coverage Ratio (LCR)
Description of the degree of centralisation of liquidity management and interaction among the Group's units.
The Group has adopted a decentralised funding model through a structure of autonomous subsidiaries that are self-sufficient in terms of liquidity.
Each subsidiary is responsible for covering the liquidity needs arising from its current and future business, either through deposits secured from its customers in its area of influence or through the wholesale markets in which it operates, within a management and supervision framework coordinated at the Group level. Therefore, each subsidiary manages and monitors its own LCR ratio, ensuring that it remains above the regulatory limits specifically established for that subsidiary at all times.
This funding model has proven itself to be highly effective during times of high market stress, as it prevents problems in one area from impacting the funding capacity of other areas and, therefore, of the Group as a whole, which can happen with centralised funding models.
The LCR detailed herein was calculated at the request of the ECB (Consolidated LCR), using a consolidation methodology that does not take into account any surplus liquidity exceeding 100% of the LCR outflows and is subject to restrictions (legal or operational) on transferability to third countries, including if the surplus liquidity can be used to
212 2024 Pillar 3 Disclosures Report
cover additional outflows within the own country, which is not subject to any restrictions.
Additionally, the Group calculates a ratio (Group LCR) using an internal methodology that determines the minimum common percentage of simultaneous coverage in all the Group's jurisdictions, while considering all existing restrictions on the transfer of liquidity to third countries. This is the methodology that most accurately reflects the Group's resilience to liquidity risk.
Explanation of the main drivers and inputs that contribute to the LCR
The Group's consolidated ratio is largely determined by the individual ratios of its three main units: the parent company, Santander UK and Santander Brazil. These units acquire most of their funding from retail deposits, which are stable liabilities that generate fewer potential outflows from the LCR ratio. Most cash outflows from the LCR ratio stem from wholesale funding, which is considerably more unstable, although the Group typically minimises and diversifies these maturities. Moreover, the Group's stock of liquid assets is of very high quality; on average approximately 97% of the assets which form part of the LCR numerator are Level 1. This is due to the units' assets portfolio mainly comprising public debt of the countries where the Group is present or countries with a good credit rating.
The Pillar 3 data submitted for the LCR is calculated based on the annual average of end of month figures.
The Group LCR ratio as end of December 2024 was 168%. This ratio is calculated using an internal methodology that determines the common minimum percentage of simultaneous coverage in all Group jurisdictions, taking into account all existing restrictions on the transfer of liquidity in third countries. This methodology reflects more accurately the Group’s resilience to liquidity risk.
This internal ratio is very much in line with that which would be achieved by applying the approach followed until mid-2024, which did not include restrictions on the transfer of liquidity between subsidiaries.
The consolidated LCR ratio as end of December 2024 was 153%, comfortably exceeding internal and regulatory requirements. This ratio is calculated, following the ECB requirement, using a consolidation methodology that does not take into account any excess liquidity in excess of 100% of the LCR outflows and that is subject to transferability restrictions (legal or operational) in third countries, even if such excess liquidity can be used to cover additional outflows within the country itself, which is not subject to any restrictions.
However, since the Group manages liquidity in a decentralized manner, consolidated metrics are not considered a representative indicator of its liquidity position.
Key to these levels was the size of the HQLA buffers upheld by all subsidiaries. The Group´s strong stable retail deposit base and low dependence on short-term funding make the movements in the commercial gap and the issuances maturities as key drivers of the LCR.
Composition of the liquidity buffer
The Group's liquidity buffer consists mainly of Level 1 assets (97%): cash and sovereign debt, with extensive diversification across issuers. In addition to the regulatory liquidity buffer,
the Group has an internal buffer that monitors the positions of other non-pledged liquid assets available to be used immediately as collateral to obtain additional funding.
Concentration of funding and liquidity sources
A diversified funding base is a key element in Santander´s liquidity risk management; and the principles listed below are established to achieve this objective: subsidiaries must have effective diversification in sources, products, and funding terms, limiting reliance on short-term wholesale funds. Additionally, the needs arising from medium-and long-term activities must be financed by medium-and long-term instruments.
The Group has a set of additional metrics in order to identify and monitor those counterparties that are of such significance that withdrawal of the funding they are providing to the entity could trigger liquidity problems. During the first half of 2024, the Group levels of concentration risk were within management limits, ensuring diversity of wholesale funding at subsidiary level.
Derivative exposures and potential collateral calls
Most derivative transactions involving Group entities are subject to collateral contracts covering the market value of the transactions. Liquidity risk related to the impact of adverse market scenarios leading to changes in the market values of derivatives, which generate additional liquidity, needs due to the requirement to post collateral. Group units include liquidity risk in their LCR ratios using the historical look-back approach, in which the most significant net change in 30 days over the preceding 24 months is calculated and then added as additional liquidity needs.
Currency mismatches in the LCR
The Group prepares its consolidated LCR ratio for each of its identified significant currencies, which reflect the geographies locations in which the Group's units operate: euro (EUR), US dollar (USD), pound sterling (GBP), Brazilian real (BRL), Mexican peso (MXN) and Chilean peso (CLP). Each of the entities also prepares its own LCR ratio in its significant currency. Units present a consistent position between the liquidity buffer and net outflows. Latin American countries have significant buffer positions in USD, so as to optimise the position and ensure high convertibility. The positions of foreign currencies are closely monitored, e.g. by conducting currency stress scenarios.
Other items in the LCR calculation not captured in the LCR disclosure template that the institution considers relevant for its liquidity profile
Contingent lines, which are the last driver of the LCR ratio, maintain a stable performance over time and line tracking and monitoring are performed daily.
For further details, see the 'Economic and financial review' chapter and the 'Risk, compliance & conduct management' chapter in the 2024 Annual report.
|
|
|
|
|
|
|
Access 2024 Annual Report available on the Santander Group website |
2024 Pillar 3 Disclosures Report 213
9.1.2. Net Stable Funding Ratio (NSFR)
The net stable funding ratio (NSFR) is a regulatory metric which represents required stable funding against available stable funding. This metric requires banks to maintain a solid balance sheet in which assets and off-balance sheet activities are funded with stable liabilities. The Group monitors this metric on a monthly basis, which goes beyond the regulatory requirement.
We benefit from a high weighting of customer deposits, which are more stable, from permanent liquidity needs deriving from commercial activity funded by medium- and long-term instruments and limited use of short-term funding. Combining them has enabled Santander to maintain a balanced liquidity structure, reflected in a NSFR higher than 100%, both at the Group level and at the level of our subsidiaries, at end of December 2024.
For more information, see the LIQ2 table at the end of the chapter.
9.1.3. Asset Encumbrance
This section covers the qualitative requirements AE4 - Accompanying narrative information.
Following the guidelines laid down by the European Banking Authority (EBA), the concept of asset encumbrance includes both on-balance-sheet assets pledged as collateral in transactions to obtain liquidity and off-balance-sheet assets that have been received and re-used for similar purposes, in addition to other assets associated with liabilities other than for funding reasons.
The Disclosures on Grupo Santander required by Commission Delegated Regulation (EU) 2017/2295 are presented below.
The scope used for the disclosures in this report is the same as the liquidity management scope on a consolidated basis, as regulated in CRR II 876/2019, which amends regulation CRR 575/2013.
There is a difference in the treatment of transactions which are pledged but not encumbered. These are treated as assets, which are pledged, due to them being delivered as collateral for financing transactions and are not considered to be encumbered (for all or part of the value of the asset) as these financing transactions are not fully drawn.
There are no cases of encumbered assets that do not lead to pledging or transfer.
The value of the exposure shown in the tables below was calculated as the median of the values disclosed in the regulatory information for the four quarters of the year, in line with European Banking Authority guidelines.
The vast majority of unencumbered assets are loans that could be pledged as collateral as presented in Table AE1.
214 2024 Pillar 3 Disclosures Report
|
|
|
|
|
|
|
|
|
|
|
|
|
|
|
|
|
|
|
|
|
|
|
|
|
|
|
|
|
|
| Table 88.AE1 - Encumbered and unencumbered assets |
|
|
EUR million |
|
|
|
|
|
|
2024 |
|
|
|
|
|
|
|
|
|
|
|
|
10 |
30 |
40 |
50 |
60 |
80 |
90 |
100 |
|
|
Carrying amount of encumbered assets |
Fair value of encumbered assets |
Carrying amount of unencumbered assets |
Fair value of unencumbered assets |
|
|
|
of which notionally eligible EHQLA and HQLA |
|
of which notionally eligible EHQLA and HQLA |
|
of which EHQLA and HQLA |
|
of which EHQLA and HQLA |
| 10 |
Assets of the reporting institution |
280,459 |
|
77,880 |
|
|
|
1,504,435 |
|
279,144 |
|
|
|
| 30 |
Equity instruments |
9,786 |
|
6,295 |
|
9,785.8965 |
|
5,655.8945 |
|
12,040 |
|
6,444 |
|
12,040.077 |
|
7,189.6615 |
|
| 40 |
Debt securities |
76,356 |
|
71,446 |
|
77,338 |
|
72,182 |
|
169,018 |
|
111,075 |
|
169,230 |
|
113,555 |
|
| 50 |
of which: covered bonds |
1,220 |
|
1,218 |
|
1,236 |
|
1,234 |
|
6,535 |
|
3,542 |
|
6,535 |
|
3,547 |
|
| 60 |
of which: securitisations |
5,467 |
|
4,008 |
|
4,975 |
|
3,466 |
|
15,473 |
|
10,694 |
|
16,062 |
|
8,918 |
|
| 70 |
of which: issued by general governments |
63,185 |
|
62,288 |
|
63,590 |
|
62,694 |
|
113,741 |
|
98,063 |
|
114,325 |
|
101,659 |
|
| 80 |
of which: issued by financial corporations |
11,979 |
|
8,494 |
|
12,428 |
|
8,699 |
|
31,196 |
|
10,180 |
|
30,649 |
|
9,242 |
|
| 90 |
of which: issued by non-financial corporations |
1,045 |
|
9 |
|
1,065 |
|
9 |
|
15,489 |
|
141 |
|
15,664 |
|
130 |
|
| 120 |
Other assets |
194,813 |
|
84 |
|
|
|
1,325,333 |
|
162,145 |
|
|
|
|
of which: loans |
168,646 |
|
— |
|
|
|
1,177,338 |
|
157,036 |
|
|
|
|
|
|
|
|
|
|
|
|
|
|
|
|
|
|
|
|
|
|
|
|
| Table 89.AE2 - Collateral received and own debt securities issued |
|
EUR million |
|
|
|
2024 |
|
|
|
|
|
|
|
|
|
10 |
30 |
|
40 |
60 |
|
|
Fair value of encumbered collateral received or own debt securities issued |
|
Unencumbered |
|
|
|
Fair value of collateral received or own debt securities issued available for encumbrance |
|
|
|
of which notionally eligible EHQLA and HQLA |
|
|
of which EHQLA and HQLA |
| 130 |
Collateral received by the reporting institution |
161,438 |
129,809 |
|
66,106 |
46,834 |
| 140 |
Loans on demand |
— |
— |
|
7 |
— |
| 150 |
Equity instruments |
7,934 |
4,982 |
|
11,139 |
6,633 |
| 160 |
Debt securities |
152,687 |
125,095 |
|
52,857 |
38,932 |
| 170 |
of which: covered bonds |
7,519 |
7,364 |
|
3,584 |
2,713 |
| 180 |
of which: securitisations |
27,262 |
26,098 |
|
8,284 |
2,898 |
| 190 |
of which: issued by general governments |
107,221 |
86,721 |
|
32,519 |
30,895 |
| 200 |
of which: issued by financial corporations |
43,402 |
37,287 |
|
13,470 |
4,744 |
| 210 |
of which: issued by non-financial corporations |
1,717 |
616 |
|
1,547 |
352 |
| 220 |
Loans and advances other than loans on demand |
1,191 |
— |
|
19 |
— |
| 230 |
Other collateral received |
— |
— |
|
211 |
— |
| 240 |
Own debt securities issued other than own covered bonds or securitisations |
64 |
— |
|
2,309 |
— |
| 241 |
Own covered bonds and asset-backed securities issued and not yet pledged |
|
|
|
24,510 |
— |
| 250 |
Total assets, collateral received and own debt securities issued |
449,502 |
162,812 |
|
|
|
2024 Pillar 3 Disclosures Report 215
Where our own covered bonds and asset-backed securities are retained and used, the pledged asset is included in Table 88 under loans and the related liability in Table 90.
The main sources and types of encumbrances and the level of over-collateralisation are set out in the following table:
|
|
|
|
|
|
|
|
|
|
|
|
| Table 90.AE3 - Sources of encumbrance |
|
|
|
2024 |
|
|
|
|
|
EUR million |
10 |
30 |
|
|
Matching liabilities, contingent liabilities or securities lent |
Assets, collateral received and own
debt securities issued other than covered bonds and securitisations encumbered |
|
| 10 |
Carrying amount of selected financial liabilities |
282,855 |
361,858 |
The table below shows the amount of own covered bonds and asset-backed securities retained and not used as collateral and the value of the related underlying assets.
|
|
|
|
|
|
|
|
|
| Table 91.Own covered bonds and asset-backed securities issued |
| EUR million |
|
2024 |
|
|
|
|
Non-encumbered |
|
Carrying amount of the underlying pool of assets |
Fair value of debt securities issued available for encumbrance |
| Own covered bonds and asset-backed securities issued |
31,174 |
24,510 |
| Retained covered bonds issued |
21,574 |
17,131 |
| Retained asset-backed securities issued |
9,600 |
7,451 |
The contribution to the group's level of asset encumbrance on a consolidated basis by the various units is uneven across geographic locations. The unit which the (relatively) most encumbered assets is the United States (Santander Consumer USA), due to the high weight of consumer business. In the Eurozone and the UK, both markets where covered bonds and securitisations are highly developed, the level of taxation of assets is similar and close to the Group average.
Asset encumbrance is also significant in Mexico, which is very active in asset repurchase agreements. The South American and Poland units have a relatively low level of asset encumbrance. Moreover, intra-group asset encumbrance is not material.
The encumbered assets are denominated in each unit in the same currency as the encumbrance, which is usually the unit's functional currency.
216 2024 Pillar 3 Disclosures Report
The following table shows quantitative information on the liquidity coverage ratio divided by quarters:
|
|
|
|
|
|
|
|
|
|
|
|
|
|
|
|
|
|
|
|
|
|
|
|
|
|
|
|
|
|
|
|
|
| Table 92.LIQ1 - Quantitative information of LCR |
|
|
|
|
|
|
|
|
|
|
|
|
|
a |
b |
c |
d |
|
e |
f |
g |
h |
|
Scope of consolidation (consolidated) |
Total unweighted value (average) |
|
Total weighted value (average) |
|
Currency and units (Million euros) |
|
| EU 1a |
Quarter ending on (DD Month YYY) |
dec'23 |
sep'23 |
jun'23 |
mar'23 |
|
dec'23 |
sep'23 |
jun'23 |
mar'23 |
| EU-1b |
Number of data points used in the calculation of averages |
12 |
12 |
12 |
12 |
|
12 |
12 |
12 |
12 |
|
HIGH-QUALITY LIQUID ASSETS |
|
|
|
|
|
|
|
|
|
| 1 |
Total high-quality liquid assets (HQLA), after application of haircuts in line with Article 9 of regulation (EU) 2015/61 |
|
|
|
|
|
330,492 |
330,156 |
330,818 |
332,445 |
|
CASH - OUTFLOWS |
|
|
|
|
|
|
|
|
|
| 2 |
retail deposits and deposits from small business customers, of which: |
622,516 |
618,791 |
617,810 |
614,704 |
|
42,634 |
42,252 |
42,202 |
42,329 |
| 3 |
Stable deposits |
371,694 |
368,778 |
365,597 |
358,567 |
|
18,585 |
18,439 |
18,280 |
17,928 |
| 4 |
Less stable deposits |
194,169 |
193,408 |
195,746 |
201,814 |
|
23,868 |
23,673 |
23,810 |
24,308 |
| 5 |
Unsecured wholesale funding |
292,540 |
293,780 |
296,729 |
296,495 |
|
144,179 |
145,914 |
148,458 |
149,574 |
| 6 |
Operational deposits (all counterparties) and deposits in networks of cooperative banks |
49,635 |
47,879 |
46,014 |
43,610 |
|
11,407 |
10,974 |
10,563 |
9,997 |
| 7 |
Non-operational deposits (all counterparties) |
229,279 |
232,842 |
237,452 |
240,070 |
|
119,146 |
121,881 |
124,632 |
126,762 |
| 8 |
Unsecured debt |
13,625 |
13,059 |
13,263 |
12,816 |
|
13,625 |
13,059 |
13,263 |
12,816 |
| 9 |
Secured wholesale funding |
|
|
|
|
|
10,810 |
10,931 |
10,626 |
10,555 |
| 10 |
Additional requirements |
233,271 |
231,149 |
230,225 |
229,941 |
|
48,508 |
48,160 |
47,289 |
46,533 |
| 11 |
Outflows related to derivative exposures and other collateral requirements |
22,751 |
23,068 |
22,961 |
22,850 |
|
21,905 |
22,282 |
22,250 |
22,158 |
| 12 |
Outflows related to loss of funding on debt products |
— |
— |
— |
— |
|
— |
— |
— |
— |
| 13 |
Credit and liquidity facilities |
210,520 |
208,081 |
207,264 |
207,090 |
|
26,603 |
25,878 |
25,039 |
24,376 |
| 14 |
Other contractual funding obligations |
23,359 |
23,337 |
21,915 |
21,322 |
|
21,617 |
21,584 |
20,187 |
19,589 |
| 15 |
Other contingent funding obligations |
171,372 |
171,606 |
172,898 |
169,881 |
|
7,761 |
8,333 |
8,959 |
9,310 |
| 16 |
TOTAL CASH OUTFLOWS |
|
|
|
|
|
275,509 |
277,175 |
277,721 |
277,890 |
|
CASH - INFLOWS |
|
|
|
|
|
|
|
|
|
| 17 |
Secured lending (e.g. reverse repos) |
101,697 |
94,082 |
86,674 |
82,118 |
|
3,942 |
3,496 |
3,065 |
2,949 |
| 18 |
Inflows from fully performing exposures |
63,441 |
64,233 |
64,855 |
65,634 |
|
46,298 |
46,614 |
46,348 |
46,327 |
| 19 |
Other cash inflows |
27,286 |
27,985 |
26,988 |
26,378 |
|
23,442 |
23,985 |
23,006 |
22,391 |
| EU-19a |
(Difference between total weighted inflows and total weighted outflows arising from transactions in third countries where there are transfer restrictions or which are denominated in non-convertible currencies) |
— |
— |
— |
— |
|
— |
— |
— |
— |
| EU-19b |
(Excess inflows from a related specialised credit institution) |
— |
— |
— |
— |
|
— |
— |
— |
— |
| 20 |
TOTAL CASH INFLOWS |
192,424 |
186,300 |
178,517 |
174,131 |
|
73,682 |
74,095 |
72,420 |
71,666 |
| EU-20a |
Fully exempt inflows |
— |
— |
— |
— |
|
— |
— |
— |
— |
2024 Pillar 3 Disclosures Report 217
|
|
|
|
|
|
|
|
|
|
|
|
|
|
|
|
|
|
|
|
|
|
|
|
|
|
|
|
|
|
|
|
|
| Table 92.LIQ1 - Quantitative information of LCR |
|
|
|
|
|
|
|
|
|
|
|
|
|
a |
b |
c |
d |
|
e |
f |
g |
h |
|
Scope of consolidation (consolidated) |
Total unweighted value (average) |
|
Total weighted value (average) |
|
Currency and units (Million euros) |
|
| EU 1a |
Quarter ending on (DD Month YYY) |
dec'23 |
sep'23 |
jun'23 |
mar'23 |
|
dec'23 |
sep'23 |
jun'23 |
mar'23 |
| EU-20b |
Inflows subject to 90% cap |
— |
— |
— |
— |
|
— |
— |
— |
— |
| EU-20c |
Inflows subject to 75% cap |
190,179 |
183,971 |
176,158 |
171,854 |
|
73,682 |
74,095 |
72,420 |
71,666 |
|
TOTAL ADJUSTED VALUE |
|
|
|
|
|
|
— |
— |
— |
| EU-21 |
LIQUIDITY BUFFER |
|
|
|
|
|
319,672 |
327,674 |
330,818 |
332,445 |
| 22 |
TOTAL NET CASH OUTFLOWS |
|
|
|
|
|
201,827 |
203,080 |
205,301 |
206,224 |
| 23 |
LIQUIDITY COVERAGE RATIO* |
|
|
|
|
|
158% |
161% |
161% |
161% |
|
|
|
|
|
|
|
|
|
|
|
|
TOTAL ADJUSTED VALUE (Internal Method) |
|
|
|
|
|
|
|
|
|
|
LIQUIDITY BUFFER |
|
|
|
|
|
323,439 |
322,982 |
323,370 |
323,272 |
|
TOTAL NET CASH OUTFLOWS |
|
|
|
|
|
202,114 |
203,874 |
206,294 |
207,375 |
|
LIQUIDITY COVERAGE RATIO |
|
|
|
|
|
156% |
158% |
157% |
156% |
|
* Liquidity coverage ratio is the average of 12 months |
|
|
|
|
|
|
|
|
|
|
* Liquidity coverage ratios are calculated following the regulatory guidelines required by the ECB. |
|
|
|
|
|
|
|
|
|
218 2024 Pillar 3 Disclosures Report
Details of the qualitative information regarding the liquidity coverage ratio is shown below:
|
|
|
|
|
|
|
|
|
| Table 93.LIQB on qualitative information on LCR, which complements template EU LIQ1 |
|
|
|
|
|
2024 |
|
Qualitative information - Free format |
| (a) |
Explanations on the main drivers of LCR results and the evolution of the contribution of inputs to the LCR’s calculation over time |
The Pillar 3 data submitted for the LCR is calculated based on the annual average of end of month figures.
The Group LCR ratio as end of December 2024 was 168%. This ratio is calculated using an internal methodology that determines the common minimum percentage of simultaneous coverage in all Group jurisdictions, taking into account all existing restrictions on the transfer of liquidity in third countries. This methodology reflects more accurately the Group’s resilience to liquidity risk.
The consolidated LCR ratio as end of December 2024 was 153%, comfortably exceeding internal and regulatory requirements. This ratio is calculated, at the request of the ECB, using a consolidation methodology that does not take into account any excess liquidity in excess of 100% of the LCR outflows and that is subject to transferability restrictions (legal or operational) in third countries, even if such excess liquidity can be used to cover additional outflows within the country itself, which is not subject to any restrictions. However, since the Group manages liquidity in a decentralized manner, consolidated metrics are not considered a representative indicator of its liquidity position.
Key to this levels was the size of the HQLA buffers upheld by all subsidiaries. Group´s strong stable retail deposits base and low dependence on short-term funding make the movements in the commercial gap and the issuances maturities as key drivers of the LCR. |
| (b) |
Explanations on the changes in the LCR over time |
Santander Group has maintained the LCR at a stable and comfortable level during the first half of 2024, performing a slight increase mainly driven by an increment in the medium and long-term issuance activity, allowing the ratio to be kept comfortably above the regulatory and internal limits. |
| (c) |
Explanations on the actual concentration of funding sources |
A diversified funding base is a key element in Santander´s liquidity risk management; and the principles listed below are established to achieve this objective: subsidiaries must have effective diversification in sources, products, and funding terms, limiting reliance on short-term wholesale funds. Additionally, the needs arising from medium and long-term activities must be financed by medium and long-term instruments.
The Group has a set of additional metrics in order to identify and monitor those counterparties that are of such significance that withdrawal of the funding they are providing to the entity could trigger liquidity problems. During the first half of 2024, the Group levels of concentration risk were within management limits, ensuring diversity of wholesale funding at subsidiary level. |
| (d) |
High-level description of the composition of the institution`s liquidity buffer. |
The Group buffer is mainly composed by Level 1 assets (97%) including central bank reserves and sovereign debt, well diversified between different issuers. Additional to the regulatory buffer, the Group has an internal buffer with a set of unencumbered liquid assets that are available for immediate use as collateral to obtain additional funding. |
| (e) |
Derivative exposures and potential collateral calls |
Other contingent exposures are limited as (i) the derivatives position is covered by collateral, and (ii) credit and liquidity lines are monitored daily with a limited impact.
|
| (f) |
Currency mismatch in the LCR |
Regarding the composition by currency, the units present a consistent position between buffer composition and net outflows. Occasionally some units in Latino America present higher positions on USD buffers in order to optimize the position while ensuring strong currency convertibility. |
| (g) |
Other items in the LCR calculation that are not captured in the LCR disclosure template but that the institution considers relevant for its liquidity profile |
There are no other relevant items in the LCR calculation not captured in the LCR disclosure template |
2024 Pillar 3 Disclosures Report 219
The following table shows the information on the stable funding ratio divided by residual maturity:
|
|
|
|
|
|
|
|
|
|
|
|
|
|
|
|
|
|
|
|
|
|
|
|
| Table 94.LIQ2 - Net Stable Funding Ratio (NFSR) |
|
|
EUR million |
a |
b |
c |
d |
e |
|
|
(in currency amount) |
Unweighted value by residual maturity |
Weighted value |
|
No maturity |
< 6 months |
6 months to < 1 year |
1 year |
| 1 |
Capital elements and instruments |
111,560 |
— |
— |
18,443 |
130,003 |
| 2 |
|
Own funds |
111,560 |
— |
— |
18,443 |
130,003 |
| 3 |
|
Other capital instruments |
|
— |
— |
— |
— |
| 4 |
Retail deposits |
|
618,621 |
17,274 |
9,065 |
601,735 |
| 5 |
|
Stable deposits |
|
401,233 |
6,054 |
2,172 |
389,094 |
| 6 |
|
Less stable deposits |
|
217,388 |
11,220 |
6,894 |
212,641 |
| 7 |
Wholesale financing: |
|
568,937 |
63,256 |
260,737 |
431,392 |
| 8 |
|
Operational deposits |
|
53,563 |
— |
— |
26,781 |
| 9 |
|
Other wholesale financing |
|
515,375 |
63,256 |
260,737 |
404,611 |
| 10 |
Interdependent liabilities |
|
2,571 |
— |
— |
— |
| 11 |
Other passives: |
14,409 |
130,616 |
12,633 |
32,015 |
35,050 |
| 12 |
|
Liabilities derived from the net stable financing ratio |
14,409 |
|
|
|
|
| 13 |
|
All other liabilities and equity instruments not included in the above categories |
|
130,616 |
12,633 |
32,015 |
35,050 |
| 14 |
Total stable financing available (FED) |
|
|
|
|
1,198,180 |
| 15 |
Total high-quality liquid assets (ALAC) |
|
|
|
|
9,816 |
| EU-15a |
Encumbered assets with a residual maturity of one year or more in a coverage pool |
|
1,596 |
1,807 |
43,364 |
39,752 |
| 16 |
Deposits held in other financial institutions for operational purposes |
|
1,785 |
97 |
657 |
1,599 |
| 17 |
Loans and securities executed: |
|
321,396 |
99,710 |
723,185 |
706,712 |
| 18 |
|
Securities financing operations with financial clients guaranteed by ALAC level 1 subject to a 0% haircut. |
|
100,254 |
6,459 |
4,677 |
9,539 |
| 19 |
|
Securities financing operations with financial clients guaranteed by other assets and loans to financial institutions |
|
41,191 |
7,414 |
37,027 |
44,147 |
| 20 |
|
Loans to non-financial corporate clients, loans to retail clients and small businesses, and loans to sovereigns, and PSEs, of which: |
|
131,626 |
71,461 |
323,085 |
607,889 |
| 21 |
|
With a risk weight of less than or equal to 35% according to the Basel II Standardized Approach to credit risk |
|
28,323 |
13,176 |
60,924 |
269,892 |
| 22 |
|
Residential mortgages in foreclosure, of which: |
|
3,725 |
3,829 |
318,740 |
— |
| 23 |
|
With a risk weight of less than or equal to 35% according to the Basel II Standardized Approach to credit risk |
|
2,317 |
2,529 |
295,053 |
— |
| 24 |
|
Other loans and securities that are not in default and are not considered ALAC, including publicly traded stocks and on-balance sheet trade finance products |
|
44,601 |
10,548 |
39,656 |
45,136 |
| 25 |
Interdependent assets |
|
2,522 |
— |
— |
— |
| 26 |
Other assets: |
|
108,245 |
3,749 |
159,239 |
184,439 |
| 27 |
|
Physically traded commodities |
|
|
|
24 |
20 |
| 28 |
|
Assets deposited as initial margin for derivative contracts and contributions to CCP default funds |
|
560 |
14 |
10,392 |
9,321 |
220 2024 Pillar 3 Disclosures Report
|
|
|
|
|
|
|
|
|
|
|
|
|
|
|
|
|
|
|
|
|
|
|
|
| Table 94.LIQ2 - Net Stable Funding Ratio (NFSR) |
|
|
EUR million |
a |
b |
c |
d |
e |
|
|
(in currency amount) |
Unweighted value by residual maturity |
Weighted value |
|
No maturity |
< 6 months |
6 months to < 1 year |
1 year |
| 29 |
|
Assets derived from the net stable financing ratio |
|
15,476 |
|
|
1,067 |
| 30 |
|
NSFR derivative liabilities before deducting posted variation margin |
|
25,895 |
|
|
1,295 |
| 31 |
|
All other assets not included in the above categories |
|
66,314 |
3,734 |
148,823 |
172,735 |
| 32 |
Off-balance sheet items |
|
227,122 |
2,824 |
5,647 |
11,942 |
| 33 |
Total RSF |
|
|
|
|
954,260 |
|
|
|
|
|
|
|
|
|
NSFR |
|
|
|
|
2024 |
|
Millions of euros |
Weighted value |
| 34 |
Net Stable Funding Ratio (%) |
|
|
|
|
126% |
2024 Pillar 3 Disclosures Report 221
222 2024 Pillar 3 Disclosures Report
|
|
|
|
|
|
|
|
|
|
|
|
|
|
|
|
|
|
|
|
|
|
|
|
|
|
|
|
|
|
|
|
|
|
|
|
|
|
|
|
|
|
|
|
|
|
|
|
|
|
|
|
|
|
|
|
|
|
|
|
|
|
|
|
|
|
|
|
|
|
|
|
|
|
|
|
|
|
|
|
|
|
|
|
|
|
|
|
|
|
|
|
|
|
10.9. Green Asset Ratio (GAR) |
|
|
|
10.9.1. Summary of key performance indicators (KPIs) on the Taxonomy-aligned exposures |
|
|
|
10.9.2. Mitigating actions: assets for the calculation of GAR |
|
|
|
10.9.3. GAR (%) |
|
|
|
|
|
|
|
|
|
|
|
|
|
|
|
|
|
|
|
|
|
|
|
|
|
|
|
10. ESG RISK |
2024 Pillar 3 Disclosures Report 223
10.1. Environmental risks
10.1.1. Business strategy and processes
This section covers the requirements on qualitative information on environmental risk, specifically, the point on business strategy and processes, for questions (a), (b) and (c)
This is a summary of the overall climate strategy integrated into the strategies of our five global businesses. For further detail, please refer to our annual report, available in our corporate website.
Our approach
Santander considers climate a material topic, having identified impacts, risks and opportunities in the double materiality assessment. Per legal requirements, below we disclose our transition plan, based on three pillars. The purpose of each pillar is to support our customers and the communities we serve in their transition objectives; assess our customers’ climate-related risks to manage the impact on their business and on our operations; and make progress with the alignment of our portfolios:
1
Supporting our customers in the green transition
Supporting our customers in the transition to a sustainable economy. Having achieved our target of raising or facilitating EUR 120 bn in green finance between 2019 and 2025 18 months in advance, we’re making headway with our next milestone of achieving EUR 220 bn by 2030. We are offering our customers guidance, advice and specific business solutions; and offering them the opportunity to invest in a wide range of products according to their sustainability preferences, with the target of reaching EUR 100 bn AUM in Socially Responsible Investments (SRI) by 2025.
2
Embedding climate in risk management
Embedding climate and environmental aspects in risk management implies adopting a risk-based approach to those factors, focusing on the most material sectors. We consider the risks stemming from climate and environmental factors in the overall risk management cycle, including a materiality assessment that informs the double materiality assessment and our sustainability strategy.
3
Aiming to align our activity with the Paris Agreement Goals
Aiming to align our portfolio with the Paris Agreement Goals to help limit global warming. We are setting sector portfolio alignment targets for 2030 in high-emissions portfolios. The progress on these targets is expected to reflect the progress of the economies we serve. We currently have seven targets in five sectors and alignment targets for our asset management activity.
Meanwhile, we continue to reduce our impact on the environment by implementing efficiency measures in our own operations and sourcing all our electricity from renewable sources by 2025.
224 2024 Pillar 3 Disclosures Report
We are making progress in integrating environmental risks into financial planning through the Group's strategic exercises, starting with the materiality assessment and its incorporation into the qualitative assessment of customers in the credit risk management framework. In addition, the evolution of environmental risks over time is indirectly considered in the climate scenarios used in the Group's strategic exercises (e.g. ICAAP). These scenarios consider the evolution of the policy framework and changing market attitudes, the level of development of low-carbon technologies or changes in consumer preferences, which may affect the level of vulnerability of risk areas to environmental events (e.g. floods leading to supply chain disruptions or droughts leading to scarcity of resources such as water), and the impact on the demographic evolution of populations in the geographies.
For fulfilling those purposes, within a broader set of ESG objectives, we have set some climate-related and environmental goals:
|
|
|
|
|
|
|
|
|
|
|
|
|
|
|
|
|
|
|
|
|
|
|
|
|
|
|
|
|
|
|
|
2019 |
2020 |
2021 |
2022 |
|
2023 |
2024 |
|
|
2025/2030 target |
Green finance raised and facilitated (accumulated EUR bn)A |
19.0 |
33.8 |
65.7 |
94.5 |
|
115.3 |
139.4 |
|
|
120 bn by 2025
220 bn by 2030 |
AUM in Socially Responsible Investments (accumulated EUR bn) |
|
|
27.1 |
53.2 |
|
67.7 |
88.8 |
|
|
100 bn by 2025 |
Thermal coal-related power & mining phase out (EUR bn) |
|
|
7.0 |
5.9 |
|
4.9 |
4.8 |
|
|
0 by 2030 |
Emissions intensity of power generation portfolioB |
0.21 |
0.17 |
0.19 |
0.16 |
|
0.15 |
|
|
|
0.11 tCO2e/MWh in 2030 |
Absolute emissions of oil & gas portfolioB |
23.84 |
22.58 |
27.43 |
20.94 |
|
20.27 |
|
|
|
16.98 mtCO2e in 2030 |
Emissions intensity of aviation portfolioB |
92.47 |
93.05 |
97.21 |
81.09 |
|
82.99 |
|
|
|
61.71 grCO2e/RPK in 2030 |
Emissions intensity of steel portfolioB |
1.58 |
1.40 |
1.36 |
1.24 |
|
1.38 |
|
|
|
1.07 tCO2e/tCS in 2030 |
Emissions intensity of auto-manufacturing portfolioB |
|
149 |
138 |
133 |
|
134 |
|
|
|
103 gCO2/vkm in 2030 |
Emissions intensity of auto-lending portfolioB,C |
|
|
|
137 |
|
133 |
|
|
|
75-89 gCO2e/vkm in 2030 |
Electricity from renewable sourcesD |
50 |
% |
57 |
% |
75 |
% |
88 |
% |
|
97% |
96 |
|
|
100% by 2025 |
|
|
|
|
|
|
|
|
|
|
|
|
A.Includes Grupo Santander's contribution to green finance: project finance; syndicated loans; green bonds; capital finance; export finance, advisory services, structuring and other products, to help customers transition to a low-carbon economy.
B.The figures displayed are the latest available given limited data availability from customers to assess financed emissions. We used Banco Santander's internal calculation methodology, which is based on the Partnership for Carbon Accounting Financials (PCAF).
C.Consumer lending for the purchase of passenger cars in Europe.
D.In countries where we can verify electricity from renewable sources at Banco Santander properties. It considers the 10 core markets where we operate.
|
2024 Pillar 3 Disclosures Report 225
Climate opportunities
Working with customers to support their transition objectives and carbon reduction emissions goals is key to progressing towards a low-carbon economy. To do this we identify business opportunities for transition financing assessing key sectors, working closely with our customers and with the knowledge of our sustainability experts. These opportunities inform our materiality assessment.
In addition, the Group calculates the ratio of green assets aligned with the European Taxonomy. In 2024, it amounts to 3.28% (vs. 2.6% in 2023). The volume of assets as at December 2024 aligned with the European taxonomy for mortgages is EUR 28.1 bn and auto is EUR 8.8 bn.
Also, from investment through our assets management business SAM, the top three climate-related opportunities embedded in our analysis model are:
•new climate solutions involving products and services that boost diversification, competitive advantage and revenue;
•lower-emission energy sources that benefit from less exposure to GHG emissions, lower costs, policy incentives; and
•efficient production and distribution of resources to lower operational costs and raise both production capacity and the value of fixed assets.
Our ambition
We continue working towards our ambition of net zero carbon emissions by 2050 by progressively setting specific actions to make headway with our three-pillar strategy.
Incentive policies and frameworks are key to driving the energy transition. The challenge goes beyond increasing the flow of capital from the regulated financial sector to funding the energy transition. We need to scale transition activity and the demand for solutions, which will require better risk-profitability profiles. Achieving climate objectives depends largely on the macroeconomic landscape and public policy.
Investment targets towards environmental objectives
To achieve our net-zero ambition, our main lever as a bank is supporting our customers in their efforts to transition to a low-carbon economy.
As a large financial institution, we have an opportunity to support our customers in their ambition to transition to low carbon business models. To this end, we continue enhancing our sustainable finance and advisory proposition, and financing in our global businesses.
To achieve this, we are:
1.Growing the green finance business, which entails drawing up a green finance strategy for the Group's businesses and delivering a strong value proposition for our customers;
2.Building the infrastructure that will support green finance across the Group. This means implementing the sustainable finance and investment classification system (SFICS); strengthening the controls to assess and manage greenwashing risk; and executing the data strategy to measure and monitor green finance results; and
3.Deploying well-trained commercial teams to capture opportunity.
In CIB (Corporate & Investment Banking), we have already reached EUR 139 billion in green finance raised and facilitated since 2019, achieving our EUR 120 billion target 18 months early and are working towards reaching EUR 220 billion by 2030.
Limits for assessing and addressing environmental risk
Our ESCC risk management policy establishes the standards for investing, and providing financial products and services to companies and customers in oil & gas, power generation and distribution, mining and metals, and soft commodities (especially retail customers dedicated to farming and livestock in the Amazon). It dictates prohibited activities and those that require special attention for the aforementioned sectors7.
These have been aligned our internal policies of sustainability and human rights, based on the market practices and the meetings with NGOs and other external stakeholders.
In this regard, we also use our ESCC policy to integrate nature and biodiversity conservation measures into financing and investment policies. Below, we summarise some of the limits associated with environmental risk management:
•Any projects or activities for oil & gas extraction, power generation or transmission, mining, manufacturing, plantations or other major infrastructure projects which put areas classified as Ramsar Sites, World Heritage Sites or by the International Union for Conservation of Nature (IUCN) as categories I, II, III or IV at risk. Additionally, projects that, in accordance with IFC Performance Standard 7 - Indigenous People, require Free, Prior and Informed Consent (FPIC) and do not meet IFC Performance Standard 7 and there is not a credible action plan to achieve compliance. Moreover, we include customer activities, business relationships or facilitation of transactions that are or can be proven to be linked to the commission of serious or gross violations of human rights (considering child labour, forced labour, discrimination at work, freedom of association, working conditions, grievance mechanisms for workers, occupational health and safety issues, impacts on communities and land grabbing) or international human rights law.
7 To the extent required by applicable law, customers and transactions involving activities enumerated in this section will be subject to an enhanced due diligence process to determine the unique risks presented prior to decisioning.
226 2024 Pillar 3 Disclosures Report
•Oil & gas: new oil exploration and production customers, except for specific financing operations for new renewable energy facilities. Also, project-related financing to oil upstream greenfield projects or any projects, or expansion of existing facilities, north of the Arctic Circle is included.
•Power generation: by 2030, any customer with more than 10% of revenue, on a consolidated basis, directly derived from coal fired power generation. New customers with more than 25% of revenue, on a consolidated basis, directly derived from coal fired power generation, except for transactions for the specific financing for new renewable energy facilities. In these exceptions, the customer must not be developing new coal power plants and/or expanding existing ones, have a robust, credible plan, with verifiable targets, which show the customer will reduce its revenue coming from coal power generation to 10% or below by 2030. Onboarding new clients with less than 25% of their revenue, on a consolidated basis, derived from coal-fired power generation is allowed, if they have a credible plan to reduce its revenue coming from coal power generation to 10% or below by 2030; and if they are not developing new coal power plants and/or expanding existing ones.
•Mining & metals: by 2030 customers that own thermal coal mines worldwide. New customers that own thermal coal mining operations and projects worldwide, except for transactions for the specific financing for renewable energy. In these exceptions, the customer must have a robust, credible plan, with verifiable targets, which show the customer will have no thermal coal by 2030. Project-related financing for new, or the expansion of thermal coal mines.
•Soft commodities: any customer that extracts native tropical wood species not certified to forest stewardship council (FSC) or any palm oil processors not certified to roundtable on sustainable palm oil (RSPO). Also, projects for developments in forested peatlands in High-Risk Geographies8.
This information is stated in the ESCC Policy.
Policies and procedures relating customer engagement on their strategies to mitigate and reduce environmental risks
This section covers the requirement on qualitative information on environmental risk, specifically, the point on business strategy and processes, for question (d)
A key element of our implementation strategy is the customer climate tiering approach. The outcome of this tiering approach is an assessment of our customers’ current and expected progress to align with our climate sector objectives.
In 2024 we implemented this approach for Automotive Manufacturing, in addition to existing target sectors (power, oil & gas, steel, aviation), and adapted it where necessary to account for sector differences. We review the climate tiering assessment for each sector every year to reflect our customers’ progress.
Our approach aims to facilitate the achievement of our emissions targets and to develop a strong understanding of
our customers’ transition strategies towards low-carbon business models.
This approach is supported by governance processes, involving various internal stakeholders, such as front office teams, risk reporting functions and senior management to guide the potential portfolio steering actions. It is structured around four main iterative steps: Collect, Assess, Engage and Review. We have used various internationally recognized references, and the Cambridge Institute for Sustainability Leadership (CISL) 'Let's Discuss Climate' guide as inputs and adapted them to our requirements and objectives.
Collect: we collect relevant information as part of regular customer dialogue and engagement. In addition, we source specific climate related information through tailored requests that contain transition-focused elements designed to help us better understand companies’ alignment strategies. Furthermore, we also seek to source reliable and consistent information from credible third parties to complement our understanding.
This information is collected and updated both at the customer onboarding stage, and as part of the regular business and risk assessment review with each customer, which is performed at least once a year.
Assess: our assessment consists of a two-step approach designed to categorize our customers according to their emissions pathway and perceived quality of their transition strategy.
The first step involves assessing how our customers’ emissions trajectory aligns with our current sectoral portfolio baseline and future sectoral portfolio targets. The second step assesses the quality of each customer’s transition plan. Our transition plan assessment methodology focuses on four pillars:
1.Targets: it focuses on the quality and ambition of the customer’s quantitative GHG emissions targets. Where possible, we assess short- and long-term, as well as absolute and intensity reduction targets.
2.Action plan: it considers the credibility of the customer’s alignment strategy. We assess the business strategy integration of climate change risks and opportunities; the existence of climate scenario planning; as well as time-bound action plans to achieve decarbonization targets.
3.Disclosure: it focuses on the transparency of reporting on historical emissions performance across all relevant scopes, the level of assurance, as well as the degree of reporting alignment with the TCFD. Where possible, it also includes assessing whether or not previous GHG emission targets were achieved.
4.Governance: it considers the level of management oversight and governance of the customer’s transition strategy. We assess the level of seniority of executives accountable for climate strategy, board committee oversight of climate change issues, and whether executive remuneration is linked to climate change performance.
We draw on established transition plan assessment methodologies, such as the Transition Pathway Initiative
8 High risk geographies are every country in Africa, plus Argentina (Chaco, Formosa, Santiago del Estero, Salta and Tucumán only), Bolivia, Brazil (the Legal Amazon and the north east of the country only), Cambodia, China, Colombia, Ecuador, Estonia, Guatemala, Honduras, India, Indonesia, Laos, Latvia, Lithuania, Madagascar, Malaysia, Myanmar, Nicaragua, Panama, Papua New Guinea, Paraguay, Peru, Russia, the Solomon Islands, Thailand, Vietnam and any customer declared 'unknown'. This list will be subject to review based on the expansion of agribusiness to new geographies.
2024 Pillar 3 Disclosures Report 227
(TPI), CDP, ACT (Assessing Low Carbon Transition), TCFD, as well as other related initiatives including the UK’s Transition Plan Taskforce (TPT).
Our transition plan assessment methodology includes higher weightings for assessment criteria deemed to be critical to credible transition plans, compared to lower weightings for those that are considered supporting criteria. The more highly weighted criteria are designed to prioritize focus areas for customer engagement.
Ultimately, our customer climate tiering system leads to four categories (Leader, Strong, Moderate and Weak).
|
|
|
|
|
|
|
|
|
| Two-step tiering system |
|
|
|
|
GHG emissions profile alignment
|
|
•Current GHG emissions profile
•Future targeted GHG emissions trajectory
•Assessment of alignment with Santander’s pathway
|
| ↓ |
|
|
|
Transition plan quality assessment
|
|
•Internal methodology to assess perceived quality of transition plans
•Developed using established transition plan assessment methodologies
|
|
|
|
|
|
|
|
|
|
| Transition Pillar |
|
Overview |
|
|
|
1. Targets |
|
Quality and ambition of quantitative targets to reduce GHG emissions |
|
|
|
| 2. Action plan |
|
Depth of decarbonization strategy to achieve GHG emissions reduction targets |
|
|
|
| 3. Disclosure |
|
Transparency on GHG emissions reporting across relevant scopes |
|
|
|
| 4. Governance |
|
Management oversight and governance of transition strategy |
|
|
|
|
|
|
|
|
|
|
|
|
|
|
|
| Tier Categories |
|
Description |
|
|
|
|
|
Tier 1 |
|
Leader |
|
•Emissions profile fully aligned with Santander’s pathway
•Strong transition plan
|
|
|
|
|
|
| Tier 2 |
|
Strong |
|
•Emissions profile fully aligned with Santander’s pathway but improvement needed in transition plan; or
•Strong transition plan but emissions profile partially aligned with Santander’s pathway
|
|
|
|
|
|
| Tier 3 |
|
Moderate |
|
•Emissions profile partially aligned with Santander’s pathway, but improvement needed in transition plan; or
•Emissions profile not aligned with Santander’s pathway, but strong transition plan
|
|
|
|
|
|
| Tier 4 |
|
Weak |
|
•Emissions profile not aligned with Santander’s pathway
•Weak transition plan
|
Internally organized training sessions were delivered to sector-specific relationship managers and Environmental Social Climate Change Risk (ESCC) analysts. These focused on gathering information to complete the transition plan quality assessment (the second step in our customer climate tiering system). These sessions were delivered by senior experts from our ESCC, Portfolio Alignment and Sustainability Solutions teams.
Expert resources from our global Sustainability Solutions team are made available for further education and advice on customers' transition plans assessment.
Engage with customers: our customer climate tiering system seeks to facilitate tailored transition dialogue to help lower-tiered customers move up to higher tiers over time.
In 2024, we focused our customer engagement efforts on oil & gas as well as lower-tiered customers in other sectors. We developed internal transition assessment dashboards for relationship managers, designed to aid the identification of customer-level priority areas, industry benchmarking, and opportunities to support our customers in financing their transition. Of the customers that are in scope of our targets, approximately three quarters included sustainability-related discussions in 2024.
In addition, on a wider scope of climate-related topics, we are engaging with various public and private organizations.
Review: the customer transition plan assessment is performed by relationship managers, in cooperation with ESCC risk analysts, followed by portfolio level reviews by Sustainability Solutions and Portfolio Alignment teams to determine final tierings. The portfolio level review is important to help identify key trends and challenges in each sector, as well as for future transition plan assessment methodology improvements.
Initial assessments were completed for both steps for all sectors where targets have been set. Subsequently, transition plan quality assessments were reviewed and enhanced, drawing on updated reference methodologies and sector-specific research. This led to improved guidance, more focused set of questions and the inclusion of additional sector- specific questions for assessing transition plan quality.
228 2024 Pillar 3 Disclosures Report
The figure below shows the breakdown of our climate tiering system output for all entities in scope of our original sector targets, by sum of drawn exposures as of the end of 2024.
Climate tiering aggregated for the sectors for which we had set targetsA
A. Based on 2024 year-end drawn exposure, according to portfolio alignment methodology, and including project finance
Of our corporate customers with drawn exposure where transition plan assessments were conducted in 2024, approximately:
•two-thirds have set quantitative emissions reduction targets on sector-material GHG scopes between 2030 and 2039;
•one-third have set, or committed to set, science-based targets (SBTi), if available for the sector;
•over two-thirds have a time-bound action plan to align their business, with almost half providing details of the expected proportional impact of different alignment levers, according to our assessment;
•over half provide details or commitments for CapEx alignment with future low-carbon solutions;
•over two thirds undertake some form of climate scenario planning; and
•over half have senior management remuneration linked to progress towards achieving their GHG emissions reduction targets.
10.1.2. Governance
This section covers the requirement on qualitative information on environmental risk, specifically, the point on governance, for questions (e), (h), and (g)
Governance bodies and frequency
We manage and review progress with sustainability at the highest level of the business. The board of directors is responsible, among other things, for approving the sustainability agenda and setting the sustainability strategy.
The responsible banking, sustainability and cultural committee proposes and oversees the development and implementation of the Group's sustainability strategy and policies, in support of the board of directors.
Other board committees also analyse specific sustainability topics. The audit committee is responsible for supervising and reviewing the financial and non-financial information process, as well as the internal control systems, to meet the most demanding international standards and complies with the guidelines established by the Committee of Sponsoring Organizations of the Treadway Commission (COSO).
The overseeing of material sustainability issues, as well as the main lines of action for their management, are periodically reviewed through the bodies shown below, which together form the governance of the function:j
ç
2024 Pillar 3 Disclosures Report 229
|
|
|
|
|
|
|
|
|
|
|
|
|
|
|
|
|
|
|
|
|
|
|
|
|
|
|
|
|
|
|
|
|
|
|
|
Board of directors
Prepares annual accounts and management report, which shall include non-financial statement,
and is presentation to the general shareholders' meeting
|
|
|
é |
|
é |
|
é é |
|
|
|
|
|
|
|
|
|
Risk supervision, regulation and compliance committee A
Reviews risk appetite statement proposals prior to board approval
|
|
Audit committee
Reviews company and Group financial statements, monitor legal requirements compliance and assesses information and internal control systems
|
|
Responsible banking, sustainability and cultural committee
Assists the board in fulfilling its oversight of the responsible business strategy and sustainability issues (company and Group)
|
|
|
|
|
|
|
|
|
|
|
|
|
|
|
|
|
|
|
|
|
|
|
|
|
|
|
|
|
|
|
|
|
|
|
|
|
|
|
|
|
|
|
é |
|
|
é |
|
|
é |
|
| Executive & management level (main bodies & functions) |
|
|
|
|
|
|
|
|
|
|
|
|
|
|
|
|
|
|
|
|
|
|
|
|
Risk control committee |
|
Accounting & financial management information corporate committee
Financial accounting & control function
|
|
Sustainability, risk, reporting and ESG businesses function |
|
|
|
|
|
|
|
|
|
|
|
|
|
|
|
|
|
|
|
|
|
|
|
|
|
|
|
|
|
|
|
|
|
| Defense lines: |
|
|
|
|
|
|
|
|
|
|
|
|
|
|
|
|
1st line of defence
(Business owners, general accounting and
management and sustainability function)
|
|
2nd line of defence
(Risk & compliance)
|
|
3rd line of defence
(Internal Audit)
|
|
|
|
|
|
|
|
|
¢ Overall responsibility ¢ Supervisory oversight é Reporting é Risk é Impact é Opportunities
A. The BRC works with the RBSCC to review ESG-related conduct risk, data protection risk, customer vulnerability, reputational issues, risk policies and how business units adopted these policies.
The above-mentioned governance bodies manage and monitor environmental risks which mainly derive from physical and transitional risks, including, when applicable, its potential legal implications.
Management body's integration of environmental risks, organizational structure both within business lines and internal control functions
This section covers the requirement on qualitative information on environmental risk, specifically, the point on governance, for question (f)
In 2024, we continued to embed climate management in business-as-usual across CIB, Risk and Sustainability. For instance, CIB strengthened its corresponding governance. And Wealth continued to reinforce and update the working groups and policies that oversee and coordinate its SRI strategy. Consumer has different working groups that meet monthly to address sustainability projects and issues, and quarterly to review progress in the sustainability agenda.
Beyond global businesses, a number of local units are engaged in a process coordinated by Group Responsible Banking. The objective is to progress the decarbonization agenda, promote knowledge and expertise sharing by local teams and seek synergy in the design of reliable transition plans.
Other corporate-level initiatives and groups that support governance meet regularly to implement our climate change agenda and inform on regulation updates. For example, our public policy sustainability working group updates on upcoming climate and sustainability regulation; a regulatory radar governance working group that meets quarterly to monitor the status of implementation of sustainability regulations and to assign responsibility for the implementation of regulatory initiatives to the Group's areas; an environmental footprint working group that measures our footprint and reviews ways to reduce it; and a sustainable bonds working group that oversees sustainable bonds issues from Group and its subsidiaries.
230 2024 Pillar 3 Disclosures Report
In addition, a new ESG Reporting & Internal Control team, set up in the second quarter of 2023, in the Financial Accounting & Management Control division oversees the disclosure, supervision and control of the ESG information the Group uses to meet regulatory requirements and stakeholder expectations. This year, the team worked with each area in question to make information gathering and the governance and control of disclosed information more automated and efficient. The emission reduction objectives of our own operations emissions (scopes 1 & 2) have been reviewed in the Group’s ESG Reporting Forum.
As part of our green transaction assessments, we created global, regional and local panels to provide additional scrutiny and validation, and coordination across the Group; agree on alabelling transactions as green, social or sustainable; and make sure that we use the same standards and procedures across our footprint. The Risk function leads these panels, which business, compliance and sustainability teams also take part in.
Finally, the internal audit function reviews climate risk, for more details see '10.2.2 Governance'.
Since 2020, the Group’s variable pay scheme and, since 2022, our long-term incentives, have considered green finance and the progress made with climate and other sustainability targets.
Santander integrates short-term, medium-term and long-term effects of environmental risks for the purposes of risk management through the integration of climate-related and environmental risk in our main strategic financial planning, that comprises annual budgeting, our three-year financial plan and the Group’s long-term strategic plan.
Alignment of the remuneration policy with environmental risk-related objectives
This section covers the requirement on qualitative information on environmental risk, specifically, the point on governance, for questions (i)
Grupo Santander’s remuneration policy reflects our strategic and long-term sustainability objectives. Variable pay is based on pre-determined, specific and quantifiable financial, sustainability-based and value-creation targets.
Our long-term incentives (LTI) scheme applies to our top 36 Groups' executives, including the Executive Chair and the CEO.
Sustainability has formed part of the last three LTI schemes, with a 20% weighting. The proposal for 2025-2027 will be subject to vote at the AGM in 2025.
Short-term variable remuneration has a qualitative and quantitative component. Under the qualitative component, sustainability has had a ±5% weighting in the Group, global businesses and subsidiaries since 2020. Short-term incentives apply to our top 236 Groups' executives and global and subsidiary corporate centre employees.
In 2024, 8% of the variable remuneration received by the Executive chair and the CEO has been linked to sustainability, while 2% of their total remuneration has been linked to climate actions.
The responsible banking, sustainability and cultural committee, remuneration committee, and board of directors approve these ESG incentive schemes.
The proposed parameters to assess ESG performance aim to reward progress with our main ESG metrics and embedding ESG in our management, as shown below:
|
|
|
|
|
|
Inclusive Culture |
Progress with inclusive culture and other initiatives such as accessibility. |
| Financial inclusion |
Progress with financial inclusion targets and other key initiatives in the social agenda (financial education, community investment, etc.). |
| Sustainable finance |
Progress with sustainable finance and socially responsible investment. |
| Climate |
Progress with our transition plan and the key levers to fulfil our net zero ambition. |
| Governance and cross-cutting matters |
Conducting our double materiality assessment, implementing sustainability policies, and enhancing data efficiency and quality. |
2024 Pillar 3 Disclosures Report 231
In 2024, shareholders at the AGM passed a board resolution on sustainability metrics for executives’ 2024-2026 long-term incentives (with a weighting of 20%), which are consistent with our public targets. Half of the sustainability dashboard covers supporting the transition to a low-carbon economy, including socially responsible investment and green finance raised and facilitated. Moreover, this line of action considers the requirement to develop a transition plan that enables a score of over 100%. Achieving a credible and comprehensive plan will depend on the regulatory and political landscape.
The executive directors’ variable remuneration consists of a single incentive scheme, linked to the achievement of short-and long-term objectives. It is structured as follows:
•The final amount of variable remuneration will be set at the start of the following year (2026) based on the target bonus amount and subject to compliance with the annual objectives described in the annual report.
•40% of the incentive will be paid immediately once the final amount has been set, and 60% will be deferred in equal parts paid out over five years and subject to long-term metrics:
◦The amount deferred over the first two years (20% of the total) will be paid in 2027 and 2028 on the condition that no malus clauses described in the annual report.
◦The amount deferred over the next three years (40% of the total) will be paid in 2029, 2030 and 2031, on the condition that no malus clauses are triggered and long-term targets are met. The long-term targets, described in the annual report, are:
A.Relative performance of Banco Santander's total shareholder return (TSR).
B.Return on tangible equity (RoTE).
C.Metrics linked to sustainability criteria.
In relation to ESG metrics, they determine the final payout of 20% of the portion of variable compensation tied to multi-year goals. Its achievement will depend on the progress made on the Group's Responsible Banking actions lines and associated targets: (i) women in executive positions, (ii) financial inclusion, (iii) socially responsible investment and (iv) supporting transition.
Regarding environmental aspects, these targets cover:
•Socially responsible investment in 2027 as a percentage of total assets under management:
|
|
|
|
|
|
Socially responsible investmentB (%) |
Coefficient |
| ≥ 21% |
1.25 |
| ≥ 19% but < 21% |
1 – 1.25A |
| ≥ 15% but < 19% |
0 – 1A |
| < 15% |
0 |
A. Increase of the coefficient is proportional to its position on this line of the scale.
B. Assets under management that meet the criteria of Santander’s Sustainable Finance and Investment Classification System (SFICS), over total assets under management.
•Supporting transition. This goal includes how we support our customers' transition through sustainable finance, and the progress on transition plan:
|
|
|
|
|
|
Business raised and facilitatedB between 2025 and 2027 (EUR bn) |
Coefficient |
| ≥ 220 |
1.25 |
| ≥ 165 but < 220 |
1 – 1.25A |
| ≥ 120 but < 165 |
1 |
| < 120 |
0 |
A. Increase of the coefficient is proportional to its position on this line of the scale.
B. Grupo Santander's contribution to the transition of our customers: green financing disbursed and facilitated by CIB, sustainable financing of Retail and Commercial banking and Digital Consumer Bank.
As regards the overall assessment of these ESG metrics, they will be measured jointly with the social risk targets set out in the section on Remuneration policy for social aspects objectives. Each ESG goal has a different weighting:
•Women in executive positions: 20%
•Financial inclusion: 20%
•Socially responsible investment: 10%
•Supporting transition: 50%
This information can be found in the 6.4 'Directors' remuneration policy for 2025, 2026 and 2027' section in the annual report.
|
|
|
|
|
|
|
Access 2024 annual report available on the Santander Group website |
232 2024 Pillar 3 Disclosures Report
10.1.3. Risk management
This section covers the requirement on qualitative information on environmental risk, specifically, the point on risk management, for questions (j), (l), (m), (n) and (q)
Integration of environmental factors in the risk framework: management, setting of limits and tools
At Grupo Santander, we manage climate and environmental factors with a special focus on those that are most material for the different risk types.
The management of these factors adopts a risk-based approach prioritizing climate and environmental aspects
based on the relevance and materiality in the Group and in the current landscape. We keep improving the consideration of the elements that stem from the transition to a low-carbon economy, the physical effects of climate change and biodiversity loss, and actions to consider negative impacts on nature.
In this section we explain how we consider environmental risks in the assessment of compliance with existing policies that affect risk management and, in particular, in the funding process by qualitatively assessing the environmental risks that may affect the assessment of their rating for CIB and Corporates portfolio customers in the sectors of the climate risk taxonomy.
Below we describe how we integrate these factors into the risk management cycle.
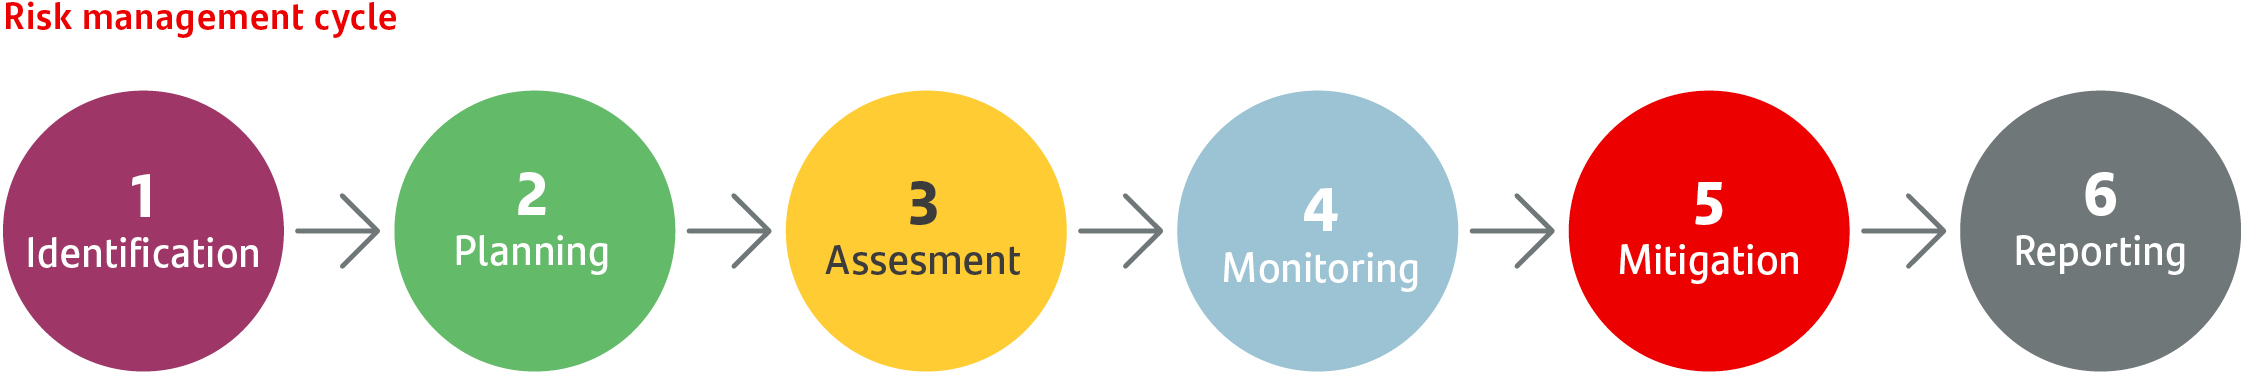
1. Identification
We conduct regular risk identification exercises to assess events that could threaten the Group's strategic plan. These exercises consider ESG risk factors — including mainly climate factors — with additional consideration of other factors such as greenwashing, environmental risks that go beyond climate (nature and biodiversity), social risks, among others.
Risk identification helps us understand the internal and external threats posed by the environment and climate change to our business model, profitability, solvency and strategy.
Moreover, our internal risk taxonomy, heatmaps and materiality assessments form the basis for identifying and classifying the material as environmental and climate-related risks in our portfolios.
2. Planning
We include risk management into the strategic planning process that has different time horizons, in addition to the ad-hoc analysis at each moment:
•One year for the short term (this is the standard time horizon for the short term in the Group).
•One to five years for the medium term (financial planning).
•More than five years for the long term (strategic plan).
3. Assessment
This phase of the risk management cycle encompasses a variety of tools and methodologies, as well as assumptions, used by the Group to manage ESG aspects, as factors that may impact existing risks across different time horizons. We assess these factors regularly according to regulatory frameworks and practices.
The assessment of the ESG factors that could be material due to their potential impact on Santander's risk profile is conducted considering the following aspects:
2024 Pillar 3 Disclosures Report 233
|
|
|
|
|
|
|
|
|
|
|
|
|
|
|
|
|
|
|
Identification of ESG drivers: we use recognized sources including but not limited to: TCFDA, UNEP-FI, ENCOREB, SBTNC, NGFSD , to identify climate and environmental aspects that can impact several risk types. We also use several tools for this exercise, including heatmaps, sectoral climate and environmental classification, historical information, idiosyncratic scenarios and forward-looking scenario projection to aid continuous monitoring. |
|
|
|
Analysis of the transmission channels: we analyse how the factors identified in the previous stage can materialize and impact on the risk types included in our risk management framework. They can be macroeconomic (e.g. socioeconomic, productive) and microeconomic (e.g. affecting household wealth and/or income) in nature. |
|
|
|
|
|
|
|
|
|
Assessment of the materiality of the potential impact on the main risks: in this stage, we analyse the potential impacts that could arise from the materialization of the risk factors previously identified through the transmission channels described, based on qualitative and/or quantitative approaches. |
|
|
|
Overview of a consolidated materiality: for internal and external disclosure of the materiality of ESG factors analysed, we aggregate the results of the impacts for each risk type in a consolidated report (detailed on the following pages), based on a five-point RAGE status (from Low to Very High) across the short, medium, and long term. |
A. Task Force on Climate-related Financial Disclosures
B. A materiality database of dependencies between production processes and ecosystem services
C. Science Based Targets Network
D. Network for Greening the Financial System
E. Red, amber and green
The following table shows the consolidated results of the materiality assessment by risk type and time horizon as of 2024:
|
|
|
|
|
|
|
|
|
|
|
|
|
|
|
|
|
|
|
|
|
|
|
|
|
Transition Risk |
|
Physical Risk |
| ST |
MT |
LT |
|
ST |
MT |
LT |
Credit riskA |
|
|
|
|
|
|
|
| CIB |
l |
l |
l |
|
l |
l |
l |
| Corporate & SME |
l |
l |
l |
|
l |
l |
l |
| Individuals |
l |
l |
l |
|
l |
l |
l |
| Auto Consumer |
l |
l |
l |
|
l |
l |
l |
Operational riskB |
l |
l |
l |
|
l |
l |
l |
| Market risk |
l |
l |
l |
|
l |
l |
l |
| Liquidity risk |
l |
l |
l |
|
l |
l |
l |
| Reputational risk |
l |
l |
l |
|
l |
l |
l |
l Low l Moderately low l Medium l High l Very high |
|
Short term (ST): 2025 | Medium term (MT): >2030 | Long term (LT): >2050
A. Assessment as of September 2024.
B. Assessment as of November 2024
|
234 2024 Pillar 3 Disclosures Report
In 2024, we continued to develop and enhance our materiality assessment approach in order to strengthen the resilience of our strategy. We have incorporated regulatory aspects, industry best practices, further homogenization, and synergy among different risk types in terms of sources, thresholds and scenarios.
The above table shows the final outcome of several procedures by risk type. These procedures use various tools and methodologies to assess the potential impact of climate factors. We use the above-mentioned risk factor materiality assessment to underpin climate risk identification and assessment as part of our double materiality procedure.
The materiality assessment's rationale for each risk type is as follows:
•3.1 Credit risk:
We conduct a materiality assessment every quarter to identify, assess and monitor the Group’s climate-related and environmental credit risks by sector and geography. This assessment involves a review of the present day and other time horizons based on climate scenarios.
We use in-house scenario analysis techniques and climate stress test models to calculate and monitor climate impacts on key credit risk metrics, such as the probability of default (PD) and loss given default (LGD), across several time horizons, scenarios and at all geography, sector and unit levels.
We complete this assessment with three further initiatives, among others:
1.Customer assessment for the CIB and corporate portfolios that analyse the key aspects of transition, physical, social and environmental aspects. This assessment is conducted locally.
2.Deep dives into key portfolios such as the collaterals in real estate and auto loans.
3.Geographical assessment of physical risk (acute and chronic) that uses information from expert models across different scenarios and time horizons.
The findings of our materiality assessments are key to defining our strategy, risk appetite, the identification of emerging risks and even for other stress test exercises (such as the ICAAP).
Materiality assessment enhancements in 2024
In 2024, we enhanced our credit materiality assessment to reflect the latest industry and regulatory developments by:
1.Enhancing geographic granularity of physical risk (acute and chronic) information in our European portfolio, from Nomenclature of territorial units for statistics at level 3 (NUTS3) to postcode in our core markets of Poland, Portugal, Spain and the United Kingdom;
2.The development of a new real estate module in Klima tool, which includes physical and transition risks;
3.Improved how we manage and assess collateral through the efficiency performance certificates (EPC) by obtaining data, developing estimation models and drawing up plans to gather such information during customer onboarding processes.
4.Implemented concentration metrics to monitor physical and transition risk management in our subsidiaries; and
5.Used internal climate stress test models (included in the ICAAP) to calculate financial impacts (customer “bottom-up” approach for the SCIB portfolio and “top-down” approach at sector and geography level for the rest of the portfolios).
Klima
We run our materiality assessments through our ESCC Credit Risk Management tool Klima, where we aggregate, manage and monitor ESCC risks at local and Group level, by sector and geography. It also includes an analysis of the physical risks of several economic activities and collateral.
We continue to work on enhancing climate information, methodologies and use cases:
1.Climate materiality:
Though the findings by sector of our 2024 credit risk materiality assessment (see table below) follow a similar pattern to 2023, transition risk exposure in CIB to most vulnerable sectors decrease slightly. Our portfolios continue to show less vulnerability to physical risk, given the concentration in low-risk locations.
2024 Pillar 3 Disclosures Report 235
|
|
|
|
|
|
|
|
|
|
|
|
|
|
|
|
|
|
|
Materiality assessment -
Climate risk analysis and portfolio heatmap
|
September 2024 (pre-mitigation) - EUR billion |
|
TR |
PR |
CIB |
Other segments |
| Power (conventional) |
|
|
26 |
2 |
Power (renewables) |
|
|
13 |
0 |
| Oil & Gas |
|
|
20 |
1 |
| Mining y metals |
|
|
13 |
7 |
| Transport |
|
|
29 |
12 |
Auto Consumer |
|
|
0 |
162 |
| Real Estate |
|
|
7 |
386 |
Other climate-related sectors |
Agriculture |
|
|
3 |
9 |
| Construction |
|
|
18 |
15 |
| Manufacturing |
|
|
44 |
25 |
| Water & Waste |
|
|
3 |
1 |
| Climate sectors |
|
|
|
175 |
621 |
| Other sectors |
|
|
|
65 |
212 |
| Total portfolio |
|
|
|
241 |
833 |
¢ Low ¢ Moderately Low ¢ Medium ¢ High ¢ Very High |
|
TR: transition risk. PR: physical risk.
CIB: REC (on and off-balance sheet lending + guarantees + derivatives PFE: Potential Future Exposure).
Other segments: Drawn amount; includes individuals, SCF, Auto US, Corporates and Institutions, and SMEs.
Other sectors: considered as low risk; include: CIB, Corporate and SMEs outside the risk taxonomy perimeter // Individuals and SCF: cards and other consumer credit // Private Banking (excl. mortgages).
Exposure 0 represents exposure below EUR 500 million.
|
2.Vulnerability heatmaps
We analyse materiality assessment findings through heatmaps that show our vulnerability to climate risk. These heatmaps rate climate risks on a scale from 1 to 5 (low to very high).
These heatmaps are based on the present day and on scenario analysis methods and models that complement our qualitative methodology and provide a forward-looking and geography-based analysis of portfolios across the medium and long term, considering impacts based on their probability, relevance and duration. Although we illustrate these in the table below according to the statistical classification of economic activities in the European Community at level 1 (NACE 1, (from the French 'Nomenclature statistique des Activites economiques dans la Communaute Europeenne'-Statistical classification of economic activities in the European Community) breakdown, our sector analysis in risk management goes up to NACE level 4 to monitor the composition of our portfolios, capturing most of our value chain.
|
|
|
|
|
|
|
|
|
|
|
|
|
|
|
|
|
|
|
|
|
|
|
|
|
|
|
|
|
|
|
|
|
|
|
|
|
|
|
|
|
|
|
|
|
Transition Risk |
|
Physical Risk |
|
|
Current |
Orderly |
Disorderly |
|
Current |
Hot House World |
|
|
2030 |
2040 |
2050 |
2030 |
2040 |
2050 |
|
2030 |
2040 |
2050 |
| Oil & Gas |
|
|
|
|
|
|
|
|
|
|
|
|
|
| Mining & Metals |
|
|
|
|
|
|
|
|
|
|
|
|
|
| Power (Conventional) |
|
|
|
|
|
|
|
|
|
|
|
|
|
| Power (Renewables) |
|
|
|
|
|
|
|
|
|
|
|
|
|
| Transport |
|
|
|
|
|
|
|
|
|
|
|
|
|
| Auto Consumer |
|
|
|
|
|
|
|
|
|
|
|
|
|
| Agriculture |
|
|
|
|
|
|
|
|
|
|
|
|
|
| Manufacturing |
|
|
|
|
|
|
|
|
|
|
|
|
|
| Water & Waste |
|
|
|
|
|
|
|
|
|
|
|
|
|
| Construction |
|
|
|
|
|
|
|
|
|
|
|
|
|
Real Estate |
|
|
|
|
|
|
|
|
|
|
|
|
|
|
|
|
Risk level: ¢ Very high ¢ High ¢ Medium ¢ Moderately low ¢ Low |
236 2024 Pillar 3 Disclosures Report
3.Internal climate models
Detailed below is an overview of our internal climate model:
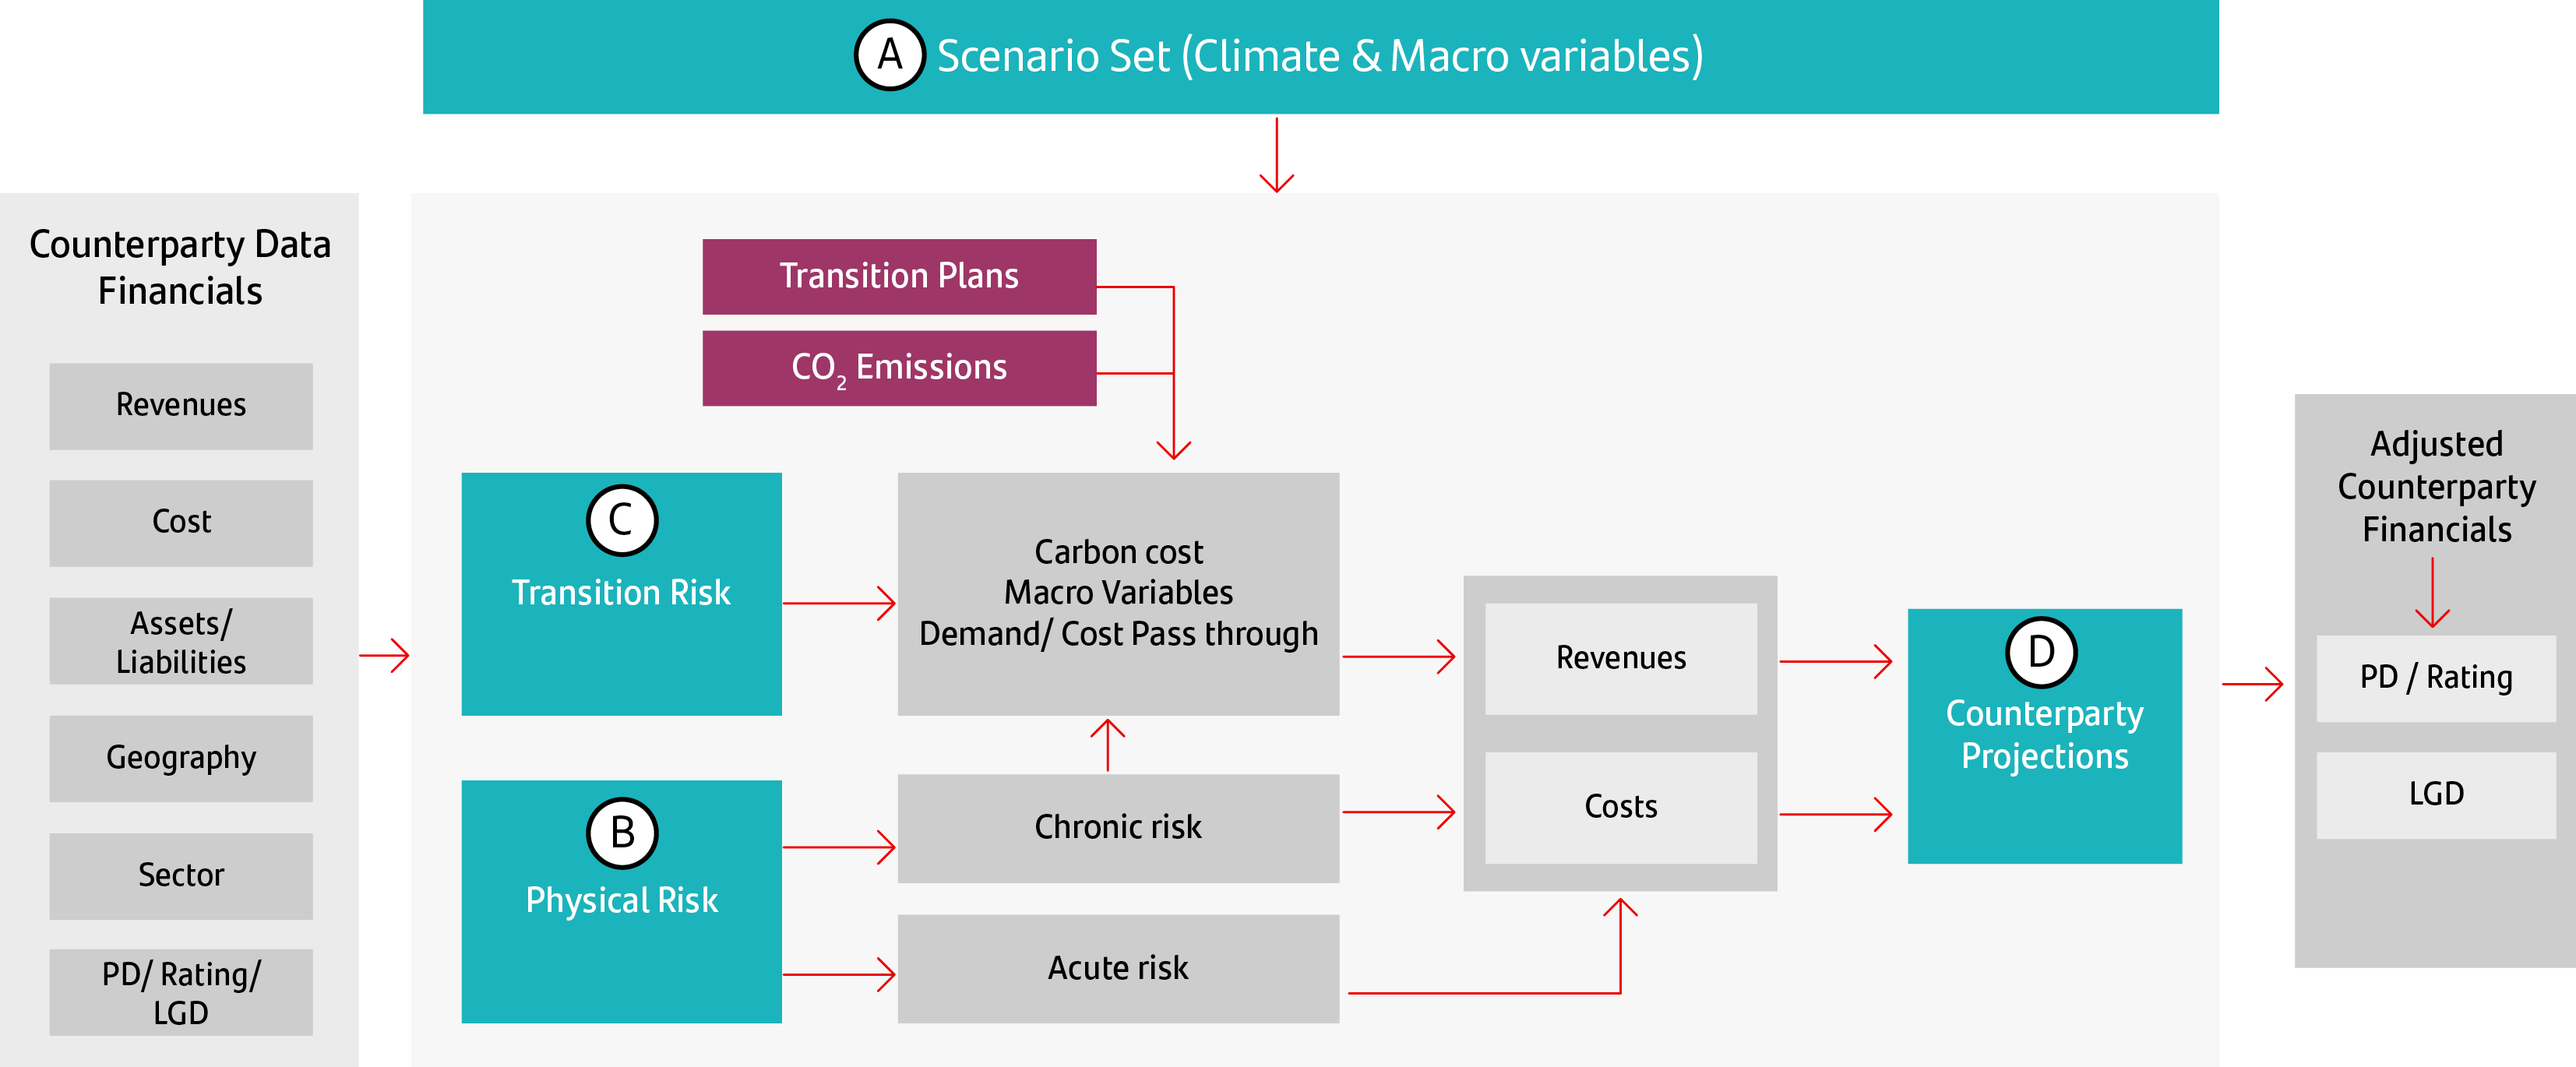
Our internal climate models enable us to quantify the financial impact9 of transition and physical risks that we monitor through changes in PD and LGD metrics. Our model estimates the direct and indirect impact of macroeconomic and climate variables, market trends and regulatory expectations. This model takes a bottom-up approach by considering each client's financial situation and technology. Where we don’t have specific customer information, we use a top-down approach by sector and geographical location.
The development of internal models allows us a high degree of flexibility and capacity for analysis and adaptation to our portfolios, including its characteristics and maturities, to new economic and regulatory requirements. The main features are briefly described below:
A.Scenarios are based on those published by the NGFS10 and Representative Concentration Pathways (RCPs), developed by the Intergovernmental Panel on Climate Change (IPCC) which are reference in the sector. Moreover, our Research department embeds and broadens external scenarios to more specific variables by country and sector to achieve thorough vision aligned to our portfolios.
B.Physical risk impact considers the financial impact of acute and chronic risks, as well as long-term changes in
weather patterns to give us a wide range of events that we assess at regional level. For these financial impacts, we use data from an expert reinsurance company, considering scenarios across different time horizons. We include physical risk impact through:
–Chronic: impact on companies' revenue due to chronic physical effects (e.g. change in productivity).
–Acute: increase in costs due to damages to companies' assets from extreme weather events.
C.The impact of transition risk, relates to changes in drivers such as climate policies, technology and investor and consumer sentiment that can affect demand, which affects customers on an individual basis. Therefore, depending on the level of information available, we carry out a bottom-up or top-down approach.
D.Counterparty forecasts, which reflect the changes in the financial ratios included in the credit risk rating models and are based on forecasted revenues and costs under the different scenarios, including physical and transition risk impacts. The projected ratings give us the associated PD to the counterparty. Lastly, the LGD is estimated using the Frye-Jacobs relationship between PD and LGD.
9 Based on internal models and results from regulatory and supervisory climate stress exercises, the Group does not believe that additional environmental or climate change risk has had a substantial impact on its equity, financial situation and results in 2024.
10 NGFS scenarios provide the common and up-to-date reference point for understanding the evolution of climate risks and trends in climate policy and technologies over different time horizons. For this reason, they are used as a basis for showing impacts on our portfolios by calculating a range of outcomes.
2024 Pillar 3 Disclosures Report 237
|
|
|
|
|
|
|
|
|
|
|
|
|
|
|
|
|
|
|
|
|
NGFS scenarios |
|
|
RCP climate scenarios |
|
|
Physical and transition risks |
|
|
|
Physical risk |
|
|
Orderly, assumes ambitious climate policies implemented early, which gradually become stricter. Therefore, both physical and transition risks are relatively moderate.
|
|
|
|
RCP 2.6: stringent mitigation scenario with the aim to keep global warming below 2ºC. This is associated with orderly scenarios. |
|
|
Disorderly, climate policies are not introduced until 2030 and may differ between countries and sectors. |
|
|
|
RCP 4.5: intermediate scenario where emissions reach their peak in 2040 and then decrease. This is associated with disorderly scenarios. |
|
|
Hot house world (current policies), it is considering that some climate policies are implemented in some jurisdictions, but that global efforts are insufficient to stop significant global warming. Serious physical risks and irreversible changes, including rising sea levels. |
|
|
|
RCP 8.5: very high GHG emissions. It is a business as usual scenario where emissions keep increasing throughout the whole century. This is associated with Hot house world scenarios. |
|
4. Customer assessment
For corporate customers within climate sectors according to our risk taxonomy, the materiality assessment is complemented with analysis performed at local level that considers key physical, transition, social and environmental aspects.
We consider their findings in loan approvals and customer rating procedures.
Challenges and next steps:
Santander continues to work on embedding ESCC factors in our processes by upgrading our data, estimations, tools and models. In particular:
i.Implementing models to assess the impact of climate on credit risk metrics (PD and LGD) by using scenario analysis and models, and including customers' ESCC assessments in corporate portfolio ratings.
ii.Localizing CIB customers’ production sites to obtain more accurate results in physical risk assessments.
iii.Calculating financial impacts across the short, medium and long term through the climate stress test models already included in the ICAAP.
Consumer Auto
We conduct an in-depth analysis of this portfolio given the weighting of the Consumer Auto in Santander's portfolio and its specific characteristics and regulations. We consider key risk factors such as products evolution, residual value risk, portfolio average maturity, shifts in market sentiment and technology developments adapted to different markets. Moreover, we review other characteristics such as product type, borrowers' credit risk profile, engine type (internal combustion engine, hybrid or electric vehicle).
238 2024 Pillar 3 Disclosures Report
Physical risk
To assess physical risk by location, we work with a leader provider in the reinsurance industry, which enables us to measure the risk of 13 physical hazards (eight acute and five chronic). We analyse the markets where we operate, with a breakdown of over 1,250 regions (NUTS 3 or equivalent) and cover all economic activities in our risk taxonomy, as well as the business lines (such as mortgages and automobiles).
We assess each region (NUTS3) to measure the associated physical risks by rating them on our five-point RAG (Red, Amber, Green) scale (low to very high).
To assess the frequency and intensity of natural hazards, we use RCP scenarios across different time horizons (present day, 2030, 2040, 2050 and 2100).
Our analysis, based on a conservative approach, uses RCP 4.5 scenario and time horizons of 2030 for economic
activity sectors and 2050 for collaterals at Group level. The results are included in our materiality assessment at Group level, by region (Europe, North America and South America) and by subsidiary. The results show that while certain sectors are more exposed to physical risks, such as agriculture, conventional energy and mining, their concentration in the Group is very low (between 1% and 2%). The collateralized portfolios have the lowest impact, albeit with very high concentration of exposure in the Group.
The granular, forward-looking physical risk assessment enables us to actively manage these risks through monitoring, metrics and mitigation measures.
Finally, to measure and quantify physical risks more accurately, we increased the granularity of physical risks for the European portfolio (Spain, Portugal, the UK and Poland, as we now have information at postcode level).
Real estate
Santander’s real estate portfolio accounts for a large proportion of Santander's balance sheet, which is why we developed a specific module within the Klima tool with a detailed overview of the portfolio’s transition and physical risk.
Regarding transition risk, we increased the quality and quantity of EPC data by obtaining information, developing estimation models and defining plans to gather information during the customer onboarding process. This internal model consists of a machine learning algorithm that applies a combination of variables related to the real estate guarantee (type of property, geographic location, etc.), learning from observations made from actual data available. These enhancements give our analysis a broader scope, covering the corporate and retail segments.
This chart shows the EPC coverage of our balance sheet and distribution of actual and estimated EPC labels based on the standards and regulation in each market where this information exists:
Residential and commercial real estate EPC data (December 2024):
Distribution of exposure to residential and commercial real estate portfolios by EPC (December 2024):
Distribution based on Portfolio with EPC information. (RAG according EPC Standards)
We made considerable progress with physical risk through a review of acute and chronic risks in several scenarios and time horizons, broken down geographically at NUTS3 level. Considering a forward-looking view across different time horizons, the percentage of exposure to high and very high physical risks is not material compared to our total portfolio.
Nonetheless, we continue working on conducting a more granular assessment in Europe, where our portfolio concentration is higher.
2024 Pillar 3 Disclosures Report 239
•3.2 Operational risk:
We assess the potential impact of physical risk through a combination of specific location-based risk scores, data on the bank’s own facilities and insurance, and internal scenario analysis for certain physical risks. We assess the potential impact of transition risk through operational risk tools and external ESG-related events.
We assess physical risk as low in the short term and moderately low in the medium and long term, mainly due to exposure to more frequent and severe weather events in the regions where we operate.
For transition risk exposure, the most affected time horizon is the medium term, owing to legal and compliance risk arising from adaptation to new regulation in each jurisdiction, an increase in the number of greenwashing-related sanctions, an increase in the volume of green business, and greater awareness of climate change among external stakeholders.
•3.3 Market risk:
To assess the potential impact of climate factors, we conduct regular analysis of our trading portfolios to identify the materiality of positions with potential exposure to market risk climate factors. We then compare the findings from climate stress scenarios (both physical and transition risk) to those from internal, stressed and budget scenarios. This analysis concludes that the materiality is low or moderately low depending on the time horizon, due to the low exposure to climate sensitive sectors both in the bond and equity portfolios.
•3.4 Liquidity risk:
To assess the potential impact of climate factors, Santander compares the findings of climate stress scenarios with liquidity stress scenarios. We have a suite of physical and transition risk scenarios (disorderly transition scenarios, extreme climate events, historical events, etc.) whose impacts on liquidity are well below current internal and regulatory stresses due to their limited effect on high quality liquid assets (HQLA) and stable retail deposits.
•3.5 Reputational risk:
We conducted a reputational risk materiality assessment in 2023 (and updated it in 2024) to assess the potential impact on reputation of the key climate-related and environmental levers across the short, medium and long term under several scenarios. In line with our strategy, policies and management models, we consider the environment collectively. Thus, the materiality assessment includes identifying and assessing climate change and other environmental impacts.
The assessment is a complex procedure that considers several sources of information and criteria across these phases: i) definition of reputational risk levers related to physical and transition risk; ii) assessment of risks by country and by portfolio exposure in sensitive sectors; iii) climate scenarios according to the Network for Greening the Financial System (NGFS); and iv) time horizons (short, medium and long-term).
The reputational risk materiality assessment findings show that transition risks would have a greater
reputational impact than physical risks, as transition risks tend to relate more to stakeholder scrutiny over time, which are the main grounds for reputational risk exposure.
It is our aim to have clear climate and environmental risk objectives, policies and procedures, and solid governance to manage them correctly. Even if extreme climate events occur, and based on the experience of several of them recently, from a reputational risk management standpoint, we believed that Santander has demonstrated its strength and robustness in this regard and its ability to react to a given event.
In 2024, we updated our reputational risk materiality assessment approach based on official reports and studies from recognized organisations. Additionally, we have continue working on further homogenization and synergy between risks in terms of information sources, thresholds, scenarios and others.
4. Monitoring
In addition to the processes described above, we carry out a continuous monitoring of ESG aspects based on:
•At Grupo Santander, we constantly monitor the risk profile and our compliance with risk appetite limits through control functions that report to the board.
Since 2021, we have been enhancing our risk appetite statement with quantitative metrics for thermal coal and mining and power related customers.
In 2024, we implemented the metrics approved in 2023 for oil and gas, steel, and aviation. We also approved two new metrics, one for the automotive sector and the other for Santander Consumer Finance's Auto business which will be implemented in 2025.
•We are in permanent contact with our customers to monitor and support their transition plans. We continue to embed ESG risk factors in credit risk granting and monitor processes through our target operating model, The Climate Race.
This model is supported by the following pillars: strategic planning, risk management, loan approval and tracking, models and systems, and culture and governance. The timeline to implement was defined for 2023 and 2024 considering the supervisory expectations and Group's strategy. During 2025, we will continue with a more granular implementation.
•Our ESG Regulatory Radar enables us to monitor updates to ESG and other regulatory frameworks, as well as the potential efforts and financial impacts that the implementation of these changes may entail.
•Moreover, the Risk, Compliance & Conduct function monitors ESG initiatives (including acquisitions and divestitures) presented to the investment forum whose delegated authorities come from the board executive committee, as well as from the corporate product governance forum (CPGF).
240 2024 Pillar 3 Disclosures Report
•During 2024, we continued working on our Climate Community as an additional lever for a proper integration of ESCC risk factors in the Group in a collaborative manner. This community keeps the units up to date, shares best practice, sets guidelines to support homogeneous implementation and provides a clear governance structure and allocation of responsibilities. For more details, see the following chart:
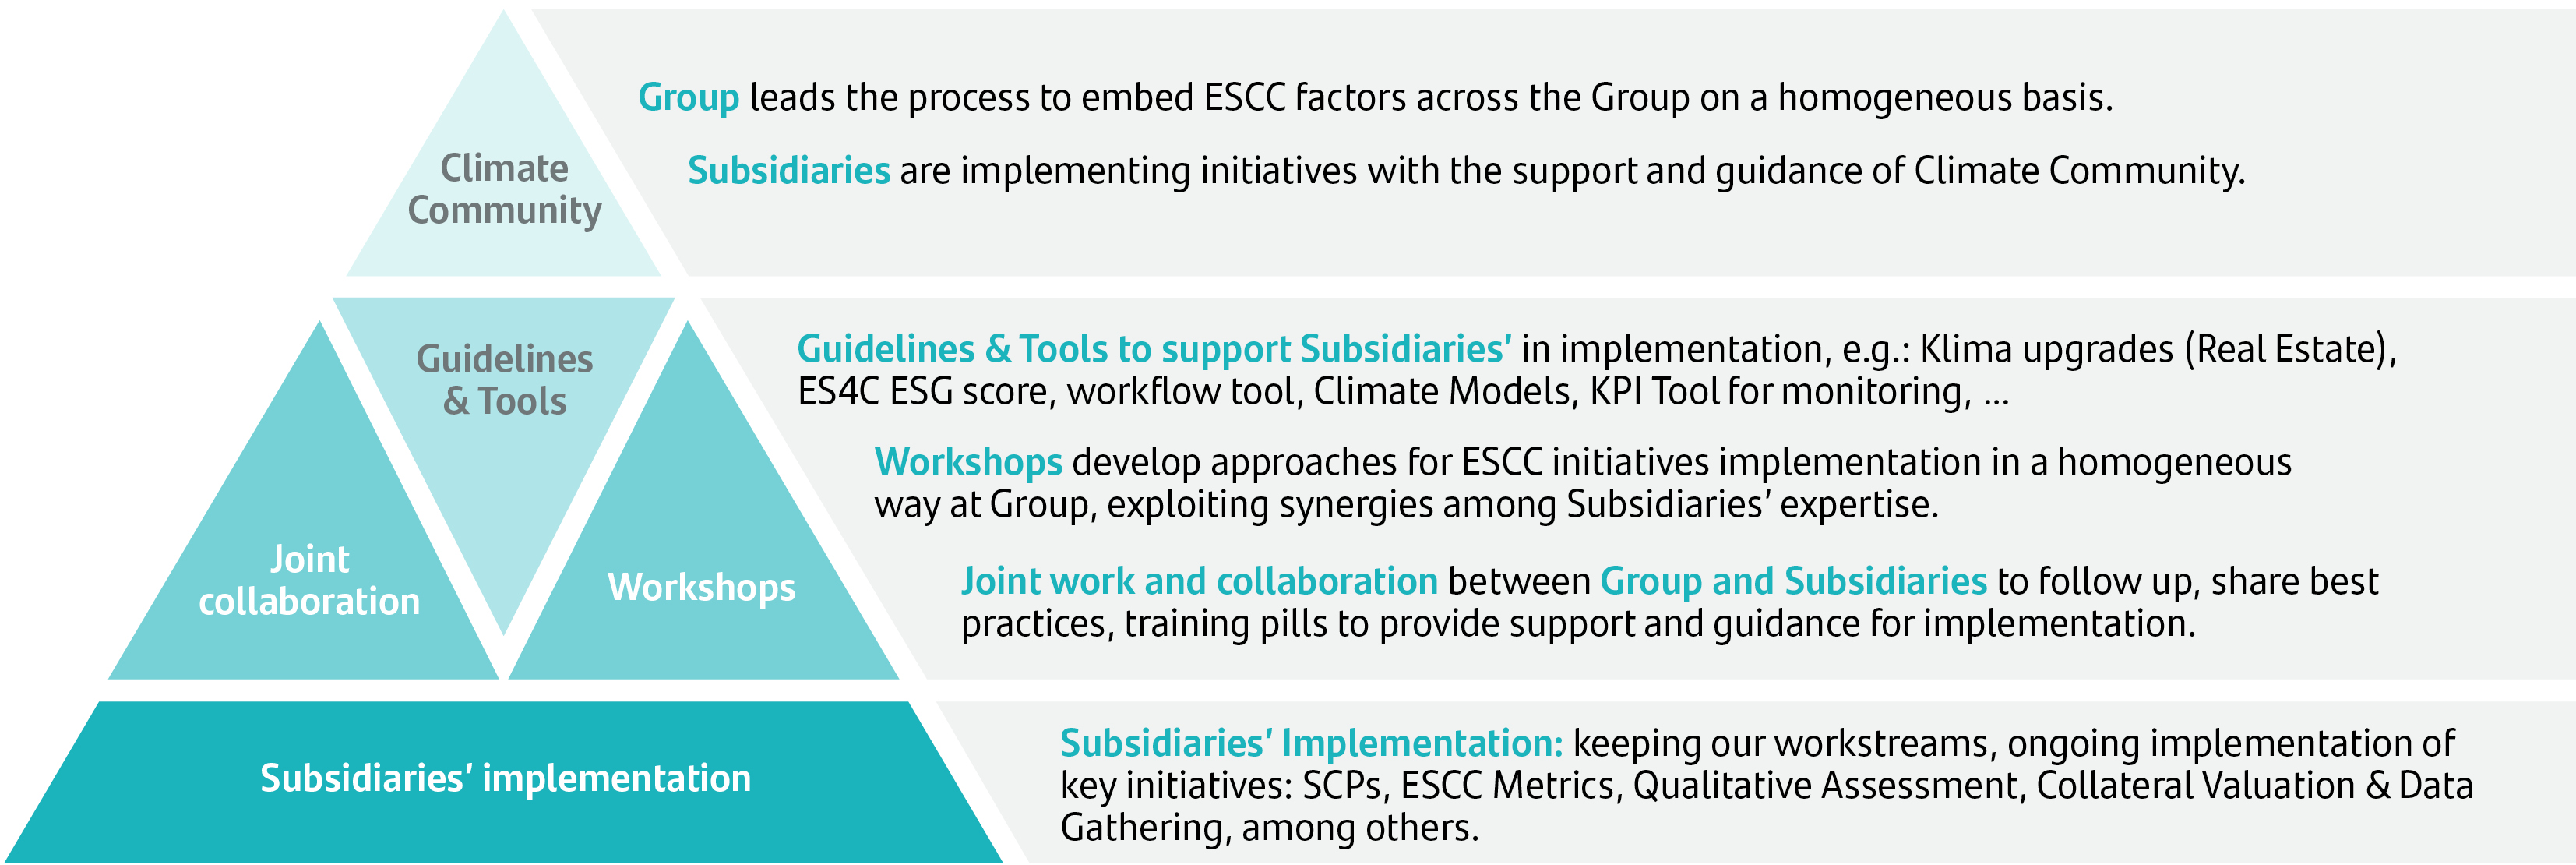
5. Mitigation
We have various internal documents, policies and frameworks that integrate climate and environmental factors into our risk management processes. These elements are key to mitigating and adapting climatic and environmental factors.
Our ESCC risk management policy establishes the standards for investing, and providing financial products and services to companies and customers in oil and gas, power generation and distribution, mining and metals, and soft commodities (especially retail customers dedicated to farming and livestock in the Amazon). It dictates prohibited activities and those that require special attention for the aforementioned sectors11.
Our credit granting policies consider climate and environmental factors such as, among others, our internal taxonomy (SFICS12), credit committees conclusions, corporate clients ratings and collateral management.
To mitigate the risk of greenwashing, we reviewed key processes and responsibilities to supervise the appropriate development, management and disclosure of our sustainability strategy, products and practices, while monitoring regulatory developments in this area.
We also mitigate this type of risk through client engagement for the most material sectors according to the climate materiality assessment.
This enables us to support customers in their transition to a more sustainable economy, offering them tailor-made solutions and generating business opportunities. Engaging with customers gives us access to data on ESG risk that we
can use for internal risk management and reporting. Obtaining and cross-checking data directly from our customers is one way to mitigate ESG risks, including greenwashing.
Additionally, we consider ESG aspects in customer assessments to determine whether they have an impact on credit quality.
We launched several projects so that credit analysts have all the information and tools necessary to perform this assessment.
•Sector guidelines are followed to identify the major transition and physical risks each sub-sector is exposed to and how to pinpoint them in customer engagement. We delivered training sessions in several markets to build on these guidelines.
•ESG assessment guidelines with different levels of detail depending on the risk. In some instances, we conduct an automated assessment at different levels for physical, transitional and reputational risk, with higher risk levels undergoing a more comprehensive and contextual assessment in material cases. We’re implementing this assessment model for our retail banking portfolio across several markets.
•Survey library (EQAL13): we developed a global tool to customize and store our numerous ESG surveys and assist in their identification and review. This will enable us to compile historical ESG data and conduct more aggregated analysis based on wider criteria. EQAL is now operational in Portugal and is currently being implemented in Spain. For Brazil, the system will be customized to replace the existing tool currently in use in the country.
11 To the extent required by applicable law, customers and transactions involving activities enumerated in this section will be subject to an enhanced due diligence process to determine the unique risks presented prior to decisioning.
12 SFICS: Sustainable Finance and Investment Classification System.
13 EQAL: ESCC Questionnaires & Assessments Library.
2024 Pillar 3 Disclosures Report 241
Lastly, we continue working on other mitigation levers:
i.Credit committees, which embed environmental, social and climate change factors in transaction reviews.
ii.CIB customer ratings, including qualitative environmental, social and climate change assessments for material sectors.
iii.Special prices for certain products.
iv.Collateral management (EPC), based on enhanced data acquisition, estimation model development, and information collection during the customer onboarding process.
v.Specific procedures to analyse environmental, social and climate change risk. The board and its committees verify that decisions are made according to our ESCC and reputational risk policies. The first line of defence conducts a due diligence with special sector-based questionnaires for credit approval. The reputational risk assessment also forms part of decision-making contributing to compliance and preventing from risk of false accusations (with particular focus on greenwashing). The due diligence consists of assessing the CIB's project finance transactions according to the Equator Principles.
vi.Lastly, we have a multidisciplinary working group, where, among others, ESG issues are considered. This group is coordinated by the reputational risk function and discusses actions needed to mitigate any matter that may have a reputational impact.
|
|
|
|
|
|
|
|
|
|
|
|
|
|
|
|
|
|
ESG classification meetings |
|
|
|
|
|
Throughout 2024, we worked on extending our sustainable operations identification model to all global businesses, amending existing processes accordingly.
We created local and global commercialization committees and ran ESG classification meetings as the governance bodies tasked, analysing and monitoring products and transactions with an ESG component, contributing to the fact that these bodies have experts to interpret and demonstrate ESG standards through centers of excellence as well as seeking input from business, risk and sustainability teams.
We began working to implement the updated sustainable classification model by identifying the affected processes and the changes to be made across markets. |
|
|
|
|
6. Reporting
Transparent and regular reports to senior managers and stakeholders help us manage climate and environmental factors and comply with the law and supervisors’ expectations.
We work so that the information available to our stakeholders is complete and consistent, conveys adequately Santander's sustainability strategy and management, and mitigates potential risks.
Our reporting on climate and environmental risk management includes our annual report, the ICAAP exercise, and our Pillar 3 disclosures report.
242 2024 Pillar 3 Disclosures Report
Main activities in 2024
•Advances in risk appetite, establishing new metrics and limits to support our strategy.
•Development of internal climate models that enable us to enhance how we quantify the financial impact of transition and physical risks on credit risk variables.
•Increased geographical granularity in physical risk information (acute and chronic) for the European portfolio, from NUTS3 to postcode in Spain, Portugal, the UK and Poland
•Improvements on how we manage and assess collateral through the EPC by obtaining data, developing estimation models and development plans to gather information.
•In order to mitigate the risk of greenwashing, we have reviewed the most relevant processes and responsibilities to supervise the correct definition, management and disclosure of our strategy, products and practices.
•Progress in the implementation of the climate risk management model through the Climate Race initiative to integrate ESCC factors into the credit risk granting process.
•Advances in materiality assessments in terms of biodiversity through an internal methodology to assess both nature-related impacts and its dependencies.
Our approach to nature and biodiversity
Climate change is inextricably linked to biodiversity and nature. Climate change is one of the main drivers of nature and biodiversity loss and impacts the resilience of ecosystems, limiting their ability to regulate climate and serve as carbon sinks.
While our materiality assessment considers 'Biodiversity and ecosystems' an informative topic, we continue to oversee our operations and impact on biodiversity and nature in view of our climate objectives.
Given our financial activity, and the location of our buildings and offices, mainly in urban areas, no sites located in or near biodiversity sensitive areas are identified14. We are conducting an analysis to determine whether any of them could be in or near biodiversity sensitive areas.
We conducted an assessment on our corporate portfolio, which considers the country in which our customers operate, to learn of the direct impact and dependency of their business on nature and biodiversity.
We followed the Task Force on Nature-related Financial Disclosures’ (TNFD) LEAP15 approach. We used two tools:
•ENCORE: A materiality database of dependencies (physical risks) between production processes and ecosystem services. For our core markets, we complemented the database with internal localization criteria based on ENCORE’s hotspot depletion maps. These criteria cover three natural capital assets: soil and sediment, water, and biodiversity.
•UNEP-FI Impact Analysis Tool: This tool provides an in-built impact (transition risks) mapping that, combined with our internal data and context, enables us to identify the most significant impact areas of the portfolio.
The ENCORE database helps us to begin to understand how the deterioration of natural assets could cause a loss of production processes, and the financial consequences it could have.
This methodology enabled us to analyse their dependencies (physical risks16) on over 20 ecosystem services in more than 10 sub-segments of our corporate lending portfolio.
Additionally, in 2024, Santander Brasil participated with various organizations in TNFD pilots to explore how to tackle nature impacts and dependencies more effectively. We used the LEAP approach and focused on the Locate phase. We gained important insight into how data gaps and a lack of methodologies tailored to highly biodiverse tropical countries limit private companies’ ability to account for those factors accurately. Addressing these issues will require further work and collaboration throughout the sector to align with stakeholders’ expectations.
Nature and biodiversity heatmap
Based on the above mentioned approach, we use a 'heatmap' to aggregate nature-related dependencies and show the level of threat of potential events that may affect our corporate portfolio at Group level.
We used this exercise as an input to meet disclosure requirements ESRS E2 (Pollution), ESRS E3 (Water and marine resources), ESRS E4 (Biodiversity and ecosystems) and ESRS E5 (Resource use and circular economy) in relation to ESRS 2 IRO-1. We rate our dependencies on a scale of 1 (very low dependence) to 5 (very high dependency). These are the results:
14 The main environmental impact of our offices stems from their maintenance and how we manage the waste we generate. So far, we have not deemed it necessary to adopt biodiversity mitigation measures in our operations. Nonetheless, on certain occasions we have considered corrective or mitigation measures as part of our customer lending due diligence and in application of our ESCC policy.
15 LEAP approach: locate, Evaluate, Assess and Prepare.
16 This analysis does not consider systemic risks since no tools have been identified that include them.
2024 Pillar 3 Disclosures Report 243
|
|
|
|
|
|
|
|
|
|
|
Corporate portfolio |
| Pollution |
Pollution of air |
l |
| Pollution of water |
l |
| Pollution of soil |
l |
| Pollution of living organisms & food resources |
l |
| Substance of concern and very high concern |
l |
| Water & marine resources |
Water withdrawals, consumption and use |
l |
| Habitat degradation & intensity of pressure on marine resources |
l |
| Biodiversity & ecosystems |
Direct drivers of biodiversity loss |
l |
| Impacts on the state of species and on the extent and conditions of ecosystems |
l |
| Impacts & dependencies on ecosystem services |
l |
| Circular economy |
Resource inflows, including resource use |
l |
| Resource outflows related to products and services |
l |
| Waste |
l |
|
|
|
|
|
|
|
|
|
|
|
|
|
|
|
|
|
|
|
|
|
|
|
|
|
|
|
|
|
|
| l |
Very low |
l |
Low |
l |
Medium |
l |
High |
l |
Very high |
No nature-related topic or sub-topic was considered material at Group level. We monitor these and other sectors closely as part of regular updates to our nature materiality assessment.
244 2024 Pillar 3 Disclosures Report
International standards on which the environmental risk management framework is based
This section covers the requirement on qualitative information on environmental risk, specifically, the point on risk management, for questions (k)
The ESCC risk management policy, which is reviewed annually, sets out the standards for investing in, and providing financial products and services17 to companies and customers in oil and gas, power generation and distribution, mining and metals, and soft commodities (especially retail customers dedicated to farming and livestock in the Amazon).
As disclosed on the ESCC risk policy, we are part of the main and most important local and global initiatives to support the inclusive and sustainable growth. Some examples are:
•World Business Council for Sustainable Development (WBCSD).
•UN Global Compact.
•Equator Principles.
The Group establishes ESG policies, procedures and guidelines adapted to local regulations and applied to all units. We review systematically the scope of the policies to adopt ESG standards in accordance with international best practices. The main ones are the ESCC risk policy and the Responsible banking and sustainability policy.
Additionally, as stated in the annual report, the SFICS outlines common standards to consider an asset or activity as environmental, social or sustainable in all the Group’s units and businesses. It draws on such international market guidelines, standards and principles as the EU Taxonomy (including the four new environmental targets for 2023), ), ICMA (International Capital Market Association) Principles, LMA (Loan Market Association) Principles, UNEP FI Framework and the Climate Bonds Standard.
The SFICS enables us to track our sustainable activity, support product development and mitigate greenwashing risk.
Impact of environmental risk on capital and liquidity risk
This section covers the requirement on qualitative information on environmental risk, specifically, the point on risk management, for question (o)
The environmental and climate-related risk drivers are considered as factors that could impact the existing risks in the medium-to-long-term. These elements include, on the one hand, those derived from the physical effects of climate change, generated by one-off events as well as by chronic changes in the environment and, on the other hand, those derived from the process of transition to a development model with lower emissions, including legislative, technological or behaviour of economic agents changes.
Given the nature of its operations, the Group has no environment-related liabilities, expenses, assets or
contingencies of a material relevance to its consolidated equity, financial situation and results.
Most exposures in sectors potentially affected by climate change risk, according to market consensus and to the execution of our materiality assessment, are with wholesale customers, whose preliminary reviews, credit approval and credit ratings take such risk into account. Customers’ ratings determine the parameters for calculating loan loss (typically in terms of probability of default or “PD”). Thus, when climate factors are relevant, in conjunction with other elements of analysis, they have an impact on the loan loss calculations which support capital and provisions.
Additionally, within the regulatory capital adequacy exercises (ICAAP) and liquidity stress testing (a component of the ILAAP), climate and environmental risk scenarios and factors have been included covering both physical and transition events. These contribute to the estimation of potential impacts on the occurrence of one or more environmental risk events on the Group's position in these scenarios.
Likewise, Grupo Santander has participated in the various climate stress regulatory exercises carried out recently, which have been classified as learning exercises in the industry. Results showed that the Group’s coverage for potential losses would be sufficient in view of portfolio maturity over time.
Therefore, based on the best information available at the time these consolidated annual financial statements were prepared, the Group sees no additional environmental or climate change risk having a substantial impact on its equity, financial situation and results in 2023.
Still, this matter is constantly changing, and, like other banks, the Group is working on developing more methodologies to better measure potential loan loss in line with new management needs, best practice, and regulators’ and supervisors’ requirements. In particular, we monitor progress in this regard both in the prudential area (mandate of the European Banking Authority in article 501c of Regulation (EU) 575/2013), and that resulting from the plan for the second phase of the post-review implementation of IAS 9 by the IASB regarding the calculation of expected losses.
17 Transactions that entail credit risk, insurance, advisory services, equity, and asset management.
2024 Pillar 3 Disclosures Report 245
a
Data availability, quality and accuracy
This section covers the requirement on qualitative information on environmental risk, specifically, the point on risk management, for question (p)
As stated by the EBA in the Report on management and supervision of ESG risks for credit institutions and investment firms, one of the main challenges faced by financial institutions in the integration of ESG risks is insufficient data. While we continue to work on increasing granularity and quality, Santander Group already has the relevant information and data to manage environmental risks, including activity codes, customer and collateral location, EPC certificates and emissions.
The main challenges in terms of data availability, quality and accuracy include the following elements:
•The availability of energy efficiency certificates, especially in those geographies where there is no specific regulation or requirement.
•The collection and availability of customers' financed emissions, information that will improve in Europe with the recent entry into force of the CSRD regulation.
•Improving the granularity and accuracy of the information needed to assess physical risks. In this regard, as explained in Template 5, granularity has been increased in Spain, Portugal, the UK and Poland, and physical risk is now analysed on the basis of postcode.
In order to achieve the above, the following lines of work are being carried out:
•Enhance the internal ESG information available.
•Strengthen the customer registration and risk admission process.
•Supplement the information available through external providers.
•Assess the development of models and proxies to be able to estimate the information not available.
Link between environmental risks with other risks in the management framework
This section covers the requirement on qualitative information on environmental risk, specifically, the point on risk management, for questions (r)
We consider ESG risk factors, especially climate-related and environmental factors, cross-cutting and likely to have an impact on credit, market, liquidity, operational, reputational, strategic risks, among others.
The management of these factors adopts a risk-based approach prioritizing climate and environmental aspects based on the relevance and materiality in the Group and in the current landscape. We keep improving the consideration of the elements that stem from the transition to a low-carbon economy, the physical effects of climate change and biodiversity loss, and actions to consider negative impacts on nature. We identify below the typologies of climate and environmental risks:
246 2024 Pillar 3 Disclosures Report
|
|
|
|
|
|
|
|
|
|
|
|
|
|
|
|
|
|
|
|
|
|
|
|
|
|
|
|
|
Transition risk (TR) |
|
Physical risk (PR) |
|
|
|
|
|
|
|
|
|
|
Market sentiment
Changes in the supply and demand of certain commodities, products and services which are considered climate risks and opportunities, pose a reputational risk among other potential issues.
|
|
|
Acute
Intense extreme weather events, such as wildfires, hurricanes or floods.
|
|
|
|
|
|
Chronic
Changes in rainfall patterns, extreme weather variability, average temperature rises, severe heatwaves, droughts and rising sea levels.
|
|
|
|
Policy action
Implementing carbon pricing mechanisms to reduce greenhouse gas emissions, using energy sources with lower emissions, adopting energy efficient solutions, and promoting water efficiency measures and more sustainable land use practices.
|
|
|
|
|
|
Beyond climate |
|
|
|
|
|
|
|
|
|
|
|
Natural risk
Negative impact of nature degradation (including its biodiversity and the loss of ecosystem services) on economies, financial institutions and financial systems; and/or the lack of alignment of economic players with actions to protect, restore and reduce negative impacts on nature.
|
|
|
|
Technology
The need to build and innovate to support the transition to an energy efficient financial system with lower CO2 emissions. This can have a significant impact on companies as new technology displaces obsolete systems and disrupts some components of the financial system as we know it.
|
|
|
|
|
|
|
|
|
|
We measure the potential impact of the climate and environmental factors of each risk type across several time horizons, based on the average maturity of the portfolios analysed. The following table shows the potential impacts and our progress against the climate and environmental matters in 2024, and next steps:
2024 Pillar 3 Disclosures Report 247
|
|
|
|
|
|
|
|
|
|
|
|
|
|
|
|
|
|
|
|
|
|
|
|
| Risk type |
ClimateA and environmental drivers |
Time horizon analysed |
Potential Impact of climate and environmental risk factors |
|
What we’re doing to manage climate and environmental risk |
|
Next steps |
|
|
|
|
|
|
|
|
|
|
|
|
|
|
|
|
| Credit |
|
Present day short - medium - long term |
•Extreme weather can lead to higher retail and corporate loan default and lower collateral value It can also lead to lower incomes, harm agriculture, and increase insurance coverage and premiums. Moreover, changes in wind patterns that reduce energy production can lead to higher operating costs and hamper productivity. The degradation of nature can affect productivity in the agricultural sector and the value of collaterals. This may increase asset depreciation and early disposal due to property damage in 'high risk' locations.
•Adverse weather conditions can cause significant financial losses, endanger communities, harm the environment and affect the value of collaterals.
•The failure of borrowers to adapt their business models to a low-carbon economy could heighten credit risk and, therefore rise the risk of an income or activity reduction that may increase default or lead to a loss of business value.
•Market sentiment that influences demand; obsolete technology; customer preferences.
•Higher operating costs for carbon-intensive customers; information requirements (data gathering), especially on emissions (e.g. Scope 3) and green taxonomy disclosures; and new EU financial information directives stemming from government measures.
|
|
•Conducting materiality assessments to identify physical and transition risk in our portfolios.
•Monitoring of climate concentration risks by sector and region in the short-, medium- and long-term.
•Creating vulnerability heatmaps for the analysis of climate risks in the present day, short, medium and long term via Orderly, Disorderly and Hot House World scenario analyses.
•Implementing mitigation measures such as policies, thresholds and insurance to combat risks and their impact.
•Conducting scenario analyses and measuring sensitivities to forecast changes in ratings, the probability of default (PD) and loss given default (LGD) considering physical and transition risk.
•Monitoring portfolios through metrics to control E&CC3 risk factors in BAU processes.
•Measuring E&CC factors across customer and transaction analysis and embed into ratings.
•Monitoring risk appetite limits and alerts to manage climate-related sectors.
|
|
•Monitor the progress of the subsidiaries against The Climate Race (our credit risk target operating model for climate and environmental factors) to ensure the successful inclusion of E&CC factors across the end to end credit risk cycle, to allow the identification and mitigation physical and transition risk.
•Calculate financial impacts through internal climate models for the short, medium and long term.
•Continue to develop and enhance tools to monitor E&CC factors that consider physical and transition risk in each segment.
|
|
|
|
|
|
|
|
|
|
|
|
|
|
|
|
|
248 2024 Pillar 3 Disclosures Report
|
|
|
|
|
|
|
|
|
|
|
|
|
|
|
|
|
|
|
|
|
|
|
|
| Risk type |
ClimateA and environmental drivers |
Time horizon analysed |
Potential Impact of climate and environmental risk factors |
|
What we’re doing to manage climate and environmental risk |
|
Next steps |
|
|
|
|
|
|
|
|
|
|
|
|
|
|
|
|
| Market |
|
Short term |
•High volatility in market factors under stress scenarios.
•Changes in market perception leading to wider credit spreads for business in impacted sectors.
•Extreme weather conditions could raise concerns about the business plans of companies operating in the impacted sectors and widen their credit spreads.
|
|
•Regular reviews of climate stress scenarios and the subsidiaries that apply them.
•Stress testing using physical and transition risk scenarios.
•Trading portfolio analysis of current exposure to climate-sensitive business activities.
|
|
•Enhance stress testing by reviewing new scenarios to include in the exercise.
•Adapt stress testing to best market practices.
|
|
|
|
|
|
|
|
|
|
|
|
|
|
|
|
|
|
|
|
|
|
|
|
|
| Liquidity |
|
Short term
|
•Market impacts on the value of high quality liquid assets in Santander's liquidity buffer.
•More frequent extreme weather that stifles economic growth in countries susceptible to climate change, causing sovereign debt to rise and limiting access to capital markets.
•Cash outflows from companies trying to boost their reputation in the market or solve problems with climate scenarios.
•Extreme weather conditions could cause financial impact on companies operating in the affected sectors impacting the funds deposited in the bank.
|
|
•Qualitative and quantitative climate scenario analyses of impacts on highly liquid assets (HQLAs) and financing of exposed companies.
•Analysis of higher outflows due to changes in market perception of corporations in climate-sensitive business activities.
|
|
•Enhance stress testing and reviewing new scenarios to include them in the exercise.
•Adapt stress testing to best market practices, including new liquidity scenarios to measure their impact.
|
|
|
|
|
|
|
|
|
|
|
|
|
|
|
|
|
| Operational |
|
Short - medium - long term
|
•Severe climate events can cause damage to our assets, including branches, data centers, headquarters and other owned or rented properties. Impacts on our own or our suppliers’ premises can also affect business continuity.
•Climate and environmental - related factors can also lead to operational risk losses from litigation, claims due to inadequate sales or non-compliance with ESG standards.
|
|
•Conducting operational risk and self-assessment controls that include ESG-related risks to evaluate our exposure.
•Conducting mandatory operational risk scenario analysis that cover extreme physical and transition risk events.
•Including an ESG flag in the operational risk events database to identify events and losses from climate-related and environmental risks.
•Including an assessment of climate threats in business continuity scenarios.
•Conducting a materiality assessment on climate-related operational risk.
•Updating documentation and delivering training relating to the embedding of ESG factors across operational risk management, as well as sharing best practices throughout the Group.
|
|
•Enhance operational risk reporting on climate and environmental - related factors.
•Promote cooperation within the industry to share data, scenarios and best practices on climate-related operational risk management.
•Work with the Corporate Insurance team to conduct analyses on the insurability of climate-related losses.
|
|
|
|
|
|
|
|
|
|
|
|
|
|
|
|
|
2024 Pillar 3 Disclosures Report 249
|
|
|
|
|
|
|
|
|
|
|
|
|
|
|
|
|
|
|
|
|
|
|
|
| Risk type |
ClimateA and environmental drivers |
Time horizon analysed |
Potential Impact of climate and environmental risk factors |
|
What we’re doing to manage climate and environmental risk |
|
Next steps |
|
|
|
|
|
|
|
|
|
|
|
|
|
|
|
|
| Reputational |
|
Short - medium - long term |
•Customers, investors and other stakeholders could believe that banks aren't doing enough to meet low-carbon targets, that they could be acting against their policies, or that their public objectives do not meet stakeholders’ expectations.
•Stakeholders’ potential perception of inadequate financing and investment in climate and environment-related sectors, including activities linked to deforestation and/or biodiversity loss.
•Possible misinterpretation by customers, investors and other stakeholders of institutional disclosures or statements, actions, announcements, policies and the sustainability features of products.
|
|
•Implementing preventative measures to manage reputational risk and disclose risk data so that governance bodies can make informed decisions when assessing or sanctioning sensitive transactions that involve climate and environmental risk.
•Regularly monitoring reputational issues and disputes (including climate and environmental matters) via working groups, involving functions such as legal, sustainability, investor relations, public policy, supervisory and regulatory affairs, risk, among others.
•Development and update of greenwashing risk management guides that define the roles and responsibilities of key processes, and subsequently set specific training programmes.
•Enhancing materiality assessments to measure climate-related and environmental reputational risk. Developing a methodology to quantify the reputational impact of climate and environmental risk.
|
|
•Continue to strengthen collaboration between business and support areas as well as risk and compliance functions to embed climate and environment-related reputational risk in our operations.
•Continue bolstering greenwashing risk identification, management and control.
•Continue managing ESG events that pose material reputational risk and anticipate these events through early detection measures.
|
|
|
|
|
|
|
|
|
|
|
|
|
|
|
|
|
|
|
|
|
|
|
|
|
| Strategic |
|
Short - medium - long term |
•Our strategy could be affected if we fail to achieve our climate and environmental targets, including those related to the activities we fund and those related to our own operations.
•Regulatory divergence between climate change and ESG requirements in the markets where we operate, including a possible new regulatory cycle and slowdown in the implementation of the Paris Agreement.
|
|
•Challenging ESG targets in the Group’s strategic planning.
•Monitoring the Group’s ESG indicators regularly.
•Monitoring ESG indicators as part of our regular competitor analysis.
•Identification of emerging ESG risks, including analysis of the potential impact under stressed scenarios on the Group’s strategic targets to ensure action plans can be implemented in the event such risks materialize.
•Monitoring ESG initiatives presented at the corporate product governance forum (CPGF) and investors’ forum.
|
|
•Regularly review ESG indicators to support alignment with the Group’s strategy.
•Regularly review indicators in relation to business model performance.
•Monitor climate and environmental threats as part of emerging risk identification.
|
A. Though all climate drivers impact on risk factors, we have only included the key ones in this table.
B. E&CC: environmental and climate change.

Chronic

Acute

Market sentiment

Policy action

Technology

Natural risk
250 2024 Pillar 3 Disclosures Report
10.2. Social risk
10.2.1. Business strategy and processes
This section covers the requirement on qualitative information on social risk, specifically, the point on business strategy and processes, for question (a)
Integration of social factors on the business strategy
According to the annual report, the Group's strategy focuses on ESG issues that are material to Santander, according to our double materiality analysis. Our social ambition is to support our employees, communities and customers. We set out below our strategy and how we integrate social risks for each of these groups.
As regards our employees, our strategy focuses on offering an attractive employee value proposition that offers real opportunities, promoting the respect of their rights and welfare. The Group's approach is based on:
•Talent and skills development: Grupo Santander promotes a culture of continuous learning and development of employees and their personal growth. From senior executives, with the Elevate programme, to the youngest workers, with initiatives such as Young Leaders or BeTech& Business.
•Working conditions: the main pillars are health, well-being and protection of employees, with good work-life balance and well-being programmes such as BeHealthy. In addition, we strive to offer adequate, competitive and equitable remuneration, accompanied by corporate benefits adapted to local conditions.
•Inclusive culture: is a component of our corporate culture policy, through which we focus on building a merit-based culture of equal opportunity and inclusion in compliance with laws. Related matters are discussed at the highest level, the Group board cannot delegate these discussions and our executive committee reviews progress. Our main lines of action are gender equality, effective inclusion of people with disabilities, visibility of the LGTBIQ+ community, ethnic and cultural diversity, and anti-bullying training.
•Employee feedback and experience: we follow a regular listening strategy to gather employee feedback, called ‘Your Voice’, and analyse identified material impacts and employee concerns. In a broader sense, cross-geographical and global business action plans are also established. During this year, numerous actions have been launched to improve the employee experience and value proposition. Some of these initiatives have focused on professional growth, recognition, and workload management.
The Group also integrates social risks related to our communities and their sustainable development into its strategy. The aim is to drive growth and job creation in the regions where we operate through:
•Responsible investment and social finance: Santander's financing activity supports social activities such as the construction of hospitals, universities and housing for vulnerable groups. During 2024, more than 1.3 million micro entrepreneurs benefited from this financing. We
also continued to make progress in offering investment proposals that promote ESG factors in both Santander Asset Management and Wealth Management & Insurance.
•Environmental, social and climate change management: to address potential negative impacts on society or the environment arising from our financing, the Group's strategy is aligned with our ESCC policy, the Equator Principles and the management of major adverse events (PIAS). In particular, in adopting the Equator Principles, Grupo Santander recognises its responsibility and that of its customers to assess and monitor potential negative social risks that may affect the communities around them.
•Community support: Santander works to address the social needs faced by the societies in which it operates. The main mechanisms are support for education, employability and entrepreneurship, complemented by volunteer programmes, foundations, financial education and response to humanitarian crises.
Finally, our customer focus is a fundamental lever in integrating social factors into business strategy. We focus on:
•Conduct with customers: based on the conduct risk management model approved by the compliance and conduct committee. The main processes and instruments encompass the design and marketing of products and services, and the management of complaints and fraud. A key pillar of the Group's strategy in this area is also the identification and management of vulnerable households and businesses, as well as the prevention of over-indebtedness.
•Financial inclusion and financial health: this aspect is essential to contribute to social progress, which is why it is at the top of Santander's agenda. We have the ambition to reach 5 million people targeted by financial inclusion measures between 2023 and 2025.
•Privacy, data protection and cybersecurity: the Group is strongly committed to compliance with personal data protection regulations throughout its life cycle. In this regard, we have a cybersecurity framework, approved by the board of directors, which includes a Chief Information Security Officer (CISO).
In 2024, we conducted a comprehensive human rights due diligence exercise to: (i) assess the effectiveness of current due diligence policies; (ii) identify and assess actual and potential adverse impacts based on their severity and probability; and (iii) assess the suitability of our communications channels and control measures to prevent, mitigate and remedy adverse impacts
Moreover, the Group's ambition and strategic pillars in the social domain (e.g. contribution to society/community, financial inclusion...) are incorporated in the conduct of strategic exercises such as financial planning. In particular, social risks are indirectly taken into account in our strategic exercises (e.g. ICAAP) by incorporating social factors such as technology developments, the political framework or market sentiment in the climate scenarios used.
2024 Pillar 3 Disclosures Report 251
Some examples of social factors analysed in the ICAAP: projections of gross value added affecting at sector country level in the value of goods and services, productivity, industrials and manufacturing processes; change in demand is also affected under each scenario, as it determines the costs and the profitability of production as well as the demand of consumers and products; technological change applies also to affecting the demand for the sectors due to growth in the low-carbon technologies and market sentiment.
Objectives, targets and limits to assess and address social risk
This section covers the requirement on qualitative information on social risk, specifically, the point on business strategy and processes, for question (b)
We analysed our agenda’s contribution to the SDGs and determined the most relevant goals to Banco Santander’s business and strategy. For more details, see the ´Banco Santander and the SDGs´ brochure on our corporate website.
Primarily, the Group has a number of ESG objectives. Among the objectives related to social risk, we find some purposes such as fostering a diverse workforce, contributing to social development through our financing activities, promoting education and entrepreneurship, or ensuring compliance with human rights.
In terms of the targets related to these objectives, the targets related to diversity stand out. Therefore, we have progressed towards equality, achieving a greater representation of women in senior positions, from 22.7% in 2019 to 31.2% in 2024.
Financial inclusion, a key driver of social progress, is also high on our agenda. In 2024, we financially included nearly 1 million people through access initiatives; and 1.6 million people through finance initiatives.
|
|
|
|
|
|
|
|
|
People subject to inclusion measuresA |
Target |
+5 mnB |
1.8 mn |
4.3 mn |
2023 |
2024 |
2025 |
A.Based on internal financial inclusion methodology. Includes the principles, definitions and standards we use consistently across our footprint to count the number of people we include financially through initiatives, products and services for access and finance.
B.Cumulative figure since 2023.
In 2024, we continued to make headway with embedding Group regulations on vulnerable customers and the prevention of overindebtedness in every market where we operate. The aim is to provide a common approach and standards to avoid disparate management between countries. During the last year, bi-monthly working meetings were held with the participation of all local units and the global team to advance in an aligned manner the implementation of the Group's standards on vulnerable customers. We also launched a global training course on vulnerable customers so that all employees consider potential vulnerabilities and are aware of the lines of action in each case.
Policies and procedures to manage social risks
This section covers the requirement on qualitative information on social risk, specifically, the point on business strategy and processes, for question (c)
Grupo Santander oversees ethical factors are properly considered when conducting business.
We therefore adhere to several policies, codes and internal rules inspired by the best practices, international conventions and protocols, codes of conduct and guides that are applicable in every area.
Our compliance with these policies is a process of continuous improvement. Santander undertakes an annual review of its corporate sustainability policies, which apply to the whole Group. These policies are approved by the Group's board of directors, indicating in the policy the date of the last update.
Among the most relevant policies relating to social aspects, are the following:
•Responsible banking and sustainability policy
It defines Santander's general principles for responsible banking and sustainability, as well as the objectives that the Group voluntarily undertakes with its main stakeholders, including Santander's position on the protection of human rights. This policy includes the main recommendations of the CNMV's Code of Good Governance in this area.
The responsible banking and sustainability policy sets out the main processes for making progress in the management and monitoring of the objectives in this area.
The policy approved by the board of directors merges the general sustainability policy and the human rights policy to better integrate the objectives of both policies into existing processes. It also facilitates implementation and understanding in a single, simpler and more operational document.
•Environmental, social and climate change risk policy
This policy sets out Grupo Santander's criteria for investing in entities, and/or providing financial products and/or services to customers involved in the oil & gas, power generation and mining & metals sectors and those arising from businesses engaged in soft commodities. The policy sets out which activities are prohibited, including those activities linked to the commission of serious violations of human rights or international human rights law, and those that require special attention from an environmental, social
252 2024 Pillar 3 Disclosures Report and climate change perspective. This policy is a substitute to the previous energy, mining and metals, and soft commodities policies.
•Policy on donations
The purpose of this policy is to set out the criteria that regulate the treatment of donations as well as the process for making donations (proposal, assessment, decision, control and monitoring) that the Grupo Santander considers making for social purposes.
•Principles of responsible behaviour for suppliers
This document establishes the minimum principles of ethical, social and environmental conduct that Banco Santander expects from all its suppliers; these are aligned with the ten principles of the Global Compact.
10.2.2. Governance
Responsibilities of the management body for setting the risk framework, supervising and managing the implementation of the objectives, strategy and policies in the context of social risk management
This section covers the requirement on qualitative information on social risk, specifically, the point on governance, for questions (d), (e) and (f)
Board of directors
It consist of 15 members, of which 13 are non-executive directors and 2 are executive directors. The majority are independent directors (66.67 of the total members of the council).
Likewise, the board of directors shall ensure that the procedures to select members guarantee the individual and collective expertise of directors, encourage diversity in terms of gender, age, geographical origin, experience and knowledge, and do not carry any implicit bias that could lead to any form of discrimination on grounds such as disability, race or ethnic origin. The board currently has a balanced presence of both genders (women - men) with a diversity ratio of 67.18 In terms of geographical origin/international experience, 60 of the directors come from continental Europe, 60 from the US/UK, 13 from Latin America, and 7 from other regions. The Board also has extensive international experience, mainly in the markets where we operate (European market, the US and the UK markets, and Latin American markets). The board also has the skills and experience to monitor materiality issues (e.g. on issues related to sustainability, human resources, culture, talent and remuneration, as well as to business conduct and risk management). None of the directors are currently assigned a specific employee representation role.
The board of directors as the highest decision-making body in the Group performs the following functions:
•approves the Responsible Banking agenda and set the strategy;
•approves the culture policy and related policies on responsible business and sustainability matters and, in particular, on environmental and social matters;
•supervise that the responsible banking strategy is consistent with Group strategy;
•reviews the performance against the goals and that the metrics are covered within the responsible banking agenda;
• tracks key initiatives; and
• reviews subsidiaries’ strategies.
For more details, see the Rules and Regulations of the board of Directors, available on the Group's corporate website.
Responsible banking, sustainability and cultural committee
The responsible banking, sustainability and cultural committee (RBSCC) assists the board in fulfilling its supervisory responsibilities regarding the responsible business strategy and sustainability issues of Banco Santander and its Group. In particular, it has the following functions:
(i) advise the council on the design of the strategy and policies on responsible business and sustainability, in particular environmental and social matters, by monitoring, supervising and evaluating them;
(ii) advise the council in formulating the Group’s strategy with interest groups; as well as supervise the involvement with them;
(iii) ensure that adequate control processes are in place with respect to responsible banking practices, and that risks and opportunities related to sustainability and accountability are identified and managed;
(iv) to report regularly to the council on the progress made by the Group on responsible business practices and sustainability.
The responsible banking, sustainability and culture committee consists of five independent directors, 80% of whom are women. All of them have been appointed by the board of directors taking into account their knowledge, qualifications and experience in the areas for which the committee is responsible. Thus, its members have competence in issues relevant to this function as strategy and human resources, culture, talent and remuneration, responsible business and sustainability, risk management and also in issues related to education and universities.
In 2024, the committee held four meetings. The key matters it addressed were discussed:
Environmental issues:
•Reviewed the Group’s climate change strategy and alignment targets. Endorsed the Group priorities for 2024 in relation to sustainability, including supporting our customers in their green transition.
•Reviewed ESG factors introduced in the credit approval process, associated action plans and related achievements. Worked with the risk supervision,
18 The diversity ratio is calculated by dividing the number of women by men. The percentage of each gender vs total membership is 40 women and 60% men.
2024 Pillar 3 Disclosures Report 253
regulation and compliance committee to review the progress made in embedding climate-related and environmental risks, as well as to monitor the implementation of controls and processes to mitigate ESG risks.
•Reviewed the green finance strategy and its execution.
•Monitored our own environmental footprint, value chain emissions and carbon neutral claim.
Social issues:
•Reviewed our social agenda, which includes financial inclusion; financial health; business with social output; and corporate social responsibility or philanthropic activities. And reviewed the outcomes of the holistic human rights due diligence exercise.
•Reviewed the progress made within our community support strategy, which includes Santander Universidades strategy and its alignment with the Group's transformation agenda.
•Discussed People and Culture's activities and progress and proposals regarding diversity, equity and inclusion in coordination with the nomination and remuneration committees, with a key focus on the representation of women in senior positions within the Group.
Governance issues:
•Identified priority sustainability areas for action based on the outcomes of a materiality assessment that the Sustainability team conducts every year. Verified that the proposed sustainability agenda and targets remained aligned with the Group´s strategy. Monitored and assessed the Group's progress on its targets to control that its KPIs remained relevant and aligned with committee expectations. And reviewed ESG global ratings' assessments of Banco Santander.
•Assisted the board in ensuring that sustainability targets and metrics were embedded in the Group's remuneration schemes. As part of that, reviewed, in coordination with the remuneration committee, a proposal to further increase the alignment of the long-term incentive for 2024-2026 with our sustainability agenda.
•Reviewed the progress made regarding the management of the supply chain in regards to ESG.
•Supported the audit committee on the supervision and assessment of the process to prepare and present non-financial information.
•Reviewed the main European and international financial regulatory and supervisory initiatives and priorities related to sustainability. Received information on local regulatory developments to remain abreast of local challenges and opportunities.
In addition, it received specific training in sustainability, with special attention to the new Sustainability Information Disclosure Directive (CSRD).
For more details, see the Rules and Regulations of the board of Directors, available on the Group's corporate website; and sections 4.2 'Board composition' and 4.9 'Responsible banking, sustainability and cultural committee activities in 2024' in the 'Corporate governance' chapter of our annual report.
Board audit committee
The board audit committee (BAC) assists the board in overseeing and reviewing the financial and non-financial information process, as well as internal control systems.
The audit committee consists of five independent directors, 60% of whom are women. All of them have been appointed by the board of directors based on their knowledge, qualifications and experience in the areas of finance, accounting and auditing, internal control, information technology, business or risk management.
In 2024, the committee held 15 meetings, including four joint sessions with the risk supervision, regulation and compliance committee. With regard to sustainability reporting, the committee oversaw the sustainability reporting process, receiving regular updates from the Group's Chief Accounting Officer (CAO) and the main functions responsible for sustainability reporting.
For more details, see the Rules and Regulations of the board of Directors, available on the Group's corporate website; and sections 4.2 'Board composition' and 4.5 'Audit committee activities in 2024' of the 'Corporate governance' chapter of our annual report.
Risk supervision, regulation and compliance committee
The risk supervision, regulation and compliance committee supports and advises the board in defining and assessing risk policies that affect the Group and in determining the current and future risk appetite and the strategy and culture in this area, including proposing appropriate changes in view of internal or external circumstances that impact on the Group, among other functions.
The risk supervision, regulation and compliance committee consists of five external directors (40% women), with three independent members, including its chair. All of them have been appointed by the board of directors based on their’ knowledge, qualifications and experience in the areas for which the committee is responsible. Thus,its members have competence in issues relevant to this function as banking, accounting, auditing and financing, strategy, risk management, governance and control, as well as in human resources, culture, talent and remuneration.
In 2024, the committee held 18 meetings, including one strategy session, four joint sessions with the audit committee, one joint session with the nomination committee and one joint session with the remuneration committee. It reviewed relevant topics on customer data protection, operational resilience, aspects of customer conduct, complaints and internal whistleblowing. Issues such as culture and internal control are also addressed.
For more information see: the Rules and Regulations of the board of Directors, available on the Group's corporate website; and sections 4.2 'Board composition' and 4.8 'Risk supervision, regulation and compliance committee activities in 2024' in the 'Corporate governance' chapter in our annual report.
Other committees of the Group board, such as the Nomination and Remuneration Committees, also support and review sustainability-related issues.
254 2024 Pillar 3 Disclosures Report The corporate accounting and financial reporting, management and sustainability committee performs these functions (among others):
Other governance bodies
•Approve the content and scope of sustainability disclosures.
•Analyse and validate or, when applicable, propose the approval of all significant sustainability information.
This committee meets monthly, or on an extraordinary basis when deemed appropriate.
The risk control committee (CRR) is responsible for controlling risks and providing a holistic view of them. Determines whether lines of business are managed according to the risk appetite approved by the board. It also identifies, tracks and evaluates the impact of current and emerging risks on the Group’s risk profile.
The CCR is composed of senior management members in the functions of risk, compliance and conduct, financial and general intervention, among others.
Other forums and support functions
First line of defence
Business functions and all other functions that generate risk exposure are the first line of defence. The first line of defence identifies, measures, controls, tracks and reports the risks that originate and applies the policies, models and procedures that regulate risk management. Risk generation must be adjusted to the approved risk appetite and associated limits. The head of each unit that generates a risk has primary responsibility for managing it.
The corporate sustainability function works continuously to define, execute and monitor our sustainability strategy, and coordinates and drives the responsible banking agenda, with support from a senior adviser on responsible business practices who reports directly to the executive chair, as well as with the sustainability network in our core markets, global businesses and corporate functions.
The accounting and management control function, is responsible for (among others):
•Establishing and maintaining the internal control system on the financial and sustainability information generated by the function; and
•Implementing the standards and policies reflected in the sustainability information sent to the Corporation.
It is the responsibility of the functions involved in executing the strategy and preparing information on sustainability (for example: Technology, Operations, Risks, Human Resources, Tax, and others) that the information provided is true and reliable, establishing the necessary controls to guarantee this and correcting any weaknesses.
Second line of defence
Risk and Compliance & Conduct functions, as the second line of defence, will provide independent challenge and oversight of the risk management activities performed by the first line of defence. This second line of defence should oversee, within their respective domains of responsibility, that risks are managed in accordance with the risk appetite
defined by senior management and promote a strong risk culture throughout the organization.
The internal control function within the Enterprise Wide Risk Management (EWRM) function will be responsible for establishing the criteria and monitoring the implementation and effectiveness of the Santander Group Internal Control System. This will help the adequacy and integrity of the internal controls established by the different functions to provide reasonable assurance in the achievement of the defined objectives (which include, among others, the reliability of financial and sustainability reporting).
Third line of defence
The internal audit function periodically assesses that policies, methods and procedures are adequate and effectively applied for the management and control of accounting, financial and management information. The annual audit plan, which was carried out on the basis of a robust risk assessment process (Top-down & Bottom-up methodology), provides reviews of the main aspects contained in this report.
In this way, issues related to climate risk and disclaimers are regularly verified as well as compliance with the rules and procedures established in the General Code of Conduct (GCC), independently monitoring their adequacy and effectiveness and those of their local developments. the Open Channel is reviewed and specifically evaluates compliance with data protection regulations.
The audit function reports to the Audit Committee, which, among other functions, assists the board in the supervision and evaluation of the process of preparing and presenting financial and non-financial information, as well as internal control systems.
Risk management and internal controls over sustainability information
In order to control the quality and reliability of the information included in the Sustainability Statement, Santander implemented an Internal Control System that complies with the most demanding international standards and complies with the guidelines established by the Committee of Sponsoring Organisations of the Treadway Commission (COSO).
Like the Sustainability information itself, at Santander we are evolving our Internal Control System so that it covers all the material aspects identified for 2026.
First, we identify the most material risks and then establish the necessary controls, complying with the requirements regarding the disclosure of sustainability information.
The most significant aspects taken into account in the process of preparing sustainability information are the following:
•Identification and definition of quantitative and qualitative criteria that emanate from regulatory interpretation or our impacts risks and opportunities in areas where there are no consolidated market practices.
•The hypotheses, judgments, estimates and approximations used in the calculation and preparation of certain metrics.
2024 Pillar 3 Disclosures Report 255
•Ensuring the completeness of information and establishing perimeters for each metric or group of metrics.
•Difficulties in having, in certain respects, third-party information necessary for the construction of our narrative or metrics, especially in the value chain (emissions information from our portfolio, alignment information, supplier information, etc.).
•Calculation, processing and consolidation of both quantitative and qualitative information.
In addition, we also begun to prepare reasonable assurance of several of the metrics to convergence in the quality standards of financial and sustainability information.
Similarly to the control of financial information, the implementation and supervision of the control system of sustainability information is carried out through the following bodies: board of directors, audit committee, risk control committee and corporate accounting and financial, management and sustainability reporting committee.
Internal control system for sustainability information
Control culture
Basis of Internal Control. Essential to provide reasonable assurance in achieving the objectives defined by the Group, acting responsibly.
Risk Assessment (RCSA)
Dynamic process of evaluating the risks associated with achieving the organization's objectives.
Control Activities
Actions established by policies and procedures that help that management instructions are carried out to mitigate identified risks.
Information and Communication
Accurate and timely information for decision-making, facilitating the escalation and governance of improvements and incidents.
Monitoring activities
Mechanisms and instruments to monitor the correct implementation and effectiveness of the internal control system, promoting a continuous evaluation of the same.
256 2024 Pillar 3 Disclosures Report
Cross-cutting regulations to embed ESG standards in our business model
Responsible banking framework
Establishes responsible banking as a strategic topic for Grupo Santander and all local units.
Accounting and Financial Reporting, Management and Sustainability information framework
Sets out the principles, directives and guidelines regarding the preparation of accounting, financial and management information that must be applied by all Group subsidiaries as an essential element of proper governance.
Responsible banking and sustainability policy
Sets out our sustainability principles, targets and strategy (including human rights protection) to create long-term stakeholder value.
In relation to human rights, this policy reflects the Bank's ESG objectives, including the protection of the human rights of employees, customers, suppliers and the community.
•We undertake initiatives to combat discrimination, forced labour, child exploitation and affronts to human dignity, as well as to preserve freedom of association and collective bargaining, the health of our employees and decent employment.
•We protect our customers' human rights through responsible business practices and data protection.
•We enhanced our environmental, social and human rights supplier questionnaires and screening to assess that respect for human rights is maintained throughout our supply chain.
•We are improving human rights questionnaires that include supply chain risks to customers under the ESCC risk management policy.
•We assess the human rights impact of operations falling within the scope of the Equator Principles.
Responsible banking model
Sets out the roles and responsibilities of the first, second and third line of defence in all responsible banking-related activity to drive our sustainability agenda, embed ESG standards and achieve our goals.
All regulations (corporate frameworks, models, policies and procedures) help maintain a high level of governance, and the highest standards in terms of their drafting, approval, and in the monitoring of their local transposition.
The approval of the regulations is responsibility of the board of directors or its committees, when the regulated matter falls within their scope of responsibility according to their rules and regulations. Corporate frameworks in all cases must be approved by the board of directors. The regulations approved by the board are as follows:
•Relevant corporate frameworks related to sustainability: Responsible Banking, Risk; Cybersecurity; Compliance and conduct; Financial Crime and compliance; Human resources.
•Relevant policies related to sustainability: Responsible banking and sustainability; Code of conduct; Code of conduct in securities markets; Corporate Defence;
Environmental, social and climate change risk; Tax; Conflict of interest; Defence sector; Anti-money laundering and countering the financing terrorism; Remuneration; Performance management; Group Succession; Culture.
For more details on the Group's key regulatory documents on sustainability, see our corporate website www.santander.com
The chart below shows the responsible banking, sustainability and culture committee ’s approximate time allocation in 2024:
Alignment of the remuneration policy with social risk-related objectives
This section covers the requirement on qualitative information on social risk, specifically, the points on governance, for question (g)
To align the remuneration policy with the institution’s social risk-related objectives, Santander applies the equal remuneration principle in the corporate remuneration policy of Grupo Santander for executive directors and employees alike, which forbids any type of differential treatment that is not exclusively based on an assessment of performance results and corporate behaviours, and promotes equal pay for men and women.
Furthermore, Santander’s remuneration framework rewards employees for their contribution based on such common principles as, among others:
•Meritocracy: non-discrimination based on sex, age, culture, religion or ethnicity.
•Consistency: remuneration consistent with the level of responsibility, leadership and performance within the Group, to promote retention of key professionals and attract the best talent.
•Sustainability: a remuneration framework that is sustainable in terms of associated costs, cost control, and related objectives (as described in the policy) that results in variable remuneration being commensurate with the Group's performance, disincentivize short termism and promote long-term sustainability. The remuneration scheme for the 1,246 Corporate Identified Staff also includes deferrals of up to 60% of their variable remuneration, payment of 50% of their variable remuneration in Santander instruments (subject to on-year retention) and malus and clawback clauses.
2024 Pillar 3 Disclosures Report 257
Also, performance objectives for annual variable remuneration have included since 2020 sustainability components. From 2022, with the purpose of increasing focus on the Group's sustainability agenda and highlight this matter as a core long-term strategy, sustainability metrics are included (described in the next section) for the last deferred variable remuneration payments.
•Social responsibility: employees’ pay cannot be lower than the legal minimum wage or the living wage in the country where they work. Additionally, in order to give our social responsibility prominence in remuneration, the Group’s responsible banking objectives for employee remuneration include the people financially included metric.
As previously mentioned in section 10.1.2 Governance, we measure our progress in ESG against these four lines of action and their related metrics: (1) women in executive positions, (2) financial inclusion, (3) socially responsible investment and (4) supporting transition.
Regarding social aspects, these targets cover
•Women in executive positions by 2027
|
|
|
|
|
|
Women in executive positionsB (%) |
Coefficient |
| ≥ 39.5% |
1.25 |
| ≥ 39.2% but < 39.5% |
1 – 1.25A |
| ≥ 38.4% but < 39.2% |
0 – 1A |
| < 38.4% |
0 |
A. Increase of the coefficient is proportional to its position on this line of the scale.
B. Executive positions make up 14% of the total workforce.
•Average annual total number of people that received financial inclusion support in the period 2025 and 2027
|
|
|
|
|
|
Financial inclusion B (million) |
Coefficient |
| ≥ 6 |
1.25 |
| ≥ 4.5 but < 6 |
1 – 1.25A |
| ≥ 3.5 but < 4.5 |
0 – 1A |
| < 3.5 |
0 |
A. Increase of the coefficient is proportional to its position on this line of the scale.
B. Number of people unbanked, underbanked, in financial distress or with difficulty to access credit to whom we provide tailored access and finance solutions, aiming to meet local financial inclusion needs in a recurrent, comprehensive, affordable and effective way.
Financial Inclusion thresholds have shifted from accumulative to annual average because it reflects better the performance of these programs.
This information can be found in the '6.4 Directors' remuneration policy for 2025, 2026 and 2027' section in the annual report.
|
|
|
|
|
|
|
Access 2024 annual report available on the Santander Group website |
10.2.3. Risk management
This section covers the requirement on qualitative information on social risk, specifically, the point on risk management, for question (h)
International standards on which the social risk management framework is based
Our social risk management framework draws up on international industry guidelines and principles. Thus, the four policies covered previously on “Policies and procedures to manage social risks”, have been established in accordance with international standards:
•The responsible banking and sustainability policy is based on standards such as the agreements reached at the 2015 COP21 summit on climate change in Paris, or the UNESCO World Heritage list, the 2011 United Nations Guiding Principles on Business and Human Rights, the Universal Declaration of Human Rights, Fundamental conventions of the International Labour Organization, among others.
•Our environmental, social & climate change risk management policy, follows the Equator Principles, the standards for social and environmental performance and the explanatory notes of the International Finance Corporation (IFC), the United Nations Global Compact, the Universal Declaration of Human Rights, the International Labour Organization Declaration, the Convention on the Rights of the Child, the Rio Declaration on Environment and the United Nations Convention against corruption.
•In the policy of donations, contributions must have, among other purposes, the defence of human rights, as proclaimed by the UN's Universal Declaration of Human Rights.
•Principles of responsible behaviour for suppliers: Banco Santander expects its suppliers to work to support and respect the protection of human rights in accordance with the United Nations Universal Declaration of Human Rights, the Fundamental Conventions of the International Labour Organization (ILO) and the United Nations Guiding Principles on Business and Human Rights.
In addition, the SFICS in the aspects related to social risk, draws on international industry guidelines, standards and principles such as the ICMA’s social and green bond principles, LMA’s principles or the UNEP FI framework among others.
258 2024 Pillar 3 Disclosures Report
Integration of social factors in the risk framework: management, setting of limits, tools and link with other risks
This section covers the requirement on qualitative information on social risk, specifically, the point on risk management, for question (i), (j), (k), (l) and (m)
The integration of social factors into the risk framework can be summarised as follows:
•Within our credit admission process, the board and its committees verify that decisions are made according to our ESCC and reputational risk policies. The first line of defence runs a due diligence with special sector-based questionnaires for credit approval. The reputational risk assessment also forms part of decision-making contributing to compliance and preventing from risk of false accusations (with particular focus on greenwashing). The due diligence consists of assessing the CIB's project finance transactions according to the Equator Principles.
In this regard, and as indicated in the ESCC risk policy, the questionnaires assessed in the customer discharge include the analysis of social aspects such as: child labour, forced labour, discrimination at work, freedom of association, working conditions, etc. grievance mechanism for workers or impact on communities, with respect to its own operations and its supply chain.
•Our ESCC risk management policy sets establishes the standards for investing, and providing financial products and services to companies and customers in oil and gas, power generation and distribution, mining and metals, and soft commodities (especially retail customers dedicated to farming and livestock in the Amazon). It dictates prohibited activities, including those activities linked to the commission of serious violations of human rights or international human rights law, and those that require special attention for the aforementioned sectors.
•A financial manager completes a questionnaire before a team of analysts conducts an overall assessment of the client's ESCC risks in the applicable sectors19.
•The ESCC risk and compliance departments delve deeper into cases that uncover red flags. The findings of the analysis (and its impact on credit and other risks) are escalated to the bank’s risk approval committees and are considered in decision-making process.
Regarding this last point, the objective of this criterion is to add a social component to the environmental dimension, so that potentially green financing to clients must also be aligned with:
◦OECD Guidelines for Multinational Enterprises
◦ILO Declaration on Fundamental Principles and Rights at Work
◦Universal Declaration of Human Rights
◦The Convention on the Rights of the Child
•As stated in our ESCC risk management policy, we enhance responsible investments that align with our sustainability goals and support the Paris Agreement Goals. Therefore, will not directly invest in, or provide financial products and services to projects that fail to meet our social responsibility standards, including projects requiring Free, Prior and Informed Consent (FPIC) under IFC Performance Standard 7 - Indigenous Peoples. Such projects must demonstrate adherence to IFC Performance Standard 7 and have a credible plan to achieve compliance.
Moreover, we conduct a detailed analysis on CIB clients that operate in sectors subject to the ESCC policy, including any activity that entails the resettlement of indigenous populations and/or other vulnerable groups.
Additionally, in the process of qualitative assessment of social risks of clients and/or projects in SCIB's portfolio, compliance with the Equator Principles and other factors such as the availability of internal policies for the protection of human rights, labour rights, protection of communities where the client and its suppliers operate, among others, are assessed.
•We continued to implement our anti-bribery and corruption (ABC) programme, which is also subject to constant review and update in line with the rest of our policies. In 2024, we continued to enhance our awareness strategy, which is based on the programmes included under our corporate framework, by combining basic training with customized programmes. Throughout the year, we ran technical sessions, FCC risk awareness workshops, courses on ABC risks for procurement staff, and specialized training for board members.
•Among the tools for integrating social factors, we run surveys and speak-up channels for employees and customers. We assess externalities to identify risks and opportunities and to appraise our impact on the community. We respond to demands from analysts, investors and ratings and NGOs; keep pace with new regulation and best practices worldwide; and take part in consultations with authorities, trade bodies and other organizations that influence policymaking on sustainable development.
•As discussed in section 10.1.3. Risk management, the methodologies and/or tools used for social risk management include the indirect consideration of the evolution of social factors in the climate scenarios used in strategic exercises, the qualitative assessment of relevant corporate customers, which allow for the evaluation of social aspects and compliance with the Group's criteria set out in its ESCC Policy that consider international and/or national labour and human rights standards (e.g. no open litigation that compromises these standards), among others. All these examples show how these aspects are taken into account in the management of the different types of risks in our framework. In addition, these tools are complemented by a comprehensive due diligence exercise, explained in section 10.2.1 Business strategy and processes.
•The interaction of social risks with credit risk management is carried out on the basis of due diligence
19 Sectors covered by the ESCC Risk management policy and additional tactical sectors included in the CIB Procedure, as well as other material businesses and sectors depending on the geography and local legal requirements.
2024 Pillar 3 Disclosures Report 259
questionnaires during the process of analysis and granting of financing, but they are also taken into account for the management of market, operational and reputational risks associated with these customers. With regard to market and liquidity risk, social risks are indirectly considered in our strategic exercises (ICAAP and ILAAP, respectively) by incorporating social factors such as the evolution of technology, the political framework or changes in market sentiment in the climate scenarios used. For operational risk, we continue working on the integration of social factors within the framework of management tools.
260 2024 Pillar 3 Disclosures Report
10.3.Governance risk
This section covers the requirement on qualitative information on risks derived from governance, specifically questions (a), (b), (c) and (d)
The management of risks derived from governance is a relevant aspect in two facets: on the one hand, in the internal governance of Grupo Santander, and on the other, in the evaluation we make of the governance of our customers.
Grupo Santander has corporate frameworks for matters considered to have a material impact on its risk profile, such as risk, capital, liquidity, compliance, financial crime, technology, auditing, accounting, finance, strategy, human resources, outsourcing, cybersecurity, special situations management communications and brand and responsible banking. These frameworks, which are mandatory, also specify:
•how the Group should supervise and exert control over subsidiaries;
•the Group’s involvement in subsidiaries’ decision-making (and vice versa).
In addition, compliance function is embedded in the process of reviewing ESG labelled transactions from a wider reputational and conduct risk perspective, with a particular focus on governance. A methodology has been developed for reviewing client governance related aspects with respect to labelled transactions in consideration of the minimum social safeguards under the EU Taxonomy, which focuses on competition, corruption and financial crime and taxation considerations. The internal methodology also gives consideration to broader issues such as allegations of greenwashing, ethics and integrity, DE&I, board composition and customer protection.
In relation to the analysis of our clients' governance, it is assessed in:
1.Clients' credit ratings. In the development of CIB's client credit ratings, we assess aspects of our clients' governance such as the application of good governance codes on our stakeholders like Sarbanes-Oxley and their involvement in management issues.
2.In customer tiering: phasing it progressively in accordance with our ambition of net zero carbon emissions by 2050, beginning with power generation (more detail in the climate finance report, section 5 'Metrics and targets').
3.In the screening and assessment process of the ESCC of clients' activities in sectors (subject to the ESCC Policy) such as oil and gas, power, soft commodities, mining and metals.
In the qualitative client assessment processes for portfolios such as SCIB, specific issues associated with the governance model and those responsible for climate management (e.g. Sustainability Committees, assignment of oversight responsibility for climate change policies to the Board of Directors, integration of climate objectives into executive remuneration frameworks, etc.) are included.
Throughout this process, questionnaires are updated annually to assess aspects of our clients' governance and risk management:
•The ethical considerations and inclusiveness assessment includes, among others, actions and policies on non-discrimination at work, working conditions, populations requiring special attention, human rights.
•The strategy and risk management assessment includes the analysis of the quality and ambition of the customer’s quantitative GHG emissions targets and the credibility of the customer’s strategy to achieve their emissions reduction targets (e.g. policies on climate change action; business strategy consideration of climate change risks and opportunities; and action plans).
•The disclosure assessment focuses on the transparency of the customer’s reporting on past emissions performance across all relevant scopes, the level of assurance, as well as the degree of reporting alignment with the TCFD. Where possible, it may also include assessment as to whether or not previous greenhouse gas (GHG) emission targets were achieved.
•In relation to conflict of interest, Santander evaluates whether both its customers and their suppliers may have activities in prohibited areas according to the Group's regulations and whether there is any process to mitigate this.
Additionally, it analyses whether its custumer's policies evaluate aspects of non-discrimination at work, working conditions, populations requiring special attention, human rights of its suppliers. The impact of the production chains of customers and suppliers on their respective communities is also considered.
•Regarding the internal communication of critical concerns, we evaluate how internal client communication works, for example, in terms of grievance mechanisms for workers.
In addition, a governance assessment is conducted considering the level of management oversight and governance of the customer’s transition strategy. We assess the level of seniority of executives accountable for climate strategy, board committee oversight of climate change issues, and whether executive remuneration is linked to climate change performance. Having an executive manager responsible for climate-related issues and a responsible board member facilitates internal communication of critical climate issues throughout the organisation.
A financial manager completes a questionnaire before a team of analysts conducts an overall assessment of the customer's ESCC risks in the applicable sectors.
The ESCC risk and compliance departments delve deeper into cases that uncover red flags. They submit the findings of their analysis (and its impact on credit and other risks) to the bank’s risk approval committees, who use them in decision-making.
4. As part of the customer due diligence process, the Group analyses publicly available information to assess the financial crime risk of our potential or existing customers (adverse media screening). If a relevant risk is identified during this process, it is escalated to the Financial Crime Prevention function for review and determination of mitigating actions.
2024 Pillar 3 Disclosures Report 261
5. According to the defence sector policy, Grupo Santander will not be involved in the financing or support in relation to the manufacture, trade, distribution or maintenance services of the prohibited materials mentioned in the policy.
Additionally, Compliance area will continue to deepen its analysis of our clients' governance, particularly in the context of our ongoing client due diligence analysis in accordance with our policies and procedures and ESG labelling, in order to broaden the focus on aspects such as ethics and integrity, board diversity and equality and customer protection.
262 2024 Pillar 3 Disclosures Report
10.4 Credit quality of exposures
This template provides information on exposures to non-financial companies operating in sectors that significantly contribute to climate change, including, among other things, information on the credit quality of the exposures and on financed emissions.
ESG disclosure in Pillar 3 follows the implementing technical standards on prudential disclosures on ESG risks defined by the EBA for this purpose. Therefore, the ESG information disclosed in this template of Pillar 3 is not necessarily aligned with other Group´s ESG management reports.
The perimeter includes exposures in the banking book, including loans and advances, debt securities and equity instruments to non-financial corporations, other than those held for trading.
Santander has an exposure of €339 billion, distributed between those sectors identified by the EBA as major climate change contributors (77% – NACE A–I and L) and other less polluting sectors (23% – NACE K, J, M–U).
The template also requires the identification of exposures excluded from benchmarks aligned with the Paris Agreement. To this end, we have applied sections d) through g) of Article 12.1, and Article 12.2 of Commission Delegated Regulation (EU) 2020/1818. Companies are identified based on the following criteria:
•1% or more of their revenue derive from exploration, mining, extraction, distribution or refining of hard coal and lignite.
•10% or more of their revenue derive from the exploration, extraction, distribution or refining of oil fuels.
•50% or more of their revenue derive from the exploration, extraction, manufacturing or distribution of gaseous fuels.
•At least 50% of its revenue comes from electricity generation with a greenhouse gas emission intensity of more than 100g CO2 equivalent/kWh.
In order to apply these criteria to our portfolio, we have used information from external providers regarding revenues of the companies by sector of activity obtained, when available.
The resulting list has been complemented with those companies not included in the information provided by external providers but included in sectors with climate targets by the Group.
The implementation of field 'of which environmentally sustainable' (CCM) has been done consistently with the aligned exposures subject to CSRD reported in the GAR template that contribute to the climate change mitigation objective.
Regarding the publication of financed emissions, the calculation is based on the PCAF standard:
•Using the actual emissions of the counterparties when available, which are obtained from Carbon Disclosure Project (CDP) database.
•Supplementing the rest of the portfolio with the latest available average emission factors from PCAF database.
Different methodologies have been used depending on the type of asset (loans to companies, real estate, and motor vehicle loans).
Larger volumes of emissions of the non financial corporations portfolio have been identified in the manufacturing and mining sectors.
2024 Pillar 3 Disclosures Report 263
|
|
|
|
|
|
|
|
|
|
|
|
|
|
|
|
|
|
|
|
|
| Table 95.ESG 1 - Banking book- Climate Change transition risk: Credit quality of exposures by sector, emissions and residual maturity |
|
|
|
|
|
|
|
|
Sector/subsector |
a |
b |
c |
d |
e |
|
|
|
Gross carrying amount (Mn EUR) |
|
|
|
Of which exposures towards companies excluded from EU Paris-aligned Benchmarks in accordance with points (d) to (g) of Article 12.1 and in accordance with Article 12.2 of Climate Benchmark Standards Regulation |
Of which environmentally sustainable (CCM) |
Of which stage 2 exposures |
Of which non-performing exposures |
| 1 |
Exposures towards sectors that highly contribute to climate change* |
259,307 |
11,248 |
1,320 |
23,156 |
9,769 |
| 2 |
A - Agriculture, forestry and fishing |
8,475 |
— |
— |
815 |
515 |
| 3 |
B - Mining and quarrying |
10,956 |
4,990 |
81 |
469 |
123 |
| 4 |
B.05 - Mining of coal and lignite |
3 |
— |
— |
1 |
— |
| 5 |
B.06 - Extraction of crude petroleum and natural gas |
3,888 |
2,198 |
4 |
206 |
34 |
| 6 |
B.07 - Mining of metal ores |
3,089 |
694 |
1 |
48 |
6 |
| 7 |
B.08 - Other mining and quarrying |
890 |
— |
— |
117 |
25 |
| 8 |
B.09 - Mining support service activities |
3,087 |
2,097 |
76 |
98 |
59 |
| 9 |
C - Manufacturing |
53,681 |
1,318 |
233 |
3,580 |
1,967 |
| 10 |
C.10 - Manufacture of food products |
14,210 |
— |
— |
659 |
543 |
| 11 |
C.11 - Manufacture of beverages |
2,590 |
— |
— |
107 |
73 |
| 12 |
C.12 - Manufacture of tobacco products |
386 |
— |
— |
3 |
— |
| 13 |
C.13 - Manufacture of textiles |
741 |
— |
— |
90 |
42 |
| 14 |
C.14 - Manufacture of wearing apparel |
646 |
— |
— |
66 |
115 |
| 15 |
C.15 - Manufacture of leather and related products |
379 |
— |
— |
51 |
58 |
| 16 |
C.16 - Manufacture of wood and of products of wood and cork, except furniture; manufacture of articles of straw and plaiting materials |
939 |
— |
1 |
74 |
63 |
| 17 |
C.17 - Manufacture of pulp, paper and paperboard |
1,795 |
— |
2 |
132 |
29 |
| 18 |
C.18 - Printing and service activities related to printing |
465 |
— |
— |
84 |
26 |
| 19 |
C.19 - Manufacture of coke oven products |
1,586 |
807 |
3 |
37 |
47 |
| 20 |
C.20 - Production of chemicals |
4,863 |
287 |
2 |
320 |
143 |
| 21 |
C.21 - Manufacture of pharmaceutical preparations |
1,993 |
— |
— |
55 |
21 |
| 22 |
C.22 - Manufacture of rubber products |
2,114 |
— |
1 |
238 |
79 |
| 23 |
C.23 - Manufacture of other non-metallic mineral products |
1,945 |
127 |
5 |
182 |
80 |
264 2024 Pillar 3 Disclosures Report
|
|
|
|
|
|
|
|
|
|
|
|
|
|
|
|
|
|
|
|
|
| 24 |
C.24 - Manufacture of basic metals |
2,852 |
50 |
56 |
182 |
59 |
| 25 |
C.25 - Manufacture of fabricated metal products, except machinery and equipment |
3,040 |
— |
— |
295 |
145 |
| 26 |
C.26 - Manufacture of computer, electronic and optical products |
2,042 |
— |
1 |
112 |
23 |
| 27 |
C.27 - Manufacture of electrical equipment |
1,872 |
— |
66 |
159 |
93 |
| 28 |
C.28 - Manufacture of machinery and equipment n.e.c. |
2,050 |
5 |
1 |
140 |
92 |
| 29 |
C.29 - Manufacture of motor vehicles, trailers and semi-trailers |
3,760 |
33 |
42 |
294 |
59 |
| 30 |
C.30 - Manufacture of other transport equipment |
1,134 |
— |
54 |
63 |
50 |
| 31 |
C.31 - Manufacture of furniture |
599 |
— |
— |
76 |
43 |
| 32 |
C.32 - Other manufacturing |
894 |
9 |
— |
79 |
40 |
| 33 |
C.33 - Repair and installation of machinery and equipment |
786 |
1 |
— |
82 |
45 |
| 34 |
D - Electricity, gas, steam and air conditioning supply |
13,915 |
2,986 |
701 |
1,486 |
275 |
| 35 |
D35.1 - Electric power generation, transmission and distribution |
13,193 |
2,440 |
689 |
1,472 |
273 |
| 36 |
D35.11 - Production of electricity |
9,040 |
1,476 |
348 |
954 |
263 |
| 37 |
D35.2 - Manufacture of gas; distribution of gaseous fuels through mains |
677 |
546 |
11 |
12 |
1 |
| 38 |
D35.3 - Steam and air conditioning supply |
45 |
— |
— |
2 |
1 |
| 39 |
E - Water supply; sewerage, waste management and remediation activities |
1,711 |
— |
5 |
151 |
50 |
| 40 |
F - Construction |
18,719 |
558 |
135 |
1,647 |
817 |
| 41 |
F.41 - Construction of buildings |
10,255 |
— |
13 |
715 |
348 |
| 42 |
F.42 - Civil engineering |
3,894 |
5 |
96 |
521 |
139 |
| 43 |
F.43 - Specialised construction activities |
4,570 |
554 |
27 |
411 |
330 |
| 44 |
G - Wholesale and retail trade; repair of motor vehicles and motorcycles |
77,696 |
752 |
50 |
7,176 |
2,948 |
| 45 |
H - Transportation and storage |
17,251 |
644 |
54 |
1,933 |
970 |
| 46 |
H.49 - Land transport and transport via pipelines |
9,324 |
551 |
41 |
688 |
328 |
| 47 |
H.50 - Water transport |
2,309 |
92 |
— |
781 |
125 |
| 48 |
H.51 - Air transport |
428 |
— |
— |
21 |
32 |
| 49 |
H.52 - Warehousing and support activities for transportation |
5,053 |
1 |
12 |
434 |
470 |
| 50 |
H.53 - Postal and courier activities |
137 |
— |
— |
9 |
16 |
| 51 |
I - Accommodation and food service activities |
11,265 |
— |
— |
1,544 |
871 |
| 52 |
L - Real estate activities |
45,637 |
— |
61 |
4,354 |
1,231 |
| 53 |
Exposures towards sectors other than those that highly contribute to climate change* |
79,205 |
4,200 |
549 |
5,491 |
2,754 |
| 54 |
K - Financial and insurance activities |
— |
— |
— |
— |
— |
| 55 |
Exposures to other sectors (NACE codes J, M - U) |
79,205 |
4,200 |
549 |
5,491 |
2,754 |
| 56 |
TOTAL |
338,512 |
15,448 |
1,869 |
28,647 |
12,523 |
|
|
2024 Pillar 3 Disclosures Report 265
|
|
|
|
|
|
|
|
|
|
|
|
|
|
|
| Table 95.ESG 1 - Banking book- Climate Change transition risk: Credit quality of exposures by sector, emissions and residual maturity |
|
|
|
|
|
|
Sector/subsector |
f |
g |
h |
|
|
Accumulated impairment, accumulated negative changes in fair value due to credit risk and provisions (Mn EUR) |
|
|
|
Of which Stage 2 exposures |
Of which non-performing exposures |
| 1 |
Exposures towards sectors that highly contribute to climate change* |
-5,548 |
-953 |
-4,096 |
| 2 |
A - Agriculture, forestry and fishing |
-267 |
-38 |
-200 |
| 3 |
B - Mining and quarrying |
-62 |
-22 |
-34 |
| 4 |
B.05 - Mining of coal and lignite |
— |
— |
— |
| 5 |
B.06 - Extraction of crude petroleum and natural gas |
-8 |
-2 |
-4 |
| 6 |
B.07 - Mining of metal ores |
-3 |
— |
-2 |
| 7 |
B.08 - Other mining and quarrying |
-22 |
-9 |
-12 |
| 8 |
B.09 - Mining support service activities |
-28 |
-10 |
-17 |
| 9 |
C - Manufacturing |
-1,070 |
-148 |
-842 |
| 10 |
C.10 - Manufacture of food products |
-304 |
-40 |
-238 |
| 11 |
C.11 - Manufacture of beverages |
-32 |
-4 |
-26 |
| 12 |
C.12 - Manufacture of tobacco products |
— |
— |
— |
| 13 |
C.13 - Manufacture of textiles |
-22 |
-4 |
-16 |
| 14 |
C.14 - Manufacture of wearing apparel |
-46 |
-4 |
-40 |
| 15 |
C.15 - Manufacture of leather and related products |
-26 |
-3 |
-22 |
| 16 |
C.16 - Manufacture of wood and of products of wood and cork, except furniture; manufacture of articles of straw and plaiting materials |
-38 |
-3 |
-33 |
| 17 |
C.17 - Manufacture of pulp, paper and paperboard |
-22 |
-3 |
-17 |
| 18 |
C.18 - Printing and service activities related to printing |
-16 |
-3 |
-12 |
| 19 |
C.19 - Manufacture of coke oven products |
-19 |
— |
-17 |
| 20 |
C.20 - Production of chemicals |
-65 |
-8 |
-53 |
| 21 |
C.21 - Manufacture of pharmaceutical preparations |
-10 |
-2 |
-6 |
| 22 |
C.22 - Manufacture of rubber products |
-50 |
-12 |
-34 |
| 23 |
C.23 - Manufacture of other non-metallic mineral products |
-43 |
-5 |
-35 |
| 24 |
C.24 - Manufacture of basic metals |
-28 |
-2 |
-24 |
| 25 |
C.25 - Manufacture of fabricated metal products, except machinery and equipment |
-77 |
-12 |
-59 |
| 26 |
C.26 - Manufacture of computer, electronic and optical products |
-19 |
-7 |
-11 |
| 27 |
C.27 - Manufacture of electrical equipment |
-45 |
-2 |
-41 |
| 28 |
C.28 - Manufacture of machinery and equipment n.e.c. |
-60 |
-5 |
-50 |
| 29 |
C.29 - Manufacture of motor vehicles, trailers and semi-trailers |
-44 |
-12 |
-27 |
266 2024 Pillar 3 Disclosures Report
|
|
|
|
|
|
|
|
|
|
|
|
|
|
|
| 30 |
C.30 - Manufacture of other transport equipment |
-24 |
-6 |
-17 |
| 31 |
C.31 - Manufacture of furniture |
-30 |
-4 |
-25 |
| 32 |
C.32 - Other manufacturing |
-23 |
-3 |
-17 |
| 33 |
C.33 - Repair and installation of machinery and equipment |
-26 |
-4 |
-20 |
| 34 |
D - Electricity, gas, steam and air conditioning supply |
-156 |
-52 |
-71 |
| 35 |
D35.1 - Electric power generation, transmission and distribution |
-154 |
-51 |
-70 |
| 36 |
D35.11 - Production of electricity |
-145 |
-47 |
-67 |
| 37 |
D35.2 - Manufacture of gas; distribution of gaseous fuels through mains |
-1 |
— |
— |
| 38 |
D35.3 - Steam and air conditioning supply |
-1 |
— |
— |
| 39 |
E - Water supply; sewerage, waste management and remediation activities |
-30 |
-6 |
-20 |
| 40 |
F - Construction |
-563 |
-89 |
-440 |
| 41 |
F.41 - Construction of buildings |
-271 |
-48 |
-206 |
| 42 |
F.42 - Civil engineering |
-103 |
-19 |
-79 |
| 43 |
F.43 - Specialised construction activities |
-188 |
-22 |
-155 |
| 44 |
G - Wholesale and retail trade; repair of motor vehicles and motorcycles |
-1,863 |
-240 |
-1,450 |
| 45 |
H - Transportation and storage |
-415 |
-72 |
-312 |
| 46 |
H.49 - Land transport and transport via pipelines |
-214 |
-41 |
-142 |
| 47 |
H.50 - Water transport |
-18 |
-5 |
-12 |
| 48 |
H.51 - Air transport |
-21 |
— |
-21 |
| 49 |
H.52 - Warehousing and support activities for transportation |
-151 |
-24 |
-128 |
| 50 |
H.53 - Postal and courier activities |
-11 |
-1 |
-9 |
| 51 |
I - Accommodation and food service activities |
-471 |
-75 |
-370 |
| 52 |
L - Real estate activities |
-653 |
-212 |
-358 |
| 53 |
Exposures towards sectors other than those that highly contribute to climate change* |
-1,579 |
-207 |
-1,197 |
| 54 |
K - Financial and insurance activities |
— |
— |
— |
| 55 |
Exposures to other sectors (NACE codes J, M - U) |
-1,579 |
-207 |
-1,197 |
| 56 |
TOTAL |
-7,127 |
-1,160 |
-5,293 |
2024 Pillar 3 Disclosures Report 267
|
|
|
|
|
|
|
|
|
|
|
|
| Table 95.ESG 1 - Banking book- Climate Change transition risk: Credit quality of exposures by sector, emissions and residual maturity |
|
|
|
|
|
Sector/subsector |
i |
j |
|
|
GHG financed emissions (scope 1, scope 2 and scope 3 emissions of the counterparty) (in tons of CO2 equivalent) |
|
|
|
Of which Scope 3 financed emissions |
| 1 |
Exposures towards sectors that highly contribute to climate change* |
217,946,584 |
159,307,581 |
| 2 |
A - Agriculture, forestry and fishing |
11,980,985 |
3,844,957 |
| 3 |
B - Mining and quarrying |
53,392,099 |
41,548,541 |
| 4 |
B.05 - Mining of coal and lignite |
5,385 |
1,652 |
| 5 |
B.06 - Extraction of crude petroleum and natural gas |
22,412,526 |
16,862,350 |
| 6 |
B.07 - Mining of metal ores |
24,198,789 |
21,679,517 |
| 7 |
B.08 - Other mining and quarrying |
1,231,419 |
315,215 |
| 8 |
B.09 - Mining support service activities |
5,543,979 |
2,689,808 |
| 9 |
C - Manufacturing |
76,893,491 |
63,176,498 |
| 10 |
C.10 - Manufacture of food products |
14,916,967 |
12,720,298 |
| 11 |
C.11 - Manufacture of beverages |
2,213,733 |
1,857,815 |
| 12 |
C.12 - Manufacture of tobacco products |
515,598 |
443,336 |
| 13 |
C.13 - Manufacture of textiles |
462,602 |
372,966 |
| 14 |
C.14 - Manufacture of wearing apparel |
414,712 |
327,101 |
| 15 |
C.15 - Manufacture of leather and related products |
236,312 |
187,491 |
| 16 |
C.16 - Manufacture of wood and of products of wood and cork, except furniture; manufacture of articles of straw and plaiting materials |
418,344 |
301,282 |
| 17 |
C.17 - Manufacture of pulp, paper and paperboard |
902,696 |
627,216 |
| 18 |
C.18 - Printing and service activities related to printing |
214,994 |
154,773 |
| 19 |
C.19 - Manufacture of coke oven products |
3,857,031 |
3,047,481 |
| 20 |
C.20 - Production of chemicals |
7,615,263 |
5,013,227 |
| 21 |
C.21 - Manufacture of pharmaceutical preparations |
1,385,000 |
771,203 |
| 22 |
C.22 - Manufacture of rubber products |
2,637,163 |
1,650,992 |
| 23 |
C.23 - Manufacture of other non-metallic mineral products |
2,563,194 |
1,223,348 |
| 24 |
C.24 - Manufacture of basic metals |
3,949,826 |
2,378,683 |
| 25 |
C.25 - Manufacture of fabricated metal products, except machinery and equipment |
3,524,541 |
2,241,949 |
| 26 |
C.26 - Manufacture of computer, electronic and optical products |
9,151,777 |
9,001,719 |
| 27 |
C.27 - Manufacture of electrical equipment |
11,254,537 |
11,074,475 |
| 28 |
C.28 - Manufacture of machinery and equipment n.e.c. |
1,124,793 |
996,624 |
268 2024 Pillar 3 Disclosures Report
|
|
|
|
|
|
|
|
|
|
|
|
| 29 |
C.29 - Manufacture of motor vehicles, trailers and semi-trailers |
5,678,266 |
5,453,322 |
| 30 |
C.30 - Manufacture of other transport equipment |
2,260,468 |
2,220,852 |
| 31 |
C.31 - Manufacture of furniture |
371,950 |
237,187 |
| 32 |
C.32 - Other manufacturing |
656,613 |
475,279 |
| 33 |
C.33 - Repair and installation of machinery and equipment |
567,108 |
397,877 |
| 34 |
D - Electricity, gas, steam and air conditioning supply |
17,841,529 |
7,168,414 |
| 35 |
D35.1 - Electric power generation, transmission and distribution |
16,035,737 |
5,760,349 |
| 36 |
D35.11 - Production of electricity |
8,939,991 |
3,137,868 |
| 37 |
D35.2 - Manufacture of gas; distribution of gaseous fuels through mains |
1,732,006 |
1,388,905 |
| 38 |
D35.3 - Steam and air conditioning supply |
73,785 |
19,160 |
| 39 |
E - Water supply; sewerage, waste management and remediation activities |
1,526,898 |
474,167 |
| 40 |
F - Construction |
5,704,955 |
4,827,338 |
| 41 |
F.41 - Construction of buildings |
2,302,104 |
1,908,480 |
| 42 |
F.42 - Civil engineering |
1,622,024 |
1,478,229 |
| 43 |
F.43 - Specialised construction activities |
1,780,826 |
1,440,630 |
| 44 |
G - Wholesale and retail trade; repair of motor vehicles and motorcycles |
37,112,354 |
30,966,035 |
| 45 |
H - Transportation and storage |
9,998,766 |
5,609,816 |
| 46 |
H.49 - Land transport and transport via pipelines |
4,538,855 |
3,033,735 |
| 47 |
H.50 - Water transport |
796,320 |
458,156 |
| 48 |
H.51 - Air transport |
256,386 |
146,396 |
| 49 |
H.52 - Warehousing and support activities for transportation |
4,384,746 |
1,958,754 |
| 50 |
H.53 - Postal and courier activities |
22,459 |
12,775 |
| 51 |
I - Accommodation and food service activities |
1,925,131 |
1,409,332 |
| 52 |
L - Real estate activities |
1,570,377 |
282,483 |
| 53 |
Exposures towards sectors other than those that highly contribute to climate change* |
|
|
| 54 |
K - Financial and insurance activities |
|
|
| 55 |
Exposures to other sectors (NACE codes J, M - U) |
|
|
| 56 |
TOTAL |
217,946,584 |
159,307,581 |
2024 Pillar 3 Disclosures Report 269
|
|
|
|
|
|
|
|
|
|
|
|
|
|
|
|
|
|
|
|
|
|
|
|
| Table 95.ESG 1 - Banking book- Climate Change transition risk: Credit quality of exposures by sector, emissions and residual maturity |
|
|
|
|
|
|
|
|
|
Sector/subsector |
k |
l |
m |
n |
o |
p |
|
|
GHG emissions (column i): gross carrying amount percentage of the portfolio derived from company-specific reporting |
<= 5 years |
> 5 year <= 10 years |
> 10 year <= 20 years |
> 20 years |
Average weighted maturity |
|
|
|
|
|
|
|
|
| 1 |
Exposures towards sectors that highly contribute to climate change* |
10 |
% |
211,273 |
26,627 |
12,289 |
9,118 |
3.1 |
| 2 |
A - Agriculture, forestry and fishing |
1 |
% |
7,030 |
1,012 |
327 |
107 |
3.3 |
| 3 |
B - Mining and quarrying |
28 |
% |
9,079 |
1,053 |
562 |
261 |
2.6 |
| 4 |
B.05 - Mining of coal and lignite |
— |
% |
3 |
— |
— |
— |
1.4 |
| 5 |
B.06 - Extraction of crude petroleum and natural gas |
23 |
% |
3,382 |
350 |
146 |
10 |
2.8 |
| 6 |
B.07 - Mining of metal ores |
48 |
% |
3,077 |
10 |
— |
1 |
0.9 |
| 7 |
B.08 - Other mining and quarrying |
— |
% |
564 |
76 |
2 |
249 |
2.9 |
| 8 |
B.09 - Mining support service activities |
23 |
% |
2,054 |
617 |
413 |
2 |
4.0 |
| 9 |
C - Manufacturing |
14 |
% |
46,850 |
4,505 |
948 |
1,378 |
2.3 |
| 10 |
C.10 - Manufacture of food products |
6 |
% |
13,255 |
738 |
81 |
137 |
2.2 |
| 11 |
C.11 - Manufacture of beverages |
11 |
% |
2,167 |
317 |
27 |
79 |
1.8 |
| 12 |
C.12 - Manufacture of tobacco products |
59 |
% |
266 |
52 |
— |
67 |
1.4 |
| 13 |
C.13 - Manufacture of textiles |
1 |
% |
647 |
68 |
23 |
3 |
2.7 |
| 14 |
C.14 - Manufacture of wearing apparel |
— |
% |
550 |
57 |
25 |
14 |
3.1 |
| 15 |
C.15 - Manufacture of leather and related products |
— |
% |
341 |
26 |
6 |
6 |
2.4 |
| 16 |
C.16 - Manufacture of wood and of products of wood and cork, except furniture; manufacture of articles of straw and plaiting materials |
13 |
% |
832 |
84 |
17 |
6 |
2.6 |
| 17 |
C.17 - Manufacture of pulp, paper and paperboard |
16 |
% |
1,537 |
234 |
9 |
15 |
2.9 |
| 18 |
C.18 - Printing and service activities related to printing |
3 |
% |
386 |
58 |
15 |
6 |
3.1 |
| 19 |
C.19 - Manufacture of coke oven products |
32 |
% |
1,081 |
372 |
116 |
17 |
4.0 |
| 20 |
C.20 - Production of chemicals |
22 |
% |
4,045 |
339 |
419 |
60 |
2.6 |
| 21 |
C.21 - Manufacture of pharmaceutical preparations |
9 |
% |
1,080 |
219 |
— |
694 |
3.1 |
| 22 |
C.22 - Manufacture of rubber products |
4 |
% |
1,886 |
181 |
14 |
33 |
2.7 |
| 23 |
C.23 - Manufacture of other non-metallic mineral products |
5 |
% |
1,800 |
113 |
9 |
22 |
2.1 |
| 24 |
C.24 - Manufacture of basic metals |
17 |
% |
2,633 |
181 |
14 |
23 |
2.1 |
| 25 |
C.25 - Manufacture of fabricated metal products, except machinery and equipment |
9 |
% |
2,693 |
265 |
45 |
37 |
2.4 |
270 2024 Pillar 3 Disclosures Report
|
|
|
|
|
|
|
|
|
|
|
|
|
|
|
|
|
|
|
|
|
|
|
|
| 26 |
C.26 - Manufacture of computer, electronic and optical products |
43 |
% |
1,926 |
97 |
2 |
17 |
1.4 |
| 27 |
C.27 - Manufacture of electrical equipment |
22 |
% |
1,630 |
224 |
6 |
12 |
1.8 |
| 28 |
C.28 - Manufacture of machinery and equipment n.e.c. |
10 |
% |
1,865 |
134 |
20 |
31 |
2.0 |
| 29 |
C.29 - Manufacture of motor vehicles, trailers and semi-trailers |
38 |
% |
3,505 |
180 |
3 |
71 |
1.3 |
| 30 |
C.30 - Manufacture of other transport equipment |
16 |
% |
728 |
391 |
12 |
3 |
4.2 |
| 31 |
C.31 - Manufacture of furniture |
— |
% |
511 |
70 |
12 |
6 |
2.9 |
| 32 |
C.32 - Other manufacturing |
3 |
% |
830 |
45 |
5 |
13 |
2.2 |
| 33 |
C.33 - Repair and installation of machinery and equipment |
11 |
% |
656 |
59 |
66 |
5 |
3.1 |
| 34 |
D - Electricity, gas, steam and air conditioning supply |
24 |
% |
9,667 |
2,197 |
1,861 |
190 |
4.6 |
| 35 |
D35.1 - Electric power generation, transmission and distribution |
22 |
% |
9,140 |
2,023 |
1,842 |
189 |
4.7 |
| 36 |
D35.11 - Production of electricity |
22 |
% |
5,516 |
1,776 |
1,575 |
174 |
5.6 |
| 37 |
D35.2 - Manufacture of gas; distribution of gaseous fuels through mains |
57 |
% |
488 |
169 |
18 |
1 |
2.8 |
| 38 |
D35.3 - Steam and air conditioning supply |
— |
% |
39 |
5 |
1 |
— |
2.8 |
| 39 |
E - Water supply; sewerage, waste management and remediation activities |
4 |
% |
1,172 |
304 |
216 |
19 |
5.5 |
| 40 |
F - Construction |
3 |
% |
15,244 |
1,590 |
1,467 |
418 |
3.9 |
| 41 |
F.41 - Construction of buildings |
1 |
% |
8,993 |
659 |
272 |
331 |
3.2 |
| 42 |
F.42 - Civil engineering |
8 |
% |
2,867 |
594 |
399 |
35 |
4.1 |
| 43 |
F.43 - Specialised construction activities |
2 |
% |
3,385 |
337 |
797 |
52 |
5.0 |
| 44 |
G - Wholesale and retail trade; repair of motor vehicles and motorcycles |
12 |
% |
68,723 |
2,789 |
1,121 |
5,062 |
2.0 |
| 45 |
H - Transportation and storage |
9 |
% |
11,246 |
4,316 |
992 |
697 |
4.8 |
| 46 |
H.49 - Land transport and transport via pipelines |
11 |
% |
7,083 |
1,482 |
105 |
654 |
4.0 |
| 47 |
H.50 - Water transport |
19 |
% |
665 |
1,132 |
511 |
1 |
7.2 |
| 48 |
H.51 - Air transport |
— |
% |
253 |
168 |
1 |
5 |
4.0 |
| 49 |
H.52 - Warehousing and support activities for transportation |
4 |
% |
3,154 |
1,490 |
373 |
36 |
4.6 |
| 50 |
H.53 - Postal and courier activities |
— |
% |
90 |
44 |
1 |
1 |
3.7 |
| 51 |
I - Accommodation and food service activities |
1 |
% |
7,002 |
2,709 |
1,283 |
271 |
5.4 |
| 52 |
L - Real estate activities |
1 |
% |
35,259 |
6,152 |
3,512 |
714 |
3.7 |
| 53 |
Exposures towards sectors other than those that highly contribute to climate change* |
|
63,083 |
7,318 |
3,001 |
5,803 |
3.3 |
| 54 |
K - Financial and insurance activities |
|
— |
— |
— |
— |
— |
| 55 |
Exposures to other sectors (NACE codes J, M - U) |
|
63,083 |
7,318 |
3,001 |
5,803 |
3.3 |
| 56 |
TOTAL |
8 |
% |
274,356 |
33,945 |
15,291 |
14,920 |
3.2 |
2024 Pillar 3 Disclosures Report 271
10.5 Energy efficiency of the collateral
The purpose of this template is to measure the energy efficiency of the loans collateralized with commercial and residential immovable property and of repossessed real estate collaterals, in terms of their consumption as expressed in kWh/m2 and/or their energy performance certificates (EPCs).
ESG disclosure in Pillar 3 follows the implementing technical standards on prudential disclosures on ESG risks defined by the EBA for this purpose. Therefore, the ESG information disclosed in this template of Pillar 3 is not necessarily aligned with other Group’s ESG management reports.
With the aim of promoting the energy efficiency of buildings, the Energy Performance of Buildings Directive (2010/31/EU) and the Energy Efficiency Directive (2012/27/EU) introduced EPCs in Europe. Following their entry into force, these certificates are compulsory for the sale and rent of immovable property in the Eurozone.
However, when analysing the information provided, the following should be considered:
•Transactions (sales/renting) prior to the date of entry into force of the directive were not subject to the obligation of providing an EPC.
•The directive is applicable across the European Union and, as such, does not cover all jurisdictions where Santander operates.
•Even at the European Union level, as recognised by the European Banking Authority (EBA) in the Implementing Technical Standards on Prudential Disclosures on ESG risks, application of the Directive is not standardised.
•Depending on the legal provisions in each country, an EPC's obligation to carry out the transaction does not always imply that the financial institution involved in the transaction has access to such information.
Given that the directive is applicable in the European Union, the Group has worked to obtain EPCs for the main collateralized portfolios in this region (Spain, Portugal and Germany), as well as the UK, since it has a EPC system that is similar to that of the European Union. For these regions, the Group is currently collecting information of new originations or has initiatives in place to obtain it.
For these countries, work has been done to obtain EPCs and energy consumption (in kWh/m2), drawing from various sources of information:
•Firstly, information already available internally has been used.
•Additionally, in Spain, the UK and Portugal, this has been supplemented by information obtained by external suppliers (Gloval and Landmark).
•In regard to immovable property for which real data was not available, for those immovable properties subject to EPCs this has been modelled both internally (in the case of Spain), as well as by an external supplier (in the case of Portugal and the UK), in order to cover a large percentage of the portfolio and allowing us to cover almost the entire portfolio in both countries. Additionally, in the case of Poland, information of energy consumption is included.
As per EBA guidelines, whereas in the report on exposure by energy certificate (EPC label) only actual energy certificates were considered, the report by energy consumption (kWh/ m2) used real consumption in addition to estimated consumption. Given this, energy consumption has been estimated for both the portion of the portfolio for which no EPC label was available, and for the part of the portfolio with EPC label where real consumption information was not available.
In the case of the UK, Spain, Portugal and Germany, actual EPCs have been reported for 68% of the portfolio, with estimated EPCs available for a further 29%. For Poland, according to local regulation there is no EPC label, so only EP score information is included.
In countries where EPC labels above A are issued, they are categorised under EPC label A (column H). Likewise, EPC labels below G are placed in EPC label G (column N).
In addition, there are incentives for operations granted with higher energy certificates (EPC A or B in Spain and A+ or A in Portugal) as well as to home renovations aimed at reducing energy consumption in the UK and Poland.
For the remaining regions, such as the US and Latin America, given the current lack of European Union equivalent regulations in this respect, the exposure of these geographies are being reported as not having EPCs.
However, the portfolios collateralized by immovable property in countries without EPC schemes or an equivalent in place represent less than 25% of the Group's total portfolio.
272 2024 Pillar 3 Disclosures Report
|
|
|
|
|
|
|
|
|
|
|
|
|
|
|
|
|
|
|
|
|
|
|
|
|
|
|
| Table 96.ESG 2 - Banking book - Climate change transition risk: Loans collateralised by immovable property - Energy efficiency of the collateral |
|
|
|
|
|
|
|
|
|
|
|
a |
b |
c |
d |
e |
f |
g |
|
Counterparty sector |
Total gross carrying amount (in MEUR) |
|
|
|
Level of energy efficiency (EP score in kWh/m² of collateral) |
|
|
|
0; <= 100 |
> 100; <= 200 |
> 200; <= 300 |
> 300; <= 400 |
> 400; <= 500 |
> 500 |
| 1 |
Total EU area |
142,421 |
39,089 |
59,797 |
16,668 |
3,341 |
652 |
1,064 |
| 2 |
Of which Loans collateralised by commercial immovable property |
28,165 |
8,397 |
8,854 |
2,959 |
584 |
156 |
127 |
| 3 |
Of which Loans collateralised by residential immovable property |
109,858 |
30,683 |
50,918 |
13,706 |
2,756 |
497 |
937 |
| 4 |
Of which Collateral obtained by taking possession: residential and commercial immovable properties |
4,397 |
9 |
25 |
3 |
— |
— |
— |
| 5 |
Of which Level of energy efficiency (EP score in kWh/m² of collateral) estimated |
86,240 |
27,452 |
48,432 |
8,704 |
902 |
19 |
732 |
| 6 |
Total non-EU area |
298,800 |
26,086 |
54,443 |
89,588 |
29,683 |
7,789 |
5,153 |
| 7 |
Of which Loans collateralised by commercial immovable property |
28,964 |
326 |
1,192 |
1,675 |
1,381 |
1,187 |
1,963 |
| 8 |
Of which Loans collateralised by residential immovable property |
269,408 |
25,760 |
53,252 |
87,914 |
28,302 |
6,602 |
3,190 |
| 9 |
Of which Collateral obtained by taking possession: residential and commercial immovable properties |
428 |
— |
— |
— |
— |
— |
— |
| 10 |
Of which Level of energy efficiency (EP score in kWh/m² of collateral) estimated |
35,770 |
539 |
5,313 |
21,721 |
5,483 |
1,289 |
1,427 |
|
|
|
|
|
|
|
|
|
|
|
|
|
|
|
|
|
|
|
|
|
|
|
|
|
|
|
|
|
|
|
|
|
| Table 96.ESG 2 - Banking book - Climate change transition risk: Loans collateralised by immovable property - Energy efficiency of the collateral |
|
|
|
|
|
|
|
|
|
|
|
|
|
h |
i |
j |
k |
l |
m |
n |
o |
p |
|
Counterparty sector |
Total gross carrying amount (in MEUR) |
|
|
Level of energy efficiency (EPC label of collateral) |
Without EPC label of collateral |
|
|
A |
B |
C |
D |
E |
F |
G |
|
Of which level of energy efficiency* |
| 1 |
Total EU area |
5,837 |
5,507 |
5,728 |
7,890 |
15,015 |
3,355 |
3,525 |
95,564 |
74 |
% |
| 2 |
Of which Loans collateralised by commercial immovable property |
1,063 |
1,522 |
1,107 |
948 |
1,008 |
291 |
240 |
21,986 |
63 |
% |
| 3 |
Of which Loans collateralised by residential immovable property |
4,773 |
3,985 |
4,620 |
6,942 |
14,007 |
3,063 |
3,284 |
69,183 |
83 |
% |
| 4 |
Of which Collateral obtained by taking possession: residential and commercial immovable properties |
— |
— |
— |
— |
— |
— |
— |
4,396 |
1 |
% |
| 5 |
Of which Level of energy efficiency (EP score in kWh/m² of collateral) estimated |
— |
— |
— |
— |
— |
— |
— |
71,147 |
100 |
% |
| 6 |
Total non-EU area |
1,015 |
28,135 |
46,397 |
69,768 |
25,453 |
5,125 |
1,079 |
121,827 |
29 |
% |
| 7 |
Of which Loans collateralised by commercial immovable property |
205 |
799 |
912 |
716 |
252 |
68 |
115 |
25,898 |
18 |
% |
| 8 |
Of which Loans collateralised by residential immovable property |
810 |
27,336 |
45,486 |
69,053 |
25,201 |
5,057 |
963 |
95,502 |
33 |
% |
| 9 |
Of which Collateral obtained by taking possession: residential and commercial immovable properties |
— |
— |
— |
— |
— |
— |
— |
428 |
— |
% |
| 10 |
Of which Level of energy efficiency (EP score in kWh/m² of collateral) estimated |
— |
— |
— |
— |
— |
— |
— |
35,770 |
100 |
% |
|
*Energy consumption in kWh/m² of the actual guarantee |
2024 Pillar 3 Disclosures Report 273
10.6 Alignment metrics
The purpose of this template is to provide information on the emissions of our customers classified according to the climate sector in which they are allocated and the alignment metrics defined by the International Energy Agency (IEA) for the various sectors.
We are aiming to align our portfolio with the Paris Agreement Goals to help limit global warming. As part of our climate ambition, we prioritize the high-emitting sectors (which also bear high and very high transition risk according to our climate materiality) to which we have material exposure and must support the transition to a low-carbon economy, considering the NZBA recommendation of prioritized sectors.
Santander has defined intermediate objectives for the year 2030 on each sector. As such, we have marked the three-year objectives requested in the template as "Not available".
To maintain consistency, the portfolio alignment methodology and assumptions applied in this template (i.e. exposure, reference year, emissions by scope etc.) are based on the decision criteria used to define the objectives in each sector. For further information on the decision criteria used, please check the 2024 annual report and the 2022–2023 Climate Finance Report.
One of these decision criteria is the choice of metric in which the objectives are expressed. Except for the energy sector (oil and gas, which is measured in absolute emissions), the objectives are defined based on physical intensity of emissions according to attributed production, i.e. the intensity of the emissions of the company or Project Finance weighted by the attribution factor, following the methodology defined by PCAF. In each sector, the parameters are defined according to different factors:
•For the Power generation sector, the scope is limited to companies and project finance for the electricity production activity, which is responsible for most of the emissions. The chosen alignment parameter is physical intensity (tonnes of CO2 equivalent/MWh), including scope 1 emissions of our credit portfolio.
•For the energy sector (oil and gas), our focus is on production companies and integrated companies with substantial revenue from exploration and production activities, and on companies dedicated solely to production. The objective is to reduce the absolute financed emissions of CO2 equivalent (scope 1, 2 and 3) for our credit portfolio, measured in tonnes of CO2 equivalent and calculated according to PCAF standards.
•In the steel sector, the objective is to reduce the intensity of CO2 equivalent emissions (scope 1 and 2) of our credit portfolio for steel manufacturers, measured in tonnes of CO2 equivalent for every tonne of steel produced.
•For the aviation sector, our focus is on passenger airlines and aircraft leasing companies. The objective is to reduce intensity of the CO2 equivalent emissions, measured in gCO2eq/RPK (scope 1 and 2), of our credit portfolio.
•Finally, the objective of the automotive sector is centered on scope 3 emissions from the use of sold goods – motor vehicles produced by light vehicle manufacturers. The objective is to reduce the intensity of CO2 emissions, measured in gCO2/km (scope 3), of our credit portfolio.
The NACE code provided in the template refers to the part of the value chain of each sector that is considered in the emissions calculation.
As for the rest of the sectors included in the portfolio alignment table, these will be published as and when additional decarbonization objectives are undertaken, in accordance with the implementing technical standards on ESG Pillar 3.
Various sources are used for these calculations, including S&P Trucost for production data or Carbon Disclosure Project for emissions. To obtain emissions intensities, we proceed in different ways: we either refer to the Transition Pathway Initiative (TPI), or gather them from JATO (for Automotive sector) and Woodmac (for Oil & Gas sector), or we calculate them based on data reported by the companies.
To set science-based decarbonization objectives for our financed sectors, we are choosing a credible scenario that traces a pathway to achieve net zero emissions by 2050 and will limit the global temperature increase to 1.5ºC. Our chosen scenario for the sectors where we have published decarbonization objectives is the "International Energy Agency – Net Zero Emissions by 2050 Scenario" (IEA-NZE). The IEA has recently updated the quantitative information of the NZE scenarios in the World Energy Outlook published in October 2024. We have used this update for calculating the distance to the scenario. Our objective for the aviation sector is guided by the expected adoption of the current technologies.
274 2024 Pillar 3 Disclosures Report
|
|
|
|
|
|
|
|
|
|
|
|
|
|
|
|
|
|
|
|
|
|
|
|
| Table 97.ESG 3 - Banking book - Climate change transition risk: Alignment metrics |
|
|
|
|
|
|
|
|
|
a |
b |
c |
d |
e |
f |
g |
|
Sector |
NACE Sectors |
Portfolio gross carrying amount (Mn EUR) |
Alignment metric |
Year of reference |
Distance to IEA NZE2050 in %3 |
Target (year of reference + 3 years) |
| 1 |
Power |
D351 |
10,746 |
0.15 t1CO e/MWh |
2023 |
-24 |
N/A2 |
| 2 |
Fossil fuel combustion |
B6 |
6,818 |
20.27 mt1CO e |
2023 |
11 |
N/A2 |
| 3 |
Automotive |
C291 |
4,022 |
134.00 grCO2/vkm |
2023 |
15 |
N/A2 |
| 4 |
Aviation |
H5110 |
696 |
82.99 grCO e/RPK |
2023 |
37 |
N/A2 |
| 5 |
Maritime transport |
|
|
|
|
|
|
| 6 |
Cement, clinker and lime production |
|
|
|
|
|
|
| 7 |
Iron and steel, coke, and metal ore production |
C241 |
2,039 |
1.38 t1CO2e/tonne steel |
2023 |
7 |
N/A2 |
| 8 |
Chemicals |
|
|
|
|
|
|
| 9 |
Iron and steel, coke, and metal ore production (Steel) |
|
|
|
|
|
|
|
1Tones |
|
|
|
|
|
|
|
2Not available |
|
|
|
|
|
|
|
3PiT distance to 2030 NZE2050 scenario in % (for each metric) |
|
|
|
|
Regarding the "Distance to IEA NZE 2050 in %" column, the reported criteria was modified in June 2023 Pillar III report compared to the December 2022 Pillar 3 report. The template reported in December 2024 maintains the criteria of the June 202320 report.
10.7. Exposure to the top 20 polluting companies
The objective of this template is to show aggregate exposure of Santander to the 20 most carbon-intensive firms globally.
The scope includes loans and advances, debt securities and equity instruments, classified in the accounting portfolios of the banking book, excluding financial assets held for trading and assets held for sale.
As stated in previous reports, Santander is continuing to report this template based on the list published by Carbon Majors. In June 2024, Carbon Majors published an update of this list, which has been used to complete this template.
The "of which environmentally sustainable (CCM)" field was constructed in line with aligned exposures subject to the CSRD reported in the GAR template which contribute to the objective of mitigating climate change.
|
|
|
|
|
|
|
|
|
|
|
|
|
|
|
|
|
|
| Table 98.ESG 4 - Banking book - Climate change transition risk: Exposures to top 20 carbon-intensive firms |
|
EUR million |
|
|
|
|
|
a |
b |
c |
d |
e |
|
Gross carrying amount (aggregate) |
Gross carrying amount towards the counterparties compared to total gross carrying amount (aggregate)* |
Of which environmentally sustainable (CCM) |
Weighted average maturity |
Number of top 20 polluting firms included |
| 1 |
5,708 |
0.44% |
7.58 |
2.8 |
9 |
|
*For counterparties among the top 20 carbon emitting companies in the world
|
20 From June 2023 onwards, the Pillar 3 report is calculated as [(Base year metric - IEA scenario metric in 2030)/IEA metric in 2030 * 100]. IEA metric in 2030)/IEA metric in 2030 * 100].
2024 Pillar 3 Disclosures Report 275
10.8. Exposures subject to physical risk
The purpose of this template is to identify exposures subject to acute and chronic physical risk, including exposures collateralized by immovable property, exposures by business sector and foreclosed assets.
ESG disclosure in Pillar 3 follows the implementing technical standards on prudential disclosures on ESG risks defined by the EBA for this purpose. Therefore, the ESG information disclosed in this template of Pillar 3 is not necessarily aligned with other Group's ESG management reports.
The perimeter includes exposures in the banking book, including loans and advances, debt securities and equity instruments not held-for-trading and not held-for-sale. Physical risk are defined as risks which arise from the physical effects of climate change and environmental degradation. They can be categorised either as acute - if they arise from climate and weather-related events and an acute destruction of the environment, or chronic - if they arise from progressive shifts in climate and weather patterns or a gradual loss of ecosystem services.
In order to assess the physical risk of its portfolio, Santander has requested information on acute and chronic physical risk from its supplier, Munich RE, to cover the main countries across over 1,250 regions. This information provided by the supplier has been improved in the assessment of chronic risks, considering additional climate change variables that strengthen the assessment valuation, obtaining a higher data accuracy.
The methodology applied by Munich RE follows the basis developed by the UNEP-FI working teams led by Acclimatise on physical risk, an example proposed by the EBA in the report on management and supervision of ESG risks for credit institutions and investment firms.
Munich RE's methodology, incorporates rating levels for the 13 threats identified and 8 vulnerability factors to adjust these hazards' impact on various economic activities in each geography. Including vulnerabilities in models allows us to identify the main physical events that each economic activity may be affected.
For each one of the regions or subdivisions of the NUTS 3 administrative units (same granularity used by the ECB in the 2022 climate risk stress test) and selected sectors (activities added to level 2 of the NACE codes), Munich RE has provided an assessment of the risks (8 acute and 5 chronic) identifying the risk associated with each one on a scale of 1 to 5, from lowest to highest risk, respectively. This analysis has been performed for the main climate-related scenarios (RCP 2.6, RCP 4.5 and RCP 8.5) and the following time horizons: current, 2030, 2040, 2050 and 2100.
The template requires determining which exposures are sensitive to the impact of physical risk, but the instructions of the European Banking Authority do not set forth under which specific metric or threshold this determination should be made. To this end, using the scale mentioned earlier, Santander has applied the conservative criteria suggested by the provider, deeming that an activity in a geography is sensitive to the impact of physical risks when at least one hazard provided by the external supplier is assessed as four or higher.
The scenario used for this assessment is RCP 4.5, which is deemed appropriate as it serves as a middle ground between the scenario that achieve the Paris Agreement target (RCP 2.6) and a scenario more typical of stress exercise (RCP 8.5).
The chosen time horizons have been deemed consistent with the average portfolio maturities, with conservative criteria. As such, for unsecured exposures, a time horizon of 2030 has been taken into account, which comfortably covers the average maturity of these portfolios. Moreover, for the longer-term secured portfolios, a time horizon of 2050 has been taken into account.
In relation to the location used for the assessment of the physical risk, the Group, like the rest of the financial industry, is working to improve the granularity of the information available to assess the physical risks and the location of its customers' activities. For the purpose of this exercise, Santander has assessed the location of the collateral, as well as customers' main offices for unsecured portfolio, at NUTS3 level, in line with the granularity used by the ECB in the Climate stress test conducted in 2022 and by the EBA in the Fit-for-55 climate risk scenario analysis. For the regions with the most collateralised exposures, Spain, Portugal, the UK and Poland, the physical risk assessment is carried out at a more granular level of detail, using zip codes, to obtain more accurate estimates.
276 2024 Pillar 3 Disclosures Report
|
|
|
|
|
|
|
|
|
|
|
|
|
|
|
|
|
|
|
|
|
|
|
|
|
|
|
|
|
|
|
|
|
|
|
|
|
|
|
|
|
|
|
|
|
|
|
|
| Table 99.ESG 5 - Banking book - Climate change physical risk: Exposures subject to physical risk |
|
|
|
|
|
|
|
|
|
|
|
|
|
|
|
|
|
a |
b |
c |
d |
e |
f |
g |
h |
i |
j |
k |
l |
m |
n |
o |
|
Europe |
Gross carrying amount (Mn EUR) |
|
|
|
of which exposures sensitive to impact from climate change physical events |
|
|
|
Breakdown by maturity bucket |
of which exposures sensitive to impact from chronic climate change events |
of which exposures sensitive to impact from acute climate change events |
of which exposures sensitive to impact both from chronic and acute climate change events |
Of which Stage 2 exposures |
Of which non-performing exposures |
Accumulated impairment, accumulated negative changes in fair value due to credit risk and provisions |
|
|
|
<= 5 years |
> 5 year <= 10 years |
> 10 year <= 20 years |
> 20 years |
Average weighted maturity |
|
of which Stage 2 exposures |
Of which non-performing exposures |
| 1 |
A - Agriculture, forestry and fishing |
3,350 |
1,595 |
253 |
8 |
9 |
3 |
1,796 |
16 |
53 |
217 |
132 |
-68 |
-10 |
-55 |
| 2 |
B - Mining and quarrying |
4,667 |
583 |
19 |
— |
7 |
1 |
251 |
347 |
11 |
32 |
18 |
-6 |
-1 |
-5 |
| 3 |
C - Manufacturing |
29,308 |
7,254 |
608 |
4 |
13 |
2 |
7,815 |
34 |
30 |
518 |
461 |
-230 |
-30 |
-190 |
| 4 |
D - Electricity, gas, steam and air conditioning supply |
7,993 |
2,423 |
1,063 |
1,121 |
12 |
6 |
2,954 |
1,664 |
1 |
434 |
158 |
-59 |
-37 |
-16 |
| 5 |
E - Water supply; sewerage, waste management and remediation activities |
1,149 |
6 |
9 |
— |
— |
5 |
— |
14 |
— |
8 |
— |
— |
— |
— |
| 6 |
F - Construction |
13,701 |
1,608 |
134 |
33 |
37 |
3 |
478 |
32 |
1,301 |
192 |
194 |
-76 |
-7 |
-67 |
| 7 |
G - Wholesale and retail trade; repair of motor vehicles and motorcycles |
50,155 |
839 |
28 |
2 |
28 |
1 |
330 |
542 |
26 |
91 |
12 |
-8 |
-3 |
-5 |
| 8 |
H - Transportation and storage |
9,719 |
325 |
183 |
5 |
— |
5 |
166 |
347 |
1 |
46 |
4 |
-5 |
-2 |
-1 |
| 9 |
L - Real estate activities |
23,474 |
150 |
18 |
2 |
— |
3 |
— |
170 |
— |
17 |
3 |
-2 |
-1 |
— |
| 10 |
Loans collateralised by residential immovable property |
320,094 |
309 |
579 |
1,670 |
2,723 |
20 |
— |
5,280 |
— |
582 |
97 |
-15 |
-4 |
-10 |
| 11 |
Loans collateralised by commercial immovable property |
36,317 |
236 |
50 |
29 |
8 |
5 |
— |
323 |
— |
49 |
6 |
-5 |
-3 |
-2 |
| 12 |
Repossessed collaterals |
4,397 |
— |
— |
— |
— |
— |
— |
— |
— |
— |
— |
— |
— |
— |
| 13 |
Other relevant sectors (breakdown below where relevant) |
|
|
|
|
|
|
|
|
|
|
|
|
|
|
2024 Pillar 3 Disclosures Report 277
|
|
|
|
|
|
|
|
|
|
|
|
|
|
|
|
|
|
|
|
|
|
|
|
|
|
|
|
|
|
|
|
|
|
|
|
|
|
|
|
|
|
|
|
|
|
|
|
| Table 99.ESG 5 - Banking book - Climate change physical risk: Exposures subject to physical risk |
|
|
|
|
|
|
|
|
|
|
|
|
|
|
|
|
|
a |
b |
c |
d |
e |
f |
g |
h |
i |
j |
k |
l |
m |
n |
o |
|
North America |
Gross carrying amount (Mn EUR) |
|
|
|
of which exposures sensitive to impact from climate change physical events |
|
|
|
Breakdown by maturity bucket |
of which exposures sensitive to impact from chronic climate change events |
of which exposures sensitive to impact from acute climate change events |
of which exposures sensitive to impact both from chronic and acute climate change events |
Of which Stage 2 exposures |
Of which non-performing exposures |
Accumulated impairment, accumulated negative changes in fair value due to credit risk and provisions |
|
|
|
<= 5 years |
> 5 year <= 10 years |
> 10 year <= 20 years |
> 20 years |
Average weighted maturity |
|
of which Stage 2 exposures |
Of which non-performing exposures |
| 1 |
A - Agriculture, forestry and fishing |
990 |
590 |
— |
— |
4 |
2 |
375 |
41 |
178 |
51 |
4 |
-8 |
-2 |
-3 |
| 2 |
B - Mining and quarrying |
2,283 |
921 |
44 |
— |
— |
3 |
78 |
— |
887 |
153 |
1 |
-12 |
-11 |
— |
| 3 |
C - Manufacturing |
7,104 |
1,101 |
43 |
53 |
12 |
2 |
944 |
189 |
77 |
92 |
6 |
-14 |
-6 |
-3 |
| 4 |
D - Electricity, gas, steam and air conditioning supply |
3,592 |
2,348 |
385 |
55 |
1 |
3 |
62 |
1,843 |
884 |
365 |
17 |
-28 |
-2 |
-4 |
| 5 |
E - Water supply; sewerage, waste management and remediation activities |
116 |
3 |
— |
— |
1 |
2 |
3 |
— |
2 |
— |
1 |
-1 |
— |
-1 |
| 6 |
F - Construction |
2,001 |
218 |
46 |
89 |
5 |
6 |
89 |
101 |
168 |
9 |
1 |
-2 |
-1 |
— |
| 7 |
G - Wholesale and retail trade; repair of motor vehicles and motorcycles |
10,143 |
2,402 |
37 |
— |
34 |
2 |
339 |
1,967 |
166 |
258 |
26 |
-23 |
-4 |
-7 |
| 8 |
H - Transportation and storage |
2,733 |
393 |
451 |
202 |
2 |
6 |
51 |
932 |
63 |
40 |
5 |
-5 |
-1 |
-1 |
| 9 |
L - Real estate activities |
19,165 |
2,784 |
454 |
— |
— |
3 |
36 |
3,202 |
— |
414 |
38 |
-33 |
-19 |
-6 |
| 10 |
Loans collateralised by residential immovable property |
27,499 |
1,062 |
535 |
492 |
68 |
8 |
584 |
1,574 |
— |
326 |
55 |
-22 |
-10 |
-9 |
| 11 |
Loans collateralised by commercial immovable property |
12,848 |
1,992 |
12 |
— |
1 |
2 |
163 |
1,842 |
— |
164 |
36 |
-26 |
-14 |
-8 |
| 12 |
Repossessed collaterals |
180 |
— |
— |
— |
5 |
— |
4 |
1 |
— |
— |
— |
— |
— |
— |
| 13 |
Other relevant sectors (breakdown below where relevant) |
|
|
|
|
|
|
|
|
|
|
|
|
|
|
278 2024 Pillar 3 Disclosures Report
|
|
|
|
|
|
|
|
|
|
|
|
|
|
|
|
|
|
|
|
|
|
|
|
|
|
|
|
|
|
|
|
|
|
|
|
|
|
|
|
|
|
|
|
|
|
|
|
| Table 99.ESG 5 - Banking book - Climate change physical risk: Exposures subject to physical risk |
|
|
|
|
|
|
|
|
|
|
|
|
|
|
|
|
|
a |
b |
c |
d |
e |
f |
g |
h |
i |
j |
k |
l |
m |
n |
o |
|
South America |
Gross carrying amount (Mn EUR) |
|
|
|
of which exposures sensitive to impact from climate change physical events |
|
|
|
Breakdown by maturity bucket |
of which exposures sensitive to impact from chronic climate change events |
of which exposures sensitive to impact from acute climate change events |
of which exposures sensitive to impact both from chronic and acute climate change events |
Of which Stage 2 exposures |
Of which non-performing exposures |
Accumulated impairment, accumulated negative changes in fair value due to credit risk and provisions |
|
|
|
<= 5 years |
> 5 year <= 10 years |
> 10 year <= 20 years |
> 20 years |
Average weighted maturity |
|
of which Stage 2 exposures |
Of which non-performing exposures |
| 1 |
A - Agriculture, forestry and fishing |
4,136 |
2,092 |
24 |
1 |
9 |
2 |
1,261 |
756 |
109 |
112 |
56 |
-41 |
-7 |
-22 |
| 2 |
B - Mining and quarrying |
4,006 |
1,949 |
135 |
— |
1 |
2 |
1,223 |
— |
862 |
223 |
77 |
-32 |
-9 |
-21 |
| 3 |
C - Manufacturing |
17,268 |
5,251 |
392 |
17 |
3 |
2 |
5,659 |
— |
3 |
212 |
97 |
-74 |
-7 |
-57 |
| 4 |
D - Electricity, gas, steam and air conditioning supply |
2,330 |
693 |
184 |
30 |
1 |
4 |
681 |
134 |
92 |
1 |
11 |
-6 |
— |
-4 |
| 5 |
E - Water supply; sewerage, waste management and remediation activities |
446 |
11 |
1 |
2 |
— |
4 |
13 |
— |
1 |
2 |
1 |
-1 |
— |
— |
| 6 |
F - Construction |
3,017 |
359 |
15 |
3 |
1 |
3 |
314 |
— |
63 |
31 |
29 |
-25 |
-3 |
-20 |
| 7 |
G - Wholesale and retail trade; repair of motor vehicles and motorcycles |
17,398 |
2,740 |
205 |
19 |
10 |
3 |
2,388 |
481 |
105 |
323 |
287 |
-236 |
-26 |
-199 |
| 8 |
H - Transportation and storage |
4,799 |
120 |
76 |
80 |
2 |
7 |
99 |
166 |
13 |
11 |
21 |
-14 |
-1 |
-12 |
| 9 |
L - Real estate activities |
2,998 |
6 |
— |
— |
— |
4 |
7 |
— |
— |
— |
1 |
— |
— |
— |
| 10 |
Loans collateralised by residential immovable property |
31,673 |
56 |
21 |
113 |
573 |
28 |
763 |
— |
— |
186 |
68 |
-10 |
-5 |
-8 |
| 11 |
Loans collateralised by commercial immovable property |
7,965 |
24 |
3 |
9 |
7 |
11 |
43 |
— |
— |
21 |
5 |
-3 |
-1 |
-2 |
| 12 |
Repossessed collaterals |
248 |
— |
— |
— |
149 |
— |
108 |
34 |
8 |
— |
— |
-12 |
— |
— |
| 13 |
Other relevant sectors (breakdown below where relevant) |
|
|
|
|
|
|
|
|
|
|
|
|
|
|
2024 Pillar 3 Disclosures Report 279
In general, and by following the methodology described, there was limited exposure affected by (acute and/or chronic) physical risk in the Grupo Santander's total portfolio. The results obtained have been aggregated by analysis regions that are reported on in other reports by the Group (Europe/North America/South America). The most exposed regions to physical risk are Europe for acute events and South America for chronic events in relation to the total exposure of Santander Group. Regarding the Europe region, the analysis has been improved by using more granular information to identify the European regions that are the most sensitive to physical risk, which has led to a reduction of the exposure subject to acute risk of the main collateralised portfolios in comparison to the previous report, by exchanging certain estimates for more accurate data.
The highest concentration of physical risk is identified in the following sectors: manufacturing, electricity, gas, steam and air conditioning supply and wholesale/retail trade and repair of vehicles. Despite in some cases immovable property are subject to chronic risks, the effect associated with these events is limited, with acute risks being the most significant.
280 2024 Pillar 3 Disclosures Report
10.9. Green Asset Ratio (GAR)
In 2020, the European Union adopted the Taxonomy Regulation establishing a list of activities that can qualify as environmentally sustainable and the obligation for companies subject to the Corporate sustainability reporting Directive (CSRD)21 disclose how their operations align with the EU Taxonomy.
Since 2023 exercise, financial institutions are disclosing the green asset ratio (GAR) for two climate objectives and the eligibility ratio of the four remaining objectives. To be aligned to the European taxonomy, activities must meet the specific taxonomy criteria and ensure that it causes no significant harm to any of the other environmental objectives (DNSH) and meets minimum social safeguards (MSS).
In the Pillar 3, according to the EBA/ITS/2022/ we disclose the GAR based on the turnover alignment of the counterparty for the general purpose lending part. Although, according to the Commission Delegated Regulation (EU) in the annual report we disclose the GAR twice, based on the turnover and the CapEx taxonomy alignment of the counterparty for general purpose lending exposures. In addition, this report includes eligibility for the new four objectives, water and marine, the transition to a circular economy, pollution prevention, and the protection and restoration of biodiversity and ecosystems.
As required under the Disclosures Delegated Act, our GAR represents the exposures aligned with the EU Taxonomy in the numerator divided by total on-balance sheet volumes22, and 3% (turnover-based)23. The exposures aligned to the EU Taxonomy and included in the numerator are:
•Aligned exposures in the household loan portfolio: residential property loans (mortgages) and vehicle loans.24
•Aligned exposures to financial and non-financial corporations subject to CSRD based on the alignment ratio publicly disclosed by the counterparties (both CapEx and turnover based alignment).
As for the eligible volumes, our eligibility ratio for the two climate-related objectives is 34% (both CapEx and turnover based), considering eligible vehicles, mortgages and building renovation portfolios, as well as information disclosed by financial and non-financial counterparties.
The difference between the eligible volumes and aligned volumes (i.e. eligibility ratio vs. GAR) is mainly driven by three reasons:
•European Taxonomy criteria is strict. Many activities which do not meet its thresholds, do contribute to the transition of a greener economy.
•The numerator and denominator are not symmetric. Santander has 24% of the adjusted balance sheet exposure (GAR denominator) to non-financial
corporations not subject to CSRD (mainly SMEs and companies from outside EU), which cannot be included as eligible or aligned financing, therefore environmentally sustainable.
•There are limitations to the available data and documentation. There is still a lack of robust evidence to verify alignment in specific purpose lending, especially when it comes to validate DNSH and MSS, as well as availability of data from companies subject to CSRD.
As informed in the annual report, based on a voluntary disclosure, we complement the GAR with an additional ratio to overcome some of these limitations:
Voluntary GAR (European & symmetric): 7.9%
•The numerator of this ratio remains the same as in the previous ratio, purely exposures to the EU Taxonomy aligned in Europe.
•In the denominator, we only keep portfolios where we can tag exposures as environmentally sustainable: CSRD European financial and non-financial corporations, households, and local governments. We excluded (non-exhaustive list): CSRD companies (since they do not have reporting obligations), cash & interbank loans, derivatives, goodwill, etc
In the following pages there is the complete disclosure, including the templates set out in the Taxonomy Regulation.
Starting on 2024, financial institutions may voluntarily disclose the Banking Book Taxonomy Alignment ratio, that includes the operations aligned with the EU Taxonomy of non-financial corporations not subject to CSRD. However the Group has decided not to publish it at the moment. The data quality of the existing data of non-CSRD clients to this date is not enough to comply with the regulatory publication standards, and the use of internal estimation methodologies will not assure adequate comparability among peers. In this sense, we will closely monitor any developments in terms of regulation, data and estimating methodologies to re-assess future disclosures of this ratio.
21 CSRD applies to large, listed companies, banks, or insurance companies that meet certain criteria, such as having a balance sheet total in excess of EUR 20 million, a turnover in excess of EUR 40 million, or an average number of employees in excess of 500 during the fiscal year.
22 Not including exposure to sovereigns, central banks, and the trading portfolio.
23 For the flow of volumes, the Green Asset Ratio is 2.6% (turnover-based).
24 Following the technical screening criteria of the EU Taxonomy Regulation. As for compliance with DNSH criteria, we followed EU Taxonomy requirements based on prudence and efficient assessment. We ran MSS criteria validation according to the recommendations of the Platform on Sustainable Finance and respective regulation.
2024 Pillar 3 Disclosures Report 281
10.9.1. Summary of key performance indicators (KPIs) on the Taxonomy-aligned exposures
This template provides an overview of the KPIs calculated on the basis of templates included in sections 10.9.2 and 10.9.3. including the green asset ratio (GAR) for the stock and flow.
|
|
|
|
|
|
|
|
|
|
|
|
|
|
|
| Table 100.ESG 6 - Summary of GAR KPIs |
|
|
KPI |
% coverage (over total assets)* |
|
Climate change mitigation |
Climate change adaptation |
Total (Climate change mitigation + Climate change adaptation) |
| GAR stock |
3.0% |
—% |
3.0% |
69.8% |
| GAR flow |
2.6% |
—% |
2.6% |
65.9% |
|
10.9.2. Mitigating actions: assets for the calculation of GAR
The perimeter of this template includes loans and advances, debt securities and equity instruments on their banking book, with a breakdown of the information by type of counterparty, including financial corporations, non-financial corporations, households, local governments as well as real estate lending towards households, and the taxonomy eligibility and taxonomy alignment of the exposures with regards to the environmental objectives of climate change mitigation and climate change adaptation.
282 2024 Pillar 3 Disclosures Report
|
|
|
|
|
|
|
|
|
|
|
|
|
|
|
|
|
|
|
|
|
|
|
|
|
|
|
|
|
|
|
|
|
|
|
|
|
|
|
| Table 101.ESG 7 - Mitigating actions: Assets for the calculation of GAR |
|
|
|
|
|
|
|
|
|
|
|
a |
b |
c |
d |
e |
f |
g |
h |
i |
j |
k |
|
|
Disclosure reference date December 2024 |
|
Total gross carrying amount |
Climate Change Mitigation (CCM) |
Climate Change Adaptation (CCA) |
|
Of which towards taxonomy relevant sectors (Taxonomy-eligible) |
Of which towards taxonomy relevant sectors (Taxonomy-eligible) |
|
|
Of which environmentally sustainable (Taxonomy-aligned) |
|
Of which environmentally sustainable (Taxonomy-aligned) |
|
|
|
Of which specialised lending |
Of which transitional |
Of which enabling |
|
|
Of which specialised lending |
Of which adaptation |
Of which enabling |
|
GAR - Covered assets in both numerator and denominator |
|
|
|
|
|
|
|
|
|
|
|
| 1 |
Loans and advances, debt securities and equity instruments not HfT eligible for GAR calculation |
664,610 |
444,137 |
39,615 |
— |
8,952 |
1,412 |
365 |
41 |
— |
23 |
18 |
| 2 |
Financial corporations |
25,544 |
4,921 |
776 |
— |
3 |
280 |
289 |
21 |
— |
20 |
2 |
| 3 |
Credit institutions |
18,208 |
3,265 |
280 |
— |
— |
5 |
25 |
2 |
— |
2 |
— |
| 4 |
Loans and advances |
16,848 |
3,028 |
260 |
— |
— |
5 |
12 |
2 |
— |
2 |
— |
| 5 |
Debt securities, including UoP |
1,360 |
237 |
19 |
— |
— |
— |
13 |
— |
— |
— |
— |
| 6 |
Equity instruments |
— |
— |
— |
|
— |
— |
— |
— |
|
— |
— |
| 7 |
Other financial corporations |
7,336 |
1,656 |
497 |
— |
2 |
274 |
264 |
20 |
— |
18 |
2 |
| 8 |
of which investment firms |
2,300 |
392 |
263 |
— |
— |
141 |
43 |
4 |
— |
3 |
2 |
| 9 |
Loans and advances |
1,778 |
174 |
68 |
— |
— |
47 |
43 |
4 |
— |
3 |
2 |
| 10 |
Debt securities, including UoP |
523 |
218 |
196 |
— |
— |
94 |
— |
— |
— |
— |
— |
| 11 |
Equity instruments |
— |
— |
— |
|
— |
— |
— |
— |
|
— |
— |
| 12 |
of which management companies |
258 |
122 |
6 |
— |
— |
4 |
— |
— |
— |
— |
— |
| 13 |
Loans and advances |
176 |
120 |
6 |
— |
— |
4 |
— |
— |
— |
— |
— |
| 14 |
Debt securities, including UoP |
80 |
1 |
— |
— |
— |
— |
— |
— |
— |
— |
— |
2024 Pillar 3 Disclosures Report 283
|
|
|
|
|
|
|
|
|
|
|
|
|
|
|
|
|
|
|
|
|
|
|
|
|
|
|
|
|
|
|
|
|
|
|
|
|
|
|
| Table 101.ESG 7 - Mitigating actions: Assets for the calculation of GAR |
|
|
|
|
|
|
|
|
|
|
|
a |
b |
c |
d |
e |
f |
g |
h |
i |
j |
k |
|
|
Disclosure reference date December 2024 |
|
Total gross carrying amount |
Climate Change Mitigation (CCM) |
Climate Change Adaptation (CCA) |
|
Of which towards taxonomy relevant sectors (Taxonomy-eligible) |
Of which towards taxonomy relevant sectors (Taxonomy-eligible) |
|
|
Of which environmentally sustainable (Taxonomy-aligned) |
|
Of which environmentally sustainable (Taxonomy-aligned) |
|
|
|
Of which specialised lending |
Of which transitional |
Of which enabling |
|
|
Of which specialised lending |
Of which adaptation |
Of which enabling |
| 15 |
Equity instruments |
2 |
— |
— |
|
— |
— |
— |
— |
|
— |
— |
| 16 |
of which insurance undertakings |
2,050 |
244 |
7 |
— |
— |
— |
219 |
15 |
— |
15 |
— |
| 17 |
Loans and advances |
1,931 |
244 |
7 |
— |
— |
— |
219 |
15 |
— |
15 |
— |
| 18 |
Debt securities, including UoP |
— |
— |
— |
— |
— |
— |
— |
— |
— |
— |
— |
| 19 |
Equity instruments |
119 |
— |
— |
|
— |
— |
— |
— |
|
— |
— |
| 20 |
Non-financial corporations (subject to NFRD disclosure obligations) |
28,232 |
9,302 |
1,869 |
— |
117 |
1,133 |
76 |
20 |
— |
3 |
17 |
| 21 |
Loans and advances |
26,333 |
9,014 |
1,648 |
— |
117 |
936 |
70 |
16 |
— |
— |
16 |
| 22 |
Debt securities, including UoP |
1,891 |
288 |
221 |
— |
— |
197 |
7 |
3 |
— |
3 |
— |
| 23 |
Equity instruments |
8 |
— |
— |
|
— |
— |
— |
— |
|
— |
— |
| 24 |
Households |
609,668 |
428,942 |
36,969 |
— |
8,832 |
— |
|
|
|
|
|
| 25 |
of which loans collateralised by residential immovable property |
362,813 |
331,277 |
28,137 |
— |
— |
— |
|
|
|
|
|
| 26 |
of which building renovation loans |
1,189 |
1,189 |
— |
— |
— |
— |
|
|
|
|
|
| 27 |
of which motor vehicle loans |
96,477 |
96,477 |
8,832 |
— |
8,832 |
— |
|
|
|
|
|
| 28 |
Local governments financing |
1,166 |
973 |
— |
— |
— |
— |
— |
— |
— |
— |
— |
| 29 |
Housing financing |
155 |
153 |
— |
— |
— |
— |
— |
— |
— |
— |
— |
284 2024 Pillar 3 Disclosures Report
|
|
|
|
|
|
|
|
|
|
|
|
|
|
|
|
|
|
|
|
|
|
|
|
|
|
|
|
|
|
|
|
|
|
|
|
|
|
|
| Table 101.ESG 7 - Mitigating actions: Assets for the calculation of GAR |
|
|
|
|
|
|
|
|
|
|
|
a |
b |
c |
d |
e |
f |
g |
h |
i |
j |
k |
|
|
Disclosure reference date December 2024 |
|
Total gross carrying amount |
Climate Change Mitigation (CCM) |
Climate Change Adaptation (CCA) |
|
Of which towards taxonomy relevant sectors (Taxonomy-eligible) |
Of which towards taxonomy relevant sectors (Taxonomy-eligible) |
|
|
Of which environmentally sustainable (Taxonomy-aligned) |
|
Of which environmentally sustainable (Taxonomy-aligned) |
|
|
|
Of which specialised lending |
Of which transitional |
Of which enabling |
|
|
Of which specialised lending |
Of which adaptation |
Of which enabling |
| 30 |
Other local governments financing |
1,012 |
819 |
— |
— |
— |
— |
— |
— |
— |
— |
— |
| 31 |
Collateral obtained by taking possession: residential and commercial immovable properties |
4,825 |
— |
— |
— |
— |
— |
— |
— |
— |
— |
— |
| 32 |
TOTAL GAR ASSETS |
669,435 |
444,137 |
39,615 |
— |
8,952 |
1,412 |
365 |
41 |
— |
23 |
18 |
|
Assets excluded from the numerator for GAR calculation (covered in the denominator) |
|
|
|
|
|
|
|
|
|
|
|
| 33 |
EU Non-financial corporations (not subject to NFRD disclosure obligations) |
134,206 |
|
|
|
|
|
|
|
|
|
|
| 34 |
Loans and advances |
132,387 |
|
|
|
|
|
|
|
|
|
|
| 35 |
Debt securities |
1,575 |
|
|
|
|
|
|
|
|
|
|
| 36 |
Equity instruments |
244 |
|
|
|
|
|
|
|
|
|
|
| 37 |
Non-EU Non-financial corporations (not subject to NFRD disclosure obligations) |
176,075 |
|
|
|
|
|
|
|
|
|
|
| 38 |
Loans and advances |
164,652 |
|
|
|
|
|
|
|
|
|
|
| 39 |
Debt securities |
10,396 |
|
|
|
|
|
|
|
|
|
|
| 40 |
Equity instruments |
1,027 |
|
|
|
|
|
|
|
|
|
|
| 41 |
Derivatives |
5,772 |
|
|
|
|
|
|
|
|
|
|
| 42 |
On demand interbank loans |
12,146 |
|
|
|
|
|
|
|
|
|
|
| 43 |
Cash and cash-related assets |
9,252 |
|
|
|
|
|
|
|
|
|
|
2024 Pillar 3 Disclosures Report 285
|
|
|
|
|
|
|
|
|
|
|
|
|
|
|
|
|
|
|
|
|
|
|
|
|
|
|
|
|
|
|
|
|
|
|
|
|
|
|
| Table 101.ESG 7 - Mitigating actions: Assets for the calculation of GAR |
|
|
|
|
|
|
|
|
|
|
|
a |
b |
c |
d |
e |
f |
g |
h |
i |
j |
k |
|
|
Disclosure reference date December 2024 |
|
Total gross carrying amount |
Climate Change Mitigation (CCM) |
Climate Change Adaptation (CCA) |
|
Of which towards taxonomy relevant sectors (Taxonomy-eligible) |
Of which towards taxonomy relevant sectors (Taxonomy-eligible) |
|
|
Of which environmentally sustainable (Taxonomy-aligned) |
|
Of which environmentally sustainable (Taxonomy-aligned) |
|
|
|
Of which specialised lending |
Of which transitional |
Of which enabling |
|
|
Of which specialised lending |
Of which adaptation |
Of which enabling |
| 44 |
Other assets (e.g. Goodwill, commodities etc.) |
299,657 |
|
|
|
|
|
|
|
|
|
|
| 45 |
TOTAL ASSETS IN THE DENOMINATOR (GAR) |
1,306,542 |
|
|
|
|
|
|
|
|
|
|
|
Other assets excluded from both the numerator and denominator for GAR calculation |
|
|
|
|
|
|
|
|
|
|
|
| 46 |
Sovereigns |
142,309 |
|
|
|
|
|
|
|
|
|
|
| 47 |
Central banks exposure |
193,354 |
|
|
|
|
|
|
|
|
|
|
| 48 |
Trading book |
230,185 |
|
|
|
|
|
|
|
|
|
|
| 49 |
TOTAL ASSETS EXCLUDED FROM NUMERATOR AND DENOMINATOR |
565,848 |
|
|
|
|
|
|
|
|
|
|
| 50 |
TOTAL ASSETS |
1,872,390 |
|
|
|
|
|
|
|
|
|
|
286 2024 Pillar 3 Disclosures Report
|
|
|
|
|
|
|
|
|
|
|
|
|
|
|
|
|
|
|
|
|
|
Table 101.ESG 7 - Mitigating actions: Assets for the calculation of GAR |
|
|
|
|
|
|
|
|
|
l |
m |
n |
o |
p |
|
|
Disclosure reference date December 2024 |
|
TOTAL (CCM + CCA) |
|
Of which towards taxonomy relevant sectors (Taxonomy-eligible) |
|
|
Of which environmentally sustainable (Taxonomy-aligned) |
|
|
|
Of which specialised lending |
Of which transitional/adaptation |
Of which enabling |
|
GAR - Covered assets in both numerator and denominator |
|
|
|
|
|
| 1 |
Loans and advances, debt securities and equity instruments not HfT eligible for GAR calculation |
444,503 |
39,656 |
— |
8,975 |
1,431 |
| 2 |
Financial corporations |
5,210 |
798 |
— |
22 |
281 |
| 3 |
Credit institutions |
3,290 |
281 |
— |
2 |
5 |
| 4 |
Loans and advances |
3,040 |
262 |
— |
2 |
5 |
| 5 |
Debt securities, including UoP |
250 |
19 |
— |
— |
— |
| 6 |
Equity instruments |
— |
— |
|
— |
— |
| 7 |
Other financial corporations |
1,919 |
516 |
— |
20 |
276 |
| 8 |
of which investment firms |
435 |
268 |
— |
3 |
143 |
| 9 |
Loans and advances |
217 |
72 |
— |
3 |
49 |
| 10 |
Debt securities, including UoP |
218 |
196 |
— |
— |
94 |
| 11 |
Equity instruments |
— |
— |
|
— |
— |
| 12 |
of which management companies |
122 |
6 |
— |
— |
4 |
| 13 |
Loans and advances |
121 |
6 |
— |
— |
4 |
| 14 |
Debt securities, including UoP |
1 |
— |
— |
— |
— |
| 15 |
Equity instruments |
— |
— |
|
— |
— |
2024 Pillar 3 Disclosures Report 287
|
|
|
|
|
|
|
|
|
|
|
|
|
|
|
|
|
|
|
|
|
|
Table 101.ESG 7 - Mitigating actions: Assets for the calculation of GAR |
|
|
|
|
|
|
|
|
|
l |
m |
n |
o |
p |
|
|
Disclosure reference date December 2024 |
|
TOTAL (CCM + CCA) |
|
Of which towards taxonomy relevant sectors (Taxonomy-eligible) |
|
|
Of which environmentally sustainable (Taxonomy-aligned) |
|
|
|
Of which specialised lending |
Of which transitional/adaptation |
Of which enabling |
| 16 |
of which insurance undertakings |
462 |
22 |
— |
15 |
— |
| 17 |
Loans and advances |
462 |
22 |
— |
15 |
— |
| 18 |
Debt securities, including UoP |
— |
— |
— |
— |
— |
| 19 |
Equity instruments |
— |
— |
|
— |
— |
| 20 |
Non-financial corporations (subject to NFRD disclosure obligations) |
9,378 |
1,889 |
— |
121 |
1,149 |
| 21 |
Loans and advances |
9,084 |
1,664 |
— |
117 |
952 |
| 22 |
Debt securities, including UoP |
294 |
224 |
— |
3 |
197 |
| 23 |
Equity instruments |
— |
— |
|
— |
— |
| 24 |
Households |
428,942 |
36,969 |
— |
8,832 |
— |
| 25 |
of which loans collateralised by residential immovable property |
331,277 |
28,137 |
— |
— |
— |
| 26 |
of which building renovation loans |
1,189 |
— |
— |
— |
— |
| 27 |
of which motor vehicle loans |
96,477 |
8,832 |
— |
8,832 |
— |
| 28 |
Local governments financing |
973 |
— |
— |
— |
— |
| 29 |
Housing financing |
153 |
— |
— |
— |
— |
| 30 |
Other local governments financing |
819 |
— |
— |
— |
— |
288 2024 Pillar 3 Disclosures Report
|
|
|
|
|
|
|
|
|
|
|
|
|
|
|
|
|
|
|
|
|
|
Table 101.ESG 7 - Mitigating actions: Assets for the calculation of GAR |
|
|
|
|
|
|
|
|
|
l |
m |
n |
o |
p |
|
|
Disclosure reference date December 2024 |
|
TOTAL (CCM + CCA) |
|
Of which towards taxonomy relevant sectors (Taxonomy-eligible) |
|
|
Of which environmentally sustainable (Taxonomy-aligned) |
|
|
|
Of which specialised lending |
Of which transitional/adaptation |
Of which enabling |
| 31 |
Collateral obtained by taking possession: residential and commercial immovable properties |
— |
— |
— |
— |
— |
| 32 |
TOTAL GAR ASSETS |
444,503 |
39,656 |
— |
8,975 |
1,431 |
|
Assets excluded from the numerator for GAR calculation (covered in the denominator) |
|
|
|
|
|
| 33 |
EU Non-financial corporations (not subject to NFRD disclosure obligations) |
|
|
|
|
|
| 34 |
Loans and advances |
|
|
|
|
|
| 35 |
Debt securities |
|
|
|
|
|
| 36 |
Equity instruments |
|
|
|
|
|
| 37 |
Non-EU Non-financial corporations (not subject to NFRD disclosure obligations) |
|
|
|
|
|
| 38 |
Loans and advances |
|
|
|
|
|
| 39 |
Debt securities |
|
|
|
|
|
| 40 |
Equity instruments |
|
|
|
|
|
| 41 |
Derivatives |
|
|
|
|
|
| 42 |
On demand interbank loans |
|
|
|
|
|
| 43 |
Cash and cash-related assets |
|
|
|
|
|
| 44 |
Other assets (e.g. Goodwill, commodities etc.) |
|
|
|
|
|
2024 Pillar 3 Disclosures Report 289
|
|
|
|
|
|
|
|
|
|
|
|
|
|
|
|
|
|
|
|
|
|
Table 101.ESG 7 - Mitigating actions: Assets for the calculation of GAR |
|
|
|
|
|
|
|
|
|
l |
m |
n |
o |
p |
|
|
Disclosure reference date December 2024 |
|
TOTAL (CCM + CCA) |
|
Of which towards taxonomy relevant sectors (Taxonomy-eligible) |
|
|
Of which environmentally sustainable (Taxonomy-aligned) |
|
|
|
Of which specialised lending |
Of which transitional/adaptation |
Of which enabling |
| 45 |
TOTAL ASSETS IN THE DENOMINATOR (GAR) |
|
|
|
|
|
|
Other assets excluded from both the numerator and denominator for GAR calculation |
|
|
|
|
|
| 46 |
Sovereigns |
|
|
|
|
|
| 47 |
Central banks exposure |
|
|
|
|
|
| 48 |
Trading book |
|
|
|
|
|
| 49 |
TOTAL ASSETS EXCLUDED FROM NUMERATOR AND DENOMINATOR |
|
|
|
|
|
| 50 |
TOTAL ASSETS |
|
|
|
|
|
10.9.3. GAR (%)
Based on the information included in template included in 10.9.2 Mitigating actions: assets for the calculation of GAR, we disclose in this template the GAR.
290 2024 Pillar 3 Disclosures Report
|
|
|
|
|
|
|
|
|
|
|
|
|
|
|
|
|
|
|
|
|
|
|
|
|
|
|
|
|
|
|
|
|
|
|
|
| Table 102.ESG 8 - GAR (%) |
|
|
|
|
|
|
|
|
|
|
|
a |
b |
c |
d |
e |
f |
g |
h |
i |
j |
|
% (compared to total covered assets in the denominator) |
Disclosure reference date December 2024: KPIs on stock |
|
Climate Change Mitigation (CCM) |
Climate Change Adaptation (CCA) |
|
Proportion of eligible assets funding taxonomy relevant sectors |
Proportion of eligible assets funding taxonomy relevant sectors |
|
|
Of which environmentally sustainable |
|
Of which environmentally sustainable |
|
|
|
Of which specialised lending |
Of which transitional |
Of which enabling |
|
|
Of which specialised lending |
Of which adaptation |
Of which enabling |
| 1 |
GAR |
34.0 |
3.0 |
— |
0.7 |
0.1 |
— |
— |
— |
— |
— |
| 2 |
Loans and advances, debt securities and equity instruments not HfT eligible for GAR calculation |
66.8 |
6.0 |
— |
1.3 |
0.2 |
0.1 |
— |
— |
— |
— |
| 3 |
Financial corporations |
19.3 |
3.0 |
— |
— |
1.1 |
1.1 |
0.1 |
— |
0.1 |
— |
| 4 |
Credit institutions |
17.9 |
1.5 |
— |
— |
— |
0.1 |
— |
— |
— |
— |
| 5 |
Other financial corporations |
22.6 |
6.8 |
— |
— |
3.7 |
3.6 |
0.3 |
— |
0.2 |
— |
| 6 |
of which investment firms |
17.1 |
11.4 |
— |
— |
6.1 |
1.9 |
0.2 |
— |
0.1 |
0.1 |
| 7 |
of which management companies |
47.1 |
2.4 |
— |
— |
1.5 |
0.2 |
— |
— |
— |
— |
| 8 |
of which insurance undertakings |
11.9 |
0.3 |
— |
— |
— |
10.7 |
0.7 |
— |
0.7 |
— |
| 9 |
Non-financial corporations subject to NFRD disclosure obligations |
32.9 |
6.6 |
— |
0.4 |
4.0 |
0.3 |
0.1 |
— |
— |
0.1 |
| 10 |
Households |
70.4 |
6.1 |
— |
1.4 |
— |
|
|
|
|
|
| 11 |
of which loans collateralised by residential immovable property |
91.3 |
7.8 |
— |
— |
— |
|
|
|
|
|
| 12 |
of which building renovation loans |
100.0 |
— |
— |
— |
— |
|
|
|
|
|
| 13 |
of which motor vehicle loans |
100.0 |
9.2 |
— |
9.2 |
— |
|
|
|
|
|
| 14 |
Local government financing |
83.4 |
— |
— |
— |
— |
|
|
|
|
|
| 15 |
Housing financing |
99.1 |
— |
— |
— |
— |
|
|
|
|
|
| 16 |
Other local governments financing |
81.0 |
— |
— |
— |
— |
— |
— |
— |
— |
— |
| 17 |
Collateral obtained by taking possession: residential and commercial immovable properties |
— |
— |
— |
— |
— |
|
|
|
|
|
2024 Pillar 3 Disclosures Report 291
|
|
|
|
|
|
|
|
|
|
|
|
|
|
|
|
|
|
|
|
|
|
|
|
|
|
|
|
| Table 102.ESG 8 - GAR (%) |
|
|
|
|
|
|
|
|
|
|
|
|
|
|
|
|
|
|
k |
l |
m |
n |
o |
p |
|
|
|
|
|
% (compared to total covered assets in the denominator) |
Disclosure reference date December 2024: KPIs on stock |
Proportion of total assets covered |
|
|
|
|
|
TOTAL (CCM + CCA) |
|
|
|
|
|
Proportion of eligible assets funding taxonomy relevant sectors |
|
|
|
|
|
|
Of which environmentally sustainable |
|
|
|
|
|
|
|
Of which specialised lending |
Of which transitional/adaptation |
Of which enabling |
|
|
|
|
| 1 |
GAR |
34.0 |
3.0 |
— |
0.7 |
0.1 |
69.8 |
|
|
|
|
| 2 |
Loans and advances, debt securities and equity instruments not HfT eligible for GAR calculation |
66.9 |
6.0 |
— |
1.4 |
0.2 |
35.5 |
|
|
|
|
| 3 |
Financial corporations |
20.4 |
3.1 |
— |
0.1 |
1.1 |
1.4 |
|
|
|
|
| 4 |
Credit institutions |
18.1 |
1.5 |
— |
— |
— |
1.0 |
|
|
|
|
| 5 |
Other financial corporations |
26.2 |
7.0 |
— |
0.3 |
3.8 |
0.4 |
|
|
|
|
| 6 |
of which investment firms |
18.9 |
11.6 |
— |
0.1 |
6.2 |
0.1 |
|
|
|
|
| 7 |
of which management companies |
47.3 |
2.4 |
— |
— |
1.5 |
— |
|
|
|
|
| 8 |
of which insurance undertakings |
22.6 |
1.1 |
— |
0.7 |
— |
0.1 |
|
|
|
|
| 9 |
Non-financial corporations subject to NFRD disclosure obligations |
33.2 |
6.7 |
— |
0.4 |
4.1 |
1.5 |
|
|
|
|
| 10 |
Households |
70.4 |
6.1 |
— |
1.4 |
— |
32.6 |
|
|
|
|
| 11 |
of which loans collateralised by residential immovable property |
91.3 |
7.8 |
— |
— |
— |
19.4 |
|
|
|
|
| 12 |
of which building renovation loans |
100.0 |
— |
— |
— |
— |
0.1 |
|
|
|
|
| 13 |
of which motor vehicle loans |
100.0 |
9.2 |
— |
9.2 |
— |
5.2 |
|
|
|
|
| 14 |
Local government financing |
83.4 |
— |
— |
— |
— |
0.1 |
|
|
|
|
| 15 |
Housing financing |
99.1 |
— |
— |
— |
— |
— |
|
|
|
|
| 16 |
Other local governments financing |
81.0 |
— |
— |
— |
— |
0.1 |
|
|
|
|
| 17 |
Collateral obtained by taking possession: residential and commercial immovable properties |
— |
— |
— |
— |
— |
0.3 |
|
|
|
|
292 2024 Pillar 3 Disclosures Report
|
|
|
|
|
|
|
|
|
|
|
|
|
|
|
|
|
|
|
|
|
|
|
|
|
|
|
|
|
|
|
|
|
|
|
|
| Table 102.ESG 8 - GAR (%) |
|
|
|
|
|
|
|
|
|
|
|
|
|
|
q |
r |
s |
t |
u |
v |
w |
x |
y |
z |
|
% (compared to total covered assets in the denominator) |
Disclosure reference date December 2024: KPIs on flows |
|
Climate Change Mitigation (CCM) |
Climate Change Adaptation (CCA) |
|
Proportion of new eligible assets funding taxonomy relevant sectors |
Proportion of new eligible assets funding taxonomy relevant sectors |
|
|
Of which environmentally sustainable |
|
Of which environmentally sustainable |
|
|
|
Of which specialised lending |
Of which transitional |
Of which enabling |
|
|
Of which specialised lending |
Of which adaptation |
Of which enabling |
| 1 |
GAR |
21.6 |
2.6 |
— |
1.5 |
0.3 |
— |
— |
— |
— |
— |
| 2 |
Loans and advances, debt securities and equity instruments not HfT eligible for GAR calculation |
56.6 |
6.9 |
— |
3.8 |
0.8 |
— |
— |
— |
— |
— |
| 3 |
Financial corporations |
21.2 |
5.3 |
— |
— |
2.1 |
0.2 |
— |
— |
— |
— |
| 4 |
Credit institutions |
18.4 |
2.0 |
— |
— |
— |
0.2 |
— |
— |
— |
— |
| 5 |
Other financial corporations |
33.0 |
18.9 |
— |
0.1 |
10.6 |
0.1 |
— |
— |
— |
— |
| 6 |
of which investment firms |
42.5 |
37.2 |
— |
— |
18.3 |
— |
— |
— |
— |
— |
| 7 |
of which management companies |
18.0 |
6.1 |
— |
— |
3.8 |
0.5 |
— |
— |
— |
— |
| 8 |
of which insurance undertakings |
— |
— |
— |
— |
— |
0.1 |
— |
— |
— |
— |
| 9 |
Non-financial corporations subject to NFRD disclosure obligations |
28.2 |
8.1 |
— |
0.6 |
5.1 |
0.2 |
— |
— |
— |
— |
| 10 |
Households |
64.4 |
6.9 |
— |
4.7 |
— |
|
|
|
|
|
| 11 |
of which loans collateralised by residential immovable property |
93.1 |
6.1 |
— |
— |
— |
|
|
|
|
|
| 12 |
of which building renovation loans |
100.0 |
— |
— |
— |
— |
|
|
|
|
|
| 13 |
of which motor vehicle loans |
100.0 |
15.4 |
— |
15.4 |
— |
|
|
|
|
|
| 14 |
Local government financing |
97.7 |
— |
— |
— |
— |
|
|
|
|
|
| 15 |
Housing financing |
94.4 |
— |
— |
— |
— |
|
|
|
|
|
| 16 |
Other local governments financing |
98.1 |
— |
— |
— |
— |
— |
— |
— |
— |
— |
| 17 |
Collateral obtained by taking possession: residential and commercial immovable properties |
— |
— |
— |
— |
— |
|
|
|
|
|
2024 Pillar 3 Disclosures Report 293
|
|
|
|
|
|
|
|
|
|
|
|
|
|
|
|
|
|
|
|
|
|
|
|
|
|
|
|
| Table 102.ESG 8 - GAR (%) |
|
|
|
|
|
|
|
|
|
|
|
|
|
|
aa |
ab |
ac |
ad |
ae |
af |
|
|
|
|
|
% (compared to total covered assets in the denominator) |
Disclosure reference date December 2024: KPIs on flows |
Proportion of total new assets covered |
|
|
|
|
|
TOTAL (CCM + CCA) |
|
|
|
|
|
Proportion of new eligible assets funding taxonomy relevant sectors |
|
|
|
|
|
|
Of which environmentally sustainable |
|
|
|
|
|
|
|
Of which specialised lending |
Of which transitional/adaptation |
Of which enabling |
|
|
|
|
| 1 |
GAR |
21.6 |
2.6 |
— |
1.5 |
0.3 |
65.9 |
|
|
|
|
| 2 |
Loans and advances, debt securities and equity instruments not HfT eligible for GAR calculation |
56.7 |
6.9 |
— |
3.8 |
0.8 |
25.1 |
|
|
|
|
| 3 |
Financial corporations |
21.4 |
5.3 |
— |
— |
2.1 |
2.0 |
|
|
|
|
| 4 |
Credit institutions |
18.6 |
2.0 |
— |
— |
— |
1.6 |
|
|
|
|
| 5 |
Other financial corporations |
33.1 |
18.9 |
— |
0.1 |
10.6 |
0.4 |
|
|
|
|
| 6 |
of which investment firms |
42.5 |
37.2 |
— |
— |
18.3 |
0.1 |
|
|
|
|
| 7 |
of which management companies |
18.5 |
6.1 |
— |
— |
3.8 |
— |
|
|
|
|
| 8 |
of which insurance undertakings |
0.1 |
— |
— |
— |
— |
— |
|
|
|
|
| 9 |
Non-financial corporations subject to NFRD disclosure obligations |
28.5 |
8.1 |
— |
0.6 |
5.1 |
3.0 |
|
|
|
|
| 10 |
Households |
64.4 |
6.9 |
— |
4.7 |
— |
20.1 |
|
|
|
|
| 11 |
of which loans collateralised by residential immovable property |
93.1 |
6.1 |
— |
— |
— |
7.3 |
|
|
|
|
| 12 |
of which building renovation loans |
100.0 |
— |
— |
— |
— |
— |
|
|
|
|
| 13 |
of which motor vehicle loans |
100.0 |
15.4 |
— |
15.4 |
— |
6.1 |
|
|
|
|
| 14 |
Local government financing |
97.7 |
— |
— |
— |
— |
— |
|
|
|
|
| 15 |
Housing financing |
94.4 |
— |
— |
— |
— |
— |
|
|
|
|
| 16 |
Other local governments financing |
98.1 |
— |
— |
— |
— |
— |
|
|
|
|
| 17 |
Collateral obtained by taking possession: residential and commercial immovable properties |
— |
— |
— |
— |
— |
— |
|
|
|
|
294 2024 Pillar 3 Disclosures Report
10.10. Other climate change mitigating actions
The purpose of this template is to report all exposures to customers that are designed to facilitate climate change adaptation and mitigation objectives and are not reported in the GAR templates.
The financial instruments included in this template, loans and bonds, contribute to the mitigation of transition and physical risks arising from climate change. The definition of these terms is in line with Article 18a of EBA/ITS/2022/01. Based on the nature and characteristics of the assets included in this template and the availability of current information, these exposures have been considered to contribute to the mitigation of transition risks and a subset of them to the mitigation of physical risks.
Therefore, the following activities have been included in the lending section for financial corporations, non-financial corporations, households and other counterparties:
•Activities that support counterparties in the process of transition and adaptation to climate change, even if they are not assessed or fully aligned with the EU taxonomy, but are considered green under other frameworks such as the SFICS.
•We classified exposures according to the currently valid Sustainable Finance & Investment Classification System (SFICS), our internal guidelines which include criteria for considering whether an asset is green, social or sustainable across the Group's units and businesses. More information on the SFICS can be found in the 2024 annual report.
•Activities that contribute to the objectives of mitigating and adapting to climate change, that meet the European Taxonomy criteria of significant contribution, due to the lack of solid evidence to verify alignment in special-purpose loans, especially when validating DNSH and MSS.
•Sustainability-linked loans with sustainable performance indicators (also included in SFICS). They adhere to recognised principles and guidelines, such as the LMA's Sustainability Linked Loan Principles. These loans are assessed in the calculation of the GAR alignment ratio under general-purpose loans.
•Financing of plug-in hybrid and gas vehicles (i.e. natural gas or LGP internal combustion engine), as these are alternative fuels that have the potential to decarbonise the transport sector.
The exposure reported in the template contributes to mitigating the transition and/or physical risk of climate change to a greater or lesser extent.
The bonds section provides information on investments in bonds issued by financial and non-financial corporations and local governments as green bonds in line with the Green, Social and Sustainable Corporate Bond Principles.
2024 Pillar 3 Disclosures Report 295
|
|
|
|
|
|
|
|
|
|
|
|
|
|
|
|
|
|
|
|
|
| Table 103.ESG 10 - Other climate change mitigating actions that are not covered in the EU Taxonomy |
|
|
|
|
|
|
|
|
a |
b |
c |
d |
e |
f |
|
Type of financial instrument |
Type of counterparty |
Gross carrying amount (million EUR) |
Type of risk mitigated (Climate change transition risk) |
Type of risk mitigated (Climate change physical risk) |
Qualitative information on the nature of the mitigating actions |
| 1 |
Bonds (e.g. green, sustainable, sustainability-linked under standards other than the EU standards) |
Financial corporations |
1,164 |
YES |
NO |
Including green bonds under standards other than the EU Taxonomy (e.g., flagged by external agencies, bonds aligned with the Group's internal taxonomy) |
| 2 |
Non-financial corporations |
711 |
YES |
YES |
Including green bonds under standards other than the EU Taxonomy (e.g., flagged by external agencies, bonds aligned with the Group's internal taxonomy) |
| 3 |
Of which Loans collateralised by commercial immovable property |
— |
|
|
N/A |
| 4 |
Households |
— |
|
|
N/A |
| 5 |
Of which Loans collateralised by residential immovable property |
— |
|
|
N/A |
| 6 |
Of which building renovation loans |
— |
|
|
N/A |
| 7 |
Other counterparties |
94 |
YES |
NO |
Including green bonds under standards other than the EU Taxonomy (e.g., flagged by external agencies, bonds aligned with the Group's internal taxonomy) |
296 2024 Pillar 3 Disclosures Report
|
|
|
|
|
|
|
|
|
|
|
|
|
|
|
|
|
|
|
|
|
| Table 103.ESG 10 - Other climate change mitigating actions that are not covered in the EU Taxonomy |
|
|
|
|
|
|
|
|
a |
b |
c |
d |
e |
f |
|
Type of financial instrument |
Type of counterparty |
Gross carrying amount (million EUR) |
Type of risk mitigated (Climate change transition risk) |
Type of risk mitigated (Climate change physical risk) |
Qualitative information on the nature of the mitigating actions |
| 8 |
Loans (e.g. green, sustainable, sustainability-linked under standards other than the EU standards) |
Financial corporations |
1,471 |
YES |
NO |
Mainly includes activities classified under the Group's internal taxonomy that have been excluded from Template 7 (GAR) due to:
i) the difficulty of ensuring full alignment with the European Taxonomy and compliance with the DNSH and MSS (such as activities related to water supply and sewerage, water management or building acquisitions/renovations)
ii) being activities not considered under the EU Taxonomy (e.g. activities related to biodiversity and conservation)
In addition, loan financing linked to sustainability is included. |
| 9 |
Non-financial corporations |
25,295 |
YES |
YES |
Mainly includes:
- Activities classified under the Group's European taxonomy that have been excluded from Template 7 (GAR) due to the difficulty of ensuring full alignment with the European Taxonomy and compliance with the DNSH and MSS (such as activities related to water supply and sewerage, water management or building acquisitions/renovations)
- Activities aligned under the Group's internal taxonomy (e.g. activities related to sustainable agriculture, biodiversity and conservation)
- Aligned activities corresponding to non-CSRD corporations
In addition, sustainability linked loans and financing of cars not aligned with the European Taxonomy are included. |
| 10 |
Of which Loans collateralised by commercial immovable property |
9,553 |
YES |
YES |
Mainly includes activities classified under the Group's internal taxonomy that have been excluded from Template 7 (GAR) due to the difficulty of ensuring full alignment with the European Taxonomy and compliance with the DNSH and MSS (such as activities related to water supply and sewerage, water management or building acquisitions/renovations) and aligned activities corresponding to non-CSRD corporations
In addition, sustainability linked loans are included. |
| 11 |
Households |
27,630 |
YES |
YES |
Sustainability linked loans and financing of cars not aligned with the European Taxonomy are included.
In addition, includes activities classified under the Group's internal taxonomy that have been excluded from Template 7 (GAR) due to the difficulty of ensuring full alignment with the European Taxonomy and compliance with the DNSH and MSS (such as activities related to building acquisition and renovations).
|
| 12 |
Of which Loans collateralised by residential immovable property |
18,023 |
YES |
YES |
It includes sustainability-related loans and real estate-related activities, such as the acquisition or renovation of homes, which have been classified under the Group's internal taxonomy and excluded from template 7 (GAR) due to the difficulty of ensuring full alignment with the European Taxonomy and compliance with DNSH and MSS. |
| 13 |
Of which building renovation loans |
232 |
YES |
NO |
N/A |
| 14 |
Other counterparties |
1,920 |
YES |
NO |
It includes financing for hybrid and gas-powered cars. |
2024 Pillar 3 Disclosures Report 297
298 2024 Pillar 3 Disclosures Report
|
|
|
|
|
|
|
|
|
|
|
|
|
|
|
|
|
|
|
|
|
|
|
|
|
|
|
|
|
|
|
|
|
|
|
|
|
|
11.1. Compliance risk |
|
|
|
|
|
|
|
|
|
|
|
|
|
|
|
|
|
|
|
|
|
|
|
11.4. Overview of Cryptoassets Activities |
|
|
|
11.4.1. Risk Management and Compliance |
|
|
|
11.4.2. Categorized Cryptoasset Activities |
|
|
|
|
|
|
|
|
|
|
|
|
|
|
|
|
|
|
|
|
|
|
|
|
|
|
|
|
|
|
|
|
|
|
|
|
|
|
|
|
|
|
|
|
|
|
|
|
|
|
|
|
|
|
|
|
|
|
|
|
|
|
|
|
|
|
|
11. OTHER RISKS |
2024 Pillar 3 Disclosures Report 299
This chapter focuses on different types of risk, such as compliance risk, model risk, capital risk and crypto assets risk.
11.1. Compliance risk
Under the current configuration of the three lines of defense, Compliance is a second line of defense organizationally placed under to the Group Chief Risk Officer (GCRO) which independently oversees and challenges risk management of the first line of the defense. Both the GCRO and the Group Chief Compliance Officer (GCCO) are responsible for the second line of defense and have direct access to the board of directors.
The Compliance function covers all matters related to corporate compliance, financial crime compliance (FCC), product governance and consumer protection, and reputational risk.
The main responsibility for Compliance risks lies with the first lines of defense, which identify, assess and manage these risks. The Compliance function is responsible for monitoring and overseeing these risks and assessing the impact on our risk appetite and risk profile.
To this effect, the Compliance function fosters Santander's adherence to rules, supervisory requirements, ethical principles and values of good conduct by setting standards and risk evaluation and control mechanisms, and discussing, advising and reporting, in the interests of employees, customers, shareholders and society in general.
Grupo Santander's risk appetite in this area takes the form of a declaration of zero tolerance for any material weaknesses and low tolerance for relevant deficiencies (as defined in the Internal Control System Model). Santander is committed to control and limit these deficiencies, promoting an adequate awareness in the monitoring and execution of their remediation plans. To pursue this, Compliance Risk performs consistent management of this area, using a common methodology and taxonomy, which is fully aligned with the Risk function's principles, and setting a series of compliance risk indicators, assessment matrices and qualitative statements.
In 2024, as in previous years, the annual process of shaping the risk appetite was completed towards the end of the year, with the aim of verifying that the current model is appropriate for measuring the Compliance function's risk appetite and thus ensuring that it is aligned with the Group's risk appetite.
To this end, the composition of the indicators and their corporate thresholds were reviewed for the purpose of providing a true picture of the function's strategy, the financial sector environment and its risk tolerance. The definition of the indicators and the setting of their thresholds
were approved by the relevant committees and communicated to the various subsidiaries.
For further details on Compliance risk, see the 'Risk, management and compliance' chapter on the 2024 Annual report.
|
|
|
|
|
|
|
Access 2024 Annual Report available on the Santander Group website |
11.2. Model risk
11.2.1. Introduction
A model is a system, approach or a quantitative method that applies statistical, economic, financial or mathematical theories, techniques and assumptions to transform data into quantitative estimates.
We use models mainly for credit scoring/rating, performance, capital and provisioning, market and structural risk, operational, compliance and liquidity risk, and financial accounting and control, among others.
The use of models entails model risk, which is defined as the potential negative consequences of decisions based on poorly developed, poorly implemented or incorrectly used models. Model risk can lead to financial losses, inappropriate business or strategic decisions or damage to the Group's operations.
11.2.2. Model Risk Management
At Santander Group we have been measuring, managing and controlling model risk for years. The Model Risk area, which extends to both the corporation and the main subsidiaries, seeks to manage and supervise this risk.
For the proper management of model risk, specific internal regulations were created establishing the principles, responsibilities and processes to organise, approve, manage and govern models through their entire life cycle.
The intensity of model risk management and monitoring is relative to the importance of each model for Santander Group. Through the tiering process, the level of importance of non-regulatory models is classified and summarized. The regulatory models, given their particular relevance for the Group, follow the most intense control and management standards.
At Santander Group we define the following phases of the model's life cycle:
300 2024 Pillar 3 Disclosures Report
1. Identification
The identified models have to be included in the scope of model risk control and, consequently, in the Group centralised inventory, a single platform based on an uniform taxonomy for all models used in the business units. This inventory is key for sound management, as it contains all relevant information of each model, enabling to closely monitor them according to their relevance and the tiering criteria.
2. Planning
An internal annual exercise approved by our subsidiaries’ governance bodies and reviewed in an aggregated form, which formulates strategic measures for models managed by the Model Risk area and pinpoints needs for any models to be developed, reviewed or implemented during the year.
3. Development
The Models unit, both at corporate and local level, is responsible for the development of the models according to the needs of each subsidiary following the Group methodological standards that promotes the quality of the models. Development by a specialized team guarantees a more efficient execution.
4. Internal validation
Independent model validation is a regulatory requirement and key feature of our model risk management and control.
A specialist unit that is totally independent from developers and users issues technical assessments of internal model suitability. These assessments are expressed through a rating that summarizes the model risk associated to it. Validation intensity and frequency are well-defined and risk-driven.
The unique validation approach led by the Single Validation Office strengthens the second line of defence ensuring a consistent and standardized model risk management across the Group. It has allowed a greater decentralised organizational structure.
5. Approval
Before the model´s implementation and use, internal governing bodies have to approve it through a governance circuit in place for our model inventory, based on its level of importance.
6. Implementation and use
In this phase, new models are added to the IT systems. Due to this being another source of model risk, technical teams and model owners test proper model integration based on methodology and expectations.
7. Monitoring and control
The models are regular reviewed to ensure functionality and are suitability for their purpose. Otherwise, they have to be adapted and redesigned . Control teams have to make sure models are managed according to the general model risk framework and other related internal rules.
11.2.3. Main activities in 2024
To strengthen the Group's model risk culture and position Santander as a benchmark in this area within the banking industry, in 2024 our strategy has focused on:
•implementation of the IV Next project for the evolution of the validation function, reinforcing the identification of root causes of incidents and the binding role of the Internal Validation teams;
•technological transformation and simplification of the function towards a more efficient model;
•continuous improvement of the IRB regulatory models to meet supervisory expectations and adaptation to the new FRTB regulatory framework;
•review of the model inventory from the point of view of the five global businesses, thus enabling effective model risk management aligned with the Group's strategy.
2024 Pillar 3 Disclosures Report 301
11.3. Capital risk
The Group takes into account, in the context of structural risk, the risk of not maintaining enough capital to absorb losses from its operations and meet internal business objectives, regulatory requirements or market expectations.
The Capital Risk function, as part of the second line of defence, controls and monitors the capital activities of the first line, verifying that capital adequacy and coverage are consistent with our risk profile. It also oversees and monitors those transactions that could be considered significant risk transfer (SRT).
Through a range of processes such as capital planning and adequacy and the resulting implementation and monitoring of the budget, along with continuous measurement of capital and reporting and disclosure of information on capital, as shown below:
This control and oversight is carried out independently, mainly through the following processes:
•Supervision of capital planning and adequacy to ensure that capital levels fit with our risk profile and are adequate and consistent with the group's strategy.
•Ongoing supervision of the measurement of the group's regulatory capital by identifying the key metrics for the calculation, setting tolerance levels and reviewing significant variations and the consistency of the calculations, including individual transactions that impact capital. The performance of capital initiatives is also reviewed and challenged, in line with the risk appetite and planning.
•Monitoring the effective risk transfer of those securitisations that allow for the release of risk-weighted assets according to the applicable regulatory criteria.
The function aims to provide complete and regular monitoring and control of capital risk by verifying that capital coverage and adequacy reflect the Group's risk profile.
Main initiatives in 2024
We continued in 2024 to continuously monitor compliance with the units' capital contribution targets, to outline the various threats and/or opportunities on order to achieve the capital targets for this year.
The impact of market variables on capital levels was also monitored. In this sense, the Bank continues to apply hedging policies to mitigate exchange rate volatility in the CET1 ratio.
In parallel, and within the risk appetite framework, the function, together with the first line of defence, established the solvency appetite limits, maintaining a calibration in line with a low average global risk and resilient to stress conditions.
In order to make the risk appetite framework more robust, the new formulation of the exercise has included the "distance to MDA" as a new metric applied at Group level.
In terms of planning, the review of the recovery plan carried out by the second line for both the Group and the subsidiaries was deepened during this year, with certain aspects of improvement in terms of measures and assumptions being improved.
As far as SRT securitization supervision is concerned, the reporting and management of corporate supervision have improved further in the development phase and a higher degree of standardization has been achieved. The monitoring process was also further strengthened by involving the subsidiaries more closely in the regular exercises and automating the process better through the use of an enterprise tool.
For further details on capital risk, see the 'Risk, compliance and conduct management' chapter of the 2024 Annual report.
|
|
|
|
|
|
|
Access 2024 Annual Report available on the Santander Group website |
11.4. Overview of Cryptoassets Activities
Grupo Santander has been active in the evolving digital asset (aka crypto asset) ecosystem since 2019 when its first digital bond was issued. Santander is committed to being one of the leading banks in the development of this new digital assets market on behalf of our clients, examples being acting as a Joint Lead Manager (JLM) in 2021 and 2022 assisting the European Investment Bank (EIB) to issue its first digital bonds.
Santander leverages innovation to meet client needs while maintaining a robust risk management framework. Our engagement spans multiple domains internally, participating in industry and regulatory consultations, while being aligned with regulatory expectations and emerging best practices.
As of 2024, Santander has organized a Group-wide Digital Assets governance with teams across the Group to match the segmentation of business lines: SCIB, Retail and Commercial Banking, and Private Wealth, etc.
11.4.1. Risk Management and Compliance
Each digital asset activity has a very different risk profile. For example, perceived risks associated with digital securities and other digital forms of traditional financial instruments are very different than those associated with crypto (e.g. Bitcoin). To address these different risks, Santander employs robust controls, on the back of a risk-based Crypto Assets Policy formally implemented in the Group in 2024.
302 2024 Pillar 3 Disclosures Report
Also, a robust product approval governance for digital assets activities including the implementation of advanced transaction monitoring tools (in the case of crypto specifically) with dedicated surveillance teams has been put in place. In order to enable an effective implementation of this risk framework, specifically with regards to working with vendors in the space, several policies and procedures for the onboarding of Crypto Asset Service Providers (CASPs) have been drafted and approved. A dedicated Compliance Digital Assets team is tasked with the oversight of all digital asset activity.
Generally, Santander does not think that digital assets present operational risk issues that are significantly different than normal business activities might present. For example, the safekeeping of cryptographic keys is not much different than our business-as-usual practices for the safekeeping of digital certificates for other purposes. I.e. Hardware Security Modules and the various access policies associated with them have been well understood for many years. Business continuity plans apply in the same way that they might today. Code audits are used where necessary.
11.4.2. Categorized Cryptoasset Activities
To reflect the diversity of our cryptoasset activities, Santander has categorized its engagements as follows:
11.4.2.1. Digital Financial Instruments (including digital Securities)
Santander is actively engaged with other banks, CSDs (Central Securities Depositaries) and custodians to explore the benefits tokenizing traditional financial instruments, utilizing blockchain technology to enhance transparency, improve liquidity and reduce operational risk. Today, in addition to primary issuances of digital bonds, our main fields of work involve the early stages digital collateral mobility by bringing programmability and always-on 24/7 capabilities to traditional capital markets activity (repo, etc.).
11.4.2.2. Digital Cash
Santander is actively exploring the full spectrum of innovation in the digital cash space. This includes central bank digital currencies (CBDCs), reserves backed digital currencies
(e.g. Fnality International), stablecoins and tokenized bank deposits. Some specific examples are below:
1) Fnality International: Santander is a founder and minority shareholding of Fnality International, a wholesale, multicurrency, digital Payment System. The first leg of the Fnality Payments System (FnUK) went live in December 2023 under supervision of the Bank of England, with Santander and other banks using the system to make real payments. The dollar leg of the Fnality Payments System is expected to launch in 2025.
2) Also in 2024, Santander along with 41 other financial institutions joined Project Agora under the Bank for International Settlements to reimagine correspondent banking and cross border payments through the lens of tokenization. Final reports and technology proof-of-concept is expected by later 2025.
Santander has also joined other industry groups such as the Regulated Liability Network (RLN), contributing to the global debate on the future of money.
11.4.2.3. Crypto
Santander Private Banking International, a division of Banco Santander, is offering its clients the opportunity to trade and invest Bitcoin (and other cryptocurrencies) in Switzerland. The service is available only upon client request and operated via relationship managers. Santander Private Banking International is open to extend its cryptocurrency offerings, as the trend of holding crypto as an alternative asset class grows and clients are increasingly looking to rely on established financial institutions for holding crypto assets.
Santander is not currently offering any services to clients in the EU under MiCA. Although this may change in the future.
|
|
|
|
|
|
|
|
|
|
|
|
|
|
|
|
Table 104.CAE1 - Exposures to crypto-assets |
|
EUR million |
|
|
|
|
2024 |
|
|
Exposure value |
Risk weighted exposures amounts (RWEA) |
Own funds requirements |
|
Type of exposures |
a |
b |
c |
| 1 |
Tokenised traditional assets |
0 |
0 |
0 |
| 2 |
Asset referenced tokens |
0 |
0 |
0 |
| 3 |
Exposures to other crypto assets |
0 |
0 |
0 |
| 4 |
Total |
0 |
0 |
0 |
|
Memorandum item |
|
|
|
| 5 |
Exposures to other crypto assets expressed as a percentage of the institution´s T1 capital |
0% |
|
|
2024 Pillar 3 Disclosures Report 303
304 2024 Pillar 3 Disclosures Report
|
|
|
|
|
|
|
|
|
|
|
|
|
|
|
|
|
|
|
|
|
|
|
|
|
|
|
|
|
|
|
|
|
|
|
|
|
|
|
|
|
|
12.2. Remuneration policy applicable to categories of staff that may have a material impact on the risk profile of Santander |
|
|
|
12.3. Main characteristics of the criteria for identifying categories of staff that may have a material impact on the risk profile of Santander |
|
|
|
|
|
|
|
|
|
|
|
|
|
|
|
|
|
|
|
|
|
|
|
|
|
|
|
|
|
|
|
|
|
|
|
|
|
|
|
|
|
|
|
|
|
|
|
|
|
|
|
|
|
|
|
|
|
|
|
|
|
|
|
|
|
|
|
|
|
|
|
|
|
|
|
|
|
|
|
12. RISK TAKERS REMUNERATIONS |
2024 Pillar 3 Disclosures Report 305
|
|
|
|
|
| 12. RISK TAKERS REMUNERATIONS |
This chapter presents various information on Grupo Santander's Remuneration Policies, including the total remuneration of the group in 2024 and the remuneration policy for 2025 and subsequent years (2026-2027).
12.1. Relevant information contained in other documents
This section covers the qualitative requirement REMA - Remuneration policy.
The corporate governance chapter in the 2024 Annual report, which was published together with the call to the 2025 General Shareholders’ Meeting, describes:
•The functions of the remuneration committee regarding the remuneration of directors, members of senior management and other executives whose work could have a material impact on the Group’s risk profile at consolidated level.
•The composition of the remuneration committee, directors’ attendance at meetings, the involvement of board members on other committees, the approximate time dedicated to each task and how the committee operates.
•The principles of the remuneration policy of directors, in their capacity as such or for their performance of executive duties, and the corporate governance principles regulating remuneration.
•The 2024 remuneration policy for directors and senior management, focusing especially on variable remuneration and how it was applied in the year.
•And the changes in the principles or in the composition of the Board Members' remuneration in terms of the performance of their supervisory tasks and collective decision-making, with respect to those established in 2024, for the years 2025, 2026 and 2027
The Board of Directors is responsible for approving the remuneration of directors and senior management, as well as the core payment terms of other executives and employees who, while not belonging to senior management, take on risks, carry out control functions (i.e. Internal Audit, Risk Management and Compliance) or receive total remuneration that places them in the same remuneration bracket as senior management, and employees who take on risk and whose professional activities may have a material impact on the Group’s risk profile. All of these, together with the senior management and the Company’s Board of Directors, are known as 'Corporate identified staff' or Corporate Material Risk Takers).
The corporate governance chapter of the Annual report also includes the following Pillar 3 disclosures:
•The decision-making process for setting the remuneration policy of directors, senior management and the core elements of the remuneration of identified staff.
•The basic features of the remuneration components.
•Information on the criteria applied for assessing the metrics that determine the variable remuneration of directors and senior management and their adjustment according to risk, as well as the results of the metrics for directors.
•The deferral policy and other conditions linked to the payment of variable remuneration, including the application of malus and clawback provisions.
306 2024 Pillar 3 Disclosures Report Santander has specific guidelines in its remuneration policy for those professionals qualified internally as Corporate Identified Staff or material risk takers. These guidelines contain:
12.2. Remuneration policy applicable to categories of staff that may have a material impact on the risk profile of Santander
•The principles and criteria that determine which people have a material impact on the Group’s risk profile, based on Commission Delegated Regulation (EU) 2021/923 of 25 March 2021 as explained in the section below.
•The specifics that modify the general remuneration policy for its application to this group, taking into account all applicable rules and European Banking Authority (EBA) guidelines, are described below.
•The mandate to apply the Group’s remuneration policy, as adapted in each case so as to comply with local regulatory requirements and recommendations issued by supervisory bodies.
The remuneration of Corporate Identified Staff in 2024 is in line with the criteria in the Group’s remuneration policy, which is reviewed annually to ensure that it is aligned with the long-term interests of shareholders, the Group’s strategic targets and regulatory requirements.
The subsidiaries formally adhere to the Group's corporate remuneration policy, which implies the alignment of their practices with the principles it contains.
12.3. Main characteristics of the criteria for identifying categories of staff that may have a material impact on the risk profile of Santander
The Corporate Identified Staff (or identified staff from now on) has been defined according to the provisions of Law 10/2014, of 26 June, on the restructuring, supervision and capital adequacy of credit institutions, (Law 10/2014 or LOSS), transposing into Spanish law the text of Directive 2013/36/EU of the European Parliament and Council of 26 June 2013, on access to the activity of credit institutions and the prudential supervision of credit institutions and investment firms (Directive CRD IV) and its successor, CRD V, is transposed through Royal Decree-Law 7/2021, of 27 April.
In accordance with the CRD V, professionals who may have a material impact on the Bank’s risk profile (at consolidated level) are deemed to include senior management, employees who assume risks, employees who exercise control functions and all employees who receive total remuneration that includes them in the same remuneration bracket as senior management. In addition to the previous definition, European legislation, through the publication of Commission Delegated Regulation (EU) No. 2021/923, 25 March 2021, supplementing CRD V with regard to the regulatory technical standards on appropriate qualitative and quantitative criteria for identifying personnel categories whose professional activities have a material impact on an institution's risk profile (hereinafter, "Delegated Regulation 2021/923"), that together with Directive 2019/879, establishes a closed list of those relating to the application of reduction (malus) and recovery (clawback) clauses.
Santander implements the quantitative and qualitative criteria in the regulation to determine the members of identified staff and has further supplemented these criteria with additional internal criteria. The following persons generally qualify as identified staff based on these criteria:
•Based on qualitative criteria, staff members who work at a material business unit, such as:
◦Members of the management body and senior management.
◦Members of staff with managerial responsibilities with regard to the entity's control functions or significant business units.
◦Those responsible for legal affairs, sound accounting policies and procedures, finance, including taxation and budgeting, conducting economic analysis, anti-money laundering and counter-terrorism financing, human resources, developing and implementing remuneration policy, information technology, information security, management of outsourcing arrangements for essential or important functions.
◦Members of senior risk committees and executives with powers to initiate, approve or veto significant credit and market risk proposals.
◦Traders authorised to take substantial positions in market risk.
◦Members of the new products committee.
•By quantitative criteria:
◦Staff who have received significant remuneration in the previous financial year.
◦Managers receiving total remuneration of over €750 thousand in 2023.
◦Managers of EU entities with more than 1,000 employees whose remuneration is in the 0.3% highest in their country.
•By internal criteria:
◦Executives of EU entities with a given level of credit or market risk responsibility at certain non-material units.
◦Heads of business units with a banking licence.
2024 Pillar 3 Disclosures Report 307
◦Managers of the managers identified by any of the qualitative criteria.
Additional criteria have also been defined to identify and classify the units to which the above criteria are applied. These criteria are based on simple and widely recognised parameters (such as capital, gross income, profit before taxes, franchise value or asset under management) and reflect the relative importance of each identified unit with an impact on the Group's risk profile.
Current legislation, best practices and market trends are taken into account when defining the proportionality standards. These apply to both the relative importance of the units and the degrees of responsibility of the positions occupied by the individuals, to facilitate implementation.
According to these criteria, the identified staff comprised 1,246 executives across Santander at year-end 2024, accounting for approximately 0.60% of total staff.
Finally, it is indicated that the entity has benefited from the exception established in Article 94, Section 3 b), of Directive 2013/36/EU. In particular, the entity applied the exception of a staff member whose annual variable remuneration does not exceed EUR 50,000 and does not represent more than one third of the staff member's total annual remuneration.
12.4. Specific features of the remuneration policy applicable to the Identified Staff
In general:
•Fixed remuneration must represent a significant proportion of total compensation.
•Variable remuneration for the year shall not exceed 100% of the fixed remuneration, in any event, of the members of the independent control functions, and generally for other employees that are part of the identified staff, unless the General Shareholders’ Meeting has authorised a higher percentage for these, which may not exceed 200%. In this respect, the General Shareholders' Meeting, held on 22 March 2024, authorised the increase up to 200% of the maximum percentage permitted, for a maximum of 805 members of the identified staff in 2024 and up to 50 additional beneficiaries, up to a maximum of 855 people in total.
Variable remuneration typically comprises:
•An incentive to be received partly in cash and partly in instruments. Payment of this incentive is deferred for a period of four to five years (up to seven years in the United Kingdom). Performance measurement elements in line with the strategy and long-term interests of shareholders. These elements, take into consideration quantitative metrics, a multiplier and qualitative criteria that reflect the entity’s results, return, capital performance, conduct in respect of customers and quality of the services provided thereto, risk management and compliance with legislation.
•Malus and clawback clauses, which are triggered in situations in which there is poor financial performance by the Bank as a whole, specific divisions or areas, or the exposure generated by the staff, attributable to the management of the person(s) in charge, based on the presence of, at least, some of the following factors:
◦Significant failures in risk management by the Bank, a business or a risk control unit.
◦Increases in capital requirements in the Bank or one of its business units that were not planned at the time that exposure was generated.
◦Regulatory penalties or legal convictions for events that might be attributable to the unit or staff responsible for them. Failure to comply with the Bank’s internal codes of conduct.
◦Improper conduct, whether individual or collective. Negative effects deriving from the marketing of unsuitable products and the liability of persons or bodies making such decisions will be considered especially significant.
In addition to the existing policy on malus and clawback clauses of our remuneration policy, the board of directors of Banco Santander approved an addendum to our remuneration policy to comply with new SEC (US Securities and Exchange Commission) regulations relating to the recoupment of compensation received by the executive directors of Banco Santander, S.A., and senior management, in the event of a financial restatement (according to the regulation) resulting from material noncompliance with financial reporting requirements under federal securities laws. This addendum to our remuneration policy is entitled "Financial Statement Restatement Compensation".
•Ban on hedging deferred or retained shares or instruments and on transferring these in the twelve months following their delivery.
For control functions, the total remuneration package must be competitive within the market to attract sufficiently qualified and experienced employees. The individual objectives of these positions must be pegged to the performance of the control function rather than business results. Performance of the control function must be assessed by staff members who are independent of the business units being supervised.
308 2024 Pillar 3 Disclosures Report
12.5. Application of the remuneration policy for the identified staff in 2024
The remuneration policy and the essential remuneration conditions of individuals belonging to the identified staff have been approved by Banco Santander’s Board of Directors at the proposal of the remuneration committee. The human resources function and the risk and compliance functions in each Santander company have duly confirmed that this policy and the remuneration practices comply with applicable law and regulations.
This is confirmed by the third independent report issued in application of article 33.2 of Act 10/2014 of 26 June on the ordering, supervision and solvency of credit institutions. The risk supervision, regulation and compliance committee
supervises the remuneration policy and remuneration schemes with the greatest impact to ensure that they are suitably aligned with risk management.
The essential elements with regard to variable remuneration include:
•The metrics used to determine the variable remuneration of senior management and other top executives, which have also been used to determine the variable remuneration of other members of the identified staff. These metrics are described in section 6.3.B ii) of the corporate governance chapter of the 2024 Annual report.
•Deferral percentages and periods for the identified staff based on their category:
◦For the Group's executive directors and Promontorio executives:
|
|
|
|
|
|
|
|
|
|
|
|
|
|
|
|
Immediate Payment Percentage |
Deferred
Percentage (**) |
Deferral
Period (**) |
Deferred Portion Subject to Objectives (**) |
| Executive Directors, members of senior management(*) and those beneficiaries of the Award whose target(**) total variable remuneration is ≥ €2.7 mill. |
40% |
60% |
5 years |
Last 3 years (3/5 of Deferred Percentage) |
| Remaining members of senior management(*) or those beneficiaries of the Award whose target(**) total variable remuneration is ≥ €1.7 mill. (< €2.7 mill.). |
50% |
50% |
5 years |
Last 3 years (3/5 of Deferred Percentage) |
| Rest of Beneficiaries of the Award A. |
60% |
40% |
4 years |
Last 2 years (2/4 of Deferred Percentage) |
(*)For the purposes of these Regulations, senior management comprises all the members included in Banco de España’s Register of senior officers.
(**) In certain countries, the deferral percentage and the deferral period may also be different to comply with applicable local regulations or with the requirements of the competent authority in each case. Similarly, the deferred part subject to objectives can be applied to years that are not the last ones, but not before the third year.
◦For the other members of the identified staff:
|
|
|
|
|
|
|
|
|
|
|
|
|
Immediate Payment Percentage |
Deferred Percentage (*) |
Deferral Period (*) |
| Beneficiaries of the Award whose target total variable remuneration is ≥ €2.7 mill. |
40% |
60% |
5 years |
| Beneficiaries of the Award whose target total variable remuneration is ≥ €1.7 mill. (< €2.7 mill.). |
50% |
50% |
5 years |
| Other Beneficiaries of the Award. |
60% |
40% |
4 years |
(*)In certain countries, the deferral percentage and the deferral period may also be different to comply with applicable local regulations or with the requirements of the competent authority in each case.
Note: Reference variable remuneration for an standard compliance (100% of the objectives).
2024 Pillar 3 Disclosures Report 309
•Pegging a part of the deferred amounts to fulfilment of multi-year objectives for executive directors, senior management and other executives based on their category. These metrics are described in section 6.3.B (iv) of the corporate governance chapter of the 2024 Annual report.
•The suitability of financial instruments used for the portion of deferred remuneration in financial instruments: use of shares in Banco Santander S.A. or in any of its listed subsidiaries (such as Brazil and Poland) or equivalent instruments (Chile); and the ratio between these instruments.
•Defining the events that might trigger the application of a malus and clawback provisions on the variable remuneration accruing in 2024. These events are described in the previous section and apply to all the identified staff.
•No discount is applied to deferred variable remuneration when calculating the ratio of variable to fixed components.
In addition to the general scheme of variable remuneration metrics, the corporate and investment banking business (Santander Corporate & Investment Banking, SCIB) follows a model that is widely applied across all geographies where the business carries out its activities. The model provides remuneration for achieving results using a pay-out system, pegging variable remuneration to the business’s ordinary net profit, the cost of capital of RWAs consumed in that profit generation, the business budget objectives and the Group's results, ensuring alignment with it. The model includes the same categories of metrics – including capital, risks and customers – as used for senior management, although they may be adapted for the needs and requirements of the individual business. For further details, see the Corporate governance chapter of the 2024 Annual report.
|
|
|
|
|
|
|
Access 2024 Annual Report available on the Santander Group website |
310 2024 Pillar 3 Disclosures Report
12.6. Total remuneration of the identified staff in 2024
At the date of release of this report, the data corresponding to the Corporate Identified Staff of Grupo Santander are presented in a preliminary basis. The following table shows the total remuneration of the identified staff in 2024, distinguishing between the supervisory function of the management body, the management function of the management body, other senior management and other identified staff:
|
|
|
|
|
|
|
|
|
|
|
|
|
|
|
|
|
|
|
|
|
| Table 105.REM1 - Remuneration awarded for the financial year |
|
EUR Thousands |
|
|
|
|
2024 |
|
|
|
a |
b |
c |
d |
|
|
|
MB Supervisory function |
MB Management function |
Other senior management |
Other identified staff |
| 1 |
Fixed remuneration |
Number of identified staff |
13 |
2 |
14 |
1,217 |
| 2 |
Total fixed remuneration |
8,663 |
10,253 |
28,490 |
532,109 |
| 3 |
Of which: cash-based |
7,601 |
7,109 |
21,051 |
438,232 |
| EU-4a |
Of which: shares or equivalent ownership interests |
— |
— |
— |
— |
| 5 |
Of which: share-linked instruments or equivalent non-cash instruments |
— |
— |
— |
— |
| EU-5x |
Of which: other instruments |
— |
— |
— |
— |
| 7 |
Of which: other forms |
1,061 |
3,144 |
7,438 |
93,877 |
| 9 |
Variable remuneration |
Number of identified staff |
13 |
2 |
14 |
1,217 |
| 10 |
Total variable remuneration |
— |
14,954 |
30,831 |
624,682 |
| 11 |
Of which: cash-based |
— |
6,979 |
15,050 |
326,692 |
| 12 |
Of which: deferred |
— |
3,849 |
7,173 |
125,065 |
| EU-13a |
Of which: shares or equivalent ownership interests |
— |
6,979 |
15,050 |
296,972 |
| EU-14a |
Of which: deferred |
— |
3,849 |
7,173 |
134,691 |
| EU-13b |
Of which: share-linked instruments or equivalent non-cash instruments |
— |
— |
— |
— |
| EU-14b |
Of which: deferred |
— |
— |
— |
— |
| EU-14x |
Of which: other instruments |
— |
— |
— |
612 |
| EU-14y |
Of which: deferred |
— |
— |
— |
293 |
| 15 |
Of which: other forms |
— |
996 |
732 |
406 |
| 16 |
Of which: deferred |
— |
996 |
732 |
406 |
| 17 |
Total remuneration |
8,663 |
25,208 |
59,320 |
1,156,791 |
2024 Pillar 3 Disclosures Report 311
The detail in the following table (REM 2) includes the special payments to personnel whose professional activities have a material impact on institutions' risk profile (identified staff):
|
|
|
|
|
|
|
|
|
|
|
|
|
|
|
|
|
|
|
Table 106.REM2 - Special payments to staff whose professional activities have a material impact on institutions’ risk profile (identified staff) |
|
EUR Thousands |
2024 |
|
|
|
|
|
|
|
|
a |
b |
c |
d |
|
|
MB Supervisory function |
MB Management function |
Other senior management |
Other identified staff |
|
Guaranteed variable remuneration awards |
|
|
|
|
| 1 |
Guaranteed variable remuneration awards - Number of identified staff |
— |
— |
— |
41 |
| 2 |
Guaranteed variable remuneration awards -Total amount |
— |
— |
— |
52,940 |
| 3 |
Of which guaranteed variable remuneration awards paid during the financial year, that are not taken into account in the bonus cap |
— |
— |
— |
29,488 |
|
Severance payments awarded in previous periods, that have been paid out during the financial year |
|
|
|
|
| 4 |
Severance payments awarded in previous periods, that have been paid out during the financial year - Number of identified staff |
— |
— |
— |
18 |
| 5 |
Severance payments awarded in previous periods, that have been paid out during the financial year - Total amount |
— |
— |
— |
5,736 |
|
Severance payments awarded during the financial year |
|
|
|
|
| 6 |
Severance payments awarded during the financial year - Number of identified staff |
— |
— |
— |
30 |
| 7 |
Severance payments awarded during the financial year - Total amount |
— |
— |
— |
31,727 |
| 8 |
Of which paid during the financial year |
— |
— |
— |
30,296 |
| 9 |
Of which deferred |
— |
— |
— |
1,431 |
| 10 |
Of which severance payments paid during the financial year, that are not taken into account in the bonus cap |
— |
— |
— |
28,123 |
| 11 |
Of which highest payment that has been awarded to a single person |
— |
— |
— |
3,662 |
312 2024 Pillar 3 Disclosures Report
|
|
|
|
|
|
|
|
|
The table REM 5 refers to the information on the remuneration of personnel whose professional activities have a material impact on the institution's risk profile (identified staff).
The Investment Banking area includes members of identified staff who belong to businesses related to corporate and investment banking (Santander Corporate & Investment Banking). |
|
The Retail and Commercial Banking area covers all customer banking businesses, including all the people who provide support in the geographies, whether they are local senior executives or other categories. |
|
|
|
|
|
|
|
|
|
|
|
|
|
|
|
|
|
|
|
|
|
|
|
|
|
|
|
|
|
|
|
|
|
|
|
|
|
Table 107.REM5 - Information on remuneration of staff whose professional activities have a material impact on institutions’ risk profile (identified staff) |
|
EUR Thousands |
2024 |
|
|
|
|
|
|
|
|
|
|
|
|
|
a |
b |
c |
d |
e |
f |
g |
h |
i |
j |
|
|
Management body remuneration |
Business areas |
|
|
|
MB Supervisory function |
MB Management function |
Total MB |
Investment banking |
Retail banking |
Asset management |
Corporate functions |
Independent internal control functions |
All other |
Total |
| 1 |
Total number of identified staff |
|
|
|
|
|
|
|
|
|
1,246 |
| 2 |
Of which: members of the MB |
13 |
2 |
15 |
|
|
|
|
|
|
|
| 3 |
Of which: other senior management |
|
|
|
1 |
1 |
1 |
8 |
3 |
— |
|
| 4 |
Of which: other identified staff |
|
|
|
177 |
708 |
47 |
50 |
235 |
— |
|
| 5 |
Total remuneration of identified staff |
8,663 |
25,208 |
33,870 |
244,023 |
685,944 |
49,232 |
98,140 |
138,772 |
— |
|
| 6 |
Of which: variable remuneration |
— |
14,954 |
14,954 |
149,857 |
366,032 |
26,588 |
52,119 |
60,916 |
— |
|
| 7 |
Of which: fixed remuneration |
8,663 |
10,253 |
18,916 |
94,166 |
319,912 |
22,644 |
46,021 |
77,856 |
— |
|
|
|
|
|
|
|
|
|
|
The total amount of severance payments and other benefits associated with contract termination, including pre-retirement payments, awarded during the year to members of the identified staff amounted to €32 million for a total of 30 people with average seniority of 15.3 years. Out of that total, 12 people received an amount corresponding to more than two annual fixed remuneration payments, with a total vested value of severance payments of €23.6 million. The maximum amount of a single award was €3.7 million.
The members of the collective of "Other senior management" who held the position at some point in 2024, not being part of this group at the close of 31 December, are included for the purposes of this reporting in "Other identified Staff". Two of these members have received severance payments and other contract termination payments.
The area of independent control functions includes risk management, internal audit and compliance functions.
|
|
Corporate functions cover people belonging to the identified staff of corporate support areas (such as Human Resources, Technology and Operations, Intervention and management control, as well as other functions related to the control of regulatory capital, Communication, Executive Secretary, Strategy, Financial Planning, etc.).
The sum of variable components in 2024 for each member of the identified staff did not exceed the limit established in each case for 2024, which was either 100% or 200%, as authorised by the General Shareholders’ Meeting. Specifically, the ratio of variable components of remuneration to fixed components for all the identified staff was 123% and the limits prescribed for each component were duly observed in all cases.
The amounts of deferred and retained remuneration are shown in the following table:
|
2024 Pillar 3 Disclosures Report 313
|
|
|
|
|
|
|
|
|
|
|
|
|
|
|
|
|
|
|
|
|
|
|
|
|
|
|
|
|
|
| Table 108.REM3 - Deferred remuneration |
|
2024 |
|
EUR Thousands |
a |
b |
c |
d |
e |
f |
EU - g |
EU - h |
|
Deferred and retained remuneration |
Total amount of deferred remuneration awarded for previous performance periods |
Of which due to vest in the financial year |
Of which vesting in subsequent financial years |
Amount of performance adjustment made in the financial year to deferred remuneration that was due to vest in the financial year |
Amount of performance adjustment made in the financial year to deferred remuneration that was due to vest in future performance years |
Total amount of adjustment during the financial year due to ex post implicit adjustments (i.e. Changes of value of deferred remuneration due to the changes of prices of instruments) |
Total amount of deferred remuneration awarded before the financial year actually paid out in the financial year |
Total of amount of deferred remuneration awarded for previous performance period that has vested but is subject to retention periods |
| 1 |
MB Supervisory function |
9,137 |
3,896 |
5,241 |
(762) |
(572) |
338 |
1,891 |
473 |
| 2 |
Cash-based |
3,513 |
945 |
2,568 |
(381) |
(286) |
— |
945 |
— |
| 3 |
Shares or equivalent ownership interests |
2,969 |
816 |
2,153 |
(381) |
(286) |
338 |
816 |
408 |
| 4 |
Share-linked instruments or equivalent non-cash instruments |
650 |
130 |
520 |
— |
— |
— |
130 |
65 |
| 5 |
Other instruments |
— |
— |
— |
— |
— |
— |
— |
— |
| 6 |
Other forms |
2,005 |
2,005 |
— |
— |
— |
— |
— |
— |
| 7 |
MB Management function |
39,067 |
16,392 |
22,675 |
(2,307) |
(3,209) |
1,674 |
10,637 |
2,557 |
| 8 |
Cash-based |
17,153 |
5,523 |
11,630 |
(858) |
(700) |
— |
5,523 |
— |
| 9 |
Shares or equivalent ownership interests |
14,289 |
4,815 |
9,474 |
(1,450) |
(2,509) |
1,674 |
4,815 |
2,407 |
| 10 |
Share-linked instruments or equivalent non-cash instruments |
1,262 |
299 |
963 |
— |
— |
— |
299 |
149 |
| 11 |
Other instruments |
— |
— |
— |
— |
— |
— |
— |
— |
| 12 |
Other forms |
6,363 |
5,755 |
608 |
— |
— |
— |
— |
— |
| 13 |
Other senior management |
73,430 |
30,054 |
43,376 |
(2,784) |
(2,828) |
5,037 |
25,514 |
6,809 |
| 14 |
Cash-based |
30,897 |
11,896 |
19,002 |
(1,315) |
(1,219) |
— |
11,896 |
— |
| 15 |
Shares or equivalent ownership interests |
32,523 |
11,801 |
20,722 |
(1,470) |
(1,609) |
5,037 |
11,801 |
5,900 |
| 16 |
Share-linked instruments or equivalent non-cash instruments |
3,740 |
1,817 |
1,922 |
— |
— |
— |
1,817 |
909 |
| 17 |
Other instruments |
634 |
— |
634 |
— |
— |
— |
— |
— |
| 18 |
Other forms |
5,636 |
4,541 |
1,095 |
— |
— |
— |
— |
— |
| 19 |
Other identified staff |
692,523 |
316,914 |
375,609 |
(19,925) |
(20,918) |
29,564 |
315,302 |
80,515 |
| 20 |
Cash-based |
329,973 |
154,272 |
175,701 |
(1,822) |
(1,735) |
— |
154,272 |
— |
| 21 |
Shares or equivalent ownership interests |
327,922 |
147,969 |
179,953 |
(18,102) |
(19,183) |
29,564 |
147,969 |
73,985 |
| 22 |
Share-linked instruments or equivalent non-cash instruments |
31,953 |
12,955 |
18,998 |
— |
— |
— |
12,955 |
6,477 |
| 23 |
Other instruments |
821 |
107 |
714 |
— |
— |
— |
107 |
53 |
| 24 |
Other forms |
1,855 |
1,612 |
243 |
— |
— |
— |
— |
— |
| 25 |
Total amount |
814,157 |
367,257 |
446,900 |
-25,778 |
-27,526 |
36,612 |
353,344 |
90,354 |
|
1.On each delivery of deferred cash amounts, a inflation adjustment has been paid (as appropriate in each case). In the financial year 2024, this adjustment amounted to a total of EUR 4,674 thousand (EUR 255 thousand in the case of the Executive Chair, Ana Botín, Héctor Grisi and José Antonio Álvarez). |
314 2024 Pillar 3 Disclosures Report
Lastly, the breakdown of the remuneration by salary band of the members of the identified staff in the whole of Santander is shown below:
|
|
|
|
|
|
|
|
|
| Table 109.REM4 - Remuneration of 1 million EUR or more per year |
|
|
|
|
|
2024 |
|
|
a |
|
EUR |
Identified staff that are high earners as set out in Article 450(i) CRR |
| 1 |
1 000 000 to below 1 500 000 |
193 |
| 2 |
1 500 000 to below 2 000 000 |
96 |
| 3 |
2 000 000 to below 2 500 000 |
42 |
| 4 |
2 500 000 to below 3 000 000 |
24 |
| 5 |
3 000 000 to below 3 500 000 |
14 |
| 6 |
3 500 000 to below 4 000 000 |
18 |
| 7 |
4 000 000 to below 4 500 000 |
9 |
| 8 |
4 500 000 to below 5 000 000 |
6 |
| 9 |
5 000 000 to below 6 000 000 |
6 |
| 10 |
6 000 000 to below 7 000 000 |
3 |
| 11 |
7 000 000 to below 8 000 000 |
4 |
| 12 |
8 000 000 to below 9 000 000 |
— |
| 13 |
9 000 000 to below 10 000 000 |
— |
| 14 |
10 000 000 to below 11 000 000 |
2 |
| 15 |
11 000 000 to below 12 000 000 |
— |
| 16 |
12 000 000 to below 13 000 000 |
— |
| 17 |
13 000 000 to below 14 000 000 |
— |
| 18 |
14 000 000 to below 15 000 000 |
1 |
| 28 |
Total |
418 |
(*) Remuneration assigned in financial year 2024 including deferred variable remuneration subject to long-term objectives at fair value that will be paid in 2028, 2029 and, where appropriate, 2030, depending on the level of achievement of the plan.
The number of individuals included in this disclosure have increased in 2024 (418 vs. 357 in 2023), driven by the higher bonuses paid in this year as a result of the good results of the entity. In 2024 a record attributable profit of EUR 12,574 million has been reached (on the back of a strong increase in revenue) enabling us to achieve the targets we set for the year, especially with regard to the CET1 capital ratio (12.8%), far exceeding forecasts, and thus generating shareholder value creation (TNAV per share plus cash DPS up 14% year on year and cash dividend per share of up 39% year on year).
It is worth noting that this chart includes an especially high concentration of US based and UK based executives (respectively 37% and 14%) where local pay and competition for talent retention and attraction are very high. In addition, a significant part of the employees who earn more than one million euros, both in these 2 geographies, and in the rest of the Group, belong to the Corporate and Investment Banking business, where we obtained record revenue and profits during the year (with double digits year-on-year), while maintaining the leadership position in efficiency and profitability, even after our investments for growth.
It is also important to note that turnover has a relevant effect in this chart, as it includes severance payment and non-compete payments, as well as sign-on bonuses for new hirings, which all lead to very large amounts for several individuals that are not strictly connected to 2024. Those bonuses are in many cases deferred, and in the case of sign-ons, may not be received if the executive leaves the organization during 2025.
2024 Pillar 3 Disclosures Report 315
12.7. Remuneration policy for 2025 and following years
The 2025 remuneration policy for directors is described in section 6.4 of the corporate governance chapter of the Annual report. The main principles of the policy, along with the fixed and variable remuneration components and the variable remuneration policy for members of the identified staff, will comply with the rules and procedures for executive directors set out in the report referred to above. In particular, as regards the variable remuneration policy:
•The existence of a single incentive, which will be determined by a set of quantitative and qualitative metrics.
•The quantitative metrics and a qualitative assessment which will include risk, compliance and ESG aspects, in the short-term incentive.
•Long-term metrics for senior managers: return on tangible equity (RoTE), relative performance of Banco Santander's total shareholder return (TSR) in relation to the weighted TSR of a reference group and metrics linked to environmental, social and corporate governance (ESG) criteria: percentage of women in executive positions, financial inclusion, socially responsible investments and supporting transition (business raised and facilitated).
•Part payment in cash or other instruments.
•Continued-employment, malus and clawback provisions
•Other conditions, such as the ban on hedging and transferring shares in the twelve months following their delivery (three years in the case of executive directors unless the director already holds shares for an amount equivalent to 200% of their net annual salary (calculated on the basis of their gross annual salary). In such case, the regulatory obligation to hold shares is for one year from their grant date.
Delivery is conditional on the beneficiary remaining in the Group's employment and is subject to the deferral rules and other regulatory restrictions, such as malus and clawback provisions.
Likewise, the Board of Directors, upon recommendation of the remuneration committee, may approve a new incentive to boost the transformation process of Banco Santander, being part of the variable remuneration of Group’s employees, including members of identified staff.
For further details, see the Corporate Governance chapter of the 2024 Annual report.
|
|
|
|
|
|
|
Access 2024 Annual Report available on the Santander Group website |
Deferral periods for members of the identified staff are as follows:
◦For the Group's executive directors and Promontorio executives:
|
|
|
|
|
|
|
|
|
|
|
|
|
|
|
|
Immediate Payment Percentage |
Deferred
Percentage (**) |
Deferral
Period (**) |
Deferred Portion Subject to Objectives (**) |
| Executive Directors, members of senior management(*) and those beneficiaries of the Award whose target(**) total variable remuneration is ≥ €2.7 mill. |
40% |
60% |
5 years |
Last 3 years (3/5 of Deferred Percentage) |
| Remaining members of senior management(*) and those beneficiaries of the Award whose target(**) total variable remuneration is ≥ €1.7 mill. (< €2.7 mill.). |
50% |
50% |
5 years |
Last 3 years (3/5 of Deferred Percentage) |
| Rest of Beneficiaries of the Award A. |
60% |
40% |
4 years |
Last 2 years (2/4 of Deferred Percentage) |
(*)For the purposes of these Regulations, senior management comprises all the members included in Banco de España’s Register of senior officers.
(**) In certain countries, the deferral percentage and the deferral period may also be different to comply with applicable local regulations or with the requirements of the competent authority in each case. Similarly, the deferred part subject to objectives can be applied to years that are not the last ones, but not before the third year.
•For the other members of the identified staff:
|
|
|
|
|
|
|
|
|
|
|
|
|
Immediate Payment Percentage |
Deferred Percentage (*) |
Deferral Period (*) |
| Beneficiaries of the Award whose target total variable remuneration is ≥ €2.7 mill. |
40% |
60% |
5 years |
| Beneficiaries of the Award whose target total variable remuneration is ≥ €1.7 mill. (< €2.7 mill.). |
50% |
50% |
5 years |
| Other Beneficiaries of the Award. |
60% |
40% |
4 years |
(*)In certain countries, the deferral percentage and the deferral period may also be different to comply with applicable local regulations or with the requirements of the competent authority in each case.
Note: Reference variable remuneration for an standard compliance (100% of the objectives).
316 2024 Pillar 3 Disclosures Report
[THIS PAGE INTENTIONALLY LEFT BLANK]
2024 Pillar 3 Disclosures Report 317
318 2024 Pillar 3 Disclosures Report
|
|
|
|
|
|
|
|
|
|
|
|
|
|
|
|
|
|
|
|
|
|
|
|
|
|
|
|
|
|
|
|
|
|
|
|
|
|
|
|
|
|
|
|
|
|
|
|
|
|
|
|
|
|
|
|
|
|
|
|
|
|
|
|
|
|
|
|
|
|
|
|
|
|
|
|
|
|
|
|
|
|
|
|
|
|
|
|
|
|
|
|
|
|
|
|
|
|
|
|
|
|
|
|
|
|
|
|
|
|
|
|
|
|
|
|
|
|
|
|
|
|
|
|
|
|
|
|
|
|
|
|
|
|
|
Appendices available in the Santander website |
|
|
|
|
|
|
|
|
|
|
|
|
|
VIII. |
CCA - Main features of regulatory own funds instruments and eligible liabilities instruments |
|
XII. |
IRB parameter models by geographic area |
|
|
IX. |
CCyB1 - Geographical distribution of credit exposures relevant for the calculation of the countercyclical buffer |
|
XIII. |
CR9.1 - AIRB approach - Back-testing of PD per exposure class (only for PD estimates according to point (f) of Article 180(1) CRR) |
|
|
X. |
CCA - Capital and TLAC instruments main features - Own Funds |
|
XIV. |
List of SPPEs |
|
|
XI. |
CCA - Capital and TLAC instruments main features - Eligible Liabilities |
|
|
|
|
|
|
|
|
|
|
|
|
|
|
|
|
|
|
|
|
|
|
|
|
|
|
|
|
|
|
|
|
|
|
|
|
|
|
|
|
|
|
|
|
|
|
|
|
|
|
|
13. APPENDICES |
2024 Pillar 3 Disclosures Report 319
Appendix I - Glossary
Advanced IRB approach: all the credit risk parameters are estimated internally by the entity, including the CCFs for calculating the EAD.
Alignment metrics: decarbonization targets to align a portfolio's emissions with the Paris Agreement targets.
ALM (Asset liability management): a series of techniques and procedures to ensure correct decision-making on investments and funding at the entity, taking into consideration the interrelation between the various on- balance-sheet and off-balance-sheet items.
AMA (Advanced Measurement Approach): an operational risk measurement technique set forth in Basel capital adequacy norms, based on an internal modelling methodology.
AQR (Asset Quality Review): asset quality review exercise performed by the European Central Bank.
Asset-backed commercial paper (ABCP) programme: a securitisation programme in which the securities issued predominantly take the form of commercial paper with an original maturity of one year or less.
AT1 (Additional Tier 1): capital which consists primarily of hybrid instruments.
Backtesting: the use of historical data to monitor the performance of the risk models.
Basel III: a set of amendments to the Basel II regulations published in December 2010, scheduled to take effect in January 2013 and to be gradually implemented until January 2019.
Basic IRB approach: all the risk parameters are determined by the regulator except for the probability of default, which is estimated internally by the bank. The CCFs required to calculate EAD are determined by the regulator.
BCBS: Basel Committee on Banking Supervision.
BEI (banking environment initiative): group of global banks, convened by the University of Cambridge Institute for Sustainability Leadership (CISL), committed to pioneering actionable pathways towards a sustainable economy.
BIS: Bank for International Settlements.
BRRD (Bank Recovery and Resolution Directive): approved in 2014, the BRRD establishes the framework for the recovery and resolution of banks with the objective of minimising the costs for taxpayers.
CASP (Crypto Asset Service Providers): a business that offers crypto wallets, crypto exchange services, and similar crypto-asset services professionally under the EU’s MiCA regulation. This term is part of a consistent approach to unifying compliance linked to digital assets.
CBDC (central bank digital currencies): is the digital form of a country’s fiat currency that is also a claim on the central bank.
CBE 2/2016: Banco de España Circular of 2 February 2016 on the supervision and solvency of credit institutions, which completes the adaptation to Spanish law of Directive 2013/36/EU and Regulation (EU) No 575/2013. The new
Circular repeals Banco de España Circular 3/2008 to credit institutions on the determination and control of minimum own funds (except the parts referred to in Circular 5/2008 regarding the regime established therein) and section 11 of Banco de España Circular 2/2014.
CBE 3/2008: Banco de España Circular of 22 May 2008 on the calculation and control of minimum capital requirements.
CBE 4/2004: Banco de España Circular of 22 December 2004 on public and confidential financial reporting standards and model financial statement forms.
CBE 9/2010: Banco de España Circular of 22 December 2010 amending Circular 3/2008.
CCAR (Comprehensive Capital Analysis Review): a framework introduced by the Federal Reserve to review the capital planning and adaptation processes of the main US financial institutions.
CCF (Credit conversion factor): a conversion factor used for converting off-balance-sheet credit risk balances into credit exposure equivalents. Under the AIRB approach Santander applies the CCFs in order to calculate the EAD value of the items representing contingent liabilities and commitments.
CCoB (Conservation Buffer): a capital buffer equal to 2.5% of risk-weighted assets (and comprised fully of high-quality liquid assets) to absorb losses generated from the business.
CCP (Central Counterparty Clearing House): entity defined in article 2.1 of Regulation (EU) no. 648/2012.
CCyB (Counter Cyclical Buffer): a buffer whose objective is to mitigate or prevent cyclical risks arising from excessive credit growth at aggregate level. Accordingly, the CCB is designed to build up capital buffers during expansionary phases with a dual objective: to enhance the solvency of the banking system and to stabilise the credit cycle.
CET1 (Common Equity Tier 1): the highest quality capital of a bank.
CoCos (Contingent Convertible Bonds): debt securities that are convertible into capital if a specified event occurs.
Common equity: a capital measure that considers, among other components, ordinary shares, the share premium and retained profits. It does not include preference shares.
Companies excluded from EU Paris-aligned Benchmarks: companies that have a certain percentage of their revenues derived from activities considered polluting are not included in the benchmarks aligned with the Paris agreements.
Concentration risk: the risk of loss due to large exposures to a small number of debtors to which the entity has lent money.
Confidence level: in the context of value at risk (VaR) and economic capital, this is the level of probability that the actual loss will not exceed the potential loss estimated by value at risk or economic capital.
COP 21: United Nations Climate Change Conference held in 2015.
Cost of capital: The minimum return required by investors (shareholders) as compensation for the opportunity cost and risk assumed when investing their capital in the entity. It represents a “cut-off rate” or “minimum return” to be achieved, enabling analysis of the activity of business units and evaluation of their efficiency
320 2024 Pillar 3 Disclosures Report
Counterparty credit risk: the risk that a counterparty will default on a derivatives contract before its maturity. The risk could arise from derivatives transactions in the trading portfolio or the banking portfolio and, as with other credit exposures, it is subject to a credit limit.
Credit default swap: a derivatives contract that transfers the credit risk of a financial instrument from the buyer (who receives the credit protection) to the seller (who guarantees the solvency of the instrument).
Credit risk: the risk that customers are unable to meet their contractual payment obligations. Credit risk includes default, country and settlement risk.
Credit risk mitigation: a technique for reducing the credit risk of a transaction by applying coverage such as personal guarantees or collateral.
CRM (Comprehensive Risk Measure): the estimate of risk in the correlation trading portfolio.
CRR (Capital Requirements Regulation) and CRD IV (Capital Requirements Directive): directive and regulation transposing the Basel II framework into European Union law.
CSP: Commercial strategic plan.
CSRD (Corporate Sustainability Reporting Directive): EU directive that require large companies and listed companies to publish regular reports on the social and environmental risks they face and the impact of their activities.
CVA (Credit Valuation Adjustment): the difference between the value of the risk-free portfolio and the true portfolio value, taking into account counterparty credit risk.
DEBA: European Banking Authority. Created in 2010, it entered into operation in 2011. The EBA acts as a coordinator between the national entities responsible for safeguarding values such as the stability of the financial system, transparency of markets and financial products, and the protection of bank customers and investors.
Default risk: the risk that counterparties will not meet their contractual payment obligations.
Derivatives: financial instruments that derive their value from one or more underlying assets, e.g. bonds or currencies.
DLGD (Downturn LGD): the LGD estimated in adverse economic conditions.
DNSH (Do not significantly harm): principle that requires an assessment to ensure that the investment does not adversely affect one or more of the six environmental objectives defined in the EU Taxonomy.
DTA: deferred tax assets.
D-SIIs: Domestic Systemically Important Institutions.
EAD (Exposure at Default): the amount that the entity could lose in the event of counterparty default.
ECAI: External Credit Assessment Institution, such as Moody’s Investors Service, Standard & Poor’s Ratings Group and Fitch Group.
ECB Governing Council: the main decision-making body of the ECB, consisting of all members of the Executive Board and the governors of the national central banks of the Euro area countries.
ECB Supervisory Board: the body which undertakes the planning and execution of the ECB’s supervisory tasks, carrying out preparatory work and making proposals for decisions for approval by the ECB Governing Board.
Economic capital: the figure that demonstrates to a high degree of certainty the quantity of capital resources that Santander needs at a given point in time to absorb unexpected losses arising from its current exposure.
EDTF (Enhanced Disclosure Task Force): task force that issues recommendations to enhance the transparency of financial institution disclosures to the market.
EL (Expected loss): a regulatory calculation of the average amount expected to be lost on an exposure, using a 12-month time horizon. EL is calculated by multiplying probability of default (a percentage) by exposure at default (an amount) and LGD (a percentage).
Energy efficiency: energy consumption of a collateral in kWh/m².
EPC label: letter code representing the energy performance of the collateral, from A (the most efficient from the point of view of energy saving) to G (the least efficient).
EP score: energy consumption of a collateral in kWh/m².
EPS (earnings per share): an indicator used to measure a company’s profitability over a specified period of time. EPS is calculated by dividing the company’s profit for the period by the number of shares comprising its share capital.
Equator Principles: common baseline and risk management framework for financial institutions to identify, assess and manage environmental and social risks when financing projects.
ESCC Policy (Environmental, Social & Climate Change): Grupo Santander’s criteria for (i) investing in entities, and/or (ii) providing financial products and/or services to customers involved in oil & gas, power generation and transmission, mining, metals and soft commodities activities.
ESG (Environmental, Social and Governance): is an evaluation of a firm's collective conscientiousness for social and environmental factors. It is typically a score that is compiled from data collected surrounding specific metrics related to intangible assets within the enterprise. It can be considered a form of corporate social credit score.
ESG risks: environmental, social and governance risks.
EU Taxonomy: Classification system, developed by the European Commission, that establishes a list of sustainable economic activities from an environmental point of view available to companies and investors.
Exposure: the gross amount that the entity could lose if the counterparty is unable to meet its contractual payment obligations, without taking into consideration any guarantees, credit enhancements or credit risk mitigation transactions.
Financed emissions: greenhouse gas emissions that are associated with a given loan or provision of financial services to a counterparty. It breaks down by three scopes:
•Scope 1: direct GHG emissions that occur from sources owned or controlled by the reporting company, such as emissions from combustion in owned or controlled boilers, furnaces, vehicles, etc.
2024 Pillar 3 Disclosures Report 321
•Scope 2: indirect GHG emissions from the generation of purchased or acquired electricity, steam, heating, or cooling consumed by the reporting company.
•Scope 3: all other indirect GHG emissions (not included in Scope 2) that occur in the value chain of the company.
First-loss tranche of a securitisation: the most subordinated tranche of a securitisation, which is the first tranche to bear losses on the securitised exposures and therefore provides protection for the second-loss tranche and, where applicable, the senior tranches.
FSB (Financial Stability Board): international institution that monitors and makes recommendations on the global financial system.
FSC (forest stewardship council): global not-profit organization dedicated to promoting responsible and sustainable forest management.
Fully-Loaded: denotes full compliance with Basel III solvency requirements (which become mandatory in 2019).
GHG: greenhouse gas.
GHOS (Group of Governors and Heads of Supervision): supervisory body of the Basel Committee.
Greenwashing: the practice of gaining an unfair competitive advantage by marketing a financial product as environmentally friendly when, in fact, it does not meet basic environmental requirements.
Global rating tools: these assign a rating to each customer using a quantitative or automatic module.
G-SIB (Global Systemically Important Bank) or SIFI (Systemically Important Financial Institution): financial institutions which, because of their size, complexity and systemic interconnectedness, if allowed to fail could cause major disruptions to the financial system and economic activity.
HQLA: High Quality Liquid Assets.
HVCRE: High Volatility Commercial Real Estate.
ICAAP: internal capital adequacy assessment process.
IFRS: International Financial Reporting Standards.
ILAAP (Internal Liquidity Adequacy Assessment Process): process for the identification, measurement, management and control of liquidity implemented by the entity in compliance with article 86 of Directive 2013/36/EU.
Implicit LGD: this is used to back-test the regulatory LGD estimates. It is based on taking NPLMV as proxy for the Observed Loss, and then dividing the Observed Loss by the PD gives an implicit or observed LGD that can be compared to the regulatory LGD.
Interest rate risk: exposure of the bank’s financial position to adverse movements in interest rates. Acceptance of this risk is a normal part of the banking business and can be a source of significant returns and creation of shareholder value.
Internal ratings-based approach (IRB): an approach based on internal ratings for the calculation of risk-weighted exposures.
Internal validation: a pre-requisite for the supervisory validation process. A sufficiently independent specialised unit of the entity obtains an expert opinion on the adequacy of the internal models for the relevant internal and regulatory purposes, and issues a conclusion on their usefulness and effectiveness.
Investment entity of a securitisation: any institution or subject, other than the originator or sponsor institution, holding a securitisation position.
IRC (Incremental Risk Charge): an estimate of the credit risk associated with unsecuritised positions in the trading book.
IRP: This report, titled Pillar 3 Disclosures in the English version. (the acronym is for the Spanish Informe de Relevancia Prudencial).
IRRBB: Interest Rate Risk in the Banking Book.
ISDA (International Swaps and Derivatives Association): OTC derivative transactions between financial institutions are usually carried out under a master agreement established by this organisation which details the definitions and general terms and conditions of the contract.
ITS: Implementing Technical Standards.
JST (Joint Supervisory Team): one of the main forms of cooperation between the ECB and the national supervisors.
LCR (Liquidity Coverage Ratio): a ratio that ensures that a bank has an adequate stock of unencumbered high quality liquid assets that can be converted, easily and immediately, into cash in private markets, to meet its liquidity needs for a 30 calendar day liquidity stress scenario.
LDP: low-default portfolio.
Leverage Ratio: a complementary (non-risk based) regulatory capital measure that attempts to guarantee banks’ financial resilience. The ratio is calculated by dividing eligible Tier 1 capital by exposure.
LGD (Loss Given Default): the portion of EAD not recovered at the end of the loan recovery process. It is equal to 1 minus the recovery rate (i.e.: LGD = 1 - recovery rate). The definition of loss used to estimate LGD must be a definition of economic loss, not an accounting loss.
Liquidity risk: the risk that Santander might be unable to meet all its payment obligations when they fall due or might only be able to meet them at an excessive cost.
LTV (Loan to value): amount of credit extended / value of guarantees and collateral.
Mark-to-market approach: in regulatory terms, an approach for calculating the value of the credit risk exposure of counterparty derivatives (present market value plus a margin, i.e. the amount that takes into consideration the potential future increase in market value).
Market risk: the risk arising from uncertainty regarding changes in market prices and rates (including interest rates, share prices, exchange rates and commodity prices), the correlations between them and their levels of volatility.
MDA: Maximum Distributable Amount.
Mezzanine tranche of a securitisation: a securitisation position that is subordinated to the senior securitisation position, senior to the first-loss tranche and subject to a risk weight of less than 1 250% and more than 25%.
322 2024 Pillar 3 Disclosures Report
MiCA (Markets in Crypto-Assets Regulation): is part of the EU’s strategy to regulate crypto-assets and digital financial services.
Model validation: the process of assessing the effectiveness of a credit risk model using a pre-defined set of criteria, such as the model’s discriminatory power, the appropriateness of the inputs and expert opinions.
MPE (Multiple Point of Entry): a resolution approach based on multiple points of entry.
MREL (Minimum Requirement of Eligible Liabilities): the final loss absorption requirement established in European legislation for institutions based on an assessment of their resolution plans.
MSS (Minimum Social Safeguards): due diligence to avoid any negative impacts and comply with the human and labour rights standards.
Netting: a bank’s ability to reduce its credit risk exposure by setting off the value of its rights against its obligations with the same counterparty.
Non-standardised customers: customers who have been assigned a risk analyst due to the risk assumed. This category includes wholesale banking customers, financial institutions and certain enterprises in retail banking.
NSFR (Net Stable Funding Ratio): a ratio designed to ensure a bank has a balanced balance sheet structure, in which stable funding requirements are funded by stable liabilities.
NZAMi (Net Zero Asset Management initiative): international group of asset managers committed to supporting the goal of net zero greenhouse gas emissions by 2050.
NZBA (Net-Zero Banking Alliance): group of 43 of the world’s leading banks with a focus on delivering the banking sector’s ambition to align its climate commitments with the Paris Agreement goals.
Operational risk: the risk of incurring losses with regard to employees, contractual specifications and documentation, technology, infrastructure failures and disasters, projects, external influences and customer relations. This definition includes legal and regulatory risk but does not include business and reputational risk.
Originator institution of a securitisation: is an institution that:
•itself or through related entities was, directly or indirectly, involved in the original agreement that created the obligations or potential obligations of the debtor or potential debtor giving rise to the exposure being securitised; or
•purchases a third party's exposures for its own account and then securitises them.
Over-the-counter (OTC): off-exchange, that is, trading done between two parties (in derivatives, for example) without the supervision of an organised exchange.
Paris Agreement: international treaty on climate change. It stipulates that the involved parties will take the necessary actions to limit further increases in global average temperatures to well below 2°C and ideally to below 1.5°C.
PCAF (Partnership for Carbon Accounting Financials): initiative created in 2019 that aims to establish an international methodology for measuring and disclosing financed greenhouse gas emissions to financial institutions.
Phased-in: refers to compliance with current solvency requirements bearing in mind the transitional period for Basel III implementation.
Physical risk: risk of losses arising from any negative financial impact on the institution stemming from the current or prospective impacts of the physical effects of environmental factors on the institution’s counterparties or invested assets.
•Acute: physical risks that include harsh meteorological events such as cyclones, hurricanes or floods, as well as the increased severity of these.
◦Chronic: physical risks that include longer-term shifts in climate patterns (e.g., sustained higher temperatures) that may cause sea level rise or chronic heat waves.
Pillar 1 – Minimum Capital Requirements: the part of the New Basel Capital Accord that establishes the minimum regulatory capital requirements for credit, market and operational risk.
Pillar 2 - Supervisory Review Process: an internal capital adequacy assessment process reviewed by the supervisor with possible additional capital requirements for risk that are not included in Pillar 1 and the use of more sophisticated methodologies than Pillar 1.
Pillar 3 - Market Discipline: this pillar is designed to complete the minimum capital requirements and the supervisory review process and, accordingly, enhance market discipline through the regulation of public disclosure by the entities.
Point-in-time (PIT) PD: the probability of default at a particular point in time or in particular state of the economic cycle.
Probability of default (PD): this represents the likelihood that a customer or a transaction will fall into default. It is the probability that an event (the default) will occur within a given time horizon.
QIS (Quantitative Impact Study): ad-hoc requests by the EBA for studies analysing and calibrating the impact of new changes in regulation.
Qualifying central counterparty (QCCP): a central counterparty that has either been authorised under article 14 of Regulation (EU) no. 648/2012, or been recognised under article 25 of said Regulation.
Rating: the result of the objective assessment of the counterparties’ future economic situation based on current characteristics and assumptions. The methodology for assigning the ratings depends largely on the type of customer and the available data. A wide range of methodologies for assessing credit risk is applied, such as expert systems and econometric methods.
RCP (representative concentration pathways): climate change projection scenarios estimated by the Intergovernmental Panel on Climate Change (IPCC).
RDL: Royal Decree Law.
2024 Pillar 3 Disclosures Report 323
Regulatory Capital requirements: the minimum amount of capital the regulatory authority requires the entity to hold to safeguard its capital adequacy, based on the amount of credit, market and operational risk.
Eligible capital: the volume of capital the regulatory authority considers eligible to meet capital requirements. The main components of eligible capital are accounting capital and reserves.
Risk appetite: the amount and type of risks considered reasonable to assume in the execution of its business strategy, so that Santander can maintain its ordinary activity in the event of unexpected circumstances. Severe scenarios are taken into account that could have a negative impact on the levels of capital, liquidity, profitability and/or the share price.
Risk limits: approval tools for certain risk types and levels.
Risk-weighted assets (RWA): calculated by assigning a level of risk, expressed as a percentage (risk weighting), to an exposure in accordance with the relevant rules under the standardised approach or the IRB approach.
RoRAC: Return on Risk Adjusted Capital.
RoRWA: Return on Risk-Weighted Assets.
ROTA (Return On Total Assets): ratio between net income and total average assets, or the amount of financial and operational income a company receives in a financial year as compared to the average of that company's total assets. The ratio is considered to be an indicator of how effectively a company is using its assets to generate earnings.
RPK: revenue passenger-kilometer.
RSPO (roundtable on sustainable palm oil): established in 2004 with the objective of promoting the growth and use of sustainable palm oil products through global standards and multistakeholder governance.
RTS: Regulatory Technical Standards.
RWA density: ratio that compares institutions’ total weighted assets and their total balance sheet, and can be interpreted as an average relative risk measure -according to regulatory criteria- of a bank’s overall operations.
SDG (Sustainable Development Goals): universal set of goals, targets and indicators that UN member states will be expected to use to frame their agendas and policies over the next years.
Senior tranche of a securitisation: all tranches other than the first loss or mezzanine tranches. Within the senior tranche, the super senior tranche is the top tranche in the priority of payments, without taking into account for these purposes of any amounts owed under interest rate or currency derivatives, brokerage charges or similar payments.
Securitisation: a financial transaction or scheme whereby the credit risk associated with an exposure or pool of exposures is divided into tranches, with both of the following characteristics:
•Payments for the transaction or scheme are dependent upon the performance of the exposure or pool of exposures.
•The subordination of the tranches determines the distribution of losses during the ongoing life of the transaction or scheme
Securitisation position: exposures arising from securitisations. For these purposes, the providers of credit risk hedges for specific securitisation positions are considered to hold positions in the securitisation.
SFT (Securities Financing Transactions): any transaction where securities are used to borrow cash, or vice versa. They mostly include repurchase agreements (repos), securities lending activities and sell/buy-back transactions.
Slotting Criteria: an approach used for calculating risk weights for specialised lending exposures, which consists of mapping the internal ratings to five supervisory categories, each with its own specific risk weight.
Special-purpose vehicle (SPV): a company created for the sole purpose of acquiring certain assets or derivative exposures and of issuing liabilities that are associated solely with these assets or exposures.
Sponsor institution of a securitisation: an institution other than the originator that establishes and manages an asset-backed commercial paper programme, or other securitisation scheme, that purchases exposures from third-party entities and to which liquidity or credit facilities or other credit enhancements are generally granted.
SRB (Single Resolution Board): the single resolution authority, which is the second pillar of the Banking Union after the Single Supervisory Mechanism.
SRB: Systemic Risk Buffer.
SREP (Supervisory Review and Evaluation Process): a review of the systems, strategies, processes and mechanisms applied by credit institutions and of their risks.
SRF: Single Resolution Fund.
SRM: Single Resolution Mechanism.
SSM (Single Supervisory System): the system of banking supervision in Europe. It comprises the ECB and the competent supervisory authorities of the participating EU countries.
Standardised approach: an approach for calculating credit risk capital requirements under Pillar I of Basel II. Under this approach, the risk weightings used in the capital calculation are determined by the regulator.
Standardized customers: customers which have not been expressly assigned a risk analyst. This category generally includes individuals, individual entrepreneurs and retail banking enterprises not classified as non-standardized customers.
Stress testing: used to describe various techniques for measuring the potential vulnerability to exceptional but plausible events.
Stressed VaR: measures the level of risk in stressed historical or simulated market situations.
Sustainable Finance and Investment Classification System (SFICS): internal guide with harmonized criteria to classify green, social and sustainable assets in all the Group’s units and businesses.
324 2024 Pillar 3 Disclosures Report
Synthetic securitisation: transactions that involve a basket of credit swap agreements and bonds serving as collateral. They are called synthetic as rather than containing physical bonds, they carry credit derivatives, also known as synthetic contracts.
TCFD (Task Force on Climate-related Financial Disclosures): created by the Financial Stability Board to improve and increase reporting of climate-related financial information.
tCS: tonnes of crude steel.
Through-the-cycle (TTC) PD: probability of default adjusted to a full economic cycle. It may be taken as a long-term average of the point-in-time PD.
Tier 1: core capital less hybrid instruments.
Tier 2: supplementary capital instruments, mainly subordinated debt and general loan loss allowances, which contribute to the robustness of financial institutions.
TLAC (Total Loss Absorbency Capacity): an additional requirement to the minimum capital requirements set out in the Basel III framework for the absorption of total losses and effecting a recapitalisation that minimises any impact on financial stability, ensures the continuity of critical functions and avoids exposing taxpayers to losses. This requirement is applicable to all G-SIBs.
TLTRO: Targeted Longer-Term Refinancing Operations.
Traditional securitisations: a securitisation in which the economic interest in the securitized exposures is transferred by the transfer of ownership of those exposures from the originator to an SSPE (securitisation special purpose entity) or by sub-participation of an SSPE, where the securities issued do not represent payment obligations of the originator.
TPI (Transition Pathway Initiative): global initiative led by asset owners and supported by asset managers that assess the progress that companies are making on the transition to a low-carbon economy.
Transition risks: risk arising from political, legal, technological and market changes generated by the transition to a lower carbon economy.
TRIM: Targeted Review of Internal Models.
TSC (Technical screening criteria): specific requirements and thresholds that each activity covered in the EU Taxonomy will need to meet in order to be considered as significantly contributing to a sustainable objective.
TSR (Total Shareholder Return): relative performance of total shareholder returns. An indicator of the returns obtained by owners of a company over a period of one year on capital provided to the company.
UNEP FI: United Nations Environment Programme Finance Initiative.
Unexpected loss: unexpected losses (not covered by allowances) must be covered by capital.
VaR (Value at Risk): estimate of the potential losses that could arise in risk positions as a result of movements in market risk factors within a given time horizon and for a specific confidence level.
Value creation: Any profit generated above the cost of economic capital. Santander creates value when risk-adjusted returns (measured by RoRAC) exceed its cost of capital, and destroys value when the reverse occurs. It measures the risk-adjusted return in absolute terms (monetary units), supplementing the RoRAC result.
2024 Pillar 3 Disclosures Report 325
Appendix II - Disclosures by Santander subsidiaries
Overview of Santander
Santander is a Retail and Consumer global powerhouse and one of the largest banks in the eurozone. At 2024 year-end, we had EUR 1,837,081 million in assets and EUR 1,348,422 million in total customer funds. Santander was the second largest bank by market capitalization in the eurozone (EUR 67,648 million as of 31 December 2024).
Banco Santander, S.A., and international Group structure
The growth of Grupo Santander in the last decades has led Banco Santander to also act, in practice, as a holding entity of the shares of the various companies in its Group, and its results are becoming progressively less representative of the performance and earnings of the Group.
At the international level, the various banks and other subsidiaries, joint ventures and associates of the Group are integrated in a corporate structure comprising various holding companies which are the ultimate shareholders of the banks and subsidiaries abroad. The purpose of this structure, all of which is controlled Banco Santander, is to optimise the international organisation from the strategic, economic, financial and tax standpoints, since it makes it possible to define the most appropriate units to be entrusted with acquiring, selling or holding stakes in other international entities, the most appropriate financing method for these transactions and the most appropriate means of remitting the profits obtained by the group’s various operating units to Spain.
Large subsidiaries within EU (according to CRR definition):
Santander Totta SGPS, S.A.
Santander Totta SGPS, S.A. is almost fully owned by Banco Santander S.A. and is the parent company for Santander Totta sub-group. On individual basis, it is a holding company that has asset participations on other entities, being the most significant one, Banco Santander Totta, S.A., the operating company of Santander Totta’s sub-group.
Santander Totta’s main business is retail banking, taking deposits and granting credits to customers. The retail banking network originates most of Santander Totta’s business
Santander Totta SGPS, S.A. is currently regulated by the ECB on consolidated basis.
Santander Bank Polska, S.A.
Santander Bank Polska S.A. is a universal bank which provides a full range of services for personal customers, SMEs, large companies, corporates and public sector institutions.
The Bank is a parent entity of Santander Bank Polska Group and forms a domestic bank holding group as defined in the Polish Banking Law Act together with its related entities, including Santander Consumer Bank S.A. (a domestic subsidiary bank). It is also registered as a foreign bank holding group with Spain-based Banco Santander S.A. as the ultimate parent entity.
Banco Santander S.A. remains a long-term majority shareholder in the company. As of 31 December 2024, Banco
Santander S.A. held a controlling stake of 62.20% in the registered capital of Santander Bank Polska S.A.
Santander Germany
Santander Germany relates to the business activities of the Santander Group in Germany (Legal entity identifier (LEI): 529900KRVTRP5RWP9K95) and contains information from Santander Consumer Holding GmbH as well as information on the direct and indirect shareholdings part of the German financial holding group. Within this, SCB AG acts as the parent institution.
As a large subsidiary of an EU parent institution, SCGFG is supervised via the Single Supervisory Mechanism of the ECB. It discloses information annually in accordance with Article 13 (1) sentence 2 CRR and semi-annually in accordance with Article 433a (2) lit. b) CRR.
Santander Consumer Finance, S.A.
Santander Consumer Finance, S.A. is a credit institution established in Spain, wholly owned by Santander S.A., which meets capital requirements on individual and sub-consolidated basis. The bank is a leading consumer finance business with presence in 16 European countries, Canada and China.
Santander Consumer Finance, S.A. offers a wide range of financial solutions through points-of-sale and direct-to-consumer channels such as branches, phone centers and internet.
Santander Consumer Finance, S.A. was established in 1963 with the name of “Banco de Fomento, S.A.”. It is a private law entity subject to the regulations and regulations of banking entities operating in Spain.
As a holding company of a financial group (Grupo Santander Consumer Finance), it manages and manages the portfolio of shares in its subsidiaries. The Bank is part of the Santander Group, the parent entity of which (Banco Santander, S.A.) owns, directly or indirectly, all the share capital of the Bank.
Other subsidiaries outside EU with local publications:
Santander UK
Santander UK Group Holdings plc (the Company) and its subsidiaries (collectively Santander UK or the Santander UK group) operate primarily in the UK and are part of Banco Santander (comprising Banco Santander SA and its subsidiaries). Santander UK plc and Santander Financial Services plc are regulated by the UK Prudential Regulation Authority (PRA) and the Financial Conduct Authority (FCA). Certain other companies within the Santander UK group are regulated by the FCA and the PRA.
326 2024 Pillar 3 Disclosures Report
Banco Santander (Brasil), S.A.
It is the third largest private bank in Brazil and the only international bank with scale in the country. The commercial name is Banco Santander and operates in the retail and
wholesale segments with high value-added offerings, which enable to provide a wide range of products and services for individuals, small and medium-sized enterprises and wholesale.
Banco Santander (Brasil), S.A. is a subsidiary of Banco Santander S.A., a financial institution founded in Spain. BS Brasil is regulated by Banco Central do Brasil.
Banco Santander (Chile), S.A.
Largest bank in Chile in terms of total assets & loans. Santander Group holds a majority ownership stake in the company.
Banco Santander Chile is a banking corporation organized under the laws of the Republic of Chile, supervised by the Financial Market Commission (FMC). The Bank provides its clients with a wide range of general banking services, from individuals to large corporations. In addition, Banco Santander Chile and its affiliates offer consumer and commercial banking services, as well as other services, including factoring, collection, leasing, securities and insurance brokerage, brokerage of mutual and investment fund and investment banking.
Banco Santander (Argentina), S.A.
Banco Santander Argentina S.A. is the leading private bank in the Argentine financial system in terms of savings and credit volume. It is one of the leading banks in payment methods, foreign trade, transactional services and cash management, and also one of the main players in the stock, government securities and foreign exchange markets. It is a subsidiary of Banco Santander S.A. and is regulated by the Central Bank of the Argentine Republic (BCRA). In terms of consolidation, it includes Santander Valores S.A., Santander Tecnología Argentina S.A., Santander Consumer S.A. and Cartasur Cards S.A.U. (subsidiary companies).
Banco Santander (Uruguay), S.A.
Banco Santander S.A. is a public limited company that acts as a financial institution in Uruguay and carries out intermediation activities and related operations, such as exchanges, transfers, securities intermediation, credit cards and debit cards, among its main operations. It is almost entirely owned by Banco Santander S.A. and is supervised by the Central Bank of Uruguay.
Banco Santander (Mexico), S.A.
As of December 31st, 2024, our principal subsidiaries are Santander Inclusión Financiera, S.A. de C.V., Sociedad Financiera de Objeto Múltiple, Entidad Regulada and Santander Tecnología México, S.A. de C.V.
Grupo Financiero Santander México, S.A. de C.V., our holding company, directly owns 74.97% of our capital. Banco Santander Matriz owns 99.99% of the capital of Grupo Financiero Santander México, S.A. de C.V.
In addition, Banco Santander Matriz owns 24.92% of the Bank's capital, bringing its total equity interest in the Bank to 99.9%.
2024 Pillar 3 Disclosures Report 327
Appendix III - Location of disclosures
|
|
|
|
|
|
|
|
|
| IMPLEMENTING TECHNICAL STANDARDS ON PUBLIC DISCLOSURES BY INSTITUTIONS UNDER PART EIGHT OF REGULATION (EU) NO 575/2013 |
Requirement |
2024 Pillar 3 Location |
| Annex I. Disclosure of key metrics and overview of risk-weighted exposure amounts |
| Annex II. Disclosure of key metrics and overview of risk-weighted exposure amounts (instructions) |
| KM1 |
Key metrics template |
Table 1 |
| OV1 |
Overview of risk weighted exposure amounts |
Table 10 |
| INS1 |
Insurance participations |
N/A1 |
| INS2 |
Financial conglomerates - Information on own funds and capital adequacy ratio |
N/A1 |
| OVC |
ICAAP information |
Section 2.7 |
| Annex III. Disclosure of risk management policies and objectives |
| Annex IV. Disclosure of risk management policies and objectives (instructions) |
| OVA |
Institution risk management approach |
Section 3.1, 3.2, 4.1, 5.1, 6.1, 7.1, 8.1, 9 |
| OVB |
Disclosure on governance arrangements |
Section 3.2 |
| Annex V. Disclosure of the scope of application |
| Annex VI. Disclosure of the scope of application (instructions) |
| LI1 |
Differences between accounting and regulatory scopes of consolidation and mapping of financial statement categories with regulatory risk categories |
Table 2 |
| LI2 |
Main sources of differences between regulatory exposure amounts and carrying values in financial statements |
Table 3 |
| LI3 |
Outline of the differences in the scopes of consolidation (entity by entity) |
Appendix VI |
| LIA |
Explanations of differences between accounting and regulatory exposure amounts |
Section 1.4 |
| LIB |
Other qualitative information on the scope of application |
Section 1.4 |
| PV1 |
Prudent valuation adjustments (PVA) |
Table 80 |
| Annex VII. Disclosure of own funds |
| Annex VIII. Disclosure of own funds (instructions) |
| CC1 |
Composition of regulatory own funds |
Appendix VII |
| CC2 |
Reconciliation of regulatory own funds to balance sheet in the audited financial statements |
Table 4 |
| CCA |
Main features of regulatory own funds instruments and eligible liabilities instruments |
Appendix VIII |
| Annex IX. Disclosure of countercyclical capital buffers |
| Annex X. Disclosure of countercyclical capital buffers (instructions) |
| CCyB1 |
Geographical distribution of credit exposures relevant for the calculation of the countercyclical buffer |
Appendix IX |
| CCyB2 |
Amount of institution-specific countercyclical capital buffer |
Table 12 |
| Annex XI. Disclosure of the leverage ratio |
| Annex XII. Disclosure of the leverage ratio (instructions) |
| LR1 |
LRSum: Summary reconciliation of accounting assets and leverage ratio exposures |
Table 15 |
| LR2 |
LRCom: Leverage ratio common disclosure |
Table 16 |
| LR3 |
LRSpl: Split-up of on balance sheet exposures (excluding derivatives, SFTs and exempted exposures) |
Table 17 |
| LRA |
Free format text boxes for disclosure on qualitative items |
Section 2.5 |
| Annex XIII. Disclosure of liquidity requirements |
| Annex XIV. Disclosure of liquidity requirements (instructions) |
| LIQA |
Liquidity risk management |
Section 9 |
| LIQ1 |
Quantitative information of LCR |
Table 92 |
| LIQB |
Qualitative information on LCR, which complements template EU LIQ1 |
Table 93 |
| LIQ2 |
Net Stable Funding Ratio |
Table 94 |
| Annex XV. Disclosure of credit risk quality |
| Annex XVI. Disclosure of credit risk quality (instructions) |
| CRA |
General qualitative information about credit risk |
Section 4.1 |
| CRB |
Additional disclosure related to the credit quality of assets |
Section 4.3 |
| CR1 |
Performing and non-performing exposures and related provisions |
Table 41 |
| CR1-A |
Maturity of exposures |
Table 39 |
1 The exemption under Article 48 of the CRR is not used, so table INS1 and table INS2 on non-deducted holdings in insurance companies does not need to be published
328 2024 Pillar 3 Disclosures Report
|
|
|
|
|
|
|
|
|
| CR2 |
Changes in the stock of non-performing loans and advances |
Table 40 |
| CR2-A |
Changes in the stock of non-performing loans and advances and related net accumulated recoveries |
N/A2 |
| CQ1 |
Credit quality of forborne exposures |
Table 45 |
| CQ2 |
Quality of forbearance |
N/A3 |
| CQ3 |
Credit quality of performing and non-performing exposures by past due days |
Table 42 |
| CQ4 |
Quality of non-performing exposures by geography |
Table 43 |
| CQ5 |
Credit quality of loans and advances by industry |
Table 44 |
| CQ6 |
Collateral valuation - loans and advances |
N/A4 |
| CQ7 |
Collateral obtained by taking possession and execution processes |
Table 46 |
| CQ8 |
Collateral obtained by taking possession and execution processes – vintage breakdown |
N/A5 |
| Annex XVII. Disclosure of the use of credit risk mitigation techniques |
| Annex XVIII. Disclosure of the use of credit risk mitigation techniques (instructions) |
| CRC |
Qualitative disclosure requirements related to CRM techniques |
Section 4.7 |
| CR3 |
CRM techniques overview: Disclosure of the use of credit risk mitigation techniques |
Table 49 |
| Annex XIX. Disclosure of the use of standardised approach |
| Annex XX. Disclosure of the use of standardised approach (instructions) |
| CRD |
Qualitative disclosure requirements related to standardised model |
Section 4.2.4 |
| CR4 |
Standardised approach – Credit risk exposure and CRM effects |
Table 37 |
| CR5 |
Standardised approach |
Table 38 |
| Annex XXI. Disclosure of the use of the IRB approach to credit risk |
| Annex XXII. Disclosure of the use of the IRB approach to credit risk (instructions) |
| CRE |
Qualitative disclosure requirements related to IRB approach |
Section 4.2.3 |
| CR6 |
IRB approach – Credit risk exposures by exposure class and PD range |
Table 26, Table 27, Table 28 |
| CR6-A |
Scope of the use of IRB and SA approaches |
Table 22 |
| CR7 |
IRB approach – Effect on the RWEAs of credit derivatives used as CRM techniques |
Table 51 |
| CR7-A |
IRB approach – Disclosure of the extent of the use of CRM techniques |
Table 52 |
| CR8 |
RWEA flow statements of credit risk exposures under the IRB approach |
Table 23 |
| CR9 |
AIRB Back-testing of PD per exposure class (fixed PD scale) |
Table 53 |
| CR9 |
AIRB Retail Back-testing of PF per exposure class (fixed PD scale) |
Table 54 |
| CR9 |
FIRB Back-testing of PD per exposure class (fixed PD scale) |
Table 55 |
| CR9.1 |
AIRB approach – Back-testing of PD per exposure class (only for PD estimates according to point (f) of Article 180(1) CRR) |
Table 56 |
| Annex XXIII. Disclosure of specialised lending |
| Annex XXIV. Disclosure of specialised lending (instructions) |
| CR10.1 |
Specialised lending and equity exposures under the simple riskweighted approach. Project financing |
Table 29 |
| CR10.2 |
Specialised lending and equity exposures under the simple riskweighted approach. Income-earning real estate and highly volatile commercial real estate |
Table 30 |
| CR10.3 |
Specialised lending and equity exposures under the simple riskweighted approach. Financing of assets |
Table 31 |
| CR10.4 |
Specialised lending and equity exposures under the simple riskweighted approach. Financing of raw materials |
Table 32 |
| CR10.5 |
Equity exposures under the simple risk-weighted approach |
Table 33 |
| Annex XXV. Disclosure of exposures to counterparty credit risk |
| Annex XXVI. Disclosure of exposures to counterparty credit risk (instructions) |
| CCRA |
Qualitative disclosure related to CCR |
Section 5.1 |
| CCR1 |
Analysis of CCR exposure by approach |
Table 59 |
| CCR2 |
Transactions subject to own funds requirements for CVA risk |
Table 57 |
| CCR3 |
Standardised approach – CCR exposures by regulatory exposure class and risk weights |
Table 60 |
| CCR4 |
AIRB approach – CCR exposures by exposure class and PD scale |
Table 61 |
| CCR4 |
FIRB approach – CCR exposures by exposure class and PD scale |
Table 62 |
| CCR5 |
Composition of collateral for CCR exposures |
Table 63 |
2 Requirement CR2A of the EBA Disclosure ITS are not published because the NPL ration does not exceed 5%.
3 Requirement CQ2 of the EBA Disclosure ITS are not published because the NPL ration does not exceed 5%.
4 Requirement CQ6 of the EBA Disclosure ITS are not published because the NPL ration does not exceed 5%.
5 Requirement CQ8 of the EBA Disclosure ITS are not published because the NPL ration does not exceed 5%.
2024 Pillar 3 Disclosures Report 329
|
|
|
|
|
|
|
|
|
| CCR6 |
Credit derivatives exposures |
Table 64 |
| CCR7 |
RWEA flow statements of CCR exposures under the IMM |
N/A6 |
| CCR8 |
Exposures to CCPs |
Table 58 |
| Annex XXVII. Disclosure of exposures to securitisation positions |
| Annex XXVIII. Disclosure of exposures to securitisation positions (instructions) |
| SECA |
Qualitative disclosure requirements related to securitisation exposures |
Section 6.2, 6.4 |
| SEC1 |
Securitisation exposures in the non-trading book |
Table 66 |
| SEC2 |
Securitisation exposures in the trading book |
Table 67 |
| SEC3 |
Securitisation exposures in the non-trading book and associated regulatory capital requirements - institution acting as originator or as sponsor |
Table 72 |
| SEC4 |
Securitisation exposures in the non-trading book and associated regulatory capital requirements - institution acting as investor |
Table 73 |
| SEC5 |
Exposures securitised by the institution - Exposures in default and specific credit risk adjustments |
Table 71 |
| List of SPPEs |
List of SPPEs |
Appendix XIV |
| Annex XXIX. Disclosure of the use of standardised approach and internal model for market risk |
| Annex XXX. Disclosure of the use of standardised approach and internal model for market risk (instructions) |
| MRA |
Qualitative disclosure requirements related to market risk |
Section 7.1 |
| MR1 |
EU MR1 - Market risk under the standardised approach |
Table 78 |
| MRB |
Qualitative disclosure requirements for institutions using the internal Market Risk Models |
Section 7.1 |
| MR2-A |
Market risk under the internal Model Approach (IMA) |
Table 76 |
| MR2-B |
RWA flow statements of market risk exposures under the IMA |
Table 77 |
| MR3 |
IMA values for trading portfolios |
Table 81 |
| MR4 |
Comparison of VaR estimates with gains/losses |
Table 84 |
| Annex XXXI. Disclosure of operational risk |
| Annex XXXII. Disclosure of operational risk (instructions) |
| ORA |
Qualitative information on operational risk |
Section 8.1 and 8.2 |
| OR1 |
Operational risk own funds requirements and risk-weighted exposure amounts |
Table 87 |
| Annex XXXIII. Disclosure of remuneration policy |
| Annex XXXIV. Disclosure of remuneration policy (instructions) |
| REMA |
Remuneration policy |
Section 12.1 |
| REM1 |
Remuneration awarded for the financial year |
Table 105 |
| REM2 |
Special payments to staff whose professional activities have a material impact on institutions’ risk profile (identified staff) |
Table 106 |
| REM3 |
Deferred remuneration |
Table 108 |
| REM4 |
Remuneration of 1 million EUR or more per year |
Table 109 |
| REM5 |
Information on remuneration of staff whose professional activities have a material impact on institutions’ risk profile (identified staff) |
Table 107 |
| Annex XXXV. Disclosure of encumbered and unencumbered assets |
| Annex XXXVI. Disclosure of encumbered and unencumbered assets (instructions) |
| AE1 |
Encumbered and unencumbered assets |
Table 88 |
| AE2 |
Collateral received and own debt securities issued |
Table 89 |
| AE3 |
Sources of encumbrance |
Table 90 |
| AE4 |
Accompanying narrative information |
Section 9.1.3 |
6 Statement of flows of risk-weighted amounts of counterparty exposures subject to IMM is not included as Santander does not have an internal model to calculate counterparty risk EAD
330 2024 Pillar 3 Disclosures Report
|
|
|
|
|
|
|
|
|
| IMPLEMENTING TECHNICAL STANDARDS ON PUBLIC DISCLOSURES BY INSTITUTIONS UNDER PART EIGHT OF REGULATION (EU) NO 2024/1623 |
Requirement |
2024 Pillar 3 Location |
| Annex XLIII. Disclosure on exposures to crypto-assets |
| Annex XLIV. Disclosure on exposures to crypto-assets (instructions) |
| CAE1 |
Exposures to crypto-assets |
Table 104 |
|
|
|
|
|
|
|
|
|
| IMPLEMENTING TECHNICAL STANDARDS ON DISCLOSURE OF INFORMATION ON EXPOSURES TO INTEREST RATE RISK ON POSITIONS NOT HELD IN THE TRADING BOOK |
Table |
Table Title |
2024 Pillar 3 Location |
| IRRBB1 |
Interest rate risks of non-trading book activities |
Table 85 |
| IRRBBA |
IRRBB qualitative information |
Section 7.4 |
|
|
|
|
|
|
|
|
|
| GUIDELINES ON UNIFORM DISCLOSURES UNDER ARTICLE 473A OF REGULATION (EU) NO 575/2013 AS REGARDS THE TRANSITIONAL PERIOD FOR MITIGATING THE IMPACT OF THE INTRODUCTION OF IFRS 9 ON OWN FUNDS - EBA/GL/2018/01 |
Table |
Table title |
2024 Pillar 3 Location |
| IFRS 9-FL Template |
Comparison of equity, capital ratios and leverage of entities with or without the application of the transitional arrangements of IFRS 9 or analog ECL |
Table 9 |
|
|
|
|
|
|
|
|
|
| IMPLEMENTING TECHNICAL STANDARDS ON DISCLOSURE AND REPORTING OF MREL AND TLAC |
Table |
Table title |
2024 Pillar 3 Location |
| KM2 |
Key metrics – MREL and, where applicable, G-SII requirement for own
funds and eligible liabilities |
Table 18 |
| TLAC1 |
Composition – MREL and, where applicable, the G-SII requirement
for own funds and eligible liabilities |
Table 19 |
| TLAC3 |
Creditor ranking – resolution entity |
Table 20 |
| CCA - Own funds |
Capital and TLAC instruments main features - Own Funds |
Appendix X |
| CCA - Eligible Liabilities |
Capital and TLAC instruments main features - Eligible Liabilities |
Appendix XI |
|
|
|
|
|
|
|
|
|
| IMPLEMENTING TECHNICAL STANDARDS (ITS) ON PRUDENTIAL DISCLOSURES ON ESG RISKS IN ACCORDANCE WITH ARTICLE 449a CRR |
Table |
Table title |
2024 Pillar 3 Location |
| ESG1 |
Banking book- Climate Change transition risk: Credit quality of exposures by sector, emissions and residual maturity |
Table 95 |
| ESG2 |
Banking book - Climate change transition risk: Loans collateralised by immovable property - Energy efficiency of the collateral |
Table 96 |
| ESG3 |
Banking book - Climate change transition risk: Alignment metrics |
Table 97 |
| ESG4 |
Banking book - Climate change transition risk: Exposures to top 20 carbon-intensive firms |
Table 98 |
| ESG5 |
Banking book - Climate change physical risk: Exposures subject to physical risk |
Table 99 |
| ESG6 |
Summary of GAR KPIs |
Table 100 |
| ESG7 |
Mitigating actions: Assets for the calculation of GAR |
Table 101 |
| ESG8 |
GAR (%) |
Table 102 |
| ESG9 |
Mitigating actions: BTAR |
N/A7 |
| ESG10 |
Other climate change mitigating actions that are not covered in the EU Taxonomy Page Size Break |
Table 103 |
7 Due to the voluntary nature of the ratio
2024 Pillar 3 Disclosures Report 331
Appendix IV - CRR Mapping
The following table links the CRR’s articles on divulging information (Part 8) to the various sections of the document that provide the information required. The ‘Location’ column specifies the section of Pillar 3 or other public document in
which the information is dealt with, in whole or in part. This information may be distributed throughout the document on a piecemeal basis.
|
|
|
|
|
|
|
|
|
|
|
|
|
|
|
Article |
Brief Description |
2024 P3DR Location |
Tables |
2024 Annual
Report Location
|
| 431. Scope of disclosures requirements |
| 431.1 |
Requirement to publish Pillar 3 disclosures. |
Pillar 3 Disclosures Report |
|
|
| 431.2 |
Permission granted by the competent authorities under Part Three for the instruments and methodologies referred to in Title III shall be subject to the public disclosure by institutions of the information laid down therein. |
Section 4.2.1. |
|
|
| 431.3 |
Institution must have a policy covering the frequency of disclosures, their verification, comprehensiveness and appropriateness, as well as policies for assuring the overall comprehension of their risk profile by market participants. |
Section 1.2.1. |
|
|
| 431.4 |
All quantitative disclosures shall be accompanied by a qualitative narrative and any other supplementary information that may be necessary |
Pillar 3 Disclosures Report |
|
|
| 431.5 |
Institutions should explain, upon request, their rating decisions to SMEs and other business loan applicants, providing a written explanation upon request. The administrative costs of the explanation should be proportionate to the amount of the loan. |
Section 4.4. |
|
|
|
|
|
|
|
| 432. Non-material, proprietary or confidential information |
| 432.1 |
Institutions may omit information that is not material if certain conditions are respected. |
Sections 1.2.1. and 1.2.3. |
|
|
| 432.2 |
Institutions may omit information that is proprietary or confidential if certain conditions are respected. |
Section 1.2.2. |
|
|
| 432.3 |
Where 432.2 applies this must be stated in the disclosures, and more general information must be disclosed. |
Section 1.2.2. |
|
|
|
|
|
|
|
| 433. Frequency of disclosure |
| 433 |
Institutions shall publish the disclosures required under Titles II and III in the manner set out in Articles 433a, 433b and 433c. |
Section 1.2.2. |
|
|
|
|
|
|
|
| 433a. Disclosures by large institutions |
| 433a |
Large institutions shall disclose the information outlined below with the following frequency: |
Section 1.2.2. |
|
|
|
|
|
|
|
| 433b. Disclosures by small and non-complex institutions |
| 433b |
Small and non-complex institutions shall disclose the information outlined below with the following frequency |
N/A |
|
|
|
|
|
|
|
| 433c. Disclosures by other institutions |
| 433c |
Institutions that are not subject to Article 433a or 433b shall disclose the information outlined below with the following frequency |
N/A |
|
|
|
|
|
|
|
| 434. Means of disclosure |
| 434.1 |
Institutions shall disclose all the information required under Titles II and III in electronic format and in a single medium or location. |
Section 1.2.1. |
|
|
| 434.2 |
Disclosures made under other requirements (e.g. accounting, listing) can be used to satisfy Pillar 3 requirements, if appropriate. |
Section 1.2.1. |
|
|
|
|
|
|
|
332 2024 Pillar 3 Disclosures Report
|
|
|
|
|
|
|
|
|
|
|
|
|
|
|
Article |
Brief Description |
2024 P3DR Location |
Tables |
2024 Annual
Report Location
|
| 434a. Uniform disclosure formats |
| 434a |
EBA shall develop draft implementing technical standards specifying uniform disclosure formats, and associated instructions in accordance with which the disclosures required under Titles II and III shall be made. |
N/A |
|
|
|
|
|
|
|
| 435. Risk management objectives and policies |
| 435.1 |
Disclose information for each separate category of risk: |
|
|
|
| 435.1.a |
The strategies and processes to manage risks. |
Chapters 3 to 10 |
|
Risk, compliance & conduct management chapter |
| 435.1.b |
Structure and organization of the risk management function. |
Chapters 3 to 10 |
|
Risk, compliance & conduct management chapter |
| 435.1.c |
Risk reporting and measurement systems. |
Chapters 3 to 10 |
|
Risk, compliance & conduct management chapter |
| 435.1.d |
Hedging and mitigating risk - policies, strategies and processes. |
Chapters 3 to 10 |
|
Risk, compliance & conduct management chapter |
| 435.1.e |
A declaration of adequacy of risk management arrangements approved by the Board. |
Section 3.1.3. |
|
Risk, compliance & conduct management chapter |
| 435.1.f |
Inclusion of a concise risk statement approved by the Board. |
Sections 1.4.1. and 3.1.3. |
|
Risk, compliance & conduct management chapter |
| 435.2 |
Information on governance arrangements, including information on Board composition and recruitment, and risk committees. |
|
|
|
| 435.2.a |
Number of directorships held by Board members. |
Section 3.2.1. |
|
Risk, compliance & conduct management chapter & Corporate Governance Chapter |
| 435.2.b |
Recruitment policy for the selection of Board members, their actual knowledge, skills and expertise. |
Section 3.2.1.1 |
|
Corporate Governance Chapter |
| 435.2.c |
Policy on diversity of Board membership, objectives, and achievement status. |
Section 3.2. |
|
Corporate Governance Chapter |
| 435.2.d |
Existence of a dedicated risk committee, and number of meetings during the year. |
Section 3.2.2. |
|
Risk, compliance & conduct management chapter & Corporate Governance Chapter |
| 435.2.e |
Description of the information flow on risk to the Board. |
Section 3.1.1.2 |
|
Risk, compliance & conduct management chapter & Corporate Governance Chapter |
|
|
|
|
|
| 436. Scope of application of the requirements |
| 436 |
Institutions shall disclose the following information regarding the scope of application of the requirements of this Regulation in accordance with Directive 2013/36/EU: |
|
|
|
| 436.a |
Name of institution to which the requirements of this Regulation applies. |
Section 1.2.1. |
|
|
| 436.b |
Difference in the basis of consolidation for accounting and prudential purposes, briefly describing entities that are:
(i) fully consolidated
(ii) proportionally consolidated
(iii) deducted from own funds
(iv) neither consolidated nor deducted |
Section 1.4.2. |
Table 2 (LI1)
Table 3 (LI2)
Appendix VI (LI3) |
|
| 436.c |
a breakdown of assets and liabilities of the consolidated financial statements prepared in accordance with the requirements on regulatory consolidation pursuant to Sections 2 and 3 of Title II of Part One |
Section 1.4.2. |
Table 2 (LI1) |
|
| 436.d |
a reconciliation identifying the main sources of differences between the carrying value amounts in the financial statements under the regulatory scope of consolidation as defined in Sections 2 and 3 of Title II of Part One |
Section 1.4.2. |
Table 2 (LI1)
Table 3 (LI2)
|
|
2024 Pillar 3 Disclosures Report 333
|
|
|
|
|
|
|
|
|
|
|
|
|
|
|
Article |
Brief Description |
2024 P3DR Location |
Tables |
2024 Annual
Report Location
|
| 436.e |
a breakdown of the amounts of the constituent elements of an institution's prudent valuation adjustment, by type of risks, and the total of constituent elements separately for the trading
book and non-trading book positions; |
|
Appendix XIV (PV1) |
|
| 436.f |
Impediments to transfer of own funds between parent and subsidiaries. |
Sections 1.3.1. and 2.3.3. |
|
|
| 436.g |
Capital shortfalls in any subsidiaries outside the scope of consolidation. |
Section 2.4.1 |
|
|
| 436.h |
The circumstance of making use of articles on derogations from:
a) Prudential requirements
b) Liquidity requirements for individual subsidiaries/entities. |
Section 2.4.1 |
|
|
|
|
|
|
|
| 437. Disclosure of own funds |
| 437.1 |
Institutions shall disclose the following information regarding their own funds: |
|
|
|
| 437.1.a |
A full reconciliation of Common Equity Tier 1 items, Additional Tier 1 items, Tier 2 items and filters and deductions applied pursuant to Articles 32 to 35, 36, 56, 66 and 79 to own funds of the institution and the balance sheet in the audited financial statements of the institution. |
|
Tables 4, 5 and 6
Appendix VII (CC1) Appendix VIII (CCA) |
|
| 437.1.b |
Description of the main features of the Common Equity Tier 1 and Additional Tier 1 instruments and Tier 2 instruments issued by the institution. |
Section 2.4.1. |
Appendix VIII (CCA) Appendix VII (CC1) |
|
| 437.1.c |
Dull terms and conditions of all Common Equity Tier 1, Additional Tier 1 and Tier 2 instruments. |
Section 2.4.1. |
Appendix VIII (CCA) Appendix VII (CC1) |
|
| 437.1.d |
Disclosure of the nature and amounts of the following: |
Sections 2.2. and 2.3. |
Appendix VII (CC1) |
|
| 437.1.d.i |
Each prudential filter applied pursuant to Articles 32 to 35; |
Sections 2.2. and 2.3. |
Appendix VII (CC1) |
|
| 437.1.d.ii |
Each deduction made pursuant to Articles 36, 56 and 66; |
Sections 2.2. and 2.3. |
Appendix VII (CC1) |
|
| 437.1.d.iii |
Items not deducted in accordance with Articles 47, 51, 56, 66 and 79. |
Sections 2.2. and 2.3. |
Appendix VII (CC1) |
|
| 437.1.e |
Description of all restrictions applied to the calculation of own funds in accordance with this Regulation and the instruments, prudential filters and deductions to which those restrictions apply. |
Section 2.4.1. |
Appendix VII (CC1) |
|
| 437.1.f |
Explanation of the calculation basis of the disclosed capital ratios estimated using elements of own funds determined, on a basis other than that laid down in this Regulation. |
2.2.3 |
|
|
|
|
|
|
|
| 437a. Disclosure of own funds and eligible liabilities |
| 437a |
Institutions that are subject to Article 92a or 92b shall disclose the following information regarding their own funds and eligible liabilities: (a) the composition of their own funds and eligible liabilities, their maturity and their main features; (b) the ranking of eligible liabilities in the creditor hierarchy; (c) the total amount of each issuance of eligible liabilities instruments referred to in Article 72b; (d) the total amount of excluded liabilities referred to in Article 72a(2). |
Sections 1.2.4. and 1.3. |
|
|
|
|
|
|
|
| 438. Capital requirements |
| 438 |
Institutions shall disclose the following information regarding their compliance with Article 92 of this Regulation
and with the requirements laid down in Article 73 and in point (a) of Article 104(1) of Directive 2013/36/EU: |
|
|
|
| 438.a |
a summary of their approach to assessing the adequacy of their internal capital to support current and future activities; |
Section 2.1. |
|
Economic and Financial Review Chapter |
| 438.b |
the amount of the additional own funds requirements |
Sections 2.4.1, 2.4.3. and 2.5. |
Table 1 (KM1) |
|
334 2024 Pillar 3 Disclosures Report
|
|
|
|
|
|
|
|
|
|
|
|
|
|
|
Article |
Brief Description |
2024 P3DR Location |
Tables |
2024 Annual
Report Location
|
| 438.c |
upon demand from the relevant competent authority, the result of the institution's internal capital adequacy assessment process; |
Section 2.6. |
|
Economic and Financial Review Chapter |
| 438.d |
the total risk-weighted exposure amount and the corresponding total own funds requirement determined in accordance with Article 92, to be broken down by the different risk categories set out in Part Three and, where applicable, an explanation of the effect on the calculation of own funds and risk-weighted exposure amounts that results from applying capital floors and not deducting items from own funds;
|
Section 2.4.2. |
Table 9 (OV1) |
|
| 438.e |
The on- and off-balance-sheet exposures, the risk-weighted exposure amounts |
Section 4.2 |
Tables 29 - 33 (CR10) |
|
| 438.f |
The exposure value and the risk-weighted exposure amount of own funds instruments held in any insurance undertaking, reinsurance undertaking or insurance holding company that the institutions do not deduct from their own funds
|
N/A |
|
|
| 438.g |
The supplementary own funds requirement and the capital adequacy ratio of the financial conglomerate
|
N/A |
|
|
| 438.h |
The variations in the risk-weighted exposure amounts of the current disclosure period compared to the immediately preceding disclosure period that result from the use of internal models, including an outline of the key drivers explaining those variations. |
|
Table 23 (CR8)
Table 77 (MR2-B) |
|
|
|
|
|
|
| 439. Exposure to counterparty credit risk |
| 439 |
Institutions shall disclose the following information regarding the institution's exposure to counterparty credit risk as referred to in Part Three, Title II, Chapter 6: |
|
|
|
| 439.a |
Description of process to assign internal capital and credit limits to CCR exposures. |
Sections 5, 5.1. and 5.6. |
Table 58 (CCR8) |
|
| 439.b |
Discussion of policies for securing collateral and establishing credit reserves. |
Section 5.2. |
Table 63 (CCR5) |
|
| 439.c |
Discussion of management of wrong-way risk exposures. |
Section 5.3. |
|
|
| 439.d |
Disclosure of collateral to be provided (outflows) in the event of a ratings downgrade. |
Section 5.4. |
|
|
| 439.e |
The amount of segregated and unsegregated collateral received and posted per type of collateral, |
|
Table 63 (CCR5) |
|
| 439.f |
For derivative transactions, the exposure values before and after the effect of the credit risk mitigation |
|
Table 59 (CCR1) |
|
| 439.g |
For securities financing transactions, the exposure values before and after the effect of the credit risk
mitigation |
|
Table 59 (CCR1) |
|
| 439.h |
The exposure values after credit risk mitigation effects and the associated risk exposures for credit valuation
adjustment capital charge |
Section 5.5. |
Table 57 (CCR2) |
|
| 439.i |
The exposure value to central counterparties and the associated risk exposures |
Section 5.6. |
Table 58 (CCR8) |
|
| 439.j |
The notional amounts and fair value of credit derivative transactions; |
|
Table 64 (CCR6) |
|
| 439.k |
The estimate of alpha where the institution has received the permission of the competent authorities to use its
own estimate of alpha |
|
Table 59 (CCR1) |
|
| 439.l |
Separately, the disclosures included in point (e) of Article 444 and point (g) of Article 452; |
|
Table 59 (CCR1)
Table 60 (CCR3)
Tables 62 and 64 (CCR4)
Table 63 (CCR5)
Table 64 (CCR6) |
|
| 439.m |
For institutions using the methods set out in Sections 4 to 5 of Chapter 6 of Title II Part Three, the size of their on- and off-balance-sheet derivative business |
|
Table 59 (CCR1) |
|
|
|
|
|
|
2024 Pillar 3 Disclosures Report 335
|
|
|
|
|
|
|
|
|
|
|
|
|
|
|
Article |
Brief Description |
2024 P3DR Location |
Tables |
2024 Annual
Report Location
|
| 440. Capital buffers |
| 440 |
Disclosure of the following information in relation to its compliance with the requirement for a countercyclical capital buffer referred to in Title VII, Chapter 4 of Directive
2013/36/EU: |
|
|
|
| 440.a |
Geographical distribution of credit exposures relevant for the calculation of countercyclical capital buffer. |
Section 2.4.3 |
Appendix IX (CCyB1) |
|
| 440.b |
Amount of the specific countercyclical capital buffer. |
Section 2.4.3. |
Table 12 (CCyB2) |
|
|
|
|
|
|
| 441. Indicators of global systemic importance |
| 441 |
Disclosure of the indicators of global systemic importance. |
Section 2.4.3. |
|
|
|
|
|
|
|
| 442. Credit risk adjustments |
| 442 |
Institutions shall disclose the following information regarding the institution's exposure to credit risk and dilution risk: |
|
|
|
| 442.a |
The scope and definitions that they use for accounting purposes of ‘past due’ and ‘impaired’ and the differences, if any, between the definitions of ‘past due’ and ‘default’ for accounting and regulatory purposes; |
Section 4.5. |
|
Risk, compliance & conduct management chapter |
| 442.b |
A description of the approaches and methods adopted for determining specific and general credit risk adjustments; |
|
Table 71 (SEC1) |
Risk, compliance & conduct management chapter |
| 442.c |
Information on the amount and quality of performing, non-performing and forborne exposures for loans, debt securities and off-balance-sheet exposures, including their related accumulated impairment, provisions and negative fair value changes due to credit risk and amounts of collateral and financial guarantees received; |
|
Table 44 (CQ5)
Table 43 (CQ4)
Table 45 (CQ1)
Table 41 CR1)
Table 46 (CQ7) |
|
| 442.d |
An ageing analysis of accounting past due exposures;
|
|
Table 42 (CQ3) |
Risk, compliance & conduct management chapter |
| 442.e |
The gross carrying amounts of both defaulted and non-defaulted exposures, the accumulated specific and general credit risk adjustments, the accumulated write-offs taken against those exposures and the net carrying amounts and their distribution by geographical area and industry type and for loans, debt securities and off balance-sheet exposures; |
|
Table 41 (CR1)
Table 44 (CQ5)
Table 43 (CQ4) |
Risk, compliance & conduct management chapter |
| 442.f |
Any changes in the gross amount of defaulted on- and off-balance-sheet exposures, including, as a minimum, information on the opening and closing balances of those exposures, the gross amount of any of those exposures reverted to non-defaulted status or subject to a write-off;
|
|
Table 40(CR2) |
Risk, compliance & conduct management chapter |
| 442.g. |
The breakdown of loans and debt securities by residual maturity |
|
Table 39 (CR1-A) |
|
|
|
|
|
|
| 443. Unencumbered assets |
| 443 |
Institutions shall disclose information concerning their encumbered and unencumbered assets. For those purposes, institutions shall use the carrying amount per exposure class broken down by asset quality and the total amount of the carrying amount that is encumbered and unencumbered. |
Section 10.1.3. |
Table 88 (AE1)
Table 89 (AE2)
Table 90 (AE3) |
Economic and Financial Report Chapter |
|
|
|
|
|
| 444. Use of ECAIs |
| 444 |
For institutions calculating the risk-weighted exposure amounts in accordance with Part Three, Title II, Chapter 2, the following information shall be disclosed for each of the exposure classes specified in Article 112: |
|
|
|
| 444.a |
Names of the ECAIs used in the calculation of Standardised approach risk-weighted assets and reasons for any changes. |
Section 4.2.3. |
|
|
| 444.b |
Exposure classes associated with each ECAI. |
Section 4.2.3. |
|
|
336 2024 Pillar 3 Disclosures Report
|
|
|
|
|
|
|
|
|
|
|
|
|
|
|
Article |
Brief Description |
2024 P3DR Location |
Tables |
2024 Annual
Report Location
|
| 444.c |
Description of the process used to transfer credit assessments to non-trading book items. |
Section 4.2.3. |
|
|
| 444.d |
Mapping of external rating to credit quality steps (CQS). |
Section 4.2.3. |
|
|
| 444.e |
Exposure value pre and post-credit risk mitigation, by CQS. |
|
Table 37 (CR4)
Table 38 (CR5)
Table 60 (CCR3) |
|
|
|
|
|
|
| 445. Exposure to market risk |
| 445 |
Disclosure of position risk, large exposures exceeding limits, FX, settlement and commodities risk. |
Section 7.2. |
Table 78 (MR1) |
|
|
|
|
|
|
| 446. Operational risk |
| 446 |
Institutions shall disclose the following information about their operational risk management: |
|
|
|
| 446.a |
The approaches for the assessment of own funds requirements for operation risk that the institution qualifies for; |
Chapter 8 |
Table 87 (OR1) |
|
| 446.b |
A discussion of the relevant internal and external factors being considered in the institution's advanced measurement approach;
|
Chapter 8 |
Table 87 (OR1) |
|
| 446.c |
In the case of partial use, the scope and coverage of the different methodologies used. |
Chapter 8 |
Table 87 (OR1) |
|
|
|
|
|
|
| 447. Disclosure of key metrics |
| 447 |
Institutions shall disclose the following key metrics in a tabular format: |
|
|
|
| 447.a |
The composition of their own funds and their own funds requirements as calculated in accordance with Article 92; |
|
Table 1 ( KM1) |
|
| 447.b |
The total risk exposure amount as calculated in accordance with Article 92(3); |
|
Table 1 ( KM1) |
|
| 447.c |
Where applicable, the amount and composition of additional own funds which the institutions are required to hold |
|
Table 1 ( KM1) |
|
| 447.d |
Their combined buffer requirement which the institutions are required to hold |
|
Table 1 ( KM1) |
|
| 447.e |
Their leverage ratio and the total exposure measure as calculated in accordance with Article 429 |
|
Table 1 ( KM1) |
|
| 447.f |
Information in relation to their liquidity coverage ratio |
|
Table 1 ( KM1) |
|
| 447.g |
Information in relation to their net stable funding requirement |
|
Table 1 ( KM1) |
|
| 447.h |
Their own funds and eligible liabilities ratios and their components, numerator and denominator |
|
|
|
|
|
|
|
|
| 448. Exposure to interest rate risk on positions not included in the trading book |
| 448.1 |
As from 28 June 2021, institutions shall disclose the following quantitative and qualitative information on the risks arising from potential changes in interest rates that affect both the economic value of equity and the net interest income of their non-trading book activities |
|
|
|
| 448.1.a |
The changes in the economic value of equity calculated under the six supervisory shock scenarios for the current and previous disclosure periods;
|
Sections 7.4. and 7.4.1. |
Table 85 (IRRBB1) |
Risk, compliance & conduct management chapter |
| 448.1.b |
The changes in the net interest income calculated under the two supervisory shock scenarios for the current and previous disclosure periods; |
Sections 7.4. and 7.4.1. |
Table 85 (IRRBB1) |
Risk, compliance & conduct management chapter |
| 448.1.c |
A description of key modelling and parametric assumptions used to calculate changes in the economic value of equity and in
the net interest income |
Sections 7.4. and 7.4.1. |
Table 85 (IRRBB1) |
|
| 448.1.d |
An explanation of the significance of the risk measures disclosed under points (a) and (b) of this paragraph and of any significant variations of those risk measures since the previous disclosure reference date; |
Sections 7.4. and 7.4.1. |
Table 85 (IRRBB1) |
|
2024 Pillar 3 Disclosures Report 337
|
|
|
|
|
|
|
|
|
|
|
|
|
|
|
Article |
Brief Description |
2024 P3DR Location |
Tables |
2024 Annual
Report Location
|
| 448.1.e |
The description of how institutions define, measure, mitigate and control the interest rate risk of their nontrading book activities for the purposes of the competent authorities' review |
Sections 7.4. and 7.4.1. |
Table 85 (IRRBB1) |
|
| 448.1.e.i |
A description of the specific risk measures that the institutions use to evaluate changes in their economic
value of equity and in their net interest income; |
Sections 7.4. and 7.4.1. |
Table 85 (IRRBB1) |
|
| 448.1.e.ii |
A description of the key modelling and parametric assumptions used in the institutions' internal measurement systems that would differ from the common modelling and parametric assumptions referred to in Article 98(5a) of Directive 2013/36/EU for the purpose of calculating changes to the economic value of equity and to the net interest income, including the rationale for those differences; |
Sections 7.4. and 7.4.1. |
Table 85 (IRRBB1) |
|
| 448.1.e.iii |
A description of the interest rate shock scenarios that institutions use to estimate the interest rate risk |
Sections 7.4. and 7.4.1. |
Table 85 (IRRBB1) |
|
| 448.1.e.iv |
The recognition of the effect of hedges against those interest rate risks, including internal hedges that meet the requirements laid down in Article 106(3) |
Sections 7.4. and 7.4.1. |
Table 85 (IRRBB1) |
|
| 448.1.e.v |
An outline of how often the evaluation of the interest rate risk occurs |
Sections 7.4. and 7.4.1. |
Table 85 (IRRBB1) |
|
| 448.1.f |
The description of the overall risk management and mitigation strategies for those risks; |
Sections 7.4. and 7.4.1. |
Table 85 (IRRBB1) |
|
| 448.1.g |
Average and longest repricing maturity assigned to non-maturity deposits. |
Sections 7.4. and 7.4.1. |
Table 85 (IRRBB1) |
|
| 448.2 |
By way of derogation from paragraph 1 of this Article, the requirements set out in points (c) and (e)(i) to (e) (iv) of paragraph 1 of this Article shall not apply to institutions that use the standardised methodology or the simplified standardised methodology referred to in Article 84(1) of Directive 2013/36/EU. |
Sections 7.4. and 7.4.1. |
Table 85 (IRRBB1) |
|
|
|
|
|
|
| 449. Exposure to securitisation positions |
| 449 |
Institutions calculating risk-weighted exposure amounts in accordance with Chapter 5 of Title II of Part Three or own funds requirements in accordance with Article 337 or 338 shall disclose the following information separately for their trading book and non-trading book activities: |
|
|
|
| 449.a |
A description of their securitisation and re-securitisation activities, including their risk management and investment objectives in connection with those activities |
Sections 6.2.1, 6.2.2 and 6.2.3 |
|
|
| 449.b |
The type of risks they are exposed to in their securitisation and re-securitisation activities by level of seniority of the relevant securitisation positions |
Sections 6.2.3. and 6.3 |
|
|
| 449.c |
Their approaches for calculating the risk-weighted exposure amounts that they apply to their securitisation
activities |
Section 6.5. |
Table 72 (SEC3) |
|
| 449.d |
A list of SSPEs falling into any of the following categories, with a description of their types of exposures to those SSPEs, including derivative contracts. |
N/A |
|
|
| 449.e |
A list of any legal entities in relation to which the institutions have disclosed that they have provided support |
N/A |
|
|
| 449.f |
A list of legal entities affiliated with the institutions and that invest in securitisations originated by the institutions or in securitisation positions issued by SSPEs sponsored by the institutions; |
N/A |
|
|
| 449.g |
A summary of their accounting policies for securitisation activity, including where relevant a distinction between securitisation and re-securitisation positions; |
Section 6.4. |
|
|
| 449.h |
The names of the ECAIs used for securitisations and the types of exposure for which each agency is used;
|
Section 6.3.2. |
|
|
| 449.i |
A description of the Internal Assessment Approach as set out in Chapter 5 of Title II of Part Three, |
6.5. |
|
|
| 449.j |
Separately for the trading book and the non-trading book, the carrying amount of securitisation exposures, |
|
Table 66 (SEC1)
Table 67 (SEC2) |
|
338 2024 Pillar 3 Disclosures Report
|
|
|
|
|
|
|
|
|
|
|
|
|
|
|
Article |
Brief Description |
2024 P3DR Location |
Tables |
2024 Annual
Report Location
|
| 449.k |
For the non-trading book activities, the following information: |
|
Table 72 (SEC3)
Table 73 (SEC4) |
|
| 449.l |
For exposures securitised by the institution, the amount of exposures in default and the amount of the specific credit risk adjustments made by the institution during the current period, both broken down by exposure type. |
|
Table 71 (SEC5) |
|
|
|
|
|
|
| 449a. Disclosure of environmental, social and governance risks (ESG risks) |
| 449a |
From 28 June 2022, large institutions which have issued securities that are admitted to trading on a regulated market of any Member State, as defined in point (21) of Article 4(1) of Directive 2014/65/EU, shall disclose information on ESG risks, including physical risks and transition risks, as defined in the report referred to in Article 98(8) of Directive 2013/36/EU. |
Chapter 9 |
Table 95 (ESG 1) Table 96 (ESG 2)
Table 97 (ESG 3)
Table 98 (ESG 4) Table 99 (ESG 5) Table 103 (ESG 10) |
|
|
|
|
|
|
| 450. Remuneration policy |
| 450 |
Remuneration disclosures (Material Risk Takers): |
Chapter 12 |
Table 105 (REM1)
Table 106 (REM2)
Table 108 (REM3)
Table 109 (REM4)
Table 107 (REM5) |
Corporate Governance Chapter |
|
|
|
|
|
| 451. Leverage |
| 451.1 |
Institutions that are subject to Part Seven shall disclose the following information regarding their leverage ratio. |
|
|
|
| 451.1.a |
The leverage ratio and how the institutions apply Article 499(2);
|
|
Table 16 (LR2) |
|
| 451.1.b |
A breakdown of the total exposure measure referred to in Article 429(4), as well as a reconciliation of the total exposure measure with the relevant information disclosed in published financial statements; |
|
Table 15(LR1) Table 16 (LR2) Table 17 (LR3) |
|
| 451.1.c |
Where applicable, the amount of exposures and the adjusted leverage ratio
|
|
Table 16 (LR2) |
|
| 451.1.d |
A description of the processes used to manage the risk of excessive leverage;
|
Section 2.5 |
Table 14 |
|
| 451.1.e |
A description of the factors that had an impact on the leverage ratio during the period to which the disclosed leverage ratio refers. |
Section 2.5 |
Table 14 |
|
| 451.2 |
Public development credit institutions as defined in Article 429a(2) shall disclose the leverage ratio without the adjustment to the total exposure measure determined in accordance with point (d) of the first subparagraph of Article 429a(1). |
|
Table 16 (LR2) |
|
| 451.3 |
Large institutions shall disclose the leverage ratio and the breakdown of the total exposure measure. |
|
Table 16 (LR2) |
|
|
|
|
|
|
| 451a. Use of the IRB Approach to credit risk |
| 451a.1 |
Institutions that are subject to Part Six shall disclose information on their liquidity coverage ratio, net stable funding ratio and liquidity risk management in accordance with this Article. |
Sections 10.1.1. and 10.1.2. |
|
|
| 451a.2 |
Institutions shall disclose the following information in relation to their liquidity coverage ratio as calculated in accordance with the delegated act referred to in Article 460(1) |
|
|
|
| 451a.2a |
The average or averages, as applicable, of their liquidity coverage ratio based on end-of-the-month observations over the preceding 12 months for each quarter of the relevant disclosure period |
Section 10.1.1. and Section 10.1.2. |
Table 92 (LIQ1) |
|
2024 Pillar 3 Disclosures Report 339
|
|
|
|
|
|
|
|
|
|
|
|
|
|
|
Article |
Brief Description |
2024 P3DR Location |
Tables |
2024 Annual
Report Location
|
| 451a.2b |
The average or averages, as applicable, of total liquid assets, after applying the relevant haircuts, included in the liquidity buffer pursuant to the delegated act referred to in Article 460(1), based on end-of-the-month observations over the preceding 12 months for each quarter of the relevant disclosure period, and a description of the composition of that liquidity buffer |
|
Table 92 (LIQ1) |
|
| 451a.2c |
the averages of their liquidity outflows, inflows and net liquidity outflows as calculated in accordance with the delegated act referred to in Article 460(1), based on end-of-the-month observations over the preceding 12 months for each quarter of the relevant disclosure period and the description of their composition |
|
Table 92 (LIQ1) |
|
| 451a.3 |
Institutions shall disclose the following information in relation to their net stable funding ratio as calculated in accordance with Title IV of Part Six |
|
Table 94 (LIQ2) |
|
| 451a.4 |
Institutions shall disclose the arrangements, systems, processes and strategies put in place to identify, measure, manage and monitor their liquidity risk in accordance with Article 86 of Directive 2013/36/EU. |
Section 10.1. |
|
Risk, compliance & conduct management chapter |
|
|
|
|
|
| 452. Use of the IRB Approach to credit risk |
| 452 |
Institutions calculating the risk-weighted exposure amounts under the IRB Approach shall disclose the following information: |
|
|
|
| 452.a |
Permission for use of the IRB approach from the competent authority. |
Section 2.4.2.1. |
|
|
| 452.b |
For each exposure class referred to in Article 147, the percentage of the total exposure value of each exposure class subject to the Standardised Approach or to the IRB Approach, as well as the part of each exposure class subject to a roll-out plan. |
|
Table 22(CR6-A) |
|
| 452.c |
The control mechanisms for rating systems at the different stages of model development, controls and changes, which shall include information on: |
Sections 3.3. and 4.5. |
|
|
| 452.c.i |
The relationship between the risk management function and the internal audit function; |
Sections 3.3. and 4.5. |
|
|
| 452.c.ii |
The rating system review; |
Sections 3.3. and 4.5. |
|
|
| 452.c.iii |
The procedure to ensure the independence of the function in charge of reviewing the models from the functions responsible for the development of the models; |
Sections 3.3. and 4.5. |
|
|
| 452.c.iv |
The procedure to ensure the accountability of the functions in charge of developing and reviewing the models; |
Sections 3.3. and 4.5. |
|
|
| 452.d |
The role of the functions involved in the development, approval and subsequent changes of the credit risk models; |
Sections 3.3.2. and 10.3. |
|
|
| 452.e |
The scope and main content of the reporting related to credit risk models; |
Sections 4.2. |
Table(CRE) |
|
| 452.f |
A description of the internal ratings process by exposure class, including the number of key models used with respect to each portfolio and a brief discussion of the main differences between the models within the same portfolio, covering: |
Sections 4.2. |
Table(CRE) |
|
| 452.f.i |
The definitions, methods and data for estimation and validation of PD |
Sections 4.2. |
Table(CRE) |
|
| 452.f.ii |
Were applicable, the definitions, methods and data for estimation and validation of LGD |
Sections 4.2. |
Table(CRE) |
|
| 452.f.iii |
Where applicable, the definitions, methods and data for estimation and validation of conversion factors |
Sections 4.2. |
Table(CRE) |
|
| 452.g |
As applicable, the following information in relation to each exposure class referred to in Article 147: |
|
Tables 26 - 28 (CR6)
Table 35 (CR4) |
|
| 452.g.i |
Their gross on-balance-sheet exposure;
|
|
Tables 26 - 28 (CR6)
Table 35 (CR4) |
|
| 452.g.ii |
Their off-balance-sheet exposure values prior to the relevant conversion factor; |
|
Tables 26 - 28 (CR6)
Table 35 (CR4) |
|
340 2024 Pillar 3 Disclosures Report
|
|
|
|
|
|
|
|
|
|
|
|
|
|
|
Article |
Brief Description |
2024 P3DR Location |
Tables |
2024 Annual
Report Location
|
| 452.g.iii |
Their exposure after applying the relevant conversion factor and credit risk mitigation; |
|
Tables 26 - 28 (CR6)
Table 35 (CR4) |
|
| 452.g.iv |
Any model, parameter or input relevant for the understanding of the risk weighting and the resulting risk exposure amounts disclosed across a sufficient number of obligor grades (including default) to allow for a meaningful differentiation of credit risk; |
|
Tables 26 - 28 (CR6)
Table 35 (CR4) |
|
| 452.g.v |
Separately for those exposure classes in relation to which institutions have received permission to use own LGDs and conversion factors for the calculation of risk-weighted exposure amounts, and for exposures for which the institutions do not use such estimates, the values referred to in points (i) to (iv) subject to that permission; |
|
Tables 26 - 28 (CR6)
Table 35 (CR4) |
|
| 452.h |
Institutions' estimates of PDs against the actual default rate for each exposure class over a longer period |
|
Table 53, Table 54 and Table 55(CR9) |
|
|
|
|
|
|
| 453. Use of credit risk mitigation techniques |
| 453 |
Institutions applying credit risk mitigation techniques shall disclose the following information: |
|
|
|
| 453.a |
Use of on and off-balance sheet netting. |
Sections 4.7. and 5.7. |
Table 49 (CR3), Table 51 (CR7), 52 (CR7-A) and Table 63 (CCR5) |
Risk, compliance & conduct management chapter |
| 453.b |
How collateral valuation is managed. |
Section 4.7. |
|
Risk, compliance & conduct management chapter |
| 453.c |
Description of types of collateral used by the institution. |
Section 4.7. |
|
Risk, compliance & conduct management chapter |
| 453.d |
Main types of guarantor and credit derivative counterparty, creditworthiness. |
Sections 4.7. and 4.7.1. |
Table 49 (CR3)
Table 51 (CR7)
Table 52 (CR7-A) |
Risk, compliance & conduct management chapter |
| 453.e |
Market or credit risk concentrations within risk mitigation exposures. |
Section 4.7. |
Table 48 |
|
| 453.f |
For institutions calculating risk-weighted exposure amounts under the Standardised Approach or the IRB Approach, the total exposure value not covered by any eligible credit protection and the total exposure value covered by eligible credit protection after applying volatility adjustments |
|
Table 49 (CR3) |
|
| 453.g |
The corresponding conversion factor and the credit risk mitigation associated with the exposure and the incidence of credit risk mitigation techniques with and without substitution effect; |
|
Table 37 (CR4)
Table 52 (CR7-A) |
|
| 453.h |
For institutions calculating risk-weighted exposure amounts under the Standardised Approach, the on- and off-balance-sheet exposure value by exposure class before and after the application of conversion factors and any associated credit risk mitigation; |
|
Table 37 (CR4) |
|
| 453.i |
for institutions calculating risk-weighted exposure amounts under the Standardised Approach, the riskweighted exposure amount and the ratio between that risk-weighted exposure amount and the exposure value after applying the corresponding conversion factor and the credit risk mitigation associated with the
exposure |
|
Table 37 (CR4) |
|
| 453.j |
For institutions calculating risk-weighted exposure amounts under the IRB Approach, the risk-weighted exposure amount before and after recognition of the credit risk mitigation impact of credit derivatives |
|
Table 37 (CR4) |
|
|
|
|
|
|
| 454. Use of the Advanced Measurement Approaches to operational risk |
| 454 |
Description of the use of insurance or other risk transfer mechanisms to mitigate operational risk. |
Chapter 8 |
Table 87 (OR1) |
|
|
|
|
|
|
| 455. Use of Internal Market Risk Models |
2024 Pillar 3 Disclosures Report 341
|
|
|
|
|
|
|
|
|
|
|
|
|
|
|
Article |
Brief Description |
2024 P3DR Location |
Tables |
2024 Annual
Report Location
|
| 455 |
Institutions calculating their capital requirements in accordance with Article 363 shall disclose the following information: |
|
|
|
| 455.a |
For each sub-portfolio covered: |
|
|
|
| 455.a.i |
Disclosure of the characteristics of the market risk models used; |
Sections 7.2, 7.3.1, 7.3.2. and 7.3.3. |
|
|
| 455.a.ii |
Disclosure of the methodologies used to measure incremental default and migration risk; |
|
|
|
| 455.a.iii |
Descriptions of stress tests applied to the portfolios; |
Sections 7.3.4. and 7.3.5. |
|
|
| 455.a.iv |
Methodology for back-testing and validating the models. |
Section 7.3.6. |
|
|
| 455.b |
Scope of permission for use of the models. |
Section 7.2. |
|
|
| 455.c |
Policies and processes to determine trading book classification, and to comply with prudential valuation requirements. |
Sections 7.3.1, 7.3.2. and 7.3.3. |
|
|
| 455.d.(i-iii) |
High/Low/Mean values over the year of VaR, SVaR and incremental risk charge. |
Section 7.3.1. |
Table 81 (MR3) |
|
| 455.e |
The elements of the own fund calculation. |
Sections 2.4.2. and 7.2. |
Table 10 (OV1)
Table 76 (MR2-A) |
|
| 455.f |
Weighted average liquidity horizons for each sub-portfolio covered by internal models. |
Section 7.2.2 |
|
|
| 455.g |
Comparison of end-of-day value-at-risk (VaR) measures compared with one-day changes in the portfolio's value. |
Section 7.3.5. |
table 84 (MR4) |
|
342 2024 Pillar 3 Disclosures Report
Appendix V - List of tables
|
|
|
|
|
|
|
|
|
Num. |
Regulatory requirement |
Name |
| CHAPTER 1. INTRODUCTION |
| Table 1 |
KM1 |
KM1 - Key metrics template |
| Table 2 |
LI1 |
Differences between accounting and regulatory scopes of consolidation and mapping of financial statement categories with regulatory risk categories |
| Table 3 |
LI2 |
Main sources of differences between regulatory exposure amounts and carrying values in financial statements |
| Table 4 |
CC2 |
CC2 - reconciliation of regulatory own funds to balance sheet in the audited financial statements |
| CHAPTER 2. CAPITAL |
| Table 5 |
|
Main capital figures and capital adequacy ratios. |
| Table 6 |
|
Reconciliation of accounting capital with regulatory capital |
| Table 7 |
|
Eligible capital |
| Table 8 |
|
Regulatory capital. Changes |
| Table 9 |
NIIF-9FL |
Comparison of institutions’ own funds and capital and leverage ratios with and without the application of transitional arrangements for IFRS 9 or analogous ECLs (IFRS 9-FL) |
| Table 10 |
OV1 |
Overview of risk weighted exposure amounts |
| Table 11 |
|
RWAs by geographical region |
| Table 12 |
CCyB2 |
Amount of institution-specific countercyclical capital buffer |
| Table 13 |
|
Leverage ratio |
| Table 14 |
|
Leverage ratio details |
| Table 15 |
LR1 |
Summary reconciliation of accounting assets and leverage ratio exposures |
| Table 16 |
LR2 |
Leverage ratio common disclosure |
| Table 17 |
LR3 |
Split-up of on balance sheet exposures (excluding derivatives, SFTs and exempted exposures) |
| Table 18 |
KM2 |
Key metrics - G-SII requirement for own funds and eligible liabilities (TLAC) |
| Table 19 |
TLAC1 |
Composition - G-SII Requirement for own funds and eligible liabilities |
| Table 20 |
TLAC3 |
creditor ranking - resolution entity |
| CHAPTER 4. CREDIT RISK |
| Table 21 |
|
Credit risk capital requirements movements |
| Table 22 |
CR6_A |
Scope of the use of IRB and SA approaches |
| Table 23 |
CR8 |
RWEA flow statements of credit risk exposures under the IRB approach |
| Table 24 |
|
Exposures and parameters by segment and geography |
| Table 25 |
|
Credit risk exposures by exposure class and PD range (CR6) |
| Table 26 |
CR6_AIRB |
AIRB approach - Credit risk exposures by exposure class |
| Table 27 |
CR6_AIRB_Retail |
AIRB approach Retail - Credit risk exposures by exposure class and PD range |
| Table 28 |
CR6_FIRB |
FIRB approach - Credit risk exposures by exposure class and PD range |
| Table 29 |
CR10_1 |
Specialised lending and equity exposures under the simple riskweighted approach. Project financing |
| Table 30 |
CR10_2 |
Specialised lending and equity exposures under the simple riskweighted approach. Income-earning real estate and highly volatile commercial real estate |
| Table 31 |
CR10_3 |
Specialised lending and equity exposures under the simple riskweighted approach. Financing of assets |
| Table 32 |
CR10_4 |
Specialised lending and equity exposures under the simple riskweighted approach. Financing of raw materials |
| Table 33 |
CR10_5 |
Equity exposures under the simple risk-weighted approach |
| Table 34 |
|
Equity instruments through other comprehensive income |
| Table 35 |
|
Equity instruments mandatory at fair value through profit and loss |
| Table 36 |
|
Equity instruments through other comprehensive income. Consolidated gross valuation adjustments |
| Table 37 |
CR4 |
Standardised approach - Credit risk exposure and CRM effects |
2024 Pillar 3 Disclosures Report 343
|
|
|
|
|
|
|
|
|
| Table 38 |
CR5 |
Standardised approach |
| Table 39 |
CR1_A |
Maturity of exposures |
| Table 40 |
CR2 |
Changes in the stock of non-performing loans and advances |
| Table 41 |
CR1 |
Performing and non-performing exposures and related provisions |
| Table 42 |
CQ3 |
Credit quality of performing and non-performing exposures by past due days |
| Table 43 |
CQ4 |
Quality of non-performing exposures by geography |
| Table 44 |
CQ5 |
Credit quality of loans and advances by industry |
| Table 45 |
CQ1 |
Credit quality of forborne exposures |
| Table 46 |
CQ7 |
Collateral obtained by taking possession and execution processes |
| Table 47 |
|
Guarantees by external rating |
| Table 48 |
|
Credit risk mitigation techniques - IRB and SA |
| Table 49 |
CR3 |
CRM techniques overview: Disclosure of the use of credit risk mitigation techniques |
| Table 50 |
|
IRB approach. Credit risk mitigation techniques: credit derivatives and personal guarantees |
| Table 51 |
CR7 |
IRB approach - Effect on the RWEAs of credit derivatives used as CRM techniques |
| Table 52 |
CR7_A |
IRB approach - Disclosure of the extent of the use of CRM techniques |
| Table 53 |
CR9_AIRB |
AIRB approach - Back-testing of PD per exposure class (fixed PD scale) |
| Table 54 |
CR9_AIRB_Retail |
AIRB approach Retail - Back-testing of PD per exposure class (fixed PD scale) |
| Table 55 |
CR9_FIRB |
FIRB approach - Back-testing of PD per exposure class (fixed PD scale) |
| Table 56 |
CR9_1_FIRB |
FIRB approach - Back-testing of PD per exposure class (only for PD estimates according to point (f) of Article 180(1) CRR) |
| CHAPTER 5. COUNTERPARTY CREDIT RISK |
| Table 57 |
CCR2 |
Transactions subject to own funds requirements for CVA risk |
| Table 58 |
CCR8 |
Exposures to CCPs |
| Table 59 |
CCR1 |
Analysis of CCR exposure by approach |
| Table 60 |
CCR3 |
Standardised approach - CCR exposures by regulatory exposure class and risk weights |
| Table 61 |
CCR4_AIRB |
AIRB approach - CCR exposures by exposure class and PD scale |
| Table 62 |
CCR4_FIRB |
FIRB approach - CCR exposures by exposure class and PD scale |
| Table 63 |
CCR5 |
Composition of collateral for CCR exposures |
| Table 64 |
CCR6 |
Credit derivatives exposures |
| CHAPTER 6. SECURITISATIONS |
| Table 65 |
|
Securitisation positions purchased and retained with risk transfer by exposure type in the banking book |
| Table 66 |
SEC1 |
Securitisation exposures in the non-trading book |
| Table 67 |
SEC2 |
Securitisation exposures in the trading book |
| Table 68 |
|
Breakdown of repurchased positions in SSPEs with risk transfer, distributed by function and approach used |
| Table 69 |
|
Aggregate amount of securitisation positions purchased and retained. Trading book |
| Table 70 |
|
Securitisation structures with risk transfer |
| Table 71 |
SEC5 |
Exposures securitised by the institution - Exposures in default and specific credit risk adjustments |
| Table 72 |
SEC3 |
Securitisation exposures in the non-trading book and associated regulatory capital requirements - institution acting as originator or as sponsor |
| Table 73 |
SEC4 |
Securitisation exposures in the non-trading book and associated regulatory capital requirements - institution acting as investor |
| CHAPTER 7. MARKET RISK |
| Table 74 |
|
Regulatory capital requirements for market risk |
| Table 75 |
|
Capital requirements for market risk. Internal model |
| Table 76 |
MR2_A |
Market risk under the internal Model Approach (IMA) |
| Table 77 |
MR2_B |
RWA flow statements of market risk exposures under the IMA |
| Table 78 |
MR1 |
Market risk under the standardised approach |
| Table 79 |
|
Capital requirements for market risk. Standardised approach |
| Table 80 |
PV1 |
Prudent valuation adjustments (PVA) |
| Table 81 |
MR3 |
IMA values for trading portfolios |
| Table 82 |
|
Stress scenario: Maximum volatility (worst case) |
| Table 83 |
|
Exceptions at units with internal model |
344 2024 Pillar 3 Disclosures Report
|
|
|
|
|
|
|
|
|
| Table 84 |
MR4 |
Comparison of VaR estimates with gains/losses |
| Table 85 |
IRRBB1 |
Interest rate risks of non-trading book activities |
| CHAPTER 8. OPERATIONAL RISK |
| Table 86 |
|
Changes in capital requirements for operation risk |
| Table 87 |
OR1 |
Operational risk own funds requirements and risk-weighted exposure amounts |
| CHAPTER 9. LIQUIDITY AND FUNDING RISK |
| Table 88 |
AE1 |
Encumbered and unencumbered assets |
| Table 89 |
AE2 |
Collateral received and own debt securities issued |
| Table 90 |
AE3 |
Sources of encumbrance |
| Table 91 |
|
Own covered bonds and asset-backed securities issued |
| Table 92 |
LIQ1 |
Quantitative information of LCR |
| Table 93 |
LIQB |
Qualitative information on LCR, which complements template EU LIQ1 |
| Table 94 |
LIQ2 |
Net Stable Funding Ratio |
| CHAPTER 10. ESG RISK |
| Table 95 |
ESG1 |
Banking book- Climate Change transition risk: Credit quality of exposures by sector, emissions and residual maturity |
| Table 96 |
ESG2 |
Banking book - Climate change transition risk: Loans collateralised by immovable property - Energy efficiency of the collateral |
| Table 97 |
ESG3 |
Banking book - Climate change transition risk: Alignment metrics |
| Table 98 |
ESG4 |
Banking book - Climate change transition risk: Exposures to top 20 carbon-intensive firms |
| Table 99 |
ESG5 |
Banking book - Climate change physical risk: Exposures subject to physical risk |
| Table 100 |
ESG6 |
Summary of GAR KPIs |
| Table 101 |
ESG7 |
Mitigating actions: Assets for the calculation of GAR |
| Table 102 |
ESG8 |
Mitigating actions GAR (%) |
| Table 103 |
ESG10 |
Other climate change mitigating actions that are not covered in the EU Taxonomy |
| CHAPTER 11. CRYPTO-ASSETS |
| Table 104 |
CAE1 |
Exposures to crypto-assets |
| CHAPTER 12. REMUNERATION POLICIES |
| Table 105 |
REM1 |
Remuneration awarded for the financial year |
| Table 106 |
REM2 |
Special payments to staff whose professional activities have a material impact on institutions’ risk profile (identified staff) |
| Table 107 |
REM5 |
Information on remuneration of staff whose professional activities have a material impact on institutions’ risk profile (identified staff) |
| Table 108 |
REM3 |
Deferred remuneration |
| Table 109 |
REM4 |
Remuneration of 1 million EUR or more per year |
2024 Pillar 3 Disclosures Report 345
|
|
|
|
|
|
|
|
|
|
|
|
|
|
|
|
|
|
|
|
|
|
|
|
| Appendix VI.LI3 - Outline of the differences in the scopes of consolidation (entity by entity) |
|
|
|
|
|
|
|
|
|
|
|
|
|
|
2024 |
| a |
b |
c |
d |
e |
f |
g |
h |
| Name of the entity |
Method of accounting consolidation |
Method of regulatory consolidation |
Description of the entity |
| Full consolidation |
Proportional consolidation |
Equity method |
Neither consolidated nor deducted |
Deducted |
| Universia Holding, S.L. |
Full consolidation |
|
|
X |
|
|
HOLDING COMPANY |
| Universia España Red de Universidades, S.A. |
Full consolidation |
|
|
X |
|
|
INTERNET |
| Santander Totta Seguros, Companhia de Seguros de Vida, S.A. |
Full consolidation |
|
|
X |
|
|
INSURANCE |
| Centro de Capacitación Santander, A.C. |
Full consolidation |
|
|
X |
|
|
NON-PROFIT INSTITUTE |
| Universia Brasil S.A. |
Full consolidation |
|
|
X |
|
|
INTERNET |
| Universia Chile S.A. |
Full consolidation |
|
|
X |
|
|
INTERNET |
| Universia Perú, S.A. |
Full consolidation |
|
|
X |
|
|
INTERNET |
| Universia México, S.A. De C.V. |
Full consolidation |
|
|
X |
|
|
INTERNET |
| Portal Universia Argentina S.A. |
Full consolidation |
|
|
X |
|
|
INTERNET |
| Universia Colombia S.A.S. |
Full consolidation |
|
|
X |
|
|
INTERNET |
| Portal Universia Portugal, Prestação de Serviços de Informática, S.A. |
Full consolidation |
|
|
X |
|
|
INTERNET |
| Santander Seguros y Reaseguros, Compañía Aseguradora, S.A. |
Full consolidation |
|
|
X |
|
|
INSURANCE |
| Laparanza, S.A. |
Full consolidation |
|
|
X |
|
|
AGRICULTURAL AND LIVESTOCK OPERATIONS |
| Santander Capitalização S.A. |
Full consolidation |
|
|
X |
|
|
INSURANCE |
| Santander Trust S.A. |
Full consolidation |
|
|
X |
|
|
SERVICES |
| U.C.I., S.A. |
Equity method |
|
X |
|
|
|
HOLDING COMPANY |
| Santander Private Real Estate Advisory & Management, S.A. |
Full consolidation |
|
|
X |
|
|
PROPERTY MANAGEMENT |
| Guaranty Car, S.A. |
Full consolidation |
|
|
X |
|
|
AUTOMOTIVE |
| Darep Designated Activity Company |
Full consolidation |
|
|
X |
|
|
REINSURANCE |
| Unión de Créditos Inmobiliarios, S.A., EFC |
Equity method |
|
X |
|
|
|
MORTGAGE CREDIT COMPANY |
| Retama Real Estate, S.A. |
Equity method |
|
X |
|
|
|
PROPERTY MANAGEMENT |
| UCI Servicios para Profesionales Inmobiliarios, S.A. |
Equity method |
|
X |
|
|
|
REAL ESTATE SERVICES |
346 2024 Pillar 3 Disclosures Report
|
|
|
|
|
|
|
|
|
|
|
|
|
|
|
|
|
|
|
|
|
|
|
|
| Appendix VI.LI3 - Outline of the differences in the scopes of consolidation (entity by entity) |
|
|
|
|
|
|
|
|
|
|
|
|
|
|
2024 |
| a |
b |
c |
d |
e |
f |
g |
h |
| Name of the entity |
Method of accounting consolidation |
Method of regulatory consolidation |
Description of the entity |
| Full consolidation |
Proportional consolidation |
Equity method |
Neither consolidated nor deducted |
Deducted |
| CCPT - ComprarCasa, Rede Serviços Imobiliários, S.A. |
Equity method |
|
X |
|
|
|
REAL ESTATE SERVICES |
| Mata Alta, S.L. |
Full consolidation |
|
|
X |
|
|
AGRICULTURAL OPERATIONS |
| Universia Uruguay, S.A. |
Full consolidation |
|
|
X |
|
|
INTERNET |
| UCI Mediação de Seguros, Unipessoal Lda. |
Equity method |
|
X |
|
|
|
INSURANCE MEDIATION |
| UCI Holding Brasil Ltda. |
Equity method |
|
X |
|
|
|
HOLDING COMPANY |
| Companhia Promotora UCI |
Equity method |
|
X |
|
|
|
FINANCIAL SERVICES |
| Fortune Auto Finance Co., Ltd |
Equity method |
|
X |
|
|
|
FINANCIAL |
| Banco RCI Brasil S.A. |
Equity method |
|
X |
|
|
|
BANKING |
| S3 Caceis Brasil Distribuidora de Títulos e Valores Mobiliários S.A. |
Equity method |
|
X |
|
|
|
SECURITIES COMPANY |
| Evidence Previdência S.A. |
Full consolidation |
|
|
X |
|
|
INSURANCE |
| Sancap Investimentos e Participações S.A. |
Full consolidation |
|
|
X |
|
|
HOLDING COMPANY |
| S3 Caceis Brasil Participações S.A. |
Equity method |
|
X |
|
|
|
HOLDING COMPANY |
| Rojo Entretenimento S.A. |
Full consolidation |
|
|
X |
|
|
PROPERTY MANAGEMENT |
| Newcomar, S.L., en liquidación |
Full consolidation |
|
|
X |
|
|
PROPERTY MANAGEMENT |
| Hyundai Capital UK Limited |
Equity method |
|
X |
|
|
|
FINANCIAL |
| Fondo de Titulización Hipotecaria UCI 12 |
Equity method |
|
X |
|
|
|
SECURITISATION |
| Fondo de Titulización de Activos UCI 14 |
Equity method |
|
X |
|
|
|
SECURITISATION |
| Fondo de Titulización de Activos UCI 15 |
Equity method |
|
X |
|
|
|
SECURITISATION |
| Fondo de Titulización de Activos UCI 16 |
Equity method |
|
X |
|
|
|
SECURITISATION |
| Fondo de Titulización de Activos UCI 17 |
Equity method |
|
X |
|
|
|
SECURITISATION |
| Venda de Veículos Fundo de Investimento em Direitos Creditórios |
Equity method |
|
X |
|
|
|
SECURITISATION |
| HCUK Auto Funding 2017-2 Ltd |
Equity method |
|
X |
|
|
|
SECURITISATION |
2024 Pillar 3 Disclosures Report 347
|
|
|
|
|
|
|
|
|
|
|
|
|
|
|
|
|
|
|
|
|
|
|
|
| Appendix VI.LI3 - Outline of the differences in the scopes of consolidation (entity by entity) |
|
|
|
|
|
|
|
|
|
|
|
|
|
|
2024 |
| a |
b |
c |
d |
e |
f |
g |
h |
| Name of the entity |
Method of accounting consolidation |
Method of regulatory consolidation |
Description of the entity |
| Full consolidation |
Proportional consolidation |
Equity method |
Neither consolidated nor deducted |
Deducted |
| RMBS Green Belém No.1 |
Equity method |
|
X |
|
|
|
SECURITISATION |
| Fondo de Titulización, RMBS Prado VII |
Equity method |
|
X |
|
|
|
SECURITISATION |
| Isar Valley S.A. |
Full consolidation |
|
|
X |
|
|
SECURITISATION |
| Evolve SPV S.r.l. |
Equity method |
|
X |
|
|
|
SECURITISATION |
| Fondo de Titulización, RMBS Prado VIII |
Equity method |
|
X |
|
|
|
SECURITISATION |
| Fondo de Titulización, RMBS Prado IX |
Equity method |
|
X |
|
|
|
SECURITISATION |
| Portland SPV S.r.l. |
Equity method |
|
X |
|
|
|
SECURITISATION |
| Fondo de Titulización, RMBS Prado X |
Equity method |
|
X |
|
|
|
SECURITISATION |
| HCUK Auto Funding 2022-1 Limited |
Equity method |
|
X |
|
|
|
SECURITISATION |
| RMBS Belém No.2 |
Equity method |
|
X |
|
|
|
SECURITISATION |
| Fondo de Titulización, RMBS Green Prado XI |
Equity method |
|
X |
|
|
|
SECURITISATION |
| DoRes Securitisation S.r.l |
Equity method |
|
X |
|
|
|
SECURITISATION |
| Axle 2023-1 Ltd |
Equity method |
|
X |
|
|
|
SECURITISATION |
| Electrolyser, S.A. de C.V. |
Full consolidation |
|
|
X |
|
|
SERVICES |
| VCFS Germany GmbH |
Equity method |
|
X |
|
|
|
MARKETING |
| UCI Greece Credit and Loan Receivables Servicing Company Single Member Societe Anonyme |
Equity method |
|
X |
|
|
|
FINANCIAL SERVICES |
| Banco S3 Caceis México, S.A., Institución de Banca Múltiple |
Equity method |
|
X |
|
|
|
BANKING |
| S3 CACEIS Colombia S.A. Sociedad Fiduciaria |
Equity method |
|
X |
|
|
|
FINANCIAL |
| Open Digital Market, S.L. |
Full consolidation |
|
|
X |
|
|
COMMERCE |
| Santander Caceis Latam Holding 2, S.L. |
Equity method |
|
X |
|
|
|
HOLDING COMPANY |
| Santander Caceis Latam Holding 1, S.L. |
Equity method |
|
X |
|
|
|
HOLDING COMPANY |
| Solar Maritime Designated Activity Company |
Equity method |
|
X |
|
|
|
LEASING |
348 2024 Pillar 3 Disclosures Report
|
|
|
|
|
|
|
|
|
|
|
|
|
|
|
|
|
|
|
|
|
|
|
|
| Appendix VI.LI3 - Outline of the differences in the scopes of consolidation (entity by entity) |
|
|
|
|
|
|
|
|
|
|
|
|
|
|
2024 |
| a |
b |
c |
d |
e |
f |
g |
h |
| Name of the entity |
Method of accounting consolidation |
Method of regulatory consolidation |
Description of the entity |
| Full consolidation |
Proportional consolidation |
Equity method |
Neither consolidated nor deducted |
Deducted |
| Innohub, S.A.P.I. de C.V. |
Full consolidation |
|
|
X |
|
|
IT SERVICES |
| Autodescuento, S.L. |
Full consolidation |
|
|
X |
|
|
AUTOMOTIVE |
| Santander Assurance Solutions, S.A. |
Equity method |
|
X |
|
|
|
INSURANCE MEDIATION |
| Allane SE |
Full consolidation |
|
|
X |
|
|
RENTING |
| Volvo Car Financial Services UK Limited |
Equity method |
|
X |
|
|
|
LEASING |
| NeoAuto S.A.C. |
Full consolidation |
|
|
X |
|
|
AUTOMOTIVE |
| Abent 3T, S.A.P.I de C.V. |
Full consolidation |
|
|
X |
|
|
ELECTRICAL ENERGY OPERATIONS |
| Tabasco Energía España, S.L. (Sociedad Unipersonal) |
Full consolidation |
|
|
X |
|
|
HOLDING COMPANY |
| Allane Schweiz AG |
Full consolidation |
|
|
X |
|
|
RENTING |
| Allane Mobility Consulting AG |
Full consolidation |
|
|
X |
|
|
CONSULTING SERVICES |
| Allane Leasing GmbH |
Full consolidation |
|
|
X |
|
|
RENTING |
| Allane Mobility Consulting GmbH |
Full consolidation |
|
|
X |
|
|
CONSULTING SERVICES |
| Autohaus24 GmbH |
Full consolidation |
|
|
X |
|
|
INTERNET |
| Allane Location Longue Durée S.a.r.l. |
Full consolidation |
|
|
X |
|
|
RENTING |
| Allane Services GmbH & co. KG |
Full consolidation |
|
|
X |
|
|
SERVICES |
| Allane Mobility Consulting B.V. |
Full consolidation |
|
|
X |
|
|
CONSULTING SERVICES |
| Allane Services Verwaltungs GmbH |
Full consolidation |
|
|
X |
|
|
PORTFOLIO MANAGEMENT |
| Allane Mobility Consulting Österreich GmbH |
Full consolidation |
|
|
X |
|
|
CONSULTING SERVICES |
| Allane Mobility Consulting S.a.r.l |
Full consolidation |
|
|
X |
|
|
CONSULTING SERVICES |
| Alma UK Holdings Ltd |
Equity method |
|
X |
|
|
|
HOLDING COMPANY |
| Santander Green Investment, S.L. |
Full consolidation |
|
|
X |
|
|
HOLDING COMPANY |
| Elcano Renovables, S.L. |
Full consolidation |
|
|
X |
|
|
HOLDING COMPANY |
2024 Pillar 3 Disclosures Report 349
|
|
|
|
|
|
|
|
|
|
|
|
|
|
|
|
|
|
|
|
|
|
|
|
| Appendix VI.LI3 - Outline of the differences in the scopes of consolidation (entity by entity) |
|
|
|
|
|
|
|
|
|
|
|
|
|
|
2024 |
| a |
b |
c |
d |
e |
f |
g |
h |
| Name of the entity |
Method of accounting consolidation |
Method of regulatory consolidation |
Description of the entity |
| Full consolidation |
Proportional consolidation |
Equity method |
Neither consolidated nor deducted |
Deducted |
| Liquetine, S.L. |
Full consolidation |
|
|
X |
|
|
RENEWABLE ENERGIES |
| Santander MAPFRE Hipoteca Inversa, E.F.C., S.A. |
Equity method |
|
X |
|
|
|
FINANCIAL |
| Energias Renovables Gladiateur 45, S.L. |
Full consolidation |
|
|
X |
|
|
RENEWABLE ENERGIES |
| Energias Renovables de Ormonde 30, S.L. |
Full consolidation |
|
|
X |
|
|
RENEWABLE ENERGIES |
| Energias Renovables Prometeo, S.L. |
Full consolidation |
|
|
X |
|
|
RENEWABLE ENERGIES |
| Energias Renovables de Titania, S.L. |
Full consolidation |
|
|
X |
|
|
RENEWABLE ENERGIES |
| Santander Consumer Leasing B.V. |
Full consolidation |
|
|
X |
|
|
RENTING |
| Carmine D - Services, Unipessoal Lda. |
Full consolidation |
|
|
X |
|
|
SOFTWARE |
| One Mobility Management GmbH |
Full consolidation |
|
|
X |
|
|
SERVICES |
| Taxos Luz, S.L.U. |
Full consolidation |
|
|
X |
|
|
RENEWABLE ENERGIES |
| FrauDfense, S.L. |
Equity method |
|
X |
|
|
|
IT SERVICES |
| Santander Insurance, S.L. |
Full consolidation |
|
|
X |
|
|
HOLDING COMPANY |
| AMS Auto Markt Am Schieferstein GmbH |
Full consolidation |
|
|
X |
|
|
VEHICLE SALES |
| Midata Service GmbH |
Full consolidation |
|
|
X |
|
|
IT SERVICES |
| San Pietro Solar PV, S.r.l. |
Full consolidation |
|
|
X |
|
|
RENEWABLE ENERGIES |
| Grafite New Energy, S.r.l. |
Full consolidation |
|
|
X |
|
|
RENEWABLE ENERGIES |
| Cianite New Energy, S.r.l. |
Full consolidation |
|
|
X |
|
|
RENEWABLE ENERGIES |
| Santander New Business, S.A. |
Full consolidation |
|
|
X |
|
|
TRADE INTERMEDIARY |
| SC Mobility AS |
Full consolidation |
|
|
X |
|
|
RENTING |
| SC Mobility AB |
Full consolidation |
|
|
X |
|
|
RENTING |
| Moon GC&P Investments, S.L.U. |
Full consolidation |
|
|
X |
|
|
HOLDING COMPANY |
| Santander Leasing AB |
Full consolidation |
|
|
X |
|
|
LEASING AND RENTING |
| Generación de Energía Villahermosa, S.A.P.I. de C.V. |
Full consolidation |
|
|
X |
|
|
ELECTRICAL ENERGY OPERATIONS |
350 2024 Pillar 3 Disclosures Report
|
|
|
|
|
|
|
|
|
|
|
|
|
|
|
|
|
|
|
|
|
|
|
|
| Appendix VI.LI3 - Outline of the differences in the scopes of consolidation (entity by entity) |
|
|
|
|
|
|
|
|
|
|
|
|
|
|
2024 |
| a |
b |
c |
d |
e |
f |
g |
h |
| Name of the entity |
Method of accounting consolidation |
Method of regulatory consolidation |
Description of the entity |
| Full consolidation |
Proportional consolidation |
Equity method |
Neither consolidated nor deducted |
Deducted |
| Santander Compara Holding, S.L. |
Full consolidation |
|
|
X |
|
|
HOLDING COMPANY |
| Santander Real Estate Equity I, F.C.R. |
Full consolidation |
|
|
X |
|
|
VENTURE CAPITAL FUND |
| Forgepoint Capital International Management Limited |
Equity method |
|
X |
|
|
|
CONSULTING SERVICES |
| Auto-Interleasing AG |
Full consolidation |
|
|
X |
|
|
RENTING |
| CLM Fleet Management Ltd |
Full consolidation |
|
|
X |
|
|
SERVICES |
| Comparanet, S.A. de C.V. |
Full consolidation |
|
|
X |
|
|
INSURANCE MEDIATION |
| Inverlur Aguilas I, S.L. |
Equity method |
|
X |
|
|
|
PROPERTY MANAGEMENT |
| Inverlur Aguilas II, S.L. |
Equity method |
|
X |
|
|
|
PROPERTY MANAGEMENT |
| Sociedad Conjunta para la Emisión y Gestión de Medios de Pago, E.F.C., S.A. |
Equity method |
|
X |
|
|
|
PAYMENT SERVICES |
| Hyundai Corretora de Seguros Ltda. |
Equity method |
|
X |
|
|
|
INSURANCE MEDIATION |
| Apolo Fundo de Investimento em Direitos Creditórios |
Equity method |
|
X |
|
|
|
INVESTMENT FUND |
| Solution 4Fleet Consultoria Empresarial S.A. |
Full consolidation |
|
|
X |
|
|
CAR RENTAL |
| Munduspar Participações S.A. |
Full consolidation |
|
|
X |
|
|
HOLDING COMPANY |
| Waycarbon Soluções Ambientais e Projetos de Carbono S.A. |
Full consolidation |
|
|
X |
|
|
CONSULTING SERVICES |
| San Preca Federal I Fundo de Investimento em Direitos Creditórios Não-Padronizados |
Equity method |
|
X |
|
|
|
INVESTMENT FUND |
| FIT Economia de Energia S.A. |
Full consolidation |
|
|
X |
|
|
ELECTRICAL ENERGY OPERATIONS |
| América Gestão Serviços em Energía S.A. |
Full consolidation |
|
|
X |
|
|
ELECTRICAL ENERGY OPERATIONS |
2024 Pillar 3 Disclosures Report 351
|
|
|
|
|
|
|
|
|
|
|
|
| Appendix VII.CC1 - Composition of regulatory own funds |
|
EUR million |
|
|
|
2024 |
|
|
(a} |
(b) |
|
|
(A)
Amounts |
(B)
Explanatory notes |
|
Common Equity Tier 1 (CET1) capital: instruments and reserves |
|
|
| 1 |
Capital instruments and the related share premium accounts |
47,655 |
|
|
of which: Instrument type 1 |
|
|
|
of which: Instrument type 2 |
|
|
|
of which: Instrument type 3 |
|
|
| 2 |
Retained earnings |
82,601 |
|
| 3 |
Accumulated other comprehensive income (and other reserves) |
(44,061) |
|
| EU-3a |
Funds for general banking risk |
— |
|
| 4 |
Amount of qualifying items referred to in Article 484 (3) and the related share premium accounts subject to phase out from CET1 |
— |
|
| 5 |
Minority interests (amount allowed in consolidated CET1) |
8,485 |
|
| EU-5a |
Independently reviewed interim profits net of any foreseeable charge or dividend |
8,821 |
|
| 6 |
Common Equity Tier 1 (CET1) capital before regulatory adjustments |
103,501 |
|
|
Common Equity Tier 1 (CET1) capital: regulatory adjustments |
|
|
| 7 |
Additional value adjustments (negative amount) |
(624) |
|
| 8 |
Intangible assets (net of related tax liability) (negative amount) |
(15,957) |
|
| 9 |
Empty set in the EU |
|
|
| 10 |
Deferred tax assets that rely on future profitability excluding those arising from temporary differences (net of related tax liability where the conditions in Article 38 (3) are met) (negative amount) |
(1,423) |
|
| 11 |
Fair value reserves related to gains or losses on cash flow hedges of financial instruments that are not valued at fair value |
294 |
|
| 12 |
Negative amounts resulting from the calculation of expected loss amounts |
(1,040) |
|
| 13 |
Any increase in equity that results from securitised assets (negative amount) |
— |
|
| 14 |
Gains or losses on liabilities valued at fair value resulting from changes in own credit standing |
(80) |
|
| 15 |
Defined-benefit pension fund assets (negative amount) |
(504) |
|
| 16 |
Direct and indirect holdings by an institution of own CET1 instruments (negative amount) |
(1,694) |
|
| 17 |
Direct, indirect and synthetic holdings of the CET 1 instruments of financial sector entities where those entities have reciprocal cross holdings with the institution designed to inflate artificially the own funds of the institution (negative amount) |
— |
|
| 18 |
Direct, indirect and synthetic holdings by the institution of the CET1 instruments of financial sector entities where the institution does not have a significant investment in those entities (amount above 10% threshold and net of eligible short positions) (negative amount) |
— |
|
| 19 |
Direct, indirect and synthetic holdings by the institution of the CET1 instruments of financial sector entities where the institution has a significant investment in those entities (amount above 10% threshold and net of eligible short positions) (negative amount) |
— |
|
| 20 |
Empty set in the EU |
|
|
| EU-20a |
Exposure amount of the following items which qualify for a RW of 1250%, where the institution opts for the deduction alternative |
(791) |
|
| EU-20b |
of which: qualifying holdings outside the financial sector (negative amount) |
— |
|
| EU-20c |
of which: securitisation positions (negative amount) |
(646) |
|
| EU-20d |
of which: free deliveries (negative amount) |
(5) |
|
| 21 |
Deferred tax assets arising from temporary differences (amount above 10% threshold, net of related tax liability where the conditions in Article 38 (3) are met) (negative amount) |
(830) |
|
| 22 |
Amount exceeding the 17.65% threshold (negative amount) |
— |
|
352 2024 Pillar 3 Disclosures Report
|
|
|
|
|
|
|
|
|
|
|
|
| Appendix VII.CC1 - Composition of regulatory own funds |
|
EUR million |
|
|
|
2024 |
|
|
(a} |
(b) |
|
|
(A)
Amounts |
(B)
Explanatory notes |
| 23 |
of which: direct, indirect and synthetic holdings by the institution of the CET1 instruments of financial sector entities where the institution has a significant investment in those entities |
— |
|
| 24 |
Empty set in the EU |
|
|
| 25 |
of which: deferred tax assets arising from temporary differences |
— |
|
| EU-25a |
Losses for the current financial year (negative amount) |
— |
|
| EU-25b |
Foreseeable tax charges relating to CET1 items except where the institution suitably adjusts the amount of CET1 items insofar as such tax charges reduce the amount up to which those items may be used to cover risks or losses (negative amount) |
|
|
| 26 |
Empty set in the EU |
|
|
| 27 |
Qualifying AT1 deductions that exceed the AT1 items of the institution (negative amount) |
— |
|
| 27a |
Other regulatory adjustments |
(1,053) |
|
| 28 |
Total regulatory adjustments to Common Equity Tier 1 (CET1) |
(23,701) |
|
| 29 |
Common Equity Tier 1 (CET1) capital |
79,800 |
|
|
Additional Tier 1 (AT1) capital: instruments |
|
|
| 30 |
Capital instruments and the related share premium accounts |
11,063 |
|
| 31 |
of which: classified as equity under applicable accounting standards |
— |
|
| 32 |
of which: classified as liabilities under applicable accounting standards |
10,086 |
|
| 33 |
Amount of qualifying items referred to in Article 484 (4) and the related share premium accounts subject to phase out from AT1 as described in Article 486(3) of CRR |
— |
|
| EU-33a |
Amount of qualifying items referred to in Article 494a(1) subject to phase out from AT1 |
— |
|
| EU-33b |
Amount of qualifying items referred to in Article 494b(1) subject to phase out from AT1 |
— |
|
| 34 |
Qualifying Tier 1 capital included in consolidated AT1 capital (including minority interests not included in row 5) issued by subsidiaries and held by third parties |
645 |
|
| 35 |
of which: instruments issued by subsidiaries subject to phase out |
— |
|
| 36 |
Additional Tier 1 (AT1) capital before regulatory adjustments |
11,708 |
|
|
Additional Tier 1 (AT1) capital: regulatory adjustments |
|
|
| 37 |
Direct and indirect holdings by an institution of own AT1 instruments (negative amount) |
(1,337) |
|
| 38 |
Direct, indirect and synthetic holdings of the AT1 instruments of financial sector entities where those entities have reciprocal cross holdings with the institution designed to inflate artificially the own funds of the institution (negative amount) |
— |
|
| 39 |
Direct, indirect and synthetic holdings of the AT1 instruments of financial sector entities where the institution does not have a significant investment in those entities (amount above 10% threshold and net of eligible short positions) (negative amount) |
— |
|
| 40 |
Direct, indirect and synthetic holdings by the institution of the AT1 instruments of financial sector entities where the institution has a significant investment in those entities (net of eligible short positions) (negative amount) |
— |
|
| 41 |
Empty set in the EU |
|
|
| 42 |
Qualifying T2 deductions that exceed the T2 items of the institution (negative amount) |
— |
|
| 42a |
Other regulatory adjustments to AT1 capital |
— |
|
| 43 |
Total regulatory adjustments to Additional Tier 1 (AT1) capital |
(1,337) |
|
| 44 |
Additional Tier 1 (AT1) capital |
10,371 |
|
| 45 |
Tier 1 capital (T1 = CET1 + AT1) |
90,170 |
|
|
Tier 2 (T2) capital: instruments |
|
|
| 46 |
Capital instruments and the related share premium accounts |
12,066 |
|
2024 Pillar 3 Disclosures Report 353
|
|
|
|
|
|
|
|
|
|
|
|
| Appendix VII.CC1 - Composition of regulatory own funds |
|
EUR million |
|
|
|
2024 |
|
|
(a} |
(b) |
|
|
(A)
Amounts |
(B)
Explanatory notes |
| 47 |
Amount of qualifying items referred to in Article 484 (5) and the related share premium accounts subject to phase out from T2 as described in Article 486 (4) CRR |
— |
|
| EU-47a |
Amount of qualifying items referred to in Article 494a (2) subject to phase out from T2 |
— |
|
| EU-47b |
Amount of qualifying items referred to in Article 494b (2) subject to phase out from T2 |
1,389 |
|
| 48 |
Qualifying own funds instruments included in consolidated T2 capital (including minority interests and AT1 instruments not included in rows 5 or 34) issued by subsidiaries and held by third parties |
5,200 |
|
| 49 |
of which: instruments issued by subsidiaries subject to phase out |
— |
|
| 50 |
Credit risk adjustments |
— |
|
| 51 |
Tier 2 (T2) capital before regulatory adjustments |
18,655 |
|
|
Tier 2 (T2) capital: regulatory adjustments |
|
|
| 52 |
Direct and indirect holdings by an institution of own T2 instruments and subordinated loans (negative amount) |
(211) |
|
| 53 |
Direct, indirect and synthetic holdings of the T2 instruments and subordinated loans of financial sector entities where those entities have reciprocal cross holdings with the institution designed to inflate artificially the own funds of the institution (negative amount) |
— |
|
| 54 |
Direct and indirect holdings of the T2 instruments and subordinated loans of financial sector entities where the institution does not have a significant investment in those entities (amount above 10% threshold and net of eligible short positions) (negative amount) |
— |
|
| 54a |
Empty set in the EU |
|
|
| 55 |
Direct and indirect holdings by the institution of the T2 instruments and subordinated loans of financial sector entities where the institution has a significant investment in those entities (net of eligible short positions) (negative amount) |
(25) |
|
| 56 |
Empty set in the EU |
0 |
|
| EU-56a |
Qualifying eligible liabilities deductions that exceed the eligible liabilities items of the institution (negative amount) |
|
|
| 56b |
Other regulatory adjustments to T2 capital |
— |
|
| 57 |
Total regulatory adjustments to Tier 2 (T2) capital |
(236) |
|
| 58 |
Tier 2 (T2) capital |
18,418 |
|
| 59 |
Total capital (TC = T1 + T2) |
108,589 |
|
| 60 |
Total risk exposure amount |
624,503 |
|
|
Capital ratios and requirements including buffers |
|
|
| 61 |
Common Equity Tier 1 (as a percentage of total risk exposure amount) |
— |
|
| 62 |
Tier 1 (as a percentage of total risk exposure amount) |
— |
|
| 63 |
Total capital (as a percentage of total risk exposure amount) |
— |
|
| 64 |
Institution CET1 overall capital requirements |
— |
|
| 65 |
of which: capital conservation buffer requirement |
— |
|
| 66 |
of which: countercyclical buffer requirement |
— |
|
| 67 |
of which: systemic risk buffer requirement |
— |
|
| EU-67a |
of which: Global Systemically Important Institution (G-SII) or Other Systemically Important Institution (O-SII) buffer |
— |
|
| EU-67b |
of which: additional own funds requirements to address the risks other than the risk of excessive leverage |
— |
|
| 68 |
Common Equity Tier 1 available to meet buffer (as a percentage of risk exposure amount) |
— |
|
| 69 |
[non relevant in EU regulation] |
|
|
| 70 |
[non relevant in EU regulation] |
|
|
| 71 |
[non relevant in EU regulation] |
|
|
|
Amounts below the thresholds for deduction (before risk weighting) |
|
|
354 2024 Pillar 3 Disclosures Report
|
|
|
|
|
|
|
|
|
|
|
|
| Appendix VII.CC1 - Composition of regulatory own funds |
|
EUR million |
|
|
|
2024 |
|
|
(a} |
(b) |
|
|
(A)
Amounts |
(B)
Explanatory notes |
| 72 |
Direct and indirect holdings of own funds and eligible liabilities of financial sector entities where the institution does not have a significant investment in those entities (amount below 10% threshold and net of eligible short positions) |
4,576 |
|
| 73 |
Direct and indirect holdings by the institution of the CET1 instruments of financial sector entities where the institution has a significant investment in those entities (amount below 17.65% thresholds and net of eligible short positions) |
915 |
|
| 74 |
Empty set in the EU |
|
|
| 75 |
Deferred tax assets arising from temporary differences (amount below 17.65% threshold, net of related tax liability where the conditions in Article 38 (3) are met) |
8,147 |
|
|
Applicable caps on the inclusion of provisions in Tier 2 |
|
|
| 76 |
Credit risk adjustments included in T2 in respect of exposures subject to standardised approach (prior to the application of the cap) |
— |
|
| 77 |
Cap on inclusion of credit risk adjustments in T2 under standardised approach |
— |
|
| 78 |
Credit risk adjustments included in T2 in respect of exposures subject to internal ratings-based approach (prior to the application of the cap) |
— |
|
| 79 |
Cap for inclusion of credit risk adjustments in T2 under internal ratings-based approach |
1,298 |
|
|
Capital instruments subject to phase-out arrangements (only applicable between 1 Jan 2014 and 1 Jan 2022) |
|
|
| 80 |
Current cap on CET1 instruments subject to phase out arrangements |
|
|
| 81 |
Amount excluded from CET1 due to cap (excess over cap after redemptions and maturities) |
|
|
| 82 |
Current cap on AT1 instruments subject to phase out arrangements |
|
|
| 83 |
Amount excluded from AT1 due to cap (excess over cap after redemptions and maturities) |
|
|
| 84 |
Current cap on T2 instruments subject to phase out arrangements |
|
|
| 85 |
Amount excluded from T2 due to cap (excess over cap after redemptions and maturities) |
|
|
2024 Pillar 3 Disclosures Report 355
IMPORTANT INFORMATION
Non-IFRS and alternative performance measures
This report contains financial information prepared according to International Financial Reporting Standards (IFRS) and taken from our consolidated financial statements, as well as alternative performance measures (APMs) as defined in the Guidelines on Alternative Performance Measures issued by the European Securities and Markets Authority (ESMA) on 5 October 2015, and other non-IFRS measures. The APMs and non-IFRS measures were calculated with information from Grupo Santander; however, they are neither defined or detailed in the applicable financial reporting framework nor audited or reviewed by our auditors. We use these APMs and non-IFRS measures when planning, monitoring and evaluating our performance. We consider them to be useful metrics for our management and investors to compare operating performance between periods. APMs we use are presented unless otherwise specified on a constant FX basis, which is computed by adjusting comparative period reported data for the effects of foreign currency translation differences, which distort period-on-period comparisons. Nonetheless, the APMs and non-IFRS measures are supplemental information; their purpose is not to substitute IFRS measures. Furthermore, companies in our industry and others may calculate or use APMs and non-IFRS measures differently, thus making them less useful for comparison purposes. APMs using ESG labels have not been calculated in accordance with the Taxonomy Regulation or with the indicators for principal adverse impact in SFDR. For further details on APMs and Non-IFRS Measures, including their definition or a reconciliation between any applicable management indicators and the financial data presented in the consolidated financial statements prepared under IFRS, please see the 2023 Annual Report on Form 20-F filed with the U.S. Securities and Exchange Commission (the SEC) on 21 February 2024 (https://www.santander.com/content/dam/santander-com/en/documentos/informacion-sobre-resultados-semestrales-y-anuales-suministrada-a-la-sec/2024/sec-2023-annual-20-f-2023-en.pdf), as well as the section “Alternative performance measures” of this Banco Santander, S.A. (Santander) Q4 2024 Financial Report, published on 5 February 2025 (https://www.santander.com/en/shareholders-and-investors/financial-and-economic-information#quarterly-results). Underlying measures, which are included in this report, are non-IFRS measures.
The businesses included in each of our geographic segments and the accounting principles under which their results are presented here may differ from the businesses included and local applicable accounting principles of our public subsidiaries in such geographies. Accordingly, the results of operations and trends shown for our geographic segments may differ materially from those of such subsidiaries.
Non-financial information
This report contains, in addition to financial information, non-financial information (NFI), including environmental, social and governance-related metrics, statements, goals, commitments and opinions.
NFI is not audited nor reviewed by an external auditor. NFI is prepared following various external and internal frameworks, reporting guidelines and measurement, collection and verification methods and practices, which are materially different from those applicable to financial information and are in many cases emerging and evolving. NFI is based on various materiality thresholds, estimates, assumptions, judgments and underlying data derived internally and from third parties. NFI is thus subject to significant measurement uncertainties, may not be comparable to NFI of other companies or over time or across periods and its inclusion is not meant to imply that the information is fit for any particular purpose or that it is material to us under mandatory reporting standards. NFI is for informational purposes only and without any liability being accepted in connection with it except where such liability cannot be limited under overriding provisions of applicable law.
Forward-looking statements
Santander hereby warns that this report contains “forward-looking statements” as per the meaning of the U.S. Private Securities Litigation Reform Act of 1995. Such statements can be understood through words and expressions like “expect”, “project”, “anticipate”, “should”, “intend”, “probability”, “risk”, “VaR”, “RoRAC”, “RoRWA”, “TNAV”, “target”, “goal”, “objective”, “estimate”, “future”, “commitment”, “commit”, “focus”, “pledge” and similar expressions. They include (but are not limited to) statements on future business development, shareholder remuneration policy and NFI.
While these forward-looking statements represent our judgement and future expectations concerning our business developments, results may differ materially from those anticipated, expected, projected or assumed in forward-looking statements.
In particular, forward looking statements are based on current expectations and future estimates about Santander’s and third-parties’ operations and businesses and address matters that are uncertain to varying degrees and may change, including, but not limited to (a) expectations, targets, objectives, strategies and goals relating to environmental, social, safety and governance performance, including expectations regarding future execution of Santander’s and third-parties’ (including governments and other public actors) energy and climate strategies, and the underlying assumptions and estimated impacts on Santander’s and third-parties’ businesses related thereto; (b) Santander’s and third-parties’ approach, plans and expectations in relation to carbon use and targeted reductions of emissions, which may be affected by conflicting interests such as energy security; (c) changes in operations or investments under existing or future environmental laws and regulations; (d) changes in rules and regulations, regulatory requirements and internal policies, including those related to climate-related initiatives; (e) our own decisions and actions including those affecting or changing our practices, operations, priorities, strategies, policies or procedures; (f) events that lead to damage to our reputation and brand; (g) exposure to operational losses, including as a result of cyberattacks, data breaches or other security incidents; and (h) the uncertainty over the scope of actions that may be required by us, governments
356 2024 Pillar 3 Disclosures Report
and others to achieve goals relating to climate, environmental and social matters, as well as the evolving nature of underlying science and industry and governmental standards and regulations.
In addition, the important factors described in this report and other risk factors, uncertainties or contingencies detailed in our most recent Form 20-F and subsequent 6-Ks filed with, or furnished to, the SEC, as well as other unknown or unpredictable factors, could affect our future development and results and could lead to outcomes materially different from what our forward-looking statements anticipate, expect, project or assume.
Forward-looking statements are therefore aspirational, should be regarded as indicative, preliminary and for illustrative purposes only, speak only as of the date of this report, are informed by the knowledge, information and views available on such date and are subject to change without notice. Santander is not required to update or revise any forward-looking statements, regardless of new information, future events or otherwise, except as required by applicable law. Santander does not accept any liability in connection with forward-looking statements except where such liability cannot be limited under overriding provisions of applicable law.
Not a securities offer
This report and the information it contains does not constitute an offer to sell nor the solicitation of an offer to buy any securities.
Past performance does not indicate future outcomes
Statements about historical performance or growth rates must not be construed as suggesting that future performance, share price or results (including earnings per share) will necessarily be the same or higher than in a previous period. Nothing in this report should be taken as a profit and loss forecast.
Third Party Information
In this report, Santander relies on and refers to certain information and statistics obtained from publicly-available information and third-party sources, which it believes to be reliable. Neither Santander nor its directors, officers and employees have independently verified the accuracy or completeness of any such publicly-available and third-party information, make any representation or warranty as to the quality, fitness for a particular purpose, non-infringement, accuracy or completeness of such information or undertake any obligation to update such information after the date of this report. In no event shall Santander be liable for any use by any party of, for any decision made or action taken by any party in reliance upon, or for inaccuracies or errors in, or omission from, such publicly-available and third-party information contained herein. Any sources of publicly-available information and third-party information referred or contained herein retain all rights with respect to such information and use of such information herein shall not be deemed to grant a license to any third party.
2024 Pillar 3 Disclosures Report 357
SIGNATURE
Pursuant to the requirements of the Securities Exchange Act of 1934, the registrant has duly caused this report to be signed on its behalf by the undersigned, thereunto duly authorized.
|
|
|
|
|
|
|
|
|
|
|
|
|
Banco Santander, S.A. |
|
|
|
|
| Date: 3 March 2025 |
By: |
/s/ José García Cantera |
|
Name: |
José García Cantera |
|
Title: |
Chief Financial Officer |