|
|
|
||||
Item 1. January - December 2024 Financial Report |
|||||

| January - December | 2024 | ||||

| BALANCE SHEET (EUR million) | Dec-24 | Sep-24 | % | Dec-24 | Dec-23 | % | Dec-22 | ||||||||||||||||
| Total assets | 1,837,081 | 1,802,259 | 1.9 | 1,837,081 | 1,797,062 | 2.2 | 1,734,659 | ||||||||||||||||
| Loans and advances to customers | 1,054,069 | 1,067,419 | (1.3) | 1,054,069 | 1,036,349 | 1.7 | 1,036,004 | ||||||||||||||||
| Customer deposits | 1,055,936 | 1,045,911 | 1.0 | 1,055,936 | 1,047,169 | 0.8 | 1,009,722 | ||||||||||||||||
| Total funds | 1,348,422 | 1,327,308 | 1.6 | 1,348,422 | 1,306,942 | 3.2 | 1,239,981 | ||||||||||||||||
| Total equity | 107,327 | 105,063 | 2.2 | 107,327 | 104,241 | 3.0 | 97,585 | ||||||||||||||||
| Note: total funds includes customer deposits, mutual funds, pension funds and managed portfolios. | |||||||||||||||||||||||
| INCOME STATEMENT (EUR million) | Q4'24 | Q3'24 | % | 2024 | 2023 | % | 2022 | ||||||||||||||||
| Net interest income | 11,986 | 11,225 | 6.8 | 46,668 | 43,261 | 7.9 | 38,619 | ||||||||||||||||
| Total income | 16,026 | 15,135 | 5.9 | 61,876 | 57,423 | 7.8 | 52,117 | ||||||||||||||||
| Net operating income | 9,254 | 8,786 | 5.3 | 35,842 | 31,998 | 12.0 | 28,214 | ||||||||||||||||
| Profit before tax | 4,600 | 4,919 | (6.5) | 19,027 | 16,459 | 15.6 | 15,250 | ||||||||||||||||
| Profit attributable to the parent | 3,265 | 3,250 | 0.5 | 12,574 | 11,076 | 13.5 | 9,605 | ||||||||||||||||
EPS, PROFITABILITY AND EFFICIENCY (%) 1 |
Q4'24 | Q3'24 | % | 2024 | 2023 | % | 2022 | ||||||||||||||||
| EPS (euros) | 0.20 | 0.20 | 0.8 | 0.77 | 0.65 | 17.9 | 0.54 | ||||||||||||||||
| RoE | 13.3 | 13.4 | 13.0 | 11.9 | 10.7 | ||||||||||||||||||
| RoTE | 16.6 | 16.7 | 16.3 | 15.1 | 13.4 | ||||||||||||||||||
| RoA | 0.78 | 0.80 | 0.76 | 0.69 | 0.63 | ||||||||||||||||||
| RoRWA | 2.27 | 2.31 | 2.18 | 1.96 | 1.77 | ||||||||||||||||||
Efficiency ratio 2 |
42.3 | 41.9 | 41.8 | 44.1 | 45.8 | ||||||||||||||||||
UNDERLYING INCOME STATEMENT 2 (EUR million) |
Q4'24 | Q3'24 | % | 2024 | 2023 | % | 2022 | ||||||||||||||||
| Net interest income | 11,986 | 11,225 | 6.8 | 46,668 | 43,261 | 7.9 | 38,619 | ||||||||||||||||
| Total income | 16,026 | 15,135 | 5.9 | 62,211 | 57,647 | 7.9 | 52,154 | ||||||||||||||||
| Net operating income | 9,254 | 8,786 | 5.3 | 36,177 | 32,222 | 12.3 | 28,251 | ||||||||||||||||
| Profit before tax | 4,600 | 4,919 | (6.5) | 19,027 | 16,698 | 13.9 | 15,250 | ||||||||||||||||
| Profit attributable to the parent | 3,265 | 3,250 | 0.5 | 12,574 | 11,076 | 13.5 | 9,605 | ||||||||||||||||
| Changes in constant euros: | |||||||||||||||||||||||
| Q4'24 / Q3'24: NII: +6.9%; Total income: +6.1%; Net operating income: +5.7%; Profit before tax: -5.9%; Attributable profit: +0.9%. | |||||||||||||||||||||||
| 2024 / 2023: NII: +9.5%; Total income: +9.9%; Net operating income: +14.6%; Profit before tax: +15.6%; Attributable profit: +15.3%. | |||||||||||||||||||||||
|
Note: for Argentina and any grouping which includes it, the variations in constant euros have been calculated considering the Argentine peso exchange rate on the last working day for each of the periods presented. Additionally, from Q2 2024 onwards for the Argentine peso, we apply an alternative exchange rate that better reflects the evolution of inflation (we continue to apply the official ARS exchange rate to all prior periods). For further information, see the 'Alternative performance measures' section in the appendix to this report.
Certain figures contained in this report, have been subject to rounding to enhance their presentation. Accordingly, in certain instances, the sum of the numbers in a column or a row in tables contained in this report may not conform exactly to the total figure given for that column or row.
| ||
The Q4 2024 Financial Report is a simplified version of the report that we publish in other quarters. It contains all the same information that we usually provide, except for the explanations in some of the sections, since all this information will be detailed in the annual report that we will publish in a few days. We will continue to publish the financial report with the usual structure and contents in the other quarters. | ||
January - December 2024 |
 |
3 |
||||||
| SOLVENCY (%) | Dec-24 | Sep-24 | Dec-24 | Dec-23 | Dec-22 | ||||||||||||||||||
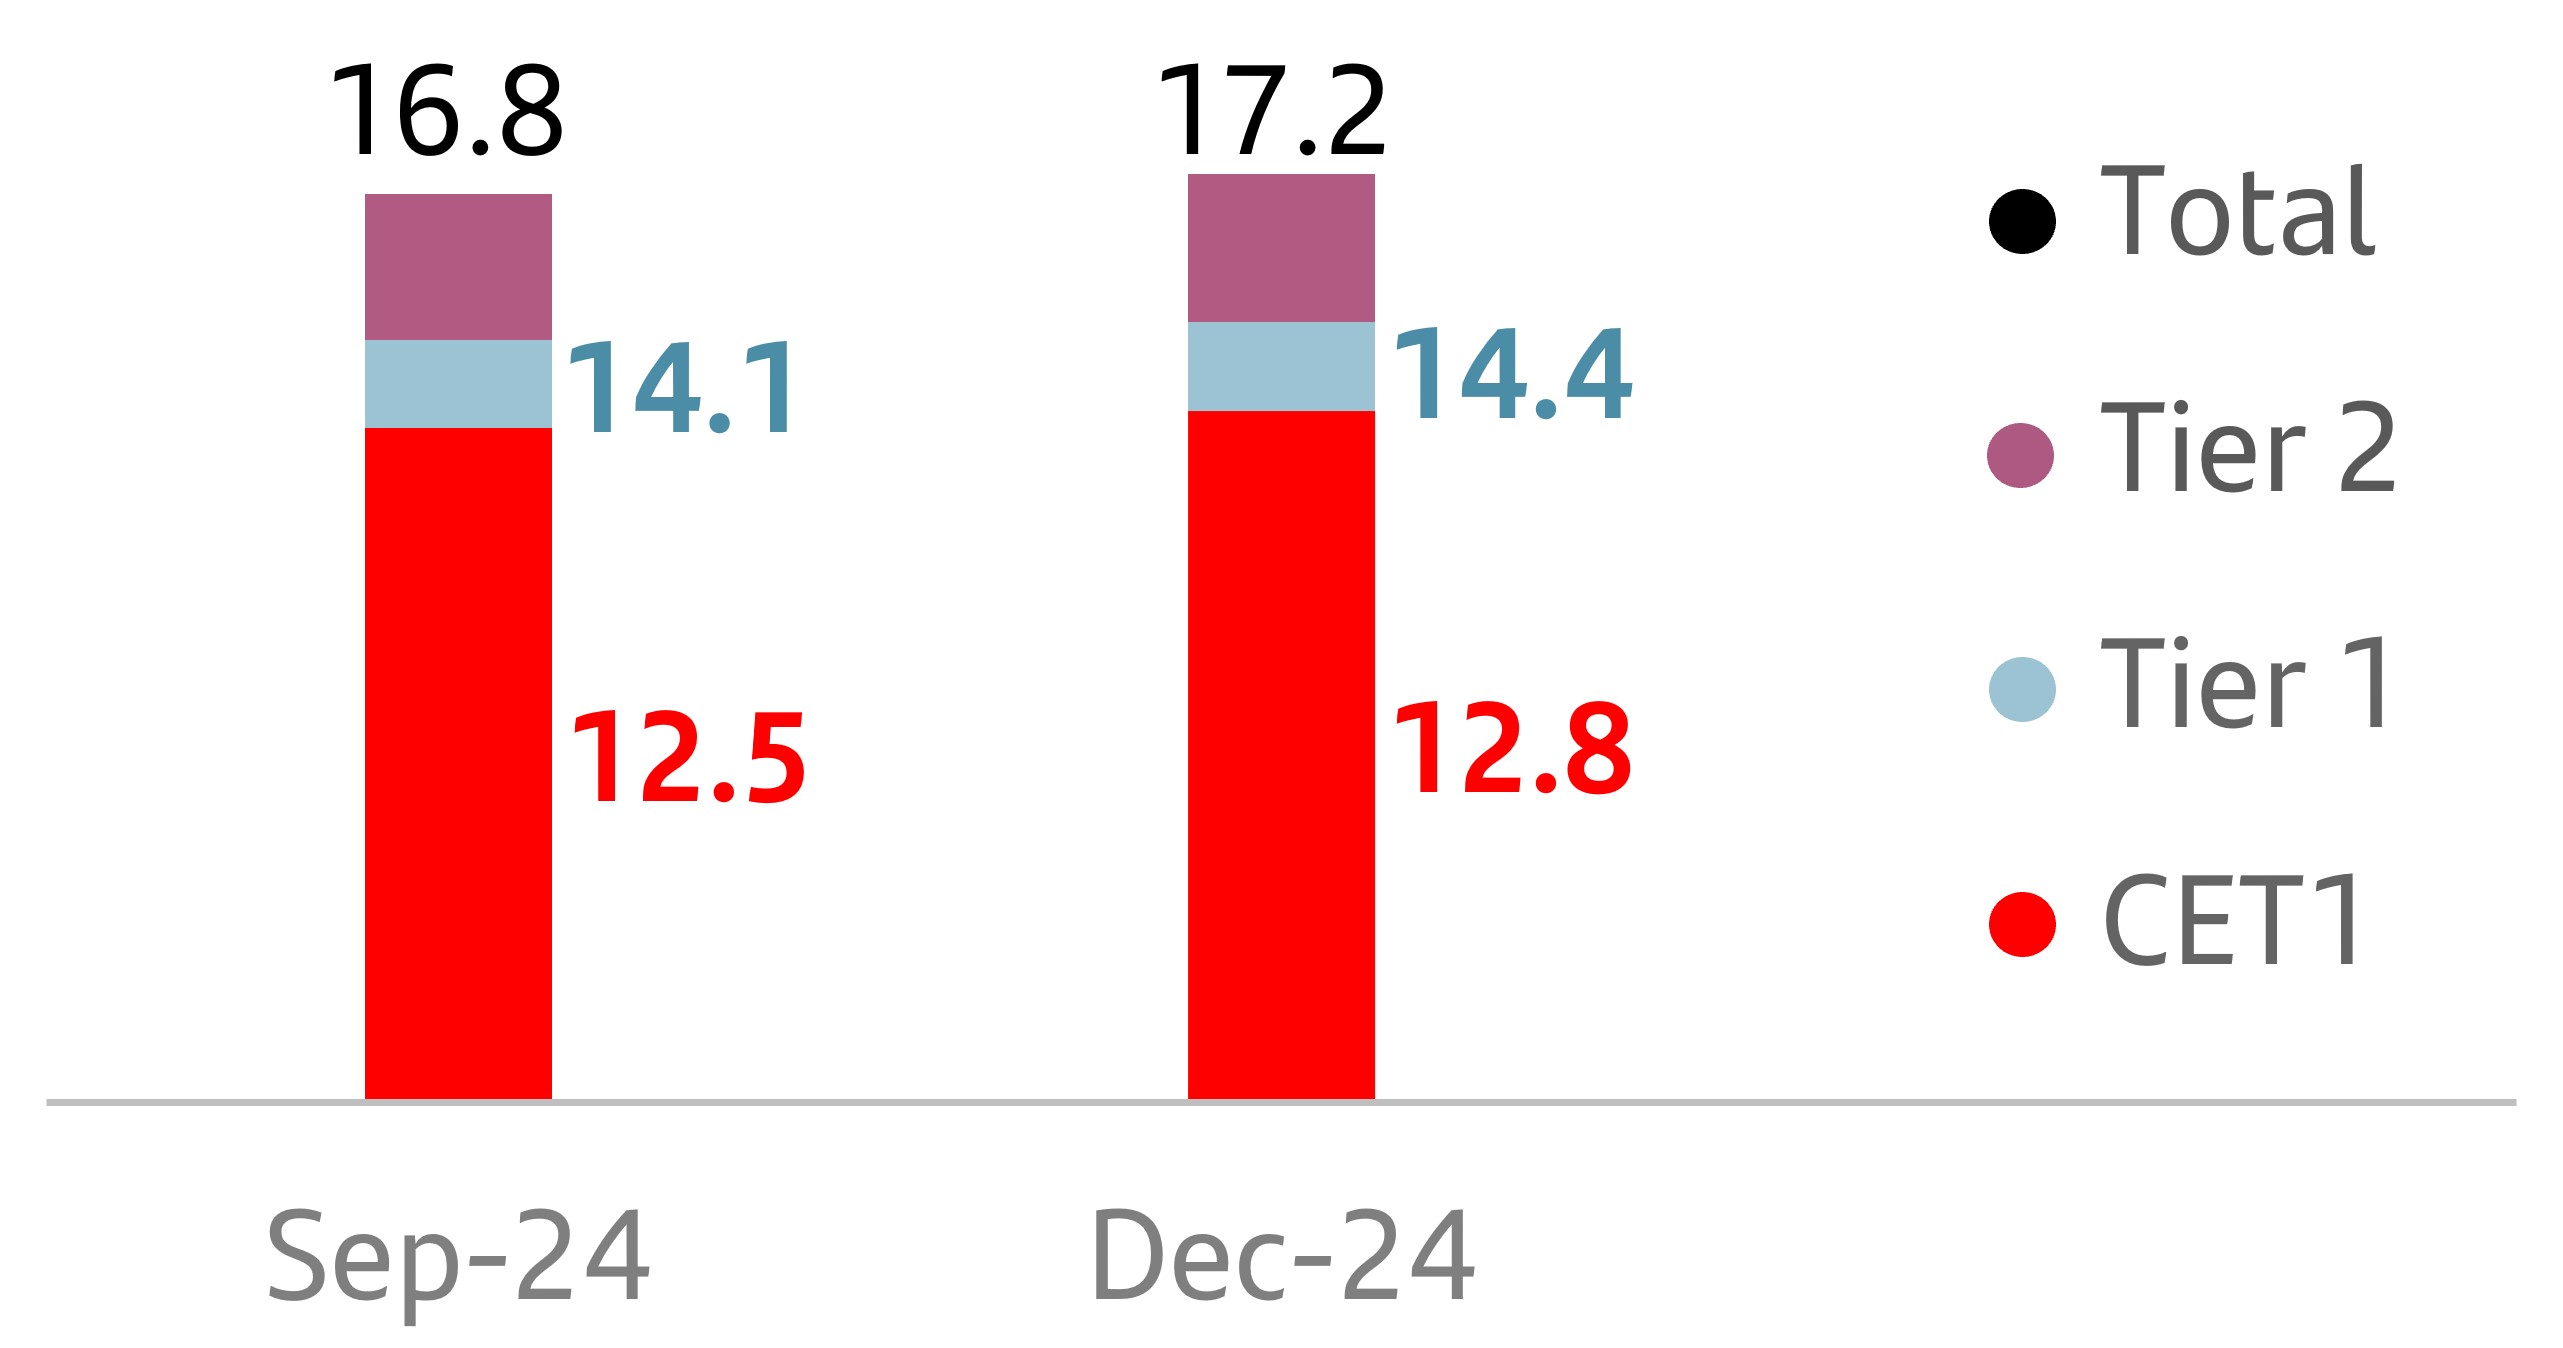
| Fully-loaded CET1 ratio | 12.8 | 12.5 | 12.8 | 12.3 | 12.0 | ||||||||||||||||||
| Fully-loaded total capital ratio | 17.2 | 16.8 | 17.2 | 16.3 | 15.8 | ||||||||||||||||||
CREDIT QUALITY (%)1 |
Q4'24 | Q3'24 | 2024 | 2023 | 2022 | ||||||||||||||||||
Cost of risk 2, 3 |
1.15 | 1.18 | 1.15 | 1.18 | 0.99 | ||||||||||||||||||
| NPL ratio | 3.05 | 3.06 | 3.05 | 3.14 | 3.08 | ||||||||||||||||||
| NPL coverage ratio | 65 | 64 | 65 | 66 | 68 | ||||||||||||||||||
| MARKET CAPITALIZATION AND SHARES | Dec-24 | Sep-24 | % | Dec-24 | Dec-23 | % | Dec-22 | ||||||||||||||||
| Shares (millions) | 15,152 | 15,494 | (2.2) | 15,152 | 16,184 | (6.4) | 16,794 | ||||||||||||||||
| Share price (euros) | 4.465 | 4.601 | (3.0) | 4.465 | 3.780 | 18.1 | 2.803 | ||||||||||||||||
| Market capitalization (EUR million) | 67,648 | 71,281 | (5.1) | 67,648 | 61,168 | 10.6 | 47,066 | ||||||||||||||||
| Tangible book value per share (euros) | 5.24 | 5.04 | 5.24 | 4.76 | 4.26 | ||||||||||||||||||
| Price / Tangible book value per share (X) | 0.85 | 0.91 | 0.85 | 0.79 | 0.66 | ||||||||||||||||||
| CUSTOMERS (thousands) | Dec-24 | Sep-24 | % | Dec-24 | Dec-23 | % | Dec-22 | ||||||||||||||||
| Total customers | 172,537 | 170,944 | 0.9 | 172,537 | 164,542 | 4.9 | 159,844 | ||||||||||||||||
| Active customers | 103,262 | 102,313 | 0.9 | 103,262 | 99,503 | 3.8 | 99,190 | ||||||||||||||||
| Digital customers | 59,317 | 57,801 | 2.6 | 59,317 | 54,161 | 9.5 | 51,471 | ||||||||||||||||
| OTHER DATA | Dec-24 | Sep-24 | % | Dec-24 | Dec-23 | % | Dec-22 | ||||||||||||||||
| Number of shareholders | 3,485,134 | 3,501,621 | (0.5) | 3,485,134 | 3,662,377 | (4.8) | 3,915,388 | ||||||||||||||||
| Number of employees | 206,753 | 208,080 | (0.6) | 206,753 | 212,764 | (2.8) | 206,462 | ||||||||||||||||
| Number of branches | 8,011 | 8,134 | (1.5) | 8,011 | 8,518 | (6.0) | 9,019 | ||||||||||||||||
| 1. | For further information, see the 'Alternative performance measures' section in the appendix to this report. |
||||
| 2. |
In addition to financial information prepared in accordance with International Financial Reporting Standards (IFRS) and derived from our consolidated financial statements, this report contains certain financial measures that constitute alternative performance measures (APMs) as defined in the Guidelines on Alternative Performance Measures issued by the European Securities and Markets Authority (ESMA) on 5 October 2015, and other non-IFRS measures, including the figures related to “underlying” results, which do not include factors that are outside the ordinary course of our business, or have been reclassified within the underlying income statement. Further details are provided in the 'Alternative performance measures' section of the appendix to this report. For further details on the APMs and non-IFRS measures used, including their definition or a reconciliation between any applicable management indicators and the financial data presented in the annual consolidated financial statements prepared under IFRS, please see our 2023 Annual Financial Report, published in the CNMV on 19 February 2024, our 20-F report for the year ending 31 December 2023 filed with the SEC in the United States on 21 February 2024 as well as the 'Alternative performance measures' section of the appendix to this report.
|
||||
| 3. | Allowances for loan-loss provisions over the last 12 months / Average loans and advances to customers over the last 12 months. | ||||
4 |
|
January - December 2024 |
||||||
| Customer focus | ||||||||||||||||||||||||||
Building a digital bank with branches |
→ We continue to build a digital bank with branches, with a multichannel offer to fulfil all our customers' financial needs. |
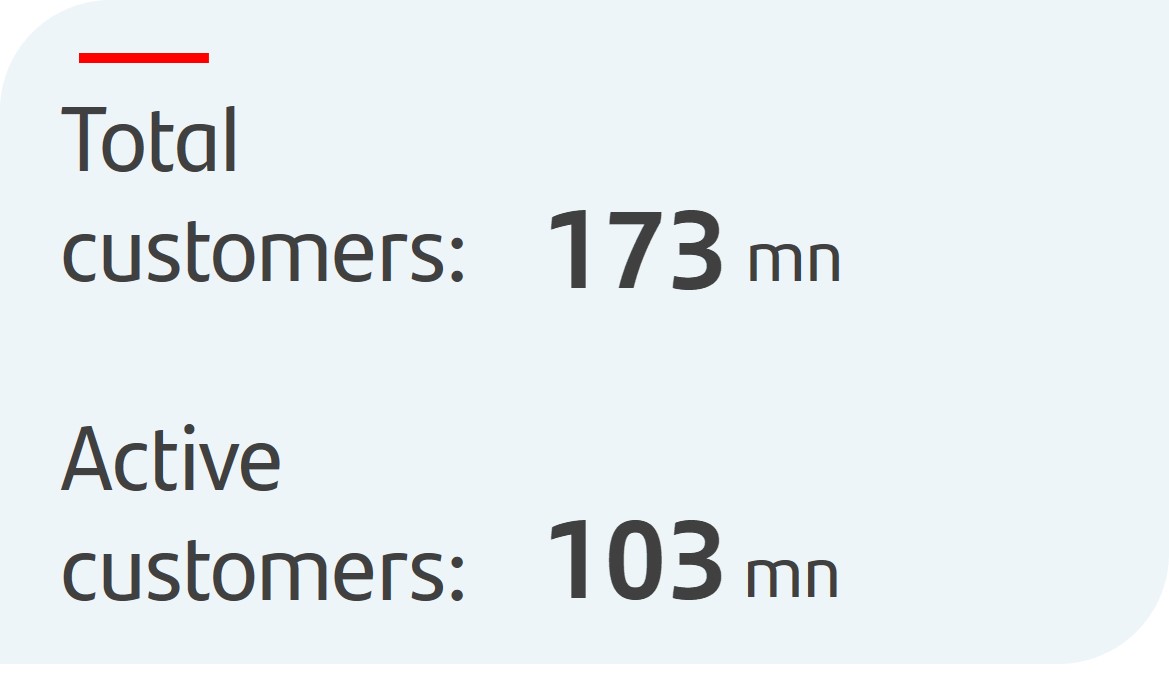
173 mn |
103 mn |
|||||||||||||||||||||||
| total customers | active customers | |||||||||||||||||||||||||
| Scale | ||||||||||||||||||||||||||
|
→ Our global and in-market scale helps us to improve our local banks' profitability, adding value and network benefits.
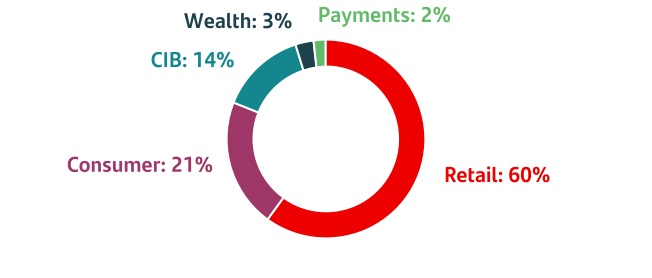
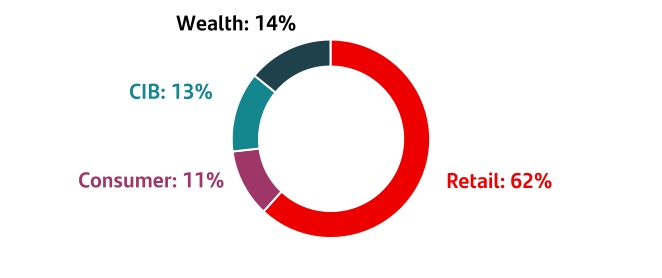
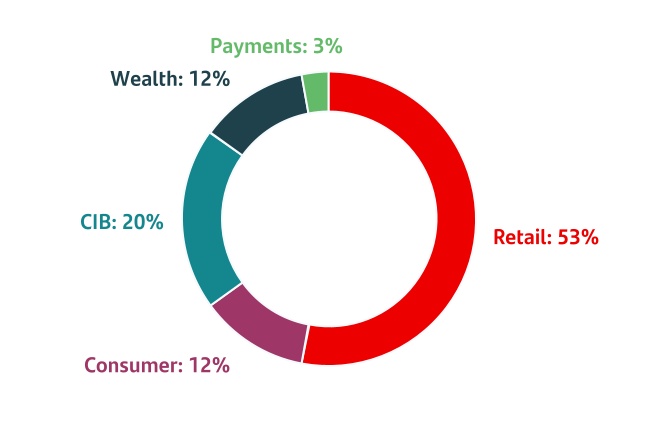
→ Our activities are organized under five global businesses: Retail & Commercial Banking (Retail), Digital Consumer Bank (Consumer), Corporate & Investment Banking (CIB), Wealth Management & Insurance (Wealth) and Payments.
→ Our five global businesses and our presence in Europe, DCB Europe, North America and South America support value creation based on the profitable growth and operational leverage that ONE Santander provides.
|
||||||||||||||||||||||||||
| Global and in-market scale | 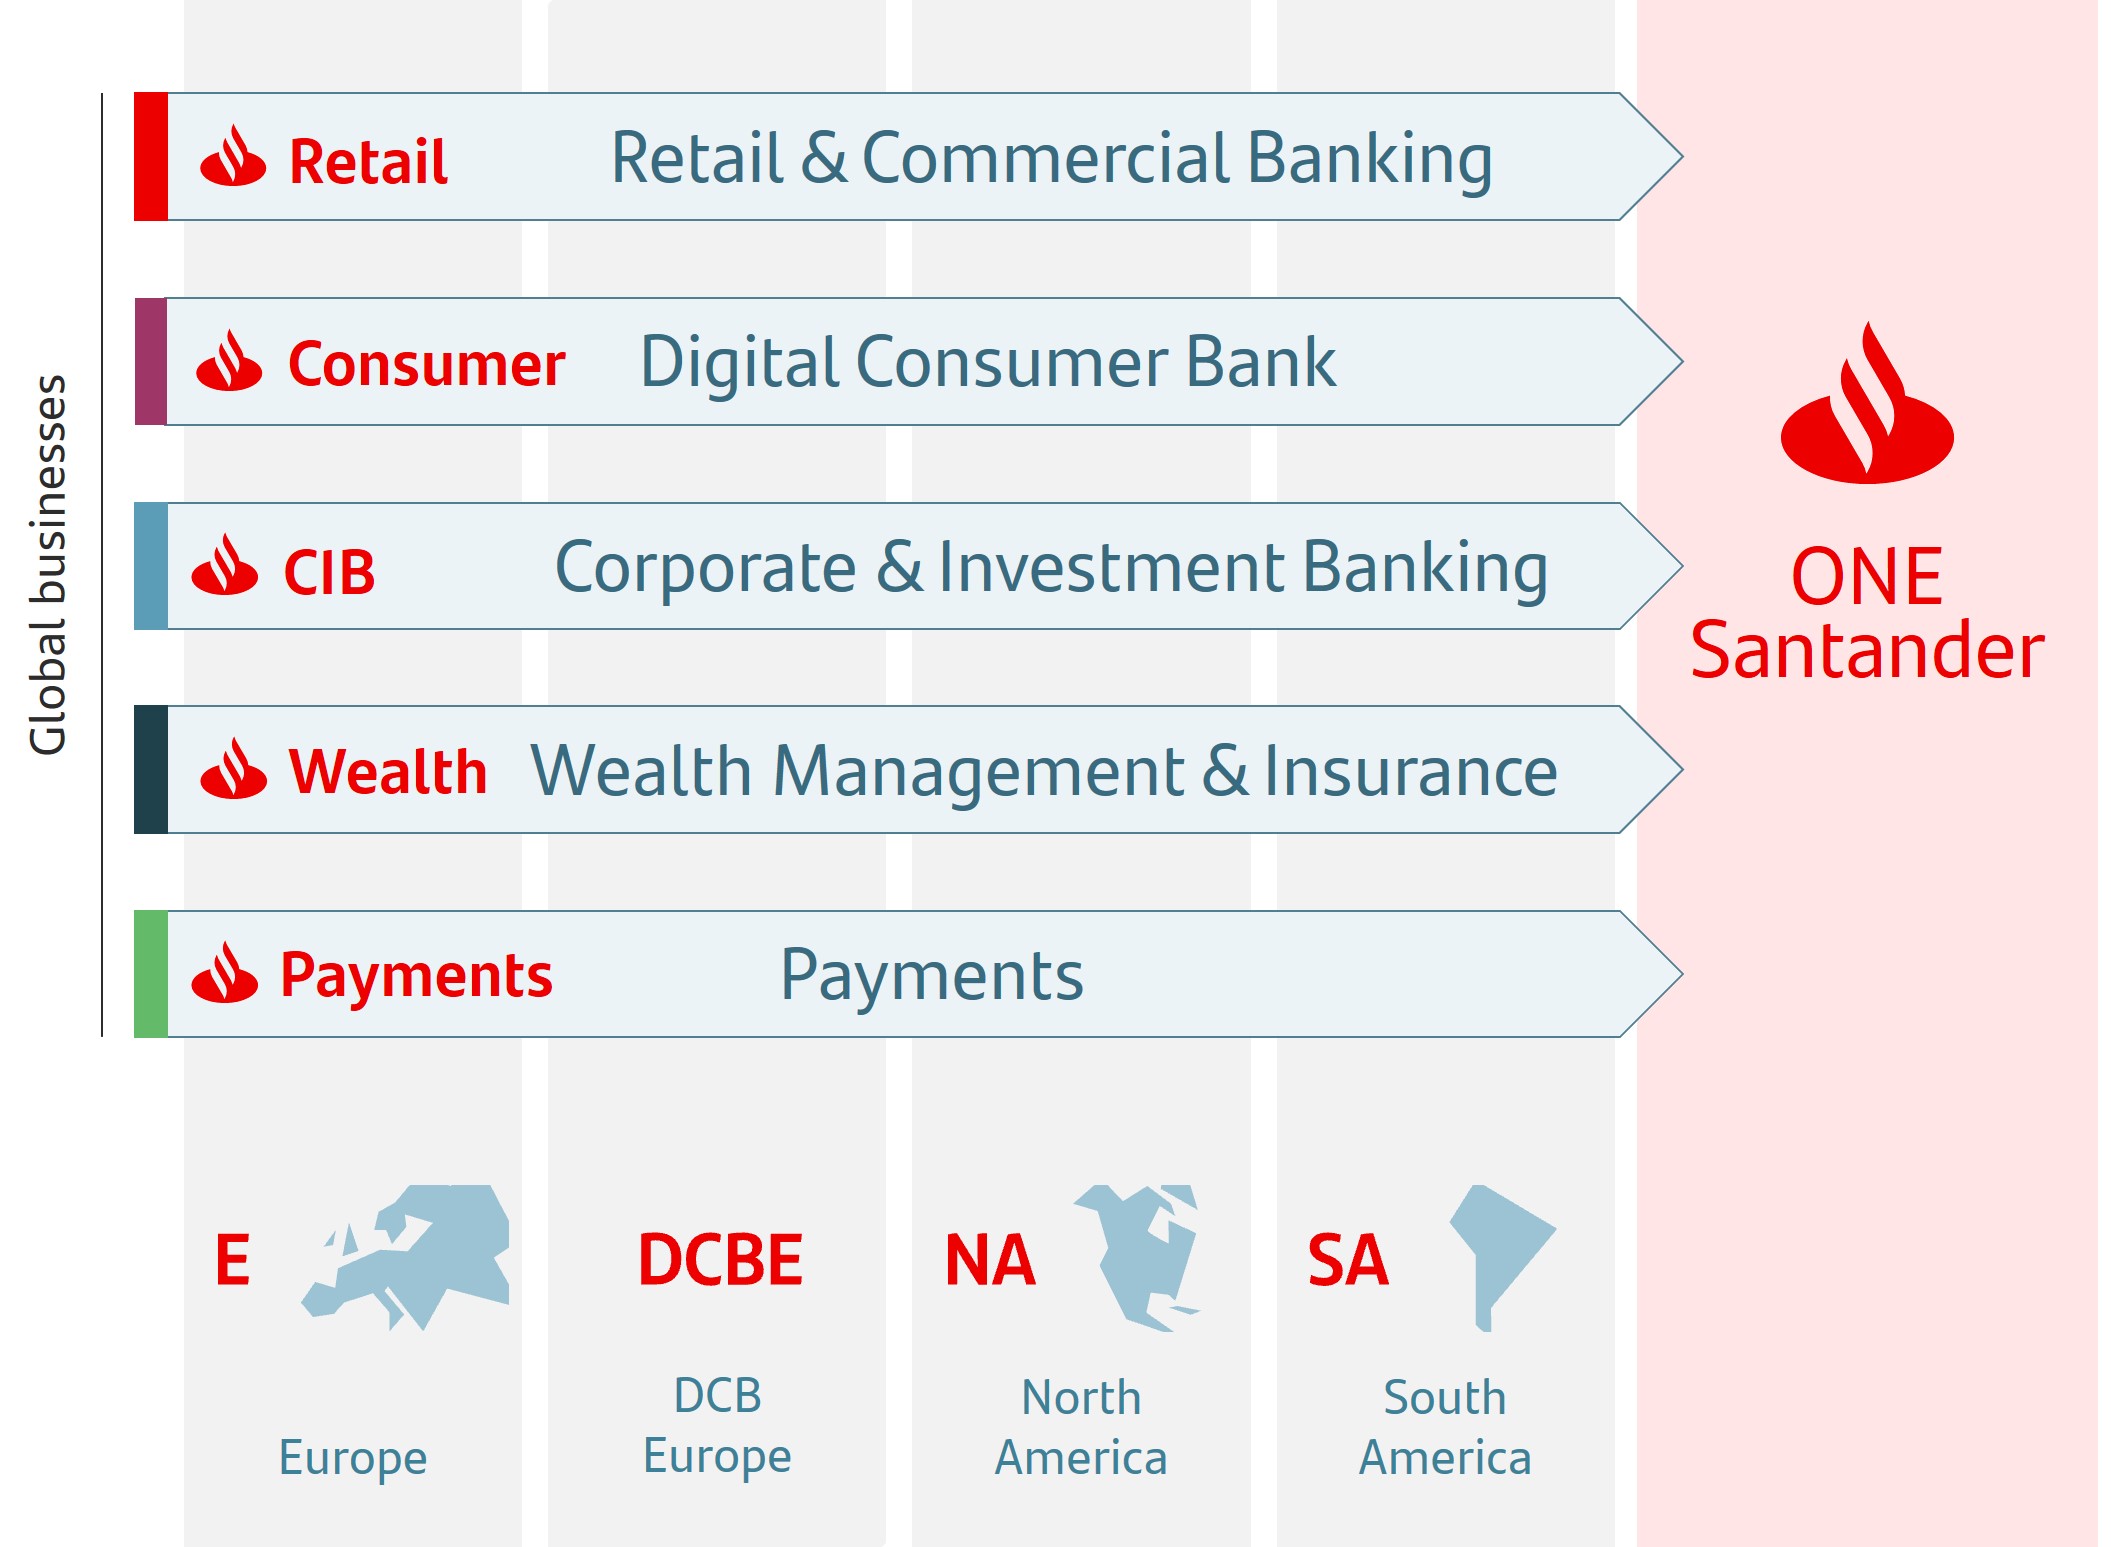 |
|||||||||||||||||||||||||
| Diversification | ||||||||||||||||||||||||||
| Business, geographical and balance sheet | → Well-balanced diversification between businesses and markets with a solid and simple balance sheet that gives us recurrent net operating income with low volatility and more predictable results. |
|||||||||||||||||||||||||
|
Our purpose
To help people and businesses prosper.
|
 |
||||||||||
|
Our aim
To be the best open financial services platform, by acting responsibly and earning the lasting loyalty of our people, customers, shareholders and communities.
|
|||||||||||
|
Our how
Everything we do should be Simple, Personal and Fair.
|
|||||||||||
January - December 2024 |
|
5 |
||||||
| Highlights of the period | ||||||||||||||||||||||||||
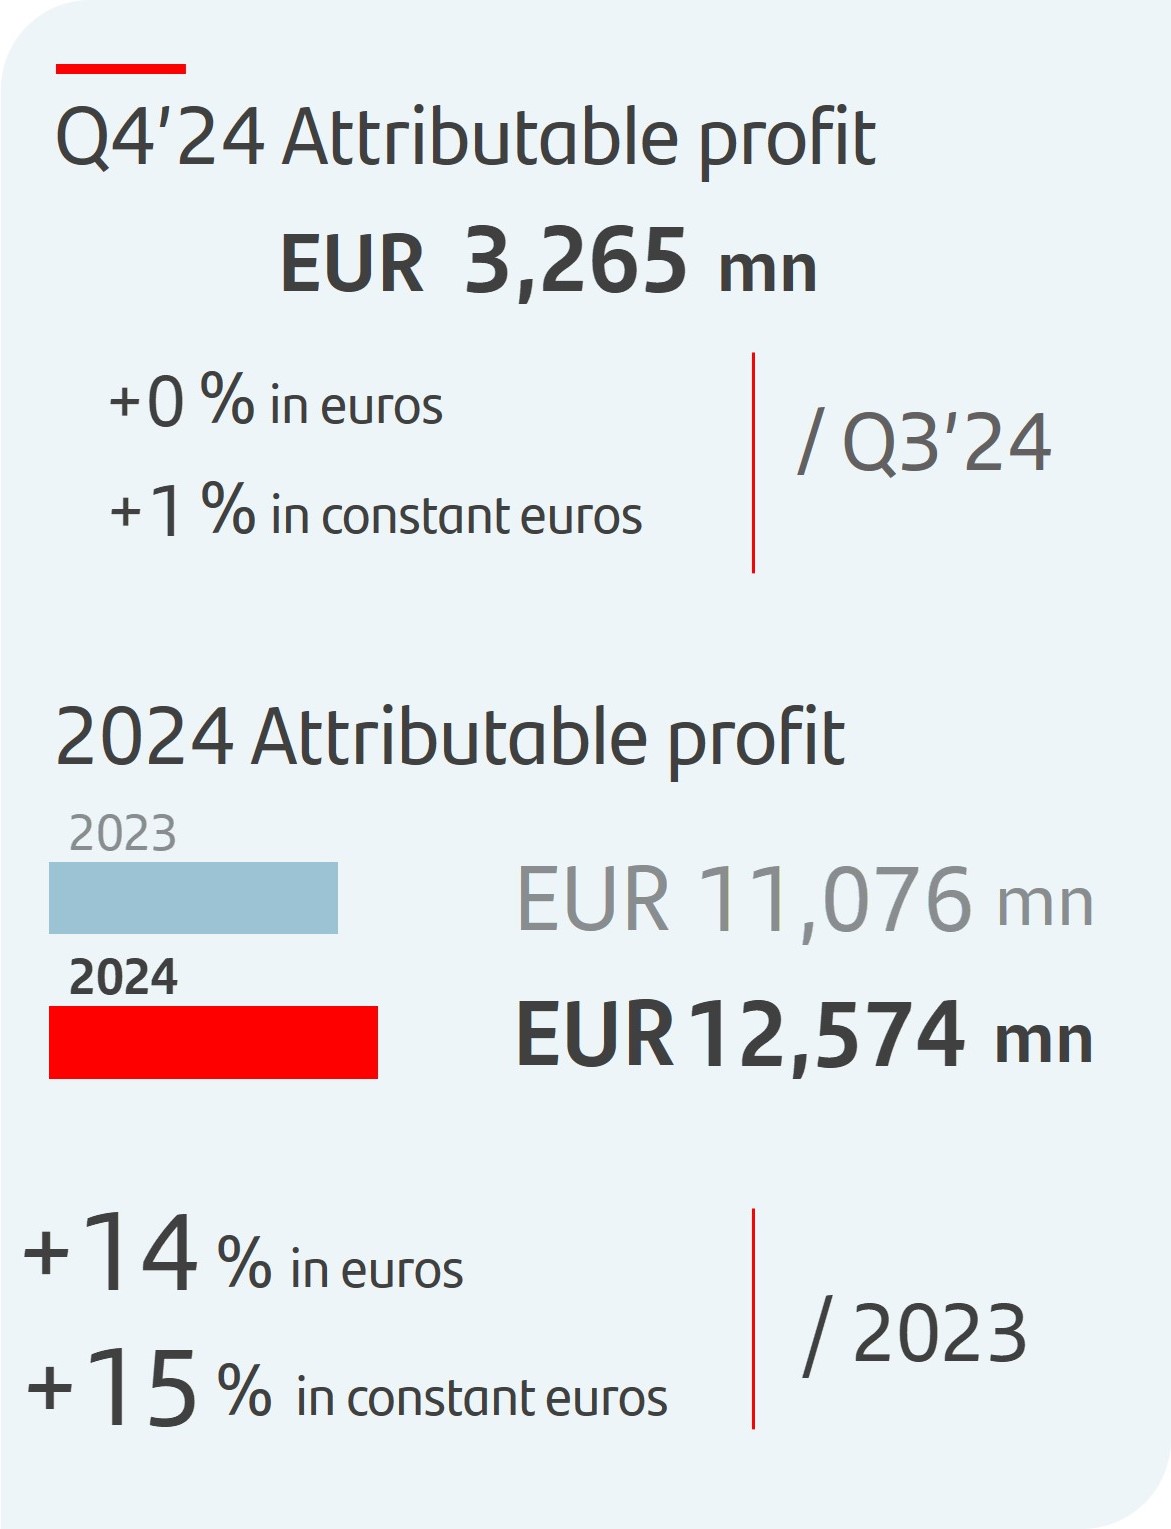 |
u | In Q4 2024, profit attributable to the parent was EUR 3,265 million, a new record for the third consecutive quarter, with a slight increase quarter-on-quarter (+0.5%). In constant euros, profit rose 1%, due to positive trends across the main revenue lines, which offset higher costs, impacted by seasonality, and the provision for potential complaints related to motor finance dealer commissions in the UK. |
|||||||||
| u | Attributable profit increased 11% compared to Q4 2023. In constant euros, profit rose 16%, supported by strong revenue growth across all global businesses and regions. |
||||||||||
| u | In 2024, attributable profit totalled EUR 12,574 million, 14% higher than in 2023 (+15% in constant euros), underpinned by solid revenue growth, which outpaced the rise in costs, and with a cost of risk improvement. |
||||||||||
| u | By business, notable year-on-year profit growth in Retail, CIB and Wealth. Consumer's bottom line performance was impacted by higher CHF mortgage portfolio provisions in Poland and the provision related to motor finance in the UK, while Payments reflected impacts related to the discontinuation of our merchant platform in Germany and Superdigital in Latin America. |
||||||||||
| u | These strong Group results, with record levels of net interest income, net fee income, total income, net operating income and profit, enabled us to achieve the 2024 targets that we upgraded in Q2 2024. |
||||||||||
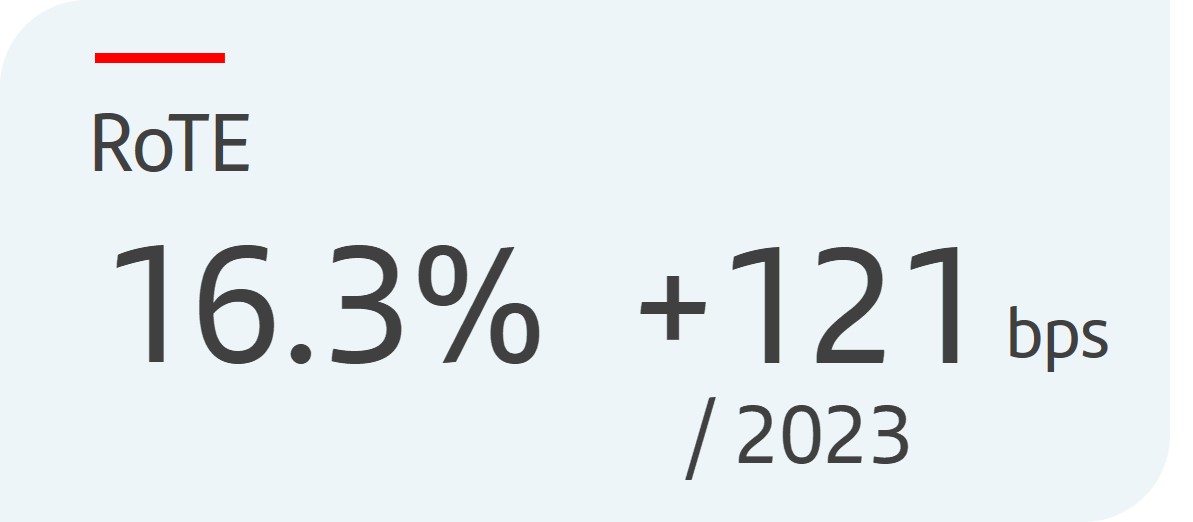 |
u | Profitability improved strongly year-on-year. RoTE in 2024 stood at 16.3%, compared to 15.1% in 2023. |
|||||||||
| u | Sustained earnings per share growth, increasing 18% year-on-year to EUR 77.1 cents in 2024, supported by the good performance in profit and the share buybacks executed in the last 12 months. |
||||||||||
 |
u |
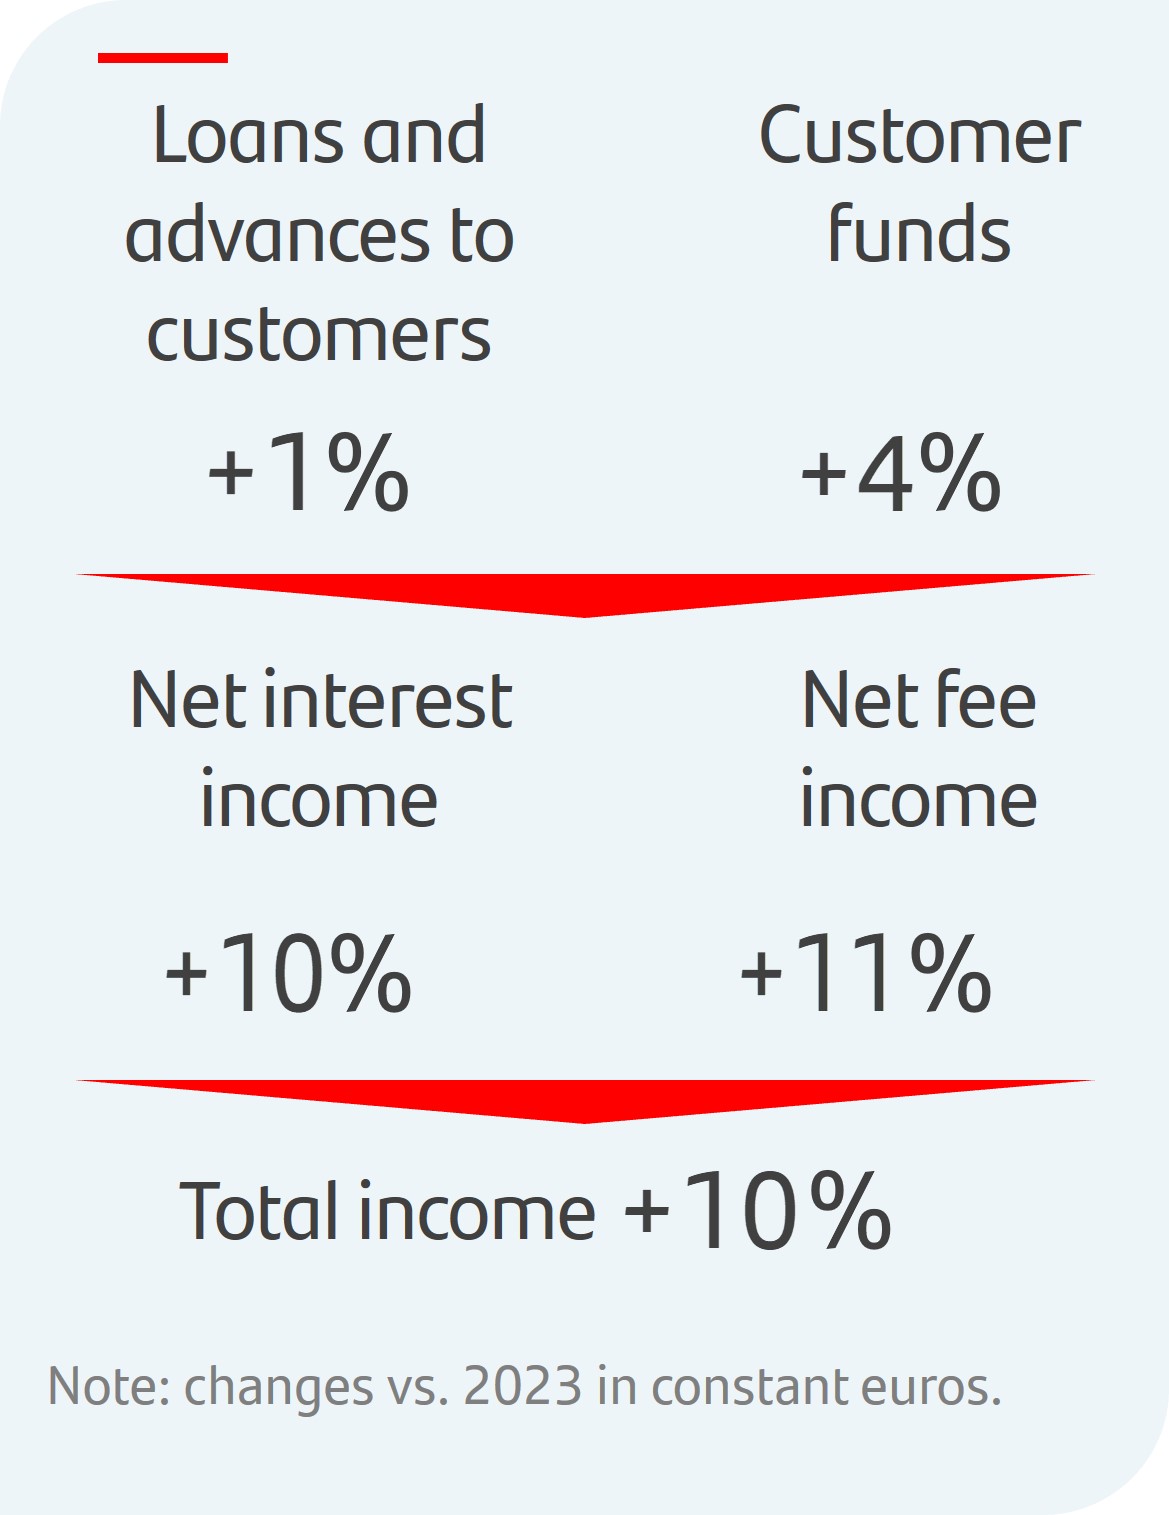
In terms of business volumes, growth of customer funds continued to outpace loans and advances to customers while we continued to focus on active capital management and disciplined capital allocation.
Gross loans and advances to customers (excluding reverse repos) rose 1% year-on-year in constant euros, supported by increases in Consumer, Payments and Wealth. They were stable in CIB and they decreased slightly in Retail, as higher volumes in South America and Mexico did not completely offset the fall in Europe due to Spain (prepayments) and the UK (strategy to prioritize profitability), and in the US (focus on capital optimization).
Customer funds (customer deposits excluding repurchase agreements plus mutual funds) increased 4% year-on-year in constant euros, underpinned by double-digit growth in mutual funds and a rise in deposits, mainly due to demand deposits, with a recovery in the quarter, particularly in Europe in a falling interest rate environment.
|
|||||||||
| u | The benefits from our global scale, margin management and higher customer activity were reflected in year-on-year increases in net interest income (+8%, +10% in constant euros) and net fee income (+8%, +11% in constant euros), resulting in 8% total income growth (+10% in constant euros). |
||||||||||
 |
u | The structural changes we have implemented to move towards a simpler and more integrated model through ONE Transformation continued to contribute to efficiency gains and profitable growth. The efficiency ratio improved 2.3 pp year-on-year to 41.8% driven mainly by Retail, Consumer and Wealth. |
|||||||||
 |
u | Credit quality remains robust, supported by the positive overall macroeconomic environment and employment across our footprint. The NPL ratio improved 9 bps year-on-year to 3.05%. Total loan-loss reserves reached EUR 22,835 million, resulting in an NPL coverage ratio of 65%. |
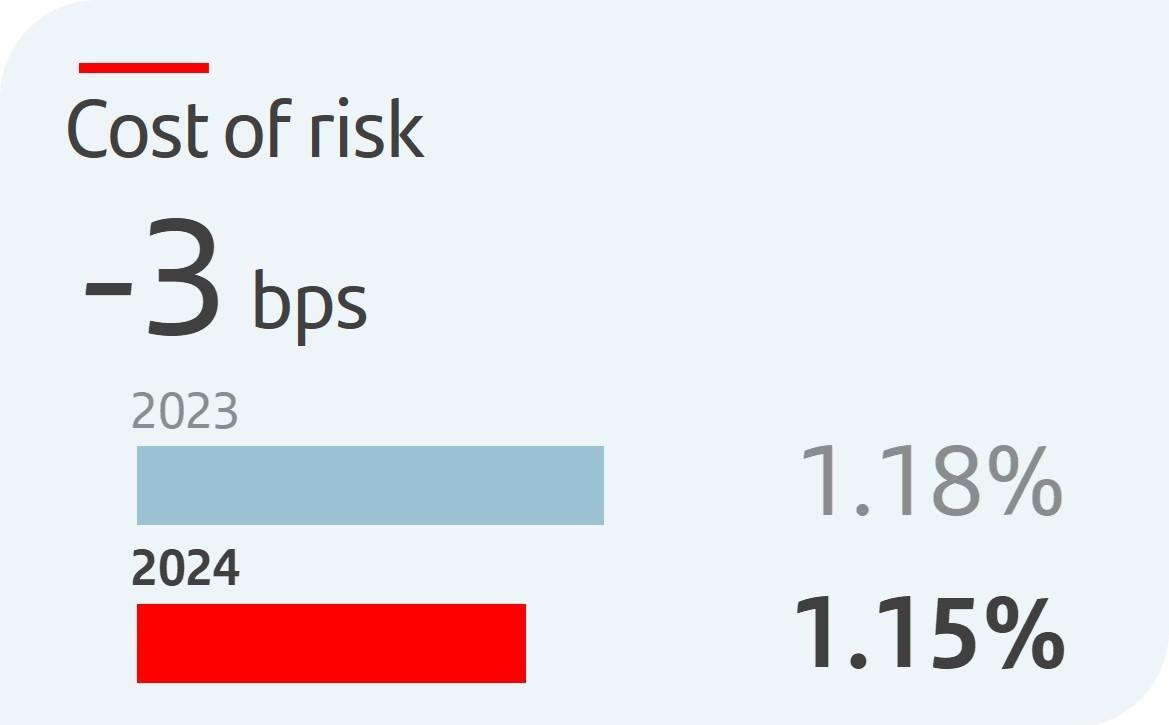
|||||||||
| u | The Group's cost of risk improved 3 bps year-on-year to 1.15%, better than our target for 2024. In Retail, the cost of risk decreased to 0.92%, while in Consumer, the ratio continued to normalize, remaining at controlled levels (2.16%). Retail and Consumer accounted for approximately 85% of the Group's net loan-loss provisions. |
||||||||||
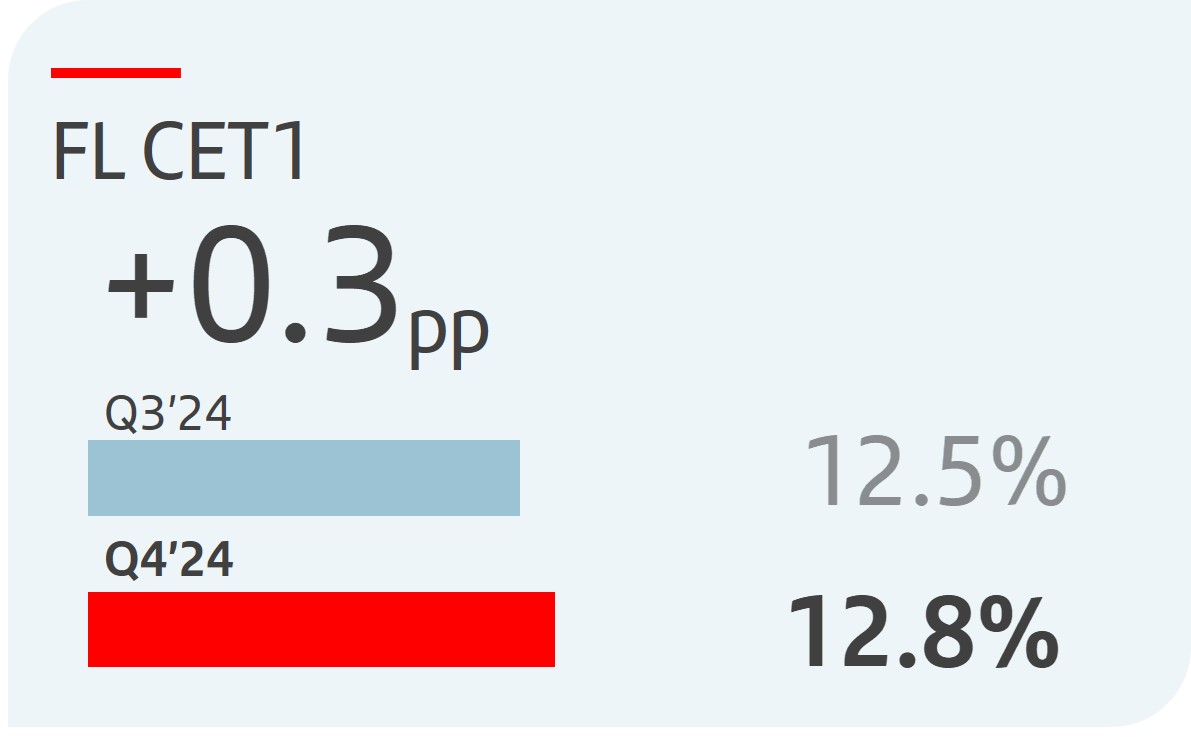 |
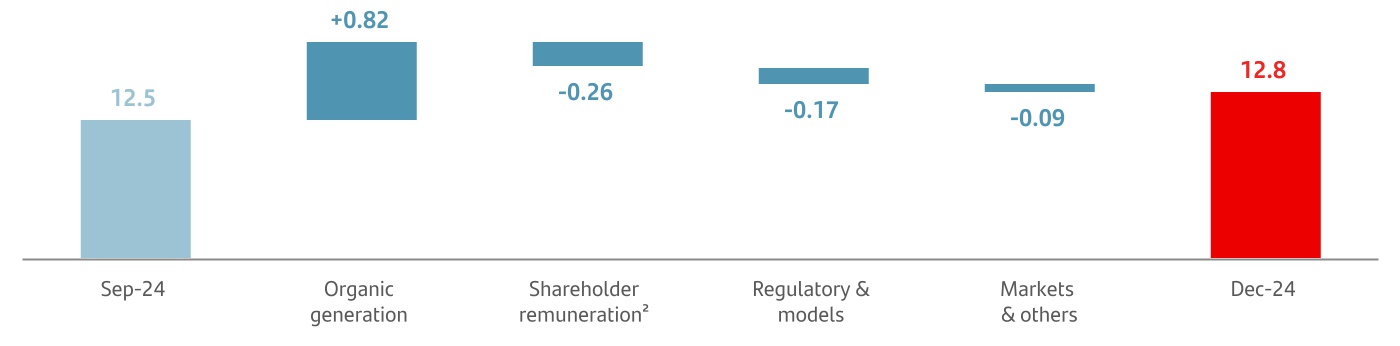
u | As at end December 2024, the fully-loaded CET1 ratio stood at 12.8%, having increased 0.3 pp quarter-on-quarter, supported by 82 bps of organic generation, mainly resulting from gross profit generation, risk transfer and RWA mobilization, which amply offset RWA growth. The ratio was also impacted by a 26 bp deduction for expected shareholder remuneration against profit earned in Q4 2024 in line with our 50% payout target1, -17 bps in regulatory charges (SME models and DTAs) and -9 bps in markets and others. |
|||||||||
6 |
|
January - December 2024 |
||||||
| Highlights of the period | |||||||||||||||||||||||
 |
Think Value |
|||||||
 |
u |
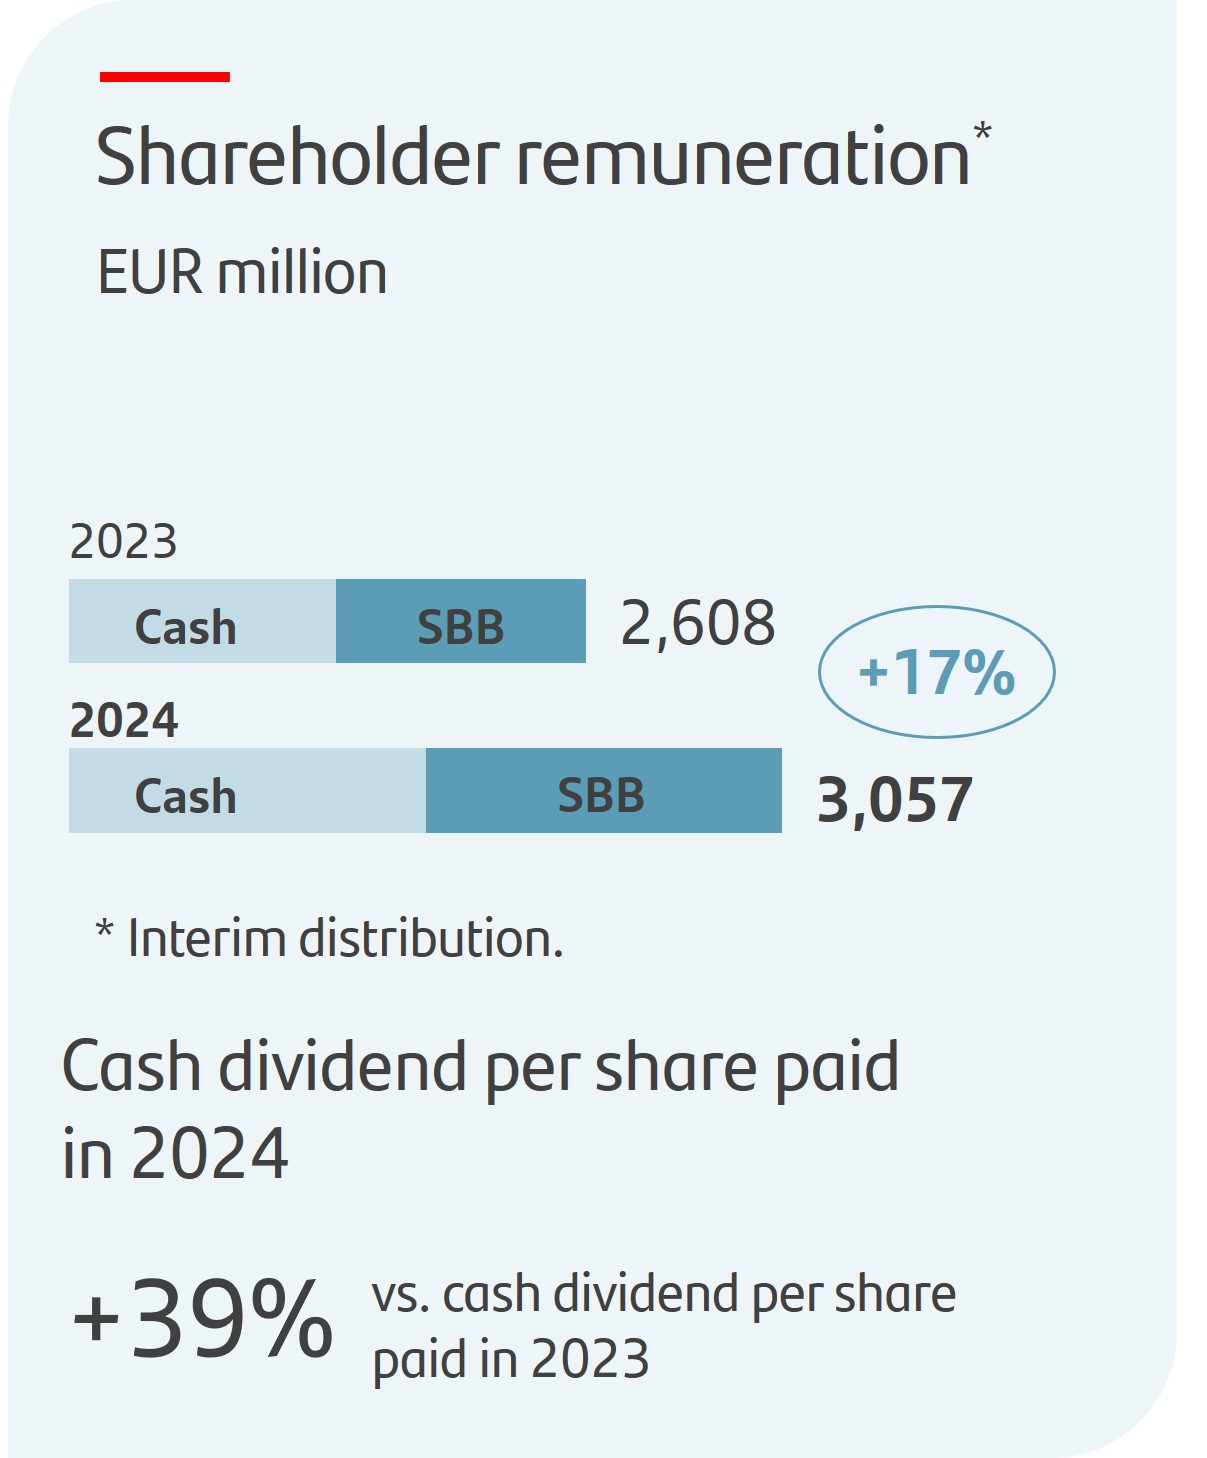
In November, in accordance with the 2024 shareholder remuneration policy, the bank paid an interim cash dividend against 2024 results of EUR 10.00 cents per share, 23% higher than its 2023 equivalent. Including the EUR 9.50 cent dividend paid in May 2024, the total cash dividend per share during 2024 was 39% greater than cash dividends per share paid during 2023.
In addition, between 27 August 2024 and 3 December 2024, the bank carried out the first share buyback programme against 2024 results totalling EUR 1,525 million.
|
|||||||||
| As a result, in this first round of shareholder remuneration charged against 2024 results, payout surpassed EUR 3,057 million, 17% higher than its equivalent in 2023, and represented approximately 50% of H1 2024 attributable profit (approximately 25% in cash dividends and 25% in share buybacks). | |||||||||||
u |
The bank's board of directors is expected to propose to the AGM the approval of a final cash dividend, in line with the current shareholder remuneration policy1. The total cash dividend per share charged against 2024 results is expected to be approximately 20% higher than the one charged against 2023 results. |
||||||||||
 |
|||||||||||
u |
As at end December 2024, TNAV per share was EUR 5.24. Including the EUR 9.50 cent dividend per share paid in May 2024 and the EUR 10.00 cent dividend per share paid in November 2024, the TNAV per share + cash dividend per share increased 14% year-on-year. |
||||||||||
|
Think Customer |
|||||||
 |
u |
Our efforts to simplify and improve our product offering and service quality are reflected in an increase of 8 million customers year-on-year, bringing our total customers to 173 million. We have 103 million active customers, up 4 million year-on-year. |
|||||||||
u |
The volume of transactions per active customer rose 9% year-on-year in 2024. |
||||||||||
u |
We continue to focus on delivering great customer experience and improving our service quality, ranking in the top 3 in NPS2 in seven of our markets. |
||||||||||
|
Think Global |
|||||||
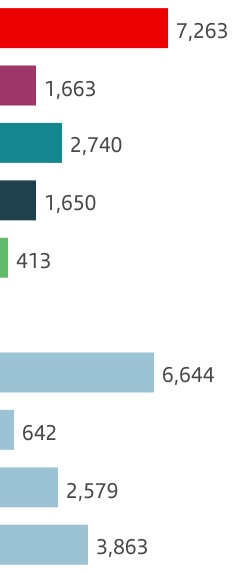
Contribution to Group revenue3 |
2024 data. Year-on-year changes in constant euros | ||||||||||
 |
u |
In Retail, attributable profit was EUR 7,263 million (+29%) driven by 11% growth in total income, structural improvements in costs due to our transformation efforts and lower provisions. |
|||||||||
u |
Efficiency improved 3.4 pp to 39.7%, cost of risk decreased year-on-year to 0.92%. RoTE increased to 18.9%. |
||||||||||
 |
|||||||||||
u |
In Consumer, net operating income grew 11%, backed by positive trends in total income (+6%) and costs (-1%), which were not reflected in attributable profit's performance (-12% to EUR 1,663 million), due to cost of risk normalization and higher provisions (CHF mortgages in Poland and the aforementioned provision in the UK). |
||||||||||
u |
Efficiency stood at 40.1%, improving 2.7 pp, cost of risk continued to normalize reaching 2.16% and RoTE stood at 9.8%. |
||||||||||
 |
u |
In CIB, record attributable profit of EUR 2,740 million, up 16%, driven by all-time high revenue, supported by double-digit growth in both net interest income and net fee income. |
|||||||||
u |
The efficiency ratio stood at 45.6%. RoTE was 18.1%. |
||||||||||
 |
u |
In Wealth, attributable profit amounted to EUR 1,650 million (+14%) underpinned by increased activity, good margin management and higher fees, boosted especially by Private Banking. |
|||||||||
u |
Efficiency improved 2.0 pp to 35.9% and RoTE was 78.7%. |
||||||||||
 |
u |
In Payments, attributable profit reached EUR 413 million, impacted by write-downs in PagoNxt related to the discontinuation of our merchant platform in Germany and Superdigital in Latin America in Q2 2024. Excluding them, profit increased 18% year-on-year, supported by revenue growth. |
|||||||||
u |
Cost of risk stood at 7.39%. In PagoNxt, EBITDA margin reached 27.5% (+2.7 pp year-on-year). |
||||||||||
January - December 2024 |
|
7 |
||||||
| Statutory income statement | ||||||||||||||||||||||||||||||||||||||
| Grupo Santander. Summarized income statement | ||||||||||||||||||||
| EUR million | ||||||||||||||||||||
| Change | Change | |||||||||||||||||||
| Q4'24 | Q3'24 | % | 2024 | 2023 | % | |||||||||||||||
| Net interest income | 11,986 | 11,225 | 6.8 | 46,668 | 43,261 | 7.9 | ||||||||||||||
Net fee income1 |
3,344 | 3,189 | 4.9 | 13,010 | 12,057 | 7.9 | ||||||||||||||
Gains or losses on financial assets and liabilities and exchange differences2 |
780 | 536 | 45.5 | 2,273 | 2,633 | (13.7) | ||||||||||||||
| Dividend income | 130 | 91 | 42.9 | 714 | 571 | 25.0 | ||||||||||||||
| Share of results of entities accounted for using the equity method | 214 | 194 | 10.3 | 711 | 613 | 16.0 | ||||||||||||||
Other operating income/expenses (net)3 |
(428) | (100) | 328.0 | (1,500) | (1,712) | (12.4) | ||||||||||||||
| Total income | 16,026 | 15,135 | 5.9 | 61,876 | 57,423 | 7.8 | ||||||||||||||
| Operating expenses | (6,772) | (6,349) | 6.7 | (26,034) | (25,425) | 2.4 | ||||||||||||||
| Administrative expenses | (5,948) | (5,535) | 7.5 | (22,740) | (22,241) | 2.2 | ||||||||||||||
| Staff costs | (3,770) | (3,497) | 7.8 | (14,328) | (13,726) | 4.4 | ||||||||||||||
| Other general administrative expenses | (2,178) | (2,038) | 6.9 | (8,412) | (8,515) | (1.2) | ||||||||||||||
| Depreciation and amortization | (824) | (814) | 1.2 | (3,294) | (3,184) | 3.5 | ||||||||||||||
| Provisions or reversal of provisions | (1,362) | (759) | 79.4 | (3,883) | (2,678) | 45.0 | ||||||||||||||
| Impairment or reversal of impairment of financial assets not measured at fair value through profit or loss (net) | (3,120) | (2,947) | 5.9 | (12,644) | (12,956) | (2.4) | ||||||||||||||
| Impairment on other assets (net) | (192) | (146) | 31.5 | (628) | (237) | 165.0 | ||||||||||||||
| Gains or losses on non-financial assets and investments, net | (4) | 5 | — | 367 | 313 | 17.3 | ||||||||||||||
| Negative goodwill recognized in results | — | — | — | — | 39 | (100.0) | ||||||||||||||
| Gains or losses on non-current assets held for sale not classified as discontinued operations | 24 | (20) | — | (27) | (20) | 35.0 | ||||||||||||||
| Profit or loss before tax from continuing operations | 4,600 | 4,919 | (6.5) | 19,027 | 16,459 | 15.6 | ||||||||||||||
| Tax expense or income from continuing operations | (1,037) | (1,330) | (22.0) | (5,283) | (4,276) | 23.6 | ||||||||||||||
| Profit from the period from continuing operations | 3,563 | 3,589 | (0.7) | 13,744 | 12,183 | 12.8 | ||||||||||||||
| Profit or loss after tax from discontinued operations | — | — | — | — | — | — | ||||||||||||||
| Profit for the period | 3,563 | 3,589 | (0.7) | 13,744 | 12,183 | 12.8 | ||||||||||||||
| Profit attributable to non-controlling interests | (298) | (339) | (12.1) | (1,170) | (1,107) | 5.7 | ||||||||||||||
| Profit attributable to the parent | 3,265 | 3,250 | 0.5 | 12,574 | 11,076 | 13.5 | ||||||||||||||
| EPS (euros) | 0.20 | 0.20 | 0.8 | 0.77 | 0.65 | 17.9 | ||||||||||||||
| Diluted EPS (euros) | 0.20 | 0.20 | 0.7 | 0.77 | 0.65 | 17.9 | ||||||||||||||
| Memorandum items: | ||||||||||||||||||||
| Average total assets | 1,834,476 | 1,793,758 | 2.3 | 1,803,272 | 1,773,103 | 1.7 | ||||||||||||||
| Average stockholders' equity | 97,952 | 96,720 | 1.3 | 96,744 | 93,035 | 4.0 | ||||||||||||||
| Note: the summarized income statement groups some lines of the consolidated statutory income statement on page 60 as follows: | |||||
1.‘Commission income’ and ‘Commission expense’. | |||||
2.‘Gain or losses on financial assets and liabilities not measured at fair value through profit or loss, net’; ‘Gain or losses on financial assets and liabilities held for trading, net’; ‘Gains or losses on non-trading financial assets and liabilities mandatorily at fair value through profit or loss’; ‘Gain or losses on financial assets and liabilities measured at fair value through profit or loss, net’; ‘Gain or losses from hedge accounting, net’; and ‘Exchange differences, net’. | |||||
3.‘Other operating income’; ‘Other operating expenses’; ’Income from insurance and reinsurance contracts’; and ‘Expenses from insurance and reinsurance contracts’. | |||||
8 |
|
January - December 2024 |
||||||
| Underlying income statement | ||||||||||||||||||||||||||||||||||||||
| Summarized underlying income statement | ||||||||||||||||||||||||||
| EUR million | Change | Change | ||||||||||||||||||||||||
| Q4'24 | Q3'24 | % | % excl. FX | 2024 | 2023 | % | % excl. FX | |||||||||||||||||||
| Net interest income | 11,986 | 11,225 | 6.8 | 6.9 | 46,668 | 43,261 | 7.9 | 9.5 | ||||||||||||||||||
| Net fee income | 3,344 | 3,189 | 4.9 | 5.3 | 13,010 | 12,057 | 7.9 | 10.7 | ||||||||||||||||||
Gains (losses) on financial transactions 1 |
780 | 536 | 45.5 | 44.6 | 2,273 | 2,633 | (13.7) | (11.3) | ||||||||||||||||||
| Other operating income | (84) | 185 | — | — | 260 | (304) | — | — | ||||||||||||||||||
| Total income | 16,026 | 15,135 | 5.9 | 6.1 | 62,211 | 57,647 | 7.9 | 9.9 | ||||||||||||||||||
| Administrative expenses and amortizations | (6,772) | (6,349) | 6.7 | 6.6 | (26,034) | (25,425) | 2.4 | 4.0 | ||||||||||||||||||
| Net operating income | 9,254 | 8,786 | 5.3 | 5.7 | 36,177 | 32,222 | 12.3 | 14.6 | ||||||||||||||||||
| Net loan-loss provisions | (3,114) | (2,976) | 4.6 | 5.0 | (12,333) | (12,458) | (1.0) | 2.0 | ||||||||||||||||||
| Other gains (losses) and provisions | (1,540) | (891) | 72.8 | 72.0 | (4,817) | (3,066) | 57.1 | 58.9 | ||||||||||||||||||
| Profit before tax | 4,600 | 4,919 | (6.5) | (5.9) | 19,027 | 16,698 | 13.9 | 15.6 | ||||||||||||||||||
| Tax on profit | (1,037) | (1,330) | (22.0) | (21.1) | (5,283) | (4,489) | 17.7 | 19.0 | ||||||||||||||||||
| Profit from continuing operations | 3,563 | 3,589 | (0.7) | (0.2) | 13,744 | 12,209 | 12.6 | 14.4 | ||||||||||||||||||
| Net profit from discontinued operations | — | — | — | — | — | — | — | — | ||||||||||||||||||
| Consolidated profit | 3,563 | 3,589 | (0.7) | (0.2) | 13,744 | 12,209 | 12.6 | 14.4 | ||||||||||||||||||
| Non-controlling interests | (298) | (339) | (12.1) | (11.2) | (1,170) | (1,133) | 3.3 | 5.3 | ||||||||||||||||||
| Net capital gains and provisions | — | — | — | — | — | — | — | — | ||||||||||||||||||
| Profit attributable to the parent | 3,265 | 3,250 | 0.5 | 0.9 | 12,574 | 11,076 | 13.5 | 15.3 | ||||||||||||||||||
Underlying profit attributable to the parent 2 |
3,265 | 3,250 | 0.5 | 0.9 | 12,574 | 11,076 | 13.5 | 15.3 | ||||||||||||||||||
January - December 2024 |
|
9 |
||||||
| Grupo Santander. Condensed balance sheet | |||||||||||||||||
| EUR million | |||||||||||||||||
| Change | |||||||||||||||||
| Assets | Dec-24 | Dec-23 | Absolute | % | Dec-22 | ||||||||||||
| Cash, cash balances at central banks and other demand deposits | 192,208 | 220,342 | (28,134) | (12.8) | 223,073 | ||||||||||||
| Financial assets held for trading | 230,253 | 176,921 | 53,332 | 30.1 | 156,118 | ||||||||||||
| Debt securities | 82,646 | 62,124 | 20,522 | 33.0 | 41,403 | ||||||||||||
| Equity instruments | 16,636 | 15,057 | 1,579 | 10.5 | 10,066 | ||||||||||||
| Loans and advances to customers | 26,591 | 11,634 | 14,957 | 128.6 | 9,550 | ||||||||||||
| Loans and advances to central banks and credit institutions | 40,280 | 31,778 | 8,502 | 26.8 | 28,097 | ||||||||||||
| Derivatives | 64,100 | 56,328 | 7,772 | 13.8 | 67,002 | ||||||||||||
Financial assets designated at fair value through profit or loss1 |
14,045 | 15,683 | (1,638) | (10.4) | 14,702 | ||||||||||||
| Loans and advances to customers | 5,652 | 7,201 | (1,549) | (21.5) | 6,642 | ||||||||||||
| Loans and advances to central banks and credit institutions | 408 | 459 | (51) | (11.1) | 673 | ||||||||||||
| Other (debt securities an equity instruments) | 7,985 | 8,023 | (38) | (0.5) | 7,387 | ||||||||||||
| Financial assets at fair value through other comprehensive income | 89,898 | 83,308 | 6,590 | 7.9 | 85,239 | ||||||||||||
| Debt securities | 76,558 | 73,565 | 2,993 | 4.1 | 75,083 | ||||||||||||
| Equity instruments | 2,193 | 1,761 | 432 | 24.5 | 1,941 | ||||||||||||
| Loans and advances to customers | 10,784 | 7,669 | 3,115 | 40.6 | 8,215 | ||||||||||||
| Loans and advances to central banks and credit institutions | 363 | 313 | 50 | 16.0 | — | ||||||||||||
| Financial assets measured at amortized cost | 1,203,707 | 1,191,403 | 12,304 | 1.0 | 1,147,044 | ||||||||||||
| Debt securities | 120,949 | 103,559 | 17,390 | 16.8 | 73,554 | ||||||||||||
| Loans and advances to customers | 1,011,042 | 1,009,845 | 1,197 | 0.1 | 1,011,597 | ||||||||||||
| Loans and advances to central banks and credit institutions | 71,716 | 77,999 | (6,283) | (8.1) | 61,893 | ||||||||||||
| Investments in subsidiaries, joint ventures and associates | 7,277 | 7,646 | (369) | (4.8) | 7,615 | ||||||||||||
| Tangible assets | 32,087 | 33,882 | (1,795) | (5.3) | 34,073 | ||||||||||||
| Intangible assets | 19,259 | 19,871 | (612) | (3.1) | 18,645 | ||||||||||||
| Goodwill | 13,438 | 14,017 | (579) | (4.1) | 13,741 | ||||||||||||
| Other intangible assets | 5,821 | 5,854 | (33) | (0.6) | 4,904 | ||||||||||||
Other assets2 |
48,347 | 48,006 | 341 | 0.7 | 48,150 | ||||||||||||
| Total assets | 1,837,081 | 1,797,062 | 40,019 | 2.2 | 1,734,659 | ||||||||||||
| Liabilities and shareholders' equity | |||||||||||||||||
| Financial liabilities held for trading | 152,151 | 122,270 | 29,881 | 24.4 | 115,185 | ||||||||||||
| Customer deposits | 18,984 | 19,837 | (853) | (4.3) | 12,226 | ||||||||||||
| Debt securities issued | — | — | — | — | — | ||||||||||||
| Deposits by central banks and credit institutions | 39,584 | 25,670 | 13,914 | 54.2 | 15,553 | ||||||||||||
| Derivatives | 57,753 | 50,589 | 7,164 | 14.2 | 64,891 | ||||||||||||
| Other | 35,830 | 26,174 | 9,656 | 36.9 | 22,515 | ||||||||||||
| Financial liabilities designated at fair value through profit or loss | 36,360 | 40,367 | (4,007) | (9.9) | 40,268 | ||||||||||||
| Customer deposits | 25,407 | 32,052 | (6,645) | (20.7) | 31,143 | ||||||||||||
| Debt securities issued | 7,554 | 5,371 | 2,183 | 40.6 | 5,427 | ||||||||||||
| Deposits by central banks and credit institutions | 3,399 | 2,944 | 455 | 15.5 | 3,698 | ||||||||||||
| Other | — | — | — | — | — | ||||||||||||
| Financial liabilities measured at amortized cost | 1,484,322 | 1,468,703 | 15,619 | 1.1 | 1,423,858 | ||||||||||||
| Customer deposits | 1,011,545 | 995,280 | 16,265 | 1.6 | 966,353 | ||||||||||||
| Debt securities issued | 317,967 | 303,208 | 14,759 | 4.9 | 274,912 | ||||||||||||
| Deposits by central banks and credit institutions | 114,894 | 130,028 | (15,134) | (11.6) | 145,534 | ||||||||||||
| Other | 39,916 | 40,187 | (271) | (0.7) | 37,059 | ||||||||||||
| Liabilities under insurance contracts | 17,829 | 17,799 | 30 | 0.2 | 16,426 | ||||||||||||
| Provisions | 8,407 | 8,441 | (34) | (0.4) | 8,149 | ||||||||||||
Other liabilities3 |
30,685 | 35,241 | (4,556) | (12.9) | 33,188 | ||||||||||||
| Total liabilities | 1,729,754 | 1,692,821 | 36,933 | 2.2 | 1,637,074 | ||||||||||||
| Shareholders' equity | 135,196 | 130,443 | 4,753 | 3.6 | 124,732 | ||||||||||||
| Capital stock | 7,576 | 8,092 | (516) | (6.4) | 8,397 | ||||||||||||
Reserves (including treasury stock)4 |
116,578 | 112,573 | 4,005 | 3.6 | 107,709 | ||||||||||||
| Profit attributable to the Group | 12,574 | 11,076 | 1,498 | 13.5 | 9,605 | ||||||||||||
| Less: dividends | (1,532) | (1,298) | (234) | 18.0 | (979) | ||||||||||||
| Other comprehensive income | (36,595) | (35,020) | (1,575) | 4.5 | (35,628) | ||||||||||||
| Minority interests | 8,726 | 8,818 | (92) | (1.0) | 8,481 | ||||||||||||
| Total equity | 107,327 | 104,241 | 3,086 | 3.0 | 97,585 | ||||||||||||
| Total liabilities and equity | 1,837,081 | 1,797,062 | 40,019 | 2.2 | 1,734,659 | ||||||||||||
| Note: The condensed balance sheet groups some lines of the consolidated balance sheet on pages 58 and 59 as follows: | ||
1.'Non-trading financial assets mandatorily at fair value through profit or loss' and 'Financial assets designated at fair value through profit or loss'. | ||
2.‘Hedging derivatives’; ‘Changes in the fair value of hedged items in portfolio hedges of interest risk’; 'Assets under reinsurance contracts'; ‘Tax assets’; ‘Other assets’; and 'Non-current assets held for sale’. | ||
3.‘Hedging derivatives’; ‘Changes in the fair value of hedged items in portfolio hedges of interest rate risk’; ‘Tax liabilities’; ‘Other liabilities’; and ‘Liabilities associated with non-current assets held for sale‘. | ||
4.‘Share premium’; ‘Equity instruments issued other than capital’; ‘Other equity’; ‘Accumulated retained earnings’; ‘Revaluation reserves’; ‘Other reserves’; and ‘Own shares (-)’. | ||
10 |
|
January - December 2024 |
||||||
| Balance sheet | ||||||||||||||||||||
| EUR million | ||||||||||||||||||||
| / | Sep-24 | / | Dec-23 | |||||||||||||||||
| Dec-24 | % | % excl. FX | % | % excl. FX | ||||||||||||||||
| Loans and advances to customers | 1,054,070 | (1.3) | (1.8) | 1.7 | 2.2 | |||||||||||||||
| Customer deposits | 1,055,936 | 1.0 | 0.5 | 0.8 | 1.6 | |||||||||||||||
| Memorandum items: | ||||||||||||||||||||
Gross loans and advances to customers 1 |
1,016,546 | 0.3 | (0.1) | 0.2 | 0.9 | |||||||||||||||
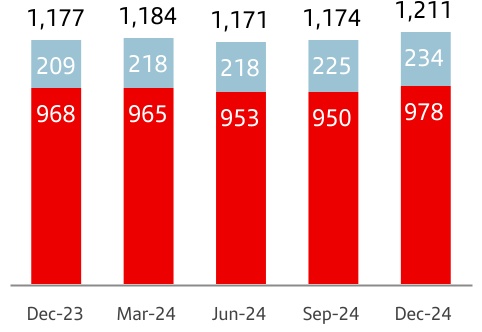
| Customer funds | 1,211,342 | 3.2 | 3.0 | 2.9 | 4.4 | |||||||||||||||
Customer deposits 2 |
977,620 | 2.9 | 2.6 | 1.0 | 1.6 | |||||||||||||||
| Mutual funds | 233,722 | 4.1 | 4.8 | 12.1 | 18.1 | |||||||||||||||
| Gross loans and advances to customers (excl. reverse repos) | |||||
| EUR billion | |||||
| 0 | % | 1 | |||
| Dec-24 / Dec-23 | |||||
| Customer funds | ||
| EUR billion | ||
| +3 | % | 1a |
||||||
| +12 | % | |||||||
| +1 | % | |||||||
•Total | ||||||||
• Mutual funds | ||||||||
|
•Deposits
exc. repos
| ||||||||
| Dec-24 / Dec-23 | ||||||||
| Gross loans and advances to customers (excl. reverse repos) | ||
| % operating areas. December 2024 | ||
| Customer funds | ||
| % operating areas. December 2024 | ||
January - December 2024 |
|
11 |
||||||
Eligible capital. December 2024 | ||||||||
| EUR million | ||||||||
| Fully-loaded | Phased-in1 |
|||||||
| CET1 | 79,705 | 79,799 | ||||||
| Basic capital | 90,076 | 90,170 | ||||||
| Eligible capital | 107,105 | 108,588 | ||||||
| Risk-weighted assets | 624,477 | 624,503 | ||||||
| % | % | |||||||
| CET1 capital ratio | 12.8 | 12.8 | ||||||
| Tier 1 capital ratio | 14.4 | 14.4 | ||||||
| Total capital ratio | 17.2 | 17.4 | ||||||
| Fully-loaded capital ratio | ||||||||
 | ||||||||
| TNAV per share | ||||||||
TNAV per share was EUR 5.24, increasing 14% year-on-year including the cash dividends. | ||||||||
Eligible capital (phased-in) 1. Consolidated | |||||||||||||||||
| EUR million | |||||||||||||||||
| Change | |||||||||||||||||
| Dec-24 | Dec-23 | Absolute | % | Dec-22 | |||||||||||||
| Capital stock and reserves | 124,263 | 121,185 | 3,078 | 2.5 | 116,956 | ||||||||||||
| Attributable profit | 12,574 | 11,076 | 1,498 | 13.5 | 9,605 | ||||||||||||
| Dividends | (3,144) | (2,769) | (375) | 13.5 | (1,921) | ||||||||||||
| Other retained earnings | (38,323) | (34,484) | (3,839) | 11.1 | (35,068) | ||||||||||||
| Minority interests | 8,479 | 6,899 | 1,580 | 22.9 | 7,416 | ||||||||||||
| Goodwill and intangible assets | (15,957) | (17,220) | 1,263 | (7.3) | (17,182) | ||||||||||||
| Other deductions | (8,093) | (7,946) | (146) | 1.8 | (5,604) | ||||||||||||
| CET1 | 79,799 | 76,741 | 3,059 | 4.0 | 74,202 | ||||||||||||
| Preferred shares and other eligible tier 1 | 10,371 | 9,002 | 1,369 | 15.2 | 8,831 | ||||||||||||
| Tier 1 | 90,170 | 85,742 | 4,428 | 5.2 | 83,033 | ||||||||||||
| Generic funds and eligible tier 2 instruments | 18,418 | 16,497 | 1,921 | 11.6 | 14,359 | ||||||||||||
| Eligible capital | 108,588 | 102,240 | 6,349 | 6.2 | 97,392 | ||||||||||||
| Risk-weighted assets | 624,503 | 623,731 | 772 | 0.1 | 609,266 | ||||||||||||
| CET1 capital ratio | 12.8 | 12.3 | 0.5 | 12.2 | |||||||||||||
| Tier 1 capital ratio | 14.4 | 13.7 | 0.7 | 13.6 | |||||||||||||
| Total capital ratio | 17.4 | 16.4 | 1.0 | 16.0 | |||||||||||||
| Fully-loaded CET1 ratio performance | ||
| % | ||
12 |
|
January - December 2024 |
||||||
| Key risk metrics | ||||||||||||||||||||||||||||||||||||||||||||||||||
Net loan-loss provisions 1 |
Cost of risk (%) 2 |
NPL ratio (%) | NPL coverage ratio (%) | |||||||||||||||||||||||||||||||||||||||||||||||
| Q4'24 | 2024 | Chg (%) / 2023 |
Chg (%) / Q3'24 |
2024 | Chg (bps) / 2023 |
Chg (bps) / Q3'24 |
2024 | Chg (bps) / 2023 |
Chg (bps) / Q3'24 |
2024 | Chg (pp) / 2023 |
Chg (pp) / Q3'24 |
||||||||||||||||||||||||||||||||||||||
| Retail | 1,388 | 5,845 | (7.3) | 2.8 | 0.92 | (10) | (5) | 3.18 | (3) | (10) | 58.4 | (3.0) | 0.7 | |||||||||||||||||||||||||||||||||||||
| Consumer | 1,248 | 4,562 | 12.4 | 9.8 | 2.16 | 13 | 4 | 5.07 | 33 | 20 | 73.6 | (2.9) | (1.1) | |||||||||||||||||||||||||||||||||||||
| CIB | 17 | 174 | 7.3 | (72.7) | 0.10 | 0 | (11) | 0.86 | (50) | (3) | 39.3 | (2.0) | 3.3 | |||||||||||||||||||||||||||||||||||||
| Wealth | 17 | 41 | — | 57.4 | 0.18 | 25 | 9 | 0.67 | (73) | (2) | 80.3 | 51.0 | 7.2 | |||||||||||||||||||||||||||||||||||||
| Payments | 448 | 1,714 | 8.2 | 10.0 | 7.39 | 17 | 38 | 5.14 | 12 | (38) | 140.1 | 0.3 | 7.0 | |||||||||||||||||||||||||||||||||||||
TOTAL GROUP 3 |
3,114 | 12,333 | 2.0 | 5.0 | 1.15 | (3) | (3) | 3.05 | (9) | (1) | 64.8 | (1.2) | 1.1 | |||||||||||||||||||||||||||||||||||||
| Europe | 418 | 1,862 | (27.7) | (2.0) | 0.32 | (12) | (3) | 2.15 | (17) | (9) | 50.2 | 0.9 | 1.8 | |||||||||||||||||||||||||||||||||||||
| DCB Europe | 345 | 1,209 | 51.9 | 23.6 | 0.88 | 27 | 13 | 2.50 | 37 | 6 | 82.5 | (5.5) | (0.8) | |||||||||||||||||||||||||||||||||||||
| North America | 950 | 3,786 | 2.4 | (0.4) | 2.04 | (1) | (11) | 4.22 | 12 | 24 | 69.7 | (4.2) | (1.6) | |||||||||||||||||||||||||||||||||||||
| South America | 1,404 | 5,478 | 9.0 | 7.3 | 3.50 | 14 | (5) | 5.42 | (30) | (13) | 76.5 | (1.9) | 1.0 | |||||||||||||||||||||||||||||||||||||
TOTAL GROUP 3 |
3,114 | 12,333 | 2.0 | 5.0 | 1.15 | (3) | (3) | 3.05 | (9) | (1) | 64.8 | (1.2) | 1.1 | |||||||||||||||||||||||||||||||||||||
| Coverage ratio by stage | |||||||||||||||||||||||
| EUR billion | |||||||||||||||||||||||
Exposure1 |
Coverage | ||||||||||||||||||||||
| Dec-24 | Sep-24 | Dec-23 | Dec-24 | Sep-24 | Dec-23 | ||||||||||||||||||
| Stage 1 | 1,002 | 1,008 | 1,000 | 0.4 | % | 0.4 | % | 0.4 | % | ||||||||||||||
| Stage 2 | 88 | 87 | 80 | 5.6 | % | 5.7 | % | 6.4 | % | ||||||||||||||
| Stage 3 | 35 | 36 | 36 | 40.6 | % | 40.1 | % | 40.6 | % | ||||||||||||||
| Credit impaired loans and loan-loss allowances | |||||||||||
| EUR million | |||||||||||
| Change (%) | |||||||||||
| Q4'24 | QoQ | YoY | |||||||||
| Balance at beginning of period | 35,723 | 1.8 | 0.5 | ||||||||
| Net additions | 2,819 | (37.4) | (34.1) | ||||||||
| Increase in scope of consolidation | — | (100.0) | — | ||||||||
| Exchange rate differences and other | 115 | — | — | ||||||||
| Write-offs | (3,392) | 0.3 | (10.7) | ||||||||
| Balance at period-end | 35,265 | (1.3) | (1.0) | ||||||||
| Loan-loss allowances | 22,835 | 0.4 | (2.8) | ||||||||
| For impaired assets | 14,301 | 0.4 | (1.1) | ||||||||
| For other assets | 8,534 | 0.5 | (5.5) | ||||||||
January - December 2024 |
|
13 |
||||||
Trading portfolios1. VaR by region | ||||||||||||||
| EUR million | ||||||||||||||
| 2024 | 2023 | |||||||||||||
| Q4 | Average | Last | Average | |||||||||||
| Total | 18.4 | 18.7 | 12.7 | |||||||||||
| Europe | 14.0 | 16.0 | 10.9 | |||||||||||
| North America | 6.2 | 6.4 | 5.3 | |||||||||||
| South America | 9.2 | 9.5 | 6.8 | |||||||||||
Trading portfolios1. VaR by market factor | ||||||||||||||
| EUR million | ||||||||||||||
| Q4 2024 | Min. | Avg. | Max. | Last | ||||||||||
| VaR total | 14.4 | 18.4 | 23.0 | 18.7 | ||||||||||
| Diversification effect | (14.5) | (23.8) | (38.0) | (27.3) | ||||||||||
| Interest rate VaR | 11.4 | 17.1 | 21.6 | 20.2 | ||||||||||
| Equity VaR | 7.0 | 10.6 | 18.8 | 9.5 | ||||||||||
| FX VaR | 4.4 | 6.1 | 8.5 | 5.9 | ||||||||||
| Credit spreads VaR | 3.9 | 5.4 | 7.0 | 5.3 | ||||||||||
| Commodities VaR | 2.2 | 3.0 | 5.1 | 5.1 | ||||||||||
|
Trading portfolios1. VaR performance
| ||
| EUR million | ||
14 |
|
January - December 2024 |
||||||
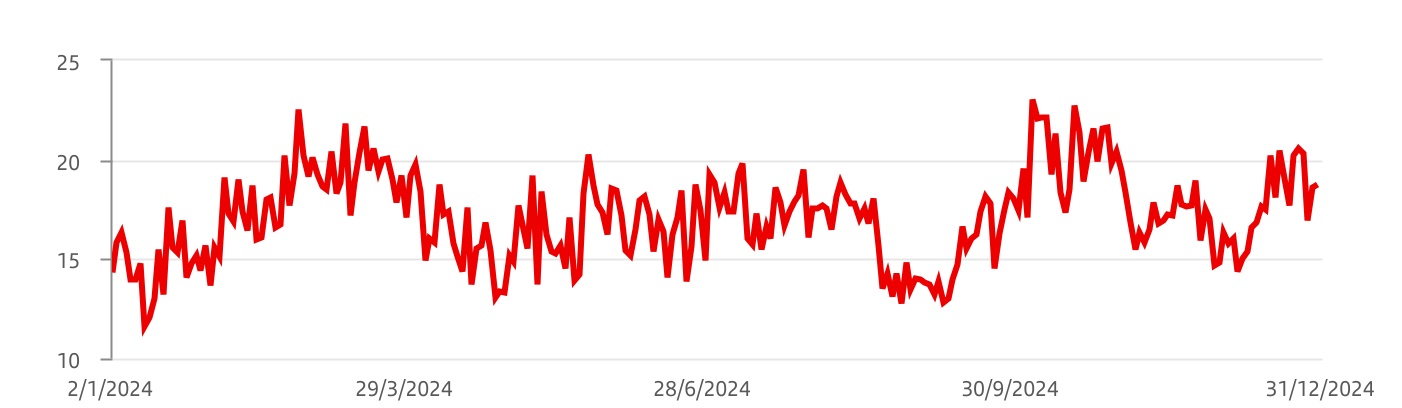
| Share price | ||||||||||||||
 |
 |
|||||||||||||
START 29/12/2023 |
END 31/12/2024 |
|||||||||||||
| €3.780 | €4.465 | |||||||||||||
 |
 |
|||||||||||||
Maximum 29/04/2024 |
Minimum 30/01/2024 |
|||||||||||||
| €4.928 | €3.563 | |||||||||||||
 |
2nd |
||||||||||
| Bank in the eurozone by market capitalization | |||||||||||
EUR 67,648 million | |||||||||||
| The Santander share | |||||
| 31 December 2024 | |||||
| Shares and trading data | |||||
| Shares (number) | 15,152,492,322 | ||||
| Average daily turnover (number of shares) | 30,127,309 | ||||
| Share liquidity (%) | 49 | ||||
| (Annualized number of shares traded during the period / number of shares) | |||||
| Stock market indicators | |||||
| Price / Tangible book value (X) | 0.85 | ||||
| Free float (%) | 99.90 | ||||
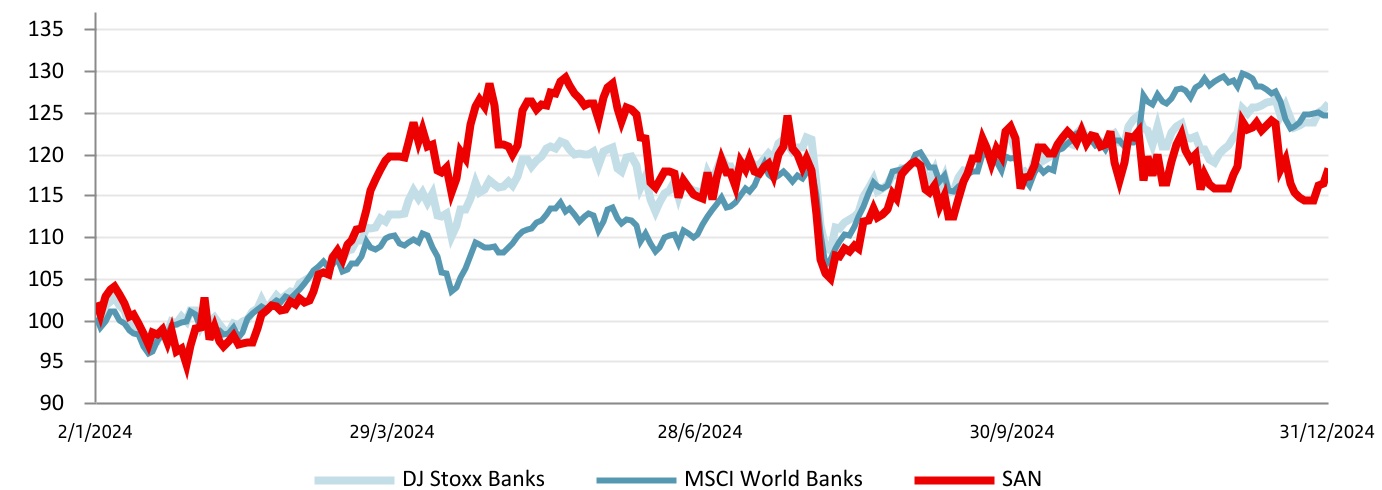
| Comparative share performance | ||
January - December 2024 |
|
15 |
||||||
| Share capital distribution by geographic area | ||||||||
| 31 December 2024 | ||||||||
| The Americas | Europe | Rest of the world | ||||||
| 25.72% | 72.73% | 1.55% | ||||||
 | ||||||||
| Source: Banco Santander, Shareholder Register. | ||||||||
| Share capital distribution by type of shareholder | |||||
| 31 December 2024 | |||||
| Institutions | ||
| 58.70% | ||
| Board* | ||
| 1.29% | ||
| Retail | ||
| 40.01% | ||
16 |
|
January - December 2024 |
||||||
January - December 2024 |
|
17 |
||||||
|
The businesses included in each of the segments in this report and the accounting principles under which their results are presented here may differ from the businesses included and accounting principles applied in the financial information separately prepared and disclosed by our subsidiaries (some of which are publicly listed) which in name or geographical description may seem to correspond to the business areas covered in this report. Accordingly, the results of operations and trends shown for our business areas in this document may differ materially from those of such subsidiaries.
The results of our segments presented below are provided on the basis of underlying results only and include the impact of foreign exchange rate fluctuations. However, for a better understanding of the changes in the performance of our business areas, we also provide and discuss the year-on-year changes to our results excluding such exchange rate impacts (i.e. in constant euros), except for Argentina, and any grouping which includes it, where the variations in constant euros have been calculated considering the Argentine peso exchange rate on the last working day for each of the periods presented. Additionally, from Q2 2024 onwards for the Argentine peso, we apply an alternative exchange rate that better reflects the evolution of inflation (we continue to apply the official ARS exchange rate to all prior periods). For further information, see methodology in the 'Alternative performance measures' section in the appendix to this report.
Certain figures contained in this report, have been subject to rounding to enhance their presentation. Accordingly, in certain instances, the sum of the numbers in a column or a row in tables contained in this report may not conform exactly to the total figure given for that column or row.
| ||
18 |
|
January - December 2024 |
||||||
| January-December 2024 | ||||||||||||||||||||
| Main items of the underlying income statement | ||||||||||||||||||||
| EUR million | ||||||||||||||||||||
| Primary segments | Net interest income |
Net fee income |
Total income |
Net operating income |
Profit before tax |
Profit attributable to the parent | ||||||||||||||
| Retail & Commercial Banking | 27,942 | 4,681 | 32,461 | 19,584 | 10,874 | 7,263 | ||||||||||||||
| Digital Consumer Bank | 10,777 | 1,508 | 12,916 | 7,733 | 2,232 | 1,663 | ||||||||||||||
| Corporate & Investment Banking | 4,020 | 2,548 | 8,343 | 4,537 | 4,009 | 2,740 | ||||||||||||||
| Wealth Management & Insurance | 1,627 | 1,489 | 3,661 | 2,348 | 2,259 | 1,650 | ||||||||||||||
| Payments | 2,609 | 2,793 | 5,505 | 3,030 | 969 | 413 | ||||||||||||||
| PagoNxt | 132 | 958 | 1,240 | 80 | (233) | (299) | ||||||||||||||
| Cards | 2,478 | 1,835 | 4,265 | 2,950 | 1,202 | 712 | ||||||||||||||
| Corporate Centre | (308) | (11) | (676) | (1,055) | (1,317) | (1,154) | ||||||||||||||
| TOTAL GROUP | 46,668 | 13,010 | 62,211 | 36,177 | 19,027 | 12,574 | ||||||||||||||
| Secondary segments | ||||||||||||||||||||
| Europe | 16,720 | 4,659 | 23,510 | 14,102 | 10,129 | 6,644 | ||||||||||||||
| Spain | 7,256 | 2,867 | 11,974 | 7,703 | 5,440 | 3,762 | ||||||||||||||
| United Kingdom | 4,950 | 283 | 5,216 | 2,299 | 1,794 | 1,306 | ||||||||||||||
| Portugal | 1,548 | 467 | 2,100 | 1,553 | 1,481 | 1,001 | ||||||||||||||
| Poland | 2,844 | 674 | 3,555 | 2,591 | 1,650 | 800 | ||||||||||||||
| Other | 121 | 367 | 664 | (42) | (236) | (225) | ||||||||||||||
| DCB Europe | 4,361 | 902 | 5,679 | 3,075 | 1,131 | 642 | ||||||||||||||
| North America | 10,330 | 2,594 | 13,915 | 7,214 | 3,091 | 2,579 | ||||||||||||||
| US | 5,693 | 1,152 | 7,580 | 3,750 | 1,053 | 1,109 | ||||||||||||||
| Mexico | 4,631 | 1,385 | 6,278 | 3,613 | 2,274 | 1,671 | ||||||||||||||
| Other | 7 | 57 | 57 | (149) | (236) | (201) | ||||||||||||||
| South America | 15,566 | 4,864 | 19,783 | 12,841 | 5,993 | 3,863 | ||||||||||||||
| Brazil | 10,121 | 3,414 | 13,536 | 9,184 | 3,830 | 2,422 | ||||||||||||||
| Chile | 1,822 | 551 | 2,592 | 1,659 | 1,111 | 629 | ||||||||||||||
| Argentina | 2,919 | 602 | 2,487 | 1,465 | 827 | 665 | ||||||||||||||
| Other | 703 | 298 | 1,168 | 533 | 225 | 146 | ||||||||||||||
| Corporate Centre | (308) | (11) | (676) | (1,055) | (1,317) | (1,154) | ||||||||||||||
| TOTAL GROUP | 46,668 | 13,010 | 62,211 | 36,177 | 19,027 | 12,574 | ||||||||||||||
Profit attributable to the parent distribution1. 2024 | ||
Profit attributable to the parent. 2024 | ||
| EUR million. % change YoY | ||
 |
||
 |
||
 |
||
 |
||
 |
||
 |
||
 |
||
 |
||
 |
||
| Var | Var2 |
||||
| +28 | % | +29 | % | ||
| -13 | % | -12 | % | ||
| +12 | % | +16 | % | ||
| +12 | % | +14 | % | ||
| -32 | % | -26 | % | ||
| +21 | % | +19 | % | ||
| -46 | % | -47 | % | ||
| +10 | % | +12 | % | ||
| +27 | % | +36 | % | ||
January - December 2024 |
|
19 |
||||||
| January-December 2023 | ||||||||||||||||||||
| Main items of the underlying income statement | ||||||||||||||||||||
| EUR million | ||||||||||||||||||||
| Primary segments | Net interest income |
Net fee income |
Total income |
Net operating income |
Profit before tax |
Profit attributable to the parent | ||||||||||||||
| Retail & Commercial Banking | 25,550 | 4,497 | 29,754 | 16,930 | 7,989 | 5,659 | ||||||||||||||
| Digital Consumer Bank | 10,221 | 1,229 | 12,296 | 7,033 | 2,677 | 1,901 | ||||||||||||||
| Corporate & Investment Banking | 3,594 | 2,131 | 7,527 | 4,140 | 3,795 | 2,440 | ||||||||||||||
| Wealth Management & Insurance | 1,513 | 1,262 | 3,210 | 1,994 | 1,994 | 1,467 | ||||||||||||||
| Payments | 2,424 | 2,952 | 5,298 | 2,954 | 1,205 | 607 | ||||||||||||||
| PagoNxt | 93 | 954 | 1,140 | 49 | (17) | (77) | ||||||||||||||
| Cards | 2,331 | 1,998 | 4,158 | 2,905 | 1,222 | 684 | ||||||||||||||
| Corporate Centre | (41) | (13) | (439) | (829) | (961) | (998) | ||||||||||||||
| TOTAL GROUP | 43,261 | 12,057 | 57,647 | 32,222 | 16,698 | 11,076 | ||||||||||||||
| Secondary segments | ||||||||||||||||||||
| Europe | 15,910 | 4,399 | 21,439 | 12,409 | 8,195 | 5,482 | ||||||||||||||
| Spain | 6,641 | 2,699 | 10,132 | 5,905 | 3,399 | 2,371 | ||||||||||||||
| United Kingdom | 5,152 | 338 | 5,525 | 2,779 | 2,107 | 1,545 | ||||||||||||||
| Portugal | 1,465 | 464 | 1,982 | 1,440 | 1,314 | 896 | ||||||||||||||
| Poland | 2,543 | 589 | 3,182 | 2,320 | 1,392 | 674 | ||||||||||||||
| Other | 109 | 309 | 618 | (35) | (17) | (3) | ||||||||||||||
| DCB Europe | 4,193 | 796 | 5,502 | 2,884 | 2,019 | 1,199 | ||||||||||||||
| North America | 10,159 | 2,192 | 13,174 | 6,708 | 2,837 | 2,354 | ||||||||||||||
| US | 5,742 | 766 | 7,209 | 3,531 | 863 | 932 | ||||||||||||||
| Mexico | 4,408 | 1,374 | 5,899 | 3,311 | 2,119 | 1,560 | ||||||||||||||
| Other | 8 | 52 | 66 | (133) | (145) | (138) | ||||||||||||||
| South America | 13,040 | 4,684 | 17,971 | 11,050 | 4,608 | 3,038 | ||||||||||||||
| Brazil | 9,116 | 3,462 | 13,104 | 8,574 | 2,911 | 1,921 | ||||||||||||||
| Chile | 1,383 | 572 | 2,285 | 1,265 | 951 | 582 | ||||||||||||||
| Argentina | 1,879 | 396 | 1,544 | 769 | 505 | 386 | ||||||||||||||
| Other | 662 | 254 | 1,038 | 441 | 241 | 150 | ||||||||||||||
| Corporate Centre | (41) | (13) | (439) | (829) | (961) | (998) | ||||||||||||||
| TOTAL GROUP | 43,261 | 12,057 | 57,647 | 32,222 | 16,698 | 11,076 | ||||||||||||||
20 |
|
January - December 2024 |
||||||
 |
Retail & Commercial Banking | Underlying attributable profit | |||||||||
| EUR 7,263 mn | |||||||||||
| EUR million | |||||||||||||||||||||||
| / | Q3'24 | / | 2023 | ||||||||||||||||||||
| Underlying income statement | Q4'24 | % | % excl. FX | 2024 | % | % excl. FX | |||||||||||||||||
| Net interest income | 7,125 | 4.7 | 5.3 | 27,942 | 9.4 | 11.0 | |||||||||||||||||
| Net fee income | 1,166 | 1.5 | 2.6 | 4,681 | 4.1 | 7.3 | |||||||||||||||||
Gains (losses) on financial transactions 1 |
257 | 101.2 | 95.8 | 812 | (4.9) | (4.0) | |||||||||||||||||
| Other operating income | (306) | 128.1 | 128.9 | (974) | (15.1) | (14.3) | |||||||||||||||||
| Total income | 8,242 | 3.7 | 4.3 | 32,461 | 9.1 | 11.0 | |||||||||||||||||
| Administrative expenses and amortizations | (3,352) | 8.1 | 8.5 | (12,877) | 0.4 | 2.5 | |||||||||||||||||
| Net operating income | 4,890 | 1.0 | 1.6 | 19,584 | 15.7 | 17.4 | |||||||||||||||||
| Net loan-loss provisions | (1,388) | 1.4 | 2.8 | (5,845) | (10.6) | (7.3) | |||||||||||||||||
| Other gains (losses) and provisions | (804) | 66.0 | 65.1 | (2,865) | 19.4 | 20.7 | |||||||||||||||||
| Profit before tax | 2,697 | (9.8) | (9.3) | 10,874 | 36.1 | 35.9 | |||||||||||||||||
| Tax on profit | (636) | (21.6) | (21.2) | (3,091) | 60.4 | 57.4 | |||||||||||||||||
| Profit from continuing operations | 2,062 | (5.4) | (4.9) | 7,783 | 28.4 | 28.9 | |||||||||||||||||
| Net profit from discontinued operations | — | — | — | — | — | — | |||||||||||||||||
| Consolidated profit | 2,062 | (5.4) | (4.9) | 7,783 | 28.4 | 28.9 | |||||||||||||||||
| Non-controlling interests | (130) | (25.0) | (24.3) | (520) | 29.0 | 29.1 | |||||||||||||||||
| Profit attributable to the parent | 1,932 | (3.7) | (3.2) | 7,263 | 28.3 | 28.8 | |||||||||||||||||
| Balance sheet and activity metrics | |||||||||||||||||||||||
| Loans and advances to customers | 608,945 | (1.7) | (0.4) | 608,945 | (1.5) | (0.9) | |||||||||||||||||
| Customer deposits | 661,152 | 1.6 | 1.7 | 661,152 | (0.8) | 0.3 | |||||||||||||||||
| Memorandum items: | |||||||||||||||||||||||
| Gross loans and advances to customers ² | 609,490 | (0.7) | (0.6) | 609,490 | (1.5) | (0.7) | |||||||||||||||||
| Customer funds | 747,567 | 2.0 | 2.3 | 747,567 | 3.0 | 4.4 | |||||||||||||||||
| Customer deposits ³ | 649,619 | 1.8 | 1.9 | 649,619 | 1.8 | 2.6 | |||||||||||||||||
| Mutual funds | 97,948 | 3.6 | 4.9 | 97,948 | 11.6 | 18.8 | |||||||||||||||||
| Risk-weighted assets | 290,922 | (0.8) | 290,922 | (0.9) | |||||||||||||||||||
| Ratios (%) and customers | |||||||||||||||||||||||
| RoTE ⁴ | 20.1 | (0.6) | 18.9 | 3.7 | |||||||||||||||||||
| Efficiency ratio | 40.7 | 1.6 | 39.7 | (3.4) | |||||||||||||||||||
| NPL ratio | 3.18 | (0.10) | 3.18 | (0.03) | |||||||||||||||||||
| NPL coverage ratio | 58.4 | 0.7 | 58.4 | (3.0) | |||||||||||||||||||
| Number of total customers (thousands) | 147,140 | 1.1 | 147,140 | 6.0 | |||||||||||||||||||
| Number of active customers (thousands) | 79,079 | 1.3 | 79,079 | 5.3 | |||||||||||||||||||
| 1. Includes exchange differences. | ||
| 2. Excluding reverse repos. | ||
| 3. Excluding repos. | ||
| 4. Allocated according to RWA consumption. | ||
January - December 2024 |
|
21 |
||||||
|
Digital Consumer Bank | Underlying attributable profit | |||||||||
| EUR 1,663 mn | |||||||||||
| EUR million | |||||||||||||||||||||||
| / | Q3'24 | / | 2023 | ||||||||||||||||||||
| Underlying income statement | Q4'24 | % | % excl. FX | 2024 | % | % excl. FX | |||||||||||||||||
| Net interest income | 2,798 | 7.1 | 5.9 | 10,777 | 5.4 | 6.1 | |||||||||||||||||
| Net fee income | 394 | 5.5 | 5.3 | 1,508 | 22.7 | 23.8 | |||||||||||||||||
Gains (losses) on financial transactions 1 |
(24) | — | — | (4) | — | — | |||||||||||||||||
| Other operating income | 164 | 12.7 | 10.4 | 635 | (13.0) | (13.3) | |||||||||||||||||
| Total income | 3,332 | 6.3 | 5.2 | 12,916 | 5.0 | 5.7 | |||||||||||||||||
| Administrative expenses and amortizations | (1,287) | 0.7 | (0.5) | (5,183) | (1.5) | (1.2) | |||||||||||||||||
| Net operating income | 2,045 | 10.1 | 9.1 | 7,733 | 10.0 | 10.9 | |||||||||||||||||
| Net loan-loss provisions | (1,248) | 11.3 | 9.8 | (4,562) | 11.1 | 12.4 | |||||||||||||||||
| Other gains (losses) and provisions | (530) | 375.0 | 370.8 | (939) | 276.0 | 283.0 | |||||||||||||||||
| Profit before tax | 267 | (57.2) | (56.9) | 2,232 | (16.6) | (16.4) | |||||||||||||||||
| Tax on profit | (43) | (63.3) | (60.8) | (295) | (30.9) | (30.8) | |||||||||||||||||
| Profit from continuing operations | 225 | (55.8) | (56.0) | 1,938 | (13.9) | (13.6) | |||||||||||||||||
| Net profit from discontinued operations | — | — | — | — | — | — | |||||||||||||||||
| Consolidated profit | 225 | (55.8) | (56.0) | 1,938 | (13.9) | (13.6) | |||||||||||||||||
| Non-controlling interests | (69) | (2.1) | (1.7) | (275) | (21.3) | (21.1) | |||||||||||||||||
| Profit attributable to the parent | 155 | (64.5) | (64.7) | 1,663 | (12.5) | (12.3) | |||||||||||||||||
| Balance sheet and activity metrics | |||||||||||||||||||||||
| Loans and advances to customers | 207,104 | 2.3 | 0.8 | 207,104 | 4.0 | 3.4 | |||||||||||||||||
| Customer deposits | 128,975 | 5.0 | 2.3 | 128,975 | 11.7 | 9.2 | |||||||||||||||||
| Memorandum items: | |||||||||||||||||||||||
| Gross loans and advances to customers ² | 215,160 | 2.4 | 0.8 | 215,160 | 4.1 | 3.6 | |||||||||||||||||
| Customer funds | 137,122 | 5.0 | 2.3 | 137,122 | 13.3 | 10.8 | |||||||||||||||||
| Customer deposits ³ | 128,933 | 5.0 | 2.3 | 128,933 | 12.8 | 10.3 | |||||||||||||||||
| Mutual funds | 8,189 | 4.8 | 1.5 | 8,189 | 22.9 | 19.4 | |||||||||||||||||
| Risk-weighted assets | 152,399 | (0.6) | 152,399 | (1.3) | |||||||||||||||||||
| Ratios (%) and customers | |||||||||||||||||||||||
| RoTE ⁴ | 3.7 | (6.5) | 9.8 | (1.8) | |||||||||||||||||||
| Efficiency ratio | 38.6 | (2.1) | 40.1 | (2.7) | |||||||||||||||||||
| NPL ratio | 5.07 | 0.20 | 5.07 | 0.33 | |||||||||||||||||||
| NPL coverage ratio | 73.6 | (1.1) | 73.6 | (2.9) | |||||||||||||||||||
| Number of total customers (thousands) | 25,041 | (0.3) | 25,041 | (1.5) | |||||||||||||||||||
| 1. Includes exchange differences. | ||
| 2. Excluding reverse repos. | ||
| 3. Excluding repos. | ||
| 4. Allocated according to RWA consumption. | ||
22 |
|
January - December 2024 |
||||||
|
Corporate & Investment Banking | Underlying attributable profit | |||||||||
| EUR 2,740 mn | |||||||||||
| EUR million | |||||||||||||||||||||||
| / | Q3'24 | / | 2023 | ||||||||||||||||||||
| Underlying income statement | Q4'24 | % | % excl. FX | 2024 | % | % excl. FX | |||||||||||||||||
| Net interest income | 1,088 | 20.7 | 20.5 | 4,020 | 11.9 | 14.8 | |||||||||||||||||
| Net fee income | 657 | 7.2 | 6.8 | 2,548 | 19.6 | 21.4 | |||||||||||||||||
Gains (losses) on financial transactions 1 |
413 | (17.4) | (17.0) | 1,619 | (9.9) | (6.7) | |||||||||||||||||
| Other operating income | (74) | — | — | 156 | — | — | |||||||||||||||||
| Total income | 2,083 | 0.5 | 0.6 | 8,343 | 10.8 | 13.6 | |||||||||||||||||
| Administrative expenses and amortizations | (1,024) | 6.1 | 5.5 | (3,807) | 12.4 | 13.8 | |||||||||||||||||
| Net operating income | 1,059 | (4.4) | (3.6) | 4,537 | 9.6 | 13.4 | |||||||||||||||||
| Net loan-loss provisions | (17) | (73.1) | (72.7) | (174) | 5.7 | 7.3 | |||||||||||||||||
| Other gains (losses) and provisions | (129) | 28.9 | 28.1 | (353) | 95.3 | 100.1 | |||||||||||||||||
| Profit before tax | 913 | (3.4) | (2.5) | 4,009 | 5.7 | 9.5 | |||||||||||||||||
| Tax on profit | (157) | (40.5) | (38.8) | (1,065) | (6.3) | (2.2) | |||||||||||||||||
| Profit from continuing operations | 756 | 10.9 | 11.7 | 2,944 | 10.8 | 14.4 | |||||||||||||||||
| Net profit from discontinued operations | — | — | — | — | — | — | |||||||||||||||||
| Consolidated profit | 756 | 10.9 | 11.7 | 2,944 | 10.8 | 14.4 | |||||||||||||||||
| Non-controlling interests | (55) | 13.6 | 14.7 | (204) | (6.5) | (1.1) | |||||||||||||||||
| Profit attributable to the parent | 701 | 10.7 | 11.5 | 2,740 | 12.3 | 15.8 | |||||||||||||||||
| Balance sheet and activity metrics | |||||||||||||||||||||||
| Loans and advances to customers | 184,923 | (5.3) | (7.3) | 184,923 | 9.4 | 9.4 | |||||||||||||||||
| Customer deposits | 202,355 | (3.3) | (4.2) | 202,355 | (0.7) | 1.0 | |||||||||||||||||
| Memorandum items: | |||||||||||||||||||||||
| Gross loans and advances to customers ² | 136,818 | (0.2) | (1.9) | 136,818 | (0.6) | 0.2 | |||||||||||||||||
| Customer funds | 152,450 | 8.5 | 8.8 | 152,450 | (10.2) | (7.0) | |||||||||||||||||
| Customer deposits ³ | 136,672 | 8.0 | 7.7 | 136,672 | (12.0) | (9.7) | |||||||||||||||||
| Mutual funds | 15,777 | 13.0 | 18.8 | 15,777 | 8.3 | 26.2 | |||||||||||||||||
| Risk-weighted assets | 122,274 | (2.4) | 122,274 | 6.5 | |||||||||||||||||||
| Ratios (%) | |||||||||||||||||||||||
| RoTE ⁴ | 18.4 | 2.0 | 18.1 | 0.5 | |||||||||||||||||||
| Efficiency ratio | 49.2 | 2.6 | 45.6 | 0.6 | |||||||||||||||||||
| NPL ratio | 0.86 | (0.03) | 0.86 | (0.50) | |||||||||||||||||||
| NPL coverage ratio | 39.3 | 3.3 | 39.3 | (2.0) | |||||||||||||||||||
| 1. Includes exchange differences. | ||
| 2. Excluding reverse repos. | ||
| 3. Excluding repos. | ||
| 4. Allocated according to RWA consumption. | ||
January - December 2024 |
|
23 |
||||||
|
Wealth Management & Insurance | Underlying attributable profit | |||||||||
| EUR 1,650 mn | |||||||||||
| WEALTH MANAGEMENT & INSURANCE | |||||||||||||||||||||||
| EUR million | |||||||||||||||||||||||
| / | Q3'24 | / | 2023 | ||||||||||||||||||||
| Underlying income statement | Q4'24 | % | % excl. FX | 2024 | % | % excl. FX | |||||||||||||||||
| Net interest income | 394 | (3.1) | (3.4) | 1,627 | 7.6 | 8.2 | |||||||||||||||||
| Net fee income | 405 | 10.8 | 10.5 | 1,489 | 18.0 | 19.2 | |||||||||||||||||
Gains (losses) on financial transactions 1 |
71 | 29.3 | 29.4 | 213 | 25.7 | 27.3 | |||||||||||||||||
| Other operating income | 74 | (28.1) | (25.8) | 332 | 24.7 | 32.0 | |||||||||||||||||
| Total income | 944 | 1.5 | 1.5 | 3,661 | 14.0 | 15.4 | |||||||||||||||||
| Administrative expenses and amortizations | (383) | 21.4 | 20.7 | (1,313) | 8.0 | 9.2 | |||||||||||||||||
| Net operating income | 561 | (8.6) | (8.3) | 2,348 | 17.7 | 19.3 | |||||||||||||||||
| Net loan-loss provisions | (17) | 55.5 | 57.4 | (41) | — | — | |||||||||||||||||
| Other gains (losses) and provisions | (15) | 459.1 | 455.0 | (48) | 170.8 | 170.3 | |||||||||||||||||
| Profit before tax | 529 | (11.9) | (11.6) | 2,259 | 13.3 | 14.8 | |||||||||||||||||
| Tax on profit | (125) | (6.2) | (6.2) | (531) | 16.9 | 18.1 | |||||||||||||||||
| Profit from continuing operations | 404 | (13.6) | (13.1) | 1,728 | 12.2 | 13.8 | |||||||||||||||||
| Net profit from discontinued operations | — | — | — | — | — | — | |||||||||||||||||
| Consolidated profit | 404 | (13.6) | (13.1) | 1,728 | 12.2 | 13.8 | |||||||||||||||||
| Non-controlling interests | (20) | 0.9 | 1.8 | (79) | 7.9 | 11.6 | |||||||||||||||||
| Profit attributable to the parent | 384 | (14.2) | (13.8) | 1,650 | 12.5 | 13.9 | |||||||||||||||||
| Balance sheet and activity metrics | |||||||||||||||||||||||
| Loans and advances to customers | 24,479 | 5.7 | 3.6 | 24,479 | 8.8 | 7.7 | |||||||||||||||||
| Customer deposits | 60,986 | 0.8 | 0.1 | 60,986 | 4.2 | 3.9 | |||||||||||||||||
| Memorandum items: | |||||||||||||||||||||||
| Gross loans and advances to customers ² | 24,611 | 5.7 | 3.7 | 24,611 | 8.9 | 7.9 | |||||||||||||||||
| Customer funds | 171,866 | 2.4 | 2.1 | 171,866 | 9.4 | 11.6 | |||||||||||||||||
| Customer deposits ³ | 60,058 | 0.8 | 0.1 | 60,058 | 4.2 | 3.7 | |||||||||||||||||
| Mutual funds | 111,807 | 3.3 | 3.2 | 111,807 | 12.4 | 16.4 | |||||||||||||||||
| Risk-weighted assets | 11,559 | 11.5 | 11,559 | (37.2) | |||||||||||||||||||
| Assets under management | 498,289 | 1.1 | 1.3 | 498,289 | 8.4 | 12.7 | |||||||||||||||||
| Gross written premiums | 2,567 | (8.7) | (9.5) | 11,526 | (11.8) | (8.5) | |||||||||||||||||
| Ratios (%) and customers | |||||||||||||||||||||||
| RoTE ⁴ | 73.5 | (11.1) | 78.7 | 6.5 | |||||||||||||||||||
| Efficiency ratio | 40.6 | 6.6 | 35.9 | (2.0) | |||||||||||||||||||
| NPL ratio | 0.67 | (0.02) | 0.67 | (0.73) | |||||||||||||||||||
| NPL coverage ratio | 80.3 | 7.2 | 80.3 | 51.0 | |||||||||||||||||||
| Number of Private Banking customers (thousands) | 299 | 2.8 | 299 | 13.7 | |||||||||||||||||||
| 1. Includes exchange differences. | ||
| 2. Excluding reverse repos. | ||
| 3. Excluding repos. | ||
| 4. Allocated according to RWA consumption. | ||
24 |
|
January - December 2024 |
||||||
|
Payments | Underlying attributable profit | |||||||||
| EUR 413 mn | |||||||||||
| EUR million | |||||||||||||||||||||||
| / | Q3'24 | / | 2023 | ||||||||||||||||||||
| Underlying income statement | Q4'24 | % | % excl. FX | 2024 | % | % excl. FX | |||||||||||||||||
| Net interest income | 694 | 16.4 | 17.7 | 2,609 | 7.6 | 12.9 | |||||||||||||||||
| Net fee income | 725 | 3.8 | 5.0 | 2,793 | (5.4) | (1.5) | |||||||||||||||||
Gains (losses) on financial transactions 1 |
41 | — | — | 41 | — | — | |||||||||||||||||
| Other operating income | 38 | 120.7 | 125.0 | 61 | — | — | |||||||||||||||||
| Total income | 1,497 | 14.6 | 15.6 | 5,505 | 3.9 | 8.6 | |||||||||||||||||
| Administrative expenses and amortizations | (621) | 5.6 | 6.3 | (2,475) | 5.6 | 8.0 | |||||||||||||||||
| Net operating income | 876 | 21.9 | 23.1 | 3,030 | 2.6 | 9.0 | |||||||||||||||||
| Net loan-loss provisions | (448) | 8.2 | 10.0 | (1,714) | 2.9 | 8.2 | |||||||||||||||||
| Other gains (losses) and provisions | (37) | 15.7 | 15.9 | (347) | 314.3 | 320.1 | |||||||||||||||||
| Profit before tax | 391 | 43.5 | 43.8 | 969 | (19.6) | (12.9) | |||||||||||||||||
| Tax on profit | (132) | 13.6 | 15.3 | (464) | (8.8) | (2.2) | |||||||||||||||||
| Profit from continuing operations | 259 | 65.8 | 64.8 | 505 | (27.4) | (20.8) | |||||||||||||||||
| Net profit from discontinued operations | — | — | — | — | — | — | |||||||||||||||||
| Consolidated profit | 259 | 65.8 | 64.8 | 505 | (27.4) | (20.8) | |||||||||||||||||
| Non-controlling interests | (24) | (12.1) | (10.6) | (92) | 3.4 | 12.0 | |||||||||||||||||
| Profit attributable to the parent | 235 | 82.1 | 79.9 | 413 | (31.9) | (25.7) | |||||||||||||||||
| Balance sheet and activity metrics | |||||||||||||||||||||||
| Loans and advances to customers | 22,840 | 8.5 | 11.2 | 22,840 | 3.6 | 15.0 | |||||||||||||||||
| Customer deposits | 1,038 | 5.7 | 5.7 | 1,038 | (26.8) | (26.8) | |||||||||||||||||
| Memorandum items: | |||||||||||||||||||||||
| Gross loans and advances to customers ² | 24,614 | 8.4 | 11.0 | 24,614 | 3.8 | 15.3 | |||||||||||||||||
| Customer funds | 1,038 | 5.7 | 5.7 | 1,038 | (26.8) | (26.8) | |||||||||||||||||
| Customer deposits ³ | 1,038 | 5.7 | 5.7 | 1,038 | (26.8) | (26.8) | |||||||||||||||||
| Mutual funds | — | — | — | — | — | — | |||||||||||||||||
| Risk-weighted assets | 20,346 | 5.8 | 20,346 | (2.9) | |||||||||||||||||||
| Ratios (%) | |||||||||||||||||||||||
| RoTE ⁴ | 35.0 | 14.9 | 15.6 | (9.4) | |||||||||||||||||||
| NPL ratio | 5.14 | (0.38) | 5.14 | 0.12 | |||||||||||||||||||
| NPL coverage ratio | 140.1 | 7.0 | 140.1 | 0.3 | |||||||||||||||||||
| 1. Includes exchange differences. | ||
| 2. Excluding reverse repos. | ||
| 3. Excluding repos. | ||
| 4. Allocated according to RWA consumption. | ||
January - December 2024 |
|
25 |
||||||
| PagoNxt | |||||||||||||||||||||||
| EUR million | |||||||||||||||||||||||
| / | Q3'24 | / | 2023 | ||||||||||||||||||||
| Underlying income statement | Q4'24 | % | % excl. FX | 2024 | % | % excl. FX | |||||||||||||||||
| Net interest income | 35 | 0.5 | 2.0 | 132 | 41.0 | 48.3 | |||||||||||||||||
| Net fee income | 261 | 8.4 | 9.4 | 958 | 0.5 | 5.2 | |||||||||||||||||
Gains (losses) on financial transactions 1 |
0 | — | — | 0 | (97.5) | (97.4) | |||||||||||||||||
| Other operating income | 49 | 35.8 | 35.9 | 150 | 46.5 | 48.3 | |||||||||||||||||
| Total income | 346 | 11.3 | 12.1 | 1,240 | 8.7 | 13.6 | |||||||||||||||||
| Administrative expenses and amortizations | (271) | (6.0) | (5.2) | (1,160) | 6.3 | 8.8 | |||||||||||||||||
| Net operating income | 75 | 231.0 | 207.6 | 80 | 62.7 | 210.4 | |||||||||||||||||
| Net loan-loss provisions | (4) | 9.1 | 9.4 | (16) | (32.5) | (30.9) | |||||||||||||||||
| Other gains (losses) and provisions | (23) | 54.1 | 55.2 | (296) | 611.6 | 639.1 | |||||||||||||||||
| Profit before tax | 48 | 997.8 | 605.1 | (233) | — | 513.0 | |||||||||||||||||
| Tax on profit | (20) | (5.8) | (2.2) | (57) | (4.0) | 8.9 | |||||||||||||||||
| Profit from continuing operations | 28 | — | — | (290) | 281.8 | 221.4 | |||||||||||||||||
| Net profit from discontinued operations | — | — | — | — | — | — | |||||||||||||||||
| Consolidated profit | 28 | — | — | (290) | 281.8 | 221.4 | |||||||||||||||||
| Non-controlling interests | (2) | (53.5) | (51.9) | (9) | 571.7 | — | |||||||||||||||||
| Profit attributable to the parent | 26 | — | — | (299) | 287.1 | 228.8 | |||||||||||||||||
| Balance sheet and activity metrics | |||||||||||||||||||||||
| Loans and advances to customers | 1,066 | 14.3 | 18.3 | 1,066 | (8.7) | 6.1 | |||||||||||||||||
| Customer deposits | 1,038 | 5.7 | 5.7 | 1,038 | (26.8) | (26.8) | |||||||||||||||||
| Memorandum items: | |||||||||||||||||||||||
| Gross loans and advances to customers ² | 1,087 | 13.8 | 17.7 | 1,087 | (9.1) | 5.2 | |||||||||||||||||
| Customer funds | 1,038 | 5.7 | 5.7 | 1,038 | (26.8) | (26.8) | |||||||||||||||||
| Customer deposits ³ | 1,038 | 5.7 | 5.7 | 1,038 | (26.8) | (26.8) | |||||||||||||||||
| Mutual funds | — | — | — | — | — | — | |||||||||||||||||
| Risk-weighted assets | 4,671 | 4.7 | 4,671 | (13.9) | |||||||||||||||||||
| Total transactions (Getnet, million) | 2,628 | 7.3 | 9,837 | 4.5 | |||||||||||||||||||
| Total payments volume (Getnet) | 59,020 | 7.1 | 8.3 | 221,787 | 7.9 | 13.0 | |||||||||||||||||
| Ratios (%) | |||||||||||||||||||||||
| EBITDA margin | 40.1 | 12.5 | 27.5 | 2.7 | |||||||||||||||||||
| Efficiency ratio | 78.4 | (14.4) | 93.6 | (2.1) | |||||||||||||||||||
| 1. Includes exchange differences. | ||
| 2. Excluding reverse repos. | ||
| 3. Excluding repos. | ||
26 |
|
January - December 2024 |
||||||
| Cards | |||||||||||||||||||||||
| EUR million | |||||||||||||||||||||||
| / | Q3'24 | / | 2023 | ||||||||||||||||||||
| Underlying income statement | Q4'24 | % | % excl. FX | 2024 | % | % excl. FX | |||||||||||||||||
| Net interest income | 659 | 17.4 | 18.6 | 2,478 | 6.3 | 11.4 | |||||||||||||||||
| Net fee income | 464 | 1.4 | 2.6 | 1,835 | (8.2) | (4.7) | |||||||||||||||||
Gains (losses) on financial transactions 1 |
41 | — | — | 41 | 309.2 | 358.5 | |||||||||||||||||
| Other operating income | (11) | (41.6) | (38.3) | (89) | (50.7) | (49.9) | |||||||||||||||||
| Total income | 1,152 | 15.7 | 16.7 | 4,265 | 2.6 | 7.2 | |||||||||||||||||
| Administrative expenses and amortizations | (350) | 16.8 | 17.2 | (1,315) | 5.0 | 7.3 | |||||||||||||||||
| Net operating income | 802 | 15.2 | 16.5 | 2,950 | 1.5 | 7.1 | |||||||||||||||||
| Net loan-loss provisions | (444) | 8.2 | 10.0 | (1,698) | 3.4 | 8.8 | |||||||||||||||||
| Other gains (losses) and provisions | (15) | (16.6) | (17.1) | (50) | 19.2 | 18.2 | |||||||||||||||||
| Profit before tax | 343 | 27.9 | 28.7 | 1,202 | (1.6) | 4.5 | |||||||||||||||||
| Tax on profit | (112) | 17.9 | 19.1 | (407) | (9.5) | (3.5) | |||||||||||||||||
| Profit from continuing operations | 230 | 33.4 | 34.0 | 795 | 3.0 | 9.1 | |||||||||||||||||
| Net profit from discontinued operations | — | — | — | — | — | — | |||||||||||||||||
| Consolidated profit | 230 | 33.4 | 34.0 | 795 | 3.0 | 9.1 | |||||||||||||||||
| Non-controlling interests | (22) | (3.6) | (2.2) | (83) | (5.7) | 1.6 | |||||||||||||||||
| Profit attributable to the parent | 209 | 38.9 | 39.3 | 712 | 4.1 | 10.1 | |||||||||||||||||
| Balance sheet and activity metrics | |||||||||||||||||||||||
| Loans and advances to customers | 21,774 | 8.3 | 10.8 | 21,774 | 4.3 | 15.4 | |||||||||||||||||
| Customer deposits | — | — | — | — | — | — | |||||||||||||||||
| Memorandum items: | |||||||||||||||||||||||
| Gross loans and advances to customers ² | 23,526 | 8.1 | 10.7 | 23,526 | 4.5 | 15.8 | |||||||||||||||||
| Customer funds | — | — | — | — | — | — | |||||||||||||||||
| Customer deposits ³ | — | — | — | — | — | — | |||||||||||||||||
| Mutual funds | — | — | — | — | — | — | |||||||||||||||||
| Risk-weighted assets | 15,675 | 6.1 | 15,675 | 0.9 | |||||||||||||||||||
| Number of cards (million) | 100 | 0.7 | 100 | 3.6 | |||||||||||||||||||
| Ratios (%) | |||||||||||||||||||||||
| RoTE ⁴ | 35.6 | 6.5 | 32.6 | (2.9) | |||||||||||||||||||
| Efficiency ratio | 30.4 | 0.3 | 30.8 | 0.7 | |||||||||||||||||||
| NPL ratio | 5.25 | (0.37) | 5.25 | 0.14 | |||||||||||||||||||
| NPL coverage ratio | 141.9 | 7.3 | 141.9 | (0.3) | |||||||||||||||||||
| 1. Includes exchange differences. | ||
| 2. Excluding reverse repos. | ||
| 3. Excluding repos. | ||
| 4. Allocated according to RWA consumption. | ||
January - December 2024 |
|
27 |
||||||
 |
Corporate Centre | Underlying attributable profit | ||||||
| -EUR 1,154 mn | ||||||||
| EUR million | |||||||||||||||||||||||
| / Q3'24 | / 2023 | ||||||||||||||||||||||
| Underlying income statement | Q4'24 | Q3'24 | % | 2024 | 2023 | % | |||||||||||||||||
| Net interest income | (113) | (95) | 19.0 | (308) | (41) | 660.3 | |||||||||||||||||
| Net fee income | (3) | (8) | (62.6) | (11) | (13) | (20.6) | |||||||||||||||||
Gains (losses) on financial transactions 1 |
22 | (145) | — | (408) | (302) | 35.2 | |||||||||||||||||
| Other operating income | 23 | (5) | — | 50 | (83) | — | |||||||||||||||||
| Total income | (72) | (254) | (71.6) | (676) | (439) | 54.1 | |||||||||||||||||
| Administrative expenses and amortizations | (104) | (101) | 2.7 | (379) | (391) | (3.1) | |||||||||||||||||
| Net operating income | (176) | (355) | (50.4) | (1,055) | (829) | 27.1 | |||||||||||||||||
| Net loan-loss provisions | 3 | 1 | 182.3 | 3 | 2 | 25.6 | |||||||||||||||||
| Other gains (losses) and provisions | (25) | (160) | (84.7) | (265) | (134) | 97.7 | |||||||||||||||||
| Profit before tax | (197) | (514) | (61.7) | (1,317) | (961) | 37.0 | |||||||||||||||||
| Tax on profit | 55 | 110 | (50.5) | 162 | (36) | — | |||||||||||||||||
| Profit from continuing operations | (142) | (403) | (64.7) | (1,155) | (998) | 15.7 | |||||||||||||||||
| Net profit from discontinued operations | — | — | — | — | — | — | |||||||||||||||||
| Consolidated profit | (142) | (403) | (64.7) | (1,155) | (998) | 15.7 | |||||||||||||||||
| Non-controlling interests | 0 | 0 | (32.1) | 1 | 0 | — | |||||||||||||||||
| Profit attributable to the parent | (142) | (403) | (64.7) | (1,154) | (998) | 15.7 | |||||||||||||||||
| Balance sheet | |||||||||||||||||||||||
| Loans and advances to customers | 5,778 | 5,896 | (2.0) | 5,778 | 5,565 | 3.8 | |||||||||||||||||
| Cash, central banks and credit institutions | 104,379 | 100,528 | 3.8 | 104,379 | 119,279 | (12.5) | |||||||||||||||||
| Debt instruments | 10,923 | 8,939 | 22.2 | 10,923 | 7,726 | 41.4 | |||||||||||||||||
| Other financial assets | 1,444 | 1,413 | 2.2 | 1,444 | 808 | 78.7 | |||||||||||||||||
| Other asset accounts | 118,425 | 121,371 | (2.4) | 118,425 | 121,327 | (2.4) | |||||||||||||||||
| Total assets | 240,948 | 238,147 | 1.2 | 240,948 | 254,705 | (5.4) | |||||||||||||||||
| Customer deposits | 1,430 | 1,612 | (11.3) | 1,430 | 1,508 | (5.2) | |||||||||||||||||
| Central banks and credit institutions | 21,730 | 22,000 | (1.2) | 21,730 | 47,747 | (54.5) | |||||||||||||||||
| Marketable debt securities | 121,122 | 115,124 | 5.2 | 121,122 | 110,144 | 10.0 | |||||||||||||||||
| Other financial liabilities | 48 | 1,375 | (96.5) | 48 | 326 | (85.3) | |||||||||||||||||
| Other liabilities accounts | 7,256 | 7,575 | (4.2) | 7,256 | 7,084 | 2.4 | |||||||||||||||||
| Total liabilities | 151,585 | 147,685 | 2.6 | 151,585 | 166,809 | (9.1) | |||||||||||||||||
| Total equity | 89,363 | 90,461 | (1.2) | 89,363 | 87,896 | 1.7 | |||||||||||||||||
| Memorandum items: | |||||||||||||||||||||||
Gross loans and advances to customers 2 |
5,853 | 5,945 | (1.5) | 5,853 | 5,640 | 3.8 | |||||||||||||||||
| Customer funds | 1,299 | 1,478 | (12.1) | 1,299 | 1,508 | (13.8) | |||||||||||||||||
Customer deposits 3 |
1,299 | 1,478 | (12.1) | 1,299 | 1,508 | (13.8) | |||||||||||||||||
| Mutual funds | — | — | — | — | — | — | |||||||||||||||||
| Resources | |||||||||||||||||||||||
| Number of employees | 1,798 | 1,857 | (3.2) | 1,798 | 1,922 | (6.5) | |||||||||||||||||
28 |
|
January - December 2024 |
||||||
|
Business model
|
|
||||||||||||||||||||||
| Secondary segments | |||||||||||||||||||||||
 |
Europe | Underlying attributable profit | ||||||
| EUR 6,644 mn | ||||||||
| EUR million | |||||||||||||||||||||||
| / | Q3'24 | / | 2023 | ||||||||||||||||||||
| Underlying income statement | Q4'24 | % | % excl. FX | 2024 | % | % excl. FX | |||||||||||||||||
| Net interest income | 4,227 | 0.5 | 0.2 | 16,720 | 5.1 | 3.3 | |||||||||||||||||
| Net fee income | 1,123 | (3.9) | (4.0) | 4,659 | 5.9 | 4.9 | |||||||||||||||||
Gains (losses) on financial transactions 1 |
339 | (16.3) | (16.5) | 1,357 | 31.3 | 30.7 | |||||||||||||||||
| Other operating income | 157 | (6.0) | (6.0) | 774 | 699.8 | 706.4 | |||||||||||||||||
| Total income | 5,846 | (1.7) | (2.0) | 23,510 | 9.7 | 8.0 | |||||||||||||||||
| Administrative expenses and amortizations | (2,450) | 4.0 | 3.5 | (9,407) | 4.2 | 2.8 | |||||||||||||||||
| Net operating income | 3,397 | (5.4) | (5.6) | 14,102 | 13.6 | 11.8 | |||||||||||||||||
| Net loan-loss provisions | (418) | (2.0) | (2.0) | (1,862) | (26.5) | (27.7) | |||||||||||||||||
| Other gains (losses) and provisions | (635) | 76.5 | 76.2 | (2,111) | 25.6 | 23.7 | |||||||||||||||||
| Profit before tax | 2,343 | (16.4) | (16.6) | 10,129 | 23.6 | 21.6 | |||||||||||||||||
| Tax on profit | (631) | (23.4) | (23.6) | (3,065) | 29.3 | 27.3 | |||||||||||||||||
| Profit from continuing operations | 1,712 | (13.4) | (13.7) | 7,064 | 21.3 | 19.3 | |||||||||||||||||
| Net profit from discontinued operations | — | — | — | — | — | — | |||||||||||||||||
| Consolidated profit | 1,712 | (13.4) | (13.7) | 7,064 | 21.3 | 19.3 | |||||||||||||||||
| Non-controlling interests | (97) | (29.0) | (28.7) | (420) | 22.8 | 16.5 | |||||||||||||||||
| Profit attributable to the parent | 1,615 | (12.3) | (12.6) | 6,644 | 21.2 | 19.5 | |||||||||||||||||
| Balance sheet | |||||||||||||||||||||||
| Loans and advances to customers | 583,754 | (2.8) | (3.1) | 583,754 | 2.4 | 0.2 | |||||||||||||||||
| Cash, central banks and credit institutions | 172,609 | 6.0 | 5.8 | 172,609 | (13.0) | (14.4) | |||||||||||||||||
| Debt instruments | 150,428 | 12.3 | 12.1 | 150,428 | 30.3 | 29.4 | |||||||||||||||||
| Other financial assets | 52,118 | 9.6 | 9.4 | 52,118 | 17.0 | 16.8 | |||||||||||||||||
| Other asset accounts | 25,243 | (6.1) | (6.3) | 25,243 | (6.0) | (7.0) | |||||||||||||||||
| Total assets | 984,151 | 1.3 | 1.0 | 984,151 | 3.0 | 1.2 | |||||||||||||||||
| Customer deposits | 652,312 | 0.2 | 0.0 | 652,312 | 1.1 | (0.7) | |||||||||||||||||
| Central banks and credit institutions | 110,850 | 8.9 | 8.3 | 110,850 | 6.4 | 4.5 | |||||||||||||||||
| Marketable debt securities | 83,036 | (2.2) | (2.3) | 83,036 | 5.0 | 2.3 | |||||||||||||||||
| Other financial liabilities | 66,358 | 8.9 | 8.7 | 66,358 | 24.4 | 23.8 | |||||||||||||||||
| Other liabilities accounts | 28,275 | (2.9) | (3.0) | 28,275 | (4.6) | (4.9) | |||||||||||||||||
| Total liabilities | 940,831 | 1.4 | 1.2 | 940,831 | 3.3 | 1.4 | |||||||||||||||||
| Total equity | 43,320 | (2.0) | (2.4) | 43,320 | (1.9) | (3.6) | |||||||||||||||||
| Memorandum items: | |||||||||||||||||||||||
Gross loans and advances to customers 2 |
554,179 | (0.7) | (1.0) | 554,179 | 0.4 | (1.7) | |||||||||||||||||
| Customer funds | 753,172 | 2.7 | 2.5 | 753,172 | 3.8 | 2.1 | |||||||||||||||||
Customer deposits 3 |
627,029 | 2.3 | 2.1 | 627,029 | 1.1 | (0.8) | |||||||||||||||||
| Mutual funds | 126,143 | 5.1 | 4.8 | 126,143 | 20.0 | 19.3 | |||||||||||||||||
| Ratios (%), operating means and customers | |||||||||||||||||||||||
| RoTE | 16.3 | (2.2) | 16.9 | 2.4 | |||||||||||||||||||
| Efficiency ratio | 41.9 | 2.3 | 40.0 | (2.1) | |||||||||||||||||||
| NPL ratio | 2.15 | (0.09) | 2.15 | (0.17) | |||||||||||||||||||
| NPL coverage ratio | 50.2 | 1.8 | 50.2 | 0.9 | |||||||||||||||||||
| Number of employees | 65,746 | (2.2) | 65,746 | (2.5) | |||||||||||||||||||
| Number of branches | 3,022 | (0.4) | 3,022 | (2.0) | |||||||||||||||||||
| Number of total customers (thousands) | 46,821 | 0.2 | 46,821 | 1.1 | |||||||||||||||||||
| Number of active customers (thousands) | 29,030 | 0.4 | 29,030 | 1.7 | |||||||||||||||||||
January - December 2024 |
|
29 |
||||||
|
Business model
|
|
||||||||||||||||||||||
| Secondary segments | |||||||||||||||||||||||
| Spain | Q |
||||||||||||||||
| EUR million | |||||||||||||||||
| / Q3'24 | / 2023 | ||||||||||||||||
| Underlying income statement | Q4'24 | % | 2024 | % | |||||||||||||
| Net interest income | 1,802 | 0.2 | 7,256 | 9.3 | |||||||||||||
| Net fee income | 676 | (4.4) | 2,867 | 6.2 | |||||||||||||
Gains (losses) on financial transactions 1 |
302 | (8.4) | 1,100 | 59.9 | |||||||||||||
| Other operating income | 146 | (1.1) | 751 | 616.5 | |||||||||||||
| Total income | 2,926 | (1.9) | 11,974 | 18.2 | |||||||||||||
| Administrative expenses and amortizations | (1,133) | 5.6 | (4,271) | 1.0 | |||||||||||||
| Net operating income | 1,793 | (6.2) | 7,703 | 30.4 | |||||||||||||
| Net loan-loss provisions | (322) | 15.2 | (1,259) | (17.3) | |||||||||||||
| Other gains (losses) and provisions | (224) | 87.9 | (1,003) | 2.0 | |||||||||||||
| Profit before tax | 1,247 | (17.5) | 5,440 | 60.1 | |||||||||||||
| Tax on profit | (322) | (25.4) | (1,678) | 63.1 | |||||||||||||
| Profit from continuing operations | 925 | (14.4) | 3,763 | 58.7 | |||||||||||||
| Net profit from discontinued operations | — | — | — | — | |||||||||||||
| Consolidated profit | 925 | (14.4) | 3,763 | 58.7 | |||||||||||||
| Non-controlling interests | 0 | (39.0) | 0 | 106.8 | |||||||||||||
| Profit attributable to the parent | 925 | (14.4) | 3,762 | 58.7 | |||||||||||||
| Balance sheet | |||||||||||||||||
| Loans and advances to customers | 246,897 | (4.0) | 246,897 | 3.2 | |||||||||||||
| Cash, central banks and credit institutions | 99,657 | 13.2 | 99,657 | (14.3) | |||||||||||||
| Debt instruments | 94,519 | 13.4 | 94,519 | 34.9 | |||||||||||||
| Other financial assets | 48,132 | 10.0 | 48,132 | 17.6 | |||||||||||||
| Other asset accounts | 17,521 | (1.4) | 17,521 | 2.6 | |||||||||||||
| Total assets | 506,725 | 3.4 | 506,725 | 4.8 | |||||||||||||
| Customer deposits | 323,425 | 0.0 | 323,425 | (0.2) | |||||||||||||
| Central banks and credit institutions | 57,218 | 31.0 | 57,218 | 27.7 | |||||||||||||
| Marketable debt securities | 27,385 | (2.9) | 27,385 | (3.9) | |||||||||||||
| Other financial liabilities | 59,976 | 9.9 | 59,976 | 28.9 | |||||||||||||
| Other liabilities accounts | 21,163 | (3.4) | 21,163 | (4.9) | |||||||||||||
| Total liabilities | 489,168 | 3.7 | 489,168 | 4.9 | |||||||||||||
| Total equity | 17,557 | (4.3) | 17,557 | 0.8 | |||||||||||||
| Memorandum items: | |||||||||||||||||
Gross loans and advances to customers 2 |
225,759 | (1.7) | 225,759 | (1.8) | |||||||||||||
| Customer funds | 399,999 | 3.8 | 399,999 | 3.4 | |||||||||||||
Customer deposits 3 |
306,389 | 3.5 | 306,389 | (0.8) | |||||||||||||
| Mutual funds | 93,609 | 4.9 | 93,609 | 19.9 | |||||||||||||
| Ratios (%), operating means and customers | |||||||||||||||||
| RoTE | 21.3 | (3.3) | 21.7 | 7.5 | |||||||||||||
| Efficiency ratio | 38.7 | 2.8 | 35.7 | (6.0) | |||||||||||||
| NPL ratio | 2.68 | (0.12) | 2.68 | (0.38) | |||||||||||||
| NPL coverage ratio | 52.6 | 2.6 | 52.6 | 3.6 | |||||||||||||
| Number of employees | 23,980 | (0.7) | 23,980 | (3.0) | |||||||||||||
| Number of branches | 1,827 | (0.3) | 1,827 | (2.5) | |||||||||||||
| Number of total customers (thousands) | 15,307 | 0.5 | 15,307 | 1.9 | |||||||||||||
| Number of active customers (thousands) | 8,842 | 1.3 | 8,842 | 5.7 | |||||||||||||
30 |
|
January - December 2024 |
||||||
|
Business model
|
|
||||||||||||||||||||||
| Secondary segments | |||||||||||||||||||||||
| United Kingdom | Q |
||||||||||||||||||||||
| EUR million | |||||||||||||||||||||||
| / | Q3'24 | / | 2023 | ||||||||||||||||||||
| Underlying income statement | Q4'24 | % | % excl. FX | 2024 | % | % excl. FX | |||||||||||||||||
| Net interest income | 1,313 | 4.5 | 3.0 | 4,950 | (3.9) | (6.5) | |||||||||||||||||
| Net fee income | 61 | (23.6) | (25.1) | 283 | (16.2) | (18.4) | |||||||||||||||||
Gains (losses) on financial transactions 1 |
(18) | — | — | (18) | — | — | |||||||||||||||||
| Other operating income | 1 | 2.3 | 1.0 | 2 | (67.2) | (68.1) | |||||||||||||||||
| Total income | 1,356 | 0.9 | (0.5) | 5,216 | (5.6) | (8.1) | |||||||||||||||||
| Administrative expenses and amortizations | (756) | 6.5 | 5.0 | (2,918) | 6.3 | 3.4 | |||||||||||||||||
| Net operating income | 600 | (5.3) | (6.7) | 2,299 | (17.3) | (19.5) | |||||||||||||||||
| Net loan-loss provisions | 34 | — | — | (64) | (74.2) | (74.9) | |||||||||||||||||
| Other gains (losses) and provisions | (179) | 65.3 | 63.9 | (441) | 3.9 | 1.1 | |||||||||||||||||
| Profit before tax | 456 | (6.8) | (8.3) | 1,794 | (14.9) | (17.1) | |||||||||||||||||
| Tax on profit | (125) | (12.8) | (14.2) | (488) | (13.3) | (15.6) | |||||||||||||||||
| Profit from continuing operations | 331 | (4.3) | (5.8) | 1,306 | (15.4) | (17.7) | |||||||||||||||||
| Net profit from discontinued operations | — | — | — | — | — | — | |||||||||||||||||
| Consolidated profit | 331 | (4.3) | (5.8) | 1,306 | (15.4) | (17.7) | |||||||||||||||||
| Non-controlling interests | — | — | — | — | — | — | |||||||||||||||||
| Profit attributable to the parent | 331 | (4.3) | (5.8) | 1,306 | (15.4) | (17.7) | |||||||||||||||||
| Balance sheet | |||||||||||||||||||||||
| Loans and advances to customers | 246,453 | (3.3) | (3.6) | 246,453 | 0.3 | (4.1) | |||||||||||||||||
| Cash, central banks and credit institutions | 54,787 | (2.8) | (3.1) | 54,787 | (12.2) | (16.1) | |||||||||||||||||
| Debt instruments | 15,120 | 13.8 | 13.4 | 15,120 | 47.7 | 41.2 | |||||||||||||||||
| Other financial assets | 390 | 39.4 | 39.0 | 390 | 35.0 | 29.1 | |||||||||||||||||
| Other asset accounts | 3,382 | (8.3) | (8.6) | 3,382 | (22.5) | (25.9) | |||||||||||||||||
| Total assets | 320,132 | (2.5) | (2.8) | 320,132 | (0.9) | (5.3) | |||||||||||||||||
| Customer deposits | 230,408 | (1.5) | (1.9) | 230,408 | (1.3) | (5.7) | |||||||||||||||||
| Central banks and credit institutions | 25,665 | (8.3) | (8.6) | 25,665 | (9.0) | (13.0) | |||||||||||||||||
| Marketable debt securities | 47,933 | (2.2) | (2.5) | 47,933 | 9.3 | 4.5 | |||||||||||||||||
| Other financial liabilities | 2,500 | (16.6) | (16.9) | 2,500 | (27.2) | (30.4) | |||||||||||||||||
| Other liabilities accounts | 1,733 | (2.4) | (2.7) | 1,733 | 1.7 | (2.8) | |||||||||||||||||
| Total liabilities | 308,239 | (2.4) | (2.7) | 308,239 | (0.8) | (5.2) | |||||||||||||||||
| Total equity | 11,893 | (5.6) | (5.9) | 11,893 | (3.9) | (8.1) | |||||||||||||||||
| Memorandum items: | |||||||||||||||||||||||
Gross loans and advances to customers 2 |
236,496 | (0.8) | (1.1) | 236,496 | 0.6 | (3.9) | |||||||||||||||||
| Customer funds | 230,479 | (0.8) | (1.1) | 230,479 | (0.5) | (4.9) | |||||||||||||||||
Customer deposits 3 |
222,835 | (0.8) | (1.1) | 222,835 | (0.7) | (5.1) | |||||||||||||||||
| Mutual funds | 7,643 | (1.0) | (1.3) | 7,643 | 5.1 | 0.5 | |||||||||||||||||
| Ratios (%), operating means and customers | |||||||||||||||||||||||
| RoTE | 11.0 | (0.6) | 11.1 | (1.9) | |||||||||||||||||||
| Efficiency ratio | 55.7 | 2.9 | 55.9 | 6.2 | |||||||||||||||||||
| NPL ratio | 1.33 | (0.11) | 1.33 | (0.09) | |||||||||||||||||||
| NPL coverage ratio | 29.3 | 0.9 | 29.3 | (1.0) | |||||||||||||||||||
| Number of employees | 20,455 | (6.2) | 20,455 | (8.2) | |||||||||||||||||||
| Number of branches | 444 | 0.0 | 444 | 0.0 | |||||||||||||||||||
| Number of total customers (thousands) | 22,541 | 0.0 | 22,541 | 0.3 | |||||||||||||||||||
| Number of active customers (thousands) | 13,646 | (0.4) | 13,646 | (1.6) | |||||||||||||||||||
January - December 2024 |
|
31 |
||||||
|
Business model
|
|
||||||||||||||||||||||
| Secondary segments | |||||||||||||||||||||||
| Portugal | Q |
||||||||||||||||
| EUR million | |||||||||||||||||
| / Q3'24 | / 2023 | ||||||||||||||||
| Underlying income statement | Q4'24 | % | 2024 | % | |||||||||||||
| Net interest income | 332 | (10.8) | 1,548 | 5.7 | |||||||||||||
| Net fee income | 110 | (3.7) | 467 | 0.8 | |||||||||||||
Gains (losses) on financial transactions 1 |
7 | 177.5 | 45 | 35.3 | |||||||||||||
| Other operating income | 9 | (17.6) | 40 | 94.3 | |||||||||||||
| Total income | 458 | (8.4) | 2,100 | 6.0 | |||||||||||||
| Administrative expenses and amortizations | (143) | 4.5 | (548) | 1.0 | |||||||||||||
| Net operating income | 315 | (13.3) | 1,553 | 7.8 | |||||||||||||
| Net loan-loss provisions | (1) | (79.8) | (11) | (85.7) | |||||||||||||
| Other gains (losses) and provisions | (18) | 249.1 | (61) | 24.5 | |||||||||||||
| Profit before tax | 296 | (15.6) | 1,481 | 12.7 | |||||||||||||
| Tax on profit | (86) | (28.8) | (478) | 14.9 | |||||||||||||
| Profit from continuing operations | 210 | (8.7) | 1,003 | 11.6 | |||||||||||||
| Net profit from discontinued operations | — | — | — | — | |||||||||||||
| Consolidated profit | 210 | (8.7) | 1,003 | 11.6 | |||||||||||||
| Non-controlling interests | 0 | (22.1) | (2) | 4.6 | |||||||||||||
| Profit attributable to the parent | 209 | (8.7) | 1,001 | 11.7 | |||||||||||||
| Balance sheet | |||||||||||||||||
| Loans and advances to customers | 38,410 | 1.0 | 38,410 | 4.2 | |||||||||||||
| Cash, central banks and credit institutions | 3,873 | (41.3) | 3,873 | (52.1) | |||||||||||||
| Debt instruments | 15,010 | 15.7 | 15,010 | 36.6 | |||||||||||||
| Other financial assets | 1,129 | 0.2 | 1,129 | 4.7 | |||||||||||||
| Other asset accounts | 1,109 | 1.9 | 1,109 | (13.3) | |||||||||||||
| Total assets | 59,530 | (0.5) | 59,530 | 2.1 | |||||||||||||
| Customer deposits | 38,304 | 0.7 | 38,304 | 5.3 | |||||||||||||
| Central banks and credit institutions | 8,813 | (4.4) | 8,813 | (4.6) | |||||||||||||
| Marketable debt securities | 4,973 | (1.6) | 4,973 | 3.3 | |||||||||||||
| Other financial liabilities | 339 | 15.2 | 339 | 6.3 | |||||||||||||
| Other liabilities accounts | 3,056 | (8.1) | 3,056 | (18.0) | |||||||||||||
| Total liabilities | 55,485 | (0.8) | 55,485 | 1.9 | |||||||||||||
| Total equity | 4,046 | 4.2 | 4,046 | 5.4 | |||||||||||||
| Memorandum items: | |||||||||||||||||
Gross loans and advances to customers 2 |
39,143 | 1.0 | 39,143 | 3.9 | |||||||||||||
| Customer funds | 43,186 | 1.1 | 43,186 | 6.3 | |||||||||||||
Customer deposits 3 |
38,304 | 0.7 | 38,304 | 5.3 | |||||||||||||
| Mutual funds | 4,882 | 4.5 | 4,882 | 14.8 | |||||||||||||
| Ratios (%), operating means and customers | |||||||||||||||||
| RoTE | 21.1 | (1.6) | 25.4 | (0.6) | |||||||||||||
| Efficiency ratio | 31.2 | 3.9 | 26.1 | (1.3) | |||||||||||||
| NPL ratio | 2.40 | (0.07) | 2.40 | (0.19) | |||||||||||||
| NPL coverage ratio | 79.4 | 1.3 | 79.4 | (3.3) | |||||||||||||
| Number of employees | 4,901 | 0.0 | 4,901 | (0.9) | |||||||||||||
| Number of branches | 374 | (0.3) | 374 | (0.5) | |||||||||||||
| Number of total customers (thousands) | 2,989 | 0.8 | 2,989 | 2.8 | |||||||||||||
| Number of active customers (thousands) | 1,905 | 1.3 | 1,905 | 3.6 | |||||||||||||
32 |
|
January - December 2024 |
||||||
|
Business model
|
|
||||||||||||||||||||||
| Secondary segments | |||||||||||||||||||||||
| Poland | Q |
||||||||||||||||||||||
| EUR million | |||||||||||||||||||||||
| / | Q3'24 | / | 2023 | ||||||||||||||||||||
| Underlying income statement | Q4'24 | % | % excl. FX | 2024 | % | % excl. FX | |||||||||||||||||
| Net interest income | 733 | 0.8 | 1.4 | 2,844 | 11.8 | 6.1 | |||||||||||||||||
| Net fee income | 166 | (2.3) | (1.8) | 674 | 14.4 | 8.5 | |||||||||||||||||
Gains (losses) on financial transactions 1 |
13 | (33.3) | (33.0) | 57 | (14.8) | (19.1) | |||||||||||||||||
| Other operating income | 9 | 57.3 | 54.8 | (20) | 15.0 | 9.1 | |||||||||||||||||
| Total income | 921 | (0.1) | 0.4 | 3,555 | 11.7 | 6.0 | |||||||||||||||||
| Administrative expenses and amortizations | (246) | (2.4) | (1.9) | (965) | 11.9 | 6.1 | |||||||||||||||||
| Net operating income | 675 | 0.8 | 1.3 | 2,591 | 11.7 | 5.9 | |||||||||||||||||
| Net loan-loss provisions | (112) | 9.0 | 9.9 | (511) | (24.2) | (28.0) | |||||||||||||||||
| Other gains (losses) and provisions | (197) | 214.6 | 216.9 | (429) | 69.3 | 60.6 | |||||||||||||||||
| Profit before tax | 366 | (27.4) | (27.1) | 1,650 | 18.5 | 12.4 | |||||||||||||||||
| Tax on profit | (111) | (1.1) | (0.5) | (431) | 14.4 | 8.5 | |||||||||||||||||
| Profit from continuing operations | 255 | (35.0) | (34.7) | 1,219 | 20.1 | 13.9 | |||||||||||||||||
| Net profit from discontinued operations | — | — | — | — | — | — | |||||||||||||||||
| Consolidated profit | 255 | (35.0) | (34.7) | 1,219 | 20.1 | 13.9 | |||||||||||||||||
| Non-controlling interests | (97) | (28.4) | (28.1) | (419) | 22.6 | 16.3 | |||||||||||||||||
| Profit attributable to the parent | 158 | (38.5) | (38.2) | 800 | 18.8 | 12.7 | |||||||||||||||||
| Balance sheet | |||||||||||||||||||||||
| Loans and advances to customers | 38,042 | 2.0 | 1.8 | 38,042 | 12.4 | 10.6 | |||||||||||||||||
| Cash, central banks and credit institutions | 10,283 | 11.6 | 11.4 | 10,283 | 10.7 | 9.0 | |||||||||||||||||
| Debt instruments | 17,489 | 15.0 | 14.8 | 17,489 | 16.1 | 14.2 | |||||||||||||||||
| Other financial assets | 493 | (15.1) | (15.3) | 493 | (32.7) | (33.8) | |||||||||||||||||
| Other asset accounts | 1,961 | (10.6) | (10.8) | 1,961 | (0.6) | (2.2) | |||||||||||||||||
| Total assets | 68,269 | 5.8 | 5.7 | 68,269 | 12.1 | 10.3 | |||||||||||||||||
| Customer deposits | 50,331 | 6.1 | 6.0 | 50,331 | 13.1 | 11.3 | |||||||||||||||||
| Central banks and credit institutions | 5,020 | 5.7 | 5.5 | 5,020 | 8.6 | 6.9 | |||||||||||||||||
| Marketable debt securities | 2,744 | 4.5 | 4.3 | 2,744 | 41.1 | 38.9 | |||||||||||||||||
| Other financial liabilities | 1,656 | 6.8 | 6.7 | 1,656 | (3.0) | (4.5) | |||||||||||||||||
| Other liabilities accounts | 1,688 | 12.2 | 12.0 | 1,688 | 0.0 | (1.5) | |||||||||||||||||
| Total liabilities | 61,439 | 6.2 | 6.0 | 61,439 | 12.8 | 11.0 | |||||||||||||||||
| Total equity | 6,830 | 2.7 | 2.5 | 6,830 | 5.8 | 4.2 | |||||||||||||||||
| Memorandum items: | |||||||||||||||||||||||
Gross loans and advances to customers 2 |
38,729 | 1.9 | 1.7 | 38,729 | 11.5 | 9.8 | |||||||||||||||||
| Customer funds | 56,581 | 7.0 | 6.9 | 56,581 | 14.6 | 12.8 | |||||||||||||||||
Customer deposits 3 |
50,086 | 7.4 | 7.2 | 50,086 | 12.6 | 10.9 | |||||||||||||||||
| Mutual funds | 6,495 | 4.4 | 4.3 | 6,495 | 32.3 | 30.2 | |||||||||||||||||
| Ratios (%), operating means and customers | |||||||||||||||||||||||
| RoTE | 16.1 | (9.9) | 20.2 | 2.5 | |||||||||||||||||||
| Efficiency ratio | 26.7 | (0.6) | 27.1 | 0.0 | |||||||||||||||||||
| NPL ratio | 3.66 | (0.25) | 3.66 | 0.11 | |||||||||||||||||||
| NPL coverage ratio | 61.9 | (4.3) | 61.9 | (11.4) | |||||||||||||||||||
| Number of employees | 11,038 | 0.4 | 11,038 | 2.0 | |||||||||||||||||||
| Number of branches | 368 | (1.6) | 368 | (3.4) | |||||||||||||||||||
| Number of total customers (thousands) | 5,979 | (0.2) | 5,979 | 1.7 | |||||||||||||||||||
| Number of active customers (thousands) | 4,632 | 0.9 | 4,632 | 3.7 | |||||||||||||||||||
January - December 2024 |
|
33 |
||||||
|
Business model
|
|
||||||||||||||||||||||
| Secondary segments | |||||||||||||||||||||||
| Other Europe | |||||||||||||||||||||||
| EUR million | |||||||||||||||||||||||
| / | Q3'24 | / | 2023 | ||||||||||||||||||||
| Underlying income statement | Q4'24 | % | % excl. FX | 2024 | % | % excl. FX | |||||||||||||||||
| Net interest income | 48 | (5.0) | (7.8) | 121 | 11.1 | 11.2 | |||||||||||||||||
| Net fee income | 109 | 13.5 | 12.2 | 367 | 19.0 | 19.0 | |||||||||||||||||
Gains (losses) on financial transactions 1 |
35 | (24.7) | (26.0) | 174 | (19.9) | (19.9) | |||||||||||||||||
| Other operating income | (7) | — | — | 2 | — | — | |||||||||||||||||
| Total income | 185 | (5.5) | (7.1) | 664 | 7.4 | 7.4 | |||||||||||||||||
| Administrative expenses and amortizations | (171) | (7.1) | (8.3) | (706) | 8.1 | 8.1 | |||||||||||||||||
| Net operating income | 14 | 20.5 | 10.4 | (42) | 20.8 | 20.5 | |||||||||||||||||
| Net loan-loss provisions | (18) | — | — | (17) | 42.6 | 42.6 | |||||||||||||||||
| Other gains (losses) and provisions | (18) | (71.9) | (72.2) | (176) | — | — | |||||||||||||||||
| Profit before tax | (22) | (59.8) | (58.7) | (236) | — | — | |||||||||||||||||
| Tax on profit | 14 | — | — | 10 | (24.2) | (24.3) | |||||||||||||||||
| Profit from continuing operations | (8) | (88.0) | (87.5) | (227) | — | — | |||||||||||||||||
| Net profit from discontinued operations | — | — | — | — | — | — | |||||||||||||||||
| Consolidated profit | (8) | (88.0) | (87.5) | (227) | — | — | |||||||||||||||||
| Non-controlling interests | 1 | — | — | 1 | (32.3) | (32.3) | |||||||||||||||||
| Profit attributable to the parent | (8) | (89.2) | (88.7) | (225) | — | — | |||||||||||||||||
| Balance sheet | |||||||||||||||||||||||
| Loans and advances to customers | 13,952 | 5.2 | (1.5) | 13,952 | (3.1) | (8.6) | |||||||||||||||||
| Cash, central banks and credit institutions | 4,009 | 47.7 | 41.6 | 4,009 | 68.9 | 63.0 | |||||||||||||||||
| Debt instruments | 8,289 | (9.6) | (10.6) | 8,289 | (8.5) | (9.3) | |||||||||||||||||
| Other financial assets | 1,975 | 9.7 | 4.2 | 1,975 | 30.6 | 24.6 | |||||||||||||||||
| Other asset accounts | 1,270 | (40.6) | (42.1) | 1,270 | (41.5) | (43.0) | |||||||||||||||||
| Total assets | 29,495 | 1.4 | (2.9) | 29,495 | (0.1) | (3.9) | |||||||||||||||||
| Customer deposits | 9,843 | 21.3 | 14.1 | 9,843 | 51.4 | 42.3 | |||||||||||||||||
| Central banks and credit institutions | 14,134 | (12.4) | (15.2) | 14,134 | (18.3) | (20.9) | |||||||||||||||||
| Marketable debt securities | 0 | — | — | 0 | — | — | |||||||||||||||||
| Other financial liabilities | 1,888 | 23.8 | 16.7 | 1,888 | 37.9 | 31.0 | |||||||||||||||||
| Other liabilities accounts | 635 | 4.0 | 2.8 | 635 | 151.4 | 146.2 | |||||||||||||||||
| Total liabilities | 26,500 | 0.5 | (3.7) | 26,500 | 4.2 | 0.1 | |||||||||||||||||
| Total equity | 2,995 | 10.7 | 5.7 | 2,995 | (26.7) | (28.6) | |||||||||||||||||
| Memorandum items: | |||||||||||||||||||||||
Gross loans and advances to customers 2 |
14,052 | 5.8 | (0.9) | 14,052 | (2.6) | (8.1) | |||||||||||||||||
| Customer funds | 22,927 | 15.3 | 10.7 | 22,927 | 35.3 | 30.4 | |||||||||||||||||
Customer deposits 3 |
9,415 | 22.2 | 14.6 | 9,415 | 48.7 | 39.6 | |||||||||||||||||
| Mutual funds | 13,512 | 10.9 | 8.1 | 13,512 | 27.2 | 24.7 | |||||||||||||||||
| Resources | |||||||||||||||||||||||
| Number of employees | 5,372 | 0.1 | 5,372 | 14.4 | |||||||||||||||||||
34 |
|
January - December 2024 |
||||||
|
Business model
|
|
||||||||||||||||||||||
| Secondary segments | |||||||||||||||||||||||
| DCBE | Digital Consumer Bank Europe | Underlying attributable profit | ||||||
| EUR 642 mn | ||||||||
| EUR million | |||||||||||||||||||||||
| / | Q3'24 | / | 2023 | ||||||||||||||||||||
| Underlying income statement | Q4'24 | % | % excl. FX | 2024 | % | % excl. FX | |||||||||||||||||
| Net interest income | 1,105 | 3.4 | 3.4 | 4,361 | 4.0 | 3.8 | |||||||||||||||||
| Net fee income | 222 | (3.1) | (3.1) | 902 | 13.4 | 13.1 | |||||||||||||||||
Gains (losses) on financial transactions 1 |
(32) | — | — | (24) | — | — | |||||||||||||||||
| Other operating income | 132 | 28.2 | 27.8 | 440 | 11.0 | 10.2 | |||||||||||||||||
| Total income | 1,427 | 2.1 | 2.0 | 5,679 | 3.2 | 2.9 | |||||||||||||||||
| Administrative expenses and amortizations | (629) | (4.2) | (4.3) | (2,604) | (0.5) | (0.7) | |||||||||||||||||
| Net operating income | 799 | 7.7 | 7.6 | 3,075 | 6.6 | 6.2 | |||||||||||||||||
| Net loan-loss provisions | (345) | 23.6 | 23.6 | (1,209) | 52.6 | 51.9 | |||||||||||||||||
| Other gains (losses) and provisions | (481) | 690.6 | 692.6 | (735) | 914.1 | 867.3 | |||||||||||||||||
| Profit before tax | (28) | — | — | 1,131 | (44.0) | (44.1) | |||||||||||||||||
| Tax on profit | 25 | — | — | (255) | (48.2) | (48.3) | |||||||||||||||||
| Profit from continuing operations | (2) | — | — | 876 | (42.6) | (42.7) | |||||||||||||||||
| Net profit from discontinued operations | — | — | — | — | — | — | |||||||||||||||||
| Consolidated profit | (2) | — | — | 876 | (42.6) | (42.7) | |||||||||||||||||
| Non-controlling interests | (51) | (12.7) | (12.7) | (234) | (28.7) | (28.8) | |||||||||||||||||
| Profit attributable to the parent | (54) | — | — | 642 | (46.5) | (46.5) | |||||||||||||||||
| Balance sheet | |||||||||||||||||||||||
| Loans and advances to customers | 137,038 | 1.2 | 1.2 | 137,038 | 3.3 | 3.4 | |||||||||||||||||
| Cash, central banks and credit institutions | 19,185 | (9.8) | (9.8) | 19,185 | 2.9 | 3.1 | |||||||||||||||||
| Debt instruments | 6,310 | 2.7 | 2.7 | 6,310 | 17.1 | 17.8 | |||||||||||||||||
| Other financial assets | 128 | (4.6) | (4.6) | 128 | (5.3) | (5.4) | |||||||||||||||||
| Other asset accounts | 11,115 | (1.7) | (1.7) | 11,115 | 11.8 | 11.3 | |||||||||||||||||
| Total assets | 173,775 | (0.3) | (0.3) | 173,775 | 4.2 | 4.3 | |||||||||||||||||
| Customer deposits | 81,376 | 1.7 | 1.8 | 81,376 | 17.4 | 17.9 | |||||||||||||||||
| Central banks and credit institutions | 28,120 | (6.0) | (6.1) | 28,120 | (12.0) | (12.9) | |||||||||||||||||
| Marketable debt securities | 43,137 | (1.1) | (1.1) | 43,137 | (3.3) | (3.1) | |||||||||||||||||
| Other financial liabilities | 1,918 | (9.8) | (9.8) | 1,918 | (13.5) | (13.7) | |||||||||||||||||
| Other liabilities accounts | 5,714 | 8.3 | 8.4 | 5,714 | 9.2 | 9.5 | |||||||||||||||||
| Total liabilities | 160,264 | (0.4) | (0.4) | 160,264 | 4.5 | 4.6 | |||||||||||||||||
| Total equity | 13,512 | 1.2 | 1.3 | 13,512 | 0.5 | 0.8 | |||||||||||||||||
| Memorandum items: | |||||||||||||||||||||||
Gross loans and advances to customers 2 |
139,927 | 1.2 | 1.2 | 139,927 | 3.5 | 3.6 | |||||||||||||||||
| Customer funds | 85,876 | 1.8 | 1.8 | 85,876 | 17.7 | 18.2 | |||||||||||||||||
Customer deposits 3 |
81,376 | 1.7 | 1.8 | 81,376 | 17.4 | 17.9 | |||||||||||||||||
| Mutual funds | 4,500 | 2.4 | 2.4 | 4,500 | 24.0 | 24.0 | |||||||||||||||||
| Ratios (%), operating means and customers | |||||||||||||||||||||||
| RoTE | (2.2) | (11.9) | 6.4 | (5.9) | |||||||||||||||||||
| Efficiency ratio | 44.0 | (2.9) | 45.9 | (1.7) | |||||||||||||||||||
| NPL ratio | 2.50 | 0.06 | 2.50 | 0.37 | |||||||||||||||||||
| NPL coverage ratio | 82.5 | (0.8) | 82.5 | (5.5) | |||||||||||||||||||
| Number of employees | 16,792 | 1.0 | 16,792 | 0.0 | |||||||||||||||||||
| Number of branches | 326 | 0.0 | 326 | (4.7) | |||||||||||||||||||
| Number of total customers (thousands) | 19,550 | (0.4) | 19,550 | (3.2) | |||||||||||||||||||
January - December 2024 |
|
35 |
||||||
|
Business model
|
|
||||||||||||||||||||||
| Secondary segments | |||||||||||||||||||||||
 |
North America | Underlying attributable profit | ||||||
| EUR 2,579 mn | ||||||||
| EUR million | |||||||||||||||||||||||
| / | Q3'24 | / | 2023 | ||||||||||||||||||||
| Underlying income statement | Q4'24 | % | % excl. FX | 2024 | % | % excl. FX | |||||||||||||||||
| Net interest income | 2,556 | 1.2 | 0.8 | 10,330 | 1.7 | 3.0 | |||||||||||||||||
| Net fee income | 654 | 2.0 | 2.1 | 2,594 | 18.3 | 20.5 | |||||||||||||||||
Gains (losses) on financial transactions 1 |
248 | 47.6 | 46.1 | 747 | 48.1 | 49.9 | |||||||||||||||||
| Other operating income | 51 | 61.2 | 46.5 | 243 | (23.6) | (24.1) | |||||||||||||||||
| Total income | 3,509 | 4.2 | 3.7 | 13,915 | 5.6 | 7.0 | |||||||||||||||||
| Administrative expenses and amortizations | (1,724) | 6.2 | 5.5 | (6,701) | 3.6 | 4.9 | |||||||||||||||||
| Net operating income | 1,785 | 2.4 | 2.1 | 7,214 | 7.5 | 9.1 | |||||||||||||||||
| Net loan-loss provisions | (950) | 0.6 | (0.4) | (3,786) | 1.4 | 2.4 | |||||||||||||||||
| Other gains (losses) and provisions | (54) | (28.8) | (29.7) | (336) | 143.1 | 146.1 | |||||||||||||||||
| Profit before tax | 781 | 7.9 | 8.6 | 3,091 | 9.0 | 11.4 | |||||||||||||||||
| Tax on profit | (132) | (4.1) | (0.6) | (509) | 8.7 | 12.5 | |||||||||||||||||
| Profit from continuing operations | 649 | 10.7 | 10.8 | 2,582 | 9.0 | 11.2 | |||||||||||||||||
| Net profit from discontinued operations | — | — | — | — | — | — | |||||||||||||||||
| Consolidated profit | 649 | 10.7 | 10.8 | 2,582 | 9.0 | 11.2 | |||||||||||||||||
| Non-controlling interests | (1) | (44.7) | (39.5) | (3) | (78.6) | (77.8) | |||||||||||||||||
| Profit attributable to the parent | 648 | 10.8 | 10.9 | 2,579 | 9.6 | 11.7 | |||||||||||||||||
| Balance sheet | |||||||||||||||||||||||
| Loans and advances to customers | 179,941 | 1.0 | (4.6) | 179,941 | 3.0 | 1.9 | |||||||||||||||||
| Cash, central banks and credit institutions | 39,855 | 9.8 | 4.1 | 39,855 | 10.8 | 12.4 | |||||||||||||||||
| Debt instruments | 57,135 | 11.1 | 6.4 | 57,135 | 13.6 | 18.8 | |||||||||||||||||
| Other financial assets | 8,759 | 6.3 | 3.1 | 8,759 | (19.9) | (15.0) | |||||||||||||||||
| Other asset accounts | 22,112 | 4.7 | (1.0) | 22,112 | (3.1) | (4.1) | |||||||||||||||||
| Total assets | 307,801 | 4.3 | (1.2) | 307,801 | 4.4 | 4.9 | |||||||||||||||||
| Customer deposits | 175,586 | 5.0 | (0.7) | 175,586 | (0.2) | (0.6) | |||||||||||||||||
| Central banks and credit institutions | 44,332 | 3.3 | (2.0) | 44,332 | 27.7 | 32.1 | |||||||||||||||||
| Marketable debt securities | 41,414 | 2.8 | (3.1) | 41,414 | 17.9 | 15.7 | |||||||||||||||||
| Other financial liabilities | 14,998 | 4.9 | 1.3 | 14,998 | (19.4) | (14.7) | |||||||||||||||||
| Other liabilities accounts | 6,869 | 14.5 | 9.6 | 6,869 | 1.6 | 5.9 | |||||||||||||||||
| Total liabilities | 283,200 | 4.6 | (0.9) | 283,200 | 4.4 | 4.9 | |||||||||||||||||
| Total equity | 24,601 | 0.7 | (4.3) | 24,601 | 4.0 | 5.2 | |||||||||||||||||
| Memorandum items: | |||||||||||||||||||||||
Gross loans and advances to customers 2 |
162,263 | 3.7 | (2.0) | 162,263 | 0.5 | 0.1 | |||||||||||||||||
| Customer funds | 169,753 | 8.4 | 3.0 | 169,753 | (0.9) | (0.1) | |||||||||||||||||
Customer deposits 3 |
135,419 | 8.9 | 3.2 | 135,419 | (4.5) | (4.6) | |||||||||||||||||
| Mutual funds | 34,334 | 6.3 | 2.3 | 34,334 | 16.6 | 22.8 | |||||||||||||||||
| Ratios (%), operating means and customers | |||||||||||||||||||||||
| RoTE | 11.1 | 0.8 | 11.2 | 1.4 | |||||||||||||||||||
| Efficiency ratio | 49.1 | 0.9 | 48.2 | (0.9) | |||||||||||||||||||
| NPL ratio | 4.22 | 0.24 | 4.22 | 0.12 | |||||||||||||||||||
| NPL coverage ratio | 69.7 | (1.6) | 69.7 | (4.2) | |||||||||||||||||||
| Number of employees | 42,846 | (1.4) | 42,846 | (6.0) | |||||||||||||||||||
| Number of branches | 1,761 | (0.1) | 1,761 | (1.3) | |||||||||||||||||||
| Number of total customers (thousands) | 25,762 | 0.3 | 25,762 | 2.9 | |||||||||||||||||||
| Number of active customers (thousands) | 15,178 | 0.7 | 15,178 | 4.8 | |||||||||||||||||||
36 |
|
January - December 2024 |
||||||
|
Business model
|
|
||||||||||||||||||||||
| Secondary segments | |||||||||||||||||||||||
| United States | Q |
||||||||||||||||||||||
| EUR million | |||||||||||||||||||||||
| / | Q3'24 | / | 2023 | ||||||||||||||||||||
| Underlying income statement | Q4'24 | % | % excl. FX | 2024 | % | % excl. FX | |||||||||||||||||
| Net interest income | 1,458 | 3.3 | 0.3 | 5,693 | (0.9) | (0.8) | |||||||||||||||||
| Net fee income | 317 | 7.0 | 4.2 | 1,152 | 50.3 | 50.4 | |||||||||||||||||
Gains (losses) on financial transactions 1 |
80 | (13.6) | (16.5) | 371 | 25.8 | 25.9 | |||||||||||||||||
| Other operating income | 86 | 23.5 | 19.1 | 365 | (10.1) | (10.1) | |||||||||||||||||
| Total income | 1,941 | 3.8 | 0.8 | 7,580 | 5.1 | 5.2 | |||||||||||||||||
| Administrative expenses and amortizations | (987) | 5.0 | 1.9 | (3,830) | 4.1 | 4.2 | |||||||||||||||||
| Net operating income | 954 | 2.7 | (0.3) | 3,750 | 6.2 | 6.3 | |||||||||||||||||
| Net loan-loss provisions | (686) | 5.6 | 2.7 | (2,507) | (3.3) | (3.3) | |||||||||||||||||
| Other gains (losses) and provisions | (45) | (27.9) | (29.9) | (190) | 154.9 | 155.0 | |||||||||||||||||
| Profit before tax | 223 | 2.8 | (1.0) | 1,053 | 22.0 | 22.1 | |||||||||||||||||
| Tax on profit | 6 | — | — | 56 | (19.1) | (19.1) | |||||||||||||||||
| Profit from continuing operations | 229 | 6.2 | 2.0 | 1,109 | 19.0 | 19.0 | |||||||||||||||||
| Net profit from discontinued operations | — | — | — | — | — | — | |||||||||||||||||
| Consolidated profit | 229 | 6.2 | 2.0 | 1,109 | 19.0 | 19.0 | |||||||||||||||||
| Non-controlling interests | — | — | — | — | — | — | |||||||||||||||||
| Profit attributable to the parent | 229 | 6.2 | 2.0 | 1,109 | 19.0 | 19.0 | |||||||||||||||||
| Balance sheet | |||||||||||||||||||||||
| Loans and advances to customers | 134,856 | 0.7 | (6.2) | 134,856 | 6.3 | (0.1) | |||||||||||||||||
| Cash, central banks and credit institutions | 28,200 | 14.5 | 6.6 | 28,200 | 32.9 | 24.9 | |||||||||||||||||
| Debt instruments | 27,042 | 3.9 | (3.3) | 27,042 | 19.2 | 12.0 | |||||||||||||||||
| Other financial assets | 2,821 | 24.3 | 15.7 | 2,821 | (30.8) | (34.9) | |||||||||||||||||
| Other asset accounts | 16,058 | 3.9 | (3.2) | 16,058 | (1.5) | (7.4) | |||||||||||||||||
| Total assets | 208,978 | 3.3 | (3.8) | 208,978 | 9.3 | 2.8 | |||||||||||||||||
| Customer deposits | 125,403 | 5.4 | (1.8) | 125,403 | 3.0 | (3.2) | |||||||||||||||||
| Central banks and credit institutions | 26,794 | (5.2) | (11.7) | 26,794 | 53.9 | 44.7 | |||||||||||||||||
| Marketable debt securities | 31,783 | 1.3 | (5.7) | 31,783 | 17.5 | 10.4 | |||||||||||||||||
| Other financial liabilities | 5,223 | 3.1 | (4.0) | 5,223 | (28.2) | (32.5) | |||||||||||||||||
| Other liabilities accounts | 3,683 | 23.7 | 15.2 | 3,683 | 18.1 | 11.0 | |||||||||||||||||
| Total liabilities | 192,886 | 3.3 | (3.8) | 192,886 | 9.2 | 2.6 | |||||||||||||||||
| Total equity | 16,091 | 2.7 | (4.3) | 16,091 | 11.1 | 4.5 | |||||||||||||||||
| Memorandum items: | |||||||||||||||||||||||
Gross loans and advances to customers 2 |
117,511 | 3.9 | (3.2) | 117,511 | 4.3 | (2.0) | |||||||||||||||||
| Customer funds | 108,246 | 9.9 | 2.3 | 108,246 | 0.2 | (5.8) | |||||||||||||||||
Customer deposits 3 |
93,545 | 10.3 | 2.7 | 93,545 | (2.2) | (8.1) | |||||||||||||||||
| Mutual funds | 14,702 | 7.4 | 0.0 | 14,702 | 18.9 | 11.8 | |||||||||||||||||
| Ratios (%), operating means and customers | |||||||||||||||||||||||
| RoTE | 5.9 | 0.1 | 7.5 | 1.5 | |||||||||||||||||||
| Efficiency ratio | 50.8 | 0.6 | 50.5 | (0.5) | |||||||||||||||||||
| NPL ratio | 4.72 | 0.32 | 4.72 | 0.15 | |||||||||||||||||||
| NPL coverage ratio | 63.8 | (0.8) | 63.8 | (3.9) | |||||||||||||||||||
| Number of employees | 12,484 | (1.6) | 12,484 | (7.5) | |||||||||||||||||||
| Number of branches | 405 | (0.7) | 405 | (2.4) | |||||||||||||||||||
| Number of total customers (thousands) | 4,474 | (0.2) | 4,474 | (0.8) | |||||||||||||||||||
| Number of active customers (thousands) | 4,308 | (0.5) | 4,308 | 2.0 | |||||||||||||||||||
January - December 2024 |
|
37 |
||||||
|
Business model
|
|
||||||||||||||||||||||
| Secondary segments | |||||||||||||||||||||||
| Mexico | Q |
||||||||||||||||||||||
| EUR million | |||||||||||||||||||||||
| / | Q3'24 | / | 2023 | ||||||||||||||||||||
| Underlying income statement | Q4'24 | % | % excl. FX | 2024 | % | % excl. FX | |||||||||||||||||
| Net interest income | 1,097 | (1.5) | 1.5 | 4,631 | 5.0 | 8.1 | |||||||||||||||||
| Net fee income | 322 | (2.1) | 0.8 | 1,385 | 0.8 | 3.8 | |||||||||||||||||
Gains (losses) on financial transactions 1 |
177 | 135.3 | 132.8 | 396 | 88.0 | 93.5 | |||||||||||||||||
| Other operating income | (38) | (6.8) | (2.9) | (133) | 41.7 | 45.9 | |||||||||||||||||
| Total income | 1,558 | 5.5 | 8.0 | 6,278 | 6.4 | 9.6 | |||||||||||||||||
| Administrative expenses and amortizations | (689) | 8.7 | 11.2 | (2,665) | 3.0 | 6.0 | |||||||||||||||||
| Net operating income | 869 | 3.1 | 5.7 | 3,613 | 9.1 | 12.3 | |||||||||||||||||
| Net loan-loss provisions | (263) | (10.4) | (7.2) | (1,277) | 12.5 | 15.8 | |||||||||||||||||
| Other gains (losses) and provisions | (17) | 26.0 | 27.1 | (62) | 8.1 | 11.3 | |||||||||||||||||
| Profit before tax | 589 | 9.9 | 12.3 | 2,274 | 7.3 | 10.5 | |||||||||||||||||
| Tax on profit | (150) | 6.5 | 9.0 | (598) | 10.5 | 13.7 | |||||||||||||||||
| Profit from continuing operations | 439 | 11.2 | 13.5 | 1,676 | 6.3 | 9.4 | |||||||||||||||||
| Net profit from discontinued operations | — | — | — | — | — | — | |||||||||||||||||
| Consolidated profit | 439 | 11.2 | 13.5 | 1,676 | 6.3 | 9.4 | |||||||||||||||||
| Non-controlling interests | (1) | 35.5 | 36.5 | (5) | (73.0) | (72.2) | |||||||||||||||||
| Profit attributable to the parent | 438 | 11.1 | 13.4 | 1,671 | 7.2 | 10.3 | |||||||||||||||||
| Balance sheet | |||||||||||||||||||||||
| Loans and advances to customers | 45,054 | 2.1 | 0.6 | 45,054 | (6.0) | 8.5 | |||||||||||||||||
| Cash, central banks and credit institutions | 10,945 | (1.6) | (3.1) | 10,945 | (22.3) | (10.4) | |||||||||||||||||
| Debt instruments | 30,092 | 18.5 | 16.8 | 30,092 | 8.9 | 25.6 | |||||||||||||||||
| Other financial assets | 5,785 | (1.2) | (2.6) | 5,785 | (14.0) | (0.8) | |||||||||||||||||
| Other asset accounts | 5,745 | 6.7 | 5.2 | 5,745 | (6.7) | 7.6 | |||||||||||||||||
| Total assets | 97,621 | 6.2 | 4.7 | 97,621 | (4.8) | 9.8 | |||||||||||||||||
| Customer deposits | 49,836 | 3.9 | 2.4 | 49,836 | (7.2) | 7.0 | |||||||||||||||||
| Central banks and credit institutions | 17,260 | 19.8 | 18.0 | 17,260 | 1.3 | 16.8 | |||||||||||||||||
| Marketable debt securities | 9,632 | 8.3 | 6.7 | 9,632 | 19.3 | 37.6 | |||||||||||||||||
| Other financial liabilities | 9,640 | 5.7 | 4.2 | 9,640 | (13.8) | (0.6) | |||||||||||||||||
| Other liabilities accounts | 3,115 | 5.8 | 4.2 | 3,115 | (13.0) | 0.3 | |||||||||||||||||
| Total liabilities | 89,483 | 7.4 | 5.8 | 89,483 | (4.4) | 10.3 | |||||||||||||||||
| Total equity | 8,138 | (4.7) | (6.1) | 8,138 | (8.6) | 5.4 | |||||||||||||||||
| Memorandum items: | |||||||||||||||||||||||
Gross loans and advances to customers 2 |
44,715 | 3.0 | 1.5 | 44,715 | (8.2) | 5.9 | |||||||||||||||||
| Customer funds | 61,160 | 5.8 | 4.3 | 61,160 | (2.6) | 12.4 | |||||||||||||||||
Customer deposits 3 |
41,528 | 6.0 | 4.4 | 41,528 | (9.1) | 4.8 | |||||||||||||||||
| Mutual funds | 19,632 | 5.6 | 4.0 | 19,632 | 14.9 | 32.5 | |||||||||||||||||
| Ratios (%), operating means and customers | |||||||||||||||||||||||
| RoTE | 22.2 | 2.5 | 20.0 | 2.3 | |||||||||||||||||||
| Efficiency ratio | 44.2 | 1.3 | 42.5 | (1.4) | |||||||||||||||||||
| NPL ratio | 2.71 | 0.01 | 2.71 | (0.11) | |||||||||||||||||||
| NPL coverage ratio | 100.4 | (3.6) | 100.4 | 0.4 | |||||||||||||||||||
| Number of employees | 28,957 | (1.2) | 28,957 | (6.2) | |||||||||||||||||||
| Number of branches | 1,356 | 0.1 | 1,356 | (0.9) | |||||||||||||||||||
| Number of total customers (thousands) | 21,289 | 0.4 | 21,289 | 3.8 | |||||||||||||||||||
| Number of active customers (thousands) | 10,871 | 1.1 | 10,871 | 5.9 | |||||||||||||||||||
38 |
|
January - December 2024 |
||||||
|
Business model
|
|
||||||||||||||||||||||
| Secondary segments | |||||||||||||||||||||||
| Other North America | |||||||||||||||||||||||
| EUR million | |||||||||||||||||||||||
| / | Q3'24 | / | 2023 | ||||||||||||||||||||
| Underlying income statement | Q4'24 | % | % excl. FX | 2024 | % | % excl. FX | |||||||||||||||||
| Net interest income | 2 | (33.4) | (32.9) | 7 | (16.7) | (16.7) | |||||||||||||||||
| Net fee income | 14 | (7.7) | (7.6) | 57 | 10.9 | 10.9 | |||||||||||||||||
Gains (losses) on financial transactions 1 |
(9) | — | — | (20) | — | — | |||||||||||||||||
| Other operating income | 3 | 5.0 | 5.0 | 12 | 86.5 | 86.5 | |||||||||||||||||
| Total income | 10 | (53.4) | (52.9) | 57 | (13.9) | (13.9) | |||||||||||||||||
| Administrative expenses and amortizations | (48) | (3.0) | (3.0) | (206) | 3.3 | 3.3 | |||||||||||||||||
| Net operating income | (39) | 33.7 | 33.1 | (149) | 11.7 | 11.7 | |||||||||||||||||
| Net loan-loss provisions | (1) | 40.0 | 40.0 | (2) | (54.0) | (54.0) | |||||||||||||||||
| Other gains (losses) and provisions | 8 | — | — | (85) | — | — | |||||||||||||||||
| Profit before tax | (32) | 6.8 | 6.1 | (236) | 62.8 | 62.8 | |||||||||||||||||
| Tax on profit | 12 | 154.6 | 153.2 | 34 | 589.9 | 588.4 | |||||||||||||||||
| Profit from continuing operations | (19) | (21.7) | (22.4) | (202) | 44.4 | 44.4 | |||||||||||||||||
| Net profit from discontinued operations | — | — | — | — | — | — | |||||||||||||||||
| Consolidated profit | (19) | (21.7) | (22.4) | (202) | 44.4 | 44.4 | |||||||||||||||||
| Non-controlling interests | 1 | — | — | 1 | (32.3) | (32.3) | |||||||||||||||||
| Profit attributable to the parent | (19) | (25.0) | (25.7) | (201) | 45.5 | 45.6 | |||||||||||||||||
| Balance sheet | |||||||||||||||||||||||
| Loans and advances to customers | 30 | (5.5) | (5.5) | 30 | (6.9) | (6.9) | |||||||||||||||||
| Cash, central banks and credit institutions | 710 | 27.6 | 27.6 | 710 | 6.5 | 6.5 | |||||||||||||||||
| Debt instruments | 1 | (25.0) | (25.0) | 1 | (28.9) | (28.9) | |||||||||||||||||
| Other financial assets | 154 | 30.9 | 30.9 | 154 | 10.5 | 10.5 | |||||||||||||||||
| Other asset accounts | 308 | 11.3 | 11.3 | 308 | (15.7) | (15.7) | |||||||||||||||||
| Total assets | 1,203 | 22.3 | 22.3 | 1,203 | (0.2) | (0.2) | |||||||||||||||||
| Customer deposits | 347 | 5.7 | 5.7 | 347 | (26.8) | (26.8) | |||||||||||||||||
| Central banks and credit institutions | 277 | 20.2 | 19.5 | 277 | 4.5 | 3.8 | |||||||||||||||||
| Marketable debt securities | — | — | — | — | — | — | |||||||||||||||||
| Other financial liabilities | 135 | 17.9 | 17.9 | 135 | (4.2) | (4.2) | |||||||||||||||||
| Other liabilities accounts | 72 | (11.1) | (11.1) | 72 | 9.1 | 9.1 | |||||||||||||||||
| Total liabilities | 830 | 10.2 | 10.0 | 830 | (12.1) | (12.3) | |||||||||||||||||
| Total equity | 372 | 61.8 | 62.8 | 372 | 43.6 | 44.6 | |||||||||||||||||
| Memorandum items: | |||||||||||||||||||||||
Gross loans and advances to customers 2 |
37 | (5.9) | (5.9) | 37 | (11.0) | (11.0) | |||||||||||||||||
| Customer funds | 347 | 5.7 | 5.7 | 347 | (26.8) | (26.8) | |||||||||||||||||
Customer deposits 3 |
347 | 5.7 | 5.7 | 347 | (26.8) | (26.8) | |||||||||||||||||
| Mutual funds | — | — | — | — | — | — | |||||||||||||||||
| Resources | |||||||||||||||||||||||
| Number of employees | 1,405 | (2.7) | 1,405 | 14.4 | |||||||||||||||||||
January - December 2024 |
|
39 |
||||||
|
Business model
|
|
||||||||||||||||||||||
| Secondary segments | |||||||||||||||||||||||
 |
South America | Underlying attributable profit | ||||||
| EUR 3,863 mn | ||||||||
| EUR million | |||||||||||||||||||||||
| / | Q3'24 | / | 2023 | ||||||||||||||||||||
| Underlying income statement | Q4'24 | % | % excl. FX | 2024 | % | % excl. FX | |||||||||||||||||
| Net interest income | 4,210 | 19.6 | 20.5 | 15,566 | 19.4 | 27.3 | |||||||||||||||||
| Net fee income | 1,348 | 16.2 | 17.3 | 4,864 | 3.9 | 11.2 | |||||||||||||||||
Gains (losses) on financial transactions 1 |
202 | 83.9 | 82.3 | 601 | (53.1) | (50.4) | |||||||||||||||||
| Other operating income | (445) | 298.1 | 299.4 | (1,247) | 20.8 | 20.3 | |||||||||||||||||
| Total income | 5,316 | 13.6 | 14.7 | 19,783 | 10.1 | 17.9 | |||||||||||||||||
| Administrative expenses and amortizations | (1,865) | 15.7 | 16.5 | (6,943) | 0.3 | 7.1 | |||||||||||||||||
| Net operating income | 3,450 | 12.5 | 13.7 | 12,841 | 16.2 | 24.8 | |||||||||||||||||
| Net loan-loss provisions | (1,404) | 5.9 | 7.3 | (5,478) | 1.4 | 9.0 | |||||||||||||||||
| Other gains (losses) and provisions | (346) | 47.1 | 46.5 | (1,369) | 31.6 | 40.1 | |||||||||||||||||
| Profit before tax | 1,701 | 13.0 | 14.2 | 5,993 | 30.1 | 39.7 | |||||||||||||||||
| Tax on profit | (354) | (6.4) | (4.9) | (1,617) | 44.3 | 54.1 | |||||||||||||||||
| Profit from continuing operations | 1,347 | 19.6 | 20.7 | 4,376 | 25.5 | 35.1 | |||||||||||||||||
| Net profit from discontinued operations | — | — | — | — | — | — | |||||||||||||||||
| Consolidated profit | 1,347 | 19.6 | 20.7 | 4,376 | 25.5 | 35.1 | |||||||||||||||||
| Non-controlling interests | (149) | 4.3 | 5.6 | (513) | 14.4 | 26.0 | |||||||||||||||||
| Profit attributable to the parent | 1,198 | 21.8 | 22.9 | 3,863 | 27.1 | 36.4 | |||||||||||||||||
| Balance sheet | |||||||||||||||||||||||
| Loans and advances to customers | 147,559 | 0.0 | 4.2 | 147,559 | (3.7) | 9.9 | |||||||||||||||||
| Cash, central banks and credit institutions | 60,865 | (12.1) | (8.0) | 60,865 | (9.7) | 4.8 | |||||||||||||||||
| Debt instruments | 58,703 | 2.8 | 7.8 | 58,703 | (8.8) | 5.6 | |||||||||||||||||
| Other financial assets | 25,121 | 17.4 | 22.0 | 25,121 | 20.8 | 34.8 | |||||||||||||||||
| Other asset accounts | 18,970 | 4.4 | 9.3 | 18,970 | (1.4) | 14.0 | |||||||||||||||||
| Total assets | 311,218 | (0.7) | 3.7 | 311,218 | (4.3) | 9.9 | |||||||||||||||||
| Customer deposits | 145,233 | (0.7) | 3.6 | 145,233 | (6.6) | 7.6 | |||||||||||||||||
| Central banks and credit institutions | 44,760 | (6.8) | (2.9) | 44,760 | (8.5) | 3.5 | |||||||||||||||||
| Marketable debt securities | 36,811 | (3.2) | 1.5 | 36,811 | (7.1) | 7.5 | |||||||||||||||||
| Other financial liabilities | 50,177 | 11.7 | 17.1 | 50,177 | 18.2 | 36.1 | |||||||||||||||||
| Other liabilities accounts | 8,808 | (22.6) | (19.0) | 8,808 | (31.0) | (21.4) | |||||||||||||||||
| Total liabilities | 285,790 | (1.0) | 3.5 | 285,790 | (4.5) | 9.7 | |||||||||||||||||
| Total equity | 25,428 | 2.0 | 6.2 | 25,428 | (1.8) | 12.2 | |||||||||||||||||
| Memorandum items: | |||||||||||||||||||||||
Gross loans and advances to customers 2 |
154,323 | 0.0 | 4.1 | 154,323 | (4.1) | 9.5 | |||||||||||||||||
| Customer funds | 201,241 | 1.3 | 5.8 | 201,241 | (2.2) | 12.6 | |||||||||||||||||
Customer deposits 3 |
132,496 | 1.4 | 5.6 | 132,496 | (2.1) | 12.1 | |||||||||||||||||
| Mutual funds | 68,745 | 1.3 | 6.2 | 68,745 | (2.3) | 13.6 | |||||||||||||||||
| Ratios (%), operating means and customers | |||||||||||||||||||||||
| RoTE | 23.3 | 3.8 | 18.7 | 4.3 | |||||||||||||||||||
| Efficiency ratio | 35.1 | 0.6 | 35.1 | (3.4) | |||||||||||||||||||
| NPL ratio | 5.42 | (0.13) | 5.42 | (0.30) | |||||||||||||||||||
| NPL coverage ratio | 76.5 | 1.0 | 76.5 | (1.9) | |||||||||||||||||||
| Number of employees | 79,571 | 0.8 | 79,571 | (1.8) | |||||||||||||||||||
| Number of branches | 2,902 | (3.7) | 2,902 | (12.3) | |||||||||||||||||||
| Number of total customers (thousands) | 80,405 | 1.9 | 80,405 | 10.1 | |||||||||||||||||||
| Number of active customers (thousands) | 40,527 | 1.9 | 40,527 | 8.0 | |||||||||||||||||||
40 |
|
January - December 2024 |
||||||
|
Business model
|
|
||||||||||||||||||||||
| Secondary segments | |||||||||||||||||||||||
| Brazil | |||||||||||||||||||||||
| EUR million | |||||||||||||||||||||||
| / | Q3'24 | / | 2023 | ||||||||||||||||||||
| Underlying income statement | Q4'24 | % | % excl. FX | 2024 | % | % excl. FX | |||||||||||||||||
| Net interest income | 2,413 | (2.5) | (0.4) | 10,121 | 11.0 | 19.5 | |||||||||||||||||
| Net fee income | 846 | 1.6 | 3.5 | 3,414 | (1.4) | 6.1 | |||||||||||||||||
Gains (losses) on financial transactions 1 |
0 | (99.9) | (97.3) | (37) | — | — | |||||||||||||||||
| Other operating income | 11 | 60.4 | 56.6 | 39 | (10.3) | (3.4) | |||||||||||||||||
| Total income | 3,270 | (0.4) | 1.6 | 13,536 | 3.3 | 11.2 | |||||||||||||||||
| Administrative expenses and amortizations | (1,063) | 3.8 | 5.4 | (4,352) | (3.9) | 3.4 | |||||||||||||||||
| Net operating income | 2,207 | (2.3) | (0.2) | 9,184 | 7.1 | 15.3 | |||||||||||||||||
| Net loan-loss provisions | (1,077) | (1.0) | 1.0 | (4,487) | (4.5) | 2.7 | |||||||||||||||||
| Other gains (losses) and provisions | (204) | 1.2 | 2.9 | (867) | (9.9) | (3.0) | |||||||||||||||||
| Profit before tax | 926 | (4.4) | (2.2) | 3,830 | 31.6 | 41.6 | |||||||||||||||||
| Tax on profit | (214) | (21.7) | (18.9) | (1,165) | 50.1 | 61.6 | |||||||||||||||||
| Profit from continuing operations | 712 | 2.4 | 4.6 | 2,665 | 24.8 | 34.4 | |||||||||||||||||
| Net profit from discontinued operations | — | — | — | — | — | — | |||||||||||||||||
| Consolidated profit | 712 | 2.4 | 4.6 | 2,665 | 24.8 | 34.4 | |||||||||||||||||
| Non-controlling interests | (60) | (8.1) | (5.4) | (243) | 13.2 | 21.9 | |||||||||||||||||
| Profit attributable to the parent | 652 | 3.5 | 5.6 | 2,422 | 26.1 | 35.8 | |||||||||||||||||
| Balance sheet | |||||||||||||||||||||||
| Loans and advances to customers | 88,620 | (2.3) | 3.4 | 88,620 | (8.1) | 10.1 | |||||||||||||||||
| Cash, central banks and credit institutions | 46,745 | (16.0) | (11.1) | 46,745 | (12.8) | 4.4 | |||||||||||||||||
| Debt instruments | 45,670 | 2.1 | 8.1 | 45,670 | (3.5) | 15.6 | |||||||||||||||||
| Other financial assets | 10,632 | 34.0 | 41.8 | 10,632 | 30.3 | 56.1 | |||||||||||||||||
| Other asset accounts | 13,844 | (0.1) | 5.7 | 13,844 | (5.1) | 13.7 | |||||||||||||||||
| Total assets | 205,510 | (3.5) | 2.2 | 205,510 | (6.6) | 11.9 | |||||||||||||||||
| Customer deposits | 93,994 | (4.7) | 0.8 | 93,994 | (14.7) | 2.2 | |||||||||||||||||
| Central banks and credit institutions | 30,878 | (7.5) | (2.1) | 30,878 | 9.0 | 30.6 | |||||||||||||||||
| Marketable debt securities | 25,351 | (4.5) | 1.1 | 25,351 | (9.4) | 8.6 | |||||||||||||||||
| Other financial liabilities | 34,215 | 13.3 | 19.9 | 34,215 | 19.5 | 43.2 | |||||||||||||||||
| Other liabilities accounts | 5,582 | (32.0) | (28.0) | 5,582 | (29.7) | (15.7) | |||||||||||||||||
| Total liabilities | 190,020 | (3.5) | 2.1 | 190,020 | (6.4) | 12.1 | |||||||||||||||||
| Total equity | 15,490 | (2.8) | 2.8 | 15,490 | (9.2) | 8.8 | |||||||||||||||||
| Memorandum items: | |||||||||||||||||||||||
Gross loans and advances to customers 2 |
93,785 | (2.4) | 3.3 | 93,785 | (8.6) | 9.5 | |||||||||||||||||
| Customer funds | 129,881 | (3.5) | 2.1 | 129,881 | (10.5) | 7.3 | |||||||||||||||||
Customer deposits 3 |
81,378 | (2.4) | 3.3 | 81,378 | (9.9) | 8.0 | |||||||||||||||||
| Mutual funds | 48,503 | (5.4) | 0.1 | 48,503 | (11.4) | 6.1 | |||||||||||||||||
| Ratios (%), operating means and customers | |||||||||||||||||||||||
| RoTE | 19.5 | 0.8 | 17.5 | 3.8 | |||||||||||||||||||
| Efficiency ratio | 32.5 | 1.3 | 32.1 | (2.4) | |||||||||||||||||||
| NPL ratio | 6.14 | (0.11) | 6.14 | (0.42) | |||||||||||||||||||
| NPL coverage ratio | 82.7 | 0.6 | 82.7 | (2.0) | |||||||||||||||||||
| Number of employees | 56,619 | 1.3 | 56,619 | (2.0) | |||||||||||||||||||
| Number of branches | 2,202 | (4.8) | 2,202 | (14.7) | |||||||||||||||||||
| Number of total customers (thousands) | 69,455 | 1.9 | 69,455 | 10.6 | |||||||||||||||||||
| Number of active customers (thousands) | 33,123 | 2.0 | 33,123 | 8.7 | |||||||||||||||||||
January - December 2024 |
|
41 |
||||||
|
Business model
|
|
||||||||||||||||||||||
| Secondary segments | |||||||||||||||||||||||
| Chile | |||||||||||||||||||||||
| EUR million | |||||||||||||||||||||||
| / | Q3'24 | / | 2023 | ||||||||||||||||||||
| Underlying income statement | Q4'24 | % | % excl. FX | 2024 | % | % excl. FX | |||||||||||||||||
| Net interest income | 516 | 7.1 | 7.7 | 1,822 | 31.8 | 48.3 | |||||||||||||||||
| Net fee income | 140 | (4.1) | (3.5) | 551 | (3.7) | 8.4 | |||||||||||||||||
Gains (losses) on financial transactions 1 |
65 | (2.3) | (1.7) | 238 | (25.7) | (16.3) | |||||||||||||||||
| Other operating income | (6) | 166.6 | 166.4 | (18) | — | — | |||||||||||||||||
| Total income | 714 | 3.4 | 4.0 | 2,592 | 13.4 | 27.7 | |||||||||||||||||
| Administrative expenses and amortizations | (232) | (1.7) | (1.1) | (933) | (8.5) | 3.0 | |||||||||||||||||
| Net operating income | 482 | 6.0 | 6.6 | 1,659 | 31.1 | 47.6 | |||||||||||||||||
| Net loan-loss provisions | (118) | (7.3) | (6.7) | (497) | 36.1 | 53.2 | |||||||||||||||||
| Other gains (losses) and provisions | (21) | 98.9 | 99.4 | (51) | — | — | |||||||||||||||||
| Profit before tax | 343 | 8.3 | 8.8 | 1,111 | 16.7 | 31.4 | |||||||||||||||||
| Tax on profit | (59) | (2.4) | (1.8) | (211) | 56.1 | 75.7 | |||||||||||||||||
| Profit from continuing operations | 285 | 10.8 | 11.3 | 899 | 10.2 | 24.1 | |||||||||||||||||
| Net profit from discontinued operations | — | — | — | — | — | — | |||||||||||||||||
| Consolidated profit | 285 | 10.8 | 11.3 | 899 | 10.2 | 24.1 | |||||||||||||||||
| Non-controlling interests | (89) | 15.5 | 16.1 | (271) | 15.5 | 30.0 | |||||||||||||||||
| Profit attributable to the parent | 196 | 8.7 | 9.3 | 629 | 8.1 | 21.7 | |||||||||||||||||
| Balance sheet | |||||||||||||||||||||||
| Loans and advances to customers | 40,332 | (1.0) | 2.1 | 40,332 | (5.4) | 1.2 | |||||||||||||||||
| Cash, central banks and credit institutions | 5,759 | 7.2 | 10.5 | 5,759 | (9.6) | (3.3) | |||||||||||||||||
| Debt instruments | 7,993 | (7.9) | (5.0) | 7,993 | (39.8) | (35.6) | |||||||||||||||||
| Other financial assets | 13,554 | 6.8 | 10.2 | 13,554 | 11.5 | 19.3 | |||||||||||||||||
| Other asset accounts | 2,796 | 9.2 | 12.6 | 2,796 | 1.8 | 8.9 | |||||||||||||||||
| Total assets | 70,434 | 0.6 | 3.7 | 70,434 | (8.7) | (2.4) | |||||||||||||||||
| Customer deposits | 30,181 | 3.6 | 6.8 | 30,181 | 2.0 | 9.2 | |||||||||||||||||
| Central banks and credit institutions | 8,133 | (9.5) | (6.7) | 8,133 | (45.1) | (41.2) | |||||||||||||||||
| Marketable debt securities | 10,403 | (1.7) | 1.4 | 10,403 | (3.5) | 3.3 | |||||||||||||||||
| Other financial liabilities | 14,323 | 5.5 | 8.8 | 14,323 | 13.5 | 21.4 | |||||||||||||||||
| Other liabilities accounts | 1,942 | (10.8) | (8.0) | 1,942 | (48.0) | (44.3) | |||||||||||||||||
| Total liabilities | 64,983 | 0.8 | 4.0 | 64,983 | (9.1) | (2.8) | |||||||||||||||||
| Total equity | 5,451 | (2.1) | 1.0 | 5,451 | (3.5) | 3.2 | |||||||||||||||||
| Memorandum items: | |||||||||||||||||||||||
Gross loans and advances to customers 2 |
41,405 | (1.1) | 2.0 | 41,405 | (5.5) | 1.1 | |||||||||||||||||
| Customer funds | 43,383 | 5.8 | 9.2 | 43,383 | 8.2 | 15.7 | |||||||||||||||||
Customer deposits 3 |
30,060 | 3.8 | 7.1 | 30,060 | 2.5 | 9.6 | |||||||||||||||||
| Mutual funds | 13,324 | 10.7 | 14.1 | 13,324 | 23.8 | 32.5 | |||||||||||||||||
| Ratios (%), operating means and customers | |||||||||||||||||||||||
| RoTE | 21.3 | 2.0 | 17.0 | 2.2 | |||||||||||||||||||
| Efficiency ratio | 32.5 | (1.7) | 36.0 | (8.6) | |||||||||||||||||||
| NPL ratio | 5.37 | 0.04 | 5.37 | 0.36 | |||||||||||||||||||
| NPL coverage ratio | 49.9 | (1.9) | 49.9 | (2.8) | |||||||||||||||||||
| Number of employees | 9,587 | 0.6 | 9,587 | (3.6) | |||||||||||||||||||
| Number of branches | 237 | 0.9 | 237 | (4.4) | |||||||||||||||||||
| Number of total customers (thousands) | 4,311 | 2.3 | 4,311 | 6.4 | |||||||||||||||||||
| Number of active customers (thousands) | 2,556 | 0.6 | 2,556 | 6.6 | |||||||||||||||||||
42 |
|
January - December 2024 |
||||||
|
Business model
|
|
||||||||||||||||||||||
| Secondary segments | |||||||||||||||||||||||
| Argentina | ||||||||||||||||||||
| EUR million | ||||||||||||||||||||
| / Q3'24 | / 2023 | |||||||||||||||||||
| Underlying income statement | Q4'24 | Q3'24 | % | 2024 | % | |||||||||||||||
| Net interest income | 1,107 | 390 | 184.0 | 2,919 | 55.3 | |||||||||||||||
| Net fee income | 287 | 111 | 157.8 | 602 | 52.2 | |||||||||||||||
Gains (losses) on financial transactions 1 |
101 | 34 | 193.1 | 229 | (32.8) | |||||||||||||||
| Other operating income | (448) | (115) | 289.5 | (1,263) | 17.9 | |||||||||||||||
| Total income | 1,047 | 421 | 149.0 | 2,487 | 61.1 | |||||||||||||||
| Administrative expenses and amortizations | (416) | (192) | 116.2 | (1,022) | 31.9 | |||||||||||||||
| Net operating income | 631 | 228 | 176.6 | 1,465 | 90.4 | |||||||||||||||
| Net loan-loss provisions | (156) | (63) | 146.6 | (284) | 89.5 | |||||||||||||||
| Other gains (losses) and provisions | (123) | (22) | 454.3 | (353) | 209.1 | |||||||||||||||
| Profit before tax | 352 | 143 | 146.6 | 827 | 63.8 | |||||||||||||||
| Tax on profit | (68) | (27) | 152.6 | (161) | 38.0 | |||||||||||||||
| Profit from continuing operations | 284 | 116 | 145.2 | 666 | 71.6 | |||||||||||||||
| Net profit from discontinued operations | — | — | — | — | — | |||||||||||||||
| Consolidated profit | 284 | 116 | 145.2 | 666 | 71.6 | |||||||||||||||
| Non-controlling interests | (1) | 0 | 166.8 | (1) | (43.9) | |||||||||||||||
| Profit attributable to the parent | 283 | 116 | 145.1 | 665 | 72.2 | |||||||||||||||
| Balance sheet | ||||||||||||||||||||
| Loans and advances to customers | 7,684 | 5,399 | 42.3 | 7,684 | 104.0 | |||||||||||||||
| Cash, central banks and credit institutions | 4,901 | 4,776 | 2.6 | 4,901 | 7.8 | |||||||||||||||
| Debt instruments | 2,654 | 1,767 | 50.2 | 2,654 | 94.0 | |||||||||||||||
| Other financial assets | 23 | 67 | (66.3) | 23 | 112.9 | |||||||||||||||
| Other asset accounts | 978 | 635 | 54.2 | 978 | 26.1 | |||||||||||||||
| Total assets | 16,240 | 12,644 | 28.4 | 16,240 | 55.1 | |||||||||||||||
| Customer deposits | 11,293 | 8,843 | 27.7 | 11,293 | 74.3 | |||||||||||||||
| Central banks and credit institutions | 852 | 941 | (9.5) | 852 | (33.0) | |||||||||||||||
| Marketable debt securities | 158 | 145 | 9.0 | 158 | 6.4 | |||||||||||||||
| Other financial liabilities | 968 | 707 | 36.9 | 968 | 51.6 | |||||||||||||||
| Other liabilities accounts | 476 | 305 | 56.2 | 476 | 4.6 | |||||||||||||||
| Total liabilities | 13,746 | 10,941 | 25.6 | 13,746 | 52.9 | |||||||||||||||
| Total equity | 2,494 | 1,703 | 46.4 | 2,494 | 68.6 | |||||||||||||||
| Memorandum items: | ||||||||||||||||||||
Gross loans and advances to customers 2 |
7,938 | 5,550 | 43.0 | 7,938 | 104.7 | |||||||||||||||
| Customer funds | 17,047 | 12,368 | 37.8 | 17,047 | 65.7 | |||||||||||||||
Customer deposits 3 |
11,293 | 8,843 | 27.7 | 11,293 | 74.3 | |||||||||||||||
| Mutual funds | 5,754 | 3,525 | 63.2 | 5,754 | 51.0 | |||||||||||||||
| Ratios (%), operating means and customers | ||||||||||||||||||||
| RoTE | 28.8 | (5.9) | 34.8 | (20.8) | ||||||||||||||||
| Efficiency ratio | 39.7 | (6.0) | 41.1 | (9.1) | ||||||||||||||||
| NPL ratio | 2.06 | 0.27 | 2.06 | 0.07 | ||||||||||||||||
| NPL coverage ratio | 177.1 | 16.1 | 177.1 | 11.4 | ||||||||||||||||
| Number of employees | 8,166 | (0.8) | 8,166 | (3.4) | ||||||||||||||||
| Number of branches | 301 | (0.7) | 301 | (6.5) | ||||||||||||||||
| Number of total customers (thousands) | 5,117 | 1.3 | 5,117 | 7.2 | ||||||||||||||||
| Number of active customers (thousands) | 3,674 | 1.3 | 3,674 | 3.1 | ||||||||||||||||
January - December 2024 |
|
43 |
||||||
|
Business model
|
|
||||||||||||||||||||||
| Secondary segments | |||||||||||||||||||||||
| Other South America | |||||||||||||||||||||||
| EUR million | |||||||||||||||||||||||
| / | Q3'24 | / | 2023 | ||||||||||||||||||||
| Underlying income statement | Q4'24 | % | % excl. FX | 2024 | % | % excl. FX | |||||||||||||||||
| Net interest income | 175 | 0.0 | 0.6 | 703 | 6.2 | 8.2 | |||||||||||||||||
| Net fee income | 75 | 7.4 | 8.3 | 298 | 17.3 | 18.0 | |||||||||||||||||
Gains (losses) on financial transactions 1 |
37 | (9.5) | (8.1) | 172 | 25.2 | 24.1 | |||||||||||||||||
| Other operating income | (2) | 41.9 | 46.9 | (5) | (68.4) | (68.3) | |||||||||||||||||
| Total income | 285 | 0.3 | 1.0 | 1,168 | 12.6 | 13.9 | |||||||||||||||||
| Administrative expenses and amortizations | (155) | (3.0) | (2.2) | (635) | 6.5 | 7.1 | |||||||||||||||||
| Net operating income | 130 | 4.4 | 5.0 | 533 | 20.8 | 23.3 | |||||||||||||||||
| Net loan-loss provisions | (53) | 10.5 | 11.3 | (210) | 13.2 | 14.7 | |||||||||||||||||
| Other gains (losses) and provisions | 2 | — | — | (97) | 566.6 | 586.5 | |||||||||||||||||
| Profit before tax | 79 | 4.7 | 5.2 | 225 | (6.4) | (4.0) | |||||||||||||||||
| Tax on profit | (13) | (26.5) | (25.2) | (80) | (13.5) | (12.4) | |||||||||||||||||
| Profit from continuing operations | 66 | 14.3 | 14.6 | 145 | (2.0) | 1.4 | |||||||||||||||||
| Net profit from discontinued operations | — | — | — | — | — | — | |||||||||||||||||
| Consolidated profit | 66 | 14.3 | 14.6 | 145 | (2.0) | 1.4 | |||||||||||||||||
| Non-controlling interests | 1 | — | — | 1 | (37.1) | (37.0) | |||||||||||||||||
| Profit attributable to the parent | 67 | 15.7 | 15.9 | 146 | (2.5) | 0.8 | |||||||||||||||||
| Balance sheet | |||||||||||||||||||||||
| Loans and advances to customers | 10,923 | 2.5 | (0.9) | 10,923 | 4.4 | 6.7 | |||||||||||||||||
| Cash, central banks and credit institutions | 3,459 | 0.1 | (2.7) | 3,459 | 20.5 | 21.9 | |||||||||||||||||
| Debt instruments | 2,387 | 22.1 | 18.9 | 2,387 | 0.1 | 4.1 | |||||||||||||||||
| Other financial assets | 913 | 27.8 | 25.6 | 913 | 96.0 | 102.5 | |||||||||||||||||
| Other asset accounts | 1,352 | 20.2 | 17.5 | 1,352 | 19.1 | 20.1 | |||||||||||||||||
| Total assets | 19,034 | 6.3 | 3.1 | 19,034 | 9.9 | 12.3 | |||||||||||||||||
| Customer deposits | 9,765 | 2.2 | (0.7) | 9,765 | 5.8 | 9.1 | |||||||||||||||||
| Central banks and credit institutions | 4,898 | 3.5 | (0.3) | 4,898 | 9.2 | 9.6 | |||||||||||||||||
| Marketable debt securities | 898 | 16.2 | 12.6 | 898 | 27.7 | 32.0 | |||||||||||||||||
| Other financial liabilities | 671 | 57.2 | 53.9 | 671 | 21.9 | 25.1 | |||||||||||||||||
| Other liabilities accounts | 807 | 17.8 | 14.3 | 807 | 25.8 | 28.3 | |||||||||||||||||
| Total liabilities | 17,040 | 5.3 | 2.1 | 17,040 | 9.2 | 11.6 | |||||||||||||||||
| Total equity | 1,994 | 15.4 | 12.0 | 1,994 | 16.6 | 19.0 | |||||||||||||||||
| Memorandum items: | |||||||||||||||||||||||
Gross loans and advances to customers 2 |
11,196 | 2.6 | (0.8) | 11,196 | 4.6 | 6.9 | |||||||||||||||||
| Customer funds | 10,930 | 2.9 | 0.0 | 10,930 | 6.7 | 10.2 | |||||||||||||||||
Customer deposits 3 |
9,765 | 2.2 | (0.7) | 9,765 | 5.8 | 9.1 | |||||||||||||||||
| Mutual funds | 1,165 | 9.0 | 6.3 | 1,165 | 14.7 | 20.5 | |||||||||||||||||
| Resources | |||||||||||||||||||||||
| Number of employees | 5,199 | (1.0) | 5,199 | 7.9 | |||||||||||||||||||
44 |
|
January - December 2024 |
||||||

January - December 2024 |
|
45 |
||||||
|
Business model
|
|
|
|
||||||||||||||||||||
| Financial information | |||||||||||||||||||||||
| Net fee income. Consolidated | ||||||||||||||||||||
| EUR million | ||||||||||||||||||||
| Q4'24 | Q3'24 | Change (%) | 2024 | 2023 | Change (%) | |||||||||||||||
| Fees from services | 1,979 | 1,758 | 12.6 | 7,347 | 7,004 | 4.9 | ||||||||||||||
| Wealth management and marketing of customer funds | 1,069 | 1,103 | (3.1) | 4,374 | 3,967 | 10.3 | ||||||||||||||
| Securities and custody | 296 | 328 | (9.8) | 1,289 | 1,086 | 18.7 | ||||||||||||||
| Net fee income | 3,344 | 3,189 | 4.9 | 13,010 | 12,057 | 7.9 | ||||||||||||||
| Underlying operating expenses. Consolidated | ||||||||||||||||||||
| EUR million | ||||||||||||||||||||
| Q4'24 | Q3'24 | Change (%) | 2024 | 2023 | Change (%) | |||||||||||||||
| Staff costs | 3,770 | 3,497 | 7.8 | 14,328 | 13,726 | 4.4 | ||||||||||||||
| Other general administrative expenses | 2,178 | 2,038 | 6.9 | 8,412 | 8,515 | (1.2) | ||||||||||||||
| Information technology | 691 | 635 | 8.8 | 2,622 | 2,471 | 6.1 | ||||||||||||||
| Communications | 108 | 94 | 14.9 | 404 | 414 | (2.4) | ||||||||||||||
| Advertising | 140 | 124 | 12.9 | 540 | 603 | (10.4) | ||||||||||||||
| Buildings and premises | 186 | 200 | (7.0) | 757 | 721 | 5.0 | ||||||||||||||
| Printed and office material | 24 | 22 | 9.1 | 89 | 97 | (8.2) | ||||||||||||||
| Taxes (other than tax on profits) | 165 | 123 | 34.1 | 556 | 570 | (2.5) | ||||||||||||||
| Other expenses | 864 | 840 | 2.9 | 3,444 | 3,639 | (5.4) | ||||||||||||||
| Administrative expenses | 5,948 | 5,535 | 7.5 | 22,740 | 22,241 | 2.2 | ||||||||||||||
| Depreciation and amortization | 824 | 814 | 1.2 | 3,294 | 3,184 | 3.5 | ||||||||||||||
| Operating expenses | 6,772 | 6,349 | 6.7 | 26,034 | 25,425 | 2.4 | ||||||||||||||
| Operating means. Consolidated | |||||||||||||||||||||||
| Employees | Branches | ||||||||||||||||||||||
| Dec-24 | Dec-23 | Change | Dec-24 | Dec-23 | Change | ||||||||||||||||||
| Europe | 65,746 | 67,457 | (1,711) | 3,022 | 3,083 | (61) | |||||||||||||||||
| Spain | 23,980 | 24,713 | (733) | 1,827 | 1,874 | (47) | |||||||||||||||||
| United Kingdom | 20,455 | 22,280 | (1,825) | 444 | 444 | 0 | |||||||||||||||||
| Portugal | 4,901 | 4,945 | (44) | 374 | 376 | (2) | |||||||||||||||||
| Poland | 11,038 | 10,822 | 216 | 368 | 381 | (13) | |||||||||||||||||
| Other | 5,372 | 4,697 | 675 | 9 | 8 | 1 | |||||||||||||||||
| DCB Europe | 16,792 | 16,795 | (3) | 326 | 342 | (16) | |||||||||||||||||
| North America | 42,846 | 45,593 | (2,747) | 1,761 | 1,784 | (23) | |||||||||||||||||
| US | 12,484 | 13,489 | (1,005) | 405 | 415 | (10) | |||||||||||||||||
| Mexico | 28,957 | 30,876 | (1,919) | 1,356 | 1,369 | (13) | |||||||||||||||||
| Other | 1,405 | 1,228 | 177 | — | — | — | |||||||||||||||||
| South America | 79,571 | 80,997 | (1,426) | 2,902 | 3,309 | (407) | |||||||||||||||||
| Brazil | 56,619 | 57,775 | (1,156) | 2,202 | 2,580 | (378) | |||||||||||||||||
| Chile | 9,587 | 9,948 | (361) | 237 | 248 | (11) | |||||||||||||||||
| Argentina | 8,166 | 8,455 | (289) | 301 | 322 | (21) | |||||||||||||||||
| Other | 5,199 | 4,819 | 380 | 162 | 159 | 3 | |||||||||||||||||
| Corporate Centre | 1,798 | 1,922 | (124) | ||||||||||||||||||||
| Total Group | 206,753 | 212,764 | (6,011) | 8,011 | 8,518 | (507) | |||||||||||||||||
46 |
|
January - December 2024 |
||||||
|
Business model
|
|
|
|
||||||||||||||||||||
| Financial information | |||||||||||||||||||||||
| Underlying net loan-loss provisions. Consolidated | ||||||||||||||||||||
| EUR million | ||||||||||||||||||||
| Q4'24 | Q3'24 | Change (%) | 2024 | 2023 | Change (%) | |||||||||||||||
| Non-performing loans | 3,526 | 3,369 | 4.7 | 13,941 | 14,048 | (0.8) | ||||||||||||||
| Country-risk | (1) | (1) | — | (2) | 2 | — | ||||||||||||||
| Recovery of written-off assets | (411) | (392) | 4.8 | (1,606) | (1,592) | 0.9 | ||||||||||||||
| Net loan-loss provisions | 3,114 | 2,976 | 4.6 | 12,333 | 12,458 | (1.0) | ||||||||||||||
| Loans and advances to customers. Consolidated | |||||||||||||||||
| EUR million | |||||||||||||||||
| Change | |||||||||||||||||
| Dec-24 | Dec-23 | Absolute | % | Dec-22 | |||||||||||||
| Commercial bills | 53,209 | 55,628 | (2,419) | (4.3) | 56,688 | ||||||||||||
| Secured loans | 557,463 | 554,375 | 3,088 | 0.6 | 565,609 | ||||||||||||
| Other term loans | 296,339 | 295,485 | 854 | 0.3 | 290,031 | ||||||||||||
| Finance leases | 40,120 | 38,723 | 1,397 | 3.6 | 39,833 | ||||||||||||
| Receivable on demand | 10,756 | 12,277 | (1,521) | (12.4) | 11,435 | ||||||||||||
| Credit cards receivable | 24,928 | 24,371 | 557 | 2.3 | 22,704 | ||||||||||||
| Impaired assets | 33,731 | 34,094 | (363) | (1.1) | 32,888 | ||||||||||||
| Gross loans and advances to customers (excl. reverse repos) | 1,016,546 | 1,014,953 | 1,593 | 0.2 | 1,019,188 | ||||||||||||
| Reverse repos | 59,648 | 44,184 | 15,464 | 35.0 | 39,500 | ||||||||||||
| Gross loans and advances to customers | 1,076,194 | 1,059,137 | 17,057 | 1.6 | 1,058,688 | ||||||||||||
| Loan-loss allowances | 22,125 | 22,788 | (663) | (2.9) | 22,684 | ||||||||||||
| Loans and advances to customers | 1,054,069 | 1,036,349 | 17,720 | 1.7 | 1,036,004 | ||||||||||||
| Total funds. Consolidated | |||||||||||||||||
| EUR million | |||||||||||||||||
| Change | |||||||||||||||||
| Dec-24 | Dec-23 | Absolute | % | Dec-22 | |||||||||||||
| Demand deposits | 677,818 | 661,262 | 16,556 | 2.5 | 710,232 | ||||||||||||
| Time deposits | 299,801 | 307,085 | (7,284) | (2.4) | 236,099 | ||||||||||||
| Mutual funds | 233,722 | 208,528 | 25,194 | 12.1 | 184,054 | ||||||||||||
| Customer funds | 1,211,341 | 1,176,875 | 34,466 | 2.9 | 1,130,385 | ||||||||||||
| Pension funds | 15,646 | 14,831 | 815 | 5.5 | 14,021 | ||||||||||||
| Managed portfolios | 43,118 | 36,414 | 6,704 | 18.4 | 32,184 | ||||||||||||
| Repos | 78,317 | 78,822 | (505) | (0.6) | 63,391 | ||||||||||||
| Total funds | 1,348,422 | 1,306,942 | 41,480 | 3.2 | 1,239,981 | ||||||||||||
January - December 2024 |
|
47 |
||||||
|
Business model
|
|
|
|
||||||||||||||||||||
| APMs | |||||||||||||||||||||||
| Reconciliation of underlying results to statutory results | |||||||||||
| EUR million | |||||||||||
| January-December 2024 | |||||||||||
| Statutory results | Adjustments | Underlying results | |||||||||
| Net interest income | 46,668 | — | 46,668 | ||||||||
| Net fee income | 13,010 | — | 13,010 | ||||||||
Gains (losses) on financial transactions 1 |
2,273 | — | 2,273 | ||||||||
| Other operating income | (75) | 335 | 260 | ||||||||
| Total income | 61,876 | 335 | 62,211 | ||||||||
| Administrative expenses and amortizations | (26,034) | — | (26,034) | ||||||||
| Net operating income | 35,842 | 335 | 36,177 | ||||||||
| Net loan-loss provisions | (12,685) | 352 | (12,333) | ||||||||
| Other gains (losses) and provisions | (4,130) | (687) | (4,817) | ||||||||
| Profit before tax | 19,027 | — | 19,027 | ||||||||
| Tax on profit | (5,283) | — | (5,283) | ||||||||
| Profit from continuing operations | 13,744 | — | 13,744 | ||||||||
| Net profit from discontinued operations | — | — | — | ||||||||
| Consolidated profit | 13,744 | — | 13,744 | ||||||||
| Non-controlling interests | (1,170) | — | (1,170) | ||||||||
| Profit attributable to the parent | 12,574 | — | 12,574 | ||||||||
| Explanation of adjustments: | |||||
| 1. | Temporary levy on revenue in Spain in Q1 2024, totalling EUR 335 million, which was reclassified from total income to other gains (losses) and provisions. | ||||
| 2. | Provisions which strengthen the balance sheet in Brazil of EUR 352 million in Q2 2024 (EUR 174 million net of tax and minority interests). | ||||
48 |
|
January - December 2024 |
||||||
|
Business model
|
|
|
|
||||||||||||||||||||
| APMs | |||||||||||||||||||||||
| Reconciliation of underlying results to statutory results | |||||||||||
| EUR million | |||||||||||
| January-December 2023 | |||||||||||
| Statutory results | Adjustments | Underlying results | |||||||||
| Net interest income | 43,261 | — | 43,261 | ||||||||
| Net fee income | 12,057 | — | 12,057 | ||||||||
Gains (losses) on financial transactions 1 |
2,633 | — | 2,633 | ||||||||
| Other operating income | (528) | 224 | (304) | ||||||||
| Total income | 57,423 | 224 | 57,647 | ||||||||
| Administrative expenses and amortizations | (25,425) | — | (25,425) | ||||||||
| Net operating income | 31,998 | 224 | 32,222 | ||||||||
| Net loan-loss provisions | (12,932) | 474 | (12,458) | ||||||||
| Other gains (losses) and provisions | (2,607) | (459) | (3,066) | ||||||||
| Profit before tax | 16,459 | 239 | 16,698 | ||||||||
| Tax on profit | (4,276) | (213) | (4,489) | ||||||||
| Profit from continuing operations | 12,183 | 26 | 12,209 | ||||||||
| Net profit from discontinued operations | — | — | — | ||||||||
| Consolidated profit | 12,183 | 26 | 12,209 | ||||||||
| Non-controlling interests | (1,107) | (26) | (1,133) | ||||||||
| Profit attributable to the parent | 11,076 | — | 11,076 | ||||||||
| Explanation of adjustments: | |||||
| 1. | Temporary levy on revenue in Spain in Q1 2023, totalling EUR 224 million, which was reclassified from total income to other gains (losses) and provisions. | ||||
| 2. | Provisions to strengthen the balance sheet in Brazil in Q1 2023, totalling EUR 235 million, net of tax and non-controlling interests (EUR 474 million recorded in net loan-loss provisions, EUR 213 million positive impact in tax and EUR 26 million in non-controlling interests). | ||||
January - December 2024 |
|
49 |
||||||
|
Business model
|
|
|
|
||||||||||||||||||||
| APMs | |||||||||||||||||||||||
| Ratio | Formula | Relevance of the metric | ||||||||||||
| RoE | Profit attributable to the parent (annualized) | This ratio measures the return that shareholders obtain on the funds invested in the bank and as such measures the company's ability to pay shareholders. | ||||||||||||
| (Return on equity) | Average stockholders’ equity 1 (excl. minority interests) |
|||||||||||||
| RoTE | Profit attributable to the parent (annualized)2 |
This indicator is used to evaluate the profitability of the company as a percentage of its tangible equity. It's measured as the return that shareholders receive as a percentage of the funds invested in the entity less intangible assets. | ||||||||||||
| (Return on tangible equity) | Average stockholders' equity 1 (excl. minority interests) - intangible assets |
|||||||||||||
| RoA | Consolidated profit (annualized) | This metric measures the profitability of a company as a percentage of its total assets. It is an indicator that reflects the efficiency of the bank's total assets in generating profit over a given period. | ||||||||||||
| (Return on assets) | Average total assets | |||||||||||||
| RoRWA | Consolidated profit (annualized) | The return adjusted for risk is a derivative of the RoA metric. The difference is that RoRWA measures profit in relation to the bank's risk-weighted assets. | ||||||||||||
| (Return on risk-weighted assets) | Average risk-weighted assets | |||||||||||||
| Efficiency ratio | Operating expenses 3 |
One of the most commonly used indicators when comparing productivity of different financial entities. It measures the amount of resources used to generate the bank's total income. | ||||||||||||
| Total income | ||||||||||||||
50 |
|
January - December 2024 |
||||||
|
Business model
|
|
|
|
||||||||||||||||||||
| APMs | |||||||||||||||||||||||
Profitability and efficiency 1, 2 |
Q4'24 | Q3'24 | 2024 | 2023 | ||||||||||
| (EUR million and %) | ||||||||||||||
| RoE | 13.3 | % | 13.4 | % | 13.0 | % | 11.9 | % | ||||||
| Profit attributable to the parent (annualized) | 13,061 | 13,000 | 12,574 | 11,076 | ||||||||||
| Average stockholders' equity (excluding minority interests) | 97,952 | 96,720 | 96,744 | 93,035 | ||||||||||
| RoTE | 16.6 | % | 16.7 | % | 16.3 | % | 15.1 | % | ||||||
| Profit attributable to the parent (annualized) | 13,061 | 13,000 | 12,574 | 11,076 | ||||||||||
| (-) Goodwill impairment | 0 | -2 | -4 | -20 | ||||||||||
| Profit attributable to the parent excluding goodwill impairment (annualized) | 13,061 | 13,002 | 12,578 | 11,096 | ||||||||||
| Average stockholders' equity (excluding minority interests) | 97,952 | 96,720 | 96,744 | 93,035 | ||||||||||
| (-) Average intangible assets | 19,158 | 19,043 | 19,428 | 19,361 | ||||||||||
| Average stockholders' equity (excl. minority interests) - intangible assets | 78,794 | 77,677 | 77,316 | 73,675 | ||||||||||
| RoA | 0.78 | % | 0.80 | % | 0.76 | % | 0.69 | % | ||||||
| Consolidated profit (annualized) | 14,252 | 14,355 | 13,744 | 12,209 | ||||||||||
| Average total assets | 1,834,476 | 1,793,758 | 1,803,272 | 1,773,103 | ||||||||||
| RoRWA | 2.27 | % | 2.31 | % | 2.18 | % | 1.96 | % | ||||||
| Consolidated profit (annualized) | 14,252 | 14,355 | 13,744 | 12,209 | ||||||||||
| Average risk-weighted assets | 627,333 | 622,347 | 630,494 | 624,031 | ||||||||||
| Efficiency ratio | 42.3 | % | 41.9 | % | 41.8 | % | 44.1 | % | ||||||
| Underlying operating expenses | 6,772 | 6,349 | 26,034 | 25,425 | ||||||||||
| Operating expenses | 6,772 | 6,349 | 26,034 | 25,425 | ||||||||||
| Adjustments to operating expenses for items outside ordinary course of businesses | — | — | — | — | ||||||||||
| Underlying total income | 16,026 | 15,135 | 62,211 | 57,647 | ||||||||||
| Total income | 16,026 | 15,135 | 61,876 | 57,423 | ||||||||||
| Adjustments to total income for items outside ordinary course of businesses | — | — | 335 | 224 | ||||||||||
1.Averages included in the RoE, RoTE, RoA and RoRWA denominators are calculated using the monthly average over the period, which we believe should not differ materially from using daily balances. | ||||||||||||||
2.The risk-weighted assets included in the denominator of the RoRWA metric are calculated in line with the criteria laid out in the CRR (Capital Requirements Regulation). | ||||||||||||||
January - December 2024 |
|
51 |
||||||
|
Business model
|
|
|
|
||||||||||||||||||||
| APMs | |||||||||||||||||||||||
| Ratio | Formula | Relevance of the metric | ||||||||||||
| Global business RoTE | Profit attributable to the parent excluding goodwill impairment (annualized) | This indicator is used to evaluate the profitability of the company as a percentage of its tangible equity. It's measured as the return that shareholders receive as a percentage of the funds invested in the entity less intangible assets. | ||||||||||||
Average stockholders' equity (excl. minority interests) - intangible assets 1 |
||||||||||||||
| RoTE (EUR million and %) | |||||||||||||||||||||||
| 2024 | 2023 | ||||||||||||||||||||||
| % | Numerator | Denominator | % | Numerator | Denominator | ||||||||||||||||||
| Retail & Commercial Banking | 18.9 | 7,265 | 38,482 | 15.1 | 5,659 | 37,362 | |||||||||||||||||
| Digital Consumer Bank | 9.8 | 1,663 | 17,050 | 11.5 | 1,901 | 16,502 | |||||||||||||||||
| Corporate & Investment Banking | 18.1 | 2,740 | 15,178 | 17.5 | 2,440 | 13,922 | |||||||||||||||||
| Wealth Management & Insurance | 78.7 | 1,650 | 2,097 | 72.2 | 1,467 | 2,033 | |||||||||||||||||
| Payments | 15.6 | 415 | 2,664 | 24.9 | 627 | 2,512 | |||||||||||||||||
| PagoNxt | - | - | - | - | - | - | |||||||||||||||||
| Cards | 32.6 | 712 | 2,187 | 35.5 | 684 | 1,928 | |||||||||||||||||
| Europe | 16.9 | 6,645 | 39,292 | 14.5 | 5,489 | 37,931 | |||||||||||||||||
| Spain | 21.7 | 3,762 | 17,347 | 14.2 | 2,371 | 16,742 | |||||||||||||||||
| United Kingdom | 11.1 | 1,306 | 11,781 | 13.0 | 1,545 | 11,874 | |||||||||||||||||
| Portugal | 25.4 | 1,001 | 3,948 | 25.9 | 896 | 3,458 | |||||||||||||||||
| Poland | 20.2 | 800 | 3,956 | 17.7 | 674 | 3,810 | |||||||||||||||||
| DCB Europe | 6.4 | 642 | 10,055 | 12.3 | 1,199 | 9,721 | |||||||||||||||||
| North America | 11.2 | 2,580 | 23,089 | 9.8 | 2,360 | 24,183 | |||||||||||||||||
| US | 7.5 | 1,109 | 14,742 | 6.1 | 932 | 15,355 | |||||||||||||||||
| Mexico | 20.0 | 1,671 | 8,343 | 17.7 | 1,560 | 8,814 | |||||||||||||||||
| South America | 18.7 | 3,865 | 20,671 | 14.4 | 3,045 | 21,097 | |||||||||||||||||
| Brazil | 17.5 | 2,424 | 13,853 | 13.7 | 1,921 | 13,987 | |||||||||||||||||
| Chile | 17.0 | 629 | 3,693 | 14.8 | 582 | 3,925 | |||||||||||||||||
| Argentina | 34.8 | 665 | 1,909 | 55.6 | 386 | 694 | |||||||||||||||||
| Efficiency ratio (EUR million and %) | |||||||||||||||||||||||
| 2024 | 2023 | ||||||||||||||||||||||
| % | Numerator | Denominator | % | Numerator | Denominator | ||||||||||||||||||
| Retail & Commercial Banking | 39.7 | 12,877 | 32,461 | 43.1 | 12,825 | 29,754 | |||||||||||||||||
| Digital Consumer Bank | 40.1 | 5,183 | 12,916 | 42.8 | 5,263 | 12,296 | |||||||||||||||||
| Corporate & Investment Banking | 45.6 | 3,807 | 8,343 | 45.0 | 3,387 | 7,527 | |||||||||||||||||
| Wealth Management & Insurance | 35.9 | 1,313 | 3,661 | 37.9 | 1,216 | 3,210 | |||||||||||||||||
| Payments | 45.0 | 2,475 | 5,505 | 44.2 | 2,344 | 5,298 | |||||||||||||||||
| PagoNxt | 93.6 | 1,160 | 1,240 | 95.7 | 1,091 | 1,140 | |||||||||||||||||
| Cards | 30.8 | 1,315 | 4,265 | 30.1 | 1,253 | 4,158 | |||||||||||||||||
| Europe | 40.0 | 9,407 | 23,510 | 42.1 | 9,030 | 21,439 | |||||||||||||||||
| Spain | 35.7 | 4,271 | 11,974 | 41.7 | 4,227 | 10,132 | |||||||||||||||||
| United Kingdom | 55.9 | 2,918 | 5,216 | 49.7 | 2,745 | 5,525 | |||||||||||||||||
| Portugal | 26.1 | 548 | 2,100 | 27.3 | 542 | 1,982 | |||||||||||||||||
| Poland | 27.1 | 965 | 3,555 | 27.1 | 862 | 3,182 | |||||||||||||||||
| DCB Europe | 45.9 | 2,604 | 5,679 | 47.6 | 2,618 | 5,502 | |||||||||||||||||
| North America | 48.2 | 6,701 | 13,915 | 49.1 | 6,465 | 13,174 | |||||||||||||||||
| US | 50.5 | 3,830 | 7,580 | 51.0 | 3,679 | 7,209 | |||||||||||||||||
| Mexico | 42.5 | 2,665 | 6,278 | 43.9 | 2,588 | 5,899 | |||||||||||||||||
| South America | 35.1 | 6,943 | 19,783 | 38.5 | 6,920 | 17,971 | |||||||||||||||||
| Brazil | 32.1 | 4,352 | 13,536 | 34.6 | 4,529 | 13,104 | |||||||||||||||||
| Chile | 36.0 | 933 | 2,592 | 44.6 | 1,020 | 2,285 | |||||||||||||||||
| Argentina | 41.1 | 1,022 | 2,487 | 50.2 | 775 | 1,544 | |||||||||||||||||
52 |
|
January - December 2024 |
||||||
|
Business model
|
|
|
|
||||||||||||||||||||
| APMs | |||||||||||||||||||||||
| Ratio | Formula | Relevance of the metric | ||||||||||||
| NPL ratio (Non-performing loans ratio) |
Credit impaired customer loans and advances, guarantees and undrawn balances | The NPL ratio is an important variable regarding financial institutions' activity since it gives an indication of the level of credit risk the entities are exposed to. It calculates risks that are, in accounting terms, declared to be credit impaired as a percentage of the total outstanding amount of customer credit and contingent liabilities. | ||||||||||||
Total Risk 1 |
||||||||||||||
| NPL coverage ratio | Total allowances to cover impairment losses on customer loans and advances, guarantees and undrawn balances | The NPL coverage ratio is a fundamental metric in the financial sector. It reflects the level of provisions as a percentage of the credit impaired assets. Therefore, it is a good indicator of the entity's solvency against customer defaults both present and future. | ||||||||||||
| Credit impaired customer loans and advances, guarantees and undrawn balances | ||||||||||||||
| Cost of risk | Allowances for loan-loss provisions over the last 12 months | This ratio quantifies loan-loss provisions arising from credit risk over a defined period of time for a given loan portfolio. As such, it acts as an indicator of credit quality. | ||||||||||||
| Average loans and advances to customers over the last 12 months | ||||||||||||||
| Credit risk (I) | Dec-24 | Sep-24 | Dec-23 | ||||||||
| (EUR million and %) | |||||||||||
| NPL ratio | 3.05 | % | 3.06 | % | 3.14 | % | |||||
| Credit impaired customer loans and advances, guarantees and undrawn balances | 35,265 | 35,723 | 35,620 | ||||||||
| Gross loans and advances to customers registered under the headings 'financial assets measured at amortized cost' and 'financial assets designated at fair value through profit or loss' classified in stage 3 (OCI), excluding POCI (Purchased or Originated Credit Impaired) | 33,568 | 33,890 | 33,821 | ||||||||
| POCI exposure (Purchased or Originated Credit Impaired) that is additionally impaired | 163 | 231 | 273 | ||||||||
| Customer guarantees and undrawn balances classified in stage 3 | 1,521 | 1,593 | 1,517 | ||||||||
| Doubtful exposure of loans and advances to customers at fair value through profit or loss | 13 | 9 | 9 | ||||||||
| Total risk | 1,157,274 | 1,168,574 | 1,133,898 | ||||||||
| Impaired and non-impaired gross loans and advances to customers | 1,076,195 | 1,089,441 | 1,059,135 | ||||||||
| Impaired and non-impaired customer guarantees and impaired undrawn customer balances | 81,079 | 79,133 | 74,763 | ||||||||
January - December 2024 |
|
53 |
||||||
|
Business model
|
|
|
|
||||||||||||||||||||
| APMs | |||||||||||||||||||||||
| Credit risk (II) | Dec-24 | Sep-24 | Dec-23 | ||||||||
| (EUR million and %) | |||||||||||
| NPL coverage ratio | 65 | % | 64 | % | 66 | % | |||||
| Total allowances to cover impairment losses on customer loans and advances, guarantees and undrawn balances | 22,835 | 22,735 | 23,490 | ||||||||
| Total allowances to cover impairment losses on loans and advances to customers measured at amortized cost and designated at fair value through OCI | 22,125 | 22,022 | 22,788 | ||||||||
| Total allowances to cover impairment losses on customer guarantees and undrawn balances | 710 | 713 | 702 | ||||||||
| Credit impaired customer loans and advances, guarantees and undrawn balances | 35,265 | 35,723 | 35,620 | ||||||||
| Gross loans and advances to customers registered under the headings 'financial assets measured at amortized cost' and 'financial assets designated at fair value through profit or loss' classified in stage 3 (OCI), excluding POCI (Purchased or Originated Credit Impaired) | 33,568 | 33,890 | 33,821 | ||||||||
| POCI exposure (Purchased or Originated Credit Impaired) that is additionally impaired | 163 | 231 | 273 | ||||||||
| Customer guarantees and undrawn balances classified in stage 3 | 1,521 | 1,593 | 1,517 | ||||||||
| Doubtful exposure of loans and advances to customers at fair value through profit or loss | 13 | 9 | 9 | ||||||||
| Cost of risk | 1.15 | % | 1.18 | % | 1.18 | % | |||||
| Underlying allowances for loan-loss provisions over the last 12 months | 12,333 | 12,640 | 12,458 | ||||||||
| Allowances for loan-loss provisions over the last 12 months | 12,685 | 12,992 | 12,932 | ||||||||
| Adjustments to loan-loss provisions for items outside ordinary course of businesses | -352 | -352 | -474 | ||||||||
| Average loans and advances to customers over the last 12 months | 1,075,821 | 1,070,585 | 1,059,566 | ||||||||
| NPL ratio | |||||||||||||||||||||||
| (EUR million and %) | |||||||||||||||||||||||
| 2024 | 2023 | ||||||||||||||||||||||
| % | Numerator | Denominator | % | Numerator | Denominator | ||||||||||||||||||
| Retail & Commercial Banking | 3.18 | 20,468 | 643,782 | 3.21 | 20,961 | 652,382 | |||||||||||||||||
| Digital Consumer Bank | 5.07 | 10,992 | 216,613 | 4.75 | 9,831 | 207,107 | |||||||||||||||||
| Corporate & Investment Banking | 0.86 | 2,068 | 241,078 | 1.36 | 3,007 | 221,593 | |||||||||||||||||
| Wealth Management & Insurance | 0.67 | 169 | 25,226 | 1.40 | 330 | 23,612 | |||||||||||||||||
| Payments | 5.14 | 1,266 | 24,615 | 5.02 | 1,191 | 23,710 | |||||||||||||||||
| PagoNxt | - | - | - | - | - | - | |||||||||||||||||
| Cards | 5.25 | 1,235 | 23,526 | 5.11 | 1,151 | 22,513 | |||||||||||||||||
| Europe | 2.15 | 13,774 | 640,094 | 2.32 | 14,495 | 624,696 | |||||||||||||||||
| Spain | 2.68 | 7,672 | 285,883 | 3.06 | 8,529 | 278,569 | |||||||||||||||||
| United Kingdom | 1.33 | 3,299 | 248,061 | 1.42 | 3,518 | 247,360 | |||||||||||||||||
| Portugal | 2.40 | 993 | 41,418 | 2.59 | 1,024 | 39,503 | |||||||||||||||||
| Poland | 3.66 | 1,636 | 44,704 | 3.55 | 1,397 | 39,329 | |||||||||||||||||
| DCB Europe | 2.50 | 3,527 | 141,312 | 2.12 | 2,877 | 135,608 | |||||||||||||||||
| North America | 4.22 | 8,375 | 198,607 | 4.09 | 7,805 | 190,720 | |||||||||||||||||
| US | 4.72 | 7,012 | 148,643 | 4.57 | 6,303 | 137,893 | |||||||||||||||||
| Mexico | 2.71 | 1,352 | 49,927 | 2.82 | 1,489 | 52,785 | |||||||||||||||||
| South America | 5.42 | 9,287 | 171,301 | 5.72 | 10,142 | 177,380 | |||||||||||||||||
| Brazil | 6.14 | 6,418 | 104,519 | 6.56 | 7,479 | 113,937 | |||||||||||||||||
| Chile | 5.37 | 2,394 | 44,590 | 5.01 | 2,332 | 46,565 | |||||||||||||||||
| Argentina | 2.06 | 173 | 8,411 | 1.99 | 78 | 3,903 | |||||||||||||||||
54 |
|
January - December 2024 |
||||||
|
Business model
|
|
|
|
||||||||||||||||||||
| APMs | |||||||||||||||||||||||
| NPL coverage ratio | |||||||||||||||||||||||
| (EUR million and %) | |||||||||||||||||||||||
| 2024 | 2023 | ||||||||||||||||||||||
| % | Numerator | Denominator | % | Numerator | Denominator | ||||||||||||||||||
| Retail & Commercial Banking | 58.4 | 11,949 | 20,468 | 61.4 | 12,868 | 20,961 | |||||||||||||||||
| Digital Consumer Bank | 73.6 | 8,088 | 10,992 | 76.5 | 7,521 | 9,831 | |||||||||||||||||
| Corporate & Investment Banking | 39.3 | 812 | 2,068 | 41.2 | 1,240 | 3,007 | |||||||||||||||||
| Wealth Management & Insurance | 80.3 | 135 | 169 | 29.3 | 97 | 330 | |||||||||||||||||
| Payments | 140.1 | 1,774 | 1,266 | 139.8 | 1,665 | 1,191 | |||||||||||||||||
| PagoNxt | - | - | - | - | - | - | |||||||||||||||||
| Cards | 141.9 | 1,752 | 1,235 | 142.1 | 1,636 | 1,151 | |||||||||||||||||
| Europe | 50.2 | 6,909 | 13,774 | 49.3 | 7,147 | 14,495 | |||||||||||||||||
| Spain | 52.6 | 4,039 | 7,672 | 49.1 | 4,185 | 8,529 | |||||||||||||||||
| United Kingdom | 29.3 | 967 | 3,299 | 30.3 | 1,066 | 3,518 | |||||||||||||||||
| Portugal | 79.4 | 789 | 993 | 82.7 | 847 | 1,024 | |||||||||||||||||
| Poland | 61.9 | 1,013 | 1,636 | 73.3 | 1,024 | 1,397 | |||||||||||||||||
| DCB Europe | 82.5 | 2,910 | 3,527 | 88.0 | 2,532 | 2,877 | |||||||||||||||||
| North America | 69.7 | 5,836 | 8,375 | 73.8 | 5,763 | 7,805 | |||||||||||||||||
| US | 63.8 | 4,471 | 7,012 | 67.7 | 4,265 | 6,303 | |||||||||||||||||
| Mexico | 100.4 | 1,358 | 1,352 | 100.0 | 1,489 | 1,489 | |||||||||||||||||
| South America | 76.5 | 7,103 | 9,287 | 78.4 | 7,948 | 10,142 | |||||||||||||||||
| Brazil | 82.7 | 5,311 | 6,418 | 84.7 | 6,338 | 7,479 | |||||||||||||||||
| Chile | 49.9 | 1,196 | 2,394 | 52.7 | 1,230 | 2,332 | |||||||||||||||||
| Argentina | 177.1 | 307 | 173 | 165.7 | 128 | 78 | |||||||||||||||||
| Cost of risk | |||||||||||||||||||||||
| (EUR million and %) | |||||||||||||||||||||||
| 2024 | 2023 | ||||||||||||||||||||||
| % | Numerator | Denominator | % | Numerator | Denominator | ||||||||||||||||||
| Retail & Commercial Banking | 0.92 | 5,845 | 632,300 | 1.02 | 6,540 | 638,166 | |||||||||||||||||
| Digital Consumer Bank | 2.16 | 4,562 | 210,747 | 2.04 | 4,106 | 201,376 | |||||||||||||||||
| Corporate & Investment Banking | 0.10 | 174 | 180,565 | 0.10 | 165 | 168,553 | |||||||||||||||||
| Wealth Management & Insurance | 0.18 | 41 | 23,264 | (0.08) | (17) | 22,366 | |||||||||||||||||
| Payments | 7.39 | 1,714 | 23,183 | 7.22 | 1,666 | 23,060 | |||||||||||||||||
| PagoNxt | - | - | - | - | - | - | |||||||||||||||||
| Cards | 7.64 | 1,698 | 22,225 | 7.44 | 1,642 | 22,058 | |||||||||||||||||
| Europe | 0.32 | 1,862 | 590,624 | 0.44 | 2,533 | 582,256 | |||||||||||||||||
| Spain | 0.50 | 1,259 | 249,759 | 0.62 | 1,522 | 246,660 | |||||||||||||||||
| United Kingdom | 0.03 | 64 | 251,348 | 0.10 | 247 | 251,362 | |||||||||||||||||
| Portugal | 0.03 | 11 | 38,454 | 0.20 | 77 | 38,546 | |||||||||||||||||
| Poland | 1.38 | 511 | 37,138 | 2.08 | 674 | 32,385 | |||||||||||||||||
| DCB Europe | 0.88 | 1,209 | 137,165 | 0.62 | 792 | 128,583 | |||||||||||||||||
| North America | 2.04 | 3,786 | 185,873 | 2.05 | 3,733 | 182,037 | |||||||||||||||||
| US | 1.82 | 2,507 | 137,581 | 1.92 | 2,593 | 135,190 | |||||||||||||||||
| Mexico | 2.64 | 1,277 | 48,439 | 2.43 | 1,135 | 46,729 | |||||||||||||||||
| South America | 3.50 | 5,478 | 156,397 | 3.36 | 5,401 | 160,644 | |||||||||||||||||
| Brazil | 4.51 | 4,487 | 99,532 | 4.77 | 4,701 | 98,555 | |||||||||||||||||
| Chile | 1.19 | 497 | 41,582 | 0.80 | 365 | 45,637 | |||||||||||||||||
| Argentina | 4.59 | 284 | 6,190 | 6.64 | 150 | 2,262 | |||||||||||||||||
January - December 2024 |
|
55 |
||||||
|
Business model
|
|
|
|
||||||||||||||||||||
| APMs | |||||||||||||||||||||||
| Ratio | Formula | Relevance of the metric | ||||||||||||
| TNAV per share | Tangible book value 1 |
This is a very commonly used ratio used to measure the company's accounting value per share having deducted the intangible assets. It is useful in evaluating the amount each shareholder would receive if the company were to enter into liquidation and had to sell all the company's tangible assets. | ||||||||||||
| (Tangible net asset value per share) | Number of shares excluding treasury stock | |||||||||||||
| Price / tangible book value per share (X) | Share price | This is one of the most commonly used ratios by market participants for the valuation of listed companies both in absolute terms and relative to other entities. This ratio measures the relationship between the price paid for a company and its accounting equity value. | ||||||||||||
| TNAV per share | ||||||||||||||
| LTD ratio | Net loans and advances to customers | This is an indicator of the bank's liquidity. It measures the total loans and advances to customers net of loan-loss provisions as a percentage of customer deposits. | ||||||||||||
| (Loan-to-deposit) | Customer deposits | |||||||||||||
| Loans and advances (excl. reverse repos) | Gross loans and advances to customers excluding reverse repos | In order to aid analysis of the commercial banking activity, reverse repos are excluded as they are highly volatile treasury products. | ||||||||||||
| Deposits (excl. repos) | Customer deposits excluding repos | In order to aid analysis of the commercial banking activity, repos are excluded as they are highly volatile treasury products. | ||||||||||||
| PAT + After tax fees paid to SAN (in Wealth Management & Insurance) | Net profit + fees ceded by Santander Asset Management and Santander Insurance to the branch network, net of taxes, excluding Private Banking customers | Metric to assess Wealth Management & Insurance's total contribution to the Group's profit. | ||||||||||||
Others (EUR million and %) |
Dec-24 | Sep-24 | Dec-23 | |||||||||||
| TNAV (tangible book value) per share | 5.24 | 5.04 | 4.76 | |||||||||||
| Tangible book value | 79,342 | 77,522 | 75,552 | |||||||||||
| Number of shares excl. treasury stock (million) | 15,137 | 15,390 | 15,886 | |||||||||||
| Price / Tangible book value per share (X) | 0.85 | 0.91 | 0.79 | |||||||||||
| Share price (euros) | 4.465 | 4.601 | 3.780 | |||||||||||
| TNAV (tangible book value) per share | 5.24 | 5.04 | 4.76 | |||||||||||
| Loan-to-deposit ratio | 100 | % | 102 | % | 99 | % | ||||||||
| Net loans and advances to customers | 1,054,069 | 1,067,419 | 1,036,349 | |||||||||||
| Customer deposits | 1,055,936 | 1,045,911 | 1,047,169 | |||||||||||
| Q4'24 | Q3'24 | 2024 | 2023 | |||||||||||
| PAT + After tax fees paid to SAN (in Wealth) (Constant EUR million) | 821 | 903 | 3,399 | 3,039 | ||||||||||
| Profit after tax | 410 | 473 | 1,728 | 1,518 | ||||||||||
| Net fee income net of tax | 411 | 431 | 1,671 | 1,521 | ||||||||||
56 |
|
January - December 2024 |
||||||
|
Business model
|
|
|
|
||||||||||||||||||||
| APMs | |||||||||||||||||||||||
| Exchange rates: 1 euro / currency parity | ||||||||||||||||||||
| Average (income statement) | Period-end (balance sheet) | |||||||||||||||||||
| 2024 | 2023 | Dec-24 | Sep-24 | Dec-23 | ||||||||||||||||
| US dollar | 1.082 | 1.081 | 1.039 | 1.116 | 1.105 | |||||||||||||||
| Pound sterling | 0.846 | 0.870 | 0.829 | 0.832 | 0.868 | |||||||||||||||
| Brazilian real | 5.809 | 5.397 | 6.427 | 6.074 | 5.365 | |||||||||||||||
| Mexican peso | 19.723 | 19.158 | 21.554 | 21.874 | 18.691 | |||||||||||||||
| Chilean peso | 1,020.473 | 906.417 | 1,032.560 | 1,001.107 | 965.192 | |||||||||||||||
Argentine peso1 |
1,232.389 | 1,617.838 | 893.635 | |||||||||||||||||
| Polish zloty | 4.305 | 4.538 | 4.275 | 4.282 | 4.343 | |||||||||||||||
January - December 2024 |
|
57 |
||||||
|
Business model
|
|
|
|
||||||||||||||||||||
| APMs | |||||||||||||||||||||||
| Average inflation | |||||
| % | Average inflation last 12 months | ||||
Retail & Commercial Banking1 |
3.4 | ||||
Digital Consumer Bank1 |
2.7 | ||||
Corporate & Investment Banking1 |
3.2 | ||||
Wealth Management & Insurance1 |
3.1 | ||||
Payments1 |
3.3 | ||||
| Europe | 2.8 | ||||
| Spain | 2.8 | ||||
| United Kingdom | 2.5 | ||||
| Portugal | 2.4 | ||||
| Poland | 3.7 | ||||
| DCB Europe | 2.4 | ||||
| North America | 3.7 | ||||
| US | 3.0 | ||||
| Mexico | 4.7 | ||||
South America1 |
3.9 | ||||
| Brazil | 4.4 | ||||
| Chile | 4.3 | ||||
Total Group1 |
3.3 | ||||
58 |
|
January - December 2024 |
||||||
|
Business model
|
|
|
|
||||||||||||||||||||
| Condensed consolidated financial statements | |||||||||||||||||||||||
| NOTE: | The following financial information for the 2024 and 2023 (attached herewith) corresponds to the condensed consolidated financial statements prepared in accordance with the International Financial Reporting Standards. | ||||
| Condensed consolidated balance sheet | ||||||||
| EUR million | ||||||||
| ASSETS | Dec-24 | Dec-23 | ||||||
| Cash, cash balances at central banks and other deposits on demand | 192,208 | 220,342 | ||||||
| Financial assets held for trading | 230,253 | 176,921 | ||||||
| Non-trading financial assets mandatorily at fair value through profit or loss | 6,130 | 5,910 | ||||||
| Financial assets designated at fair value through profit or loss | 7,915 | 9,773 | ||||||
| Financial assets at fair value through other comprehensive income | 89,898 | 83,308 | ||||||
| Financial assets at amortised cost | 1,203,707 | 1,191,403 | ||||||
| Hedging derivatives | 5,672 | 5,297 | ||||||
| Changes in the fair value of hedged items in portfolio hedges of interest risk | (704) | (788) | ||||||
| Investments | 7,277 | 7,646 | ||||||
| Joint ventures entities | 2,061 | 1,964 | ||||||
| Associated entities | 5,216 | 5,682 | ||||||
| Assets under reinsurance contracts | 222 | 237 | ||||||
| Tangible assets | 32,087 | 33,882 | ||||||
| Property, plant and equipment | 31,212 | 32,926 | ||||||
| For own-use | 12,636 | 13,408 | ||||||
| Leased out under an operating lease | 18,576 | 19,518 | ||||||
| Investment property | 875 | 956 | ||||||
| Of which : Leased out under an operating lease | 749 | 851 | ||||||
| Intangible assets | 19,259 | 19,871 | ||||||
| Goodwill | 13,438 | 14,017 | ||||||
| Other intangible assets | 5,821 | 5,854 | ||||||
| Tax assets | 30,596 | 31,390 | ||||||
| Current tax assets | 11,426 | 10,623 | ||||||
| Deferred tax assets | 19,170 | 20,767 | ||||||
| Other assets | 8,559 | 8,856 | ||||||
| Insurance contracts linked to pensions | 81 | 93 | ||||||
| Inventories | 6 | 7 | ||||||
| Other | 8,472 | 8,756 | ||||||
| Non-current assets held for sale | 4,002 | 3,014 | ||||||
| TOTAL ASSETS | 1,837,081 | 1,797,062 | ||||||
January - December 2024 |
|
59 |
||||||
|
Business model
|
|
|
|
||||||||||||||||||||
| Condensed consolidated financial statements | |||||||||||||||||||||||
| Condensed consolidated balance sheet | ||||||||
| EUR million | ||||||||
| LIABILITIES | Dec-24 | Dec-23 | ||||||
| Financial liabilities held for trading | 152,151 | 122,270 | ||||||
| Financial liabilities designated at fair value through profit or loss | 36,360 | 40,367 | ||||||
| Financial liabilities at amortized cost | 1,484,322 | 1,468,703 | ||||||
| Hedging derivatives | 4,752 | 7,656 | ||||||
| Changes in the fair value of hedged items in portfolio hedges of interest rate risk | (9) | 55 | ||||||
| Liabilities under insurance contracts | 17,829 | 17,799 | ||||||
| Provisions | 8,407 | 8,441 | ||||||
| Pensions and other post-retirement obligations | 1,731 | 2,225 | ||||||
| Other long term employee benefits | 915 | 880 | ||||||
| Taxes and other legal contingencies | 2,717 | 2,715 | ||||||
| Contingent liabilities and commitments | 710 | 702 | ||||||
| Other provisions | 2,334 | 1,919 | ||||||
| Tax liabilities | 9,598 | 9,932 | ||||||
| Current tax liabilities | 3,322 | 3,846 | ||||||
| Deferred tax liabilities | 6,276 | 6,086 | ||||||
| Other liabilities | 16,344 | 17,598 | ||||||
| Liabilities associated with non-current assets held for sale | — | — | ||||||
| TOTAL LIABILITIES | 1,729,754 | 1,692,821 | ||||||
| EQUITY | ||||||||
| Shareholders' equity | 135,196 | 130,443 | ||||||
| Capital | 7,576 | 8,092 | ||||||
| Called up paid capital | 7,576 | 8,092 | ||||||
| Unpaid capital which has been called up | — | — | ||||||
| Share premium | 40,079 | 44,373 | ||||||
| Equity instruments issued other than capital | — | 720 | ||||||
| Equity component of the compound financial instrument | — | — | ||||||
| Other equity instruments issued | — | 720 | ||||||
| Other equity | 217 | 195 | ||||||
| Accumulated retained earnings | 82,326 | 74,114 | ||||||
| Revaluation reserves | — | — | ||||||
| Other reserves | (5,976) | (5,751) | ||||||
| (-) Own shares | (68) | (1,078) | ||||||
| Profit attributable to shareholders of the parent | 12,574 | 11,076 | ||||||
| (-) Interim dividends | (1,532) | (1,298) | ||||||
| Other comprehensive income (loss) | (36,595) | (35,020) | ||||||
| Items not reclassified to profit or loss | (4,757) | (5,212) | ||||||
| Items that may be reclassified to profit or loss | (31,838) | (29,808) | ||||||
| Non-controlling interest | 8,726 | 8,818 | ||||||
| Other comprehensive income | (2,020) | (1,559) | ||||||
| Other items | 10,746 | 10,377 | ||||||
| TOTAL EQUITY | 107,327 | 104,241 | ||||||
| TOTAL LIABILITIES AND EQUITY | 1,837,081 | 1,797,062 | ||||||
| MEMORANDUM ITEMS: OFF BALANCE SHEET AMOUNTS | ||||||||
| Loan commitments granted | 302,861 | 279,589 | ||||||
| Financial guarantees granted | 16,901 | 15,435 | ||||||
| Other commitments granted | 134,493 | 113,273 | ||||||
60 |
|
January - December 2024 |
||||||
|
Business model
|
|
|
|
||||||||||||||||||||
| Condensed consolidated financial statements | |||||||||||||||||||||||
| Condensed consolidated income statement | ||||||||
| EUR million | ||||||||
| 2024 | 2023 | |||||||
| Interest income | 112,735 | 105,252 | ||||||
| Financial assets at fair value through other comprehensive income | 7,324 | 5,995 | ||||||
| Financial assets at amortized cost | 84,309 | 77,701 | ||||||
| Other interest income | 21,102 | 21,556 | ||||||
| Interest expense | (66,067) | (61,991) | ||||||
| Interest income/ (charges) | 46,668 | 43,261 | ||||||
| Dividend income | 714 | 571 | ||||||
| Income from companies accounted for using the equity method | 711 | 613 | ||||||
| Commission income | 17,602 | 16,321 | ||||||
| Commission expense | (4,592) | (4,264) | ||||||
| Gain or losses on financial assets and liabilities not measured at fair value through profit or loss, net | (114) | 96 | ||||||
| Financial assets at amortized cost | (190) | (3) | ||||||
| Other financial assets and liabilities | 76 | 99 | ||||||
| Gain or losses on financial assets and liabilities held for trading, net | 1,459 | 2,322 | ||||||
| Reclassification of financial assets at fair value through other comprehensive income | — | — | ||||||
| Reclassification of financial assets from amortized cost | — | — | ||||||
| Other gains (losses) | 1,459 | 2,322 | ||||||
| Gains or losses on non-trading financial assets and liabilities mandatorily at fair value through profit or loss | 495 | 204 | ||||||
| Reclassification of financial assets at fair value through other comprehensive income | — | — | ||||||
| Reclassification of financial assets from amortized cost | — | — | ||||||
| Other gains (losses) | 495 | 204 | ||||||
| Gain or losses on financial assets and liabilities measured at fair value through profit or loss, net | 691 | (93) | ||||||
| Gain or losses from hedge accounting, net | 16 | 63 | ||||||
| Exchange differences, net | (274) | 41 | ||||||
| Other operating income (*) | 803 | 1,104 | ||||||
| Other operating expenses | (2,324) | (2,827) | ||||||
| Income from insurance and reinsurance contracts | 470 | 460 | ||||||
| Expenses from insurance and reinsurance contracts | (449) | (449) | ||||||
| Total income | 61,876 | 57,423 | ||||||
| Administrative expenses | (22,740) | (22,241) | ||||||
| Staff costs | (14,328) | (13,726) | ||||||
| Other general and administrative expenses | (8,412) | (8,515) | ||||||
| Depreciation and amortization | (3,294) | (3,184) | ||||||
| Provisions or reversal of provisions, net | (3,883) | (2,678) | ||||||
| Impairment or reversal of impairment of financial assets not measured at fair value through profit or loss and net gains and losses from modifications |
(12,644) | (12,956) | ||||||
| Financial assets at fair value through other comprehensive income | — | (44) | ||||||
| Financial assets at amortized cost | (12,644) | (12,912) | ||||||
| Impairment of investments in subsidiaries, joint ventures and associates, net | — | — | ||||||
| Impairment on non-financial assets, net | (628) | (237) | ||||||
| Tangible assets | (386) | (136) | ||||||
| Intangible assets | (231) | (73) | ||||||
| Others | (11) | (28) | ||||||
| Gain or losses on non-financial assets and investments, net | 367 | 313 | ||||||
| Negative goodwill recognized in results | — | 39 | ||||||
| Gains or losses on non-current assets held for sale not classified as discontinued operations | (27) | (20) | ||||||
| Operating profit/(loss) before tax | 19,027 | 16,459 | ||||||
| Tax expense or income from continuing operations | (5,283) | (4,276) | ||||||
| Profit/(loss) for the period from continuing operations | 13,744 | 12,183 | ||||||
| Profit/( loss) after tax from discontinued operations | — | — | ||||||
| Profit/(loss) for the period | 13,744 | 12,183 | ||||||
| Profit attributable to non-controlling interests | 1,170 | 1,107 | ||||||
| Profit/(loss) attributable to the parent | 12,574 | 11,076 | ||||||
| Earnings/(losses) per share | ||||||||
| Basic | 0.77 | 0.65 | ||||||
| Diluted | 0.77 | 0.65 | ||||||
January - December 2024 |
|
61 |
||||||
|
Business model
|
|
|
|
||||||||||||||||||||
| Glossary | |||||||||||||||||||||||
62 |
|
January - December 2024 |
||||||
|
Business model
|
|
|
|
||||||||||||||||||||
| Important Information | |||||||||||||||||||||||
January - December 2024 |
|
63 |
||||||
|
Business model
|
|
|
|
||||||||||||||||||||
| Important Information | |||||||||||||||||||||||
This document is a translation of a document originally issued in Spanish. Should there be any discrepancies between the English and the Spanish versions, only the original Spanish version should be binding. | ||
64 |
|
January - December 2024 |
||||||

| Banco Santander, S.A. | ||||||||
| Date: 5 February 2025 | By: | /s/ José García Cantera | ||||||
| Name: | José García Cantera | |||||||
| Title: | Chief Financial Officer | |||||||
