| (Mark One) | |||||
| ☐ | REGISTRATION STATEMENT PURSUANT TO SECTION 12(b) OR (g) OF THE SECURITIES EXCHANGE ACT OF 1934 | ||||
| OR | |||||
| ☒ | ANNUAL REPORT PURSUANT TO SECTION 13 OR 15(d) OF THE SECURITIES EXCHANGE ACT OF 1934 | ||||
For the fiscal year ending 31 December 2023 | |||||
| OR | |||||
| ☐ | TRANSITION REPORT PURSUANT TO SECTION 13 OR 15(d) OF THE SECURITIES EXCHANGE ACT OF 1934 | ||||
| ☐ | SHELL COMPANY REPORT PURSUANT TO SECTION 13 OR 15(d) OF THE SECURITIES EXCHANGE ACT OF 1934 | ||||
| Title of each class | Name of each exchange on which registered | |||||||
| American Depositary Shares, each representing the right to receive one Share of Capital Stock of Banco Santander, S.A., par value euro 0.50 each | SAN | New York Stock Exchange | ||||||
| Shares of Capital Stock of Banco Santander, S.A., par value euro 0.50 each | Not applicable | New York Stock Exchange * |
||||||
| Non-cumulative Preferred Stock Series 6 | SAN PRB | New York Stock Exchange | ||||||
| 4.250% Second Ranking Senior Debt Securities due 2027 | SAN27 | New York Stock Exchange | ||||||
| 3.800% Senior Non Preferred Fixed Rate Notes due 2028 | SAN28 | New York Stock Exchange | ||||||
| 2.706% Senior Preferred Fixed Rate Notes due 2024 | SAN24 | New York Stock Exchange | ||||||
| 3.306% Senior Non Preferred Fixed Rate Notes due 2029 | SAN29 | New York Stock Exchange | ||||||
| 4.379% Senior Non Preferred Fixed Rate Notes due 2028 | SAN28A | New York Stock Exchange | ||||||
| 5.179% Subordinated Debt Securities due 2025 | SAN/25 | New York Stock Exchange | ||||||
| 2.746% Senior Non Preferred Fixed Rate Notes due 2025 | SAN25 | New York Stock Exchange | ||||||
| 3.490% Senior Non Preferred Fixed Rate Notes due 2030 | SAN30 | New York Stock Exchange | ||||||
| 2.749% Tier 2 Subordinated Fixed Rate Notes due 2030 | SAN30A | New York Stock Exchange | ||||||
| 1.849% Senior Non Preferred Fixed Rate Notes due 2026 | SAN26 | New York Stock Exchange | ||||||
| 2.958% Senior Non Preferred Fixed Rate Notes due 2031 | SAN31 | New York Stock Exchange | ||||||
| 4.750% Non-Step-Up Non-Cumulative Contingent Convertible Perpetual Preferred Tier 1 Securities | SANP1 | New York Stock Exchange | ||||||
| 4.125% Non-Step-Up Non-Cumulative Contingent Convertible Perpetual Preferred Tier 1 Securities | SANP2 | New York Stock Exchange | ||||||
| 0.701% Senior Preferred Fixed-to-Fixed Rate Notes due 2024 | SAN24A | New York Stock Exchange | ||||||
| 1.722% Senior Non Preferred Callable Fixed-to-Fixed Rate Notes due 2027 | SAN27A | New York Stock Exchange | ||||||
| 3.225% Tier 2 Subordinated Callable Fixed-to-Fixed Rate Notes due 2032 | SAN32 | New York Stock Exchange | ||||||
| 3.496% Senior Preferred Fixed Rate Notes due 2025 | SAN25A | New York Stock Exchange | ||||||
| 4.175% Senior Non Preferred Fixed-to-Fixed Rate Notes due 2028 | SAN28B | New York Stock Exchange | ||||||
| 3.892% Senior Preferred Fixed Rate Notes due 2024 | SAN24B | New York Stock Exchange | ||||||
| Senior Preferred Floating Rate Notes due 2024 | SAN24C | New York Stock Exchange | ||||||
| 5.147% Senior Non Preferred Fixed Rate Notes due 2025 | SAN25B | New York Stock Exchange | ||||||
| 5.294% Senior Non Preferred Fixed Rate Notes due 2027 | SAN27B | New York Stock Exchange | ||||||
| 6.921% Tier 2 Subordinated Fixed Rate Notes due 2033 | SAN33 | New York Stock Exchange | ||||||
| 5.588% Senior Preferred Fixed Rate Notes due 2028 | SAN28C | New York Stock Exchange | ||||||
| 6.527% Senior Preferred Callable Fixed-to-Fixed Rate Notes due 2027 | SAN27C | New York Stock Exchange | ||||||
| 6.607% Senior Preferred Fixed Rate Notes due 2028 | SAN28D | New York Stock Exchange | ||||||
| 6.938% Senior Preferred Fixed Rate Notes due 2033 | SAN33A | New York Stock Exchange | ||||||
| 9.625% Non-Step-Up Non-Cumulative Contingent Convertible Perpetual Preferred Tier 1 Securities | SANP3 | New York Stock Exchange | ||||||
| 9.625% Non-Step-Up Non-Cumulative Contingent Convertible Perpetual Preferred Tier 1 Securities | SANP4 | New York Stock Exchange | ||||||
Large accelerated filer ☒ |
Accelerated filer ☐ |
Non-accelerated filer ☐ |
||||||
U.S. GAAP ☐ |
International Financial Reporting Standards as issued by the International Accounting Standards Board ☒ |
Other ☐ |
||||||
| Cross-reference to Form 20-F | Consolidated directors' report | Consolidated financial statements | Supplemental information | |||||||||||||||||
Form 20-F Item Number and Caption |
Location |
Page |
|||||||||
Presentation of Financial and Other Information |
|||||||||||
Cautionary Statement Regarding Forward-Looking Statements |
|||||||||||
PART I |
|||||||||||
ITEM 1. |
IDENTITY OF DIRECTORS, SENIOR MANAGEMENT AND ADVISERS |
||||||||||
A. Directors and Senior Management |
Not required for Annual Report on Form 20-F |
- |
|||||||||
B. Advisers |
Not required for Annual Report on Form 20-F |
- |
|||||||||
C. Auditors |
Not required for Annual Report on Form 20-F |
- |
|||||||||
ITEM 2. |
OFFER STATISTICS AND EXPECTED TIMETABLE |
||||||||||
A. Offer Statistics |
Not required for Annual Report on Form 20-F |
- |
|||||||||
B. Method and Expected Timetable |
Not required for Annual Report on Form 20-F |
- |
|||||||||
ITEM 3. |
KEY INFORMATION |
||||||||||
| Selected financial data | |||||||||||
| A. [Reserved] | |||||||||||
B. Capitalization and indebtedness |
Not required for Annual Report on Form 20-F |
- |
|||||||||
C. Reasons for the offer and use of proceeds |
Not required for Annual Report on Form 20-F |
- |
|||||||||
D. Risk factors |
|||||||||||
ITEM 4. |
INFORMATION ON THE COMPANY |
||||||||||
A. History and development of the company |
|||||||||||
Acquisitions, Dispositions, Reorganizations |
|||||||||||
Capital Increases |
|||||||||||
Recent Events |
|||||||||||
B. Business overview |
|||||||||||
Selected Statistical information |
|||||||||||
Competition in Spain |
|||||||||||
Supervision and Regulation |
|||||||||||
C. Organizational structure |
|||||||||||
| D. Property, plants and equipment | |||||||||||
ITEM 4A. |
UNRESOLVED STAFF COMMENTS |
||||||||||
ITEM 5. |
OPERATING AND FINANCIAL REVIEW AND PROSPECTS |
||||||||||
| A. Operating results | |||||||||||
| B. Liquidity and capital resources | |||||||||||
| Tabular disclosure of contractual obligations | |||||||||||
| Off balance sheet arrangements | |||||||||||
| C. Research and development, patents and licenses, etc. | |||||||||||
| D. Trend information | |||||||||||
| Cross-reference to Form 20-F | Consolidated directors' report | Consolidated financial statements | Supplemental information | |||||||||||||||||
Form 20-F Item Number and Caption |
Location |
Page |
|||||||||
| E. Critical accounting estimates | |||||||||||
ITEM 6. |
DIRECTORS, SENIOR MANAGEMENT AND EMPLOYEES |
||||||||||
A. Directors and senior management |
|||||||||||
B. Compensation |
|||||||||||
C. Board practices |
|||||||||||
D. Employees |
|||||||||||
E. Share ownership |
|||||||||||
| F. Disclosure of a registrant's action to recover erroneously awarded compensation | None | ||||||||||
ITEM 7. |
MAJOR SHAREHOLDERS AND RELATED PARTY TRANSACTIONS |
||||||||||
A. Major shareholders |
|||||||||||
B. Related party transactions |
|||||||||||
C. Interests of experts and counsel |
Not required for Annual Report on Form 20-F |
- |
|||||||||
ITEM 8. |
FINANCIAL INFORMATION |
||||||||||
A. Consolidated statements and other financial information |
|||||||||||
Financial statements |
|||||||||||
Legal proceedings |
|||||||||||
Shareholders remuneration |
|||||||||||
B. Significant Changes |
Not applicable |
- |
|||||||||
ITEM 9. |
THE OFFER AND LISTING |
||||||||||
A. Offer and listing details |
|||||||||||
B. Plan of distribution |
Not required for Annual Report on Form 20-F |
- |
|||||||||
C. Markets |
|||||||||||
D. Selling shareholders |
Not required for Annual Report on Form 20-F |
- |
|||||||||
E. Dilution |
Not required for Annual Report on Form 20-F |
- |
|||||||||
| F. Expenses of the issue | Not required for Annual Report on Form 20-F |
- |
|||||||||
ITEM 10. |
ADDITIONAL INFORMATION |
||||||||||
A. Share capital |
Not required for Annual Report on Form 20-F |
- |
|||||||||
B. Memorandum and articles of association |
|||||||||||
C. Material contracts |
|||||||||||
D. Exchange controls |
|||||||||||
E. Taxation |
|||||||||||
F. Dividends and paying agents |
Not required for Annual Report on Form 20-F |
- |
|||||||||
G. Statement by experts |
Not required for Annual Report on Form 20-F |
- |
|||||||||
H. Documents on display |
|||||||||||
I. Subsidiary information |
Not required for Annual Report on Form 20-F |
- |
|||||||||
| J. Annual report to security holders | Not required for Annual Report on Form 20-F |
- |
|||||||||
| Cross-reference to Form 20-F | Consolidated directors' report | Consolidated financial statements | Supplemental information | |||||||||||||||||
Form 20-F Item Number and Caption |
Location |
Page |
|||||||||
ITEM 11. |
QUANTITATIVE AND QUALITATIVE DISCLOSURES ABOUT MARKET RISK |
||||||||||
ITEM 12. |
DESCRIPTION OF SECURITIES OTHER THAN EQUITY SECURITIES |
||||||||||
| A. Debt securities | Not required for Annual Report on Form 20-F |
- |
|||||||||
| B. Warrants and rights | Not required for Annual Report on Form 20-F |
- |
|||||||||
| C. Other securities | Not required for Annual Report on Form 20-F |
- |
|||||||||
D. American Depositary Shares |
|||||||||||
PART II |
|||||||||||
ITEM 13. |
DEFAULTS, DIVIDEND ARREARAGES AND DELINQUENCIES |
Not applicable |
- |
||||||||
ITEM 14. |
MATERIAL MODIFICATIONS TO THE RIGHTS OF SECURITY HOLDERS AND USE OF PROCEEDS |
Not applicable |
- |
||||||||
ITEM 15. |
CONTROLS AND PROCEDURES |
||||||||||
ITEM 16 |
[Reserved] |
||||||||||
| A. Audit committee financial expert | |||||||||||
| B. Code of ethics | |||||||||||
| C. Principal accountant fees and services | |||||||||||
| D. Exemptions from the listing standards for audit committees | Not applicable |
- |
|||||||||
| E. Purchases of equity securities by the issuer and affiliated purchasers | |||||||||||
| F. Change in registrant’s certifying accountant | Not applicable |
- |
|||||||||
| G. Corporate governance | |||||||||||
| H. Mine safety disclosure | Not applicable |
- |
|||||||||
| I. Disclosure regarding foreign jurisdictions that prevent inspections | Not applicable | - | |||||||||
| J. Insider trading policies | Not applicable | - | |||||||||
| K. Cybersecurity | |||||||||||
PART III |
|||||||||||
ITEM 17. |
FINANCIAL STATEMENTS |
||||||||||
ITEM 18. |
FINANCIAL STATEMENTS |
||||||||||
ITEM 19 |
EXHIBITS |
||||||||||
| Part 1 | |||||
| Part 2 | |||||


|
2023
Annual report
Unless otherwise specified, references in this annual report to other documents, including but not limited to other reports and websites, including our own, are for information purposes only. If the contents of such other documents and websites refer to this annual report, they are not nor should be considered part of it.
Unless the context suggests otherwise, 'Banco Santander' means Banco Santander, S.A., and 'Santander', 'the Group' and 'Grupo Santander' mean Banco Santander, S.A. and subsidiaries.
|
||||||||
Business model and strategy |
||||||||||||||
 | ||||||||||||||
 Our purpose
|
 Our aim
|
 Our how
|
||||||||||||||||||||||||||||||
| To help people and businesses prosper | To be the best open financial services platform by acting responsibly and earning the lasting loyalty of our people, customers, shareholders and communities |
Everything we do should be
Simple, Personal and Fair
|
||||||||||||||||||||||||||||||
which motivates | ||
|
support for our
communities
| ||
so we deliver | ||
|
An engaged and
talented team
| ||
|
strong financial
results for our
shareholders
| ||
generates | ||
|
customer
loyalty
| ||
leading to | ||
| 2023 | 2022 | |||||||
| Total customers (mn) | 165 | 160 | ||||||
| Active customers (mn) | 100 | 99 | ||||||
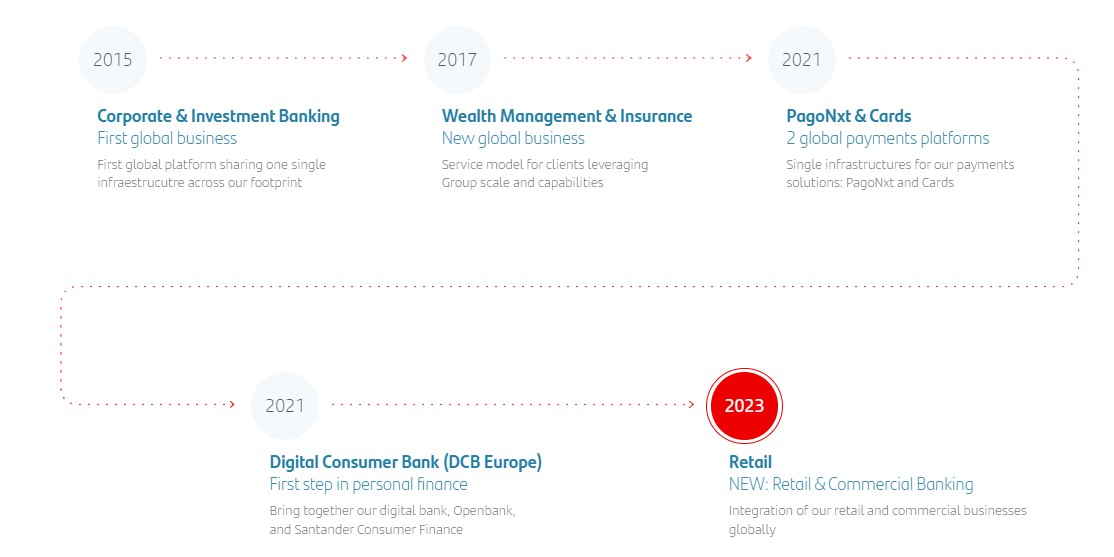
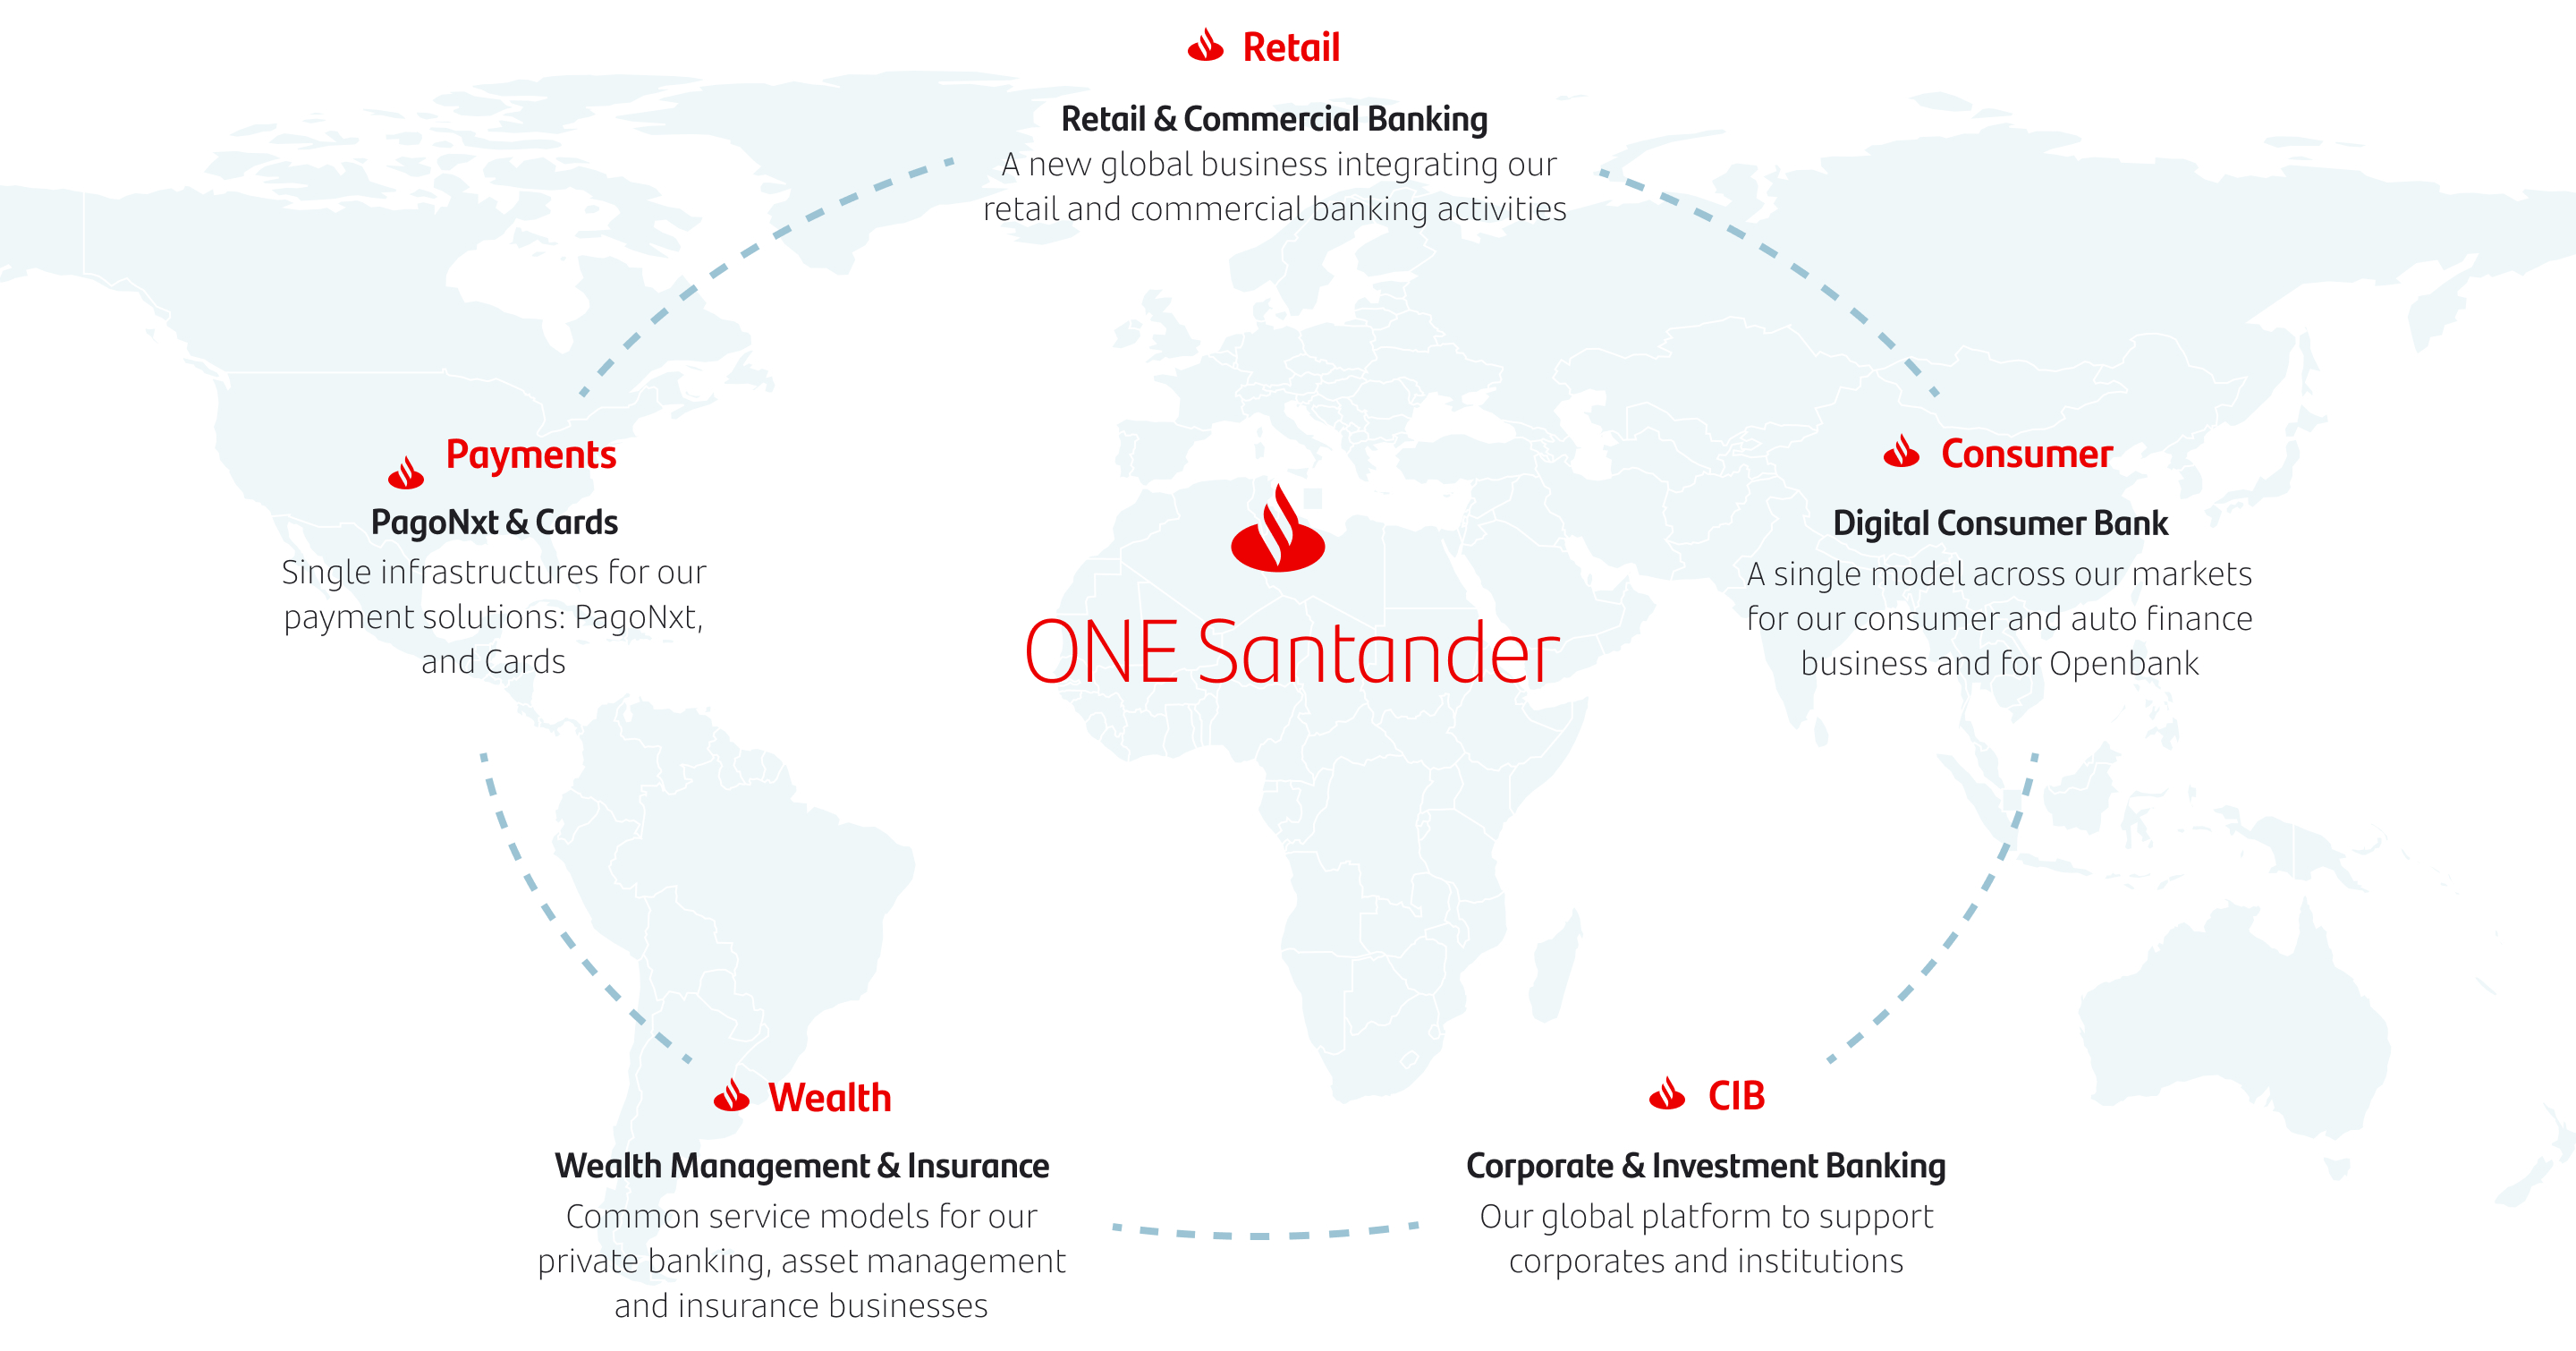
 ONE
Santander
|
|||||||||||||||||||||||||||||||||||||||||
| Global businesses |  |
Retail & Commercial Banking |  |
||||||||||||||||||||||||||||||||||||||
 |
Digital Consumer Bank | |
|||||||||||||||||||||||||||||||||||||||
 |
Corporate & Investment Banking | |
|||||||||||||||||||||||||||||||||||||||
 |
Wealth Management & Insurance | |
|||||||||||||||||||||||||||||||||||||||
 |
Payments | |
|||||||||||||||||||||||||||||||||||||||
|
Europe
 |
North America
 |
South America
 |
DCB Europe
 |
||||||||||||||||||||||||||||||||||||||
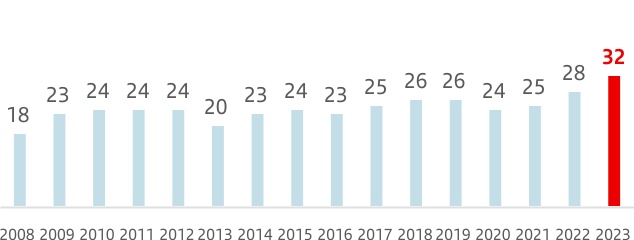
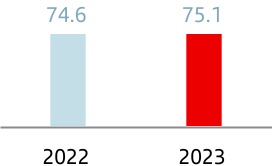
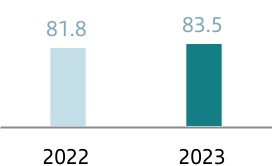
| Group net operating income (pre-provision profit) | ||
| EUR billion | ||

|
→Record results with 5mn new customers YoY contributing to double-digit revenue growth
→First year of ONE Transformation driving profitable growth and structural efficiency improvement
→Strong balance sheet, with solid credit quality metrics and a higher capital ratio
→Delivering double-digit value creation and higher shareholder remuneration
| ||
| FY’23 Attributable Profit | FY’23 Revenue | |||||||
|
€11.1bn
+15%
|
€58bn
+11%
|
|||||||
| Cost-to-income | RoTE | |||||||
|
44.1%
–173bps
|
15.1%
+169bps
|
|||||||
| CoR | FL CET1 | |||||||
|
1.18%
+0.19pp
|
12.3%
+0.2pp
|
|||||||
| TNAVps + DPS | EPS | |||||||
|
+15%
Cash DPS +c.50%
|
+21.5% |
|||||||
| 2023 targets | 2023 achievement | |||||||||||||
RevenueA |
 |
Double-digit growth | +13% | ü | ||||||||||
| Efficiency ratio | |
44-45% | 44.1% | ü | ||||||||||
| CoR | |
<1.2% | 1.18% | ü | ||||||||||
| FL CET1 | |
>12% | 12.3% | ü | ||||||||||
| RoTE | |
>15% | 15.1% | ü | ||||||||||
| 2023 vs. 2022 |
Attributable profit
(€ bn)
|
Contribution to Group's profitA |
Efficiency | RoTE | |||||||||||||
| Europe | 5.5 | 45% | 42.1% | 14.5% | |||||||||||||
| North America | 2.4 | 20% | 49.1% | 9.8% | |||||||||||||
| South America | 3.0 | 25% | 38.5% | 14.4% | |||||||||||||
| DCB Europe | 1.2 | 10% | 47.6% | 12.3% | |||||||||||||
|
DCB Europe is the Digital Consumer Bank defined under the criteria prior to the 20 December 2023 announcement.
A. As % of total operating areas, excluding the Corporate Centre.
| |||||||||||||||||
 |
 |
|||||||
North America |
Europe | |||||||
We are leveraging the strength of our global businesses to accelerate the transformation of our businesses in the US and Mexico |
We remain focused on customer experience and service quality, and on making the structural changes needed to develop a common operating model for Europe |
|||||||
 |
 |
|||||||
South America |
DCB Europe (former DCB) |
|||||||
We are focused on increasing the value we bring to the Group and on working to become the most profitable bank in each of the countries where we operate in the region |
Continue to reinforce our auto leadership through strategic alliances, leasing and subscription. In non-auto, keep upscaling our buy now, pay later business. Transformation for future growth deploying a simpler organizational structure to deliver through best-in-class digital platforms, launching new channels and products |
|||||||
| 2024 Group targets | ||||||||||||||||||||||||||
| Revenue | Efficiency | CoR |
FL CET1
after Basel III
implementation
|
RoTE | ||||||||||||||||||||||
|
Mid-single
digitA growth
|
<43% | c.1.2% | >12.0% | 16% | ||||||||||||||||||||||
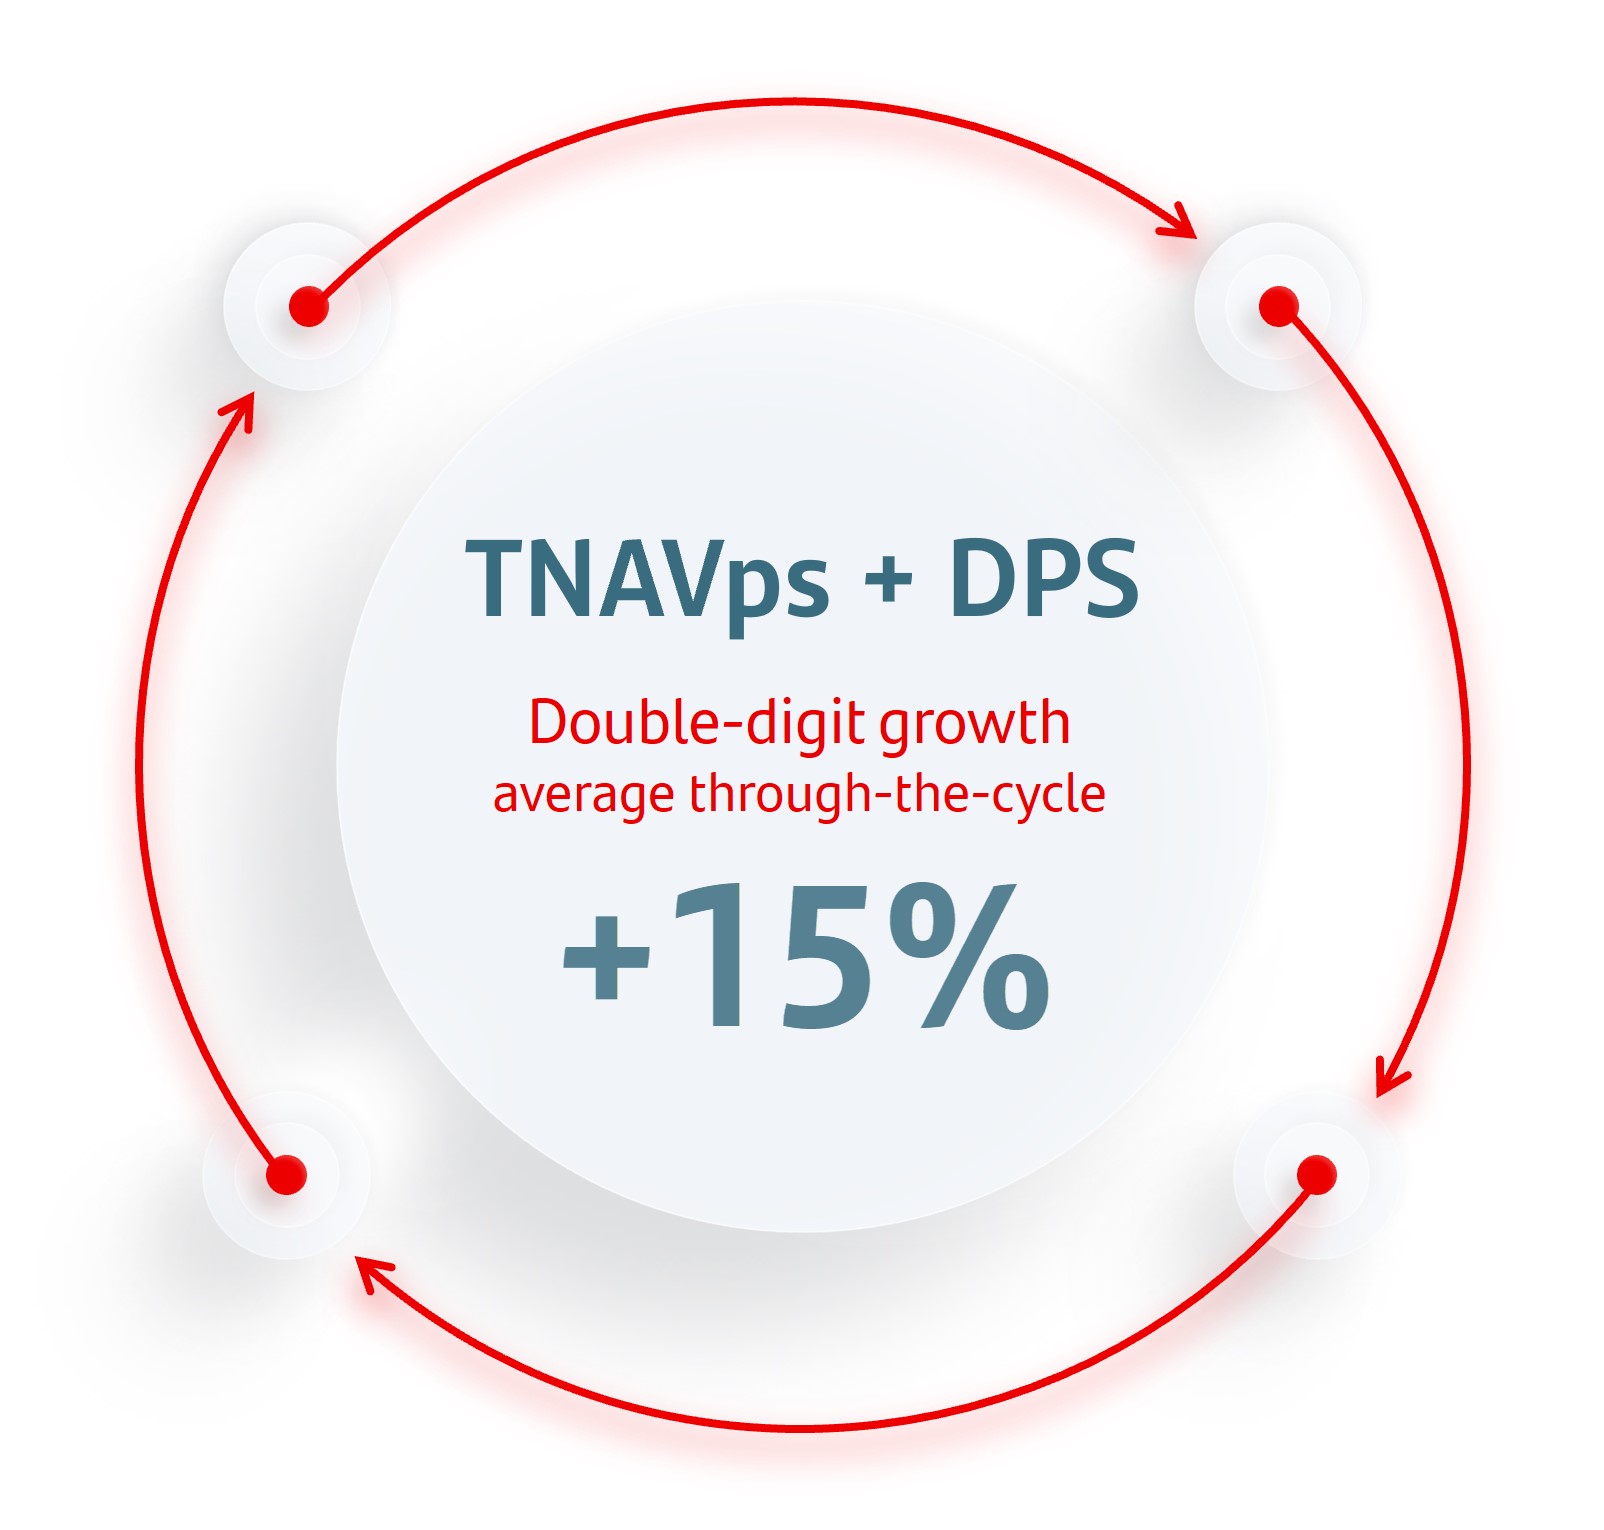
Double-digit growth of TNAV per share + dividend per share through-the-cycle | ||||||||||||||||||||||||||
|
A.YoY revenue growth in constant euros, but Argentina in current euros.
Note: All targets presented in this chapter are market dependent and do not represent guidance. Actual results may vary materially.
| ||||||||||||||||||||||||||
 |
Think Value |
Delivering double-digit value creation, on average through-the-cycle |
|||||||||||||||
 |
Think Customer |
Building a digital bank with branches with well targeted products and services to grow our customer base |
|||||||||||||||
 |
Think Global |
Best customer experience leveraging our global and in-market scale, network and technology capabilities to accelerate profitable growth |
|||||||||||||||
| Strength | ||||||||
|
FL CET1
>12%
12.3%
|
||||||||
| Shareholder remuneration | ||||||||
|
Payout
50%
Cash dividend + SBB
50% annually
|
||||||||
| Disciplined capital allocation | ||||||||
|
RWAs with RoRWA > CoE
c.85%
84%
|
||||||||
| Profitability | ||||||||
|
RoTE
15-17%
15.1%
|
||||||||
| 2023 | 2025 targets | ||||||||||||||||
| Customer centric | Total customers (mn) | 165 | |
c. 200 | |||||||||||||
| Active customers (mn) | 100 | |
c. 125 | ||||||||||||||
| Simplification & automation | Efficiency ratio (%) | 44.1 | |
c.42 | |||||||||||||
| Customer activity | Transactions volume per active customer (month, % growth) | 10 | |
c. +8% | |||||||||||||
| Our new model capitalizes on our strategic advantage of combining global capabilities with local expertise | ||||||||||||||||||||
Serve our customers better |
Be more efficient |
|||||||||||||||||||
Better risk management from a global perspective across business lines |
||||||||||||||||||||
Grow more and faster |
More resilient balance sheet |
|||||||||||||||||||
Improved and more disciplined capital allocation for higher profitability |
||||||||||||||||||||
 Customer experience
|
 Operational leverage
|
 Global platform
|
 2025 target
|
|||||||||||||||||||||||||||||||||||||||||
Product simplification and digital first |
Common operating model, globally leveraging process automation |
Proprietary back-end (Gravity) and our cloud based front-end (ODS) technologies |
c.17% RoTE
15.1% 2023
<42% C/I
43.1% 2023
|
|||||||||||||||||||||||||||||||||||||||||
| Key drivers | ||
 | ||
|
Customer experience
|
Operational leverage
|
Global platform
|
2025 target
|
|||||||||||||||||||||||||||||||||||||||||
Global relationship management (OEMs, importers and retailers) |
Operational & commercial benchmark to maximize profitability and growth |
From multiple country-specific platforms to global platforms
(e.g. leasing, BNPL)
|
>14% RoTE
11.5% 2023
c.40% C/I 42.8% 2023
|
|||||||||||||||||||||||||||||||||||||||||
| Key drivers | ||
| ||
|
Customer experience
|
Operational leverage
|
Global platform
|
2025 target
|
|||||||||||||||||||||||||||||||||||||||||
Trusted advisor for our customers, leveraging our global and local products |
Continue growing fee and transactional business through our global centres of expertise and tech |
Optimize capital returns on the back of global origination and distribution capabilities
|
>20% RoTE
17.5% 2023
<45% C/I 45.0% 2023
|
|||||||||||||||||||||||||||||||||||||||||
| Key drivers | ||
| ||
|
Customer experience
|
Operational leverage
|
Global platform
|
2025 target
|
|||||||||||||||||||||||||||||||||||||||||
Providing our customers with a specialized product & service proposition in all countries |
Leverage our global operations and factories to connect countries and increase collaboration with CIB and Retail |
Global platforms and infrastructure
to improve efficiency and time-to-market
|
c.60% RoTE
72.2% 2023
c.10% Revenue growth +22% 2023
|
|||||||||||||||||||||||||||||||||||||||||
| Key drivers | ||
| ||
|
Customer experience
|
Operational leverage
|
Global platform
|
2025 target
|
|||||||||||||||||||||||||||||||||||||||||
Deliver best-in-class payment solutions leveraging our global and local scale |
Reduce cost per transaction through capex optimization and operational efficiency |
Migrate volumes to common global platforms to gain scale and offer competitive pricing in the open market |
PagoNxt
>30% EBITDA margin
24.8% 2023 c.30% Revenue growth
+17% 2023
|
|||||||||||||||||||||||||||||||||||||||||
| Key drivers | ||
| ||
| 2023 vs. 2022 |
Revenue
(€bn)
|
Contribution to Group revenueA |
Efficiency | RoTEB |
2025 RoTEB target |
|||||||||||||||
 |
30
+12%
|
51% |
43.1%
-157bps
|
15.1%
+1.0pp
|
c.17% | |||||||||||||||
 |
12
+1%
|
21% |
42.8%
+86bps
|
11.5%
-4.0pp
|
>14% | |||||||||||||||
 |
8
+17%
|
13% |
45.0%
+171bps
|
17.5%
+1.6pp
|
>20% | |||||||||||||||
 |
3
+22%
|
6% |
37.9%
-333bps
|
72.2%
+19.8pp
|
c.60% | |||||||||||||||
|
Revenue
(€bn)
|
Contribution to Group's revenueA |
Efficiency | EBITDA margin PagoNxt | 2025 EBITDA margin PagoNxt target | ||||||||||||||||
 |
5
+12%
|
9% |
44.2%
-235bps
|
24.8%
+15.7pp
|
>30% | |||||||||||||||
|
Note: YoY change in constant euros. New global business definitions as published on 20 December 2023.
A.As % of total operating units, excluding the Corporate Centre.
B. Global businesses’ RoTEs are adjusted based on the Group’s deployed capital.
For more information, see section 8 'Alternative Performance Measures' of 'Economic and financial review' chapter.
|
||||||||||||||||||||
| 2023 | 2025 targets | |||||||||||||
| Green finance raised and facilitated (since 2019) | €114.6bn | |
€120bn | |||||||||||
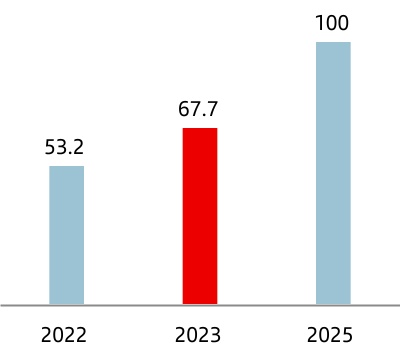
| Socially responsible investments (AuMs) | €67.7bn | |
€100bn | |||||||||||
Financial inclusion (# People) |
1.8mn | |
5mn | |||||||||||
|
Responsible
banking Consolidated non-financial information statement
|
|||||
 | |||||
|
Green
finance
EUR 114.6 bnA
EUR 120 bn target by 2025
EUR 220 bn target by 2023
|
Socially responsible investment AUM
EUR 67.7 bn
EUR 100 bn target by 2025
|
Financial
inclusion 1.8 mn
EUR 5 mn target by 2025
|
||||||||||||
 |
Set 2 new decarbonization targets for 2030 for corporate auto manufacturing portfolio and auto lending portfolio in Europe. |
|
Progress on portfolio alignment in relevant portfolios, including disclosure of financed emissions for UK Mortgages and Brazil Agriculture. |
|
Progress embedding climate and environmental factors in our risk management practices, leveraging on market good practices and supervisory expectations, including setting three additional risk appetite limits consistent with our decarbonization strategy. |
||||||||||||||||||
 |
1. We drive economic growth by helping people and businesses prosper. |
||||
|
→EUR 352,181 million to help people buy homes and EUR 208,276 million to purchase other goods.A
→EUR 346,211 million to help set up or grow companies (39% to individuals and SMEs).A
→EUR 10,937 million paid to suppliers. 91% are local and account for 94% of total procurement turnover.
→EUR 9,664 million in total taxes paid by the Group. EUR 10,250 million in taxes channelled from customers to tax authorities.
→Santander’s stock of credit contributes to generating economic activity of more than EUR 290 billion, around 2.5% of GDP on average in the main countries where we operate.B
|
||||||||
 |
2. We help create jobs. |
||||
|
→212,764 employees. EUR 13,726 million paid in wages and benefits.
→53% of our workforce are women, 31.4% of whom are in senior executive positions. 40% of our board members are women.
→In 2023 we achieved our target of ~0% Equal Pay GapC two years ahead.
→Santander’s stock of credit helps support more than 8 million jobs in the main countries where we operate.B
|
||||||||
|
3. We tackle global challenges. |
||||
|
→EUR 20.2 billionD in green finance raised and facilitated and EUR 67.7 billion assets under management in Socially Responsible Investment.
→1.8 million new people financially included and a total of 1.2 million underbanked entrepreneurs supported through EUR 1,172 million in credit disbursed.
→EUR 174 million invested in communities, including 105 million to promote higher education, employability and entrepreneurship, benefitting 2.7 million people.
|
||||||||
|
Our values
Simple Personal Fair
|
||||||||
|
Our behaviours
 |
||||||||
|
Our leadership principles
→Promote a 'Group First' mindset
→Lead transformation
→Build, develop and grow talent
→Display T.E.A.M.S. flawlessly
→Drive diversity, equity and inclusion
|
||||||||
|
Our strong risk management culture
 |
||||||||
| Ambition | Action | |||||||||||||||||||
|
E
Support the transition to a low-carbon economy
|
→Support and engage with customers in accelerating their transition, and develop a best-in-class sustainable finance and investment proposition.
→Progress with decarbonizing our portfolios to align to net zero by 2050, while considering other environmental goals.
|
|||||||||||||||||||
|
S
Promote inclusive growth
|
→Promote employees' wellbeing and equal treatment and opportunity for all.
→Support financial inclusion by promoting access to financial products and services and financial health, including financial literacy.
→Foster customer information transparency and data privacy.
→Support education, employability and entrepreneurship.
|
|||||||||||||||||||
|
G
Strong governance and culture across the organization
|
→Drive culture, conduct and ethical behaviour, doing everything the Santander Way: Simple, Personal and Fair.
→Continue integrating ESG in governance and our core activities, and enhancing capabilities across teams including business, risk management and data reporting.
|
|||||||||||||||||||
→We increased two ESG targets at our Investor Day: 35% of senior executive positions to be held by women by 2025 and to financially include 5 million people between 2023 and 2025. |
→To help fulfil our ambition to be net zero by 2050, in 2023 we have set two new decarbonization targets for 2030 in the transport sector: auto lending in Europe and auto manufacturing. This way, we now have seven targets in five high emitting sectors. |
→We have set a target to invest EUR 400 million between 2023-2026 to foster education, employability and entrepreneurship. |
||||||||||||||||||||||||||||||
|
→In Corporate & Investment Banking, we raised and facilitated EUR 20.2 bnA in greenB finance in 2023, reaching EUR 114.6 bn since 2019:
•Santander remains among the top banks in renewable energy project finance, with 85 transactions and EUR 6.7 bn in financing.
•We financed the construction of green assets and an EV battery gigafactory plant, signed green loans with clients such as Grenergy, structured sustainable transactions in Export and Supply Chain finance, and launched Green Deposits.
•We advised on several corporate finance transactions in the renewable energy sector and acted as sole financial advisor in one of the largest ever hydrogen transactions globally at the time.
|
||||||||
|
→In Retail & Commercial Banking, in 2023, we strengthened our green proposition with new solutions for clients, e.g.:
•Green mortgages, electric vehicles or financing of solar panel installations (11 partnerships for solar panel solutions across our three regions). At the end of the year, we had a stock of EUR 22.6 bn in mortgages aligned with the EU Taxonomy.
•EUR 1.4 bn in new financing agreements with multilateral development banks to finance the investment and liquidity needs of our customers in Europe and Latin America.
•The EIB granted EUR 300 million to Banco Santander Brasil for small-scale solar energy investments.
|
||||||||
|
→Our SRI AUM amounted to EUR 67.7 bn, of which EUR 48.1 bn are from SAM and EUR 19.6 bn from our Private Banking services associated with third party funds:
•70.8% of financed emissions from SAM’s portfolio were either aligning to net zero or under either individual or collective engagement in which SAM is involved.
•SAM Spain was the first asset manager to adhere to and report on the CNMV stewardship code compliance.
|
||||||||
→In Digital Consumer Bank, in 2023, in Europe we financed more than 208,000 new electric vehicles, with volume of EUR 6.5 bn. This equals a market share of EV sales in Europe of over 10%. |
|||||||||||
→In Cards, in 2023, we acquired 37 million cards (72% of the year's total) made of sustainable materials (recycled PVC or PLA).C |
|||||||||||
→We exceeded our target for 30% of senior executive positions by 2025 to be held by women in Q2, reaching 31.4% by year end. Additionally, we have reached our target of Equal Pay gap close to zero two years in advance. |
|||||||||||
→We financially included 1.8 million new people through our access and finance initiatives and granted EUR 1,172 m in microloans to a total of 1.2 million underbanked entrepreneurs during the year. In addition, we reached 11.5 million people with financial education initiatives, including content in social media. |
|||||||||||
|
→We invested EUR 174 million in our communities:
•EUR 105 million in supporting education, employment and entrepreneurship through Santander Universities, our unique global initiative. In 2023 we granted 28,849 scholarships.
•EUR 69 million in other programmes with 2.2 million people helped.
|
|||||||||||
 |
|||||||||||
 |
World’s best bank for financial inclusion by Euromoney for the third year in a row; World’s best bank for SMEs and World’s best bank for emerging markets by Euromoney (Euromoney Awards for Excellence). |
 |
We were the highest ranked bank on Fortune's list of 50 companies that are changing the world, owing to Santander Universities support for education, entrepreneurship and employability over the past 27 years. |
|||||||||||||||||
 |
For more details on our policies and governance structure, see section 9.2 'Main internal regulations and governance'
|
||||
Impact materiality |
 |
How business affects people and/or the environment through positive and negative impacts. |
||||||
Financial materiality |
|
How sustainability matters can affect financial results through risk and opportunity. |
||||||
| Financial materiality | |||||||||||||||||
| Sustainability matters | Impact materiality | Risk | Opportunity |
Double materiality
(final output)
|
|||||||||||||
| ESRS E1: Climate Change | |||||||||||||||||
| ESRS E2: Pollution | |||||||||||||||||
| ESRS E3: Water and marine resources | |||||||||||||||||
| ESRS E4: Biodiversity and ecosystems | |||||||||||||||||
| ESRS E5: Resource use & circular economy | |||||||||||||||||
| ESRS S1: Own workforce | |||||||||||||||||
| ESRS S2: Workers in the value chain | |||||||||||||||||
| ESRS S3: Affected Communities | |||||||||||||||||
| ESRS S4: Consumers and end-users | |||||||||||||||||
| ESRS G1: Business conduct | |||||||||||||||||
Thresholds: ¢ Critical ¢ Significant ¢ Important ¢ Informative ¢ Minimal | |||||||||||||||||
| Impact | Risk | Opportunities | ||||||||||||||||||||||||
| Climate change | Santander can have a positive impact by financing customers’ transition to a low-carbon economy. This transition will benefit the reduction of total emissions released into the atmosphere, thus making a positive contribution to the Paris Agreement. |
Climate change can cause economic losses to our customers, who might be affected by physical or transition risk.
These risks could lead to increased default rates or reduced value of collaterals. Our diversification by geography and sector reduces this risk across our balance sheet and we manage this risk by embedding climate into risk management. For more details, see section 2.3 Risk Management.
|
Supporting our customers in their transition has become a key business driver.
Our target is to raise or facilitate €220 bn in green finance by 2030. To do so, we are building capabilities and developing our value proposition for customers across sectors and activities (finance, investment, advisory etc.).
|
|||||||||||||||||||||||
| Business conduct | Santander’s behaviour and actions have an influence due to the bank’s leadership in the markets where we operate. |
Inadequate behaviour or conduct could lead to fines and reputational risk.
Fostering a solid corporate culture in which everything we do should be Simple, Personal and Fair is how we mitigate this risk.
|
Applying a solid corporate culture and conduct when dealing with customers can earn their trust and help set us apart. |
|||||||||||||||||||||||
| Consumers and end-users | Santander can have a positive impact on consumers and end users due to our ability to help customers access financial services and in promoting their financial health. |
Lack of transparency in customer information or unfair disclosure may lead to customer dissatisfaction and complaints, which would entail direct and indirect costs. Data privacy events may hamper customers’ trust.
A deterioration in the financial health of our customers may increase the risk of default on loans. We mitigate this risk by developing a solid corporate culture and behaviours and policies to set clear guidelines about how we deal with customers, process customer data and interact with vulnerable customers.
|
Robust data privacy measures and Know Your Customer protocols can boost our revenue by building trust with customers.
Our financial inclusion proposition is also a source of new customers.
|
|||||||||||||||||||||||
| Own workforce | Santander employs over 200,000 people worldwide. We aim to have a positive impact on our workforce through working conditions, remuneration schemes and Diversity, Equity and Inclusion policies. |
Less motivated people could lead to higher rotation and absenteeism, which could increase our cost base. Poor talent retention can also harm our performance.
Our own workforce strategy seeks to mitigate this risk with initiatives in areas such as diversity, equity and inclusion, culture, and health and well-being.
|
A well skilled and diverse workforce boosts results by increasing productivity, fostering innovation and enhancing customer satisfaction. |
|||||||||||||||||||||||
| Affected communities | Santander can have a positive impact by using our scale and local leadership to help the communities where we operate access basic needs (affordable housing, water and sanitation, etc.) and make a positive contribution to the sustainable development goals (SDGs). |
Some of the activities we finance can pose environmental and social risk related to the communities where these operations take place. We mitigate this risk through our Environmental, Social and Climate Change (ESCC) policy and other internal controls. |
Financing basic needs in the regions where we operate (affordable housing, water and sanitation, etc.) is an opportunity to increase revenue.
Our financial education proposition and our support for higher education, employability and entrepreneurship help build trust and enhance the perception of the bank in the communities where we operate.
|
|||||||||||||||||||||||
Thresholds: ¢ Critical ¢ Significant ¢ Important ¢ Informative ¢ Minimal | ||||||||||||||||||||||||||
| ó | ó | ó | ó | |||||||||||||||||||||||||||||||||||||||||
|
Aligning our portfolio with the Paris Agreement goals
 Contribute to
limiting temperature
increases to 1.5ºC in line with the NZBA and NZAMi
|
Supporting our customers in the transition
 Provide customers with a wide range of solutions to support their transition to a low-carbon economy
|
Reducing our environmental
impact
 Remain carbon neutral in own operations and consume 100% electricity from renewable sources by 2025A
|
Embedding climate in risk management
 Manage climate and environmental
risk according to regulatory and supervisory expectations
|
|||||||||||||||||||||||||||||||||||||||||
| 2018 | 2019 | 2020 | 2021 | 2022 | 2023 | 2025/2030 target | |||||||||||||||||||||||||||||||||||||||||
Electricity from renewable sourcesA |
43% | 50% | 57% | 75% | 88% | 97% |  |
100% by 2025 | |||||||||||||||||||||||||||||||||||||||
Carbon neutral in our own operationsB |
|
 |
|
|
|
Every year | |||||||||||||||||||||||||||||||||||||||||
Green finance raised and facilitated (EUR bn)C |
19 | 33.8 | 65.7 | 94.5 |
114.6 |
120 bn by 2025 220 bn by 2030 |
|||||||||||||||||||||||||||||||||||||||||
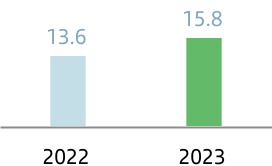
AuMs in Socially Responsible Investments (SRI) (EUR bn) |
27.1 | 53.2 |
67.7 |
|
100 bn by 2025 | ||||||||||||||||||||||||||||||||||||||||||
Thermal coal-related power & mining phase out (EUR bn) |
7 | 5.9 |
4.9 |
|
0 by 2030 | ||||||||||||||||||||||||||||||||||||||||||
Emissions intensity of power generation portfolio |
0.21 | 0.17 | 0.19 | |
0.11 tCO2e / MWh in 2030 |
||||||||||||||||||||||||||||||||||||||||||
Absolute emissions of energy (oil & gas) portfolio |
23.84 | 22.58 | 27.43 | |
16.98 mtCO2e in 2030 |
||||||||||||||||||||||||||||||||||||||||||
Emissions intensity of aviation portfolio |
92.47 | 93.05 | 97.21 | |
61.71 gCO2e/ RPK in 2030 |
||||||||||||||||||||||||||||||||||||||||||
Emissions intensity of steel portfolio |
1.58 | 1.40 | 1.36 | |
1.07 tCO2e/ tS in 2030 |
||||||||||||||||||||||||||||||||||||||||||
| New in 2023 | Emissions intensity of auto manufacturing portfolio |
149 | 138 | |
103 gCO2/vkm in 2030 |
||||||||||||||||||||||||||||||||||||||||||
Emissions intensity of auto lending portfolioD |
137 | |
75-89 gCO2e/vkm in 2030 |
||||||||||||||||||||||||||||||||||||||||||||
|
From…To | Cumulative target | |
Commitment Achieved |
||||||||||||||||
|
Since 2021, we are a founding member of the Net Zero Banking Alliance (NZBA, under the United Nations Environment Programme Finance Initiative), committing the Group to:
→support the transition of operational and attributable greenhouse gas (GHG) emissions from lending and investment portfolios towards pathways to net zero by mid-century; and
→set intermediate targets for priority GHG emitting sectors for 2030 (or sooner).
|
||||||||
Santander Asset Management (SAM) aims to achieve net zero greenhouse gas emissions with its assets under management by 2050. SAM joined the global Net Zero Asset Managers initiative (NZAMi) in 2021 as part of its commitment to fight climate change and set an interim target to halve net emissions for 50% of its AUM in scope by 2030. |
||||||||
|
For more details on our 'Climate Finance Report' and the net zero announcement press release, see our corporate website santander.com. |
||||
|
For more details on SAM’s strategy, see 'Our net zero strategy' in section 3. 'Responsible Investment'. |
||||
|
For more details on the topics discussed by the RBSCC and actions taken, see section 4.9 'Responsible banking, sustainability and culture committee' in the 'Corporate governance' chapter. |
||||
|
|||||
|
|
|
|
|||||||||||||||||||||||
| Pillar of the climate change strategy | Aligning our portfolio with the Paris Agreement goals | Supporting our customers in the green transition | Reducing our environmental impact | Embedding climate in risk management | ||||||||||||||||||||||
| Main areas | Responsible banking, global businesses and local units set alignment targets | Green Finance, CIB (ESG solutions), SCF and Wealth Management & Insurance | Facilities, General services and Responsible banking | Global and local teams across all areas of Risk and Compliance | ||||||||||||||||||||||
|
For more details on ESG in remuneration schemes, see section 6.4 'Directors' remuneration policy for 2024, 2025 and 2026' in the 'Corporate governance' chapter. |
||||
|
For more details on our risk management approach and progress, see section 10.'ESG risk factors' in 'Risk, compliance and conduct management.' chapter. For more details on our Climate Finance Report, visit our corporate website santander.com. |
||||
| Decarbonization targets | ||||||||||||||||||||||||||
| Sector | Scenario | Emissions | Metric | Baseline | 2020 | 2021 | 2030 targets | |||||||||||||||||||
 |
Power generation | IEA Net Zero 2050 | Scope 1 | tCO2e/MWh |
0.21
(2019 baseline year)
|
0.17 | 0.19 | 0.11 (-46%) | ||||||||||||||||||
 |
Energy (Oil & Gas) | IEA Net Zero 2050 | Scope 1 + 2 + 3A |
mtCO2e |
23.84
(2019 baseline year)
|
22.58 | 27.43 | 16.98 (-29%) | ||||||||||||||||||
 |
Aviation | IEA Net Zero 2050 | Scope 1 + 2 | gCO2e/RPK |
92.47
(2019 baseline year)
|
93.05 | 97.21 | 61.71 (-33%) | ||||||||||||||||||
 |
Steel | IEA Net Zero 2050 | Scope 1 + 2 | tCO2e/tS |
1.58
(2019 baseline year)
|
1.40 | 1.36 | 1.07 (-32%) | ||||||||||||||||||
 |
Auto manufacturing | IEA Net Zero 2050 | Scope 3A |
gCO2/vkm |
149
(2020 baseline year)
|
149 | 138 | 103 (-31%)B |
||||||||||||||||||
 |
Auto lendingC |
IEA Net Zero 2050 | Scope 1 + 2 | gCO2e/vkm |
137
(2022 baseline year)
|
N/A | N/A | 75-89 (-35-45%) | ||||||||||||||||||
 |
Thermal coal | Phase-out targets to eliminate exposure by 2030 to power generation customers with a revenue dependency on coal of over 10%, and thermal coal mining | ||||||||||||||||||||||||
|
A Use of sold products.
B Target reduction is -25% vs 2021 reference
C Consumer lending for the acquisition of passenger cars, covering a significant majority of the exposure in Europe.
| ||||||||||||||||||||||||||
|
The automotive sector is one of the key sectors to tackle in the transition to a low-carbon economy. According to the International Energy Agency (IEA), road transport accounts for over 15% of global energy-related emissions. The switch from internal-combustion engines (ICE) to electric vehicles (EV) and plug-in hybrid electric vehicles (PHEV) is the most important decarbonization lever for this sector.
We are helping our auto manufacturer customers adapt their business models and product offering towards EVs and PHEVs.
As we are a leading auto end-user lender in Europe, we are also helping our retail customers finance purchases of an increasing number of EVs and PHEVs.
As part of our net zero ambition, we are committing to decarbonize our global auto manufacturing and European auto lending loan portfolios, with a 2030 target and a 2030 target range, respectively.
|
||||||||
|
The fulfillment of both targets for the automotive sector will depend on, among other conditions, several external factors such as:
→Regulation and policy: Effective government measures and policies are needed to reach the EV sales and decarbonization levels that net zero scenario requires. Countries will need to meet the timelines set to end sales of ICE. The introduction of low emissions zones would support this change. Further adoption of subsidies on EV purchases will be key to drive up penetration, as we have seen in the Nordic countries.
→Technology: A guaranteed supply of the required materials to produced EVs and PHEVs at scale is needed, to match demand. Also, reducing EV and PHEV production costs is needed to ensure affordability in comparison with the less clean alternative (ICE), and thus ensure a just transition.
→Infrastructure: Reaching a high penetration of EVs and PHEVs will require a deep transformation of the supply chains and the infrastructure that powers them (increasing the number of charging points and their performance) to shift from a model of predominantly ICE cars to an EV and PHEV majority. The investment needed for this infrastructure will require support from governments and other actors, which could be affected by conflicting interests such as energy security.
|
||||||||
| Two-step tiering system | ||||||||
 GHG emissions profile alignment
|
•Current GHG emissions profile
•Future targeted GHG emissions trajectory
•Assessment of alignment with Santander’s pathway
|
|||||||
 |
||||||||
 Transition plan quality assessment
|
•Internal methodology to assess perceived quality of transition plans
•Developed using established transition plan assessment methodologies
|
|||||||
| Transition Pillar | Overview | |||||||
1. Targets |
Quality and ambition of quantitative targets to reduce GHG emissions | |||||||
| 2. Action plan | Depth of decarbonization strategy to achieve GHG emissions reduction targets | |||||||
| 3. Disclosure | Transparency on GHG emissions reporting across relevant scopes | |||||||
| 4. Governance | Management oversight and governance of transition strategy | |||||||
| Tier Categories | Description | |||||||||||||
Tier 1 |
Leader |
•Emissions profile fully aligned with Santander’s pathway
•Strong transition plan
|
||||||||||||
| Tier 2 | Strong |
•Emissions profile fully aligned with Santander’s pathway but improvement needed in transition plan; or
•Strong transition plan but emissions profile partially aligned with Santander’s pathway
|
||||||||||||
| Tier 3 | Moderate |
•Emissions profile partially aligned with Santander’s pathway, but improvement needed in transition plan; or
•Emissions profile not aligned with Santander’s pathway, but strong transition plan
|
||||||||||||
| Tier 4 | Weak |
•Emissions profile not aligned with Santander’s pathway
•Weak transition plan
|
||||||||||||
| Sector | What we finance |
Value proposition 2023 |
|||||||||||||||||||||||||||||||||
|
Renewables
 |
Renewable energy production and transportation. Energy storage. |
Financing of solar panels, wind farms and battery and storage battery production. |
 |
 |
 |
 |
 |
||||||||||||||||||||||||||||
 |
 |
 |
|||||||||||||||||||||||||||||||||
|
Real Estate
 |
Purchase, construction and renovation of energy-efficient buildings. Renewable power system installation and refurbishments that use 30% less energy. |
Developer loans, private solar panel installation, smart meters, energy-efficient lighting, mortgages with an A or B energy rating. |
|
|
|
 |
|
||||||||||||||||||||||||||||
|
 |
|
 |
|
|||||||||||||||||||||||||||||||
|
Mobility
 |
Clean transport and infrastructure. |
Leasing and financing of electric and hybrid vehicles (<50 g CO2 per passenger-km), charging stations, bicycle lanes and others. |
|
|
|
|
|
|
|||||||||||||||||||||||||||
|
|
|
|
|
|||||||||||||||||||||||||||||||
|
Agriculture
 |
Sustainable and protected agriculture. Land and forest conservation. Sustainable farming. |
Financing of sustainable agriculture practice such as more efficient irrigation systems, machinery and reduced fertilizer use. |
|
|
|
|
|
|
|||||||||||||||||||||||||||
|
Waste & Water Management
 |
Activities to adapt to, or mitigate, climate change; preserve biodiversity; boost the circular economy and waste & water management. |
Financing of water, waste and soil treatment, greater energy efficiency, lower emissions and conservation. |
|
|
|
||||||||||||||||||||||||||||||
|
Circular economy
 |
|||||||||||||||||||||||||||||||||||
|
For more details on 'Santander and the Brazilian Amazon', visit our corporate website santander.com or our 'Climate Finance Report'. |
||||
|
805 million kWh
total electricity
|
97%
renewable
electricity |
3,444,543 GJ
energy consumption
|
||||||||||||
|
172,711 t CO2e
total emissions (market based)
| ||||||||||||||
|
Scope 1
25,755 t CO2e
direct emissions
|
Scope 2
21,516 t CO2e
indirect emissions from electricity and other (market based)
|
Scope 3
125,441 t CO2e
indirect emissions from employee commuting and business travel
|
||||||||||||
SRI AUM (EUR billion)12 | ||
| +27% | ||
| 2022 vs 2023 | ||
|
For more details on our ESG approach, visit our website santanderassetmanagement.com/sustainability. |
||||
|
For more details, see our stewardship activities report at santanderassetmanagement.com/content/view/11966/file/SAM_Stewardship_Report_221123_EN.pdf |
||||


|
For more details, visit our website santanderprivatebanking.com |
||||
Insurance products aligned with SFICS14 | ||||||||||||||
| Core insurance products in our geographies | ||||||||||||||
|
Personal accident insurance for Seniors
Auto Insurance
Dependency Insurance
Senior Home Insurance
|
|
Life Insurance for low income people
Health Insurance for self employed or low income people
|
|||||||||||
|
Life Insurance for low income people
Personal accident insurance for low income people
|
|
Life Insurance
for low income women
Life Insurance
for micro-entrepreneurs
|
|||||||||||
|
Micro mobility Insurance |  |
Life Insurance for low income people |
|||||||||||
|
Motor insurance for EV | |
Multirisk Insurance for SMEs (photovoltaic pannels) |
|||||||||||
|
We want to be an employer of choice.
Our approach is based on three pillars:
|
Main regulations | |||||||||||||
| Human resources framework | ||||||||||||||
| Remuneration policy | Performance management policy | Learning and development policy | Group Succession policy | |||||||||||||||||||||||||||||
| Having the right talent and skills in place to enable the Bank's transformation; attracting and engaging the best talent, with a strong focus on employee development; and having a best-in-class employee value proposition. | ||||||||||||||||||||||||||||||||
| Culture policy | General health, safety and wellbeing policy | |||||||||||||||||||
| Putting the employee at the centre of all we do; working to have the best culture and a great employee experience delivered through diversity, equity and inclusion, culture, and health and well-being initiatives; and listening to employees so we can continuously improve. | ||||||||||||||||||||
| International mobility policy | ||||||||||||||
| Driving change in the company; shaping a more dynamic organization that’s ready to face the future with a positive impact on society; having the best organizational design; utilizing new ways of working to drive value; and holding meaningful conversations with our stakeholders. | ||||||||||||||
|
For more information related to the level of approval and public disclosure, see section 9.2 'Main internal regulations and governance'
|
||||
| LONG-TERM POSITIONS |
1. International assignments (EXPATS)
2. Permanent movements
|
|||||||
| TEMPORARY COLLABORATIONS (GIGs) |
1. Project-based assignments (Mundo Santander)
2. SWAP programme
|
|||||||
 |
In 2023, our employees' inclusion sentiment (in terms of gender, nationality, sexual orientation, religion, etc.) was 9.3 out of 10 (+0.5 above the finance sector benchmark and in the top 5% of the finance sectorA)
A.2023 Your Voice Survey
|
||||


| 1. Women on the board | 2. Women in senior executive positions | |||||||||||||||||||
40% |
31.4% |
|||||||||||||||||||
| We are committed to having women members make up between 40% and 60% of our board of directors | In early 2023, we raised our public target to have women in at least 35% of our senior executive positions in 2025. Santander leaders are involved in achieving this target as part of their long-term incentives |
|||||||||||||||||||
| 1. Equal Pay | 2. Gender Pay Gap | |||||||||||||||||||
c. 0% |
27.8% |
|||||||||||||||||||
| We have accomplished the target for 2025 (~0%) two years early. We set up fair pay programmes to eliminate the equal pay gap. They include systematic reviews tied to remuneration cycles (merit-based promotions and bonuses). |
Santander addresses the gender pay gap with a methodology based on best practices and common guidelines for the Group. The pay gap in 2023 decreased compared to the previous year (30.2% in 2022). |
|||||||||||||||||||
|
1. The equal pay gap measures 'equal pay for equal work' for women and men in the same job at the same level. Our comparison does not consider such factors as tenure, length of service, previous experience and background. The year-end figure is 0.44%. Having met the target set the Group has set itself the objective of maintaining a pay equity ratio in line with best market practices.
2. The gender pay gap measures differences in remuneration between women and men in an organization, business, industry or the broader economy, irrespective of the type of work. At Santander, fewer women hold senior and business management roles than men (something we are focused on addressing), while more women work in Retail & Commercial Banking and support roles. We calculate the gender pay gap as the difference in the median remuneration paid to male and female employees, expressed as a percentage of the male remuneration.
| ||||||||||||||||||||
| Women | LGBTIQ+ | |||||||
|
Santander Woman Network (2019)
EmpowHer (2017)
Women in Business (2015)
>8,000
members in 10 countries
|
Embrace (2015)
>5,000
members in 5 countries
|
|||||||
| Persons with disabilities | Black colleagues | |||||||
|
Enable (2022)
Thrive (2020)
Habilidade não tem limites (2018)
>1,000
members
|
BOLD (2017)
Reach (2015)
Talento não tem cor (2018)
>1,300
members
|
|||||||
|
8.4 (out of 10)
Average employee rating of the statement 'Employee health and well-being is a priority at Santander' (+0.4 above the finance sector benchmark, and in the top 25% of the finance sectorA).
| ||
| A. 2023 Your Voice Survey | ||
|
|||||
 BeHealthy
|
22%
Passives
|
|||||
|
70%
Promoters
|
8%
Detractors
|
|||||||
|
+27K
employees participating in social activities
|
+83K
labour hours volunteered
|
|||||||
|
For more details, see section 6.2 'Other community support programmes’. |
||||
|
For more details on board remuneration, see section 6. 'Remuneration' in the 'Corporate governance’ chapter. |
||||
|
|||||
|
8.7 (out of 10)
Employees’ rating of the question on whether they are satisfied with the amount of flexibility they have in their work schedulesA
| ||
| A. 2023 Your Voice Survey | ||
 |
→The customer comes first. Customer and business impact must take precedence in any working arrangement. |
||||
 |
→Managers play a critical role in organizing their team's work. Team and individual productivity are key to building working models. |
||||
|
→The office is our main place of work. Workplaces are no longer just where we do our job; they're also social space that meets diverse working needs and affords the best opportunity for collaboration, innovation and creativity. Building critical mass at workspaces is key to our culture. |
||||
 |
→Test and learn approach trough constant listening that evolves over time, with the focus on customer, individual performance, productivity outputs, and employer branding. |
||||
 |
→Flexibility, fairness, inclusion and equal opportunity are guiding principles in decision-making. |
||||
| Our approach is to make every customer experience Simple, Personal, and Fair. | Main regulations | |||||||||||||||||||
|
Compliance and conduct;
Cybersecurity Corporate frameworks
|
||||||||||||||||||||
| Customer conduct risk management model | Approval of products and services policy | |||||||||||||||||||
| The customer is at the centre of everything we do. We constantly listen to our customers to deliver the best practices. | ||||||||||||||||||||
| Customer service, dissatisfactions handling and root-cause analysis policy | ||||||||||||||||||||
|
Vulnerable customers, consideration of special
circumstances and prevention of overindebtedness policy
|
||||||||||||||||||||
| We place great importance on protecting vulnerable groups who may be susceptible to financial vulnerability or situations that may impact their ability to make informed decisions through solutions to financially include people and boost our customers' financial health. | ||||||||||||||||||||
| Data protection policy | ||||||||||||||||||||
| We apply high standards to enable individuals to maintain control over their personal data, while protecting and providing resources to keep it safe online. | ||||||||||||||||||||
|
For more information related to the level of approval and public disclosure, see section 9.2 'Main internal regulations and governance' |
||||
|
For more details, see tables 4, 5 and 6 in section 8.2. 'Customers'. |
||||
 | ||
|
Top 3
for NPS in 7 marketsA
A.Santander US has a separate target and is not included.
| ||
|
For more details, see section 7.2 'Compliance and conduct risk management' in 'Risk, compliance & conduct management' chapter. |
||||
|
For more details on our vulnerable customer initiatives, see section 5.3 'Financial health and inclusion’. |
||||
Complaint typeA,B (%) | ||
ResolutionA,B (%) | ||
→The World's Best Bank for Financial Inclusion (Euromoney) for the second year in a row. |
 |
||||
 Our targets Our targets | ||
 |
11.8 mnB |
Target achieved three years early | |||||||||
| 2019 | 2022 | ||||||||||
Financially included peopleA |
Target | |||||||
+5 mnB | ||||||||
1.8 mn |
||||||||
| 2023 | 2024 | 2025 | ||||||
|
Promoting access to cash and transactions
We aim to ensure underserved communities can get cash anywhere, through our remote branches and agreements with private and state-run entities that widen our footprint.
|
Branches in underbanked and remote regionsA |
|
|
|
|
|
||||||||||||||||||||||||||
Partnerships to reach underserved communitiesB |
|
|
|
|||||||||||||||||||||||||||||
|
Promoting digital access
We help people access the banking system so they can make payments; use basic, tailored financial services; take greater control of their finances; and make faster and more secure transactions.
|
Digital wallets and points of saleC |
|
|
|||||||||||||||||||||||||||||
Basic accountsD |
|
|
||||||||||||||||||||||||||||||
|
Financial solutions for vulnerable groups
We offer financial support to vulnerable groups so customers will have access to basic products and know how to use them.
|
Support to senior citizen customersE |
|
|
|
||||||||||||||||||||||||||||
|
|
|||||||||||||||||||||||||||||||
|
Microfinance
We promote social mobility and help low-income and underbanked entrepreneurs set up and grow businesses.
|
Microfinance programmes | |
|
 |
||||||||||||||||||||||||||||
 |
||||||||||||||||||||||||||||||||
|
Supporting customers in financial distress
We have debt relief programmes that include payment deferrals and line of credit extensions.
|
Supporting customers in financial distressF |
|
|
|
||||||||||||||||||||||||||||
|
Financing low-income households' basic needs
We offer products and services that enable low-income households to access housing and meet other basic financial needs.
|
Affordable housing supplyG |
|
|
|||||||||||||||||||||||||||||
Credit support for low-income households/people with difficulty getting creditH |
|
|
|
|
||||||||||||||||||||||||||||
|
For more details on financial education, visit our website santander.com/en/our-approach/inclusive-and-sustainable-growth/financial-education |
||||
|
For more information on our cybersecurity plan and the initiatives undertaken during the year, see section 5. 'Research, development and innovation (R&D&I)' in 'Economic and financial review' chapter; and section '6.2 Operational risk management' in 'Risk, compliance & conduct management' chapter. |
||||
|
Progress in 2023
GRI 3-3, 203-1, 203-2, 413-1
| ||||||||||||||||||||
| ó | ||||||||||||||||||||
Over 174 million euros in community investment in 202316 | ||||||||||||||||||||
| ó | ó | |||||||||||||||||||
|
Support for higher education, employability and entrepreneurship
 |
Other community
support programmes  |
|||||||||||||||||||
|
105 million
euros invested
|
69 million
euros invested16
|
|||||||||||||||||||
|
105
million euros invested
|
498,930
people and businesses helped17
|
1,238
partner universities and academic institutions in 26 countries18
|
||||||||||||
|
For more details, visit the website metared.org |
||||
|
For more details, visit the website mycampusdigital.com |
||||
|
For more details, visit the website
santander.com/universities
|
||||
|
For more details, visit the website
santanderopenacademy.com
|
||||
|
636
partner universities and institutions with Universia in 22 countries
| ||
|
For more details, visit the website universia.net |
||||
|
475
scholarships for university students with disabilities
|
50
people with disabilities hired by companies
|
160
people helped through the Plan Circular19
|
||||||||||||
|
For more details, visit the website fundacionuniversia.net |
||||
|
7,036
entrepreneurship and business initiatives helped
| ||
|
For more details, visit the website santanderx.com |
||||
|
 |
||||
|
69
million euros in social investment20
|
2.2
million people helped21
|
||||
| ó | ó | ó | ||||||||||||||||||||||||||||||
|
Childhood education
 Helping children and young people get a well-rounded, quality education.
|
Social welfare
 Helping vulnerable people and those at risk of social exclusion.
|
Arts and sciences
 Helping people access cultural events and programmes.
|
||||||||||||||||||||||||||||||
|
For more details on Fundación Banco Santander’s core work, visit the website fundacionbancosantander.com/es/fundacion/memorias |
||||
| Our approach is to act responsibly and with integrity across our value chain | Main regulations | |||||||||||||||||||||||||||||||||||||||||||
| Risk corporate ; Compliance and conduct corporate; and Financial crime and compliance corporate frameworks |
||||||||||||||||||||||||||||||||||||||||||||
| General code of conduct |
Code of conduct in securities markets |
Corporate defence
policy
|
||||||||||||||||||||||||
| Our code of conduct sets out shared principles and values set out in The Santander Way. | ||||||||||||||||||||||||||
Canal Abierto (whistleblowing) policy |
Environmental, social and climate change risk | Tax policy | ||||||||||||||||||||||||
| Conflict of interest Policy | Defense sector | Financing for sensitive sectors | ||||||||||||||||||||||||
| Anti-bribery and corruption policy (ABC policy) | Anti-money laundering and countering the financing terrorism policy | |||||||||||||||||||||||||||||||||||||
| Our commitment to ethical principles is reflected in our determination to fight corruption, and our status as a signatory to the United Nations Global Compact. | ||||||||||||||||||||||||||||||||||||||
| Financing of political parties policy | ||||||||||||||||||||||||||||||||||||||
| Third-party certification policy | ||||||||||||||||||||||||||||||||||||||
| Our business conduct principles apply to vendors. | ||||||||||||||||||||||||||||||||||||||
| Outsourcing and third-party management model | ||||||||||||||||||||||||||||||||||||||
|
For more information related to the level of approval and public disclosure, see section 9.2 'Main internal regulations and governance'
|
||||
|
For more details, see section 7.2 ‘Compliance and conduct risk management’ in the ‘Risk management and compliance’ chapter. |
||||
|
|||||
|
For more details on the Group’s tax strategy, visit our corporate website santander.com. |
||||
| 2023 | 2022 | |||||||
Received reports |
3,611 | 3,935 | ||||||
Closed reports |
2,929 | 3,477 | ||||||
| Disciplinary action | 655 | 907 | ||||||
which led to dismissal |
366 | 387 | ||||||
|
|||||
|
For more information on Santander’s environmental, social and climate change risk management policy, see section 9.2 'Main internal regulations and governance'. |
||||
|
|||||
|
|||||
|
For more details, see section 7.2 'Ethical channels’.
|
||||
|
For more details on financial crime, see section 7.2 ‘Compliance and conduct risk management’ in ‘Risk management and compliance’ chapter. |
||||
| 1. Total taxes paid | |||||||||||||||||
| EUR million | |||||||||||||||||
| 2023 | |||||||||||||||||
| Jurisdiction | Corporate income taxA |
Other taxes paid |
Total taxes paid by the GroupB |
Third-party taxesC |
Total contribution |
||||||||||||
| Spain | 323 | 1,310 | 1,633 | 1,642 | 3,275 | ||||||||||||
| UK | 728 | 500 | 1,228 | 569 | 1,797 | ||||||||||||
| Portugal | 302 | 190 | 492 | 220 | 712 | ||||||||||||
| Poland | 150 | 281 | 431 | 252 | 683 | ||||||||||||
| Germany | 173 | 90 | 263 | 2 | 265 | ||||||||||||
| Rest of Europe | 518 | 282 | 800 | (3) | 797 | ||||||||||||
| Total Europe | 2,194 | 2,653 | 4,847 | 2,682 | 7,529 | ||||||||||||
| Brazil | 1,396 | 583 | 1,979 | 3,141 | 5,120 | ||||||||||||
| Mexico | 840 | 497 | 1,337 | 916 | 2,253 | ||||||||||||
| Chile | 167 | 93 | 260 | 352 | 612 | ||||||||||||
| Argentina | 54 | 389 | 443 | 2,186 | 2,629 | ||||||||||||
| Uruguay | 57 | 100 | 157 | 50 | 207 | ||||||||||||
| Rest of Latin America | 48 | 20 | 68 | 16 | 84 | ||||||||||||
| Total Latin America | 2,562 | 1,682 | 4,244 | 6,661 | 10,905 | ||||||||||||
| United States | 446 | 111 | 557 | 898 | 1,455 | ||||||||||||
| Other | 12 | 4 | 16 | 9 | 25 | ||||||||||||
| TOTAL | 5,214 | 4,450 | 9,664 | 10,250 | 19,914 | ||||||||||||
2. GROUP CUSTOMERSA | |||||||||||
| 2023 | 2022 | var. | |||||||||
Europe |
46,293,433 | 45,563,811 | 2% | ||||||||
| Spain | 15,022,877 | 14,319,525 | 5% | ||||||||
| United Kingdom | 22,480,761 | 22,402,482 | —% | ||||||||
| Portugal | 2,908,192 | 2,922,944 | (1)% | ||||||||
| Poland | 5,877,433 | 5,696,967 | 3% | ||||||||
Others EuropeB |
4,170 | 221,894 | (98)% | ||||||||
South America |
73,028,442 | 69,553,448 | 5% | ||||||||
BrazilC |
62,804,350 | 60,117,170 | 4% | ||||||||
Chile |
4,052,314 | 3,577,094 | 13% | ||||||||
Argentina |
4,771,370 | 4,385,406 | 9% | ||||||||
Others South AmericaD |
1,400,408 | 1,473,778 | (5)% | ||||||||
| North America | 25,027,302 | 24,980,487 | —% | ||||||||
United StatesF |
4,510,043 | 4,523,339 | —% | ||||||||
| México | 20,517,259 | 20,239,179 | 1% | ||||||||
Others- North AmericaF |
0 | 217,969 | (100)% | ||||||||
Digital Consumer Bank |
20,192,858 | 19,746,178 | 2% | ||||||||
Santander Consumer BankG |
17,665,556 | 17,793,206 | (1)% | ||||||||
Santander Digital |
2,527,302 | 1,952,972 | 29% | ||||||||
Total |
164,542,034 | 159,843,924 | 3% | ||||||||
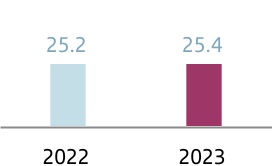
| 3. DIALOGUE BY CHANNEL | |||||||||||
| 2023 | 2022 | Var .2023/2022 %. | |||||||||
Branches |
|||||||||||
Number of branches |
8,518 | 9,019 | (5.6) | % | |||||||
Digital bankingA |
|||||||||||
Digital customersB (millions) |
54.2 | 51.5 | 5.2 | % | |||||||
| 4. GROUP NPS | ||||||||||||||
| 2022 | 2021 | 2020 | 2019 | |||||||||||
| Argentina | 1 | 1 | 2 | 3 | ||||||||||
| Brazil | 4 | 3 | 1 | 2 | ||||||||||
| Chile | 1 | 1 | 1 | 1 | ||||||||||
| Uruguay | 2 | 2 | 2 | 3 | ||||||||||
| Spain | 3 | 2 | 2 | 2 | ||||||||||
| Poland | 3 | 3 | 3 | 4 | ||||||||||
| Portugal | 2 | 2 | 3 | 1 | ||||||||||
| UK | 5 | 6 | 3 | 6 | ||||||||||
| Mexico | 2 | 3 | 4 | 4 | ||||||||||
| USA | 9 | 9 | 8 | 9 | ||||||||||
5. GROUP NPS BY CHANNELA | |||||||||||
| 2023 | 2022 | 2021 | |||||||||
| Branch | 70 | 66 | 64 | ||||||||
| Contact center | 72 | 60 | 43 | ||||||||
InternetB |
67 | 62 | 58 | ||||||||
| Mobile | 67 | 65 | 69 | ||||||||
6. CUSTOMER SATISFACTIONA | ||||||||||||||
| 2023 | 2022 | 2021 | 2020 | |||||||||||
| Argentina | 92 | 93 | 91 | 90 | ||||||||||
| Brazil | 88 | 88 | n/a | 89 | ||||||||||
| Chile | 89 | 90 | 90 | 87 | ||||||||||
| Uruguay | 95 | 97 | 96 | 93 | ||||||||||
| Spain | 89 | 89 | 84 | 87 | ||||||||||
| Poland | 95 | 95 | 96 | 99 | ||||||||||
| Portugal | 86 | 90 | 90 | 86 | ||||||||||
| UK | 96 | 96 | 95 | 94 | ||||||||||
| Mexico | 98 | 94 | 94 | 95 | ||||||||||
| USA | 89 | 89 | 88 | 87 | ||||||||||
GroupB |
91 | 92 | 92 | 91 | ||||||||||
7. TOTAL COMPLAINTSA | |||||||||||
| 2023 | 2022 | 2021 | |||||||||
SpainB |
88,326 | 76,272 | 120,953 | ||||||||
PortugalC |
4,789 | 3,584 | 3,570 | ||||||||
United KingdomD |
25,309 | 20,624 | 20,069 | ||||||||
PolandE |
6,272 | 5,169 | 5,179 | ||||||||
Brazil |
207,211 | 215,906 | 195,340 | ||||||||
Mexico |
68,565 | 70,100 | 82,033 | ||||||||
Chile |
8,441 | 7,873 | 8,009 | ||||||||
Argentina |
5,525 | 5,294 | 5,013 | ||||||||
USF |
5,712 | 1,717 | 3,205 | ||||||||
SCFG |
33,074 | 29,777 | 35,215 | ||||||||
8.1 Financially included peopleA | |||||
| million people (Accumulated since 2023) | 2023 | ||||
Access |
1.0 | ||||
Finance |
0.8 | ||||
| Total | 1.8 | ||||
8.2 People helped through Financial education initiativesA,B | |||||||||||
| million people | 2023 | 2022 | 2021 | ||||||||
Financial educationA |
11.5 | 2.7 | 1.3 | ||||||||
| 9. Microfinance | |||||||||||
| million euros / people | 2023 | 2022 | 2021 | ||||||||
Total credit disbursedA |
1,172.3 | 950.0 | 571.0 | ||||||||
Total micro-entrepreneurs supportedB |
1.2 | 1.6 | 1.0 | ||||||||
| million euros | 2023 | 2022 | 2021 | ||||||||
Support for higher education, employability, and entrepreneurship |
105 | 100 | 106 | ||||||||
Other local initiatives |
69 | 63 | 46 | ||||||||
Total |
174 | 163 | 152 | ||||||||
| 11.1 People helped through Santander Universities programmes | |||||||||||
| people helped | 2023 | 2022 | 2021 | ||||||||
Higher educationA |
28,849 | 49,490 | 40,632 | ||||||||
EmployabilityB |
463,045 | 195,798 | 98,480 | ||||||||
EntrepreneurshipA |
7,036 | 20,739 | 23,120 | ||||||||
TotalA |
498,930 | 266,027 | 162,232 | ||||||||
11.2 People helped from local initiativesA | |||||||||||
| million people | 2023 | 2022 | 2021 | ||||||||
Support for childhood education |
0.6 | 0.4 | 0.8 | ||||||||
Support for social welfare |
1.0 | 0.9 | 1.3 | ||||||||
| Support for the arts and science | 0.1 | 0.0 | 0.0 | ||||||||
| Others | 0.5 | 1.0 | 0.0 | ||||||||
Total |
2.2 | 2.3 | 2.1 | ||||||||
12. EMPLOYEES BY REGION AND GENDERA | ||||||||||||||||||||||||||
No employees |
% men |
% women |
||||||||||||||||||||||||
| Region | 2023 | 2022 | 2023 | 2022 | 2023 | 2022 | ||||||||||||||||||||
| Spain | 35,266 | 34,153 | 53 | 52 | 47 | 48 | ||||||||||||||||||||
| Brazil | 57,868 | 55,632 | 46 | 44 | 54 | 56 | ||||||||||||||||||||
| Chile | 9,576 | 9,544 | 44 | 44 | 56 | 56 | ||||||||||||||||||||
| Poland | 13,361 | 13,053 | 34 | 33 | 66 | 67 | ||||||||||||||||||||
| Argentina | 8,365 | 8,228 | 51 | 52 | 49 | 48 | ||||||||||||||||||||
| Mexico | 31,239 | 29,389 | 47 | 47 | 53 | 53 | ||||||||||||||||||||
| Portugal | 5,303 | 5,251 | 51 | 51 | 49 | 49 | ||||||||||||||||||||
| UK | 24,221 | 22,905 | 47 | 45 | 53 | 55 | ||||||||||||||||||||
| USA | 12,579 | 13,971 | 44 | 43 | 56 | 57 | ||||||||||||||||||||
| Others | 14,986 | 14,336 | 51 | 50 | 49 | 50 | ||||||||||||||||||||
| Total | 212,764 | 206,462 | 47 | 46 | 53 | 54 | ||||||||||||||||||||
13.1 DISTRIBUTION BY ROLE AND GENDER 2023A | |||||||||||||||||||||||||||||||||||||||||||||||||||||
Senior executivesB |
Other executivesC |
Other employees |
|||||||||||||||||||||||||||||||||||||||||||||||||||
Men |
Women |
Total |
Men |
Women |
Total |
Men |
Women |
Total |
|||||||||||||||||||||||||||||||||||||||||||||
| Europe | 1,073 | 68.2 | % | 500 | 31.8 | % | 1,573 | 10,704 | 58.4 | % | 7,629 | 41.6 | % | 18,333 | 31,413 | 45.2 | % | 38,062 | 54.8 | % | 69,475 | ||||||||||||||||||||||||||||||||
| North America | 202 | 71.1 | % | 82 | 28.9 | % | 284 | 3,778 | 60.0 | % | 2,522 | 40.0 | % | 6,300 | 16,387 | 43.7 | % | 21,111 | 56.3 | % | 37,498 | ||||||||||||||||||||||||||||||||
| South America | 305 | 68.4 | % | 141 | 31.6 | % | 446 | 3,878 | 58.9 | % | 2,708 | 41.1 | % | 6,586 | 32,709 | 45.3 | % | 39,560 | 54.7 | % | 72,269 | ||||||||||||||||||||||||||||||||
| Group total | 1,580 | 68.6 | % | 723 | 31.4 | % | 2,303 | 18,360 | 58.8 | % | 12,859 | 41.2 | % | 31,219 | 80,509 | 44.9 | % | 98,733 | 55.1 | % | 179,242 | ||||||||||||||||||||||||||||||||
13.2 DISTRIBUTION BY ROLE AND GENDER 2022A | |||||||||||||||||||||||||||||||||||||||||||||||||||||
Senior executivesB |
Other executives |
Other employees |
|||||||||||||||||||||||||||||||||||||||||||||||||||
Men |
Women |
Total |
Men |
Women |
Total |
Men |
Women |
Total |
|||||||||||||||||||||||||||||||||||||||||||||
| Europe | 1,093 | 69.6 | % | 478 | 30.4 | % | 1,571 | 6,779 | 63.5 | % | 3,893 | 36.5 | % | 10,672 | 33,041 | 44.7 | % | 40,919 | 55.3 | % | 73,960 | ||||||||||||||||||||||||||||||||
| North America | 221 | 77.0 | % | 66 | 23.0 | % | 287 | 1,334 | 68.2 | % | 621 | 31.8 | % | 1,955 | 18,300 | 44.3 | % | 23,055 | 55.7 | % | 41,355 | ||||||||||||||||||||||||||||||||
| South America | 320 | 70.5 | % | 134 | 29.5 | % | 454 | 3,147 | 60.0 | % | 2,096 | 40.0 | % | 5,243 | 31,108 | 43.8 | % | 39,857 | 56.2 | % | 70,965 | ||||||||||||||||||||||||||||||||
| Group total | 1,634 | 70.7 | % | 678 | 29.3 | % | 2,312 | 11,260 | 63.0 | % | 6,610 | 37.0 | % | 17,870 | 82,449 | 44.3 | % | 103,831 | 55.7 | % | 186,280 | ||||||||||||||||||||||||||||||||
14.1. WORKFORCE BY AGE BRACKET 2023A | ||||||||||||||||||||||||||||||||||||||||||||
| Number and % of total | ||||||||||||||||||||||||||||||||||||||||||||
aged <= 25 |
aged 26 - 35 |
aged 36 - 45 | aged 46 - 50 |
age over 50 |
||||||||||||||||||||||||||||||||||||||||
| Europe | 5,563 | 6.22 | % | 19,992 | 22.37 | % | 29,111 | 32.57 | % | 14,320 | 16.02 | % | 20,395 | 22.82 | % | |||||||||||||||||||||||||||||
| North America | 5,206 | 11.81 | % | 17,859 | 40.51 | % | 11,713 | 26.57 | % | 3,427 | 7.77 | % | 5,877 | 13.33 | % | |||||||||||||||||||||||||||||
| South America | 12,311 | 15.52 | % | 30,516 | 38.48 | % | 24,156 | 30.46 | % | 6,101 | 7.69 | % | 6,217 | 7.84 | % | |||||||||||||||||||||||||||||
| Group total | 23,080 | 10.85 | % | 68,367 | 32.13 | % | 64,980 | 30.54 | % | 23,848 | 11.21 | % | 32,489 | 15.27 | % | |||||||||||||||||||||||||||||
14.2. WORKFORCE BY AGE BRACKET 2022A,B | ||||||||||||||||||||||||||||||||||||||||||||
| Number and % of total | ||||||||||||||||||||||||||||||||||||||||||||
aged <= 25 |
aged 26 - 35 |
aged 36 - 45 |
aged 46 - 50 |
age over 50 |
||||||||||||||||||||||||||||||||||||||||
| Europe | 4,875 | 5.66 | % | 19,393 | 22.49 | % | 29,500 | 34.22 | % | 13,775 | 15.98 | % | 18,660 | 21.65 | % | |||||||||||||||||||||||||||||
| North America | 5,114 | 11.73 | % | 17,634 | 40.45 | % | 11,430 | 26.22 | % | 3,448 | 7.91 | % | 5,971 | 13.70 | % | |||||||||||||||||||||||||||||
| South America | 12,306 | 16.05 | % | 29,663 | 38.69 | % | 23,034 | 30.05 | % | 5,863 | 7.65 | % | 5,796 | 7.56 | % | |||||||||||||||||||||||||||||
| Group total | 22,295 | 10.80 | % | 66,690 | 32.30 | % | 63,964 | 30.98 | % | 23,086 | 11.18 | % | 30,427 | 14.74 | % | |||||||||||||||||||||||||||||
15.1. TYPE OF EMPLOYMENT CONTRACT IN 2023A | |||||||||||||||||||||||||||||||||||
Permanent/Full-time |
Permanent/Part-time |
||||||||||||||||||||||||||||||||||
Men |
Women |
Total |
Men |
Women |
Total |
||||||||||||||||||||||||||||||
| Europe | 40,888 | 51.4 | % | 38,681 | 48.6 | % | 79,569 | 860 | 13.7 | % | 5,434 | 86.3 | % | 6,294 | |||||||||||||||||||||
| North America | 20,216 | 46.5 | % | 23,246 | 53.5 | % | 43,462 | 107 | 21.7 | % | 386 | 78.3 | % | 493 | |||||||||||||||||||||
| South America | 36,654 | 46.6 | % | 41,962 | 53.4 | % | 78,616 | 27 | 33.3 | % | 54 | 66.7 | % | 81 | |||||||||||||||||||||
| Group total | 97,758 | 48.5 | % | 103,889 | 51.5 | % | 201,647 | 994 | 14.5 | % | 5,874 | 85.5 | % | 6,868 | |||||||||||||||||||||
Temporary/Full-time |
Temporary/Part-time |
||||||||||||||||||||||||||||||||||
Men |
Women |
Total |
Men |
Women |
Total |
||||||||||||||||||||||||||||||
| Europe | 1,270 | 40.6 | % | 1,855 | 59.4 | % | 3,125 | 172 | 43.8 | % | 221 | 56.2 | % | 393 | |||||||||||||||||||||
| North America | 44 | 35.5 | % | 80 | 64.5 | % | 124 | 0 | 0 | % | 3 | 100 | % | 3 | |||||||||||||||||||||
| South America | 211 | 35.2 | % | 389 | 64.8 | % | 600 | 0 | 0 | % | 4 | 100 | % | 4 | |||||||||||||||||||||
| Group total | 1,525 | 39.6 | % | 2,324 | 60.4 | % | 3,849 | 172 | 43.0 | % | 228 | 57.0 | % | 400 | |||||||||||||||||||||
15.2. TYPE OF EMPLOYMENT CONTRACT IN 2022A | |||||||||||||||||||||||||||||||||||
Permanent/Full-time |
Permanent/Part-time |
||||||||||||||||||||||||||||||||||
Men |
Women |
Total |
Men |
Women |
Total |
||||||||||||||||||||||||||||||
| Europe | 38,361 | 50.7 | % | 37,371 | 49.3 | % | 75,732 | 783 | 12.8 | % | 5,332 | 87.2 | % | 6,115 | |||||||||||||||||||||
| North America | 19,408 | 45.7 | % | 23,054 | 54.3 | % | 42,462 | 104 | 23.2 | % | 345 | 76.8 | % | 449 | |||||||||||||||||||||
| South America | 33,232 | 46.4 | % | 38,409 | 53.6 | % | 71,641 | 1,074 | 23.5 | % | 3,499 | 76.5 | % | 4,573 | |||||||||||||||||||||
| Group total | 91,001 | 47.9 | % | 98,834 | 52.1 | % | 189,835 | 1,961 | 17.6 | % | 9,176 | 82.4 | % | 11,137 | |||||||||||||||||||||
Temporary/Full-time |
Temporary/Part-time |
||||||||||||||||||||||||||||||||||
Men |
Women |
Total |
Men |
Women |
Total |
||||||||||||||||||||||||||||||
| Europe | 1,608 | 40.4 | % | 2,372 | 59.6 | % | 3,980 | 161 | 42.8 | % | 215 | 57.2 | % | 376 | |||||||||||||||||||||
| North America | 339 | 49.8 | % | 342 | 50.2 | % | 681 | 3 | 60.0 | % | 2 | 40.0 | % | 5 | |||||||||||||||||||||
| South America | 245 | 61.7 | % | 152 | 38.3 | % | 397 | 24 | 47.1 | % | 27 | 52.9 | % | 51 | |||||||||||||||||||||
| Group total | 2,192 | 43.3 | % | 2,866 | 56.7 | % | 5,058 | 188 | 43.5 | % | 244 | 56.5 | % | 432 | |||||||||||||||||||||
| 16. YEARLY AVERAGE OF CONTRACTS BY GENDER | |||||||||||||||||||||||
| 2023 | 2022 | ||||||||||||||||||||||
Men |
Women |
Total |
Men |
Women |
Total |
||||||||||||||||||
| Employees with permanent/full-time contract | 95,851 | 104,281 | 200,133 | 88,260 | 97,216 | 185,476 | |||||||||||||||||
| Employees with permanent/part-time contracts | 1,052 | 6,080 | 7,132 | 1,924 | 9,199 | 11,123 | |||||||||||||||||
| Employees with temporary/full-time contracts | 1,516 | 2,310 | 3,826 | 1,921 | 2,545 | 4,466 | |||||||||||||||||
| Employees with temporary/part-time contracts | 179 | 245 | 424 | 176 | 275 | 451 | |||||||||||||||||
| Group total | 98,598 | 112,916 | 211,514 | 92,281 | 109,235 | 201,516 | |||||||||||||||||
| 17.1. YEARLY AVERAGE OF CONTRACTS BY AGE BRACKET IN 2023 | ||||||||||||||||||||
aged <= 25 |
aged 26-35 |
aged 36-45 |
aged 46-50 |
aged over 50 |
Total |
|||||||||||||||
| Employees with permanent/full-time contract | 19,753 | 64,064 | 62,171 | 22,962 | 31,183 | 200,133 | ||||||||||||||
| Employees with permanent/part-time contracts | 643 | 1,567 | 2,261 | 793 | 1,867 | 7,132 | ||||||||||||||
| Employees with temporary/full-time contracts | 820 | 1,682 | 854 | 207 | 264 | 3,826 | ||||||||||||||
| Employees with temporary/part-time contracts | 131 | 137 | 84 | 23 | 50 | 424 | ||||||||||||||
| Group total | 21,347 | 67,450 | 65,370 | 23,985 | 33,363 | 211,514 | ||||||||||||||
| 17.2. YEARLY AVERAGE OF CONTRACTS BY AGE BRACKET IN 2022 | ||||||||||||||||||||
| aged <= 25 | aged 26-35 | aged 36-45 | aged 46-50 | aged over 50 | Total | |||||||||||||||
| Employees with permanent/full-time contract | 16,667 | 59,627 | 60,092 | 21,592 | 27,498 | 185,476 | ||||||||||||||
| Employees with permanent/part-time contracts | 3,169 | 2,554 | 2,649 | 904 | 1,847 | 11,123 | ||||||||||||||
| Employees with temporary/full-time contracts | 1,153 | 1,966 | 893 | 208 | 246 | 4,466 | ||||||||||||||
| Employees with temporary/part-time contracts | 150 | 144 | 83 | 16 | 58 | 451 | ||||||||||||||
| Group total | 21,139 | 64,291 | 63,717 | 22,720 | 29,649 | 201,516 | ||||||||||||||
| 18. YEARLY AVERAGE OF CONTRACTS BY ROLE | |||||||||||||||||||||||||||||
| 2023 | 2022 | ||||||||||||||||||||||||||||
| Executives | Managers | Other employees |
Total |
Executives | Managers | Other employees |
Total |
||||||||||||||||||||||
| Employees with permanent/full-time contract | 2,262 | 31,531 | 166,340 | 200,133 | 2,194 | 16,304 | 166,978 | 185,476 | |||||||||||||||||||||
| Employees with permanent/part-time contracts | 6 | 456 | 6,669 | 7,132 | 7 | 163 | 10,953 | 11,123 | |||||||||||||||||||||
| Employees with temporary/full-time contracts | 18 | 382 | 3,426 | 3,826 | 20 | 104 | 4,342 | 4,466 | |||||||||||||||||||||
| Employees with temporary/part-time contracts | 0 | 83 | 341 | 424 | 0 | 17 | 434 | 451 | |||||||||||||||||||||
| Group total | 2,287 | 32,452 | 176,776 | 211,514 | 2,221 | 16,588 | 182,707 | 201,516 | |||||||||||||||||||||
19. EMPLOYEES WORKING IN THEIR HOME COUNTRYA,B | ||||||||||||||||||||||||||
Executives |
Other employees |
Total |
||||||||||||||||||||||||
| % | 2023 | 2022 | 2023 | 2022 | 2023 | 2022 | ||||||||||||||||||||
| Europe | 90.21 | 88.22 | 91.26 | 94.33 | 91.03 | 94.22 | ||||||||||||||||||||
| North America | 77.73 | 91.29 | 94.15 | 99.69 | 91.70 | 99.63 | ||||||||||||||||||||
| South America | 97.06 | 91.85 | 98.23 | 98.23 | 98.12 | 98.19 | ||||||||||||||||||||
| Group total | 89.20 | 89.32 | 94.68 | 96.92 | 93.81 | 96.84 | ||||||||||||||||||||
20.1 EMPLOYEES WITH DISABILITIES BY REGIONA,B | ||||||||
| % | 2023 | 2022 | ||||||
| Europe | 2.19 | 1.98 | ||||||
| North America | 0.92 | 0.67 | ||||||
| South America | 2.94 | 2.80 | ||||||
| Group total | 2.21 | 1.99 | ||||||
20.2. EMPLOYEES WITH DISABILITIESA,B | ||||||||
| Number of employees | 2023 | 2022 | ||||||
| Spain | 570 | 564 | ||||||
| Rest of the Group | 4,131 | 3,550 | ||||||
| Group total | 4,701 | 4,114 | ||||||
21. HEADCOUNT COVERED BY COLLECTIVE AGREEMENTA | |||||||||||||||||
| 2023 | 2022 | ||||||||||||||||
| Countries | % | Employees | % | Employees | |||||||||||||
| Spain | 99.95 | 35,247 | 99.94 | 34,132 | |||||||||||||
| Brazil | 96.77 | 55,998 | 97.18 | 54,061 | |||||||||||||
| Chile | 100.00 | 9,576 | 99.48 | 9,494 | |||||||||||||
| Poland | 0.00 | 0 | 0.00 | 0 | |||||||||||||
| Argentina | 81.06 | 6,781 | 86.05 | 7,080 | |||||||||||||
| Mexico | 28.24 | 8,823 | 27.64 | 8,122 | |||||||||||||
| Portugal | 88.25 | 4,680 | 90.46 | 4,750 | |||||||||||||
| UK | 99.32 | 24,057 | 96.63 | 22,134 | |||||||||||||
| US | 0.00 | 0 | 0.00 | 0 | |||||||||||||
| Other business units | 37.51 | 5,621 | 45.98 | 6,592 | |||||||||||||
| Total Group | 70.3 | 149,575 | 70.89 | 146,365 | |||||||||||||
22.1. NEW HIRES BY AGE BRACKET IN 2023A | |||||||||||||||||
| % of total | |||||||||||||||||
aged <= 25 |
aged 26-35 |
aged 36-45 |
aged over 45 |
aged > 50 |
|||||||||||||
| Europe | 25.61 | 40.44 | 20.75 | 6.32 | 6.87 | ||||||||||||
| North America | 29.44 | 44.68 | 16.94 | 4.40 | 4.53 | ||||||||||||
| South America | 32.23 | 42.37 | 18.94 | 3.57 | 2.89 | ||||||||||||
| Group total | 29.79 | 42.40 | 18.95 | 4.50 | 4.35 | ||||||||||||
22.2. NEW HIRES BY AGE BRACKET IN 2022A | |||||||||||||||||
| % of total | |||||||||||||||||
aged <= 25 |
aged 26-35 |
aged 36-45 |
aged over 45 |
aged > 50 |
|||||||||||||
| Europe | 31.23 | 39.98 | 19.94 | 4.84 | 4.02 | ||||||||||||
| North America | 34.00 | 40.65 | 16.22 | 4.04 | 5.09 | ||||||||||||
| South America | 41.69 | 38.02 | 15.59 | 2.54 | 2.15 | ||||||||||||
| Group total | 37.01 | 39.20 | 16.88 | 3.52 | 3.39 | ||||||||||||
23. NEW HIRES BY GENDERA | |||||||||||||||||||||||
| 2023 | 2022 | ||||||||||||||||||||||
| Men | Women | Total | Men | Women | Total | ||||||||||||||||||
| Europe | 14.66 | % | 12.79 | % | 13.68 | % | 15.10 | % | 13.55 | % | 14.28 | % | |||||||||||
| North America | 26.74 | % | 22.27 | % | 24.31 | % | 30.00 | % | 26.42 | % | 28.05 | % | |||||||||||
| South America | 27.84 | % | 28.29 | % | 28.09 | % | 28.97 | % | 31.02 | % | 30.10 | % | |||||||||||
| Group total | 21.97% | 20.71% | 21.29% | 23.23% | 22.92% | 23.06% | |||||||||||||||||
24. DISMISSALSA | |||||||||||||||||||||||||||||||||||||||||
by gender and role |
2023 | 2022 | |||||||||||||||||||||||||||||||||||||||
Men |
%B |
Women |
%B |
Total |
%B |
Men |
%B |
Women |
%B |
Total |
%B |
||||||||||||||||||||||||||||||
| Senior executives | 57 | 3.58 | % | 18 | 2.63 | % | 75 | 3.28 | % | 58 | 3.55 | % | 17 | 2.51 | % | 75 | 3.24 | % | |||||||||||||||||||||||
Other executivesC |
759 | 4.17 | % | 612 | 4.72 | % | 1,371 | 4.22 | % | 378 | 3.36 | % | 216 | 3.27 | % | 594 | 3.32 | % | |||||||||||||||||||||||
| Other employees | 5,226 | 6.89 | % | 7,497 | 7.77 | % | 12,723 | 7.20 | % | 5,771 | 7.00 | % | 7,837 | 7.55 | % | 13,608 | 7.31 | % | |||||||||||||||||||||||
| Total Group | 6,042 | 6.13 | % | 8,127 | 7.20 | % | 14,169 | 6.70 | % | 6,207 | 6.51 | % | 8,070 | 7.26 | % | 14,277 | 6.92 | % | |||||||||||||||||||||||
| by gender and age | 2023 | 2022 | |||||||||||||||||||||
| Men | Women | Total | Men | Women | Total | ||||||||||||||||||
| aged <=25 | 960 | 1,547 | 2,507 | 1,002 | 1,546 | 2,548 | |||||||||||||||||
| aged 26-35 | 2,100 | 2,608 | 4,708 | 2,025 | 2,719 | 4,744 | |||||||||||||||||
| aged 36-45 | 1,609 | 2,308 | 3,917 | 1,539 | 2,229 | 3,768 | |||||||||||||||||
| aged 46-50 | 502 | 619 | 1,121 | 558 | 594 | 1,152 | |||||||||||||||||
| aged >50 | 871 | 1,045 | 1,916 | 1,083 | 982 | 2,065 | |||||||||||||||||
| Total Group | 6,042 | 8,127 | 14,169 | 6,207 | 8,070 | 14,277 | |||||||||||||||||
25. EXTERNAL TURNOVER RATE BY GENDERA | |||||||||||||||||||||||
| % of total | 2023 | 2022 | |||||||||||||||||||||
| Men | Women | Total | Men | Women | Total | ||||||||||||||||||
| Europe | 9.60 | 10.49 | 10.07 | 10.36 | 10.30 | 10.33 | |||||||||||||||||
| North America | 25.31 | 23.29 | 24.21 | 31.28 | 28.35 | 29.68 | |||||||||||||||||
| South America | 22.88 | 29.37 | 26.41 | 24.68 | 30.89 | 28.09 | |||||||||||||||||
| Group total | 17.69 | 20.40 | 19.14 | 19.90 | 21.93 | 20.99 | |||||||||||||||||
26.1 EXTERNAL TURNOVER RATE BY AGE BRACKETA 2023 | ||||||||||||||||||||
| % of total | ||||||||||||||||||||
| aged <= 25 | aged 26-35 | aged 36-45 | aged 46-50 | aged over 50 | Total | |||||||||||||||
| Europe | 28.31 | 15.38 | 7.30 | 4.57 | 8.45 | 10.07 | ||||||||||||||
| North America | 39.96 | 25.87 | 19.06 | 18.75 | 20.74 | 24.21 | ||||||||||||||
| South America | 51.95 | 25.17 | 20.17 | 16.25 | 18.71 | 26.41 | ||||||||||||||
| Group total | 43.94 | 22.55 | 14.26 | 9.68 | 12.72 | 19.14 | ||||||||||||||
26.2. EXTERNAL TURNOVER RATE BY AGE BRACKETA 2022 | ||||||||||||||||||||
| % of total | ||||||||||||||||||||
| aged <= 25 | aged 26-35 | aged 36-45 | aged 46-50 | aged over 50 | Total | |||||||||||||||
| Europe | 31.10 | 16.62 | 6.96 | 4.27 | 8.29 | 10.33 | ||||||||||||||
| North America | 60.66 | 30.29 | 21.09 | 20.04 | 23.38 | 29.68 | ||||||||||||||
| South America | 51.78 | 27.80 | 20.06 | 16.65 | 22.76 | 28.09 | ||||||||||||||
| Group total | 49.29 | 25.21 | 14.20 | 9.77 | 14.00 | 20.99 | ||||||||||||||
27. REMUNERATION BY ROLE, GENDER AND REGIONA | |||||||||||||||||||||||||||||
Senior executivesB |
Other executives | ||||||||||||||||||||||||||||
| Men | Women |
GPG ratio
(Median)C
|
GPG-SAB ratio
(Median)D
|
Men | Women |
GPG ratio
(Median)C
|
GPG-SAB ratio
(Median)D
|
||||||||||||||||||||||
| Europe | 498,350 | 348,263 | 18.8 | % | 13.3 | % | 147,649 | 108,662 | 15.1 | % | 15.1 | % | |||||||||||||||||
| North America | 796,406 | 576,925 | 29.0 | % | 13.7 | % | 150,795 | 97,475 | 29.3 | % | 30.5 | % | |||||||||||||||||
| South America | 584,353 | 325,287 | 35.6 | % | 20.0 | % | 158,856 | 134,045 | 12.7 | % | 9.9 | % | |||||||||||||||||
| Group total | 550,670 | 368,162 | 28.0 | % | 17.9 | % | 150,169 | 108,384 | 20.0 | % | 18.8 | % | |||||||||||||||||
| 2023 average remuneration | 493,914 | 134,691 | |||||||||||||||||||||
| 2022 average remuneration | 469,180 | 132,943 | |||||||||||||||||||||
| Variation 2023 vs. 2022 (%) | 5.3% | 1.3% | |||||||||||||||||||||
| Other employees | Total | ||||||||||||||||||||||||||||||||||
Men |
Women |
Ratio GPG
(Median)C
|
GPG-SAB ratio
(Median)D
|
Men |
Women |
Ratio GPG
(Median)C
|
GPG-SAB ratio
(Median)D
|
Total employees | |||||||||||||||||||||||||||
| Europe | 54,880 | 43,839 | 17.9 | % | 16.3 | % | 80,843 | 52,404 | 22.4 | % | 19.8 | % | 65,983 | ||||||||||||||||||||||
| North America | 51,546 | 36,278 | 19.8 | % | 22.6 | % | 74,118 | 43,176 | 30.2 | % | 28.0 | % | 57,110 | ||||||||||||||||||||||
| South America | 30,464 | 22,611 | 21.8 | % | 24.5 | % | 40,607 | 25,735 | 25.9 | % | 29.1 | % | 32,666 | ||||||||||||||||||||||
| Group total | 44,223 | 33,846 | 23.3 | % | 22.4 | % | 64,318 | 40,310 | 27.8 | % | 29.0 | % | 51,535 | ||||||||||||||||||||||
| 2023 average remuneration | 38,516 | 64,318 | 40,310 | 27.8 | % | 29.0 | % | 51,535 | |||||||||||||||||||||||||||
| 2022 average remuneration | 38,276 | 60,793 | 37,606 | 30.2 | % | 29.8 | % | 48,232 | |||||||||||||||||||||||||||
| Variation 2023 vs 2022 (%) | 0.6% | 5.8 | % | 7.2 | % | (7.8 | %) | (2.6 | %) | 6.8 | % | ||||||||||||||||||||||||
| By age bracket | ||||||||||||||||||||
aged <= 25 |
aged 26-35 |
aged 36-45 |
aged 46-50 |
aged over 50 |
Total |
|||||||||||||||
| 2023 average remuneration | 14,792 | 29,882 | 51,887 | 70,415 | 79,958 | 51,535 | ||||||||||||||
| 2022 average remuneration | 14,060 | 27,551 | 48,002 | 65,336 | 74,744 | 48,232 | ||||||||||||||
| Variation 2023 vs 2022 (%) | 5.2 | % | 8.5 | % | 8.1 | % | 7.8 | % | 7.0 | % | 6.8 | % | ||||||||
| 28.1 AVERAGE REMUNERATION OF SENIOR MANAGEMENT (with variable remuneration not linked to long-term objectives) | |||||||||||||||||||||||
| Thousand euros | 2023 | 2022 | |||||||||||||||||||||
Men |
Women |
Total |
Men |
Women |
Total |
||||||||||||||||||
Executive directors |
8,257 | 11,544 | 9,900 | 9,086 | 11,001 | 10,044 | |||||||||||||||||
Non-executive directors |
368 | 327 | 352 | 285 | 304 | 292 | |||||||||||||||||
Senior management |
4,112 | 1,645 | 3,583 | 4,365 | 1,574 | 3,767 | |||||||||||||||||
| 28.2 AVERAGE VARIABLE REMUNERATION OF SENIOR MANAGEMENT LINKED TO LONG-TERM OBJECTIVES (fair value) | |||||||||||||||||||||||
| Thousand euros | 2023 | 2022 | |||||||||||||||||||||
Men |
Women |
Total |
Men |
Women |
Total |
||||||||||||||||||
Executive directors |
1,537 | 2,243 | 1,890 | 1,436 | 2,128 | 1,782 | |||||||||||||||||
Senior managementA |
563 | 189 | 483 | 597 | 191 | 510 | |||||||||||||||||
| 28.3 SENIOR MANAGEMENT COMPOSITION | |||||||||||||||||||||||
| Number | 2023 | 2022 | |||||||||||||||||||||
Men |
Women |
Total |
Men |
Women |
Total |
||||||||||||||||||
Executive directors |
1 | 1 | 2 | 1 | 1 | 2 | |||||||||||||||||
Non-executive directors |
8 | 5 | 13 | 8 | 5 | 13 | |||||||||||||||||
Senior management |
11 | 3 | 14 | 11 | 3 | 14 | |||||||||||||||||
29.1 RATIO OF THE BANK’S MINIMUM ANNUAL SALARY TO THE LEGAL MINIMUM ANNUAL SALARY BY COUNTRY AND GENDER, 2023A | |||||||||||
| % Legal minimum wage | |||||||||||
| Men | Women | % legal minimum wage | |||||||||
| Argentina | 315 | % | 315 | % | 315 | % | |||||
| Brazil | 121 | % | 121 | % | 121 | % | |||||
| Chile | 213 | % | 213 | % | 213 | % | |||||
| US | 276 | % | 276 | % | 276 | % | |||||
| Spain | 141 | % | 141 | % | 141 | % | |||||
| Mexico | 100 | % | 100 | % | 100 | % | |||||
| Poland | 101 | % | 101 | % | 101 | % | |||||
| Portugal | 184 | % | 184 | % | 184 | % | |||||
UKB |
112 | % | 112 | % | 112 | % | |||||
29.2 RATIO OF THE BANK’S MINIMUM ANNUAL SALARY TO THE LEGAL MINIMUM ANNUAL SALARY BY COUNTRY AND GENDER, 2022A,B | |||||||||||
| % Legal minimum wage | |||||||||||
| Men | Women | % Legal minimum wage | |||||||||
| Germany | 191 | % | 191 | % | 191 | % | |||||
| Argentina | 377 | % | 377 | % | 377 | % | |||||
| Brazil | 241 | % | 241 | % | 241 | % | |||||
| Chile | 160 | % | 140 | % | 150 | % | |||||
| US | 234 | % | 232 | % | 233 | % | |||||
| Spain | 154 | % | 150 | % | 152 | % | |||||
| Mexico | 145 | % | 145 | % | 145 | % | |||||
| Poland | 100 | % | 100 | % | 100 | % | |||||
| Portugal | 170 | % | 170 | % | 170 | % | |||||
| UK | 223 | % | 223 | % | 223 | % | |||||
| 30. TRAINING | ||||||||
| 2023 | 2022 | |||||||
Total hours of training |
6,067,569 | 6,884,251 | ||||||
% employees trainedA |
89.48 | 100.00 | ||||||
Total attendees |
6,775,921 | 5,748,422 | ||||||
Hours of training per employeeB |
28.69 | 33.34 | ||||||
Total investment in trainingC |
60,162,751 | 71,630,151 | ||||||
Investment per employee |
284.44 | 346.94 | ||||||
Cost per hour |
9.92 | 10.40 | ||||||
% women participants |
50.42 | 55.18 | ||||||
Employee satisfaction (up to 10) |
8.93 | 9.81 | ||||||
| 31. HOURS OF TRAINING BY CATEGORY | |||||||||||||||||
| 2023 | 2022 | ||||||||||||||||
Hours |
Average |
Hours |
Average |
||||||||||||||
Senior executives |
77,889 | 34.06 | 87,353 | 37.78 | |||||||||||||
Other executives |
857,455 | 26.42 | 493,474 | 27.61 | |||||||||||||
Other employees |
5,132,225 | 29.03 | 6,303,424 | 33.84 | |||||||||||||
Group total |
6,067,569 | 28.69 | 6,884,251 | 33.34 | |||||||||||||
| 32. HOURS OF TRAINING BY GENDER | ||||||||
| 2023 | 2022 | |||||||
Average |
Average |
|||||||
Men |
29.6 | 33.15 | ||||||
Women |
27.88 | 33.51 | ||||||
| Group total | 28.69 | 33.34 | ||||||
33. ABSENTEEISM BY GENDER AND REGIONA,B | |||||||||||||||||||||||
| 2023 | 2022 | ||||||||||||||||||||||
Men |
Women |
Total |
Men |
Women |
Total |
||||||||||||||||||
| Europe | 2.13 | 4.55 | 3.39 | 2.68 | 5.36 | 4.11 | |||||||||||||||||
| North America | 0.84 | 1.66 | 1.28 | 0.95 | 2.05 | 1.55 | |||||||||||||||||
South AmericaC |
2.18 | 5.29 | 3.87 | 1.45 | 3.14 | 2.34 | |||||||||||||||||
| Group total | 1.89 | 4.22 | 3.13 | 1.80 | 3.73 | 2.83 | |||||||||||||||||
34. ACCIDENT RATEA,B | |||||||||||||||||||||||
| % | 2023 | 2022 | |||||||||||||||||||||
Men |
Women |
Total |
Men |
Women |
Total |
||||||||||||||||||
| Europe | 0.02 | 0.09 | 0.06 | 0.04 | 0.12 | 0.08 | |||||||||||||||||
| North America | 0.03 | 0.03 | 0.03 | 0.01 | 0.04 | 0.02 | |||||||||||||||||
| South America | 0.01 | 0.00 | 0.00 | 0.02 | 0.03 | 0.02 | |||||||||||||||||
| Group total | 0.02 | 0.04 | 0.03 | 0.02 | 0.06 | 0.05 | |||||||||||||||||
35. OCCUPATIONAL HEALTH AND SAFETYA,B | |||||||||||||||||||||||
| 2023 | 2022 | ||||||||||||||||||||||
| Men | Women | Total | Men | Women | Total | ||||||||||||||||||
Frequency rateC |
1 | 1 | 1 | 1 | 2 | 1 | |||||||||||||||||
Severity rateD |
0.03 | 0.06 | 0.04 | 0.04 | 0.09 | 0.06 | |||||||||||||||||
No. of fatal occupational accidents |
0 | 0 | 0 | 1 | 0 | 1 | |||||||||||||||||
Work-related illnessE |
3 | 12 | 15 | 0 | 0 | 0 | |||||||||||||||||
Total number of accidentsF |
128 | 271 | 399 | 239 | 477 | 716 | |||||||||||||||||
36. Green financeA | ||||||||||||||
| EUR bn | 2023 | 2022 | 2021 | 2020 | ||||||||||
Raised and facilitated |
20.2 | 28.8 | 31.9 | 14.8 | ||||||||||
Accumulated since 2019 |
114.6 | 94.5 | 65.7 | 33.8 | ||||||||||
37. Financed emissions for alignmentA | |||||||||||||||||||||||
| Sector | YearB |
Exposure (drawn amount €bn) | Emissions scope |
Absolute emissions (mtCO2e) |
Physical emissions intensity |
Financial emissions intensity (mtCO2e/EUR bn lent) |
Overall PCAF scoreC |
||||||||||||||||
| Power generation | 2020 | 10.31 | 1 | 4.59 | 0.17 tCO2e/MWh |
0.45 | 2.5 | ||||||||||||||||
| 2021 | 10.23 | 4.24 | 0.19 tCO2e/MWh |
0.41 | 2.8 | ||||||||||||||||||
| Energy (Oil & Gas) | 2020 | 6.67 | 1 + 2 + 3D |
22.58 | 73.60 tCO2e/TJ |
3.38 | 3.6 | ||||||||||||||||
| 2021 | 8.25 | 27.43 | 74.36 tCO2e/TJ |
3.33 | 3.9 | ||||||||||||||||||
| Aviation | 2020 | 2.44 | 1 + 2 |
1.08 | 93.05 grCO2e/RPK |
0.44 | 3.7 | ||||||||||||||||
| 2021 | 2.02 | 0.84 | 97.21 grCO2e/RPK |
0.42 | 3.2 | ||||||||||||||||||
| Steel | 2020 | 1.31 | 1 + 2 |
2.14 | 1.40 tCO2e/tS |
1.63 | 3.1 | ||||||||||||||||
| 2021 | 1.42 | 1.90 | 1.36 tCO2e/tS |
1.33 | 3.1 | ||||||||||||||||||
| Auto - manufacturing | 2020 | 4.45 | 3D |
3.49 | 149 gCO2/vkm |
0.79 | 3.1 | ||||||||||||||||
| 2021 | 3.90 | 2.67 | 138 gCO2/vkm |
0.68 | 3.0 | ||||||||||||||||||
AgroE |
2022 | 1.80 | 1 + 2 |
6.20 | N/A | 3.52 | 3.3 | ||||||||||||||||
Auto - lendingF |
2022 | 55.27 | 1 + 2 |
5.84 | 137 gCO2e/vkm |
0.11 | 3.2 | ||||||||||||||||
MortgagesG |
2022 | 211.05 | 1 + 2 |
2.63 | 39.72 kgCO2e/m2 |
0.01 | 3.3 | ||||||||||||||||
| 2023 | 2022 | Var. 2023-2022 (%) | |||||||||
Consumption |
|||||||||||
Water (m3)B |
1,858,645 | 1,887,857 | -1.5 | ||||||||
Water (m3/employee) |
9.56 | 9.75 | -1.9 | ||||||||
Normal electricity (millions of kwh) |
25.63 | 97.42 | -73.7 | ||||||||
Green electricity (millions of kwh) |
779.68 | 745.82 | 4.5 | ||||||||
Total electricity (millions of kwh) |
805.31 | 843.24 | -4.5 | ||||||||
Total internal energy consumption (GJ) |
3,444,543 | 3,431,272 | 0.4 | ||||||||
Total internal energy consumption per employee (GJ/employee) |
17.72 | 17.73 | 0.0 | ||||||||
Total paper (t)C |
4,932 | 5,849 | -15.7 | ||||||||
Recycled or certified paper (t)C |
4,417 | 4,860 | -9.1 | ||||||||
Total paper per employee (t/employee)C |
0.025 | 0.030 | -15.9 | ||||||||
Waste |
|||||||||||
Paper and cardboard waste (kg)C |
3,787,667 | 4,123,740 | -8.1 | ||||||||
Paper and cardboard waste per employee (kg/employee)C |
19.49 | 21.30 | -8.5 | ||||||||
Greenhouse gas emissionsH |
|||||||||||
Direct emissions (t CO2e)D |
25,755 | 21,967 | 17.2 | ||||||||
Indirect electricity emissions and other (t CO2e)-market basedE,F |
21,516 | 30,917 | -30.4 | ||||||||
Indirect electricity emissions and other (t CO2e)-location basedE,F |
205,292 | 217,906 | -5.8 | ||||||||
Indirect emissions from displacement of employees (t CO2e)G |
125,441 | 81,535 | 53.8 | ||||||||
Total emissions (t CO2 e)- market based |
172,711 | 134,419 | 28.5 | ||||||||
Total emissions per employee(t CO2e/employee) |
0.89 | 0.69 | 28.0 | ||||||||
39. Equator Principles | |||||||||||||||||||||||||||||||||||
| Number of projects | Project Finance | Project Related Corporate Loans | Project-Related Refinance and Project-Related Acquisition for Project Finance | ||||||||||||||||||||||||||||||||
| Category | A | B | C | A | B | C | A | B | C | ||||||||||||||||||||||||||
TOTAL |
8 | 24 | 4 | 4 | 0 | 1 | 0 | 0 | 0 | ||||||||||||||||||||||||||
 Sector Sector |
|||||||||||||||||||||||||||||||||||
| Mining | 0 | 0 | 0 | 0 | 0 | 0 | 0 | 0 | 0 | ||||||||||||||||||||||||||
| Infrastructure | 2 | 2 | 0 | 0 | 0 | 0 | 0 | 0 | 0 | ||||||||||||||||||||||||||
| Oil & Gas | 3 | 1 | 0 | 1 | 0 | 0 | 0 | 0 | 0 | ||||||||||||||||||||||||||
| Power | 1 | 19 | 4 | 0 | 0 | 0 | 0 | 0 | 0 | ||||||||||||||||||||||||||
| Others | 2 | 2 | 0 | 3 | 0 | 1 | 0 | 0 | 0 | ||||||||||||||||||||||||||
 Region Region |
|||||||||||||||||||||||||||||||||||
Americas |
4 | 3 | 2 | 0 | 0 | 1 | 0 | 0 | 0 | ||||||||||||||||||||||||||
Europe, Middle East & Africa |
4 | 21 | 2 | 2 | 0 | 0 | 0 | 0 | 0 | ||||||||||||||||||||||||||
| Asia pacific | 0 | 0 | 0 | 2 | 0 | 0 | 0 | 0 | 0 | ||||||||||||||||||||||||||
 Type Type |
|||||||||||||||||||||||||||||||||||
Designated countriesA |
5 | 22 | 4 | 0 | 0 | 0 | 0 | 0 | 0 | ||||||||||||||||||||||||||
Non-designated countries |
3 | 2 | 0 | 4 | 0 | 1 | 0 | 0 | 0 | ||||||||||||||||||||||||||
 Independent review Independent review |
|||||||||||||||||||||||||||||||||||
Yes |
8 | 24 | 4 | 4 | 0 | 1 | 0 | 0 | 0 | ||||||||||||||||||||||||||
No |
0 | 0 | 0 | 0 | 0 | 0 | 0 | 0 | 0 | ||||||||||||||||||||||||||
| Table 40. Country by country report (according to GRI 207-4). | ||||||||||||||
| EUR million | ||||||||||||||
| 2023 | ||||||||||||||
| Jurisdiction |
Revenue from
third-party salesA
|
Revenue from intra-group transactions with other tax jurisdictionsA |
Tangible assets other than cash and cash equivalentsB |
Corporate income tax accrued on profit/lossC |
||||||||||
| Germany | 1,635 | -97 | 3,675 | 76 | ||||||||||
| Argentina | 1,643 | -67 | 449 | 235 | ||||||||||
| Australia | 6 | 0 | 2 | 0 | ||||||||||
| Austria | 238 | -20 | 14 | 18 | ||||||||||
| Bahamas | 36 | 9 | 1 | 0 | ||||||||||
| Belgium | 70 | 51 | 66 | 7 | ||||||||||
BrazilD |
12,568 | -137 | 1,731 | 1,353 | ||||||||||
| Canada | 90 | -16 | 1 | 3 | ||||||||||
| Chile | 2,241 | 4 | 521 | 289 | ||||||||||
| China | 13 | 16 | 2 | 0 | ||||||||||
| Colombia | 89 | 4 | 2 | 1 | ||||||||||
| United Arab Emirates | 4 | 4 | 1 | 0 | ||||||||||
SpainE |
8,565 | 1,986 | 10,806 | 378 | ||||||||||
| United States | 7,335 | -272 | 13,550 | 479 | ||||||||||
| Denmark | 219 | -4 | 143 | 26 | ||||||||||
| Finland | 122 | -21 | 39 | 10 | ||||||||||
| France | 1,158 | -236 | 90 | 31 | ||||||||||
| Greece | 14 | -5 | 1 | 0 | ||||||||||
| Hong Kong | 175 | -57 | 8 | 5 | ||||||||||
| India | 0 | 2 | 0 | 0 | ||||||||||
| Ireland | 2 | 18 | 824 | 3 | ||||||||||
| Isle of Man | -78 | 128 | 10 | 3 | ||||||||||
| Italy | 850 | -269 | 93 | 52 | ||||||||||
| Jersey | -39 | 72 | 11 | 1 | ||||||||||
| Luxembourg | 460 | 72 | 0 | 216 | ||||||||||
| Mexico | 5,991 | -51 | 1,962 | 737 | ||||||||||
| Norway | 344 | -101 | 8 | -7 | ||||||||||
| Netherlands | 138 | 25 | 119 | 98 | ||||||||||
| Peru | 202 | -6 | 5 | 21 | ||||||||||
| Poland | 3,584 | 18 | 268 | 390 | ||||||||||
| Portugal | 2,113 | -55 | 461 | 399 | ||||||||||
| United Kingdom | 6,623 | -9 | 1,917 | 685 | ||||||||||
| Romania | 5 | 0 | 0 | 0 | ||||||||||
| Singapore | 45 | -25 | 1 | 1 | ||||||||||
| Sweden | 187 | -33 | 2 | -3 | ||||||||||
| Switzerland | 174 | -9 | 66 | 10 | ||||||||||
| Uruguay | 601 | -8 | 53 | 51 | ||||||||||
| Consolidated group total | 57,423 | 911 | 36,902 | 5,568 | ||||||||||
|
For more details, see section 1. 'Economy, regulation and competition'' in the 'Economic and financial review' chapter. |
||||
|
For more details, see sections 2.1 'Share capital', 2.6 'Stock market information', 3.1 'Shareholder communication and engagement' and 3.3 'Dividends and shareholder remuneration' in the Corporate Governance chapter. |
||||
|
People
 |
91%
aggregated participation in Your voice SurveyA
|
3,611
complaints received through ethical channels
|
||||||||||||||||||||||||
|
Customers
|
+9 million
customer satisfaction surveys
|
453,224
complaints received
|
||||||||||||||||||||||||
|
Shareholders
|
9,120
responses from retail shareholders on their perception of Santander as a bank that is Simple, Personal and Fair
|
239,238
responses from retail shareholders and institutional investors in quality studies and surveysC
|
206
events with retail shareholders
|
930
contacts with institutional investors (47 on ESG matters)
|
||||||||||||||||||||||
|
Communities
|
1,238
partner universities and institutionsB
|
+400
social media profiles +30 million followers
|
||||||||||||||||||||||||
| The SDGs on which Banco Santander has the greatest impact | Other SDGs on which Banco Santander also has an impact |
||||||||||||||||||||||
 |
SDG 8. Decent Work and Economic Growth
We guarantee the best employee experience and an inclusive workplace. Our financial inclusion and community support programmes help entrepreneurs create businesses and jobs; and strength local economies.
|
 |
SDG 1. No Poverty
We want to reduce poverty and boost wealth and well-being in the countries where we operate. Our financial inclusion products and services and our community investment programmes empower millions each year.
|
 |
SDG 4. Quality Education
Our pioneering Santander Universities programme promotes education, entrepreneurship and employment so universities and students can prosper. Also, Santander Scholarships is one of the world's largest private education grant funds.
|
||||||||||||||||||
 |
SDG 13. Climate Action
We tackle climate change with the ambition to be net zero by 2050, helping our customers transition to a sustainable economy and reducing our own carbon footprint and environmental impact.
|
 |
SDG 5. Gender Equality
We promote an inclusive and diverse workplace, ensuring equal opportunity as a strategic priority. We also run initiatives to drive diversity.
|
 |
SDG 7. Affordable and Clean Energy
We're the global leader in renewable energy financing, and finance energy efficiency projects; low-emission, electric and hybrid vehicles; and other cleaner transport solutions.
|
||||||||||||||||||
 |
SDG 16. Peace, Justice, and Strong Institutions
We promote transparency, the fight against corruption and robust governance across our organization. Our policies and codes of conduct regulate our business and behaviour and steer our commitments towards a more responsible banking system.
|
 |
SDG 10. Reducing Inequality
Our products and services give society's most vulnerable better access to financial services, and we teach them the concepts and skills they need to manage their finances effectively.
|
 |
SDG 11. Sustainable Cities and Communities
We finance sustainable infrastructure and promote access to affordable housing to guarantee basic services and inclusive economic growth.
|
||||||||||||||||||
 |
SDG 12. Responsible Consumption and Production
We are firmly committed to reducing our environmental footprint, implementing energy efficiency plans, promoting the use of renewable energies and offsetting the consumption of our internal operations.
|
 |
SDG 17. Partnerships for the Goals
We participate in prominent local and international initiatives and working groups.
|
||||||||||||||||||||
|
For more details, see section 10.8 'SDGs contribution content index'. |
||||
| Other international and local initiatives that Santander supports | ||||||||||||||||||||
|
→UN Women's Empowerment Principles
→The Valuable 500
→UN Principles for Responsible Investment
→CDP
→UN Global Investors for Sustainable Development (GISD) Alliance
→Green Recovery Alliance of the European Union
→Equator Principles
→Partnership for Carbon Accounting Financials (PCAF)
|
→Round Table on Responsible Soy
→Working Group on Sustainable Livestock
→Climate Leadership Council
→The Wolfsberg Group
→United For Wildlife’s Financial Taskforce against the illegal wildlife trade
→United Nations Office on Drugs and Crime's (UNODC) Private Sector Dialogue on the Disruption of Financial Crimes Related to Environmental Crimes
|
|||||||||||||||||||
Responsible banking frameworkA |
Responsible banking and sustainability policy | Responsible banking model | ||||||||||||||||||||||||||||||
| Establishes responsible banking as a strategic topic for Grupo Santander and all local units. | Sets out our sustainability principles, commitments, targets and strategy (including human rights protection) to create long-term stakeholder value. | Sets out the roles and responsibilities of the first, second and third line of defence in all responsible banking-related activity to drive our sustainability agenda, embed ESG standards and achieve our goals. | ||||||||||||||||||||||||||||||
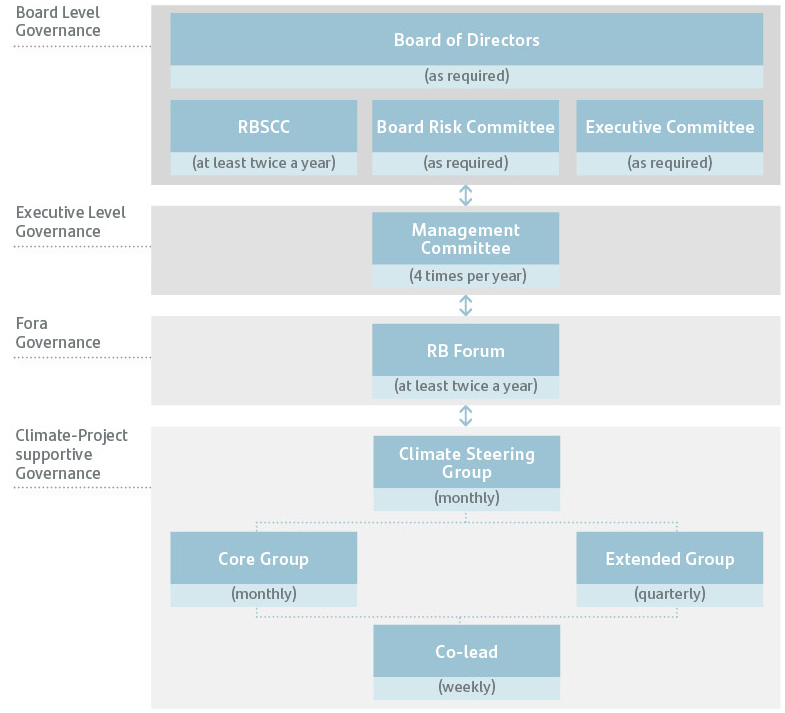
|
For more details, see section 4.9 ´Responsible banking, sustainability and culture committee activities in 2023´ in the Corporate governance chapter |
||||
| 2018 | 2019 | 2020 | 2021 | 2022 | 2023 | Target | ||||||||||||||||||||
Green finance raised and facilitated (cumulative)(EUR bn)A |
19 bn | 33.8 bn | 65.7 bn | 94.5 bn |
114.6 bn |
120 bn by 2025 220 bn by 2030 |
||||||||||||||||||||
| Socially Responsible Investments AuMs (EUR bn) | 27.1 bn | 53.2 bn |
67.7 bn |
 |
100 bn by 2025 | |||||||||||||||||||||
Electricity used from renewable energy sourcesB |
43%
|
50% | 57% | 75% | 88% | 97% | |
100% by 2025 | ||||||||||||||||||
| Thermal coal-related power & mining phase-out (EUR bn) | 7 bn | 5.9 bn |
4.9 bn |
|
0 by 2030 | |||||||||||||||||||||
Emissions intensity of power generation portfolioC,D |
0.21 | 0.17 | 0.19 | |
0.11 tCO2e / MWh in 2030 |
|||||||||||||||||||||
Absolute emissions of energy (oil & gas) portfolioC |
23.84 | 22.58 | 27.43 | |
16.98 mtCO2e in 2030 |
|||||||||||||||||||||
Emissions intensity of aviation portfolioC |
92.47 | 93.05 | 97.21 | |
61.71 grCO2e / RPK in 2030 |
|||||||||||||||||||||
Emissions intensity of steel portfolioC |
1.58 | 1.40 | 1.36 | |
1.07 tCO2e / tS in 2030 |
|||||||||||||||||||||
Emissions intensity of auto manufacturing portfolio |
149 | 138 | |
103 gCO2/vkm in 2030 |
||||||||||||||||||||||
Emissions intensity of auto lending portfolioE |
137 | |
75-89 gCO2e/vkm in 2030 |
|||||||||||||||||||||||
Women in senior executives positions (%)F |
20%
|
22.7% | 23.7% | 26.3% | 29.3% | 31.4% | |
35% by 2025 | ||||||||||||||||||
Equal pay gapG |
3%
|
2% | 2% | 1% | 1% | c. 0% 
|
|
~0% by 2025 | ||||||||||||||||||
Financially empowered people (cumulative)H |
2.0 mn | 4.9 mn | 7.5 mn | 11.8 mn
|
10 mn by 2025 | |||||||||||||||||||||
|
Financially included people
(cumulative)I
|
1.8 mn |
5mn between 2023-2025 | ||||||||||||||||||||||||
| Investment to foster education, employability and entrepreneurship | 105 mn |
€400m between 2023-2026 | ||||||||||||||||||||||||
| Cumulative target |  From… to… From… to… |
|
Commitment Achieved | ||||||||||||||
| Description | ||||||||
| External | UNEP-FI Impact tool |
Assess positive and negative impacts of Santander’s business, including exposure to different sectors and products. |
||||||
| SASB | Main source for the assessment of risks in Social and Governance sustainability -related matters. | |||||||
| Additional market research | Consulted sources such as IEA, CDP, OECD, and WEF to complement the internal forecasts when evaluating sustainability business opportunity assessments.38 |
|||||||
| Internal | Klima tool | Santander’s internal climate risk assessment tool, which analyses climate physical and transition risk per sector. |
||||||
Nature internal assessment |
Leveraging on Encore, Santander has performed an assessment to identifying main key impacts and dependencies to nature sustainability related matters. |
|||||||
Financial planning forecasts |
Santander’s internal revenue forecast per business sector. | |||||||
 Retail
Customers
|
 Investors
|
 NGOs
|
 Senior management
|
 Employees
|
 Regulators and supervisors39
|
|||||||||||||||||||||||||||
| N = 9000+ | N = 8 | N = 5 | N = 8 | N = c.200 | N = 2 | |||||||||||||||||||||||||||
|
Impact materiality
'Material if connected to actual or potential significant impacts related to the matter on people or the environment'
|
Financial materiality
'Material if it triggers or may trigger financial effects on undertakings, i.e.,
generates or may generate risks or opportunities that influence or are likely to influence the future cash flows' |
|||||||||||||||||||||||||||||||||||||||||||||||||||||||||||||
| OR | ||||||||||||||||||||||||||||||||||||||||||||||||||||||||||||||
Positive and negative impact |
Risks | Opportunities | ||||||||||||||||||||||||||||||||||||||||||||||||||||||||||||
 UNEP-FI
|
+
|
Portfolio data
|
Climate Tool scores
(ESRS E1)
|
 + +
Biodiversity Internal
analysis
(ESRS E2-5)
|
 Assessment
(ESRS S & G)
|
Internal revenue forecast per business sector
|
Industry research | |||||||||||||||||||||||||||||||||||||||||||||||||||||||
|
Stakeholder overlay
(surveys inputs from NGOs, Retail customers, Employees,
Senior management, regulatory views, and investors)
| ||||||||||||||||||||||||||||||||||||||||||||||||||||||||||||||
| Material topics in 2022 | ESRS topic 2023 | |||||||||||||||||||
| Customer experience and satisfaction |
Consumers and end-users:
•Material topic.
•Strong mapping. Customer experience and satisfaction included having a value proposition and service tailored to customer needs.
|
|||||||||||||||||||
| Financial health |
Consumers and end-users:
•Material topic
•Strong mapping. We considered all our efforts to foster financial health as a key strategy to promote social inclusion of consumers and end-users.
|
|||||||||||||||||||
| Green finance and SRI |
Climate change:
•Material topic.
•Strong mapping. Green finance and socially responsible investment referred specifically to business opportunities arising from climate change.
|
|||||||||||||||||||
| Environmental and social risk management | •No mapping. The 2022 topic included all the risks arising from sustainability matters. Our approach in 2023 was to consider this topic as represented in the risk dimension across all sustainability matters. |
|||||||||||||||||||
| Culture, conduct and ethical behaviour |
Business conduct
•Material topic
•Strong mapping. We consider culture and doing everything simple, personal and fair as one of the key levers of business conduct.
|
|||||||||||||||||||
|
For more details on how our financial strategy, product design and relations with customers and counterparties comply with the EU Taxonomy, please see the sections 2. 'Supporting the green transition' and 10.9 'GFANZ transition planning'. |
||||
| Total environmentally sustainable assets (1) | KPI (3) | KPI (4) | % coverage (over total assets) (5) | % of assets excluded from the numerator of the GAR (Article 7.2 and 7.3 and Section 1.1.2. of Annex V) | % of assets excluded from the denominator of the GAR (Article 7.1 and Section 1.2.4 of Annex V) | ||||||||||||||||||
| Main KPI | Green asset ratio (GAR) stock | 31,151 | 2.4 | 2.6 | 70.3 | 33.9 | 29.7 | ||||||||||||||||
| Total environmentally sustainable activities (2) | KPI | KPI | % coverage (over total assets) | % of assets excluded from the numerator of the GAR (Article 7.2 and 7.3 and Section 1.1.2. of Annex V) | % of assets excluded from the denominator of the GAR (Article 7.1 and Section 1.2.4 of Annex V) | ||||||||||||||||||
| Additional KPIs | GAR (flow) | 7,079 | 1.6 | 1.9 | 50.6 | 36.0 | 49.4 | ||||||||||||||||
| Trading book(6) | |||||||||||||||||||||||
| Financial guarantees | 142 | 0.9 | 1.8 | ||||||||||||||||||||
| Assets under management | 829 | 0.6 | 1.1 | ||||||||||||||||||||
| Fees and commissions income(6) | |||||||||||||||||||||||
| (1) Total environmentally sustainable assets used for turnover KPI. Total environmentally sustainable assets used for Capex KPI amounts to EUR 33,422 million | ||
| (2) Total environmentally sustainable assets used for turnover KPI. Total environmentally sustainable assets used for Capex KPI amounts to EUR 8,435 million for GAR flow, EUR 289 million for financial guarantees and EUR 1,550 million for assets under management | ||
| (3) Based on the Turnover KPI of the counterparty | ||
| (4) Based on the CapEx KPI of the counterparty | ||
| (5) % of assets covered by the KPI over banks´ total assets | ||
| (6) Fees and Commissions and Trading Book KPIs shall only apply starting 2026 | ||
| Million EUR | 2023 | |||||||||||||||||||||||||||||||||||||||||||||||||||||||
| Climate Change Mitigation (CCM) | Climate Change Adaptation (CCA) | TOTAL (CCM + CCA) | ||||||||||||||||||||||||||||||||||||||||||||||||||||||
| Total [gross] carrying amount | Of which towards taxonomy relevant sectors (Taxonomy-eligible) | Of which towards taxonomy relevant sectors (Taxonomy-eligible) |
Of which towards taxonomy relevant sectors (Taxonomy-eligible) | |||||||||||||||||||||||||||||||||||||||||||||||||||||
| Of which environmentally sustainable (Taxonomy-aligned) | Of which environmentally sustainable (Taxonomy-aligned) |
Of which environmentally sustainable (Taxonomy-aligned) | ||||||||||||||||||||||||||||||||||||||||||||||||||||||
| Of which Use of Proceeds | Of which transitional | Of which enabling | Of which Use of Proceeds | Of which enabling | Of which Use of Proceeds | Of which transitional | Of which enabling | |||||||||||||||||||||||||||||||||||||||||||||||||
| GAR - Covered assets in both numerator and denominator | ||||||||||||||||||||||||||||||||||||||||||||||||||||||||
| 1 | Loans and advances, debt securities and equity instruments not HfT eligible for GAR calculation | 661,433 | 465,892 | 33,416 | 29,115 | 6,975 | 1,640 | 60 | 7 | 0 | 5 | 465,953 | 33,422 | 29,115 | 6,975 | 1,645 | ||||||||||||||||||||||||||||||||||||||||
| 2 | Financial undertakings | 28,156 | 7,544 | 510 | 0 | 11 | 349 | 4 | 0 | 0 | 0 | 7,548 | 510 | 0 | 11 | 349 | ||||||||||||||||||||||||||||||||||||||||
| 3 | Credit institutions | 22,517 | 6,241 | 3 | 0 | 0 | 2 | 4 | 0 | 0 | 0 | 6,245 | 3 | 0 | 0 | 2 | ||||||||||||||||||||||||||||||||||||||||
| 4 | Loans and advances | 20,257 | 5,232 | 3 | 0 | 0 | 2 | 4 | 0 | 0 | 0 | 5,236 | 3 | 0 | 0 | 2 | ||||||||||||||||||||||||||||||||||||||||
| 5 | Debt securities, including UoP | 2,261 | 1,009 | 0 | 0 | 0 | 0 | 0 | 0 | 0 | 0 | 1,009 | 0 | 0 | 0 | 0 | ||||||||||||||||||||||||||||||||||||||||
| 6 | Equity instruments | 0 | 0 | 0 | 0 | 0 | 0 | 0 | 0 | 0 | 0 | 0 | 0 | |||||||||||||||||||||||||||||||||||||||||||
| 7 | Other financial corporations | 5,639 | 1,303 | 507 | 0 | 10 | 347 | 0 | 0 | 0 | 0 | 1,303 | 507 | 0 | 10 | 347 | ||||||||||||||||||||||||||||||||||||||||
| 8 | of which investment firms | 1,987 | 438 | 349 | 0 | 0 | 307 | 0 | 0 | 0 | 0 | 438 | 349 | 0 | 0 | 307 | ||||||||||||||||||||||||||||||||||||||||
| 9 | Loans and advances | 1,455 | 138 | 49 | 0 | 0 | 7 | 0 | 0 | 0 | 0 | 138 | 49 | 0 | 0 | 7 | ||||||||||||||||||||||||||||||||||||||||
| 10 | Debt securities, including UoP | 313 | 300 | 300 | 0 | 0 | 300 | 0 | 0 | 0 | 0 | 300 | 300 | 0 | 0 | 300 | ||||||||||||||||||||||||||||||||||||||||
| 11 | Equity instruments | 219 | 0 | 0 | 0 | 0 | 0 | 0 | 0 | 0 | 0 | 0 | 0 | |||||||||||||||||||||||||||||||||||||||||||
| 12 | of which management companies | 141 | 102 | 11 | 0 | 1 | 1 | 0 | 0 | 0 | 0 | 102 | 11 | 0 | 1 | 1 | ||||||||||||||||||||||||||||||||||||||||
| 13 | Loans and advances | 141 | 102 | 11 | 0 | 1 | 1 | 0 | 0 | 0 | 0 | 102 | 11 | 0 | 1 | 1 | ||||||||||||||||||||||||||||||||||||||||
| 14 | Debt securities, including UoP | 0 | 0 | 0 | 0 | 0 | 0 | 0 | 0 | 0 | 0 | 0 | 0 | 0 | 0 | 0 | ||||||||||||||||||||||||||||||||||||||||
| 15 | Equity instruments | 0 | 0 | 0 | 0 | 0 | 0 | 0 | 0 | 0 | 0 | 0 | 0 | |||||||||||||||||||||||||||||||||||||||||||
| 16 | of which insurance undertakings | 1,892 | 318 | 0 | 0 | 0 | 0 | 0 | 0 | 0 | 0 | 318 | 0 | 0 | 0 | 0 | ||||||||||||||||||||||||||||||||||||||||
| 17 | Loans and advances | 1,892 | 318 | 0 | 0 | 0 | 0 | 0 | 0 | 0 | 0 | 318 | 0 | 0 | 0 | 0 | ||||||||||||||||||||||||||||||||||||||||
| 18 | Debt securities, including UoP | 0 | 0 | 0 | 0 | 0 | 0 | 0 | 0 | 0 | 0 | 0 | 0 | 0 | 0 | 0 | ||||||||||||||||||||||||||||||||||||||||
| 19 | Equity instruments | 0 | 0 | 0 | 0 | 0 | 0 | 0 | 0 | 0 | 0 | 0 | 0 | |||||||||||||||||||||||||||||||||||||||||||
| 20 | Non-financial undertakings | 25,910 | 10,901 | 3,791 | 0 | 395 | 1,291 | 56 | 7 | 0 | 5 | 10,957 | 3,798 | 0 | 395 | 1,296 | ||||||||||||||||||||||||||||||||||||||||
| 21 | Loans and advances | 24,347 | 10,367 | 3,315 | 0 | 395 | 1,063 | 49 | 7 | 0 | 5 | 10,416 | 3,322 | 0 | 395 | 1,068 | ||||||||||||||||||||||||||||||||||||||||
| 22 | Debt securities, including UoP | 1,563 | 534 | 476 | 0 | 0 | 228 | 7 | 0 | 0 | 0 | 541 | 476 | 0 | 0 | 228 | ||||||||||||||||||||||||||||||||||||||||
| 23 | Equity instruments | 0 | 0 | 0 | 0 | 0 | 0 | 0 | 0 | 0 | 0 | 0 | 0 | |||||||||||||||||||||||||||||||||||||||||||
| 24 | Households | 607,245 | 447,326 | 29,115 | 29,115 | 6,569 | 0 | 0 | 0 | 0 | 0 | 447,326 | 29,115 | 29,115 | 6,569 | 0 | ||||||||||||||||||||||||||||||||||||||||
| 25 | of which loans collateralised by residential immovable property | 366,626 | 356,979 | 22,545 | 22,545 | 0 | 0 | 0 | 0 | 0 | 0 | 356,979 | 22,545 | 22,545 | 0 | 0 | ||||||||||||||||||||||||||||||||||||||||
| 26 | of which building renovation loans | 528 | 528 | 0 | 0 | 0 | 0 | 0 | 0 | 0 | 0 | 528 | 0 | 0 | 0 | 0 | ||||||||||||||||||||||||||||||||||||||||
| 27 | of which motor vehicle loans | 89,820 | 89,820 | 6,569 | 6,569 | 6,569 | 0 | 89,820 | 6,569 | 6,569 | 6,569 | 0 | ||||||||||||||||||||||||||||||||||||||||||||
| Million EUR | 2023 | |||||||||||||||||||||||||||||||||||||||||||||||||||||||
| Climate Change Mitigation (CCM) | Climate Change Adaptation (CCA) | TOTAL (CCM + CCA) | ||||||||||||||||||||||||||||||||||||||||||||||||||||||
| Total [gross] carrying amount | Of which towards taxonomy relevant sectors (Taxonomy-eligible) | Of which towards taxonomy relevant sectors (Taxonomy-eligible) |
Of which towards taxonomy relevant sectors (Taxonomy-eligible) | |||||||||||||||||||||||||||||||||||||||||||||||||||||
| Of which environmentally sustainable (Taxonomy-aligned) | Of which environmentally sustainable (Taxonomy-aligned) |
Of which environmentally sustainable (Taxonomy-aligned) | ||||||||||||||||||||||||||||||||||||||||||||||||||||||
| Of which Use of Proceeds | Of which transitional | Of which enabling | Of which Use of Proceeds | Of which enabling | Of which Use of Proceeds | Of which transitional | Of which enabling | |||||||||||||||||||||||||||||||||||||||||||||||||
| 28 | Local governments financing | 122 | 122 | 0 | 0 | 0 | 0 | 0 | 0 | 0 | 0 | 122 | 0 | 0 | 0 | 0 | ||||||||||||||||||||||||||||||||||||||||
| 29 | Housing financing | 75 | 75 | 0 | 0 | 0 | 0 | 0 | 0 | 0 | 0 | 75 | 0 | 0 | 0 | 0 | ||||||||||||||||||||||||||||||||||||||||
| 30 | Other local government financing | 46 | 46 | 0 | 0 | 0 | 0 | 0 | 0 | 0 | 0 | 46 | 0 | 0 | 0 | 0 | ||||||||||||||||||||||||||||||||||||||||
| 31 | Collateral obtained by taking possession: residential and commercial immovable properties | 5,595 | 0 | 0 | 0 | 0 | 0 | 0 | 0 | 0 | 0 | 0 | 0 | 0 | 0 | 0 | ||||||||||||||||||||||||||||||||||||||||
| 32 | Assets excluded from the numerator for GAR calculation (covered in the denominator) | 621,271 | 0 | 0 | 0 | 0 | 0 | 0 | 0 | 0 | 0 | 0 | 0 | 0 | 0 | 0 | ||||||||||||||||||||||||||||||||||||||||
| 33 | Financial and Non-financial undertakings | 478,101 | ||||||||||||||||||||||||||||||||||||||||||||||||||||||
| 34 | SMEs and NFCs (other than SMEs) not subject to NFRD disclosure obligations | 141,389 | ||||||||||||||||||||||||||||||||||||||||||||||||||||||
| 35 | Loans and advances | 139,095 | ||||||||||||||||||||||||||||||||||||||||||||||||||||||
| 36 | of which loans collateralised by commercial immovable property | 22,909 | ||||||||||||||||||||||||||||||||||||||||||||||||||||||
| 37 | of which building renovation loans | 141 | ||||||||||||||||||||||||||||||||||||||||||||||||||||||
| 38 | Debt securities | 2,140 | ||||||||||||||||||||||||||||||||||||||||||||||||||||||
| 39 | Equity instruments | 155 | ||||||||||||||||||||||||||||||||||||||||||||||||||||||
| 40 | Non-EU country counterparties not subject to NFRD disclosure obligations | 296,567 | ||||||||||||||||||||||||||||||||||||||||||||||||||||||
| 41 | Loans and advances | 272,256 | ||||||||||||||||||||||||||||||||||||||||||||||||||||||
| 42 | Debt securities | 21,525 | ||||||||||||||||||||||||||||||||||||||||||||||||||||||
| 43 | Equity instruments | 2,787 | ||||||||||||||||||||||||||||||||||||||||||||||||||||||
| 44 | Derivatives | 5,421 | ||||||||||||||||||||||||||||||||||||||||||||||||||||||
| 45 | On demand interbank loans | 11,911 | ||||||||||||||||||||||||||||||||||||||||||||||||||||||
| 46 | Cash and cash-related assets | 8,621 | ||||||||||||||||||||||||||||||||||||||||||||||||||||||
| 47 | Other categories of assets (e.g. Goodwill, commodities etc.) | 117,217 | ||||||||||||||||||||||||||||||||||||||||||||||||||||||
| 48 | Total GAR assets | 1,288,300 | 465,892 | 33,416 | 29,115 | 6,975 | 1,640 | 60 | 7 | 0 | 5 | 465,953 | 33,422 | 29,115 | 6,975 | 1,645 | ||||||||||||||||||||||||||||||||||||||||
| 49 | Assets not covered for GAR calculation | 545,242 | ||||||||||||||||||||||||||||||||||||||||||||||||||||||
| 50 | Central governments and Supranational issuers | 137,606 | ||||||||||||||||||||||||||||||||||||||||||||||||||||||
| 51 | Central banks exposure | 230,835 | ||||||||||||||||||||||||||||||||||||||||||||||||||||||
| Million EUR | 2023 | |||||||||||||||||||||||||||||||||||||||||||||||||||||||
| Climate Change Mitigation (CCM) | Climate Change Adaptation (CCA) | TOTAL (CCM + CCA) | ||||||||||||||||||||||||||||||||||||||||||||||||||||||
| Total [gross] carrying amount | Of which towards taxonomy relevant sectors (Taxonomy-eligible) | Of which towards taxonomy relevant sectors (Taxonomy-eligible) |
Of which towards taxonomy relevant sectors (Taxonomy-eligible) | |||||||||||||||||||||||||||||||||||||||||||||||||||||
| Of which environmentally sustainable (Taxonomy-aligned) | Of which environmentally sustainable (Taxonomy-aligned) |
Of which environmentally sustainable (Taxonomy-aligned) | ||||||||||||||||||||||||||||||||||||||||||||||||||||||
| Of which Use of Proceeds | Of which transitional | Of which enabling | Of which Use of Proceeds | Of which enabling | Of which Use of Proceeds | Of which transitional | Of which enabling | |||||||||||||||||||||||||||||||||||||||||||||||||
| 52 | Trading book | 176,800 | ||||||||||||||||||||||||||||||||||||||||||||||||||||||
| 53 | Total assets | 1,833,542 | 465,892 | 33,416 | 29,115 | 6,975 | 1,640 | 60 | 7 | 0 | 5 | 465,953 | 33,422 | 29,115 | 6,975 | 1,645 | ||||||||||||||||||||||||||||||||||||||||
| Off-balance sheet exposures - Undertakings subject to NFRD disclosure obligations | ||||||||||||||||||||||||||||||||||||||||||||||||||||||||
| 54 | Financial guarantees | 15,573 | 644 | 285 | 0 | 4 | 152 | 26 | 0 | 0 | 0 | 669 | 286 | 0 | 4 | 152 | ||||||||||||||||||||||||||||||||||||||||
| 55 | Assets under management | 137,531 | 4,979 | 1,550 | 0 | 77 | 665 | 36 | 0 | 0 | 0 | 5,015 | 1,550 | 0 | 77 | 665 | ||||||||||||||||||||||||||||||||||||||||
| 56 | Of which debt securities | 39,836 | 3,613 | 837 | 0 | 26 | 440 | 7 | 0 | 0 | 0 | 3,621 | 837 | 0 | 26 | 440 | ||||||||||||||||||||||||||||||||||||||||
| 57 | Of which equity instruments | 43,158 | 1,365 | 713 | 0 | 52 | 225 | 29 | 0 | 0 | 0 | 1,394 | 713 | 0 | 52 | 225 | ||||||||||||||||||||||||||||||||||||||||
| Million EUR | 2023 | |||||||||||||||||||||||||||||||||||||||||||||||||||||||
| Climate Change Mitigation (CCM) | Climate Change Adaptation (CCA) | TOTAL (CCM + CCA) | ||||||||||||||||||||||||||||||||||||||||||||||||||||||
| Total [gross] carrying amount | Of which towards taxonomy relevant sectors (Taxonomy-eligible) | Of which towards taxonomy relevant sectors (Taxonomy-eligible) |
Of which towards taxonomy relevant sectors (Taxonomy-eligible) | |||||||||||||||||||||||||||||||||||||||||||||||||||||
| Of which environmentally sustainable (Taxonomy-aligned) | Of which environmentally sustainable (Taxonomy-aligned) |
Of which environmentally sustainable (Taxonomy-aligned) | ||||||||||||||||||||||||||||||||||||||||||||||||||||||
| Of which Use of Proceeds | Of which transitional | Of which enabling | Of which Use of Proceeds | Of which enabling | Of which Use of Proceeds | Of which transitional | Of which enabling | |||||||||||||||||||||||||||||||||||||||||||||||||
| GAR - Covered assets in both numerator and denominator | ||||||||||||||||||||||||||||||||||||||||||||||||||||||||
| 1 | Loans and advances, debt securities and equity instruments not HfT eligible for GAR calculation | 661,433 | 464,201 | 31,142 | 29,115 | 6,834 | 799 | 474 | 9 | 0 | 8 | 464,675 | 31,151 | 29,115 | 6,834 | 807 | ||||||||||||||||||||||||||||||||||||||||
| 2 | Financial undertakings | 28,156 | 7,899 | 310 | 0 | 4 | 208 | 373 | 0 | 0 | 0 | 8,272 | 310 | 0 | 4 | 208 | ||||||||||||||||||||||||||||||||||||||||
| 3 | Credit institutions | 22,517 | 6,892 | 1 | 0 | 0 | 0 | 15 | 0 | 0 | 0 | 6,907 | 1 | 0 | 0 | 0 | ||||||||||||||||||||||||||||||||||||||||
| 4 | Loans and advances | 20,257 | 5,883 | 1 | 0 | 0 | 0 | 15 | 0 | 0 | 0 | 5,898 | 1 | 0 | 0 | 0 | ||||||||||||||||||||||||||||||||||||||||
| 5 | Debt securities, including UoP | 2,261 | 1,009 | 0 | 0 | 0 | 0 | 0 | 0 | 0 | 0 | 1,009 | 0 | 0 | 0 | 0 | ||||||||||||||||||||||||||||||||||||||||
| 6 | Equity instruments | 0 | 0 | 0 | 0 | 0 | 0 | 0 | 0 | 0 | 0 | 0 | 0 | |||||||||||||||||||||||||||||||||||||||||||
| 7 | Other financial corporations | 5,639 | 1,006 | 309 | 0 | 4 | 208 | 358 | 0 | 0 | 0 | 1,365 | 309 | 0 | 4 | 208 | ||||||||||||||||||||||||||||||||||||||||
| 8 | of which investment firms | 1,987 | 280 | 172 | 0 | 0 | 155 | 41 | 0 | 0 | 0 | 321 | 172 | 0 | 0 | 155 | ||||||||||||||||||||||||||||||||||||||||
| 9 | Loans and advances | 1,455 | 127 | 19 | 0 | 0 | 2 | 41 | 0 | 0 | 0 | 168 | 19 | 0 | 0 | 2 | ||||||||||||||||||||||||||||||||||||||||
| 10 | Debt securities, including UoP | 313 | 153 | 153 | 0 | 0 | 153 | 0 | 0 | 0 | 0 | 153 | 153 | 0 | 0 | 153 | ||||||||||||||||||||||||||||||||||||||||
| 11 | Equity instruments | 219 | 0 | 0 | 0 | 0 | 0 | 0 | 0 | 0 | 0 | 0 | 0 | |||||||||||||||||||||||||||||||||||||||||||
| 12 | of which management companies | 141 | 99 | 17 | 0 | 0 | 0 | 0 | 0 | 0 | 0 | 99 | 17 | 0 | 0 | 0 | ||||||||||||||||||||||||||||||||||||||||
| 13 | Loans and advances | 141 | 99 | 17 | 0 | 0 | 0 | 0 | 0 | 0 | 0 | 99 | 17 | 0 | 0 | 0 | ||||||||||||||||||||||||||||||||||||||||
| 14 | Debt securities, including UoP | 0 | 0 | 0 | 0 | 0 | 0 | 0 | 0 | 0 | 0 | 0 | 0 | 0 | 0 | 0 | ||||||||||||||||||||||||||||||||||||||||
| 15 | Equity instruments | 0 | 0 | 0 | 0 | 0 | 0 | 0 | 0 | 0 | 0 | 0 | 0 | |||||||||||||||||||||||||||||||||||||||||||
| 16 | of which insurance undertakings | 1,892 | 317 | 0 | 0 | 0 | 0 | 317 | 0 | 0 | 0 | 634 | 0 | 0 | 0 | 0 | ||||||||||||||||||||||||||||||||||||||||
| 17 | Loans and advances | 1,892 | 317 | 0 | 0 | 0 | 0 | 317 | 0 | 0 | 0 | 634 | 0 | 0 | 0 | 0 | ||||||||||||||||||||||||||||||||||||||||
| 18 | Debt securities, including UoP | 0 | 0 | 0 | 0 | 0 | 0 | 0 | 0 | 0 | 0 | 0 | 0 | 0 | 0 | 0 | ||||||||||||||||||||||||||||||||||||||||
| 19 | Equity instruments | 0 | 0 | 0 | 0 | 0 | 0 | 0 | 0 | 0 | 0 | 0 | 0 | |||||||||||||||||||||||||||||||||||||||||||
| 20 | Non-financial undertakings | 25,910 | 8,855 | 1,718 | 0 | 260 | 591 | 101 | 9 | 0 | 7 | 8,955 | 1,727 | 0 | 260 | 598 | ||||||||||||||||||||||||||||||||||||||||
| 21 | Loans and advances | 24,347 | 8,617 | 1,509 | 0 | 258 | 552 | 83 | 9 | 0 | 7 | 8,700 | 1,518 | 0 | 258 | 560 | ||||||||||||||||||||||||||||||||||||||||
| 22 | Debt securities, including UoP | 1,563 | 237 | 208 | 0 | 2 | 39 | 18 | 0 | 0 | 0 | 255 | 208 | 0 | 2 | 39 | ||||||||||||||||||||||||||||||||||||||||
| 23 | Equity instruments | 0 | 0 | 0 | 0 | 0 | 0 | 0 | 0 | 0 | 0 | 0 | 0 | |||||||||||||||||||||||||||||||||||||||||||
| 24 | Households | 607,245 | 447,326 | 29,115 | 29,115 | 6,569 | 0 | 0 | 0 | 0 | 0 | 447,326 | 29,115 | 29,115 | 6,569 | 0 | ||||||||||||||||||||||||||||||||||||||||
| 25 | of which loans collateralised by residential immovable property | 366,626 | 356,979 | 22,545 | 22,545 | 0 | 0 | 0 | 0 | 0 | 0 | 356,979 | 22,545 | 22,545 | 0 | 0 | ||||||||||||||||||||||||||||||||||||||||
| 26 | of which building renovation loans | 528 | 528 | 0 | 0 | 0 | 0 | 0 | 0 | 0 | 0 | 528 | 0 | 0 | 0 | 0 | ||||||||||||||||||||||||||||||||||||||||
| 27 | of which motor vehicle loans | 89,820 | 89,820 | 6,569 | 6,569 | 6,569 | 0 | 89,820 | 6,569 | 6,569 | 6,569 | 0 | ||||||||||||||||||||||||||||||||||||||||||||
| 28 | Local governments financing | 122 | 122 | 0 | 0 | 0 | 0 | 0 | 0 | 0 | 0 | 122 | 0 | 0 | 0 | 0 | ||||||||||||||||||||||||||||||||||||||||
| 29 | Housing financing | 75 | 75 | 0 | 0 | 0 | 0 | 0 | 0 | 0 | 0 | 75 | 0 | 0 | 0 | 0 | ||||||||||||||||||||||||||||||||||||||||
| Million EUR | 2023 | |||||||||||||||||||||||||||||||||||||||||||||||||||||||
| Climate Change Mitigation (CCM) | Climate Change Adaptation (CCA) | TOTAL (CCM + CCA) | ||||||||||||||||||||||||||||||||||||||||||||||||||||||
| Total [gross] carrying amount | Of which towards taxonomy relevant sectors (Taxonomy-eligible) | Of which towards taxonomy relevant sectors (Taxonomy-eligible) |
Of which towards taxonomy relevant sectors (Taxonomy-eligible) | |||||||||||||||||||||||||||||||||||||||||||||||||||||
| Of which environmentally sustainable (Taxonomy-aligned) | Of which environmentally sustainable (Taxonomy-aligned) |
Of which environmentally sustainable (Taxonomy-aligned) | ||||||||||||||||||||||||||||||||||||||||||||||||||||||
| Of which Use of Proceeds | Of which transitional | Of which enabling | Of which Use of Proceeds | Of which enabling | Of which Use of Proceeds | Of which transitional | Of which enabling | |||||||||||||||||||||||||||||||||||||||||||||||||
| 30 | Other local government financing | 46 | 46 | 0 | 0 | 0 | 0 | 0 | 0 | 0 | 0 | 46 | 0 | 0 | 0 | 0 | ||||||||||||||||||||||||||||||||||||||||
| 31 | Collateral obtained by taking possession: residential and commercial immovable properties | 5,595 | 0 | 0 | 0 | 0 | 0 | 0 | 0 | 0 | 0 | 0 | 0 | 0 | 0 | 0 | ||||||||||||||||||||||||||||||||||||||||
| 32 | Assets excluded from the numerator for GAR calculation (covered in the denominator) | 621,271 | 0 | 0 | 0 | 0 | 0 | 0 | 0 | 0 | 0 | 0 | 0 | 0 | 0 | 0 | ||||||||||||||||||||||||||||||||||||||||
| 33 | Financial and Non-financial undertakings | 478,101 | ||||||||||||||||||||||||||||||||||||||||||||||||||||||
| 34 | SMEs and NFCs (other than SMEs) not subject to NFRD disclosure obligations | 141,389 | ||||||||||||||||||||||||||||||||||||||||||||||||||||||
| 35 | Loans and advances | 139,095 | ||||||||||||||||||||||||||||||||||||||||||||||||||||||
| 36 | of which loans collateralised by commercial immovable property | 22,909 | ||||||||||||||||||||||||||||||||||||||||||||||||||||||
| 37 | of which building renovation loans | 141 | ||||||||||||||||||||||||||||||||||||||||||||||||||||||
| 38 | Debt securities | 2,140 | ||||||||||||||||||||||||||||||||||||||||||||||||||||||
| 39 | Equity instruments | 155 | ||||||||||||||||||||||||||||||||||||||||||||||||||||||
| 40 | Non-EU country counterparties not subject to NFRD disclosure obligations | 296,567 | ||||||||||||||||||||||||||||||||||||||||||||||||||||||
| 41 | Loans and advances | 272,256 | ||||||||||||||||||||||||||||||||||||||||||||||||||||||
| 42 | Debt securities | 21,525 | ||||||||||||||||||||||||||||||||||||||||||||||||||||||
| 43 | Equity instruments | 2,787 | ||||||||||||||||||||||||||||||||||||||||||||||||||||||
| 44 | Derivatives | 5,421 | ||||||||||||||||||||||||||||||||||||||||||||||||||||||
| 45 | On demand interbank loans | 11,911 | ||||||||||||||||||||||||||||||||||||||||||||||||||||||
| 46 | Cash and cash-related assets | 8,621 | ||||||||||||||||||||||||||||||||||||||||||||||||||||||
| 47 | Other categories of assets (e.g. Goodwill, commodities etc.) | 117,217 | ||||||||||||||||||||||||||||||||||||||||||||||||||||||
| 48 | Total GAR assets | 1,288,300 | 464,201 | 31,142 | 29,115 | 6,834 | 799 | 474 | 9 | 0 | 8 | 464,675 | 31,151 | 29,115 | 6,834 | 807 | ||||||||||||||||||||||||||||||||||||||||
| 49 | Assets not covered for GAR calculation | 545,242 | ||||||||||||||||||||||||||||||||||||||||||||||||||||||
| 50 | Central governments and Supranational issuers | 137,606 | ||||||||||||||||||||||||||||||||||||||||||||||||||||||
| 51 | Central banks exposure | 230,835 | ||||||||||||||||||||||||||||||||||||||||||||||||||||||
| 52 | Trading book | 176,800 | ||||||||||||||||||||||||||||||||||||||||||||||||||||||
| 53 | Total assets | 1,833,542 | 464,201 | 31,142 | 29,115 | 6,834 | 799 | 474 | 9 | 0 | 8 | 464,675 | 31,151 | 29,115 | 6,834 | 807 | ||||||||||||||||||||||||||||||||||||||||
| Million EUR | 2023 | |||||||||||||||||||||||||||||||||||||||||||||||||||||||
| Climate Change Mitigation (CCM) | Climate Change Adaptation (CCA) | TOTAL (CCM + CCA) | ||||||||||||||||||||||||||||||||||||||||||||||||||||||
| Total [gross] carrying amount | Of which towards taxonomy relevant sectors (Taxonomy-eligible) | Of which towards taxonomy relevant sectors (Taxonomy-eligible) |
Of which towards taxonomy relevant sectors (Taxonomy-eligible) | |||||||||||||||||||||||||||||||||||||||||||||||||||||
| Of which environmentally sustainable (Taxonomy-aligned) | Of which environmentally sustainable (Taxonomy-aligned) |
Of which environmentally sustainable (Taxonomy-aligned) | ||||||||||||||||||||||||||||||||||||||||||||||||||||||
| Of which Use of Proceeds | Of which transitional | Of which enabling | Of which Use of Proceeds | Of which enabling | Of which Use of Proceeds | Of which transitional | Of which enabling | |||||||||||||||||||||||||||||||||||||||||||||||||
| Off-balance sheet exposures - Undertakings subject to NFRD disclosure obligations | ||||||||||||||||||||||||||||||||||||||||||||||||||||||||
| 54 | Financial guarantees | 15,573 | 494 | 142 | 0 | 3 | 98 | 6 | 0 | 0 | 0 | 500 | 142 | 0 | 3 | 99 | ||||||||||||||||||||||||||||||||||||||||
| 55 | Assets under management | 137,531 | 4,302 | 825 | 0 | 57 | 431 | 406 | 4 | 0 | 4 | 4,708 | 829 | 0 | 57 | 435 | ||||||||||||||||||||||||||||||||||||||||
| 56 | Of which debt securities | 39,836 | 3,308 | 445 | 0 | 11 | 269 | 233 | 0 | 0 | 0 | 3,541 | 446 | 0 | 11 | 269 | ||||||||||||||||||||||||||||||||||||||||
| 57 | Of which equity instruments | 43,158 | 993 | 380 | 0 | 46 | 162 | 173 | 3 | 0 | 3 | 1,167 | 384 | 0 | 46 | 165 | ||||||||||||||||||||||||||||||||||||||||
| Breakdown by sector - NACE 4 digits level (code and label) |
2023 | |||||||||||||||||||||||||||||||||||||||||||||||||||||||
| Climate Change Mitigation (CCM) | Climate Change Adaptation (CCA) | TOTAL (CCM + CCA) | ||||||||||||||||||||||||||||||||||||||||||||||||||||||
| Non-Financial corporates (Subject to NFRD) | SMEs and other NFC not subject to NFRD | Non-Financial corporates (Subject to NFRD) | SMEs and other NFC not subject to NFRD | Non-Financial corporates (Subject to NFRD) | SMEs and other NFC not subject to NFRD | |||||||||||||||||||||||||||||||||||||||||||||||||||
| [Gross] carrying amount | [Gross] carrying amount | [Gross] carrying amount | [Gross] carrying amount | [Gross] carrying amount | [Gross] carrying amount | |||||||||||||||||||||||||||||||||||||||||||||||||||
| Mn EUR | Of which environmentally sustainable (CCM) | Mn EUR | Of which environmentally sustainable (CCM) | Mn EUR | Of which environmentally sustainable (CCA) | Mn EUR | Of which environmentally sustainable (CCA) | Mn EUR | Of which environmentally sustainable (CCM+CCA) | Mn EUR | Of which environmentally sustainable (CCM+CCA) | |||||||||||||||||||||||||||||||||||||||||||||
| 1 | A Agriculture, forestry and fishing | 6 | 5 | 0 | 0 | 6 | 5 | |||||||||||||||||||||||||||||||||||||||||||||||||
| 2 | B910 - Support activities for petroleum and natural gas extraction | 151 | 77 | 0 | 0 | 151 | 77 | |||||||||||||||||||||||||||||||||||||||||||||||||
| 3 | Other B Mining and quarrying | 37 | 14 | 0 | 0 | 37 | 14 | |||||||||||||||||||||||||||||||||||||||||||||||||
| 4 | C1086 - Manufacture of homogenised food preparations and dietetic food | 69 | 0 | 0 | 0 | 69 | 0 | |||||||||||||||||||||||||||||||||||||||||||||||||
| 5 | C1920 - Manufacture of refined petroleum products | 121 | 90 | 0 | 0 | 121 | 90 | |||||||||||||||||||||||||||||||||||||||||||||||||
| 6 | C2410 - Manufacture of basic iron and steel and of ferro-alloys | 120 | 51 | 0 | 0 | 120 | 51 | |||||||||||||||||||||||||||||||||||||||||||||||||
| 7 | C2442 - Aluminium production | 62 | 39 | 0 | 0 | 62 | 39 | |||||||||||||||||||||||||||||||||||||||||||||||||
| 8 | C2732 - Manufacture of other electronic and electric wires and cables | 99 | 57 | 0 | 0 | 99 | 57 | |||||||||||||||||||||||||||||||||||||||||||||||||
| 9 | C2733 - Manufacture of wiring devices | 55 | 40 | 0 | 0 | 55 | 40 | |||||||||||||||||||||||||||||||||||||||||||||||||
| 10 | C2910 - Manufacture of motor vehicles | 516 | 190 | 0 | 0 | 516 | 190 | |||||||||||||||||||||||||||||||||||||||||||||||||
| 11 | C3011 - Building of ships and floating structures | 74 | 7 | 0 | 0 | 74 | 7 | |||||||||||||||||||||||||||||||||||||||||||||||||
| 12 | C3020 - Manufacture of railway locomotives and rolling stock | 143 | 76 | 0 | 0 | 143 | 76 | |||||||||||||||||||||||||||||||||||||||||||||||||
| 13 | Other C Manufacturing | 482 | 84 | 0 | 0 | 482 | 84 | |||||||||||||||||||||||||||||||||||||||||||||||||
| 14 | D3511 - Production of electricity | 1,594 | 1,343 | 0 | 0 | 1,594 | 1,343 | |||||||||||||||||||||||||||||||||||||||||||||||||
| 15 | D3512 - Transmission of electricity | 145 | 138 | 0 | 0 | 145 | 138 | |||||||||||||||||||||||||||||||||||||||||||||||||
| 16 | D3513 - Distribution of electricity | 512 | 399 | 0 | 0 | 512 | 399 | |||||||||||||||||||||||||||||||||||||||||||||||||
| 17 | D3514 - Trade of electricity | 315 | 295 | 0 | 0 | 315 | 295 | |||||||||||||||||||||||||||||||||||||||||||||||||
| 18 | Other D Electricity, gas, steam and air conditioning supply | 74 | 66 | 1 | 1 | 75 | 67 | |||||||||||||||||||||||||||||||||||||||||||||||||
| 19 | E Water supply | 89 | 1 | 0 | 0 | 89 | 1 | |||||||||||||||||||||||||||||||||||||||||||||||||
| 20 | F4110 - Development of building projects | 192 | 10 | 0 | 0 | 192 | 10 | |||||||||||||||||||||||||||||||||||||||||||||||||
| Breakdown by sector - NACE 4 digits level (code and label) |
2023 | |||||||||||||||||||||||||||||||||||||||||||||||||||||||
| Climate Change Mitigation (CCM) | Climate Change Adaptation (CCA) | TOTAL (CCM + CCA) | ||||||||||||||||||||||||||||||||||||||||||||||||||||||
| Non-Financial corporates (Subject to NFRD) | SMEs and other NFC not subject to NFRD | Non-Financial corporates (Subject to NFRD) | SMEs and other NFC not subject to NFRD | Non-Financial corporates (Subject to NFRD) | SMEs and other NFC not subject to NFRD | |||||||||||||||||||||||||||||||||||||||||||||||||||
| [Gross] carrying amount | [Gross] carrying amount | [Gross] carrying amount | [Gross] carrying amount | [Gross] carrying amount | [Gross] carrying amount | |||||||||||||||||||||||||||||||||||||||||||||||||||
| Mn EUR | Of which environmentally sustainable (CCM) | Mn EUR | Of which environmentally sustainable (CCM) | Mn EUR | Of which environmentally sustainable (CCA) | Mn EUR | Of which environmentally sustainable (CCA) | Mn EUR | Of which environmentally sustainable (CCM+CCA) | Mn EUR | Of which environmentally sustainable (CCM+CCA) | |||||||||||||||||||||||||||||||||||||||||||||
| 21 | F4120 - Construction of residential and non-residential buildings | 84 | 18 | 0 | 0 | 84 | 18 | |||||||||||||||||||||||||||||||||||||||||||||||||
| 22 | F4211 - Construction of roads and motorways | 187 | 3 | 1 | 0 | 187 | 3 | |||||||||||||||||||||||||||||||||||||||||||||||||
| 23 | F4222 - Construction of utility projects for electricity and telecommunications | 328 | 3 | 0 | 0 | 328 | 3 | |||||||||||||||||||||||||||||||||||||||||||||||||
| 24 | F4299 - Construction of other civil engineering projects n.e.c. | 156 | 5 | 0 | 0 | 156 | 5 | |||||||||||||||||||||||||||||||||||||||||||||||||
| 25 | F4312 - Site preparation | 130 | 5 | 0 | 0 | 130 | 5 | |||||||||||||||||||||||||||||||||||||||||||||||||
| 26 | F4321 - Electrical installation | 94 | 6 | 0 | 0 | 94 | 6 | |||||||||||||||||||||||||||||||||||||||||||||||||
| 27 | Other F Construction | 105 | 5 | 0 | 0 | 105 | 5 | |||||||||||||||||||||||||||||||||||||||||||||||||
| 28 | G4711 - Retail sale in non-specialised stores with food, beverages or tobacco predominating | 92 | 5 | 0 | 0 | 92 | 5 | |||||||||||||||||||||||||||||||||||||||||||||||||
| 29 | G4778 - Other retail sale of new goods in specialised stores | 94 | 0 | 0 | 0 | 94 | 0 | |||||||||||||||||||||||||||||||||||||||||||||||||
| 30 | Other G Wholesale and retail trade | 349 | 62 | 1 | 1 | 350 | 62 | |||||||||||||||||||||||||||||||||||||||||||||||||
| 31 | H4910 - Passenger rail transport, interurban | 57 | 7 | 0 | 0 | 57 | 7 | |||||||||||||||||||||||||||||||||||||||||||||||||
| 32 | H4950 - Transport via pipeline | 92 | 84 | 0 | 0 | 92 | 84 | |||||||||||||||||||||||||||||||||||||||||||||||||
| 33 | H5221 - Service activities incidental to land transportation | 425 | 2 | 0 | 0 | 425 | 2 | |||||||||||||||||||||||||||||||||||||||||||||||||
| 34 | Other H Transport and storage | 71 | 4 | 0 | 0 | 71 | 4 | |||||||||||||||||||||||||||||||||||||||||||||||||
| 35 | I5510 - Hotels and similar accommodation | 321 | 0 | 0 | 0 | 321 | 0 | |||||||||||||||||||||||||||||||||||||||||||||||||
| 36 | Other I Accommodation and food service activities | 29 | 0 | 0 | 0 | 29 | 0 | |||||||||||||||||||||||||||||||||||||||||||||||||
| 37 | J6110 - Wired telecommunications activities | 91 | 3 | 0 | 0 | 91 | 3 | |||||||||||||||||||||||||||||||||||||||||||||||||
| 38 | J6120 - Wireless telecommunications activities | 228 | 5 | 27 | 1 | 255 | 6 | |||||||||||||||||||||||||||||||||||||||||||||||||
| 39 | J6399 - Other information service activities n.e.c. | 504 | 0 | 0 | 0 | 504 | 0 | |||||||||||||||||||||||||||||||||||||||||||||||||
| 40 | Other J Information and communication | 110 | 2 | 18 | 4 | 128 | 6 | |||||||||||||||||||||||||||||||||||||||||||||||||
| 41 | L6810 - Buying and selling of own real estate | 68 | 8 | 0 | 0 | 68 | 8 | |||||||||||||||||||||||||||||||||||||||||||||||||
| Breakdown by sector - NACE 4 digits level (code and label) |
2023 | |||||||||||||||||||||||||||||||||||||||||||||||||||||||
| Climate Change Mitigation (CCM) | Climate Change Adaptation (CCA) | TOTAL (CCM + CCA) | ||||||||||||||||||||||||||||||||||||||||||||||||||||||
| Non-Financial corporates (Subject to NFRD) | SMEs and other NFC not subject to NFRD | Non-Financial corporates (Subject to NFRD) | SMEs and other NFC not subject to NFRD | Non-Financial corporates (Subject to NFRD) | SMEs and other NFC not subject to NFRD | |||||||||||||||||||||||||||||||||||||||||||||||||||
| [Gross] carrying amount | [Gross] carrying amount | [Gross] carrying amount | [Gross] carrying amount | [Gross] carrying amount | [Gross] carrying amount | |||||||||||||||||||||||||||||||||||||||||||||||||||
| Mn EUR | Of which environmentally sustainable (CCM) | Mn EUR | Of which environmentally sustainable (CCM) | Mn EUR | Of which environmentally sustainable (CCA) | Mn EUR | Of which environmentally sustainable (CCA) | Mn EUR | Of which environmentally sustainable (CCM+CCA) | Mn EUR | Of which environmentally sustainable (CCM+CCA) | |||||||||||||||||||||||||||||||||||||||||||||
| 42 | L6820 - Renting and operating of own or leased real estate | 264 | 1 | 0 | 0 | 264 | 1 | |||||||||||||||||||||||||||||||||||||||||||||||||
| 43 | L6831 - Real estate agencies | 205 | 26 | 0 | 0 | 205 | 26 | |||||||||||||||||||||||||||||||||||||||||||||||||
| 44 | Other L Real estate activities | 26 | 0 | 0 | 0 | 26 | 0 | |||||||||||||||||||||||||||||||||||||||||||||||||
| 45 | M6920 - Accounting, bookkeeping and auditing activities; tax consultancy | 115 | 99 | 0 | 0 | 115 | 99 | |||||||||||||||||||||||||||||||||||||||||||||||||
| 46 | M7010 - Activities of head offices | 534 | 251 | 0 | 0 | 534 | 251 | |||||||||||||||||||||||||||||||||||||||||||||||||
| 47 | M7022 - Business and other management consultancy activities | 77 | 7 | 0 | 0 | 77 | 7 | |||||||||||||||||||||||||||||||||||||||||||||||||
| 48 | M7490 - Other professional, scientific and technical activities n.e.c. | 134 | 45 | 0 | 0 | 134 | 45 | |||||||||||||||||||||||||||||||||||||||||||||||||
| 49 | Other M Professional, scientific and technical activities | 46 | 12 | 0 | 0 | 46 | 12 | |||||||||||||||||||||||||||||||||||||||||||||||||
| 50 | N7711 - Renting and leasing of cars and light motor vehicles | 130 | 48 | 0 | 0 | 130 | 48 | |||||||||||||||||||||||||||||||||||||||||||||||||
| 51 | N7712 - Renting and leasing of trucks | 60 | 5 | 0 | 0 | 60 | 5 | |||||||||||||||||||||||||||||||||||||||||||||||||
| 52 | N8299 - Other business support service activities n.e.c. | 159 | 0 | 0 | 0 | 159 | 0 | |||||||||||||||||||||||||||||||||||||||||||||||||
| 53 | Other N Administrative and support service activities | 126 | 23 | 0 | 0 | 126 | 23 | |||||||||||||||||||||||||||||||||||||||||||||||||
| 54 | O Public administration and defence, compulsory social security | 0 | 0 | 0 | 0 | 0 | 0 | |||||||||||||||||||||||||||||||||||||||||||||||||
| 55 | P Education | 14 | 0 | 0 | 0 | 14 | 0 | |||||||||||||||||||||||||||||||||||||||||||||||||
| 56 | Q Human health services and social work activities | 18 | 2 | 0 | 0 | 18 | 2 | |||||||||||||||||||||||||||||||||||||||||||||||||
| 57 | R Arts, entertainment and recreation | 2 | 0 | 0 | 0 | 2 | 0 | |||||||||||||||||||||||||||||||||||||||||||||||||
| 58 | S Other services | 519 | 63 | 7 | 0 | 525 | 63 | |||||||||||||||||||||||||||||||||||||||||||||||||
| 1. Exposures in the banking book towards those sectors covered by the Taxonomy (NACE sectors 4 levels of detail), using the relevant NACE Codes on the basis of the principal activity of the counterparty. A threshold above 0.5% of the eligible exposure has been set for reporting NACE at level 4. All other NACEs outside this threshold are reported at level 1. | ||
| Breakdown by sector - NACE 4 digits level (code and label) |
2023 | |||||||||||||||||||||||||||||||||||||||||||||||||||||||
| Climate Change Mitigation (CCM) | Climate Change Adaptation (CCA) | TOTAL (CCM + CCA) | ||||||||||||||||||||||||||||||||||||||||||||||||||||||
| Non-Financial corporates (Subject to NFRD) | SMEs and other NFC not subject to NFRD | Non-Financial corporates (Subject to NFRD) | SMEs and other NFC not subject to NFRD | Non-Financial corporates (Subject to NFRD) | SMEs and other NFC not subject to NFRD | |||||||||||||||||||||||||||||||||||||||||||||||||||
| [Gross] carrying amount | [Gross] carrying amount | [Gross] carrying amount | [Gross] carrying amount | [Gross] carrying amount | [Gross] carrying amount | |||||||||||||||||||||||||||||||||||||||||||||||||||
| Mn EUR | Of which environmentally sustainable (CCM) | Mn EUR | Of which environmentally sustainable (CCM) | Mn EUR | Of which environmentally sustainable (CCA) | Mn EUR | Of which environmentally sustainable (CCA) | Mn EUR | Of which environmentally sustainable (CCM+CCA) | Mn EUR | Of which environmentally sustainable (CCM+CCA) | |||||||||||||||||||||||||||||||||||||||||||||
| 1 | A Agriculture, forestry and fishing | 5 | 4 | 0 | 0 | 5 | 4 | |||||||||||||||||||||||||||||||||||||||||||||||||
| 2 | B910 - Support activities for petroleum and natural gas extraction | 101 | 15 | 0 | 0 | 101 | 15 | |||||||||||||||||||||||||||||||||||||||||||||||||
| 3 | Other B Mining and quarrying | 20 | 9 | 0 | 0 | 20 | 9 | |||||||||||||||||||||||||||||||||||||||||||||||||
| 4 | C2410 - Manufacture of basic iron and steel and of ferro-alloys | 132 | 50 | 0 | 0 | 132 | 50 | |||||||||||||||||||||||||||||||||||||||||||||||||
| 5 | C2420 - Manufacture of tubes, pipes, hollow profiles and related fittings, of steel | 52 | 4 | 0 | 0 | 52 | 4 | |||||||||||||||||||||||||||||||||||||||||||||||||
| 6 | C2442 - Aluminium production | 84 | 45 | 0 | 0 | 84 | 45 | |||||||||||||||||||||||||||||||||||||||||||||||||
| 7 | C2732 - Manufacture of other electronic and electric wires and cables | 56 | 16 | 0 | 0 | 56 | 16 | |||||||||||||||||||||||||||||||||||||||||||||||||
| 8 | C2751 - Manufacture of electric domestic appliances | 48 | 0 | 0 | 0 | 48 | 0 | |||||||||||||||||||||||||||||||||||||||||||||||||
| 9 | C2910 - Manufacture of motor vehicles | 484 | 50 | 0 | 0 | 484 | 50 | |||||||||||||||||||||||||||||||||||||||||||||||||
| 10 | C3011 - Building of ships and floating structures | 81 | 10 | 0 | 0 | 81 | 10 | |||||||||||||||||||||||||||||||||||||||||||||||||
| 11 | C3020 - Manufacture of railway locomotives and rolling stock | 143 | 83 | 0 | 0 | 143 | 83 | |||||||||||||||||||||||||||||||||||||||||||||||||
| 12 | C3313 - Repair of electronic and optical equipment | 55 | 0 | 0 | 0 | 55 | 0 | |||||||||||||||||||||||||||||||||||||||||||||||||
| 13 | Other C Manufacturing | 243 | 40 | 0 | 0 | 243 | 40 | |||||||||||||||||||||||||||||||||||||||||||||||||
| 14 | D3511 - Production of electricity | 843 | 537 | 0 | 0 | 843 | 537 | |||||||||||||||||||||||||||||||||||||||||||||||||
| 15 | D3512 - Transmission of electricity | 100 | 75 | 0 | 0 | 100 | 75 | |||||||||||||||||||||||||||||||||||||||||||||||||
| 16 | D3513 - Distribution of electricity | 338 | 174 | 0 | 0 | 338 | 174 | |||||||||||||||||||||||||||||||||||||||||||||||||
| 17 | D3514 - Trade of electricity | 137 | 108 | 0 | 0 | 137 | 108 | |||||||||||||||||||||||||||||||||||||||||||||||||
| 18 | Other D Electricity, gas, steam and air conditioning supply | 30 | 8 | 0 | 0 | 30 | 8 | |||||||||||||||||||||||||||||||||||||||||||||||||
| 19 | E3600 - Water collection, treatment and supply | 53 | 1 | 0 | 0 | 53 | 1 | |||||||||||||||||||||||||||||||||||||||||||||||||
| 20 | Other E Water supply | 39 | 1 | 0 | 0 | 39 | 1 | |||||||||||||||||||||||||||||||||||||||||||||||||
| Breakdown by sector - NACE 4 digits level (code and label) |
2023 | |||||||||||||||||||||||||||||||||||||||||||||||||||||||
| Climate Change Mitigation (CCM) | Climate Change Adaptation (CCA) | TOTAL (CCM + CCA) | ||||||||||||||||||||||||||||||||||||||||||||||||||||||
| Non-Financial corporates (Subject to NFRD) | SMEs and other NFC not subject to NFRD | Non-Financial corporates (Subject to NFRD) | SMEs and other NFC not subject to NFRD | Non-Financial corporates (Subject to NFRD) | SMEs and other NFC not subject to NFRD | |||||||||||||||||||||||||||||||||||||||||||||||||||
| [Gross] carrying amount | [Gross] carrying amount | [Gross] carrying amount | [Gross] carrying amount | [Gross] carrying amount | [Gross] carrying amount | |||||||||||||||||||||||||||||||||||||||||||||||||||
| Mn EUR | Of which environmentally sustainable (CCM) | Mn EUR | Of which environmentally sustainable (CCM) | Mn EUR | Of which environmentally sustainable (CCA) | Mn EUR | Of which environmentally sustainable (CCA) | Mn EUR | Of which environmentally sustainable (CCM+CCA) | Mn EUR | Of which environmentally sustainable (CCM+CCA) | |||||||||||||||||||||||||||||||||||||||||||||
| 21 | F4110 - Development of building projects | 214 | 14 | 0 | 0 | 214 | 14 | |||||||||||||||||||||||||||||||||||||||||||||||||
| 22 | F4120 - Construction of residential and non-residential buildings | 81 | 12 | 0 | 0 | 81 | 12 | |||||||||||||||||||||||||||||||||||||||||||||||||
| 23 | F4211 - Construction of roads and motorways | 192 | 3 | 1 | 0 | 193 | 4 | |||||||||||||||||||||||||||||||||||||||||||||||||
| 24 | F4222 - Construction of utility projects for electricity and telecommunications | 314 | 1 | 0 | 0 | 315 | 1 | |||||||||||||||||||||||||||||||||||||||||||||||||
| 25 | F4299 - Construction of other civil engineering projects n.e.c. | 164 | 18 | 0 | 0 | 164 | 18 | |||||||||||||||||||||||||||||||||||||||||||||||||
| 26 | F4312 - Site preparation | 122 | 0 | 0 | 0 | 122 | 0 | |||||||||||||||||||||||||||||||||||||||||||||||||
| 27 | F4321 - Electrical installation | 109 | 8 | 0 | 0 | 109 | 8 | |||||||||||||||||||||||||||||||||||||||||||||||||
| 28 | Other F Construction | 105 | 15 | 0 | 0 | 105 | 15 | |||||||||||||||||||||||||||||||||||||||||||||||||
| 29 | G Wholesale and retail trade | 168 | 15 | 0 | 0 | 169 | 15 | |||||||||||||||||||||||||||||||||||||||||||||||||
| 30 | H5221 - Service activities incidental to land transportation | 421 | 1 | 0 | 0 | 421 | 1 | |||||||||||||||||||||||||||||||||||||||||||||||||
| 31 | Other H Transport and storage | 177 | 36 | 0 | 0 | 177 | 36 | |||||||||||||||||||||||||||||||||||||||||||||||||
| 32 | I5510 - Hotels and similar accommodation | 250 | 0 | 0 | 0 | 250 | 0 | |||||||||||||||||||||||||||||||||||||||||||||||||
| 33 | Other I Accommodation and food service activities | 26 | 0 | 0 | 0 | 26 | 0 | |||||||||||||||||||||||||||||||||||||||||||||||||
| 34 | J6110 - Wired telecommunications activities | 59 | 4 | 2 | 0 | 61 | 4 | |||||||||||||||||||||||||||||||||||||||||||||||||
| 35 | J6120 - Wireless telecommunications activities | 365 | 30 | 49 | 1 | 414 | 32 | |||||||||||||||||||||||||||||||||||||||||||||||||
| 36 | J6399 - Other information service activities n.e.c. | 504 | 0 | 0 | 0 | 504 | 0 | |||||||||||||||||||||||||||||||||||||||||||||||||
| 37 | Other J Information and communication | 97 | 1 | 15 | 5 | 112 | 7 | |||||||||||||||||||||||||||||||||||||||||||||||||
| 38 | L6810 - Buying and selling of own real estate | 74 | 9 | 0 | 0 | 74 | 9 | |||||||||||||||||||||||||||||||||||||||||||||||||
| 39 | L6820 - Renting and operating of own or leased real estate | 267 | 1 | 0 | 0 | 267 | 1 | |||||||||||||||||||||||||||||||||||||||||||||||||
| 40 | L6831 - Real estate agencies | 234 | 18 | 0 | 0 | 234 | 18 | |||||||||||||||||||||||||||||||||||||||||||||||||
| 41 | Other L Real estate activities | 26 | 2 | 0 | 0 | 26 | 2 | |||||||||||||||||||||||||||||||||||||||||||||||||
| 42 | M6920 - Accounting, bookkeeping and auditing activities; tax consultancy | 66 | 42 | 8 | 1 | 74 | 43 | |||||||||||||||||||||||||||||||||||||||||||||||||
| 43 | M7010 - Activities of head offices | 488 | 158 | 0 | 0 | 488 | 158 | |||||||||||||||||||||||||||||||||||||||||||||||||
| Breakdown by sector - NACE 4 digits level (code and label) |
2023 | |||||||||||||||||||||||||||||||||||||||||||||||||||||||
| Climate Change Mitigation (CCM) | Climate Change Adaptation (CCA) | TOTAL (CCM + CCA) | ||||||||||||||||||||||||||||||||||||||||||||||||||||||
| Non-Financial corporates (Subject to NFRD) | SMEs and other NFC not subject to NFRD | Non-Financial corporates (Subject to NFRD) | SMEs and other NFC not subject to NFRD | Non-Financial corporates (Subject to NFRD) | SMEs and other NFC not subject to NFRD | |||||||||||||||||||||||||||||||||||||||||||||||||||
| [Gross] carrying amount | [Gross] carrying amount | [Gross] carrying amount | [Gross] carrying amount | [Gross] carrying amount | [Gross] carrying amount | |||||||||||||||||||||||||||||||||||||||||||||||||||
| Mn EUR | Of which environmentally sustainable (CCM) | Mn EUR | Of which environmentally sustainable (CCM) | Mn EUR | Of which environmentally sustainable (CCA) | Mn EUR | Of which environmentally sustainable (CCA) | Mn EUR | Of which environmentally sustainable (CCM+CCA) | Mn EUR | Of which environmentally sustainable (CCM+CCA) | |||||||||||||||||||||||||||||||||||||||||||||
| 44 | M7022 - Business and other management consultancy activities | 95 | 8 | 1 | 0 | 96 | 8 | |||||||||||||||||||||||||||||||||||||||||||||||||
| 45 | M7112 - Engineering activities and related technical consultancy | 46 | 16 | 0 | 0 | 46 | 16 | |||||||||||||||||||||||||||||||||||||||||||||||||
| 46 | M7490 - Other professional, scientific and technical activities n.e.c. | 99 | 35 | 0 | 0 | 100 | 35 | |||||||||||||||||||||||||||||||||||||||||||||||||
| 47 | Other M Professional, scientific and technical activities | 3 | 0 | 0 | 0 | 3 | 0 | |||||||||||||||||||||||||||||||||||||||||||||||||
| 48 | N7711 - Renting and leasing of cars and light motor vehicles | 127 | 10 | 0 | 0 | 127 | 10 | |||||||||||||||||||||||||||||||||||||||||||||||||
| 49 | N7712 - Renting and leasing of trucks | 58 | 0 | 0 | 0 | 58 | 0 | |||||||||||||||||||||||||||||||||||||||||||||||||
| 50 | N8010 - Private security activities | 49 | 0 | 0 | 0 | 49 | 0 | |||||||||||||||||||||||||||||||||||||||||||||||||
| 51 | N8299 - Other business support service activities n.e.c. | 157 | 0 | 0 | 0 | 157 | 0 | |||||||||||||||||||||||||||||||||||||||||||||||||
| 52 | Other N Administrative and support service activities | 92 | 11 | 1 | 0 | 93 | 11 | |||||||||||||||||||||||||||||||||||||||||||||||||
| 53 | O Public administration and defence, compulsory social security | 0 | 0 | 0 | 0 | 0 | 0 | |||||||||||||||||||||||||||||||||||||||||||||||||
| 54 | P Education | 14 | 0 | 0 | 0 | 14 | 0 | |||||||||||||||||||||||||||||||||||||||||||||||||
| 55 | Q Human health services and social work activities | 17 | 1 | 0 | 0 | 17 | 1 | |||||||||||||||||||||||||||||||||||||||||||||||||
| 56 | R Arts, entertainment and recreation | 0 | 0 | 0 | 0 | 0 | 0 | |||||||||||||||||||||||||||||||||||||||||||||||||
| 57 | S Other services | 534 | 21 | 24 | 1 | 558 | 21 | |||||||||||||||||||||||||||||||||||||||||||||||||
| 1. Exposures in the banking book towards those sectors covered by the Taxonomy (NACE sectors 4 levels of detail), using the relevant NACE Codes on the basis of the principal activity of the counterparty. A threshold above 0.5% of the eligible exposure has been set for reporting NACE at level 4. All other NACEs outside this threshold are reported at level 1. | ||
| % (compared to total covered assets in the denominator) | 2023 | |||||||||||||||||||||||||||||||||||||||||||||||||||||||
| Climate Change Mitigation (CCM) | Climate Change Adaptation (CCA) | TOTAL (CCM + CCA) | ||||||||||||||||||||||||||||||||||||||||||||||||||||||
| Of which towards taxonomy relevant sectors (Taxonomy-eligible) |
Of which towards taxonomy relevant sectors (Taxonomy-eligible) | Of which towards taxonomy relevant sectors (Taxonomy-eligible) |
Proportion of total assets covered | |||||||||||||||||||||||||||||||||||||||||||||||||||||
| Of which environmentally sustainable (Taxonomy-aligned) |
Of which environmentally sustainable (Taxonomy-aligned) | Of which environmentally sustainable (Taxonomy-aligned) |
||||||||||||||||||||||||||||||||||||||||||||||||||||||
| Of which Use of Proceeds | Of which transitional | Of which enabling | Of which Use of Proceeds | Of which enabling | Of which Use of Proceeds | Of which transitional | Of which enabling | |||||||||||||||||||||||||||||||||||||||||||||||||
| GAR - Covered assets in both numerator and denominator | ||||||||||||||||||||||||||||||||||||||||||||||||||||||||
| 1 | Loans and advances, debt securities and equity instruments not HfT eligible for GAR calculation | 70.4 | 5.1 | 4.4 | 1.1 | 0.2 | 0 | 0 | 0 | 0 | 70.4 | 5.1 | 4.4 | 1.1 | 0.2 | 36.1 | ||||||||||||||||||||||||||||||||||||||||
| 2 | Financial undertakings | 26.8 | 1.8 | 0 | 0 | 1.2 | 0 | 0 | 0 | 0 | 26.8 | 1.8 | 0 | 0 | 1.2 | 1.5 | ||||||||||||||||||||||||||||||||||||||||
| 3 | Credit institutions | 27.7 | 0 | 0 | 0 | 0 | 0 | 0 | 0 | 0 | 27.7 | 0 | 0 | 0 | 0 | 1.2 | ||||||||||||||||||||||||||||||||||||||||
| 4 | Loans and advances | 25.8 | 0 | 0 | 0 | 0 | 0 | 0 | 0 | 0 | 25.8 | 0 | 0 | 0 | 0 | 1.1 | ||||||||||||||||||||||||||||||||||||||||
| 5 | Debt securities, including UoP | 44.6 | 0 | 0 | 0 | 0 | 0 | 0 | 0 | 0 | 44.6 | 0 | 0 | 0 | 0 | 0.1 | ||||||||||||||||||||||||||||||||||||||||
| 6 | Equity instruments | 0 | 0 | 0 | 0 | 0 | 0 | 0 | 0 | 0 | 0 | 0 | 0 | |||||||||||||||||||||||||||||||||||||||||||
| 7 | Other financial corporations | 23.1 | 9 | 0 | 0.2 | 6.2 | 0 | 0 | 0 | 0 | 23.1 | 9 | 0 | 0.2 | 6.2 | 0.3 | ||||||||||||||||||||||||||||||||||||||||
| 8 | of which investment firms | 22 | 17.6 | 0 | 0 | 15.4 | 0 | 0 | 0 | 0 | 22 | 17.6 | 0 | 0 | 15.4 | 0.1 | ||||||||||||||||||||||||||||||||||||||||
| 9 | Loans and advances | 9.5 | 3.4 | 0 | 0 | 0.5 | 0 | 0 | 0 | 0 | 9.5 | 3.4 | 0 | 0 | 0.5 | 0.1 | ||||||||||||||||||||||||||||||||||||||||
| 10 | Debt securities, including UoP | 96 | 96 | 0 | 0 | 96 | 0 | 0 | 0 | 0 | 96 | 96 | 0 | 0 | 96 | 0 | ||||||||||||||||||||||||||||||||||||||||
| 11 | Equity instruments | 0 | 0 | 0 | 0 | 0 | 0 | 0 | 0 | 0 | 0 | 0 | 0 | |||||||||||||||||||||||||||||||||||||||||||
| 12 | of which management companies | 72 | 7.7 | 0 | 0.9 | 0.5 | 0 | 0 | 0 | 0 | 72 | 7.7 | 0 | 0.9 | 0.5 | 0 | ||||||||||||||||||||||||||||||||||||||||
| 13 | Loans and advances | 72 | 7.7 | 0 | 0.9 | 0.5 | 0 | 0 | 0 | 0 | 72 | 7.7 | 0 | 0.9 | 0.5 | 0 | ||||||||||||||||||||||||||||||||||||||||
| 14 | Debt securities, including UoP | 0 | 0 | 0 | 0 | 0 | 0 | 0 | 0 | 0 | 0 | 0 | 0 | 0 | 0 | 0 | ||||||||||||||||||||||||||||||||||||||||
| 15 | Equity instruments | 0 | 0 | 0 | 0 | 0 | 0 | 0 | 0 | 0 | 0 | 0 | 0 | |||||||||||||||||||||||||||||||||||||||||||
| 16 | of which insurance undertakings | 16.8 | 0 | 0 | 0 | 0 | 0 | 0 | 0 | 0 | 16.8 | 0 | 0 | 0 | 0 | 0.1 | ||||||||||||||||||||||||||||||||||||||||
| 17 | Loans and advances | 16.8 | 0 | 0 | 0 | 0 | 0 | 0 | 0 | 0 | 16.8 | 0 | 0 | 0 | 0 | 0.1 | ||||||||||||||||||||||||||||||||||||||||
| 18 | Debt securities, including UoP | 0 | 0 | 0 | 0 | 0 | 0 | 0 | 0 | 0 | 0 | 0 | 0 | 0 | 0 | 0 | ||||||||||||||||||||||||||||||||||||||||
| 19 | Equity instruments | 0 | 0 | 0 | 0 | 0 | 0 | 0 | 0 | 0 | 0 | 0 | 0 | |||||||||||||||||||||||||||||||||||||||||||
| 20 | Non-financial undertakings | 42.1 | 14.6 | 0 | 1.5 | 5 | 0.2 | 0 | 0 | 0 | 42.3 | 14.7 | 0 | 1.5 | 5 | 1.4 | ||||||||||||||||||||||||||||||||||||||||
| 21 | Loans and advances | 42.6 | 13.6 | 0 | 1.6 | 4.4 | 0.2 | 0 | 0 | 0 | 42.8 | 13.6 | 0 | 1.6 | 4.4 | 1.3 | ||||||||||||||||||||||||||||||||||||||||
| 22 | Debt securities, including UoP | 34.2 | 30.4 | 0 | 0 | 14.6 | 0.4 | 0 | 0 | 0 | 34.6 | 30.4 | 0 | 0 | 14.6 | 0.1 | ||||||||||||||||||||||||||||||||||||||||
| 23 | Equity instruments | 0 | 0 | 0 | 0 | 0 | 0 | 0 | 0 | 0 | 0 | 0 | 0 | |||||||||||||||||||||||||||||||||||||||||||
| 24 | Households | 73.7 | 4.8 | 4.8 | 1.1 | 0 | 0 | 0 | 0 | 0 | 73.7 | 4.8 | 4.8 | 1.1 | 0 | 33.1 | ||||||||||||||||||||||||||||||||||||||||
| 25 | of which loans collateralised by residential immovable property | 97.4 | 6.1 | 6.1 | 0 | 0 | 0 | 0 | 0 | 0 | 97.4 | 6.1 | 6.1 | 0 | 0 | 20 | ||||||||||||||||||||||||||||||||||||||||
| 26 | of which building renovation loans | 100 | 0 | 0 | 0 | 0 | 0 | 0 | 0 | 0 | 100 | 0 | 0 | 0 | 0 | 0 | ||||||||||||||||||||||||||||||||||||||||
| 27 | of which motor vehicle loans | 100 | 7.3 | 7.3 | 7.3 | 0 | 100 | 7.3 | 7.3 | 7.3 | 0 | 4.9 | ||||||||||||||||||||||||||||||||||||||||||||
| % (compared to total covered assets in the denominator) | 2023 | |||||||||||||||||||||||||||||||||||||||||||||||||||||||
| Climate Change Mitigation (CCM) | Climate Change Adaptation (CCA) | TOTAL (CCM + CCA) | ||||||||||||||||||||||||||||||||||||||||||||||||||||||
| Of which towards taxonomy relevant sectors (Taxonomy-eligible) |
Of which towards taxonomy relevant sectors (Taxonomy-eligible) | Of which towards taxonomy relevant sectors (Taxonomy-eligible) |
Proportion of total assets covered | |||||||||||||||||||||||||||||||||||||||||||||||||||||
| Of which environmentally sustainable (Taxonomy-aligned) |
Of which environmentally sustainable (Taxonomy-aligned) | Of which environmentally sustainable (Taxonomy-aligned) |
||||||||||||||||||||||||||||||||||||||||||||||||||||||
| Of which Use of Proceeds | Of which transitional | Of which enabling | Of which Use of Proceeds | Of which enabling | Of which Use of Proceeds | Of which transitional | Of which enabling | |||||||||||||||||||||||||||||||||||||||||||||||||
| 28 | Local governments financing | 100 | 0 | 0 | 0 | 0 | 0 | 0 | 0 | 0 | 100 | 0 | 0 | 0 | 0 | 0 | ||||||||||||||||||||||||||||||||||||||||
| 29 | Housing financing | 100 | 0 | 0 | 0 | 0 | 0 | 0 | 0 | 0 | 100 | 0 | 0 | 0 | 0 | 0 | ||||||||||||||||||||||||||||||||||||||||
| 30 | Other local government financing | 100 | 0 | 0 | 0 | 0 | 0 | 0 | 0 | 0 | 100 | 0 | 0 | 0 | 0 | 0 | ||||||||||||||||||||||||||||||||||||||||
| 31 | Collateral obtained by taking possession: residential and commercial immovable properties | 0 | 0 | 0 | 0 | 0 | 0 | 0 | 0 | 0 | 0 | 0 | 0 | 0 | 0 | 0.3 | ||||||||||||||||||||||||||||||||||||||||
| 32 | Total GAR assets | 36.2 | 2.6 | 2.3 | 0.5 | 0.1 | 0 | 0 | 0 | 0 | 36.2 | 2.6 | 2.3 | 0.5 | 0.1 | 70.3 | ||||||||||||||||||||||||||||||||||||||||
| % (compared to total covered assets in the denominator) | 2023 | |||||||||||||||||||||||||||||||||||||||||||||||||||||||
| Climate Change Mitigation (CCM) | Climate Change Adaptation (CCA) | TOTAL (CCM + CCA) | ||||||||||||||||||||||||||||||||||||||||||||||||||||||
| Of which towards taxonomy relevant sectors (Taxonomy-eligible) |
Of which towards taxonomy relevant sectors (Taxonomy-eligible) | Of which towards taxonomy relevant sectors (Taxonomy-eligible) |
Proportion of total assets covered | |||||||||||||||||||||||||||||||||||||||||||||||||||||
| Of which environmentally sustainable (Taxonomy-aligned) |
Of which environmentally sustainable (Taxonomy-aligned) | Of which environmentally sustainable (Taxonomy-aligned) |
||||||||||||||||||||||||||||||||||||||||||||||||||||||
| Of which Use of Proceeds | Of which transitional | Of which enabling | Of which Use of Proceeds | Of which enabling | Of which Use of Proceeds | Of which transitional | Of which enabling | |||||||||||||||||||||||||||||||||||||||||||||||||
| GAR - Covered assets in both numerator and denominator | ||||||||||||||||||||||||||||||||||||||||||||||||||||||||
| 1 | Loans and advances, debt securities and equity instruments not HfT eligible for GAR calculation | 70.2 | 4.7 | 4.4 | 1 | 0.1 | 0.1 | 0 | 0 | 0 | 70.3 | 4.7 | 4.4 | 1 | 0.1 | 36.1 | ||||||||||||||||||||||||||||||||||||||||
| 2 | Financial undertakings | 28.1 | 1.1 | 0 | 0 | 0.7 | 1.3 | 0 | 0 | 0 | 29.4 | 1.1 | 0 | 0 | 0.7 | 1.5 | ||||||||||||||||||||||||||||||||||||||||
| 3 | Credit institutions | 30.6 | 0 | 0 | 0 | 0 | 0.1 | 0 | 0 | 0 | 30.7 | 0 | 0 | 0 | 0 | 1.2 | ||||||||||||||||||||||||||||||||||||||||
| 4 | Loans and advances | 29 | 0 | 0 | 0 | 0 | 0.1 | 0 | 0 | 0 | 29.1 | 0 | 0 | 0 | 0 | 1.1 | ||||||||||||||||||||||||||||||||||||||||
| 5 | Debt securities, including UoP | 44.6 | 0 | 0 | 0 | 0 | 0 | 0 | 0 | 0 | 44.6 | 0 | 0 | 0 | 0 | 0.1 | ||||||||||||||||||||||||||||||||||||||||
| 6 | Equity instruments | 0 | 0 | 0 | 0 | 0 | 0 | 0 | 0 | 0 | 0 | 0 | 0 | |||||||||||||||||||||||||||||||||||||||||||
| 7 | Other financial corporations | 17.8 | 5.5 | 0 | 0.1 | 3.7 | 6.4 | 0 | 0 | 0 | 24.2 | 5.5 | 0 | 0.1 | 3.7 | 0.3 | ||||||||||||||||||||||||||||||||||||||||
| 8 | of which investment firms | 14.1 | 8.7 | 0 | 0 | 7.8 | 2.1 | 0 | 0 | 0 | 16.1 | 8.7 | 0 | 0 | 7.8 | 0.1 | ||||||||||||||||||||||||||||||||||||||||
| 9 | Loans and advances | 8.7 | 1.3 | 0 | 0 | 0.1 | 2.8 | 0 | 0 | 0 | 11.5 | 1.3 | 0 | 0 | 0.1 | 0.1 | ||||||||||||||||||||||||||||||||||||||||
| 10 | Debt securities, including UoP | 49 | 49 | 0 | 0 | 49 | 0 | 0 | 0 | 0 | 49 | 49 | 0 | 0 | 49 | 0 | ||||||||||||||||||||||||||||||||||||||||
| 11 | Equity instruments | 0 | 0 | 0 | 0 | 0 | 0 | 0 | 0 | 0 | 0 | 0 | 0 | |||||||||||||||||||||||||||||||||||||||||||
| 12 | of which management companies | 70.2 | 12 | 0 | 0 | 0 | 0 | 0 | 0 | 0 | 70.2 | 12 | 0 | 0 | 0 | 0 | ||||||||||||||||||||||||||||||||||||||||
| 13 | Loans and advances | 70.2 | 12 | 0 | 0 | 0 | 0 | 0 | 0 | 0 | 70.2 | 12 | 0 | 0 | 0 | 0 | ||||||||||||||||||||||||||||||||||||||||
| 14 | Debt securities, including UoP | 0 | 0 | 0 | 0 | 0 | 0 | 0 | 0 | 0 | 0 | 0 | 0 | 0 | 0 | 0 | ||||||||||||||||||||||||||||||||||||||||
| 15 | Equity instruments | 0 | 0 | 0 | 0 | 0 | 0 | 0 | 0 | 0 | 0 | 0 | 0 | |||||||||||||||||||||||||||||||||||||||||||
| 16 | of which insurance undertakings | 16.7 | 0 | 0 | 0 | 0 | 16.8 | 0 | 0 | 0 | 33.5 | 0 | 0 | 0 | 0 | 0.1 | ||||||||||||||||||||||||||||||||||||||||
| 17 | Loans and advances | 16.7 | 0 | 0 | 0 | 0 | 16.8 | 0 | 0 | 0 | 33.5 | 0 | 0 | 0 | 0 | 0.1 | ||||||||||||||||||||||||||||||||||||||||
| 18 | Debt securities, including UoP | 0 | 0 | 0 | 0 | 0 | 0 | 0 | 0 | 0 | 0 | 0 | 0 | 0 | 0 | 0 | ||||||||||||||||||||||||||||||||||||||||
| 19 | Equity instruments | 0 | 0 | 0 | 0 | 0 | 0 | 0 | 0 | 0 | 0 | 0 | 0 | |||||||||||||||||||||||||||||||||||||||||||
| 20 | Non-financial undertakings | 34.2 | 6.6 | 0 | 1 | 2.3 | 0.4 | 0 | 0 | 0 | 34.6 | 6.7 | 0 | 1 | 2.3 | 1.4 | ||||||||||||||||||||||||||||||||||||||||
| 21 | Loans and advances | 35.4 | 6.2 | 0 | 1.1 | 2.3 | 0.3 | 0 | 0 | 0 | 35.7 | 6.2 | 0 | 1.1 | 2.3 | 1.3 | ||||||||||||||||||||||||||||||||||||||||
| 22 | Debt securities, including UoP | 15.2 | 13.3 | 0 | 0.2 | 2.5 | 1.2 | 0 | 0 | 0 | 16.3 | 13.3 | 0 | 0.2 | 2.5 | 0.1 | ||||||||||||||||||||||||||||||||||||||||
| 23 | Equity instruments | 0 | 0 | 0 | 0 | 0 | 0 | 0 | 0 | 0 | 0 | 0 | 0 | |||||||||||||||||||||||||||||||||||||||||||
| 24 | Households | 73.7 | 4.8 | 4.8 | 1.1 | 0 | 0 | 0 | 0 | 0 | 73.7 | 4.8 | 4.8 | 1.1 | 0 | 33.1 | ||||||||||||||||||||||||||||||||||||||||
| 25 | of which loans collateralised by residential immovable property | 97.4 | 6.1 | 6.1 | 0 | 0 | 0 | 0 | 0 | 0 | 97.4 | 6.1 | 6.1 | 0 | 0 | 20 | ||||||||||||||||||||||||||||||||||||||||
| 26 | of which building renovation loans | 100 | 0 | 0 | 0 | 0 | 0 | 0 | 0 | 0 | 100 | 0 | 0 | 0 | 0 | 0 | ||||||||||||||||||||||||||||||||||||||||
| 27 | of which motor vehicle loans | 100 | 7.3 | 7.3 | 7.3 | 0 | 100 | 7.3 | 7.3 | 7.3 | 0 | 4.9 | ||||||||||||||||||||||||||||||||||||||||||||
| % (compared to total covered assets in the denominator) | 2023 | |||||||||||||||||||||||||||||||||||||||||||||||||||||||
| Climate Change Mitigation (CCM) | Climate Change Adaptation (CCA) | TOTAL (CCM + CCA) | ||||||||||||||||||||||||||||||||||||||||||||||||||||||
| Of which towards taxonomy relevant sectors (Taxonomy-eligible) |
Of which towards taxonomy relevant sectors (Taxonomy-eligible) | Of which towards taxonomy relevant sectors (Taxonomy-eligible) |
Proportion of total assets covered | |||||||||||||||||||||||||||||||||||||||||||||||||||||
| Of which environmentally sustainable (Taxonomy-aligned) |
Of which environmentally sustainable (Taxonomy-aligned) | Of which environmentally sustainable (Taxonomy-aligned) |
||||||||||||||||||||||||||||||||||||||||||||||||||||||
| Of which Use of Proceeds | Of which transitional | Of which enabling | Of which Use of Proceeds | Of which enabling | Of which Use of Proceeds | Of which transitional | Of which enabling | |||||||||||||||||||||||||||||||||||||||||||||||||
| 28 | Local governments financing | 100 | 0 | 0 | 0 | 0 | 0 | 0 | 0 | 0 | 100 | 0 | 0 | 0 | 0 | 0 | ||||||||||||||||||||||||||||||||||||||||
| 29 | Housing financing | 100 | 0 | 0 | 0 | 0 | 0 | 0 | 0 | 0 | 100 | 0 | 0 | 0 | 0 | 0 | ||||||||||||||||||||||||||||||||||||||||
| 30 | Other local government financing | 100 | 0 | 0 | 0 | 0 | 0 | 0 | 0 | 0 | 100 | 0 | 0 | 0 | 0 | 0 | ||||||||||||||||||||||||||||||||||||||||
| 31 | Collateral obtained by taking possession: residential and commercial immovable properties | 0 | 0 | 0 | 0 | 0 | 0 | 0 | 0 | 0 | 0 | 0 | 0 | 0 | 0 | 0.3 | ||||||||||||||||||||||||||||||||||||||||
| 32 | Total GAR assets | 36 | 2.4 | 2.3 | 0.5 | 0.1 | 0 | 0 | 0 | 0 | 36.1 | 2.4 | 2.3 | 0.5 | 0.1 | 70.3 | ||||||||||||||||||||||||||||||||||||||||
| % (compared to total covered assets in the denominator) | 2023 | |||||||||||||||||||||||||||||||||||||||||||||||||||||||
| Climate Change Mitigation (CCM) | Climate Change Adaptation (CCA) | TOTAL (CCM + CCA) | ||||||||||||||||||||||||||||||||||||||||||||||||||||||
| Of which towards taxonomy relevant sectors (Taxonomy-eligible) |
Of which towards taxonomy relevant sectors (Taxonomy-eligible) | Of which towards taxonomy relevant sectors (Taxonomy-eligible) |
Proportion of total new assets covered | |||||||||||||||||||||||||||||||||||||||||||||||||||||
| Of which environmentally sustainable (Taxonomy-aligned) |
Of which environmentally sustainable (Taxonomy-aligned) | Of which environmentally sustainable (Taxonomy-aligned) |
||||||||||||||||||||||||||||||||||||||||||||||||||||||
| Of which Use of Proceeds | Of which transitional | Of which enabling | Of which Use of Proceeds | Of which enabling | Of which Use of Proceeds | Of which transitional | Of which enabling | |||||||||||||||||||||||||||||||||||||||||||||||||
| GAR - Covered assets in both numerator and denominator | ||||||||||||||||||||||||||||||||||||||||||||||||||||||||
| 1 | Loans and advances, debt securities and equity instruments not HfT eligible for GAR calculation | 59.5 | 6.8 | 4.7 | 3.2 | 1 | 0 | 0 | 0 | 0 | 59.5 | 6.8 | 4.7 | 3.2 | 1 | 14.5 | ||||||||||||||||||||||||||||||||||||||||
| 2 | Financial undertakings | 29.8 | 2.7 | 0 | 0 | 2.3 | 0 | 0 | 0 | 0 | 29.8 | 2.7 | 0 | 0 | 2.3 | 1.7 | ||||||||||||||||||||||||||||||||||||||||
| 3 | Credit institutions | 28.7 | 0 | 0 | 0 | 0 | 0 | 0 | 0 | 0 | 28.7 | 0 | 0 | 0 | 0 | 1.5 | ||||||||||||||||||||||||||||||||||||||||
| 4 | Loans and advances | 28.6 | 0 | 0 | 0 | 0 | 0 | 0 | 0 | 0 | 28.6 | 0 | 0 | 0 | 0 | 1.5 | ||||||||||||||||||||||||||||||||||||||||
| 5 | Debt securities, including UoP | 44 | 0 | 0 | 0 | 0 | 0 | 0 | 0 | 0 | 44 | 0 | 0 | 0 | 0 | 0 | ||||||||||||||||||||||||||||||||||||||||
| 6 | Equity instruments | 0 | 0 | 0 | 0 | 0 | 0 | 0 | 0 | 0 | 0 | 0 | 0 | |||||||||||||||||||||||||||||||||||||||||||
| 7 | Other financial corporations | 39.8 | 26.7 | 0 | 0.3 | 22.7 | 0 | 0 | 0 | 0 | 39.8 | 26.7 | 0 | 0.3 | 22.7 | 0.2 | ||||||||||||||||||||||||||||||||||||||||
| 8 | of which investment firms | 55.7 | 54.4 | 0 | 0 | 54.4 | 0 | 0 | 0 | 0 | 55.7 | 54.4 | 0 | 0 | 54.4 | 0.1 | ||||||||||||||||||||||||||||||||||||||||
| 9 | Loans and advances | 40.9 | 14 | 0 | 0 | 14 | 0 | 0 | 0 | 0 | 40.9 | 14 | 0 | 0 | 14 | 0 | ||||||||||||||||||||||||||||||||||||||||
| 10 | Debt securities, including UoP | 96 | 96 | 0 | 0 | 96 | 0 | 0 | 0 | 0 | 96 | 96 | 0 | 0 | 96 | 0 | ||||||||||||||||||||||||||||||||||||||||
| 11 | Equity instruments | 0 | 0 | 0 | 0 | 0 | 0 | 0 | 0 | 0 | 0 | 0 | 0 | |||||||||||||||||||||||||||||||||||||||||||
| 12 | of which management companies | 7.8 | 0 | 0 | 0 | 0 | 0 | 0 | 0 | 0 | 7.8 | 0 | 0 | 0 | 0 | 0 | ||||||||||||||||||||||||||||||||||||||||
| 13 | Loans and advances | 7.8 | 0 | 0 | 0 | 0 | 0 | 0 | 0 | 0 | 7.8 | 0 | 0 | 0 | 0 | 0 | ||||||||||||||||||||||||||||||||||||||||
| 14 | Debt securities, including UoP | 0 | 0 | 0 | 0 | 0 | 0 | 0 | 0 | 0 | 0 | 0 | 0 | 0 | 0 | 0 | ||||||||||||||||||||||||||||||||||||||||
| 15 | Equity instruments | 0 | 0 | 0 | 0 | 0 | 0 | 0 | 0 | 0 | 0 | 0 | 0 | |||||||||||||||||||||||||||||||||||||||||||
| 16 | of which insurance undertakings | 0.5 | 0 | 0 | 0 | 0 | 0 | 0 | 0 | 0 | 0.5 | 0 | 0 | 0 | 0 | 0 | ||||||||||||||||||||||||||||||||||||||||
| 17 | Loans and advances | 0.5 | 0 | 0 | 0 | 0 | 0 | 0 | 0 | 0 | 0.5 | 0 | 0 | 0 | 0 | 0 | ||||||||||||||||||||||||||||||||||||||||
| 18 | Debt securities, including UoP | 0 | 0 | 0 | 0 | 0 | 0 | 0 | 0 | 0 | 0 | 0 | 0 | 0 | 0 | 0 | ||||||||||||||||||||||||||||||||||||||||
| 19 | Equity instruments | 0 | 0 | 0 | 0 | 0 | 0 | 0 | 0 | 0 | 0 | 0 | 0 | |||||||||||||||||||||||||||||||||||||||||||
| 20 | Non-financial undertakings | 42.6 | 16.9 | 0 | 1.1 | 6.6 | 0.1 | 0 | 0 | 0 | 42.8 | 16.9 | 0 | 1.1 | 6.6 | 1.5 | ||||||||||||||||||||||||||||||||||||||||
| 21 | Loans and advances | 43.7 | 15 | 0 | 1.3 | 5.5 | 0.2 | 0 | 0 | 0 | 43.9 | 15.1 | 0 | 1.3 | 5.5 | 1.3 | ||||||||||||||||||||||||||||||||||||||||
| 22 | Debt securities, including UoP | 34.5 | 31.1 | 0 | 0 | 14.9 | 0 | 0 | 0 | 0 | 34.5 | 31.1 | 0 | 0 | 14.9 | 0.2 | ||||||||||||||||||||||||||||||||||||||||
| 23 | Equity instruments | 0 | 0 | 0 | 0 | 0 | 0 | 0 | 0 | 0 | 0 | 0 | 0 | |||||||||||||||||||||||||||||||||||||||||||
| 24 | Households | 66.1 | 6 | 6 | 3.9 | 0 | 0 | 0 | 0 | 0 | 66.1 | 6 | 6 | 3.9 | 0 | 11.4 | ||||||||||||||||||||||||||||||||||||||||
| 25 | of which loans collateralised by residential immovable property | 98.9 | 6.1 | 6.1 | 0 | 0 | 0 | 0 | 0 | 0 | 98.9 | 6.1 | 6.1 | 0 | 0 | 3.8 | ||||||||||||||||||||||||||||||||||||||||
| 26 | of which building renovation loans | 100 | 0 | 0 | 0 | 0 | 0 | 0 | 0 | 0 | 100 | 0 | 0 | 0 | 0 | 0 | ||||||||||||||||||||||||||||||||||||||||
| 27 | of which motor vehicle loans | 100 | 12 | 12 | 12 | 0 | 100 | 12 | 12 | 12 | 0 | 3.7 | ||||||||||||||||||||||||||||||||||||||||||||
| % (compared to total covered assets in the denominator) | 2023 | |||||||||||||||||||||||||||||||||||||||||||||||||||||||
| Climate Change Mitigation (CCM) | Climate Change Adaptation (CCA) | TOTAL (CCM + CCA) | ||||||||||||||||||||||||||||||||||||||||||||||||||||||
| Of which towards taxonomy relevant sectors (Taxonomy-eligible) |
Of which towards taxonomy relevant sectors (Taxonomy-eligible) | Of which towards taxonomy relevant sectors (Taxonomy-eligible) |
Proportion of total new assets covered | |||||||||||||||||||||||||||||||||||||||||||||||||||||
| Of which environmentally sustainable (Taxonomy-aligned) |
Of which environmentally sustainable (Taxonomy-aligned) | Of which environmentally sustainable (Taxonomy-aligned) |
||||||||||||||||||||||||||||||||||||||||||||||||||||||
| Of which Use of Proceeds | Of which transitional | Of which enabling | Of which Use of Proceeds | Of which enabling | Of which Use of Proceeds | Of which transitional | Of which enabling | |||||||||||||||||||||||||||||||||||||||||||||||||
| 28 | Local governments financing | 100 | 0 | 0 | 0 | 0 | 0 | 0 | 0 | 0 | 100 | 0 | 0 | 0 | 0 | 0 | ||||||||||||||||||||||||||||||||||||||||
| 29 | Housing financing | 100 | 0 | 0 | 0 | 0 | 0 | 0 | 0 | 0 | 100 | 0 | 0 | 0 | 0 | 0 | ||||||||||||||||||||||||||||||||||||||||
| 30 | Other local government financing | 100 | 0 | 0 | 0 | 0 | 0 | 0 | 0 | 0 | 100 | 0 | 0 | 0 | 0 | 0 | ||||||||||||||||||||||||||||||||||||||||
| 31 | Collateral obtained by taking possession: residential and commercial immovable properties | 0 | 0 | 0 | 0 | 0 | 0 | 0 | 0 | 0 | 0 | 0 | 0 | 0 | 0 | 0 | ||||||||||||||||||||||||||||||||||||||||
| 32 | Total GAR assets | 17.1 | 1.9 | 1.3 | 0.9 | 0.3 | 0 | 0 | 0 | 0 | 17.1 | 1.9 | 1.3 | 0.9 | 0.3 | 50.6 | ||||||||||||||||||||||||||||||||||||||||
| % (compared to total covered assets in the denominator) | 2023 | |||||||||||||||||||||||||||||||||||||||||||||||||||||||
| Climate Change Mitigation (CCM) | Climate Change Adaptation (CCA) | TOTAL (CCM + CCA) | ||||||||||||||||||||||||||||||||||||||||||||||||||||||
| Of which towards taxonomy relevant sectors (Taxonomy-eligible) |
Of which towards taxonomy relevant sectors (Taxonomy-eligible) | Of which towards taxonomy relevant sectors (Taxonomy-eligible) |
Proportion of total new assets covered | |||||||||||||||||||||||||||||||||||||||||||||||||||||
| Of which environmentally sustainable (Taxonomy-aligned) |
Of which environmentally sustainable (Taxonomy-aligned) | Of which environmentally sustainable (Taxonomy-aligned) |
||||||||||||||||||||||||||||||||||||||||||||||||||||||
| Of which Use of Proceeds | Of which transitional | Of which enabling | Of which Use of Proceeds | Of which enabling | Of which Use of Proceeds | Of which transitional | Of which enabling | |||||||||||||||||||||||||||||||||||||||||||||||||
| GAR - Covered assets in both numerator and denominator | ||||||||||||||||||||||||||||||||||||||||||||||||||||||||
| 1 | Loans and advances, debt securities and equity instruments not HfT eligible for GAR calculation | 58.6 | 5.7 | 4.7 | 3.2 | 0.5 | 0.1 | 0 | 0 | 0 | 58.7 | 5.7 | 4.7 | 3.2 | 0.5 | 14.5 | ||||||||||||||||||||||||||||||||||||||||
| 2 | Financial undertakings | 30.1 | 1.7 | 0 | 0 | 1.4 | 0.1 | 0 | 0 | 0 | 30.2 | 1.7 | 0 | 0 | 1.4 | 1.7 | ||||||||||||||||||||||||||||||||||||||||
| 3 | Credit institutions | 30.3 | 0 | 0 | 0 | 0 | 0 | 0 | 0 | 0 | 30.3 | 0 | 0 | 0 | 0 | 1.5 | ||||||||||||||||||||||||||||||||||||||||
| 4 | Loans and advances | 30.3 | 0 | 0 | 0 | 0 | 0 | 0 | 0 | 0 | 30.3 | 0 | 0 | 0 | 0 | 1.5 | ||||||||||||||||||||||||||||||||||||||||
| 5 | Debt securities, including UoP | 44 | 0 | 0 | 0 | 0 | 0 | 0 | 0 | 0 | 44 | 0 | 0 | 0 | 0 | 0 | ||||||||||||||||||||||||||||||||||||||||
| 6 | Equity instruments | 0 | 0 | 0 | 0 | 0 | 0 | 0 | 0 | 0 | 0 | 0 | 0 | |||||||||||||||||||||||||||||||||||||||||||
| 7 | Other financial corporations | 27.8 | 16.7 | 0 | 0.1 | 13.6 | 1.3 | 0 | 0 | 0 | 29.1 | 16.7 | 0 | 0.1 | 13.6 | 0.2 | ||||||||||||||||||||||||||||||||||||||||
| 8 | of which investment firms | 29.2 | 27.6 | 0 | 0 | 27.6 | 0 | 0 | 0 | 0 | 29.2 | 27.6 | 0 | 0 | 27.6 | 0.1 | ||||||||||||||||||||||||||||||||||||||||
| 9 | Loans and advances | 37.8 | 3.8 | 0 | 0 | 3.8 | 0 | 0 | 0 | 0 | 37.8 | 3.8 | 0 | 0 | 3.8 | 0 | ||||||||||||||||||||||||||||||||||||||||
| 10 | Debt securities, including UoP | 49 | 49 | 0 | 0 | 49 | 0 | 0 | 0 | 0 | 49 | 49 | 0 | 0 | 49 | 0 | ||||||||||||||||||||||||||||||||||||||||
| 11 | Equity instruments | 0 | 0 | 0 | 0 | 0 | 0 | 0 | 0 | 0 | 0 | 0 | 0 | |||||||||||||||||||||||||||||||||||||||||||
| 12 | of which management companies | 0 | 0 | 0 | 0 | 0 | 0 | 0 | 0 | 0 | 0 | 0 | 0 | 0 | 0 | 0 | ||||||||||||||||||||||||||||||||||||||||
| 13 | Loans and advances | 0 | 0 | 0 | 0 | 0 | 0 | 0 | 0 | 0 | 0 | 0 | 0 | 0 | 0 | 0 | ||||||||||||||||||||||||||||||||||||||||
| 14 | Debt securities, including UoP | 0 | 0 | 0 | 0 | 0 | 0 | 0 | 0 | 0 | 0 | 0 | 0 | 0 | 0 | 0 | ||||||||||||||||||||||||||||||||||||||||
| 15 | Equity instruments | 0 | 0 | 0 | 0 | 0 | 0 | 0 | 0 | 0 | 0 | 0 | 0 | |||||||||||||||||||||||||||||||||||||||||||
| 16 | of which insurance undertakings | 0.5 | 0 | 0 | 0 | 0 | 43.8 | 0 | 0 | 0 | 44.3 | 0 | 0 | 0 | 0 | 0 | ||||||||||||||||||||||||||||||||||||||||
| 17 | Loans and advances | 0.5 | 0 | 0 | 0 | 0 | 43.8 | 0 | 0 | 0 | 44.3 | 0 | 0 | 0 | 0 | 0 | ||||||||||||||||||||||||||||||||||||||||
| 18 | Debt securities, including UoP | 0 | 0 | 0 | 0 | 0 | 0 | 0 | 0 | 0 | 0 | 0 | 0 | 0 | 0 | 0 | ||||||||||||||||||||||||||||||||||||||||
| 19 | Equity instruments | 0 | 0 | 0 | 0 | 0 | 0 | 0 | 0 | 0 | 0 | 0 | 0 | |||||||||||||||||||||||||||||||||||||||||||
| 20 | Non-financial undertakings | 33.8 | 7.6 | 0 | 0.8 | 2.9 | 0.4 | 0 | 0 | 0 | 34.2 | 7.6 | 0 | 0.8 | 2.9 | 1.5 | ||||||||||||||||||||||||||||||||||||||||
| 21 | Loans and advances | 36.3 | 6.8 | 0 | 0.9 | 2.9 | 0.4 | 0 | 0 | 0 | 36.7 | 6.8 | 0 | 0.9 | 3 | 1.3 | ||||||||||||||||||||||||||||||||||||||||
| 22 | Debt securities, including UoP | 15.4 | 13.6 | 0 | 0.2 | 2.5 | 0 | 0 | 0 | 0 | 15.4 | 13.6 | 0 | 0.2 | 2.5 | 0.2 | ||||||||||||||||||||||||||||||||||||||||
| 23 | Equity instruments | 0 | 0 | 0 | 0 | 0 | 0 | 0 | 0 | 0 | 0 | 0 | 0 | |||||||||||||||||||||||||||||||||||||||||||
| 24 | Households | 66.1 | 6 | 6 | 3.9 | 0 | 0 | 0 | 0 | 0 | 66.1 | 6 | 6 | 3.9 | 0 | 11.4 | ||||||||||||||||||||||||||||||||||||||||
| 25 | of which loans collateralised by residential immovable property | 98.9 | 6.1 | 6.1 | 0 | 0 | 0 | 0 | 0 | 0 | 98.9 | 6.1 | 6.1 | 0 | 0 | 3.8 | ||||||||||||||||||||||||||||||||||||||||
| 26 | of which building renovation loans | 100 | 0 | 0 | 0 | 0 | 0 | 0 | 0 | 0 | 100 | 0 | 0 | 0 | 0 | 0 | ||||||||||||||||||||||||||||||||||||||||
| 27 | of which motor vehicle loans | 100 | 12 | 12 | 12 | 0 | 100 | 12 | 12 | 12 | 0 | 3.7 | ||||||||||||||||||||||||||||||||||||||||||||
| % (compared to total covered assets in the denominator) | 2023 | |||||||||||||||||||||||||||||||||||||||||||||||||||||||
| Climate Change Mitigation (CCM) | Climate Change Adaptation (CCA) | TOTAL (CCM + CCA) | ||||||||||||||||||||||||||||||||||||||||||||||||||||||
| Of which towards taxonomy relevant sectors (Taxonomy-eligible) |
Of which towards taxonomy relevant sectors (Taxonomy-eligible) | Of which towards taxonomy relevant sectors (Taxonomy-eligible) |
Proportion of total new assets covered | |||||||||||||||||||||||||||||||||||||||||||||||||||||
| Of which environmentally sustainable (Taxonomy-aligned) |
Of which environmentally sustainable (Taxonomy-aligned) | Of which environmentally sustainable (Taxonomy-aligned) |
||||||||||||||||||||||||||||||||||||||||||||||||||||||
| Of which Use of Proceeds | Of which transitional | Of which enabling | Of which Use of Proceeds | Of which enabling | Of which Use of Proceeds | Of which transitional | Of which enabling | |||||||||||||||||||||||||||||||||||||||||||||||||
| 28 | Local governments financing | 100 | 0 | 0 | 0 | 0 | 0 | 0 | 0 | 0 | 100 | 0 | 0 | 0 | 0 | 0 | ||||||||||||||||||||||||||||||||||||||||
| 29 | Housing financing | 100 | 0 | 0 | 0 | 0 | 0 | 0 | 0 | 0 | 100 | 0 | 0 | 0 | 0 | 0 | ||||||||||||||||||||||||||||||||||||||||
| 30 | Other local government financing | 100 | 0 | 0 | 0 | 0 | 0 | 0 | 0 | 0 | 100 | 0 | 0 | 0 | 0 | 0 | ||||||||||||||||||||||||||||||||||||||||
| 31 | Collateral obtained by taking possession: residential and commercial immovable properties | 0 | 0 | 0 | 0 | 0 | 0 | 0 | 0 | 0 | 0 | 0 | 0 | 0 | 0 | 0 | ||||||||||||||||||||||||||||||||||||||||
| 32 | Total GAR assets | 16.9 | 1.6 | 1.3 | 0.9 | 0.1 | 0 | 0 | 0 | 0 | 16.9 | 1.6 | 1.3 | 0.9 | 0.1 | 50.6 | ||||||||||||||||||||||||||||||||||||||||
| % (compared to total eligible off-balance sheet assets) | 2023 | ||||||||||||||||||||||||||||||||||||||||||||||||||||
| Climate Change Mitigation (CCM) | Climate Change Adaptation (CCA) | TOTAL (CCM + CCA) | |||||||||||||||||||||||||||||||||||||||||||||||||||
| Proportion of total covered assets funding taxonomy relevant sectors (Taxonomy-eligible) | Proportion of total covered assets funding taxonomy relevant sectors (Taxonomy-eligible) | Proportion of total covered assets funding taxonomy relevant sectors (Taxonomy-eligible) | |||||||||||||||||||||||||||||||||||||||||||||||||||
| Proportion of total covered assets funding taxonomy relevant sectors (Taxonomy-aligned) | Proportion of total covered assets funding taxonomy relevant sectors (Taxonomy-aligned) |
Proportion of total covered assets funding taxonomy relevant sectors (Taxonomy-aligned) | |||||||||||||||||||||||||||||||||||||||||||||||||||
| Of which Use of Proceeds | Of which transitional | Of which enabling | Of which Use of Proceeds | Of which enabling | Of which Use of Proceeds | Of which transitional | Of which enabling | ||||||||||||||||||||||||||||||||||||||||||||||
| 1 | Financial guarantees (FinGuar KPI) | 4.1 | 1.8 | 0 | 0 | 1 | 0.2 | 0 | 0 | 0 | 4.3 | 1.8 | 0 | 0 | 1 | ||||||||||||||||||||||||||||||||||||||
| 2 | Assets under management (AuM KPI) | 3.6 | 1.1 | 0 | 0.1 | 0.5 | 0 | 0 | 0 | 0 | 3.6 | 1.1 | 0 | 0.1 | 0.5 | ||||||||||||||||||||||||||||||||||||||
| % (compared to total eligible off-balance sheet assets) | 2023 | ||||||||||||||||||||||||||||||||||||||||||||||||||||
| Climate Change Mitigation (CCM) | Climate Change Adaptation (CCA) | TOTAL (CCM + CCA) | |||||||||||||||||||||||||||||||||||||||||||||||||||
| Proportion of total covered assets funding taxonomy relevant sectors (Taxonomy-eligible) | Proportion of total covered assets funding taxonomy relevant sectors (Taxonomy-eligible) | Proportion of total covered assets funding taxonomy relevant sectors (Taxonomy-eligible) | |||||||||||||||||||||||||||||||||||||||||||||||||||
| Proportion of total covered assets funding taxonomy relevant sectors (Taxonomy-aligned) | Proportion of total covered assets funding taxonomy relevant sectors (Taxonomy-aligned) |
Proportion of total covered assets funding taxonomy relevant sectors (Taxonomy-aligned) | |||||||||||||||||||||||||||||||||||||||||||||||||||
| Of which Use of Proceeds | Of which transitional | Of which enabling | Of which Use of Proceeds | Of which enabling | Of which Use of Proceeds | Of which transitional | Of which enabling | ||||||||||||||||||||||||||||||||||||||||||||||
| 1 | Financial guarantees (FinGuar KPI) | 3.2 | 0.9 | 0 | 0 | 0.6 | 0 | 0 | 0 | 0 | 3.2 | 0.9 | 0 | 0 | 0.6 | ||||||||||||||||||||||||||||||||||||||
| 2 | Assets under management (AuM KPI) | 3.1 | 0.6 | 0 | 0 | 0.3 | 0.3 | 0 | 0 | 0 | 3.4 | 0.6 | 0 | 0 | 0.3 | ||||||||||||||||||||||||||||||||||||||
| % (compared to total eligible off-balance sheet assets) | 2023 | ||||||||||||||||||||||||||||||||||||||||||||||||||||
| Climate Change Mitigation (CCM) | Climate Change Adaptation (CCA) | TOTAL (CCM + CCA) | |||||||||||||||||||||||||||||||||||||||||||||||||||
| Proportion of total covered assets funding taxonomy relevant sectors (Taxonomy-eligible) | Proportion of total covered assets funding taxonomy relevant sectors (Taxonomy-eligible) | Proportion of total covered assets funding taxonomy relevant sectors (Taxonomy-eligible) | |||||||||||||||||||||||||||||||||||||||||||||||||||
| Proportion of total covered assets funding taxonomy relevant sectors (Taxonomy-aligned) | Proportion of total covered assets funding taxonomy relevant sectors (Taxonomy-aligned) |
Proportion of total covered assets funding taxonomy relevant sectors (Taxonomy-aligned) | |||||||||||||||||||||||||||||||||||||||||||||||||||
| Of which Use of Proceeds | Of which transitional | Of which enabling | Of which Use of Proceeds | Of which enabling | Of which Use of Proceeds | Of which transitional | Of which enabling | ||||||||||||||||||||||||||||||||||||||||||||||
| 1 | Financial guarantees (FinGuar KPI) | 5.9 | 2 | 0 | 0 | 1.2 | 0.4 | 0 | 0 | 0 | 6.3 | 2 | 0 | 0 | 1.2 | ||||||||||||||||||||||||||||||||||||||
| 2 | Assets under management (AuM KPI) | 7.6 | 2.2 | 0 | 0 | 1.1 | 0 | 0 | 0 | 0 | 7.6 | 2.2 | 0 | 0 | 1.1 | ||||||||||||||||||||||||||||||||||||||
| % (compared to total eligible off-balance sheet assets) | 2023 | ||||||||||||||||||||||||||||||||||||||||||||||||||||
| Climate Change Mitigation (CCM) | Climate Change Adaptation (CCA) | TOTAL (CCM + CCA) | |||||||||||||||||||||||||||||||||||||||||||||||||||
| Proportion of total covered assets funding taxonomy relevant sectors (Taxonomy-eligible) | Proportion of total covered assets funding taxonomy relevant sectors (Taxonomy-eligible) | Proportion of total covered assets funding taxonomy relevant sectors (Taxonomy-eligible) | |||||||||||||||||||||||||||||||||||||||||||||||||||
| Proportion of total covered assets funding taxonomy relevant sectors (Taxonomy-aligned) | Proportion of total covered assets funding taxonomy relevant sectors (Taxonomy-aligned) |
Proportion of total covered assets funding taxonomy relevant sectors (Taxonomy-aligned) | |||||||||||||||||||||||||||||||||||||||||||||||||||
| Of which Use of Proceeds | Of which transitional | Of which enabling | Of which Use of Proceeds | Of which enabling | Of which Use of Proceeds | Of which transitional | Of which enabling | ||||||||||||||||||||||||||||||||||||||||||||||
| 1 | Financial guarantees (FinGuar KPI) | 4 | 0.5 | 0 | 0 | 0.4 | 0 | 0 | 0 | 0 | 4 | 0.5 | 0 | 0 | 0.4 | ||||||||||||||||||||||||||||||||||||||
| 2 | Assets under management (AuM KPI) | 6.5 | 2.3 | 0 | 0 | 1.7 | 0.2 | 0 | 0 | 0 | 6.7 | 2.3 | 0 | 0 | 1.7 | ||||||||||||||||||||||||||||||||||||||
| Nuclear energy related activities | ||||||||
| 1 | The undertaking carries out, funds or has exposures to research, development, demonstration and deployment of innovative electricity generation facilities that produce energy from nuclear processes with minimal waste from the fuel cycle. | NO | ||||||
| 2 | The undertaking carries out, funds or has exposures to construction and safe operation of new nuclear installations to produce electricity or process heat, including for the purposes of district heating or industrial processes such as hydrogen production, as well as their safety upgrades, using best available technologies. | YES | ||||||
| 3 | The undertaking carries out, funds or has exposures to safe operation of existing nuclear installations that produce electricity or process heat, including for the purposes of district heating or industrial processes such as hydrogen production from nuclear energy, as well as their safety upgrades. | YES | ||||||
| Nuclear energy related activities | ||||||||
| 4 | The undertaking carries out, funds or has exposures to construction or operation of electricity generation facilities that produce electricity using fossil gaseous fuels. | YES | ||||||
| 5 | The undertaking carries out, funds or has exposures to construction, refurbishment, and operation of combined heat/cool and power generation facilities using fossil gaseous fuels. | YES | ||||||
| 6 | The undertaking carries out, funds or has exposures to construction, refurbishment and operation of heat generation facilities that produce heat/cool using fossil gaseous fuels. | NO | ||||||
| CCM+CCA | CCM | CCA | |||||||||||||||||||||
| Nuclear energy related activities | Amount | % | Amount | % | Amount | % | |||||||||||||||||
| 1 | Amount and proportion of taxonomy- aligned economic activity referred to in Section 4.26 of Annexes I and II to Delegated Regulation 2021/2139 in the denominator of the applicable KPI | 0 | 0 | 0 | 0 | 0 | 0 | ||||||||||||||||
| 2 | Amount and proportion of taxonomy- aligned economic activity referred to in Section 4.27 of Annexes I and II to Delegated Regulation 2021/2139 in the denominator of the applicable KPI | 16 | 0 | 16 | 0 | 0 | 0 | ||||||||||||||||
| 3 | Amount and proportion of taxonomy- aligned economic activity referred to in Section 4.28 of Annexes I and II to Delegated Regulation 2021/2139 in the denominator of the applicable KPI | 123 | 0 | 123 | 0 | 0 | 0 | ||||||||||||||||
| 4 | Amount and proportion of taxonomy- aligned economic activity referred to in Section 4.29 of Annexes I and II to Delegated Regulation 2021/2139 in the denominator of the applicable KPI | 0 | 0 | 0 | 0 | 0 | 0 | ||||||||||||||||
| 5 | Amount and proportion of taxonomy- aligned economic activity referred to in Section 4.30 of Annexes I and II to Delegated Regulation 2021/2139 in the denominator of the applicable KPI | 0 | 0 | 0 | 0 | 0 | 0 | ||||||||||||||||
| 6 | Amount and proportion of taxonomy- aligned economic activity referred to in Section 4.31 of Annexes I and II to Delegated Regulation 2021/2139 in the denominator of the applicable KPI | 0 | 0 | 0 | 0 | 0 | 0 | ||||||||||||||||
| 7 | Amount and proportion of other taxonomy-aligned economic activities not referred to in rows 1 to 6 above in the denominator of the applicable KPI | 33,284 | 2.6 | 33,277 | 2.6 | 7 | 0 | ||||||||||||||||
| 8 | Total applicable KPI | 33,422 | 2.6 | 33,416 | 2.6 | 7 | 0 | ||||||||||||||||
| Note 1: The denominator of the applicable KPI is 1,288,300 millions of euro | ||
| CCM+CCA | CCM | CCA | |||||||||||||||||||||
| Nuclear energy related activities | Amount | % | Amount | % | Amount | % | |||||||||||||||||
| 1 | Amount and proportion of taxonomy- aligned economic activity referred to in Section 4.26 of Annexes I and II to Delegated Regulation 2021/2139 in the denominator of the applicable KPI | 0 | 0 | 0 | 0 | 0 | 0 | ||||||||||||||||
| 2 | Amount and proportion of taxonomy- aligned economic activity referred to in Section 4.27 of Annexes I and II to Delegated Regulation 2021/2139 in the denominator of the applicable KPI | 0 | 0 | 0 | 0 | 0 | 0 | ||||||||||||||||
| 3 | Amount and proportion of taxonomy- aligned economic activity referred to in Section 4.28 of Annexes I and II to Delegated Regulation 2021/2139 in the denominator of the applicable KPI | 76 | 0 | 76 | 0 | 0 | 0 | ||||||||||||||||
| 4 | Amount and proportion of taxonomy- aligned economic activity referred to in Section 4.29 of Annexes I and II to Delegated Regulation 2021/2139 in the denominator of the applicable KPI | 0 | 0 | 0 | 0 | 0 | 0 | ||||||||||||||||
| 5 | Amount and proportion of taxonomy- aligned economic activity referred to in Section 4.30 of Annexes I and II to Delegated Regulation 2021/2139 in the denominator of the applicable KPI | 1 | 0 | 1 | 0 | 0 | 0 | ||||||||||||||||
| 6 | Amount and proportion of taxonomy- aligned economic activity referred to in Section 4.31 of Annexes I and II to Delegated Regulation 2021/2139 in the denominator of the applicable KPI | 0 | 0 | 0 | 0 | 0 | 0 | ||||||||||||||||
| 7 | Amount and proportion of other taxonomy-aligned economic activities not referred to in rows 1 to 6 above in the denominator of the applicable KPI | 31,074 | 2.4 | 31,065 | 2.4 | 9 | 0 | ||||||||||||||||
| 8 | Total applicable KPI | 31,151 | 2.4 | 31,142 | 2.4 | 9 | 0 | ||||||||||||||||
| Note 1: The denominator of the applicable KPI is 1,288,300 millions of euro | ||
| CCM+CCA | CCM | CCA | |||||||||||||||||||||
| Nuclear energy related activities | Amount | % | Amount | % | Amount | % | |||||||||||||||||
| 1 | Amount and proportion of taxonomy- aligned economic activity referred to in Section 4.26 of Annexes I and II to Delegated Regulation 2021/2139 in the numerator of the applicable KPI | 0 | 0 | 0 | 0 | 0 | 0 | ||||||||||||||||
| 2 | Amount and proportion of taxonomy- aligned economic activity referred to in Section 4.27 of Annexes I and II to Delegated Regulation 2021/2139 in the numerator of the applicable KPI | 16 | 0 | 16 | 0 | 0 | 0 | ||||||||||||||||
| 3 | Amount and proportion of taxonomy- aligned economic activity referred to in Section 4.28 of Annexes I and II to Delegated Regulation 2021/2139 in the numerator of the applicable KPI | 123 | 0.4 | 123 | 0.4 | 0 | 0 | ||||||||||||||||
| 4 | Amount and proportion of taxonomy- aligned economic activity referred to in Section 4.29 of Annexes I and II to Delegated Regulation 2021/2139 in the numerator of the applicable KPI | 0 | 0 | 0 | 0 | 0 | 0 | ||||||||||||||||
| 5 | Amount and proportion of taxonomy- aligned economic activity referred to in Section 4.30 of Annexes I and II to Delegated Regulation 2021/2139 in the numerator of the applicable KPI | 0 | 0 | 0 | 0 | 0 | 0 | ||||||||||||||||
| 6 | Amount and proportion of taxonomy- aligned economic activity referred to in Section 4.31 of Annexes I and II to Delegated Regulation 2021/2139 in the numerator of the applicable KPI | 0 | 0 | 0 | 0 | 0 | 0 | ||||||||||||||||
| 7 | Amount and proportion of other taxonomy-aligned economic activities not referred to in rows 1 to 6 above in the numerator of the applicable KPI | 33,284 | 99.6 | 33,277 | 99.6 | 7 | 0 | ||||||||||||||||
| 8 | Total amount and proportion of taxonomy-aligned economic activities in the numerator of the applicable KPI | 33,422 | 100 | 33,416 | 100 | 7 | 0 | ||||||||||||||||
| CCM+CCA | CCM | CCA | |||||||||||||||||||||
| Nuclear energy related activities | Amount | % | Amount | % | Amount | % | |||||||||||||||||
| 1 | Amount and proportion of taxonomy- aligned economic activity referred to in Section 4.26 of Annexes I and II to Delegated Regulation 2021/2139 in the numerator of the applicable KPI | 0 | 0 | 0 | 0 | 0 | 0 | ||||||||||||||||
| 2 | Amount and proportion of taxonomy- aligned economic activity referred to in Section 4.27 of Annexes I and II to Delegated Regulation 2021/2139 in the numerator of the applicable KPI | 0 | 0 | 0 | 0 | 0 | 0 | ||||||||||||||||
| 3 | Amount and proportion of taxonomy- aligned economic activity referred to in Section 4.28 of Annexes I and II to Delegated Regulation 2021/2139 in the numerator of the applicable KPI | 76 | 0.2 | 76 | 0.2 | 0 | 0 | ||||||||||||||||
| 4 | Amount and proportion of taxonomy- aligned economic activity referred to in Section 4.29 of Annexes I and II to Delegated Regulation 2021/2139 in the numerator of the applicable KPI | 0 | 0 | 0 | 0 | 0 | 0 | ||||||||||||||||
| 5 | Amount and proportion of taxonomy- aligned economic activity referred to in Section 4.30 of Annexes I and II to Delegated Regulation 2021/2139 in the numerator of the applicable KPI | 1 | 0 | 1 | 0 | 0 | 0 | ||||||||||||||||
| 6 | Amount and proportion of taxonomy- aligned economic activity referred to in Section 4.31 of Annexes I and II to Delegated Regulation 2021/2139 in the numerator of the applicable KPI | 0 | 0 | 0 | 0 | 0 | 0 | ||||||||||||||||
| 7 | Amount and proportion of other taxonomy-aligned economic activities not referred to in rows 1 to 6 above in the numerator of the applicable KPI | 31,074 | 99.8 | 31,065 | 99.7 | 9 | 0 | ||||||||||||||||
| 8 | Total amount and proportion of taxonomy-aligned economic activities in the numerator of the applicable KPI | 31,151 | 100 | 31,142 | 100 | 9 | 0 | ||||||||||||||||
| CCM+CCA | CCM | CCA | |||||||||||||||||||||
| Nuclear energy related activities | Amount | % | Amount | % | Amount | % | |||||||||||||||||
| 1 | Amount and proportion of taxonomy- eligible but not taxonomy-aligned economic activity referred to in Section 4.26 of Annexes I and II to Delegated Regulation 2021/2139 in the denominator of the applicable KPI | 0 | 0 | 0 | 0 | 0 | 0 | ||||||||||||||||
| 2 | Amount and proportion of taxonomy- eligible but not taxonomy-aligned economic activity referred to in Section 4.27 of Annexes I and II to Delegated Regulation 2021/2139 in the denominator of the applicable KPI | 0 | 0 | 0 | 0 | 0 | 0 | ||||||||||||||||
| 3 | Amount and proportion of taxonomy- eligible but not taxonomy-aligned economic activity referred to in Section 4.28 of Annexes I and II to Delegated Regulation 2021/2139 in the denominator of the applicable KPI | 0 | 0 | 0 | 0 | 0 | 0 | ||||||||||||||||
| 4 | Amount and proportion of taxonomy- eligible but not taxonomy-aligned economic activity referred to in Section 4.29 of Annexes I and II to Delegated Regulation 2021/2139 in the denominator of the applicable KPI | 84 | 0 | 84 | 0 | 0 | 0 | ||||||||||||||||
| 5 | Amount and proportion of taxonomy- eligible but not taxonomy-aligned economic activity referred to in Section 4.30 of Annexes I and II to Delegated Regulation 2021/2139 in the denominator of the applicable KPI | 13 | 0 | 13 | 0 | 0 | 0 | ||||||||||||||||
| 6 | Amount and proportion of taxonomy- eligible but not taxonomy-aligned economic activity referred to in Section 4.31 of Annexes I and II to Delegated Regulation 2021/2139 in the denominator of the applicable KPI | 0 | 0 | 0 | 0 | 0 | 0 | ||||||||||||||||
| 7 | Amount and proportion of other taxonomy-eligible but not taxonomy-aligned economic activities not referred to in rows 1 to 6 above in the denominator of the applicable KPI | 432,433 | 33.6 | 432380 | 33.6 | 54 | 0 | ||||||||||||||||
| 8 | Total amount and proportion of taxonomy eligible but not taxonomy- aligned economic activities in the denominator of the applicable KPI | 432,530 | 33.6 | 432477 | 33.6 | 54 | 0 | ||||||||||||||||
| CCM+CCA | CCM | CCA | |||||||||||||||||||||
| Nuclear energy related activities | Amount | % | Amount | % | Amount | % | |||||||||||||||||
| 1 | Amount and proportion of taxonomy- eligible but not taxonomy-aligned economic activity referred to in Section 4.26 of Annexes I and II to Delegated Regulation 2021/2139 in the denominator of the applicable KPI | 0 | 0 | 0 | 0 | 0 | 0 | ||||||||||||||||
| 2 | Amount and proportion of taxonomy- eligible but not taxonomy-aligned economic activity referred to in Section 4.27 of Annexes I and II to Delegated Regulation 2021/2139 in the denominator of the applicable KPI | 0 | 0 | 0 | 0 | 0 | 0 | ||||||||||||||||
| 3 | Amount and proportion of taxonomy- eligible but not taxonomy-aligned economic activity referred to in Section 4.28 of Annexes I and II to Delegated Regulation 2021/2139 in the denominator of the applicable KPI | 84 | 0 | 84 | 0 | 0 | 0 | ||||||||||||||||
| 4 | Amount and proportion of taxonomy- eligible but not taxonomy-aligned economic activity referred to in Section 4.29 of Annexes I and II to Delegated Regulation 2021/2139 in the denominator of the applicable KPI | 653 | 0.1 | 653 | 0.1 | 0 | 0 | ||||||||||||||||
| 5 | Amount and proportion of taxonomy- eligible but not taxonomy-aligned economic activity referred to in Section 4.30 of Annexes I and II to Delegated Regulation 2021/2139 in the denominator of the applicable KPI | 9 | 0 | 9 | 0 | 0 | 0 | ||||||||||||||||
| 6 | Amount and proportion of taxonomy- eligible but not taxonomy-aligned economic activity referred to in Section 4.31 of Annexes I and II to Delegated Regulation 2021/2139 in the denominator of the applicable KPI | 0 | 0 | 0 | 0 | 0 | 0 | ||||||||||||||||
| 7 | Amount and proportion of other taxonomy-eligible but not taxonomy-aligned economic activities not referred to in rows 1 to 6 above in the denominator of the applicable KPI | 432,780 | 33.6 | 432,313 | 33.6 | 468 | 0 | ||||||||||||||||
| 8 | Total amount and proportion of taxonomy eligible but not taxonomy- aligned economic activities in the denominator of the applicable KPI | 433,527 | 33.7 | 433,059 | 33.6 | 468 | 0 | ||||||||||||||||
| Nuclear energy related activities | Amount | % | |||||||||
| 1 | Amount and proportion of taxonomy- eligible but not taxonomy-aligned economic activity referred to in Section 4.26 of Annexes I and II to Delegated Regulation 2021/2139 in the denominator of the applicable KPI | 0 | 0 | ||||||||
| 2 | Amount and proportion of taxonomy- eligible but not taxonomy-aligned economic activity referred to in Section 4.27 of Annexes I and II to Delegated Regulation 2021/2139 in the denominator of the applicable KPI | 0 | 0 | ||||||||
| 3 | Amount and proportion of taxonomy- eligible but not taxonomy-aligned economic activity referred to in Section 4.28 of Annexes I and II to Delegated Regulation 2021/2139 in the denominator of the applicable KPI | 0 | 0 | ||||||||
| 4 | Amount and proportion of taxonomy- eligible but not taxonomy-aligned economic activity referred to in Section 4.29 of Annexes I and II to Delegated Regulation 2021/2139 in the denominator of the applicable KPI | 0 | 0 | ||||||||
| 5 | Amount and proportion of taxonomy- eligible but not taxonomy-aligned economic activity referred to in Section 4.30 of Annexes I and II to Delegated Regulation 2021/2139 in the denominator of the applicable KPI | 0 | 0 | ||||||||
| 6 | Amount and proportion of taxonomy- eligible but not taxonomy-aligned economic activity referred to in Section 4.31 of Annexes I and II to Delegated Regulation 2021/2139 in the denominator of the applicable KPI | 0 | 0 | ||||||||
| 7 | Amount and proportion of other taxonomy-eligible but not taxonomy-aligned economic activities not referred to in rows 1 to 6 above in the denominator of the applicable KPI | 822,367 | 63.8 | ||||||||
| 8 | Total amount and proportion of taxonomy eligible but not taxonomy- aligned economic activities in the denominator of the applicable KPI | 822,367 | 63.8 | ||||||||
| Nuclear energy related activities | Amount | % | |||||||||
| 1 | Amount and proportion of economic activity referred to in row 1 of Template 1 that is taxonomy-non-eligible in accordance with Section 4.26 of Annexes I and II to Delegated Regulation 2021/2139 in the denominator of the applicable KPI | 0 | 0 | ||||||||
| 2 | Amount and proportion of economic activity referred to in row 1 of Template 1 that is taxonomy-non-eligible in accordance with Section 4.26 of Annexes I and II to Delegated Regulation 2021/2139 in the denominator of the applicable KPI | 0 | 0 | ||||||||
| 3 | Amount and proportion of economic activity referred to in row 1 of Template 1 that is taxonomy-non-eligible in accordance with Section 4.26 of Annexes I and II to Delegated Regulation 2021/2139 in the denominator of the applicable KPI | 0 | 0 | ||||||||
| 4 | Amount and proportion of economic activity referred to in row 1 of Template 1 that is taxonomy-non-eligible in accordance with Section 4.26 of Annexes I and II to Delegated Regulation 2021/2139 in the denominator of the applicable KPI | 0 | 0 | ||||||||
| 5 | Amount and proportion of economic activity referred to in row 1 of Template 1 that is taxonomy-non-eligible in accordance with Section 4.26 of Annexes I and II to Delegated Regulation 2021/2139 in the denominator of the applicable KPI | 0 | 0 | ||||||||
| 6 | Amount and proportion of economic activity referred to in row 1 of Template 1 that is taxonomy-non-eligible in accordance with Section 4.26 of Annexes I and II to Delegated Regulation 2021/2139 in the denominator of the applicable KPI | 0 | 0 | ||||||||
| 7 | Amount and proportion of other taxonomy-non-eligible economic activities not referred to in rows 1 to 6 above in the denominator of the applicable KPI | 823,644 | 63.9 | ||||||||
| 8 | Total amount and proportion of taxonomy-non-eligible economic activities in the denominator of the applicable KPI | 823,644 | 63.9 | ||||||||
 |
A sustainability approach for customers that complements the activity-based approach. | ||||
 |
Additional details on manufacturing, real estate, sustainable agriculture and other activities. | ||||
|
New activities that come to light on the back of developments in the EU Taxonomy and to cover new environmental goals related to water, waste, the circular economy and biodiversity. | ||||
| Internationally recognized sector principles and guidelines that the SFICS draws on | ||||||||||||||||||||||||||||||||
| EU taxonomy | ICMA Green/Social Bond Principles | LMA Green Loan Principles | LMA Sustainability Linked Loan Principles | ICMA Sustainability Linked Bond Principles | Febraban taxonomy (Brazil) | UNEP FI framework | Climate Bond Standards | |||||||||||||||||||||||||
| Eligible products | ||||||||||||||||||||||||||||||||
Dedicated purpose |
Sustainability-linked financing |
|||||||||||||||||||||||||||||||
|
→Proceeds go towards eligible environmental and social activities and initiatives.
→Eligibility criteria: Activities with a specific environmental and social purpose under accepted standards that follow internationally recognized sector guidelines and principles (ICMA, LMA, Climate Bonds Standard) and the EU Taxonomy.
|
→Sustainability-linked transactions designed to help our customers achieve their ESG objectives.
→Transaction structured to achieve pre-determined sustainability performance targets (ESG ratings and metrics).
→Alignment with sector standards (ICMA and LMA).
|
|||||||||||||||||||||||||||||||
| Topics | Scope of information | |||||||
| Business conduct | ||||||||
| Ethical channel | Main Group companies in: Argentina, Brazil, Chile, Spain, Mexico, Poland, Portugal, United Kingdom, United States, Uruguay, Colombia, Peru, Switzerland, Bahamas, and Digital Consumer Bank subsidiaries and branches. | |||||||
| Socio-environmental risk (Equator Principles) | Full Group scope (Corporate & Investment Banking business). | |||||||
| Responsible procurement | Main companies of the Group in: Argentina, Brazil, Chile, Germany, Mexico, Portugal, Spain, United Kingdom, United States and United States. | |||||||
Acting responsibly towards customers | ||||||||
NPS and customer satisfaction |
Main companies of the Group in: Argentina, Brazil, Chile, Spain, United States, Mexico, Poland, Portugal and United Kingdom, Uruguay. | |||||||
| Customer complaints | All Group entities (>1% of reported claims volume in 2023) | |||||||
| Financial health and inclusion | Main companies of the Group in: Argentina, Brazil, Colombia, Chile, Chile, Germany, Mexico, Peru, Poland, Portugal, Spain, United Kingdom, United States and Uruguay. | |||||||
Acting responsibly towards our employees | ||||||||
| Employees | Full Group scope | |||||||
Supporting communities | ||||||||
| Support for higher education, employability and entrepreneurship | Main companies of the Group in: Argentina, Brazil, Chile, Germany, Mexico, Poland, Portugal, Spain, United Kingdom, United States, United Kingdom and Uruguay, in addition to Fundación Universia. | |||||||
| Other community support programmes | Main Group companies in: Germany, Argentina, Brazil, Colombia, Chile, Spain, United States, Mexico, Poland, Portugal, United Kingdom, Uruguay, and the rest of the countries in which DCB operates, as well as Foundations associated to the Group (e.g. Fund. Banco Santander in Spain, Santander Foundation in the UK, etc). | |||||||
| Supporting the green transition | ||||||||
| Green finance | Corporate & Investment Banking. | |||||||
| Portfolio alignment | Corporate & Investment Banking for thermal coal, power generation, energy (oil & gas), aviation, steel and auto manufacturing portfolios. DCB for the auto loan portfolio. |
|||||||
| Agreements with multilateral development banks | Full Group scope. Companies that have signed financing operations (loans, guarantees, risk, sharings or securitisations) with multilateral development banks (MDBs). | |||||||
| Environmental footprint | Wholly owned companies in: Argentina, Brazil, Chile, Germany, Mexico, Poland, Portugal, Spain, the United Kingdom and the United States. | |||||||
Responsible investment | ||||||||
| SRI AuMs | Wealth Management & Insurance: SAM and Private Banking | |||||||
| Other topics | ||||||||
| Corporate governance | Banco Santander, S.A. | |||||||
| Customers | Full Group scope | |||||||
| Tax contribution | Full Group scope | |||||||
| Litigation and penalties | Full Group scope | |||||||
| Communications with shareholders and investors | Banco Santander, S.A. | |||||||
Taxes paid by the Group |
The taxes Santander pays directly are included in the cash flow statement and mainly stem from the corporate income tax paid. They also include non-recoverable value added tax (VAT), employers' social security contributions, charges levied on banks and financial transactions in the geographies were we operate, and other taxes..
See data in the section 8.1 Tax contribution of this chapter.
|
It reflects how the Bank complies with its commitment to tax transparency in the jurisdictions where it operates.
Additionally, the "Taxes paid by the Group" metric is a requirement of the GRI standard, GRI 201-1: Direct economic value generated and distributed.
For more information see: https://www.globalreporting.org/
|
||||||||||||
Third-party taxes |
These are those generated by the development of our economic activity.
This is the sum of salary withholdings and employees' social security contributions, recoverable VAT, tax deduced at source on capital, non-resident taxes, property taxes, stamp taxes, taxes related to the financial activity, and others.
See data in the section 8.1 Tax contribution of this chapter.
|
|||||||||||||
| Total tax contribution |
The Group's total tax contribution includes the taxes paid by the Group as a direct cost and the taxes collected from third parties in the course of our economic activity.
See data in the section 8.1 Tax contribution of this chapter.
|
|||||||||||||
|
Revenue from
third-party sales
|
Revenue from intra-group transactions with other tax jurisdictions includes interest income; interest expenses; commission income and expenses for transactions between Santander companies whose residence is in different tax jurisdictions; and intra-group income, excluded from total income in the consolidated income statement because counterparty expense is recorded under another item of the consolidated income statement not included in total income.
Data available on the section 8.8 Country by country report of this chapter.
|
Metrics required by GRI 207-4: Country-by-Country Report. This standard requires the presentation of a country-by-country report with financial, economic and tax information on each jurisdiction in which Grupo Santander operates.
These indicators are complemented by the other indicators (not considered alternative performance measures) available in Appendix VI. Annual banking report of the Group's annual accounts (see page 824 of the annual accounts).
For more information see: https://www.globalreporting.org/
|
||||||||||||
Revenue from intra-group transactions with other tax jurisdictions |
||||||||||||||
Tangible assets other than cash and cash equivalents |
Composed of tangible assets, non-current assets held for sale and inventories.
See data in section 8.8 Country by country report of this chapter.
|
|||||||||||||
Corporate income tax accrued on profit/loss |
The accrued corporate income tax is a current-year expense and does not include deferred taxes.
|
|||||||||||||
| Green finance raised and facilitated |
Nominal amount of project finance, financial advisory, project bonds, green bonds (DCM), export finance (ECA), mergers and acquisitions (M&A), and equity capital markets (ECM) transactions ranked by the SCFS panel and reported in the League Tables of Dealogic, Inframation News, TXF and Mergermarket since the beginning of the year.
See data in section 2.6 Supporting a green transition and 8.6 Green transition (table 36. Green finance) in this chapter.
|
It reflects Santander's commitment and contribution to helping our customers, and society as a whole, in the transition to a low-carbon economy. |
||||||||||||
| Financing volume of renewable energy projects |
Nominal amount of renewable energy projects (greenfield and brownfield) financed since the beginning of the year and reported externally as reported in Infralogic's League Tables for project financing.
See data in section IV. 2023 highlights of this chapter.
|
|||||||||||||
| Financing volume of renewable electric vehicles |
Financing volume of vehicles powered exclusively by a rechargeable electric battery (no petrol engine).
See data in section IV. 2023 highlights of this chapter.
|
|||||||||||||
Credit disbursed to microentrepreneurs (EUR) |
Total amount of credit disbursed during the year to low-income entrepreneurs with low access to banking services, or with difficulties in accessing credit, with the objective of creating and/or growing their businesses. Data includes information on microfinance programmes in Brazil, Colombia, Mexico and Peru.
See data in section IV. 2023 highlights and 8.3 Financial inclusion (table 9. Microfinance) of this chapter.
|
It reflects Santander's commitment and contribution to help address financial inclusion challenges in the markets where we operate. |
||||||||||||
Socially responsible investment assets under management (SRI AUM) |
Value corresponding to total volume of assets under management registered as article 8 - promoting ESG characteristics - and 9 - with explicit sustainability objectives - of the SFDR regulation (EU Reg. 2019/2088) except for illiquid investments in Private Banking which are reported in terms of committed capital. Includes assets managed by Santander Asset Management (SAM) in the EU and with equivalent criteria in geographies where SFDR does not apply (mainly Latam) and Third Party Funds.
See data in section 3. Responsible investment of this chapter.
|
It reflects Santander's commitment and contribution to promote responsible investment. It also allows our managers to have a more complete vision of the assets in which to invest and identify competitive advantages and prevent potential risks. |
||||||||||||
Cost per hour |
Sum of total training expenditure divided by total hours of training completed by active employees in the period.
See data in section 8.5 Employees (table 30. Training) of this chapter.
|
It reflects the bank's commitment to training and lifelong learning for its employees. |
||||||||||||
Investment per employee |
Total expenditure on training divided by the average number of employees per year.
See data in section 8.5 Employees (table 30. Training) of this chapter.
|
|||||||||||||
Total investment in training |
Sum of all expenditures accrued in Learning Activities, during the period, including: Direct costs from trainers who are employed as Employees (i.e. Total Compensation prorated for the dedication to training activities), but not including Salaries of Learning and Development Employees, External suppliers / vendors expenses paid and budgeted by the Learning department (for any type of service: training design, training sessions delivery, communications, consulting), logistic and facilities costs (training rooms, catering, accommodation and travel, materials), Labour cost of employees within the Learning Department (actual amounts accrued during the period, including gross compensation - all items-, plus company taxes - contributions, ), IT costs and licenses plus their applicable services; expenditures in Marketing and Communications paid and budgeted by the Learning Department.; Other expenses
See data in section 8.5 Employees (table 30. Training) of this chapter.
|
|||||||||||||
Support (investment) for education, employment and entrepreneurship |
Total amount invested to support education, employment and entrepreneurship.
See data in section 6. Supporting communities and 8.4 Community investment (table 10. Community investment)of this chapter.
|
It reflects Santander's commitment and contribution to promoting (beyond our business operations) the progress and inclusive and sustainable growth of the communities where we are present. |
||||||||||||
Support (investment) for other local initiatives |
Total amount invested through local initiatives to promote childhood education, social welfare (especially among vulnerable groups), art and culture.
See data in section 6. Supporting communities and 8.4 Community investment (table 10. Community investment)of this chapter.
|
|||||||||||||
Total community investment |
Sum of investment in education, employability and entrepreneurship, plus investment in other community support programmes.
See data in section 6. Supporting communities and 8.4 Community investment (table 10. Community investment)of this chapter.
|
|||||||||||||
Payments to suppliers |
Total amount of payments made to suppliers outside the Group (excludes payments made by the Group in Poland).
See data in section 7.5 Acting responsibly towards suppliers of this chapter.
|
It reflects the Group's economic contribution through the purchase of products and services in its operations.
It also reflects our commitment to the local economies of the geographies in which we operate.
|
||||||||||||
% Turnover of locally contracted suppliers (M EUR) |
% of the Group's total turnover made to suppliers based in the same geography where the services are purchased (excludes payments made by the Group in Poland).
Turnover from locally contracted suppliers is divided by total turnover to suppliers.
See data in section 7.5 Acting responsibly towards suppliers of this chapter.
|
|||||||||||||
|
GRI 201 -1. Direct economic value generated and
distributed
|
Direct economic value generated and distributed (EVG&D) on an accruals basis, including the basic components for the organization’s global operations as listed below.
i.Direct economic value generated: revenues;
ii.Economic value distributed: operating costs, employee wages and benefits, payments to providers of capital, payments to government by country, and community investments;
iii.Economic value retained: ‘direct economic value generated’ less ‘economic value distributed’.
See data in section 7.5 Acting responsibly towards suppliers of this chapter.
|
Economic performance indicator that reflects how an organisation has generated economic wealth for its stakeholders.
It is a requirement of the GRI standard (201-1: Direct economic value generated and distributed).
For more information see: https://www.globalreporting.org/
|
||||||||||||
| Non-financial information to be disclosed | Chapter/section of the annual report | Correspondence with GRI indicators/Other regulations |
|||||||||||||||
| 0. General Information |
Brief description of the Group’s business model (including its business environment, organization and structure, markets, objectives and strategies, plus the main factors and trends that can affect its future performance). |
GRI 2-1
GRI 2-2
GRI 2-3
GRI 2-4
GRI 2-5
GRI 2-6
GRI 2-7
GRI 2-22
|
|||||||||||||||
A description of the Group's policies that includes due diligence procedures for identifying, assessing, preventing and mitigating risks and significant impacts, and for verifying and controlling, including the measures in which they have been adopted): |
Main internal regulation and governance (p. 92); Business conduct (p. 64) (Environmental, social and climate change risk management section).
|
GRI 2-23
GRI 3-3
|
|||||||||||||||
The results of these policies, including key indicators of relevant non-financial results that allow the monitoring and evaluation of progress and that favour the comparability between companies and sectors, in accordance with national, European or international frameworks of reference used for each matter. |
GRI 2-24
GRI 3-3
|
||||||||||||||||
Our progress in figures (p. 70). |
|||||||||||||||||
The main risks related to these matters associated with the Group's activities (business relationships, products or services) that may have a negative effect in these areas, and how the Group manages these risks, explaining the procedures used to detect and assess them in accordance with national, European or international frameworks of reference for each matter. It must include information about the impacts that have been detected, offering a breakdown, in particular of the main risks in the short, medium and long term. |
GRI 2-12 |
||||||||||||||||
| Non-financial information to be disclosed | Chapter/section of the annual report | Correspondence with GRI indicators/Other regulations |
|||||||||||||||
1. Environmental Information |
Detailed information on the current and foreseeable effects of the activities of the company in the environment and, where appropriate, health and safety, environmental evaluation or certification procedures; the resources dedicated to the prevention of environmental risks; the application of the principle of caution, the amount of provisions and guarantees for environmental risks. |
Supporting the green transition (p. 30);
Business conduct (p. 64) (Environmental, social and climate change risk management).
At the end of the 2023 financial year, no significant account is presented in the Consolidated Annual Accounts of the Group that should be included in this chapter regarding environmental provisions or guarantees.
|
GRI 2-12
GRI 2-23
GRI 3-3
|
||||||||||||||
| Contamination: | |||||||||||||||||
Measures to prevent, reduce or repair CO2 emissions that seriously affect the environment, taking into account any form of air pollution, including noise and light pollution. |
Supporting the green transition (p. 30) (Reducing our environmental footprint). |
GRI 3-3
GRI 305-5
|
|||||||||||||||
| Circular economy and waste prevention and management: | |||||||||||||||||
| Waste prevention measures, waste recycling measures, waste reuse measures; other forms of waste recovery and reuse; actions against food waste. | Supporting the green transition (p. 30) (Our environmental footprint). |
GRI 3-3
GRI 301-1
GRI 306-2
|
|||||||||||||||
| Sustainable use of resources: | |||||||||||||||||
| Use and supply of water according to local limitations | GRI 303-5 |
||||||||||||||||
| Consumption of raw materials and measures taken to improve the efficiency of its use. | GRI 301-1 |
||||||||||||||||
| Energy: direct and indirect consumption, measures taken to improve energy efficiency, use of renewable energies |
GRI 3-3
GRI 302-1
GRI 302-3
GRI 302-4
|
||||||||||||||||
| Climate change: | |||||||||||||||||
| Important elements of greenhouse gas emissions generated as a business activity (including goods and services produced) |
GRI 3-3
GRI 305-1
GRI 305-2
GRI 305-3
GRI 305-4
|
||||||||||||||||
| Measures taken to adapt to the consequences of climate change | Supporting the green transition (p. 30) |
GRI 3-3
GRI 201-2
|
|||||||||||||||
| Reduction targets voluntarily established in the medium and long term to reduce greenhouse gas emissions and means implemented for this purpose. | Supporting the green transition (p. 30) |
GRI 2-23
GRI 3-3
|
|||||||||||||||
| Protection of biodiversity: | |||||||||||||||||
| Measures taken to preserve or restore biodiversity | Supporting the green transition (p. 30) (Nature and biodiversity). |
GRI 304-2 |
|||||||||||||||
| Impacts caused by the activities or operations of protected areas | |||||||||||||||||
| Non-financial information to be disclosed | Chapter/section of the annual report | Correspondence with GRI indicators/Other regulations |
|||||||||||||||
| 2. Social |
Employment: | ||||||||||||||||
| Total number and distribution of employees by gender, age, country and professional classification | Our progress in figures (p. 70). |
GRI 2-7
GRI 3-3
GRI 405-1
|
|||||||||||||||
Total number and distribution of contracts modes and annual average of undefined contracts, temporary contracts, and part-time contracts by: sex, age and professional classification. |
Our progress in figures (p. 70). |
GRI 2-7
GRI 405-1
|
|||||||||||||||
Number of dismissals by: gender, age and professional classification. |
Our progress in figures (p. 70). |
GRI 401-1 |
|||||||||||||||
Average remuneration and its progression broken down by gender, age and professional classification |
Our progress in figures (p. 70). |
GRI 405-2 |
|||||||||||||||
Salary gap and remuneration of equal or average jobs in society |
Acting responsibly towards employees (p. 46) (Diversity, equity and inclusion section). |
GRI 3-3
GRI 405-2
|
|||||||||||||||
Average remuneration of directors and executives (including variable remuneration, allowances, compensation, payment to long-term savings forecast systems and any other payment broken down by gender) |
Our progress in figures (p. 70). |
GRI 2-19
GRI 2-20
GRI 3-3
GRI 405-2
|
|||||||||||||||
Implementation of work disconnection policies |
Acting responsibly towards employees (p. 46) (Transforming the way we work section). |
GRI 3-3 |
|||||||||||||||
Employees with disabilities |
Our progress in figures (p. 70). |
GRI 405-1 |
|||||||||||||||
| Organization of work: | |||||||||||||||||
Organization of work time |
Acting responsibly towards employees (p. 46) (Transforming the way we work section). |
GRI 3-3 |
|||||||||||||||
Number of absent hours |
Our progress in figures (p. 70). |
GRI 403-9
GRI 403-10
|
|||||||||||||||
Measures designed to facilitate work-life balance and encourage a jointly responsible use of said measures by parents |
Acting responsibly towards employees (p. 46) (Gender equality section). |
GRI 3-3 |
|||||||||||||||
| Health and safety: | |||||||||||||||||
Conditions of health and safety in the workplace |
Acting responsibly towards employees (p. 46) (Employees’ health and well-being section). |
GRI 3-3 |
|||||||||||||||
Occupational accidents, in particular their frequency and severity, as well as occupational illnesses. Broken down by gender. |
Our progress in figures (p. 70). |
GRI 403-9
GRI 403-10
|
|||||||||||||||
| Social relations: | |||||||||||||||||
Organization of social dialogue (including procedures to inform and consult staff and negotiate with them) |
GRI 3-3 |
||||||||||||||||
Percentage of employees covered by collective bargaining agreements by country |
Our progress in figures (p. 70). |
GRI 2-30 |
|||||||||||||||
Balance of the collective bargaining agreements (particularly in the field of health and safety in the workplace) |
Acting responsibly towards employees (p. 46) (Employees’ health and well-being section) |
GRI 403-1
GRI 403-4
|
|||||||||||||||
| Mechanisms and procedures that employers have for encouraging the involvement of workers in management of the company, in terms of information, consultation and participation | Business conduct (p. 64) (Ethical channels) |
||||||||||||||||
| Training: | |||||||||||||||||
The policies implemented in the field of training |
Acting responsibly towards employees (p. 46) (Attracting talent and Developing talent sections). |
GRI 3-3
GRI 404-2
|
|||||||||||||||
Total number of hours of training by professional categories. |
Our progress in figures (p. 70). |
GRI 404-1 |
|||||||||||||||
| Non-financial information to be disclosed | Chapter/section of the annual report | Correspondence with GRI indicators/Other regulations |
|||||||||||||||
| 2. Social |
Accessibility: | ||||||||||||||||
Universal accessibility of people |
GRI 3-3 |
||||||||||||||||
| Equality: | |||||||||||||||||
Measures taken to promote equal treatment and opportunities between women and men, Equality plans (Chapter III of Organic Law 3/2007, of 22 March, for the effective equality of women and men), measures taken to promote employment, protocols against sexual and gender-based harassment, Policy against all types of discrimination and, where appropriate, integration of protocols against sexual and gender-based harassment and protocols against all types of discrimination and, where appropriate, management of diversity |
GRI 3-3 |
||||||||||||||||
| 3. Human Rights |
Application of due diligence procedures in the field of Human Rights |
GRI 2-25
GRI 3-3
|
|||||||||||||||
| Prevention of the risks of Human Rights violations and, where appropriate, measures to mitigate, manage and repair any possible abuses committed | GRI 2-23 GRI 2-24 GRI 2-25 GRI 2-26 |
||||||||||||||||
| Complaints about cases of human rights violations | Business conduct (p. 64) (Ethical channels section). |
GRI 406-1 | |||||||||||||||
| Promotion and compliance with the provisions of the fundamental conventions of the International Labour Organization regarding respect for freedom of association and the right to collective bargaining. | Acting responsibly towards employees (p. 46) |
GRI 3-3 | |||||||||||||||
| Elimination of discrimination in respect of employment and occupation; elimination of forced or compulsory labour; and the effective abolition of child labour. | Business conduct (p. 64) (Environmental, social and climate change risk management and Human rights sections) |
GRI 2-23 GRI 3-3 GRI 406-1 |
|||||||||||||||
| 4. Fight against corruption |
Measures taken to prevent corruption and bribery |
Main internal regulations and governance (p. 92); Business conduct (p. 64) (Financial crime compliance section).
Risk, compliance and conduct management chapter: 7.2 Compliance and conduct risk management section (p. 497).
|
GRI 2-23
GRI 2-26
GRI 3-3
GRI 205-1
GRI 205-2
|
||||||||||||||
| Measures to combat money laundering |
Main internal regulations and governance (p. 92); Business conduct (p. 64) (Financial crime compliance section).
Risk, compliance and conduct management chapter: 7.2 Compliance and conduct risk management section (p. 497).
|
GRI 2-23
GRI 2-26
GRI 3-3
GRI 205-1
GRI 205-2
|
|||||||||||||||
| Contributions to non-profit foundations and entities | Supporting communities (p. 61). |
GRI 413-1 | |||||||||||||||
| Non-financial information to be disclosed | Chapter/section of the annual report | Correspondence with GRI indicators/Other regulations |
|||||||||||||||
| 5. Information on the company |
Commitments of the company to sustainable development: | ||||||||||||||||
| The impact of the company’s activity on employment and local development |
GRI 3-3
GRI 203-1
GRI 203-2
GRI 413-1
GRI 413-2
|
||||||||||||||||
| The impact of the company’s activity on local towns and villages and in the country. |
GRI 203-1
GRI 203-2
GRI 411-1
GRI 413-1
GRI 413-2
|
||||||||||||||||
| Relations maintained with the representatives of local communities and the modalities of dialogue with them. | Stakeholder engagement (p. 89). |
GRI 2-29 |
|||||||||||||||
| Association or sponsorship actions | Santander participates in the sectoral associations representing financial activity in the countries in which it operates, such as the AEB in the case of Spain. | GRI 2-28 |
|||||||||||||||
| Outsourcing and suppliers: | |||||||||||||||||
| Inclusion of social, gender equality and environmental issues in the procurement policy | Acting responsibly towards suppliers (p. 69). |
GRI 2-6
GRI 3-3
|
|||||||||||||||
| Consideration in relations with suppliers and subcontractors of their responsibility | Acting responsibly towards suppliers (p. 69). |
GRI 204-1 GRI 308-1 GRI 414-1 |
|||||||||||||||
| Supervision and audit systems and resolution thereof | Acting responsibly towards suppliers (p. 69). |
GRI 3-3 | |||||||||||||||
| Consumers: | |||||||||||||||||
| Measures for the health and safety of consumers |
GRI 3-3
GRI 416-1
GRI 417-1
|
||||||||||||||||
| Systems for complaints received and resolution thereof |
Acting responsibly towards customers (p. 55). Risk, compliance and conduct management chapter: 7.2 Compliance and conduct risk management section (p. 497)
|
GRI 2-26
GRI 3-3
GRI 416-2
GRI 417-2
GRI 418-1
|
|||||||||||||||
| Tax information: | |||||||||||||||||
| The profits obtained country by country | Auditor's report and 2023 annual consolidate accounts (p. 519) (Annex VI Annual banking report) and Auditor's Report and 2022 annual consolidate accounts (Annex VI Annual banking report). |
GRI 3-3
GRI 207-1
|
|||||||||||||||
| Taxes on benefits paid | Our progress in figures (p. 70) (8.1 Tax contribution) |
||||||||||||||||
| Public grants received | GRI content index (p. 151). |
GRI 201-4 |
|||||||||||||||
| 6. Other relevant information |
EU Taxonomy |
Information related to article 8 of EU Taxonomy:
|
EU Regulation 2020/852 and Commission Delegated Regulations 2021/2139 and 2021/2178 as amended by Delegated Regulations (EU) 2022/1214, 2023/2485 and 2023/2486 |
||||||||||||||
| Principles | Reference in the 2023 Annual report |
Correspondence with GRI indicators |
|||||||||
| Human rights | |||||||||||
| Principle 1: | Businesses should support and respect the protection of internationally proclaimed human rights. |
Main internal regulations and governance (p. 92);
Business conduct (p. 64) (sections: Conduct standards, Environmental, social and climate change risk management, Acting responsibly towards suppliers)
|
GRI 2-7, 2-22, 2-23, 2-30, 201-3, 205-2, 401-1, 401-2, 403-1, 403-6, 403-9, 406-1, 414-1 | ||||||||
| Principle 2: | Businesses should make sure they are not complicit in human rights abuses. |
Business conduct (p. 64) (Ethical channels section);
Acting responsibly towards employees (p. 46) (Employee feedback subsection)
|
GRI 406-1, 414-1 | ||||||||
| Labour | |||||||||||
| Principle 3: | Businesses should uphold the freedom of association and the effective recognition of the right to collective bargaining. | Acting responsibly towards employees (p. 46) (Working conditions and social dialogue section). |
GRI 2-30, 401-2 | ||||||||
| Principle 4: | Businesses should uphold the elimination of all forms of forced and compulsory labour. | Business conduct (p. 64) (Environmental, social and climate change risk management section). |
|||||||||
| Principle 5: | Businesses should uphold the effective abolition of child labour. | Business conduct (p. 64) (Environmental, social and climate change risk management section). |
|||||||||
| Principle 6: | Businesses should uphold the elimination of discrimination in respect to employment and occupation. | Acting responsibly towards employees (p. 46) (Diversity, equity and inclusion (DE&I) subsection). |
GRI 2-7, 401-1, 401-2, 403-9, 404-1, 404-2, 404-3, 405-1, 406-1 | ||||||||
| Environment | |||||||||||
| Principle 7: | Businesses should support a precautionary approach to environmental challenges. | Supporting the green transition (p. 30). |
GRI 308-1 | ||||||||
| Principle 8: | Businesses should undertake initiatives to promote greater environmental responsibility. | Supporting the green transition (p. 30). |
GRI 302-1, 302-4, 303-5, 305-1, 305-2, 305-3, 305-4, 305-5 | ||||||||
| Principle 9: | Businesses should encourage the development and diffusion of environmentally friendly technologies. |
Supporting the green transition (p. 30) (Our environmental footprint section).
Our progress in figures (p. 70).
|
GRI 302-4, 305-5 | ||||||||
| Anti-Corruption | |||||||||||
| Principle 10: | Businesses should work against corruption in all its forms, including extortion and bribery. |
Main internal regulations and governance (p. 92);
|
GRI 2-23, 2-27, 205-1, 205-2 | ||||||||
| Principle 1: Alignment | ||||||||
 |
We will align our business strategy to be consistent with and contribute to individuals’ needs and society’s goals, as expressed in the Sustainable Development Goals, the Paris Climate Agreement and relevant national and regional frameworks. |
|||||||
|
Business model
Describe (high-level) your bank’s business model, including the main customer segments served, types of products and services provided, the main sectors and types of activities across the main geographies in which your bank operates or provides products and services. Please also quantify the information by disclosing e.g. the distribution of your bank’s portfolio (%) in terms of geographies, segments (i.e. by balance sheet and/or off-balance sheet) or by disclosing the number of customers and clients served.
| ||||||||
|
Santander is a retail bank that operates in three regions (Europe, North America and South America) and in 10 core markets. We structure our operations into five global businesses: Retail & Commercial Banking; Digital Consumer Bank; Corporate & Investment Banking; Wealth Management & Insurance; and Payments.
We want to be the best digital and open financial services platform by acting responsibly and earning the lasting loyalty of employees, customers, shareholders and broader society. Our purpose is to help people and businesses prosper. We strive to make sure that everything we do is Simple, Personal and Fair.
Our strategy is to create value for all our stakeholders. With a talented and motivated team, we earn our customers’ trust and achieve strong financial results for our shareholders, which in turn enables us to support the communities we serve.
Our business model is based on three pillars:
•Customer focus. Digital bank with branches. We are transforming our business and operating model through technology-based initiatives to build a digital bank with branches that enables our customers to access financial services through several channels.
•Our scale: Our scale in each core market, coupled with our global reach, drives profitable growth and competitive advantage over local peers.
•Diversification: Our diversification by geography (in emerging and mature markets) and business (with presence in every sector — retail customers, SMEs, corporates, etc.) enables us to keep net interest income stable.
By numbers:
•Total customers served: 165 million
•Gross loans and advances to customers: EUR 1,015 billion
•Distribution by region: Europe (55%); North America (16%); South America (16%); Digital Consumer Bank (13%).
•Distribution by segment: retail customers (63%), SMEs and corporates (24%); CIB (13%).
|
Links and references
Corporate website - santander.com
• About us
• Our approach
2023 Digital Annual Review
2023 Annual report
• Business model and strategy chapter
• Economic and financial review chapter
|
|||||||
|
Strategy alignment
Does your corporate strategy identify and reflect sustainability as strategic priority/ies for your bank?
☒ Yes
☐ No
Please describe how your bank has aligned and/or is planning to align its strategy to be consistent with the Sustainable Development Goals (SDGs), the Paris Climate Agreement, and relevant national and regional frameworks.
Does your bank also reference any of the following frameworks or sustainability regulatory reporting requirements in its strategic priorities or policies to implement these?
☒ UN Guiding Principles on Business and Human Rights
☒ International Labour Organization fundamental convention
☒ UN Global Compact
☒ UN Declaration on the Rights of Indigenous Peoples
☒ Any applicable regulatory reporting requirements on environmental risk assessments, e.g. on climate risk - please specify which ones: NFRD (Spanish Act 11/2018), Pillar III
☒ Any applicable regulatory reporting requirements on social risk assessments, e.g. on modern slavery - please specify which ones: Modern Slavery Act 2015 UK
☐ None of the above
| ||||||||
|
Banco Santander is firmly committed to driving inclusive and sustainable growth. Our purpose is to help people and businesses prosper.
Our operations and investments contribute to several United Nations' Sustainable Development Goals (SDGs) and to the Paris Agreement. We pinpointed three SDGs on which the Group has the greatest impact (8, 13 and 16) and eight more to which we also make a significant contribution through our activity and our social programmes (1, 4, 5, 7, 10, 11, 12, 13 and 17).
We support the Paris Agreement goals and in 2021 set our ambition to be net zero in CO2 emissions by 2050.
We also drive our responsible banking agenda through local and international initiatives and working groups.
We comply with all regulatory requirements regarding ESG disclosure. The Responsible Banking chapter of the 2023 Annual Report is the Group’s consolidated non-financial information statement. It provides detailed information in accordance with Spain’s Act 11/2018, which transposes Directive 2014/95/EU into Spanish law. Our Pillar 3 ESG risk disclosures also cover new market requirements.
Our three priorities as a responsible bank are:
•Support the transition to a low-carbon economy:
•Support and engage with customers in accelerating their transition, and develop a best-in-class sustainable finance and investment proposition.
•Progress with decarbonizing our portfolios to align to net zero by 2050, while considering other environmental goals.
•Promote inclusive growth:
•Promote employees' wellbeing and equal treatment and opportunity for all.
•Support financial inclusion by promoting access to financial products and services and financial health, including financial literacy.
•Foster customer information transparency and data privacy.
•Support education, employability and entrepreneurship.
•Strong governance and culture across the organization:
•Drive culture, conduct and ethical behaviour, doing everything the Santander Way: Simple, Personal and Fair.
•Continue integrating ESG in governance and our core activities, and enhancing capabilities across teams including business, risk management and data reporting.
|
Links and references
2023 Digital Annual Review
•About us
2023 Annual report - Responsible banking chapter
Other references
•Santander UK Modern Slavery Statement - santander.co.uk/about-santander/investor-relations/modern-slavery-statement
|
|||||||
| Principle 2: Impact and Target Setting | ||||||||
 |
We will continuously increase our positive impacts while reducing the negative impacts on, and managing the risks to, people and environment resulting from our activities, products and services. To this end, we will set and publish targets where we can have the most significant impacts. |
|||||||
|
2.1 Impact Analysis (Key Step 1)
Show that your bank has performed an impact analysis of its portfolio/s to identify its most significant impact areas and determine priority areas for target-setting. The impact analysis shall be updated regularly1 and fulfil the following requirements/elements (a-d)2:
a) Scope: What is the scope of your bank’s impact analysis? Please describe which parts of the bank’s core business areas, products/services across the main geographies that the bank operates in (as described under 1.1) have been considered in the impact analysis. Please also describe which areas have not yet been included, and why
| ||||||||
|
Grupo Santander performs an annual materiality assessment to identify the most pressing sustainability matters. In 2023, we took a double-materiality approach based on the Corporate Sustainability Reporting Directive (CSRD). Our assessment covered two dimensions: impact materiality and financial materiality.
Impact materiality assesses the potential positive and negative impacts of sustainability matters on people and the environment. We used the UNEP FI impact tool to assess impact materiality.
The assessment covered the entire group, including information on all our businesses (Retail & Commercial Banking; Digital Consumer Bank; Corporate & Investment Banking; Wealth Management & Insurance; and Payments) and our own operations. It did not consider our vendors’ value chain.
|
Links and references
2023 Annual report - Responsible banking chapter
|
|||||||
|
1. That means that where the initial impact analysis has been carried out in a previous period, the information should be updated accordingly, the scope expanded as well as the quality of the impact analysis improved over time.
2. Further guidance can be found in the Interactive Guidance on impact analysis and target setting (unepfi.org/wordpress/wp-content/uploads/2022/05/Impact-and-Target-Process-V-1.1-09.05.2022.pdf).
| ||||||||
|
b) Portfolio composition: Has your bank considered the composition of its portfolio (in %) in the analysis? Please provide proportional composition of your portfolio globally and per geographical scope
i) by sectors & industries3 for business, corporate and investment banking portfolios (i.e. sector exposure or industry breakdown in %), and/or
ii) by products & services and by types of customers for consumer and retail banking portfolios.
If your bank has taken another approach to determine the bank’s scale of exposure, please elaborate, to show how you have considered where the bank’s core business/major activities lie in terms of industries or sectors.
| ||||||||
|
Santander used the Consumer Banking and Investment Banking modules.
The Consumer Banking module (52% of total assets, not including cash and debt securities) included products and credit volumes in the retail segment (mainly mortgages and consumer loans).
The Investment Banking module (48%) included credit volumes in business segments (from SMEs to corporates), split by NACE sector.
|
Links and references
2023 Annual report - Responsible banking chapter
2023 Annual report - Risk management and compliance chapter
|
|||||||
c) Context: What are the main challenges and priorities related to sustainable development in the main countries/regions in which your bank and/or your clients operate?4 Please describe how these have been considered, including what stakeholders you have engaged to help inform this element of the impact analysis. | ||||||||
|
We used the Context module as input to point out the key sustainability challenges in the markets where the Group operates. We conducted this assessment on the Group’s five biggest markets (Spain, the UK, Brazil, Mexico and the US) in the three regions where we are present (Europe, North America and South America).
The key sustainability challenges across the Group's footprint according to the Context module of the UNEPFI tool are:
•availability, accessibility, affordability, which for us relates significantly to financial inclusion; and
•climate stability
We also included feedback from other main stakeholders — customers, regulators and NGOs – to confirm our findings and prioritize areas of focus.
|
Links and references
2023 Annual report - Responsible banking chapter
|
|||||||
| 3. ‘Key sectors’ relative to different impact areas, i.e. those sectors whose positive and negative impacts are particularly strong, are particularly relevant here. 4. Global priorities might alternatively be considered for banks with highly diversified and international portfolios.
| ||||||||
Based on these first 3 elements of an impact analysis, what positive and negative impact areas has your bank identified? Which (at least two) significant impact areas did you prioritize to pursue your target setting strategy (see 2.2)5? Please disclose. | ||||||||
|
The two main areas of impact, which we made pivotal components of our strategy, are:
•availability, accessibility, affordability, which for us relates significantly to financial inclusion; and
•climate stability
The positive impacts outweigh the negative impacts in both areas.
Based on banks’ business models, we consider these areas of impact to:
•promote the financial health and inclusion of our customers; and
•help our customers transition to a low-carbon economy.
|
Links and references
2023 Annual report - Responsible banking chapter
|
|||||||
| 5. To prioritize the areas of most significant impact, a qualitative overlay to the quantitative analysis as described in a), b) and c) will be important, e.g. through stakeholder engagement and further geographic contextualisation. | ||||||||
|
d) For these (min. two prioritized impact areas): Performance measurement: Has your bank identified which sectors & industries as well as types of customers financed or invested in are causing the strongest actual positive or negative impacts? Please describe how you assessed the performance of these, using appropriate indicators related to significant impact areas that apply to your bank’s context.
In determining priority areas for target-setting among its areas of most significant impact, you should consider the bank’s current performance levels, i.e. qualitative and/or quantitative indicators and/or proxies of the social, economic and environmental impacts resulting from the bank’s activities and provision of products and services. If you have identified climate and/or financial health&inclusion as your most significant impact areas, please also refer to the applicable indicators in the Annex.
If your bank has taken another approach to assess the intensity of impact resulting from the bank’s activities and provision of products and services, please describe this.
| ||||||||
|
The main impacts within the two selected areas are:
•availability, accessibility, affordability: Positive impact from retail exposure; and
•climate stability: Impact from the most emissions-intensive sectors, such as mining, manufacturing, energy, transport, and storage.
|
Links and references
2023 Annual report - Responsible banking chapter
|
|||||||
|
Self-assessment summary:
Which of the following components of impact analysis has your bank completed, in order to identify the areas in which your bank has its most significant (potential) positive and negative impacts?6
Scope: ☒ Yes ☐ In progress ☐ No
Portfolio composition: ☒ Yes ☐ In progress ☐
Context: ☒ Yes ☐ In progress ☐ No
Performance measurement: ☐ Yes ☒ In progress ☐ No
Which most significant impact areas have you identified for your bank, as a result of the impact analysis?
Climate change mitigation and financial health & inclusion
How recent is the data used for and disclosed in the impact analysis?
☒ Up to 6 months prior to publication
☐ Up to 12 months prior to publication
☐ Up to 18 months prior to publication
☐ Longer than 18 months prior to publication
Open text field to describe potential challenges, aspects not covered by the above etc.: (optional)
| ||
|
2.2 Target Setting (Key Step 2)
Show that your bank has set and published a minimum of two targets which address at least two different areas of most significant impact that you identified in your impact analysis.
The targets7 have to be Specific, Measurable (qualitative or quantitative), Achievable, Relevant and Time-bound (SMART). Please disclose the following elements of target setting (a-d), for each target separately:
a) Alignment: which international, regional or national policy frameworks to align your bank’s portfolio with8 have you identified as relevant? Show that the selected indicators and targets are linked to and drive alignment with and greater contribution to appropriate Sustainable Development Goals, the goals of the Paris Agreement, and other relevant international, national or regional frameworks.
| |||||||||||||||||
|
Regarding climate change, we set our ambition to be net zero in carbon emissions by 2050 in February 2021 (2020 Annual Report). We’re also a founding member of the UNEP FI Net Zero Banking Alliance (NZBA, a coalition of leading banks that represent 41% of global banking assets) as a key banking sector initiative to help us drive our net zero ambition.
Since setting our ambition, we’ve announced seven decarbonization targets for the most emissions-intensive sectors. These sectors are power generation; thermal coal mining and power generation; oil and gas; aviation; steel; auto manufacturing; and auto lending.
According to our last assessment, aluminium, cement and maritime transport are not material to Santander.
Within the NZBA sectors, we are also making headway with analysing, measuring and acting to help decarbonize other climate-related sectors such as agriculture, mortgages and commercial real estate, which are key in the retail segments. The climate performance dynamics of these sectors are heavily dependent on their regulatory landscape. There is currently a lack of public policies, actions and specific plans and measures at the level the changes require for a net zero pathway. We continue to work with clients in these sectors on their decarbonization efforts and internal monitoring of their performance; but we understand we should refrain from setting public targets until their regulatory landscape is sufficiently supportive. We have been actively and constructively sharing our understanding and experience of these policy gaps with authorities, as well as other sectors, and plan to keep doing so.
Regarding financial inclusion, having exceeded our target to financially empower 10 million people between 2019 and 2025 (reaching 11.8 million in 2022), in 2023 we set a new target to financially include 5 million more between 2023 and 2025 through access and financing initiatives. We came up with an internal methodology to calculate the number of people we financially include. It considers best international practice and received independent, third-party validation. Santander also has an active role in the UNEP FI Working Group on Financial Health and Inclusion, which underpins the methodology we use.
|
Links and references
2023 Annual report - Responsible banking chapter
Climate finance report
•5. Metrics and targets
|
||||||||||||||||
| 7. Operational targets (relating to for example water consumption in office buildings, gender equality on the bank’s management board or business-trip related greenhouse gas emissions) are not in scope of the PRB. 8. Your bank should consider the main challenges and priorities in terms of sustainable development in your main country/ies of operation for the purpose of setting targets. These can be found in National Development Plans and strategies, international goals such as the SDGs or the Paris Climate Agreement, and regional frameworks. Aligning means there should be a clear link between the bank’s targets and these frameworks and priorities, therefore showing how the target supports and drives contributions to the national and global goals.
| |||||||||||||||||
b) Baseline: Have you determined a baseline for selected indicators and assessed the current level of alignment? Please disclose the indicators used as well as the year of the baseline. | |||||||||||||||||
| In case you have identified other and/or additional indicators as relevant to determine the baseline and assess the level of alignment towards impact driven targets, please disclose these. | |||||||||||||||||
|
Regarding climate change, we set baselines for our decarbonization targets.
Baseline: We use 2019 as the baseline for four of our targets.
For auto manufacturing and auto lending, we use 2020 and 2022, respectively.
In financial inclusion, we achieved our target to financially empower 10 million people between 2019 and 2025 through access, financing and education initiatives three years early in 2022. To revise this target, in 2023 we conducted a study using reliable public information (i.e. from the World Bank) to pinpoint the barriers to financial services in our core markets. Based on that study and the initiatives we’re running, we set a new target to financially empower 5 million people between 2023 and 2025.
|
Links and references
Climate finance report
•5. Metrics and targets
|
||||||||||||||||
c) SMART targets (incl. key performance indicators (KPIs)9): Please disclose the targets for your first and your second area of most significant impact, if already in place (as well as further impact areas, if in place). Which KPIs are you using to monitor progress towards reaching the target? Please disclose. | |||||
|
Climate change: Our aim is to support the green transition and reach net zero carbon emissions by 2050 by aligning our portfolio with the Paris Agreement goals:
•Target/KPI 1: Thermal coal mining and power generation phase-out. From 7 bn (2021) to 0 by 2030.
•Target/KPI 2: Reduce the emissions intensity of the power generation portfolio from 0.21 tCO2e/MWh (2019) to 0.11 tCO2e/MWh by 2030.
•Target/KPI 3: Reduce the absolute emissions of the energy portfolio (oil and gas) from 23.84 mtCO2e (2019) to 16.98 mtCO2e by 2030.
•Target/KPI 4: Reduce the emissions intensity of the aviation portfolio from 92.47 grCO2e/RPK (2019) to 61.71 grCO2e/RPK by 2030.
•Target/KPI 5: Reduce the emissions intensity of the steel portfolio from 1.58 tCO2e/tS (2019) to 1.07 tCO2e/tS by 2030.
•New target for 2023/KPI 6: Reduce the emissions intensity of the auto manufacturing portfolio from 149 gCO2/vkm (2020) to 103 gCO2/vkm by 2030.
•New target for 2023/KPI 7: Reduce the emissions intensity of the auto lending portfolio from 137 gCO2e/vkm (2022) to 75- 89 gCO2/vkm by 2030.
Helping customers transition to a low-carbon economy
•Target/KPI 8: Invest or mobilize EUR 120 billion in green finance between 2019 and 2025, and EUR 22 billion by 2023.
Helping customers transition to a sustainable economy
Target/KPI 9: EUR 100 billion in socially responsible investment by 2025.
Financial health and inclusion. Our aim is to help people access and use basic financial services, and provide tailored finance to individuals and SMEs with difficulty accessing credit or that are in financial distress through financial education initiatives that help maximize our impact.
•Target 1: Financially empower 5 million people between 2023 and 2025.
•Target/KPI 1: # people benefited from access to, and use of, basic financial services through simple payment platforms and cash services in remote and small communities.
•Target/KPI 2: # microentrepreneurs, customers in financial distress and low-income households with difficulty getting credit for housing or basic financial needs supported.
|
Links and references
2023 Annual report - Responsible banking chapter
|
||||
|
d) Action plan: which actions including milestones have you defined to meet the set targets? Please describe.
Please also show that your bank has analysed and acknowledged significant (potential) indirect impacts of the set targets within the impact area or on other impact areas and that it has set out relevant actions to avoid, mitigate, or compensate potential negative impacts.
| |||||
|
Climate change
We drew up a climate strategy and are working to (1) set and implement decarbonization targets in the highest-emitting sectors, reporting on progress and action plans every year; (2) support our customers’ transition (rolling out solutions and ramping up our green operations), which we pledge to do as part of our action plan; (3) embed climate in risk management and revise the risk appetite of our portfolios though decarbonization targets; and (4) manage the environmental footprint of our own operations, with multi-year plans agreed for all units.
Financial health and inclusion
We promote financial health and inclusion through these three initiatives:
•Access. Helping people access and use basic financial services through simple payment platforms and cash services in remote and small communities.
•Finance. We provide tailored finance to individuals and SMEs with difficulty accessing credit or that are in financial distress.
•Financial health. We help people manage their finances better in the short, medium and long term by expanding their knowledge of finance and making concepts easy to understand, which enables them to make more informed decisions.
Our access and finance initiatives contribute towards our public target to financially empower five million people.
|
Links and references
2023 Annual report - Responsible banking chapter
|
||||
| 9. Key Performance Indicators are chosen indicators by the bank for the purpose of monitoring progress towards targets. | |||||
|
Self-assessment summary
Which of the following components of target setting in line with the PRB requirements has your bank completed or is currently in a process of assessing for your…
| |||||||||||
… first area of most significant impact: … Climate change |
… second area of most significant impact: … Financial health and inclusion |
(If you are setting targets in more impact areas) …your third (and subsequent) area(s) of impact: … N/A |
|||||||||
| Alignment |
☒ Yes
☐ In progress
☐ No
|
☒ Yes
☐ In progress
☐ No
|
☐ Yes
☐ In progress
☐ No
|
||||||||
| Baseline |
☒ Yes
☐ In progress
☐ No
|
☒ Yes
☐ In progress
☐ No
|
☐ Yes
☐ In progress
☐ No
|
||||||||
| SMART targets |
☒ Yes
☐ In progress
☐ No
|
☒ Yes
☐ In progress
☐ No
|
☐ Yes
☐ In progress
☐ No
|
||||||||
| Action plan |
☒ Yes
☐ In progress
☐ No
|
☒ Yes
☐ In progress
☐ No
|
☐ Yes
☐ In progress
☐ No
|
||||||||
|
2.3 Target Implementation and Monitoring (Key Step 2)
For each target separately:
Show that your bank has implemented the actions it had previously defined to meet the set target.
Report on your bank’s progress since the last report towards achieving each of the set targets and the impact your progress resulted in, using the indicators and KPIs to monitor progress you have defined under 2.2.
| |||||
|
Climate change
We set the wheels in motion to implement our financed emissions reduction targets. This includes engaging with customers on climate matters; gathering data as part of our analysis on the risk of exclusion; and linking targets to senior executives’ remuneration. In 2023, we took this approach with sectors other than power generation (oil and gas, steel, and aviation) and set targets that adapt to their particularities.
Our approach seeks to facilitate the achievement of emissions targets and develop a solid understanding of our customers’ strategies to transition to low-carbon business models.
We base our approach on governance procedures run by our customer relations and risk teams and overseen by senior managers to guide our portfolio management. Its four stages are gather, assess, engage and review. We used several internationally recognized references such as the Cambridge Institute for Sustainability Leadership's (CISL) 'Let's Discuss Climate' guide and adapted them to our needs and objectives.
Financial health and inclusion
After achieving our target (in 2022) to financially empower 10 million people, in 2023 we:
•conducted a study using reliable public information (i.e. from the World Bank) to pinpoint the barriers to financial services in our core markets. Based on that study and the initiatives we’re running, we set a new target to financially empower 5 million people between 2023 and 2025;
•updated our methodologies on measuring the number of people we financially empower and who benefit from our financial education programme; and
•began reporting progress every quarter through automated control to ensure the quality and consistency of information.
In 2023, we financially included further 1.8 million people through access and lending solutions.
|
Links and references
2023 Annual report - Responsible banking chapter
|
||||
| Principle 3: Clients and Customers | ||||||||
 |
We will work responsibly with our clients and our customers to encourage sustainable practices and enable economic activities that create shared prosperity for current and future generations. |
|||||||
|
3.1 Client engagement
Does your bank have a policy or engagement process with clients and customers10 in place to encourage sustainable practices?
☒ Yes ☐ In progress ☐ No
Does your bank have a policy for sectors in which you have identified the highest (potential) negative impacts?
☒ Yes ☐ In progress ☐ No
Describe how your bank has worked with and/or is planning to work with its clients and customers to encourage sustainable practices and enable sustainable economic activities11). It should include information on relevant policies, actions planned/implemented to support clients’ transition, selected indicators on client engagement and, where possible, the impacts achieved.
| ||||||||
|
Our Responsible banking and sustainability policy sets out the general principles, commitments, objectives and strategy that guide the Group’s progress with responsible banking and sustainability matters. The aim is to promote long-term value creation for all our stakeholders by acting on opportunity and managing risk. By fulfilling our purpose to help people and businesses prosper, we grow as a business and support society’s efforts to face global challenges, which drives our ambition in environmental, social and governance. We also have other policies that support our responsible banking strategy in such areas as compliance and conduct, cybersecurity, customer conduct risk management, customer service, product and service approval, sensitive sectors, data protection, and treatment of vulnerable customers.
We want to act responsibly to make sure that every customer has a Simple, Personal and Fair experience with us. These are our key initiatives in this area:
•We are continuously enhancing procedures that impact on customers’ experience with products and services, based on our NPS scores. In 2023, we enhanced contact centre and innovation-related procedures.
•To enhance our sales of products and services, 40% of our sales units' variable pay is based on customer satisfaction and quality metrics. We included the contact centre in this variable pay scheme for the first time in 2023.
•We have several initiatives for vulnerable customers, including a customer service protocol for senior citizens and people with disabilities.
As part of our customer engagement, our Environmental, social and climate change risk management policy sets out how we identify, assess, monitor and manage environmental and social risks and other climate change-related operations. Together with the Equator Principles, we analyse operations in relation to investment in entities, the provision of financial products or services in the oil and gas, power generation and mining and metallurgy sectors, as well as those derived from soft commodity businesses.
|
Links and references
2023 Annual report - Responsible banking chapter
Corporate website - santander.com
•Our approach/Policies - santander.com/en/our-approach/policies
|
|||||||
| 10. A client engagement process is a process of supporting clients towards transitioning their business models in line with sustainability goals by strategically accompanying them through a variety of customer relationship channels. 11. Sustainable economic activities promote the transition to a low-carbon, more resource-efficient and sustainable economy.
| ||||||||
|
3.2 Business opportunities
Describe what strategic business opportunities in relation to the increase of positive and the reduction of negative impacts your bank has identified and/or how you have worked on these in the reporting period. Provide information on existing products and services , information on sustainable products developed in terms of value (USD or local currency) and/or as a % of your portfolio, and which SDGs or impact areas you are striving to make a positive impact on (e.g. green mortgages – climate, social bonds – financial inclusion, etc.).
| ||||||||
|
These are the main growth opportunities that Banco Santander has identified:
•Green finance: All our initiatives are to help our customers transition to a low-carbon economy. For large corporates, we focus on renewable energy and sustainable technology solutions. In Retail & Commercial Banking, we identified five areas of priority: green buildings, clean mobility, renewables, sustainable agriculture, and the circular economy.
•AUM in socially responsible investment: We run initiatives to reach our goal of EUR 100 billion of socially responsible investment (SRI) AUM by 2025
•Financial inclusion/Microfinance: Our microfinance operations in Brazil, Mexico, Uruguay, Colombia, Peru and other Latin American markets aim to help microentrepreneurs set up and grow their businesses.
•Financial inclusion/Access: We have the opportunity to provide access through bank accounts and digital solutions and wallets to those at the base of the pyramid.
|
Links and references
2023 Annual report - Responsible banking chapter
|
|||||||
| Principle 4: Stakeholders | ||||||||
 |
We will proactively and responsibly consult, engage and partner with relevant stakeholders to achieve society’s goals. | |||||||
|
4.1 Stakeholder identification and consultation
Does your bank have a process to identify and regularly consult, engage, collaborate and partner with stakeholders (or stakeholder groups12) you have identified as relevant in relation to the impact analysis and target setting process?
☒ Yes ☐ In progress ☐ No
Please describe which stakeholders (or groups/types of stakeholders) you have identified, consulted, engaged, collaborated or partnered with for the purpose of implementing the Principles and improving your bank’s impacts. This should include a high-level overview of how your bank has identified relevant stakeholders, what issues were addressed/results achieved and how they fed into the action planning process.
| ||||||||
|
Our materiality assessment includes inputs from customers, employees, senior managers, investors, supervisors, regulators and NGOs. Their contributions were key to understand the importance of the impact, risk and opportunity of sustainability matters. This stakeholder feedback supplemented our double-materiality assessment.
We engaged our stakeholders mainly through surveys, which are the most direct way of incorporating their feedback into the materiality assessment. We also conducted interviews with our teams to build on the information we received.
Findings are somewhat consistent across the six stakeholder groups we surveyed. Their primary concerns include the fight against climate change, customer data protection, transparency, and inclusion.
Beyond the annual materiality assessment, we run continuous active listening and engagement initiatives throughout the year. We conduct surveys and have speak-up channels for employees and customers. We assess external factors to identify risk and opportunity and to gauge our impact on the community. We respond to demands from analysts, investors and ratings agencies and NGOs; keep pace with new regulation and best practices worldwide; and take part in consultations with authorities, trade bodies and other organizations on sustainability. We’re also involved in major local and international initiatives to support inclusive and sustainable growth.
|
Links and references
2023 Annual report - Responsible banking chapter
|
|||||||
| Principle 5: Governance & Culture | ||||||||
 |
We will implement our commitment to these Principles through effective governance and a culture of responsible banking | |||||||
|
5.1 Governance Structure for Implementation of the Principles
Does your bank have a governance system in place that incorporates the PRB?
☒ Yes ☐ In progress ☐ No
Please describe the relevant governance structures, policies and procedures your bank has in place/is planning to put in place to manage significant positive and negative (potential) impacts and support the effective implementation of the Principles. This includes information about
•which committee has responsibility over the sustainability strategy as well as targets approval and monitoring (including information about the highest level of governance the PRB is subjected to),
•details about the chair of the committee and the process and frequency for the board having oversight of PRB implementation (including remedial action in the event of targets or milestones not being achieved or unexpected negative impacts being detected), as well as
•remuneration practices linked to sustainability targets.
| ||||||||
|
Santander’s ESG governance
1) The board of directors approves and oversees the implementation of policies and strategies related to our corporate culture and values, responsible practices and sustainability. It also ensures that all the Group's employees are aware of our codes of conduct and act ethically, and comply with the law, customs and good practices of the sectors and countries in which we operate.
2) The responsible banking, sustainability and culture committee (RBSCC) oversees the Group's responsible banking programme and strategy. This committee comprises between three and nine directors (all independent or non-executive), with a majority independent directors.
3) The Responsible Banking Forum promotes and implements the responsible banking strategy throughout the Group, drives decision-making and ensures the execution of any mandates from the CBRSC, other board committees and the board of directors. The Forum also ensures alignment on key issues, including the review and submission of reports to the RBSCC.
4) The management meeting, chaired by the CEO, is where we discuss our quarterly progress with the responsible banking agenda (including climate change), with a focus on the implementation of the TCFD recommendations and ESG business opportunity.
Remuneration linked to sustainability targets
Sustainability is part of our short-term (variable remuneration) and long-term reward schemes. In both cases, Santander has scorecards to assess progress with sustainability matters, which are largely based on public targets.
The long-term incentive scorecard for 2022-2024 comprises the following metrics: the percentage of senior positions held by women; the number of financially empowered people; the amount of green finance invested and mobilized and SRI AUM; and the phase-out of exposure to thermal coal mining and power generation.
|
Links and references
2023 Annual report - Responsible banking chapter
•4. Acting responsibly towards employees (Performance management and remuneration)
2023 Annual report - Corporate governance chapter
Corporate website - santander.com
•Corporate governance - santander.com/en/shareholders-and-investors/corporate-governance
◦Rules and regulations of the Board of directors
◦Board of directors
◦Board committees
|
|||||||
|
5.2 Promoting a culture of responsible banking:
Describe the initiatives and measures of your bank to foster a culture of responsible banking among its employees (e.g., capacity building, e-learning, sustainability trainings for client-facing roles, inclusion in remuneration structures and performance management and leadership communication, amongst others).
| ||||||||
|
Our corporate culture, The Santander Way', is the bedrock of our success. Our values (Simple, Personal and Fair), our corporate behaviours (TEAMS), our leadership principles and our robust risk culture (Risk Pro) guide our day-to-day operations.
Employee training on sustainability is key to Santander. We further developed our three-tier training strategy and created a global ESG content platform:
•We have global mandatory ESG training for all employees, Sustainability for all.
•We continued to run ESG Talks, a series of webinars with internal experts for the areas that work on our sustainability agenda.
•We provided the content for employees to obtain Santander ESG Commitment Fundamentals, International Sustainable Finance Specialist-IASE level II and other sustainability certifications.
In 2023, the board of directors completed training programmes on climate change, with modules on the Paris Agreement, net zero, portfolio alignment, climate risk management, transition plans, regulation, and information disclosure.
We also trained our employees on the Code of conduct, diversity and inclusion, health and safety, customer and vendor relations, the environment, anti-corruption, cyber security, and other topics.
We believe it is key to lead by example when promoting sustainability awareness and culture. Since 2021, our offices and buildings in our core markets have been free of single-use plastics in fulfilment of our public commitments on responsible banking.38% of our employees work in buildings certified to ISO 14001 or ISO 50001 management systems; this is above the 36% ambition considered in our 2022-2025 plan. Today, almost all of Santander’s headquarters in our core markets are LEED, BREEAM or ISO 14001-certified.
Some buildings in Brazil, Germany, Poland and Spain are LEED Gold or Platinum-certified, while the Grupo Santander City and Santander España’s central services buildings have ‘Zero waste’ certification.
Santander runs global and local employee awareness campaigns on the importance of reducing waste and consumption. Each subsidiary posts news and feature articles on the environment and the Group’s ESG initiatives on its internal portal. In 2023, we observed Earth Hour for the 14th year in a row by switching off the lights at the Group’s most emblematic buildings.
|
Links and references
2023 Annual report - Responsible banking chapter
|
|||||||
|
5.3 Policies and due diligence processes
Does your bank have policies in place that address environmental and social risks within your portfolio?13 Please describe.
Please describe what due diligence processes your bank has installed to identify and manage environmental and social risks associated with your portfolio. This can include aspects such as identification of significant/salient risks, environmental and social risks mitigation and definition of action plans, monitoring and reporting on risks and any existing grievance mechanism, as well as the governance structures you have in place to oversee these risks.
| ||||||||
|
Our Environmental, social and climate change risk management policy sets out standards for investing in, and providing financial products and services to, companies and customers who engage in sensitive activities in the oil and gas, power generation and transmission, mining and metals, and soft commodities industries (especially retail customers involved in farming and ranching in the Amazon). We analyse customers who are subject to the policy through a detailed questionnaire that their assigned banker completes before a team of analysts conducts an overall assessment of their environmental, social and climate change risks (which we update every year). We also analyse one-off, project-related transactions in accordance with the Equator Principles and such international regulations as the International Finance Corporation Performance Standards. After conducting environmental and social due diligence on projects, we ask our customers for mitigation plans based on their risk rating.
In 2023, we kicked off an initiative to identify and assess the actual and potential adverse impact on human rights that our operations may cause or contribute to, or that may be linked to our operations, products or services through business relationships, based on the recommendations of international frameworks such as the UNGPs and the OECD Guidelines for Multinational Enterprises on Responsible Business Conduct. In addition to this initiative (the findings of which we will publish in 2024), we assess the socio-environmental impact of our operations on customers and vendors.
•Customers: Per the Environmental, social and climate change risk management policy, we analysed customers who are subject to the policy through a detailed questionnaire and one-off, project-related transactions in accordance with the Equator Principles and such international regulations as the International Finance Corporation Performance Standards. After conducting environmental and social due diligence on projects, we asked our customers for mitigation plans based on their risk rating.
•Vendors: We assess vendors who provide risk services to the bank through special questionnaires on environmental, social, human rights and good governance matters. We use the assessment findings to work with vendors on remediation plans and specific ESG training. In 2023, we worked on drawing up and implementing a new ESG approval methodology to classify our vendors according to risk, including a criticality assessment and action plans for vendors with the highest ESG risk.
|
Links and references
2023 Annual report - Responsible banking chapter
Corporate website - santander.com
•Our approach - Policies santander.com/en/our-approach/policies
|
|||||||
13. Applicable examples of types of policies are: exclusion policies for certain sectors/activities; zero-deforestation policies; zero-tolerance policies; gender-related policies; social due diligence policies; stakeholder engagement policies; whistle-blower policies etc., or any applicable national guidelines related to social risks. | ||||||||
|
Self-assessment summary
Does the CEO or other C-suite officers have regular oversight over the implementation of the Principles through the bank’s governance system?
☒ Yes ☐ No
Does the governance system entail structures to oversee PRB implementation (e.g. incl. impact analysis and target setting, actions to achieve these targets and processes of remedial action in the event targets/milestones are not achieved or unexpected neg. impacts are detected)?
☒ Yes ☐ No
Does your bank have measures in place to promote a culture of sustainability among employees (as described in 5.2)?
☒ Yes ☐ In progress ☐ No
| ||
| Principle 6: Transparency & Accountability | ||||||||
 |
We will periodically review our individual and collective implementation of these Principles and be transparent about and accountable for our positive and negative impacts and our contribution to society’s goals. | |||||||
|
6.1 Assurance
Has this publicly disclosed information on your PRB commitments been assured by an independent assurer?
☒ Yes ☐ Partially ☐
If applicable, please include the link or description of the assurance statement.
| ||||||||
This is our fifth report on the Principles for Responsible Banking. It has been verified with limited assurance by PricewaterhouseCoopers Auditores, S.L. for sections 2.1 (Impact Analysis), 2.2 (Target Setting), 2.3 (Target Implementation and Monitoring) and 5.1 (Governance Structure for Implementation of the Principles). PricewaterhouseCoopers Auditores, S.L. is an independent firm that also audited Banco Santander, S.A.’s consolidated non-financial and financial statements for 2023. |
Links and references
2023 Annual report - Responsible banking chapter
|
|||||||
|
6.2 Reporting on other frameworks
Does your bank disclose sustainability information in any of the listed below standards and frameworks?
☒ GRI
☒ SASB
☒ CDP
☐ IFRS Sustainability Disclosure Standards (to be published
☒ TCFD
☒ Other: WEF Stakeholder Capitalism Metrics
| ||||||||
This chapter meets Spain’s Act 11/2018, EU Guidelines 2017/C215/01 on non-financial reporting, the European Taxonomy regulation (Regulation (EU) 2020/852 and Commission Delegated Regulations 2021/2139 and 2021/2178), the GRI Standards, and the GRI G4 guidelines on financial services disclosures. It also considers the Sustainability Accounting Standards Board’s (SASB) 2018-10 industry standards, and the World Economic Forum's Stakeholder Capitalism Metrics. It shows Santander's progress with the UN Principles for Responsible Banking, the TCFD recommendations, the 2030 Agenda, the UN Sustainable Development Goals and the GFANZ requirements on transition plans. |
Links and references
2023 Annual report - Responsible banking chapter
|
|||||||
|
6.3 Outlook
What are the next steps your bank will undertake in next 12 month-reporting period (particularly on impact analysis14, target setting15 and governance structure for implementing the PRB)? Please describe briefly.
| ||||||||
We will continue to make headway with identifying material items, risk and opportunity. |
Links and references |
|||||||
|
6.4 Challenges
Here is a short section to find out about challenges your bank is possibly facing regarding the implementation of the Principles for Responsible Banking. Your feedback will be helpful to contextualise the collective progress of PRB signatory banks.
What challenges have you prioritized to address when implementing the Principles for Responsible Banking? Please choose what you consider the top three challenges your bank has prioritized to address in the last 12 months (optional question).
If desired, you can elaborate on challenges and how you are tackling these:
| |||||
|
☐ Embedding PRB oversight into governance
☐ Gaining or maintaining momentum in the bank
☐ Getting started: where to start and what to focus on in the beginning
☒ Conducting an impact analysis
☒ Assessing negative environmental and social impacts
☐ Choosing the right performance measurement methodology/ies
☒ Setting targets
☐ Other: …
|
☒ Customer engagement
☐ Stakeholder engagement
☒ Data availability
☒ Data quality
☐ Access to resources
☐ Reporting
☐ Assurance
☐ Prioritizing actions internally
|
||||
|
If desired, you can elaborate on challenges and how you are tackling these: | |||||
| Statement of use | Grupo Santander has reported in accordance with the GRI Standards for the period between 01 January 2023 and 31 December 2023 |
||||
| GRI 1 used | Foundation 2021 | ||||
| Sectoral standard of application | Financial Services (GRI G4) | ||||
| GRI Standard | Disclosure |
Page |
Omission |
Reason |
Explanation |
||||||||||||
| GRI 2: GENERAL DISCLOSURES | 2-1 Organizational details |
- | - | - | |||||||||||||
2-2 Entities included in the organization's sustainability reporting |
- | - | - | ||||||||||||||
2-3 Reporting period, frequency and contact point |
- | - | - | ||||||||||||||
2-4 Restatements of information |
|
- | - | - | |||||||||||||
2-5 External assurance |
- | - | - | ||||||||||||||
2-6 Activities, value chain and other business relationships |
- | - | - | ||||||||||||||
2-7 Employees |
|
- | - | - | |||||||||||||
2-8 Workers who are not employees |
- | D |
1 | ||||||||||||||
2-9 Governance structure and composition |
- | - | - | ||||||||||||||
2-10 Nomination and selection of the highest governance body |
Corporate Governance chapter of the annual report (p. 177)(4.2 Board composition). |
- | - | - | |||||||||||||
2-11 Chair of the highest governance body |
Corporate Governance chapter of the annual report (p. 177)(4.3 Board functioning and effectiveness). |
- | - | - | |||||||||||||
2-12 Role of the highest governance body in overseeing the management of impacts |
- | - | - | ||||||||||||||
2-13 Delegation of responsibility for managing impacts |
- | - | - | ||||||||||||||
| GRI Standard | Disclosure |
Page |
Omission |
Reason |
Explanation |
||||||||||||
| GRI 2: GENERAL DISCLOSURES | 2-14 Role of the highest governance body in sustainability reporting |
- | - | - | |||||||||||||
2-15 Conflicts of interest |
- | - | - | ||||||||||||||
2-16 Communication of critical concerns |
- | - | - | ||||||||||||||
2-17 Collective knowledge of the highest governance body |
Acting responsibly towards employees (p. 46) (3.3.2 Ensuring we have the right talent and skills); Corporate Governance chapter of the annual report (p. 177) (4.3 Board functioning and effectiveness). |
- | - | - | |||||||||||||
2-18 Evaluation of the performance of the highest governance body |
Corporate Governance chapter of the annual report (p. 177) (4.3 Board functioning and effectiveness). |
- | - | - | |||||||||||||
2-19 Remuneration policies |
- | - | - | ||||||||||||||
2.20 Process to determine remuneration |
Corporate Governance chapter of the Annual Report (p. 177)(4.7 Remuneration committee activities in 2023; 6. Remuneration). |
- | - | - | |||||||||||||
2-21 Annual total compensation ratio |
- | C |
- | ||||||||||||||
2-22 Statement on sustainable development strategy |
- | - | - | ||||||||||||||
2-23 Policy commitments |
- | - | - | ||||||||||||||
2-24 Embedding policy commitments |
Main internal regulation and governance (p. 92); Business conduct (p.64); Acting responsibly towards employees (p. 46); Acting responsibly towards customers (p. 55); Acting responsibly towards suppliers (p. 69); Supporting the green transition (p. 30); Responsible investment (p. 44). Corporate Governance chapter of the annual report (p. 177) (4. Board composition); Risk management and compliance chapter (p. 451)(7. Compliance and conduct risk). |
- | - | - | |||||||||||||
2-25 Processes to remediate negative impacts |
- | - | - | ||||||||||||||
2-26 Mechanisms for seeking advice and raising concerns |
- | - | - | ||||||||||||||
| GRI Standard | Disclosure |
Page |
Omission |
Reason |
Explanation |
||||||||||||
| GRI 2: GENERAL DISCLOSURES | 2-27 Compliance with laws and regulations |
On 18 March 2021, a putative Pennsylvania-only class action filed in state court against Santander Consumer USA, Inc. (SC) alleging SC violated the Uniform Commercial Code and related Pennsylvania state law, and that the repossessions were not commercially reasonable and done in good faith and that SC failed to inform the consumer of a redemption and/or personal property fee that would have been required to have been paid in order to retrieve their personal affects. The parties agreed to settle this putative class action for US 14 million dollars. The court granted final approval of the settlement on 17 October 2023 and entered a final approval order of the class action settlement on 15 December 2023.
In September 2021, the Financial Supervisory Authority of Norway (NFSA) carried out an IT/AML inspection at Santander Consumer Bank, AS Norwegian operations. The purpose of the inspection was to assess the bank´s compliance with certain provisions in the Norwegian IT Regulation and AML legislation. In October 2022, NFSA issued its assessment establishing that SCB Nordics had deficiencies in complying with the Norwegian AML legislation and in November 2022 it imposed an administrative fine for an amount of EUR 15,000,000 which was paid in January 2023.
See also GRI 206-1, 416-2, 417-2, 417-3, 418-1 and note 25 of annual consolidated accounts (p. 519)
|
- | - | 2 |
||||||||||||
| 2-28 Membership associations | Santander participates in industry associations representing financial activity in the countries where it operates, as the AEB in the case of Spain | - | - | - | |||||||||||||
2-29 Approach to stakeholder engagement |
- | - | - | ||||||||||||||
2-30 Collective bargaining agreements |
- | - | - | ||||||||||||||
GRI standard |
Disclosure |
Location |
Scope |
Omission |
Reason |
Explanation |
|||||||||||||||||
MATERIAL TOPICS | |||||||||||||||||||||||
GRI 3: MATERIAL TOPICS |
3-1 Process to determine material topics | - | - | - | |||||||||||||||||||
| 3-2 List of material topics | - | - | - | ||||||||||||||||||||
CLIMATE CHANGE | |||||||||||||||||||||||
GRI 3 MATERIAL TOPICS |
3-3 Management of material topics |
Group |
- | - | - | ||||||||||||||||||
GRI 201: ECONOMIC PERFORMANCE |
201-2 Financial implications and other risks and opportunities due to climate change | Group | - | - | - | ||||||||||||||||||
GRI 302: ENERGY |
302-1 Energy consumption within the organization | Main countries of operation |
- | - | 4 |
||||||||||||||||||
| 302-2 Energy consumption outside of the organization | Our progress in figures (p. 70)(Environmental footprint). |
Main countries of operation |
- | - | 4 |
||||||||||||||||||
| 302-3 Energy intensity | Our progress in figures (p. 70)(Environmental footprint). |
Main countries of operation |
- | - | 4 |
||||||||||||||||||
| 302-4 Reduction of energy consumption | Supporting the green transition (p. 30) (Our environmental footprint). |
Main countries of operation |
- | - | 4 |
||||||||||||||||||
| 302-5 Reductions in energy requirements of products and services | - | - | A |
5 |
|||||||||||||||||||
GRI 305: EMISSIONS |
305-1 Direct (Scope 1) GHG emissions | Main countries of operation |
- | - | 4 |
||||||||||||||||||
| 305-2 Energy indirect (Scope 2) GHG emissions | Main countries of operation |
- | - | 4 |
|||||||||||||||||||
| 305-3 Other indirect (Scope 3) GHG emissions | Main countries of operation |
- | - | 4 |
|||||||||||||||||||
| 305-4 GHG emissions intensity | Our progress in figures (p. 70) (Environmental footprint) |
Main countries of operation |
- | - | 4 |
||||||||||||||||||
| 305-5 Reduction of GHG emissions | Main countries of operation |
- | - | 4 |
|||||||||||||||||||
| 305-6 Emissions of ozone-depleting substances (ODS) | - | - | A |
5 |
|||||||||||||||||||
305-7 Nitrogen oxides (NOX), sulphur oxides (SOX), and other significant air emissions |
- | - | A | 5 |
|||||||||||||||||||
GRI standard |
Disclosure |
Location |
Scope |
Omission |
Reason |
Explanation |
|||||||||||||||||
| FS8 | Monetary value of products and services designed to deliver a specific environmental benefit for each business line broken down by purpose |
Group |
- | - | - | ||||||||||||||||||
| FS11 | Percentage of assets subject to positive and negative environmental or social screening | Group |
- | D | 7 |
||||||||||||||||||
| BUSINESS CONDUCT | |||||||||||||||||||||||
GRI 3 MATERIAL TOPICS |
3-3 Management of material topics |
Group |
- | - | - | ||||||||||||||||||
| GRI 204: PROCUREMENT PRACTICES | 204-1 Proportion of spending on local suppliers | Acting responsibly towards suppliers (p. 69). |
Group (excluded Poland) |
- | - | - | |||||||||||||||||
GRI 205: ANTI-CORRUPTION |
205-1 Operations assessed for risks related to corruption | Risk, compliance and conduct management chapter (p. 451). |
Group |
- | - | - | |||||||||||||||||
| 205-2 Communication and training about anti-corruption policies and procedures | Group |
- | - | - | |||||||||||||||||||
| 205-3 Confirmed incidents of corruption and actions taken | Group |
- | - | 3 |
|||||||||||||||||||
GRI 206: ANTI-COMPETITIVE BEHAVIOUR |
206-1 Legal actions for anti-competitive behaviour, anti-trust, and monopoly practices | The Bank has not received final sanctions for this concept. Additional information on litigation and other Group contingencies can be found in note 25 of Auditor’s report and annual consolidated accounts. |
Group |
- | - | 2 |
|||||||||||||||||
GRI 207: TAX |
207-1 Approach to tax | Business conduct (p. 64) (Principles of action in tax matters). |
Group |
- | - | - | |||||||||||||||||
| 207-2 Tax governance, control, and risk management | Business conduct (p. 64) (Principles of action in tax matters). |
Group |
- | - | - | ||||||||||||||||||
| 207-3 Stakeholder engagement and management of concerns related to tax | Business conduct (p. 64) (Principles of action in tax matters). |
Group |
- | - | - | ||||||||||||||||||
| 207-4 Country-by-country reporting | Group | - | - | - | |||||||||||||||||||
| GRI 308: SUPPLIER ENVIRONMENTAL ASSESSMENT | 308-1 New suppliers that were screened using environmental criteria | Acting responsibly towards suppliers (p. 69). |
Group (excluded Poland) | - | - | - | |||||||||||||||||
| 308-2 Negative environmental impacts in the supply chain and actions taken | - | - | D |
6 |
|||||||||||||||||||
GRI 414: SUPPLIER SOCIAL ASSESSMENT |
414-1 New suppliers that were screened using social criteria | Acting responsibly towards suppliers (p. 69). |
Group (excluded Poland) | - | - | - | |||||||||||||||||
| 414-2 Negative social impacts in the supply chain and actions taken | - | - | D |
6 |
|||||||||||||||||||
GRI standard |
Disclosure |
Location |
Scope |
Omission |
Reason |
Explanation |
|||||||||||||||||
| GRI 415: PUBLIC POLICY | 415-1 Political contributions |
The ties, membership or collaboration with political parties or with other kind of entities, institutions or associations with public purposes, as well as contributions or services to them, should be done in a way that can assure the personal character and that avoids any involvement of the Group, as indicated in Grupo Santander General Code of Conduct.
In 2023 we made a contribution of $78,684 to the US Political Action Committee.
Business conduct (p. 64)(Relations with political parties)
|
Group | - | - | - | |||||||||||||||||
| FS9 | Coverage and frequency of audits to assess implementation of environmental and social policies and risk assessment procedures |
Every two years, the Group’s Internal audit function reviews the corporate Responsible banking function's governance, materiality analyses, control, procedures and risk culture. If it spots areas for improvement, it will give recommendations to mitigate any operational risks from the Responsible banking function's procedures. The last audit in 2023 ended with an overall rating of 'need improvement'. |
Group |
- | - | - | |||||||||||||||||
CONSUMERS AND END-USERS | |||||||||||||||||||||||
GRI 3 MATERIAL TOPICS |
3-3 Management of material topics |
Group |
- | - | - | ||||||||||||||||||
GRI 416: CUSTOMER HEALTH AND SAFETY |
416-1 Assessment of the health and safety impacts of product and service categories | Acting responsibly towards our customers (p.55). The Commercialization Committee evaluates potential impact of all products and services, previously they are launched onto the market. These impacts include, among others, clients security and compatibility with other products. |
Group |
- | - | - | |||||||||||||||||
| 416-2 Incidents of non-compliance concerning the health and safety impacts of products and services | The Bank has not received final sanctions for this concept. Additional information on litigation and other Group contingencies can be found in note 25 of Auditor’s report and annual consolidated accounts. |
Group |
- | - | 2 |
||||||||||||||||||
GRI 417: MARKETING AND LABELLING |
417-1 Requirements for product and service information and labelling |
Acting responsibly towards our customers (p. 55)(Consumer protection).
Responsible business practices. The Commercialization Committee evaluates potential impact of all products and services, previously they are launched onto the market. These impacts include, among others, clients security and compatibility with other products. In addition, the Bank is member of the Association for Commercial Self- Regulation (Autocontrol) assuming the ethical commitment to be responsible regarding the freedom of commercial communication.
|
Group |
- | - | - | |||||||||||||||||
417-2 Incidents of non-compliance concerning product and service information and labelling |
The Bank has not received final sanctions for this concept. Additional information on litigation and other Group contingencies can be found in note 25 of Auditor’s report and annual consolidated accounts. |
Group |
- | - | 2 |
||||||||||||||||||
| 417-3 Incidents of non-compliance concerning marketing communications | The Bank hasn't received any sanctions concerning this matter. Additional information on litigation and other Group contingencies can be found in note 25 of Auditor’s report and annual consolidated accounts.. |
Group | - | - | 2 |
||||||||||||||||||
| GRI 418: CUSTOMER PRIVACY | 418-1 Substantiated complaints concerning breaches of customer privacy and losses of customer data | The Bank hasn't received any sanctions concerning this matter. Additional information on litigation and other Group contingencies can be found in note 25 of Auditor’s report and annual consolidated accounts. |
Grupo | - | - | 2 | |||||||||||||||||
| FS6 | Percentage of the portfolio for business lines by specific region, size (e.g. micro/ SME/large) and by sector | Group | - | - | - | ||||||||||||||||||
GRI standard |
Disclosure |
Location |
Scope |
Omission |
Reason |
Explanation |
|||||||||||||||||
| FS15 | Policies for the fair design and sale of financial products and services | Acting responsibly towards customers (p. 55) (Consumer protection). |
Group | - | - | - | |||||||||||||||||
OTHER NON-MATERIAL TOPICS ON WHICH INFORMATION IS REPORTED FOR GREATER TRANSPARENCY | |||||||||||||||||||||||
| OWN WORKFORCE | |||||||||||||||||||||||
| GRI 202: MARKET PRESENCE | 202-1 Ratios of standard entry level wage by gender compared to local minimum wage | Our progress in figures (p. 70). |
Group | Req. b | D | 1 | |||||||||||||||||
| 202-2 Proportion of senior management hired from the local community | Our progress in figures (p. 70). The Group Corporate Human Resources Model aims to attract and retain the best professionals in the countries in which it operates. |
Group | - | - | - | ||||||||||||||||||
| GRI 401: EMPLOYMENT | 401-1 New employee hires and employee turnover | Group |
- | - | - | ||||||||||||||||||
| 401-2 Benefits provided to full-time employees that are not provided to temporary or part-time employees | Group | - | - | - | |||||||||||||||||||
| 401-3 Parental leave | Information unavailable. | - | - | D |
8 |
||||||||||||||||||
|
GRI 403: OCCUPATIONAL HEALTH AND SAFETY
|
403-1 Occupational health and safety management system | Banco Santander has occupational health and safety management systems in place in all the geographies in which it operates, complying with the legal requirements of each country regarding occupational risk prevention. | Group | - | - | - | |||||||||||||||||
| 403-2 Hazard identification, risk assessment, and incident investigation | Acting responsibly towards employees (p. 46) (Employee experience. Employee health and wellbeing). |
Group | - | - | - | ||||||||||||||||||
| 403-3 Occupational health services | Acting responsibly towards employees (p. 46) (Employee experience. Employee health and wellbeing). |
Group | - | - | - | ||||||||||||||||||
| 403-4 Worker participation, consultation, and communication on occupational health and safety | At Banco Santander SA, the percentage of Representation in the Security Committee is 100%. |
Banco Santander S.A. and SCF |
- | - | - | ||||||||||||||||||
| 403-5 Worker training on occupational health and safety | Acting responsibly towards employees (p. 46) (Employee experience. Employee health and wellbeing). |
Group |
- | - | - | ||||||||||||||||||
| 403-6 Promotion of worker health | Acting responsibly towards employees (p. 46) (Employee experience. Employee health and wellbeing). |
Group |
- | - | - | ||||||||||||||||||
| 403-8 Workers covered by an occupational health and safety management system | 100% of Banco Santander own employees are covered by health and safety management systems at work. |
Group |
- | - | - | ||||||||||||||||||
| 403-9 Work-related injuries | Group |
Req. b |
D |
1 |
|||||||||||||||||||
| 403-10 Work-related ill health | Our progress in figures (p. 70). |
Group |
Req. b |
D |
1 |
||||||||||||||||||
GRI standard |
Disclosure |
Location |
Scope |
Omission |
Reason |
Explanation |
|||||||||||||||||
GRI 404: TRAINING AND EDUCATION |
404-1 Average hours of training per year per employee | Group |
- | - | - | ||||||||||||||||||
| 404-2 Programs for upgrading employee skills and transition assistance programs | Banco Santander offers management programmes and continuous training skills that foster the employees´ employability and that, sometimes, help them manage the end of their professional careers. Acting responsibly towards employees (p. 46) (Talent. Developing talent). |
Group |
- | - | - | ||||||||||||||||||
| 404-3 Percentage of employees receiving regular performance and career development omissions. | Acting responsibly towards employees (p. 46) (Working conditions and social dialogue. Performance review and remuneration). Santander regularly appraises employee performance; at the end of 2023, 74.2% of our employees had a performance review in which their contribution to Santander's results, their alignment with risk management and our TEAMS corporate culture were evaluated. Additionally, 14,065 retail branch employees in Mexico will have their performance review during the first quarter of 2024. In total, 80.8% of the workforce receives a MyContribution. |
Group |
- | - | - | ||||||||||||||||||
GRI 405: DIVERSITY AND EQUAL OPPORTUNITIES |
405-1 Diversity of governance bodies and employees | Group |
- | - | - | ||||||||||||||||||
| 405-2 Ratio of basic salary and remuneration of women to men | Group |
- | - | - | |||||||||||||||||||
| GRI 406: NON-DISCRMINATION | 406-1 Incidents of discrimination and corrective actions taken | Group |
- | - | - | ||||||||||||||||||
| AFFECTED COMMUNITIES | |||||||||||||||||||||||
| GRI 203: INDIRECT ECONOMIC IMPACT | 203-1 Infrastructure investments and services supported | Group | - | - | - | ||||||||||||||||||
| 203-2 Significant indirect economic impacts | Group | - | - | - | |||||||||||||||||||
| GRI 411: RIGHTS OF INIDGENOUS PEOPLE | 411-1 Incidents of violations involving rights of indigenous people | The Bank ensures, through social and environmental risk assessments in their financing operations under the Equator Principles, that no violations of the indigenous peoples’ rights occur in such operations. In 2023, a total of 41 operations were evaluated in this respect. |
Group |
- | D |
7 |
|||||||||||||||||
| GRI 413: LOCAL COMMUNITIES | 413-1 Operations with local community engagement, impact assessments, and development programs |
Grupo Santander has several programmes in its main countries aim to encourage development and participation of local communities, in which it is carried out an assessment on people helped, scholarships given through agreement with Universities, among others. Moreover, in the last years the Group has developed different products and services offering social and/or environmental added value adapted to each country where Santander develops its activities.
|
Group |
- | - | - | |||||||||||||||||
| 413-2 Operations with significant actual and potential negative impacts on local communities | Business conduct (p. 64) (Environmental, social and climate change risk management). |
Group |
- | D | 7 | ||||||||||||||||||
| FS7 | Monetary value of products and services designed to deliver a specific social benefit for each business line broken down by purpose |
Financial health and inclusion (p. 57). |
Group | - | - | - | |||||||||||||||||
| FS13 | Access points in low-populated or economically disadvantaged areas by type | Financial health and inclusion (p. 57). |
Group | - | - | - | |||||||||||||||||
GRI standard |
Disclosure |
Location |
Scope |
Omission |
Reason |
Explanation |
|||||||||||||||||
| FS14 | Initiatives to improve access to financial services for disadvantaged people | Financial health and inclusion (p. 57). |
Group | - | - | - | |||||||||||||||||
| FS16 | Initiatives to enhance financial literacy by type of beneficiary | Financial health and inclusion (p. 57). |
Group | - | - | - | |||||||||||||||||
| OTHER GRI (NON-MATERIAL) TOPICS ON WHICH THE BANK REPORTS ON A VOLUNTARY BASIS FOR GREATER TRANSPARENCY | |||||||||||||||||||||||
| GRI 201: ECONOMIC PERFORMANCE | 201-1 Direct economic value generated and distributed | € million | 2023 | Group | - | - | - | ||||||||||||||||
Economic value generated1 |
57,716 | ||||||||||||||||||||||
| Gross income | 57,423 | ||||||||||||||||||||||
| Net loss on discontinued operations | 0 | ||||||||||||||||||||||
| Gains/(losses) on disposal of assets not classified as non-current held for sale | 313 | ||||||||||||||||||||||
| Gains/(losses) on disposal of assets not classified as discontinued operations | -20 | ||||||||||||||||||||||
| Economic value distributed | 32,807 | ||||||||||||||||||||||
Payments to providers of capital (dividends) |
1,298 | ||||||||||||||||||||||
Operating costs (except taxes) |
7,945 | ||||||||||||||||||||||
Employee wages and benefits |
13,726 | ||||||||||||||||||||||
Payments to government2 |
9,664 | ||||||||||||||||||||||
| CSR investment | 174 | ||||||||||||||||||||||
| Economic value retained (economic value generated less economic value distributed) | 24,909 | ||||||||||||||||||||||
|
1. Gross income plus net gains on asset disposals.
2. Our progress in figures (p. 70) (8.1 Tax contribution) provides additional information on the taxes paid.
3. For comparative issues see Auditor's report and 2022 annual consolidate accounts.
|
|||||||||||||||||||||||
| 201-3 Defined benefit plan obligations and other retirement plans | The liability for provisions for pensions and similar obligations at 2023 year-end amounted to EUR 2,225 million (p. 531). Endowments and contributions to the pension funds in the 2023 financial year have amounted to EUR 352 million. The detail may be consulted in Auditor´s report and annual consolidated accounts (p. 547)(Note 47.a to annual consolidated accounts). For comparative purposes see Audit report and consolidated annual accounts 2022. |
Group | - | - | - | ||||||||||||||||||
| 201-4 Financial assistance received from government | The Bank has not received significant subsidies or public aids during 2022 and 2023. The detail may be consulted in Annual banking report, section e) Public subsidies (p. 824). |
Group | - | - | - | ||||||||||||||||||
GRI 301: MATERIALS |
301-1 Materials used by weight or volume | Main countries of operation |
- | - | 4 |
||||||||||||||||||
|
GRI 303: WATER AND EFFLUENTS
|
303-5 Water consumption | Banco Santander manages its water consumption and supply in accordance with local limitations. In addition, the Bank collects its water from the public water supply and discharges the used water to the public network. Our progress in figures (p. 70)(Environmental footprint). |
Main countries of operation |
- | - | 4 |
|||||||||||||||||
GRI standard |
Disclosure |
Location |
Scope |
Omission |
Reason |
Explanation |
|||||||||||||||||
GRI 304: BIODIVERSITY |
304-1 Operational sites owned, leased, managed in, or adjacent to, protected areas and areas of high biodiversity value outside protected areas | Group |
- | A |
5 |
||||||||||||||||||
| 304-2 Significant impacts of activities, products, and services on biodiversity | Supporting the green transition (p. 30) (Nature and biodiversity) |
Group |
- | - | - | ||||||||||||||||||
| 304-3 Habitats protected or restored | Group |
- | A |
5 |
|||||||||||||||||||
| 304-4 IUCN Red List species and national conservation list species with habitats in areas affected by operations | Group |
- | A |
5 |
|||||||||||||||||||
GRI 306: WASTE |
306-1 Waste generation and significant waste-related impacts |
Supporting the green transition (p. 30) |
Main countries of operation |
- | - | 4 |
|||||||||||||||||
306-2 Management of significant waste-related impacts |
Supporting the green transition (p. 30) |
Main countries of operation |
- | - | 4 |
||||||||||||||||||
306-3 Waste generated |
Main countries of operation |
- | - | 4 |
|||||||||||||||||||
306-4 Waste diverted from disposal |
Our progress in figures (p. 70) (Environmental footprint) |
Main countries of operation |
- | - | 4 |
||||||||||||||||||
306-5 Waste directed to disposal |
Our progress in figures (p. 70) (Environmental footprint) |
Main countries of operation | - | - | 4 | ||||||||||||||||||
| FS1 | Policies with specific environmental and social components applied to business lines | Group | - | - | - | ||||||||||||||||||
| FS2 | Procedures for assessing and screening environmental and social risks in business lines | Group | - | - | - | ||||||||||||||||||
| FS3 | Processes for monitoring clients´ implementation of and compliance with environmental and social requirements included in agreements of transactions | Group | - | - | - | ||||||||||||||||||
| FS4 | Process(es) for improving staff competency to implement the environmental and social policies and procedures as applied to business lines | Group | - | - | - | ||||||||||||||||||
| FS5 | Interactions with clients/ investees/business partners regarding environmental and social risks and opportunities | Group | - | - | - | ||||||||||||||||||
GRI standard |
Disclosure |
Location |
Scope |
Omission |
Reason |
Explanation |
|||||||||||||||||
| FS10 | Percentage and number of companies held in the institution´s portfolio with which the reporting organization has interacted on environmental or social issues |
Conduct and ethical behaviour (p. 64) (Environmental, social and climate change risk management). |
Group | - | D | 7 |
|||||||||||||||||
| FS12 | Voting policy(ies) applied to environmental or social issues for shares over which the reporting organization hold the right to vote shares or advises on voting | Grupo Santander has no voting policies relating to social and/or environmental matters for entities over which acts as an advisor. The Santander Employees Pension Fund does have a policy of formal vote in relation to social and environmental aspects, for shareholder meetings of the entities over which it has voting rights. | Group | 0 | 0 | 0 | |||||||||||||||||
| Topic | Industry | Accounting Metric | Code | Response | ||||||||||
| Data Security | Commercial Banks Consumer Finance |
(1) Number of data breaches, (2) percentage involving personally identifiable information (PII), (3) number of account holders affected. | FN-CB-230a.1 FN-CF-230a.1 |
|||||||||||
| Commercial Banks Consumer Finance |
Description of approach to identifying and addressing data security risks. | FN-CB-230a.2 FN-CF-230a.3 |
Refer to ‘Risk Pro’ in 'Our culture' section of this chapter (p. 24).; and to ‘Relevant mitigation actions’ in section 6.2 of 'Risk, compliance and conduct management chapter' (p. 451). |
|||||||||||
| Financial Inclusion & Capacity Building | Commercial Banks | (1) Number and (2) amount of loans outstanding qualified to programs designed to promote small business and community development. | FN-CB-240a.1 |
Refer to 5. ‘Acting responsibly towards customers‘ section of this chapter (p. 55).
For more detail see note 10. ‘Loans and advances to customers´ in the Auditor's report and consolidated financial statements (p. 519).
Additionally, all the information related to microfinance programmes are available on the 5.3 ‘Financial health and inclusion‘ section of this report (p. 57).
|
||||||||||
| Commercial Banks | (1) Number and (2) amount of past due and nonaccrual loans qualified to programs designed to promote small business and community development. | FN-CB-240a.2 |
Refer to ‘Amounts past due‘ and ‘Impairment of financial assets‘ in 3.3 'Key metrics' section of the Risk management and compliance chapter. (p. 451).
Also refer to notes 2.g and 10.d of the consolidated accounts in the Auditor's report and consolidated financial statements (p. 519).
|
|||||||||||
| Commercial Banks | Number of no-cost retail checking accounts provided to previously unbanked or underbanked customers. | FN-CB-240a.3 | Refer to 5.3 ‘Financial health and inclusion‘ section of this chapter (p. 57). |
|||||||||||
| Commercial Banks | Number of participants in financial literacy initiatives for unbanked, underbanked, or underserved customers. | FN-CB-240a.4 |
In 2023, Grupo Santander has financially included 1.8 million people.
For further information refer to ‘5.3 Financial health and inclusion‘ section of this chapter (p. 57).
|
|||||||||||
| Topic | Industry | Accounting Metric | Code | Response | ||||||||||
| Incorporation of Environmental, Social, and Governance Factors in Credit Analysis | Commercial Banks | Commercial and industrial credit exposure, by industry. | FN-CB-410a.1 | Refer to ‘Concentration risk‘ in section 3.5 'Other credit risk details' of the Risk Management and compliance chapter (p. 451). |
||||||||||
| Commercial Banks | Description of approach to incorporation of environmental, social,and governance (ESG) factors in credit analysis. | FN-CB-410a.2 |
Refer to 7.3 ‘Environmental, social and climate change risk management’ on business conduct section (p. 64), and the 10. ‘ESG risk factors‘ (p. 507).section of the Risk management and compliance chapter
For further information see our ‘General Sustainability Policy and our ‘Environmental, social & climate change risk management Policy’, both available on our corporate website.
|
|||||||||||
| Incorporation of Environmental, Social, and Governance Factors in investment Banking & Brokerage Activities | Investment Banking & Brokerage | (1) Number and (2) total value of investments and loans incorporating integration of environmental, social, and governance (ESG) factors, by industry. | FN-IB-410a.2 | Refer to 2. ‘Supporting the green transition’ section of this chapter (p. 30). |
||||||||||
| Investment Banking & Brokerage | Description of approach to incorporation of environmental, social, and governance (ESG) factors in investment banking and brokerage activities. | FN-IB-410a.3 |
Refer to 2. ‘Supporting the green transition‘ section of this chapter (p. 30).
For further information see our ‘General Sustainability Policy‘, and our ‘Environmental, social & climate change risk management policy‘, both available on our corporate website.
|
|||||||||||
| Business Ethics |
Asset Management & Custody Activities
Commercial Banks
Investment Banking & Brokerage
|
Total amount of monetary losses as a result of legal proceedings associated with fraud, insider trading, anti-trust, anti-competitive behavior,market manipulation, malpractice, or other related financial industry laws or regulations. | FN-AC-510a.1 FN-CB-510a.1 FN-IB-510a.1 |
Refer to GRI 206-1 discloses legal actions for anticompetitive behaviour, anti-trust, and monopoly practices.
For further information, refer to ’Litigation and other matters’ section on the Auditor's report and consolidated financial statements (p. 519).
|
||||||||||
|
Asset Management & Custody Activities
Commercial Banks
Investment Banking & Brokerage
|
Description of whistleblower policies and procedures. | FN-AC-510a.2 FN-CB-510a.2 FN-IB-510a.2 |
Refer to 7.2 ‘Ethical Channels’ in the section 4. 'Acting responsibly towards employees' of this chapter (p. 46).
For further information, see our ‘General Code of Conduct’, available on our website.
|
|||||||||||
| Systemic Risk Management | Commercial Banks Investment Banking & Brokerage |
Global Systemically Important Bank (G-SIB) score, by category | FN-CB-550a.1. FN-IB-550a.1. |
According to the ‘2023 list of global systemically important banks (G-SIBs)’ released by the Financial Stability Board, Santander´s G-SIB buffer is 1.0 %. (G-SIBs as of November 2023).
According to the G-SIB Scores Dashboard from the Basel Committee on Banking Supervision (BCBS), Grupo Santander´s scores are (end-2022 data):
•Score: 190
•Complexity: 102
•Cross-jurisdictional: 483
•Interconnectedness: 147
•Size: 174
•Substitutability: 42
|
||||||||||
| Commercial Banks Investment Banking & Brokerage |
Description of approach to incorporation of results of mandatory and voluntary stress tests into capital adequacy planning, long-term corporate strategy, and other business activities | FN-CB-550a.2. FN-IB-550a.2. | Refer to ‘Capital planning and stress tests’ in the section 3.5 'Capital management and adequacy' (p. 362) of the Economic and Financial chapter. |
|||||||||||
| Topic | Industry | Accounting Metric | Code | Response | ||||||||||
| Employee Diversity & Inclusion | Commercial Banks, Investment Banking & Brokerage |
Percentage of gender and racial/ethnic group representation for (1) executive management, (2) non-executive management, (3) professionals, and (4) all other employees | FN-AC-330a.1 FN-IB-330a.1 |
Refer to 8. 'Our progress in figures' section of this chapter (p. 70).
For further information, refer to ‘Diversity & Inclusion’ section of 4. ‘Acting responsibly towards employees’ this chapter (p. 46).
For further information about our diversity and inclusion principles, see our ‘Corporate Culture Policy’, available on our corporate website.
|
||||||||||
| Activity metrics | Commercial Banks | (1) Number and (2) value of checking and savings accounts by segment: (a) personal and (b) small business. | FN-CB-000.A | Refer to ‘Consolidated annual accounts‘ in Auditor's report and consolidated financial statements (p. 519). |
||||||||||
| Commercial Banks | (1) Number and (2) value of loans by segment: (a) personal, (b) small business, and (c) corporate. | FN-CB-000.B | Refer to ‘Consolidated annual accounts‘ in Auditor's report and consolidated financial statements (p. 519). |
|||||||||||
| Theme | Metric | Response | ||||||||||||
| Principles of governance | ||||||||||||||
| Governing Purpose | Setting Purpose: The company’s stated purpose, as the expression of the means by which a business proposes solutions to economic, environmental, and social issues. Corporate purpose should create value for all stakeholders, including shareholders. |
'Business model and strategy' (p. 7) chapter reflects how we help people and businesses prosper whilst adopting ESG practices.
Additionally, in 'Our sustainability strategy' (p. 25) section in 'Responsible banking' chapter, we detail in deep how we work to be a more sustainable bank.
|
||||||||||||
Purpose-led management: How the company’s stated purpose is embedded in company strategies, policies, and goals. |
||||||||||||||
| Quality of Governing Body | Governing Body Composition: Composition of the highest governance body and its committees by: competencies relating to economic, environmental, and social topics; executive or non-executive; independence; tenure on the governance body; number of each individual’s other significant positions and commitments, and the nature of the commitments; gender; membership of under-represented social groups; stakeholder representation. |
|||||||||||||
Progress against strategic milestones: Disclosure of the material strategic economic, environmental, and social milestones expected to be achieved in the following year, such milestones achieved from the previous year, and how those milestones are expected to or have contributed to long-term value. |
Refer to 'Santander's support for society' (p. 20), '2023 Highlights' (p. 20) and 'Our sustainability strategy' (p. 25) sections in 'Responsible banking' chapter. |
|||||||||||||
|
Remuneration:
1. How performance criteria in the remuneration policies relate to the highest governance body’s and senior executives’ objectives for economic, environmental and social topics, as connected to the company’s stated purpose, strategy, and long-term value.
2. Remuneration policies for the highest governance body and senior executives for the following types of remuneration: Fixed pay and variable pay, including performance-based pay, equity-based pay, bonuses, and deferred or vested shares, Sign-on bonuses or recruitment incentive payments, termination payments, clawback and retirement benefits.
|
1. Refer to ´Performance review and remuneration´ in 'Acting responsibly towards employees' section (p. 46) in 'Responsible banking' chapter.
2. Refer to ´Remuneration´ section (p. 252) in 'Corporate governance' chapter.
|
|||||||||||||
| Ethical Behavior |
Anti-corruption:
1. Total percentage of governance body members, employees and business partners who have received training on the organization’s anti-corruption policies and procedures, broken down by region.
2. (a) Total number and nature of incidents of corruption confirmed during the current year but related to previous years and
(b) Total number and nature of incidents of corruption confirmed during the current year, related to this year.
3. Discussion of initiatives and stakeholder engagement to improve the broader operating environment and culture, in order to combat corruption.
|
1. Refer to Financial Crime Compliance on 7.2 'Compliance and conduct risk management' section (p. 497) in 'Risk, compliance and conduct management' chapter. Refer also to GCC in Conduct and 'Ethical behaviour' section in 'Responsible banking' chapter.
All our employees receive mandatory training on the GCC on an annual basis.
3. Refer to Financial Crime Compliance on 7.2 'Compliance and conduct risk management' section (p. 497) in 'Risk, compliance and conduct management' chapter.
|
||||||||||||
|
Protected ethics advice and reporting mechanisms: A description of internal and external mechanisms for:
1. Seeking advice about ethical and lawful behaviour and organizational integrity
2. Reporting concerns about unethical or unlawful behaviour and organizational integrity
|
Refer to pages 13-14 in our Code of Conduct (available in our corporate website).
In addition see 7.2 'Compliance and conduct risk management´ (p. 497) in 'Risk and compliance management' section on 'Risk, compliance and conduct management' chapter. And ´Ethical channels´ on ´Business conduct´ section (p. 64) in 'Responsible banking' chapter.
|
|||||||||||||
| Theme | Metric | Response | ||||||||||||
Monetary losses from unethical behaviour: Total amount of monetary losses as a result of legal proceedings associated with: fraud, insider trading, anti-trust, anti-competitive behaviour, market manipulation, malpractice, or violations of other related industry laws or regulations. |
||||||||||||||
Alignment of strategy and policies to lobbying: The significant issues that are the focus of the company’s participation in public policy development and lobbying; the company’s strategy relevant to these areas of focus; and any differences between its lobbying positions, purpose, and any stated policies, goals, or other public positions. |
Refer to ´Principles of action in our relationship with political parties´ in 'Business conduct' section in 'Responsible banking' chapter (p. 64)
The Financing of political parties policy is available on our corporate website.
|
|||||||||||||
| Risk and Opportunity Oversight | Integrating risk and opportunity into business process: Company risk factor and opportunity disclosures that clearly identify the principal material risks and opportunities facing the company specifically (as opposed to generic sector risks), the company appetite in respect of these risks, how these risks and opportunities have moved over time and the response to those changes. These opportunities and risks should integrate material economic, environmental, and social issues, including climate change and data stewardship. |
Refer to 'Risk and opportunities' section in 'Risk, compliance and conduct management' chapter (p. 451).
In addition, we report our progress in implementing TCFD recommendations (including Risk management) in 'Responsible banking' chapter (p. 30).
Our Environmental, social and climate change risk policy is available at our corporate website.
|
||||||||||||
| Stakeholder Engagement | Material issues impacting stakeholders: A list of the topics that are material to key stakeholders and the company, how the topics were identified, and how the stakeholders were engaged. |
Refer to 'Materiality assessment' (p. 28) and 'Double materiality assessment and sources' (p. 95) section in 'Responsible banking' chapter. Refer also to 'Our sustainability strategy' (p. 25). |
||||||||||||
| Planet | ||||||||||||||
| Climate Change | Greenhouse Gas (GHG) emissions: For all relevant greenhouse gases (e.g. carbon dioxide, methane, nitrous oxide, F-gases etc.), report in metric tonnes of carbon dioxide equivalent (tCO₂e) GHG Protocol Scope 1 and Scope 2 emissions. Estimate and report material upstream and downstream (GHG Protocol Scope 3) emissions where appropriate. |
Refer to Environmental footprint 2022-2023 table in 'Our progress in figures' section in 'Responsible banking' chapter (p. 70).
•Total emissions (market based): 172,711 T CO2e
•Scope 1: 25,755 T CO2eT2e
•Scope 2 – market based: 21,516 T CO2e
•Scope 2 – location based: 205,292 T CO2e
•Scope 3: 125,441 T CO2e
|
||||||||||||
TCFD implementation: Fully implement the recommendations of the Task Force on Climate-related Financial Disclosures (TCFD). If necessary, disclose a timeline of at most three years for full implementation. Disclose whether you have set, or have committed to set GHG emissions targets that are in line with the goals of the Paris Agreement — to limit global warming to well-below 2°C above pre-industrial levels and pursue efforts to limit warming to 1.5°C — and to achieve net-zero emissions before 2050. |
Refer to 'Supporting the green transition' (p. 30) and 'TCFD content index' (p. 170) sections in 'Responsible banking' chapter, were we report our progress in implementing TCFD recommendations.
In 2020, we became carbon neutral in our own operations. In 2021, we set our commitment to be net-zero in carbon emissions by 2050, and we set our first decarbonization targets.
In addition, refer to 'Climate and environmental risk' section (p. 507) in 'Risk management and compliance' chapter.
|
|||||||||||||
Paris-aligned GHG emissions targets: Define and report progress against time-bound science-based GHG emissions targets that are in line with the goals of the Paris Agreement — to limit global warming to well-below 2°C above pre-industrial levels and pursue efforts to limit warming to 1.5°C. This should include defining a date before 2050 by which you will achieve net-zero greenhouse gas emissions and interim reduction targets based on the methodologies provided by the Science Based Targets initiative if applicable. |
Refer to 'Supporting the green transition' section (p. 30) of the 'Responsible banking' chapter.
We set our first decarbonization targets. We're committed to aligning our power generation portfolio with the Paris Agreement by 2030. We are also ending financial services to power generation clients by 2030 if over 10% of their revenue depends on thermal coal.
|
|||||||||||||
| Fresh water availability | Water consumption and withdrawal in water-stressed areas: Report for operations where material, mega litres of water withdrawn, mega litres of water consumed and the percentage of each in regions with high or extremely high baseline water stress according to WRI Aqueduct water risk atlas tool. Estimate and report the same information for the full value chain (upstream and downstream) where appropriate. |
Refer to Environmental footprint 2022-2023 table in 'Our progress in figures' section (p. 70) in 'Responsible banking' chapter.
In 2022, Santander consumed 1,858,645 m3 from the public network, equalling a consumption of 9.56 m3/employee. (Information is provided exclusively on water withdrawal from the public network).
We do not disclose data on water stress, due to our financial activities generating negligible impacts.
|
||||||||||||
| Nature Loss | Land use and ecological sensitivity: Report the number and area (in hectares) of sites owned, leased or managed in oradjacent to protected areas and/or key biodiversity areas (KBA). |
Refer to Nature and biodiversity on 'Supporting the green transition' section (p. 70) of the 'Responsible banking' chapter.
|
||||||||||||
| Theme | Metric | Response | ||||||||||||
| Single-use plastics |
Report wherever material along the value chain: estimated metric tonnes of single-use plastic consumed.
Disclose the most significant applications of single-use plastic identified, the quantification approach used and the definition of single-use plastic adopted.
|
Refer to Our environmental footprint on 'Supporting the green transition' section (p. 30) in 'Responsible banking' chapter.
In 2021 we have met our goal of eliminating unnecessary single-use plastics from our buildings and branches. In 2022 we also continue not providing single-use plastics in our buildings and offices.
|
||||||||||||
| Prosperity | ||||||||||||||
| Employment and wealth generation |
Absolute number and rate of employment:
1. Total number and rate of new employee hires during the reporting period, by age group, gender, other indicators of diversity and region.
2. Total number and rate of employee turnover during the reporting period, by age group, gender, other indicators of diversity and region.
|
Refer to 'Our progress in figures' section (p. 70) in 'Responsible banking' chapter.
1. See:
•Table 22.1. Distribution of new hires by age bracket
•Table 23. Distribution of new hires by gender
2. See:
•Table 25. External turnover rate by gender
•Table 26. External turnover rate by age bracket
|
||||||||||||
|
Economic Contribution:
1. Direct economic value generated and distributed (EVG&D) — on an accrual basis, covering the basic components for the organization’s global operations, ideally split out by:
a. Revenue
b. Operating Costs
c. Employee wages and benefits
d. Payments to providers of capital
e. Payments to government
f. Community Investment.
2. Financial assistance received from the government.
Total monetary value of financial assistance received by the organization from any government during the reporting period.
|
1. Refer to Global Reporting Initiative (GRI) content index in 'Responsible banking' chapter, and more specifically to GRI 201.1 Direct economic value generated and distributed (p. 151).
•Economic value generated in 2023: EUR 57,716 million
•Economic value distributed: EUR 31,476 million
•Economic value retained EUR 26,240 million
1.a Revenue: EUR 57,423 million
1.b Operating cost: EUR 25,425 million
1.c Employee wages and benefits: EUR 13,726 million
1.d Payments to providers of capital: N/A
1.e Payments to government: EUR 9,664 million (total taxes)
1.f Community investment: EUR 174 million
Further detail for 1a-c refer to Group financial performance section on Economic and financial review chapter (p. 334).
Further detail for 1d refer to 3.3 Dividends in Shareholders section on Corporate governance chapter (p. 195).
Further detail for 1e refer to 'Total taxes paid' table on 8. 'Our progress in figures' in 'Responsible banking' chapter (p. 70).
2. Grupo Santander did not receive significant public subsidies in 2023. Refer to 'Annual banking report', e) (p. 824).
|
|||||||||||||
| Wealth creation and Employment |
Financial investment contribution disclosure:
1. Total capital expenditures (CapEx) minus depreciation supported by narrative to describe the company’s investment strategy.
2. Share buybacks plus dividend payments supported by narrative to describe the company’s strategy for returns of capital to shareholders.
|
1.Refer to note 16 Tangible assets (p. 613) – For own use section in 'Auditor's report' in the consolidated financial statements.
Additionally, refer to
- Operating expenses data (p. 325) in 'Economic and financial review' chapter.
2. Refer to 3. 'Shareholders. Engagement and general meeting' section (p. 177) in 'Corporate governance' chapter.
|
||||||||||||
| Community and social vitality | Total tax paid: The total global tax borne by the company, including corporate income taxes, property taxes, non- creditable VAT and other sales taxes, employer-paid payroll taxes and other taxes that constitute costs to the company, by category of taxes. |
Refer to 'Total taxes paid' table on 'Our progress in figures' section in 'Responsible banking' chapter (p. 70).
|
||||||||||||
| Additional tax remitted | The total additional global tax collected by the company on behalf of other taxpayers, including VAT and employee-related taxes that are remitted by the company on behalf of customers or employees, by category of taxes. | Refer to 'Total taxes paid' table on 'Our progress in figures' section in 'Responsible banking' chapter (p. 70). |
||||||||||||
| Total tax paid by country for significant locations | Total tax paid and, if reported, additional tax remitted, by country for significant locations. |
Refer to 'Total taxes paid' table on 'Our progress in figures' section in 'Responsible banking' chapter (p. 70).
|
||||||||||||
| Theme | Metric | Response | ||||||||||||
| Innovation in better products and services | Total R&D expenses ($): Total costs related to research and development. |
Innovation and technological development are strategic pillars of Grupo Santander.
As in previous years, the European Commission's 2023 EU Industrial R&D Investment Scoreboard (based on 2022 data) recognized our technological effort. We were the first Spanish bank and the second best bank globally in R&D investment. The equivalent investment in R&D&I to that considered in the ranking was EUR 2,197 million.
Refer to 'Research, development and innovation (R&D&I)' section in 'Economic and financial review' (p. 427).
|
||||||||||||
| People | ||||||||||||||
| Dignity and equality | Diversity and inclusion (%): Percentage of employees per employee category, per age group, gender and other indicators of diversity (e.g. ethnicity). |
Refer to 'Our progress in figures' section (p. 70) of the Responsible Banking chapter.
Additional information on how we promote DEI refer to ´Diversity, equity and inclusion´ in 'Acting responsibly towards employees' section (p. 46) in 'Responsible banking' chapter.
|
||||||||||||
Pay equality: Ratio of the basic salary and remuneration for each employee category by significant locations of operation for priority areas of equality: women to men; minor to major ethnic groups; and other relevant equality areas. |
Gender and equal pay gap figures match 2021 trends, on the back of a firm commitment and ambitious action plans assumed throughout the Group (0%).
Refer to ´Equal pay´ in 'Acting responsibly towards employees' section (p. 46) on 'Responsible banking' chapter.
|
|||||||||||||
|
Wage level (%):
1. Ratios of standard entry-level wage by gender compared to local minimum wage
2. Ratio of CEO’s total annual compensation to median total annual compensation of all employees (excluding the CEO)
|
1. Refer to 'Our progress in figures' section (p. 70) in 'Responsible banking' chapter.
Table 29 ´Ratio between the Bank’s minimum annual salary and the legal minimum annual salary by country and gender 2023´. We take as a reference the Bank’s minimum annual salary in each country.
2. Refer to 6. 'Remuneration section' (p. 252) on 'Corporate governance' chapter.
|
|||||||||||||
Risk for incidents of child, forced or compulsory labor: An explanation of the operations and suppliers considered to have significant risk for incidents of child labor, forced or compulsory labor. Such risks could emerge in relation to type of operation (such as manufacturing plant) and type of supplier; or countries or geographic areas with operations and suppliers considered at risk. |
Refer to ´Protecting human rights´ in 'Environmental, social and climate change risk management' on 'Business conduct' section (p. 64) of the 'Responsible banking' chapter.
We have zero tolerance towards employee, customer and supplier discrimination, forced labour and child exploitation. We respect the provisions of the ILO convention and the legal minimum working aged established in countries.
Further detail on our Responsible banking and sustainability policy, available at our corporate website.
|
|||||||||||||
Discrimination and Harassment Incidents (#) and the Total Amount of Monetary Losses ($): Number of discrimination and harassment incidents, status of the incidents and actions taken and the total amount of monetary losses as a result of legal proceedings associated with (1) law violations and (2) employment discrimination. |
||||||||||||||
| Theme | Metric | Response | ||||||||||||
|
Freedom of Association and Collective Bargaining at Risk (%):
1. Percentage of active workforce covered under collective bargaining agreements
2. An explanation of the assessment performed on suppliers for which the right to freedom of association and collective bargaining is at risk including measures taken by the organization to address these risks.
|
1. Refer to 'Our progress in figures' section (p. 70) in 'Responsible banking' chapter.
- Table 21. Coverage of the workforce by collective agreement
|
|||||||||||||
| Health and well being |
Health and Safety (%):
1. The number and rate of fatalities as a result of work-related injury; high-consequence work-related injuries (excluding fatalities); recordable work-related injuries, main types of work- related injury; and the number of hours worked.
2. An explanation of how the organization facilitates workers’ access to non-occupational medical and healthcare services and the scope of access provided for employees and workers.
|
1. Refer to 'Our progress in figures' section (p. 70) on the 'Responsible banking' chapter.
•Table 34. Accident rate
•Table 35. Occupational health and safety
2. Refer to 'Our wellbeing' in 'Acting responsibly towards employees' section on 'Responsible banking' chapter (p. 46).
|
||||||||||||
| Skills for the future |
Training provided (#, $):
1. Average hours of training per person that the organization’s employees have undertaken during the reporting period, by gender and employee category (total number of trainings provided to employees divided by the number of employees).
2. Average training and development expenditure per full time employee.
|
Refer to 'Our progress in figures' section (p. 70) in 'Responsible banking' chapter.
•Table 30. Training
•Table 31. Hours of training by category
•Table 32. Hours of training by gender
•28.7 hours per employee
•EUR 284.4 of investment per employee.
|
||||||||||||
| TCFD Recommendations | Reference in this Annual Report | Reference in Climate Finance Report 2022 - June 2023 | ||||||||||||
| Governance | a | Describe the board’s oversight of climate-related risks and opportunities. | 3. Governance; 5. Metrics and targets - Action plan - Power generation sector alignment | |||||||||||
| b | Describe management’s role in assessing and managing climate-related risks and opportunities. | 3. Governance; 6. Financing the green transition - ESG governance in Santander Asset Management | ||||||||||||
| Strategy | a | Describe the climate-related risks and opportunities the organization has identified over the short, medium, and long term. | 2. Strategy - Climate risks and opportunities; Resilience of Santander’s strategy. Scenario analysis | |||||||||||
| b | Describe the impact of climate-related risks and opportunities on the organization’s businesses, strategy, and financial planning. | |||||||||||||
| c | Describe the resilience of the organization’s strategy, taking into consideration different climate-related scenarios, including a 2°C or lower scenario. | |||||||||||||
| Risk Management | a | Describe the organization’s processes for identifying and assessing climate-related risks. | 4. Risk management - I. Identification; II. Planning; III. Assessment; IV. Monitoring; V. Mitigation; VI. Reporting | |||||||||||
| b | Describe the organization’s processes for managing climate-related risks. | |||||||||||||
| c | Describe how processes for identifying, assessing, and managing climate-related risks are integrated into the organization’s overall risk management. | |||||||||||||
| Metrics and Targets | a | Disclose the metrics used by the organization to assess climate-related risks and opportunities in line with its strategy and risk management process. | 5. Metrics and targets - Aligning our portfolio to the Paris agreement | |||||||||||
| b | Disclose Scope 1, Scope 2, and, if appropriate, Scope 3 greenhouse gas (GHG) emissions, and the related risks. | 5. Metrics and targets - Decarbonization targets - Financed emissions; Our environmental footprint | ||||||||||||
| c | Describe the targets used by the organization to manage climate-related risks and opportunities and performance against targets. | 5. Metrics and targets - Decarbonization targets | ||||||||||||
| Summary of SDG target | Reference in the 2023 Annual report | |||||||
| SDG 1 | ||||||||
| 1.2 Reduce at least by half the proportion of men, women and children of all ages living in poverty in all its dimensions | •Supporting communities (p.61) (Other community support programmes section). |
|||||||
| 1.4 Ensure that all men and women, in particular the poor and the vulnerable, have equal rights to economic resources, as well as access to basic services |
•Acting responsibly towards customers (p. 36) (Consumer protection section)
•Financial health and inclusion (p. 57)
|
|||||||
| 1.5 Build the resilience of the poor and those in vulnerable situations and reduce their exposure and vulnerability to climate-related extreme events and other economic, social and environmental shocks and disasters | •Financial health and inclusion (p. 57) |
|||||||
| SDG 4 | ||||||||
| 4.3 Ensure equal access for all to affordable and quality technical, vocational and tertiary education, including university. | •Supporting communities (p. 61) (Support for higher education, employability and entrepreneurship section). |
|||||||
| 4.4 Substantially increase the number of young people and adults with technical and vocational skills to access quality employment and entrepreneurial opportunities. | •Supporting communities (p. 61) (Support for higher education, employability and entrepreneurship section). |
|||||||
| 4.5 Eliminate gender disparities in education and ensure equal access to all levels of education and vocational training for persons with disabilities, indigenous populations and vulnerable children, among others. | •Supporting communities (p. 61) (sections: Support for higher education, employability and entrepreneurship, Other community support programmes). |
|||||||
| 4.6 Substantially increase the scholarships available to developing countries for enrolment in higher education, including vocational training and ICT, technical, engineering and scientific programmes |
•Supporting communities (p. 61) (sections: Support for higher education, employability and entrepreneurship, Other community support programmes).
•Financial health and inclusion (p. 57)
|
|||||||
| SDG 5 | ||||||||
| 5.1. End all forms of discrimination against all women and girls everywhere. | •Acting responsibly towards employees (p. 46) (Employee experience section). |
|||||||
| 5.5 Ensure women’s full and effective participation in, and equal opportunities for, leadership at all levels of decision making | •Acting responsibly towards employees (p. 46) (Employee experience section). |
|||||||
| SDG 7 | ||||||||
| 7.1 Ensure universal access to affordable, reliable and modern energy services | •Supporting the green transition (p. 30) (Supporting our customers in the green transition section). |
|||||||
| 7.b Expand infrastructure and improve technology to provide modern and sustainable energy services | •Supporting the green transition (p. 30) (Supporting our customers in the green transition section). |
|||||||
| Summary of SDG target | Reference in the 2023 Annual report | |||||||
| SDG 8 | ||||||||
| 8.3 Promote development-orientated policies that support production, job creation, entrepreneurship, creativity and innovation, and promote the start-up and growth of micro, small and medium-sized enterprises through access to financial services and other means. |
•Financial health and inclusion (p. 57)
•Supporting communities (p. 61) (Support for higher education, employability and entrepreneurship section).
|
|||||||
8.4 Improve progressively, through 2030, global resource efficiency in consumption and production and endeavour to decouple economic growth from environmental degradation [...] |
•Supporting the green transition (p. 30) (Our environmental footprint section). |
|||||||
| 8.5 Secure wholesome and productive employment and decent work for all - most notably young people and persons with disabilities - and equal pay for work of equal value. |
•Acting responsibly towards employees (p. 46) (Diversity, equity and inclusion (DE&I) section)
•Supporting communities (p. 61) (Support for higher education, employability and entrepreneurship section).
|
|||||||
| 8.6 Substantially reduce the proportion of youth not in employment, education or training | •Supporting communities (p. 61) (Support for higher education, employability and entrepreneurship section). |
|||||||
| 8.8 Protect labour rights and promote safe and secure working environments for all workers, including migrant workers, in particular women migrants, and those in precarious employment |
•Business conduct (p. 64) (Ethical channels section)
•Acting responsibly towards employees (p. 46)
|
|||||||
| 8.10 Strengthen the capacity of domestic financial institutions to encourage and expand access to banking, insurance and financial services for all | •Financial health and inclusion (p. 57) |
|||||||
| SDG 10 | ||||||||
| 10.2 Strengthen and promote social, economic and political inclusion for all |
•Financial health and inclusion (p. 57)
•Supporting communities (p. 61) (Other community support programmes section)
|
|||||||
| SDG 11 | ||||||||
| 11.1 Ensure access for all to adequate, safe and affordable housing and basic services and upgrade slums | •Financial health and inclusion (p. 57) |
|||||||
| 11.4 Strengthen efforts to protect and safeguard the world’s cultural and natural heritage |
•Business conduct (p. 64) (Environmental, social and climate change risk management section)
•Supporting communities (p. 61) (Other community support programmes section).
|
|||||||
| 11.6 Reduce the adverse per capita environmental impact of cities, including by paying special attention to air quality and municipal and other waste management | •Supporting the green transition (p. 30) (Our environmental footprint section) |
|||||||
| SDG 12 | ||||||||
| 12.2 Achieve the sustainable management and efficient use of natural resources | •Supporting the green transition (p. 30) (Our environmental footprint section) |
|||||||
| 12.5 Substantially reduce waste generation through prevention, reduction, recycling and reuse | •Supporting the green transition (p. 30) (Our environmental footprint section) |
|||||||
| 12.6 Achieve full and productive employment and decent work for all women and men, including for young people and persons with disabilities, and equal pay for work of equal value | •See Responsible Banking chapter (p. 19) |
|||||||
| SDG 13 | ||||||||
| 13.1 Strengthen resilience and adaptive capacity to climate-related hazards and natural disasters in all countries | •Supporting the green transition (p. 30) |
|||||||
| SDG 16 | ||||||||
| 16.5 Considerably reduce corruption and bribery in all their forms. | •Business conduct (p. 64) |
|||||||
| 16.6 Develop effective, accountable and transparent institutions at all levels |
•About this chapter (p. 21)
•Stakeholder engagement (p. 89)
|
|||||||
| 16.7 Ensure responsive, inclusive, participatory and representative decision-making at all levels | •Stakeholder engagement (p. 89) |
|||||||
| SDG 17 | ||||||||
•Stakeholder engagement (p. 89) (Partnerships to promote our agenda section) |
||||||||
| GFANZ recommendations | Reference in this report | Reference in Climate Finance Report 2022 - June 2023 | |||||||||
| Foundations | Objectives and priorities | 2. Strategy: Our Ambition, Our strategy, Our objectives and priorities, Our approach | |||||||||
| Implementation strategy | Products and services | 6. Financing the green transition | |||||||||
| Activities and decision-making | 3. Governance: Climate change and green transition oversight, Main areas involved in the implementation of the climate change strategy |
||||||||||
| Policies and conditions | 3. Governance:Policies and guidance; 4. Risk management: Monitoring | ||||||||||
| Engagement strategy | Engagement with clients and portfolio companies | 4. Risk management: Santander and the Brazilian Amazon; 5. Metrics and targets: Action plan | |||||||||
| Engagement with industry | 7. Partnerships: Sector working groups | ||||||||||
| Engagement with government and public sector | 7. Partnerships: Engagement with regulators, industry bodies and other stakeholders |
||||||||||
| Metrics and Targets | Metrics and targets | 5. Metrics and targets | |||||||||
| Governance | Roles, responsibilities, and remuneration | 3. Governance: Climate change and green transition oversight; 6. Financing the green transition: ESG governance in Santander Asset Management | |||||||||
| Skills and culture | 3. Governance: ESG culture and skills development | ||||||||||
Corporate governance |
|||||
 | |||||
|
Broad and balanced
shareholder base
| ||
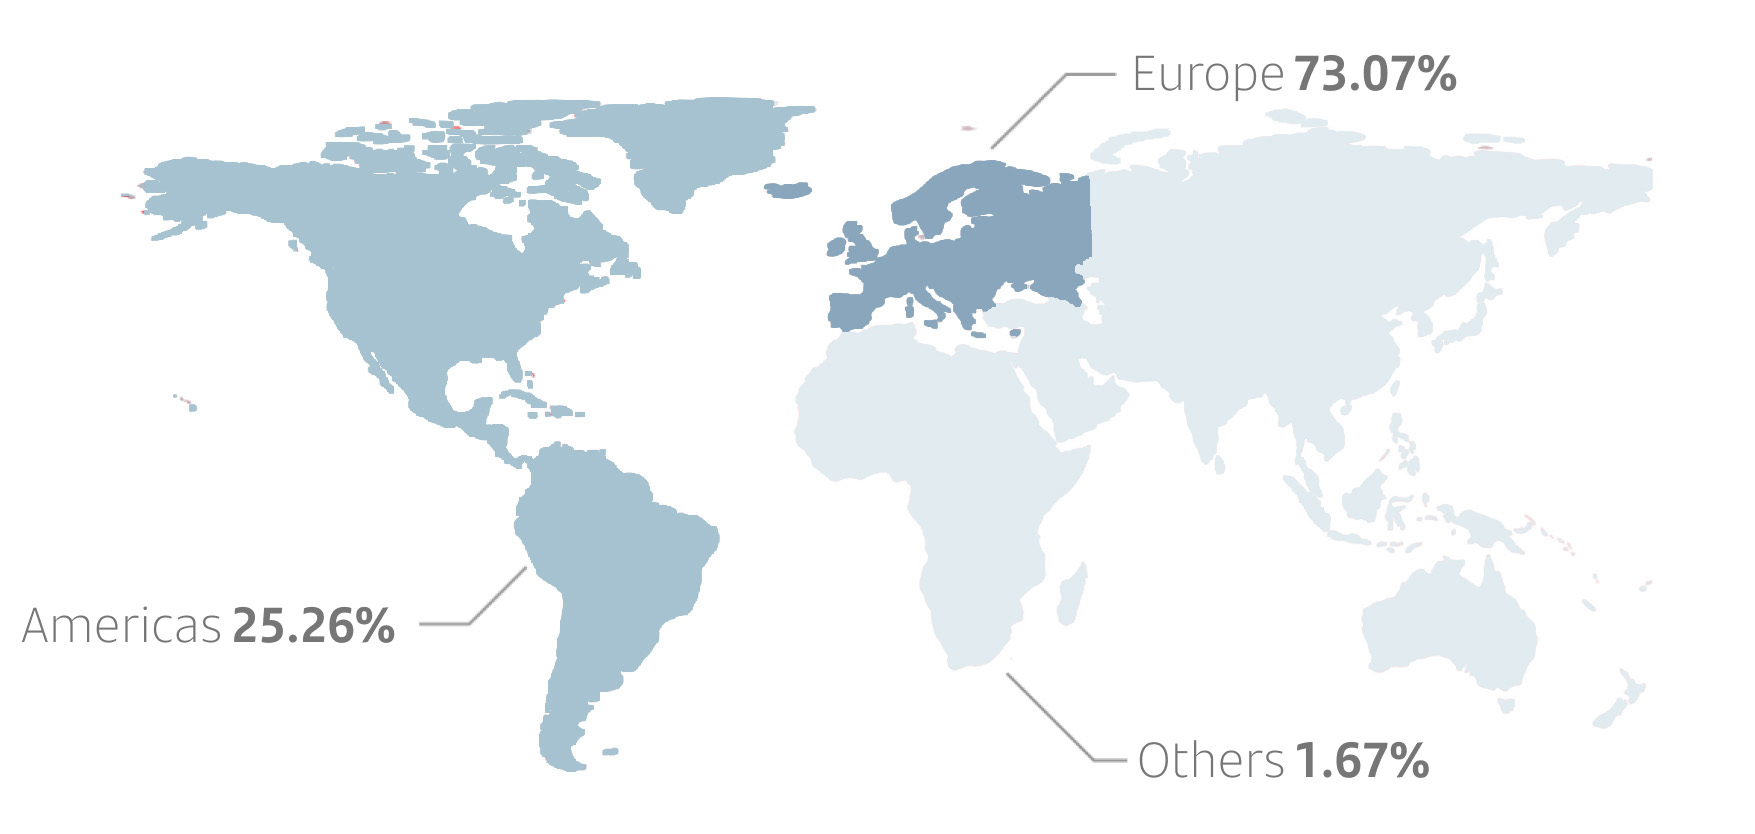 | ||
Aligned with high corporate governance standards | ||
 | ||
Banco Santander has the highest score in the Spanish Association for Standardisation and Certification's (AENOR) Good Corporate Governance Index (GCGI V2.0), which verifies aspects such as composition and functioning of the board and its committees, shareholders' general meeting, remuneration policy, compliance and transparency. | ||
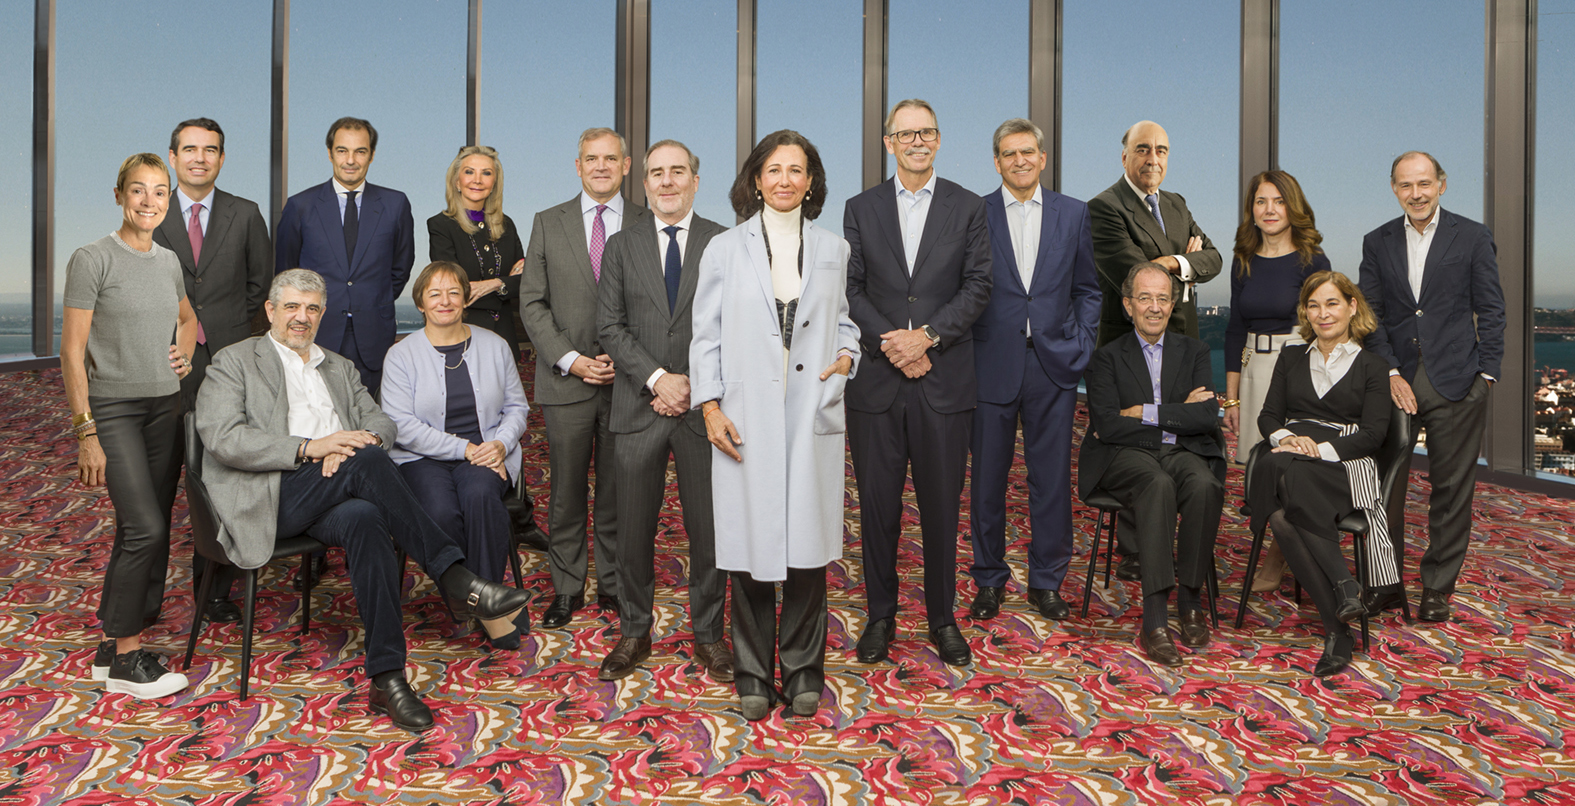
|
15
directors
| ||
|
66.67%
independent
directors
| ||
|
40%
women
| ||
|
5
geographies of origin
| ||
 |
"It is our goal as members of the board of directors of Banco Santander to increase shareholder value by delivering the sustainable results outlined at our Investor Day in February 2023. We believe that effective governance and rigorous oversight are key enablers to accomplishing these plans for success. As a result, the board paid close attention in 2023 to our operating model and succession planning process in addition to our other important governance tasks.
One key strategic initiative in 2023 was to consolidate all activities across our footprint under five global businesses. In 2024 onwards, we will closely monitor the execution of this strategy to ensure that it accomplishes the intended customer benefits, operating efficiencies and clarity in external reporting. In 2023, we further supported the Group's strategic goals with a disciplined succession process, implementing key appointments to the board and senior management. First, the board oversaw the transition of the Chief Executive Officer, who reports directly to the board. In particular, we focused on monitoring the split of responsibilities between the Executive Chair and the Chief Executive Officer.
Secondly, we managed the handover of the Lead Independent Director responsibilities from Bruce Carnegie-Brown to me as of October 2023. Bruce will stay on the board until the AGM and also continue to chair the nomination committee until then. All of us at Santander are deeply grateful to him for his many years of effective service. Further, under Bruce’s leadership during the year, we conducted a rigorous nomination process for new directors to replace him and Ramiro Mato, who will also be stepping down from the board. As a result, we nominated Carlos Barrabés and Antonio Weiss, who will both join the board shortly. I am delighted to welcome them and I am sure that we will greatly benefit from their broad experience and contributions.
The board believes that effective governance is key to the successful development and execution of the Group’s strategy. To this end, we will continue to deepen diversity on our board, recognizing the benefits of a mix of gender, background, origin, skills, knowledge, experience and familiarity with our key markets to support our strategy. In particular, we commissioned an external evaluation of the board and its committees in order to continue to improve our overall effectiveness. We were pleased by the results which concluded that the board continues to operate effectively, while also identifying some areas for improvement. See more details in 'Board effectiveness review in 2023', in section 4.3.
Importantly, the board also strongly believes in the value of engaging directly with our stakeholders. As part of that, Bruce Carnegie-Brown and I conducted an extensive engagement with shareholders in 2023/2024 ahead of the AGM (see more details in section 3.1 'Shareholder communication and engagement’). We deeply appreciate the time and effort expended by many of our shareholders to share their questions and recommendations with us.
Looking back to 2023, I would like to thank Ramiro Mato, for his constructive challenges and contributions, and Bruce Carnegie-Brown for his exceptional professionalism and commitment to the Group. I also would like to compliment José Antonio Álvarez, now our non-executive board colleague and Vice Chair, for his many years of executive service to the Group. Their work will redound to the benefit of all of our stakeholders for years to come.
Looking ahead, we are committed to increasing shareholder value in a manner consistent with the highest industry standards for serving our customers, employees and communities, while fulfilling our supervisory expectations and governance obligations. We are also mindful that the volatile geopolitical, economic and market conditions of 2023 could extend into the coming year. Working closely with our executive team, our board is confident that we will continue to create long-term, sustainable value for all stakeholders in 2024 and beyond."
Glenn Hutchins, Vice Chair and Lead Independent Director
|
|||||||

2023 goals |
How we delivered | |||||||
Ensure a smooth transition of the new Chief Executive Officer and new Group Chief Risk Officer (CRO) | ||||||||
To oversee the orderly transition into the CEO and CRO roles, providing ongoing support and constructive challenge to both Héctor Grisi and Mahesh Aditya. |
The board oversaw the smooth transition of the new CEO and CRO and ensured that their onboarding was robust, enabling them to be truly effective in their roles. Their transition was further facilitated by the fact that both were already familiar with the Group, in line with the board’s focus on continuing to develop the quality of our internal pipeline of talent.
Specifically, the board supported Héctor Grisi during his transition as new CEO, and in particular, José Antonio Álvarez, who remains as a non-executive director, providing an ongoing transitional reference throughout 2023. In addition, the non-executive directors met with Héctor Grisi in a private session to retrieve his early views and comments after three months in the role. In turn, Mahesh Aditya transitioned into the CRO role assisted by a structured transition with the former CRO and, in addition to his direct and unfettered access to the board and its committees, has maintained regular informal meetings with the Chair of the risk supervision, regulation and compliance committee.
Both executives have visited a significant number of units across our footprint to engage directly with the local management team to gain a deeper understanding and knowledge of the idiosyncrasies of our key businesses. They also successfully completed their induction programmes to the board’s satisfaction.
|
|||||||
2023 goals |
How we delivered | |||||||
Progressing in our ESG commitments | ||||||||
To oversee the fulfilment of our ESG commitments to reach net zero emissions by 2050, accelerating green finance with new and wider value propositions for our customers, and at the same time taking care of the sustainability and responsible banking agenda. |
We continued to progress on our ESG targets. In particular:
•We expanded our capabilities to measure carbon emissions and approved new decarbonization targets for specific sectors.
•We raised EUR 20.1 billion of green finance in 2023 (EUR 114.6 billion since 2019), towards our target of EUR 120 billion by 2025.
•We increased our financial inclusion target, and the goal is now to financially include 5 million people by 2023-2025. In 2023, we have financially empowered 1.8 million people.
•We invested EUR 105 million to support education, employability and entrepreneurship through Santander Universidades, helping 498 thousand people (2.7 million since 2019).
•31.4% of our senior managers are women (35% target by 2025). We continued to prioritize diversity and inclusion awareness and equal opportunity regardless of gender, culture, sexual orientation or disability.
See the 'Responsible banking' chapter for additional details.
|
|||||||
Governance effectiveness | ||||||||
To continue enhancing the overall effectiveness of the board with an appropriate composition and ensuring that its role is discharged in the most tangible and effective manner. To consolidate the enhancements delivered as part of our action plan executed in 2022, following the review of our governance arrangements. |
In 2023, we successfully managed succession planning throughout Santander, most notably conducting a rigorous and effective process that led to the appointment of Glenn Hutchins as new Lead Independent Director with effect from 1 October 2023. Glenn Hutchins replaced Bruce Carnegie-Brown, who had been in the role for almost nine years.
We continued to work on an appropriately refreshed board of directors ensuring diversity in its broadest sense. As part of that, we will shortly welcome Carlos Barrabés and Antonio Weiss, whose appointments have been submitted to the 2024 AGM (subject to regulatory approval), further reinforcing the board's composition to ensure that we are well placed to address the challenges ahead in our business and taking into account feedback from previous board effectiveness reviews.
In 2023, the nomination committee monitored execution of the action plan resulting from the 2022 internal board effectiveness review, which was successfully completed. In addition, the board conducted its annual effectiveness review in 2023 with the collaboration of Spencer Stuart as independent expert. The findings of the review concluded that the board and its committees operate effectively. See 'Board effectiveness review in 2023' in section 4.3. As part of that, the split of responsibilities between the Executive Chair and the CEO, together with the executive chair model, were positively rated by Spencer Stuart in 2023.
The board verified that the arrangements to manage the Group with five global businesses were aligned with governance principles and management of the Group, whilst respecting the current governance structure of subsidiaries that are autonomous in capital and liquidity and aligned with accelerating transformation across the Group, with CEOs / Country Heads as ultimately responsible for the budget, execution of the customer and commercial strategy and financial delivery.
|
|||||||
2023 goals |
How we delivered | |||||||
Balance sheet strength and long-term shareholder value | ||||||||
|
To maintain the solvency of the balance sheet and in particular, the quality of the credit risk portfolio as a key priority due to the current economic environment. To maintain our focus on capital management and capital allocation to businesses with high returns on risk-weighted assets (RoRWA).
To promote the generation of long-term and sustainable shareholder value creation through consistent and reliable returns growth while continuing to build capital strength organically to ensure strong shareholder remuneration and the resources required to deliver our strategic transformation.
|
Even if the global economy in 2023 did better than expected, the board maintained a conservative risk appetite during the year given the increasing geopolitical risk and its potential macroeconomic implications, higher interest rates, and continued inflation, although the latter moderated its increase. During 2023, we continued maintaining a very active discipline of capital allocation and we have conducted a qualitative improvement in our asset mobilization capabilities.
In 2023 we delivered a strong performance in the first year of our new phase of shareholder value creation that we outlined at the 2023 Investor Day. As part of that, the board continued to drive our potential through leveraging our unique business model based on the customer (building a digital bank with branches), scale (global and in-market scale) and diversification (business, geography and balance sheet). Specifically, we delivered on all our 2024 public targets disclosed to the market as follows:
•Revenue and customer growth: revenue increased 13% in constant euros (11% in current euros) up to EUR 57,647 million and with customer numbers climbed five million to 165 million (vs.160 million customers in 2022).
•Strength: CET1 above 12%, closing the year at 12.3% (vs. 12.0% in 2022), where we have maintained a disciplined capital allocation methodology and prudent risk management.
•Profitability: RoTE above 15%, closing the year with a 15.1% RoTE (vs. 13.4% in 2022).
•Cost discipline: the efficiency ratio improved in 2023 to 44.1% (vs. 45.8% in 2022), despite the impact of inflation on costs.
•Conservative risk appetite: the Group cost of risk remained in line with the target below 1.2% at 1.18% at the end of 2023 (vs. 0.99% in 2022).
•Shareholder remuneration: in 2023 the payout remained at 50% and TNAV raised up to EUR 4.76 per share (vs. EUR 4.26 per share in 2022). The paid cash dividend in 2023 amounted to 14.05 euro cents per share, which entailed a combined increase of TNAV and dividends of 15%.
|
|||||||
Type of investor | |||||
% of share capital |
|||||
BoardA |
1.20 | % | |||
Institutional |
58.75 | % | |||
Retail |
40.05 | % | |||
Total |
100 | % | |||
| Geographic distribution | |||||
% of share capital |
|||||
Europe |
73.07 | % | |||
The Americas |
25.26 | % | |||
Rest of the world |
1.67 | % | |||
| Total | 100 | % | |||
Number of shares | |||||
% of share capital |
|||||
1-3,000 |
8.67 | % | |||
3,001-30,000 |
16.91 | % | |||
30,001-400,000 |
11.78 | % | |||
Over 400,000 |
62.64 | % | |||
Total |
100 | % | |||
| Issues of contingent convertible preferred securities | ||||||||||||||
| Date of issuance | Nominal amount |
Discretionary remuneration per annum |
Conversion predetermined threshold |
Maximum number of shares in case of conversion A |
||||||||||
19/03/2018 |
EUR 1,500 million |
4.75% for the first 7 years |
If, at any time, the CET1 ratio of
Banco Santander or the Group is
lower than 5.125%
|
416,666,666 | ||||||||||
14/01/2020 |
EUR 1,500 million |
4.375% for the first 6 years |
604,594,921 | |||||||||||
| 06/05/2021 | USD 1,000 million | 4.75% for the first 6 years |
391,389,432 | |||||||||||
| 06/05/2021 | EUR 750 million | 4.125% for the first 7 years |
352,278,064 | |||||||||||
| 21/09/2021 | EUR 1,000 million | 3.625% for the first 8 years |
498,007,968 | |||||||||||
| 16/11/2023 | USD 1,150 million |
9.625% for the first 5 years and 6 months |
447,470,817 | |||||||||||
| 16/11/2023 | USD 1,350 million |
9.625% for the first 10 years |
525,291,828 | |||||||||||
| Significant shareholding | ||||||||
| Date of entry in CNMV register | Name | % holdingA |
||||||
| 24/10/2019 | BlackRock Inc | 5.426 | ||||||
| 16/06/2022 | Dodge & Cox | 3.038 | ||||||
| A. Percentage of capital as at the date of notification to the CNMV. | ||||||||
Significant shareholding | |||||||||||
| Date | Shareholder name | % previous share | % subsequent share | ||||||||
8/3/2023 |
Norges Bank | 3.006 | 2.996A |
||||||||
| A. Shares and financial instruments. | |||||||||||
Monthly average of daily positions in treasury shares | ||||||||
| % of Banco Santander’s share capital at month end | ||||||||
| 2023 | 2022 | |||||||
January |
1.75 | % | 1.64 | % | ||||
February |
2.16 | % | 1.62 | % | ||||
March |
1.46 | % | 1.65 | % | ||||
April |
1.50 | % | 1.96 | % | ||||
May |
1.72 | % | 1.68 | % | ||||
June |
1.68 | % | 1.62 | % | ||||
July |
0.08 | % | 0.02 | % | ||||
August |
0.08 | % | 0.10 | % | ||||
September |
0.08 | % | 0.11 | % | ||||
October |
0.64 | % | 0.05 | % | ||||
November |
1.25 | % | 0.15 | % | ||||
December |
1.56% |
0.98 | % | |||||
Acquisitions and transfers of treasury shares in 2023 | ||||||||||||||||||||||||||||||||
| Acquisitions | Transfers | |||||||||||||||||||||||||||||||
| EUR (except number of shares) | Number of shares | Total par value | Total cash amount | Average purchase price | Number of shares | Total par value | Total cash amount | Average purchase price | Profit (loss) net of taxes | |||||||||||||||||||||||
| Discretionary trading | 39,020,430 | 19,510,215 | 135,372,000 | 3.47 |
50,793,292A |
25,396,646A |
157,268,000A |
3.46B |
13,031,000B |
|||||||||||||||||||||||
Client induced tradingC |
196,118,212 | 98,059,106 | 649,037,000 | 3.31 | 196,118,212 | 98,059,106.00 | 649,037,000 | 3.31 | ||||||||||||||||||||||||
| Buyback programmes | 676,155,035 | 338,077,518 | 2,324,924,000 | 3.44 | N/A | N/A | N/A | N/A | N/A | |||||||||||||||||||||||
| Total | 911,293,677 | 455,646,839 | 3,109,333,000 | 3.41 | 246,911,504A |
123,455,752A |
806,305,000A |
3.34B |
13,031,000B |
|||||||||||||||||||||||
Significant changes in treasury shares in 2023A | |||||||||||
| % of voting rights represented by shares | |||||||||||
Reported on |
acquired since last notice |
transferred since last notice |
held at reference date of notice | ||||||||
13/01/2023B |
1.06% | 0.22% | 1.40% | ||||||||
| 8/02/2023 | 1.01% | 0.23% | 2.18% | ||||||||
| 24/03/2023 | 1.02% | 2.54% | 0.70% | ||||||||
| 20/04/2023 | 1.03% | 0.18% | 1.55% | ||||||||
| 5/07/2023 | 0.54% | 2.03% | 0.09% | ||||||||
| 19/10/2023 | 1.06% | 0.46% | 0.68% | ||||||||
| 13/12/2023 | 1.00% | 0.19% | 1.50% | ||||||||
| The Banco Santander share | ||||||||
| 2023 | 2022 | |||||||
| Shares (million) | 16,184.1 | 16,794.4 | ||||||
| Price (EUR) | ||||||||
| Closing price | 3.780 | 2.803 | ||||||
| Change in the price | 35 | % | (5%) | |||||
| Maximum for the period | 3.970 | 3.482 | ||||||
| Date of maximum for the period | 06/12/2023 | 10/02/2022 | ||||||
| Minimum for the period | 2.812 | 2.324 | ||||||
| Date of minimum for the period | 03/01/2023 | 15/07/2022 | ||||||
| Average for the period | 3.447 | 2.795 | ||||||
| End-of-period market capitalization (EUR million) | 61,168 | 47,066 | ||||||
| Trading | ||||||||
| Total volume of shares traded (million) | 11,132.3 | 14,217 | ||||||
| Average daily volume of shares traded (million) | 43.7 | 55.3 | ||||||
| Total cash traded (EUR million) | 38,143.5 | 40,262 | ||||||
| Average daily cash traded (EUR million) | 149.6 | 156.7 | ||||||
Other activities | ||||||||
→Regular meetings between the Lead Independent Director and key investors |
Since October, our Lead Independent Director, Glenn Hutchins, accompanied by Bruce Carnegie-Brown, met with institutional investors, particularly in the months leading up to the AGM. In total, he met with 17 institutional investors, who represent approximately 24.6% of share capital. |
|||||||
→Investor roadshows |
Our Shareholder and Investor Relations team had 930 meetings (both in person and virtually) with 379 investors, including 47 meetings focused on ESG matters. We engaged with 36.18% of share capital. |
|||||||
→Interaction with retail shareholders |
Our Shareholder and Investor Relations team held 206 events (online, in person and hybrid). Attendees accounted for 8.4% of the capital held by retail shareholders in Spain. Shareholders engaged with the Group’s senior management at several of these events. |
|||||||
→Studies and surveys |
We received 239,238 shareholders and investors opinions through quality surveys and studies, of which 9,120 corresponded to opinions received in the SPF (Simple, Personal and Fair) survey of Banco Santander. |
|||||||
Other channels | |||||
In order to maximize the dissemination and quality of information, we offer shareholders and investors an app (Santander Shareholders and Investors) compatible for Android and Apple iOS that contains a broad range of information about the Group. |
 |
||||
We also engage with shareholders through various channels, such as an email address, telephone lines, WhatsApp, postal service and virtual office. | |||||
|
In addition, we regularly post information about Banco Santander on our official Twitter and LinkedIn accounts.
The contents included in these profiles are not incorporated by reference to this annual report nor should be considered part of it for any purpose.
| |||||
Quorum breakdown | |||||
| Present | 3.358 | % | |||
| In person and virtual attendance | 0.717 | % | |||
| Remote voting | |||||
By post or direct delivery |
0.423 | % | |||
| By electronic means | 2.218 | % | |||
| Represented | 64.206 | % | |||
By post or direct delivery |
5.592 | % | |||
By electronic means |
58.614 | % | |||
Total |
67.564 | % | |||
VOTES A |
QuorumD |
||||||||||||||||
ForB |
AgainstB |
BlankC |
AbstentionC |
||||||||||||||
1. Annual accounts and corporate management |
|||||||||||||||||
1A. Annual accounts and directors’ reports for 2022 |
99.68 | 0.32 | 0.06 | 0.27 | 67.56 | ||||||||||||
1B. Consolidated statement of non-financial statements for 2022 |
99.79 | 0.21 | 0.06 | 0.22 | 67.56 | ||||||||||||
1C. Corporate management for 2022 |
99.72 | 0.28 | 0.06 | 0.58 | 67.56 | ||||||||||||
2. Application of results for 2022 |
99.75 | 0.25 | 0.06 | 0.21 | 67.56 | ||||||||||||
3. Board of directors: appointment, re-election or ratification of directors |
|||||||||||||||||
3A. Setting of the number of directors |
99.60 | 0.40 | 0.06 | 0.27 | 67.56 | ||||||||||||
3B. Ratification of the appointment and re-election of Mr Héctor Blas Grisi Checa |
99.54 | 0.46 | 0.07 | 0.31 | 67.56 | ||||||||||||
3C. Ratification of the appointment and re-election of Mr Glenn Hogan Hutchins |
98.87 | 1.13 | 0.06 | 0.31 | 67.56 | ||||||||||||
3D. Re-election of Mrs Pamela Ann Walkden |
99.49 | 0.51 | 0.07 | 0.30 | 67.56 | ||||||||||||
3E. Re-election of Ms Ana Patricia Botín-Sanz de Sautuola y O'Shea |
98.15 | 1.85 | 0.06 | 0.42 | 67.56 | ||||||||||||
3F. Re-election of Ms Sol Daurella Comadrán |
97.03 | 2.97 | 0.07 | 0.29 | 67.56 | ||||||||||||
3G. Re-election of Ms Gina Lorenza Díez Barroso Azcárraga |
98.58 | 1.42 | 0.07 | 0.30 | 67.56 | ||||||||||||
3H. Re-election of Ms Homaira Akbari |
99.50 | 0.50 | 0.07 | 0.31 | 67.56 | ||||||||||||
4. Re-election of the external auditor for financial year 2023 |
99.31 | 0.69 | 0.06 | 0.28 | 67.56 | ||||||||||||
5. Share capital and convertible securities |
|||||||||||||||||
5A. Reduction in share capital in the maximum amount of EUR 757,225,978.50, through the cancellation of a maximum of 1,514,451,957 own shares |
99.32 | 0.68 | 0.05 | 0.21 | 67.56 | ||||||||||||
5B. Reduction in share capital in the maximum amount of EUR 822,699,750.50, through the cancellation of a maximum of 1,645,399,501 own shares |
99.28 | 0.72 | 0.05 | 0.19 | 67.56 | ||||||||||||
5C. Authorisation for the Bank and its subsidiaries to be able to acquire own shares |
98.72 | 1.28 | 0.05 | 0.19 | 67.56 | ||||||||||||
5D. Delegation to the board of the power to issue securities convertible into shares of the Bank within a 5-year period and subject to a maximum aggregate limit of EUR 10,000 million. Setting of standards to determine the bases for and terms and conditions applicable to the conversion and granting of powers to increase capital. Delegation to exclude pre-emptive rights |
96.65 | 3.35 | 0.05 | 0.22 | 67.56 | ||||||||||||
6. Remuneration |
|||||||||||||||||
6A. Directors' remuneration policy |
90.78 | 9.22 | 0.06 | 0.27 | 67.56 | ||||||||||||
6B. Setting of the maximum total annual remuneration of directors in their capacity as directors |
97.66 | 2.34 | 0.06 | 0.26 | 67.56 | ||||||||||||
6C. Approval of the maximum ratio of fixed and variable components of total remuneration of executive directors and other employees belonging to categories with professional activities that have a material impact on the risk profile |
98.52 | 1.48 | 0.06 | 0.30 | 67.16 | ||||||||||||
6D. Deferred Multiyear Objectives Variable Remuneration Plan |
96.72 | 3.28 | 0.06 | 1.47 | 67.56 | ||||||||||||
6E. Application of the Group’s buy-out regulations |
98.38 | 1.62 | 0.07 | 0.33 | 67.56 | ||||||||||||
6F. Annual directors' remuneration report (consultative vote) |
89.22 | 10.78 | 0.06 | 0.26 | 67.56 | ||||||||||||
7. Authorization to the board and grant of powers for conversion into public instrument |
99.74 | 0.26 | 0.06 | 0.23 | 67.56 | ||||||||||||
8 to 23. Corporate action to demand director liability and dismissal and removal of directorsE |
0.00 | 100.00 | 0.00 | 0.03 | 64.92 | ||||||||||||
Annual accounts and corporate management. To approve: |
||||||||
|
→The annual accounts and the directors’ reports of Banco Santander and its consolidated Group for the financial year ended on 31 December 2023. For more details, see 'Consolidated financial statements'.
→The consolidated non-financial statement for the financial year ended on 31 December 2023, which is part of the consolidated directors' report. See the 'Responsible banking' chapter.
→The corporate management for financial year 2023.
|
||||||||
Application of results of financial year 2023 |
||||||||
→To approve the application of results obtained by Banco Santander during financial year 2023. See note 4.a) to the consolidated financial statements. |
||||||||
Board of directors: appointment and re-election |
||||||||
|
→To set the number of directors at 15, within the maximum and minimum limits stated in the Bylaws.
→To appoint Carlos Barrabés and Antonio Weiss as independent directors. See section 1.1 'Board skills and diversity'.
→To re-elect Javier Botín, Germán de la Fuente, Henrique de Castro, José Antonio Álvarez and Belén Romana for a three-year period. See section 4.1 'Our directors'.
|
||||||||
External auditor |
||||||||
→To re-elect the firm PricewaterhouseCoopers Auditores, S.L. (PwC) as external auditor of Banco Santander and its consolidated group for financial year 2024. |
||||||||
Share capital and convertible securities |
||||||||
|
→To authorize the increase of the share capital. Delegation for the exclusion of the preferential subscription right.
→To reduce the share capital of Banco Santander with the following purposes:
•Cancelling a maximum of 1,566,857,857 treasury shares purchased under the Second 2023 Buyback Programme.
•Cancelling a maximum of 1,582,557,857 treasury shares acquired through one or more share buyback programmes or by other legally permitted means, authorizing the board of directors to cancel them on one or several occasions in a maximum timescale of one year or by the date of the next annual general meeting.
See sections 2.1 'Share capital' and 2.5 'Treasury shares'.
|
||||||||
Remuneration. See section 6. 'Remuneration'
|
||||||||
|
→To approve the director's remuneration policy for 2024, 2025 and 2026.
→To set the maximum amount of annual remuneration to be paid to all the directors in their capacity as such.
→To approve a maximum ratio of 200% of variable components to fixed components of total remuneration for executive directors and certain employees belonging to professional categories that have a material impact on the Group’s risk profile.
→To approve the Deferred Multiyear Objectives Variable Remuneration Plan.
→To approve the Group's buy-out regulations.
→To hold a non-binding vote on the annual directors’ remuneration report.
|
||||||||
|
1 Germán de la Fuente
Member
Non-executive director
(independent)
òp
|
2 Pamela Walkden
Member
Non-executive director
(independent)
òCp
|
3 Héctor Grisi
CEO
Executive director
òp
|
4 Ana Botín
Executive Chair
Executive director
òCpC
|
5 Glenn Hutchins
Vice Chair and Lead Independent Director
Non-executive director (independent)
¢¢Cp
|
6 Ramiro Mato
Member
Non-executive director
(independent)
òòpŸC
|
7 Belén Romana
Member
Non-executive director
(independent)
òò¢pCŸp
|
8 Sol Daurella
Member
Non-executive director
(independent)
¢¢Ÿ
|
||||||||||||||||
|
9 Javier Botín
Member
Non-executive director
|
10 Henrique de Castro
Member
Non-executive director
(independent)
ò¢p
|
11 Gina Díez Barroso
Member
Non-executive director
(independent)
¢Ÿ
|
12 Bruce Carnegie-Brown
Member
Non-executive director
(independent)
¢C¢
|
13 José Antonio Álvarez
Vice Chair
Non-executive director
òp
|
14 Luis Isasi
Member
Non-executive director
ò¢p
|
15 Homaira Akbari
Member
Non-executive director
(independent)
òŸp
|
16 Jaime Pérez Renovales
General Counsel and secretary of the board
|
||||||||||||||||

 |
|||||||||||
|
Ana
Botín-Sanz de Sautuola y O’Shea
EXECUTIVE CHAIR
Executive director
|
|||||||||||
 |
|||||||||||
|
Héctor
Grisi Checa
CHIEF EXECUTIVE OFFICER
Executive director
|
|||||||||||
|
|||||||||||
|
Glenn Hogan
Hutchins VICE CHAIR AND LEAD INDEPENDENT DIRECTOR Non-executive director (independent)
|
|||||||||||
 |
|||||||||||
|
José Antonio
Álvarez Álvarez VICE CHAIR
Non-executive director
|
|||||||||||
 |
|||||||||||
|
Homaira
Akbari Non-executive director (independent)
|
|||||||||||
 |
|||||||||||
|
Javier
Botín-Sanz de Sautuola y O’Shea Non-executive director
|
|||||||||||
 |
|||||||||||
|
Bruce
Carnegie-Brown Non-executive director (independent)
|
|||||||||||
 |
|||||||||||
|
Sol
Daurella Comadrán Non-executive director (independent)
|
|||||||||||
 |
|||||||||||
|
Henrique
de Castro Non-executive director (independent)
|
|||||||||||
 |
|||||||||||
|
Germán
de la Fuente Escamilla Non-executive director (independent)
|
|||||||||||
 |
|||||||||||
|
Gina
Díez Barroso Azcárraga
Non-executive director (independent)
|
|||||||||||
 |
|||||||||||
|
Luis
Isasi Fernández de Bobadilla
Non-executive director (*)
|
|||||||||||
 |
|||||||||||
|
Ramiro
Mato García-Ansorena Non-executive director (independent)
|
|||||||||||
 |
|||||||||||
|
Belén
Romana García Non-executive director (independent)
|
|||||||||||
 |
|||||||||||
|
Pamela
Walkden Non-executive director (independent)
|
|||||||||||
 |
|||||||||||
|
Jaime
Pérez Renovales General Counsel and secretary of the board
|
|||||||||||
| Our board composition | ||
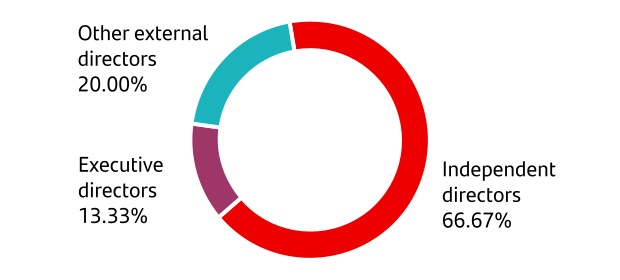
Board tenure | ||
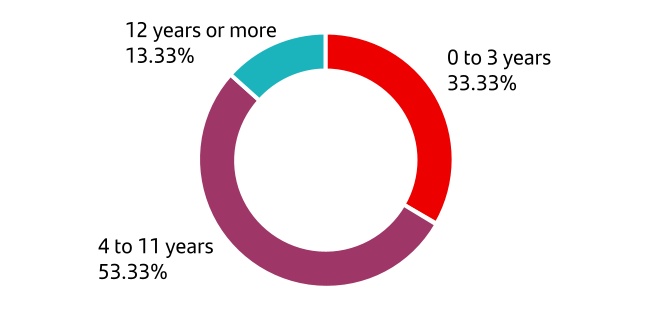
Tenure and equity ownershipA | |||||||||||||||||||||||||||||||||||
| Board of directors | Tenure | Banco Santander shareholdingD |
|||||||||||||||||||||||||||||||||
Date of first appointmentB |
Date of last appointment | End dateC |
Direct | Indirect | Shares represented | Total | % of share capital | ||||||||||||||||||||||||||||
Executive Chair |
Ana Botín |
04/02/1989 |
31/03/2023 |
31/03/2026 |
1,463,276 | 31,161,724 | 32,625,000 | 0.202% | |||||||||||||||||||||||||||
Chief Executive Officer |
Héctor Grisi |
20/12/2022 |
31/03/2023 | 31/03/2026 | 1,693,710 | 1,693,710 |
0,010% |
||||||||||||||||||||||||||||
Vice Chair and Lead Independent Director |
Glenn Hutchins |
20/12/2022 |
31/03/2023 |
31/03/2026 |
524,027 | 524,027 | 0.003% | ||||||||||||||||||||||||||||
Vice Chair |
José Antonio Álvarez | 25/11/2014 | 01/04/2022 |
01/04/2025 |
2,497,881 | 2,497,881 | 0.015% | ||||||||||||||||||||||||||||
| Members | Homaira Akbari |
27/09/2016 |
31/03/2023 |
31/03/2026 |
67,826 | 100,913 | 168,739 | 0.001% | |||||||||||||||||||||||||||
Javier Botín |
25/07/2004 |
26/03/2021 |
26/03/2024 |
5,502,083 | 25,598,851 | 156.529.169 E |
187,630,103 | 1.159% | |||||||||||||||||||||||||||
|
Bruce
Carnegie-Brown
|
25/11/2014 |
26/03/2021 |
26/03/2024 |
59,940 | 59,940 | 0.000% | |||||||||||||||||||||||||||||
Sol Daurella |
25/11/2014 |
31/03/2023 |
31/03/2026 |
149,483 | 476,837 | 626,320 | 0.004% | ||||||||||||||||||||||||||||
Henrique de Castro |
12/04/2019 |
01/04/2022 |
01/04/2025 |
2,982 | 2,982 | 0.000% | |||||||||||||||||||||||||||||
| Germán de la Fuente | 01/04/2022 | 01/04/2022 | 01/04/2025 | 10,000 | 10,000 | 0.000% | |||||||||||||||||||||||||||||
Gina Díez |
22/12/2020 |
31/03/2023 |
31/03/2026 |
27,000 | 27,000 | 0.000% | |||||||||||||||||||||||||||||
| Luis Isasi | 03/04/2020 | 01/04/2022 |
01/04/2025 |
0.000% | |||||||||||||||||||||||||||||||
Ramiro Mato |
28/11/2017 |
26/03/2021 |
26/03/2024 |
506,860 | 506,860 | 0.003% | |||||||||||||||||||||||||||||
Belén Romana |
22/12/2015 |
01/04/2022 |
01/04/2025 |
208 | 4 | 212 | 0.000% | ||||||||||||||||||||||||||||
Pamela Walkden |
29/10/2019 |
31/03/2023 |
31/03/2026 |
82,608 | 82,608 | 0.001% | |||||||||||||||||||||||||||||
Total |
12,587,884 | 57,338,329 | 156,529,169 | 193,830,382 | 1.198% |
||||||||||||||||||||||||||||||
General secretary and secretary of the board |
Jaime Pérez Renovales |
||||||||||||||||||||||||||||||||||
| Board skills and diversity matrix | ||||||||||||||||||||||||||||||||||||||||||||||||||
| Ana Botín | Héctor Grisi | Glenn Hutchins |
José Antonio Álvarez | Homaira Akbari | Javier Botín |
Bruce
Carnegie-Brown
|
Sol Daurella | Henrique de Castro |
Germán de la Fuente | Gina Díez Barroso |
Luis Isasi | Ramiro Mato | Belén Romana | Pamela Walkden | ||||||||||||||||||||||||||||||||||||
| Executive Chair | CEO | Vice Chair Lead Independent Director | Vice Chair Non-executive |
Independent | Non-executive | Independent | Independent | Independent | Independent | Independent | Non-executive | Independent | Independent | Independent | ||||||||||||||||||||||||||||||||||||
| SKILLS AND EXPERIENCE | ||||||||||||||||||||||||||||||||||||||||||||||||||
| THEMATIC SKILLS | ||||||||||||||||||||||||||||||||||||||||||||||||||
Banking (93.3%) |
• | • | • | • | • | • | • | • | • | • | • | • | • | • | ||||||||||||||||||||||||||||||||||||
Other financial services (86.7%) |
• | • | • | • | • | • | • | • | • | • | • | • | • | |||||||||||||||||||||||||||||||||||||
Accounting, auditing and financial literacy (100%) |
• | • | • | • | • | • | • | • | • | • | • | • | • | • | • | |||||||||||||||||||||||||||||||||||
Retail (80%) |
• | • | • | • | • | • | • | • | • | • | • | • | ||||||||||||||||||||||||||||||||||||||
| Digital & information technology (60%) | • | • | • | • | • | • | • | • | • | |||||||||||||||||||||||||||||||||||||||||
Risk management (86.7%) |
• | • | • | • | • | • | • | • | • | • | • | • | • | |||||||||||||||||||||||||||||||||||||
Business strategy (100%) |
• | • | • | • | • | • | • | • | • | • | • | • | • | • | • | |||||||||||||||||||||||||||||||||||
Responsible business & sustainability (73.3%) |
• | • | • | • | • | • | • | • | • | • | • | |||||||||||||||||||||||||||||||||||||||
Human resources, culture, talent & remuneration (93.3%) |
• | • | • | • | • | • | • | • | • | • | • | • | • | • | ||||||||||||||||||||||||||||||||||||
Legal and regulatory (13.3%) |
• | • | ||||||||||||||||||||||||||||||||||||||||||||||||
Governance and control (86.7%) |
• | • | • | • | • | • | • | • | • | • | • | • | • | |||||||||||||||||||||||||||||||||||||
International experience |
Continental Europe (73.3%) |
• | • | • | • | • | • | • | • | • | • | • | ||||||||||||||||||||||||||||||||||||||
US/UK (93.3%) |
• | • | • | • | • | • | • | • | • | • | • | • | • | • | ||||||||||||||||||||||||||||||||||||
Latam (66.7%) |
• | • | • | • | • | • | • | • | • | • | ||||||||||||||||||||||||||||||||||||||||
| Others (40%) | • | • | • | • | • | • | ||||||||||||||||||||||||||||||||||||||||||||
| HORIZONTAL SKILLS | ||||||||||||||||||||||||||||||||||||||||||||||||||
Top management (100%) |
• | • | • | • | • | • | • | • | • | • | • | • | • | • | • | |||||||||||||||||||||||||||||||||||
Government, regulatory and public policy (13.3%) |
• | • | ||||||||||||||||||||||||||||||||||||||||||||||||
Academia and education (40%) |
• | • | • | • | • | • | ||||||||||||||||||||||||||||||||||||||||||||
Significant directorship tenure (93.3%) |
• | • | • | • | • | • | • | • | • | • | • | • | • | • | ||||||||||||||||||||||||||||||||||||
| DIVERSITY | ||||||||||||||||||||||||||||||||||||||||||||||||||
Gender |
Female (40%) |
• | • | • | • | • | • | |||||||||||||||||||||||||||||||||||||||||||
Male (60%) |
• | • | • | • | • | • | • | • | • | |||||||||||||||||||||||||||||||||||||||||
Country of origin/international education |
Continental Europe (60%) |
• | • | • | • | • | • | • | • | • | ||||||||||||||||||||||||||||||||||||||||
US/UK (66.7%) |
• | • | • | • | • | • | • | • | • | • | ||||||||||||||||||||||||||||||||||||||||
Latam (13.3%) |
• | • | ||||||||||||||||||||||||||||||||||||||||||||||||
Others (6.7%) |
• | |||||||||||||||||||||||||||||||||||||||||||||||||
| Age | Under 55 (6.7%) |
• | ||||||||||||||||||||||||||||||||||||||||||||||||
55 to 65 (66.7%) |
• | • | • | • | • | • | • | • | • | • | ||||||||||||||||||||||||||||||||||||||||
Over 65 (26.7%) |
• | • | • | • | ||||||||||||||||||||||||||||||||||||||||||||||
| BOARD TENURE | ||||||||||||||||||||||||||||||||||||||||||||||||||
0 to 3 years (33.3%) |
• | • | • | • | • | |||||||||||||||||||||||||||||||||||||||||||||
4 to 11 years (53.3%) |
• | • | • | • | • | • | • | • | ||||||||||||||||||||||||||||||||||||||||||
12 years or more (13.3%) |
• | • | ||||||||||||||||||||||||||||||||||||||||||||||||
| Committees skills and diversity matrix | ||||||||||||||||||||||||||
| Executive committee | Audit committee |
Nomination committee | Remuneration committee | Risk supervision, regulation and compliance committee |
Responsible banking, sustainability and
culture committee
|
Innovation and technology committee |
||||||||||||||||||||
| SKILLS AND EXPERIENCE | ||||||||||||||||||||||||||
| THEMATIC SKILLS | ||||||||||||||||||||||||||
Banking |
100% | 83.3% | 100% | 80% | 100% | 100% | 85.7% | |||||||||||||||||||
Other financial services |
100% | 83.3% | 80% | 80% | 80% | 80% | 100% | |||||||||||||||||||
Accounting, auditing and financial literacy |
100% | 100% | 100% | 100% | 100% | 100% | 100% | |||||||||||||||||||
Retail |
100% | 83.3% | 60% | 80% | 80% | 80% | 85.7% | |||||||||||||||||||
Digital and information technology |
83.3% | 66.7% | 60% | 60% | 40% | 60% | 100% | |||||||||||||||||||
Risk management |
100% | 83.3% | 80% | 80% | 100% | 80% | 85.7% | |||||||||||||||||||
Business strategy |
100% | 100% | 100% | 100% | 100% | 100% | 100% | |||||||||||||||||||
Responsible business and sustainability |
83.3% | 50% | 100% | 60% | 40% | 100% | 85.7% | |||||||||||||||||||
Human resources, culture, talent and remuneration |
100% | 100% | 100% | 100% | 100% | 100% | 100% | |||||||||||||||||||
Legal and regulatory |
16.7% | 16.7% | 40% | 20% | 20% | 20% | 28.6% | |||||||||||||||||||
Governance and control |
100% | 83.3% | 80% | 80% | 100% | 80% | 85.7% | |||||||||||||||||||
International experience |
Continental Europe |
83.3% | 83.3% | 60% | 80% | 80% | 80% | 71.4% | ||||||||||||||||||
US/UK |
100% | 100% | 80% | 100% | 100% | 80% | 100% | |||||||||||||||||||
Latam |
83.3% | 66.7% | 20% | 40% | 60% | 60% | 71.4% | |||||||||||||||||||
Others |
16.7% | 66.7% | 40% | 60% | 60% | 40% | 14.3% | |||||||||||||||||||
| HORIZONTAL SKILLS | ||||||||||||||||||||||||||
Top management |
100% | 100% | 100% | 100% | 100% | 100% | 100% | |||||||||||||||||||
Government, regulatory and public policy |
16.7% |
16.7% | 40% | 20% | 20% | 20% | 28.6% | |||||||||||||||||||
Academia and education |
33.3% |
33.3% | 60% | 40% | 20% | 80% | 28.6% | |||||||||||||||||||
Significant directorship tenure |
100% | 83.3% | 100% | 100% | 80% | 100% | 100% | |||||||||||||||||||
| DIVERSITY | ||||||||||||||||||||||||||
Gender |
Female |
33.3% | 50% | 60% | 20% | 40% | 80% | 42.9% | ||||||||||||||||||
Male |
66.7% | 50% | 40% | 80% | 60% | 20% | 57.1% | |||||||||||||||||||
Country of origin/international education |
Continental Europe |
83.3% | 66.7% | 40% | 60% | 80% | 60% | 57.1% | ||||||||||||||||||
US/UK |
83.3% | 66.7% | 80% | 60% | 80% | 80% | 71.4% | |||||||||||||||||||
Latam |
16.7% | – |
20% | – |
– |
20% | 14.3% | |||||||||||||||||||
Others |
– |
16.7% | – |
– |
– |
20% | 14.3% | |||||||||||||||||||
| Age | Under 55 |
– |
– |
– |
– |
– |
– |
– |
||||||||||||||||||
55 to 65 |
66.7% | 83.3% | 60% | 60% | 60% | 60% | 85.7% | |||||||||||||||||||
Over 65 |
33.3% | 16.7% | 40% | 40% | 40% | 40% | 14.3% | |||||||||||||||||||
| BOARD TENURE | ||||||||||||||||||||||||||
0 to 3 years |
33.3% | 16.7% | 40% | 40% | 40% | 20% | 28.6% | |||||||||||||||||||
4 to 11 years |
50% | 83.3% | 60% | 60% | 60% | 80% | 57.1% | |||||||||||||||||||
12 years or more |
16.7% | – |
– |
– |
– |
– |
14.3% | |||||||||||||||||||
| Roles of the Executive Chair and the Chief Executive Officer | ||||||||
| Executive Chair | Chief Executive Officer | |||||||
|
•The Chair is the highest-ranking executive in Grupo Santander and its main representative with regulators, authorities and other major stakeholders.
•The Chair is responsible for the long-term strategy of the Group, including new tech and digital growth engines, namely PagoNxt and the Digital Consumer Bank.
•The Chair is also responsible for other corporate functions and units that help drive the Group's long-term strategy and transformation, comprising Technology and Data & Architecture, Human Resources, Talent, Financial Accounting & Control, Strategy and Corporate Development, General Secretariat and Communications & Corporate Marketing. This reflects the Chair's ultimate accountability for Transformation.
•The Chair also leads the appointment and succession planning of Grupo Santander senior management, to be submitted to the nomination committee and board for approval.
|
•The Chief Executive Officer is entrusted with the day-to-day management of the business with the highest executive functions and reports exclusively to the board.
•Accordingly, the Chief Executive Officer’s direct reports are the senior managers in charge of the business units: the regional heads (Europe, North America and South America) and those in charge of the global businesses (Wealth Management & Insurance, Corporate & Investment Banking, Payments and Retail & Commercial Banking (including TransformationA)), encompassing the relevant support and control functions. Whilst the Chair is accountable for Digital Consumer Bank, given that it is a global business, the Group CEO remains fully accountable for the Countries through which Digital Consumer Bank operates.
•As responsible for day-to-day management, the CFO and head of Investment Platforms & Corporate Investments also report to the Chief Executive Officer.
•Additionally, the Chief Executive Officer is responsible for Regulatory & Supervisory Relations and for embedding the Group's sustainability policy in the day-to-day management of Group businesses and the support and control functions.
|
|||||||
Duties of the Lead Independent Director and activities during 2023 | ||||||||
| Duties | Activities in 2023 |
|||||||
Facilitate discussion and open dialogue among independent directors, coordinating private meetings of non-executive directors without the executive directors present and proactively engaging with them to consider their views and opinions. |
Held five meetings with non-executive directors where they were able to voice their views and opinions. These meetings provided a valuable opportunity to reflect on the overall board and committee cycle throughout the year, to discuss board training topics, strategy execution, executive director and top management performance and objectives, succession planning and reflections on areas of continuous improvement. Given the appointment of a new Chief Executive Officer, the non-executive directors invited him to one session to gain his views after three months in office. In addition, the Lead Independent Director included in the agenda for these sessions the performance assessment of the CEO, in recognition of his reporting line to the board. |
|||||||
Direct the periodic evaluation of the Chair of the board of directors and coordinate her succession plans. |
Bruce Carnegie-Brown led the Executive Chair's annual performance review in order to determine her variable pay. Furthermore, he led her succession planning activity, as additionally facilitated through his chairmanship of the nomination committee. |
|||||||
Engage with shareholders and other investors to learn of their concerns, especially with regard to Banco Santander's corporate governance. |
See section 3.1 'Shareholder communication and engagement' for full details of the Lead Independent Director’s activities. |
|||||||
| Replace the Chair in her absence, with such key rights as the ability to call board meetings under the terms of the Rules and regulations of the board. | Though the Lead Independent Director did not have to replace the Executive Chair at any board meeting, he remained committed to ensure the proper functioning of board meetings. |
|||||||
Request a board meeting or that new items be added to the agenda. |
While the Lead Independent Director did not need to request additional board meetings to be called, he remained fully engaged in, and informed of, board meeting agendas to make proposals of items. |
|||||||
Mandatory committeesA |
Executive
committee
|
Audit
committee
|
Nomination
committee
|
Remuneration
committee
|
Risk supervision, regulation and compliance committee |
|||||||||||||||||||||||||||
|
Decision-making
powers
|
Supervision, information, advice and recommendations regarding functions in risk, financial reporting and audit, nomination and remuneration matters |
|||||||||||||||||||||||||||||||
Voluntary committees |
Responsible banking, sustainability and culture committee |
Innovation and technology committee |
||||||||||||
Support and proposal in strategic areas | ||||||||||||||
Comparison of number of meetings heldA | ||||||||||||||
Banco Santander |
Spain average |
US average |
UK average |
|||||||||||
| Board | 15 | 11.3 | 7.6 | 8.9 | ||||||||||
| Executive committee | 23 | 8.6 | — | — | ||||||||||
| Audit committee | 15 | 8.5 | 8.2 | 5.4 | ||||||||||
| Nomination committee | 13 | 6.8 | 4.6 | 4.2 | ||||||||||
| Remuneration committee | 12 | 6.8 | 5.8 | 5.4 | ||||||||||
| Risk supervision, regulation and compliance committee | 17 | NA | NA |
NA | ||||||||||
Approximate allocation of the board’s time in 2023 | ||
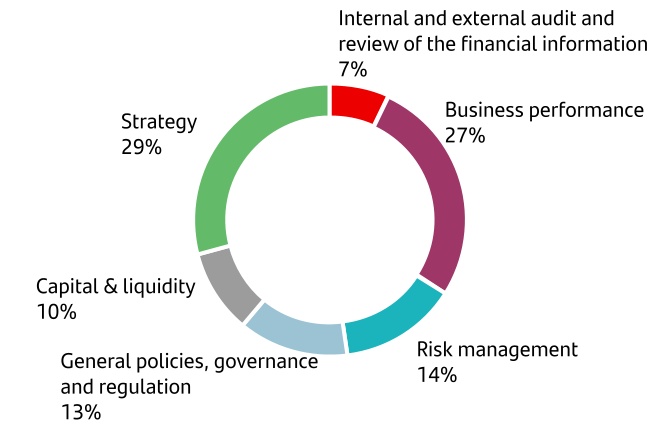
Committees |
||||||||||||||||||||||||||
| Directors |
Board
|
Executive
|
Audit
|
Nomination |
Remuneration
|
Risk supervision, regulation and compliance | Responsible banking, sustainability and culture | Innovation and technology | ||||||||||||||||||
| Average attendance | 100% | 95% | 99% | 94% | 95% | 98% | 93% | 98% | ||||||||||||||||||
| Individual attendance | ||||||||||||||||||||||||||
Ana Botín |
15/15 |
23/23 |
_ |
_ |
_ |
_ |
_ |
4/4 |
||||||||||||||||||
Héctor Grisi |
15/15 |
22/23 |
_ |
_ |
_ |
_ |
_ |
3/4 |
||||||||||||||||||
Glenn Hutchins |
15/15 |
_ |
_ | 13/13 |
12/12 |
_ |
_ |
4/4 |
||||||||||||||||||
| José Antonio Álvarez | 15/15 |
23/23 |
_ | _ | _ | _ | _ |
4/4 |
||||||||||||||||||
| Homaira Akbari | 15/15 |
_ | 15/15 |
_ | _ | _ | 5/6 |
4/4 |
||||||||||||||||||
| Javier Botín | 15/15 |
_ | _ | _ | _ | _ | _ | _ | ||||||||||||||||||
Bruce Carnegie-BrownA |
15/15 |
12/16 |
_ |
13/13 |
12/12 |
_ |
_ |
3/3 |
||||||||||||||||||
| Sol Daurella | 15/15 |
_ | _ | 10/13 |
10/12 |
_ | 5/6 |
_ |
||||||||||||||||||
| Henrique de Castro | 15/15 |
_ | 14/15 |
_ | 12/12 |
_ | _ |
4/4 |
||||||||||||||||||
Germán de la Fuente |
15/15 |
_ | 15/15 |
_ | _ | 17/17 |
_ | _ | ||||||||||||||||||
| Gina Díez Barroso | 15/15 |
_ | _ | 13/13 |
_ | _ | 6/6 |
_ | ||||||||||||||||||
| Luis Isasi | 15/15 |
22/23 |
_ | _ | 11/12 |
14/17 |
_ | _ | ||||||||||||||||||
| Ramiro Mato | 15/15 |
22/23 |
15/15 |
_ | _ | 17/17 | 6/6 |
_ |
||||||||||||||||||
Belén Romana |
15/15 |
22/23 |
15/15 |
_ | _ | 17/17 | 6/6 |
4/4 |
||||||||||||||||||
Pamela Walkden |
15/15 |
_ |
15/15 |
_ |
_ |
17/17 |
_ |
_ |
||||||||||||||||||
| Meetings | Average of hours per memberA |
Average of hours per chairA |
|||||||||
| Board | 15 | 169B |
338B |
||||||||
| Executive committee | 23 | 138 | 276 | ||||||||
| Audit committee | 15 | 150 | 300 | ||||||||
| Nomination committee | 13 | 52 | 104 | ||||||||
| Remuneration committee | 12 | 48 | 96 | ||||||||
| Risk supervision, regulation and compliance committee | 17 | 170 | 340 | ||||||||
Responsible banking, sustainability and culture committee |
6 | 30 | 60 | ||||||||
Innovation and technology committee |
4 | 16 | 32 | ||||||||
| Entity | Amount (EUR) |
||||
Santander Asset Management |
360,995 | ||||
Banco Santander |
349,272 | ||||
TOTAL |
710,267 | ||||
COMPOSITION | ||
| Position | Category |
Appointed on | |||||||||
Chair |
Ana Botín |
Executive |
11/12/1989A |
||||||||
Members |
Héctor Grisi | Executive |
01/01/2023 | ||||||||
José Antonio Álvarez |
Other external | 13/01/2015 | |||||||||
Luis Isasi |
Other external |
20/05/2020 | |||||||||
Ramiro Mato |
Independent |
28/11/2017 | |||||||||
Belén Romana |
Independent |
01/07/2018 | |||||||||
Secretary |
Jaime Pérez Renovales |
||||||||||
|
We have maintained a close communication with our subsidiary audit committee chairs throughout the year, as it allowed us to share our priorities, concerns and thoughts with them. In addition, the committee continued to benefit from our members’ mix of experience and skills, leveraging their collective insights to ensure best possible outcomes.
In the coming year, we will continue to supervise the Group’s units and global businesses and especially those more relevant to One Transformation, to ensure that appropriate controls remain in place. In addition, we will review the new primary reporting segments as part of our fundamental responsibility to provide oversight of the integrity of the financial statements. As part of that, we will progress how all the Group’s activities across all markets are consolidated under the five global businesses, in which we will continue to strike the right balance of supporting management and ensuring an appropriate level of control for a Group of our size. The committee, in coordination with the responsible banking, sustainability and culture committee, will monitor compliance with new ESG regulatory initiatives and non-financial reporting standards across the world and particularly, in the European Union.
I have been delighted to chair this committee over the last four years and will ensure a smooth transition with my successor so that the committee continues to be effective in the exercise of its duties."
 |
|||||||||||||
|
Pamela Walkden
Chair of the audit committee
| ||||||||||||||
|
"In 2023, we have remained focused on the effective oversight of the financial information process and internal controls, the effectiveness of our Internal Audit function, while maintaining a professional and open relationship with the external auditors.
The enhancements of our ESG reporting were high on our agenda last year. In particular, significant time was devoted to ensuring its consistency and our preparedness for the greater independent assurance required, closely monitoring the progress in all the units. In addition, we continued to focus on the oversight of the internal audit plan execution, ensuring appropriate amendments to facilitate an ongoing focus on fundamental risks, such as credit risk, and new risks and, in particular, a key focus was given to cyber risk and Internal Audit’s approach to it.
| ||||||||||||||
| COMPOSITION | ||
| Position | Category |
Appointed on | |||||||||
Chair |
Pamela Walkden |
Independent |
29/10/2019A |
||||||||
Members |
Homaira Akbari |
Independent |
26/06/2017 | ||||||||
Henrique de Castro |
Independent |
21/10/2019 | |||||||||
| Germán de la Fuente | Independent | 21/04/2022 | |||||||||
| Ramiro Mato | Independent | 28/11/2017 |
|||||||||
Belén Romana |
Independent | 22/12/2015 |
|||||||||
Secretary |
Jaime Pérez Renovales |
||||||||||
| TIME ALLOCATION | ||
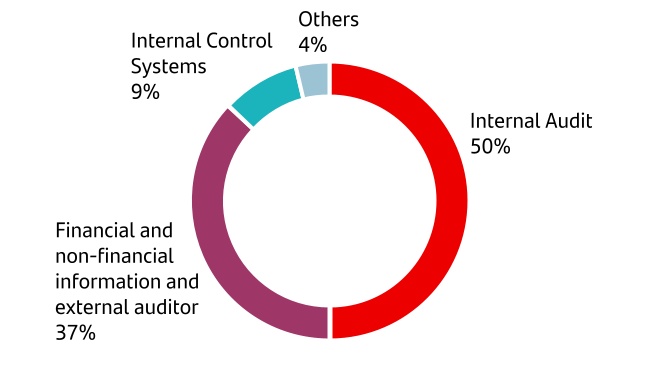
| Duties | Actions taken | ||||||||||||||||
Financial and non-financial information | |||||||||||||||||
Review the financial statements and other financial information |
•Reviewed the individual and consolidated financial statements and directors' report for 2023 and submitted them to the board of directors for approval. Monitored compliance with legal requirements and accounting principles, and ensured that the external auditor issued a report on the effectiveness of the Group’s system of internal control over financial reporting (ICFR).
•Reviewed quarterly financial information (dated 31 December 2022, 31 March, 30 June and 30 September 2023, respectively), before being approved by the board and subsequently released to the market and supervisory bodies.
•Reviewed such other financial information included in the annual report; Universal Registration Document filed with the CNMV; Form 20-F filed with the SEC; and the half-yearly financial information filed with the CNMV and with the SEC as Form 6-K.
•Reviewed, prior to their submission to the board for approval, the adaptation of the 2022 and 2023 financial information by segments, in line with the agreed change of reporting to the five global businesses as primary segments.
|
||||||||||||||||
Review the non-financial information |
•Oversaw and assessed the preparation and reporting processes of non-financial reporting, in coordination with the responsible banking, sustainability and culture committee, and informed the board accordingly.
•Received regular updates on ESG reporting evolution and progress within the Group, including the associated scope of metrics and action plans.
•Reviewed the Climate Finance Report and the Green Bond Report in coordination with the responsible banking, sustainability and culture committee, prior to its submission to the board for approval, assessing the integrity of such disclosures and the review conducted by the external auditor.
|
||||||||||||||||
Information on applied tax policies |
•Was informed by the Head of Tax on applied tax policies based on the Code of Good Tax Practices, as well as the annual review of the tax strategy and policy on control and management of risk, including tax risk, prior to their submission to the board for approval.
•Was informed on the filing of the 2022 Tax transparency report with the Spanish tax agency (Agencia Estatal de Administración Tributaria).
|
||||||||||||||||
| Relations with the external auditor | |||||||||||||||||
Information on the external audit plan |
•Received updates on the planning, progress and execution of the audit plan.
•Was informed on the impact of new legal and regulatory requirements in connection with financial information.
•Obtained the external auditor's confirmation of its full access to all information to conduct the audit.
•Analysed the audits for the annual financial statements before the external auditor submitted them to the board of directors.
•Received reports on ESG information reporting process, evolution of reporting requirements, their impact on timelines and assurance scope of the independent external verification of such information.
|
||||||||||||||||
Interaction with the external auditor |
•Met twice with the lead audit partner without executives present to ensure fluent communication and the independent performance of its function.
•The lead audit partner, who met periodically with the committee Chair, attended all committee meetings, which facilitated effective communication between the external auditor and the board.
|
||||||||||||||||
Assessment of the external auditor’s performance |
•Conducted the final evaluation of the external auditor's performance and how it has contributed to the integrity of the financial information based on its knowledge of the business, the frequency and quality of its communications; its independence; and opinions of the main local audit committee Chairs and controllers of the main local units or relevant subgroups on it, among others.
•Received PwC's 2023 Transparency report from the lead audit partner, who also informed about the public outcomes of quality controls conducted by the ICAC or other supervisors and any other relevant investigations.
|
||||||||||||||||
| Duties | Actions taken | ||||||||||||||||
External auditor independence | |||||||||||||||||
PwC’s remuneration for audit and non-audit services |
•Monitored PwC’s remuneration, including the following fees for audit and non-audit services provided to the Group: |
||||||||||||||||
| EUR million | |||||||||||||||||
2023 |
2022 | 2021 | |||||||||||||||
Audit |
116.8 | 115.4 | 106.0 | ||||||||||||||
Audit-related services |
8.6 | 6.4 | 6.0 | ||||||||||||||
Tax advisory services |
1.6 | 0.5 | 0.7 | ||||||||||||||
Other services |
5.9 | 4.8 | 2.4 | ||||||||||||||
Total |
132.9 | 127.1 | 115.1 | ||||||||||||||
|
The audit services and main non-audit services included for each item in the above breakdown are detailed as follows:
•Audit services: audit of the individual and consolidated financial statements of Banco Santander and its subsidiaries (of which PwC or another firm in its network is the statutory auditor); audit of the interim consolidated financial statements of Banco Santander; audit of the integrated audits prepared in order to file Form 20-F for the annual report with the SEC in the US and the internal control audit (SOx) for required Grupo Santander's entities; the limited review of the financial statements; and the regulatory auditor’s reports on Grupo Santander’s entities.
•Audit-related services: comfort letters; verification of the financial and non-financial information (as required by regulators); and other reviews of documents that, due to their nature, the external auditor provides for submission to domestic or foreign authorities.
•Tax services: tax compliance and advisory services provided to Group companies outside Spain, which have no direct effect on the audited financial statements and are permitted in accordance with independence regulations.
•Other services: agreed-upon procedure reports, assurance reports and special reports performed under the accepted profession's standards; as well as other reports required by the regulator.
The 'Audit' heading includes the fees for the year's audit, regardless of the date the audit was completed. Any subsequent adjustments, which are not significant, and for purposes of comparison, are shown in note 47.b) in the 'Notes to the consolidated financial statements' for each year. The fees corresponding to the rest of the services are shown by reference to when the audit committee approved them.
•Verified that the ratio of PwC's total fees paid for all services for Banco Santander and the Group to its annual revenue in Spain and worldwide did not exceed 15% for three consecutive years. In 2023 the ratio stood at 0.27% of PwC's worldwide total revenues.
•Verified every quarter, according to Regulation (EU) No 537/2014 of the European Parliament and of the Council, that the fees approved in 2023 for non-audit services provided by PricewaterhouseCoopers Auditores, S.L. (PwC), (including for ‘Other services’ and ‘Audit-related services’, and not including services that the external auditor is required to perform under domestic or EU laws) were significantly less than 70% of the average fees paid specifically to PwC in the past three consecutive years for the ‘Audit’ of Banco Santander and its subsidiaries in Spain (not including fees for reviews with more limited assurance than required for accounts auditing, which are included as non-audit services). In 2023, the ratio stood at 31.12%; and it would be 21.05% if services approved for PwC and other firms in its network and provided to Grupo Santander in and outside Spain were included.
See subsection C.1.32 of section 9.1 'Reconciliation with the CNMV’s corporate governance report model' for the reconciled amounts of the above mentioned fees listed, with the numerator and denominator values of each ratio found in section C.1.32 of section 9.2 'Statistical information on corporate governance required by the CNMV'.
•In 2023, Grupo Santander contracted for services by audit firms other than PwC in the amount of EUR 174.1 million (EUR 185.5 and 263.8 million in 2022 and 2021, respectively).
|
|||||||||||||||||
Non-audit services |
•Approved, on a monthly basis, all non-audit services rendered by the Group's external auditor verifying that all of them met the independence requirements in line with applicable Spanish and European regulation, SEC and Public Company Accounting Oversight Board (PCAOB) rules. |
||||||||||||||||
| Duties | Actions taken | ||||||||||||||||
| Personal and financial relations |
•Received confirmation from PwC that the designated audit team, PwC as the auditor firm, everyone else that forms part of PwC or of other firms in its network, including all applicable extended relations to them complied with requirements on external auditor independence, analysing possible threats and taking appropriate safeguarding measures in line with their internal policies and procedures.
•Received information about the results of the internal review carried out every six months of possible financial ties between the Group and PwC and its related parties, which concluded that no existing ties compromised the independence of PwC as external auditor.
|
||||||||||||||||
External auditor independence report |
•Verified the external auditor's independence prior to the issuance of the 2023 auditor’s report on the financial statements, considering:
•the remuneration it has received for audit and non-audit services;
•all non-audit services rendered by the external auditor; and
•the personal circumstances and financial dealings, that the external auditor or persons performing the audit may have with the Group.
•Received written confirmation from PwC of its independence from Grupo Santander in accordance with applicable European and Spanish law, the SEC and the PCAOB rules.
•Concluded that, by its judgement, it had no objective reason to question the external auditor's independence.
|
||||||||||||||||
| Re-election of the external auditor | |||||||||||||||||
Re-election of the external auditor |
•Recommended to the board, for subsequent submission to the 2024 AGM, the re-election of PwC as the external auditor of Banco Santander and its consolidated Group for 2024. As from 2021, the lead audit partner is Julián González, PwC's banking sector audit leader who has experience as a global group audit partner (mainly in Spain and the UK) and a strong background in the Spanish financial sector. He also participates in various international banking supervisory and regulatory forums.
•Was informed on the changes introduced by the Law on Auditing in connection with the external auditor's mandate, as well as the associated calendar and selection process milestones for a nomination in 2026.
|
||||||||||||||||
| Internal audit | |||||||||||||||||
Oversight of the Internal Audit function |
•Supervised the Internal Audit function and ensured its independence and effectiveness in 2023.
•Reviewed the external quality assessment performed by the Institute of Internal Auditors in Spain to further ensure the effectiveness of the function and its alignment with best practice.
•Held meetings with the Group Chief Audit Executive (CAE) and internal audit officers, and one private meeting with the CAE without other executives or the external auditor present.
•Proposed a 2023 Internal Audit function budget, ensuring that the function had the resources needed to discharge its duties effectively.
•Was kept apprised of the hubs created to improve the efficiency of the internal audit works and the internal audit digital initiatives, including artificial intelligence capabilities.
•Assessed the preparedness and effectiveness of the Internal Audit function to fulfil its duties.
•Reviewed and reported to the board on the CAE's 2023 objectives and performance in 2023 and reported to the remuneration committee and board of directors to set his variable remuneration.
•Verified the suitability of the subsidiary CAEs, in coordination with the nomination committee.
|
||||||||||||||||
| Monitoring of internal audit activities |
•Reported on the internal audit plan, internal audit recommendations and ratings of units and corporate functions. Each unit CAE reported to the committee at least once in 2023.
•Reviewed the strategic audit plan for 2023-2026 and recommended it to the board for approval, ensuring that it covered the Group's relevant risks.
•Received regular information on the internal audit activities carried out in 2023, monitoring the progress in audit ratings, and further promoting a continued focus on a stronger control environment; and conducted an additional review of issued audit reports, requiring that relevant areas to present action plans.
•Continued promoting the first-line’s further involvement in internal audit recommendations and ensured that senior management and the board understood the conclusions of internal audit reports.
•Received holistic reviews of internal audit coverage of cybersecurity, IT risks, financial crime, ESG, model risk, capital and solvency, operational risk, access control and vendor management, amongst other topics, to ensure proper oversight, with first and second line of defence representatives invited to provide additional feedback, as appropriate.
|
||||||||||||||||
| Duties | Actions taken | ||||||||||||||||
| Internal control systems | |||||||||||||||||
Monitoring the assessment of internal control systems |
•Received information on the Group's internal control system and monitored related action plans, together with the internal control strategic plan.
•Received reports and certification on the Group’s 2022 internal control system (ICS) and assessed its effectiveness in compliance with CNMV (SCIIF) and the SEC (SOx).
•Received specific training on SOx to further enhance committee members' knowledge on this matter. See 'Director training and induction programmes' in section 4.3.
|
||||||||||||||||
Coordination with Risk and with Compliance and Conduct |
•Held four joint meetings with the risk supervision, regulation and compliance committee to review risk, compliance and internal audit aspects of the different regions and global businesses, with first line of defence representatives present.
•Received information in a joint meeting with the risk supervision, regulation and compliance committee on Canal Abierto, the Group's whistleblowing channel with a special focus on matters within the committee's area of authority to ensure the Group's culture empowers employees and other persons related to Banco Santander can talk straight, be heard and report irregular practices without fear of reprisal.
•Collectively discussed with the risk supervision, regulation and compliance committee additional topics of mutual interest, such as risk culture, third-party supplier risk management, SEC cybersecurity rules and received an update on internal audit matters of the Risk and Compliance and Conduct functions.
•Received biannual reports on the main legal contingencies, associated provisions and applicable public information, in coordination with the risk supervision, regulation and compliance committee.
•Invited the CRO to all 2023 committee meetings.
•The Chairs of the audit committee and of the risk supervision, regulation and compliance committee met regularly, ensuring ongoing coordination and collaboration.
|
||||||||||||||||
Other activities |
•Endorsed the Pillar III disclosures report, which was submitted to the board for approval.
•Received reports from Santander España audit committee on the main items covered at its meetings throughout the year.
•Invited subsidiary audit committee chairs to specific committee meetings throughout the year and, in turn, the committee Chair attended specific subsidiary audit committee meetings to further enhance communication between them.
|
||||||||||||||||
| Related-party and corporate transactions | |||||||||||||||||
Creation or acquisition of special-purpose vehicles and entities based in countries considered non-cooperative jurisdictions |
•Was informed of the activities of the Group’s offshore entities by the Head of Tax. See note 3.c) in the 'Notes to the consolidated financial statements'.
•Reported favourably to the board, for its approval, on proposals to create or acquire interests in special purpose entities and also received the Special Purpose Entities Annual Update.
|
||||||||||||||||
Authorization and oversight of related-party transactions |
•Reviewed the details and balances of the related-party transactions that appear in the annual and half-yearly financial statements. Checked that those transactions were carried out under market conditions.
•Conducted bi-annual reviews to check that related-party transactions complied with the law, the Rules and regulations of the board and the conditions set by board resolution, and met the requirements to be considered fair, reasonable and transparent. Reported its findings to the board.
•Issued the Related-party transactions report. See section 4.12 'Related-party transactions and other conflicts of interest'.
|
||||||||||||||||
| Information for general meetings and corporate documents | |||||||||||||||||
Shareholder information |
•Was represented by Pamela Walkden, in her capacity as committee Chair, to report at the 2023 AGM on the committee's activities in 2022. |
||||||||||||||||
Corporate documents for 2023 |
•Prepared this activities report on 13 February 2024, which includes a performance review of the committee's functions and key priorities identified for 2024. The board of directors approved it on 19 February 2024. |
||||||||||||||||
|
and structured handover process which enabled Glenn seamlessly to assume Lead Director responsibilities.
We also remained focused on board composition, ensuring that its depth of skills, experience and overall make-up remained appropriate and relevant to the needs of the Group. As a result, we strengthened the board with the addition of both Carlos Barrabés and Antonio Weiss, who both bring highly relevant skills and experience.
With respect to senior executive appointments, the committee has supported Héctor Grisi in his first year as the Group’s CEO and overseen the recommendations of new senior appointments for the Regional Heads of Europe and North America and for the Global Head of Retail & Commercial Banking, amongst others.
The effectiveness of the board, its committees and our overall governance remained a key priority in the year. We tested our progress on our overall effectiveness through commissioning an external evaluation of the board and its committees. The review, conducted by Spencer Stuart, considered our board to be highly effective. Recommendations resulting from this review have been incorporated into each committee’s priorities for 2024.
The committee continued to benefit from a great mix of experience and skills, and we have complemented this with the appointment of Belén Romana as a member with effect from 1 January 2024. It has been a privilege for me to chair this committee over the last nine years and I am confident that my committee Chair successor and colleagues will play their part in supporting the further development of the Group in the years to come."
 |
|||||||||||||
|
Bruce Carnegie-Brown
Chair of the nomination committee
| ||||||||||||||
|
"Board composition, succession planning, senior appointments, effective governance, career development and talent strategy remained top priorities in our agenda throughout 2023. The committee holds the belief that effective group-wide governance is an essential element of business success, and supported initiatives such as the subsidiary Chairs in-person convention hosted by the Group Executive Chair in Madrid, with a clear focus on the importance of effective governance across the Group, ongoing connectivity and sharing knowledge and associated best practices. We remained focused on robust governance standards aligned to our strategic goals. In this regard, a diverse workforce and an ambitious and compelling employee value proposition are key to both developing the quality of our internal pipeline and attracting the external talent required to deliver our strategic targets.
In particular, significant time was devoted to the robust succession process followed for the Lead Independent Director role, which I passed to Glenn Hutchins on 1 October 2023. This work included the importance of an appropriate
| ||||||||||||||
| COMPOSITION | ||
Position |
Category |
Appointed on | |||||||||
Chair |
Bruce Carnegie-Brown |
Independent | 12/02/2015A |
||||||||
Members |
Sol Daurella | Independent | 23/02/2015 | ||||||||
| Gina Díez Barroso | Independent | 22/12/2021 | |||||||||
| Glenn Hutchins | Independent | 20/12/2022 |
|||||||||
Belén Romana |
Independent | 01/01/2024 |
|||||||||
Secretary |
Jaime Pérez Renovales |
||||||||||
| TIME ALLOCATION | ||
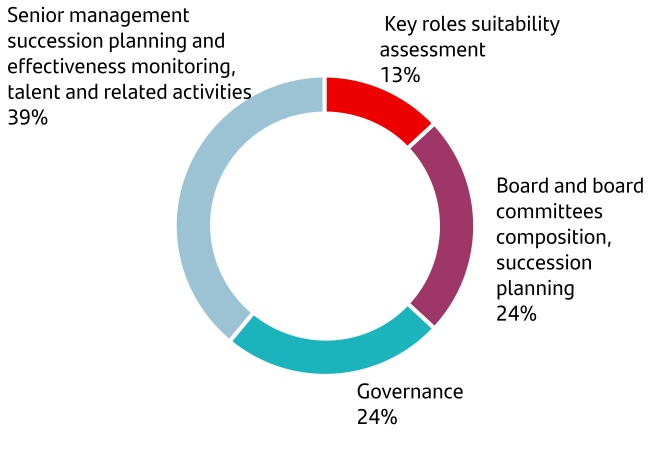
| Duties | Actions taken | |||||||
| Board and committees composition and succession planning | ||||||||
Selection and succession of the board and its committees |
•Ensured board member selection procedures guaranteed directors’ individual and collective suitability; fostered diversity in its broadest sense; and analysed the required expertise, skills and time commitment for effective board membership.
•Continued to be involved, together with the Group Executive Chair, in succession planning activities for the board.
•Assessed the composition of the board committees and the international advisory board in order to ensure they had the right skills and experience to perform their duties successfully.
•Continued monitoring the board of directors’ overall skills and competencies, ensuring that the collective board and its committees composition remains appropriate to oversee and lead the strategic direction of the Group.
•Ensured that any proposed appointment had been drawn from a depth of candidate pool which recognised diversity in its broadest sense.
|
|||||||
Appointment, re-election and ratification of directors and committee members |
•Considered areas of expertise and experience required to complement the board of directors by reference to the board skills and diversity matrix as well as the annual board effectiveness review in order to target the relevant recruitment.
•Recommended the appointments of Carlos Barrabés and Antonio Weiss, as independent directors, effective from the 2024 AGM, subject to regulatory approval.
•Oversaw a rigorous and comprehensive process to facilitate the orderly succession of the Lead Independent Director position, taking into account and constructively challenging all relevant factors. As a result, confirmed the suitability of Glenn Hutchins for the position and proposed his nomination to the board.
•Proposed composition changes for certain committees to further enhance their performance and support to the board in their areas of authority. See section 1.1 'Board skills and diversity'.
•Recommended the nominations of Carolyn Everson and Juan Ignacio Gallardo Thurlow as members of the international advisory board.
|
|||||||
| Annual verification of the status of directors |
•Verified each director category (i.e. executive, independent and other external) and submitted a proposal to the board of directors for it to be confirmed in the annual corporate governance report and at the 2024 AGM. See section 4.2 'Board composition'.
•Assessed directors’ independence, verifying there were no significant business ties between the Group and companies in which they are or have been significant shareholders, directors or senior managers, in particular regarding financing extended by the Group to such companies. In all cases, the committee concluded that existing ties were not significant because (i) financing (a) did not constitute economic dependency for such companies because other sources of funding were available, and (b) was consistent with the Group’s share of the relevant market; and because (ii) business ties did not reach comparable materiality thresholds used in other jurisdictions as benchmarks (e.g. New York Stock Exchange (NYSE), Nasdaq and Canada’s Bank Act), among other reasons.
|
|||||||
| Directors' potential conflicts of interest and other professional activities | •Examined the information provided by directors about their intention to carry out other professional activities or positions outside the Group and the related time commitment. Concluded that those commitments were compliant with applicable legislation regarding the maximum number of boards to which they may belong, and did not interfere with their obligations as Banco Santander directors nor entail any conflict of interest. |
|||||||
| Director induction, training and development programmes |
•Assessed the effectiveness of the director induction, training and development programmes, guaranteeing that such programmes are designed according to each director’s circumstances and needs.
•Identified areas for improvement and additional training topics for the 2024 training programme.
|
|||||||
Senior management succession planning and effectiveness monitoring, talent and related activities | ||||||||
Succession planning for executive directors and senior management |
•Oversaw the discipline applied to senior executive succession planning, which included key positions in subsidiaries, and made sure plans were being implemented for the orderly succession of senior managers through a rigorous, transparent, merit-based and objective process that promotes diversity in its broadest sense.
•Oversaw appointments of key positions and monitored the effectiveness of the top management succession plans.
|
|||||||
| Appointment of key officers |
•Recommended the following nominees, later agreed by the board:
•Pedro Castro e Almeida, as Regional Head for Europe.
•Christiana Riley, as Regional Head for North America.
•Daniel Barriuso, as Global Head of Retail & Commercial Banking and Group Chief Transformation Officer.
•José Luis de Mora, as Global Head of Digital Consumer Bank.
|
|||||||
| Duties | Actions taken | |||||||
Talent and culture |
•Discussed Human Resources' activities and progress and proposals regarding diversity, equity and inclusion; and reviewed the Group’s STEM (science, technology, engineering and mathematics) talent strategy.
•Assessed and challenged proposals on top-leadership goals, career development plans and mobility.
|
|||||||
| Governance | ||||||||
| Board effectiveness review |
•Reviewed the execution of the action plan to address the areas for improvement revealed in the 2022 board effectiveness annual review.
•Oversaw the 2023 board effectiveness review, which was conducted with the collaboration of an independent external consultant (Spencer Stuart), whose independence was verified by the committee upon analysing its business relations with the Group and, in particular, the services rendered and the amounts received. See 'Board effectiveness review in 2023' in section 4.3.
|
|||||||
Internal governance |
•Assessed the suitability of certain proposed key position appointments for the subsidiaries, subject to the Group’s appointments and suitability procedure.
•Oversaw subsidiary board composition to ensure consistent suitability in line with expectations across the Group.
•Endorsed Group director nominations for subsidiary boards to ensure they were suitable and correctly perform their duties.
•Verified the suitability of the subsidiary CAEs, CROs and CCOs with the Group audit and risk supervision, regulation and compliance committees.
•Remained apprised on new governance regulation, trends, best practices and implications for the Group.
•Verified that subsidiaries followed the provisions of the GSGM relating to board and committee structure and their functions pursuant to best practices. In addition, the committee tracked subsidiary actions and progress in implementing internal regulation required by the Group. See section 7. 'Group structure and internal governance'.
•Reviewed the subsidiary board and board Chairs annual effectiveness reviews.
|
|||||||
| Corporate governance |
•Reviewed the key highlights of the 2023 AGM.
•Reviewed the activities conducted by the Lead Independent Director, ensuring the discharge of his duties, as evidenced through a summary of his activities in the year, which was also submitted to the board.
•Reviewed the activities conducted by the Shareholder and Investor Relations team, as well as the Lead Independent Director's engagement with investors, shareholders and proxy advisors, and their feedback on the Group's corporate governance arrangements.
•Reviewed the independence of the external advisers hired by the nomination committee and the remuneration committee in 2023, analysing their services, the amounts they received and other items.
•Reviewed the annual corporate governance report to verify that information contained therein conforms to the applicable law and that the corporate governance system promotes corporate interests and considers all stakeholders' expectations.
•Endorsed the proposed amendments to the Rules and regulations of the board which were submitted to the board for approval.
|
|||||||
Suitability assessment | ||||||||
Annual suitability assessment of directors and key function holders |
•Assessed the suitability of directors, senior management, heads of internal control functions and the Group's key position holders, confirming their continued business and professional good reputes and appropriate knowledge and experience to perform their duties.
•Concluded that board members are capable of good governance. To this effect, it supervised, amongst others, the attendance of the directors at the meetings of the board and the committees, ensuring that it was not less than 75% and, in the specific cases of lower attendance, that the absences were duly justified and do not undermine their capacity to devote sufficient time to discharge their functions. Furthermore, average board attendance was verified as 100%. See 'Board and committee preparation and attendance' in section 4.3.
•Confirmed the absence of circumstances that could harm the Group's credit and reputation, based on the information received from directors.
|
|||||||
| Information for general meetings and corporate documents | ||||||||
Shareholder information |
•Was represented by Bruce Carnegie-Brown, in his capacity as committee Chair, to report at the 2023 AGM on the committee's activities in 2022. |
|||||||
Corporate documents for 2023 |
•Prepared this activities report on 12 February 2024, which includes a performance review of the committee's functions and key priorities identified for 2024. The board of directors approved it on 19 February 2024. |
|||||||
|
balance key objectives such as fair pay, effective risk management, sustainability, meritocracy, and cross-collaboration - all the while taking stakeholder feedback into account.
The committee continued to benefit from a good mix of experience and skills of our members, each providing valuable advice and challenge to management. As in previous years, we received the confirmation from an external provider that the Group's policies, procedures and practices fully comply with applicable legislation.
I would like especially to thank Bruce Carnegie-Brown for his service over the last years as Chair of the committee until I took over in October 2023, and his continued membership until the 2024 AGM. He has been an effective steward of the interest of our stakeholder community."
 |
|||||||||||||
|
Glenn Hutchins
Chair of the remuneration committee
| ||||||||||||||
"Our role, in coordination with the nomination committee, is to attract and retain key talent to support the Group’s transformation agenda and strategic ambitions in order to increase shareholder value. Our remuneration philosophy involves enhancing our employee value proposition while simultaneously meeting supervisory expectations and serving all of our stakeholders' best interests. This requires us to | ||||||||||||||
| COMPOSITION | ||
| Position | Category | Appointed on | |||||||||
| Chair | Glenn Hutchins |
Independent | 20/12/2022 |
||||||||
| Members | Bruce Carnegie-Brown |
Independent |
12/02/2015 |
||||||||
| Sol Daurella | Independent | 23/02/2015 | |||||||||
| Henrique de Castro | Independent | 29/10/2019 | |||||||||
Luis Isasi |
Other external |
19/05/2020 | |||||||||
| Secretary | Jaime Pérez Renovales | ||||||||||
| TIME ALLOCATION | ||
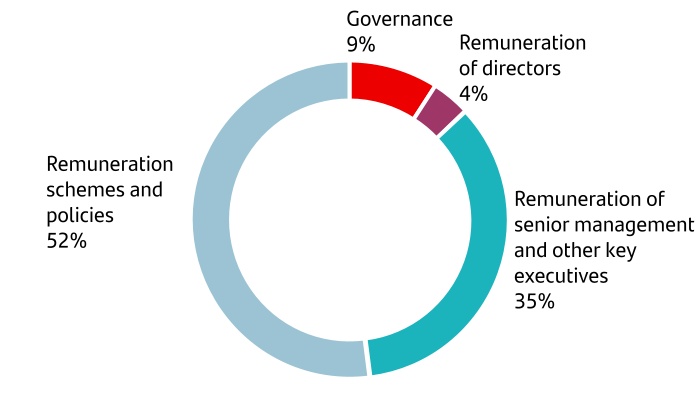
| Duties | Actions taken | |||||||
| Remuneration schemes and policies | ||||||||
| Remuneration policy for executive directors, senior management and other key executives |
•Remained focused on simplifying executive directors and senior management remuneration, shaping remuneration schemes consistent with Banco Santander's Simple, Personal and Fair values, and updated the long-term ESG-related metrics in coordination with the responsible banking, sustainability and culture committee.
•Recommended the 2022 individual variable remuneration of members of senior management, based on annual performance targets and their weightings as set by the board.
•Proposed to the board the global annual variable remuneration for 2023 (payable immediately and deferred executive remuneration), based on achievement of previously set quantitative and qualitative targets.
•Recommended to the board the annual performance indicators to calculate variable remuneration for 2024 with limited variations versus previous years in order to maintain focus on customer centricity, risk, capital, profitable sustainable growth and cost discipline.
•Set the achievement scales for the annual and multi-year performance targets and weightings for submission to the board.
•Endorsed specific enhancements in the performance management process for senior management to further promote the latter as corporate culture representatives and supporters of the effective transformation of the business.
|
|||||||
| Assist the board of directors in supervising compliance with remuneration policies |
•Checked that remuneration schemes were appropriate to the Group’s results, corporate culture and risk appetite and created no incentive to breach risk appetite.
•Reported to the board on Group remuneration practices and assessed their effectiveness, receiving confirmation on their alignment with the Group remuneration policy.
•Reported to the board that an external advisor assessment on the remuneration policy found that the Group's policies, procedures and practices comply with the regulatory requirements for credit institutions.
•Endorsed proposed changes to the remuneration policy to adapt it to the SEC Remuneration Recoupment ('clawback') rules, amongst others.
•Reviewed the adoption of ex-post risk adjustments, including the application of malus and clawback arrangements within the Group.
|
|||||||
| Diversity, equity and inclusion |
•Reviewed gender pay gap reduction and equal pay with a view to promoting greater diversity in its broadest sense, acknowledging progress made in the number of women in senior positions.
•Reviewed internal 'equal pay for equal work' data against the previous year and targets and focused on measures to enhance them in each unit.
•Received information on inclusion indicators and initiatives launched to continue promoting a culture of inclusion in the Group and ensured the avoidance of pay gaps in this regard.
|
|||||||
| Remuneration of senior management and other key executives | ||||||||
Performance assessments |
•Reviewed the calibration of executives’ performance reviews for the senior management and, in particular, for the Executive Chair, the CEO and the main executives in coordination with non-executive directors; for the CRO and CCO with the risk supervision, regulation and compliance committee; and for the CAE with the audit committee. |
|||||||
Fixed remuneration for executive directors and senior management |
•Checked that executive directors' fixed remuneration remained appropriate to their duties based on market rates.
•Made sure remuneration for senior management remained fair and competitive, recommending adjustments where appropriate to the board, based on a benchmark analysis and specific pay principles.
|
|||||||
| Variable remuneration for executive directors and senior management | •Proposed to the board variable remuneration for the preceding year payable either immediately or in deferred amounts. |
|||||||
Share plans |
•Submitted a proposal to the board for approval and subsequently for vote at the 2023 AGM on remuneration plans that involve the delivery to executive directors of shares or share options (deferred multiyear target variable remuneration plan; deferred and conditional variable remuneration plan; application of the Group buy-out policy).
•Analysed and submitted to the board tailored incentive schemes for different units to drive talent retention and alignment with the Group’s strategic priorities.
|
|||||||
| Duties | Actions taken | |||||||
| Remuneration of directors | ||||||||
| Individual remuneration of directors in their capacity as such | •Analysed and proposed adjustments to the directors’ remuneration in their capacity as such, based on the positions they held on the collective decision-making body, their membership and attendance at committee meetings, benchmark information and other objective circumstances. |
|||||||
| Remuneration of Identified Staff | ||||||||
Remuneration of other executives who are Identified Staff |
•Reviewed the volume of the Identified Staff (Material Risk Takers) in 2023, trends versus previous years and checked that fixed and variable remuneration ratios for control functions remained consistent with regulation and targets.
•Set key remuneration components for Identified Staff in coordination with the risk supervision, regulation and compliance committee.
•Submitted a proposal to the board, for subsequent submission to the 2023 AGM, regarding the approval of maximum variable remuneration of up to 200% of the fixed component for certain e Identified Staff, including executive directors and senior management.
•Checked that remuneration schemes supported attraction and retention of key talent to help drive the Group's strategy, the application of the incentives implemented in the Group, and the level of achievement of long-term deferred remuneration metrics.
|
|||||||
| Governance | ||||||||
Coordination with subsidiaries |
•Received information on practices, remuneration trends and challenges in different local markets.
•Held a joint session with the risk supervision, regulation and compliance committee to review the subsidiary action plans on internal sales force pay and conduct risk for the external sales force.
•Verified that remuneration schemes factor in capital and liquidity, and do not offer incentives to assume risks that exceed Banco Santander's tolerance, thus promoting and being compatible with adequate and effective risk management.
|
|||||||
Director remuneration policy report |
•Reviewed the Lead Independent Director’s report on engagement with key shareholders and proxy advisors regarding executive director remuneration.
•Reviewed and proposed to the board the annual directors' remuneration report for an advisory vote at the 2023 AGM.
•Assisted the board in overseeing compliance with the director remuneration policy.
•Positively recommended the proposal for the directors' remuneration policy for 2024, 2025 and 2026 that will be submitted by the board of directors at the 2024 AGM as a separate item on the agenda pursuant to Article 529 novodecies of the Spanish Companies Act and is an integral part of this report. See sections 6.4 Directors' remuneration policy for 2024, 2025 and 2026' and 6.5 'Preparatory work and decision-making for the remuneration policy; remuneration committee involvement'. As part of that, the committee considered the inputs from shareholder and stakeholder engagement during the year. It also considered any recommendations from regulators, legal requirements or applicable regulation concerning remuneration matters and verified that the policy is consistent with the Group's culture and Simple, Personal and Fair values.
•Confirmed that the directors' remuneration policy for 2024, 2025 and 2026 is consistent with the Group's remuneration policy and with the remuneration scheme outlined in the Bylaws. The main changes included are as follows: the simplification of the short-term bonus pool scorecard, moving the multiplier approved in 2023 to the qualitative adjustment going forward, with an associated weight of +/-10%. In addition, we reinforced the focus on our solid cost discipline as a measure to succeed in transformation. We also eliminated the stock options for the executive directors.
|
|||||||
| Information for general meetings and corporate documents | ||||||||
Shareholders information |
•Was represented by Bruce Carnegie-Brown, in his capacity as committee Chair, to report at the 2023 AGM on the committee's activities in 2022. |
|||||||
Corporate documents for 2023 |
•Prepared this report on 12 February 2024, which includes a performance review of the committee's functions and key priorities identified for 2024. The board of directors approved it on 19 February 2024. |
|||||||
|
strong commitment to compliance and conduct risk to safeguard our reputation and integrity, with an ongoing focus on financial crime compliance.
We have also reflected and acknowledged how critical it is, in the current environment, to enhance cross-country collaboration. As a result, we have shared our concerns, best practices and views by organising a convention with the Chairs of the subsidiary risk supervision, regulation and compliance committees. In addition, the committee has maintained a key focus on identifying emerging and non-traditional risks in order to anticipate potential impacts on our business model; as in previous years, this featured the committee’s strategy meeting agenda.
The committee continues to benefit from a good mix of experience and skills, and I am confident that this would help us to successfully navigate the challenges ahead. In the coming year, the committee will remain vigilant on the main risks of the Group, including credit, operational, financial crime compliance and model risks and also the risks related to the transformation of the Group, amongst others."
 |
|||||||||||||
|
Belén Romana
Chair of the risk supervision, regulation and compliance committee
| ||||||||||||||
|
"In 2023, we navigated a complex and dynamic risk landscape, characterised by macroeconomic and industry-specific challenges, primarily driven by rising inflation and interest rates, as well as a volatile geopolitical landscape. As part of this, the committee has closely monitored the actions taken by management to address these circumstances.
During the year, the committee has ensured that we maintained prudent lending practices to achieve adequate credit quality of our loan portfolio and that the exposure remained within acceptable limits. The committee has kept its
| ||||||||||||||
| COMPOSITION | ||
| Position | Category |
Appointed on | |||||||||
Chair |
Belén Romana | Independent | 28/10/2016A |
||||||||
Members |
Germán de la Fuente | Independent | 01/01/2023 | ||||||||
| Luis Isasi | Other external | 19/05/2020 | |||||||||
| Ramiro Mato | Independent | 28/11/2017 | |||||||||
| Pamela Walkden | Independent | 01/05/2021 | |||||||||
Secretary |
Jaime Pérez Renovales | ||||||||||
| TIME ALLOCATION | ||
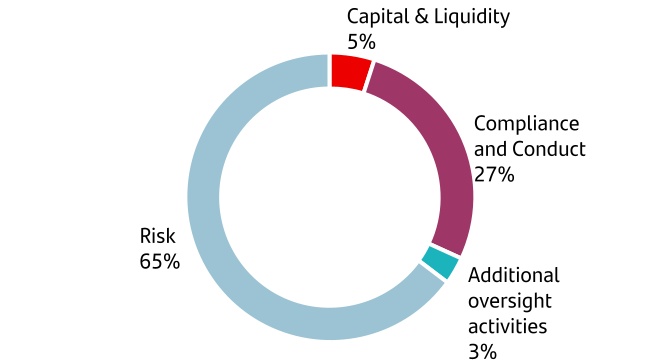
| Duties | Actions taken | |||||||
| Risk | ||||||||
Assist the board in (i) defining the Group's risks policies, (ii) determining the risk appetite strategy and culture, and (iii) supervising their alignment with the Group’s corporate values |
•Reviewed and proposed to the board for approval the annual risk appetite statement proposal, and the analysis of proposed new metrics and limits.
•Reviewed risk appetite metrics, compliance with the limits and any breaches in the year on a quarterly basis.
•Reviewed the internal capital adequacy assessment process (ICAAP) and internal liquidity adequacy assessment process (ILAAP), the Strategic Plan, the three-year strategic financial plan, the annual budget and the recovery and resolution plans before the board of directors approved them. Reviewed and challenged the identified risks and mitigating factors associated with those key processes, their consistency, and their alignment to the Group' risk appetite.
|
|||||||
|
Risk management and control
|
•Reviewed the Group's main risks by unit and risk type, with a special focus on credit risk, operational risk and financial crime.
•Analysed the subsidiaries and businesses risk management and control periodically, in coordination with the audit committee.
•Reviewed the risks of strategic projects before their submission to the board of directors, and their mitigation measures, with a special focus on the new global businesses and strategic initiatives.
•Checked that the Group's risk control management, most notably the risk profile assessment (RPA) and the risk control self-assessment (RCSA), remained robust.
•Analysed the potential impact and opportunities associated with emerging risks and how they would affect different geographies, our subsidiaries and businesses.
•Supported the board in conducting stress tests of Banco Santander through the assessment of scenarios and assumptions, analysing the results and the measures proposed by the Risk function.
•Ensured that the stress test programme was aligned with the EBA Guidelines 2018/04 on institutions' stress testing.
•Received and analysed specific information on credit risk, with a special focus on non-performing assets; market risk, structural and counterparty risk; operational risk, specially the risks derived from the cybersecurity and technological obsolescence, with a key focus on legal, reputational, social and environmental risks. The analysis on each matter was conducted in coordination with the audit and innovation and technology committees. The committee reviewed the business continuity and contingency plans with the latter.
•Supervised, together with the responsible banking, sustainability and culture committee, (i) the alignment of risk appetite and limits with corporate culture and values; (ii) non-financial risks; and (iii) new metrics related to climate that were proposed under the Risk Appetite Statement annual proposal.
•Supported the board in the supervision of crisis management and resolution planning.
|
|||||||
Supervise the Risk function |
•Reviewed the Risk function’s activities, strategy, strengths and potential areas for improvement.
•Ensured the ongoing independence and effectiveness of the Risk function, including the assessment of the sufficiency and appropriateness of its resourcing.
•Reported to the board on the CRO's 2023 objectives and reviewed his performance against those, and reported to the remuneration committee and board of directors to set his variable remuneration.
•Verified the suitability of the subsidiary CROs, in coordination with the nomination committee of the Group.
|
|||||||
Collaboration to establish rational remuneration policies and practices |
•Held a joint session with the remuneration committee to review the subsidiary action plans on internal sales force pay and conduct risk for the external sales force.
•Verified that remuneration schemes factor in capital and liquidity, and do not offer incentives to assume risks that exceed Banco Santander's tolerance, thus promoting and being compatible with adequate and effective risk management.
•Reviewed the ex-ante risk adjustment of total variable remuneration assigned to the units, based on actual risk outcomes and their management, in conjunction with the remuneration committee.
•Reviewed the 2023 bonus pool and results of the exercise carried out annually to identify employees whose professional activities had a material impact on the Group´s risk profile (Identified Staff).
|
|||||||
| Regulatory and supervisory relations | •Reviewed relevant developments regarding regulatory and supervisory relations and maintained focus on the most relevant developments related to the Single Supervisory Mechanism (SSM), the Single Resolution Board (SRB), the supervisors of all the Group’s subsidiaries and the Supervisory Review and Evaluation Process (SREP) and specific on-site inspections related to risk and compliance matters, as appropriate. |
|||||||
| Duties | Actions taken | |||||||
| Compliance and conduct | ||||||||
Supervise the Compliance and Conduct function |
•Supervised the Compliance and Conduct function's activities, strategy, strength and potential areas of improvement, as well as the development of the 2023 compliance programme.
•Ensured the ongoing independence and effectiveness of the Compliance and Conduct function, including the assessment of its staffing levels and overall appropriateness of its resourcing.
•Reviewed monthly reports on regulatory issues, product governance and consumer protection, reputational risk, internal and external events, notifications and inspections by supervisors, updates on the One Financial Crime Compliance (One FCC) programme, amongst others.
•Received updates on compliance and conduct risks from the Group's main subsidiaries and global businesses, with a special focus on the status of the implementation of the One FCC programme.
•Met with the CCO (twice in private session, in addition to other informal meetings) to discuss strategic compliance topics as well as to discuss independently and directly any potential material issue relating to the Compliance and Conduct function.
•Reported to the board on the CCO's 2023 objectives and reviewed her performance against those, and reported to the remuneration committee and board to set her variable remuneration.
•Verified the suitability of the subsidiary CCOs, in coordination with the nomination committee of the Group.
|
|||||||
Regulatory compliance including Canal Abierto |
•Reviewed the situation of compliance with data protection regulation across Grupo Santander and received the data protection officer's annual report.
•Endorsed, prior to presentation to the board, the changes to the general code of conduct.
•Received information, in a joint meeting with the audit committee, on Canal Abierto, the Group's whistleblowing channel with a special focus on matters within the committee's area of authority to ensure the Group's culture empowers employees and other persons related to Banco Santander can talk straight, be heard and report irregular practices without fear of reprisal.
|
|||||||
Financial crime compliance (FCC) |
•Oversaw the Group's observance of FCC regulations as well as the activities carried out by the function:
•Was provided with quarterly updates on progress on the One FCC implementation and reviewed the sanctions screening activity.
•Received recommendations and observations stemming from the annual independent expert report on Banco Santander in accordance with Act 10/2010 and Royal Decree 304/2014 (on anti-money laundering and terrorism financing).
|
|||||||
Product governance and consumer protection |
•Reviewed reports on customer complaints, their causes and action plans launched to reduce and mitigate the identified deficiencies, in coordination with the responsible banking, sustainability and culture committee.
•Reviewed risk management and the main risks identified, as well as the concerns, priorities and actions taken by the Product Governance and Consumer Protection area regarding conduct risk with retail and vulnerable customers.
|
|||||||
| Capital and liquidity | ||||||||
| Assist the board in reviewing and approving capital and liquidity strategies and supervising their implementation |
•Reviewed and reported to the board on the annual ICAAP run by the Finance division and challenged by the Risk function in accordance with industry best practices and supervisory guidelines.
•Reviewed a capital plan according to the scenarios envisaged over a three-year period.
•Reviewed and reported to the board on the ILAAP, which was challenged by the Risk function and developed in line with the Group´s business model and its liquidity needs.
•Reviewed liquidity risk and liquidity levels of the Group and its subsidiaries.
•Continuously monitored capital levels, capital management and associated tools, the 2023 securitizations plan and the analysis of the portfolio profitability versus the risk undertaken.
|
|||||||
| Additional oversight activities | ||||||||
Additional oversight activities |
•Held four joint meetings with the audit committee to review risk, compliance and internal audit aspects of the different regions and global businesses, with first line of defence representatives present.
•Collectively discussed with the audit committee additional topics of mutual interest, such as risk culture, third-party supplier risk management and SEC cybersecurity rules, and received an update on internal audit matters of the Risk and Compliance and Conduct functions.
•Received reports from the Santander España risk committee on the main items covered at its meetings throughout the year.
•The committee Chair attended specific subsidiary risk supervision, regulation and compliance committee to further enhance communication between them.
•Received updates on the matters discussed at the responsible banking, sustainability and culture committee by the Chair of that committee.
•Received monthly updates from the CRO and CCO on the work conducted by both the risk control and the compliance and conduct committees in their capacity as Chairs, respectively.
•The Chairs of the audit committee and of the risk supervision, regulation and compliance committee met regularly, ensuring ongoing coordination and collaboration.
|
|||||||
| Duties | Actions taken | |||||||
| Information for general meetings and corporate documents | ||||||||
Shareholder information |
•Was represented by Belén Romana, in her capacity as committee Chair, to report at the 2023 AGM committee's activities in 2022. |
|||||||
| Corporate documents for 2023 | •Prepared this activities report on 14 February 2024, which includes a performance review of the committee's functions and key priorities identified for 2024. The board of directors approved it on 19 February 2024. |
|||||||
|
initiatives to effectively integrate green finance within risk management. Furthermore, the inevitable range of challenges faced in the countries where Santander is present (geopolitical environment, regulatory fragmentation, different governmental support, etc) were considered by the committee to ensure the right approach to achieve the best possible outcomes, including achieving our established targets.
In addition, education and our communities also remained high on our agenda. We further reinforced our working relationship with the audit committee by reviewing the preparation and presentation of non-financial information according to the applicable regulations and international standards.
Members’ skills and experience helped the committee to operate effectively and to provide appropriate constructive challenge to management, and to assist the board with the significant ESG challenges ahead. In addition, we shared concerns and views with our subsidiary responsible banking, sustainability and culture committees throughout the year, which enabled us to harness their vast collective expertise.
Going forward, we will remain focused on progressing our climate change strategy and monitoring the development of our green and sustainable finance proposition."
 |
|||||||||||||
|
Ramiro Mato
Chair of the responsible banking, sustainability and culture committee
| ||||||||||||||
|
"As in previous years, the committee´s main focus was to assist the board in driving ESG to build a more responsible bank. As part of this, in 2023 we have remained focused on delivering our Net Zero ambition by 2050, while we continue helping customers transition to a low carbon economy, developing best-in-class sustainable propositions, and doing things in a Simple, Personal and Fair way.
Specifically, the committee oversaw actions, recommendations and targets to help Santander to become a global leader in green finance and an engine of profitable growth for the Group, helping our clients in their green transition. The committee monitored progress and key
| ||||||||||||||
| COMPOSITION | ||
| Position | Category |
Appointed on | |||||||||
Chair |
Ramiro Mato |
Independent |
01/07/2018A |
||||||||
| Members | Homaira Akbari |
Independent |
01/07/2018 | ||||||||
| Sol Daurella | Independent | 01/07/2018 | |||||||||
| Gina Díez Barroso | Independent | 31/01/2023 | |||||||||
Belén Romana |
Independent |
01/07/2018 | |||||||||
| Secretary | Jaime Pérez Renovales | ||||||||||
| TIME ALLOCATION | ||
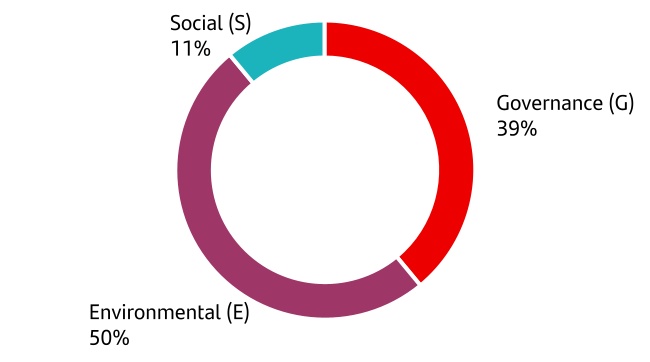
| Duties | Actions taken | |||||||
| Environmental (E) | ||||||||
| Portfolio alignment with Net Zero by 2050 |
•Reviewed the Group's climate change strategy, providing challenge to it to ensure that it remained a key enabler to achieve our ambition of net zero emissions by 2050.
•Reviewed decarbonization targets in the thermal coal, power generation, energy (oil and gas), aviation and steel sectors and discussed and recommended to the board for approval new decarbonization targets for auto manufacturers (SCIB) and auto lending portfolio in Europe (SCF).
•Reviewed the decarbonization plans of the subsidiaries, covering activity regarding mortgages, commercial real estate and agriculture to further develop our roadmap towards net zero while we address supervisory expectations.
•Endorsed the Group priorities for 2023 in relation to responsible banking, including supporting our customers in their green transition and promoting a sustainable culture.
•Reviewed actions proposed to align with the Task Force on Climate-Related Financial Disclosures (TCFD) recommendations and the transition plans and its communication needed in relation to the Glasgow Financial Alliance for Net Zero (GFANZ).
|
|||||||
| ESG in risk management |
•Reviewed ESG factors introduced in the credit approval process, associated action plans and related achievements.
•Reviewed the proposed risk appetite statement to support the reduction of carbon emissions relative to thermal coal, power generation, energy (oil and gas), aviation and steel sectors.
|
|||||||
| Green Finance | •Review the green finance strategy and its execution, including the Group´s exposure in green finance more generally. |
|||||||
| Biodiversity |
•Reviewed a disclosure proposal concerning Banco Santander's position on nature and biodiversity and submitted it to the board of directors for approval.
•Reviewed Santander's participation with respect to the Febraban Protocol, which includes standards for managing the risk of illegal deforestation in Brazil and defines guidelines to be adopted by its signatories.
|
|||||||
| Environmental Footprint |
•Reviewed our 2022-2025 Environmental Footprint Plan and carbon emissions offset criteria.
•Monitored carbon footprint offsetting projects across the Group to fulfil public targets.
|
|||||||
| Regulatory landscape | •Reviewed the main European and international financial regulatory and supervisory initiatives and priorities related to ESG under discussion for 2023 and 2024, to maximize investment in the transition to a low carbon economy by 2050 and increase transparency on business models and operations. |
|||||||
| Social (S) | ||||||||
Social agenda |
•Reviewed our social agenda, which includes financial inclusion; financial health; business with social output; and corporate social responsibility or philanthropic activities. |
|||||||
| Education and other support to communities |
•Reviewed the strategy, objectives, and performance indicators in relation to Universia's activity in the communities, in the context of the Group's social agenda, which includes our support to universities in education, employability and entrepreneurship.
•Reviewed and challenged communication strategy in relation to universities.
|
|||||||
| Duties | Actions taken | |||||||
| Governance (G) | ||||||||
| Corporate governance |
•Assisted the board in ensuring that responsible banking targets and metrics were embedded in the Group's remuneration schemes. As part of that, reviewed, in coordination with the remuneration committee, a proposal to further increase the alignment of the long-term incentive for 2023-2025 with our ESG agenda.
•Monitored and assessed the Group's progress on its public targets to ensure that its KPIs remained relevant and aligned with committee expectations.
•Worked with the risk supervision, regulation and compliance committee to review the progress made in embedding climate-related and environmental risks, as well as to monitor the implementation of controls and processes to mitigate ESG risks, including greenwashing.
•Reviewed responsible banking progress in the regions, units, global businesses and corporate areas on a regular basis to ensure best practices globally.
•Identified priority ESG areas for action based on the outcomes of a materiality assessment exercise, which the Responsible Banking team conducts every year.
•Verified that the proposed responsible banking agenda and targets remain aligned with Santander´s strategy.
•Reviewed ESG global ratings' assessments of Banco Santander, identifying strengths, areas for improvement and areas of focus. Reviewed any resultant action plans after engaging with investors and NGOs on ESG matters.
•Reviewed reports on customer complaints, their causes and associated action plans launched to reduce and mitigate the identified deficiencies, in coordination with the risk supervision, regulation and compliance committee.
•Revised the environmental, social and climate change risk management policy and the responsible banking and sustainability policy.
|
|||||||
| ESG reporting |
•Supported the audit committee on the supervision and assessment of the process of preparation and presentation of non-financial information according to the applicable regulations and international standards.
•Reviewed the 2023 Group statement on non-financial information and the independent expert's report. See the 'Responsible banking' chapter.
•Reviewed the Climate Finance Report in coordination with the audit committee, prior to its submission to the board for approval, including new targets for the energy, metal and aviation sectors, the action plan for the power generation sector and the disclosures for nature and biodiversity.
•Reviewed the Green Bond Report in coordination with the audit committee, prior to its submission to the board for approval.
•Analysed industry practices in ESG reporting under the Pilar III framework.
|
|||||||
Others |
•The Chair of the committee periodically reported on its activities to the risk supervision, regulation and compliance committee.
•Invited subsidiary responsible banking, sustainability and culture Chairs to specific committee meetings throughout the year and, in turn, the committee Chair attended specific subsidiary responsible banking, sustainability and culture committee meetings to further enhance communication between them.
|
|||||||
| Information for general meetings and corporate documents | ||||||||
| Shareholder information | •Was represented by Ramiro Mato, in his capacity as committee Chair, to report at the 2023 AGM committee's activities in 2022. |
|||||||
Corporate documents for 2023 |
•Prepared this activities report on 13 February 2024, which includes a performance review of the committee's functions and key priorities identified for 2024. The board of directors approved it on 19 February 2024. |
|||||||
|
Cybersecurity and data strategy remained a top priority of our agenda during the year, recognising the importance of having adequate defences and security controls in place against increasing threats; and how data contributes to improve business growth and customer experience.
In addition, we addressed the challenges and opportunities that artificial intelligence poses to the Group, ensuring that its use promotes effective risk management. In the coming year, we will continue to focus on how innovation and technology can help us deliver on our strategic ambitions, particularly linked to our newly created Retail & Commercial Banking and Digital Consumer Bank global businesses.
An appropriate mix of members’ skills ensured that the committee remained well positioned to fulfil its responsibilities and operate effectively. I would like to thank Bruce Carnegie-Brown, who left the committee in October 2023, for his hard work, contribution, and commitment."
 |
|||||||||||||
|
Ana Botín
Chair of the innovation and technology committee
| ||||||||||||||
"We aim to be the best open financial services platform by acting responsibly. We continued our work on enhancing our technology capabilities to drive the improvement of our customer’s experience when banking with us, while delivering significant efficiencies through cutting-edge technologies and end-to-end automation. In this regard, we remained focused on overseeing the execution and progress of One Transformation and its overall alignment with the 2023 Investor Day targets and the Group’s strategy. | ||||||||||||||
| COMPOSITION | ||
Position |
Category |
Appointed on | |||||||||
Chair |
Ana Botín |
Executive |
23/04/2007A |
||||||||
Members |
Homaira Akbari |
Independent |
27/09/2016 |
||||||||
José Antonio Álvarez |
Other external |
23/02/2015 |
|||||||||
Henrique de Castro |
Independent |
23/07/2019 | |||||||||
| Héctor Grisi | Executive | 01/01/2023 | |||||||||
| Glenn Hutchins | Independent |
20/12/2022 | |||||||||
Belén Romana |
Independent |
19/12/2017 | |||||||||
Secretary |
Jaime Pérez Renovales |
||||||||||
| TIME ALLOCATION | ||
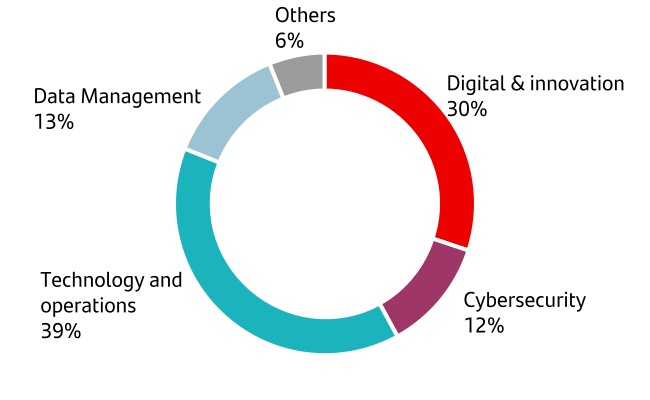
| Duties | Actions taken | |||||||
| Digital & innovation | ||||||||
| Digital |
•Monitored metrics in connection with the digital evolution and associated transformation, with a special focus on customer experience, simplification and efficiency.
•Reviewed core digital strategies to transform the business and accelerate new businesses growth.
•Reviewed strategic technological tools developed internally to further increase value creation across the Group, improving efficiency and driving appropriate synergies.
•Reviewed the execution and progress of One Transformation and its overall alignment with our strategy and targets disclosed at the 2023 Investor Day.
|
|||||||
| Cloud | •Reviewed the cloud strategy focused on improving innovation, time–to-market and efficiency with a business-based approach. |
|||||||
| Innovation framework |
•Reviewed the implementation of the technological and strategic plan and Group's innovation agenda, leveraging on our digital and data management capabilities.
•Identified the challenges and capabilities in terms of innovation in order to increase end-to-end business agile transformation.
•Identified new opportunities for accelerated innovation across the Group and increased the likelihood of success in new business models, technologies, systems and platforms.
|
|||||||
| Technology and operations | ||||||||
| Technology and operations (T&O) |
•Assisted the board in supervising technological risks in coordination with the risk supervision, regulation and compliance and audit committees.
•Reviewed the global technology strategy plan, reported to the board on T&O planning and activities, and ensured that T&O strategy was properly focused on the Group's relevant priorities, supervising its execution progress through defined top-level strategic KPIs, including those specific to the execution of One Transformation.
•Endorsed the Group's core strategic technology priorities to integrate key digital capabilities, leveraging five pillars: agile, cloud, core systems evolution, artificial intelligence and deep technology related skills and data.
•Continued to oversee the implementation of a new operating model and a common architecture.
•Analysed the priorities of the T&O function and specifically, their alignment with the Group’s ambition to become a 'digital bank with branches', with a special focus on the contact centres’ contribution for such purposes and alternatives for further optimization, simplification and improvement of processes.
|
|||||||
| Cybersecurity | ||||||||
| Strategy |
•Reviewed the cybersecurity strategy and the progress made on its main action lines: protecting the Group, bolstering its defences, and generating trust among stakeholders, customers, and society in general.
•Monitored the status and progress made on the fraud prevention plan, including its associated impacts and the actions underway to further harmonize fraud prevention capabilities across the Group.
|
|||||||
| Risk management oversight |
•Assisted the board in the supervision of cybersecurity risks in coordination with the risk supervision, regulation and compliance and audit committees.
•Supervised defences against increasing threats and reviewed security controls and automated security processes.
•Analysed cyber incidents and specific incidents outside the Group according to their relevance and impact, as appropriate.
•Monitored closely the global cybersecurity threat landscape and continued to monitor the associated impacts of the Ukraine war and the conflict in the Middle East.
•Received quarterly updates on cybersecurity risks, with a special focus on crisis simulation exercises and internal data leakage protection.
•Reviewed external threats such as ransomware and analysed the strategy designed to shorten data recovery time and reduce its potential impact.
|
|||||||
| Data management | ||||||||
Data management |
•Reviewed data management strategy and the Models & Data unit's priorities for the year, focusing on the business model and how data contributes to improve the business growth and customer experience.
•Reviewed the Group approach to artificial intelligence usage based on a specific governance and risk management framework.
|
|||||||
| Duties | Actions taken | |||||||
| Information for general meetings and corporate documents | ||||||||
Corporate documents for 2023 |
•Prepared this activities report on 25 January 2024, which includes a performance review of the committee's functions and key priorities identified for 2024. The board of directors approved it on 19 February 2024. |
|||||||
| Position | Background | |||||||
Chair |
Larry Summers |
Former Secretary of the US Treasury and President Emeritus and Charles W. Eliot University Professor of Harvard University | ||||||
| Members | Sheila C. Bair |
Former Chair of the Federal Deposit Insurance Corporation and former President of Washington College |
||||||
Mike Rhodin |
Supervisory board member of TomTom and director of HzO. Former IBM Watson Senior Vice President |
|||||||
Francisco D’Souza |
Managing Partner and co-founder at Recognize | |||||||
James Whitehurst |
Senior Advisor at IBM and former CEO of Red Hat |
|||||||
George Kurtz |
CEO and co-founder of CrowdStrike. Former Chief Technology Officer of McAfee | |||||||
Nadia Schadlow |
Former Deputy National Security Advisor for Strategy and former Assistant to the President of the United States | |||||||
| Andreas Dombret | Former board member of Deutsche Bundesbank, of Supervisory Board of the ECB and of Bank International Settlements and former Vice Chair of Bank of America in Europe |
|||||||
Carolyn Everson |
Director at The Coca-Cola Company and The Walt Disney Company. Former chair of Instacart and former vice-president of Global Business Group at Facebook (Meta) |
|||||||
Juan Ignacio Gallardo Thurlow |
Chair of Organización Cultiba, Grupo Azucarero México and Grupo GEPP (PepsiCo bottling company in Mexico) |
|||||||
Secretary |
Jaime Pérez Renovales |
|||||||
Name |
Position |
Profile |
|||||||||
Mahesh Aditya |
GROUP CHIEF RISK OFFICER |
Born in 1962, Mahesh Aditya joined Grupo Santander in 2017 as Chief Operating Officer of Santander Holdings USA. He became Chief Risk Officer in 2018 and Chief Executive Officer of Santander Consumer USA in 2019. Previously, he had been Chief Risk Officer at Visa (2017-2019) and Chief Risk Officer of Retail & Mortgage Banking at JP Morgan, Capital One and Citibank. He was appointed Group Chief Risk Officer in 2023. |
|||||||||
Daniel Barriuso |
GLOBAL HEAD OF RETAIL & COMMERCIAL BANKING AND GROUP CHIEF TRANSFORMATION OFFICER |
Born in 1973, Daniel Barriuso joined Grupo Santander in 2017 as Global Head of Cyber Security (CISO) and Fraud Prevention. In 2023, he was named Senior Executive Vice President, Chief Transformation Officer, and Global Head of Retail and Commercial Banking. Previously, he had held several executive roles at BP, Credit Suisse and ABN AMRO. |
|||||||||
Alexandra Brandão |
GROUP HEAD OF HUMAN RESOURCES |
Born in 1978, Alexandra Brandão joined Grupo Santander in 2003 as Head of Products and Services for Individuals at Santander Totta. She was Global Head of Knowledge and Development at the Grupo Santander Corporate Centre (2012-2016); Head of Human Resources (2016-2018); and Head of Commercial Management and Segments at Santander Portugal (2019-2020). She was appointed Group Head of Human Resources in 2021. |
|||||||||
| Juan Manuel Cendoya | GROUP HEAD OF COMMUNICATIONS, CORPORATE MARKETING AND RESEARCH | Born in 1967, Juan Manuel Cendoya joined Grupo Santander in 2001 as Senior Executive Vice President and Group Head of the Communications, Corporate Marketing and Research division. In 2016, he was appointed Vice Chair of the board of directors and Head of Institutional and Media Relations of Santander España. Previously, he had been Head of the Legal and Tax department of Bankinter, S.A. He is also a State Attorney for Spain. |
|||||||||
| José Doncel | GROUP CHIEF ACCOUNTING OFFICER |
Born in 1961, José Doncel joined Grupo Santander in 1989 as Head of Accounting. He had also served as Head of Accounting and Financial Management at Banesto (1994-2013). He was appointed Senior Executive Vice President and Head of the Internal Audit division in 2013 and Group Chief Accounting Officer in 2014. |
|||||||||
| José Antonio García Cantera | GROUP CHIEF FINANCIAL OFFICER | Born in 1966, José Antonio García joined Grupo Santander in 2003 as Senior Executive Vice President of Global Wholesale Banking of Banesto and was appointed CEO in 2006. Previously, he had served on the executive committee of Citigroup EMEA, as well as on the board of directors of Citigroup Capital Markets, Ltd and Citigroup Capital Markets UK. He was appointed Senior Executive Vice President of Global Corporate Banking in 2012 and Group Chief Financial Officer in 2015. |
|||||||||
| Juan Guitard | GROUP CHIEF AUDIT EXECUTIVE | Born in 1960, Juan Guitard joined Grupo Santander in 1997 as Head of Human Resources at Santander Investment, S.A. and was also General Counsel and secretary of the board of Santander Investment, S.A. and Banco Santander de Negocios, S.A. In 2002, he was appointed Vice General Counsel of Banco Santander. In 2013, he was Head of Banco Santander’s Risk division. In 2014, he was appointed Group Chief Audit Executive. He is also a State Attorney for Spain. |
|||||||||
| José María Linares | GLOBAL HEAD OF CORPORATE & INVESTMENT BANKING | Born in 1971, José María Linares joined Grupo Santander in 2017 as Senior Executive Vice President and Global Head of Corporate and Investment Banking. Previously, he served as an equity analyst at Morgan Stanley & Co. (1993-1994). He worked as Senior Vice President and senior equity analyst at Oppenheimer & Co. (1994-1997), as well as director and senior equity analyst at Société Générale (1997-1999). He joined J.P. Morgan in 1999 and was subsequently appointed managing director and Head of Global Corporate Banking at J.P. Morgan Chase & Co. (2011-2017). |
|||||||||
| Mónica López-Monís | GROUP HEAD OF SUPERVISORY AND REGULATORY RELATIONS | Born in 1969, Mónica López-Monís joined Grupo Santander in 2009 as General Counsel and secretary of the board of Banesto. Previously, she had been General Counsel at Aldeasa, S.A. She also was General Counsel at Bankinter, S.A., as well as independent director at Abertis Infraestructuras, S.A. In 2015, she was appointed Senior Executive Vice President of Banco Santander and Group Chief Compliance Officer until her appointment in 2019 as Group Head of Supervisory and Regulatory Relations. She is also a State Attorney for Spain. |
|||||||||
| Dirk Marzluf | GROUP CHIEF OPERATING & TECHNOLOGY OFFICER |
Born in 1970, Dirk Marzluf joined Grupo Santander in 2018 as Senior Executive Vice President and Head of IT and Operations. Previously, he had held several roles at AXA Group, where he became CIO, leading the insurance group’s technology and information security transformation and co-sponsoring its digital strategy. He also held global senior management roles at Accenture, Daimler Chrysler and Winterthur Group. |
|||||||||
| Víctor Matarranz | GLOBAL HEAD OF WEALTH MANAGEMENT & INSURANCE | Born in 1976, Víctor Matarranz joined Grupo Santander in 2012 as Head of Strategy and Innovation at Santander UK. In 2014, he was appointed Senior Executive Vice President and Head of the Executive Chairman’s Office and Strategy until his appointment in 2017 as global Head of Wealth Management & Insurance. Previously, he held several management roles at McKinsey & Company, where he had become partner. |
|||||||||
| José Luis de Mora | GLOBAL HEAD OF DIGITAL CONSUMER BANK AND GROUP HEAD OF CORPORATE DEVELOPMENT AND FINANCIAL PLANNING |
Born in 1966, José Luis de Mora joined Grupo Santander in 2003 to Head the Group’s Strategic Plan Development and Acquisitions. In 2015, he was appointed Senior Executive Vice President and Group Head of Financial Planning and Corporate Development. In 2020, he was named Head of Consumer Finance (now Digital Consumer Bank). He was also Head of Strategy (2019-2023). |
|||||||||
| Jaime Pérez Renovales | GROUP GENERAL COUNSEL |
See profile in section 4.1 'Our directors'. |
|||||||||
| Marjolein van Hellemondt-Gerdingh | GROUP CHIEF COMPLIANCE OFFICER | Born in 1964, Marjolein van Hellemondt-Gerdingh joined Grupo Santander in 2019 as Senior Executive Vice President and Group Chief Compliance Officer. Previously, she had been Chief Compliance Officer of several banking and financial entities such as NN Group, Zurich Insurance Company and De Lage Landen International B.V. |
|||||||||
| 1 | Remuneration must be in line with shareholders and customers' interests, conducive to creating long-term value and compatible with our rigorous risk management, long-term strategy and values, as well as with maintaining a sound capital base. |
|||||||
| 2 | Fixed remuneration must make up a significant proportion of total compensation. |
|||||||
| 3 | Variable remuneration must reward performance for achieving individual, local company and, as the case may be, Group targets. |
|||||||
| 4 | The global remuneration package and its structure must be competitive in order to attract and retain talent. |
|||||||
| 5 | Remuneration decisions must be free of conflicts of interest and discrimination of any kind different from that based on the performance assessment of objectives and corporate behaviours. Remuneration must be free of gender-based bias and help eliminate inequalities that could result from it. |
|||||||
| Amount per director in euros | 2023 | 2022 | ||||||
| Members of the board of directors | 98,000 | 95,000 | ||||||
| Members of the executive committee | 170,000 | 170,000 | ||||||
| Members of the audit committee | 43,000 | 40,000 | ||||||
| Members of the nomination committee | 28,000 | 25,000 | ||||||
| Members of the remuneration committee | 28,000 | 25,000 | ||||||
| Members of the risk supervision, regulation and compliance committee | 43,000 | 40,000 | ||||||
| Members of the responsible banking, sustainability and culture committee | 18,000 | 15,000 | ||||||
| Members of the innovation and technology committee | 28,000 | 25,000 | ||||||
| Chair of the audit committee | 70,000 | 70,000 | ||||||
| Chair of the nomination committee | 50,000 | 50,000 | ||||||
| Chair of the remuneration committee | 50,000 | 50,000 | ||||||
| Chair of the risk supervision, regulation and compliance committee | 70,000 | 70,000 | ||||||
| Chair of the responsible banking, sustainability and culture committee | 50,000 | 50,000 | ||||||
| Chair of the innovation and technology committee | 70,000 | 70,000 | ||||||
Lead independent directorA |
110,000 | 110,000 | ||||||
| Non-executive Vice Chair | 30,000 | 30,000 | ||||||
| Attendance fees per director per meeting in euros | 2023 | 2022 | ||||||
| Board of directors | 2,600 | 2,600 | ||||||
| Audit committee and risk supervision, regulation and compliance committee | 1,700 | 1,700 | ||||||
| Other committees (excluding executive committee) | 1,500 | 1,500 | ||||||
| Amount in euros | |||||||||||||||||||||||||||||||||||||||||||||||
| Directors | 2023 | 2022 | |||||||||||||||||||||||||||||||||||||||||||||
| Annual allotment | Board and committee attendance fees | Total By-law stipulated emoluments and attendance fees | |||||||||||||||||||||||||||||||||||||||||||||
Category |
BoardG |
EC | AC | NC | RC | RSRCC | RBSCC | ITC | Total | ||||||||||||||||||||||||||||||||||||||
| Ana Botín | Executive |
98,000 | 170,000 | — | — | — | — | — | 98,000 | 366,000 | 45,000 | 411,000 | 379,900 | ||||||||||||||||||||||||||||||||||
Héctor GrisiA |
Executive |
98,000 | 170,000 | — | — | — | — | — | 28,000 | 296,000 | 43,500 | 339,500 | — | ||||||||||||||||||||||||||||||||||
| José Antonio Álvarez | Other external |
128,000 | 170,000 | — | — | — | — | — | 28,000 | 326,000 | 45,000 | 371,000 | 329,400 | ||||||||||||||||||||||||||||||||||
| Bruce Carnegie-Brown | Independent | 203,000 | 127,500 | — | 78,000 | 65,500 | — | — | 21,000 | 495,000 | 81,000 | 576,000 | 700,000 | ||||||||||||||||||||||||||||||||||
| Homaira Akbari | Independent | 98,000 | — | 43,000 | — | — | — | 18,000 | 28,000 | 187,000 | 78,000 | 265,000 | 243,800 | ||||||||||||||||||||||||||||||||||
Javier BotínB |
Other external |
98,000 | — | — | — | — | — | — | — | 98,000 | 39,000 | 137,000 | 128,800 | ||||||||||||||||||||||||||||||||||
| Sol Daurella | Independent | 98,000 | — | — | 28,000 | 28,000 | — | 18,000 | — | 172,000 | 76,500 | 248,500 | 229,800 | ||||||||||||||||||||||||||||||||||
| Henrique de Castro | Independent | 98,000 | — | 43,000 | — | 28,000 | — | — | 28,000 | 197,000 | 86,800 | 283,800 | 261,100 | ||||||||||||||||||||||||||||||||||
| Gina Díez | Independent | 98,000 | — | — | 28,000 | — | — | 16,550 | — | 142,550 | 67,500 | 210,050 | 171,800 | ||||||||||||||||||||||||||||||||||
| Luis Isasi | Other external |
98,000 | 170,000 | — | — | 28,000 | 43,000 | — | — | 339,000 | 77,800 | 416,800 | 411,600 | ||||||||||||||||||||||||||||||||||
| Ramiro Mato | Independent | 98,000 | 170,000 | 43,000 | — | — | 43,000 | 68,000 | — | 422,000 | 95,600 | 517,600 | 499,800 | ||||||||||||||||||||||||||||||||||
| Belén Romana | Independent | 98,000 | 170,000 | 43,000 | — | — | 113,000 | 18,000 | 28,000 | 470,000 | 101,600 | 571,600 | 549,300 | ||||||||||||||||||||||||||||||||||
| Pamela Walkden | Independent | 98,000 | — | 113,000 | — | — | 43,000 | — | — | 254,000 | 86,600 | 340,600 | 323,000 | ||||||||||||||||||||||||||||||||||
Germán de la Fuente |
Independent | 98,000 | — | 43,000 | — | — | 43,000 | — | — | 184,000 | 86,600 | 270,600 | 136,683 | ||||||||||||||||||||||||||||||||||
Glenn HutchinsC |
Independent | 192,600 | — | — | 28,000 | 40,500 | — | — | 28,000 | 289,100 | 82,500 | 371,600 | 9,689 | ||||||||||||||||||||||||||||||||||
Álvaro CardosoD |
Independent | — | — | — | — | — | — | — | — | — | — | — | 38,601 | ||||||||||||||||||||||||||||||||||
R. Martín ChavezE |
Independent | — | — | — | — | — | — | — | — | — | — | — | 146,447 | ||||||||||||||||||||||||||||||||||
Sergio RialF |
Other external |
— | — | — | — | — | — | — | — | — | — | — | 131,400 | ||||||||||||||||||||||||||||||||||
| 1,699,600 | 1,147,500 | 328,000 | 162,000 | 190,000 | 285,000 | 138,550 | 287,000 | 4,237,650 | 1,093,000 | 5,330,650 | 4,691,121 | ||||||||||||||||||||||||||||||||||||
Component |
Type |
Policy |
Effective in 2023 |
||||||||||||||||||||
Gross annual salary |
Fixed |
→Paid in cash on a monthly basis. |
Ana Botin: EUR 3,271 thousand.
Héctor Grisi: EUR 3,000 thousand.
|
||||||||||||||||||||
Variable remuneration |
Variable |
→Individual benchmark reference
→Calculated against annual quantitative metrics, a multiplier and a qualitative assessment, and taking into account individual performance.
→50% of each payment is instruments, consisting of Banco Santander, S.A instruments, and restricted stock units (RSUs) of PagoNxt, S.A., split as:
◦the amount of PagoNxt RSUs set for each executive director; and.
◦the rest, all in shares of Banco Santander, S.A.
→The number of instruments is set at the time of the award.
→40% paid in 2024.
→60% deferred in five years.
◦24% paid in equal parts in 2025 and 2026.
◦36% paid in equal parts in 2027, 2028 and 2029, provided certain long-term objectives are met (2023-2025).
|
•See section 6.3 B ii for details on annual metrics and assessment.
•See section 6.3 B iv for details on long-term metrics.
•See section 6.3 B iii for details on individual variable pay.
|
||||||||||||||||||||
Pension scheme |
Fixed |
→Annual contribution of 22% of base salary. |
•No changes. |
||||||||||||||||||||
|
Variable
|
→Annual contribution of 22% of 30% of the average of variable remuneration in the last three years. |
•See section 6.3 C for details on annual contributions and pension balance. |
|||||||||||||||||||||
Other remuneration |
Fixed |
→Includes life, accident and medical insurance, and other in-kind compensation.
→Includes for the Executive Chair a fixed remuneration supplement in cash (not considered salary or pensionable) since supplementary death and disability benefits were eliminated.
|
•Regarding fixed remuneration supplement, no change for Ana Botín since 2018.
•Héctor Grisi will not receive supplement in his fixed remuneration.
|
||||||||||||||||||||
→Payment for non-compete commitment |
No changes. |
||||||||||||||||||||||
Shareholding policy |
N/A |
→Executive directors also have the obligation to hold them for three years from their award date, unless the director already holds shares for an amount equivalent to 200% of their net annual salary (calculated on the basis of their gross annual salary). In such case, the regulatory obligation to hold shares is for one year from their grant date. |
•Policy updated during 2020 to assure compliance with recommendation 62 to the Good Governance Code for Listed Companies of the CNMV.
•Both Ana Botín and Héctor Grisi maintain an amount in shares higher than 200% of their fixed pay.
|
||||||||||||||||||||
| EUR thousand | 2023 | 2022 | |||||||||||||||||||||
| Gross annual salary | Fixed annual pension contribution | TotalA |
Gross annual salary | Fixed annual pension contribution | TotalA |
||||||||||||||||||
| Ana Botín | 3,271 | 720 | 3,991 | 3,176 | 699 | 3,875 | |||||||||||||||||
| Héctor Grisi | 3,000 | 660 | 3,660 | — | — | — | |||||||||||||||||
| José Antonio Álvarez | — | — | — | 2,541 | 559 | 3,100 | |||||||||||||||||
| Total | 6,271 | 1,380 | 7,651 | 5,717 | 1,258 | 6,975 | |||||||||||||||||
| Individual benchmark variable remuneration | |
Quantitative metrics, a multiplier and qualitative assessmentA |
|
Individual performance | |
Final individual variable remuneration | ||||||||||||||
| Cash | |||||||||||||||||||||||||||||
| Instruments | |||||||||||||||||||||||||||||
| Immediately following performance year | Deferred not subject to long-term metrics |
Long-term performance deferral | Total | ||||||||||||||||||||||||||
 |
40% | ||||||||||||||||||||||||||||
 |
|
24% | |||||||||||||||||||||||||||
|
|
|
36% | ||||||||||||||||||||||||||
| 2024 | 2025 | 2026 | 2027 | 2028 | 2029 | 100% | |||||||||||||||||||||||
|
Category
and (weight)
|
A.Quantitative metricsA |
||||||||||
Targets |
Achievement over
target
|
Assessment |
|||||||||
Transformation: (45%) |
Total customers (growth) (10%) |
Target: 8.83 million. Achievement: 11.05 million. |
125.17 | % | |||||||
Active customers (growth) (10%) |
Target: 5.43 million. Achievement: 5.43 million. | 100.03 | % | ||||||||
Revenue per active customer (10%) |
Target: EUR 572. Achievement: EUR 597. | 104.46 | % | ||||||||
Operative cost per active customer (15%) |
Target: EUR 251.10. Achievement: EUR 264. |
94.82 | % | ||||||||
Capital (30%) |
CET1 ratio |
Target: 12.45%. Achievement: 12.54% |
125.19 | % | |||||||
Profitability (25%) |
RoTE (Return on tangible equity) |
Target: 15.72%. Achievement: 15.39%. |
97.92 | % | |||||||
TOTAL metrics |
109.22% | ||||||||||
|
B. MULTIPLIER
(relative performance vs. market)
|
Net interest margin (NIM), cost to income, CoR,
NPLs, net promoter score (NPS) and Net Margin after
provisions as references.
|
Santander registered record results in 2023, which enabled us to climb to second in the ranking for net margin after provisions. Moreover, the Group outperformed its peers in terms of capitalization, with an increase of 45% in the measuring period, which is well above our major competitors’ 21% average. Regarding subsidiaries, Spain (NIM and NPS) and Portugal (practically all metrics) were among the top performers, as well as Digital Consumer Bank (NIM and cost to income). |
1.02 |
||||||||
C. Qualitative assessment | ||||||||
Indicators |
Level of achievement |
Assessment |
||||||
Risk (+/- 5%) |
Strengthened the control environment and escalation, especially for non-financial risks (fraud, budgeting), market risk and structural risk (management of the US banking crisis). Significant progress with strategic and transformation initiatives, and further integration of advanced risk management techniques (automated decision-making, machine learning, and artificial intelligence). |
+3.20% | ||||||
Compliance (+/- 5%) |
General enhancement of the control environment, most notably in relation to regulatory compliance. Progress with the implementation of strategic and transformation initiatives (vulnerable customer strategy and branch conduct rating, among others). | +2.60% | ||||||
Network Collaboration (+/- 10%) |
In 2023, our strategic focus involved the commitment by the global businesses, regions and subsidiaries and cross-cutting functions to work together. Thanks to our unique combination of a global scale with local leadership and a network that creates value for the Group, we nurtured relationships between subsidiaries and regions by sharing expertise and ways of working. In 2023 we monitored performance indicators that showed an increase in cooperation between the global businesses, subsidiaries and support functions, who worked together to create synergy and share best practice in pursuit of our goal to become ONE Santander. | +2.73% | ||||||
ESG targets (+/- 5%) |
(i) We made headway with our target on the percentage of women in senior executive positions — up from 29.3% in 2022 to 31.4% in 2023; (ii) we financially included 1.8 million people through our access and finance programmes; (iii) we raised or facilitated over EUR 22,000 million in green finance and reached EUR 67,700 million in socially-responsible assets under management; (iv) we set new targets for our auto manufacturing and auto lending portfolios, as well as decarbonization plans for key retail portfolios; and (v) we continued to enhance the quality control of our sustainability disclosures. |
+3.40% | ||||||
TOTAL qualitative assessment |
+11.93% | |||||||
D. Exceptional adjustment approved by board of directors upon recommendation of remuneration committee |
Following the same rationale applied to the discretionary decreases of 14.5% of the bonus pools of 2019 and 2021 due to worse total shareholder returns, and taking into account the record attributable profit obtained (11,076 million euros, +15% compared to 2022) and the very high shareholders return (+40.5%, beating the average of our peer group by 5%), the board of directors, upon the recommendation of the remuneration committee, agreed to set the same bonus pool (138.91%) as in 2022, thus making an exceptional upward adjustment of +15.57% |
+15.57% |
||||||
Final bonus pool 2023 |
138.91% | |||||||
| Immediately payable and deferred (not linked to long-term objectives) variable remuneration | ||||||||||||||||||||||||||||||||
| EUR thousand | 2023 | 2022 | ||||||||||||||||||||||||||||||
| In cash | In sharesA |
In RSUsA |
Total | In cash | In sharesB |
In share optionsB |
In RSUsB |
Total | ||||||||||||||||||||||||
| Ana Botín | 2,848 | 2,648 | 200 | 5,696 | 2,702 | 1,229 | 1,229 | 243 | 5,403 | |||||||||||||||||||||||
| Héctor Grisi | 1,952 | 1,784 | 168 | 3,904 | — | — | — | — | — | |||||||||||||||||||||||
| José Antonio Álvarez | — | — | — | — | 1,823 | 830 | 830 | 164 | 3,647 | |||||||||||||||||||||||
| Total | 4,800 | 4,432 | 368 | 9,600 | 4,525 | 2,059 | 2,059 | 407 | 9,050 | |||||||||||||||||||||||
| Deferred variable remuneration linked to long-term objectives (fair value) | ||||||||||||||||||||||||||||||||
| EUR thousand | 2023 | 2022 | ||||||||||||||||||||||||||||||
| In cash | In sharesA |
In RSUsA |
Total | In cash | In sharesB |
In share optionsB |
In RSUsB |
Total | ||||||||||||||||||||||||
| Ana Botín | 1,121 | 911 | 210 | 2,243 | 1,064 | 404 | 404 | 255 | 2,128 | |||||||||||||||||||||||
| Héctor Grisi | 769 | 592 | 176 | 1,537 | — | — | — | — | — | |||||||||||||||||||||||
| José Antonio Álvarez | — | — | — | — | 718 | 273 | 273 | 172 | 1,436 | |||||||||||||||||||||||
| Total | 1,890 | 1,504 | 386 | 3,780 | 1,782 | 677 | 677 | 428 | 3,564 | |||||||||||||||||||||||
| Metrics | Weight | Target and compliance scales (metrics ratios) | ||||||||||||
A |
Banco Santander’s consolidated Return on tangible equity (RoTE)
target in 2025
|
40% |
If RoTE in 2025 is ≥ 17%, then metric ratio is 1.5
If RoTE in 2025 is ≥ 14% but <17%, then metric ratio is 0 – 1.5B
If RoTe in 2025 is < 14%, then metric is 0
|
|||||||||||
B |
Relative Total Shareholder Return (TSR)A in
2023-2025 within a peer group
|
40% |
If ranking Santander above or equal percentile 100, then metric ratio is 1.5
If ranking Santander between percentiles 75 and 100 (not inclusive), then metric ratio is
1 – 1.5C
If ranking Santander between percentiles 40 and 75 (not inclusive), then metric ratio is 0.5 – 1C
If ranking Santander below percentile 40, then metric ratio is 0
|
|||||||||||
| C |
Four ESG (environmental, social and governance) metrics with same weighting
(1/4 x Coefficient 1 + 1/4 x Coefficient 2 + 1/4 x Coefficient
3 +1/4 x Coefficient 4)
On which:
Coefficient 3: (0.7 x Subcoefficient 3.a) + (0.3 x Subcoefficient 3.b)
|
20% | 1) |
If % women in senior executive positions in 2025 is ≥ 36%, then metric ratio is 1.25
If % women in senior executive positions in 2025 is ≥ 35% but <36%, then metric ratio is
1 – 1.25D
If % women in senior executive positions in 2025 is ≥ 29.3% but <35%, then metric ratio is 0 – 1D
If % women in senior executive positions in 2025 is < 29.3%, then metric ratio is 0
|
||||||||||
2) |
If number of banking proposals or tailored financeE between 2023 and 2025 (in million) is ≥ 6, then metric ratio is 1.25
If number of banking proposals or tailored financeE between 2023 and 2025 (in million) is ≥ 5 but <6, then metric ratio is 1 – 1.25D
If number of banking proposals or tailored financeE between 2023 and 2025 (in million) is ≥ 3 but <5, then metric ratio is 0 – 1D
If number of banking proposals or tailored financeE between 2023 and 2025 (in million) is < 3, then metric ratio is 0
|
|||||||||||||
3) a. |
If green finance raised and facilitatedF target between 2019 and 2025 (in euro billions) is ≥ 240, then metric ratio is 1.25
If green finance raised and facilitatedF target between 2019 and 2025 (in euro billions) is ≥ 220 but < 240, then metric ratio is 1 –1.25D
If green finance raised and facilitatedF target between 2019 and 2025 (in euro billions) is ≥ 160 but < 220, then metric ratio is 0 –1D
If green finance raised and facilitatedF target between 2019 and 2025 (in euro billions) is < 160, then metric ratio is 0
|
|||||||||||||
3) b. |
If socially responsible investmentsG (in euro billions) in 2025 is ≥ 102, then metric ratio is 1.25
If socially responsible investmentsG (in euro billions) in 2025 is ≥ 100 but < 102, then metric ratio is 1 –1.25D
If socially responsible investmentsG (in euro billions) in 2025 is ≥ 53 but < 100, then metric ratio is 0 – 1D
If socially responsible investmentsG (in euro billions) in 2025 is < 53, then metric ratio is 0
|
|||||||||||||
4) |
If credit risk exposure with customers affected by the thermal coalH (in euro billions) in 2025 is ≤ 3.8, then metric ratio is 1.25
If credit risk exposure with customers affected by the thermal coalH (in euro billions) in 2025 is < 5.8 but > 3.8, then metric ratio is 1 –1.25D
If credit risk exposure with customers affected by the thermal coalH (in euro billions) in 2025 is = 5.8, then metric ratio is 1
If credit risk exposure with customers affected by the thermal coalH (in euro billions) in 2025 is > 5.8, then metric ratio is 0
|
|||||||||||||
Category |
Factors |
||||
| Risk | Significant failures in risk management by Banco Santander, or by a business or risk control unit. |
||||
| Capital | An increase in capital requirements at the Banco Santander or one of its business units not planned at the time that exposure was generated. |
||||
| Regulation and internal codes | Regulatory penalties or legal convictions for events that might be attributable to the unit or staff responsible for them. In addition, failure to comply with Banco Santander’s internal codes of conduct. |
||||
| Conduct | Improper conduct, whether individual or collective. Negative effects deriving from the marketing of unsuitable products and the liability of persons or bodies making such decisions will be considered especially significant. |
||||
| EUR thousand | 2023 | 2022 | ||||||
| Ana Botín | 1,144 | 1,081 | ||||||
| Héctor Grisi | 966 | — | ||||||
| José Antonio Álvarez | — | 811 | ||||||
| Total | 2,110 | 1,892 | ||||||
| EUR thousand | 2023 | 2022 | ||||||
| Ana Botín | 49,257 | 46,725 | ||||||
| Héctor Grisi | 585 | — | ||||||
| José Antonio Álvarez | 19,495 | 18,958 | ||||||
| Total | 69,338 | 65,683 | ||||||
| 2023 | |||||||||||
| Gross annual salary (thousand) | Number of shares (thousand) | X | |||||||||
| Ana Botín | 3,271 | 32,625 | 37.8 | ||||||||
Héctor Grisi |
3,000 | 1,694 | 2.1 | ||||||||
Director |
Position |
Remuneration |
||||||
| Homaira Akbari |
Member of the board of Santander Consumer USA
Holdings, Inc.
|
USD 120 thousand (EUR 111 thousand) |
||||||
Member of the Board of PagoNxt, S.L. |
EUR 200 thousand |
|||||||
Henrique de Castro |
Member of the Board of PagoNxt, S.L. |
EUR 200 thousand |
||||||
José Antonio Álvarez |
Member of the Board of PagoNxt, S.L. |
EUR 200 thousand |
||||||
Member of the Board of Banco Santander (Brasil) S.A. |
BRL 755 thousand (EUR 141 thousand) |
|||||||
| Pamela Walkden |
Member of the Santander UK,
plc and Santander UK Group Holdings Limited
|
GBP 132 thousand (EUR 152 thousand) |
||||||
| EUR thousand | ||||||||||||||||||||||||||||||||||||||
| Directors | 2023 | 2022 | ||||||||||||||||||||||||||||||||||||
| Bylaw-stipulated emoluments | Salary and bonus of executive directors | Total | Total | |||||||||||||||||||||||||||||||||||
| Board and board committees annual allotment | Board and committee attendance fees | Fixed Salary | Immediate payment bonus (50% in instruments) | Deferred payment bonus (50% in instruments) | Total | Pension Contribution | Other remunerationF |
|||||||||||||||||||||||||||||||
| Ana Botín | 366 | 45 | 3,271 | 3,560 | 2,136 | 8,967 | 1,144 | 1,022 | 11,544 | 11,001 | ||||||||||||||||||||||||||||
Héctor GrisiA |
296 | 44 | 3,000 | 2,440 | 1,464 | 6,904 | 966 | 47 | 8,257 | — | ||||||||||||||||||||||||||||
| José Antonio Álvarez | 326 | 45 | — | — | — | — | — | 3,182 | 3,553 | 9,086 | ||||||||||||||||||||||||||||
| Bruce Carnegie-Brown | 495 | 81 | — | — | — | — | — | — | 576 | 700 | ||||||||||||||||||||||||||||
| Homaira Akbari | 187 | 78 | — | — | — | — | — | — | 265 | 244 | ||||||||||||||||||||||||||||
Javier BotínB |
98 | 39 | — | — | — | — | — | — | 137 | 129 | ||||||||||||||||||||||||||||
| Sol Daurella | 172 | 77 | — | — | — | — | — | — | 249 | 230 | ||||||||||||||||||||||||||||
| Henrique de Castro | 197 | 87 | — | — | — | — | — | — | 284 | 261 | ||||||||||||||||||||||||||||
| Gina Díez | 143 | 68 | — | — | — | — | — | — | 211 | 172 | ||||||||||||||||||||||||||||
| Luis Isasi | 339 | 78 | — | — | — | — | — | 1,000 | 1,417 | 1,412 | ||||||||||||||||||||||||||||
| Ramiro Mato | 422 | 96 | — | — | — | — | — | — | 518 | 500 | ||||||||||||||||||||||||||||
| Belén Romana | 470 | 102 | — | — | — | — | — | — | 572 | 549 | ||||||||||||||||||||||||||||
| Pamela Walkden | 254 | 87 | — | — | — | — | — | — | 341 | 323 | ||||||||||||||||||||||||||||
| Germán de la Fuente | 184 | 87 | — | — | — | — | — | — | 271 | 137 | ||||||||||||||||||||||||||||
| Glenn Hutchins | 289 | 83 | — | — | — | — | — | — | 372 | 10 | ||||||||||||||||||||||||||||
Álvaro CardosoC |
— | — | — | — | — | — | — | — | — | 39 | ||||||||||||||||||||||||||||
R. Martín ChavezD |
— | — | — | — | — | — | — | — | — | 147 | ||||||||||||||||||||||||||||
Sergio RialE |
— | — | — | — | — | — | — | — | — | 131 | ||||||||||||||||||||||||||||
| Total 2023 | 4,238 | 1,097 | 6,271 | 6,000 | 3,600 | 15,871 | 2,110 | 5,251 | 28,567 | — | ||||||||||||||||||||||||||||
| Total 2022 | 3,762 | 931 | 5,717 | 5,656 | 3,394 | 14,767 | 1,892 | 3,719 | — | 25,071 | ||||||||||||||||||||||||||||
EUR thousandA |
||||||||
| 2023 | 2022 | |||||||
| Ana Botín | 2,243 | 2,128 | ||||||
| Héctor Grisi | 1,537 | — | ||||||
| José Antonio Álvarez | — | 1,436 | ||||||
| Total | 3,780 | 3,564 | ||||||
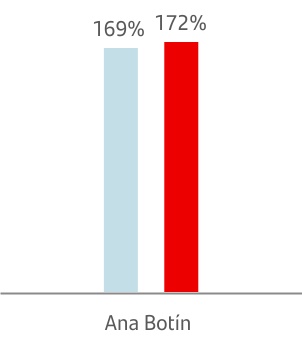
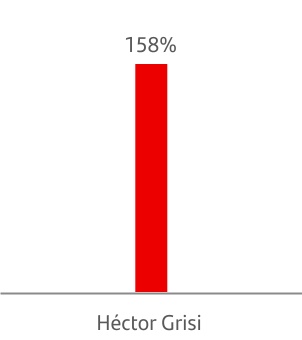
Ratio of executive directors’ total remuneration to underlying attributable profit | ||
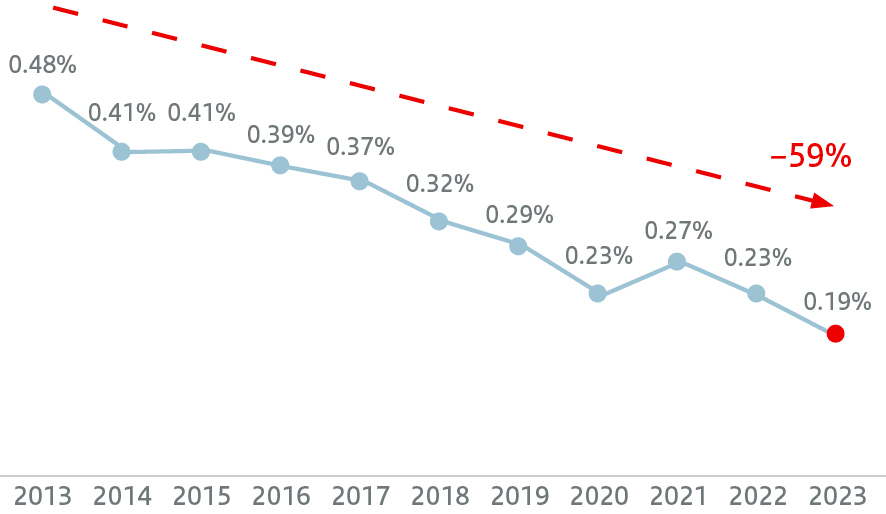
Directors' remuneration1 (EUR thousand) |
2023 | % var. 23/22 |
2022 | % var. 22/21 | 2021 | % var. 21/20 | 2020 | % var. 20/19 | 2019 | ||||||||||||||||||||
| • Executive Directors | |||||||||||||||||||||||||||||
| Ana Botín | 11,544 | 5% | 11,001 | (4)% | 11,435 | 68% | 6,818 | (32)% | 9,954 | ||||||||||||||||||||
Héctor GrisiA |
8,257 | — | |||||||||||||||||||||||||||
• Non-Executive Directors2 |
|||||||||||||||||||||||||||||
| José Antonio Álvarez | 3,553 | (61%) | 9,086 | (1%) | 9,160 | 52% | 6,018 | (27%) | 8,270 | ||||||||||||||||||||
| Bruce Carnegie-Brown | 576 | (18%) | 700 | — | 700 | 18% | 595 | (15%) | 700 | ||||||||||||||||||||
Javier BotínB |
137 | 6% | 129 | — | 129 | 6% | 122 | (11%) | 137 | ||||||||||||||||||||
| Sol Daurella | 249 | 8% | 230 | (4%) | 239 | 12% | 214 | (11%) | 240 | ||||||||||||||||||||
| Belén Romana | 572 | 4% | 549 | 3% | 533 | 28% | 417 | (21%) | 525 | ||||||||||||||||||||
| Homaira Akbari | 265 | 9% | 244 | (2%) | 248 | 23% | 202 | (11%) | 226 | ||||||||||||||||||||
| Ramiro Mato | 518 | 4% | 500 | — | 499 | 16% | 430 | (14%) | 500 | ||||||||||||||||||||
| Henrique de Castro | 284 | 9% | 261 | (2%) | 267 | 23% | 217 | 152% | 86 | ||||||||||||||||||||
| Pamela Walkden | 341 | 6% | 323 | 7% | 303 | 42% | 214 | 529% | 34 | ||||||||||||||||||||
| Luis Isasi | 1,417E |
— | 1,412E |
— | 1,406E |
49% | 943 | — | — | ||||||||||||||||||||
| Gina Díez Barroso | 211 | 23% | 172 | 32% | 130 | — | 4 | — | — | ||||||||||||||||||||
Germán de la FuenteC |
271 | — | 137 | — | — | — | — | — | — | ||||||||||||||||||||
Glenn HutchinsD |
372 | — | 10 | — | — | — | — | — | — | ||||||||||||||||||||
| Company’s performance | |||||||||||||||||||||||||||||
| Underlying profit attributable to the Group (EUR mn) | 11,076 | 15% | 9,605 | 11% | 8,654 | 70% | 5,081 | (38%) | 8,252 | ||||||||||||||||||||
Consolidated results of the Group3 (EUR mn) |
16,459 | 8% | 15,250 | 5% | 14,547 | — | (2,076) | — | 12,543 | ||||||||||||||||||||
| Ordinary RoTE | 15.06% | 13% | 13.37% | 5% | 12.73% | 71% | 7.44% | (37%) | 11.79% | ||||||||||||||||||||
Employees' average remuneration4 (EUR thousand) |
58 | 3% | 56 | 1% | 56 | 18% | 47 | (12%) | 54 | ||||||||||||||||||||
Employees' average remuneration in Spain5 (EUR thousand) |
73 | 6% | 68 | 10% | 62 | (2%) | 63 | — | n.a. |
||||||||||||||||||||
Key words |
Aspect aligning risk, performance and remuneration |
||||
| Metrics balance | The balance of quantitative metrics and qualitative assessments, including customer, risk, capital and profitability in relation to risk, used to determine the executive directors’ variable remuneration. | ||||
| Financial thresholds | The adjustment to variable remuneration if certain financial thresholds are not reached, which may limit the variable remuneration to 50% of the previous year's amount or lead to it not being awarded at all. | ||||
| Long-term objectives | The long-term objectives linked to the last three portions of the deferred variable remuneration. These objectives are directly associated with return to shareholders relative to a peer group, return on tangible equity (RoTE) and the five public targets linked to our Responsible banking agenda. |
||||
| Individual performance | The discretion of the board to consider the performance of each executive director in the award of their individual variable remuneration. | ||||
| Variable remuneration cap | 200% of fixed remuneration. | ||||
| Control functions involvement | The work undertaken by the human resources committee aided by senior managers leading Control functions in relation to the analysis of quantitative metrics information and undertaking qualitative analysis. |
||||
| Malus and clawback | Malus can be applied to unvested deferred pay and clawback can be applied to vested or paid compensation under the conditions dictated by the Group’s remuneration policy. |
||||
| Payment in shares | At least 50% of variable pay is in instruments and subject to retention or prohibition from exercise of at least one year from their delivery. |
||||
| Category | Quantitative metricsA |
||||
|
Transformation:
Weight: 45%
|
Total and active customers (growth)
(Weight: 20%)
|
||||
|
Costs
(Weight: 15%)
| |||||
|
Revenue per active customer
(Weight: 10%)
| |||||
|
Capital
Weight: 30%
|
CET1 ratio |
||||
|
Profitability
Weight: 25%
|
RoTE (Return on tangible equity) |
||||
| Qualitative assessment | Weight | ||||
Performance vs. Market |
'+/-10% |
||||
Compliance and Risk |
+/-5% | ||||
| Network collaboration | '+/-5% |
||||
| ESG targets | +/-5% | ||||
RoTE in 2026 (%) |
‘RoTE Ratio' |
||||
≥ 18% |
1.5 | ||||
≥ 15% but <18% |
0 – 1.5A |
||||
< 15% |
0 | ||||
Ranking of Santander TSR |
'TSR Ratio' |
||||
The100th percentile |
1.5 | ||||
Between the 75th and 100th percentiles (not inclusive) |
1 – 1.5A |
||||
Between the 40th and 75th percentiles (not inclusive) |
0.5 - 1A |
||||
| Less than the 40th percentile | 0 | ||||
Women in senior executive positionsB (%) |
Coefficient | ||||
≥ 37% |
1.25 | ||||
≥ 36% but < 37% |
1 – 1.25A |
||||
≥ 34% but < 36% |
0 – 1A |
||||
< 34% |
0 | ||||
Financial inclusionB (millions of people) |
Coefficient | ||||
≥ 6.3 |
1.25 | ||||
≥ 5.3 but < 6.3 |
1 – 1.25A |
||||
≥ 3.5 but < 5.3 |
0 – 1A |
||||
< 3.5 |
0 | ||||
Socially responsible investmentB (%) |
Coefficient | ||||
≥ 21% |
1.25 | ||||
≥ 18% but < 21% |
1 – 1.25A |
||||
≥ 15% but < 18% |
0 – 1A |
||||
< 15% |
0 | ||||
Business raised and facilitatedB between 2024 and 2026 (EUR bn) |
Coefficient | ||||
≥ 180 |
1.25 | ||||
≥ 150 but < 180 |
1 – 1,25A |
||||
≥ 110 but < 150 |
1 | ||||
< 110 |
0 | ||||
Number |
% of totalA |
|||||||
| Votes | 11,087,900,806 | 99.74 | % | |||||
Number |
% |
|||||||
Votes forB |
9,886,665,679 | 89.22 | % | |||||
Votes againstB |
1,194,192,063 | 10.78 | % | |||||
BlankC |
7,043,064 | 0.06 | % | |||||
AbstentionsC |
29,058,164 | 0.26 | % | |||||
EUR thousand | |||||||||||||||||||||||
Short-term and deferred salary remuneration |
|||||||||||||||||||||||
Year |
Number of people |
Fixed |
Immediately receivable variable remuneration (50% in instruments)A |
Deferred variable remuneration (50% in instruments)B |
Pension contributions |
Other remunerationC |
Total |
||||||||||||||||
| 2023 | 14 | 17,109 | 14,711 | 6,439 | 4,775 | 7,135 | 50,169 | ||||||||||||||||
| 2022 | 14 | 18,178 | 15,466 | 6,797 | 5,339 | 6,956 | 52,736 | ||||||||||||||||
Thousands of euros | ||||||||
Year |
Number of people |
Deferred variable remuneration subject to long-term metricsA (50% in instruments)B |
||||||
| 2023 | 14 | 6,761 | ||||||
| 2022 | 14 | 7,137 | ||||||
Group |
Subsidiaries |
||||
| Board of directors | ||||||||||||||||||||
| Board of directors | ||||||||||||||||||||
 |
||||||||||||||||||||
Group Executive ChairA |
||||||||||||||||||||
|
The GSGM enhances control and oversight through:
Presence of Group Santander on the subsidiaries' boards of directors, establishing guidelines for board structure, dynamics and effectiveness.
| ||
|
Group CEOB
 Regional headsC
|
CEO/Country head |  |
|||||||||||||||
Reporting of the CEO/country heads to the Group CEO/regional heads and Group executive committee. | ||
Control management and business functions, as well as Group global businessesD |
Control management and business functions, as well as local global businesses | |
||||||||||||
Interaction between the Group's and subsidiaries' control, management and business functions. | ||
Best practices and talent sharing across the whole Group and between subsidiaries is key to our success. |
Multiple point of entry structure that has proved to be a key resilience instrument and is a result of our diversification strategy. |
Continuous collaboration and daily interaction between local and corporate teams. |
||||||||||||||||||||||||||||||
A common set of corporate frameworks and policies across the Group adapted to local market conditions. |
Synergies and economies of scale across the Group. |
Planning and implementation of new Group-wide and local initiatives to keep developing our management and control model. |
||||||||||||||||||||||||||||||
Section in the CNMV model |
Included in statistical report |
Comments |
||||||
| A. OWNERSHIP STRUCTURE | ||||||||
| A.1 | Yes | |||||||
| A.2 | Yes | |||||||
| A.3 | Yes | See 'Tenure and equity ownership' in section 4.2 and section 9.2 'Statistical information on corporate governance required by the CNMV'. |
||||||
| A.4 | No | See section 2.3 'Significant shareholders' where we explain there are no significant shareholders on their own account so this section does not apply. |
||||||
| A.5 | No | See section 2.3 'Significant shareholders' where we explain there are no significant shareholders on their own account so this section does not apply. |
||||||
| A.6 | No | See section 2.3 'Significant shareholders' where we explain there are no significant shareholders on their own account so this section does not apply. |
||||||
| A.7 | Yes | |||||||
| A.8 | Yes | Not applicable. See section 9.2 'Statistical information on corporate governance required by the CNMV'. |
||||||
| A.9 | Yes | |||||||
| A.10 | No | See sections 2.2 'Authority to increase capital' and 2.5 'Treasury shares'. |
||||||
| A.11 | Yes | |||||||
| A.12 | No | See section 'Voting rights and unrestricted share transfers' in section 3.2. |
||||||
| A.13 | No | See section 3.2 'Shareholder rights'. |
||||||
| A.14 | Yes | |||||||
Section in the CNMV model |
Included in statistical report |
Comments |
||||||
| C.1.29 | Yes | See section 4.1 'Our directors', 'Secretary of the board' in section 4.3 and section 9.2 'Statistical information on corporate governance as required by the CNMV'. |
||||||
| C.1.30 | No | See section 3.1 'Shareholder communication and engagement'and 'External auditor independence' in section 4.5. |
||||||
| C.1.31 | Yes | See 'Re-election of the external auditor' in section 4.5. |
||||||
| C.1.32 | Yes | In accordance with the CNMV’s instructions, see 'External auditor independence' in section 4.5 and sub-section C.1.32 of section 9.2 'Statistical information on corporate governance required by the CNMV'. Per the CNMV’s instructions on preparing annual reports on corporate governance, sub-section C.1.32 provides the fee ratios of non-audit services to total audit services, with these differences in the ratio set out in Regulation (EU) No 537/2014 that is included in section 4.5 'Audit committee activities in 2023': (a) the ratios in sub-section C.1.32 have two perimeters to the one established by Regulation (EU) No 537/2014: fees for the approved services to be performed by PricewaterhouseCoopers Auditores, S.L. (PwC) for Banco Santander and fees for the approved services to be performed by PwC and other firms in its network for all other Grupo Santander entities, in and outside Spain; and (b) the ratios' denominator is the fees amount for audit services in 2022 and not the average fee value from the past three consecutive years that Regulation (EU) No 537/2014 dictates. |
||||||
| C.1.33 | Yes | |||||||
| C.1.34 | Yes | |||||||
| C.1.35 | Yes | See 'Board operation' and 'Committee operation' in section 4.3. |
||||||
| C.1.36 | No | See 'Election, appointment, re-election and succession of directors' in section 4.2. |
||||||
| C.1.37 | No | Not applicable. See 'Duties and activities in 2023' in section 4.6. |
||||||
| C.1.38 | No | Not applicable. | ||||||
| C.1.39 | Yes | |||||||
| C.2 Board committees | ||||||||
| C.2.1 | Yes | See 'Structure of board committees' and 'Committee operation' in section 4.3, sections 4.4, 4.5, 4.6, 4.7, 4.8, 4.9, 4.10 and 9.2 'Statistical information on corporate governance required by the CNMV'. |
||||||
| C.2.2 | Yes | |||||||
| C.2.3 | No | See 'Board regulation' and 'Structure of board committees', 'Committee operation' in section 4.3 and 'Duties and activities in 2023' in sections 4.4, 4.5, 4.6, 4.7, 4.8, 4.9 and 4.10. |
||||||
| D. RELATED PARTY AND INTRAGROUP TRANSACTIONS | ||||||||
| D.1 | No | See 'Related-party transactions' in section 4.12. |
||||||
| D.2 | Yes | Not applicable. See 'Related-party transactions' in section 4.12. |
||||||
| D.3 | Yes | Not applicable. See 'Related-party transactions' in section 4.12. |
||||||
| D.4 | Yes | |||||||
| D.5 | Yes | Not applicable. See 'Related-party transactions' in section 4.12. |
||||||
| D.6 | No | See 'Other conflicts of interest' in section 4.12. |
||||||
| D.7 | Yes | Not applicable. See section 2.3 'Significant shareholders' and 'Other conflicts of interest' in section 4.12. |
||||||
| E. CONTROL AND RISK MANAGEMENT SYSTEMS | ||||||||
| E.1 | No | See chapter 'Risk, compliance & conduct management', in particular section 2.'Risk management and control model' and sections 1.2 'Impacts, risks and opportunities', 2.3 'Risk management' and 7.1.4 'Principles of action in tax matters' in the 'Responsible banking' chapter. |
||||||
| E.2 | No | See note 54 to the consolidated financial statements, section 2.3 'Risk and compliance governance' in the 'Risk, compliance & conduct management' chapter. See also sections 1.2 'Impacts, risks and opportunities', 2.2 'Governance' and 7.1.4 'Principles of action in tax matters' in the 'Responsible banking' chapter. |
||||||
| E.3 | No | See sections 2.2 'Key risk types', 3. 'Credit risk', 4. 'Market, structural and liquidity risk', 5. 'Capital risk', 6. 'Operational risk', 7. 'Compliance and conduct risk', 8. 'Model risk', 9. 'Strategic risk' and 10. 'ESG risk factors' in the 'Risk, compliance & conduct management' chapter. See also the 'Responsible banking' chapter and, for our capital needs, see section 3.5 'Capital management and adequacy. Solvency ratios' of the 'Economic and financial review' chapter. |
||||||
| E.4 | No | See section 2.4. 'Management processes and tools' in the 'Risk, compliance & compliance management' chapter and sections 1.2 'Impacts, risks and opportunities', 2.3 'Risk management' and 7.1.4 'Principles of action in tax matters' in the 'Responsible banking' chapter. |
||||||
| E.5 | No | See 3. 'Credit risk', 4. 'Market, structural and liquidity risk', 5. 'Capital risk', 6. 'Operational risk', 7 'Compliance and conduct risk', 8 .'Model risk', 9. 'Strategic risk' and in 10.'ESG risk factors' the 'Risk, compliance & conduct management' chapter. Additionally, see note 25e) in the 'Notes to the consolidated financial statements'. |
||||||
| E.6 | No | See sections 2.'Risk management and control model', 3. 'Credit risk', 4. 'Market, structural and liquidity risk', 5. 'Capital risk', 6. 'Operational risk', 7. 'Compliance and conduct risk', 8. 'Model risk', 9. 'Strategic risk' and 10.'ESG risk factors' in the 'Risk, compliance & conduct management' chapter. See also sections 2.2 'Governance' and 2.3 'Risk management' in the in the 'Responsible banking' chapter. |
||||||
Section in the CNMV model |
Included in statistical report |
Comments |
||||||
| F. ICFRS | ||||||||
| F.1 | No | See section 8.1 'Control environment'. |
||||||
| F.2 | No | See section 8.2 'Risk assessment in financial reporting'. |
||||||
| F.3 | No | See section 8.3 'Control activities'. |
||||||
| F.4 | No | See section 8.4 'Information and communication'. |
||||||
| F.5 | No | See section 8.5 'Monitoring of system functioning'. |
||||||
| F.6 | No | Not applicable. | ||||||
| F7 | No | See section 8.6 'External auditor report'. |
||||||
| G. DEGREE OF COMPLIANCE WITH CORPORATE GOVERNANCE RECOMMENDATIONS | ||||||||
| G | Yes | |||||||
| H. OTHER INFORMATION OF INTEREST | ||||||||
| H | No | See 'Board regulation' in section 4.3. Banco Santander also complies with the Polish Code of Best Practices, except in areas where regulation is different in Spain and Poland. In addition, see sections 7. 'Business conduct' and 9.2 'Main internal regulations and governance', in particular, 9.1 'Stakeholder engagement', in the Responsible banking chapter. |
||||||
| Date of last modification |
Share capital (euros) |
Number of shares |
Number of voting rights |
||||||||
| 30/06/2023 | 8,092,073,029.50 | 16,184,146,059 | 16,184,146,059 | ||||||||
| % of voting rights attributed to shares |
% of voting rights through financial instruments |
Total % of voting rights | ||||||||||||||||||
| Name or corporate name of shareholder | Direct | Indirect | Direct | Indirect | ||||||||||||||||
| BlackRock Inc. | 0 | 5.08 | 0 | 0.346 | 5.43 | |||||||||||||||
| Dodge & Cox | 0 | 3.04 | 0 | 0 | 3.04 | |||||||||||||||
| Name or corporate name of the indirect shareholder | Name or corporate name of the direct shareholder | % of voting rights attributed to shares | % of voting rights through financial instruments | Total % of voting rights | ||||||||||
| BlackRock Inc. | Subsidiaries of BlackRock Inc. | 5.08 | 0.346 | 5.43 | ||||||||||
| Dodge & Cox | Funds and portfolios managed by Dodge & Cox | 3.04 | 0 | 3.04 | ||||||||||
Name or corporate name of director |
% of voting rights attributed to shares (including loyalty votes) |
% of voting rights through financial instruments |
Total % of voting rights |
From the total % of voting rights attributed to the shares, indicate, where appropriate, the % of the additional votes attributed corresponding to the shares with a loyalty vote | ||||||||||||||||||||||
Direct |
Indirect |
Direct |
Indirect |
Direct |
Indirect |
|||||||||||||||||||||
| Ana Botín-Sanz de Sautuola y O’Shea | 0.01 | 0.19 | 0.00 | 0.00 | 0.20 | 0.00 | 0.00 | |||||||||||||||||||
Héctor Grisi Checa |
0.01 | 0.00 | 0.00 | 0.00 | 0.01 | 0.00 | 0.00 | |||||||||||||||||||
Glenn Hutchins |
0.00 | 0.00 | 0.00 | 0.00 | 0.00 | 0.00 | 0.00 | |||||||||||||||||||
| José Antonio Álvarez Álvarez | 0.02 | 0.00 | 0.00 | 0.00 | 0.02 | 0.00 | 0.00 | |||||||||||||||||||
| Homaira Akbari | 0.00 | 0.00 | 0.00 | 0.00 | 0.00 | 0.00 | 0.00 | |||||||||||||||||||
| Javier Botín-Sanz de Sautuola y O’Shea | 0.03 | 0.16 | 0.00 | 0.00 | 0.19 | 0.00 | 0.00 | |||||||||||||||||||
| Bruce Carnegie-Brown | 0.00 | 0.00 | 0.00 | 0.00 | 0.00 | 0.00 | 0.00 | |||||||||||||||||||
| Sol Daurella Comadrán | 0.00 | 0.00 | 0.00 | 0.00 | 0.00 | 0.00 | 0.00 | |||||||||||||||||||
| Germán de la Fuente | 0.00 | 0.00 | 0.00 | 0.00 | 0.00 | 0.00 | 0.00 | |||||||||||||||||||
| Henrique de Castro | 0.00 | 0.00 | 0.00 | 0.00 | 0.00 | 0.00 | 0.00 | |||||||||||||||||||
| Gina Díez Barroso | 0.00 | 0.00 | 0.00 | 0.00 | 0.00 | 0.00 | 0.00 | |||||||||||||||||||
| Luis Isasi Fernández de Bobadilla | 0.00 | 0.00 | 0.00 | 0.00 | 0.00 | 0.00 | 0.00 | |||||||||||||||||||
| Ramiro Mato García Ansorena | 0.00 | 0.00 | 0.00 | 0.00 | 0.00 | 0.00 | 0.00 | |||||||||||||||||||
| Sergio Rial | 0.00 | 0.00 | 0.00 | 0.00 | 0.00 | 0.00 | 0.00 | |||||||||||||||||||
| Belén Romana García | 0.00 | 0.00 | 0.00 | 0.00 | 0.00 | 0.00 | 0.00 | |||||||||||||||||||
| Pamela Walkden | 0.00 | 0.00 | 0.00 | 0.00 | 0.00 | 0.00 | 0.00 | |||||||||||||||||||
| % total voting rights held by the board of directors | 0.43 | |||||||||||||||||||||||||
% total voting rights represented on the board of directors |
0.77 | |||||||||||||||||||||||||
| Name or corporate name of director | Name or corporate name of direct owner | % of voting rights attributed to shares | % of voting rights through financial instruments | Total % of voting rights | From the total % of voting rights attributed to the shares, indicate, where appropriate, the % of the additional votes attributed corresponding to the shares with a loyalty vote |
||||||||||||
| _ | _ | _ | _ | _ | _ | ||||||||||||
| Parties to the shareholders’ agreement | % of share capital affected |
Brief description of agreement | Expiry date, if applicable |
|||||||||||
| Javier Botín-Sanz de Sautuola y O’Shea (directly and indirectly through Agropecuaria El Castaño, S.L.U.) Emilio Botín-Sanz de Sautuola y O’Shea, Puente San Miguel, S.L.U. Ana Botín-Sanz de Sautuola y O’Shea, CRONJE, S.L.U. Nueva Azil, S.L. Carmen Botín-Sanz de Sautuola y O’Shea Paloma Botín-Sanz de Sautuola y O’Shea Bright Sky 2012, S.L. |
0.67 | Transfer restrictions and syndication of voting rights as described under section 2.4 'Shareholders’ agreements' of the 'Corporate governance' chapter in the annual report. The communications to CNMV relating to this shareholders' agreement can be found in material facts with entry numbers 64179, 171949, 177432, 194069, 211556, 218392, 223703, 226968 and 285567 filed in CNMV on 17 February 2006, 3 August 2012, 19 November 2012, 17 October, 2013, 3 October 2014, 6 February 2015, 29 May 2015, 29 July 2015 and 31 December 2019, respectively. |
01/01/2056 | |||||||||||
| Participants in the concerted action | % of share capital affected |
Brief description of concerted action | Expiry date, if applicable |
|||||||||||
| Javier Botín-Sanz de Sautuola y O’Shea (directly and indirectly through Agropecuaria El Castaño, S.L.U.) Emilio Botín-Sanz de Sautuola y O’Shea, Puente San Miguel, S.L.U. Ana Botín-Sanz de Sautuola y O’Shea, CRONJE, S.L.U. Nueva Azil, S.L. Carmen Botín-Sanz de Sautuola y O’Shea Paloma Botín-Sanz de Sautuola y O’Shea Bright Sky 2012, S.L. |
0.67 | Transfer restrictions and syndication of voting rights as described under section 2.4 'Shareholders’ agreements' of the 'Corporate governance' chapter in the annual report. The communications to CNMV relating to this shareholders' agreement can be found in material facts with entry numbers 64179, 171949, 177432, 194069, 211556, 218392, 223703, 226968 and 285567 filed in CNMV on 17 February 2006, 3 August 2012, 19 November 2012, 17 October, 2013, 3 October 2014, 6 February 2015, 29 May 2015, 29 July 2015 and 31 December 2019, respectively. |
01/01/2056 | |||||||||||
Number of shares held directly |
Number of shares held indirectly (*) | % of total share capital |
||||||
| 286,842,316 | 10,973,357 | 1.84% | ||||||
Name or corporate name of the direct shareholder |
Number of shares held directly |
||||
| Pereda Gestión, S.A. | 9,000,000 | ||||
| Banco Santander Río, S.A. | 629,222 | ||||
| Banco Santander México, S.A. | 1,344,135 | ||||
| Total: | 10,973,357 | ||||
| % | |||||
| Estimated free float | 88.49 | ||||
Attendance data |
|||||||||||||||||
% remote voting |
|||||||||||||||||
Date of General Meeting |
% attending in person | % by proxy | Electronic means | Other | Total | ||||||||||||
| 26/03/2021 | 0.06 | 65.02 | 2.04 | 0.55 | 67.67 | ||||||||||||
| Of which free float: | 0.01 | 64.03 | 2.04 | 0.55 | 66.63 | ||||||||||||
Attendance data |
|||||||||||||||||
% remote voting |
|||||||||||||||||
Date of General Meeting |
% attending in person | % by proxy | Electronic means | Other | Total | ||||||||||||
| 01/04/2022 | 0.71 | 65.41 | 2.08 | 0.57 | 68.77 | ||||||||||||
| Of which free float: | 0.09 | 64.98 | 2.08 | 0.57 | 67.72 | ||||||||||||
Attendance data |
|||||||||||||||||
% remote voting |
|||||||||||||||||
Date of General Meeting |
% attending in person |
% by proxy |
Electronic means |
Other |
Total |
||||||||||||
| 31/03/2023 | 0.72 | 64.20 | 2.22 | 0.42 | 67.56 | ||||||||||||
| Of which free float: | 0.06 | 63.73 | 2.22 | 0.42 | 66.43 | ||||||||||||
| Maximum number of directors | 17 | ||||
| Minimum number of directors | 12 | ||||
| Number of directors set by the General Meeting | 15 | ||||
|
Name or corporate
name of director
|
Representative |
Category of
director
|
Position in
the board
|
Date of first
appointment
|
Date of last
appointment
|
Election procedure |
||||||||||||||
| Ana Botín-Sanz de Sautuola y O’Shea | N/A | Executive | Chair | 04/02/1989 | 31/03/2023 | Vote in general shareholders’ meeting | ||||||||||||||
Héctor Grisi Checa |
N/A |
Executive |
Chief Executive Officer |
20/12/2022 | 31/03/2023 | Vote in general shareholders’ meeting | ||||||||||||||
| Glenn Hutchins | N/A | Independent | Lead Independent Director |
20/12/2022 | 31/03/2023 | Vote in general shareholders’ meeting | ||||||||||||||
| José Antonio Álvarez Álvarez | N/A | Other external | Director | 25/11/2014 | 01/04/2022 | Vote in general shareholders’ meeting | ||||||||||||||
| Homaira Akbari | N/A | Independent | Director | 27/09/2016 | 31/03/2023 | Vote in general shareholders’ meeting | ||||||||||||||
| Javier Botín-Sanz de Sautuola y O’Shea | N/A | Other external | Director | 25/07/2004 | 26/03/2021 | Vote in general shareholders’ meeting | ||||||||||||||
| Bruce Carnegie-Brown | N/A | Independent | Director | 25/11/2014 | 26/03/2021 | Vote in general shareholders’ meeting | ||||||||||||||
| Sol Daurella Comadrán | N/A | Independent | Director | 25/11/2014 | 31/03/2023 | Vote in general shareholders’ meeting | ||||||||||||||
| Henrique de Castro | N/A | Independent | Director | 12/04/2019 | 01/04/2022 | Vote in general shareholders’ meeting | ||||||||||||||
| Germán de la Fuente | N/A | Independent | Director | 01/04/2022 | 01/04/2022 | Vote in general shareholders’ meeting | ||||||||||||||
| Gina Díez Barroso | N/A | Independent | Director | 22/12/2020 | 31/03/2023 | Vote in general shareholders’ meeting | ||||||||||||||
| Luis Isasi Fernández de Bobadilla | N/A | Other external | Director | 03/04/2020 | 01/04/2022 | Vote in general shareholders' meeting | ||||||||||||||
| Ramiro Mato García-Ansorena | N/A | Independent | Director | 28/11/2017 | 26/03/2021 | Vote in general shareholders´ meeting | ||||||||||||||
| Belén Romana García | N/A | Independent | Director | 22/12/2015 | 01/04/2022 | Vote in general shareholders’ meeting | ||||||||||||||
| Pamela Walkden | N/A | Independent | Director | 29/10/2019 | 31/03/2023 | Vote in general shareholders’ meeting | ||||||||||||||
| Total number of directors | 15 | |||||||||||||||||||
Name or corporate name of director |
Category of director at the time he/her left |
Date of last appointment |
Date of leave |
Board committees he or she was a member of |
Indicate whether he or she has left before the expiry of his or her term |
||||||||||||
Sergio Rial |
Other external |
03/04/2020 | 01/01/2023 | – |
YES | ||||||||||||
| Executive directors | ||||||||
| Name or corporate name of director | Position held in the company | Profile | ||||||
| Ana Botín-Sanz de Sautuola y O’Shea | Executive Chair |
See section 4.1 'Our directors' in the 'Corporate governance' chapter in the annual report. |
||||||
Héctor Grisi Checa |
CEO | See section 4.1 'Our directors' in the 'Corporate governance' chapter in the annual report. |
||||||
| Total number of executive directors | 2 | |||||||
| % of the Board | 13.33 | |||||||
Proprietary non-executive directors | ||||||||
Name or corporate name of director |
Name or corporate name of significant shareholder represented or having proposed his or her appointment |
Profile |
||||||
| N/A | N/A | N/A | ||||||
| Total number of proprietary non-executive directors | 0 | |||||||
| % of the Board | 0 | |||||||
Independent directors | |||||
Name or corporate name of director |
Profile |
||||
Glenn Hutchins |
See section 4.1 'Our directors' in the 'Corporate governance' chapter in the annual report. |
||||
| Homaira Akbari | See section 4.1 'Our directors' in the 'Corporate governance' chapter in the annual report. |
||||
Bruce Carnegie-Brown |
See section 4.1 'Our directors' in the 'Corporate governance' chapter in the annual report. |
||||
| Sol Daurella Comadrán | See section 4.1 'Our directors' in the 'Corporate governance' chapter in the annual report. |
||||
| Henrique de Castro | See section 4.1 'Our directors' in the 'Corporate governance' chapter in the annual report. |
||||
Germán de la Fuente |
See section 4.1 'Our directors' in the 'Corporate governance' chapter in the annual report. |
||||
| Gina Díez Barroso | See section 4.1 'Our directors' in the 'Corporate governance' chapter in the annual report. |
||||
| Ramiro Mato García-Ansorena | See section 4.1 'Our directors' in the 'Corporate governance' chapter in the annual report. |
||||
| Belén Romana Garcia | See section 4.1 'Our directors' in the 'Corporate governance' chapter in the annual report. |
||||
| Pamela Walkden | See section 4.1 'Our directors' in the 'Corporate governance' chapter in the annual report. |
||||
| Total number of independent directors | 10 | ||||
| % of the Board | 66.67 | ||||
| Name or corporate name of director | Description of the relationship | Reasoned statement | ||||||
| Sol Daurella | Business/Financing |
When conducting the annual verification of the independence of directors classified as independent, the nomination committee analysed the business relationships between Grupo Santander and the companies in which they are or have previously been principal shareholders, directors or senior managers.
The committee concluded that the business relationships maintained and the funding Grupo Santander granted to companies in which Sol Daurella was a principal shareholder or director in 2023 were not significant because, among other reasons: (i) did not generate economic dependence on the companies involved in view of the substitutability of this funding by other sources, whether banks or others, (ii) were aligned with Grupo Santander's share in the corresponding market, and (iii) did not reach certain comparable materiality thresholds used in other jurisdictions, e.g. NYSE, Nasdaq and the Canadian Bank Act.
|
||||||
| Henrique de Castro | Business |
When conducting the annual verification of the independence of directors classified as independent, the nomination committee analysed the business relationships between Grupo Santander and the companies in which they are or have previously been principal shareholders, directors or senior managers.
The committee concluded that the business relationships maintained between Grupo Santander and the company in which Henrique de Castro was a director in 2023 were not significant because, among other reasons they did not reach certain comparable materiality thresholds used in other jurisdictions, e.g. NYSE and Nasdaq.
|
||||||
| Gina Díez Barroso | Business/Financing |
When conducting the annual verification of the independence of directors classified as independent, the nomination committee analysed the business relationships between Grupo Santander and the companies in which they are or have previously been principal shareholders, directors or senior managers.
The committee concluded that the business relationships maintained and the funding granted by Grupo Santander to the companies in which Gina Díez Barroso was a principal shareholder and director in 2023 were not significant because, among other reasons: (i) did not generate a situation of economic dependence on the company involved in view of the substitutability of this funding by other sources, whether banks or others, (ii) were aligned with Grupo Santander's share in the corresponding market, and (iii) did not reach certain comparable materiality thresholds used in other jurisdictions, e.g. NYSE, Nasdaq and the Canadian Bank Act.
|
||||||
| Glenn Hutchins | Financing |
When conducting the annual verification of the independence of directors classified as independent, the nomination committee analysed the business relationships between Grupo Santander and the companies in which they are or have previously been principal shareholders, directors or senior managers.
The committee concluded that the funding Grupo Santander granted to the company in which Glenn Hutchins was a director in 2023 was not significant because, among other reasons: (i) did not generate economic dependence on the companies involved in view of the substitutability of this funding by other sources, whether banks or others, (ii) was aligned with Grupo Santander's share in the corresponding market, and (iii) did not reach certain comparable materiality thresholds used in other jurisdictions, e.g. NYSE, Nasdaq and the Canadian Bank Act.
|
||||||
| Belén Romana | Business/Financing |
When conducting the annual verification of the independence of directors classified as independent, the nomination committee analysed the business relationships between Grupo Santander and the companies in which they are or have previously been principal shareholders, directors or senior managers.
The committee concluded that the business relationships maintained and the funding Grupo Santander granted to the companies in which Belén Romana was a director in 2023 were not significant because, among other reasons: (i) did not generate economic dependence on the companies involved in view of the substitutability of this funding by other sources, whether banks or others, (ii) were aligned with Grupo Santander's share in the corresponding market, and (iii) did not reach certain comparable materiality thresholds used in other jurisdictions, e.g. NYSE, Nasdaq and the Canadian Bank Act.
|
||||||
Other external directors | |||||
| Name or corporate name of director | Reasons | Company, manager or shareholder to which or to whom the director is related | Profile | ||||||||
José Antonio Álvarez Álvarez |
Given that Mr Álvarez was the former CEO of Banco Santander until 31 December 2022, pursuant to sub-section 4.a) of article 529 duodecies of the Spanish Companies Act. |
Banco Santander, S.A. |
See section 4.1 'Our directors' in the Corporate governance chapter in the annual report. |
||||||||
| Javier Botín-Sanz de Sautuola y O’Shea | Given that Mr Botín has been director for over 12 years, pursuant to sub-section 4. i) of article 529 duodecies of the Spanish Companies Act. |
Banco Santander, S.A. | See section 4.1 'Our directors' in the Corporate governance chapter in the annual report. |
||||||||
| Luis Isasi Fernández de Bobadilla | Under prudent criteria given his remuneration as non-executive Chair of Santander España’s body as supervisor, unit without its own corporate identity separate to Banco Santander, pursuant to sub-sections 2 to 4 of article 529 duodecies of the Spanish Companies Act. |
Banco Santander, S.A. | See section 4.1 'Our directors' in the Corporate governance chapter in the annual report. |
||||||||
| Total number of other external directors | 3 | ||||||||||
| % of the Board | 20.00 | ||||||||||
Name or corporate name of director |
Date of change |
Previous category |
Current category |
||||||||
José Antonio Álvarez Álvarez |
01/01/2023 | Executive |
Other external |
||||||||
Number of female directors |
% of total directors of each category | |||||||||||||||||||||||||
FY 2023 |
FY 2022 | FY 2021 | FY 2020 | FY 2023 |
FY 2022 | FY 2021 | FY 2020 | |||||||||||||||||||
| Executive | 1 | 1 | 1 | 1 | 50.00 | 50.00 | 50.00 | 33.33 | ||||||||||||||||||
| Proprietary | — | — | — | — | 0.00 | 0.00 | 0.00 | 0.00 | ||||||||||||||||||
| Independent | 5 | 5 | 5 | 5 | 50.00 | 50.00 | 50.00 | 50.00 | ||||||||||||||||||
| Other external | — | — | — | — | 0.00 | 0.00 | 0.00 | 0.00 | ||||||||||||||||||
| Total: | 6 | 6 | 6 | 6 | 40.00 | 40.00 | 40.00 | 40.00 | ||||||||||||||||||
| Identity of the director or representative | Company name of the listed or non-listed entity |
Position |
Remunerated YES/NO | ||||||||
| Ana Botín-Sanz de Sautuola y O’Shea | The Coca-Cola Company | Director | YES | ||||||||
Héctor Grisi Checa |
Cogrimex, S.A. de C.V. |
Chair |
NO |
||||||||
| Bruce Carnegie-Brown | Lloyd's of London | Chair | YES | ||||||||
| Cuvva Limited | Chair | YES | |||||||||
| Javier Botín-Sanz de Sautuola y O’Shea | JB Capital Markets, S. V., S.A.U. |
Chair | YES | ||||||||
| Inversiones Zulú, S.L. | Chair-chief executive officer | NO | |||||||||
Agropecuaria El Castaño, S.L.E |
Joint administrator |
NO | |||||||||
| Inversiones Peña Cabarga, S.L. | Joint and several administrator |
NO | |||||||||
| Homaira Akbari | Landstar System, Inc. | Director | YES | ||||||||
| AKnowledge Partners, LLC | Chief executive officer | YES | |||||||||
| Sol Daurella Comadrán | Coca-Cola Europacific Partners PLC | Chair | YES | ||||||||
| Cobega, S.A. | Representative of director | NO | |||||||||
| Equatorial Coca Cola Bottling Company, S.L. | Director | YES | |||||||||
| Cobega Invest S.L. | Joint administrator |
NO | |||||||||
| Olive Partners, S.A. | Representative of director | NO | |||||||||
| Indau, S.A.R.L. | Joint and several administrator |
YES | |||||||||
| Henrique de Castro | Fiserv Inc. | Director | YES | ||||||||
| Stakecorp Capital, s.a.r.l. | Director | NO | |||||||||
| Gina Díez Barroso Azcárraga | Grupo Diarq, S.A. de C.V. | Chair | NO | ||||||||
| Dalia Women, S.A.P.I. de C.V. | Director | NO | |||||||||
| Centro de Diseño y Comunicación, S.C. | Chair | NO | |||||||||
| Bolsa Mexicana de Valores, S.A.B. de C.V. | Director | YES | |||||||||
| Glenn Hogan Hutchins | AT&T Inc. | Director | YES | ||||||||
| North Island, LL | Chair | NO | |||||||||
| North Island Ventures, LLC | Chair | NO | |||||||||
| Luis Isasi Fernández de Bobadilla | Compañía de Distribución Integral Logista Holdings, S.A. | Vice Chair |
YES | ||||||||
| Balcón del Parque, S.L. | Sole administrator | NO | |||||||||
Santa Clara de C. Activos, S.L. |
Director | NO | |||||||||
| Ramiro Mato García-Ansorena | Ansorena, S.A. |
Chair | NO | ||||||||
| Belén Romana García | Werfen, S.A. | Director | YES | ||||||||
| Six Group AG | Director | YES | |||||||||
SIX Digital Exchange AG |
Chair |
YES |
|||||||||
SDX Trading AG |
Chair |
YES |
|||||||||
| Bolsas y Mercados Españoles, Sociedad Holding de Mercados y Sistemas Financieros, S.A. | Director | YES | |||||||||
| Identity of the director or representative | Other paid activities | ||||
| Bruce Carnegie-Brown | Member of investment committee of Gresham House PLC | ||||
| Glenn Hogan Hutchins | Member of the international advisory board Government of Singapore Investment Corporation | ||||
| Member of the executive committee of Boston Celtics | |||||
| Luis Isasi Fernández de Bobadilla | Senior Advisor of Morgan Stanley | ||||
| Ramiro Mato García-Ansorena | External advisor of ACON Southern Europe Advisory, S.L. | ||||
| Belén Romana García | Senior advisor of Artá Capital, S.G.E.I.C., S.A | ||||
Academic director of the IE Leadership & Foresight Hub Programme | |||||
| Pamela Walkden | Member of the advisory board of JD Haspel Limited | ||||
| Board remuneration accrued in the fiscal year (EUR thousand) | 28,567 | ||||
| Funds accumulated by current directors for long-term savings systems with consolidated economic rights (EUR thousand) | 69,338 | ||||
Funds accumulated by current directors for long-term savings systems with unconsolidated economic rights (EUR thousand) |
0 | ||||
| Pension rights accumulated by former directors (EUR thousand) | 46,200 | ||||
Name or corporate name |
Position (s) |
||||
Mahesh Aditya |
Group Chief Risk Officer |
||||
Daniel Barriuso |
Global Head of Retail & Commercial Banking and Group Chief Transformation Officer |
||||
| Alexandra Brandão | Group Head of Human Resources |
||||
| Juan Manuel Cendoya Méndez de Vigo | Group Head of Communications, Corporate Marketing and Research |
||||
| José Francisco Doncel Razola | Group Chief Accounting Officer |
||||
| José Antonio García Cantera | Group Chief Financial Officer | ||||
| Juan Guitard Marín | Group Chief Audit Executive | ||||
| José Maria Linares Perou | Global Head of Corporate & Investment Banking |
||||
| Mónica Lopez-Monís Gallego | Group Head of Supervisory and Regulatory Relations |
||||
| Dirk Marzluf | Group Chief Operating & Technology Officer |
||||
| Víctor Matarranz Sanz de Madrid | Global Head of Wealth Management & Insurance |
||||
| José Luis de Mora Gil-Gallardo | Group Head of Digital Consumer Bank and Group Head of Corporate Development and Financial Planning |
||||
| Jaime Pérez Renovales | Group General Counsel |
||||
| Marjolein van Hellemondt-Gerdingh | Group Chief Compliance Officer | ||||
| Number of women in senior management | 3 | ||||
| Percentage of total senior management | 21.43 | ||||
| Total remuneration accrued by the senior management (EUR thousand) | 50,369 | ||||
| Number of board meetings | 15 | ||||
| Number of board meetings held without the Chair’s attendance | 0 | ||||
| Number of meetings | 5 | ||||
| Number of meetings of the audit committee | 15 | ||||
| Number of meetings of the responsible banking, sustainability and culture committee | 6 | ||||
| Number of meetings of the innovation and technology committee | 4 | ||||
| Number of meetings of the nomination committee | 13 | ||||
| Number of meetings of the remuneration committee | 12 | ||||
| Number of meetings of the risk supervision, regulation and compliance committee | 17 | ||||
| Number of meetings of the executive committee | 23 | ||||
| Number of meetings with at least 80% of directors being present | 15 | ||||
| % of votes cast by members present over total votes in the financial year | 100 | ||||
| Number of board meetings with all directors being present (or represented having given specific instructions) | 15 | ||||
| % of votes cast by members present at the meeting or represented with specific instructions over total votes in the financial year | 100 | ||||
Name |
Position | ||||
| José Francisco Doncel Razola | Group Chief Accounting Officer |
||||
Name or corporate name of the secretary |
Representative |
||||
| Jaime Pérez Renovales | N/A | ||||
| Company | Group companies | Total | |||||||||
| Amount of non-audit work (EUR thousand) | 9,372 | 10,192 | 19,564 | ||||||||
| Amount of non-audit work as a % of amount of audit work | 35.08 | 13.12 | 18.74 | ||||||||
Individual financial statements |
Consolidated financial statements |
|||||||
| Number of consecutive years | 8 | 8 | ||||||
Company |
Group |
|||||||
| Number of years audited by current audit firm/Number of years the company’s or its Group financial statements have been audited (%) | 19.05 | 19.51 | ||||||
| Procedures | ||
| Our Rules and regulations of the board foresees that members of the board and committees are provided with the relevant documentation for each meeting sufficiently in advance of the meeting date. | ||
| Number of beneficiaries | 22 | ||||
| Type of beneficiary | Description of the agreement: | ||||
| Employees | The Bank has no commitments to provide severance pay to directors. A number of employees have a right to compensation equivalent to one to two years of their basic salary in the event of their contracts being terminated by the Bank in the first two years of their contract in the event of dismissal on grounds other than their own will, retirement, disability or serious dereliction of duties. In addition, for the purposes of legal compensation, in the event of redundancy a number of employees are entitled to recognition of length of service including services provided prior to being contracted by the Bank; this would entitle them to higher compensation than they would be due based on their actual length of service with the Bank itself. |
||||
| Board of directors | General Shareholders’ Meeting | |||||||
| Body authorising clauses | √ | |||||||
YES |
NO |
|||||||
| Is the general shareholders’ meeting informed of such clauses? | √ | |||||||
Executive committee | ||||||||
Name |
Position |
Type |
||||||
| Ana Botín-Sanz de Sautuola y O’Shea | Chair | Executive director | ||||||
Héctor Grisi Checa |
Member |
Executive director |
||||||
| José Antonio Álvarez Álvarez | Member | Other external director | ||||||
| Luis Isasi Fernández de Bobadilla | Member | Other external director | ||||||
| Ramiro Mato García-Ansorena | Member | Independent director | ||||||
| Belén Romana García | Member | Independent director | ||||||
| % of executive directors | 33.33 | |||||||
| % of proprietary directors | 0.00 | |||||||
| % of independent directors | 33.33 | |||||||
| % of other external directors | 33.33 | |||||||
| Audit committee | ||||||||
Name |
Position |
Type |
||||||
| Pamela Walkden | Chair | Independent director | ||||||
| Homaira Akbari | Member | Independent director | ||||||
| Henrique de Castro | Member | Independent director | ||||||
| Germán de la Fuente | Member | Independent director | ||||||
| Ramiro Mato García-Ansorena | Member | Independent director | ||||||
| Belén Romana García | Member | Independent director | ||||||
| % of executive directors | 0 | |||||||
| % of proprietary directors | 0 | |||||||
| % of independent directors | 100 | |||||||
| % of other external directors | 0 | |||||||
Name of directors with accounting or audit experience |
Pamela Walkden
Belén Romana García
Homaira Akbari Germán de la Fuente Henrique de Castro
Ramiro Mato García-Ansorena
|
||||
Date of appointment of the committee chair for that position |
26 April 2020 |
||||
| Nomination committee | ||||||||
Name |
Position |
Type |
||||||
Bruce Carnegie-Brown |
Chair |
Independent director | ||||||
Sol Daurella Comadrán |
Member |
Independent director | ||||||
| Gina Díez Barroso | Member | Independent director | ||||||
| Glenn Hutchins | Member | Independent director | ||||||
% of executive directors |
0 | |||||||
% of proprietary directors |
0 | |||||||
% of independent directors |
100 | |||||||
| % of other external directors | 0 | |||||||
| Remuneration committee | ||||||||
Name |
Position |
Type |
||||||
Glenn Hogan Hutchins |
Chair |
Independent director | ||||||
Bruce Carnegie-Brown |
Member |
Independent director | ||||||
Sol Daurella Comadrán |
Member |
Independent director | ||||||
Henrique de Castro |
Member |
Independent director | ||||||
| Luis Isasi Fernández de Bobadilla | Member | Other external director | ||||||
% of executive directors |
0 | |||||||
% of proprietary directors |
0 | |||||||
% of independent directors |
80.00 | |||||||
% of other external directors |
20.00 | |||||||
| Risk supervision, regulation and compliance committee | ||||||||
Name |
Position |
Type |
||||||
| Belén Romana García | Chair |
Independent director | ||||||
Germán de la Fuente |
Member |
Independent director | ||||||
Luis Isasi Fernández de Bobadilla |
Member |
Other external director |
||||||
Ramiro Mato García-Ansorena |
Member |
Independent director | ||||||
Pamela Walkden |
Member |
Independent director | ||||||
% of executive directors |
0 | |||||||
% of proprietary directors |
0 | |||||||
% of independent directors |
80.00 | |||||||
% of other external directors |
20.00 | |||||||
| Responsible banking, sustainability and culture committee | ||||||||
Name |
Position |
Type |
||||||
Ramiro Mato García-Ansorena |
Chair |
Independent director | ||||||
Homaira Akbari |
Member |
Independent director | ||||||
Sol Daurella Comadrán |
Member |
Independent director | ||||||
Gina Díez Barroso |
Member |
Independent director | ||||||
Belén Romana García |
Member |
Independent director | ||||||
% of executive directors |
0 | |||||||
% of proprietary directors |
0 | |||||||
% of independent directors |
100 | |||||||
% of other external directors |
0 | |||||||
| Innovation and technology committee | ||||||||
Name |
Position |
Type |
||||||
| Ana Botín-Sanz de Sautuola y O'Shea | Chair | Executive director | ||||||
Homaira Akbari |
Member |
Independent director | ||||||
José Antonio Álvarez Álvarez |
Member |
Other external director |
||||||
Henrique de Castro |
Member |
Independent director | ||||||
Héctor Grisi Checa |
Member |
Executive director |
||||||
Glenn Hogan Hutchins |
Member |
Independent director | ||||||
Belén Romana García |
Member |
Independent director | ||||||
% of executive directors |
28.57 | |||||||
% of proprietary directors |
0.00 | |||||||
% of independent directors |
57.14 | |||||||
| % of other external directors | 14.29 | |||||||
Number of female directors |
|||||||||||||||||||||||||||||||||||
| FY 2023 | FY 2022 | FY 2021 | FY 2020 | ||||||||||||||||||||||||||||||||
| Number | % | Number | % | Number | % | Number |
% |
||||||||||||||||||||||||||||
Audit committee |
3 | 50.00 | 3 | 50.00 | 3 | 60.00 | 3 | 60.00 | |||||||||||||||||||||||||||
Responsible banking, sustainability and culture committee |
4 | 80.00 | 3 | 75.00 | 3 | 60.00 | 3 | 60.00 | |||||||||||||||||||||||||||
Innovation and technology committee |
3 | 42.86 | 3 | 42.86 | 3 | 42.86 | 3 | 42.85 | |||||||||||||||||||||||||||
Nomination committee |
2 | 50.00 | 2 | 50.00 | 2 | 50.00 | 1 | 33.33 | |||||||||||||||||||||||||||
Remuneration committee |
1 | 20.00 | 1 | 20.00 | 1 | 20.00 | 1 | 20.00 | |||||||||||||||||||||||||||
Risk supervision, regulation and compliance committee |
2 | 40.00 | 2 | 50.00 | 2 | 40.00 | 1 | 20.00 | |||||||||||||||||||||||||||
Executive committee |
2 | 33.33 | 2 | 33.33 | 2 | 33.33 | 2 | 33.33 | |||||||||||||||||||||||||||
| Corporate name of the group company | Brief description of the transaction and any other information necessary for its evaluation | Amount (EUR thousand) | ||||||
|
The information included in this chart shows the transactions and the results obtained by the Bank in Spain and its foreign branches as of 31 December 2023 with Group entities resident in countries or territories that were considered non-cooperative jurisdictions pursuant to Spanish legislation, at such date (Law 11/2021 on measures to prevent and fight against tax fraud).
These results, and the balances indicated below, were eliminated in the consolidation process. See note 3 to the 2023 consolidated financial statements for more information on offshore entities.
| ||||||||
| Banco Santander (Brasil) S.A. (Cayman Islands Branch) |
The amount shown on the right corresponds to negative results (including results due to exchange differences) relating to contracting of derivatives.
The referred derivatives had a net negative market value of EUR 697 million and covered the following transactions:
- 142 Non Delivery Forwards.
- 175 Swaps.
- 55 Cross Currency Swaps.
- 24 Options.
- 26 Forex.
|
416,850 | ||||||
The amount shown on the right corresponds to negative results relating to demand deposits (liability). These deposits had a nominal value of EUR 2,311 million as of 31 December 2023. |
61,906 | |||||||
The amount shown on the right corresponds to positive results relating to demand deposits (asset). These deposits had a nominal value of EUR 19 million as of 31 December 2023. |
22 | |||||||
The amount shown on the right corresponds to positive results relating to fixed income securities-subordinated instruments (asset). This relates to the investment in November 2018 in two subordinated instruments (Tier I Subordinated Perpetual Notes and Tier II Subordinated Notes with maturity 2028, but with a full and early redemption option exercised in November 2023). Tier I Notes had an amortised cost of EUR 1,146 million as of 31 December 2023. |
148,680 | |||||||
The amount shown on the right corresponds to negative results relating to interests and commissions concerning correspondent accounts (liability). This relates to correspondent accounts with a credit balance of EUR 22 million as of 31 December 2023. |
412 | |||||||
The amount shown on the right corresponds to positive results relating to commissions received. |
139 | |||||||
Section in the CNMV model |
Included in statistical report |
Further information elsewhere and comments |
||||||
| A. Remuneration policy for the present fiscal year | ||||||||
| A.1 | No |
•See section 6.4: A.1.1, A.1.2, A.1.3, A.1.4, A.1.5, A.1.6, A.1.7, A.1.8, A.1.9, A.1.10, A.1.11 (note 5), A.1.12.
•See 'Summary of link between risk, performance and reward' in section 6.3.
|
||||||
| A.2 | No | See section 6.4. |
||||||
| A.3 | No | See section 6.4. See Introduction. |
||||||
| A.4 | No | See section 6.5. |
||||||
| B. Overall summary of application of the remuneration policy over the last fiscal year | ||||||||
| B.1 | No |
For B.1.2 y B.1.3 (not applicable) see section 6.5.
|
||||||
| B.2 | No | See 'Summary of link between risk, performance and reward' in section 6.3. |
||||||
| B.3 | No | |||||||
| B.4 | No | See section 6.5. |
||||||
| B.5 | No | |||||||
| B.6 | No | See 'Gross annual salary' in section 6.3. |
||||||
| B.7 | No | |||||||
| B.8 | No | Not applicable. | ||||||
| B.9 | No | See 'Main features of the benefit plans' in section 6.3. |
||||||
| B.10 | No | See 'Other remuneration' in section 6.3. |
||||||
| B.11 | No | See 'Terms and conditions of executive directors´ contracts' in section 6.4. |
||||||
| B.12 | No | See section 6.3: "Remuneration of board members as representatives of Banco Santander" |
||||||
| B.13 | No | See note 5 to the consolidated financial statements. |
||||||
| B.14 | No | See 'Insurance and other remuneration and benefits in kind' in section 6.4. |
||||||
| B.15 | No | See 'Remuneration of board members as representatives of the Bank' in section 6.3. |
||||||
| B.16 | No | No remuneration for this component. | ||||||
| C. Breakdown of the individual remuneration of directors | ||||||||
| C | Yes | See section 9.5. |
||||||
| C.1 a) i) | Yes |
See section 9.5. |
||||||
C.1 a) ii) |
Yes |
See section 9.5. |
||||||
C.1 a) iii) |
Yes |
See section 9.5. |
||||||
C.1 a) iii) |
Yes |
See section 9.5. |
||||||
C.1 b) i) |
Yes |
See section 9.5. |
||||||
C.1 b) ii) |
No |
No remuneration for this component. |
||||||
C.1 b) iii) |
No |
No remuneration for this component. |
||||||
C.1 b) iv) |
No |
No remuneration for this component. |
||||||
C.1 c) |
Yes |
See section 9.5. |
||||||
| C.2 | Yes | See section 9.5. |
||||||
| D. Other information of interest | ||||||||
D |
No |
See section 4.7 |
||||||
| Number | % of total | |||||||
| Votes cast | 11,116,958,970 | 100.00 | % | |||||
| Number | % of votes cast | |||||||
| Votes in favour | 9,886,665,679 | 88.93 | % | |||||
| Votes against | 1,194,192,063 | 10.74 | % | |||||
| Blank | 7,043,064 | 0.06 | % | |||||
| Abstentions | 29,058,164 | 0.26 | % | |||||
| Directors | Type | Period of accrual in year 2023 | ||||||
| Ana Botín-Sanz de Sautuola y O’Shea | Executive Chair | From 01/01/2023 to 31/12/2023 | ||||||
| Héctor Grisi Checa | CEO | From 01/01/2023 to 31/12/2023 | ||||||
| José Antonio Álvarez Álvarez | Vice-Chair | From 01/01/2023 to 31/12/2023 | ||||||
| Bruce Carnegie-Brown | Independent | From 01/01/2023 to 31/12/2023 | ||||||
| Homaira Akbari | Independent | From 01/01/2023 to 31/12/2023 | ||||||
| Javier Botín-Sanz de Sautuola y O’Shea | Other external | From 01/01/2023 to 31/12/2023 | ||||||
| Sol Daurella Comadrán | Independent | From 01/01/2023 to 31/12/2023 | ||||||
| Henrique de Castro | Independent | From 01/01/2023 to 31/12/2023 | ||||||
| Gina Díez Barroso | Independent | From 01/01/2023 to 31/12/2023 | ||||||
| Luis Isasi Fernández de Bobadilla | Other External | From 01/01/2023 to 31/12/2023 | ||||||
| Ramiro Mato García-Ansorena | Independent | From 01/01/2023 to 31/12/2023 | ||||||
| Belén Romana García | Independent | From 01/01/2023 to 31/12/2023 | ||||||
| Pamela Walkden | Independent | From 01/01/2023 to 31/12/2023 | ||||||
| Germán de la Fuente | Independent | From 01/01/2023 to 31/12/2023 | ||||||
| Glenn Hutchins | Lead independent director | From 01/01/2023 to 31/12/2023 | ||||||
Comments (Not included in the electronic submission to the CNMV) | ||
Glenn Hutchins was appointed as Vice Chair and Lead Independent Director with effect from 1 October 2023 replacing Bruce Carnegie-Brown in the role. | ||
| Name | Fixed remuneration | Per diem allowances | Remuneration for membership of Board's committees | Salary | Short-term variable remuneration | Long-term variable remuneration1 |
Severance pay | Other grounds | Total year 2023 | Total year 2022 | ||||||||||||||||||||||
| Ana Botín-Sanz de Sautuola y O’Shea | 98 | 45 | 268 | 3,271 | 2,838 | 361 | — | 525 | 7,406 | 7,227 | ||||||||||||||||||||||
| Héctor Grisi Checa | 98 | 44 | 198 | 3,000 | 1,220 | — | — | — | 4,560 | — | ||||||||||||||||||||||
| José Antonio Álvarez Álvarez | 128 | 45 | 198 | — | 714 | 231 | — | 2,460 | 3,776 | 5,700 | ||||||||||||||||||||||
| Bruce Carnegie-Brown | 203 | 81 | 292 | — | — | — | — | — | 576 | 700 | ||||||||||||||||||||||
| Homaira Akbari | 98 | 78 | 89 | — | — | — | — | — | 265 | 244 | ||||||||||||||||||||||
| Javier Botín-Sanz de Sautuola y O’Shea | 98 | 39 | — | — | — | — | — | — | 137 | 129 | ||||||||||||||||||||||
| Sol Daurella Comadrán | 98 | 77 | 74 | — | — | — | — | — | 249 | 230 | ||||||||||||||||||||||
| Henrique de Castro | 98 | 87 | 99 | — | — | — | — | — | 284 | 261 | ||||||||||||||||||||||
| Gina Díez Barroso | 98 | 68 | 45 | — | — | — | — | — | 211 | 172 | ||||||||||||||||||||||
| Luis Isasi Fernández de Bobadilla | 98 | 78 | 241 | — | — | — | — | 1,000 | 1,417 | 1,412 | ||||||||||||||||||||||
| Ramiro Mato García-Ansorena | 98 | 96 | 324 | — | — | — | — | — | 518 | 500 | ||||||||||||||||||||||
| Belén Romana García | 98 | 102 | 372 | — | — | — | — | — | 572 | 549 | ||||||||||||||||||||||
| Pamela Walkden | 98 | 87 | 156 | — | — | — | — | — | 341 | 323 | ||||||||||||||||||||||
| Germán de la Fuente | 98 | 87 | 86 | — | — | — | — | — | 271 | 137 | ||||||||||||||||||||||
| Glenn Hutchins | 193 | 83 | 96 | — | — | — | — | — | 372 | 10 | ||||||||||||||||||||||
Comments (Not included in the electronic submission to the CNMV) | ||
|
The remuneration of Luis Isasi includes EUR 1,000 thousand for his role as non-executive Chair of Santander España and for Santander España board and committees meetings.
The variable remuneration only includes amounts related to the position of executive director of Banco Santander S.A.
| ||
| Financial instruments at start of year 2023 | Financial instruments granted during 2023 year | Financial instruments consolidated during 2023 | Instruments matured but not exercised |
Financial instruments at end of year 2023 | ||||||||||||||||||||||||||||||||||||||||||||||
| Name | Name of Plan | No. of instruments | No. of equivalent shares | No. of instruments | No. of equivalent shares | No. of instruments | No. of equivalent shares / handed over |
Price of the consolidated shares | Gross profit from shares handed over or consolidated financial instruments (EUR thousand) |
No. of instruments | No. of instruments | No. of equivalent shares | ||||||||||||||||||||||||||||||||||||||
| Ana Botín Sanz de Sautuola y O'Shea | 3rd cycle of deferred variable remuneration plan linked to multi-year targets (2018) |
103,303 | 103,303 | — | — | 34,400 | 34,400 | 3.793 | 130 | 68,903 | — | — | ||||||||||||||||||||||||||||||||||||||
| 4th cycle of deferred variable remuneration plan linked to multi-year targets (2019) |
212,927 | 212,927 | — | — | 35,452 | 35,452 | 3.793 | 134 | 71,011 | 106,464 | 106,464 | |||||||||||||||||||||||||||||||||||||||
| 5th cycle of deferred variable remuneration plan linked to multi-year targets (2020) |
111,821 | 111,821 | — | — | 31,049 | 31,049 | 3.793 | 118 | 6,225 | 74,547 | 74,547 | |||||||||||||||||||||||||||||||||||||||
| 6th cycle of deferred variable remuneration plan linked to multi-year targets (2021) |
710,698 | 710,698 | — | — | 177,675 | 177,675 | 3.793 | 674 | — | 533,023 | 533,023 | |||||||||||||||||||||||||||||||||||||||
| 7th cycle of deferred variable remuneration plan linked to multi-year targets (2022) in shares |
311,669 | 311,669 | — | — | 62,334 | 62,334 | 3.793 | 236 | — | 249,335 | 249,335 | |||||||||||||||||||||||||||||||||||||||
| 7th cycle (Bis) of deferred variable remuneration plan linked to multi-year targets (2022) in shares options. |
839,174 | 311,669 | — | — | 167,835 | 62,334 | 3.793 | 118 | — | 671,339 | 249,335 | |||||||||||||||||||||||||||||||||||||||
| 8th cycle of deferred variable remuneration plan linked to multi-year targets (2023) in shares |
— | — | 1,041,392 | 1,041,392 | 469,286 | 469,286 | 3.793 | 1,780 | — | 572,107 | 572,107 | |||||||||||||||||||||||||||||||||||||||
| Financial instruments at start of year 2023 | Financial instruments granted during 2023 year | Financial instruments consolidated during 2023 | Instruments matured but not exercised |
Financial instruments at end of year 2023 | ||||||||||||||||||||||||||||||||||||||||||||||
| Name | Name of Plan | No. of instruments | No. of equivalent shares | No. of instruments | No. of equivalent shares | No. of instruments | No. of equivalent shares / handed over |
Price of the consolidated shares | Gross profit from shares handed over or consolidated financial instruments (EUR thousand) |
No. of instruments | No. of instruments | No. of equivalent shares | ||||||||||||||||||||||||||||||||||||||
| Héctor Grisi Checa | 8th cycle of deferred variable remuneration plan linked to multi-year targets (2023) in shares |
— | — | 693,383 | 693,383 | 321,645 | 321,645 | 3.793 | 1,220 | — | 371,737 | 371,737 | ||||||||||||||||||||||||||||||||||||||
| Financial instruments at start of year 2023 | Financial instruments granted during 2023 year | Financial instruments consolidated during 2023 | Instruments matured but not exercised |
Financial instruments at end of year 2023 | ||||||||||||||||||||||||||||||||||||||||||||||
| Name | Name of Plan | No. of instruments | No. of equivalent shares | No. of instruments | No. of equivalent shares | No. of instruments | No. of equivalent shares / handed over |
Price of the consolidated shares | Gross profit from shares handed over or consolidated financial instruments (EUR thousand) |
No. of instruments | No. of instruments | No. of equivalent shares | ||||||||||||||||||||||||||||||||||||||
| José Antonio Álvarez Álvarez |
3rd cycle of deferred variable remuneration plan linked to multi-year targets (2018) |
69,033 | 69,033 | — | — | 22,988 | 22,988 | 3.793 | 87 | 46,045 | — | — | ||||||||||||||||||||||||||||||||||||||
| 4th cycle of deferred variable remuneration plan linked to multi-year targets (2019) |
142,299 | 142,299 | — | — | 23,693 | 23,693 | 3.793 | 90 | 47,457 | 71,149 | 71,149 | |||||||||||||||||||||||||||||||||||||||
| 5th cycle of deferred variable remuneration plan linked to multi-year targets (2020) |
60,737 | 60,737 | — | — | 16,865 | 16,865 | 3.793 | 64 | 3,381 | 40,491 | 40,491 | |||||||||||||||||||||||||||||||||||||||
| 6th cycle of deferred variable remuneration plan linked to multi-year targets (2021) |
479,644 | 479,644 | — | — | 119,911 | 119,911 | 3.793 | 455 | — | 359,733 | 359,733 | |||||||||||||||||||||||||||||||||||||||
| 7th cycle of deferred variable remuneration plan linked to multi-year targets (2022) in shares |
210,395 | 210,395 | — | — | 42,079 | 42,079 | 3.793 | 160 | — | 168,316 | 168,316 | |||||||||||||||||||||||||||||||||||||||
| 7th cycle (Bis) of deferred variable remuneration plan linked to multi-year targets (2022) in shares options. |
566,492 | 210,395 | — | — | 113,298 | 42,079 | 3.793 | 80 | — | 453,194 | 168,316 | |||||||||||||||||||||||||||||||||||||||
Comments (Not included in the electronic submission to the CNMV) | ||
|
nThe variable remuneration only includes the amounts related to the position of executive director of Banco Santander S.A. The figures are impacted by the adaptation for 2023 and successive financial years of the information on "short-term variable remuneration" and "long-term variable remuneration" to the consolidation criteria of CNMV, the latter understood as the fulfillment at the end of the accrual period of the different objectives or conditions to which the variable remuneration was linked, including the verification of whether or not the application of malus clauses is appropriate (instead of including amounts accrued to the executive director under short- and long-term results that are put to the vote of the annual general meeting each year). In 2023 there was no application of malus clauses.
nThe variable remuneration consolidated as of the date of this report corresponds to the following plans:
1) Short-term variable remuneration:
a.40% immediate payment of variable remuneration of the eight cycle of the deferred multi-year objectives variable remuneration plan (2023).
b.First fifth deferred (12%) of variable remuneration of the seventh cycle of the deferred multi-year objectives variable remuneration plan (2022).
c.Second fifth deferred (12%) of variable remuneration of the sixth cycle of the deferred multi-year objectives variable remuneration plan (2021).
2) Long-term variable remuneration:
a.Third deferred (first fifth subject to multi-year metrics) of variable remuneration of the fifth cycle of the deferred multi-year objectives variable remuneration plan (2020).
b.Fourth deferred (second fifth subject to multiyear metrics) of variable remuneration of the fourth cycle of the deferred multi-year objectives variable remuneration plan (2019).
c.Fifth deferred (third fifth subject to multiyear metrics) of variable remuneration of the third cycle of the deferred multi-year objectives variable remuneration plan (2018).
For the purpose of calculating the hypothetical current cash value of Gross profit from shares handed over or consolidated financial instruments, the same share price used for VR 2023 has been taken, calculated with the weighted average daily volume of weighted average listing prices of Santander shares in the 50 trading sessions prior to the Friday (not inclusive) before 30 January 2024 (the date on which the board approved the 2023 bonus for executive directors), which was EUR 3.793 per share.
In the case of the 2022 VR share options, the gross profit of the consolidated instruments has been calculated as the difference between the EUR 3.793 and the exercise price of the option in that remuneration plan (EUR 3.088).
nAnd below are the levels of achievement of the multi-year metrics of the long-term variable remuneration plans:
1) Fifth cycle of the deferred multi-year objectives variable remuneration plan (2020): 83.3% of achievement for the period 2020-2022.
a.CET1 metric at 100% of achievement for 2022 year-end period (target 12.00%). Weight of 33.3%.
b.Underlying BPA growth at 150% of achievement (target growth of 10%). Weight of 33.3%.
c.TSR metric at 0% of achievement (minimum target of 33% not reached). Weight of 33.3%.
2) Fourth cycle of the deferred multi-year objectives variable remuneration plan (2019): 33.3% of achievement for the period 2019-2021.
a.CET1 metric at 100% of achievement for 2021 year-end period (target 12.00%). Weight of 33.3%.
b.Underlying BPA growth at 0% of achievement (target growth of 15%). Weight of 33.3%.
c.TSR metric at 0% of achievement (minimum target of 33% not reached). Weight of 33.3%.
3) Third cycle of the deferred multi-year objectives variable remuneration plan (2018): 33.3% of achievement for the period 2018-2020.
a.CET1 metric at 100% of achievement for 2020 year-end period (target 11.30%). Weight of 33.3%.
b.Underlying BPA growth at 0% of achievement (target growth of 25%). Weight of 33.3%.
c.TSR metric at 0% of achievement (minimum target of 33% not reached). Weight of 33.3%.
| ||
| Name | Remuneration from consolidation of rights to savings system |
||||
| Ana Botín-Sanz de Sautuola y O’Shea | 1,144 | ||||
Héctor Grisi Checa |
966 | ||||
| Contribution over the year from the company (EUR thousand) | |||||||||||||||||||||||||||||||||||
| Savings systems with consolidated economic rights |
Savings systems with unconsolidated economic rights |
Amount of accumulated funds (EUR thousand) | |||||||||||||||||||||||||||||||||
| 2023 | 2022 | ||||||||||||||||||||||||||||||||||
| Name | 2023 | 2022 | 2023 | 2022 | Systems with consolidated economic rights | Systems with unconsolidated economic rights | Systems with consolidated economic rights | Systems with unconsolidated economic rights | |||||||||||||||||||||||||||
| Ana Botín-Sanz de Sautuola y O’Shea | 1,144 | 1,081 | — | — | 49,257 | — | 46,725 | — | |||||||||||||||||||||||||||
| Héctor Grisi Checa | 966 | — | 585 | — | — | — | |||||||||||||||||||||||||||||
José Antonio Álvarez |
— | 811 | — | — | — | — | 19,495 | — | — | 18,958 | — | ||||||||||||||||||||||||
| Name | Item | Amount remunerated | ||||||
| Ana Botín-Sanz de Sautuola y O’Shea | Life insurance and complement |
470 | ||||||
| Other remuneration | 28 | |||||||
| Name | Item | Amount remunerated | ||||||
Héctor Grisi Checa |
Life insurance and complement |
1 | ||||||
| Other remuneration | 46 | |||||||
| Name | Item | Amount remunerated | ||||||
José Antonio Álvarez Álvarez |
Life insurance and complement |
716 | ||||||
| Other remuneration | 6 | |||||||
| Name | Fixed remuneration | Per diem allowances | Remuneration for membership of Board's committees | Salary | Short-term variable remuneration | Long-term variable remuneration | Severance pay | Other grounds | Total year 2023 | Total year 2022 | ||||||||||||||||||||||
| Homaira Akbari | 311 | — | — | — | — | — | — | — | 311 | 361 | ||||||||||||||||||||||
| Henrique de Castro | 200 | — | — | — | — | — | — | — | 200 | 200 | ||||||||||||||||||||||
| Pamela Walkden | 152 | — | — | — | — | — | — | — | 152 | 147 | ||||||||||||||||||||||
| José Antonio Álvarez Álvarez | 200 | — | 141 | — | — | — | — | — | 341 | — | ||||||||||||||||||||||
Comments (Not included in the electronic submission to the CNMV) | ||
The variable remuneration only includes the amounts accrued since the appointment of executive director of Banco Santander S.A. | ||
Remuneration accrued in the company |
Remuneration accrued in group companies |
Total 2023 Company + group companies | |||||||||||||||||||||||||||||||||
| Name | Total cash remuneration | Gross profit on consolidated shares or financial instruments | Contributions to the long-term savings plan | Remuneration for other items | Total 2023 | Total cash remuneration | Gross profit on consolidated shares or financial instruments | Contributions to the long-term savings plan | Remuneration for other items | Total 2023 | |||||||||||||||||||||||||
| Ana Botín-Sanz de Sautuola y O’Shea | 7,406 | 3,190 | 1,144 | 498 | 12,239 | — | — | — | — | — | 12,239 | ||||||||||||||||||||||||
| Héctor Grisi Checa | 4,560 | 1,220 | 966 | 47 | 6,793 | — | — | — | — | — | 6,793 | ||||||||||||||||||||||||
| José Antonio Álvarez Álvarez | 3,776 | 936 | — | 722 | 5,434 | 341 | — | — | — | 341 | 5,775 | ||||||||||||||||||||||||
| Bruce Carnegie-Brown | 576 | — | — | — | 576 | — | — | — | — | — | 576 | ||||||||||||||||||||||||
| Homaira Akbari | 265 | — | — | — | 265 | 311 | — | — | — | 311 | 576 | ||||||||||||||||||||||||
| Javier Botín-Sanz de Sautuola y O’Shea | 137 | — | — | — | 137 | — | — | — | — | — | 137 | ||||||||||||||||||||||||
| Sol Daurella Comadrán | 249 | — | — | — | 249 | — | — | — | — | — | 249 | ||||||||||||||||||||||||
| Henrique de Castro | 284 | — | — | — | 284 | 200 | — | — | — | 200 | 484 | ||||||||||||||||||||||||
| Gina Díez Barroso | 211 | — | — | — | 211 | — | — | — | — | — | 211 | ||||||||||||||||||||||||
| Luis Isasi Fernández de Bobadilla | 1,417 | — | — | — | 1,417 | — | — | — | — | — | 1,417 | ||||||||||||||||||||||||
| Ramiro Mato García-Ansorena | 518 | — | — | — | 518 | — | — | — | — | — | 518 | ||||||||||||||||||||||||
| Belén Romana García | 572 | — | — | — | 572 | — | — | — | — | — | 572 | ||||||||||||||||||||||||
| Pamela Walkden | 341 | — | — | — | 341 | 152 | — | — | — | 152 | 493 | ||||||||||||||||||||||||
| Germán de la Fuente | 271 | — | — | — | 271 | — | — | — | — | — | 271 | ||||||||||||||||||||||||
| Glenn Hutchins | 372 | — | — | — | 372 | — | — | — | — | — | 372 | ||||||||||||||||||||||||
Total |
20,955 | 5,346 | 2,110 | 1,267 | 29,679 | 1,004 | — | — | — | 1,004 | 30,683 | ||||||||||||||||||||||||
Comments (Not included in the electronic submission to the CNMV) | ||
The remuneration of Luis Isasi includes EUR 1,000 thousand for his role as non-executive Chair of Santander España and for Santander España board and committees meetings. | ||
| Directors' remuneration (EUR thousand) | 2023 | % var. 23/22 |
2022 | % var. 22/21 | 2021 | % var. 21/20 | 2020 | % var. 20/19 | 2019 | ||||||||||||||||||||
| • Executive Directors | |||||||||||||||||||||||||||||
| Ana Botín-Sanz de Sautuola y O’Shea | 12,239 | 4% | 11,735 | (5)% | 12,288 | 52% | 8,090 | (19)% | 9,954 | ||||||||||||||||||||
Héctor Grisi Checa |
6,793 | — | — | — | — | — | — | — | — | ||||||||||||||||||||
• External Directors1 |
|||||||||||||||||||||||||||||
| José Antonio Álvarez Álvarez | 5,775 | (40)% | 9,575 | (2)% | 9,728 | 41% | 6,877 | (17)% | 8,270 | ||||||||||||||||||||
| Bruce Carnegie-Brown | 576 | (18)% | 700 | — | 700 | 18% | 595 | (15)% | 700 | ||||||||||||||||||||
| Javier Botín-Sanz de Sautuola y O’Shea | 137 | 6% | 129 | —% | 129 | 6% | 122 | (11)% | 137 | ||||||||||||||||||||
| Sol Daurella Comadrán | 249 | 8% | 230 | (4)% | 239 | 12% | 214 | (11)% | 240 | ||||||||||||||||||||
| Belén Romana García | 572 | 4% | 549 | 3% | 533 | 28% | 417 | (21)% | 525 | ||||||||||||||||||||
| Homaira Akbari | 576 | (5)% | 605 | 31% | 461 | 19% | 386 | 71% | 226 | ||||||||||||||||||||
| Ramiro Mato García Ansorena | 518 | 4% | 500 | — | 499 | 16% | 430 | (14)% | 500 | ||||||||||||||||||||
| Henrique de Castro | 484 | 5% | 461 | 45% | 319 | 36% | 234 | 172% | 86 | ||||||||||||||||||||
| Pamela Walkden | 493 | 5% | 470 | 38% | 339 | 59% | 214 | 529% | 34 | ||||||||||||||||||||
Luis Isasi Fernández de Bobadilla2 |
1,417 | — | 1,412 | — | 1,406 | 49% | 943 | — | — | ||||||||||||||||||||
| Gina Díez Barroso | 211 | 23% | 172 | 32% | 130 | 622% | 18 | — | — | ||||||||||||||||||||
| Germán de la Fuente | 271 | — | 137 | — | — | — | — | — | — | ||||||||||||||||||||
| Glenn Hutchins | 372 | — | 10 | — | — | — | — | — | — | ||||||||||||||||||||
| Company’s performance | |||||||||||||||||||||||||||||
| Underlying profit attributable to the Group (EUR mn) | 11,076 | 15% | 9,605 | 11% | 8,654 | 70% | 5,081 | (38)% | 8,252 | ||||||||||||||||||||
| Consolidated results of the Group3 (EUR mn) | 16,459 | 8% | 15,250 | 5% | 14,547 | — | (2,076) | — | 12,543 | ||||||||||||||||||||
| Ordinary RoTE | 15.06% | 13% | 13.37% | 5% | 12.73% | 71% | 7.44% | (37)% | 11.79% | ||||||||||||||||||||
Employees' average remuneration4 (EUR thousand) |
58 | 3% | 56 | 1% | 56 | 18% | 47 | (12%) | 54 | ||||||||||||||||||||
Employees' average remuneration in Spain5 (EUR thousand) |
73 | 6% | 68 | 10% | 62 | (2%) | 63 | — | n.a. |
||||||||||||||||||||
| Comments (Not included in the electronic submission to the CNMV) | ||
|
nThe variable remuneration only includes the amounts related to the position of executive director of Banco Santander S.A. The figures are impacted by the adaptation for 2023 and successive financial years of the information on "short-term variable remuneration" and "long-term variable remuneration" to the consolidation criteria of CNMV, the latter understood as the fulfillment at the end of the accrual period of the different objectives or conditions to which the variable remuneration was linked, including the verification of whether or not the application of malus clauses is appropriate (instead of including amounts accrued to the executive director under short- and long-term results that are put to the vote of the annual general meeting each year). In 2023 there was no application of malus clauses.
nTotal remuneration of executive directors is impacted by the excellent evolution of Santander share price. In 2023, the revaluation of the share price used to set the 2023 variable remuneration (EUR 3.793) was +23%, so the Gross profit from shares handed over or consolidated financial instruments (Price x Volume) increased due to such revaluation. If it had remained stable in EUR 3.088 (share price of VR 2022), the increase in the total remuneration of the Executive Chair would have been only +1% compared to the figure released in 2022 report (EUR 11,735 thousand).
nAnd regarding the average remuneration of employees (EUR 58 thousand), to highlight the following ideas:
a.Normally the increases or decreases in remuneration are greater for the executive directors, depending on the results of the entity, because the percentage of variable remuneration over fixed remuneration is lower in the average employee than in the executive directors.
b.Our local presence and global scale, based on three regions and ten core markets, and our vast branch network (c.8,500), have a direct impact on this figure: more than a half of our employees are based in Mexico and South America (mainly in Brazil). The salaries of these employees are adapted to the local cost of living. Therefore, the comparison with the remuneration of executive directors (which remuneration was set for living in a mature country) is also distorted by the difference between both costs of living. Developing countries have a lower cost of living than the country where both directors carried out their functions (Spain).
c.The different annual exchange rates have also an impact on this calculation where all local wages and salaries are translated into euros at the average year-end exchange rate.
d.Finally, the average remuneration figure of Banco Santander is impacted by the different departures (retirements and early retirements) and annual new hires, with the average cost of the former (a more senior profile) being higher than the latter (a more junior profile).
| ||
Economic and financial review |
|||||
 | |||||
|
→Record results with 5mn new customers YoY contributing to double-digit revenue growth
→First year of ONE Transformation driving profitable growth and structural efficiency improvement
→Strong balance sheet, with solid credit quality metrics and a higher capital ratio
→Delivering double-digit value creation and higher shareholder remuneration
| ||
| FY’23 Attributable Profit | FY’23 Revenue | |||||||
|
€11.1bn
+15%
|
€58bn
+11%
|
|||||||
| Cost-to-income | RoTE | |||||||
|
44.1%
–173bps
|
15.1%
+169bps
|
|||||||
| CoR | FL CET1 | |||||||
|
1.18%
+0.19pp
|
12.3%
+0.2pp
|
|||||||
| TNAVps + DPS | EPS | |||||||
|
+15%
Cash DPS +c.50%
|
+21.5% |
|||||||
| 2023 targets | 2023 achievement | |||||||||||||
RevenueA |
 |
Double-digit growth | +13% | ü | ||||||||||
| Efficiency ratio | |
44-45% | 44.1% | ü | ||||||||||
| CoR | |
<1.2% | 1.18% | ü | ||||||||||
| FL CET1 | |
>12% | 12.3% | ü | ||||||||||
| RoTE | |
>15% | 15.1% | ü | ||||||||||
| Exchange rates: 1 euro/currency parity | |||||||||||||||||
Average |
Period-end |
||||||||||||||||
| 2023 | 2022 | 2023 | 2022 | ||||||||||||||
| US dollar | 1.081 | 1.051 | 1.105 | 1.068 | |||||||||||||
| Pound sterling | 0.870 | 0.853 | 0.868 | 0.887 | |||||||||||||
| Brazilian real | 5.397 | 5.421 | 5.365 | 5.650 | |||||||||||||
| Mexican peso | 19.158 | 21.131 | 18.691 | 20.805 | |||||||||||||
| Chilean peso | 906.417 | 916.688 | 965.192 | 909.200 | |||||||||||||
| Argentine peso | 282.765 | 134.786 | 893.635 | 189.116 | |||||||||||||
| Polish zloty | 4.538 | 4.683 | 4.343 | 4.684 | |||||||||||||
| Santander and public policy | |||||||||||||||||
| 1 | Capital and bank resilience | ||||||||||||||||
| Although we believe that reforms in the last decade have made financial institutions more robust in terms of capital, helping banks grow in stress situations such as the covid-19 pandemic or the war in Ukraine, we continue to advocate for: | |||||||||||||||||
|
•The correction of the current regulatory bias that favours risk aversion over growth and competitiveness.
•The need for a stable and predictable framework to facilitate institutions' management and investors' understanding of this agenda.
•The building of a genuine single financial services market in Europe, which we believe is key to competitiveness.
•Banking regulation that takes into account the realities of banks with a global footprint, does not penalize expansion to other countries and includes the recognition of the Multiple Point of Entry (MPE) resolution framework.
•A common deposit insurance scheme for EU banks that breaks the bank/sovereign loop. Furthermore, the alignment of the different rules and the revitalization of the securitization market are essential for the construction of a Capital Markets Union.
|
|||||||||||||||||
| 2 | Sustainability and sustainable finance | ||||||||||||||||
| We believe that decarbonization is a top social and environmental challenge in which banks have an important role to play and we are fully committed to the objectives. We continue to advocate for: | |||||||||||||||||
|
•In this new political cycle in Europe, a carefully carried out impact assessment of related legislation adopted to date to assess whether it is contributing to the ultimate goal of a stable and fair transition.
•Avoiding regulation and supervision that restrict banks from supporting their customers' transition. It is not only important to finance companies that are already green, but it is also important to help those in carbon-intensive sectors to transition.
•International coordination as sustainability knows no borders.
•Regulation that supports governments with their responsibility to define transition paths for different economic sectors, along with implementation tools and policies, with banks as a major player in supporting individuals and companies in their transitions.
|
|||||||||||||||||
| 3 | The digital landscape | ||||||||||||||||
| The banking sector is undergoing significant changes during its digital transformation with the aim of leveraging technology and innovation opportunities and improving customer choice and experience. We continue to advocate for: | |||||||||||||||||
|
•Simple, future-proof regulation and supervision that allows the banking sector to innovate and take advantage of the potential benefits of technology and digitalization on an equal basis with other companies.
•A true data economy that puts the consumer at the centre of decision making, with an appropriate framework of incentives and accountability in the use of data. In addition, data sharing across sectors (financial and non-financial) that would make a real difference in providing better services and products for consumers and customers.
•A framework that allows banks to continue to offer the solutions that customers demand, including innovative and novel capabilities. The debate around the issuance of digital currencies by central banks should consider the role that the financial system plays in financing the economy.
•Customer protection rules that facilitate access to different products with conditions that favour a smooth and user-friendly experience, without being detrimental to customer protection.
|
|||||||||||||||||
| BALANCE SHEET (EUR million) | 2023 | 2022 | % 2023 vs. 2022 | 2021 | ||||||||||
| Total assets | 1,797,062 | 1,734,659 | 3.6 | 1,595,835 | ||||||||||
| Loans and advances to customers | 1,036,349 | 1,036,004 | 0.0 | 972,682 | ||||||||||
| Customer deposits | 1,047,169 | 1,009,722 | 3.7 | 900,554 | ||||||||||
Total funds A |
1,306,942 | 1,239,981 | 5.4 | 1,135,866 | ||||||||||
| Total equity | 104,241 | 97,585 | 6.8 | 97,053 | ||||||||||
| INCOME STATEMENT (EUR million) | 2023 | 2022 | % 2023 vs. 2022B |
2021 | ||||||||||
| Net interest income | 43,261 | 38,619 | 12.0 | 33,370 | ||||||||||
| Total income | 57,423 | 52,117 | 10.2 | 46,404 | ||||||||||
| Net operating income | 31,998 | 28,214 | 13.4 | 24,989 | ||||||||||
| Profit before tax | 16,459 | 15,250 | 7.9 | 14,547 | ||||||||||
| Profit attributable to the parent | 11,076 | 9,605 | 15.3 | 8,124 | ||||||||||
EPS, PROFITABILITY AND EFFICIENCY (%)C |
2023 | 2022 | % 2023 vs. 2022 | 2021 | ||||||||||
| EPS (euro) | 0.654 | 0.539 | 21.5 | 0.438 | ||||||||||
| RoE | 11.91 | 10.67 | 9.66 | |||||||||||
| RoTE | 15.06 | 13.37 | 11.96 | |||||||||||
| RoA | 0.69 | 0.63 | 0.62 | |||||||||||
| RoRWA | 1.96 | 1.77 | 1.69 | |||||||||||
Efficiency ratio D |
44.1 | 45.8 | 46.2 | |||||||||||
UNDERLYING INCOME STATEMENT D (EUR million) |
2023 | 2022 | % 2023 vs. 2022E |
2021 | ||||||||||
| Net interest income | 43,261 | 38,619 | 12.0 | 33,370 | ||||||||||
| Total income | 57,647 | 52,154 | 10.5 | 46,404 | ||||||||||
| Net operating income | 32,222 | 28,251 | 14.1 | 24,989 | ||||||||||
| Profit before tax | 16,698 | 15,250 | 9.5 | 15,260 | ||||||||||
| Attributable profit to the parent | 11,076 | 9,605 | 15.3 | 8,654 | ||||||||||
UNDERLYING EPS AND PROFITABILITY D (%) |
2023 | 2022 | % 2023 vs. 2022 | 2021 | ||||||||||
| Underlying EPS (euro) | 0.654 | 0.539 | 21.5 | 0.468 | ||||||||||
| Underlying RoE | 11.91 | 10.67 | 10.29 | |||||||||||
| Underlying RoTE | 15.06 | 13.37 | 12.73 | |||||||||||
| Underlying RoA | 0.69 | 0.63 | 0.65 | |||||||||||
| Underlying RoRWA | 1.96 | 1.77 | 1.78 | |||||||||||
SOLVENCY (%) |
2023 | 2022 | 2021 | |||||||||||
| Fully-loaded CET1 capital ratio | 12.3 | 12.0 | 12.1 | |||||||||||
| Fully-loaded total capital ratio | 16.3 | 15.8 | 16.4 | |||||||||||
CREDIT QUALITY (%)C |
2023 | 2022 | 2021 | |||||||||||
| Cost of risk | 1.18 | 0.99 | 0.77 | |||||||||||
| NPL ratio | 3.14 | 3.08 | 3.16 | |||||||||||
| Total coverage ratio | 66 | 68 | 71 | |||||||||||
THE SHARE AND MARKET CAPITALIZATION |
2023 | 2022 | % 2023 vs. 2022 | 2021 | ||||||||||
| Number of shareholders | 3,662,377 | 3,915,388 | (6.5) | 3,936,922 | ||||||||||
| Shares (millions) | 16,184 | 16,794 | (3.6) | 17,341 | ||||||||||
| Share price (euro) | 3.780 | 2.803 | 34.9 | 2.941 | ||||||||||
| Market capitalization (EUR million) | 61,168 | 47,066 | 30.0 | 50,990 | ||||||||||
| Tangible book value per share (euro) | 4.76 | 4.26 | 4.12 | |||||||||||
| Price / Tangible book value per share (X) | 0.79 | 0.66 | 0.71 | |||||||||||
| CUSTOMERS (thousands) | 2023 | 2022 | % 2023 vs. 2022 | 2021 | ||||||||||
| Total customers | 164,542 | 159,844 | 2.9 | 152,943 | ||||||||||
Active customers F |
99,503 | 99,190 | 0.3 | 96,887 | ||||||||||
Loyal customers G |
29,286 | 27,456 | 6.7 | 25,548 | ||||||||||
Digital customers H |
54,161 | 51,471 | 5.2 | 47,489 | ||||||||||
| Digital sales / Total sales (%) | 56.3 | 55.1 | 54.4 | |||||||||||
| OPERATING DATA | 2023 | 2022 | % 2023 vs. 2022 | 2021 | ||||||||||
| Number of employees | 212,764 | 206,462 | 3.1 | 199,177 | ||||||||||
| Number of branches | 8,518 | 9,019 | (5.6) | 9,229 | ||||||||||
| A. Includes customer deposits, mutual funds, pension funds and managed portfolios. | ||
| B. In constant euros: Net interest income: +15.8%; Total income: +12.8%; Net operating income: +15.4%; Profit before tax: +9.7%; Attributable profit: +17.7%. | ||
C. For more information, see section 8. 'Alternative Performance Measures' of this chapter. | ||
D. In addition to IFRS measures, we present non-IFRS measures including some which we refer to as underlying measures. These non-IFRS measures exclude items outside the ordinary course of business and reclassify certain items under some headings of the underlying income statement as described at the end of section 3.2 'Results' and in section 8. 'Alternative Performance Measures' of this chapter. In our view, this provides a better year-on-year comparison. | ||
| E. In constant euros: Net interest income: +15.8%; Total income: +13.1%; Net operating income: +16.1%; Profit before tax: +11.3%; Attributable profit: +17.7%. | ||
| F. Those customers who comply with the minimum balance, income and/or transactionality requirements as defined according to the business area. | ||
| G. Active customers who receive most of their financial services from the Group according to the commercial segment to which they belong. Various engaged customer levels have been defined taking profitability into account. | ||
| H. Every physical or legal person, that, being part of a commercial bank, has logged in its personal area of internet banking or mobile phone or both in the last 30 days. | ||
| Executive summary | |||||||||||||||||||||||||||||||||||||||||||||||||||||||||||||||||||||||||||||||||||||||||
| Attributable profit | Performance (2023 vs. 2022) | ||||||||||||||||||||||||||||||||||||||||||||||||||||||||||||||||||||||||||||||||||||||||
| Record profit, reaching all targets for the year | Double-digit revenue growth, increasing more than operating expenses, and controlled cost of risk | ||||||||||||||||||||||||||||||||||||||||||||||||||||||||||||||||||||||||||||||||||||||||
| +15% in euros | Total income | Costs | Provisions | ||||||||||||||||||||||||||||||||||||||||||||||||||||||||||||||||||||||||||||||||||||||
| EUR 11,076 mn | +11% | +6% | +19% | in euros | |||||||||||||||||||||||||||||||||||||||||||||||||||||||||||||||||||||||||||||||||||||
| +18% in constant euros | +13% | +10% | +19% | in constant euros | |||||||||||||||||||||||||||||||||||||||||||||||||||||||||||||||||||||||||||||||||||||
| Efficiency | Profitability | ||||||||||||||||||||||||||||||||||||||||||||||||||||||||||||||||||||||||||||||||||||||||
| The Group's efficiency ratio improved driven by Europe | Profitability continued to improve | ||||||||||||||||||||||||||||||||||||||||||||||||||||||||||||||||||||||||||||||||||||||||
| Group | Europe | RoTE | RoRWA | ||||||||||||||||||||||||||||||||||||||||||||||||||||||||||||||||||||||||||||||||||||||
| 44.1% | 42.1% | 15.1% | 1.96% | ||||||||||||||||||||||||||||||||||||||||||||||||||||||||||||||||||||||||||||||||||||||
| -1.7 pp | -5.2 pp | +1.7 pp | +0.19 pp | ||||||||||||||||||||||||||||||||||||||||||||||||||||||||||||||||||||||||||||||||||||||
| Changes 2023 vs. 2022 | |||||||||||||||||||||||||||||||||||||||||||||||||||||||||||||||||||||||||||||||||||||||||
| Condensed income statement | ||||||||||||||||||||
| EUR million | ||||||||||||||||||||
| Change | ||||||||||||||||||||
| 2023 | 2022 | Absolute | % | % excl. FX | 2021 | |||||||||||||||
| Net interest income | 43,261 | 38,619 | 4,642 | 12.0 | 15.8 | 33,370 | ||||||||||||||
| Net fee income (commission income minus commission expense) | 12,057 | 11,790 | 267 | 2.3 | 5.0 | 10,502 | ||||||||||||||
| Gains or losses on financial assets and liabilities and exchange differences (net) | 2,633 | 1,653 | 980 | 59.3 | 77.1 | 1,563 | ||||||||||||||
| Dividend income | 571 | 488 | 83 | 17.0 | 17.4 | 513 | ||||||||||||||
| Income from companies accounted for using the equity method | 613 | 702 | (89) | (12.7) | (13.3) | 432 | ||||||||||||||
| Other operating income/expenses | (1,712) | (1,135) | (577) | 50.8 | 177.9 | 24 | ||||||||||||||
| Total income | 57,423 | 52,117 | 5,306 | 10.2 | 12.8 | 46,404 | ||||||||||||||
| Operating expenses | (25,425) | (23,903) | (1,522) | 6.4 | 9.6 | (21,415) | ||||||||||||||
| Administrative expenses | (22,241) | (20,918) | (1,323) | 6.3 | 9.4 | (18,659) | ||||||||||||||
| Staff costs | (13,726) | (12,547) | (1,179) | 9.4 | 12.2 | (11,216) | ||||||||||||||
| Other general administrative expenses | (8,515) | (8,371) | (144) | 1.7 | 5.2 | (7,443) | ||||||||||||||
| Depreciation and amortization | (3,184) | (2,985) | (199) | 6.7 | 11.2 | (2,756) | ||||||||||||||
| Provisions or reversal of provisions | (2,678) | (1,881) | (797) | 42.4 | 55.2 | (2,814) | ||||||||||||||
| Impairment or reversal of impairment of financial assets not measured at fair value through profit or loss (net) | (12,956) | (10,863) | (2,093) | 19.3 | 19.6 | (7,407) | ||||||||||||||
| Impairment of other assets (net) | (237) | (239) | 2 | (0.8) | 33.1 | (231) | ||||||||||||||
| Gains or losses on non-financial assets and investments (net) | 313 | 12 | 301 | — | — | 53 | ||||||||||||||
| Negative goodwill recognized in results | 39 | — | 39 | — | — | — | ||||||||||||||
| Gains or losses on non-current assets held for sale not classified as discontinued operations | (20) | 7 | (27) | — | — | (43) | ||||||||||||||
| Profit or loss before tax from continuing operations | 16,459 | 15,250 | 1,209 | 7.9 | 9.7 | 14,547 | ||||||||||||||
| Tax expense or income from continuing operations | (4,276) | (4,486) | 210 | (4.7) | (3.3) | (4,894) | ||||||||||||||
| Profit from the period from continuing operations | 12,183 | 10,764 | 1,419 | 13.2 | 15.1 | 9,653 | ||||||||||||||
| Profit or loss after tax from discontinued operations | — | — | — | — | — | — | ||||||||||||||
| Profit for the period | 12,183 | 10,764 | 1,419 | 13.2 | 15.1 | 9,653 | ||||||||||||||
| Profit attributable to non-controlling interests | (1,107) | (1,159) | 52 | (4.5) | (5.5) | (1,529) | ||||||||||||||
| Profit attributable to the parent | 11,076 | 9,605 | 1,471 | 15.3 | 17.7 | 8,124 | ||||||||||||||
| Average balance sheet - assets and interest income | |||||||||||||||||||||||
| EUR million | |||||||||||||||||||||||
| 2023 | 2022 | ||||||||||||||||||||||
| Assets | Average balance | Interest | Average rate | Average balance | Interest | Average rate | |||||||||||||||||
Cash balances at central banks and other deposits on demand and loans and advances to central banks and credit institutions A |
310,887 | 16,467 | 5.30 | % | 304,935 | 7,139 | 2.34 | % | |||||||||||||||
| Domestic | 117,332 | 4,694 | 4.00 | % | 111,697 | 1,166 | 1.04 | % | |||||||||||||||
| International - Mature markets | 124,570 | 5,611 | 4.50 | % | 139,105 | 1,971 | 1.42 | % | |||||||||||||||
| International - Developing markets | 68,985 | 6,162 | 8.93 | % | 54,133 | 4,002 | 7.39 | % | |||||||||||||||
| of which: | |||||||||||||||||||||||
| Reverse repurchase agreements | 55,570 | 4,745 | 8.54 | % | 39,572 | 1,862 | 4.71 | % | |||||||||||||||
| Domestic | 24,292 | 1,336 | 5.50 | % | 19,072 | 146 | 0.77 | % | |||||||||||||||
| International - Mature markets | 4,845 | 278 | 5.74 | % | 4,713 | 55 | 1.17 | % | |||||||||||||||
| International - Developing markets | 26,433 | 3,131 | 11.85 | % | 15,787 | 1,661 | 10.52 | % | |||||||||||||||
| Loans and advances to customers | 1,036,547 | 70,619 | 6.81 | % | 1,031,226 | 54,110 | 5.25 | % | |||||||||||||||
| Domestic | 265,322 | 10,581 | 3.99 | % | 272,826 | 5,929 | 2.17 | % | |||||||||||||||
| International - Mature markets | 546,641 | 28,771 | 5.26 | % | 552,674 | 19,821 | 3.59 | % | |||||||||||||||
| International - Developing markets | 224,584 | 31,267 | 13.92 | % | 205,726 | 28,360 | 13.79 | % | |||||||||||||||
| of which: | |||||||||||||||||||||||
| Reverse repurchase agreements | 46,382 | 3,603 | 7.77 | % | 43,505 | 1,026 | 2.36 | % | |||||||||||||||
| Domestic | 8,725 | 261 | 2.99 | % | 9,509 | 42 | 0.44 | % | |||||||||||||||
| International - Mature markets | 36,546 | 3,210 | 8.78 | % | 33,068 | 919 | 2.78 | % | |||||||||||||||
| International - Developing markets | 1,111 | 132 | 11.88 | % | 928 | 65 | 7.00 | % | |||||||||||||||
| Debt securities | 224,304 | 14,501 | 6.46 | % | 183,013 | 10,416 | 5.69 | % | |||||||||||||||
| Domestic | 71,507 | 2,503 | 3.50 | % | 45,932 | 809 | 1.76 | % | |||||||||||||||
| International - Mature markets | 51,327 | 1,444 | 2.81 | % | 43,877 | 803 | 1.83 | % | |||||||||||||||
| International - Developing markets | 101,470 | 10,554 | 10.40 | % | 93,204 | 8,804 | 9.45 | % | |||||||||||||||
| Hedging income | 3,561 | (236) | |||||||||||||||||||||
| Domestic | (45) | 16 | |||||||||||||||||||||
| International - Mature markets | 2,955 | 480 | |||||||||||||||||||||
| International - Developing markets | 651 | (732) | |||||||||||||||||||||
| Other interest | 104 | 1 | |||||||||||||||||||||
| Domestic | (47) | (121) | |||||||||||||||||||||
| International - Mature markets | 63 | 40 | |||||||||||||||||||||
| International - Developing markets | 88 | 82 | |||||||||||||||||||||
| Total interest-earning assets | 1,571,738 | 105,252 | 6.70 | % | 1,519,174 | 71,430 | 4.70 | % | |||||||||||||||
| Domestic | 454,161 | 17,686 | 3.89 | % | 430,455 | 7,799 | 1.81 | % | |||||||||||||||
| International - Mature markets | 722,538 | 38,844 | 5.38 | % | 735,656 | 23,115 | 3.14 | % | |||||||||||||||
| International - Developing markets | 395,039 | 48,722 | 12.33 | % | 353,063 | 40,516 | 11.48 | % | |||||||||||||||
| Other assets | 201,365 | 201,099 | |||||||||||||||||||||
| Assets from discontinued operations | — | — | |||||||||||||||||||||
| Average total assets | 1,773,103 | 105,252 | 1,720,273 | 71,430 | |||||||||||||||||||
| Average balance sheet - liabilities and interest expense | |||||||||||||||||||||||
| EUR million | |||||||||||||||||||||||
| 2023 | 2022 | ||||||||||||||||||||||
| Liabilities and stockholders’ equity | Average balance |
Interest | Average rate |
Average balance |
Interest | Average rate |
|||||||||||||||||
Deposits from central banks and credit institutions A |
175,164 | 9,350 | 5.34 | % | 214,879 | 3,636 | 1.69 | % | |||||||||||||||
| Domestic | 62,366 | 2,723 | 4.37 | % | 92,373 | 560 | 0.61 | % | |||||||||||||||
| International - Mature markets | 63,456 | 2,989 | 4.71 | % | 78,230 | 972 | 1.24 | % | |||||||||||||||
| International - Developing markets | 49,342 | 3,638 | 7.37 | % | 44,276 | 2,104 | 4.75 | % | |||||||||||||||
| of which: | |||||||||||||||||||||||
| Repurchase agreements | 55,619 | 3,737 | 6.72 | % | 34,298 | 1,349 | 3.93 | % | |||||||||||||||
| Domestic | 34,123 | 1,686 | 4.94 | % | 17,321 | 186 | 1.07 | % | |||||||||||||||
| International - Mature markets | 6,542 | 388 | 5.93 | % | 2,743 | 50 | 1.82 | % | |||||||||||||||
| International - Developing markets | 14,954 | 1,663 | 11.12 | % | 14,234 | 1,113 | 7.82 | % | |||||||||||||||
| Customer deposits | 1,011,471 | 33,238 | 3.29 | % | 963,359 | 16,994 | 1.76 | % | |||||||||||||||
| Domestic | 302,379 | 3,269 | 1.08 | % | 286,233 | 698 | 0.24 | % | |||||||||||||||
| International - Mature markets | 468,602 | 12,386 | 2.64 | % | 460,386 | 3,279 | 0.71 | % | |||||||||||||||
| International - Developing markets | 240,490 | 17,583 | 7.31 | % | 216,740 | 13,017 | 6.01 | % | |||||||||||||||
| of which: | |||||||||||||||||||||||
| Repurchase agreements | 73,193 | 7,084 | 9.68 | % | 57,646 | 3,199 | 5.55 | % | |||||||||||||||
| Domestic | 4,602 | 263 | 5.71 | % | 2,327 | 24 | 1.03 | % | |||||||||||||||
| International - Mature markets | 46,992 | 4,125 | 8.78 | % | 37,380 | 1,099 | 2.94 | % | |||||||||||||||
| International - Developing markets | 21,599 | 2,696 | 12.48 | % | 17,939 | 2,076 | 11.57 | % | |||||||||||||||
Marketable debt securities B |
288,345 | 12,751 | 4.42 | % | 255,721 | 8,464 | 3.31 | % | |||||||||||||||
| Domestic | 134,045 | 4,184 | 3.12 | % | 111,682 | 2,262 | 2.03 | % | |||||||||||||||
| International - Mature markets | 108,912 | 4,219 | 3.87 | % | 107,374 | 2,262 | 2.11 | % | |||||||||||||||
| International - Developing markets | 45,388 | 4,348 | 9.58 | % | 36,665 | 3,940 | 10.75 | % | |||||||||||||||
| of which: | |||||||||||||||||||||||
| Commercial paper | 29,195 | 1,329 | 4.55 | % | 17,907 | 375 | 2.09 | % | |||||||||||||||
| Domestic | 21,509 | 888 | 4.13 | % | 12,377 | 222 | 1.79 | % | |||||||||||||||
| International - Mature markets | 5,641 | 243 | 4.31 | % | 4,280 | 60 | 1.40 | % | |||||||||||||||
| International - Developing markets | 2,045 | 198 | 9.68 | % | 1,250 | 93 | 7.44 | % | |||||||||||||||
Other interest-bearing liabilities C |
23,139 | 638 | 2.76 | % | 23,861 | 216 | 0.91 | % | |||||||||||||||
| Domestic | 16,109 | 469 | 2.91 | % | 16,616 | 93 | 0.56 | % | |||||||||||||||
| International - Mature markets | 4,830 | 1 | 0.02 | % | 5,416 | 1 | 0.02 | % | |||||||||||||||
| International - Developing markets | 2,200 | 168 | 7.64 | % | 1,829 | 122 | 6.67 | % | |||||||||||||||
| Hedging expenses | 4,436 | 2,055 | |||||||||||||||||||||
| Domestic | 1,045 | 218 | |||||||||||||||||||||
| International - Mature markets | 1,756 | 207 | |||||||||||||||||||||
| International - Developing markets | 1,635 | 1,630 | |||||||||||||||||||||
| Other interest | 1,578 | 1,446 | |||||||||||||||||||||
| Domestic | 567 | 435 | |||||||||||||||||||||
| International - Mature markets | 304 | 186 | |||||||||||||||||||||
| International - Developing markets | 707 | 825 | |||||||||||||||||||||
| Total interest-bearing liabilities | 1,498,119 | 61,991 | 4.14 | % | 1,457,820 | 32,811 | 2.25 | % | |||||||||||||||
| Domestic | 514,899 | 12,257 | 2.38 | % | 506,904 | 4,266 | 0.84 | % | |||||||||||||||
| International - Mature markets | 645,800 | 21,655 | 3.35 | % | 651,406 | 6,907 | 1.06 | % | |||||||||||||||
| International - Developing markets | 337,420 | 28,079 | 8.32 | % | 299,510 | 21,638 | 7.22 | % | |||||||||||||||
| Other liabilities | 173,299 | 163,832 | |||||||||||||||||||||
| Non-controlling interests | 8,650 | 8,635 | |||||||||||||||||||||
| Shareholders´ equity | 93,035 | 89,986 | |||||||||||||||||||||
| Liabilities from discontinued operations | — | — | |||||||||||||||||||||
| Average total liabilities and equity | 1,773,103 | 61,991 | 1,720,273 | 32,811 | |||||||||||||||||||
| Volume and profitability analysis | |||||||||||
| EUR million | |||||||||||
| 2023 vs. 2022 | |||||||||||
| Increase (decrease) due to changes in | |||||||||||
| Interest income | Volume | Rate | Net change | ||||||||
| Cash and deposits on demand and loans and advances to central banks and credit institutions | 1,064 | 8,264 | 9,328 | ||||||||
| Domestic | 62 | 3,466 | 3,528 | ||||||||
| International - Mature markets | (226) | 3,866 | 3,640 | ||||||||
| International - Developing markets | 1,228 | 932 | 2,160 | ||||||||
| of which: | |||||||||||
| Reverse repurchase agreements | 1,291 | 1,592 | 2,883 | ||||||||
| Domestic | 50 | 1,140 | 1,190 | ||||||||
| International - Mature markets | 2 | 221 | 223 | ||||||||
| International - Developing markets | 1,239 | 231 | 1,470 | ||||||||
| Loans and advances to customers | 2,237 | 14,272 | 16,509 | ||||||||
| Domestic | (167) | 4,819 | 4,652 | ||||||||
| International - Mature markets | (219) | 9,169 | 8,950 | ||||||||
| International - Developing markets | 2,623 | 284 | 2,907 | ||||||||
| of which: | |||||||||||
| Reverse repurchase agreements | 117 | 2,460 | 2,577 | ||||||||
| Domestic | (4) | 223 | 219 | ||||||||
| International - Mature markets | 106 | 2,185 | 2,291 | ||||||||
| International - Developing markets | 15 | 52 | 67 | ||||||||
| Debt securities | 1,583 | 2,502 | 4,085 | ||||||||
| Domestic | 611 | 1,083 | 1,694 | ||||||||
| International - Mature markets | 154 | 487 | 641 | ||||||||
| International - Developing markets | 818 | 932 | 1,750 | ||||||||
| Hedging income | 3,797 | — | 3,797 | ||||||||
| Domestic | (61) | — | (61) | ||||||||
| International - Mature markets | 2,475 | — | 2,475 | ||||||||
| International - Developing markets | 1,383 | — | 1,383 | ||||||||
| Other interest | 103 | — | 103 | ||||||||
| Domestic | 74 | — | 74 | ||||||||
| International - Mature markets | 23 | — | 23 | ||||||||
| International - Developing markets | 6 | — | 6 | ||||||||
| Total interest-earning assets | 8,784 | 25,038 | 33,822 | ||||||||
| Domestic | 519 | 9,368 | 9,887 | ||||||||
| International - Mature markets | 2,207 | 13,522 | 15,729 | ||||||||
| International - Developing markets | 6,058 | 2,148 | 8,206 | ||||||||
Volume and cost analysis |
|||||||||||
| EUR million | |||||||||||
| 2023 vs. 2022 | |||||||||||
| Increase (decrease) due to changes in | |||||||||||
| Interest expense | Volume | Rate | Net change | ||||||||
| Deposits from central banks and credit institutions | (190) | 5,904 | 5,714 | ||||||||
| Domestic | (238) | 2,401 | 2,163 | ||||||||
| International - Mature markets | (216) | 2,233 | 2,017 | ||||||||
| International - Developing markets | 264 | 1,270 | 1,534 | ||||||||
| of which: | |||||||||||
| Repurchase agreements | 506 | 1,882 | 2,388 | ||||||||
| Domestic | 318 | 1,182 | 1,500 | ||||||||
| International - Mature markets | 129 | 209 | 338 | ||||||||
| International - Developing markets | 59 | 491 | 550 | ||||||||
| Customer deposits | 1,632 | 14,612 | 16,244 | ||||||||
| Domestic | 42 | 2,529 | 2,571 | ||||||||
| International - Mature markets | 60 | 9,047 | 9,107 | ||||||||
| International - Developing markets | 1,530 | 3,036 | 4,566 | ||||||||
| of which: | |||||||||||
| Repurchase agreements | 837 | 3,048 | 3,885 | ||||||||
| Domestic | 42 | 197 | 239 | ||||||||
| International - Mature markets | 347 | 2,679 | 3,026 | ||||||||
| International - Developing markets | 448 | 172 | 620 | ||||||||
| Marketable debt securities | 1,420 | 2,867 | 4,287 | ||||||||
| Domestic | 519 | 1,403 | 1,922 | ||||||||
| International - Mature markets | 33 | 1,924 | 1,957 | ||||||||
| International - Developing markets | 868 | (460) | 408 | ||||||||
| of which: | |||||||||||
| Commercial paper | 336 | 618 | 954 | ||||||||
| Domestic | 241 | 425 | 666 | ||||||||
| International - Mature markets | 24 | 159 | 183 | ||||||||
| International - Developing markets | 71 | 34 | 105 | ||||||||
| Other interest-bearing liabilities | 24 | 398 | 422 | ||||||||
| Domestic | (3) | 379 | 376 | ||||||||
| International - Mature markets | 0 | 0 | 0 | ||||||||
| International - Developing markets | 27 | 19 | 46 | ||||||||
| Hedging expenses | 2,381 | — | 2,381 | ||||||||
| Domestic | 827 | — | 827 | ||||||||
| International - Mature markets | 1,549 | — | 1,549 | ||||||||
| International - Developing markets | 5 | — | 5 | ||||||||
| Other interest | 132 | — | 132 | ||||||||
| Domestic | 132 | — | 132 | ||||||||
| International - Mature markets | 118 | — | 118 | ||||||||
| International - Developing markets | (118) | — | (118) | ||||||||
| Total interest-bearing liabilities | 5,399 | 23,781 | 29,180 | ||||||||
| Domestic | 1,279 | 6,712 | 7,991 | ||||||||
| International - Mature markets | 1,544 | 13,204 | 14,748 | ||||||||
| International - Developing markets | 2,576 | 3,865 | 6,441 | ||||||||
| Net interest income. Volume, profitability and cost analysis summary | |||||||||||
| EUR million | |||||||||||
| 2023 vs. 2022 | |||||||||||
| Increase (decrease) due to changes in | |||||||||||
| Volume | Rate | Net change | |||||||||
| Interest income | 8,784 | 25,038 | 33,822 | ||||||||
| Domestic | 519 | 9,368 | 9,887 | ||||||||
| International - Mature markets | 2,207 | 13,522 | 15,729 | ||||||||
| International - Developing markets | 6,058 | 2,148 | 8,206 | ||||||||
| Interest expense | 5,399 | 23,781 | 29,180 | ||||||||
| Domestic | 1,279 | 6,712 | 7,991 | ||||||||
| International - Mature markets | 1,544 | 13,204 | 14,748 | ||||||||
| International - Developing markets | 2,576 | 3,865 | 6,441 | ||||||||
| Net interest income | 3,385 | 1,257 | 4,642 | ||||||||
| Domestic | (760) | 2,656 | 1,896 | ||||||||
| International - Mature markets | 663 | 318 | 981 | ||||||||
| International - Developing markets | 3,482 | (1,717) | 1,765 | ||||||||
Net interest income | ||
| EUR million | ||
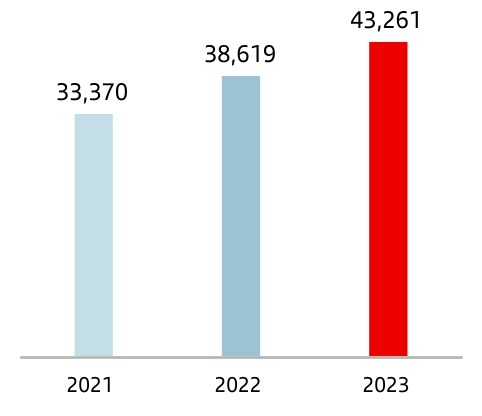
| +12% | A | ||||
| 2023 vs. 2022 | |||||
Net fee income | ||
| EUR million | ||
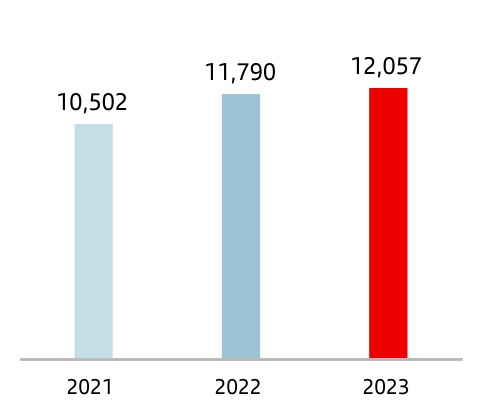
| +2% | A | ||||
| 2023 vs. 2022 | |||||
| Net fee income | ||||||||||||||||||||
| EUR million | ||||||||||||||||||||
| Change | ||||||||||||||||||||
| 2023 | 2022 | Absolute | % | % excl. FX | 2021 | |||||||||||||||
| Asset management business, funds and insurance | 3,967 | 4,032 | (65) | (1.6) | 6.4 | 3,649 | ||||||||||||||
| Credit and debit cards | 2,386 | 2,139 | 247 | 11.6 | 19.2 | 1,782 | ||||||||||||||
| Securities and custody services | 1,086 | 986 | 100 | 10.1 | 17.4 | 1,035 | ||||||||||||||
| Account management and availability fees | 2,005 | 2,032 | (27) | (1.3) | 22.3 | 1,850 | ||||||||||||||
| Cheques and payment orders | 826 | 797 | 29 | 3.6 | 45.6 | 642 | ||||||||||||||
| Foreign exchange | 797 | 788 | 9 | 1.1 | 2.9 | 522 | ||||||||||||||
| Charges for past-due/unpaid balances and guarantees | 297 | 277 | 20 | 7.3 | 12.8 | 266 | ||||||||||||||
| Bill discounting | 208 | 227 | (19) | (8.3) | 1.7 | 199 | ||||||||||||||
| Other | 484 | 512 | (28) | (5.4) | (26.6) | 557 | ||||||||||||||
| Net fee income | 12,057 | 11,790 | 267 | 2.3 | 5.0 | 10,502 | ||||||||||||||
| Operating expenses | ||||||||||||||||||||
| EUR million | ||||||||||||||||||||
Change |
||||||||||||||||||||
| 2023 | 2022 | Absolute | % | % excl. FX |
2021 | |||||||||||||||
| Staff costs | 13,726 | 12,547 | 1,179 | 9.4 | 12.2 | 11,216 | ||||||||||||||
| Other administrative expenses | 8,515 | 8,371 | 144 | 1.7 | 5.2 | 7,443 | ||||||||||||||
| Information technology | 2,471 | 2,473 | (2) | (0.1) | 7.3 | 2,182 | ||||||||||||||
| Communications | 414 | 410 | 4 | 1.0 | 17.5 | 401 | ||||||||||||||
| Advertising | 603 | 559 | 44 | 7.9 | 16.9 | 510 | ||||||||||||||
| Buildings and premises | 721 | 708 | 13 | 1.8 | 7.8 | 699 | ||||||||||||||
| Printed and office material | 97 | 96 | 1 | 1.0 | 9.9 | 90 | ||||||||||||||
| Taxes (other than tax on profits) | 570 | 559 | 11 | 2.0 | 35.4 | 558 | ||||||||||||||
| Other expenses | 3,639 | 3,566 | 73 | 2.0 | 11.6 | 3,003 | ||||||||||||||
| Administrative expenses | 22,241 | 20,918 | 1,323 | 6.3 | 9.4 | 18,659 | ||||||||||||||
| Depreciation and amortization | 3,184 | 2,985 | 199 | 6.7 | 11.2 | 2,756 | ||||||||||||||
| Operating expenses | 25,425 | 23,903 | 1,522 | 6.4 | 9.6 | 21,415 | ||||||||||||||
Efficiency ratio (cost to income) | ||
| % | ||
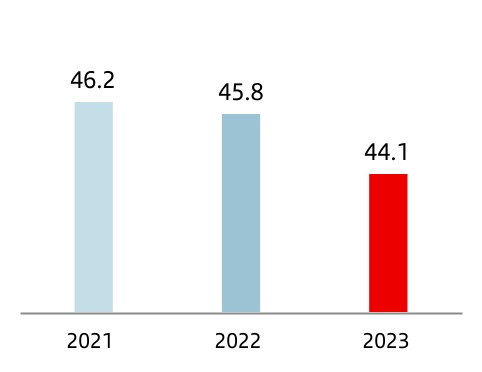
| -1.7 | pp | ||||
| 2023 vs. 2022 | |||||
Impairment or reversal of impairment of financial assets not measured at fair value through profit or loss (net) | |||||||||||
| EUR million | |||||||||||
| 2023 | 2022 | 2021 | |||||||||
| Financial assets at fair value through other comprehensive income | 44 | 7 | 19 | ||||||||
| Financial assets at amortized cost | 12,912 | 10,856 | 7,388 | ||||||||
| Impairment or reversal of impairment of financial assets not measured at fair value through profit or loss and net gains and losses from changes | 12,956 | 10,863 | 7,407 | ||||||||
Impairment on other assets (net) | |||||||||||
| EUR million | |||||||||||
| 2023 | 2022 | 2021 | |||||||||
| Impairment of investments in subsidiaries, joint ventures and associates, net | — | — | — | ||||||||
| Impairment on non-financial assets, net | 237 | 239 | 231 | ||||||||
| Tangible assets | 136 | 140 | 150 | ||||||||
| Intangible assets | 73 | 75 | 71 | ||||||||
| Others | 28 | 24 | 10 | ||||||||
| Impairment on other assets (net) | 237 | 239 | 231 | ||||||||
| Profit attributable to the parent | ||
| EUR million | ||
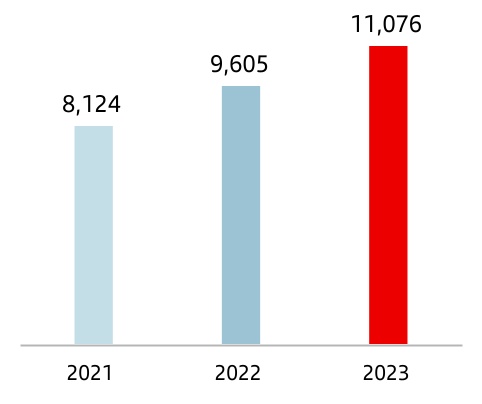
| +15% | A |
||||
| 2023 vs. 2022 | |||||
Earnings per share | ||
| EUR | ||
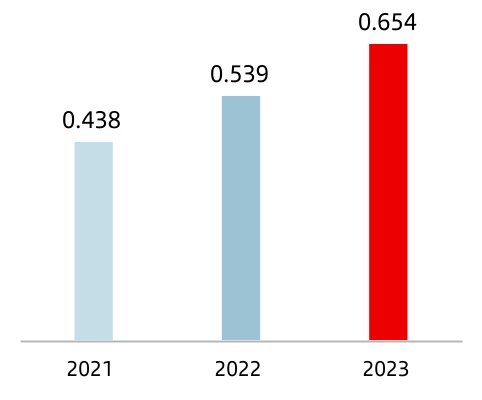
| +21% | |||||
| 2023 vs. 2022 | |||||
RoTE | ||
| % | ||
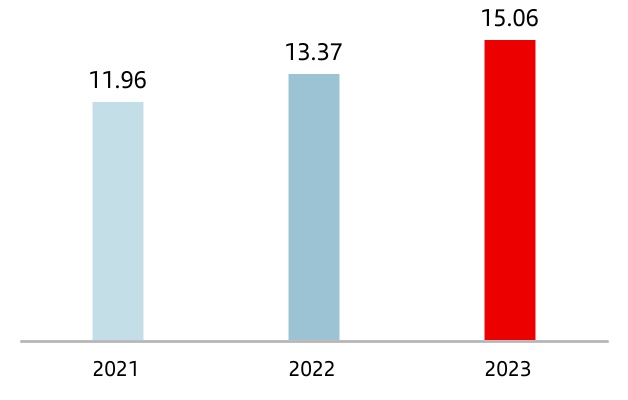
RoRWA | ||
% | ||
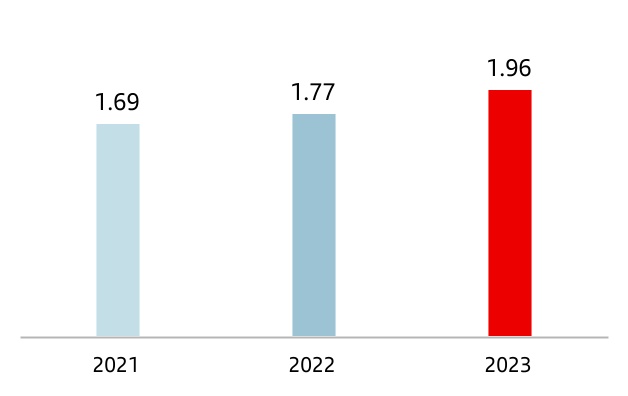
Condensed underlying income statement | ||||||||||||||||||||
| EUR million | ||||||||||||||||||||
Change |
||||||||||||||||||||
| 2023 | 2022 | Absolute | % | % excl. FX |
2021 | |||||||||||||||
| Net interest income | 43,261 | 38,619 | 4,642 | 12.0 | 15.8 | 33,370 | ||||||||||||||
| Net fee income | 12,057 | 11,790 | 267 | 2.3 | 5.0 | 10,501 | ||||||||||||||
| Gains (losses) on financial transactions and exchange differences | 2,633 | 1,653 | 980 | 59.3 | 77.1 | 1,564 | ||||||||||||||
| Other operating income | (304) | 92 | (396) | — | — | 968 | ||||||||||||||
| Total income | 57,647 | 52,154 | 5,493 | 10.5 | 13.1 | 46,404 | ||||||||||||||
| Administrative expenses and amortizations | (25,425) | (23,903) | (1,522) | 6.4 | 9.6 | (21,415) | ||||||||||||||
| Net operating income | 32,222 | 28,251 | 3,971 | 14.1 | 16.1 | 24,988 | ||||||||||||||
| Net loan-loss provisions | (12,458) | (10,509) | (1,949) | 18.5 | 19.1 | (7,436) | ||||||||||||||
| Other gains (losses) and provisions | (3,066) | (2,492) | (574) | 23.0 | 33.5 | (2,292) | ||||||||||||||
| Profit before tax | 16,698 | 15,250 | 1,448 | 9.5 | 11.3 | 15,260 | ||||||||||||||
| Tax on profit | (4,489) | (4,486) | (3) | 0.1 | 1.5 | (5,076) | ||||||||||||||
| Profit from continuing operations | 12,209 | 10,764 | 1,445 | 13.4 | 15.4 | 10,184 | ||||||||||||||
| Net profit from discontinued operations | — | — | — | — | — | — | ||||||||||||||
| Consolidated profit | 12,209 | 10,764 | 1,445 | 13.4 | 15.4 | 10,184 | ||||||||||||||
| Non-controlling interests | (1,133) | (1,159) | 26 | (2.2) | (3.4) | (1,530) | ||||||||||||||
| Net capital gains and provisions | — | — | — | — | — | (530) | ||||||||||||||
| Profit attributable to the parent | 11,076 | 9,605 | 1,471 | 15.3 | 17.7 | 8,124 | ||||||||||||||
Underlying profit attributable to the parent A |
11,076 | 9,605 | 1,471 | 15.3 | 17.7 | 8,654 | ||||||||||||||
Net loan-loss provisions | ||
| EUR million | ||
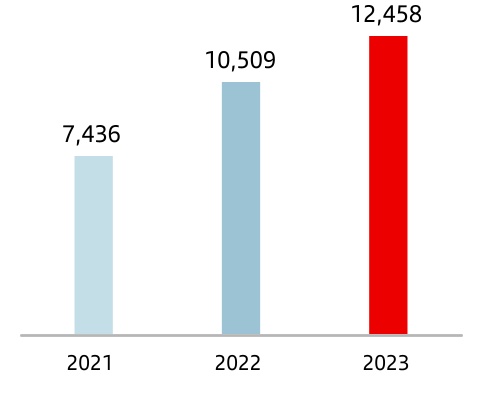
| +19 | % | A |
|||
| 2023 vs. 2022 | |||||
Underlying profit attributable to the parentA | ||
| EUR million | ||
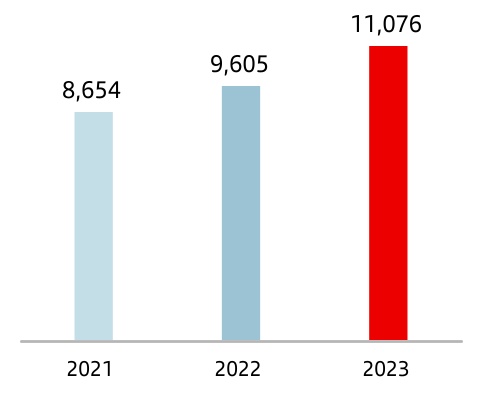
| +15 | % | B |
|||
| 2023 vs. 2022 | |||||
Cost of risk | ||
| % | ||
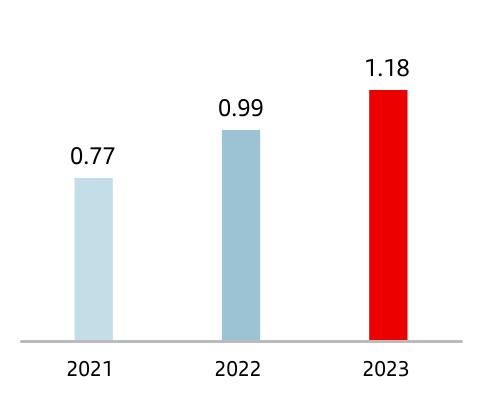
| +0.19 | pp | ||||
| 2023 vs. 2022 | |||||
Underlying earnings per shareA | ||
| EUR | ||
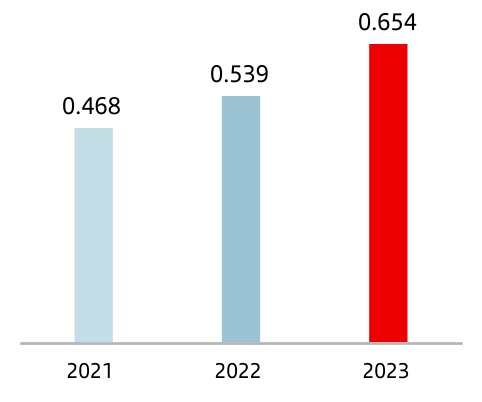
| +21% | |||||
| 2023 vs. 2022 | |||||
| Balance sheet | |||||||||||||||||
| EUR million | |||||||||||||||||
Change |
|||||||||||||||||
Assets |
2023 | 2022 | Absolute | % | 2021 | ||||||||||||
| Cash, cash balances at central banks and other deposits on demand | 220,342 | 223,073 | (2,731) | (1.2) | 210,689 | ||||||||||||
| Financial assets held for trading | 176,921 | 156,118 | 20,803 | 13.3 | 116,953 | ||||||||||||
| Non-trading financial assets mandatorily at fair value through profit or loss | 5,910 | 5,713 | 197 | 3.4 | 5,536 | ||||||||||||
| Financial assets designated at fair value through profit or loss | 9,773 | 8,989 | 784 | 8.7 | 15,957 | ||||||||||||
| Financial assets at fair value through other comprehensive income | 83,308 | 85,239 | (1,931) | (2.3) | 108,038 | ||||||||||||
| Financial assets at amortized cost | 1,191,403 | 1,147,044 | 44,359 | 3.9 | 1,037,898 | ||||||||||||
| Hedging derivatives | 5,297 | 8,069 | (2,772) | (34.4) | 4,761 | ||||||||||||
| Changes in the fair value of hedged items in portfolio hedges of interest risk | (788) | (3,749) | 2,961 | (79.0) | 410 | ||||||||||||
| Investments | 7,646 | 7,615 | 31 | 0.4 | 7,525 | ||||||||||||
| Assets under insurance or reinsurance contracts | 237 | 308 | (71) | (23.1) | 283 | ||||||||||||
| Tangible assets | 33,882 | 34,073 | (191) | (0.6) | 33,321 | ||||||||||||
| Intangible assets | 19,871 | 18,645 | 1,226 | 6.6 | 16,584 | ||||||||||||
| Tax assets | 31,390 | 29,987 | 1,403 | 4.7 | 25,196 | ||||||||||||
| Other assets | 8,856 | 10,082 | (1,226) | (12.2) | 8,595 | ||||||||||||
| Non-current assets held for sale | 3,014 | 3,453 | (439) | (12.7) | 4,089 | ||||||||||||
| Total assets | 1,797,062 | 1,734,659 | 62,403 | 3.6 | 1,595,835 | ||||||||||||
| Liabilities and equity | |||||||||||||||||
| Financial liabilities held for trading | 122,270 | 115,185 | 7,085 | 6.2 | 79,469 | ||||||||||||
| Financial liabilities designated at fair value through profit or loss | 40,367 | 40,268 | 99 | 0.2 | 14,943 | ||||||||||||
| Financial liabilities at amortized cost | 1,468,703 | 1,423,858 | 44,845 | 3.1 | 1,349,169 | ||||||||||||
| Hedging derivatives | 7,656 | 9,228 | (1,572) | (17.0) | 5,463 | ||||||||||||
| Changes in the fair value of hedged items in portfolio hedges of interest rate risk | 55 | (117) | 172 | — | 248 | ||||||||||||
| Liabilities under insurance or reinsurance contracts | 17,799 | 16,426 | 1,373 | 8.4 | 18,560 | ||||||||||||
| Provisions | 8,441 | 8,149 | 292 | 3.6 | 9,583 | ||||||||||||
| Tax liabilities | 9,932 | 9,468 | 464 | 4.9 | 8,649 | ||||||||||||
| Other liabilities | 17,598 | 14,609 | 2,989 | 20.5 | 12,698 | ||||||||||||
| Liabilities associated with non-current assets held for sale | — | — | — | — | — | ||||||||||||
| Total liabilities | 1,692,821 | 1,637,074 | 55,747 | 3.4 | 1,498,782 | ||||||||||||
| Shareholders' equity | 130,443 | 124,732 | 5,711 | 4.6 | 119,649 | ||||||||||||
| Other comprehensive income | (35,020) | (35,628) | 608 | (1.7) | (32,719) | ||||||||||||
| Non-controlling interest | 8,818 | 8,481 | 337 | 4.0 | 10,123 | ||||||||||||
| Total equity | 104,241 | 97,585 | 6,656 | 6.8 | 97,053 | ||||||||||||
| Total liabilities and equity | 1,797,062 | 1,734,659 | 62,403 | 3.6 | 1,595,835 | ||||||||||||
Executive summary A |
||||||||||||||||||||||||||||||||||||||||||||||||||||||||||||||||||||||||||
| Loans and advances to customers (minus reverse repos) | Customer funds (deposits minus repos + mutual funds) | |||||||||||||||||||||||||||||||||||||||||||||||||||||||||||||||||||||||||
Credit performance reflects the impact of macroeconomic environment and rising interest rates on customer behaviour |
Customer funds continued to grow year-on-year | |||||||||||||||||||||||||||||||||||||||||||||||||||||||||||||||||||||||||
| EUR 1,015 billion | -1% | EUR 1,177 billion | +4% | |||||||||||||||||||||||||||||||||||||||||||||||||||||||||||||||||||||||
è By segment: |
è By product: |
|||||||||||||||||||||||||||||||||||||||||||||||||||||||||||||||||||||||||
| Year-on-year decline in corporates, while loans to individuals remained stable | Increase in time deposits and mutual funds on the back of demand deposits | |||||||||||||||||||||||||||||||||||||||||||||||||||||||||||||||||||||||||
| Individuals | SMEs and corporates | CIB | Demand | Time | Mutual funds | |||||||||||||||||||||||||||||||||||||||||||||||||||||||||||||||||||||
| 0% | -1% | -6% | -7% | +30% | +13% | |||||||||||||||||||||||||||||||||||||||||||||||||||||||||||||||||||||
| A. 2023 vs. 2022 changes in constant euros. | ||||||||||||||||||||||||||||||||||||||||||||||||||||||||||||||||||||||||||
| Loans and advances to customers | |||||||||||||||||
| EUR million | |||||||||||||||||
| Change | |||||||||||||||||
| 2023 | 2022 | Absolute | % | 2021 | |||||||||||||
| Commercial bills | 55,628 | 56,688 | (1,060) | (1.9) | 49,603 | ||||||||||||
| Secured loans | 554,375 | 565,609 | (11,234) | (2.0) | 542,404 | ||||||||||||
| Other term loans | 295,485 | 290,031 | 5,454 | 1.9 | 269,526 | ||||||||||||
| Finance leases | 38,723 | 39,833 | (1,110) | (2.8) | 38,503 | ||||||||||||
| Receivable on demand | 12,277 | 11,435 | 842 | 7.4 | 10,304 | ||||||||||||
| Credit cards receivable | 24,371 | 22,704 | 1,667 | 7.3 | 20,397 | ||||||||||||
| Impaired assets | 34,094 | 32,888 | 1,206 | 3.7 | 31,645 | ||||||||||||
| Gross loans and advances to customers (minus repurchase agreements) | 1,014,953 | 1,019,188 | (4,235) | (0.4) | 962,382 | ||||||||||||
| Repurchase agreements | 44,184 | 39,500 | 4,684 | 11.9 | 33,264 | ||||||||||||
| Gross loans and advances to customers | 1,059,137 | 1,058,688 | 449 | 0.0 | 995,646 | ||||||||||||
| Loan-loss allowances | 22,788 | 22,684 | 104 | 0.5 | 22,964 | ||||||||||||
| Net loans and advances to customers | 1,036,349 | 1,036,004 | 345 | 0.0 | 972,682 | ||||||||||||
| Gross loans and advances to customers (minus reverse repos) | ||
| EUR billion | ||
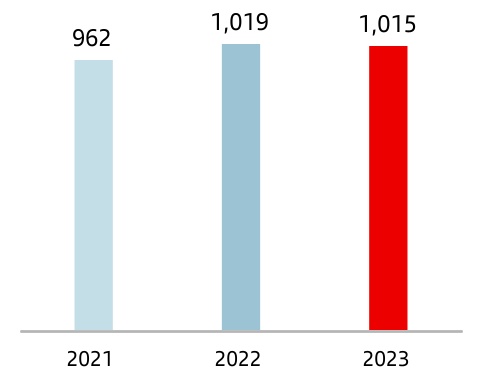
| 0 | % | A |
|||
| 2023 vs. 2022 | |||||
| Gross loans and advances to customers (minus reverse repos) | ||
| % of operating areas. December 2023 | ||
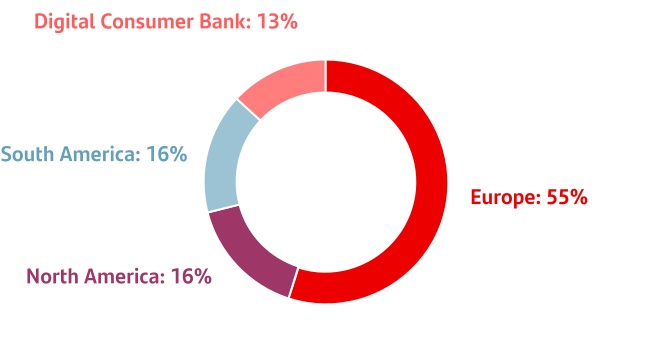
| Loans and advances to customers with maturities exceeding one year at 2023 year end | ||||||||||||||||||||||||||
| EUR million | ||||||||||||||||||||||||||
| Domestic | International | TOTAL | ||||||||||||||||||||||||
| Amount | Weight as % of the total | Amount | Weight as % of the total | Amount | Weight as % of the total | |||||||||||||||||||||
| Fixed | 78,163 | 50 | % | 376,339 | 66 | % | 454,502 | 62 | % | |||||||||||||||||
| Floating | 77,650 | 50 | % | 197,240 | 34 | % | 274,890 | 38 | % | |||||||||||||||||
| TOTAL | 155,813 | 100 | % | 573,579 | 100 | % | 729,392 | 100 | % | |||||||||||||||||
| Total customer funds | |||||||||||||||||
| EUR million | |||||||||||||||||
| Change | |||||||||||||||||
| 2023 | 2022 | Absolute | % | 2021 | |||||||||||||
| Demand deposits | 661,262 | 710,232 | (48,970) | (6.9) | 717,728 | ||||||||||||
| Time deposits | 307,085 | 236,099 | 70,986 | 30.1 | 146,469 | ||||||||||||
Mutual funds A |
208,528 | 184,054 | 24,474 | 13.3 | 188,096 | ||||||||||||
| Customer funds | 1,176,875 | 1,130,385 | 46,490 | 4.1 | 1,052,293 | ||||||||||||
Pension funds A |
14,831 | 14,021 | 810 | 5.8 | 16,078 | ||||||||||||
Managed portfolios A |
36,414 | 32,184 | 4,230 | 13.1 | 31,138 | ||||||||||||
| Repurchase agreements | 78,822 | 63,391 | 15,431 | 24.3 | 36,357 | ||||||||||||
| Total funds | 1,306,942 | 1,239,981 | 66,961 | 5.4 | 1,135,866 | ||||||||||||
| Customer funds (minus repos) | ||
| EUR billion | ||
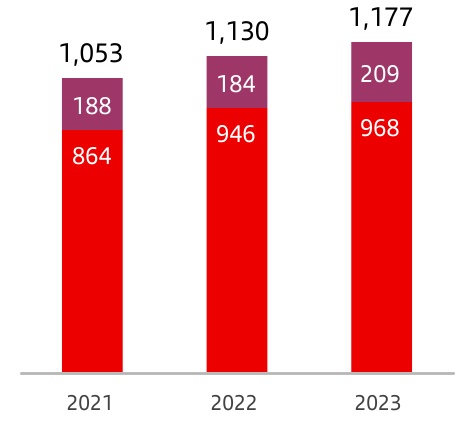
| +4 | % | A |
|||
| +13 | % | ||||
| +2 | % | ||||
•Total | |||||
•Mutual fundsB | |||||
•Deposits minus repos | |||||
| 2023 vs. 2022 | |||||
| Customer funds (minus repos) | ||
| % of operating areas. December 2023 | ||
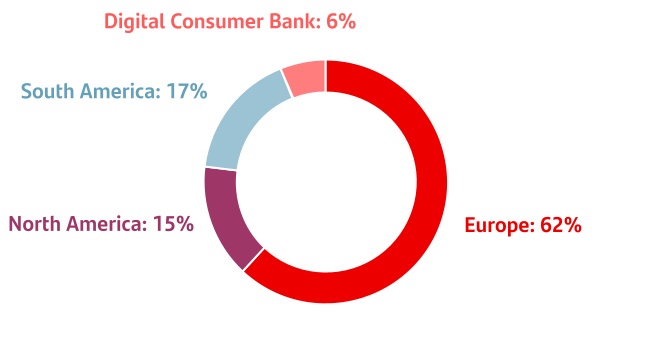
| Executive Summary | ||||||||||||||||||||||||||||||||||||||||||||||||||||||||||||||||||||
| Regulatory ratios | Debt issuances in 2023 | |||||||||||||||||||||||||||||||||||||||||||||||||||||||||||||||||||
| The LCR and NSFR ratios amply exceed regulatory requirements (both 100%) | We issued more than EUR 62 bn in debt in 2023, diversified by product, currency, country and maturity | |||||||||||||||||||||||||||||||||||||||||||||||||||||||||||||||||||
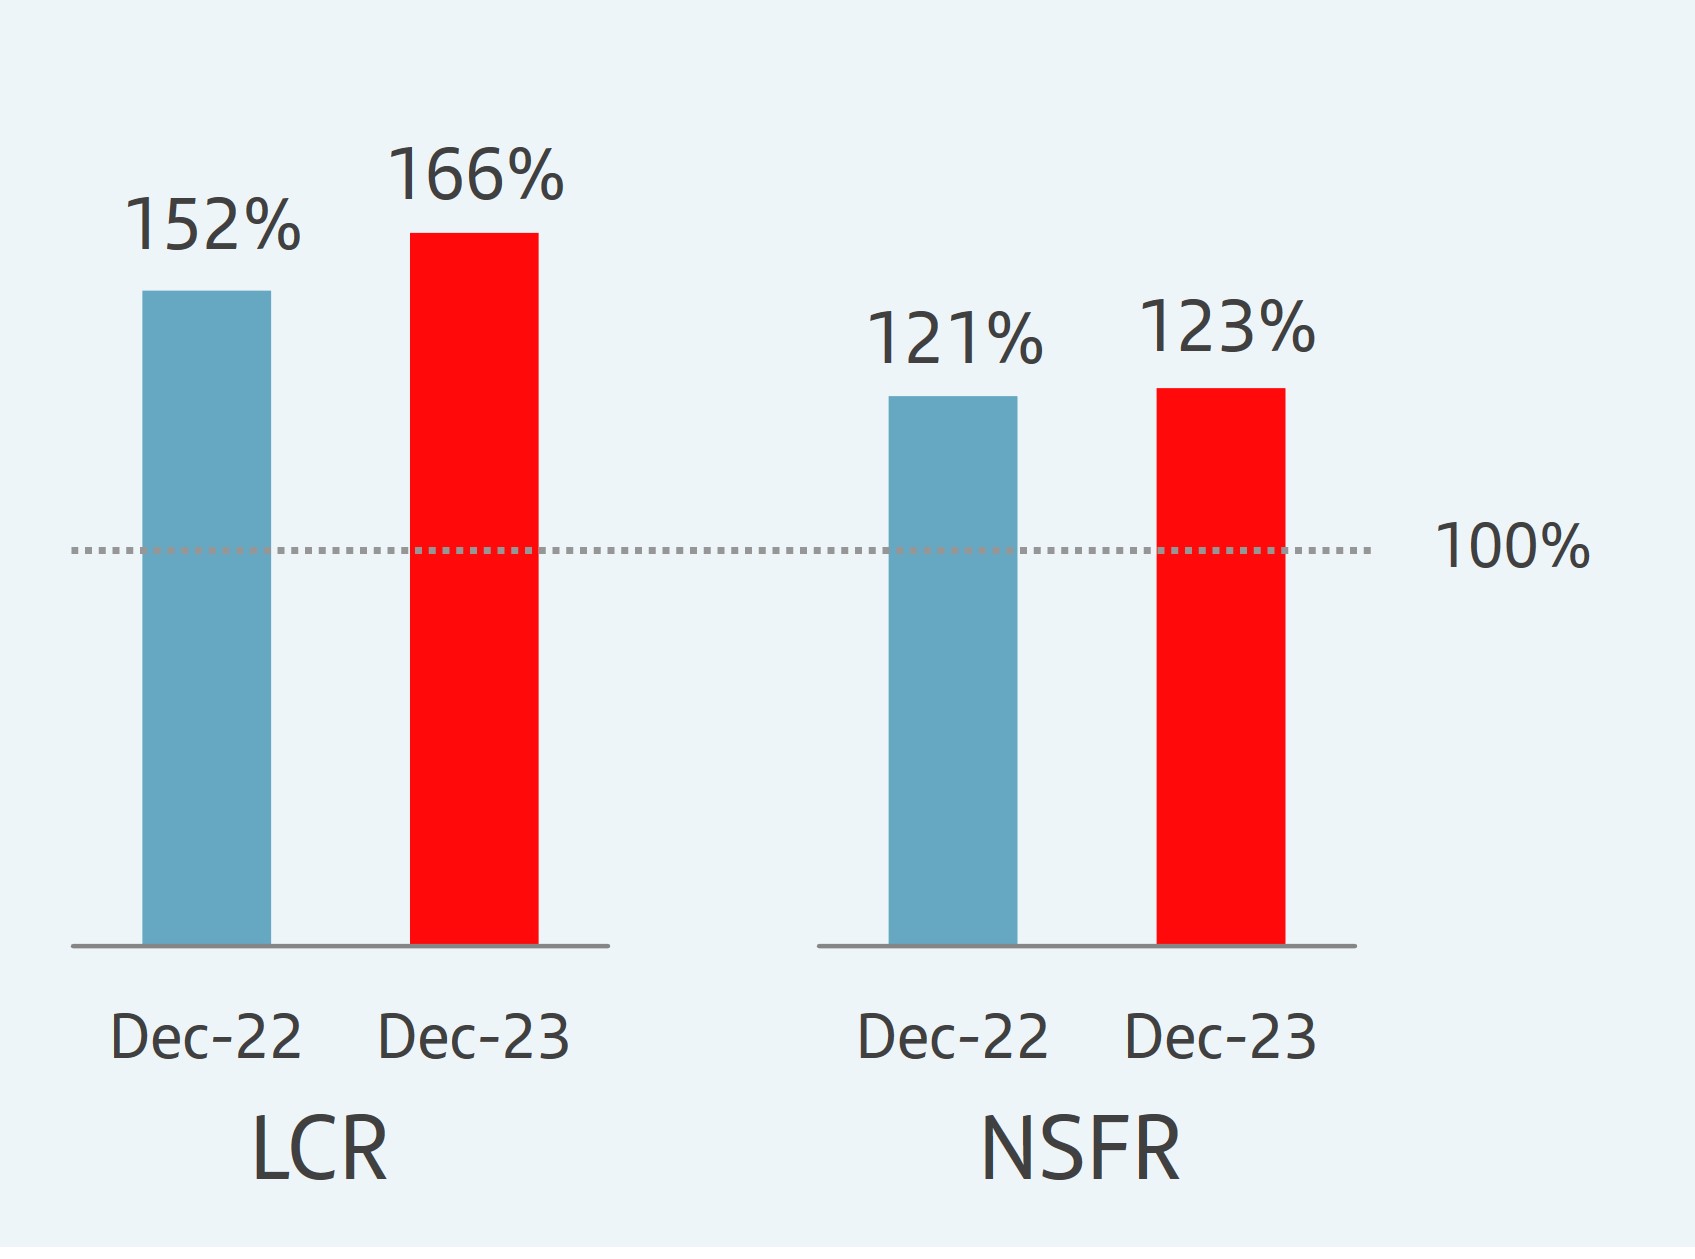 |
EUR 44.5 bn | Medium- and long-term debt | ||||||||||||||||||||||||||||||||||||||||||||||||||||||||||||||||||
| EUR 19.9 bn | Securitizations | |||||||||||||||||||||||||||||||||||||||||||||||||||||||||||||||||||
| Comfortable and stable funding structure | ||||||||||||||||||||||||||||||||||||||||||||||||||||||||||||||||||||
| High contribution from customer deposits | ||||||||||||||||||||||||||||||||||||||||||||||||||||||||||||||||||||
| 99% | LTD ratio | |||||||||||||||||||||||||||||||||||||||||||||||||||||||||||||||||||
| Group's liquidity balance sheet | ||
| %. December 2023 | ||
Financial assets |
|||||
Fixed assets & other |
|||||
Loans and advances to customers |
|||||
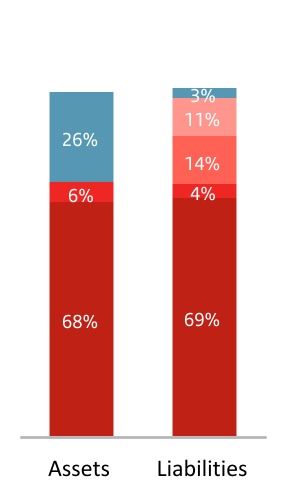
| n | ST funding |
||||
| n | Equity and other |
||||
| n | M/LT debt issuance |
||||
| n | Securitizations and others |
||||
| n | Customer deposits |
||||
Group. Stock of medium- and long-term debt issuances A | |||||||||||
| EUR million | |||||||||||
| 2023 | 2022 | 2021 | |||||||||
| Preferred | 9,892 | 8,693 | 10,238 | ||||||||
| Subordinated | 20,708 | 17,573 | 16,953 | ||||||||
| Senior debt | 125,951 | 116,350 | 104,553 | ||||||||
| Covered bonds | 49,639 | 44,073 | 41,908 | ||||||||
| Total | 206,190 | 186,689 | 173,652 | ||||||||
| Group. Distribution by contractual maturity. December 2023 | |||||||||||||||||||||||||||||
| EUR million | |||||||||||||||||||||||||||||
|
0-1
month
|
1-3
months
|
3-6
months
|
6-9
months
|
9-12
months
|
12-24
months
|
2-5
years
|
more than
5 years
|
Total |
|||||||||||||||||||||
| Preferred | — | — | — | — | — | — | — | 9,892 | 9,892 | ||||||||||||||||||||
| Subordinated | — | — | — | — | — | 3,370 | 5,678 | 11,660 | 20,708 | ||||||||||||||||||||
| Senior debt | 524 | 2,193 | 12,327 | 2,529 | 2,842 | 25,471 | 53,375 | 26,691 | 125,951 | ||||||||||||||||||||
| Covered bonds | 100 | 1,105 | 2,310 | 540 | 3,654 | 4,613 | 24,810 | 12,506 | 49,639 | ||||||||||||||||||||
| Total | 624 | 3,298 | 14,637 | 3,068 | 6,496 | 33,454 | 83,863 | 60,750 | 206,190 | ||||||||||||||||||||
| Loans and advances to customers and M/LT wholesale funding | ||
| %. December 2023 | ||
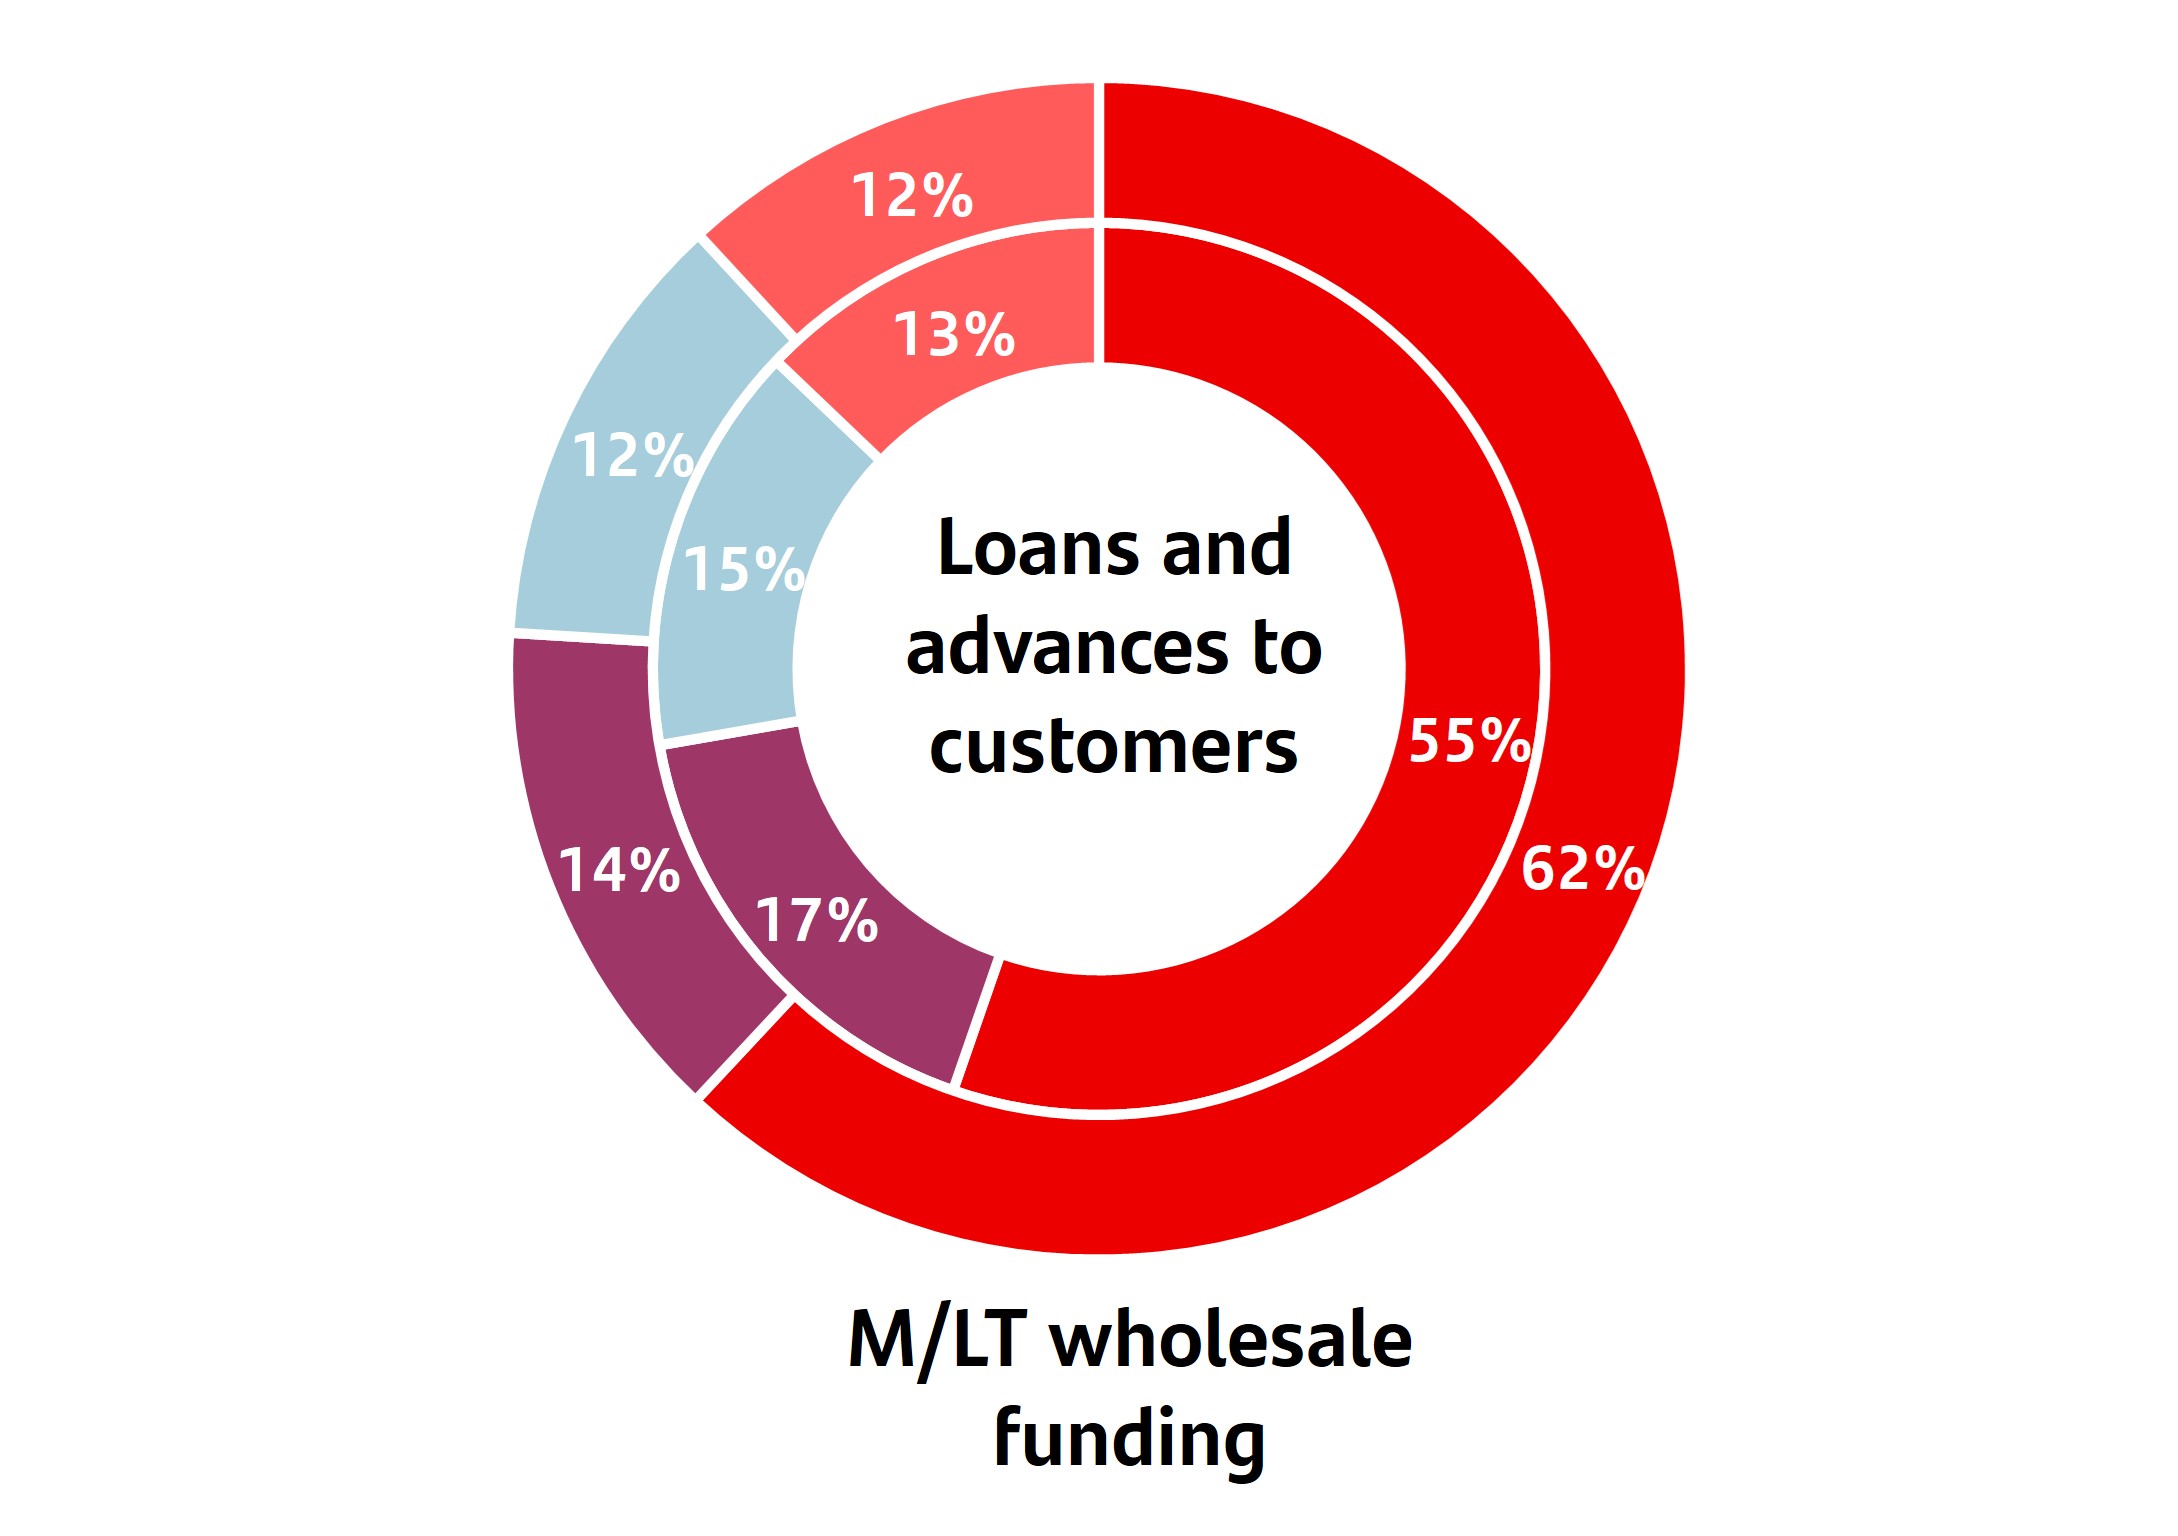 |
|||||||||||
| Europe | |||||||||||
| North America | |||||||||||
| South America | |||||||||||
| DCB | |||||||||||
| Group’s liquidity monitoring metrics | |||||||||||
| % | |||||||||||
| 2023 | 2022 | 2021 | |||||||||
Loans A / Net assets |
68 | % | 72 | % | 75 | % | |||||
Loan A -to-deposit ratio (LTD) |
99 | % | 103 | % | 108 | % | |||||
Customer deposits and medium-and long-term funding / Loans A |
127 | % | 121 | % | 115 | % | |||||
| Short-term wholesale funding / Net liabilities | 3 | % | 3 | % | 2 | % | |||||
| Structural liquidity surplus (% of net liabilities) | 23 | % | 19 | % | 16 | % | |||||
| Main subsidiaries' liquidity metrics | ||||||||
| %. December 2023 | ||||||||
LTD ratio (loans A / deposits) |
Deposits + M/LT funding / Loans A |
|||||||
| Spain | 74 | % | 147 | % | ||||
| United Kingdom | 105 | % | 110 | % | ||||
| Portugal | 101 | % | 112 | % | ||||
| Poland | 76 | % | 137 | % | ||||
| United States | 104 | % | 122 | % | ||||
| Mexico | 89 | % | 121 | % | ||||
| Brazil | 88 | % | 138 | % | ||||
| Chile | 144 | % | 92 | % | ||||
| Argentina | 58 | % | 172 | % | ||||
| Digital Consumer Bank | 191 | % | 76 | % | ||||
| Group | 99 | % | 127 | % | ||||
| Distribution by instrument and region | ||
| %. December 2023 | ||
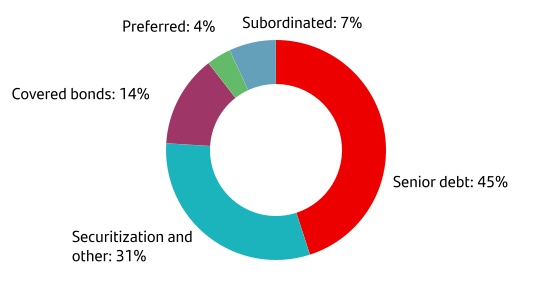
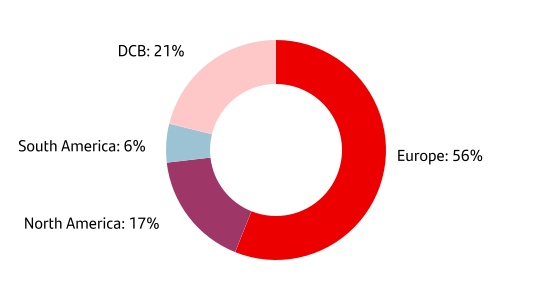
| Liquidity Coverage Ratio (LCR) | ||||||||
| % | ||||||||
| December 2023 | December 2022 | |||||||
| Parent bank | 159 | % | 147 | % | ||||
| United Kingdom | 159 | % | 157 | % | ||||
| Portugal | 150 | % | 132 | % | ||||
| Poland | 221 | % | 178 | % | ||||
| United States | 138 | % | 125 | % | ||||
| Mexico | 171 | % | 197 | % | ||||
| Brazil | 154 | % | 127 | % | ||||
| Chile | 207 | % | 189 | % | ||||
| Argentina | 226 | % | 235 | % | ||||
| Santander Consumer Finance | 357 | % | 241 | % | ||||
| Group | 166 | % | 152 | % | ||||
| Net Stable Funding Ratio | ||||||||
| % | ||||||||
| December 2023 | December 2022 | |||||||
| Parent bank | 117 | % | 116 | % | ||||
| United Kingdom | 138 | % | 137 | % | ||||
| Portugal | 117 | % | 116 | % | ||||
| Poland | 157 | % | 146 | % | ||||
| United States | 117 | % | 109 | % | ||||
| Mexico | 129 | % | 120 | % | ||||
| Brazil | 113 | % | 112 | % | ||||
| Chile | 115 | % | 117 | % | ||||
| Argentina | 202 | % | 195 | % | ||||
| Santander Consumer Finance | 111 | % | 109 | % | ||||
| Group | 123 | % | 121 | % | ||||
| Group. Disclosure on asset encumbrance as at December 2023 | ||||||||||||||
| EUR billion | ||||||||||||||
| Carrying amount of encumbered assets | Fair value of encumbered assets | Carrying amount of unencumbered assets | Fair value of unencumbered assets | |||||||||||
| Assets | 306.3 | — | 1,490.7 | — | ||||||||||
| Loans and advances | 186.4 | — | 1,172.2 | — | ||||||||||
| Equity instruments | 9.4 | 9.4 | 11.5 | 11.5 | ||||||||||
| Debt instruments | 86.8 | 87.6 | 156.4 | 156.1 | ||||||||||
| Other assets | 23.7 | — | 150.6 | — | ||||||||||
| Group. Collateral received as at December 2023 | ||||||||
| EUR billion | ||||||||
| Fair value of encumbered collateral received or own debt securities issued | Fair value of collateral received or own debt securities issued available for encumbrance | |||||||
| Collateral received | 138.8 | 51.3 | ||||||
| Loans and advances | 1.1 | — | ||||||
| Equity instruments | 5.5 | 8.7 | ||||||
| Debt instruments | 132.2 | 42.5 | ||||||
| Other collateral received | — | 0.1 | ||||||
| Own debt securities issued other than own covered bonds or ABSs | — | 1.9 | ||||||
| Group. Encumbered assets/collateral received and associated liabilities as at December 2023 | ||||||||
| EUR billion | ||||||||
|
Matching liabilities,
contingent liabilities
or securities lent
|
Assets, collateral received and own debt securities issued other than covered bonds and ABSs encumbered |
|||||||
| Total sources of encumbrance (carrying amount) | 330.6 | 445.2 | ||||||
| Rating agencies | |||||||||||
| Long term | Short term | Outlook | |||||||||
| DBRS | A (High) | R-1 (Middle) | Stable | ||||||||
| Fitch Ratings | A-(SeniorA) | F2 (Senior F1) | Stable | ||||||||
| Moody's | A2 | P-1 | Stable | ||||||||
| Standard & Poor's | A+ | A-1 | Stable | ||||||||
| Scope | AA- | S-1+ | Stable | ||||||||
| JCR Japan | A+ | — | Stable | ||||||||
| Executive summary | ||||||||||||||||||||||||||||||||||||||||||||||||||||||||||||||||||||||||||||||||||||||||||||||||||
| Fully-loaded capital ratio | Fully-loaded CET1 | |||||||||||||||||||||||||||||||||||||||||||||||||||||||||||||||||||||||||||||||||||||||||||||||||
| The fully-loaded CET1 ratio remained above 12% in every quarter in 2023 | Strong organic generation driven by higher profit | |||||||||||||||||||||||||||||||||||||||||||||||||||||||||||||||||||||||||||||||||||||||||||||||||
| % | 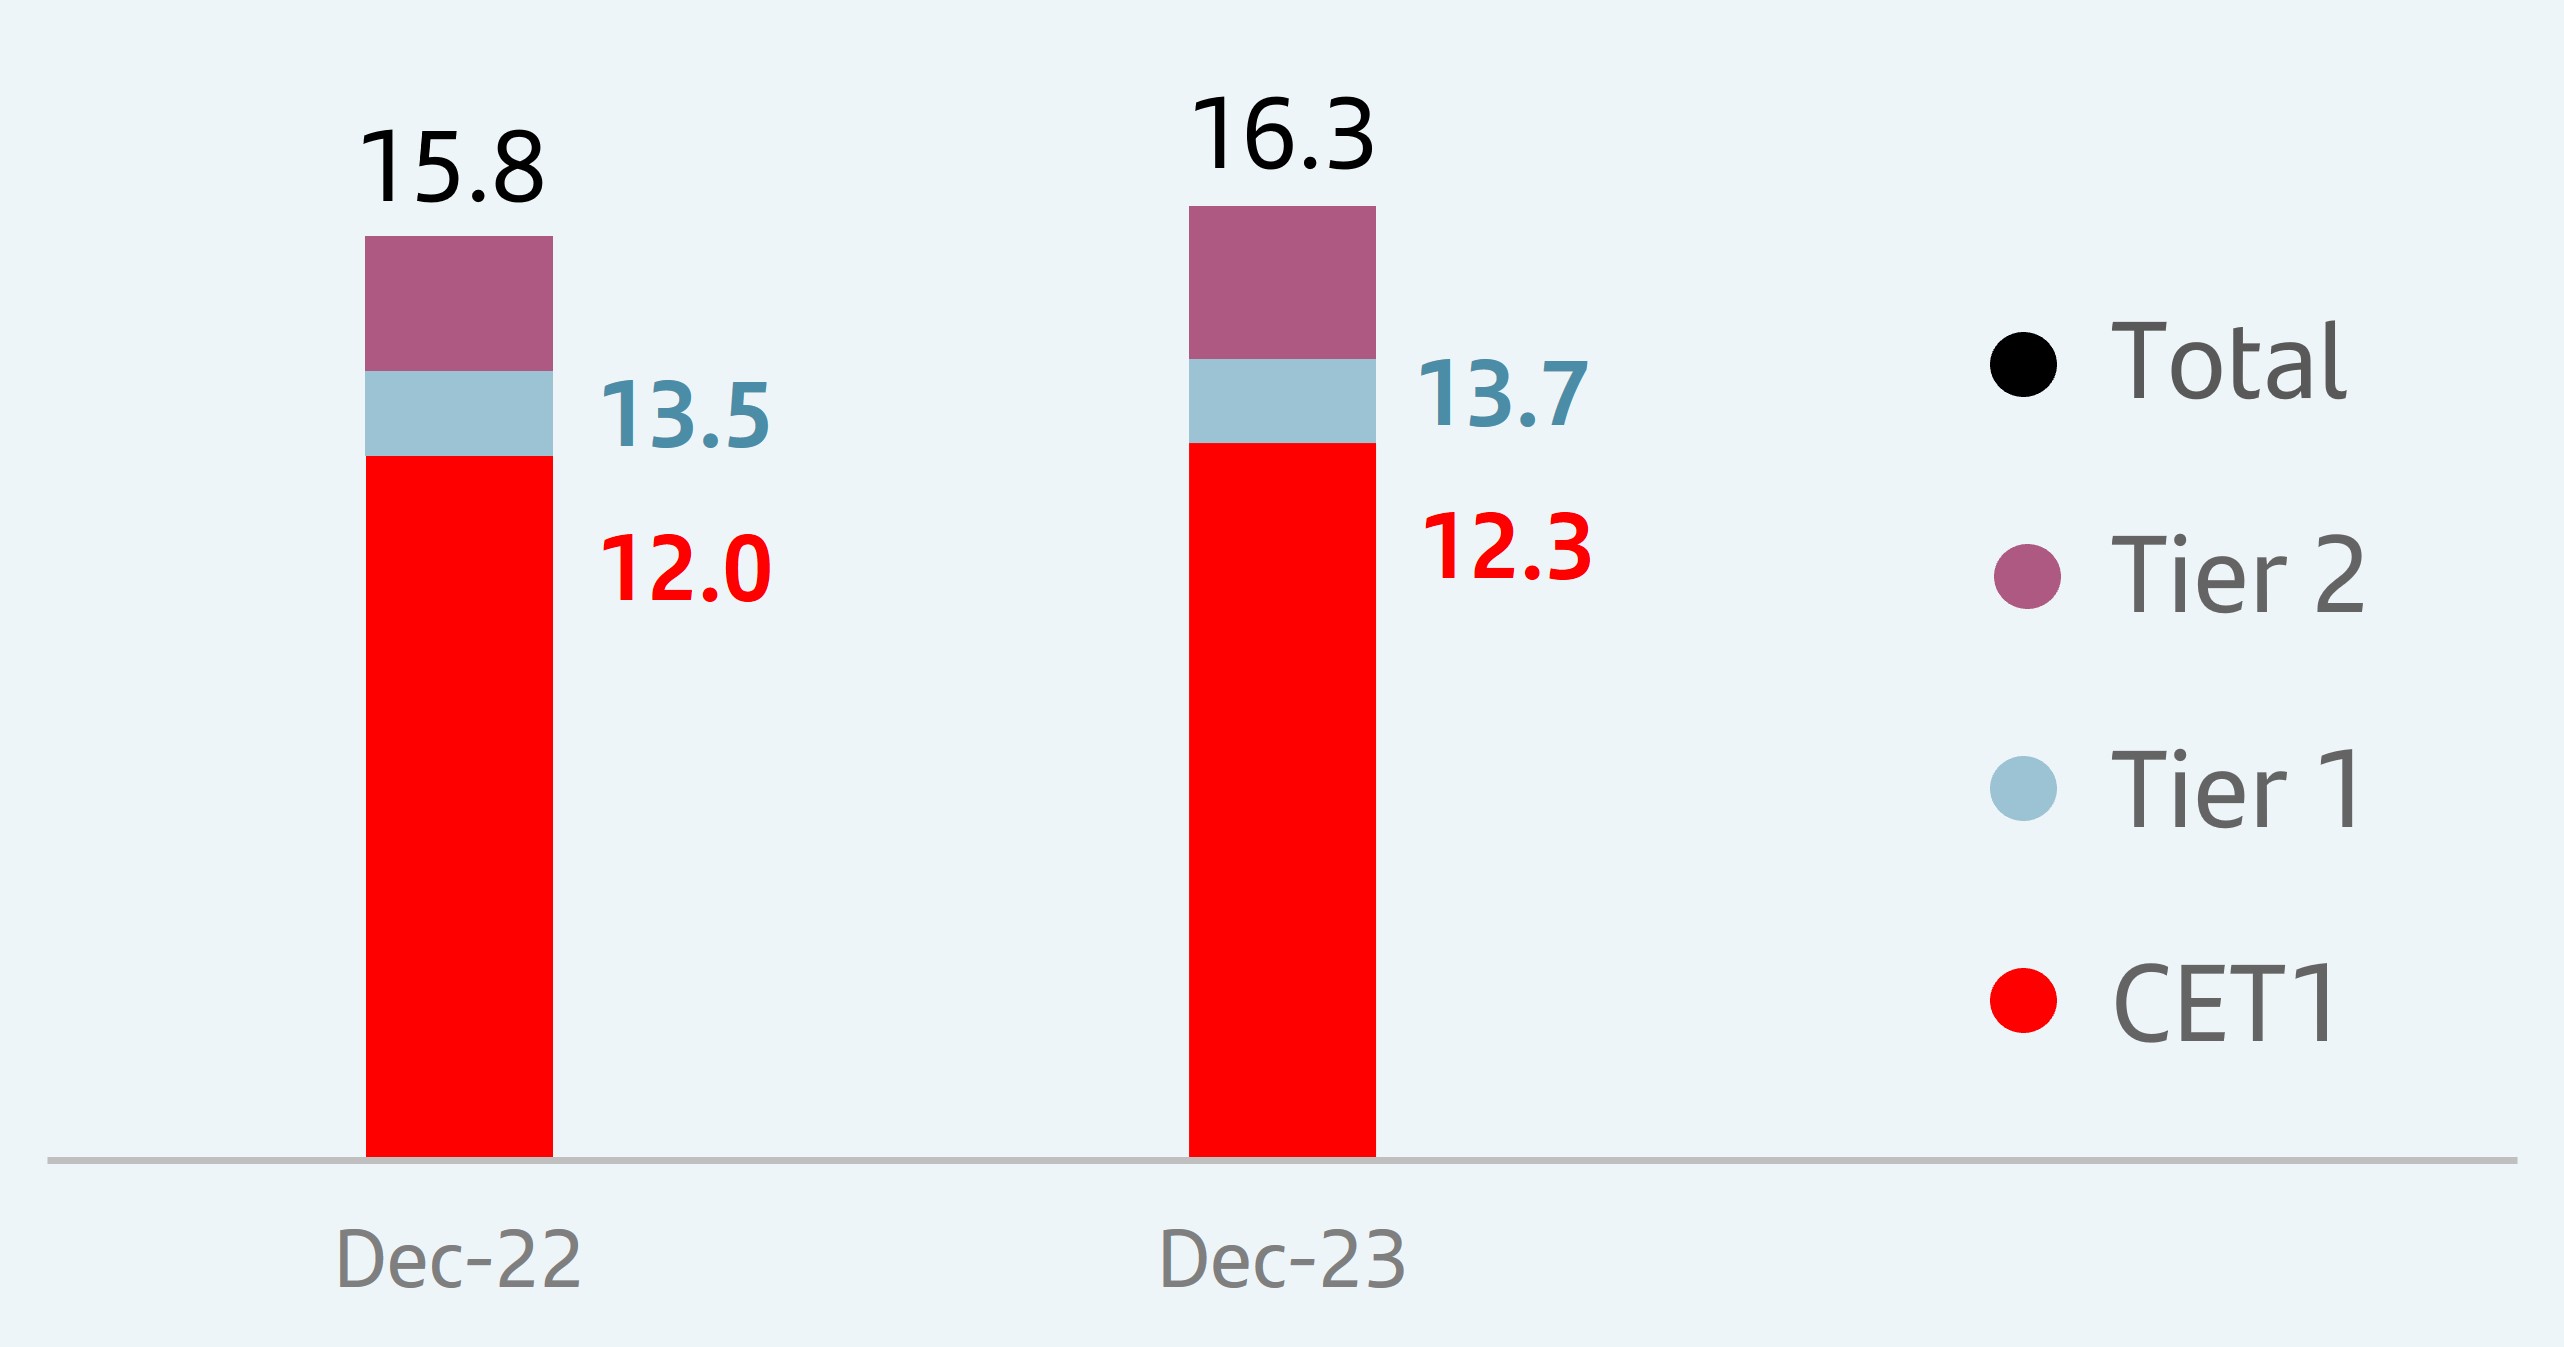 |
Organic generation | +119 bps | |||||||||||||||||||||||||||||||||||||||||||||||||||||||||||||||||||||||||||||||||||||||||||||||
| TNAV per share | ||||||||||||||||||||||||||||||||||||||||||||||||||||||||||||||||||||||||||||||||||||||||||||||||||
The TNAV per share was EUR 4.76, +15% year-on-year including cash dividends paid in 2023 |
||||||||||||||||||||||||||||||||||||||||||||||||||||||||||||||||||||||||||||||||||||||||||||||||||
 |
Regulatory capital | ||||||||||||||||
| The first step in managing regulatory capital is to analyse the capital base, the capital adequacy ratios under the current regulatory criteria and the scenarios used in capital planning to make the capital structure as efficient as possible, both in terms of costs and compliance with regulatory requirements and out internal capital targets. Active capital management includes strategies for allocation and efficient use of capital, securitizations, asset sales and issuances of equity instruments (hybrid equity instruments and subordinated debt). | |||||||||||||||||
 |
Economic capital | ||||||||||||||||
| The economic capital model aims to ensure we adequately allocate our capital to cover every risk we are exposed to a result of our activity and risk appetite. It also aims to optimize economic value added at Group and business unit level. | |||||||||||||||||
 |
Profitability and pricing | ||||||||||||||||
| Creating value and maximizing profitability is one of Santander's main objectives. We carefully select the most appropriate markets and portfolios based on profitability while considering risk. Thus, profitability and pricing are integral to our key capital model processes. | |||||||||||||||||
Fully-loaded CET1 ratioA | ||
| % | ||
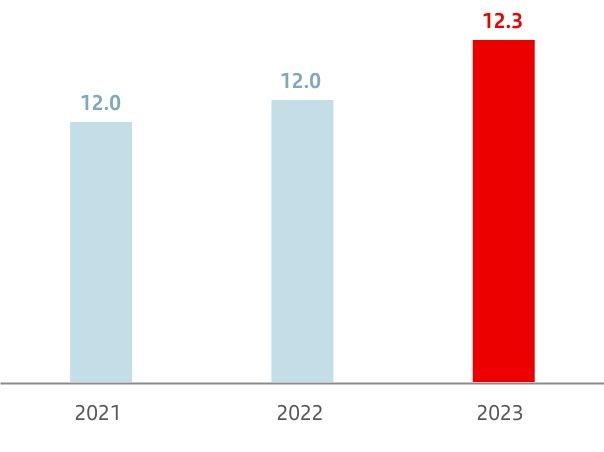
Regulatory phased-in CET1 ratioB |
||||||||||||||
| % | ||||||||||||||
| 12.5 | 12.2 | 12.3 | ||||||||||||
| Main capital data and solvency ratios | |||||||||||||||||
| EUR million | |||||||||||||||||
| Fully loaded | Phased-in B |
||||||||||||||||
| 2023 | 2022 | 2023 | 2022 | ||||||||||||||
| Common equity (CET1) | 76,448 | 73,390 | 76,741 | 74,202 | |||||||||||||
| Tier1 (T1) | 85,450 | 82,221 | 85,742 | 83,033 | |||||||||||||
| Eligible capital | 101,747 | 96,373 | 102,240 | 97,392 | |||||||||||||
| Risk-weighted assets | 623,652 | 609,702 | 623,731 | 609,266 | |||||||||||||
| CET1 capital ratio | 12.3 | % | 12.0 | % | 12.3 | % | 12.2 | % | |||||||||
| T1 capital ratio | 13.7 | % | 13.5 | % | 13.7 | % | 13.6 | % | |||||||||
| Total capital ratio | 16.3 | % | 15.8 | % | 16.4 | % | 16.0 | % | |||||||||
| Leverage ratio | 4.68 | % | 4.70 | % | 4.69 | % | 4.74 | % | |||||||||
| Fully-loaded CET1 ratio in 2023 | ||
| % | ||
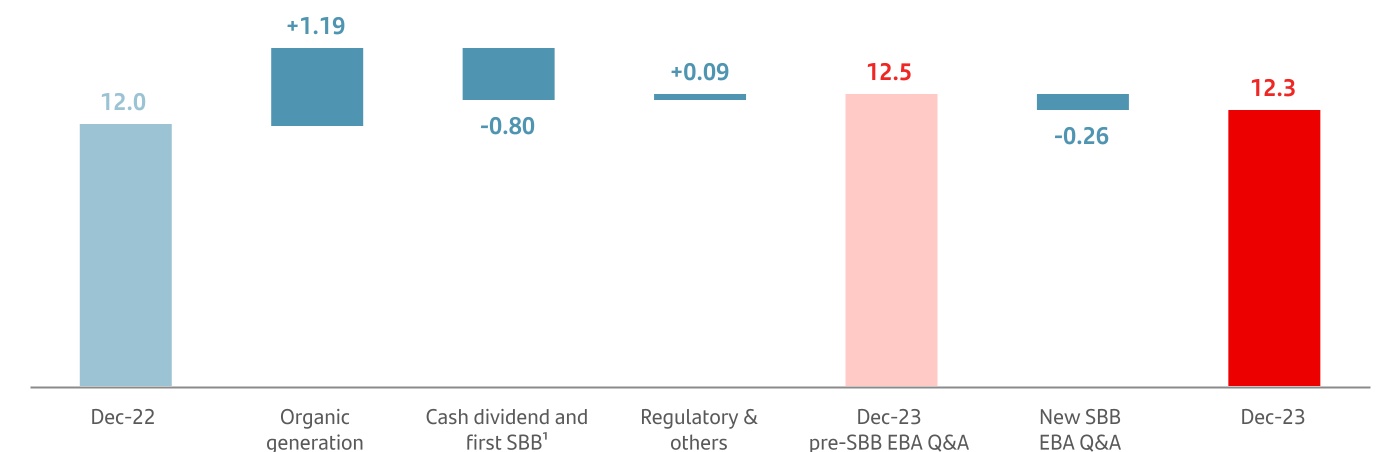
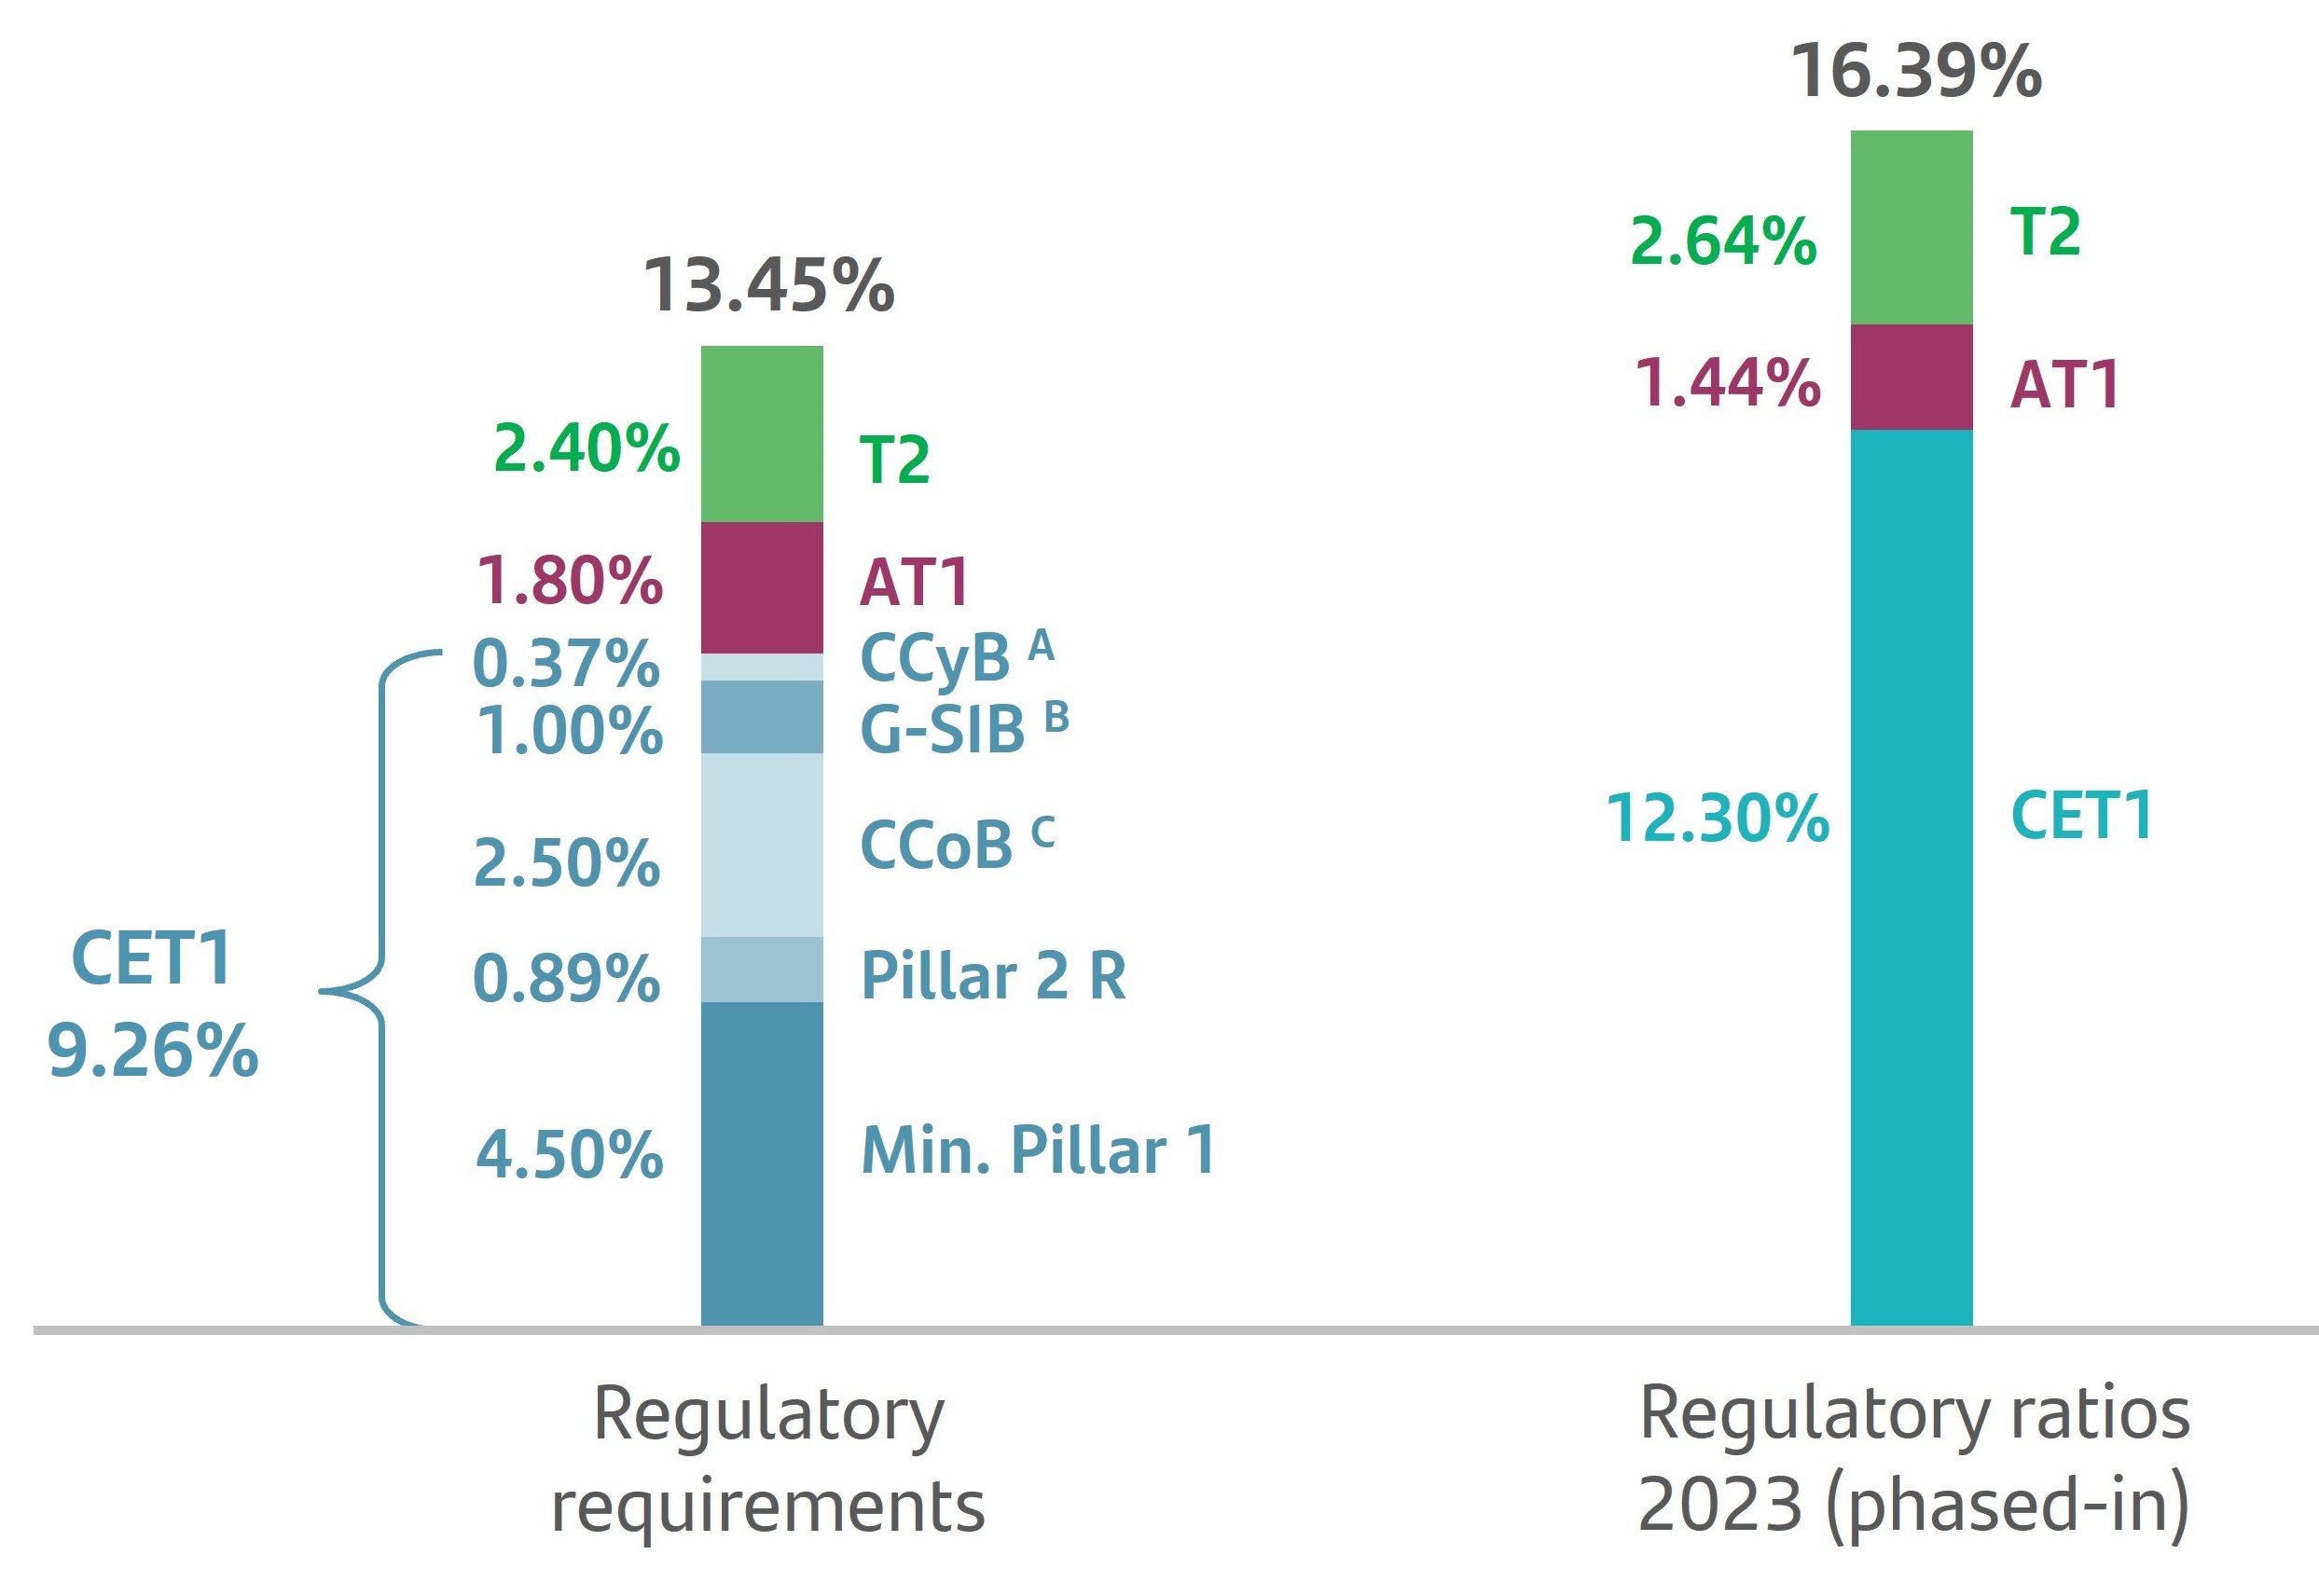
| Regulatory capital (phased-in). Flow statement | |||||
| EUR million | |||||
| 2023 | |||||
| Capital Core Tier 1 (CET 1) | |||||
| Starting amount (31/12/2022) | 74,202 | ||||
| Shares issued in the year and share premium | (2,205) | ||||
| Treasury shares and own shares financed | (2,787) | ||||
| Reserves | (1,209) | ||||
| Attributable profit net of dividends | 8,307 | ||||
| Other retained earnings | 2,400 | ||||
| Minority interests | (518) | ||||
| Decrease/(increase) in goodwill and other intangible assets | (38) | ||||
| Other | (1,412) | ||||
| Ending amount (31/12/2023) | 76,741 | ||||
| Additional Capital Tier 1 (AT1) | |||||
| Starting amount (31/12/2022) | 8,831 | ||||
| AT1 eligible instruments | 117 | ||||
| AT1 excesses - subsidiaries | 54 | ||||
| Residual value of intangible assets | — | ||||
| Deductions | — | ||||
| Ending amount (31/12/2023) | 9,002 | ||||
| Capital Tier 2 (T2) | |||||
| Starting amount (31/12/2022) | 14,359 | ||||
| T2 eligible instruments | 2,331 | ||||
| Generic funds and surplus loan-loss provisions-IRB | 76 | ||||
| T2 excesses - subsidiaries | (269) | ||||
| Deductions | — | ||||
| Ending amount (31/12/2023) | 16,497 | ||||
| Deductions from total capital | — | ||||
| Total capital ending amount (31/12/2023) | 102,240 | ||||
| Risk-weighted assets (phased-in CRR, phased-in IFRS 9) | ||||||||||||||
| EUR million | ||||||||||||||
| RWAs | Minimum capital requirements | |||||||||||||
| 2023 | 2022 | 2023 | ||||||||||||
Credit risk (excluding CCR) A |
515,238 | 507,775 | 41,219 | |||||||||||
| Of which: standardized approach (SA) | 285,728 | 274,922 | 22,858 | |||||||||||
| Of which: the foundation IRB (FIRB) approach | 56,913 | 11,759 | 4,553 | |||||||||||
Of which: slotting approach B |
14,123 | 14,509 | 1,130 | |||||||||||
| Of which: equities under the simple risk-weighted approach | 3,603 | 2,828 | 288 | |||||||||||
| Of which: the advanced IRB (AIRB) approach | 138,204 | 188,442 | 11,056 | |||||||||||
| Counterparty credit risk (CCR) | 13,593 | 13,096 | 1,087 | |||||||||||
Of which: standardized approach |
10,150 | 9,493 | 812 | |||||||||||
| Of which: internal model method (IMM) | — | — | — | |||||||||||
| Of which: exposures to a CCP | 324 | 278 | 26 | |||||||||||
| Of which: credit valuation adjustment (CVA) | 680 | 1,097 | 54 | |||||||||||
| Of which: other CCR | 2,439 | 2,229 | 195 | |||||||||||
| Settlement risk | 4 | 4 | 0 | |||||||||||
| Securitization exposure in the banking book (after the cap) | 11,419 | 9,898 | 914 | |||||||||||
| Of which: SEC-IRBA approach | 4,275 | 4,471 | 342 | |||||||||||
| Of which: SEC-ERBA approach | 2,257 | 2,156 | 181 | |||||||||||
Of which: SEC-SA approach B |
4,887 | 3,270 | 391 | |||||||||||
Of which: 1250% deduction C |
— | — | — | |||||||||||
| Position, foreign exchange and commodities risks (Market risk) | 16,454 | 15,791 | 1,316 | |||||||||||
| Of which: standardized approach | 9,166 | 7,521 | 733 | |||||||||||
| Of which: internal model approach (IMA) | 7,288 | 8,270 | 583 | |||||||||||
| Large exposures | — | — | — | |||||||||||
| Operational risk | 67,022 | 62,702 | 5,362 | |||||||||||
| Of which: basic indicator approach | — | — | — | |||||||||||
| Of which: standardized approach | 67,022 | 62,702 | 5,362 | |||||||||||
| Of which: advanced measurement approach | — | — | — | |||||||||||
| Amounts below the thresholds for deduction | 28,732 | 25,868 | 2,299 | |||||||||||
Total B |
623,731 | 609,266 | 49,898 | |||||||||||
| RWAs by geographical distribution (phased-in CRR, phased-in IFRS 9) | ||||||||||||||||||||||||||
EUR billion | ||||||||||||||||||||||||||
| TOTAL | EUROPE | o/w: Spain | o/w: United Kingdom | NORTH AMERICA | o/w: US | SOUTH AMERICA | o/w: Brazil | |||||||||||||||||||
| Credit risk (excluding CRR) | 540 | 323 | 132 | 69 | 94 | 67 | 123 | 89 | ||||||||||||||||||
| of which, standardised approach (SA) | 290 | 122 | 36 | 19 | 74 | 56 | 94 | 65 | ||||||||||||||||||
of which, internal rating-based (IRB) approach |
218 | 172 | 74 | 46 | 18 | 9 | 28 | 23 | ||||||||||||||||||
| of which, equity and DTAs | 19 | 19 | 19 | — | — | — | — | — | ||||||||||||||||||
of which, securitizations A |
11 | 9 | 2 | 3 | 2 | 2 | 0 | 0 | ||||||||||||||||||
| of which, rest | 1 | 1 | 0 | — | 0 | — | — | — | ||||||||||||||||||
| Market risk | 16 | 12 | 11 | 0 | 2 | 1 | 3 | 1 | ||||||||||||||||||
| Operational risk | 67 | 35 | 14 | 7 | 16 | 11 | 16 | 10 | ||||||||||||||||||
Total |
624 | 369 | 157 | 77 | 112 | 80 | 142 | 100 | ||||||||||||||||||
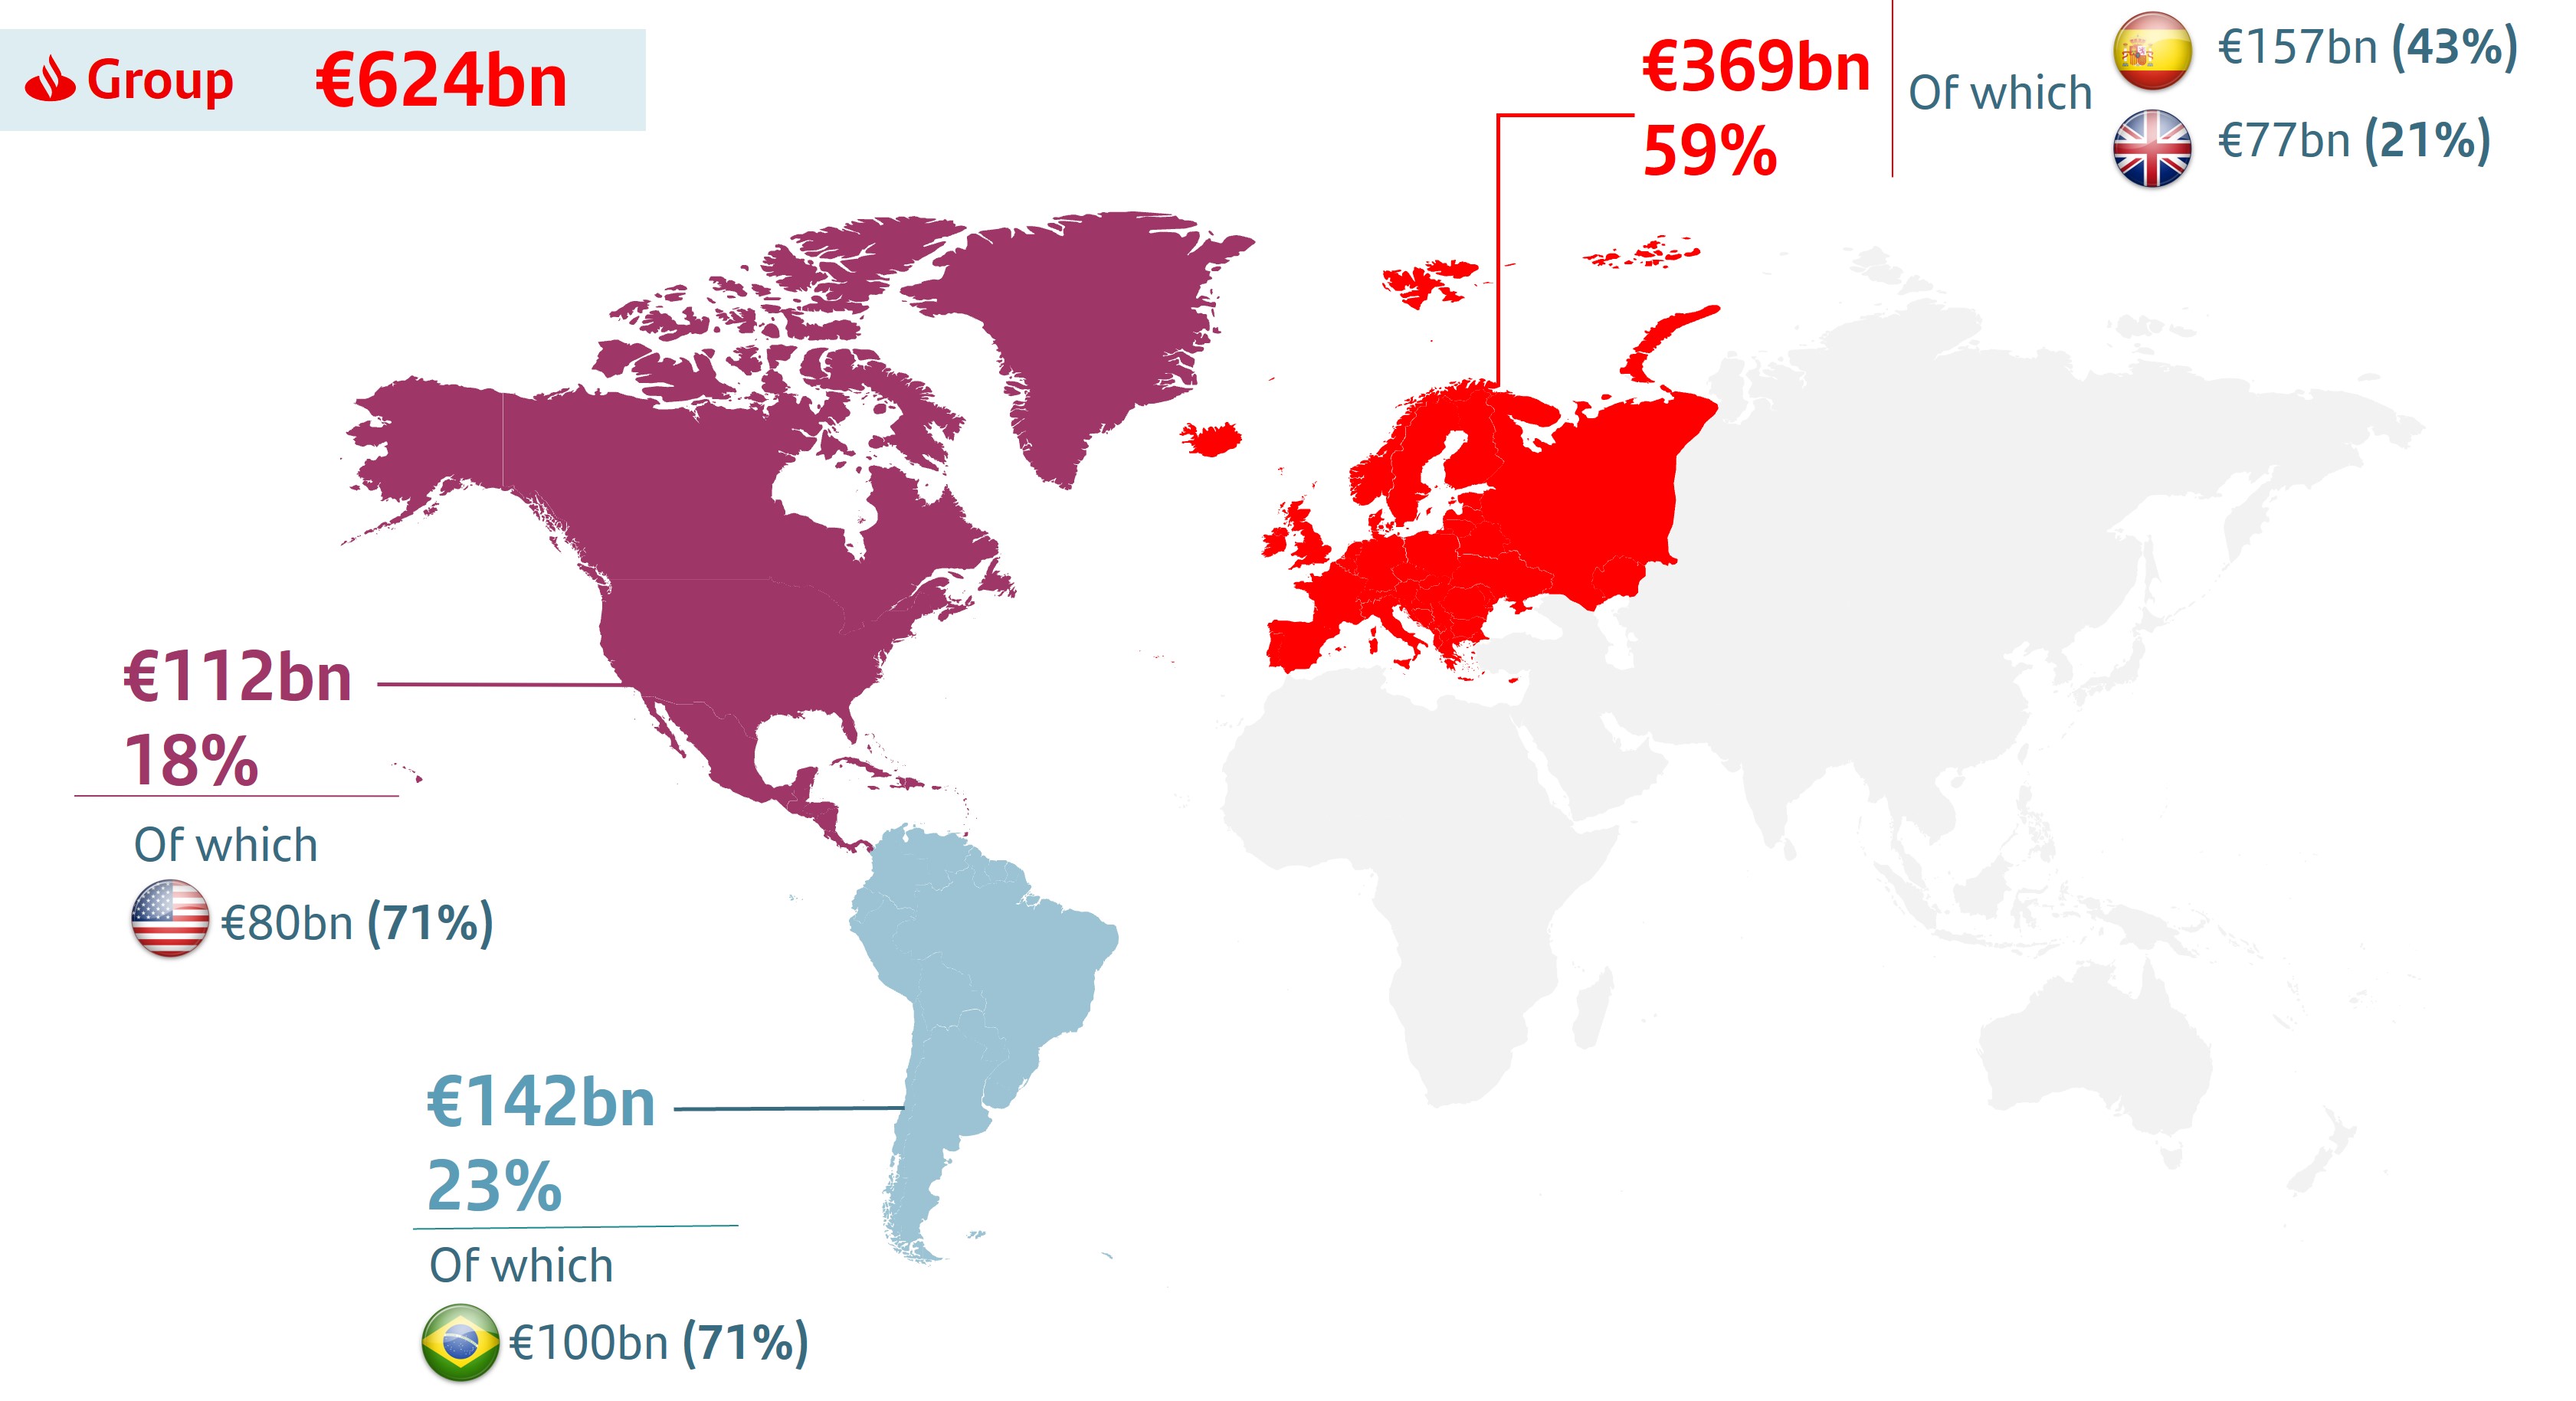
Credit risk capital movements A | ||||||||
| EUR million | ||||||||
| RWAs | Capital requirements | |||||||
| Starting amount (31/12/2022) | 529,401 | 42,352 | ||||||
| Asset size | 14,247 | 1,140 | ||||||
| Asset quality | (2,091) | (167) | ||||||
| Model updates | (13) | (1) | ||||||
| Regulatory | — | — | ||||||
| Acquisitions and disposals | — | — | ||||||
| Foreign exchange movements | (2,297) | (184) | ||||||
| Other | — | — | ||||||
| Ending amount (31/12/2023) | 539,247 | 43,140 | ||||||
| Reconciliation of economic and regulatory capital | ||||||||
| EUR million | ||||||||
| 2023 | 2022 | |||||||
| Net capital and issuance premiums | 49,618 | 54,610 | ||||||
| Reserves and retained profits | 76,841 | 67,978 | ||||||
| Valuation adjustments | (34,484) | (35,068) | ||||||
| Minority interests | 6,908 | 7,426 | ||||||
| Prudential filters | (669) | (708) | ||||||
Other A |
(3,986) | (2,522) | ||||||
| Base economic capital available | 94,228 | 91,716 | ||||||
| Deductions | (18,867) | (18,603) | ||||||
| Goodwill | (14,161) | (14,484) | ||||||
| Other intangible assets | (3,059) | (2,698) | ||||||
| DTAs | (1,648) | (1,421) | ||||||
| Other | 1,088 | 237 | ||||||
| Base regulatory (FL CET1) capital available | 76,448 | 73,350 | ||||||
| Base economic capital available | 94,228 | 91,716 | ||||||
Economic capital required B |
74,721 | 70,900 | ||||||
| Capital surplus | 19,507 | 20,816 | ||||||
| A. Includes: deficit of provisions over economic expected loss, pension assets and other adjustments. | ||
| B. For a better comparison with regulatory capital, the differences in goodwill due to FX changes are included in the required economic capital. All figures according to EC 2022 methodology. | ||
Economic Value AddedA and RoRAC | |||||||||||||||||
| EUR million | |||||||||||||||||
| 2023 | 2022 | ||||||||||||||||
| Main segments | RoRAC | EVA | RoRAC | EVA | |||||||||||||
| Europe | 24.1 | % | 3,169 | 15.5 | % | 1,082 | |||||||||||
| North America | 18.8 | % | 886 | 23.4 | % | 1,418 | |||||||||||
| South America | 19.0 | % | (45) | 23.4 | % | 966 | |||||||||||
| Digital Consumer Bank | 23.2 | % | 788 | 26.5 | % | 974 | |||||||||||
| Total Group | 15.3 | % | 3,285 | 14.0 | % | 2,146 | |||||||||||
|
|
||||||||||||||
| 1 | Macroeconomic scenario |
•Central and recession
•Idiosyncratic: based on specific risks the entity faces
•Multi-year horizon
•Reverse stress tests
|
||||||||||||
| 2 | Balance sheet and income statement forecasts |
•Projection of volumes. Business strategy
•Margins and funding costs
•Fees and operating expenses
•Market shocks and operational losses
•Credit losses and provisions. PIT LGD and PD models
•IFRS 9 models and migration among stages
|
||||||||||||
| 3 |
Capital requirements
forecasts
|
•Consistent with projected balance sheet
•Regulatory and economic risk parameters (PD, LGD and EAD)
|
||||||||||||
| 4 | Solvency analysis |
•Available capital base. Profits and dividends
•Regulatory and legislative impacts
•Capital and solvency ratios
•Compliance with capital objectives
•Regulatory and economic view
|
||||||||||||
| 5 | Action plan |
•In the event of failure to comply with internal objectives or regulatory requirements This structure supports the ultimate objective of capital planning, by making it an important strategic component that: |
||||||||||||
| Gross Domestic Product (GDP) | |||||||||||||||||||||||||||||||||||||||||||||||||||||
| Change (%) | |||||||||||||||||||||||||||||||||||||||||||||||||||||
| Spain | UK | US | Mexico | Brazil | Chile | ||||||||||||||||||||||||||||||||||||||||||||||||
| 2023 | 2023-25 | 2023 | 2023-25 | 2023 | 2023-25 | 2023 | 2023-25 | 2023 | 2023-25 | 2023 | 2023-25 | ||||||||||||||||||||||||||||||||||||||||||
| Baseline scenario | 1.3 | 6.1 | 0.3 | 3.2 | 1.0 | 4.0 | 1.2 | 5.1 | 1.0 | 4.9 | -1.0 | 3.3 | |||||||||||||||||||||||||||||||||||||||||
| Adverse scenario | -2.6 | -5.4 | -4.8 | -8.5 | -5.7 | -4.5 | -4.6 | -6.8 | -4.0 | -5.5 | -7.0 | -7.9 | |||||||||||||||||||||||||||||||||||||||||
| Fully-loaded CET1 ratio 2025 vs 2022 | Profit after tax (accumulated 3 years) | |||||||
| Adverse scenario. Basis points | Adverse scenario. EUR million | |||||||
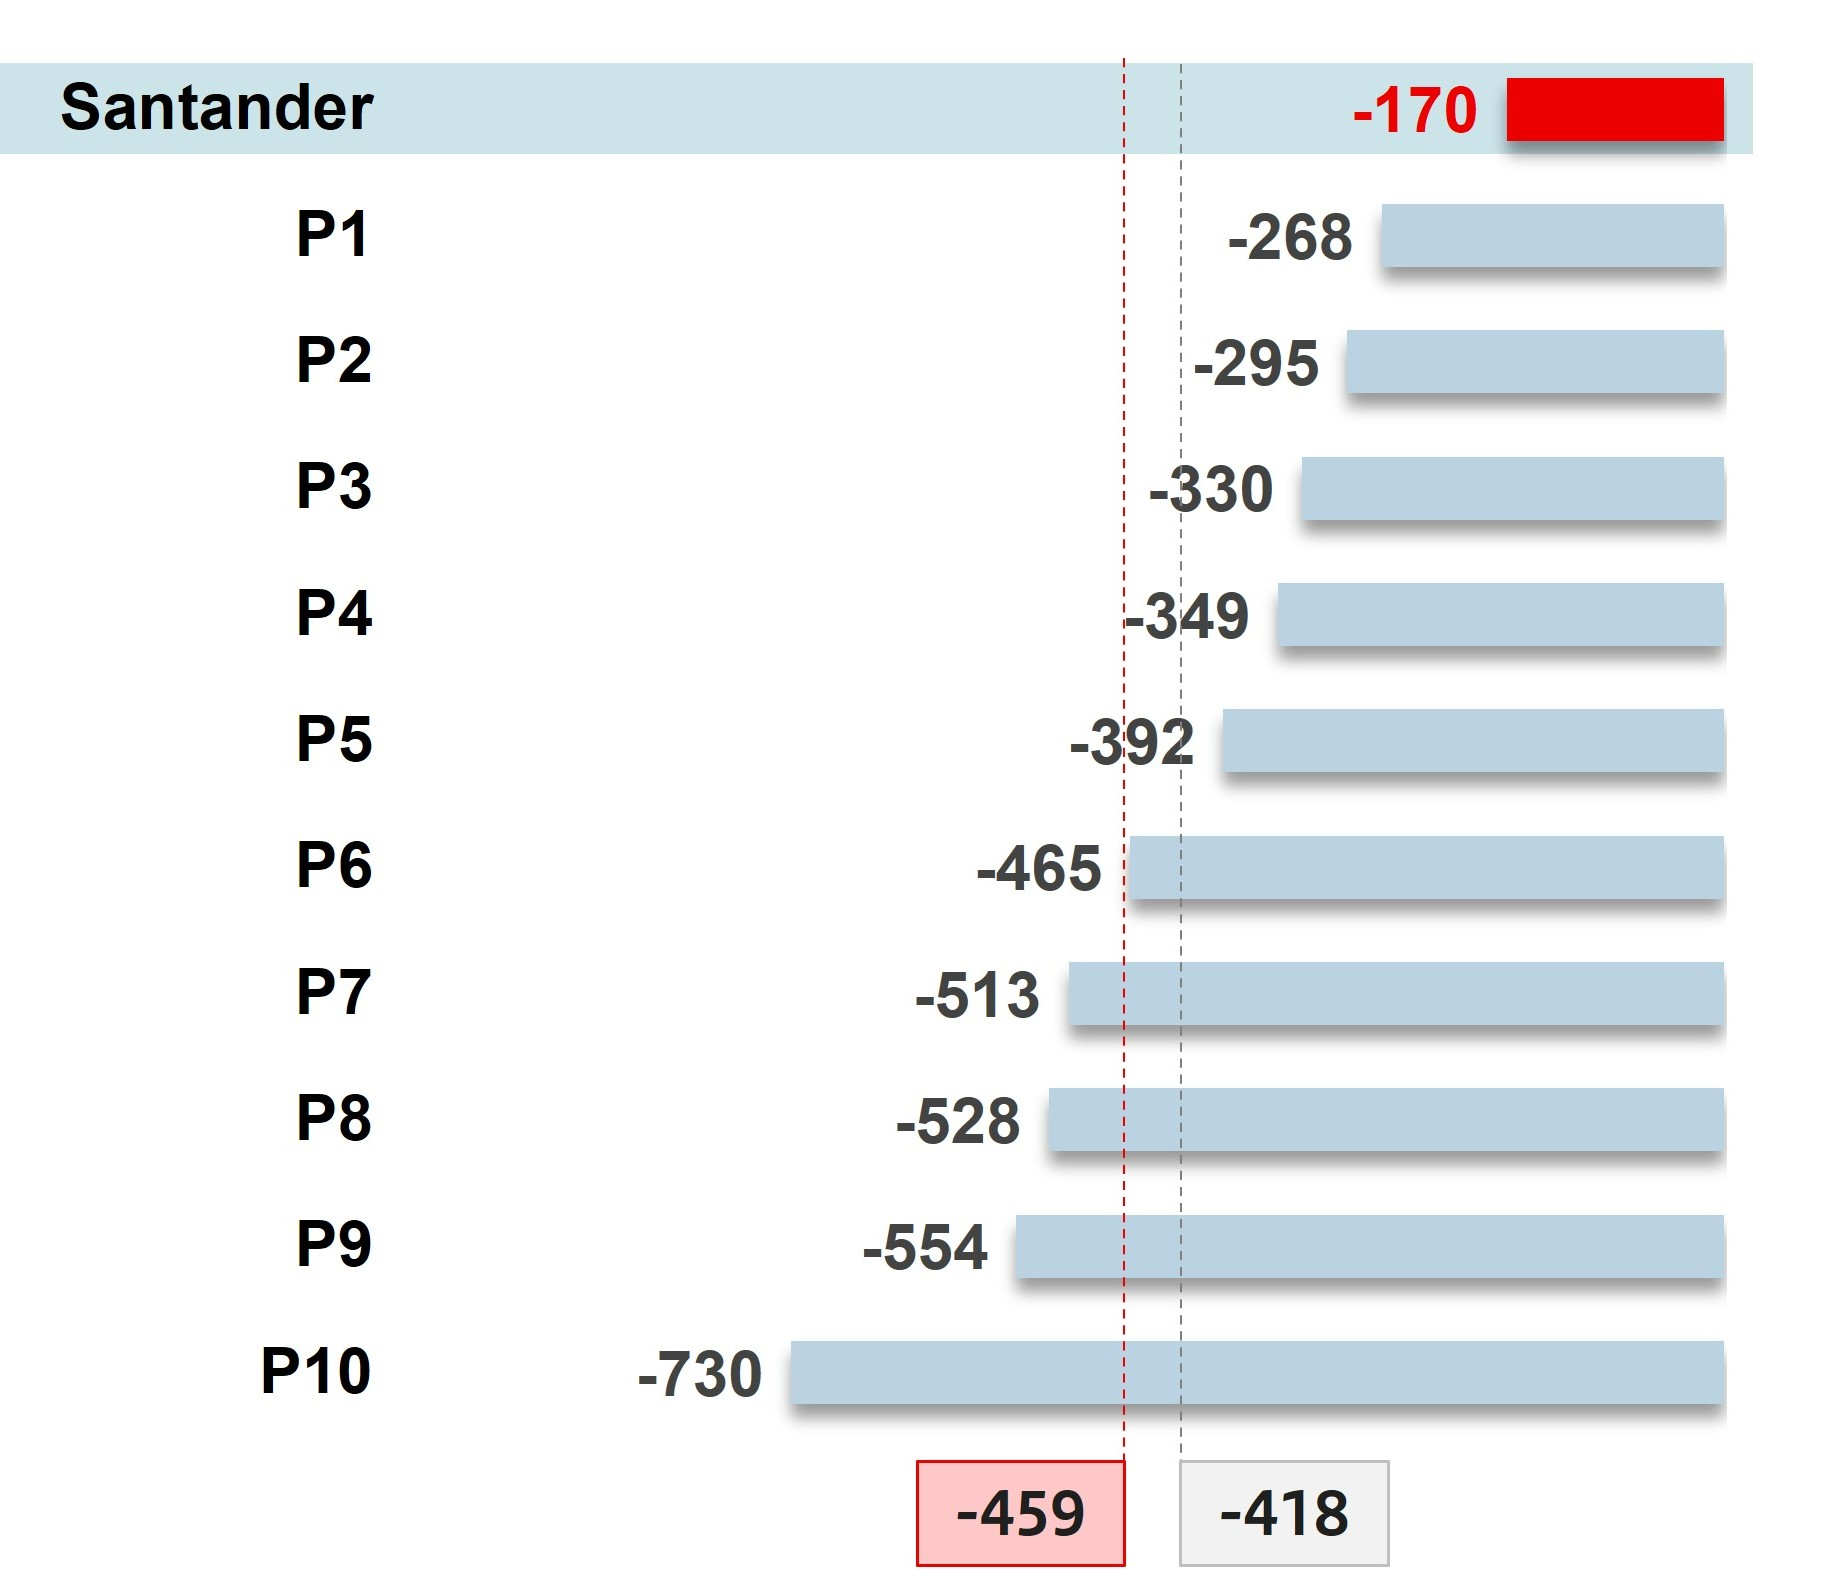 |
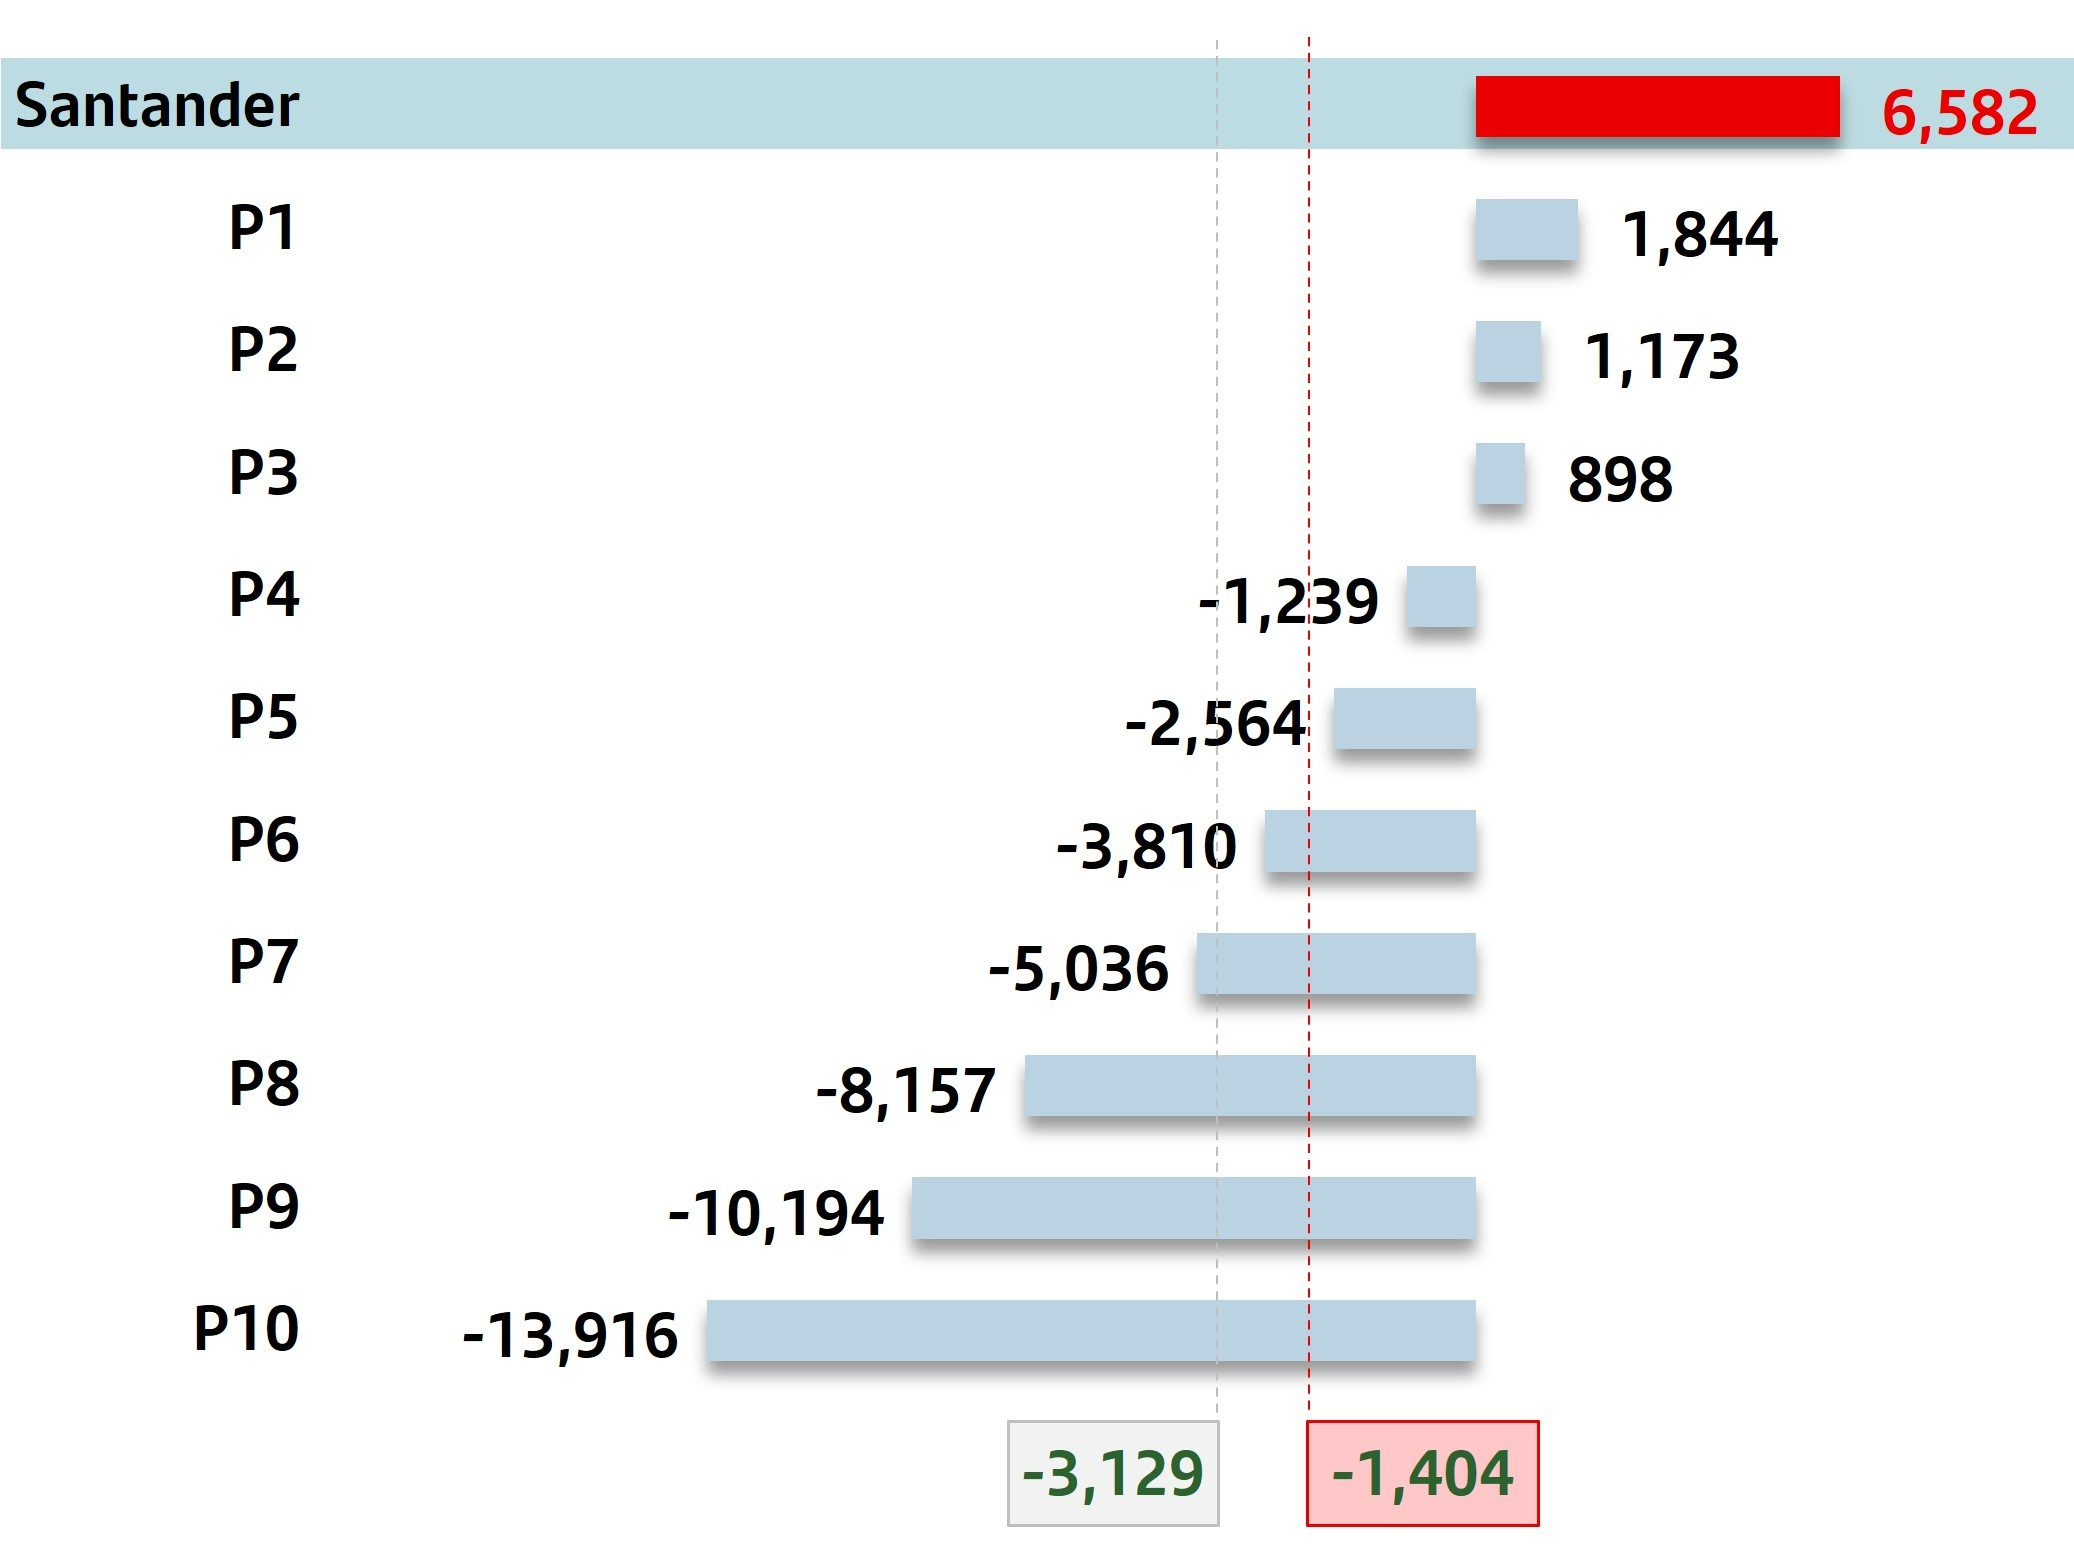 |
|||||||
| Peer average | System | ||||||||||||||||||||||
| TLAC 2023 | MREL 2023 | |||||||
| % | % | |||||||
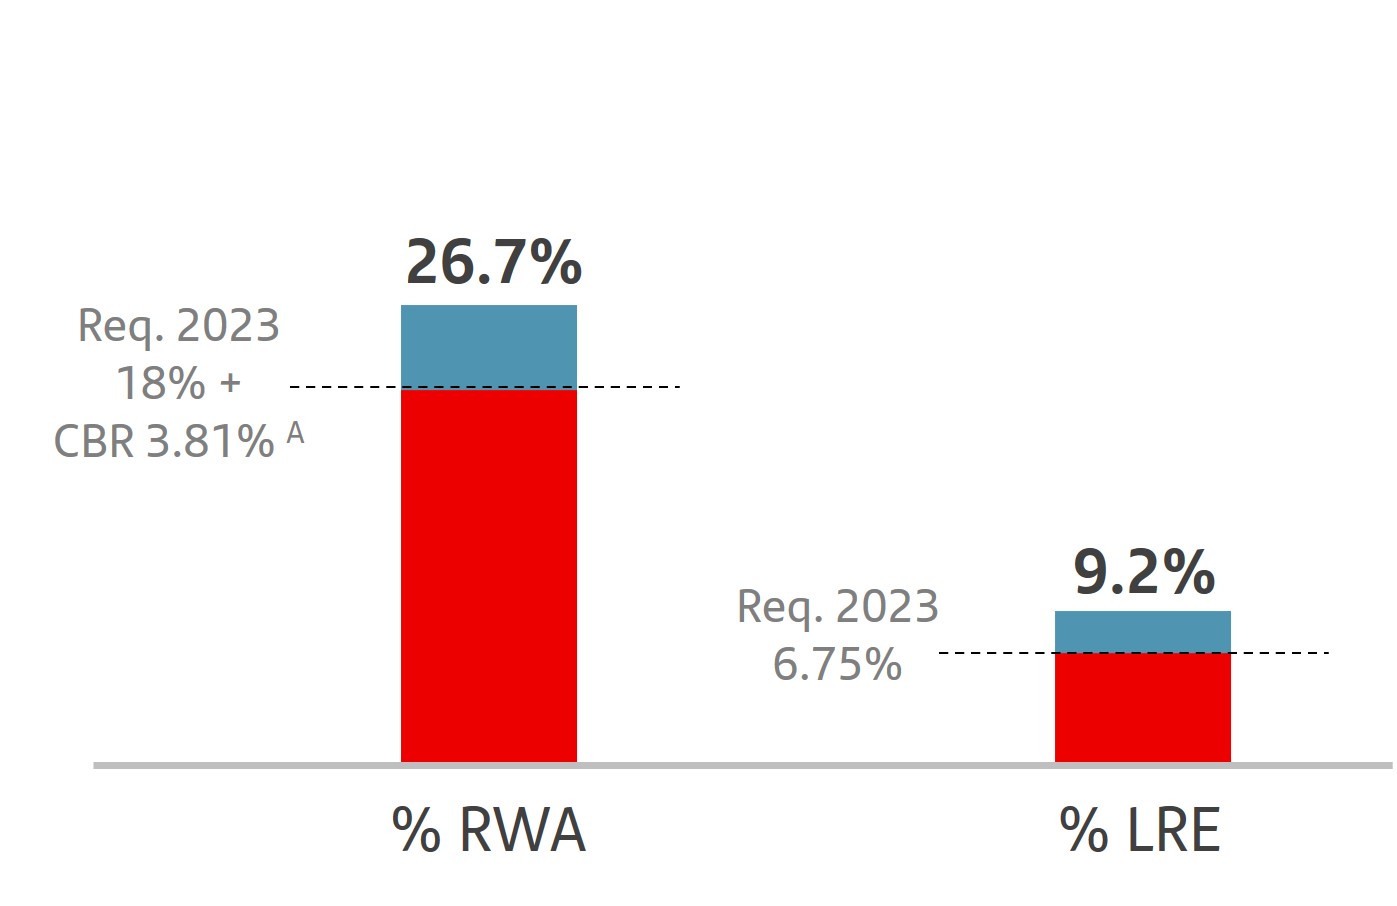 |
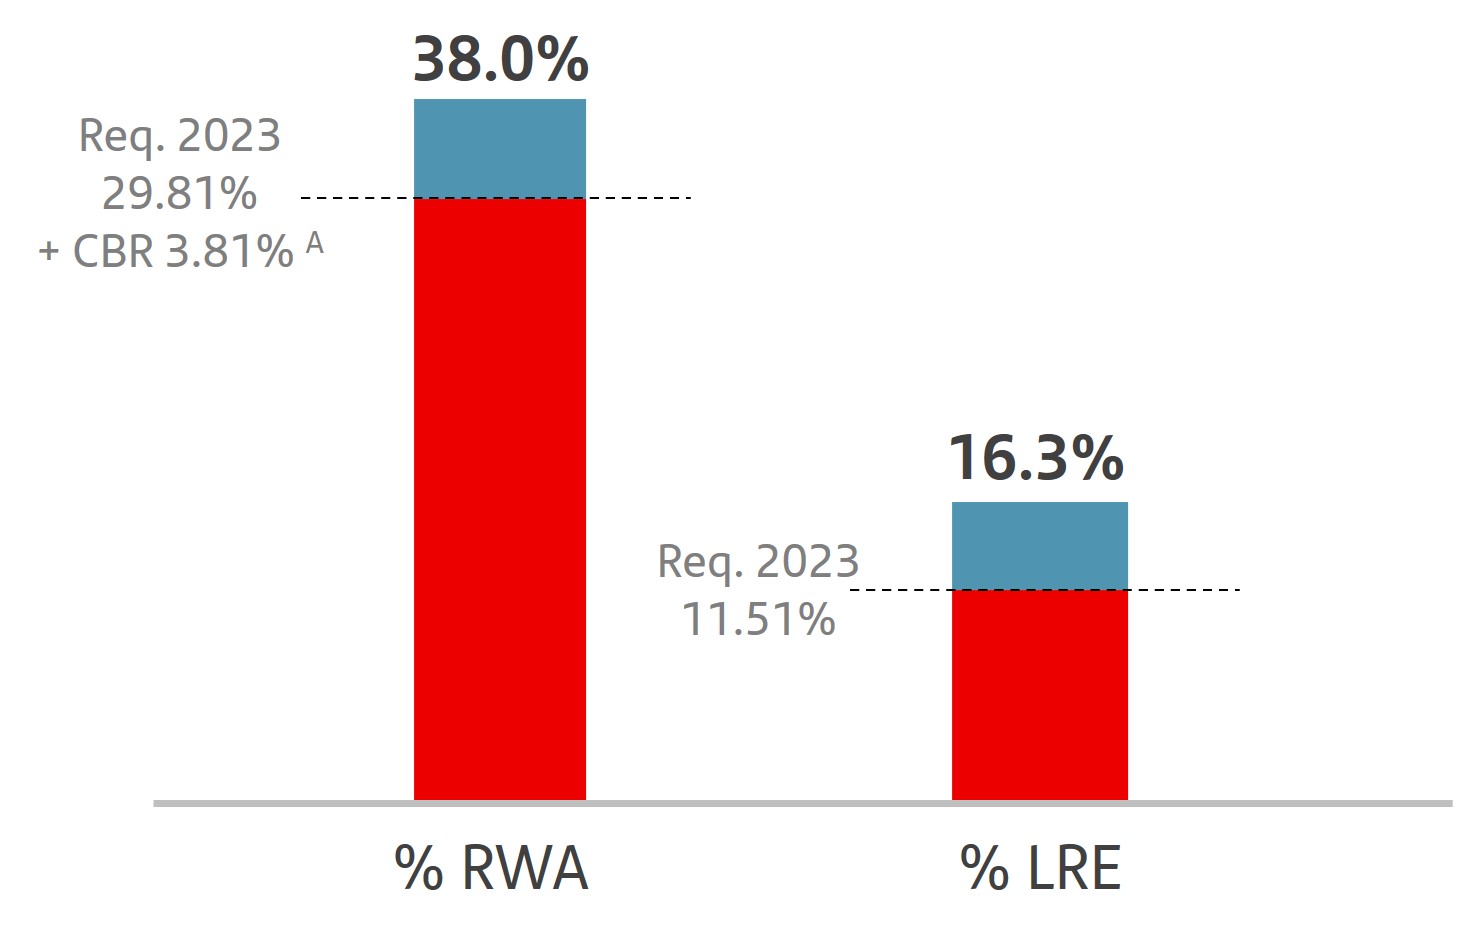 |
|||||||
A.CBR: Combined Buffer Requirement, comprising a capital conservation buffer (2.5%), a G-SII buffer (1%) and a countercyclical capital buffer (0.31%). | ||||||||
|
The businesses included in each of the primary segments in this report and the accounting principles under which their results are presented here may differ from the businesses included and accounting principles applied in the financial information separately prepared and disclosed by our subsidiaries (some of which are publicly listed) which in name or geographical description may seem to correspond to the business areas covered in this report. Accordingly, the results of operations and trends shown for our business areas in this document may differ materially from those of such subsidiaries.
As described in section 3 'Group financial performance' above, the results of our business areas presented below are provided on the basis of underlying results only and generally including the impact of foreign exchange rate fluctuations. However, for a better understanding of the changes in the performance of our business segments, we also provide and discuss the year-on-year changes to our results excluding such exchange rate impacts.
The statements included in this section regarding Santander's competitiveness and that of its subsidiaries have been produced by the Group based on public information (corporate websites of competing entities and information published by national banking institutions).
|
||||||||
| 2023 | ||||||||||||||||||||
| Main items of the underlying income statement | ||||||||||||||||||||
| EUR million | ||||||||||||||||||||
| Primary segments | Net interest income | Net fee income |
Total income |
Net operating income | Profit before tax | Profit attributable to the parent | ||||||||||||||
| Europe | 15,910 | 4,399 | 21,439 | 12,409 | 8,195 | 5,482 | ||||||||||||||
| Spain | 6,641 | 2,699 | 10,132 | 5,905 | 3,399 | 2,371 | ||||||||||||||
| United Kingdom | 5,152 | 338 | 5,525 | 2,779 | 2,107 | 1,545 | ||||||||||||||
| Portugal | 1,465 | 464 | 1,982 | 1,440 | 1,314 | 896 | ||||||||||||||
| Poland | 2,543 | 589 | 3,182 | 2,320 | 1,392 | 674 | ||||||||||||||
| Other | 109 | 309 | 618 | (35) | (17) | (3) | ||||||||||||||
| North America | 10,159 | 2,192 | 13,174 | 6,708 | 2,837 | 2,354 | ||||||||||||||
| US | 5,742 | 766 | 7,209 | 3,531 | 863 | 932 | ||||||||||||||
| Mexico | 4,408 | 1,374 | 5,899 | 3,311 | 2,119 | 1,560 | ||||||||||||||
| Other | 8 | 52 | 66 | (133) | (145) | (138) | ||||||||||||||
| South America | 13,040 | 4,684 | 17,971 | 11,050 | 4,608 | 3,038 | ||||||||||||||
| Brazil | 9,116 | 3,462 | 13,104 | 8,574 | 2,911 | 1,921 | ||||||||||||||
| Chile | 1,383 | 572 | 2,285 | 1,265 | 951 | 582 | ||||||||||||||
| Argentina | 1,879 | 396 | 1,544 | 769 | 505 | 386 | ||||||||||||||
| Other | 662 | 254 | 1,038 | 441 | 241 | 150 | ||||||||||||||
| Digital Consumer Bank | 4,193 | 796 | 5,502 | 2,884 | 2,019 | 1,199 | ||||||||||||||
| Corporate Centre | (41) | (13) | (439) | (829) | (961) | (998) | ||||||||||||||
| TOTAL GROUP | 43,261 | 12,057 | 57,647 | 32,222 | 16,698 | 11,076 | ||||||||||||||
| Secondary segments | ||||||||||||||||||||
| Retail Banking | 37,985 | 7,661 | 45,254 | 25,858 | 10,872 | 7,436 | ||||||||||||||
| Corporate & Investment Banking | 3,485 | 2,190 | 8,296 | 4,905 | 4,570 | 3,078 | ||||||||||||||
| Wealth Management & Insurance | 1,739 | 1,265 | 3,396 | 2,240 | 2,235 | 1,637 | ||||||||||||||
| PagoNxt | 93 | 954 | 1,140 | 49 | (17) | (77) | ||||||||||||||
| Corporate Centre | (41) | (13) | (439) | (829) | (961) | (998) | ||||||||||||||
| TOTAL GROUP | 43,261 | 12,057 | 57,647 | 32,222 | 16,698 | 11,076 | ||||||||||||||
| Profit attributable to the parent distribution | ||
Distribution A by primary segment. 2023 | ||
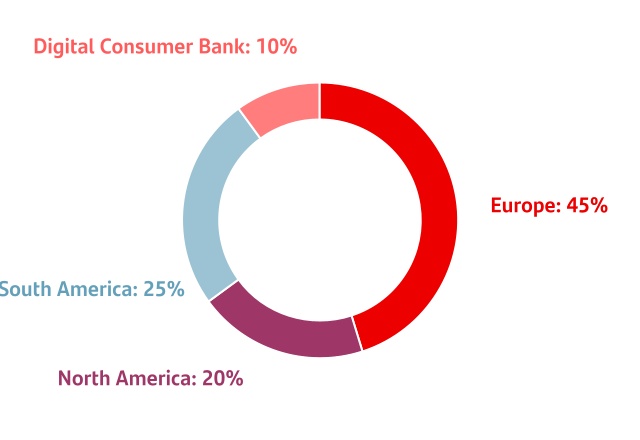
| Profit attributable to the parent. 2023 | ||
| EUR million. % change YoY | ||
| Europe | |
|||||||
|
||||||||
|
||||||||
|
||||||||
| North America |
|
|||||||
|
||||||||
| South America |
|
|||||||
|
||||||||
|
||||||||
| Digital Consumer Bank | DCB | |||||||
| Global businesses |  |
|||||||
 |
||||||||
 | ||||||||
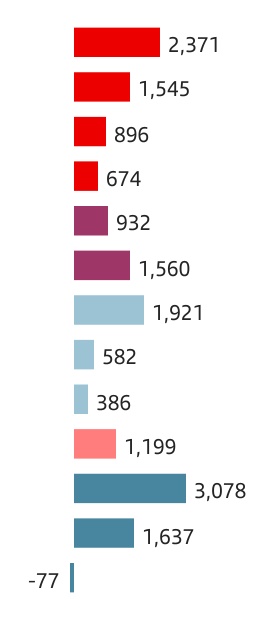
| Var. | Var. B |
||||
| +52 | % | +52 | % | ||
| +11 | % | +13 | % | ||
| +68 | % | +68 | % | ||
| +85 | % | +80 | % | ||
| -48 | % | -46 | % | ||
| +29 | % | +17 | % | ||
| -25 | % | -25 | % | ||
| -14 | % | -15 | % | ||
| +19 | % | +462 | % | ||
| -8 | % | -7 | % | ||
| +9 | % | +20 | % | ||
| +46 | % | +48 | % | ||
| -64 | % | -63 | % | ||
| 2022 | ||||||||||||||||||||
| Main items of the underlying income statement | ||||||||||||||||||||
| EUR million | ||||||||||||||||||||
| Primary segments | Net interest income |
Net fee income |
Total income |
Net operating income |
Profit before tax | Profit attributable to the parent | ||||||||||||||
| Europe | 12,565 | 4,493 | 18,030 | 9,507 | 5,482 | 3,810 | ||||||||||||||
| Spain | 4,539 | 2,818 | 8,233 | 4,236 | 2,079 | 1,560 | ||||||||||||||
| United Kingdom | 4,992 | 390 | 5,418 | 2,733 | 1,900 | 1,395 | ||||||||||||||
| Portugal | 747 | 484 | 1,295 | 793 | 775 | 534 | ||||||||||||||
| Poland | 1,976 | 528 | 2,474 | 1,782 | 789 | 364 | ||||||||||||||
| Other | 312 | 273 | 609 | (38) | (61) | (42) | ||||||||||||||
| North America | 9,705 | 1,958 | 12,316 | 6,445 | 3,790 | 2,878 | ||||||||||||||
| US | 6,140 | 771 | 7,623 | 4,025 | 2,261 | 1,784 | ||||||||||||||
| Mexico | 3,565 | 1,140 | 4,623 | 2,547 | 1,665 | 1,213 | ||||||||||||||
| Other | — | 47 | 70 | (126) | (137) | (119) | ||||||||||||||
| South America | 12,979 | 4,515 | 18,025 | 11,350 | 5,764 | 3,658 | ||||||||||||||
| Brazil | 8,901 | 3,296 | 12,910 | 8,730 | 4,055 | 2,544 | ||||||||||||||
| Chile | 1,772 | 468 | 2,449 | 1,468 | 1,062 | 677 | ||||||||||||||
| Argentina | 1,778 | 542 | 1,833 | 846 | 443 | 324 | ||||||||||||||
| Other | 527 | 210 | 832 | 306 | 205 | 112 | ||||||||||||||
| Digital Consumer Bank | 4,022 | 843 | 5,269 | 2,807 | 2,237 | 1,308 | ||||||||||||||
| Corporate Centre | (652) | (19) | (1,487) | (1,858) | (2,022) | (2,049) | ||||||||||||||
| TOTAL GROUP | 38,619 | 11,790 | 52,154 | 28,251 | 15,250 | 9,605 | ||||||||||||||
| Secondary segments | ||||||||||||||||||||
| Retail Banking | 34,855 | 7,654 | 42,674 | 24,123 | 11,785 | 7,933 | ||||||||||||||
| Corporate & Investment Banking | 3,548 | 1,981 | 7,378 | 4,476 | 4,097 | 2,817 | ||||||||||||||
| Wealth Management & Insurance | 847 | 1,293 | 2,635 | 1,581 | 1,531 | 1,119 | ||||||||||||||
| PagoNxt | 22 | 881 | 953 | (71) | (141) | (215) | ||||||||||||||
| Corporate Centre | (652) | (19) | (1,487) | (1,858) | (2,022) | (2,049) | ||||||||||||||
| TOTAL GROUP | 38,619 | 11,790 | 52,154 | 28,251 | 15,250 | 9,605 | ||||||||||||||
 |
EUROPE | Underlying attributable profit | |||||||||||||||
| EUR 5,482 mn | |||||||||||||||||
| EXECUTIVE SUMMARY | |||||||||||||||||
| Strategy | Business performance1 |
Results1 |
||||||||||||
We remain focused on customer experience and service quality, and on making the structural changes needed to develop a common operating model for Europe |
Our customer base grew 2% year-on-year. Loans decreased 6%, affected by higher interest rates. In customer funds, change of mix from demand to time deposits with double-digit growth in mutual funds |
Underlying attributable profit rose 45% year-on-year underpinned by NII growth, significant efficiency gains (despite inflation) and controlled cost of risk |
||||||||||||
| Europe. Customers | ||||||||||||||||||||||||||||||||||||||||||||
 |
 |
|
|
|
||||||||||||||||||||||||||||||||||||||||
 |
Total customers | Thousands | 46,293 | 15,023 | 22,481 | 2,908 | 5,877 | |||||||||||||||||||||||||||||||||||||
| YoY | +2 | % | +5 | % | 0 | % | -1 | % | +3 | % | ||||||||||||||||||||||||||||||||||
 |
Active customers | Thousands | 28,538 | 8,367 | 13,864 | 1,838 | 4,465 | |||||||||||||||||||||||||||||||||||||
| YoY | +1 | % | +7 | % | -1 | % | +3 | % | +3 | % | ||||||||||||||||||||||||||||||||||
|
Spain | ||||
|
United Kingdom | ||||
|
Portugal | ||||
|
Poland | ||||
| Europe. 2023 business performance | ||||||||||||||||||||||||||||||||
| EUR billion and YoY % change in constant euros | ||||||||||||||||||||||||||||||||
 |
552 | -6% | |
725 | -1% | |||||||||||||||||||||||||||
| ||
| ||
| ||
| ||

| ||
| ||
| ||
| ||
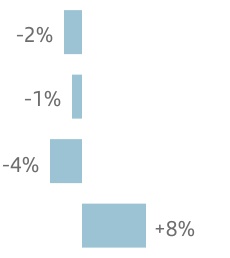
| Gross loans and advances to customers minus reverse repos | Customer deposits minus repos + mutual funds |
|||||||||||||||||||||||||||||||||||||
| Europe. Underlying income statement | ||||||||||||||
| EUR million and % change | ||||||||||||||
| / | 2022 | |||||||||||||
| 2023 | 2022 | % | % excl. FX | |||||||||||
| Revenue | 21,439 | 18,030 | +19 | +19 | ||||||||||
| Expenses | (9,030) | (8,523) | +6 | +6 | ||||||||||
| Net operating income | 12,409 | 9,507 | +31 | +31 | ||||||||||
| LLPs | (2,533) | (2,396) | +6 | +5 | ||||||||||
| PBT | 8,195 | 5,482 | +50 | +50 | ||||||||||
| Attributable profit | 5,482 | 3,810 | +44 | +45 | ||||||||||
|
Spain | Underlying attributable profit | ||||||
| EUR 2,371 | mn | |||||||
| Spain. Underlying income statement | |||||||||||
| EUR million and % change | |||||||||||
| / 2022 | |||||||||||
| 2023 | 2022 | % | |||||||||
| Revenue | 10,132 | 8,233 | +23 | ||||||||
| Expenses | (4,227) | (3,998) | +6 | ||||||||
| Net operating income | 5,905 | 4,236 | +39 | ||||||||
| LLPs | (1,522) | (1,618) | (6) | ||||||||
| PBT | 3,399 | 2,079 | +64 | ||||||||
| Attributable profit | 2,371 | 1,560 | +52 | ||||||||
|
United Kingdom | Underlying attributable profit | ||||||
| EUR 1,545 | mn | |||||||
| United Kingdom. Underlying income statement | ||||||||||||||
| EUR million and % change | ||||||||||||||
| / | 2022 | |||||||||||||
| 2023 | 2022 | % | % excl. FX | |||||||||||
| Revenue | 5,525 | 5,418 | +2 | +4 | ||||||||||
| Expenses | (2,745) | (2,685) | +2 | +4 | ||||||||||
| Net operating income | 2,779 | 2,733 | +2 | +4 | ||||||||||
| LLPs | (247) | (316) | (22) | (20) | ||||||||||
| PBT | 2,107 | 1,900 | +11 | +13 | ||||||||||
| Attributable profit | 1,545 | 1,395 | +11 | +13 | ||||||||||
|
Portugal | Underlying attributable profit | ||||||
| EUR 896 | mn | |||||||
| Portugal. Underlying income statement | |||||||||||
| EUR million and % change | |||||||||||
| / 2022 | |||||||||||
| 2023 | 2022 | % | |||||||||
| Revenue | 1,982 | 1,295 | +53 | ||||||||
| Expenses | (542) | (502) | +8 | ||||||||
| Net operating income | 1,440 | 793 | +82 | ||||||||
| LLPs | (77) | (17) | +354 | ||||||||
| PBT | 1,314 | 775 | +69 | ||||||||
| Attributable profit | 896 | 534 | +68 | ||||||||
|
Poland | Underlying attributable profit | ||||||
| EUR 674 | mn | |||||||
| Poland. Underlying income statement | ||||||||||||||
| EUR million and % change | ||||||||||||||
| / | 2022 | |||||||||||||
| 2023 | 2022 | % | % excl. FX | |||||||||||
| Revenue | 3,182 | 2,474 | +29 | +25 | ||||||||||
| Expenses | (862) | (692) | +25 | +21 | ||||||||||
| Net operating income | 2,320 | 1,782 | +30 | +26 | ||||||||||
| LLPs | (674) | (440) | +53 | +48 | ||||||||||
| PBT | 1,392 | 789 | +76 | +71 | ||||||||||
| Attributable profit | 674 | 364 | +85 | +80 | ||||||||||
 |
NORTH AMERICA | Underlying attributable profit | |||||||||||||||
| EUR 2,354 mn | |||||||||||||||||
| EXECUTIVE SUMMARY | |||||||||||||||||
| Strategy | Business performance1 |
Results | ||||||||||||
We are leveraging the strength of our global businesses to accelerate the transformation of our businesses in the US and Mexico |
Loans and advances to customers increased 3% year-on-year driven by business growth in both Mexico and the US. Customer funds also rose 3%, boosted by time deposits |
Attributable profit amounted to EUR 2,354 million, down 18% year-on-year (-20% in constant euros) |
||||||||||||
|
United States | ||||
|
Mexico | ||||
| North America. Customers | ||||||||||||||||||||||||||||||||
 |
|
|
||||||||||||||||||||||||||||||
|
Total customers | Thousands | 25,027 | 4,510 | 20,517 | |||||||||||||||||||||||||||
| YoY | 0 | % | 0 | % | +1 | % | ||||||||||||||||||||||||||
|
Active customers | Thousands | 14,486 | 4,223 | 10,263 | |||||||||||||||||||||||||||
| YoY | +3 | % | +2 | % | +6 | % | ||||||||||||||||||||||||||
| North America. 2023 Business performance | ||||||||||||||||||||||||||||||||
| EUR billion and YoY % change in constant euros | ||||||||||||||||||||||||||||||||
 |
161 | +3% | |
171 | +3% | |||||||||||||||||||||||||||
| ||
| ||
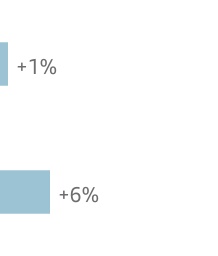
| ||
| ||
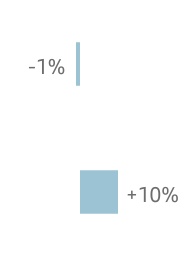
| Gross loans and advances to customers minus reverse repos | Customer deposits minus repos + mutual funds |
|||||||||||||||||||||||||||||||||||||
| North America. Underlying income statement | ||||||||||||||
| EUR million and % change | ||||||||||||||
| / | 2022 | |||||||||||||
| 2023 | 2022 | % | % excl. FX | |||||||||||
| Revenue | 13,174 | 12,316 | +7 | +5 | ||||||||||
| Expenses | (6,465) | (5,871) | +10 | +8 | ||||||||||
| Net operating income | 6,708 | 6,445 | +4 | +2 | ||||||||||
| LLPs | (3,733) | (2,538) | +47 | +45 | ||||||||||
| PBT | 2,837 | 3,790 | (25) | (27) | ||||||||||
| Attributable profit | 2,354 | 2,878 | (18) | (20) | ||||||||||
|
United States | Underlying attributable profit | ||||||
| EUR 932 | mn | |||||||
| United States. Underlying income statement | ||||||||||||||
| EUR million and % change | ||||||||||||||
| / | 2022 | |||||||||||||
| 2023 | 2022 | % | % excl. FX | |||||||||||
| Revenue | 7,209 | 7,623 | (5) | (3) | ||||||||||
| Expenses | (3,679) | (3,599) | +2 | +5 | ||||||||||
| Net operating income | 3,531 | 4,025 | (12) | (10) | ||||||||||
| LLPs | (2,593) | (1,744) | +49 | +53 | ||||||||||
| PBT | 863 | 2,261 | (62) | (61) | ||||||||||
| Attributable profit | 932 | 1,784 | (48) | (46) | ||||||||||
|
Mexico | Underlying attributable profit | ||||||
| EUR 1,560 | mn | |||||||
| Mexico. Underlying income statement | ||||||||||||||
| EUR million and % change | ||||||||||||||
| / | 2022 | |||||||||||||
| 2023 | 2022 | % | % excl. FX | |||||||||||
| Revenue | 5,899 | 4,623 | +28 | +16 | ||||||||||
| Expenses | (2,588) | (2,076) | +25 | +13 | ||||||||||
| Net operating income | 3,311 | 2,547 | +30 | +18 | ||||||||||
| LLPs | (1,135) | (788) | +44 | +31 | ||||||||||
| PBT | 2,119 | 1,665 | +27 | +15 | ||||||||||
| Attributable profit | 1,560 | 1,213 | +29 | +17 | ||||||||||
 |
SOUTH AMERICA | Underlying attributable profit | |||||||||||||||
| EUR 3,038 mn | |||||||||||||||||
| EXECUTIVE SUMMARY | |||||||||||||||||
| Strategy | Business performance1 |
Results1 |
||||||||||||
We are focused on increasing the value we bring to the Group and on working to become the most profitable bank in each of the countries where we operate in the region |
Year-on-year growth in both loans and deposits, as we aim to become the leading bank in inclusive and sustainable businesses through differential value propositions |
Attributable profit reached EUR 3,038 million, 11% lower year-on-year as the strong revenue performance failed to offset higher costs and provisions |
||||||||||||
|
Brazil | ||||
|
Chile | ||||
|
Argentina | ||||
|
Uruguay | ||||
| South America. Customers | ||||||||||||||||||||||||||||||||||||||||||||
 |
|
|
|
Other South America | ||||||||||||||||||||||||||||||||||||||||
|
Total customers | Thousands | 73,028 | 62,804 | 4,052 | 4,771 | 1,400 | |||||||||||||||||||||||||||||||||||||
| YoY | +5 | % | +4 | % | +13 | % | +9 | % | -5 | % | ||||||||||||||||||||||||||||||||||
|
Active customers | Thousands | 37,517 | 30,460 | 2,399 | 3,562 | 1,096 | |||||||||||||||||||||||||||||||||||||
| YoY | -2 | % | -4 | % | +9 | % | +11 | % | -5 | % | ||||||||||||||||||||||||||||||||||
|
Peru | ||||
|
Colombia | ||||
| South America. 2023 business performance | ||||||||||||||||||||||||||||||||
| EUR billion and YoY % change in constant euros. | ||||||||||||||||||||||||||||||||
 |
161 | +7% | |
206 | +17% | |||||||||||||||||||||||||||
| ||
| ||
| ||
 | ||
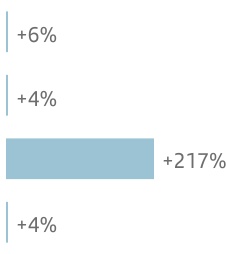
| ||
| ||
| ||
| ||
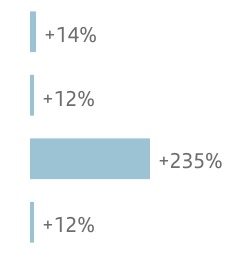
| Gross loans and advances to customers minus reverse repos | Customer deposits minus repos + mutual funds |
|||||||||||||||||||||||||||||||||||||
| South America. Underlying income statement | ||||||||||||||
| EUR million and % change | ||||||||||||||
| / | 2022 | |||||||||||||
| 2023 | 2022 | % | % excl. FX | |||||||||||
| Revenue | 17,971 | 18,025 | 0 | +8 | ||||||||||
| Expenses | (6,920) | (6,675) | +4 | +17 | ||||||||||
| Net operating income | 11,050 | 11,350 | (3) | +3 | ||||||||||
| LLPs | (5,401) | (5,041) | +7 | +9 | ||||||||||
| PBT | 4,608 | 5,764 | (20) | (15) | ||||||||||
| Attributable profit | 3,038 | 3,658 | (17) | (11) | ||||||||||
|
Brazil | Underlying attributable profit | ||||||
| EUR 1,921 | mn | |||||||
| Brazil. Underlying income statement | ||||||||||||||
| EUR million and % change | ||||||||||||||
| / | 2022 | |||||||||||||
| 2023 | 2022 | % | % excl. FX | |||||||||||
| Revenue | 13,104 | 12,910 | +1 | +1 | ||||||||||
| Expenses | (4,529) | (4,180) | +8 | +8 | ||||||||||
| Net operating income | 8,574 | 8,730 | (2) | (2) | ||||||||||
| LLPs | (4,701) | (4,417) | +6 | +6 | ||||||||||
| PBT | 2,911 | 4,055 | (28) | (29) | ||||||||||
| Attributable profit | 1,921 | 2,544 | (25) | (25) | ||||||||||
|
Chile | Underlying attributable profit | ||||||
| EUR 582 | mn | |||||||
| Chile. Underlying income statement | ||||||||||||||
| EUR million and % change | ||||||||||||||
| / | 2022 | |||||||||||||
| 2023 | 2022 | % | % excl. FX | |||||||||||
| Revenue | 2,285 | 2,449 | (7) | (8) | ||||||||||
| Expenses | (1,020) | (981) | +4 | +3 | ||||||||||
| Net operating income | 1,265 | 1,468 | (14) | (15) | ||||||||||
| LLPs | (365) | (399) | (8) | (9) | ||||||||||
| PBT | 951 | 1,062 | (10) | (11) | ||||||||||
| Attributable profit | 582 | 677 | (14) | (15) | ||||||||||
|
Argentina | Underlying attributable profit | ||||||
| EUR 386 | mn | |||||||
| Argentina. Underlying income statement | ||||||||||||||
| EUR million and % change | ||||||||||||||
| / | 2022 | |||||||||||||
| 2023 | 2022 | % | % excl. FX | |||||||||||
| Revenue | 1,544 | 1,833 | (16) | +298 | ||||||||||
| Expenses | (775) | (987) | (21) | +271 | ||||||||||
| Net operating income | 769 | 846 | (9) | +330 | ||||||||||
| LLPs | (150) | (132) | +14 | +437 | ||||||||||
| PBT | 505 | 443 | +14 | +438 | ||||||||||
| Attributable profit | 386 | 324 | +19 | +462 | ||||||||||
|
Uruguay | Underlying attributable profit | ||||||
| EUR 187 | mn | |||||||
| Uruguay. Underlying income statement | ||||||||||||||
| EUR million and % change | ||||||||||||||
| / | 2022 | |||||||||||||
| 2023 | 2022 | % | % excl. FX | |||||||||||
| Revenue | 593 | 453 | +31 | +27 | ||||||||||
| Expenses | (228) | (194) | +17 | +14 | ||||||||||
| Net operating income | 365 | 259 | +41 | +37 | ||||||||||
| LLPs | (114) | (56) | +104 | +99 | ||||||||||
| PBT | 242 | 201 | +20 | +17 | ||||||||||
| Attributable profit | 187 | 138 | +36 | +32 | ||||||||||
|
Peru | Underlying attributable profit | ||||||
| EUR 84 | mn | |||||||
|
Colombia | Underlying attributable profit | ||||||
| EUR 28 | mn | |||||||
| Other South America. Underlying income statement | |||||||||||||||||||||||||||||
| EUR million and % change | |||||||||||||||||||||||||||||
| Net operating income | Attributable profit | ||||||||||||||||||||||||||||
| / | 2022 | / | 2022 | ||||||||||||||||||||||||||
| 2023 | 2022 | % | % excl. FX | 2023 | 2022 | % | % excl. FX | ||||||||||||||||||||||
| Peru | 155 | 131 | +18 | +19 | 84 | 73 | +14 | +14 | |||||||||||||||||||||
| Colombia | 67 | 49 | +37 | +43 | 28 | 27 | +5 | +10 | |||||||||||||||||||||
 |
DIGITAL CONSUMER BANK | Underlying attributable profit | |||||||||||||||
| EUR 1,199 mn | |||||||||||||||||
| EXECUTIVE SUMMARY | |||||||||||||||||
| Strategy | Business performance1 |
Results1 |
||||||||||||
Continue to reinforce our auto leadership through strategic alliances, leasing and subscription. In non-auto, keep upscaling our buy now, pay later business. Transformation for future growth deploying a simpler organizational structure to deliver through best-in-class digital platforms, launching new channels and products |
Although the operating environment remains complex as inflation and high rates are denting consumer appetite, new lending rose 3% year-on-year, +6% in auto, and deposits grew 19%. In this environment we were focused on profitability, asset quality and providing the best customer service |
Underlying attributable profit stood at EUR 1,199 million (-7% year-on-year), despite total income growth (+6% year-on-year), affected by net loan-loss provisions |
||||||||||||
| Loans and advances to customers by geographic area | ||
| December 2023 | ||
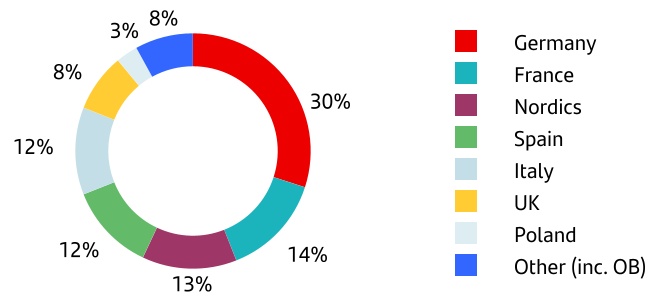
| Digital Consumer Bank. 2023 activity | ||||||||||||||||||||||||||||||||
| EUR billion and % change in constant euros | ||||||||||||||||||||||||||||||||
| +8% | ||||||||||||||||||||||||||||||||
| 135 | YoY | |||||||||||||||||||||||||||||||
| 73 | +19% | |||||||||||||||||||||||||||||||
| YoY | ||||||||||||||||||||||||||||||||
Gross loans and advances to customers minus reverse repos |
Customer deposits minus
repos + mutual funds
|
|||||||||||||||||||||||||||||||
| Digital Consumer Bank. Underlying income statement | ||||||||||||||
| EUR million and % change | ||||||||||||||
| / | 2022 | |||||||||||||
| 2023 | 2022 | % | % excl. FX | |||||||||||
| Revenue | 5,502 | 5,269 | +4 | +6 | ||||||||||
| Expenses | (2,618) | (2,462) | +6 | +8 | ||||||||||
| Net operating income | 2,884 | 2,807 | +3 | +4 | ||||||||||
| LLPs | (792) | (544) | +46 | +48 | ||||||||||
| PBT | 2,019 | 2,237 | (10) | (9) | ||||||||||
| Attributable profit | 1,199 | 1,308 | (8) | (7) | ||||||||||
 |
CORPORATE CENTRE | Underlying attributable profit | |||||||||||||||
| -EUR 998 mn | |||||||||||||||||
| EXECUTIVE SUMMARY | |||||||||||||||||
|
2023 HIGHLIGHTS:
The Corporate Centre continued to support the Group.
The Corporate Centre’s objective is to define, develop and coordinate the Group's strategy and aid the operating units by contributing value and carrying out the corporate oversight and control function. It also carries out functions related to financial and capital management.
Lower underlying attributable loss compared to 2022 due to higher liquidity buffer remuneration and lower negative impact from foreign currency (FX) hedging.
|
|||||||||||||||||
 Global Headquarters in Boadilla del Monte.
| Corporate Centre | ||||||||||||||
| EUR million | ||||||||||||||
| Underlying income statement | 2023 | 2022 | % | |||||||||||
| Net interest income | (41) | (652) | (93.8) | |||||||||||
| Net fee income | (13) | (19) | (30.8) | |||||||||||
Gains (losses) on financial transactions A |
(302) | (724) | (58.3) | |||||||||||
| Other operating income | (83) | (92) | (9.0) | |||||||||||
| Total income | (439) | (1,487) | (70.5) | |||||||||||
| Administrative expenses and amortizations | (391) | (372) | 5.2 | |||||||||||
| Net operating income | (829) | (1,858) | (55.4) | |||||||||||
| Net loan-loss provisions | 2 | 9 | (77.3) | |||||||||||
| Other gains (losses) and provisions | (134) | (173) | (22.7) | |||||||||||
| Profit before tax | (961) | (2,022) | (52.5) | |||||||||||
| Tax on profit | (36) | (27) | 36.9 | |||||||||||
| Profit from continuing operations | (998) | (2,049) | (51.3) | |||||||||||
| Net profit from discontinued operations | — | — | — | |||||||||||
| Consolidated profit | (998) | (2,049) | (51.3) | |||||||||||
| Non-controlling interests | — | — | — | |||||||||||
| Profit attributable to the parent | (998) | (2,049) | (51.3) | |||||||||||
| Balance sheet | ||||||||||||||
| Loans and advances to customers | 5,565 | 5,785 | (3.8) | |||||||||||
| Cash, central banks and credit institutions | 119,279 | 123,230 | (3.2) | |||||||||||
| Debt instruments | 7,726 | 8,588 | (10.0) | |||||||||||
| Other financial assets | 808 | 273 | 196.6 | |||||||||||
| Other asset accounts | 121,327 | 124,343 | (2.4) | |||||||||||
| Total assets | 254,705 | 262,217 | (2.9) | |||||||||||
| Customer deposits | 1,508 | 895 | 68.5 | |||||||||||
| Central banks and credit institutions | 47,747 | 71,226 | (33.0) | |||||||||||
| Marketable debt securities | 110,144 | 98,733 | 11.6 | |||||||||||
| Other financial liabilities | 326 | 308 | 6.1 | |||||||||||
| Other liabilities accounts | 7,084 | 7,489 | (5.4) | |||||||||||
| Total liabilities | 166,809 | 178,650 | (6.6) | |||||||||||
| Total equity | 87,896 | 83,567 | 5.2 | |||||||||||
| Memorandum items: | ||||||||||||||
Gross loans and advances to customers B |
5,640 | 5,779 | (2.4) | |||||||||||
| Customer funds | 1,508 | 895 | 68.5 | |||||||||||
Customer deposits C |
1,508 | 895 | 68.5 | |||||||||||
| Mutual funds | — | — | — | |||||||||||
| Operating means | ||||||||||||||
| Number of employees | 1,922 | 1,899 | 1.2 | |||||||||||
| A. Includes exchange differences. | ||||||||||||||
| B. Minus reverse repurchase agreements. | ||||||||||||||
| C. Minus repurchase agreements. | ||||||||||||||
| RETAIL BANKING | Underlying attributable profit | ||||||||||||||||
| EUR 7,436 mn | |||||||||||||||||
| EXECUTIVE SUMMARY | |||||||||||||||||
| Strategy | Business performance1 |
Results | ||||||||||||
We continued improving digitization and simplification of our products and services through our ONE Transformation programme |
Lending remained stable during the year, with growth in South America and North America offsetting the decline in Europe. Deposits grew driven by term deposits |
Underlying attributable profit of EUR 7,436 million, down 6% in euros (-7% in constant euros) due to higher provisions, partly offset by the good revenue performance |
||||||||||||
| Total customers | Active customers | Digital customers | ||||||||||||||||||||||||||||||
| Millions | Millions | Millions | ||||||||||||||||||||||||||||||
| +3% | 0% | +5% | ||||||||||||||||||||||||||||||
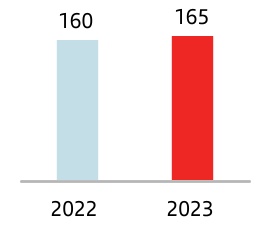
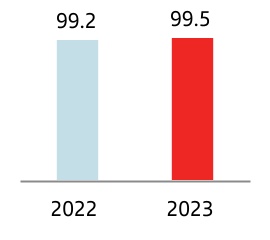
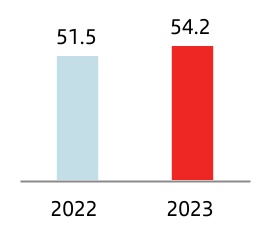
| Retail Banking. Underlying income statement | ||||||||||||||
| EUR million and % change | ||||||||||||||
| / | 2022 | |||||||||||||
| 2023 | 2022 | % | % excl. FX | |||||||||||
| Revenue | 45,254 | 42,674 | +6 | +8 | ||||||||||
| Expenses | (19,396) | (18,552) | +5 | +8 | ||||||||||
| Net operating income | 25,858 | 24,123 | +7 | +8 | ||||||||||
| LLPs | (12,295) | (10,212) | +20 | +21 | ||||||||||
| PBT | 10,872 | 11,785 | (8) | (8) | ||||||||||
| Attributable profit | 7,436 | 7,933 | (6) | (7) | ||||||||||
| Santander Corporate & Investment Banking | Underlying attributable profit | ||||||||||||||||
| EUR 3,078 mn | |||||||||||||||||
| EXECUTIVE SUMMARY | |||||||||||||||||
| Strategy | Business performance | Results | ||||||||||||
Become a world-class CIB business leveraging our strengths, positioning ourselves as a strategic advisor to our clients and delivering profitable growth |
Activity in 2023 delivered growth and profitability in a challenging macroeconomic environment that affected the entire industry. We maintained business levels similar to 2022 |
Underlying attributable profit reached EUR 3,078 million due to an increase in total income. Efficiency remains among the best in the sector |
||||||||||||
2023 Ranking | ||||||||
| Award/ranking | Source | Area | ||||||
| Europe Bank of the Year | Proximo | Global | ||||||
| Corporate Bond House of the Year / Best Investment Bank in Brazil | Bonds, Loans LatAm Awards | Global | ||||||
| Eurobond of the Year | IFR | GDF | ||||||
| North America Financial Bond of the Year | IFR | GDF | ||||||
| Infrastructure Bank of the Year | LatinFinance | GDF | ||||||
| Deal of the Year - Infrastructure and Project Finance for DigitalBridge and Brookfield's majority stake in GD Towers | The Banker | GDF | ||||||
| Most Impressive Bank for ESG Capital Markets in Latin America | Global Capital | Markets | ||||||
| LatAm's Best Foreign Exchange Bank | Euromoney | Markets | ||||||
Deal of the Year - Equities for Porsche's €9.4bn IPO |
The Banker | CF | ||||||
| Best Iberian Broker | Institutional Investor | CF | ||||||
| Best Bank for Export Finance | Global Finance | GTB | ||||||
| Best Bank for Cash Management in Latin America | Global Finance | GTB | ||||||
| Best Trade Finance Bank / Best Receivables Finance Provider | TFG | GTB | ||||||
| Best Supply Chain Finance Bank | GTR | GTB | ||||||
| Total income breakdown | ||
Constant EUR million | ||
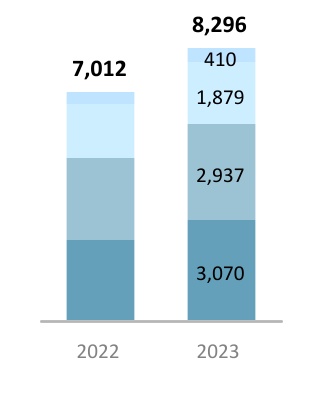
| TOTAL | +18 | % | |||
| Other | +11 | % | |||
| Global Debt Financing | +11 | % | |||
| Global Transactional Banking | +20 | % | |||
| Markets | +22 | % | |||
| SCIB. Underlying income statement | ||||||||||||||
| EUR million and % change | ||||||||||||||
| / | 2022 | |||||||||||||
| 2023 | 2022 | % | % excl. FX | |||||||||||
| Revenue | 8,296 | 7,378 | +12 | +18 | ||||||||||
| Expenses | (3,391) | (2,902) | +17 | +20 | ||||||||||
| Net operating income | 4,905 | 4,476 | +10 | +17 | ||||||||||
| LLPs | (162) | (249) | (35) | (34) | ||||||||||
| PBT | 4,570 | 4,097 | +12 | +20 | ||||||||||
| Attributable profit | 3,078 | 2,817 | +9 | +20 | ||||||||||
| Wealth Management & Insurance | Underlying attributable profit | ||||||||||||||||
| EUR 1,637 mn | |||||||||||||||||
| EXECUTIVE SUMMARY | |||||||||||||||||
| Strategy | Business performance1 |
Results1 |
||||||||||||
We aim to become the best Wealth and Insurance Manager in Europe and the Americas by leveraging Group's scale and capabilities |
Total assets under management grew by 14% year-on-year to EUR 460 billion, as a result of strong commercial dynamics |
Total contribution to profit in 2023 grew 21% year-on-year to EUR 3,296 million, driven by higher net interest income and commercial activity |
||||||||||||
1. In constant euros. |
||||||||||||||

| Business performance: SAM and Private Banking | |||||
| EUR billion and % change in constant euros. December 2023 | |||||
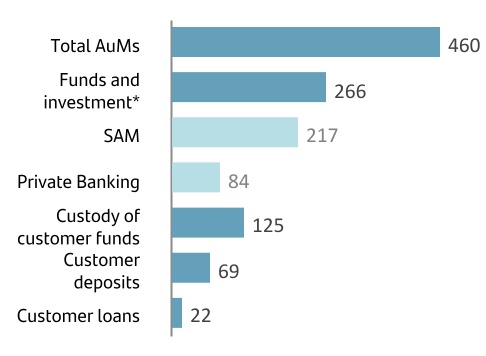
| / 2022 | ||
| +14 | % | |
| +10 | % | |
| +15 | % | |
| +10 | % | |
| +31 | % | |
| +4 | % | |
| +2 | % | |
| Total contribution to profit | ||||||||||||||||||||
| EUR million and % change in constant euros | ||||||||||||||||||||
| 3,296 | ||||||||||||||||||||
| 〉 | +21% | |||||||||||||||||||
| / 2022 | ||||||||||||||||||||
| WM&I. Underlying income statement | ||||||||||||||
| EUR million and % change | ||||||||||||||
| / | 2022 | |||||||||||||
| 2023 | 2022 | % | % excl. FX | |||||||||||
| Revenue | 3,396 | 2,635 | +29 | +31 | ||||||||||
| Expenses | (1,156) | (1,054) | +10 | +12 | ||||||||||
| Net operating income | 2,240 | 1,581 | +42 | +44 | ||||||||||
| LLPs | 21 | (14) | — | — | ||||||||||
| PBT | 2,235 | 1,531 | +46 | +48 | ||||||||||
| Attributable profit | 1,637 | 1,119 | +46 | +48 | ||||||||||
| PagoNxt | Underlying attributable profit | ||||||||||||||||
| -EUR 77 mn | |||||||||||||||||
| EXECUTIVE SUMMARY | |||||||||||||||||
| Strategy | Business performance1 |
Results | ||||||||||||
Scale up our global platform of innovative payments and integrated value-added solutions serving the payment needs for Grupo Santander and for open market customers worldwide |
PagoNxt continued to expand in 2023. Getnet's Total Payments Volume reached EUR 206 billion globally, a 22% increase versus 2022 |
Continued momentum in total income in 2023, reaching EUR 1,140 million, up 20% year-on-year (+17% in constant euros) |
||||||||||||
PagoNxt. Total income performance | ||||||||||||||||||||
| Constant EUR million | ||||||||||||||||||||
| +17% | ||||||||||||||
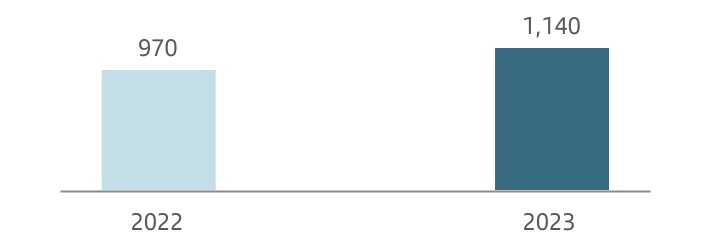
| PagoNxt. Underlying income statement | ||||||||||||||
| EUR million and % change | ||||||||||||||
| / | 2022 | |||||||||||||
| 2023 | 2022 | % | % excl. FX | |||||||||||
| Revenue | 1,140 | 953 | +20 | +17 | ||||||||||
| Expenses | (1,091) | (1,024) | +7 | +6 | ||||||||||
| Net operating income | 49 | (71) | — | — | ||||||||||
| LLPs | (24) | (44) | (46) | (46) | ||||||||||
| PBT | (17) | (141) | (88) | (87) | ||||||||||
| Attributable profit | (77) | (215) | (64) | (63) | ||||||||||
| Primary segments | ||||||||||||||||||||||||||||||||
| EUR million | ||||||||||||||||||||||||||||||||
| Europe | Spain | |||||||||||||||||||||||||||||||
| Underlying income statement | 2023 | 2022 | % | % excl. FX | 2023 | 2022 | % | |||||||||||||||||||||||||
| Net interest income | 15,910 | 12,565 | 26.6 | 27.0 | 6,641 | 4,539 | 46.3 | |||||||||||||||||||||||||
| Net fee income | 4,399 | 4,493 | (2.1) | (2.2) | 2,699 | 2,818 | (4.2) | |||||||||||||||||||||||||
Gains (losses) on financial transactions A |
1,033 | 821 | 25.9 | 25.8 | 688 | 612 | 12.3 | |||||||||||||||||||||||||
| Other operating income | 97 | 151 | (35.8) | (34.2) | 105 | 265 | (60.4) | |||||||||||||||||||||||||
| Total income | 21,439 | 18,030 | 18.9 | 19.2 | 10,132 | 8,233 | 23.1 | |||||||||||||||||||||||||
| Administrative expenses and amortizations | (9,030) | (8,523) | 5.9 | 6.4 | (4,227) | (3,998) | 5.7 | |||||||||||||||||||||||||
| Net operating income | 12,409 | 9,507 | 30.5 | 30.5 | 5,905 | 4,236 | 39.4 | |||||||||||||||||||||||||
| Net loan-loss provisions | (2,533) | (2,396) | 5.7 | 5.4 | (1,522) | (1,618) | (5.9) | |||||||||||||||||||||||||
| Other gains (losses) and provisions | (1,681) | (1,629) | 3.2 | 2.8 | (984) | (539) | 82.4 | |||||||||||||||||||||||||
| Profit before tax | 8,195 | 5,482 | 49.5 | 49.9 | 3,399 | 2,079 | 63.5 | |||||||||||||||||||||||||
| Tax on profit | (2,371) | (1,492) | 58.9 | 59.2 | (1,029) | (518) | 98.5 | |||||||||||||||||||||||||
| Profit from continuing operations | 5,824 | 3,989 | 46.0 | 46.4 | 2,371 | 1,560 | 51.9 | |||||||||||||||||||||||||
| Net profit from discontinued operations | — | — | — | — | — | — | — | |||||||||||||||||||||||||
| Consolidated profit | 5,824 | 3,989 | 46.0 | 46.4 | 2,371 | 1,560 | 51.9 | |||||||||||||||||||||||||
| Non-controlling interests | (342) | (179) | 90.6 | 84.7 | — | — | (26.2) | |||||||||||||||||||||||||
| Profit attributable to the parent | 5,482 | 3,810 | 43.9 | 44.6 | 2,371 | 1,560 | 51.9 | |||||||||||||||||||||||||
| Balance sheet | ||||||||||||||||||||||||||||||||
| Loans and advances to customers | 570,067 | 591,280 | (3.6) | (4.8) | 239,214 | 256,397 | (6.7) | |||||||||||||||||||||||||
| Cash, central banks and credit institutions | 198,451 | 216,310 | (8.3) | (9.1) | 116,317 | 129,113 | (9.9) | |||||||||||||||||||||||||
| Debt instruments | 115,428 | 76,319 | 51.2 | 49.1 | 70,072 | 42,008 | 66.8 | |||||||||||||||||||||||||
| Other financial assets | 44,538 | 47,737 | (6.7) | (6.7) | 40,926 | 43,555 | (6.0) | |||||||||||||||||||||||||
| Other asset accounts | 26,860 | 26,564 | 1.1 | 0.5 | 17,075 | 17,995 | (5.1) | |||||||||||||||||||||||||
| Total assets | 955,344 | 958,209 | (0.3) | (1.4) | 483,603 | 489,067 | (1.1) | |||||||||||||||||||||||||
| Customer deposits | 644,921 | 643,875 | 0.2 | (1.1) | 324,099 | 329,414 | (1.6) | |||||||||||||||||||||||||
| Central banks and credit institutions | 104,164 | 112,254 | (7.2) | (7.9) | 44,802 | 43,110 | 3.9 | |||||||||||||||||||||||||
| Marketable debt securities | 79,095 | 71,731 | 10.3 | 8.7 | 28,486 | 23,674 | 20.3 | |||||||||||||||||||||||||
| Other financial liabilities | 53,361 | 60,010 | (11.1) | (11.2) | 46,532 | 52,876 | (12.0) | |||||||||||||||||||||||||
| Other liabilities accounts | 29,633 | 27,300 | 8.5 | 8.0 | 22,264 | 19,600 | 13.6 | |||||||||||||||||||||||||
| Total liabilities | 911,173 | 915,169 | (0.4) | (1.5) | 466,184 | 468,674 | (0.5) | |||||||||||||||||||||||||
| Total equity | 44,171 | 43,040 | 2.6 | 1.2 | 17,419 | 20,394 | (14.6) | |||||||||||||||||||||||||
| Memorandum items: | ||||||||||||||||||||||||||||||||
Gross loans and advances to customers B |
551,722 | 579,476 | (4.8) | (6.0) | 229,803 | 249,821 | (8.0) | |||||||||||||||||||||||||
| Customer funds | 725,417 | 720,910 | 0.6 | (0.5) | 386,810 | 394,679 | (2.0) | |||||||||||||||||||||||||
Customer deposits C |
620,299 | 627,630 | (1.2) | (2.4) | 308,745 | 322,284 | (4.2) | |||||||||||||||||||||||||
| Mutual funds | 105,118 | 93,280 | 12.7 | 12.2 | 78,065 | 72,395 | 7.8 | |||||||||||||||||||||||||
| Ratios (%), operating means and customers | ||||||||||||||||||||||||||||||||
| RoTE | 14.47 | 9.28 | 5.19 | 14.16 | 7.89 | 6.27 | ||||||||||||||||||||||||||
| Efficiency ratio | 42.1 | 47.3 | (5.2) | 41.7 | 48.6 | (6.8) | ||||||||||||||||||||||||||
| NPL ratio | 2.32 | 2.37 | (0.05) | 3.06 | 3.27 | (0.21) | ||||||||||||||||||||||||||
| Total coverage ratio | 49.3 | 51.8 | (2.5) | 49.1 | 51.0 | (1.9) | ||||||||||||||||||||||||||
| Number of employees | 67,457 | 65,581 | 2.9 | 26,834 | 26,839 | (0.0) | ||||||||||||||||||||||||||
| Number of branches | 3,083 | 3,148 | (2.1) | 1,874 | 1,913 | (2.0) | ||||||||||||||||||||||||||
| Number of total customers (thousands) | 46,293 | 45,564 | 1.6 | 15,023 | 14,320 | 4.9 | ||||||||||||||||||||||||||
| Number of active customers (thousands) | 28,538 | 28,124 | 1.5 | 8,367 | 7,852 | 6.6 | ||||||||||||||||||||||||||
| A. Includes exchange differences. | ||||||||||||||||||||||||||||||||
| B. Minus reverse repurchase agreements. | ||||||||||||||||||||||||||||||||
| C. Minus repurchase agreements. | ||||||||||||||||||||||||||||||||
| Primary segments | ||||||||||||||||||||||||||||||||
| EUR million | ||||||||||||||||||||||||||||||||
| United Kingdom | Portugal | |||||||||||||||||||||||||||||||
| Underlying income statement | 2023 | 2022 | % | % excl. FX | 2023 | 2022 | % | |||||||||||||||||||||||||
| Net interest income | 5,152 | 4,992 | 3.2 | 5.3 | 1,465 | 747 | 96.2 | |||||||||||||||||||||||||
| Net fee income | 338 | 390 | (13.3) | (11.5) | 464 | 484 | (4.2) | |||||||||||||||||||||||||
Gains (losses) on financial transactions A |
29 | 31 | (4.6) | (2.7) | 33 | 56 | (41.0) | |||||||||||||||||||||||||
| Other operating income | 5 | 6 | (7.2) | (5.3) | 21 | 8 | 152.5 | |||||||||||||||||||||||||
| Total income | 5,525 | 5,418 | 2.0 | 4.0 | 1,982 | 1,295 | 53.1 | |||||||||||||||||||||||||
| Administrative expenses and amortizations | (2,745) | (2,685) | 2.2 | 4.3 | (542) | (502) | 8.1 | |||||||||||||||||||||||||
| Net operating income | 2,779 | 2,733 | 1.7 | 3.7 | 1,440 | 793 | 81.6 | |||||||||||||||||||||||||
| Net loan-loss provisions | (247) | (316) | (21.7) | (20.1) | (77) | (17) | 353.6 | |||||||||||||||||||||||||
| Other gains (losses) and provisions | (425) | (517) | (17.9) | (16.3) | (49) | (1) | — | |||||||||||||||||||||||||
| Profit before tax | 2,107 | 1,900 | 10.9 | 13.1 | 1,314 | 775 | 69.4 | |||||||||||||||||||||||||
| Tax on profit | (563) | (505) | 11.4 | 13.6 | (416) | (240) | 73.2 | |||||||||||||||||||||||||
| Profit from continuing operations | 1,545 | 1,395 | 10.8 | 13.0 | 898 | 536 | 67.8 | |||||||||||||||||||||||||
| Net profit from discontinued operations | — | — | — | — | — | — | — | |||||||||||||||||||||||||
| Consolidated profit | 1,545 | 1,395 | 10.8 | 13.0 | 898 | 536 | 67.8 | |||||||||||||||||||||||||
| Non-controlling interests | — | — | — | — | (2) | (2) | 38.9 | |||||||||||||||||||||||||
| Profit attributable to the parent | 1,545 | 1,395 | 10.8 | 13.0 | 896 | 534 | 67.9 | |||||||||||||||||||||||||
| Balance sheet | ||||||||||||||||||||||||||||||||
| Loans and advances to customers | 245,743 | 251,892 | (2.4) | (4.5) | 36,864 | 39,126 | (5.8) | |||||||||||||||||||||||||
| Cash, central banks and credit institutions | 62,387 | 65,962 | (5.4) | (7.5) | 8,084 | 9,634 | (16.1) | |||||||||||||||||||||||||
| Debt instruments | 10,234 | 7,294 | 40.3 | 37.3 | 10,991 | 7,887 | 39.4 | |||||||||||||||||||||||||
| Other financial assets | 289 | 601 | (52.0) | (53.0) | 1,078 | 1,095 | (1.6) | |||||||||||||||||||||||||
| Other asset accounts | 4,363 | 3,292 | 32.5 | 29.7 | 1,279 | 1,481 | (13.7) | |||||||||||||||||||||||||
| Total assets | 323,016 | 329,042 | (1.8) | (3.9) | 58,297 | 59,223 | (1.6) | |||||||||||||||||||||||||
| Customer deposits | 233,453 | 230,829 | 1.1 | (1.0) | 36,366 | 38,506 | (5.6) | |||||||||||||||||||||||||
| Central banks and credit institutions | 28,202 | 37,022 | (23.8) | (25.5) | 9,237 | 9,182 | 0.6 | |||||||||||||||||||||||||
| Marketable debt securities | 43,850 | 44,088 | (0.5) | (2.7) | 4,813 | 3,288 | 46.4 | |||||||||||||||||||||||||
| Other financial liabilities | 3,434 | 3,549 | (3.2) | (5.3) | 319 | 448 | (28.8) | |||||||||||||||||||||||||
| Other liabilities accounts | 1,704 | 1,553 | 9.7 | 7.4 | 3,725 | 4,467 | (16.6) | |||||||||||||||||||||||||
| Total liabilities | 310,642 | 317,041 | (2.0) | (4.1) | 54,460 | 55,890 | (2.6) | |||||||||||||||||||||||||
| Total equity | 12,373 | 12,001 | 3.1 | 0.9 | 3,837 | 3,333 | 15.1 | |||||||||||||||||||||||||
| Memorandum items: | ||||||||||||||||||||||||||||||||
Gross loans and advances to customers B |
235,111 | 244,840 | (4.0) | (6.0) | 37,658 | 40,066 | (6.0) | |||||||||||||||||||||||||
| Customer funds | 231,667 | 228,993 | 1.2 | (1.0) | 40,618 | 42,129 | (3.6) | |||||||||||||||||||||||||
Customer deposits C |
224,396 | 221,884 | 1.1 | (1.0) | 36,366 | 38,506 | (5.6) | |||||||||||||||||||||||||
| Mutual funds | 7,272 | 7,109 | 2.3 | 0.1 | 4,252 | 3,623 | 17.4 | |||||||||||||||||||||||||
| Ratios (%), operating means and customers | ||||||||||||||||||||||||||||||||
| RoTE | 13.01 | 10.70 | 2.31 | 25.92 | 15.03 | 10.89 | ||||||||||||||||||||||||||
| Efficiency ratio | 49.7 | 49.6 | 0.1 | 27.3 | 38.7 | (11.4) | ||||||||||||||||||||||||||
| NPL ratio | 1.42 | 1.21 | 0.22 | 2.59 | 2.99 | (0.39) | ||||||||||||||||||||||||||
| Total coverage ratio | 30.3 | 33.8 | (3.4) | 82.7 | 79.3 | 3.4 | ||||||||||||||||||||||||||
| Number of employees | 22,280 | 21,185 | 5.2 | 4,945 | 4,952 | (0.1) | ||||||||||||||||||||||||||
| Number of branches | 444 | 449 | (1.1) | 376 | 383 | (1.8) | ||||||||||||||||||||||||||
| Number of total customers (thousands) | 22,481 | 22,402 | 0.4 | 2,908 | 2,923 | (0.5) | ||||||||||||||||||||||||||
| Number of active customers (thousands) | 13,864 | 13,995 | (0.9) | 1,838 | 1,784 | 3.0 | ||||||||||||||||||||||||||
| A. Includes exchange differences. | ||||||||||||||||||||||||||||||||
| B. Minus reverse repurchase agreements. | ||||||||||||||||||||||||||||||||
| C. Minus repurchase agreements. | ||||||||||||||||||||||||||||||||
| Primary segments | |||||||||||||||||||||||||||||||||||
| EUR million | |||||||||||||||||||||||||||||||||||
| Poland | Other Europe | ||||||||||||||||||||||||||||||||||
| Underlying income statement | 2023 | 2022 | % | % excl. FX | 2023 | 2022 | % | % excl. FX | |||||||||||||||||||||||||||
| Net interest income | 2,543 | 1,976 | 28.7 | 24.7 | 109 | 312 | (65.0) | (64.4) | |||||||||||||||||||||||||||
| Net fee income | 589 | 528 | 11.6 | 8.1 | 309 | 273 | 13.2 | 14.7 | |||||||||||||||||||||||||||
Gains (losses) on financial transactions A |
67 | 93 | (28.2) | (30.4) | 217 | 29 | 641.1 | 685.2 | |||||||||||||||||||||||||||
| Other operating income | (17) | (123) | (85.8) | (86.3) | (16) | (5) | 249.6 | 266.1 | |||||||||||||||||||||||||||
| Total income | 3,182 | 2,474 | 28.6 | 24.6 | 618 | 609 | 1.6 | 3.2 | |||||||||||||||||||||||||||
| Administrative expenses and amortizations | (862) | (692) | 24.6 | 20.7 | (653) | (646) | 1.1 | 2.1 | |||||||||||||||||||||||||||
| Net operating income | 2,320 | 1,782 | 30.1 | 26.1 | (35) | (38) | (6.5) | (14.4) | |||||||||||||||||||||||||||
| Net loan-loss provisions | (674) | (440) | 53.2 | 48.5 | (12) | (6) | 112.3 | 112.2 | |||||||||||||||||||||||||||
| Other gains (losses) and provisions | (253) | (553) | (54.2) | (55.6) | 30 | (18) | — | — | |||||||||||||||||||||||||||
| Profit before tax | 1,392 | 789 | 76.4 | 71.0 | (17) | (61) | (71.5) | (72.8) | |||||||||||||||||||||||||||
| Tax on profit | (377) | (247) | 52.7 | 47.9 | 13 | 18 | (28.5) | (31.7) | |||||||||||||||||||||||||||
| Profit from continuing operations | 1,015 | 542 | 87.3 | 81.5 | (5) | (43) | (89.1) | (89.6) | |||||||||||||||||||||||||||
| Net profit from discontinued operations | — | — | — | — | — | — | — | — | |||||||||||||||||||||||||||
| Consolidated profit | 1,015 | 542 | 87.3 | 81.5 | (5) | (43) | (89.1) | (89.6) | |||||||||||||||||||||||||||
| Non-controlling interests | (342) | (179) | 91.2 | 85.3 | 2 | 1 | 103.7 | 103.7 | |||||||||||||||||||||||||||
| Profit attributable to the parent | 674 | 364 | 85.3 | 79.6 | (3) | (42) | (93.7) | (94.0) | |||||||||||||||||||||||||||
| Balance sheet | |||||||||||||||||||||||||||||||||||
| Loans and advances to customers | 33,850 | 29,659 | 14.1 | 5.8 | 14,397 | 14,206 | 1.3 | 4.7 | |||||||||||||||||||||||||||
| Cash, central banks and credit institutions | 9,289 | 8,898 | 4.4 | (3.2) | 2,374 | 2,703 | (12.2) | (10.3) | |||||||||||||||||||||||||||
| Debt instruments | 15,070 | 11,865 | 27.0 | 17.8 | 9,060 | 7,265 | 24.7 | 24.9 | |||||||||||||||||||||||||||
| Other financial assets | 733 | 628 | 16.8 | 8.3 | 1,512 | 1,857 | (18.6) | (16.1) | |||||||||||||||||||||||||||
| Other asset accounts | 1,974 | 1,616 | 22.2 | 13.3 | 2,170 | 2,180 | (0.5) | 1.1 | |||||||||||||||||||||||||||
| Total assets | 60,916 | 52,665 | 15.7 | 7.2 | 29,512 | 28,211 | 4.6 | 6.9 | |||||||||||||||||||||||||||
| Customer deposits | 44,500 | 39,299 | 13.2 | 5.0 | 6,503 | 5,827 | 11.6 | 15.4 | |||||||||||||||||||||||||||
| Central banks and credit institutions | 4,623 | 4,969 | (7.0) | (13.7) | 17,300 | 17,971 | (3.7) | (2.1) | |||||||||||||||||||||||||||
| Marketable debt securities | 1,945 | 681 | 185.6 | 164.8 | — | — | — | — | |||||||||||||||||||||||||||
| Other financial liabilities | 1,706 | 1,179 | 44.7 | 34.2 | 1,369 | 1,958 | (30.1) | (28.0) | |||||||||||||||||||||||||||
| Other liabilities accounts | 1,687 | 1,378 | 22.4 | 13.5 | 253 | 302 | (16.3) | (15.9) | |||||||||||||||||||||||||||
| Total liabilities | 54,462 | 47,506 | 14.6 | 6.3 | 25,425 | 26,058 | (2.4) | (0.3) | |||||||||||||||||||||||||||
| Total equity | 6,454 | 5,159 | 25.1 | 16.0 | 4,087 | 2,153 | 89.9 | 95.2 | |||||||||||||||||||||||||||
| Memorandum items: | |||||||||||||||||||||||||||||||||||
Gross loans and advances to customers B |
34,729 | 30,524 | 13.8 | 5.5 | 14,420 | 14,226 | 1.4 | 4.7 | |||||||||||||||||||||||||||
| Customer funds | 49,371 | 42,370 | 16.5 | 8.0 | 16,951 | 12,740 | 33.1 | 35.1 | |||||||||||||||||||||||||||
Customer deposits C |
44,462 | 39,299 | 13.1 | 4.9 | 6,330 | 5,658 | 11.9 | 15.8 | |||||||||||||||||||||||||||
| Mutual funds | 4,909 | 3,071 | 59.9 | 48.2 | 10,621 | 7,082 | 50.0 | 50.0 | |||||||||||||||||||||||||||
| Ratios (%), operating means and customers | |||||||||||||||||||||||||||||||||||
| RoTE | 17.68 | 11.93 | 5.75 | ||||||||||||||||||||||||||||||||
| Efficiency ratio | 27.1 | 28.0 | (0.9) | ||||||||||||||||||||||||||||||||
| NPL ratio | 3.55 | 3.80 | (0.25) | ||||||||||||||||||||||||||||||||
| Total coverage ratio | 73.3 | 74.0 | (0.6) | ||||||||||||||||||||||||||||||||
| Number of employees | 10,822 | 10,532 | 2.8 | ||||||||||||||||||||||||||||||||
| Number of branches | 381 | 395 | (3.5) | ||||||||||||||||||||||||||||||||
| Number of total customers (thousands) | 5,877 | 5,697 | 3.2 | ||||||||||||||||||||||||||||||||
| Number of active customers (thousands) | 4,465 | 4,316 | 3.4 | ||||||||||||||||||||||||||||||||
| A. Includes exchange differences. | |||||||||||||||||||||||||||||||||||
| B. Minus reverse repurchase agreements. | |||||||||||||||||||||||||||||||||||
| C. Minus repurchase agreements. | |||||||||||||||||||||||||||||||||||
| Primary segments | |||||||||||||||||||||||||||||||||||
| EUR million | |||||||||||||||||||||||||||||||||||
| North America | United States | ||||||||||||||||||||||||||||||||||
| Underlying income statement | 2023 | 2022 | % | % excl. FX | 2023 | 2022 | % | % excl. FX | |||||||||||||||||||||||||||
| Net interest income | 10,159 | 9,705 | 4.7 | 2.6 | 5,742 | 6,140 | (6.5) | (3.8) | |||||||||||||||||||||||||||
| Net fee income | 2,192 | 1,958 | 11.9 | 6.7 | 766 | 771 | (0.6) | 2.2 | |||||||||||||||||||||||||||
Gains (losses) on financial transactions A |
505 | 204 | 147.3 | 147.9 | 294 | 164 | 79.2 | 84.3 | |||||||||||||||||||||||||||
| Other operating income | 318 | 449 | (29.1) | (24.4) | 406 | 548 | (25.9) | (23.8) | |||||||||||||||||||||||||||
| Total income | 13,174 | 12,316 | 7.0 | 4.7 | 7,209 | 7,623 | (5.4) | (2.7) | |||||||||||||||||||||||||||
| Administrative expenses and amortizations | (6,465) | (5,871) | 10.1 | 8.0 | (3,679) | (3,599) | 2.2 | 5.1 | |||||||||||||||||||||||||||
| Net operating income | 6,708 | 6,445 | 4.1 | 1.7 | 3,531 | 4,025 | (12.3) | (9.8) | |||||||||||||||||||||||||||
| Net loan-loss provisions | (3,733) | (2,538) | 47.1 | 45.2 | (2,593) | (1,744) | 48.7 | 52.9 | |||||||||||||||||||||||||||
| Other gains (losses) and provisions | (138) | (118) | 17.4 | 9.0 | (74) | (20) | 278.1 | 288.9 | |||||||||||||||||||||||||||
| Profit before tax | 2,837 | 3,790 | (25.1) | (27.2) | 863 | 2,261 | (61.8) | (60.7) | |||||||||||||||||||||||||||
| Tax on profit | (468) | (869) | (46.1) | (47.9) | 69 | (478) | — | — | |||||||||||||||||||||||||||
| Profit from continuing operations | 2,369 | 2,921 | (18.9) | (21.1) | 932 | 1,784 | (47.7) | (46.3) | |||||||||||||||||||||||||||
| Net profit from discontinued operations | — | — | — | — | — | — | — | — | |||||||||||||||||||||||||||
| Consolidated profit | 2,369 | 2,921 | (18.9) | (21.1) | 932 | 1,784 | (47.7) | (46.3) | |||||||||||||||||||||||||||
| Non-controlling interests | (15) | (43) | (64.9) | (68.3) | — | — | — | — | |||||||||||||||||||||||||||
| Profit attributable to the parent | 2,354 | 2,878 | (18.2) | (20.3) | 932 | 1,784 | (47.7) | (46.3) | |||||||||||||||||||||||||||
| Balance sheet | |||||||||||||||||||||||||||||||||||
| Loans and advances to customers | 174,780 | 171,519 | 1.9 | 1.8 | 126,843 | 130,390 | (2.7) | 0.7 | |||||||||||||||||||||||||||
| Cash, central banks and credit institutions | 35,969 | 35,607 | 1.0 | (1.9) | 21,215 | 20,000 | 6.1 | 9.8 | |||||||||||||||||||||||||||
| Debt instruments | 50,311 | 44,060 | 14.2 | 9.7 | 22,686 | 21,637 | 4.8 | 8.5 | |||||||||||||||||||||||||||
| Other financial assets | 10,937 | 14,668 | (25.4) | (29.6) | 4,075 | 5,241 | (22.3) | (19.5) | |||||||||||||||||||||||||||
| Other asset accounts | 22,829 | 22,741 | 0.4 | 0.8 | 16,307 | 17,837 | (8.6) | (5.4) | |||||||||||||||||||||||||||
| Total assets | 294,827 | 288,595 | 2.2 | 0.8 | 191,126 | 195,106 | (2.0) | 1.4 | |||||||||||||||||||||||||||
| Customer deposits | 175,958 | 168,748 | 4.3 | 3.8 | 121,782 | 124,209 | (2.0) | 1.5 | |||||||||||||||||||||||||||
| Central banks and credit institutions | 34,723 | 25,294 | 37.3 | 29.2 | 17,411 | 8,572 | 103.1 | 110.3 | |||||||||||||||||||||||||||
| Marketable debt securities | 35,133 | 41,063 | (14.4) | (14.1) | 27,059 | 32,685 | (17.2) | (14.3) | |||||||||||||||||||||||||||
| Other financial liabilities | 18,606 | 20,883 | (10.9) | (15.4) | 7,276 | 8,346 | (12.8) | (9.7) | |||||||||||||||||||||||||||
| Other liabilities accounts | 6,764 | 6,943 | (2.6) | (5.0) | 3,119 | 4,116 | (24.2) | (21.6) | |||||||||||||||||||||||||||
| Total liabilities | 271,183 | 262,931 | 3.1 | 1.8 | 176,646 | 177,929 | (0.7) | 2.8 | |||||||||||||||||||||||||||
| Total equity | 23,644 | 25,664 | (7.9) | (9.1) | 14,480 | 17,177 | (15.7) | (12.7) | |||||||||||||||||||||||||||
| Memorandum items: | |||||||||||||||||||||||||||||||||||
Gross loans and advances to customers B |
161,401 | 156,521 | 3.1 | 2.6 | 112,671 | 115,248 | (2.2) | 1.2 | |||||||||||||||||||||||||||
| Customer funds | 171,310 | 164,414 | 4.2 | 3.0 | 108,062 | 112,856 | (4.2) | (0.9) | |||||||||||||||||||||||||||
Customer deposits C |
141,863 | 135,955 | 4.3 | 3.7 | 95,697 | 98,346 | (2.7) | 0.7 | |||||||||||||||||||||||||||
| Mutual funds | 29,447 | 28,459 | 3.5 | (0.3) | 12,364 | 14,510 | (14.8) | (11.8) | |||||||||||||||||||||||||||
| Ratios (%), operating means and customers | |||||||||||||||||||||||||||||||||||
| RoTE | 9.76 | 11.06 | (1.30) | 6.07 | 9.40 | (3.33) | |||||||||||||||||||||||||||||
| Efficiency ratio | 49.1 | 47.7 | 1.4 | 51.0 | 47.2 | 3.8 | |||||||||||||||||||||||||||||
| NPL ratio | 4.09 | 3.03 | 1.06 | 4.57 | 3.25 | 1.32 | |||||||||||||||||||||||||||||
| Total coverage ratio | 73.8 | 93.3 | (19.4) | 67.7 | 90.3 | (22.6) | |||||||||||||||||||||||||||||
| Number of employees | 45,593 | 44,518 | 2.4 | 13,489 | 14,610 | (7.7) | |||||||||||||||||||||||||||||
| Number of branches | 1,784 | 1,854 | (3.8) | 415 | 485 | (14.4) | |||||||||||||||||||||||||||||
| Number of total customers (thousands) | 25,027 | 24,980 | 0.2 | 4,510 | 4,523 | (0.3) | |||||||||||||||||||||||||||||
| Number of active customers (thousands) | 14,486 | 14,020 | 3.3 | 4,223 | 4,137 | 2.1 | |||||||||||||||||||||||||||||
| A. Includes exchange differences. | |||||||||||||||||||||||||||||||||||
| B. Minus reverse repurchase agreements. | |||||||||||||||||||||||||||||||||||
| C. Minus repurchase agreements. | |||||||||||||||||||||||||||||||||||
| Primary segments | |||||||||||||||||||||||||||||||||||
| EUR million | |||||||||||||||||||||||||||||||||||
| Mexico | Other North America | ||||||||||||||||||||||||||||||||||
| Underlying income statement | 2023 | 2022 | % | % excl. FX | 2023 | 2022 | % | % excl. FX | |||||||||||||||||||||||||||
| Net interest income | 4,408 | 3,565 | 23.7 | 12.1 | 8 | — | — | — | |||||||||||||||||||||||||||
| Net fee income | 1,374 | 1,140 | 20.5 | 9.3 | 52 | 47 | 10.0 | 10.0 | |||||||||||||||||||||||||||
Gains (losses) on financial transactions A |
211 | 39 | 435.2 | 385.2 | (1) | — | — | — | |||||||||||||||||||||||||||
| Other operating income | (94) | (122) | (22.6) | (29.8) | 6 | 22 | (71.7) | (71.7) | |||||||||||||||||||||||||||
| Total income | 5,899 | 4,623 | 27.6 | 15.7 | 66 | 70 | (6.1) | (6.1) | |||||||||||||||||||||||||||
| Administrative expenses and amortizations | (2,588) | (2,076) | 24.7 | 13.0 | (199) | (196) | 1.3 | 1.4 | |||||||||||||||||||||||||||
| Net operating income | 3,311 | 2,547 | 30.0 | 17.9 | (133) | (126) | 5.4 | 5.5 | |||||||||||||||||||||||||||
| Net loan-loss provisions | (1,135) | (788) | 44.1 | 30.6 | (5) | (6) | (15.2) | (15.2) | |||||||||||||||||||||||||||
| Other gains (losses) and provisions | (57) | (94) | (39.1) | (44.7) | (7) | (5) | 52.0 | 52.5 | |||||||||||||||||||||||||||
| Profit before tax | 2,119 | 1,665 | 27.2 | 15.4 | (145) | (137) | 6.1 | 6.1 | |||||||||||||||||||||||||||
| Tax on profit | (541) | (407) | 32.9 | 20.5 | 5 | 17 | (70.6) | (70.6) | |||||||||||||||||||||||||||
| Profit from continuing operations | 1,577 | 1,257 | 25.4 | 13.7 | (140) | (120) | 16.8 | 16.8 | |||||||||||||||||||||||||||
| Net profit from discontinued operations | — | — | — | — | — | — | — | — | |||||||||||||||||||||||||||
| Consolidated profit | 1,577 | 1,257 | 25.4 | 13.7 | (140) | (120) | 16.8 | 16.8 | |||||||||||||||||||||||||||
| Non-controlling interests | (17) | (44) | (61.0) | (64.7) | 2 | 1 | 103.7 | 103.7 | |||||||||||||||||||||||||||
| Profit attributable to the parent | 1,560 | 1,213 | 28.6 | 16.6 | (138) | (119) | 16.0 | 16.1 | |||||||||||||||||||||||||||
| Balance sheet | |||||||||||||||||||||||||||||||||||
| Loans and advances to customers | 47,905 | 41,080 | 16.6 | 4.8 | 32 | 48 | (33.3) | (33.3) | |||||||||||||||||||||||||||
| Cash, central banks and credit institutions | 14,088 | 15,254 | (7.6) | (17.0) | 666 | 354 | 88.5 | 88.5 | |||||||||||||||||||||||||||
| Debt instruments | 27,624 | 22,423 | 23.2 | 10.7 | 2 | — | — | — | |||||||||||||||||||||||||||
| Other financial assets | 6,723 | 9,257 | (27.4) | (34.8) | 139 | 170 | (18.0) | (18.0) | |||||||||||||||||||||||||||
| Other asset accounts | 6,156 | 4,622 | 33.2 | 19.6 | 366 | 282 | 29.8 | 29.8 | |||||||||||||||||||||||||||
| Total assets | 102,496 | 92,636 | 10.6 | (0.6) | 1,205 | 853 | 41.2 | 41.2 | |||||||||||||||||||||||||||
| Customer deposits | 53,703 | 44,309 | 21.2 | 8.9 | 473 | 230 | 105.9 | 105.9 | |||||||||||||||||||||||||||
| Central banks and credit institutions | 17,047 | 16,592 | 2.7 | (7.7) | 265 | 130 | 103.1 | 103.1 | |||||||||||||||||||||||||||
| Marketable debt securities | 8,074 | 8,378 | (3.6) | (13.4) | — | — | — | — | |||||||||||||||||||||||||||
| Other financial liabilities | 11,189 | 12,374 | (9.6) | (18.8) | 141 | 163 | (13.2) | (13.2) | |||||||||||||||||||||||||||
| Other liabilities accounts | 3,579 | 2,764 | 29.5 | 16.4 | 66 | 64 | 2.9 | 2.9 | |||||||||||||||||||||||||||
| Total liabilities | 93,592 | 84,416 | 10.9 | (0.4) | 945 | 587 | 61.1 | 61.1 | |||||||||||||||||||||||||||
| Total equity | 8,904 | 8,220 | 8.3 | (2.7) | 259 | 266 | (2.6) | (2.6) | |||||||||||||||||||||||||||
| Memorandum items: | |||||||||||||||||||||||||||||||||||
Gross loans and advances to customers B |
48,688 | 41,218 | 18.1 | 6.1 | 41 | 55 | (24.8) | (24.8) | |||||||||||||||||||||||||||
| Customer funds | 62,775 | 51,328 | 22.3 | 9.9 | 473 | 230 | 105.9 | 105.9 | |||||||||||||||||||||||||||
Customer deposits C |
45,693 | 37,379 | 22.2 | 9.8 | 473 | 230 | 105.9 | 105.9 | |||||||||||||||||||||||||||
| Mutual funds | 17,082 | 13,949 | 22.5 | 10.0 | — | — | — | — | |||||||||||||||||||||||||||
| Ratios (%), operating means and customers | |||||||||||||||||||||||||||||||||||
| RoTE | 17.70 | 16.92 | 0.77 | ||||||||||||||||||||||||||||||||
| Efficiency ratio | 43.9 | 44.9 | (1.0) | ||||||||||||||||||||||||||||||||
| NPL ratio | 2.82 | 2.32 | 0.50 | ||||||||||||||||||||||||||||||||
| Total coverage ratio | 100.0 | 106.6 | (6.6) | ||||||||||||||||||||||||||||||||
| Number of employees | 30,876 | 28,834 | 7.1 | ||||||||||||||||||||||||||||||||
| Number of branches | 1,369 | 1,369 | 0.0 | ||||||||||||||||||||||||||||||||
| Number of total customers (thousands) | 20,517 | 20,239 | 1.4 | ||||||||||||||||||||||||||||||||
| Number of active customers (thousands) | 10,263 | 9,711 | 5.7 | ||||||||||||||||||||||||||||||||
| A. Includes exchange differences. | |||||||||||||||||||||||||||||||||||
| B. Minus reverse repurchase agreements. | |||||||||||||||||||||||||||||||||||
| C. Minus repurchase agreements. | |||||||||||||||||||||||||||||||||||
| Primary segments | |||||||||||||||||||||||||||||||||||
| EUR million | |||||||||||||||||||||||||||||||||||
| South America | Brazil | ||||||||||||||||||||||||||||||||||
| Underlying income statement | 2023 | 2022 | % | % excl. FX | 2023 | 2022 | % | % excl. FX | |||||||||||||||||||||||||||
| Net interest income | 13,040 | 12,979 | 0.5 | 12.0 | 9,116 | 8,901 | 2.4 | 2.0 | |||||||||||||||||||||||||||
| Net fee income | 4,684 | 4,515 | 3.7 | 14.0 | 3,462 | 3,296 | 5.0 | 4.6 | |||||||||||||||||||||||||||
Gains (losses) on financial transactions A |
1,280 | 1,291 | (0.9) | 13.8 | 483 | 736 | (34.5) | (34.7) | |||||||||||||||||||||||||||
| Other operating income | (1,033) | (761) | 35.8 | 403.0 | 43 | (23) | — | — | |||||||||||||||||||||||||||
| Total income | 17,971 | 18,025 | (0.3) | 7.8 | 13,104 | 12,910 | 1.5 | 1.1 | |||||||||||||||||||||||||||
| Administrative expenses and amortizations | (6,920) | (6,675) | 3.7 | 16.7 | (4,529) | (4,180) | 8.3 | 7.9 | |||||||||||||||||||||||||||
| Net operating income | 11,050 | 11,350 | (2.6) | 2.9 | 8,574 | 8,730 | (1.8) | (2.2) | |||||||||||||||||||||||||||
| Net loan-loss provisions | (5,401) | (5,041) | 7.1 | 8.9 | (4,701) | (4,417) | 6.4 | 6.0 | |||||||||||||||||||||||||||
| Other gains (losses) and provisions | (1,041) | (544) | 91.1 | 212.9 | (963) | (259) | 272.0 | 270.4 | |||||||||||||||||||||||||||
| Profit before tax | 4,608 | 5,764 | (20.1) | (15.4) | 2,911 | 4,055 | (28.2) | (28.5) | |||||||||||||||||||||||||||
| Tax on profit | (1,121) | (1,549) | (27.7) | (23.4) | (776) | (1,232) | (37.0) | (37.3) | |||||||||||||||||||||||||||
| Profit from continuing operations | 3,487 | 4,215 | (17.3) | (12.5) | 2,135 | 2,822 | (24.3) | (24.7) | |||||||||||||||||||||||||||
| Net profit from discontinued operations | — | — | — | — | — | — | — | — | |||||||||||||||||||||||||||
| Consolidated profit | 3,487 | 4,215 | (17.3) | (12.5) | 2,135 | 2,822 | (24.3) | (24.7) | |||||||||||||||||||||||||||
| Non-controlling interests | (449) | (557) | (19.4) | (19.9) | (215) | (278) | (22.9) | (23.2) | |||||||||||||||||||||||||||
| Profit attributable to the parent | 3,038 | 3,658 | (16.9) | (11.2) | 1,921 | 2,544 | (24.5) | (24.8) | |||||||||||||||||||||||||||
| Balance sheet | |||||||||||||||||||||||||||||||||||
| Loans and advances to customers | 153,244 | 144,812 | 5.8 | 7.2 | 96,399 | 86,202 | 11.8 | 6.2 | |||||||||||||||||||||||||||
| Cash, central banks and credit institutions | 67,410 | 52,358 | 28.7 | 30.1 | 53,618 | 40,858 | 31.2 | 24.6 | |||||||||||||||||||||||||||
| Debt instruments | 64,352 | 57,106 | 12.7 | 18.7 | 47,325 | 37,387 | 26.6 | 20.2 | |||||||||||||||||||||||||||
| Other financial assets | 20,796 | 19,854 | 4.7 | 7.8 | 8,161 | 5,682 | 43.6 | 36.4 | |||||||||||||||||||||||||||
| Other asset accounts | 19,247 | 18,795 | 2.4 | 3.6 | 14,590 | 14,037 | 3.9 | (1.3) | |||||||||||||||||||||||||||
| Total assets | 325,049 | 292,925 | 11.0 | 13.3 | 220,093 | 184,165 | 19.5 | 13.5 | |||||||||||||||||||||||||||
| Customer deposits | 155,448 | 137,661 | 12.9 | 17.3 | 110,162 | 89,957 | 22.5 | 16.3 | |||||||||||||||||||||||||||
| Central banks and credit institutions | 48,898 | 42,921 | 13.9 | 14.1 | 28,333 | 23,477 | 20.7 | 14.6 | |||||||||||||||||||||||||||
| Marketable debt securities | 39,603 | 35,063 | 12.9 | 11.2 | 27,976 | 23,997 | 16.6 | 10.7 | |||||||||||||||||||||||||||
| Other financial liabilities | 42,438 | 41,445 | 2.4 | 2.7 | 28,625 | 25,719 | 11.3 | 5.7 | |||||||||||||||||||||||||||
| Other liabilities accounts | 12,768 | 11,327 | 12.7 | 16.8 | 7,938 | 5,477 | 44.9 | 37.6 | |||||||||||||||||||||||||||
| Total liabilities | 299,155 | 268,417 | 11.5 | 13.6 | 203,035 | 168,627 | 20.4 | 14.3 | |||||||||||||||||||||||||||
| Total equity | 25,894 | 24,508 | 5.7 | 10.1 | 17,058 | 15,539 | 9.8 | 4.2 | |||||||||||||||||||||||||||
| Memorandum items: | |||||||||||||||||||||||||||||||||||
Gross loans and advances to customers B |
160,987 | 152,435 | 5.6 | 6.9 | 102,583 | 92,194 | 11.3 | 5.7 | |||||||||||||||||||||||||||
| Customer funds | 205,675 | 182,541 | 12.7 | 17.3 | 145,044 | 120,911 | 20.0 | 13.9 | |||||||||||||||||||||||||||
Customer deposits C |
135,342 | 123,307 | 9.8 | 15.3 | 90,297 | 75,767 | 19.2 | 13.2 | |||||||||||||||||||||||||||
| Mutual funds | 70,333 | 59,234 | 18.7 | 21.3 | 54,747 | 45,144 | 21.3 | 15.2 | |||||||||||||||||||||||||||
| Ratios (%), operating means and customers | |||||||||||||||||||||||||||||||||||
| RoTE | 14.43 | 18.77 | (4.33) | 13.73 | 19.23 | (5.50) | |||||||||||||||||||||||||||||
| Efficiency ratio | 38.5 | 37.0 | 1.5 | 34.6 | 32.4 | 2.2 | |||||||||||||||||||||||||||||
| NPL ratio | 5.72 | 6.20 | (0.49) | 6.56 | 7.57 | (1.00) | |||||||||||||||||||||||||||||
| Total coverage ratio | 78.4 | 76.0 | 2.4 | 84.7 | 79.5 | 5.2 | |||||||||||||||||||||||||||||
| Number of employees | 80,997 | 78,271 | 3.5 | 57,775 | 55,993 | 3.2 | |||||||||||||||||||||||||||||
| Number of branches | 3,309 | 3,653 | (9.4) | 2,580 | 2,847 | (9.4) | |||||||||||||||||||||||||||||
| Number of total customers (thousands) | 73,028 | 69,553 | 5.0 | 62,804 | 60,117 | 4.5 | |||||||||||||||||||||||||||||
| Number of active customers (thousands) | 37,517 | 38,368 | (2.2) | 30,460 | 31,813 | (4.3) | |||||||||||||||||||||||||||||
| A. Includes exchange differences. | |||||||||||||||||||||||||||||||||||
| B. Minus reverse repurchase agreements. | |||||||||||||||||||||||||||||||||||
| C. Minus repurchase agreements. | |||||||||||||||||||||||||||||||||||
| Primary segments | |||||||||||||||||||||||||||||||||||
| EUR million | |||||||||||||||||||||||||||||||||||
| Chile | Argentina | ||||||||||||||||||||||||||||||||||
| Underlying income statement | 2023 | 2022 | % | % excl. FX | 2023 | 2022 | % | % excl. FX | |||||||||||||||||||||||||||
| Net interest income | 1,383 | 1,772 | (22.0) | (22.9) | 1,879 | 1,778 | 5.7 | 399.4 | |||||||||||||||||||||||||||
| Net fee income | 572 | 468 | 22.2 | 20.8 | 396 | 542 | (26.9) | 245.2 | |||||||||||||||||||||||||||
Gains (losses) on financial transactions A |
320 | 242 | 32.2 | 30.7 | 341 | 218 | 56.0 | 637.0 | |||||||||||||||||||||||||||
| Other operating income | 11 | (33) | — | — | (1,071) | (705) | 51.9 | 617.8 | |||||||||||||||||||||||||||
| Total income | 2,285 | 2,449 | (6.7) | (7.7) | 1,544 | 1,833 | (15.8) | 298.1 | |||||||||||||||||||||||||||
| Administrative expenses and amortizations | (1,020) | (981) | 4.0 | 2.8 | (775) | (987) | (21.5) | 271.0 | |||||||||||||||||||||||||||
| Net operating income | 1,265 | 1,468 | (13.8) | (14.8) | 769 | 846 | (9.1) | 329.7 | |||||||||||||||||||||||||||
| Net loan-loss provisions | (365) | (399) | (8.5) | (9.5) | (150) | (132) | 13.6 | 436.9 | |||||||||||||||||||||||||||
| Other gains (losses) and provisions | 51 | (8) | — | — | (114) | (270) | (57.7) | 99.8 | |||||||||||||||||||||||||||
| Profit before tax | 951 | 1,062 | (10.4) | (11.4) | 505 | 443 | 13.8 | 437.9 | |||||||||||||||||||||||||||
| Tax on profit | (135) | (105) | 28.5 | 27.0 | (117) | (118) | (1.4) | 366.1 | |||||||||||||||||||||||||||
| Profit from continuing operations | 816 | 956 | (14.7) | (15.6) | 388 | 325 | 19.4 | 464.1 | |||||||||||||||||||||||||||
| Net profit from discontinued operations | — | — | — | — | — | — | — | — | |||||||||||||||||||||||||||
| Consolidated profit | 816 | 956 | (14.7) | (15.6) | 388 | 325 | 19.4 | 464.1 | |||||||||||||||||||||||||||
| Non-controlling interests | (234) | (279) | (16.0) | (16.9) | (2) | (1) | 154.0 | — | |||||||||||||||||||||||||||
| Profit attributable to the parent | 582 | 677 | (14.1) | (15.1) | 386 | 324 | 19.0 | 462.3 | |||||||||||||||||||||||||||
| Balance sheet | |||||||||||||||||||||||||||||||||||
| Loans and advances to customers | 42,616 | 43,336 | (1.7) | 4.4 | 3,767 | 5,586 | (32.6) | 218.7 | |||||||||||||||||||||||||||
| Cash, central banks and credit institutions | 6,373 | 6,344 | 0.5 | 6.6 | 4,548 | 3,021 | 50.6 | 611.4 | |||||||||||||||||||||||||||
| Debt instruments | 13,273 | 11,977 | 10.8 | 17.6 | 1,368 | 5,317 | (74.3) | 21.6 | |||||||||||||||||||||||||||
| Other financial assets | 12,159 | 13,898 | (12.5) | (7.1) | 11 | 74 | (85.8) | (32.7) | |||||||||||||||||||||||||||
| Other asset accounts | 2,746 | 2,869 | (4.3) | 1.6 | 776 | 1,017 | (23.7) | 260.6 | |||||||||||||||||||||||||||
| Total assets | 77,167 | 78,425 | (1.6) | 4.5 | 10,470 | 15,015 | (30.3) | 229.5 | |||||||||||||||||||||||||||
| Customer deposits | 29,578 | 29,042 | 1.8 | 8.1 | 6,478 | 10,547 | (38.6) | 190.2 | |||||||||||||||||||||||||||
| Central banks and credit institutions | 14,808 | 13,906 | 6.5 | 13.0 | 1,271 | 1,080 | 17.6 | 455.9 | |||||||||||||||||||||||||||
| Marketable debt securities | 10,775 | 10,415 | 3.5 | 9.8 | 148 | 153 | (3.4) | 356.6 | |||||||||||||||||||||||||||
| Other financial liabilities | 12,624 | 14,650 | (13.8) | (8.5) | 638 | 811 | (21.3) | 272.0 | |||||||||||||||||||||||||||
| Other liabilities accounts | 3,733 | 4,832 | (22.7) | (18.0) | 455 | 514 | (11.5) | 318.4 | |||||||||||||||||||||||||||
| Total liabilities | 71,518 | 72,845 | (1.8) | 4.2 | 8,990 | 13,105 | (31.4) | 224.2 | |||||||||||||||||||||||||||
| Total equity | 5,648 | 5,580 | 1.2 | 7.5 | 1,479 | 1,910 | (22.6) | 266.0 | |||||||||||||||||||||||||||
| Memorandum items: | |||||||||||||||||||||||||||||||||||
Gross loans and advances to customers B |
43,823 | 44,588 | (1.7) | 4.3 | 3,878 | 5,781 | (32.9) | 217.0 | |||||||||||||||||||||||||||
| Customer funds | 40,098 | 38,014 | 5.5 | 12.0 | 10,288 | 14,499 | (29.0) | 235.3 | |||||||||||||||||||||||||||
Customer deposits C |
29,337 | 28,889 | 1.6 | 7.8 | 6,478 | 10,547 | (38.6) | 190.2 | |||||||||||||||||||||||||||
| Mutual funds | 10,761 | 9,126 | 17.9 | 25.2 | 3,810 | 3,952 | (3.6) | 355.5 | |||||||||||||||||||||||||||
| Ratios (%), operating means and customers | |||||||||||||||||||||||||||||||||||
| RoTE | 14.82 | 19.47 | (4.65) | 55.60 | 26.23 | 29.36 | |||||||||||||||||||||||||||||
| Efficiency ratio | 44.6 | 40.1 | 4.6 | 50.2 | 53.9 | (3.7) | |||||||||||||||||||||||||||||
| NPL ratio | 5.01 | 4.99 | 0.02 | 1.99 | 2.08 | (0.10) | |||||||||||||||||||||||||||||
| Total coverage ratio | 52.7 | 56.3 | (3.6) | 165.7 | 180.4 | (14.7) | |||||||||||||||||||||||||||||
| Number of employees | 9,948 | 9,773 | 1.8 | 8,455 | 8,251 | 2.5 | |||||||||||||||||||||||||||||
| Number of branches | 248 | 283 | (12.4) | 322 | 375 | (14.1) | |||||||||||||||||||||||||||||
| Number of total customers (thousands) | 4,052 | 3,577 | 13.3 | 4,771 | 4,385 | 8.8 | |||||||||||||||||||||||||||||
| Number of active customers (thousands) | 2,399 | 2,196 | 9.2 | 3,562 | 3,203 | 11.2 | |||||||||||||||||||||||||||||
| A. Includes exchange differences. | |||||||||||||||||||||||||||||||||||
| B. Minus reverse repurchase agreements. | |||||||||||||||||||||||||||||||||||
| C. Minus repurchase agreements. | |||||||||||||||||||||||||||||||||||
| Primary segments | |||||||||||||||||||||||||||||||||||
| EUR million | |||||||||||||||||||||||||||||||||||
| Other South America | Digital Consumer Bank | ||||||||||||||||||||||||||||||||||
| Underlying income statement | 2023 | 2022 | % | % excl. FX | 2023 | 2022 | % | % excl. FX | |||||||||||||||||||||||||||
| Net interest income | 662 | 527 | 25.6 | 24.1 | 4,193 | 4,022 | 4.3 | 6.1 | |||||||||||||||||||||||||||
| Net fee income | 254 | 210 | 21.2 | 20.2 | 796 | 843 | (5.6) | (5.3) | |||||||||||||||||||||||||||
Gains (losses) on financial transactions A |
137 | 95 | 44.5 | 45.1 | 117 | 60 | 95.5 | 94.8 | |||||||||||||||||||||||||||
| Other operating income | (16) | 1 | — | — | 396 | 344 | 15.1 | 15.3 | |||||||||||||||||||||||||||
| Total income | 1,038 | 832 | 24.6 | 23.5 | 5,502 | 5,269 | 4.4 | 5.9 | |||||||||||||||||||||||||||
| Administrative expenses and amortizations | (596) | (527) | 13.2 | 12.7 | (2,618) | (2,462) | 6.4 | 8.1 | |||||||||||||||||||||||||||
| Net operating income | 441 | 306 | 44.3 | 42.1 | 2,884 | 2,807 | 2.7 | 3.9 | |||||||||||||||||||||||||||
| Net loan-loss provisions | (186) | (94) | 98.4 | 96.1 | (792) | (544) | 45.7 | 47.8 | |||||||||||||||||||||||||||
| Other gains (losses) and provisions | (15) | (7) | 95.0 | 92.8 | (72) | (27) | 169.9 | 167.0 | |||||||||||||||||||||||||||
| Profit before tax | 241 | 205 | 17.7 | 15.7 | 2,019 | 2,237 | (9.7) | (8.7) | |||||||||||||||||||||||||||
| Tax on profit | (93) | (94) | (0.8) | (1.9) | (493) | (549) | (10.3) | (9.5) | |||||||||||||||||||||||||||
| Profit from continuing operations | 148 | 111 | 33.3 | 30.4 | 1,526 | 1,687 | (9.5) | (8.4) | |||||||||||||||||||||||||||
| Net profit from discontinued operations | — | — | — | — | — | — | — | — | |||||||||||||||||||||||||||
| Consolidated profit | 148 | 111 | 33.3 | 30.4 | 1,526 | 1,687 | (9.5) | (8.4) | |||||||||||||||||||||||||||
| Non-controlling interests | 2 | 1 | 96.8 | 96.8 | (327) | (379) | (13.7) | (13.7) | |||||||||||||||||||||||||||
| Profit attributable to the parent | 150 | 112 | 33.9 | 31.0 | 1,199 | 1,308 | (8.4) | (6.9) | |||||||||||||||||||||||||||
| Balance sheet | |||||||||||||||||||||||||||||||||||
| Loans and advances to customers | 10,463 | 9,689 | 8.0 | 3.6 | 132,692 | 122,608 | 8.2 | 8.5 | |||||||||||||||||||||||||||
| Cash, central banks and credit institutions | 2,870 | 2,135 | 34.4 | 31.9 | 18,636 | 12,311 | 51.4 | 52.7 | |||||||||||||||||||||||||||
| Debt instruments | 2,386 | 2,425 | (1.6) | (1.2) | 5,387 | 7,644 | (29.5) | (29.8) | |||||||||||||||||||||||||||
| Other financial assets | 466 | 200 | 133.3 | 133.1 | 135 | 190 | (28.8) | (29.0) | |||||||||||||||||||||||||||
| Other asset accounts | 1,135 | 872 | 30.2 | 28.9 | 9,945 | 8,262 | 20.4 | 20.3 | |||||||||||||||||||||||||||
| Total assets | 17,320 | 15,320 | 13.1 | 9.8 | 166,796 | 151,016 | 10.4 | 10.7 | |||||||||||||||||||||||||||
| Customer deposits | 9,230 | 8,116 | 13.7 | 12.5 | 69,334 | 58,544 | 18.4 | 19.0 | |||||||||||||||||||||||||||
| Central banks and credit institutions | 4,486 | 4,457 | 0.6 | (6.6) | 31,965 | 39,169 | (18.4) | (18.5) | |||||||||||||||||||||||||||
| Marketable debt securities | 703 | 498 | 41.3 | 43.8 | 44,605 | 33,749 | 32.2 | 32.7 | |||||||||||||||||||||||||||
| Other financial liabilities | 550 | 265 | 107.8 | 105.7 | 2,218 | 1,820 | 21.9 | 21.4 | |||||||||||||||||||||||||||
| Other liabilities accounts | 641 | 504 | 27.4 | 27.1 | 5,233 | 4,704 | 11.2 | 11.6 | |||||||||||||||||||||||||||
| Total liabilities | 15,611 | 13,840 | 12.8 | 9.4 | 153,355 | 137,986 | 11.1 | 11.4 | |||||||||||||||||||||||||||
| Total equity | 1,709 | 1,480 | 15.5 | 14.1 | 13,441 | 13,029 | 3.2 | 3.6 | |||||||||||||||||||||||||||
| Memorandum items: | |||||||||||||||||||||||||||||||||||
Gross loans and advances to customers B |
10,703 | 9,872 | 8.4 | 4.1 | 135,202 | 124,976 | 8.2 | 8.4 | |||||||||||||||||||||||||||
| Customer funds | 10,246 | 9,117 | 12.4 | 11.5 | 72,963 | 61,625 | 18.4 | 18.9 | |||||||||||||||||||||||||||
Customer deposits C |
9,230 | 8,105 | 13.9 | 12.6 | 69,334 | 58,544 | 18.4 | 19.0 | |||||||||||||||||||||||||||
| Mutual funds | 1,016 | 1,011 | 0.5 | 2.5 | 3,629 | 3,081 | 17.8 | 17.8 | |||||||||||||||||||||||||||
| Ratios (%), operating means and customers | |||||||||||||||||||||||||||||||||||
| RoTE | 12.33 | 13.65 | (1.32) | ||||||||||||||||||||||||||||||||
| Efficiency ratio | 47.6 | 46.7 | 0.9 | ||||||||||||||||||||||||||||||||
| NPL ratio | 2.12 | 2.06 | 0.06 | ||||||||||||||||||||||||||||||||
| Total coverage ratio | 88.0 | 92.8 | (4.8) | ||||||||||||||||||||||||||||||||
| Number of employees | 16,795 | 16,193 | 3.7 | ||||||||||||||||||||||||||||||||
| Number of branches | 342 | 364 | (6.0) | ||||||||||||||||||||||||||||||||
| Number of total customers (thousands) | 20,193 | 19,746 | 2.3 | ||||||||||||||||||||||||||||||||
| A. Includes exchange differences. | |||||||||||||||||||||||||||||||||||
| B. Minus reverse repurchase agreements. | |||||||||||||||||||||||||||||||||||
| C. Minus repurchase agreements. | |||||||||||||||||||||||||||||||||||
| Secondary segments | |||||||||||||||||||||||||||||||||||
| EUR million | |||||||||||||||||||||||||||||||||||
| Retail Banking | Corporate & Investment Banking | ||||||||||||||||||||||||||||||||||
| Underlying income statement | 2023 | 2022 | % | % excl. FX | 2023 | 2022 | % | % excl. FX | |||||||||||||||||||||||||||
| Net interest income | 37,985 | 34,855 | 9.0 | 11.9 | 3,485 | 3,548 | (1.8) | 7.5 | |||||||||||||||||||||||||||
| Net fee income | 7,661 | 7,654 | 0.1 | 3.3 | 2,190 | 1,981 | 10.5 | 13.6 | |||||||||||||||||||||||||||
Gains (losses) on financial transactions A |
214 | 449 | (52.3) | (54.0) | 2,581 | 1,818 | 42.0 | 57.0 | |||||||||||||||||||||||||||
| Other operating income | (606) | (283) | 114.2 | — | 41 | 31 | 30.8 | (79.5) | |||||||||||||||||||||||||||
| Total income | 45,254 | 42,674 | 6.0 | 8.1 | 8,296 | 7,378 | 12.5 | 18.3 | |||||||||||||||||||||||||||
| Administrative expenses and amortizations | (19,396) | (18,552) | 4.6 | 8.1 | (3,391) | (2,902) | 16.8 | 20.4 | |||||||||||||||||||||||||||
| Net operating income | 25,858 | 24,123 | 7.2 | 8.1 | 4,905 | 4,476 | 9.6 | 17.0 | |||||||||||||||||||||||||||
| Net loan-loss provisions | (12,295) | (10,212) | 20.4 | 20.9 | (162) | (249) | (35.0) | (33.7) | |||||||||||||||||||||||||||
| Other gains (losses) and provisions | (2,691) | (2,126) | 26.6 | 39.3 | (174) | (130) | 34.0 | 33.9 | |||||||||||||||||||||||||||
| Profit before tax | 10,872 | 11,785 | (7.8) | (8.1) | 4,570 | 4,097 | 11.5 | 19.6 | |||||||||||||||||||||||||||
| Tax on profit | (2,586) | (2,950) | (12.3) | (11.5) | (1,280) | (1,098) | 16.6 | 19.7 | |||||||||||||||||||||||||||
| Profit from continuing operations | 8,286 | 8,835 | (6.2) | (7.0) | 3,290 | 2,999 | 9.7 | 19.6 | |||||||||||||||||||||||||||
| Net profit from discontinued operations | — | — | — | — | — | — | — | — | |||||||||||||||||||||||||||
| Consolidated profit | 8,286 | 8,835 | (6.2) | (7.0) | 3,290 | 2,999 | 9.7 | 19.6 | |||||||||||||||||||||||||||
| Non-controlling interests | (849) | (902) | (5.8) | (6.9) | (212) | (182) | 16.3 | 15.1 | |||||||||||||||||||||||||||
| Profit attributable to the parent | 7,436 | 7,933 | (6.3) | (7.0) | 3,078 | 2,817 | 9.3 | 19.9 | |||||||||||||||||||||||||||
| A. Includes exchange differences. | |||||||||||||||||||||||||||||||||||
| Secondary segments | |||||||||||||||||||||||||||||||||||
| EUR million | |||||||||||||||||||||||||||||||||||
| Wealth Management & Insurance | PagoNxt | ||||||||||||||||||||||||||||||||||
| Underlying income statement | 2023 | 2022 | % | % excl. FX | 2023 | 2022 | % | % excl. FX | |||||||||||||||||||||||||||
| Net interest income | 1,739 | 847 | 105.4 | 112.1 | 93 | 22 | 325.2 | 320.8 | |||||||||||||||||||||||||||
| Net fee income | 1,265 | 1,293 | (2.1) | 0.5 | 954 | 881 | 8.3 | 6.3 | |||||||||||||||||||||||||||
Gains (losses) on financial transactions A |
149 | 123 | 20.8 | 29.5 | (10) | (14) | (29.4) | (32.0) | |||||||||||||||||||||||||||
| Other operating income | 242 | 371 | (34.8) | (39.3) | 102 | 64 | 59.9 | 58.7 | |||||||||||||||||||||||||||
| Total income | 3,396 | 2,635 | 28.9 | 31.0 | 1,140 | 953 | 19.6 | 17.5 | |||||||||||||||||||||||||||
| Administrative expenses and amortizations | (1,156) | (1,054) | 9.7 | 11.6 | (1,091) | (1,024) | 6.6 | 6.0 | |||||||||||||||||||||||||||
| Net operating income | 2,240 | 1,581 | 41.6 | 43.9 | 49 | (71) | — | — | |||||||||||||||||||||||||||
| Net loan-loss provisions | 21 | (14) | — | — | (24) | (44) | (45.6) | (45.8) | |||||||||||||||||||||||||||
| Other gains (losses) and provisions | (26) | (36) | (28.6) | (28.0) | (42) | (26) | 62.3 | 66.1 | |||||||||||||||||||||||||||
| Profit before tax | 2,235 | 1,531 | 46.0 | 48.3 | (17) | (141) | (88.1) | (87.0) | |||||||||||||||||||||||||||
| Tax on profit | (528) | (349) | 51.2 | 55.5 | (59) | (63) | (5.6) | (9.8) | |||||||||||||||||||||||||||
| Profit from continuing operations | 1,707 | 1,182 | 44.4 | 46.2 | (76) | (203) | (62.7) | (60.9) | |||||||||||||||||||||||||||
| Net profit from discontinued operations | — | — | — | — | — | — | — | — | |||||||||||||||||||||||||||
| Consolidated profit | 1,707 | 1,182 | 44.4 | 46.2 | (76) | (203) | (62.7) | (60.9) | |||||||||||||||||||||||||||
| Non-controlling interests | (71) | (63) | 11.8 | 9.9 | (1) | (12) | (87.8) | (88.2) | |||||||||||||||||||||||||||
| Profit attributable to the parent | 1,637 | 1,119 | 46.3 | 48.4 | (77) | (215) | (64.0) | (62.5) | |||||||||||||||||||||||||||
| A. Includes exchange differences. | |||||||||||||||||||||||||||||||||||
2023. Main items of the underlying income statement of the new primary segments | ||||||||||||||||||||
| EUR million | ||||||||||||||||||||
| Primary segments | Net interest income |
Net fee income |
Total income |
Net operating income |
Profit before tax |
Profit attributable to the parent |
||||||||||||||
| Retail & Commercial Banking | 25,550 | 4,497 | 29,754 | 16,930 | 7,989 | 5,659 | ||||||||||||||
| Digital Consumer Bank | 10,221 | 1,229 | 12,296 | 7,033 | 2,677 | 1,901 | ||||||||||||||
| Corporate & Investment Banking | 3,594 | 2,131 | 7,527 | 4,140 | 3,795 | 2,440 | ||||||||||||||
| Wealth Management & Insurance | 1,513 | 1,262 | 3,210 | 1,994 | 1,994 | 1,467 | ||||||||||||||
| Payments | 2,424 | 2,952 | 5,298 | 2,954 | 1,205 | 607 | ||||||||||||||
| Corporate Centre | (41) | (13) | (439) | (829) | (961) | (998) | ||||||||||||||
| TOTAL GROUP | 43,261 | 12,057 | 57,647 | 32,222 | 16,698 | 11,076 | ||||||||||||||
2022. Main items of the underlying income statement of the new primary segments | ||||||||||||||||||||
| EUR million | ||||||||||||||||||||
| Primary segments | Net interest income |
Net fee income |
Total income |
Net operating income |
Profit before tax |
Profit attributable to the parent |
||||||||||||||
| Retail & Commercial Banking | 22,093 | 4,672 | 26,994 | 14,935 | 7,099 | 5,017 | ||||||||||||||
| Digital Consumer Bank | 10,121 | 1,269 | 12,391 | 7,194 | 3,880 | 2,610 | ||||||||||||||
| Corporate & Investment Banking | 3,816 | 1,922 | 6,703 | 3,802 | 3,379 | 2,233 | ||||||||||||||
| Wealth Management & Insurance | 883 | 1,293 | 2,678 | 1,574 | 1,516 | 1,101 | ||||||||||||||
| Payments | 2,359 | 2,653 | 4,874 | 2,604 | 1,398 | 693 | ||||||||||||||
| Corporate Centre | (652) | (19) | (1,487) | (1,858) | (2,022) | (2,049) | ||||||||||||||
| TOTAL GROUP | 38,619 | 11,790 | 52,154 | 28,251 | 15,250 | 9,605 | ||||||||||||||
 |
RETAIL & COMMERCIAL BANKING | Underlying attributable profit | |||||||||||||||
| EUR 5,659 mn | |||||||||||||||||
| Retail & Commercial Banking | |||||||||||||||||
| EUR million | |||||||||||||||||
| Underlying income statement | 2023 | 2022 | % | % excl. FX | |||||||||||||
| Net interest income | 25,550 | 22,093 | 15.6 | 18.9 | |||||||||||||
| Net fee income | 4,497 | 4,672 | (3.8) | (0.1) | |||||||||||||
Gains (losses) on financial transactions A |
854 | 1,141 | (25.2) | (27.0) | |||||||||||||
| Other operating income | (1,146) | (913) | 25.6 | 61.2 | |||||||||||||
| Total income | 29,754 | 26,994 | 10.2 | 12.5 | |||||||||||||
| Administrative expenses and amortizations | (12,825) | (12,059) | 6.3 | 10.3 | |||||||||||||
| Net operating income | 16,930 | 14,935 | 13.4 | 14.2 | |||||||||||||
| Net loan-loss provisions | (6,540) | (5,887) | 11.1 | 11.1 | |||||||||||||
| Other gains (losses) and provisions | (2,401) | (1,950) | 23.1 | 33.6 | |||||||||||||
| Profit before tax | 7,989 | 7,099 | 12.5 | 11.8 | |||||||||||||
| Tax on profit | (1,927) | (1,676) | 15.0 | 15.6 | |||||||||||||
| Profit from continuing operations | 6,062 | 5,423 | 11.8 | 10.6 | |||||||||||||
| Net profit from discontinued operations | — | — | — | — | |||||||||||||
| Consolidated profit | 6,062 | 5,423 | 11.8 | 10.6 | |||||||||||||
| Non-controlling interests | (403) | (406) | (0.9) | (2.9) | |||||||||||||
| Profit attributable to the parent | 5,659 | 5,017 | 12.8 | 11.7 | |||||||||||||
| Business volumes | |||||||||||||||||
Gross loans and advances to customers B |
618,773 | 629,478 | (1.7) | (3.0) | |||||||||||||
| Customer funds | 712,433 | 689,330 | 3.4 | 2.3 | |||||||||||||
Customer deposits C |
621,598 | 598,110 | 3.9 | 2.8 | |||||||||||||
| Mutual funds | 90,835 | 91,220 | (0.4) | (1.0) | |||||||||||||
| A. Includes exchange differences. | |||||||||||||||||
| B. Excluding reverse repos. | |||||||||||||||||
| C. Excluding repos. | |||||||||||||||||
 |
DIGITAL CONSUMER BANK | Underlying attributable profit | |||||||||||||||
| EUR 1,901 mn | |||||||||||||||||
| Digital Consumer Bank | |||||||||||||||||
| EUR million | |||||||||||||||||
| Underlying income statement | 2023 | 2022 | % | % excl. FX | |||||||||||||
| Net interest income | 10,221 | 10,121 | 1.0 | 3.5 | |||||||||||||
| Net fee income | 1,229 | 1,269 | (3.1) | (2.5) | |||||||||||||
Gains (losses) on financial transactions A |
116 | 144 | (19.9) | (20.0) | |||||||||||||
| Other operating income | 730 | 856 | (14.7) | (17.0) | |||||||||||||
| Total income | 12,296 | 12,391 | (0.8) | 1.1 | |||||||||||||
| Administrative expenses and amortizations | (5,263) | (5,197) | 1.3 | 3.5 | |||||||||||||
| Net operating income | 7,033 | 7,194 | (2.2) | (0.6) | |||||||||||||
| Net loan-loss provisions | (4,106) | (3,222) | 27.4 | 29.8 | |||||||||||||
| Other gains (losses) and provisions | (250) | (91) | 173.0 | 187.0 | |||||||||||||
| Profit before tax | 2,677 | 3,880 | (31.0) | (30.0) | |||||||||||||
| Tax on profit | (426) | (881) | (51.6) | (50.5) | |||||||||||||
| Profit from continuing operations | 2,251 | 3,000 | (25.0) | (24.0) | |||||||||||||
| Net profit from discontinued operations | — | — | — | — | |||||||||||||
| Consolidated profit | 2,251 | 3,000 | (25.0) | (24.0) | |||||||||||||
| Non-controlling interests | (350) | (389) | (10.2) | (10.2) | |||||||||||||
| Profit attributable to the parent | 1,901 | 2,610 | (27.2) | (26.1) | |||||||||||||
| Business volumes | |||||||||||||||||
Gross loans and advances to customers B |
206,649 | 196,878 | 5.0 | 5.8 | |||||||||||||
| Customer funds | 117,963 | 106,027 | 11.3 | 13.1 | |||||||||||||
Customer deposits C |
114,334 | 102,946 | 11.1 | 13.0 | |||||||||||||
| Mutual funds | 3,629 | 3,081 | 17.8 | 17.8 | |||||||||||||
| A. Includes exchange differences. | |||||||||||||||||
| B. Excluding reverse repos. | |||||||||||||||||
| C. Excluding repos. | |||||||||||||||||
 |
CORPORATE & INVESTMENT BANKING |
Underlying attributable profit | |||||||||||||||
| EUR 2,440 mn | |||||||||||||||||
| Corporate & Investment Banking | |||||||||||||||||
| EUR million | |||||||||||||||||
| Underlying income statement | 2023 | 2022 | % | % excl. FX | |||||||||||||
| Net interest income | 3,594 | 3,816 | (5.8) | (0.3) | |||||||||||||
| Net fee income | 2,131 | 1,922 | 10.8 | 14.1 | |||||||||||||
Gains (losses) on financial transactions A |
1,795 | 962 | 86.6 | 125.6 | |||||||||||||
| Other operating income | 7 | 3 | 122.7 | (95.9) | |||||||||||||
| Total income | 7,527 | 6,703 | 12.3 | 16.9 | |||||||||||||
| Administrative expenses and amortizations | (3,387) | (2,901) | 16.7 | 20.3 | |||||||||||||
| Net operating income | 4,140 | 3,802 | 8.9 | 14.3 | |||||||||||||
| Net loan-loss provisions | (165) | (257) | (35.8) | (34.5) | |||||||||||||
| Other gains (losses) and provisions | (181) | (166) | 8.9 | 25.8 | |||||||||||||
| Profit before tax | 3,795 | 3,379 | 12.3 | 17.6 | |||||||||||||
| Tax on profit | (1,137) | (955) | 19.0 | 21.4 | |||||||||||||
| Profit from continuing operations | 2,658 | 2,424 | 9.6 | 16.0 | |||||||||||||
| Net profit from discontinued operations | — | — | — | — | |||||||||||||
| Consolidated profit | 2,658 | 2,424 | 9.6 | 16.0 | |||||||||||||
| Non-controlling interests | (219) | (191) | 14.3 | 13.0 | |||||||||||||
| Profit attributable to the parent | 2,440 | 2,233 | 9.2 | 16.2 | |||||||||||||
| Business volumes | |||||||||||||||||
Gross loans and advances to customers B |
137,578 | 142,646 | (3.6) | (3.2) | |||||||||||||
| Customer funds | 186,410 | 196,021 | (4.9) | (3.3) | |||||||||||||
Customer deposits C |
171,845 | 186,678 | (7.9) | (6.8) | |||||||||||||
| Mutual funds | 14,565 | 9,343 | 55.9 | 72.0 | |||||||||||||
| A. Includes exchange differences. | |||||||||||||||||
| B. Excluding reverse repos. | |||||||||||||||||
| C. Excluding repos. | |||||||||||||||||
 |
WEALTH MANAGEMENT & INSURANCE |
Underlying attributable profit | |||||||||||||||
| EUR 1,467 mn | |||||||||||||||||
| Wealth Management & Insurance | |||||||||||||||||
| EUR million | |||||||||||||||||
| Underlying income statement | 2023 | 2022 | % | % excl. FX | |||||||||||||
| Net interest income | 1,513 | 883 | 71.4 | 76.0 | |||||||||||||
| Net fee income | 1,262 | 1,293 | (2.4) | 0.2 | |||||||||||||
Gains (losses) on financial transactions A |
170 | 108 | 56.7 | 69.4 | |||||||||||||
| Other operating income | 266 | 394 | (32.4) | (36.9) | |||||||||||||
| Total income | 3,210 | 2,678 | 19.9 | 21.6 | |||||||||||||
| Administrative expenses and amortizations | (1,216) | (1,104) | 10.2 | 11.8 | |||||||||||||
| Net operating income | 1,994 | 1,574 | 26.7 | 28.4 | |||||||||||||
| Net loan-loss provisions | 17 | (21) | — | — | |||||||||||||
| Other gains (losses) and provisions | (18) | (37) | (52.5) | (51.0) | |||||||||||||
| Profit before tax | 1,994 | 1,516 | 31.5 | 33.2 | |||||||||||||
| Tax on profit | (454) | (346) | 31.2 | 34.5 | |||||||||||||
| Profit from continuing operations | 1,540 | 1,170 | 31.6 | 32.8 | |||||||||||||
| Net profit from discontinued operations | — | — | — | — | |||||||||||||
| Consolidated profit | 1,540 | 1,170 | 31.6 | 32.8 | |||||||||||||
| Non-controlling interests | (73) | (69) | 5.1 | 3.1 | |||||||||||||
| Profit attributable to the parent | 1,467 | 1,101 | 33.3 | 34.8 | |||||||||||||
| Business volumes | |||||||||||||||||
Gross loans and advances to customers B |
22,603 | 22,247 | 1.6 | 2.2 | |||||||||||||
| Customer funds | 157,142 | 137,423 | 14.3 | 14.0 | |||||||||||||
Customer deposits C |
57,643 | 57,014 | 1.1 | 1.4 | |||||||||||||
| Mutual funds | 99,499 | 80,409 | 23.7 | 22.9 | |||||||||||||
| A. Includes exchange differences. | |||||||||||||||||
| B. Excluding reverse repos. | |||||||||||||||||
| C. Excluding repos. | |||||||||||||||||
 |
PAYMENTS |
Underlying attributable profit | |||||||||||||||
| EUR 607 mn | |||||||||||||||||
| Payments | |||||||||||||||||
| EUR million | |||||||||||||||||
| Underlying income statement | 2023 | 2022 | % | % excl. FX | |||||||||||||
| Net interest income | 2,424 | 2,359 | 2.8 | 10.8 | |||||||||||||
| Net fee income | 2,952 | 2,653 | 11.3 | 13.0 | |||||||||||||
Gains (losses) on financial transactions A |
1 | 20 | (97.1) | — | |||||||||||||
| Other operating income | (79) | (158) | (50.1) | 45.5 | |||||||||||||
| Total income | 5,298 | 4,874 | 8.7 | 11.6 | |||||||||||||
| Administrative expenses and amortizations | (2,344) | (2,271) | 3.2 | 6.1 | |||||||||||||
| Net operating income | 2,954 | 2,604 | 13.5 | 16.5 | |||||||||||||
| Net loan-loss provisions | (1,666) | (1,132) | 47.2 | 44.8 | |||||||||||||
| Other gains (losses) and provisions | (84) | (74) | 13.5 | 41.3 | |||||||||||||
| Profit before tax | 1,205 | 1,398 | (13.8) | (9.2) | |||||||||||||
| Tax on profit | (509) | (603) | (15.6) | (14.2) | |||||||||||||
| Profit from continuing operations | 696 | 795 | (12.5) | (5.2) | |||||||||||||
| Net profit from discontinued operations | — | — | — | — | |||||||||||||
| Consolidated profit | 696 | 795 | (12.5) | (5.2) | |||||||||||||
| Non-controlling interests | (89) | (103) | (12.9) | (14.4) | |||||||||||||
| Profit attributable to the parent | 607 | 693 | (12.4) | (3.6) | |||||||||||||
| Business volumes | |||||||||||||||||
Gross loans and advances to customers B |
23,709 | 22,161 | 7.0 | 9.1 | |||||||||||||
| Customer funds | 1,418 | 688 | 105.9 | 105.9 | |||||||||||||
Customer deposits C |
1,418 | 688 | 105.9 | 105.9 | |||||||||||||
| Mutual funds | — | — | — | — | |||||||||||||
| A. Includes exchange differences. | |||||||||||||||||
| B. Excluding reverse repos. | |||||||||||||||||
| C. Excluding repos. | |||||||||||||||||
 |
Retail & Commercial Banking's priorities for 2024 are to:
→Implement a common operating model, leveraging the scale of Group and our local presence.
→Spread transformation efforts across our footprint to foster simplification, process automation and deployment of our best-in-class tech platform.
→Further increase profitability supported by customer base growth and cost-to-serve efficiencies.
|
|||||||||||||
| Retail & Commercial Banking | ||||||||||||||
| A new global business integrating our retail and commercial banking activities | ||||||||||||||
 |
 |
 |
||||||||||||||||||||||||
| Customer experience | Operational leverage | Global platform | ||||||||||||||||||||||||
|
Product simplification
and digital first
|
Common operating
model, globally
leveraging process
automation
|
Proprietary back-end (Gravity) and our cloud based front-end (ODS) technologies
|
||||||||||||||||||||||||
 |
Our priorities for 2024 are to:
→Expand our leadership in consumer lending across our footprint (e.g. #1 finance company in Europe and LatAm, top 5 in the US and top 10 in China in auto finance) by providing the best customer experience and enhancing our global relationships.
→Converge towards a more digital global operating model, building a world-class digital offering in mobility, supporting our partners' transformation journeys.
→Continue to build flex-term solutions (leasing, subscription) based on common platforms.
|
|||||||||||||
| Digital Consumer Bank | ||||||||||||||
| A single model across our markets for our consumer and auto finance business and for Openbank | ||||||||||||||
|
|
|
||||||||||||||||||||||||
| Customer experience | Operational leverage | Global platform | ||||||||||||||||||||||||
Global relationship management (OEMs, importers and retailers) |
Operational & commercial benchmark to maximize profitability and growth
|
From multiple country-specific platforms to global platforms (e.g. leasing, BNPL)
|
||||||||||||||||||||||||
 |
Our aim is to become a focused, world-class Corporate & Investment Banking business, positioning ourselves as a trusted advisor to our clients whilst delivering profitable growth. Our priorities for 2024 are to:
→Deepen our client relationships with a particular focus on the US.
→Make our centres of expertise more sophisticated and further digitalize our business.
→Manage capital actively.
|
|||||||||||||
| Corporate & Investment Banking | ||||||||||||||
| Our global platform to support corporates and institutions | ||||||||||||||
|
|
|
||||||||||||||||||||||||
| Customer experience | Operational leverage | Global platform | ||||||||||||||||||||||||
|
Trusted advisor for our
customers, leveraging our global and local products
|
Continue growing fee and
transactional business
through our global centres
of expertise and tech
|
Optimize capital returns
on the back of global origination and distribution
capabilities
|
||||||||||||||||||||||||
 |
Our ambition in 2024 is continue building the best Wealth and Insurance Manager in Europe and the Americas through 3 strategic pillars:
→Improve our customer experience and expand our presence to new countries and businesses.
→Boost operational leverage through our global operations and factories.
→Continue to build our global platforms.
|
|||||||||||||
| Wealth Management & Insurance | ||||||||||||||
| Common service models for private banking, asset management and insurance businesses | ||||||||||||||
|
|
|
||||||||||||||||||||||||
| Customer experience | Operational leverage | Global platform | ||||||||||||||||||||||||
|
Providing our customers
with a specialized
product & service
proposition in all countries
|
Leverage our global
operations and factories to
connect countries and
increase collaboration
with CIB and Retail
|
Global platforms and
infrastructure
to improve efficiency
and time-to-market
|
||||||||||||||||||||||||
 |
Our priorities for 2024 are to:
→Scale up our global platform of innovative payments and integrated value-added solutions
→Roll out our global payment platform to all our regions and the open market
→Expand our cards business while improving customer experience
|
|||||||||||||
| Payments | ||||||||||||||
| Single infrastructures for payments solutions: PagoNxt and Cards | ||||||||||||||
|
|
|
||||||||||||||||||||||||
| Customer experience | Operational leverage | Global platform | ||||||||||||||||||||||||
|
Deliver best-in-class
payment solutions
leveraging our global
and local scale
|
Reduce cost per transaction through capex optimization and operational efficiency
|
Migrate volumes to
common global platforms
to gain scale and offer
competitive pricing
in the open market
|
||||||||||||||||||||||||
|
Europe | ||||||||||
|
Our strategy in Europe is to remain focused on customer experience, service quality and delivering a common operating model. Our top priorities for 2024 are to:
→Improve our customer experience as we progress in our omni-channel strategy, simplifying and adding value to our interactions, moving towards our shared vision of being a digital bank with branches.
→Expand our franchise, leveraging our unique position of geographic diversification and scale.
→Increase efficiency, maintaining strong cost discipline and increasing productivity by implementing a common operating model based on simplification, scale and agility.
→Maximize our business value through agile pricing and active capital management focused on sustainable asset rotation and greater emphasis on high-value origination.
| |||||||||||
|
Spain | ||||
|
United Kingdom | ||||
|
Portugal | ||||
|
Poland | ||||
|
North America | ||||||||||
|
In 2024, we expect to begin to see the impact of our platform development programme as we build on our local strengths and increasingly take advantage of our global businesses capabilities to:
→Launch new capabilities in each of our North American markets, particularly in digital consumer banking.
→Develop our Corporate & Investment Banking platforms in both countries and Wealth Management offshore and in Mexico, to accelerate revenue growth in capital-light businesses.
→Continue to simplify our regional operating model to reduce overlaps and increase efficiency.
→Increase cross-border coordination to leverage our differentiated footprint across Europe and the Americas.
| |||||||||||
|
United States | ||||
|
Mexico | ||||
|
South America | ||||||||||
|
The Group's priorities in the region are to:
→Strengthen connectivity between our countries and with the Group, through the development of our global and regional businesses, fostering inclusive and sustainable businesses.
→Accelerate revenue growth by focusing on more transactional businesses that generate higher fees.
→Increase liabilities business, improve specialized value propositions for corporate customers and strengthen our payment services business through our global platforms.
| |||||||||||
|
Brazil | ||||
|
Chile | ||||
|
Argentina | ||||
|
Uruguay | ||||
|
Peru | ||||
|
Colombia | ||||
|
DCB Europe | ||||||||||
|
Our priorities for 2024 are to:
→Expand our European leadership in profitability and scale in auto and consumer lending with competitive, innovative financing solutions.
→Accelerate transformation of our operating model towards single platforms, building off Group solutions to improve both end customers' and partners' customer experience, providing the best service while maintaining best-in-class efficiency.
→Reduce sensitivity to interest rates by increasing deposit acquisition.
→Continue supporting the green transformation of mobility in Europe.
| |||||||||||
| Ratio | Formula | Relevance of the metric | ||||||||||||
| RoE | Profit attributable to the parent | This ratio measures the return that shareholders obtain on the funds invested in the bank and as such measures the bank’s ability to pay shareholders. | ||||||||||||
| (Return on Equity) | Average stockholders’ equity A (excl. minority interests) |
|||||||||||||
| Underlying RoE | Underlying profit attributable to the parent | This ratio measures the return that shareholders obtain on the funds invested in the bank excluding results from operations outside the ordinary course of business. | ||||||||||||
Average stockholders’ equity A (excl. minority interests) |
||||||||||||||
| RoTE | Profit attributable to the parent B |
This is used to evaluate the profitability of the company as a percentage of its tangible equity. It is measured as the return that shareholders receive as a percentage of the funds invested in the bank less intangible assets. | ||||||||||||
| (Return on Tangible Equity) | Average stockholders’ equity A (excl. minority interests) - intangible assets |
|||||||||||||
| Underlying RoTE | Underlying profit attributable to the parent B |
This very common indicator measures the profitability of the tangible equity of a company arising from underlying activities, i.e. excluding results from operations outside the ordinary course of business. | ||||||||||||
Average stockholders’ equity A (excl. minority interests) - intangible assets |
||||||||||||||
| RoA | Consolidated profit | This metric measures the profitability of a company as a percentage of its total assets. It is an indicator that reflects the efficiency of the bank’s total assets in generating profit over a given period. | ||||||||||||
| (Return on Assets) | Average total assets | |||||||||||||
| Underlying RoA | Underlying consolidated profit | This metric measures the profitability of a company as a percentage of its total assets excluding results from operations outside the ordinary course of business. It is an indicator that reflects the efficiency of the bank’s total assets in generating underlying profit over a given period. | ||||||||||||
| Average total assets | ||||||||||||||
| RoRWA | Consolidated profit | The return adjusted for risk is a derivative of the RoA metric. The difference is that RoRWA measures profit in relation to the Group’s risk-weighted assets. | ||||||||||||
| (Return on Risk-Weighted Assets) | Average risk-weighted assets | |||||||||||||
| Underlying RoRWA | Underlying consolidated profit | This relates the underlying consolidated profit (excluding results from operations outside the ordinary course of business) to the Group’s risk-weighted assets. | ||||||||||||
| Average risk-weighted assets | ||||||||||||||
| RoRAC | Underlying consolidated profit | This is the return on economic capital required internally (necessary to support all risks inherent in our activity). | ||||||||||||
| (Return on Risk-Adjusted Capital) | Average economic capital | |||||||||||||
| Economic Value Added | Underlying consolidated profit – (average economic capital x cost of capital) | Economic value added is the profit generated in excess of the cost of economic capital employed. This measures risk-adjusted returns in absolute terms, complementing the RoRAC approach. | ||||||||||||
| Efficiency | Operating expenses C |
One of the most commonly used indicators when comparing productivity of different financial entities. It measures the amount of resources used to generate the bank’s operating income. | ||||||||||||
| (Cost-to-income) | Total income | |||||||||||||
Profitability and efficiency A B (EUR million and %) |
2023 | 2022 | 2021 | ||||||||
| RoE | 11.91 | % | 10.67 | % | 9.66 | % | |||||
| Profit attributable to the parent | 11,076 | 9,605 | 8,124 | ||||||||
| Average stockholders' equity (excluding minority interests) | 93,035 | 89,986 | 84,133 | ||||||||
| Underlying RoE | 11.91 | % | 10.67 | % | 10.29 | % | |||||
| Profit attributable to the parent | 11,076 | 9,605 | 8,124 | ||||||||
| (-) Net capital gains and provisions | — | — | -530 | ||||||||
| Underlying profit attributable to the parent | 11,076 | 9,605 | 8,654 | ||||||||
| Average stockholders' equity (excluding minority interests) | 93,035 | 89,986 | 84,133 | ||||||||
| RoTE | 15.06 | % | 13.37 | % | 11.96 | % | |||||
| Profit attributable to the parent | 11,076 | 9,605 | 8,124 | ||||||||
| (-) Goodwill impairment | -20 | — | -6 | ||||||||
| Profit attributable to the parent (excluding goodwill impairment) | 11,096 | 9,605 | 8,130 | ||||||||
| Average stockholders' equity (excluding minority interests) | 93,035 | 89,986 | 84,133 | ||||||||
| (-) Average intangible assets | 19,361 | 18,164 | 16,169 | ||||||||
| Average stockholders' equity (excl. minority interests) - intangible assets | 73,675 | 71,822 | 67,964 | ||||||||
| Underlying RoTE | 15.06 | % | 13.37 | % | 12.73 | % | |||||
| Profit attributable to the parent | 11,076 | 9,605 | 8,124 | ||||||||
| (-) Goodwill impairment | -20 | — | — | ||||||||
| Profit attributable to the parent (excluding goodwill impairment) | 11,096 | 9,605 | 8,124 | ||||||||
| (-) Net capital gains and provisions | — | — | -530 | ||||||||
| Underlying profit attributable to the parent (excluding goodwill impairment) | 11,096 | 9,605 | 8,654 | ||||||||
| Average stockholders' equity (excl. minority interests) - intangible assets | 73,675 | 71,822 | 67,964 | ||||||||
| RoA | 0.69 | % | 0.63 | % | 0.62 | % | |||||
| Consolidated profit | 12,209 | 10,764 | 9,653 | ||||||||
| Average total assets | 1,773,103 | 1,720,273 | 1,563,899 | ||||||||
| Underlying RoA | 0.69 | % | 0.63 | % | 0.65 | % | |||||
| Consolidated profit | 12,209 | 10,764 | 9,653 | ||||||||
| (-) Net capital gains and provisions | — | — | -530 | ||||||||
| Underlying consolidated profit | 12,209 | 10,764 | 10,183 | ||||||||
| Average total assets | 1,773,103 | 1,720,273 | 1,563,899 | ||||||||
| RoRWA | 1.96 | % | 1.77 | % | 1.69 | % | |||||
| Consolidated profit | 12,209 | 10,764 | 9,653 | ||||||||
| Average risk-weighted assets | 624,031 | 606,952 | 572,136 | ||||||||
| Underlying RoRWA | 1.96 | % | 1.77 | % | 1.78 | % | |||||
| Consolidated profit | 12,209 | 10,764 | 9,653 | ||||||||
| (-) Net capital gains and provisions | — | — | -530 | ||||||||
| Underlying consolidated profit | 12,209 | 10,764 | 10,183 | ||||||||
| Average risk-weighted assets | 624,031 | 606,952 | 572,136 | ||||||||
RoRAC C |
15.34 | % | 14.00 | % | 13.73 | % | |||||
| Consolidated profit | 12,209 | 10,764 | 9,653 | ||||||||
| (-) Net capital gains and provisions | — | — | -530 | ||||||||
| Underlying consolidated profit | 12,209 | 10,764 | 10,183 | ||||||||
| Average economic capital | 79,605 | 76,872 | 74,166 | ||||||||
Economic value added C |
3,285 | 2,146 | 2,707 | ||||||||
| Underlying consolidated profit | 12,209 | 10,764 | 10,183 | ||||||||
| (-) Average economic capital x cost of capital | -8,924 | -8,617 | -7,476 | ||||||||
| Average economic capital | 79,605 | 76,872 | 74,166 | ||||||||
| Cost of capital | 11.21 | % | 11.21 | % | 10.08 | % | |||||
| Efficiency ratio | 44.1 | % | 45.8 | % | 46.1 | % | |||||
| Underlying operating expenses | 25,425 | 23,903 | 21,415 | ||||||||
| Operating expenses | 25,425 | 23,903 | 21,415 | ||||||||
Net capital gains and provisions impact in operating expenses D |
— | — | — | ||||||||
| Underlying total income | 57,647 | 52,154 | 46,404 | ||||||||
| Total income | 57,423 | 52,117 | 46,404 | ||||||||
Net capital gains and provisions impact in total income D |
224 | 37 | — | ||||||||
Efficiency ratio by business area (EUR million and %) | ||||||||||||||||||||
| 2023 | 2022 | |||||||||||||||||||
| % | Operating expenses | Total income | % | Operating expenses | Total income | |||||||||||||||
| Europe | 42.1 | 9,030 | 21,439 | 47.3 | 8,523 | 18,030 | ||||||||||||||
| Spain | 41.7 | 4,227 | 10,132 | 48.6 | 3,998 | 8,233 | ||||||||||||||
| United Kingdom | 49.7 | 2,745 | 5,525 | 49.6 | 2,685 | 5,418 | ||||||||||||||
| Portugal | 27.3 | 542 | 1,982 | 38.7 | 502 | 1,295 | ||||||||||||||
| Poland | 27.1 | 862 | 3,182 | 28.0 | 692 | 2,474 | ||||||||||||||
| North America | 49.1 | 6,465 | 13,174 | 47.7 | 5,871 | 12,316 | ||||||||||||||
| US | 51.0 | 3,679 | 7,209 | 47.2 | 3,599 | 7,623 | ||||||||||||||
| Mexico | 43.9 | 2,588 | 5,899 | 44.9 | 2,076 | 4,623 | ||||||||||||||
| South America | 38.5 | 6,920 | 17,971 | 37.0 | 6,675 | 18,025 | ||||||||||||||
| Brazil | 34.6 | 4,529 | 13,104 | 32.4 | 4,180 | 12,910 | ||||||||||||||
| Chile | 44.6 | 1,020 | 2,285 | 40.1 | 981 | 2,449 | ||||||||||||||
| Argentina | 50.2 | 775 | 1,544 | 53.9 | 987 | 1,833 | ||||||||||||||
| Digital Consumer Bank | 47.6 | 2,618 | 5,502 | 46.7 | 2,462 | 5,269 | ||||||||||||||
RoTE by business area (EUR million and %) | ||||||||||||||||||||
| 2023 | 2022 | |||||||||||||||||||
| % | Profit attributable to the parent (excluding goodwill impairment) |
Average stockholders' equity (excl. minority interests) - intangible assets | % | Profit attributable to the parent (excluding goodwill impairment) | Average stockholders' equity (excl. minority interests) - intangible assets | |||||||||||||||
| Europe | 14.47 | 5,489 | 37,931 | 9.28 | 3,810 | 41,054 | ||||||||||||||
| Spain | 14.16 | 2,371 | 16,742 | 7.89 | 1,560 | 19,786 | ||||||||||||||
| United Kingdom | 13.01 | 1,545 | 11,874 | 10.70 | 1,395 | 13,038 | ||||||||||||||
| Portugal | 25.92 | 896 | 3,458 | 15.03 | 534 | 3,553 | ||||||||||||||
| Poland | 17.68 | 674 | 3,810 | 11.93 | 364 | 3,047 | ||||||||||||||
| North America | 9.76 | 2,360 | 24,183 | 11.06 | 2,878 | 26,025 | ||||||||||||||
| US | 6.07 | 932 | 15,355 | 9.40 | 1,784 | 18,968 | ||||||||||||||
| Mexico | 17.70 | 1,560 | 8,814 | 16.92 | 1,213 | 7,168 | ||||||||||||||
| South America | 14.43 | 3,045 | 21,097 | 18.77 | 3,658 | 19,491 | ||||||||||||||
| Brazil | 13.73 | 1,921 | 13,987 | 19.23 | 2,544 | 13,232 | ||||||||||||||
| Chile | 14.82 | 582 | 3,925 | 19.47 | 677 | 3,479 | ||||||||||||||
| Argentina | 55.60 | 386 | 694 | 26.23 | 324 | 1,237 | ||||||||||||||
| Digital Consumer Bank | 12.33 | 1,199 | 9,721 | 13.65 | 1,308 | 9,583 | ||||||||||||||
Ratio |
Formula |
Relevance of the metric |
||||||||||||
NPL ratio (Non-performing loans ratio) |
Credit impaired loans and advances to customers, customer guarantees and customer commitments granted | The NPL ratio is an important variable regarding financial institutions' activity since it gives an indication of the level of risk the entities are exposed to. It calculates risks that are, in accounting terms, declared to be credit impaired as a percentage of the total outstanding amount of customer credit and contingent liabilities. | ||||||||||||
Total Risk A |
||||||||||||||
| Total coverage ratio | Total allowances to cover impairment losses on loans and advances to customers, customer guarantees and customer commitments granted | The total coverage ratio is a fundamental metric in the financial sector. It reflects the level of provisions as a percentage of the credit impaired assets. Therefore it is a good indicator of the entity's solvency against customer defaults both present and future. | ||||||||||||
| Credit impaired loans and advances to customers, customer guarantees and customer commitments granted | ||||||||||||||
| Cost of risk | Allowances for loan-loss provisions over the last 12 months | This ratio quantifies loan-loss provisions arising from credit risk over a defined period of time for a given loan portfolio. As such, it acts as an indicator of credit quality. | ||||||||||||
| Average loans and advances to customers over the last 12 months | ||||||||||||||
Credit risk (I) (EUR million and %) |
2023 | 2022 | 2021 | ||||||||
| NPL ratio | 3.14 | % | 3.08 | % | 3.16 | % | |||||
| Credit impaired loans and advances to customers, customer guarantees and customer commitments granted | 35,620 | 34,673 | 33,234 | ||||||||
| Gross loans and advances to customers registered under the headings 'financial assets measured at amortized cost' and 'financial assets designated at fair value through profit or loss' classified in stage 3 (OCI), excluding POCI (Purchased or Originated Credit Impaired) that is currently impaired | 33,821 | 32,617 | 31,288 | ||||||||
| POCI exposure (Purchased or Originated Credit Impaired) that is currently impaired | 273 | 271 | 358 | ||||||||
| Customer guarantees and customer commitments granted classified in stage 3 | 1,517 | 1,776 | 1,578 | ||||||||
| Doubtful exposure of loans and advances to customers at fair value through profit or loss | 9 | 9 | 10 | ||||||||
| Total risk | 1,133,898 | 1,124,121 | 1,051,115 | ||||||||
| Impaired and non-impaired gross loans and advances to customers | 1,059,135 | 1,058,688 | 995,646 | ||||||||
| Impaired and non-impaired customer guarantees and customer commitments granted | 74,763 | 65,433 | 55,469 | ||||||||
Credit risk (II) (EUR million and %) |
2023 | 2022 | 2021 | ||||||||
| Total coverage ratio | 66 | % | 68 | % | 71 | % | |||||
| Total allowances to cover impairment losses on loans and advances to customers, customer guarantees and customer commitments granted | 23,490 | 23,418 | 23,698 | ||||||||
| Total allowances to cover impairment losses on loans and advances to customers measured at amortised cost and designated at fair value through OCI | 22,788 | 22,684 | 22,964 | ||||||||
| Total allowances to cover impairment losses on customer guarantees and customer commitments granted | 702 | 734 | 734 | ||||||||
| Credit impaired loans and advances to customers, customer guarantees and customer commitments granted | 35,620 | 34,673 | 33,234 | ||||||||
| Gross loans and advances to customers registered under the headings 'financial assets measured at amortized cost' and 'financial assets designated at fair value through profit or loss' classified in stage 3 (OCI), excluding POCI (Purchased or Originated Credit Impaired) that is currently impaired | 33,821 | 32,617 | 31,288 | ||||||||
| POCI exposure (Purchased or Originated Credit Impaired) that is currently impaired | 273 | 271 | 358 | ||||||||
| Customer guarantees and customer commitments granted classified in stage 3 | 1,517 | 1,776 | 1,578 | ||||||||
| Doubtful exposure of loans and advances to customers at fair value through profit or loss | 9 | 9 | 10 | ||||||||
| Cost of risk | 1.18 | % | 0.99 | % | 0.77 | % | |||||
| Underlying allowances for loan-loss provisions over the last 12 months | 12,458 | 10,509 | 7,436 | ||||||||
| Allowances for loan-loss provisions over the last 12 months | 12,932 | 10,836 | 7,436 | ||||||||
| Net capital gains and provisions impact in allowances for loan-loss provisions | -474 | -327 | — | ||||||||
| Average loans and advances to customers over the last 12 months | 1,059,566 | 1,059,972 | 968,931 | ||||||||
NPL ratio by business area (EUR million and %) |
||||||||||||||||||||
| 2023 | 2022 | |||||||||||||||||||
| % | Credit impaired loans and advances to customers, customer guarantees and customer commitments granted | Total risk | % | Credit impaired loans and advances to customers, customer guarantees and customer commitments granted | Total risk | |||||||||||||||
| Europe | 2.32 | 14,495 | 624,696 | 2.37 | 15,186 | 639,996 | ||||||||||||||
| Spain | 3.06 | 8,529 | 278,569 | 3.27 | 9,598 | 293,197 | ||||||||||||||
| United Kingdom | 1.42 | 3,518 | 247,360 | 1.21 | 3,059 | 253,455 | ||||||||||||||
| Portugal | 2.59 | 1,024 | 39,503 | 2.99 | 1,247 | 41,755 | ||||||||||||||
| Poland | 3.55 | 1,397 | 39,329 | 3.80 | 1,268 | 33,350 | ||||||||||||||
| North America | 4.09 | 7,805 | 190,720 | 3.03 | 5,629 | 185,614 | ||||||||||||||
| US | 4.57 | 6,303 | 137,893 | 3.25 | 4,571 | 140,452 | ||||||||||||||
| Mexico | 2.82 | 1,489 | 52,785 | 2.32 | 1,047 | 45,107 | ||||||||||||||
| South America | 5.72 | 10,142 | 177,380 | 6.20 | 10,381 | 167,348 | ||||||||||||||
| Brazil | 6.56 | 7,479 | 113,937 | 7.57 | 7,705 | 101,801 | ||||||||||||||
| Chile | 5.01 | 2,332 | 46,565 | 4.99 | 2,384 | 47,811 | ||||||||||||||
| Argentina | 1.99 | 78 | 3,903 | 2.08 | 122 | 5,844 | ||||||||||||||
| Digital Consumer Bank | 2.12 | 2,877 | 135,608 | 2.06 | 2,583 | 125,339 | ||||||||||||||
Total coverage ratio by business area (EUR million and %) |
|
|
|
|||||||||||||||||
| 2023 | 2022 | |||||||||||||||||||
| % | Total allowances to cover impairment losses on loans and advances to customers, customer guarantees and customer commitments granted | Credit impaired loans and advances to customers, customer guarantees and customer commitments granted | % | Total allowances to cover impairment losses on loans and advances to customers, customer guarantees and customer commitments granted | Credit impaired loans and advances to customers, customer guarantees and customer commitments granted | |||||||||||||||
| Europe | 49.3 | 7,147 | 14,495 | 51.8 | 7,871 | 15,186 | ||||||||||||||
| Spain | 49.1 | 4,185 | 8,529 | 51.0 | 4,890 | 9,598 | ||||||||||||||
| United Kingdom | 30.3 | 1,066 | 3,518 | 33.8 | 1,033 | 3,059 | ||||||||||||||
| Portugal | 82.7 | 847 | 1,024 | 79.3 | 990 | 1,247 | ||||||||||||||
| Poland | 73.3 | 1,024 | 1,397 | 74.0 | 938 | 1,268 | ||||||||||||||
| North America | 73.8 | 5,763 | 7,805 | 93.3 | 5,250 | 5,629 | ||||||||||||||
| US | 67.7 | 4,265 | 6,303 | 90.3 | 4,127 | 4,571 | ||||||||||||||
| Mexico | 100.0 | 1,489 | 1,489 | 106.6 | 1,116 | 1,047 | ||||||||||||||
| South America | 78.4 | 7,948 | 10,142 | 76.0 | 7,886 | 10,381 | ||||||||||||||
| Brazil | 84.7 | 6,338 | 7,479 | 79.5 | 6,128 | 7,705 | ||||||||||||||
| Chile | 52.7 | 1,230 | 2,332 | 56.3 | 1,343 | 2,384 | ||||||||||||||
| Argentina | 165.7 | 128 | 78 | 180.4 | 220 | 122 | ||||||||||||||
| Digital Consumer Bank | 88.0 | 2,532 | 2,877 | 92.8 | 2,397 | 2,583 | ||||||||||||||
Cost of risk by business area (EUR million and %) |
||||||||||||||||||||
| 2023 | 2022 | |||||||||||||||||||
| % | Underlying allowances for loan-loss provisions over the last 12 months | Average loans and advances to customers over the last 12 months | % | Underlying allowances for loan-loss provisions over the last 12 months | Average loans and advances to customers over the last 12 months | |||||||||||||||
| Europe | 0.44 | 2,533 | 582,256 | 0.39 | 2,396 | 612,142 | ||||||||||||||
| Spain | 0.62 | 1,522 | 246,660 | 0.61 | 1,618 | 265,051 | ||||||||||||||
| United Kingdom | 0.10 | 247 | 251,362 | 0.12 | 316 | 262,973 | ||||||||||||||
| Portugal | 0.20 | 77 | 38,546 | 0.04 | 17 | 40,286 | ||||||||||||||
| Poland | 2.08 | 674 | 32,385 | 1.43 | 440 | 30,721 | ||||||||||||||
| North America | 2.05 | 3,733 | 182,037 | 1.49 | 2,538 | 169,980 | ||||||||||||||
| US | 1.92 | 2,593 | 135,190 | 1.35 | 1,744 | 128,834 | ||||||||||||||
| Mexico | 2.43 | 1,135 | 46,729 | 1.95 | 788 | 40,348 | ||||||||||||||
| South America | 3.36 | 5,401 | 160,644 | 3.32 | 5,041 | 151,705 | ||||||||||||||
| Brazil | 4.77 | 4,701 | 98,555 | 4.79 | 4,417 | 92,188 | ||||||||||||||
| Chile | 0.80 | 365 | 45,637 | 0.93 | 399 | 42,953 | ||||||||||||||
| Argentina | 6.64 | 150 | 2,262 | 2.91 | 132 | 4,541 | ||||||||||||||
| Digital Consumer Bank | 0.62 | 792 | 128,583 | 0.45 | 544 | 119,524 | ||||||||||||||
Ratio |
Formula |
Relevance of the metric |
||||||||||||
TNAV per share (Tangible net asset value per share) |
Tangible book value A |
This is a very commonly used ratio used to measure the company’s accounting value per share having deducted the intangible assets. It is useful in evaluating the amount each shareholder would receive if the company were to enter into liquidation and had to sell all the company’s tangible assets. | ||||||||||||
| Number of shares excluding treasury stock | ||||||||||||||
| Price to tangible book value per share (X) |
Share price | This is one of the most commonly used ratios by market participants for the valuation of listed companies both in absolute terms and relative to other entities. This ratio measures the relationship between the price paid for a company and its accounting equity value. | ||||||||||||
| TNAV per share | ||||||||||||||
| LTD (Loan-to-deposit) |
Net loans and advances to customers | This is an indicator of the bank's liquidity. It measures the total loans and advances to customers net of loan-loss provisions as a percentage of customer deposits. |
||||||||||||
| Customer deposits | ||||||||||||||
| Loans and advances (minus reverse repos) | Gross loans and advances to customers minus reverse repos | In order to aid analysis of the commercial banking activity, reverse repos are excluded as they are highly volatile treasury products. | ||||||||||||
| Deposits (minus repos) | Customer deposits minus repos | In order to aid analysis of the commercial banking activity, repos are excluded as they are highly volatile treasury products. | ||||||||||||
| PAT + After tax fees paid to SAN (in Wealth Management & Insurance) | Net profit + fees paid from Santander Asset Management and Santander Insurance to Santander, net of taxes, excluding Private Banking customers | Metric to assess Wealth Management & Insurance’s total contribution to Group’s profit. | ||||||||||||
Others (EUR million and %) |
2023 | 2022 | 2021 | ||||||||
| TNAV (tangible book value) per share | 4.76 | 4.26 | 4.12 | ||||||||
| Tangible book value | 75,552 | 70,459 | 70,346 | ||||||||
| Number of shares excl. treasury stock (million) | 15,886 | 16,551 | 17,063 | ||||||||
| Price to tangible book value per share (X) | 0.79 | 0.66 | 0.71 | ||||||||
| Share price (euros) | 3.780 | 2.803 | 2.941 | ||||||||
| TNAV (tangible book value) per share | 4.76 | 4.26 | 4.12 | ||||||||
| Loan-to-deposit ratio | 99 | % | 103 | % | 108 | % | |||||
| Net loans and advances to customers | 1,036,349 | 1,036,004 | 972,682 | ||||||||
| Customer deposits | 1,047,169 | 1,009,722 | 900,554 | ||||||||
| PAT + After tax fees paid to SAN (in WM&I) (Constant EUR million) | 3,296 | 2,730 | |||||||||
| Profit after tax | 1,707 | 1,167 | |||||||||
| Net fee income net of tax | 1,589 | 1,563 | |||||||||
| Exchange rates: 1 euro/currency parity | |||||||||||||||||
| Average | Period-end | ||||||||||||||||
| 2023 | 2022 | 2023 | 2022 | ||||||||||||||
| US dollar | 1.081 | 1.051 | 1.105 | 1.068 | |||||||||||||
| Pound sterling | 0.870 | 0.853 | 0.868 | 0.887 | |||||||||||||
| Brazilian real | 5.397 | 5.421 | 5.365 | 5.650 | |||||||||||||
| Mexican peso | 19.158 | 21.131 | 18.691 | 20.805 | |||||||||||||
| Chilean peso | 906.417 | 916.688 | 965.192 | 909.200 | |||||||||||||
| Argentine peso | 282.765 | 134.786 | 893.635 | 189.116 | |||||||||||||
| Polish zloty | 4.538 | 4.683 | 4.343 | 4.684 | |||||||||||||
| Average inflation 2023 | |||||
| % | |||||
| Europe | 5.7 | ||||
| Spain | 3.6 | ||||
| United Kingdom | 7.4 | ||||
| Portugal | 4.4 | ||||
| Poland | 11.6 | ||||
| North America | 4.7 | ||||
| US | 4.2 | ||||
| Mexico | 5.6 | ||||
| South America | 19.5 | ||||
| Brazil | 4.6 | ||||
| Chile | 7.7 | ||||
| Argentina | 127.9 | ||||
| Digital Consumer Bank | 5.5 | ||||
| Total Group | 9.3 | ||||
| Ratio | Formula |
Relevance of the metric | ||||||||||||
Global Business RoTE |
Profit attributable to the parent (excluding goodwill impairment) |
This is used to evaluate the profitability of the company as a percentage of its tangible equity. It is measured as the return that shareholders receive as a percentage of the funds invested in the bank less intangible assets. |
||||||||||||
|
Average stockholders’ equity (excl. minority
interests) - intangible assetsA
|
||||||||||||||
Efficiency ratio by new primary segment (EUR million and %) | ||||||||||||||||||||
| 2023 | 2022 | |||||||||||||||||||
| % | Operating expenses | Total income | % | Operating expenses | Total income | |||||||||||||||
| Retail & Commercial Banking | 43.1 | 12,825 | 29,754 | 44.7 | 12,059 | 26,994 | ||||||||||||||
| Digital Consumer Bank | 42.8 | 5,263 | 12,296 | 41.9 | 5,197 | 12,391 | ||||||||||||||
| Corporate & Investment Banking | 45.0 | 3,387 | 7,527 | 43.3 | 2,901 | 6,703 | ||||||||||||||
| Wealth Management & Insurance | 37.9 | 1,216 | 3,210 | 41.2 | 1,104 | 2,678 | ||||||||||||||
| Payments | 44.2 | 2,344 | 5,298 | 46.6 | 2,271 | 4,874 | ||||||||||||||
RoTE by new primary segment (EUR million and %) | ||||||||||||||||||||
| 2023 | 2022 | |||||||||||||||||||
| % | Profit attributable to the parent (excluding goodwill impairment) |
Average stockholders' equity (excl. minority interests) - intangible assets | % | Profit attributable to the parent (excluding goodwill impairment) | Average stockholders' equity (excl. minority interests) - intangible assets | |||||||||||||||
| Retail & Commercial Banking | 15.15 | 5,659 | 37,362 | 14.15 | 5,017 | 35,462 | ||||||||||||||
| Digital Consumer Bank | 11.52 | 1,901 | 16,502 | 15.47 | 2,610 | 16,869 | ||||||||||||||
| Corporate & Investment Banking | 17.52 | 2,440 | 13,922 | 15.85 | 2,233 | 14,085 | ||||||||||||||
| Wealth Management & Insurance | 72.16 | 1,467 | 2,033 | 52.42 | 1,101 | 2,100 | ||||||||||||||
| Payments | 24.94 | 627 | 2,512 | 30.01 | 693 | 2,309 | ||||||||||||||
Risk, compliance & conduct management |
|||||
 | |||||
→ Our risk management and control model together with our risk culture and robust governance contribute to maintaining a medium-low risk profile. |
→ Risk, compliance & conduct continue to support our customers and all our stakeholders to face a challenging environment. |
→ We keep embedding ESG factors across the different risks, both from a regulatory and management perspective. |
||||||||||||
| Santander’s risk culture is part of the Santander Way. It represents how we manage risks on a day-to-day basis. | ||
| ||
|
9.0 (over 10)
Average rating by employees agreeing to the statement: "Group leaders frequently highlight the importance of managing risks on our day-to-day"
|
||||||||
|
8.3 (over 10)
Employees rating of Santander’s performance.
Development and reward frameworks motivate people to effectively manage risks
|
||||||||
| Credit risk | |||||
NPL ratio |
Cost of risk |
|||||||
|
3.14%
▲ 6bp s/2022
|
1.18%
▲ 19bp s/2022
|
|||||||
| Market, structural and liquidity risk | |||||
Average VaR |
LCRA |
|||||||
|
€ 11.7 Mn
▼ 2.4 Mn s/2022
|
166%
▲ 14 pp s/2022
|
|||||||
Capital risk |
|||||
CET 1 Fully Loaded |
RWA |
|||||||
|
12.3%
▲ 22 bp s/2022
| ||
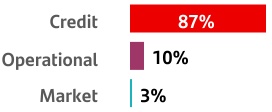
|
624 bn
▲ 15Mn s/2022
| ||
| Operational risk | |||||
| Compliance and conduct risk | |||||
| Model risk | |||||
| Strategic risk | |||||
ESG risk factors |
|||||
Proactive and efficient risk management in a challenging macroeconomic and geopolitical environment by strengthening how we monitor all risks, key indicators and the most affected customers and sectors. |
Our business model and solvency levels have demonstrated, once again, their resilience to the most severe macroeconomic scenarios, according to the latest EBA stress exercise. |
The transition to a low-carbon economy represents a great business opportunity for financial entities that are committed to sustainability, which is why we embed ESG factors in our risk management model. |
||||||||||||||||||||||||||||||
|
For more details on segments, see section '4.1 Description of segments' of the 'Economic and financial review' chapter. |
||||
|
For more details about Group's risk culture, see the section '1. Our culture' of the 'Responsible Banking' chapter. |
||||
 |
|
|||||||||||||||||||||||||||||||
|
|
|||||||||||||||||||||||||||||||
|
|
|||||||||||||||||||||||||||||||
|
|
|||||||||||||||||||||||||||||||
|
||||||||||||||||||||||||||||||||
1st |
The business and support areas that take or originate risks are primarily responsible for managing them. The first line detects, measures, controls, monitors and reports on the risks it originates according to internal risk management policies, models and procedures. Risk management must be consistent with the approved risk appetite and related limits. |
|||||||
2nd |
The second line of defence, comprising the risk, compliance & conduct areas, independently oversees and challenges risk management at the first line of defence. Its duties include promoting that risks will be managed according to the risk appetite approved by senior management and strengthening our risk culture across the Group. |
|||||||
3rd |
The third line of defence, which is the Internal Audit area, is fully independent to give the board and senior management assurance of high-quality and efficient internal control, governance and risk management to preserve our value, solvency and reputation. |
|||||||
Board level: |
 Board of directors
|
|||||||||||||||||||||||||||||||||||||
Risk management |
Risk control |
|||||||||||||||||||||||||||||||||||||
 |
Executive committee |
 |
Risk supervision, regulation and compliance committee |
|||||||||||||||||||||||||||||||||||
Executive level: |
 |
Executive risk committee (ERC) |
 |
Risk control committee (RCC) |
|
Compliance and conduct committee |
|||||||||||||||||||||||
Chair: |
CEO | Group CRO | Group CCO | ||||||||||||||||||||||||||
Frequency: |
Weekly | Monthly | Monthly | ||||||||||||||||||||||||||
Fora: |
•Model approval forum
•Risk proposal forum
|
•Market, structural, liquidity and capital risk control forum
•Credit risk control forum
•Provisions forum
|
•Corporate product governance forum
•Financial crime compliance forum
•Reputational risk forum
|
||||||||||||||||||||||||||
|
For more details, see section 4.8 ‘Risk supervision, regulation and compliance committee activities in 2023’ on 'Corporate governance' chapter. |
||||
|
For more details on our relationship with our subsidiaries, see section 7. ‘Group structure and internal governance’ of the 'Corporate Governance' chapter. |
||||
| Key risks | ||||||||||||||||||||||||||||||||||||||||||||||||||||||||
| Risk Appetite axes | Credit risk | Market risk | Liquidity risk | Structural risk | Operat. risk | Financial Crime Risk | Model risk | Reputat. risk | Strategic risk | |||||||||||||||||||||||||||||||||||||||||||||||
| P&L volatility | Control of P&L volatility associated with business plan under baseline and stressed conditions |
|||||||||||||||||||||||||||||||||||||||||||||||||||||||
| Solvency | Control of capital ratios under baseline and stressed scenarios (aligned with ICAAP) | |||||||||||||||||||||||||||||||||||||||||||||||||||||||
| Liquidity | Control of liquidity ratios under base and stress scenarios (aligned with ILAAP) | |||||||||||||||||||||||||||||||||||||||||||||||||||||||
| Concentration | Control of concentration levels in customers, sectors and portfolios |
|||||||||||||||||||||||||||||||||||||||||||||||||||||||
| Non financial risks | Solid controls on non financial risks aimed to minimize financial, operative, technological losses, as well as legal and regulatory breaches, and conduct events or reputational damage |
|||||||||||||||||||||||||||||||||||||||||||||||||||||||
|
For more details on these exercises see sections ‘Management and control model’ 6.2 Operational risk management' and '1.2 Emerging risks'.
|
||||
| RAS (Risk appetite statement and limits) |
||||||||||||||||||||||||||||||||||||||
| Group's RAS | ||||||||||||||||||||||||||||||||||||||
| RAS Unit 1 |
RAS Unit 2 |
RAS Unit n |
||||||||||||||||||||||||||||||||||||
| RAS embedding (Management limits) |
||||||||||||||||||||||||||||||||||||||
| Global limits & policies | Risk limits & policies Unit 1 |
Risk limits & policies Unit 2 |
Risk limits & policies Unit n |
|||||||||||||||||||||||||||||||||||
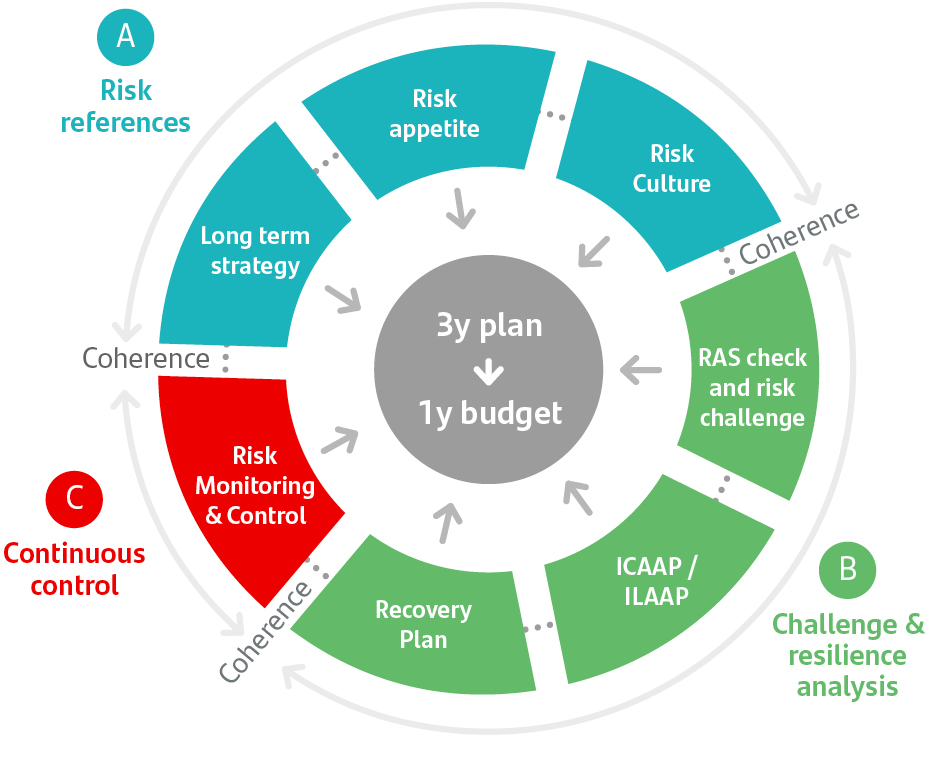
|
For more details on scenario analysis, see sections 3.2 ‘Credit risk management', 4.2 ‘Market risk management’ and 4.6 'Liquidity risk management' and section 'Expected loss estimation' in Note 54 to the consolidated financial statement. |
||||
|
Planning
Our planning helps us set business targets and draw up action plans within our risk appetite statement.
Strategic commercial plans (SCPs) are a risk management and control tool the business and risk areas prepare for our credit portfolios. They determine commercial strategies, risk policies, resources and infrastructure, to have a holistic view of portfolios.
|
Risk assessment and credit rating
Risk approval generally depends on the applicant’s ability to repay the debt, regardless of any collateral or personal guarantees we require. We review their regular sources of income, including funds and net cash flows from any businesses.
Our credit quality assessment models are based on the credit rating engines for each of our segments, which we monitor to calibrate and adjust the decisions and ratings they assign.
|
|||||||||||||||||||||||||
 |
||||||||||||||||||||||||||
|
Collections and recoveries
The Collections & Recoveries area draws up a strategy based on local economic conditions, business models and other recovery-related particulars.
For effective and efficient recoveries management, the area segments customers based on certain aspects, using new digital channels that help create sustainable value.
|
Scenario analysis
Scenario analyses determine potential risks in credit portfolios; give us a better understanding of their performance under various macroeconomic conditions; and enable us to employ management strategies that will avoid future deviations from set plans and targets.
|
|||||||||||||||||||||||||
|
Mitigation techniques
We generally approve risk according to a borrower’s ability to make due payment, regardless of any additional collateral or personal guarantees we may require. We always consider guarantees or collateral as a reinforcement measure in a credit transaction to mitigate a loss if the borrower defaults on their payment obligation.
|
Monitoring
Our holistic, regular monitoring allows us to track credit quality, spot risk trends early and check credit performance against original targets based on a system that helps us determine monitoring levels, policies and special measures for each customer.
|
|||||||||||||||||||||||||
|
For more details see section 'Credit risk management', in Note 54 to the consolidated financial statement |
||||
Main credit risk metricsA | |||||||||||||||||||||||||||||||||||
| Data as of 31 December | |||||||||||||||||||||||||||||||||||
Credit risk with customersB (EUR million) |
Impaired loans (EUR million) |
NPL ratio (%) |
|||||||||||||||||||||||||||||||||
| 2023 | 2022 | 2021 | 2023 | 2022 | 2021 | 2023 | 2022 | 2021 | |||||||||||||||||||||||||||
| Europe | 624,696 | 639,996 | 636,123 | 14,495 | 15,186 | 19,822 | 2.32 | 2.37 | 3.12 | ||||||||||||||||||||||||||
| Spain | 278,569 | 293,197 | 283,953 | 8,529 | 9,598 | 13,403 | 3.06 | 3.27 | 4.72 | ||||||||||||||||||||||||||
| UK | 247,360 | 253,455 | 262,869 | 3,518 | 3,059 | 3,766 | 1.42 | 1.21 | 1.43 | ||||||||||||||||||||||||||
| Portugal | 39,503 | 41,755 | 41,941 | 1,024 | 1,247 | 1,442 | 2.59 | 2.99 | 3.44 | ||||||||||||||||||||||||||
| Poland | 39,329 | 33,350 | 33,497 | 1,397 | 1,268 | 1,210 | 3.55 | 3.80 | 3.61 | ||||||||||||||||||||||||||
| North America | 190,720 | 185,614 | 149,792 | 7,805 | 5,629 | 3,632 | 4.09 | 3.03 | 2.42 | ||||||||||||||||||||||||||
| US | 137,893 | 140,452 | 112,808 | 6,303 | 4,571 | 2,624 | 4.57 | 3.25 | 2.33 | ||||||||||||||||||||||||||
| Mexico | 52,785 | 45,107 | 36,984 | 1,489 | 1,047 | 1,009 | 2.82 | 2.32 | 2.73 | ||||||||||||||||||||||||||
| South America | 177,380 | 167,348 | 141,874 | 10,142 | 10,381 | 6,387 | 5.72 | 6.20 | 4.50 | ||||||||||||||||||||||||||
| Brazil | 113,937 | 101,801 | 85,702 | 7,479 | 7,705 | 4,182 | 6.56 | 7.57 | 4.88 | ||||||||||||||||||||||||||
| Chile | 46,565 | 47,811 | 41,479 | 2,332 | 2,384 | 1,838 | 5.01 | 4.99 | 4.43 | ||||||||||||||||||||||||||
| Argentina | 3,903 | 5,844 | 5,481 | 78 | 122 | 198 | 1.99 | 2.08 | 3.61 | ||||||||||||||||||||||||||
| Digital Consumer Bank | 135,608 | 125,339 | 116,989 | 2,877 | 2,583 | 2,490 | 2.12 | 2.06 | 2.13 | ||||||||||||||||||||||||||
| Corporate Centre | 5,494 | 5,824 | 6,337 | 301 | 894 | 903 | 5.48 | 15.35 | 14.38 | ||||||||||||||||||||||||||
| Total Group | 1,133,898 | 1,124,121 | 1,051,114 | 35,620 | 34,673 | 33,234 | 3.14 | 3.08 | 3.16 | ||||||||||||||||||||||||||
| NPL coverage ratio (%) |
Loan-loss provisions C (EUR million) |
Cost of risk (%/risk)D |
|||||||||||||||||||||||||||||||||
| 2023 | 2022 | 2021 | 2023 | 2022 | 2021 | 2023 | 2022 | 2021 | |||||||||||||||||||||||||||
| Europe | 49.3 | 51.8 | 49.4 | 2,533 | 2,396 | 2,293 | 0.44 | 0.39 | 0.39 | ||||||||||||||||||||||||||
| Spain | 49.1 | 51.0 | 51.4 | 1,522 | 1,618 | 2,320 | 0.62 | 0.61 | 0.92 | ||||||||||||||||||||||||||
| UK | 30.3 | 33.8 | 25.8 | 247 | 316 | -245 | 0.10 | 0.12 | (0.09) | ||||||||||||||||||||||||||
| Portugal | 82.7 | 79.3 | 71.7 | 77 | 17 | 38 | 0.20 | 0.04 | 0.09 | ||||||||||||||||||||||||||
| Poland | 73.3 | 74.0 | 73.9 | 674 | 440 | 200 | 2.08 | 1.43 | 0.67 | ||||||||||||||||||||||||||
| North America | 73.8 | 93.3 | 134.9 | 3,733 | 2,538 | 1,210 | 2.05 | 1.49 | 0.93 | ||||||||||||||||||||||||||
| US | 67.7 | 90.3 | 150.3 | 2,593 | 1,744 | 419 | 1.92 | 1.35 | 0.43 | ||||||||||||||||||||||||||
| Mexico | 100.0 | 106.6 | 95.0 | 1,135 | 788 | 791 | 2.43 | 1.95 | 2.44 | ||||||||||||||||||||||||||
| South America | 78.4 | 76.0 | 98.3 | 5,401 | 5,041 | 3,251 | 3.36 | 3.32 | 2.60 | ||||||||||||||||||||||||||
| Brazil | 84.7 | 79.5 | 111.2 | 4,701 | 4,417 | 2,715 | 4.77 | 4.79 | 3.73 | ||||||||||||||||||||||||||
| Chile | 52.7 | 56.3 | 63.3 | 365 | 399 | 341 | 0.80 | 0.93 | 0.85 | ||||||||||||||||||||||||||
| Argentina | 165.7 | 180.4 | 153.8 | 150 | 132 | 140 | 6.64 | 2.91 | 3.01 | ||||||||||||||||||||||||||
| Digital Consumer Bank | 88.0 | 92.8 | 107.8 | 792 | 544 | 527 | 0.62 | 0.45 | 0.46 | ||||||||||||||||||||||||||
| Corporate Centre | 32.8 | 1.5 | 3.6 | (2) | -10 | 155 | (0.04) | (0.14) | 2.45 | ||||||||||||||||||||||||||
| Total Group | 65.9 | 67.5 | 71.3 | 12,458 | 10,509 | 7,436 | 1.18 | 0.99 | 0.77 | ||||||||||||||||||||||||||
|
For more details on the main subsidiaries see section 'Detail of the main geographical areas' in Note 54 of the consolidated accounts. |
||||
Gross credit risk with customersA |
||||||||||||||||||||||||||
| 1,133,898 | ||||||||||||||||||||||||||
Gross credit risk with customers |
= |
Gross loans and advances to customers & others
1,059,137
|
+ | Contingent liabilities |
||||||||||||||||||||||
| 1,133,898 | 74,761 | |||||||||||||||||||||||||
Loans and advances to customers(Gross) |
= | Financial assets measured at amortised cost (Gross)B |
+ | Financial assets held for tradingB |
+ | Financial assets at fair value (Gross)B |
||||||||||||||||||||
| 1,059,137 | 1,032,511 | 11,634 | 14,992 | |||||||||||||||||||||||
Loan-loss reserves |
= |
Loan-loss
reserves
|
+ |
Loan-loss
reserves
|
||||||||||||||||||||||
| -22,788 | -22,666 | -122 | ||||||||||||||||||||||||
Net loans and advances to customers |
= |
Net financial assets
measured at amortised cost
|
+ |
Financial assets
held for trading
|
+ | Net financial assets at fair value |
||||||||||||||||||||
| 1,036,349 | 1,009,845 | 11,634 | 14,870 | |||||||||||||||||||||||
Net loans and advances to customers |
||||||||||||||||||||||||||
| 1,036,349 | ||||||||||||||||||||||||||
| Credit risk distribution | ||
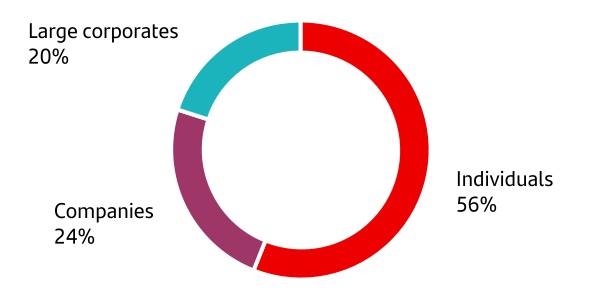
| Total | ||
| Total | ||
| Eur Mn | ||
| 1,133,898 | ||
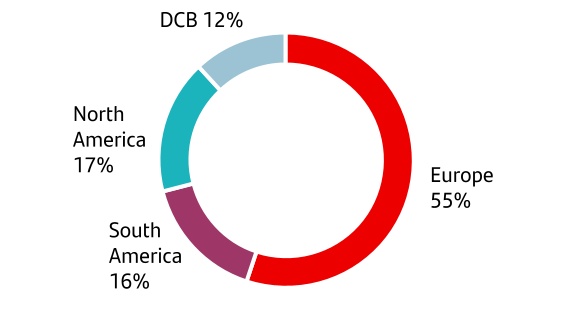
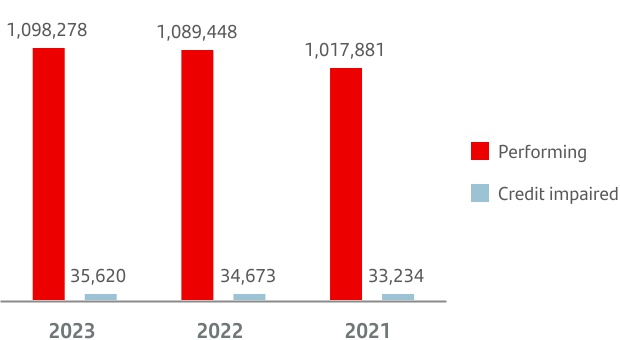
| Segments | ||
 |
Individuals | ||||||||||
| Eur Mn | 634,455 | ||||||||||
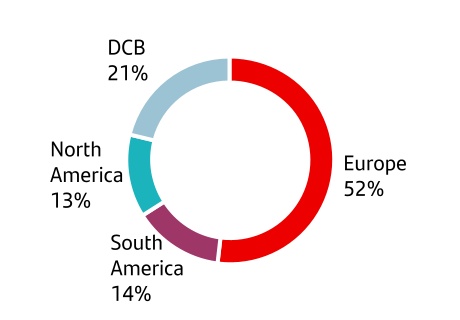
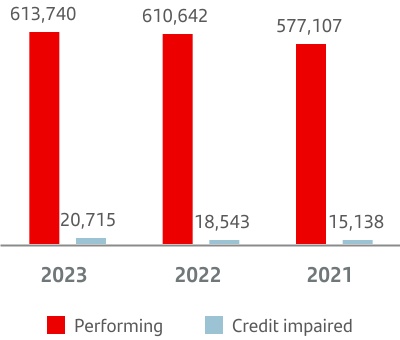
 |
SME, Commercial Banking and Institutions | ||||||||||
| Eur Mn | 277,234 | ||||||||||
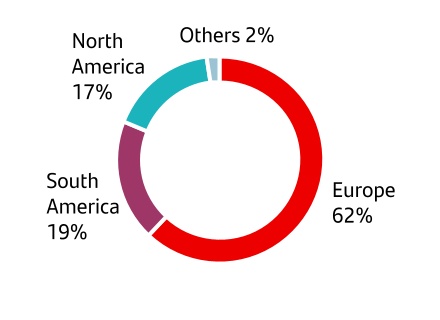
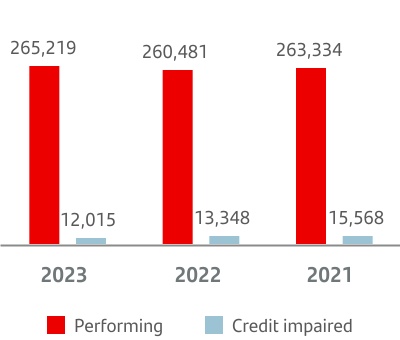
|
Large Corporates |
||||||||||
| Eur Mn | 222,209 | ||||||||||
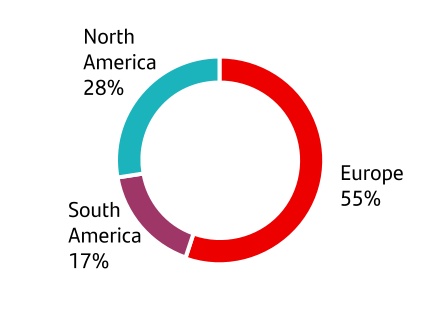
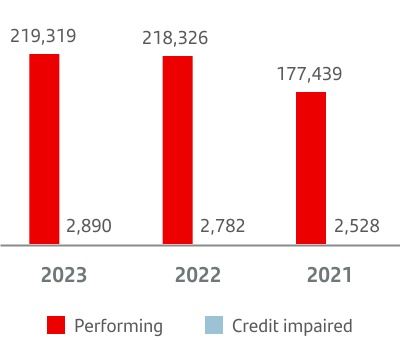
Observed credit risk impairment since the initial recognition of the financial instrument |
|||||
 | ||
| Risk category | Stage 1 | Stage 2 | Stage 3 | ||||||||
| Classification criteria |
Financial instruments with no significant increase in risk since initial recognition.
|
Financial instruments with a significant credit risk increase since initial recognition but with no materialized impairment event. |
Financial instruments with true signs of impairment as a result of one or more events resulting in a loss. |
||||||||
| Provisions recognised |
The impairment provision reflects expected credit losses from defaults over 12 months from the reporting date.
|
The impairment provision reflects expected losses from defaults over the financial instrument’s residual life.
|
The impairment provision reflects expected losses from defaults over the financial instrument’s residual life.
In this stage, the calculation considers that loss events have already occurred and, therefore, the only possible scenario is that they will materialize in losses.
|
||||||||
Exposure by stage and geographyA | ||||||||||||||
EUR million. Dec.23 |
||||||||||||||
| Stage 1 | Stage 2 |
Stage 3 |
Total | |||||||||||
| Europe | 531,686 | 48,215 | 14,495 | 594,396 | ||||||||||
| Spain | 235,757 | 16,141 | 8,529 | 260,426 | ||||||||||
| UK | 205,707 | 26,118 | 3,518 | 235,344 | ||||||||||
| Portugal | 34,489 | 3,990 | 1,024 | 39,503 | ||||||||||
| Poland | 35,906 | 1,907 | 1,397 | 39,209 | ||||||||||
| North America | 152,026 | 11,861 | 7,805 | 171,692 | ||||||||||
| US | 103,811 | 9,377 | 6,303 | 119,490 | ||||||||||
| Mexico | 48,191 | 2,484 | 1,489 | 52,164 | ||||||||||
| South America | 152,964 | 13,726 | 10,142 | 176,832 | ||||||||||
| Brazil | 96,799 | 9,130 | 7,479 | 113,408 | ||||||||||
| Chile | 40,198 | 4,033 | 2,332 | 46,562 | ||||||||||
| Argentina | 3,469 | 357 | 78 | 3,903 | ||||||||||
| Digital Consumer Bank | 128,145 | 4,569 | 2,877 | 135,591 | ||||||||||
| Corporate Centre | 3,930 | 934 | 301 | 5,165 | ||||||||||
| Total Group | 968,751 | 79,305 | 35,620 | 1,083,676 | ||||||||||
2021 - 2023 Impaired credit assets | |||||||||||
| EUR million | |||||||||||
| 2023 | 2022 | 2021 | |||||||||
| Start of period | 34,673 | 33,234 | 31,767 | ||||||||
| Net entries | 14,658 | 13,257 | 10,027 | ||||||||
| Perimeter | (59) | — | — | ||||||||
| FX and others | 195 | 417 | 529 | ||||||||
| Write-off | (13,847) | (12,235) | (9,089) | ||||||||
| End of period | 35,620 | 34,673 | 33,234 | ||||||||
2021 - 2023 loan loss reserves | |||||||||||
| EUR million | |||||||||||
| 2023 | 2022 | 2021 | |||||||||
Start of period |
23,418 | 23,698 | 24,271 | ||||||||
| Stage 1 and 2 | 9,272 | 9,983 | 10,491 | ||||||||
| Stage 3 | 14,146 | 13,714 | 13,780 | ||||||||
| Gross provision for impaired assets and write-downs | 13,524 | 11,665 | 8,824 | ||||||||
| Provision for other assets | 526 | 305 | (6) | ||||||||
| FX and other | (132) | (14) | (303) | ||||||||
| Write-off | (13,847) | (12,235) | (9,089) | ||||||||
End of period |
23,490 | 23,418 | 23,698 | ||||||||
| Stage 1 and 2 | 9,026 | 9,272 | 9,983 | ||||||||
| Stage 3 | 14,464 | 14,146 | 13,714 | ||||||||
|
For more information regarding Financial asset impairment, see 'Credit risk management' in section '2. Main aggregates and variations' on Note 54 to the consolidated financial statement. |
||||
| Key forbearance figures | |||||||||||
| EUR million | |||||||||||
| 2023 | 2022 | 2021 | |||||||||
| Performing | 16,919 | 18,988 | 20,504 | ||||||||
Credit impaired |
15,044 | 15,185 | 15,539 | ||||||||
| Total forborne | 31,963 | 34,173 | 36,042 | ||||||||
% Total coverageA |
25 | % | 24 | % | 23 | % | |||||
|
Counterparty risk: exposure in terms of market value and
credit risk equivalent, including the mitigation effectA
| |||||||||||
| EUR million | |||||||||||
| 2023 | 2022 | 2021 | |||||||||
Market value with netting effect and collateralB |
13,428 | 13,249 | 5,491 | ||||||||
Net CREC |
48,372 | 45,157 | 31,444 | ||||||||
Counterparty risk by nominalA | |||||||||||||||||
| EUR million | |||||||||||||||||
| 2023 | 2022 | 2021 | |||||||||||||||
Nominal |
Nominal |
Nominal |
|||||||||||||||
Credit derivativesB |
24,528 | 14,765 | 17,164 | ||||||||||||||
| Equity derivatives | 20,326 | 26,177 | 79,062 | ||||||||||||||
| Fixed income derivatives | 4,793 | 13,320 | 4,409 | ||||||||||||||
| Exchange rate derivatives | 1,256,997 | 1,069,870 | 947,061 | ||||||||||||||
| Interest rate derivatives | 6,775,004 | 5,538,173 | 4,915,150 | ||||||||||||||
| Commodity derivatives | 20,061 | 13,496 | 12,022 | ||||||||||||||
| Total OTC derivatives | 7,909,027 | 6,479,325 | 5,786,114 | ||||||||||||||
Derivatives organised marketsC |
192,682 | 196,476 | 188,755 | ||||||||||||||
| Repos | 421,937 | 259,946 | 129,085 | ||||||||||||||
| Securities lending | 61,374 | 52,269 | 48,346 | ||||||||||||||
Total counterparty riskD |
8,585,020 | 6,988,017 | 6,152,300 | ||||||||||||||
Counterparty risk: Distribution of nominal risk by maturityA | ||||||||||||||
EUR million. Dec.23 data | ||||||||||||||
| Up to 1 year | Up to 5 years | Up to 10 years | More than 10 years | |||||||||||
Credit derivativesB |
14 | % | 58 | % | 25 | % | 3 | % | ||||||
| Equity derivatives | 63 | % | 35 | % | 2 | % | — | % | ||||||
| Fixed income derivatives | 97 | % | 3 | % | — | % | — | % | ||||||
| Exchange rate derivatives | 56 | % | 27 | % | 11 | % | 6 | % | ||||||
| Interest rate derivatives | 40 | % | 38 | % | 14 | % | 8 | % | ||||||
| Commodity derivatives | 71 | % | 27 | % | 2 | % | — | % | ||||||
| Total OTC derivatives | 42 | % | 36 | % | 14 | % | 8 | % | ||||||
Derivatives organised marketsC |
65 | % | 23 | % | 10 | % | 2 | % | ||||||
| Repos | 94 | % | 6 | % | — | % | — | % | ||||||
| Securities lending | 98 | % | 2 | % | — | % | — | % | ||||||
| Total counterparty risk | 46 | % | 34 | % | 13 | % | 7 | % | ||||||
Counterparty risk: Notional values by customer ratingA | |||||
Dec.23 data | |||||
Rating |
% |
||||
| AAA | 0.81 | % | |||
| AA | 2.38 | % | |||
| A | 84.36 | % | |||
| BBB | 11.32 | % | |||
| BB | 1.03 | % | |||
| B | 0.08 | % | |||
| Other | 0.02 | % | |||
| Counterparty risk: Notional values by customer segment | ||
Dec. 23 data | ||
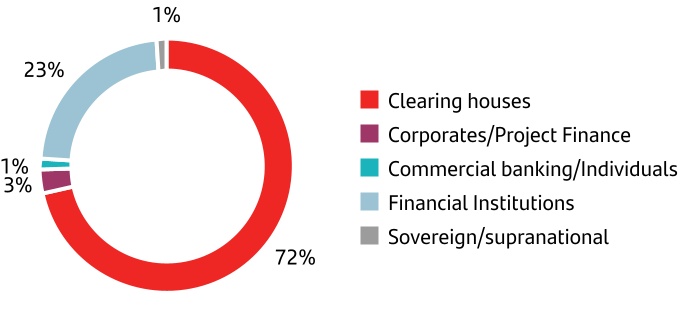
Counterparty risk: Notional values by settlement channel and productA | ||||||||||||||||||||||||||||||||
| Nominal in EUR million | ||||||||||||||||||||||||||||||||
Bilateral |
CCPB |
Organised marketsC |
Total |
|||||||||||||||||||||||||||||
Nominal |
% |
Nominal |
% |
Nominal |
% |
|||||||||||||||||||||||||||
| Credit derivatives | 14,388 | 58.7 | % | 10,140 | 41.3 | % | — | — | % | 24,528 | ||||||||||||||||||||||
| Equity derivatives | 14,980 | 73.7 | % | 559 | 2.8 | % | 4,786 | 23.5 | % | 20,326 | ||||||||||||||||||||||
| Fixed income derivatives | 4,793 | 100.0 | % | — | — | % | — | — | % | 4,793 | ||||||||||||||||||||||
| Exchange rate derivatives | 1,186,033 | 94.4 | % | 44,152 | 3.5 | % | 26,812 | 2.1 | % | 1,256,997 | ||||||||||||||||||||||
| Interest rate derivatives | 786,925 | 11.6 | % | 5,844,580 | 86.3 | % | 143,500 | 2.1 | % | 6,775,004 | ||||||||||||||||||||||
| Commodity derivatives | 2,477 | 12.3 | % | — | — | % | 17,584 | 87.7 | % | 20,061 | ||||||||||||||||||||||
| Repos | 228,551 | 54.2 | % | 193,386 | 45.8 | % | — | — | % | 421,937 | ||||||||||||||||||||||
| Securities lending | 61,374 | 100.0 | % | — | — | % | — | — | % | 61,374 | ||||||||||||||||||||||
| Total | 2,299,521 | 6,092,817 | 192,682 | 8,585,020 | ||||||||||||||||||||||||||||
Risk settled by CCP and productA | |||||||||||
| Nominal in EUR million | |||||||||||
2023 |
2022 |
2021 |
|||||||||
| Credit derivatives | 10,140 | 4,848 | 6,714 | ||||||||
| Equity derivatives | 559 | 758 | — | ||||||||
| Fixed income derivatives | — | 15 | — | ||||||||
| Exchange rate derivatives | 44,152 | 24,349 | 38,755 | ||||||||
| Interest rate derivatives | 5,844,580 | 4,555,519 | 4,054,711 | ||||||||
| Commodity derivatives | — | — | — | ||||||||
| Repos | 193,386 | 109,248 | 35,284 | ||||||||
| Securities lending | — | — | — | ||||||||
| Total | 6,092,817 | 4,694,737 | 4,135,464 | ||||||||
Diversification by economic sectorA | ||
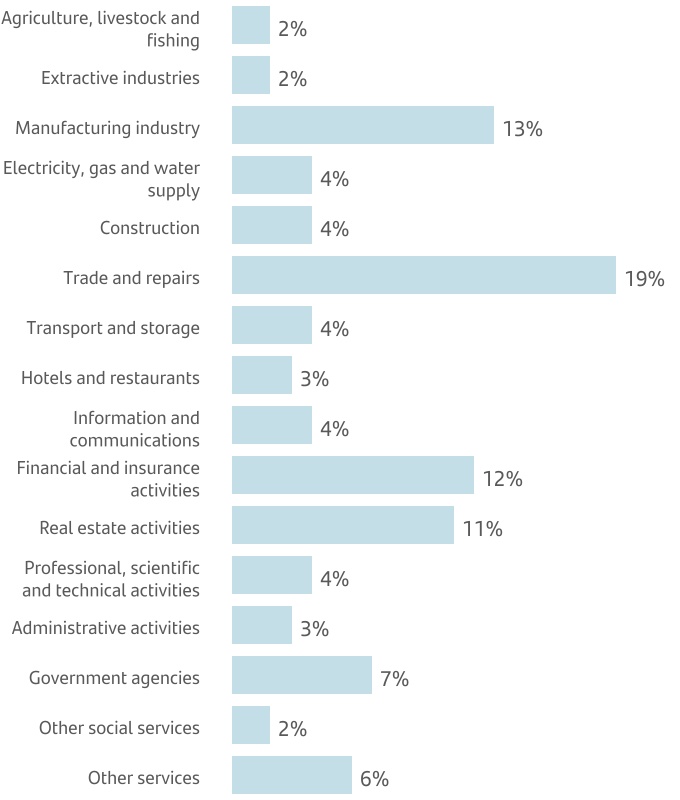
| 2023 | 2022 | 2021 | |||||||||
| AAA | 18 | % | 27 | % | 15 | % | |||||
| AA | 19 | % | 19 | % | 32 | % | |||||
| A | 41 | % | 34 | % | 26 | % | |||||
| BBB | 12 | % | 11 | % | 11 | % | |||||
| Lower than BBB | 10 | % | 9 | % | 16 | % | |||||
2023 |
2022 | ||||||||||||||||||||||
Portfolio |
|||||||||||||||||||||||
|
|
Financial assets held for trading and Financial assets designated as FV with changes in results | Financial assets at fair value through other comprehensive income |
Financial assets at amortised cost |
Non-trading financial assets mandatory at fair value through profit or loss | Total net direct exposure | Total net direct exposure | |||||||||||||||||
| Spain | 4,996 | 97 | 34,534 | — | 39,627 | 29,095 | |||||||||||||||||
| Portugal | 462 | 1,247 | 5,150 | — | 6,859 | 5,456 | |||||||||||||||||
| Italy | (2,187) | 415 | 7,366 | — | 5,594 | 7,415 | |||||||||||||||||
| Greece | — | — | — | — | — | — | |||||||||||||||||
| Ireland | — | — | — | — | — | — | |||||||||||||||||
| Rest Eurozone | 2,899 | 604 | 4,621 | — | 8,124 | 5,651 | |||||||||||||||||
| UK | 1,261 | 607 | 1,919 | — | 3,787 | 2,106 | |||||||||||||||||
| Poland | 194 | 6,340 | 4,733 | — | 11,267 | 8,715 | |||||||||||||||||
| Rest of Europe | 16 | 2,467 | 310 | — | 2,793 | 132 | |||||||||||||||||
| US | 2,049 | 5,253 | 14,002 | — | 21,304 | 23,298 | |||||||||||||||||
| Brazil | 11,715 | 10,273 | 5,745 | — | 27,733 | 23,728 | |||||||||||||||||
| Mexico | 3,311 | 12,075 | 5,439 | — | 20,825 | 17,306 | |||||||||||||||||
| Chile | 97 | 1,040 | 5,148 | — | 6,285 | 6,485 | |||||||||||||||||
| Rest of America | 277 | 543 | 1,430 | — | 2,250 | 1,964 | |||||||||||||||||
| Rest of the World | 229 | 2,843 | 1,455 | — | 4,527 | 3,542 | |||||||||||||||||
| Total | 25,319 | 43,804 | 91,852 | — | 160,975 | 134,893 | |||||||||||||||||
|
For further detail on market factors see section 'Activities subject to market risk and types of market risk', in Note 54 to the consolidated financial statement. |
||||
|
For further detail on CVA and DVA see 'Credit risk from financial markets activities' in section 3.4 'Other credit risk aspect'
|
||||
VaR 2021-2023 | ||
| EUR million. VaR at 99% over a one day horizon | ||
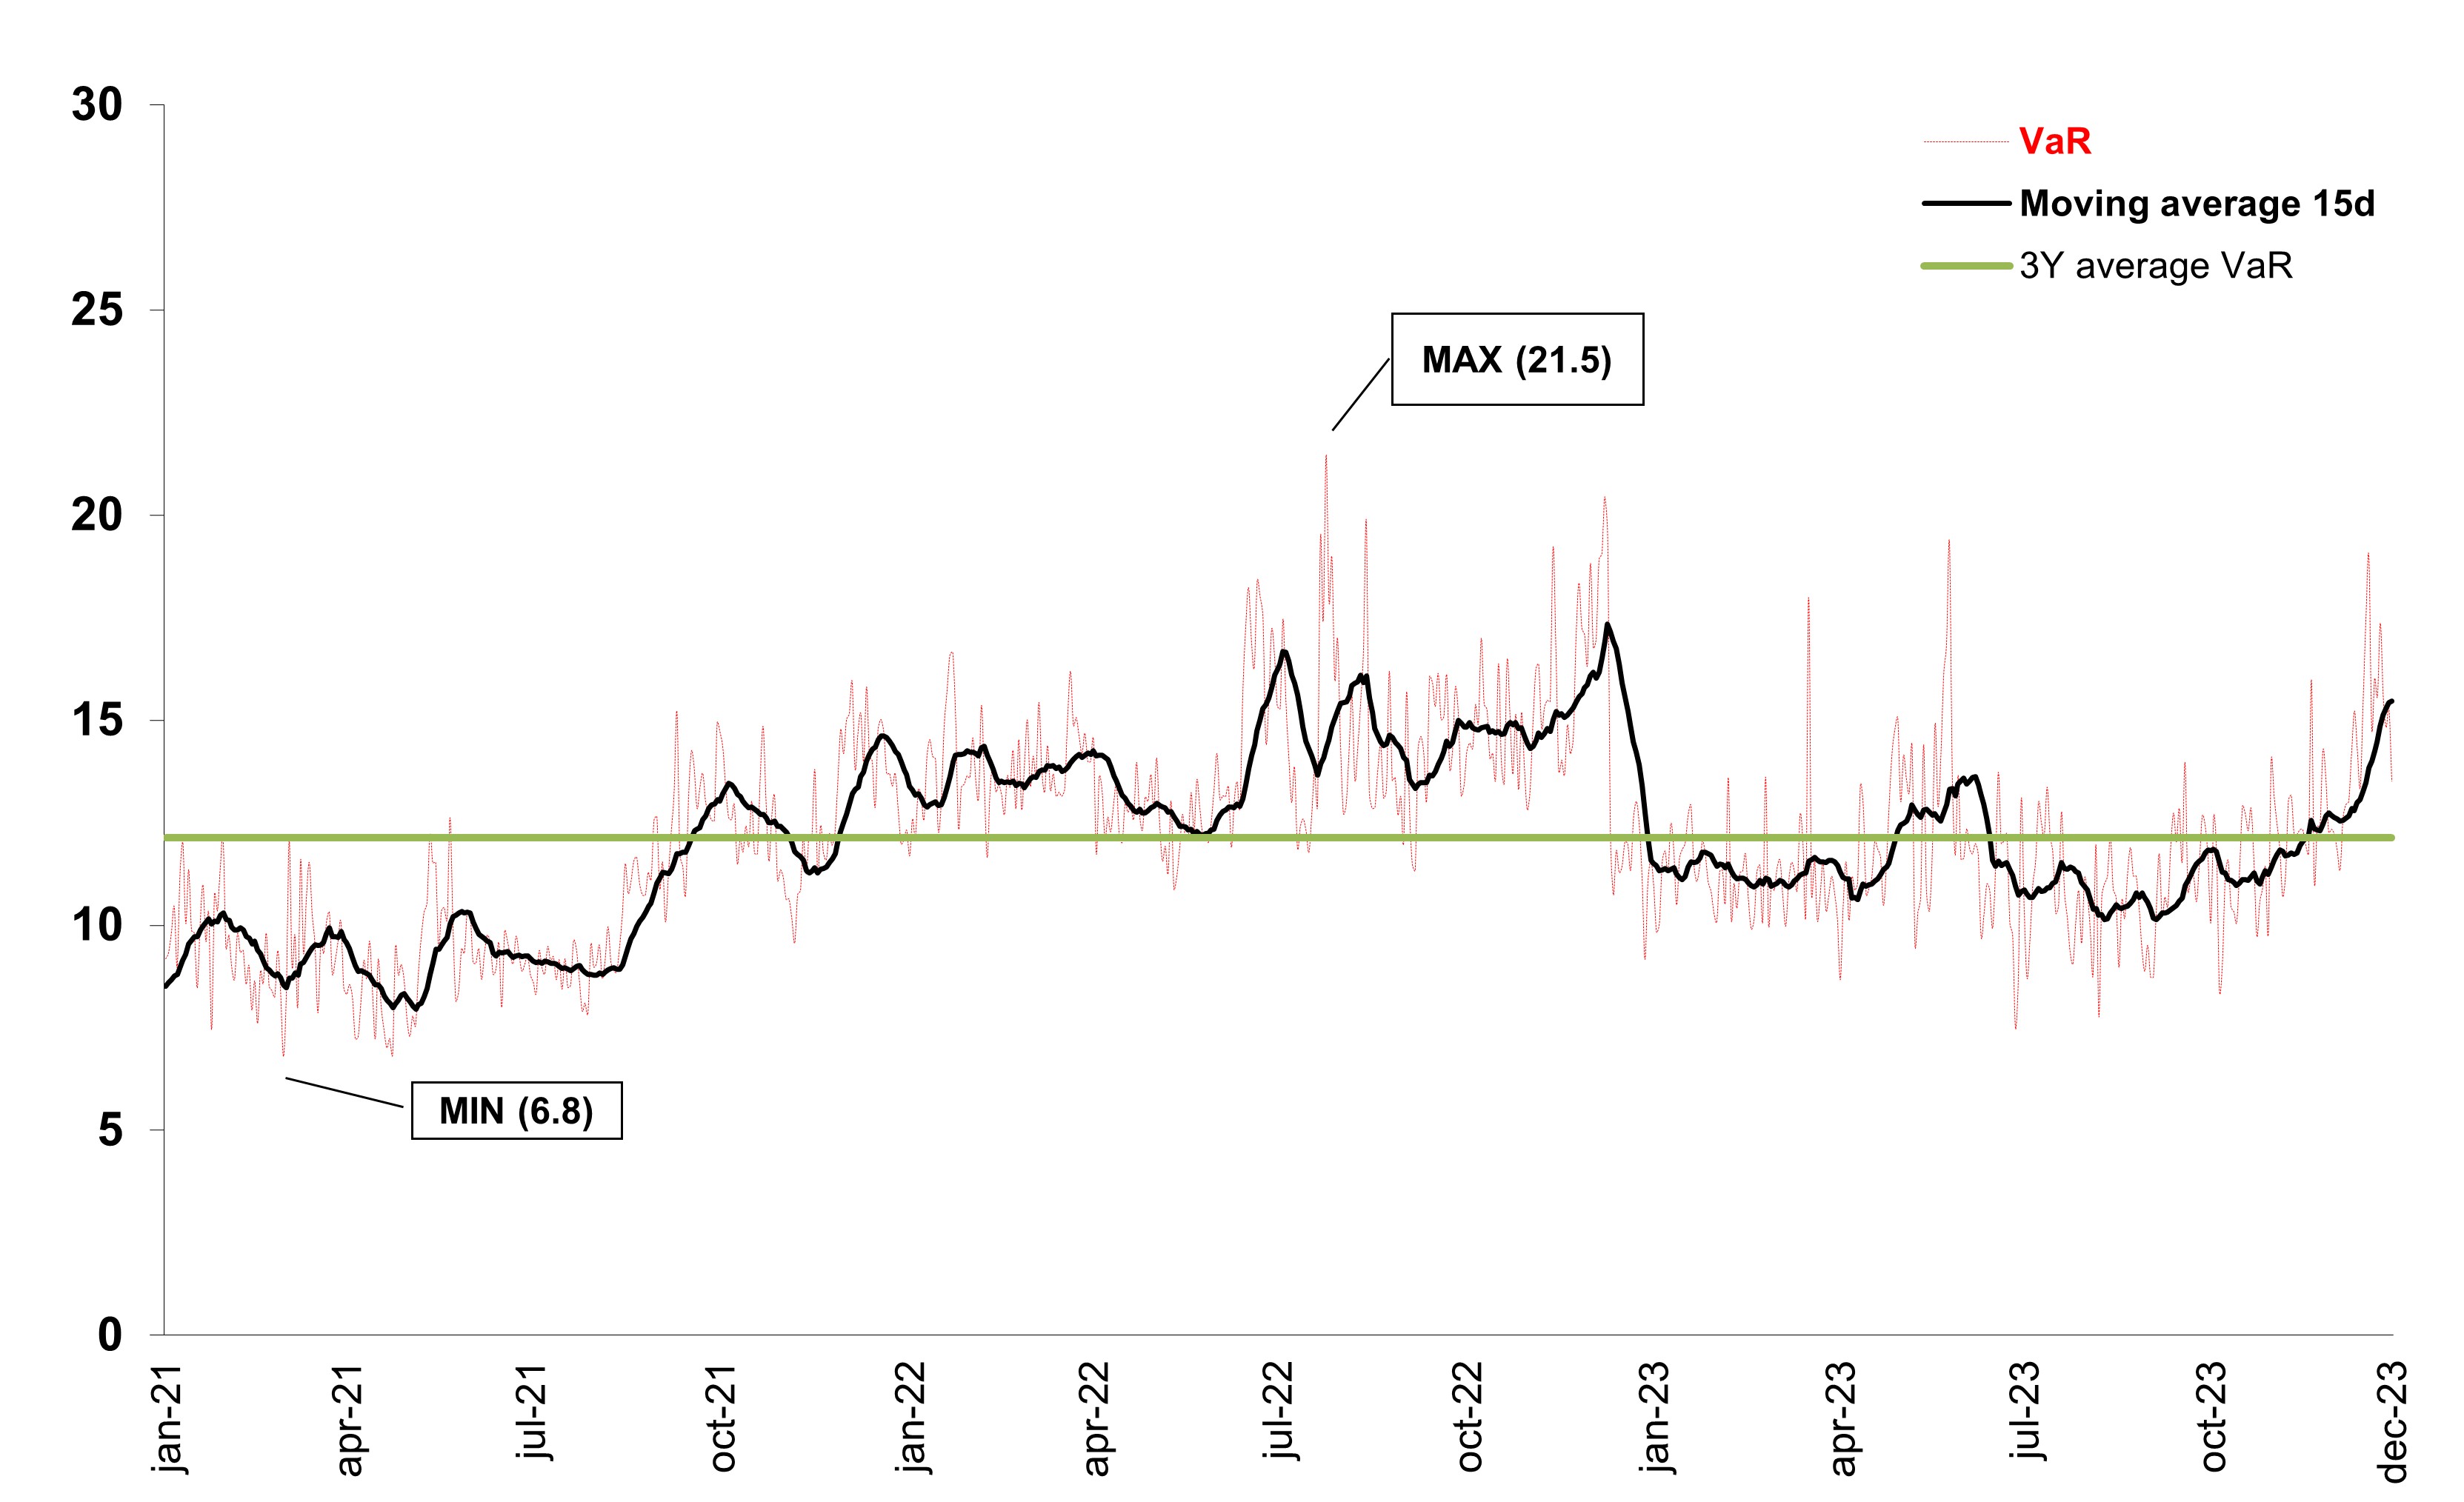
VaR statistics and Expected Shortfall by risk factorA | ||||||||||||||||||||||||||||||||||||||
| EUR million. VaR at 99% and ES at 97.5% with a one-day time horizon | ||||||||||||||||||||||||||||||||||||||
| 2023 | 2022 | 2021 | ||||||||||||||||||||||||||||||||||||
VaR (99%) |
ES (97.5%) |
VaR |
VaR |
|||||||||||||||||||||||||||||||||||
Min |
Average |
Max |
Latest |
Latest |
Average |
Latest |
Average |
Latest |
||||||||||||||||||||||||||||||
| Total Trading | 7.5 | 11.7 | 19.3 | 13.5 | 12.5 | 14.1 | 11.6 | 10.5 | 12.3 | |||||||||||||||||||||||||||||
| Diversification effect | (8.5) | (14.9) | (27.3) | (17.1) | (18.9) | (14.6) | (15.5) | (12.9) | (13.4) | |||||||||||||||||||||||||||||
| Interest rate | 8.9 | 12.2 | 20.3 | 11.1 | 11.5 | 12.6 | 9.9 | 9.6 | 9.1 | |||||||||||||||||||||||||||||
| Equities | 1.4 | 3.2 | 7.3 | 6.0 | 6.1 | 4.2 | 5.5 | 3.5 | 5.1 | |||||||||||||||||||||||||||||
| Exchange rate | 2.3 | 5.3 | 9.4 | 4.8 | 4.9 | 4.8 | 3.6 | 4.2 | 5.7 | |||||||||||||||||||||||||||||
| Credit spread | 2.7 | 4.3 | 6.4 | 6.1 | 5.9 | 5.4 | 5.8 | 4.8 | 5.1 | |||||||||||||||||||||||||||||
| Commodities | 0.7 | 1.6 | 3.2 | 2.6 | 3.0 | 1.7 | 2.3 | 1.3 | 0.7 | |||||||||||||||||||||||||||||
| Total Europe | 6.6 | 9.4 | 14.7 | 11.8 | 11.1 | 12.2 | 10.5 | 9.3 | 9.9 | |||||||||||||||||||||||||||||
| Diversification effect | (5.3) | (10.5) | (21.6) | (13.8) | (14.9) | (10.4) | (14.2) | (9.3) | (12.6) | |||||||||||||||||||||||||||||
| Interest rate | 5.6 | 9.1 | 16.5 | 8.2 | 9.3 | 10.2 | 10.1 | 7.7 | 7.1 | |||||||||||||||||||||||||||||
| Equities | 1.5 | 2.8 | 7.1 | 5.8 | 5.3 | 3.6 | 5.5 | 3.3 | 5.8 | |||||||||||||||||||||||||||||
| Exchange rate | 2.1 | 3.5 | 5.7 | 5.2 | 5.2 | 3.4 | 3.3 | 2.8 | 4.5 | |||||||||||||||||||||||||||||
| Credit spread | 2.7 | 4.3 | 6.4 | 6.1 | 5.9 | 5.4 | 5.8 | 4.8 | 5.1 | |||||||||||||||||||||||||||||
| Commodities | — | 0.2 | 0.6 | 0.3 | 0.3 | — | — | — | — | |||||||||||||||||||||||||||||
| Total North America | 1.8 | 4.0 | 6.4 | 5.0 | 5.0 | 2.3 | 2.7 | 2.5 | 2.7 | |||||||||||||||||||||||||||||
| Diversification effect | (0.3) | (0.7) | (2.6) | (0.5) | (0.5) | (0.8) | (1.1) | (0.7) | (0.6) | |||||||||||||||||||||||||||||
| Interest rate | 1.8 | 3.7 | 6.3 | 5.0 | 5.0 | 2.2 | 2.7 | 2.5 | 2.7 | |||||||||||||||||||||||||||||
| Equities | — | 0.2 | 0.5 | — | — | 0.1 | 0.1 | 0.1 | — | |||||||||||||||||||||||||||||
| Exchange rate | 0.3 | 0.8 | 2.2 | 0.5 | 0.5 | 0.8 | 1.0 | 0.6 | 0.6 | |||||||||||||||||||||||||||||
| Total South America | 4.2 | 7.3 | 13.3 | 7.0 | 6.2 | 8.0 | 6.2 | 5.9 | 6.3 | |||||||||||||||||||||||||||||
| Diversification effect | (1.3) | (6.2) | (14.2) | (6.6) | (7.6) | (5.0) | (4.2) | (4.9) | (5.1) | |||||||||||||||||||||||||||||
| Interest rate | 4.3 | 7.3 | 12.6 | 5.6 | 5.4 | 7.0 | 5.5 | 5.5 | 5.8 | |||||||||||||||||||||||||||||
| Equities | — | 1.4 | 3.7 | 2.4 | 2.5 | 1.6 | 1.7 | 1.2 | 1.1 | |||||||||||||||||||||||||||||
| Exchange rate | 0.5 | 3.2 | 8.0 | 3.0 | 2.9 | 2.7 | 0.9 | 2.8 | 3.8 | |||||||||||||||||||||||||||||
| Commodities | 0.7 | 1.6 | 3.2 | 2.6 | 3.0 | 1.7 | 2.3 | 1.3 | 0.7 | |||||||||||||||||||||||||||||
| Backtesting of trading portfolios: daily results vs. VaR for previous day | ||
| EUR million | ||
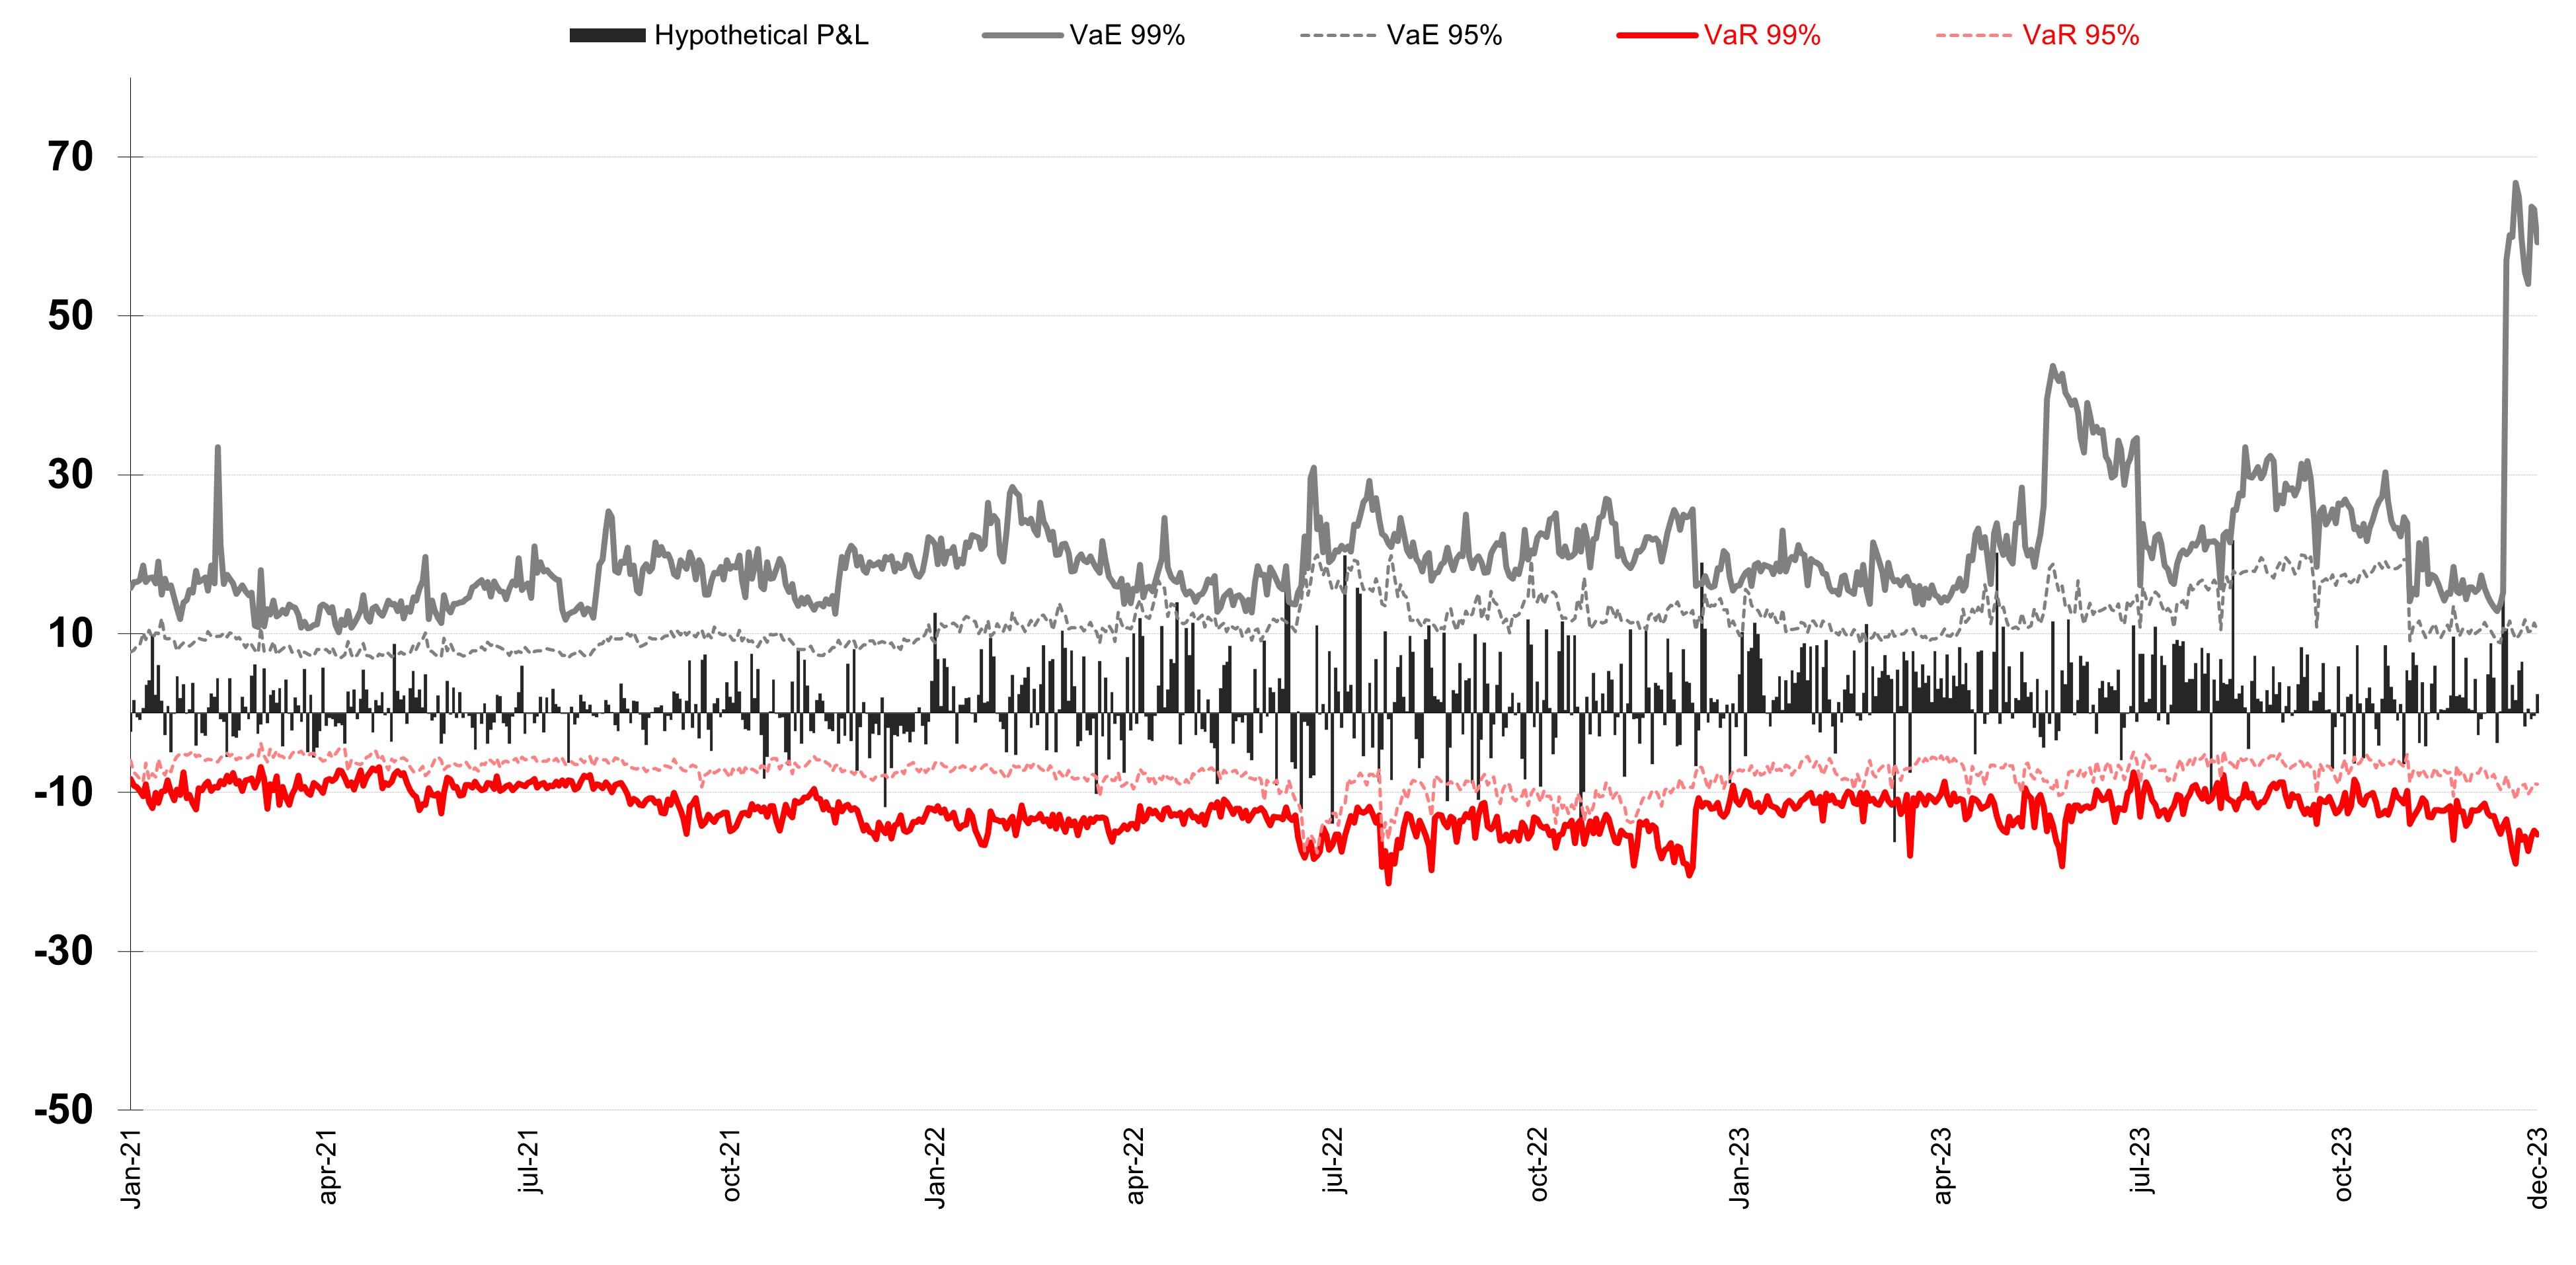
| Change in risk over time (VaR) of structure derivatives | ||
| EUR million. VaR Vega at a 99% over a one day horizon | ||
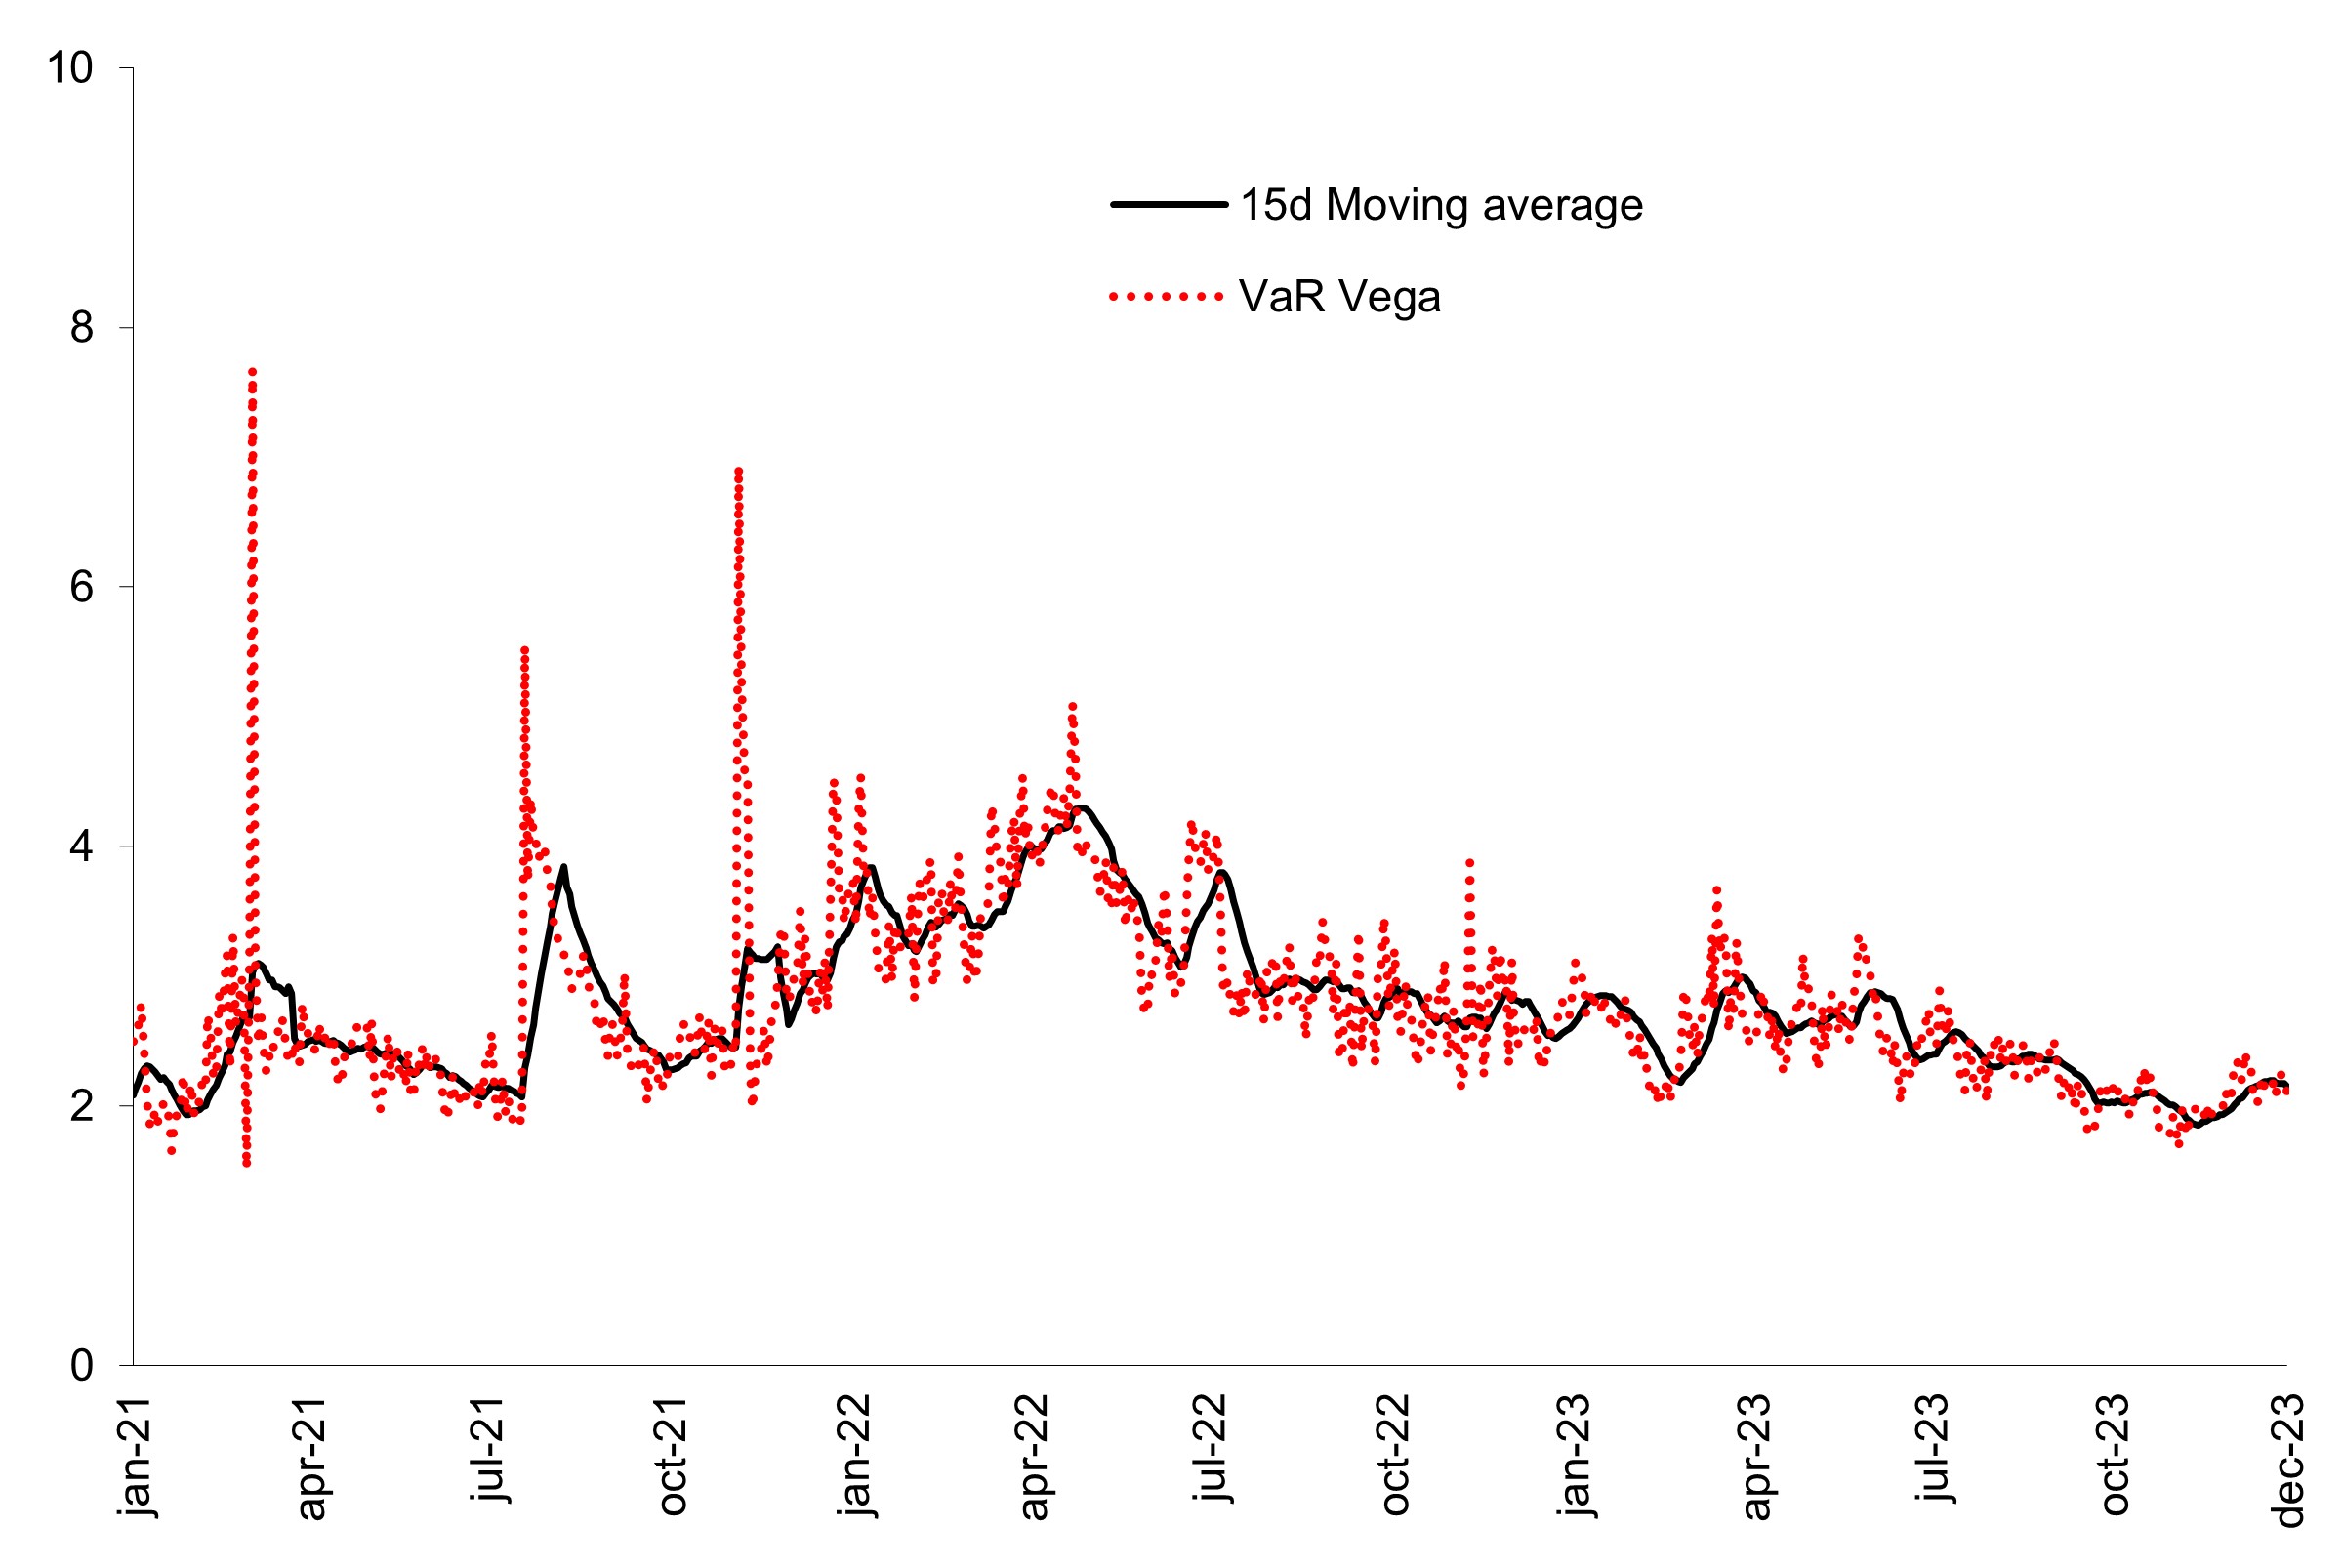
| Financial derivatives. Risk (VaR) by risk factor | ||||||||||||||||||||||||||||||||
| EUR million. VaR at a 99% over a one day horizon | ||||||||||||||||||||||||||||||||
| c | ||||||||||||||||||||||||||||||||
| 2023 | 2022 | 2021 | ||||||||||||||||||||||||||||||
| Minimum | Average | Maximum | Latest | Average | Latest | Average | Latest | |||||||||||||||||||||||||
| Total VaR Vega | 1.7 | 2.4 | 3.7 | 2.1 | 3.2 | 2.7 | 2.6 | 3.7 | ||||||||||||||||||||||||
| Diversification effect | (0.8) | (1.9) | (8.6) | (1.2) | (1.1) | (1.0) | (0.9) | (0.1) | ||||||||||||||||||||||||
Interest rate VaR |
1.0 | 2.0 | 8.6 | 1.5 | 2.0 | 1.4 | 1.4 | 1.2 | ||||||||||||||||||||||||
| Equity VaR | 1.0 | 1.4 | 2.0 | 1.2 | 1.4 | 0.9 | 1.2 | 1.6 | ||||||||||||||||||||||||
| FX VaR | 0.5 | 0.9 | 1.7 | 0.6 | 0.9 | 1.4 | 0.9 | 1.0 | ||||||||||||||||||||||||
| Commodity VaR | — | — | — | — | — | — | — | — | — | |||||||||||||||||||||||
| Stress scenario: maximum volatility (worst case) | ||||||||||||||||||||
EUR million. Dec. 2023 | ||||||||||||||||||||
Interest rate |
Equities |
Exchange rate |
Credit spread |
Commodities |
Total |
|||||||||||||||
| Total trading | (37.5) | (10.4) | (32.3) | (0.5) | — | (80.7) | ||||||||||||||
| Europe | (10.1) | (4.9) | (21.4) | (0.5) | — | (36.9) | ||||||||||||||
| North America | (0.6) | (0.1) | (1.0) | — | — | (1.7) | ||||||||||||||
| South America | (26.8) | (5.4) | (9.9) | — | — | (42.1) | ||||||||||||||
| Risk metric values on the consolidated balance sheet | ||||||||||||||
EUR million. Dec. 2023 |
||||||||||||||
Main market risk metrics |
||||||||||||||
| Assets subject to market risk | Balance sheet amount |
VaR | Other | Main risk factors for 'Other' balance | ||||||||||
| Cash, cash balances at central banks and other deposits on demand | 220,342 | 220,342 | Interest rate | |||||||||||
| Financial assets held for trading | 176,921 | 176,921 | ||||||||||||
| Non-trading financial assets mandatorily at fair value through profit or loss | 5,910 | 4,068 | 1,842 | Interest rate, spread | ||||||||||
| Financial assets designated at fair value through profit or loss | 9,773 | 1,360 | 8,413 | Interest rate, spread | ||||||||||
| Financial assets at fair value through other comprehensive income | 83,308 | 1,761 | 81,547 | Interest rate, spread | ||||||||||
| Financial assets measured at amortised cost | 1,191,403 | 1,191,403 | Interest rate, spread | |||||||||||
| Hedging derivatives | 5,297 | 5,297 | Interest rate, exchange rate | |||||||||||
| Changes in the fair value of hedged items in portfolio hedges of interest risk | (788) | (788) | Interest rate | |||||||||||
| Other assets | 104,896 | |||||||||||||
| Total assets | 1,797,062 | |||||||||||||
| Liabilities subject to market risk | ||||||||||||||
| Financial liabilities held for trading | 122,270 | 122,270 | ||||||||||||
| Financial liabilities designated at fair value through profit or loss | 40,367 | 450 | 39,917 | Interest rate, spread | ||||||||||
| Financial liabilities at amortised cost | 1,468,703 | 1,468,703 | Interest rate, spread | |||||||||||
| Hedging derivatives | 7,656 | 7,656 | Interest rate, exchange rate | |||||||||||
| Changes in the fair value hedged items in portfolio hedges of interest rate risk | 55 | 55 | Interest rate | |||||||||||
| Other liabilities | 53,770 | |||||||||||||
| Total liabilities | 1,692,821 | |||||||||||||
| Total equity | 104,241 | |||||||||||||
| Net interest income (NII) sensitivity | ||
| % of total | ||
| 68.1% | 19.7% | 3.9% | 8.3 | % | |||||||

| Economic value of equity (EVE) sensitivity | ||
| % of total | ||
| 55.2% | 28.8% | 16.0% | ||||||

| Net interest income (NII) sensitivity | ||
| % of total | ||
| 87.8% | 12.2% | ||||

| Economic value of equity (EVE) sensitivity | ||
| % of total | ||
| 92.6% | 7.4% | ||||

| Net interest income (NII) sensitivity | ||
| % of total | ||
| 75.0% | 19.1% | 5.9% | ||||||

Economic value of equity (EVE) | ||
| % of total | ||
| 53.1% | 37.6% | 9.3% | ||||||

| Structural VaR | ||||||||||||||||||||||||||||||||
| EUR million. VaR at a 99% over a one day horizon | ||||||||||||||||||||||||||||||||
| 2023 | 2022 | 2021 | ||||||||||||||||||||||||||||||
| Minimum | Average | Maximum | Latest | Average | Latest | Average | Latest | |||||||||||||||||||||||||
| Structural VaR | 552.7 | 705.0 | 914.5 | 749.5 | 664.0 | 538.5 | 993.7 | 1,011.9 | ||||||||||||||||||||||||
| Diversification effect | (368.7) | (416.6) | (422.2) | (444.1) | (417.1) | (422.4) | (327.3) | (240.2) | ||||||||||||||||||||||||
VaR Interest RateA |
273.3 | 348.4 | 478.0 | 380.2 | 350.8 | 304.5 | 400.7 | 287.8 | ||||||||||||||||||||||||
| VaR Exchange Rate | 477.0 | 580.4 | 661.1 | 642.9 | 493.4 | 461.0 | 600.6 | 655.2 | ||||||||||||||||||||||||
| VaR Equities | 171.1 | 192.8 | 197.6 | 171.1 | 236.9 | 195.4 | 319.7 | 309.1 | ||||||||||||||||||||||||
|
For more details on liquidity metrics, see section 3.4 ‘Liquidity and funding management’ of 'Economic and financial review' chapter. |
||||
RWA by risk typeA |
|||||
Dec. 23 data |
|||||
RWA by regionB | ||
Dec. 23 data | ||
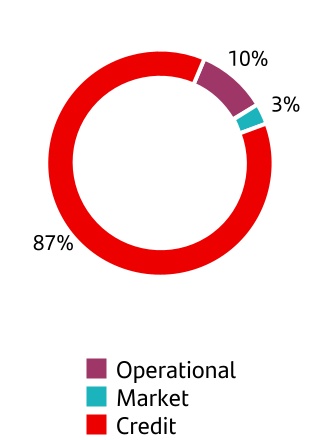
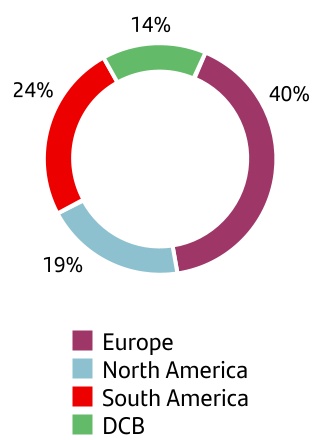
|
For more details, see section 3.5 ‘Capital management and adequacy. Solvency ratios' in the 'Economic and financial review' chapter. |
||||
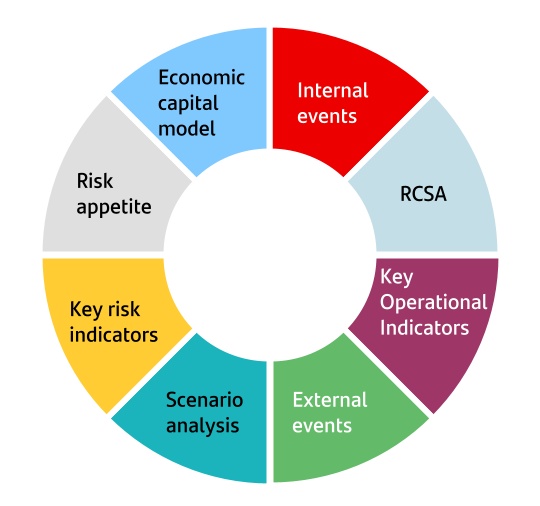
|
For more details on cyber security, see section 5 'Research, development and innovation (R&D&I)' on 'Economic and financial review' chapter. |
||||
|
For more details on compliance risk mitigation, see section 7.2 'Compliance and conduct risk management'.
|
||||
|
For more details on regulatory compliance in markets, see section 'CIB Compliance' in 7.2 'Compliance and conduct risk management' |
||||
Net losses by operational risk categoryA | ||
| (% o/total) | ||
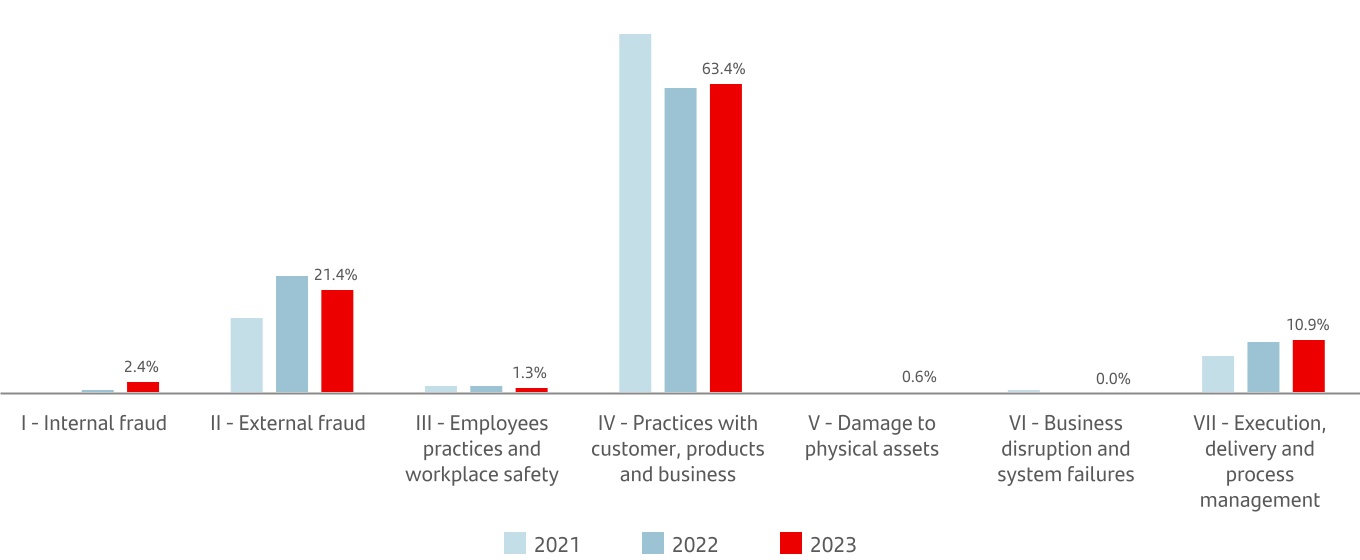
Net losses by countryA | ||
| (% o/total) | ||
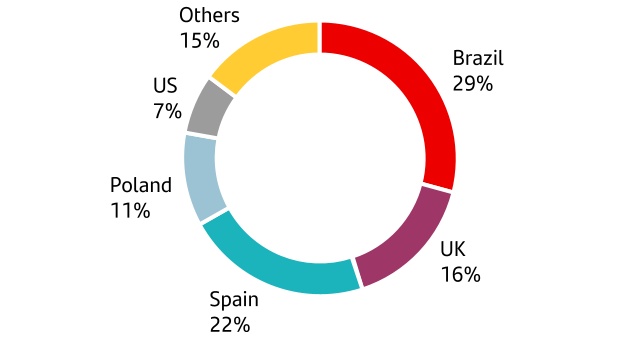
| Employees’ compliance functions | ||||||||||||||
| Canal Abierto | Training and awareness | |||||||||||||
 |
→Provides a channel for employees to report unethical conduct and breaches of internal regulation.
→Manages and investigate reported cases.
→Promotes a culture of speaking up and truly listening.
|
 |
→Develop employee training programmes and awareness campaigns on corporate defense and employee' compliance.
→Issue messages about ethics to the entire Group to build relationships based on trust.
→ Train the Group’s board members.
|
|||||||||||
| Disciplinary proceedings | Policies and procedures | |||||||||||||
 |
→Investigate conduct that is misaligned with our ethics and compliance principles.
→ Assess disciplinary measures.
|
 |
→Promote compliance with the GCC and enact special policies and procedures to enforce it.
→ Report to governing bodies regularly.
|
|||||||||||
Appointments |
Queries about ethics | |||||||||||||
 |
→Assess the suitability of the Group’s board and senior management nominations.* |
 |
→Manage queries from employees and members of governing bodies about ethics and internal regulation.
→Provide advice on ethics amid controversies.
|
|||||||||||
| Anti-trust | ||||||||||||||
 |
→Manage the anti-trust compliance programme. |
|||||||||||||
(*) Run by the Corporate Centre Regulatory Compliance, Legal and Internal Governance areas. | ||||||||||||||
|
|||||

Key conduct risk lines of action in 2023 | ||||||||||||||
| Objectives | Lines of action | |||||||||||||
 |
Continue to enhance conduct risk management with customers |
Adapting internal rules and management models to the shifting landscape and customers’ needs. |
→Keeping retail customer conduct guidelines consistent with regulation and industry best practice.
→ Embedding lessons learned from customer conduct risks detected, measured and mitigated by our risk management, especially through first-line self-assessments that boost awareness and accountability.
→ Exploring advanced analysis and machine learning techniques through the development of algorithms that correlate customer voice data with business indicators to monitor customer’s conduct, embracing innovation and technology for an effective process of corrective measures.
|
|||||||||||
 |
Awareness and accountability of the first line of defence | Raising awareness of conduct risk management and prevention in business and support areas. |
→Regularly training our local first- and second-line defence teams on conduct risk. In 2023, we updated mandatory conduct training for all Group employees.
→ Linking first-line teams’ remuneration to conduct and quality, with a holistic view of branches, online channels, remote customer assistance, and services.
|
|||||||||||
|
Sustainable products and services | Supporting projects relating to the Group’s transition towards a more sustainable economy. |
→Transparent reporting on investment products and services for retail customers.
→ Embedding ESG risks in our management through measurement tools and methodologies that enable us to categorize products appropriately, measure ESG risk and meet customers’ sustainability needs.
|
|||||||||||
 |
Vulnerable customers and special cases | Treating vulnerable customers fairly and appropriately, and making sure we consider their circumstances as part of our services. |
→Developing our global vulnerable customer strategy and helping units implement it.
→ Monitoring collection and recovery indicators every month.
→ Performing special monitoring of practices for customers who are affected by the rising cost of living, have disabilities, and are senior citizens.
|
|||||||||||
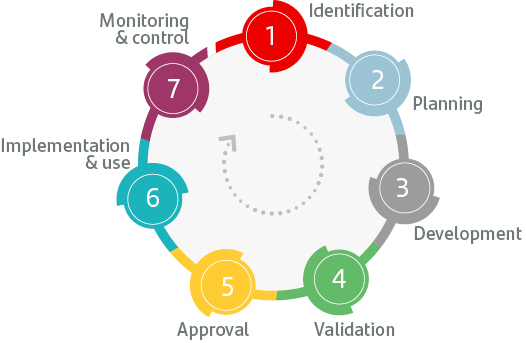
| 1 | Business model risk, which includes the risk of the model being out of date, becoming irrelevant and/or losing its capacity to continue generating the desired results. |
||||
| 2 | Strategy design risk, which relates to the strategy and assumptions set out in Grupo’s long-term plan, considering that this plan may be unsuitable in its nature or because of its assumptions, which could result in the Group not achieving the expected results. |
||||
| 3 | Strategy execution risk, which involves the three-year strategic plan and potential deviations from it due to internal and external factors, the lack of capacity to respond to changes in the business environment and the risks associated with corporate development transactions. |
||||
|
|||||
|
Environmental
Managing climate and environmental risk factors is crucial to implementing our strategy, aiding the transition to a low-carbon economy, and fulfilling our ambition to be net zero by 2050.
|
Social
Our social risk management is supported by the definition of several policies and internal frameworks that are leveraged on best practices, conventions, international protocols and codes of conduct in each matter.
|
Governance
The management of risks derived from governance is a relevant aspect in two facets: on the one hand, in the internal governance of the Grupo Santander, and on the other, in the evaluation we make of the governance of our customers.
|
||||||||||||||||||||||||||||||
Acute 
|
|
More intense extreme weather events, such as droughts, hurricanes or floods. |
||||||
Chronic 
|
|
Changes in rainfall patterns, extreme weather variability, average temperature rises, severe heatwaves and rising sea levels. |
||||||
Market sentiment 
|
|
Changes in the supply and demand of certain commodities, products and services as they consider climate risk and opportunity, which could lead to reputational and other issues. |
||||||
Policy action 
|
|
Implementing carbon pricing mechanisms to reduce greenhouse gas emissions; using energy sources with lower emissions; adopting energy efficient solutions; and promoting water efficiency measures and more sustainable land use practices. |
||||||
Technology 
|
|
The need to build and innovate to support the transition to an energy efficient financial system with lower CO2 emissions. This can have a significant impact on companies as new technology displaces obsolete systems and disrupts some components of the financial system as we know it. |
||||||
| Risk type | Key climate drivers1 |
Main time horizon2 |
Potential impact on climate risk factors | What we’re doing to manage climate risk | Next steps | ||||||||||||||||||
| Credit |
|
Medium-long term |
→Extreme weather can lead to higher retail and corporate loan default and lower collateral value. It can also cause income to fall, harm agriculture, and increase insurance coverage and premiums. Moreover, changes in wind patterns that reduce energy production can lead to higher operating costs and hamper productivity. This may increase asset depreciation and early disposal due to property damage in 'high risk' locations.
→A failure by borrowers to adapt their business models to a low-carbon economy could heighten credit risk and, therefore, the risk of a reduction in income or activity that may increase default or cause the business to lose value.
→Adverse weather conditions can cause significant financial loss, endanger communities, harm the environment and affect the value of guarantees.
→Market sentiment that influences demand; obsolete technology; customer preferences.
→Higher operating costs for carbon-intensive customers; information requirements (data gathering), especially on emissions (e.g. Scope 3) and green taxonomy disclosures; and new EU financial information directives stemming from government measures.
|
→Conducting materiality assessments to spot physical and transition risk in our portfolios.
→Analysing short-, medium- and long-term risk concentration by sector and region.
→Creating heatmaps that follow orderly, disorderly and Hot House World scenarios up to 2050.
→Implementing mitigation measures such as policies, thresholds and insurance to combat risks and their impact.
→Conducting scenario analyses and measuring sensitivities to forecast changes in ratings, PD and LGD in view of physical and transition risk.
→Drawing up credit risk metrics to monitor and control E&CC3 risk factors in BAU processes.
→Measuring E&CC factors in customer and transaction analysis and ratings.
→Setting risk appetite limits and alerts to manage climate-related sectors.
|
→Run the second phase of 'Climate Race', our credit risk target operating model for climate and environmental factors and embedding of E&CC factors in the entire credit cycle to pinpoint and mitigate physical and transition risk.
→Include climate factors in internal physical and transition risk models and embed scenario analysis techniques in risk management through a forward-looking approach by sector and geography.
→Develop tools to monitor E&CC factors that consider physical and transition risk in the property sector.
|
||||||||||||||||||
| Market |
|
Short-Medium term |
→Higher volatility in market factors under stress scenarios.
→Changes in market perception leading to wider credit spreads for business in impacted sectors.
|
→Regular reviews of climate stress scenarios and subsidiaries that apply them.
→Stress testing using physical and transition risk scenarios.
→Portfolio analysis of current exposure to climate-sensitive business activities.
|
→Enhancing analysis of material climate impact on trading portfolios to help with future sector-based stress testing.
→Enriching stress testing and reviewing new scenarios to be included.
→Adapting stress testing to best market practices.
|
||||||||||||||||||
| Liquidity |
|
Short-Medium term |
→Market impacts on the value of high quality liquid assets in Santander's liquidity buffer.
→More frequent extreme weather stifling economic growth in countries susceptible to climate change, causing sovereign debt to rise and limiting access to capital markets.
→Cash outflows from companies trying to boost their reputation in the market or solve problems with climate scenarios.
|
→Qualitative and quantitative climate scenario analyses of impacts on highly liquid assets (HQLAs) and financing of exposed companies.
→Analysis of higher outflows due to changes in market perception of corporations in climate-sensitive business activities.
|
→Enhancing stress testing and reviewing new scenarios to be included.
→Adapting stress testing to best market practices, including new liquidity scenarios to measure their impact.
|
||||||||||||||||||
| Risk type | Key climate drivers1 |
Main time horizon2 |
Potential impact on climate risk factors | What we’re doing to manage climate risk | Next steps | ||||||||||||||||||
| Operational |
|
Medium-long term |
→Severe climate events can cause damage to our assets, including branches, offices and data centres. They can also affect business continuity, processes and staff.
→Climate-related factors can also lead to operational risk losses from litigation (e.g., if a bank is perceived to misrepresent sustainability-related practices).
|
→Conducting operational risk and control self-assessments that include ESG-related risks to evaluate our exposure.
→Conducting mandatory operational risk scenario analysis that covers physical and transition risk.
→Adding ESG flag to the operational risk events database to classify incidents and environmental- and climate-related losses.
→Including an assessment of climate threats in business continuity scenarios.
|
→Enhance operational risk reporting on climate-related factors.
→Update documentation and provide training on the embedding of ESG factors in operational risk management.
|
||||||||||||||||||
| Reputational |
|
Short-medium-long term |
→Customers, investors and other stakeholders who believe banks aren't doing enough to meet low-carbon targets, act against their policies or that their public commitments can pose reputational risk.
→Misleading customers, investors and stakeholders with statements, actions, announcements, policies and the sustainability features of products or 'greenwashing' practices.
|
→Updating climate and environmental risk policies and procedures.
→Addressing reputational risk through corporate credit committees that assess sensitive transactions that involve climate and environmental risk.
→Holding formal meetings to review reputational issues (including climate matters), involving the legal, responsible banking, investor relations, risk and other teams.
→Implementing proactive measures to support companies’ green transition and decarbonization.
|
→Continue driving cooperation between the reputational risk area and other teams to address reputational impact.
→Conduct a materiality assessment to measure climate-related and environmental reputational risk.
→Implement a methodology to quantify the reputational impact of climate and environmental risk.
|
||||||||||||||||||
| Strategic |
|
Short-medium-long term |
→A failure to achieve our climate and environmental targets, including those relating to our own and our customers’ operations, could affect our strategy.
|
→Checking that ESG targets are embedded in the Group’s strategic planning.
→Monitoring the Group’s strategic 'Climate change' project, including net zero KPIs.
→Identifying emerging risks, which includes an ESG risk event and analysis of how low-probability stress scenarios might impact on the Group’s strategic targets to draw up suitable action plans.
→Monitoring ESG initiatives presented at the corporate product governance forum (CGPF) and investors’ forum.
→Reviewing ESG factors and KPIs in the business model.
|
→Continue monitoring climate and environmental threats as part of emerging risk identification.
→Revise ESG KPIs regularly so that they remain consistent with the Group’s strategy.
→Continue reviewing ESG factors in relation to business model performance.
|
||||||||||||||||||
|
For more information regarding climate and environmental risks factors, see our 'Climate Finance Report' on our corporate website. |
||||
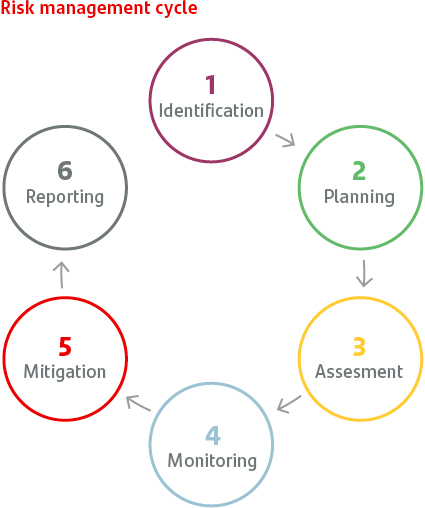
|
Materiality assessment -
Climate risk analysis and portfolio heatmap
| |||||||||||||||||
| September 2023 (pre-mitigation) - EUR billion | |||||||||||||||||
| TR | PR | CIB |
Other segments | ||||||||||||||
| Power (conventional) | 28 | 2 | |||||||||||||||
Power (renewables) |
12 | 0 | |||||||||||||||
| Oil & Gas | 23 | 1 | |||||||||||||||
| Mining y metals | 14 | 8 | |||||||||||||||
| Transport | 28 | 12 | |||||||||||||||
Auto Consumer |
0 | 159 | |||||||||||||||
| Real Estate | 8 | 388 | |||||||||||||||
Other climate-related sectors |
Agriculture | 2 | 9 | ||||||||||||||
| Construction | 17 | 14 | |||||||||||||||
| Manufacturing | 49 | 26 | |||||||||||||||
| Water & Waste | 3 | 1 | |||||||||||||||
| Climate sectors | 184 | 620 | |||||||||||||||
| Other sectors | 58 | 230 | |||||||||||||||
| Total portfolio | 242 | 850 | |||||||||||||||
¢ Low ¢ Moderately Low ¢ Medium ¢ High ¢ Very High | |||||||||||||||||
|
TR: transition risk. PR: physical risk.
CIB: REC (on and off-balance sheet lending + guarantees + derivatives PFE: Potential Future Exposure).
Other segments: Drawn amount; includes individuals, SCF, Auto US, Corporates and Institutions, and SMEs.
Other sectors: considered as low risk; include: CIB, Corporate and SMEs outside the risk taxonomy perimeter // Individuals and SCF: cards and other consumer credit // Private Banking (excl. mortgages).
Exposure 0 represents exposure below EUR 500 million.
| |||||||||||||||||
|
For more information regarding our materiality assessment, see our 'Climate Finance Report' on our corporate website. |
||||
| 2023 AGM | Annual general shareholders’ meeting of Banco Santander held on 31 March 2023 at second call | ||||
| 2024 AGM | Annual general shareholders’ meeting of Banco Santander called for 21 or 22 March 2024 at first or second call, respectively | ||||
| ABC | Anti-bribery and corruption | ||||
| Act 10/2014 | Act 10/2014, of 26 June, on the organization, supervision and solvency of credit institutions | ||||
| Active customer | Those customers who comply with the minimum balance, income and/or transactionality requirements as defined according to the business area | ||||
| ADR | American depositary receipts | ||||
| ADS | American depositary shares | ||||
| AEOI | Automatic Exchange of Information standard | ||||
| AI | Artificial intelligence | ||||
| ALCO | Assets and liabilities committee | ||||
| ALM | Asset and liability management | ||||
| AML | Anti-money laundering | ||||
| API | Application programming interface | ||||
| APM | Alternative performance measure | ||||
| APS | Amherst Pierpont Securities | ||||
| AuM | Assets under management | ||||
| Banesto | Banco Español de Crédito, S.A. | ||||
| BCMS | Business continuity management system | ||||
| BCP | Business continuity plan | ||||
| bn | Billion | ||||
| BNPL | Buy-now-pay-later. Short-term financing that allows consumers to make purchases and pay for them at a future date | ||||
| BoE | Bank of England | ||||
| bps | Basis points | ||||
| BRRD | Directive 2014/59/EU establishing a framework for the recovery and resolution of credit institutions and investment firms, as amended from time to time | ||||
| Bylaws | Bylaws of Banco Santander, S.A. | ||||
| CAE | Chief Audit Executive | ||||
| CAGR | Compounded annual growth rate | ||||
| CAO | Chief Accounting Officer | ||||
| CARF | Conselho Administrativo de Recursos Fiscais (Administrative Council for Tax Appeals) |
||||
| CBDC | Central bank digital currency | ||||
| CCCA | Collective Commitment to Climate Action | ||||
| CCO | Chief Compliance Officer | ||||
| CCPS | Contingent convertible preferred stock | ||||
| CCR | Counterparty credit risk | ||||
| CCSM | Code of Conduct in Securities Markets | ||||
| CDI | CREST Depositary Interests | ||||
| CEO | Chief Executive Officer | ||||
| CFO | Chief Financial Officer | ||||
| CFT | Combating the financing of terrorism | ||||
| CHF | Swiss franc | ||||
| CIB | Corporate & Investment Banking | ||||
| CIO | Chief Information Officer | ||||
| CNBV | Comisión Nacional Bancaria y de Valores (Mexican stock market authority) |
||||
| CNMV | Comisión Nacional del Mercado de Valores (Spanish stock market authority) |
||||
| CoE | Cost of equity | ||||
| COFINS | Contribuiçao para Financiamiento da Seguridade Social (Contribution for Social Security Financing) |
||||
| Constant euros | Excluding exchange rates impact | ||||
| COSO | Committee of Sponsoring Organizations of the Treadway Commission | ||||
| Costs in real terms | Costs excluding the effect of average inflation over the last twelve months | ||||
| CPGF | Corporate product governance forum | ||||
| CRD | Capital Requirements Directive | ||||
| CRE | Credit risk equivalent | ||||
| CRO | Chief Risk Officer | ||||
| CRR | Regulation (EU) 575/2013 on prudential requirements for credit institutions and investment firms, as amended from time to time | ||||
| CRS | Common reporting standards | ||||
| CSA | Credit Support Annex | ||||
| CSLL | Contribuçao Social sobre o Lucro Liquido (Social Contribution on Net Profit) |
||||
| CSRBB | Credit spread risk in the banking book | ||||
| CSRD | Corporate Sustainability Reporting Directive | ||||
| CVA | Credit valuation adjustment | ||||
| DCB | Digital Consumer Bank | ||||
| Digital customer | Every consumer of commercial banking services who has logged on to their personal online banking and/or mobile banking in the last 30 days | ||||
| DNSH | Do not significant harm | ||||
| DORA | Digital Operational Resilience Act | ||||
| DPO | Data protection officer | ||||
| DTA | Deferred tax asset | ||||
| DVA | Debt valuation adjustment | ||||
| E&CC | Environmental and climate change related | ||||
| EAD | Exposure at default | ||||
| EBA | European Banking Authority | ||||
| EBITDA | Earnings before interest, taxes, depreciation and amortization | ||||
| ECB | European Central Bank | ||||
| EIB | European Investment Bank | ||||
| EIOPA | European Insurance and Occupational Pensions Authority | ||||
| EMIR | European Market Infrastructure Regulation | ||||
| eNPS | Employee Net Promoter Score is a method of measuring employee satisfaction | ||||
| EOIR | Exchange Of Information on Request standard | ||||
| EPC | Energy performance certificate | ||||
| EPS | Earnings per share | ||||
| Equal pay gap | The equal pay gap measures differences in remuneration between women and men in the same job at the same level | ||||
| ESCC | Environmental, social and climate change related | ||||
| ESG | Environmental, social and governance | ||||
| ESMA | European Securities and Markets Authority | ||||
| ESRS | European Sustainability Reporting Standards | ||||
| EU | European Union | ||||
| EV | Electric vehicle | ||||
| EVA | Economic value added | ||||
| EVP | Employee value proposition | ||||
| FATCA | Foreign Account Tax Compliance Act | ||||
| FCA | Financial Conduct Authority | ||||
| FCC | Financial crime compliance | ||||
| Fed | Federal Reserve | ||||
| Financial inclusion | Number of people who are unbanked, underbanked, in financial difficulty, with difficulties in accessing credit who, through the Group's products and services, are able to access the financial system or receive tailored finance. Financially underserved groups are defined as people who do not have a current account, or who have an account but obtained alternative (non-bank) financial services in the last 12 months. Beneficiaries of various programmes are included in the quantification process only once in the entire period. Only new empowered people are counted, taking as a base year those existing since 2019 | ||||
| First 2023 Buyback Programme | First buyback programme carried out within the 2023 shareholder remuneration policy | ||||
| FL CET1 | Fully-Loaded Common Equity Tier 1 | ||||
| FRTB | Fundamental review of the trading book | ||||
| FSB | Financial Stability Board | ||||
| FX | Foreign exchange | ||||
| G-SIB | Global systemically important bank | ||||
| GAR | Green asset ratio | ||||
| GBP | Sterling pound | ||||
| GCC | General Code of Conduct | ||||
| GDP | Gross Domestic Product | ||||
| GDPR | General Data Protection Regulation | ||||
| Gender pay gap | The gender pay gap measures differences in remuneration between women and men in an organization, business, industry or the broader economy, irrespective of the type of work | ||||
| GFANZ | Glasgow Financial Alliance for Net Zero | ||||
| GHG | Greenhouse gases | ||||
| GMRA | Global master repurchase agreement | ||||
| GRC | Governance, risk and compliance | ||||
| GRI | Global Reporting Initiative | ||||
| GSGM | Group-Subsidiary governance model | ||||
| GTB | Global transactional banking | ||||
| HQLA | High-quality liquid assets | ||||
| HtC | Held to collect | ||||
| ICAAP | Internal capital adequacy assessment process | ||||
| ICAC | Instituto de Contabilidad y Auditoría de Cuentas (Institute of accounting and auditing) |
||||
ICE |
Internal combustion engines |
||||
| ICFR | Internal control over financial reporting | ||||
| ICO | Instituto Oficial de Crédito (Spanish public credit institution) |
||||
| ICS | Internal control system | ||||
| Identified staff | Other executives whose activities may have a significant impact on the Group's risk profile | ||||
| IEA | International Energy Agency | ||||
| IFRS | International Financial Reporting Standards | ||||
| ILAAP | Internal liquidity adequacy assessment process | ||||
| IMA | International model approach | ||||
| IMF | International Monetary Fund | ||||
| IOSCO | International Organization of Securities Commissions | ||||
| IPO | Initial Public Offering | ||||
| IRB | Internal ratings-based | ||||
| IRC | Incremental risk charge | ||||
| IROs | Impacts, risks and opportunities | ||||
| IRPJ | Imposto sobre a Renda das Pessoas Jurídicas (Corporate Income Tax) |
||||
| IRRBB | Interest rate risk in the banking book | ||||
| ISMA | International Securities Market Association | ||||
| JPY | Japanese yen | ||||
| KOR | Key operational risks | ||||
| KPI | Key performance indicators | ||||
| KRI | Key risk indicators | ||||
| LCR | Liquidity coverage ratio | ||||
| LDA | Loss distribution approach | ||||
| LGD | Loss given default | ||||
| LLP | Loan-loss provisions | ||||
| Loyal customer | Active customers who receive most of their financial services from the Group according to the commercial segment to which they belong. Various loyalty customer levels have been defined taking profitability into account | ||||
| LTD | Loan to deposit ratio. Ratio of loans and advances to customers over customer deposits | ||||
| LTV | Loan to value ratio. Ratio of loans and advances to customers to the value of the asset used as collateral | ||||
LUC |
Land use change (cambio en el uso del terreno) |
||||
| M/LT | Medium-and long-term | ||||
| Material Risk Taker | Other executives whose activities could have a significant impact on the Group's risk profile | ||||
| MDA | Maximum distributable amount | ||||
| MiFID | Markets in Financial Instruments Directive | ||||
| MILRO | Money Laundering Reporting Officer | ||||
| mn | Million | ||||
| MRAP | Market risk advanced platform | ||||
| MREL | Minimum requirements for own funds and eligible liabilities which are required under the BRRD | ||||
| MSS | Minimum social safeguards | ||||
| NACE | Nomenclature of Economic Activities of the European Union | ||||
| NFR | Non-financial risk | ||||
| NGFS | Network for greening the financial system | ||||
| NGO | Non-governmental organization | ||||
| NGO TMT | Non-governmental organization Trygg Mat Tracking | ||||
| NII | Net interest income | ||||
| NPL | Non-performing loans | ||||
| NPS | Net Promoter Score | ||||
| NSFR | Net stable funding ratio | ||||
| NYSE | New York Stock Exchange | ||||
| NZAMi | Net Zero Asset Managers initiative | ||||
| NZBA | Net Zero Banking Alliance | ||||
| NZE | Net zero emissions | ||||
| OECD | Organization for Economic Cooperation and Development | ||||
| OEM | Original equipment manufacturer | ||||
| OTC | Over-the-counter | ||||
| P&L | Profit and loss statement | ||||
| PBT | Profit before taxes | ||||
| PCAF | Partnership for Carbon Accounting Financials | ||||
| PCAOB | Public Company Accounting Oversight Board | ||||
| PD | Probability of default | ||||
| PHEV | plug-in hybrid electric vehicle | ||||
| PIS | Programa de Integraçao Social (Social Integration Programme) |
||||
| POCI | Purchased or originated credit impaired | ||||
| PoS | Point of sale | ||||
| pp | Percentage point | ||||
| PRA | Prudential Regulation Authority | ||||
PRB |
Principles for responsible banking |
||||
| PSD2 | Payment Services Directive Two | ||||
| RAS | Risk appetite statement | ||||
RBF |
Responsible banking forum |
||||
| RBSCC | Responsible banking, sustainability and culture committee | ||||
| RCP | Representative concentration pathway | ||||
| RCSA | Risk control self-assessment | ||||
| Repos | Repurchase agreements | ||||
| RoA | Return on assets | ||||
| RoE | Return on equity | ||||
| RoRWA | Return (net of tax) on risk weighted assets for a particular business | ||||
| RoTE | Return on tangible equity | ||||
| RPA | Risk profile assessment | ||||
RPK |
Revenue passenger kilometers |
||||
| RWA | Risk-weighted assets | ||||
| S&P 500 | Index maintained by S&P Dow Jones Indices LLC | ||||
| SAM | Santander Asset Management | ||||
| SBNA | Santander Bank N.A. | ||||
| SBTi | Science Based Targets initiative | ||||
| SBTN | Science Based Targets Network | ||||
| SC USA | Santander Consumer US | ||||
| SCF | Santander Consumer Finance | ||||
| SCIB | Santander Corporate & Investment Banking | ||||
| SDG | Sustainable development goals | ||||
| SEC | Securities and Exchange Commission | ||||
| Second 2023 Buyback Programme | Second share buyback programme charged against 2023 results | ||||
| SFDR | Sustainable Finance Disclosure Regulation | ||||
| SFICS | Sustainable finance and investment classification system | ||||
| SHUSA | Santander Holding USA, Inc | ||||
| SME | Small and medium enterprises | ||||
| SOx | Sarbanes-Oxley Act of 2002 | ||||
| Spanish Corporate Governance Code | CNMV's Good Governance Code for Listed Companies | ||||
| Spanish Securities Markets Act | Act 6/2023, of 17 March, on the Securities Markets and on Investment Services | ||||
| SPC | Strategic commercial plans | ||||
| SPF | Simple, Personal and Fair | ||||
| SRB | European Single Resolution Board | ||||
| SREP | Supervisory review and evaluation process | ||||
| SRI | Socially responsible investment | ||||
| SRT | Significant risk transfer | ||||
| SSM | Single Supervisory Mechanism. The system of banking supervision in Europe. It is composed of the ECB and the competent supervisory authorities of the participating EU countries | ||||
| STEM | Science, Technology, Engineering, Mathematics | ||||
| STR | Suspicious transaction reporting | ||||
| T&O | Technology & operations | ||||
| TCFD | Task Force on Climate-related Financial Disclosures | ||||
| TLAC | Total loss-absorbing capacity requirement which is required to be met under the CRD V package | ||||
| TLTRO | Targeted longer-term refinancing operations | ||||
| TNAV | Tangible net asset value | ||||
| TNFD | Taskforce on Nature-related Financial Disclosure | ||||
| TOM | Target operating model | ||||
| TPV | Total payments volume | ||||
| TRIM | Targeted review of internal models | ||||
| TSR | Total shareholder return | ||||
| UK | United Kingdom | ||||
| UNEP FI | United Nations Environmental Programme Finance Initiative | ||||
| US | United States of America | ||||
| USD | United States dollar | ||||
| VaR | Value at risk | ||||
| VAT | Value added tax | ||||
vkm |
Vehicle-kilometer |
||||
| WBCSD | World Business Council for Sustainable Development | ||||
| YoY | Year-on-Year | ||||
Auditor's report and consolidated financial statements |
|||||
 | |||||
Auditor's report |
|||||
 | |||||
Consolidated financial statements |
|||||
 | |||||
| CONSOLIDATED BALANCE SHEETS AS OF 31 DECEMBER 2023, 2022 AND 2021 | ||||||||||||||
| EUR million | ||||||||||||||
| ASSETS | Note | 2023 | 2022 |
2021 |
||||||||||
| CASH, CASH BALANCES AT CENTRAL BANKS AND OTHER DEPOSITS ON DEMAND | 220,342 | 223,073 | 210,689 | |||||||||||
| FINANCIAL ASSETS HELD FOR TRADING | 176,921 | 156,118 | 116,953 | |||||||||||
| Derivatives | 9 and 11 | 56,328 | 67,002 | 54,292 | ||||||||||
| Equity instruments | 8 | 15,057 | 10,066 | 15,077 | ||||||||||
| Debt securities | 7 | 62,124 | 41,403 | 26,750 | ||||||||||
| Loans and advances | 43,412 | 37,647 | 20,834 | |||||||||||
| Central banks | 6 | 17,717 | 11,595 | 3,608 | ||||||||||
| Credit institutions | 6 | 14,061 | 16,502 | 10,397 | ||||||||||
| Customers | 10 | 11,634 | 9,550 | 6,829 | ||||||||||
| NON-TRADING FINANCIAL ASSETS MANDATORILY AT FAIR VALUE THROUGH PROFIT OR LOSS |
5,910 | 5,713 | 5,536 | |||||||||||
| Equity instruments | 8 | 4,068 | 3,711 | 4,042 | ||||||||||
| Debt securities | 7 | 860 | 1,134 | 957 | ||||||||||
| Loans and advances | 982 | 868 | 537 | |||||||||||
| Central banks | 6 | — | — | — | ||||||||||
| Credit institutions | 6 | — | — | — | ||||||||||
| Customers | 10 | 982 | 868 | 537 | ||||||||||
| FINANCIAL ASSETS DESIGNATED AT FAIR VALUE THROUGH PROFIT OR LOSS | 9,773 | 8,989 | 15,957 | |||||||||||
| Debt securities | 7 | 3,095 | 2,542 | 2,516 | ||||||||||
| Loans and advances | 6,678 | 6,447 | 13,441 | |||||||||||
| Central banks | 6 | — | — | — | ||||||||||
| Credit institutions | 6 | 459 | 673 | 3,152 | ||||||||||
| Customers | 10 | 6,219 | 5,774 | 10,289 | ||||||||||
| FINANCIAL ASSETS AT FAIR VALUE THROUGH OTHER COMPREHENSIVE INCOME | 83,308 | 85,239 | 108,038 | |||||||||||
| Equity instruments | 8 | 1,761 | 1,941 | 2,453 | ||||||||||
| Debt securities | 7 | 73,565 | 75,083 | 97,922 | ||||||||||
| Loans and advances | 7,982 | 8,215 | 7,663 | |||||||||||
| Central banks | 6 | — | — | — | ||||||||||
| Credit institutions | 6 | 313 | — | — | ||||||||||
| Customers | 10 | 7,669 | 8,215 | 7,663 | ||||||||||
| FINANCIAL ASSETS AT AMORTIZED COST | 1,191,403 | 1,147,044 | 1,037,898 | |||||||||||
| Debt securities | 7 | 103,559 | 73,554 | 35,708 | ||||||||||
| Loans and advances | 1,087,844 | 1,073,490 | 1,002,190 | |||||||||||
| Central banks | 6 | 20,082 | 15,375 | 15,657 | ||||||||||
| Credit institutions | 6 | 57,917 | 46,518 | 39,169 | ||||||||||
| Customers | 10 | 1,009,845 | 1,011,597 | 947,364 | ||||||||||
| HEDGING DERIVATIVES | 36 | 5,297 | 8,069 | 4,761 | ||||||||||
| CHANGES IN THE FAIR VALUE OF HEDGED ITEMS IN PORTFOLIO HEDGES OF INTEREST RATE RISK |
36 | (788) | (3,749) | 410 | ||||||||||
| CONSOLIDATED BALANCE SHEETS AS OF 31 DECEMBER 2023, 2022 AND 2021 | ||||||||||||||
| EUR million | ||||||||||||||
| ASSETS | Note | 2023 | 2022 |
2021 |
||||||||||
| INVESTMENTS | 13 | 7,646 | 7,615 | 7,525 | ||||||||||
| Joint venture entities | 1,964 | 1,981 | 1,692 | |||||||||||
| Associated entities | 5,682 | 5,634 | 5,833 | |||||||||||
| ASSETS UNDER REINSURANCE CONTRACTS | 237 | 308 | 283 | |||||||||||
| TANGIBLE ASSETS | 33,882 | 34,073 | 33,321 | |||||||||||
| Property, plant and equipment | 16 | 32,926 | 33,044 | 32,342 | ||||||||||
| For own-use | 13,408 | 13,489 | 13,259 | |||||||||||
| Leased out under an operating lease | 19,518 | 19,555 | 19,083 | |||||||||||
| Investment properties | 16 | 956 | 1,029 | 979 | ||||||||||
| Of which leased out under an operating lease | 851 | 804 | 839 | |||||||||||
| INTANGIBLE ASSETS | 19,871 | 18,645 | 16,584 | |||||||||||
| Goodwill | 17 | 14,017 | 13,741 | 12,713 | ||||||||||
| Other intangible assets | 18 | 5,854 | 4,904 | 3,871 | ||||||||||
| TAX ASSETS | 31,390 | 29,987 | 25,196 | |||||||||||
| Current tax assets | 10,623 | 9,200 | 5,756 | |||||||||||
| Deferred tax assets | 27 | 20,767 | 20,787 | 19,440 | ||||||||||
| OTHER ASSETS | 8,856 | 10,082 | 8,595 | |||||||||||
| Insurance contracts linked to pensions | 14 | 93 | 104 | 149 | ||||||||||
| Inventories | 7 | 11 | 6 | |||||||||||
| Other | 19 | 8,756 | 9,967 | 8,440 | ||||||||||
| NON-CURRENT ASSETS HELD FOR SALE | 12 | 3,014 | 3,453 | 4,089 | ||||||||||
| TOTAL ASSETS | 1,797,062 | 1,734,659 | 1,595,835 | |||||||||||
| CONSOLIDATED BALANCE SHEETS AS OF 31 DECEMBER 2023, 2022 AND 2021 | ||||||||||||||
| EUR million | ||||||||||||||
| LIABILITIES | Note | 2023 | 2022 |
2021 |
||||||||||
| FINANCIAL LIABILITIES HELD FOR TRADING | 122,270 | 115,185 | 79,469 | |||||||||||
| Derivatives | 9 and 11 | 50,589 | 64,891 | 53,566 | ||||||||||
| Short positions | 9 | 26,174 | 22,515 | 12,236 | ||||||||||
| Deposits | 45,507 | 27,779 | 13,667 | |||||||||||
| Central banks | 20 | 7,808 | 5,757 | 1,038 | ||||||||||
| Credit institutions | 20 | 17,862 | 9,796 | 6,488 | ||||||||||
| Customers | 21 | 19,837 | 12,226 | 6,141 | ||||||||||
| Marketable debt securities | 22 | — | — | — | ||||||||||
| Other financial liabilities | 24 | — | — | — | ||||||||||
| FINANCIAL LIABILITIES DESIGNATED AT FAIR VALUE THROUGH PROFIT OR LOSS | 40,367 | 40,268 | 14,943 | |||||||||||
| Deposits | 34,996 | 34,841 | 9,489 | |||||||||||
| Central banks | 20 | 1,209 | 1,740 | 607 | ||||||||||
| Credit institutions | 20 | 1,735 | 1,958 | 1,064 | ||||||||||
| Customers | 21 | 32,052 | 31,143 | 7,818 | ||||||||||
| Marketable debt securities | 22 | 5,371 | 5,427 | 5,454 | ||||||||||
| Other financial liabilities | 24 | — | — | — | ||||||||||
| Memorandum items: subordinated liabilities | 23 | — | — | — | ||||||||||
| FINANCIAL LIABILITIES AT AMORTIZED COST | 1,468,703 | 1,423,858 | 1,349,169 | |||||||||||
| Deposits | 1,125,308 | 1,111,887 | 1,078,587 | |||||||||||
| Central banks | 20 | 48,782 | 76,952 | 139,757 | ||||||||||
| Credit institutions | 20 | 81,246 | 68,582 | 52,235 | ||||||||||
| Customers | 21 | 995,280 | 966,353 | 886,595 | ||||||||||
| Marketable debt securities | 22 | 303,208 | 274,912 | 240,709 | ||||||||||
| Other financial liabilities | 24 | 40,187 | 37,059 | 29,873 | ||||||||||
| Memorandum items: subordinated liabilities | 23 | 30,912 | 25,926 | 26,196 | ||||||||||
| HEDGING DERIVATIVES | 36 | 7,656 | 9,228 | 5,463 | ||||||||||
| CHANGES IN THE FAIR VALUE OF HEDGED ITEMS IN PORTFOLIO HEDGES OF INTEREST RATE RISK |
36 | 55 | (117) | 248 | ||||||||||
| LIABILITIES UNDER INSURANCE CONTRACTS | 15 | 17,799 | 16,426 | 18,560 | ||||||||||
| PROVISIONS | 25 | 8,441 | 8,149 | 9,583 | ||||||||||
| Pensions and other post-retirement obligations | 2,225 | 2,392 | 3,185 | |||||||||||
| Other long term employee benefits | 880 | 950 | 1,242 | |||||||||||
| Taxes and other legal contingencies | 2,715 | 2,074 | 1,996 | |||||||||||
| Contingent liabilities and commitments | 702 | 734 | 733 | |||||||||||
| Other provisions | 1,919 | 1,999 | 2,427 | |||||||||||
| TAX LIABILITIES | 9,932 | 9,468 | 8,649 | |||||||||||
| Current tax liabilities | 3,846 | 3,040 | 2,187 | |||||||||||
| Deferred tax liabilities | 27 | 6,086 | 6,428 | 6,462 | ||||||||||
| OTHER LIABILITIES | 26 | 17,598 | 14,609 | 12,698 | ||||||||||
| LIABILITIES ASSOCIATED WITH NON-CURRENT ASSETS HELD FOR SALE | — | — | — | |||||||||||
| TOTAL LIABILITIES | 1,692,821 | 1,637,074 | 1,498,782 | |||||||||||
| CONSOLIDATED BALANCE SHEETS AS OF 31 DECEMBER 2023, 2022 AND 2021 | ||||||||||||||
| EUR million | ||||||||||||||
| EQUITY | Note | 2023 | 2022 |
2021 |
||||||||||
| SHAREHOLDERS´ EQUITY | 30 | 130,443 | 124,732 | 119,649 | ||||||||||
| CAPITAL | 31 | 8,092 | 8,397 | 8,670 | ||||||||||
| Called up paid capital | 8,092 | 8,397 | 8,670 | |||||||||||
| Unpaid capital which has been called up | — | — | — | |||||||||||
| SHARE PREMIUM | 32 | 44,373 | 46,273 | 47,979 | ||||||||||
| EQUITY INSTRUMENTS ISSUED OTHER THAN CAPITAL | 34 | 720 | 688 | 658 | ||||||||||
| Equity component of the compound financial instrument | — | — | — | |||||||||||
| Other equity instruments issued | 720 | 688 | 658 | |||||||||||
| OTHER EQUITY | 34 | 195 | 175 | 152 | ||||||||||
| ACCUMULATED RETAINED EARNINGS | 33 | 74,114 | 66,702 | 60,273 | ||||||||||
| REVALUATION RESERVES | 33 | — | — | — | ||||||||||
| OTHER RESERVES | 33 | (5,751) | (5,454) | (4,477) | ||||||||||
| Reserves or accumulated losses in joint venture investments | 1,762 | 1,553 | 1,572 | |||||||||||
| Others | (7,513) | (7,007) | (6,049) | |||||||||||
| (-) OWN SHARES | 34 | (1,078) | (675) | (894) | ||||||||||
| PROFIT OR LOSS ATTRIBUTABLE TO SHAREHOLDERS OF THE PARENT | 11,076 | 9,605 | 8,124 | |||||||||||
| (-) INTERIM DIVIDENDS | 4 | (1,298) | (979) | (836) | ||||||||||
| OTHER COMPREHENSIVE INCOME OR LOSS | 29 | (35,020) | (35,628) | (32,719) | ||||||||||
Items that will not be reclassified to profit or loss |
(5,212) | (4,635) | (4,241) | |||||||||||
| Items that may be reclassified to profit or loss | (29,808) | (30,993) | (28,478) | |||||||||||
| NON-CONTROLLING INTEREST | 28 | 8,818 | 8,481 | 10,123 | ||||||||||
| Other comprehensive income or loss | (1,559) | (1,856) | (2,104) | |||||||||||
| Other items | 10,377 | 10,337 | 12,227 | |||||||||||
| TOTAL EQUITY | 104,241 | 97,585 | 97,053 | |||||||||||
| TOTAL LIABILITIES AND EQUITY | 1,797,062 | 1,734,659 | 1,595,835 | |||||||||||
| MEMORANDUM ITEMS: OFF BALANCE SHEET AMOUNTS | 35 | |||||||||||||
| Loan commitments granted | 279,589 | 274,075 | 262,737 | |||||||||||
| Financial guarantees granted | 15,435 | 12,856 | 10,758 | |||||||||||
| Other commitments granted | 113,273 | 92,672 | 75,733 | |||||||||||
| CONSOLIDATED INCOME STATEMENTS FOR THE YEARS ENDED 31 DECEMBER 2023, 2022 AND 2021 | ||||||||||||||
| EUR million | ||||||||||||||
| (Debit) Credit | ||||||||||||||
| Note | 2023 | 2022 |
2021 |
|||||||||||
| Interest income | 38 | 105,252 | 71,430 | 46,463 | ||||||||||
| Financial assets at fair value through other comprehensive income | 5,995 | 5,479 | 2,582 | |||||||||||
| Financial assets at amortized cost | 77,701 | 59,214 | 40,471 | |||||||||||
| Other interest income | 21,556 | 6,737 | 3,410 | |||||||||||
| Interest expense | 39 | (61,991) | (32,811) | (13,093) | ||||||||||
| Interest income/(charges) | 43,261 | 38,619 | 33,370 | |||||||||||
| Dividend income | 40 | 571 | 488 | 513 | ||||||||||
| Income from companies accounted for using the equity method | 13 | 613 | 702 | 432 | ||||||||||
| Commission income | 41 | 16,321 | 15,867 | 13,812 | ||||||||||
| Commission expense | 42 | (4,264) | (4,077) | (3,310) | ||||||||||
| Gain or losses on financial assets and liabilities not measured at fair value through profit or loss, net |
43 | 96 | 149 | 628 | ||||||||||
| Financial assets at amortized cost | (3) | 34 | 89 | |||||||||||
| Other financial assets and liabilities | 99 | 115 | 539 | |||||||||||
| Gain or losses on financial assets and liabilities held for trading, net | 43 | 2,322 | 842 | 1,141 | ||||||||||
| Reclassification of financial assets at fair value through other comprehensive income | — | — | — | |||||||||||
| Reclassification of financial assets at amortized cost | — | — | — | |||||||||||
| Other gains (losses) | 2,322 | 842 | 1,141 | |||||||||||
| Gains or losses on non-trading financial assets and liabilities mandatorily at fair value through profit or loss |
43 | 204 | 162 | 132 | ||||||||||
| Reclassification of financial assets at fair value through other comprehensive income | — | — | — | |||||||||||
| Reclassification of financial assets at amortized cost | — | — | — | |||||||||||
| Other gains (losses) | 204 | 162 | 132 | |||||||||||
| Gain or losses on financial assets and liabilities measured at fair value through profit or loss, net |
43 | (93) | 968 | 270 | ||||||||||
| Gain or losses from hedge accounting, net | 43 | 63 | 74 | (46) | ||||||||||
| Exchange differences, net | 44 | 41 | (542) | (562) | ||||||||||
| Other operating income | 45 | 1,104 | 1,510 | 2,255 | ||||||||||
| Other operating expenses | 45 | (2,827) | (2,803) | (2,442) | ||||||||||
| Income from insurance and reinsurance contracts | 460 | 2,698 | 1,516 | |||||||||||
| Expenses from insurance and reinsurance contracts | (449) | (2,540) | (1,305) | |||||||||||
| CONSOLIDATED INCOME STATEMENTS FOR THE YEARS ENDED 31 DECEMBER 2023, 2022 AND 2021 | ||||||||||||||
| EUR million | ||||||||||||||
| (Debit) Credit | ||||||||||||||
| Note | 2023 | 2022 |
2021 |
|||||||||||
| Total income | 57,423 | 52,117 | 46,404 | |||||||||||
| Administrative expenses | (22,241) | (20,918) | (18,659) | |||||||||||
| Staff costs | 46 | (13,726) | (12,547) | (11,216) | ||||||||||
| Other general administrative expenses | 47 | (8,515) | (8,371) | (7,443) | ||||||||||
| Depreciation and amortisation cost | 16 and 18 | (3,184) | (2,985) | (2,756) | ||||||||||
| Provisions or reversal of provisions, net | 25 | (2,678) | (1,881) | (2,814) | ||||||||||
| Impairment or reversal of impairment at financial assets not measured at fair value through profit or loss and net gains and losses from changes |
(12,956) | (10,863) | (7,407) | |||||||||||
| Financial assets at fair value through other comprehensive income | (44) | (7) | (19) | |||||||||||
| Financial assets at amortized cost | 10 | (12,912) | (10,856) | (7,388) | ||||||||||
| Impairment or reversal of impairment of investments in subsidiaries, joint ventures and associates, net |
17 and 18 | — | — | — | ||||||||||
| Impairment or reversal of impairment on non-financial assets, net | (237) | (239) | (231) | |||||||||||
| Tangible assets | 16 | (136) | (140) | (150) | ||||||||||
| Intangible assets | 17 and 18 | (73) | (75) | (71) | ||||||||||
| Others | (28) | (24) | (10) | |||||||||||
| Gain or losses on non-financial assets and investments, net | 48 | 313 | 12 | 53 | ||||||||||
| Negative goodwill recognized in results | 39 | — | — | |||||||||||
| Gains or losses on non-current assets held for sale not classified as discontinued operations |
49 | (20) | 7 | (43) | ||||||||||
| Operating profit/(loss) before tax | 16,459 | 15,250 | 14,547 | |||||||||||
| Tax expense or income from continuing operations | 27 | (4,276) | (4,486) | (4,894) | ||||||||||
| Profit/(loss) from continuing operations | 12,183 | 10,764 | 9,653 | |||||||||||
| Profit/(loss) after tax from discontinued operations | 37 | — | — | — | ||||||||||
| Profit/(loss) for the year | 12,183 | 10,764 | 9,653 | |||||||||||
| Profit/(loss) attributable to non-controlling interests | 28 | 1,107 | 1,159 | 1,529 | ||||||||||
| Profit/(loss) attributable to the parent | 11,076 | 9,605 | 8,124 | |||||||||||
| Earnings/(losses) per share | ||||||||||||||
| Basic | 4 | 0.654 | 0.539 | 0.438 | ||||||||||
| Diluted | 4 | 0.651 | 0.537 | 0.436 | ||||||||||
| CONSOLIDATED STATEMENTS OF RECOGNISED INCOME AND EXPENSE FOR THE YEARS ENDED 31 DECEMBER 2023, 2022 AND 2021 | ||||||||||||||
| EUR million | ||||||||||||||
| Note | 2023 | 2022 |
2021 |
|||||||||||
| CONSOLIDATED PROFIT/(LOSS) FOR THE YEAR | 12,183 | 10,764 | 9,653 | |||||||||||
| OTHER RECOGNISED INCOME AND EXPENSE | 614 | (2,660) | (220) | |||||||||||
| Items that will not be reclassified to profit or loss | 29 | (964) | (399) | 754 | ||||||||||
| Actuarial gains and losses on defined benefit pension plans | (1,038) | (56) | 1,567 | |||||||||||
| Non-current assets held for sale | — | — | — | |||||||||||
| Other recognised income and expense of investments in subsidiaries, joint ventures and associates |
(5) | 17 | (1) | |||||||||||
| Changes in the fair value of equity instruments measured at fair value through other comprehensive income | (162) | (497) | (171) | |||||||||||
| Gains or losses resulting from the accounting for hedges of equity instruments measured at fair value through other comprehensive income, net | 36 | — | — | — | ||||||||||
| Changes in the fair value of equity instruments measured at fair value through other comprehensive income (hedged item) | (29) | 18 | 117 | |||||||||||
| Changes in the fair value of equity instruments measured at fair value through other comprehensive income (hedging instrument) | 29 | (18) | (117) | |||||||||||
| Changes in the fair value of financial liabilities at fair value through profit or loss attributable to changes in credit risk | (120) | 88 | (99) | |||||||||||
| Income tax relating to items that will not be reclassified | 361 | 49 | (542) | |||||||||||
| Items that may be reclassified to profit or loss | 29 | 1,578 | (2,261) | (974) | ||||||||||
| Hedges of net investments in foreign operations (effective portion) | 36 | (1,888) | (2,467) | (1,159) | ||||||||||
| Revaluation gains (losses) | (1,888) | (2,467) | (1,159) | |||||||||||
| Amounts transferred to income statement | — | — | — | |||||||||||
| Other reclassifications | — | — | — | |||||||||||
| Exchanges differences | 1,017 | 3,658 | 3,082 | |||||||||||
| Revaluation gains (losses) | 1,009 | 3,658 | 3,082 | |||||||||||
| Amounts transferred to income statement | 8 | — | — | |||||||||||
| Other reclassifications | — | — | — | |||||||||||
| Cash flow hedges (effective portion) | 36 | 2,592 | (3,016) | (938) | ||||||||||
| Revaluation gains (losses) | (30) | (1,762) | (1,739) | |||||||||||
| Amounts transferred to income statement | 2,622 | (1,254) | 801 | |||||||||||
| Transferred to initial carrying amount of hedged items | — | — | — | |||||||||||
| Other reclassifications | — | — | — | |||||||||||
| Hedging instruments (items not designated) | 36 | — | — | — | ||||||||||
| Revaluation gains (losses) | — | — | — | |||||||||||
| Amounts transferred to income statement | — | — | — | |||||||||||
| Other reclassifications | — | — | — | |||||||||||
| Debt instruments at fair value with changes in other comprehensive income | 858 | (2,086) | (3,250) | |||||||||||
| Revaluation gains (losses) | 29 | 852 | (2,591) | (3,063) | ||||||||||
| Amounts transferred to income statement | 6 | (99) | (545) | |||||||||||
| Other reclassifications | — | 604 | 358 | |||||||||||
| Non-current assets held for sale | — | — | — | |||||||||||
| Revaluation gains (losses) | — | — | — | |||||||||||
| Amounts transferred to income statement | — | — | — | |||||||||||
| Other reclassifications | — | — | — | |||||||||||
| Share of other recognised income and expense of investments | 19 | 85 | 19 | |||||||||||
| Income tax relating to items that may be reclassified to profit or loss | (1,020) | 1,565 | 1,272 | |||||||||||
| Total recognised income and expenses for the year | 12,797 | 8,104 | 9,433 | |||||||||||
| Attributable to non-controlling interests | 1,401 | 1,410 | 1,255 | |||||||||||
| Attributable to the parent | 11,396 | 6,694 | 8,178 | |||||||||||
| CONSOLIDATED STATEMENTS OF CHANGES IN TOTAL EQUITY FOR THE YEARS ENDED 31 DECEMBER 2023, 2022 AND 2021 | |||||||||||||||||
| EUR million | |||||||||||||||||
| Capital | Share premium | Equity instruments issued (not capital) | Other equity instruments | Accumulated retained earnings | |||||||||||||
Balance at 31 December 2022 |
8,397 | 46,273 | 688 | 175 | 66,702 | ||||||||||||
| Adjustments due to errors | — | — | — | — | — | ||||||||||||
| Adjustments due to changes in accounting policies | — | — | — | — | — | ||||||||||||
Opening balance at 1 January 2023 |
8,397 | 46,273 | 688 | 175 | 66,702 | ||||||||||||
| Total recognised income and expense | — | — | — | — | — | ||||||||||||
| Other changes in equity | (305) | (1,900) | 32 | 20 | 7,412 | ||||||||||||
| Issuance of ordinary shares | — | — | — | — | — | ||||||||||||
| Issuance of preferred shares | — | — | — | — | — | ||||||||||||
| Issuance of other financial instruments | — | — | — | — | — | ||||||||||||
| Maturity of other financial instruments | — | — | — | — | — | ||||||||||||
| Conversion of financial liabilities into equity | — | — | — | — | — | ||||||||||||
| Capital reduction | (305) | (1,900) | — | — | — | ||||||||||||
Dividends |
— | — | — | — | (963) | ||||||||||||
| Purchase of equity instruments | — | — | — | — | — | ||||||||||||
| Disposal of equity instruments | — | — | — | — | — | ||||||||||||
| Transfer from equity to liabilities | — | — | — | — | — | ||||||||||||
| Transfer from liabilities to equity | — | — | — | — | — | ||||||||||||
| Transfers between equity items | — | — | — | — | 8,375 | ||||||||||||
| Increases (decreases) due to business combinations | — | — | — | — | — | ||||||||||||
| Share-based payment | — | — | — | (60) | — | ||||||||||||
| Others increases or (-) decreases in equity | — | — | 32 | 80 | — | ||||||||||||
| Balance at 31 December 2023 | 8,092 | 44,373 | 720 | 195 | 74,114 | ||||||||||||
| Non-controlling interest | ||||||||||||||||||||||||||
| Revaluation reserves | Other reserves | (-) Own shares | Profit attributable to shareholders of the parent | (-) Interim dividends | Other comprehensive income | Other comprehensive income | Other items | Total | ||||||||||||||||||
| — | (5,454) | (675) | 9,605 | (979) | (35,628) | (1,856) | 10,337 | 97,585 | ||||||||||||||||||
| — | — | — | — | — | — | — | — | — | ||||||||||||||||||
| — | — | — | — | — | — | — | — | — | ||||||||||||||||||
| — | (5,454) | (675) | 9,605 | (979) | (35,628) | (1,856) | 10,337 | 97,585 | ||||||||||||||||||
| — | — | — | 11,076 | — | 320 | 294 | 1,107 | 12,797 | ||||||||||||||||||
| — | (297) | (403) | (9,605) | (319) | 288 | 3 | (1,067) | (6,141) | ||||||||||||||||||
| — | — | — | — | — | — | — | 1 | 1 | ||||||||||||||||||
| — | — | — | — | — | — | — | — | — | ||||||||||||||||||
| — | — | — | — | — | — | — | — | — | ||||||||||||||||||
| — | — | — | — | — | — | — | — | — | ||||||||||||||||||
| — | — | — | — | — | — | — | — | — | ||||||||||||||||||
| — | 305 | 1,900 | — | — | — | — | — | — | ||||||||||||||||||
| — | — | — | — | (1,298) | — | — | (748) | (3,009) | ||||||||||||||||||
| — | — | (3,109) | — | — | — | — | — | (3,109) | ||||||||||||||||||
| — | 13 | 806 | — | — | — | — | — | 819 | ||||||||||||||||||
| — | — | — | — | — | — | — | — | — | ||||||||||||||||||
| — | — | — | — | — | — | — | — | — | ||||||||||||||||||
| — | (37) | — | (9,605) | 979 | 288 | 3 | (3) | — | ||||||||||||||||||
| — | — | — | — | — | — | — | (364) | (364) | ||||||||||||||||||
| — | — | — | — | — | — | — | — | (60) | ||||||||||||||||||
| — | (578) | — | — | — | — | — | 47 | (419) | ||||||||||||||||||
| — | (5,751) | (1,078) | 11,076 | (1,298) | (35,020) | (1,559) | 10,377 | 104,241 | ||||||||||||||||||
| CONSOLIDATED STATEMENTS OF CHANGES IN TOTAL EQUITY FOR THE YEARS ENDED 31 DECEMBER 2023, 2022 AND 2021 | |||||||||||||||||
| EUR million | |||||||||||||||||
| Capital | Share premium | Equity instruments issued (not capital) | Other equity instruments | Accumulated retained earnings | |||||||||||||
Balance at 31 December 2021 |
8,670 | 47,979 | 658 | 152 | 60,273 | ||||||||||||
| Adjustments due to errors | — | — | — | — | — | ||||||||||||
| Adjustments due to changes in accounting policies | — | — | — | — | — | ||||||||||||
Opening balance at 1 January 2022 |
8,670 | 47,979 | 658 | 152 | 60,273 | ||||||||||||
| Total recognised income and expense | — | — | — | — | — | ||||||||||||
| Other changes in equity | (273) | (1,706) | 30 | 23 | 6,429 | ||||||||||||
| Issuance of ordinary shares | — | — | — | — | — | ||||||||||||
| Issuance of preferred shares | — | — | — | — | — | ||||||||||||
| Issuance of other financial instruments | — | — | — | — | — | ||||||||||||
| Maturity of other financial instruments | — | — | — | — | — | ||||||||||||
| Conversion of financial liabilities into equity | — | — | — | — | — | ||||||||||||
| Capital reduction | (273) | (1,706) | — | — | — | ||||||||||||
| Dividends | — | — | — | — | (869) | ||||||||||||
| Purchase of equity instruments | — | — | — | — | — | ||||||||||||
| Disposal of equity instruments | — | — | — | — | — | ||||||||||||
| Transfer from equity to liabilities | — | — | — | — | — | ||||||||||||
| Transfer from liabilities to equity | — | — | — | — | — | ||||||||||||
| Transfers between equity items | — | — | — | — | 7,298 | ||||||||||||
| Increases (decreases) due to business combinations | — | — | — | — | — | ||||||||||||
| Share-based payment | — | — | — | (49) | — | ||||||||||||
| Others increases or (-) decreases in equity | — | — | 30 | 72 | — | ||||||||||||
Balance at 31 December 2022 |
8,397 | 46,273 | 688 | 175 | 66,702 | ||||||||||||
Non-controlling interest |
||||||||||||||||||||||||||
Revaluation reserves |
Other reserves |
(-) Own shares |
Profit attributable to shareholders of the parent |
(-) Interim dividends |
Other comprehensive income |
Other comprehensive income |
Other items | Total |
||||||||||||||||||
| — | (4,477) | (894) | 8,124 | (836) | (32,719) | (2,104) | 12,227 | 97,053 | ||||||||||||||||||
| — | — | — | — | — | — | — | — | — | ||||||||||||||||||
| — | — | — | — | — | — | — | — | — | ||||||||||||||||||
| — | (4,477) | (894) | 8,124 | (836) | (32,719) | (2,104) | 12,227 | 97,053 | ||||||||||||||||||
| — | — | — | 9,605 | — | (2,911) | 251 | 1,159 | 8,104 | ||||||||||||||||||
| — | (977) | 219 | (8,124) | (143) | 2 | (3) | (3,049) | (7,572) | ||||||||||||||||||
| — | — | — | — | — | — | — | 9 | 9 | ||||||||||||||||||
| — | — | — | — | — | — | — | — | — | ||||||||||||||||||
| — | — | — | — | — | — | — | — | — | ||||||||||||||||||
| — | — | — | — | — | — | — | (756) | (756) | ||||||||||||||||||
| — | — | — | — | — | — | — | — | — | ||||||||||||||||||
| — | 273 | 1,706 | — | — | — | — | — | — | ||||||||||||||||||
| — | — | — | — | (979) | — | — | (500) | (2,348) | ||||||||||||||||||
| — | — | (2,050) | — | — | — | — | — | (2,050) | ||||||||||||||||||
| — | 7 | 563 | — | — | — | — | — | 570 | ||||||||||||||||||
| — | — | — | — | — | — | — | — | — | ||||||||||||||||||
| — | — | — | — | — | — | — | — | — | ||||||||||||||||||
| — | (12) | — | (8,124) | 836 | 2 | (3) | 3 | — | ||||||||||||||||||
| — | — | — | — | — | — | — | 31 | 31 | ||||||||||||||||||
| — | — | — | — | — | — | — | — | (49) | ||||||||||||||||||
| — | (1,245) | — | — | — | — | — | (1,836) | (2,979) | ||||||||||||||||||
| — | (5,454) | (675) | 9,605 | (979) | (35,628) | (1,856) | 10,337 | 97,585 | ||||||||||||||||||
| CONSOLIDATED STATEMENTS OF CHANGES IN TOTAL EQUITY FOR THE YEARS ENDED 31 DECEMBER 2023, 2022 AND 2021 | |||||||||||||||||
| EUR million | |||||||||||||||||
| Capital | Share premium | Equity instruments issued (not capital) | Other equity instruments | Accumulated retained earnings | |||||||||||||
Balance at 31 December 2020 |
8,670 | 52,013 | 627 | 163 | 65,583 | ||||||||||||
| Adjustments due to errors | — | — | — | — | — | ||||||||||||
| Adjustments due to changes in accounting policies | — | — | — | — | — | ||||||||||||
Opening balance at 1 January 2021 |
8,670 | 52,013 | 627 | 163 | 65,583 | ||||||||||||
| Total recognised income and expense | — | — | — | — | — | ||||||||||||
| Other changes in equity | — | (4,034) | 31 | (11) | (5,310) | ||||||||||||
| Issuance of ordinary shares | — | — | — | — | — | ||||||||||||
| Issuance of preferred shares | — | — | — | — | — | ||||||||||||
| Issuance of other financial instruments | — | — | — | — | — | ||||||||||||
| Maturity of other financial instruments | — | — | — | — | — | ||||||||||||
| Conversion of financial liabilities into equity | — | — | — | — | — | ||||||||||||
| Capital reduction | — | — | — | — | — | ||||||||||||
| Dividends | — | (477) | — | — | — | ||||||||||||
| Purchase of equity instruments | — | — | — | — | — | ||||||||||||
| Disposal of equity instruments | — | — | — | — | — | ||||||||||||
| Transfer from equity to liabilities | — | — | — | — | — | ||||||||||||
| Transfer from liabilities to equity | — | — | — | — | — | ||||||||||||
| Transfers between equity items | — | (3,557) | — | — | (5,310) | ||||||||||||
| Increases (decreases) due to business combinations | — | — | — | — | — | ||||||||||||
| Share-based payment | — | — | — | (62) | — | ||||||||||||
| Others increases or (-) decreases in equity | — | — | 31 | 51 | — | ||||||||||||
Balance at 31 December 2021 |
8,670 | 47,979 | 658 | 152 | 60,273 | ||||||||||||
| Non-controlling interest | ||||||||||||||||||||||||||
Revaluation reserves |
Other reserves |
(-) Own shares |
Profit attributable to shareholders of the parent |
(-) Interim dividends |
Other comprehensive income |
Other comprehensive income |
Other items | Total |
||||||||||||||||||
| — | (3,596) | (69) | (8,771) | — | (33,144) | (1,800) | 11,646 | 91,322 | ||||||||||||||||||
| — | — | — | — | — | — | — | — | — | ||||||||||||||||||
| — | — | — | — | — | — | — | — | — | ||||||||||||||||||
| — | (3,596) | (69) | (8,771) | — | (33,144) | (1,800) | 11,646 | 91,322 | ||||||||||||||||||
| — | — | — | 8,124 | — | 54 | (274) | 1,529 | 9,433 | ||||||||||||||||||
| — | (881) | (825) | 8,771 | (836) | 371 | (30) | (948) | (3,702) | ||||||||||||||||||
| — | — | — | — | — | — | — | 17 | 17 | ||||||||||||||||||
| — | — | — | — | — | — | — | — | — | ||||||||||||||||||
| — | — | — | — | — | — | — | — | — | ||||||||||||||||||
| — | — | — | — | — | — | — | — | — | ||||||||||||||||||
| — | — | — | — | — | — | — | — | — | ||||||||||||||||||
| — | — | — | — | — | — | — | — | — | ||||||||||||||||||
| — | — | — | — | (836) | — | — | (648) | (1,961) | ||||||||||||||||||
| — | — | (1,645) | — | — | — | — | — | (1,645) | ||||||||||||||||||
| — | 23 | 820 | — | — | — | — | — | 843 | ||||||||||||||||||
| — | — | — | — | — | — | — | — | — | ||||||||||||||||||
| — | — | — | — | — | — | — | — | — | ||||||||||||||||||
| — | (275) | — | 8,771 | — | 371 | (30) | 30 | — | ||||||||||||||||||
| — | — | — | — | — | — | — | (5) | (5) | ||||||||||||||||||
| — | — | — | — | — | — | — | — | (62) | ||||||||||||||||||
| — | (629) | — | — | — | — | — | (342) | (889) | ||||||||||||||||||
| — | (4,477) | (894) | 8,124 | (836) | (32,719) | (2,104) | 12,227 | 97,053 | ||||||||||||||||||
| CONSOLIDATED STATEMENTS OF CASH FLOWS FOR THE YEARS ENDED 2023, 2022 AND 2021 | ||||||||||||||
| EUR million | ||||||||||||||
| Note | 2023 | 2022 |
2021 |
|||||||||||
| A. CASH FLOWS FROM OPERATING ACTIVITIES | 5,015 | 27,706 | 56,691 | |||||||||||
| Profit or loss for the year | 12,183 | 10,764 | 9,653 | |||||||||||
| Adjustments made to obtain the cash flows from operating activities | 26,948 | 23,970 | 21,363 | |||||||||||
| Depreciation and amortisation cost | 3,184 | 2,985 | 2,756 | |||||||||||
| Other adjustments | 23,764 | 20,985 | 18,607 | |||||||||||
| Net increase/(decrease) in operating assets | 74,982 | 108,774 | 27,258 | |||||||||||
| Financial assets held-for-trading | 18,332 | 30,837 | 2,064 | |||||||||||
| Non-trading financial assets mandatorily at fair value through profit or loss | 286 | 218 | 969 | |||||||||||
| Financial assets at fair value through profit or loss | 874 | (7,083) | (32,746) | |||||||||||
| Financial assets at fair value through other comprehensive income | (4,470) | (22,358) | (9,152) | |||||||||||
| Financial assets at amortized cost | 60,525 | 105,618 | 73,181 | |||||||||||
| Other operating assets | (565) | 1,542 | (7,058) | |||||||||||
| Net increase/(decrease) in operating liabilities | 46,080 | 107,244 | 56,945 | |||||||||||
| Financial liabilities held-for-trading | 5,450 | 29,533 | (1,386) | |||||||||||
| Financial liabilities designated at fair value through profit or loss | (11) | 27,705 | (11,528) | |||||||||||
| Financial liabilities at amortized cost | 40,138 | 55,595 | 79,114 | |||||||||||
| Other operating liabilities | 503 | (5,589) | (9,255) | |||||||||||
| Income tax recovered/(paid) | (5,214) | (5,498) | (4,012) | |||||||||||
| B. CASH FLOWS FROM INVESTING ACTIVITIES | (5,366) | (3,898) | (3,715) | |||||||||||
| Payments | 15,056 | 11,776 | 11,669 | |||||||||||
| Tangible assets | 16 | 11,446 | 9,066 | 10,015 | ||||||||||
| Intangible assets | 18 | 2,197 | 1,774 | 1,388 | ||||||||||
| Investments | 13 | 139 | 152 | 126 | ||||||||||
| Subsidiaries and other business units | 1,274 | 784 | 140 | |||||||||||
| Non-current assets held for sale and associated liabilities | — | — | — | |||||||||||
| Other payments related to investing activities | — | — | — | |||||||||||
| Proceeds | 9,690 | 7,878 | 7,954 | |||||||||||
| Tangible assets | 16 | 7,074 | 5,558 | 6,382 | ||||||||||
| Intangible assets | 18 | — | — | — | ||||||||||
| Investments | 13 | 814 | 533 | 672 | ||||||||||
| Subsidiaries and other business units | 885 | 734 | 6 | |||||||||||
| Non-current assets held for sale and associated liabilities | 12 | 917 | 1,053 | 894 | ||||||||||
| Other proceeds related to investing activities | — | — | — | |||||||||||
| C. CASH FLOW FROM FINANCING ACTIVITIES | (2,058) | (9,964) | (1,322) | |||||||||||
| Payments | 10,187 | 10,665 | 7,741 | |||||||||||
| Dividends | 4 | 2,261 | 1,848 | 1,313 | ||||||||||
| Subordinated liabilities | 23 | 2,931 | 2,291 | 2,684 | ||||||||||
| Redemption of own equity instruments | — | — | — | |||||||||||
| Acquisition of own equity instruments | 3,109 | 2,050 | 1,645 | |||||||||||
| Other payments related to financing activities | 1,886 | 4,476 | 2,099 | |||||||||||
| Proceeds | 8,129 | 701 | 6,419 | |||||||||||
| Subordinated liabilities | 23 | 7,007 | 119 | 5,340 | ||||||||||
| Issuance of own equity instruments | — | — | — | |||||||||||
| Disposal of own equity instruments | 825 | 573 | 854 | |||||||||||
| Other proceeds related to financing activities | 297 | 9 | 225 | |||||||||||
| CONSOLIDATED STATEMENTS OF CASH FLOWS FOR THE YEARS ENDED 2023, 2022 AND 2021 | ||||||||||||||
| EUR million | ||||||||||||||
| Note | 2023 | 2022 |
2021 |
|||||||||||
| D. EFFECT OF FOREIGN EXCHANGE RATE DIFFERENCES | (322) | (1,460) | 5,196 | |||||||||||
| E. NET INCREASE/(DECREASE) IN CASH AND CASH EQUIVALENTS | (2,731) | 12,384 | 56,850 | |||||||||||
| F. CASH AND CASH EQUIVALENTS AT BEGINNING OF THE YEAR | 223,073 | 210,689 | 153,839 | |||||||||||
| G. CASH AND CASH EQUIVALENTS AT END OF THE YEAR | 220,342 | 223,073 | 210,689 | |||||||||||
| COMPONENTS OF CASH AND CASH EQUIVALENTS AT END OF THE YEAR | ||||||||||||||
| Cash | 8,621 | 8,929 | 8,142 | |||||||||||
| Cash equivalents at central banks | 199,932 | 200,830 | 193,102 | |||||||||||
| Other financial assets | 11,789 | 13,314 | 9,445 | |||||||||||
| Less, bank overdrafts refundable on demand | — | — | — | |||||||||||
| TOTAL CASH AND CASH EQUIVALENTS AT END OF THE YEAR | 220,342 | 223,073 | 210,689 | |||||||||||
| In which, restricted cash | — | — | — | |||||||||||
Notes to the consolidated financial statements |
|||||
 | |||||
| EUR million | |||||||||||||||||||||||
| Effect on consolidated equity |
Effect on consolidated profit |
||||||||||||||||||||||
| Currency | 2023 | 2022 | 2021 | 2023 | 2022 | 2021 | |||||||||||||||||
| US dollar | (136.9) | (146.0) | (133.3) | (3.4) | (4.4) | (8.6) | |||||||||||||||||
| Chilean peso | (35.3) | (14.8) | (11.4) | (2.3) | (2.0) | (2.4) | |||||||||||||||||
| Pound sterling | (79.1) | (94.7) | (105.9) | (3.1) | (1.5) | (2.3) | |||||||||||||||||
| Mexican peso | (36.4) | (27.7) | (23.1) | (0.1) | (2.0) | (0.9) | |||||||||||||||||
| Brazilian real | (175.7) | (100.1) | (80.8) | (6.5) | (5.9) | (15.4) | |||||||||||||||||
| Polish zloty | (48.8) | (19.8) | (27.5) | — | (1.3) | (1.1) | |||||||||||||||||
| Argentine peso | (7.5) | (17.1) | (10.7) | (4.2) | (2.1) | (2.5) | |||||||||||||||||
| EUR million | |||||||||||||||||||||||
| Effect on consolidated equity |
Effect on consolidated profit |
||||||||||||||||||||||
| Currency | 2023 | 2022 | 2021 | 2023 | 2022 | 2021 | |||||||||||||||||
| US dollar | 139.7 | 148.9 | 136.0 | 3.4 | 4.5 | 8.8 | |||||||||||||||||
| Chilean peso | 36.0 | 15.1 | 11.6 | 2.3 | 2.1 | 2.4 | |||||||||||||||||
| Pound sterling | 80.7 | 96.7 | 108.0 | 3.1 | 1.5 | 2.3 | |||||||||||||||||
| Mexican peso | 37.1 | 28.2 | 23.6 | 0.1 | 2.0 | 0.9 | |||||||||||||||||
| Brazilian real | 179.3 | 102.1 | 82.4 | 6.6 | 6.0 | 15.7 | |||||||||||||||||
Polish zloty |
49.8 | 20.2 | 28.0 | — | 1.4 | 1.1 | |||||||||||||||||
| Argentine peso | 7.7 | 17.4 | 11.0 | 4.2 | 2.2 | 2.6 | |||||||||||||||||
| Quantitative criteria | Changes in the risk of a default occurring through the expected life of the financial instrument are analysed and quantified with respect to its credit level in its initial recognition. With the purpose of determining if such changes are considered as significant, with the consequent classification into stage 2, each Group unit has defined the quantitative thresholds to consider in each of its portfolios taking into account corporate guidelines ensuring a consistent interpretation in all units. Within the quantitative thresholds, two types are considered: A relative threshold is those that compare current credit quality with credit quality at the time of origination in percentage terms of change. In addition, an absolute threshold compares both references in total terms, calculating the difference between the two. These absolute/relative concepts are used homogeneously (with different values) in all geographies. The use of one type of threshold or another (or both) is determined in accordance with the process described in note 54, below, and is marked by the type of portfolio and characteristics such as the starting point of the average credit quality of the portfolio. |
||||
| Qualitative criteria | In addition to the quantitative criteria indicated, various indicators are used that are aligned with those used by the Group in the normal management of credit risk. Irregular positions of more than 30 days and renewals are common criteria in all Group units. In addition, each unit can define other qualitative indicators, for each of its portfolios, according to the particularities and normal management practices in line with the policies currently in force (i.e. use of management alerts, etc.). The use of these qualitative criteria is complemented with the use of an expert judgement, under the corresponding governance. |
||||
| Average annual rate |
|||||
| Buildings for own use | 2.6 | % | |||
| Furniture | 10.3 | % | |||
| Fixtures | 10.3 | % | |||
| Office and IT equipment | 23.8 | % | |||
| Lease use rights | Less than the lease term or the useful life of the underlying asset |
||||
Presence of the Group in non-cooperative jurisdictionsa |
Spanish legislation | Council of the EU blacklist | OECDb |
|||||||||||||||||
| Sub. | Branch | Sub. | Branch | Sub. | Branch | |||||||||||||||
| Jersey | 1 | 1 | ||||||||||||||||||
| Isle of Man | 1 | |||||||||||||||||||
| Cayman Islands | 1 | |||||||||||||||||||
| The Bahamas | 1 | 1 | ||||||||||||||||||
2023c |
1 | 3 | 1 | 1 | — | — | ||||||||||||||
| 2022 | 1 | 3 | 2 | 1 | — | — | ||||||||||||||
| EUR million | |||||
| To dividends | 2,769 | ||||
Dividend paid at 31 DecemberA |
1,298 | ||||
Complementary dividendB |
1,471 | ||||
To voluntary reservesC |
6,470 | ||||
| Net profit for the year | 9,239 | ||||
| EUR million | |||||
| 31 August 2023 | |||||
| Profit before taxes | 5,109 | ||||
| Tax expense | 267 | ||||
| Dividends paid in cash | — | ||||
| Distributable maximum amount | 4,842 | ||||
| Available liquidity | 107,067 | ||||
| 2023 | 2022 | 2021 | |||||||||
| Profit (Loss) attributable to the Parent (EUR million) | 11,076 | 9,605 | 8,124 | ||||||||
| Remuneration of PPCC and PPCA (EUR million) (note 23) | (492) | (529) | (566) | ||||||||
| 10,584 | 9,076 | 7,558 | |||||||||
| Of which: | |||||||||||
| Profit (Loss) from discontinued operations (non controlling interest net) (EUR million) | — | — | — | ||||||||
| Profit (Loss) from continuing operations (non-controlling interest and PPCC and PPCA net) (EUR million) |
10,584 | 9,076 | 7,558 | ||||||||
| Weighted average number of shares outstanding | 16,172,084,714 | 16,848,344,667 | 17,272,055,430 | ||||||||
| Adjusted number of shares | 16,172,084,714 | 16,848,344,667 | 17,272,055,430 | ||||||||
| Basic earnings (Loss) per share (euros) | 0.654 | 0.539 | 0.438 | ||||||||
| Of which, from discounted operations (euros) | — | — | — | ||||||||
| Basic earnings (Loss) per share from continuing operations (euros) | 0.654 | 0.539 | 0.438 | ||||||||
| 2023 | 2022 | 2021 | |||||||||
| Profit (Loss) attributable to the Parent (EUR million) | 11,076 | 9,605 | 8,124 | ||||||||
| Remuneration of PPCC and PPCA (EUR million) (Note 23) | (492) | (529) | (566) | ||||||||
| Dilutive effect of changes in profit for the period arising from potential conversion of ordinary shares | — | — | — | ||||||||
| 10,584 | 9,076 | 7,558 | |||||||||
| Of which: | |||||||||||
| Profit (Loss) from discontinued operations (net of non-controlling interests) (EUR million) | — | — | — | ||||||||
| Profit (Loss) from continuing operations (net of non-controlling interests and PPCC and PPCA) (EUR million) | 10,584 | 9,076 | 7,558 | ||||||||
| Weighted average number of shares outstanding | 16,172,084,714 | 16,848,344,667 | 17,272,055,430 | ||||||||
| Dilutive effect of options/rights on shares | 75,180,407 | 55,316,206 | 48,972,459 | ||||||||
| Adjusted number of shares | 16,247,265,121 | 16,903,660,873 | 17,321,027,889 | ||||||||
| Diluted earnings (Loss) per share (euros) | 0.651 | 0.537 | 0.436 | ||||||||
| Of which, from discounted operations (euros) | — | — | — | ||||||||
| Diluted earnings (Loss) per share from continuing operations (euros) | 0.651 | 0.537 | 0.436 | ||||||||
| Amount per director in euros | 2023 | 2022 | ||||||
| Members of the board of directors | 98,000 | 95,000 | ||||||
| Members of the executive committee | 170,000 | 170,000 | ||||||
| Members of the audit committee | 43,000 | 40,000 | ||||||
| Members of the appointments committee | 28,000 | 25,000 | ||||||
| Members of the remuneration committee | 28,000 | 25,000 | ||||||
| Members of the risk supervision, regulation and compliance committee | 43,000 | 40,000 | ||||||
| Members of the responsible banking, sustainability and culture committee | 18,000 | 15,000 | ||||||
| Members of the innovation and technology committee | 28,000 | 25,000 | ||||||
| Chair of the audit committee | 70,000 | 70,000 | ||||||
| Chair of the appointments committee | 50,000 | 50,000 | ||||||
| Chair of the remuneration committee | 50,000 | 50,000 | ||||||
| Chair of the risk supervision, regulation and compliance committee | 70,000 | 70,000 | ||||||
| Chair of the responsible banking, sustainability and culture committee | 50,000 | 50,000 | ||||||
| Chair of the innovation and technology committee | 70,000 | 70,000 | ||||||
Lead independent directorA |
110,000 | 110,000 | ||||||
| Non-executive Vice Chair | 30,000 | 30,000 | ||||||
| Attendance fees per director per meeting in euros | 2023 | 2022 | ||||||
| Board of directors | 2,600 | 2,600 | ||||||
| Audit committee and risk supervision, regulation and compliance committee | 1,700 | 1,700 | ||||||
| Other committees (excluding executive committee) | 1,500 | 1,500 | ||||||
| EUR thousand | |||||||||||||||||||||||||||||
| 2023 | |||||||||||||||||||||||||||||
| Bylaw-stipulated emoluments | |||||||||||||||||||||||||||||
| Annual emolument | |||||||||||||||||||||||||||||
BoardF |
Executive committee | Audit committee | Appointments committee | Remuneration committee | Risk supervision, regulation and compliance oversight committee | Responsible banking, sustainability and culture committee | Innovation and technology committee | Attendance fees and commissions | |||||||||||||||||||||
| Ana Botín | 98 | 170 | — | — | — | — | — | 98 | 45 | ||||||||||||||||||||
Héctor GrisiA |
98 | 170 | — | — | — | — | — | 28 | 44 | ||||||||||||||||||||
| José Antonio Álvarez | 128 | 170 | — | — | — | — | — | 28 | 45 | ||||||||||||||||||||
| Bruce Carnegie-Brown | 203 | 127 | — | 78 | 66 | — | — | 21 | 81 | ||||||||||||||||||||
| Homaira Akbari | 98 | — | 43 | — | — | — | 18 | 28 | 78 | ||||||||||||||||||||
Javier BotínB |
98 | — | — | — | — | — | — | — | 39 | ||||||||||||||||||||
| Sol Daurella | 98 | — | — | 28 | 28 | — | 18 | — | 77 | ||||||||||||||||||||
| Henrique de Castro | 98 | — | 43 | — | 28 | — | — | 28 | 87 | ||||||||||||||||||||
| Gina Díez | 98 | — | — | 28 | — | — | 17 | — | 68 | ||||||||||||||||||||
| Luis Isasi | 98 | 170 | — | — | 28 | 43 | — | — | 78 | ||||||||||||||||||||
| Ramiro Mato | 98 | 170 | 43 | — | — | 43 | 68 | — | 96 | ||||||||||||||||||||
| Belén Romana | 98 | 170 | 43 | — | — | 113 | 18 | 28 | 102 | ||||||||||||||||||||
| Pamela Walkden | 98 | — | 113 | — | — | 43 | — | — | 87 | ||||||||||||||||||||
| Germán de la Fuente | 98 | — | 43 | — | — | 43 | — | — | 87 | ||||||||||||||||||||
Glenn Hutchins2 |
193 | — | — | 28 | 41 | — | — | 28 | 83 | ||||||||||||||||||||
Álvaro CardosoC |
— | — | — | — | — | — | — | — | — | ||||||||||||||||||||
R. Martín ChavezD |
— | — | — | — | — | — | — | — | — | ||||||||||||||||||||
Sergio RialE |
— | — | — | — | — | — | — | — | — | ||||||||||||||||||||
| Total 2023 | 1,700 | 1,147 | 328 | 162 | 191 | 285 | 139 | 287 | 1,096 | ||||||||||||||||||||
| Total 2022 | 1,561 | 1,020 | 301 | 139 | 159 | 241 | 114 | 229 | 930 | ||||||||||||||||||||
| 2023 | 2022 | ||||||||||||||||||||||||||||||||||
| Short-term and deferred (not subject to long-term goals) salaries of executive directors | |||||||||||||||||||||||||||||||||||
| Fixed | Variable - immediate payment | Deferred variable | |||||||||||||||||||||||||||||||||
| In cash | In instruments | In cash | In instruments | Total | Pension contribution | Other remuneration1 |
Total | Total | |||||||||||||||||||||||||||
| Ana Botín | 3,271 | 1,780 | 1,780 | 1,068 | 1,068 | 8,967 | 1,144 | 1,022 | 11,544 | 11,001 | |||||||||||||||||||||||||
Héctor GrisiA |
3,000 | 1,220 | 1,220 | 732 | 732 | 6,904 | 966 | 47 | 8,257 | — | |||||||||||||||||||||||||
| José Antonio Álvarez | — | — | — | — | — | — | — | 3,182 | 3,553 | 9,086 | |||||||||||||||||||||||||
| Bruce Carnegie-Brown | — | — | — | — | — | — | — | — | 576 | 700 | |||||||||||||||||||||||||
| Homaira Akbari | — | — | — | — | — | — | — | — | 265 | 244 | |||||||||||||||||||||||||
Javier BotínB |
— | — | — | — | — | — | — | — | 137 | 129 | |||||||||||||||||||||||||
| Sol Daurella | — | — | — | — | — | — | — | — | 249 | 230 | |||||||||||||||||||||||||
| Henrique de Castro | — | — | — | — | — | — | — | — | 284 | 261 | |||||||||||||||||||||||||
| Gina Díez | — | — | — | — | — | — | — | — | 211 | 172 | |||||||||||||||||||||||||
| Luis Isasi | — | — | — | — | — | — | — | 1,000 | 1,417 | 1,412 | |||||||||||||||||||||||||
| Ramiro Mato | — | — | — | — | — | — | — | — | 518 | 500 | |||||||||||||||||||||||||
| Belén Romana | — | — | — | — | — | — | — | — | 572 | 549 | |||||||||||||||||||||||||
| Pamela Walkden | — | — | — | — | — | — | — | — | 341 | 323 | |||||||||||||||||||||||||
| Germán de la Fuente | — | — | — | — | — | — | — | — | 271 | 137 | |||||||||||||||||||||||||
Glenn Hutchins2 |
— | — | — | — | — | — | — | — | 372 | 10 | |||||||||||||||||||||||||
Álvaro CardosoC |
— | — | — | — | — | — | — | — | — | 39 | |||||||||||||||||||||||||
R. Martín ChavezD |
— | — | — | — | — | — | — | — | — | 147 | |||||||||||||||||||||||||
Sergio RialE |
— | — | — | — | — | — | — | — | — | 131 | |||||||||||||||||||||||||
| Total 2023 | 6,271 | 3,000 | 3,000 | 1,800 | 1,800 | 15,871 | 2,110 | 5,251 | 28,567 | — | |||||||||||||||||||||||||
| Total 2022 | 5,717 | 2,827 | 2,829 | 1,697 | 1,697 | 14,767 | 1,892 | 3,719 | 25,071 | ||||||||||||||||||||||||||
| EUR thousand | |||||||||||||||||
| 2023 | 2022 | ||||||||||||||||
Variable subject to long-term objectives1 |
|||||||||||||||||
| In cash | In shares | In RSUs | Total | Total | |||||||||||||
| Ana Botín | 1,121 | 911 | 210 | 2,243 | 2,128 | ||||||||||||
| Héctor Grisi | 769 | 592 | 176 | 1,537 | — | ||||||||||||
| José Antonio Álvarez | — | — | — | — | 1,436 | ||||||||||||
| Total | 1,890 | 1,504 | 386 | 3,780 | 3,564 | ||||||||||||
| EUR thousand | ||||||||
| 2023 | 2022 | |||||||
| Ana Botín | 1,144 | 1,081 | ||||||
| Héctor Grisi | 966 | — | ||||||
| José Antonio Álvarez | — | 811 | ||||||
| Total | 2,110 | 1,892 | ||||||
| EUR thousand | ||||||||
| 2023 | 2022 | |||||||
| Ana Botín | 49,257 | 46,725 | ||||||
| Héctor Grisi | 585 | — | ||||||
| José Antonio Álvarez | 19,495 | 18,958 | ||||||
| Total | 69,338 | 65,683 | ||||||
| Insured capital | ||||||||
| EUR thousand | ||||||||
| 2023 | 2022 | |||||||
| Ana Botín | 21,054 | 20,988 | ||||||
| Héctor Grisi | 50 | — | ||||||
| José Antonio Álvarez | 11,910 | 17,345 | ||||||
| Total | 33,014 | 38,333 | ||||||
| Share-based variable remuneration | |||||||||||||||||||||||
| Maximum number of shares to be delivered at January 1,2022 | Shares delivered in 2022 (immediate payment 2021 variable remuneration) | Shares delivered in 2022 (deferred payment 2020 variable remuneration) | Shares delivered in 2022 (deferred payment 2019 variable remuneration) | Shares delivered in 2022 (deferred payment 2018 variable remuneration) | Shares delivered in 2022 (deferred payment 2017 variable remuneration) | Variable remuneration 2022 (Maximum number of shares to be delivered) | |||||||||||||||||
| 2017 variable remuneration | |||||||||||||||||||||||
| Ana Botín | 62,722 | — | — | — | — | (31,361) | — | ||||||||||||||||
| José Antonio Álvarez | 41,946 | — | — | — | — | (20,973) | — | ||||||||||||||||
| 104,668 | (52,334) | ||||||||||||||||||||||
| 2018 variable remuneration | |||||||||||||||||||||||
| Ana Botín | 103,201 | — | — | — | (34,400) | — | — | ||||||||||||||||
| José Antonio Álvarez | 68,963 | — | — | — | (22,988) | — | — | ||||||||||||||||
| 172,164 | (57,388) | ||||||||||||||||||||||
| 2019 variable remuneration | |||||||||||||||||||||||
| Ana Botín | 425,853 | — | — | (106,463) | — | — | — | ||||||||||||||||
| José Antonio Álvarez | 284,599 | — | — | (71,150) | — | — | — | ||||||||||||||||
| 710,452 | (177,613) | ||||||||||||||||||||||
| 2020 variable remuneration | |||||||||||||||||||||||
| Ana Botín | 186,369 | — | (37,274) | — | — | — | — | ||||||||||||||||
| José Antonio Álvarez | 101,229 | — | (20,246) | — | — | — | — | ||||||||||||||||
| 287,598 | (57,520) | ||||||||||||||||||||||
| 2021 variable remuneration | |||||||||||||||||||||||
| Ana Botín | 1,480,622 | (592,249) | — | — | — | — | — | ||||||||||||||||
| José Antonio Álvarez | 999,259 | (399,704) | — | — | — | — | — | ||||||||||||||||
| 2,479,881 | (991,953) | ||||||||||||||||||||||
| 2022 variable remuneration | |||||||||||||||||||||||
| Ana Botín | — | — | — | — | — | — | 631,829 | ||||||||||||||||
| José Antonio Álvarez | — | — | — | — | — | — | 426,475 | ||||||||||||||||
| 1,058,305 | |||||||||||||||||||||||
2023 variable remuneration1 |
|||||||||||||||||||||||
| Ana Botín | — | — | — | — | — | — | — | ||||||||||||||||
| Héctor Grisi | — | — | — | — | — | — | — | ||||||||||||||||
| Maximum number of shares to be delivered at December 31, 2022 | Instruments matured but not consolidated at January 1, 20232 |
Shares delivered in 2023 (immediate payment 2022 variable remuneration) | Shares delivered in 2023 (deferred payment 2021 variable remuneration) | Shares delivered in 2023 (deferred payment 2020 variable remuneration) | Shares delivered in 2023 (deferred payment 2019 variable remuneration) | Shares delivered in 2023 (deferred payment 2018 variable remuneration) | Shares delivered in 2023 (deferred payment 2017 variable remuneration) | Variable remuneration 2023 (Maximum number of shares to be delivered) | Maximum number of shares to be delivered at December 31, 2023 | ||||||||||||||||||||
| 31,361 | — | — | — | — | — | — | (31,361) | — | — | ||||||||||||||||||||
| 20,973 | — | — | — | — | — | — | (20,973) | — | — | ||||||||||||||||||||
| 52,334 | (52,334) | ||||||||||||||||||||||||||||
| 68,800 | — | — | — | — | — | (34,400) | — | — | 34,400 | ||||||||||||||||||||
| 45,975 | — | — | — | — | — | (22,988) | — | — | 22,988 | ||||||||||||||||||||
| 114,776 | (57,388) | 57,388 | |||||||||||||||||||||||||||
| 319,390 | (106,453) | — | — | — | (35,452) | — | — | — | 177,485 | ||||||||||||||||||||
| 213,449 | (71,143) | — | — | — | (23,693) | — | — | — | 118,614 | ||||||||||||||||||||
| 532,839 | (177,595) | (59,145) | 296,099 | ||||||||||||||||||||||||||
| 149,095 | — | — | — | (37,274) | — | — | — | — | 111,821 | ||||||||||||||||||||
| 80,983 | — | — | — | (20,246) | — | — | — | — | 60,737 | ||||||||||||||||||||
| 230,078 | (57,520) | 172,558 | |||||||||||||||||||||||||||
| 888,373 | — | — | (177,675) | — | — | — | — | — | 710,698 | ||||||||||||||||||||
| 599,555 | — | — | (119,911) | — | — | — | — | — | 479,644 | ||||||||||||||||||||
| 1,487,928 | (297,586) | 1,190,342 | |||||||||||||||||||||||||||
| 631,829 | — | (273,410) | — | — | — | — | — | — | 358,419 | ||||||||||||||||||||
| 426,475 | — | (184,521) | — | — | — | — | — | — | 241,954 | ||||||||||||||||||||
| 1,058,305 | (457,931) | 600,374 | |||||||||||||||||||||||||||
| — | — | — | — | — | — | — | — | 1,127,208 | 1,127,208 | ||||||||||||||||||||
| — | — | — | — | — | — | — | — | 749,143 | 749,143 | ||||||||||||||||||||
| 1,876,351 | 1,876,351 | ||||||||||||||||||||||||||||
| EUR thousand | |||||||||||||||||
| 2023 | 2022 | ||||||||||||||||
| Cash paid (immediate payment 2022 variable remuneration) | Cash paid (deferred payments from 2021, 2020, 2019 and 2018 variable remuneration) | Cash paid (immediate payment 2021 variable remuneration) | Cash paid (deferred payments from 2020, 2019, 2018 and 2017 variable remuneration) | ||||||||||||||
| Ana Botín | 1,689 | 1,117 | 1,838 | 1,102 | |||||||||||||
| Héctor Grisi | 1,823 | 697 | — | — | |||||||||||||
| José Antonio Álvarez | 1,140 | 737 | 1,241 | 726 | |||||||||||||
| Total | 4,652 | 2,551 | 3,079 | 1,827 | |||||||||||||
| Maximum number of shares to be delivered | ||||||||
| 2023 | 2022 | |||||||
| Deferred conditional variable remuneration plan and linked to objectives (2016) | — | — | ||||||
| Deferred conditional variable remuneration plan and linked to objectives (2017) | — | 33,783 | ||||||
| Deferred conditional variable remuneration plan and linked to objectives (2018) | 29,860 | 36,543 | ||||||
| Deferred conditional variable remuneration plan and linked to objectives (2019) | 48,980 | 98,092 | ||||||
| Deferred conditional variable remuneration plan and linked to objectives (2020) | 106,536 | — | ||||||
| Deferred conditional variable remuneration plan and linked to objectives (2021) | 300,000 | — | ||||||
| Deferred conditional variable remuneration plan and linked to objectives (2022) | — | — | ||||||
| Number of shares delivered | ||||||||
| 2023 | 2022 | |||||||
| Deferred conditional variable remuneration plan and linked to objectives (2016) | — | 60,251 | ||||||
| Deferred conditional variable remuneration plan and linked to objectives (2017) | 6,145 | 33,783 | ||||||
| Deferred conditional variable remuneration plan and linked to objectives (2018) | 29,860 | 18,272 | ||||||
| Deferred conditional variable remuneration plan and linked to objectives (2019) | 24,490 | 32,698 | ||||||
| Deferred conditional variable remuneration plan and linked to objectives (2020) | 42,632 | — | ||||||
| Deferred conditional variable remuneration plan and linked to objectives (2021) | 75,000 | — | ||||||
| Deferred conditional variable remuneration plan and linked to objectives (2022) | — | |||||||
| EUR thousand | |||||||||||||||||||||||
| 2023 | 2022 | ||||||||||||||||||||||
| Loans and credits | Guarantees | Total | Loans and credits | Guarantees | Total | ||||||||||||||||||
| Ana Botín | 26 | — | 26 | 20 | — | 20 | |||||||||||||||||
| José Antonio Álvarez | 4 | — | 4 | 7 | — | 7 | |||||||||||||||||
| Bruce Carnegie-Brown | — | — | — | — | — | — | |||||||||||||||||
| Javier Botín | 4 | — | 4 | 23 | — | 23 | |||||||||||||||||
| Sol Daurella | 51 | — | 51 | 49 | — | 49 | |||||||||||||||||
| Belén Romana | — | — | — | — | — | — | |||||||||||||||||
| Ramiro Mato | — | — | — | 1 | — | 1 | |||||||||||||||||
| Homaira Akbari | — | — | — | — | — | — | |||||||||||||||||
| Henrique de Castro | — | — | — | — | — | — | |||||||||||||||||
| Pamela Walkden | — | — | — | — | — | — | |||||||||||||||||
| Luis Isasi | — | — | — | — | — | — | |||||||||||||||||
Sergio Rial1 |
— | — | — | 5 | — | 5 | |||||||||||||||||
| Héctor Grisi | 8 | — | 8 | — | — | — | |||||||||||||||||
| Gina Díez Barroso | 1 | — | 1 | — | — | — | |||||||||||||||||
| Glenn Hutchins | — | — | — | — | — | — | |||||||||||||||||
| Germán de la Fuente | — | — | — | — | — | — | |||||||||||||||||
| 94 | — | 94 | 105 | — | 105 | ||||||||||||||||||
| EUR thousand | ||||||||||||||||||||||||||||||||
| Short-term salaries and deferred remuneration | ||||||||||||||||||||||||||||||||
| Variable remuneration (bonus) - Immediate payment | Deferred variable remuneration | |||||||||||||||||||||||||||||||
| Year | Number of persons |
Fixed | In cash | In instruments2 |
In cash | In instruments3 |
Pensions | Other remuneration1 |
Total | |||||||||||||||||||||||
| 2023 | 14 | 17,109 | 7,355 | 7,356 | 3,219 | 3,220 | 4,775 | 7,135 | 50,169 | |||||||||||||||||||||||
| 2022 | 14 | 18,178 | 7,733 | 7,733 | 3,398 | 3,399 | 5,339 | 6,956 | 52,736 | |||||||||||||||||||||||
| EUR thousand | ||||||||||||||
Variable remuneration subject to long-term objectives1 |
||||||||||||||
| Year | Number of people | Cash payment |
Instrument
payment
|
Total | ||||||||||
| 2023 | 14 | 3,380 | 3,381 | 6,761 | ||||||||||
| 2022 | 14 | 3,568 | 3,569 | 7,137 | ||||||||||
| Maximum number of shares to be delivered | ||||||||
| 2023 | 2022 | |||||||
| Deferred conditional variable remuneration plan and linked to objectives (2016) | — | 18,500 | ||||||
| Deferred conditional variable remuneration plan and linked to objectives (2017) | — | 76,053 | ||||||
| Deferred conditional variable remuneration plan and linked to objectives (2018) | 72,734 | 155,758 | ||||||
| Deferred conditional variable remuneration plan and linked to objectives (2019) | 176,704 | 949,917 | ||||||
| Deferred conditional variable remuneration plan and linked to objectives (2020) | 728,200 | 1,438,437 | ||||||
| Deferred conditional variable remuneration plan and linked to objectives (2021) | 1,824,824 | 2,711,926 | ||||||
| Deferred conditional variable remuneration plan and linked to objectives (2022) | 2,320,032 | — | ||||||
| Number of shares delivered | ||||||||
| 2023 | 2022 | |||||||
| Deferred conditional variable remuneration plan and linked to objectives (2016) | — | 114,006 | ||||||
| Deferred conditional variable remuneration plan and linked to objectives (2017) | 11,046 | 107,891 | ||||||
| Deferred conditional variable remuneration plan and linked to objectives (2018) | 72,734 | 79,037 | ||||||
| Deferred conditional variable remuneration plan and linked to objectives (2019) | 88,352 | 288,041 | ||||||
| Deferred conditional variable remuneration plan and linked to objectives (2020) | 292,737 | 360,614 | ||||||
| Deferred conditional variable remuneration plan and linked to objectives (2021) | 456,206 | 2,556,117 | ||||||
| Deferred conditional variable remuneration plan and linked to objectives (2022) | 2,070,634 | — | ||||||
| EUR million | |||||||||||
| 2023 | 2022 | 2021 | |||||||||
| CENTRAL BANKS | |||||||||||
| Classification | |||||||||||
| Financial assets held for trading | 17,717 | 11,595 | 3,608 | ||||||||
| Non-trading financial assets mandatorily at fair value through profit or loss |
— | — | — | ||||||||
| Financial assets designated at fair value through profit or loss | — | — | — | ||||||||
| Financial assets designated at fair value through other comprehensive income |
— | — | — | ||||||||
| Financial assets at amortised cost | 20,082 | 15,375 | 15,657 | ||||||||
| 37,799 | 26,970 | 19,265 | |||||||||
| Type | |||||||||||
| Time deposits | 17,747 | 15,180 | 13,275 | ||||||||
| Reverse repurchase agreements | 20,052 | 11,790 | 5,990 | ||||||||
| Impaired assets | — | — | — | ||||||||
| Valuation adjustments for impairment | — | — | — | ||||||||
| 37,799 | 26,970 | 19,265 | |||||||||
| CREDIT INSTITUTIONS | |||||||||||
| Classification | |||||||||||
| Financial assets held for trading | 14,061 | 16,502 | 10,397 | ||||||||
| Non-trading financial assets mandatorily at fair value through profit or loss |
— | — | — | ||||||||
| Financial assets designated at fair value through profit or loss | 459 | 673 | 3,152 | ||||||||
| Financial assets designated at fair value through other comprehensive income |
313 | — | — | ||||||||
| Financial assets at amortised cost | 57,917 | 46,518 | 39,169 | ||||||||
| 72,750 | 63,693 | 52,718 | |||||||||
| Type | |||||||||||
| Time deposits | 8,560 | 8,891 | 10,684 | ||||||||
| Reverse repurchase agreements | 35,846 | 27,321 | 18,853 | ||||||||
| Non- loans advances | 28,353 | 27,487 | 23,188 | ||||||||
| Impaired assets | — | — | 1 | ||||||||
| Valuation adjustments for impairment | (9) | (6) | (8) | ||||||||
| 72,750 | 63,693 | 52,718 | |||||||||
| CURRENCY | |||||||||||
| Euro | 34,229 | 26,024 | 24,286 | ||||||||
| Pound sterling | 3,539 | 4,474 | 3,228 | ||||||||
| US dollar | 17,602 | 18,468 | 12,639 | ||||||||
| Brazilian real | 47,151 | 34,863 | 24,011 | ||||||||
| Other currencies | 8,028 | 6,834 | 7,819 | ||||||||
| TOTAL | 110,549 | 90,663 | 71,983 | ||||||||
| EUR million | |||||||||||
| 2023 | 2022 | 2021 | |||||||||
| Classification | |||||||||||
| Financial assets held for trading | 62,124 | 41,403 | 26,750 | ||||||||
| Non-trading financial assets mandatorily at fair value through profit or loss | 860 | 1,134 | 957 | ||||||||
| Financial assets designated at fair value through profit or loss | 3,095 | 2,542 | 2,516 | ||||||||
| Financial assets designated at fair value through other comprehensive income | 73,565 | 75,083 | 97,922 | ||||||||
| Financial assets at amortised cost | 103,559 | 73,554 | 35,708 | ||||||||
| 243,203 | 193,716 | 163,853 | |||||||||
| Type | |||||||||||
| Spanish government debt securities | 40,321 | 26,876 | 20,638 | ||||||||
| Foreign government debt securities | 145,732 | 121,018 | 102,976 | ||||||||
| Issued by financial institutions | 14,681 | 10,176 | 12,324 | ||||||||
| Other fixed-income securities | 42,294 | 35,468 | 27,850 | ||||||||
| Impaired financial assets | 461 | 404 | 280 | ||||||||
| Impairment losses | (286) | (226) | (215) | ||||||||
| 243,203 | 193,716 | 163,853 | |||||||||
| Currency | |||||||||||
| Euro | 90,857 | 63,903 | 45,197 | ||||||||
| Pound sterling | 9,284 | 6,732 | 6,304 | ||||||||
| US dollar | 38,161 | 37,749 | 34,229 | ||||||||
| Brazilian real | 46,190 | 35,841 | 35,907 | ||||||||
| Other currencies | 58,997 | 49,717 | 42,431 | ||||||||
| Debt securities excluding impairment adjustments | 243,489 | 193,942 | 164,068 | ||||||||
| Impairment losses | (286) | (226) | (215) | ||||||||
| 243,203 | 193,716 | 163,853 | |||||||||
| EUR million | ||||||||||||||||||||||||||||||||||||||||||||
| 2023 | 2022 | 2021 | ||||||||||||||||||||||||||||||||||||||||||
| Private fixed-income | Public fixed-income | Total | % | Private fixed-income | Public fixed-income | Total | % | Private fixed-income | Public fixed-income | Total | % | |||||||||||||||||||||||||||||||||
| Spain | 2,525 | 40,321 | 42,846 | 17.62 | % | 1,015 | 26,876 | 27,891 | 14.40 | % | 3,773 | 20,638 | 24,411 | 14.90 | % | |||||||||||||||||||||||||||||
| United Kingdom | 2,816 | 4,748 | 7,564 | 3.11 | % | 2,545 | 3,013 | 5,558 | 2.87 | % | 3,334 | 2,097 | 5,431 | 3.31 | % | |||||||||||||||||||||||||||||
| Portugal | 2,826 | 4,815 | 7,641 | 3.14 | % | 2,572 | 3,603 | 6,175 | 3.19 | % | 3,008 | 3,845 | 6,853 | 4.18 | % | |||||||||||||||||||||||||||||
| Italy | 2,968 | 12,945 | 15,913 | 6.54 | % | 1,948 | 8,329 | 10,277 | 5.31 | % | 1,215 | 1,531 | 2,746 | 1.68 | % | |||||||||||||||||||||||||||||
| Ireland | 5,632 | 11 | 5,643 | 2.32 | % | 6,141 | 11 | 6,152 | 3.18 | % | 4,759 | 52 | 4,811 | 2.94 | % | |||||||||||||||||||||||||||||
| Poland | 2,937 | 12,482 | 15,419 | 6.34 | % | 2,830 | 9,443 | 12,273 | 6.34 | % | 2,848 | 12,727 | 15,575 | 9.51 | % | |||||||||||||||||||||||||||||
| Other European countries | 9,797 | 15,495 | 25,292 | 10.40 | % | 8,161 | 9,655 | 17,816 | 9.20 | % | 8,922 | 3,422 | 12,344 | 7.53 | % | |||||||||||||||||||||||||||||
| United States | 8,959 | 22,992 | 31,951 | 13.14 | % | 8,950 | 22,318 | 31,268 | 16.14 | % | 5,634 | 21,465 | 27,099 | 16.54 | % | |||||||||||||||||||||||||||||
| Brazil | 13,551 | 32,342 | 45,893 | 18.87 | % | 9,201 | 28,191 | 37,392 | 19.30 | % | 5,446 | 29,251 | 34,697 | 21.18 | % | |||||||||||||||||||||||||||||
| Mexico | 1,969 | 20,738 | 22,707 | 9.34 | % | 481 | 17,578 | 18,059 | 9.32 | % | 517 | 14,572 | 15,089 | 9.21 | % | |||||||||||||||||||||||||||||
| Chile | 49 | 11,995 | 12,044 | 4.95 | % | 28 | 10,009 | 10,037 | 5.18 | % | 51 | 9,467 | 9,518 | 5.81 | % | |||||||||||||||||||||||||||||
| Other American countries | 2,315 | 2,546 | 4,861 | 2.00 | % | 1,560 | 5,960 | 7,520 | 3.88 | % | 655 | 2,128 | 2,783 | 1.70 | % | |||||||||||||||||||||||||||||
| Rest of the world | 806 | 4,623 | 5,429 | 2.23 | % | 390 | 2,908 | 3,298 | 1.70 | % | 77 | 2,419 | 2,496 | 1.52 | % | |||||||||||||||||||||||||||||
| 57,150 | 186,053 | 243,203 | 100 | % | 45,822 | 147,894 | 193,716 | 100 | % | 40,239 | 123,614 | 163,853 | 100 | % | ||||||||||||||||||||||||||||||
| EUR million | ||||||||||||||||||||||||||||||||||||||||||||
| 2023 | 2022 | 2021 | ||||||||||||||||||||||||||||||||||||||||||
| Private fixed-income | Public fixed-income | Total | % | Private fixed-income | Public fixed-income | Total | % | Private fixed-income | Public fixed-income | Total | % | |||||||||||||||||||||||||||||||||
| AAA | 15,152 | 7,887 | 23,039 | 9.47 | % | 13,481 | 5,494 | 18,975 | 9.80 | % | 15,956 | 1,773 | 17,729 | 10.82 | % | |||||||||||||||||||||||||||||
| AA | 15,142 | 36,704 | 51,846 | 21.32 | % | 9,542 | 30,502 | 40,044 | 20.67 | % | 2,005 | 26,355 | 28,360 | 17.31 | % | |||||||||||||||||||||||||||||
| A | 11,175 | 68,112 | 79,287 | 32.60 | % | 10,058 | 48,341 | 58,399 | 30.15 | % | 8,594 | 44,359 | 52,953 | 32.32 | % | |||||||||||||||||||||||||||||
| BBB | 7,749 | 39,173 | 46,922 | 19.29 | % | 5,181 | 29,900 | 35,081 | 18.11 | % | 5,234 | 20,304 | 25,538 | 15.59 | % | |||||||||||||||||||||||||||||
| Below BBB | 4,654 | 34,177 | 38,831 | 15.97 | % | 2,974 | 33,657 | 36,631 | 18.91 | % | 3,584 | 30,823 | 34,407 | 21.00 | % | |||||||||||||||||||||||||||||
| Unrated | 3,278 | — | 3,278 | 1.35 | % | 4,586 | — | 4,586 | 2.37 | % | 4,866 | — | 4,866 | 2.97 | % | |||||||||||||||||||||||||||||
| 57,150 | 186,053 | 243,203 | 100 | % | 45,822 | 147,894 | 193,716 | 100 | % | 40,239 | 123,614 | 163,853 | 100 | % | ||||||||||||||||||||||||||||||
| EUR million | |||||||||||
| 2023 | 2022 | 2021 | |||||||||
| Securitised mortgage bonds | 9,310 | 9,222 | 5,806 | ||||||||
| Other asset-backed bonds | 10,243 | 7,120 | 6,304 | ||||||||
| Floating rate debt | 15,376 | 12,397 | 8,081 | ||||||||
| Fixed rate debt | 22,221 | 17,083 | 20,048 | ||||||||
| Total | 57,150 | 45,822 | 40,239 | ||||||||
| EUR million | |||||||||||
| 2023 | 2022 | 2021 | |||||||||
| Balance at beginning of year | 226 | 215 | 284 | ||||||||
Net impairment losses for the yearA |
24 | 16 | 28 | ||||||||
| Of which: | |||||||||||
| Impairment losses charged to income | 36 | 30 | 49 | ||||||||
| Impairment losses reversed with a credit to income | (12) | (14) | (21) | ||||||||
| Exchange differences and other items | 36 | (5) | (97) | ||||||||
| Balance at end of year | 286 | 226 | 215 | ||||||||
| Of which: | |||||||||||
| By geographical location of risk: | |||||||||||
| European Union | 22 | 26 | 25 | ||||||||
| Latin America | 264 | 200 | 190 | ||||||||
| EUR million | |||||||||||
| 2023 | 2022 | 2021 | |||||||||
| Classification | |||||||||||
| Financial assets held for trading | 15,057 | 10,066 | 15,077 | ||||||||
| Non-trading financial assets mandatorily at fair value through profit or loss | 4,068 | 3,711 | 4,042 | ||||||||
| Financial assets designated at fair value through other comprehensive income | 1,761 | 1,941 | 2,453 | ||||||||
| 20,886 | 15,718 | 21,572 | |||||||||
| Type | |||||||||||
| Shares of Spanish companies | 3,540 | 3,284 | 3,896 | ||||||||
| Shares of foreign companies | 15,185 | 10,494 | 15,184 | ||||||||
| Shares of investment funds | 2,161 | 1,940 | 2,492 | ||||||||
| 20,886 | 15,718 | 21,572 | |||||||||
| EUR million | |||||||||||
| 2023 | 2022 | 2021 | |||||||||
| Balance at beginning of the year | 1,941 | 2,453 | 2,783 | ||||||||
| Net additions (disposals) | 11 | (33) | (276) | ||||||||
Changes in the fair value of equity instruments measured at fair value through other comprehensive income (EIGR)A |
(162) | (497) | (171) | ||||||||
| Changes in the RV hedged with micro-hedging transactions | (29) | 18 | 117 | ||||||||
| Balance at end of year | 1,761 | 1,941 | 2,453 | ||||||||
| EUR million | ||||||||||||||||||||
| 2023 | 2022 | 2021 | ||||||||||||||||||
| Debit balance | Credit balance | Debit balance | Credit balance | Debit balance | Credit balance | |||||||||||||||
| Interest rate risk | 31,480 | 26,014 | 38,789 | 37,641 | 31,884 | 30,192 | ||||||||||||||
| Currency risk | 22,834 | 23,094 | 26,391 | 26,063 | 19,823 | 21,894 | ||||||||||||||
| Price risk | 1,279 | 904 | 1,347 | 817 | 1,498 | 891 | ||||||||||||||
| Other risks | 735 | 577 | 475 | 370 | 1,087 | 589 | ||||||||||||||
| 56,328 | 50,589 | 67,002 | 64,891 | 54,292 | 53,566 | |||||||||||||||
| EUR million | |||||||||||
| 2023 | 2022 | 2021 | |||||||||
| Borrowed securities | |||||||||||
| Debt instruments | 3,263 | 1,979 | 825 | ||||||||
| Of which: | |||||||||||
| Banco Santander México, S.A., Institución de Banca Múltiple, Grupo Financiero Santander México | 1,881 | 1,362 | 825 | ||||||||
| Banco Santander, S.A. | 1,383 | 617 | — | ||||||||
| Equity instruments | 546 | 993 | 389 | ||||||||
| Of which: | |||||||||||
| Banco Santander, S.A. | 312 | 934 | 318 | ||||||||
| Short sales | |||||||||||
| Debt instruments | 22,365 | 19,543 | 11,022 | ||||||||
| Of which: | |||||||||||
| Banco Santander, S.A. | 16,143 | 12,902 | 8,926 | ||||||||
| Banco Santander (Brasil) S.A. | 3,462 | 3,857 | 1,952 | ||||||||
| Santander US Capital Markets LLC | 2,442 | 2,690 | — | ||||||||
| 26,174 | 22,515 | 12,236 | |||||||||
| EUR million | |||||||||||
| 2023 | 2022 | 2021 | |||||||||
| Financial assets held for trading | 11,634 | 9,550 | 6,829 | ||||||||
| Non-trading financial assets mandatorily at fair value through profit or loss |
982 | 868 | 537 | ||||||||
| Financial assets designated at fair value through profit or loss | 6,219 | 5,774 | 10,289 | ||||||||
| Financial assets at fair value through other comprehensive income | 7,669 | 8,215 | 7,663 | ||||||||
| Financial assets at amortized cost | 1,009,845 | 1,011,597 | 947,364 | ||||||||
| Of which: | |||||||||||
| Impairment losses | (22,788) | (22,684) | (22,964) | ||||||||
| 1,036,349 | 1,036,004 | 972,682 | |||||||||
| Loans and advances to customers disregarding impairment losses | 1,059,137 | 1,058,688 | 995,646 | ||||||||
| EUR million | |||||||||||
| 2023 | 2022 | 2021 | |||||||||
| Loan type and status | |||||||||||
| Commercial credit | 55,628 | 56,688 | 49,603 | ||||||||
| Secured loans | 554,375 | 565,609 | 542,404 | ||||||||
| Reverse repurchase agreements | 44,184 | 39,500 | 33,264 | ||||||||
| Other term loans | 295,485 | 290,031 | 269,526 | ||||||||
| Finance leases | 38,723 | 39,833 | 38,503 | ||||||||
| Receivable on demand | 12,277 | 11,435 | 10,304 | ||||||||
| Credit cards receivables | 24,371 | 22,704 | 20,397 | ||||||||
| Impaired assets | 34,094 | 32,888 | 31,645 | ||||||||
| 1,059,137 | 1,058,688 | 995,646 | |||||||||
| Geographical area | |||||||||||
| Spain | 203,680 | 212,804 | 216,741 | ||||||||
| European Union (excluding Spain) | 211,368 | 202,958 | 190,032 | ||||||||
| United States and Puerto Rico | 126,894 | 125,436 | 102,491 | ||||||||
Other OECD countriesA |
374,812 | 385,906 | 374,729 | ||||||||
| South America (non - OECD) | 120,610 | 112,803 | 94,010 | ||||||||
| Rest of the world | 21,773 | 18,781 | 17,643 | ||||||||
| 1,059,137 | 1,058,688 | 995,646 | |||||||||
| Interest rate formula | |||||||||||
| Fixed rate | 647,349 | 642,537 | 593,645 | ||||||||
| Floating rate | 411,788 | 416,151 | 402,001 | ||||||||
| 1,059,137 | 1,058,688 | 995,646 | |||||||||
| EUR million | ||||||||||||||||||||||||||||||||
| Secured loans | ||||||||||||||||||||||||||||||||
| Net exposure | Loan to value ratioC |
|||||||||||||||||||||||||||||||
| Total | Without collateral |
Of which property collateral |
Of which other collateral |
Less than or equal to 40% | More than 40% and less than or equal to 60% |
More than 60% and less than or equal to 80% |
More than 80% and less than or equal to 100% |
More than 100% | ||||||||||||||||||||||||
| Public sector | 24,244 | 23,933 | 185 | 126 | 78 | 68 | 29 | 111 | 25 | |||||||||||||||||||||||
| Other financial institutions (financial business activity) | 86,908 | 32,499 | 2,307 | 52,102 | 2,101 | 1,030 | 787 | 49,638 | 853 | |||||||||||||||||||||||
| Non-financial corporations and individual entrepreneurs (non-financial business activity) (broken down by purpose) | 346,211 | 191,266 | 73,311 | 81,634 | 33,074 | 27,279 | 22,263 | 47,483 | 24,846 | |||||||||||||||||||||||
| Of which: | ||||||||||||||||||||||||||||||||
| Construction and property development | 18,156 | 1,887 | 14,452 | 1,817 | 5,401 | 5,326 | 1,364 | 2,954 | 1,224 | |||||||||||||||||||||||
| Civil engineering construction | 3,125 | 1,898 | 192 | 1,035 | 112 | 149 | 191 | 739 | 36 | |||||||||||||||||||||||
| Large companies | 189,654 | 123,353 | 24,368 | 41,933 | 14,610 | 7,958 | 7,504 | 24,357 | 11,872 | |||||||||||||||||||||||
| SMEs and individual entrepreneurs | 135,276 | 64,128 | 34,299 | 36,849 | 12,951 | 13,846 | 13,204 | 19,433 | 11,714 | |||||||||||||||||||||||
| Households – other (broken down by purpose) | 560,457 | 113,611 | 359,020 | 87,826 | 103,277 | 126,351 | 124,879 | 54,229 | 38,110 | |||||||||||||||||||||||
| Of which: | ||||||||||||||||||||||||||||||||
| Residential | 352,181 | 1,479 | 350,128 | 574 | 94,426 | 116,017 | 113,764 | 23,951 | 2,544 | |||||||||||||||||||||||
| Consumer loans | 190,457 | 108,485 | 2,270 | 79,702 | 5,411 | 7,968 | 8,586 | 25,124 | 34,883 | |||||||||||||||||||||||
| Other purposes | 17,819 | 3,647 | 6,622 | 7,550 | 3,440 | 2,366 | 2,529 | 5,154 | 683 | |||||||||||||||||||||||
TotalA |
1,017,820 | 361,309 | 434,823 | 221,688 | 138,530 | 154,728 | 147,958 | 151,461 | 63,834 | |||||||||||||||||||||||
| Memorandum item | ||||||||||||||||||||||||||||||||
Refinanced and restructured transactionsB |
23,874 | 10,208 | 8,024 | 5,642 | 3,383 | 1,878 | 2,030 | 4,910 | 1,465 | |||||||||||||||||||||||
| 2023 | ||||||||||||||
| EUR million | ||||||||||||||
| Stage 1 | Stage 2 | Stage 3 | Total | |||||||||||
| Balance at the beginning of year | 942,861 | 66,696 | 32,617 | 1,042,174 | ||||||||||
| Movements | ||||||||||||||
| Transfers | ||||||||||||||
| To stage 2 from stage 1 | (43,278) | 43,278 | — | |||||||||||
To stage 3 from stage 1A |
(12,636) | 12,636 | — | |||||||||||
| To stage 3 from stage 2 | (9,915) | 9,915 | — | |||||||||||
| To stage 1 from stage 2 | 15,180 | (15,180) | — | |||||||||||
| To stage 2 from stage 3 | 2,899 | (2,899) | — | |||||||||||
| To stage 1 from stage 3 | 488 | (488) | — | |||||||||||
| Net changes on financial assets | 29,696 | (10,673) | (4,218) | 14,805 | ||||||||||
| Write-offs | — | — | (13,847) | (13,847) | ||||||||||
| Exchange differences and others | (3,178) | (451) | 105 | (3,524) | ||||||||||
| Balance at the end of the year | 929,133 | 76,654 | 33,821 | 1,039,608 | ||||||||||
| 2022 | ||||||||||||||
| EUR million | ||||||||||||||
| Stage 1 | Stage 2 | Stage 3 | Total | |||||||||||
| Balance at the beginning of year | 878,700 | 67,584 | 31,287 | 977,571 | ||||||||||
| Movements | ||||||||||||||
| Transfers | ||||||||||||||
| To stage 2 from stage 1 | (31,811) | 31,811 | — | |||||||||||
To stage 3 from stage 1A |
(11,143) | 11,143 | — | |||||||||||
| To stage 3 from stage 2 | (8,487) | 8,487 | — | |||||||||||
| To stage 1 from stage 2 | 18,907 | (18,907) | — | |||||||||||
| To stage 2 from stage 3 | 3,250 | (3,250) | — | |||||||||||
| To stage 1 from stage 3 | 456 | (456) | — | |||||||||||
| Net changes on financial assets | 86,459 | (8,839) | (2,568) | 75,052 | ||||||||||
| Write-offs | — | — | (12,235) | (12,235) | ||||||||||
| Exchange differences and others | 1,293 | 284 | 209 | 1,786 | ||||||||||
| Balance at the end of the year | 942,861 | 66,696 | 32,617 | 1,042,174 | ||||||||||
| 2021 | ||||||||||||||
| EUR million | ||||||||||||||
| Stage 1 | Stage 2 | Stage 3 | Total | |||||||||||
| Balance at the beginning of year | 817,906 | 66,104 | 30,318 | 914,328 | ||||||||||
| Movements | ||||||||||||||
| Transfers | ||||||||||||||
| To stage 2 from stage 1 | (33,051) | 33,051 | — | |||||||||||
| To stage 3 from stage 1 | (6,617) | 6,617 | — | |||||||||||
| To stage 3 from stage 2 | (5,836) | 5,836 | — | |||||||||||
| To stage 1 from stage 2 | 17,796 | (17,796) | — | |||||||||||
| To stage 2 from stage 3 | 1,865 | (1,865) | — | |||||||||||
| To stage 1 from stage 3 | 271 | (271) | — | |||||||||||
| Net changes on financial assets | 62,629 | (11,629) | (719) | 50,281 | ||||||||||
| Write-offs | — | — | (9,089) | (9,089) | ||||||||||
| Exchange differences and others | 19,766 | 1,825 | 460 | 22,051 | ||||||||||
| Balance at the end of the year | 878,700 | 67,584 | 31,287 | 977,571 | ||||||||||
| EUR million | |||||||||||
| 2023 | 2022 | 2021 | |||||||||
| Amount at beginning of the year | 22,684 | 22,964 | 23,595 | ||||||||
| Impairment losses charged to income for the year | 14,011 | 11,676 | 8,762 | ||||||||
| Of which: | |||||||||||
| Impairment losses charged to profit or loss | 21,413 | 19,879 | 18,240 | ||||||||
| Impairment losses reversed with a credit to profit or loss | (7,402) | (8,203) | (9,478) | ||||||||
| Change of perimeter | (48) | — | — | ||||||||
| Write-off of impaired balances against recorded impairment allowance | (13,847) | (12,235) | (9,089) | ||||||||
| Exchange differences and other changes | (12) | 279 | (304) | ||||||||
| Amount at end of the year | 22,788 | 22,684 | 22,964 | ||||||||
| Which correspond to: | |||||||||||
| Impaired assets | 14,238 | 13,931 | 13,550 | ||||||||
| Other assets | 8,550 | 8,753 | 9,414 | ||||||||
| Of which: | |||||||||||
| Individually calculated | 2,951 | 2,493 | 2,496 | ||||||||
| Collective calculated | 19,837 | 20,191 | 20,468 | ||||||||
| 2023 | ||||||||||||||
| EUR million | ||||||||||||||
| Stage 1 | Stage 2 | Stage 3 | Total | |||||||||||
| Loss allowance at the beginning of the year | 3,626 | 5,127 | 13,931 | 22,684 | ||||||||||
| Transfers | ||||||||||||||
| To stage 2 from stage 1 | (696) | 2,954 | 2,258 | |||||||||||
| To stage 3 from stage 1 | (405) | 4,278 | 3,873 | |||||||||||
| To stage 3 from stage 2 | (1,820) | 3,721 | 1,901 | |||||||||||
| To stage 1 from stage 2 | 149 | (905) | (756) | |||||||||||
| To stage 2 from stage 3 | 282 | (920) | (638) | |||||||||||
| To stage 1 from stage 3 | 27 | (184) | (157) | |||||||||||
| Net changes of the exposure and modifications in the credit risk | 875 | (557) | 7,212 | 7,530 | ||||||||||
| Write-offs | — | — | (13,847) | (13,847) | ||||||||||
| FX and other movements | 20 | (127) | 47 | (60) | ||||||||||
| Loss allowance at the end of the year | 3,596 | 4,954 | 14,238 | 22,788 | ||||||||||
| 2022 | ||||||||||||||
| EUR million | ||||||||||||||
| Stage 1 | Stage 2 | Stage 3 | Total | |||||||||||
| Loss allowance at the beginning of the year | 4,188 | 5,226 | 13,550 | 22,964 | ||||||||||
| Transfers | ||||||||||||||
| To stage 2 from stage 1 | (713) | 3,046 | 2,333 | |||||||||||
| To stage 3 from stage 1 | (557) | 4,586 | 4,029 | |||||||||||
| To stage 3 from stage 2 | (1,802) | 3,182 | 1,380 | |||||||||||
| To stage 1 from stage 2 | 215 | (894) | (679) | |||||||||||
| To stage 2 from stage 3 | 400 | (933) | (533) | |||||||||||
| To stage 1 from stage 3 | 9 | (161) | (152) | |||||||||||
| Net changes of the exposure and modifications in the credit risk | 414 | (1,056) | 5,940 | 5,298 | ||||||||||
| Write-offs | — | — | (12,235) | (12,235) | ||||||||||
| FX and other movements | 70 | 207 | 2 | 279 | ||||||||||
| Loss allowance at the end of the year | 3,626 | 5,127 | 13,931 | 22,684 | ||||||||||
| 2021 | ||||||||||||||
| EUR million | ||||||||||||||
| Stage 1 | Stage 2 | Stage 3 | Total | |||||||||||
| Loss allowance at the beginning of the year | 4,265 | 5,672 | 13,658 | 23,595 | ||||||||||
| Transfers | ||||||||||||||
| To stage 2 from stage 1 | (578) | 2,968 | 2,390 | |||||||||||
| To stage 3 from stage 1 | (237) | 2,209 | 1,972 | |||||||||||
| To stage 3 from stage 2 | (1,086) | 2,474 | 1,388 | |||||||||||
| To stage 1 from stage 2 | 254 | (1,025) | (771) | |||||||||||
| To stage 2 from stage 3 | 216 | (760) | (544) | |||||||||||
| To stage 1 from stage 3 | 8 | (67) | (59) | |||||||||||
| Net changes of the exposure and modifications in the credit risk | 617 | (1,557) | 5,326 | 4,386 | ||||||||||
| Write-offs | — | — | (9,089) | (9,089) | ||||||||||
| FX and other movements | (141) | 38 | (201) | (304) | ||||||||||
| Loss allowance at the end of the year | 4,188 | 5,226 | 13,550 | 22,964 | ||||||||||
| EUR million | |||||||||||
| 2023 | 2022 | 2021 | |||||||||
| Balance at beginning of year | 32,888 | 31,645 | 30,815 | ||||||||
| Net additions | 14,944 | 13,060 | 9,390 | ||||||||
| Written-off assets | (13,847) | (12,235) | (9,089) | ||||||||
| Changes in the scope of consolidation | (59) | — | — | ||||||||
| Exchange differences and other | 168 | 418 | 529 | ||||||||
| Balance at end of year | 34,094 | 32,888 | 31,645 | ||||||||
| EUR million | |||||||||||
| Gross amount |
Allowance recognised | Estimated collateral valueA |
|||||||||
| Without associated real collateral | 14,375 | 8,102 | — | ||||||||
| With real estate collateral | 10,373 | 2,583 | 7,682 | ||||||||
| With other collateral | 9,346 | 3,553 | 5,213 | ||||||||
| Total | 34,094 | 14,238 | 12,895 | ||||||||
| EUR million | |||||||||||
| 2023 | 2022 | 2021 | |||||||||
| Retained on the balance sheet | 75,738 | 82,603 | 80,600 | ||||||||
| Of which | |||||||||||
| Securitised mortgage assets | 16,994 | 16,265 | 19,523 | ||||||||
| Of which: UK assets | 6,096 | 4,144 | 5,295 | ||||||||
| Other securitised assets | 58,744 | 66,338 | 61,077 | ||||||||
TotalA |
75,738 | 82,603 | 80,600 | ||||||||
| EUR million | ||||||||||||||||||||||||||
| 2023 | 2022 | 2021 | ||||||||||||||||||||||||
| Notional amount | Market value |
Notional amount | Market value |
Notional amount | Market value |
|||||||||||||||||||||
| Trading derivatives | ||||||||||||||||||||||||||
| Interest rate risk | ||||||||||||||||||||||||||
| Forward rate agreements | 829,913 | 3 | 100,579 | 22 | 147,603 | (11) | ||||||||||||||||||||
| Interest rate swaps | 5,381,966 | 5,514 | 4,844,043 | 2,387 | 3,920,945 | 1,931 | ||||||||||||||||||||
| Options, futures and other derivatives | 398,519 | (51) | 495,994 | (1,261) | 508,723 | (228) | ||||||||||||||||||||
| Credit risk | ||||||||||||||||||||||||||
| Credit default swaps | 22,462 | (86) | 16,185 | (6) | 13,571 | 436 | ||||||||||||||||||||
| Foreign currency risk | ||||||||||||||||||||||||||
| Foreign currency purchases and sales | 471,955 | 33 | 384,024 | 423 | 329,781 | (664) | ||||||||||||||||||||
| Foreign currency options | 77,934 | 288 | 54,967 | 150 | 49,680 | (114) | ||||||||||||||||||||
| Currency swaps | 586,405 | (581) | 496,441 | (245) | 430,644 | (1,293) | ||||||||||||||||||||
| Securities and commodities derivatives and other | 68,664 | 619 | 71,237 | 641 | 69,850 | 669 | ||||||||||||||||||||
| Total | 7,837,818 | 5,739 | 6,463,470 | 2,111 | 5,470,797 | 726 | ||||||||||||||||||||
| EUR million | |||||||||||
| 2023 | 2022 | 2021 | |||||||||
| Tangible assets | 2,991 | 3,435 | 4,089 | ||||||||
| Of which: | |||||||||||
| Foreclosed assets | 2,773 | 3,101 | 3,651 | ||||||||
| Of which property assets in Spain | 2,138 | 2,596 | 3,120 | ||||||||
| Other tangible assets held for sale | 218 | 334 | 438 | ||||||||
| Other assets | 23 | 18 | — | ||||||||
| Total | 3,014 | 3,453 | 4,089 | ||||||||
| EUR million | |||||||||||
| 2023 | 2022 | 2021 | |||||||||
| Associated entities | 5,682 | 5,634 | 5,833 | ||||||||
| Merlin Properties, SOCIMI, S.A. | 1,621 | 1,653 | 1,640 | ||||||||
| Caceis | 1,139 | 1,046 | 975 | ||||||||
| Zurich Santander Insurance America, S.L. - Consolidated |
936 | 916 | 826 | ||||||||
| Metrovacesa, S.A. | 899 | 979 | 1,087 | ||||||||
| CNP Santander | 423 | 406 | 418 | ||||||||
| Ebury Partners Limited (note 3) | — | — | 394 | ||||||||
| Other companies | 664 | 634 | 493 | ||||||||
| Joint Ventures entities | 1,964 | 1,981 | 1,692 | ||||||||
| Santander Caceis Latam Holding 1, S.L. - Consolidated (previously Santander Securities Services Latam Holding, S.L) | 389 | 359 | 334 | ||||||||
| Santander Vida Seguros y Reaseguros, S.A. | 362 | 356 | 378 | ||||||||
| U.C.I., S.A. - Consolidated | 349 | 416 | 228 | ||||||||
| Fortune Auto Finance Co., Ltd. | 254 | 244 | 222 | ||||||||
| Hyundai Capital UK Limited | 205 | 223 | 201 | ||||||||
| Banco RCI Brasil S.A. | 92 | 95 | 92 | ||||||||
| Other companies | 313 | 288 | 237 | ||||||||
| Total Associated entities and Joint ventures | 7,646 | 7,615 | 7,525 | ||||||||
| EUR million | |||||||||||
| 2023 | 2022 | 2021 | |||||||||
| Goodwill | 1,460 | 1,508 | 1,723 | ||||||||
| Of which: | |||||||||||
| Zurich Santander Insurance America, S.L. - Consolidated | 526 | 526 | 526 | ||||||||
| Caceis | 337 | 337 | 337 | ||||||||
| EUR million | |||||||||||
| 2023 | 2022 | 2021 | |||||||||
| Balance at beginning of year | 7,615 | 7,525 | 7,622 | ||||||||
| Acquisitions (disposals) of companies and capital increases (reductions) | 52 | 142 | 94 | ||||||||
| Changes in the consolidation method (note 3) | (43) | (320) | — | ||||||||
| Of which: | |||||||||||
| Ebury Partners Limited | — | (382) | — | ||||||||
| Effect of equity accounting | 613 | 702 | 432 | ||||||||
| Dividends distributed and reimbursements of share premium | (565) | (560) | (662) | ||||||||
| Of which: | |||||||||||
| Zurich Santander Insurance América, S.L. - Consolidado | (202) | (160) | (230) | ||||||||
| Caceis | — | — | (144) | ||||||||
| Hyundai Capital UK Limited | (58) | — | — | ||||||||
| Santander Vida Seguros y Reaseguros, S.A.- Consolidated | (52) | (40) | (31) | ||||||||
| CNP Santander | (51) | (15) | (60) | ||||||||
| Merlin Properties, SOCIMI, S.A. | (51) | (139) | (52) | ||||||||
| Metrovacesa, S.A. | (50) | (124) | (60) | ||||||||
| Other global result | (24) | 70 | (13) | ||||||||
| Exchange differences and other changes | (2) | 56 | 52 | ||||||||
| Balance at end of year | 7,646 | 7,615 | 7,525 | ||||||||
| EUR million | ||||||||||||||||||||||||||||||||||||||
| Associates | Joint ventures | |||||||||||||||||||||||||||||||||||||
Merlin Properties, SOCIMI, S.A.A |
Metrovacesa, S.A.A |
Caceis | Zurich Santander Insurance América, S.L. - Consolidated | CNP Santander | Santander Caceis Latam Holding, S.L. - Consolidated | U.C.I., S.A. - Consolidated | Hyundai Capital UK Limited | Fortune Auto Finance Co., LTD | Santander Vida Seguros y Reaseguros, S.A.- Consolidated (note 3) | Banco RCI Brasil S.A. | ||||||||||||||||||||||||||||
| Current assets | 539 | 2,106 | 31,026 | 1,595 | 217 | 140 | 270 | 1,885 | 186 | 88 | 8 | |||||||||||||||||||||||||||
| Non current assets | 11,512 | 407 | 85,305 | 19,252 | 2,157 | 584 | 10,302 | 3,099 | 2,034 | 1,702 | 2,144 | |||||||||||||||||||||||||||
| Total assets | 12,051 | 2,513 | 116,331 | 20,847 | 2,374 | 724 | 10,572 | 4,984 | 2,220 | 1,790 | 2,152 | |||||||||||||||||||||||||||
| Current liabilities | 951 | 382 | 8,979 | 333 | 25 | 136 | 146 | 2,465 | 21 | 198 | 73 | |||||||||||||||||||||||||||
| Non current liabilities | 4,252 | 326 | 102,575 | 19,405 | 1,907 | 13 | 9,776 | 2,107 | 1,691 | 1,025 | 1,842 | |||||||||||||||||||||||||||
| Total liabilities | 5,203 | 708 | 111,554 | 19,738 | 1,932 | 149 | 9,922 | 4,572 | 1,712 | 1,223 | 1,915 | |||||||||||||||||||||||||||
| Attributable profit for the period | 263 | (23) | 392 | 465 | 100 | 80 | (88) | 72 | 50 | 109 | 31 | |||||||||||||||||||||||||||
| Other accumulated comprehensive income | 80 | — | (6) | (639) | (43) | (209) | 150 | (7) | (19) | (48) | (223) | |||||||||||||||||||||||||||
| Rest of equity | 6,505 | 1,828 | 4,391 | 1,283 | 385 | 704 | 588 | 347 | 477 | 506 | 429 | |||||||||||||||||||||||||||
| Total Equity | 6,848 | 1,805 | 4,777 | 1,109 | 442 | 575 | 650 | 412 | 508 | 567 | 237 | |||||||||||||||||||||||||||
| Total liabilities and equity | 12,051 | 2,513 | 116,331 | 20,847 | 2,374 | 724 | 10,572 | 4,984 | 2,220 | 1,790 | 2,152 | |||||||||||||||||||||||||||
| Ordinary activities income | 487 | 524 | 6,459 | 5,097 | 817 | 143 | 592 | 1,110 | 219 | 737 | 299 | |||||||||||||||||||||||||||
| Profit (loss) from continuing operations | 41 | (23) | 392 | 465 | 100 | 80 | (88) | 72 | 50 | 109 | 31 | |||||||||||||||||||||||||||
| Profit (loss) for the year from discontinuing operations | 222 | — | — | — | — | — | — | — | — | — | — | |||||||||||||||||||||||||||
| EUR million | |||||||||||
| 2023 | 2022 | 2021 | |||||||||
| Assets relating to insurance contracts covering post-employment benefit plan obligations: | |||||||||||
| Banco Santander, S.A. | 93 | 104 | 149 | ||||||||
| 93 | 104 | 149 | |||||||||
| EUR million | |||||||||||
| 2023 | 2022 | 2021 | |||||||||
| Liabilities relating to insurance contracts | 17,799 | 16,426 | 18,560 | ||||||||
| Component of the present value of future cash flows (BEL) | 16,627 | 15,206 | 17,196 | ||||||||
| Risk adjustment (RA) | 211 | 154 | 185 | ||||||||
| Contractual service margin (CSM) | 424 | 481 | 592 | ||||||||
| Remaining coverage liability | 71 | 78 | 75 | ||||||||
| Liabilities for incurred claims (LIC) | 466 | 507 | 512 | ||||||||
| EUR million | |||||||||||||||||||||||||||||
| Tangible assets | Of which: For leasing |
||||||||||||||||||||||||||||
For own use |
Leased out under an operating lease |
Investment property |
Total | For own use | Leased out under an operating lease |
Investment property |
Total | ||||||||||||||||||||||
| Cost | |||||||||||||||||||||||||||||
| Balances at 1 January 2021 | 24,896 | 24,204 | 1,460 | 50,560 | 3,948 | — | — | 3,948 | |||||||||||||||||||||
| Additions / disposals (net) due to change in the scope of consolidation | 66 | (257) | — | (191) | 1 | — | — | 1 | |||||||||||||||||||||
| Additions / disposals (net) | 781 | (1,076) | (64) | (359) | 96A |
— | — | 96 | |||||||||||||||||||||
| Transfers, exchange differences and other items | (214) | 1,552 | 141 | 1,479 | 384 | — | — | 384 | |||||||||||||||||||||
| Balance at 31 December 2021 | 25,529 | 24,423 | 1,537 | 51,489 | 4,429 | — | — | 4,429 | |||||||||||||||||||||
| Additions / disposals (net) due to change in the scope of consolidation | 14 | 89 | — | 103 | 1 | — | — | 1 | |||||||||||||||||||||
| Additions / disposals (net) | 604 | (822) | (64) | (282) | 109A |
— | — | 109 | |||||||||||||||||||||
| Transfers, exchange differences and other items | 423 | 1,476 | 107 | 2,006 | 153 | — | — | 153 | |||||||||||||||||||||
| Balance at 31 December 2022 | 26,570 | 25,166 | 1,580 | 53,316 | 4,692 | — | — | 4,692 | |||||||||||||||||||||
| Additions / disposals (net) due to change in the scope of consolidation | 11 | 37 | — | 48 | (13) | — | — | (13) | |||||||||||||||||||||
| Additions / disposals (net) | 1,122 | 742 | (34) | 1,830 | 125A |
— | — | 125 | |||||||||||||||||||||
| Transfers, exchange differences and other items | (1,460) | (641) | 30 | (2,071) | 33 | — | — | 33 | |||||||||||||||||||||
| Balance at 31 December 2023 | 26,243 | 25,304 | 1,576 | 53,123 | 4,837 | — | — | 4,837 | |||||||||||||||||||||
| Accumulated depreciation | |||||||||||||||||||||||||||||
| Balances at 1 January 2021 | (11,543) | (5,585) | (133) | (17,261) | (1,217) | — | — | (1,217) | |||||||||||||||||||||
| Disposals due to change in the scope of consolidation | (1) | 40 | — | 39 | — | — | — | — | |||||||||||||||||||||
| Disposals | 733 | 3,390 | 3 | 4,126 | 44 | — | — | 44 | |||||||||||||||||||||
| Charge for the year | (1,733) | — | (10) | (1,743) | (612) | — | — | (612) | |||||||||||||||||||||
| Transfers, exchange differences and other items | 529 | (3,083) | (9) | (2,563) | (4) | — | — | (4) | |||||||||||||||||||||
| Balance at 31 December 2021 | (12,015) | (5,238) | (149) | (17,402) | (1,789) | — | — | (1,789) | |||||||||||||||||||||
| Disposals due to change in the scope of consolidation | (7) | (30) | 4 | (33) | — | — | — | — | |||||||||||||||||||||
| Disposals | 1,065 | 2,882 | 16 | 3,963 | 164 | — | — | 164 | |||||||||||||||||||||
| Charge for the year | (1,821) | — | (13) | (1,834) | (636) | — | — | (636) | |||||||||||||||||||||
| Transfers, exchange differences and other items | (114) | (3,192) | (30) | (3,336) | (4) | — | — | (4) | |||||||||||||||||||||
| Balance at 31 December 2022 | (12,892) | (5,578) | (172) | (18,642) | (2,265) | — | — | (2,265) | |||||||||||||||||||||
| Disposals due to change in the scope of consolidation | 7 | — | — | 7 | 7 | — | — | 7 | |||||||||||||||||||||
| Disposals | 284 | 2,540 | — | 2,824 | 160 | — | — | 160 | |||||||||||||||||||||
| Charge for the year | (1,744) | — | (11) | (1,755) | (609) | — | — | (609) | |||||||||||||||||||||
| Transfers, exchange differences and other items | 1,708 | (2,744) | (16) | (1,052) | 98 | — | — | 98 | |||||||||||||||||||||
| Balance at 31 December 2023 | (12,637) | (5,782) | (199) | (18,618) | (2,609) | — | — | (2,609) | |||||||||||||||||||||
| EUR million | |||||||||||||||||||||||||||||
| Tangible assets | Of which: For leasing |
||||||||||||||||||||||||||||
| For own use | Leased out under an operating lease |
Investment property |
Total | For own use | Leased out under an operating lease |
Investment property |
Total | ||||||||||||||||||||||
| Impairment losses | |||||||||||||||||||||||||||||
| Balances at 1 January 2021 | (140) | (60) | (364) | (564) | (9) | — | — | (9) | |||||||||||||||||||||
| Impairment charge for the year | (144) | (17) | (8) | (169) | (13) | — | — | (13) | |||||||||||||||||||||
| Releases | 10 | 4 | 5 | 19 | 1 | — | — | 1 | |||||||||||||||||||||
| Disposals due to change in the scope of consolidation | — | — | — | — | — | — | — | — | |||||||||||||||||||||
| Disposals | 61 | — | 3 | 64 | 7 | — | — | 7 | |||||||||||||||||||||
| Exchange differences and other | (42) | (29) | (44) | (115) | (1) | — | — | (1) | |||||||||||||||||||||
| Balance at 31 December 2021 | (255) | (102) | (408) | (765) | (15) | — | — | (15) | |||||||||||||||||||||
| Impairment charge for the year | (95) | (33) | (29) | (157) | (2) | — | — | (2) | |||||||||||||||||||||
| Releases | 12 | 1 | 4 | 17 | 1 | — | — | 1 | |||||||||||||||||||||
| Disposals due to change in the scope of consolidation | — | — | — | — | — | — | — | — | |||||||||||||||||||||
| Disposals | 34 | 76 | 9 | 119 | 13 | 13 | |||||||||||||||||||||||
| Exchange differences and other | 115 | 25 | 45 | 185 | (11) | — | — | (11) | |||||||||||||||||||||
| Balance at 31 December 2022 | (189) | (33) | (379) | (601) | (14) | — | — | (14) | |||||||||||||||||||||
| Impairment charge for the year | (115) | (29) | (12) | (156) | (39) | — | — | (39) | |||||||||||||||||||||
| Releases | 5 | 11 | 4 | 20 | 4 | — | — | 4 | |||||||||||||||||||||
| Disposals due to change in the scope of consolidation | — | — | — | — | — | — | — | — | |||||||||||||||||||||
| Disposals | 36 | — | 4 | 40 | 5 | 5 | |||||||||||||||||||||||
| Exchange differences and other | 65 | 47 | (38) | 74 | (1) | — | — | (1) | |||||||||||||||||||||
| Balance at 31 December 2023 | (198) | (4) | (421) | (623) | (45) | — | — | (45) | |||||||||||||||||||||
| Tangible assets, net | |||||||||||||||||||||||||||||
| Balances at 31 December 2021 | 13,259 | 19,083 | 979 | 33,321 | 2,625 | — | — | 2,625 | |||||||||||||||||||||
| Balances at 31 December 2022 | 13,489 | 19,555 | 1,029 | 34,073 | 2,413 | — | — | 2,413 | |||||||||||||||||||||
| Balances at 31 December 2023 | 13,408 | 19,518 | 956 | 33,882 | 2,183 | 0 | — | 2,183 | |||||||||||||||||||||
| EUR million | |||||||||||||||||
Tangible assets for own use |
Of which: for leasing |
||||||||||||||||
| Cost | Accumulated depreciation |
Impairment losses |
Carrying amount |
||||||||||||||
| Land and buildings | 13,855 | (3,675) | (240) | 9,940 | 2,570 | ||||||||||||
| IT equipment and fixtures | 5,543 | (4,335) | — | 1,208 | 42 | ||||||||||||
| Furniture and vehicles | 5,982 | (3,954) | — | 2,028 | 12 | ||||||||||||
| Construction in progress and other items | 149 | (51) | (15) | 83 | — | ||||||||||||
| Balances at 31 December 2021 | 25,529 | (12,015) | (255) | 13,259 | 2,624 | ||||||||||||
| Land and buildings | 14,623 | (4,467) | (175) | 9,981 | 2,349 | ||||||||||||
| IT equipment and fixtures | 5,285 | (3,984) | — | 1,301 | 53 | ||||||||||||
| Furniture and vehicles | 6,445 | (4,389) | — | 2,056 | 11 | ||||||||||||
| Construction in progress and other items | 217 | (52) | (14) | 151 | — | ||||||||||||
| Balances at 31 December 2022 | 26,570 | (12,892) | (189) | 13,489 | 2,413 | ||||||||||||
| Land and buildings | 14,973 | (5,010) | (154) | 9,809 | 2,104 | ||||||||||||
| IT equipment and fixtures | 5,614 | (4,154) | — | 1,460 | 60 | ||||||||||||
| Furniture and vehicles | 5,412 | (3,424) | — | 1,988 | 19 | ||||||||||||
| Construction in progress and other items | 244 | (49) | (44) | 151 | — | ||||||||||||
| Balances at 31 December 2023 | 26,243 | (12,637) | (198) | 13,408 | 2,183 | ||||||||||||
| EUR million | |||||
| 2023 | |||||
| Maturity Analysis | |||||
| 2024 | 3,365 | ||||
| 2025 | 4,248 | ||||
| 2026 | 5,100 | ||||
| 2027 | 1,124 | ||||
| EUR million | |||||||||||
| 2023 | 2022 | 2021 | |||||||||
| Banco Santander (Brasil) | 3,679 | 3,503 | 3,219 | ||||||||
| SAM Investment Holdings Limited | 1,444 | 1,444 | 1,444 | ||||||||
| Santander Consumer Germany | 1,304 | 1,304 | 1,304 | ||||||||
| Santander Bank Polska | 1,159 | 1,075 | 1,095 | ||||||||
| Santander Portugal | 1,040 | 1,040 | 1,040 | ||||||||
| Santander US Auto | 1,003 | 1,039 | 979 | ||||||||
| Santander España | 998 | 998 | 1,027 | ||||||||
Santander Holding USA (ex. Auto)A |
814 | 844 | 643 | ||||||||
| Santander UK | 612 | 599 | 633 | ||||||||
| Grupo Financiero Santander (México) | 523 | 469 | 435 | ||||||||
| Banco Santander - Chile | 516 | 548 | 516 | ||||||||
| Ebury Partners | 350 | 298 | — | ||||||||
| Santander Consumer Nordics | 206 | 215 | 224 | ||||||||
| Other companies | 369 | 365 | 154 | ||||||||
| Total Goodwill | 14,017 | 13,741 | 12,713 | ||||||||
| EUR million | |||||||||||
| 2023 | 2022 | 2021 | |||||||||
| Balance at beginning of year | 13,741 | 12,713 | 12,471 | ||||||||
| Additions (note 3) | 56 | 534 | 81 | ||||||||
| Of which: | |||||||||||
| Ebury Partners | 45 | 316 | — | ||||||||
Santander Holding USA (ex. Auto) A |
— | 158 | — | ||||||||
| Impairment losses | (20) | — | (6) | ||||||||
| Disposals or changes in scope of consolidation | — | — | — | ||||||||
| Exchange differences and other items | 240 | 494 | 167 | ||||||||
| Balance at end of year | 14,017 | 13,741 | 12,713 | ||||||||
| 2023 | |||||||||||
| Projected period | Discount rateA |
Nominal perpetual growth rate |
|||||||||
| Santander UK | 5 years | 11.9 | % | 2.5 | % | ||||||
| Santander Bank Polska | 5 years | 13.2 | % | 5.0 | % | ||||||
| Santander US Auto | 3 years | 12.8 | % | 3.0 | % | ||||||
Santander Holding USA (ex. Auto)B |
5 years | 13.4 | % | 3.5 | % | ||||||
| Santander Consumer Germany | 5 years | 9.7 | % | 2.3 | % | ||||||
| SAM Investment Holdings, Limited | 5 years | 11.6 | % | 2.5 | % | ||||||
| Santander Portugal | 5 years | 11.2 | % | 2.5 | % | ||||||
Discount rateA |
Nominal perpetual growth rate |
|||||||||||||
| 2022 | 2021 | 2022 | 2021 | |||||||||||
| Santander UK | 11.1 | % | 9.2 | % | 2.5 | % | 2.3 | % | ||||||
| Santander Bank Polska | 15.6 | % | 10.3 | % | 4.8 | % | 3.5 | % | ||||||
| Santander US Auto | 12.2 | % | 10.6 | % | 2.8 | % | 1.5 | % | ||||||
Santander Holding USA (ex. Auto)B |
12.6 | % | 11.6 | % | 3.5 | % | 3.0 | % | ||||||
| Santander Consumer Germany | 9.4 | % | 8.3 | % | 2.3 | % | 1.8 | % | ||||||
| SAM Investment Holdings, Limited | 12.2 | % | 10.4 | % | 2.5 | % | 2.5 | % | ||||||
| Santander Portugal | 11.1 | % | 9.7 | % | 2.3 | % | 1.8 | % | ||||||
| EUR million | ||||||||||||||||||||||||||
| Estimated useful life |
31/12/2022 | Net additions and disposals |
Change in scope of consolidation |
Amortization and impairment |
Application of amortization and impairment |
Exchange differences and other |
31/12/2023 | |||||||||||||||||||
| Cost | 12,502 | 2,197 | 176 | — | (230) | 128 | 14,773 | |||||||||||||||||||
| Brand names | 33 | — | 8 | (2) | 1 | 40 | ||||||||||||||||||||
| IT developments | 3-10 years |
10,721 | 2,197 | 18 | (196) | 127 | 12,867 | |||||||||||||||||||
| Other | 1,748 | — | 150 | (32) | — | 1,866 | ||||||||||||||||||||
| Accumulated amortisation | (7,554) | — | 5 | (1,429) | 209 | (82) | (8,851) | |||||||||||||||||||
| Development | (6,866) | — | — | (1,294) | 177 | (95) | (8,078) | |||||||||||||||||||
| Other | (688) | — | 5 | (135) | 32 | 13 | (773) | |||||||||||||||||||
| Impairment losses | (44) | — | — | (53) | 21 | 8 | (68) | |||||||||||||||||||
| Of which addition | — | — | — | (53) | — | — | — | |||||||||||||||||||
| Liberation | — | — | — | — | — | — | — | |||||||||||||||||||
| 4,904 | 2,197 | 181 | (1,482) | — | 54 | 5,854 | ||||||||||||||||||||
| EUR million | ||||||||||||||||||||||||||
| Estimated useful life |
31/12/2021 | Net additions and disposals |
Change in scope of consolidation |
Amortization and impairment |
Application of amortization and impairment |
Exchange differences and other |
31/12/2022 | |||||||||||||||||||
| Cost | 10,712 | 1,757 | 381 | — | (511) | 163 | 12,502 | |||||||||||||||||||
| Brand names | 4 | — | 27 | — | 2 | 33 | ||||||||||||||||||||
| IT developments | 3-10 years |
9,189 | 1,748 | 153 | (497) | 128 | 10,721 | |||||||||||||||||||
| Other | 1,519 | 9 | 201 | (14) | 33 | 1,748 | ||||||||||||||||||||
| Accumulated amortisation | (6,707) | — | — | (1,151) | 412 | (108) | (7,554) | |||||||||||||||||||
| Development | (6,149) | — | — | (1,024) | 403 | (96) | (6,866) | |||||||||||||||||||
| Other | (558) | — | — | (127) | 9 | (12) | (688) | |||||||||||||||||||
| Impairment losses | (134) | — | — | (75) | 99 | 66 | (44) | |||||||||||||||||||
| Of which addition | — | — | — | (75) | — | — | — | |||||||||||||||||||
| Liberation | — | — | — | — | — | — | — | |||||||||||||||||||
| 3,871 | 1,757 | 381 | (1,226) | — | 121 | 4,904 | ||||||||||||||||||||
| EUR million | ||||||||||||||||||||||||||
| Estimated useful life |
31/12/2020 | Net additions and disposals |
Change in scope of consolidation |
Amortization and impairment |
Application of amortization and impairment |
Exchange differences and other |
31/12/2021 | |||||||||||||||||||
| Cost | 9,376 | 1,409 | 5 | — | (293) | 215 | 10,712 | |||||||||||||||||||
| Brand names | 37 | — | — | (34) | 1 | 4 | ||||||||||||||||||||
| IT developments | 3-10 years |
7,900 | 1,325 | 4 | (212) | 172 | 9,189 | |||||||||||||||||||
| Other | 1,439 | 84 | 1 | (47) | 42 | 1,519 | ||||||||||||||||||||
| Accumulated amortisation | (5,809) | — | (2) | (1,013) | 232 | (115) | (6,707) | |||||||||||||||||||
| Development | (5,307) | — | (1) | (922) | 178 | (97) | (6,149) | |||||||||||||||||||
| Other | (502) | — | (1) | (91) | 54 | (18) | (558) | |||||||||||||||||||
| Impairment losses | (130) | — | — | (65) | 61 | — | (134) | |||||||||||||||||||
| Of which addition | — | — | — | (65) | — | — | — | |||||||||||||||||||
| Liberation | — | — | — | — | — | — | — | |||||||||||||||||||
| 3,437 | 1,409 | 3 | (1,078) | — | 100 | 3,871 | ||||||||||||||||||||
| EUR million | |||||||||||
| 2023 | 2022 | 2021 | |||||||||
| Transactions in transit | 246 | 83 | 157 | ||||||||
| Net pension plan assets (note 25) | 1,001 | 1,345 | 1,990 | ||||||||
| Prepayments and accrued income | 2,911 | 3,003 | 2,610 | ||||||||
| Other (note 2.m) | 4,598 | 5,536 | 3,683 | ||||||||
| 8,756 | 9,967 | 8,440 | |||||||||
| EUR million | |||||||||||
| 2023 | 2022 | 2021 | |||||||||
| CENTRAL BANKS | |||||||||||
| Classification | |||||||||||
| Financial liabilities held for trading | 7,808 | 5,757 | 1,038 | ||||||||
| Financial liabilities designated at fair value through profit or loss | 1,209 | 1,740 | 607 | ||||||||
| Financial liabilities at amortized cost | 48,782 | 76,952 | 139,757 | ||||||||
| 57,799 | 84,449 | 141,402 | |||||||||
| Type | |||||||||||
| Deposits on demand | 117 | — | 10 | ||||||||
| Time deposits | 43,853 | 72,320 | 134,439 | ||||||||
| Reverse repurchase agreements | 13,829 | 12,129 | 6,953 | ||||||||
| 57,799 | 84,449 | 141,402 | |||||||||
| CREDIT INSTITUTIONS | |||||||||||
| Classification | |||||||||||
| Financial liabilities held for trading | 17,862 | 9,796 | 6,488 | ||||||||
| Financial liabilities designated at fair value through profit or loss | 1,735 | 1,958 | 1,064 | ||||||||
| Financial liabilities at amortized cost | 81,246 | 68,582 | 52,235 | ||||||||
| 100,843 | 80,336 | 59,787 | |||||||||
| Type | |||||||||||
| Deposits on demand | 5,468 | 6,808 | 6,139 | ||||||||
| Time deposits | 54,402 | 49,221 | 37,332 | ||||||||
| Reverse repurchase agreements | 40,689 | 24,245 | 16,198 | ||||||||
| Subordinated deposits | 284 | 62 | 118 | ||||||||
| 100,843 | 80,336 | 59,787 | |||||||||
| Currency | |||||||||||
| Euro | 53,921 | 65,133 | 107,908 | ||||||||
| Pound sterling | 27,697 | 35,357 | 42,451 | ||||||||
| US dollar | 49,447 | 30,924 | 24,012 | ||||||||
| Brazilian real | 7,997 | 14,195 | 11,297 | ||||||||
| Other currencies | 19,580 | 19,176 | 15,521 | ||||||||
| TOTAL | 158,642 | 164,785 | 201,189 | ||||||||
| EUR million | |||||||||||
| 2023 | 2022 | 2021 | |||||||||
| Classification | |||||||||||
| Financial liabilities held for trading | 19,837 | 12,226 | 6,141 | ||||||||
| Financial liabilities designated at fair value through profit or loss | 32,052 | 31,143 | 7,818 | ||||||||
| Financial liabilities at amortized cost |
995,280 | 966,353 | 886,595 | ||||||||
| 1,047,169 | 1,009,722 | 900,554 | |||||||||
| Geographical area | |||||||||||
| Spain | 388,736 | 386,826 | 305,775 | ||||||||
| European Union (excluding Spain) | 120,540 | 111,930 | 108,361 | ||||||||
| United Kingdom | 235,698 | 232,364 | 243,734 | ||||||||
| United States | 83,555 | 87,497 | 73,814 | ||||||||
| Rest of America | 208,713 | 181,782 | 159,381 | ||||||||
| Rest of the world | 9,927 | 9,323 | 9,489 | ||||||||
| 1,047,169 | 1,009,722 | 900,554 | |||||||||
| Type | |||||||||||
| Demand deposits- | 661,262 | 710,232 | 717,728 | ||||||||
| Current accounts | 437,972 | 477,739 | 482,649 | ||||||||
| Savings accounts | 216,077 | 225,445 | 227,318 | ||||||||
| Other demand deposits | 7,213 | 7,048 | 7,761 | ||||||||
| Time deposits- | 307,085 | 236,099 | 146,469 | ||||||||
| Fixed-term deposits and other term deposits | 302,545 | 232,619 | 144,382 | ||||||||
| Home-purchase savings accounts | 33 | 38 | 38 | ||||||||
| Discount deposits | — | — | 3 | ||||||||
| Hybrid financial liabilities | 4,408 | 3,296 | 1,906 | ||||||||
| Subordinated liabilities | 99 | 146 | 140 | ||||||||
| Repurchase agreements | 78,822 | 63,391 | 36,357 | ||||||||
| 1,047,169 | 1,009,722 | 900,554 | |||||||||
| EUR million | |||||||||||
| 2023 | 2022 | 2021 | |||||||||
| Classification | |||||||||||
| Financial liabilities held for trading |
— | — | — | ||||||||
| Financial liabilities designated at fair value through profit or loss |
5,371 | 5,427 | 5,454 | ||||||||
| Financial liabilities at amortized cost |
303,208 | 274,912 | 240,709 | ||||||||
| 308,579 | 280,339 | 246,163 | |||||||||
| Type | |||||||||||
| Bonds and debentures outstanding | 231,880 | 211,597 | 194,362 | ||||||||
| Subordinated | 30,529 | 25,717 | 25,938 | ||||||||
| Notes and other securities | 46,170 | 43,025 | 25,863 | ||||||||
| 308,579 | 280,339 | 246,163 | |||||||||
| EUR million | ||||||||||||||||||||
| Within 3 months | 3 to 12 months |
1 to 3 years |
3 to 5 years |
More than 5 years |
Total | |||||||||||||||
| Subordinated debt | — | — | 5,934 | 3,160 | 21,435 | 30,529 | ||||||||||||||
| Senior unsecured debt | 2,788 | 23,351 | 54,527 | 35,156 | 28,099 | 143,921 | ||||||||||||||
| Senior secured debt | 3,283 | 17,845 | 33,733 | 20,344 | 12,754 | 87,959 | ||||||||||||||
| Promissory notes and other securities | 22,802 | 23,368 | — | — | — | 46,170 | ||||||||||||||
| Debt securities issued | 28,873 | 64,564 | 94,194 | 58,660 | 62,288 | 308,579 | ||||||||||||||
| EUR million | ||||||||||||||||||||
| Within 3 months | 3 to 12 months |
1 to 3 years |
3 to 5 years |
More than 5 years |
Total | |||||||||||||||
| Subordinated debt | — | — | 5,913 | 3,135 | 20,978 | 30,026 | ||||||||||||||
| Senior unsecured debt | 2,741 | 22,957 | 53,607 | 34,563 | 27,624 | 141,492 | ||||||||||||||
| Senior secured debt | 3,290 | 17,884 | 33,806 | 20,388 | 12,782 | 88,150 | ||||||||||||||
| Promissory notes and other securities | 22,788 | 23,352 | — | — | — | 46,140 | ||||||||||||||
| Debt securities issued | 28,819 | 64,193 | 93,326 | 58,086 | 61,384 | 305,808 | ||||||||||||||
| 2023 | |||||||||||||||||
| EUR million | |||||||||||||||||
| Currency of issue | 2023 | 2022 | 2021 | Outstanding issue amount in foreign currency (Million) | Annual interest rate (%) |
||||||||||||
| Euro | 101,657 | 87,295 | 90,348 | 101,657 | 2.22% | ||||||||||||
| US dollar | 70,229 | 75,798 | 66,581 | 77,624 | 3.95% | ||||||||||||
| Pound sterling | 20,520 | 15,883 | 13,340 | 17,805 | 3.86% | ||||||||||||
| Brazilian real | 21,861 | 18,024 | 9,131 | 117,281 | 11.71% | ||||||||||||
| Chilean peso | 4,921 | 4,653 | 3,757 | 4,749,711 | 3.12% | ||||||||||||
| Other currencies | 12,692 | 9,944 | 11,205 | ||||||||||||||
| Balance at end of year | 231,880 | 211,597 | 194,362 | ||||||||||||||
| EUR million | |||||||||||
| 2023 | 2022 | 2021 | |||||||||
| Balance at beginning of year | 211,597 | 194,362 | 191,577 | ||||||||
| Net inclusion of entities in the Group | (1,467) | — | — | ||||||||
| Of which: | |||||||||||
| Auto ABS UK Loans PLC | (841) | — | — | ||||||||
| PSA Bank Deutschland GmbH | (626) | — | — | ||||||||
| Issues | 68,568 | 66,033 | 59,937 | ||||||||
| Of which: | |||||||||||
| Banco Santander, S.A. | 19,706 | 19,243 | 11,766 | ||||||||
| Banco Santander (Brasil) S.A. | 12,781 | 11,233 | 14,996 | ||||||||
| Santander Consumer USA Holdings Inc. | 7,309 | 13,315 | 15,771 | ||||||||
| Santander UK Group Holdings plc | 6,002 | 10,178 | 3,372 | ||||||||
| Santander Consumer Finance, S.A. | 2,557 | 1,293 | 1,169 | ||||||||
| Santander Holdings USA, Inc. | 1,850 | 2,315 | — | ||||||||
| Banco Santander Totta, S.A. | 1,734 | 113 | 183 | ||||||||
| Santander Consumer Bank S.p.A. | 1,460 | — | 505 | ||||||||
| Santander Bank, National Association | 1,346 | 1,222 | 252 | ||||||||
| Santander Consumer Bank AG | 1,256 | — | — | ||||||||
| Banque Stellantis France (previously PSA Banque France) | 1,145 | 60 | 815 | ||||||||
| Santander Bank Polska S.A. | 1,102 | — | — | ||||||||
| Santander International Products, Plc. | 1,054 | 599 | 914 | ||||||||
| Banco Santander - Chile | 814 | 1,486 | 1,158 | ||||||||
| SC Germany S.A., Compartment Consumer 2023-1 | 783 | — | — | ||||||||
| Santander Consumo 4, F.T. | — | — | 1,531 | ||||||||
| SC Germany S.A., Compartment Consumer 2021-1 | — | — | 1,496 | ||||||||
| Redemptions and repurchases | (48,825) | (49,903) | (61,846) | ||||||||
| Of which: | |||||||||||
| Santander Consumer USA Holdings Inc. | (14,466) | (15,252) | (15,151) | ||||||||
| Banco Santander (Brasil) S.A. | (10,542) | (2,721) | (15,182) | ||||||||
| Banco Santander, S.A. | (7,889) | (9,297) | (3,185) | ||||||||
| Santander UK Group Holdings plc | (6,185) | (5,267) | (14,695) | ||||||||
| Santander Consumer Finance, S.A. | (1,800) | (3,357) | (3,779) | ||||||||
| Banque Stellantis France (previously PSA Banque France) | (813) | (1,165) | (335) | ||||||||
| Banco Santander - Chile | (575) | (1,452) | (1,030) | ||||||||
| Banco Santander México, S.A., Institución de Banca Múltiple, Grupo Financiero Santander México | (140) | (1,316) | (411) | ||||||||
| Santander Holdings USA, Inc. | — | (3,153) | (778) | ||||||||
| Exchange differences and other movements | 2,007 | 1,105 | 4,694 | ||||||||
| Balance at year-end | 231,880 | 211,597 | 194,362 | ||||||||
| EUR million | |||||||||||
| 2023 | 2022 | 2021 | |||||||||
| Asset-backed securities | 37,717 | 40,138 | 40,519 | ||||||||
| Of which, mortgage-backed securities | 3,019 | 1,549 | 1,487 | ||||||||
| Other mortgage securities | 49,478 | 43,650 | 41,779 | ||||||||
| Of which: mortgage-backed bonds | 24,619 | 22,049 | 23,197 | ||||||||
| Covered bonds (non mortgage and export financing) | 764 | 352 | 630 | ||||||||
| 87,959 | 84,140 | 82,928 | |||||||||
| 2023 | |||||||||||||||||
| EUR million | Outstanding issue amount in foreign currency (million) | Annual interest rate (%) | |||||||||||||||
| Currency of issue | 2023 | 2022 | 2021 | ||||||||||||||
| Euro | 13,684 | 12,940 | 13,857 | 13,684 | 3.81% | ||||||||||||
| US dollar | 11,300 | 8,438 | 8,236 | 12,490 | 6.17% | ||||||||||||
| Pound sterling | 1,353 | 1,358 | 1,535 | 1,174 | 4.30% | ||||||||||||
| Brazilian real | 2,518 | 1,127 | 879 | 13,509 | 13.72% | ||||||||||||
| Other currencies | 2,057 | 2,063 | 1,689 | ||||||||||||||
| Balance at end of year | 30,912 | 25,926 | 26,196 | ||||||||||||||
| EUR million | |||||||||||
| 2023 | 2022 | 2021 | |||||||||
| Balance at beginning of year | 25,926 | 26,196 | 21,880 | ||||||||
| Net inclusion of entities in the Group | (40) | — | — | ||||||||
IssuancesA |
7,007 | 119 | 5,340 | ||||||||
| Of which: | |||||||||||
| Banco Santander, S.A. | 5,610 | — | 4,469 | ||||||||
| Banco Santander (Brasil) S.A. | 1,112 | — | 871 | ||||||||
| Banque Stellantis France | 150 | — | — | ||||||||
| Banco Santander - Chile | — | 113 | — | ||||||||
Redemptions and repurchasesA |
(1,781) | (1,040) | (1,500) | ||||||||
| Of which: | |||||||||||
| Banco Santander, S.A. | (1,000) | (889) | (1,500) | ||||||||
| Santander UK plc | (702) | (98) | — | ||||||||
| Banque Stellantis France | (78) | — | — | ||||||||
| Banco Santander México, S.A., Institución de Banca Múltiple, Grupo Financiero Santander México | — | (52) | — | ||||||||
| Exchange differences and other movements | (200) | 651 | 476 | ||||||||
| Balance at end of year | 30,912 | 25,926 | 26,196 | ||||||||
| EUR million | |||||||||||
| 2023 | 2022 | 2021 | |||||||||
| Trade payables | 1,783 | 1,563 | 1,475 | ||||||||
| Clearing houses | 1,269 | 1,200 | 650 | ||||||||
| Tax collection accounts: | |||||||||||
| Public Institutions | 4,986 | 5,796 | 5,315 | ||||||||
| Factoring accounts payable | 272 | 262 | 275 | ||||||||
| Unsettled financial transactions | 6,412 | 5,429 | 3,779 | ||||||||
| Lease liabilities (note 2.k) | 2,400 | 2,622 | 2,856 | ||||||||
| Other financial liabilities | 23,065 | 20,187 | 15,523 | ||||||||
| 40,187 | 37,059 | 29,873 | |||||||||
| EUR million | |||||||||||
| 2023 | 2022 | 2021 | |||||||||
Maturity Analysis - Discounted payments |
|||||||||||
| Within 1 year | 586 | 707 | 690 | ||||||||
| Between 1 and 3 years | 918 | 1,005 | 933 | ||||||||
| Between 3 and 5 years | 480 | 454 | 534 | ||||||||
| Later than 5 years | 416 | 456 | 699 | ||||||||
| Total discounted payments at the end of the year | 2,400 | 2,622 | 2,856 | ||||||||
| EUR million | |||||||||||
| 2023 | 2022 | 2021 | |||||||||
| Provision for pensions and other obligations post-employments | 2,225 | 2,392 | 3,185 | ||||||||
| Other long term employee benefits | 880 | 950 | 1,242 | ||||||||
| Provisions for taxes and other legal contingencies | 2,715 | 2,074 | 1,996 | ||||||||
| Contingent liabilities and commitments (note 2.o) | 702 | 734 | 733 | ||||||||
| Other provisions | 1,919 | 1,999 | 2,427 | ||||||||
| Provisions | 8,441 | 8,149 | 9,583 | ||||||||
| EUR million | |||||||||||||||||
| 2023 | |||||||||||||||||
| Post employment plans | Long term employee benefits | Contingent liabilities and commitments | Other provisions | Total | |||||||||||||
| Balances at beginning of year | 2,392 | 950 | 734 | 4,073 | 8,149 | ||||||||||||
| Incorporation of Group companies, net | (4) | — | — | — | (4) | ||||||||||||
| Additions charged to income | 93 | 244 | (24) | 2,501 | 2,814 | ||||||||||||
| Interest expense (note 39) | 60 | 34 | — | — | 94 | ||||||||||||
Staff costs (note 46) |
33 | 9 | — | — | 42 | ||||||||||||
| Provisions or reversion of provisions | — | 201 | (24) | 2,501 | 2,678 | ||||||||||||
| Addition | 3 | 204 | 392 | 4,013 | 4,612 | ||||||||||||
| Release | (3) | (3) | (416) | (1,512) | (1,934) | ||||||||||||
| Other additions arising from insurance contracts linked to pensions | — | — | — | — | — | ||||||||||||
| Changes in value recognised in equity | 944 | — | — | — | 944 | ||||||||||||
| Payments to pensioners and pre-retirees with a charge to internal provisions | (182) | (316) | — | — | (498) | ||||||||||||
| Insurance premiums paid | — | — | — | — | — | ||||||||||||
| Payments to external funds | (750) | — | — | — | (750) | ||||||||||||
| Amounts used | — | — | (1) | (2,087) | (2,088) | ||||||||||||
| Transfer, exchange differences and other changes | (268) | 2 | (7) | 147 | (126) | ||||||||||||
| Balances at end of year | 2,225 | 880 | 702 | 4,634 | 8,441 | ||||||||||||
| EUR million | |||||||||||||||||||||||||||||||||||
| 2022 | 2021 | ||||||||||||||||||||||||||||||||||
| Post employment plans | Long term employee benefits | Contingent liabilities and commitments | Other provisions | Total | Post employment plans | Long term employee benefits | Contingent liabilities and commitments | Other provisions | Total | ||||||||||||||||||||||||||
| Balances at beginning of year | 3,185 | 1,242 | 733 | 4,423 | 9,583 | 3,976 | 1,751 | 700 | 4,425 | 10,852 | |||||||||||||||||||||||||
| Incorporation of Group companies, net | — | — | — | — | — | — | — | — | — | — | |||||||||||||||||||||||||
| Additions charged to income | 128 | 69 | (27) | 1,876 | 2,046 | 100 | 101 | 29 | 2,748 | 2,978 | |||||||||||||||||||||||||
| Interest expense (note 39) | 73 | 27 | — | — | 100 | 78 | 13 | — | — | 91 | |||||||||||||||||||||||||
Staff costs (note 46) |
57 | 8 | — | — | 65 | 67 | 6 | — | — | 73 | |||||||||||||||||||||||||
| Provisions or reversion of provisions | (2) | 34 | (27) | 1,876 | 1,881 | (45) | 82 | 29 | 2,748 | 2,814 | |||||||||||||||||||||||||
| Addition | 10 | 105 | 618 | 3,484 | 4,217 | 21 | 154 | 473 | 3,065 | 3,713 | |||||||||||||||||||||||||
| Release | (12) | (71) | (645) | (1,608) | (2,336) | (66) | (72) | (444) | (317) | (899) | |||||||||||||||||||||||||
| Other additions arising from insurance contracts linked to pensions | (33) | — | — | — | (33) | (8) | — | — | — | (8) | |||||||||||||||||||||||||
| Changes in value recognised in equity | 242 | — | — | — | 242 | (1,705) | — | — | — | (1,705) | |||||||||||||||||||||||||
| Payments to pensioners and pre-retirees with a charge to internal provisions | (229) | (363) | — | — | (592) | (201) | (605) | — | — | (806) | |||||||||||||||||||||||||
| Insurance premiums paid | (3) | — | — | — | (3) | — | — | — | — | — | |||||||||||||||||||||||||
| Payments to external funds | (451) | — | — | — | (451) | (440) | — | — | — | (440) | |||||||||||||||||||||||||
| Amounts used | — | — | — | (2,817) | (2,817) | — | — | — | (2,961) | (2,961) | |||||||||||||||||||||||||
| Transfer, exchange differences and other changes | (447) | 2 | 28 | 591 | 174 | 1,463 | (5) | 4 | 211 | 1,673 | |||||||||||||||||||||||||
| Balances at end of year | 2,392 | 950 | 734 | 4,073 | 8,149 | 3,185 | 1,242 | 733 | 4,423 | 9,583 | |||||||||||||||||||||||||
| EUR million | |||||||||||
| 2023 | 2022 | 2021 | |||||||||
| Provisions for post-employment plans - Spanish entities | 770 | 1,245 | 1,709 | ||||||||
| Provisions for other similar obligations - Spanish entities | 817 | 895 | 1,188 | ||||||||
| Of which pre-retirements | 805 | 884 | 1,176 | ||||||||
| Provisions for post-employment plans - United Kingdom | 76 | 29 | 44 | ||||||||
| Provisions for post-employment plans - Other subsidiaries | 1,379 | 1,118 | 1,432 | ||||||||
| Provisions for other similar obligations - Other subsidiaries | 63 | 55 | 54 | ||||||||
| Provision for pensions and other obligations post -employments and Other long term employee benefits | 3,105 | 3,342 | 4,427 | ||||||||
| Of which defined benefits | 3,097 | 3,335 | 4,419 | ||||||||
| Post-employment plans | Other similar obligations | ||||||||||||||||||||||
| 2023 | 2022 | 2021 | 2023 | 2022 | 2021 | ||||||||||||||||||
| Annual discount rate | 3.35 | % | 3.80 | % | 0.90 | % | 3.35 | % | 3.80 | % | 0.90 | % | |||||||||||
| Mortality tables | PE2020 M/F Col. Orden 1 | PE2020 M/F Col. Orden 1 | PE2020 M/F Col. Orden 1 | PE2020 M/F Col. Orden 1 | PE2020 M/F Col. Orden 1 | PE2020 M/F Col. Orden 1 | |||||||||||||||||
| Cumulative annual CPI growth | 2.00 | % | 2.00 | % | 1.00 | % | 2.00 | % | 2.00 | % | 1.00 | % | |||||||||||
| Annual salary increase rate | 1.25%A |
1.25%A |
1.25%A |
N/A | N/A | N/A | |||||||||||||||||
| Annual social security pension increase rate | 2.12 | % | 2.00 | % | 1.00 | % | N/A | N/A | N/A | ||||||||||||||
| Annual benefit increase rate | N/A | N/A | N/A | 0 | % | 0 | % | 0 | % | ||||||||||||||
| Post-employment plans | Other similar obligations | ||||||||||||||||||||||
| 2023 | 2022 | 2021 | 2023 | 2022 | 2021 | ||||||||||||||||||
| Expected rate of return on plan assets | 3.35 | % | 3.80 | % | 0.90 | % | 3.35 | % | 3.80 | % | 0.90 | % | |||||||||||
| Expected rate of return on reimbursement rights | 3.35 | % | 3.80 | % | 0.90 | % | N/A | N/A | N/A | ||||||||||||||
| EUR million | |||||||||||||||||||||||
| Post-employment plans | Other similar obligations | ||||||||||||||||||||||
| 2023 | 2022 | 2021 | 2023 | 2022 | 2021 | ||||||||||||||||||
| Present value of the obligations | |||||||||||||||||||||||
| To current employees | 21 | 25 | 29 | — | — | — | |||||||||||||||||
| Vested obligations to retired employees | 1,917 | 2,005 | 2,797 | — | — | — | |||||||||||||||||
| To pre-retirees employees | — | — | — | 812 | 892 | 1,186 | |||||||||||||||||
| Long-service bonuses and other benefits | — | — | — | 12 | 11 | 12 | |||||||||||||||||
| Other | 49 | 46 | 65 | — | — | — | |||||||||||||||||
| 1,987 | 2,076 | 2,891 | 824 | 903 | 1,198 | ||||||||||||||||||
| Less - Fair value of plan assets | 1,235 | 861 | 1,217 | 7 | 8 | 10 | |||||||||||||||||
| Provisions - Provisions for pensions | 752 | 1,215 | 1,674 | 817 | 895 | 1,188 | |||||||||||||||||
| Of which: | |||||||||||||||||||||||
| Internal provisions for pensions | 677 | 1,141 | 1,560 | 817 | 895 | 1,188 | |||||||||||||||||
| Net pension assets | (14) | (24) | (30) | — | — | — | |||||||||||||||||
| Insurance contracts linked to pensions (note 14) | 93 | 104 | 149 | — | — | — | |||||||||||||||||
| Unrecognised net assets for pensions | (4) | (6) | (5) | — | — | — | |||||||||||||||||
| EUR million | |||||||||||||||||||||||
| Post-employment plans | Other similar obligations | ||||||||||||||||||||||
| 2023 | 2022 | 2021 | 2023 | 2022 | 2021 | ||||||||||||||||||
| Current service cost | 2 | 3 | 5 | 1 | 1 | 1 | |||||||||||||||||
| Interest cost (net) | 42 | 48 | 24 | 30 | 25 | 11 | |||||||||||||||||
| Expected return on insurance contracts linked to pensions | (4) | (4) | (1) | — | — | — | |||||||||||||||||
| Provisions or reversion of provisions | |||||||||||||||||||||||
| Actuarial (gains)/losses recognised in the year | — | — | — | 7 | (67) | (15) | |||||||||||||||||
| Past service cost | 2 | 2 | 13 | 13 | — | — | |||||||||||||||||
| Pre-retirement cost | — | — | — | 160 | 92 | 139 | |||||||||||||||||
OtherA |
(1) | (8) | (39) | (1) | — | (55) | |||||||||||||||||
| 41 | 41 | 2 | 210 | 51 | 81 | ||||||||||||||||||
| EUR million | |||||||||||||||||||||||
| Post-employment plans | Other similar obligations | ||||||||||||||||||||||
| 2023 | 2022 | 2021 | 2023 | 2022 | 2021 | ||||||||||||||||||
| Present value of the obligations at beginning of year | 2,076 | 2,891 | 3,419 | 903 | 1,198 | 1,707 | |||||||||||||||||
| Incorporation of Group companies, net | — | — | 6 | — | — | — | |||||||||||||||||
| Current service cost | 2 | 3 | 5 | 1 | 1 | 1 | |||||||||||||||||
| Interest cost | 82 | 78 | 36 | 30 | 25 | 11 | |||||||||||||||||
| Pre-retirement cost | — | — | — | 160 | 92 | 139 | |||||||||||||||||
| Effect of curtailment/settlement | (1) | (8) | (61) | (1) | — | (55) | |||||||||||||||||
| Benefits paid | (210) | (258) | (248) | (290) | (346) | (589) | |||||||||||||||||
| Benefits paid due to settlements | — | — | (166) | — | — | — | |||||||||||||||||
| Past service cost | 2 | 2 | 13 | 13 | — | — | |||||||||||||||||
| Actuarial (gains)/losses | 37 | (631) | (121) | 7 | (68) | (15) | |||||||||||||||||
| Demographic actuarial (gains)/losses | (2) | 2 | 9 | — | (5) | (8) | |||||||||||||||||
| Financial actuarial (gains)/losses | 39 | (633) | (130) | 7 | (63) | (7) | |||||||||||||||||
| Exchange differences and other items | (1) | (1) | 8 | 1 | 1 | (1) | |||||||||||||||||
| Present value of the obligations at end of year | 1,987 | 2,076 | 2,891 | 824 | 903 | 1,198 | |||||||||||||||||
| Plan Assets | |||||||||||||||||||||||
| EUR million | |||||||||||||||||||||||
| Post-employment plans | Other similar obligations | ||||||||||||||||||||||
| 2023 | 2022 | 2021 | 2023 | 2022 | 2021 | ||||||||||||||||||
| Fair value of plan assets at beginning of year | 861 | 1,217 | 1,542 | 8 | 10 | 12 | |||||||||||||||||
| Incorporation of Group companies, net | — | — | 6 | — | — | — | |||||||||||||||||
| Expected return on plan assets | 40 | 30 | 12 | — | — | — | |||||||||||||||||
| Gains/(losses) on settlements | — | — | (22) | — | — | — | |||||||||||||||||
| Benefits paid | (89) | (78) | (263) | (2) | (2) | (2) | |||||||||||||||||
| Contributions/(surrenders) | 409 | 2 | 15 | — | — | — | |||||||||||||||||
| Actuarial gains/(losses) | 25 | (303) | (76) | — | (1) | — | |||||||||||||||||
| Exchange differences and other items | (11) | (7) | 3 | 1 | 1 | — | |||||||||||||||||
| Fair value of plan assets at end of year | 1,235 | 861 | 1,217 | 7 | 8 | 10 | |||||||||||||||||
| Insurance Contracts linked to pensions | |||||||||||||||||||||||
| EUR million | |||||||||||||||||||||||
| Post-employment plans | Other similar obligations | ||||||||||||||||||||||
| 2023 | 2022 | 2021 | 2023 | 2022 | 2021 | ||||||||||||||||||
| Fair value of insurance contracts linked to pensions at beginning of year | 104 | 149 | 174 | — | — | — | |||||||||||||||||
| Incorporation of Group companies, net | — | — | — | — | — | — | |||||||||||||||||
| Expected return on insurance contracts linked to pensions | 4 | 4 | 1 | — | — | — | |||||||||||||||||
| Benefits paid | (15) | (16) | (19) | — | — | — | |||||||||||||||||
| Paid premiums | — | — | 1 | — | — | — | |||||||||||||||||
| Actuarial gains/(losses) | — | (33) | (8) | — | — | — | |||||||||||||||||
| Fair value of insurance contracts linked to pensions at end of year | 93 | 104 | 149 | — | — | — | |||||||||||||||||
| EUR million | |||||
| 2024 | 464 | ||||
| 2025 | 390 | ||||
| 2026 | 338 | ||||
| 2027 | 281 | ||||
| 2028 | 229 | ||||
| 2029 to 2033 | 744 | ||||
| 2023 | 2022 | 2021 | |||||||||
| Annual discount rate | 4.63% | 4.88% | 1.90% | ||||||||
| Mortality tables | The S3 Middle tables weighted at 84% of the CMI_2022 projection with an initial addition of 0.25%, smoothing parameter 7 and improving 1.25%. | The S3 Middle tables weighted at 84% of the CMI_2021 projection with an initial addition of 0.25%, smoothing parameter 7 and improving 1.25%. | The S3 Middle tables weighted at 84% of the CMI_2020 projection with an initial addition of 0.15%, smoothing parameter 7 and improving 1.25%. | ||||||||
| Cumulative annual CPI growth | 3.02% | 3.11% | 3.37% | ||||||||
| Annual salary increase rate | 1.00% | 1.00% | 1.00% | ||||||||
| Annual pension increase rate | 2.96% | 2.98% | 3.21% | ||||||||
| EUR million | |||||||||||
| 2023 | 2022 | 2021 | |||||||||
| Present value of the obligations | 9,451 | 8,982 | 15,392 | ||||||||
| Less- | |||||||||||
| Fair value of plan assets | 10,208 | 10,152 | 17,244 | ||||||||
| Provisions - Provisions for pensions | (757) | (1,170) | (1,852) | ||||||||
| Of which: | |||||||||||
| Internal provisions for pensions | 76 | 29 | 44 | ||||||||
| Net assets for pensions | (833) | (1,199) | (1,896) | ||||||||
| EUR million | |||||||||||
| 2023 | 2022 | 2021 | |||||||||
| Current service cost | 14 | 30 | 33 | ||||||||
| Interest cost (net) | (62) | (37) | (6) | ||||||||
| Provisions or reversal of provisions, net | |||||||||||
| Cost of services provided | — | — | 6 | ||||||||
| Others | — | — | — | ||||||||
| (48) | (7) | 33 | |||||||||
| EUR million | |||||||||||
| 2023 | 2022 | 2021 | |||||||||
| Present value of the obligations at beginning of year | 8,982 | 15,392 | 15,472 | ||||||||
| Net incorporation of companies into the Group | (28) | — | — | ||||||||
| Current service cost | 14 | 30 | 33 | ||||||||
| Interest cost | 436 | 283 | 219 | ||||||||
| Benefits paid | (428) | (487) | (465) | ||||||||
| Benefits paid by settlements | (9) | — | — | ||||||||
| Contributions made by employees | 6 | 9 | 18 | ||||||||
| Past service cost | — | — | 6 | ||||||||
| Actuarial (gains)/losses | 281 | (5,660) | (933) | ||||||||
| Demographic actuarial (gains)/losses | (59) | (144) | (17) | ||||||||
| Financial actuarial (gains)/losses | 340 | (5,516) | (916) | ||||||||
| Exchange differences and other items | 197 | (585) | 1,042 | ||||||||
| Present value of the obligations at end of year | 9,451 | 8,982 | 15,392 | ||||||||
| EUR million | |||||||||||
| 2023 | 2022 | 2021 | |||||||||
| Fair value of plan assets at beginning of year | 10,152 | 17,244 | 15,575 | ||||||||
| Net incorporation of companies into the Group | (41) | — | — | ||||||||
| Expected return on plan assets | 498 | 320 | 225 | ||||||||
| Benefits paid | (434) | (487) | (463) | ||||||||
| Contributions | 225 | 262 | 285 | ||||||||
| Actuarial gains/(losses) | (406) | (6,517) | 541 | ||||||||
| Exchange differences and other items | 214 | (670) | 1,081 | ||||||||
| Fair value of plan assets at end of year | 10,208 | 10,152 | 17,244 | ||||||||
| 2023 | 2022 | 2021 | |||||||||
| Equity instruments | — | — | 10 | % | |||||||
| Debt instruments | 62 | % | 51 | % | 51 | % | |||||
| Properties | 12 | % | 13 | % | 10 | % | |||||
| Other | 26 | % | 36 | % | 29 | % | |||||
| EUR million | |||||
| 2024 | 525 | ||||
| 2025 | 448 | ||||
| 2026 | 466 | ||||
| 2027 | 494 | ||||
| 2028 | 512 | ||||
| 2029 to 2033 | 2,764 | ||||
| EUR million | ||||||||||||||
| 2023 | Of which business in Brazil | 2022 | 2021 | |||||||||||
| Present value of the obligations | 8,485 | 5,961 | 7,578 | 8,018 | ||||||||||
| Less- | ||||||||||||||
| Of which: with a charge to the participants | 114 | 114 | 107 | 106 | ||||||||||
| Fair value of plan assets | 7,787 | 6,132 | 7,321 | 7,167 | ||||||||||
| Provisions - Provisions for pensions | 584 | (285) | 150 | 745 | ||||||||||
| Of which: | ||||||||||||||
| Internal provisions for pensions | 1,434 | 474 | 1,166 | 1,478 | ||||||||||
| Net assets for pensions | (154) | (63) | (122) | (64) | ||||||||||
| Unrecognised net assets for pensions | (696) | (696) | (894) | (669) | ||||||||||
| EUR million | |||||||||||
| 2023 | 2022 | 2021 | |||||||||
| Current service cost | 25 | 31 | 34 | ||||||||
| Interest cost (net) | 84 | 64 | 62 | ||||||||
| Provisions or reversion of provisions | |||||||||||
| (Actuarial gains)/losses recognised in the year | 23 | 8 | 11 | ||||||||
| Past service cost | 1 | 8 | 3 | ||||||||
| Pre-retirement cost | — | — | (24) | ||||||||
| Other | (3) | (3) | (3) | ||||||||
| 130 | 108 | 83 | |||||||||
| EUR million | |||||||||||
| 2023 | 2022 | 2021 | |||||||||
| Present value of the obligations at beginning of year | 7,578 | 8,018 | 8,434 | ||||||||
| Incorporation of Group companies, net | (20) | — | (5) | ||||||||
| Current service cost | 25 | 31 | 34 | ||||||||
| Interest cost | 600 | 546 | 429 | ||||||||
| Pre-retirement cost | — | — | (24) | ||||||||
| Effect of curtailment/settlement | (2) | (3) | (3) | ||||||||
| Benefits paid | (730) | (653) | (538) | ||||||||
| Benefits paid due to settlements | (2) | (179) | — | ||||||||
| Contributions made by employees | 3 | 5 | 3 | ||||||||
| Past service cost | 1 | 8 | 3 | ||||||||
| Actuarial (gains)/losses | 697 | (876) | (486) | ||||||||
| Demographic actuarial (gains)/losses | 40 | 5 | 16 | ||||||||
| Financial actuarial (gains)/losses | 657 | (881) | (502) | ||||||||
| Exchange differences and other items | 335 | 681 | 171 | ||||||||
| Present value of the obligations at end of year |
8,485 | 7,578 | 8,018 | ||||||||
| EUR million | |||||||||||
| 2023 | 2022 | 2021 | |||||||||
| Fair value of plan assets at beginning of year | 7,321 | 7,167 | 7,182 | ||||||||
| Incorporation of Group companies, net | (16) | — | (6) | ||||||||
| Expected return on plan assets | 588 | 570 | 411 | ||||||||
| Benefits paid | (644) | (766) | (478) | ||||||||
| Contributions | 124 | 198 | 152 | ||||||||
| Actuarial gains/(losses) | 110 | (498) | (155) | ||||||||
| Exchange differences and other items | 304 | 650 | 61 | ||||||||
| Fair value of plan assets at end of year | 7,787 | 7,321 | 7,167 | ||||||||
| 2023 | 2022 | 2021 | |||||||||
| Equity instruments | 11 | % | 11% | 12% | |||||||
| Debt instruments | 83 | % | 83% | 83% | |||||||
| Properties | 1 | % | 1% | 1% | |||||||
| Other | 5 | % | 5% | 4% | |||||||
| EUR million | |||||
| 2024 | 658 | ||||
| 2025 | 665 | ||||
| 2026 | 671 | ||||
| 2027 | 682 | ||||
| 2028 | 694 | ||||
| 2029 to 2033 | 3,499 | ||||
| EUR million | |||||||||||
| 2023 | 2022 | 2021 | |||||||||
| Recognised by Spanish companies | 1,921 | 1,768 | 1,595 | ||||||||
| Recognised by other EU companies | 433 | 328 | 779 | ||||||||
| Recognised by other companies | 2,280 | 1,977 | 2,049 | ||||||||
| Of which: | |||||||||||
| Brazil | 1,618 | 1,243 | 1,339 | ||||||||
| 4,634 | 4,073 | 4,423 | |||||||||
| EUR million | |||||||||||
| 2023 | 2022 | 2021 | |||||||||
| Provisions for taxes | 745 | 679 | 564 | ||||||||
| Provisions for employment-related proceedings (Brazil) | 611 | 301 | 328 | ||||||||
| Provisions for other legal proceedings | 1,359 | 1,094 | 1,104 | ||||||||
| Provision for customer remediation | 454 | 349 | 745 | ||||||||
| Provision for restructuring | 596 | 641 | 749 | ||||||||
| Other | 869 | 1,009 | 933 | ||||||||
| 4,634 | 4,073 | 4,423 | |||||||||
| EUR million | |||||||||||
| 2023 | 2022 | 2021 | |||||||||
| Transactions in transit | 767 | 457 | 545 | ||||||||
| Accrued expenses and deferred income | 9,136 | 8,445 | 7,084 | ||||||||
| Other | 7,695 | 5,707 | 5,069 | ||||||||
| 17,598 | 14,609 | 12,698 | |||||||||
| EUR million | |||||||||||
| 2023 | 2022 | 2021 | |||||||||
| Consolidated profit (loss) before tax: | |||||||||||
| From continuing operations | 16,459 | 15,250 | 14,547 | ||||||||
| From discontinued operations | — | — | — | ||||||||
| 16,459 | 15,250 | 14,547 | |||||||||
| Income tax at tax rate applicable in Spain (30%) | 4,938 | 4,575 | 4,364 | ||||||||
By the effect of application of the various tax rates applicable in each countryA |
(100) | 61 | 210 | ||||||||
| Of which: | |||||||||||
| Brazil | 198 | 472 | 634 | ||||||||
| United Kingdom | (51) | (161) | (158) | ||||||||
| United States | (28) | (99) | (179) | ||||||||
| Chile | (28) | (30) | (34) | ||||||||
| Poland | (164) | (101) | — | ||||||||
| Effect of profit or loss of associates and joint ventures | (184) | (210) | (130) | ||||||||
| USA electric vehicle leasing incentives | (259) | — | — | ||||||||
| Effect of reassessment of deferred taxes | — | — | 9 | ||||||||
Permanent differences and other |
(119) | 60 | 441 | ||||||||
| Current income tax | 4,276 | 4,486 | 4,894 | ||||||||
| Effective tax rate | 25.98% | 29.42 | % | 33.64 | % | ||||||
| Of which: | |||||||||||
| Continuing operations | 4,276 | 4,486 | 4,894 | ||||||||
| Of which: | |||||||||||
| Current taxes | 5,568 | 4,272 | 3,799 | ||||||||
| Deferred taxes | (1,292) | 214 | 1,095 | ||||||||
| Income tax (receipts)/payments | 5,214 | 5,498 | 4,012 | ||||||||
| EUR million | |||||||||||
| 2023 | 2022 | 2021 | |||||||||
| Other comprehensive income | |||||||||||
| Items not reclassified to profit or loss | 358 | 49 | (510) | ||||||||
| Actuarial gains or (-) losses on defined benefit pension plans | 302 | 96 | (530) | ||||||||
| Changes in the fair value of equity instruments measured at fair value through other comprehensive income | 20 | (19) | (13) | ||||||||
| Financial liabilities at fair value with changes in results attributable to changes in credit risk | 36 | (26) | 33 | ||||||||
| Other recognised income and expense of investments in subsidiaries, joint ventures and associates | — | (2) | — | ||||||||
| Items that may be reclassified to profit or loss | (919) | 1,522 | 1,136 | ||||||||
| Cash flow hedges | (732) | 912 | 278 | ||||||||
| Changes in the fair value of debt instruments through other comprehensive income | (214) | 661 | 857 | ||||||||
| Other recognised income and expense of investments in subsidiaries, joint ventures and associates | 27 | (51) | 1 | ||||||||
| Total | (561) | 1,571 | 626 | ||||||||
| EUR million | ||||||||||||||||||||||||||
| 2023 | 2022 | 2021 | ||||||||||||||||||||||||
MonetizableA |
Other | MonetizableA |
Other | MonetizableA |
Other | |||||||||||||||||||||
| Tax assets | 11,099 | 9,668 | 10,660 | 10,127 | 10,473 | 8,967 | ||||||||||||||||||||
| Tax losses and tax credits | — | 2,393 | — | 1,778 | — | 1,249 | ||||||||||||||||||||
| Temporary differences | 11,099 | 7,275 | 10,660 | 8,349 | 10,473 | 7,718 | ||||||||||||||||||||
| Of which: | ||||||||||||||||||||||||||
| Non-deductible provisions | — | 1,965 | — | 2,182 | — | 2,256 | ||||||||||||||||||||
| Valuation of financial instruments | — | 1,543 | — | 1,535 | — | 600 | ||||||||||||||||||||
| Loan losses | 8,248 | 1,577 | 7,696 | 1,232 | 6,888 | 988 | ||||||||||||||||||||
| Pensions | 2,851 | 665 | 2,964 | 560 | 3,585 | 669 | ||||||||||||||||||||
| Valuation of tangible and intangible assets | — | 1,060 | — | 1,270 | — | 1,509 | ||||||||||||||||||||
| Tax liabilities | — | 6,086 | — | 6,428 | — | 6,462 | ||||||||||||||||||||
| Temporary differences | — | 6,086 | — | 6,428 | — | 6,462 | ||||||||||||||||||||
| Of which: | ||||||||||||||||||||||||||
| Valuation of financial instruments | — | 2,059 | — | 1,792 | — | 1,419 | ||||||||||||||||||||
| Valuation of tangible and intangible assets | — | 2,594 | — | 3,169 | — | 3,081 | ||||||||||||||||||||
| Investments in Group companies | — | 378 | — | 359 | — | 337 | ||||||||||||||||||||
| EUR million | ||||||||||||||||||||
| Balances at 31 December 2022 | (Charge)/Credit to income | Foreign currency balance translation differences and other items | (Charge)/Credit to asset and liability valuation adjustments | Acquisition for the year (net) | Balances at 31 December 2023 | |||||||||||||||
| Deferred tax assets | 20,787 | 629 | (130) | (422) | (97) | 20,767 | ||||||||||||||
| Tax losses and tax credits | 1,778 | 392 | 224 | — | (1) | 2,393 | ||||||||||||||
| Temporary differences | 19,009 | 237 | (354) | (422) | (96) | 18,374 | ||||||||||||||
| Of which monetizable | 10,660 | 1,232 | (787) | — | (6) | 11,099 | ||||||||||||||
| Deferred tax liabilities | (6,428) | 663 | 3 | (338) | 14 | (6,086) | ||||||||||||||
| Temporary differences | (6,428) | 663 | 3 | (338) | 14 | (6,086) | ||||||||||||||
| 14,359 | 1,292 | (127) | (760) | (83) | 14,681 | |||||||||||||||
| EUR million | ||||||||||||||||||||
| Balance at 31 December 2021 | (Charge)/Credit to income | Foreign currency balance translation differences and other items | (Charge)/Credit to asset and liability valuation adjustments | Acquisition for the year (net) | Balance at 31 December 2022 | |||||||||||||||
| Deferred tax assets | 19,440 | 273 | 376 | 697 | 1 | 20,787 | ||||||||||||||
| Tax losses and tax credits | 1,250 | 211 | 317 | — | — | 1,778 | ||||||||||||||
| Temporary differences | 18,190 | 62 | 59 | 697 | 1 | 19,009 | ||||||||||||||
| Of which monetizable | 10,473 | 507 | (320) | — | — | 10,660 | ||||||||||||||
| Deferred tax liabilities | (6,462) | (487) | (149) | 684 | (14) | (6,428) | ||||||||||||||
| Temporary differences | (6,462) | (487) | (149) | 684 | (14) | (6,428) | ||||||||||||||
| 12,978 | (214) | 227 | 1,381 | (13) | 14,359 | |||||||||||||||
| EUR million | ||||||||||||||||||||
| Balances at 31 December 2020 | (Charge)/Credit to income | Foreign currency balance translation differences and other items | (Charge)/Credit to asset and liability valuation adjustments | Acquisition for the year (net) | Balance at 31 December 2021 | |||||||||||||||
| Deferred tax assets | 19,246 | (209) | 193 | 209 | 1 | 19,440 | ||||||||||||||
| Tax losses and tax credits | 1,093 | 129 | 28 | — | — | 1,250 | ||||||||||||||
| Temporary differences | 18,153 | (338) | 165 | 209 | 1 | 18,190 | ||||||||||||||
| Of which monetizable | 10,721 | (273) | 25 | — | — | 10,473 | ||||||||||||||
| Deferred tax liabilities | (5,933) | (886) | (170) | 528 | (1) | (6,462) | ||||||||||||||
| Temporary differences | (5,933) | (886) | (170) | 528 | (1) | (6,462) | ||||||||||||||
| 13,313 | (1,095) | 23 | 737 | — | 12,978 | |||||||||||||||
| EUR million | |||||||||||
| 2023 | 2022 | 2021 | |||||||||
| Santander Bank Polska S.A. | 1,934 | 1,603 | 1,559 | ||||||||
| Grupo PSA | 1,590 | 1,728 | 1,543 | ||||||||
| Santander Consumer USA Holdings Inc. | — | — | 1,255 | ||||||||
| Banco Santander - Chile | 1,379 | 1,317 | 1,042 | ||||||||
| Banco Santander (Brasil) S.A. | 1,493 | 1,210 | 1,023 | ||||||||
| Banco Santander México, S.A. Institución de Banca Múltiple, Grupo Financiero Santander México | 4 | 251 | 202 | ||||||||
Other companiesA |
1,311 | 1,213 | 1,970 | ||||||||
| 7,711 | 7,322 | 8,594 | |||||||||
| Profit/(Loss) for the year attributable to non-controlling interests | 1,107 | 1,159 | 1,529 | ||||||||
| Of which: | |||||||||||
| Santander Consumer USA Holdings Inc. | — | — | 494 | ||||||||
| Grupo PSA | 285 | 323 | 311 | ||||||||
| Banco Santander - Chile | 235 | 280 | 292 | ||||||||
| Banco Santander (Brasil) S.A. | 182 | 259 | 251 | ||||||||
| Santander Bank Polska S.A. | 347 | 196 | 75 | ||||||||
| Banco Santander México, S.A. Institución de Banca Múltiple, Grupo Financiero Santander México | 13 | 42 | 62 | ||||||||
| Other companies | 45 | 59 | 44 | ||||||||
| TOTAL | 8,818 | 8,481 | 10,123 | ||||||||
| EUR million | |||||||||||
| 2023 | 2022 | 2021 | |||||||||
| Balance at the end of the previous year | 8,481 | 10,123 | 9,846 | ||||||||
| Balance at beginning of year | 8,481 | 10,123 | 9,846 | ||||||||
| Other comprehensive income | 297 | 248 | (304) | ||||||||
| Other | 40 | (1,890) | 581 | ||||||||
| Profit attributable to non-controlling interests | 1,107 | 1,159 | 1,529 | ||||||||
Modification of participation ratesA |
(258) | (1,811) | (390) | ||||||||
| Change of perimeter | (364) | 31 | (5) | ||||||||
| Dividends paid to minority shareholders | (748) | (500) | (648) | ||||||||
Changes in capital and other conceptsB |
303 | (769) | 95 | ||||||||
| Balance at end of year | 8,818 | 8,481 | 10,123 | ||||||||
EUR millionA | ||||||||||||||
| Santander Bank Polska S.A. | Banco Santander (Brasil) S.A. | Banco Santander - Chile | Grupo Financiero Santander México, S.A.B. de C.V. | |||||||||||
| Total assets | 60,916 | 220,093 | 77,167 | 102,496 | ||||||||||
| Total liabilities | 54,462 | 203,035 | 71,518 | 93,592 | ||||||||||
| Net assets | 6,454 | 17,058 | 5,648 | 8,904 | ||||||||||
| Total income | 3,182 | 13,104 | 2,285 | 5,899 | ||||||||||
| Total profit | 1,015 | 2,135 | 816 | 1,577 | ||||||||||
EUR millionA | |||||||||||
| 2023 | 2022 | 2021 | |||||||||
Other comprehensive income |
(35,020) | (35,628) | (32,719) | ||||||||
Items that will not be reclassified to profit or loss |
(5,212) | (4,635) | (4,241) | ||||||||
| Actuarial gains and losses on defined benefit pension plans | (4,324) | (3,945) | (3,986) | ||||||||
| Non-current assets held for sale | — | — | — | ||||||||
| Share in other income and expenses recognised in investments, joint ventures and associates | 1 | 10 | (8) | ||||||||
| Other valuation adjustments | — | — | — | ||||||||
| Changes in the fair value of equity instruments measured at fair value with changes in other comprehensive income | (776) | (672) | (157) | ||||||||
| Inefficiency of fair value hedges of equity instruments measured at fair value with changes in other comprehensive income | — | — | — | ||||||||
| Changes in the fair value of equity instruments measured at fair value with changes in other comprehensive income (hedged item) | 264 | 293 | 275 | ||||||||
| Changes in the fair value of equity instruments measured at fair value with changes in other comprehensive income (hedging instrument) | (264) | (293) | (275) | ||||||||
| Changes in the fair value of financial liabilities measured at fair value through profit or loss attributable to changes in credit risk | (113) | (28) | (90) | ||||||||
Items that may be reclassified to profit or loss |
(29,808) | (30,993) | (28,478) | ||||||||
| Hedges of net investments in foreign operations (Effective portion) | (8,684) | (6,750) | (4,283) | ||||||||
| Exchange differences | (19,510) | (20,420) | (23,887) | ||||||||
| Hedging derivatives. Cash flow hedges (Effective portion) | (740) | (2,437) | (276) | ||||||||
| Changes in the fair value of debt instruments measured at fair value with changes in other comprehensive income | (555) | (1,002) | 436 | ||||||||
| Hedging instruments (items not designated) | — | — | — | ||||||||
| Non-current assets classified as held for sale | — | — | — | ||||||||
| Share in other income and expenses recognised in investments, joint ventures and associates | (319) | (384) | (468) | ||||||||
| EUR million | ||||||||||||||
| 2023 | ||||||||||||||
| Capital gains by valuation | Capital losses by valuation | Net gains/losses by valuation | Fair Value | |||||||||||
| Equity instruments | ||||||||||||||
| Domestic | ||||||||||||||
| Spain | 32 | (1,173) | (1,141) | 252 | ||||||||||
| International | ||||||||||||||
| Rest of Europe | 117 | (71) | 46 | 267 | ||||||||||
| United States | 16 | — | 16 | 19 | ||||||||||
| Latin America and rest | 370 | (67) | 303 | 1,223 | ||||||||||
| 535 | (1,311) | (776) | 1,761 | |||||||||||
| Of which: | ||||||||||||||
| Publicly listed | 316 | (118) | 198 | 1,225 | ||||||||||
| Non publicly listed | 219 | (1,193) | (974) | 536 | ||||||||||
| EUR million | ||||||||||||||
| 2022 | ||||||||||||||
| Capital gains by valuation | Capital losses by valuation | Net gains/losses by valuation | Fair Value | |||||||||||
| Equity instruments | ||||||||||||||
| Domestic | ||||||||||||||
| Spain | 30 | (926) | (896) | 500 | ||||||||||
| International | ||||||||||||||
| Rest of Europe | 84 | (60) | 24 | 225 | ||||||||||
| United States | 15 | — | 15 | 29 | ||||||||||
| Latin America and rest | 244 | (59) | 185 | 1,187 | ||||||||||
| 373 | (1,045) | (672) | 1,941 | |||||||||||
| Of which: | ||||||||||||||
| Publicly listed | 246 | (113) | 133 | 1,200 | ||||||||||
| Non publicly listed | 127 | (932) | (805) | 741 | ||||||||||
| EUR million | ||||||||||||||
| 2021 | ||||||||||||||
| Capital gains by valuation | Capital losses by valuation | Net gains/losses by valuation | Fair Value | |||||||||||
| Equity instruments | ||||||||||||||
| Domestic | ||||||||||||||
| Spain | 25 | (663) | (638) | 759 | ||||||||||
| International | ||||||||||||||
| Rest of Europe | 39 | (58) | (19) | 170 | ||||||||||
| United States | 13 | (4) | 9 | 31 | ||||||||||
| Latin America and rest | 496 | (5) | 491 | 1,493 | ||||||||||
| 573 | (730) | (157) | 2,453 | |||||||||||
| Of which: | ||||||||||||||
| Publicly listed | 500 | (44) | 456 | 1,521 | ||||||||||
| Non publicly listed | 73 | (686) | (613) | 932 | ||||||||||
| EUR million | |||||||||||
| 2023 | 2022 | 2021 | |||||||||
| Net balance at end of year | (28,194) | (27,170) | (28,170) | ||||||||
| Of which: | |||||||||||
| Brazilian real | (16,340) | (16,735) | (17,440) | ||||||||
| Pound sterling | (3,964) | (4,219) | (3,415) | ||||||||
| Mexican peso | (2,942) | (3,010) | (3,088) | ||||||||
| Argentine peso | (2,655) | (1,755) | (2,109) | ||||||||
| Chilean peso | (2,531) | (2,081) | (2,039) | ||||||||
| US dollar | 1,819 | 2,384 | 1,536 | ||||||||
| Polish zloty | (786) | (999) | (809) | ||||||||
| Other | (795) | (755) | (806) | ||||||||
| EUR million | ||||||||||||||||||||
| 2023 | Of which: | |||||||||||||||||||
| Currency | Balance at the beginning of the year | Balance at the end of the year | Movement | From goodwill | From resultsA |
From net assets | ||||||||||||||
| Brazilian real | (14,199) | (13,287) | 912 | 191 | 11 | 710 | ||||||||||||||
| Pound sterling | (4,446) | (4,064) | 382 | 20 | 4 | 358 | ||||||||||||||
| Mexican peso | (1,132) | (64) | 1,068 | 62 | 41 | 965 | ||||||||||||||
| Argentine peso | (1,754) | (2,658) | (904) | (4) | — | (900) | ||||||||||||||
| Chilean peso | (1,605) | (1,890) | (285) | (32) | (34) | (219) | ||||||||||||||
| US dollar | 4,062 | 3,433 | (629) | (64) | (16) | (549) | ||||||||||||||
| Polish zloty | (776) | (325) | 451 | 87 | 32 | 332 | ||||||||||||||
| Other | (570) | (655) | (85) | (11) | (1) | (73) | ||||||||||||||
| Total Group | (20,420) | (19,510) | 910 | 249 | 37 | 624 | ||||||||||||||
| EUR million | ||||||||||||||||||||
| 2022 | Of which: | |||||||||||||||||||
| Currency | Balance at the beginning of the year | Balance at the end of the year | Movement | From goodwill | From resultsA |
From net assets | ||||||||||||||
| Brazilian real | (15,913) | (14,199) | 1,714 | 376 | (98) | 1,436 | ||||||||||||||
| Pound sterling | (3,504) | (4,446) | (942) | (51) | (67) | (824) | ||||||||||||||
| Mexican peso | (2,012) | (1,132) | 880 | 56 | 18 | 806 | ||||||||||||||
| Argentine peso | (2,109) | (1,754) | 355 | — | — | 355 | ||||||||||||||
| Chilean peso | (1,852) | (1,605) | 247 | 31 | 5 | 211 | ||||||||||||||
| US dollar | 2,775 | 4,062 | 1,287 | 102 | (24) | 1,209 | ||||||||||||||
| Polish zloty | (678) | (776) | (98) | (21) | — | (77) | ||||||||||||||
| Other | (594) | (570) | 24 | 3 | (7) | 28 | ||||||||||||||
| Total Group | (23,887) | (20,420) | 3,467 | 496 | (173) | 3,144 | ||||||||||||||
| EUR million | ||||||||||||||||||||
| 2021 | Of which: | |||||||||||||||||||
| Currency | Balance at the beginning of the year | Balance at the end of the year | Movement | From goodwill | From resultsA |
From net assets | ||||||||||||||
| Brazilian real | (16,032) | (15,913) | 119 | 30 | 19 | 70 | ||||||||||||||
| Pound sterling | (4,602) | (3,504) | 1,098 | 41 | 38 | 1,019 | ||||||||||||||
| Mexican peso | (2,393) | (2,012) | 381 | 26 | 29 | 326 | ||||||||||||||
| Argentine peso | (2,287) | (2,109) | 178 | — | — | 178 | ||||||||||||||
| Chilean peso | (1,450) | (1,852) | (402) | (55) | (43) | (304) | ||||||||||||||
| US dollar | 1,253 | 2,775 | 1,522 | 125 | 102 | 1,295 | ||||||||||||||
| Polish zloty | (638) | (678) | (40) | (9) | (1) | (30) | ||||||||||||||
| Other | (762) | (594) | 168 | 9 | 11 | 148 | ||||||||||||||
| Total Group | (26,911) | (23,887) | 3,024 | 167 | 155 | 2,702 | ||||||||||||||
| EUR million | ||||||||||||||
| 31 December 2023 | ||||||||||||||
| Revaluation gains | Revaluation losses | Net revaluation gains/ (losses) | Fair value | |||||||||||
| Debt instruments | ||||||||||||||
| Issued by Public-sector | ||||||||||||||
| Spain | 17 | — | 17 | 9,867 | ||||||||||
| Rest of Europe | 333 | (96) | 237 | 18,258 | ||||||||||
| Latin America and rest of the world | 194 | (820) | (626) | 38,169 | ||||||||||
| Issued by Private-sector | ||||||||||||||
| Spain | 98 | (9) | 89 | 5,129 | ||||||||||
Rest of Europe |
19 | (30) | (11) | 5,018 | ||||||||||
| Latin America and rest of the world | 6 | (267) | (261) | 5,106 | ||||||||||
| 667 | (1,222) | (555) | 81,547 | |||||||||||
| EUR million | ||||||||||||||
| 31 December 2022 | ||||||||||||||
| Revaluation gains | Revaluation losses | Net revaluation gains/ (losses) | Fair value | |||||||||||
| Debt instruments | ||||||||||||||
| Issued by Public-sector | ||||||||||||||
| Spain | 26 | (1) | 25 | 9,312 | ||||||||||
| Rest of Europe | 268 | (199) | 69 | 17,593 | ||||||||||
| Latin America and rest of the world | 196 | (937) | (741) | 40,873 | ||||||||||
| Issued by Private-sector | ||||||||||||||
| Spain | — | (24) | (24) | 5,727 | ||||||||||
Rest of Europe |
11 | (68) | (57) | 5,203 | ||||||||||
| Latin America and rest of the world | 16 | (290) | (274) | 4,590 | ||||||||||
| 517 | (1,519) | (1,002) | 83,298 | |||||||||||
| EUR million | ||||||||||||||
| 31 December 2021 | ||||||||||||||
| Revaluation gains | Revaluation losses | Net revaluation gains/ (losses) | Fair value | |||||||||||
| Debt instruments | ||||||||||||||
| Issued by Public-sector | ||||||||||||||
| Spain | 271 | — | 271 | 12,917 | ||||||||||
| Rest of Europe | 544 | (118) | 426 | 20,397 | ||||||||||
| Latin America and rest of the world | 334 | (438) | (104) | 49,847 | ||||||||||
| Issued by Private-sector | ||||||||||||||
| Spain | 2 | (20) | (18) | 4,759 | ||||||||||
| Rest of Europe | 47 | (171) | (124) | 11,708 | ||||||||||
| Latin America and rest of the world | 31 | (46) | (15) | 5,957 | ||||||||||
| 1,229 | (793) | 436 | 105,585 | |||||||||||
| EUR million | |||||||||||
| 2023 | 2022 | 2021 | |||||||||
| Restricted reserves | 2,899 | 2,798 | 2,543 | ||||||||
Legal reserveA |
1,618 | 1,734 | 1,734 | ||||||||
| Own shares | 649 | 737 | 755 | ||||||||
| Revaluation reserve Royal Decree-Law 7/1996 | 43 | 43 | 43 | ||||||||
| Reserve for retired capital | 589 | 284 | 11 | ||||||||
| Unrestricted reserves | 16,033 | 7,701 | 4,243 | ||||||||
Voluntary reservesB |
14,284 | 7,917 | 6,123 | ||||||||
| Consolidation reserves attributable to the Bank | 1,749 | (216) | (1,880) | ||||||||
| Reserves of subsidiaries | 47,669 | 49,196 | 47,438 | ||||||||
| Reserves of entities accounted for using the equity method | 1,762 | 1,553 | 1,572 | ||||||||
| 68,363 | 61,248 | 55,796 | |||||||||
| EUR million | |||||||||||
| 2023 | 2022 | 2021 | |||||||||
| Banco Santander (Brasil) S.A. (Consolidated Group) | 14,512 | 14,663 | 14,325 | ||||||||
| Santander UK Group | 8,700 | 8,358 | 8,558 | ||||||||
| Banco Santander México, S.A., Institución de Banca Múltiple, Grupo Financiero Santander México | 5,684 | 5,437 | 4,753 | ||||||||
| Santander Consumer Finance Group | 4,344 | 3,858 | 3,502 | ||||||||
| Banco Santander - Chile | 4,112 | 3,875 | 3,194 | ||||||||
| Banco Santander Argentina S.A. | 2,813 | 2,527 | 2,318 | ||||||||
| Banco Santander Totta, S.A. (Consolidated Group) | 2,626 | 3,297 | 2,940 | ||||||||
| Santander Bank Polska S.A. | 2,535 | 2,140 | 1,990 | ||||||||
| Grupo Santander Holdings USA | 1,893 | 4,324 | 4,913 | ||||||||
| Santander Investment, S.A. | 1,215 | 1,316 | 1,307 | ||||||||
| Santander Seguros y Reaseguros, Compañía Aseguradora, S.A. | 1,044 | 1,050 | 869 | ||||||||
| Banco Santander International SA (former Banco Santander (Suisse) S.A) | 346 | 310 | 277 | ||||||||
| Other companies and consolidation adjustments | (2,155) | (1,959) | (1,508) | ||||||||
| 47,669 | 49,196 | 47,438 | |||||||||
| Of which, restricted | 3,870 | 3,614 | 3,392 | ||||||||
| 2023 | 2022 | 2021 | |||||||||
| Loans commitment granted | 279,589 | 274,075 | 262,737 | ||||||||
| Of which impaired | 406 | 653 | 615 | ||||||||
| Financial guarantees granted | 15,435 | 12,856 | 10,758 | ||||||||
| Of which impaired | 578 | 521 | 188 | ||||||||
| Financial guarantees | 15,400 | 12,813 | 10,715 | ||||||||
| Credit derivatives sold | 35 | 43 | 43 | ||||||||
| Other commitments granted | 113,273 | 92,672 | 75,733 | ||||||||
| Of which impaired | 542 | 608 | 781 | ||||||||
| Technical guarantees | 57,363 | 50,508 | 40,158 | ||||||||
| Other | 55,910 | 42,164 | 35,575 | ||||||||
| EUR million | |||||||||||
| 2023 | 2022 | 2021 | |||||||||
| Investment funds | 165,174 | 142,189 | 145,987 | ||||||||
| Pension funds | 14,831 | 14,021 | 16,078 | ||||||||
| Assets under management | 29,732 | 25,670 | 24,862 | ||||||||
| 209,737 | 181,880 | 186,927 | |||||||||
| EUR million | |||||||||||||||||
| 2023 | |||||||||||||||||
| Carrying amount | |||||||||||||||||
| Nominal value | Assets | Liabilities | Changes in fair value used for calculating hedge ineffectiveness | Balance sheet line items | |||||||||||||
| Fair value hedges | 241,792 | 2,661 | 4,231 | (1,869) | |||||||||||||
| Interest rate risk | 225,377 | 2,280 | 3,644 | (1,684) | Hedging derivatives | ||||||||||||
| Of which: | |||||||||||||||||
| Interest rate swap | 92,491 | 1,671 | 2,236 | (47) | |||||||||||||
| Call money swap | 122,891 | 344 | 1,226 | (1,824) | |||||||||||||
| Exchange rate risk | 4,331 | 15 | 24 | (98) | Hedging derivatives | ||||||||||||
| Fx forward | 1,913 | 15 | 24 | (11) | |||||||||||||
| Future interest rate | 2,418 | — | — | (87) | |||||||||||||
| Interest rate and exchange rate risk | 12,084 | 366 | 563 | (87) | Hedging derivatives | ||||||||||||
| Interest rate swap | 1,218 | 6 | 82 | 59 | |||||||||||||
| Call money swap | 1,093 | 3 | 97 | (39) | |||||||||||||
| Currency swap | 9,773 | 357 | 384 | (107) | |||||||||||||
| Cash flow hedges | 157,796 | 2,575 | 2,889 | 1,828 | |||||||||||||
| Interest rate risk | 97,780 | 913 | 1,246 | 2,181 | |||||||||||||
| Of which: | |||||||||||||||||
| Future interest rate | 3,020 | — | — | 6 | |||||||||||||
| Interest rate swap | 37,864 | 403 | 948 | 1,188 | |||||||||||||
| Call money swap | 53,705 | 469 | 266 | 1,000 | |||||||||||||
| Exchange rate risk | 34,823 | 1,001 | 663 | (498) | Hedging derivatives | ||||||||||||
| Of which: | |||||||||||||||||
| FX forward | 11,160 | 502 | 241 | 43 | |||||||||||||
| Currency swap | 20,043 | 446 | 397 | (537) | |||||||||||||
| Interest rate and exchange rate risk | 12,217 | 484 | 74 | (98) | Hedging derivatives | ||||||||||||
| Interest rate swap | 2,847 | — | (45) | 227 | |||||||||||||
| Currency swap | 9,370 | 484 | 119 | (325) | |||||||||||||
| Inflation risk | 12,908 | 155 | 906 | 234 | Hedging derivatives | ||||||||||||
| Of which: | |||||||||||||||||
| Currency swap | 12,495 | 153 | 906 | 240 | |||||||||||||
| Equity risk | 68 | 22 | — | 9 | Hedging derivatives | ||||||||||||
| Option | 68 | 22 | — | 9 | |||||||||||||
| Hedges of net investments in foreign operations | 18,706 | 61 | 536 | (1,888) | |||||||||||||
| Exchange rate risk | 18,706 | 61 | 536 | (1,888) | Hedging derivatives | ||||||||||||
| FX forward | 18,706 | 61 | 536 | (1,888) | |||||||||||||
| 418,294 | 5,297 | 7,656 | (1,929) | ||||||||||||||
| EUR million | |||||||||||||||||
| 2022 | |||||||||||||||||
| Carrying amount | |||||||||||||||||
| Nominal value | Assets | Liabilities | Changes in fair value used for calculating hedge ineffectiveness | Balance sheet line items | |||||||||||||
| Fair value hedges | 214,473 | 5,095 | 4,630 | 3,351 | |||||||||||||
| Interest rate risk | 190,513 | 4,405 | 4,239 | 2,554 | Hedging derivatives | ||||||||||||
| Of which: | |||||||||||||||||
| Interest rate swap | 87,477 | 2,950 | 3,203 | (716) | |||||||||||||
| Call money swap | 88,059 | 1,367 | 623 | 3,468 | |||||||||||||
| Exchange rate risk | 4,492 | 147 | 25 | (9) | Hedging derivatives | ||||||||||||
| FX forward | 3,745 | 147 | 25 | (36) | |||||||||||||
| Future interest rate | 747 | — | — | 27 | |||||||||||||
| Interest rate and exchange rate risk | 19,412 | 543 | 366 | 805 | Hedging derivatives | ||||||||||||
| Of which: | |||||||||||||||||
| Currency swap | 9,522 | 266 | 286 | (61) | |||||||||||||
| Future interest rate | 8,679 | 261 | — | 922 | |||||||||||||
| Interest rate swap | 905 | 4 | 80 | (79) | |||||||||||||
| Credit risk | 56 | — | — | 1 | Hedging derivatives | ||||||||||||
| CDS | 56 | — | — | 1 | |||||||||||||
| Cash flow hedges | 149,756 | 2,730 | 3,767 | (519) | |||||||||||||
| Interest rate risk | 81,626 | 137 | 1,325 | (2,461) | Hedging derivatives | ||||||||||||
| Of which: | |||||||||||||||||
| Future interest rate | 2,027 | — | — | 51 | |||||||||||||
| Interest rate swap | 55,886 | 59 | 1,494 | (1,439) | |||||||||||||
| Call money swap | 20,784 | 49 | (184) | (1,151) | |||||||||||||
| Exchange rate risk | 34,973 | 1,358 | 746 | 1,760 | Hedging derivatives | ||||||||||||
| Of which: | |||||||||||||||||
| FX forward | 10,754 | 267 | 172 | 773 | |||||||||||||
| Currency swap | 20,005 | 951 | 455 | 982 | |||||||||||||
| Interest rate and exchange rate risk | 16,175 | 1,046 | 292 | (80) | Hedging derivatives | ||||||||||||
| Interest rate swap | 3,361 | — | 161 | (333) | |||||||||||||
| Currency swap | 12,814 | 1,046 | 131 | 249 | |||||||||||||
| Inflation risk | 16,924 | 180 | 1,403 | 261 | Hedging derivatives | ||||||||||||
| Of which: | |||||||||||||||||
| Currency swap | 14,096 | 179 | 1,364 | 241 | |||||||||||||
| Equity risk | 58 | 9 | 1 | — | Hedging derivatives | ||||||||||||
| Option | 58 | 9 | 1 | — | |||||||||||||
| Hedges of net investments in foreign operations | 22,614 | 244 | 831 | (2,467) | |||||||||||||
| Exchange rate risk | 22,614 | 244 | 831 | (2,467) | Hedging derivatives | ||||||||||||
| FX forward | 22,614 | 244 | 831 | (2,467) | |||||||||||||
| 386,843 | 8,069 | 9,228 | 364 | ||||||||||||||
| EUR million | |||||||||||||||||
| 2021 | |||||||||||||||||
| Carrying amount | |||||||||||||||||
| Nominal value | Assets | Liabilities | Changes in fair value used for calculating hedge ineffectiveness | Balance sheet line items | |||||||||||||
| Fair value hedges | 206,957 | 2,528 | 2,656 | 1,079 | |||||||||||||
| Interest rate risk | 176,176 | 2,227 | 1,778 | 591 | Hedging derivatives | ||||||||||||
| Of which: | |||||||||||||||||
| Interest rate swap | 66,904 | 1,668 | 920 | (377) | |||||||||||||
| Call money swap | 97,321 | 1 | 734 | 714 | |||||||||||||
| Exchange rate risk | 21,238 | 7 | 423 | 287 | Hedging derivatives | ||||||||||||
| Fx forward | 13,909 | 7 | 423 | 22 | |||||||||||||
| Future interest rate | 7,329 | — | — | 265 | |||||||||||||
| Interest rate and exchange rate risk | 9,326 | 294 | 452 | 200 | Hedging derivatives | ||||||||||||
| Of which: | |||||||||||||||||
| Currency swap | 7,397 | 281 | 443 | 192 | |||||||||||||
| Interest rate swap | 1,650 | 12 | 9 | (7) | |||||||||||||
| Credit risk | 173 | — | 2 | 1 | Hedging derivatives | ||||||||||||
| Inflation risk | 44 | — | 1 | — | Hedging derivatives | ||||||||||||
| Cash flow hedges | 160,397 | 2,034 | 2,157 | (1,703) | |||||||||||||
| Interest rate risk | 99,648 | 156 | 420 | (526) | Hedging derivatives | ||||||||||||
| Of which: | |||||||||||||||||
| Futures | 7,652 | — | — | (155) | |||||||||||||
| Interest rate swap | 69,471 | 70 | 155 | (212) | |||||||||||||
| Call money swap | 16,846 | 20 | 182 | (409) | |||||||||||||
| Exchange rate risk | 27,343 | 396 | 657 | (112) | Hedging derivatives | ||||||||||||
| Of which: | |||||||||||||||||
| FX forward | 8,381 | 280 | 42 | 26 | |||||||||||||
| Currency swap | 15,004 | 100 | 606 | (133) | |||||||||||||
| Interest rate and exchange rate risk | 21,609 | 1,425 | 400 | (815) | Hedging derivatives | ||||||||||||
| Of which: | |||||||||||||||||
| Interest rate swap | 3,604 | 95 | 2 | (112) | |||||||||||||
| Currency swap | 17,005 | 1,330 | 393 | (702) | |||||||||||||
| Inflation risk | 11,741 | 52 | 679 | (247) | Hedging derivatives | ||||||||||||
| Of which: | |||||||||||||||||
| Currency swap | 10,503 | 51 | 678 | (232) | |||||||||||||
| Equity risk | 56 | 5 | 1 | (3) | Hedging derivatives | ||||||||||||
| Hedges of net investments in foreign operations | 25,594 | 199 | 650 | (1,159) | |||||||||||||
| Exchange rate risk | 25,594 | 199 | 650 | (1,159) | Hedging derivatives | ||||||||||||
| FX forward | 25,594 | 199 | 650 | (1,159) | |||||||||||||
| 392,948 | 4,761 | 5,463 | (1,783) | ||||||||||||||
| EUR million | ||||||||||||||||||||
| 31 December 2023 | ||||||||||||||||||||
| Up to one month | One to three months | Three months to one year | One year to five years | More than five years | Total | |||||||||||||||
| Fair value hedges | 6,862 | 14,535 | 59,170 | 139,486 | 21,739 | 241,792 | ||||||||||||||
| Interest rate risk | 6,266 | 13,749 | 56,860 | 131,323 | 17,179 | 225,377 | ||||||||||||||
| Of which: | ||||||||||||||||||||
| Interest rate swap | 2,013 | 2,104 | 16,045 | 59,952 | 12,377 | 92,491 | ||||||||||||||
| Call money swap | 4,163 | 11,421 | 39,873 | 65,453 | 1,981 | 122,891 | ||||||||||||||
| Exchange rate risk | 566 | 678 | 619 | 50 | 2,418 | 4,331 | ||||||||||||||
| Fx forward | 566 | 678 | 619 | 50 | — | 1,913 | ||||||||||||||
| Future interest rate | — | — | — | — | 2,418 | 2,418 | ||||||||||||||
| Interest rate and exchange rate risk | 30 | 108 | 1,691 | 8,113 | 2,142 | 12,084 | ||||||||||||||
| Of which: | ||||||||||||||||||||
| Interest rate swap | — | — | 321 | 535 | 362 | 1,218 | ||||||||||||||
| Call Money Swap | — | 21 | — | 973 | 99 | 1,093 | ||||||||||||||
| Currency swap | 30 | 87 | 1,370 | 6,605 | 1,681 | 9,773 | ||||||||||||||
| Cash flow hedges | 7,873 | 16,149 | 43,913 | 83,291 | 6,570 | 157,796 | ||||||||||||||
| Interest rate risk | 4,467 | 6,859 | 30,846 | 53,038 | 2,570 | 97,780 | ||||||||||||||
| Of which: | ||||||||||||||||||||
| Future interest rate | — | — | — | 3,020 | — | 3,020 | ||||||||||||||
| Interest rate swap | 3,191 | 2,876 | 14,108 | 16,793 | 896 | 37,864 | ||||||||||||||
| Call money swap | 1,050 | 3,553 | 15,755 | 31,942 | 1,405 | 53,705 | ||||||||||||||
| Exchange rate risk | 2,655 | 7,087 | 6,607 | 16,711 | 1,763 | 34,823 | ||||||||||||||
| Of which: | ||||||||||||||||||||
| FX forward | 2,013 | 2,344 | 4,617 | 2,186 | — | 11,160 | ||||||||||||||
| Currency swap | 642 | 2,209 | 1,990 | 14,525 | 677 | 20,043 | ||||||||||||||
| Interest rate and exchange rate risk | 407 | 1,547 | 2,270 | 7,187 | 806 | 12,217 | ||||||||||||||
| Of which: | ||||||||||||||||||||
| Interest rate swap | — | 80 | — | 2,575 | 192 | 2,847 | ||||||||||||||
| Currency swap | 407 | 1,467 | 2,270 | 4,612 | 614 | 9,370 | ||||||||||||||
| Inflation risk | 344 | 656 | 4,182 | 6,296 | 1,430 | 12,908 | ||||||||||||||
| Of which: | ||||||||||||||||||||
| Currency swap | 318 | 618 | 3,833 | 6,296 | 1,430 | 12,495 | ||||||||||||||
| Equity risk | — | — | 8 | 59 | 1 | 68 | ||||||||||||||
| Option | — | — | 8 | 59 | 1 | 68 | ||||||||||||||
| Hedges of net investments in foreign operations: | 4,303 | 4,940 | 9,463 | — | — | 18,706 | ||||||||||||||
| Exchange rate risk | 4,303 | 4,940 | 9,463 | — | — | 18,706 | ||||||||||||||
| FX forward | 4,303 | 4,940 | 9,463 | — | — | 18,706 | ||||||||||||||
| 19,038 | 35,624 | 112,546 | 222,777 | 28,309 | 418,294 | |||||||||||||||
| EUR million | ||||||||||||||||||||
| 31 December 2022 | ||||||||||||||||||||
| Up to one month | One to three months | Three months to one year | One year to five years | More than five years | Total | |||||||||||||||
| Fair value hedges | 6,588 | 9,811 | 37,723 | 136,223 | 24,128 | 214,473 | ||||||||||||||
| Interest rate risk | 5,120 | 8,822 | 34,074 | 120,829 | 21,668 | 190,513 | ||||||||||||||
| Of which: | ||||||||||||||||||||
| Interest rate swap | 2,535 | 3,005 | 8,854 | 56,868 | 16,215 | 87,477 | ||||||||||||||
| Call money swap | 2,492 | 5,039 | 23,511 | 54,786 | 2,231 | 88,059 | ||||||||||||||
| Exchange rate risk | 556 | 741 | 2,448 | — | 747 | 4,492 | ||||||||||||||
| Fx forward | 556 | 741 | 2,448 | — | — | 3,745 | ||||||||||||||
| Future interest rate | — | — | — | — | 747 | 747 | ||||||||||||||
| Interest rate and exchange rate risk | 912 | 238 | 1,193 | 15,356 | 1,713 | 19,412 | ||||||||||||||
| Of which: | ||||||||||||||||||||
| Currency swap | 912 | 238 | 788 | 6,188 | 1,396 | 9,522 | ||||||||||||||
| Interest rate swap | — | — | 405 | 192 | 308 | 905 | ||||||||||||||
| Future interest rate | — | — | — | 8,679 | — | 8,679 | ||||||||||||||
| Credit risk | — | 10 | 8 | 38 | — | 56 | ||||||||||||||
| CDS | — | 10 | 8 | 38 | — | 56 | ||||||||||||||
| Cash flow hedges | 10,182 | 15,202 | 41,514 | 75,653 | 7,205 | 149,756 | ||||||||||||||
| Interest rate risk | 5,546 | 7,424 | 30,568 | 36,501 | 1,587 | 81,626 | ||||||||||||||
| Of which: | ||||||||||||||||||||
| Future interest rate | 2,027 | — | — | — | — | 2,027 | ||||||||||||||
| Interest rate swap | 2,292 | 4,877 | 28,103 | 20,568 | 46 | 55,886 | ||||||||||||||
| Call money swap | 1,175 | 2,471 | 1,196 | 14,728 | 1,214 | 20,784 | ||||||||||||||
| Exchange rate risk | 3,777 | 4,295 | 4,452 | 19,940 | 2,509 | 34,973 | ||||||||||||||
| Of which: | ||||||||||||||||||||
| FX forward | 1,996 | 2,487 | 1,982 | 4,289 | — | 10,754 | ||||||||||||||
| Currency swap | 1,313 | 1,809 | 2,470 | 13,028 | 1,385 | 20,005 | ||||||||||||||
| Interest rate and exchange rate risk | 182 | 509 | 3,982 | 10,294 | 1,208 | 16,175 | ||||||||||||||
| Interest rate swap | — | — | 659 | 2,468 | 234 | 3,361 | ||||||||||||||
| Currency swap | 182 | 509 | 3,323 | 7,826 | 974 | 12,814 | ||||||||||||||
| Inflation risk | 677 | 2,974 | 2,505 | 8,870 | 1,898 | 16,924 | ||||||||||||||
| Of which: | ||||||||||||||||||||
| Currency swap | 483 | 951 | 1,895 | 8,869 | 1,898 | 14,096 | ||||||||||||||
| Equity risk | — | — | 7 | 48 | 3 | 58 | ||||||||||||||
| Option | — | — | 7 | 48 | 3 | 58 | ||||||||||||||
| Hedges of net investments in foreign operations: | 2,249 | 5,393 | 14,972 | — | — | 22,614 | ||||||||||||||
| Exchange rate risk | 2,249 | 5,393 | 14,972 | — | — | 22,614 | ||||||||||||||
| FX forward | 2,249 | 5,393 | 14,972 | — | — | 22,614 | ||||||||||||||
| 19,019 | 30,406 | 94,209 | 211,876 | 31,333 | 386,843 | |||||||||||||||
| EUR million | ||||||||||||||||||||
| 31 December 2021 | ||||||||||||||||||||
| Up to one month | One to three months | Three months to one year |
One year to five years |
More than five years |
Total | |||||||||||||||
| Fair value hedges | 5,546 | 11,786 | 45,119 | 114,828 | 29,678 | 206,957 | ||||||||||||||
| Interest rate risk | 4,324 | 9,978 | 33,873 | 103,216 | 24,785 | 176,176 | ||||||||||||||
| Of which: | ||||||||||||||||||||
| Interest rate swap | 267 | 2,138 | 4,189 | 42,398 | 17,912 | 66,904 | ||||||||||||||
| Call money swap | 3,716 | 7,527 | 25,588 | 56,120 | 4,370 | 97,321 | ||||||||||||||
| Exchange rate risk | 598 | 1,712 | 11,013 | 5,550 | 2,365 | 21,238 | ||||||||||||||
| Future interest rate | — | — | — | 4,964 | 2,365 | 7,329 | ||||||||||||||
| Fx forward | 598 | 1,712 | 11,013 | 586 | — | 13,909 | ||||||||||||||
| Interest rate and exchange rate risk | 624 | 77 | 199 | 5,898 | 2,528 | 9,326 | ||||||||||||||
| Of which: | ||||||||||||||||||||
| Interest rate swap | — | — | — | 1,232 | 418 | 1,650 | ||||||||||||||
| Currency swap | 624 | 72 | 198 | 4,437 | 2,066 | 7,397 | ||||||||||||||
| Credit risk | — | 19 | 34 | 120 | — | 173 | ||||||||||||||
| Inflation risk | — | — | — | 44 | — | 44 | ||||||||||||||
| Cash flow hedges | 17,674 | 3,208 | 20,459 | 102,833 | 16,223 | 160,397 | ||||||||||||||
| Interest rate risk | 13,047 | 1,061 | 9,875 | 68,867 | 6,798 | 99,648 | ||||||||||||||
| Of which: | ||||||||||||||||||||
| Future interest rate | 7,097 | — | 244 | 311 | — | 7,652 | ||||||||||||||
| Interest rate swap | 2,336 | 310 | 7,759 | 58,930 | 136 | 69,471 | ||||||||||||||
| Call money swap | 1,202 | 751 | 858 | 7,920 | 6,115 | 16,846 | ||||||||||||||
| Exchange rate risk | 3,438 | 1,348 | 3,195 | 15,506 | 3,856 | 27,343 | ||||||||||||||
| Of which: | ||||||||||||||||||||
| FX forward | 2,406 | 1,309 | 1,947 | 2,719 | — | 8,381 | ||||||||||||||
| Currency swap | 1,032 | 39 | 1,248 | 9,885 | 2,800 | 15,004 | ||||||||||||||
| Interest rate and exchange rate risk | 860 | 336 | 5,924 | 11,165 | 3,324 | 21,609 | ||||||||||||||
| Of which: | ||||||||||||||||||||
| Interest rate swap | — | — | — | 2,505 | 1,099 | 3,604 | ||||||||||||||
| Currency swap | 860 | 336 | 5,924 | 7,660 | 2,225 | 17,005 | ||||||||||||||
| Inflation risk | 329 | 463 | 1,463 | 7,246 | 2,240 | 11,741 | ||||||||||||||
| Of which: | ||||||||||||||||||||
| Currency swap | 82 | 339 | 597 | 7,245 | 2,240 | 10,503 | ||||||||||||||
| Equity risk | — | — | 2 | 49 | 5 | 56 | ||||||||||||||
| Hedges of net investments in foreign operations | 4,097 | 5,346 | 13,235 | 2,916 | — | 25,594 | ||||||||||||||
| Exchange rate risk | 4,097 | 5,346 | 13,235 | 2,916 | — | 25,594 | ||||||||||||||
| FX forward | 4,097 | 5,346 | 13,235 | 2,916 | — | 25,594 | ||||||||||||||
| 27,317 | 20,340 | 78,813 | 220,577 | 45,901 | 392,948 | |||||||||||||||
| 31 December 2023 | ||||||||||||||||||||
| EUR million | ||||||||||||||||||||
| Up to one month | One to three months | Three months to one year |
One year to five years |
More than five years |
Total | |||||||||||||||
| Fair value hedges | ||||||||||||||||||||
| Interest rate risk | ||||||||||||||||||||
| Interest rate instruments | ||||||||||||||||||||
| Nominal | 4,163 | 8,230 | 37,158 | 70,075 | 3,467 | 123,093 | ||||||||||||||
| Average fixed interest rate (%) GBP | 2.380 | 3.190 | 3.420 | 3.890 | 3.990 | |||||||||||||||
| Average fixed interest rate (%) EUR | 1.140 | 0.180 | 0.450 | 0.210 | 3.920 | |||||||||||||||
| Average fixed interest rate (%) USD | 2.600 | 2.460 | 4.230 | 1.360 | 4.910 | |||||||||||||||
| Interest rate and foreign exchange rate risk | ||||||||||||||||||||
| Exchange and interest rate instruments | ||||||||||||||||||||
| Nominal | — | 41 | — | 2,172 | 198 | 2,411 | ||||||||||||||
| Average GBP/EUR exchange rate | — | 1.113 | — | 1.156 | 1.148 | |||||||||||||||
| Average GBP/USD exchange rate | — | — | — | 1.318 | — | |||||||||||||||
| Average fixed interest rate (%) EUR | — | — | — | 2.770 | 3.480 | |||||||||||||||
| Average fixed interest rate (%) USD | — | — | — | 4.830 | — | |||||||||||||||
| Cash flow hedges | ||||||||||||||||||||
| Interest rate risk | ||||||||||||||||||||
| Interest rate instruments | ||||||||||||||||||||
| Nominal | 1,050 | 3,553 | 15,756 | 31,941 | 1,405 | 53,705 | ||||||||||||||
| Average fixed interest rate (%) GBP | 5.060 | 3.050 | 5.380 | 3.840 | 3.450 | |||||||||||||||
| Foreign exchange risk | ||||||||||||||||||||
| Exchange and interest rate instruments | ||||||||||||||||||||
| Nominal | 1,068 | 6,266 | 3,104 | 10,888 | 1,763 | 23,089 | ||||||||||||||
| Average GBP/JPY exchange rate | 154.135 | 153.954 | 167.846 | — | — | |||||||||||||||
| Average GBP/CHF exchange rate | 1.092 | 1.093 | 1.089 | 1.121 | 1.121 | |||||||||||||||
| Average GBP/EUR exchange rate | — | 1.197 | 1.167 | 1.179 | — | |||||||||||||||
| Average GBP/USD exchange rate | — | 1.392 | — | 1.277 | 1.388 | |||||||||||||||
| Equity risk | ||||||||||||||||||||
| Equity instruments | ||||||||||||||||||||
| Nominal | — | — | 8 | 58 | 2 | 68 | ||||||||||||||
| Interest rate and foreign exchange rate risk | ||||||||||||||||||||
| Exchange and interest rate instruments | ||||||||||||||||||||
| Nominal | 100 | 905 | 576 | 5,614 | 719 | 7,914 | ||||||||||||||
| Average GBP/EUR exchange rate | 1.183 | — | 1.254 | 1.198 | 1.189 | |||||||||||||||
| Average GBP/USD exchange rate | — | 1.663 | — | 1.383 | 1.537 | |||||||||||||||
| Average fixed interest rate (%) GBP | 2.570 | 2.540 | 2.960 | 2.420 | 4.810 | |||||||||||||||
| 31 December 2022 | |||||||||||||||||||||||
| EUR million | |||||||||||||||||||||||
| Up to one month | One to three months | Three months to one year | One year to five years | More than five years |
Total | ||||||||||||||||||
| Fair value hedges | |||||||||||||||||||||||
| Interest rate risk | |||||||||||||||||||||||
| Interest rate instruments | |||||||||||||||||||||||
| Nominal | 2,492 | 5,039 | 24,447 | 51,257 | 4,294 | 87,529 | |||||||||||||||||
| Average fixed interest rate (%) GBP | 2.580 | 0.880 | 0.560 | 2.070 | 3.780 | ||||||||||||||||||
| Average fixed interest rate (%) EUR | 1.770 | 1.600 | 0.770 | 0.280 | 3.090 | ||||||||||||||||||
| Average fixed interest rate (%) USD | 1.350 | 3.470 | 3.510 | 2.000 | 4.920 | ||||||||||||||||||
| Interest rate and foreign exchange rate risk | |||||||||||||||||||||||
| Exchange and interest rate instruments | |||||||||||||||||||||||
| Nominal | — | — | 74 | 821 | 16 | 911 | |||||||||||||||||
| Average GBP/EUR exchange rate | — | — | 1.212 | 1.157 | 1.100 | ||||||||||||||||||
| Average GBP/USD exchange rate | — | — | — | 1.186 | — | ||||||||||||||||||
| Average fixed interest rate (%) EUR | — | — | 3.420 | 2.060 | — | ||||||||||||||||||
| Average fixed interest rate (%) USD | — | — | — | 4.630 | — | ||||||||||||||||||
| Cash flow hedges | |||||||||||||||||||||||
| Interest rate risk | |||||||||||||||||||||||
| Interest rate instruments | |||||||||||||||||||||||
| Nominal | 1,175 | 2,471 | 2,188 | 14,728 | 1,213 | 21,775 | |||||||||||||||||
| Average fixed interest rate (%) GBP | 1.770 | 2.290 | 1.980 | 2.350 | 1.840 | ||||||||||||||||||
| Foreign exchange risk | |||||||||||||||||||||||
| Exchange and interest rate instruments | |||||||||||||||||||||||
| Nominal | 3,063 | 3,536 | 2,685 | 14,583 | 2,436 | 26,303 | |||||||||||||||||
| Average GBP/JPY exchange rate | — | 157.450 | 160.039 | — | — | ||||||||||||||||||
| Average GBP/CHF exchange rate | — | 1.131 | — | — | — | ||||||||||||||||||
| Average GBP/EUR exchange rate | — | — | 1.123 | 1.181 | 1.165 | ||||||||||||||||||
| Average GBP/USD exchange rate | 1.224 | 1.253 | 1.171 | 1.314 | 1.388 | ||||||||||||||||||
| Equity risk | |||||||||||||||||||||||
| Equity instruments | |||||||||||||||||||||||
| Nominal | — | — | 7 | 48 | 2 | 57 | |||||||||||||||||
| Interest rate and foreign exchange rate risk | |||||||||||||||||||||||
| Exchange and interest rate instruments | |||||||||||||||||||||||
| Nominal | — | — | 1,983 | 7,621 | 968 | 10,572 | |||||||||||||||||
| Average GBP/EUR exchange rate | — | — | 1.185 | 1.210 | 1.196 | ||||||||||||||||||
| Average GBP/USD exchange rate | — | — | 1.604 | 1.503 | 1.537 | ||||||||||||||||||
| Average fixed interest rate (%) GBP | — | — | 3.270 | 2.580 | 4.590 | ||||||||||||||||||
| 31 December 2021 | ||||||||||||||||||||
| EUR million | ||||||||||||||||||||
| Up to one month | One to three months | Three months to one year |
One year to five years |
More than five years |
Total | |||||||||||||||
| Fair value hedges | ||||||||||||||||||||
| Interest rate risk | ||||||||||||||||||||
| Interest rate instruments | ||||||||||||||||||||
| Nominal | 3,716 | 7,408 | 25,525 | 53,427 | 5,942 | 96,018 | ||||||||||||||
| Average fixed interest rate (%) GBP | 0.590 | 0.420 | 0.090 | 0.910 | 3.130 | |||||||||||||||
| Average fixed interest rate (%) EUR | 0.510 | 1.740 | 1.080 | 0.810 | 2.610 | |||||||||||||||
| Average fixed interest rate (%) USD | 1.910 | 0.960 | 1.440 | 2.760 | 4.050 | |||||||||||||||
| Interest rate and foreign exchange rate risk | ||||||||||||||||||||
| Exchange and interest rate instruments | ||||||||||||||||||||
| Nominal | — | — | 127 | 683 | 165 | 975 | ||||||||||||||
| Average GBP/EUR exchange rate | — | — | 1.205 | 1.159 | 1.171 | |||||||||||||||
| Average fixed interest rate (%) EUR | — | — | 3.290 | 2.030 | 2.620 | |||||||||||||||
| Cash flow hedges | ||||||||||||||||||||
| Interest rate risk | ||||||||||||||||||||
| Interest rate instruments | ||||||||||||||||||||
| Nominal | 1,203 | 572 | 1,036 | 8,967 | 6,115 | 17,893 | ||||||||||||||
| Average fixed interest rate (%) GBP | 1.970 | 0.440 | 0.080 | 1.290 | 0.970 | |||||||||||||||
| Foreign exchange risk | ||||||||||||||||||||
| Exchange and interest rate instruments | ||||||||||||||||||||
| Nominal | 3,218 | 1,114 | 2,448 | 10,897 | 3,584 | 21,261 | ||||||||||||||
| Average GBP/JPY exchange rate | — | 142.905 | 148.856 | — | — | |||||||||||||||
| Average GBP/EUR exchange rate | 1.165 | — | 1.185 | 1.159 | 1.174 | |||||||||||||||
| Average GBP/USD exchange rate | 1.344 | 1.342 | 1.332 | 1.339 | 1.388 | |||||||||||||||
| Interest rate and foreign exchange rate risk | ||||||||||||||||||||
| Exchange and interest rate instruments | ||||||||||||||||||||
| Nominal | 739 | — | 1,000 | 8,112 | 2,860 | 12,711 | ||||||||||||||
| Average GBP/EUR exchange rate | 1.277 | — | 1.386 | 1.202 | 1.200 | |||||||||||||||
| Average GBP/USD exchange rate | — | — | — | 1.609 | 1.381 | |||||||||||||||
| Average fixed interest rate (%) GBP | 2.260 | — | 1.170 | 2.720 | 3.410 | |||||||||||||||
| 31 December 2023 | ||||||||||||||||||||
| EUR million | ||||||||||||||||||||
| Up to one month | One to three months | Three months to one year | One year to five years | More than five years |
Total | |||||||||||||||
| Fair value hedges | ||||||||||||||||||||
| Interest rate risk | ||||||||||||||||||||
| Interest rate instruments | ||||||||||||||||||||
| Nominal | 1,532 | 194 | 7,880 | 22,714 | 8,775 | 41,095 | ||||||||||||||
| Average fixed interest rate (%) GBP | — | — | 1.38 | 4.48 | 2.04 | |||||||||||||||
| Average fixed interest rate (%) EUR | 0.096 | 0.014 | 2.085 | 2.422 | 3.421 | |||||||||||||||
| Average fixed interest rate (%) CHF | — | — | 1.010 | — | — | |||||||||||||||
| Average fixed interest rate (%) USD | 0.015 | 3.688 | 2.603 | 3.801 | 4.446 | |||||||||||||||
| Foreign exchange risk | ||||||||||||||||||||
| Exchange and interest rate instruments | ||||||||||||||||||||
| Nominal | 278 | 634 | 524 | 50 | — | 1,486 | ||||||||||||||
| Average PEN/USD exchange rate | 3.784 | 3.751 | — | — | — | |||||||||||||||
| Average CNY/EUR exchange rate | — | 7.323 | 7.732 | 7.716 | — | |||||||||||||||
| Average AUD/EUR exchange rate | 1.648 | 1.665 | — | — | — | |||||||||||||||
| Average MXN/EUR exchange rate | — | 19.363 | — | — | — | |||||||||||||||
| Average COP/USD exchange rate | 4,159 | 3,998 | — | — | — | |||||||||||||||
| Average MAD/EUR exchange rate | 10.929 | 11.057 | — | — | — | |||||||||||||||
| Average PEN/EUR exchange rate | 4.095 | 4.110 | — | — | — | |||||||||||||||
| Interest rate and foreign exchange rate risk | ||||||||||||||||||||
| Exchange and interest rate instruments | ||||||||||||||||||||
| Nominal | 30 | 66 | 1,450 | 4,321 | 1,150 | 7,017 | ||||||||||||||
| Average fixed interest rate (%) AUD/EUR | — | — | — | 4.800 | 3.615 | |||||||||||||||
| Average fixed interest rate (%) CZK/EUR | — | — | — | 2.000 | — | |||||||||||||||
| Average fixed interest rate (%) RON/EUR | 5.130 | — | — | 3.967 | — | |||||||||||||||
| Average fixed interest rate (%) HKD/EUR | — | — | 2.580 | 5.270 | — | |||||||||||||||
| Average fixed interest rate (%) JPY/EUR | — | — | 0.465 | 1.298 | 1.407 | |||||||||||||||
| Average fixed interest rate (%) NOK/EUR | — | — | — | 3.441 | 4.501 | |||||||||||||||
| Average fixed interest rate (%) CHF/EUR | — | — | — | 1.243 | — | |||||||||||||||
| Average fixed interest rate (%) USD/MXN | — | — | 14.250 | — | — | |||||||||||||||
| Average fixed interest rate (%) USD/COP | — | 17.980 | 6.152 | 13.207 | 7.149 | |||||||||||||||
| Average fixed interest rate (%) EUR/USD | — | — | (0.140) | — | — | |||||||||||||||
| Average fixed interest rate (%) USD/CLP | — | — | 3.450 | — | — | |||||||||||||||
| Average AUD/EUR exchange rate | — | — | — | 1.499 | 1.545 | |||||||||||||||
| Average CZK/EUR exchange rate | — | — | — | 25.831 | — | |||||||||||||||
| Average EUR/USD exchange rate | — | — | 0.891 | 0.961 | — | |||||||||||||||
| Average HKD/EUR exchange rate | — | — | 8.782 | 8.666 | — | |||||||||||||||
| Average JPY/EUR exchange rate | — | — | 120.568 | 134.151 | 129.229 | |||||||||||||||
| Average NOK/EUR exchange rate | — | — | — | 9.519 | 10.429 | |||||||||||||||
| Average RON/EUR exchange rate | 4.711 | — | — | 4.887 | — | |||||||||||||||
| Average CHF/EUR exchange rate | — | — | — | 1.104 | — | |||||||||||||||
| Average MXN/EUR exchange rate | — | — | — | — | 19.083 | |||||||||||||||
| Average USD/CLP exchange rate | — | — | 0.001 | — | — | |||||||||||||||
| Average NZD/EUR exchange rate | — | — | — | — | 1.666 | |||||||||||||||
| Average USD/MXN exchange rate | — | — | 0.058 | — | — | |||||||||||||||
| Cash flow hedges | ||||||||||||||||||||
| Interest rate and foreign exchange rate risk | ||||||||||||||||||||
| Interest rate and foreign exchange rate instruments | ||||||||||||||||||||
| 31 December 2023 | ||||||||||||||||||||
| EUR million | ||||||||||||||||||||
| Up to one month | One to three months | Three months to one year | One year to five years | More than five years |
Total | |||||||||||||||
| Nominal | — | — | 414 | 1,075 | 86 | 1,575 | ||||||||||||||
| Average fixed interest rate (%) CHF/EUR | — | — | — | 3.106 | — | |||||||||||||||
| Average fixed interest rate (%) AUD/EUR | — | — | — | 3.521 | — | |||||||||||||||
| Average EUR/GBP exchange rate | — | — | 1.173 | — | — | |||||||||||||||
| Average AUD/EUR exchange rate | — | — | 1.625 | 1.584 | 1.562 | |||||||||||||||
| Average RON/EUR exchange rate | — | — | — | 4.940 | — | |||||||||||||||
| Average CHF/EUR exchange rate | — | — | — | 1.002 | — | |||||||||||||||
| Interest rate risk | ||||||||||||||||||||
| Bond Forward instruments | ||||||||||||||||||||
| Nominal | 750 | 1,500 | 7,750 | — | — | 10,000 | ||||||||||||||
| Average fixed interest rate (%) EUR | (0.124) | (0.889) | 0.016 | — | — | |||||||||||||||
| Exchange rate risk | ||||||||||||||||||||
| Exchange instruments | ||||||||||||||||||||
| Nominal | 13 | 25 | 111 | — | — | 149 | ||||||||||||||
| Average exchange rate GBP/EUR | 1.148 | 1.146 | 1.138 | — | — | |||||||||||||||
| Hedges of net investments in foreign operations | ||||||||||||||||||||
| Exchange rate risk | ||||||||||||||||||||
| Exchange and interest rate instruments | ||||||||||||||||||||
| Nominal | 3,593 | 4,870 | 8,034 | — | — | 16,497 | ||||||||||||||
| Average BRL/EUR exchange rate | 5.569 | 5.505 | 5.481 | — | — | |||||||||||||||
| Average CLP/EUR exchange rate | 916.724 | 936.166 | 987.202 | — | — | |||||||||||||||
| Average COP/EUR exchange rate | — | 4,526 | — | — | — | |||||||||||||||
| Average GBP/EUR exchange rate | 0.866 | 0.867 | 0.876 | — | — | |||||||||||||||
| Average MXN/EUR exchange rate | 20.078 | 20.589 | 20.210 | — | — | |||||||||||||||
| Average USD/EUR exchange rate | — | 1.129 | 1.081 | — | — | |||||||||||||||
| Average PLN/EUR exchange rate | 4.664 | 4.752 | 4.580 | — | — | |||||||||||||||
| Average CAD/EUR exchange rate | — | 1.461 | — | — | — | |||||||||||||||
| Average CHF/EUR exchange rate | — | 0.940 | — | — | — | |||||||||||||||
| Average UYU/EUR exchange rate | 43.235 | 43.521 | 44.400 | — | — | |||||||||||||||
| 31 December 2022 | ||||||||||||||||||||
| EUR million | ||||||||||||||||||||
| Up to one month | One to three months | Three months to one year | One year to five years | More than five years |
Total | |||||||||||||||
| Fair value hedges | ||||||||||||||||||||
| Interest rate risk | ||||||||||||||||||||
| Interest rate instruments | ||||||||||||||||||||
| Nominal | 1,032 | 1,248 | 2,348 | 24,115 | 8,809 | 37,552 | ||||||||||||||
| Average fixed interest rate (%) GBP | — | 2.036 | 2.036 | 1.856 | 2.036 | |||||||||||||||
| Average fixed interest rate (%) EUR | 0.569 | (0.406) | 0.278 | 2.396 | 1.674 | |||||||||||||||
| Average fixed interest rate (%) CHF | — | — | — | 0.530 | — | |||||||||||||||
| Average fixed interest rate (%) JPY | — | — | — | 0.465 | — | |||||||||||||||
| Average fixed interest rate (%) CZK | — | — | — | 1.650 | — | |||||||||||||||
| Average fixed interest rate (%) NOK | — | — | — | — | 2.327 | |||||||||||||||
| Average fixed interest rate (%) AUD | — | 1.073 | — | — | — | |||||||||||||||
| Average fixed interest rate (%) USD | 2.892 | 3.123 | 3.835 | 3.181 | 3.374 | |||||||||||||||
| Average fixed interest rate (%) RON | — | — | — | 3.610 | — | |||||||||||||||
| Foreign exchange risk | ||||||||||||||||||||
| Exchange and interest rate instruments | ||||||||||||||||||||
| Nominal | 250 | 899 | 2,064 | — | — | 3,213 | ||||||||||||||
| Average GBP/EUR exchange rate | — | — | 0.877 | — | — | |||||||||||||||
| Average USD/EUR exchange rate | 1.040 | — | 0.992 | — | — | |||||||||||||||
| Average CNY/EUR exchange rate | 7.172 | 7.252 | 7.159 | — | — | |||||||||||||||
| Average AUD/EUR exchange rate | — | 1.587 | — | — | — | |||||||||||||||
| Average MXN/EUR exchange rate | — | 21.529 | — | — | — | |||||||||||||||
| Average JPY/EUR exchange rate | ||||||||||||||||||||
| Interest rate and foreign exchange rate risk | ||||||||||||||||||||
| Exchange and interest rate instruments | ||||||||||||||||||||
| Nominal | 912 | 38 | 1,101 | 3,767 | 988 | 6,806 | ||||||||||||||
| Average fixed interest rate (%) AUD/EUR | 4.000 | — | — | 4.800 | 3.824 | |||||||||||||||
| Average fixed interest rate (%) CZK/EUR | — | — | 0.860 | — | — | |||||||||||||||
| Average fixed interest rate (%) RON/EUR | — | 4.520 | — | 5.130 | — | |||||||||||||||
| Average fixed interest rate (%) HKD/EUR | — | — | — | 2.580 | — | |||||||||||||||
| Average fixed interest rate (%) JPY/EUR | 0.568 | — | — | 1.442 | 1.360 | |||||||||||||||
| Average fixed interest rate (%) NOK/EUR | — | — | — | 3.010 | 3.762 | |||||||||||||||
| Average fixed interest rate (%) CHF/EUR | — | — | — | 1.243 | — | |||||||||||||||
| Average fixed interest rate (%) EUR/GBP | — | 5.170 | — | — | — | |||||||||||||||
| Average fixed interest rate (%) NZD/EUR | — | — | — | — | — | |||||||||||||||
| Average fixed interest rate (%) USD/MXN | — | — | 12.982 | — | — | |||||||||||||||
| Average fixed interest rate (%) USD/COP | — | — | 15.452 | 13.614 | 7.150 | |||||||||||||||
| Average fixed interest rate (%) EUR/USD | — | — | — | (0.140) | — | |||||||||||||||
| Average fixed interest rate (%) USD/CLP | — | — | — | 3.450 | — | |||||||||||||||
| Average AUD/EUR exchange rate | 1.499 | — | — | 1.499 | 1.545 | |||||||||||||||
| Average CZK/EUR exchange rate | — | — | 25.407 | 25.677 | — | |||||||||||||||
| Average EUR/GBP exchange rate | — | 1.162 | — | — | — | |||||||||||||||
| Average EUR/USD exchange rate | — | — | — | 0.945 | — | |||||||||||||||
| Average HKD/EUR exchange rate | — | — | — | 8.851 | — | |||||||||||||||
| Average JPY/EUR exchange rate | 133.840 | — | — | 130.227 | 118.180 | |||||||||||||||
| Average NOK/EUR exchange rate | — | — | — | 9.492 | 9.685 | |||||||||||||||
| Average RON/EUR exchange rate | — | 4.746 | — | 4.842 | 4.927 | |||||||||||||||
| Average CHF/EUR exchange rate | — | — | 1.092 | 1.105 | — | |||||||||||||||
| Average USD/CLP exchange rate | — | — | — | 0.001 | — | |||||||||||||||
| 31 December 2022 | ||||||||||||||||||||
| EUR million | ||||||||||||||||||||
| Up to one month | One to three months | Three months to one year | One year to five years | More than five years |
Total | |||||||||||||||
| Average NZD/EUR exchange rate | — | — | — | — | 1.666 | |||||||||||||||
| Average USD/MXN exchange rate | — | — | 0.051 | — | — | |||||||||||||||
| Credit risk | ||||||||||||||||||||
| Credit risk instruments | ||||||||||||||||||||
| Nominal | — | 9 | 8 | 38 | — | 55 | ||||||||||||||
| Cash flow hedges | ||||||||||||||||||||
| Interest rate and foreign exchange rate risk | ||||||||||||||||||||
| Interest rate and foreign exchange rate instruments | ||||||||||||||||||||
| Nominal | — | 3 | 597 | 1,451 | 184 | 2,235 | ||||||||||||||
| Average fixed interest rate (%) EUR/PEN | — | — | 6.496 | — | — | |||||||||||||||
| Average fixed rate (%) USD/COP | — | 15.398 | — | — | ||||||||||||||||
| Average fixed interest rate (%) EUR/AUD | — | 3.207 | — | — | — | |||||||||||||||
| Average fixed interest rate (%) AUD/EUR | — | — | — | 0.305 | — | |||||||||||||||
| Average EUR/GBP exchange rate | — | — | 1.084 | 1.173 | — | |||||||||||||||
| Average AUD/EUR exchange rate | — | — | — | 1.604 | 1.562 | |||||||||||||||
| Average RON/EUR exchange rate | — | — | — | 4.885 | — | |||||||||||||||
| Average JPY/EUR exchange rate | — | — | — | 120.568 | — | |||||||||||||||
| Average CHF/EUR exchange rate | — | — | — | 1.102 | — | |||||||||||||||
| Average NOK/EUR exchange rate | — | — | — | — | 10.242 | |||||||||||||||
| Average CZK/EUR exchange rate | — | — | — | 26.131 | — | |||||||||||||||
| Average EUR/PEN exchange rate | — | — | 0.252 | — | — | |||||||||||||||
| Average EUR/AUD exchange rate | — | 0.654 | — | — | — | |||||||||||||||
| Interest rate risk | ||||||||||||||||||||
| Bond Forward instruments | ||||||||||||||||||||
| Nominal | 2,250 | 4,500 | 11,453 | 10,000 | 0 | 28,203 | ||||||||||||||
| Average fixed interest rate (%) EUR | (0.431) | (0.404) | (0.348) | (0.010) | — | |||||||||||||||
| Inflation risk | ||||||||||||||||||||
| Bond Forward instruments | ||||||||||||||||||||
| Nominal | — | — | 700 | — | — | 700 | ||||||||||||||
| Average fixed interest rate (%) EUR | — | — | 0.322 | — | — | |||||||||||||||
| Exchange rate risk | ||||||||||||||||||||
| Exchange instruments | ||||||||||||||||||||
| Nominal | 11 | 22 | 99 | — | — | |||||||||||||||
| Average exchange rate GBP/EUR | 1.156 | 1.153 | 1.142 | — | — | |||||||||||||||
| Hedges of net investments in foreign operations | ||||||||||||||||||||
| Exchange rate risk | ||||||||||||||||||||
| Exchange and interest rate instruments | ||||||||||||||||||||
| Nominal | 2,020 | 4,711 | 13,839 | — | — | 20,570 | ||||||||||||||
| Average BRL/EUR exchange rate | 6.554 | 5.797 | 5.866 | — | — | |||||||||||||||
| Average CLP/EUR exchange rate | 953.549 | 955.790 | 944.113 | — | — | |||||||||||||||
| Average COP/EUR exchange rate | — | 4,935.121 | — | — | — | |||||||||||||||
| Average GBP/EUR exchange rate | 0.869 | 0.873 | 0.876 | — | — | |||||||||||||||
| Average MXN/EUR exchange rate | 25.130 | 23.968 | 22.156 | — | — | |||||||||||||||
| Average USD/EUR exchange rate | — | — | 1.158 | — | — | |||||||||||||||
| Average PLN/EUR exchange rate | 4.832 | 4.837 | 4.991 | — | — | |||||||||||||||
| 31 December 2021 | ||||||||||||||||||||
| EUR million | ||||||||||||||||||||
| Up to one month | One to three months | Three months to one year | One year to five years | More than five years |
Total | |||||||||||||||
| Fair value hedges | ||||||||||||||||||||
| Interest rate risk | ||||||||||||||||||||
| Interest rate instruments | ||||||||||||||||||||
| Nominal | 14 | 1,822 | 3,038 | 21,507 | 10,031 | 36,412 | ||||||||||||||
| Average fixed interest rate (%) GBP | — | — | — | 2.139 | 1.750 | |||||||||||||||
| Average fixed interest rate (%) EUR | 3.859 | 0.989 | (0.031) | 1.212 | 1.532 | |||||||||||||||
| Average fixed interest rate (%) CHF | — | — | — | 0.828 | 0.403 | |||||||||||||||
| Average fixed interest rate (%) JPY | — | — | — | 0.465 | — | |||||||||||||||
| Average fixed interest rate (%) USD | 4.746 | 1.449 | 3.459 | 2.737 | 3.374 | |||||||||||||||
| Average fixed interest rate (%) RON | — | — | — | 4.211 | 3.200 | |||||||||||||||
| Foreign exchange risk | ||||||||||||||||||||
| Exchange and interest rate instruments | ||||||||||||||||||||
| Nominal | 503 | 1,634 | 10,350 | 586 | — | 13,073 | ||||||||||||||
| Average GBP/EUR exchange rate | — | 0.882 | 0.865 | 0.876 | — | |||||||||||||||
| Average USD/EUR exchange rate | 1.187 | 1.172 | 1.180 | — | — | |||||||||||||||
| Average CNY/EUR exchange rate | 7.859 | 7.717 | 7.412 | — | — | |||||||||||||||
| Average PEN/USD exchange rate | — | 4.003 | — | — | — | |||||||||||||||
| Average JPY/EUR exchange rate | 132.688 | 130.741 | — | — | — | |||||||||||||||
| Interest rate and foreign exchange rate risk | ||||||||||||||||||||
| Exchange and interest rate instruments | ||||||||||||||||||||
| Nominal | 116 | 1,109 | 53 | 3,255 | 1,279 | 5,812 | ||||||||||||||
| Average fixed interest rate (%) AUD/EUR | — | — | — | 4.000 | 4.661 | |||||||||||||||
| Average fixed interest rate (%) CZK/EUR | — | — | — | 0.860 | — | |||||||||||||||
| Average fixed interest rate (%) RON/EUR | — | — | — | 4.849 | — | |||||||||||||||
| Average fixed interest rate (%) HKD/EUR | — | — | — | 2.580 | — | |||||||||||||||
| Average fixed interest rate (%) JPY/EUR | — | — | — | 0.730 | 1.144 | |||||||||||||||
| Average fixed interest rate (%) NOK/EUR | — | — | — | — | 3.605 | |||||||||||||||
| Average fixed interest rate (%) CHF/EUR | — | — | — | 0.760 | 1.243 | |||||||||||||||
| Average fixed interest rate (%) USD/COP | — | 5.140 | 9.470 | 6.789 | 7.153 | |||||||||||||||
| Average fixed interest rate (%) COP/USD | — | — | — | (0.140) | — | |||||||||||||||
| Average fixed interest rate (%) USD/CLP | — | — | — | 3.450 | — | |||||||||||||||
| Average AUD/EUR exchange rate | — | — | — | 1.499 | 1.529 | |||||||||||||||
| Average CZK/EUR exchange rate | — | — | — | 25.506 | — | |||||||||||||||
| Average EUR/GBP exchange rate | — | 1.176 | — | — | — | |||||||||||||||
| Average EUR/USD exchange rate | — | — | — | 0.891 | — | |||||||||||||||
| Average HKD/EUR exchange rate | — | — | — | 8.782 | — | |||||||||||||||
| Average JPY/EUR exchange rate | — | — | — | 132.966 | 126.605 | |||||||||||||||
| Average MXN/EUR exchange rate | — | — | 14.696 | — | — | |||||||||||||||
| Average NOK/EUR exchange rate | — | — | — | — | 9.606 | |||||||||||||||
| Average RON/EUR exchange rate | — | — | — | 4.815 | 4.927 | |||||||||||||||
| Average CHF/EUR exchange rate | — | — | — | 1.092 | 1.105 | |||||||||||||||
| Average USD/CLP exchange rate | — | — | — | 0.001 | — | |||||||||||||||
| Average NZD/EUR exchange rate | — | — | — | — | 1.666 | |||||||||||||||
| Average USD/MXN exchange rate | — | — | — | 0.050 | — | |||||||||||||||
| 31 December 2021 | ||||||||||||||||||||
| EUR million | ||||||||||||||||||||
| Up to one month | One to three months | Three months to one year | One year to five years | More than five years |
Total | |||||||||||||||
| Credit risk | ||||||||||||||||||||
| Credit risk instruments | ||||||||||||||||||||
| Nominal | — | 19 | 34 | 120 | — | 173 | ||||||||||||||
| Cash flow hedges | ||||||||||||||||||||
| Interest rate and foreign exchange rate risk | ||||||||||||||||||||
| Interest rate and foreign exchange rate instruments | ||||||||||||||||||||
| Nominal | — | 9 | 1,169 | 1,848 | 408 | 3,434 | ||||||||||||||
| Average fixed interest rate (%) EUR/PEN | — | — | 3.441 | — | — | |||||||||||||||
| Average fixed interest rate (%) EUR/AUD | — | 1.632 | — | — | — | |||||||||||||||
| Average fixed interest rate (%) AUD/EUR | — | — | — | 0.305 | — | |||||||||||||||
| Average EUR/GBP exchange rate | — | — | 1.102 | 1.113 | — | |||||||||||||||
| Average EUR/USD exchange rate | — | — | — | 0.882 | — | |||||||||||||||
| Average AUD/EUR exchange rate | — | — | — | 1.604 | 1.562 | |||||||||||||||
| Average RON/EUR exchange rate | — | — | — | 4.885 | — | |||||||||||||||
| Average JPY/EUR exchange rate | — | — | — | 120.568 | — | |||||||||||||||
| Average CHF/EUR exchange rate | — | — | — | — | 1.102 | |||||||||||||||
| Average NOK/EUR exchange rate | — | — | — | — | 10.242 | |||||||||||||||
| Average CZK/EUR exchange rate | — | — | — | 26.131 | — | |||||||||||||||
| Average EUR/PEN exchange rate | — | — | 0.208 | — | — | |||||||||||||||
| Average EUR/AUD exchange rate | — | 0.624 | — | — | — | |||||||||||||||
| Interest rate risk | ||||||||||||||||||||
| Bond Forward instruments | ||||||||||||||||||||
| Nominal | 4,279 | — | 5,191 | 38,314 | — | 47,784 | ||||||||||||||
| Average fixed interest rate (%) EUR | — | — | (0.465) | (0.258) | — | |||||||||||||||
| Average fixed interest rate (%) USD | — | — | 1.765 | — | — | |||||||||||||||
| Average fixed interest rate (%) AUD | — | — | — | 1.650 | — | |||||||||||||||
| Hedges of net investments in foreign operations | ||||||||||||||||||||
| Exchange rate risk | ||||||||||||||||||||
| Exchange and interest rate instruments | ||||||||||||||||||||
| Nominal | 3,778 | 4,848 | 11,815 | 2,916 | — | 23,357 | ||||||||||||||
| Average BRL/EUR exchange rate | 6.663 | 6.758 | 6.841 | — | — | |||||||||||||||
| Average CLP/EUR exchange rate | 943.354 | 929.690 | 949.615 | — | — | |||||||||||||||
| Average COP/EUR exchange rate | — | — | 4,538.997 | — | — | |||||||||||||||
| Average GBP/EUR exchange rate | 0.854 | 0.857 | 0.855 | 0.875 | — | |||||||||||||||
| Average MXN/EUR exchange rate | 25.541 | 25.335 | 25.192 | — | — | |||||||||||||||
| Average PLN/EUR exchange rate | 4.592 | 4.582 | 4.634 | — | — | |||||||||||||||
| Average USD/EUR exchange rate | — | — | 1.167 | 1.233 | — | |||||||||||||||
| EUR million | |||||||||||||||||||||||||||||
| 31 December 2023 | |||||||||||||||||||||||||||||
| Carrying amount of hedged items | Accumulated amount of fair value adjustments on the hedged item | Balance sheet line item | Change in fair value of hedged item for ineffectiveness assessment | Cash flow reserves or conversion reserves | |||||||||||||||||||||||||
| Assets | Liabilities | Assets | Liabilities | Continuing hedges | Discontinued hedges | ||||||||||||||||||||||||
| Fair value hedges | 134,095 | 26,946 | (1,798) | (1,652) | 1,928 | — | |||||||||||||||||||||||
| Interest rate risk | 130,672 | 19,176 | (1,682) | (1,546) | 1,757 | — | — | ||||||||||||||||||||||
| Exchange rate risk | 637 | 1,365 | (1) | (3) | 60 | — | — | ||||||||||||||||||||||
| Interest and Exchange rate risk | 2,786 | 6,405 | (115) | (103) | 111 | — | — | ||||||||||||||||||||||
| Inflation risk | — | — | — | — | — | — | — | ||||||||||||||||||||||
| Credit risk | — | — | — | — | — | — | — | ||||||||||||||||||||||
| Cash flow hedges | (1,824) | (813) | (173) | ||||||||||||||||||||||||||
| Interest rate risk | (2,182) | (797) | (77) | ||||||||||||||||||||||||||
| Exchange rate risk | 500 | (80) | — | ||||||||||||||||||||||||||
| Interest and Exchange rate risk | 100 | (144) | — | ||||||||||||||||||||||||||
| Inflation risk | (233) | 196 | (96) | ||||||||||||||||||||||||||
| Equity risk | (9) | 12 | — | ||||||||||||||||||||||||||
| Net foreign investments hedges | 18,706 | — | 1,888 | (8,684) | — | ||||||||||||||||||||||||
| Exchange rate risk | 18,706 | — | 1,888 | (8,684) | — | ||||||||||||||||||||||||
| 152,801 | 26,946 | (1,798) | (1,652) | 1,992 | (9,497) | (173) | |||||||||||||||||||||||
| EUR million | |||||||||||||||||||||||||||||
| 31 December 2022 | |||||||||||||||||||||||||||||
| Carrying amount of hedged items | Accumulated amount of fair value adjustments on the hedged item | Balance sheet line item | Change in fair value of hedged item for ineffectiveness assessment | Cash flow reserves or conversion reserves | |||||||||||||||||||||||||
| Assets | Liabilities | Assets | Liabilities | Continuing hedges | Discontinued hedges | ||||||||||||||||||||||||
| Fair value hedges | 126,665 | 59,837 | (5,487) | (3,581) | Loans and advances / Deposits and Debt securities / Debt securities issued | (3,232) | — | — | |||||||||||||||||||||
| Interest rate risk | 121,605 | 53,239 | (5,069) | (3,428) | (2,397) | — | — | ||||||||||||||||||||||
| Exchange rate risk | 2,792 | 1,040 | (284) | — | (7) | — | — | ||||||||||||||||||||||
| Interest and Exchange rate risk | 2,126 | 5,558 | (134) | (153) | (826) | — | — | ||||||||||||||||||||||
| Inflation risk | — | — | — | — | — | — | — | ||||||||||||||||||||||
| Credit risk | 142 | — | — | — | (2) | — | — | ||||||||||||||||||||||
| Cash flow hedges | 475 | (3,353) | (225) | ||||||||||||||||||||||||||
| Interest rate risk | 2,458 | (2,973) | (75) | ||||||||||||||||||||||||||
| Exchange rate risk | (1,764) | (88) | (2) | ||||||||||||||||||||||||||
| Interest and Exchange rate risk | 39 | (309) | 1 | ||||||||||||||||||||||||||
| Inflation risk | (258) | 14 | (149) | ||||||||||||||||||||||||||
| Equity risk | — | 3 | — | ||||||||||||||||||||||||||
| Net foreign investments hedges | 22,614 | — | 2,467 | (6,750) | — | ||||||||||||||||||||||||
| Exchange rate risk | 22,614 | — | 2,467 | (6,750) | — | ||||||||||||||||||||||||
| 149,279 | 59,837 | (5,487) | (3,581) | (290) | (10,103) | (225) | |||||||||||||||||||||||
| EUR million | |||||||||||||||||||||||||||||
| 31 December 2021 | |||||||||||||||||||||||||||||
| Carrying amount of hedged items | Accumulated amount of fair value adjustments on the hedged item | Balance sheet line item | Change in fair value of hedged item for ineffectiveness assessment | Cash flow reserves or conversion reserves | |||||||||||||||||||||||||
| Assets | Liabilities | Assets | Liabilities | Continuing hedges | Discontinued hedges | ||||||||||||||||||||||||
| Fair value hedges | 193,949 | 51,395 | 462 | 453 | Loans and advances / Deposits and Debt securities / Debt securities issued | (1,061) | — | — | |||||||||||||||||||||
| Interest rate risk | 125,479 | 47,347 | 727 | 366 | (543) | — | — | ||||||||||||||||||||||
| Exchange rate risk | 64,531 | — | (282) | — | (343) | — | — | ||||||||||||||||||||||
| Interest and Exchange rate risk | 3,714 | 4,048 | 15 | 87 | (173) | — | — | ||||||||||||||||||||||
| Inflation risk | 46 | — | — | — | — | — | — | ||||||||||||||||||||||
| Credit risk | 179 | — | 2 | — | (2) | — | — | ||||||||||||||||||||||
| Cash flow hedges | 1,639 | (414) | (148) | ||||||||||||||||||||||||||
| Interest rate risk | 494 | (540) | (52) | ||||||||||||||||||||||||||
| Exchange rate risk | 115 | 81 | 8 | ||||||||||||||||||||||||||
| Interest and Exchange rate risk | 778 | 330 | — | ||||||||||||||||||||||||||
| Inflation risk | 249 | (289) | (104) | ||||||||||||||||||||||||||
| Equity risk | 3 | 4 | — | ||||||||||||||||||||||||||
| Net foreign investments hedges | 25,594 | — | 1,159 | (4,283) | — | ||||||||||||||||||||||||
| Exchange rate risk | 25,594 | — | 1,159 | (4,283) | — | ||||||||||||||||||||||||
| 219,543 | 51,395 | 462 | 453 | 1,737 | (4,697) | (148) | |||||||||||||||||||||||
| EUR million | |||||||||||||||||
| 31 December 2023 | |||||||||||||||||
| Earnings/(losses) recognised in another cumulative overall result | Ineffective recognised in the income statement | Line of the income statement that includes the ineffectiveness of cash flows | Reclassified amount of reserves to the income statement due to: | ||||||||||||||
| Gains or losses financial assets/liabilities | Cover transaction affecting the income statement | Line of the income statement that includes reclassified items | |||||||||||||||
| Fair value hedges | 59 | ||||||||||||||||
| Interest rate risk | 72 | ||||||||||||||||
| Exchange rate risk | (38) | ||||||||||||||||
| Interest rate and exchange rate risk | 25 | ||||||||||||||||
| Cash flow hedges | 2,592 | 4 | Gains or losses financial assets/liabilities | (2,622) | Interest margin/Gains or losses financial assets/liabilities | ||||||||||||
| Interest rate risk | 2,179 | 2 | (1,647) | ||||||||||||||
| Exchange rate risk | 7 | (1) | (416) | ||||||||||||||
| Interest rate and exchange rate risk | 164 | 2 | (431) | ||||||||||||||
| Inflation risk | 233 | 1 | (128) | ||||||||||||||
| Equity risk | 9 | — | — | ||||||||||||||
| Net foreign investments hedges | (1,888) | — | — | ||||||||||||||
| Exchange rate risk | (1,888) | — | — | ||||||||||||||
| 704 | 63 | (2,622) | |||||||||||||||
| EUR million | |||||||||||||||||
| 31 December 2022 | |||||||||||||||||
| Earnings/(losses) recognised in another cumulative overall result | Ineffective coverage recognised in the income statement | Line of the income statement that includes the ineffectiveness of cash flows | Reclassified amount of reserves to the income statement due to: | ||||||||||||||
| Gains or losses financial assets/liabilities | Cover transaction affecting the income statement | Line of the income statement that includes reclassified items | |||||||||||||||
| Fair value hedges | 119 | ||||||||||||||||
| Interest rate risk | 155 | ||||||||||||||||
| Exchange rate risk | (16) | ||||||||||||||||
| Interest rate and exchange rate risk | (20) | ||||||||||||||||
| Cash flow hedges | (3,016) | (45) | Gains or losses financial assets/liabilities | 1,254 | Interest margin/Gains or losses financial assets/liabilities | ||||||||||||
| Interest rate risk | (2,458) | 1 | (370) | ||||||||||||||
| Exchange rate risk | (178) | (10) | 2,130 | ||||||||||||||
| Interest rate and exchange rate risk | (638) | (39) | 587 | ||||||||||||||
| Inflation risk | 258 | 3 | (1,093) | ||||||||||||||
| Equity risk | — | — | — | ||||||||||||||
| Net foreign investments hedges hedges |
(2,467) | — | — | ||||||||||||||
| Exchange rate risk | (2,467) | — | — | ||||||||||||||
| (5,483) | 74 | 1,254 | |||||||||||||||
| EUR million | |||||||||||||||||
| 31 December 2021 | |||||||||||||||||
| Earnings/(losses) recognised in another cumulative overall result | Ineffective coverage recognised in the income statement | Line of the income statement that includes the ineffectiveness of cash flows | Reclassified amount of reserves to the income statement due to: | ||||||||||||||
| Gains or losses financial assets/liabilities | Cover transaction affecting the income statement | Line of the income statement that includes reclassified items | |||||||||||||||
| Fair value hedges | 18 | ||||||||||||||||
| Interest rate risk | 46 | ||||||||||||||||
| Risk of Exchange rate | (55) | ||||||||||||||||
| Risk of interest rate and exchange rate | 27 | ||||||||||||||||
| Credit risk | |||||||||||||||||
| Cash flow hedges | (938) | (64) | Gains or losses financial assets/liabilities | (801) | Interest margin/Gains or losses financial assets/liabilities | ||||||||||||
| Interest rate risk | (491) | (34) | 269 | ||||||||||||||
| Exchange rate risk | 155 | 2 | (262) | ||||||||||||||
| Interest rate and exchange rate risk | (350) | (35) | (350) | ||||||||||||||
| Inflation risk | (249) | 3 | (458) | ||||||||||||||
| Equity risk | (3) | — | — | ||||||||||||||
| Net foreign investments hedges |
(1,159) | — | — | ||||||||||||||
| Exchange rate risk | (1,159) | — | — | ||||||||||||||
| (2,097) | (46) | (801) | |||||||||||||||
| EUR million | |||||||||||
| 2023 | 2022 | 2021 | |||||||||
| Balance at beginning of year | (9,187) | (4,559) | (2,829) | ||||||||
| Cash flow hedges | |||||||||||
| Interest rate risk | 2,179 | (2,458) | (491) | ||||||||
| Amounts transferred to income statements | 1,647 | 370 | (269) | ||||||||
| Gain or loss in value CFE - recognized in equity | 532 | (2,828) | (222) | ||||||||
| Exchange rate risk | 7 | (178) | 155 | ||||||||
| Amounts transferred to income statements | 416 | (2,130) | 262 | ||||||||
| Gain or loss in value CFE - recognized in equity | (409) | 1,952 | (107) | ||||||||
| Interest rate and exchange rate risk | 164 | (638) | (350) | ||||||||
| Amounts transferred to income statements | 431 | (587) | 350 | ||||||||
| Gain or loss in value CFE - recognized in equity | (267) | (51) | (700) | ||||||||
| Inflation risk | 233 | 258 | (249) | ||||||||
| Amounts transferred to income statements | 128 | 1,093 | 458 | ||||||||
| Gain or loss in value CFE - recognized in equity | 105 | (835) | (707) | ||||||||
| Equity risk | 9 | — | (3) | ||||||||
| Amounts transferred to income statements | — | — | — | ||||||||
| Gain or loss in value CFE - recognized in equity | 9 | — | (3) | ||||||||
| Net foreign investments hedges | |||||||||||
| Exchange rate risk | (1,888) | (2,467) | (1,159) | ||||||||
| Amounts transferred to income statements | — | — | — | ||||||||
| Gain or loss in value CFE - recognized in equity | (1,888) | (2,467) | (1,159) | ||||||||
| Minorities, taxes and others | (941) | 855 | 367 | ||||||||
| Balance at end of year | (9,424) | (9,187) | (4,559) | ||||||||
| EUR million | |||||||||||
| 2023 | 2022 | 2021 | |||||||||
| Loans and advances, central banks | 1,959 | 1,606 | 476 | ||||||||
| Loans and advances, credit institutions | 5,361 | 2,186 | 916 | ||||||||
| Debt instruments | 14,501 | 10,416 | 5,724 | ||||||||
| Loans and advances, customers | 70,619 | 54,110 | 38,649 | ||||||||
Other interestA |
12,812 | 3,112 | 698 | ||||||||
| 105,252 | 71,430 | 46,463 | |||||||||
| EUR million | |||||||||||
| 2023 | 2022 | 2021 | |||||||||
| Central banks deposits | 2,178 | 706 | 338 | ||||||||
| Credit institution deposits | 7,172 | 2,784 | 1,140 | ||||||||
| Customer deposits | 33,238 | 16,994 | 5,452 | ||||||||
| Debt securities issued and subordinated liabilities | 12,751 | 8,464 | 4,838 | ||||||||
| Marketable debt securities | 11,702 | 7,472 | 4,190 | ||||||||
| Subordinated liabilities (note 23) | 1,049 | 992 | 648 | ||||||||
| Provisions for pensions (note 25) | 94 | 100 | 91 | ||||||||
| Lease Liabilities | 130 | 116 | 125 | ||||||||
| Other interest expense | 6,428 | 3,647 | 1,109 | ||||||||
| 61,991 | 32,811 | 13,093 | |||||||||
| EUR million | |||||||||||
| 2023 | 2022 | 2021 | |||||||||
| Dividend income classified as: | |||||||||||
| Financial assets held for trading | 415 | 366 | 369 | ||||||||
| Non-trading financial assets mandatorily at fair value through profit or loss | 68 | 35 | 32 | ||||||||
| Financial assets at fair value through other comprehensive income | 88 | 87 | 112 | ||||||||
| 571 | 488 | 513 | |||||||||
| EUR million | |||||||||||
| 2023 | 2022 | 2021 | |||||||||
| Coming from collection and payment services | |||||||||||
| Bills | 232 | 245 | 214 | ||||||||
| Demand accounts | 1,457 | 1,526 | 1,408 | ||||||||
| Cards | 4,278 | 4,012 | 3,138 | ||||||||
| Orders | 698 | 625 | 503 | ||||||||
| Cheques and other | 128 | 172 | 139 | ||||||||
| 6,793 | 6,580 | 5,402 | |||||||||
| Coming from non-banking financial products | |||||||||||
| Investment funds | 1,092 | 1,017 | 992 | ||||||||
| Pension funds | 178 | 167 | 161 | ||||||||
| Insurance | 2,715 | 2,743 | 2,467 | ||||||||
| 3,985 | 3,927 | 3,620 | |||||||||
| Coming from Securities services | |||||||||||
| Securities underwriting and placement | 511 | 438 | 431 | ||||||||
| Securities trading | 348 | 339 | 319 | ||||||||
| Administration and custody | 354 | 321 | 402 | ||||||||
| Asset management | 341 | 446 | 369 | ||||||||
| 1,554 | 1,544 | 1,521 | |||||||||
| Other | |||||||||||
| Foreign exchange | 846 | 822 | 522 | ||||||||
| Financial guarantees | 486 | 433 | 415 | ||||||||
| Commitment fees | 549 | 506 | 442 | ||||||||
| Other fees and commissions | 2,108 | 2,055 | 1,890 | ||||||||
| 3,989 | 3,816 | 3,269 | |||||||||
| 16,321 | 15,867 | 13,812 | |||||||||
| EUR million | |||||||||||
| 2023 | 2022 | 2021 | |||||||||
| Commissions assigned to third parties | 2,644 | 2,554 | 1,993 | ||||||||
| Cards | 1,891 | 1,872 | 1,355 | ||||||||
| By collection and return of effects | 24 | 18 | 16 | ||||||||
| Other fees assigned | 729 | 664 | 622 | ||||||||
| Other commissions paid | 1,620 | 1,523 | 1,317 | ||||||||
| Brokerage fees on lending and deposit transactions | 105 | 77 | 60 | ||||||||
| Sales of insurance and pension funds | 358 | 340 | 341 | ||||||||
| Other fees and commissions | 1,157 | 1,106 | 916 | ||||||||
| 4,264 | 4,077 | 3,310 | |||||||||
| EUR million | |||||||||||
| 2023 | 2022 | 2021 | |||||||||
| Gains or losses on financial assets and liabilities not measured at fair value through profit or loss, net | 96 | 149 | 628 | ||||||||
| Financial assets at amortized cost | (3) | 34 | 89 | ||||||||
| Other financial assets and liabilities | 99 | 115 | 539 | ||||||||
| Of which debt instruments | 51 | 122 | 567 | ||||||||
Gains or losses on financial assets and liabilities held for trading, netA |
2,322 | 842 | 1,141 | ||||||||
| Gains or losses on non-trading financial assets and liabilities mandatory at fair value through profit or loss | 204 | 162 | 132 | ||||||||
Gains or losses on financial assets and liabilities measured at fair value through profit or loss, netA |
(93) | 968 | 270 | ||||||||
| Gains or losses from hedge accounting, net | 63 | 74 | (46) | ||||||||
| 2,592 | 2,195 | 2,125 | |||||||||
| EUR million | |||||||||||
| 2023 | 2022 | 2021 | |||||||||
| Exchange differences, net | 41 | (542) | (562) | ||||||||
| EUR million | |||||||||||
| 2023 | 2022 | 2021 | |||||||||
| Loans and receivables: | 51,072 | 44,962 | 34,812 | ||||||||
| Central banks | 17,717 | 11,595 | 3,608 | ||||||||
| Credit institutions | 14,520 | 17,175 | 13,549 | ||||||||
| Customers | 18,835 | 16,192 | 17,655 | ||||||||
| Debt instruments | 66,079 | 45,079 | 30,223 | ||||||||
| Equity instruments | 19,125 | 13,777 | 19,119 | ||||||||
| Derivatives | 56,328 | 67,002 | 54,292 | ||||||||
| 192,604 | 170,820 | 138,446 | |||||||||
| EUR million | |||||||||||
| 2023 | 2022 | 2021 | |||||||||
| Deposits | 80,503 | 62,620 | 23,156 | ||||||||
| Central banks | 9,017 | 7,497 | 1,645 | ||||||||
| Credit institutions | 19,597 | 11,754 | 7,552 | ||||||||
| Customer | 51,889 | 43,369 | 13,959 | ||||||||
| Marketable debt securities | 5,371 | 5,427 | 5,454 | ||||||||
| Short positions | 26,174 | 22,515 | 12,236 | ||||||||
| Derivatives | 50,589 | 64,891 | 53,566 | ||||||||
| Other financial liabilities | — | — | — | ||||||||
| 162,637 | 155,453 | 94,412 | |||||||||
| EUR million | |||||||||||
| 2023 | 2022 | 2021 | |||||||||
| Other operating income | 1,104 | 1,510 | 2,255 | ||||||||
| Non- financial services | 752 | 770 | 291 | ||||||||
| Other operating income | 352 | 740 | 1,964 | ||||||||
| Other operating expense | (2,827) | (2,803) | (2,442) | ||||||||
| Non-financial services | (674) | (661) | (283) | ||||||||
| Other operating expense: | (2,153) | (2,142) | (2,159) | ||||||||
| Of which, credit institutions deposit guarantee fund and single resolution fund | (1,119) | (1,258) | (1,016) | ||||||||
| (1,723) | (1,293) | (187) | |||||||||
| EUR million | |||||||||||
| 2023 | 2022 | 2021 | |||||||||
| Wages and salaries | 10,351 | 9,563 | 8,466 | ||||||||
| Social Security costs | 1,637 | 1,441 | 1,323 | ||||||||
| Additions to provisions for defined benefit pension plans (note 25) | 42 | 65 | 73 | ||||||||
| Contributions to defined contribution pension funds | 310 | 296 | 286 | ||||||||
| Other Staff costs | 1,386 | 1,182 | 1,068 | ||||||||
| 13,726 | 12,547 | 11,216 | |||||||||
| Functional breakdown by gender | ||||||||||||||||||||||||||
Senior executivesA |
Other executives | Other employees | ||||||||||||||||||||||||
| Men | Women | Men | Women | Men | Women | |||||||||||||||||||||
| Europe | 1,073 | 500 | 10,704 | 7,629 | 31,413 | 38,062 | ||||||||||||||||||||
| North America | 202 | 82 | 3,778 | 2,522 | 16,387 | 21,111 | ||||||||||||||||||||
| South America | 305 | 141 | 3,878 | 2,708 | 32,709 | 39,560 | ||||||||||||||||||||
| 1,580 | 723 | 18,360 | 12,859 | 80,509 | 98,733 | |||||||||||||||||||||
| Functional breakdown by gender | ||||||||||||||||||||||||||
Senior executivesA |
Other executives | Other employees | ||||||||||||||||||||||||
| Men | Women | Men | Women | Men | Women | |||||||||||||||||||||
| Europe | 68 | % | 32 | % | 58 | % | 42 | % | 45 | % | 55 | % | ||||||||||||||
| North America | 71 | % | 29 | % | 60 | % | 40 | % | 44 | % | 56 | % | ||||||||||||||
| South America | 68 | % | 32 | % | 59 | % | 41 | % | 45 | % | 55 | % | ||||||||||||||
| 69 | % | 31 | % | 59 | % | 41 | % | 45 | % | 55 | % | |||||||||||||||
Number of employeesA | |||||
| 2023 | |||||
| Senior executives | 18 | ||||
| Other executives | 281 | ||||
| Other employees | 4,402 | ||||
| 4,701 | |||||
Deferred variable remuneration systems |
Description and plan beneficiaries |
Conditions |
Calculation Base |
||||||||
| (i) Deferred and conditional variable remuneration plan (2015, 2016, 2017, 2018, 2019, 2020, 2021, 2022 and 2023) |
The purpose of these cycles is to defer a portion of the variable remuneration of the beneficiaries over a period of three years for the sixth cycles, over three or five years for the fifth, seventh, eighth, ninth, tenth and eleventh cycles, and over four or five years for the twelfth cycle, for it to be paid, where appropriate, in cash and in Santander shares. The other portion of the variable remuneration is also to be paid in cash and Santander shares, upon commencement of the cycles, in accordance with the rules set forth below.
Beneficiaries:
•Executive directors and certain executives (including senior management) and employees who assume risk, who perform control functions or receive an overall remuneration which puts them on the same remuneration level as executives and employees who assume risks (fifth cycle)
•In the case of the sixth, seventh, eighth, ninth, tenth, eleventh twelfth and thirteenth cycle, the beneficiaries are Material Risk Takers (Identified staff) that are not beneficiaries of the Deferred Multiyear Objectives Variable Remuneration Plan.
|
For the fifth and sixth cycles (2015 to 2016), the accrual of the deferred compensation is conditioned, in addition to the requirement that the beneficiary remains in the Group's employ, with the exceptions included in the plan regulations on none of the following circumstances existing during the period prior to each delivery, pursuant to the provisions set forth in each case in the plan regulations:
•Poor financial performance of the Group.
•Breach by the beneficiary of internal regulations, including, in particular, those relating to risks.
•Material restatement of the Group's consolidated financial statements, except when it is required pursuant to a change in accounting standards.
•Significant changes in the Group’s economic capital or risk profile
In the case of the seventh, eighth, ninth, tenth, eleventh, twelfth and thirteenth cycles (2017 to 2022), the accrual of deferred compensation is conditioned, in addition to the permanence of the beneficiary in the Group, with the exceptions contained in the plan's regulations, to non-occurrence of a poor performance of the entity as a whole or of a specific division or area of the entity or of the exposures generated by the personnel:
i.significant failures in risk management by the entity , or by a business unit or risk control unit.
ii.the increase suffered by the entity or by a business unit of its capital needs, not foreseen at the time of generation of the exposures.
iii.Regulatory sanctions or judicial sentences for events that could be attributable to the unit or the personnel responsible for those. Also, the breach of internal codes of conduct of the entity.
iv.Irregular behaviours, whether individual or collective, considering in particular the negative effects derived from the marketing of inappropriate products and the responsibilities of the persons or bodies that made those decisions.
|
Fifth cycle (2015):
•Executive directors and members of the Identified Staff with total variable remuneration higher than 2.6 million euros: 40% paid immediately and 60% deferred over 5 years deferral period.
•Division managers, country heads (of countries which represent at least 1% of Group's economic capital), other executives of the Group with a similar profile and members of the Identified Staff with total variable remuneration between 1.7 million euros (1.8 million in fourth cycle) and 2.6 million euros: 50% paid immediately and 50% deferred over 5 years (fifth cycle)
•Other beneficiaries: 60% paid immediately and 40% deferred over 3 years.
Sixth cycle (2016):
•60% of bonus will be paid immediately and 40% deferred over a three years period.
Seventh, eighth, ninth, tenth and eleventh cycle (2017, 2018, 2019, 2020 and 2021):
•Beneficiaries of these plans with target total variable remuneration higher or equal to 2.7 million euros: 40% paid immediately and 60% deferred over 5 years
•Beneficiaries of these plans with target total variable remuneration between 1.7 million euros and 2.7 million euros: 50% paid immediately and 50%paid over 5 years
•Other beneficiaries of these plans: 60% paid immediately and 40% deferred over 3 years.
Twelfth (2022) and thirteenth (2023) cycle:
•Beneficiaries of these plans with target total variable remuneration higher or equal to 2.7 million euros: 40% paid immediately and 60% deferred over 5 years
•Beneficiaries of these plans with target total variable remuneration between 1.7 million euros and 2.7 million euros: 50% paid immediately and 50% paid over 5 years
•Other beneficiaries of these plans: 60% paid immediately and 40% deferred over 4 years .
T
|
||||||||
Deferred variable remuneration systems |
Description and plan beneficiaries |
Conditions |
Calculation Base |
||||||||
| (ii)Deferred Multiyear Objectives Variable Remuneration Plan (2016, 2017, 2018, 2019, 2020, 2021, 2022 and 2023) |
The aim is simplifying the remuneration structure, improving the ex ante risk adjustment and increasing the impact of the long-term objectives on the Group’s most relevant roles. The purpose of these cycles is to defer a portion of the variable remuneration of the beneficiaries over a period of three or five years (four or five years for the seventh cycle) for it to be paid, where appropriate, in cash and in Santander shares; the other portion of the variable remuneration is also to be paid in cash and Santander shares (regarding the instruments part, executive directors in the seventh cycle have the opportunity to choose all in share options or half in share options and half in shares), upon commencement of the cycles, in accordance with the rules set forth below. The accrual of the last third of the deferral (in the case of 3 years deferral), the last 2 fourths (in the case of 4 years deferral) and the last three fifths (in the case of 5 years deferral) is also subject to long-term objectives.
Beneficiaries
Executive directors, senior management and certain executives of the Group’s first lines of responsibility.
|
In 2016 the accrual is conditioned, in addition to the permanence of the beneficiary in the Group, with the exceptions contained in the plan’s regulations, to non-occurrence of the following circumstances during the period prior to each of the deliveries in the terms set forth in each case in the plan’s regulations:
i.Poor performance of the Group.
ii.Breach by the beneficiary of the internal regulations, including in particular that relating to risks.
iii.Material restatement of the Group’s consolidated financial statements, except when appropriate under a change in accounting regulations.
iv.Significant changes in the Group’s economic capital or risk profile.
In 2017, 2018, 2019, 2020 and 2021 the accrual is conditioned, in addition to the beneficiary' permanence in the Group, with the exceptions contained in the plan’s regulations, to the non-occurrence of poor financial performance from the entity as a whole or of a specific division or area thereof or of the exposures generated by the personnel, taking into account the following factors:
v.Significant failures in risk management committed by the entity, or by a business unit or risk control unit.
vi.the increase suffered by the entity or by a business unit of its capital needs, not foreseen at the time of generation of the exposures.
vii.Regulatory sanctions or court rulings for events that could be attributable to the unit or the personnel responsible for those. Also, the breach of internal codes of conduct of the entity.
viii.Irregular behaviours, whether individual or collective, considering in particular negative effects derived from the marketing of inappropriate products and responsibilities of persons or bodies that made those decisions.
Paid half in cash and half in shares. In the seventh cycle, and only for executive directors: half in cash and 25% in share options and 25% in shares (unless the director chooses to receive options only). The maximum number of shares to be delivered is calculated by taking into account the weighted average daily volume of weighted average prices for the fifteen trading sessions prior to the previous Friday (excluding) on the date on which the board decides the bonus for the Executive directors of the Bank.
In the eighth cycle, and for all Identified Staff: half in cash and 25% in shares and 25% in share options, or half in cash and half in shares, according to each executive´s choice.
|
First cycle (2016):
•Executive directors and members of the Identified Staff with total variable remuneration higher than or equal to 2.7 million euros: 40% paid immediately and 60% deferred over a 5 years period.
•Senior managers, country heads of countries representing at least 1% of the Group´s capital and other members of the identified staff whose total variable remuneration is between 1.7 million and 2.7 million euros: 50% paid immediately and 50% deferred over a 5 years period.
•Other beneficiaries: 60% paid immediately and 40% deferred over a 3 years period.
The second, third, fourth, fifth and sixth cycles (2017, 2018, 2019,2020 and 2021 respectively) are under the aforementioned deferral rules, except that the variable remuneration considered is the target for each executive and not the actual award.
In 2016 the metrics for the deferred portion subject to long-term objectives (last third or last three fifths, respectively, for the cases of three years and five years deferrals) are:
•Earnings per share (EPS) growth in 2018 over 2015.
•Relative Total Shareholder Return (TSR) in the 2016-2018 period measured against a group of credit institutions.
•Compliance with the fully-loaded common equity tier 1 (“CET1”) ratio target for financial year 2018.
•Compliance with Grupo Santander’s underlying return on risk-weighted assets (“RoRWA”) growth target for financial year 2018 compared to financial year 2015.
In the second, third, fourth, fifth and sixth cycle (2017, 2018, 2019, 2020 and 2021) the metrics for the deferred portion subject to long-term objectives (last third or last three fifths, respectively, for the cases of three years and five years deferrals) are:
•EPS growth in 2019, 2020, 2021, 2022 and 2023 (over 2016, 2017, 2018, 2019 and 2020, for each respective cycle)
•Relative Total Shareholder Return (TSR) measured against a group of 17 credit institutions (second and third cycles) in the periods 2017-2019 and 2018-2019, respectively, and against a group of 9 entities (fourth, fifth and sixth cycle) for the 2019-2021, 2020-2022 and 2010-2023 period.
•Compliance with the fully-loaded common equity tier 1 (“CET1”) ratio target for financial years 2019, 2020, 2021,2022 and 2023, respectively.
In the seventh (2022) and eighth cycle (2023), the metrics for the deferred portion subject to long-term objectives (two last fourths and last three fifths, for the cases of four years and five years deferrals) are:
•Banco Santander's consolidated Return on tangible equity (RoTE) target in 2024 (7th cycle) and 2025 (8th cycle).
•Relative Total Shareholder Return (TSR) measured against a group of 9 credit institutions for the period 2022-2024 (7th cycle) and 2023-2025 (8th cycle).
•Five ESG metrics linked to our public targets of our Responsible Banking agenda.
|
||||||||
Deferred variable remuneration systems |
Description and plan beneficiaries |
Conditions |
Calculation Base |
||||||||
| (iii) Digital Transformation Award (2019, 2020 and 2021) |
The 2019, 2020 and 2021 Digital Transformation Incentive (the “Digital Incentive”) is a variable remuneration system that includes the delivery of Santander shares and share options.
The aim of the Digital Incentive is to attract and retain the critical skill sets to support and accelerate the digital transformation of the Group. By means of this program, the Group offers a remuneration element which is competitive with the remuneration systems offered by other market operators who also compete for digital talent.
The number of beneficiaries is limited to a maximum of 250 employees and the total amount of the incentive is limited to 30 million euros.
|
The funding of this incentive is subject to meeting important milestones that are aligned with the Group´s digital roadmap and have been approved by the board of directors, taking into account the digitalization strategy of the Group, with the aim of becoming the best open, responsible global financial services platform.
Performance of 2019 incentive was measured based on achievement of the following milestones: (i) Launch of a Global Trade Services (GTS) platform; (ii) launch of a Global Merchant Services (GMS) platform; (iii) migration of our fully digital bank, OpenBank, to a "next generation" platform and launch in 3 markets; (iv) extension of SuperDigital in Brazil to at least one other country; (v) and launch of our international payments app based on blockchain Pago FX to non-Santander customers.
The milestones for the 2020 Digital Transformation Award were: (i) rolling out the global merchant services (GMS) platform in 3 new geographies, enhancing the platform functionality and achieving volume targets for transactions and participating merchants; (ii) doing the commercial rollout of the global trade services (GTS) platform in 8 new geographies, enhancing platform functionality, and achieving volume targets for on-boarded clients and monthly active users; (iii) launching OpenBank in a new market and migrating the retail banking infrastructure to “new-mode” bank; (iv) launch the global platform SuperDigital in at least 4 countries, driving target active user growth; (v) deploying machine learning across pre-defined markets for 4 priority use cases, rolling out Conversion Rate Optimization (Digital marketing) for at least 40 sales programs, delivering profit targets, and driving reduction of agent handled calls in contact centers; (vi) successfully implementing initiatives related to on-board and identity services, common API (application programming interface) layer, payment hubs, mobile app for SMEs and virtual assistant services; and (vii) launching the PagoFX global platform in at least 4 countries.
The milestones for 2021 were: (i)in relation to Pago Nxt Consumer payment platform: implementation of Superdigital platform in seven countries, acquisition of over 1.5 million active customer base and accelerating growth through B2B (business to business) and B2B2C (business to business to customer) partnerships, acquiring more than 50% of the new customers through these channels, which are more cost-effective; (ii)in relation to Digital Consumer Bank: launching online API for checkout lending in the European Union and completion of controllable items for Openbank launch in USA; (iii)in relation to One Santander strategy: implementation in Europe of One Common Mobile Experience and, specifically, implementation of Europe ONE app for individual customers in at least three of the four countries by December 2021; and be among the three-top rated entities in terms of Mobile NetPromoter Score (Mobile NPS) in at least two of the four countries by December 2021; (iv) In relation to cloud adoption: host 75% of migratable virtual machines on cloud technology (either public cloud or OHE) by December 2021. For these purposes, mainframes, physical servers and servers with non-x86 operating systems will be considered non-migratable.
|
The Digital Incentive is structured 50% in Santander shares and 50% in options over Santander shares, taking into account the fair value of the option at the moment in which they are granted. For Material Risk Takers subject to five years deferrals, the Digital Incentive (shares and options over shares) shall be delivered in thirds, on the third, fourth and fifth anniversary from their granting. For Material Risk Takers subject to three years deferrals and employees not subject to deferrals, delivery shall be done on the third anniversary from their granting.
Any delivery of shares, either directly or via exercise of options overs shares, will be subject generally to the Group’s general malus & clawback provisions as described in the Group’s remuneration policy and to the continuity of the beneficiary within the Grupo Santander. In this regard, the board may define specific rules for non-Identified Staff.
Vested share options can be exercised until maturity, with all options lapsing after ten years (for granting the 2019 incentive) and eight years (for granting the 2020 and 2021 incentive).
The total achievement for 2021 Digital Incentive was 77.5% (85% en 2020 and 83% en 2019).
|
||||||||
| Deferred variable remuneration systems | Description and plan beneficiaries |
Conditions | Calculation base | ||||||||
| (iv) Digital Transformation Award (2022) |
The board of directors approved the 2022 Digital
Transformation Incentive. It is a variable remuneration scheme
splits in two different blocks:
• The first one, with the same mechanism than previous years,
that delivers Santander shares and share options if the group hits major milestones on its digital roadmap. This is aimed at a group of up to 250 (is limited to 30 million euros)employees whose functions are deemed essential to Santander’s growth.
• And the second one, which delivers PagoNxt, S.L. RSUs and premium prices options (PPOs), and is aimed at up to 50
employees (and limited to 15 million euros) whose roles are considered key to PagoNxt’s success.
The aim of the Digital Incentive is to attract and retain the critical skill sets to support and accelerate the digital transformation of the Group. By means of this program, the Group offers a remuneration element which is competitive with the remuneration systems offered by other market operators who also compete for digital talent.
|
Performance of the first block of the incentive shall be measured based on achievement of the following milestones:
i. Edelweiss: Our Santander future retail architecture EDELWEISS will mean moving from our current Core centric banking architecture towards a Customer and Data-Centric Core supported by lean Record Processing engines.
ii. Simplification: Speed up the simplification of our technology platform and business model by Reducing the total number of applications in production and reducing number of products in the regions.
iii. Agile: Agile ways of working enable a better and faster reaction to customers’ needs and is based on a value-driven delivery that increases efficiency by reducing time-to-market and development costs, and increasing quality. People working in Agile are more collaborative, engaged, empowered and creative.
iv. In Digital Consumer Bank:
a) To create the BNPL platform connected to at least one merchant in Netherlands and Germany, and to make sure the platform is ready to connect in Spain.
b) To support the definition of Openbank US’s IT digital strategy and achieve 2022 milestones in it.
c) To have the new leasing platform connected to dealers in Italy.
d) To expand the Wabi B2B online business to Germany. To execute the first B2B deal with an Original Equipment Manufacturer or mobility player in at least one country. To expand coches.com business and platform to Portugal.
And in regard to the second block of digital incentive: the consolidation of PagoNxt Core Perimeter.
|
The first block of thee Digital Incentive is structured 50% in Santander shares and 50% in options over Santander shares, taking into account the fair value of the option at the moment in which they are granted. For Material Risk Takers subject to five years deferrals, the Digital Incentive (shares and options over shares) shall be delivered in thirds, on the third, fourth and fifth anniversary from their granting. For Material Risk Takers subject to three years deferrals and employees not subject to deferrals, delivery shall be done on the third anniversary from their granting.
Any delivery of shares, either directly or via exercise of options overs shares, will be subject generally to the Group’s general malus & clawback provisions as described in the Group’s remuneration policy and to the continuity of the beneficiary within the Grupo Santander. In this regard, the board may define specific rules for non-Identified Staff.
Vested share options can be exercised until maturity, with all options lapsing after ten years.
The total achievement for 2022 Digital Incentive was 96.5%.
The second block of Digital Incentive is structures in restricted stock units (RSUs) and premium priced Options (PPOs) of PagoNxt S.L. in a percentage determined by the internal category of the beneficiary. The total achievement for 2022 was 100%.
|
||||||||
| (iv) Digital Transformation Award (2023) |
The board of directors approved the 2022 Digital
Transformation Incentive. It is a variable remuneration scheme which delivers PagoNxt, S.L. RSUs and premium prices options (PPOs), and is aimed at up to 50
employees (and limited to 15 million euros) whose roles are considered key to PagoNxt’s success.
With this program, the Group offers a remuneration element which is competitive with the remuneration systems offered by other market operators who also compete for digital talent.
|
And the performance conditions were focus on key digital projects related with PagoNxt's main businesses (Trade, Merchant and Payments) in its core geographies. |
This incentive is structures in restricted stock units (RSUs) and premium priced Options (PPOs) of PagoNxt S.L. in a percentage determined by the internal category of the beneficiary. The average achievement for 2023 was 88%. |
||||||||
| Number of shares (in thousand) | Exercise price in pounds sterlingA |
Year granted | Employee group | Number of personsB |
Date of commencement of exercise period | Date of expiry of exercise period | |||||||||||||||||
| Plans outstanding at 01/01/2021 | 21,162 | ||||||||||||||||||||||
| Options granted (sharesave) | 9,414 | 2.43 | 2021 | Employees | 4,142 | 01/11/21 | 01/11/24 | ||||||||||||||||
| 01/11/21 | 01/11/26 | ||||||||||||||||||||||
| Options exercised | (48) | 1.86 | |||||||||||||||||||||
| Options cancelled (net) or not exercised | (4,592) | 2.95 | |||||||||||||||||||||
| Plans outstanding at 31/12/2021 | 25,936 | ||||||||||||||||||||||
| Options granted (sharesave) | 13,068 | 1.89 | 2022 | Employees | 4,362 | 01/11/22 | 01/11/25 | ||||||||||||||||
| 01/11/22 | 01/11/27 | ||||||||||||||||||||||
| Options exercised | (242) | 1.69 | |||||||||||||||||||||
| Options cancelled (net) or not exercised | (8,774) | 2.59 | |||||||||||||||||||||
| Plans outstanding at 31/12/2022 | 29,988 | ||||||||||||||||||||||
| Options granted (sharesave) | 7,175 | 2.78 | 2023 | Employees | 4,752 | 01/11/23 | 01/11/26 | ||||||||||||||||
| 01/11/23 | 01/11/28 | ||||||||||||||||||||||
| Options exercised | (5,980) | 1.7 | |||||||||||||||||||||
| Options cancelled (net) or not exercised | (4,044) | 2.53 | |||||||||||||||||||||
| Plans outstanding at 31/12/2023 | 27,139 | ||||||||||||||||||||||
| EUR million | |||||||||||
| 2023 | 2022 | 2021 | |||||||||
| Technology and systems | 2,471 | 2,473 | 2,182 | ||||||||
| Property, fixtures and supplies (note 2.k) |
818 | 804 | 789 | ||||||||
| Technical reports | 809 | 785 | 689 | ||||||||
| Advertising | 603 | 559 | 510 | ||||||||
| Taxes other than income tax | 570 | 559 | 558 | ||||||||
| Communications | 414 | 410 | 401 | ||||||||
| Surveillance and cash courier services | 337 | 336 | 306 | ||||||||
| Per diems and travel expenses | 218 | 163 | 69 | ||||||||
| Insurance premiums | 95 | 108 | 109 | ||||||||
| Other administrative expenses | 2,180 | 2,174 | 1,830 | ||||||||
| 8,515 | 8,371 | 7,443 | |||||||||
| EUR million | |||||||||||
| 2023 | 2022 | 2021 | |||||||||
| Audit | 116.8 | 115.4 | 106.0 | ||||||||
| Audit-related services | 8.6 | 6.4 | 6.0 | ||||||||
| Tax services | 1.6 | 0.5 | 0.7 | ||||||||
| All other | 5.9 | 4.8 | 2.4 | ||||||||
| Total | 132.9 | 127.1 | 115.1 | ||||||||
| Number of branches | |||||||||||
| Group | |||||||||||
| 2023 | 2022 | 2021 | |||||||||
| Spain | 1,924 | 1,966 | 1,998 | ||||||||
| Group | 6,594 | 7,053 | 7,231 | ||||||||
| 8,518 | 9,019 | 9,229 | |||||||||
| EUR million | |||||||||||
| 2023 | 2022 | 2021 | |||||||||
| Gains | |||||||||||
| Tangible and intangible assets | 53 | 56 | 87 | ||||||||
| Investments | 285 | 5 | 2 | ||||||||
| 338 | 61 | 89 | |||||||||
| Losses | |||||||||||
| Tangible and intangible assets | (25) | (49) | (36) | ||||||||
| Investments | — | — | — | ||||||||
| (25) | (49) | (36) | |||||||||
| 313 | 12 | 53 | |||||||||
| EUR million | |||||||||||
| Net balance | 2023 | 2022 | 2021 | ||||||||
| Tangible assets | (20) | 7 | (52) | ||||||||
| Impairment (note 12) | (51) | (94) | (141) | ||||||||
| Gain (loss) on sale (note 12) | 31 | 101 | 89 | ||||||||
| Other gains and other losses | — | — | 9 | ||||||||
| (20) | 7 | (43) | |||||||||
| EUR million | |||||||||||||||||||||||||||||
| 2023 | 2022 | 2021 | |||||||||||||||||||||||||||
| Published price quotations in active markets (level 1) |
Internal Models (level 2 and 3) |
Total | Published price quotations in active markets (level 1) |
Internal Models (level 2 and 3) |
Total | Published price quotations in active markets (level 1) |
Internal Models (level 2 and 3) |
Total | |||||||||||||||||||||
| Financial assets held for trading | 67,842 | 109,079 | 176,921 | 45,014 | 111,104 | 156,118 | 39,678 | 77,275 | 116,953 | ||||||||||||||||||||
| Non-trading financial assets mandatorily at fair value through profit or loss | 1,765 | 4,145 | 5,910 | 1,800 | 3,913 | 5,713 | 2,398 | 3,138 | 5,536 | ||||||||||||||||||||
| Financial assets designated at fair value through profit or loss | 2,746 | 7,027 | 9,773 | 1,976 | 7,013 | 8,989 | 2,113 | 13,844 | 15,957 | ||||||||||||||||||||
| Financial assets at fair value through other comprehensive income | 64,631 | 18,677 | 83,308 | 64,216 | 21,023 | 85,239 | 77,749 | 30,289 | 108,038 | ||||||||||||||||||||
| Hedging derivatives (assets) | — | 5,297 | 5,297 | — | 8,069 | 8,069 | — | 4,761 | 4,761 | ||||||||||||||||||||
| Financial liabilities held for trading | 20,298 | 101,972 | 122,270 | 16,237 | 98,948 | 115,185 | 10,379 | 69,090 | 79,469 | ||||||||||||||||||||
Financial liabilities designated at fair value through profit or lossA |
25 | 40,342 | 40,367 | 212 | 40,056 | 40,268 | 3,620 | 11,323 | 14,943 | ||||||||||||||||||||
| Hedging derivatives (liabilities) | — | 7,656 | 7,656 | — | 9,228 | 9,228 | — | 5,463 | 5,463 | ||||||||||||||||||||
Liabilities under insurance contractsA |
— | 17,799 | 17,799 | — | 16,426 | 16,426 | — | 18,560 | 18,560 | ||||||||||||||||||||
| EUR million | |||||||||||||||||
| Fair values calculated using internal models at |
|||||||||||||||||
2023A |
|||||||||||||||||
| Level 2 | Level 3 | Valuation techniques | Main assumptions | ||||||||||||||
| ASSETS | 133,874 | 10,351 | |||||||||||||||
| Financial assets held for trading | 106,993 | 2,086 | |||||||||||||||
Central banksB |
17,717 | — | Present value method | Yield curves, FX market prices | |||||||||||||
Credit institutionsB |
14,061 | — | Present value method | Yield curves, FX market prices | |||||||||||||
CustomersB |
11,418 | 24 | Present value method | Yield curves, FX market prices | |||||||||||||
| Debt and equity instruments | 8,683 | 915 | Present value method | Yield curves, FX market prices | |||||||||||||
| Derivatives | 55,114 | 1,147 | |||||||||||||||
| Swaps | 44,987 | 577 | Present value method, Gaussian CopulaC |
Yield curves, FX market prices, HPI, Basis, Liquidity | |||||||||||||
| Exchange rate options | 836 | 9 | Black-Scholes Model | Yield curves, Volatility surfaces, FX market prices, Liquidity | |||||||||||||
| Interest rate options | 2,210 | 153 | Black's Model, multifactorial advanced models interest rate | Yield curves, Volatility surfaces, FX market prices, Liquidity | |||||||||||||
| Interest rate futures | 33 | — | Present value method | Yield curves, FX market prices | |||||||||||||
| Index and securities options | 126 | 235 | Black's Model, multifactorial advanced models interest rate | Yield curves, Volatility surfaces, FX & EQ market prices, Dividends, Liquidity | |||||||||||||
| Other | 6,922 | 173 | Present value method, Advanced stochastic volatility models and other | Yield curves, Volatility surfaces, FX and EQ market prices, Dividends, Correlation, HPI, Credit, Others | |||||||||||||
| Hedging derivatives | 5,297 | — | |||||||||||||||
| Swaps | 4,665 | — | Present value method | Yield curves, FX market prices, Basis | |||||||||||||
| Interest rate options | 2 | — | Black's Model | Yield curves, FX market prices, Volatility surfaces | |||||||||||||
| Other | 630 | — | Present value method, Advanced stochastic volatility models and other | Yield curves, Volatility surfaces, FX market prices, Credit, Liquidity, Others | |||||||||||||
| Non-trading financial assets mandatorily at fair value through profit or loss | 2,050 | 2,095 | |||||||||||||||
| Equity instruments | 815 | 1,495 | Present value method | Market price, Interest rates curves, Dividends and Others | |||||||||||||
| Debt securities | 539 | 313 | Present value method | Yield curves | |||||||||||||
| Loans and receivables | 696 | 287 | Present value method, swap asset model & CDS | Yield curves and Credit curves | |||||||||||||
| Financial assets designated at fair value through profit or loss | 6,846 | 181 | |||||||||||||||
| Credit institutions | 459 | — | Present value method | Yield curves, FX market prices | |||||||||||||
CustomersC |
6,189 | 31 | Present value method | Yield curves, FX market prices, HPI | |||||||||||||
| Debt securities | 198 | 150 | Present value method | Yield curves, FX market prices | |||||||||||||
| Financial assets at fair value through other comprehensive income | 12,688 | 5,989 | |||||||||||||||
| Equity instruments | 5 | 492 | Present value method | Market price, Yield curves, Dividends and Others | |||||||||||||
| Debt securities | 9,638 | 559 | Present value method | Yield curves, FX market prices | |||||||||||||
| Loans and receivables | 3,045 | 4,938 | Present value method | Yield curves, FX market prices and Credit curves | |||||||||||||
| EUR million | |||||||||||||||||
| Fair values calculated using internal models at |
|||||||||||||||||
2023A |
|||||||||||||||||
| Level 2 | Level 3 | Valuation techniques | Main assumptions | ||||||||||||||
| LIABILITIES | 166,542 | 1,227 | |||||||||||||||
| Financial liabilities held for trading | 101,103 | 869 | |||||||||||||||
Central banksB |
7,808 | — | Present value method | FX market prices, Yield curves | |||||||||||||
Credit institutionsB |
17,862 | — | Present value method | FX market prices, Yield curves | |||||||||||||
| Customers | 19,837 | — | Present value method | FX market prices, Yield curves | |||||||||||||
| Derivatives | 49,380 | 869 | |||||||||||||||
| Swaps | 39,395 | 388 | Present value method, Gaussian CopulaC |
Yield curves, FX market prices, Basis, Liquidity, HPI | |||||||||||||
| Interest rate options | 2,207 | 139 | Black's Model, multifactorial advanced models interest rate | Yield curves, Volatility surfaces, FX market prices, Liquidity | |||||||||||||
| Exchange rate options | 549 | 8 | Black-Scholes Model | Yield curves, Volatility surfaces, FX market prices, Liquidity | |||||||||||||
| Index and securities options | 466 | 187 | Black-Scholes model | Yield curves, FX market prices | |||||||||||||
| Futures on interest rate and variable income | 101 | — | Present value method | Yield curves, Volatility surfaces, FX & EQ market prices, Dividends, Correlation, Liquidity, HPI | |||||||||||||
| Other | 6,662 | 147 | Present value method, Advanced stochastic volatility models | Yield curves, Volatility surfaces, FX & EQ market prices, Dividends, Correlation, Liquidity, HPI, Credit, Others | |||||||||||||
| Short positions | 6,216 | — | Present value method | Yield curves ,FX & EQ market prices, Equity | |||||||||||||
| Hedging derivatives | 7,650 | 6 | |||||||||||||||
| Swaps | 6,866 | 6 | Present value method | Yield curves ,FX & EQ market prices, Basis | |||||||||||||
| Interest rate options | 1 | — | Black's Model | Yield curves , Volatility surfaces, FX market prices and Liquidity | |||||||||||||
| Other | 783 | — | Present value method, Advanced stochastic volatility models and other | Yield curves , Volatility surfaces, FX market prices, Credit, Liquidity, Other | |||||||||||||
| Financial liabilities designated at fair value through profit or loss | 40,313 | 29 | Present value method | Yield curves, FX market prices | |||||||||||||
Liabilities under insurance contractsD |
17,476 | 323 | Present Value Method with actuarial techniques | Mortality tables and interest rate curves | |||||||||||||
| EUR million | |||||||||||||||||||||||
| Fair values calculated using internal models at |
Fair values calculated using internal models at |
||||||||||||||||||||||
2022A |
2021A |
||||||||||||||||||||||
| Level 2 | Level 3 | Level 2 | Level 3 | Valuation techniques | |||||||||||||||||||
| ASSETS | 142,832 | 8,290 | 121,640 | 7,667 | |||||||||||||||||||
| Financial assets held for trading | 110,721 | 383 | 76,738 | 537 | |||||||||||||||||||
Central banksB |
11,595 | — | 3,608 | — | Present value method | ||||||||||||||||||
Credit institutionsB |
16,502 | — | 10,397 | — | Present Value method | ||||||||||||||||||
CustomersB |
9,550 | — | 6,829 | — | Present Value method | ||||||||||||||||||
| Debt and equity instruments | 6,537 | 43 | 2,312 | 24 | Present Value method | ||||||||||||||||||
| Derivatives | 66,537 | 340 | 53,592 | 513 | |||||||||||||||||||
| Swaps | 54,367 | 139 | 43,700 | 224 | Present Value method, Gaussian Copula | ||||||||||||||||||
| Exchange rate options | 916 | 4 | 539 | 12 | Black-Scholes Model | ||||||||||||||||||
| Interest rate options | 2,681 | 39 | 2,112 | 182 | Black's Model, advanced multifactor interest rate models | ||||||||||||||||||
| Interest rate futures | 113 | — | 409 | — | Present Value method | ||||||||||||||||||
| Index and securities options | 354 | 48 | 439 | 41 | Black's Model, advanced multifactor interest rate models | ||||||||||||||||||
| Other | 8,106 | 110 | 6,393 | 54 | Present Value method, Advanced stochastic volatility models and other | ||||||||||||||||||
| Hedging derivatives | 8,069 | — | 4,761 | — | |||||||||||||||||||
| Swaps | 6,687 | — | 4,204 | — | Present Value method | ||||||||||||||||||
| Interest rate options | 2 | — | 9 | — | Black’s Model | ||||||||||||||||||
| Other | 1,380 | — | 548 | — | Present Value method, Advanced stochastic volatility models and other | ||||||||||||||||||
| Non-trading financial assets mandatorily at fair value through profit or loss | 2,080 | 1,833 | 1,273 | 1,865 | |||||||||||||||||||
| Equity instruments | 643 | 1,269 | 415 | 1,231 | Present Value method | ||||||||||||||||||
| Debt securities issued | 809 | 325 | 589 | 366 | Present Value method | ||||||||||||||||||
| Loans and receivables | 628 | 239 | 269 | 268 | Present Value method, swap asset model & CDS | ||||||||||||||||||
| Financial assets designated at fair value through profit or loss | 6,586 | 427 | 13,426 | 418 | |||||||||||||||||||
| Credit institutions | 673 | — | 3,152 | — | Present Value method | ||||||||||||||||||
CustomersC |
5,769 | 5 | 10,270 | 18 | Present Value method | ||||||||||||||||||
| Debt securities | 144 | 422 | 4 | 400 | Present Value method | ||||||||||||||||||
| Financial assets at fair value through other comprehensive income | 15,376 | 5,647 | 25,442 | 4,847 | |||||||||||||||||||
| Equity instruments | 9 | 700 | 74 | 821 | Present Value method | ||||||||||||||||||
| Debt securities | 11,869 | 229 | 21,585 | 146 | Present Value method | ||||||||||||||||||
| Loans and receivables | 3,498 | 4,718 | 3,783 | 3,880 | Present Value method | ||||||||||||||||||
| EUR million | |||||||||||||||||||||||
| Fair values calculated using internal models at |
Fair values calculated using internal models at |
||||||||||||||||||||||
2022A |
2021A |
||||||||||||||||||||||
| Level 2 | Level 3 | Level 2 | Level 3 | Valuation techniques | |||||||||||||||||||
| LIABILITIES | 163,733 | 925 | 103,807 | 629 | |||||||||||||||||||
| Financial liabilities held for trading | 98,533 | 415 | 68,930 | 160 | |||||||||||||||||||
Central banksB |
5,759 | — | 1,038 | — | Present Value method | ||||||||||||||||||
Credit institutionsB |
9,796 | — | 6,488 | — | Present Value method | ||||||||||||||||||
| Customers | 12,226 | — | 6,141 | — | Present Value method | ||||||||||||||||||
| Derivatives | 64,147 | 415 | 53,234 | 160 | |||||||||||||||||||
| Swaps | 51,191 | 235 | 42,438 | 44 | Present Value method, Gaussian Copula | ||||||||||||||||||
| Interest rate options | 3,268 | 19 | 2,720 | 26 | Black's Model, advanced multifactor interest rate models | ||||||||||||||||||
| Exchange rate options | 769 | — | 658 | 7 | Black-Scholes Model | ||||||||||||||||||
| Index and securities options | 591 | 42 | 446 | 67 | Black's Model, advanced multifactor interest rate models | ||||||||||||||||||
| Interest rate and equity futures | 807 | — | 184 | — | Present Value method | ||||||||||||||||||
| Other | 7,521 | 119 | 6,788 | 16 | Present Value method, Advanced stochastic volatility models and other | ||||||||||||||||||
| Short positions | 6,605 | — | 2,029 | — | Present Value method | ||||||||||||||||||
| Hedging derivatives | 9,214 | 14 | 5,463 | — | |||||||||||||||||||
| Swaps | 8,142 | 14 | 4,149 | — | Present Value method | ||||||||||||||||||
| Other | 1,072 | — | 1,314 | — | Present Value method, Advanced stochastic volatility models and other | ||||||||||||||||||
Financial liabilities designated at fair value through profit or lossD |
39,905 | 151 | 11,172 | 151 | Present Value method | ||||||||||||||||||
| Liabilities under insurance contracts | 16,081 | 345 | 18,242 | 318 | Present Value method with actuarial techniques | ||||||||||||||||||
| 2023 | |||||||||||||||||||||||
| Portfolio/Instrument | Valuation technique | Main unobservable inputs |
Range | Weighted average | Impacts (EUR million) | ||||||||||||||||||
| (Level 3) | Unfavourable scenario | Favourable scenario | |||||||||||||||||||||
| Financial assets held for trading | |||||||||||||||||||||||
| Loans and advances to customers | |||||||||||||||||||||||
| Repos/Reverse repos | Other | Long-term repo spread | n.a. | n.a. | (0.08) | — | |||||||||||||||||
| Debt securities | |||||||||||||||||||||||
| Corporate debt | Discounted Cash Flows | Credit spread | 0% - 10% |
5.01 | % | (1.90) | 1.90 | ||||||||||||||||
| Government debt | Discounted Cash Flows | Discount curve | 0% - 8% |
3.99 | % | (7.77) | 7.72 | ||||||||||||||||
| Derivatives | |||||||||||||||||||||||
| CCS | Forward estimation | Interest rate | (6)bps - 6bps |
0.40 | bps | (0.90) | 1.03 | ||||||||||||||||
| CDS | Credit default models | Illiquid credit default spread curves | 100bps - 200bps |
149.14 | bps | (0.14) | 0.14 | ||||||||||||||||
| EQ Options | EQ option pricing model | Volatility | 0% - 70% |
44.39 | % | (0.51) | 0.89 | ||||||||||||||||
| EQ Options | Local volatility | Volatility | 10% - 90% |
50.00 | % | (1.26) | 1.26 | ||||||||||||||||
| FX Options | FX option pricing model | Volatility | 0% - 40% |
20.81 | % | (0.55) | 0.59 | ||||||||||||||||
| Inflation Derivatives | Asset Swap model | Inflation Swap Rate | 2% - 8% |
4.18 | % | (0.28) | 0.16 | ||||||||||||||||
| IR Options | IR option pricing model | Volatility | 0.4% - 32.2% |
18.86 | % | (0.29) | 0.41 | ||||||||||||||||
| IRS | Others | Others | 5% - n.a. |
n.a. | (1.25) | — | |||||||||||||||||
| IRS | Discounted Cash Flows | Credit spread | 2.6% - 8.3% |
5.60 | % | (1.97) | 2.18 | ||||||||||||||||
| IRS | Discounted Cash Flows | Swap rate | 9.4% - 9.8% |
9.60 | % | (1.01) | 0.95 | ||||||||||||||||
| IRS | Forward estimation | Interest rate | (5.2)bps - 5.2bps |
0.09 | bps | (0.03) | 0.03 | ||||||||||||||||
| IRS | Prepayment modelling | Prepayment rate | 2.5% - 9.0% |
8.92 | % | — | 0.05 | ||||||||||||||||
| Property derivatives | Option pricing model | Growth rate | (5)% - 5% |
0.00 | % | (3.92) | 3.92 | ||||||||||||||||
| Securitisation Swap | Discounted Cash Flows | Constant prepayment rates | (22.30)% - 27.20% |
2.47 | % | (4.95) | 4.95 | ||||||||||||||||
| Structured notes | Price based | Price | (10)% - 10% |
0.00 | % | (1.53) | 1.53 | ||||||||||||||||
| Financial assets designated at fair value through profit or loss | |||||||||||||||||||||||
| Loans and advances to customers | |||||||||||||||||||||||
| Loans | Discounted Cash Flows | Credit spreads | 0.1% - 3% |
1.55 | % | (0.21) | 0.21 | ||||||||||||||||
| Mortgage portfolio | Black Scholes model | Growth rate | (5)%- 5% |
0.00 | % | (0.23) | 0.23 | ||||||||||||||||
| Debt securities | |||||||||||||||||||||||
| Other debt securities | Others | Inflation Swap Rate | 0% - 8% |
3.89 | % | (4.48) | 4.25 | ||||||||||||||||
| 2023 | ||||||||||||||||||||
| Portfolio/Instrument | Valuation technique | Main unobservable inputs |
Range | Weighted average | Impacts (EUR million) | |||||||||||||||
| (Level 3) | Unfavourable scenario | Favourable scenario | ||||||||||||||||||
| Non-trading financial assets mandatorily at fair value through profit or loss | ||||||||||||||||||||
| Debt securities | ||||||||||||||||||||
| Property securities | Probability weighting | Growth rate | (5)% - 5% |
0.00 | % | (0.35) | 0.35 | |||||||||||||
| Equity instruments | ||||||||||||||||||||
| Equities | Price Based | Price | 90% - 110% |
100.00 | % | (149.49) | 149.49 | |||||||||||||
| Financial assets at fair value through other comprehensive income | ||||||||||||||||||||
| Loans and advances to customers | ||||||||||||||||||||
| Loans | Discounted Cash Flows | Credit spread | n.a. |
n.a. | (20.8) | — | ||||||||||||||
| Loans | Discounted Cash Flows | Interest rate curve | 4.6% - 9.0% |
6.80 | % | (0.68) | 0.68 | |||||||||||||
| Loans | Discounted Cash Flows | Margin of a reference portfolio | (1)bp - 1bp |
0bp |
(20.3) | 20.30 | ||||||||||||||
| Loans | Forward estimation | Credit spread | 167.7bps - 365.8bps |
167.74 | bps | (3.46) | — | |||||||||||||
| Loans | Market price | Market price | (10)% - 20% |
0.00 | % | (5.02) | 2.51 | |||||||||||||
| Debt securities | ||||||||||||||||||||
| Corporate debt | Discounted Cash Flows | Margin of a reference portfolio | (1)% - 1% |
0.00 | % | (0.09) | 0.09 | |||||||||||||
| Government debt | Discounted Cash Flows | Interest rate | 0% - 2% |
0.99 | % | — | — | |||||||||||||
| Equity instruments | ||||||||||||||||||||
| Equities | Price Based | Price | 90% - 110% |
100.00 | % | (49.24) | 49.24 | |||||||||||||
| Financial liabilities held for trading | ||||||||||||||||||||
| Derivatives | ||||||||||||||||||||
| Cap&Floor | Volatility option model | Volatility | 10% - 90% |
39.03 | % | (0.45) | 0.25 | |||||||||||||
| CMS | Discounted Cash Flows | Volatility | 10% - 90% |
47.66 | % | — | — | |||||||||||||
| FX Options | Volatility option model | Volatility | 10% - 90% |
28.09 | % | (0.45) | 0.13 | |||||||||||||
| IRS | Discounted Cash Flows | Inflation Swap Rate | 10% - 90% |
39.03 | % | (0.45) | 0.25 | |||||||||||||
| Swaptions | Volatility option model | Volatility | 10% - 90% |
35.55 | % | (0.21) | 0.10 | |||||||||||||
| 2022 | ||||||||||||||||||||
| Portfolio/Instrument | Impacts (EUR million) | |||||||||||||||||||
| (Level 3) | Valuation technique | Main unobservable inputs | Range | Weighted average |
Unfavourable scenario |
Favourable
scenario
|
||||||||||||||
| Financial assets held for trading | ||||||||||||||||||||
| Debt securities | ||||||||||||||||||||
| Corporate debt | Discounted Cash Flows | Credit spread | 0% - 20% |
10.07 | % | (1.38) | 1.40 | |||||||||||||
| Corporate debt | Price based | Market price | 85% - 115% |
100.00 | % | — | — | |||||||||||||
| Government debt | Discounted Cash Flows | Discount curve | 0% - 10% |
4.92 | % | (8.34) | 8.07 | |||||||||||||
| Derivatives | ||||||||||||||||||||
| CCS | Discounted Cash Flows | Interest rate | (0.7)% - 0.7% |
0.00 | % | — | — | |||||||||||||
| CCS | Forward estimation | Interest rate | (4)bps - 4bps |
0.42bps |
(0.06) | 0.07 | ||||||||||||||
| CDS | Discounted Cash flows | Credit Spread | 14.9bps - 42.1bps |
21.99bps |
(0.05) | 0.02 | ||||||||||||||
| EQ Options | EQ option pricing model | Volatility | 0% - 90% |
61.30 | % | (0.23) | 0.48 | |||||||||||||
| EQ Options | Local volatility | Volatility | 10% - 90% |
50.00 | % | (1.05) | 1.05 | |||||||||||||
| FRAs | Asset Swap model | Interest rate | 0% - 6% |
2.71 | % | (1.16) | 0.95 | |||||||||||||
| Fx Swap | Others | Others | n.a. |
n.a | (1.37) | 1.37 | ||||||||||||||
| Inflation Derivatives | Asset Swap model | Inflation Swap Rate | 0% - 10% |
3.41 | % | (0.21) | 0.11 | |||||||||||||
| Inflation Derivatives | Volatility option model | Volatility | 0% - 40% |
17.37 | % | (0.14) | 0.11 | |||||||||||||
| IR Options | IR option pricing model | Volatility | 0% -60% |
35.82 | % | (0.30) | 0.44 | |||||||||||||
| IRS | Asset Swap model | Interest rate | 0% - 15% |
9.20 | % | (0.05) | 0.08 | |||||||||||||
| IRS | Discounted Cash Flows | Credit spread | 1.25% - 6.29% |
3.89 | % | (2.25) | 2.47 | |||||||||||||
| IRS | Discounted Cash Flows | Swap rate | 8.6% - 9.1% |
8.84 | % | (0.02) | 0.03 | |||||||||||||
| IRS | Forward estimation | Interest rate | (6)bps - 6bps |
0.13bps |
(0.04) | 0.04 | ||||||||||||||
| IRS | Others | Others | 5% - n.a. |
n.a | (11.58) | — | ||||||||||||||
| IRS | Prepayment modelling | Prepayment rate | 2.5% - 6.2% |
4.17 | % | (0.06) | 0.05 | |||||||||||||
| Others | Forward estimation | Price | 0% -2% |
0.62 | % | (0.53) | 0.24 | |||||||||||||
| Property derivatives | Option pricing model | Growth rate | (5)% - 5% |
0.00 | % | (5.75) | 5.75 | |||||||||||||
| Financial assets designated at fair value through profit or loss | ||||||||||||||||||||
| Loans and advances to customers | ||||||||||||||||||||
| Loans | Discounted Cash Flows | Credit spreads | 0.1% - 2% |
1.05 | % | (0.18) | 0.18 | |||||||||||||
| Mortgage portfolio | Black Scholes model | Growth rate | (5)% - 5% |
0.00 | % | (0.79) | 0.79 | |||||||||||||
| Debt securities | ||||||||||||||||||||
| Other debt securities | Others | Inflation Swap Rate | 0% - 10% |
4.74 | % | (4.25) | 3.83 | |||||||||||||
| Non-trading financial assets mandatorily at fair value through profit or loss | ||||||||||||||||||||
| Debt securities | ||||||||||||||||||||
| Corporate debt | Discounted Cash Flows | Margin of a reference portfolio | (1)bp - 1bp |
0.01pbs |
(0.33) | 0.33 | ||||||||||||||
| Property securities | Probability weighting | Growth rate | (5)% - 5% |
0.00 | % | (0.68) | 0.68 | |||||||||||||
| Equity instruments | ||||||||||||||||||||
| Equities | Price Based | Price | 90% - 110% |
100.00 | % | (126.87) | 126.87 | |||||||||||||
| Financial assets at fair value through other comprehensive income | ||||||||||||||||||||
| Loans and advances to customers | ||||||||||||||||||||
| Loans | Discounted Cash Flows | Credit spread | n.a. |
n.a | (24.10) | — | ||||||||||||||
| Loans | Discounted Cash Flows | Interest rate curve | 0.8% - 1.0% |
0.88 | % | (0.08) | 0.08 | |||||||||||||
| Loans | Discounted Cash Flows | Margin of a reference portfolio | (1)bp - 1bp |
0bp |
(17.51) | 17.51 | ||||||||||||||
| Loans | Forward estimation | Credit spread | 2.56% - 3.4% |
2.56 | % | (0.49) | — | |||||||||||||
| Debt securities | ||||||||||||||||||||
| Government debt | Discounted Cash Flows | Interest rate | (0.4)% - 1.6% |
0.63 | % | (0.01) | 0.01 | |||||||||||||
| Equity instruments | ||||||||||||||||||||
| Equities | Price Based | Price | 90% - 110% |
100.00 | % | (70.04) | 70.04 | |||||||||||||
| Financial liabilities held for trading | ||||||||||||||||||||
| Derivatives | ||||||||||||||||||||
| Cap&Floor | Volatility option model | Volatility | 10% - 90% |
40.73 | % | (0.29) | 0.18 | |||||||||||||
| Financial liabilities designated at fair value through profit or loss | ||||||||||||||||||||
| Loans and advances to customers | ||||||||||||||||||||
| Repos/Reverse repos | Others | Long-term repo spread | n.a. | n.a. | (0.13) | — | ||||||||||||||
| 2021 | ||||||||||||||||||||
| Portfolio/Instrument | Impacts (EUR million) | |||||||||||||||||||
| (Level 3) | Valuation technique | Main unobservable inputs | Range | Weighted average |
Unfavourable scenario |
Favourable scenario |
||||||||||||||
| Financial assets held for trading | ||||||||||||||||||||
| Derivatives | ||||||||||||||||||||
| CCS | Discounted Cash Flows | Interest rate | (0.7)% - 0.7% |
0.73 | % | (0.11) | 0.11 | |||||||||||||
| CCS | Forward estimation | Interest rate | (4)bps - 4bps |
(0.09)bps |
(0.03) | 0.03 | ||||||||||||||
| Convertibility curve - inputs: NDFs Offshore | Forward estimation | Price | 0% - 2% |
0.61 | % | (0.65) | 0.28 | |||||||||||||
| EQ Options | EQ option pricing model | Volatility | 0% -90% |
61.20 | % | (0.24) | 0.52 | |||||||||||||
| EQ Options | Local volatility | Volatility | 10% - 90% |
40.00 | % | (6.82) | 6.82 | |||||||||||||
| FRAs | Asset Swap model | Interest rate | 0% - 4% |
1.78 | % | (0.91) | 0.73 | |||||||||||||
| FX Options | FX option pricing model | Volatility | 0% - 50% |
32.14 | % | (0.28) | 0.50 | |||||||||||||
| Inflation Derivatives | Asset Swap model | Inflation Swap Rate | (50)% - 50% |
50.00 | % | (0.56) | 0.28 | |||||||||||||
| Inflation Derivatives | Volatility option model | Volatility | 0% - 40% |
13.29 | % | (0.47) | 0.24 | |||||||||||||
| IR Futures | Asset Swap model | Interest rate | 0% - 15% |
5.91 | % | (1.09) | 0.71 | |||||||||||||
| IR Options | IR option pricing model | Volatility | 0% - 60% |
36.28 | % | (0.20) | 0.31 | |||||||||||||
| IRS | Asset Swap model | Interest rate | (6)% - 12.80% |
10.36 | % | (0.07) | 0.13 | |||||||||||||
| IRS | Discounted Cash Flows | Credit spread | 1.03% - 3.75% |
2.02 | % | (7.21) | 4.16 | |||||||||||||
| IRS | Discounted Cash Flows | Inflation Swap Rate | (0.8)%-6.5% |
1.81 | % | (0.04) | 0.01 | |||||||||||||
| IRS | Discounted Cash Flows | Swap Rate | 7.7%-8.2% |
(2.87 | %) | (0.23) | 0.10 | |||||||||||||
| IRS | Forward estimation | Interest rate | TIIE91(8.98)bps - TIIE91 + 11.12bps |
n.a. | (0.27) | 0.17 | ||||||||||||||
| IRS | Forward estimation | Prepayment rate | 6% - 12% |
n.a. | — | — | ||||||||||||||
| IRS | Others | Others | 0.05% | n.a. | (1.49) | — | ||||||||||||||
| IRS | Prepayment modelling | Prepayment rate | 2.5% - 6.2% |
0.44 | % | (0.09) | 0.05 | |||||||||||||
| Property derivatives | Option pricing model | Growth rate | 0% - 5% |
2.50 | % | (2.62) | 2.62 | |||||||||||||
| Swaptions | IR option pricing model | Volatility | 0% - 40% |
26.67 | % | (0.13) | 0.27 | |||||||||||||
| Debt securities | ||||||||||||||||||||
| Corporate debt | Price based | Market price | 85% - 115% |
100 | % | — | — | |||||||||||||
| Financial assets designated at fair value through profit or loss | ||||||||||||||||||||
| Loans and advances to customers | ||||||||||||||||||||
| Loans | Discounted Cash Flows | Credit spreads | 0.1% - 1.4% |
0.66 | % | (0.26) | 0.26 | |||||||||||||
| Mortgage portfolio | Black Scholes model | Growth rate | 0% - 5% |
2.50 | % | (1.90) | 1.90 | |||||||||||||
| Debt securities | ||||||||||||||||||||
| Corporate debt | Discounted Cash Flows | Credit spread | 0% - 20% |
9.88 | % | (1.23) | 1.20 | |||||||||||||
| Government debt | Discounted Cash Flows | Discount curve | 0% - 10% |
8.33 | % | (4.14) | 20.69 | |||||||||||||
| Other debt securities | Others | Inflation Swap Rate | 0% - 10% |
4.74 | % | (5.47) | 4.92 | |||||||||||||
| Non-trading financial assets mandatorily at fair value through profit or loss | ||||||||||||||||||||
| Debt securities | ||||||||||||||||||||
| Corporate debt | Discounted Cash Flows | Margin of a reference portfolio | (1)bp - 1bp |
1bp |
(0.56) | 0.60 | ||||||||||||||
| Property securities | Probability weighting | Growth rate | 0% - 5% |
2.50 | % | (1.19) | 1.19 | |||||||||||||
| Equity instruments | ||||||||||||||||||||
| Equities | Price Based | Price | 90% - 110% |
100.00 | % | (123.10) | 123.10 | |||||||||||||
| 2021 | ||||||||||||||||||||
| Portfolio/Instrument | Impacts (EUR million) | |||||||||||||||||||
| (Level 3) | Valuation technique | Main unobservable inputs | Range | Weighted average |
Unfavourable scenario |
Favourable scenario |
||||||||||||||
| Financial assets at fair value through other comprehensive income | ||||||||||||||||||||
| Loans and advances to customers | ||||||||||||||||||||
| Loans | Discounted Cash Flows | Credit spread | n.a. | n.a. | (19.84) | — | ||||||||||||||
| Loans | Discounted Cash Flows | Interest rate curve | (0.1)% - 1.0% |
0.12 | % | (0.07) | 0.07 | |||||||||||||
| Loans | Discounted Cash Flows | Margin of a reference portfolio | (1)bp - 1bp |
1bp |
(13.12) | 13.04 | ||||||||||||||
| Loans | Forward estimation | Credit spread | 0.77% - 2.42% |
n.a. | — | — | ||||||||||||||
| Debt securities | ||||||||||||||||||||
| Government debt | Discounted Cash Flows | Interest rate | 0.6% - 0.8% |
0.09 | % | (0.01) | 0.01 | |||||||||||||
| Equity instruments | ||||||||||||||||||||
| Equities | Price Based | Price | 90% - 110% |
100.00 | % | (82.13) | 82.13 | |||||||||||||
| Financial liabilities held for trading | ||||||||||||||||||||
| Derivatives | ||||||||||||||||||||
| Cap&Floor | Volatility option model | Volatility | 10% - 90% |
36.30 | % | (0.50) | 0.43 | |||||||||||||
| Financial liabilities designated at fair value through profit or loss | ||||||||||||||||||||
| Loans and advances to customers | ||||||||||||||||||||
| Repos/Reverse repos | Asset Swap Repo Model | Long-term repo spread | n.a | n.a. | (0.36) | — | ||||||||||||||
| 01/01/2023 | Changes | 31/12/2023 | ||||||||||||||||||||||||||||||
| EUR million | Fair value calculated using internal models (Level 3) |
Purchases/
Issuances
|
Sales/Settlements | Changes in fair value recognised in profit or loss |
Changes in fair value recognised in equity |
Level reclassifications |
Other | Fair value calculated using internal models (level 3) |
||||||||||||||||||||||||
| Financial assets held for trading | 383 | 496 | (149) | 194 | — | 1,162 | — | 2,086 | ||||||||||||||||||||||||
| Customers | — | 23 | — | 1 | — | — | — | 24 | ||||||||||||||||||||||||
| Debt securities | 42 | 126 | (63) | 30 | — | 773 | 6 | 914 | ||||||||||||||||||||||||
| Equity instruments | 1 | — | — | — | — | — | — | 1 | ||||||||||||||||||||||||
| Trading derivatives | 340 | 347 | (86) | 163 | — | 389 | (6) | 1,147 | ||||||||||||||||||||||||
| Swaps | 139 | 90 | (4) | 179 | — | 191 | (18) | 577 | ||||||||||||||||||||||||
| Exchange rate options | 4 | 1 | — | 4 | — | — | — | 9 | ||||||||||||||||||||||||
| Interest rate options | 39 | — | — | 2 | — | 112 | — | 153 | ||||||||||||||||||||||||
| Index and securities options | 48 | 132 | (4) | (20) | — | 76 | 3 | 235 | ||||||||||||||||||||||||
| Other | 110 | 124 | (78) | (2) | — | 10 | 9 | 173 | ||||||||||||||||||||||||
| Financial assets at fair value through profit or loss | 427 | 51 | — | (21) | — | 22 | (298) | 181 | ||||||||||||||||||||||||
| Loans and advances to customers | 5 | — | — | 4 | — | 22 | — | 31 | ||||||||||||||||||||||||
| Debt securities | 422 | 51 | — | (25) | — | — | (298) | 150 | ||||||||||||||||||||||||
| Non-trading financial assets mandatorily at fair value through profit or loss | 1,833 | 345 | (238) | 107 | — | (6) | 54 | 2,095 | ||||||||||||||||||||||||
| Customers | 239 | 99 | (73) | 13 | — | — | 9 | 287 | ||||||||||||||||||||||||
| Debt instruments | 325 | 38 | (48) | (5) | — | — | 3 | 313 | ||||||||||||||||||||||||
| Equity instruments | 1,269 | 208 | (117) | 99 | — | (6) | 42 | 1,495 | ||||||||||||||||||||||||
| Financial assets at fair value through other comprehensive income | 5,647 | 3,322 | (3,411) | — | (204) | 231 | 404 | 5,989 | ||||||||||||||||||||||||
| Loans and advances | 4,718 | 3,322 | (3,408) | — | 36 | 160 | 110 | 4,938 | ||||||||||||||||||||||||
| Debt securities | 229 | — | — | — | 5 | 71 | 254 | 559 | ||||||||||||||||||||||||
| Equity instruments | 700 | — | (3) | — | (245) | — | 40 | 492 | ||||||||||||||||||||||||
| TOTAL ASSETS | 8,290 | 4,214 | (3,798) | 280 | (204) | 1,409 | 160 | 10,351 | ||||||||||||||||||||||||
| Financial liabilities held for trading | 415 | 276 | (167) | (118) | — | 476 | (13) | 869 | ||||||||||||||||||||||||
| Trading derivatives | 415 | 276 | (167) | (118) | — | 476 | (13) | 869 | ||||||||||||||||||||||||
| Swaps | 235 | 53 | (83) | (58) | — | 257 | (16) | 388 | ||||||||||||||||||||||||
| Exchange rate options | — | 6 | — | 2 | — | — | — | 8 | ||||||||||||||||||||||||
| Interest rate options | 19 | 4 | (5) | (16) | — | 137 | — | 139 | ||||||||||||||||||||||||
| Index and securities options | 42 | 88 | (13) | (15) | — | 82 | 3 | 187 | ||||||||||||||||||||||||
| Others | 119 | 125 | (66) | (31) | — | — | — | 147 | ||||||||||||||||||||||||
| Hedging derivatives (Liabilities) | 14 | — | — | (3) | — | (5) | — | 6 | ||||||||||||||||||||||||
| Swaps | 14 | — | — | (3) | — | (5) | — | 6 | ||||||||||||||||||||||||
| Financial liabilities designated at fair value through profit or loss | 151 | 32 | (151) | (3) | — | — | — | 29 | ||||||||||||||||||||||||
| Liabilities under insurance contracts | 345 | — | — | — | (40) | — | 18 | 323 | ||||||||||||||||||||||||
| TOTAL LIABILITIES | 925 | 308 | (318) | (124) | (40) | 471 | 5 | 1,227 | ||||||||||||||||||||||||
| 01/01/2022 | Changes | 31/12/2022 | ||||||||||||||||||||||||||||||
| EUR million | Fair value calculated using internal models (level 3) |
Purchases /Issuances |
Sales/Settlements | Changes in fair value recognized in profit or loss |
Changes in fair value recognized in equity |
Level reclassifications |
Other | Fair value calculated using internal models (level 3) |
||||||||||||||||||||||||
| Financial assets held for trading | 537 | 91 | (99) | (116) | — | (15) | (15) | 383 | ||||||||||||||||||||||||
| Debt securities | 22 | 2 | (2) | 15 | — | 2 | 3 | 42 | ||||||||||||||||||||||||
| Equity instruments | 2 | — | — | — | — | (1) | — | 1 | ||||||||||||||||||||||||
| Trading derivatives | 513 | 89 | (97) | (131) | — | (16) | (18) | 340 | ||||||||||||||||||||||||
| Swaps | 224 | 1 | (47) | (20) | — | 4 | (23) | 139 | ||||||||||||||||||||||||
| Exchange rate options | 12 | — | (9) | 2 | — | — | (1) | 4 | ||||||||||||||||||||||||
| Interest rate options | 182 | — | — | (142) | — | (1) | — | 39 | ||||||||||||||||||||||||
| Index and securities options | 41 | 27 | (28) | 29 | — | (26) | 5 | 48 | ||||||||||||||||||||||||
| Other | 54 | 61 | (13) | — | — | 7 | 1 | 110 | ||||||||||||||||||||||||
| Financial assets at fair value through profit or loss | 418 | — | (9) | (31) | — | — | 49 | 427 | ||||||||||||||||||||||||
| Loans and advances to customers | 18 | — | (9) | (5) | — | — | 1 | 5 | ||||||||||||||||||||||||
| Debt securities | 400 | — | — | (26) | — | — | 48 | 422 | ||||||||||||||||||||||||
| Non-trading financial assets mandatorily at fair value through profit or loss | 1,865 | 521 | (579) | 98 | — | (22) | (50) | 1,833 | ||||||||||||||||||||||||
| Customers | 268 | 276 | (280) | (25) | — | — | — | 239 | ||||||||||||||||||||||||
| Debt securities | 366 | 51 | (33) | (31) | — | (27) | (1) | 325 | ||||||||||||||||||||||||
| Equity instruments | 1,231 | 194 | (266) | 154 | — | 5 | (49) | 1,269 | ||||||||||||||||||||||||
| Financial assets at fair value through other comprehensive income | 4,847 | 8,564 | (8,029) | — | (172) | 417 | 20 | 5,647 | ||||||||||||||||||||||||
| Loans and advances | 3,880 | 8,471 | (7,988) | — | 1 | 349 | 5 | 4,718 | ||||||||||||||||||||||||
| Debt securities | 146 | 91 | (23) | — | — | — | 15 | 229 | ||||||||||||||||||||||||
| Equity instruments | 821 | 2 | (18) | — | (173) | 68 | — | 700 | ||||||||||||||||||||||||
| TOTAL ASSETS | 7,667 | 9,176 | (8,716) | (49) | (172) | 380 | 4 | 8,290 | ||||||||||||||||||||||||
| Financial liabilities held for trading | 160 | 328 | (97) | 35 | — | (2) | (9) | 415 | ||||||||||||||||||||||||
| Trading derivatives | 160 | 328 | (97) | 35 | — | (2) | (9) | 415 | ||||||||||||||||||||||||
| Swaps | 44 | 32 | (16) | 189 | — | 9 | (23) | 235 | ||||||||||||||||||||||||
| Exchange rate options | 7 | 6 | (14) | 1 | — | — | — | — | ||||||||||||||||||||||||
| Interest rate options | 26 | 56 | (44) | (19) | — | — | — | 19 | ||||||||||||||||||||||||
| Index and securities options | 67 | 23 | (19) | (32) | — | (11) | 14 | 42 | ||||||||||||||||||||||||
| Others | 16 | 211 | (4) | (104) | — | — | — | 119 | ||||||||||||||||||||||||
| Hedging derivatives (Liabilities) | — | — | — | 14 | — | — | — | 14 | ||||||||||||||||||||||||
| Swaps | — | — | — | 14 | — | — | — | 14 | ||||||||||||||||||||||||
| Financial liabilities designated at fair value through profit or loss | 151 | 0 | (3) | 3 | — | 0 | 0 | 151 | ||||||||||||||||||||||||
| Liabilities under insurance contracts | 318 | 0 | 0 | (11) | — | 0 | 38 | 345 | ||||||||||||||||||||||||
| TOTAL LIABILITIES | 629 | 328 | (100) | 41 | — | (2) | 29 | 925 | ||||||||||||||||||||||||
| 01/01/2021 | Changes | 31/12/2021 | ||||||||||||||||||||||||||||||
| EUR million | Fair value calculated using internal models (level 3) |
Purchases/
Issuances
|
Sales/Settlements |
Changes in fair value recognised in profit or loss |
Changes in fair value recognised in equity |
Level reclassifications |
Other | Fair value calculated using internal models (level 3) |
||||||||||||||||||||||||
| Financial assets held for trading | 740 | 136 | (124) | (181) | — | (15) | (19) | 537 | ||||||||||||||||||||||||
| Debt securities | 7 | 20 | (2) | (2) | — | — | (1) | 22 | ||||||||||||||||||||||||
| Equity instruments | 3 | — | (1) | — | — | — | — | 2 | ||||||||||||||||||||||||
| Trading derivatives | 730 | 116 | (121) | (179) | — | (15) | (18) | 513 | ||||||||||||||||||||||||
| Swaps | 272 | 5 | (33) | (35) | — | 33 | (18) | 224 | ||||||||||||||||||||||||
| Exchange rate options | 22 | 14 | (27) | 3 | — | — | — | 12 | ||||||||||||||||||||||||
| Interest rate options | 241 | 7 | (39) | (27) | — | — | — | 182 | ||||||||||||||||||||||||
| Index and securities options | 94 | 18 | (12) | (51) | — | (8) | — | 41 | ||||||||||||||||||||||||
| Other | 101 | 72 | (10) | (69) | — | (40) | — | 54 | ||||||||||||||||||||||||
| Financial assets at fair value through profit or loss | 649 | 59 | (120) | (11) | — | (163) | 4 | 418 | ||||||||||||||||||||||||
| Credit entities | 163 | — | — | — | — | (163) | — | — | ||||||||||||||||||||||||
| Loans and advances to customers | 19 | — | (2) | — | — | — | 1 | 18 | ||||||||||||||||||||||||
| Debt securities | 467 | 59 | (118) | (11) | — | — | 3 | 400 | ||||||||||||||||||||||||
| Non-trading financial assets mandatorily at fair value through profit or loss | 934 | 534 | (251) | 127 | — | 485 | 36 | 1,865 | ||||||||||||||||||||||||
| Loans and advances to customers | 295 | 122 | (149) | — | — | (3) | 3 | 268 | ||||||||||||||||||||||||
| Debt securities | 134 | 206 | (28) | 28 | — | 17 | 9 | 366 | ||||||||||||||||||||||||
| Equity instruments | 505 | 206 | (74) | 99 | — | 471 | 24 | 1,231 | ||||||||||||||||||||||||
| Financial assets at fair value through other comprehensive income | 6,220 | 5,681 | (6,588) | — | (228) | (241) | 3 | 4,847 | ||||||||||||||||||||||||
| Loans and advances | 4,791 | 5,597 | (6,298) | — | (37) | (173) | — | 3,880 | ||||||||||||||||||||||||
| Debt securities | 206 | 75 | (25) | — | (43) | (68) | 1 | 146 | ||||||||||||||||||||||||
| Equity instruments | 1,223 | 9 | (265) | — | (148) | — | 2 | 821 | ||||||||||||||||||||||||
| TOTAL ASSETS | 8,543 | 6,410 | (7,083) | (65) | (228) | 66 | 24 | 7,667 | ||||||||||||||||||||||||
| Financial liabilities held for trading | 295 | 85 | (42) | (138) | — | (21) | (19) | 160 | ||||||||||||||||||||||||
| Trading derivatives | 295 | 85 | (42) | (138) | — | (21) | (19) | 160 | ||||||||||||||||||||||||
| Swaps | 81 | 4 | (10) | (36) | — | 3 | 2 | 44 | ||||||||||||||||||||||||
| Exchange rate options | 1 | 2 | — | 4 | — | — | — | 7 | ||||||||||||||||||||||||
| Interest rate options | 49 | 26 | (19) | (8) | — | — | (22) | 26 | ||||||||||||||||||||||||
| Index and securities options | 97 | 23 | (5) | (27) | — | (22) | 1 | 67 | ||||||||||||||||||||||||
| Securities and interest rate futures | 2 | — | (2) | — | — | — | — | — | ||||||||||||||||||||||||
| Others | 65 | 30 | (6) | (71) | — | (2) | — | 16 | ||||||||||||||||||||||||
| Financial liabilities designated at fair value through profit or loss | 301 | 143 | — | (6) | — | (289) | 2 | 151 | ||||||||||||||||||||||||
| Liabilities under insurance contracts | 309 | — | — | 6 | — | — | 3 | 318 | ||||||||||||||||||||||||
| TOTAL LIABILITIES | 905 | 228 | (42) | (138) | — | (310) | (14) | 629 | ||||||||||||||||||||||||
| 31 December 2023 | |||||||||||||||||||||||
| EUR million | |||||||||||||||||||||||
| On demand | Within 3 months | 3 to 12 months | 1 to 3 years | 3 to 5 years | More than 5 years | Total | |||||||||||||||||
| Assets | |||||||||||||||||||||||
| Cash, cash balances at Central Banks and other deposits on demand | 220,342 | — | — | — | — | — | 220,342 | ||||||||||||||||
| Financial assets at fair value through other comprehensive income | — | 13,544 | 9,234 | 19,372 | 14,162 | 25,235 | 81,547 | ||||||||||||||||
| Debt securities | — | 13,078 | 8,433 | 18,432 | 12,764 | 20,858 | 73,565 | ||||||||||||||||
| Loans and advances | — | 466 | 801 | 940 | 1,398 | 4,377 | 7,982 | ||||||||||||||||
| Customers | — | 466 | 801 | 940 | 1,085 | 4,377 | 7,669 | ||||||||||||||||
| Financial assets at amortized cost |
40,687 | 202,066 | 171,494 | 232,190 | 158,556 | 386,410 | 1,191,403 | ||||||||||||||||
| Debt securities | — | 12,281 | 14,114 | 18,608 | 11,281 | 47,275 | 103,559 | ||||||||||||||||
| Loans and advances | 40,687 | 189,785 | 157,380 | 213,582 | 147,275 | 339,135 | 1,087,844 | ||||||||||||||||
| Central banks | — | 18,730 | — | — | — | 1,352 | 20,082 | ||||||||||||||||
| Credits institutions | 6,783 | 26,671 | 6,313 | 7,151 | 1,521 | 9,478 | 57,917 | ||||||||||||||||
| Customers | 33,904 | 144,384 | 151,067 | 206,431 | 145,754 | 328,305 | 1,009,845 | ||||||||||||||||
| 261,029 | 215,610 | 180,728 | 251,562 | 172,718 | 411,645 | 1,493,292 | |||||||||||||||||
| Liabilities | |||||||||||||||||||||||
| Financial liabilities at amortized cost | 711,093 | 246,898 | 182,516 | 161,784 | 88,527 | 77,885 | 1,468,703 | ||||||||||||||||
| Deposits | 697,339 | 210,538 | 118,035 | 61,332 | 22,161 | 15,903 | 1,125,308 | ||||||||||||||||
| Central banks | 168 | 20,224 | 6,941 | 16,846 | 4,581 | 22 | 48,782 | ||||||||||||||||
| Credit institutions | 6,572 | 25,990 | 21,390 | 13,434 | 5,963 | 7,897 | 81,246 | ||||||||||||||||
| Customer deposits | 690,599 | 164,324 | 89,704 | 31,052 | 11,617 | 7,984 | 995,280 | ||||||||||||||||
Marketable debt securitiesA |
— | 28,371 | 63,440 | 92,554 | 57,639 | 61,204 | 303,208 | ||||||||||||||||
| Other financial liabilities | 13,754 | 7,989 | 1,041 | 7,898 | 8,727 | 778 | 40,187 | ||||||||||||||||
| 711,093 | 246,898 | 182,516 | 161,784 | 88,527 | 77,885 | 1,468,703 | |||||||||||||||||
| Difference (assets less liabilities) | (450,064) | (31,288) | (1,788) | 89,778 | 84,191 | 333,760 | 24,589 | ||||||||||||||||
| 31 December 2022 | |||||||||||||||||||||||
| EUR million | |||||||||||||||||||||||
| On demand | Within 3 months | 3 to 12 months | 1 to 3 years | 3 to 5 years | More than 5 years | Total | |||||||||||||||||
| Assets | |||||||||||||||||||||||
| Cash, cash balances at Central Banks and other deposits on demand | 223,073 | — | — | — | — | — | 223,073 | ||||||||||||||||
| Financial assets at fair value through other comprehensive income | — | 19,215 | 5,425 | 15,377 | 17,693 | 25,588 | 83,298 | ||||||||||||||||
| Debt securities | — | 19,011 | 4,528 | 13,884 | 16,631 | 21,029 | 75,083 | ||||||||||||||||
| Loans and advances | — | 204 | 897 | 1,493 | 1,062 | 4,559 | 8,215 | ||||||||||||||||
| Customers | — | 204 | 897 | 1,493 | 1,062 | 4,559 | 8,215 | ||||||||||||||||
| Financial assets at amortized cost |
45,322 | 194,757 | 137,632 | 196,939 | 135,156 | 437,238 | 1,147,044 | ||||||||||||||||
| Debt securities | — | 7,956 | 7,417 | 21,459 | 6,715 | 30,007 | 73,554 | ||||||||||||||||
| Loans and advances | 45,322 | 186,801 | 130,215 | 175,480 | 128,441 | 407,231 | 1,073,490 | ||||||||||||||||
| Central banks | — | 14,139 | — | — | — | 1,236 | 15,375 | ||||||||||||||||
| Credits institutions | 7,565 | 22,578 | 2,756 | 3,580 | 139 | 9,900 | 46,518 | ||||||||||||||||
| Customers | 37,757 | 150,084 | 127,459 | 171,900 | 128,302 | 396,095 | 1,011,597 | ||||||||||||||||
| 268,395 | 213,972 | 143,057 | 212,316 | 152,849 | 462,826 | 1,453,415 | |||||||||||||||||
| Liabilities | |||||||||||||||||||||||
| Financial liabilities at amortized cost |
731,837 | 236,565 | 144,666 | 168,984 | 81,808 | 59,998 | 1,423,858 | ||||||||||||||||
| Deposits | 718,366 | 193,092 | 96,667 | 82,663 | 19,343 | 1,756 | 1,111,887 | ||||||||||||||||
| Central banks | 117 | 6,991 | 18,311 | 47,018 | 4,506 | 9 | 76,952 | ||||||||||||||||
| Credit institutions | 7,172 | 30,557 | 15,901 | 9,670 | 3,925 | 1,357 | 68,582 | ||||||||||||||||
| Customer deposits | 711,077 | 155,544 | 62,455 | 25,975 | 10,912 | 390 | 966,353 | ||||||||||||||||
Marketable debt securitiesA |
— | 34,408 | 46,480 | 81,051 | 55,359 | 57,614 | 274,912 | ||||||||||||||||
| Other financial liabilities | 13,471 | 9,065 | 1,519 | 5,270 | 7,106 | 628 | 37,059 | ||||||||||||||||
| 731,837 | 236,565 | 144,666 | 168,984 | 81,808 | 59,998 | 1,423,858 | |||||||||||||||||
| Difference (assets less liabilities) | (463,442) | (22,593) | (1,609) | 43,332 | 71,041 | 402,828 | 29,557 | ||||||||||||||||
| 31 December 2021 | |||||||||||||||||||||||
| EUR million | |||||||||||||||||||||||
| On demand | Within 3 months | 3 to 12 months | 1 to 3 years | 3 to 5 years | More than 5 years | Total | |||||||||||||||||
| Assets | |||||||||||||||||||||||
| Cash, cash balances at Central Banks and other deposits on demand | 210,689 | — | — | — | — | — | 210,689 | ||||||||||||||||
| Financial assets at fair value through other comprehensive income | — | 19,885 | 10,447 | 20,001 | 17,745 | 37,507 | 105,585 | ||||||||||||||||
| Debt securities | — | 19,598 | 9,609 | 19,133 | 16,494 | 33,088 | 97,922 | ||||||||||||||||
| Loans and advances | — | 287 | 838 | 868 | 1,251 | 4,419 | 7,663 | ||||||||||||||||
| Customers | — | 287 | 838 | 868 | 1,251 | 4,419 | 7,663 | ||||||||||||||||
| Financial assets at amortized cost |
35,520 | 161,837 | 121,272 | 154,345 | 130,456 | 434,468 | 1,037,898 | ||||||||||||||||
| Debt securities | — | 4,212 | 4,171 | 2,205 | 15,388 | 9,732 | 35,708 | ||||||||||||||||
| Loans and advances | 35,520 | 157,625 | 117,101 | 152,140 | 115,068 | 424,736 | 1,002,190 | ||||||||||||||||
| Central banks | — | 14,544 | — | — | — | 1,113 | 15,657 | ||||||||||||||||
| Credit institutions | 11,849 | 20,802 | 4,542 | 93 | 150 | 1,733 | 39,169 | ||||||||||||||||
| Customers | 23,671 | 122,279 | 112,559 | 152,047 | 114,918 | 421,890 | 947,364 | ||||||||||||||||
| 246,209 | 181,722 | 131,719 | 174,346 | 148,201 | 471,975 | 1,354,172 | |||||||||||||||||
| Liabilities | |||||||||||||||||||||||
| Financial liabilities at amortized cost |
718,435 | 169,013 | 99,223 | 194,879 | 98,210 | 69,409 | 1,349,169 | ||||||||||||||||
| Deposits | 711,377 | 126,956 | 64,096 | 117,585 | 52,658 | 5,915 | 1,078,587 | ||||||||||||||||
| Central banks | 92 | 5,861 | 2,130 | 91,651 | 40,013 | 10 | 139,757 | ||||||||||||||||
| Credit institutions | 12,854 | 16,208 | 12,507 | 4,712 | 1,981 | 3,973 | 52,235 | ||||||||||||||||
| Customer deposits | 698,431 | 104,887 | 49,459 | 21,222 | 10,664 | 1,932 | 886,595 | ||||||||||||||||
Marketable debt securitiesA |
— | 31,550 | 29,798 | 71,333 | 45,198 | 62,830 | 240,709 | ||||||||||||||||
| Other financial liabilities | 7,058 | 10,507 | 5,329 | 5,961 | 354 | 664 | 29,873 | ||||||||||||||||
| 718,435 | 169,013 | 99,223 | 194,879 | 98,210 | 69,409 | 1,349,169 | |||||||||||||||||
| Difference (assets less liabilities) | (472,226) | 12,709 | 32,496 | (20,533) | 49,991 | 402,566 | 5,003 | ||||||||||||||||
| 31 December 2023 | |||||||||||||||||||||||
| EUR million | |||||||||||||||||||||||
| On demand | Within 3 months | 3 to 12 months | 1 to 3 years | 3 to 5 years | More than 5 years | Total | |||||||||||||||||
| Financial liabilities at amortized cost | |||||||||||||||||||||||
| Deposits | 698,595 | 204,001 | 109,311 | 51,191 | 20,761 | 15,585 | 1,099,444 | ||||||||||||||||
| Central banks | 168 | 20,334 | 6,853 | 16,846 | 4,581 | 35 | 48,817 | ||||||||||||||||
| Credit institutions | 6,884 | 25,642 | 21,334 | 13,079 | 5,924 | 7,685 | 80,548 | ||||||||||||||||
| Customer | 691,543 | 158,025 | 81,124 | 21,266 | 10,256 | 7,865 | 970,079 | ||||||||||||||||
| Marketable debt securities | — | 28,258 | 62,935 | 91,492 | 56,944 | 60,166 | 299,795 | ||||||||||||||||
| Other financial liabilities | 13,666 | 8,078 | 1,041 | 7,898 | 8,727 | 777 | 40,187 | ||||||||||||||||
| 712,261 | 240,337 | 173,287 | 150,581 | 86,432 | 76,528 | 1,439,426 | |||||||||||||||||
| 31 December 2022 | |||||||||||||||||||||||
| EUR million | |||||||||||||||||||||||
| On demand | Within 3 months | 3 to 12 months | 1 to 3 years | 3 to 5 years | More than 5 years | Total | |||||||||||||||||
| Financial liabilities at amortized cost | |||||||||||||||||||||||
| Deposits | 718,366 | 192,609 | 96,482 | 82,618 | 19,354 | 1,595 | 1,111,024 | ||||||||||||||||
| Central banks | 117 | 7,003 | 18,210 | 46,933 | 4,506 | 9 | 76,778 | ||||||||||||||||
| Credit institutions | 7,172 | 30,548 | 15,808 | 9,722 | 3,924 | 1,190 | 68,364 | ||||||||||||||||
| Customer | 711,077 | 155,058 | 62,464 | 25,963 | 10,924 | 396 | 965,882 | ||||||||||||||||
| Marketable debt securities | — | 34,312 | 46,396 | 81,059 | 55,357 | 57,576 | 274,700 | ||||||||||||||||
| Other financial liabilities | 13,471 | 9,065 | 1,519 | 5,270 | 7,106 | 626 | 37,057 | ||||||||||||||||
| 731,837 | 235,986 | 144,397 | 168,947 | 81,817 | 59,797 | 1,422,781 | |||||||||||||||||
| 31 December 2021 | |||||||||||||||||||||||
| EUR million | |||||||||||||||||||||||
| On demand | Within 3 months | 3 to 12 months | 1 to 3 years | 3 to 5 years | More than 5 years | Total | |||||||||||||||||
| Financial liabilities at amortized cost | |||||||||||||||||||||||
| Deposits | 705,129 | 120,654 | 62,896 | 116,343 | 52,031 | 5,884 | 1,062,937 | ||||||||||||||||
| Central banks | 83 | 5,862 | 2,131 | 91,327 | 39,579 | 10 | 138,992 | ||||||||||||||||
| Credit institutions | 12,683 | 16,184 | 11,867 | 4,504 | 1,945 | 3,950 | 51,133 | ||||||||||||||||
| Customer | 692,363 | 98,608 | 48,898 | 20,512 | 10,507 | 1,924 | 872,812 | ||||||||||||||||
| Marketable debt securities | — | 32,575 | 30,618 | 73,131 | 46,367 | 64,318 | 247,009 | ||||||||||||||||
| Other financial liabilities | 7,059 | 10,507 | 5,329 | 5,961 | 354 | 663 | 29,873 | ||||||||||||||||
| 712,188 | 163,736 | 98,843 | 195,435 | 98,752 | 70,865 | 1,339,819 | |||||||||||||||||
| 31 December 2023 | ||||||||||||||||||||
| EUR million | ||||||||||||||||||||
| Within 3 months | 3 to 12 months | 1 to 3 years |
3 to 5 years |
More than 5 years | Total | |||||||||||||||
| FINANCIAL ASSETS | ||||||||||||||||||||
| Financial assets held for trading | 36,120 | 49,668 | 30,602 | 17,912 | 42,619 | 176,921 | ||||||||||||||
| Derivatives | 8,777 | 10,551 | 17,775 | 9,532 | 9,693 | 56,328 | ||||||||||||||
| Equity instruments | — | — | — | — | 15,057 | 15,057 | ||||||||||||||
| Debt securities | 7,598 | 18,315 | 10,274 | 8,137 | 17,800 | 62,124 | ||||||||||||||
| Loans and advances | 19,745 | 20,802 | 2,553 | 243 | 69 | 43,412 | ||||||||||||||
| Central banks | 1,146 | 16,571 | — | — | — | 17,717 | ||||||||||||||
| Credits institutions | 10,861 | 2,076 | 1,079 | 45 | — | 14,061 | ||||||||||||||
| Customers | 7,738 | 2,155 | 1,474 | 198 | 69 | 11,634 | ||||||||||||||
| Financial assets designated at fair value through profit or loss | 1,657 | 557 | 2,529 | 1,350 | 3,680 | 9,773 | ||||||||||||||
| Debt securities | 252 | 77 | 1,269 | 690 | 807 | 3,095 | ||||||||||||||
| Loans and advances | 1,405 | 480 | 1,260 | 660 | 2,873 | 6,678 | ||||||||||||||
| Credit institutions | 26 | 22 | 3 | 15 | 393 | 459 | ||||||||||||||
| Customers | 1,379 | 458 | 1,257 | 645 | 2,480 | 6,219 | ||||||||||||||
| Non-trading financial assets mandatorily at fair value through profit or loss | 591 | 153 | 71 | 80 | 5,015 | 5,910 | ||||||||||||||
| Equity instruments | — | — | — | — | 4,068 | 4,068 | ||||||||||||||
| Debt securities | 41 | — | 57 | 3 | 759 | 860 | ||||||||||||||
| Loans and advances | 550 | 153 | 14 | 77 | 188 | 982 | ||||||||||||||
| Customers | 550 | 153 | 14 | 77 | 188 | 982 | ||||||||||||||
| Financial assets at fair value through other comprehensive income | — | — | — | — | 1,761 | 1,761 | ||||||||||||||
| Equity instruments | — | — | — | — | 1,761 | 1,761 | ||||||||||||||
| Hedging derivatives | 1,188 | 412 | 1,535 | 937 | 1,225 | 5,297 | ||||||||||||||
| Changes in the fair value of hedged items in portfolio hedges of interest rate risk | (237) | (225) | 156 | (402) | (80) | (788) | ||||||||||||||
| TOTAL FINANCIAL ASSETS | 39,319 | 50,565 | 34,893 | 19,877 | 54,220 | 198,874 | ||||||||||||||
| 31 December 2023 | ||||||||||||||||||||
| EUR million | ||||||||||||||||||||
| Within 3 months | 3 to 12 months | 1 to 3 years |
3 to 5 years |
More than 5 years | Total | |||||||||||||||
| FINANCIAL LIABILITIES | ||||||||||||||||||||
| Financial liabilities held for trading | 73,257 | 12,127 | 19,180 | 10,591 | 7,115 | 122,270 | ||||||||||||||
| Derivatives | 8,147 | 9,486 | 17,990 | 10,060 | 4,906 | 50,589 | ||||||||||||||
| Shorts positions | 21,381 | 1,288 | 765 | 531 | 2,209 | 26,174 | ||||||||||||||
| Deposits | 43,729 | 1,353 | 425 | — | — | 45,507 | ||||||||||||||
| Central banks | 7,808 | — | — | — | — | 7,808 | ||||||||||||||
| Credits institutions | 17,228 | 209 | 425 | — | — | 17,862 | ||||||||||||||
| Customers | 18,693 | 1,144 | — | — | — | 19,837 | ||||||||||||||
| Financial liabilities designated at fair value through profit or loss | 23,190 | 7,583 | 4,863 | 1,359 | 3,372 | 40,367 | ||||||||||||||
| Deposits | 22,688 | 6,459 | 3,223 | 338 | 2,288 | 34,996 | ||||||||||||||
| Central banks | 1,158 | 51 | — | — | — | 1,209 | ||||||||||||||
| Credits institutions | 1,161 | 57 | 84 | 61 | 372 | 1,735 | ||||||||||||||
| Customers | 20,369 | 6,351 | 3,139 | 277 | 1,916 | 32,052 | ||||||||||||||
Marketable debt securitiesA |
502 | 1,124 | 1,640 | 1,021 | 1,084 | 5,371 | ||||||||||||||
| Hedging derivatives | 1,525 | 2,064 | 1,577 | 878 | 1,612 | 7,656 | ||||||||||||||
| Changes in the fair value of hedged items in portfolio hedges of interest rate risk | (1) | (4) | 36 | (5) | 29 | 55 | ||||||||||||||
| TOTAL FINANCIAL LIABILITIES | 97,971 | 21,770 | 25,656 | 12,823 | 12,128 | 170,348 | ||||||||||||||
| 31 December 2023 | ||||||||||||||||||||
| EUR million | ||||||||||||||||||||
| Within 3 months | 3 to 12 months | 1 to 3 years |
3 to 5 years |
More than 5 years | Total | |||||||||||||||
| Memorandum items | ||||||||||||||||||||
| Loans commitment granted | 125,083 | 31,658 | 55,344 | 47,204 | 20,300 | 279,589 | ||||||||||||||
| Financial guarantees granted | 7,870 | 4,734 | 1,654 | 686 | 491 | 15,435 | ||||||||||||||
| Other commitments granted | 81,146 | 17,448 | 9,699 | 3,386 | 1,594 | 113,273 | ||||||||||||||
| MEMORANDUM ITEMS | 214,099 | 53,840 | 66,697 | 51,276 | 22,385 | 408,297 | ||||||||||||||
| 31 December 2022 | ||||||||||||||||||||
| EUR million | ||||||||||||||||||||
| Within 3 months | 3 to 12 months | 1 to 3 years |
3 to 5 years |
More than 5 years | Total | |||||||||||||||
| FINANCIAL ASSETS | ||||||||||||||||||||
| Financial assets held for trading | 44,770 | 27,562 | 29,753 | 20,177 | 33,856 | 156,118 | ||||||||||||||
| Derivatives | 7,631 | 9,983 | 23,156 | 15,533 | 10,699 | 67,002 | ||||||||||||||
| Equity instruments | — | — | — | — | 10,066 | 10,066 | ||||||||||||||
| Debt securities | 5,160 | 13,357 | 5,667 | 4,193 | 13,026 | 41,403 | ||||||||||||||
| Loans and advances | 31,979 | 4,222 | 930 | 451 | 65 | 37,647 | ||||||||||||||
| Central banks | 11,595 | — | — | — | — | 11,595 | ||||||||||||||
| Credits institutions | 13,650 | 2,852 | — | — | — | 16,502 | ||||||||||||||
| Customers | 6,734 | 1,370 | 930 | 451 | 65 | 9,550 | ||||||||||||||
| Financial assets designated at fair value through profit or loss | 236 | 756 | 2,732 | 1,691 | 3,574 | 8,989 | ||||||||||||||
| Debt securities | 68 | 77 | 1,026 | 599 | 772 | 2,542 | ||||||||||||||
| Loans and advances | 168 | 679 | 1,706 | 1,092 | 2,802 | 6,447 | ||||||||||||||
| Central banks | — | — | — | — | — | — | ||||||||||||||
| Credit institutions | 6 | 181 | 23 | 4 | 459 | 673 | ||||||||||||||
| Customers | 162 | 498 | 1,683 | 1,088 | 2,343 | 5,774 | ||||||||||||||
| Non-trading financial assets mandatorily at fair value through profit or loss | 164 | 214 | 265 | 70 | 5,000 | 5,713 | ||||||||||||||
| Equity instruments | — | — | — | — | 3,711 | 3,711 | ||||||||||||||
| Debt instruments | 6 | 52 | 52 | — | 1,024 | 1,134 | ||||||||||||||
| Loans and advances | 158 | 162 | 213 | 70 | 265 | 868 | ||||||||||||||
| Central banks | — | — | — | — | — | — | ||||||||||||||
| Credits institutions | — | — | — | — | — | — | ||||||||||||||
| Customers | 158 | 162 | 213 | 70 | 265 | 868 | ||||||||||||||
| Financial assets at fair value through other comprehensive income | — | — | — | — | 1,941 | 1,941 | ||||||||||||||
| Equity instruments | — | — | — | — | 1,941 | 1,941 | ||||||||||||||
| Hedging derivatives | 2,200 | 1,076 | 1,356 | 1,451 | 1,986 | 8,069 | ||||||||||||||
| Changes in the fair value of hedged items in portfolio hedges of interest rate risk | (734) | (498) | (1,178) | (1,036) | (303) | (3,749) | ||||||||||||||
| TOTAL FINANCIAL ASSETS | 46,636 | 29,110 | 32,928 | 22,353 | 46,054 | 177,081 | ||||||||||||||
| 31 December 2022 | ||||||||||||||||||||
| EUR million | ||||||||||||||||||||
| Within 3 months | 3 to 12 months | 1 to 3 years |
3 to 5 years |
More than 5 years | Total | |||||||||||||||
| FINANCIAL LIABILITIES | ||||||||||||||||||||
| Financial liabilities held for trading | 51,621 | 12,012 | 23,669 | 18,273 | 9,610 | 115,185 | ||||||||||||||
| Derivatives | 7,749 | 9,671 | 22,479 | 16,955 | 8,037 | 64,891 | ||||||||||||||
| Shorts positions | 17,952 | 888 | 1,031 | 1,071 | 1,573 | 22,515 | ||||||||||||||
| Deposits | 25,920 | 1,453 | 159 | 247 | — | 27,779 | ||||||||||||||
| Central banks | 5,757 | — | — | — | — | 5,757 | ||||||||||||||
| Credits institutions | 7,963 | 1,435 | 151 | 247 | — | 9,796 | ||||||||||||||
| Customers | 12,200 | 18 | 8 | — | — | 12,226 | ||||||||||||||
| Marketable debt securities | — | — | — | — | — | — | ||||||||||||||
| Other financial liabilities | — | — | — | — | — | — | ||||||||||||||
| Financial liabilities designated at fair value through profit or loss | 25,180 | 3,984 | 4,389 | 1,796 | 4,918 | 40,268 | ||||||||||||||
| Deposits | 25,017 | 3,183 | 3,278 | 699 | 2,663 | 34,841 | ||||||||||||||
| Central banks | 1,702 | 38 | — | — | — | 1,740 | ||||||||||||||
| Credits institutions | 1,284 | 129 | 54 | 87 | 404 | 1,958 | ||||||||||||||
| Customers | 22,031 | 3,016 | 3,224 | 612 | 2,259 | 31,143 | ||||||||||||||
Marketable debt securitiesA |
163 | 801 | 1,111 | 1,097 | 2,255 | 5,427 | ||||||||||||||
| Hedging derivatives | 947 | 1,469 | 3,650 | 1,159 | 2,003 | 9,228 | ||||||||||||||
| Changes in the fair value of hedged items in portfolio hedges of interest rate risk | 11 | (52) | (140) | 20 | 44 | (117) | ||||||||||||||
| TOTAL FINANCIAL LIABILITIES | 77,759 | 17,413 | 31,568 | 21,248 | 16,575 | 164,564 | ||||||||||||||
| 31 December 2022 | ||||||||||||||||||||
| EUR million | ||||||||||||||||||||
| Within 3 months | 3 to 12 months | 1 to 3 years |
3 to 5 years |
More than 5 years | Total | |||||||||||||||
| Memorandum items | ||||||||||||||||||||
| Loans commitment granted | 120,962 | 32,538 | 50,875 | 54,033 | 15,667 | 274,075 | ||||||||||||||
| Financial guarantees granted | 7,023 | 3,586 | 1,427 | 441 | 379 | 12,856 | ||||||||||||||
| Other commitments granted | 66,716 | 16,152 | 7,119 | 1,517 | 1,168 | 92,672 | ||||||||||||||
| MEMORANDUM ITEMS | 194,701 | 52,276 | 59,421 | 55,991 | 17,214 | 379,603 | ||||||||||||||
| 31 December 2021 | ||||||||||||||||||||
| EUR million | ||||||||||||||||||||
| Within 3 months | 3 to 12 months | 1 to 3 years |
3 to 5 years |
More than 5 years | Total | |||||||||||||||
| FINANCIAL ASSETS | ||||||||||||||||||||
| Financial assets held for trading | 21,887 | 20,627 | 20,047 | 15,105 | 39,287 | 116,953 | ||||||||||||||
| Derivatives | 4,943 | 7,426 | 12,285 | 11,980 | 17,658 | 54,292 | ||||||||||||||
| Equity instruments | — | — | — | — | 15,077 | 15,077 | ||||||||||||||
| Debt securities | 2,978 | 8,585 | 5,766 | 2,869 | 6,552 | 26,750 | ||||||||||||||
| Loans and advances | 13,966 | 4,616 | 1,996 | 256 | — | 20,834 | ||||||||||||||
| Central banks | 3,608 | — | — | — | — | 3,608 | ||||||||||||||
| Credits institutions | 5,607 | 3,982 | 808 | — | — | 10,397 | ||||||||||||||
| Customers | 4,751 | 634 | 1,188 | 256 | — | 6,829 | ||||||||||||||
| Financial assets designated at fair value through profit or loss | 2,451 | 2,928 | 3,686 | 2,334 | 4,558 | 15,957 | ||||||||||||||
| Debt securities | 64 | 142 | 699 | 700 | 911 | 2,516 | ||||||||||||||
| Loans and advances | 2,387 | 2,786 | 2,987 | 1,634 | 3,647 | 13,441 | ||||||||||||||
| Credit institutions | 1,138 | 1,476 | 205 | 10 | 323 | 3,152 | ||||||||||||||
| Customers | 1,249 | 1,310 | 2,782 | 1,624 | 3,324 | 10,289 | ||||||||||||||
| Non-trading financial assets mandatorily at fair value through profit or loss | 116 | 49 | 127 | 67 | 5,177 | 5,536 | ||||||||||||||
| Equity instruments | — | 4,042 | 4,042 | |||||||||||||||||
| Debt instruments | 4 | 40 | 4 | 6 | 903 | 957 | ||||||||||||||
| Loans and advances | 112 | 9 | 123 | 61 | 232 | 537 | ||||||||||||||
| Customers | 112 | 9 | 123 | 61 | 232 | 537 | ||||||||||||||
| Financial assets at fair value through other comprehensive income | — | — | — | — | 2,453 | 2,453 | ||||||||||||||
| Equity instruments | — | — | — | — | 2,453 | 2,453 | ||||||||||||||
| Hedging derivatives | 368 | 857 | 748 | 1,270 | 1,518 | 4,761 | ||||||||||||||
| Changes in the fair value of hedged items in portfolio hedges of interest rate risk | 429 | (11) | (304) | 19 | 277 | 410 | ||||||||||||||
| TOTAL FINANCIAL ASSETS | 25,251 | 24,450 | 24,304 | 18,795 | 53,270 | 146,070 | ||||||||||||||
| 31 December 2021 | ||||||||||||||||||||
| EUR million | ||||||||||||||||||||
| Within 3 months | 3 to 12 months | 1 to 3 years |
3 to 5 years |
More than 5 years | Total | |||||||||||||||
| FINANCIAL LIABILITIES | ||||||||||||||||||||
| Financial liabilities held for trading | 26,142 | 9,234 | 15,709 | 12,750 | 15,634 | 79,469 | ||||||||||||||
| Derivatives | 4,485 | 7,583 | 14,868 | 11,912 | 14,718 | 53,566 | ||||||||||||||
| Shorts positions | 8,559 | 1,290 | 728 | 743 | 916 | 12,236 | ||||||||||||||
| Deposits | 13,098 | 361 | 113 | 95 | — | 13,667 | ||||||||||||||
| Central banks | 1,038 | — | — | — | — | 1,038 | ||||||||||||||
| Credits institutions | 5,919 | 361 | 113 | 95 | — | 6,488 | ||||||||||||||
| Customers | 6,141 | — | — | — | — | 6,141 | ||||||||||||||
| Financial liabilities designated at fair value through profit or loss | 4,809 | 1,187 | 2,621 | 1,085 | 5,241 | 14,943 | ||||||||||||||
| Deposits | 4,683 | 748 | 753 | 624 | 2,681 | 9,489 | ||||||||||||||
| Central banks | 569 | 38 | — | — | — | 607 | ||||||||||||||
| Credits institutions | 237 | 487 | 30 | 178 | 132 | 1,064 | ||||||||||||||
| Customers | 3,877 | 223 | 723 | 446 | 2,549 | 7,818 | ||||||||||||||
Marketable debt securitiesA |
126 | 439 | 1,868 | 461 | 2,560 | 5,454 | ||||||||||||||
| Hedging derivatives | 613 | 930 | 1,667 | 824 | 1,429 | 5,463 | ||||||||||||||
| Changes in the fair value of hedged items in portfolio hedges of interest rate risk | 45 | 16 | 58 | 49 | 80 | 248 | ||||||||||||||
| TOTAL FINANCIAL LIABILITIES | 31,609 | 11,367 | 20,055 | 14,708 | 22,384 | 100,123 | ||||||||||||||
| 31 December 2021 | ||||||||||||||||||||
| EUR million | ||||||||||||||||||||
| Within 3 months | 3 to 12 months | 1 to 3 years |
3 to 5 years |
More than 5 years | Total | |||||||||||||||
| Memorandum items | ||||||||||||||||||||
| Loans commitment granted | 123,529 | 27,587 | 51,999 | 49,781 | 9,841 | 262,737 | ||||||||||||||
| Financial guarantees granted | 3,617 | 4,251 | 1,749 | 687 | 454 | 10,758 | ||||||||||||||
| Other commitments granted | 52,359 | 12,008 | 7,297 | 1,539 | 2,530 | 75,733 | ||||||||||||||
| MEMORANDUM ITEMS | 179,505 | 43,846 | 61,045 | 52,007 | 12,825 | 349,228 | ||||||||||||||
| Equivalent value in EUR million | ||||||||||||||||||||||||||
| 2023 | 2022 | 2021 | ||||||||||||||||||||||||
| Assets | Liabilities | Assets | Liabilities | Assets | Liabilities | |||||||||||||||||||||
| Cash, cash balances at central banks and other deposits on demand | 114,410 | — | 122,391 | — | 105,457 | — | ||||||||||||||||||||
| Financial assets/liabilities held for trading | 106,011 | 60,581 | 94,256 | 60,105 | 65,345 | 49,314 | ||||||||||||||||||||
| Non-trading financial assets mandatorily at fair value through profit or loss | 3,291 | — | 3,210 | — | 2,460 | — | ||||||||||||||||||||
| Other financial assets/liabilities at fair value through profit or loss | 1,721 | 12,699 | 1,085 | 19,929 | 1,230 | 8,785 | ||||||||||||||||||||
| Financial assets at fair value through other comprehensive income | 60,516 | — | 62,046 | — | 78,086 | — | ||||||||||||||||||||
| Financial assets at amortized cost | 773,504 | — | 747,138 | — | 680,774 | — | ||||||||||||||||||||
| Investments | 1,689 | — | 1,296 | — | 1,666 | — | ||||||||||||||||||||
| Tangible assets | 20,797 | — | 21,834 | — | 22,350 | — | ||||||||||||||||||||
| Intangible assets | 12,772 | — | 11,881 | — | 10,066 | — | ||||||||||||||||||||
| Financial liabilities at amortized cost | — | 937,917 | — | 893,531 | — | 796,395 | ||||||||||||||||||||
| Liabilities under insurance contracts | — | 330 | — | 349 | — | 328 | ||||||||||||||||||||
| Other | 26,236 | 25,740 | 23,886 | 24,372 | 22,631 | 20,420 | ||||||||||||||||||||
| 1,120,947 | 1,037,267 | 1,089,023 | 998,286 | 990,065 | 875,242 | |||||||||||||||||||||
| EUR million | |||||||||||||||||||||||||||||||||||||||||||||||||||||
| 2023 | 2022 | 2021 | |||||||||||||||||||||||||||||||||||||||||||||||||||
| Assets | Carrying amount | Fair value | Level 1 | Level 2 | Level 3 | Carrying amount | Fair value | Level 1 | Level 2 | Level 3 | Carrying amount | Fair value | Level 1 | Level 2 | Level 3 | ||||||||||||||||||||||||||||||||||||||
| Loans and advances | 1,087,844 | 1,077,543 | — | 103,414 | 974,129 | 1,073,490 | 1,053,703 | — | 64,968 | 988,735 | 1,002,190 | 1,006,711 | — | 69,840 | 936,871 | ||||||||||||||||||||||||||||||||||||||
| Debt securities | 103,559 | 102,888 | 67,951 | 11,057 | 23,880 | 73,554 | 70,373 | 37,805 | 19,254 | 13,314 | 35,708 | 35,378 | 13,558 | 12,158 | 9,662 | ||||||||||||||||||||||||||||||||||||||
| 1,191,403 | 1,180,431 | 67,951 | 114,471 | 998,009 | 1,147,044 | 1,124,076 | 37,805 | 84,222 | 1,002,049 | 1,037,898 | 1,042,089 | 13,558 | 81,998 | 946,533 | |||||||||||||||||||||||||||||||||||||||
| EUR million | |||||||||||||||||||||||||||||||||||||||||||||||||||||
| 2023 | 2022 | 2021 | |||||||||||||||||||||||||||||||||||||||||||||||||||
LiabilitiesA |
Carrying amount | Fair value | Level 1 | Level 2 | Level 3 | Carrying amount | Fair value | Level 1 | Level 2 | Level 3 | Carrying amount | Fair value | Level 1 | Level 2 | Level 3 | ||||||||||||||||||||||||||||||||||||||
| Deposits | 1,125,308 | 1,124,373 | — | 263,428 | 860,945 | 1,111,887 | 1,108,918 | — | 258,701 | 850,217 | 1,078,587 | 1,076,876 | — | 286,613 | 790,263 | ||||||||||||||||||||||||||||||||||||||
| Debt securities | 303,208 | 298,792 | 136,109 | 125,575 | 37,108 | 274,912 | 263,191 | 106,169 | 124,939 | 32,083 | 240,709 | 246,697 | 109,346 | 115,034 | 22,317 | ||||||||||||||||||||||||||||||||||||||
| 1,428,516 | 1,423,165 | 136,109 | 389,003 | 898,053 | 1,386,799 | 1,372,109 | 106,169 | 383,640 | 882,300 | 1,319,296 | 1,323,573 | 109,346 | 401,647 | 812,580 | |||||||||||||||||||||||||||||||||||||||
| 31 December 2023 | |||||||||||
| EUR million | |||||||||||
| Assets | Gross amount of financial assets |
Gross amount of financial assets offset in the balance sheet |
Net amount of financial assets presented in the balance sheet |
||||||||
| Derivatives | 149,508 | (87,883) | 61,625 | ||||||||
| Reverse repurchase agreements | 179,580 | (79,500) | 100,080 | ||||||||
| Total | 329,088 | (167,383) | 161,705 | ||||||||
| 31 December 2022 | |||||||||||
| EUR million | |||||||||||
| Assets | Gross amount of financial assets |
Gross amount of financial assets offset in the balance sheet |
Net amount of financial assets presented in the balance sheet |
||||||||
| Derivatives | 176,814 | (101,743) | 75,071 | ||||||||
| Reverse repurchase agreements | 127,561 | (48,949) | 78,612 | ||||||||
| Total | 304,375 | (150,692) | 153,683 | ||||||||
| 31 December 2021 | |||||||||||
| EUR million | |||||||||||
| Assets | Gross amount of financial assets |
Gross amount of financial assets offset in the balance sheet |
Net amount of financial assets presented in the balance sheet |
||||||||
| Derivatives | 101,486 | (42,432) | 59,054 | ||||||||
| Reverse repurchase agreements | 72,023 | (13,917) | 58,106 | ||||||||
| Total | 173,509 | (56,349) | 117,160 | ||||||||
| 31 December 2023 | |||||||||||
| EUR million | |||||||||||
| Liabilities | Gross amount of financial liabilities |
Gross amount of financial liabilities offset in the balance sheet |
Net amount of financial liabilities presented in the balance sheet |
||||||||
| Derivatives | 146,128 | (87,883) | 58,245 | ||||||||
| Reverse repurchase agreements | 212,840 | (79,500) | 133,340 | ||||||||
| Total | 358,968 | (167,383) | 191,585 | ||||||||
| 31 December 2022 | |||||||||||
| EUR million | |||||||||||
| Liabilities | Gross amount of financial liabilities |
Gross amount of financial liabilities offset in the balance sheet |
Net amount of financial liabilities presented in the balance sheet |
||||||||
| Derivatives | 175,862 | (101,743) | 74,119 | ||||||||
| Reverse repurchase agreements | 148,715 | (48,949) | 99,766 | ||||||||
| Total | 324,577 | (150,692) | 173,885 | ||||||||
| 31 December 2021 | |||||||||||
| EUR million | |||||||||||
| Liabilities | Gross amount of financial liabilities |
Gross amount of financial liabilities offset in the balance sheet |
Net amount of financial liabilities presented in the balance sheet |
||||||||
| Derivatives | 101,462 | (42,432) | 59,029 | ||||||||
| Reverse repurchase agreements | 73,424 | (13,916) | 59,508 | ||||||||
| Total | 174,886 | (56,348) | 118,537 | ||||||||
| EUR million | |||||||||||||||||||||||
| 2023 | |||||||||||||||||||||||
| Balance sheet (condensed) | Europe | North America | South America | Digital Consumer Bank | Corporate Centre | Intra-Group eliminations | Total | ||||||||||||||||
| Total assets | 955,344 | 294,827 | 325,049 | 166,796 | 254,705 | (199,660) | 1,797,062 | ||||||||||||||||
| Total liabilities | 911,173 | 271,183 | 299,155 | 153,355 | 166,809 | (108,854) | 1,692,821 | ||||||||||||||||
| Total equity | 44,171 | 23,644 | 25,894 | 13,441 | 87,896 | (90,806) | 104,241 | ||||||||||||||||
| Other customer funds under management | 111,933 | 18,733 | 78,076 | 996 | — | — | 209,737 | ||||||||||||||||
| Other non-managed marketed customer funds | 26,390 | 18,503 | 1,087 | 4,057 | — | — | 50,036 | ||||||||||||||||
| EUR million | |||||||||||||||||||||||
| 2022 | |||||||||||||||||||||||
| Balance sheet (condensed) | Europe | North America | South America | Digital Consumer Bank | Corporate Centre | Intra-Group eliminations | Total | ||||||||||||||||
| Total assets | 958,207 | 288,595 | 292,925 | 151,015 | 262,218 | (218,301) | 1,734,659 | ||||||||||||||||
| Total liabilities | 915,167 | 262,931 | 268,417 | 137,986 | 178,651 | (126,078) | 1,637,074 | ||||||||||||||||
| Total equity | 43,040 | 25,664 | 24,508 | 13,029 | 83,567 | (92,223) | 97,585 | ||||||||||||||||
| Other customer funds under management | 100,178 | 15,571 | 65,251 | 880 | — | — | 181,880 | ||||||||||||||||
| Other non-managed marketed customer funds | 23,305 | 20,908 | 1,077 | 3,089 | — | — | 48,379 | ||||||||||||||||
| EUR million | |||||||||||||||||||||||
| 2021 | |||||||||||||||||||||||
| Balance sheet (condensed) | Europe |
North America | South America | Digital Consumer Bank | Corporate Centre |
Intra-Group eliminations | Total | ||||||||||||||||
| Total assets | 943,875 | 244,734 | 257,805 | 148,005 | 215,467 | (214,051) | 1,595,835 | ||||||||||||||||
| Total liabilities | 899,007 | 216,048 | 237,375 | 135,599 | 135,950 | (125,197) | 1,498,782 | ||||||||||||||||
| Total equity | 44,868 | 28,686 | 20,430 | 12,406 | 79,517 | (88,854) | 97,053 | ||||||||||||||||
| Other customer funds under management | 114,698 | 13,949 | 57,428 | 852 | — | — | 186,927 | ||||||||||||||||
| Other non-managed marketed customer funds | 25,572 | 20,213 | 103 | 2,497 | — | — | 48,385 | ||||||||||||||||
| EUR million | ||||||||||||||||||||
| 2023 | ||||||||||||||||||||
| Underlying income statement (condensed) | Europe | North America | South America | Digital Consumer Bank | Corporate centre | Total | ||||||||||||||
Net interest incomeA |
15,910 | 10,159 | 13,040 | 4,193 | (41) | 43,261 | ||||||||||||||
| Net fee income | 4,399 | 2,192 | 4,684 | 796 | (13) | 12,057 | ||||||||||||||
Gains (losses) on financial transactionsB |
1,033 | 505 | 1,280 | 117 | (302) | 2,633 | ||||||||||||||
Other operating incomeC |
97 | 318 | (1,033) | 396 | (83) | (304) | ||||||||||||||
| Total income | 21,439 | 13,174 | 17,971 | 5,502 | (439) | 57,647 | ||||||||||||||
| Administrative expenses, depreciation and amortisation | (9,030) | (6,465) | (6,920) | (2,618) | (391) | (25,425) | ||||||||||||||
Net operating incomeD |
12,409 | 6,708 | 11,050 | 2,884 | (829) | 32,222 | ||||||||||||||
Net loan-loss provisionsE |
(2,533) | (3,733) | (5,401) | (792) | 2 | (12,458) | ||||||||||||||
Other gains (losses) and provisionsF |
(1,681) | (138) | (1,041) | (72) | (134) | (3,066) | ||||||||||||||
| Operating profit/(loss) before tax | 8,195 | 2,837 | 4,608 | 2,019 | (961) | 16,698 | ||||||||||||||
| Tax on profit | (2,371) | (468) | (1,121) | (493) | (36) | (4,489) | ||||||||||||||
| Profit from continuing operations | 5,824 | 2,369 | 3,487 | 1,526 | (998) | 12,209 | ||||||||||||||
| Net profit from discontinued operations | — | — | — | — | — | — | ||||||||||||||
| Consolidated profit | 5,824 | 2,369 | 3,487 | 1,526 | (998) | 12,209 | ||||||||||||||
| Non-controlling interests | (342) | (15) | (449) | (327) | — | (1,133) | ||||||||||||||
| Attributable profit to the parent | 5,482 | 2,354 | 3,038 | 1,199 | (998) | 11,076 | ||||||||||||||
| EUR million | ||||||||||||||||||||
| 2022 | ||||||||||||||||||||
| Underlying income statement (condensed) | Europe |
North America | South America | Digital Consumer Bank | Corporate Centre |
Total | ||||||||||||||
Net interest incomeA |
12,565 | 9,705 | 12,979 | 4,022 | (652) | 38,619 | ||||||||||||||
| Net fee income | 4,493 | 1,958 | 4,515 | 843 | (19) | 11,790 | ||||||||||||||
Gains (losses) on financial transactionsB |
821 | 204 | 1,291 | 60 | (723) | 1,653 | ||||||||||||||
Other operating incomeC |
151 | 449 | (761) | 344 | (91) | 92 | ||||||||||||||
| Total income | 18,030 | 12,316 | 18,024 | 5,269 | (1,485) | 52,154 | ||||||||||||||
| Administrative expenses, depreciation and amortisation | (8,523) | (5,871) | (6,675) | (2,462) | (372) | (23,903) | ||||||||||||||
Net operating incomeD |
9,507 | 6,445 | 11,349 | 2,807 | (1,857) | 28,251 | ||||||||||||||
Net loan-loss provisionsE |
(2,396) | (2,538) | (5,041) | (544) | 10 | (10,509) | ||||||||||||||
Other gains (losses) and provisionsF |
(1,629) | (118) | (544) | (27) | (174) | (2,492) | ||||||||||||||
| Operating profit/(loss) before tax | 5,482 | 3,789 | 5,764 | 2,236 | (2,021) | 15,250 | ||||||||||||||
| Tax on profit | (1,492) | (869) | (1,549) | (549) | (27) | (4,486) | ||||||||||||||
| Profit from continuing operations | 3,990 | 2,920 | 4,215 | 1,687 | (2,048) | 10,764 | ||||||||||||||
| Net profit from discontinued operations | — | — | — | — | — | — | ||||||||||||||
| Consolidated profit | 3,990 | 2,920 | 4,215 | 1,687 | (2,048) | 10,764 | ||||||||||||||
| Non-controlling interests | 179 | 43 | 557 | 379 | 1 | 1,159 | ||||||||||||||
| Attributable profit to the parent | 3,811 | 2,877 | 3,658 | 1,308 | (2,049) | 9,605 | ||||||||||||||
| EUR million | ||||||||||||||||||||
| 2021 | ||||||||||||||||||||
| Underlying income statement (condensed) | Europe |
North America | South America |
Digital
Consumer
Bank
|
Corporate Centre |
Total | ||||||||||||||
Net interest incomeA |
10,574 | 8,072 | 11,307 | 4,041 | (624) | 33,370 | ||||||||||||||
| Net fee income | 4,344 | 1,644 | 3,721 | 821 | (28) | 10,502 | ||||||||||||||
Gains (losses) on financial transactionsB |
756 | 224 | 716 | 8 | (141) | 1,563 | ||||||||||||||
Other operating incomeC |
260 | 914 | (407) | 229 | (27) | 969 | ||||||||||||||
| Total income | 15,934 | 10,854 | 15,337 | 5,099 | (820) | 46,404 | ||||||||||||||
| Administrative expenses, depreciation and amortisation | (8,318) | (4,967) | (5,379) | (2,405) | (346) | (21,415) | ||||||||||||||
Net operating incomeD |
7,616 | 5,887 | 9,958 | 2,694 | (1,166) | 24,989 | ||||||||||||||
Net loan-loss provisionsE |
(2,293) | (1,210) | (3,251) | (527) | (155) | (7,436) | ||||||||||||||
Other gains (losses) and provisionsF |
(1,290) | (145) | (474) | (194) | (190) | (2,293) | ||||||||||||||
| Operating profit/(loss) before tax | 4,033 | 4,532 | 6,233 | 1,973 | (1,511) | 15,260 | ||||||||||||||
| Tax on profit | (1,212) | (1,016) | (2,360) | (464) | (24) | (5,076) | ||||||||||||||
| Profit from continuing operations | 2,821 | 3,516 | 3,873 | 1,509 | (1,535) | 10,184 | ||||||||||||||
| Net profit from discontinued operations | — | — | — | — | — | — | ||||||||||||||
| Consolidated profit | 2,821 | 3,516 | 3,873 | 1,509 | (1,535) | 10,184 | ||||||||||||||
| Non-controlling interests | 71 | 556 | 556 | 345 | 2 | 1,530 | ||||||||||||||
| Attributable profit to the parent | 2,750 | 2,960 | 3,317 | 1,164 | (1,537) | 8,654 | ||||||||||||||
| EUR million | ||||||||||||||||||||
| 2023 | ||||||||||||||||||||
| Underlying income statement (condensed) | Retail Banking |
Santander Corporate & Investment Banking |
Wealth Management & Insurance |
PagoNxt | Corporate centre |
Total | ||||||||||||||
Net interest incomeA |
37,985 | 3,485 | 1,739 | 93 | (41) | 43,261 | ||||||||||||||
| Net fee income | 7,661 | 2,190 | 1,265 | 954 | (13) | 12,057 | ||||||||||||||
Gains (losses) on financial transactionsB |
214 | 2,581 | 149 | (10) | (302) | 2,633 | ||||||||||||||
Other operating incomeC |
(606) | 41 | 241 | 102 | (83) | (304) | ||||||||||||||
| Total income | 45,254 | 8,296 | 3,396 | 1,140 | (439) | 57,647 | ||||||||||||||
| Administrative expenses, depreciation and amortisation | (19,396) | (3,391) | (1,156) | (1,091) | (391) | (25,425) | ||||||||||||||
Net operating incomeD |
25,858 | 4,905 | 2,240 | 49 | (829) | 32,222 | ||||||||||||||
Net loan-loss provisionsE |
(12,295) | (162) | 21 | (24) | 2 | (12,458) | ||||||||||||||
Other gains (losses) and provisionsF |
(2,691) | (174) | (26) | (42) | (134) | (3,066) | ||||||||||||||
| Operating profit/(loss) before tax | 10,872 | 4,570 | 2,235 | (17) | (961) | 16,698 | ||||||||||||||
| Tax on profit | (2,586) | (1,280) | (528) | (59) | (36) | (4,489) | ||||||||||||||
| Profit/(loss) from continuing operations | 8,286 | 3,290 | 1,707 | (76) | (998) | 12,209 | ||||||||||||||
| Net profit/(loss) from discontinued operations | — | — | — | — | — | — | ||||||||||||||
| Consolidated profit/(loss) | 8,286 | 3,290 | 1,707 | (76) | (998) | 12,209 | ||||||||||||||
| Non-controlling interests | (849) | (212) | (71) | (1) | — | (1,133) | ||||||||||||||
| Attributable profit/(loss) to the parent | 7,436 | 3,078 | 1,637 | (77) | (998) | 11,076 | ||||||||||||||
| EUR million | ||||||||||||||||||||
| 2022 | ||||||||||||||||||||
| Underlying income statement (condensed) | Retail Banking |
Santander Corporate & Investment Banking (SCIB) |
Wealth Management & Insurance |
PagoNxt | Corporate Centre | Total | ||||||||||||||
Net interest incomeA |
34,880 | 3,544 | 825 | 22 | (652) | 38,619 | ||||||||||||||
| Net fee income | 7,650 | 1,988 | 1,291 | 881 | (19) | 11,790 | ||||||||||||||
Gains (losses) on financial transactionsB |
435 | 1,833 | 123 | (14) | (723) | 1,653 | ||||||||||||||
Other operating incomeC |
(280) | 31 | 369 | 64 | (91) | 92 | ||||||||||||||
| Total income | 42,685 | 7,396 | 2,608 | 953 | (1,485) | 52,154 | ||||||||||||||
| Administrative expenses, depreciation and amortisation | (18,568) | (2,898) | (1,041) | (1,024) | (372) | (23,903) | ||||||||||||||
Net operating incomeD |
24,117 | 4,498 | 1,567 | (71) | (1,857) | 28,251 | ||||||||||||||
Net loan-loss provisionsE |
(10,210) | (251) | (14) | (44) | 10 | (10,509) | ||||||||||||||
Other gains (losses) and provisionsF |
(2,135) | (131) | (26) | (26) | (174) | (2,492) | ||||||||||||||
| Operating profit/(loss) before tax | 11,772 | 4,116 | 1,527 | (141) | (2,021) | 15,250 | ||||||||||||||
| Tax on profit | (2,931) | (1,119) | (347) | (63) | (27) | (4,486) | ||||||||||||||
| Profit/(loss) from continuing operations | 8,841 | 2,997 | 1,180 | (204) | (2,048) | 10,764 | ||||||||||||||
| Net profit/(loss) from discontinued operations | — | — | — | — | — | — | ||||||||||||||
| Consolidated profit/(loss) | 8,841 | 2,997 | 1,180 | (204) | (2,048) | 10,764 | ||||||||||||||
| Non-controlling interests | 895 | 192 | 60 | 12 | 1 | 1,159 | ||||||||||||||
| Attributable profit/(loss) to the parent | 7,946 | 2,805 | 1,120 | (216) | (2,049) | 9,605 | ||||||||||||||
| EUR million | ||||||||||||||||||||
| 2021 | ||||||||||||||||||||
| Underlying income statement (condensed) | Retail Banking |
Santander Corporate & Investment Banking (SCIB) |
Wealth Management & Insurance |
PagoNxt | Corporate Centre |
Total | ||||||||||||||
Net interest incomeA |
30,595 | 2,921 | 477 | 1 | (624) | 33,370 | ||||||||||||||
| Net fee income | 7,045 | 1,744 | 1,248 | 493 | (28) | 10,502 | ||||||||||||||
Gains (losses) on financial transactionsB |
839 | 766 | 100 | (1) | (141) | 1,563 | ||||||||||||||
Other operating incomeC |
390 | 188 | 416 | 2 | (27) | 969 | ||||||||||||||
| Total income | 38,869 | 5,619 | 2,241 | 495 | (820) | 46,404 | ||||||||||||||
| Administrative expenses, depreciation and amortisation | (17,102) | (2,380) | (914) | (673) | (346) | (21,415) | ||||||||||||||
Net operating incomeD |
21,767 | 3,239 | 1,327 | (178) | (1,166) | 24,989 | ||||||||||||||
Net loan-loss provisionsE |
(7,082) | (151) | (38) | (10) | (155) | (7,436) | ||||||||||||||
Other gains (losses) and provisionsF |
(2,053) | (17) | 6 | (39) | (190) | (2,293) | ||||||||||||||
| Operating profit/(loss) before tax | 12,632 | 3,071 | 1,295 | (227) | (1,511) | 15,260 | ||||||||||||||
| Tax on profit | (3,898) | (821) | (309) | (24) | (24) | (5,076) | ||||||||||||||
| Profit/(loss) from continuing operations | 8,734 | 2,250 | 986 | (251) | (1,535) | 10,184 | ||||||||||||||
| Net profit/(loss) from discontinued operations | — | — | — | — | — | — | ||||||||||||||
| Consolidated profit/(loss) | 8,734 | 2,250 | 986 | (251) | (1,535) | 10,184 | ||||||||||||||
| Non-controlling interests | 1,345 | 137 | 44 | 2 | 2 | 1,530 | ||||||||||||||
| Attributable profit/(loss) to the parent | 7,389 | 2,113 | 942 | (253) | (1,537) | 8,654 | ||||||||||||||
| EUR million | |||||||||||
| 2023 | |||||||||||
| Reconciliation of statutory results to underlying results | Statutory results | Adjustments | Underlying results | ||||||||
Net interest incomeA |
43,261 | — | 43,261 | ||||||||
| Net fee income | 12,057 | — | 12,057 | ||||||||
Gains (losses) on financial transactionsB |
2,633 | — | 2,633 | ||||||||
Other operating incomeC |
(528) | 224 | (304) | ||||||||
| Total income | 57,423 | 224 | 57,647 | ||||||||
| Administrative expenses, depreciation and amortisation | (25,425) | — | (25,425) | ||||||||
Net operating incomeD |
31,998 | 224 | 32,222 | ||||||||
Net loan-loss provisionsE |
(12,932) | 474 | (12,458) | ||||||||
Other gains (losses) and provisionsF |
(2,607) | (459) | (3,066) | ||||||||
| Operating profit/(loss) before tax | 16,459 | 239 | 16,698 | ||||||||
| Tax on profit | (4,276) | (213) | (4,489) | ||||||||
| Adjusted profit for the year from continuing operations | 12,183 | 26 | 12,209 | ||||||||
| Profit from discontinued operations (net) | — | — | — | ||||||||
| Consolidated profit/(loss) | 12,183 | 26 | 12,209 | ||||||||
| Non-controlling interests | (1,107) | (26) | (1,133) | ||||||||
| Attributable profit/(loss) to the parent | 11,076 | — | 11,076 | ||||||||
| EUR million | |||||||||||
| 2022 | |||||||||||
| Reconciliation of statutory results to underlying results | Statutory results | Adjustments | Underlying results | ||||||||
Net interest incomeA |
38,619 | — | 38,619 | ||||||||
| Net fee income | 11,790 | — | 11,790 | ||||||||
Gains (losses) on financial transactionsB |
1,653 | — | 1,653 | ||||||||
Other operating incomeC |
55 | 37 | 92 | ||||||||
| Total income | 52,117 | 37 | 52,154 | ||||||||
| Administrative expenses, depreciation and amortisation | (23,903) | — | (23,903) | ||||||||
Net operating incomeD |
28,214 | 37 | 28,251 | ||||||||
Net loan-loss provisionsE |
(10,836) | 327 | (10,509) | ||||||||
Other gains (losses) and provisionsF |
(2,128) | (364) | (2,492) | ||||||||
| Operating profit/(loss) before tax | 15,250 | — | 15,250 | ||||||||
| Tax on profit | (4,486) | — | (4,486) | ||||||||
| Adjusted profit for the year from continuing operations | 10,764 | — | 10,764 | ||||||||
| Profit from discontinued operations (net) | — | — | — | ||||||||
| Consolidated profit/(loss) | 10,764 | — | 10,764 | ||||||||
| Non-controlling interests | (1,159) | — | (1,159) | ||||||||
| Attributable profit/(loss) to the parent | 9,605 | — | 9,605 | ||||||||
| EUR million | |||||||||||
| 2021 | |||||||||||
| Reconciliation of statutory results to underlying results | Statutory results | Adjustments | Underlying results | ||||||||
Net interest incomeA |
33,370 | — | 33,370 | ||||||||
| Net fee income | 10,502 | — | 10,502 | ||||||||
Gains (losses) on financial transactionsB |
1,563 | — | 1,563 | ||||||||
Other operating incomeC |
969 | — | 969 | ||||||||
| Total income | 46,404 | — | 46,404 | ||||||||
| Administrative expenses, depreciation and amortisation | (21,415) | — | (21,415) | ||||||||
Net operating incomeD |
24,989 | — | 24,989 | ||||||||
Net loan-loss provisionsE |
(7,436) | — | (7,436) | ||||||||
Other gains (losses) and provisionsF |
(3,006) | 713 | (2,293) | ||||||||
| Operating profit/(loss) before tax | 14,547 | 713 | 15,260 | ||||||||
| Tax on profit | (4,894) | (182) | (5,076) | ||||||||
| Adjusted profit for the year from continuing operations | 9,653 | 531 | 10,184 | ||||||||
| Profit from discontinued operations (net) | — | — | — | ||||||||
| Consolidated profit/(loss) | 9,653 | 531 | 10,184 | ||||||||
| Non-controlling interests | (1,529) | (1) | (1,530) | ||||||||
| Attributable profit/(loss) to the parent | 8,124 | 530 | 8,654 | ||||||||
| EUR million | ||||||||||||||
| 2023 | ||||||||||||||
| Associates and joint ventures | Members of the board of directors | Senior Management | Other related parties | |||||||||||
| Assets | 10,497 | — | 12 | 186 | ||||||||||
| Cash, cash balances at central banks and other deposits on demand | 154 | — | — | — | ||||||||||
| Loans and advances: credit institutions | 405 | — | — | — | ||||||||||
| Loans and advances: customers | 9,275 | — | 12 | 185 | ||||||||||
| Debt securities | 391 | — | — | 1 | ||||||||||
| Others | 272 | — | — | — | ||||||||||
| Liabilities | 2,480 | 14 | 5 | 150 | ||||||||||
| Financial liabilities: credit institutions | 463 | — | — | — | ||||||||||
| Financial liabilities: customers | 1,727 | 14 | 5 | 150 | ||||||||||
| Marketable debt securities | — | — | — | — | ||||||||||
| Others | 290 | — | — | — | ||||||||||
| Income statement | 1,698 | — | — | 11 | ||||||||||
| Interest income | 427 | — | — | 9 | ||||||||||
| Interest expense | (149) | — | — | (1) | ||||||||||
| Gains/losses on financial assets and liabilities and others | 43 | — | — | — | ||||||||||
| Commission income | 1,499 | — | — | 3 | ||||||||||
| Commission expense | (122) | — | — | — | ||||||||||
| Other | 4,189 | 3 | 2 | 1,094 | ||||||||||
| Financial guarantees granted and Others | 10 | 2 | 1 | 861 | ||||||||||
| Loan commitments and Other commitments granted | 274 | 1 | 1 | 9 | ||||||||||
| Derivative financial instruments | 3,905 | — | — | 224 | ||||||||||
| EUR million | ||||||||||||||
| 2022 | ||||||||||||||
| Associates and joint ventures | Members of the board of directors | Senior Management | Other related parties | |||||||||||
| Assets | 10,257 | — | 13 | 455 | ||||||||||
| Cash, cash balances at central banks and other deposits on demand | 227 | — | — | — | ||||||||||
| Loans and advances: credit institutions | 489 | — | — | — | ||||||||||
| Loans and advances: customers | 8,822 | — | 13 | 455 | ||||||||||
| Debt securities | 463 | — | — | — | ||||||||||
| Others | 256 | — | — | — | ||||||||||
| Liabilities | 3,611 | 11 | 11 | 109 | ||||||||||
| Financial liabilities: credit institutions | 938 | — | — | — | ||||||||||
| Financial liabilities: customers | 2,301 | 11 | 11 | 109 | ||||||||||
| Marketable debt securities | — | — | — | — | ||||||||||
| Others | 372 | — | — | — | ||||||||||
| Income statement | 1,357 | — | — | 2 | ||||||||||
| Interest income | 189 | — | — | 1 | ||||||||||
| Interest expense | (60) | — | — | — | ||||||||||
| Gains/losses on financial assets and liabilities and others | (225) | — | — | — | ||||||||||
| Commission income | 1,541 | — | — | 1 | ||||||||||
| Commission expense | (88) | — | — | — | ||||||||||
| Other | 3,535 | 2 | 2 | 79 | ||||||||||
| Financial guarantees granted and Others | 11 | 1 | 1 | 23 | ||||||||||
| Loan commitments and Other commitments granted | 201 | 1 | 1 | 13 | ||||||||||
| Derivative financial instruments | 3,323 | — | — | 43 | ||||||||||
| EUR million | ||||||||||||||
| 2021 | ||||||||||||||
| Associates and joint ventures | Members of the board of directors | Senior Management | Other related parties | |||||||||||
| Assets | 9,386 | — | 14 | 384 | ||||||||||
| Cash, cash balances at central banks and other deposits on demand | 131 | — | — | — | ||||||||||
| Loans and advances: credit institutions | 437 | — | — | — | ||||||||||
| Loans and advances: customers | 8,148 | — | 14 | 384 | ||||||||||
| Debt securities | 496 | — | — | — | ||||||||||
| Others | 174 | — | — | — | ||||||||||
| Liabilities | 3,405 | 8 | 11 | 197 | ||||||||||
| Financial liabilities: credit institutions | 867 | — | — | — | ||||||||||
| Financial liabilities: customers | 2,464 | 8 | 11 | 197 | ||||||||||
| Marketable debt securities | — | — | — | — | ||||||||||
| Others | 74 | — | — | — | ||||||||||
| Income statement | 1,265 | — | — | 1 | ||||||||||
| Interest income | 90 | — | — | 1 | ||||||||||
| Interest expense | (13) | — | — | — | ||||||||||
| Gains/losses on financial assets and liabilities and others | (32) | — | — | — | ||||||||||
| Commission income | 1,268 | — | — | — | ||||||||||
| Commission expense | (48) | — | — | — | ||||||||||
| Other | 3,965 | 2 | 2 | 76 | ||||||||||
| Financial guarantees granted and Others | 11 | 1 | 1 | 17 | ||||||||||
| Loan commitments and Other commitments granted | 314 | 1 | 1 | 13 | ||||||||||
| Derivative financial instruments | 3,640 | — | — | 46 | ||||||||||
Main credit risk performance metrics from activity with customersA | |||||||||||||||||||||||||||||||||||
| December data | |||||||||||||||||||||||||||||||||||
Credit risk with customers (EUR million)B |
Credit impaired loans (EUR million) |
NPL ratio (%) | |||||||||||||||||||||||||||||||||
| 2023 | 2022 | 2021 | 2023 | 2022 | 2021 | 2023 | 2022 | 2021 | |||||||||||||||||||||||||||
| Europe | 624,696 | 639,996 | 636,123 | 14,495 | 15,186 | 19,822 | 2.32 | % | 2.37 | % | 3.12 | % | |||||||||||||||||||||||
| Spain | 278,569 | 293,197 | 283,953 | 8,529 | 9,598 | 13,403 | 3.06 | % | 3.27 | % | 4.72 | % | |||||||||||||||||||||||
| UK | 247,360 | 253,455 | 262,869 | 3,518 | 3,059 | 3,766 | 1.42 | % | 1.21 | % | 1.43 | % | |||||||||||||||||||||||
| Portugal | 39,503 | 41,755 | 41,941 | 1,024 | 1,247 | 1,442 | 2.59 | % | 2.99 | % | 3.44 | % | |||||||||||||||||||||||
| Poland | 39,329 | 33,350 | 33,497 | 1,397 | 1,268 | 1,210 | 3.55 | % | 3.80 | % | 3.61 | % | |||||||||||||||||||||||
| North America | 190,720 | 185,614 | 149,792 | 7,805 | 5,629 | 3,632 | 4.09 | % | 3.03 | % | 2.42 | % | |||||||||||||||||||||||
| US | 137,893 | 140,452 | 112,808 | 6,303 | 4,571 | 2,624 | 4.57 | % | 3.25 | % | 2.33 | % | |||||||||||||||||||||||
| Mexico | 52,785 | 45,107 | 36,984 | 1,489 | 1,047 | 1,009 | 2.82 | % | 2.32 | % | 2.73 | % | |||||||||||||||||||||||
| South America | 177,380 | 167,348 | 141,874 | 10,142 | 10,381 | 6,387 | 5.72 | % | 6.20 | % | 4.50 | % | |||||||||||||||||||||||
| Brazil | 113,937 | 101,801 | 85,702 | 7,479 | 7,705 | 4,182 | 6.56 | % | 7.57 | % | 4.88 | % | |||||||||||||||||||||||
| Chile | 46,565 | 47,811 | 41,479 | 2,332 | 2,384 | 1,838 | 5.01 | % | 4.99 | % | 4.43 | % | |||||||||||||||||||||||
| Argentina | 3,903 | 5,844 | 5,481 | 78 | 122 | 198 | 1.99 | % | 2.08 | % | 3.61 | % | |||||||||||||||||||||||
| Digital Consumer Bank | 135,608 | 125,339 | 116,989 | 2,877 | 2,583 | 2,490 | 2.12 | % | 2.06 | % | 2.13 | % | |||||||||||||||||||||||
| Corporate Centre | 5,494 | 5,824 | 6,337 | 301 | 894 | 903 | 5.48 | % | 15.35 | % | 14.38 | % | |||||||||||||||||||||||
| Total Group | 1,133,898 | 1,124,121 | 1,051,114 | 35,620 | 34,673 | 33,234 | 3.14 | % | 3.08 | % | 3.16 | % | |||||||||||||||||||||||
| Exposure and impairment losses by stage | ||||||||||||||
| EUR million | ||||||||||||||
| 2023 | ||||||||||||||
Credit quality A |
Stage 1 | Stage 2 | Stage 3 | Total | ||||||||||
| From AAA to AA- | 147,065 | 2,261 | — | 149,326 | ||||||||||
| From A+ to BB | 421,449 | 13,910 | — | 435,359 | ||||||||||
| From BB- to B- | 262,954 | 41,237 | — | 304,191 | ||||||||||
| CCC and below | 11,829 | 19,376 | 33,838 | 65,043 | ||||||||||
Total exposure B |
843,297 | 76,784 | 33,838 | 953,919 | ||||||||||
Impairment lossesC |
3,592 | 5,055 | 14,131 | 22,778 | ||||||||||
| Exposure and impairment losses by stage | ||||||||||||||
| EUR million | ||||||||||||||
| 2022 | ||||||||||||||
Credit quality A |
Stage 1 | Stage 2 | Stage 3 | Total | ||||||||||
| From AAA to AA- | 172,440 | 1,506 | — | 173,946 | ||||||||||
| From A+ to BB | 394,084 | 10,601 | — | 404,685 | ||||||||||
| From BB- to B- | 272,456 | 32,653 | — | 305,109 | ||||||||||
| CCC and below | 11,799 | 21,436 | 32,608 | 65,843 | ||||||||||
Total exposureB |
850,779 | 66,196 | 32,608 | 949,583 | ||||||||||
Impairment lossesC |
3,807 | 5,195 | 13,852 | 22,854 | ||||||||||
| Exposure and impairment losses by stage | ||||||||||||||
| EUR million | ||||||||||||||
| 2021 | ||||||||||||||
Credit quality A |
Stage 1 | Stage 2 | Stage 3 | Total | ||||||||||
| From AAA to AA- | 188,434 | 1,844 | — | 190,278 | ||||||||||
| From A+ to BB | 377,008 | 11,954 | — | 388,962 | ||||||||||
| From BB- to B- | 233,779 | 44,292 | — | 278,071 | ||||||||||
| CCC and below | 3,746 | 11,878 | 30,711 | 46,335 | ||||||||||
Total exposure B |
802,967 | 69,968 | 30,711 | 903,646 | ||||||||||
Impairment lossesC |
4,149 | 5,103 | 12,873 | 22,125 | ||||||||||
| Exposure and impairment losses by stage | ||||||||||||||
| EUR million | ||||||||||||||
| 2023 | ||||||||||||||
Credit qualityA |
Stage 1 | Stage 2 | Stage 3 | Total | ||||||||||
| From AAA to AA- | 46,236 | 1,273 | — | 47,509 | ||||||||||
| From A+ to BB | 145,884 | 10,850 | — | 156,734 | ||||||||||
| From BB- to B- | 13,588 | 13,995 | — | 27,583 | ||||||||||
| CCC and below | 0 | — | 3,518 | 3,518 | ||||||||||
Total exposureB |
205,708 | 26,118 | 3,518 | 235,344 | ||||||||||
Impairment lossesC |
172 | 498 | 396 | 1,066 | ||||||||||
| Exposure and impairment losses by stage | ||||||||||||||
| EUR million | ||||||||||||||
| 2022 | ||||||||||||||
Credit quality A |
Stage 1 | Stage 2 | Stage 3 | Total | ||||||||||
| From AAA to AA- | 85,930 | 827 | — | 86,757 | ||||||||||
| From A+ to BB | 118,585 | 7,547 | — | 126,132 | ||||||||||
| From BB- to B- | 16,831 | 11,093 | — | 27,924 | ||||||||||
| CCC and below | 220 | 978 | 3,059 | 4,257 | ||||||||||
Total exposure B |
221,566 | 20,445 | 3,059 | 245,070 | ||||||||||
Impairment lossesC |
166 | 529 | 337 | 1,032 | ||||||||||
| Exposure and impairment losses by stage | ||||||||||||||
| EUR million | ||||||||||||||
| 2021 | ||||||||||||||
Credit quality A |
Stage 1 | Stage 2 | Stage 3 | Total | ||||||||||
| From AAA to AA- | 97,388 | 1,015 | — | 98,403 | ||||||||||
| From A+ to BB | 113,030 | 8,074 | — | 121,104 | ||||||||||
| From BB- to B- | 13,063 | 10,657 | — | 23,720 | ||||||||||
| CCC and below | — | 943 | 3,508 | 4,451 | ||||||||||
Total exposure B |
223,481 | 20,689 | 3,508 | 247,678 | ||||||||||
Impairment lossesC |
135 | 372 | 460 | 967 | ||||||||||
| 2024 - 2028 | |||||||||||||||||
| Variables | Pessimistic scenario 3 | Pessimistic scenario 2 | Pessimistic scenario 1 | Base scenario | Optimistic scenario 1 | ||||||||||||
| Interest rate | 4.4 | % | 2.8 | % | 3.9 | % | 3.7 | % | 3.3 | % | |||||||
| Unemployment rate | 5.8 | % | 7.3 | % | 5.1 | % | 4.4 | % | 3.6 | % | |||||||
| Housing price change | -3.1 | % | -4.8 | % | -0.9 | % | 1.7 | % | 3.8 | % | |||||||
| GDP growth | -0.2 | % | 0.2 | % | 0.3 | % | 1.2 | % | 2.1 | % | |||||||
| 2023 | 2022 | 2021 | |||||||||
| Pessimistic scenario 3 | 20 | % | 20 | % | 5 | % | |||||
| Pessimistic scenario 2 | 10 | % | 10 | % | 20 | % | |||||
| Pessimistic scenario 1 | 10 | % | 15 | % | 25 | % | |||||
| Base scenario | 50 | % | 50 | % | 45 | % | |||||
| Optimistic scenario 1 | 10 | % | 5 | % | 5 | % | |||||
| Change in Provision | ||||||||
| Mortgages | Corporates | |||||||
| GDP Growth | ||||||||
| -100 bp | 9.5 | % | 3.0 | % | ||||
| 100 bp | -5.9 | % | -2.0 | % | ||||
| Housing price change | ||||||||
| -100 bp | 6.7 | % | 4.6 | % | ||||
| 100 bp | -4.2 | % | -2.6 | % | ||||
| Unemployment rate | ||||||||
| -100 bp | -8.6 | % | -4.4 | % | ||||
| 100 bp | 25.7 | % | 7.8 | % | ||||
| 2023 | ||||||||
| EUR Million | Gross amount | Of which: impaired | ||||||
| Home purchase loans to families | 61,097 | 924 | ||||||
| Without mortgage guarantee | 215 | 16 | ||||||
| With mortgage guarantee | 60,882 | 908 | ||||||
| 2022 | ||||||||
| EUR Million | Gross amount | Of which: impaired | ||||||
| Home purchase loans to families | 63,688 | 1,088 | ||||||
| Without mortgage guarantee | 288 | 24 | ||||||
| With mortgage guarantee | 63,400 | 1,064 | ||||||
| 2021 | ||||||||
| EUR Million | Gross amount | Of which: impaired | ||||||
| Home purchase loans to families | 62,324 | 1,860 | ||||||
| Without mortgage guarantee | 419 | 115 | ||||||
| With mortgage guarantee | 61,905 | 1,745 | ||||||
| 2023 | ||||||||||||||||||||
| Loan to value ratio | ||||||||||||||||||||
| EUR Million | Less than or equal to 40% | More than 40% and less than 60% | More than 60% and less than 80% | More than 80% and less than or equal to 100% | More than 100% | Total | ||||||||||||||
| Gross amount | 18,728 | 20,720 | 18,083 | 2,294 | 1,057 | 60,882 | ||||||||||||||
| Of which impaired | 131 | 192 | 199 | 151 | 235 | 908 | ||||||||||||||
| EUR million | |||||||||||
| 2023 | 2022 | 2021 | |||||||||
| Balance at beginning of year | 2,327 | 2,625 | 2,871 | ||||||||
| Foreclosed assets | (1) | — | (1) | ||||||||
| Net variation | 115 | (295) | (230) | ||||||||
| Written-off assets | (8) | (3) | (15) | ||||||||
| Balance at end of year | 2,433 | 2,327 | 2,625 | ||||||||
| 2023 | |||||||||||
| EUR Million | Gross amount | Excess of gross exposure over maximum recoverable amount of effective collateral | Specific allowance | ||||||||
| Financing for construction and property development (including land) (business in Spain) | 2,433 | 259 | 40 | ||||||||
| Of which impaired | 74 | 5 | 29 | ||||||||
| Memorandum items written-off assets | 346 | — | — | ||||||||
| Memorandum items: Data from the public consolidated balance sheet | |||||
| 2023 | |||||
| EUR Million | Carrying amount | ||||
| Total loans and advances to customers excluding the Public sector (business in Spain) (Book value) | 241,695 | ||||
| Total consolidated assets (Total business) (Book value) | 1,797,062 | ||||
| Impairment losses and credit risk allowances. Coverage for unimpaired assets (business in Spain) | 1,230 | ||||
| 2023 | |||||
| EUR Million | Loans: gross amount | ||||
| 1. Without mortgage guarantee | 16 | ||||
| 2. With mortgage guarantee | 2,417 | ||||
| 2.1 Completed buildings | 1,032 | ||||
| 2.1.1 Residential | 642 | ||||
| 2.1.2 Other | 390 | ||||
| 2.2 Buildings and other constructions under construction | 1,364 | ||||
| 2.2.1 Residential | 1,292 | ||||
| 2.2.2 Other | 72 | ||||
| 2.3 Land | 21 | ||||
| 2.3.1 Developed consolidated land | 14 | ||||
| 2.3.2 Other land | 7 | ||||
| Total | 2,433 | ||||
| 2023 | ||||||||||||||
| EUR Million | Gross carrying amount | Valuation adjustments | Of which impairment losses on assets since time of foreclosure | Net Carrying amount | ||||||||||
| Property assets arising from financing provided to construction and property development companies | 4,901 | 2,801 | 2,072 | 2,100 | ||||||||||
| Of which: | ||||||||||||||
| Completed buildings | 1,054 | 615 | 519 | 439 | ||||||||||
| Residential | 224 | 111 | 89 | 113 | ||||||||||
| Other | 830 | 504 | 430 | 326 | ||||||||||
| Buildings under construction | 101 | 45 | 36 | 56 | ||||||||||
| Residential | 12 | 9 | 6 | 3 | ||||||||||
| Other | 89 | 36 | 30 | 53 | ||||||||||
| Land | 3,746 | 2,141 | 1,517 | 1,605 | ||||||||||
| Developed land | 1,107 | 589 | 366 | 518 | ||||||||||
| Other land | 2,639 | 1,552 | 1,151 | 1,087 | ||||||||||
| Property assets from home purchase mortgage loans to households | 473 | 197 | 131 | 276 | ||||||||||
| Other foreclosed property assets | 132 | 60 | 46 | 72 | ||||||||||
| Total property assets | 5,506 | 3,058 | 2,249 | 2,448 | ||||||||||
| EUR Billion | |||||||||||
| 2023 | 2022 | 2021 | |||||||||
| Gross additions | 0.3 | 0.2 | 0.4 | ||||||||
| Disposals | (1.2) | (1.3) | (1.1) | ||||||||
| Difference | (0.9) | (1.1) | (0.7) | ||||||||
| Exposure and impairment losses by stage | ||||||||||||||
| EUR million | ||||||||||||||
| 2023 | ||||||||||||||
Credit quality A |
Stage 1 | Stage 2 | Stage 3 | Total | ||||||||||
| From AAA to AA- | 46,827 | 48 | — | 46,875 | ||||||||||
| From A+ to BB | 101,079 | 780 | — | 101,859 | ||||||||||
| From BB- to B- | 33,905 | 9,789 | — | 43,694 | ||||||||||
| CCC and below | 1,513 | 4,517 | 7,536 | 13,566 | ||||||||||
Total exposureB |
183,324 | 15,134 | 7,536 | 205,994 | ||||||||||
Impairment lossesC |
300 | 663 | 2,959 | 3,922 | ||||||||||
| Exposure and impairment losses by stage | ||||||||||||||
| EUR million | ||||||||||||||
| 2022 | ||||||||||||||
Credit quality A |
Stage 1 | Stage 2 | Stage 3 | Total | ||||||||||
| From AAA to AA- | 37,133 | 447 | — | 37,580 | ||||||||||
| From A+ to BB | 107,667 | 282 | — | 107,949 | ||||||||||
| From BB- to B- | 46,296 | 6,388 | — | 52,684 | ||||||||||
| CCC and below | 253 | 5,234 | 8,893 | 14,380 | ||||||||||
Total exposureB |
191,349 | 12,351 | 8,893 | 212,593 | ||||||||||
Impairment lossesC |
507 | 666 | 3,472 | 4,645 | ||||||||||
| Exposure and impairment losses by stage | ||||||||||||||
| EUR million | ||||||||||||||
| 2021 | ||||||||||||||
Credit quality A |
Stage 1 | Stage 2 | Stage 3 | Total | ||||||||||
| From AAA to AA- | 43,978 | 352 | — | 44,330 | ||||||||||
| From A+ to BB | 109,142 | 555 | — | 109,697 | ||||||||||
| From BB- to B- | 33,104 | 11,716 | — | 44,820 | ||||||||||
| CCC and below | 336 | 5,008 | 13,762 | 19,106 | ||||||||||
Total exposureB |
186,353 | 15,647 | 12,761 | 214,761 | ||||||||||
Impairment lossesC |
422 | 580 | 5,005 | 6,007 | ||||||||||
| 2024-2028 | |||||||||||
| Variables | Pessimistic scenario | Base scenario | Optimistic scenario | ||||||||
| Interest rate | 3.6 | % | 3.1 | % | 3.0 | % | |||||
| Unemployment rate | 14.3 | % | 11.0 | % | 9.5 | % | |||||
| Housing price change | 0.5 | % | 2.1 | % | 2.6 | % | |||||
| GDP growth | 0.0 | % | 1.5 | % | 2.7 | % | |||||
| 2023 | 2022 | 2021 | |||||||||
| Pessimistic scenario | 30 | % | 30 | % | 30 | % | |||||
| Base scenario | 40 | % | 40 | % | 40 | % | |||||
| Optimistic scenario 1 | 30 | % | 30 | % | 30 | % | |||||
| Change in Provision | |||||||||||
| Mortgages | Corporates | Others | |||||||||
| GDP Growth | |||||||||||
| -100 bp | 4.1 | % | 3.3 | % | 3.7 | % | |||||
| 100 bp | -1.9 | % | -1.2 | % | -2.2 | % | |||||
| Housing price change | |||||||||||
| -100 bp | 3.1 | % | 2.5 | % | 4.2 | % | |||||
| 100 bp | -2.1 | % | -1.2 | % | -2.1 | % | |||||
| Exposure and impairment losses by stage | ||||||||||||||
| EUR million | ||||||||||||||
| 2023 | ||||||||||||||
Credit quality A |
Stage 1 | Stage 2 | Stage 3 | Total | ||||||||||
| From AAA to AA- | 4,834 | 76 | — | 4,910 | ||||||||||
| From A+ to BB | 20,468 | 459 | — | 20,926 | ||||||||||
| From BB- to B- | 25,312 | 3,439 | — | 28,751 | ||||||||||
| CCC and below | 52 | 450 | 894 | 1,396 | ||||||||||
Total exposureB |
50,665 | 4,424 | 894 | 55,983 | ||||||||||
Impairment lossesC |
409 | 335 | 141 | 885 | ||||||||||
| Exposure and impairment losses by stage | ||||||||||||||
| EUR million | ||||||||||||||
| 2022 | ||||||||||||||
Credit quality A |
Stage 1 | Stage 2 | Stage 3 | Total | ||||||||||
| From AAA to AA- | 6,884 | 145 | — | 7,029 | ||||||||||
| From A+ to BB | 20,768 | 366 | — | 21,134 | ||||||||||
| From BB- to B- | 30,359 | 2,225 | — | 32,584 | ||||||||||
| CCC and below | 308 | 558 | 459 | 1,325 | ||||||||||
Total exposureB |
58,319 | 3,294 | 459 | 62,072 | ||||||||||
Impairment lossesC |
392 | 241 | 74 | 707 | ||||||||||
| Exposure and impairment losses by stage | ||||||||||||||
| EUR million | ||||||||||||||
| 2021 | ||||||||||||||
Credit quality A |
Stage 1 | Stage 2 | Stage 3 | Total | ||||||||||
| From AAA to AA- | 8,811 | 124 | — | 8,935 | ||||||||||
| From A+ to BB | 29,379 | 1,033 | — | 30,412 | ||||||||||
| From BB- to B- | 12,193 | 2,756 | — | 14,949 | ||||||||||
| CCC and below | 19 | 361 | 477 | 857 | ||||||||||
Total exposure B |
50,402 | 4,274 | 477 | 55,153 | ||||||||||
Impairment lossesC |
263 | 314 | 45 | 622 | ||||||||||
| 2024 - 2028 | ||||||||||||||
| Variables | Pessimistic scenario 2 | Pessimistic scenario 1 | Base scenario | Optimistic scenario | ||||||||||
| Interest rate (annual averaged) | 2.4 | % | 3.1 | % | 3.4 | % | 3.7 | % | ||||||
| Unemployment rate | 5.9 | % | 4.6 | % | 4.1 | % | 3.3 | % | ||||||
| House price change | -0.7 | % | -0.2 | % | 0.3 | % | 1.0 | % | ||||||
| GDP growth | 1.6 | % | 2.0 | % | 1.8 | % | 2.6 | % | ||||||
Manheim growthA |
-1.6 | % | -1.5 | % | -1.6 | % | -1.3 | % | ||||||
| 2023 | 2022 | 2021 | |||||||||
| Pessimistic scenario 2 | 18 | % | 18 | % | 18 | % | |||||
| Pessimistic scenario 1 | 20 | % | 20 | % | 20 | % | |||||
| Base scenario | 33 | % | 33 | % | 33 | % | |||||
| Optimistic scenario | 30 | % | 30 | % | 30 | % | |||||
| Change in Provision | ||||||||
| Mortgages | Corporates | |||||||
| GDP Growth | ||||||||
| -100 bp | 9.9% | 8.7% | ||||||
| 100 bp | -7.5% | -6.4% | ||||||
| Housing price change | ||||||||
| -100 bp | 11.3% | 10.7% | ||||||
| 100 bp | -7.4% | -6.9% | ||||||
| Unemployment rate | ||||||||
| -100 bp | -30.3% | -23.8% | ||||||
| 100 bp | 35.9% | 30.1% | ||||||
| Exposure and impairment losses by stage | ||||||||||||||
| EUR million | ||||||||||||||
| 2023 | ||||||||||||||
Credit quality A |
Stage 1 | Stage 2 | Stage 3 | Total | ||||||||||
| From AAA to AA- | — | — | — | — | ||||||||||
| From A+ to BB | 99 | — | — | 99 | ||||||||||
| From BB- to B- | 12,120 | 395 | — | 12,515 | ||||||||||
| CCC and below | 6,754 | 4,237 | 5,272 | 16,263 | ||||||||||
Total exposure B |
18,973 | 4,632 | 5,272 | 28,877 | ||||||||||
Impairment lossesC |
597 | 1,019 | 1,712 | 3,327 | ||||||||||
| Exposure and impairment losses by stage | ||||||||||||||
| EUR million | ||||||||||||||
| 2022 | ||||||||||||||
Credit quality A |
Stage 1 | Stage 2 | Stage 3 | Total | ||||||||||
| From AAA to AA- | — | — | — | — | ||||||||||
| From A+ to BB | 171 | — | — | 171 | ||||||||||
| From BB- to B- | 14,564 | 512 | — | 15,076 | ||||||||||
| CCC and below | 7,735 | 5,108 | 3,870 | 16,713 | ||||||||||
Total exposure B |
22,470 | 5,620 | 3,870 | 31,960 | ||||||||||
Impairment lossesC |
672 | 1,232 | 1,452 | 3,356 | ||||||||||
| Exposure and impairment losses by stage | ||||||||||||||
| EUR million | ||||||||||||||
| 2021 | ||||||||||||||
Credit quality A |
Stage 1 | Stage 2 | Stage 3 | Total | ||||||||||
| From AAA to AA- | 417 | 4 | — | 421 | ||||||||||
| From A+ to BB | 800 | 35 | — | 835 | ||||||||||
| From BB- to B- | 18,655 | 5,930 | — | 24,585 | ||||||||||
| CCC and below | 222 | 1,931 | 1,658 | 3,811 | ||||||||||
Total exposure B |
20,094 | 7,900 | 1,658 | 29,652 | ||||||||||
Impairment lossesC |
524 | 1,741 | 572 | 2,837 | ||||||||||
| 2024 - 2028 | ||||||||||||||
| Variables | Pessimistic scenario 2 | Pessimistic scenario 1 | Base scenario | Optimistic scenario | ||||||||||
| Interest rate (annual averaged) | 2.4 | % | 3.1 | % | 3.4 | % | 3.7 | % | ||||||
| Unemployment rate | 5.9 | % | 4.6 | % | 4.1 | % | 3.3 | % | ||||||
| House price change | -0.7 | % | -0.2 | % | 0.3 | % | 1.0 | % | ||||||
| GDP growth | 1.6 | % | 2.0 | % | 1.8 | % | 2.6 | % | ||||||
ManheimA index |
-1.6 | % | -1.5 | % | -1.6 | % | -1.3 | % | ||||||
| 2023 | 2022 | 2020 | |||||||||
| Pessimistic scenario 2 | 18 | % | 18 | % | 18 | % | |||||
| Pessimistic scenario 1 | 20 | % | 20 | % | 20 | % | |||||
| Base scenario | 33 | % | 33 | % | 33 | % | |||||
| Optimistic scenario | 30 | % | 30 | % | 30 | % | |||||
| Change in provision | |||||
| SC Auto | |||||
| Manheim index | |||||
| -100 bp | 0.8% | ||||
| 100 bp | -0.7% | ||||
| Unemployment Rate | |||||
| -100 bp | -3.7% | ||||
| 100 bp | 4.0% | ||||
| House Price Change | |||||
| -100 bp | 1.6% | ||||
| 100 bp | -1.2% | ||||
| GDP growth | |||||
| -100 bp | 1.4% | ||||
| 100 bp | -1.1% | ||||
| Exposure and impairment losses | ||||||||||||||
| EUR million | 2023 | |||||||||||||
Credit quality A |
Stage 1 | Stage 2 | Stage 3 | Total | ||||||||||
| From AAA to AA- | 20,670 | 468 | — | 21,138 | ||||||||||
| From A+ to BB | 38,869 | 751 | — | 39,620 | ||||||||||
| From BB- to B- | 36,107 | 4,177 | — | 40,284 | ||||||||||
| CCC and below | 1,153 | 3,735 | 7,479 | 12,367 | ||||||||||
Total exposureB |
96,799 | 9,131 | 7,479 | 113,409 | ||||||||||
Impairment lossesC |
722 | 1,078 | 4,538 | 6,338 | ||||||||||
| Exposure and impairment losses | ||||||||||||||
| EUR million | 2022 | |||||||||||||
Credit quality A |
Stage 1 | Stage 2 | Stage 3 | Total | ||||||||||
| From AAA to AA- | 18,033 | 41 | — | 18,074 | ||||||||||
| From A+ to BB | 35,902 | 342 | — | 36,244 | ||||||||||
| From BB- to B- | 31,269 | 3,195 | — | 34,464 | ||||||||||
| CCC and below | 432 | 4,547 | 7,705 | 12,684 | ||||||||||
Total exposureB |
85,636 | 8,125 | 7,705 | 101,466 | ||||||||||
Impairment lossesC |
575 | 1,219 | 4,334 | 6,128 | ||||||||||
| Exposure and impairment losses | ||||||||||||||
| EUR million | 2021 | |||||||||||||
Credit quality A |
Stage 1 | Stage 2 | Stage 3 | Total | ||||||||||
| From AAA to AA- | 22,555 | 296 | — | 22,851 | ||||||||||
| From A+ to BB | 24,003 | 280 | — | 24,283 | ||||||||||
| From BB- to B- | 27,040 | 2,241 | — | 29,281 | ||||||||||
| CCC and below | 1,542 | 2,544 | 4,182 | 8,268 | ||||||||||
Total exposureB |
75,140 | 5,361 | 4,182 | 84,683 | ||||||||||
Impairment lossesC |
1,232 | 909 | 2,510 | 4,651 | ||||||||||
2024-2028 |
|||||||||||
| Variables | Pessimistic scenario | Base scenario | Optimistic scenario | ||||||||
| Interest rate (annual averaged) | 10.8 | % | 8.4 | % | 6.6 | % | |||||
| Unemployment rate | 10.6 | % | 8.4 | % | 6.2 | % | |||||
| House price change | 1.8 | % | 3.8 | % | 5.6 | % | |||||
| GDP growth | 0.0 | % | 1.8 | % | 3.0 | % | |||||
| Burden income | 26.6 | % | 24.3 | % | 23.0 | % | |||||
| 2023 | 2022 | 2021 | |||||||||
| Pessimistic scenario | 10 | % | 10 | % | 10 | % | |||||
| Base scenario | 80 | % | 80 | % | 80 | % | |||||
| Optimistic scenario | 10 | % | 10 | % | 10 | % | |||||
| Change in provision | |||||||||||
| Consumer | Corporate | Other | |||||||||
| GDP growth | |||||||||||
| -100 bp | 1.1 | % | 3.2 | % | 1.8 | % | |||||
| 100 bp | -0.6 | % | -1.8 | % | -0.8 | % | |||||
| Unemployment rate | |||||||||||
| -100 bp | -0.3 | % | -0.6 | % | -0.5 | % | |||||
| 100 bp | 1.4 | % | 3.7 | % | 2.3 | % | |||||
| Interest rate (SELIC) | |||||||||||
| -100 bp | -1.4 | % | -5.2 | % | -1.8 | % | |||||
| 100 bp | 2.7 | % | 6.2 | % | 4.1 | % | |||||
| EUR million | |||||||||||||||||
2023A |
|||||||||||||||||
| Total | Spain | Other EU countries | America | Rest of the world | |||||||||||||
| Central banks and Credit institutions | 379,533 | 99,186 | 69,692 | 132,573 | 78,082 | ||||||||||||
| Public sector | 215,038 | 56,158 | 51,160 | 96,477 | 11,243 | ||||||||||||
| Of which: | |||||||||||||||||
| Central government | 186,872 | 43,442 | 45,469 | 87,217 | 10,744 | ||||||||||||
| Other central government | 28,166 | 12,716 | 5,691 | 9,260 | 499 | ||||||||||||
| Other financial institutions (financial business activity) | 158,730 | 15,578 | 44,480 | 60,321 | 38,351 | ||||||||||||
| Non-financial companies and individual entrepreneurs (non-financial business activity) (broken down by purpose) | 455,926 | 109,246 | 106,328 | 179,349 | 61,003 | ||||||||||||
| Of which: | |||||||||||||||||
| Construction and property development | 20,621 | 3,318 | 4,189 | 7,561 | 5,553 | ||||||||||||
| Civil engineering construction | 5,538 | 2,354 | 1,740 | 1,257 | 187 | ||||||||||||
| Large companies | 282,357 | 48,777 | 61,506 | 126,207 | 45,867 | ||||||||||||
| SMEs and individual entrepreneurs | 147,410 | 54,797 | 38,893 | 44,324 | 9,396 | ||||||||||||
| Households – other (broken down by purpose) | 564,425 | 88,660 | 103,380 | 148,026 | 224,359 | ||||||||||||
| Of which: | |||||||||||||||||
| Residential | 352,478 | 63,294 | 36,480 | 47,347 | 205,357 | ||||||||||||
| Consumer loans | 192,960 | 17,428 | 64,084 | 94,805 | 16,643 | ||||||||||||
| Other purposes | 18,987 | 7,938 | 2,816 | 5,874 | 2,359 | ||||||||||||
| Total | 1,773,652 | 368,828 | 375,040 | 616,746 | 413,038 | ||||||||||||
| 2023 | 2022 | 2021 | |||||||||
| AAA | 18 | % | 27 | % | 15 | % | |||||
| AA | 19 | % | 19 | % | 32 | % | |||||
| A | 41 | % | 34 | % | 26 | % | |||||
| BBB | 12 | % | 11 | % | 11 | % | |||||
| Less than BBB | 10 | % | 9 | % | 16 | % | |||||
| 2023 | 2022 | ||||||||||||||||||||||
| Portfolio | |||||||||||||||||||||||
| Country | Financial assets designated at fair value through profit or loss | Financial assets at fair value through other comprehensive income | Financial assets at amortized cost | Non-trading financial assets mandatorily at fair value through profit or loss | Total net direct exposure | Total net direct exposure |
|||||||||||||||||
| Spain | 4,996 | 97 | 34,534 | — | 39,627 | 29,095 | |||||||||||||||||
| Portugal | 462 | 1,247 | 5,150 | — | 6,859 | 5,456 | |||||||||||||||||
| Italy | (2,187) | 415 | 7,366 | — | 5,594 | 7,415 | |||||||||||||||||
| Greece | — | — | — | — | — | — | |||||||||||||||||
| Ireland | — | — | — | — | — | — | |||||||||||||||||
| Rest Eurozone | 2,899 | 604 | 4,621 | — | 8,124 | 5,651 | |||||||||||||||||
| UK | 1,261 | 607 | 1,919 | — | 3,787 | 2,106 | |||||||||||||||||
| Poland | 194 | 6,340 | 4,733 | — | 11,267 | 8,715 | |||||||||||||||||
| Rest of Europe | 16 | 2,467 | 310 | — | 2,793 | 132 | |||||||||||||||||
| US | 2,049 | 5,253 | 14,002 | — | 21,304 | 23,298 | |||||||||||||||||
| Brazil | 11,715 | 10,273 | 5,745 | — | 27,733 | 23,728 | |||||||||||||||||
| Mexico | 3,311 | 12,075 | 5,439 | — | 20,825 | 17,306 | |||||||||||||||||
| Chile | 97 | 1,040 | 5,148 | — | 6,285 | 6,485 | |||||||||||||||||
| Rest of America | 277 | 543 | 1,430 | — | 2,250 | 1,964 | |||||||||||||||||
| Rest of the World | 229 | 2,843 | 1,455 | — | 4,527 | 3,542 | |||||||||||||||||
| TOTAL | 25,319 | 43,804 | 91,852 | — | 160,975 | 134,893 | |||||||||||||||||
| Current refinancing and restructuring balances | |||||||||||||||||||||||
| Amounts in EUR million, except number of transactions that are in units | |||||||||||||||||||||||
2023 | |||||||||||||||||||||||
| Total | |||||||||||||||||||||||
| Without real guarantee | With real guarantee | ||||||||||||||||||||||
| Maximum amount of the actual collateral that can be considered | Impairment of accumulated value or accumulated losses in fair value due to credit risk | ||||||||||||||||||||||
| Number of transactions | Gross amount | Number of transactions | Gross amount | Real estate guarantee | Rest of real guarantees | ||||||||||||||||||
| Credit entities | — | — | — | — | — | — | — | ||||||||||||||||
| Public sector | 12,851 | 437 | 37 | 5 | 2 | — | 4 | ||||||||||||||||
| Other financial institutions and: individual shareholder | 1,011 | 258 | 833 | 285 | 38 | 182 | 58 | ||||||||||||||||
| Non-financial institutions and individual shareholder | 728,123 | 7,709 | 61,110 | 6,977 | 4,079 | 1,461 | 3,543 | ||||||||||||||||
| Of which financing for constructions and property development | 14,236 | 106 | 2,035 | 506 | 415 | 41 | 134 | ||||||||||||||||
| Other warehouses | 4,400,346 | 6,107 | 507,378 | 10,185 | 4,602 | 4,043 | 4,484 | ||||||||||||||||
| Total | 5,142,331 | 14,511 | 569,358 | 17,452 | 8,721 | 5,686 | 8,089 | ||||||||||||||||
| Financing classified as non-current assets and disposable groups of items that have been classified as held for sale | — | — | — | — | — | — | — | ||||||||||||||||
| Current refinancing and restructuring balances | |||||||||||||||||||||||
| Amounts in EUR million, except number of transactions that are in units | |||||||||||||||||||||||
| 2023 | |||||||||||||||||||||||
| Of which, non-performing/Doubtful | |||||||||||||||||||||||
| Without real guarantee | With real guarantee | ||||||||||||||||||||||
| Maximum amount of the actual collateral that can be considered | Impairment of accumulated value or accumulated losses in fair value due to credit risk | ||||||||||||||||||||||
| Number of transactions | Gross amount | Number of transactions |
Gross amount | Real estate guarantee | Rest of real guarantees | ||||||||||||||||||
| Credit entities | — | — | — | — | — | — | — | ||||||||||||||||
| Public sector | 7 | 3 | 7 | 1 | 1 | — | 3 | ||||||||||||||||
| Other financial institutions and: individual shareholder | 472 | 25 | 428 | 107 | 21 | 51 | 50 | ||||||||||||||||
| Non-financial institutions and individual shareholder | 385,859 | 3,307 | 37,225 | 3,751 | 2,134 | 709 | 3,078 | ||||||||||||||||
| Of which financing for constructions and property development | 7,759 | 56 | 1,155 | 235 | 183 | 18 | 112 | ||||||||||||||||
| Other warehouses | 2,092,099 | 2,593 | 293,433 | 5,257 | 1,744 | 2,394 | 3,415 | ||||||||||||||||
| Total | 2,478,437 | 5,928 | 331,093 | 9,116 | 3,900 | 3,154 | 6,546 | ||||||||||||||||
| Financing classified as non-current assets and disposable groups of items that have been classified as held for sale | — | — | — | — | — | — | — | ||||||||||||||||
| Risk metric values on the consolidated balance sheet | ||||||||||||||
| EUR million | ||||||||||||||
| Main market risk metric | ||||||||||||||
| Balance sheet amount | VaR | Other | Main risk factor for 'Other' balance | |||||||||||
| Assets subject to market risk | ||||||||||||||
| Cash, cash balances at central banks and other deposits on demand | 220,342 | 220,342 | Interest rate | |||||||||||
| Financial assets held for trading | 176,921 | 176,921 | ||||||||||||
| Non-trading financial assets mandatorily at fair value through profit or loss | 5,910 | 4,068 | 1,842 | Interest rate, spread | ||||||||||
| Financial assets designated at fair value through profit or loss | 9,773 | 1,360 | 8,413 | Interest rate, spread | ||||||||||
| Financial assets designated at fair value through other comprehensive income | 83,308 | 1,761 | 81,547 | Interest rate, spread | ||||||||||
| Financial assets at amortized cost | 1,191,403 | 1,191,403 | Interest rate, spread | |||||||||||
| Hedging derivatives | 5,297 | 5,297 | Interest rate, exchange rate | |||||||||||
| Changes in the fair value of hedged items in portfolio hedges of interest risk | (788) | (788) | Interest rate | |||||||||||
| Other assets | 104,896 | |||||||||||||
| Total assets | 1,797,062 | — | — | |||||||||||
| Liabilities subject to market risk | ||||||||||||||
| Financial liabilities held for trading | 122,270 | 122,270 | ||||||||||||
| Financial liabilities designated at fair value through profit or loss | 40,367 | 450 | 39,917 | Interest rate, spread | ||||||||||
| Financial liabilities at amortized cost | 1,468,703 | 1,468,703 | Interest rate, spread | |||||||||||
| Hedging derivatives | 7,656 | 7,656 | Interest rate, exchange rate | |||||||||||
| Changes in the fair value of hedged items in portfolio hedges of interest rate risk | 55 | 55 | Interest rate | |||||||||||
| Other liabilities | 53,770 | |||||||||||||
| Total liabilities | 1,692,821 | |||||||||||||
| Equity | 104,241 | |||||||||||||
VaR statistics and expected shortfall by risk factorA | |||||||||||||||||||||||||||||||||||
EUR million. VaR at 99% and ES at 97.5% with one day time horizon | |||||||||||||||||||||||||||||||||||
| 2023 | 2022 | 2021 | |||||||||||||||||||||||||||||||||
VaR (99%) |
ES (97.5%) |
VaR |
VaR |
||||||||||||||||||||||||||||||||
Min |
Average |
Max |
Latest |
Latest |
Average |
Latest |
Average |
Latest |
|||||||||||||||||||||||||||
| Total Trading | 7.5 | 11.7 | 19.3 | 13.5 | 12.5 | 14.1 | 11.6 | 10.5 | 12.3 | ||||||||||||||||||||||||||
| Diversification effect | (8.5) | (14.9) | (27.3) | (17.1) | (18.9) | (14.6) | (15.5) | (12.9) | (13.4) | ||||||||||||||||||||||||||
| Interest rate | 8.9 | 12.2 | 20.3 | 11.1 | 11.5 | 12.6 | 9.9 | 9.6 | 9.1 | ||||||||||||||||||||||||||
| Equities | 1.4 | 3.2 | 7.3 | 6.0 | 6.1 | 4.2 | 5.5 | 3.5 | 5.1 | ||||||||||||||||||||||||||
| Exchange rate | 2.3 | 5.3 | 9.4 | 4.8 | 4.9 | 4.8 | 3.6 | 4.2 | 5.7 | ||||||||||||||||||||||||||
| Credit spread | 2.7 | 4.3 | 6.4 | 6.1 | 5.9 | 5.4 | 5.8 | 4.8 | 5.1 | ||||||||||||||||||||||||||
| Commodities | 0.7 | 1.6 | 3.2 | 2.6 | 3.0 | 1.7 | 2.3 | 1.3 | 0.7 | ||||||||||||||||||||||||||
| Total Europe | 6.6 | 9.4 | 14.7 | 11.8 | 11.1 | 12.2 | 10.5 | 9.3 | 9.9 | ||||||||||||||||||||||||||
| Diversification effect | (5.3) | (10.5) | (21.6) | (13.8) | (14.9) | (10.4) | (14.2) | (9.3) | (12.6) | ||||||||||||||||||||||||||
| Interest rate | 5.6 | 9.1 | 16.5 | 8.2 | 9.3 | 10.2 | 10.1 | 7.7 | 7.1 | ||||||||||||||||||||||||||
| Equities | 1.5 | 2.8 | 7.1 | 5.8 | 5.3 | 3.6 | 5.5 | 3.3 | 5.8 | ||||||||||||||||||||||||||
| Exchange rate | 2.1 | 3.5 | 5.7 | 5.2 | 5.2 | 3.4 | 3.3 | 2.8 | 4.5 | ||||||||||||||||||||||||||
| Credit spread | 2.7 | 4.3 | 6.4 | 6.1 | 5.9 | 5.4 | 5.8 | 4.8 | 5.1 | ||||||||||||||||||||||||||
| Commodities | — | 0.2 | 0.6 | 0.3 | 0.3 | — | — | — | — | ||||||||||||||||||||||||||
| Total North America | 1.8 | 4.0 | 6.4 | 5.0 | 5.0 | 2.3 | 2.7 | 2.5 | 2.7 | ||||||||||||||||||||||||||
| Diversification effect | (0.3) | (0.7) | (2.6) | (0.5) | (0.5) | (0.8) | (1.1) | (0.7) | (0.6) | ||||||||||||||||||||||||||
| Interest rate | 1.8 | 3.7 | 6.3 | 5.0 | 5.0 | 2.2 | 2.7 | 2.5 | 2.7 | ||||||||||||||||||||||||||
| Equities | — | 0.2 | 0.5 | 0.0 | 0.0 | 0.1 | 0.1 | 0.1 | 0.0 | ||||||||||||||||||||||||||
| Exchange rate | 0.3 | 0.8 | 2.2 | 0.5 | 0.5 | 0.8 | 1.0 | 0.6 | 0.6 | ||||||||||||||||||||||||||
| Total South America | 4.2 | 7.3 | 13.3 | 7.0 | 6.2 | 8.0 | 6.2 | 5.9 | 6.3 | ||||||||||||||||||||||||||
| Diversification effect | (1.3) | (6.2) | (14.2) | (6.6) | (7.6) | (5.0) | (4.2) | (4.9) | (5.1) | ||||||||||||||||||||||||||
| Interest rate | 4.3 | 7.3 | 12.6 | 5.6 | 5.4 | 7.0 | 5.5 | 5.5 | 5.8 | ||||||||||||||||||||||||||
| Equities | 0.0 | 1.4 | 3.7 | 2.4 | 2.5 | 1.6 | 1.7 | 1.2 | 1.1 | ||||||||||||||||||||||||||
| Exchange rate | 0.5 | 3.2 | 8.0 | 3.0 | 2.9 | 2.7 | 0.9 | 2.8 | 3.8 | ||||||||||||||||||||||||||
| Commodities | 0.7 | 1.6 | 3.2 | 2.6 | 3.0 | 1.7 | 2.3 | 1.3 | 0.7 | ||||||||||||||||||||||||||
| Structural VaR | ||||||||||||||||||||||||||
EUR million. Structural VaR 99% with a temporary horizon of one day. | ||||||||||||||||||||||||||
| 2023 | 2022 | 2021 | ||||||||||||||||||||||||
| Min | Average | Max | Latest | Average | Latest | Average | Latest | |||||||||||||||||||
| Structural VaR | 552.7 | 705.0 | 914.5 | 749.5 | 664.0 | 538.5 | 993.7 | 1,011.9 | ||||||||||||||||||
| Diversification effect | (368.7) | (416.6) | (422.2) | (444.7) | (417.1) | (422.4) | (327.3) | (240.2) | ||||||||||||||||||
VaR Interest RateA |
273.3 | 348.4 | 478.0 | 380.2 | 350.8 | 304.5 | 400.7 | 287.8 | ||||||||||||||||||
| VaR Exchange Rate | 477.0 | 580.4 | 661.1 | 642.9 | 493.4 | 461.0 | 600.6 | 655.2 | ||||||||||||||||||
| VaR Equities | 171.1 | 192.8 | 197.6 | 171.1 | 236.9 | 195.4 | 319.7 | 309.1 | ||||||||||||||||||
| EUR million | |||||||||||
| 2023 | 2022 | 2021 | |||||||||
| Amount weighted applicable | Amount weighted applicable | Amount weighted applicable | |||||||||
| High-quality liquid assets-HQLAs | |||||||||||
| Cash and reserves available at central banks | 217,935 | 127,285 | 206,507 | ||||||||
| Marketable assets Level 1 | 119,043 | 177,887 | 81,925 | ||||||||
| Marketable assets Level 2A | 4,236 | 3,308 | 3,422 | ||||||||
| Marketable assets Level 2B | 6,814 | 3,562 | 5,446 | ||||||||
| Total high-quality liquid assets | 348,028 | 312,042 | 297,300 | ||||||||
| EUR million | |||||||||||
| 2023 | 2022 | 2021 | |||||||||
| High-quality liquid assets-HQLAs (numerator) | 348,028 | 312,042 | 297,300 | ||||||||
| Total net cash outflows (denominator) | 209,892 | 204,759 | 181,953 | ||||||||
| Cash outflows | 282,982 | 270,748 | 233,294 | ||||||||
| Cash inflows | 73,090 | 65,989 | 51,341 | ||||||||
| LCR ratio (%) | 166 | % | 152 | % | 163 | % | |||||
| NSFR ratio (%) | 123 | % | 121 | % | 126 | % | |||||
| Residual maturities of the liabilities | Unmatured | <=1month | >1 month <=3 months |
>3 months <=12 months |
>1 year <=2 years |
>2 years <=3 years |
3 years <=5 years |
5 years <=10 years |
>10 years | Total | ||||||||||||||||||||||
| Committed assets | 40.8 | 49.3 | 21.6 | 39.7 | 40.8 | 27.9 | 55.0 | 17.4 | 13.8 | 306.3 | ||||||||||||||||||||||
| Guarantees received committed | 31.6 | 72.3 | 17.6 | 11.0 | 3.2 | 2.5 | 0.6 | — | — | 138.8 | ||||||||||||||||||||||
| On-balance-sheet encumbered assets | ||||||||||||||
| EUR billion | ||||||||||||||
| Carrying amount of encumbered assets | Fair value of encumbered assets | Fair value of non-encumbered assets | Carrying amount of non-encumbered assets | |||||||||||
| Loans and advances | 186.4 | 1,172.2 | ||||||||||||
| Equity instruments | 9.4 | 9.4 | 11.5 | 11.5 | ||||||||||
| Debt securities | 86.8 | 87.6 | 156.4 | 156.1 | ||||||||||
| Other assets | 23.7 | 150.6 | ||||||||||||
| Total assets | 306.3 | 1,490.7 | ||||||||||||
| Encumbrance of collateral received | ||||||||
| EUR billion | ||||||||
| Fair value of encumbered collateral received or own debt securities issued | Fair value of collateral received or own debt securities issued available for encumbrance | |||||||
| Collateral received | 138.8 | 51.3 | ||||||
| Loans and advances | 1.1 | — | ||||||
| Equity instruments | 5.5 | 8.7 | ||||||
| Debt securities | 132.2 | 42.5 | ||||||
| Other collateral received | — | 0.1 | ||||||
| Own debt securities issued other than own covered bonds or ABSs | — | 1.9 | ||||||
| Encumbered assets and collateral received and matching liabilities | ||||||||
| EUR billion | ||||||||
| Matching liabilities, contingent liabilities or securities lent | Assets, collateral received and own debt securities issued other than covered bonds and ABSs encumbered | |||||||
| Total sources of encumbrance (carrying amount) |
330.6 | 445.2 | ||||||
| Reconciliation of accounting capital with regulatory capital | |||||||||||
| EUR million | |||||||||||
| 2022 | 2021 | 2020 | |||||||||
| Subscribed capital | 8,092 | 8,397 | 8,670 | ||||||||
| Share premium account | 44,373 | 46,273 | 47,979 | ||||||||
| Reserves | 69,278 | 62,111 | 56,606 | ||||||||
| Treasury shares | (1,078) | (675) | (894) | ||||||||
| Attributable profit | 11,076 | 9,605 | 8,124 | ||||||||
Approved dividendC |
(1,298) | (979) | (836) | ||||||||
| Shareholders’ equity on public balance sheet | 130,443 | 124,732 | 119,649 | ||||||||
| Valuation adjustments | (35,020) | (35,628) | (32,719) | ||||||||
| Non-controlling interests | 8,818 | 8,481 | 10,123 | ||||||||
| Total Equity on public balance sheet | 104,241 | 97,585 | 97,053 | ||||||||
| Goodwill and intangible assets | (17,313) | (17,272) | (16,132) | ||||||||
| Eligible preference shares and participating securities | 9,002 | 8,831 | 10,050 | ||||||||
Accrued dividendC |
(1,471) | (942) | (895) | ||||||||
Other adjustmentsA |
(8,717) | (5,169) | (7,624) | ||||||||
Tier 1B |
85,742 | 83,033 | 82,452 | ||||||||
| Capital coefficients | |||||||||||
| EUR million | |||||||||||
| 2023 | 2022 | 2021 | |||||||||
| Level 1 ordinary eligible capital (EUR million) | 76,741 | 74,202 | 72,402 | ||||||||
| Level 1 additional eligible capital (EUR million) | 9,002 | 8,831 | 10,050 | ||||||||
| Level 2 eligible capital (EUR million) | 16,497 | 14,359 | 14,865 | ||||||||
| Risk-weighted assets (EUR million) | 623,731 | 609,266 | 578,930 | ||||||||
| Level 1 ordinary capital coefficient (CET 1) | 12.30 | % | 12.18 | % | 12.51 | % | |||||
| Level 1 additional capital coefficient (AT1) | 1.45 | % | 1.45 | % | 1.73 | % | |||||
| Level 1 capital coefficient (TIER1) | 13.75 | % | 13.63 | % | 14.24 | % | |||||
| Level 2 capital coefficient (TIER 2) | 2.64 | % | 2.36 | % | 2.57 | % | |||||
| Total capital coefficient | 16.39 | % | 15.99 | % | 16.81 | % | |||||
| Eligible capital | |||||||||||
| EUR million | |||||||||||
| 2023 | 2022 | 2021 | |||||||||
| Eligible capital | |||||||||||
| Common Equity Tier I | 76,741 | 74,202 | 72,402 | ||||||||
| Capital | 8,092 | 8,397 | 8,670 | ||||||||
| (-) Treasure shares and own shares financed | (2,847) | (60) | (966) | ||||||||
| Share Premium | 44,373 | 46,273 | 47,979 | ||||||||
| Reserves | 68,721 | 62,246 | 58,157 | ||||||||
| Other retained earnings | (35,038) | (37,439) | (34,784) | ||||||||
| Minority interests | 6,899 | 7,416 | 6,736 | ||||||||
| Profit net of dividends | 8,307 | 7,684 | 6,394 | ||||||||
| Deductions | (21,766) | (20,315) | (19,784) | ||||||||
| Goodwill and intangible assets | (17,220) | (17,182) | (16,064) | ||||||||
| Others | (4,546) | (3,133) | (3,720) | ||||||||
| Additional Tier I | 9,002 | 8,831 | 10,050 | ||||||||
| Eligible instruments AT1 | 8,461 | 8,344 | 10,102 | ||||||||
| AT1-excesses-subsidiaries | 541 | 487 | (52) | ||||||||
| Tier II | 16,497 | 14,359 | 14,865 | ||||||||
| Eligible instruments T2 | 17,101 | 14,770 | 15,424 | ||||||||
Excess IRB provision on PE |
76 | — | 75 | ||||||||
| T2-excesses - subsidiaries | (680) | (411) | (634) | ||||||||
| Total eligible capital | 102,240 | 97,392 | 97,317 | ||||||||
| EUR million | |||||||||||
| 2023 | 2022 | 2021 | |||||||||
| Leverage | |||||||||||
| Level 1 Capital | 85,742 | 83,033 | 82,452 | ||||||||
| Exposure | 1,826,922 | 1,750,626 | 1,536,516 | ||||||||
| Leverage Ratio | 4.69 | % | 4.74 | % | 5.37 | % | |||||
| CONDENSED BALANCE SHEETS (Parent company only) | 31 December 2023 | 31 December 2022 | 31 December 2021 | |||||||||||||||||
| (Millions of Euros) | ||||||||||||||||||||
| Assets | ||||||||||||||||||||
| Cash and due from banks | 172,524 | 177,920 | 138,388 | |||||||||||||||||
| Of which: | ||||||||||||||||||||
| To bank subsidiaries | 6,834 | 14,548 | 15,459 | |||||||||||||||||
| Trading account assets | 102,296 | 92,128 | 77,988 | |||||||||||||||||
| Investment securities | 63,325 | 47,560 | 29,949 | |||||||||||||||||
| Of which: | ||||||||||||||||||||
| To bank subsidiaries | 16,137 | 14,287 | 12,137 | |||||||||||||||||
| To non-bank subsidiaries | 1,229 | 1,327 | 2,087 | |||||||||||||||||
| Net loans and leases | 298,068 | 314,905 | 301,342 | |||||||||||||||||
| Of which: | ||||||||||||||||||||
| To non-bank subsidiaries | 22,435 | 25,312 | 31,296 | |||||||||||||||||
| Investment in affiliated companies | 99,326 | 94,213 | 88,549 | |||||||||||||||||
| Of which: | ||||||||||||||||||||
| To bank subsidiaries | 74,016 | 70,698 | 67,735 | |||||||||||||||||
| To non-bank subsidiaries | 25,310 | 23,515 | 20,814 | |||||||||||||||||
| Premises and equipment, net | 6,368 | 6,513 | 6,515 | |||||||||||||||||
| Other assets | 15,435 | 16,787 | 15,219 | |||||||||||||||||
| Total assets | 757,342 | 750,026 | 657,950 | |||||||||||||||||
| Liabilities | ||||||||||||||||||||
| Deposits | 398,374 | 418,841 | 401,212 | |||||||||||||||||
| Of which: | ||||||||||||||||||||
| To bank subsidiaries | 7,832 | 16,619 | 18,114 | |||||||||||||||||
| To non-bank subsidiaries | 14,610 | 15,106 | 18,594 | |||||||||||||||||
| Short-term debt | 70,771 | 54,255 | 19,181 | |||||||||||||||||
| Long-term debt | 129,258 | 114,447 | 99,650 | |||||||||||||||||
| Total debt | 200,029 | 168,702 | 118,831 | |||||||||||||||||
| Of which: | ||||||||||||||||||||
| To bank subsidiaries | — | — | 221 | |||||||||||||||||
| To non-bank subsidiaries | 1,816 | 1,638 | 649 | |||||||||||||||||
| Other liabilities | 84,065 | 92,437 | 71,334 | |||||||||||||||||
| Total liabilities | 682,468 | 679,980 | 591,377 | |||||||||||||||||
| Stockholders' equity | ||||||||||||||||||||
| Capital stock | 8,092 | 8,397 | 8,670 | |||||||||||||||||
| Retained earnings and other reserves | 66,782 | 61,649 | 57,903 | |||||||||||||||||
| Total stockholders' equity | 74,874 | 70,046 | 66,573 | |||||||||||||||||
| Total liabilities and Stockholders’ Equity | 757,342 | 750,026 | 657,950 | |||||||||||||||||
| Year ended | ||||||||||||||||||||
| CONDENSED STATEMENTS OF INCOME (Parent company only) | 31 December 2023 | 31 December 2022 | 31 December 2021 | |||||||||||||||||
| (Millions of Euros) | ||||||||||||||||||||
| Interest income | 32,231 | 19,322 | 11,893 | |||||||||||||||||
| Interest from earning assets | 23,049 | 10,579 | 6,821 | |||||||||||||||||
| Dividends from affiliated companies | 9,182 | 8,743 | 5,072 | |||||||||||||||||
| Of which: | ||||||||||||||||||||
| From bank subsidiaries | 8,159 | 8,228 | 4,075 | |||||||||||||||||
| From non-bank subsidiaries | 1,023 | 515 | 997 | |||||||||||||||||
| Interest expense | (16,204) | (5,958) | (2,785) | |||||||||||||||||
| Interest income / (charges) | 16,027 | 13,364 | 9,108 | |||||||||||||||||
| Provision for credit losses | (1,372) | (1,397) | (2,287) | |||||||||||||||||
| Interest income / (charges) after provision for credit losses | 14,655 | 11,967 | 6,821 | |||||||||||||||||
| Non-interest income | 4,778 | 4,808 | 4,092 | |||||||||||||||||
| Non-interest expense | (9,661) | (8,811) | (7,049) | |||||||||||||||||
| Income before income taxes | 9,772 | 7,964 | 3,864 | |||||||||||||||||
| Income tax benefit (expense) | (533) | (43) | 68 | |||||||||||||||||
| Net income | 9,239 | 7,921 | 3,932 | |||||||||||||||||
| Year ended | ||||||||||||||||||||
| CONDENSED STATEMENTS OF COMPREHENSIVE INCOME (Parent company only) | 31 December 2023 | 31 December 2022 | 31 December 2021 | |||||||||||||||||
| (Millions of Euros) | ||||||||||||||||||||
| NET INCOME | 9,239 | 7,921 | 3,932 | |||||||||||||||||
| OTHER COMPREHENSIVE INCOME | (57) | (735) | (662) | |||||||||||||||||
| Items that may be reclassified subsequently to profit or loss | 276 | (524) | (265) | |||||||||||||||||
| Hedging instruments (items not designated) | — | — | — | |||||||||||||||||
| Revaluation gains (losses) | — | — | — | |||||||||||||||||
| Amounts transferred to income statement | — | — | — | |||||||||||||||||
| Other reclassifications | — | — | — | |||||||||||||||||
| Debt instruments at fair value with changes in other comprehensive income | 104 | (328) | (524) | |||||||||||||||||
| Revaluation gains (losses) | 65 | (242) | (243) | |||||||||||||||||
| Amounts transferred to income statement | 39 | (86) | (281) | |||||||||||||||||
| Other reclassifications | — | — | — | |||||||||||||||||
| Cash flow hedges: | 284 | (420) | 146 | |||||||||||||||||
| Revaluation gains/(losses) | (70) | (505) | 152 | |||||||||||||||||
| Amounts transferred to income statement | 354 | 85 | (6) | |||||||||||||||||
| Amounts transferred to initial carrying amount of hedged items | — | — | — | |||||||||||||||||
| Other reclassifications | — | — | — | |||||||||||||||||
| Hedges of net investments in foreign operations: | — | — | — | |||||||||||||||||
| Exchange differences | — | — | — | |||||||||||||||||
| Non-current assets held for sale | — | — | — | |||||||||||||||||
| Income tax | (112) | 224 | 113 | |||||||||||||||||
| Items that will not be reclassified to profit or loss | (333) | (211) | (397) | |||||||||||||||||
| Actuarial gains/(losses) on pension plans | (14) | 279 | 29 | |||||||||||||||||
| Other recognised income and expense of investments in subsidiaries, joint ventures and associates | — | — | — | |||||||||||||||||
| Changes in the fair value of equity instruments measured at fair value through other comprehensive income | (250) | (450) | (347) | |||||||||||||||||
| Gains or losses resulting from the accounting for hedges of equity instruments measured at fair value through other comprehensive income, net | — | — | — | |||||||||||||||||
| Changes in the fair value of equity instruments measured at fair value through other comprehensive income (hedged item) | (31) | 18 | 117 | |||||||||||||||||
| Changes in the fair value of equity instruments measured at fair value through other comprehensive income (hedging instrument) | 31 | (18) | (117) | |||||||||||||||||
| Changes in the fair value of financial liabilities at fair value through profit or loss attributable to changes in credit risk | (107) | 58 | (93) | |||||||||||||||||
| Income tax relating to items that will not be reclassified | 38 | (98) | 14 | |||||||||||||||||
| TOTAL COMPREHENSIVE INCOME | 9,182 | 7,186 | 3,270 | |||||||||||||||||
| Year ended | ||||||||||||||||||||
| CONDENSED CASH FLOW STATEMENTS (Parent company only) | 31 December 2023 | 31 December 2022 | 31 December 2021 | |||||||||||||||||
| (Millions of Euros) | ||||||||||||||||||||
| 1. Cash flows from operating activities | ||||||||||||||||||||
| Consolidated profit | 9,239 | 7,921 | 3,932 | |||||||||||||||||
| Adjustments to profit | (3,746) | 3,370 | 2,052 | |||||||||||||||||
| Net increase/decrease in operating assets | (6,765) | (58,102) | (9,622) | |||||||||||||||||
| Net increase/decrease in operating liabilities | (6,880) | 85,367 | 24,024 | |||||||||||||||||
| Reimbursements/payments of income tax | (360) | (1,724) | (352) | |||||||||||||||||
| Total net cash flows from operating activities (1) | (8,512) | 36,832 | 20,034 | |||||||||||||||||
| 2. Cash flows from investing activities | ||||||||||||||||||||
| Investments (-) | (5,458) | (4,257) | (2,266) | |||||||||||||||||
| Divestments (+) | 10,880 | 10,852 | 6,349 | |||||||||||||||||
| Total net cash flows from investment activities (2) | 5,422 | 6,595 | 4,083 | |||||||||||||||||
| 3. Cash flows from financing activities | ||||||||||||||||||||
| Issuance of own equity instruments | — | — | — | |||||||||||||||||
| Disposal of own equity instruments | 649 | 369 | 605 | |||||||||||||||||
| Acquisition of own equity instruments | (2,974) | (1,847) | (1,446) | |||||||||||||||||
| Issuance of debt securities | 5,636 | — | 4,440 | |||||||||||||||||
| Redemption of debt securities | (1,813) | (1,678) | (2,248) | |||||||||||||||||
| Dividends paid | (2,261) | (1,848) | (1,313) | |||||||||||||||||
| Issuance/Redemption of equity instruments | — | — | — | |||||||||||||||||
| Other collections/payments related to financing activities | (166) | (180) | (315) | |||||||||||||||||
| Total net cash flows from financing activities (3) | (929) | (5,184) | (277) | |||||||||||||||||
| 4. Effect of exchange rate changes on cash and cash equivalents (4) | (1,044) | 104 | 335 | |||||||||||||||||
| 5. Net increase/decrease in cash and cash equivalents (1+2+3+4) | (5,063) | 38,347 | 24,175 | |||||||||||||||||
| Cash and cash equivalents at beginning of period | 130,083 | 91,736 | 67,561 | |||||||||||||||||
| Cash and cash equivalents at end of period | 125,020 | 130,083 | 91,736 | |||||||||||||||||
| 2023 | 2022 | 2021 | ||||||||||||||||||
| (Millions of Euros) | ||||||||||||||||||||
| Preference shares | 202 | 198 | 209 | |||||||||||||||||
| Preferred securities | 9,081 | 7,898 | 8,601 | |||||||||||||||||
| Total | 9,283 | 8,096 | 8,810 | |||||||||||||||||
| Outstanding at 31 December 2023 | ||||||||||||||||||||||||||
| Preference Shares Issuer/Date of issue | Currency | Amount in currency (million) | Interest rate | Redemption Option (A) |
||||||||||||||||||||||
| Santander UK plc, October 1995 | Pounds Sterling | 80.3 | 10.375% | No option | ||||||||||||||||||||||
| Santander UK plc, February 1996 | Pounds Sterling | 80.3 | 10.375% | No option | ||||||||||||||||||||||
| Outstanding at 31 December 2023 | ||||||||||||||||||||||||||
| Preferred Securities Issuer/Date of issue | Currency | Amount in currency (million) |
Interest rate | Maturity date | ||||||||||||||||||||||
| Banco Santander, S.A., March 2018 | Euro | 1,499.8 | 4.750% | (B) | Perpetuity | |||||||||||||||||||||
| Banco Santander, S.A., February 2019 | US Dollar | 1,199.6 | 7.500% | (C) | Perpetuity | |||||||||||||||||||||
| Banco Santander, S.A., January 2020 | Euro | 1,487.6 | 4.375% | (D) | Perpetuity | |||||||||||||||||||||
| Banco Santander, S.A., May 2021 | US Dollar | 1,000.0 | 4.750% | (E) | Perpetuity | |||||||||||||||||||||
| Banco Santander, S.A., May 2021 | Euro | 750.0 | 4.125% | (F) | Perpetuity | |||||||||||||||||||||
| Banco Santander, S.A., September 2021 | Euro | 999.6 | 3.625% | (G) | Perpetuity | |||||||||||||||||||||
| Banco Santander, S.A., November 2023 | US Dollar | 1,150.0 | 9.625% | (H) | Perpetuity | |||||||||||||||||||||
| Banco Santander, S.A., November 2023 | US Dollar | 1,350.0 | 9.625% | (I) | Perpetuity | |||||||||||||||||||||
| Santander Finance Preferred, S.A. (Unipersonal), September 2004 | Euro | 144.0 | €CMS 10 + 0.05% subject to a maximum distribution of 8% per annum |
Perpetuity | ||||||||||||||||||||||
Appendix |
|||||
 | |||||
Subsidiaries of Banco Santander, S.A. 1 | |||||||||||||||||||||||
|
% of ownership held by
Banco Santander
|
Percentage of voting power (d) | ||||||||||||||||||||||
Company |
Location |
Direct | Indirect | Year 2023 | Year 2022 | Activity | |||||||||||||||||
| 2 & 3 Triton Limited | United Kingdom | 0.00 | % | 100.00 | % | 100.00 | % | 100.00 | % | Real estate | |||||||||||||
| A & L CF (Guernsey) Limited (f) | Guernsey | 0.00 | % | 100.00 | % | 100.00 | % | 100.00 | % | Leasing | |||||||||||||
| A & L CF June (2) Limited (c) | United Kingdom | 0.00 | % | 100.00 | % | 100.00 | % | 100.00 | % | Inactive | |||||||||||||
| A & L CF June (3) Limited | United Kingdom | 0.00 | % | 100.00 | % | 100.00 | % | 100.00 | % | Leasing | |||||||||||||
| A & L CF March (5) Limited (c) | United Kingdom | 0.00 | % | 100.00 | % | 100.00 | % | 100.00 | % | Inactive | |||||||||||||
| A & L CF September (4) Limited | United Kingdom | 0.00 | % | 100.00 | % | 100.00 | % | 100.00 | % | Inactive | |||||||||||||
| Abbey Business Services (India) Private Limited | India | 0.00 | % | 100.00 | % | 100.00 | % | 100.00 | % | Holding company | |||||||||||||
| Abbey Covered Bonds (Holdings) Limited | United Kingdom | — | (a) | — | — | Securitization | |||||||||||||||||
| Abbey Covered Bonds (LM) Limited | United Kingdom | 0.00 | % | 100.00 | % | 100.00 | % | 100.00 | % | Securitization | |||||||||||||
| Abbey Covered Bonds LLP | United Kingdom | — | (a) | — | — | Securitization | |||||||||||||||||
| Abbey National Beta Investments Limited | United Kingdom | 0.00 | % | 100.00 | % | 100.00 | % | 100.00 | % | Inactive | |||||||||||||
| Abbey National Business Office Equipment Leasing Limited | United Kingdom | 0.00 | % | 100.00 | % | 100.00 | % | 100.00 | % | Inactive | |||||||||||||
| Abbey National International Limited | Jersey | 0.00 | % | 100.00 | % | 100.00 | % | 100.00 | % | Financial services | |||||||||||||
| Abbey National Nominees Limited | United Kingdom | 0.00 | % | 100.00 | % | 100.00 | % | 100.00 | % | Inactive | |||||||||||||
| Abbey National PLP (UK) Limited | United Kingdom | 0.00 | % | 100.00 | % | 100.00 | % | 100.00 | % | Inactive | |||||||||||||
| Abbey National Property Investments | United Kingdom | 0.00 | % | 100.00 | % | 100.00 | % | 100.00 | % | Finance company | |||||||||||||
| Abbey National Treasury Services Investments Limited | United Kingdom | 0.00 | % | 100.00 | % | 100.00 | % | 100.00 | % | Inactive | |||||||||||||
| Abbey National Treasury Services Overseas Holdings | United Kingdom | 0.00 | % | 100.00 | % | 100.00 | % | 100.00 | % | Inactive | |||||||||||||
| Abbey National UK Investments | United Kingdom | 0.00 | % | 100.00 | % | 100.00 | % | 100.00 | % | Inactive | |||||||||||||
| Abbey Stockbrokers (Nominees) Limited | United Kingdom | 0.00 | % | 100.00 | % | 100.00 | % | 100.00 | % | Inactive | |||||||||||||
| Abbey Stockbrokers Limited | United Kingdom | 0.00 | % | 100.00 | % | 100.00 | % | 100.00 | % | Inactive | |||||||||||||
| Abent 3T, S.A.P.I de C.V. | Mexico | 0.00 | % | 100.00 | % | 100.00 | % | 100.00 | % | Electricity production | |||||||||||||
| Ablasa Participaciones, S.L. Unipersonal | Spain | 100.00 | % | 0.00 | % | 100.00 | % | 100.00 | % | Holding company | |||||||||||||
| Aduro S.A. | Uruguay | 0.00 | % | 100.00 | % | 100.00 | % | 100.00 | % | Payments and collection services | |||||||||||||
| Aevis Europa, S.L. | Spain | 96.34 | % | 0.00 | % | 96.34 | % | 96.34 | % | Cards | |||||||||||||
| AFB SAM Holdings, S.L. | Spain | 1.00 | % | 99.00 | % | 100.00 | % | 100.00 | % | Holding company | |||||||||||||
| Afisa S.A. | Chile | 0.00 | % | 100.00 | % | 100.00 | % | 100.00 | % | Fund management company | |||||||||||||
| Allane Leasing GmbH | Austria | 0.00 | % | 46.95 | % | 100.00 | % | 100.00 | % | Renting | |||||||||||||
| Allane Location Longue Durée S.a.r.l. | France | 0.00 | % | 46.95 | % | 100.00 | % | 100.00 | % | Renting | |||||||||||||
| Allane Mobility Consulting AG | Switzerland | 0.00 | % | 46.95 | % | 100.00 | % | 100.00 | % | Consulting services | |||||||||||||
| Allane Mobility Consulting B.V. | Netherlands | 0.00 | % | 46.95 | % | 100.00 | % | 100.00 | % | Consulting services | |||||||||||||
Subsidiaries of Banco Santander, S.A. 1 | |||||||||||||||||||||||
|
% of ownership held by
Banco Santander
|
Percentage of voting power (d) | ||||||||||||||||||||||
Company |
Location |
Direct | Indirect | Year 2023 | Year 2022 | Activity | |||||||||||||||||
| Allane Mobility Consulting GmbH | Germany | 0.00 | % | 46.95 | % | 100.00 | % | 100.00 | % | Consulting services | |||||||||||||
| Allane Mobility Consulting Österreich GmbH | Austria | 0.00 | % | 46.95 | % | 100.00 | % | 100.00 | % | Consulting services | |||||||||||||
| Allane Mobility Consulting S.a.r.l | France | 0.00 | % | 46.95 | % | 100.00 | % | 100.00 | % | Consulting services | |||||||||||||
| Allane Schweiz AG | Switzerland | 0.00 | % | 46.95 | % | 100.00 | % | 100.00 | % | Renting | |||||||||||||
| Allane SE | Germany | 0.00 | % | 46.95 | % | 92.07 | % | 92.07 | % | Renting | |||||||||||||
| Allane Services GmbH & co. KG | Germany | 0.00 | % | 46.95 | % | 100.00 | % | 100.00 | % | Services | |||||||||||||
| Allane Services Verwaltungs GmbH | Germany | 0.00 | % | 46.95 | % | 100.00 | % | 100.00 | % | Management of portfolios | |||||||||||||
| Alliance & Leicester Cash Solutions Limited | United Kingdom | 0.00 | % | 100.00 | % | 100.00 | % | 100.00 | % | Inactive | |||||||||||||
| Alliance & Leicester Commercial Bank Limited | United Kingdom | 0.00 | % | 100.00 | % | 100.00 | % | 100.00 | % | Inactive | |||||||||||||
| Alliance & Leicester Investments (Derivatives) Limited | United Kingdom | 0.00 | % | 100.00 | % | 100.00 | % | 100.00 | % | Inactive | |||||||||||||
| Alliance & Leicester Investments (No.2) Limited | United Kingdom | 0.00 | % | 100.00 | % | 100.00 | % | 100.00 | % | Inactive | |||||||||||||
| Alliance & Leicester Investments Limited (c) | United Kingdom | 0.00 | % | 100.00 | % | 100.00 | % | 100.00 | % | Inactive | |||||||||||||
| Alliance & Leicester Limited | United Kingdom | 0.00 | % | 100.00 | % | 100.00 | % | 100.00 | % | Inactive | |||||||||||||
| Alliance & Leicester Personal Finance Limited | United Kingdom | 0.00 | % | 100.00 | % | 100.00 | % | 100.00 | % | Finance company | |||||||||||||
| Altamira Santander Real Estate, S.A. | Spain | 100.00 | % | 0.00 | % | 100.00 | % | 100.00 | % | Real estate | |||||||||||||
| Alternative Leasing, FIL (Compartimento B) | Spain | 100.00 | % | 0.00 | % | 100.00 | % | 100.00 | % | Investment fund | |||||||||||||
| Amazonia Trade Limited | United Kingdom | 100.00 | % | 0.00 | % | 100.00 | % | 100.00 | % | Inactive | |||||||||||||
| Amherst Pierpont Commercial Mortgage Securities LLC | United States | 0.00 | % | 100.00 | % | 100.00 | % | 100.00 | % | Securitization | |||||||||||||
| Amherst Pierpont International Ltd. | Hong-Kong | 0.00 | % | 100.00 | % | 100.00 | % | 100.00 | % | Inactive | |||||||||||||
| AMS Auto Markt Am Schieferstein GmbH | Germany | 0.00 | % | 90.01 | % | 100.00 | % | — | Vehicle sales | ||||||||||||||
| AN (123) Limited | United Kingdom | 0.00 | % | 100.00 | % | 100.00 | % | 100.00 | % | Inactive | |||||||||||||
| Andaluza de Inversiones, S.A. Unipersonal | Spain | 0.00 | % | 100.00 | % | 100.00 | % | 100.00 | % | Holding company | |||||||||||||
| ANITCO Limited | United Kingdom | 0.00 | % | 100.00 | % | 100.00 | % | 100.00 | % | Inactive | |||||||||||||
| AP Acquisition Trust I | United States | 0.00 | % | 100.00 | % | 100.00 | % | 100.00 | % | Trust company | |||||||||||||
| AP Acquisition Trust II | United States | 0.00 | % | 100.00 | % | 100.00 | % | 100.00 | % | Inactive | |||||||||||||
| AP Asset Acquisition LLC | United States | 0.00 | % | 100.00 | % | 100.00 | % | 100.00 | % | Financial services | |||||||||||||
| Apê11 Tecnologia e Negócios Imobiliários S.A. | Brazil | 0.00 | % | 81.17 | % | 90.00 | % | 90.00 | % | Real estate | |||||||||||||
| APSG GP LLC | United States | 0.00 | % | 100.00 | % | 100.00 | % | 100.00 | % | Holding company | |||||||||||||
| Aquanima Brasil Ltda. | Brazil | 0.00 | % | 100.00 | % | 100.00 | % | 100.00 | % | E-commerce | |||||||||||||
| Aquanima Chile S.A. | Chile | 0.00 | % | 100.00 | % | 100.00 | % | 100.00 | % | Services | |||||||||||||
| Aquanima México S. de R.L. de C.V. | Mexico | 0.00 | % | 100.00 | % | 100.00 | % | 100.00 | % | E-commerce | |||||||||||||
| Aquanima S.A. | Argentine | 0.00 | % | 100.00 | % | 100.00 | % | 100.00 | % | Services | |||||||||||||
| Artarien S.A. | Uruguay | 100.00 | % | 0.00 | % | 100.00 | % | 100.00 | % | Insurance intermediary | |||||||||||||
| Athena Corporation Limited | United Kingdom | 0.00 | % | 100.00 | % | 100.00 | % | 100.00 | % | Financial services | |||||||||||||
| Atlantes Mortgage No. 2 | Portugal | — | (a) | — | — | Securitization | |||||||||||||||||
| Atlantes Mortgage No. 3 | Portugal | — | (a) | — | — | Securitization | |||||||||||||||||
| Atlantes Mortgage No. 4 | Portugal | — | (a) | — | — | Securitization | |||||||||||||||||
Subsidiaries of Banco Santander, S.A. 1 | |||||||||||||||||||||||
|
% of ownership held by
Banco Santander
|
Percentage of voting power (d) | ||||||||||||||||||||||
Company |
Location |
Direct | Indirect | Year 2023 | Year 2022 | Activity | |||||||||||||||||
| Atual - Fundo de Invest Multimercado Crédito Privado Investimento no Exterior | Brazil | 0.00 | % | 90.19 | % | 100.00 | % | 100.00 | % | Investment fund | |||||||||||||
| Auto ABS Belgium Loans 2019 SA/NV | Belgium | — | (a) | — | — | Securitization | |||||||||||||||||
| Auto ABS DFP Master Compartment France 2013 | France | — | (a) | — | — | Securitization | |||||||||||||||||
| Auto ABS French Leases 2021 | France | — | (a) | — | — | Securitization | |||||||||||||||||
| Auto ABS French Leases 2023 | France | — | (a) | — | — | Securitization | |||||||||||||||||
| Auto ABS French Leases Master Compartment 2016 | France | — | (a) | — | — | Securitization | |||||||||||||||||
| Auto ABS French Loans Master | France | — | (a) | — | — | Securitization | |||||||||||||||||
| Auto ABS French LT Leases Master | France | — | (a) | — | — | Securitization | |||||||||||||||||
| Auto ABS Italian Balloon 2019-1 S.r.l. | Italy | — | (a) | — | — | Securitization | |||||||||||||||||
| Auto ABS Italian Rainbow Loans S.r.l. | Italy | — | (a) | — | — | Securitization | |||||||||||||||||
| Auto ABS Italian Stella Loans 2023-1 S.r.l. | Italy | — | (a) | — | — | Securitization | |||||||||||||||||
| Auto ABS Spanish Loans 2018-1, Fondo de Titulización | Spain | — | (a) | — | — | Securitization | |||||||||||||||||
| Auto ABS Spanish Loans 2020-1, Fondo de Titulización | Spain | — | (a) | — | — | Securitization | |||||||||||||||||
| Auto ABS Spanish Loans 2022-1, Fondo de Titulización | Spain | — | (a) | — | — | Securitization | |||||||||||||||||
| Autodescuento, S.L. | Spain | 0.00 | % | 93.89 | % | 93.89 | % | 93.89 | % | Vehicles purchased by internet | |||||||||||||
| Autohaus24 GmbH | Germany | 0.00 | % | 46.95 | % | 100.00 | % | 100.00 | % | Internet | |||||||||||||
| Auttar HUT Processamento de Dados Ltda. | Brazil | 0.00 | % | 100.00 | % | 100.00 | % | 100.00 | % | IT services | |||||||||||||
| Aviación Antares, A.I.E. | Spain | 99.99 | % | 0.01 | % | 100.00 | % | 100.00 | % | Renting | |||||||||||||
| Aviación Británica, A.I.E. | Spain | 99.99 | % | 0.01 | % | 100.00 | % | 100.00 | % | Renting | |||||||||||||
| Aviación Comillas, S.L. Unipersonal | Spain | 100.00 | % | 0.00 | % | 100.00 | % | 100.00 | % | Renting | |||||||||||||
| Aviación Laredo, S.L. | Spain | 99.00 | % | 1.00 | % | 100.00 | % | 100.00 | % | Air transport | |||||||||||||
| Aviación Oyambre, S.L. Unipersonal | Spain | 100.00 | % | 0.00 | % | 100.00 | % | 100.00 | % | Renting | |||||||||||||
| Aviación Santillana, S.L. | Spain | 99.00 | % | 1.00 | % | 100.00 | % | 100.00 | % | Renting | |||||||||||||
| Aviación Suances, S.L. | Spain | 99.00 | % | 1.00 | % | 100.00 | % | 100.00 | % | Air transport | |||||||||||||
| Aymoré Crédito, Financiamento e Investimento S.A. | Brazil | 0.00 | % | 90.19 | % | 100.00 | % | 100.00 | % | Finance company | |||||||||||||
| Banco Bandepe S.A. | Brazil | 0.00 | % | 90.19 | % | 100.00 | % | 100.00 | % | Banking | |||||||||||||
| Banco de Albacete, S.A. Unipersonal | Spain | 100.00 | % | 0.00 | % | 100.00 | % | 100.00 | % | Banking | |||||||||||||
| Banco Hyundai Capital Brasil S.A. | Brazil | 0.00 | % | 45.09 | % | 50.00 | % | 50.00 | % | Banking | |||||||||||||
| Banco Santander - Chile | Chile | 0.00 | % | 67.13 | % | 67.18 | % | 67.18 | % | Banking | |||||||||||||
| Banco Santander (Brasil) S.A. | Brazil | 0.04 | % | 90.15 | % | 90.80 | % | 90.90 | % | Banking | |||||||||||||
| Banco Santander (México), S.A., Institución de Banca Múltiple, Grupo Financiero Santander México como Fiduciaria del Fideicomiso 100740 | Mexico | 0.00 | % | 99.97 | % | 100.00 | % | 100.00 | % | Finance company | |||||||||||||
| Banco Santander (México), S.A., Institución de Banca Múltiple, Grupo Financiero Santander México como Fiduciaria del Fideicomiso 2002114 | Mexico | 0.00 | % | 99.97 | % | 100.00 | % | 100.00 | % | Finance company | |||||||||||||
| Banco Santander (México), S.A., Institución de Banca Múltiple, Grupo Financiero Santander México como Fiduciaria del Fideicomiso GFSSLPT | Mexico | 0.00 | % | 99.97 | % | 100.00 | % | 100.00 | % | Finance company | |||||||||||||
| Banco Santander Argentina S.A. | Argentina | 0.00 | % | 99.82 | % | 99.78 | % | 99.77 | % | Banking | |||||||||||||
| Banco Santander de Negocios Colombia S.A. | Colombia | 94.90 | % | 5.10 | % | 100.00 | % | 100.00 | % | Banking | |||||||||||||
| Banco Santander International | United States | 0.00 | % | 100.00 | % | 100.00 | % | 100.00 | % | Banking | |||||||||||||
| Banco Santander International SA | Switzerland | 0.00 | % | 100.00 | % | 100.00 | % | 100.00 | % | Banking | |||||||||||||
| Banco Santander México, S.A., Institución de Banca Múltiple, Grupo Financiero Santander México | Mexico | 24.93 | % | 75.05 | % | 99.97 | % | 96.24 | % | Banking | |||||||||||||
Subsidiaries of Banco Santander, S.A. 1 | |||||||||||||||||||||||
|
% of ownership held by
Banco Santander
|
Percentage of voting power (d) | ||||||||||||||||||||||
Company |
Location |
Direct | Indirect | Year 2023 | Year 2022 | Activity | |||||||||||||||||
| Banco Santander Perú S.A. | Peru | 99.90 | % | 0.10 | % | 100.00 | % | 100.00 | % | Banking | |||||||||||||
| Banco Santander S.A. | Uruguay | 97.75 | % | 2.25 | % | 100.00 | % | 100.00 | % | Banking | |||||||||||||
| Banco Santander Totta, S.A. | Portugal | 0.00 | % | 99.87 | % | 99.96 | % | 99.96 | % | Banking | |||||||||||||
| Banque Stellantis France | France | 0.00 | % | 50.00 | % | 50.00 | % | 50.00 | % | Banking | |||||||||||||
| Bansa Santander S.A. | Chile | 0.00 | % | 100.00 | % | 100.00 | % | 100.00 | % | Real estate | |||||||||||||
| BEN Benefícios e Serviços Instituição de Pagamento S.A. | Brazil | 0.00 | % | 90.19 | % | 100.00 | % | 100.00 | % | Payment services | |||||||||||||
| BEXs Banco de Cambio S/A | Brazil | 0.00 | % | 66.54 | % | 100.00 | % | — | Payment services | ||||||||||||||
| BEXs Tech Participacoes Ltda. | Brazil | 0.00 | % | 66.54 | % | 100.00 | % | — | Holding company | ||||||||||||||
| BEXs Tecnología da Informacao Ltda. | Brazil | 0.00 | % | 66.54 | % | 100.00 | % | — | IT services | ||||||||||||||
| Bilkreditt 7 Designated Activity Company (c) | Ireland | — | (a) | — | — | Securitization | |||||||||||||||||
| Blecno Investments, S.L. Unipersonal | Spain | 100.00 | % | 0.00 | % | 100.00 | % | 100.00 | % | Real estate | |||||||||||||
| BRS Investments S.A. | Argentine | 5.10 | % | 94.90 | % | 100.00 | % | 100.00 | % | Finance company | |||||||||||||
| Camine D - Services, Unipessoal Lda. | Portugal | 0.00 | % | 100.00 | % | 100.00 | % | — | Software | ||||||||||||||
| Cántabra de Inversiones, S.A. | Spain | 100.00 | % | 0.00 | % | 100.00 | % | 100.00 | % | Holding company | |||||||||||||
| Cántabro Catalana de Inversiones, S.A. | Spain | 100.00 | % | 0.00 | % | 100.00 | % | 100.00 | % | Holding company | |||||||||||||
| Capital Street Delaware LP | United States | 0.00 | % | 100.00 | % | 100.00 | % | 100.00 | % | Holding company | |||||||||||||
| Capital Street Holdings, LLC | United States | 0.00 | % | 100.00 | % | 100.00 | % | 100.00 | % | Holding company | |||||||||||||
| Capital Street REIT Holdings, LLC | United States | 0.00 | % | 100.00 | % | 100.00 | % | 100.00 | % | Holding company | |||||||||||||
| Capital Street S.A. | Luxembourg | 0.00 | % | 100.00 | % | 100.00 | % | 100.00 | % | Finance company | |||||||||||||
| Cartasur Cards S.A. | Argentine | 0.00 | % | 99.82 | % | 100.00 | % | — | Finance company | ||||||||||||||
| Casa de Bolsa Santander, S.A. de C.V., Grupo Financiero Santander México | Mexico | 0.00 | % | 99.97 | % | 99.97 | % | 99.97 | % | Securities company | |||||||||||||
| Cater Allen Holdings Limited | United Kingdom | 0.00 | % | 100.00 | % | 100.00 | % | 100.00 | % | Inactive | |||||||||||||
| Cater Allen International Limited | United Kingdom | 0.00 | % | 100.00 | % | 100.00 | % | 100.00 | % | Inactive | |||||||||||||
| Cater Allen Limited | United Kingdom | 0.00 | % | 100.00 | % | 100.00 | % | 100.00 | % | Banking | |||||||||||||
| Cater Allen Lloyd's Holdings Limited (c) | United Kingdom | 0.00 | % | 100.00 | % | 100.00 | % | 100.00 | % | Inactive | |||||||||||||
| Cater Allen Syndicate Management Limited | United Kingdom | 0.00 | % | 100.00 | % | 100.00 | % | 100.00 | % | Inactive | |||||||||||||
| CCAP Auto Lease Ltd. | United States | 0.00 | % | 100.00 | % | 100.00 | % | 100.00 | % | Leasing | |||||||||||||
| Centro de Capacitación Santander, A.C. | Mexico | 0.00 | % | 99.97 | % | 100.00 | % | 100.00 | % | Non-profit institute | |||||||||||||
| Certidesa, S.L. Unipersonal | Spain | 0.00 | % | 100.00 | % | 100.00 | % | 100.00 | % | Aircraft rental | |||||||||||||
| Charlotte 2023 Funding Plc | United Kingdom | 0.00 | % | 100.00 | % | 100.00 | % | — | Securitization | ||||||||||||||
| Charlotte 2023 Holdings Limited | United Kingdom | — | (a) | — | — | Securitization | |||||||||||||||||
| Chrysler Capital Auto Funding II LLC | United States | 0.00 | % | 100.00 | % | 100.00 | % | 100.00 | % | Finance company | |||||||||||||
| Chrysler Capital Master Auto Receivables Funding 2 LLC | United States | 0.00 | % | 100.00 | % | 100.00 | % | 100.00 | % | Finance company | |||||||||||||
| Cianite New Energy, S.r.l. | Italy | 0.00 | % | 49.00 | % | 70.00 | % | — | Renewable energies | ||||||||||||||
| CIMA Finance DAC Series 2022-1 | Ireland | — | (a) | — | — | Securitization | |||||||||||||||||
| CiMA Finance Designated Activity Company Loan Series 2023-11 | Ireland | — | (a) | — | — | Finance company | |||||||||||||||||
Subsidiaries of Banco Santander, S.A. 1 | |||||||||||||||||||||||
|
% of ownership held by
Banco Santander
|
Percentage of voting power (d) | ||||||||||||||||||||||
Company |
Location |
Direct | Indirect | Year 2023 | Year 2022 | Activity | |||||||||||||||||
| CiMA Finance Designated Activity Company Series 2023-15 | Ireland | — | (a) | — | — | Finance company | |||||||||||||||||
| Cobranza Amigable, S.A.P.I. de C.V. | Mexico | 0.00 | % | 85.00 | % | 100.00 | % | 100.00 | % | Collection services | |||||||||||||
| Community Development and Affordable Housing Fund LLC | United States | 0.00 | % | 96.00 | % | 96.00 | % | 96.00 | % | Asset management | |||||||||||||
| Compagnie Generale de Credit Aux Particuliers - Credipar S.A. | France | 0.00 | % | 50.00 | % | 100.00 | % | 100.00 | % | Banking | |||||||||||||
| Compagnie Pour la Location de Vehicules - CLV | France | 0.00 | % | 50.00 | % | 100.00 | % | 100.00 | % | Banking | |||||||||||||
| Consulteam Consultores de Gestão, Unipessoal, Lda. | Portugal | 100.00 | % | 0.00 | % | 100.00 | % | 100.00 | % | Real estate | |||||||||||||
| Consumer Totta 1 | Portugal | — | (a) | — | — | Securitization | |||||||||||||||||
| Credileads S.A. | Uruguay | 0.00 | % | 100.00 | % | 100.00 | % | 100.00 | % | Advertising | |||||||||||||
| Cyber Guardian Solutions, S.L. Unipersonal | Spain | 0.00 | % | 100.00 | % | 100.00 | % | — | IT consulting | ||||||||||||||
| Darep Designated Activity Company | Ireland | 100.00 | % | 0.00 | % | 100.00 | % | 100.00 | % | Reinsurances | |||||||||||||
| Decarome, S.A.P.I. de C.V. | Mexico | 0.00 | % | 100.00 | % | 100.00 | % | 100.00 | % | Finance company | |||||||||||||
| Decarope S.A.C. | Peru | 0.00 | % | 100.00 | % | 100.00 | % | — | Investment Company | ||||||||||||||
| Deva Capital Advisory Company, S.L. Unipersonal | Spain | 0.00 | % | 100.00 | % | 100.00 | % | 100.00 | % | Advisory services | |||||||||||||
| Deva Capital Holding Company, S.L. Unipersonal | Spain | 100.00 | % | 0.00 | % | 100.00 | % | 100.00 | % | Holding company | |||||||||||||
| Deva Capital Investment Company, S.L. Unipersonal | Spain | 0.00 | % | 100.00 | % | 100.00 | % | 100.00 | % | Holding company | |||||||||||||
| Deva Capital Management Company, S.L. Unipersonal | Spain | 0.00 | % | 100.00 | % | 100.00 | % | 100.00 | % | Advisory services | |||||||||||||
| Deva Capital Servicer Company, S.L. Unipersonal | Spain | 0.00 | % | 100.00 | % | 100.00 | % | 100.00 | % | Holding company | |||||||||||||
| Diglo Servicer Company 2021, S.L. Unipersonal | Spain | 0.00 | % | 100.00 | % | 100.00 | % | 100.00 | % | Real estate management | |||||||||||||
| Diners Club Spain, S.A. Unipersonal | Spain | 100.00 | % | 0.00 | % | 100.00 | % | 100.00 | % | Cards | |||||||||||||
| Dirección Estratega, S.C. | Mexico | 0.00 | % | 100.00 | % | 100.00 | % | 100.00 | % | Services | |||||||||||||
| Drive Auto Receivables Trust 2020-1 | United States | — | (a) | — | — | Securitization | |||||||||||||||||
| Drive Auto Receivables Trust 2020-2 | United States | — | (a) | — | — | Securitization | |||||||||||||||||
| Drive Auto Receivables Trust 2021-1 | United States | — | (a) | — | — | Securitization | |||||||||||||||||
| Drive Auto Receivables Trust 2021-2 | United States | — | (a) | — | — | Securitization | |||||||||||||||||
| Drive Auto Receivables Trust 2021-3 | United States | — | (a) | — | — | Securitization | |||||||||||||||||
| Drive Auto Receivables Trust 2023-1 | United States | — | (a) | — | — | Inactive | |||||||||||||||||
| Drive Auto Receivables Trust 2023-2 | United States | — | (a) | — | — | Inactive | |||||||||||||||||
| Drive Auto Receivables Trust 2023-3 | United States | — | (a) | — | — | Inactive | |||||||||||||||||
| Drive Auto Receivables Trust 2024-1 | United States | — | (a) | — | — | Inactive | |||||||||||||||||
| Drive S.r.l. | Italy | 0.00 | % | 75.00 | % | 75.00 | % | 100.00 | % | Renting | |||||||||||||
| Ductor Real Estate, S.L. Unipersonal | Spain | 100.00 | % | 0.00 | % | 100.00 | % | 100.00 | % | Real estate | |||||||||||||
| Ebury Brasil Consultoria S.A. | Brazil | 0.00 | % | 66.54 | % | 100.00 | % | 100.00 | % | Consulting services | |||||||||||||
| Ebury Brasil Participacões S.A. | Brazil | 0.00 | % | 66.54 | % | 100.00 | % | 100.00 | % | Holding company | |||||||||||||
| Ebury Facilitadora De Pagamentos Ltda. | Brazil | 0.00 | % | 66.54 | % | 100.00 | % | 100.00 | % | Software | |||||||||||||
| Ebury Finance Belgium NV (c) | Belgium | 0.00 | % | 66.54 | % | 100.00 | % | 100.00 | % | Finance company | |||||||||||||
Subsidiaries of Banco Santander, S.A. 1 | |||||||||||||||||||||||
|
% of ownership held by
Banco Santander
|
Percentage of voting power (d) | ||||||||||||||||||||||
Company |
Location |
Direct | Indirect | Year 2023 | Year 2022 | Activity | |||||||||||||||||
| Ebury Mass Payments Holdco Limited | United Kingdom | 0.00 | % | 66.54 | % | 100.00 | % | 100.00 | % | Holding company | |||||||||||||
| Ebury Mass Payments Limited | United Kingdom | 0.00 | % | 66.54 | % | 100.00 | % | 100.00 | % | Payment services | |||||||||||||
| Ebury Partners (DIFC) Limited | Arab United Emirates | 0.00 | % | 66.54 | % | 100.00 | % | — | Finance company | ||||||||||||||
| Ebury Partners Australia Pty Ltd. | Australia | 0.00 | % | 66.54 | % | 100.00 | % | 100.00 | % | Finance company | |||||||||||||
| Ebury Partners Belgium NV | Belgium | 0.00 | % | 66.54 | % | 100.00 | % | 100.00 | % | Payment services | |||||||||||||
| Ebury Partners Canada Limited | Canada | 0.00 | % | 66.54 | % | 100.00 | % | 100.00 | % | Finance company | |||||||||||||
| Ebury Partners Chile S.p.A. | Chile | 0.00 | % | 66.54 | % | 100.00 | % | — | Finance company | ||||||||||||||
| Ebury Partners China Limited | China | 0.00 | % | 66.54 | % | 100.00 | % | 100.00 | % | Inactive | |||||||||||||
| Ebury Partners Finance Limited | United Kingdom | 0.00 | % | 66.54 | % | 100.00 | % | 100.00 | % | Finance company | |||||||||||||
| Ebury Partners Holdings Limited | United Kingdom | 0.00 | % | 66.54 | % | 100.00 | % | 100.00 | % | Holding company | |||||||||||||
| Ebury Partners Hong Kong Limited | Hong-Kong | 0.00 | % | 66.54 | % | 100.00 | % | 100.00 | % | Finance company | |||||||||||||
| Ebury Partners Limited | United Kingdom | 0.00 | % | 66.54 | % | 66.54 | % | 66.54 | % | Holding company | |||||||||||||
| Ebury Partners Markets Cyprus Limited | Cyprus | 0.00 | % | 66.54 | % | 100.00 | % | — | Finance company | ||||||||||||||
| Ebury Partners Markets Limited | United Kingdom | 0.00 | % | 66.54 | % | 100.00 | % | 100.00 | % | Finance company | |||||||||||||
| Ebury Partners SA (Pty) Ltd. | Republic of South Africa | 0.00 | % | 66.54 | % | 100.00 | % | 100.00 | % | Inactive | |||||||||||||
| Ebury Partners South Africa (Pty) Ltd | Republic of South Africa | 0.00 | % | 66.54 | % | 100.00 | % | — | Finance company | ||||||||||||||
| Ebury Partners Switzerland AG | Switzerland | 0.00 | % | 66.54 | % | 100.00 | % | 100.00 | % | Finance company | |||||||||||||
| Ebury Partners UK Limited | United Kingdom | 0.00 | % | 66.54 | % | 100.00 | % | 100.00 | % | Electronic money | |||||||||||||
| Ebury Payments PTE Ltd. | Singapur | 0.00 | % | 66.54 | % | 100.00 | % | 100.00 | % | Payment services | |||||||||||||
| Ebury Technology Limited | United Kingdom | 0.00 | % | 66.54 | % | 100.00 | % | 100.00 | % | Software | |||||||||||||
| EDT FTPYME Pastor 3, Fondo de Titulización de Activos | Spain | — | (a) | — | — | Securitization | |||||||||||||||||
| Elcano Renovables, S.L. | Spain | 0.00 | % | 70.00 | % | 70.00 | % | 70.00 | % | Holding company | |||||||||||||
| Electrolyser, S.A. de C.V. | Mexico | 0.00 | % | 99.97 | % | 100.00 | % | 100.00 | % | Services | |||||||||||||
| Elevate Tech Platforms, S.L. Unipersonal | Spain | 100.00 | % | 0.00 | % | 100.00 | % | 100.00 | % | Holding company | |||||||||||||
| Em Dia Serviços Especializados em Cobranças Ltda. | Brazil | 0.00 | % | 90.19 | % | 100.00 | % | 100.00 | % | Collection services | |||||||||||||
| Empresa de Créditos Santander Consumo Perú S.A. | Peru | 100.00 | % | 0.00 | % | 100.00 | % | 100.00 | % | Finance company | |||||||||||||
| Erestone S.A.S. (c) | France | 0.00 | % | 90.00 | % | 90.00 | % | 90.00 | % | Inactive | |||||||||||||
| Esfera Fidelidade S.A. | Brazil | 0.00 | % | 90.19 | % | 100.00 | % | 100.00 | % | Services | |||||||||||||
| Evidence Previdência S.A. | Brazil | 0.00 | % | 90.19 | % | 100.00 | % | 100.00 | % | Insurance | |||||||||||||
| Eyemobile Tecnologia S.A. | Brazil | 0.00 | % | 100.00 | % | 100.00 | % | 60.00 | % | IT services | |||||||||||||
| F1rst Tecnologia e Inovação Ltda. | Brazil | 0.00 | % | 90.19 | % | 100.00 | % | 100.00 | % | IT services | |||||||||||||
| Financeira El Corte Inglés, Portugal, S.F.C., S.A. | Portugal | 0.00 | % | 51.00 | % | 100.00 | % | 100.00 | % | Finance company | |||||||||||||
| Financiera El Corte Inglés, E.F.C., S.A. | Spain | 0.00 | % | 51.00 | % | 51.00 | % | 51.00 | % | Finance company | |||||||||||||
| Finsantusa, S.L. Unipersonal | Spain | 0.00 | % | 100.00 | % | 100.00 | % | 100.00 | % | Holding company | |||||||||||||
Subsidiaries of Banco Santander, S.A. 1 | |||||||||||||||||||||||
|
% of ownership held by
Banco Santander
|
Percentage of voting power (d) | ||||||||||||||||||||||
Company |
Location |
Direct | Indirect | Year 2023 | Year 2022 | Activity | |||||||||||||||||
| First National Motor plc | United Kingdom | 0.00 | % | 100.00 | % | 100.00 | % | 100.00 | % | Inactive | |||||||||||||
| First National Tricity Finance Limited | United Kingdom | 0.00 | % | 100.00 | % | 100.00 | % | 100.00 | % | Inactive | |||||||||||||
| Fondation Holding Auto ABS Belgium Loans | Belgium | — | (a) | — | — | Securitization | |||||||||||||||||
| Fondo de Titulización PYMES Santander 15 | Spain | — | (a) | — | — | Securitization | |||||||||||||||||
| Fondo de Titulización Santander Consumer Spain Auto 2016-2 | Spain | — | (a) | — | — | Securitization | |||||||||||||||||
| Fondo de Titulización Santander Financiación 1 | Spain | — | (a) | — | — | Securitization | |||||||||||||||||
| Fondo de Titulización, RMBS Santander 7 | Spain | — | (a) | — | — | Securitization | |||||||||||||||||
| Fondos Santander, S.A. Administradora de Fondos de Inversión (en liquidación) (c) | Uruguay | 0.00 | % | 100.00 | % | 100.00 | % | 100.00 | % | Fund management company | |||||||||||||
| Foreign Exchange Solutions (UK) Limited (c) | United Kingdom | 0.00 | % | 66.54 | % | 100.00 | % | 100.00 | % | IT services | |||||||||||||
| Foreign Exchange Solutions S.L. (o) | Spain | 0.00 | % | 66.54 | % | 100.00 | % | 100.00 | % | IT services | |||||||||||||
| Fortensky Trading, Ltd. | Ireland | 0.00 | % | 100.00 | % | 100.00 | % | 100.00 | % | Finance company | |||||||||||||
| Fosse (Master Issuer) Holdings Limited | United Kingdom | — | (a) | — | — | Securitization | |||||||||||||||||
| Fosse Funding (No.1) Limited | United Kingdom | 0.00 | % | 100.00 | % | 100.00 | % | 100.00 | % | Securitization | |||||||||||||
| Fosse Master Issuer PLC | United Kingdom | 0.00 | % | 100.00 | % | 100.00 | % | 100.00 | % | Securitization | |||||||||||||
| Fosse Trustee (UK) Limited | United Kingdom | 0.00 | % | 100.00 | % | 100.00 | % | 100.00 | % | Securitization | |||||||||||||
| Freedom Depository Holdings, LLC | United States | 0.00 | % | 100.00 | % | 100.00 | % | 100.00 | % | Holding company | |||||||||||||
| Freedom Depository, LLC | United States | 0.00 | % | 100.00 | % | 100.00 | % | 100.00 | % | Securitization | |||||||||||||
| Fundo de Investimento em Direitos Creditórios Atacado - Não Padronizado | Brazil | 0.00 | % | 90.19 | % | 100.00 | % | 100.00 | % | Investment fund | |||||||||||||
| Fundo de Investimento em Direitos Creditórios Tellus | Brazil | 0.00 | % | 90.19 | % | 100.00 | % | — | Investment fund | ||||||||||||||
| Fundo de Investimentos em Direitos Creditórios Multisegmentos NPL Ipanema VI – Não padronizado | Brazil | 0.00 | % | 90.19 | % | 100.00 | % | 100.00 | % | Investment fund | |||||||||||||
| Gamma, Sociedade Financeira de Titularização de Créditos, S.A. | Portugal | 0.00 | % | 99.87 | % | 100.00 | % | 100.00 | % | Securitization | |||||||||||||
| GC FTPYME Pastor 4, Fondo de Titulización de Activos | Spain | — | (a) | — | — | Securitization | |||||||||||||||||
| Gesban México Servicios Administrativos Globales, S.A. de C.V. | Mexico | 0.00 | % | 100.00 | % | 100.00 | % | 100.00 | % | Services | |||||||||||||
| Gesban Santander Servicios Profesionales Contables Limitada | Chile | 0.00 | % | 100.00 | % | 100.00 | % | 100.00 | % | Accounting services | |||||||||||||
| Gesban Servicios Administrativos Globales, S.L. | Spain | 99.99 | % | 0.01 | % | 100.00 | % | 100.00 | % | Services | |||||||||||||
| Gesban UK Limited | United Kingdom | 0.00 | % | 100.00 | % | 100.00 | % | 100.00 | % | Payments and collection services | |||||||||||||
| Gestión de Inversiones JILT, S.A. Unipersonal | Spain | 100.00 | % | 0.00 | % | 100.00 | % | 100.00 | % | Services | |||||||||||||
| Gestora de Procesos S.A. en liquidación (c) | Peru | 0.00 | % | 100.00 | % | 100.00 | % | 100.00 | % | Holding company | |||||||||||||
| Getnet Adquirência e Serviços para Meios de Pagamento S.A. - Instituição de Pagamento | Brazil | 0.00 | % | 100.00 | % | 100.00 | % | 97.10 | % | Payment services | |||||||||||||
| Getnet Argentina S.A.U. | Argentine | 0.00 | % | 100.00 | % | 100.00 | % | 100.00 | % | Payment methods | |||||||||||||
| Getnet Europe, Entidad de Pago, S.L. Unipersonal | Spain | 0.00 | % | 100.00 | % | 100.00 | % | 100.00 | % | Payment services | |||||||||||||
Subsidiaries of Banco Santander, S.A. 1 | |||||||||||||||||||||||
|
% of ownership held by
Banco Santander
|
Percentage of voting power (d) | ||||||||||||||||||||||
Company |
Location |
Direct | Indirect | Year 2023 | Year 2022 | Activity | |||||||||||||||||
| Getnet Fundo de Investimento em Direitos Creditórios | Brazil | 0.00 | % | 90.19 | % | 100.00 | % | 100.00 | % | Investment fund | |||||||||||||
| Getnet Merchant Solutions UK Ltd | United Kingdom | 0.00 | % | 100.00 | % | 100.00 | % | 100.00 | % | Financial services | |||||||||||||
| Getnet Sociedade de Credito Direto S.A. | Brazil | 0.00 | % | 100.00 | % | 100.00 | % | 100.00 | % | Finance company | |||||||||||||
| Getnet Uruguay S.A. | Uruguay | 0.00 | % | 100.00 | % | 100.00 | % | 100.00 | % | Payment methods | |||||||||||||
| Gira, Gestão Integrada de Recebíveis do Agronegócio S.A. (p) | Brazil | 0.00 | % | 72.15 | % | 80.00 | % | 80.00 | % | Consulting services | |||||||||||||
| GNXT Serviços de Atendimento Ltda. | Brazil | 0.00 | % | 100.00 | % | 100.00 | % | 100.00 | % | Telemarketing | |||||||||||||
| Golden Bar (Securitisation) S.r.l. | Italy | — | (a) | — | — | Securitization | |||||||||||||||||
| Golden Bar Stand Alone 2019-1 | Italy | — | (a) | — | — | Securitization | |||||||||||||||||
| Golden Bar Stand Alone 2020-1 | Italy | — | (a) | — | — | Securitization | |||||||||||||||||
| Golden Bar Stand Alone 2020-2 | Italy | — | (a) | — | — | Securitization | |||||||||||||||||
| Golden Bar Stand Alone 2021-1 | Italy | — | (a) | — | — | Securitization | |||||||||||||||||
| Golden Bar Stand Alone 2022-1 | Italy | — | (a) | — | — | Securitization | |||||||||||||||||
| Golden Bar Stand Alone 2023-1 | Italy | — | (a) | — | — | Securitization | |||||||||||||||||
| Golden Bar Stand Alone 2023-2 | Italy | — | (a) | — | — | Securitization | |||||||||||||||||
| Grafite New Energy, S.r.l. | Italy | 0.00 | % | 49.00 | % | 70.00 | % | — | Renewable energies | ||||||||||||||
| Gravity Cloud Technology, S.L. | Spain | 100.00 | % | 0.00 | % | 100.00 | % | 100.00 | % | IT services | |||||||||||||
| Grupo Empresarial Santander, S.L. | Spain | 99.62 | % | 0.38 | % | 100.00 | % | 100.00 | % | Holding company | |||||||||||||
| Grupo Financiero Santander México, S.A. de C.V. | Mexico | 100.00 | % | 0.00 | % | 100.00 | % | 100.00 | % | Holding company | |||||||||||||
| Guaranty Car, S.A. Unipersonal | Spain | 0.00 | % | 100.00 | % | 100.00 | % | 100.00 | % | Automotive | |||||||||||||
| Hipototta No. 13 | Portugal | — | (a) | — | — | Securitization | |||||||||||||||||
| Hipototta No. 4 FTC | Portugal | — | (a) | — | — | Securitization | |||||||||||||||||
| Hipototta No. 4 plc | Ireland | — | (a) | — | — | Securitization | |||||||||||||||||
| Hipototta No. 5 FTC | Portugal | — | (a) | — | — | Securitization | |||||||||||||||||
| Hipototta No. 5 plc | Ireland | — | (a) | — | — | Securitization | |||||||||||||||||
| Holbah Santander, S.L. Unipersonal | Spain | 0.00 | % | 100.00 | % | 100.00 | % | 100.00 | % | Holding company | |||||||||||||
| Holding BEXs Banco Participacoes Ltda. | Brazil | 0.00 | % | 66.54 | % | 100.00 | % | — | Holding company | ||||||||||||||
| Holmes Funding Limited | United Kingdom | 0.00 | % | 100.00 | % | 100.00 | % | 100.00 | % | Securitization | |||||||||||||
| Holmes Holdings Limited | United Kingdom | — | (a) | — | — | Securitization | |||||||||||||||||
| Holmes Master Issuer plc | United Kingdom | 0.00 | % | 100.00 | % | 100.00 | % | 100.00 | % | Securitization | |||||||||||||
| Holmes Trustees Limited | United Kingdom | 0.00 | % | 100.00 | % | 100.00 | % | 100.00 | % | Securitization | |||||||||||||
| Hyundai Capital Bank Europe GmbH | Germany | 0.00 | % | 51.00 | % | 51.00 | % | 51.00 | % | Banking | |||||||||||||
| Ibérica de Compras Corporativas, S.L. | Spain | 97.17 | % | 2.83 | % | 100.00 | % | 100.00 | % | E-commerce | |||||||||||||
| Independence Community Bank Corp. | United States | 0.00 | % | 100.00 | % | 100.00 | % | 100.00 | % | Holding company | |||||||||||||
| Innohub, S.A.P.I. de C.V. | Mexico | 0.00 | % | 62.01 | % | 62.01 | % | 40.84 | % | IT services | |||||||||||||
| Insurance Funding Solutions Limited | United Kingdom | 0.00 | % | 100.00 | % | 100.00 | % | 100.00 | % | Inactive | |||||||||||||
| Inversiones Capital Global, S.A. Unipersonal | Spain | 100.00 | % | 0.00 | % | 100.00 | % | 100.00 | % | Holding company | |||||||||||||
| Inversiones Marítimas del Mediterráneo, S.A. | Spain | 0.00 | % | 100.00 | % | 100.00 | % | 100.00 | % | Inactive | |||||||||||||
| Isar Valley S.A. | Luxembourg | — | (a) | — | — | Securitization | |||||||||||||||||
| Isla de los Buques, S.A. | Spain | 99.98 | % | 0.02 | % | 100.00 | % | 100.00 | % | Finance company | |||||||||||||
| Klare Corredora de Seguros S.A. | Chile | 0.00 | % | 33.63 | % | 50.10 | % | 50.10 | % | Insurance intermediary | |||||||||||||
Subsidiaries of Banco Santander, S.A. 1 | |||||||||||||||||||||||
|
% of ownership held by
Banco Santander
|
Percentage of voting power (d) | ||||||||||||||||||||||
Company |
Location |
Direct | Indirect | Year 2023 | Year 2022 | Activity | |||||||||||||||||
| Landcompany 2020, S.L. Unipersonal | Spain | 100.00 | % | 0.00 | % | 100.00 | % | 100.00 | % | Real estate management | |||||||||||||
| Laparanza, S.A. | Spain | 61.59 | % | 0.00 | % | 61.59 | % | 61.59 | % | Agricultural holding | |||||||||||||
| Lerma Investments 2018, S.L. Unipersonal | Spain | 100.00 | % | 0.00 | % | 100.00 | % | 100.00 | % | Real estate | |||||||||||||
| Liquetine, S.L. Unipersonal | Spain | 0.00 | % | 70.00 | % | 100.00 | % | 100.00 | % | Renewable energies | |||||||||||||
| Liquidity Limited | United Kingdom | 0.00 | % | 100.00 | % | 100.00 | % | 100.00 | % | Factoring | |||||||||||||
| Lynx Financial Crime Tech, S.A. Unipersonal | Spain | 0.00 | % | 100.00 | % | 100.00 | % | 100.00 | % | IT services | |||||||||||||
| MAC No. 1 Limited | United Kingdom | — | (a) | — | — | Mortgage credit company | |||||||||||||||||
| Master Red Europa, S.L. | Spain | 96.34 | % | 0.00 | % | 96.34 | % | 96.34 | % | Cards | |||||||||||||
| Mata Alta, S.L. Unipersonal | Spain | 0.00 | % | 61.59 | % | 100.00 | % | 100.00 | % | Agricultural holding | |||||||||||||
| MCE Bank GmbH | Germany | 0.00 | % | 90.01 | % | 90.01 | % | — | Banking | ||||||||||||||
| MCE Verwaltung GmbH | Germany | 0.00 | % | 90.01 | % | 100.00 | % | — | Real estate rental | ||||||||||||||
| Mercadotecnia, Ideas y Tecnología, S.A. de C.V. | Mexico | 0.00 | % | 70.00 | % | 70.00 | % | 70.00 | % | Payment methods | |||||||||||||
| Merciver, S.L. | Spain | 99.90 | % | 0.10 | % | 100.00 | % | 100.00 | % | Financial advisory | |||||||||||||
| Mercury Trade Finance Solutions S.A.S. | Colombia | 0.00 | % | 50.10 | % | 100.00 | % | 100.00 | % | IT services | |||||||||||||
| Mercury Trade Finance Solutions SpA | Chile | 0.00 | % | 50.10 | % | 100.00 | % | 100.00 | % | Inactive | |||||||||||||
| Mercury Trade Finance Solutions, S.A. de C.V. | Mexico | 0.00 | % | 50.10 | % | 100.00 | % | 100.00 | % | IT services | |||||||||||||
| Mercury Trade Finance Solutions, S.L. | Spain | 0.00 | % | 50.10 | % | 50.10 | % | 50.10 | % | IT services | |||||||||||||
| Merlion Aviation One Designated Activity Company | Ireland | — | (a) | — | — | Renting | |||||||||||||||||
| Midata Service GmbH | Germany | 0.00 | % | 90.01 | % | 100.00 | % | — | IT services | ||||||||||||||
| Mobills Corretora de Seguros Ltda. | Brazil | 0.00 | % | 56.48 | % | 100.00 | % | 100.00 | % | Insurance intermediary | |||||||||||||
| Mobills Labs Soluções em Tecnologia Ltda. - EPP | Brazil | 0.00 | % | 56.48 | % | 100.00 | % | 100.00 | % | IT services | |||||||||||||
| Motor 2016-1 Holdings Limited | United Kingdom | — | (a) | — | — | Securitization | |||||||||||||||||
| Motor 2016-1 PLC | United Kingdom | 0.00 | % | 100.00 | % | 100.00 | % | 100.00 | % | Securitization | |||||||||||||
| Motor 2017-1 Holdings Limited | United Kingdom | — | (a) | — | — | Securitization | |||||||||||||||||
| Motor Securities 2018-1 Designated Activity Company (c) | Ireland | — | (a) | — | — | Securitization | |||||||||||||||||
| Mouro Capital I LP | United Kingdom | 0.00 | % | 100.00 | % | 100.00 | % | 100.00 | % | Investment fund | |||||||||||||
| Multiplica SpA | Chile | 0.00 | % | 100.00 | % | 100.00 | % | 100.00 | % | Payment services | |||||||||||||
| Munduspar Participações S.A. | Brazil | 80.00 | % | 0.00 | % | 80.00 | % | 80.00 | % | Holding company | |||||||||||||
Subsidiaries of Banco Santander, S.A. 1 | |||||||||||||||||||||||
|
% of ownership held by
Banco Santander
|
Percentage of voting power (d) | ||||||||||||||||||||||
| Company | Location | Direct | Indirect | Year 2023 | Year 2022 | Activity | |||||||||||||||||
| Navegante Américo Vespucio SpA | Chile | 0.00 | % | 100.00 | % | 100.00 | % | 100.00 | % | Real estate | |||||||||||||
| Naviera Mirambel, S.L. Unipersonal | Spain | 0.00 | % | 100.00 | % | 100.00 | % | 100.00 | % | Finance company | |||||||||||||
| Naviera Trans Gas, A.I.E. | Spain | 99.99 | % | 0.01 | % | 100.00 | % | 100.00 | % | Renting | |||||||||||||
| Naviera Trans Ore, A.I.E. | Spain | 99.99 | % | 0.01 | % | 100.00 | % | 100.00 | % | Renting | |||||||||||||
| Naviera Transcantábrica, S.L. | Spain | 100.00 | % | 0.00 | % | 100.00 | % | 100.00 | % | Leasing | |||||||||||||
| Naviera Transchem, S.L. Unipersonal | Spain | 100.00 | % | 0.00 | % | 100.00 | % | 100.00 | % | Leasing | |||||||||||||
| NeoAuto S.A.C. | Peru | 0.00 | % | 100.00 | % | 100.00 | % | 55.00 | % | Vehicles purchased by internet | |||||||||||||
| Newco Didier Holding Ltda. | Brazil | 0.00 | % | 66.54 | % | 100.00 | % | — | Holding company | ||||||||||||||
| Newcomar, S.L., en liquidación (c) | Spain | 40.00 | % | 40.00 | % | 80.00 | % | 80.00 | % | Real estate | |||||||||||||
| Novimovest – Fundo de Investimento Imobiliário | Portugal | 0.00 | % | 78.64 | % | 78.74 | % | 78.74 | % | Investment fund | |||||||||||||
| NW Services CO. | United States | 0.00 | % | 100.00 | % | 100.00 | % | 100.00 | % | E-commerce | |||||||||||||
| One Mobility Management GmbH | Germany | 0.00 | % | 46.95 | % | 100.00 | % | 100.00 | % | Services | |||||||||||||
| Open Bank Argentina S.A. | Argentine | 0.00 | % | 99.91 | % | 100.00 | % | 100.00 | % | Banking | |||||||||||||
| Open Bank, S.A. | Spain | 100.00 | % | 0.00 | % | 100.00 | % | 100.00 | % | Banking | |||||||||||||
| Open Digital Market, S.L. | Spain | 0.00 | % | 100.00 | % | 100.00 | % | 100.00 | % | Commerce | |||||||||||||
| Open Digital Services, S.L. | Spain | 99.97 | % | 0.03 | % | 100.00 | % | 100.00 | % | Services | |||||||||||||
| Openbank México, S.A., Institución de Banca Múltiple, Grupo Financiero Santander México | Mexico | 0.00 | % | 100.00 | % | 100.00 | % | 100.00 | % | Banking | |||||||||||||
| Operadora de Carteras Gamma, S.A.P.I. de C.V. | Mexico | 100.00 | % | 0.00 | % | 100.00 | % | 100.00 | % | Holding company | |||||||||||||
| Optimal Investment Services SA | Switzerland | 100.00 | % | 0.00 | % | 100.00 | % | 100.00 | % | Fund management company | |||||||||||||
| Optimal Multiadvisors Ireland Plc / Optimal Strategic US Equity Ireland Euro Fund (b) | Ireland | 0.00 | % | 0.00 | % | 0.00 | % | 0.00 | % | Fund management company | |||||||||||||
| Optimal Multiadvisors Ireland Plc / Optimal Strategic US Equity Ireland US Dollar Fund (b) | Ireland | 0.00 | % | 0.00 | % | 0.00 | % | 0.00 | % | Fund management company | |||||||||||||
| Paga Después, S.A. de C.V. | Mexico | 0.00 | % | 100.00 | % | 100.00 | % | 100.00 | % | Financial services | |||||||||||||
| PagoFX UK Ltd | United Kingdom | 0.00 | % | 100.00 | % | 100.00 | % | 100.00 | % | Payment services | |||||||||||||
| PagoNxt Emoney, E.D.E., S.L. | Spain | 0.00 | % | 100.00 | % | 100.00 | % | 100.00 | % | Financial services | |||||||||||||
| PagoNxt Ltd | United Kingdom | 100.00 | % | 0.00 | % | 100.00 | % | 100.00 | % | Holding company | |||||||||||||
| PagoNxt Merchant SoluçõesTecnológicas Brasil Ltda. | Brazil | 0.00 | % | 100.00 | % | 100.00 | % | 100.00 | % | IT services | |||||||||||||
| PagoNxt Merchant Solutions FZ-LLC | Arab United Emirates | 0.00 | % | 100.00 | % | 100.00 | % | 100.00 | % | Financial services | |||||||||||||
| PagoNxt Merchant Solutions India Private Limited | India | 0.00 | % | 100.00 | % | 100.00 | % | 100.00 | % | Financial services | |||||||||||||
| PagoNxt Merchant Solutions, S.L. | Spain | 0.00 | % | 100.00 | % | 100.00 | % | 100.00 | % | Holding company | |||||||||||||
| PagoNxt One Trade UK Ltd | United Kingdom | 0.00 | % | 100.00 | % | 100.00 | % | 100.00 | % | Inactive | |||||||||||||
| PagoNxt Payments Platform México, S.A. de C.V. | Mexico | 0.00 | % | 100.00 | % | 100.00 | % | 100.00 | % | IT services | |||||||||||||
| PagoNxt Solutions, S.L. | Spain | 0.00 | % | 100.00 | % | 100.00 | % | 100.00 | % | Payment services | |||||||||||||
| PagoNxt Trade Brasil Ltda. | Brazil | 0.00 | % | 100.00 | % | 100.00 | % | 100.00 | % | Financial services | |||||||||||||
| PagoNxt Trade Chile SpA | Chile | 0.00 | % | 100.00 | % | 100.00 | % | 100.00 | % | Services | |||||||||||||
| PagoNxt Trade Services, S.L. | Spain | 0.00 | % | 100.00 | % | 100.00 | % | 100.00 | % | Services | |||||||||||||
| PagoNxt Trade, S.L. | Spain | 0.00 | % | 100.00 | % | 100.00 | % | 100.00 | % | IT services | |||||||||||||
Subsidiaries of Banco Santander, S.A. 1 | |||||||||||||||||||||||
|
% of ownership held by
Banco Santander
|
Percentage of voting power (d) | ||||||||||||||||||||||
| Company | Location | Direct | Indirect | Year 2023 | Year 2022 | Activity | |||||||||||||||||
| PagoNxt US, LLC | United States | 0.00 | % | 100.00 | % | 100.00 | % | — | Inactive | ||||||||||||||
| PagoNxt, S.L. | Spain | 100.00 | % | 0.00 | % | 100.00 | % | 100.00 | % | Holding company | |||||||||||||
| Parasant SA | Switzerland | 100.00 | % | 0.00 | % | 100.00 | % | 100.00 | % | Holding company | |||||||||||||
| Partners Ebury México, S.A. de C.V. | Mexico | 0.00 | % | 66.54 | % | 100.00 | % | — | Payment services | ||||||||||||||
| Paytec Logística e Armazém Ltda. | Brazil | 0.00 | % | 100.00 | % | 100.00 | % | 100.00 | % | Logistics services | |||||||||||||
| Paytec Tecnologia em Pagamentos Ltda. | Brazil | 0.00 | % | 100.00 | % | 100.00 | % | 100.00 | % | Commerce | |||||||||||||
| PBE Companies, LLC | United States | 0.00 | % | 100.00 | % | 100.00 | % | 100.00 | % | Real estate | |||||||||||||
| Pereda Gestión, S.A. | Spain | 99.99 | % | 0.01 | % | 100.00 | % | 100.00 | % | Securities brokerage | |||||||||||||
| Phoenix C1 Aviation Designated Activity Company | Ireland | — | (a) | — | — | Renting | |||||||||||||||||
| Phoenix S.A. | Uruguay | 0.00 | % | 100.00 | % | 100.00 | % | 100.00 | % | Payment methods | |||||||||||||
| Pingham International, S.A. (c) | Uruguay | 0.00 | % | 100.00 | % | 100.00 | % | 100.00 | % | Inactive | |||||||||||||
| Pony S.A. | Luxembourg | — | (a) | — | — | Securitization | |||||||||||||||||
| Pony S.A., Compartment German Auto Loans 2021-1 | Luxembourg | — | (a) | — | — | Securitization | |||||||||||||||||
| Pony S.A., Compartment German Auto Loans 2023-1 | Luxembourg | — | (a) | — | — | Securitization | |||||||||||||||||
| Portal Universia Argentina S.A. | Argentine | 0.00 | % | 75.75 | % | 75.75 | % | 75.75 | % | Internet | |||||||||||||
| Portal Universia Portugal, Prestação de Serviços de Informática, S.A. | Portugal | 0.00 | % | 100.00 | % | 100.00 | % | 100.00 | % | Internet | |||||||||||||
| Precato IV Fundo de Investimento em Direitos Creditórios - Não Padronizados | Brazil | 0.00 | % | 90.19 | % | 100.00 | % | — | Investment fund | ||||||||||||||
| Prime 16 – Fundo de Investimentos Imobiliário | Brazil | 0.00 | % | 90.19 | % | 100.00 | % | 100.00 | % | Investment fund | |||||||||||||
| Punta Lima Wind Farm, LLC | United States | 0.00 | % | 100.00 | % | 100.00 | % | 100.00 | % | Renewable energies | |||||||||||||
| Punta Lima, LLC | United States | 0.00 | % | 100.00 | % | 100.00 | % | 100.00 | % | Leasing | |||||||||||||
| Repton 2023-1 Limited | United Kingdom | — | (a) | — | — | Securitization | |||||||||||||||||
| Retailcompany 2021, S.L. Unipersonal | Spain | 100.00 | % | 0.00 | % | 100.00 | % | 100.00 | % | Real estate | |||||||||||||
| Retop S.A. | Uruguay | 100.00 | % | 0.00 | % | 100.00 | % | 100.00 | % | Finance company | |||||||||||||
| Return Capital S.A. | Brazil | 0.00 | % | 90.19 | % | 100.00 | % | 100.00 | % | Collection services | |||||||||||||
| Roc Aviation One Designated Activity Company | Ireland | — | (a) | — | — | Renting | |||||||||||||||||
| Roc Shipping One Designated Activity Company | Ireland | — | (a) | — | — | Renting | |||||||||||||||||
| Rojo Entretenimento S.A. | Brazil | 0.00 | % | 85.32 | % | 94.60 | % | 94.60 | % | Real estate | |||||||||||||
| SAFO Alternative Lending, S.L. Unipersonal | Spain | 0.00 | % | 100.00 | % | 100.00 | % | 100.00 | % | Finance company | |||||||||||||
| SALCO, Servicios de Seguridad Santander, S.A. | Spain | 99.99 | % | 0.01 | % | 100.00 | % | 100.00 | % | Security | |||||||||||||
| SAM Argentina Sociedad Gerente de Fondos Comunes de Inversión S.A. | Argentine | 0.00 | % | 100.00 | % | 100.00 | % | — | Investment fund management | ||||||||||||||
| SAM Asset Management, S.A. de C.V., Sociedad Operadora de Fondos de Inversión | Mexico | 0.00 | % | 100.00 | % | 100.00 | % | 100.00 | % | Fund management company | |||||||||||||
| SAM Inversiones Argentina S.A. | Argentine | 0.00 | % | 100.00 | % | 100.00 | % | — | Pension fund management company | ||||||||||||||
| SAM Investment Holdings, S.L. | Spain | 92.37 | % | 7.63 | % | 100.00 | % | 100.00 | % | Holding company | |||||||||||||
Subsidiaries of Banco Santander, S.A. 1 | |||||||||||||||||||||||
|
% of ownership held by
Banco Santander
|
Percentage of voting power (d) | ||||||||||||||||||||||
| Company | Location | Direct | Indirect | Year 2023 | Year 2022 | Activity | |||||||||||||||||
| San Créditos Estruturados i Fundo de Investimento em Direitos Creditórios Não Padronizados | Brazil | 0.00 | % | 90.19 | % | 100.00 | % | — | Investment fund | ||||||||||||||
| San Pietro Solar PV, S.r.l. | Italy | 0.00 | % | 56.00 | % | 80.00 | % | — | Renewable energies | ||||||||||||||
| SANB Promotora de Vendas e Cobrança S.A. | Brazil | 0.00 | % | 90.19 | % | 100.00 | % | 100.00 | % | Finance company | |||||||||||||
| Sancap Investimentos e Participações S.A. | Brazil | 0.00 | % | 90.19 | % | 100.00 | % | 100.00 | % | Holding company | |||||||||||||
| Santander (CF Trustee Property Nominee) Limited | United Kingdom | 0.00 | % | 100.00 | % | 100.00 | % | 100.00 | % | Inactive | |||||||||||||
| Santander (CF Trustee) Limited | United Kingdom | — | (a) | — | — | Inactive | |||||||||||||||||
| Santander (UK) Group Pension Schemes Trustees Limited | United Kingdom | 0.00 | % | 100.00 | % | 100.00 | % | 100.00 | % | Inactive | |||||||||||||
| Santander Ahorro Inmobiliario 1, S.A. | Spain | 98.53 | % | 0.00 | % | 98.53 | % | 98.53 | % | Real estate rental | |||||||||||||
| Santander Alternative Investments, S.G.I.I.C., S.A. Unipersonal | Spain | 0.00 | % | 100.00 | % | 100.00 | % | — | Fund management company | ||||||||||||||
| Santander AM Global Working Capital Fund I | Luxembourg | 100.00 | % | 0.00 | % | 100.00 | % | — | Investment fund | ||||||||||||||
| Santander Asesorías Financieras Limitada | Chile | 0.00 | % | 67.45 | % | 100.00 | % | 100.00 | % | Financial advisory | |||||||||||||
| Santander Asset Finance (December) Limited | United Kingdom | 0.00 | % | 100.00 | % | 100.00 | % | 100.00 | % | Leasing | |||||||||||||
| Santander Asset Finance Opportunities | Luxembourg | 100.00 | % | 0.00 | % | 100.00 | % | 100.00 | % | Investment fund | |||||||||||||
| Santander Asset Finance plc | United Kingdom | 0.00 | % | 100.00 | % | 100.00 | % | 100.00 | % | Leasing | |||||||||||||
| Santander Asset Management - SGOIC, S.A. | Portugal | 0.00 | % | 100.00 | % | 100.00 | % | 100.00 | % | Fund management company | |||||||||||||
| Santander Asset Management Chile S.A. | Chile | 0.00 | % | 100.00 | % | 100.00 | % | 100.00 | % | Securities Investment | |||||||||||||
| Santander Asset Management Gerente de Fondos Comunes de Inversión S.A. | Argentine | 0.00 | % | 100.00 | % | 100.00 | % | 100.00 | % | Fund management company | |||||||||||||
| Santander Asset Management Luxembourg, S.A. | Luxembourg | 0.00 | % | 100.00 | % | 100.00 | % | 100.00 | % | Fund management company | |||||||||||||
| Santander Asset Management S.A. Administradora General de Fondos | Chile | 0.00 | % | 100.00 | % | 100.00 | % | 100.00 | % | Fund management company | |||||||||||||
| Santander Asset Management UK Holdings Limited | United Kingdom | 0.00 | % | 100.00 | % | 100.00 | % | 100.00 | % | Holding company | |||||||||||||
| Santander Asset Management UK Limited | United Kingdom | 0.00 | % | 100.00 | % | 100.00 | % | 100.00 | % | Management of funds and portfolios | |||||||||||||
| Santander Asset Management, S.A., SGIIC | Spain | 0.00 | % | 100.00 | % | 100.00 | % | 100.00 | % | Fund management company | |||||||||||||
| Santander Auto Lease Titling Ltd. | United States | 0.00 | % | 100.00 | % | 100.00 | % | 100.00 | % | Leasing | |||||||||||||
| Santander Back-Offices Globales Mayoristas, S.A. | Spain | 100.00 | % | 0.00 | % | 100.00 | % | 100.00 | % | Services | |||||||||||||
| Santander Banca de Inversión Colombia, S.A.S. | Colombia | 100.00 | % | 0.00 | % | 100.00 | % | 100.00 | % | Advisory services | |||||||||||||
| Santander Bank & Trust Ltd. | Bahamas | 0.00 | % | 100.00 | % | 100.00 | % | 100.00 | % | Banking | |||||||||||||
| Santander Bank Polska S.A. | Poland | 67.41 | % | 0.00 | % | 67.41 | % | 67.41 | % | Banking | |||||||||||||
| Santander Bank, National Association | United States | 0.00 | % | 100.00 | % | 100.00 | % | 100.00 | % | Banking | |||||||||||||
| Santander Brasil Administradora de Consórcio Ltda. | Brazil | 0.00 | % | 90.19 | % | 100.00 | % | 100.00 | % | Services | |||||||||||||
| Santander Brasil Gestão de Recursos Ltda. | Brazil | 0.08 | % | 99.92 | % | 100.00 | % | 100.00 | % | Securities Investment | |||||||||||||
Subsidiaries of Banco Santander, S.A. 1 | |||||||||||||||||||||||
|
% of ownership held by
Banco Santander
|
Percentage of voting power (d) | ||||||||||||||||||||||
| Company | Location | Direct | Indirect | Year 2023 | Year 2022 | Activity | |||||||||||||||||
| Santander Capital Holdings LLC | United States | 0.00 | % | 100.00 | % | 100.00 | % | 100.00 | % | Holding company | |||||||||||||
| Santander Capital Structuring, S.A. de C.V. | Mexico | 0.00 | % | 100.00 | % | 100.00 | % | 100.00 | % | Investment Company | |||||||||||||
| Santander Capitalização S.A. | Brazil | 0.00 | % | 90.19 | % | 100.00 | % | 100.00 | % | Insurance | |||||||||||||
| Santander Cards Ireland Limited (f) | Ireland | 0.00 | % | 100.00 | % | 100.00 | % | 100.00 | % | Cards | |||||||||||||
| Santander Cards Limited | United Kingdom | 0.00 | % | 100.00 | % | 100.00 | % | 100.00 | % | Cards | |||||||||||||
| Santander Cards UK Limited | United Kingdom | 0.00 | % | 100.00 | % | 100.00 | % | 100.00 | % | Finance company | |||||||||||||
| Santander Chile Holding S.A. | Chile | 22.11 | % | 77.75 | % | 99.86 | % | 99.86 | % | Holding company | |||||||||||||
| Santander Consulting (Beijing) Co., Ltd. | China | 0.00 | % | 100.00 | % | 100.00 | % | 100.00 | % | Advisory services | |||||||||||||
| Santander Consumer (UK) plc | United Kingdom | 0.00 | % | 100.00 | % | 100.00 | % | 100.00 | % | Finance company | |||||||||||||
| Santander Consumer Auto Receivables Funding 2018-L1 LLC | United States | 0.00 | % | 100.00 | % | 100.00 | % | 100.00 | % | Finance company | |||||||||||||
| Santander Consumer Auto Receivables Funding 2018-L3 LLC | United States | 0.00 | % | 100.00 | % | 100.00 | % | 100.00 | % | Finance company | |||||||||||||
| Santander Consumer Auto Receivables Funding 2018-L5 LLC | United States | 0.00 | % | 100.00 | % | 100.00 | % | 100.00 | % | Finance company | |||||||||||||
| Santander Consumer Auto Receivables Funding 2020-L1 LLC | United States | 0.00 | % | 100.00 | % | 100.00 | % | 100.00 | % | Finance company | |||||||||||||
| Santander Consumer Auto Receivables Funding 2022-B1 LLC | United States | 0.00 | % | 100.00 | % | 100.00 | % | 100.00 | % | Finance company | |||||||||||||
| Santander Consumer Auto Receivables Funding 2022-B2 LLC | United States | 0.00 | % | 100.00 | % | 100.00 | % | 100.00 | % | Finance company | |||||||||||||
| Santander Consumer Auto Receivables Funding 2022-B3 LLC | United States | 0.00 | % | 100.00 | % | 100.00 | % | 100.00 | % | Finance company | |||||||||||||
| Santander Consumer Auto Receivables Funding 2022-B4 LLC | United States | 0.00 | % | 100.00 | % | 100.00 | % | 100.00 | % | Finance company | |||||||||||||
| Santander Consumer Auto Receivables Funding 2023-B1 LLC | United States | 0.00 | % | 100.00 | % | 100.00 | % | 100.00 | % | Finance company | |||||||||||||
| Santander Consumer Auto Receivables Funding 2023-B2 LLC | United States | 0.00 | % | 100.00 | % | 100.00 | % | — | Finance company | ||||||||||||||
| Santander Consumer Auto Receivables Funding 2023-B3 LLC | United States | 0.00 | % | 100.00 | % | 100.00 | % | — | Finance company | ||||||||||||||
| Santander Consumer Auto Receivables Funding 2023-B4 LLC | United States | 0.00 | % | 100.00 | % | 100.00 | % | 100.00 | % | Finance company | |||||||||||||
| Santander Consumer Auto Receivables Funding 2023-B5 LLC | United States | 0.00 | % | 100.00 | % | 100.00 | % | — | Inactive | ||||||||||||||
| Santander Consumer Auto Receivables Funding 2023-B6 LLC | United States | 0.00 | % | 100.00 | % | 100.00 | % | — | Inactive | ||||||||||||||
| Santander Consumer Auto Receivables Funding 2023-L1 LLC | United States | 0.00 | % | 100.00 | % | 100.00 | % | — | Inactive | ||||||||||||||
| Santander Consumer Auto Receivables Funding 2024-B1 LLC | United States | 0.00 | % | 100.00 | % | 100.00 | % | — | Inactive | ||||||||||||||
| Santander Consumer Auto Receivables Funding 2024-B2 LLC | United States | 0.00 | % | 100.00 | % | 100.00 | % | — | Inactive | ||||||||||||||
| Santander Consumer Auto Receivables Funding 2024-B3 LLC | United States | 0.00 | % | 100.00 | % | 100.00 | % | — | Inactive | ||||||||||||||
| Santander Consumer Auto Receivables Funding 2024-L1 LLC | United States | 0.00 | % | 100.00 | % | 100.00 | % | — | Inactive | ||||||||||||||
| Santander Consumer Auto Receivables Funding 2024-L2 LLC | United States | 0.00 | % | 100.00 | % | 100.00 | % | — | Inactive | ||||||||||||||
| Santander Consumer Auto Receivables Funding 2024-L3 LLC | United States | 0.00 | % | 100.00 | % | 100.00 | % | — | Inactive | ||||||||||||||
| Santander Consumer Auto Receivables Grantor Trust 2021-D | United States | — | (a) | — | — | Inactive | |||||||||||||||||
| Santander Consumer Auto Receivables Grantor Trust 2023-A | United States | — | (a) | — | — | Inactive | |||||||||||||||||
Subsidiaries of Banco Santander, S.A. 1 | |||||||||||||||||||||||
|
% of ownership held by
Banco Santander
|
Percentage of voting power (d) | ||||||||||||||||||||||
| Company | Location | Direct | Indirect | Year 2023 | Year 2022 | Activity | |||||||||||||||||
| Santander Consumer Auto Receivables Grantor Trust 2023-B | United States | — | (a) | — | — | Inactive | |||||||||||||||||
| Santander Consumer Auto Receivables Trust 2021-D | United States | — | (a) | — | — | Inactive | |||||||||||||||||
| Santander Consumer Auto Receivables Trust 2023-A | United States | — | (a) | — | — | Inactive | |||||||||||||||||
| Santander Consumer Auto Receivables Trust 2023-B | United States | — | (a) | — | — | Inactive | |||||||||||||||||
| Santander Consumer Bank AG | Germany | 0.00 | % | 100.00 | % | 100.00 | % | 100.00 | % | Banking | |||||||||||||
| Santander Consumer Bank AS | Norway | 0.00 | % | 100.00 | % | 100.00 | % | 100.00 | % | Banking | |||||||||||||
| Santander Consumer Bank GmbH | Austria | 0.00 | % | 100.00 | % | 100.00 | % | 100.00 | % | Banking | |||||||||||||
| Santander Consumer Bank S.A. | Poland | 0.00 | % | 80.44 | % | 100.00 | % | 100.00 | % | Banking | |||||||||||||
| Santander Consumer Bank S.p.A. | Italy | 0.00 | % | 100.00 | % | 100.00 | % | 100.00 | % | Banking | |||||||||||||
| Santander Consumer Credit Services Limited | United Kingdom | 0.00 | % | 100.00 | % | 100.00 | % | 100.00 | % | Finance company | |||||||||||||
| Santander Consumer Finance Global Services, S.L. | Spain | 0.00 | % | 100.00 | % | 100.00 | % | 100.00 | % | IT | |||||||||||||
| Santander Consumer Finance Inc. | Canada | 0.00 | % | 100.00 | % | 100.00 | % | 100.00 | % | Holding company | |||||||||||||
| Santander Consumer Finance Limitada | Chile | 49.00 | % | 34.24 | % | 100.00 | % | 100.00 | % | Finance company | |||||||||||||
| Santander Consumer Finance México, S.A. de C.V., S.O.F.O.M., E.R., Grupo Financiero Santander México | Mexico | 0.00 | % | 99.97 | % | 100.00 | % | 100.00 | % | Inactive | |||||||||||||
| Santander Consumer Finance Oy | Finland | 0.00 | % | 100.00 | % | 100.00 | % | 100.00 | % | Finance company | |||||||||||||
| Santander Consumer Finance Schweiz AG | Switzerland | 0.00 | % | 100.00 | % | 100.00 | % | 100.00 | % | Leasing | |||||||||||||
| Santander Consumer Finance, S.A. | Spain | 100.00 | % | 0.00 | % | 100.00 | % | 100.00 | % | Banking | |||||||||||||
| Santander Consumer Financial Solutions Sp. z o.o. | Poland | 0.00 | % | 80.44 | % | 100.00 | % | 100.00 | % | Leasing | |||||||||||||
| Santander Consumer Holding Austria GmbH | Austria | 0.00 | % | 100.00 | % | 100.00 | % | 100.00 | % | Holding company | |||||||||||||
| Santander Consumer Holding GmbH | Germany | 0.00 | % | 100.00 | % | 100.00 | % | 100.00 | % | Holding company | |||||||||||||
| Santander Consumer Inc. | Canada | 0.00 | % | 100.00 | % | 100.00 | % | 100.00 | % | Finance company | |||||||||||||
| Santander Consumer Leasing B.V. | Netherlands | 0.00 | % | 100.00 | % | 100.00 | % | 100.00 | % | Renting | |||||||||||||
| Santander Consumer Leasing GmbH | Germany | 0.00 | % | 100.00 | % | 100.00 | % | 100.00 | % | Leasing | |||||||||||||
| Santander Consumer Leasing S.A. | France | 0.00 | % | 100.00 | % | 100.00 | % | — | Renting | ||||||||||||||
| Santander Consumer Mobility Services, S.A. | Spain | 0.00 | % | 100.00 | % | 100.00 | % | 100.00 | % | Renting | |||||||||||||
| Santander Consumer Multirent Sp. z o.o. | Poland | 0.00 | % | 80.44 | % | 100.00 | % | 100.00 | % | Leasing | |||||||||||||
| Santander Consumer Operations Services GmbH | Germany | 0.00 | % | 100.00 | % | 100.00 | % | 100.00 | % | Services | |||||||||||||
| Santander Consumer Receivables 10 LLC | United States | 0.00 | % | 100.00 | % | 100.00 | % | 100.00 | % | Finance company | |||||||||||||
| Santander Consumer Receivables 11 LLC | United States | 0.00 | % | 100.00 | % | 100.00 | % | 100.00 | % | Finance company | |||||||||||||
| Santander Consumer Receivables 15 LLC | United States | 0.00 | % | 100.00 | % | 100.00 | % | 100.00 | % | Finance company | |||||||||||||
| Santander Consumer Receivables 16 LLC | United States | 0.00 | % | 100.00 | % | 100.00 | % | 100.00 | % | Finance company | |||||||||||||
| Santander Consumer Receivables 20 LLC | United States | 0.00 | % | 100.00 | % | 100.00 | % | — | Inactive | ||||||||||||||
| Santander Consumer Receivables 21 LLC | United States | 0.00 | % | 100.00 | % | 100.00 | % | — | Inactive | ||||||||||||||
| Santander Consumer Receivables 7 LLC | United States | 0.00 | % | 100.00 | % | 100.00 | % | 100.00 | % | Finance company | |||||||||||||
| Santander Consumer Receivables Funding LLC | United States | 0.00 | % | 100.00 | % | 100.00 | % | 100.00 | % | Finance company | |||||||||||||
Subsidiaries of Banco Santander, S.A. 1 | |||||||||||||||||||||||
|
% of ownership held by
Banco Santander
|
Percentage of voting power (d) | ||||||||||||||||||||||
| Company | Location | Direct | Indirect | Year 2023 | Year 2022 | Activity | |||||||||||||||||
| Santander Consumer Renting S.r.l. | Italy | 0.00 | % | 100.00 | % | 100.00 | % | 100.00 | % | Renting | |||||||||||||
| Santander Consumer Renting, S.L. | Spain | 0.00 | % | 100.00 | % | 100.00 | % | 100.00 | % | Renting | |||||||||||||
| Santander Consumer S.A. | Argentine | 0.00 | % | 99.82 | % | 100.00 | % | 100.00 | % | Finance company | |||||||||||||
| Santander Consumer S.A. Compañía de Financiamiento | Colombia | 79.02 | % | 20.98 | % | 100.00 | % | 100.00 | % | Finance company | |||||||||||||
| Santander Consumer Services GmbH | Austria | 0.00 | % | 100.00 | % | 100.00 | % | 100.00 | % | Services | |||||||||||||
| Santander Consumer Services, S.A. | Portugal | 0.00 | % | 100.00 | % | 100.00 | % | 100.00 | % | Finance company | |||||||||||||
| Santander Consumer Spain Auto 2019-1, Fondo de Titulización | Spain | — | (a) | — | — | Securitization | |||||||||||||||||
| Santander Consumer Spain Auto 2020-1, Fondo de Titulización | Spain | — | (a) | — | — | Securitization | |||||||||||||||||
| Santander Consumer Spain Auto 2021-1, Fondo de Titulización | Spain | — | (a) | — | — | Securitization | |||||||||||||||||
| Santander Consumer Spain Auto 2022-1, Fondo de Titulización | Spain | — | (a) | — | — | Securitization | |||||||||||||||||
| Santander Consumer Spain Auto 2023-1, Fondo de Titulización | Spain | — | (a) | — | — | Securitization | |||||||||||||||||
| Santander Consumer Technology Services GmbH | Germany | 0.00 | % | 100.00 | % | 100.00 | % | 100.00 | % | IT services | |||||||||||||
| Santander Consumer USA Holdings Inc. | United States | 0.00 | % | 100.00 | % | 100.00 | % | 100.00 | % | Holding company | |||||||||||||
| Santander Consumer USA Inc. | United States | 0.00 | % | 100.00 | % | 100.00 | % | 100.00 | % | Finance company | |||||||||||||
| Santander Consumo 4, F.T. | Spain | — | (a) | — | — | Securitization | |||||||||||||||||
| Santander Consumo 5, F.T. | Spain | — | (a) | — | — | Securitization | |||||||||||||||||
| Santander Corredora de Seguros Limitada | Chile | 0.00 | % | 67.21 | % | 100.00 | % | 100.00 | % | Insurance intermediary | |||||||||||||
| Santander Corredores de Bolsa Limitada | Chile | 0.00 | % | 83.24 | % | 100.00 | % | 100.00 | % | Securities company | |||||||||||||
| Santander Corretora de Câmbio e Valores Mobiliários S.A. | Brazil | 0.00 | % | 90.19 | % | 100.00 | % | 100.00 | % | Securities company | |||||||||||||
| Santander Corretora de Seguros, Investimentos e Serviços S.A. | Brazil | 0.00 | % | 90.19 | % | 100.00 | % | 100.00 | % | Insurance intermediary | |||||||||||||
| Santander Customer Voice, S.A. | Spain | 99.50 | % | 0.50 | % | 100.00 | % | 100.00 | % | Services | |||||||||||||
| Santander de Titulización, S.G.F.T., S.A. | Spain | 81.00 | % | 19.00 | % | 100.00 | % | 100.00 | % | Fund management company | |||||||||||||
| Santander Distribuidora de Títulos e Valores Mobiliários S.A. | Brazil | 0.00 | % | 90.19 | % | 100.00 | % | 100.00 | % | Securities company | |||||||||||||
| Santander Drive Auto Receivables Grantor Trust 2023-A | United States | — | (a) | — | — | Inactive | |||||||||||||||||
| Santander Drive Auto Receivables LLC | United States | 0.00 | % | 100.00 | % | 100.00 | % | 100.00 | % | Finance company | |||||||||||||
| Santander Drive Auto Receivables Trust 2020-1 | United States | — | (a) | — | — | Securitization | |||||||||||||||||
| Santander Drive Auto Receivables Trust 2020-2 | United States | — | (a) | — | — | Securitization | |||||||||||||||||
| Santander Drive Auto Receivables Trust 2020-3 | United States | — | (a) | — | — | Securitization | |||||||||||||||||
| Santander Drive Auto Receivables Trust 2020-4 | United States | — | (a) | — | — | Securitization | |||||||||||||||||
| Santander Drive Auto Receivables Trust 2021-1 | United States | — | (a) | — | — | Securitization | |||||||||||||||||
| Santander Drive Auto Receivables Trust 2021-2 | United States | — | (a) | — | — | Securitization | |||||||||||||||||
| Santander Drive Auto Receivables Trust 2021-3 | United States | — | (a) | — | — | Securitization | |||||||||||||||||
| Santander Drive Auto Receivables Trust 2021-4 | United States | — | (a) | — | — | Securitization | |||||||||||||||||
Subsidiaries of Banco Santander, S.A. 1 | |||||||||||||||||||||||
|
% of ownership held by
Banco Santander
|
Percentage of voting power (d) | ||||||||||||||||||||||
| Company | Location | Direct | Indirect | Year 2023 | Year 2022 | Activity | |||||||||||||||||
| Santander Drive Auto Receivables Trust 2022-1 | United States | — | (a) | — | — | Securitization | |||||||||||||||||
| Santander Drive Auto Receivables Trust 2022-2 | United States | — | (a) | — | — | Securitization | |||||||||||||||||
| Santander Drive Auto Receivables Trust 2022-3 | United States | — | (a) | — | — | Securitization | |||||||||||||||||
| Santander Drive Auto Receivables Trust 2022-4 | United States | — | (a) | — | — | Securitization | |||||||||||||||||
| Santander Drive Auto Receivables Trust 2022-5 | United States | — | (a) | — | — | Securitization | |||||||||||||||||
| Santander Drive Auto Receivables Trust 2022-6 | United States | — | (a) | — | — | Securitization | |||||||||||||||||
| Santander Drive Auto Receivables Trust 2022-7 | United States | — | (a) | — | — | Securitization | |||||||||||||||||
| Santander Drive Auto Receivables Trust 2023-1 | United States | — | (a) | — | — | Securitization | |||||||||||||||||
| Santander Drive Auto Receivables Trust 2023-2 | United States | — | (a) | — | — | Securitization | |||||||||||||||||
| Santander Drive Auto Receivables Trust 2023-3 | United States | — | (a) | — | — | Securitization | |||||||||||||||||
| Santander Drive Auto Receivables Trust 2023-4 | United States | — | (a) | — | — | Securitization | |||||||||||||||||
| Santander Drive Auto Receivables Trust 2023-5 | United States | — | (a) | — | — | Securitization | |||||||||||||||||
| Santander Drive Auto Receivables Trust 2023-6 | United States | — | (a) | — | — | Securitization | |||||||||||||||||
| Santander Drive Auto Receivables Trust 2023-A | United States | — | (a) | — | — | Inactive | |||||||||||||||||
| Santander Drive Auto Receivables Trust 2023-S1 | United States | — | (a) | — | — | Securitization | |||||||||||||||||
| Santander Drive Auto Receivables Trust 2024-1 | United States | — | (a) | — | — | Inactive | |||||||||||||||||
| Santander Drive Auto Receivables Trust 2024-2 | United States | — | (a) | — | — | Inactive | |||||||||||||||||
| Santander Drive Auto Receivables Trust 2024-3 | United States | — | (a) | — | — | Inactive | |||||||||||||||||
| Santander Drive Auto Receivables Trust 2024-4 | United States | — | (a) | — | — | Inactive | |||||||||||||||||
| Santander Drive Auto Receivables Trust 2024-5 | United States | — | (a) | — | — | Inactive | |||||||||||||||||
| Santander Drive Auto Receivables Trust 2024-6 | United States | — | (a) | — | — | Inactive | |||||||||||||||||
| Santander Drive Auto Receivables Trust 2024-7 | United States | — | (a) | — | — | Inactive | |||||||||||||||||
| Santander Equity Investments Limited | United Kingdom | 0.00 | % | 100.00 | % | 100.00 | % | 100.00 | % | Finance company | |||||||||||||
| Santander España Servicios Legales y de Cumplimiento, S.L. | Spain | 99.97 | % | 0.03 | % | 100.00 | % | 100.00 | % | Services | |||||||||||||
| Santander Estates Limited | United Kingdom | 0.00 | % | 100.00 | % | 100.00 | % | 100.00 | % | Real estate | |||||||||||||
| Santander European Hospitality Opportunities | Luxembourg | 100.00 | % | 0.00 | % | 100.00 | % | 100.00 | % | Investment fund | |||||||||||||
| Santander F24 S.A. | Poland | 0.00 | % | 67.41 | % | 100.00 | % | 100.00 | % | Finance company | |||||||||||||
| Santander Facility Management España, S.L. Unipersonal | Spain | 100.00 | % | 0.00 | % | 100.00 | % | 100.00 | % | Real estate | |||||||||||||
| Santander Factoring S.A. | Chile | 0.00 | % | 99.86 | % | 100.00 | % | 100.00 | % | Factoring | |||||||||||||
| Santander Factoring Sp. z o.o. | Poland | 0.00 | % | 67.41 | % | 100.00 | % | 100.00 | % | Financial services | |||||||||||||
| Santander Factoring y Confirming, S.A. Unipersonal, E.F.C. | Spain | 100.00 | % | 0.00 | % | 100.00 | % | 100.00 | % | Factoring | |||||||||||||
| Santander Finance 2012-1 LLC | United States | 0.00 | % | 100.00 | % | 100.00 | % | 100.00 | % | Financial services | |||||||||||||
Subsidiaries of Banco Santander, S.A. 1 | |||||||||||||||||||||||
|
% of ownership held by
Banco Santander
|
Percentage of voting power (d) | ||||||||||||||||||||||
| Company | Location | Direct | Indirect | Year 2023 | Year 2022 | Activity | |||||||||||||||||
| Santander Financial Exchanges Limited | United Kingdom | 100.00 | % | 0.00 | % | 100.00 | % | 100.00 | % | Inactive | |||||||||||||
| Santander Financial Services plc | United Kingdom | 0.00 | % | 100.00 | % | 100.00 | % | 100.00 | % | Banking | |||||||||||||
| Santander Financiamientos S.A. | Peru | 100.00 | % | 0.00 | % | 100.00 | % | 100.00 | % | Finance company | |||||||||||||
| Santander Financing S.A.S. | Colombia | 100.00 | % | 0.00 | % | 100.00 | % | 100.00 | % | Financial advisory | |||||||||||||
| Santander Finanse Sp. z o.o. | Poland | 0.00 | % | 67.41 | % | 100.00 | % | 100.00 | % | Financial services | |||||||||||||
| Santander Fintech Holdings, S.L. | Spain | 100.00 | % | 0.00 | % | 100.00 | % | 100.00 | % | Holding company | |||||||||||||
| Santander Fintech Limited (c) | United Kingdom | 100.00 | % | 0.00 | % | 100.00 | % | 100.00 | % | Finance company | |||||||||||||
| Santander Flex Fundo de Investimento Direitos Creditórios | Brazil | 0.00 | % | 90.19 | % | 100.00 | % | — | Investment fund | ||||||||||||||
| Santander Fundo de Investimento SBAC Referenciado di Crédito Privado | Brazil | 0.00 | % | 90.19 | % | 100.00 | % | 100.00 | % | Investment fund | |||||||||||||
| Santander Gestión de Recaudación y Cobranzas Ltda. | Chile | 0.00 | % | 99.86 | % | 100.00 | % | 100.00 | % | Financial services | |||||||||||||
| Santander Global Cards & Digital Solutions Brasil S.A. | Brazil | 0.00 | % | 100.00 | % | 100.00 | % | 100.00 | % | IT consulting | |||||||||||||
| Santander Global Cards & Digital Solutions, S.L. | Spain | 100.00 | % | 0.00 | % | 100.00 | % | 100.00 | % | IT services | |||||||||||||
| Santander Global Consumer Finance Limited | United Kingdom | 0.00 | % | 100.00 | % | 100.00 | % | 100.00 | % | Finance company | |||||||||||||
| Santander Global Facilities, S.A. de C.V. | Mexico | 100.00 | % | 0.00 | % | 100.00 | % | 100.00 | % | Services | |||||||||||||
| Santander Global Services S.A. (c) | Uruguay | 0.00 | % | 100.00 | % | 100.00 | % | 100.00 | % | Services | |||||||||||||
| Santander Global Services, S.L. | Spain | 100.00 | % | 0.00 | % | 100.00 | % | 100.00 | % | Real estate | |||||||||||||
| Santander Global Sport, S.A. | Spain | 100.00 | % | 0.00 | % | 100.00 | % | 100.00 | % | Sports activity | |||||||||||||
| Santander Global Technology and Operations Brasil Ltda. | Brazil | 0.00 | % | 100.00 | % | 100.00 | % | 100.00 | % | IT services | |||||||||||||
| Santander Global Technology and Operations Chile Limitada | Chile | 0.00 | % | 100.00 | % | 100.00 | % | 100.00 | % | IT services | |||||||||||||
| Santander Global Technology and Operations, S.L. Unipersonal | Spain | 100.00 | % | 0.00 | % | 100.00 | % | 100.00 | % | IT services | |||||||||||||
| Santander Green Investment, S.L. | Spain | 99.97 | % | 0.03 | % | 100.00 | % | 100.00 | % | Holding company | |||||||||||||
| Santander Guarantee Company | United Kingdom | 0.00 | % | 100.00 | % | 100.00 | % | 100.00 | % | Leasing | |||||||||||||
| Santander Hipotecario 2 Fondo de Titulización de Activos | Spain | — | (a) | — | — | Securitization | |||||||||||||||||
| Santander Hipotecario 3 Fondo de Titulización de Activos | Spain | — | (a) | — | — | Securitization | |||||||||||||||||
| Santander Holding Imobiliária S.A. | Brazil | 0.00 | % | 90.19 | % | 100.00 | % | 100.00 | % | Real estate | |||||||||||||
| Santander Holding Internacional, S.A. | Spain | 99.95 | % | 0.05 | % | 100.00 | % | 100.00 | % | Holding company | |||||||||||||
| Santander Holdings USA, Inc. | United States | 100.00 | % | 0.00 | % | 100.00 | % | 100.00 | % | Holding company | |||||||||||||
| Santander Inclusión Financiera, S.A. de C.V., S.O.F.O.M., E.R., Grupo Financiero Santander México | Mexico | 0.00 | % | 99.97 | % | 100.00 | % | 100.00 | % | Finance company | |||||||||||||
| Santander Insurance Agency, U.S., LLC | United States | 0.00 | % | 100.00 | % | 100.00 | % | 100.00 | % | Insurance intermediary | |||||||||||||
| Santander Insurance Services UK Limited | United Kingdom | 100.00 | % | 0.00 | % | 100.00 | % | 100.00 | % | Wealth management | |||||||||||||
| Santander Insurance, S.L. | Spain | 100.00 | % | 0.00 | % | 100.00 | % | — | Holding company | ||||||||||||||
| Santander Intermediación Correduría de Seguros, S.A. | Spain | 100.00 | % | 0.00 | % | 100.00 | % | 100.00 | % | Insurance intermediary | |||||||||||||
| Santander International Products, Plc. (e) | Ireland | 99.99 | % | 0.01 | % | 100.00 | % | 100.00 | % | Finance company | |||||||||||||
| Santander Inversiones S.A. | Chile | 0.00 | % | 100.00 | % | 100.00 | % | 100.00 | % | Holding company | |||||||||||||
Subsidiaries of Banco Santander, S.A. 1 | |||||||||||||||||||||||
|
% of ownership held by
Banco Santander
|
Percentage of voting power (d) | ||||||||||||||||||||||
| Company | Location | Direct | Indirect | Year 2023 | Year 2022 | Activity | |||||||||||||||||
| Santander Investment Chile Limitada | Chile | 0.00 | % | 100.00 | % | 100.00 | % | 100.00 | % | Finance company | |||||||||||||
| Santander Investment, S.A. | Spain | 100.00 | % | 0.00 | % | 100.00 | % | 100.00 | % | Banking | |||||||||||||
| Santander Investments GP 1 S.à.r.l. | Luxembourg | 0.00 | % | 100.00 | % | 100.00 | % | 100.00 | % | Fund management company | |||||||||||||
| Santander Inwestycje Sp. z o.o. | Poland | 0.00 | % | 67.41 | % | 100.00 | % | 100.00 | % | Securities company | |||||||||||||
| Santander ISA Managers Limited | United Kingdom | 0.00 | % | 100.00 | % | 100.00 | % | 100.00 | % | Management of funds and portfolios | |||||||||||||
| Santander Lease, S.A., E.F.C. | Spain | 100.00 | % | 0.00 | % | 100.00 | % | 100.00 | % | Leasing | |||||||||||||
| Santander Leasing S.A. | Poland | 0.00 | % | 67.41 | % | 100.00 | % | 100.00 | % | Leasing | |||||||||||||
| Santander Leasing S.A. Arrendamento Mercantil | Brazil | 0.00 | % | 90.19 | % | 100.00 | % | 100.00 | % | Leasing | |||||||||||||
| Santander Leasing, LLC | United States | 0.00 | % | 100.00 | % | 100.00 | % | 100.00 | % | Leasing | |||||||||||||
| Santander Lending Limited | United Kingdom | 0.00 | % | 100.00 | % | 100.00 | % | 100.00 | % | Mortgage credit company | |||||||||||||
| Santander Mediación Operador de Banca-Seguros Vinculado, S.A. | Spain | 100.00 | % | 0.00 | % | 100.00 | % | 100.00 | % | Insurance intermediary | |||||||||||||
| Santander Merchant S.A. | Argentine | 5.10 | % | 94.90 | % | 100.00 | % | 100.00 | % | Finance company | |||||||||||||
| Santander Mortgage Holdings Limited | United Kingdom | 0.00 | % | 100.00 | % | 100.00 | % | 100.00 | % | Holding company | |||||||||||||
| Santander New Business, S.A. | Spain | 99.00 | % | 1.00 | % | 100.00 | % | — | Trade intermediary | ||||||||||||||
| Santander Paraty Qif PLC | Ireland | 0.00 | % | 90.19 | % | 100.00 | % | 100.00 | % | Investment Company | |||||||||||||
| Santander Pensiones, S.A., E.G.F.P. | Spain | 0.00 | % | 100.00 | % | 100.00 | % | 100.00 | % | Pension fund management company | |||||||||||||
| Santander Pensões - Sociedade Gestora de Fundos de Pensões, S.A. | Portugal | 100.00 | % | 0.00 | % | 100.00 | % | 100.00 | % | Pension fund management company | |||||||||||||
| Santander Prime Auto Issuance Notes 2018-A Designated Activity Company | Ireland | — | (a) | — | — | Inactive | |||||||||||||||||
| Santander Prime Auto Issuance Notes 2018-B Designated Activity Company | Ireland | — | (a) | — | — | Inactive | |||||||||||||||||
| Santander Prime Auto Issuance Notes 2018-C Designated Activity Company | Ireland | — | (a) | — | — | Inactive | |||||||||||||||||
| Santander Prime Auto Issuance Notes 2018-D Designated Activity Company | Ireland | — | (a) | — | — | Inactive | |||||||||||||||||
| Santander Prime Auto Issuance Notes 2018-E Designated Activity Company | Ireland | — | (a) | — | — | Inactive | |||||||||||||||||
| Santander Private Banking Gestión, S.A., S.G.I.I.C. | Spain | 100.00 | % | 0.00 | % | 100.00 | % | 100.00 | % | Fund management company | |||||||||||||
| Santander Private Banking s.p.a. in Liquidazione (c) | Italy | 100.00 | % | 0.00 | % | 100.00 | % | 100.00 | % | Finance company | |||||||||||||
| Santander Private Banking UK Limited | United Kingdom | 0.00 | % | 100.00 | % | 100.00 | % | 100.00 | % | Holding company | |||||||||||||
| Santander Private Real Estate Advisory & Management, S.A. | Spain | 99.99 | % | 0.01 | % | 100.00 | % | 100.00 | % | Real estate | |||||||||||||
| Santander Private Real Estate Advisory, S.A. | Spain | 100.00 | % | 0.00 | % | 100.00 | % | 100.00 | % | Real estate | |||||||||||||
| Santander Real Estate Debt 1 sub-fund | Luxembourg | 100.00 | % | 0.00 | % | 100.00 | % | — | Investment fund | ||||||||||||||
| Santander Real Estate, S.A. | Spain | 100.00 | % | 0.00 | % | 100.00 | % | 100.00 | % | Inactive | |||||||||||||
| Santander Retail Auto Lease Funding LLC | United States | 0.00 | % | 100.00 | % | 100.00 | % | 100.00 | % | Finance company | |||||||||||||
Subsidiaries of Banco Santander, S.A. 1 | |||||||||||||||||||||||
|
% of ownership held by
Banco Santander
|
Percentage of voting power (d) | ||||||||||||||||||||||
| Company | Location | Direct | Indirect | Year 2023 | Year 2022 | Activity | |||||||||||||||||
| Santander Retail Auto Lease Trust 2021-A | United States | — | (a) | — | — | Securitization | |||||||||||||||||
| Santander Retail Auto Lease Trust 2021-B | United States | — | (a) | — | — | Securitization | |||||||||||||||||
| Santander Retail Auto Lease Trust 2021-C | United States | — | (a) | — | — | Securitization | |||||||||||||||||
| Santander Retail Auto Lease Trust 2022-A | United States | — | (a) | — | — | Securitization | |||||||||||||||||
| Santander Retail Auto Lease Trust 2022-B | United States | — | (a) | — | — | Securitization | |||||||||||||||||
| Santander Retail Auto Lease Trust 2022-C | United States | — | (a) | — | — | Inactive | |||||||||||||||||
| Santander Revolving Auto Loan Trust 2019-A | United States | — | (a) | — | — | Securitization | |||||||||||||||||
| Santander Revolving Auto Loan Trust 2021-A | United States | — | (a) | — | — | Inactive | |||||||||||||||||
| Santander RMBS 6, Fondo de Titulización | Spain | — | (a) | — | — | Securitization | |||||||||||||||||
| Santander S.A. Sociedad Securitizadora | Chile | 0.00 | % | 67.25 | % | 100.00 | % | 100.00 | % | Fund management company | |||||||||||||
| Santander Secretariat Services Limited | United Kingdom | 0.00 | % | 100.00 | % | 100.00 | % | 100.00 | % | Inactive | |||||||||||||
| Santander Securities LLC | United States | 0.00 | % | 100.00 | % | 100.00 | % | 100.00 | % | Securities company | |||||||||||||
| Santander Seguros y Reaseguros, Compañía Aseguradora, S.A. | Spain | 0.00 | % | 100.00 | % | 100.00 | % | 100.00 | % | Insurance | |||||||||||||
| Santander Servicios Corporativos, S.A. de C.V. | Mexico | 0.00 | % | 99.97 | % | 100.00 | % | 100.00 | % | Services | |||||||||||||
| Santander Technology USA, LLC | United States | 0.00 | % | 100.00 | % | 100.00 | % | 100.00 | % | IT services | |||||||||||||
| Santander Tecnología Argentina S.A. | Argentine | 0.00 | % | 99.83 | % | 100.00 | % | 100.00 | % | IT services | |||||||||||||
| Santander Tecnología México, S.A. de C.V. | Mexico | 0.00 | % | 99.97 | % | 100.00 | % | 100.00 | % | IT services | |||||||||||||
| Santander Totta Seguros, Companhia de Seguros de Vida, S.A. | Portugal | 0.00 | % | 100.00 | % | 100.00 | % | 100.00 | % | Insurance | |||||||||||||
| Santander Totta, SGPS, S.A. | Portugal | 99.91 | % | 0.00 | % | 99.91 | % | 99.91 | % | Holding company | |||||||||||||
| Santander Towarzystwo Funduszy Inwestycyjnych S.A. | Poland | 50.00 | % | 33.70 | % | 100.00 | % | 100.00 | % | Fund management company | |||||||||||||
| Santander Trade Services Limited | Hong-Kong | 0.00 | % | 100.00 | % | 100.00 | % | 100.00 | % | Inactive | |||||||||||||
| Santander Trust S.A. | Argentine | 0.00 | % | 99.99 | % | 100.00 | % | 100.00 | % | Services | |||||||||||||
| Santander UK Group Holdings plc | United Kingdom | 77.67 | % | 22.33 | % | 100.00 | % | 100.00 | % | Holding company | |||||||||||||
| Santander UK Investments | United Kingdom | 100.00 | % | 0.00 | % | 100.00 | % | 100.00 | % | Finance company | |||||||||||||
| Santander UK Operations Limited | United Kingdom | 0.00 | % | 100.00 | % | 100.00 | % | 100.00 | % | Finance company | |||||||||||||
| Santander UK plc | United Kingdom | 0.00 | % | 100.00 | % | 100.00 | % | 100.00 | % | Banking | |||||||||||||
| Santander UK Technology Limited | United Kingdom | 0.00 | % | 100.00 | % | 100.00 | % | 100.00 | % | IT services | |||||||||||||
| Santander US Capital Markets LLC | United States | 0.00 | % | 100.00 | % | 100.00 | % | 100.00 | % | Real Estate investment | |||||||||||||
| Santander Valores S.A. | Argentine | 5.10 | % | 94.73 | % | 100.00 | % | 100.00 | % | Securities company | |||||||||||||
| Santusa Holding, S.L. | Spain | 69.76 | % | 30.24 | % | 100.00 | % | 100.00 | % | Holding company | |||||||||||||
| SBNA Auto Lease Funding LLC | United States | 0.00 | % | 100.00 | % | 100.00 | % | — | Finance company | ||||||||||||||
Subsidiaries of Banco Santander, S.A. 1 | |||||||||||||||||||||||
|
% of ownership held by
Banco Santander
|
Percentage of voting power (d) | ||||||||||||||||||||||
| Company | Location | Direct | Indirect | Year 2023 | Year 2022 | Activity | |||||||||||||||||
| SBNA Auto Lease Trust 2023-A | United States | — | (a) | — | — | Securitization | |||||||||||||||||
| SBNA Auto Lease Trust 2024-A | United States | — | (a) | — | — | Inactive | |||||||||||||||||
| SBNA Auto Lease Trust 2024-B | United States | — | (a) | — | — | Inactive | |||||||||||||||||
| SBNA Auto Lease Trust 2024-C | United States | — | (a) | — | — | Inactive | |||||||||||||||||
| SBNA Investor LLC | United States | 0.00 | % | 100.00 | % | 100.00 | % | — | Holding company | ||||||||||||||
| SC Austria Auto Finance 2020-1 Designated Activity Company | Ireland | — | (a) | — | — | Securitization | |||||||||||||||||
| SC Austria Consumer Loan 2021 Designated Activity Company | Ireland | — | (a) | — | — | Securitization | |||||||||||||||||
| SC Canada Asset Securitization Trust | Canada | — | (a) | — | — | Securitization | |||||||||||||||||
| SC Germany Auto 2014-2 UG (haftungsbeschränkt) (c) | Germany | — | (a) | — | — | Securitization | |||||||||||||||||
| SC Germany Auto 2016-2 UG (haftungsbeschränkt) (c) | Germany | — | (a) | — | — | Securitization | |||||||||||||||||
| SC Germany Auto 2018-1 UG (haftungsbeschränkt) (c) | Germany | — | (a) | — | — | Securitization | |||||||||||||||||
| SC Germany Auto 2019-1 UG (haftungsbeschränkt) | Germany | — | (a) | — | — | Securitization | |||||||||||||||||
| SC Germany Consumer 2018-1 UG (haftungsbeschränkt) (c) | Germany | — | (a) | — | — | Securitization | |||||||||||||||||
| SC Germany Mobility 2019-1 UG (haftungsbeschränkt) (c) | Germany | — | (a) | — | — | Securitization | |||||||||||||||||
| SC Germany S.A. | Luxembourg | — | (a) | — | — | Securitization | |||||||||||||||||
| SC Germany S.A., Compartment Consumer 2020-1 | Luxembourg | — | (a) | — | — | Securitization | |||||||||||||||||
| SC Germany S.A., Compartment Consumer 2021-1 | Luxembourg | — | (a) | — | — | Securitization | |||||||||||||||||
| SC Germany S.A., Compartment Consumer 2022-1 | Luxembourg | — | (a) | — | — | Securitization | |||||||||||||||||
| SC Germany S.A., Compartment Consumer 2023-1 | Luxembourg | — | (a) | — | — | Securitization | |||||||||||||||||
| SC Germany S.A., Compartment Consumer Private 2023-1 | Luxembourg | — | (a) | — | — | Securitization | |||||||||||||||||
| SC Germany S.A., Compartment Leasing 2023-1 | Luxembourg | — | (a) | — | — | Securitization | |||||||||||||||||
| SC Germany S.A., Compartment Mobility 2020-1 | Luxembourg | — | (a) | — | — | Securitization | |||||||||||||||||
| SC Mobility AB | Sweden | 0.00 | % | 100.00 | % | 100.00 | % | — | Renting | ||||||||||||||
| SC Mobility AS | Norway | 0.00 | % | 100.00 | % | 100.00 | % | — | Renting | ||||||||||||||
| SC Poland Consumer 23-1 Designated Activity Company | Ireland | — | (a) | — | — | Securitization | |||||||||||||||||
| SCF Ajoneuvohallinto IX Limited | Ireland | — | (a) | — | — | Securitization | |||||||||||||||||
| SCF Ajoneuvohallinto VII Limited (c) | Ireland | — | (a) | — | — | Securitization | |||||||||||||||||
| SCF Ajoneuvohallinto VIII Limited | Ireland | — | (a) | — | — | Securitization | |||||||||||||||||
| SCF Ajoneuvohallinto X Limited | Ireland | — | (a) | — | — | Securitization | |||||||||||||||||
| SCF Ajoneuvohallinto XI Limited | Ireland | — | (a) | — | — | Securitization | |||||||||||||||||
| SCF Ajoneuvohallinto XII Limited | Ireland | — | (a) | — | — | Securitization | |||||||||||||||||
| SCF Eastside Locks GP Limited | United Kingdom | 0.00 | % | 100.00 | % | 100.00 | % | 100.00 | % | Real estate management | |||||||||||||
| SCF Rahoituspalvelut IX DAC | Ireland | — | (a) | — | — | Securitization | |||||||||||||||||
| SCF Rahoituspalvelut VII Designated Activity Company (c) | Ireland | — | (a) | — | — | Securitization | |||||||||||||||||
| SCF Rahoituspalvelut VIII Designated Activity Company | Ireland | — | (a) | — | — | Securitization | |||||||||||||||||
| SCF Rahoituspalvelut X DAC | Ireland | — | (a) | — | — | Securitization | |||||||||||||||||
| SCF Rahoituspalvelut XI Designated Activity Company | Ireland | — | (a) | — | — | Securitization | |||||||||||||||||
Subsidiaries of Banco Santander, S.A. 1 | |||||||||||||||||||||||
|
% of ownership held by
Banco Santander
|
Percentage of voting power (d) | ||||||||||||||||||||||
| Company | Location | Direct | Indirect | Year 2023 | Year 2022 | Activity | |||||||||||||||||
| SCF Rahoituspalvelut XII DAC | Ireland | — | (a) | — | — | Securitization | |||||||||||||||||
| SCM Poland Auto 2019-1 DAC | Ireland | — | (a) | — | — | Securitization | |||||||||||||||||
| SDMX Superdigital, S.A. de C.V., Institución de Fondos de Pago Electrónico | Mexico | 0.00 | % | 100.00 | % | 100.00 | % | 100.00 | % | Payment platform | |||||||||||||
| Secucor Finance 2021-1, DAC | Ireland | — | (a) | — | — | Securitization | |||||||||||||||||
| Services and Promotions Delaware Corp. | United States | 0.00 | % | 100.00 | % | 100.00 | % | 100.00 | % | Holding company | |||||||||||||
| Services and Promotions Miami LLC | United States | 0.00 | % | 100.00 | % | 100.00 | % | 100.00 | % | Real estate | |||||||||||||
| Servicios de Cobranza, Recuperación y Seguimiento, S.A. de C.V. | Mexico | 0.00 | % | 85.00 | % | 85.00 | % | 85.00 | % | Finance company | |||||||||||||
| Sheppards Moneybrokers Limited | United Kingdom | 0.00 | % | 100.00 | % | 100.00 | % | 100.00 | % | Inactive | |||||||||||||
| Shiloh III Wind Project, LLC | United States | 0.00 | % | 100.00 | % | 100.00 | % | 100.00 | % | Renewable energies | |||||||||||||
| SIB Besaya, S.L. Unipersonal | Spain | 0.00 | % | 100.00 | % | 100.00 | % | 100.00 | % | Holding company | |||||||||||||
| Silk Finance No. 5 | Portugal | — | (a) | — | — | Securitization | |||||||||||||||||
| SMPS Merchant Platform Solutions México, S.A de C.V. | Mexico | 0.00 | % | 100.00 | % | 100.00 | % | 100.00 | % | Payments and collection services | |||||||||||||
| Sociedad Integral de Valoraciones Automatizadas, S.A. Unipersonal | Spain | 100.00 | % | 0.00 | % | 100.00 | % | 100.00 | % | Appraisals | |||||||||||||
| Sociedad Operadora de Tarjetas de Pago Santander Getnet Chile S.A. | Chile | 0.00 | % | 67.13 | % | 100.00 | % | 100.00 | % | Payments and collection services | |||||||||||||
| Socur S.A. | Uruguay | 100.00 | % | 0.00 | % | 100.00 | % | 100.00 | % | Finance company | |||||||||||||
| Solarlaser Limited (c) | United Kingdom | 0.00 | % | 100.00 | % | 100.00 | % | 100.00 | % | Inactive | |||||||||||||
| Solution 4Fleet Consultoria Empresarial S.A. | Brazil | 0.00 | % | 72.15 | % | 80.00 | % | 80.00 | % | Vehicle rental | |||||||||||||
| Sovereign Community Development Company | United States | 0.00 | % | 100.00 | % | 100.00 | % | 100.00 | % | Holding company | |||||||||||||
| Sovereign Delaware Investment Corporation | United States | 0.00 | % | 100.00 | % | 100.00 | % | 100.00 | % | Holding company | |||||||||||||
| Sovereign Lease Holdings, LLC | United States | 0.00 | % | 100.00 | % | 100.00 | % | 100.00 | % | Financial services | |||||||||||||
| Sovereign REIT Holdings, Inc. | United States | 0.00 | % | 100.00 | % | 100.00 | % | 100.00 | % | Holding company | |||||||||||||
| Sovereign Spirit Limited (f) | Bermudas | 0.00 | % | 100.00 | % | 100.00 | % | 100.00 | % | Leasing | |||||||||||||
| SPIRE SA Compartment 2023-265 | Luxembourg | — | (a) | — | — | Finance company | |||||||||||||||||
| SPIRE SA Compartment 2023-374 | Luxembourg | — | (a) | — | — | Finance company | |||||||||||||||||
| SSA Swiss Advisors AG | Switzerland | 0.00 | % | 100.00 | % | 100.00 | % | 100.00 | % | Wealth management | |||||||||||||
| Stellantis Consumer Financial Services Polska Sp. z o.o. | Poland | 0.00 | % | 40.22 | % | 100.00 | % | 100.00 | % | Finance company | |||||||||||||
| Stellantis Financial Services Belux SA | Belgium | 0.00 | % | 50.00 | % | 100.00 | % | 100.00 | % | Finance company | |||||||||||||
| Stellantis Financial Services España, E.F.C., S.A. | Spain | 0.00 | % | 50.00 | % | 50.00 | % | 50.00 | % | Finance company | |||||||||||||
| Stellantis Financial Services Italia S.p.A. | Italy | 0.00 | % | 50.00 | % | 50.00 | % | 50.00 | % | Banking | |||||||||||||
| Stellantis Financial Services Nederland B.V. | Netherlands | 0.00 | % | 50.00 | % | 100.00 | % | 100.00 | % | Finance company | |||||||||||||
| Stellantis Financial Services Polska Sp. z o.o. | Poland | 0.00 | % | 40.22 | % | 50.00 | % | 50.00 | % | Finance company | |||||||||||||
| Stellantis Renting Italia S.p.A. | Italy | 0.00 | % | 50.00 | % | 100.00 | % | 100.00 | % | Renting | |||||||||||||
| Sterrebeeck B.V. | Netherlands | 100.00 | % | 0.00 | % | 100.00 | % | 100.00 | % | Holding company | |||||||||||||
Subsidiaries of Banco Santander, S.A. 1 | |||||||||||||||||||||||
|
% of ownership held by
Banco Santander
|
Percentage of voting power (d) | ||||||||||||||||||||||
| Company | Location | Direct | Indirect | Year 2023 | Year 2022 | Activity | |||||||||||||||||
| Suleyado 2003, S.L. Unipersonal | Spain | 0.00 | % | 100.00 | % | 100.00 | % | 100.00 | % | Securities Investment | |||||||||||||
| Summer Empreendimentos Ltda. | Brazil | 0.00 | % | 90.19 | % | 100.00 | % | 100.00 | % | Real estate management | |||||||||||||
| Superdigital Argentina S.A.U. | Argentine | 0.00 | % | 100.00 | % | 100.00 | % | 100.00 | % | IT services | |||||||||||||
| Superdigital Colombia S.A.S. | Colombia | 0.00 | % | 100.00 | % | 100.00 | % | 100.00 | % | IT services | |||||||||||||
| Superdigital Holding Company, S.L. | Spain | 0.00 | % | 100.00 | % | 100.00 | % | 100.00 | % | Holding company | |||||||||||||
| Superdigital Instituição de Pagamento S.A. | Brazil | 0.00 | % | 100.00 | % | 100.00 | % | 100.00 | % | Payment services | |||||||||||||
| Superdigital Perú S.A.C. | Peru | 0.00 | % | 100.00 | % | 100.00 | % | 100.00 | % | Financial services | |||||||||||||
| Suzuki Servicios Financieros, S.L. | Spain | 0.00 | % | 51.00 | % | 51.00 | % | 51.00 | % | Intermediation | |||||||||||||
| Svensk Autofinans WH 1 Designated Activity Company (c) | Ireland | — | (a) | — | — | Securitization | |||||||||||||||||
| Swesant SA | Switzerland | 0.00 | % | 100.00 | % | 100.00 | % | 100.00 | % | Holding company | |||||||||||||
| SX Negócios Ltda. | Brazil | 0.00 | % | 90.19 | % | 100.00 | % | 100.00 | % | Telemarketing | |||||||||||||
| Tabasco Energía España, S.L. Unipersonal | Spain | 100.00 | % | 0.00 | % | 100.00 | % | 100.00 | % | Holding company | |||||||||||||
| Taxagest Sociedade Gestora de Participações Sociais, S.A. | Portugal | 0.00 | % | 99.87 | % | 100.00 | % | 100.00 | % | Holding company | |||||||||||||
| Taxos Luz, S.L. Unipersonal | Spain | 0.00 | % | 70.00 | % | 100.00 | % | 100.00 | % | Renewable energies | |||||||||||||
| Teatinos Siglo XXI Inversiones S.A. | Chile | 50.00 | % | 50.00 | % | 100.00 | % | 100.00 | % | Holding company | |||||||||||||
| The Alliance & Leicester Corporation Limited | United Kingdom | 0.00 | % | 100.00 | % | 100.00 | % | 100.00 | % | Real estate | |||||||||||||
| The Best Specialty Coffee, S.L. Unipersonal | Spain | 100.00 | % | 0.00 | % | 100.00 | % | 100.00 | % | Restaurant services | |||||||||||||
| Time Retail Finance Limited (c) | United Kingdom | 0.00 | % | 100.00 | % | 100.00 | % | 100.00 | % | Services | |||||||||||||
| TIMFin S.p.A. | Italy | 0.00 | % | 51.00 | % | 51.00 | % | 51.00 | % | Finance company | |||||||||||||
| Tonopah Solar I, LLC | United States | 0.00 | % | 100.00 | % | 100.00 | % | 100.00 | % | Holding company | |||||||||||||
| Tools Soluções e Serviços Compartilhados Ltda. | Brazil | 0.00 | % | 90.19 | % | 100.00 | % | 100.00 | % | Services | |||||||||||||
| Tornquist Asesores de Seguros S.A. (c) | Argentine | 0.00 | % | 99.99 | % | 99.99 | % | 99.99 | % | Inactive | |||||||||||||
| Toro Asset Management S.A. | Brazil | 0.00 | % | 56.48 | % | 100.00 | % | 100.00 | % | Securities Investment | |||||||||||||
| Toro Corretora de Títulos e Valores Mobiliários Ltda. | Brazil | 0.00 | % | 56.38 | % | 62.51 | % | 63.00 | % | Securities company | |||||||||||||
| Toro Investimentos S.A. | Brazil | 0.00 | % | 56.48 | % | 91.32 | % | 91.32 | % | Securities company | |||||||||||||
| Totta (Ireland), PLC | Ireland | 0.00 | % | 99.87 | % | 100.00 | % | 100.00 | % | Finance company | |||||||||||||
| Totta Urbe - Empresa de Administração e Construções, S.A. | Portugal | 0.00 | % | 99.87 | % | 100.00 | % | 100.00 | % | Real estate | |||||||||||||
| Trabajando.com Mexico, S.A. de C.V. en liquidación (c) | Mexico | 0.00 | % | 100.00 | % | 100.00 | % | 100.00 | % | Services | |||||||||||||
| Trainera Venture Finance I, F.C.R.-PYME | Spain | 99.00 | % | 0.00 | % | 99.00 | % | — | Venture capital fund | ||||||||||||||
Subsidiaries of Banco Santander, S.A.1 | |||||||||||||||||||||||
|
% of ownership held by
Banco Santander
|
Percentage of voting power (d) | ||||||||||||||||||||||
Company |
Location |
Direct | Indirect | Year 2023 | Year 2022 | Activity | |||||||||||||||||
| Trans Skills Employment Services - Sole Proprietorship LLC | Arab United Emirates | 0.00 | % | 66.54 | % | 100.00 | % | — | Human resources services | ||||||||||||||
| Trans Skills Information Technology LLC | Saudi Arabia | 0.00 | % | 66.54 | % | 100.00 | % | — | Inactive | ||||||||||||||
| Trans Skills Investment in Commercial Enterprises & Management Co. LLC | Arab United Emirates | 0.00 | % | 66.54 | % | 100.00 | % | — | Holding company | ||||||||||||||
| Trans Skills South Africa (Pty) Limited | Republic of South Africa | 0.00 | % | 66.54 | % | 100.00 | % | — | Inactive | ||||||||||||||
| Trans Skills Technology Services LLC | Arab United Emirates | 0.00 | % | 66.54 | % | 100.00 | % | — | IT services | ||||||||||||||
| Transolver Finance EFC, S.A. | Spain | 0.00 | % | 51.00 | % | 51.00 | % | 51.00 | % | Leasing | |||||||||||||
| Tresmares Santander Direct Lending, SICC, S.A. | Spain | 99.67 | % | 0.00 | % | 99.67 | % | 99.60 | % | Fund management company | |||||||||||||
| Tuttle and Son Limited (c) | United Kingdom | 0.00 | % | 100.00 | % | 100.00 | % | 100.00 | % | Inactive | |||||||||||||
| TVG-Trappgroup Versicherungsvermittlungs-GmbH | Germany | 0.00 | % | 90.01 | % | 100.00 | % | — | Insurance brokerage | ||||||||||||||
| Universia Brasil S.A. | Brazil | 0.00 | % | 100.00 | % | 100.00 | % | 100.00 | % | Internet | |||||||||||||
| Universia Chile S.A. | Chile | 0.00 | % | 86.84 | % | 86.84 | % | 86.84 | % | Internet | |||||||||||||
| Universia Colombia S.A.S. | Colombia | 0.00 | % | 100.00 | % | 100.00 | % | 100.00 | % | Internet | |||||||||||||
| Universia España Red de Universidades, S.A. | Spain | 0.00 | % | 89.45 | % | 89.45 | % | 89.45 | % | Internet | |||||||||||||
| Universia Holding, S.L. | Spain | 100.00 | % | 0.00 | % | 100.00 | % | 100.00 | % | Holding company | |||||||||||||
| Universia México, S.A. de C.V. | Mexico | 0.00 | % | 100.00 | % | 100.00 | % | 100.00 | % | Internet | |||||||||||||
| Universia Perú, S.A. | Peru | 0.00 | % | 99.40 | % | 99.40 | % | 99.76 | % | Internet | |||||||||||||
| Universia Uruguay, S.A. | Uruguay | 0.00 | % | 100.00 | % | 100.00 | % | 100.00 | % | Internet | |||||||||||||
| Uro Property Holdings, S.A. | Spain | 99.99 | % | 0.00 | % | 99.99 | % | 99.99 | % | Real estate investment | |||||||||||||
| Virtua Advanced Solutions FZE | Arab United Emirates | 0.00 | % | 66.54 | % | 100.00 | % | — | Payment services | ||||||||||||||
| Wallcesa, S.A. | Spain | 100.00 | % | 0.00 | % | 100.00 | % | 100.00 | % | Financial services | |||||||||||||
| Waycarbon Soluções Ambientais e Projetos de Carbono S.A. | Brazil | 0.00 | % | 80.00 | % | 100.00 | % | 100.00 | % | Consulting services | |||||||||||||
| WIM Servicios Corporativos, S.A. de C.V. | Mexico | 0.00 | % | 85.00 | % | 100.00 | % | 100.00 | % | Advisory services | |||||||||||||
| WTW Shipping Designated Activity Company | Ireland | 100.00 | % | 0.00 | % | 100.00 | % | 100.00 | % | Leasing | |||||||||||||
| Societies of which Grupo Santander owns more than 5% (c) , entities associated with Grupo Santander and jointly controlled entities | ||||||||||||||||||||||||||
| % of ownership held by Banco Santander | Percentage of voting power (b) | |||||||||||||||||||||||||
| Company | Location | Direct | Indirect | Year 2023 | Year 2022 | Activity | Type of company | |||||||||||||||||||
| Abra 1 Limited | Cayman Island | — | (d) | — | — | Leasing | Joint ventures | |||||||||||||||||||
| Administrador Financiero de Transantiago S.A. | Chile | 0.00 | % | 13.43 | % | 20.00 | % | 20.00 | % | Collection and payment services | Associated | |||||||||||||||
| Aegon Santander Portugal Não Vida - Companhia de Seguros, S.A. | Portugal | 0.00 | % | 49.00 | % | 49.00 | % | 49.00 | % | Insurance | Joint Ventures | |||||||||||||||
| Aegon Santander Portugal Vida - Companhia de Seguros Vida, S.A. | Portugal | 0.00 | % | 49.00 | % | 49.00 | % | 49.00 | % | Insurance | Joint Ventures | |||||||||||||||
| Aeroplan - Sociedade Construtora de Aeroportos, Lda. (a) | Portugal | 0.00 | % | 19.97 | % | 20.00 | % | 20.00 | % | Inactive | — | |||||||||||||||
| Aguas de Fuensanta, S.A. (a) | Spain | 36.78 | % | 0.00 | % | 36.78 | % | 36.78 | % | Food | — | |||||||||||||||
| Alcuter 2, S.L. | Spain | 37.23 | % | 0.00 | % | 37.23 | % | 37.23 | % | Technical services | — | |||||||||||||||
| Alma UK Holdings Ltd (consolidado) | United Kingdom | 30.00 | % | 0.00 | % | 30.00 | % | 30.00 | % | Holding company | Joint Ventures | |||||||||||||||
| Apolo Fundo de Investimento em Direitos Creditórios | Brazil | 0.00 | % | 30.06 | % | 33.33 | % | 33.33 | % | Investment fund | Joint Ventures | |||||||||||||||
| Attijariwafa Bank Société Anonyme (consolidado) | Morocco | 0.00 | % | 5.10 | % | 5.10 | % | 5.10 | % | Banking | — | |||||||||||||||
| AutoFi Inc. | United States | 0.00 | % | 18.01 | % | 4.99 | % | 4.99 | % | E-commerce | — | |||||||||||||||
| Autopistas del Sol S.A. | Argentina | 0.00 | % | 14.17 | % | 14.17 | % | 14.17 | % | Highway concession | — | |||||||||||||||
| Avanath Affordable Housing IV LLC | United States | 0.00 | % | 7.27 | % | 7.27 | % | 7.27 | % | Investment company | — | |||||||||||||||
| Banco RCI Brasil S.A. | Brazil | 0.00 | % | 35.98 | % | 39.89 | % | 39.89 | % | Banking | Joint Ventures | |||||||||||||||
| Banco S3 Caceis México, S.A., Institución de Banca Múltiple | Mexico | 0.00 | % | 50.00 | % | 50.00 | % | 50.00 | % | Banking | Joint Ventures | |||||||||||||||
| Bank of Beijing Consumer Finance Company | China | 0.00 | % | 20.00 | % | 20.00 | % | 20.00 | % | Financial company | Associated | |||||||||||||||
| Bank of Shanghai Co., Ltd. (consolidado) | China | 6.54 | % | 0.00 | % | 6.54 | % | 6.54 | % | Banking | — | |||||||||||||||
| Biomas – Serviços Ambientais, Restauração e Carbono S.A. | Brazil | 0.00 | % | 15.03 | % | 16.67 | % | — | Consulting services | Associated | ||||||||||||||||
| Bizum, S.L. | Spain | 20.92 | % | 0.00 | % | 20.92 | % | 20.92 | % | Payment services | Associated | |||||||||||||||
| CACEIS (consolidado) | France | 0.00 | % | 30.50 | % | 30.50 | % | 30.50 | % | Custody services | Associated | |||||||||||||||
| Campo Grande Empreendimentos Ltda. (a) | Brazil | 0.00 | % | 22.84 | % | 25.32 | % | 25.32 | % | Inactive | — | |||||||||||||||
| Carrow Works (Norwich) Limited | United Kingdom | 0.00 | % | 88.00 | % | 88.00 | % | — | Real Estate investment | Joint Ventures | ||||||||||||||||
| CCPT - ComprarCasa, Rede Serviços Imobiliários, S.A. | Portugal | 0.00 | % | 49.98 | % | 49.98 | % | 49.98 | % | Real Estate services | Joint Ventures | |||||||||||||||
| Centro de Compensación Automatizado S.A. | Chile | 0.00 | % | 22.38 | % | 33.33 | % | 33.33 | % | Collection and payment services | Associated | |||||||||||||||
| Centro para el Desarrollo, Investigación y Aplicación de Nuevas Tecnologías, S.A. | Spain | 0.00 | % | 49.00 | % | 49.00 | % | 49.00 | % | Technology | Associated | |||||||||||||||
| CIP S.A. | Brazil | 0.00 | % | 15.80 | % | 17.52 | % | 17.87 | % | Financial services | Associated | |||||||||||||||
| CNP Santander Insurance Europe Designated Activity Company | Ireland | 0.00 | % | 49.00 | % | 49.00 | % | 49.00 | % | Insurance | Associated | |||||||||||||||
| CNP Santander Insurance Life Designated Activity Company | Ireland | 0.00 | % | 49.00 | % | 49.00 | % | 49.00 | % | Insurance | Associated | |||||||||||||||
| CNP Santander Insurance Services Ireland Limited | Ireland | 0.00 | % | 49.00 | % | 49.00 | % | 49.00 | % | Services | Associated | |||||||||||||||
| Societies of which Grupo Santander owns more than 5% (c) , entities associated with Grupo Santander and jointly controlled entities | ||||||||||||||||||||||||||
| % of ownership held by Banco Santander | Percentage of voting power (b) | |||||||||||||||||||||||||
| Company | Location | Direct | Indirect | Year 2023 | Year 2022 | Activity | Type of company | |||||||||||||||||||
| Comder Contraparte Central S.A | Chile | 0.00 | % | 8.37 | % | 12.47 | % | 12.47 | % | Financial services | Associated | |||||||||||||||
| Companhia Promotora UCI | Brazil | 0.00 | % | 25.00 | % | 25.00 | % | 25.00 | % | Financial services | Joint Ventures | |||||||||||||||
| Compañia Española de Financiación de Desarrollo, Cofides, S.A., SME | Spain | 20.18 | % | 0.00 | % | 20.18 | % | 20.18 | % | Financial company | — | |||||||||||||||
| Compañía Española de Seguros de Crédito a la Exportación, S.A., Compañía de Seguros y Reaseguros (consolidado) | Spain | 23.33 | % | 0.55 | % | 23.88 | % | 23.88 | % | Credit Insurance | — | |||||||||||||||
| Compañía Española de Viviendas en Alquiler, S.A. | Spain | 24.07 | % | 0.00 | % | 24.07 | % | 24.07 | % | Real Estate | Associated | |||||||||||||||
| Compañía para los Desarrollos Inmobiliarios de la Ciudad de Hispalis, S.L., en liquidación (a) | Spain | 21.98 | % | 0.00 | % | 21.98 | % | 21.98 | % | Real Estate promotion | — | |||||||||||||||
| Connecting Visions Ecosystems, S.L. | Spain | 19.90 | % | 0.00 | % | 19.90 | % | 19.90 | % | Consulting services | Joint Ventures | |||||||||||||||
| Corkfoc Cortiças, S.A. | Portugal | 0.00 | % | 27.54 | % | 27.58 | % | 27.58 | % | Cork industry | — | |||||||||||||||
| CSD Central de Serviços de Registro e Depósito Aos Mercados Financeiro e de Capitais S.A. | Brazil | 0.00 | % | 18.04 | % | 20.00 | % | 20.00 | % | Financial services | Associated | |||||||||||||||
| Desarrollo Eólico las Majas VI, S.L. | Spain | 45.00 | % | 0.00 | % | 45.00 | % | 45.00 | % | Renewable energies | Joint Ventures | |||||||||||||||
| DoRes Securitisation S.r.l | Italy | — | (d) | — | — | Securitization | Joint Ventures | |||||||||||||||||||
| Enauta Participaçoes S.A. (consolidado) | Brazil | 0.00 | % | 5.52 | % | 6.12 | % | — | Holding company | — | ||||||||||||||||
| Energias Renovables de Ormonde 25, S.L. | Spain | 0.00 | % | 55.00 | % | 55.00 | % | 55.00 | % | Renewable energies | Joint Ventures | |||||||||||||||
| Energias Renovables de Ormonde 26, S.L. | Spain | 0.00 | % | 55.00 | % | 55.00 | % | 55.00 | % | Renewable energies | Joint Ventures | |||||||||||||||
| Energias Renovables de Ormonde 27, S.L. | Spain | 0.00 | % | 55.00 | % | 55.00 | % | 55.00 | % | Renewable energies | Joint Ventures | |||||||||||||||
| Energias Renovables de Ormonde 30, S.L. | Spain | 0.00 | % | 55.00 | % | 55.00 | % | 55.00 | % | Renewable energies | Joint Ventures | |||||||||||||||
| Energias Renovables de Titania, S.L. | Spain | 0.00 | % | 55.00 | % | 55.00 | % | 55.00 | % | Renewable energies | Joint Ventures | |||||||||||||||
| Energias Renovables Gladiateur 45, S.L. | Spain | 0.00 | % | 55.00 | % | 55.00 | % | 55.00 | % | Renewable energies | Joint Ventures | |||||||||||||||
| Energias Renovables Prometeo, S.L. | Spain | 0.00 | % | 55.00 | % | 55.00 | % | 55.00 | % | Renewable energies | Joint Ventures | |||||||||||||||
| Ethias Lease N.V. | Belgium | 0.00 | % | 50.00 | % | 50.00 | % | — | Leasing | Associated | ||||||||||||||||
| Euro Automatic Cash Entidad de Pago, S.L. | Spain | 50.00 | % | 0.00 | % | 50.00 | % | 50.00 | % | Payment services | Associated | |||||||||||||||
| European Hospitality Opportunities S.à r.l. | Luxembourg | 0.00 | % | 49.00 | % | 49.00 | % | 49.00 | % | Holding company | Joint Ventures | |||||||||||||||
| Evacuación Liquesun, S.L. | Spain | 0.00 | % | 35.00 | % | 50.00 | % | — | Exploitation of electrical energy | Joint Ventures | ||||||||||||||||
| Evolve SPV S.r.l. | Italy | — | (d) | — | — | Securitization | Joint Ventures | |||||||||||||||||||
| FAFER- Empreendimentos Urbanísticos e de Construção, S.A. (a) | Portugal | 0.00 | % | 36.58 | % | 36.62 | % | 36.62 | % | Real Estate | — | |||||||||||||||
| Federal Home Loan Bank of Pittsburgh | United States | 0.00 | % | 7.48 | % | 7.48 | % | 6.05 | % | Banking | — | |||||||||||||||
| Federal Reserve Bank of Boston | United States | 0.00 | % | 19.14 | % | 19.14 | % | 19.12 | % | Banking | — | |||||||||||||||
| Fondo de Titulización de Activos UCI 11 | Spain | — | (d) | — | — | Securitization | Joint Ventures | |||||||||||||||||||
| Fondo de Titulización de Activos UCI 14 | Spain | — | (d) | — | — | Securitization | Joint Ventures | |||||||||||||||||||
| Societies of which Grupo Santander owns more than 5% (c) , entities associated with Grupo Santander and jointly controlled entities | ||||||||||||||||||||||||||
| % of ownership held by Banco Santander | Percentage of voting power (b) | |||||||||||||||||||||||||
| Company | Location | Direct | Indirect | Year 2023 | Year 2022 | Activity | Type of company | |||||||||||||||||||
| Fondo de Titulización de Activos UCI 15 | Spain | — | (d) | — | — | Securitization | Joint Ventures | |||||||||||||||||||
| Fondo de Titulización de Activos UCI 16 | Spain | — | (d) | — | — | Securitization | Joint Ventures | |||||||||||||||||||
| Fondo de Titulización de Activos UCI 17 | Spain | — | (d) | — | — | Securitization | Joint Ventures | |||||||||||||||||||
| Fondo de Titulización Hipotecaria UCI 12 | Spain | — | (d) | — | — | Securitization | Joint Ventures | |||||||||||||||||||
| Fondo de Titulización, RMBS Green Prado XI | Spain | — | (d) | — | — | Securitization | Joint Ventures | |||||||||||||||||||
| Fondo de Titulización, RMBS Prado IX | Spain | — | (d) | — | — | Securitization | Joint Ventures | |||||||||||||||||||
| Fondo de Titulización, RMBS Prado VII | Spain | — | (d) | — | — | Securitization | Joint Ventures | |||||||||||||||||||
| Fondo de Titulización, RMBS Prado VIII | Spain | — | (d) | — | — | Securitization | Joint Ventures | |||||||||||||||||||
| Fondo de Titulización, RMBS Prado X | Spain | — | (d) | — | — | Securitization | Joint Ventures | |||||||||||||||||||
| Fortune Auto Finance Co., Ltd | China | 0.00 | % | 50.00 | % | 50.00 | % | 50.00 | % | Finance Company | Joint Ventures | |||||||||||||||
| FrauDfense, S.L. | Spain | 0.00 | % | 33.33 | % | 33.33 | % | — | Technological services | Joint Ventures | ||||||||||||||||
| Fremman limited | United Kingdom | 32.99 | % | 0.00 | % | 4.99 | % | 4.99 | % | Finance Company | Associated | |||||||||||||||
| Gestora de Inteligência de Crédito S.A. | Brazil | 0.00 | % | 14.03 | % | 16.00 | % | 10.00 | % | Collection service | Joint Ventures | |||||||||||||||
| Gire S.A. | Argentina | 0.00 | % | 58.23 | % | 58.33 | % | 58.33 | % | Collection and payment services | Associated | |||||||||||||||
| Glenrowan Solar Holdings Pty Ltd | Australia | 49.00 | % | 0.00 | % | 49.00 | % | — | Holding company | Joint Ventures | ||||||||||||||||
| HCUK Auto Funding 2017-2 Ltd | United Kingdom | — | (d) | — | — | Securitization | Joint Ventures | |||||||||||||||||||
| HCUK Auto Funding 2022-1 Limited | United Kingdom | — | (d) | — | — | Securitization | Joint Ventures | |||||||||||||||||||
| Healthy Neighborhoods Equity Fund I LP | United States | 0.00 | % | 22.37 | % | 22.37 | % | 22.37 | % | Real Estate | — | |||||||||||||||
| Hillcrest Private Equity Real Estate LLP | United Kingdom | 0.00 | % | 88.00 | % | 88.00 | % | — | Real Estate | Joint Ventures | ||||||||||||||||
| Hyundai Capital UK Limited | United Kingdom | 0.00 | % | 50.01 | % | 50.01 | % | 50.01 | % | Finance Company | Joint Ventures | |||||||||||||||
| Hyundai Corretora de Seguros Ltda. | Brazil | 0.00 | % | 45.09 | % | 50.00 | % | 50.00 | % | Insurance mediation | Joint Ventures | |||||||||||||||
| Imperial Holding S.C.A. (a) | Luxembourg | 0.00 | % | 36.36 | % | 36.36 | % | 36.36 | % | Securities Investment | — | |||||||||||||||
| Imperial Management S.à r.l. (a) | Luxembourg | 0.00 | % | 40.20 | % | 40.20 | % | 40.20 | % | Holding company | — | |||||||||||||||
| Inverlur Aguilas I, S.L. | Spain | 0.00 | % | 50.00 | % | 50.00 | % | 50.00 | % | Real Estate | Joint Ventures | |||||||||||||||
| Inverlur Aguilas II, S.L. | Spain | 0.00 | % | 50.00 | % | 50.00 | % | 50.00 | % | Real Estate | Joint Ventures | |||||||||||||||
| Inversiones Ibersuizas, S.A. en liquidación (a) | Spain | 25.42 | % | 0.00 | % | 25.42 | % | 25.42 | % | Venture Capital company | — | |||||||||||||||
| Inversiones ZS América Dos Ltda. | Chile | 0.00 | % | 49.00 | % | 49.00 | % | 49.00 | % | Seurities and Real Estate Investment | Associated | |||||||||||||||
| Inversiones ZS América SpA | Chile | 0.00 | % | 49.00 | % | 49.00 | % | 49.00 | % | Seurities and Real Estate Investment | Associated | |||||||||||||||
| LB Oprent, S.A. | Spain | 40.00 | % | 0.00 | % | 40.00 | % | 40.00 | % | Rental of industrial machinery | Associated | |||||||||||||||
| Societies of which Grupo Santander owns more than 5% (c) , entities associated with Grupo Santander and jointly controlled entities | ||||||||||||||||||||||||||
| % of ownership held by Banco Santander | Percentage of voting power (b) | |||||||||||||||||||||||||
| Company | Location | Direct | Indirect | Year 2023 | Year 2022 | Activity | Type of company | |||||||||||||||||||
| Mapfre Santander Portugal - Companhia de Seguros, S.A. | Portugal | 0.00 | % | 49.99 | % | 49.99 | % | 49.99 | % | Insurance | Associated | |||||||||||||||
| Massachusetts Business Development Corp. (consolidado) | United States | 0.00 | % | 21.61 | % | 21.61 | % | 21.61 | % | Finance Company | — | |||||||||||||||
| MB Capital Fund IV, LLC | United States | 0.00 | % | 21.51 | % | 21.51 | % | 21.51 | % | Finance Company | — | |||||||||||||||
| Merlin Properties, SOCIMI, S.A. (consolidado) | Spain | 19.03 | % | 5.63 | % | 24.66 | % | 24.64 | % | Real Estate investment | Associated | |||||||||||||||
| Metrovacesa, S.A. (consolidado) | Spain | 31.94 | % | 17.55 | % | 49.49 | % | 49.44 | % | Real Estate promotion | Associated | |||||||||||||||
| Niuco 15, S.L. | Spain | 57.10 | % | 0.00 | % | 57.10 | % | 57.10 | % | Technical services | — | |||||||||||||||
| Ocyener 2008, S.L. | Spain | 0.00 | % | 45.00 | % | 45.00 | % | 45.00 | % | Holding company | Associated | |||||||||||||||
| Operadora de Activos Beta, S.A. de C.V. | Mexico | 49.99 | % | 0.00 | % | 49.99 | % | 49.99 | % | Finance Company | Associated | |||||||||||||||
| Payever GmbH | Germany | 0.00 | % | 10.00 | % | 10.00 | % | 10.00 | % | Software | Associated | |||||||||||||||
| Play Digital S.A. | Argentina | 0.00 | % | 14.69 | % | 14.71 | % | 15.38 | % | Payment platform | Associated | |||||||||||||||
| POLFUND - Fundusz Poręczeń Kredytowych S.A. | Poland | 0.00 | % | 33.70 | % | 50.00 | % | 50.00 | % | Investment management | Associated | |||||||||||||||
| Portland SPV S.r.l. | Italy | — | (d) | — | — | Securitization | Joint Ventures | |||||||||||||||||||
| Premier House (Twickenham) Limited | United Kingdom | 0.00 | % | 88.00 | % | 88.00 | % | — | Real Estate | Joint Ventures | ||||||||||||||||
| Procapital - Investimentos Imobiliários, S.A. (a) | Portugal | 0.00 | % | 39.97 | % | 40.00 | % | 40.00 | % | Real Estate | — | |||||||||||||||
| Project Quasar Investments 2017, S.L. (consolidado) | Spain | 49.00 | % | 0.00 | % | 49.00 | % | 49.00 | % | Holding company | — | |||||||||||||||
| Promontoria Manzana, S.A. (consolidado) | Spain | 20.00 | % | 0.00 | % | 20.00 | % | 20.00 | % | Holding company | Associated | |||||||||||||||
| Redbanc S.A. | Chile | 0.00 | % | 22.44 | % | 33.43 | % | 33.43 | % | Services | Associated | |||||||||||||||
| Redsys Servicios de Procesamiento, S.L. (consolidado) | Spain | 24.90 | % | 0.06 | % | 24.96 | % | 24.96 | % | Cards | Associated | |||||||||||||||
| Retama Real Estate, S.A. Unipersonal | Spain | 0.00 | % | 50.00 | % | 50.00 | % | 50.00 | % | Real Estate | Joint Ventures | |||||||||||||||
| Rías Redbanc S.A. | Uruguay | 0.00 | % | 25.00 | % | 25.00 | % | 25.00 | % | Services | — | |||||||||||||||
| RMBS Belém No.2 | Portugal | — | (d) | — | — | Securitization | Joint Ventures | |||||||||||||||||||
| RMBS Green Belém No.1 | Portugal | — | (d) | — | — | Securitization | Joint Ventures | |||||||||||||||||||
| S3 Caceis Brasil Distribuidora de Títulos e Valores Mobiliários S.A. | Brazil | 0.00 | % | 50.00 | % | 50.00 | % | 50.00 | % | Securities company | Joint Ventures | |||||||||||||||
| S3 Caceis Brasil Participações S.A. | Brazil | 0.00 | % | 50.00 | % | 50.00 | % | 50.00 | % | Holding company | Joint Ventures | |||||||||||||||
| S3 CACEIS Colombia S.A. Sociedad Fiduciaria | Colombia | 0.00 | % | 50.00 | % | 50.00 | % | 50.00 | % | Finance Company | Joint Ventures | |||||||||||||||
| San Preca Federal I Fundo de Investimento em Direitos Creditórios Não-Padronizados | Brazil | 0.00 | % | 45.09 | % | 50.00 | % | 50.00 | % | Investment fund | Joint Ventures | |||||||||||||||
| Sancus Green Investments II, S.C.R., S.A. | Spain | 0.00 | % | 32.95 | % | 32.95 | % | 41.60 | % | Venture Capital company | — | |||||||||||||||
| Santander Allianz Towarzystwo Ubezpieczeń na Życie S.A. | Poland | 0.00 | % | 33.03 | % | 49.00 | % | 49.00 | % | Insurance | Associated | |||||||||||||||
| Santander Allianz Towarzystwo Ubezpieczeń S.A. | Poland | 0.00 | % | 33.03 | % | 49.00 | % | 49.00 | % | Insurance | Associated | |||||||||||||||
| Santander Assurance Solutions, S.A. | Spain | 0.00 | % | 66.67 | % | 66.67 | % | 66.67 | % | Insurance mediation | Joint Ventures | |||||||||||||||
| Santander Auto S.A. | Brazil | 0.00 | % | 45.09 | % | 50.00 | % | 50.00 | % | Insurance | Associated | |||||||||||||||
| Societies of which Grupo Santander owns more than 5% (c) , entities associated with Grupo Santander and jointly controlled entities | ||||||||||||||||||||||||||
| % of ownership held by Banco Santander | Percentage of voting power (b) | |||||||||||||||||||||||||
| Company | Location | Direct | Indirect | Year 2023 | Year 2022 | Activity | Type of company | |||||||||||||||||||
| Santander Caceis Latam Holding 1, S.L. | Spain | 0.00 | % | 50.00 | % | 50.00 | % | 50.00 | % | Holding company | Joint Ventures | |||||||||||||||
| Santander Caceis Latam Holding 2, S.L. | Spain | 0.00 | % | 50.00 | % | 50.00 | % | 50.00 | % | Holding company | Joint Ventures | |||||||||||||||
| Santander Generales Seguros y Reaseguros, S.A. | Spain | 0.00 | % | 49.00 | % | 49.00 | % | 49.00 | % | Insurance | Joint Ventures | |||||||||||||||
| Santander Mapfre Hipoteca Inversa, E.F.C., S.A. | Spain | 0.00 | % | 50.00 | % | 50.00 | % | 45.00 | % | Finance Company | Associated | |||||||||||||||
| Santander Mapfre Seguros y Reaseguros, S.A. | Spain | 0.00 | % | 49.99 | % | 49.99 | % | 49.99 | % | Insurance | Associated | |||||||||||||||
| Santander Vida Seguros y Reaseguros, S.A. | Spain | 0.00 | % | 49.00 | % | 49.00 | % | 49.00 | % | Insurance | Joint Ventures | |||||||||||||||
| Sepacon 31, S.L. | Spain | 37.23 | % | 0.00 | % | 37.23 | % | 37.23 | % | Technical services | — | |||||||||||||||
| Servicios de Infraestructura de Mercado OTC S.A | Chile | 0.00 | % | 8.38 | % | 12.48 | % | 12.48 | % | Services | Associated | |||||||||||||||
| SIBS-SGPS, S.A. (consolidado) | Portugal | 0.00 | % | 15.54 | % | 15.56 | % | 16.55 | % | Portfolio Management | — | |||||||||||||||
| SIG RCRS A/B MF 2023 Venture LLC (f) | United States | 0.00 | % | 20.00 | % | 20.00 | % | — | Finance Company | — | ||||||||||||||||
| Siguler Guff SBIC Fund LP | United States | 0.00 | % | 20.00 | % | 20.00 | % | 20.00 | % | Investment company | — | |||||||||||||||
| Sistema de Tarjetas y Medios de Pago, S.A. | Spain | 20.61 | % | 0.00 | % | 20.61 | % | 20.61 | % | Payment methods | Associated | |||||||||||||||
| Sociedad Conjunta para la Emisión y Gestión de Medios de Pago, E.F.C., S.A. | Spain | 45.70 | % | 0.00 | % | 45.70 | % | 45.70 | % | Payment services | Joint Ventures | |||||||||||||||
| Sociedad de Garantía Recíproca de Santander, S.G.R. | Spain | 24.94 | % | 0.22 | % | 25.16 | % | 25.60 | % | Financial services | — | |||||||||||||||
| Sociedad de Gestión de Activos Procedentes de la Reestructuración Bancaria, S.A. | Spain | 22.21 | % | 0.00 | % | 22.21 | % | 22.21 | % | Financial services | — | |||||||||||||||
| Sociedad Interbancaria de Depósitos de Valores S.A. | Chile | 0.00 | % | 19.66 | % | 29.29 | % | 29.29 | % | Securities depository | Associated | |||||||||||||||
| Solar Maritime Designated Activity Company | Ireland | — | (d) | — | — | Leasing | Joint Ventures | |||||||||||||||||||
| STELLANTIS Insurance Europe Limited | Malta | 0.00 | % | 50.00 | % | 50.00 | % | 50.00 | % | Insurance | Joint Ventures | |||||||||||||||
| STELLANTIS Life Insurance Europe Limited | Malta | 0.00 | % | 50.00 | % | 50.00 | % | 50.00 | % | Insurance | Joint Ventures | |||||||||||||||
| Stephens Ranch Wind Energy Holdco LLC (consolidado) | United States | 0.00 | % | 17.00 | % | 17.00 | % | 20.50 | % | Renewable energies | — | |||||||||||||||
| Tecnologia Bancária S.A. | Brazil | 0.00 | % | 17.11 | % | 19.81 | % | 18.98 | % | ATMs | Associated | |||||||||||||||
| Tonopah Solar Energy Holdings I, LLC | United States | 0.00 | % | 26.80 | % | 26.80 | % | 26.80 | % | Holding company | Joint Ventures | |||||||||||||||
| Trabajando.com Chile S.A. | Chile | 0.00 | % | 33.33 | % | 33.33 | % | 33.33 | % | Services | Associated | |||||||||||||||
| Transbank S.A. | Chile | 0.00 | % | 16.78 | % | 25.00 | % | 25.00 | % | Cards | Associated | |||||||||||||||
| Tresmares Growth Fund II, S.C.R., S.A. | Spain | 40.00 | % | 0.00 | % | 40.00 | % | 40.00 | % | Holding company | — | |||||||||||||||
| Tresmares Growth Fund III, S.C.R., S.A. | Spain | 40.00 | % | 0.00 | % | 40.00 | % | 40.00 | % | Holding company | — | |||||||||||||||
| Tresmares Growth Fund Santander, S.C.R., S.A. (e) | Spain | 100.00 | % | 0.00 | % | 100.00 | % | 100.00 | % | Holding company | — | |||||||||||||||
| U.C.I., S.A. | Spain | 50.00 | % | 0.00 | % | 50.00 | % | 50.00 | % | Holding company | Joint Ventures | |||||||||||||||
| UCI Hellas Credit and Loan Receivables Servicing Company S.A. | Greece | 0.00 | % | 50.00 | % | 50.00 | % | 50.00 | % | Financial services | Joint Ventures | |||||||||||||||
| UCI Holding Brasil Ltda. | Brazil | 0.00 | % | 50.00 | % | 50.00 | % | 50.00 | % | Holding company | Joint Ventures | |||||||||||||||
| UCI Mediação de Seguros, Unipessoal Lda. | Portugal | 0.00 | % | 50.00 | % | 50.00 | % | 50.00 | % | Insurance mediation | Joint Ventures | |||||||||||||||
| Societies of which Grupo Santander owns more than 5% (c) , entities associated with Grupo Santander and jointly controlled entities | ||||||||||||||||||||||||||
| % of ownership held by Banco Santander | Percentage of voting power (b) | |||||||||||||||||||||||||
| Company | Location | Direct | Indirect | Year 2023 | Year 2022 | Activity | Type of company | |||||||||||||||||||
| UCI Servicios para Profesionales Inmobiliarios, S.A. Unipersonal | Spain | 0.00 | % | 50.00 | % | 50.00 | % | 50.00 | % | Real Estate services | Joint Ventures | |||||||||||||||
| Unicre-Instituição Financeira de Crédito, S.A. | Portugal | 0.00 | % | 21.83 | % | 21.86 | % | 21.86 | % | Finance Company | — | |||||||||||||||
| Unión de Créditos Inmobiliarios, S.A. Unipersonal, EFC | Spain | 0.00 | % | 50.00 | % | 50.00 | % | 50.00 | % | Mortgage company | Joint Ventures | |||||||||||||||
| VCFS Germany GmbH | Germany | 0.00 | % | 50.00 | % | 50.00 | % | 50.00 | % | Marketing | Joint Ventures | |||||||||||||||
| Venda de Veículos Fundo de Investimento em Direitos Creditórios | Brazil | 0.00 | % | 35.87 | % | 39.77 | % | — | Securitization | Joint Ventures | ||||||||||||||||
| Volvo Car Financial Services UK Limited | United Kingdom | 0.00 | % | 50.01 | % | 50.01 | % | 50.01 | % | Leasing | Joint Ventures | |||||||||||||||
| Webmotors S.A. | Brazil | 0.00 | % | 27.06 | % | 30.00 | % | 70.00 | % | Services | Associated | |||||||||||||||
| Zurich Santander Brasil Seguros e Previdência S.A. | Brazil | 0.00 | % | 48.79 | % | 48.79 | % | 48.79 | % | Insurance | Associated | |||||||||||||||
| Zurich Santander Holding (Spain), S.L. Unipersonal | Spain | 0.00 | % | 49.00 | % | 49.00 | % | 49.00 | % | Holding company | Associated | |||||||||||||||
| Zurich Santander Holding Dos (Spain), S.L. Unipersonal | Spain | 0.00 | % | 49.00 | % | 49.00 | % | 49.00 | % | Holding company | Associated | |||||||||||||||
| Zurich Santander Insurance América, S.L. | Spain | 0.00 | % | 49.00 | % | 49.00 | % | 49.00 | % | Holding company | Associated | |||||||||||||||
| Zurich Santander Seguros Argentina S.A. | Argentina | 0.00 | % | 49.00 | % | 49.00 | % | 49.00 | % | Insurance | Associated | |||||||||||||||
| Zurich Santander Seguros de Vida Chile S.A. | Chile | 0.00 | % | 49.00 | % | 49.00 | % | 49.00 | % | Insurance | Associated | |||||||||||||||
| Zurich Santander Seguros Generales Chile S.A. | Chile | 0.00 | % | 49.00 | % | 49.00 | % | 49.00 | % | Insurance | Associated | |||||||||||||||
| Zurich Santander Seguros México, S.A. | Mexico | 0.00 | % | 49.00 | % | 49.00 | % | 49.00 | % | Insurance | Associated | |||||||||||||||
| Zurich Santander Seguros Uruguay S.A. | Uruguay | 0.00 | % | 49.00 | % | 49.00 | % | 49.00 | % | Insurance | Associated | |||||||||||||||
| Issuing subsidiaries of shares and preference shares | ||||||||||||||
| % of ownership held by Banco Santander | ||||||||||||||
| Company | Location | Direct | Indirect | Activity | ||||||||||
| Emisora Santander España, S.A. Unipersonal | Spain | 100.00 | % | 0.00 | % | Finance company | ||||||||
| Santander Global Issuances B.V. (a) | Netherlands | 100.00 | % | 0.00 | % | Finance company | ||||||||
| Santander UK (Structured Solutions) Limited | United Kingdom | 0.00 | % | 100.00 | % | Finance company | ||||||||
| Sovereign Real Estate Investment Trust | United States | 0.00 | % | 100.00 | % | Finance company | ||||||||
| Instrument | Type | Term | Amount | Available | ||||||||||
| Issuance Program of unsecured bonds and unsecured certificates of deposit | Revolving | 4-Mar-2026 | 55,000 million Mexican pesos, or its equivalent in UDIs, dollars or any other foreign currency | $10,060 million Mexican pesos | ||||||||||
| Private banking structured bonds Act with subsequent placements (JBSANPRIV 21-1) | Not RevolvingA |
28-Ene-2026 | 20,000 million Mexican pesos | $0 million Mexican pesos | ||||||||||
| Private banking structured bonds Act with subsequent placements (JBSANPRIV 22-1) | Not RevolvingA |
9-Mar-2027 | 20,000 million Mexican pesos | $0 million Mexican pesos | ||||||||||
| Private banking structured bonds Act with subsequent placements (JBSANPRIV 22-2) | Not RevolvingA |
28-Oct-2027 | 20,000 million Mexican pesos | $0 million Mexican pesos | ||||||||||
| Private structured bonds Act with subsequent placements (JBSANPRIV 23-1) | Not Revolving | 47010 | 20,000 million Mexican pesos | $7,825 million Mexican pesos | ||||||||||
| Private structured bonds Act with subsequent placements (JBSANPRIV 23-2) | Not Revolving | 47095 | 20,000 million Mexican pesos | $20,000 million Mexican pesos | ||||||||||
| Public banking structured bonds Act with subsequent placements (JBSANPRIV 22-1) | Not Revolving | 16-Dic-2027 | 10,000 million Mexican pesos | $10,000 million Mexican pesos | ||||||||||
| Capital Notes (Tier 2 Capital) | Not Revolving | 1-Oct-2028 | 1,300 million American dollars | N/A | ||||||||||
| Senior notes 144.ª/RegS | Not Revolving | 17-Abr-2025 | 1,750 million American dollars | N/A | ||||||||||
| Subordinated Notes, perpetual and convertible (Tier 1) | Not Revolving | perpetual | 700 million American dollars | N/A | ||||||||||
| 2023 | ||||||||||||||
Jurisdiction |
Turnover (EUR million) | Full-time equivalent employees | Gross profit or loss before tax (EUR million) | Tax on profit or loss (EUR million) | ||||||||||
| Germany | 1,524 | 5,422 | 375 | 173 | ||||||||||
| Argentina | 1,574 | 8,152 | 552 | 54 | ||||||||||
| Australia | 6 | 61 | — | — | ||||||||||
| Austria | 218 | 333 | 104 | 16 | ||||||||||
| Bahamas | 45 | 26 | 37 | — | ||||||||||
| Belgium | 98 | 217 | 58 | 5 | ||||||||||
| Brazil1 | 12,424 | 57,438 | 2,033 | 1,396 | ||||||||||
| Canada | 73 | 275 | 9 | 1 | ||||||||||
| Chile | 2,244 | 9,573 | 938 | 167 | ||||||||||
| China | 25 | 104 | (8) | — | ||||||||||
| Colombia | 87 | 1,092 | 3 | 20 | ||||||||||
| United Arab Emirates | 4 | 79 | (4) | — | ||||||||||
| Spain2 | 9,994 | 35,142 | 2,013 | 323 | ||||||||||
| United States | 7,072 | 13,250 | 752 | 446 | ||||||||||
| Denmark | 216 | 224 | 112 | 34 | ||||||||||
| Finland | 101 | 157 | 51 | 8 | ||||||||||
| France | 916 | 987 | 567 | 43 | ||||||||||
| Greece | 9 | 54 | — | — | ||||||||||
| Hong Kong | 96 | 225 | 15 | 9 | ||||||||||
| India | — | 97 | — | — | ||||||||||
| Ireland | 20 | 1 | 3 | 1 | ||||||||||
| Isle of Man | 49 | 88 | 31 | 3 | ||||||||||
| Italy | 578 | 1,294 | 233 | 68 | ||||||||||
| Jersey | 20 | 72 | 10 | 2 | ||||||||||
| Luxembourg | 532 | 27 | 524 | 193 | ||||||||||
| Mexico | 5,872 | 30,444 | 2,134 | 840 | ||||||||||
| Norway | 243 | 516 | 118 | 5 | ||||||||||
| Netherlands | 155 | 362 | 96 | 114 | ||||||||||
| Peru | 196 | 867 | 74 | 28 | ||||||||||
| Poland | 3,600 | 12,601 | 1,513 | 150 | ||||||||||
| Portugal | 2,058 | 5,307 | 1,348 | 302 | ||||||||||
| United Kingdom | 6,436 | 21,118 | 2,444 | 728 | ||||||||||
| Romania | 5 | 30 | 3 | — | ||||||||||
| Singapore | 24 | 36 | 9 | 1 | ||||||||||
| Sweden | 153 | 275 | 44 | 19 | ||||||||||
| Switzerland | 165 | 359 | 29 | 8 | ||||||||||
| Uruguay | 591 | 1,528 | 239 | 57 | ||||||||||
| Consolidated Group Total | 57,423 | 207,833 | 16,459 | 5,214 | ||||||||||

| Cross-reference to Form 20-F | Consolidated directors' report | Consolidated financial statements | Supplemental information | |||||||||||||||||

829 | ||
| Cross-reference to Form 20-F | Consolidated directors' report | Consolidated financial statements | Supplemental information | |||||||||||||||||
| 1. Presentation of financial and other information | |||||
| 2. Cautionary statement regarding forward-looking statements | |||||
3. Selected financial data |
|||||
| 4. Risk factors | |||||
| 5. Information on the company | |||||
| Average balance sheets and interest rates | |||||
| Other statistical disclosure requirements | |||||
| 6. Supplement to the operating and financial review disclosure in the directors’ report | |||||
| 7. Tabular disclosure of contractual obligations | |||||
| 8. Employees | |||||
| 9. Competition | |||||
| 10. Supervision and regulation | |||||
| 11. Shareholders remuneration | |||||
| 12. The offer and listing | |||||
| 13. Additional information | |||||
| Memorandum and articles of association | |||||
| Material contracts | |||||
| Exchange controls | |||||
| Taxation | |||||
| Documents on display and other | |||||
| 14. Recent events | |||||
| 15. Controls and procedures | |||||
| 16. Corporate governance | |||||
| 17. Exhibits | |||||
| 18. Signature | |||||
830 | ||
831 | ||
| Cross-reference to Form 20-F | Consolidated directors' report | Consolidated financial statements | Supplemental information | |||||||||||||||||
832 | ||
833 | ||
| Cross-reference to Form 20-F | Consolidated directors' report | Consolidated financial statements | Supplemental information | |||||||||||||||||
| Year ended 31 December, | |||||||||||
| BALANCE SHEET (EUR million) | 2023 | 2022 | 2021 | ||||||||
| Total assets | 1,797,062 | 1,734,659 | 1,595,835 | ||||||||
| Loans and advances to customers | 1,036,349 | 1,036,004 | 972,682 | ||||||||
| Customer deposits | 1,047,169 | 1,009,722 | 900,554 | ||||||||
| Total customer funds (A) | 1,306,942 | 1,239,981 | 1,135,866 | ||||||||
| Total equity | 104,241 | 97,585 | 97,053 | ||||||||
| CAPITALIZATION (EUR million) | |||||||||||
| Shareholders' equity | 130,443 | 124,732 | 119,649 | ||||||||
| Other comprehensive income | (35,020) | (35,628) | (32,719) | ||||||||
| Stockholders' equity (B) | 95,423 | 89,104 | 86,930 | ||||||||
| Non-controlling interest (including net income of the period) | 8,818 | 8,481 | 10,123 | ||||||||
| Total equity | 104,241 | 97,585 | 97,053 | ||||||||
| Subordinated debt issued by Banco Santander, S.A. or issued by subsidiaries and guaranteed by Banco Santander, S.A., excluding preferred securities and preferred shares | 15,070 | 11,900 | 11,845 | ||||||||
| Other Subordinated debt (C) | 6,559 | 5,930 | 5,541 | ||||||||
| Preferred securities (D) | 9,081 | 7,898 | 8,601 | ||||||||
| Preferred shares (D) | 202 | 198 | 209 | ||||||||
| Total subordinated debt | 30,912 | 25,926 | 26,196 | ||||||||
| Total capitalization and Indebtedness | 135,153 | 123,511 | 123,249 | ||||||||
| Stockholders’ Equity per average share (B) | 5.90 | 5.29 | 5.03 | ||||||||
| Stockholders’ Equity per share at period end (B) | 6.01 | 5.38 | 5.09 | ||||||||
| INCOME STATEMENT (EUR million) | |||||||||||
| Interest income / (charges) | 43,261 | 38,619 | 33,370 | ||||||||
| Total income | 57,423 | 52,117 | 46,404 | ||||||||
| Net operating income (E) | 31,998 | 28,214 | 24,989 | ||||||||
| Operating profit/(loss) before tax | 16,459 | 15,250 | 14,547 | ||||||||
| Profit from continuing operations | 12,183 | 10,764 | 9,653 | ||||||||
| Profit attributable to the Parent | 11,076 | 9,605 | 8,124 | ||||||||
| PERFORMANCE | |||||||||||
| ROE (F) | 11.91 | % | 10.67 | % | 9.66 | % | |||||
| RoTE (G) | 15.06 | % | 13.37 | % | 11.96 | % | |||||
| ROA | 0.69 | % | 0.63 | % | 0.62 | % | |||||
| SOLVENCY RATIOS | |||||||||||
| Fully loaded CET1 (H) | 12.3 | % | 12.0 | % | 12.1 | % | |||||
| Phased-in CET1 (H) | 12.3 | % | 12.2 | % | 12.5 | % | |||||
834 | ||
| CREDIT QUALITY DATA | 2023 | 2022 | 2021 | ||||||||
| Loans and advances to customers | |||||||||||
| Allowances for total balances as a percentage of total gross loans | 2.15 | % | 2.14 | % | 2.31 | % | |||||
| Credit impaired balances as a percentage of total gross loans (I) | 3.22 | % | 3.11 | % | 3.18 | % | |||||
| Allowances for total balances as a percentage of credit impaired balances (I) | 67 | % | 69 | % | 73 | % | |||||
| Net loan charge-offs as a percentage of total gross loans | 1.16 | % | 1.02 | % | 0.77 | % | |||||
| Ratios adding contingent liabilities to loans and advances to customers (J) | |||||||||||
| Allowances for total balances as a percentage of total loans and contingent liabilities | 2.07 | % | 2.08 | % | 2.25 | % | |||||
| Credit impaired balances as a percentage of total loans and contingent liabilities (K) (I) | 3.14 | % | 3.08 | % | 3.16 | % | |||||
| Allowances for total balances as a percentage of credit impaired balances (K) (I) | 66 | % | 68 | % | 71 | % | |||||
| Net loan and contingent liabilities charge-offs as a percentage of total loans and contingent liabilities | 1.08 | % | 0.96 | % | 0.73 | % | |||||
| MARKET CAPITALIZATION AND SHARES | |||||||||||
| Number of shareholders | 3,662,377 | 3,915,388 | 3,936,922 | ||||||||
| Shares (millions) | 16,184 | 16,794 | 17,341 | ||||||||
| Share price (EUR) | 3.780 | 2.803 | 2.941 | ||||||||
| Market capitalization (EUR million) | 61,168 | 47,066 | 50,990 | ||||||||
| Payout ratio (L) | 25 | % | 20 | % | 20 | % | |||||
| PER SHARE INFORMATION | |||||||||||
| Average number of shares (EUR thousands) (M) | 16,172,085 | 16,848,345 | 17,272,055 | ||||||||
| Basic earnings per share (EUR) | 0.654 | 0.539 | 0.438 | ||||||||
| Basic earnings per share continuing operation (EUR) | 0.654 | 0.539 | 0.438 | ||||||||
| Diluted earnings per share (EUR) | 0.651 | 0.537 | 0.436 | ||||||||
| Diluted earnings per share continuing operation (EUR) | 0.651 | 0.537 | 0.436 | ||||||||
| Remuneration (EUR) (N) | 0.1760 | 0.1178 | 0.10 | ||||||||
| Remuneration (US$) (N) | 0.1945 | 0.1258 | 0.11 | ||||||||
| OPERATING DATA | |||||||||||
| Number of employees (O) | 212,764 | 206,462 | 199,177 | ||||||||
| Number of branches | 8,518 | 9,019 | 9,229 | ||||||||
835 | ||
| Cross-reference to Form 20-F | Consolidated directors' report | Consolidated financial statements | Supplemental information | |||||||||||||||||
| (million euros, except percentages) | |||||||||||
| 2023 | 2022 | 2021 | |||||||||
| Profit attributable to the parent | 11,076 | 9,605 | 8,124 | ||||||||
| Profit attributable to the parent excluding goodwill impairment | 11,096 | 9,605 | 8,130 | ||||||||
| Average equity | 93,035 | 89,986 | 84,133 | ||||||||
| Effect of goodwill and other intangible assets | (19,361) | (18,164) | (16,169) | ||||||||
| Average tangible equity | 73,675 | 71,822 | 67,964 | ||||||||
| Return on equity (ROE) | 11.91 | % | 10.67 | % | 9.66 | % | |||||
| Return on tangible equity (ROTE) | 15.06 | % | 13.37 | % | 11.96 | % | |||||
836 | ||
| 2023 | 2022 | 2021 | |||||||||
| Allowances refers to: | |||||||||||
| Allowances for total balances (A) | 23,490 | 23,418 | 23,698 | ||||||||
| Allowances for contingent liabilities and commitments | 702 | 734 | 734 | ||||||||
| Allowances for total balances (excluding contingent liabilities and commitments): | 22,788 | 22,684 | 22,964 | ||||||||
| Other allowances (B) | 295 | 232 | 222 | ||||||||
| Allowances for total balances (excluding contingent liabilities and commitments) | 23,083 | 22,916 | 23,186 | ||||||||
| Of which: | |||||||||||
| Allowances for customers | 22,788 | 22,684 | 22,964 | ||||||||
| Allowances for credit institutions and other financial assets | 9 | 6 | 7 | ||||||||
| Allowances for Debt instruments | 286 | 226 | 215 | ||||||||
| Allowances for Financial assets at amortised cost | 22,950 | 22,888 | 23,164 | ||||||||
| Allowances for Financial assets at fair value through other comprehensive income | 133 | 28 | 22 | ||||||||
837 | ||
| Cross-reference to Form 20-F | Consolidated directors' report | Consolidated financial statements | Supplemental information | |||||||||||||||||
838 | ||
839 | ||
| Cross-reference to Form 20-F | Consolidated directors' report | Consolidated financial statements | Supplemental information | |||||||||||||||||
840 | ||
841 | ||
| Cross-reference to Form 20-F | Consolidated directors' report | Consolidated financial statements | Supplemental information | |||||||||||||||||
842 | ||
843 | ||
| Cross-reference to Form 20-F | Consolidated directors' report | Consolidated financial statements | Supplemental information | |||||||||||||||||
844 | ||
845 | ||
| Cross-reference to Form 20-F | Consolidated directors' report | Consolidated financial statements | Supplemental information | |||||||||||||||||
846 | ||
847 | ||
| Cross-reference to Form 20-F | Consolidated directors' report | Consolidated financial statements | Supplemental information | |||||||||||||||||
848 | ||
849 | ||
| Cross-reference to Form 20-F | Consolidated directors' report | Consolidated financial statements | Supplemental information | |||||||||||||||||
850 | ||
851 | ||
| Cross-reference to Form 20-F | Consolidated directors' report | Consolidated financial statements | Supplemental information | |||||||||||||||||
852 | ||
853 | ||
| Cross-reference to Form 20-F | Consolidated directors' report | Consolidated financial statements | Supplemental information | |||||||||||||||||
854 | ||
855 | ||
| Cross-reference to Form 20-F | Consolidated directors' report | Consolidated financial statements | Supplemental information | |||||||||||||||||
856 | ||
857 | ||
| Cross-reference to Form 20-F | Consolidated directors' report | Consolidated financial statements | Supplemental information | |||||||||||||||||
858 | ||
859 | ||
| Cross-reference to Form 20-F | Consolidated directors' report | Consolidated financial statements | Supplemental information | |||||||||||||||||
860 | ||
861 | ||
| Cross-reference to Form 20-F | Consolidated directors' report | Consolidated financial statements | Supplemental information | |||||||||||||||||
| Banco Santander, S.A. | ||||||||||||||
| Rating agency | Long term | Short term | Last report date | Outlook | ||||||||||
| Fitch Ratings |
A-
(Senior A)
|
F2
(Senior F1)
|
Dec 2023 |
Stable | ||||||||||
| Moody's | A2 | P-1 | Jul 2023 |
Stable | ||||||||||
| Standard & Poor's | A+ | A-1 | Oct 2023 |
Stable | ||||||||||
| DBRS | A (High) | R-1 (Middle) | Sep 2023 |
Stable | ||||||||||
862 | ||
| Santander UK, plc | ||||||||||||||
| Rating agency | Long term | Short term | Last report date | Outlook | ||||||||||
| Fitch Ratings | A+ |
F1 | Dec 2023 |
Stable | ||||||||||
| Moody's | A1 | P-1 | Jun 2023 |
Stable |
||||||||||
| Standard & Poor's | A | A-1 |
Jun 2023 |
Stable | ||||||||||
| Banco Santander (Brasil) | (Foreign currency) | |||||||||||||
| Rating agency | Long term | Short term | Last report update | Outlook | ||||||||||
| Moody's | Ba1 | - | Feb 2023 | Stable | ||||||||||
| Standard & Poor's | BB |
B | Dec 2023 |
Stable |
||||||||||
863 | ||
| Cross-reference to Form 20-F | Consolidated directors' report | Consolidated financial statements | Supplemental information | |||||||||||||||||
864 | ||
865 | ||
| Cross-reference to Form 20-F | Consolidated directors' report | Consolidated financial statements | Supplemental information | |||||||||||||||||
866 | ||
867 | ||
| Cross-reference to Form 20-F | Consolidated directors' report | Consolidated financial statements | Supplemental information | |||||||||||||||||
868 | ||
869 | ||
| Cross-reference to Form 20-F | Consolidated directors' report | Consolidated financial statements | Supplemental information | |||||||||||||||||
870 | ||
871 | ||
| Cross-reference to Form 20-F | Consolidated directors' report | Consolidated financial statements | Supplemental information | |||||||||||||||||
872 | ||
873 | ||
| Cross-reference to Form 20-F | Consolidated directors' report | Consolidated financial statements | Supplemental information | |||||||||||||||||
| Year ended 31 December, | |||||||||||||||||||||||||||||||||||
| 2023 | 2022 | 2021 | |||||||||||||||||||||||||||||||||
| ASSETS | Average Balance | Interest | Average Rate | Average Balance | Interest | Average Rate | Average Balance | Interest | Average Rate | ||||||||||||||||||||||||||
| (in millions of euros, except percentages) | |||||||||||||||||||||||||||||||||||
| Cash balances at central banks and other deposits on demand, and loans and advances to central banks and credit institutions (A) | 310,887 | 16,467 | 5.30 | % | 304,935 | 7,139 | 2.34 | % | 265,417 | 2,682 | 1.01 | % | |||||||||||||||||||||||
| Domestic | 117,332 | 4,694 | 4.00 | % | 111,697 | 1,166 | 1.04 | % | 112,621 | 809 | 0.72 | % | |||||||||||||||||||||||
| International - Mature markets | 124,570 | 5,611 | 4.50 | % | 139,105 | 1,971 | 1.42 | % | 109,672 | 542 | 0.49 | % | |||||||||||||||||||||||
| International - Developing markets | 68,985 | 6,162 | 8.93 | % | 54,133 | 4,002 | 7.39 | % | 43,124 | 1,331 | 3.09 | % | |||||||||||||||||||||||
| Of which | |||||||||||||||||||||||||||||||||||
| Reverse repurchase agreements | 55,570 | 4,745 | 8.54 | % | 39,572 | 1,862 | 4.71 | % | 38,236 | 707 | 1.85 | % | |||||||||||||||||||||||
| Domestic | 24,292 | 1,336 | 5.50 | % | 19,072 | 146 | 0.77 | % | 23,390 | 29 | 0.12 | % | |||||||||||||||||||||||
| International - Mature markets | 4,845 | 278 | 5.74 | % | 4,713 | 55 | 1.17 | % | 5,101 | 15 | 0.29 | % | |||||||||||||||||||||||
| International - Developing markets | 26,433 | 3,131 | 11.85 | % | 15,787 | 1,661 | 10.52 | % | 9,745 | 663 | 6.80 | % | |||||||||||||||||||||||
| Loans and advances to customers | 1,036,547 | 70,619 | 6.81 | % | 1,031,226 | 54,110 | 5.25 | % | 943,071 | 38,649 | 4.10 | % | |||||||||||||||||||||||
| Domestic | 265,322 | 10,581 | 3.99 | % | 272,826 | 5,929 | 2.17 | % | 254,232 | 4,799 | 1.89 | % | |||||||||||||||||||||||
| International - Mature markets | 546,641 | 28,771 | 5.26 | % | 552,674 | 19,821 | 3.59 | % | 513,910 | 16,090 | 3.13 | % | |||||||||||||||||||||||
| International - Developing markets | 224,584 | 31,267 | 13.92 | % | 205,726 | 28,360 | 13.79 | % | 174,929 | 17,760 | 10.15 | % | |||||||||||||||||||||||
| Of which | |||||||||||||||||||||||||||||||||||
| Reverse repurchase agreements | 46,382 | 3,603 | 7.77 | % | 43,505 | 1,026 | 2.36 | % | 36,660 | 60 | 0.16 | % | |||||||||||||||||||||||
| Domestic | 8,725 | 261 | 2.99 | % | 9,509 | 42 | 0.44 | % | 9,521 | 7 | 0.07 | % | |||||||||||||||||||||||
| International - Mature markets | 36,546 | 3,210 | 8.78 | % | 33,068 | 919 | 2.78 | % | 25,622 | 18 | 0.07 | % | |||||||||||||||||||||||
| International - Developing markets | 1,111 | 132 | 11.88 | % | 928 | 65 | 7.00 | % | 1,517 | 35 | 2.31 | % | |||||||||||||||||||||||
| Debt securities | 224,304 | 14,501 | 6.46 | % | 183,013 | 10,416 | 5.69 | % | 168,834 | 5,724 | 3.39 | % | |||||||||||||||||||||||
| Domestic | 71,507 | 2,503 | 3.50 | % | 45,932 | 809 | 1.76 | % | 42,740 | 313 | 0.73 | % | |||||||||||||||||||||||
| International - Mature markets | 51,327 | 1,444 | 2.81 | % | 43,877 | 803 | 1.83 | % | 40,579 | 446 | 1.10 | % | |||||||||||||||||||||||
| International - Developing markets | 101,470 | 10,554 | 10.40 | % | 93,204 | 8,804 | 9.45 | % | 85,515 | 4,965 | 5.81 | % | |||||||||||||||||||||||
| Income from hedging operations | 3,561 | (236) | (723) | ||||||||||||||||||||||||||||||||
| Domestic | (45) | 16 | 20 | ||||||||||||||||||||||||||||||||
| International - Mature markets | 2,955 | 480 | (91) | ||||||||||||||||||||||||||||||||
| International - Developing markets | 651 | (732) | (652) | ||||||||||||||||||||||||||||||||
| Other interest | 104 | 1 | 131 | ||||||||||||||||||||||||||||||||
| Domestic | (47) | (121) | (29) | ||||||||||||||||||||||||||||||||
| International - Mature markets | 63 | 40 | 13 | ||||||||||||||||||||||||||||||||
| International - Developing markets | 88 | 82 | 147 | ||||||||||||||||||||||||||||||||
| Total Interest earning assets | 1,571,738 | 105,252 | 6.70 | % | 1,519,174 | 71,430 | 4.70 | % | 1,377,322 | 46,463 | 3.37 | % | |||||||||||||||||||||||
| Domestic | 454,161 | 17,686 | 3.89 | % | 430,455 | 7,799 | 1.81 | % | 409,593 | 5,912 | 1.44 | % | |||||||||||||||||||||||
| International - Mature markets | 722,538 | 38,844 | 5.38 | % | 735,656 | 23,115 | 3.14 | % | 664,161 | 17,000 | 2.56 | % | |||||||||||||||||||||||
| International - Developing markets | 395,039 | 48,722 | 12.33 | % | 353,063 | 40,516 | 11.48 | % | 303,568 | 23,551 | 7.76 | % | |||||||||||||||||||||||
| Other non-interest earning assets | 201,365 | 201,099 | 186,577 | ||||||||||||||||||||||||||||||||
| Assets from discontinued operations | — | — | — | ||||||||||||||||||||||||||||||||
| Total Average Assets | 1,773,103 | 105,252 | 1,720,273 | 71,430 | 1,563,899 | 46,463 | |||||||||||||||||||||||||||||
874 | ||
| Year ended 31 December, | |||||||||||||||||||||||||||||||||||
| 2023 | 2022 | 2021 | |||||||||||||||||||||||||||||||||
| LIABILITIES AND STOCKHOLDERS' EQUITY | Average Balance | Interest | Average Rate | Average Balance | Interest | Average Rate | Average Balance | Interest | Average Rate | ||||||||||||||||||||||||||
| (in millions of euros, except percentages) | |||||||||||||||||||||||||||||||||||
| Deposits from central banks and credit institutions (B) | 175,164 | 9,350 | 5.34 | % | 214,879 | 3,636 | 1.69 | % | 197,997 | 1,750 | 0.88 | % | |||||||||||||||||||||||
| Domestic | 62,366 | 2,723 | 4.37 | % | 92,373 | 560 | 0.61 | % | 96,209 | 376 | 0.39 | % | |||||||||||||||||||||||
| International - Mature markets | 63,456 | 2,989 | 4.71 | % | 78,230 | 972 | 1.24 | % | 63,047 | 227 | 0.36 | % | |||||||||||||||||||||||
| International - Developing markets | 49,342 | 3,638 | 7.37 | % | 44,276 | 2,104 | 4.75 | % | 38,741 | 1,147 | 2.96 | % | |||||||||||||||||||||||
| Of which | |||||||||||||||||||||||||||||||||||
| Repurchase agreements | 55,619 | 3,737 | 6.72 | % | 34,298 | 1,349 | 3.93 | % | 28,763 | 703 | 2.44 | % | |||||||||||||||||||||||
| Domestic | 34,123 | 1,686 | 4.94 | % | 17,321 | 186 | 1.07 | % | 11,268 | 18 | 0.16 | % | |||||||||||||||||||||||
| International - Mature markets | 6,542 | 388 | 5.93 | % | 2,743 | 50 | 1.82 | % | 2,300 | 8 | 0.35 | % | |||||||||||||||||||||||
| International - Developing markets | 14,954 | 1,663 | 11.12 | % | 14,234 | 1,113 | 7.82 | % | 15,195 | 677 | 4.46 | % | |||||||||||||||||||||||
| Customer deposits | 1,011,471 | 33,238 | 3.29 | % | 963,359 | 16,994 | 1.76 | % | 870,063 | 5,452 | 0.63 | % | |||||||||||||||||||||||
| Domestic | 302,379 | 3,269 | 1.08 | % | 286,233 | 698 | 0.24 | % | 272,352 | 282 | 0.10 | % | |||||||||||||||||||||||
| International - Mature markets | 468,602 | 12,386 | 2.64 | % | 460,386 | 3,279 | 0.71 | % | 406,890 | 706 | 0.17 | % | |||||||||||||||||||||||
| International - Developing markets | 240,490 | 17,583 | 7.31 | % | 216,740 | 13,017 | 6.01 | % | 190,821 | 4,464 | 2.34 | % | |||||||||||||||||||||||
| Of which | |||||||||||||||||||||||||||||||||||
| Repurchase agreements | 73,193 | 7,084 | 9.68 | % | 57,646 | 3,199 | 5.55 | % | 41,475 | 520 | 1.25 | % | |||||||||||||||||||||||
| Domestic | 4,602 | 263 | 5.71 | % | 2,327 | 24 | 1.03 | % | 7,918 | — | — | % | |||||||||||||||||||||||
| International - Mature markets | 46,992 | 4,125 | 8.78 | % | 37,380 | 1,099 | 2.94 | % | 19,311 | 6 | 0.03 | % | |||||||||||||||||||||||
| International - Developing markets | 21,599 | 2,696 | 12.48 | % | 17,939 | 2,076 | 11.57 | % | 14,246 | 514 | 3.61 | % | |||||||||||||||||||||||
| Marketable debt securities (A) | 288,345 | 12,751 | 4.42 | % | 255,721 | 8,464 | 3.31 | % | 234,887 | 4,838 | 2.06 | % | |||||||||||||||||||||||
| Domestic | 134,045 | 4,184 | 3.12 | % | 111,682 | 2,262 | 2.03 | % | 104,602 | 1,538 | 1.47 | % | |||||||||||||||||||||||
| International - Mature markets | 108,912 | 4,219 | 3.87 | % | 107,374 | 2,262 | 2.11 | % | 102,330 | 1,670 | 1.63 | % | |||||||||||||||||||||||
| International - Developing markets | 45,388 | 4,348 | 9.58 | % | 36,665 | 3,940 | 10.75 | % | 27,955 | 1,630 | 5.83 | % | |||||||||||||||||||||||
| Of which | |||||||||||||||||||||||||||||||||||
| Commercial paper | 29,195 | 1,329 | 4.55 | % | 17,907 | 375 | 2.09 | % | 17,794 | 135 | 0.76 | % | |||||||||||||||||||||||
| Domestic | 21,509 | 888 | 4.13 | % | 12,377 | 222 | 1.79 | % | 12,247 | 22 | 0.18 | % | |||||||||||||||||||||||
| International - Mature markets | 5,641 | 243 | 4.31 | % | 4,280 | 60 | 1.40 | % | 4,582 | 59 | 1.29 | % | |||||||||||||||||||||||
| International - Developing markets | 2,045 | 198 | 9.68 | % | 1,250 | 93 | 7.44 | % | 965 | 54 | 5.60 | % | |||||||||||||||||||||||
| Other interest-bearing liabilities (C) | 23,139 | 638 | 2.76 | % | 23,861 | 216 | 0.91 | % | 27,855 | 216 | 0.78 | % | |||||||||||||||||||||||
| Domestic | 16,109 | 469 | 2.91 | % | 16,616 | 93 | 0.56 | % | 20,179 | 70 | 0.35 | % | |||||||||||||||||||||||
| International - Mature markets | 4,830 | 1 | 0.02 | % | 5,416 | 1 | 0.02 | % | 5,822 | 30 | 0.52 | % | |||||||||||||||||||||||
| International - Developing markets | 2,200 | 168 | 7.64 | % | 1,829 | 122 | 6.67 | % | 1,854 | 116 | 6.26 | % | |||||||||||||||||||||||
| Expenses from hedging operations | 4,436 | 2,055 | (368) | ||||||||||||||||||||||||||||||||
| Domestic | 1,045 | 218 | (153) | ||||||||||||||||||||||||||||||||
| International - Mature markets | 1,756 | 207 | (147) | ||||||||||||||||||||||||||||||||
| International - Developing markets | 1,635 | 1,630 | (68) | ||||||||||||||||||||||||||||||||
| Other interest | 1,578 | 1,446 | 1,205 | ||||||||||||||||||||||||||||||||
| Domestic | 567 | 435 | 306 | ||||||||||||||||||||||||||||||||
| International - Mature markets | 304 | 186 | 109 | ||||||||||||||||||||||||||||||||
| International - Developing markets | 707 | 825 | 790 | ||||||||||||||||||||||||||||||||
| Total interest-bearing liabilities | 1,498,119 | 61,991 | 4.14 | % | 1,457,820 | 32,811 | 2.25 | % | 1,330,802 | 13,093 | 0.98 | % | |||||||||||||||||||||||
| Domestic | 514,899 | 12,257 | 2.38 | % | 506,904 | 4,266 | 0.84 | % | 493,342 | 2,419 | 0.49 | % | |||||||||||||||||||||||
875 | ||
| Cross-reference to Form 20-F | Consolidated directors' report | Consolidated financial statements | Supplemental information | |||||||||||||||||
| Year ended 31 December, | |||||||||||||||||||||||||||||||||||
| 2023 | 2022 | 2021 | |||||||||||||||||||||||||||||||||
| LIABILITIES AND STOCKHOLDERS' EQUITY | Average Balance | Interest | Average Rate | Average Balance | Interest | Average Rate | Average Balance | Interest | Average Rate | ||||||||||||||||||||||||||
| (in millions of euros, except percentages) | |||||||||||||||||||||||||||||||||||
| International - Mature markets | 645,800 | 21,655 | 3.35 | % | 651,406 | 6,907 | 1.06 | % | 578,089 | 2,595 | 0.45 | % | |||||||||||||||||||||||
| International - Developing markets | 337,420 | 28,079 | 8.32 | % | 299,510 | 21,638 | 7.22 | % | 259,371 | 8,079 | 3.11 | % | |||||||||||||||||||||||
| Other non-interest bearing liabilities | 173,299 | 163,832 | 138,824 | ||||||||||||||||||||||||||||||||
| Non-Controlling interest | 8,650 | 8,635 | 10,140 | ||||||||||||||||||||||||||||||||
| Stockholders' Equity | 93,035 | 89,986 | 84,133 | ||||||||||||||||||||||||||||||||
| Liabilities from discontinued operations | — | — | — | ||||||||||||||||||||||||||||||||
| Total average liabilities and Stockholders' Equity | 1,773,103 | 61,991 | 1,720,273 | 32,811 | 1,563,899 | 13,093 | |||||||||||||||||||||||||||||
876 | ||
Year ended 31 December, |
|||||||||||
| 2023 / 2022 | |||||||||||
Increase (Decrease) due to changes in |
|||||||||||
INTEREST INCOME |
Volume (1) |
Rate (2) |
Net Change | ||||||||
| (in millions of euros) | |||||||||||
| Cash balances at central banks and other deposits on demand, and loans and advances to central banks and credit institutions | 1,064 | 8,264 | 9,328 | ||||||||
| Domestic | 62 | 3,466 | 3,528 | ||||||||
| International - Mature markets | (226) | 3,866 | 3,640 | ||||||||
| International - Developing markets | 1,228 | 932 | 2,160 | ||||||||
| Of which | |||||||||||
| Reverse repurchase agreements | 1,291 | 1,592 | 2,883 | ||||||||
| Domestic | 50 | 1,140 | 1,190 | ||||||||
| International - Mature markets | 2 | 221 | 223 | ||||||||
| International - Developing markets | 1,239 | 231 | 1,470 | ||||||||
| Loans and advances to customers | 2,237 | 14,272 | 16,509 | ||||||||
| Domestic | (167) | 4,819 | 4,652 | ||||||||
| International - Mature markets | (219) | 9,169 | 8,950 | ||||||||
| International - Developing markets | 2,623 | 284 | 2,907 | ||||||||
| Of which | |||||||||||
| Reverse repurchase agreements | 117 | 2,460 | 2,577 | ||||||||
| Domestic | (4) | 223 | 219 | ||||||||
| International - Mature markets | 106 | 2,185 | 2,291 | ||||||||
| International - Developing markets | 15 | 52 | 67 | ||||||||
| Debt securities | 1,583 | 2,502 | 4,085 | ||||||||
| Domestic | 611 | 1,083 | 1,694 | ||||||||
| International - Mature markets | 154 | 487 | 641 | ||||||||
| International - Developing markets | 818 | 932 | 1,750 | ||||||||
| Income from hedging operations | 3,797 | — | 3,797 | ||||||||
| Domestic | (61) | — | (61) | ||||||||
| International - Mature markets | 2,475 | — | 2,475 | ||||||||
| International - Developing markets | 1,383 | — | 1,383 | ||||||||
| Other interest | 103 | — | 103 | ||||||||
| Domestic | 74 | — | 74 | ||||||||
| International - Mature markets | 23 | — | 23 | ||||||||
| International - Developing markets | 6 | — | 6 | ||||||||
| Total Interest earning assets | 8,784 | 25,038 | 33,822 | ||||||||
| Domestic | 519 | 9,368 | 9,887 | ||||||||
Year ended 31 December, |
|||||||||||
| 2023 / 2022 | |||||||||||
Increase (Decrease) due to changes in |
|||||||||||
INTEREST INCOME |
Volume (1) |
Rate (2) |
Net Change | ||||||||
| (in millions of euros) | |||||||||||
| International - Mature markets | 2,207 | 13,522 | 15,729 | ||||||||
| International - Developing markets | 6,058 | 2,148 | 8,206 | ||||||||
Year ended 31 December, |
|||||||||||
| 2022 / 2021 | |||||||||||
Increase (Decrease) due to changes in |
|||||||||||
INTEREST INCOME |
Volume (1) |
Rate (2) |
Net Change | ||||||||
| (in millions of euros) | |||||||||||
| Cash balances at central banks and other deposits on demand, and loans and advances to central banks and credit institutions | 586 | 3,871 | 4,457 | ||||||||
| Domestic | (7) | 364 | 357 | ||||||||
| International - Mature markets | 180 | 1,249 | 1,429 | ||||||||
| International - Developing markets | 413 | 2,258 | 2,671 | ||||||||
| Of which | |||||||||||
| Reverse repurchase agreements | 523 | 632 | 1,155 | ||||||||
| Domestic | (6) | 123 | 117 | ||||||||
| International - Mature markets | (1) | 41 | 40 | ||||||||
| International - Developing markets | 530 | 468 | 998 | ||||||||
| Loans and advances to customers | 5,138 | 10,323 | 15,461 | ||||||||
| Domestic | 368 | 762 | 1,130 | ||||||||
| International - Mature markets | 1,274 | 2,457 | 3,731 | ||||||||
| International - Developing markets | 3,496 | 7,104 | 10,600 | ||||||||
| Of which | |||||||||||
| Reverse repurchase agreements | (11) | 977 | 966 | ||||||||
| Domestic | 0 | 35 | 35 | ||||||||
| International - Mature markets | 7 | 894 | 901 | ||||||||
| International - Developing markets | (18) | 48 | 30 | ||||||||
| Debt securities | 546 | 4,146 | 4,692 | ||||||||
| Domestic | 25 | 471 | 496 | ||||||||
| International - Mature markets | 39 | 318 | 357 | ||||||||
| International - Developing markets | 482 | 3,357 | 3,839 | ||||||||
| Income from hedging operations | 487 | — | 487 | ||||||||
| Domestic | (4) | — | (4) | ||||||||
| International - Mature markets | 571 | — | 571 | ||||||||
877 | ||
| Cross-reference to Form 20-F | Consolidated directors' report | Consolidated financial statements | Supplemental information | |||||||||||||||||
Year ended 31 December, |
|||||||||||
| 2022 / 2021 | |||||||||||
Increase (Decrease) due to changes in |
|||||||||||
INTEREST INCOME |
Volume (1) |
Rate (2) |
Net Change | ||||||||
| International - Developing markets | (80) | — | (80) | ||||||||
| Other interest | (130) | — | (130) | ||||||||
| Domestic | (92) | — | (92) | ||||||||
| International - Mature markets | 27 | — | 27 | ||||||||
| International - Developing markets | (65) | — | (65) | ||||||||
| Total Interest earning assets | 6,627 | 18,340 | 24,967 | ||||||||
| Domestic | 290 | 1,597 | 1,887 | ||||||||
| International - Mature markets | 2,091 | 4,024 | 6,115 | ||||||||
| International - Developing markets | 4,246 | 12,719 | 16,965 | ||||||||
Year ended 31 December, |
|||||||||||
| 2023 / 2022 | |||||||||||
Increase (Decrease) due to changes in |
|||||||||||
INTEREST CHARGES |
Volume (1) |
Rate (2) |
Net Change |
||||||||
| (in millions of euros) | |||||||||||
| Deposits from central banks and credit institutions | (190) | 5,904 | 5,714 | ||||||||
| Domestic | (238) | 2,401 | 2,163 | ||||||||
| International - Mature markets | (216) | 2,233 | 2,017 | ||||||||
| International - Developing markets | 264 | 1,270 | 1,534 | ||||||||
| Of which | |||||||||||
| Repurchase agreements | 506 | 1,882 | 2,388 | ||||||||
| Domestic | 318 | 1,182 | 1,500 | ||||||||
| International - Mature markets | 129 | 209 | 338 | ||||||||
| International - Developing markets | 59 | 491 | 550 | ||||||||
| Customer Deposits | 1,632 | 14,612 | 16,244 | ||||||||
| Domestic | 42 | 2,529 | 2,571 | ||||||||
| International - Mature markets | 60 | 9,047 | 9,107 | ||||||||
| International - Developing markets | 1,530 | 3,036 | 4,566 | ||||||||
| Of which | |||||||||||
| Repurchase agreements | 837 | 3,048 | 3,885 | ||||||||
| Domestic | 42 | 197 | 239 | ||||||||
| International - Mature markets | 347 | 2,679 | 3,026 | ||||||||
| International - Developing markets | 448 | 172 | 620 | ||||||||
| Marketable debt securities | 1,420 | 2,867 | 4,287 | ||||||||
| Domestic | 519 | 1,403 | 1,922 | ||||||||
Year ended 31 December, |
|||||||||||
| 2023 / 2022 | |||||||||||
Increase (Decrease) due to changes in |
|||||||||||
INTEREST CHARGES |
Volume (1) |
Rate (2) |
Net Change |
||||||||
| (in millions of euros) | |||||||||||
| International - Mature markets | 33 | 1,924 | 1,957 | ||||||||
| International - Developing markets | 868 | (460) | 408 | ||||||||
| Of which | |||||||||||
| Commercial paper | 336 | 618 | 954 | ||||||||
| Domestic | 241 | 425 | 666 | ||||||||
| International - Mature markets | 24 | 159 | 183 | ||||||||
| International - Developing markets | 71 | 34 | 105 | ||||||||
| Other interest-bearing liabilities (3) | 24 | 398 | 422 | ||||||||
| Domestic | (3) | 379 | 376 | ||||||||
| International - Mature markets | 0 | 0 | 0 | ||||||||
| International - Developing markets | 27 | 19 | 46 | ||||||||
| Expenses from hedging operations | 2,381 | — | 2,381 | ||||||||
| Domestic | 827 | — | 827 | ||||||||
| International - Mature markets | 1,549 | — | 1,549 | ||||||||
| International - Developing markets | 5 | — | 5 | ||||||||
| Other interest | 132 | — | 132 | ||||||||
| Domestic | 132 | — | 132 | ||||||||
| International - Mature markets | 118 | — | 118 | ||||||||
| International - Developing markets | (118) | — | (118) | ||||||||
| Total interest-bearing liabilities | 5,399 | 23,781 | 29,180 | ||||||||
| Domestic | 1,279 | 6,712 | 7,991 | ||||||||
| International - Mature markets | 1,544 | 13,204 | 14,748 | ||||||||
| International - Developing markets | 2,576 | 3,865 | 6,441 | ||||||||
878 | ||
Year ended 31 December, |
|||||||||||
| 2022 / 2021 | |||||||||||
Increase (Decrease) due to changes in |
|||||||||||
INTEREST CHARGES |
Volume (1) |
Rate (2) |
Net Change | ||||||||
| (in millions of euros) | |||||||||||
| Deposits from central banks and credit institutions | 234 | 1,652 | 1,886 | ||||||||
| Domestic | (16) | 200 | 184 | ||||||||
| International - Mature markets | 67 | 678 | 745 | ||||||||
| International - Developing markets | 183 | 774 | 957 | ||||||||
| Of which | |||||||||||
| Repurchase agreements | (29) | 675 | 646 | ||||||||
| Domestic | 14 | 154 | 168 | ||||||||
| International - Mature markets | 2 | 40 | 42 | ||||||||
| International - Developing markets | (45) | 481 | 436 | ||||||||
| Customer Deposits | 802 | 10,740 | 11,542 | ||||||||
| Domestic | 15 | 401 | 416 | ||||||||
| International - Mature markets | 105 | 2,468 | 2,573 | ||||||||
| International - Developing markets | 682 | 7,871 | 8,553 | ||||||||
| Of which | |||||||||||
| Repurchase agreements | 175 | 2,504 | 2,679 | ||||||||
| Domestic | — | 24 | 24 | ||||||||
| International - Mature markets | 11 | 1,082 | 1,093 | ||||||||
| International - Developing markets | 164 | 1,398 | 1,562 | ||||||||
| Marketable debt securities | 819 | 2,807 | 3,626 | ||||||||
| Domestic | 110 | 614 | 724 | ||||||||
| International - Mature markets | 86 | 506 | 592 | ||||||||
| International - Developing markets | 623 | 1,687 | 2,310 | ||||||||
| Of which | |||||||||||
| Commercial paper | 14 | 226 | 240 | ||||||||
| Domestic | 0 | 200 | 200 | ||||||||
| International - Mature markets | (4) | 5 | 1 | ||||||||
| International - Developing markets | 18 | 21 | 39 | ||||||||
| Other interest-bearing liabilities (3) | (18) | 18 | 0 | ||||||||
| Domestic | (14) | 37 | 23 | ||||||||
| International - Mature markets | (2) | (27) | (29) | ||||||||
| International - Developing markets | (2) | 8 | 6 | ||||||||
Year ended 31 December, |
|||||||||||
| 2022 / 2021 | |||||||||||
Increase (Decrease) due to changes in |
|||||||||||
INTEREST CHARGES |
Volume (1) |
Rate (2) |
Net Change | ||||||||
| (in millions of euros) | |||||||||||
| Expenses from hedging operations | 2,423 | — | 2,423 | ||||||||
| Domestic | 371 | — | 371 | ||||||||
| International - Mature markets | 354 | — | 354 | ||||||||
| International - Developing markets | 1,698 | — | 1,698 | ||||||||
| Other interest | 241 | — | 241 | ||||||||
| Domestic | 129 | — | 129 | ||||||||
| International - Mature markets | 77 | — | 77 | ||||||||
| International - Developing markets | 35 | — | 35 | ||||||||
| Total interest-bearing liabilities | 4,501 | 15,217 | 19,718 | ||||||||
| Domestic | 595 | 1,252 | 1,847 | ||||||||
| International - Mature markets | 687 | 3,625 | 4,312 | ||||||||
| International - Developing markets | 3,219 | 10,340 | 13,559 | ||||||||
879 | ||
| Cross-reference to Form 20-F | Consolidated directors' report | Consolidated financial statements | Supplemental information | |||||||||||||||||
Year ended 31 December, |
|||||||||||
| 2023 | 2022 | 2021 | |||||||||
| (in millions of euros, except percentages) | |||||||||||
| Average interest earning assets | 1,571,738 | 1,519,174 | 1,377,322 | ||||||||
| Domestic | 454,161 | 430,455 | 409,593 | ||||||||
| International - Mature markets | 722,538 | 735,656 | 664,161 | ||||||||
| International - Developing markets | 395,039 | 353,063 | 303,568 | ||||||||
| Interest and similar income | 105,252 | 71,430 | 46,463 | ||||||||
| Domestic | 17,686 | 7,799 | 5,912 | ||||||||
| International - Mature markets | 38,844 | 23,115 | 17,000 | ||||||||
| International - Developing markets | 48,722 | 40,516 | 23,551 | ||||||||
| Interest income / (charges) (A) | 43,261 | 38,619 | 33,370 | ||||||||
| Domestic | 5,429 | 3,533 | 3,493 | ||||||||
| International - Mature markets | 17,189 | 16,208 | 14,405 | ||||||||
| International - Developing markets | 20,643 | 18,878 | 15,472 | ||||||||
| Gross yield (B) | 6.70 | % | 4.70 | % | 3.37 | % | |||||
| Domestic | 3.89 | % | 1.81 | % | 1.44 | % | |||||
| International - Mature markets | 5.38 | % | 3.14 | % | 2.56 | % | |||||
| International - Developing markets | 12.33 | % | 11.48 | % | 7.76 | % | |||||
| Net yield (C) | 2.75 | % | 2.54 | % | 2.42 | % | |||||
| Domestic | 1.20 | % | 0.82 | % | 0.85 | % | |||||
| International - Mature markets | 2.38 | % | 2.20 | % | 2.17 | % | |||||
| International - Developing markets | 5.23 | % | 5.35 | % | 5.10 | % | |||||
| Yield spread (D) | 2.56 | % | 2.45 | % | 2.39 | % | |||||
| Domestic | 1.51 | % | 0.97 | % | 0.95 | % | |||||
| International - Mature markets | 2.03 | % | 2.08 | % | 2.11 | % | |||||
| International - Developing markets | 4.01 | % | 4.26 | % | 4.65 | % | |||||
Year ended 31 December, |
|||||||||||
| 2023 | 2022 | 2021 | |||||||||
| Cash balances at central banks and other deposits on demand, and loans and advances to central banks and credit institutions | 19.78 | % | 20.07 | % | 19.27 | % | |||||
| Domestic | 7.47 | % | 7.35 | % | 8.18 | % | |||||
| International - Mature markets | 7.93 | % | 9.16 | % | 7.96 | % | |||||
| International - Developing markets | 4.38 | % | 3.56 | % | 3.13 | % | |||||
| Loans and advances to customers | 65.95 | % | 67.88 | % | 68.47 | % | |||||
| Domestic | 16.88 | % | 17.96 | % | 18.46 | % | |||||
| International - Mature markets | 34.78 | % | 36.38 | % | 37.31 | % | |||||
| International - Developing markets | 14.29 | % | 13.54 | % | 12.70 | % | |||||
| Debt securities | 14.27 | % | 12.05 | % | 12.26 | % | |||||
| Domestic | 4.55 | % | 3.02 | % | 3.10 | % | |||||
| International - Mature markets | 3.27 | % | 2.89 | % | 2.95 | % | |||||
| International - Developing markets | 6.45 | % | 6.14 | % | 6.21 | % | |||||
880 | ||
| Year ended 31 December 2023 | |||||||||||||||||||||||||||||
| Maturing Within 1 Year |
Yield Within 1 Year | Maturing Between 1 and 5 Years | Yield 1 and 5 Years | Maturing Between 5 and 10 Years | Yield 5 and 10 Years | Maturing After 10 Years | Yield After 10 Years | Total | |||||||||||||||||||||
| Debt securities | (in millions of euros, except percentages) | ||||||||||||||||||||||||||||
| Domestic: | |||||||||||||||||||||||||||||
| Spanish Government | 1,497 | 1.69 | % | 5,129 | 1.42 | % | 18,387 | 2.52 | % | 4,708 | 3.26 | % | 29,721 | ||||||||||||||||
| Issued by financial institutions | 1,459 | 9.29% (**) | 44 | 0.68 | % | 14 | 0.88 | % | — | — | % | 1,517 | |||||||||||||||||
| Other fixed-income securities | 47 | 2.23 | % | 238 | 5.33 | % | 115 | 3.63 | % | 110 | 3.14 | % | 510 | ||||||||||||||||
| Total Domestic | 3,003 | 5,411 | 18,516 | 4,818 | 31,748 | ||||||||||||||||||||||||
| International: | |||||||||||||||||||||||||||||
| Mature | |||||||||||||||||||||||||||||
| Foreign government | 18,343 | 0.98 | % | 8,266 | 3.05 | % | 8,726 | 2.69 | % | 11,242 | 3.34 | % | 46,577 | ||||||||||||||||
| Issued by financial institutions | 1,067 | 2.61 | % | 4,333 | 3.83 | % | 1,259 | 3.08 | % | 16 | 2.48 | % | 6,675 | ||||||||||||||||
| Other fixed-income securities | 3,548 | 2.40 | % | 2,036 | 5.52 | % | 4,293 | 1.65 | % | 9,200 | 1.86 | % | 19,077 | ||||||||||||||||
| Total Mature | 22,958 | 14,635 | 14,278 | 20,458 | 72,329 | ||||||||||||||||||||||||
| Developing | |||||||||||||||||||||||||||||
| Foreign government | 19,053 | 7.21 | % | 32,608 | 7.14 | % | 4,396 | 4.68 | % | 2,448 | 6.88 | % | 58,505 | ||||||||||||||||
| Issued by financial institutions | 41 | 5.44 | % | 1,118 | 2.05 | % | 506 | 2.35 | % | 1 | 4.15 | % | 1,666 | ||||||||||||||||
| Other fixed-income securities | 3,845 | 10.88 | % | 7,290 | 10.78 | % | 1,631 | 12.05 | % | 110 | 10.02 | % | 12,876 | ||||||||||||||||
| Total Developing | 22,939 | 41,016 | 6,533 | 2,559 | 73,047 | ||||||||||||||||||||||||
| Total international | 45,897 | 55,651 | 20,811 | 23,017 | 145,376 | ||||||||||||||||||||||||
| Total debt securities | 48,900 | 61,062 | 39,327 | 27,835 | 177,124 | ||||||||||||||||||||||||
881 | ||
| Cross-reference to Form 20-F | Consolidated directors' report | Consolidated financial statements | Supplemental information | |||||||||||||||||
| Maturity | |||||||||||||||||||||||||||||||||||||||||||||||||||||||||||
| Less than one year |
One to five years |
Five to fifteen years | Over fifteen years |
Total | |||||||||||||||||||||||||||||||||||||||||||||||||||||||
| Balance | % of Total | Balance | % of Total | Balance | % of Total | Balance | % of Total | Balance | % of Total | ||||||||||||||||||||||||||||||||||||||||||||||||||
| (in millions of euros, except percentages) | |||||||||||||||||||||||||||||||||||||||||||||||||||||||||||
| Loans and advances to customers in Spain: (A) | |||||||||||||||||||||||||||||||||||||||||||||||||||||||||||
| Commercial credit | 14,124 | 4 | % | — | — | % | 70 | — | % | — | — | % | 14,194 | 1 | % | ||||||||||||||||||||||||||||||||||||||||||||
| Secured loans | 4,516 | 1 | % | 12,015 | 4 | % | 30,638 | 16 | % | 47,322 | 21 | % | 94,491 | 9 | % | ||||||||||||||||||||||||||||||||||||||||||||
| Reverse repurchase agreements | 762 | — | % | — | — | % | — | — | % | — | — | % | 762 | — | % | ||||||||||||||||||||||||||||||||||||||||||||
| Other term loans | 20,475 | 6 | % | 35,515 | 11 | % | 19,246 | 10 | % | 2,073 | 1 | % | 77,309 | 7 | % | ||||||||||||||||||||||||||||||||||||||||||||
| Finance leases | 469 | — | % | 2,872 | 1 | % | 1,095 | 1 | % | 9 | — | % | 4,445 | — | % | ||||||||||||||||||||||||||||||||||||||||||||
| Receivable on demand | 2,461 | 1 | % | 8 | — | % | 3 | — | % | — | — | % | 2,472 | — | % | ||||||||||||||||||||||||||||||||||||||||||||
| Credit cards receivables | 2,149 | 1 | % | 207 | — | % | 5 | — | % | — | — | % | 2,361 | — | % | ||||||||||||||||||||||||||||||||||||||||||||
| Impaired assets | 2,911 | 1 | % | 2,157 | 1 | % | 1,428 | 1 | % | 1,150 | 1 | % | 7,646 | 1 | % | ||||||||||||||||||||||||||||||||||||||||||||
| Total loans and advances to customers in Spain | 47,867 | 15 | % | 52,774 | 17 | % | 52,485 | 28 | % | 50,554 | 23 | % | 203,680 | 19 | % | ||||||||||||||||||||||||||||||||||||||||||||
| Loans and advances to customers outside Spain: (A) | |||||||||||||||||||||||||||||||||||||||||||||||||||||||||||
| Commercial credit | 39,530 | 12 | % | 1,850 | 1 | % | 54 | — | % | — | — | % | 41,434 | 4 | % | ||||||||||||||||||||||||||||||||||||||||||||
| Secured loans | 65,791 | 20 | % | 127,960 | 41 | % | 103,124 | 54 | % | 163,009 | 73 | % | 459,884 | 43 | % | ||||||||||||||||||||||||||||||||||||||||||||
| Reverse repurchase agreements | 38,187 | 12 | % | 1,733 | 1 | % | — | — | % | 3,502 | 2 | % | 43,422 | 4 | % | ||||||||||||||||||||||||||||||||||||||||||||
| Other term loans | 83,712 | 25 | % | 98,922 | 31 | % | 29,534 | 16 | % | 6,008 | 3 | % | 218,176 | 21 | % | ||||||||||||||||||||||||||||||||||||||||||||
| Finance leases | 11,861 | 4 | % | 21,738 | 7 | % | 670 | — | % | 9 | — | % | 34,278 | 3 | % | ||||||||||||||||||||||||||||||||||||||||||||
| Receivable on demand | 8,758 | 3 | % | 821 | — | % | 225 | — | % | 1 | — | % | 9,805 | 1 | % | ||||||||||||||||||||||||||||||||||||||||||||
| Credit cards receivables | 20,125 | 6 | % | 1,824 | 1 | % | 61 | — | % | — | — | % | 22,010 | 2 | % | ||||||||||||||||||||||||||||||||||||||||||||
| Impaired assets | 13,914 | 4 | % | 7,107 | 2 | % | 4,181 | 2 | % | 1,246 | 1 | % | 26,448 | 2 | % | ||||||||||||||||||||||||||||||||||||||||||||
| Total loans and advances to customers outside Spain | 281,878 | 85 | % | 261,955 | 83 | % | 137,849 | 72 | % | 173,775 | 77 | % | 855,457 | 81 | % | ||||||||||||||||||||||||||||||||||||||||||||
| Total loans and advances to customers, gross | 329,745 | 100 | % | 314,729 | 100 | % | 190,334 | 100 | % | 224,329 | 100 | % | 1,059,137 | 100 | % | ||||||||||||||||||||||||||||||||||||||||||||
882 | ||
| Fixed and variable rate loans having a maturity of more than one year |
||||||||||||||||||||
| Domestic | International | Total | ||||||||||||||||||
| (in millions of euros) | ||||||||||||||||||||
| Fixed rate | ||||||||||||||||||||
| Commercial credit | 70 | 496 | 566 | |||||||||||||||||
| Secured loans | 30,915 | 276,993 | 307,908 | |||||||||||||||||
| Reverse repurchase agreements | — | 2,323 | 2,323 | |||||||||||||||||
| Other term loans | 42,932 | 68,490 | 111,422 | |||||||||||||||||
| Finance leases | 2,234 | 17,528 | 19,762 | |||||||||||||||||
| Receivable on demand | 9 | 933 | 942 | |||||||||||||||||
| Credit cards receivables | 212 | 1,818 | 2,030 | |||||||||||||||||
| Impaired assets | 1,791 | 7,758 | 9,549 | |||||||||||||||||
| Total Fixed rate | 78,163 | 376,339 | 454,502 | |||||||||||||||||
| Variable rate | ||||||||||||||||||||
| Commercial credit | — | 1,408 | 1,408 | |||||||||||||||||
| Secured loans | 59,060 | 117,100 | 176,160 | |||||||||||||||||
| Reverse repurchase agreements | — | 2,912 | 2,912 | |||||||||||||||||
| Other term loans | 13,902 | 65,974 | 79,876 | |||||||||||||||||
| Finance leases | 1,742 | 4,889 | 6,631 | |||||||||||||||||
| Receivable on demand | 2 | 114 | 116 | |||||||||||||||||
| Credit cards receivables | — | 67 | 67 | |||||||||||||||||
| Impaired assets | 2,944 | 4,776 | 7,720 | |||||||||||||||||
| Total Variable rate | 77,650 | 197,240 | 274,890 | |||||||||||||||||
| Total | 155,813 | 573,579 | 729,392 | |||||||||||||||||
883 | ||
| Cross-reference to Form 20-F | Consolidated directors' report | Consolidated financial statements | Supplemental information | |||||||||||||||||
| 31 December | |||||||||||||||||
| 2023 | 2022 | 2021 | |||||||||||||||
| (in millions of euros, except percentages) | |||||||||||||||||
| Impairment losses to total loans outstanding | 2.15 | % | 2.14 | % | 2.31 | % | |||||||||||
| Allowances for credit losses | 22,788 | 22,684 | 22,964 | ||||||||||||||
| Total loans outstanding | 1,059,137 | 1,058,688 | 995,646 | ||||||||||||||
| Net Charge-offs during the period to average loans outstanding: | |||||||||||||||||
| Commercial credit | 0.28 | % | 0.38 | % | 0.23 | % | |||||||||||
| Net Charge-off during the period | 141 | 197 | 89 | ||||||||||||||
| Average loans outstanding | 49,673 | 51,535 | 39,513 | ||||||||||||||
| Secured loans | 0.63 | % | 0.85 | % | 0.69 | % | |||||||||||
| Net Charge-off during the period | 3,652 | 4,990 | 3,702 | ||||||||||||||
| Average loans outstanding | 582,007 | 583,899 | 538,935 | ||||||||||||||
| Reverse repurchase agreements | n/a | n/a | n/a | ||||||||||||||
| Net Charge-off during the period | n/a | n/a | n/a | ||||||||||||||
| Average loans outstanding | 46,382 | 43,505 | 36,660 | ||||||||||||||
| Other term loans | 2.21 | % | 1.43 | % | 1.06 | % | |||||||||||
| Net Charge-off during the period | 6,730 | 4,308 | 3,020 | ||||||||||||||
| Average loans outstanding | 304,776 | 301,252 | 284,235 | ||||||||||||||
| Finance leases | 0.11 | % | 0.31 | % | 0.10 | % | |||||||||||
| Net Charge-off during the period | 44 | 125 | 37 | ||||||||||||||
| Average loans outstanding | 38,764 | 39,829 | 38,348 | ||||||||||||||
| Receivable on demand | 1.49 | % | 1.73 | % | 0.36 | % | |||||||||||
| Net Charge-off during the period | 196 | 207 | 35 | ||||||||||||||
| Average loans outstanding | 13,132 | 11,964 | 9,640 | ||||||||||||||
| Credit cards receivables | 6.01 | % | 4.12 | % | 4.25 | % | |||||||||||
| Net Charge-off during the period | 1,492 | 949 | 823 | ||||||||||||||
| Average loans outstanding | 24,832 | 23,039 | 19,360 | ||||||||||||||
| Total Loans | 1.16 | % | 1.02 | % | 0.80 | % | |||||||||||
| Net Charge-off during the period | 12,255 | 10,776 | 7,706 | ||||||||||||||
| Average loans outstanding | 1,059,566 | 1,055,023 | 966,690 | ||||||||||||||
884 | ||
| At 31 December, | |||||||||||||||||
| 2023 | 2022 | 2021 | |||||||||||||||
| (in millions of euros, except percentages) | |||||||||||||||||
| Computable credit risk (A) | 1,133,898 | 1,124,121 | 1,051,115 | ||||||||||||||
| Credit impaired balances | 35,620 | 34,673 | 33,234 | ||||||||||||||
| Allowances for credit impaired balances | 23,490 | 23,418 | 23,698 | ||||||||||||||
| Net loans and contingent liabilities charged-off | 12,255 | 10,776 | 7,706 | ||||||||||||||
| Ratios: | |||||||||||||||||
| NPL ratio (B) | 3.14 | % | 3.08 | % | 3.16 | % | |||||||||||
| Coverage ratio (C) | 66 | % | 68 | % | 71 | % | |||||||||||
| Net loan and contingent liabilities charged-off to computable credit risk | 1.08 | % | 0.96 | % | 0.73 | % | |||||||||||
885 | ||
| Cross-reference to Form 20-F | Consolidated directors' report | Consolidated financial statements | Supplemental information | |||||||||||||||||
| 31 December 2023 | 31 December 2022 | 31 December 2021 | |||||||||
| (in millions of euros) | |||||||||||
| Insured deposits | 502,461 | 485,288 | 470,571 | ||||||||
| Uninsured deposits | 465,886 | 461,043 | 393,626 | ||||||||
| Total deposits | 968,347 | 946,331 | 864,197 | ||||||||
| 31 December 2023 | |||||
| Time deposits | (in millions of euros) | ||||
| Insured time deposits | 98,569 | ||||
| Uninsured time deposits | 208,516 | ||||
| Excess over guaranteed limit | 120,402 | ||||
| Otherwise uninsured | 88,113 | ||||
| Total time deposits | 307,085 | ||||
| 31 December 2023 | |||||||||||||||||
| Domestic | International | Total | |||||||||||||||
| (in millions of euros) | |||||||||||||||||
| Under 3 months | 37,516 | 79,362 | 116,878 | ||||||||||||||
| 3 to 6 months | 10,504 | 13,929 | 24,433 | ||||||||||||||
| 6 to 12 months | 6,656 | 23,109 | 29,765 | ||||||||||||||
| Over 12 months | 11,569 | 25,871 | 37,440 | ||||||||||||||
| Total | 66,245 | 142,271 | 208,516 | ||||||||||||||
886 | ||
| Country | Guarantee fund | Definition | ||||||
| Spain | Fondo de Garantía de Depósitos (FGD) | The FGD guarantees deposits in cash and securities or other financial instruments held by credit institutions, up to the limit of EUR 100,000 for cash deposits or, in the case of deposits in other currencies, the equivalent sum at the applicable exchange rates. The FGD also guarantees the following deposits, irrespective of their amount, for three months from the moment the funds have been credited or these deposits have become legally transferable: (1) deposits from real estate transactions involving private residential properties; (2) deposits deriving from payments received by the depositor on a one-off basis in connection with marriage, divorce, retirement, dismissal, disability or death; and (3) deposits concerning insurance payments or indemnity payments for damages as a result of a criminal act or judicial error. | ||||||
| UK | The Financial Services Compensation Scheme (FSCS) | The Financial Services Compensation Scheme (FSCS) protects UK authorised banks, building societies and credit unions up to £85,000 per depositor in the event of their insolvency. If deposits or savings are in a joint account the total of FSCS protection doubles to £170,000. The FSCS is fully funded by the financial services industry. Firms authorized by the FCA and the PRA pay an annual levy which is calculated based on the size of the firm. | ||||||
| Portugal | Fundo de Garantia de Depósitos | The Fundo de Garantía de Depósitos guarantees the reimbursement of the total value of the cash balances of each depositor, per participating credit institution, up to a limit of EUR 100,000. However, the following deposits will be fully guaranteed and, as such, potentially beyond the EUR 100,000 limit, for a period of one year from the date the amount has been credited to the relevant deposit account: deposits related to private urban residential real estate transactions; deposits with social purposes; and deposits resulting from insurance payments or compensation for damages. |
||||||
| Germany | Einlagensicherungsfonds | In the event of bank insolvency, legal deposit protection guarantees sums of up to EUR 100,000 per customer. Guaranteed deposits include basically demand, time and savings deposits and registered savings bonds. The liabilities of bearer and order bonds are not guaranteed. The Deposit Protection Fund protects deposits regardless of the currency in which they are held. However, the deposit protection fund has the right to make compensation in euros. | ||||||
| Poland | Bankowy Fundusz Gwarancyjny (BFG) |
The deposit guarantee system covers accumulated funds: (1) in all domestic banks, i.e., with registered office in the territory of the Republic of Poland, (2) in cooperative credit unions, and (3) in branches of foreign banks (i.e., branches of banks with their head office abroad, in the territory of a non-EU country) to the extent that the deposit guarantee system of that country fails to provide guarantees at least in the amount provided by the BFG.
The level of coverage in all the countries of the European Union since 31 December 2010, is EUR 100,000 (or its equivalent in national currency).
|
||||||
| US | Federal Deposit Insurance Corporation (FDIC) | The standard insurance amount is US$250,000 per depositor, per insured bank, for each account ownership category. A deposit account opened in an FDIC-insured bank is automatically covered. | ||||||
| Mexico | Instituto para la Protección al Ahorro Bancario (IPAB) | The IPAB is the federal institution (decentralized of the Ministry of Finance and Public Credit of Mexico) responsible for protecting depositors. Deposit insurance coverage is limited to a maximum of 400,000 UDIs ('Unidades de Inversión’, which are inflation indexed currency units) per bank and depositor. The IPAB guarantees, among others, funds deposited in savings accounts, time deposits such as certificates of deposit and deposits associated to debit cards. |
||||||
| Brazil | Fundo Garantidor de Créditos (FGC) | The FGC protects depositors and investors within the scope of the National Financial System, up to the limits established by the regulations. The maximum amount of guarantee per person against the same member institution, or against all member institutions of the same financial corporation, will be of R$ 250,000.00. The following credits are duly covered by the ordinary guarantee granted by the FGC: (1) demand deposits or deposits drawable upon prior notice; (2) savings deposits; (3) time deposits with or without the issuance of certificate; (4) deposits kept in accounts other than checking accounts used for registration and control of the flow of funds relative to the payment of salaries, compensation, retirement benefits, pension and the like; (5) bills of exchange; (6) real estate notes; (7) mortgage notes; (8) real estate credit notes; (9) agribusiness credit notes; and (10) repurchase agreements that have as object securities issued by an affiliated company after 8 March 2012. | ||||||
887 | ||
| Cross-reference to Form 20-F | Consolidated directors' report | Consolidated financial statements | Supplemental information | |||||||||||||||||
| Chile | Comisión para el Mercado Financiero (CMF)- Ley General de Bancos | The ‘Ley General de Bancos’ protects depositors according to certain limits defined by articles 144 to 153 in paragraph 3 of title XV. The guarantee covers individually a maximum of 200 UFs ('Unidades de Fomento’, which are inflation indexed currency units) per credit institution and calendar year; and the maximum of the guarantee of all the obligations that the banking system has with the same individual will be of 400 UFs per calendar year. Exceptions: (i) the guarantee does not cover term deposits, savings accounts balances and notes where the depositor is an institution (including profit and non-profit institutions); and (ii) the guarantee covers 100% of demand deposits (both for institutions and individuals) in the event of forced liquidation of a bank . |
||||||
| Argentina | Sistema de Seguros de Depósitos | The Deposit Insurance System guarantees up to AR$ 6,000,000 per person, account and deposit. In the accounts in name of two or more persons, the guarantee shall not exceed the limit of AR$ 6,000,000, regardless the number of depositors; this amount will be proportionally distributed among the depositors. The following deposits, in AR$ and foreign currency, are covered by the system: check accounts, current accounts opened in cooperative credit institutions, savings accounts, fixed term deposits, payroll/social security and special accounts and term investments. |
||||||
888 | ||
889 | ||
| Cross-reference to Form 20-F | Consolidated directors' report | Consolidated financial statements | Supplemental information | |||||||||||||||||
| Contractual obligations | |||||||||||||||||||||||||||||
| (in millions of euros) | Less than 1 year |
More than 1 year but less than 3 years |
More than 3 year but less than 5 years |
More than 5 years |
Total | ||||||||||||||||||||||||
| Deposits from central banks and credit institutions (A) | 81,285 | 30,280 | 10,544 | 7,919 | — | 130,028 | |||||||||||||||||||||||
| Customer deposits (A) | 944,627 | 31,052 | 11,617 | 7,984 | — | 995,280 | |||||||||||||||||||||||
| Marketable debt securities (A) | 91,811 | 92,554 | 57,639 | 61,204 | — | 303,208 | |||||||||||||||||||||||
| Liabilities under insurance contracts (B) | 2,321 | 3,738 | 4,444 | 7,296 | — | 17,799 | |||||||||||||||||||||||
| Lease obligations | 586 | 918 | 480 | 416 | — | 2,400 | |||||||||||||||||||||||
| Other long-term liabilities (C) | 1,647 | 2,978 | 2,892 | 7,007 | — | 14,524 | |||||||||||||||||||||||
| Contractual interest payment (D) | 19,720 | 13,459 | 13,974 | 33,916 | — | 81,069 | |||||||||||||||||||||||
| Total | 1,141,997 | 174,979 | 101,590 | 125,742 | 1,544,308 | ||||||||||||||||||||||||
890 | ||
Number of employees (A) |
|||||||||||||||||
| 31 December 2023 | 31 December 2022 | 31 December 2021 | |||||||||||||||
| Spain | 35,266 | 34,153 | 32,800 | ||||||||||||||
| United Kingdom | 24,221 | 22,905 | 20,992 | ||||||||||||||
| Rest of Europe | 29,395 | 28,668 | 27,834 | ||||||||||||||
| Brazil | 57,868 | 55,653 | 52,573 | ||||||||||||||
| Rest of Latin America | 52,672 | 50,405 | 49,262 | ||||||||||||||
| US | 12,579 | 13,971 | 15,096 | ||||||||||||||
| Canada | 239 | 230 | 212 | ||||||||||||||
| Asia | 499 | 451 | 382 | ||||||||||||||
| Other | 25 | 26 | 26 | ||||||||||||||
| TOTAL | 212,764 | 206,462 | 199,177 | ||||||||||||||
891 | ||
| Cross-reference to Form 20-F | Consolidated directors' report | Consolidated financial statements | Supplemental information | |||||||||||||||||
892 | ||
893 | ||
| Cross-reference to Form 20-F | Consolidated directors' report | Consolidated financial statements | Supplemental information | |||||||||||||||||
894 | ||
895 | ||
| Cross-reference to Form 20-F | Consolidated directors' report | Consolidated financial statements | Supplemental information | |||||||||||||||||
896 | ||
897 | ||
| Cross-reference to Form 20-F | Consolidated directors' report | Consolidated financial statements | Supplemental information | |||||||||||||||||
898 | ||
899 | ||
| Cross-reference to Form 20-F | Consolidated directors' report | Consolidated financial statements | Supplemental information | |||||||||||||||||
900 | ||
901 | ||
| Cross-reference to Form 20-F | Consolidated directors' report | Consolidated financial statements | Supplemental information | |||||||||||||||||
902 | ||
903 | ||
| Cross-reference to Form 20-F | Consolidated directors' report | Consolidated financial statements | Supplemental information | |||||||||||||||||
904 | ||
905 | ||
| Cross-reference to Form 20-F | Consolidated directors' report | Consolidated financial statements | Supplemental information | |||||||||||||||||
906 | ||
907 | ||
| Cross-reference to Form 20-F | Consolidated directors' report | Consolidated financial statements | Supplemental information | |||||||||||||||||
908 | ||
909 | ||
| Cross-reference to Form 20-F | Consolidated directors' report | Consolidated financial statements | Supplemental information | |||||||||||||||||
910 | ||
911 | ||
| Cross-reference to Form 20-F | Consolidated directors' report | Consolidated financial statements | Supplemental information | |||||||||||||||||
912 | ||
913 | ||
| Cross-reference to Form 20-F | Consolidated directors' report | Consolidated financial statements | Supplemental information | |||||||||||||||||
| Euro per Share | Dollars per ADS | ||||||||||||||||||||||||||||||||||||||||||||||||||||||||||
| First | Second | Third | Fourth | Total | First | Second | Third | Fourth | Total | ||||||||||||||||||||||||||||||||||||||||||||||||||
| 2019(A) | 0.096 | 0.096 | n.a. | n.a. | 0.19 | 0.106 | 0.115 | n.a. | n.a. | 0.22 | |||||||||||||||||||||||||||||||||||||||||||||||||
| 2020(A) | 0.0275 | n.a. | n.a. | n.a. | 0.0275 | 0.034 | n.a. | n.a. | n.a. | 0.034 | |||||||||||||||||||||||||||||||||||||||||||||||||
| 2021(A) | 0.0485 | 0.0515 | n.a. | n.a. | 0.10 | 0.0561 | 0.0541 | n.a. | n.a. | 0.1102 | |||||||||||||||||||||||||||||||||||||||||||||||||
| 2022(A) | 0.0583 | 0.0595 | n.a. | n.a. | 0.1178 | 0.0575 | 0.0651 | n.a. | n.a. | 0.1227 | |||||||||||||||||||||||||||||||||||||||||||||||||
| 2023(A) | 0.0810 | 0.0950 | n.a. | n.a. | 0.1760 | 0.0858 | 0.1024 | n.a. | n.a. | 0.1882 | |||||||||||||||||||||||||||||||||||||||||||||||||
914 | ||
| Service | Rate | By Whom Paid | ||||||
| (1) Issuance of ADSs (e.g., an issuance upon a deposit of Shares, upon a change in the ADS(s)-to-Share(s) ratio, or for any other reason), excluding issuances as a result of distributions described in paragraph (4) below. | Up to USD 5.00 per 100 ADSs (or fraction thereof) issued. | Person for whom ADSs are issued. | ||||||
| (2) Cancellation of ADSs (e.g., a cancellation of ADSs for Delivery of deposited Shares, upon a change in the ADS(s)-to-Share(s) ratio, or for any other reason). | Up to USD 5.00 per 100 ADSs (or fraction thereof) cancelled. | Person for whom ADSs are being cancelled. | ||||||
| (3) Distribution of cash dividends or other cash distributions (e.g., upon a sale of rights and other entitlements). | Up to USD 5.00 per 100 ADSs (or fraction thereof) held. | Person to whom the distribution is made. | ||||||
| (4) Distribution of ADSs pursuant to (i) stock dividends or other free stock distributions, or (ii) an exercise of rights to purchase additional ADSs. | Up to USD 5.00 per 100 ADSs (or fraction thereof) held. | Person to whom the distribution is made. | ||||||
| (5) Distribution of securities other than ADSs or rights to purchase additional ADSs (e.g., spin-off shares). | Up to USD 5.00 per 100 ADSs (or fraction thereof) held. | Person to whom the distribution is made. | ||||||
| (6) ADS Services. | Up to USD 5.00 per 100 ADSs (or fraction thereof) held on the applicable record date(s) established by the Depositary. | Person holding ADSs on the applicable record date(s) established by the Depositary. | ||||||
| (7) Registration of ADS Transfers (e.g., upon a registration of the transfer of registered ownership of ADSs, upon a transfer of ADSs into DTC and vice versa, or for any other reason). | Up to USD 5.00 per 100 ADSs (or fraction thereof) transferred. | Person for whom or to whom ADSs are transferred. | ||||||
| (8) Conversion of ADSs of one series for ADSs of another series (e.g., upon conversion of Partial Entitlement ADSs for Full Entitlement ADSs, or upon conversion of Restricted ADSs into freely transferable ADSs, and vice versa). | Up to USD 5.00 per 100 ADSs (or fraction thereof) converted. | Person for whom ADSs are converted or to whom the converted ADSs are delivered. | ||||||
915 | ||
| Cross-reference to Form 20-F | Consolidated directors' report | Consolidated financial statements | Supplemental information | |||||||||||||||||
| 2023 | Total number of shares -or units purchased (A) |
Average price paid per share (or unit) in euros |
Total number of shares (or units) purchased as part of publicly announced plans or programs (B) |
Euro value of the maximum number of shares (or units) that may yet be purchased under the plans or programs (B) |
||||||||||||||||||||||
| January | 127,007,944 | 3.04 | 105,966,627 | 43,284,247 | ||||||||||||||||||||||
| February | 37,475,283 | 3.35 | 13,497,139 | 921,000,000 | ||||||||||||||||||||||
| March | 214,435,120 | 3.36 | 185,500,000 | 295,187,184 | ||||||||||||||||||||||
| April | 108,615,021 | 3.39 | 84,348,953 | — | ||||||||||||||||||||||
| May | 13,992,359 | 3.14 | ||||||||||||||||||||||||
| June | 25,280,221 | 3.10 | ||||||||||||||||||||||||
| July | 6,370,711 | 3.50 | ||||||||||||||||||||||||
| August | 10,641,739 | 3.58 | ||||||||||||||||||||||||
| September | 33,158,258 | 3.46 | 1,310,000,000 | |||||||||||||||||||||||
| October | 168,050,717 | 3.54 | 158,278,640 | 749,908,102 | ||||||||||||||||||||||
| November | 58,999,110 | 3.48 | 49,179,885 | 575,037,161 | ||||||||||||||||||||||
| December | 107,267,194 | 3.83 | 79,383,791 | 271,052,800 | ||||||||||||||||||||||
| Total | 911,293,677 | 676,155,035 | ||||||||||||||||||||||||
916 | ||
917 | ||
| Cross-reference to Form 20-F | Consolidated directors' report | Consolidated financial statements | Supplemental information | |||||||||||||||||
918 | ||
919 | ||
| Cross-reference to Form 20-F | Consolidated directors' report | Consolidated financial statements | Supplemental information | |||||||||||||||||
920 | ||
921 | ||
| Cross-reference to Form 20-F | Consolidated directors' report | Consolidated financial statements | Supplemental information | |||||||||||||||||
922 | ||
923 | ||
| Cross-reference to Form 20-F | Consolidated directors' report | Consolidated financial statements | Supplemental information | |||||||||||||||||
924 | ||
925 | ||
| Cross-reference to Form 20-F | Consolidated directors' report | Consolidated financial statements | Supplemental information | |||||||||||||||||
926 | ||
| Shares | Options on Banco Santander shares | |||||||||||||||||||||||||
| Directors | Direct Stake | Indirect Stake | Represented Stake | Total shares | % of Capital Stock | Direct | Indirect | |||||||||||||||||||
| Ana Botín-Sanz de Sautuola y O´Shea | 1,893,028 | 31,161,724 | 33,054,752 | 0.209 | % | 903,995 | 1,337,614 | |||||||||||||||||||
| Héctor Grisi | 1,938,074 | 1,938,074 | 0.012 | % | 123,990 | |||||||||||||||||||||
| Glenn Hutchins | 524,027 | 524,027 | 0.003 | % | ||||||||||||||||||||||
| José Antonio Álvarez Álvarez | 2,617,170 | 2,617,170 | 0.017 | % | 610,123 | |||||||||||||||||||||
| Homaira Akbari | 67,826 | 100,913 | 168,739 | 0.001 | % | |||||||||||||||||||||
| Javier Botín-Sanz de Sautuola y O´Shea | 5,502,083 | 25,598,851 | 156,958,921 (A) |
188,059,855 | 1.188 | % | ||||||||||||||||||||
| Bruce Carnegie-Brown | 59,940 | 59,940 | 0.000 | % | ||||||||||||||||||||||
| Sol Daurella Comadrán | 149,483 | 476,837 | 626,320 | 0.004 | % | |||||||||||||||||||||
| Henrique de Castro | 2,982 | 2,982 | 0.000 | % | ||||||||||||||||||||||
| Germán de la Fuente | 10,000 | 10,000 | 0.000 | % | ||||||||||||||||||||||
| Gina Díez Barroso | 27,000 | 27,000 | 0.000 | % | ||||||||||||||||||||||
| Luis Isasi Fernández de Bobadilla | 45,000 | 45,000 | 0.000 | % | ||||||||||||||||||||||
| Ramiro Mato García-Ansorena | 506,860 | 506,860 | 0.003 | % | ||||||||||||||||||||||
| Belén Romana García | 208 | 4 | 212 | 0.000 | % | |||||||||||||||||||||
| Pamela Ann Walkden | 82,608 | 82,608 | 0.001 | % | ||||||||||||||||||||||
| TOTAL | 13,426,289 | 57,338,329 | 156,958,921 | 194,668,787 | 1.230 | % | 1,638,108 | 1,337,614 | ||||||||||||||||||
| Shares | Options on Banco Santander shares | ||||||||||||||||||||||
| Senior Managers | Direct Stake | Indirect Stake (A) |
Total shares | % of Capital Stock | Direct | Indirect | |||||||||||||||||
| Daniel Barriuso | 59,346 | 59,346 | 0.000 | % | 96,585 | ||||||||||||||||||
| Alexandra Brandao | 124,342 | 124,342 | 0.001 | % | 117,656 | ||||||||||||||||||
| Juan Manuel Cendoya | 1,227,027 | 3 | 1,227,030 | 0.008 | % | ||||||||||||||||||
José Doncel |
932,116 | 1,825 | 933,941 | 0.006 | % | ||||||||||||||||||
| Mahesh Aditya | 75,340 | 75,340 | 0.000 | % | |||||||||||||||||||
| José Antonio García Cantera | 2,330,724 | 2 | 2,330,726 | 0.015 | % | ||||||||||||||||||
| Juan Guitard | 1,716,391 | 1,716,391 | 0.011 | % | |||||||||||||||||||
| José María Linares | 594,258 | 594,258 | 0.004 | % | 564,099 | ||||||||||||||||||
| Mónica López-Monís | 434,417 | 818 | 435,235 | 0.003 | % | ||||||||||||||||||
| Dirk Marzluf | 1,321,765 | 1,321,765 | 0.008 | % | 572,725 | ||||||||||||||||||
| Víctor Matarranz | 810,706 | 9 | 810,715 | 0.005 | % | 111,111 | |||||||||||||||||
| José Luis de Mora | 737,635 | 737,635 | 0.005 | % | 202,534 | ||||||||||||||||||
| Jaime Pérez Renovales | 830,367 | 17,380 | 847,747 | 0.005 | % | ||||||||||||||||||
| Marjolein van Hellemondt-Gerdingh | 249,006 | 249,006 | 0.002 | % | 95,349 | ||||||||||||||||||
| TOTAL | 11,443,440 | 20,037 | 11,463,477 | 0.072 | % | 1,760,059 | |||||||||||||||||
927 | ||
| Cross-reference to Form 20-F | Consolidated directors' report | Consolidated financial statements | Supplemental information | |||||||||||||||||
928 | ||
929 | ||
| Cross-reference to Form 20-F | Consolidated directors' report | Consolidated financial statements | Supplemental information | |||||||||||||||||
930 | ||
931 | ||
| Cross-reference to Form 20-F | Consolidated directors' report | Consolidated financial statements | Supplemental information | |||||||||||||||||
932 | ||
Exhibit Number |
Description |
|||||||
| 1.1 | ||||||||
| 2.1 |
|
|||||||
| 2.2 |
|
|||||||
| 8.1 | List of Subsidiaries (incorporated as Appendices I, II and III of our Financial Statements filed with this Form 20-F). |
|||||||
| 12.1 | ||||||||
| 12.2 | ||||||||
| 12.3 | ||||||||
| 13.1 | ||||||||
| 15.1 | ||||||||
| 97.1 | ||||||||
101.SCH |
Inline XBRL Taxonomy Extension Schema Document |
|||||||
101.CAL |
Inline XBRL Taxonomy Extension Calculation Linkbase Document |
|||||||
101.LAB |
Inline XBRL Taxonomy Extension Label Linkbase Document |
|||||||
101.PRE |
Inline XBRL Taxonomy Extension Presentation Linkbase Document |
|||||||
101.DEF |
Inline XBRL Taxonomy Extension Definition Linkbase Document |
|||||||
933 | ||
| BANCO SANTANDER, S.A. | |||||||||||
| By: | /s/ José G. Cantera | ||||||||||
| Name: | José G. Cantera | ||||||||||
| Title: | Chief Financial Officer |
||||||||||
934 | ||
| /s/ Héctor Grisi | ||||||||
| Name: | Héctor Grisi | |||||||
| Title: | Chief Executive Officer | |||||||
| /s/ José G. Cantera | ||||||||
| Name: | José G. Cantera | |||||||
| Title: | Chief Financial Officer | |||||||
| /s/ José Doncel | ||||||||
| Name: | José Doncel | |||||||
| Title: | Chief Accounting Officer | |||||||


 2023 Annual report
