Document
Letter to
Q3 2024 | November 6, 2024
Third Quarter 2024 Financial Highlights
|
|
|
|
|
|
|
|
|
|
|
|
|
|
|
|
|
|
| • |
|
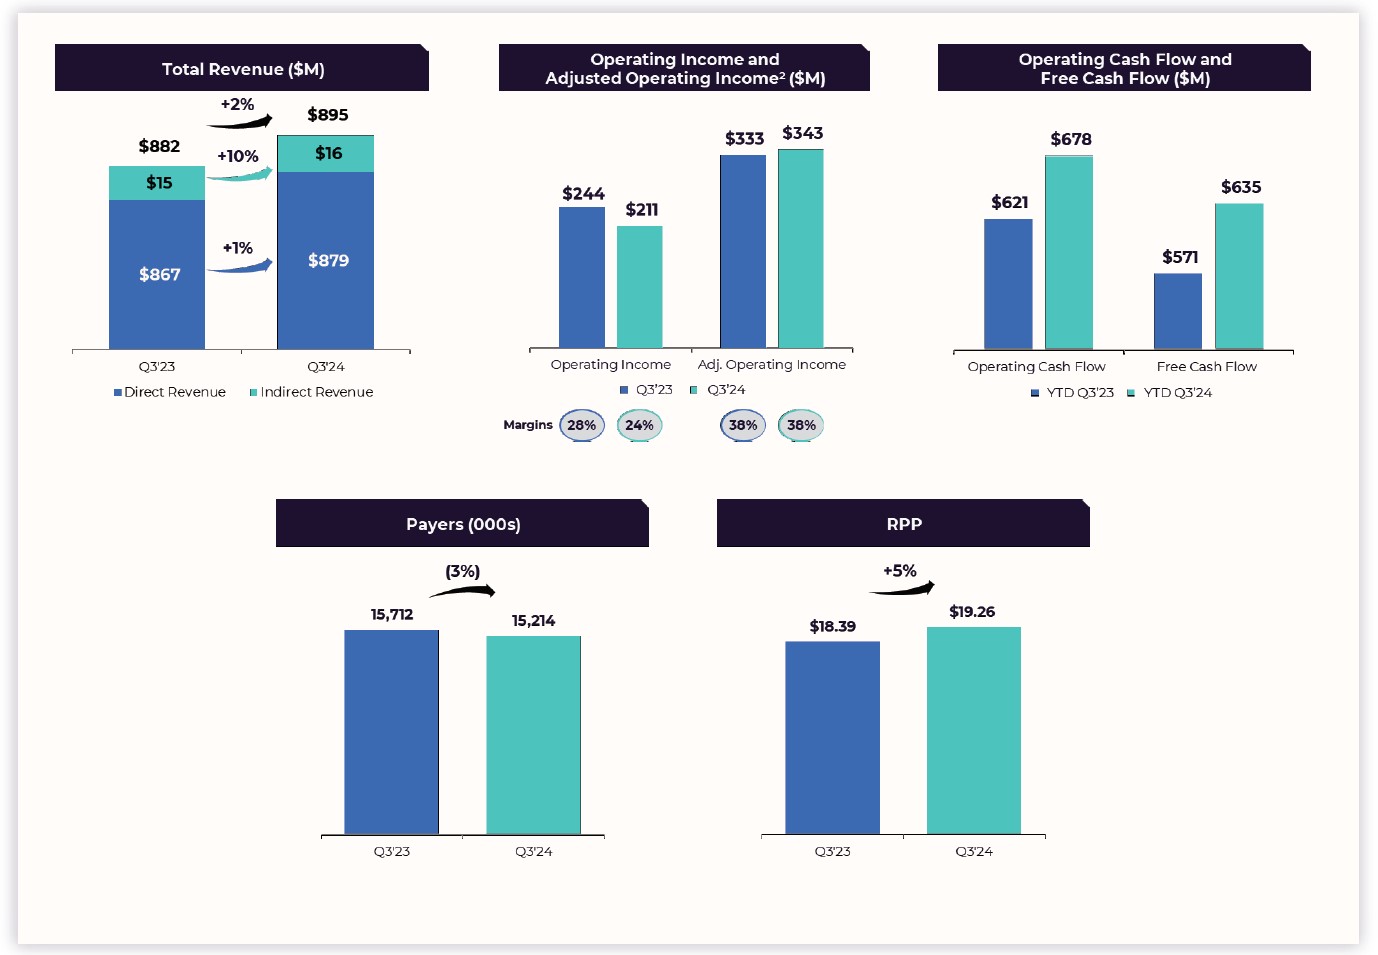
Total Revenue grew 2% over the prior year quarter to $895 million. On a foreign exchange (“FX”) neutral (“FXN”) basis, Total Revenue was up 3% over the prior year quarter to $907 million. |
• |
|
Adjusted Operating Income was $343 million, an increase of 3% over the prior year quarter, representing an Adjusted Operating Income Margin of 38%. |
|
|
|
|
|
|
|
|
|
|
|
|
|
|
|
|
|
|
|
|
|
|
• |
|
Repurchased1 $241 million of our stock in the quarter, 7.1 million shares at an average price of $34 per share. |
| • |
|
Payers declined 3% to 15.2 million over the prior year quarter. |
|
|
|
|
|
|
|
|
|
|
|
|
|
|
| • |
|
RPP increased 5% over the prior year quarter to $19.26. |
• |
|
Operating Cash Flow and Free Cash Flow were $678 million and $635 million, respectively, year-to-date (“YTD”) as of September 30, 2024. We have deployed approximately 100% of our free cash flow year-to-date for share repurchases. |
|
|
|
|
|
|
|
|
|
|
|
| • |
|
Operating income was $211 million, a decrease of 14% from the prior year quarter, representing an operating margin of 24%, impacted by $37 million of impairments of intangibles and other charges related to our exit from Hakuna and other of our live streaming services. |
|
|
|
|
|
|
|
|
|
|
|
|
|
|
|
|
|
|
|
|
|
|
|
|
|
|
|
|
|
|
|
|
1,2
1 On a trade date basis.
2 Operating Income in Q3’24 includes $37 million of impairments of intangible assets and other charges related to the shutdown of Hakuna and other of our live streaming services.
Dear Shareholders,
Match Group delivered Total Revenue consistent with our outlook and Adjusted Operating Income (“AOI”) that exceeded our expectations in the third quarter.
In Q3, Tinder Payer trends improved on a year-over-year basis (“Y/Y”), declining 4% Y/Y versus down 8% Y/Y in Q2, and on a sequential basis, with 311,000 sequential Payer additions. Tinder Direct Revenue was slightly below our expectations, driven by modestly lower RPP. Tinder monthly active users (“MAU”) remained down 9% Y/Y and we opted to delay à la carte (“ALC”) initiatives for further iteration as they were impacting subscription revenue more than we had anticipated, which we expect will have some downstream impacts in Q4.
We remain encouraged by Tinder’s progress on product initiatives to transform the brand. We expect to see tangible markers of improvement as Tinder’s new features roll out over the coming quarters.
Hinge Direct Revenue grew 36% Y/Y and reached an all-time high in downloads in the quarter. It was the second most downloaded3 dating app in aggregate across its English-speaking and European expansion markets, where it widened its lead over its next largest competitor throughout the quarter. In October, Hinge leap-frogged to become the second most downloaded dating app in the U.S. for the first time ever, took the number one spot in France, and further strengthened its number one position in several other markets.
At Match Group Asia (“MG Asia”), live video chat app Azar has solid momentum in Europe, and U.S. expansion is underway. In the Japanese dating market, we’re seeing signs of stabilization in user trends. At Evergreen and Emerging (“E&E”), consolidation efforts are progressing as planned, with BLK and Chispa fully migrated to the shared platform in the quarter, and the Emerging brands continue to grow and present opportunities for further expansion.
Throughout 2024, we’ve taken meaningful steps to put the portfolio on better financial footing, including exiting Hakuna and other of our live streaming services, and making progress on our consolidation efforts at E&E. These actions are helping to drive improved margins and cash flow. We’re focused on appropriately managing the differing growth stages of our brands, leveraging the strength of our category-leading portfolio, and driving efficiencies. Simultaneously, we remain committed to our innovation efforts, including AI-driven initiatives, which we believe will improve the user experience, accelerate growth at our existing brands, and may support the launch of exciting new brands as well.
We look forward to sharing more on our long-term plans, product roadmaps, and strategies to drive shareholder value at our Investor Day on December 11, 2024.
|
|
|
|
|
|
|
|
| Bernard Kim (“BK”) |
Gary Swidler |
| Chief Executive Officer |
President &
Chief Financial Officer |
3 Source: Sensor Tower. Combined downloads across Apple App Store and Google Play Store. Among all dating apps, as defined by Match Group.
Q3 2024 Business Unit Financial Results
Beginning this quarter, we will present our business units as four operating segments: Tinder®, Hinge®, MG Asia, and E&E. Providing greater detail about these business units offers better insight into the company’s overall performance. As a result of these changes, we will no longer report revenue by geography because we believe it is less relevant to understanding the drivers of our performance.
Business Unit Updates
Tinder: Continued Evolution of Product and Brand Story
In Q3, Tinder Direct Revenue was $503 million, down 1% (up 1% FXN) from the prior year quarter. Tinder Payers declined 4% Y/Y in Q3, an improvement from an 8% Y/Y decline in Q2, and sequential net additions were 311,000, the most since Q3 2022. RPP was up 4% Y/Y to $16.87.
Tinder began testing several ALC initiatives in Q3, including Passport ALC, Likes You ALC, and a new feature called First Impressions. These initiatives were well received by users but more cannibalistic to subscription revenue than expected and will require further iteration and testing before being fully rolled out. While this had only a modest impact on Q3 Direct Revenue, we do expect a more significant revenue impact in Q4.
Tinder MAU was down 9% Y/Y in Q3, which was the same rate of decline as in Q2, falling short of our expectations for continued improvement in Y/Y trends. From mid-September through October, we saw more pressure on new users (registrations and reactivations) than we expected, which has led to pressure on MAU.
Tinder’s primary focus remains driving its product transformation efforts forward to improve ecosystem health and user outcomes, which we believe are necessary for durable improvements in user, Payer, and revenue trends.
Testing features to improve Tinder’s ecosystem. In Q3, Tinder began testing mandating face photos on a user's profile in several markets. This requirement prevents a user from sending likes without uploading a face photo. Initial tests have been positive. Tinder also began testing, in a small market, technology that further helps verify the authenticity of a profile, another critical step toward improving the perception of realness on the platform. Tinder is carefully assessing the impacts of these two features on the ecosystem and user experience before launching more broadly.

Improving user outcomes, especially for women. In August, Tinder began testing a new feature called Spotlight Drops, which highlights a set of profiles with common interests. Tinder also recently started testing a revamped Explore tab which includes new tiles that allow users to find others with similar interests and intents, leading to better engagement trends. We believe Spotlight Drops and the new Explore tab are foundational steps toward improving user outcomes, especially for women, and creating a more dynamic discovery experience.
Efforts targeting college-aged users and improving brand perception. Tinder returned to college campuses in September with updates to Tinder U, including simplified onboarding, college-specific profile elements, and student pricing. These product initiatives, complemented by robust marketing, helped drive the highest ever single day enrollment since Tinder U launched five years ago.
Tinder also introduced its fourth College Swipe Off, a nationwide contest for college students. The college with the highest Swipe® activity, Temple University, will receive a free on-campus concert featuring Grammy-nominated artists Gunna and GloRilla. Across ambassador schools, College Swipe Off garnered approximately 52 million Swipes.
Tinder’s ongoing global It Starts with a Swipe™ campaign continues to drive improvements in users’ perception of Tinder’s “hookup stigma”4, which has improved 7 points in the U.S. from March 2023 to September 2024.
4 Source: Internal Tinder survey of U.S. market.
Hinge: Clear User Momentum and Rapidly Growing Revenue
Hinge achieved exceptional results in the quarter, with 36% Y/Y Direct Revenue growth driven by 21% Payer, 12% RPP, and 20% MAU growth Y/Y. Hinge continues to drive extraordinary user momentum in both core English-speaking and European expansion markets.
In Q3, Hinge’s global downloads reached an all-time high, ranking it as the second most downloaded5 dating app in aggregate across its core English-speaking and European expansion markets. Hinge’s share of downloads widened throughout the quarter in the European markets compared to the next most-downloaded app. Downloads increased by more than 20% Y/Y across the Nordic and DACH regions, and more than 40% in France in September.
Remaining true to its brand narrative as the app that’s Designed to be Deleted® Hinge launched Your Turn Limits globally in September. The feature directly combats ghosting—a known user pain point—by increasing a user’s focus on current matches, and ultimately helps get users out on great dates faster. Tests of Your Turn Limits showed a ~20% increase in user responsiveness to their matches.
Hinge also launched two new marketing campaigns in August, including No Ordinary Love, a digital and printed anthology of six real, authentic, and unfiltered Hinge dating journeys in the U.S. and UK; and “The Moment I Knew” across European markets, which celebrates the ‘aha’ moments when Hinge daters knew they’ve met their person on the app.
5 Source: Sensor Tower. Combined downloads across Apple App Store and Google Play Store. Among all dating apps as defined by Match Group. MAU based on internal data.
MG Asia: Azar® Expansion Continues; User Stability in Japan
In Q3, MG Asia Direct Revenue declined 6% Y/Y (down 1% FXN). Excluding Hakuna from the prior year quarter, MG Asia Direct Revenue declined 2% Y/Y.
Azar’s personalized AI technology, which provides users with a safer community-based video chat environment, is clearly resonating. Total MAU rose 14% Y/Y globally in Q3. Similarly, Azar’s expansion into Europe continues to be well-received, with MAU growing 27% Y/Y across the region. In October, Azar began its initial push into the U.S. We believe Azar can attract users, especially Gen Z, looking for a more spontaneous and casual experience.
At Pairs™, ongoing marketing initiatives and product refinements have led to stabilizing user trends, including 4% Y/Y growth in Q3 downloads6. This positive trend is reflective of Japanese dating market trends overall, where downloads across the category reached their highest level since late 2022.
E&E: Stabilizing Revenue and Achieving Consolidation Milestones
In Q3, E&E Direct Revenue declined 9% Y/Y, driven by a 14% Y/Y decline in Evergreen brands’ Direct Revenue, partially offset by a 14% Y/Y increase in Emerging brands’ Direct Revenue. Excluding our live streaming services, E&E Direct Revenue was down 4% Y/Y.
6 Source: Sensor Tower. Combined downloads across Apple App Store and Google Play Store. Includes all dating apps in the online dating category in Japan as defined by Match Group.
The Evergreen brands consist of longstanding brands, including Match®, Meetic®, Plenty of Fish®, and OkCupid®, that maintain meaningful user bases and revenue, with improving profitability as a result of recent consolidation efforts. Our Emerging brands consist of brands tailored for specific demographic groups, including Latinx singles (Chispa™), Black singles (BLK®), gay men (Archer®), Muslims (Salams®), Christians (Upward®) and East Asians (Yuzu™). We can offer all these demographically tailored brands because they leverage a common platform and team, enabling us to serve specific groups well and cost effectively. Over the coming years, we expect to fill in our portfolio to serve other demographic groups who are currently underserved by our existing Emerging brands. Collectively, our Emerging Brands reached three million MAU in Q3 from zero in 2018 when we began to incubate these brands.

7
Efforts to eliminate redundancies and consolidate platforms at E&E are ongoing, with the successful migration of BLK and Chispa to the new combined E&E platform completed in Q3. E&E’s platform consolidation efforts are expected to lead to substantial operational efficiency improvements and cost savings, which we continue to expect to realize partially in 2025 and fully in 2026. The operational efficiencies include dramatically improving time-to-market for product features and enhanced user experiences by enabling each E&E brand to offer the best-in-class features from across the E&E portfolio.
7 Source: Sensor Tower. Combined downloads across Apple App Store and Google Play Store. Among all dating apps, as defined by Match Group U.S. only.
Financial Outlook
Q4 2024
For Q4, we expect Match Group Total Revenue of $865 million to $875 million, essentially flat Y/Y. When excluding revenue from the now-exited Hakuna and other of our live streaming services from the prior year quarter, we expect Match Group Total Revenue to be up 2% to 3% Y/Y.
For Tinder, we expect Direct Revenue of $480 to $485 million, down 2% to 3% Y/Y, given the MAU headwinds and ALC initiative delays. We expect mid-single-digit Y/Y declines in Payers, partially offset by modest improvements in RPP.
Across our other brands, we expect Direct Revenue to be $370 to $375 million, representing 3% to 5% Y/Y growth. Within our other brands, we expect Hinge Direct Revenue of approximately $145 million, representing ~25% Y/Y growth. We expect Indirect Revenue to be approximately $15 million in the quarter.
We expect Q4 Match Group AOI to be $335 to $340 million, including approximately $7 million in employee severance and similar charges and the Canada Digital Services Tax. We expect AOI to be down 6% to 7% Y/Y, but up 4% to 6% Y/Y excluding the $40 million escrow refund as a result of the settlement of the Google litigation in Q4’23. We expect Q4 Match Group AOI margin of 39% at the midpoints of the ranges.
|
|
|
|
|
|
|
|
|
|
|
|
|
|
|
|
|
Total Revenue |
|
Adjusted Operating Income |
| Q4 2024 |
|
$865 to $870 million |
|
$335 to $340 million |
|
|
|
|
|
|
|
|
|
|
|
|
|
|
|
|
|
|
|
|
Conference Call
Match Group will audiocast a conference call to answer questions regarding its third quarter financial results on Thursday, November 7, 2024, at 8:30 a.m. Eastern Time. This call will include the disclosure of certain information, including forward-looking information, which may be material to an investor’s understanding of Match Group’s business. The live audiocast will be open to the public on Match Group’s investor relations website at https://ir.mtch.com.
Financial Results
Revenue and Key Drivers
|
|
|
|
|
|
|
|
|
|
|
|
|
|
|
|
|
|
|
Three Months Ended September 30, |
|
|
|
2024 |
|
2023 |
|
Change |
|
|
|
|
|
|
|
(In thousands, except RPP) |
|
|
|
|
|
|
|
|
|
|
|
|
|
|
|
|
|
|
|
|
|
|
|
|
|
|
|
|
|
|
|
|
|
|
|
|
|
|
|
|
|
|
|
|
|
|
|
|
|
|
|
|
|
|
|
|
|
|
|
|
|
|
|
|
|
|
|
|
|
|
|
|
|
|
|
|
|
|
|
|
|
|
|
|
|
|
|
|
|
|
|
|
|
|
|
|
|
|
| Revenue |
|
|
|
|
|
| Direct Revenue |
|
|
|
|
|
| Tinder |
$ |
503,217 |
|
|
$ |
508,521 |
|
|
(1)% |
| Hinge |
145,425 |
|
|
107,265 |
|
|
36% |
| MG Asia |
72,164 |
|
|
76,765 |
|
|
(6)% |
| Evergreen and Emerging |
158,390 |
|
|
174,249 |
|
|
(9)% |
| Total Direct Revenue |
879,196 |
|
|
866,800 |
|
|
1% |
|
|
|
|
|
|
|
|
|
|
|
|
|
|
|
|
|
|
|
|
|
|
|
|
|
|
|
|
|
|
|
|
|
|
|
|
|
|
|
|
|
|
| Indirect Revenue |
16,288 |
|
|
14,800 |
|
|
10% |
| Total Revenue |
$ |
895,484 |
|
|
$ |
881,600 |
|
|
2% |
|
|
|
|
|
|
| Payers |
|
|
|
|
|
|
|
|
|
|
|
|
|
|
|
|
|
|
|
|
|
|
|
|
|
|
|
|
|
|
|
|
|
|
|
|
|
|
|
|
|
| Tinder |
9,945 |
|
|
10,412 |
|
|
(4)% |
| Hinge |
1,602 |
|
|
1,327 |
|
|
21% |
| MG Asia |
1,046 |
|
|
917 |
|
|
14% |
| Evergreen and Emerging |
2,621 |
|
|
3,056 |
|
|
(14)% |
| Total Payers |
15,214 |
|
|
15,712 |
|
|
(3)% |
|
|
|
|
|
|
| Revenue Per Payer (“RPP”) |
|
|
|
|
|
|
|
|
|
|
|
|
|
|
|
|
|
|
|
|
|
|
|
|
|
|
|
|
|
| Tinder |
$ |
16.87 |
|
|
$ |
16.28 |
|
|
4% |
| Hinge |
$ |
30.26 |
|
|
$ |
26.95 |
|
|
12% |
| MG Asia |
$ |
23.00 |
|
|
$ |
27.92 |
|
|
(18)% |
| Evergreen and Emerging |
$ |
20.14 |
|
|
$ |
19.01 |
|
|
6% |
| Total RPP |
$ |
19.26 |
|
|
$ |
18.39 |
|
|
5% |
Operating Income and Adjusted Operating Income
|
|
|
|
|
|
|
|
|
|
|
|
|
|
|
|
|
|
|
Three Months Ended September 30, |
|
|
|
2024 |
|
2023 |
|
Change |
|
|
|
|
|
|
|
(In thousands) |
|
|
|
|
|
|
|
|
|
|
|
|
|
|
|
|
|
|
|
|
|
|
|
|
|
|
|
|
|
|
|
|
|
|
|
|
|
|
|
|
|
|
|
|
|
|
|
|
|
|
| Operating income (loss) |
|
|
|
|
|
| Tinder |
$ |
234,812 |
|
|
$ |
256,513 |
|
|
(8)% |
| Hinge |
42,241 |
|
|
23,190 |
|
|
82% |
| MG Asia |
(18,956) |
|
|
(2,324) |
|
|
NM |
| E&E |
2,965 |
|
|
25,778 |
|
|
(88)% |
| Corporate & unallocated costs8 |
(50,402) |
|
|
(59,598) |
|
|
(15)% |
|
|
|
|
|
|
| Total Match Group |
$ |
210,660 |
|
|
$ |
243,559 |
|
|
(14)% |
|
|
|
|
|
|
| Operating income (loss) Margin |
|
|
|
|
|
| Tinder |
45 |
% |
|
49 |
% |
|
(3.8) points |
| Hinge |
29 |
% |
|
22 |
% |
|
7.4 points |
| MG Asia |
(26 |
%) |
|
(3 |
%) |
|
(23.2) points |
| E&E |
2 |
% |
|
15 |
% |
|
(12.8) points |
| Match Group |
24 |
% |
|
28 |
% |
|
(4.1) points |
|
|
|
|
|
|
| Adjusted Operating Income (Loss) |
|
|
|
|
|
| Tinder |
$ |
266,833 |
|
|
$ |
281,494 |
|
|
(5)% |
| Hinge |
51,460 |
|
|
31,262 |
|
|
65% |
| MG Asia |
17,779 |
|
|
16,327 |
|
|
9% |
| E&E |
41,423 |
|
|
46,034 |
|
|
(10)% |
Corporate & unallocated costs8 |
(34,955) |
|
|
(42,014) |
|
|
(17)% |
|
|
|
|
|
|
| Total Match Group |
$ |
342,540 |
|
|
$ |
333,103 |
|
|
3% |
|
|
|
|
|
|
| Adjusted Operating Income Margin |
|
|
|
|
|
| Tinder |
52 |
% |
|
54 |
% |
|
(2.4) points |
| Hinge |
35 |
% |
|
29 |
% |
|
6.2 points |
| MG Asia |
25 |
% |
|
21 |
% |
|
3.4 points |
| E&E |
26 |
% |
|
26 |
% |
|
(0.4) points |
| Match Group |
38 |
% |
|
38 |
% |
|
0.5 points |
8 Corporate and unallocated costs includes 1) corporate expenses (such as executive management, investor relations, corporate development, and board of director and public company listing fees), 2) portions of corporate services (such as legal, human resources, accounting, and tax), and 3) certain centrally managed services and technology that have not been allocated to the individual business segments (such as central trust and safety operations and certain shared software).
Consolidated Operating Costs and Expenses
|
|
|
|
|
|
|
|
|
|
|
|
|
|
|
|
|
|
|
|
|
|
|
|
|
|
|
|
|
|
|
Q3 2024 |
|
% of Revenue |
|
Q3 2023 |
|
% of Revenue |
|
Change |
|
|
|
|
|
|
|
|
|
|
|
(In thousands) |
|
|
| Cost of revenue |
$ |
253,129 |
|
|
28% |
|
$ |
255,598 |
|
|
29% |
|
(1)% |
| Selling and marketing expense |
156,656 |
|
|
17% |
|
153,408 |
|
|
17% |
|
2% |
| General and administrative expense |
103,923 |
|
|
12% |
|
107,095 |
|
|
12% |
|
(3)% |
| Product development expense |
103,724 |
|
|
12% |
|
94,141 |
|
|
11% |
|
10% |
| Depreciation |
25,302 |
|
|
3% |
|
17,310 |
|
|
2% |
|
46% |
| Impairments and amortization of intangibles |
42,090 |
|
|
5% |
|
10,489 |
|
|
1% |
|
301% |
| Total operating costs and expenses |
$ |
684,824 |
|
|
76% |
|
$ |
638,041 |
|
|
72% |
|
7% |
Liquidity and Capital Resources
During the nine months ended September 30, 2024, we generated operating cash flow of $678 million and Free Cash Flow of $635 million.
During the quarter ended September 30, 2024, we repurchased 7.1 million shares of our common stock for $241 million on a trade date basis at an average price of $34.07. Between October 1, 2024 and November 1, 2024, we repurchased an additional 3.0 million shares of our common stock for $112 million on a trade date basis. As of November 1, 2024, $252 million in aggregate value of shares of Match Group stock remains available under our previously announced share repurchase program.
As of September 30, 2024, we had $861 million in cash and cash equivalents and short-term investments and $3.9 billion of long-term debt, $3.5 billion of which is fixed rate debt, including $1.2 billion of Exchangeable Senior Notes. Our $500 million revolving credit facility was undrawn as of September 30, 2024. Match Group’s trailing twelve-month leverage9 as of September 30, 2024 is 3.0x on a gross basis and 2.3x on a net basis.
Income Taxes
We recorded an income tax provision of $41 million in the third quarter of 2024, which equated to an effective tax rate of 23%. In the third quarter of 2023, the income tax provision was $47 million, which equated to an effective tax rate of 22%.
9 Leverage is calculated utilizing the non-GAAP measure Adjusted Operating Income as the denominator. For a reconciliation of the non-GAAP measure for each period presented, see page 22.
GAAP Financial Statements
Consolidated Statement of Operations
|
|
|
|
|
|
|
|
|
|
|
|
|
|
|
|
|
|
|
|
|
|
|
|
| |
Three Months Ended September 30, |
|
Nine Months Ended September 30, |
| |
2024 |
|
2023 |
|
2024 |
|
2023 |
|
|
|
|
|
|
|
|
| |
(In thousands, except per share data) |
| Revenue |
$ |
895,484 |
|
|
$ |
881,600 |
|
|
$ |
2,619,197 |
|
|
$ |
2,498,276 |
|
| Operating costs and expenses: |
|
|
|
|
|
|
|
| Cost of revenue (exclusive of depreciation shown separately below) |
253,129 |
|
|
255,598 |
|
|
754,859 |
|
|
745,902 |
|
| Selling and marketing expense |
156,656 |
|
|
153,408 |
|
|
476,585 |
|
|
427,364 |
|
| General and administrative expense |
103,923 |
|
|
107,095 |
|
|
324,468 |
|
|
305,404 |
|
| Product development expense |
103,724 |
|
|
94,141 |
|
|
333,037 |
|
|
286,614 |
|
| Depreciation |
25,302 |
|
|
17,310 |
|
|
66,915 |
|
|
42,427 |
|
| Impairments and amortization of intangibles |
42,090 |
|
|
10,489 |
|
|
63,409 |
|
|
33,921 |
|
| Total operating costs and expenses |
684,824 |
|
|
638,041 |
|
|
2,019,273 |
|
|
1,841,632 |
|
| Operating income |
210,660 |
|
|
243,559 |
|
|
599,924 |
|
|
656,644 |
|
| Interest expense |
(40,120) |
|
|
(40,380) |
|
|
(120,511) |
|
|
(119,473) |
|
|
|
|
|
|
|
|
|
| Other income, net |
7,100 |
|
|
7,905 |
|
|
27,099 |
|
|
14,729 |
|
Earnings before income taxes |
177,640 |
|
|
211,084 |
|
|
506,512 |
|
|
551,900 |
|
Income tax provision |
(41,159) |
|
|
(47,328) |
|
|
(113,477) |
|
|
(130,108) |
|
Net earnings |
136,481 |
|
|
163,756 |
|
|
393,035 |
|
|
421,792 |
|
|
|
|
|
|
|
|
|
|
|
|
|
|
|
|
|
|
|
|
|
|
|
|
|
|
|
|
|
|
|
|
|
|
|
|
|
|
|
|
|
Net (earnings) loss attributable to noncontrolling interests |
(13) |
|
|
(29) |
|
|
(55) |
|
|
89 |
|
Net earnings attributable to Match Group, Inc. shareholders |
$ |
136,468 |
|
|
$ |
163,727 |
|
|
$ |
392,980 |
|
|
$ |
421,881 |
|
|
|
|
|
|
|
|
|
|
|
|
|
|
|
|
|
|
|
|
|
|
|
|
|
|
|
|
|
|
|
|
|
Net earnings per share attributable to Match Group, Inc. shareholders: |
|
|
|
|
|
|
|
| Basic |
$ |
0.53 |
|
|
$ |
0.59 |
|
|
$ |
1.49 |
|
|
$ |
1.52 |
|
| Diluted |
$ |
0.51 |
|
|
$ |
0.57 |
|
|
$ |
1.43 |
|
|
$ |
1.46 |
|
|
|
|
|
|
|
|
|
|
|
|
|
|
|
|
|
|
|
|
|
|
|
|
|
| Basic shares outstanding |
257,070 |
|
|
275,223 |
|
|
263,181 |
|
|
277,524 |
|
| Diluted shares outstanding |
275,738 |
|
|
293,380 |
|
|
281,255 |
|
|
294,996 |
|
|
|
|
|
|
|
|
|
| Stock-based compensation expense by function: |
|
|
|
|
|
|
|
| Cost of revenue |
$ |
1,747 |
|
|
$ |
1,521 |
|
|
$ |
5,267 |
|
|
$ |
4,511 |
|
| Selling and marketing expense |
3,259 |
|
|
2,374 |
|
|
9,395 |
|
|
6,845 |
|
| General and administrative expense |
26,639 |
|
|
27,862 |
|
|
75,868 |
|
|
69,067 |
|
| Product development expense |
32,843 |
|
|
29,988 |
|
|
107,645 |
|
|
83,522 |
|
| Total stock-based compensation expense |
$ |
64,488 |
|
|
$ |
61,745 |
|
|
$ |
198,175 |
|
|
$ |
163,945 |
|
Consolidated Balance Sheet
|
|
|
|
|
|
|
|
|
|
|
|
|
September 30, 2024 |
|
December 31, 2023 |
|
|
|
|
|
(In thousands) |
| ASSETS |
|
|
|
| Cash and cash equivalents |
$ |
855,532 |
|
|
$ |
862,440 |
|
| Short-term investments |
5,323 |
|
|
6,200 |
|
| Accounts receivable, net |
340,087 |
|
|
298,648 |
|
|
|
|
|
|
|
|
|
| Other current assets |
121,759 |
|
|
104,023 |
|
|
|
|
|
| Total current assets |
1,322,701 |
|
|
1,271,311 |
|
|
|
|
|
|
|
|
|
| Property and equipment, net |
172,112 |
|
|
194,525 |
|
| Goodwill |
2,319,732 |
|
|
2,342,612 |
|
| Intangible assets, net |
241,226 |
|
|
305,746 |
|
| Deferred income taxes |
242,610 |
|
|
259,803 |
|
|
|
|
|
| Other non-current assets |
127,456 |
|
|
133,889 |
|
|
|
|
|
| TOTAL ASSETS |
$ |
4,425,837 |
|
|
$ |
4,507,886 |
|
|
|
|
|
| LIABILITIES AND SHAREHOLDERS’ EQUITY |
|
|
|
| LIABILITIES |
|
|
|
|
|
|
|
|
|
|
|
| Accounts payable |
$ |
27,351 |
|
|
$ |
13,187 |
|
| Deferred revenue |
181,411 |
|
|
211,282 |
|
|
|
|
|
|
|
|
|
| Accrued expenses and other current liabilities |
321,526 |
|
|
307,299 |
|
|
|
|
|
| Total current liabilities |
530,288 |
|
|
531,768 |
|
|
|
|
|
| Long-term debt, net |
3,847,272 |
|
|
3,842,242 |
|
| Income taxes payable |
30,744 |
|
|
24,860 |
|
| Deferred income taxes |
13,405 |
|
|
26,302 |
|
|
|
|
|
|
|
|
|
| Other long-term liabilities |
92,632 |
|
|
101,787 |
|
|
|
|
|
|
|
|
|
|
|
|
|
|
|
|
|
| Commitments and contingencies |
|
|
|
|
|
|
|
| SHAREHOLDERS’ EQUITY |
|
|
|
| Common stock |
294 |
|
|
290 |
|
|
|
|
|
|
|
|
|
|
|
|
|
|
|
|
|
| Additional paid-in capital |
8,729,833 |
|
|
8,529,200 |
|
| Retained deficit |
(6,738,049) |
|
|
(7,131,029) |
|
| Accumulated other comprehensive loss |
(407,534) |
|
|
(385,471) |
|
| Treasury stock |
(1,673,070) |
|
|
(1,032,538) |
|
| Total Match Group, Inc. shareholders’ equity |
(88,526) |
|
|
(19,548) |
|
| Noncontrolling interests |
22 |
|
|
475 |
|
| Total shareholders’ equity |
(88,504) |
|
|
(19,073) |
|
| TOTAL LIABILITIES AND SHAREHOLDERS’ EQUITY |
$ |
4,425,837 |
|
|
$ |
4,507,886 |
|
Consolidated Statement of Cash Flows
|
|
|
|
|
|
|
|
|
|
|
|
| |
Nine Months Ended September 30, |
| |
2024 |
|
2023 |
|
|
|
|
| |
(In thousands) |
| Cash flows from operating activities: |
|
|
|
|
|
|
|
|
|
|
|
| Net earnings |
$ |
393,035 |
|
|
$ |
421,792 |
|
Adjustments to reconcile net earnings to net cash provided by operating activities: |
|
|
|
| Stock-based compensation expense |
198,175 |
|
|
163,945 |
|
| Depreciation |
66,915 |
|
|
42,427 |
|
| Impairments and amortization of intangibles |
63,409 |
|
|
33,921 |
|
| Deferred income taxes |
5,223 |
|
|
44,789 |
|
|
|
|
|
|
|
|
|
| Other adjustments, net |
5,553 |
|
|
6,647 |
|
| Changes in assets and liabilities |
|
|
|
| Accounts receivable |
(41,412) |
|
|
(100,134) |
|
| Other assets |
4,968 |
|
|
7,457 |
|
| Accounts payable and other liabilities |
403 |
|
|
15,701 |
|
| Income taxes payable and receivable |
11,387 |
|
|
7,779 |
|
| Deferred revenue |
(29,647) |
|
|
(23,652) |
|
Net cash provided by operating activities |
678,009 |
|
|
620,672 |
|
| Cash flows from investing activities: |
|
|
|
|
|
|
|
| Capital expenditures |
(43,011) |
|
|
(50,020) |
|
|
|
|
|
|
|
|
|
|
|
|
|
|
|
|
|
|
|
|
|
| Other, net |
(8,061) |
|
|
2,444 |
|
| Net cash used in investing activities |
(51,072) |
|
|
(47,576) |
|
| Cash flows from financing activities: |
|
|
|
|
|
|
|
|
|
|
|
|
|
|
|
|
|
|
|
|
|
|
|
|
|
|
|
|
|
|
|
|
|
|
|
|
|
|
|
|
|
|
|
|
|
|
|
|
|
|
|
|
|
|
|
|
|
|
|
| Proceeds from issuance of common stock pursuant to stock-based awards |
9,411 |
|
|
16,407 |
|
Withholding taxes paid on behalf of employees on net settled stock-based awards |
(11,430) |
|
|
(5,933) |
|
|
|
|
|
|
|
|
|
|
|
|
|
Purchase of treasury stock |
(630,623) |
|
|
(445,108) |
|
|
|
|
|
| Purchase of noncontrolling interests |
(1,291) |
|
|
(1,872) |
|
|
|
|
|
|
|
|
|
| Other, net |
(2,193) |
|
|
— |
|
Net cash used in financing activities |
(636,126) |
|
|
(436,506) |
|
Total cash (used) provided |
(9,189) |
|
|
136,590 |
|
|
|
|
|
|
|
|
|
|
|
|
|
|
|
|
|
| Effect of exchange rate changes on cash, cash equivalents, and restricted cash |
2,281 |
|
|
(2,104) |
|
| Net (decrease) increase in cash, cash equivalents, and restricted cash |
(6,908) |
|
|
134,486 |
|
| Cash, cash equivalents, and restricted cash at beginning of period |
862,440 |
|
|
572,516 |
|
| Cash, cash equivalents, and restricted cash at end of period |
$ |
855,532 |
|
|
$ |
707,002 |
|
Earnings Per Share
The following table sets forth the computation of the basic and diluted earnings per share attributable to Match Group shareholders:
|
|
|
|
|
|
|
|
|
|
|
|
|
|
|
|
|
|
|
|
|
|
|
|
|
Three Months Ended September 30, |
|
2024 |
|
2023 |
|
Basic |
|
Diluted |
|
Basic |
|
Diluted |
|
|
|
|
|
|
|
|
|
(In thousands, except per share data) |
| Numerator |
|
|
|
|
|
|
|
Net earnings |
$ |
136,481 |
|
|
$ |
136,481 |
|
|
$ |
163,756 |
|
|
$ |
163,756 |
|
Net earnings attributable to noncontrolling interests |
(13) |
|
|
(13) |
|
|
(29) |
|
|
(29) |
|
Impact from subsidiaries’ dilutive securities |
— |
|
|
(6) |
|
|
— |
|
|
(12) |
|
| Interest on dilutive Exchangeable Senior Notes, net of tax |
— |
|
|
3,171 |
|
|
— |
|
|
3,179 |
|
|
|
|
|
|
|
|
|
|
|
|
|
|
|
|
|
|
|
|
|
|
|
|
|
|
|
|
|
|
|
|
|
|
|
|
|
|
|
|
|
|
|
|
|
|
|
|
|
Net earnings attributable to Match Group, Inc. shareholders |
$ |
136,468 |
|
|
$ |
139,633 |
|
|
$ |
163,727 |
|
|
$ |
166,894 |
|
|
|
|
|
|
|
|
|
| Denominator |
|
|
|
|
|
|
|
| Weighted average basic shares outstanding |
257,070 |
|
|
257,070 |
|
|
275,223 |
|
|
275,223 |
|
Dilutive securities |
— |
|
|
5,271 |
|
|
— |
|
|
4,760 |
|
| Dilutive shares from Exchangeable Senior Notes, if-converted |
— |
|
|
13,397 |
|
|
— |
|
|
13,397 |
|
Denominator for earnings per share—weighted average shares |
257,070 |
|
|
275,738 |
|
|
275,223 |
|
|
293,380 |
|
|
|
|
|
|
|
|
|
| Earnings per share: |
|
|
|
|
|
|
|
|
|
|
|
|
|
|
|
|
|
|
|
|
|
|
|
| Earnings per share attributable to Match Group, Inc. shareholders |
$ |
0.53 |
|
|
$ |
0.51 |
|
|
$ |
0.59 |
|
|
$ |
0.57 |
|
|
|
|
|
|
|
|
|
|
|
|
|
|
|
|
|
|
|
|
|
|
|
|
|
|
Nine Months Ended September 30, |
|
2024 |
|
2023 |
|
Basic |
|
Diluted |
|
Basic |
|
Diluted |
|
|
|
|
|
|
|
|
|
(In thousands, except per share data) |
| Numerator |
|
|
|
|
|
|
|
Net earnings |
$ |
393,035 |
|
|
$ |
393,035 |
|
|
$ |
421,792 |
|
|
$ |
421,792 |
|
Net (earnings) loss attributable to noncontrolling interests |
(55) |
|
|
(55) |
|
|
89 |
|
|
89 |
|
Impact from subsidiaries’ dilutive securities |
— |
|
|
(19) |
|
|
— |
|
|
(76) |
|
| Interest on dilutive Exchangeable Senior Notes, net of tax |
— |
|
|
9,513 |
|
|
— |
|
|
9,536 |
|
|
|
|
|
|
|
|
|
|
|
|
|
|
|
|
|
|
|
|
|
|
|
|
|
|
|
|
|
|
|
|
|
|
|
|
|
|
|
|
|
|
|
|
|
|
|
|
|
Net earnings attributable to Match Group, Inc. shareholders |
$ |
392,980 |
|
|
$ |
402,474 |
|
|
$ |
421,881 |
|
|
$ |
431,341 |
|
|
|
|
|
|
|
|
|
| Denominator |
|
|
|
|
|
|
|
| Weighted average basic shares outstanding |
263,181 |
|
|
263,181 |
|
|
277,524 |
|
|
277,524 |
|
Dilutive securities |
— |
|
|
4,677 |
|
|
— |
|
|
4,075 |
|
| Dilutive shares from Exchangeable Senior Notes, if-converted |
— |
|
|
13,397 |
|
|
— |
|
|
13,397 |
|
| Denominator for earnings per share—weighted average shares |
263,181 |
|
|
281,255 |
|
|
277,524 |
|
|
294,996 |
|
|
|
|
|
|
|
|
|
Earnings per share: |
|
|
|
|
|
|
|
|
|
|
|
|
|
|
|
|
|
|
|
|
|
|
|
Earnings per share attributable to Match Group, Inc. shareholders |
$ |
1.49 |
|
|
$ |
1.43 |
|
|
$ |
1.52 |
|
|
$ |
1.46 |
|
Trended Revenue Metrics
|
|
|
|
|
|
|
|
|
|
|
|
|
|
|
|
|
|
|
|
|
|
|
|
|
|
|
|
|
|
|
|
|
|
|
|
|
|
|
|
|
|
|
|
|
|
|
|
|
|
|
|
|
|
|
|
|
|
|
|
|
|
|
|
|
|
|
|
|
|
|
|
|
|
|
|
|
|
|
|
|
|
|
|
|
|
|
|
|
|
|
|
|
2022 |
|
2023 |
|
2024 |
|
|
|
|
|
|
|
|
|
|
|
|
|
Year Ended December 31, |
|
Q1 |
|
Q2 |
|
Q3 |
|
Q4 |
|
Q1 |
|
Q2 |
|
Q3 |
|
Q4 |
|
Q1 |
|
Q2 |
|
Q3 |
|
|
|
|
|
|
|
|
|
|
|
|
|
|
|
2022 |
|
2023 |
|
|
|
|
|
|
|
|
|
|
|
|
|
|
|
|
|
|
|
|
|
|
|
|
|
|
|
|
|
|
|
|
|
|
|
|
|
|
|
|
|
|
|
|
|
|
|
|
|
|
|
|
|
|
|
|
|
|
|
|
|
|
|
|
|
|
|
|
|
|
|
|
|
|
|
|
|
|
|
|
|
|
|
|
|
|
|
|
|
|
|
|
|
|
|
|
|
|
|
|
|
|
|
|
|
|
|
|
|
|
|
|
|
|
|
|
|
|
|
|
|
|
|
|
|
|
|
|
|
|
|
|
|
|
|
|
|
|
|
|
|
|
|
|
|
|
|
|
|
|
|
|
|
|
|
|
|
|
|
|
|
|
|
|
|
|
|
|
|
|
|
|
|
|
|
|
|
|
|
|
|
|
|
|
|
|
|
|
|
|
|
|
|
|
|
|
|
|
|
|
|
|
|
|
|
|
|
|
|
|
|
|
|
|
|
|
|
|
|
|
|
|
|
|
|
|
|
|
|
|
|
|
|
|
|
|
|
|
|
|
|
|
|
|
|
|
|
|
|
|
|
|
|
|
|
|
|
|
|
|
|
|
|
|
|
|
|
|
|
|
|
|
|
|
|
|
|
|
|
|
|
|
|
|
|
|
|
|
|
|
|
|
|
|
|
|
|
|
|
|
|
|
|
|
|
|
|
|
|
|
|
|
|
|
|
|
|
|
|
|
|
|
|
|
|
|
|
|
|
|
|
|
|
|
|
|
|
|
|
|
|
|
|
|
|
|
|
|
|
|
|
|
|
Revenue (in millions, rounding differences may occur) |
|
|
|
|
|
|
|
|
|
|
|
|
|
|
|
|
|
|
|
|
|
|
|
|
|
|
|
|
|
|
|
|
| Direct Revenue: |
|
|
|
|
|
|
|
|
|
|
|
|
|
|
|
|
|
|
|
|
|
|
|
|
|
|
|
|
|
|
|
|
| Tinder |
$ |
441.0 |
|
|
$ |
449.1 |
|
|
$ |
460.2 |
|
|
$ |
444.2 |
|
|
$ |
441.1 |
|
|
$ |
474.7 |
|
|
$ |
508.5 |
|
|
$ |
493.2 |
|
|
$ |
481.5 |
|
|
$ |
479.9 |
|
|
$ |
503.2 |
|
|
|
|
|
|
|
|
|
|
|
|
|
|
|
|
$ |
1,794.5 |
|
|
$ |
1,917.6 |
|
| Hinge |
65.0 |
|
|
67.1 |
|
|
74.4 |
|
|
77.2 |
|
|
82.8 |
|
|
90.3 |
|
|
107.3 |
|
|
116.1 |
|
|
123.8 |
|
|
133.6 |
|
|
145.4 |
|
|
|
|
|
|
|
|
|
|
|
|
|
|
|
|
283.7 |
|
|
396.5 |
|
| MG Asia |
87.2 |
|
|
79.6 |
|
|
80.6 |
|
|
74.3 |
|
|
75.7 |
|
|
76.6 |
|
|
76.8 |
|
|
73.6 |
|
|
71.5 |
|
|
73.7 |
|
|
72.2 |
|
|
|
|
|
|
|
|
|
|
|
|
|
|
|
|
321.7 |
|
|
302.6 |
|
| Evergreen & Emerging |
190.7 |
|
|
184.3 |
|
|
180.0 |
|
|
175.4 |
|
|
174.9 |
|
|
174.5 |
|
|
174.2 |
|
|
167.8 |
|
|
168.6 |
|
|
160.9 |
|
|
158.4 |
|
|
|
|
|
|
|
|
|
|
|
|
|
|
|
|
730.4 |
|
|
691.4 |
|
| Total Direct Revenue |
783.8 |
|
|
780.2 |
|
|
795.1 |
|
|
771.1 |
|
|
774.4 |
|
|
816.1 |
|
|
866.8 |
|
|
850.8 |
|
|
845.3 |
|
|
848.1 |
|
|
879.2 |
|
|
|
|
|
|
|
|
|
|
|
|
|
|
|
|
3,130.2 |
|
|
3,308.1 |
|
| Indirect Revenue |
14.8 |
|
|
14.4 |
|
|
14.4 |
|
|
15.1 |
|
|
12.7 |
|
|
13.4 |
|
|
14.8 |
|
|
15.5 |
|
|
14.3 |
|
|
15.9 |
|
|
16.3 |
|
|
|
|
|
|
|
|
|
|
|
|
|
|
|
|
58.6 |
|
|
56.4 |
|
| Match Group |
$ |
798.6 |
|
|
$ |
794.5 |
|
|
$ |
809.5 |
|
|
$ |
786.2 |
|
|
$ |
787.1 |
|
|
$ |
829.6 |
|
|
$ |
881.6 |
|
|
$ |
866.2 |
|
|
$ |
859.6 |
|
|
$ |
864.1 |
|
|
$ |
895.5 |
|
|
|
|
|
|
|
|
|
|
|
|
|
|
|
|
$ |
3,188.8 |
|
|
$ |
3,364.5 |
|
|
|
|
|
|
|
|
|
|
|
|
|
|
|
|
|
|
|
|
|
|
|
|
|
|
|
|
|
|
|
|
|
|
|
|
|
|
|
|
|
Payers (in thousands) |
|
|
|
|
|
|
|
|
|
|
|
|
|
|
|
|
|
|
|
|
|
|
|
|
|
|
|
|
|
|
|
|
|
|
|
|
|
|
|
| Tinder |
10,686 |
|
|
10,890 |
|
|
11,103 |
|
|
10,830 |
|
|
10,653 |
|
|
10,469 |
|
|
10,412 |
|
|
9,968 |
|
|
9,713 |
|
|
9,634 |
|
|
9,945 |
|
|
|
|
|
|
|
|
|
|
|
|
|
|
|
|
10,877 |
|
|
10,375 |
|
| Hinge |
941 |
|
|
962 |
|
|
998 |
|
|
1,021 |
|
|
1,085 |
|
|
1,193 |
|
|
1,327 |
|
|
1,362 |
|
|
1,424 |
|
|
1,484 |
|
|
1,602 |
|
|
|
|
|
|
|
|
|
|
|
|
|
|
|
|
980 |
|
|
1,242 |
|
| MG Asia |
1,000 |
|
|
971 |
|
|
1,031 |
|
|
964 |
|
|
924 |
|
|
859 |
|
|
917 |
|
|
969 |
|
|
954 |
|
|
1,005 |
|
|
1,046 |
|
|
|
|
|
|
|
|
|
|
|
|
|
|
|
|
992 |
|
|
919 |
|
| Evergreen & Emerging |
3,707 |
|
|
3,572 |
|
|
3,416 |
|
|
3,250 |
|
|
3,212 |
|
|
3,109 |
|
|
3,056 |
|
|
2,887 |
|
|
2,839 |
|
|
2,718 |
|
|
2,621 |
|
|
|
|
|
|
|
|
|
|
|
|
|
|
|
|
3,487 |
|
|
3,066 |
|
| Match Group |
16,334 |
|
|
16,395 |
|
|
16,548 |
|
|
16,065 |
|
|
15,874 |
|
|
15,630 |
|
|
15,712 |
|
|
15,186 |
|
|
14,930 |
|
|
14,841 |
|
|
15,214 |
|
|
|
|
|
|
|
|
|
|
|
|
|
|
|
|
16,336 |
|
|
15,602 |
|
|
|
|
|
|
|
|
|
|
|
|
|
|
|
|
|
|
|
|
|
|
|
|
|
|
|
|
|
|
|
|
|
|
|
|
|
|
|
|
|
| RPP |
|
|
|
|
|
|
|
|
|
|
|
|
|
|
|
|
|
|
|
|
|
|
|
|
|
|
|
|
|
|
|
|
|
|
|
|
|
|
|
| Tinder |
$ |
13.76 |
|
|
$ |
13.75 |
|
|
$ |
13.82 |
|
|
$ |
13.67 |
|
|
$ |
13.80 |
|
|
$ |
15.12 |
|
|
$ |
16.28 |
|
|
$ |
16.49 |
|
|
$ |
16.52 |
|
|
$ |
16.61 |
|
|
$ |
16.87 |
|
|
|
|
|
|
|
|
|
|
|
|
|
|
|
|
$ |
13.75 |
|
|
$ |
15.40 |
|
| Hinge |
$ |
23.00 |
|
|
$ |
23.27 |
|
|
$ |
24.85 |
|
|
$ |
25.20 |
|
|
$ |
25.42 |
|
|
$ |
25.23 |
|
|
$ |
26.95 |
|
|
$ |
28.42 |
|
|
$ |
28.96 |
|
|
$ |
30.01 |
|
|
$ |
30.26 |
|
|
|
|
|
|
|
|
|
|
|
|
|
|
|
|
$ |
24.11 |
|
|
$ |
26.61 |
|
| MG Asia |
$ |
29.08 |
|
|
$ |
27.33 |
|
|
$ |
26.06 |
|
|
$ |
25.69 |
|
|
$ |
27.31 |
|
|
$ |
29.71 |
|
|
$ |
27.92 |
|
|
$ |
25.32 |
|
|
$ |
24.96 |
|
|
$ |
24.44 |
|
|
$ |
23.00 |
|
|
|
|
|
|
|
|
|
|
|
|
|
|
|
|
$ |
27.04 |
|
|
$ |
27.50 |
|
| Evergreen & Emerging |
$ |
17.14 |
|
|
$ |
17.20 |
|
|
$ |
17.57 |
|
|
$ |
17.99 |
|
|
$ |
18.15 |
|
|
$ |
18.71 |
|
|
$ |
19.01 |
|
|
$ |
19.38 |
|
|
$ |
19.80 |
|
|
$ |
19.73 |
|
|
$ |
20.14 |
|
|
|
|
|
|
|
|
|
|
|
|
|
|
|
|
$ |
17.46 |
|
|
$ |
18.79 |
|
| Match Group |
$ |
16.00 |
|
|
$ |
15.86 |
|
|
$ |
16.02 |
|
|
$ |
16.00 |
|
|
$ |
16.26 |
|
|
$ |
17.41 |
|
|
$ |
18.39 |
|
|
$ |
18.67 |
|
|
$ |
18.87 |
|
|
$ |
19.05 |
|
|
$ |
19.26 |
|
|
|
|
|
|
|
|
|
|
|
|
|
|
|
|
$ |
15.97 |
|
|
$ |
17.67 |
|
Reconciliations of GAAP to Non-GAAP Measures
Reconciliation of Operating income (loss) to Adjusted Operating Income
|
|
|
|
|
|
|
|
|
|
|
|
|
|
|
|
|
|
|
|
|
|
|
|
|
|
|
|
|
|
|
|
|
|
|
|
|
|
|
|
|
|
|
Three Months Ended September 30, 2024 |
|
Tinder |
|
Hinge |
|
MG Asia |
|
E&E |
|
Corporate & unallocated costs |
|
Eliminations |
|
Total Match Group |
|
|
|
|
|
|
|
|
|
|
|
|
|
|
|
(Dollars in thousands) |
Operating income (loss) |
$ |
234,812 |
|
|
$ |
42,241 |
|
|
$ |
(18,956) |
|
|
$ |
2,965 |
|
|
$ |
(50,402) |
|
|
$ |
— |
|
|
$ |
210,660 |
|
| Stock-based compensation expense |
22,601 |
|
|
8,599 |
|
|
5,844 |
|
|
13,310 |
|
|
14,134 |
|
|
— |
|
|
64,488 |
|
| Depreciation |
9,420 |
|
|
620 |
|
|
8,031 |
|
|
5,918 |
|
|
1,313 |
|
|
— |
|
|
25,302 |
|
Impairments and amortization of intangibles |
— |
|
|
— |
|
|
22,860 |
|
|
19,230 |
|
|
— |
|
|
— |
|
|
42,090 |
|
|
|
|
|
|
|
|
|
|
|
|
|
|
|
| Adjusted Operating Income |
$ |
266,833 |
|
|
$ |
51,460 |
|
|
$ |
17,779 |
|
|
$ |
41,423 |
|
|
$ |
(34,955) |
|
|
$ |
— |
|
|
$ |
342,540 |
|
|
|
|
|
|
|
|
|
|
|
|
|
|
|
| Revenue |
$ |
516,778 |
|
|
$ |
145,425 |
|
|
$ |
72,282 |
|
|
$ |
161,181 |
|
|
$ |
— |
|
|
$ |
(182) |
|
|
$ |
895,484 |
|
| Operating income (loss) margin |
45 |
% |
|
29 |
% |
|
(26) |
% |
|
2 |
% |
|
NA |
|
NA |
|
24 |
% |
| Adjusted Operating Income margin |
52 |
% |
|
35 |
% |
|
25 |
% |
|
26 |
% |
|
NA |
|
NA |
|
38 |
% |
|
|
|
|
|
|
|
|
|
|
|
|
|
|
|
|
|
|
|
|
|
|
|
|
|
|
|
|
|
|
|
|
|
|
|
|
|
|
|
|
|
|
|
Three Months Ended September 30, 2023 |
|
Tinder |
|
Hinge |
|
MG Asia |
|
E&E |
|
Corporate & unallocated costs |
|
Eliminations |
|
Total Match Group |
|
|
|
|
|
|
|
|
|
|
|
|
|
|
|
(Dollars in thousands) |
Operating income (loss) |
$ |
256,513 |
|
|
$ |
23,190 |
|
|
$ |
(2,324) |
|
|
$ |
25,778 |
|
|
$ |
(59,598) |
|
|
$ |
— |
|
|
$ |
243,559 |
|
| Stock-based compensation expense |
16,990 |
|
|
7,515 |
|
|
7,288 |
|
|
13,508 |
|
|
16,444 |
|
|
— |
|
|
61,745 |
|
| Depreciation |
7,991 |
|
|
557 |
|
|
2,962 |
|
|
4,660 |
|
|
1,140 |
|
|
— |
|
|
17,310 |
|
Amortization of intangibles |
— |
|
|
— |
|
|
8,401 |
|
|
2,088 |
|
|
— |
|
|
— |
|
|
10,489 |
|
|
|
|
|
|
|
|
|
|
|
|
|
|
|
| Adjusted Operating Income |
$ |
281,494 |
|
|
$ |
31,262 |
|
|
$ |
16,327 |
|
|
$ |
46,034 |
|
|
$ |
(42,014) |
|
|
$ |
— |
|
|
$ |
333,103 |
|
|
|
|
|
|
|
|
|
|
|
|
|
|
|
| Revenue |
$ |
520,688 |
|
|
$ |
107,265 |
|
|
$ |
76,972 |
|
|
$ |
176,675 |
|
|
$ |
— |
|
|
$ |
— |
|
|
$ |
881,600 |
|
| Operating income (loss) margin |
49 |
% |
|
22 |
% |
|
(3) |
% |
|
15 |
% |
|
NA |
|
NA |
|
28 |
% |
| Adjusted Operating Income margin |
54 |
% |
|
29 |
% |
|
21 |
% |
|
26 |
% |
|
NA |
|
NA |
|
38 |
% |
Reconciliation of Operating income (loss) to Adjusted Operating Income (Continued)
|
|
|
|
|
|
|
|
|
|
|
|
|
|
|
|
|
|
|
|
|
|
|
|
|
|
|
|
|
|
|
|
|
|
|
|
|
|
|
|
|
|
|
Nine Months Ended September 30, 2024 |
|
Tinder |
|
Hinge |
|
MG Asia |
|
E&E |
|
Corporate & unallocated costs |
|
Eliminations |
|
Total Match Group |
|
|
|
|
|
|
|
|
|
|
|
|
|
|
|
(Dollars in thousands) |
Operating income (loss) |
$ |
664,396 |
|
|
$ |
90,978 |
|
|
$ |
(31,789) |
|
|
$ |
39,566 |
|
|
$ |
(163,227) |
|
|
$ |
— |
|
|
$ |
599,924 |
|
| Stock-based compensation expense |
66,557 |
|
|
29,978 |
|
|
20,683 |
|
|
41,978 |
|
|
38,979 |
|
|
— |
|
|
198,175 |
|
| Depreciation |
28,425 |
|
|
1,702 |
|
|
16,957 |
|
|
15,910 |
|
|
3,921 |
|
|
— |
|
|
66,915 |
|
Impairments and amortization of intangibles |
— |
|
|
— |
|
|
39,204 |
|
|
24,205 |
|
|
— |
|
|
— |
|
|
63,409 |
|
|
|
|
|
|
|
|
|
|
|
|
|
|
|
| Adjusted Operating Income |
$ |
759,378 |
|
|
$ |
122,658 |
|
|
$ |
45,055 |
|
|
$ |
121,659 |
|
|
$ |
(120,327) |
|
|
$ |
— |
|
|
$ |
928,423 |
|
|
|
|
|
|
|
|
|
|
|
|
|
|
|
| Revenue |
$ |
1,502,796 |
|
|
$ |
402,747 |
|
|
$ |
217,768 |
|
|
$ |
496,074 |
|
|
$ |
— |
|
|
$ |
(188) |
|
|
$ |
2,619,197 |
|
| Operating income (loss) margin |
44 |
% |
|
23 |
% |
|
(15) |
% |
|
8 |
% |
|
NA |
|
NA |
|
23 |
% |
| Adjusted Operating Income margin |
51 |
% |
|
30 |
% |
|
21 |
% |
|
25 |
% |
|
NA |
|
NA |
|
35 |
% |
|
|
|
|
|
|
|
|
|
|
|
|
|
|
|
|
|
|
|
|
|
|
|
|
|
|
|
|
|
|
|
|
|
|
|
|
|
|
|
|
|
|
|
Nine Months Ended September 30, 2023 |
|
Tinder |
|
Hinge |
|
MG Asia |
|
E&E |
|
Corporate & unallocated costs |
|
Eliminations |
|
Total Match Group |
|
|
|
|
|
|
|
|
|
|
|
|
|
|
|
(Dollars in thousands) |
Operating income (loss) |
$ |
718,521 |
|
|
$ |
47,395 |
|
|
$ |
(1,784) |
|
|
$ |
69,127 |
|
|
$ |
(176,615) |
|
|
$ |
— |
|
|
$ |
656,644 |
|
| Stock-based compensation expense |
50,779 |
|
|
19,019 |
|
|
16,119 |
|
|
36,213 |
|
|
41,815 |
|
|
— |
|
|
163,945 |
|
| Depreciation |
16,447 |
|
|
1,405 |
|
|
7,908 |
|
|
13,494 |
|
|
3,173 |
|
|
— |
|
|
42,427 |
|
Amortization of intangibles |
— |
|
|
— |
|
|
27,042 |
|
|
6,879 |
|
|
— |
|
|
— |
|
|
33,921 |
|
|
|
|
|
|
|
|
|
|
|
|
|
|
|
| Adjusted Operating Income |
$ |
785,747 |
|
|
$ |
67,819 |
|
|
$ |
49,285 |
|
|
$ |
125,713 |
|
|
$ |
(131,627) |
|
|
$ |
— |
|
|
$ |
896,937 |
|
|
|
|
|
|
|
|
|
|
|
|
|
|
|
| Revenue |
$ |
1,457,889 |
|
|
$ |
280,349 |
|
|
$ |
229,680 |
|
|
$ |
530,358 |
|
|
$ |
— |
|
|
$ |
— |
|
|
$ |
2,498,276 |
|
| Operating income (loss) margin |
49 |
% |
|
17 |
% |
|
(1) |
% |
|
13 |
% |
|
NA |
|
NA |
|
26 |
% |
| Adjusted Operating Income margin |
54 |
% |
|
24 |
% |
|
21 |
% |
|
24 |
% |
|
NA |
|
NA |
|
36 |
% |
Reconciliation of Net Earnings to Adjusted Operating Income used in Leverage Ratios
|
|
|
|
|
|
|
|
|
|
|
|
|
|
|
|
|
|
|
|
|
|
|
|
|
|
|
|
|
|
|
Twelve months ended |
|
|
|
|
|
|
|
|
|
|
|
|
|
9/30/2024 |
|
|
|
|
|
|
|
|
|
|
|
|
|
|
|
|
|
|
|
|
|
|
|
|
|
|
|
(In thousands) |
| Net earnings attributable to Match Group, Inc. shareholders |
|
|
|
|
|
|
|
|
|
|
|
|
$ |
622,638 |
|
Add back: |
|
|
|
|
|
|
|
|
|
|
|
|
|
| Net earnings attributable to noncontrolling interests |
|
|
|
|
|
|
|
|
|
|
|
|
77 |
|
|
|
|
|
|
|
|
|
|
|
|
|
|
|
| Income tax provision |
|
|
|
|
|
|
|
|
|
|
|
|
108,678 |
|
| Other income, net |
|
|
|
|
|
|
|
|
|
|
|
|
(32,142) |
|
Interest expense |
|
|
|
|
|
|
|
|
|
|
|
|
160,925 |
|
Operating income |
|
|
|
|
|
|
|
|
|
|
|
|
860,176 |
|
| Stock-based compensation expense |
|
|
|
|
|
|
|
|
|
|
|
|
266,329 |
|
| Depreciation |
|
|
|
|
|
|
|
|
|
|
|
|
86,295 |
|
Impairments and amortization of intangibles |
|
|
|
|
|
|
|
|
|
|
|
|
77,219 |
|
|
|
|
|
|
|
|
|
|
|
|
|
|
|
| Adjusted Operating Income |
|
|
|
|
|
|
|
|
|
|
|
|
$ |
1,290,019 |
|
Reconciliation of Operating Cash Flow to Free Cash Flow
|
|
|
|
|
|
|
|
|
|
|
|
|
Nine Months Ended September 30, |
|
2024 |
|
2023 |
|
|
|
|
|
(In thousands) |
| Net cash provided by operating activities |
$ |
678,009 |
|
|
$ |
620,672 |
|
| Capital expenditures |
(43,011) |
|
|
(50,020) |
|
| Free Cash Flow |
$ |
634,998 |
|
|
$ |
570,652 |
|
Reconciliation of Forecasted Operating Income to Adjusted Operating Income
|
|
|
|
|
|
|
|
|
Three Months Ended December 31, 2024 |
|
|
|
|
|
|
|
|
|
(In millions) |
Operating income |
$235 to $240 |
|
|
| Stock-based compensation expense |
68 |
|
|
| Depreciation and impairments and amortization of intangibles |
32 |
|
|
| Adjusted Operating Income |
$335 to $340 |
|
|
Reconciliation of GAAP Revenue to Non-GAAP Revenue, Excluding Foreign Exchange Effects
|
|
|
|
|
|
|
|
|
|
|
|
|
|
|
|
|
|
|
|
|
|
|
|
|
|
|
|
|
|
|
|
|
|
|
|
|
|
|
|
|
|
|
|
|
|
|
|
| |
Three Months Ended September 30, |
|
Nine Months Ended September 30, |
| |
2024 |
|
$ Change |
|
% Change |
|
2023 |
|
2024 |
|
$ Change |
|
% Change |
|
2023 |
|
|
|
|
|
|
|
|
|
|
|
|
|
|
|
|
| |
(Dollars in millions, rounding differences may occur) |
| Total Revenue, as reported |
$ |
895.5 |
|
|
$ |
13.9 |
|
|
2% |
|
$ |
881.6 |
|
|
$ |
2,619.2 |
|
|
$ |
120.9 |
|
|
5% |
|
$ |
2,498.3 |
|
| Foreign exchange effects |
11.0 |
|
|
|
|
|
|
|
|
58.9 |
|
|
|
|
|
|
|
| Total Revenue, excluding foreign exchange effects |
$ |
906.5 |
|
|
$ |
24.9 |
|
|
3% |
|
$ |
881.6 |
|
|
$ |
2,678.1 |
|
|
$ |
179.8 |
|
|
7% |
|
$ |
2,498.3 |
|
|
|
|
|
|
|
|
|
|
|
|
|
|
|
|
|
| Direct Revenue, as reported |
$ |
879.2 |
|
|
$ |
12.4 |
|
|
1% |
|
$ |
866.8 |
|
|
$ |
2,572.6 |
|
|
$ |
115.3 |
|
|
5% |
|
$ |
2,457.4 |
|
| Foreign exchange effects |
10.8 |
|
|
|
|
|
|
|
|
58.3 |
|
|
|
|
|
|
|
| Direct Revenue, excluding foreign exchange effects |
$ |
890.0 |
|
|
$ |
23.2 |
|
|
3% |
|
$ |
866.8 |
|
|
$ |
2,630.9 |
|
|
$ |
173.5 |
|
|
7% |
|
$ |
2,457.4 |
|
|
|
|
|
|
|
|
|
|
|
|
|
|
|
|
|
|
|
|
|
|
|
|
|
|
|
|
|
|
|
|
|
|
|
|
|
|
|
|
|
|
|
|
|
|
|
|
|
|
|
|
|
|
|
|
|
|
|
|
|
|
|
|
|
|
|
|
|
|
|
|
|
|
|
|
|
|
|
|
|
|
|
|
|
|
|
|
|
|
|
|
|
|
|
|
|
|
|
|
|
|
|
|
|
|
|
|
|
|
|
|
|
|
|
|
|
|
|
|
|
|
|
|
|
|
|
|
|
|
|
|
|
|
|
|
|
|
|
|
|
|
|
|
|
|
|
|
|
|
|
|
|
|
|
|
|
|
|
|
|
|
|
|
|
|
|
|
|
|
|
|
|
|
|
|
|
|
|
|
|
|
|
|
|
|
|
|
|
|
|
|
|
|
|
|
|
|
|
|
|
|
|
|
|
|
|
|
|
| Tinder Direct Revenue, as reported |
$ |
503.2 |
|
|
$ |
(5.3) |
|
|
(1)% |
|
$ |
508.5 |
|
|
$ |
1,464.6 |
|
|
$ |
40.2 |
|
|
3% |
|
$ |
1,424.4 |
|
| Foreign exchange effects |
7.9 |
|
|
|
|
|
|
|
|
34.6 |
|
|
|
|
|
|
|
| Tinder Direct Revenue, excluding foreign exchange effects |
$ |
511.1 |
|
|
$ |
2.6 |
|
|
1% |
|
$ |
508.5 |
|
|
$ |
1,499.2 |
|
|
$ |
74.8 |
|
|
5% |
|
$ |
1,424.4 |
|
|
|
|
|
|
|
|
|
|
|
|
|
|
|
|
|
| Hinge Direct Revenue, as reported |
$ |
145.4 |
|
|
$ |
38.2 |
|
|
36% |
|
$ |
107.3 |
|
|
$ |
402.7 |
|
|
$ |
122.4 |
|
|
44% |
|
$ |
280.3 |
|
| Foreign exchange effects |
(0.6) |
|
|
|
|
|
|
|
|
(0.3) |
|
|
|
|
|
|
|
| Hinge Direct Revenue, excluding foreign exchange effects |
$ |
144.9 |
|
|
$ |
37.6 |
|
|
35% |
|
$ |
107.3 |
|
|
$ |
402.4 |
|
|
$ |
122.1 |
|
|
44% |
|
$ |
280.3 |
|
|
|
|
|
|
|
|
|
|
|
|
|
|
|
|
|
| MG Asia Direct Revenue, as reported |
$ |
72.2 |
|
|
$ |
(4.6) |
|
|
(6)% |
|
$ |
76.8 |
|
|
$ |
217.3 |
|
|
$ |
(11.7) |
|
|
(5)% |
|
$ |
229.0 |
|
| Foreign exchange effects |
3.7 |
|
|
|
|
|
|
|
|
22.9 |
|
|
|
|
|
|
|
| MG Asia Direct Revenue, excluding foreign exchange effects |
$ |
75.8 |
|
|
$ |
(0.9) |
|
|
(1)% |
|
$ |
76.8 |
|
|
$ |
240.2 |
|
|
$ |
11.2 |
|
|
5% |
|
$ |
229.0 |
|
|
|
|
|
|
|
|
|
|
|
|
|
|
|
|
|
| E&E Direct Revenue, as reported |
$ |
158.4 |
|
|
$ |
(15.9) |
|
|
(9)% |
|
$ |
174.2 |
|
|
$ |
487.9 |
|
|
$ |
(35.7) |
|
|
(7)% |
|
$ |
523.6 |
|
| Foreign exchange effects |
(0.2) |
|
|
|
|
|
|
|
|
1.1 |
|
|
|
|
|
|
|
| E&E Direct Revenue, excluding foreign exchange effects |
$ |
158.2 |
|
|
$ |
(16.1) |
|
|
(9)% |
|
$ |
174.2 |
|
|
$ |
489.0 |
|
|
$ |
(34.5) |
|
|
(7)% |
|
$ |
523.6 |
|
|
|
|
|
|
|
|
|
|
|
|
|
|
|
|
|
|
|
|
|
|
|
|
|
|
|
|
|
|
|
|
|
|
|
|
|
|
|
|
|
|
|
|
|
|
|
|
|
|
|
|
|
|
|
|
|
|
|
|
|
|
|
|
|
|
|
|
|
|
|
|
|
|
|
|
|
|
|
|
|
|
|
|
|
|
|
|
|
|
|
|
|
|
|
|
|
|
|
|
|
|
|
|
|
|
|
|
|
|
|
|
|
|
|
|
|
|
|
|
|
|
|
|
|
|
|
|
|
|
|
|
|
|
|
|
|
|
|
|
|
|
|
|
|
| Azar Direct Revenue, as reported |
$ |
40.0 |
|
|
$ |
(0.7) |
|
|
(2)% |
|
$ |
40.7 |
|
|
$ |
115.9 |
|
|
$ |
0.5 |
|
|
—% |
|
$ |
115.4 |
|
| Foreign exchange effects |
2.6 |
|
|
|
|
|
|
|
|
13.9 |
|
|
|
|
|
|
|
| Azar Direct Revenue, excluding foreign exchange effects |
$ |
42.6 |
|
|
$ |
1.9 |
|
|
5% |
|
$ |
40.7 |
|
|
$ |
129.8 |
|
|
$ |
14.4 |
|
|
13% |
|
$ |
115.4 |
|
|
|
|
|
|
|
|
|
|
|
|
|
|
|
|
|
| Pairs Direct Revenue, as reported |
$ |
29.3 |
|
|
$ |
(0.4) |
|
|
(1)% |
|
$ |
29.7 |
|
|
$ |
85.1 |
|
|
$ |
(7.5) |
|
|
(8)% |
|
$ |
92.6 |
|
| Foreign exchange effects |
0.9 |
|
|
|
|
|
|
|
|
7.9 |
|
|
|
|
|
|
|
| Pairs Direct Revenue, excluding foreign exchange effects |
$ |
30.2 |
|
|
$ |
0.5 |
|
|
2% |
|
$ |
29.7 |
|
|
$ |
93.0 |
|
|
$ |
0.4 |
|
|
—% |
|
$ |
92.6 |
|
|
|
|
|
|
|
|
|
|
|
|
|
|
|
|
|
|
|
|
|
|
|
|
|
|
|
|
|
|
|
|
|
|
|
|
|
|
|
|
|
|
|
|
|
|
|
|
|
|
|
|
|
|
|
|
|
|
|
|
|
|
|
|
|
Reconciliation of GAAP Revenue to Non-GAAP Revenue, Excluding Foreign Exchange Effects (Revenue Per Payer)
|
|
|
|
|
|
|
|
|
|
|
|
|
|
|
|
|
|
|
|
|
|
|
|
|
|
|
|
|
|
|
|
|
|
|
|
|
|
|
|
|
|
|
|
|
|
|
|
| |
Three Months Ended September 30, |
|
Nine Months Ended September 30, |
| |
2024 |
|
$ Change |
|
% Change |
|
2023 |
|
2024 |
|
$ Change |
|
% Change |
|
2023 |
|
|
|
|
|
|
|
|
|
|
|
|
|
|
|
|
| (Percentage change calculated using non-rounded numbers) |
| RPP, as reported |
$ |
19.26 |
|
|
$ |
0.87 |
|
|
5% |
|
$ |
18.39 |
|
|
$ |
19.06 |
|
|
$ |
1.71 |
|
|
10% |
|
$ |
17.35 |
|
| Foreign exchange effects |
0.24 |
|
|
|
|
|
|
|
|
0.43 |
|
|
|
|
|
|
|
| RPP, excluding foreign exchange effects |
$ |
19.50 |
|
|
$ |
1.11 |
|
|
6% |
|
$ |
18.39 |
|
|
$ |
19.49 |
|
|
$ |
2.14 |
|
|
12% |
|
$ |
17.35 |
|
|
|
|
|
|
|
|
|
|
|
|
|
|
|
|
|
|
|
|
|
|
|
|
|
|
|
|
|
|
|
|
|
|
|
|
|
|
|
|
|
|
|
|
|
|
|
|
|
|
|
|
|
|
|
|
|
|
|
|
|
|
|
|
|
|
|
|
|
|
|
|
|
|
|
|
|
|
|
|
|
|
|
|
|
|
|
|
|
|
|
|
|
|
|
|
|
|
|
|
|
|
|
|
|
|
|
|
|
|
|
|
|
|
|
|
|
|
|
|
|
|
|
|
|
|
|
|
|
|
|
|
|
|
|
|
|
|
|
|
|
|
|
|
|
|
|
|
|
|
|
|
|
|
|
|
|
|
|
|
|
|
|
|
|
|
|
|
|
|
|
|
|
|
|
|
|
|
|
|
|
|
|
|
|
|
|
|
|
|
|
|
|
|
|
|
|
|
|
|
|
|
|
|
|
|
|
|
|
|
|
|
|
|
|
|
|
|
|
|
|
|
|
|
|
|
|
|
|
|
|
|
|
|
|
|
|
|
|
|
|
|
|
|
|
|
|
|
|
|
|
|
|
|
|
|
|
|
|
|
|
|
|
|
|
|
|
|
|
|
|
|
|
|
|
|
|
|
|
|
|
|
|
|
|
|
|
|
|
|
|
|
|
|
|
|
|
|
|
|
|
|
|
|
|
|
|
|
|
|
|
|
|
|
|
|
|
|
|
|
|
|
|
|
|
|
|
|
|
|
|
|
|
|
|
|
|
|
|
|
|
|
|
|
|
|
|
|
|
|
|
|
|
|
|
|
|
|
|
|
|
|
|
|
|
|
|
|
|
|
|
|
|
|
|
|
|
|
|
|
|
|
|
|
|
|
|
|
|
|
|
|
|
|
|
|
|
|
|
|
|
|
|
|
|
|
|
|
|
|
|
|
|
|
|
|
|
|
|
|
|
|
|
|
|
|
|
|
|
|
|
|
|
|
|
|
|
|
|
|
|
|
|
|
|
|
|
|
|
|
|
|
|
|
|
|
|
|
|
|
|
|
|
|
|
|
|
|
|
|
|
|
|
|
|
|
|
|
|
|
|
|
|
|
|
|
|
|
|
|
|
|
|
|
|
|
|
|
|
|
|
|
|
|
|
|
|
|
|
|
|
|
|
Dilutive Securities
Match Group has various tranches of dilutive securities. The table below details these securities and their potentially dilutive impact (shares in millions; rounding differences may occur).
|
|
|
|
|
|
|
|
|
|
|
|
|
|
|
|
|
|
|
|
|
Average Exercise Price |
|
11/1/2024 |
|
|
| Share Price |
|
|
$35.69 |
|
|
|
|
|
|
|
|
| Absolute Shares |
|
|
251.1 |
|
|
|
|
|
|
|
|
|
|
|
|
|
|
|
|
|
|
|
|
|
|
|
|
|
|
|
|
|
|
|
|
| Equity Awards |
|
|
|
|
|
|
|
|
|
|
|
| Options |
$17.95 |
|
1.2 |
|
|
|
|
|
|
|
|
| RSUs and subsidiary denominated equity awards |
|
|
15.1 |
|
|
|
|
|
|
|
|
| Total Dilution - Equity Awards |
|
|
16.3 |
|
|
|
|
|
|
|
|
| Outstanding Warrants |
|
|
|
|
|
|
|
|
|
|
|
| Warrants expiring on September 15, 2026 (6.6 million outstanding) |
$134.76 |
|
— |
|
|
|
|
|
|
|
|
| Warrants expiring on April 15, 2030 (6.8 million outstanding) |
$134.82 |
|
— |
|
|
|
|
|
|
|
|
| Total Dilution - Outstanding Warrants |
|
|
— |
|
|
|
|
|
|
|
|
|
|
|
|
|
|
|
|
|
|
|
|
| Total Dilution |
|
|
16.3 |
|
|
|
|
|
|
|
|
| % Dilution |
|
|
6.1% |
|
|
|
|
|
|
|
|
| Total Diluted Shares Outstanding |
|
|
267.4 |
|
|
|
|
|
|
|
|
______________________
The dilutive securities presentation above is calculated using the methods and assumptions described below; these are different from GAAP dilution, which is calculated based on the treasury stock method.
Options — The table above assumes the option exercise price is used to repurchase Match Group shares.
RSUs and subsidiary denominated equity awards — The table above assumes RSUs are fully dilutive. All performance-based and market-based awards reflect the expected shares that will vest based on current performance or market estimates. The table assumes no change in the fair value estimate of the subsidiary denominated equity awards from the values used for GAAP purposes at September 30, 2024.
Exchangeable Senior Notes — The Company has two series of Exchangeable Senior Notes outstanding. In the event of an exchange, each series of Exchangeable Senior Notes can be settled in cash, shares, or a combination of cash and shares. At the time of each Exchangeable Senior Notes issuance, the Company purchased call options with a strike price equal to the exchange price of each series of Exchangeable Senior Notes (“Note Hedge”), which can be used to offset the dilution of each series of the Exchangeable Senior Notes. No dilution is reflected in the table above for any of the Exchangeable Senior Notes because it is the Company’s intention to settle the Exchangeable Senior Notes with cash equal to the face amount of the notes; any shares issued would be offset by shares received upon exercise of the Note Hedge.
Warrants — At the time of the issuance of each series of Exchangeable Senior Notes, the Company also sold warrants for the number of shares with the strike prices reflected in the table above. The cash generated from the exercise of the warrants is assumed to be used to repurchase Match Group shares and the resulting net dilution, if any, is reflected in the table above.
Non-GAAP Financial Measures
Match Group reports Adjusted Operating Income, Adjusted Operating Income Margin, Free Cash Flow, and Revenue Excluding Foreign Exchange Effects, all of which are supplemental measures to U.S. generally accepted accounting principles (“GAAP”). The Adjusted Operating Income, Adjusted Operating Income Margin, and Free Cash Flow measures are among the primary metrics by which we evaluate the performance of our business, on which our internal budget is based and by which management is compensated. Revenue Excluding Foreign Exchange Effects provides a comparable framework for assessing the performance of our business without the effect of exchange rate differences when compared to prior periods. We believe that investors should have access to the same set of tools that we use in analyzing our results. These non-GAAP measures should be considered in addition to results prepared in accordance with GAAP but should not be considered a substitute for or superior to GAAP results. Match Group endeavors to compensate for the limitations of the non-GAAP measures presented by providing the comparable GAAP measures and descriptions of the reconciling items, including quantifying such items, to derive the non-GAAP measures. We encourage investors to examine the reconciling adjustments between the GAAP and non-GAAP measures, which we describe below. Interim results are not necessarily indicative of the results that may be expected for a full year.
Definitions of Non-GAAP Measures
Adjusted Operating Income is defined as operating income excluding: (1) stock-based compensation expense; (2) depreciation; and (3) acquisition-related items consisting of (i) amortization of intangible assets and impairments of goodwill and intangible assets, if applicable, and (ii) gains and losses recognized on changes in the fair value of contingent consideration arrangements, as applicable. We believe Adjusted Operating Income is useful to analysts and investors as this measure allows a more meaningful comparison between our performance and that of our competitors. The above items are excluded from our Adjusted Operating Income measure because they are non-cash in nature. Adjusted Operating Income has certain limitations because it excludes certain expenses.
Adjusted Operating Income Margin is defined as Adjusted Operating Income divided by revenues. We believe Adjusted Operating Income Margin is useful for analysts and investors as this measure allows a more meaningful comparison between our performance and that of our competitors. Adjusted Operating Income margin has certain limitations in that it does not take into account the impact to our consolidated statement of operations of certain expenses.
Free Cash Flow is defined as net cash provided by operating activities, less capital expenditures. We believe Free Cash Flow is useful to investors because it represents the cash that our operating businesses generate, before taking into account non-operational cash movements. Free Cash Flow has certain limitations in that it does not represent the total increase or decrease in the cash balance for the period, nor does it represent the residual cash flow for discretionary expenditures. Therefore, we think it is important to evaluate Free Cash Flow along with our consolidated statement of cash flows.
We look at Free Cash Flow as a measure of the strength and performance of our businesses, not for valuation purposes. In our view, applying “multiples” to Free Cash Flow is inappropriate because it is subject to timing, seasonality and one-time events. We manage our business for cash, and we think it is of utmost importance to maximize cash – but our primary valuation metric is Adjusted Operating Income.
Revenue Excluding Foreign Exchange Effects is calculated by translating current period revenues using prior period exchange rates. The percentage change in Revenue Excluding Foreign Exchange Effects is calculated by determining the change in current period revenues over prior period revenues where current period revenues are translated using prior period exchange rates. We believe the impact of foreign exchange rates on Match Group, due to its global reach, may be an important factor in understanding period over period comparisons if movement in rates is significant. Since our results are reported in U.S. dollars, international revenues are favorably impacted as the U.S. dollar weakens relative to other currencies, and unfavorably impacted as the U.S. dollar strengthens relative to other currencies. We believe the presentation of revenue excluding foreign exchange effects in addition to reported revenue helps improve the ability to understand Match Group’s performance because it excludes the impact of foreign currency volatility that is not indicative of Match Group’s core operating results.
Non-Cash Expenses That Are Excluded From Our Non-GAAP Measures
Stock-based compensation expense consists principally of expense associated with the grants of stock options, RSUs, performance-based RSUs and market-based awards. These expenses are not paid in cash, and we include the related shares in our fully diluted shares outstanding using the treasury stock method; however, performance-based RSUs and market-based awards are included only to the extent the applicable performance or market condition(s) have been met (assuming the end of the reporting period is the end of the contingency period). To the extent stock-based awards are settled on a net basis, we remit the required tax-withholding amounts from our current funds.
Depreciation is a non-cash expense relating to our property and equipment and is computed using the straight-line method to allocate the cost of depreciable assets to operations over their estimated useful lives, or, in the case of leasehold improvements, the lease term, if shorter.
Amortization of intangible assets and impairments of goodwill and intangible assets are non-cash expenses related primarily to acquisitions. At the time of an acquisition, the identifiable definite-lived intangible assets of the acquired company, such as customer lists, trade names and technology, are valued and amortized over their estimated lives. Value is also assigned to (i) acquired indefinite-lived intangible assets, which consist of trade names and trademarks, and (ii) goodwill, which are not subject to amortization. An impairment is recorded when the carrying value of an intangible asset or goodwill exceeds its fair value. We believe that intangible assets represent costs incurred by the acquired company to build value prior to acquisition and the related amortization and impairment charges of intangible assets or goodwill, if applicable, are not ongoing costs of doing business.
Additional Definitions
Match Group Asia (“MG Asia”) primarily consists of the brands Pairs and Azar.
Evergreen & Emerging (“E&E”) consists primarily of the brands Match, Meetic, OkCupid, Plenty of Fish, and a number of demographically focused brands.
Direct Revenue is revenue that is received directly from end users of our services and includes both subscription and à la carte revenue.
Indirect Revenue is revenue that is not received directly from end users of our services, substantially all of which is advertising revenue.
Payers are unique users at a brand level in a given month from whom we earned Direct Revenue. When presented as a quarter-to-date or year-to-date value, Payers represents the average of the monthly values for the respective period presented. At a consolidated level and a business unit level to the extent a business unit consists of multiple brands, duplicate Payers may exist when we earn revenue from the same individual at multiple brands in a given month, as we are unable to identify unique individuals across brands in the Match Group portfolio.
Revenue Per Payer (“RPP”) is the average monthly revenue earned from a Payer and is Direct Revenue for a period divided by the Payers in the period, further divided by the number of months in the period.
Monthly Active User (“MAU”) is a unique registered user at a brand level who has visited the brand’s app or, if applicable, their website in the last 28 days as of the measurement date. At a consolidated level, duplicate users will exist within MAU when the same individual visits multiple brands in a given month.
Leverage on a gross basis is calculated as principal debt balance divided by Adjusted Operating Income for the period referenced.
Leverage on a net basis is calculated as principal debt balance less cash and cash equivalents and short-term investments divided by Adjusted Operating Income for the period referenced.
Other Information
Safe Harbor Statement Under the Private Securities Litigation Reform Act of 1995
This letter and our conference call, which will be held at 8:30 a.m. Eastern Time on November 7, 2024, may contain “forward-looking statements” within the meaning of the Private Securities Litigation Reform Act of 1995. All statements that are not historical facts are “forward looking statements.” The use of words such as “anticipates,” “estimates,” “expects,” “plans” and “believes,” among others, generally identify forward-looking statements. These forward-looking statements include, among others, statements relating to: Match Group’s future financial performance, Match Group’s business prospects and strategy, anticipated trends, and other similar matters. These forward-looking statements are based on management’s current expectations and assumptions about future events, which are inherently subject to uncertainties, risks and changes in circumstances that are difficult to predict. Actual results could differ materially from those contained in these forward-looking statements for a variety of reasons, including, among others: our ability to maintain or grow the size of our user base, competition, the limited operating history of some of our brands, our ability to attract users to our services through cost-effective marketing and related efforts, our ability to distribute our services through third parties and offset related fees, risks relating to our use of artificial intelligence, foreign currency exchange rate fluctuations, the integrity and scalability of our systems and infrastructure (and those of third parties) and our ability to adapt ours to changes in a timely and cost-effective manner, our ability to protect our systems from cyberattacks and to protect personal and confidential user information, risks relating to certain of our international operations and acquisitions, damage to our brands' reputations as a result of inappropriate actions by users of our services, uncertainties related to the tax treatment of our separation from IAC, uncertainties related to the acquisition of Hyperconnect, including, among other things, the expected benefits of the transaction and the impact of the transaction on the businesses of Match Group, and macroeconomic conditions. Certain of these and other risks and uncertainties are discussed in Match Group’s filings with the Securities and Exchange Commission. Other unknown or unpredictable factors that could also adversely affect Match Group’s business, financial condition and results of operations may arise from time to time. In light of these risks and uncertainties, these forward-looking statements may not prove to be accurate. Accordingly, you should not place undue reliance on these forward-looking statements, which only reflect the views of Match Group management as of the date of this letter. Match Group does not undertake to update these forward-looking statements.
About Match Group
Match Group (NASDAQ: MTCH), through its portfolio companies, is a leading provider of digital technologies designed to help people make meaningful connections. Our global portfolio of brands includes Tinder®, Hinge®, Match®, Meetic®, OkCupid®, Pairs™, PlentyOfFish®, Azar®, BLK®, and more, each built to increase our users’ likelihood of connecting with others. Through our trusted brands, we provide tailored services to meet the varying preferences of our users. Our services are available in over 40 languages to our users all over the world.
Contact Us
|
|
|
|
|
|
|
Tanny Shelburne
Match Group Investor Relations
ir@match.com
|
Match Group Corporate Communications
matchgroupPR@match.com
|
|
|
|
Match Group
8750 North Central Expressway, Suite 1400, Dallas, TX 75231, (214) 576-9352 https://mtch.com
|