| WASHINGTON, D.C. 20579 | ||
| CURRENT REPORT | ||
| Delaware | 0-20388 | 36-3795742 | ||||||
| (State of other jurisdiction of incorporation) |
(Commission File Number) |
(IRS Employer Identification No.) |
||||||
| ☐ | Written communications pursuant to Rule 425 under the Securities Act (17 CFR 230.425) | ||||
| ☐ | Soliciting material pursuant to Rule 14a-12 under the Exchange Act (17 CFR 240.14a-12) | ||||
| ☐ | Pre-commencement communications pursuant to Rule 14d-2(b) under the Exchange Act (17 CFR 240.14d-2(b)) | ||||
| ☐ | Pre-commencement communications pursuant to Rule 13e-4(c) under the Exchange Act (17 CFR 240.13e-4(c)) | ||||
| Title of Each Class | Trading Symbol | Name of exchange on which registered | ||||||||||||
| Common Stock, par value $0.01 per share | LFUS | NASDAQ Global Select Market |
||||||||||||
| Item 2.02 | Results of Operations and Financial Condition | ||||
| Item 7.01 | Regulation FD Disclosure | ||||
| Item 9.01 | Financial Statements and Exhibits. | ||||
| (d) | Exhibits | |||||||
| The following exhibit is furnished with this Form 8-K: | ||||||||
| 104 Cover Page Interactive Data File (embedded within the Inline XBRL document) | ||||||||
| Littelfuse, Inc. | |||||
Date: July 30, 2024 |
By: /s/ Meenal A. Sethna |
||||
| Meenal A. Sethna Executive Vice President and Chief Financial Officer |
|||||
 |
 |
||||
|
FOR IMMEDIATE RELEASE
David Kelley
224-727-2535
dkelley@littelfuse.com
|
|||||
| Littelfuse Inc. 8755 West Higgins Road, Suite 500 Chicago, Illinois 60631 p: (773) 628-1000 www.littelfuse.com |
|||||
| (Unaudited) | ||||||||||||||
| (in thousands, except share and per share data) | June 29, 2024 |
December 30, 2023 |
||||||||||||
| ASSETS | ||||||||||||||
| Current assets: | ||||||||||||||
| Cash and cash equivalents | $ | 561,742 | $ | 555,513 | ||||||||||
| Short-term investments | 971 | 235 | ||||||||||||
| Trade receivables, less allowances of $73,744 and $84,696 at June 29, 2024 and December 30, 2023, respectively | 317,963 | 287,018 | ||||||||||||
| Inventories | 451,186 | 474,607 | ||||||||||||
| Prepaid income taxes and income taxes receivable | 6,413 | 8,701 | ||||||||||||
| Prepaid expenses and other current assets | 125,703 | 82,526 | ||||||||||||
| Total current assets | 1,463,978 | 1,408,600 | ||||||||||||
| Net property, plant, and equipment | 472,537 | 493,153 | ||||||||||||
| Intangible assets, net of amortization | 566,030 | 606,136 | ||||||||||||
| Goodwill | 1,287,762 | 1,309,998 | ||||||||||||
| Investments | 22,904 | 24,821 | ||||||||||||
| Deferred income taxes | 10,950 | 10,486 | ||||||||||||
| Right of use lease assets | 59,563 | 62,370 | ||||||||||||
| Other long-term assets | 41,254 | 79,711 | ||||||||||||
| Total assets | $ | 3,924,978 | $ | 3,995,275 | ||||||||||
| LIABILITIES AND EQUITY | ||||||||||||||
| Current liabilities: | ||||||||||||||
| Accounts payable | $ | 176,095 | $ | 173,535 | ||||||||||
| Accrued liabilities | 135,180 | 149,214 | ||||||||||||
| Accrued income taxes | 39,235 | 38,725 | ||||||||||||
| Current portion of long-term debt | 67,679 | 14,020 | ||||||||||||
| Total current liabilities | 418,189 | 375,494 | ||||||||||||
| Long-term debt, less current portion | 795,825 | 857,915 | ||||||||||||
| Deferred income taxes | 96,214 | 110,820 | ||||||||||||
| Accrued post-retirement benefits | 31,810 | 34,422 | ||||||||||||
| Non-current lease liabilities | 49,581 | 49,472 | ||||||||||||
| Other long-term liabilities | 67,872 | 86,671 | ||||||||||||
| Total equity | 2,465,487 | 2,480,481 | ||||||||||||
| Total liabilities and equity | $ | 3,924,978 | $ | 3,995,275 | ||||||||||
| Three Months Ended | Six Months Ended | |||||||||||||||||||||||||
| (in thousands, except per share data) | June 29, 2024 |
July 1, 2023 |
June 29, 2024 |
July 1, 2023 |
||||||||||||||||||||||
| Net sales | $ | 558,489 | $ | 611,997 | $ | 1,093,874 | $ | 1,221,779 | ||||||||||||||||||
| Cost of sales | 351,485 | 377,165 | 699,062 | 741,990 | ||||||||||||||||||||||
| Gross profit | 207,004 | 234,832 | 394,812 | 479,789 | ||||||||||||||||||||||
| Selling, general, and administrative expenses | 93,371 | 94,543 | 179,498 | 182,853 | ||||||||||||||||||||||
| Research and development expenses | 27,146 | 24,496 | 54,813 | 51,786 | ||||||||||||||||||||||
| Amortization of intangibles | 15,729 | 16,885 | 31,554 | 33,751 | ||||||||||||||||||||||
| Restructuring, impairment, and other charges | 5,252 | 6,855 | 8,489 | 8,705 | ||||||||||||||||||||||
| Total operating expenses | 141,498 | 142,779 | 274,354 | 277,095 | ||||||||||||||||||||||
| Operating income | 65,506 | 92,053 | 120,458 | 202,694 | ||||||||||||||||||||||
| Interest expense | 9,975 | 10,056 | 19,586 | 19,702 | ||||||||||||||||||||||
| Foreign exchange gain | (315) | (1,404) | (5,357) | (3,079) | ||||||||||||||||||||||
| Other income, net | (5,298) | (2,050) | (10,619) | (8,283) | ||||||||||||||||||||||
| Income before income taxes | 61,144 | 85,451 | 116,848 | 194,354 | ||||||||||||||||||||||
| Income taxes | 15,678 | 15,380 | 22,930 | 35,538 | ||||||||||||||||||||||
| Net income | $ | 45,466 | $ | 70,071 | $ | 93,918 | $ | 158,816 | ||||||||||||||||||
| Earnings per share: | ||||||||||||||||||||||||||
| Basic | $ | 1.83 | $ | 2.82 | $ | 3.78 | $ | 6.40 | ||||||||||||||||||
| Diluted | $ | 1.82 | $ | 2.79 | $ | 3.75 | $ | 6.33 | ||||||||||||||||||
| Weighted-average shares and equivalent shares outstanding: | ||||||||||||||||||||||||||
| Basic | 24,822 | 24,839 | 24,867 | 24,810 | ||||||||||||||||||||||
| Diluted | 25,030 | 25,095 | 25,075 | 25,078 | ||||||||||||||||||||||
| Comprehensive income | $ | 24,399 | $ | 55,160 | $ | 42,560 | $ | 157,188 | ||||||||||||||||||
| Six Months Ended | ||||||||||||||
| (in thousands) | June 29, 2024 | July 1, 2023 | ||||||||||||
| OPERATING ACTIVITIES | ||||||||||||||
| Net income | $ | 93,918 | $ | 158,816 | ||||||||||
| Adjustments to reconcile net income to net cash provided by operating activities: | 73,161 | 83,347 | ||||||||||||
| Changes in operating assets and liabilities: | ||||||||||||||
| Trade receivables | (36,474) | (30,562) | ||||||||||||
| Inventories | 16,241 | 26,638 | ||||||||||||
| Accounts payable | 6,819 | (33,796) | ||||||||||||
| Accrued liabilities and income taxes | (28,829) | (57,790) | ||||||||||||
| Prepaid expenses and other assets | 1,738 | 4,980 | ||||||||||||
| Net cash provided by operating activities | 126,574 | 151,633 | ||||||||||||
| INVESTING ACTIVITIES | ||||||||||||||
| Acquisitions of businesses, net of cash acquired | — | (158,260) | ||||||||||||
| Purchases of property, plant, and equipment | (34,674) | (41,501) | ||||||||||||
| Net proceeds from sale of property, plant and equipment, and other | 7,997 | 741 | ||||||||||||
| Net cash used in investing activities | (26,677) | (199,020) | ||||||||||||
| FINANCING ACTIVITIES | ||||||||||||||
| Net payments of credit facility | (3,750) | (3,750) | ||||||||||||
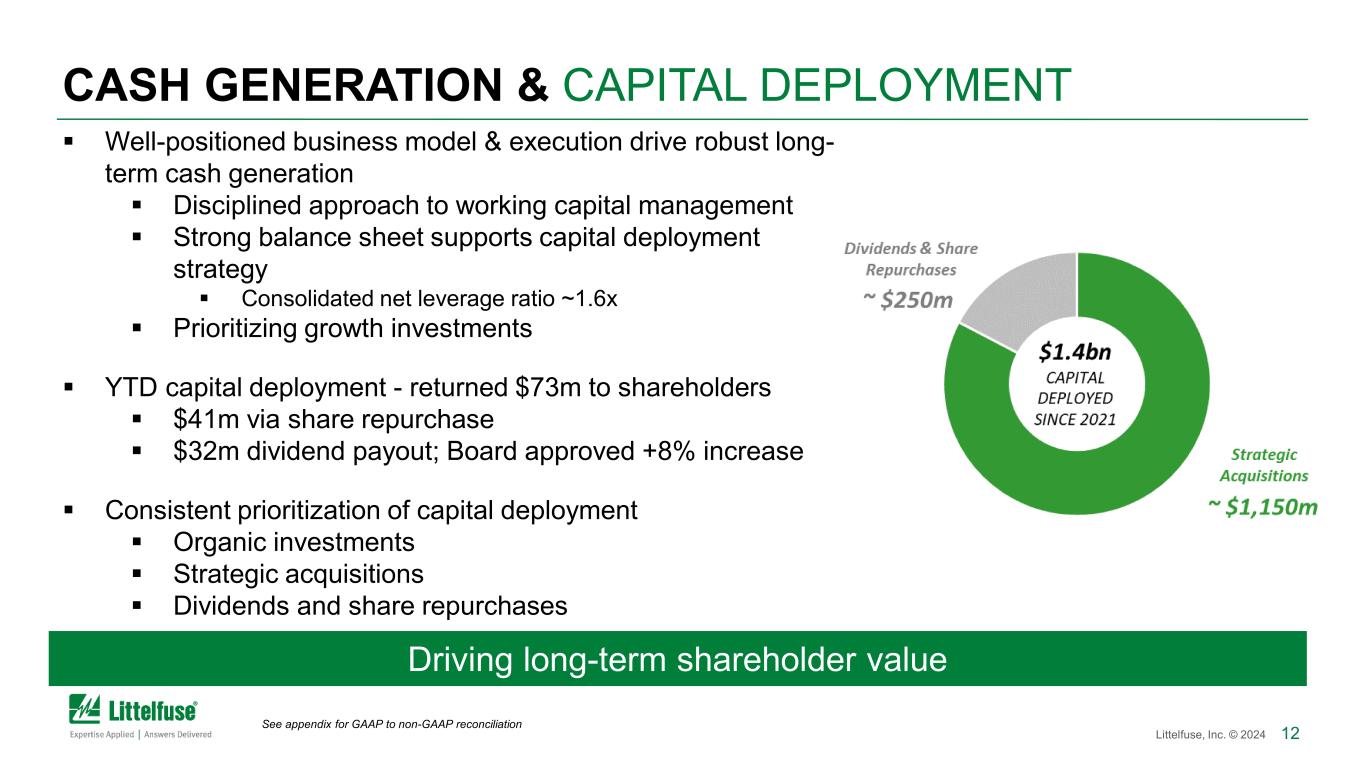
| Repurchases of common stock | (40,862) | — | ||||||||||||
| Cash dividends paid | (32,330) | (29,790) | ||||||||||||
| All other cash (used in) provided by financing activities | (2,348) | 854 | ||||||||||||
| Net cash used in financing activities | (79,290) | (32,686) | ||||||||||||
| Effect of exchange rate changes on cash, cash equivalents, and restricted cash | (14,434) | (1,772) | ||||||||||||
| Increase (decrease) in cash, cash equivalents, and restricted cash | 6,173 | (81,845) | ||||||||||||
| Cash, cash equivalents, and restricted cash at beginning of period | 557,123 | 564,939 | ||||||||||||
| Cash, cash equivalents, and restricted cash at end of period | $ | 563,296 | $ | 483,094 | ||||||||||
| Second Quarter | Year-to-Date | |||||||||||||||||||||||||||||||||||||
| (in thousands) | 2024 | 2023 | % (Decline) / Growth |
2024 | 2023 | % (Decline) / Growth |
||||||||||||||||||||||||||||||||
| Net sales | ||||||||||||||||||||||||||||||||||||||
| Electronics | $ | 305,639 | $ | 350,147 | (12.7) | % | $ | 596,744 | $ | 708,740 | (15.8) | % | ||||||||||||||||||||||||||
| Transportation | 168,964 | 172,048 | (1.8) | % | 339,331 | 338,689 | 0.2 | % | ||||||||||||||||||||||||||||||
| Industrial | 83,886 | 89,802 | (6.6) | % | 157,799 | 174,350 | (9.5) | % | ||||||||||||||||||||||||||||||
| Total net sales | $ | 558,489 | $ | 611,997 | (8.7) | % | $ | 1,093,874 | $ | 1,221,779 | (10.5) | % | ||||||||||||||||||||||||||
| Operating income | ||||||||||||||||||||||||||||||||||||||
| Electronics | $ | 46,165 | $ | 79,844 | (42.2) | % | $ | 83,968 | $ | 170,006 | (50.6) | % | ||||||||||||||||||||||||||
| Transportation | 15,234 | 7,789 | 95.6 | % | 31,440 | 16,321 | 92.6 | % | ||||||||||||||||||||||||||||||
| Industrial | 9,547 | 15,108 | (36.8) | % | 14,343 | 32,249 | (55.5) | % | ||||||||||||||||||||||||||||||
| Other(a) | (5,440) | (10,688) | N.M. | (9,293) | (15,882) | N.M. | ||||||||||||||||||||||||||||||||
| Total operating income | $ | 65,506 | $ | 92,053 | (28.8) | % | $ | 120,458 | $ | 202,694 | (40.6) | % | ||||||||||||||||||||||||||
| Operating Margin | 11.7 | % | 15.0 | % | 11.0 | % | 16.6 | % | ||||||||||||||||||||||||||||||
| Interest expense | 9,975 | 10,056 | 19,586 | 19,702 | ||||||||||||||||||||||||||||||||||
| Foreign exchange gain | (315) | (1,404) | (5,357) | (3,079) | ||||||||||||||||||||||||||||||||||
| Other income, net | (5,298) | (2,050) | (10,619) | (8,283) | ||||||||||||||||||||||||||||||||||
| Income before income taxes | $ | 61,144 | $ | 85,451 | (28.4) | % | $ | 116,848 | $ | 194,354 | (39.9) | % | ||||||||||||||||||||||||||
| Second Quarter | Year-to-Date | |||||||||||||||||||||||||||||||||||||
| (in thousands) | 2024 | 2023 | % (Decline)/Growth |
2024 | 2023 | % (Decline)/Growth |
||||||||||||||||||||||||||||||||
| Operating Margin | ||||||||||||||||||||||||||||||||||||||
| Electronics | 15.1 | % | 22.8 | % | (7.7) | % | 14.1 | % | 24.0 | % | (9.9) | % | ||||||||||||||||||||||||||
| Transportation | 9.0 | % | 4.5 | % | 4.5 | % | 9.3 | % | 4.8 | % | 4.5 | % | ||||||||||||||||||||||||||
| Industrial | 11.4 | % | 16.8 | % | (5.4) | % | 9.1 | % | 18.5 | % | (9.4) | % | ||||||||||||||||||||||||||
| Non-GAAP EPS reconciliation | ||||||||||||||||||||||||||
| Q2-24 | Q2-23 | YTD-24 | YTD-23 | |||||||||||||||||||||||
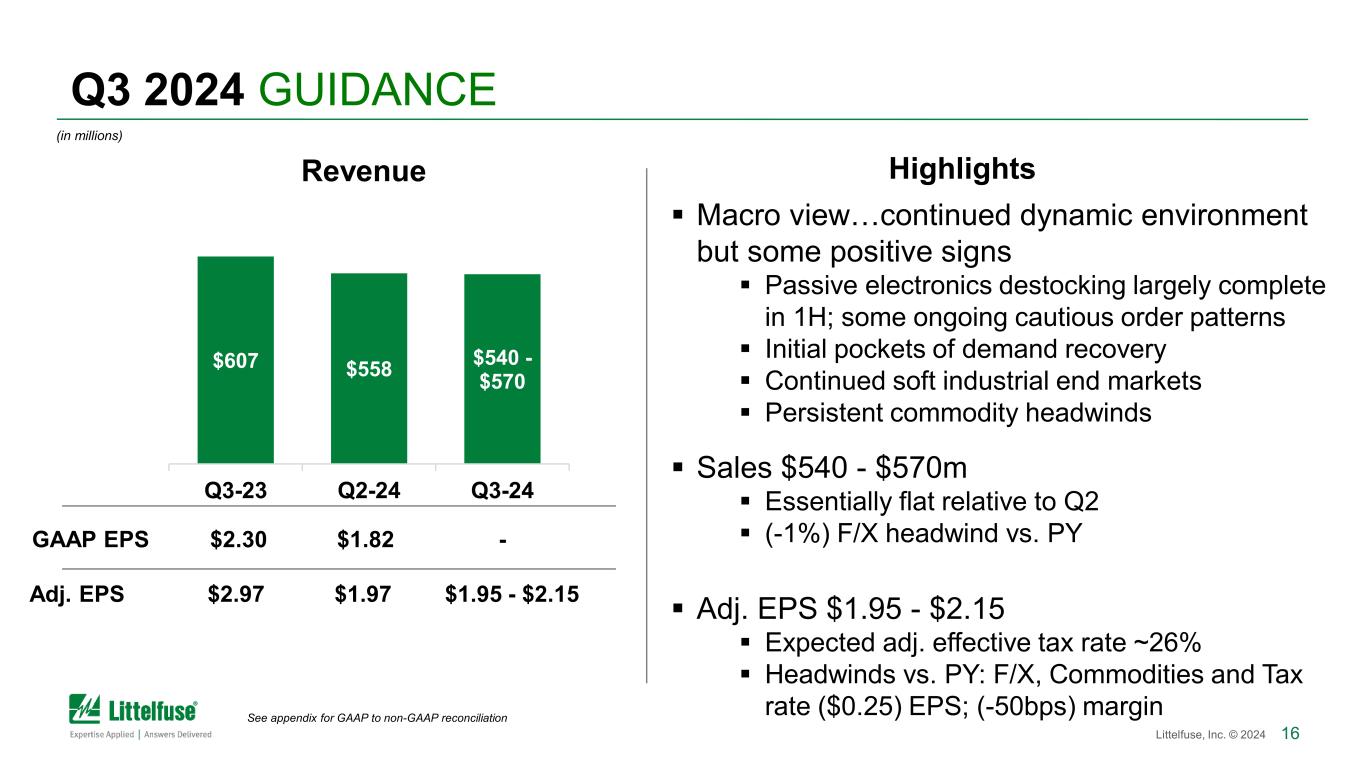
| GAAP diluted EPS | $ | 1.82 | $ | 2.79 | $ | 3.75 | $ | 6.33 | ||||||||||||||||||
| EPS impact of Non-GAAP adjustments (below) | 0.15 | 0.33 | (0.02) | 0.42 | ||||||||||||||||||||||
| Adjusted diluted EPS | $ | 1.97 | $ | 3.12 | $ | 3.73 | $ | 6.75 | ||||||||||||||||||
| Non-GAAP adjustments - (income) / expense | ||||||||||||||||||||||||||
| Q2-24 | Q2-23 | YTD-24 | YTD-23 | |||||||||||||||||||||||
| Acquisition-related and integration costs (a) | $ | 0.8 | $ | 3.8 | $ | 1.8 | $ | 7.2 | ||||||||||||||||||
| Restructuring, impairment and other charges (b) | 5.3 | 6.9 | 8.5 | 8.7 | ||||||||||||||||||||||
| Gain on sale of fixed assets (c) | (0.7) | — | (1.0) | — | ||||||||||||||||||||||
| Non-GAAP adjustments to operating income | 5.4 | 10.7 | 9.3 | 15.9 | ||||||||||||||||||||||
| Other income, net (d) | (0.5) | — | (0.3) | (0.2) | ||||||||||||||||||||||
| Non-operating foreign exchange gain | (0.3) | (1.4) | (5.4) | (3.1) | ||||||||||||||||||||||
| Non-GAAP adjustments to income before income taxes | 4.6 | 9.3 | 3.6 | 12.6 | ||||||||||||||||||||||
| Income taxes (e) | 0.7 | 1.0 | 4.1 | 1.9 | ||||||||||||||||||||||
| Non-GAAP adjustments to net income | $ | 3.9 | $ | 8.3 | $ | (0.5) | $ | 10.7 | ||||||||||||||||||
| Total EPS impact | $ | 0.15 | $ | 0.33 | $ | (0.02) | $ | 0.42 | ||||||||||||||||||
| Adjusted operating margin / Adjusted EBITDA reconciliation | ||||||||||||||||||||||||||
| Q2-24 | Q2-23 | YTD-24 | YTD-23 | |||||||||||||||||||||||
| Net income | $ | 45.5 | $ | 70.1 | $ | 93.9 | $ | 158.8 | ||||||||||||||||||
| Add: | ||||||||||||||||||||||||||
| Income taxes | 15.7 | 15.4 | 22.9 | 35.5 | ||||||||||||||||||||||
| Interest expense | 10.0 | 10.1 | 19.6 | 19.7 | ||||||||||||||||||||||
| Foreign exchange gain | (0.3) | (1.4) | (5.4) | (3.1) | ||||||||||||||||||||||
| Other income, net | (5.3) | (2.1) | (10.6) | (8.3) | ||||||||||||||||||||||
| GAAP operating income | $ | 65.5 | $ | 92.1 | $ | 120.5 | $ | 202.7 | ||||||||||||||||||
| Non-GAAP adjustments to operating income | 5.4 | 10.7 | 9.3 | 15.9 | ||||||||||||||||||||||
| Adjusted operating income | $ | 70.9 | $ | 102.8 | $ | 129.8 | $ | 218.6 | ||||||||||||||||||
| Amortization of intangibles | 15.7 | 16.9 | 31.6 | 33.8 | ||||||||||||||||||||||
| Depreciation expenses | 17.1 | 18.0 | 33.7 | 35.6 | ||||||||||||||||||||||
| Adjusted EBITDA | $ | 103.7 | $ | 137.7 | $ | 195.0 | $ | 288.0 | ||||||||||||||||||
| Net sales | $ | 558.5 | $ | 612.0 | $ | 1,093.9 | $ | 1,221.8 | ||||||||||||||||||
| Net income as a percentage of net sales | 8.1 | % | 11.5 | % | 8.6 | % | 13.0 | % | ||||||||||||||||||
| Operating margin | 11.7 | % | 15.0 | % | 11.0 | % | 16.6 | % | ||||||||||||||||||
| Adjusted operating margin | 12.7 | % | 16.8 | % | 11.9 | % | 17.9 | % | ||||||||||||||||||
| Adjusted EBITDA margin | 18.6 | % | 22.5 | % | 17.8 | % | 23.6 | % | ||||||||||||||||||
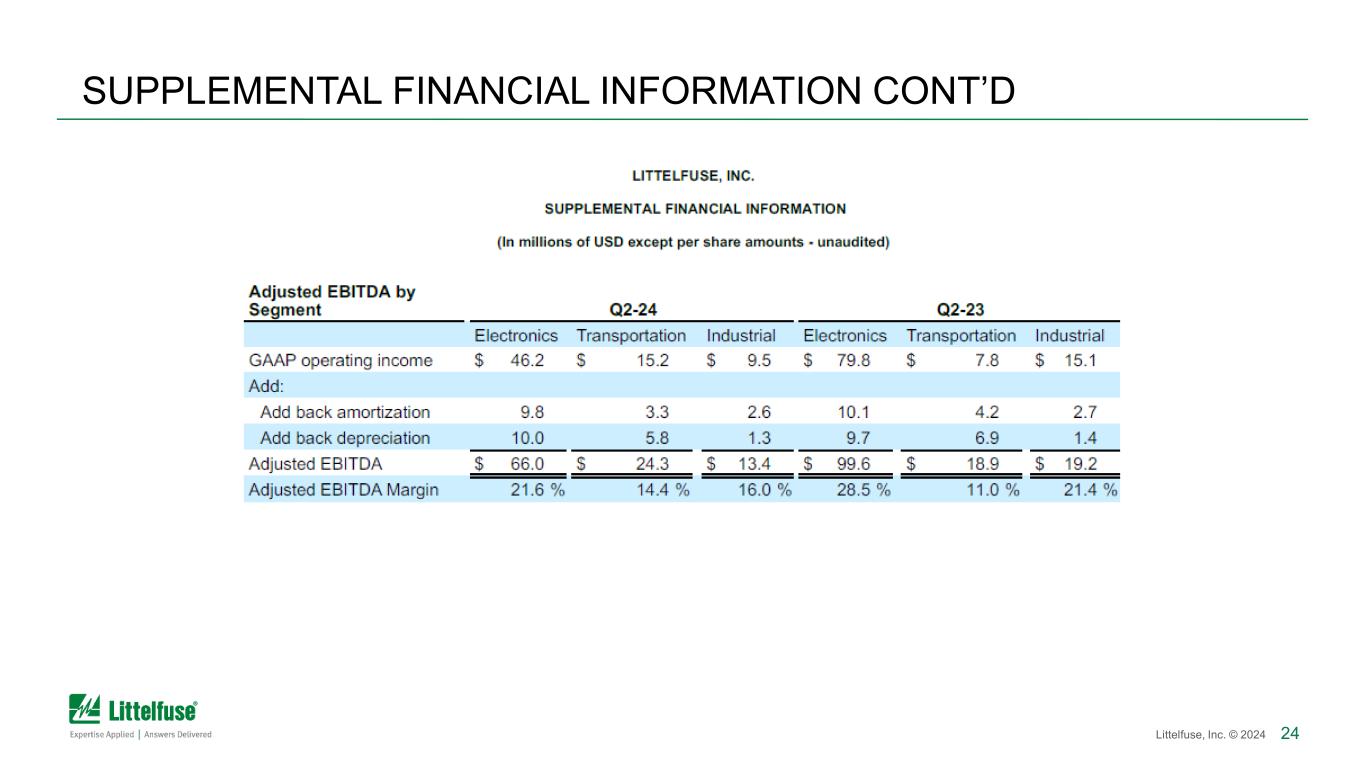
| Adjusted EBITDA by Segment | Q2-24 | Q2-23 | ||||||||||||||||||||||||||||||||||||
| Electronics | Transportation | Industrial | Electronics | Transportation | Industrial | |||||||||||||||||||||||||||||||||
| GAAP operating income | $ | 46.2 | $ | 15.2 | $ | 9.5 | $ | 79.8 | $ | 7.8 | $ | 15.1 | ||||||||||||||||||||||||||
| Add: | ||||||||||||||||||||||||||||||||||||||
| Add back amortization | 9.8 | 3.3 | 2.6 | 10.1 | 4.2 | 2.7 | ||||||||||||||||||||||||||||||||
| Add back depreciation | 10.0 | 5.8 | 1.3 | 9.7 | 6.9 | 1.4 | ||||||||||||||||||||||||||||||||
| Adjusted EBITDA | $ | 66.0 | $ | 24.3 | $ | 13.4 | $ | 99.6 | $ | 18.9 | $ | 19.2 | ||||||||||||||||||||||||||
| Adjusted EBITDA Margin | 21.6 | % | 14.4 | % | 16.0 | % | 28.5 | % | 11.0 | % | 21.4 | % | ||||||||||||||||||||||||||
| Adjusted EBITDA by Segment | YTD-24 | YTD-23 | ||||||||||||||||||||||||||||||||||||
| Electronics | Transportation | Industrial | Electronics | Transportation | Industrial | |||||||||||||||||||||||||||||||||
| GAAP operating income | $ | 84.0 | $ | 31.4 | $ | 14.3 | $ | 170.0 | $ | 16.3 | $ | 32.2 | ||||||||||||||||||||||||||
| Add: | ||||||||||||||||||||||||||||||||||||||
| Add back amortization | 19.7 | 6.8 | 5.1 | 20.3 | 8.6 | 4.9 | ||||||||||||||||||||||||||||||||
| Add back depreciation | 19.9 | 11.0 | 2.8 | 19.5 | 13.6 | 2.5 | ||||||||||||||||||||||||||||||||
| Adjusted EBITDA | $ | 123.6 | $ | 49.2 | $ | 22.2 | $ | 209.9 | $ | 38.5 | $ | 39.6 | ||||||||||||||||||||||||||
| Adjusted EBITDA Margin | 20.7 | % | 14.5 | % | 14.1 | % | 29.6 | % | 11.4 | % | 22.7 | % | ||||||||||||||||||||||||||
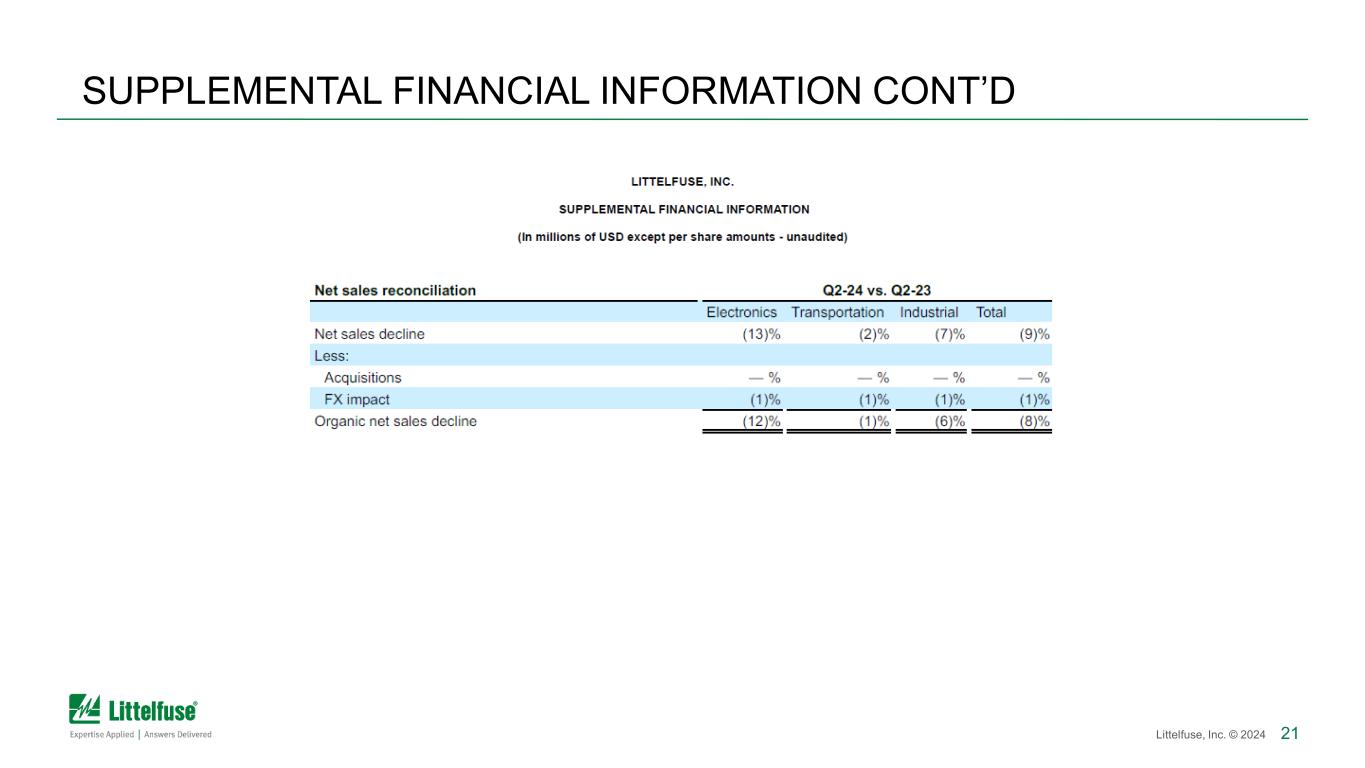
| Net sales reconciliation | Q2-24 vs. Q2-23 | |||||||||||||||||||||||||
| Electronics | Transportation | Industrial | Total | |||||||||||||||||||||||
| Net sales decline | (13) | % | (2) | % | (7) | % | (9) | % | ||||||||||||||||||
| Less: | ||||||||||||||||||||||||||
| Acquisitions | — | % | — | % | — | % | — | % | ||||||||||||||||||
| FX impact | (1) | % | (1) | % | (1) | % | (1) | % | ||||||||||||||||||
| Organic net sales decline | (12) | % | (1) | % | (6) | % | (8) | % | ||||||||||||||||||
| Net sales reconciliation | YTD-24 vs. YTD-23 | |||||||||||||||||||||||||
| Electronics | Transportation | Industrial | Total | |||||||||||||||||||||||
| Net sales (decline) growth | (16) | % | — | % | (9) | % | (10) | % | ||||||||||||||||||
| Less: | ||||||||||||||||||||||||||
| Acquisitions | — | % | — | % | 1 | % | — | % | ||||||||||||||||||
| FX impact | (1) | % | (1) | % | — | % | — | % | ||||||||||||||||||
| Organic net sales (decline) growth | (15) | % | 1 | % | (10) | % | (10) | % | ||||||||||||||||||
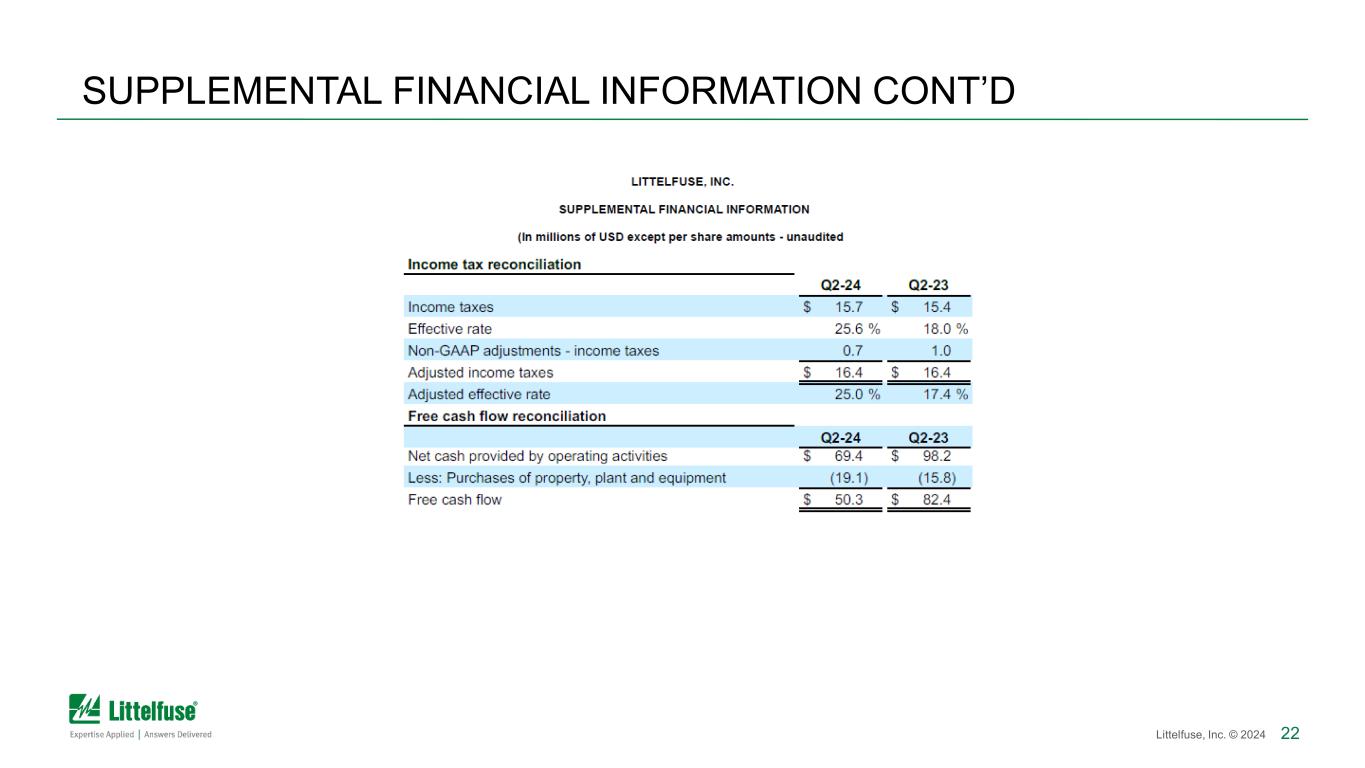
| Income tax reconciliation | ||||||||||||||||||||||||||
| Q2-24 | Q2-23 | YTD-24 | YTD-23 | |||||||||||||||||||||||
| Income taxes | $ | 15.7 | $ | 15.4 | $ | 22.9 | $ | 35.5 | ||||||||||||||||||
| Effective rate | 25.6 | % | 18.0 | % | 19.6 | % | 18.3 | % | ||||||||||||||||||
| Non-GAAP adjustments - income taxes | 0.7 | 1.0 | 4.1 | 1.9 | ||||||||||||||||||||||
| Adjusted income taxes | $ | 16.4 | $ | 16.4 | $ | 27.0 | $ | 37.4 | ||||||||||||||||||
| Adjusted effective rate | 25.0 | % | 17.4 | % | 22.4 | % | 18.1 | % | ||||||||||||||||||
| Free cash flow reconciliation | ||||||||||||||||||||||||||
| Q2-24 | Q2-23 | YTD-24 | YTD-23 | |||||||||||||||||||||||
| Net cash provided by operating activities | $ | 69.4 | $ | 98.2 | $ | 126.6 | $ | 151.6 | ||||||||||||||||||
| Less: Purchases of property, plant and equipment | (19.1) | (15.8) | (34.7) | (41.5) | ||||||||||||||||||||||
| Free cash flow | $ | 50.3 | $ | 82.4 | $ | 91.9 | $ | 110.1 | ||||||||||||||||||
| Consolidated Total Debt | As of June 29, 2024 |
|||||||
| Consolidated Total Debt | $ | 863.5 | ||||||
| Unamortized debt issuance costs | 3.3 | |||||||
| Finance lease liability | 0.4 | |||||||
| Consolidated funded indebtedness | 867.2 | |||||||
| Cash held in U.S. (up to $400 million) | 102.1 | |||||||
| Net debt | $ | 765.1 | ||||||
| Consolidated EBITDA | Twelve Months Ended June 29, 2024 |
|||||||
| Net Income | $ | 194.5 | ||||||
| Interest expense | 39.7 | |||||||
| Income taxes | 56.5 | |||||||
| Depreciation | 69.7 | |||||||
| Amortization | 63.6 | |||||||
| Non-cash additions: | ||||||||
| Stock-based compensation expense | 24.5 | |||||||
| Purchase accounting inventory step-up charge | — | |||||||
| Unrealized loss on investments | 2.1 | |||||||
| Impairment charges | 1.9 | |||||||
| Other | 13.7 | |||||||
| Consolidated EBITDA (1) | $ | 466.2 | ||||||
| Consolidated Net Leverage Ratio (as defined in the Credit Agreement) * | 1.6x | |||||||

