| Washington | 000-20288 | 91-1422237 | ||||||
(State or Other Jurisdiction of Incorporation or Organization) |
(Commission File Number) |
(I.R.S. Employer Identification Number) |
||||||
| TITLE OF EACH CLASS | TRADING SYMBOL | NAME OF EXCHANGE | ||||||
| Common Stock, No Par Value | COLB | The NASDAQ Stock Market LLC | ||||||
| Item 2.02 | Results of Operations and Financial Condition. | ||||
| Item 7.01 | Regulation FD Disclosure. | ||||
| Item 9.01 | Financial Statements and Exhibits. | ||||
| (d) | EXHIBITS | ||||
| 104 Cover Page Interactive Data File (embedded within the Inline XBRL document) | |||||
|
Columbia Banking System, Inc.
(Registrant)
|
|||||
Dated: April 25, 2024 |
By: /s/ Ronald L. Farnsworth
Ronald L. Farnsworth
Executive Vice President/Chief Financial Officer
|
||||
 |
|||||
COLUMBIA BANKING SYSTEM, INC. REPORTS FIRST QUARTER 2024 RESULTS | ||||||||||||||||||||
| $0.59 | $0.65 | $23.68 | $16.03 | |||||||||||||||||
| Earnings per diluted common share | Operating earnings per diluted common share 1 | Book value per common share | Tangible book value per common share 1 |
|||||||||||||||||
| CEO Commentary | ||
"Our first quarter results reflect early progress on our targeted actions to improve our financial performance and drive shareholder value,” said Clint Stein, President and CEO. "Enterprise-wide evaluations and targeted changes resulted in tighter expense control and stabilizing deposit costs in the latter part of the quarter. We will continue to exercise prudent expense management, and we expect to see the positive financial impact of near-term initiatives fully reflected in the fourth quarter's expense run rate. Longer-term initiatives will optimize our performance from a revenue, expense, and profitability standpoint. As an organization, Columbia remains laser-focused on regaining our placement as a top-quartile bank across financial metrics as we strive to drive long-term, consistent, repeatable performance." | ||
–Clint Stein, President and CEO of Columbia Banking System, Inc. | ||
1Q24 HIGHLIGHTS (COMPARED TO 4Q23) |
||||||||
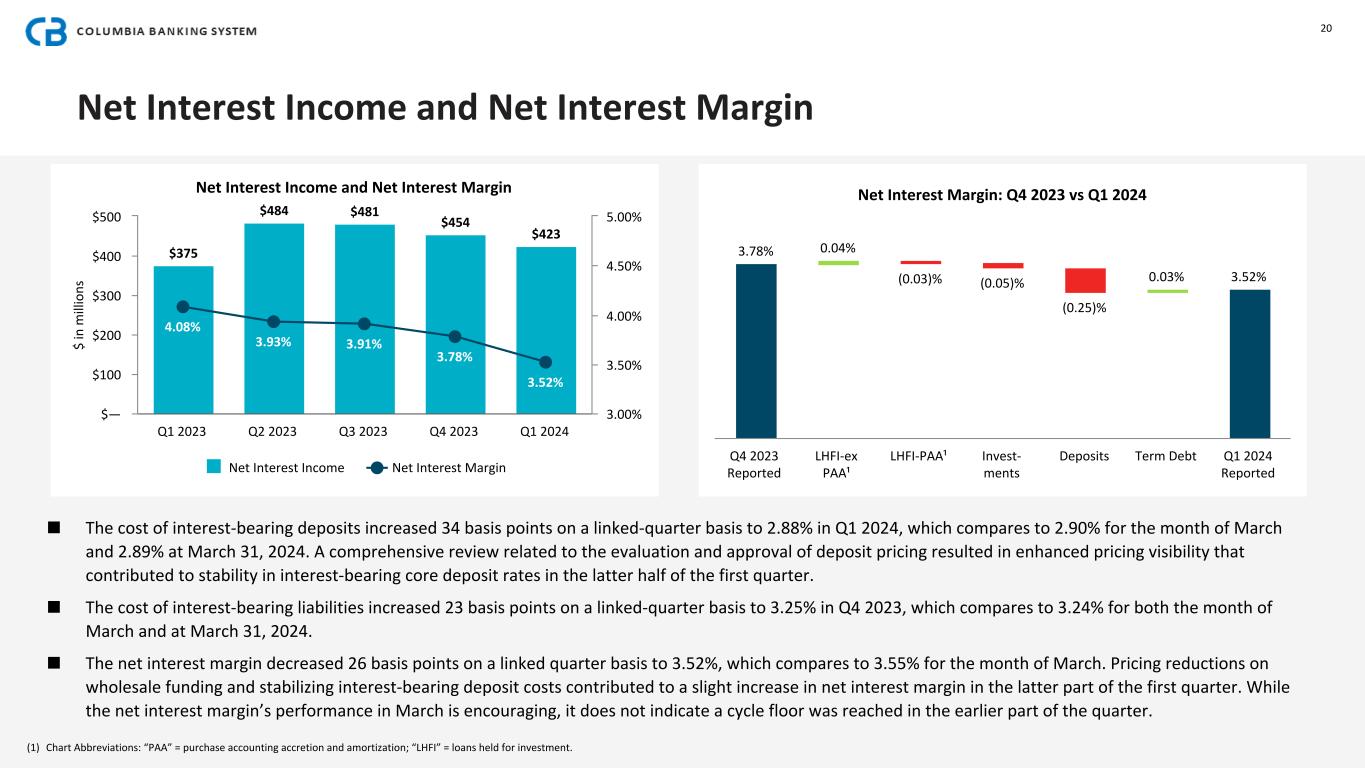
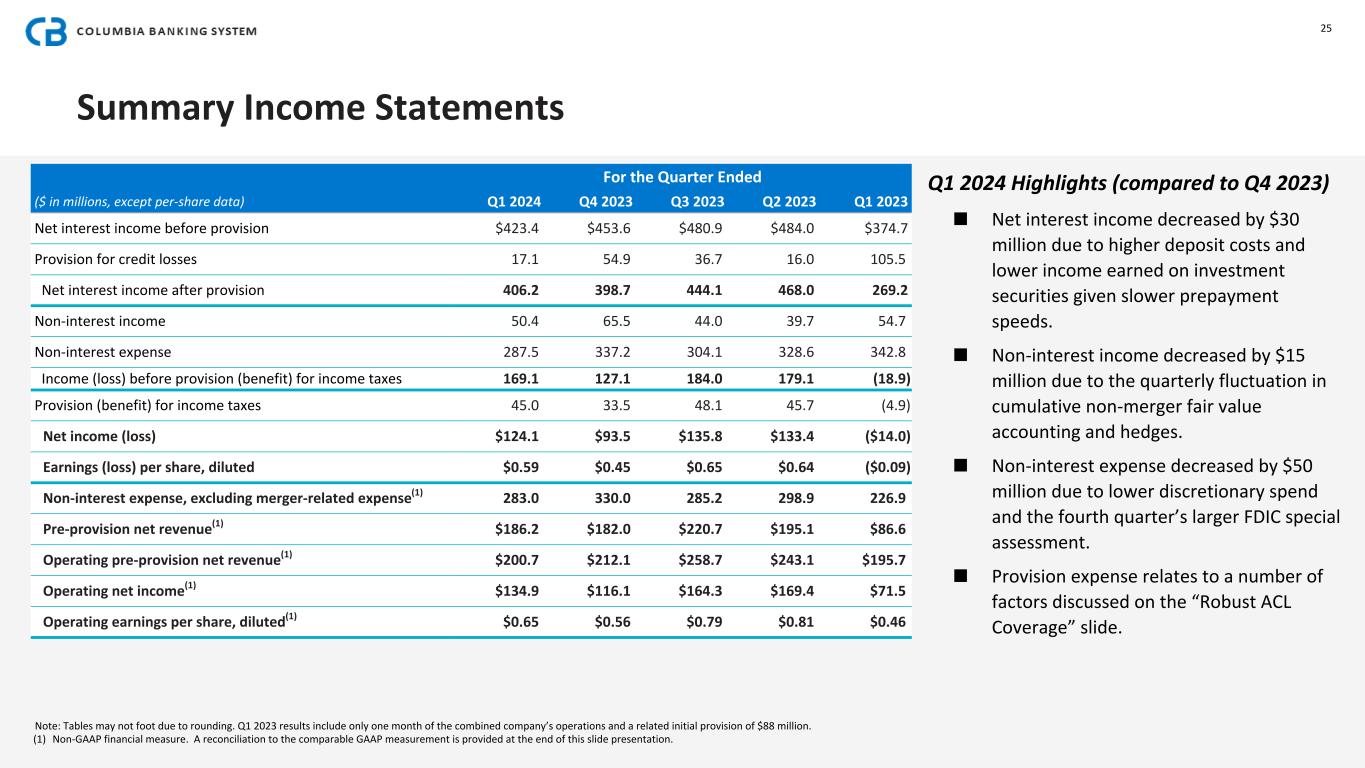
| Net Interest Income and NIM | •Net interest income decreased by $30 million on a linked-quarter basis due to higher deposit costs relative to the fourth quarter and lower income earned on investment securities given slower prepayment activity. |
|||||||
•Net interest margin was 3.52%, down 26 basis points from the prior quarter given the full-quarter effect of deposit repricing and balance mix shift during the fourth quarter. |
||||||||
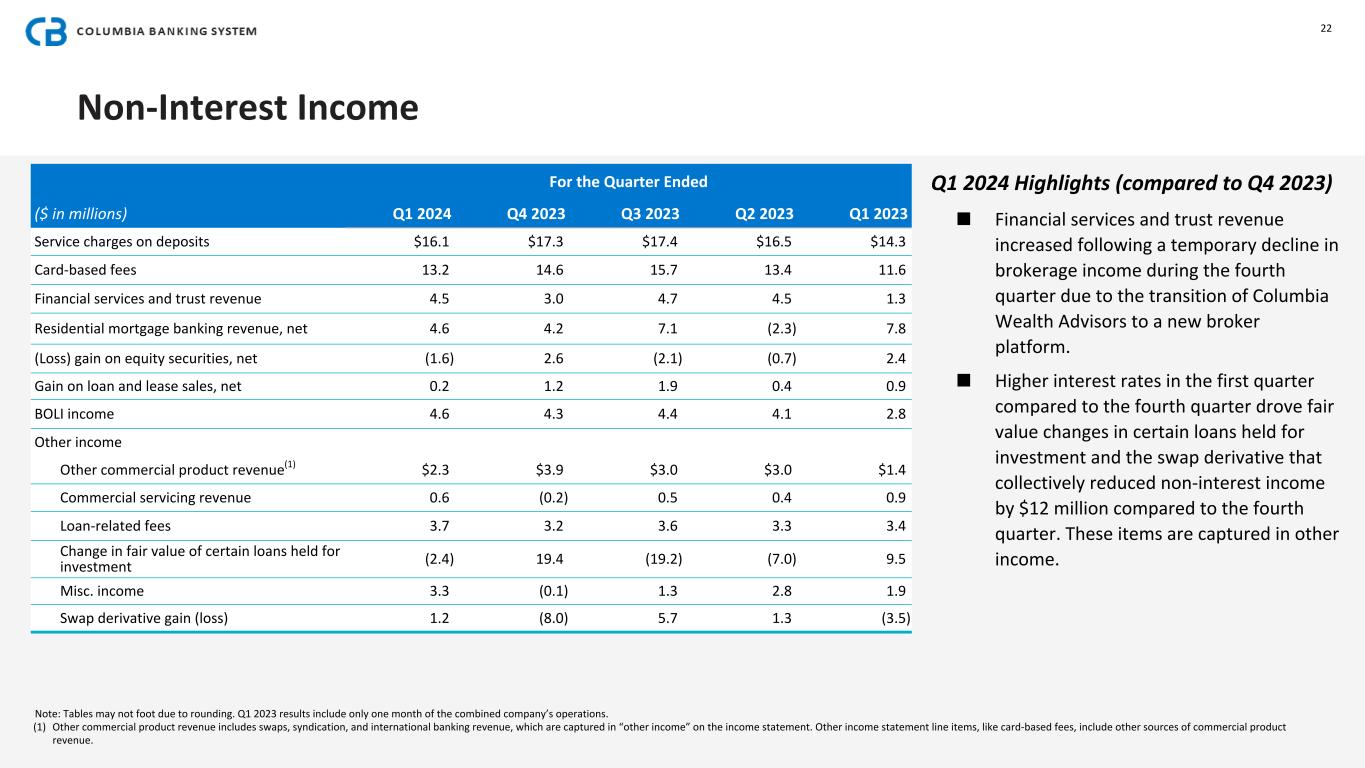
| Non-Interest Income and Expense | •Non-interest income decreased by $15 million due to the quarterly fluctuation in cumulative non-merger fair value accounting and hedges. Excluding these items, non-interest income increased by $1 million. |
|||||||
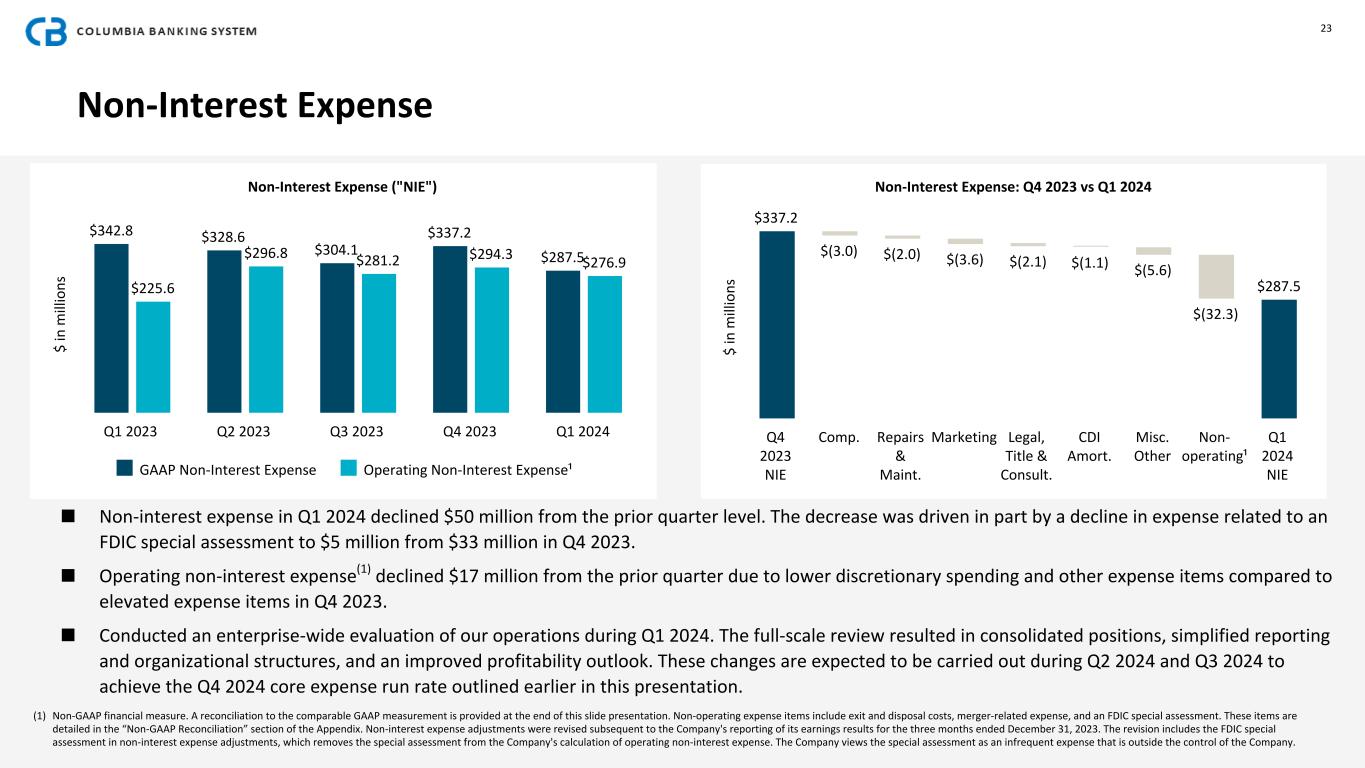
•Non-interest expense decreased by $50 million due to lower discretionary spend and the fourth quarter's larger FDIC special assessment. |
||||||||
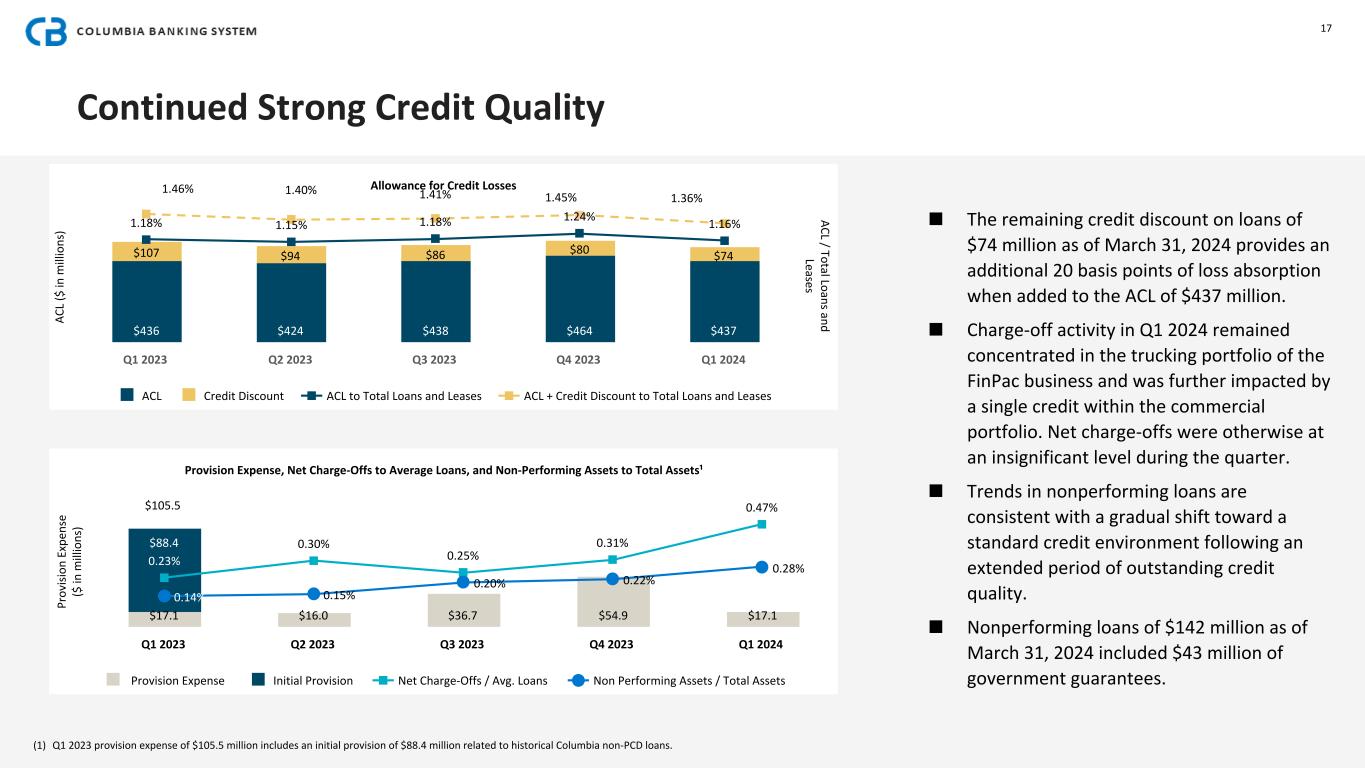
| Credit Quality | •Net charge-offs were 0.47% of average loans and leases (annualized), compared to 0.31% in the prior quarter. |
|||||||
•Provision expense of $17 million compares to $55 million in the prior quarter. |
||||||||
•Non-performing assets to total assets was 0.28%, compared to 0.22% as of December 31, 2023. |
||||||||
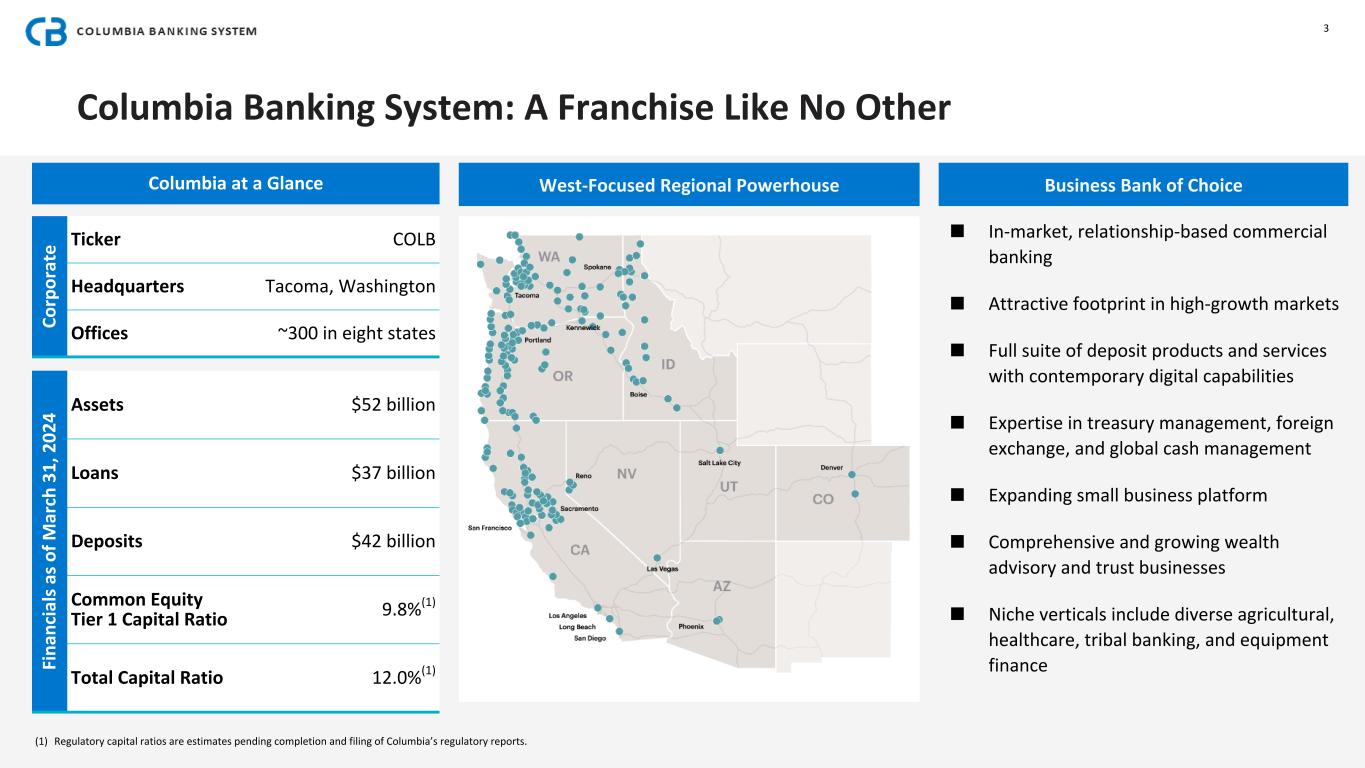
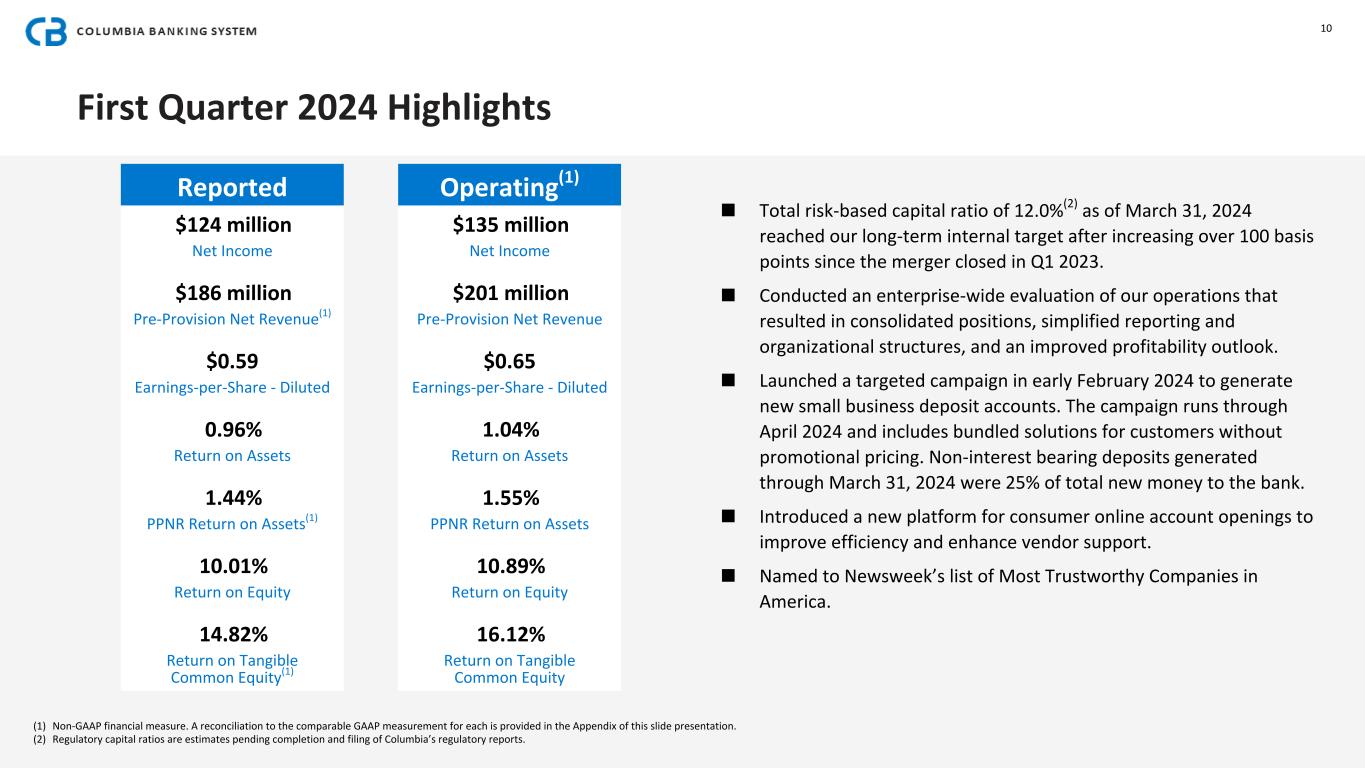
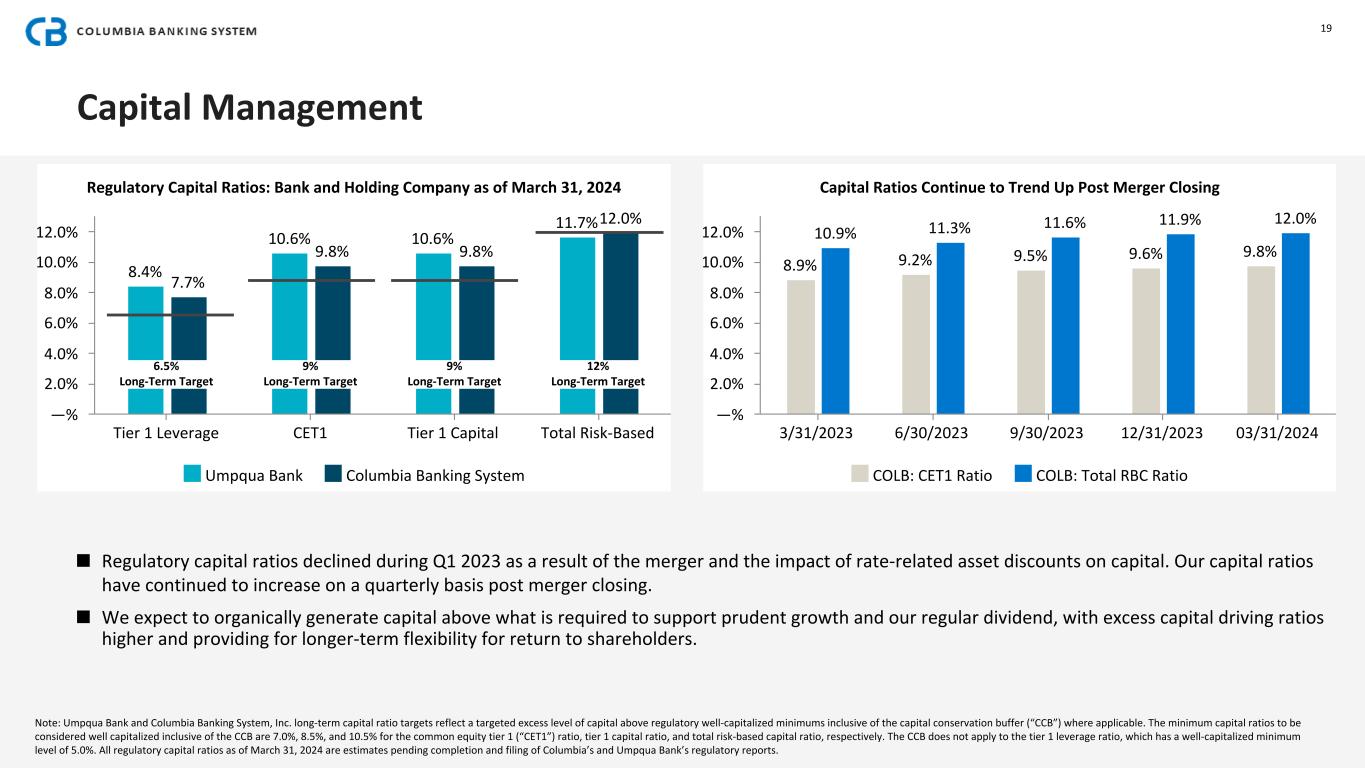
| Capital | •Estimated total risk-based capital ratio of 12.0% and estimated common equity tier 1 risk-based capital ratio of 9.8%. |
|||||||
•Declared a quarterly cash dividend of $0.36 per common share on February 9, 2024, which was paid March 11, 2024. |
||||||||
| Notable Items | •Recalibrated the commercial CECL model to be more reflective of the post-merger loan portfolio after a full year operating as a combined organization. |
|||||||
•Incurred $4 million in merger-related expense and $5 million in expense related to an FDIC special assessment. |
||||||||
1Q24 KEY FINANCIAL DATA | |||||||||||||||||
| PERFORMANCE METRICS | 1Q24 |
4Q23 |
1Q23 |
||||||||||||||
| Return on average assets | 0.96% | 0.72% | (0.14)% | ||||||||||||||
| Return on average common equity | 10.01% | 7.90% | (1.70)% | ||||||||||||||
Return on average tangible common equity 1 |
14.82% | 12.19% | (2.09)% | ||||||||||||||
Operating return on average assets 1 |
1.04% | 0.89% | 0.74% | ||||||||||||||
Operating return on average common equity 1 |
10.89% | 9.81% | 8.66% | ||||||||||||||
Operating return on average tangible common equity 1 |
16.12% | 15.14% | 10.64% | ||||||||||||||
| Net interest margin | 3.52% | 3.78% | 4.08% | ||||||||||||||
| Efficiency ratio | 60.57% | 64.81% | 79.71% | ||||||||||||||
Operating efficiency ratio, as adjusted 1 |
56.97% | 57.31% | 52.84% | ||||||||||||||
|
INCOME STATEMENT
($ in 000s, excl. per share data)
|
1Q24 |
4Q23 |
1Q23 |
||||||||||||||
| Net interest income | $423,362 | $453,623 | $374,698 | ||||||||||||||
| Provision for credit losses | $17,136 | $54,909 | $105,539 | ||||||||||||||
| Non-interest income | $50,357 | $65,533 | $54,735 | ||||||||||||||
| Non-interest expense | $287,516 | $337,176 | $342,818 | ||||||||||||||
Pre-provision net revenue 1 |
$186,203 | $181,980 | $86,615 | ||||||||||||||
Operating pre-provision net revenue 1 |
$200,684 | $212,136 | $195,730 | ||||||||||||||
| Earnings per common share - diluted | $0.59 | $0.45 | ($0.09) | ||||||||||||||
Operating earnings per common share - diluted 1 |
$0.65 | $0.56 | $0.46 | ||||||||||||||
| Dividends paid per share | $0.36 | $0.36 | $0.35 | ||||||||||||||
| BALANCE SHEET | 1Q24 |
4Q23 |
1Q23 |
||||||||||||||
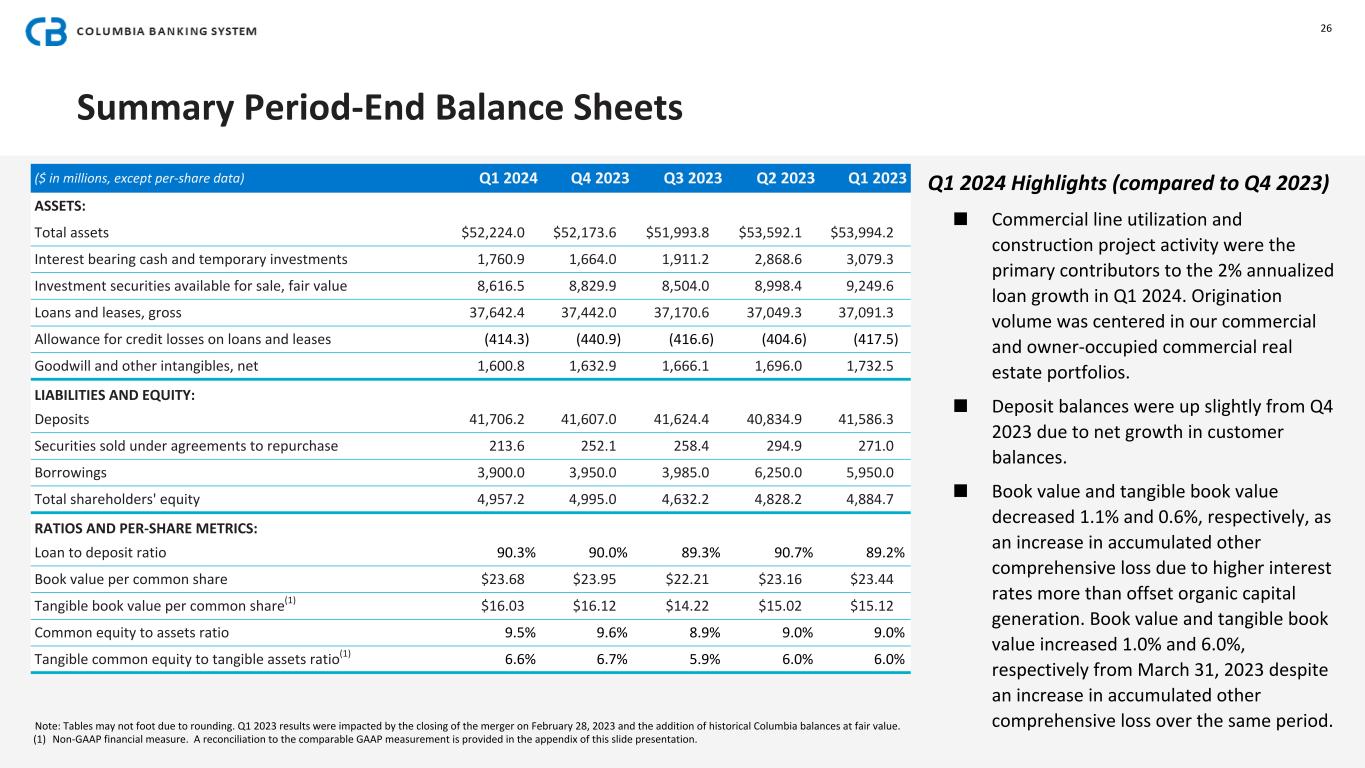
| Total assets | $52.2 | B | $52.2 | B | $54.0 | B | |||||||||||
| Loans and leases | $37.6 | B | $37.4 | B | $37.1 | B | |||||||||||
| Total deposits | $41.7 | B | $41.6 | B | $41.6 | B | |||||||||||
| Book value per common share | $23.68 | $23.95 | $23.44 | ||||||||||||||
Tangible book value per share 1 |
$16.03 | $16.12 | $15.12 | ||||||||||||||
| TABLE INDEX | |||||
| Page | |||||
| Columbia Banking System, Inc. | |||||||||||||||||||||||||||||||||||||||||
| Consolidated Statements of Operations | |||||||||||||||||||||||||||||||||||||||||
| (Unaudited) | |||||||||||||||||||||||||||||||||||||||||
| Quarter Ended | % Change | ||||||||||||||||||||||||||||||||||||||||
| ($ in thousands, except per share data) | Mar 31, 2024 | Dec 31, 2023 | Sep 30, 2023 | Jun 30, 2023 | Mar 31, 2023 | Seq. Quarter |
Year over Year | ||||||||||||||||||||||||||||||||||
| Interest income: | |||||||||||||||||||||||||||||||||||||||||
| Loans and leases | $ | 575,044 | $ | 577,741 | $ | 569,670 | $ | 552,679 | $ | 413,525 | — | % | 39 | % | |||||||||||||||||||||||||||
| Interest and dividends on investments: | |||||||||||||||||||||||||||||||||||||||||
| Taxable | 75,017 | 78,010 | 80,066 | 79,036 | 39,729 | (4) | % | 89 | % | ||||||||||||||||||||||||||||||||
| Exempt from federal income tax | 6,904 | 6,966 | 6,929 | 6,817 | 3,397 | (1) | % | 103 | % | ||||||||||||||||||||||||||||||||
| Dividends | 3,707 | 4,862 | 4,941 | 2,581 | 719 | (24) | % | 416 | % | ||||||||||||||||||||||||||||||||
| Temporary investments and interest bearing deposits | 23,553 | 24,055 | 34,407 | 34,616 | 18,581 | (2) | % | 27 | % | ||||||||||||||||||||||||||||||||
| Total interest income | 684,225 | 691,634 | 696,013 | 675,729 | 475,951 | (1) | % | 44 | % | ||||||||||||||||||||||||||||||||
| Interest expense: | |||||||||||||||||||||||||||||||||||||||||
| Deposits | 198,435 | 170,659 | 126,974 | 100,408 | 63,613 | 16 | % | 212 | % | ||||||||||||||||||||||||||||||||
| Securities sold under agreement to repurchase and federal funds purchased | 1,266 | 1,226 | 1,220 | 1,071 | 406 | 3 | % | 212 | % | ||||||||||||||||||||||||||||||||
| Borrowings | 51,275 | 56,066 | 77,080 | 81,004 | 28,764 | (9) | % | 78 | % | ||||||||||||||||||||||||||||||||
| Junior and other subordinated debentures | 9,887 | 10,060 | 9,864 | 9,271 | 8,470 | (2) | % | 17 | % | ||||||||||||||||||||||||||||||||
| Total interest expense | 260,863 | 238,011 | 215,138 | 191,754 | 101,253 | 10 | % | 158 | % | ||||||||||||||||||||||||||||||||
| Net interest income | 423,362 | 453,623 | 480,875 | 483,975 | 374,698 | (7) | % | 13 | % | ||||||||||||||||||||||||||||||||
| Provision for credit losses | 17,136 | 54,909 | 36,737 | 16,014 | 105,539 | (69) | % | (84) | % | ||||||||||||||||||||||||||||||||
| Non-interest income: | |||||||||||||||||||||||||||||||||||||||||
| Service charges on deposits | 16,064 | 17,349 | 17,410 | 16,454 | 14,312 | (7) | % | 12 | % | ||||||||||||||||||||||||||||||||
| Card-based fees | 13,183 | 14,593 | 15,674 | 13,435 | 11,561 | (10) | % | 14 | % | ||||||||||||||||||||||||||||||||
| Financial services and trust revenue | 4,464 | 3,011 | 4,651 | 4,512 | 1,297 | 48 | % | 244 | % | ||||||||||||||||||||||||||||||||
| Residential mortgage banking revenue (loss), net | 4,634 | 4,212 | 7,103 | (2,342) | 7,816 | 10 | % | (41) | % | ||||||||||||||||||||||||||||||||
| Gain on sale of debt securities, net | 12 | 9 | 4 | — | — | 33 | % | nm | |||||||||||||||||||||||||||||||||
| (Loss) gain on equity securities, net | (1,565) | 2,636 | (2,055) | (697) | 2,416 | (159) | % | (165) | % | ||||||||||||||||||||||||||||||||
| Gain on loan and lease sales, net | 221 | 1,161 | 1,871 | 442 | 940 | (81) | % | (76) | % | ||||||||||||||||||||||||||||||||
| BOLI income | 4,639 | 4,331 | 4,440 | 4,063 | 2,790 | 7 | % | 66 | % | ||||||||||||||||||||||||||||||||
| Other income (loss) | 8,705 | 18,231 | (5,117) | 3,811 | 13,603 | (52) | % | (36) | % | ||||||||||||||||||||||||||||||||
| Total non-interest income | 50,357 | 65,533 | 43,981 | 39,678 | 54,735 | (23) | % | (8) | % | ||||||||||||||||||||||||||||||||
| Non-interest expense: | |||||||||||||||||||||||||||||||||||||||||
| Salaries and employee benefits | 154,538 | 157,572 | 159,041 | 163,398 | 136,092 | (2) | % | 14 | % | ||||||||||||||||||||||||||||||||
| Occupancy and equipment, net | 45,291 | 48,160 | 43,070 | 50,550 | 41,700 | (6) | % | 9 | % | ||||||||||||||||||||||||||||||||
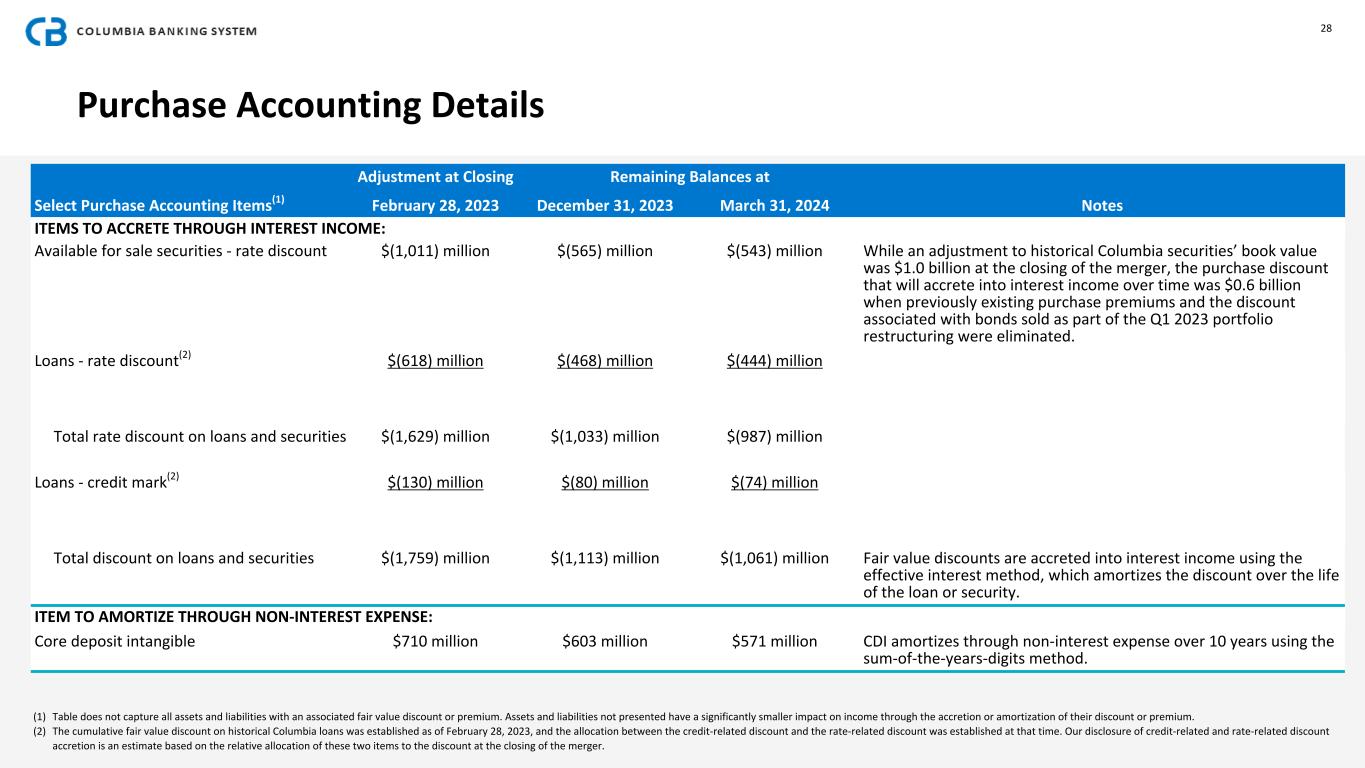
| Intangible amortization | 32,091 | 33,204 | 29,879 | 35,553 | 12,660 | (3) | % | 153 | % | ||||||||||||||||||||||||||||||||
| FDIC assessments | 14,460 | 42,510 | 11,200 | 11,579 | 6,113 | (66) | % | 137 | % | ||||||||||||||||||||||||||||||||
| Merger-related expense | 4,478 | 7,174 | 18,938 | 29,649 | 115,898 | (38) | % | (96) | % | ||||||||||||||||||||||||||||||||
| Other expenses | 36,658 | 48,556 | 42,019 | 37,830 | 30,355 | (25) | % | 21 | % | ||||||||||||||||||||||||||||||||
| Total non-interest expense | 287,516 | 337,176 | 304,147 | 328,559 | 342,818 | (15) | % | (16) | % | ||||||||||||||||||||||||||||||||
| Income (loss) before provision (benefit) for income taxes | 169,067 | 127,071 | 183,972 | 179,080 | (18,924) | 33 | % | nm | |||||||||||||||||||||||||||||||||
| Provision (benefit) for income taxes | 44,987 | 33,540 | 48,127 | 45,703 | (4,886) | 34 | % | nm | |||||||||||||||||||||||||||||||||
| Net income (loss) | $ | 124,080 | $ | 93,531 | $ | 135,845 | $ | 133,377 | $ | (14,038) | 33 | % | nm | ||||||||||||||||||||||||||||
| Weighted average basic shares outstanding | 208,260 | 208,083 | 208,070 | 207,977 | 156,383 | — | % | 33 | % | ||||||||||||||||||||||||||||||||
| Weighted average diluted shares outstanding | 208,956 | 208,739 | 208,645 | 208,545 | 156,383 | — | % | 34 | % | ||||||||||||||||||||||||||||||||
| Earnings (loss) per common share – basic | $ | 0.60 | $ | 0.45 | $ | 0.65 | $ | 0.64 | $ | (0.09) | 33 | % | nm | ||||||||||||||||||||||||||||
| Earnings (loss) per common share – diluted | $ | 0.59 | $ | 0.45 | $ | 0.65 | $ | 0.64 | $ | (0.09) | 31 | % | nm | ||||||||||||||||||||||||||||
| nm = Percentage changes greater than +/-500% are considered not meaningful and are presented as "nm." | |||||||||||||||||||||||||||||||||||||||||
| Columbia Banking System, Inc. Consolidated Balance Sheets | |||||||||||||||||||||||||||||||||||||||||
| (Unaudited) | |||||||||||||||||||||||||||||||||||||||||
| % Change | |||||||||||||||||||||||||||||||||||||||||
| ($ in thousands, except per share data) | Mar 31, 2024 | Dec 31, 2023 | Sep 30, 2023 | Jun 30, 2023 | Mar 31, 2023 | Seq. Quarter |
Year over Year | ||||||||||||||||||||||||||||||||||
| Assets: | |||||||||||||||||||||||||||||||||||||||||
| Cash and due from banks | $ | 440,215 | $ | 498,496 | $ | 492,474 | $ | 538,653 | $ | 555,919 | (12) | % | (21) | % | |||||||||||||||||||||||||||
| Interest-bearing cash and temporary investments | 1,760,902 | 1,664,038 | 1,911,221 | 2,868,563 | 3,079,266 | 6 | % | (43) | % | ||||||||||||||||||||||||||||||||
| Investment securities: | |||||||||||||||||||||||||||||||||||||||||
| Equity and other, at fair value | 77,203 | 76,995 | 73,638 | 76,361 | 76,532 | — | % | 1 | % | ||||||||||||||||||||||||||||||||
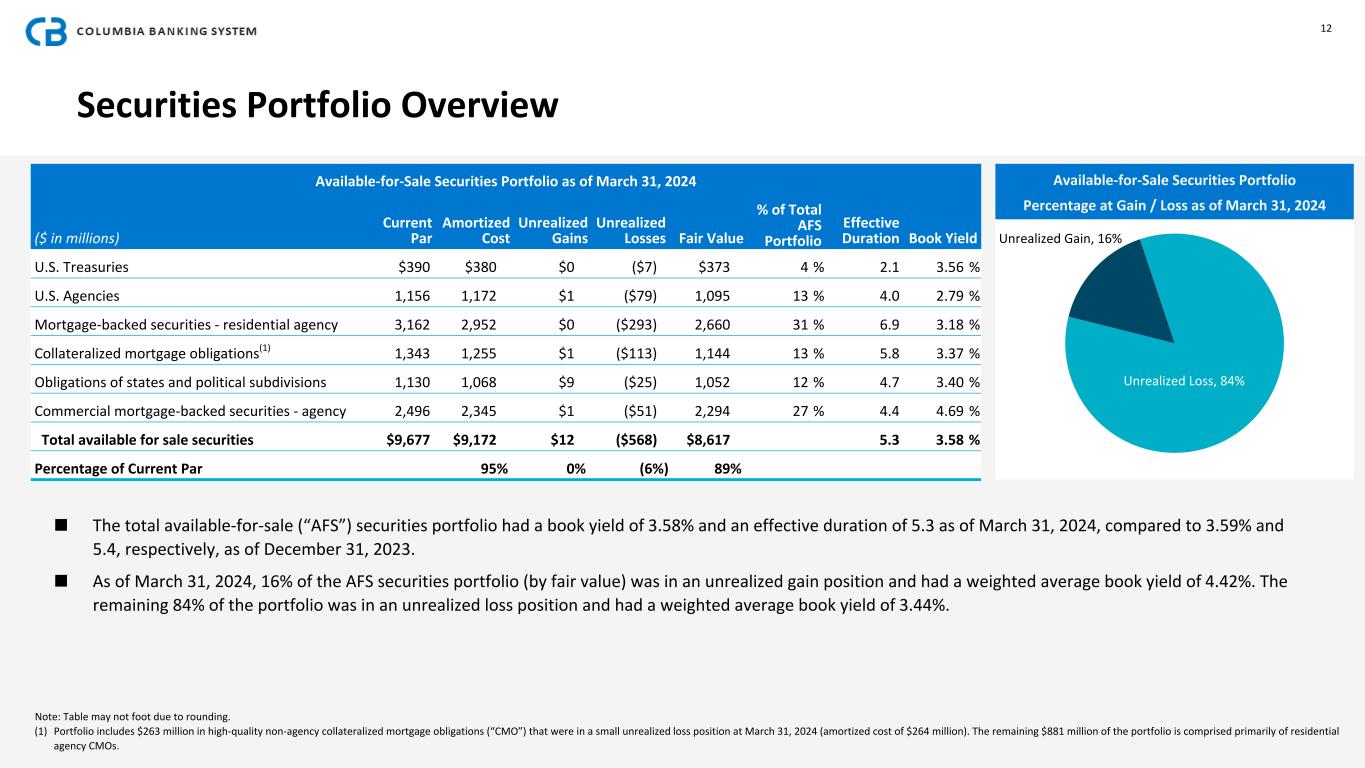
| Available for sale, at fair value | 8,616,545 | 8,829,870 | 8,503,986 | 8,998,428 | 9,249,600 | (2) | % | (7) | % | ||||||||||||||||||||||||||||||||
| Held to maturity, at amortized cost | 2,247 | 2,300 | 2,344 | 2,388 | 2,432 | (2) | % | (8) | % | ||||||||||||||||||||||||||||||||
| Loans held for sale | 47,201 | 30,715 | 60,313 | 183,633 | 49,338 | 54 | % | (4) | % | ||||||||||||||||||||||||||||||||
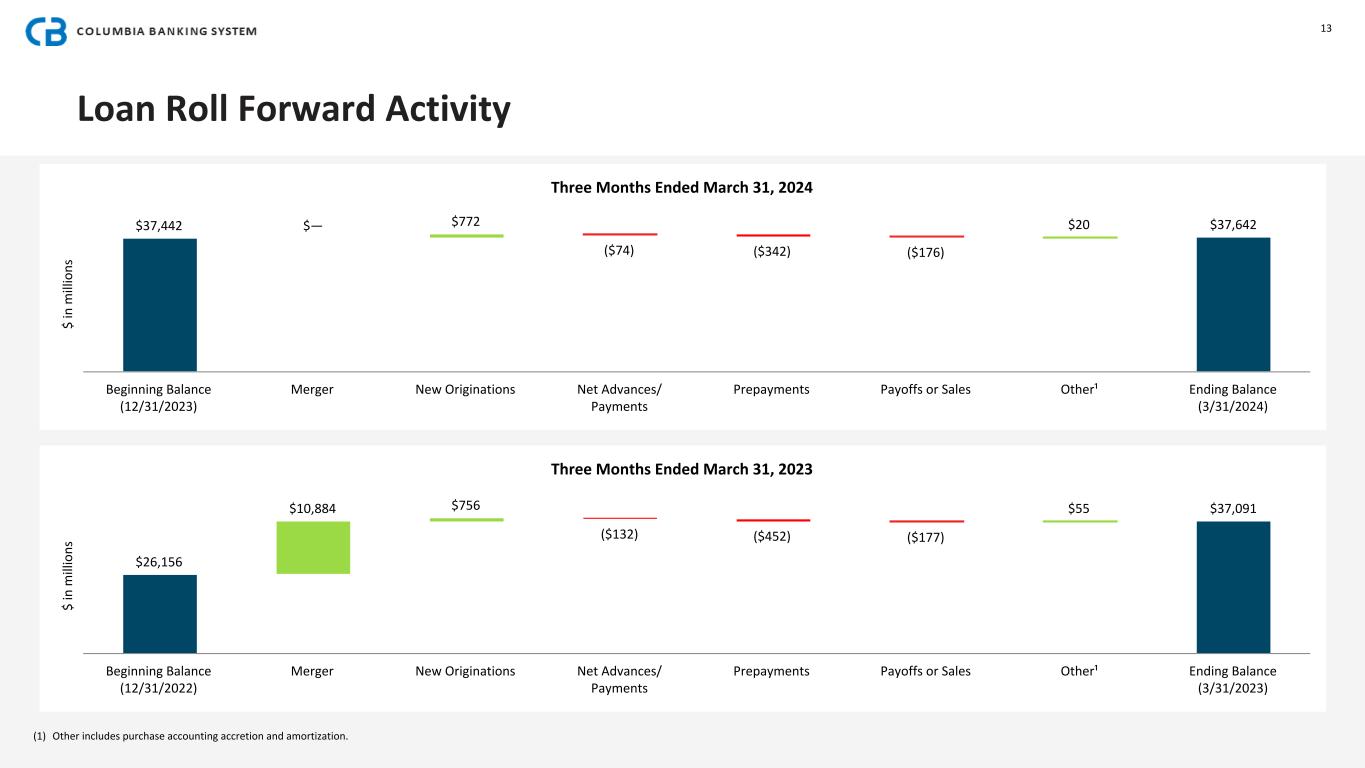
| Loans and leases | 37,642,413 | 37,441,951 | 37,170,598 | 37,049,299 | 37,091,280 | 1 | % | 1 | % | ||||||||||||||||||||||||||||||||
| Allowance for credit losses on loans and leases | (414,344) | (440,871) | (416,560) | (404,603) | (417,464) | (6) | % | (1) | % | ||||||||||||||||||||||||||||||||
| Net loans and leases | 37,228,069 | 37,001,080 | 36,754,038 | 36,644,696 | 36,673,816 | 1 | % | 2 | % | ||||||||||||||||||||||||||||||||
| Restricted equity securities | 116,274 | 179,274 | 168,524 | 258,524 | 246,525 | (35) | % | (53) | % | ||||||||||||||||||||||||||||||||
| Premises and equipment, net | 336,869 | 338,970 | 337,855 | 368,698 | 375,190 | (1) | % | (10) | % | ||||||||||||||||||||||||||||||||
| Operating lease right-of-use assets | 113,833 | 115,811 | 114,220 | 119,255 | 127,296 | (2) | % | (11) | % | ||||||||||||||||||||||||||||||||
| Goodwill | 1,029,234 | 1,029,234 | 1,029,234 | 1,029,234 | 1,030,142 | — | % | — | % | ||||||||||||||||||||||||||||||||
| Other intangible assets, net | 571,588 | 603,679 | 636,883 | 666,762 | 702,315 | (5) | % | (19) | % | ||||||||||||||||||||||||||||||||
| Residential mortgage servicing rights, at fair value | 110,444 | 109,243 | 117,640 | 172,929 | 178,800 | 1 | % | (38) | % | ||||||||||||||||||||||||||||||||
| Bank-owned life insurance | 682,293 | 680,948 | 648,232 | 643,727 | 641,922 | — | % | 6 | % | ||||||||||||||||||||||||||||||||
| Deferred tax asset, net | 356,031 | 347,203 | 469,841 | 362,880 | 351,229 | 3 | % | 1 | % | ||||||||||||||||||||||||||||||||
| Other assets | 735,058 | 665,740 | 673,372 | 657,365 | 653,904 | 10 | % | 12 | % | ||||||||||||||||||||||||||||||||
| Total assets | $ | 52,224,006 | $ | 52,173,596 | $ | 51,993,815 | $ | 53,592,096 | $ | 53,994,226 | — | % | (3) | % | |||||||||||||||||||||||||||
| Liabilities: | |||||||||||||||||||||||||||||||||||||||||
| Deposits | |||||||||||||||||||||||||||||||||||||||||
| Non-interest-bearing | $ | 13,808,554 | $ | 14,256,452 | $ | 15,532,948 | $ | 16,019,408 | $ | 17,215,781 | (3) | % | (20) | % | |||||||||||||||||||||||||||
| Interest-bearing | 27,897,606 | 27,350,568 | 26,091,420 | 24,815,509 | 24,370,566 | 2 | % | 14 | % | ||||||||||||||||||||||||||||||||
| Total deposits | 41,706,160 | 41,607,020 | 41,624,368 | 40,834,917 | 41,586,347 | — | % | — | % | ||||||||||||||||||||||||||||||||
| Securities sold under agreements to repurchase | 213,573 | 252,119 | 258,383 | 294,914 | 271,047 | (15) | % | (21) | % | ||||||||||||||||||||||||||||||||
| Borrowings | 3,900,000 | 3,950,000 | 3,985,000 | 6,250,000 | 5,950,000 | (1) | % | (34) | % | ||||||||||||||||||||||||||||||||
| Junior subordinated debentures, at fair value | 309,544 | 316,440 | 331,545 | 312,872 | 297,721 | (2) | % | 4 | % | ||||||||||||||||||||||||||||||||
| Junior and other subordinated debentures, at amortized cost | 107,838 | 107,895 | 107,952 | 108,009 | 108,066 | — | % | — | % | ||||||||||||||||||||||||||||||||
| Operating lease liabilities | 129,240 | 130,576 | 129,845 | 132,099 | 140,648 | (1) | % | (8) | % | ||||||||||||||||||||||||||||||||
| Other liabilities | 900,406 | 814,512 | 924,560 | 831,097 | 755,674 | 11 | % | 19 | % | ||||||||||||||||||||||||||||||||
| Total liabilities | 47,266,761 | 47,178,562 | 47,361,653 | 48,763,908 | 49,109,503 | — | % | (4) | % | ||||||||||||||||||||||||||||||||
| Shareholders' equity: | |||||||||||||||||||||||||||||||||||||||||
| Common stock | 5,802,322 | 5,802,747 | 5,798,167 | 5,792,792 | 5,788,553 | — | % | — | % | ||||||||||||||||||||||||||||||||
| Accumulated deficit | (418,946) | (467,571) | (485,576) | (545,842) | (603,696) | (10) | % | (31) | % | ||||||||||||||||||||||||||||||||
| Accumulated other comprehensive loss | (426,131) | (340,142) | (680,429) | (418,762) | (300,134) | 25 | % | 42 | % | ||||||||||||||||||||||||||||||||
| Total shareholders' equity | 4,957,245 | 4,995,034 | 4,632,162 | 4,828,188 | 4,884,723 | (1) | % | 1 | % | ||||||||||||||||||||||||||||||||
| Total liabilities and shareholders' equity | $ | 52,224,006 | $ | 52,173,596 | $ | 51,993,815 | $ | 53,592,096 | $ | 53,994,226 | — | % | (3) | % | |||||||||||||||||||||||||||
| Common shares outstanding at period end | 209,370 | 208,585 | 208,575 | 208,514 | 208,429 | — | % | — | % | ||||||||||||||||||||||||||||||||
| Columbia Banking System, Inc. | ||||||||||||||||||||||||||||||||||||||||||||
| Financial Highlights | ||||||||||||||||||||||||||||||||||||||||||||
| (Unaudited) | ||||||||||||||||||||||||||||||||||||||||||||
| Quarter Ended | % Change | |||||||||||||||||||||||||||||||||||||||||||
| Mar 31, 2024 | Dec 31, 2023 | Sep 30, 2023 | Jun 30, 2023 | Mar 31, 2023 | Seq. Quarter | Year over Year | ||||||||||||||||||||||||||||||||||||||
Per Common Share Data: |
||||||||||||||||||||||||||||||||||||||||||||
| Dividends | $ | 0.36 | $ | 0.36 | $ | 0.36 | $ | 0.36 | $ | 0.35 | — | % | 3 | % | ||||||||||||||||||||||||||||||
| Book value | $ | 23.68 | $ | 23.95 | $ | 22.21 | $ | 23.16 | $ | 23.44 | (1) | % | 1 | % | ||||||||||||||||||||||||||||||
Tangible book value (1) |
$ | 16.03 | $ | 16.12 | $ | 14.22 | $ | 15.02 | $ | 15.12 | (1) | % | 6 | % | ||||||||||||||||||||||||||||||
| Performance Ratios: | ||||||||||||||||||||||||||||||||||||||||||||
Efficiency ratio (2) |
60.57 | % | 64.81 | % | 57.82 | % | 62.60 | % | 79.71 | % | (4.24) | (19.14) | ||||||||||||||||||||||||||||||||
Non-interest expense to average assets (1) |
2.22 | % | 2.58 | % | 2.28 | % | 2.46 | % | 3.53 | % | (0.36) | (1.31) | ||||||||||||||||||||||||||||||||
| Return on average assets ("ROAA") | 0.96 | % | 0.72 | % | 1.02 | % | 1.00 | % | (0.14) | % | 0.24 | 1.10 | ||||||||||||||||||||||||||||||||
Pre-provision net revenue ("PPNR") ROAA (1) |
1.44 | % | 1.39 | % | 1.65 | % | 1.46 | % | 0.89 | % | 0.05 | 0.55 | ||||||||||||||||||||||||||||||||
| Return on average common equity | 10.01 | % | 7.90 | % | 11.07 | % | 10.84 | % | (1.70) | % | 2.11 | 11.71 | ||||||||||||||||||||||||||||||||
Return on average tangible common equity (1) |
14.82 | % | 12.19 | % | 16.93 | % | 16.63 | % | (2.09) | % | 2.63 | 16.91 | ||||||||||||||||||||||||||||||||
Performance Ratios - Operating: (1) |
||||||||||||||||||||||||||||||||||||||||||||
Operating efficiency ratio, as adjusted (1), (2), (5), (6) |
56.97 | % | 57.31 | % | 51.26 | % | 54.04 | % | 52.84 | % | (0.34) | 4.13 | ||||||||||||||||||||||||||||||||
Operating non-interest expense to average assets (1) |
2.14 | % | 2.25 | % | 2.10 | % | 2.22 | % | 2.32 | % | (0.11) | (0.18) | ||||||||||||||||||||||||||||||||
Operating ROAA (1), (5) |
1.04 | % | 0.89 | % | 1.23 | % | 1.27 | % | 0.74 | % | 0.15 | 0.30 | ||||||||||||||||||||||||||||||||
Operating PPNR ROAA (1), (5) |
1.55 | % | 1.62 | % | 1.94 | % | 1.82 | % | 2.01 | % | (0.07) | (0.46) | ||||||||||||||||||||||||||||||||
Operating return on average common equity (1), (5) |
10.89 | % | 9.81 | % | 13.40 | % | 13.77 | % | 8.66 | % | 1.08 | 2.23 | ||||||||||||||||||||||||||||||||
Operating return on average tangible common equity (1), (5) |
16.12 | % | 15.14 | % | 20.48 | % | 21.13 | % | 10.64 | % | 0.98 | 5.48 | ||||||||||||||||||||||||||||||||
| Average Balance Sheet Yields, Rates, & Ratios: | ||||||||||||||||||||||||||||||||||||||||||||
| Yield on loans and leases | 6.13 | % | 6.13 | % | 6.08 | % | 5.95 | % | 5.55 | % | — | 0.58 | ||||||||||||||||||||||||||||||||
Yield on earning assets (2) |
5.69 | % | 5.75 | % | 5.65 | % | 5.48 | % | 5.19 | % | (0.06) | 0.50 | ||||||||||||||||||||||||||||||||
| Cost of interest bearing deposits | 2.88 | % | 2.54 | % | 2.01 | % | 1.64 | % | 1.32 | % | 0.34 | 1.56 | ||||||||||||||||||||||||||||||||
| Cost of interest bearing liabilities | 3.25 | % | 3.02 | % | 2.72 | % | 2.45 | % | 1.82 | % | 0.23 | 1.43 | ||||||||||||||||||||||||||||||||
| Cost of total deposits | 1.92 | % | 1.63 | % | 1.23 | % | 0.99 | % | 0.80 | % | 0.29 | 1.12 | ||||||||||||||||||||||||||||||||
Cost of total funding (3) |
2.27 | % | 2.05 | % | 1.81 | % | 1.61 | % | 1.16 | % | 0.22 | 1.11 | ||||||||||||||||||||||||||||||||
Net interest margin (2) |
3.52 | % | 3.78 | % | 3.91 | % | 3.93 | % | 4.08 | % | (0.26) | (0.56) | ||||||||||||||||||||||||||||||||
| Average interest bearing cash / Average interest earning assets | 3.56 | % | 3.64 | % | 5.17 | % | 5.47 | % | 4.33 | % | (0.08) | (0.77) | ||||||||||||||||||||||||||||||||
| Average loans and leases / Average interest earning assets | 77.87 | % | 78.04 | % | 75.64 | % | 75.18 | % | 80.96 | % | (0.17) | (3.09) | ||||||||||||||||||||||||||||||||
| Average loans and leases / Average total deposits | 90.41 | % | 89.91 | % | 90.63 | % | 90.98 | % | 93.01 | % | 0.50 | (2.60) | ||||||||||||||||||||||||||||||||
| Average non-interest bearing deposits / Average total deposits | 33.29 | % | 35.88 | % | 38.55 | % | 40.05 | % | 39.55 | % | (2.59) | (6.26) | ||||||||||||||||||||||||||||||||
Average total deposits / Average total funding (3) |
90.09 | % | 90.02 | % | 86.66 | % | 85.59 | % | 91.36 | % | 0.07 | (1.27) | ||||||||||||||||||||||||||||||||
| Select Credit & Capital Ratios: | ||||||||||||||||||||||||||||||||||||||||||||
Non-performing loans and leases to total loans and leases |
0.38 | % | 0.30 | % | 0.28 | % | 0.22 | % | 0.20 | % | 0.08 | 0.18 | ||||||||||||||||||||||||||||||||
Non-performing assets to total assets |
0.28 | % | 0.22 | % | 0.20 | % | 0.15 | % | 0.14 | % | 0.06 | 0.14 | ||||||||||||||||||||||||||||||||
| Allowance for credit losses to loans and leases | 1.16 | % | 1.24 | % | 1.18 | % | 1.15 | % | 1.18 | % | (0.08) | (0.02) | ||||||||||||||||||||||||||||||||
Total risk-based capital ratio (4) |
12.0 | % | 11.9 | % | 11.6 | % | 11.3 | % | 10.9 | % | 0.10 | 1.10 | ||||||||||||||||||||||||||||||||
Common equity tier 1 risk-based capital ratio (4) |
9.8 | % | 9.6 | % | 9.5 | % | 9.2 | % | 8.9 | % | 0.20 | 0.90 | ||||||||||||||||||||||||||||||||
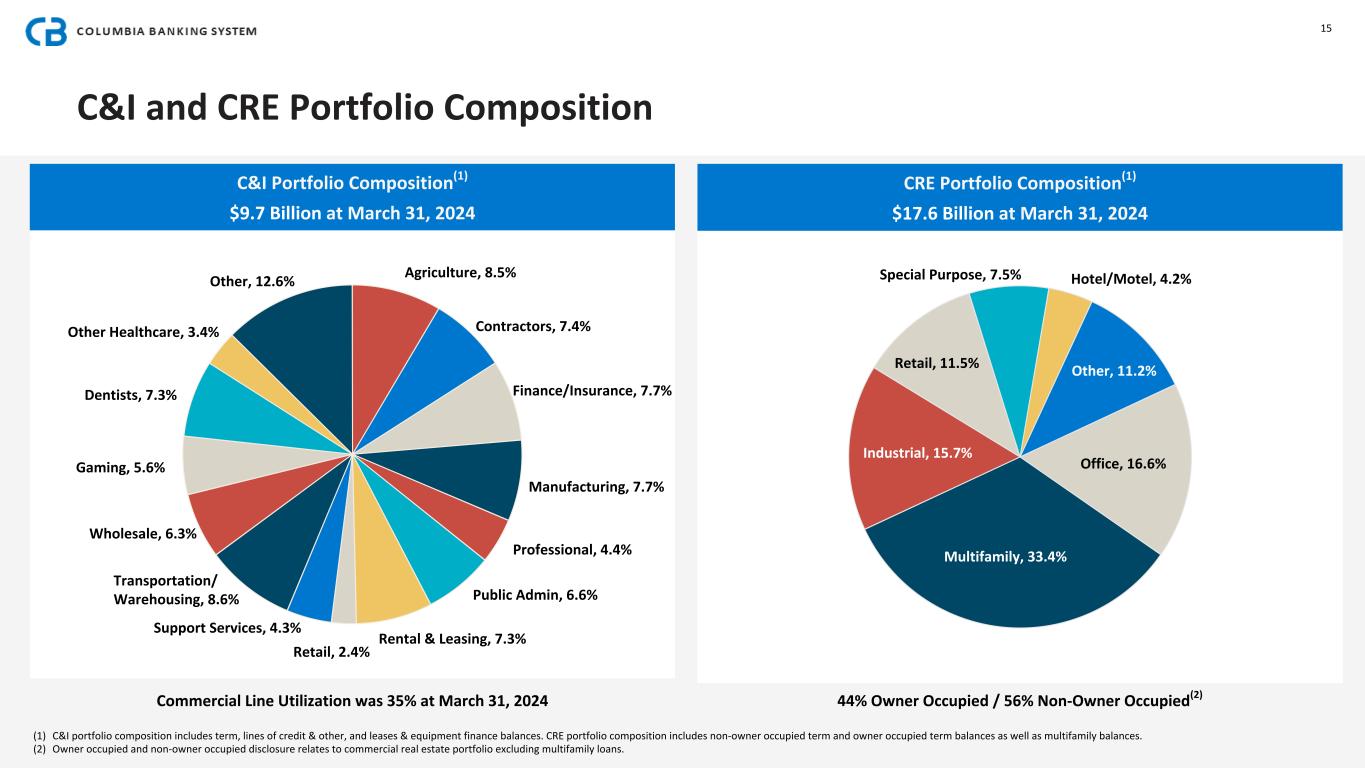
| nm = Percentage changes greater than +/-500% are considered not meaningful and are presented as "nm." | ||||||||||||||||||||||||||||||||||||||||||||
| Columbia Banking System, Inc. | |||||||||||||||||||||||||||||||||||||||||
| Loan & Lease Portfolio Balances and Mix | |||||||||||||||||||||||||||||||||||||||||
| (Unaudited) | |||||||||||||||||||||||||||||||||||||||||
| Mar 31, 2024 | Dec 31, 2023 | Sep 30, 2023 | Jun 30, 2023 | Mar 31, 2023 | % Change | ||||||||||||||||||||||||||||||||||||
| ($ in thousands) | Amount | Amount | Amount | Amount | Amount | Seq. Quarter | Year over Year | ||||||||||||||||||||||||||||||||||
| Loans and leases: | |||||||||||||||||||||||||||||||||||||||||
| Commercial real estate: | |||||||||||||||||||||||||||||||||||||||||
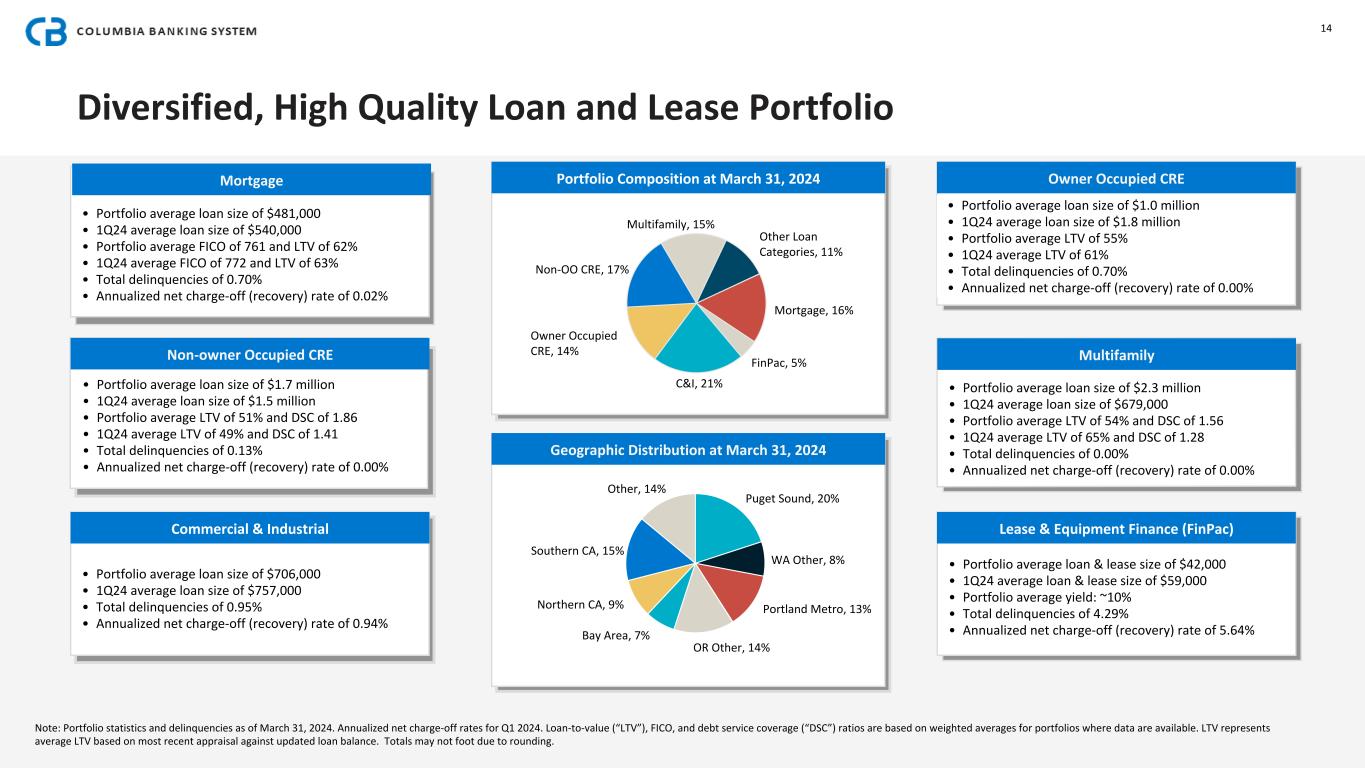
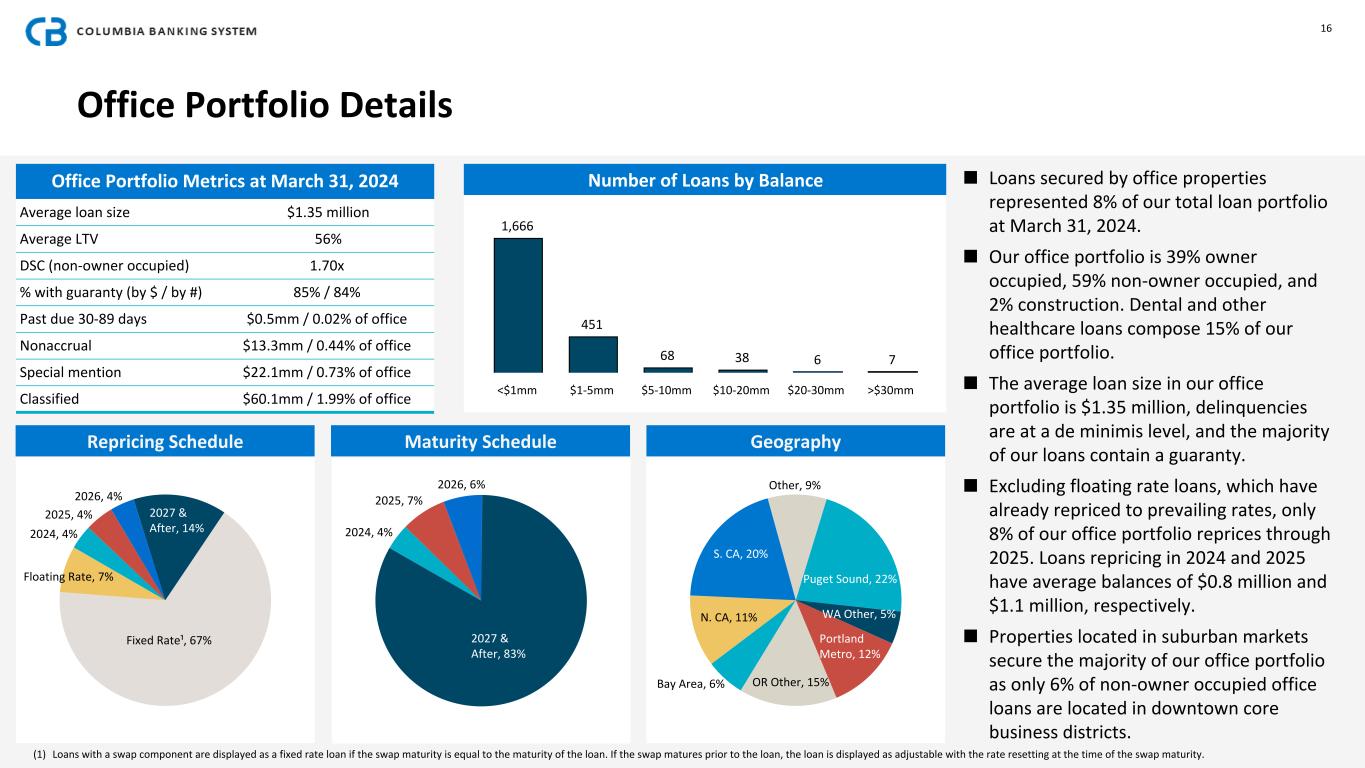
| Non-owner occupied term, net | $ | 6,557,768 | $ | 6,482,940 | $ | 6,490,638 | $ | 6,434,673 | $ | 6,353,550 | 1 | % | 3 | % | |||||||||||||||||||||||||||
| Owner occupied term, net | 5,231,676 | 5,195,605 | 5,235,227 | 5,254,401 | 5,156,848 | 1 | % | 1 | % | ||||||||||||||||||||||||||||||||
| Multifamily, net | 5,828,960 | 5,704,734 | 5,684,495 | 5,622,875 | 5,590,587 | 2 | % | 4 | % | ||||||||||||||||||||||||||||||||
| Construction & development, net | 1,728,652 | 1,747,302 | 1,669,918 | 1,528,924 | 1,467,561 | (1) | % | 18 | % | ||||||||||||||||||||||||||||||||
| Residential development, net | 284,117 | 323,899 | 354,922 | 388,641 | 440,667 | (12) | % | (36) | % | ||||||||||||||||||||||||||||||||
| Commercial: | |||||||||||||||||||||||||||||||||||||||||
| Term, net | 5,544,450 | 5,536,765 | 5,437,915 | 5,449,787 | 5,906,774 | — | % | (6) | % | ||||||||||||||||||||||||||||||||
| Lines of credit & other, net | 2,491,557 | 2,430,127 | 2,353,548 | 2,268,790 | 2,184,762 | 3 | % | 14 | % | ||||||||||||||||||||||||||||||||
| Leases & equipment finance, net | 1,706,759 | 1,729,512 | 1,728,991 | 1,740,037 | 1,746,267 | (1) | % | (2) | % | ||||||||||||||||||||||||||||||||
| Residential: | |||||||||||||||||||||||||||||||||||||||||
| Mortgage, net | 6,128,884 | 6,157,166 | 6,121,838 | 6,272,898 | 6,187,964 | — | % | (1) | % | ||||||||||||||||||||||||||||||||
| Home equity loans & lines, net | 1,950,421 | 1,938,166 | 1,899,948 | 1,898,958 | 1,870,002 | 1 | % | 4 | % | ||||||||||||||||||||||||||||||||
| Consumer & other, net | 189,169 | 195,735 | 193,158 | 189,315 | 186,298 | (3) | % | 2 | % | ||||||||||||||||||||||||||||||||
| Total loans and leases, net of deferred fees and costs | $ | 37,642,413 | $ | 37,441,951 | $ | 37,170,598 | $ | 37,049,299 | $ | 37,091,280 | 1 | % | 1 | % | |||||||||||||||||||||||||||
| Loans and leases mix: | |||||||||||||||||||||||||||||||||||||||||
| Commercial real estate: | |||||||||||||||||||||||||||||||||||||||||
| Non-owner occupied term, net | 17 | % | 17 | % | 17 | % | 17 | % | 16 | % | |||||||||||||||||||||||||||||||
| Owner occupied term, net | 14 | % | 14 | % | 14 | % | 14 | % | 14 | % | |||||||||||||||||||||||||||||||
| Multifamily, net | 15 | % | 15 | % | 15 | % | 15 | % | 15 | % | |||||||||||||||||||||||||||||||
| Construction & development, net | 5 | % | 5 | % | 4 | % | 4 | % | 4 | % | |||||||||||||||||||||||||||||||
| Residential development, net | 1 | % | 1 | % | 1 | % | 1 | % | 1 | % | |||||||||||||||||||||||||||||||
| Commercial: | |||||||||||||||||||||||||||||||||||||||||
| Term, net | 15 | % | 15 | % | 15 | % | 15 | % | 16 | % | |||||||||||||||||||||||||||||||
| Lines of credit & other, net | 6 | % | 6 | % | 6 | % | 6 | % | 6 | % | |||||||||||||||||||||||||||||||
| Leases & equipment finance, net | 5 | % | 5 | % | 5 | % | 5 | % | 5 | % | |||||||||||||||||||||||||||||||
| Residential: | |||||||||||||||||||||||||||||||||||||||||
| Mortgage, net | 16 | % | 16 | % | 17 | % | 17 | % | 17 | % | |||||||||||||||||||||||||||||||
| Home equity loans & lines, net | 5 | % | 5 | % | 5 | % | 5 | % | 5 | % | |||||||||||||||||||||||||||||||
| Consumer & other, net | 1 | % | 1 | % | 1 | % | 1 | % | 1 | % | |||||||||||||||||||||||||||||||
| Total | 100 | % | 100 | % | 100 | % | 100 | % | 100 | % | |||||||||||||||||||||||||||||||
| Columbia Banking System, Inc. | |||||||||||||||||||||||||||||||||||||||||
| Deposit Portfolio Balances and Mix | |||||||||||||||||||||||||||||||||||||||||
| (Unaudited) | |||||||||||||||||||||||||||||||||||||||||
| Mar 31, 2024 | Dec 31, 2023 | Sep 30, 2023 | Jun 30, 2023 | Mar 31, 2023 | % Change | ||||||||||||||||||||||||||||||||||||
| ($ in thousands) | Amount | Amount | Amount | Amount | Amount | Seq. Quarter | Year over Year | ||||||||||||||||||||||||||||||||||
| Deposits: | |||||||||||||||||||||||||||||||||||||||||
| Demand, non-interest bearing | $ | 13,808,554 | $ | 14,256,452 | $ | 15,532,948 | $ | 16,019,408 | $ | 17,215,781 | (3) | % | (20) | % | |||||||||||||||||||||||||||
| Demand, interest bearing | 8,095,211 | 8,044,432 | 6,898,831 | 6,300,082 | 5,900,462 | 1 | % | 37 | % | ||||||||||||||||||||||||||||||||
| Money market | 10,822,498 | 10,324,454 | 10,349,217 | 10,115,908 | 10,681,422 | 5 | % | 1 | % | ||||||||||||||||||||||||||||||||
| Savings | 2,640,060 | 2,754,113 | 3,018,706 | 3,171,714 | 3,469,112 | (4) | % | (24) | % | ||||||||||||||||||||||||||||||||
| Time | 6,339,837 | 6,227,569 | 5,824,666 | 5,227,805 | 4,319,570 | 2 | % | 47 | % | ||||||||||||||||||||||||||||||||
| Total | $ | 41,706,160 | $ | 41,607,020 | $ | 41,624,368 | $ | 40,834,917 | $ | 41,586,347 | — | % | — | % | |||||||||||||||||||||||||||
Total core deposits (1) |
$ | 37,436,569 | $ | 37,423,402 | $ | 37,597,830 | $ | 37,639,368 | $ | 39,155,298 | — | % | (4) | % | |||||||||||||||||||||||||||
| Deposit mix: | |||||||||||||||||||||||||||||||||||||||||
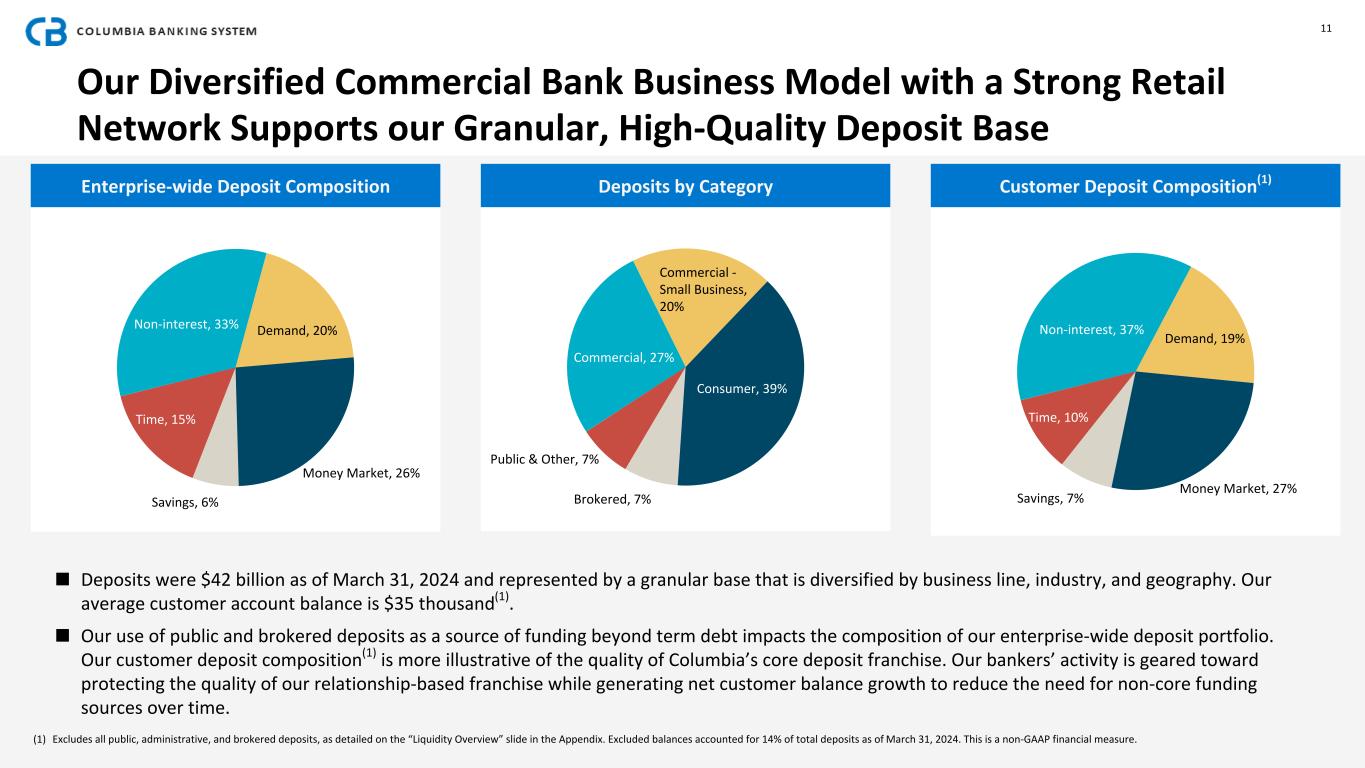
| Demand, non-interest bearing | 33 | % | 34 | % | 37 | % | 39 | % | 41 | % | |||||||||||||||||||||||||||||||
| Demand, interest bearing | 20 | % | 19 | % | 17 | % | 15 | % | 14 | % | |||||||||||||||||||||||||||||||
| Money market | 26 | % | 25 | % | 25 | % | 25 | % | 26 | % | |||||||||||||||||||||||||||||||
| Savings | 6 | % | 7 | % | 7 | % | 8 | % | 9 | % | |||||||||||||||||||||||||||||||
| Time | 15 | % | 15 | % | 14 | % | 13 | % | 10 | % | |||||||||||||||||||||||||||||||
| Total | 100 | % | 100 | % | 100 | % | 100 | % | 100 | % | |||||||||||||||||||||||||||||||
| Columbia Banking System, Inc. | ||||||||||||||||||||||||||||||||||||||||||||
| Credit Quality – Non-performing Assets | ||||||||||||||||||||||||||||||||||||||||||||
| (Unaudited) | ||||||||||||||||||||||||||||||||||||||||||||
| Quarter Ended | % Change | |||||||||||||||||||||||||||||||||||||||||||
| ($ in thousands) | Mar 31, 2024 | Dec 31, 2023 | Sep 30, 2023 | Jun 30, 2023 | Mar 31, 2023 | Seq. Quarter | Year over Year | |||||||||||||||||||||||||||||||||||||
Non-performing assets: (1) |
||||||||||||||||||||||||||||||||||||||||||||
| Loans and leases on non-accrual status: | ||||||||||||||||||||||||||||||||||||||||||||
| Commercial real estate, net | $ | 39,736 | $ | 28,689 | $ | 26,053 | $ | 10,994 | $ | 15,612 | 39 | % | 155 | % | ||||||||||||||||||||||||||||||
| Commercial, net | 58,960 | 45,682 | 44,341 | 39,316 | 42,301 | 29 | % | 39 | % | |||||||||||||||||||||||||||||||||||
| Total loans and leases on non-accrual status | 98,696 | 74,371 | 70,394 | 50,310 | 57,913 | 33 | % | 70 | % | |||||||||||||||||||||||||||||||||||
Loans and leases past due 90+ days and accruing: (2) |
||||||||||||||||||||||||||||||||||||||||||||
| Commercial real estate, net | 253 | 870 | 71 | 184 | 1 | (71) | % | nm | ||||||||||||||||||||||||||||||||||||
| Commercial, net | 10,733 | 8,232 | 8,606 | 7,720 | 151 | 30 | % | nm | ||||||||||||||||||||||||||||||||||||
Residential, net (2) |
31,916 | 29,102 | 25,180 | 21,370 | 17,423 | 10 | % | 83 | % | |||||||||||||||||||||||||||||||||||
| Consumer & other, net | 437 | 326 | 240 | 399 | 140 | 34 | % | 212 | % | |||||||||||||||||||||||||||||||||||
Total loans and leases past due 90+ days and accruing |
43,339 | 38,530 | 34,097 | 29,673 | 17,715 | 12 | % | 145 | % | |||||||||||||||||||||||||||||||||||
Total non-performing loans and leases (1), (2) |
142,035 | 112,901 | 104,491 | 79,983 | 75,628 | 26 | % | 88 | % | |||||||||||||||||||||||||||||||||||
| Other real estate owned | 1,762 | 1,036 | 1,170 | 278 | 409 | 70 | % | 331 | % | |||||||||||||||||||||||||||||||||||
Total non-performing assets (1), (2) |
$ | 143,797 | $ | 113,937 | $ | 105,661 | $ | 80,261 | $ | 76,037 | 26 | % | 89 | % | ||||||||||||||||||||||||||||||
| Loans and leases past due 31-89 days | $ | 109,673 | $ | 85,235 | $ | 82,918 | $ | 73,376 | $ | 78,641 | 29 | % | 39 | % | ||||||||||||||||||||||||||||||
| Loans and leases past due 31-89 days to total loans and leases | 0.29 | % | 0.23 | % | 0.22 | % | 0.20 | % | 0.21 | % | 0.06 | 0.08 | ||||||||||||||||||||||||||||||||
Non-performing loans and leases to total loans and leases (1), (2) |
0.38 | % | 0.30 | % | 0.28 | % | 0.22 | % | 0.20 | % | 0.08 | 0.18 | ||||||||||||||||||||||||||||||||
Non-performing assets to total assets (1), (2) |
0.28 | % | 0.22 | % | 0.20 | % | 0.15 | % | 0.14 | % | 0.06 | 0.14 | ||||||||||||||||||||||||||||||||
| nm = Percentage changes greater than +/-500% are considered not meaningful and are presented as "nm." | ||||||||||||||||||||||||||||||||||||||||||||
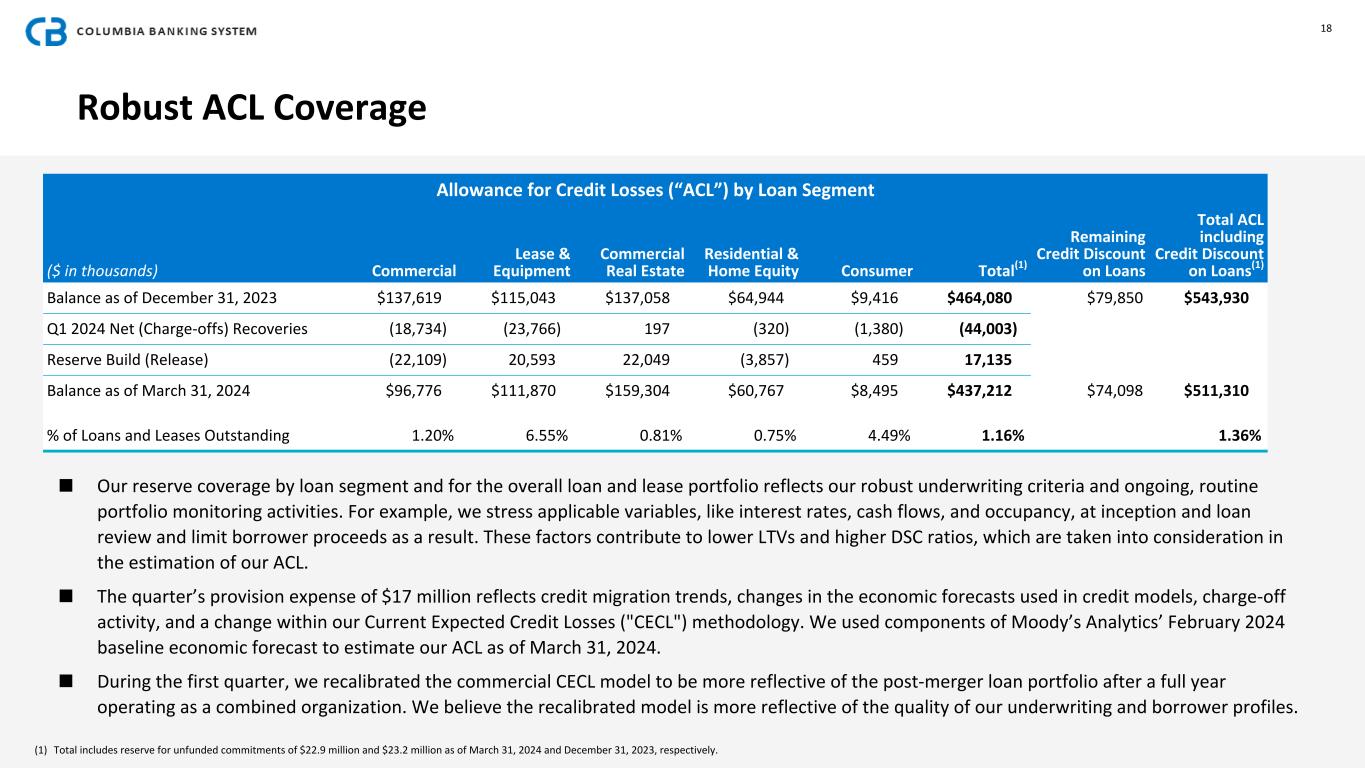
| Columbia Banking System, Inc. | ||||||||||||||||||||||||||||||||||||||||||||
| Credit Quality – Allowance for Credit Losses | ||||||||||||||||||||||||||||||||||||||||||||
| (Unaudited) | ||||||||||||||||||||||||||||||||||||||||||||
| Quarter Ended | % Change | |||||||||||||||||||||||||||||||||||||||||||
| ($ in thousands) | Mar 31, 2024 | Dec 31, 2023 | Sep 30, 2023 | Jun 30, 2023 | Mar 31, 2023 | Seq. Quarter | Year over Year | |||||||||||||||||||||||||||||||||||||
| Allowance for credit losses on loans and leases (ACLLL) | ||||||||||||||||||||||||||||||||||||||||||||
| Balance, beginning of period | $ | 440,871 | $ | 416,560 | $ | 404,603 | $ | 417,464 | $ | 301,135 | 6 | % | 46 | % | ||||||||||||||||||||||||||||||
| Initial ACL recorded for PCD loans acquired during the period | — | — | — | — | 26,492 | nm | (100) | % | ||||||||||||||||||||||||||||||||||||
Provision for credit losses on loans and leases (1) |
17,476 | 53,183 | 35,082 | 15,216 | 106,498 | (67) | % | (84) | % | |||||||||||||||||||||||||||||||||||
| Charge-offs | ||||||||||||||||||||||||||||||||||||||||||||
| Commercial real estate, net | (161) | (629) | — | (174) | — | (74) | % | nm | ||||||||||||||||||||||||||||||||||||
| Commercial, net | (47,232) | (31,949) | (26,629) | (32,036) | (19,248) | 48 | % | 145 | % | |||||||||||||||||||||||||||||||||||
| Residential, net | (490) | (89) | (206) | (4) | (248) | 451 | % | 98 | % | |||||||||||||||||||||||||||||||||||
| Consumer & other, net | (1,870) | (1,841) | (1,884) | (1,264) | (773) | 2 | % | 142 | % | |||||||||||||||||||||||||||||||||||
| Total charge-offs | (49,753) | (34,508) | (28,719) | (33,478) | (20,269) | 44 | % | 145 | % | |||||||||||||||||||||||||||||||||||
| Recoveries | ||||||||||||||||||||||||||||||||||||||||||||
| Commercial real estate, net | 358 | 35 | 31 | 209 | 58 | nm | nm | |||||||||||||||||||||||||||||||||||||
| Commercial, net | 4,732 | 4,414 | 4,901 | 4,511 | 3,058 | 7 | % | 55 | % | |||||||||||||||||||||||||||||||||||
| Residential, net | 170 | 781 | 156 | 63 | 123 | (78) | % | 38 | % | |||||||||||||||||||||||||||||||||||
| Consumer & other, net | 490 | 406 | 506 | 618 | 369 | 21 | % | 33 | % | |||||||||||||||||||||||||||||||||||
| Total recoveries | 5,750 | 5,636 | 5,594 | 5,401 | 3,608 | 2 | % | 59 | % | |||||||||||||||||||||||||||||||||||
| Net (charge-offs) recoveries | ||||||||||||||||||||||||||||||||||||||||||||
| Commercial real estate, net | 197 | (594) | 31 | 35 | 58 | nm | 240 | % | ||||||||||||||||||||||||||||||||||||
| Commercial, net | (42,500) | (27,535) | (21,728) | (27,525) | (16,190) | 54 | % | 163 | % | |||||||||||||||||||||||||||||||||||
| Residential, net | (320) | 692 | (50) | 59 | (125) | (146) | % | 156 | % | |||||||||||||||||||||||||||||||||||
| Consumer & other, net | (1,380) | (1,435) | (1,378) | (646) | (404) | (4) | % | 242 | % | |||||||||||||||||||||||||||||||||||
| Total net charge-offs | (44,003) | (28,872) | (23,125) | (28,077) | (16,661) | 52 | % | 164 | % | |||||||||||||||||||||||||||||||||||
| Balance, end of period | $ | 414,344 | $ | 440,871 | $ | 416,560 | $ | 404,603 | $ | 417,464 | (6) | % | (1) | % | ||||||||||||||||||||||||||||||
| Reserve for unfunded commitments | ||||||||||||||||||||||||||||||||||||||||||||
| Balance, beginning of period | $ | 23,208 | $ | 21,482 | $ | 19,827 | $ | 19,029 | $ | 14,221 | 8 | % | 63 | % | ||||||||||||||||||||||||||||||
| Initial ACL recorded for unfunded commitments acquired during the period | — | — | — | — | 5,767 | nm | (100) | % | ||||||||||||||||||||||||||||||||||||
| (Recapture) provision for credit losses on unfunded commitments | (340) | 1,726 | 1,655 | 798 | (959) | (120) | % | (65) | % | |||||||||||||||||||||||||||||||||||
| Balance, end of period | 22,868 | 23,208 | 21,482 | 19,827 | 19,029 | (1) | % | 20 | % | |||||||||||||||||||||||||||||||||||
| Total Allowance for credit losses (ACL) | $ | 437,212 | $ | 464,079 | $ | 438,042 | $ | 424,430 | $ | 436,493 | (6) | % | — | % | ||||||||||||||||||||||||||||||
| Net charge-offs to average loans and leases (annualized) | 0.47 | % | 0.31 | % | 0.25 | % | 0.30 | % | 0.23 | % | 0.16 | 0.24 | ||||||||||||||||||||||||||||||||
| Recoveries to gross charge-offs | 11.56 | % | 16.33 | % | 19.48 | % | 16.13 | % | 17.80 | % | (4.77) | (6.24) | ||||||||||||||||||||||||||||||||
| ACLLL to loans and leases | 1.10 | % | 1.18 | % | 1.12 | % | 1.09 | % | 1.13 | % | (0.08) | (0.03) | ||||||||||||||||||||||||||||||||
| ACL to loans and leases | 1.16 | % | 1.24 | % | 1.18 | % | 1.15 | % | 1.18 | % | (0.08) | (0.02) | ||||||||||||||||||||||||||||||||
| nm = Percentage changes greater than +/-500% are considered not meaningful and are presented as "nm." | ||||||||||||||||||||||||||||||||||||||||||||
| Columbia Banking System, Inc. | |||||||||||||||||||||||||||||||||||||||||||||||||||||
| Consolidated Average Balance Sheets, Net Interest Income, and Yields/Rates | |||||||||||||||||||||||||||||||||||||||||||||||||||||
| (Unaudited) | |||||||||||||||||||||||||||||||||||||||||||||||||||||
| Quarter Ended | |||||||||||||||||||||||||||||||||||||||||||||||||||||
| March 31, 2024 | December 31, 2023 | March 31, 2023 | |||||||||||||||||||||||||||||||||||||||||||||||||||
| ($ in thousands) | Average Balance | Interest Income or Expense | Average Yields or Rates | Average Balance | Interest Income or Expense | Average Yields or Rates | Average Balance | Interest Income or Expense | Average Yields or Rates | ||||||||||||||||||||||||||||||||||||||||||||
| INTEREST-EARNING ASSETS: | |||||||||||||||||||||||||||||||||||||||||||||||||||||
| Loans held for sale | $ | 30,550 | $ | 525 | 6.88 | % | $ | 48,868 | $ | 649 | 5.31 | % | $ | 54,008 | $ | 799 | 5.92 | % | |||||||||||||||||||||||||||||||||||
Loans and leases (1) |
37,597,101 | 574,519 | 6.13 | % | 37,333,310 | 577,092 | 6.13 | % | 29,998,630 | 412,726 | 5.55 | % | |||||||||||||||||||||||||||||||||||||||||
| Taxable securities | 8,081,003 | 78,724 | 3.90 | % | 7,903,053 | 82,872 | 4.19 | % | 4,960,966 | 40,448 | 3.26 | % | |||||||||||||||||||||||||||||||||||||||||
Non-taxable securities (2) |
851,342 | 7,886 | 3.71 | % | 809,551 | 8,073 | 3.99 | % | 437,020 | 4,068 | 3.72 | % | |||||||||||||||||||||||||||||||||||||||||
| Temporary investments and interest-bearing cash | 1,720,791 | 23,553 | 5.51 | % | 1,743,447 | 24,055 | 5.47 | % | 1,605,081 | 18,581 | 4.69 | % | |||||||||||||||||||||||||||||||||||||||||
| Total interest-earning assets | 48,280,787 | $ | 685,207 | 5.69 | % | 47,838,229 | $ | 692,741 | 5.75 | % | 37,055,705 | $ | 476,622 | 5.19 | % | ||||||||||||||||||||||||||||||||||||||
| Goodwill and other intangible assets | 1,619,134 | 1,652,282 | 623,042 | ||||||||||||||||||||||||||||||||||||||||||||||||||
| Other assets | 2,184,052 | 2,341,845 | 1,747,228 | ||||||||||||||||||||||||||||||||||||||||||||||||||
| Total assets | $ | 52,083,973 | $ | 51,832,356 | $ | 39,425,975 | |||||||||||||||||||||||||||||||||||||||||||||||
| INTEREST-BEARING LIABILITIES: | |||||||||||||||||||||||||||||||||||||||||||||||||||||
| Interest-bearing demand deposits | $ | 8,035,339 | $ | 51,378 | 2.57 | % | $ | 7,617,427 | $ | 44,861 | 2.34 | % | $ | 4,759,251 | $ | 9,815 | 0.84 | % | |||||||||||||||||||||||||||||||||||
| Money market deposits | 10,612,073 | 72,497 | 2.75 | % | 10,276,894 | 61,055 | 2.36 | % | 8,845,784 | 32,238 | 1.48 | % | |||||||||||||||||||||||||||||||||||||||||
| Savings deposits | 2,688,360 | 715 | 0.11 | % | 2,880,622 | 698 | 0.10 | % | 2,686,388 | 556 | 0.08 | % | |||||||||||||||||||||||||||||||||||||||||
| Time deposits | 6,406,807 | 73,845 | 4.64 | % | 5,847,400 | 64,045 | 4.35 | % | 3,205,128 | 21,004 | 2.66 | % | |||||||||||||||||||||||||||||||||||||||||
| Total interest-bearing deposits | 27,742,579 | 198,435 | 2.88 | % | 26,622,343 | 170,659 | 2.54 | % | 19,496,551 | 63,613 | 1.32 | % | |||||||||||||||||||||||||||||||||||||||||
| Repurchase agreements and federal funds purchased | 231,667 | 1,266 | 2.20 | % | 245,989 | 1,226 | 1.98 | % | 281,032 | 406 | 0.59 | % | |||||||||||||||||||||||||||||||||||||||||
| Borrowings | 3,920,879 | 51,275 | 5.26 | % | 3,918,261 | 56,066 | 5.68 | % | 2,352,715 | 28,764 | 4.96 | % | |||||||||||||||||||||||||||||||||||||||||
| Junior and other subordinated debentures | 423,528 | 9,887 | 9.39 | % | 440,007 | 10,060 | 9.07 | % | 417,966 | 8,470 | 8.22 | % | |||||||||||||||||||||||||||||||||||||||||
| Total interest-bearing liabilities | 32,318,653 | $ | 260,863 | 3.25 | % | 31,226,600 | $ | 238,011 | 3.02 | % | 22,548,264 | $ | 101,253 | 1.82 | % | ||||||||||||||||||||||||||||||||||||||
| Non-interest-bearing deposits | 13,841,582 | 14,899,001 | 12,755,080 | ||||||||||||||||||||||||||||||||||||||||||||||||||
| Other liabilities | 937,863 | 1,011,019 | 772,870 | ||||||||||||||||||||||||||||||||||||||||||||||||||
| Total liabilities | 47,098,098 | 47,136,620 | 36,076,214 | ||||||||||||||||||||||||||||||||||||||||||||||||||
| Common equity | 4,985,875 | 4,695,736 | 3,349,761 | ||||||||||||||||||||||||||||||||||||||||||||||||||
| Total liabilities and shareholders' equity | $ | 52,083,973 | $ | 51,832,356 | $ | 39,425,975 | |||||||||||||||||||||||||||||||||||||||||||||||
NET INTEREST INCOME (2) |
$ | 424,344 | $ | 454,730 | $ | 375,369 | |||||||||||||||||||||||||||||||||||||||||||||||
| NET INTEREST SPREAD | 2.44 | % | 2.73 | % | 3.37 | % | |||||||||||||||||||||||||||||||||||||||||||||||
NET INTEREST INCOME TO EARNING ASSETS OR NET INTEREST MARGIN (1), (2) |
3.52 | % | 3.78 | % | 4.08 | % | |||||||||||||||||||||||||||||||||||||||||||||||
| Columbia Banking System, Inc. | |||||||||||||||||||||||||||||||||||||||||
| Residential Mortgage Banking Activity | |||||||||||||||||||||||||||||||||||||||||
| (Unaudited) | |||||||||||||||||||||||||||||||||||||||||
| Quarter Ended | % Change | ||||||||||||||||||||||||||||||||||||||||
| ($ in thousands) | Mar 31, 2024 | Dec 31, 2023 | Sep 30, 2023 | Jun 30, 2023 | Mar 31, 2023 | Seq. Quarter | Year over Year | ||||||||||||||||||||||||||||||||||
| Residential mortgage banking revenue: | |||||||||||||||||||||||||||||||||||||||||
| Origination and sale | $ | 2,920 | $ | 2,686 | $ | 2,442 | $ | 3,166 | $ | 3,587 | 9 | % | (19) | % | |||||||||||||||||||||||||||
| Servicing | 6,021 | 5,966 | 8,887 | 9,167 | 9,397 | 1 | % | (36) | % | ||||||||||||||||||||||||||||||||
| Change in fair value of MSR asset: | |||||||||||||||||||||||||||||||||||||||||
| Changes due to collection/realization of expected cash flows over time | (3,153) | (3,215) | (4,801) | (4,797) | (4,881) | (2) | % | (35) | % | ||||||||||||||||||||||||||||||||
| Changes due to valuation inputs or assumptions | 3,117 | (6,251) | 5,308 | (2,242) | (2,937) | nm | nm | ||||||||||||||||||||||||||||||||||
| MSR hedge (loss) gain | (4,271) | 5,026 | (4,733) | (7,636) | 2,650 | (185) | % | (261) | % | ||||||||||||||||||||||||||||||||
| Total | $ | 4,634 | $ | 4,212 | $ | 7,103 | $ | (2,342) | $ | 7,816 | 10 | % | (41) | % | |||||||||||||||||||||||||||
| Closed loan volume for-sale | $ | 86,903 | $ | 87,033 | $ | 103,333 | $ | 119,476 | $ | 131,726 | — | % | (34) | % | |||||||||||||||||||||||||||
| Gain on sale margin | 3.36 | % | 3.09 | % | 2.36 | % | 2.65 | % | 2.72 | % | 0.27 | 0.64 | |||||||||||||||||||||||||||||
| Residential mortgage servicing rights: | |||||||||||||||||||||||||||||||||||||||||
| Balance, beginning of period | $ | 109,243 | $ | 117,640 | $ | 172,929 | $ | 178,800 | $ | 185,017 | (7) | % | (41) | % | |||||||||||||||||||||||||||
| Additions for new MSR capitalized | 1,237 | 920 | 1,658 | 1,168 | 1,601 | 34 | % | (23) | % | ||||||||||||||||||||||||||||||||
| Sale of MSR assets | — | 149 | (57,454) | — | — | (100) | % | nm | |||||||||||||||||||||||||||||||||
| Change in fair value of MSR asset: | |||||||||||||||||||||||||||||||||||||||||
| Changes due to collection/realization of expected cash flows over time | (3,153) | (3,215) | (4,801) | (4,797) | (4,881) | (2) | % | (35) | % | ||||||||||||||||||||||||||||||||
| Changes due to valuation inputs or assumptions | 3,117 | (6,251) | 5,308 | (2,242) | (2,937) | nm | nm | ||||||||||||||||||||||||||||||||||
| Balance, end of period | $ | 110,444 | $ | 109,243 | $ | 117,640 | $ | 172,929 | $ | 178,800 | 1 | % | (38) | % | |||||||||||||||||||||||||||
| Residential mortgage loans serviced for others | $ | 8,081,039 | $ | 8,175,664 | $ | 8,240,950 | $ | 12,726,615 | $ | 12,914,046 | (1) | % | (37) | % | |||||||||||||||||||||||||||
| MSR as % of serviced portfolio | 1.37 | % | 1.34 | % | 1.43 | % | 1.36 | % | 1.38 | % | 0.03 | (0.01) | |||||||||||||||||||||||||||||
| nm = Percentage changes greater than +/-500% are considered not meaningful and are presented as "nm." | |||||||||||||||||||||||||||||||||||||||||
| Columbia Banking System, Inc. | |||||||||||||||||||||||||||||||||||||||||||||||
| GAAP to Non-GAAP Reconciliation | |||||||||||||||||||||||||||||||||||||||||||||||
| (Unaudited) | |||||||||||||||||||||||||||||||||||||||||||||||
| Quarter Ended | % Change | ||||||||||||||||||||||||||||||||||||||||||||||
| ($ in thousands, except per share data) | Mar 31, 2024 | Dec 31, 2023 | Sep 30, 2023 | Jun 30, 2023 | Mar 31, 2023 | Seq. Quarter | Year over Year | ||||||||||||||||||||||||||||||||||||||||
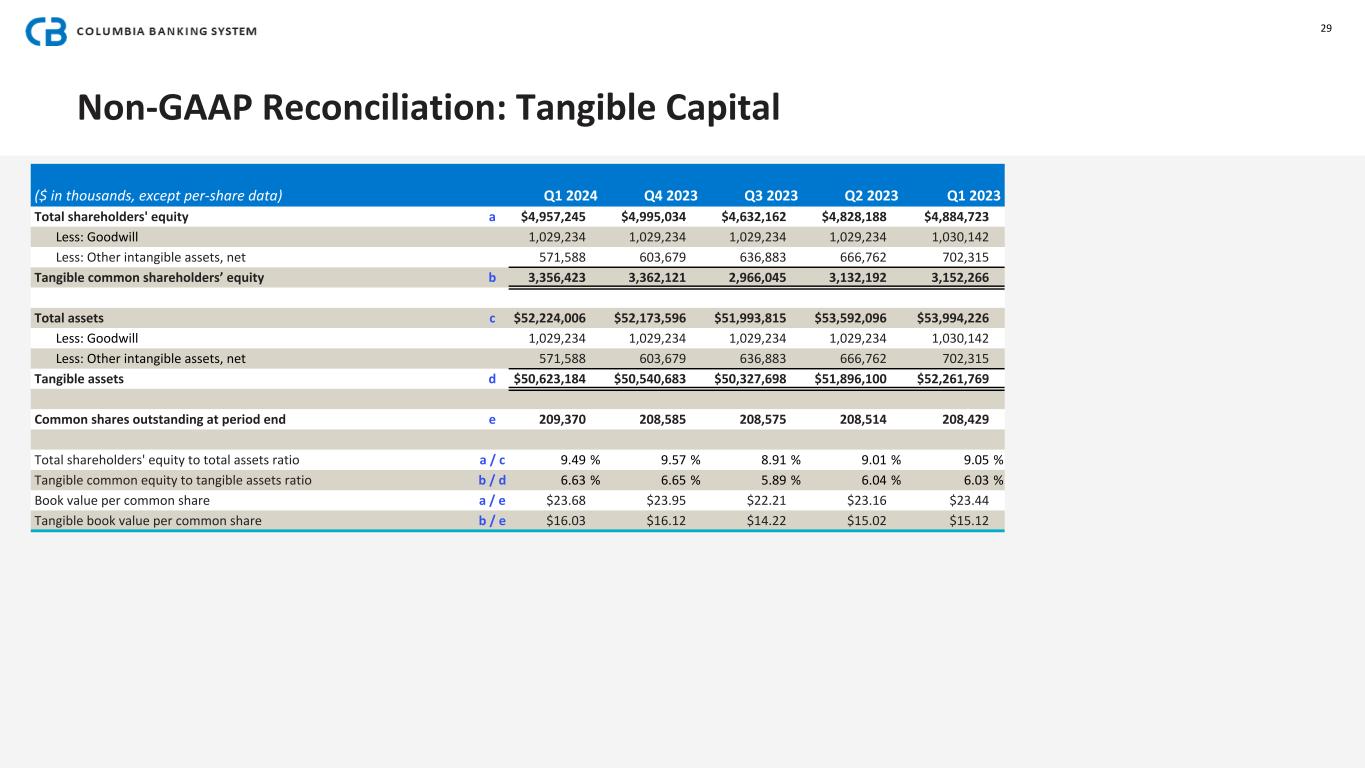
| Total shareholders' equity | a | $ | 4,957,245 | $ | 4,995,034 | $ | 4,632,162 | $ | 4,828,188 | $ | 4,884,723 | (1) | % | 1 | % | ||||||||||||||||||||||||||||||||
| Less: Goodwill | 1,029,234 | 1,029,234 | 1,029,234 | 1,029,234 | 1,030,142 | — | % | — | % | ||||||||||||||||||||||||||||||||||||||
| Less: Other intangible assets, net | 571,588 | 603,679 | 636,883 | 666,762 | 702,315 | (5) | % | (19) | % | ||||||||||||||||||||||||||||||||||||||
| Tangible common shareholders' equity | b | $ | 3,356,423 | $ | 3,362,121 | $ | 2,966,045 | $ | 3,132,192 | $ | 3,152,266 | — | % | 6 | % | ||||||||||||||||||||||||||||||||
| Total assets | c | $ | 52,224,006 | $ | 52,173,596 | $ | 51,993,815 | $ | 53,592,096 | $ | 53,994,226 | — | % | (3) | % | ||||||||||||||||||||||||||||||||
| Less: Goodwill | 1,029,234 | 1,029,234 | 1,029,234 | 1,029,234 | 1,030,142 | — | % | — | % | ||||||||||||||||||||||||||||||||||||||
| Less: Other intangible assets, net | 571,588 | 603,679 | 636,883 | 666,762 | 702,315 | (5) | % | (19) | % | ||||||||||||||||||||||||||||||||||||||
| Tangible assets | d | $ | 50,623,184 | $ | 50,540,683 | $ | 50,327,698 | $ | 51,896,100 | $ | 52,261,769 | — | % | (3) | % | ||||||||||||||||||||||||||||||||
| Common shares outstanding at period end | e | 209,370 | 208,585 | 208,575 | 208,514 | 208,429 | — | % | — | % | |||||||||||||||||||||||||||||||||||||
| Total shareholders' equity to total assets ratio | a / c | 9.49 | % | 9.57 | % | 8.91 | % | 9.01 | % | 9.05 | % | (0.08) | 0.44 | ||||||||||||||||||||||||||||||||||
| Tangible common equity ratio | b / d | 6.63 | % | 6.65 | % | 5.89 | % | 6.04 | % | 6.03 | % | (0.02) | 0.60 | ||||||||||||||||||||||||||||||||||
| Book value per common share | a / e | $ | 23.68 | $ | 23.95 | $ | 22.21 | $ | 23.16 | $ | 23.44 | (1) | % | 1 | % | ||||||||||||||||||||||||||||||||
| Tangible book value per common share | b / e | $ | 16.03 | $ | 16.12 | $ | 14.22 | $ | 15.02 | $ | 15.12 | (1) | % | 6 | % | ||||||||||||||||||||||||||||||||
| Columbia Banking System, Inc. | |||||||||||||||||||||||||||||||||||||||||||||||
| GAAP to Non-GAAP Reconciliation - Continued | |||||||||||||||||||||||||||||||||||||||||||||||
| (Unaudited) | |||||||||||||||||||||||||||||||||||||||||||||||
| Quarter Ended | % Change | ||||||||||||||||||||||||||||||||||||||||||||||
| ($ in thousands) | Mar 31, 2024 | Dec 31, 2023 | Sep 30, 2023 | Jun 30, 2023 | Mar 31, 2023 | Seq. Quarter | Year over Year | ||||||||||||||||||||||||||||||||||||||||
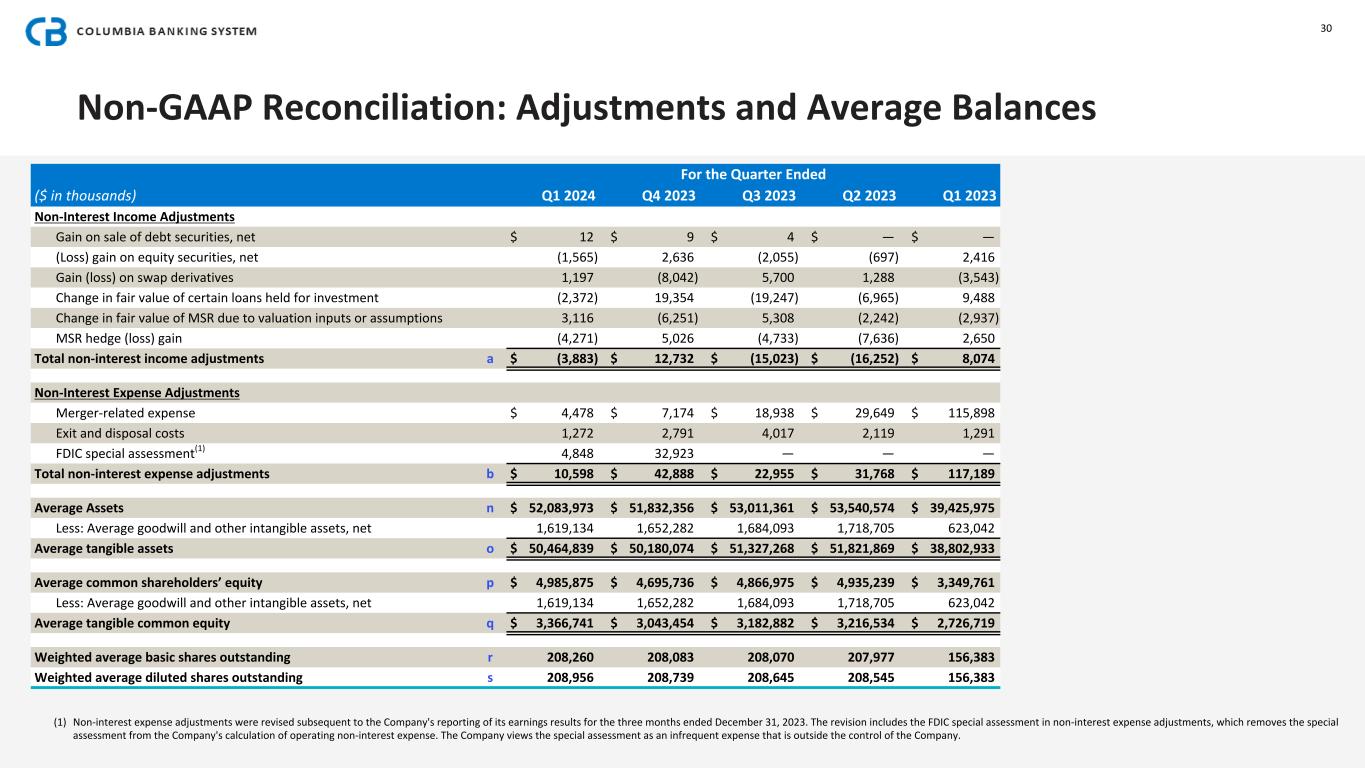
| Non-Interest Income Adjustments | |||||||||||||||||||||||||||||||||||||||||||||||
| Gain on sale of debt securities, net | $ | 12 | $ | 9 | $ | 4 | $ | — | $ | — | 33 | % | nm | ||||||||||||||||||||||||||||||||||
| (Loss) gain on equity securities, net | (1,565) | 2,636 | (2,055) | (697) | 2,416 | (159) | % | (165) | % | ||||||||||||||||||||||||||||||||||||||
| Gain (loss) on swap derivatives | 1,197 | (8,042) | 5,700 | 1,288 | (3,543) | nm | nm | ||||||||||||||||||||||||||||||||||||||||
| Change in fair value of certain loans held for investment | (2,372) | 19,354 | (19,247) | (6,965) | 9,488 | (112) | % | (125) | % | ||||||||||||||||||||||||||||||||||||||
| Change in fair value of MSR due to valuation inputs or assumptions | 3,116 | (6,251) | 5,308 | (2,242) | (2,937) | nm | nm | ||||||||||||||||||||||||||||||||||||||||
| MSR hedge (loss) gain | (4,271) | 5,026 | (4,733) | (7,636) | 2,650 | (185) | % | (261) | % | ||||||||||||||||||||||||||||||||||||||
| Total non-interest income adjustments | a | $ | (3,883) | $ | 12,732 | $ | (15,023) | $ | (16,252) | $ | 8,074 | (130) | % | (148) | % | ||||||||||||||||||||||||||||||||
| Non-Interest Expense Adjustments | |||||||||||||||||||||||||||||||||||||||||||||||
| Merger-related expense | $ | 4,478 | $ | 7,174 | $ | 18,938 | $ | 29,649 | $ | 115,898 | (38) | % | (96) | % | |||||||||||||||||||||||||||||||||
| Exit and disposal costs | 1,272 | 2,791 | 4,017 | 2,119 | 1,291 | (54) | % | (1) | % | ||||||||||||||||||||||||||||||||||||||
FDIC special assessment (2) |
4,848 | 32,923 | — | — | — | (85) | % | nm | |||||||||||||||||||||||||||||||||||||||
| Total non-interest expense adjustments | b | $ | 10,598 | $ | 42,888 | $ | 22,955 | $ | 31,768 | $ | 117,189 | (75) | % | (91) | % | ||||||||||||||||||||||||||||||||
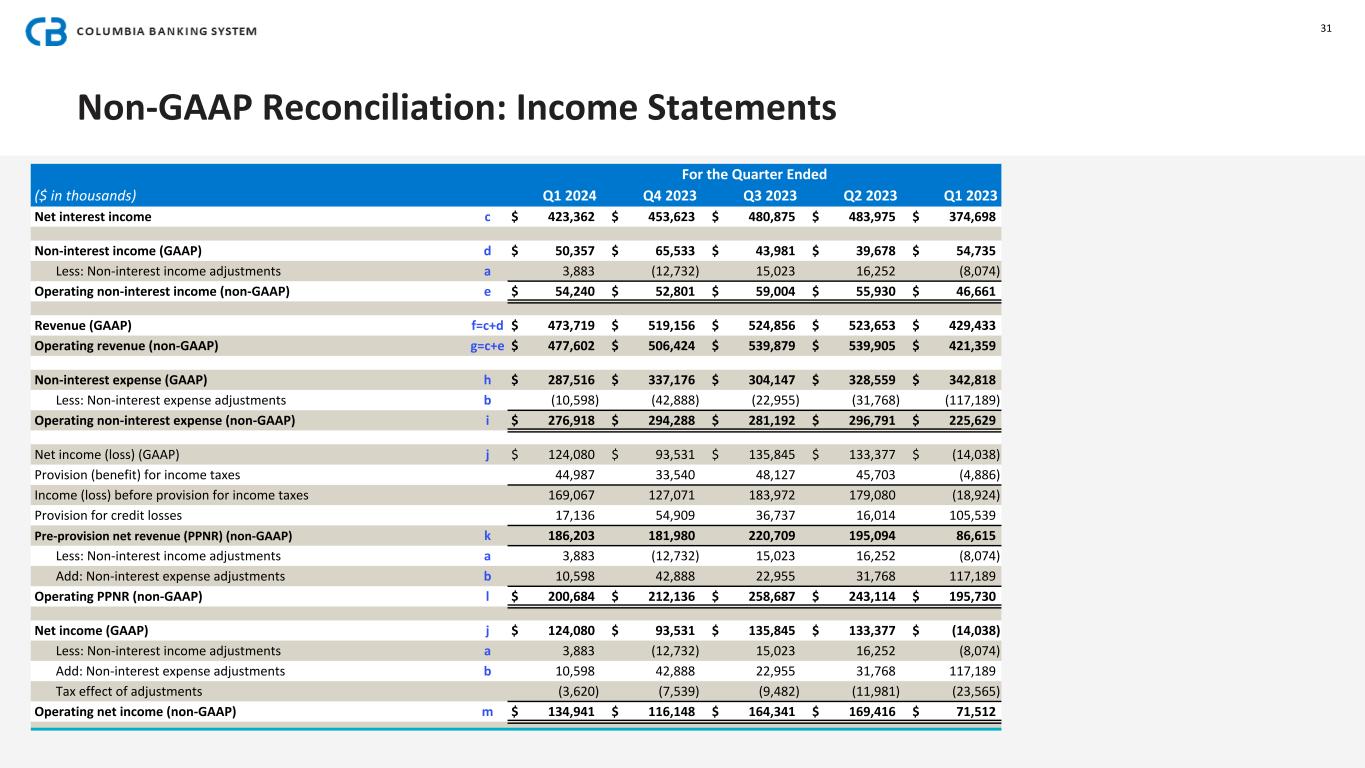
| Net interest income | c | $ | 423,362 | $ | 453,623 | $ | 480,875 | $ | 483,975 | $ | 374,698 | (7) | % | 13 | % | ||||||||||||||||||||||||||||||||
| Non-interest income (GAAP) | d | $ | 50,357 | $ | 65,533 | $ | 43,981 | $ | 39,678 | $ | 54,735 | (23) | % | (8) | % | ||||||||||||||||||||||||||||||||
| Less: Non-interest income adjustments | a | 3,883 | (12,732) | 15,023 | 16,252 | (8,074) | nm | nm | |||||||||||||||||||||||||||||||||||||||
| Operating non-interest income (non-GAAP) | e | $ | 54,240 | $ | 52,801 | $ | 59,004 | $ | 55,930 | $ | 46,661 | 3 | % | 16 | % | ||||||||||||||||||||||||||||||||
| Revenue (GAAP) | f=c+d | $ | 473,719 | $ | 519,156 | $ | 524,856 | $ | 523,653 | $ | 429,433 | (9) | % | 10 | % | ||||||||||||||||||||||||||||||||
| Operating revenue (non-GAAP) | g=c+e | $ | 477,602 | $ | 506,424 | $ | 539,879 | $ | 539,905 | $ | 421,359 | (6) | % | 13 | % | ||||||||||||||||||||||||||||||||
| Non-interest expense (GAAP) | h | $ | 287,516 | $ | 337,176 | $ | 304,147 | $ | 328,559 | $ | 342,818 | (15) | % | (16) | % | ||||||||||||||||||||||||||||||||
| Less: Non-interest expense adjustments | b | (10,598) | (42,888) | (22,955) | (31,768) | (117,189) | (75) | % | (91) | % | |||||||||||||||||||||||||||||||||||||
| Operating non-interest expense (non-GAAP) | i | $ | 276,918 | $ | 294,288 | $ | 281,192 | $ | 296,791 | $ | 225,629 | (6) | % | 23 | % | ||||||||||||||||||||||||||||||||
| Net income (loss) (GAAP) | j | $ | 124,080 | $ | 93,531 | $ | 135,845 | $ | 133,377 | $ | (14,038) | 33 | % | nm | |||||||||||||||||||||||||||||||||
| Provision (benefit) for income taxes | 44,987 | 33,540 | 48,127 | 45,703 | (4,886) | 34 | % | nm | |||||||||||||||||||||||||||||||||||||||
| Income (loss) before provision for income taxes | 169,067 | 127,071 | 183,972 | 179,080 | (18,924) | 33 | % | nm | |||||||||||||||||||||||||||||||||||||||
| Provision for credit losses | 17,136 | 54,909 | 36,737 | 16,014 | 105,539 | (69) | % | (84) | % | ||||||||||||||||||||||||||||||||||||||
| Pre-provision net revenue (PPNR) (non-GAAP) | k | 186,203 | 181,980 | 220,709 | 195,094 | 86,615 | 2 | % | 115 | % | |||||||||||||||||||||||||||||||||||||
| Less: Non-interest income adjustments | a | 3,883 | (12,732) | 15,023 | 16,252 | (8,074) | nm | nm | |||||||||||||||||||||||||||||||||||||||
| Add: Non-interest expense adjustments | b | 10,598 | 42,888 | 22,955 | 31,768 | 117,189 | (75) | % | (91) | % | |||||||||||||||||||||||||||||||||||||
| Operating PPNR (non-GAAP) | l | $ | 200,684 | $ | 212,136 | $ | 258,687 | $ | 243,114 | $ | 195,730 | (5) | % | 3 | % | ||||||||||||||||||||||||||||||||
| Net income (loss) (GAAP) | j | $ | 124,080 | $ | 93,531 | $ | 135,845 | $ | 133,377 | $ | (14,038) | 33 | % | nm | |||||||||||||||||||||||||||||||||
| Less: Non-interest income adjustments | a | 3,883 | (12,732) | 15,023 | 16,252 | (8,074) | nm | nm | |||||||||||||||||||||||||||||||||||||||
| Add: Non-interest expense adjustments | b | 10,598 | 42,888 | 22,955 | 31,768 | 117,189 | (75) | % | (91) | % | |||||||||||||||||||||||||||||||||||||
| Tax effect of adjustments | (3,620) | (7,539) | (9,482) | (11,981) | (23,565) | (52) | % | (85) | % | ||||||||||||||||||||||||||||||||||||||
| Operating net income (non-GAAP) | m | $ | 134,941 | $ | 116,148 | $ | 164,341 | $ | 169,416 | $ | 71,512 | 16 | % | 89 | % | ||||||||||||||||||||||||||||||||
| nm = Percentage changes greater than +/-500% are considered not meaningful and are presented as "nm." | |||||||||||||||||||||||||||||||||||||||||||||||
| Columbia Banking System, Inc. | |||||||||||||||||||||||||||||||||||||||||||||||
| GAAP to Non-GAAP Reconciliation - Continued | |||||||||||||||||||||||||||||||||||||||||||||||
| (Unaudited) | |||||||||||||||||||||||||||||||||||||||||||||||
| Quarter Ended | % Change | ||||||||||||||||||||||||||||||||||||||||||||||
| ($ in thousands, except per share data) | Mar 31, 2024 | Dec 31, 2023 | Sep 30, 2023 | Jun 30, 2023 | Mar 31, 2023 | Seq. Quarter | Year over Year | ||||||||||||||||||||||||||||||||||||||||
| Average assets | n | $ | 52,083,973 | $ | 51,832,356 | $ | 53,011,361 | $ | 53,540,574 | $ | 39,425,975 | — | % | 32 | % | ||||||||||||||||||||||||||||||||
| Less: Average goodwill and other intangible assets, net | 1,619,134 | 1,652,282 | 1,684,093 | 1,718,705 | 623,042 | (2) | % | 160 | % | ||||||||||||||||||||||||||||||||||||||
| Average tangible assets | o | $ | 50,464,839 | $ | 50,180,074 | $ | 51,327,268 | $ | 51,821,869 | $ | 38,802,933 | 1 | % | 30 | % | ||||||||||||||||||||||||||||||||
| Average common shareholders' equity | p | $ | 4,985,875 | $ | 4,695,736 | $ | 4,866,975 | $ | 4,935,239 | $ | 3,349,761 | 6 | % | 49 | % | ||||||||||||||||||||||||||||||||
| Less: Average goodwill and other intangible assets, net | 1,619,134 | 1,652,282 | 1,684,093 | 1,718,705 | 623,042 | (2) | % | 160 | % | ||||||||||||||||||||||||||||||||||||||
| Average tangible common equity | q | $ | 3,366,741 | $ | 3,043,454 | $ | 3,182,882 | $ | 3,216,534 | $ | 2,726,719 | 11 | % | 23 | % | ||||||||||||||||||||||||||||||||
| Weighted average basic shares outstanding | r | 208,260 | 208,083 | 208,070 | 207,977 | 156,383 | — | % | 33 | % | |||||||||||||||||||||||||||||||||||||
| Weighted average diluted shares outstanding | s | 208,956 | 208,739 | 208,645 | 208,545 | 156,383 | — | % | 34 | % | |||||||||||||||||||||||||||||||||||||
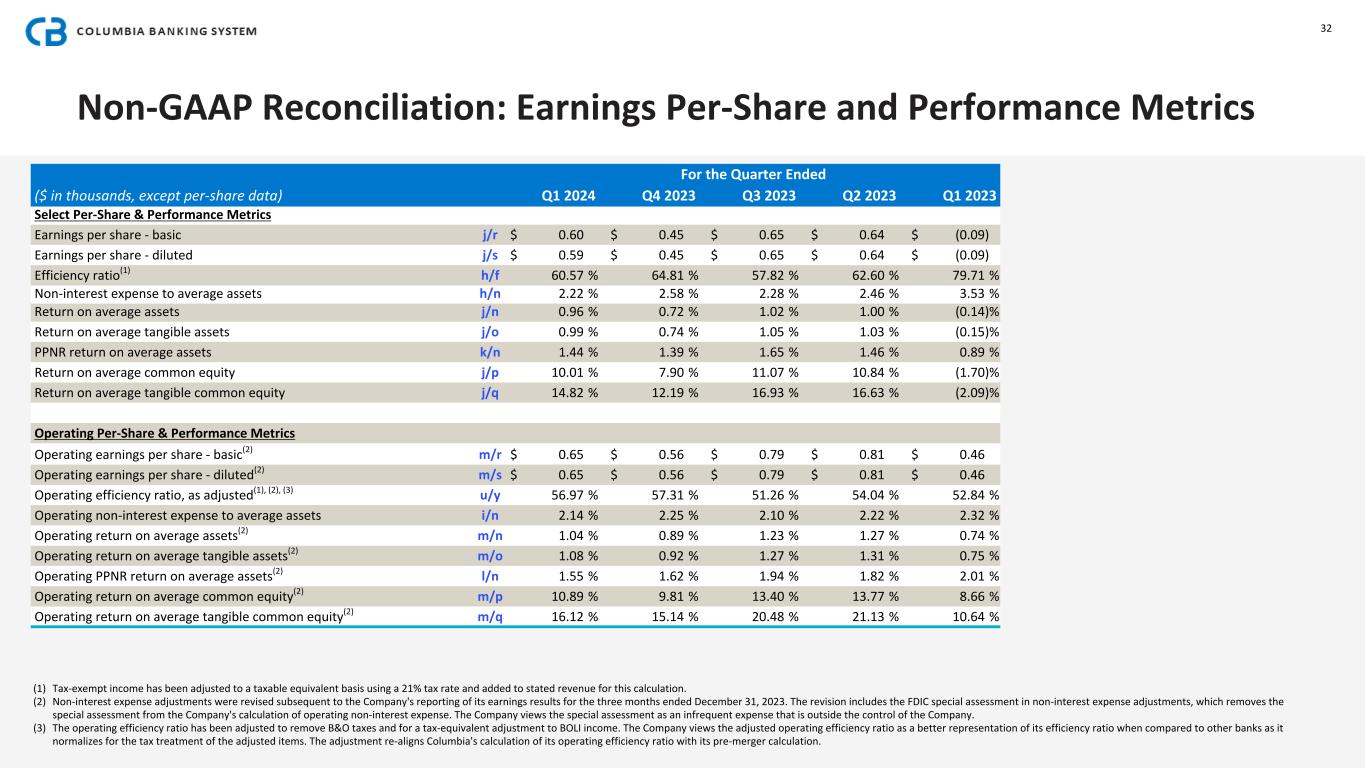
| Select Per-Share & Performance Metrics | |||||||||||||||||||||||||||||||||||||||||||||||
| Earnings-per-share - basic | j / r | $ | 0.60 | $ | 0.45 | $ | 0.65 | $ | 0.64 | $ | (0.09) | 33 | % | nm | |||||||||||||||||||||||||||||||||
| Earnings-per-share - diluted | j / s | $ | 0.59 | $ | 0.45 | $ | 0.65 | $ | 0.64 | $ | (0.09) | 31 | % | nm | |||||||||||||||||||||||||||||||||
Efficiency ratio (1) |
h / f | 60.57 | % | 64.81 | % | 57.82 | % | 62.60 | % | 79.71 | % | (4.24) | (19.14) | ||||||||||||||||||||||||||||||||||
| Non-interest expense to average assets | h / n | 2.22 | % | 2.58 | % | 2.28 | % | 2.46 | % | 3.53 | % | (0.36) | (1.31) | ||||||||||||||||||||||||||||||||||
| Return on average assets | j / n | 0.96 | % | 0.72 | % | 1.02 | % | 1.00 | % | (0.14) | % | 0.24 | 1.10 | ||||||||||||||||||||||||||||||||||
| Return on average tangible assets | j / o | 0.99 | % | 0.74 | % | 1.05 | % | 1.03 | % | (0.15) | % | 0.25 | 1.14 | ||||||||||||||||||||||||||||||||||
| PPNR return on average assets | k / n | 1.44 | % | 1.39 | % | 1.65 | % | 1.46 | % | 0.89 | % | 0.05 | 0.55 | ||||||||||||||||||||||||||||||||||
| Return on average common equity | j / p | 10.01 | % | 7.90 | % | 11.07 | % | 10.84 | % | (1.70) | % | 2.11 | 11.71 | ||||||||||||||||||||||||||||||||||
| Return on average tangible common equity | j / q | 14.82 | % | 12.19 | % | 16.93 | % | 16.63 | % | (2.09) | % | 2.63 | 16.91 | ||||||||||||||||||||||||||||||||||
| Operating Per-Share & Performance Metrics | |||||||||||||||||||||||||||||||||||||||||||||||
Operating earnings-per-share - basic (2) |
m / r | $ | 0.65 | $ | 0.56 | $ | 0.79 | $ | 0.81 | $ | 0.46 | 16 | % | 41 | % | ||||||||||||||||||||||||||||||||
Operating earnings-per-share - diluted (2) |
m / s | $ | 0.65 | $ | 0.56 | $ | 0.79 | $ | 0.81 | $ | 0.46 | 16 | % | 41 | % | ||||||||||||||||||||||||||||||||
Operating efficiency ratio, as adjusted (1), (2), (3) |
u / y | 56.97 | % | 57.31 | % | 51.26 | % | 54.04 | % | 52.84 | % | (0.34) | 4.13 | ||||||||||||||||||||||||||||||||||
| Operating non-interest expense to average assets | i / n | 2.14 | % | 2.25 | % | 2.10 | % | 2.22 | % | 2.32 | % | (0.11) | (0.18) | ||||||||||||||||||||||||||||||||||
Operating return on average assets (2) |
m / n | 1.04 | % | 0.89 | % | 1.23 | % | 1.27 | % | 0.74 | % | 0.15 | 0.30 | ||||||||||||||||||||||||||||||||||
Operating return on average tangible assets (2) |
m / o | 1.08 | % | 0.92 | % | 1.27 | % | 1.31 | % | 0.75 | % | 0.16 | 0.33 | ||||||||||||||||||||||||||||||||||
Operating PPNR return on average assets (2) |
l / n | 1.55 | % | 1.62 | % | 1.94 | % | 1.82 | % | 2.01 | % | (0.07) | (0.46) | ||||||||||||||||||||||||||||||||||
Operating return on average common equity (2) |
m / p | 10.89 | % | 9.81 | % | 13.40 | % | 13.77 | % | 8.66 | % | 1.08 | 2.23 | ||||||||||||||||||||||||||||||||||
Operating return on average tangible common equity (2) |
m / q | 16.12 | % | 15.14 | % | 20.48 | % | 21.13 | % | 10.64 | % | 0.98 | 5.48 | ||||||||||||||||||||||||||||||||||
| nm = Percentage changes greater than +/-500% are considered not meaningful and are presented as "n/m." | |||||||||||||||||||||||||||||||||||||||||||||||
| Columbia Banking System, Inc. | |||||||||||||||||||||||||||||||||||||||||||||||
| GAAP to Non-GAAP Reconciliation - Continued | |||||||||||||||||||||||||||||||||||||||||||||||
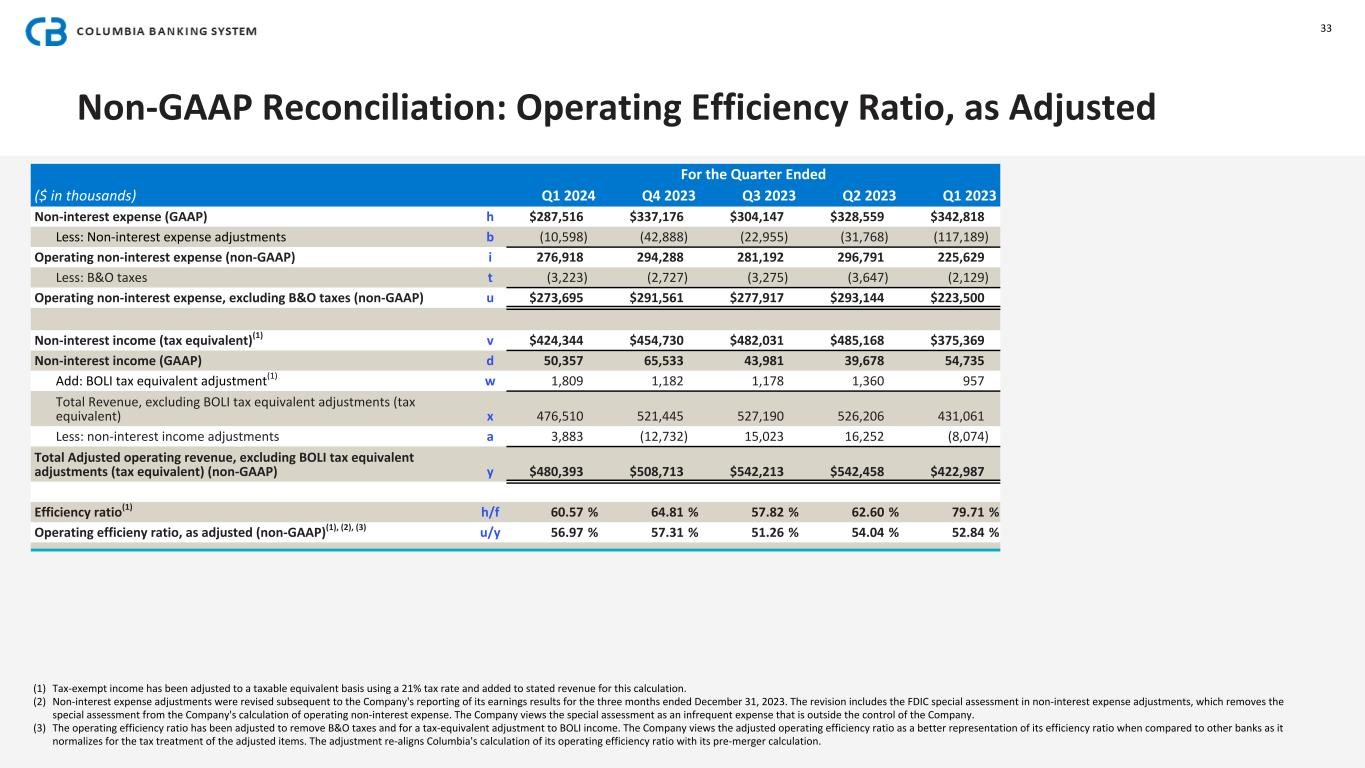
| Operating Efficiency Ratio, as adjusted | |||||||||||||||||||||||||||||||||||||||||||||||
| (Unaudited) | |||||||||||||||||||||||||||||||||||||||||||||||
| Quarter Ended | % Change | ||||||||||||||||||||||||||||||||||||||||||||||
| ($ in thousands) | Mar 31, 2024 | Dec 31, 2023 | Sep 30, 2023 | Jun 30, 2023 | Mar 31, 2023 | Seq. Quarter | Year over Year | ||||||||||||||||||||||||||||||||||||||||
| Non-interest expense (GAAP) | h | $ | 287,516 | $ | 337,176 | $ | 304,147 | $ | 328,559 | $ | 342,818 | (15) | % | (16) | % | ||||||||||||||||||||||||||||||||
| Less: Non-interest expense adjustments | b | (10,598) | (42,888) | (22,955) | (31,768) | (117,189) | (75) | % | (91) | % | |||||||||||||||||||||||||||||||||||||
| Operating non-interest expense (non-GAAP) | i | 276,918 | 294,288 | 281,192 | 296,791 | 225,629 | (6) | % | 23 | % | |||||||||||||||||||||||||||||||||||||
| Less: B&O taxes | t | (3,223) | (2,727) | (3,275) | (3,647) | (2,129) | 18 | % | 51 | % | |||||||||||||||||||||||||||||||||||||
| Operating non-interest expense, excluding B&O taxes (non-GAAP) | u | $ | 273,695 | $ | 291,561 | $ | 277,917 | $ | 293,144 | $ | 223,500 | (6) | % | 22 | % | ||||||||||||||||||||||||||||||||
Net interest income (tax equivalent) (1) |
v | $ | 424,344 | $ | 454,730 | $ | 482,031 | $ | 485,168 | $ | 375,369 | (7) | % | 13 | % | ||||||||||||||||||||||||||||||||
| Non-interest income (GAAP) | d | 50,357 | 65,533 | 43,981 | 39,678 | 54,735 | (23) | % | (8) | % | |||||||||||||||||||||||||||||||||||||
Add: BOLI tax equivalent adjustment (1) |
w | 1,809 | 1,182 | 1,178 | 1,360 | 957 | 53 | % | 89 | % | |||||||||||||||||||||||||||||||||||||
| Total Revenue, excluding BOLI tax equivalent adjustments (tax equivalent) | x | 476,510 | 521,445 | 527,190 | 526,206 | 431,061 | (9) | % | 11 | % | |||||||||||||||||||||||||||||||||||||
| Less: Non-interest income adjustments | a | 3,883 | (12,732) | 15,023 | 16,252 | (8,074) | nm | nm | |||||||||||||||||||||||||||||||||||||||
| Total Adjusted Operating Revenue, excluding BOLI tax equivalent adjustments (tax equivalent) (non-GAAP) | y | $ | 480,393 | $ | 508,713 | $ | 542,213 | $ | 542,458 | $ | 422,987 | (6) | % | 14 | % | ||||||||||||||||||||||||||||||||
Efficiency ratio (1) |
h / f | 60.57 | % | 64.81 | % | 57.82 | % | 62.60 | % | 79.71 | % | (4.24) | (19.14) | ||||||||||||||||||||||||||||||||||
Operating efficiency ratio, as adjusted (non-GAAP) (1), (2), (3) |
u / y | 56.97 | % | 57.31 | % | 51.26 | % | 54.04 | % | 52.84 | % | (0.34) | 4.13 | ||||||||||||||||||||||||||||||||||
| nm = Percentage changes greater than +/-500% are considered not meaningful and are presented as "nm." | |||||||||||||||||||||||||||||||||||||||||||||||
| Columbia Banking System, Inc. | |||||||||||||||||||||||||||||||||||||||||||||||
| GAAP to Non-GAAP Reconciliation - Continued | |||||||||||||||||||||||||||||||||||||||||||||||
| (Unaudited) | |||||||||||||||||||||||||||||||||||||||||||||||
| Quarter Ended | % Change | ||||||||||||||||||||||||||||||||||||||||||||||
| ($ in thousands) | Mar 31, 2024 | Dec 31, 2023 | Sep 30, 2023 | Jun 30, 2023 | Mar 31, 2023 | Seq. Quarter | Year over Year | ||||||||||||||||||||||||||||||||||||||||
| Loans and leases interest income | a | $ | 574,519 | $ | 577,092 | $ | 567,929 | $ | 551,997 | $ | 412,726 | — | % | 39 | % | ||||||||||||||||||||||||||||||||
Less: Acquired loan accretion - rate related (2), (3) |
b | 23,482 | 26,914 | 28,963 | 30,548 | 11,832 | (13) | % | 98 | % | |||||||||||||||||||||||||||||||||||||
Less: Acquired loan accretion - credit related (3) |
c | 5,119 | 5,430 | 6,370 | 7,100 | 3,806 | (6) | % | 34 | % | |||||||||||||||||||||||||||||||||||||
| Adjusted loans and leases interest income | d=a-b-c | $ | 545,918 | $ | 544,748 | $ | 532,596 | $ | 514,349 | $ | 397,088 | — | % | 37 | % | ||||||||||||||||||||||||||||||||
| Taxable securities interest income | e | $ | 78,724 | $ | 82,872 | $ | 85,007 | $ | 81,617 | $ | 40,448 | (5) | % | 95 | % | ||||||||||||||||||||||||||||||||
| Less: Acquired taxable securities accretion - rate related | f | 31,527 | 34,290 | 39,219 | 34,801 | 15,356 | (8) | % | 105 | % | |||||||||||||||||||||||||||||||||||||
| Adjusted Taxable securities interest income | g=e-f | $ | 47,197 | $ | 48,582 | $ | 45,788 | $ | 46,816 | $ | 25,092 | (3) | % | 88 | % | ||||||||||||||||||||||||||||||||
Non-taxable securities interest income (1) |
h | $ | 7,886 | $ | 8,073 | $ | 8,085 | $ | 8,010 | $ | 4,068 | (2) | % | 94 | % | ||||||||||||||||||||||||||||||||
| Less: Acquired non-taxable securities accretion - rate related | i | 2,270 | 2,309 | 2,288 | 2,274 | 901 | (2) | % | 152 | % | |||||||||||||||||||||||||||||||||||||
Adjusted Taxable securities interest income (1) |
j=h-i | $ | 5,616 | $ | 5,764 | $ | 5,797 | $ | 5,736 | $ | 3,167 | (3) | % | 77 | % | ||||||||||||||||||||||||||||||||
Interest income (1) |
k | $ | 685,207 | $ | 692,741 | $ | 697,169 | $ | 676,922 | $ | 476,622 | (1) | % | 44 | % | ||||||||||||||||||||||||||||||||
| Less: Acquired loan and securities accretion - rate related | l=b+f+i | 57,279 | 63,513 | 70,470 | 67,623 | 28,089 | (10) | % | 104 | % | |||||||||||||||||||||||||||||||||||||
| Less: Acquired loan accretion - credit related | c | 5,119 | 5,430 | 6,370 | 7,100 | 3,806 | (6) | % | 34 | % | |||||||||||||||||||||||||||||||||||||
Adjusted interest income (1) |
m=k-l-c | $ | 622,809 | $ | 623,798 | $ | 620,329 | $ | 602,199 | $ | 444,727 | — | % | 40 | % | ||||||||||||||||||||||||||||||||
| Interest-bearing deposits interest expense | n | $ | 198,435 | $ | 170,659 | $ | 126,974 | $ | 100,408 | $ | 63,613 | 16 | % | 212 | % | ||||||||||||||||||||||||||||||||
| Less: Acquired deposit accretion | o | — | (187) | (373) | (280) | (93) | nm | nm | |||||||||||||||||||||||||||||||||||||||
| Adjusted interest-bearing deposits interest expense | p=n-o | $ | 198,435 | $ | 170,846 | $ | 127,347 | $ | 100,688 | $ | 63,706 | 16 | % | 211 | % | ||||||||||||||||||||||||||||||||
| Interest expense | q | $ | 260,863 | $ | 238,011 | $ | 215,138 | $ | 191,754 | $ | 101,253 | 10 | % | 158 | % | ||||||||||||||||||||||||||||||||
Less: Acquired interest-bearing liabilities accretion (2) |
r | (57) | (244) | (430) | (337) | (150) | (77) | % | (62) | % | |||||||||||||||||||||||||||||||||||||
| Adjusted interest expense | s=q-r | $ | 260,920 | $ | 238,255 | $ | 215,568 | $ | 192,091 | $ | 101,403 | 10 | % | 157 | % | ||||||||||||||||||||||||||||||||
Net Interest Income (1) |
t | $ | 424,344 | $ | 454,730 | $ | 482,031 | $ | 485,168 | $ | 375,369 | (7) | % | 13 | % | ||||||||||||||||||||||||||||||||
Less: Acquired loan, securities, and interest-bearing liabilities accretion - rate related (3) |
u=l-r | 57,336 | 63,757 | 70,900 | 67,960 | 28,239 | (10) | % | 103 | % | |||||||||||||||||||||||||||||||||||||
Less: Acquired loan accretion - credit related (3) |
c | 5,119 | 5,430 | 6,370 | 7,100 | 3,806 | (6) | % | 34 | % | |||||||||||||||||||||||||||||||||||||
Adjusted net interest income (1) |
v=t-u-c | $ | 361,889 | $ | 385,543 | $ | 404,761 | $ | 410,108 | $ | 343,324 | (6) | % | 5 | % | ||||||||||||||||||||||||||||||||
| Average loans and leases | aa | 37,597,101 | 37,333,310 | 37,050,518 | 37,169,315 | 29,998,630 | 1 | % | 25 | % | |||||||||||||||||||||||||||||||||||||
| Average taxable securities | ab | 8,081,003 | 7,903,053 | 8,356,165 | 8,656,147 | 4,960,966 | 2 | % | 63 | % | |||||||||||||||||||||||||||||||||||||
| Average non-taxable securities | ac | 851,342 | 809,551 | 844,417 | 865,278 | 437,020 | 5 | % | 95 | % | |||||||||||||||||||||||||||||||||||||
| Average interest-earning assets | ad | 48,280,787 | 47,838,229 | 48,981,105 | 49,442,518 | 37,055,705 | 1 | % | 30 | % | |||||||||||||||||||||||||||||||||||||
| Average interest-bearing deposits | ae | 27,742,579 | 26,622,343 | 25,121,745 | 24,494,717 | 19,496,551 | 4 | % | 42 | % | |||||||||||||||||||||||||||||||||||||
| Average interest-bearing liabilities | af | 32,318,653 | 31,226,600 | 31,413,978 | 31,372,416 | 22,548,264 | 3 | % | 43 | % | |||||||||||||||||||||||||||||||||||||
| nm = Percentage changes greater than +/-500% are considered not meaningful and are presented as "nm." | |||||||||||||||||||||||||||||||||||||||||||||||
| Columbia Banking System, Inc. | |||||||||||||||||||||||||||||||||||||||||||||||
| GAAP to Non-GAAP Reconciliation - Continued | |||||||||||||||||||||||||||||||||||||||||||||||
| (Unaudited) | |||||||||||||||||||||||||||||||||||||||||||||||
| Quarter Ended | % Change | ||||||||||||||||||||||||||||||||||||||||||||||
| ($ in thousands) | Mar 31, 2024 | Dec 31, 2023 | Sep 30, 2023 | Jun 30, 2023 | Mar 31, 2023 | Seq. Quarter | Year over Year | ||||||||||||||||||||||||||||||||||||||||
| Average yield on loans and leases | a / aa | 6.13 | % | 6.13 | % | 6.08 | % | 5.95 | % | 5.55 | % | — | 0.58 | ||||||||||||||||||||||||||||||||||
Less: Acquired loan accretion - rate related (2),(3) |
b / aa | 0.25 | % | 0.29 | % | 0.31 | % | 0.33 | % | 0.16 | % | (0.04) | 0.09 | ||||||||||||||||||||||||||||||||||
Less: Acquired loan accretion - credit related (3) |
c / aa | 0.05 | % | 0.06 | % | 0.07 | % | 0.08 | % | 0.05 | % | (0.01) | — | ||||||||||||||||||||||||||||||||||
| Adjusted average yield on loans and leases | d / aa | 5.83 | % | 5.78 | % | 5.70 | % | 5.54 | % | 5.34 | % | 0.05 | 0.49 | ||||||||||||||||||||||||||||||||||
| Average yield on taxable securities | e / ab | 3.90 | % | 4.19 | % | 4.07 | % | 3.77 | % | 3.26 | % | (0.29) | 0.64 | ||||||||||||||||||||||||||||||||||
| Less: Acquired taxable securities accretion - rate related | f / ab | 1.57 | % | 1.72 | % | 1.86 | % | 1.61 | % | 1.26 | % | (0.15) | 0.31 | ||||||||||||||||||||||||||||||||||
| Adjusted average yield on taxable securities | g / ab | 2.33 | % | 2.47 | % | 2.21 | % | 2.16 | % | 2.00 | % | (0.14) | 0.33 | ||||||||||||||||||||||||||||||||||
Average yield on non-taxable securities (1) |
h / ac | 3.71 | % | 3.99 | % | 3.83 | % | 3.70 | % | 3.72 | % | (0.28) | (0.01) | ||||||||||||||||||||||||||||||||||
| Less: Acquired non-taxable securities accretion - rate related | i / ac | 1.07 | % | 1.13 | % | 1.07 | % | 1.05 | % | 0.84 | % | (0.06) | 0.23 | ||||||||||||||||||||||||||||||||||
Adjusted yield on non-taxable securities (1) |
j / ac | 2.64 | % | 2.86 | % | 2.76 | % | 2.65 | % | 2.88 | % | (0.22) | (0.24) | ||||||||||||||||||||||||||||||||||
Average yield on interest-earning assets (1) |
k / ad | 5.69 | % | 5.75 | % | 5.65 | % | 5.48 | % | 5.19 | % | (0.06) | 0.50 | ||||||||||||||||||||||||||||||||||
| Less: Acquired loan and securities accretion - rate related | l / ad | 0.48 | % | 0.53 | % | 0.57 | % | 0.55 | % | 0.31 | % | (0.05) | 0.17 | ||||||||||||||||||||||||||||||||||
| Less: Acquired loan accretion - credit related | c / ad | 0.04 | % | 0.05 | % | 0.05 | % | 0.06 | % | 0.04 | % | (0.01) | — | ||||||||||||||||||||||||||||||||||
Adjusted average yield on interest-earning assets (1) |
m / ad | 5.17 | % | 5.17 | % | 5.03 | % | 4.87 | % | 4.84 | % | — | 0.33 | ||||||||||||||||||||||||||||||||||
| Average rate on interest-bearing deposits | n / ae | 2.88 | % | 2.54 | % | 2.01 | % | 1.64 | % | 1.32 | % | 0.34 | 1.56 | ||||||||||||||||||||||||||||||||||
| Less: Acquired deposit accretion | o / ae | — | % | — | % | (0.01) | % | — | % | — | % | — | — | ||||||||||||||||||||||||||||||||||
| Adjusted average rate on interest-bearing deposits | p / ae | 2.88 | % | 2.54 | % | 2.02 | % | 1.64 | % | 1.32 | % | 0.34 | 1.56 | ||||||||||||||||||||||||||||||||||
| Average rate on interest-bearing liabilities | q / af | 3.25 | % | 3.02 | % | 2.72 | % | 2.45 | % | 1.82 | % | 0.23 | 1.43 | ||||||||||||||||||||||||||||||||||
Less: Acquired interest-bearing liabilities accretion (2) |
r / af | — | % | — | % | (0.01) | % | — | % | — | % | — | — | ||||||||||||||||||||||||||||||||||
| Adjusted average rate on interest-bearing liabilities | s / af | 3.25 | % | 3.02 | % | 2.73 | % | 2.45 | % | 1.82 | % | 0.23 | 1.43 | ||||||||||||||||||||||||||||||||||
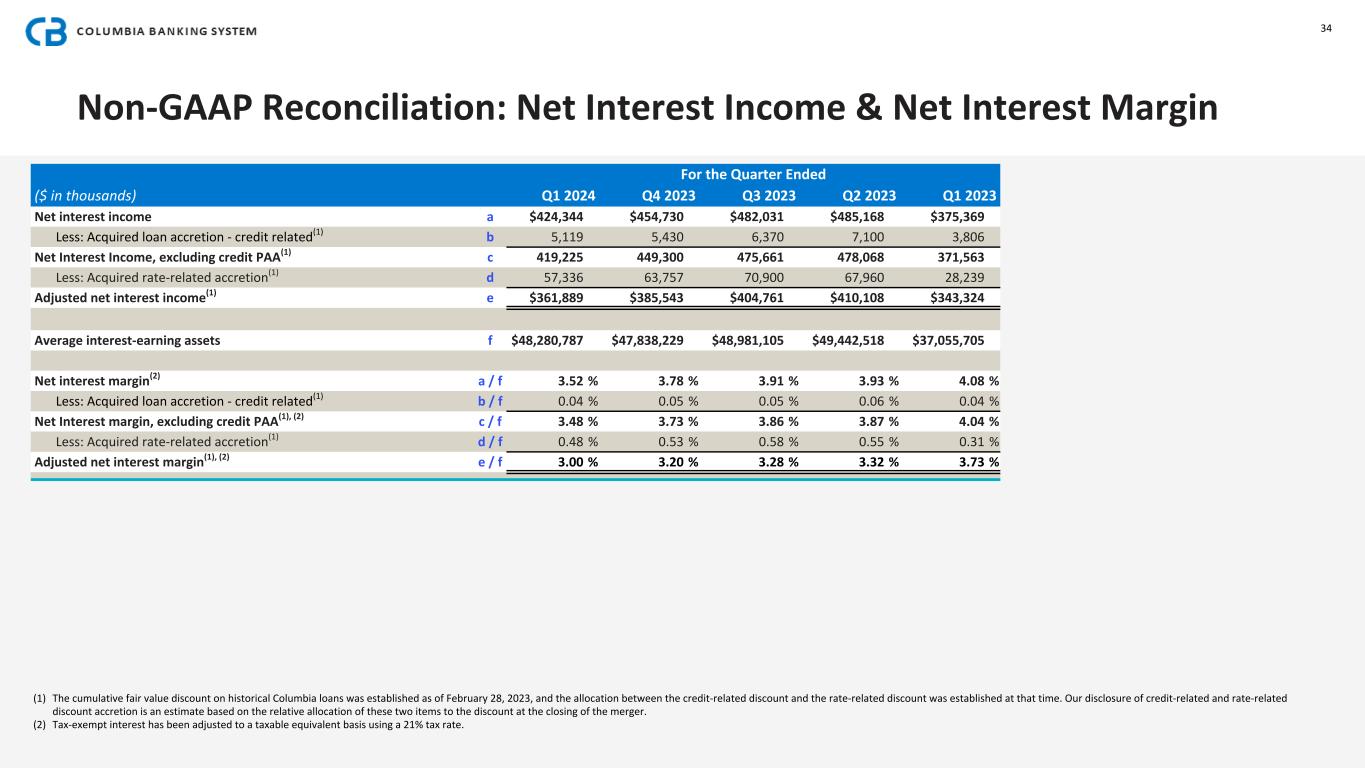
Net interest margin (1) |
t / ad | 3.52 | % | 3.78 | % | 3.91 | % | 3.93 | % | 4.08 | % | (0.26) | (0.56) | ||||||||||||||||||||||||||||||||||
Less: Acquired loan, securities, and interest-bearing liabilities accretion - rate related (3) |
u / ad | 0.48 | % | 0.53 | % | 0.58 | % | 0.55 | % | 0.31 | % | (0.05) | 0.17 | ||||||||||||||||||||||||||||||||||
Less: Acquired loan accretion - credit related (3) |
c / ad | 0.04 | % | 0.05 | % | 0.05 | % | 0.06 | % | 0.04 | % | (0.01) | — | ||||||||||||||||||||||||||||||||||
Adjusted net interest margin (1) |
v / ad | 3.00 | % | 3.20 | % | 3.28 | % | 3.32 | % | 3.73 | % | (0.20) | (0.73) | ||||||||||||||||||||||||||||||||||
