1 Investor Update 1 August 30, 2023 Exhibit 99.2

2 About This Presentation This presentation contains statements, estimates and projections that are forward-looking statements (as defined in Section 21E of the Securities Exchange Act of 1934, as amended, and Section 27A of the Securities Act of 1933, as amended). Such statements use forward-looking words such as “believe,” “plan,” “anticipate,” “continue,” “estimate,” “expect,” “may,” or other similar words and terms of similar meaning, although not all forward-looking statements contain such words. These statements discuss plans, strategies, events or developments that we expect or anticipate will or may occur in the future. Management believes that these are reasonable as of today’s date only. Actual results may differ significantly because of risks and uncertainties that are difficult to predict and many of which are beyond management’s control; accordingly, there is no assurance that results will be realized. You should read UGI’s Annual Report on Form 10-K and Quarterly Reports on Form 10-Q for a more extensive list of factors that could affect results. We undertake no obligation (and expressly disclaim any obligation) to update publicly any forward-looking statement, whether as a result of new information or future events, except as required by the federal securities laws. Among them are adverse weather conditions (including increasingly uncertain weather patterns due to climate change) resulting in reduced demand, the seasonal nature of our business, and disruptions in our operations and supply chain; cost volatility and availability of energy products, including propane and other LPG, natural gas, and electricity, as well as the availability of LPG cylinders, and the capacity to transport product to our customers; changes in domestic and foreign laws and regulations, including safety, health, tax, transportation, consumer protection, data privacy, accounting, and environmental matters, such as regulatory responses to climate change; the inability to timely recover costs through utility rate proceedings; increased customer conservation measures due to high energy prices and improvements in energy efficiency and technology resulting in reduced demand; adverse labor relations and our ability to address existing or potential workforce shortages; the impact of pending and future legal or regulatory proceedings, inquiries or investigations; competitive pressures from the same and alternative energy sources; failure to acquire new customers or retain current customers, thereby reducing or limiting any increase in revenues; liability for environmental claims; customer, counterparty, supplier, or vendor defaults; liability for uninsured claims and for claims in excess of insurance coverage, including those for personal injury and property damage arising from explosions, acts of war, terrorism, natural disasters, pandemics and other catastrophic events that may result from operating hazards and risks incidental to generating and distributing electricity and transporting, storing and distributing natural gas and LPG in all forms; transmission or distribution system service interruptions; political, regulatory and economic conditions in the United States, Europe and other foreign countries, including uncertainties related to the war between Russia and Ukraine, the European energy crisis, and foreign currency exchange rate fluctuations (particularly the euro); credit and capital market conditions, including reduced access to capital markets and interest rate fluctuations; changes in commodity market prices resulting in significantly higher cash collateral requirements; impacts of our indebtedness and the restrictive covenants in our debt agreements; reduced distributions from subsidiaries impacting the ability to pay dividends or service debt; changes in Marcellus and Utica Shale gas production; the availability, timing and success of our acquisitions, commercial initiatives and investments to grow our businesses; our ability to successfully integrate acquired businesses and achieve anticipated synergies; the interruption, disruption, failure, malfunction, or breach of our information technology systems, and those of our third-party vendors or service providers, including due to cyber-attack; the inability to complete pending or future energy infrastructure projects; our ability to achieve the operational benefits and cost efficiencies expected from the completion of pending and future business transformation initiatives, including the impact of customer service disruptions resulting in potential customer loss due to the transformation activities; our ability to attract, develop, retain and engage key employees; uncertainties related to global pandemics; the impact of proposed or future tax legislation; the impact of declines in the stock market or bond market, and a low interest rate environment, on our pension liability; our ability to protect our intellectual property; and our ability to overcome supply chain issues that may result in delays or shortages in, as well as increased costs of, equipment, materials or other resources that are critical to our business operations.
3 UGI Supplemental Footnotes Management uses "adjusted net income attributable to UGI Corporation“, "adjusted diluted earnings per share“, “AmeriGas Free Cash Flow” and “UGI International Free Cash Flow”, all of which are non-GAAP financial measures, when evaluating UGI's overall performance. Management believes that these non-GAAP measures provide meaningful information to investors about UGI’s performance because they eliminate the impacts of (1) gains and losses on commodity and certain foreign currency derivative instruments not associated with current-period transactions and (2) other significant discrete items that can affect the comparison of period-over-period results. Volatility in net income at UGI can occur as a result of gains and losses on commodity and certain foreign currency derivative instruments not associated with current-period transactions but included in earnings in accordance with U.S. generally accepted accounting principles ("GAAP"). Non-GAAP financial measures are not in accordance with, or an alternative to, GAAP and should be considered in addition to, and not as a substitute for, the comparable GAAP measures. The tables in slides 17 and 18 reconcile adjusted diluted earnings per share and adjusted net income attributable to UGI Corporation to their most directly comparable GAAP measures. The tables on slides 19 and 20 reconcile “AmeriGas Free Cash Flow” and “UGI International Free Cash Flow” to their most directly comparable GAAP measures, respectively.
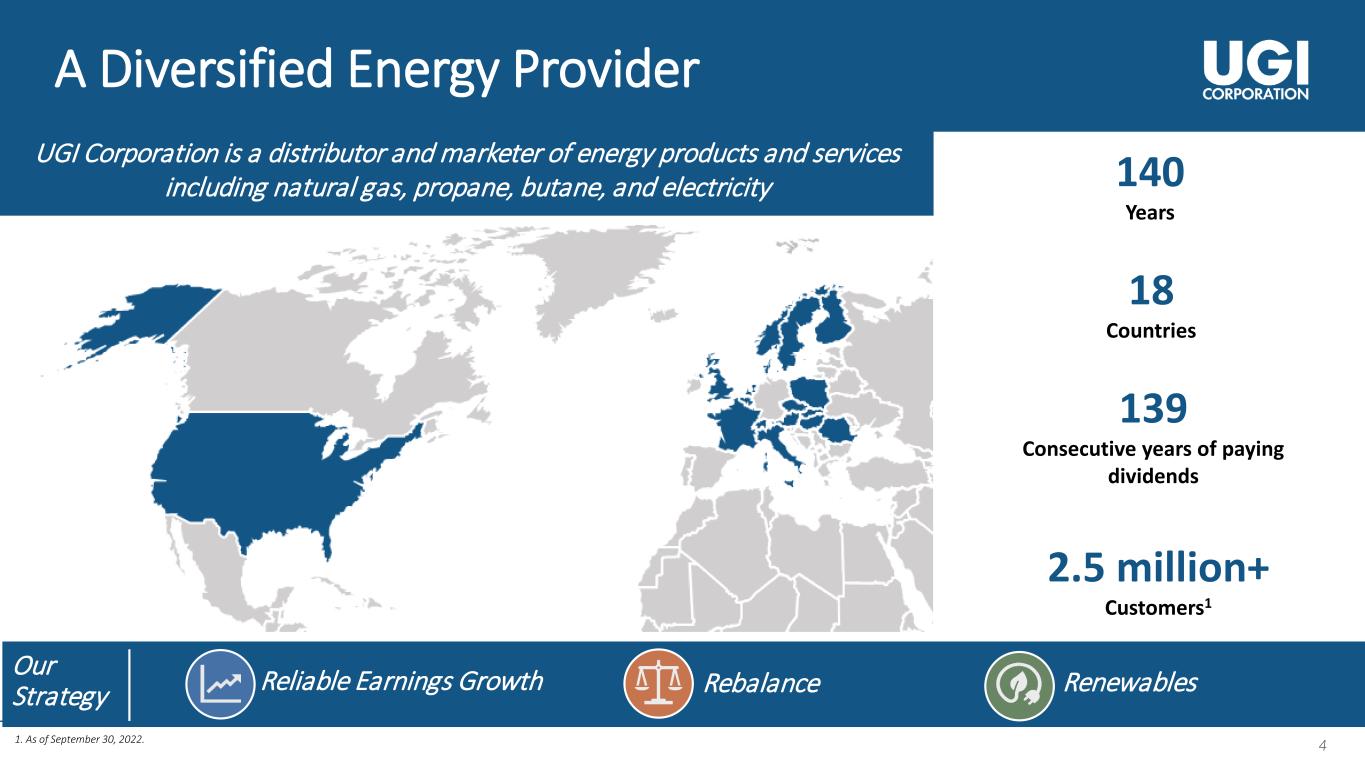
4 A Diversified Energy Provider Reliable Earnings Growth RenewablesRebalance UGI Corporation is a distributor and marketer of energy products and services including natural gas, propane, butane, and electricity 140 Years 18 Countries 139 Consecutive years of paying dividends 2.5 million+ Customers1 1. As of September 30, 2022. Our Strategy

5 Our Strategy Core Values Safety Respect Integrity Sustainability Excellence Reliability Reliable Earnings Growth Renewables Rebalance • Ongoing investments to grow predictable regulated utility, fee-based and weather resilient volume to enable strong stable returns • Continuous improvements and focused growth across the business • Reduce weather sensitivity • Disciplined capital allocation to committed renewable projects that align with delivering reliable earnings growth • Leverage existing infrastructure and expertise • Prioritize investments in the natural gas line of business • Optimize benefits from operational and geographic diversification
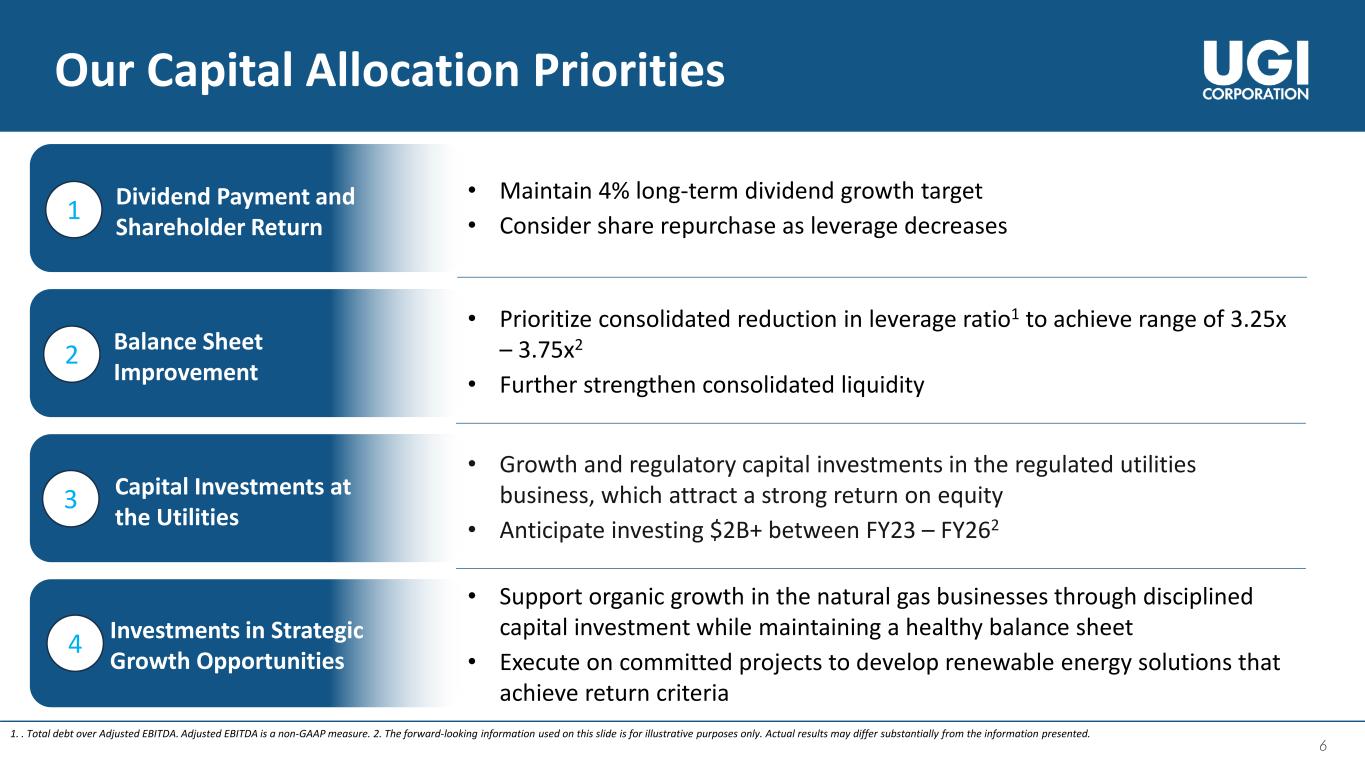
6 • Maintain 4% long-term dividend growth target • Consider share repurchase as leverage decreases Our Capital Allocation Priorities Dividend Payment and Shareholder Return • Growth and regulatory capital investments in the regulated utilities business, which attract a strong return on equity • Anticipate investing $2B+ between FY23 – FY262 • Prioritize consolidated reduction in leverage ratio1 to achieve range of 3.25x – 3.75x2 • Further strengthen consolidated liquidity • Support organic growth in the natural gas businesses through disciplined capital investment while maintaining a healthy balance sheet • Execute on committed projects to develop renewable energy solutions that achieve return criteria 1 2 3 Capital Investments at the Utilities Balance Sheet Improvement Investments in Strategic Growth Opportunities4 1. . Total debt over Adjusted EBITDA. Adjusted EBITDA is a non-GAAP measure. 2. The forward-looking information used on this slide is for illustrative purposes only. Actual results may differ substantially from the information presented.
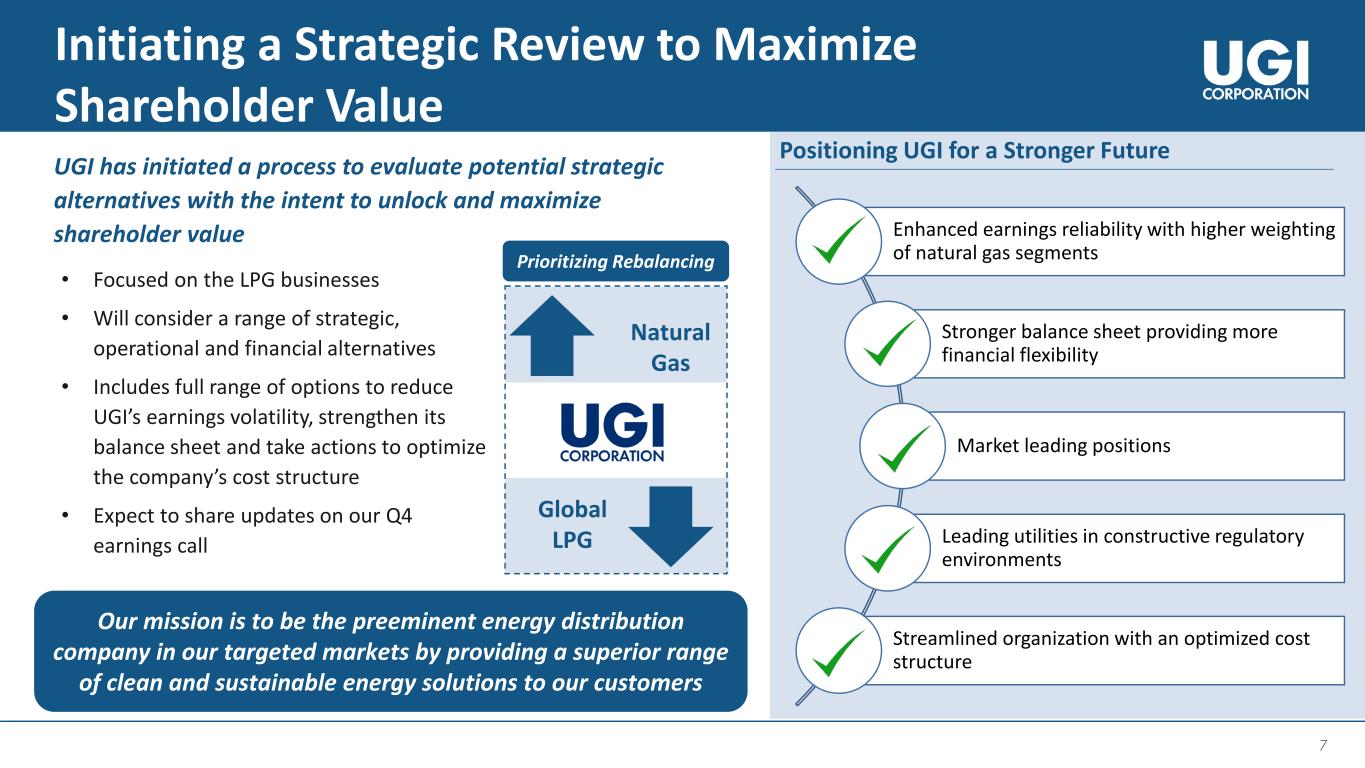
7 Initiating a Strategic Review to Maximize Shareholder Value Our mission is to be the preeminent energy distribution company in our targeted markets by providing a superior range of clean and sustainable energy solutions to our customers Enhanced earnings reliability with higher weighting of natural gas segments Stronger balance sheet providing more financial flexibility Market leading positions Leading utilities in constructive regulatory environments Streamlined organization with an optimized cost structure Positioning UGI for a Stronger Future • Focused on the LPG businesses • Will consider a range of strategic, operational and financial alternatives • Includes full range of options to reduce UGI’s earnings volatility, strengthen its balance sheet and take actions to optimize the company’s cost structure • Expect to share updates on our Q4 earnings call Natural Gas Global LPG UGI has initiated a process to evaluate potential strategic alternatives with the intent to unlock and maximize shareholder value Prioritizing Rebalancing
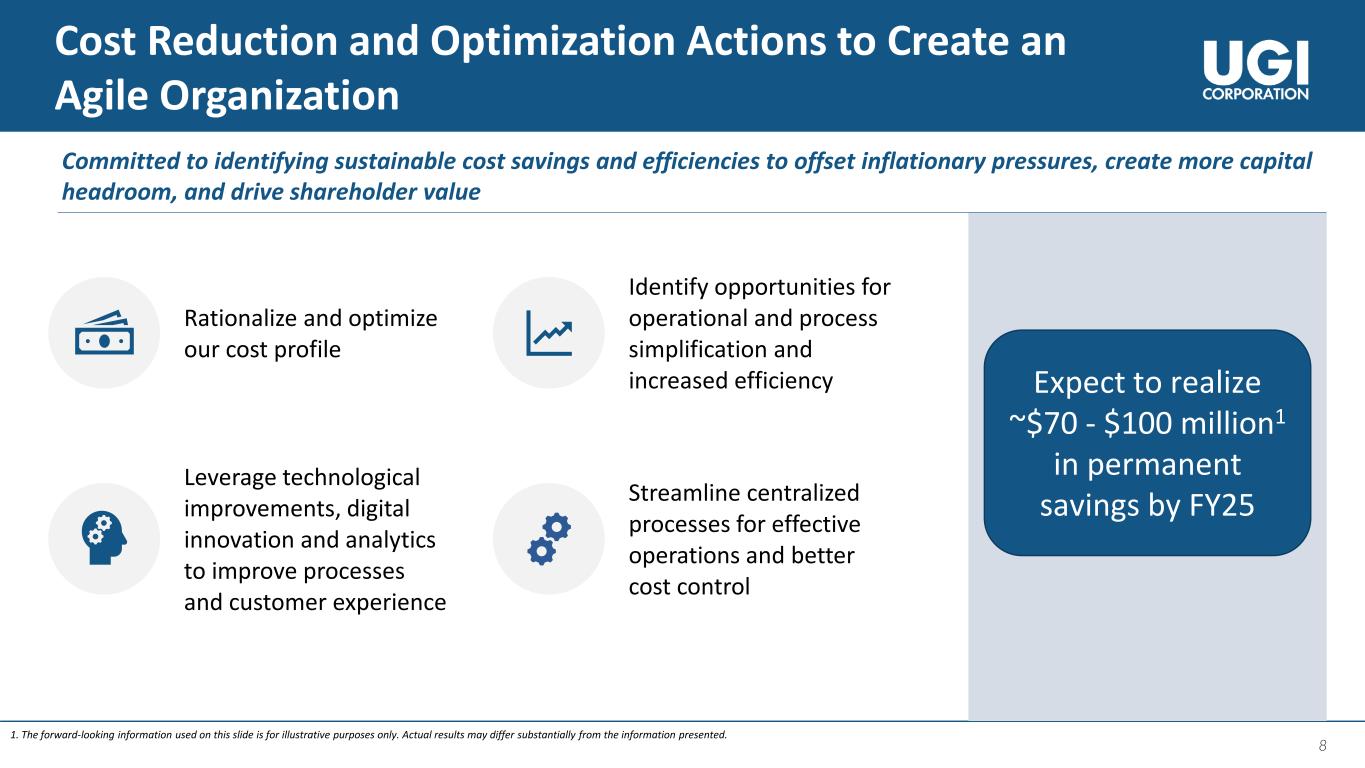
8 Cost Reduction and Optimization Actions to Create an Agile Organization Rationalize and optimize our cost profile Identify opportunities for operational and process simplification and increased efficiency Leverage technological improvements, digital innovation and analytics to improve processes and customer experience Streamline centralized processes for effective operations and better cost control Committed to identifying sustainable cost savings and efficiencies to offset inflationary pressures, create more capital headroom, and drive shareholder value Expect to realize ~$70 - $100 million1 in permanent savings by FY25 1. The forward-looking information used on this slide is for illustrative purposes only. Actual results may differ substantially from the information presented.
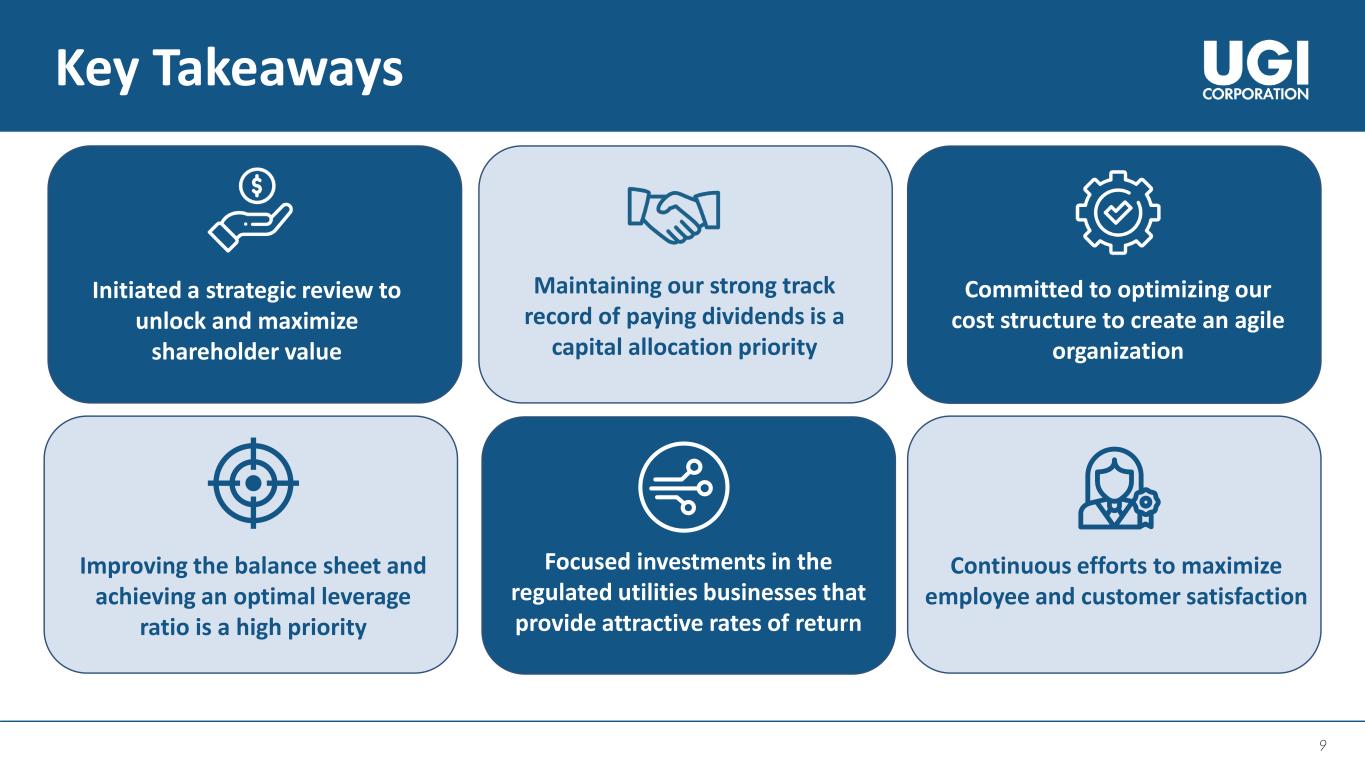
9 Key Takeaways Focused investments in the regulated utilities businesses that provide attractive rates of return Improving the balance sheet and achieving an optimal leverage ratio is a high priority Initiated a strategic review to unlock and maximize shareholder value Maintaining our strong track record of paying dividends is a capital allocation priority Continuous efforts to maximize employee and customer satisfaction Committed to optimizing our cost structure to create an agile organization

10 Appendix

11 Our Business Portfolio 1. YTD FY23 signifies 9 months ended June 30, 2023. 2. Does not include Corporate & Other. 3. Adjusted Diluted EPS is a non-GAAP measure. Please see slide 17 for reconciliation. 4. The information is as of September 30, 2022. 5. Based on total customers. 6. Based on the volume of propane gallons distributed annually. 7. Free Cash Flow is a non-GAAP measure. See Slides 19 and 20 for reconciliation. Lines of Businesses Segments Key Highlights4 YTD FY231 Adjusted Diluted EPS Contribution2,3 • 2nd largest regulated gas utility in Pennsylvania (PA)5 • Largest regulated gas utility in West Virginia (WV)5 • Weather normalization at the PA gas utility • Authorized gas ROEs of 10.15% (DSIC) in PA and 9.75% (IREP) in WV • Minimal regulatory lag with ~90% of capital recoverable within 12 months • Full suite of midstream services and gas marketing on 48 gas utility systems and 20 electric utility systems • Significant strategic assets within the Marcellus Shale / Utica production area • ~84% fee-based income, including minimum volume commitments and take or pay arrangements • Largest retail LPG distributor in the US6 • Broad geographic footprint serving all 50 states • Strong track record of attractive unit margins despite fluctuating commodity price environments • ~$1.5 billion of Free Cash Flow Generation7 since 2020 • LPG distribution in 17 countries in Europe • Largest LPG distributor in France, Austria, Belgium, Denmark, Hungary, and Luxembourg • ~$1.1 billion of Free Cash Flow Generation7 since 2020 • Strategically located supply assets • Exiting non-core energy marketing business Natural Gas Global LPG 14% Utilities Midstream & Marketing UGI International AmeriGas Propane 23% 26% 37%

12 AmeriGas Propane 14% UGI International 23% Midstream & Marketing 26% Utilities 37% YTD FY23 12 1. YTD FY22 and YTD FY23 signify 9 months ended June 30, 2022, and June 30, 2023, respectively. 2. Adjusted diluted EPS is a non-GAAP measure. See Slide 17 for reconciliation. 3. EBIT is defined as Earnings before interest expense and income taxes. 4. Liquidity as of June 30, 2023. Liquidity is defined as cash and cash equivalents, and available borrowing capacity on our revolving credit facilities. 5. Because we are unable to predict certain potentially material items affecting diluted EPS on a GAAP basis, principally mark-to-market gains and losses on commodity and certain foreign currency derivative instruments, we cannot reconcile FY23 adjusted diluted EPS, a non-GAAP measure, to diluted EPS, the most directly comparable GAAP measure, in reliance on the “unreasonable efforts” exception set forth in SEC rules. 6. Excludes Corporate & Other. YTD FY231 Financial Highlights 7.2% 10-Year Dividend CAGR (2013 – 2023) $1.8B Available Liquidity4 ~$650M YTD Capital Expenditure YTD Adjusted Diluted EPS by Segment2,6 $2.75 - $2.90 FY23 Adjusted Diluted EPS Guidance5 YTD Adjusted Diluted EPS2 $2.90 $2.81 YTD FY22 YTD FY231 1 • Focused on improving earnings reliability and strengthening the balance sheet o On a YTD basis, reportable segment EBIT3 was relatively consistent year- over-year largely due to: Significant benefits from the weather normalization adjustment and higher gas base rates in our Pennsylvania (PA) Gas Utility Higher margins and attractive fee-based contract structures in Midstream & Marketing Higher LPG unit margins in the Global LPG businesses that partially offset the impact of lower base volumes and increased operating and administrative expenses o Entered into agreements to divest a majority of the non-core European energy marketing business o ~$200M debt reduction at AmeriGas Propane during Q3 • Expect to be at the low end of the FY23 adjusted diluted EPS guidance range of $2.75 to $2.905

13 $0.7 $0.4 $0.3 $0.3 $0.3 $1.4 $1.3 $0.9 $1.6 1.5 $2.1 $1.7 $1.2 $1.9 $1.8 Jun-22 Sep-22 Dec-22 Mar-23 Jun-23 Cash and cash equivalents Available Credit Facilities Liquidity Update • $1.8B in available liquidity1 as of June 30, 2023 • On May 31, 2023, AmeriGas Partners issued 9.375% senior unsecured notes of $500 million due 2028 o Net proceeds, together with cash on hand, a cash contribution from UGI and other sources of liquidity, were used to tender or redeem all outstanding Senior Notes of $675 million due 2024 o 2028 Notes are redeemable at the issuer’s option2: Prior to June 2025 at a make-whole premium or, On or after June 2025, at a call premium that declines from 4.688% to 0% depending on the year of redemption • Reduced ~$200 million in debt at AmeriGas Propane during Q3 FY23 1. Defined as cash and cash equivalents and available borrowing capacity on our revolving credit facilities. 2. Calculated as set forth in the 2028 Notes Indenture. 3. As of June 30, 2023. Long-term debt with maturities of less than $10 million in a particular year have not been represented in the chart. Available Liquidity ($ in billion) $700 $675 $525 $500 $763 $796 $281 $70 $1,270 $497 $515 $- $500 $1,000 $1,500 $2,000 $2,500 $3,000 $3,500 FY24 FY25 FY26 FY27 FY28 - 52 AmeriGas Propane UGI International Midstream & Marketing Utilities UGI Corporation UGI Corporation Long-Term Debt Maturities ($ in million)3Available Liquidity ($ in billion)

14 ESG Update UGI ESG Rating History - MSCI UGI is positioned among top 7%5 of all peers Key ESG Focus Areas “With its excellent awareness of potential future disruptions, we believe UGI is well positioned to capitalize on the energy transition compared with industry peers.” - S&P Global Ratings 1. Achievement of these goals is in progress. For more information on UGI’s ESG initiatives, please see UGI’s sustainability reports and visit www.ugiesg.com. 2. Diversity represents ethnicity and gender. 3. As defined under the rules of the New York Stock Exchange. 4. As of April 1, 2023. 5. Universe: MSCI ACWI Index constituents, Oil & Gas refining, Marketing, Transportation & Storage. Environmental Social Governance 55% 5-year Scope-1 GHG Emissions Reduction Target 25% Targeted spend improvement with diverse Tier I and Tier II suppliers by 2025 (using 2020 as the base year) 44% Board Diversity 90%+ Reduction in fugitive methane emission at UGI Utilities over the 20 years Executive compensation linked to safety and diversity & inclusion ~6 Years Average Board Tenure 35% Targeted reduction in Total Recordable Injuries by 2025 (using 2017 as the base year) Partnership with the Human Library Organization to help organizations with their diversity, equity, and inclusion efforts 89% Independent Directors and an Independent Board Chair 1 1 1 2,4 3,4 4

15 Our Renewables Projects1 Renewable Natural Gas Projects Committed to Date CY22 CY23 CY24 New Energy One – Joint Venture (<25%) Cayuga - Spruce Haven Cayuga - Allen Farms Cayuga - El-Vi MBL Bioenergy – Moody Hamilton – Synthica St. Bernard Cayuga – Bergen Farms Cayuga – New Hope View Farms MBL Bioenergy – Brookings & Lakeside Aurum Renewables – Joint Venture (40%) WTL Project In service Expected In service Feedstock Status: Feedstock: Dairy Food Other Key Renewables Projects/Collaborations 1. The information on this slide is as of June 30, 2023. The forward-looking information used on this slide is for illustrative purposes only. Actual numbers may differ substantially from the figures presented. Landfill GHI Energy (California) Leading marketer of RNG acquired in 2020 Archaea (Pennsylvania) Largest RNG interconnection in the US to date JV with SHV Energy 1st renewable Dimethyl ether plant expected in the UK, with anticipated annual production of 50 kilotons, when completed in CY25 Partnership with Vertimass ~1 billion gallons1 of renewable propane and sustainable aviation fuel over a 15-year period Global Clean Energy (USA) collaboration Exclusive supply agreement for renewable LPG Energy Developments (Ohio) collaboration Accepting RNG into system to transport from the Carbon Limestone Landfill Ag-Grid (Connecticut and Massachusetts) 33% equity interest in Ag-Grid, a renewable energy producer

16 Strong Track Record of Paying Dividends Dividend Per Share1 ($) FY03 – 23E CAGR of 7.1% $0.38 $0.42 $0.45 $0.47 $0.49 $0.51 $0.53 $0.67 $0.69 $0.72 $0.75 $0.87 $0.91 $0.95 $1.00 $1.04 $1.30 $1.32 $1.38 $1.44 $1.50 FY03 FY04 FY05 FY06 FY07 FY08 FY09 FY10 FY11 FY12 FY13 FY14 FY15 FY16 FY17 FY18 FY19 FY20 FY21 FY22 FY23E 1. Adjusted for stock splits. Dividend figures represent annualized dividends based on the last dividend issued in that fiscal year. 139 years Consecutively Paying Dividends 36 years Consecutively Increasing Dividends 35% – 45% Dividend Payout Ratio
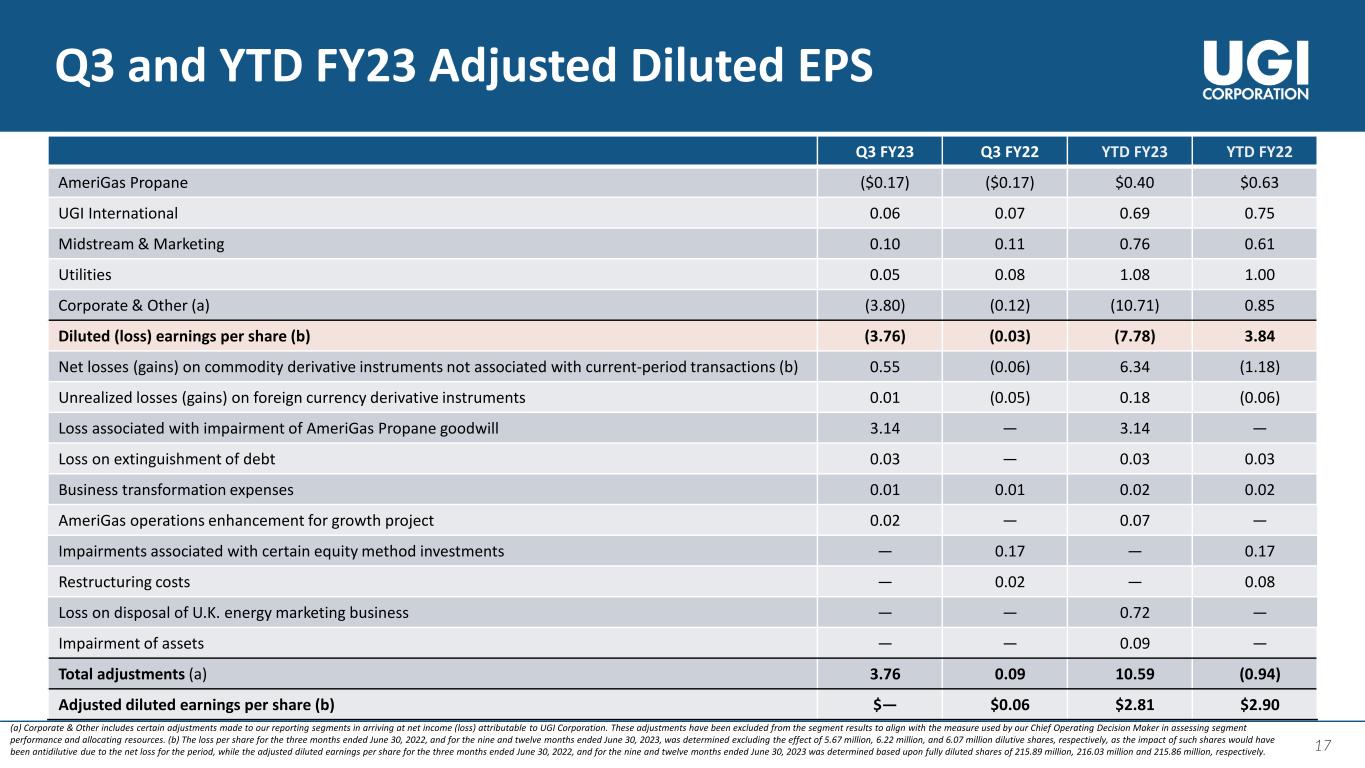
17 17 Q3 and YTD FY23 Adjusted Diluted EPS Q3 FY23 Q3 FY22 YTD FY23 YTD FY22 AmeriGas Propane ($0.17) ($0.17) $0.40 $0.63 UGI International 0.06 0.07 0.69 0.75 Midstream & Marketing 0.10 0.11 0.76 0.61 Utilities 0.05 0.08 1.08 1.00 Corporate & Other (a) (3.80) (0.12) (10.71) 0.85 Diluted (loss) earnings per share (b) (3.76) (0.03) (7.78) 3.84 Net losses (gains) on commodity derivative instruments not associated with current-period transactions (b) 0.55 (0.06) 6.34 (1.18) Unrealized losses (gains) on foreign currency derivative instruments 0.01 (0.05) 0.18 (0.06) Loss associated with impairment of AmeriGas Propane goodwill 3.14 — 3.14 — Loss on extinguishment of debt 0.03 — 0.03 0.03 Business transformation expenses 0.01 0.01 0.02 0.02 AmeriGas operations enhancement for growth project 0.02 — 0.07 — Impairments associated with certain equity method investments — 0.17 — 0.17 Restructuring costs — 0.02 — 0.08 Loss on disposal of U.K. energy marketing business — — 0.72 — Impairment of assets — — 0.09 — Total adjustments (a) 3.76 0.09 10.59 (0.94) Adjusted diluted earnings per share (b) $— $0.06 $2.81 $2.90 (a) Corporate & Other includes certain adjustments made to our reporting segments in arriving at net income (loss) attributable to UGI Corporation. These adjustments have been excluded from the segment results to align with the measure used by our Chief Operating Decision Maker in assessing segment performance and allocating resources. (b) The loss per share for the three months ended June 30, 2022, and for the nine and twelve months ended June 30, 2023, was determined excluding the effect of 5.67 million, 6.22 million, and 6.07 million dilutive shares, respectively, as the impact of such shares would have been antidilutive due to the net loss for the period, while the adjusted diluted earnings per share for the three months ended June 30, 2022, and for the nine and twelve months ended June 30, 2023 was determined based upon fully diluted shares of 215.89 million, 216.03 million and 215.86 million, respectively.

18 18 Q3 and YTD FY23 Adjusted Net Income ($ in Million) Q3 FY23 Q3 FY22 YTD FY23 YTD FY22 AmeriGas Propane ($35) ($37) $87 $135 UGI International 13 15 150 161 Midstream & Marketing 22 23 165 132 Utilities 10 19 234 216 Corporate & Other (a) (799) (27) (2,269) 185 Net (loss) income attributable to UGI Corporation (789) (7) (1,633) 829 Net losses (gains) on commodity derivative instruments not associated with current-period transactions (net of tax of $(36), $5, $(465) and $98, respectively) 115 (12) 1,349 (255) Unrealized losses (gains) on foreign currency derivative instruments (net of tax of $(1), $4, $(15) and $5, respectively) 1 (10) 37 (14) Loss associated with impairment of AmeriGas Propane goodwill (net of tax of $4, $0, $4 and $0, respectively) 660 — 660 — Loss on extinguishments of debt (net of tax of $(2), $0, $(2) and $(3), respectively) 7 — 7 8 Acquisition and integration expenses associated with the Mountaineer Acquisition (net of tax of $0, $0, $0 and $0, respectively) — — — 1 Business transformation expenses (net of tax of $(1), $(1), $(2) and $(2), respectively) 1 1 4 4 AmeriGas operations enhancement for growth project (net of tax of $(2), $0, $(5) and $0, respectively) 4 — 14 — Impairments associated with certain equity method investments (net of tax of $0, $(14), $0 and $(14) — 36 — 36 Restructuring costs (net of tax of $0, $(1), $0 and $(6), respectively) — 4 — 17 Loss on disposal of U.K. energy marketing business (net of tax of $0, $0, $(64) and $0, respectively) — — 151 — Impairment of assets (net of tax of $0, $0, $0, and $0, respectively) — — 19 — Total adjustments (a) (b) 788 19 2,241 (203) Adjusted net (loss) income attributable to UGI Corporation ($1) $12 $608 $626 (a) Corporate & Other includes certain adjustments made to our reporting segments in arriving at net income (loss) attributable to UGI Corporation. These adjustments have been excluded from the segment results to align with the measure used by our Chief Operating Decision Maker in assessing segment performance and allocating resources. (b) Income taxes associated with pre-tax adjustments determined using statutory business unit tax rates.
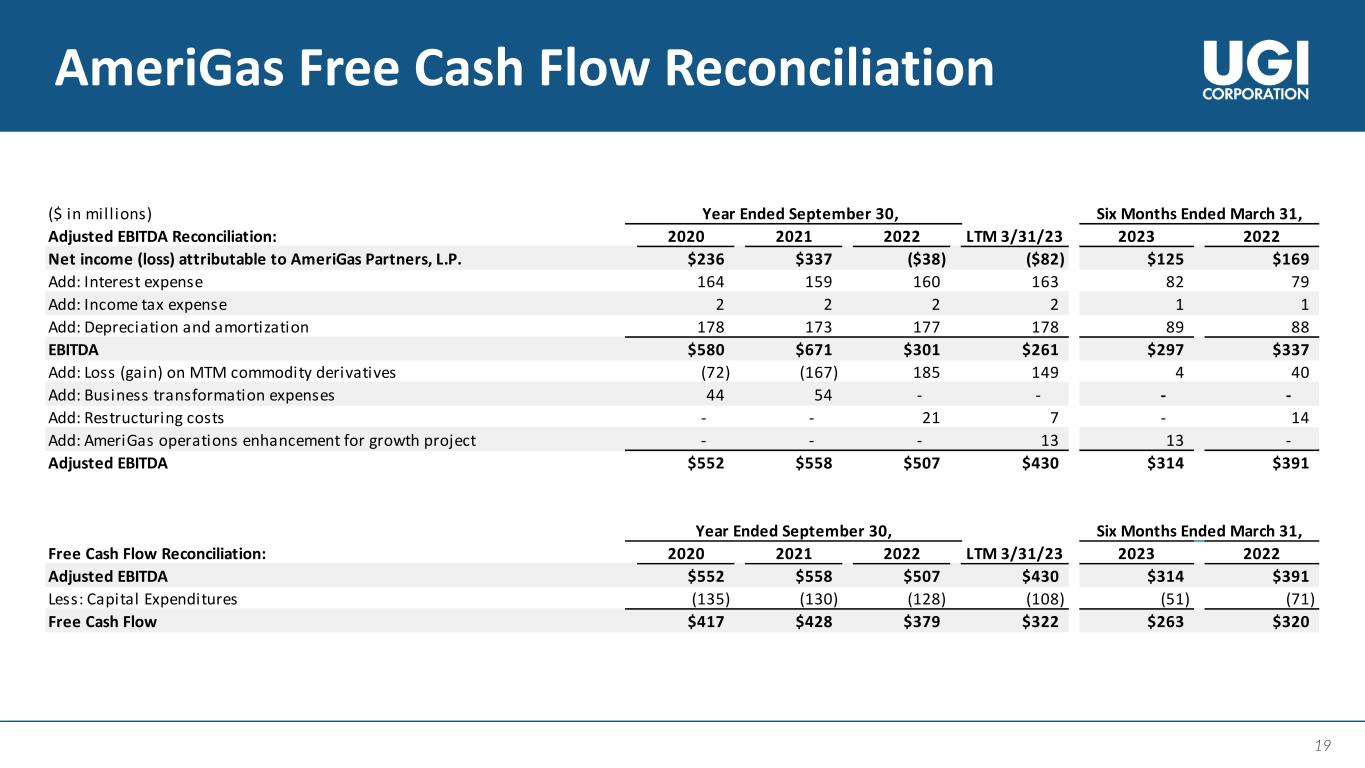
19 19 AmeriGas Free Cash Flow Reconciliation ($ in mill ions) Year Ended September 30, Six Months Ended March 31, Adjusted EBITDA Reconciliation: 2020 2021 2022 LTM 3/31/23 2023 2022 Net income (loss) attributable to AmeriGas Partners, L.P. $236 $337 ($38) ($82) $125 $169 Add: Interest expense 164 159 160 163 82 79 Add: Income tax expense 2 2 2 2 1 1 Add: Depreciation and amortization 178 173 177 178 89 88 EBITDA $580 $671 $301 $261 $297 $337 Add: Loss (gain) on MTM commodity derivatives (72) (167) 185 149 4 40 Add: Business transformation expenses 44 54 - - - - Add: Restructuring costs - - 21 7 - 14 Add: AmeriGas operations enhancement for growth project - - - 13 13 - Adjusted EBITDA $552 $558 $507 $430 $314 $391 Year Ended September 30, Six Months Ended March 31, Free Cash Flow Reconciliation: 2020 2021 2022 LTM 3/31/23 2023 2022 Adjusted EBITDA $552 $558 $507 $430 $314 $391 Less: Capital Expenditures (135) (130) (128) (108) (51) (71) Free Cash Flow $417 $428 $379 $322 $263 $320

20 20 UGI International Free Cash Flow Reconciliation ($ in millions) Year Ended September 30, Six Months Ended March 31 Adjusted EBITDA Reconciliation: 2020 2021 2022 LTM 3/31/23 2023 2022 Net income (loss) attributable to UGI International, LLC $137 $979 $808 ($703) ($1,113) $398 Net income (loss) attributable to noncontrolling interests - - 1 (1) - 2 Income tax 37 331 250 (272) (390) 132 Interest expense 31 27 28 28 15 15 D&A 125 134 117 113 56 60 EBITDA $330 $1,471 $1,204 ($835) ($1,432) $607 Net (gains) losses on commodity derivative instruments not associated with current-period transactions - (1,065) (808) 948 1,403 (353) Unrealized losses (gains) on foreign currency derivative instruments 36 (8) (50) 5 50 (5) Loss on extinguishments of debt - - 11 - - 11 Business transformation expenses 18 33 - - - - Impairment of customer relationship intangible - 20 - - - - Restructuring Costs - - 9 7 - 2 Loss on Disposal of U.K. energy marketing business - - - 215 215 - Impairment of Assets - - 5 19 14 - Adjusted EBITDA $384 $451 $371 $359 $250 $262 Year Ended September 30, Six Months Ended March 31 Free Cash Flow Reconciliation: 2020 2021 2022 LTM 3/31/23 2023 2022 Adjusted EBITDA $384 $451 $371 $359 $250 $262 Less: Capital Expenditure (89) (107) (107) ($118) (57) (46) Free Cash Flow $295 $344 $264 $241 $193 $216

21 Investor Relations: Tameka Morris 610-456-6297 morrista@ugicorp.com Arnab Mukherjee 610-768-7498 mukherjeea@ugicorp.com


