United States
SECURITIES AND EXCHANGE COMMISSION
Washington, D.C. 20549
FORM 8-K
CURRENT REPORT
Pursuant to Section 13 or 15(d) of The Securities Exchange Act of 1934
Date of Report (Date of earliest event reported): July 31, 2023
ATLANTIC UNION BANKSHARES CORPORATION
(Exact name of registrant as specified in its charter)
Virginia |
001-39325 |
54-1598552 |
(State or other jurisdiction |
(Commission |
(I.R.S. Employer |
of incorporation) |
File Number) |
Identification No.) |
|
|
|
1051 East Cary Street
Suite 1200
Richmond, Virginia 23219
(Address of principal executive offices, including Zip Code)
Registrant’s telephone number, including area code: (804) 633-5031
Check the appropriate box below if the Form 8-K filing is intended to simultaneously satisfy the filing obligation of the registrant under any of the following provisions (see General Instruction A.2. below):
☐ |
Written communications pursuant to Rule 425 under the Securities Act (17 CFR 230.425) |
☐ |
Soliciting material pursuant to Rule 14a-12 under the Exchange Act (17 CFR 240.14a-12) |
☐ |
Pre-commencement communications pursuant to Rule 14d-2(b) under the Exchange Act (17 CFR 240.14d-2(b)) |
☐ |
Pre-commencement communications pursuant to Rule 13e-4(c) under the Exchange Act (17 CFR 240.13e-4(c)) |
Securities registered pursuant to Section 12(b) of the Act:
Title of each class |
|
Trading Symbol(s) |
|
Name of each exchange on which registered |
Common Stock, par value $1.33 per share |
|
AUB |
|
New York Stock Exchange |
Depositary Shares, Each Representing a 1/400th Interest in a Share of 6.875% Perpetual Non-Cumulative Preferred Stock, Series A |
|
AUB.PRA |
|
New York Stock Exchange |
Indicate by check mark whether the registrant is an emerging growth company as defined in Rule 405 of the Securities Act of 1933 (§230.405 of this chapter) or Rule 12b-2 of the Securities Exchange Act of 1934 (§240.12b-2 of this chapter).
Emerging growth company |
☐ |
If an emerging growth company, indicate by check mark if the registrant has elected not to use the extended transition period for complying with any new or revised financial accounting standards provided pursuant to Section 13(a) of the Exchange Act. |
☐ |
Item 7.01 Regulation FD Disclosure.
Attached as Exhibit 99.1 is a handout containing information that certain members of Atlantic Union Bankshares Corporation (the “Company”) management will use during meetings with investors, analysts, and other interested parties to assist their understanding of the Company from time to time during the third quarter of 2023. Other presentations and related materials will be made available as they are presented. This handout is also available under the Presentations link in the Investor Relations section of the Company’s website at http://investors.atlanticunionbank.com. Exhibit 99.1 is incorporated by reference into this Item 7.01.
The information disclosed in or incorporated by reference into this Item 7.01, including Exhibit 99.1, is furnished and shall not be deemed filed for purposes of Section 18 of the Securities Exchange Act of 1934.
Item 9.01 Financial Statements and Exhibits.
(d) Exhibits.
Exhibit No. |
|
Description of Exhibit |
99.1 |
|
Atlantic Union Bankshares Corporation investor presentation. |
104 |
|
Cover Page Interactive Data File – the cover page iXBRL tags are embedded within the Inline XBRL document |
1
SIGNATURES
Pursuant to the requirements of the Securities Exchange Act of 1934, the registrant has duly caused this report to be signed on its behalf by the undersigned hereunto duly authorized.
|
ATLANTIC UNION BANKSHARES CORPORATION |
||
|
|
|
|
|
|
|
|
|
|
|
|
Date: July 31, 2023 |
By: |
/s/ Robert M. Gorman |
|
|
|
Robert M. Gorman |
|
|
|
Executive Vice President and |
|
|
|
Chief Financial Officer |
|
|
|
|
|
2
|
Investor Presentation NYSE: AUB August - September 2023 |
|
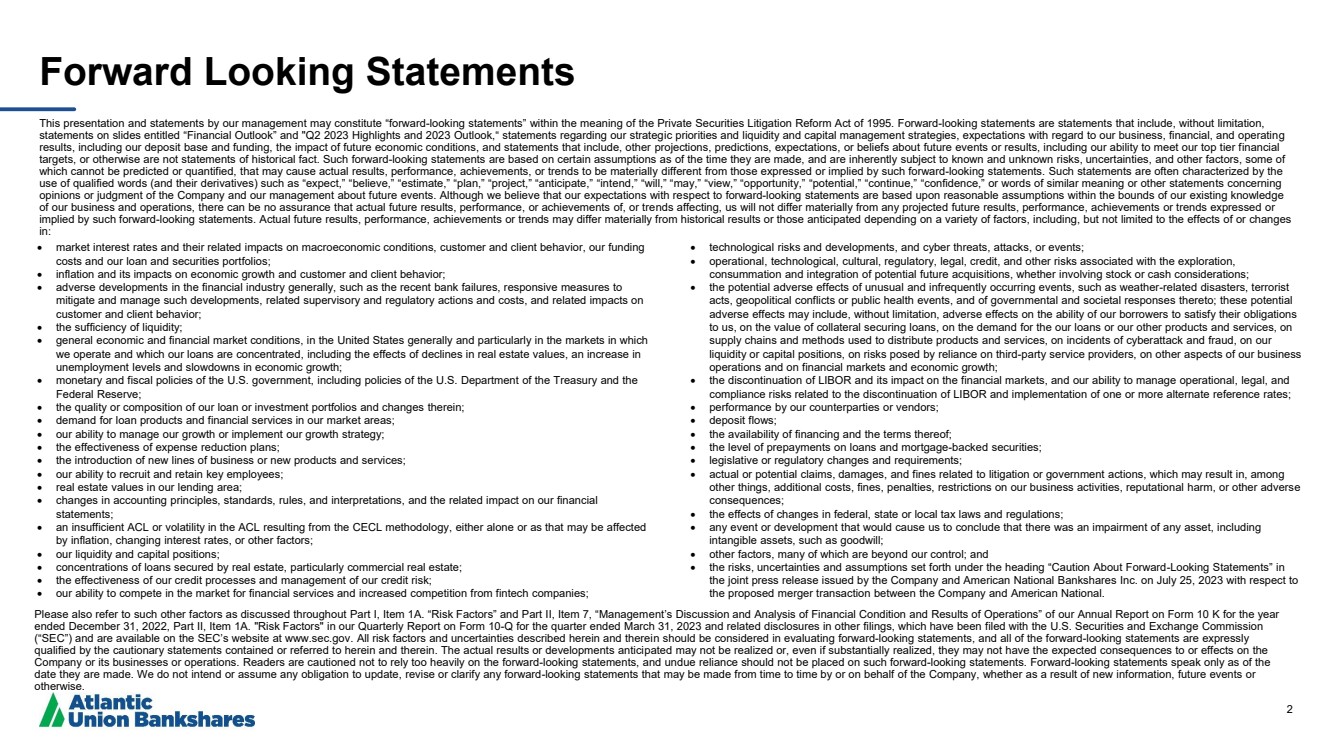
2 Forward Looking Statements This presentation and statements by our management may constitute “forward-looking statements” within the meaning of the Private Securities Litigation Reform Act of 1995. Forward-looking statements are statements that include, without limitation, statements on slides entitled “Financial Outlook” and "Q2 2023 Highlights and 2023 Outlook,“ statements regarding our strategic priorities and liquidity and capital management strategies, expectations with regard to our business, financial, and operating results, including our deposit base and funding, the impact of future economic conditions, and statements that include, other projections, predictions, expectations, or beliefs about future events or results, including our ability to meet our top tier financial targets, or otherwise are not statements of historical fact. Such forward-looking statements are based on certain assumptions as of the time they are made, and are inherently subject to known and unknown risks, uncertainties, and other factors, some of which cannot be predicted or quantified, that may cause actual results, performance, achievements, or trends to be materially different from those expressed or implied by such forward-looking statements. Such statements are often characterized by the use of qualified words (and their derivatives) such as “expect,” “believe,” “estimate,” “plan,” “project,” “anticipate,” “intend,” “will,” “may,” “view,” “opportunity,” “potential,” “continue,” “confidence,” or words of similar meaning or other statements concerning opinions or judgment of the Company and our management about future events. Although we believe that our expectations with respect to forward-looking statements are based upon reasonable assumptions within the bounds of our existing knowledge of our business and operations, there can be no assurance that actual future results, performance, or achievements of, or trends affecting, us will not differ materially from any projected future results, performance, achievements or trends expressed or implied by such forward-looking statements. Actual future results, performance, achievements or trends may differ materially from historical results or those anticipated depending on a variety of factors, including, but not limited to the effects of or changes in: • market interest rates and their related impacts on macroeconomic conditions, customer and client behavior, our funding costs and our loan and securities portfolios; • inflation and its impacts on economic growth and customer and client behavior; • adverse developments in the financial industry generally, such as the recent bank failures, responsive measures to mitigate and manage such developments, related supervisory and regulatory actions and costs, and related impacts on customer and client behavior; • the sufficiency of liquidity; • general economic and financial market conditions, in the United States generally and particularly in the markets in which we operate and which our loans are concentrated, including the effects of declines in real estate values, an increase in unemployment levels and slowdowns in economic growth; • monetary and fiscal policies of the U.S. government, including policies of the U.S. Department of the Treasury and the Federal Reserve; • the quality or composition of our loan or investment portfolios and changes therein; • demand for loan products and financial services in our market areas; • our ability to manage our growth or implement our growth strategy; • the effectiveness of expense reduction plans; • the introduction of new lines of business or new products and services; • our ability to recruit and retain key employees; • real estate values in our lending area; • changes in accounting principles, standards, rules, and interpretations, and the related impact on our financial statements; • an insufficient ACL or volatility in the ACL resulting from the CECL methodology, either alone or as that may be affected by inflation, changing interest rates, or other factors; • our liquidity and capital positions; • concentrations of loans secured by real estate, particularly commercial real estate; • the effectiveness of our credit processes and management of our credit risk; • our ability to compete in the market for financial services and increased competition from fintech companies; • technological risks and developments, and cyber threats, attacks, or events; • operational, technological, cultural, regulatory, legal, credit, and other risks associated with the exploration, consummation and integration of potential future acquisitions, whether involving stock or cash considerations; • the potential adverse effects of unusual and infrequently occurring events, such as weather-related disasters, terrorist acts, geopolitical conflicts or public health events, and of governmental and societal responses thereto; these potential adverse effects may include, without limitation, adverse effects on the ability of our borrowers to satisfy their obligations to us, on the value of collateral securing loans, on the demand for the our loans or our other products and services, on supply chains and methods used to distribute products and services, on incidents of cyberattack and fraud, on our liquidity or capital positions, on risks posed by reliance on third-party service providers, on other aspects of our business operations and on financial markets and economic growth; • the discontinuation of LIBOR and its impact on the financial markets, and our ability to manage operational, legal, and compliance risks related to the discontinuation of LIBOR and implementation of one or more alternate reference rates; • performance by our counterparties or vendors; • deposit flows; • the availability of financing and the terms thereof; • the level of prepayments on loans and mortgage-backed securities; • legislative or regulatory changes and requirements; • actual or potential claims, damages, and fines related to litigation or government actions, which may result in, among other things, additional costs, fines, penalties, restrictions on our business activities, reputational harm, or other adverse consequences; • the effects of changes in federal, state or local tax laws and regulations; • any event or development that would cause us to conclude that there was an impairment of any asset, including intangible assets, such as goodwill; • other factors, many of which are beyond our control; and • the risks, uncertainties and assumptions set forth under the heading “Caution About Forward-Looking Statements” in the joint press release issued by the Company and American National Bankshares Inc. on July 25, 2023 with respect to the proposed merger transaction between the Company and American National. Please also refer to such other factors as discussed throughout Part I, Item 1A. “Risk Factors” and Part II, Item 7, “Management’s Discussion and Analysis of Financial Condition and Results of Operations” of our Annual Report on Form 10 K for the year ended December 31, 2022, Part II, Item 1A. "Risk Factors" in our Quarterly Report on Form 10-Q for the quarter ended March 31, 2023 and related disclosures in other filings, which have been filed with the U.S. Securities and Exchange Commission (“SEC”) and are available on the SEC’s website at www.sec.gov. All risk factors and uncertainties described herein and therein should be considered in evaluating forward-looking statements, and all of the forward-looking statements are expressly qualified by the cautionary statements contained or referred to herein and therein. The actual results or developments anticipated may not be realized or, even if substantially realized, they may not have the expected consequences to or effects on the Company or its businesses or operations. Readers are cautioned not to rely too heavily on the forward-looking statements, and undue reliance should not be placed on such forward-looking statements. Forward-looking statements speak only as of the date they are made. We do not intend or assume any obligation to update, revise or clarify any forward-looking statements that may be made from time to time by or on behalf of the Company, whether as a result of new information, future events or otherwise. |
|
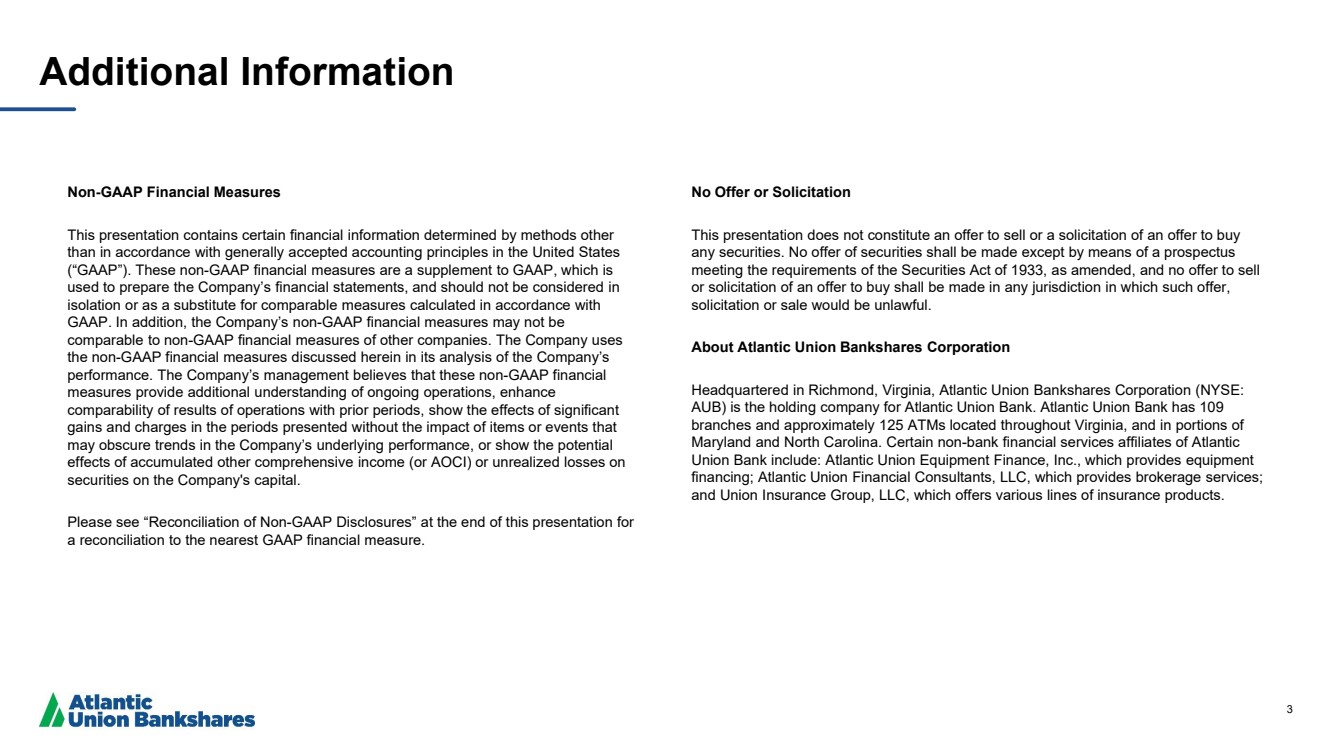
3 Additional Information Non-GAAP Financial Measures This presentation contains certain financial information determined by methods other than in accordance with generally accepted accounting principles in the United States (“GAAP”). These non-GAAP financial measures are a supplement to GAAP, which is used to prepare the Company’s financial statements, and should not be considered in isolation or as a substitute for comparable measures calculated in accordance with GAAP. In addition, the Company’s non-GAAP financial measures may not be comparable to non-GAAP financial measures of other companies. The Company uses the non-GAAP financial measures discussed herein in its analysis of the Company’s performance. The Company’s management believes that these non-GAAP financial measures provide additional understanding of ongoing operations, enhance comparability of results of operations with prior periods, show the effects of significant gains and charges in the periods presented without the impact of items or events that may obscure trends in the Company’s underlying performance, or show the potential effects of accumulated other comprehensive income (or AOCI) or unrealized losses on securities on the Company's capital. Please see “Reconciliation of Non-GAAP Disclosures” at the end of this presentation for a reconciliation to the nearest GAAP financial measure. No Offer or Solicitation This presentation does not constitute an offer to sell or a solicitation of an offer to buy any securities. No offer of securities shall be made except by means of a prospectus meeting the requirements of the Securities Act of 1933, as amended, and no offer to sell or solicitation of an offer to buy shall be made in any jurisdiction in which such offer, solicitation or sale would be unlawful. About Atlantic Union Bankshares Corporation Headquartered in Richmond, Virginia, Atlantic Union Bankshares Corporation (NYSE: AUB) is the holding company for Atlantic Union Bank. Atlantic Union Bank has 109 branches and approximately 125 ATMs located throughout Virginia, and in portions of Maryland and North Carolina. Certain non-bank financial services affiliates of Atlantic Union Bank include: Atlantic Union Equipment Finance, Inc., which provides equipment financing; Atlantic Union Financial Consultants, LLC, which provides brokerage services; and Union Insurance Group, LLC, which offers various lines of insurance products. |
|
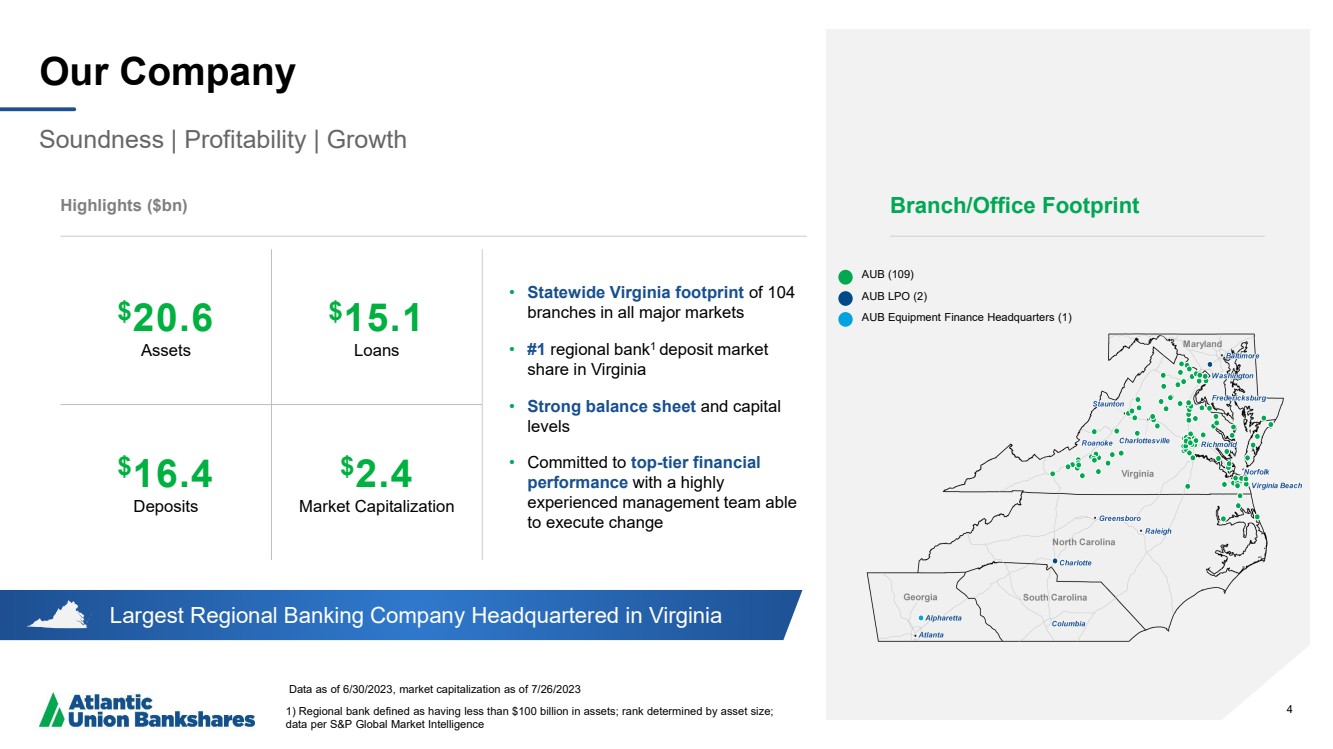
4 Largest Regional Banking Company Headquartered in Virginia Our Company Soundness | Profitability | Growth Data as of 6/30/2023, market capitalization as of 7/26/2023 1) Regional bank defined as having less than $100 billion in assets; rank determined by asset size; data per S&P Global Market Intelligence Highlights ($bn) • Statewide Virginia footprint of 104 branches in all major markets • #1 regional bank1 deposit market share in Virginia • Strong balance sheet and capital levels • Committed to top-tier financial performance with a highly experienced management team able to execute change 4 $20.6 Assets $15.1 Loans $16.4 Deposits $2.4 Market Capitalization Branch/Office Footprint AUB (109) AUB LPO (2) AUB Equipment Finance Headquarters (1) |
|
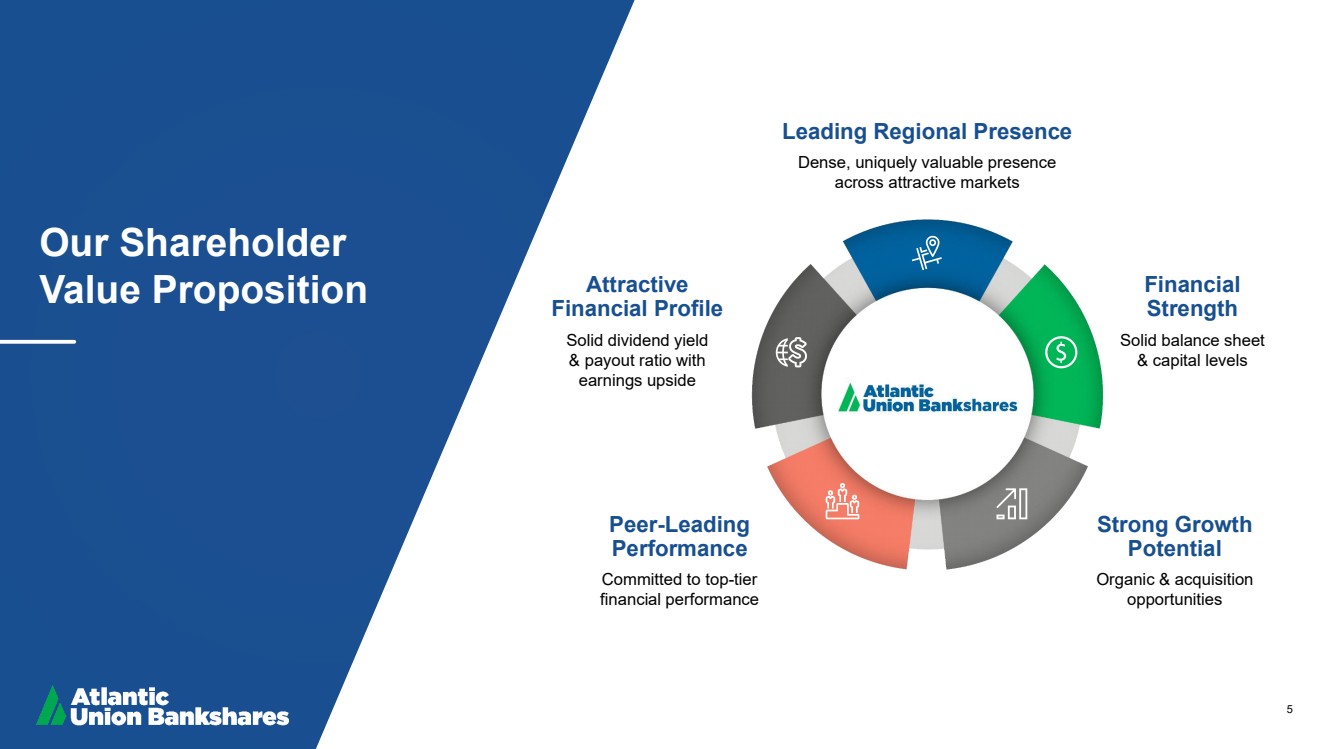
5 Our Shareholder Value Proposition Leading Regional Presence Dense, uniquely valuable presence across attractive markets Financial Strength Solid balance sheet & capital levels Attractive Financial Profile Solid dividend yield & payout ratio with earnings upside Strong Growth Potential Organic & acquisition opportunities Peer-Leading Performance Committed to top-tier financial performance |
|
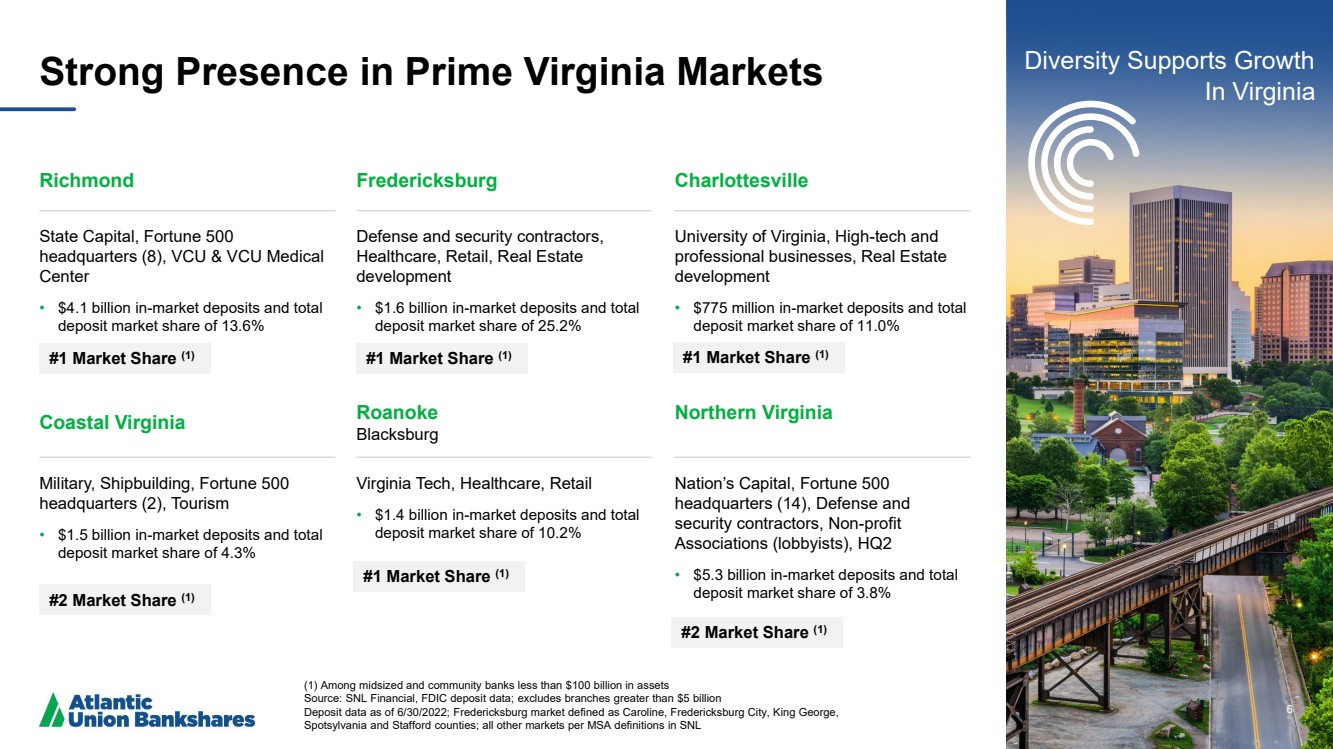
6 Strong Presence in Prime Virginia Markets (1) Among midsized and community banks less than $100 billion in assets Source: SNL Financial, FDIC deposit data; excludes branches greater than $5 billion Deposit data as of 6/30/2022; Fredericksburg market defined as Caroline, Fredericksburg City, King George, Spotsylvania and Stafford counties; all other markets per MSA definitions in SNL 6 Coastal Virginia Military, Shipbuilding, Fortune 500 headquarters (2), Tourism • $1.5 billion in-market deposits and total deposit market share of 4.3% Roanoke Blacksburg Virginia Tech, Healthcare, Retail • $1.4 billion in-market deposits and total deposit market share of 10.2% Northern Virginia Nation’s Capital, Fortune 500 headquarters (14), Defense and security contractors, Non-profit Associations (lobbyists), HQ2 • $5.3 billion in-market deposits and total deposit market share of 3.8% Diversity Supports Growth In Virginia Richmond State Capital, Fortune 500 headquarters (8), VCU & VCU Medical Center • $4.1 billion in-market deposits and total deposit market share of 13.6% Fredericksburg Defense and security contractors, Healthcare, Retail, Real Estate development • $1.6 billion in-market deposits and total deposit market share of 25.2% Charlottesville University of Virginia, High-tech and professional businesses, Real Estate development • $775 million in-market deposits and total deposit market share of 11.0% #1 Market Share (1) #2 Market Share (1) #2 Market Share (1) #1 Market Share (1) #1 Market Share (1) #1 Market Share (1) |
|
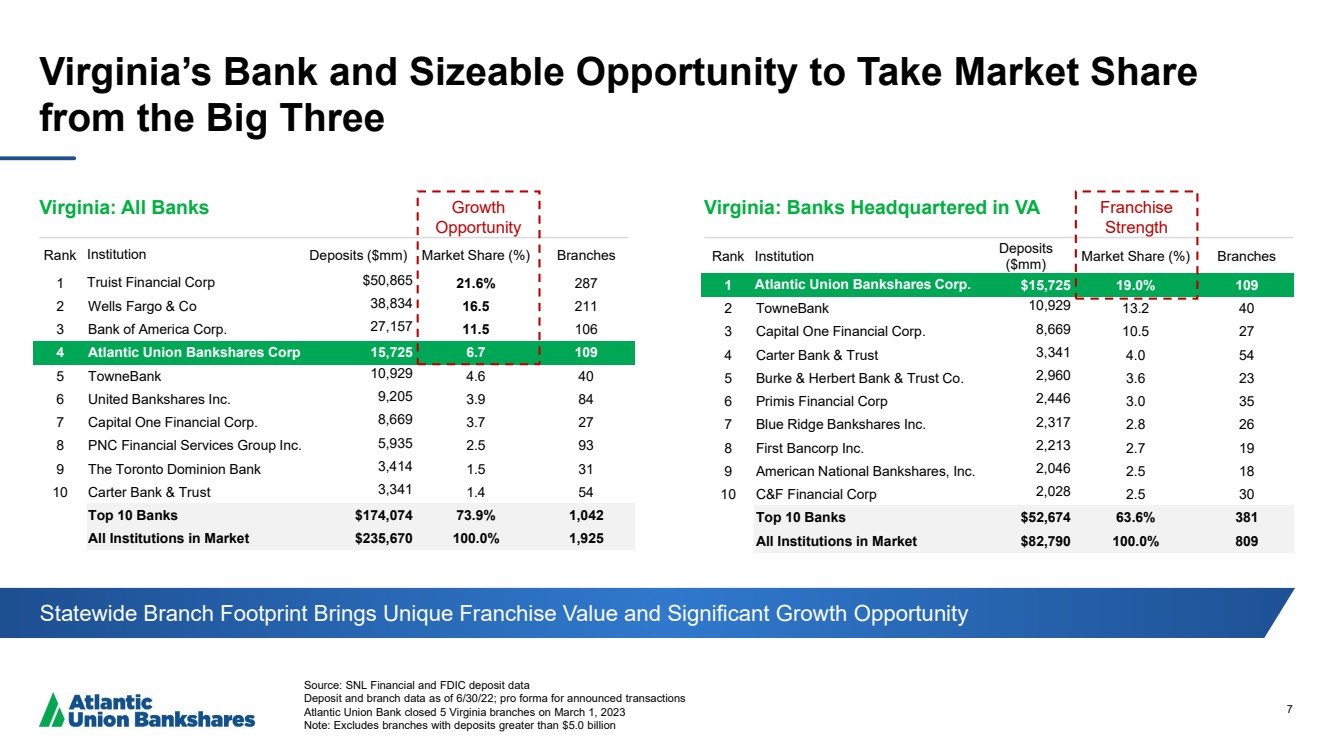
7 Virginia’s Bank and Sizeable Opportunity to Take Market Share from the Big Three Source: SNL Financial and FDIC deposit data Deposit and branch data as of 6/30/22; pro forma for announced transactions Atlantic Union Bank closed 5 Virginia branches on March 1, 2023 Note: Excludes branches with deposits greater than $5.0 billion Virginia: All Banks Virginia: Banks Headquartered in VA Rank Institution Deposits ($mm) Market Share (%) Branches 1 Truist Financial Corp $50,865 21.6% 287 2 Wells Fargo & Co 38,834 16.5 211 3 Bank of America Corp. 27,157 11.5 106 4 Atlantic Union Bankshares Corp 15,725 6.7 109 5 TowneBank 10,929 4.6 40 6 United Bankshares Inc. 9,205 3.9 84 7 Capital One Financial Corp. 8,669 3.7 27 8 PNC Financial Services Group Inc. 5,935 2.5 93 9 The Toronto Dominion Bank 3,414 1.5 31 10 Carter Bank & Trust 3,341 1.4 54 Top 10 Banks $174,074 73.9% 1,042 All Institutions in Market $235,670 100.0% 1,925 Rank Institution Deposits ($mm) Market Share (%) Branches 1 Atlantic Union Bankshares Corp. $15,725 19.0% 109 2 TowneBank 10,929 13.2 40 3 Capital One Financial Corp. 8,669 10.5 27 4 Carter Bank & Trust 3,341 4.0 54 5 Burke & Herbert Bank & Trust Co. 2,960 3.6 23 6 Primis Financial Corp 2,446 3.0 35 7 Blue Ridge Bankshares Inc. 2,317 2.8 26 8 First Bancorp Inc. 2,213 2.7 19 9 American National Bankshares, Inc. 2,046 2.5 18 10 C&F Financial Corp 2,028 2.5 30 Top 10 Banks $52,674 63.6% 381 All Institutions in Market $82,790 100.0% 809 Statewide Branch Footprint Brings Unique Franchise Value and Significant Growth Opportunity Growth Opportunity Franchise Strength |
|
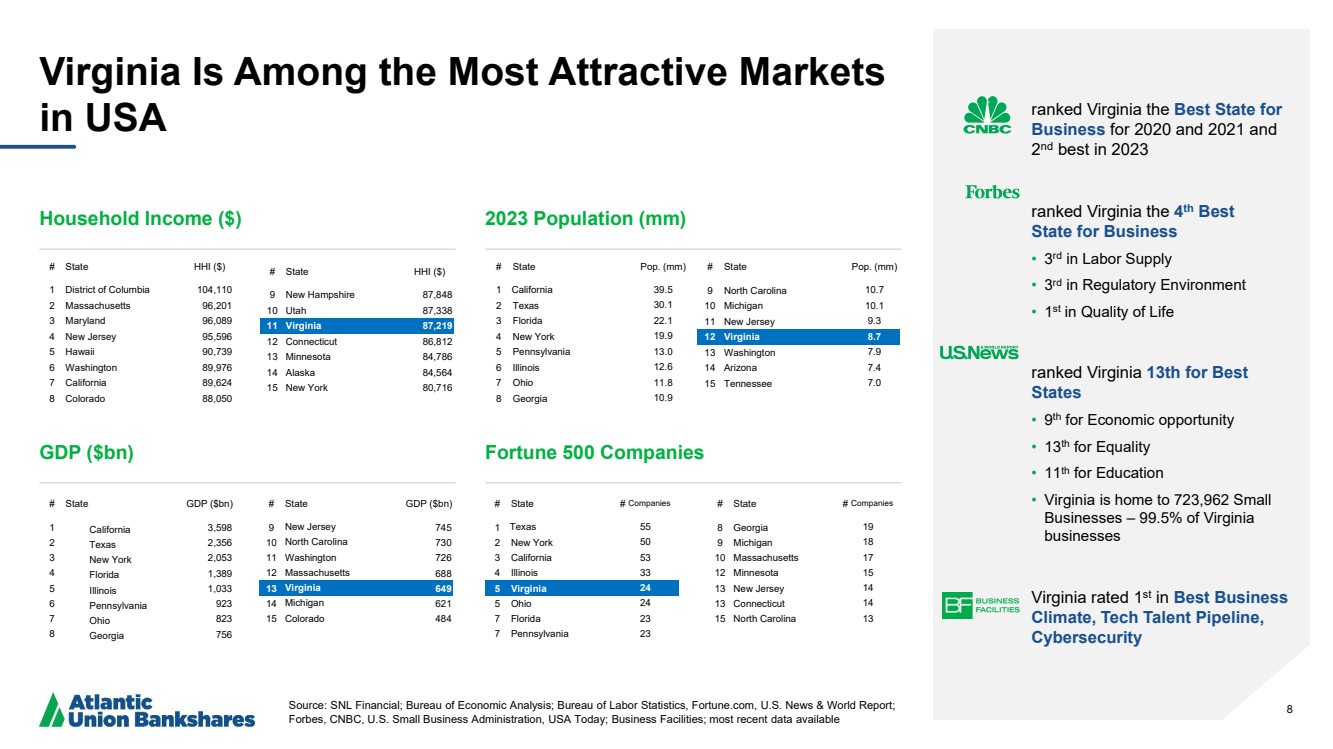
8 Virginia Is Among the Most Attractive Markets in USA Source: SNL Financial; Bureau of Economic Analysis; Bureau of Labor Statistics, Fortune.com, U.S. News & World Report; Forbes, CNBC, U.S. Small Business Administration, USA Today; Business Facilities; most recent data available ranked Virginia the Best State for Business for 2020 and 2021 and 2 nd best in 2023 ranked Virginia the 4 th Best State for Business • 3 rd in Labor Supply • 3 rd in Regulatory Environment • 1 st in Quality of Life ranked Virginia 13th for Best States • 9 th for Economic opportunity • 13th for Equality • 11th for Education • Virginia is home to 723,962 Small Businesses – 99.5% of Virginia businesses Virginia rated 1st in Best Business Climate, Tech Talent Pipeline, Cybersecurity # State # Companies 1 Texas 55 2 New York 50 3 California 53 4 Illinois 33 5 Virginia 24 5 Ohio 24 7 Florida 23 7 Pennsylvania 23 # State Pop. (mm) 1 California 39.5 2 Texas 30.1 3 Florida 22.1 4 New York 19.9 5 Pennsylvania 13.0 6 Illinois 12.6 7 Ohio 11.8 8 Georgia 10.9 # State HHI ($) 1 District of Columbia 104,110 2 Massachusetts 96,201 3 Maryland 96,089 4 New Jersey 95,596 5 Hawaii 90,739 6 Washington 89,976 7 California 89,624 8 Colorado 88,050 # State GDP ($bn) 1 California 3,598 2 Texas 2,356 3 New York 2,053 4 Florida 1,389 5 Illinois 1,033 6 Pennsylvania 923 7 Ohio 823 8 Georgia 756 Household Income ($) 2023 Population (mm) # State Pop. (mm) 9 North Carolina 10.7 10 Michigan 10.1 11 New Jersey 9.3 12 Virginia 8.7 13 Washington 7.9 14 Arizona 7.4 15 Tennessee 7.0 # State HHI ($) 9 New Hampshire 87,848 10 Utah 87,338 11 Virginia 87,219 12 Connecticut 86,812 13 Minnesota 84,786 14 Alaska 84,564 15 New York 80,716 GDP ($bn) Fortune 500 Companies # State # Companies 8 Georgia 19 9 Michigan 18 10 Massachusetts 17 12 Minnesota 15 13 New Jersey 14 13 Connecticut 14 15 North Carolina 13 # State GDP ($bn) 9 New Jersey 745 10 North Carolina 730 11 Washington 726 12 Massachusetts 688 13 Virginia 649 14 Michigan 621 15 Colorado 484 |
|
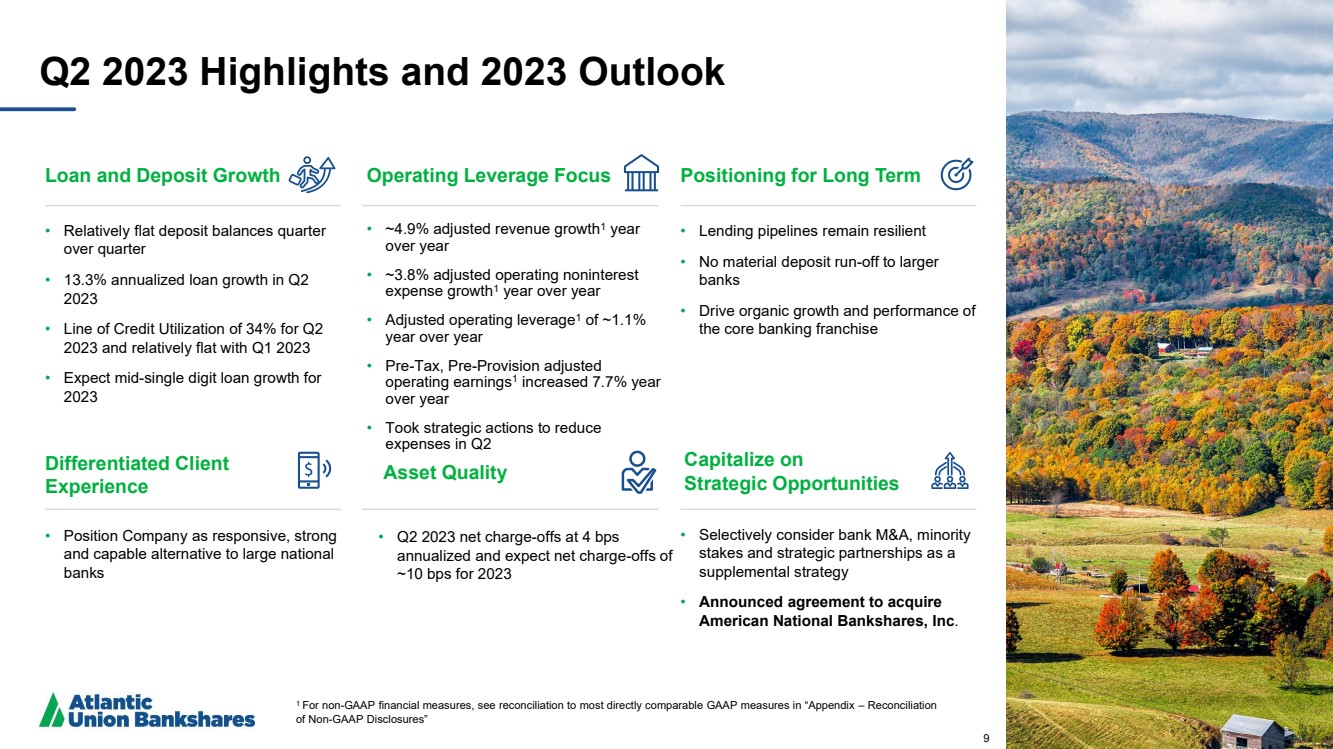
9 Q2 2023 Highlights and 2023 Outlook Loan and Deposit Growth • Relatively flat deposit balances quarter over quarter • 13.3% annualized loan growth in Q2 2023 • Line of Credit Utilization of 34% for Q2 2023 and relatively flat with Q1 2023 • Expect mid-single digit loan growth for 2023 Asset Quality • Q2 2023 net charge-offs at 4 bps annualized and expect net charge-offs of ~10 bps for 2023 Positioning for Long Term • Lending pipelines remain resilient • No material deposit run-off to larger banks • Drive organic growth and performance of the core banking franchise Differentiated Client Experience • Position Company as responsive, strong and capable alternative to large national banks Operating Leverage Focus • ~4.9% adjusted revenue growth1 year over year • ~3.8% adjusted operating noninterest expense growth1 year over year • Adjusted operating leverage1 of ~1.1% year over year • Pre-Tax, Pre-Provision adjusted operating earnings1 increased 7.7% year over year • Took strategic actions to reduce expenses in Q2 Capitalize on Strategic Opportunities • Selectively consider bank M&A, minority stakes and strategic partnerships as a supplemental strategy • Announced agreement to acquire American National Bankshares, Inc. 9 1 For non-GAAP financial measures, see reconciliation to most directly comparable GAAP measures in “Appendix – Reconciliation of Non-GAAP Disclosures” |
|
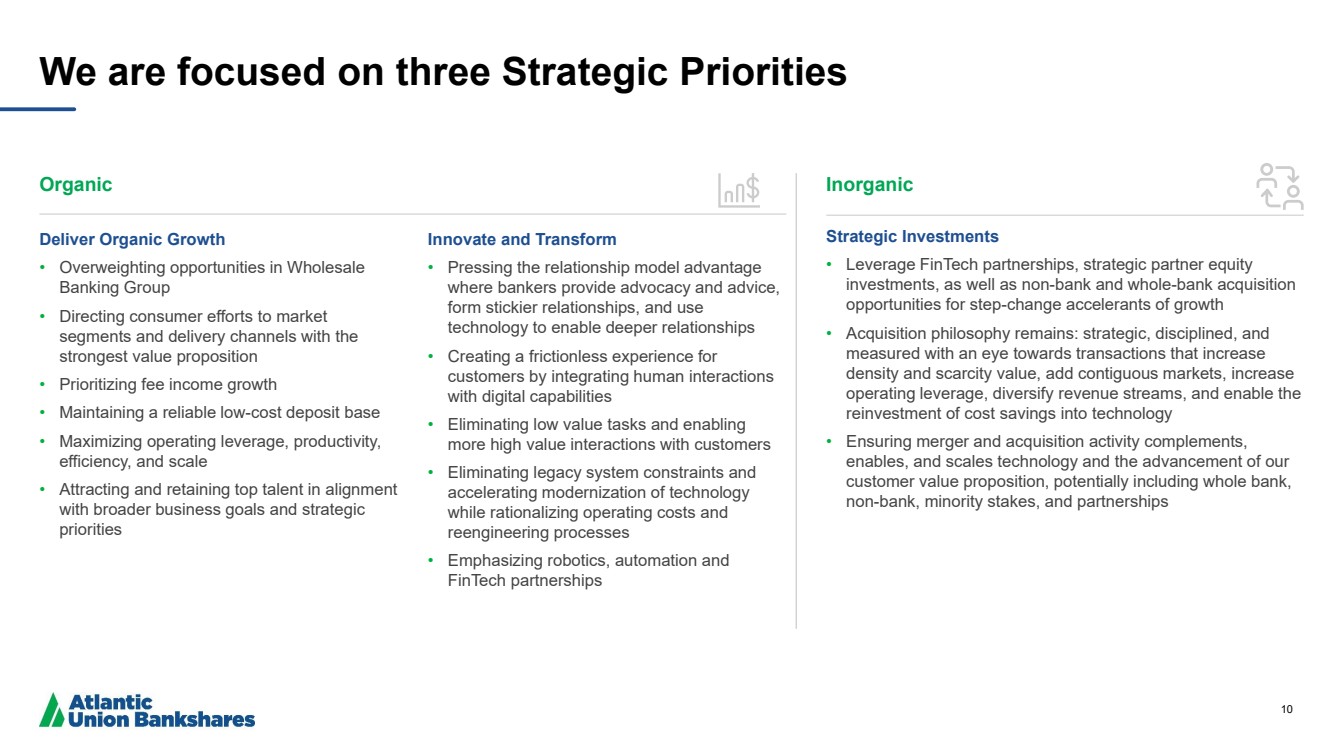
10 We are focused on three Strategic Priorities Organic Deliver Organic Growth • Overweighting opportunities in Wholesale Banking Group • Directing consumer efforts to market segments and delivery channels with the strongest value proposition • Prioritizing fee income growth • Maintaining a reliable low-cost deposit base • Maximizing operating leverage, productivity, efficiency, and scale • Attracting and retaining top talent in alignment with broader business goals and strategic priorities Innovate and Transform • Pressing the relationship model advantage where bankers provide advocacy and advice, form stickier relationships, and use technology to enable deeper relationships • Creating a frictionless experience for customers by integrating human interactions with digital capabilities • Eliminating low value tasks and enabling more high value interactions with customers • Eliminating legacy system constraints and accelerating modernization of technology while rationalizing operating costs and reengineering processes • Emphasizing robotics, automation and FinTech partnerships Inorganic Strategic Investments • Leverage FinTech partnerships, strategic partner equity investments, as well as non-bank and whole-bank acquisition opportunities for step-change accelerants of growth • Acquisition philosophy remains: strategic, disciplined, and measured with an eye towards transactions that increase density and scarcity value, add contiguous markets, increase operating leverage, diversify revenue streams, and enable the reinvestment of cost savings into technology • Ensuring merger and acquisition activity complements, enables, and scales technology and the advancement of our customer value proposition, potentially including whole bank, non-bank, minority stakes, and partnerships |
|
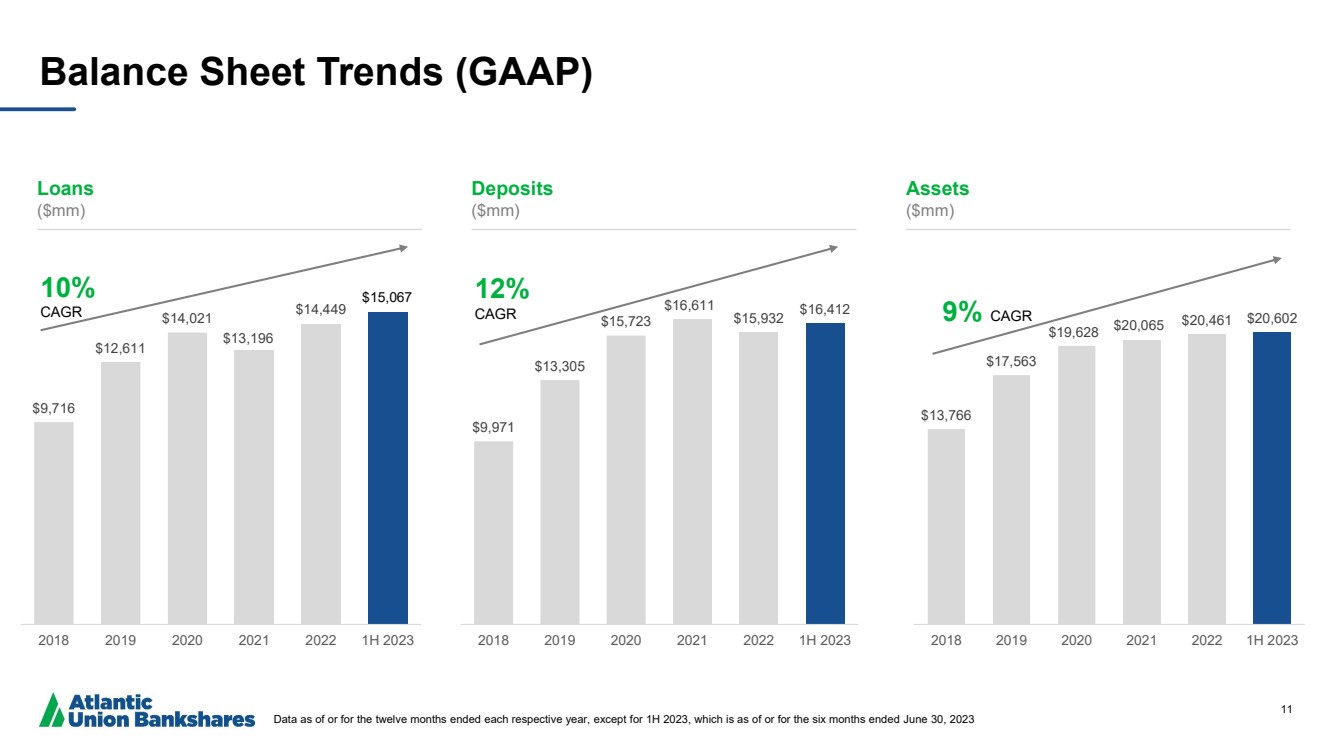
11 $9,971 $13,305 $15,723 $16,611 $15,932 $16,412 2018 2019 2020 2021 2022 1H 2023 12% CAGR Balance Sheet Trends (GAAP) Data as of or for the twelve months ended each respective year, except for 1H 2023, which is as of or for the six months ended June 30, 2023 Loans ($mm) Deposits ($mm) Assets ($mm) $9,716 $12,611 $14,021 $13,196 $14,449 2018 2019 2020 2021 2022 1H 2023 10% CAGR $13,766 $17,563 $19,628 $20,065 $20,461 $20,602 2018 2019 2020 2021 2022 1H 2023 9% CAGR $15,067 |
|
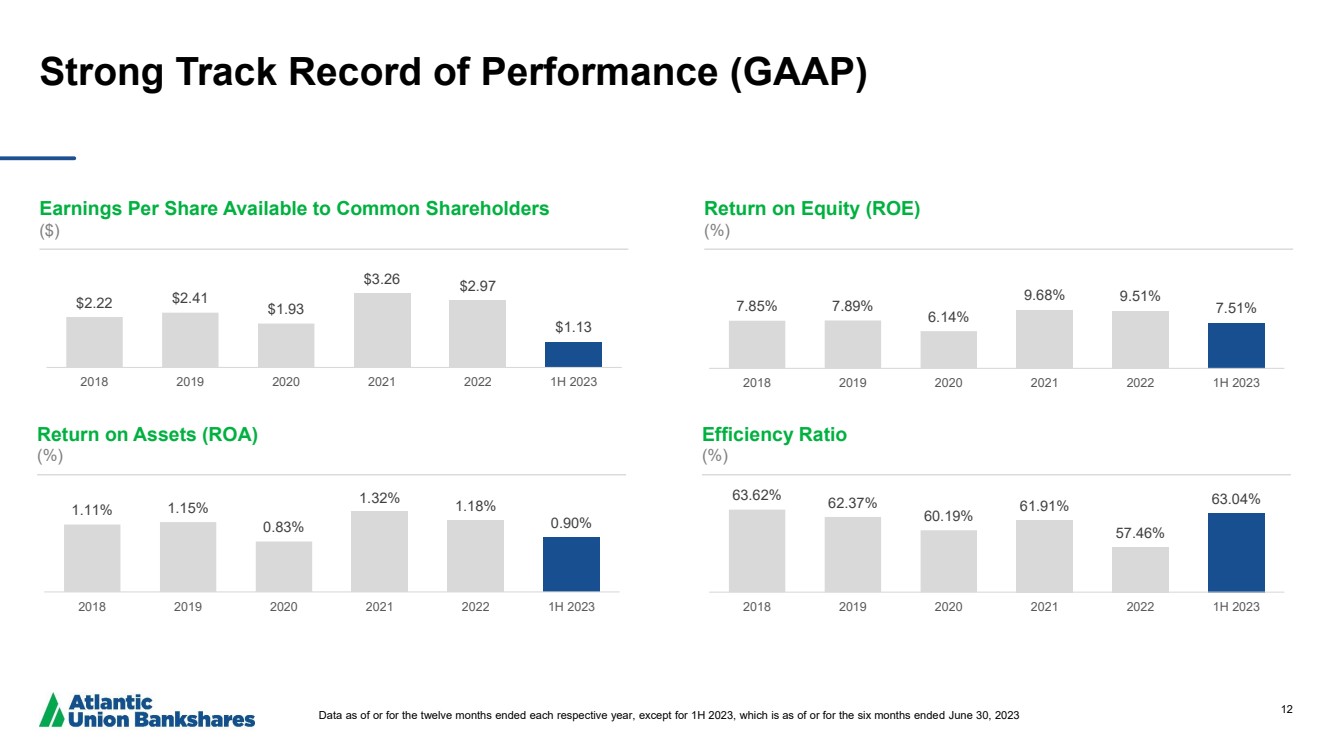
12 Strong Track Record of Performance (GAAP) Earnings Per Share Available to Common Shareholders ($) Return on Equity (ROE) (%) Return on Assets (ROA) (%) Efficiency Ratio (%) $2.22 $2.41 $1.93 $3.26 $2.97 $1.13 2018 2019 2020 2021 2022 1H 2023 7.85% 7.89% 6.14% 9.68% 9.51% 7.51% 2018 2019 2020 2021 2022 1H 2023 63.62% 62.37% 60.19% 61.91% 57.46% 63.04% 2018 2019 2020 2021 2022 1H 2023 1.11% 1.15% 0.83% 1.32% 1.18% 0.90% 2018 2019 2020 2021 2022 1H 2023 Data as of or for the twelve months ended each respective year, except for 1H 2023, which is as of or for the six months ended June 30, 2023 |
|
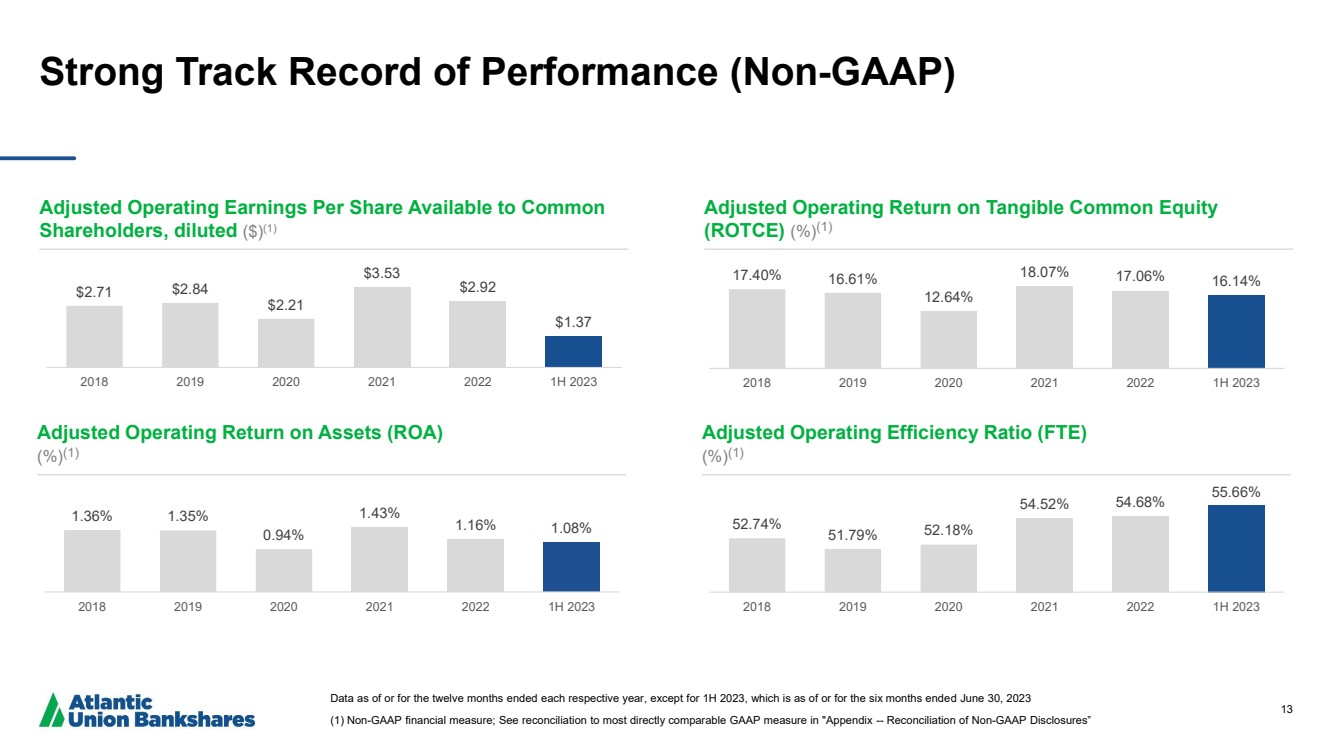
13 Strong Track Record of Performance (Non-GAAP) Data as of or for the twelve months ended each respective year, except for 1H 2023, which is as of or for the six months ended June 30, 2023 (1) Non-GAAP financial measure; See reconciliation to most directly comparable GAAP measure in "Appendix -- Reconciliation of Non-GAAP Disclosures” Adjusted Operating Earnings Per Share Available to Common Shareholders, diluted ($)(1) Adjusted Operating Return on Tangible Common Equity (ROTCE) (%)(1) Adjusted Operating Return on Assets (ROA) (%)(1) Adjusted Operating Efficiency Ratio (FTE) (%)(1) $2.71 $2.84 $2.21 $3.53 $2.92 $1.37 2018 2019 2020 2021 2022 1H 2023 17.40% 16.61% 12.64% 18.07% 17.06% 16.14% 2018 2019 2020 2021 2022 1H 2023 52.74% 51.79% 52.18% 54.52% 54.68% 55.66% 2018 2019 2020 2021 2022 1H 2023 1.36% 1.35% 0.94% 1.43% 1.16% 1.08% 2018 2019 2020 2021 2022 1H 2023 |
|
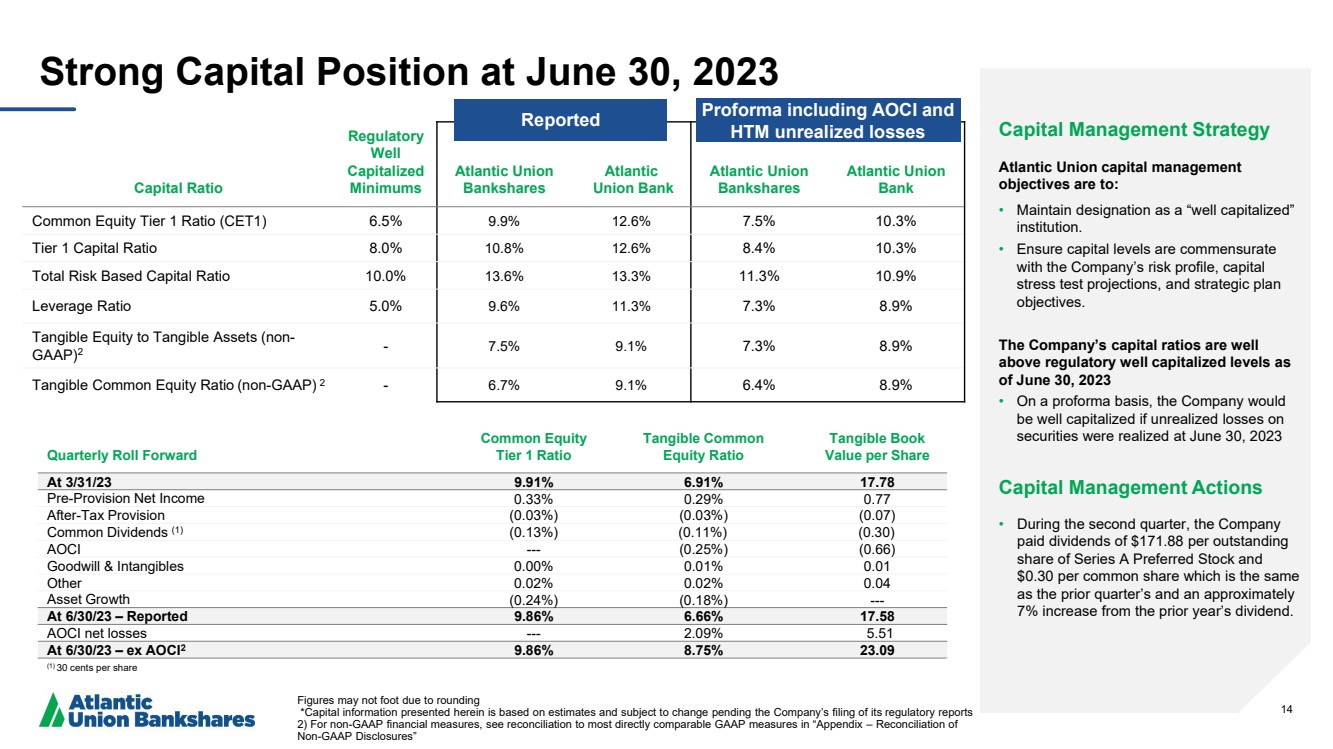
14 Capital Ratio Regulatory Well Capitalized Minimums Atlantic Union Bankshares Atlantic Union Bank Atlantic Union Bankshares Atlantic Union Bank Common Equity Tier 1 Ratio (CET1) 6.5% 9.9% 12.6% 7.5% 10.3% Tier 1 Capital Ratio 8.0% 10.8% 12.6% 8.4% 10.3% Total Risk Based Capital Ratio 10.0% 13.6% 13.3% 11.3% 10.9% Leverage Ratio 5.0% 9.6% 11.3% 7.3% 8.9% Tangible Equity to Tangible Assets (non-GAAP)2 - 7.5% 9.1% 7.3% 8.9% Tangible Common Equity Ratio (non-GAAP) 2 - 6.7% 9.1% 6.4% 8.9% Strong Capital Position at June 30, 2023 Figures may not foot due to rounding *Capital information presented herein is based on estimates and subject to change pending the Company’s filing of its regulatory reports 2) For non-GAAP financial measures, see reconciliation to most directly comparable GAAP measures in “Appendix – Reconciliation of Non-GAAP Disclosures” Capital Management Strategy Atlantic Union capital management objectives are to: • Maintain designation as a “well capitalized” institution. • Ensure capital levels are commensurate with the Company’s risk profile, capital stress test projections, and strategic plan objectives. The Company’s capital ratios are well above regulatory well capitalized levels as of June 30, 2023 • On a proforma basis, the Company would be well capitalized if unrealized losses on securities were realized at June 30, 2023 Capital Management Actions • During the second quarter, the Company paid dividends of $171.88 per outstanding share of Series A Preferred Stock and $0.30 per common share which is the same as the prior quarter’s and an approximately 7% increase from the prior year’s dividend. Quarterly Roll Forward Common Equity Tier 1 Ratio Tangible Common Equity Ratio Tangible Book Value per Share At 3/31/23 9.91% 6.91% 17.78 Pre-Provision Net Income 0.33% 0.29% 0.77 After-Tax Provision (0.03%) (0.03%) (0.07) Common Dividends (1) (0.13%) (0.11%) (0.30) AOCI --- (0.25%) (0.66) Goodwill & Intangibles 0.00% 0.01% 0.01 Other 0.02% 0.02% 0.04 Asset Growth (0.24%) (0.18%) --- At 6/30/23 – Reported 9.86% 6.66% 17.58 AOCI net losses --- 2.09% 5.51 At 6/30/23 – ex AOCI2 9.86% 8.75% 23.09 (1) 30 cents per share Reported Proforma including AOCI and HTM unrealized losses |
|
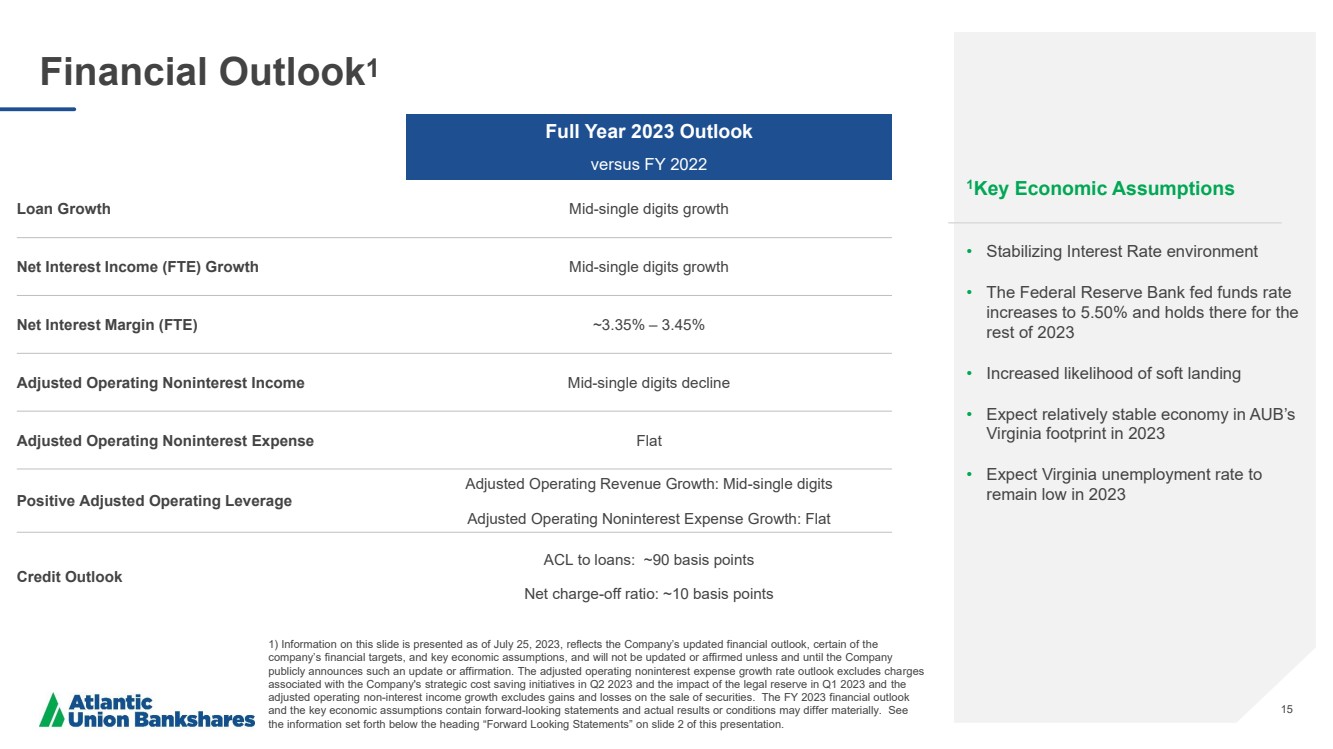
15 Financial Outlook1 1Key Economic Assumptions • Stabilizing Interest Rate environment • The Federal Reserve Bank fed funds rate increases to 5.50% and holds there for the rest of 2023 • Increased likelihood of soft landing • Expect relatively stable economy in AUB’s Virginia footprint in 2023 • Expect Virginia unemployment rate to remain low in 2023 Full Year 2023 Outlook versus FY 2022 Loan Growth Mid-single digits growth Net Interest Income (FTE) Growth Mid-single digits growth Net Interest Margin (FTE) ~3.35% – 3.45% Adjusted Operating Noninterest Income Mid-single digits decline Adjusted Operating Noninterest Expense Flat Positive Adjusted Operating Leverage Adjusted Operating Revenue Growth: Mid-single digits Adjusted Operating Noninterest Expense Growth: Flat Credit Outlook ACL to loans: ~90 basis points Net charge-off ratio: ~10 basis points 1) Information on this slide is presented as of July 25, 2023, reflects the Company’s updated financial outlook, certain of the company’s financial targets, and key economic assumptions, and will not be updated or affirmed unless and until the Company publicly announces such an update or affirmation. The adjusted operating noninterest expense growth rate outlook excludes charges associated with the Company's strategic cost saving initiatives in Q2 2023 and the impact of the legal reserve in Q1 2023 and the adjusted operating non-interest income growth excludes gains and losses on the sale of securities. The FY 2023 financial outlook and the key economic assumptions contain forward-looking statements and actual results or conditions may differ materially. See the information set forth below the heading “Forward Looking Statements” on slide 2 of this presentation. |
|
16 Appendix |
|
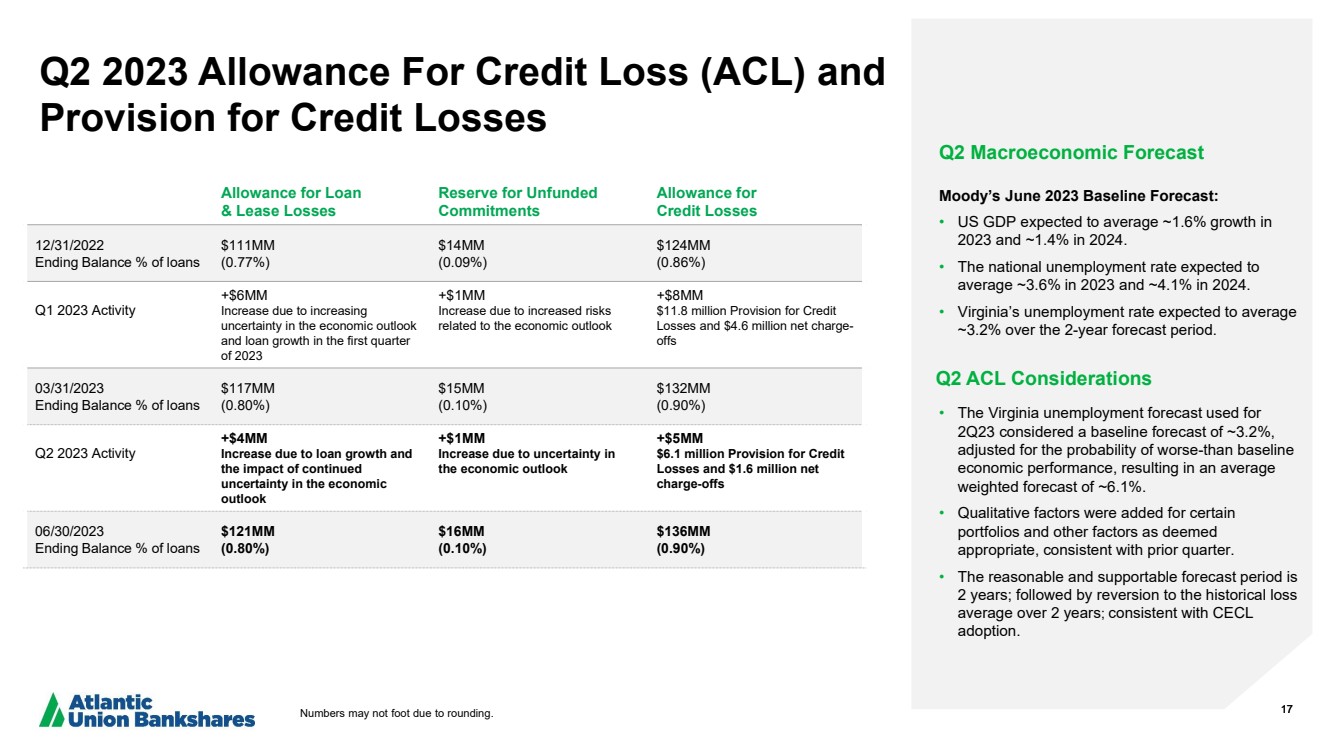
17 Q2 2023 Allowance For Credit Loss (ACL) and Provision for Credit Losses Q2 Macroeconomic Forecast Moody’s June 2023 Baseline Forecast: • US GDP expected to average ~1.6% growth in 2023 and ~1.4% in 2024. • The national unemployment rate expected to average ~3.6% in 2023 and ~4.1% in 2024. • Virginia’s unemployment rate expected to average ~3.2% over the 2-year forecast period. Q2 ACL Considerations • The Virginia unemployment forecast used for 2Q23 considered a baseline forecast of ~3.2%, adjusted for the probability of worse-than baseline economic performance, resulting in an average weighted forecast of ~6.1%. • Qualitative factors were added for certain portfolios and other factors as deemed appropriate, consistent with prior quarter. • The reasonable and supportable forecast period is 2 years; followed by reversion to the historical loss average over 2 years; consistent with CECL adoption. Allowance for Loan & Lease Losses Reserve for Unfunded Commitments Allowance for Credit Losses 12/31/2022 Ending Balance % of loans $111MM (0.77%) $14MM (0.09%) $124MM (0.86%) Q1 2023 Activity +$6MM Increase due to increasing uncertainty in the economic outlook and loan growth in the first quarter of 2023 +$1MM Increase due to increased risks related to the economic outlook +$8MM $11.8 million Provision for Credit Losses and $4.6 million net charge-offs 03/31/2023 Ending Balance % of loans $117MM (0.80%) $15MM (0.10%) $132MM (0.90%) Q2 2023 Activity +$4MM Increase due to loan growth and the impact of continued uncertainty in the economic outlook +$1MM Increase due to uncertainty in the economic outlook +$5MM $6.1 million Provision for Credit Losses and $1.6 million net charge-offs 06/30/2023 Ending Balance % of loans $121MM (0.80%) $16MM (0.10%) $136MM (0.90%) Numbers may not foot due to rounding. |
|
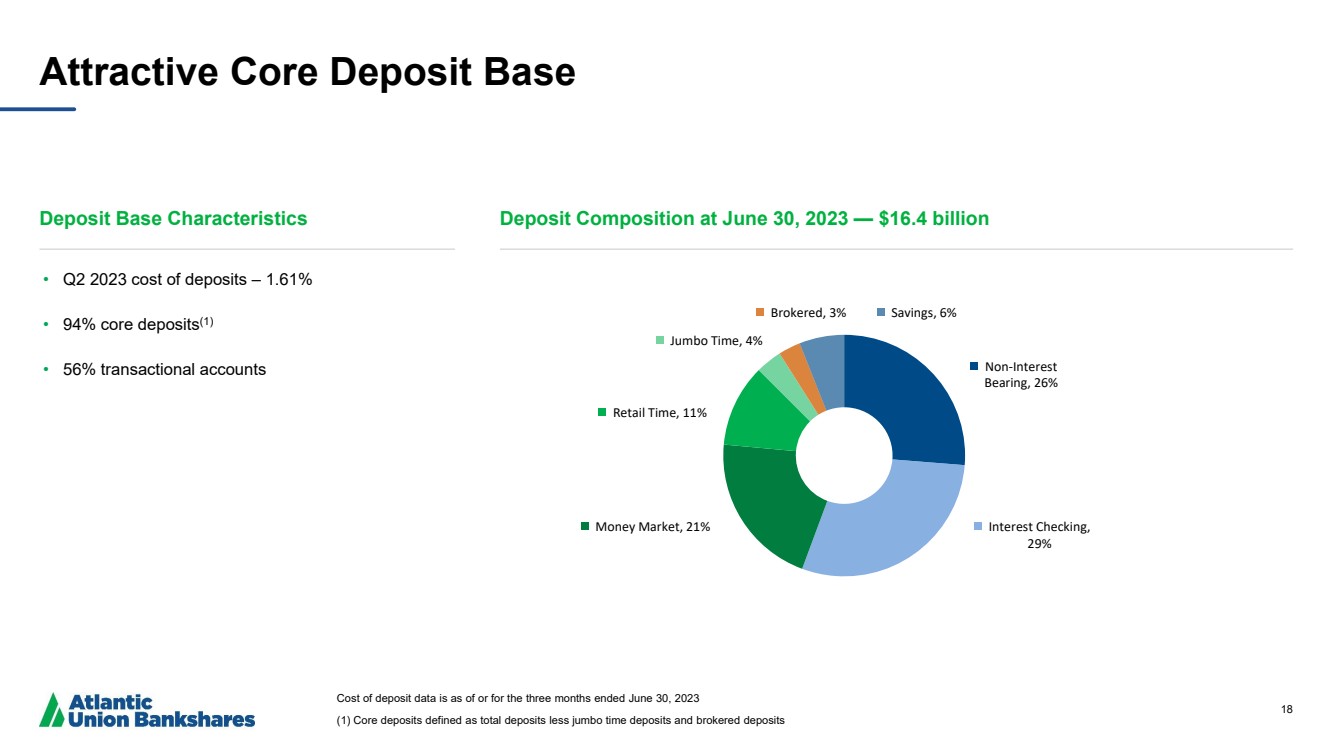
18 Attractive Core Deposit Base Deposit Base Characteristics Deposit Composition at June 30, 2023 — $16.4 billion Cost of deposit data is as of or for the three months ended June 30, 2023 (1) Core deposits defined as total deposits less jumbo time deposits and brokered deposits • Q2 2023 cost of deposits – 1.61% • 94% core deposits(1) • 56% transactional accounts Non-Interest Bearing, 26% Interest Checking, 29% Money Market, 21% Retail Time, 11% Jumbo Time, 4% Brokered, 3% Savings, 6% |
|
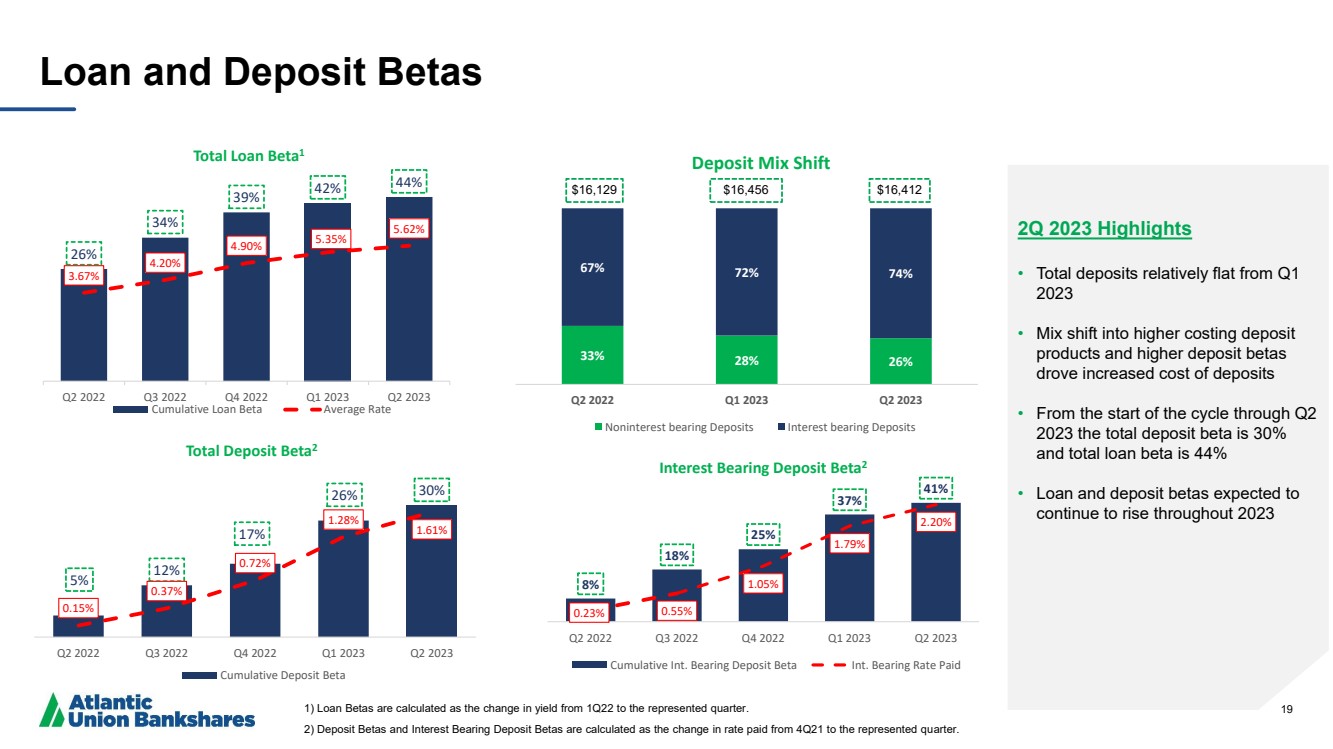
19 Loan and Deposit Betas 8% 18% 25% 37% 41% 0.23% 0.55% 1.05% 1.79% 2.20% Q2 2022 Q3 2022 Q4 2022 Q1 2023 Q2 2023 Interest Bearing Deposit Beta2 Cumulative Int. Bearing Deposit Beta Int. Bearing Rate Paid 5% 12% 17% 26% 30% 0.15% 0.37% 0.72% 1.28% 1.61% Q2 2022 Q3 2022 Q4 2022 Q1 2023 Q2 2023 Total Deposit Beta2 Cumulative Deposit Beta 33% 28% 26% 67% 72% 74% Q2 2022 Q1 2023 Q2 2023 Deposit Mix Shift Noninterest bearing Deposits Interest bearing Deposits 26% 34% 39% 42% 44% 3.67% 4.20% 4.90% 5.35% 5.62% Q2 2022 Q3 2022 Q4 2022 Q1 2023 Q2 2023 Total Loan Beta1 Cumulative Loan Beta Average Rate $16,129 $16,456 $16,412 2Q 2023 Highlights • Total deposits relatively flat from Q1 2023 • Mix shift into higher costing deposit products and higher deposit betas drove increased cost of deposits • From the start of the cycle through Q2 2023 the total deposit beta is 30% and total loan beta is 44% • Loan and deposit betas expected to continue to rise throughout 2023 1) Loan Betas are calculated as the change in yield from 1Q22 to the represented quarter. 2) Deposit Betas and Interest Bearing Deposit Betas are calculated as the change in rate paid from 4Q21 to the represented quarter. |
|
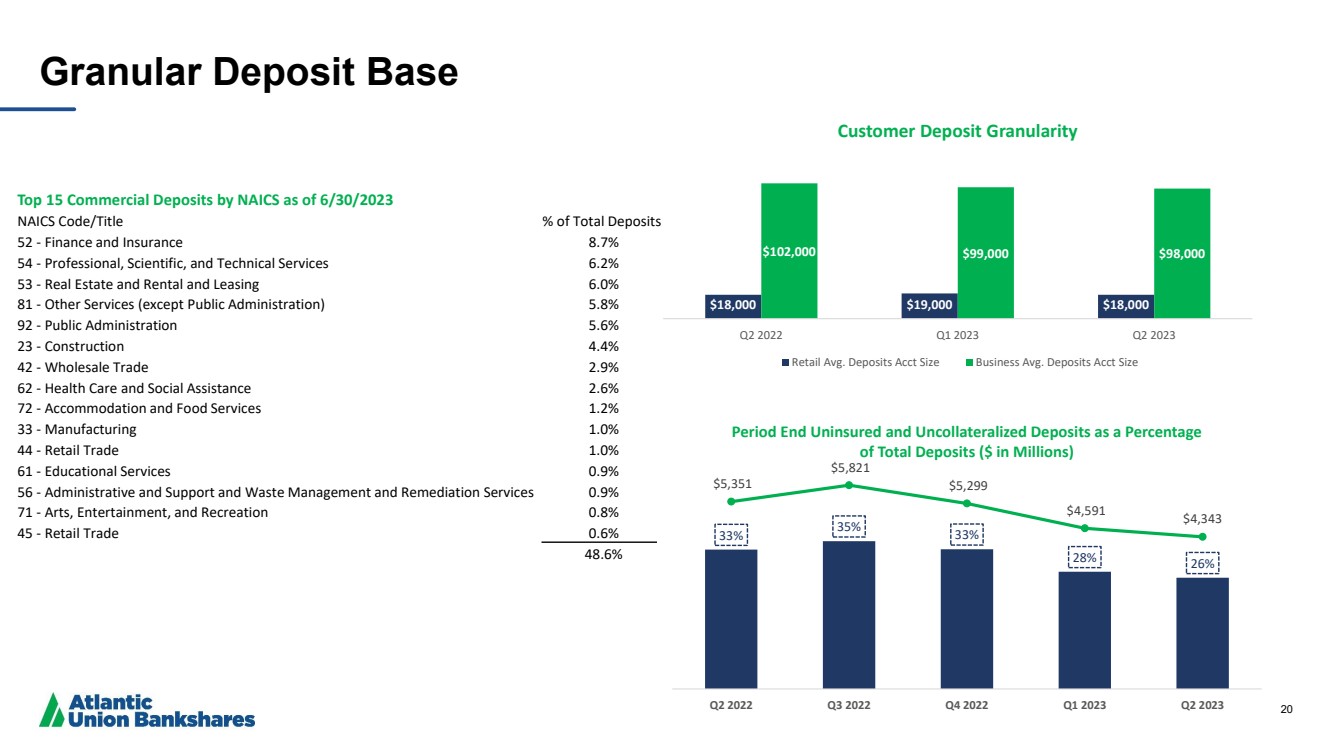
20 Granular Deposit Base Top 15 Commercial Deposits by NAICS as of 6/30/2023 NAICS Code/Title % of Total Deposits 52 - Finance and Insurance 8.7% 54 - Professional, Scientific, and Technical Services 6.2% 53 - Real Estate and Rental and Leasing 6.0% 81 - Other Services (except Public Administration) 5.8% 92 - Public Administration 5.6% 23 - Construction 4.4% 42 - Wholesale Trade 2.9% 62 - Health Care and Social Assistance 2.6% 72 - Accommodation and Food Services 1.2% 33 - Manufacturing 1.0% 44 - Retail Trade 1.0% 61 - Educational Services 0.9% 56 - Administrative and Support and Waste Management and Remediation Services 0.9% 71 - Arts, Entertainment, and Recreation 0.8% 45 - Retail Trade 0.6% 48.6% $18,000 $19,000 $18,000 $102,000 $99,000 $98,000 Q2 2022 Q1 2023 Q2 2023 Customer Deposit Granularity Retail Avg. Deposits Acct Size Business Avg. Deposits Acct Size 33% 35% 33% 28% 26% $5,351 $5,821 $5,299 $4,591 $4,343 Q2 2022 Q3 2022 Q4 2022 Q1 2023 Q2 2023 Period End Uninsured and Uncollateralized Deposits as a Percentage of Total Deposits ($ in Millions) |
|
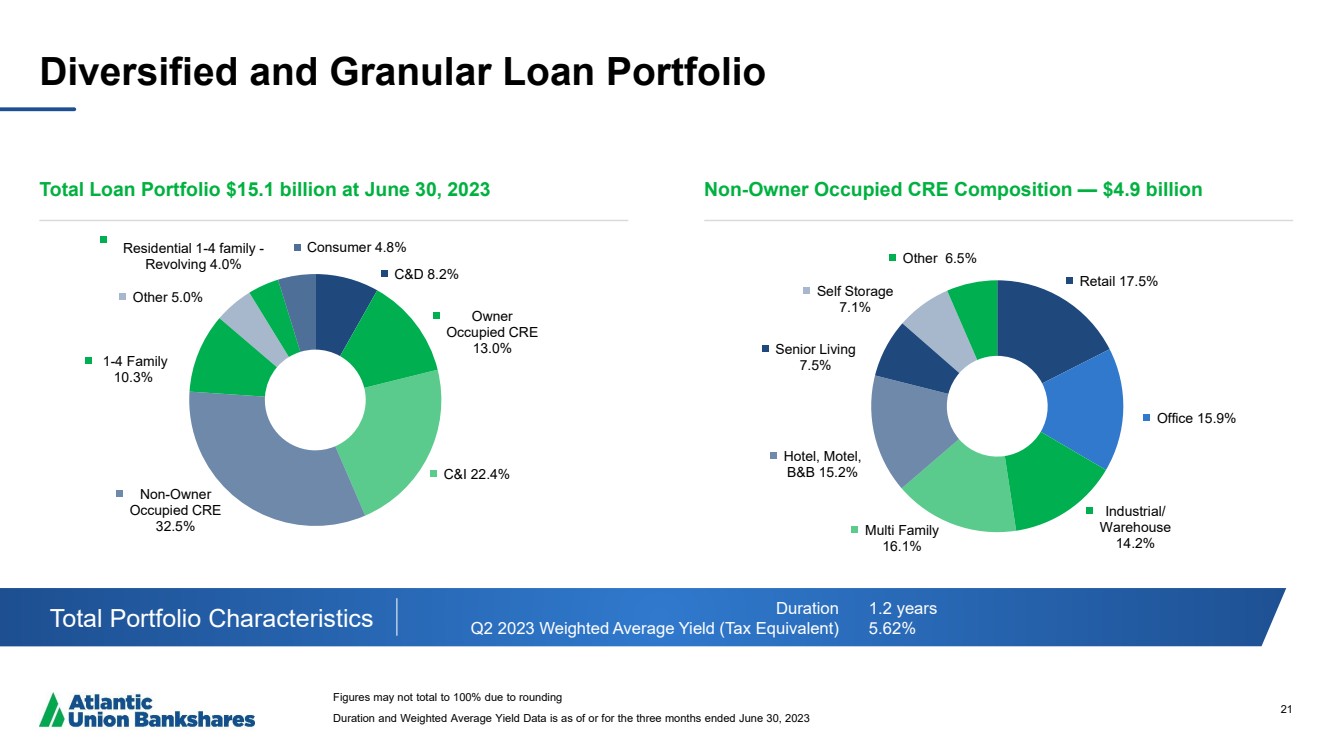
21 Diversified and Granular Loan Portfolio Total Loan Portfolio $15.1 billion at June 30, 2023 Non-Owner Occupied CRE Composition — $4.9 billion Total Portfolio Characteristics Duration Q2 2023 Weighted Average Yield (Tax Equivalent) 1.2 years 5.62% Figures may not total to 100% due to rounding Duration and Weighted Average Yield Data is as of or for the three months ended June 30, 2023 C&D 8.2% Owner Occupied CRE 13.0% C&I 22.4% Non-Owner Occupied CRE 32.5% 1-4 Family 10.3% Other 5.0% Residential 1-4 family - Revolving 4.0% Consumer 4.8% Retail 17.5% Office 15.9% Industrial/ Warehouse 14.2% Multi Family 16.1% Hotel, Motel, B&B 15.2% Senior Living 7.5% Self Storage 7.1% Other 6.5% |
|
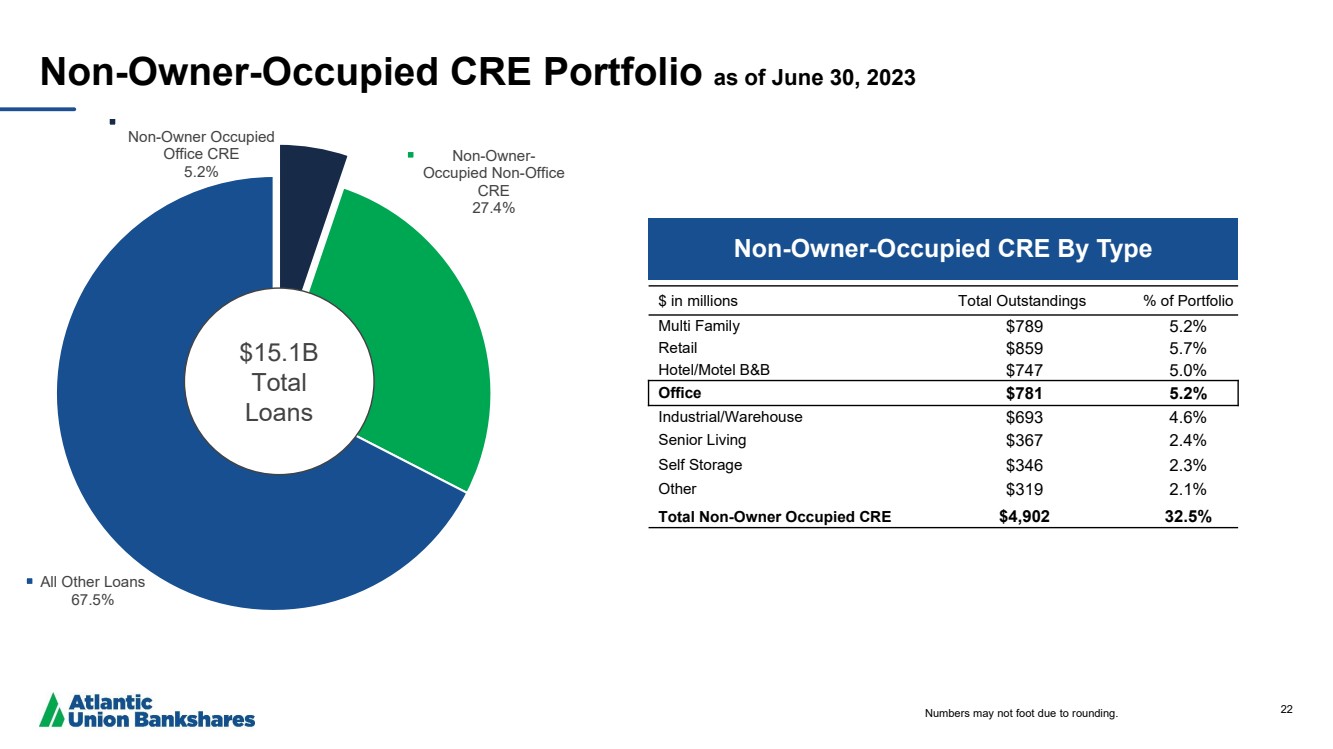
22 Non-Owner-Occupied CRE Portfolio as of June 30, 2023 $ in millions Total Outstandings % of Portfolio Multi Family $789 5.2% Retail $859 5.7% Hotel/Motel B&B $747 5.0% Office $781 5.2% Industrial/Warehouse $693 4.6% Senior Living $367 2.4% Self Storage $346 2.3% Other $319 2.1% Total Non-Owner Occupied CRE $4,902 32.5% Non-Owner Occupied Office CRE 5.2% Non-Owner-Occupied Non-Office CRE 27.4% All Other Loans 67.5% $15.1B Total Loans Non-Owner-Occupied CRE By Type Numbers may not foot due to rounding. |
|
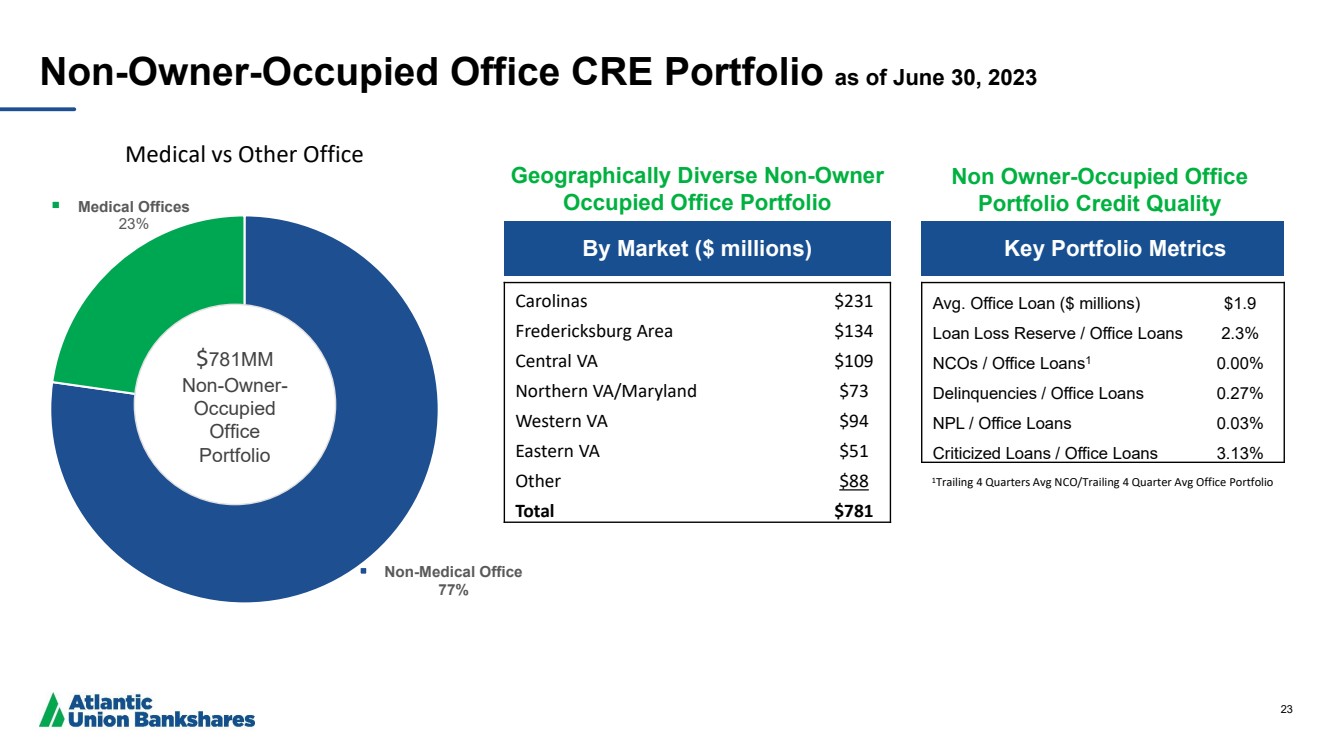
23 Non-Medical Office 77% Medical Offices 23% Medical vs Other Office By Market ($ millions) Key Portfolio Metrics Carolinas $231 Fredericksburg Area $134 Central VA $109 Northern VA/Maryland $73 Western VA $94 Eastern VA $51 Other $88 Total $781 Avg. Office Loan ($ millions) $1.9 Loan Loss Reserve / Office Loans 2.3% NCOs / Office Loans1 0.00% Delinquencies / Office Loans 0.27% NPL / Office Loans 0.03% Criticized Loans / Office Loans 3.13% Non-Owner-Occupied Office CRE Portfolio as of June 30, 2023 $781MM Non-Owner-Occupied Office Portfolio Non Owner-Occupied Office Portfolio Credit Quality Geographically Diverse Non-Owner Occupied Office Portfolio 1Trailing 4 Quarters Avg NCO/Trailing 4 Quarter Avg Office Portfolio |
|
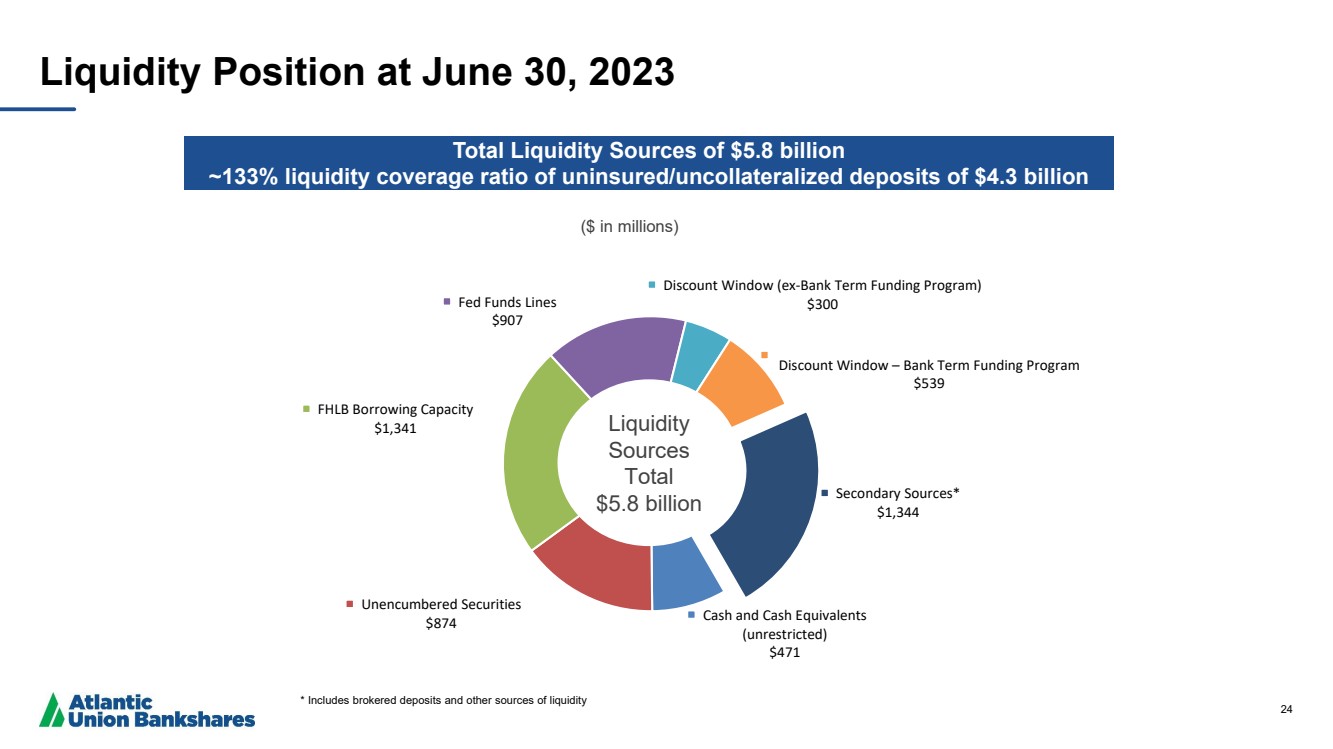
24 Cash and Cash Equivalents (unrestricted) $471 Unencumbered Securities $874 FHLB Borrowing Capacity $1,341 Fed Funds Lines $907 Discount Window (ex-Bank Term Funding Program) $300 Discount Window – Bank Term Funding Program $539 Secondary Sources* $1,344 ($ in millions) Liquidity Position at June 30, 2023 Total Liquidity Sources of $5.8 billion ~133% liquidity coverage ratio of uninsured/uncollateralized deposits of $4.3 billion * Includes brokered deposits and other sources of liquidity Liquidity Sources Total $5.8 billion |
|
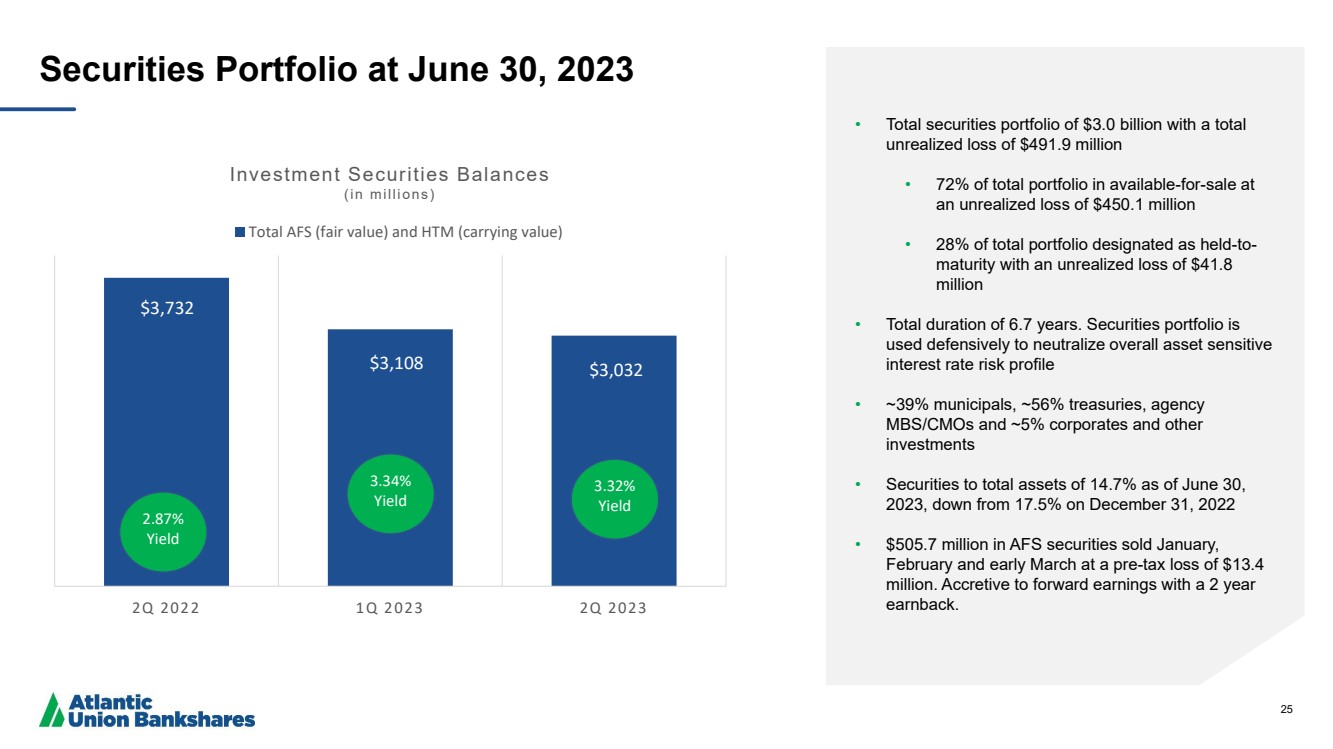
25 Securities Portfolio at June 30, 2023 • Total securities portfolio of $3.0 billion with a total unrealized loss of $491.9 million • 72% of total portfolio in available-for-sale at an unrealized loss of $450.1 million • 28% of total portfolio designated as held-to-maturity with an unrealized loss of $41.8 million • Total duration of 6.7 years. Securities portfolio is used defensively to neutralize overall asset sensitive interest rate risk profile • ~39% municipals, ~56% treasuries, agency MBS/CMOs and ~5% corporates and other investments • Securities to total assets of 14.7% as of June 30, 2023, down from 17.5% on December 31, 2022 • $505.7 million in AFS securities sold January, February and early March at a pre-tax loss of $13.4 million. Accretive to forward earnings with a 2 year earnback. $3,732 $3,108 $3,032 2Q 2022 1Q 2023 2Q 2023 Investment Securities Balances (in millions) Total AFS (fair value) and HTM (carrying value) 2.87% Yield 3.32% Yield 3.34% Yield |
|
26 Reconciliation of Non-GAAP Disclosures The Company has provided supplemental performance measures on a tax-equivalent, tangible, operating, adjusted, or pre-tax pre-provision basis. These non-GAAP financial measures are a supplement to GAAP, which is used to prepare the Company’s financial statements, and should not be considered in isolation or as a substitute for comparable measures calculated in accordance with GAAP. In addition, the Company’s non-GAAP financial measures may not be comparable to non-GAAP financial measures of other companies. The Company uses the non-GAAP financial measures discussed herein in its analysis of the Company’s performance. The Company’s management believes that these non-GAAP financial measures provide additional understanding of ongoing operations, enhance comparability of results of operations with prior periods and show the effects of significant gains and charges in the periods presented without the impact of items or events that may obscure trends in the Company’s underlying performance. |
|
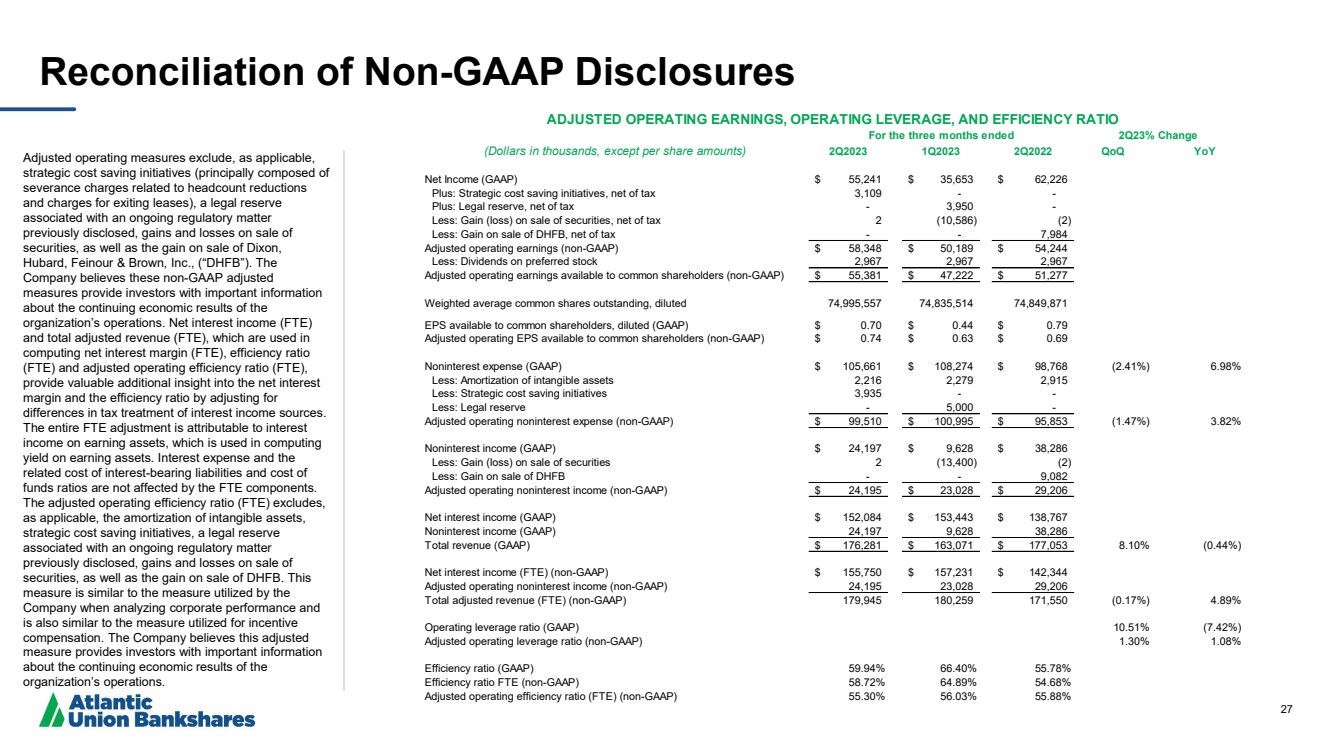
27 Reconciliation of Non -GAAP Disclosures Adjusted operating measures exclude, as applicable, strategic cost saving initiatives (principally composed of severance charges related to headcount reductions and charges for exiting leases), a legal reserve associated with an ongoing regulatory matter previously disclosed, gains and losses on sale of securities, as well as the gain on sale of Dixon, Hubard, Feinour & Brown, Inc., (“DHFB”). The Company believes these non -GAAP adjusted measures provide investors with important information about the continuing economic results of the organization’s operations. Net interest income (FTE) and total adjusted revenue (FTE), which are used in computing net interest margin (FTE), efficiency ratio (FTE) and adjusted operating efficiency ratio (FTE), provide valuable additional insight into the net interest margin and the efficiency ratio by adjusting for differences in tax treatment of interest income sources. The entire FTE adjustment is attributable to interest income on earning assets, which is used in computing yield on earning assets. Interest expense and the related cost of interest -bearing liabilities and cost of funds ratios are not affected by the FTE components. The adjusted operating efficiency ratio (FTE) excludes, as applicable, the amortization of intangible assets, strategic cost saving initiatives, a legal reserve associated with an ongoing regulatory matter previously disclosed, gains and losses on sale of securities, as well as the gain on sale of DHFB. This measure is similar to the measure utilized by the Company when analyzing corporate performance and is also similar to the measure utilized for incentive compensation. The Company believes this adjusted measure provides investors with important information about the continuing economic results of the organization’s operations. (Dollars in thousands, except per share amounts) 2Q2023 1Q2023 2Q2022 QoQ YoY Net Income (GAAP) $ 55,241 $ 35,653 $ 62,226 Plus: Strategic cost saving initiatives, net of tax 3,109 - - Plus: Legal reserve, net of tax - 3,950 - Less: Gain (loss) on sale of securities, net of tax 2 (10,586) (2) Less: Gain on sale of DHFB, net of tax - - 7,984 Adjusted operating earnings (non-GAAP) $ 58,348 $ 50,189 $ 54,244 Less: Dividends on preferred stock 2,967 2,967 2,967 Adjusted operating earnings available to common shareholders (non-GAAP) $ 55,381 $ 47,222 $ 51,277 Weighted average common shares outstanding, diluted 74,995,557 74,835,514 74,849,871 EPS available to common shareholders, diluted (GAAP) $ 0.70 $ 0.44 $ 0.79 Adjusted operating EPS available to common shareholders (non-GAAP) $ 0.74 $ 0.63 $ 0.69 Noninterest expense (GAAP) $ 105,661 $ 108,274 $ 98,768 (2.41%) 6.98% Less: Amortization of intangible assets 2,216 2,279 2,915 Less: Strategic cost saving initiatives 3,935 - - Less: Legal reserve - 5,000 - Adjusted operating noninterest expense (non-GAAP) $ 99,510 $ 100,995 $ 95,853 (1.47%) 3.82% Noninterest income (GAAP) $ 24,197 $ 9,628 $ 38,286 Less: Gain (loss) on sale of securities 2 (13,400) (2) Less: Gain on sale of DHFB - - 9,082 Adjusted operating noninterest income (non-GAAP) $ 24,195 $ 23,028 $ 29,206 Net interest income (GAAP) $ 152,084 $ 153,443 $ 138,767 Noninterest income (GAAP) 24,197 9,628 38,286 Total revenue (GAAP) $ 176,281 $ 163,071 $ 177,053 8.10% (0.44%) Net interest income (FTE) (non-GAAP) $ 155,750 $ 157,231 $ 142,344 Adjusted operating noninterest income (non-GAAP) 24,195 23,028 29,206 Total adjusted revenue (FTE) (non-GAAP) 179,945 180,259 171,550 (0.17%) 4.89% Operating leverage ratio (GAAP) 10.51% (7.42%) Adjusted operating leverage ratio (non-GAAP) 1.30% 1.08% Efficiency ratio (GAAP) 59.94% 66.40% 55.78% Efficiency ratio FTE (non-GAAP) 58.72% 64.89% 54.68% Adjusted operating efficiency ratio (FTE) (non-GAAP) 55.30% 56.03% 55.88% 2Q23% Change ADJUSTED OPERATING EARNINGS, OPERATING LEVERAGE, AND EFFICIENCY RATIO For the three months ended |
|
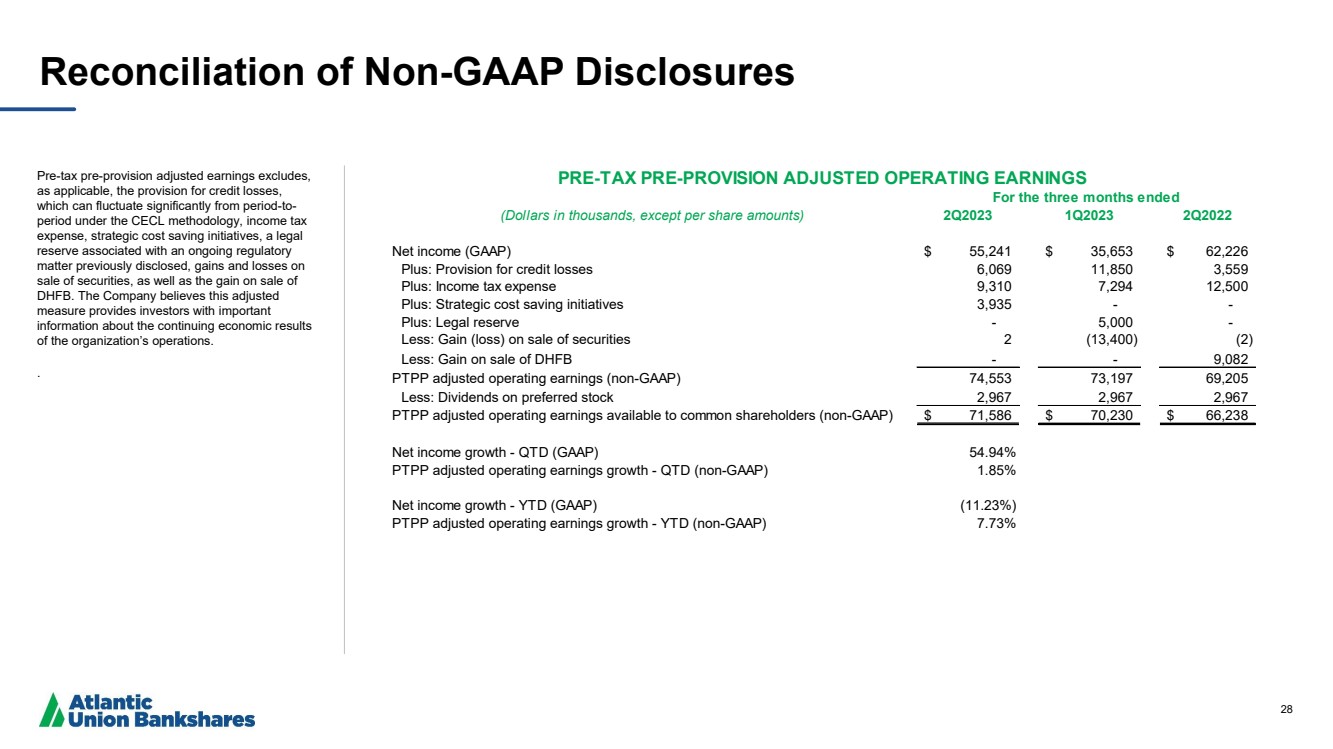
28 Reconciliation of Non-GAAP Disclosures Pre-tax pre-provision adjusted earnings excludes, as applicable, the provision for credit losses, which can fluctuate significantly from period-to-period under the CECL methodology, income tax expense, strategic cost saving initiatives, a legal reserve associated with an ongoing regulatory matter previously disclosed, gains and losses on sale of securities, as well as the gain on sale of DHFB. The Company believes this adjusted measure provides investors with important information about the continuing economic results of the organization’s operations. . (Dollars in thousands, except per share amounts) 2Q2023 1Q2023 2Q2022 Net income (GAAP) $ 55,241 $ 35,653 $ 62,226 Plus: Provision for credit losses 6,069 11,850 3,559 Plus: Income tax expense 9,310 7,294 12,500 Plus: Strategic cost saving initiatives 3,935 - - Plus: Legal reserve - 5,000 - Less: Gain (loss) on sale of securities 2 (13,400) (2) Less: Gain on sale of DHFB - - 9,082 PTPP adjusted operating earnings (non-GAAP) 74,553 73,197 69,205 Less: Dividends on preferred stock 2,967 2,967 2,967 PTPP adjusted operating earnings available to common shareholders (non-GAAP) $ 71,586 $ 70,230 $ 66,238 Net income growth - QTD (GAAP) 54.94% PTPP adjusted operating earnings growth - QTD (non-GAAP) 1.85% Net income growth - YTD (GAAP) (11.23%) PTPP adjusted operating earnings growth - YTD (non-GAAP) 7.73% For the three months ended PRE-TAX PRE-PROVISION ADJUSTED OPERATING EARNINGS |
|
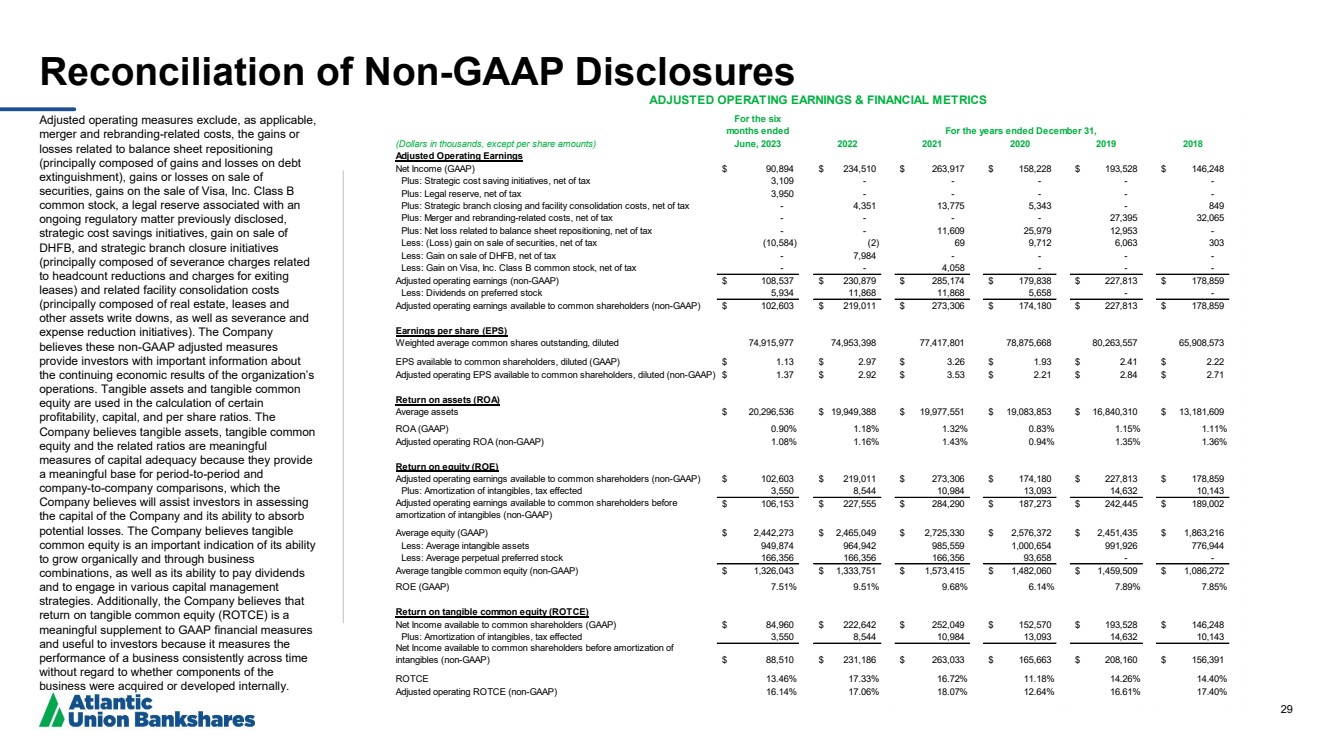
29 Reconciliation of Non -GAAP Disclosures Adjusted operating measures exclude, as applicable, merger and rebranding -related costs, the gains or losses related to balance sheet repositioning (principally composed of gains and losses on debt extinguishment), gains or losses on sale of securities, gains on the sale of Visa, Inc. Class B common stock, a legal reserve associated with an ongoing regulatory matter previously disclosed, strategic cost savings initiatives, gain on sale of DHFB, and strategic branch closure initiatives (principally composed of severance charges related to headcount reductions and charges for exiting leases) and related facility consolidation costs (principally composed of real estate, leases and other assets write downs, as well as severance and expense reduction initiatives). The Company believes these non -GAAP adjusted measures provide investors with important information about the continuing economic results of the organization’s operations. Tangible assets and tangible common equity are used in the calculation of certain profitability, capital, and per share ratios. The Company believes tangible assets, tangible common equity and the related ratios are meaningful measures of capital adequacy because they provide a meaningful base for period -to -period and company -to -company comparisons, which the Company believes will assist investors in assessing the capital of the Company and its ability to absorb potential losses. The Company believes tangible common equity is an important indication of its ability to grow organically and through business combinations, as well as its ability to pay dividends and to engage in various capital management strategies. Additionally, the Company believes that return on tangible common equity (ROTCE) is a meaningful supplement to GAAP financial measures and useful to investors because it measures the performance of a business consistently across time without regard to whether components of the business were acquired or developed internally. For the six months ended (Dollars in thousands, except per share amounts) June, 2023 2022 2021 2020 2019 2018 Adjusted Operating Earnings Net Income (GAAP) $ 90,894 $ 234,510 $ 263,917 $ 158,228 $ 193,528 $ 146,248 Plus: Strategic cost saving initiatives, net of tax 3,109 - - - - - Plus: Legal reserve, net of tax 3,950 - - - - - Plus: Strategic branch closing and facility consolidation costs, net of tax - 4,351 13,775 5,343 - 849 Plus: Merger and rebranding-related costs, net of tax - - - - 27,395 32,065 Plus: Net loss related to balance sheet repositioning, net of tax - - 11,609 25,979 12,953 - Less: (Loss) gain on sale of securities, net of tax (10,584) (2) 69 9,712 6,063 303 Less: Gain on sale of DHFB, net of tax - 7,984 - - - - Less: Gain on Visa, Inc. Class B common stock, net of tax - - 4,058 - - - Adjusted operating earnings (non-GAAP) $ 108,537 $ 230,879 $ 285,174 $ 179,838 $ 227,813 $ 178,859 Less: Dividends on preferred stock 5,934 11,868 11,868 5,658 - - Adjusted operating earnings available to common shareholders (non-GAAP) $ 102,603 $ 219,011 $ 273,306 $ 174,180 $ 227,813 $ 178,859 Earnings per share (EPS) Weighted average common shares outstanding, diluted 74,915,977 74,953,398 77,417,801 78,875,668 80,263,557 65,908,573 EPS available to common shareholders, diluted (GAAP) $ 1.13 $ 2.97 $ 3.26 $ 1.93 $ 2.41 $ 2.22 Adjusted operating EPS available to common shareholders, diluted (non-GAAP) $ 1.37 $ 2.92 $ 3.53 $ 2.21 $ 2.84 $ 2.71 Return on assets (ROA) Average assets $ 20,296,536 $ 19,949,388 $ 19,977,551 $ 19,083,853 $ 16,840,310 $ 13,181,609 ROA (GAAP) 0.90% 1.18% 1.32% 0.83% 1.15% 1.11% Adjusted operating ROA (non-GAAP) 1.08% 1.16% 1.43% 0.94% 1.35% 1.36% Return on equity (ROE) Adjusted operating earnings available to common shareholders (non-GAAP) $ 102,603 $ 219,011 $ 273,306 $ 174,180 $ 227,813 $ 178,859 Plus: Amortization of intangibles, tax effected 3,550 8,544 10,984 13,093 14,632 10,143 Adjusted operating earnings available to common shareholders before amortization of intangibles (non-GAAP) $ 106,153 $ 227,555 $ 284,290 $ 187,273 $ 242,445 $ 189,002 Average equity (GAAP) $ 2,442,273 $ 2,465,049 $ 2,725,330 $ 2,576,372 $ 2,451,435 $ 1,863,216 Less: Average intangible assets 949,874 964,942 985,559 1,000,654 991,926 776,944 Less: Average perpetual preferred stock 166,356 166,356 166,356 93,658 - - Average tangible common equity (non-GAAP) $ 1,326,043 $ 1,333,751 $ 1,573,415 $ 1,482,060 $ 1,459,509 $ 1,086,272 ROE (GAAP) 7.51% 9.51% 9.68% 6.14% 7.89% 7.85% Return on tangible common equity (ROTCE) Net Income available to common shareholders (GAAP) $ 84,960 $ 222,642 $ 252,049 $ 152,570 $ 193,528 $ 146,248 Plus: Amortization of intangibles, tax effected 3,550 8,544 10,984 13,093 14,632 10,143 Net Income available to common shareholders before amortization of intangibles (non-GAAP) $ 88,510 $ 231,186 $ 263,033 $ 165,663 $ 208,160 $ 156,391 ROTCE 13.46% 17.33% 16.72% 11.18% 14.26% 14.40% Adjusted operating ROTCE (non-GAAP) 16.14% 17.06% 18.07% 12.64% 16.61% 17.40% ADJUSTED OPERATING EARNINGS & FINANCIAL METRICS For the years ended December 31, |
|
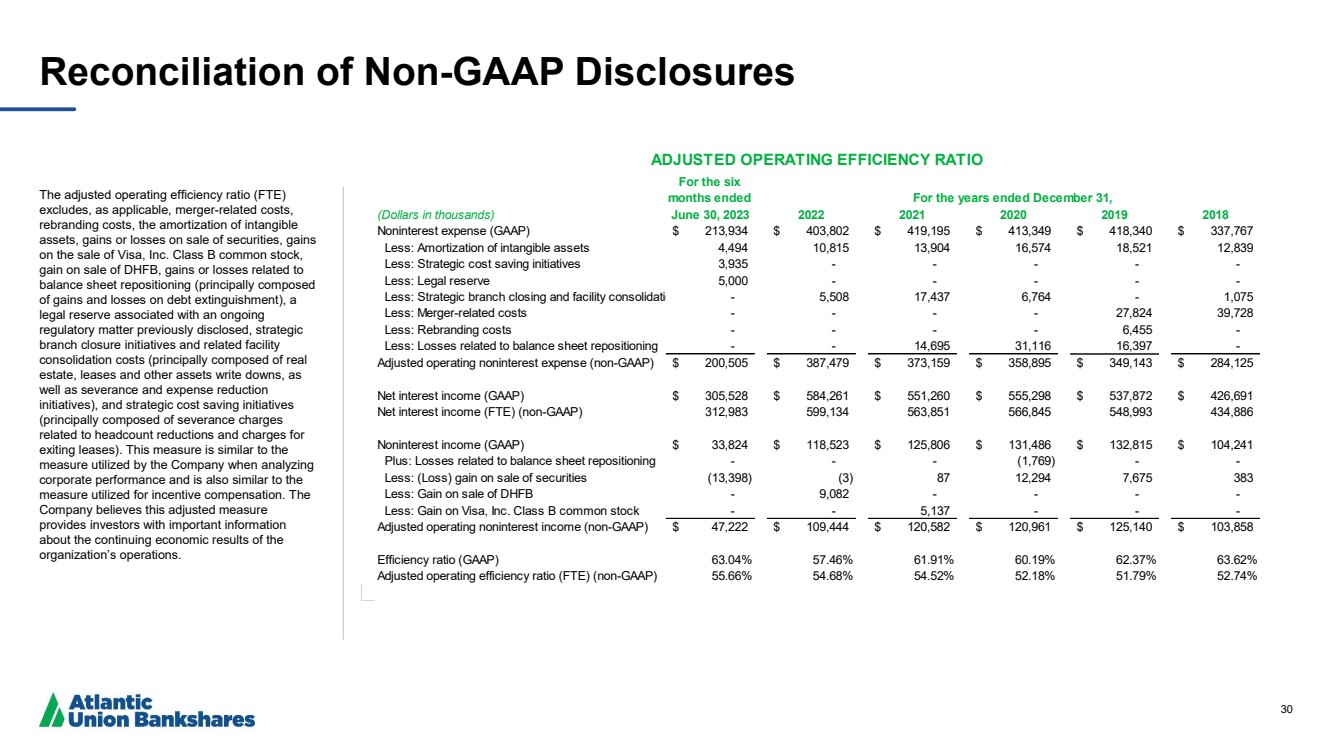
30 Reconciliation of Non-GAAP Disclosures The adjusted operating efficiency ratio (FTE) excludes, as applicable, merger-related costs, rebranding costs, the amortization of intangible assets, gains or losses on sale of securities, gains on the sale of Visa, Inc. Class B common stock, gain on sale of DHFB, gains or losses related to balance sheet repositioning (principally composed of gains and losses on debt extinguishment), a legal reserve associated with an ongoing regulatory matter previously disclosed, strategic branch closure initiatives and related facility consolidation costs (principally composed of real estate, leases and other assets write downs, as well as severance and expense reduction initiatives), and strategic cost saving initiatives (principally composed of severance charges related to headcount reductions and charges for exiting leases). This measure is similar to the measure utilized by the Company when analyzing corporate performance and is also similar to the measure utilized for incentive compensation. The Company believes this adjusted measure provides investors with important information about the continuing economic results of the organization’s operations. For the six months ended (Dollars in thousands) June 30, 2023 2022 2021 2020 2019 2018 Total noninterest expenses Noninterest expense (GAAP) $ 213,934 $ 403,802 $ 419,195 $ 413,349 $ 418,340 $ 337,767 Less: Amortization of intangible assets Less: Amortization of intangible assets 4,494 10,815 13,904 16,574 18,521 12,839 Less: Strategic cost saving initiatives 3,935 - - - - - Less: Legal reserve 5,000 - - - - - Less: Strategic branch closing and facility consolidation costs - 5,508 17,437 6,764 - 1,075 Less: Merger-related costs - - - - 27,824 39,728 Less: Rebranding costs - - - - 6,455 - 7709800 Loss on Balance Sheet Repositioning Less: Losses related to balance sheet repositioning - - 14,695 31,116 16,397 - Adjusted operating noninterest expense (non-GAAP) $ 200,505 $ 387,479 $ 373,159 $ 358,895 $ 349,143 $ 284,125 Net Interest Income Net interest income (GAAP) $ 305,528 $ 584,261 $ 551,260 $ 555,298 $ 537,872 $ 426,691 Net interest income FTE Net interest income (FTE) (non-GAAP) 312,983 599,134 563,851 566,845 548,993 434,886 Total noninterest income Noninterest income (GAAP) $ 33,824 $ 118,523 $ 125,806 $ 131,486 $ 132,815 $ 104,241 6809800 Gain on Balance Sheet Repositioning Plus: Losses related to balance sheet repositioning - - - (1,769) - - Plus: Loss on sale of securities Less: (Loss) gain on sale of securities (13,398) (3) 87 12,294 7,675 383 Less: Gain on sale of DHFB - 9,082 - - - - Less: Gain on Visa, Inc. Class B common stock - - 5,137 - - - Adjusted operating noninterest income (non-GAAP) $ 47,222 $ 109,444 $ 120,582 $ 120,961 $ 125,140 $ 103,858 Efficiency ratio (GAAP) 63.04% 57.46% 61.91% 60.19% 62.37% 63.62% Adjusted operating efficiency ratio (FTE) (non-GAAP) 55.66% 54.68% 54.52% 52.18% 51.79% 52.74% ADJUSTED OPERATING EFFICIENCY RATIO For the years ended December 31, |
|
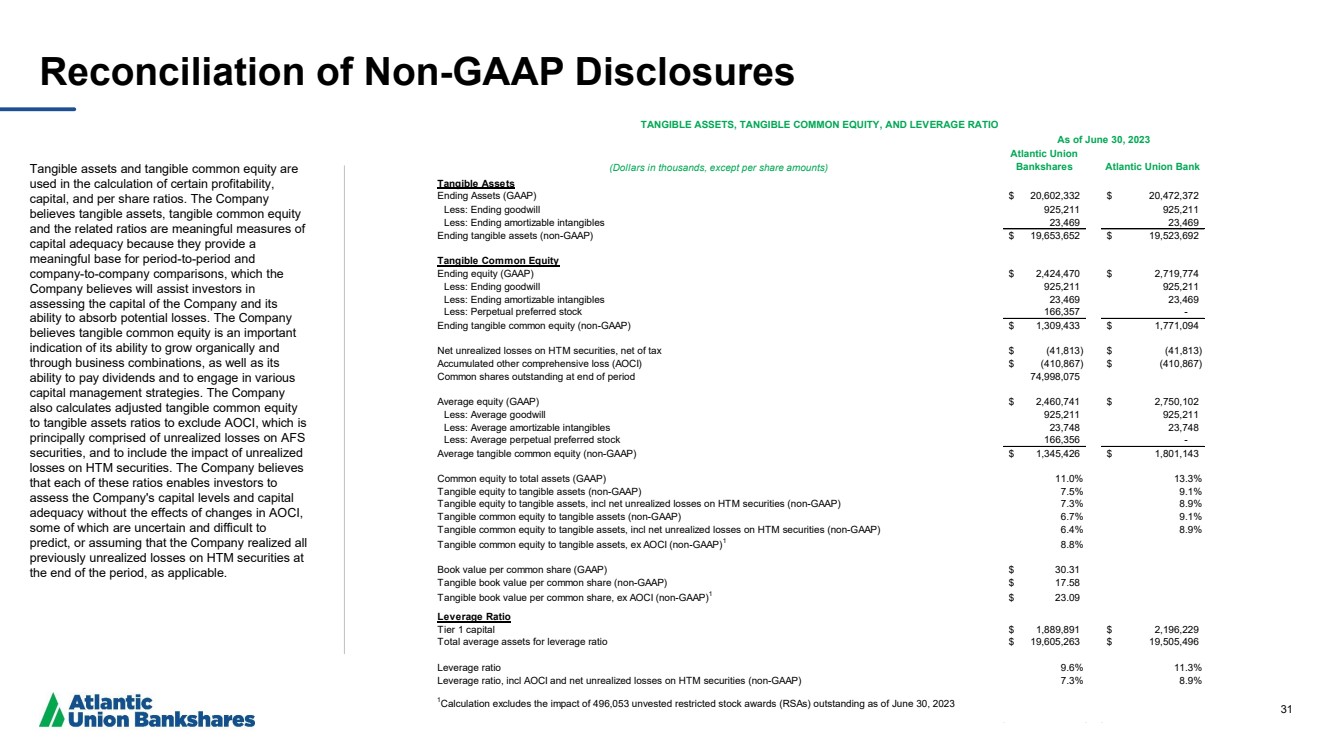
31 Reconciliation of Non-GAAP Disclosures Tangible assets and tangible common equity are used in the calculation of certain profitability, capital, and per share ratios. The Company believes tangible assets, tangible common equity and the related ratios are meaningful measures of capital adequacy because they provide a meaningful base for period-to-period and company-to-company comparisons, which the Company believes will assist investors in assessing the capital of the Company and its ability to absorb potential losses. The Company believes tangible common equity is an important indication of its ability to grow organically and through business combinations, as well as its ability to pay dividends and to engage in various capital management strategies. The Company also calculates adjusted tangible common equity to tangible assets ratios to exclude AOCI, which is principally comprised of unrealized losses on AFS securities, and to include the impact of unrealized losses on HTM securities. The Company believes that each of these ratios enables investors to assess the Company's capital levels and capital adequacy without the effects of changes in AOCI, some of which are uncertain and difficult to predict, or assuming that the Company realized all previously unrealized losses on HTM securities at the end of the period, as applicable. (Dollars in thousands, except per share amounts) Atlantic Union Bankshares Atlantic Union Bank Tangible Assets Ending Assets (GAAP) $ 20,602,332 $ 20,472,372 Less: Ending goodwill 925,211 925,211 Less: Ending amortizable intangibles 23,469 23,469 Ending tangible assets (non-GAAP) $ 19,653,652 $ 19,523,692 Tangible Common Equity Ending equity (GAAP) $ 2,424,470 $ 2,719,774 Less: Ending goodwill 925,211 925,211 Less: Ending amortizable intangibles 23,469 23,469 Less: Perpetual preferred stock 166,357 - Ending tangible common equity (non-GAAP) $ 1,309,433 $ 1,771,094 Net unrealized losses on HTM securities, net of tax $ (41,813) $ (41,813) Accumulated other comprehensive loss (AOCI) $ (410,867) $ (410,867) Common shares outstanding at end of period 74,998,075 Average equity (GAAP) $ 2,460,741 $ 2,750,102 Less: Average goodwill 925,211 925,211 Less: Average amortizable intangibles 23,748 23,748 Less: Average perpetual preferred stock 166,356 - Average tangible common equity (non-GAAP) $ 1,345,426 $ 1,801,143 Less: Perpetual preferred stock Common equity to total assets (GAAP) 11.0% 13.3% Tangible equity to tangible assets (non-GAAP) 7.5% 9.1% Tangible equity to tangible assets, incl net unrealized losses on HTM securities (non-GAAP) 7.3% 8.9% Tangible common equity to tangible assets (non-GAAP) 6.7% 9.1% Tangible common equity to tangible assets, incl net unrealized losses on HTM securities (non-GAAP) 6.4% 8.9% Tangible common equity to tangible assets, ex AOCI (non-GAAP)1 8.8% Book value per common share (GAAP) $ 30.31 Tangible book value per common share (non-GAAP) $ 17.58 Tangible book value per common share, ex AOCI (non-GAAP)1 $ 23.09 Leverage Ratio Tier 1 capital $ 1,889,891 $ 2,196,229 Total average assets for leverage ratio $ 19,605,263 $ 19,505,496 Leverage ratio 9.6% 11.3% Leverage ratio, incl AOCI and net unrealized losses on HTM securities (non-GAAP) 7.3% 8.9% 1Calculation excludes the impact of 496,053 unvested restricted stock awards (RSAs) outstanding as of June 30, 2023 TANGIBLE ASSETS, TANGIBLE COMMON EQUITY, AND LEVERAGE RATIO As of June 30, 2023 |
|
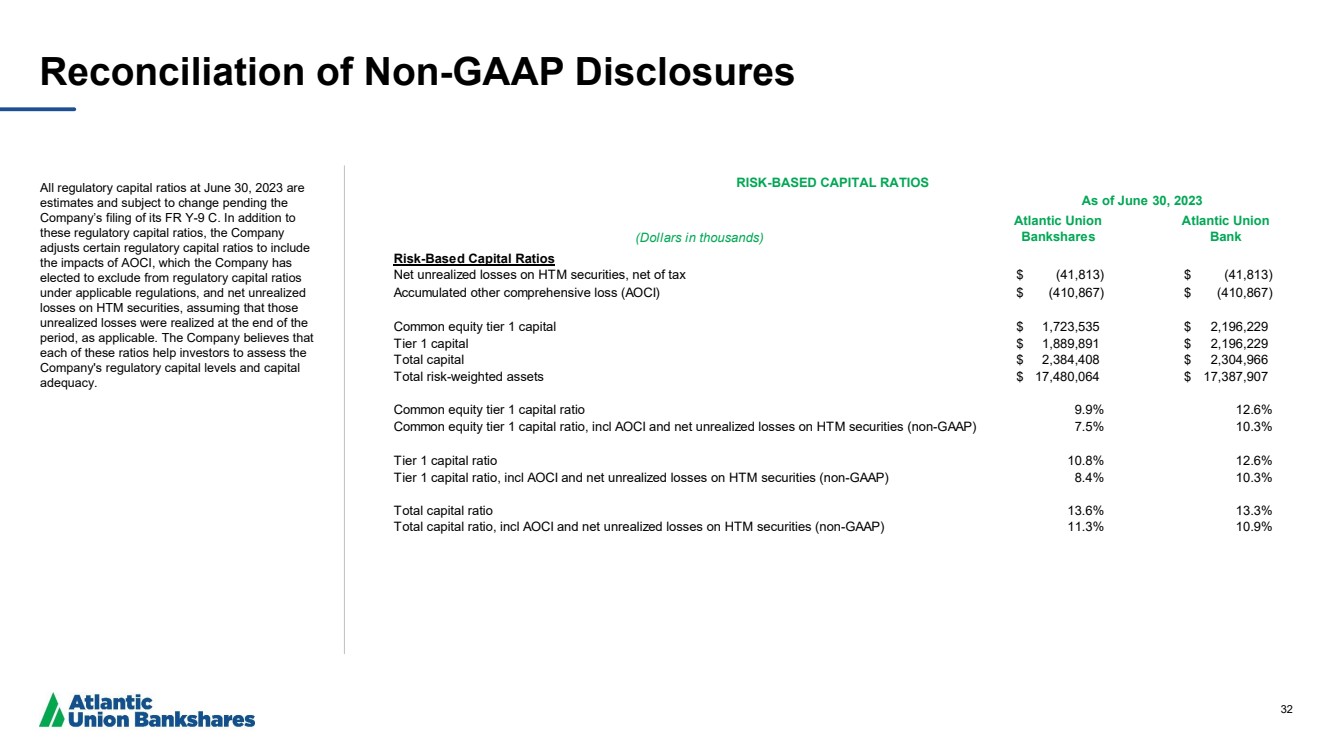
32 Reconciliation of Non-GAAP Disclosures All regulatory capital ratios at June 30, 2023 are estimates and subject to change pending the Company’s filing of its FR Y-9 C. In addition to these regulatory capital ratios, the Company adjusts certain regulatory capital ratios to include the impacts of AOCI, which the Company has elected to exclude from regulatory capital ratios under applicable regulations, and net unrealized losses on HTM securities, assuming that those unrealized losses were realized at the end of the period, as applicable. The Company believes that each of these ratios help investors to assess the Company's regulatory capital levels and capital adequacy. (Dollars in thousands) Atlantic Union Bankshares Atlantic Union Bank Risk-Based Capital Ratios Net unrealized losses on HTM securities, net of tax $ (41,813) $ (41,813) Accumulated other comprehensive loss (AOCI) $ (410,867) $ (410,867) Common equity tier 1 capital $ 1,723,535 $ 2,196,229 Tier 1 capital $ 1,889,891 $ 2,196,229 Total capital $ 2,384,408 $ 2,304,966 Total risk-weighted assets $ 17,480,064 $ 17,387,907 Common equity tier 1 capital ratio 9.9% 12.6% Common equity tier 1 capital ratio, incl AOCI and net unrealized losses on HTM securities (non-GAAP) 7.5% 10.3% Tier 1 capital ratio 10.8% 12.6% Tier 1 capital ratio, incl AOCI and net unrealized losses on HTM securities (non-GAAP) 8.4% 10.3% Total capital ratio 13.6% 13.3% Total capital ratio, incl AOCI and net unrealized losses on HTM securities (non-GAAP) 11.3% 10.9% RISK-BASED CAPITAL RATIOS As of June 30, 2023 |