United States
SECURITIES AND EXCHANGE COMMISSION
Washington, D.C. 20549
FORM 8-K
CURRENT REPORT
Pursuant to Section 13 or 15(d) of The Securities Exchange Act of 1934
Date of Report (Date of earliest event reported): July 25, 2023
ATLANTIC UNION BANKSHARES CORPORATION
(Exact name of registrant as specified in its charter)
Virginia |
001-39325 |
54-1598552 |
(State or other jurisdiction |
(Commission |
(I.R.S. Employer |
of incorporation) |
File Number) |
Identification No.) |
|
|
|
1051 East Cary Street
Suite 1200
Richmond, Virginia 23219
(Address of principal executive offices, including Zip Code)
Registrant’s telephone number, including area code: (804) 633-5031
Check the appropriate box below if the Form 8-K filing is intended to simultaneously satisfy the filing obligation of the registrant under any of the following provisions (see General Instruction A.2. below):
☐ |
Written communications pursuant to Rule 425 under the Securities Act (17 CFR 230.425) |
☐ |
Soliciting material pursuant to Rule 14a-12 under the Exchange Act (17 CFR 240.14a-12) |
☐ |
Pre-commencement communications pursuant to Rule 14d-2(b) under the Exchange Act (17 CFR 240.14d-2(b)) |
☐ |
Pre-commencement communications pursuant to Rule 13e-4(c) under the Exchange Act (17 CFR 240.13e-4(c)) |
Securities registered pursuant to Section 12(b) of the Act:
Title of each class |
|
Trading Symbol(s) |
|
Name of each exchange on which registered |
Common Stock, par value $1.33 per share |
|
AUB |
|
New York Stock Exchange |
Depositary Shares, Each Representing a 1/400th Interest in a Share of 6.875% Perpetual Non-Cumulative Preferred Stock, Series A |
|
AUB.PRA |
|
New York Stock Exchange |
Indicate by check mark whether the registrant is an emerging growth company as defined in Rule 405 of the Securities Act of 1933 (§230.405 of this chapter) or Rule 12b-2 of the Securities Exchange Act of 1934 (§240.12b-2 of this chapter).
Emerging growth company |
☐ |
If an emerging growth company, indicate by check mark if the registrant has elected not to use the extended transition period for complying with any new or revised financial accounting standards provided pursuant to Section 13(a) of the Exchange Act. |
☐ |
Item 2.02 Results of Operations and Financial Condition.
On July 25, 2023, Atlantic Union Bankshares Corporation (the “Company”) issued a press release announcing its financial results for the second quarter 2023. A copy of the press release is being furnished as Exhibit 99.1 hereto and is incorporated herein by reference.
The information disclosed in or incorporated by reference into this Item 2.02, including Exhibit 99.1, is furnished and shall not be deemed filed for purposes of Section 18 of the Securities Exchange Act of 1934.
Item 7.01 Regulation FD Disclosure
Attached as Exhibit 99.2 and incorporated herein by reference is a presentation that the Company will use in connection with a webcast and conference call for investors and analysts at 9:00 a.m. Eastern Time on Tuesday, July 25, 2023. This presentation is also available under the Presentations link in the Investor Relations – News & Events section of the Company’s website at https://investors.atlanticunionbank.com.
The information disclosed in or incorporated by reference into this Item 7.01, including Exhibit 99.2, is furnished and shall not be deemed filed for purposes of Section 18 of the Securities Exchange Act of 1934.
Item 9.01 Financial Statements and Exhibits.
(d) Exhibits.
Exhibit No. |
|
Description of Exhibit |
99.1 |
|
Press release dated July 25, 2023 regarding the second quarter 2023 results. |
99.2 |
|
|
104 |
|
Cover Page Interactive Data File – the cover page iXBRL tags are embedded within the Inline XBRL document |
1
SIGNATURES
Pursuant to the requirements of the Securities Exchange Act of 1934, the registrant has duly caused this report to be signed on its behalf by the undersigned hereunto duly authorized.
|
ATLANTIC UNION BANKSHARES CORPORATION |
||
|
|
|
|
|
|
|
|
|
|
|
|
Date: July 25, 2023 |
By: |
/s/ Robert M. Gorman |
|
|
|
Robert M. Gorman |
|
|
|
Executive Vice President and |
|
|
|
Chief Financial Officer |
|
|
|
|
|
2
Exhibit 99.1

Contact: Robert M. Gorman - (804) 523-7828
Executive Vice President / Chief Financial Officer
ATLANTIC UNION BANKSHARES REPORTS SECOND QUARTER FINANCIAL RESULTS
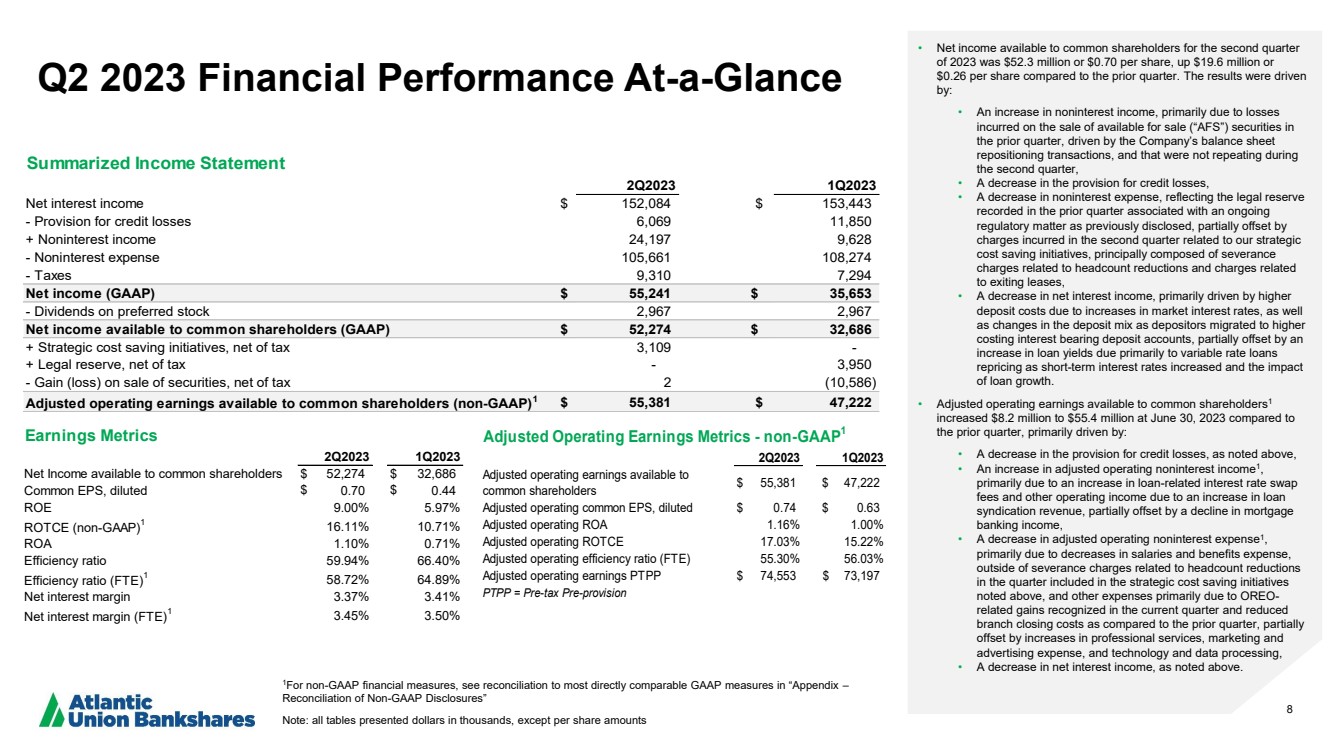
Richmond, Va., July 25, 2023 – Atlantic Union Bankshares Corporation (the “Company” or “Atlantic Union”) (NYSE: AUB) reported net income available to common shareholders of $52.3 million and basic and diluted earnings per common share of $0.70 for the second quarter of 2023 and adjusted operating earnings available to common shareholders(1) of $55.4 million and adjusted diluted operating earnings per common share(1) of $0.74 for the second quarter of 2023.
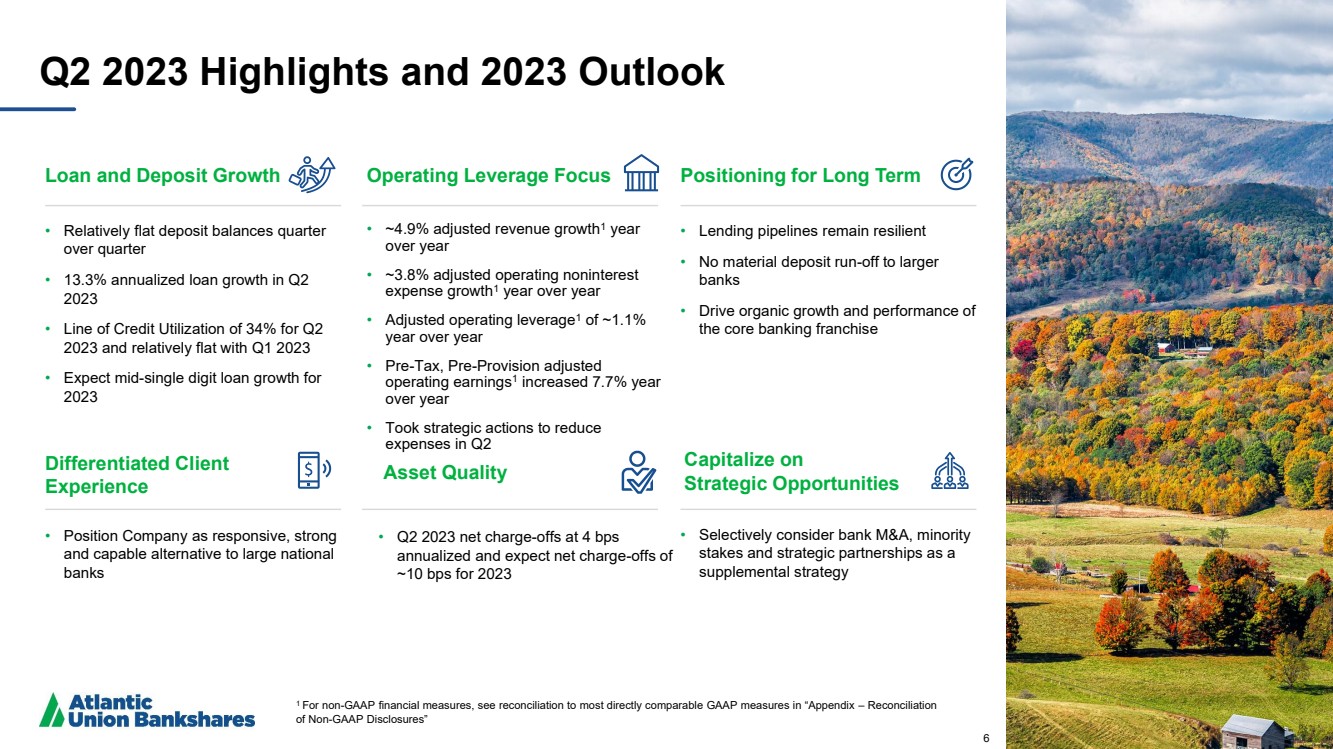
As previously disclosed, the Company initiated a series of cost saving measures during the second quarter of 2023 that is expected to reduce the annual expense run rate by approximately $17 million. As a result of these measures, the Company incurred $3.9 million in pre-tax expenses during the second quarter of 2023, and the Company expects to recognize additional pre-tax expenses associated with these actions of approximately $7.5 million during the third quarter of 2023.
“Atlantic Union delivered strong second quarter financial results despite the turmoil in the banking industry during the first half of the year,” said John C. Asbury, president and chief executive officer of Atlantic Union. “Loan growth remained strong and deposit levels were stable during the quarter. We believe that our model of a diversified, traditional, full-service bank that delivers the products and services that our customers want and need combined with local decision making, responsiveness and client service orientation positively sets us apart from other banks, both larger and smaller, in these challenging times.”
“Operating under the mantra of soundness, profitability and growth – in that order of priority – Atlantic Union remains committed to generating sustainable, profitable growth and building long term value for our shareholders.”
NET INTEREST INCOME
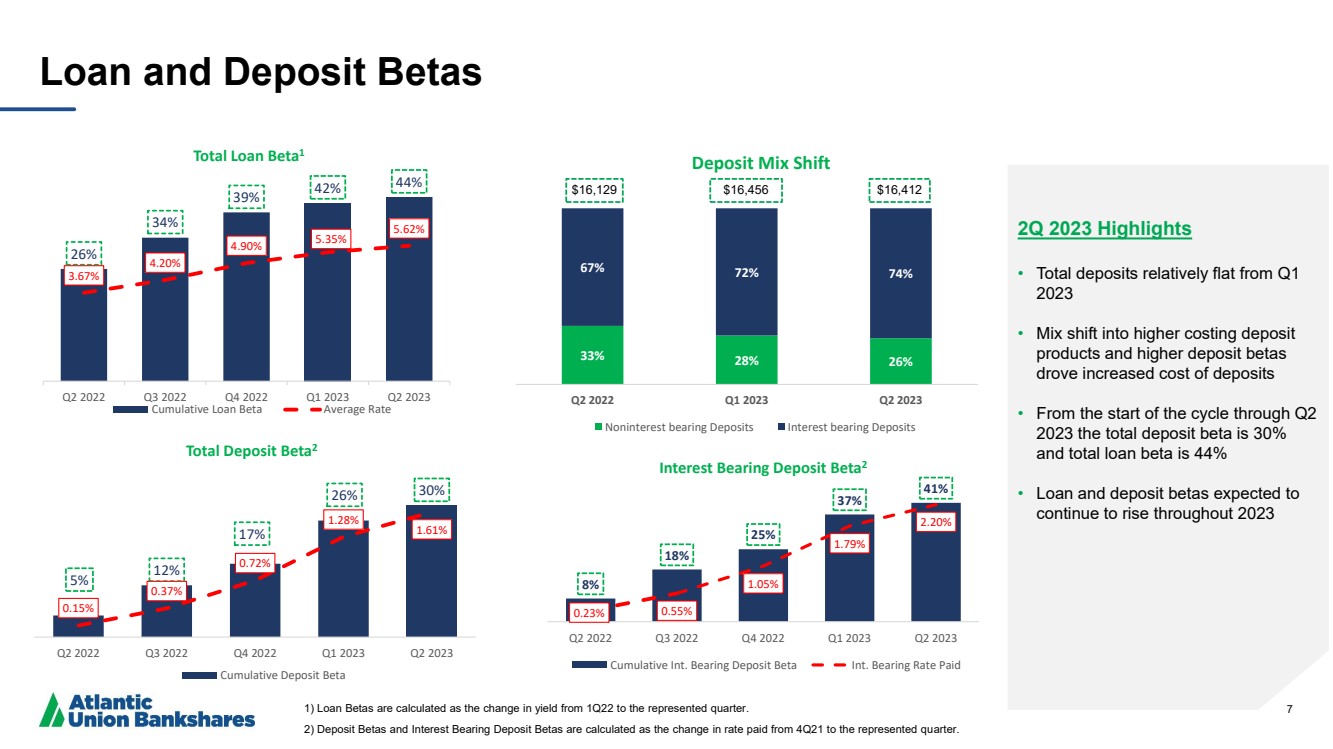
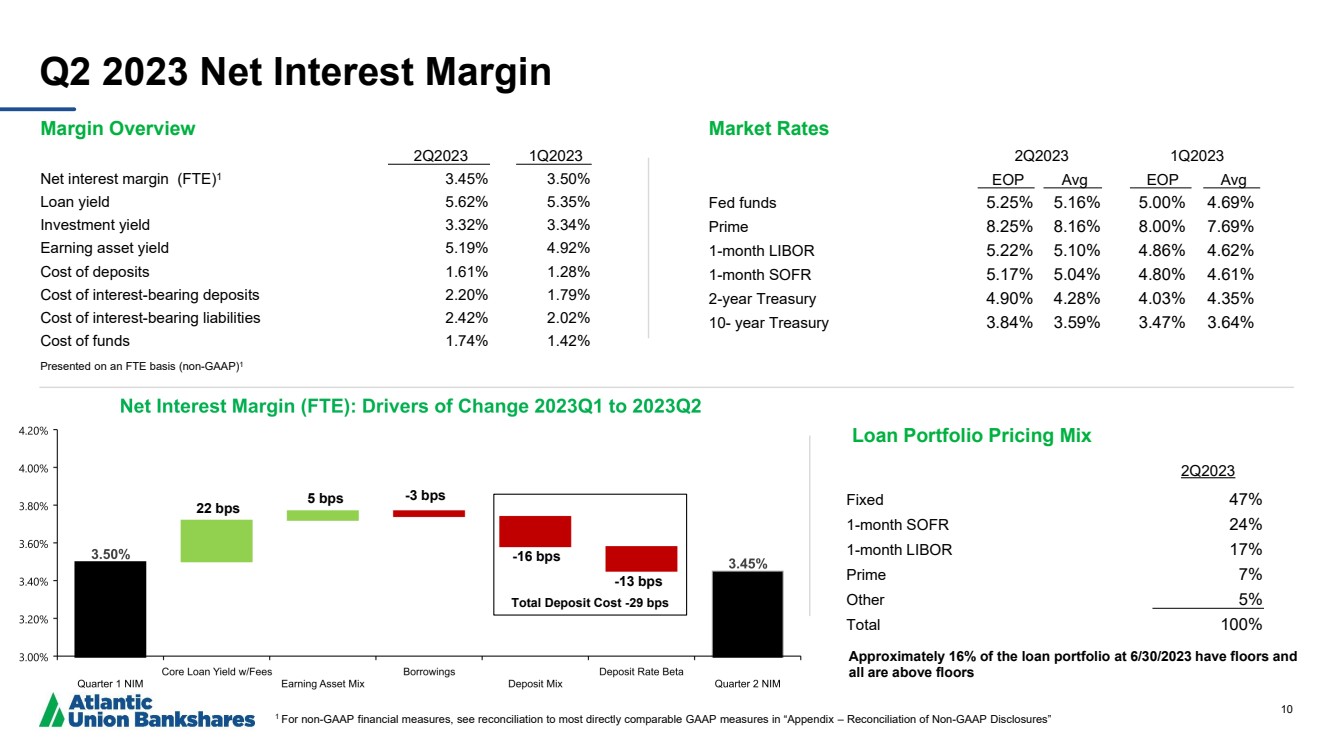
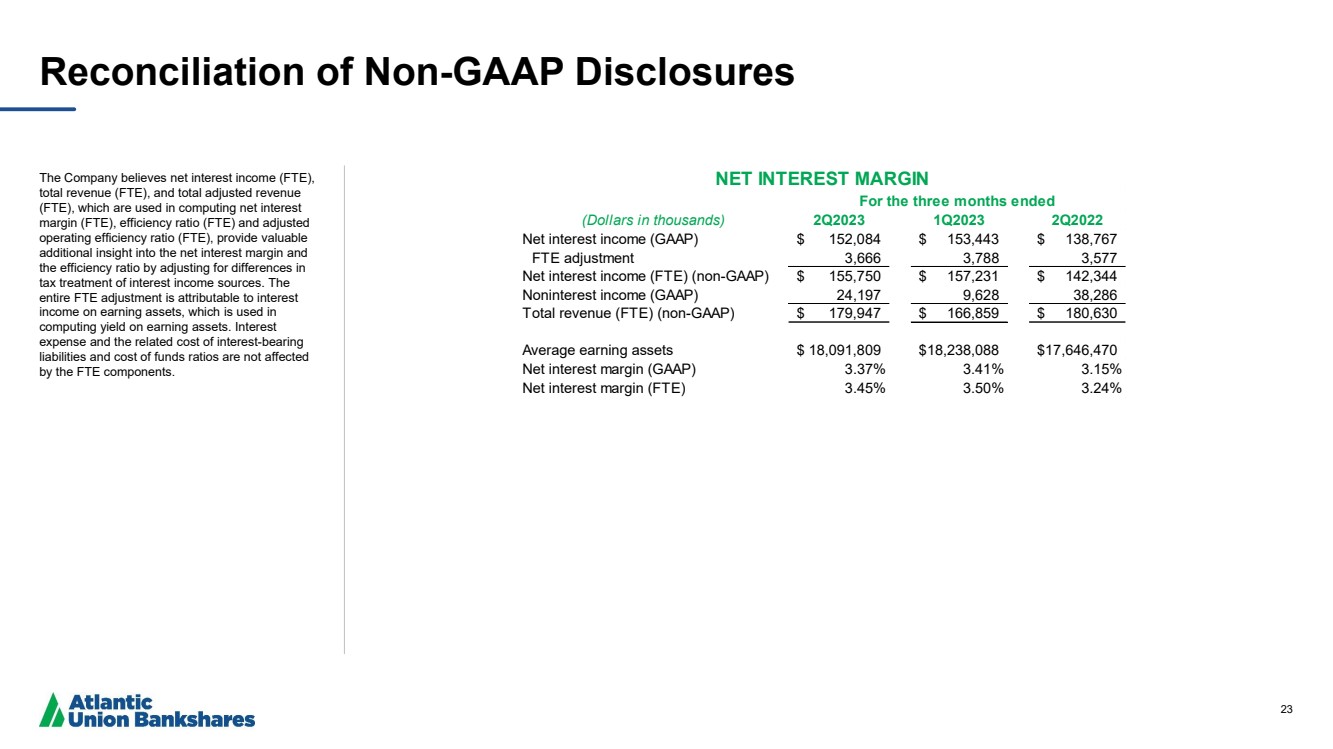
For the second quarter of 2023, net interest income was $152.1 million, a decrease of $1.3 million from $153.4 million in the first quarter of 2023. Net interest income (FTE)(1) was $155.8 million in the second quarter of 2023, a decrease of $1.5 million from the first quarter of 2023. The decreases in net interest income and net interest income (FTE)(1) were primarily driven by higher deposit costs due to increases in market interest rates, as well as changes in the deposit mix as depositors migrated to higher cost interest bearing deposit accounts. These decreases were partially offset by an increase in interest income on loans due to net loan growth and variable rate loans repricing as short-term interest rates increased. Our net interest margin decreased 4 basis points from the prior quarter to 3.37% at June 30, 2023, and our net interest margin (FTE)(1) decreased 5 basis points during the same period to 3.45%. Earning asset yields increased by 27 basis points to 5.19% in the second quarter of 2023 compared to the first quarter of 2023, primarily due to the impact of increases in market interest rates on loans. Our cost of funds increased by 32 basis points to 1.74% at June 30, 2023 compared to the prior quarter, driven by higher deposit and borrowing costs and funding mix as noted above.
The Company’s net interest margin (FTE) (1) includes the impact of acquisition accounting fair value adjustments. The impact of net accretion in the first and second quarters of 2023 are reflected in the following table (dollars in thousands):
|
|
|
|
|
|
|
|
|
|
|
|
|
|
|
Loan |
|
Deposit |
|
Borrowings |
|
|
|
|||
|
|
Accretion |
|
Amortization |
|
Amortization |
|
Total |
||||
For the quarter ended March 31, 2023 |
|
$ |
1,106 |
|
$ |
(14) |
|
$ |
(209) |
|
$ |
883 |
For the quarter ended June 30, 2023 |
|
|
1,073 |
|
|
(7) |
|
|
(213) |
|
|
853 |
ASSET QUALITY
Overview
At June 30, 2023, nonperforming assets (“NPAs”) as a percentage of total loans held for investment (“LHFI”) decreased 1 basis point from the prior quarter to 0.19% and included nonaccrual loans of $29.1 million. Accruing past due loans as a percentage of total LHFI totaled 16 basis points at June 30, 2023, a decrease of 5 basis points from March 31, 2023, and an increase of 1 basis point from June 30, 2022. Net charge-offs were 0.04% of total average LHFI (annualized) for the second quarter of 2023, a decrease of 9 basis points from March 31, 2023, and an increase of 1 basis point from June 30, 2022. The allowance for credit losses (“ACL”) totaled $136.2 million at June 30, 2023, a $4.5 million increase from the prior quarter.
Nonperforming Assets
At June 30, 2023, NPAs totaled $29.2 million, compared to $29.1 million in the prior quarter. The following table shows a summary of NPA balances at the quarter ended (dollars in thousands):
|
|
|
|
|
|
|
|
|
|
|
|
|
|
|
|
|
|
June 30, |
|
March 31, |
|
December 31, |
|
September 30, |
|
June 30, |
|||||
|
|
2023 |
|
2023 |
|
2022 |
|
2022 |
|
2022 |
|||||
Nonaccrual loans |
|
$ |
29,105 |
|
$ |
29,082 |
|
$ |
27,038 |
|
$ |
26,500 |
|
$ |
29,070 |
Foreclosed properties |
|
|
50 |
|
|
29 |
|
|
76 |
|
|
2,087 |
|
|
2,065 |
Total nonperforming assets |
|
$ |
29,155 |
|
$ |
29,111 |
|
$ |
27,114 |
|
$ |
28,587 |
|
$ |
31,135 |
The following table shows the activity in nonaccrual loans for the quarter ended (dollars in thousands):
|
|
June 30, |
|
March 31, |
|
December 31, |
|
September 30, |
|
June 30, |
|||||
|
|
2023 |
|
2023 |
|
2022 |
|
2022 |
|
2022 |
|||||
Beginning Balance |
|
$ |
29,082 |
|
$ |
27,038 |
|
$ |
26,500 |
|
$ |
29,070 |
|
$ |
29,032 |
Net customer payments |
|
|
(5,950) |
|
|
(1,755) |
|
|
(1,805) |
|
|
(3,725) |
|
|
(2,472) |
Additions |
|
|
6,685 |
|
|
4,151 |
|
|
2,935 |
|
|
1,302 |
|
|
3,203 |
Charge-offs |
|
|
(712) |
|
|
(39) |
|
|
(461) |
|
|
(125) |
|
|
(311) |
Loans returning to accruing status |
|
|
— |
|
|
(313) |
|
|
(131) |
|
|
— |
|
|
— |
Transfers to foreclosed property |
|
|
— |
|
|
— |
|
|
— |
|
|
(22) |
|
|
(382) |
Ending Balance |
|
$ |
29,105 |
|
$ |
29,082 |
|
$ |
27,038 |
|
$ |
26,500 |
|
$ |
29,070 |
Past Due Loans
At June 30, 2023, past due loans still accruing interest totaled $24.1 million or 0.16% of total LHFI, compared to $30.9 million or 0.21% of total LHFI at March 31, 2023, and $20.4 million or 0.15% of total LHFI at June 30, 2022. Of the total past due loans still accruing interest, $10.1 million or 0.07% of total LHFI were loans past due 90 days or more at June 30, 2023, compared to $7.2 million or 0.05% of total LHFI at March 31, 2023, and $4.6 million or 0.03% of total LHFI at June 30, 2022. The increase in loans past due 90 days or more was primarily due to one credit relationship within the commercial real estate – non-owner occupied portfolio.
Allowance for Credit Losses
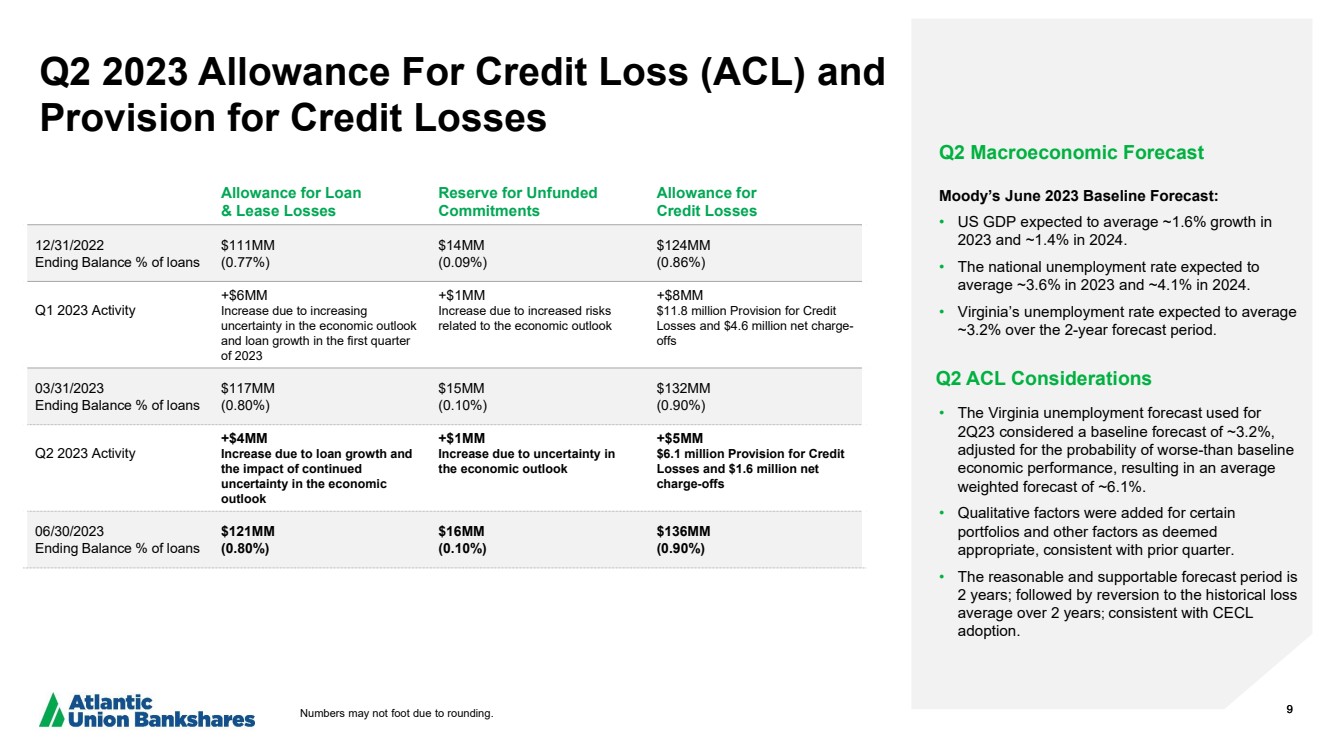
At June 30, 2023, the ACL was $136.2 million and included an allowance for loan and lease losses (“ALLL”) of $120.7 million and a reserve for unfunded commitments of $15.5 million. The ACL at June 30, 2023 increased $4.5 million from March 31, 2023 due to loan growth in the second quarter of 2023 and the impact of continued uncertainty in the economic outlook.
At both June 30, 2023 and March 31, 2023, the ACL as a percentage of total LHFI was 0.90%, and the ALLL as a percentage of total LHFI was 0.80%.
Net Charge-offs
Net charge-offs were $1.6 million or 0.04% of total average LHFI on an annualized basis for the second quarter of 2023, compared to $4.6 million or 0.13% (annualized) for the first quarter of 2023, and $939,000 or 0.03% (annualized) for the second quarter of 2022.
Provision for Credit Losses
For the second quarter of 2023, the Company recorded a provision for credit losses of $6.1 million, compared to a provision for credit losses of $11.9 million in the prior quarter, and a provision for credit losses of $3.6 million in the second quarter of 2022. The provision for credit losses for the second quarter of 2023 reflected a provision of $5.7 million for loan losses and a $349,000 provision for unfunded commitments.
NONINTEREST INCOME
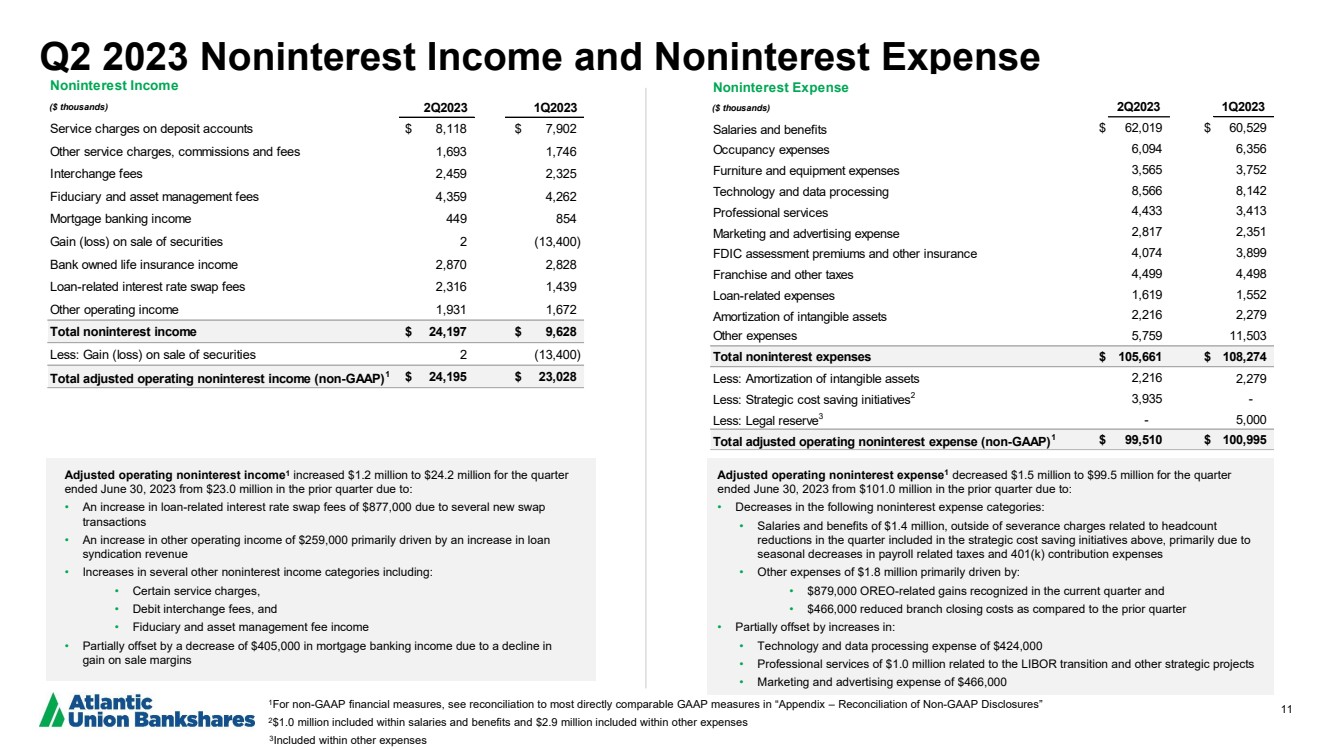
Noninterest income increased $14.6 million to $24.2 million for the second quarter of 2023 from $9.6 million in the prior quarter, primarily due to $13.4 million of losses incurred on the sale of available for sale (“AFS”) securities in the prior quarter, driven by the Company’s balance sheet repositioning transactions, and that were not repeated during the second quarter. In addition, loan-related interest rate swap fees increased $877,000 from the prior quarter due to several new swap transactions, and other operating income increased $259,000 from the prior quarter primarily driven by an increase in loan syndication revenue. These increases in noninterest income were partially offset by a $405,000 decrease in mortgage banking income due to a decline in gain on sale margins.
NONINTEREST EXPENSE
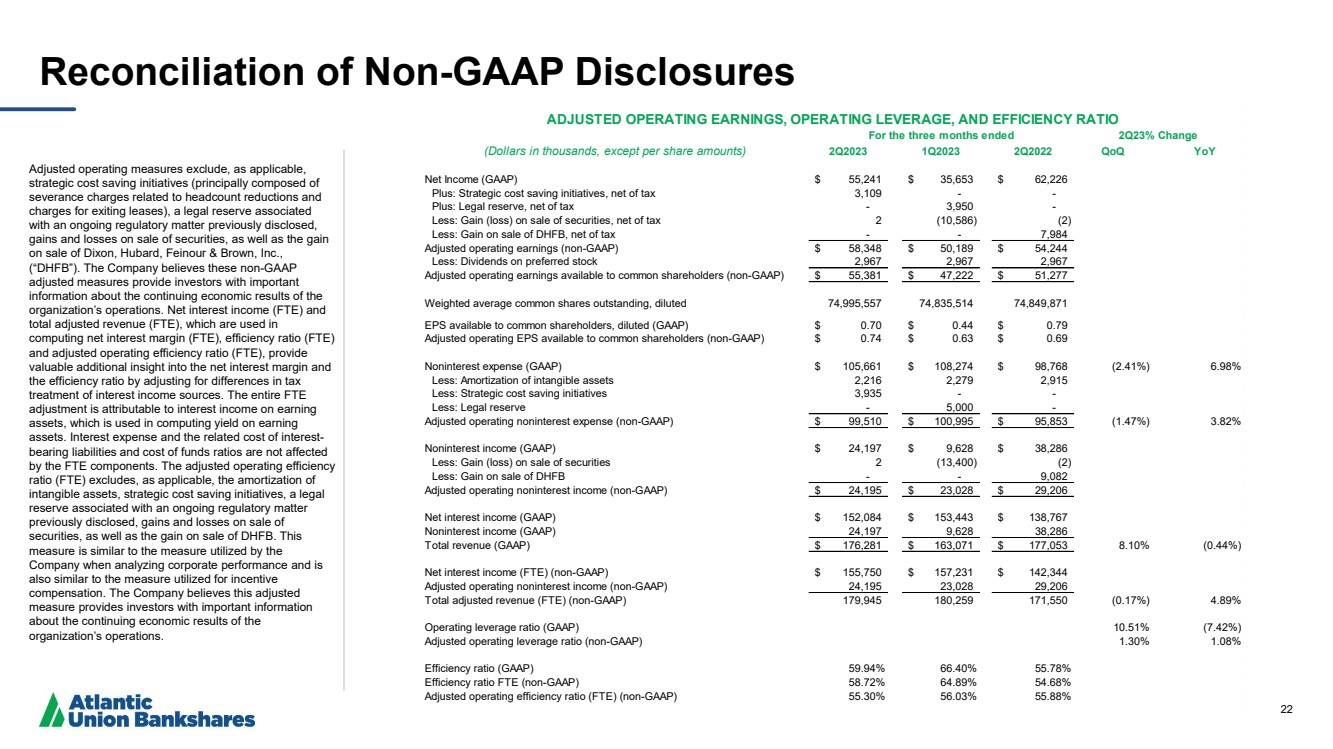
Noninterest expense decreased $2.6 million to $105.7 million for the second quarter of 2023 from $108.3 million in the prior quarter. Adjusted operating noninterest expense,(1) which excludes amortization of intangible assets ($2.2 million in the second quarter and $2.3 million in the first quarter), expenses incurred associated with our strategic cost savings initiatives principally composed of severance charges related to headcount reductions and charges for exiting leases ($3.9 million in the second quarter), and the legal reserve associated with an ongoing regulatory matter as previously disclosed ($5.0 million in the first quarter), decreased $1.5 million to $99.5 million for the second quarter of 2023 from $101.0 million in the prior quarter. The decrease in adjusted operating noninterest expense(1) was primarily due to a $1.8 million decrease included within other expenses, composed of OREO-related gains recognized in the current quarter and reduced branch closing costs as compared to the prior quarter, and a $1.4 million decrease in salaries and benefits expense, outside of severance charges related to headcount reductions in the quarter, primarily due to seasonal decreases in payroll related taxes and 401(k) contribution expenses. These decreases in adjusted operating noninterest expense(1) were partially offset by increases of $1.0 million in professional services expense related to the LIBOR transition and other strategic projects, $466,000 in marketing and advertising expense, and $424,000 in technology and data processing expense.
INCOME TAXES
The effective tax rate for the three months ended June 30, 2023 and 2022 was 14.4% and 16.7%, respectively, and the effective tax rate for the six months ended June 30, 2023 and 2022 was 15.5% and 17.1%, respectively. The decrease in the effective tax rates is due to the increased proportion of tax-exempt income to pre-tax income for both the three and six months ended June 30, 2023 compared to the prior quarter and prior year, respectively.
BALANCE SHEET
At June 30, 2023, total assets were $20.6 billion, an increase of $499.0 million or approximately 10.0% (annualized)
from March 31, 2023, and an increase of $940.5 million or approximately 4.8% from June 30, 2022. Total assets increased from the prior quarter primarily due to a $482.7 million increase in LHFI (net of deferred fees and costs). Total assets increased from the prior year period primarily due to a $1.4 billion increase in LHFI (net of deferred fees and costs), partially offset by a $676.8 million decrease in investment securities due to the sale of $505.7 million in AFS securities as part of the Company’s balance sheet restructuring executed in the first quarter of 2023, as well as a decline in the market value of the AFS securities portfolio, due to the impact of market interest rate fluctuations.
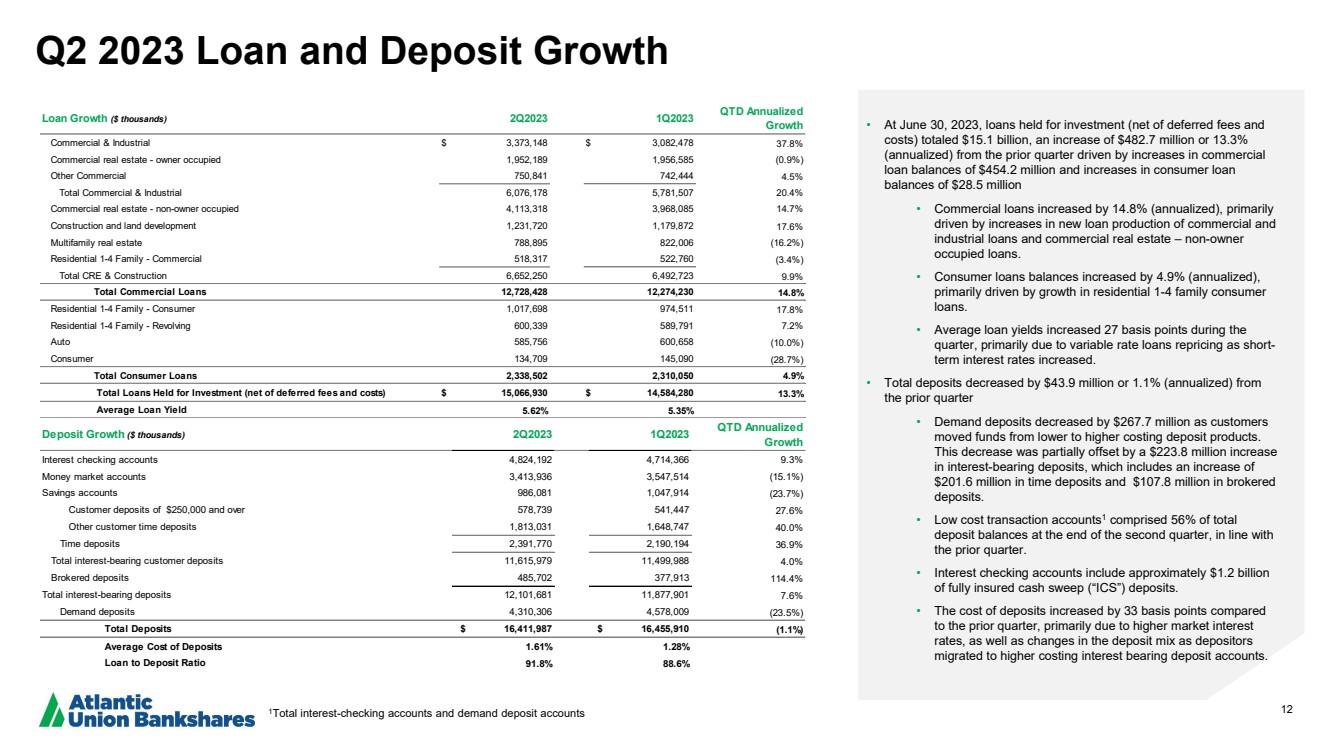
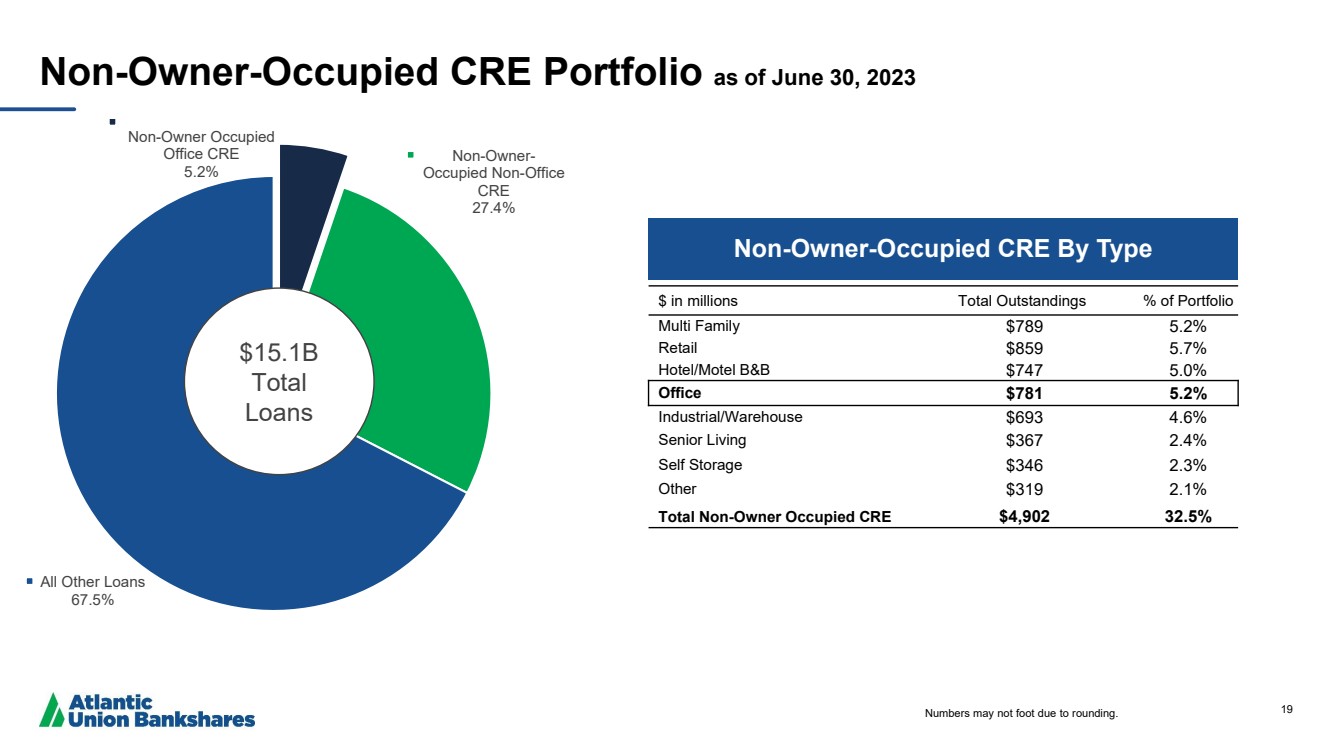
At June 30, 2023, LHFI (net of deferred fees and costs) totaled $15.1 billion, an increase of $482.7 million or 13.3% (annualized) from $14.6 billion at March 31, 2023. Average LHFI (net of deferred fees and costs) totaled $14.7 billion at June 30, 2023, an increase of $240.6 million or 6.7% (annualized) from the prior quarter.
At June 30, 2023, LHFI (net of deferred fees and costs) increased $1.4 billion or 10.3% from June 30, 2022, and quarterly average LHFI (net of deferred fees and costs) increased $1.2 billion or 9.0% from the same period in the prior year. LHFI (net of deferred fees and costs) increased from the prior quarter and the same period in the prior year primarily due to increases in the commercial and industrial and commercial real estate non-owner occupied portfolios.
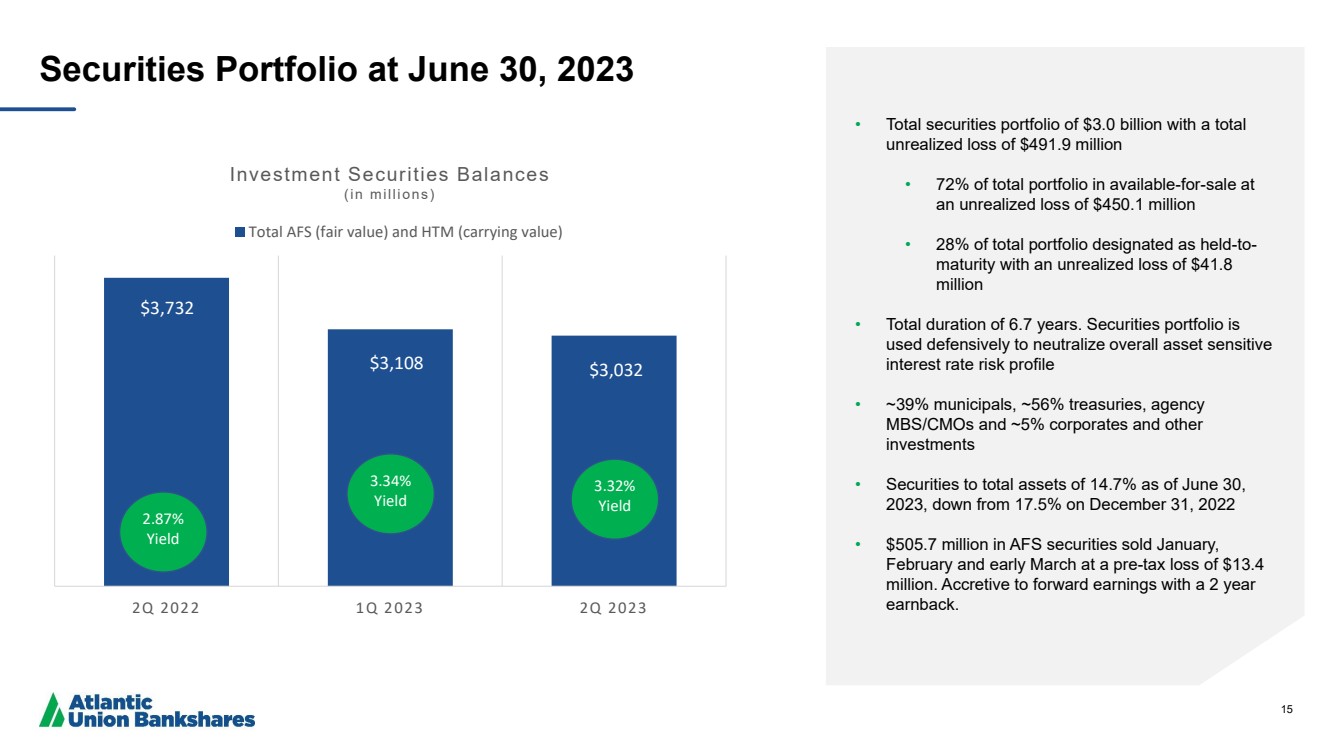
At June 30, 2023, total investments were $3.1 billion, a decrease of $52.2 million from March 31, 2023 and a decrease of $676.8 million from June 30, 2022. AFS securities totaled $2.2 billion at June 30, 2023, $2.3 billion at March 31, 2023, and $3.0 billion at June 30, 2022. At June 30, 2023, total net unrealized losses on the AFS securities portfolio were $450.1 million, an increase of $42.2 million from total net unrealized losses on AFS securities of $407.9 at March 31, 2023. Held to maturity (“HTM”) securities are carried at cost and totaled $849.6 million at June 30, 2023, $855.4 million at March 31, 2023, and $780.7 million at June 30, 2022 and have net unrealized losses of $41.8 million at June 30, 2023, an increase of $9.5 million from net unrealized losses on HTM securities of $32.3 million at March 31, 2023.
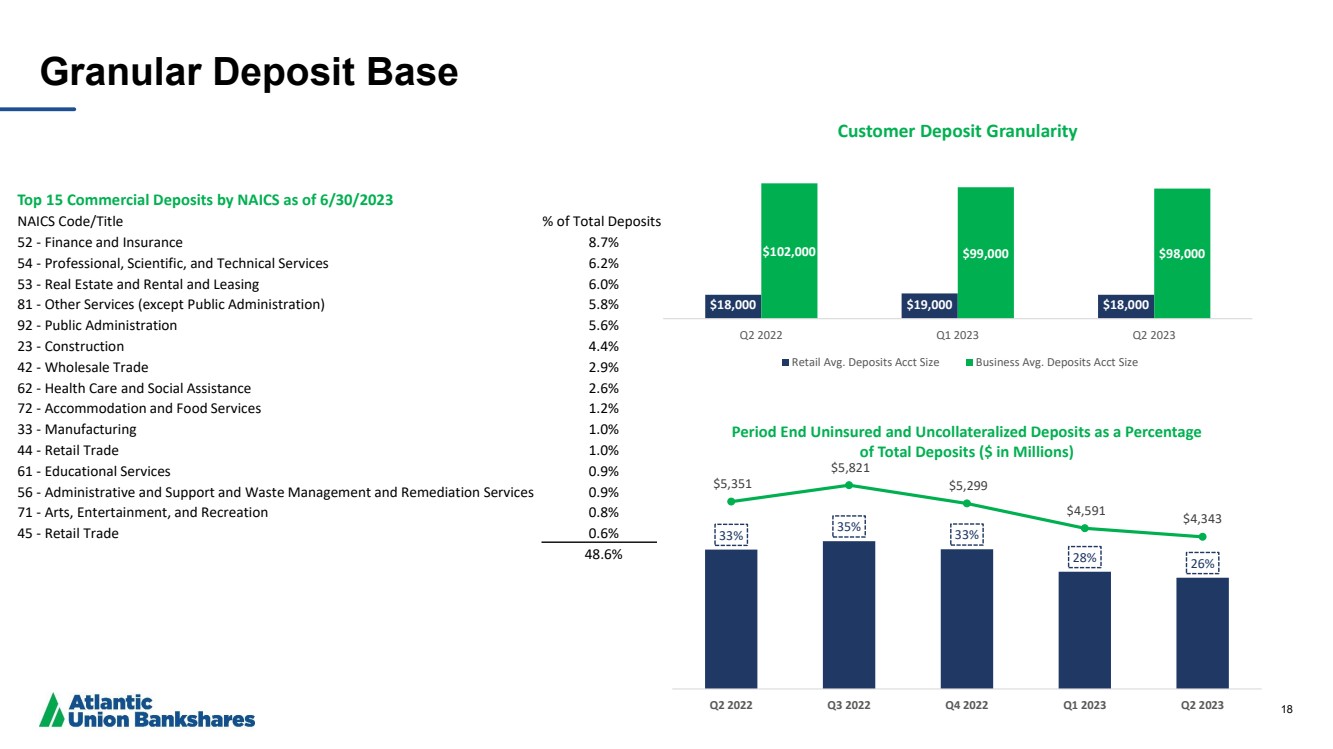
At June 30, 2023, total deposits were $16.4 billion, a decrease of $43.9 million or approximately 1.1% (annualized) from March 31, 2023. Average deposits at June 30, 2023 decreased from the prior quarter by $137.1 million or 3.3% (annualized). Total deposits decreased from the prior quarter due to the impact of customer behavior in response to inflation and higher market interest rates, resulting in a decrease in low costing customer deposits, partially offset by an increase in customer time deposits and brokered deposits. Total deposits at June 30, 2023 increased $283.4 million or 1.8% from June 30, 2022, and quarterly average deposits at June 30, 2023 increased $89.1 million or 0.6% from the same period in the prior year. Total deposits increased from the same period in the prior year primarily due to increases in interest bearing customer deposits and brokered deposits, partially offset by decreases in demand deposits.
At June 30, 2023, total borrowings were $1.3 billion, an increase of $521.4 million from March 31, 2023 and an increase of $522.4 million from June 30, 2022. Total borrowings increased from the prior quarter and prior year primarily due to an increase in Federal Home Loan Bank short-term borrowings, which was used to fund loan growth.
The following table shows the Company’s capital ratios at the quarters ended:
|
|
June 30, |
|
March 31, |
|
June 30, |
|
|
|
2023 |
|
2023 |
|
2022 |
|
Common equity Tier 1 capital ratio (2) |
|
9.86 |
% |
9.91 |
% |
9.96 |
% |
Tier 1 capital ratio (2) |
|
10.81 |
% |
10.89 |
% |
11.00 |
% |
Total capital ratio (2) |
|
13.64 |
% |
13.76 |
% |
13.86 |
% |
Leverage ratio (Tier 1 capital to average assets) (2) |
|
9.64 |
% |
9.38 |
% |
9.26 |
% |
Common equity to total assets |
|
10.96 |
% |
11.31 |
% |
11.32 |
% |
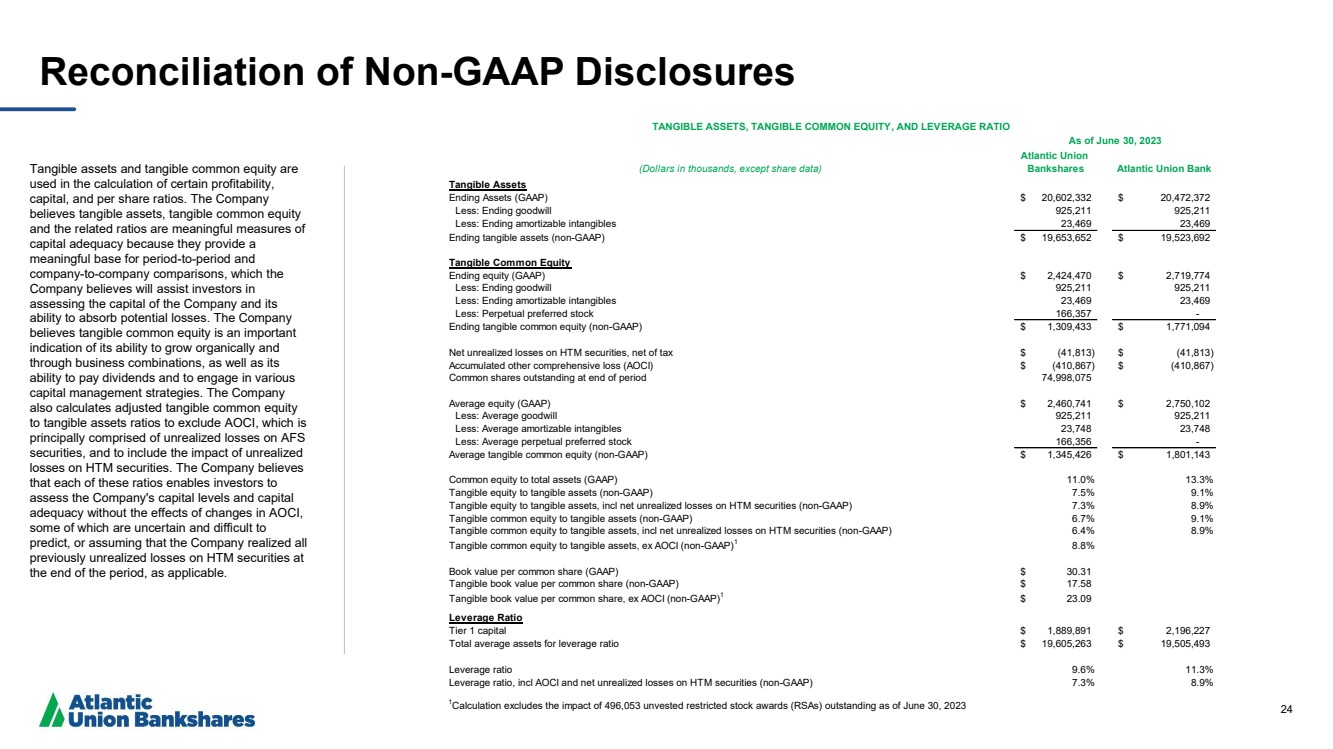
Tangible common equity to tangible assets (1) |
|
6.66 |
% |
6.91 |
% |
6.78 |
% |
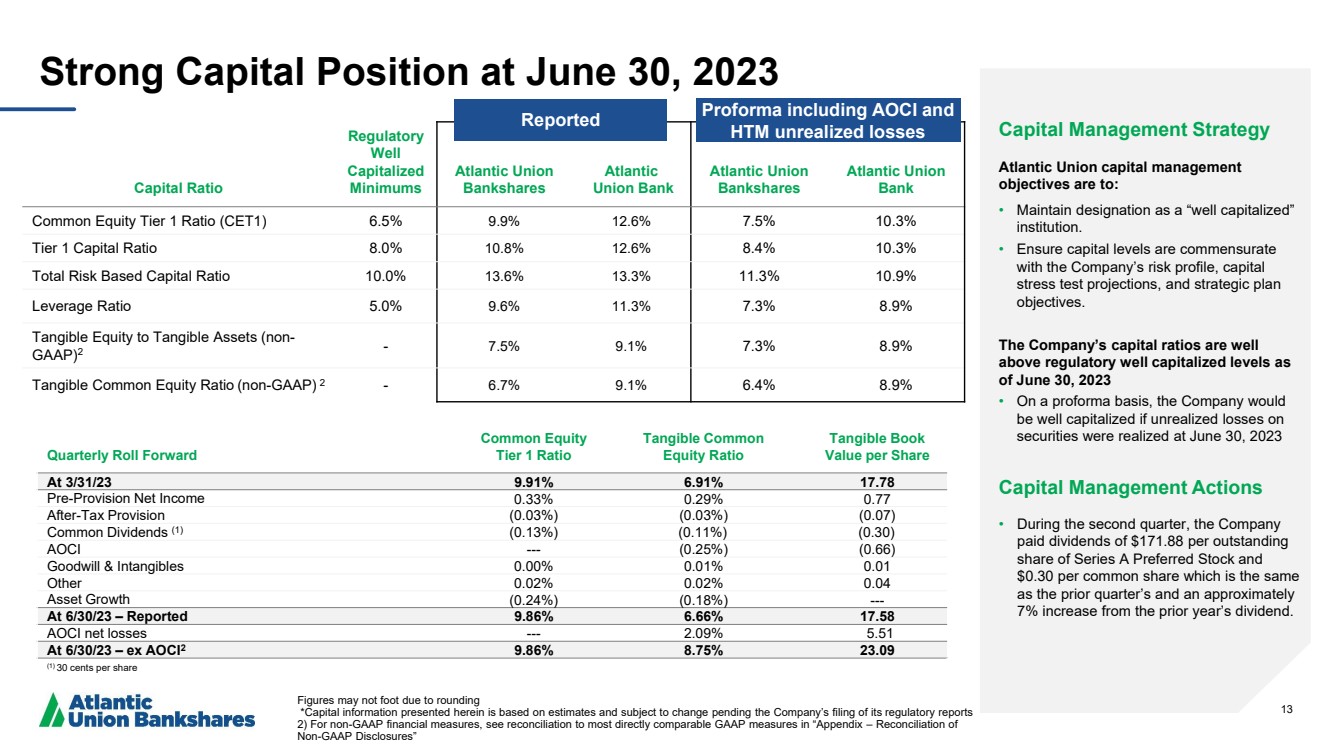
At June 30, 2023, the Company’s common equity to total assets ratio and tangible common equity to tangible assets ratio decreased compared to the prior quarter and prior year primarily due to the unrealized losses on the AFS securities portfolio recorded in other comprehensive income due to higher market interest rates, as well as the increase in total assets.
During the second quarter of 2023, the Company declared and paid a quarterly dividend on the outstanding shares of Series A Preferred Stock of $171.88 per share (equivalent to $0.43 per outstanding depositary share), consistent with the first quarter of 2023 and the second quarter of 2022. During the second quarter of 2023, the Company also declared and paid cash dividends of $0.30 per common share, consistent with the first quarter of 2023 and an increase of $0.02 or approximately 7.1% from the second quarter of 2022.
(1) These are financial measures not calculated in accordance with generally accepted accounting principles (“GAAP”). For a reconciliation of these non-GAAP financial measures, see the “Alternative Performance Measures (non-GAAP)” section of the Key Financial Results.
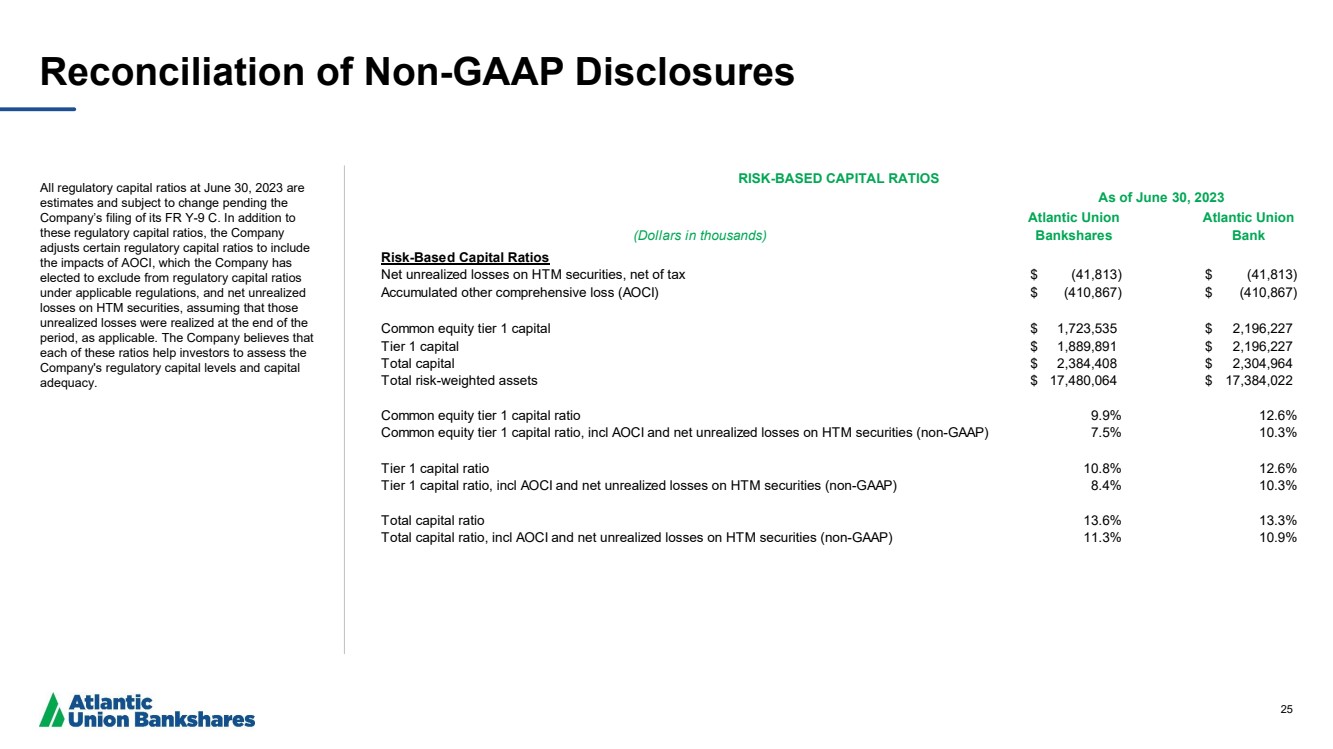
(2) All ratios at June 30, 2023 are estimates and subject to change pending the Company’s filing of its FR Y9-C. All other periods are presented as filed.
ANNOUNCED TRANSACTION
As announced and further described in a separate press release issued by the Company today, the Company has entered into a merger agreement to acquire American National Bankshares Inc. (“American National”) in an all-stock transaction.
ABOUT ATLANTIC UNION BANKSHARES CORPORATION
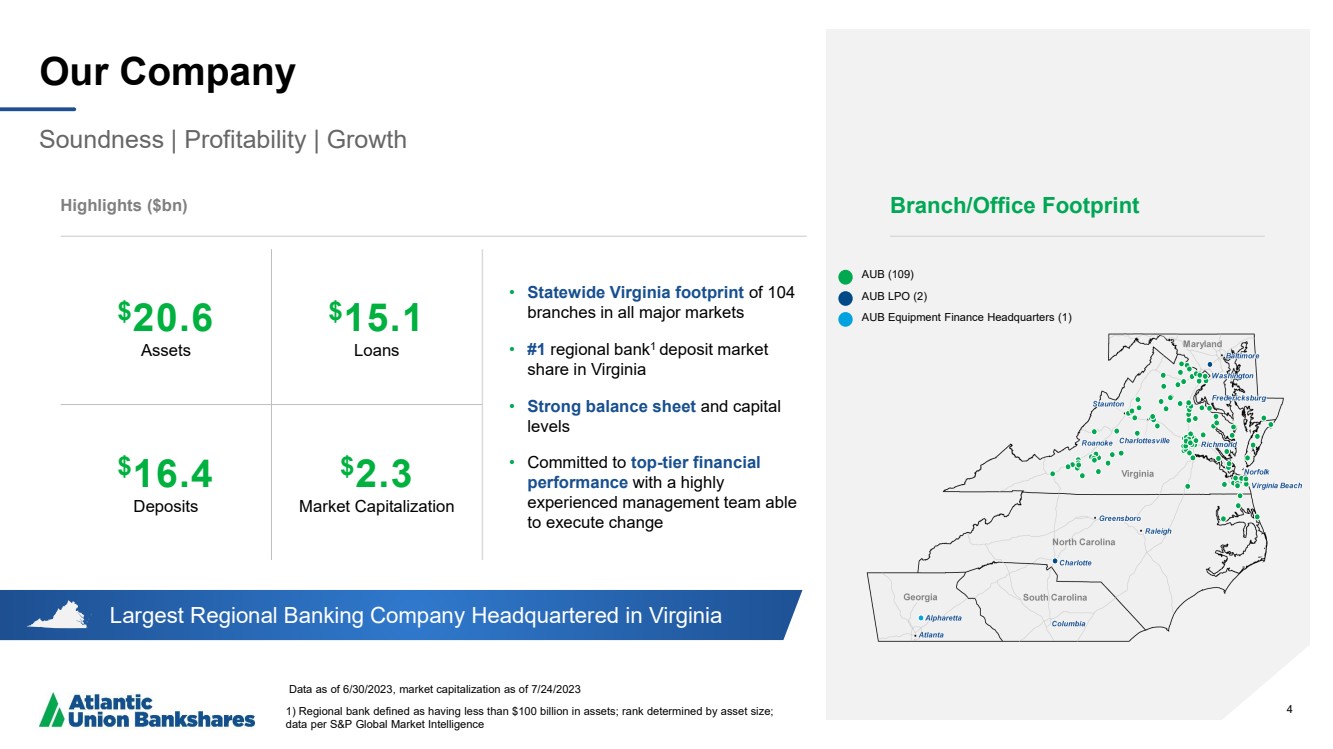
Headquartered in Richmond, Virginia, Atlantic Union Bankshares Corporation (NYSE: AUB) is the holding company for Atlantic Union Bank. Atlantic Union Bank has 109 branches and approximately 125 ATMs located throughout Virginia and in portions of Maryland and North Carolina. Certain non-bank financial services affiliates of Atlantic Union Bank include: Atlantic Union Equipment Finance, Inc., which provides equipment financing; Atlantic Union Financial Consultants, LLC, which provides brokerage services; and Union Insurance Group, LLC, which offers various lines of insurance products.
SECOND QUARTER 2023 EARNINGS RELEASE CONFERENCE CALL
In light of today’s announcement that the Company has entered into a merger agreement to acquire American National, the Company will hold a conference call and webcast for investors at 9:00 a.m. Eastern Time on Tuesday, July 25, 2023 during which the Company’s management will review the Company’s financial results for the second quarter 2023 and discuss the proposed merger.
The listen-only webcast and the accompanying slides can be accessed at:
https://edge.media-server.com/mmc/p/g5jw6mu3.
For analysts who wish to participate in the conference call, please register at the following URL:
https://register.vevent.com/register/BI1a5d16a5982740369c57e980002f5ab6. To participate in the conference call, you must use the link to receive an audio dial-in number and an Access PIN.
A replay of the webcast, and the accompanying slides, will be available on the Company’s website for 90 days at: https://investors.atlanticunionbank.com/.
NON-GAAP FINANCIAL MEASURES
In reporting the results as of and for the period ended June 30, 2023, the Company has provided supplemental performance measures on a tax-equivalent, tangible, operating, adjusted or pre-tax pre-provision basis. These non-GAAP financial measures are a supplement to GAAP, which is used to prepare the Company’s financial statements, and should not be considered in isolation or as a substitute for comparable measures calculated in accordance with GAAP. In addition, the Company’s non-GAAP financial measures may not be comparable to non-GAAP financial measures of other companies. The Company uses the non-GAAP financial measures discussed herein in its analysis of the Company’s performance. The Company’s management believes that these non-GAAP financial measures provide additional understanding of ongoing operations, enhance comparability of results of operations with prior periods and show the effects of significant gains and charges in the periods presented without the impact of items or events that may obscure trends in the Company’s underlying performance. For a reconciliation of these measures to their most directly comparable GAAP measures and additional information about these non-GAAP financial measures, see “Alternative Performance Measures (non-GAAP)” in the tables within the section “Key Financial Results.”
FORWARD-LOOKING STATEMENTS
This press release and statements by our management may constitute “forward-looking statements” within the meaning of the Private Securities Litigation Reform Act of 1995. Forward-looking statements are statements that include, without limitation, statements made in Mr. Asbury’s quotations, statements regarding our expectations with regard to our business, financial and operating results, including our deposit base, the impact of future economic conditions, the impact of cost saving measures, and statements that include other projections, predictions, expectations, or beliefs about future events or results or otherwise are not statements of historical fact. Such forward-looking statements are based on certain assumptions as of the time they are made, and are inherently subject to known and unknown risks, uncertainties, and other factors, some of which cannot be predicted or quantified, that may cause actual results, performance, or achievements to be materially different from those expressed or implied by such forward-looking statements. Forward-looking statements are often characterized by the use of qualified words (and their derivatives) such as “expect,” “believe,” “estimate,” “plan,” “project,” “anticipate,” “intend,” “will,” “may,” “view,” “opportunity,” “potential,” “continue,” “confidence,” or words of similar meaning or other statements concerning opinions or judgment of the Company and our management about future events. Although we believe that our expectations with respect to forward-looking statements are based upon reasonable assumptions within the bounds of our existing knowledge of our business and operations, there can be no assurance that actual future results, performance, or achievements of, or trends affecting, us will not differ materially from any projected future results, performance, achievements or trends expressed or implied by such forward-looking statements. Actual future results, performance, achievements or trends may differ materially from historical results or those anticipated depending on a variety of factors, including, but not limited to, the effects of or changes in:
| ● | market interest rates and their related impacts on macroeconomic conditions, customer and client behavior, our funding costs and our loan and securities portfolios; |
| ● | inflation and its impacts on economic growth and customer and client behavior; |
| ● | adverse developments in the financial industry generally, such as bank failures, responsive measures to mitigate and manage such developments, related supervisory and regulatory actions and costs, and related impacts on customer and client behavior; |
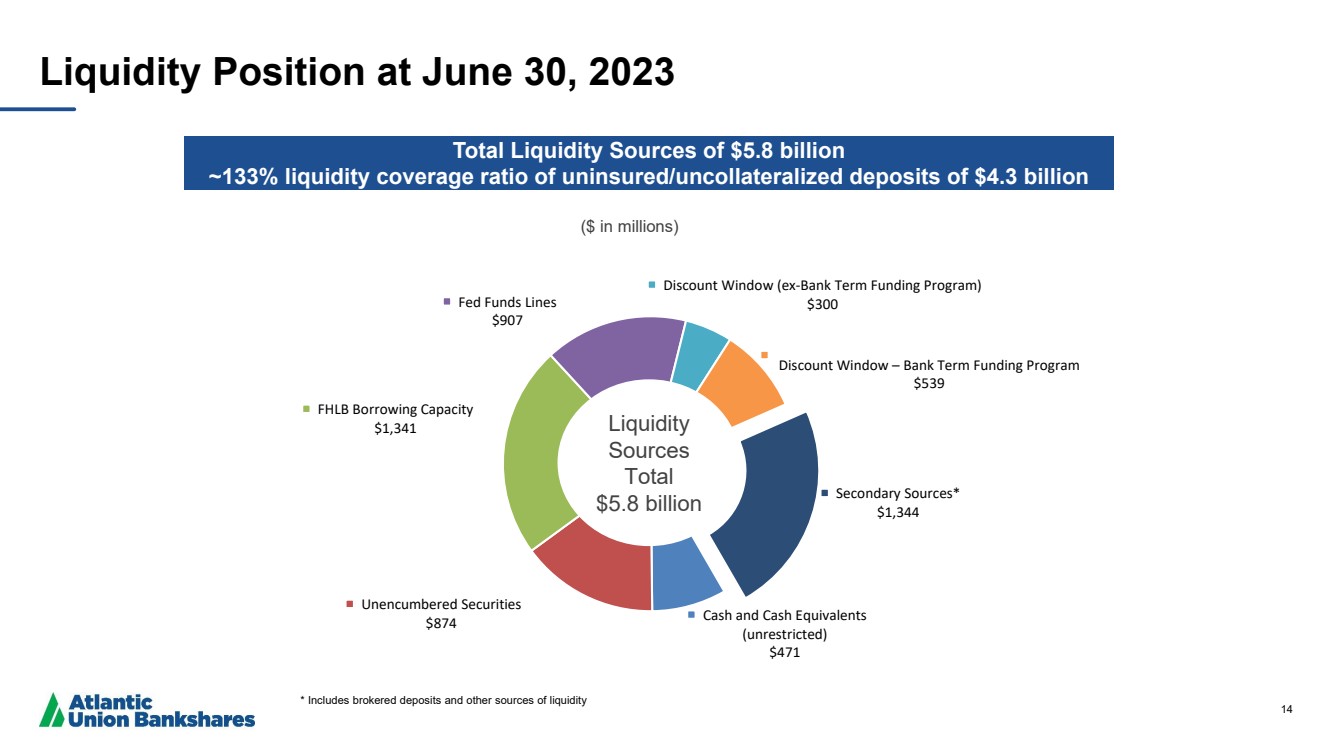
| ● | the sufficiency of liquidity; |
| ● | general economic and financial market conditions, in the United States generally and particularly in the markets in which we operate and which our loans are concentrated, including the effects of declines in real estate values, an increase in unemployment levels and slowdowns in economic growth; |
| ● | monetary and fiscal policies of the U.S. government, including policies of the U.S. Department of the Treasury and the Federal Reserve; |
| ● | the quality or composition of our loan or investment portfolios and changes therein; |
| ● | demand for loan products and financial services in our market areas; |
| ● | our ability to manage our growth or implement our growth strategy; |
| ● | the effectiveness of expense reduction plans; |
| ● | the introduction of new lines of business or new products and services; |
| ● | our ability to recruit and retain key employees; |
| ● | real estate values in our lending area; |
| ● | changes in accounting principles, standards, rules, and interpretations, and the related impact on our financial statements; |
| ● | an insufficient ACL or volatility in the ACL resulting from the CECL methodology, either alone or as that may be affected by inflation, changing interest rates, or other factors; |
| ● | our liquidity and capital positions; |
| ● | concentrations of loans secured by real estate, particularly commercial real estate; |
| ● | the effectiveness of our credit processes and management of our credit risk; |
| ● | our ability to compete in the market for financial services and increased competition from fintech companies; |
| ● | technological risks and developments, and cyber threats, attacks, or events; |
| ● | operational, technological, cultural, regulatory, legal, credit, and other risks associated with the exploration, consummation and integration of potential future acquisitions, whether involving stock or cash considerations; |
| ● | the potential adverse effects of unusual and infrequently occurring events, such as weather-related disasters, terrorist acts, geopolitical conflicts or public health events, and of governmental and societal responses thereto; these potential adverse effects may include, without limitation, adverse effects on the ability of our borrowers to satisfy their obligations to us, on the value of collateral securing loans, on the demand for the our loans or our |
| other products and services, on supply chains and methods used to distribute products and services, on incidents of cyberattack and fraud, on our liquidity or capital positions, on risks posed by reliance on third-party service providers, on other aspects of our business operations and on financial markets and economic growth; |
| ● | the discontinuation of LIBOR and its impact on the financial markets, and our ability to manage operational, legal, and compliance risks related to the discontinuation of LIBOR and implementation of one or more alternate reference rates; |
| ● | performance by our counterparties or vendors; |
| ● | deposit flows; |
| ● | the availability of financing and the terms thereof; |
| ● | the level of prepayments on loans and mortgage-backed securities; |
| ● | legislative or regulatory changes and requirements; |
| ● | actual or potential claims, damages, and fines related to litigation or government actions, which may result in, among other things, additional costs, fines, penalties, restrictions on our business activities, reputational harm, or other adverse consequences; |
| ● | the effects of changes in federal, state or local tax laws and regulations; |
| ● | any event or development that would cause us to conclude that there was an impairment of any asset, including intangible assets, such as goodwill; |
| ● | other factors, many of which are beyond our control; and |
| ● | the risks, uncertainties and assumptions set forth under the heading “Caution About Forward-Looking Statements” in the joint press release issued by the Company and American National on the date hereof with respect to the proposed merger transaction between the Company and American National. |
Please also refer to such other factors as discussed throughout Part I, Item 1A. “Risk Factors” and Part II, Item 7. “Management’s Discussion and Analysis of Financial Condition and Results of Operations” of our Annual Report on Form 10-K for the year ended December 31, 2022, Part II, Item 1A. Risk Factors in our Quarterly Report on Form 10-Q for the quarter ended March 31, 2023, and related disclosures in other filings, which have been filed with the U.S. Securities and Exchange Commission (“SEC”) and are available on the SEC’s website at www.sec.gov. All risk factors and uncertainties described herein and therein should be considered in evaluating forward-looking statements, and all of the forward-looking statements are expressly qualified by the cautionary statements contained or referred to herein and therein. The actual results or developments anticipated may not be realized or, even if substantially realized, they may not have the expected consequences to or effects on the Company or its businesses or operations. Readers are cautioned not to rely too heavily on the forward-looking statements, and undue reliance should not be placed on such forward-looking statements. Forward-looking statements speak only as of the date they are made. We do not intend or assume any obligation to update, revise or clarify any forward-looking statements that may be made from time to time by or on behalf of the Company, whether as a result of new information, future events or otherwise.
ATLANTIC UNION BANKSHARES CORPORATION AND SUBSIDIARIES
KEY FINANCIAL RESULTS (UNAUDITED)
(Dollars in thousands, except share data)
|
|
As of & For Three Months Ended |
|
As of & For Six Months Ended |
|
|||||||||||
|
|
06/30/23 |
|
03/31/23 |
|
06/30/22 |
|
06/30/23 |
|
06/30/22 |
|
|||||
Results of Operations |
|
|
|
|
|
|
|
|
|
|
|
|
|
|
|
|
Interest and dividend income |
|
$ |
230,247 |
|
$ |
217,546 |
|
$ |
148,755 |
|
$ |
447,793 |
|
$ |
287,212 |
|
Interest expense |
|
|
78,163 |
|
|
64,103 |
|
|
9,988 |
|
|
142,265 |
|
|
17,514 |
|
Net interest income |
|
|
152,084 |
|
|
153,443 |
|
|
138,767 |
|
|
305,528 |
|
|
269,698 |
|
Provision for credit losses |
|
|
6,069 |
|
|
11,850 |
|
|
3,559 |
|
|
17,920 |
|
|
6,359 |
|
Net interest income after provision for credit losses |
|
|
146,015 |
|
|
141,593 |
|
|
135,208 |
|
|
287,608 |
|
|
263,339 |
|
Noninterest income |
|
|
24,197 |
|
|
9,628 |
|
|
38,286 |
|
|
33,824 |
|
|
68,439 |
|
Noninterest expenses |
|
|
105,661 |
|
|
108,274 |
|
|
98,768 |
|
|
213,934 |
|
|
204,089 |
|
Income before income taxes |
|
|
64,551 |
|
|
42,947 |
|
|
74,726 |
|
|
107,498 |
|
|
127,689 |
|
Income tax expense |
|
|
9,310 |
|
|
7,294 |
|
|
12,500 |
|
|
16,604 |
|
|
21,773 |
|
Net income |
|
|
55,241 |
|
|
35,653 |
|
|
62,226 |
|
|
90,894 |
|
|
105,916 |
|
Dividends on preferred stock |
|
|
2,967 |
|
|
2,967 |
|
|
2,967 |
|
|
5,934 |
|
|
5,934 |
|
Net income available to common shareholders |
|
$ |
52,274 |
|
$ |
32,686 |
|
$ |
59,259 |
|
$ |
84,960 |
|
$ |
99,982 |
|
|
|
|
|
|
|
|
|
|
|
|
|
|
|
|
|
|
Interest earned on earning assets (FTE) (1) |
|
$ |
233,913 |
|
$ |
221,334 |
|
$ |
152,332 |
|
$ |
455,248 |
|
$ |
294,124 |
|
Net interest income (FTE) (1) |
|
|
155,750 |
|
|
157,231 |
|
|
142,344 |
|
|
312,983 |
|
|
276,610 |
|
Total revenue (FTE) (1) |
|
|
179,947 |
|
|
166,859 |
|
|
180,630 |
|
|
346,807 |
|
|
345,049 |
|
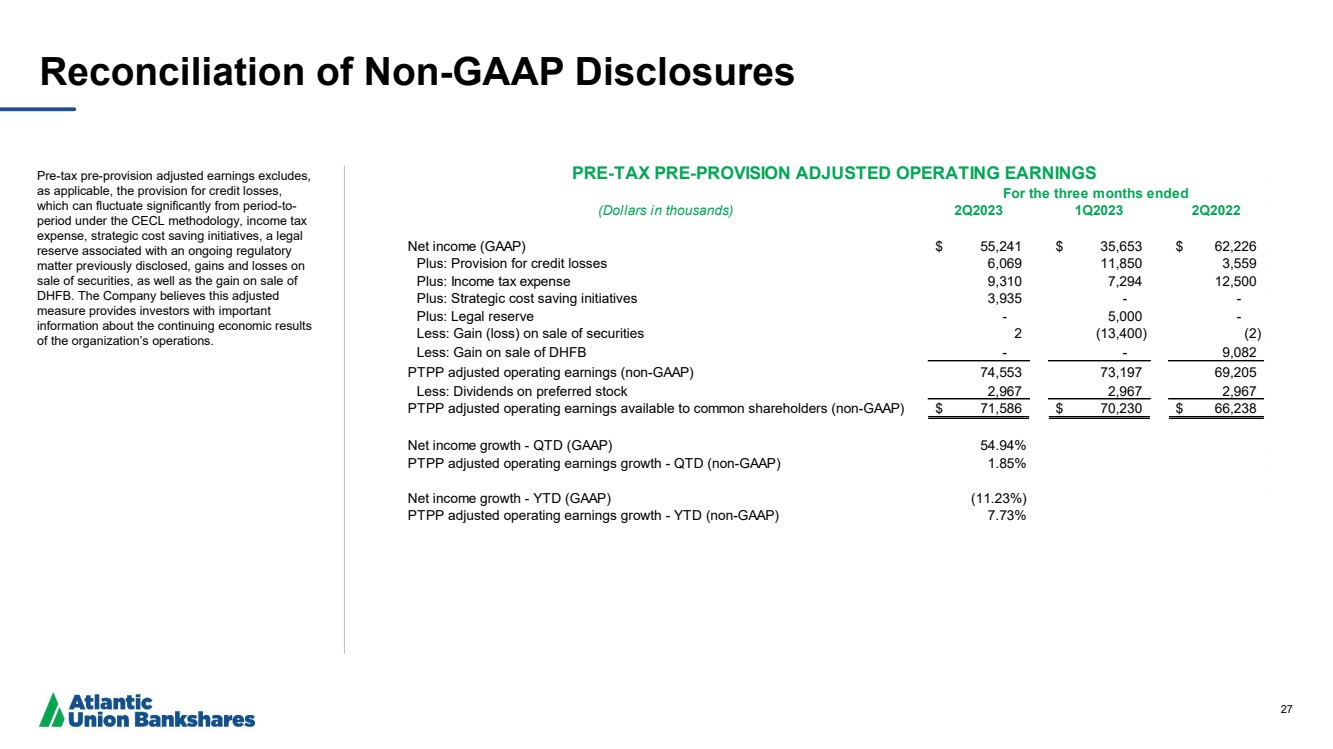
Pre-tax pre-provision adjusted operating earnings (7) |
|
|
74,553 |
|
|
73,197 |
|
|
69,205 |
|
|
147,751 |
|
|
130,476 |
|
|
|
|
|
|
|
|
|
|
|
|
|
|
|
|
|
|
Key Ratios |
|
|
|
|
|
|
|
|
|
|
|
|
|
|
|
|
Earnings per common share, diluted |
|
$ |
0.70 |
|
$ |
0.44 |
|
$ |
0.79 |
|
$ |
1.13 |
|
$ |
1.33 |
|
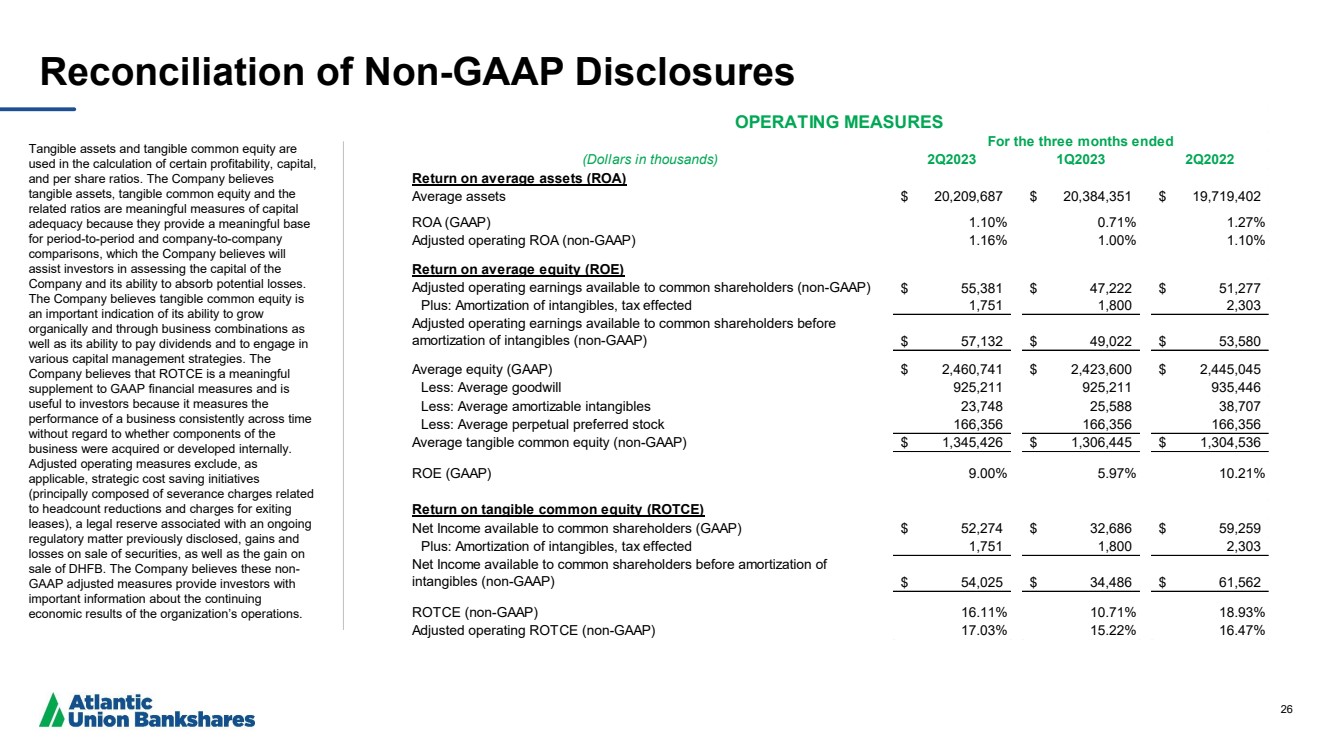
Return on average assets (ROA) |
|
|
1.10 |
% |
|
0.71 |
% |
|
1.27 |
% |
|
0.90 |
% |
|
1.08 |
% |
Return on average equity (ROE) |
|
|
9.00 |
% |
|
5.97 |
% |
|
10.21 |
% |
|
7.51 |
% |
|
8.37 |
% |
Return on average tangible common equity (ROTCE) (2) (3) |
|
|
16.11 |
% |
|
10.71 |
% |
|
18.93 |
% |
|
13.46 |
% |
|
14.97 |
% |
Efficiency ratio |
|
|
59.94 |
% |
|
66.40 |
% |
|
55.78 |
% |
|
63.04 |
% |
|
60.36 |
% |
Efficiency ratio (FTE) (1) |
|
|
58.72 |
% |
|
64.89 |
% |
|
54.68 |
% |
|
61.69 |
% |
|
59.15 |
% |
Net interest margin |
|
|
3.37 |
% |
|
3.41 |
% |
|
3.15 |
% |
|
3.39 |
% |
|
3.06 |
% |
Net interest margin (FTE) (1) |
|
|
3.45 |
% |
|
3.50 |
% |
|
3.24 |
% |
|
3.47 |
% |
|
3.14 |
% |
Yields on earning assets (FTE) (1) |
|
|
5.19 |
% |
|
4.92 |
% |
|
3.46 |
% |
|
5.05 |
% |
|
3.34 |
% |
Cost of interest-bearing liabilities |
|
|
2.42 |
% |
|
2.02 |
% |
|
0.35 |
% |
|
2.22 |
% |
|
0.30 |
% |
Cost of deposits |
|
|
1.61 |
% |
|
1.28 |
% |
|
0.15 |
% |
|
1.44 |
% |
|
0.13 |
% |
Cost of funds |
|
|
1.74 |
% |
|
1.42 |
% |
|
0.22 |
% |
|
1.58 |
% |
|
0.20 |
% |
|
|
|
|
|
|
|
|
|
|
|
|
|
|
|
|
|
Operating Measures (4) |
|
|
|
|
|
|
|
|
|
|
|
|
|
|
|
|
Adjusted operating earnings |
|
$ |
58,348 |
|
$ |
50,189 |
|
$ |
54,244 |
|
$ |
108,537 |
|
$ |
102,285 |
|
Adjusted operating earnings available to common shareholders |
|
|
55,381 |
|
|
47,222 |
|
|
51,277 |
|
|
102,603 |
|
|
96,351 |
|
Adjusted operating earnings per common share, diluted |
|
$ |
0.74 |
|
$ |
0.63 |
|
$ |
0.69 |
|
$ |
1.37 |
|
$ |
1.28 |
|
Adjusted operating ROA |
|
|
1.16 |
% |
|
1.00 |
% |
|
1.10 |
% |
|
1.08 |
% |
|
1.04 |
% |
Adjusted operating ROE |
|
|
9.51 |
% |
|
8.40 |
% |
|
8.90 |
% |
|
8.96 |
% |
|
8.08 |
% |
Adjusted operating ROTCE (2) (3) |
|
|
17.03 |
% |
|
15.22 |
% |
|
16.47 |
% |
|
16.14 |
% |
|
14.45 |
% |
Adjusted operating efficiency ratio (FTE) (1)(6) |
|
|
55.30 |
% |
|
56.03 |
% |
|
55.88 |
% |
|
55.66 |
% |
|
57.34 |
% |
|
|
|
|
|
|
|
|
|
|
|
|
|
|
|
|
|
Per Share Data |
|
|
|
|
|
|
|
|
|
|
|
|
|
|
|
|
Earnings per common share, basic |
|
$ |
0.70 |
|
$ |
0.44 |
|
$ |
0.79 |
|
$ |
1.13 |
|
$ |
1.33 |
|
Earnings per common share, diluted |
|
|
0.70 |
|
|
0.44 |
|
|
0.79 |
|
|
1.13 |
|
|
1.33 |
|
Cash dividends paid per common share |
|
|
0.30 |
|
|
0.30 |
|
|
0.28 |
|
|
0.60 |
|
|
0.56 |
|
Market value per share |
|
|
25.95 |
|
|
35.05 |
|
|
33.92 |
|
|
25.95 |
|
|
33.92 |
|
Book value per common share |
|
|
30.31 |
|
|
30.53 |
|
|
29.95 |
|
|
30.31 |
|
|
29.95 |
|
Tangible book value per common share (2) |
|
|
17.58 |
|
|
17.78 |
|
|
17.07 |
|
|
17.58 |
|
|
17.07 |
|
Price to earnings ratio, diluted |
|
|
9.28 |
|
|
19.77 |
|
|
10.68 |
|
|
11.35 |
|
|
12.65 |
|
Price to book value per common share ratio |
|
|
0.86 |
|
|
1.15 |
|
|
1.13 |
|
|
0.86 |
|
|
1.13 |
|
Price to tangible book value per common share ratio (2) |
|
|
1.48 |
|
|
1.97 |
|
|
1.99 |
|
|
1.48 |
|
|
1.99 |
|
Weighted average common shares outstanding, basic |
|
|
74,995,450 |
|
|
74,832,141 |
|
|
74,847,899 |
|
|
74,914,247 |
|
|
75,194,347 |
|
Weighted average common shares outstanding, diluted |
|
|
74,995,557 |
|
|
74,835,514 |
|
|
74,849,871 |
|
|
74,915,977 |
|
|
75,201,326 |
|
Common shares outstanding at end of period |
|
|
74,998,075 |
|
|
74,989,228 |
|
|
74,688,314 |
|
|
74,998,075 |
|
|
74,688,314 |
|
ATLANTIC UNION BANKSHARES CORPORATION AND SUBSIDIARIES
KEY FINANCIAL RESULTS (UNAUDITED)
(Dollars in thousands, except share data)
|
|
As of & For Three Months Ended |
|
As of & For Six Months Ended |
|
|||||||||||
|
|
06/30/23 |
|
03/31/23 |
|
06/30/22 |
|
06/30/23 |
|
06/30/22 |
|
|||||
Capital Ratios |
|
|
|
|
|
|
|
|
|
|
|
|
|
|
|
|
Common equity Tier 1 capital ratio (5) |
|
|
9.86 |
% |
|
9.91 |
% |
|
9.96 |
% |
|
9.86 |
% |
|
9.96 |
% |
Tier 1 capital ratio (5) |
|
|
10.81 |
% |
|
10.89 |
% |
|
11.00 |
% |
|
10.81 |
% |
|
11.00 |
% |
Total capital ratio (5) |
|
|
13.64 |
% |
|
13.76 |
% |
|
13.86 |
% |
|
13.64 |
% |
|
13.86 |
% |
Leverage ratio (Tier 1 capital to average assets) (5) |
|
|
9.64 |
% |
|
9.38 |
% |
|
9.26 |
% |
|
9.64 |
% |
|
9.26 |
% |
Common equity to total assets |
|
|
10.96 |
% |
|
11.31 |
% |
|
11.32 |
% |
|
10.96 |
% |
|
11.32 |
% |
Tangible common equity to tangible assets (2) |
|
|
6.66 |
% |
|
6.91 |
% |
|
6.78 |
% |
|
6.66 |
% |
|
6.78 |
% |
|
|
|
|
|
|
|
|
|
|
|
|
|
|
|
|
|
Financial Condition |
|
|
|
|
|
|
|
|
|
|
|
|
|
|
|
|
Assets |
|
$ |
20,602,332 |
|
$ |
20,103,370 |
|
$ |
19,661,799 |
|
$ |
20,602,332 |
|
$ |
19,661,799 |
|
LHFI (net of deferred fees and costs) |
|
|
15,066,930 |
|
|
14,584,280 |
|
|
13,655,408 |
|
|
15,066,930 |
|
|
13,655,408 |
|
Securities |
|
|
3,143,236 |
|
|
3,195,399 |
|
|
3,820,078 |
|
|
3,143,236 |
|
|
3,820,078 |
|
Earning Assets |
|
|
18,452,007 |
|
|
17,984,057 |
|
|
17,578,979 |
|
|
18,452,007 |
|
|
17,578,979 |
|
Goodwill |
|
|
925,211 |
|
|
925,211 |
|
|
925,211 |
|
|
925,211 |
|
|
925,211 |
|
Amortizable intangibles, net |
|
|
23,469 |
|
|
24,482 |
|
|
31,621 |
|
|
23,469 |
|
|
31,621 |
|
Deposits |
|
|
16,411,987 |
|
|
16,455,910 |
|
|
16,128,635 |
|
|
16,411,987 |
|
|
16,128,635 |
|
Borrowings |
|
|
1,320,301 |
|
|
798,910 |
|
|
797,948 |
|
|
1,320,301 |
|
|
797,948 |
|
Stockholders' equity |
|
|
2,424,470 |
|
|
2,440,236 |
|
|
2,391,476 |
|
|
2,424,470 |
|
|
2,391,476 |
|
Tangible common equity (2) |
|
|
1,309,433 |
|
|
1,324,186 |
|
|
1,268,287 |
|
|
1,309,433 |
|
|
1,268,287 |
|
|
|
|
|
|
|
|
|
|
|
|
|
|
|
|
|
|
LHFI, net of deferred fees and costs |
|
|
|
|
|
|
|
|
|
|
|
|
|
|
|
|
Construction and land development |
|
$ |
1,231,720 |
|
$ |
1,179,872 |
|
$ |
988,379 |
|
$ |
1,231,720 |
|
$ |
988,379 |
|
Commercial real estate - owner occupied |
|
|
1,952,189 |
|
|
1,956,585 |
|
|
1,965,702 |
|
|
1,952,189 |
|
|
1,965,702 |
|
Commercial real estate - non-owner occupied |
|
|
4,113,318 |
|
|
3,968,085 |
|
|
3,860,819 |
|
|
4,113,318 |
|
|
3,860,819 |
|
Multifamily real estate |
|
|
788,895 |
|
|
822,006 |
|
|
762,502 |
|
|
788,895 |
|
|
762,502 |
|
Commercial & Industrial |
|
|
3,373,148 |
|
|
3,082,478 |
|
|
2,595,891 |
|
|
3,373,148 |
|
|
2,595,891 |
|
Residential 1-4 Family - Commercial |
|
|
518,317 |
|
|
522,760 |
|
|
553,771 |
|
|
518,317 |
|
|
553,771 |
|
Residential 1-4 Family - Consumer |
|
|
1,017,698 |
|
|
974,511 |
|
|
865,174 |
|
|
1,017,698 |
|
|
865,174 |
|
Residential 1-4 Family - Revolving |
|
|
600,339 |
|
|
589,791 |
|
|
583,073 |
|
|
600,339 |
|
|
583,073 |
|
Auto |
|
|
585,756 |
|
|
600,658 |
|
|
525,301 |
|
|
585,756 |
|
|
525,301 |
|
Consumer |
|
|
134,709 |
|
|
145,090 |
|
|
180,045 |
|
|
134,709 |
|
|
180,045 |
|
Other Commercial |
|
|
750,841 |
|
|
742,444 |
|
|
774,751 |
|
|
750,841 |
|
|
774,751 |
|
Total LHFI |
|
$ |
15,066,930 |
|
$ |
14,584,280 |
|
$ |
13,655,408 |
|
$ |
15,066,930 |
|
$ |
13,655,408 |
|
|
|
|
|
|
|
|
|
|
|
|
|
|
|
|
|
|
Deposits |
|
|
|
|
|
|
|
|
|
|
|
|
|
|
|
|
Interest checking accounts |
|
$ |
4,824,192 |
|
$ |
4,714,366 |
|
$ |
3,943,303 |
|
$ |
4,824,192 |
|
$ |
3,943,303 |
|
Money market accounts |
|
|
3,413,936 |
|
|
3,547,514 |
|
|
3,956,046 |
|
|
3,413,936 |
|
|
3,956,046 |
|
Savings accounts |
|
|
986,081 |
|
|
1,047,914 |
|
|
1,165,577 |
|
|
986,081 |
|
|
1,165,577 |
|
Customer time deposits of $250,000 and over |
|
|
578,739 |
|
|
541,447 |
|
|
335,706 |
|
|
578,739 |
|
|
335,706 |
|
Other customer time deposits |
|
|
1,813,031 |
|
|
1,648,747 |
|
|
1,308,493 |
|
|
1,813,031 |
|
|
1,308,493 |
|
Time deposits |
|
|
2,391,770 |
|
|
2,190,194 |
|
|
1,644,199 |
|
|
2,391,770 |
|
|
1,644,199 |
|
Total interest-bearing customer deposits |
|
|
11,615,979 |
|
|
11,499,988 |
|
|
10,709,125 |
|
|
11,615,979 |
|
|
10,709,125 |
|
Brokered deposits |
|
|
485,702 |
|
|
377,913 |
|
|
57,972 |
|
|
485,702 |
|
|
57,972 |
|
Total interest-bearing deposits |
|
$ |
12,101,681 |
|
$ |
11,877,901 |
|
$ |
10,767,097 |
|
$ |
12,101,681 |
|
$ |
10,767,097 |
|
Demand deposits |
|
|
4,310,306 |
|
|
4,578,009 |
|
|
5,361,538 |
|
|
4,310,306 |
|
|
5,361,538 |
|
Total deposits |
|
$ |
16,411,987 |
|
$ |
16,455,910 |
|
$ |
16,128,635 |
|
$ |
16,411,987 |
|
$ |
16,128,635 |
|
|
|
|
|
|
|
|
|
|
|
|
|
|
|
|
|
|
Averages |
|
|
|
|
|
|
|
|
|
|
|
|
|
|
|
|
Assets |
|
$ |
20,209,687 |
|
$ |
20,384,351 |
|
$ |
19,719,402 |
|
$ |
20,296,536 |
|
$ |
19,819,330 |
|
LHFI (net of deferred fees and costs) |
|
|
14,746,218 |
|
|
14,505,611 |
|
|
13,525,529 |
|
|
14,626,579 |
|
|
13,413,780 |
|
Loans held for sale |
|
|
14,413 |
|
|
5,876 |
|
|
20,634 |
|
|
10,168 |
|
|
17,652 |
|
Securities |
|
|
3,176,662 |
|
|
3,467,561 |
|
|
3,930,912 |
|
|
3,321,308 |
|
|
4,064,007 |
|
Earning assets |
|
|
18,091,809 |
|
|
18,238,088 |
|
|
17,646,470 |
|
|
18,164,545 |
|
|
17,765,085 |
|
Deposits |
|
|
16,280,154 |
|
|
16,417,212 |
|
|
16,191,056 |
|
|
16,348,304 |
|
|
16,351,822 |
|
Time deposits |
|
|
2,500,966 |
|
|
2,291,530 |
|
|
1,667,378 |
|
|
2,396,827 |
|
|
1,716,743 |
|
Interest-bearing deposits |
|
|
11,903,004 |
|
|
11,723,865 |
|
|
10,824,465 |
|
|
11,813,929 |
|
|
11,054,095 |
|
Borrowings |
|
|
1,071,171 |
|
|
1,122,244 |
|
|
765,886 |
|
|
1,096,567 |
|
|
639,506 |
|
Interest-bearing liabilities |
|
|
12,974,175 |
|
|
12,846,109 |
|
|
11,590,351 |
|
|
12,910,496 |
|
|
11,693,601 |
|
Stockholders' equity |
|
|
2,460,741 |
|
|
2,423,600 |
|
|
2,445,045 |
|
|
2,442,273 |
|
|
2,552,418 |
|
Tangible common equity (2) |
|
|
1,345,426 |
|
|
1,306,445 |
|
|
1,304,536 |
|
|
1,326,043 |
|
|
1,410,342 |
|
ATLANTIC UNION BANKSHARES CORPORATION AND SUBSIDIARIES
KEY FINANCIAL RESULTS (UNAUDITED)
(Dollars in thousands, except share data)
|
|
As of & For Three Months Ended |
|
As of & For Six Months Ended |
|
|||||||||||
|
|
06/30/23 |
|
03/31/23 |
|
06/30/22 |
|
06/30/23 |
|
06/30/22 |
|
|||||
Asset Quality |
|
|
|
|
|
|
|
|
|
|
|
|
|
|
|
|
Allowance for Credit Losses (ACL) |
|
|
|
|
|
|
|
|
|
|
|
|
|
|
|
|
Beginning balance, Allowance for loan and lease losses (ALLL) |
|
$ |
116,512 |
|
$ |
110,768 |
|
$ |
102,591 |
|
$ |
110,768 |
|
$ |
99,787 |
|
Add: Recoveries |
|
|
1,035 |
|
|
1,167 |
|
|
1,018 |
|
|
2,202 |
|
|
2,531 |
|
Less: Charge-offs |
|
|
2,602 |
|
|
5,726 |
|
|
1,957 |
|
|
8,328 |
|
|
3,466 |
|
Add: Provision for loan losses |
|
|
5,738 |
|
|
10,303 |
|
|
2,532 |
|
|
16,041 |
|
|
5,332 |
|
Ending balance, ALLL |
|
$ |
120,683 |
|
$ |
116,512 |
|
$ |
104,184 |
|
$ |
120,683 |
|
$ |
104,184 |
|
|
|
|
|
|
|
|
|
|
|
|
|
|
|
|
|
|
Beginning balance, Reserve for unfunded commitment (RUC) |
|
$ |
15,199 |
|
$ |
13,675 |
|
$ |
8,000 |
|
$ |
13,675 |
|
$ |
8,000 |
|
Add: Provision for unfunded commitments |
|
|
349 |
|
|
1,524 |
|
|
1,000 |
|
|
1,873 |
|
|
1,000 |
|
Ending balance, RUC |
|
$ |
15,548 |
|
$ |
15,199 |
|
$ |
9,000 |
|
$ |
15,548 |
|
$ |
9,000 |
|
Total ACL |
|
$ |
136,231 |
|
$ |
131,711 |
|
$ |
113,184 |
|
$ |
136,231 |
|
$ |
113,184 |
|
|
|
|
|
|
|
|
|
|
|
|
|
|
|
|
|
|
ACL / total LHFI |
|
|
0.90 |
% |
|
0.90 |
% |
|
0.83 |
% |
|
0.90 |
% |
|
0.83 |
% |
ALLL / total LHFI |
|
|
0.80 |
% |
|
0.80 |
% |
|
0.76 |
% |
|
0.80 |
% |
|
0.76 |
% |
Net charge-offs / total average LHFI |
|
|
0.04 |
% |
|
0.13 |
% |
|
0.03 |
% |
|
0.08 |
% |
|
0.01 |
% |
Provision for loan losses/ total average LHFI |
|
|
0.16 |
% |
|
0.29 |
% |
|
0.08 |
% |
|
0.22 |
% |
|
0.08 |
% |
|
|
|
|
|
|
|
|
|
|
|
|
|
|
|
|
|
Nonperforming Assets |
|
|
|
|
|
|
|
|
|
|
|
|
|
|
|
|
Construction and land development |
|
$ |
284 |
|
$ |
363 |
|
$ |
581 |
|
$ |
284 |
|
$ |
581 |
|
Commercial real estate - owner occupied |
|
|
3,978 |
|
|
6,174 |
|
|
4,996 |
|
|
3,978 |
|
|
4,996 |
|
Commercial real estate - non-owner occupied |
|
|
6,473 |
|
|
1,481 |
|
|
3,301 |
|
|
6,473 |
|
|
3,301 |
|
Commercial & Industrial |
|
|
2,738 |
|
|
4,815 |
|
|
2,728 |
|
|
2,738 |
|
|
2,728 |
|
Residential 1-4 Family - Commercial |
|
|
1,844 |
|
|
1,907 |
|
|
2,031 |
|
|
1,844 |
|
|
2,031 |
|
Residential 1-4 Family - Consumer |
|
|
10,033 |
|
|
10,540 |
|
|
12,084 |
|
|
10,033 |
|
|
12,084 |
|
Residential 1-4 Family - Revolving |
|
|
3,461 |
|
|
3,449 |
|
|
3,069 |
|
|
3,461 |
|
|
3,069 |
|
Auto |
|
|
291 |
|
|
347 |
|
|
279 |
|
|
291 |
|
|
279 |
|
Consumer |
|
|
3 |
|
|
6 |
|
|
1 |
|
|
3 |
|
|
1 |
|
Nonaccrual loans |
|
$ |
29,105 |
|
$ |
29,082 |
|
$ |
29,070 |
|
$ |
29,105 |
|
$ |
29,070 |
|
Foreclosed property |
|
|
50 |
|
|
29 |
|
|
2,065 |
|
|
50 |
|
|
2,065 |
|
Total nonperforming assets (NPAs) |
|
$ |
29,155 |
|
$ |
29,111 |
|
$ |
31,135 |
|
$ |
29,155 |
|
$ |
31,135 |
|
Construction and land development |
|
$ |
24 |
|
$ |
249 |
|
$ |
1 |
|
$ |
24 |
|
$ |
1 |
|
Commercial real estate - owner occupied |
|
|
2,463 |
|
|
2,133 |
|
|
792 |
|
|
2,463 |
|
|
792 |
|
Commercial real estate - non-owner occupied |
|
|
2,763 |
|
|
1,032 |
|
|
642 |
|
|
2,763 |
|
|
642 |
|
Commercial & Industrial |
|
|
810 |
|
|
633 |
|
|
322 |
|
|
810 |
|
|
322 |
|
Residential 1-4 Family - Commercial |
|
|
693 |
|
|
232 |
|
|
184 |
|
|
693 |
|
|
184 |
|
Residential 1-4 Family - Consumer |
|
|
1,716 |
|
|
859 |
|
|
1,112 |
|
|
1,716 |
|
|
1,112 |
|
Residential 1-4 Family - Revolving |
|
|
1,259 |
|
|
1,766 |
|
|
997 |
|
|
1,259 |
|
|
997 |
|
Auto |
|
|
243 |
|
|
137 |
|
|
134 |
|
|
243 |
|
|
134 |
|
Consumer |
|
|
74 |
|
|
137 |
|
|
79 |
|
|
74 |
|
|
79 |
|
Other Commercial |
|
|
66 |
|
|
66 |
|
|
329 |
|
|
66 |
|
|
329 |
|
LHFI ≥ 90 days and still accruing |
|
$ |
10,111 |
|
$ |
7,244 |
|
$ |
4,592 |
|
$ |
10,111 |
|
$ |
4,592 |
|
Total NPAs and LHFI ≥ 90 days |
|
$ |
39,266 |
|
$ |
36,355 |
|
$ |
35,727 |
|
$ |
39,266 |
|
$ |
35,727 |
|
NPAs / total LHFI |
|
|
0.19 |
% |
|
0.20 |
% |
|
0.23 |
% |
|
0.19 |
% |
|
0.23 |
% |
NPAs / total assets |
|
|
0.14 |
% |
|
0.14 |
% |
|
0.16 |
% |
|
0.14 |
% |
|
0.16 |
% |
ALLL / nonaccrual loans |
|
|
414.65 |
% |
|
400.63 |
% |
|
358.39 |
% |
|
414.65 |
% |
|
358.39 |
% |
ALLL/ nonperforming assets |
|
|
413.94 |
% |
|
400.23 |
% |
|
334.62 |
% |
|
413.94 |
% |
|
334.62 |
% |
ATLANTIC UNION BANKSHARES CORPORATION AND SUBSIDIARIES
KEY FINANCIAL RESULTS (UNAUDITED)
(Dollars in thousands, except share data)
|
|
As of & For Three Months Ended |
|
As of & For Six Months Ended |
|
|||||||||||
|
|
06/30/23 |
|
03/31/23 |
|
06/30/22 |
|
06/30/23 |
|
06/30/22 |
|
|||||
Past Due Detail |
|
|
|
|
|
|
|
|
|
|
|
|
|
|
|
|
Construction and land development |
|
$ |
295 |
|
$ |
815 |
|
$ |
645 |
|
$ |
295 |
|
$ |
645 |
|
Commercial real estate - owner occupied |
|
|
602 |
|
|
2,251 |
|
|
1,374 |
|
|
602 |
|
|
1,374 |
|
Commercial real estate - non-owner occupied |
|
|
— |
|
|
52 |
|
|
511 |
|
|
— |
|
|
511 |
|
Commercial & Industrial |
|
|
254 |
|
|
981 |
|
|
2,581 |
|
|
254 |
|
|
2,581 |
|
Residential 1-4 Family - Commercial |
|
|
1,076 |
|
|
1,399 |
|
|
1,944 |
|
|
1,076 |
|
|
1,944 |
|
Residential 1-4 Family - Consumer |
|
|
1,504 |
|
|
11,579 |
|
|
594 |
|
|
1,504 |
|
|
594 |
|
Residential 1-4 Family - Revolving |
|
|
1,729 |
|
|
1,384 |
|
|
1,368 |
|
|
1,729 |
|
|
1,368 |
|
Auto |
|
|
2,877 |
|
|
2,026 |
|
|
1,841 |
|
|
2,877 |
|
|
1,841 |
|
Consumer |
|
|
334 |
|
|
295 |
|
|
361 |
|
|
334 |
|
|
361 |
|
Other Commercial |
|
|
23 |
|
|
— |
|
|
11 |
|
|
23 |
|
|
11 |
|
LHFI 30-59 days past due |
|
$ |
8,694 |
|
$ |
20,782 |
|
$ |
11,230 |
|
$ |
8,694 |
|
$ |
11,230 |
|
Commercial real estate - owner occupied |
|
|
10 |
|
|
798 |
|
|
807 |
|
|
10 |
|
|
807 |
|
Commercial & Industrial |
|
|
400 |
|
|
61 |
|
|
546 |
|
|
400 |
|
|
546 |
|
Residential 1-4 Family - Commercial |
|
|
189 |
|
|
271 |
|
|
474 |
|
|
189 |
|
|
474 |
|
Residential 1-4 Family - Consumer |
|
|
2,813 |
|
|
158 |
|
|
1,646 |
|
|
2,813 |
|
|
1,646 |
|
Residential 1-4 Family - Revolving |
|
|
1,114 |
|
|
1,069 |
|
|
731 |
|
|
1,114 |
|
|
731 |
|
Auto |
|
|
564 |
|
|
295 |
|
|
213 |
|
|
564 |
|
|
213 |
|
Consumer |
|
|
214 |
|
|
176 |
|
|
210 |
|
|
214 |
|
|
210 |
|
LHFI 60-89 days past due |
|
$ |
5,304 |
|
$ |
2,828 |
|
$ |
4,627 |
|
$ |
5,304 |
|
$ |
4,627 |
|
|
|
|
|
|
|
|
|
|
|
|
|
|
|
|
|
|
Past Due and still accruing |
|
$ |
24,109 |
|
$ |
30,854 |
|
$ |
20,449 |
|
$ |
24,109 |
|
$ |
20,449 |
|
Past Due and still accruing / total LHFI |
|
|
0.16 |
% |
|
0.21 |
% |
|
0.15 |
% |
|
0.16 |
% |
|
0.15 |
% |
|
|
|
|
|
|
|
|
|
|
|
|
|
|
|
|
|
Alternative Performance Measures (non-GAAP) |
|
|
|
|
|
|
|
|
|
|
|
|
|
|
|
|
Net interest income (FTE) (1) |
|
|
|
|
|
|
|
|
|
|
|
|
|
|
|
|
Net interest income (GAAP) |
|
$ |
152,084 |
|
$ |
153,443 |
|
$ |
138,767 |
|
$ |
305,528 |
|
$ |
269,698 |
|
FTE adjustment |
|
|
3,666 |
|
|
3,788 |
|
|
3,577 |
|
|
7,455 |
|
|
6,912 |
|
Net interest income (FTE) (non-GAAP) |
|
$ |
155,750 |
|
$ |
157,231 |
|
$ |
142,344 |
|
$ |
312,983 |
|
$ |
276,610 |
|
Noninterest income (GAAP) |
|
|
24,197 |
|
|
9,628 |
|
|
38,286 |
|
|
33,824 |
|
|
68,439 |
|
Total revenue (FTE) (non-GAAP) |
|
$ |
179,947 |
|
$ |
166,859 |
|
$ |
180,630 |
|
$ |
346,807 |
|
$ |
345,049 |
|
|
|
|
|
|
|
|
|
|
|
|
|
|
|
|
|
|
Average earning assets |
|
$ |
18,091,809 |
|
$ |
18,238,088 |
|
$ |
17,646,470 |
|
$ |
18,164,545 |
|
$ |
17,765,085 |
|
Net interest margin |
|
|
3.37 |
% |
|
3.41 |
% |
|
3.15 |
% |
|
3.39 |
% |
|
3.06 |
% |
Net interest margin (FTE) |
|
|
3.45 |
% |
|
3.50 |
% |
|
3.24 |
% |
|
3.47 |
% |
|
3.14 |
% |
|
|
|
|
|
|
|
|
|
|
|
|
|
|
|
|
|
Tangible Assets (2) |
|
|
|
|
|
|
|
|
|
|
|
|
|
|
|
|
Ending assets (GAAP) |
|
$ |
20,602,332 |
|
$ |
20,103,370 |
|
$ |
19,661,799 |
|
$ |
20,602,332 |
|
$ |
19,661,799 |
|
Less: Ending goodwill |
|
|
925,211 |
|
|
925,211 |
|
|
925,211 |
|
|
925,211 |
|
|
925,211 |
|
Less: Ending amortizable intangibles |
|
|
23,469 |
|
|
24,482 |
|
|
31,621 |
|
|
23,469 |
|
|
31,621 |
|
Ending tangible assets (non-GAAP) |
|
$ |
19,653,652 |
|
$ |
19,153,677 |
|
$ |
18,704,967 |
|
$ |
19,653,652 |
|
$ |
18,704,967 |
|
|
|
|
|
|
|
|
|
|
|
|
|
|
|
|
|
|
Tangible Common Equity (2) |
|
|
|
|
|
|
|
|
|
|
|
|
|
|
|
|
Ending equity (GAAP) |
|
$ |
2,424,470 |
|
$ |
2,440,236 |
|
$ |
2,391,476 |
|
$ |
2,424,470 |
|
$ |
2,391,476 |
|
Less: Ending goodwill |
|
|
925,211 |
|
|
925,211 |
|
|
925,211 |
|
|
925,211 |
|
|
925,211 |
|
Less: Ending amortizable intangibles |
|
|
23,469 |
|
|
24,482 |
|
|
31,621 |
|
|
23,469 |
|
|
31,621 |
|
Less: Perpetual preferred stock |
|
|
166,357 |
|
|
166,357 |
|
|
166,357 |
|
|
166,357 |
|
|
166,357 |
|
Ending tangible common equity (non-GAAP) |
|
$ |
1,309,433 |
|
$ |
1,324,186 |
|
$ |
1,268,287 |
|
$ |
1,309,433 |
|
$ |
1,268,287 |
|
|
|
|
|
|
|
|
|
|
|
|
|
|
|
|
|
|
Average equity (GAAP) |
|
$ |
2,460,741 |
|
$ |
2,423,600 |
|
$ |
2,445,045 |
|
$ |
2,442,273 |
|
$ |
2,552,418 |
|
Less: Average goodwill |
|
|
925,211 |
|
|
925,211 |
|
|
935,446 |
|
|
925,211 |
|
|
935,503 |
|
Less: Average amortizable intangibles |
|
|
23,748 |
|
|
25,588 |
|
|
38,707 |
|
|
24,663 |
|
|
40,217 |
|
Less: Average perpetual preferred stock |
|
|
166,356 |
|
|
166,356 |
|
|
166,356 |
|
|
166,356 |
|
|
166,356 |
|
Average tangible common equity (non-GAAP) |
|
$ |
1,345,426 |
|
$ |
1,306,445 |
|
$ |
1,304,536 |
|
$ |
1,326,043 |
|
$ |
1,410,342 |
|
|
|
|
|
|
|
|
|
|
|
|
|
|
|
|
|
|
ROTCE (2)(3) |
|
|
|
|
|
|
|
|
|
|
|
|
|
|
|
|
Net income available to common shareholders (GAAP) |
|
$ |
52,274 |
|
$ |
32,686 |
|
$ |
59,259 |
|
$ |
84,960 |
|
$ |
99,982 |
|
Plus: Amortization of intangibles, tax effected |
|
|
1,751 |
|
|
1,800 |
|
|
2,303 |
|
|
3,550 |
|
|
4,704 |
|
Net income available to common shareholders before amortization of intangibles (non-GAAP) |
|
$ |
54,025 |
|
$ |
34,486 |
|
$ |
61,562 |
|
$ |
88,510 |
|
$ |
104,686 |
|
|
|
|
|
|
|
|
|
|
|
|
|
|
|
|
|
|
Return on average tangible common equity (ROTCE) |
|
|
16.11 |
% |
|
10.71 |
% |
|
18.93 |
% |
|
13.46 |
% |
|
14.97 |
% |
ATLANTIC UNION BANKSHARES CORPORATION AND SUBSIDIARIES
KEY FINANCIAL RESULTS (UNAUDITED)
(Dollars in thousands, except share data)
|
|
As of & For Three Months Ended |
|
As of & For Six Months Ended |
|
|||||||||||
|
|
06/30/23 |
|
03/31/23 |
|
06/30/22 |
|
06/30/23 |
|
06/30/22 |
|
|||||
Operating Measures (4) |
|
|
|
|
|
|
|
|
|
|
|
|
|
|
|
|
Net income (GAAP) |
|
$ |
55,241 |
|
$ |
35,653 |
|
$ |
62,226 |
|
$ |
90,894 |
|
$ |
105,916 |
|
Plus: Strategic cost saving initiatives, net of tax |
|
|
3,109 |
|
|
— |
|
|
— |
|
|
3,109 |
|
|
— |
|
Plus: Legal reserve, net of tax |
|
|
— |
|
|
3,950 |
|
|
— |
|
|
3,950 |
|
|
— |
|
Plus: Strategic branch closing and facility consolidation costs, net of tax |
|
|
— |
|
|
— |
|
|
— |
|
|
— |
|
|
4,351 |
|
Less: Gain (loss) on sale of securities, net of tax |
|
|
2 |
|
|
(10,586) |
|
|
(2) |
|
|
(10,584) |
|
|
(2) |
|
Less: Gain on sale of DHFB, net of tax |
|
|
— |
|
|
— |
|
|
7,984 |
|
|
— |
|
|
7,984 |
|
Adjusted operating earnings (non-GAAP) |
|
|
58,348 |
|
|
50,189 |
|
|
54,244 |
|
|
108,537 |
|
|
102,285 |
|
Less: Dividends on preferred stock |
|
|
2,967 |
|
|
2,967 |
|
|
2,967 |
|
|
5,934 |
|
|
5,934 |
|
Adjusted operating earnings available to common shareholders (non-GAAP) |
|
$ |
55,381 |
|
$ |
47,222 |
|
$ |
51,277 |
|
$ |
102,603 |
|
$ |
96,351 |
|
|
|
|
|
|
|
|
|
|
|
|
|
|
|
|
|
|
Noninterest expense (GAAP) |
|
$ |
105,661 |
|
$ |
108,274 |
|
$ |
98,768 |
|
$ |
213,934 |
|
$ |
204,089 |
|
Less: Amortization of intangible assets |
|
|
2,216 |
|
|
2,279 |
|
|
2,915 |
|
|
4,494 |
|
|
5,954 |
|
Less: Strategic cost saving initiatives |
|
|
3,935 |
|
|
— |
|
|
— |
|
|
3,935 |
|
|
— |
|
Less: Legal reserve |
|
|
— |
|
|
5,000 |
|
|
— |
|
|
5,000 |
|
|
— |
|
Less: Strategic branch closing and facility consolidation costs |
|
|
— |
|
|
— |
|
|
— |
|
|
— |
|
|
5,508 |
|
Adjusted operating noninterest expense (non-GAAP) |
|
$ |
99,510 |
|
$ |
100,995 |
|
$ |
95,853 |
|
$ |
200,505 |
|
$ |
192,627 |
|
|
|
|
|
|
|
|
|
|
|
|
|
|
|
|
|
|
Noninterest income (GAAP) |
|
$ |
24,197 |
|
$ |
9,628 |
|
$ |
38,286 |
|
$ |
33,824 |
|
$ |
68,439 |
|
Less: Gain (loss) on sale of securities |
|
|
2 |
|
|
(13,400) |
|
|
(2) |
|
|
(13,398) |
|
|
(2) |
|
Less: Gain on sale of DHFB |
|
|
— |
|
|
— |
|
|
9,082 |
|
|
— |
|
|
9,082 |
|
Adjusted operating noninterest income (non-GAAP) |
|
$ |
24,195 |
|
$ |
23,028 |
|
$ |
29,206 |
|
$ |
47,222 |
|
$ |
59,359 |
|
|
|
|
|
|
|
|
|
|
|
|
|
|
|
|
|
|
Net interest income (FTE) (non-GAAP) (1) |
|
$ |
155,750 |
|
$ |
157,231 |
|
$ |
142,344 |
|
$ |
312,983 |
|
$ |
276,610 |
|
Adjusted operating noninterest income (non-GAAP) |
|
|
24,195 |
|
|
23,028 |
|
|
29,206 |
|
|
47,222 |
|
|
59,359 |
|
Total adjusted revenue (FTE) (non-GAAP) (1) |
|
$ |
179,945 |
|
$ |
180,259 |
|
$ |
171,550 |
|
$ |
360,205 |
|
$ |
335,969 |
|
|
|
|
|
|
|
|
|
|
|
|
|
|
|
|
|
|
Efficiency ratio |
|
|
59.94 |
% |
|
66.40 |
% |
|
55.78 |
% |
|
63.04 |
% |
|
60.36 |
% |
Efficiency ratio (FTE) (1) |
|
|
58.72 |
% |
|
64.89 |
% |
|
54.68 |
% |
|
61.69 |
% |
|
59.15 |
% |
Adjusted operating efficiency ratio (FTE) (1)(6) |
|
|
55.30 |
% |
|
56.03 |
% |
|
55.88 |
% |
|
55.66 |
% |
|
57.34 |
% |
|
|
|
|
|
|
|
|
|
|
|
|
|
|
|
|
|
Operating ROA & ROE (4) |
|
|
|
|
|
|
|
|
|
|
|
|
|
|
|
|
Adjusted operating earnings (non-GAAP) |
|
$ |
58,348 |
|
$ |
50,189 |
|
$ |
54,244 |
|
$ |
108,537 |
|
$ |
102,285 |
|
|
|
|
|
|
|
|
|
|
|
|
|
|
|
|
|
|
Average assets (GAAP) |
|
$ |
20,209,687 |
|
$ |
20,384,351 |
|
$ |
19,719,402 |
|
$ |
20,296,536 |
|
$ |
19,819,330 |
|
Return on average assets (ROA) (GAAP) |
|
|
1.10 |
% |
|
0.71 |
% |
|
1.27 |
% |
|
0.90 |
% |
|
1.08 |
% |
Adjusted operating return on average assets (ROA) (non-GAAP) |
|
|
1.16 |
% |
|
1.00 |
% |
|
1.10 |
% |
|
1.08 |
% |
|
1.04 |
% |
|
|
|
|
|
|
|
|
|
|
|
|
|
|
|
|
|
Average equity (GAAP) |
|
$ |
2,460,741 |
|
$ |
2,423,600 |
|
$ |
2,445,045 |
|
$ |
2,442,273 |
|
$ |
2,552,418 |
|
Return on average equity (ROE) (GAAP) |
|
|
9.00 |
% |
|
5.97 |
% |
|
10.21 |
% |
|
7.51 |
% |
|
8.37 |
% |
Adjusted operating return on average equity (ROE) (non-GAAP) |
|
|
9.51 |
% |
|
8.40 |
% |
|
8.90 |
% |
|
8.96 |
% |
|
8.08 |
% |
|
|
|
|
|
|
|
|
|
|
|
|
|
|
|
|
|
Operating ROTCE (2)(3)(4) |
|
|
|
|
|
|
|
|
|
|
|
|
|
|
|
|
Adjusted operating earnings available to common shareholders (non-GAAP) |
|
$ |
55,381 |
|
$ |
47,222 |
|
$ |
51,277 |
|
$ |
102,603 |
|
$ |
96,351 |
|
Plus: Amortization of intangibles, tax effected |
|
|
1,751 |
|
|
1,800 |
|
|
2,303 |
|
|
3,550 |
|
|
4,704 |
|
Adjusted operating earnings available to common shareholders before amortization of intangibles (non-GAAP) |
|
$ |
57,132 |
|
$ |
49,022 |
|
$ |
53,580 |
|
$ |
106,153 |
|
$ |
101,055 |
|
|
|
|
|
|
|
|
|
|
|
|
|
|
|
|
|
|
Average tangible common equity (non-GAAP) |
|
$ |
1,345,426 |
|
$ |
1,306,445 |
|
$ |
1,304,536 |
|
$ |
1,326,043 |
|
$ |
1,410,342 |
|
Adjusted operating return on average tangible common equity (non-GAAP) |
|
|
17.03 |
% |
|
15.22 |
% |
|
16.47 |
% |
|
16.14 |
% |
|
14.45 |
% |
|
|
|
|
|
|
|
|
|
|
|
|
|
|
|
|
|
Pre-tax pre-provision adjusted operating earnings (7) |
|
|
|
|
|
|
|
|
|
|
|
|
|
|
|
|
Net income (GAAP) |
|
$ |
55,241 |
|
$ |
35,653 |
|
$ |
62,226 |
|
$ |
90,894 |
|
$ |
105,916 |
|
Plus: Provision for credit losses |
|
|
6,069 |
|
|
11,850 |
|
|
3,559 |
|
|
17,920 |
|
|
6,359 |
|
Plus: Income tax expense |
|
|
9,310 |
|
|
7,294 |
|
|
12,500 |
|
|
16,604 |
|
|
21,773 |
|
Plus: Strategic cost saving initiatives |
|
|
3,935 |
|
|
— |
|
|
— |
|
|
3,935 |
|
|
— |
|
Plus: Legal reserve |
|
|
— |
|
|
5,000 |
|
|
— |
|
|
5,000 |
|
|
— |
|
Plus: Strategic branch closing and facility consolidation costs |
|
|
— |
|
|
— |
|
|
— |
|
|
— |
|
|
5,508 |
|
Less: Gain (loss) on sale of securities |
|
|
2 |
|
|
(13,400) |
|
|
(2) |
|
|
(13,398) |
|
|
(2) |
|
Less: Gain on sale of DHFB |
|
|
— |
|
|
— |
|
|
9,082 |
|
|
— |
|
|
9,082 |
|
Pre-tax pre-provision adjusted operating earnings (non-GAAP) |
|
$ |
74,553 |
|
$ |
73,197 |
|
$ |
69,205 |
|
$ |
147,751 |
|
$ |
130,476 |
|
Less: Dividends on preferred stock |
|
|
2,967 |
|
|
2,967 |
|
|
2,967 |
|
|
5,934 |
|
|
5,934 |
|
Pre-tax pre-provision adjusted operating earnings available to common shareholders (non-GAAP) |
|
$ |
71,586 |
|
$ |
70,230 |
|
$ |
66,238 |
|
$ |
141,817 |
|
$ |
124,542 |
|
|
|
|
|
|
|
|
|
|
|
|
|
|
|
|
|
|
Weighted average common shares outstanding, diluted |
|
|
74,995,557 |
|
|
74,835,514 |
|
|
74,849,871 |
|
|
74,915,977 |
|
|
75,201,326 |
|
Pre-tax pre-provision earnings per common share, diluted |
|
$ |
0.95 |
|
$ |
0.94 |
|
$ |
0.88 |
|
$ |
1.89 |
|
$ |
1.66 |
|
ATLANTIC UNION BANKSHARES CORPORATION AND SUBSIDIARIES
KEY FINANCIAL RESULTS (UNAUDITED)
(Dollars in thousands, except share data)
|
|
As of & For Three Months Ended |
|
As of & For Six Months Ended |
|
|||||||||||
|
|
06/30/23 |
|
03/31/23 |
|
06/30/22 |
|
06/30/23 |
|
06/30/22 |
|
|||||
Mortgage Origination Held for Sale Volume |
|
|
|
|
|
|
|
|
|
|
|
|
|
|
|
|
Refinance Volume |
|
$ |
4,076 |
|
$ |
3,452 |
|
$ |
14,916 |
|
$ |
7,528 |
|
$ |
48,116 |
|
Purchase Volume |
|
|
32,168 |
|
|
32,192 |
|
|
84,551 |
|
|
64,361 |
|
|
142,846 |
|
Total Mortgage loan originations held for sale |
|
$ |
36,244 |
|
$ |
35,644 |
|
$ |
99,467 |
|
$ |
71,889 |
|
$ |
190,962 |
|
% of originations held for sale that are refinances |
|
|
11.2 |
% |
|
9.7 |
% |
|
15.0 |
% |
|
10.5 |
% |
|
25.2 |
% |
|
|
|
|
|
|
|
|
|
|
|
|
|
|
|
|
|
Wealth |
|
|
|
|
|
|
|
|
|
|
|
|
|
|
|
|
Assets under management |
|
$ |
4,774,501 |
|
$ |
4,494,268 |
|
$ |
4,415,537 |
|
$ |
4,774,501 |
|
$ |
4,415,537 |
|
|
|
|
|
|
|
|
|
|
|
|
|
|
|
|
|
|
Other Data |
|
|
|
|
|
|
|
|
|
|
|
|
|
|
|
|
End of period full-time employees |
|
|
1,878 |
|
|
1,840 |
|
|
1,856 |
|
|
1,878 |
|
|
1,856 |
|
Number of full-service branches |
|
|
109 |
|
|
109 |
|
|
114 |
|
|
109 |
|
|
114 |
|
Number of automatic transaction machines ("ATMs") |
|
|
123 |
|
|
127 |
|
|
131 |
|
|
123 |
|
|
131 |
|
| (1) | These are non-GAAP financial measures. The Company believes net interest income (FTE), total revenue (FTE), and total adjusted revenue (FTE), which are used in computing net interest margin (FTE), efficiency ratio (FTE) and adjusted operating efficiency ratio (FTE), provide valuable additional insight into the net interest margin and the efficiency ratio by adjusting for differences in tax treatment of interest income sources. The entire FTE adjustment is attributable to interest income on earning assets, which is used in computing yield on earning assets. Interest expense and the related cost of interest-bearing liabilities and cost of funds ratios are not affected by the FTE components. |
| (2) | These are non-GAAP financial measures. Tangible assets and tangible common equity are used in the calculation of certain profitability, capital, and per share ratios. The Company believes tangible assets, tangible common equity and the related ratios are meaningful measures of capital adequacy because they provide a meaningful base for period-to-period and company-to-company comparisons, which the Company believes will assist investors in assessing the capital of the Company and its ability to absorb potential losses. The Company believes tangible common equity is an important indication of its ability to grow organically and through business combinations as well as its ability to pay dividends and to engage in various capital management strategies. |
| (3) | These are non-GAAP financial measures. The Company believes that ROTCE is a meaningful supplement to GAAP financial measures and is useful to investors because it measures the performance of a business consistently across time without regard to whether components of the business were acquired or developed internally. |
(4)
These are non-GAAP financial measures. Adjusted operating measures exclude, as applicable, gain (loss) on sale of securities, a legal reserve associated with an ongoing regulatory matter previously disclosed, strategic cost saving initiatives (principally composed of severance charges related to headcount reductions and charges for exiting leases), gain on sale of DHFB, as well as strategic branch closure initiatives and related facility consolidation costs (principally composed of real estate, leases and other assets write downs, as well as severance and expense reduction initiatives). The Company believes these non-GAAP adjusted measures provide investors with important information about the continuing economic results of the organization’s operations.
|
| (5) | All ratios at June 30, 2023 are estimates and subject to change pending the Company’s filing of its FR Y9-C. All other periods are presented as filed. |
| (6) | The adjusted operating efficiency ratio (FTE) excludes, as applicable, the amortization of intangible assets, gain (loss) on sale of securities, a legal reserve associated with an ongoing regulatory matter previously disclosed, strategic cost saving initiatives, gain on sale of DHFB, as well as strategic branch closure initiatives and related facility consolidation costs. This measure is similar to the measure utilized by the Company when analyzing corporate performance and is also similar to the measure utilized for incentive compensation. The Company believes this adjusted measure provides investors with important information about the continuing economic results of the organization’s operations. |
| (7) | These are non-GAAP financial measures. Pre-tax pre-provision adjusted earnings excludes, as applicable, the provision for credit losses, which can fluctuate significantly from period-to-period under the CECL methodology, income tax expense, gain (loss) on sale of securities, a legal reserve associated with an ongoing regulatory matter previously disclosed, strategic cost saving initiatives, gain on sale of DHFB, as well as strategic branch closure initiatives and related facility consolidation costs. The Company believes this adjusted measure provides investors with important information about the continuing economic results of the Company’s operations. |
ATLANTIC UNION BANKSHARES CORPORATION AND SUBSIDIARIES
CONSOLIDATED BALANCE SHEETS
(Dollars in thousands, except share data)
|
June 30, |
|
December 31, |
|
June 30, |
|||
|
2023 |
|
2022 |
|
2022 |
|||
ASSETS |
|
(unaudited) |
|
|
(audited) |
|
|
(unaudited) |
Cash and cash equivalents: |
|
|
|
|
|
|
|
|
Cash and due from banks |
$ |
199,778 |
|
$ |
216,384 |
|
$ |
158,902 |
Interest-bearing deposits in other banks |
|
227,015 |
|
|
102,107 |
|
|
82,086 |
Federal funds sold |
|
1,474 |
|
|
1,457 |
|
|
388 |
Total cash and cash equivalents |
|
428,267 |
|
|
319,948 |
|
|
241,376 |
Securities available for sale, at fair value |
|
2,182,448 |
|
|
2,741,816 |
|
|
2,951,421 |
Securities held to maturity, at carrying value |
|
849,610 |
|
|
847,732 |
|
|
780,749 |
Restricted stock, at cost |
|
111,178 |
|
|
120,213 |
|
|
87,908 |
Loans held for sale |
|
10,327 |
|
|
3,936 |
|
|
15,866 |
Loans held for investment, net of deferred fees and costs |
|
15,066,930 |
|
|
14,449,142 |
|
|
13,655,408 |
Less: allowance for loan and lease losses |
|
120,683 |
|
|
110,768 |
|
|
104,184 |
Total loans held for investment, net |
|
14,946,247 |
|
|
14,338,374 |
|
|
13,551,224 |
Premises and equipment, net |
|
114,786 |
|
|
118,243 |
|
|
128,661 |
Goodwill |
|
925,211 |
|
|
925,211 |
|
|
925,211 |
Amortizable intangibles, net |
|
23,469 |
|
|
26,761 |
|
|
31,621 |
Bank owned life insurance |
|
446,441 |
|
|
440,656 |
|
|
436,703 |
Other assets |
|
564,348 |
|
|
578,248 |
|
|
511,059 |
Total assets |
$ |
20,602,332 |
|
$ |
20,461,138 |
|
$ |
19,661,799 |
LIABILITIES |
|
|
|
|
|
|
|
|
Noninterest-bearing demand deposits |
$ |
4,310,306 |
|
$ |
4,883,239 |
|
$ |
5,361,538 |
Interest-bearing deposits |
|
12,101,681 |
|
|
11,048,438 |
|
|
10,767,097 |
Total deposits |
|
16,411,987 |
|
|
15,931,677 |
|
|
16,128,635 |
Securities sold under agreements to repurchase |
|
130,461 |
|
|
142,837 |
|
|
118,658 |
Other short-term borrowings |
|
799,400 |
|
|
1,176,000 |
|
|
290,000 |
Long-term borrowings |
|
390,440 |
|
|
389,863 |
|
|
389,290 |
Other liabilities |
|
445,574 |
|
|
448,024 |
|
|
343,740 |
Total liabilities |
|
18,177,862 |
|
|
18,088,401 |
|
|
17,270,323 |
Commitments and contingencies |
|
|
|
|
|
|
|
|
STOCKHOLDERS' EQUITY |
|
|
|
|
|
|
|
|
Preferred stock, $10.00 par value |
|
173 |
|
|
173 |
|
|
173 |
Common stock, $1.33 par value |
|
99,088 |
|
|
98,873 |
|
|
98,822 |
Additional paid-in capital |
|
1,776,494 |
|
|
1,772,440 |
|
|
1,767,063 |
Retained earnings |
|
959,582 |
|
|
919,537 |
|
|
841,701 |
Accumulated other comprehensive loss |
|
(410,867) |
|
|
(418,286) |
|
|
(316,283) |
Total stockholders' equity |
|
2,424,470 |
|
|
2,372,737 |
|
|
2,391,476 |
Total liabilities and stockholders' equity |
$ |
20,602,332 |
|
$ |
20,461,138 |
|
$ |
19,661,799 |
|
|
|
|
|
|
|
|
|
Common shares outstanding |
|
74,998,075 |
|
|
74,712,622 |
|
|
74,688,314 |
Common shares authorized |
|
200,000,000 |
|
|
200,000,000 |
|
|
200,000,000 |
Preferred shares outstanding |
|
17,250 |
|
|
17,250 |
|
|
17,250 |
Preferred shares authorized |
|
500,000 |
|
|
500,000 |
|
|
500,000 |
ATLANTIC UNION BANKSHARES CORPORATION AND SUBSIDIARIES
CONSOLIDATED STATEMENTS OF INCOME (UNAUDITED)
(Dollars in thousands, except share data)
|
Three Months Ended |
|
Six Months Ended |
|||||||||||
|
June 30, |
|
March 31, |
|
June 30, |
|
June 30, |
|
June 30, |
|||||
|
2023 |
|
2023 |
|
2022 |
|
2023 |
|
2022 |
|||||
Interest and dividend income: |
|
|
|
|
|
|
|
|
|
|
|
|
|
|
Interest and fees on loans |
$ |
205,172 |
|
$ |
189,992 |
|
$ |
123,266 |
|
$ |
395,165 |
|
$ |
237,466 |
Interest on deposits in other banks |
|
1,014 |
|
|
1,493 |
|
|
157 |
|
|
2,507 |
|
|
288 |
Interest and dividends on securities: |
|
|
|
|
|
|
|
|
|
|
|
|
|
|
Taxable |
|
15,565 |
|
|
16,753 |
|
|
14,695 |
|
|
32,317 |
|
|
28,361 |
Nontaxable |
|
8,496 |
|
|
9,308 |
|
|
10,637 |
|
|
17,804 |
|
|
21,097 |
Total interest and dividend income |
|
230,247 |
|
|
217,546 |
|
|
148,755 |
|
|
447,793 |
|
|
287,212 |
Interest expense: |
|
|
|
|
|
|
|
|
|
|
|
|
|
|
Interest on deposits |
|
65,267 |
|
|
51,834 |
|
|
6,097 |
|
|
117,100 |
|
|
10,580 |
Interest on short-term borrowings |
|
8,044 |
|
|
7,563 |
|
|
555 |
|
|
15,607 |
|
|
576 |
Interest on long-term borrowings |
|
4,852 |
|
|
4,706 |
|
|
3,336 |
|
|
9,558 |
|
|
6,358 |
Total interest expense |
|
78,163 |
|
|
64,103 |
|
|
9,988 |
|
|
142,265 |
|
|
17,514 |
Net interest income |
|
152,084 |
|
|
153,443 |
|
|
138,767 |
|
|
305,528 |
|
|
269,698 |
Provision for credit losses |
|
6,069 |
|
|
11,850 |
|
|
3,559 |
|
|
17,920 |
|
|
6,359 |
Net interest income after provision for credit losses |
|
146,015 |
|
|
141,593 |
|
|
135,208 |
|
|
287,608 |
|
|
263,339 |
Noninterest income: |
|
|
|
|
|
|
|
|
|
|
|
|
|
|
Service charges on deposit accounts |
|
8,118 |
|
|
7,902 |
|
|
8,040 |
|
|
16,020 |
|
|
15,637 |
Other service charges, commissions and fees |
|
1,693 |
|
|
1,746 |
|
|
1,709 |
|
|
3,439 |
|
|
3,364 |
Interchange fees |
|
2,459 |
|
|
2,325 |
|
|
2,268 |
|
|
4,784 |
|
|
4,078 |
Fiduciary and asset management fees |
|
4,359 |
|
|
4,262 |
|
|
6,939 |
|
|
8,620 |
|
|
14,194 |
Mortgage banking income |
|
449 |
|
|
854 |
|
|
2,200 |
|
|
1,303 |
|
|
5,317 |
Gain (loss) on sale of securities |
|
2 |
|
|
(13,400) |
|
|
(2) |
|
|
(13,398) |
|
|
(2) |
Bank owned life insurance income |
|
2,870 |
|
|
2,828 |
|
|
2,716 |
|
|
5,698 |
|
|
5,413 |
Loan-related interest rate swap fees |
|
2,316 |
|
|
1,439 |
|
|
2,600 |
|
|
3,755 |
|
|
6,460 |
Other operating income |
|
1,931 |
|
|
1,672 |
|
|
11,816 |
|
|
3,603 |
|
|
13,978 |
Total noninterest income |
|
24,197 |
|
|
9,628 |
|
|
38,286 |
|
|
33,824 |
|
|
68,439 |
Noninterest expenses: |
|
|
|
|
|
|
|
|
|
|
|
|
|
|
Salaries and benefits |
|
62,019 |
|
|
60,529 |
|
|
55,305 |
|
|
122,547 |
|
|
113,603 |
Occupancy expenses |
|
6,094 |
|
|
6,356 |
|
|
6,395 |
|
|
12,450 |
|
|
13,278 |
Furniture and equipment expenses |
|
3,565 |
|
|
3,752 |
|
|
3,590 |
|
|
7,317 |
|
|
7,187 |
Technology and data processing |
|
8,566 |
|
|
8,142 |
|
|
7,862 |
|
|
16,708 |
|
|
15,658 |
Professional services |
|
4,433 |
|
|
3,413 |
|
|
4,680 |
|
|
7,847 |
|
|
8,770 |
Marketing and advertising expense |
|
2,817 |
|
|
2,351 |
|
|
2,502 |
|
|
5,168 |
|
|
4,665 |
FDIC assessment premiums and other insurance |
|
4,074 |
|
|
3,899 |
|
|
2,765 |
|
|
7,973 |
|
|
5,250 |
Franchise and other taxes |
|
4,499 |
|
|
4,498 |
|
|
4,500 |
|
|
8,997 |
|
|
8,999 |
Loan-related expenses |
|
1,619 |
|
|
1,552 |
|
|
1,867 |
|
|
3,171 |
|
|
3,643 |
Amortization of intangible assets |
|
2,216 |
|
|
2,279 |
|
|
2,915 |
|
|
4,494 |
|
|
5,954 |
Other expenses |
|
5,759 |
|
|
11,503 |
|
|
6,387 |
|
|
17,262 |
|
|
17,082 |
Total noninterest expenses |
|
105,661 |
|
|
108,274 |
|
|
98,768 |
|
|
213,934 |
|
|
204,089 |
Income before income taxes |
|
64,551 |
|
|
42,947 |
|
|
74,726 |
|
|
107,498 |
|
|
127,689 |
Income tax expense |
|
9,310 |
|
|
7,294 |
|
|
12,500 |
|
|
16,604 |
|
|
21,773 |
Net income |
$ |
55,241 |
|
$ |
35,653 |
|
$ |
62,226 |
|
|
90,894 |
|
|
105,916 |
Dividends on preferred stock |
|
2,967 |
|
|
2,967 |
|
|
2,967 |
|
|
5,934 |
|
|
5,934 |
Net income available to common shareholders |
$ |
52,274 |
|
$ |
32,686 |
|
$ |
59,259 |
|
$ |
84,960 |
|
$ |
99,982 |
|
|
|
|
|
|
|
|
|
|
|
|
|
|
|
Basic earnings per common share |
$ |
0.70 |
|
$ |
0.44 |
|
$ |
0.79 |
|
$ |
1.13 |
|
$ |
1.33 |
Diluted earnings per common share |
$ |
0.70 |
|
$ |
0.44 |
|
$ |
0.79 |
|
$ |
1.13 |
|
$ |
1.33 |
AVERAGE BALANCES, INCOME AND EXPENSES, YIELDS AND RATES (TAXABLE EQUIVALENT BASIS) (UNAUDITED)
(Dollars in thousands)
|
For the Quarter Ended |
||||||||||||||
|
June 30, 2023 |
|
March 31, 2023 |
||||||||||||
|
Average |
|
Interest |
|
Yield / |
|
Average |
|
Interest |
|
Yield / |
||||
Assets: |
|
|
|
|
|
|
|
|
|
|
|
|
|
|
|
Securities: |
|
|
|
|
|
|
|
|
|
|
|
|
|
|
|
Taxable |
$ |
1,865,193 |
|
$ |
15,565 |
|
3.35% |
|
$ |
2,038,215 |
|
$ |
16,753 |
|
3.33% |
Tax-exempt |
|
1,311,469 |
|
|
10,755 |
|
3.29% |
|
|
1,429,346 |
|
|
11,782 |
|
3.34% |
Total securities |
|
3,176,662 |
|
|
26,320 |
|
3.32% |
|
|
3,467,561 |
|
|
28,535 |
|
3.34% |
LHFI, net of deferred fees and costs (3) |
|
14,746,218 |
|
|
206,452 |
|
5.62% |
|
|
14,505,611 |
|
|
191,178 |
|
5.35% |
Other earning assets |
|
168,929 |
|
|
1,141 |
|
2.71% |
|
|
264,916 |
|
|
1,621 |
|
2.48% |
Total earning assets |
|
18,091,809 |
|
$ |
233,913 |
|
5.19% |
|
|
18,238,088 |
|
$ |
221,334 |
|
4.92% |
Allowance for loan and lease losses |
|
(117,643) |
|
|
|
|
|
|
|
(112,172) |
|
|
|
|
|
Total non-earning assets |
|
2,235,521 |
|
|
|
|
|
|
|
2,258,435 |
|
|
|
|
|
Total assets |
$ |
20,209,687 |
|
|
|
|
|
|
$ |
20,384,351 |
|
|
|
|
|
|
|
|
|
|
|
|
|
|
|
|
|
|
|
|
|
Liabilities and Stockholders' Equity: |
|
|
|
|
|
|
|
|
|
|
|
|
|
|
|
Interest-bearing deposits: |
|
|
|
|
|
|
|
|
|
|
|
|
|
|
|
Transaction and money market accounts |
$ |
8,387,473 |
|
$ |
46,953 |
|
2.25% |
|
$ |
8,344,900 |
|
$ |
38,315 |
|
1.86% |
Regular savings |
|
1,014,565 |
|
|
430 |
|
0.17% |
|
|
1,087,435 |
|
|
364 |
|
0.14% |
Time deposits |
|
2,500,966 |
|
|
17,884 |
|
2.87% |
|
|
2,291,530 |
|
|
13,155 |
|
2.33% |
Total interest-bearing deposits |
|
11,903,004 |
|
|
65,267 |
|
2.20% |
|
|
11,723,865 |
|
|
51,834 |
|
1.79% |
Other borrowings |
|
1,071,171 |
|
|
12,896 |
|
4.83% |
|
|
1,122,244 |
|
|
12,269 |
|
4.43% |
Total interest-bearing liabilities |
$ |
12,974,175 |
|
$ |
78,163 |
|
2.42% |
|
$ |
12,846,109 |
|
$ |
64,103 |
|
2.02% |
|
|
|
|
|
|
|
|
|
|
|
|
|
|
|
|
Noninterest-bearing liabilities: |
|
|
|
|
|
|
|
|
|
|
|
|
|
|
|
Demand deposits |
|
4,377,150 |
|
|
|
|
|
|
|
4,693,347 |
|
|
|
|
|
Other liabilities |
|
397,621 |
|
|
|
|
|
|
|
421,295 |
|
|
|
|
|
Total liabilities |
|
17,748,946 |
|
|
|
|
|
|
|
17,960,751 |
|
|
|
|
|
Stockholders' equity |
|
2,460,741 |
|
|
|
|
|
|
|
2,423,600 |
|
|
|
|
|
Total liabilities and stockholders' equity |
$ |
20,209,687 |
|
|
|
|
|
|
$ |
20,384,351 |
|
|
|
|
|
Net interest income |
|
|
|
$ |
155,750 |
|
|
|
|
|
|
$ |
157,231 |
|
|
|
|
|
|
|
|
|
|
|
|
|
|
|
|
|
|
Interest rate spread |
|
|
|
|
|
|
2.77% |
|
|
|
|
|
|
|
2.90% |
Cost of funds |
|
|
|
|
|
|
1.74% |
|
|
|
|
|
|
|
1.42% |
Net interest margin |
|
|
|
|
|
|
3.45% |
|
|
|
|
|
|
|
3.50% |
| (1) | Income and yields are reported on a taxable equivalent basis using the statutory federal corporate tax rate of 21%. |
| (2) | Rates and yields are annualized and calculated from actual, not rounded amounts in thousands, which appear above. |
| (3) | Nonaccrual loans are included in average loans outstanding. |
|
2nd Quarter 2023 Earnings Presentation NYSE: AUB July 25, 2023 |
|
2 Forward Looking Statements This presentation and statements by our management may constitute “forward-looking statements” within the meaning of the Private Securities Litigation Reform Act of 1995. Forward-looking statements are statements that include, without limitation, statements on slides entitled “Financial Outlook” and "Q2 2023 Highlights and 2023 Outlook,“ statements regarding our strategic priorities and liquidity and capital management strategies, expectations with regard to our business, financial, and operating results, including our deposit base and funding, the impact of future economic conditions, and statements that include, other projections, predictions, expectations, or beliefs about future events or results, including our ability to meet our top tier financial targets, or otherwise are not statements of historical fact. Such forward-looking statements are based on certain assumptions as of the time they are made, and are inherently subject to known and unknown risks, uncertainties, and other factors, some of which cannot be predicted or quantified, that may cause actual results, performance, achievements, or trends to be materially different from those expressed or implied by such forward-looking statements. Such statements are often characterized by the use of qualified words (and their derivatives) such as “expect,” “believe,” “estimate,” “plan,” “project,” “anticipate,” “intend,” “will,” “may,” “view,” “opportunity,” “potential,” “continue,” “confidence,” or words of similar meaning or other statements concerning opinions or judgment of the Company and our management about future events. Although we believe that our expectations with respect to forward-looking statements are based upon reasonable assumptions within the bounds of our existing knowledge of our business and operations, there can be no assurance that actual future results, performance, or achievements of, or trends affecting, us will not differ materially from any projected future results, performance, achievements or trends expressed or implied by such forward-looking statements. Actual future results, performance, achievements or trends may differ materially from historical results or those anticipated depending on a variety of factors, including, but not limited to the effects of or changes in: • market interest rates and their related impacts on macroeconomic conditions, customer and client behavior, our funding costs and our loan and securities portfolios; • inflation and its impacts on economic growth and customer and client behavior; • adverse developments in the financial industry generally, such as the recent bank failures, responsive measures to mitigate and manage such developments, related supervisory and regulatory actions and costs, and related impacts on customer and client behavior; • the sufficiency of liquidity; • general economic and financial market conditions, in the United States generally and particularly in the markets in which we operate and which our loans are concentrated, including the effects of declines in real estate values, an increase in unemployment levels and slowdowns in economic growth; • monetary and fiscal policies of the U.S. government, including policies of the U.S. Department of the Treasury and the Federal Reserve; • the quality or composition of our loan or investment portfolios and changes therein; • demand for loan products and financial services in our market areas; • our ability to manage our growth or implement our growth strategy; • the effectiveness of expense reduction plans; • the introduction of new lines of business or new products and services; • our ability to recruit and retain key employees; • real estate values in our lending area; • changes in accounting principles, standards, rules, and interpretations, and the related impact on our financial statements; • an insufficient ACL or volatility in the ACL resulting from the CECL methodology, either alone or as that may be affected by inflation, changing interest rates, or other factors; • our liquidity and capital positions; • concentrations of loans secured by real estate, particularly commercial real estate; • the effectiveness of our credit processes and management of our credit risk; • our ability to compete in the market for financial services and increased competition from fintech companies; • technological risks and developments, and cyber threats, attacks, or events; • operational, technological, cultural, regulatory, legal, credit, and other risks associated with the exploration, consummation and integration of potential future acquisitions, whether involving stock or cash considerations; • the potential adverse effects of unusual and infrequently occurring events, such as weather-related disasters, terrorist acts, geopolitical conflicts or public health events, and of governmental and societal responses thereto; these potential adverse effects may include, without limitation, adverse effects on the ability of our borrowers to satisfy their obligations to us, on the value of collateral securing loans, on the demand for the our loans or our other products and services, on supply chains and methods used to distribute products and services, on incidents of cyberattack and fraud, on our liquidity or capital positions, on risks posed by reliance on third-party service providers, on other aspects of our business operations and on financial markets and economic growth; • the discontinuation of LIBOR and its impact on the financial markets, and our ability to manage operational, legal, and compliance risks related to the discontinuation of LIBOR and implementation of one or more alternate reference rates; • performance by our counterparties or vendors; • deposit flows; • the availability of financing and the terms thereof; • the level of prepayments on loans and mortgage-backed securities; • legislative or regulatory changes and requirements; • actual or potential claims, damages, and fines related to litigation or government actions, which may result in, among other things, additional costs, fines, penalties, restrictions on our business activities, reputational harm, or other adverse consequences; • the effects of changes in federal, state or local tax laws and regulations; • any event or development that would cause us to conclude that there was an impairment of any asset, including intangible assets, such as goodwill; • other factors, many of which are beyond our control; and • the risks, uncertainties and assumptions set forth under the heading “Caution About Forward-Looking Statements” in the joint press release issued by the Company and American National Bankshares, Inc. on the date hereof with respect to the proposed merger transaction between the Company and American National. Please also refer to such other factors as discussed throughout Part I, Item 1A. “Risk Factors” and Part II, Item 7, “Management’s Discussion and Analysis of Financial Condition and Results of Operations” of our Annual Report on Form 10 K for the year ended December 31, 2022, Part II, Item 1A. "Risk Factors" in our Quarterly Report on Form 10-Q for the quarter ended March 31, 2023 and related disclosures in other filings, which have been filed with the U.S. Securities and Exchange Commission (“SEC”) and are available on the SEC’s website at www.sec.gov. All risk factors and uncertainties described herein and therein should be considered in evaluating forward-looking statements, and all of the forward-looking statements are expressly qualified by the cautionary statements contained or referred to herein and therein. The actual results or developments anticipated may not be realized or, even if substantially realized, they may not have the expected consequences to or effects on the Company or its businesses or operations. Readers are cautioned not to rely too heavily on the forward-looking statements, and undue reliance should not be placed on such forward-looking statements. Forward-looking statements speak only as of the date they are made. We do not intend or assume any obligation to update, revise or clarify any forward-looking statements that may be made from time to time by or on behalf of the Company, whether as a result of new information, future events or otherwise. |
|
3 Additional Information Non-GAAP Financial Measures This presentation contains certain financial information determined by methods other than in accordance with generally accepted accounting principles in the United States (“GAAP”). These non-GAAP financial measures are a supplement to GAAP, which is used to prepare the Company’s financial statements, and should not be considered in isolation or as a substitute for comparable measures calculated in accordance with GAAP. In addition, the Company’s non-GAAP financial measures may not be comparable to non-GAAP financial measures of other companies. The Company uses the non-GAAP financial measures discussed herein in its analysis of the Company’s performance. The Company’s management believes that these non-GAAP financial measures provide additional understanding of ongoing operations, enhance comparability of results of operations with prior periods, show the effects of significant gains and charges in the periods presented without the impact of items or events that may obscure trends in the Company’s underlying performance, or show the potential effects of accumulated other comprehensive income (or AOCI) or unrealized losses on securities on the Company's capital. Please see “Reconciliation of Non-GAAP Disclosures” at the end of this presentation for a reconciliation to the nearest GAAP financial measure. No Offer or Solicitation This presentation does not constitute an offer to sell or a solicitation of an offer to buy any securities. No offer of securities shall be made except by means of a prospectus meeting the requirements of the Securities Act of 1933, as amended, and no offer to sell or solicitation of an offer to buy shall be made in any jurisdiction in which such offer, solicitation or sale would be unlawful. About Atlantic Union Bankshares Corporation Headquartered in Richmond, Virginia, Atlantic Union Bankshares Corporation (NYSE: AUB) is the holding company for Atlantic Union Bank. Atlantic Union Bank has 109 branches and approximately 125 ATMs located throughout Virginia, and in portions of Maryland and North Carolina. Certain non-bank financial services affiliates of Atlantic Union Bank include: Atlantic Union Equipment Finance, Inc., which provides equipment financing; Atlantic Union Financial Consultants, LLC, which provides brokerage services; and Union Insurance Group, LLC, which offers various lines of insurance products. |
|
4 Largest Regional Banking Company Headquartered in Virginia Our Company Soundness | Profitability | Growth Data as of 6/30/2023, market capitalization as of 7/24/2023 1) Regional bank defined as having less than $100 billion in assets; rank determined by asset size; data per S&P Global Market Intelligence Highlights ($bn) • Statewide Virginia footprint of 104 branches in all major markets • #1 regional bank1 deposit market share in Virginia • Strong balance sheet and capital levels • Committed to top-tier financial performance with a highly experienced management team able to execute change 4 $20.6 Assets $15.1 Loans $16.4 Deposits $2.3 Market Capitalization Branch/Office Footprint AUB (109) AUB LPO (2) AUB Equipment Finance Headquarters (1) |
|
5 Our Shareholder Value Proposition Leading Regional Presence Dense, uniquely valuable presence across attractive markets Financial Strength Solid balance sheet & capital levels Attractive Financial Profile Solid dividend yield & payout ratio with earnings upside Strong Growth Potential Organic & acquisition opportunities Peer-Leading Performance Committed to top-tier financial performance |
|
6 Q2 2023 Highlights and 2023 Outlook Loan and Deposit Growth • Relatively flat deposit balances quarter over quarter • 13.3% annualized loan growth in Q2 2023 • Line of Credit Utilization of 34% for Q2 2023 and relatively flat with Q1 2023 • Expect mid-single digit loan growth for 2023 Asset Quality • Q2 2023 net charge-offs at 4 bps annualized and expect net charge-offs of ~10 bps for 2023 Positioning for Long Term • Lending pipelines remain resilient • No material deposit run-off to larger banks • Drive organic growth and performance of the core banking franchise Differentiated Client Experience • Position Company as responsive, strong and capable alternative to large national banks Operating Leverage Focus • ~4.9% adjusted revenue growth1 year over year • ~3.8% adjusted operating noninterest expense growth1 year over year • Adjusted operating leverage1 of ~1.1% year over year • Pre-Tax, Pre-Provision adjusted operating earnings1 increased 7.7% year over year • Took strategic actions to reduce expenses in Q2 Capitalize on Strategic Opportunities • Selectively consider bank M&A, minority stakes and strategic partnerships as a supplemental strategy 6 1 For non-GAAP financial measures, see reconciliation to most directly comparable GAAP measures in “Appendix – Reconciliation of Non-GAAP Disclosures” |
|
7 Loan and Deposit Betas 8% 18% 25% 37% 41% 0.23% 0.55% 1.05% 1.79% 2.20% Q2 2022 Q3 2022 Q4 2022 Q1 2023 Q2 2023 Interest Bearing Deposit Beta2 Cumulative Int. Bearing Deposit Beta Int. Bearing Rate Paid 5% 12% 17% 26% 30% 0.15% 0.37% 0.72% 1.28% 1.61% Q2 2022 Q3 2022 Q4 2022 Q1 2023 Q2 2023 Total Deposit Beta2 Cumulative Deposit Beta 33% 28% 26% 67% 72% 74% Q2 2022 Q1 2023 Q2 2023 Deposit Mix Shift Noninterest bearing Deposits Interest bearing Deposits 26% 34% 39% 42% 44% 3.67% 4.20% 4.90% 5.35% 5.62% Q2 2022 Q3 2022 Q4 2022 Q1 2023 Q2 2023 Total Loan Beta1 Cumulative Loan Beta Average Rate $16,129 $16,456 $16,412 2Q 2023 Highlights • Total deposits relatively flat from Q1 2023 • Mix shift into higher costing deposit products and higher deposit betas drove increased cost of deposits • From the start of the cycle through Q2 2023 the total deposit beta is 30% and total loan beta is 44% • Loan and deposit betas expected to continue to rise throughout 2023 1) Loan Betas are calculated as the change in yield from 1Q22 to the represented quarter. 2) Deposit Betas and Interest Bearing Deposit Betas are calculated as the change in rate paid from 4Q21 to the represented quarter. |
|
8 Q2 2023 Financial Performance At-a-Glance 1For non-GAAP financial measures, see reconciliation to most directly comparable GAAP measures in “Appendix – Reconciliation of Non-GAAP Disclosures” Note: all tables presented dollars in thousands, except per share amounts • Net income available to common shareholders for the second quarter of 2023 was $52.3 million or $0.70 per share, up $19.6 million or $0.26 per share compared to the prior quarter. The results were driven by: • An increase in noninterest income, primarily due to losses incurred on the sale of available for sale (“AFS”) securities in the prior quarter, driven by the Company’s balance sheet repositioning transactions, and that were not repeating during the second quarter, • A decrease in the provision for credit losses, • A decrease in noninterest expense, reflecting the legal reserve recorded in the prior quarter associated with an ongoing regulatory matter as previously disclosed, partially offset by charges incurred in the second quarter related to our strategic cost saving initiatives, principally composed of severance charges related to headcount reductions and charges related to exiting leases, • A decrease in net interest income, primarily driven by higher deposit costs due to increases in market interest rates, as well as changes in the deposit mix as depositors migrated to higher costing interest bearing deposit accounts, partially offset by an increase in loan yields due primarily to variable rate loans repricing as short-term interest rates increased and the impact of loan growth. • Adjusted operating earnings available to common shareholders1 increased $8.2 million to $55.4 million at June 30, 2023 compared to the prior quarter, primarily driven by: • A decrease in the provision for credit losses, as noted above, • An increase in adjusted operating noninterest income1 , primarily due to an increase in loan-related interest rate swap fees and other operating income due to an increase in loan syndication revenue, partially offset by a decline in mortgage banking income, • A decrease in adjusted operating noninterest expense1 , primarily due to decreases in salaries and benefits expense, outside of severance charges related to headcount reductions in the quarter included in the strategic cost saving initiatives noted above, and other expenses primarily due to OREO-related gains recognized in the current quarter and reduced branch closing costs as compared to the prior quarter, partially offset by increases in professional services, marketing and advertising expense, and technology and data processing, • A decrease in net interest income, as noted above. 2Q2023 1Q2023 Net Income available to common shareholders $ 52,274 $ 32,686 Common EPS, diluted $ 0.70 $ 0.44 ROE 9.00% 5.97% ROTCE (non-GAAP)1 16.11% 10.71% ROA 1.10% 0.71% Efficiency ratio 59.94% 66.40% Efficiency ratio (FTE)1 58.72% 64.89% Net interest margin 3.37% 3.41% Net interest margin (FTE)1 3.45% 3.50% Earnings Metrics 2Q2023 1Q2023 Adjusted operating earnings available to common shareholders $ 55,381 $ 47,222 Adjusted operating common EPS, diluted $ 0.74 $ 0.63 Adjusted operating ROA 1.16% 1.00% Adjusted operating ROTCE 17.03% 15.22% Adjusted operating efficiency ratio (FTE) 55.30% 56.03% Adjusted operating earnings PTPP $ 74,553 $ 73,197 PTPP = Pre-tax Pre-provision Adjusted Operating Earnings Metrics - non-GAAP1 2Q2023 1Q2023 Net interest income $ 152,084 $ 153,443 - Provision for credit losses 6,069 11,850 + Noninterest income 24,197 9,628 - Noninterest expense 105,661 108,274 - Taxes 9,310 7,294 Net income (GAAP) $ 55,241 $ 35,653 - Dividends on preferred stock 2,967 2,967 Net income available to common shareholders (GAAP) $ 52,274 $ 32,686 + Strategic cost saving initiatives, net of tax 3,109 - + Legal reserve, net of tax - 3,950 - Gain (loss) on sale of securities, net of tax 2 (10,586) Adjusted operating earnings available to common shareholders (non-GAAP)1 $ 55,381 $ 47,222 Summarized Income Statement |
|
9 Q2 2023 Allowance For Credit Loss (ACL) and Provision for Credit Losses Q2 Macroeconomic Forecast Moody’s June 2023 Baseline Forecast: • US GDP expected to average ~1.6% growth in 2023 and ~1.4% in 2024. • The national unemployment rate expected to average ~3.6% in 2023 and ~4.1% in 2024. • Virginia’s unemployment rate expected to average ~3.2% over the 2-year forecast period. Q2 ACL Considerations • The Virginia unemployment forecast used for 2Q23 considered a baseline forecast of ~3.2%, adjusted for the probability of worse-than baseline economic performance, resulting in an average weighted forecast of ~6.1%. • Qualitative factors were added for certain portfolios and other factors as deemed appropriate, consistent with prior quarter. • The reasonable and supportable forecast period is 2 years; followed by reversion to the historical loss average over 2 years; consistent with CECL adoption. Allowance for Loan & Lease Losses Reserve for Unfunded Commitments Allowance for Credit Losses 12/31/2022 Ending Balance % of loans $111MM (0.77%) $14MM (0.09%) $124MM (0.86%) Q1 2023 Activity +$6MM Increase due to increasing uncertainty in the economic outlook and loan growth in the first quarter of 2023 +$1MM Increase due to increased risks related to the economic outlook +$8MM $11.8 million Provision for Credit Losses and $4.6 million net charge-offs 03/31/2023 Ending Balance % of loans $117MM (0.80%) $15MM (0.10%) $132MM (0.90%) Q2 2023 Activity +$4MM Increase due to loan growth and the impact of continued uncertainty in the economic outlook +$1MM Increase due to uncertainty in the economic outlook +$5MM $6.1 million Provision for Credit Losses and $1.6 million net charge-offs 06/30/2023 Ending Balance % of loans $121MM (0.80%) $16MM (0.10%) $136MM (0.90%) Numbers may not foot due to rounding. |
|
10 Q2 2023 Net Interest Margin Market Rates 2Q2023 1Q2023 EOP Avg EOP Avg Fed funds 5.25% 5.16% 5.00% 4.69% Prime 8.25% 8.16% 8.00% 7.69% 1-month LIBOR 5.22% 5.10% 4.86% 4.62% 1-month SOFR 5.17% 5.04% 4.80% 4.61% 2-year Treasury 4.90% 4.28% 4.03% 4.35% 10- year Treasury 3.84% 3.59% 3.47% 3.64% Margin Overview 2Q2023 1Q2023 Net interest margin (FTE)1 3.45% 3.50% Loan yield 5.62% 5.35% Investment yield 3.32% 3.34% Earning asset yield 5.19% 4.92% Cost of deposits 1.61% 1.28% Cost of interest-bearing deposits 2.20% 1.79% Cost of interest-bearing liabilities 2.42% 2.02% Cost of funds 1.74% 1.42% Presented on an FTE basis (non-GAAP)1 Approximately 16% of the loan portfolio at 6/30/2023 have floors and all are above floors Loan Portfolio Pricing Mix 2Q2023 Fixed 47% 1-month SOFR 24% 1-month LIBOR 17% Prime 7% Other 5% Total 100% 1 For non-GAAP financial measures, see reconciliation to most directly comparable GAAP measures in “Appendix – Reconciliation of Non-GAAP Disclosures” 22 bps 5 bps -13 bps -3 bps -16 bps Total Deposit Cost -29 bps |
|
11 Q2 2023 Noninterest Income and Noninterest Expense Adjusted operating noninterest income1 increased $1.2 million to $24.2 million for the quarter ended June 30, 2023 from $23.0 million in the prior quarter due to: • An increase in loan-related interest rate swap fees of $877,000 due to several new swap transactions • An increase in other operating income of $259,000 primarily driven by an increase in loan syndication revenue • Increases in several other noninterest income categories including: • Certain service charges, • Debit interchange fees, and • Fiduciary and asset management fee income • Partially offset by a decrease of $405,000 in mortgage banking income due to a decline in gain on sale margins Adjusted operating noninterest expense1 decreased $1.5 million to $99.5 million for the quarter ended June 30, 2023 from $101.0 million in the prior quarter due to: • Decreases in the following noninterest expense categories: • Salaries and benefits of $1.4 million, outside of severance charges related to headcount reductions in the quarter included in the strategic cost saving initiatives above, primarily due to seasonal decreases in payroll related taxes and 401(k) contribution expenses • Other expenses of $1.8 million primarily driven by: • $879,000 OREO-related gains recognized in the current quarter and • $466,000 reduced branch closing costs as compared to the prior quarter • Partially offset by increases in: • Technology and data processing expense of $424,000 • Professional services of $1.0 million related to the LIBOR transition and other strategic projects • Marketing and advertising expense of $466,000 1For non-GAAP financial measures, see reconciliation to most directly comparable GAAP measures in “Appendix – Reconciliation of Non-GAAP Disclosures” 2$1.0 million included within salaries and benefits and $2.9 million included within other expenses 3 Included within other expenses Noninterest Income ($ thousands) 2Q2023 1Q2023 Service charges on deposit accounts $ 8,118 $ 7,902 Other service charges, commissions and fees 1,693 1,746 Interchange fees 2,459 2,325 Fiduciary and asset management fees 4,359 4,262 Mortgage banking income 449 854 Gain (loss) on sale of securities 2 (13,400) Bank owned life insurance income 2,870 2,828 Loan-related interest rate swap fees 2,316 1,439 Other operating income 1,931 1,672 Total noninterest income $ 24,197 $ 9,628 Less: Gain (loss) on sale of securities 2 (13,400) Total adjusted operating noninterest income (non-GAAP)1 $ 24,195 $ 23,028 Noninterest Expense ($ thousands) 2Q2023 1Q2023 Salaries and benefits $ 62,019 $ 60,529 Occupancy expenses 6,094 6,356 Furniture and equipment expenses 3,565 3,752 Technology and data processing 8,566 8,142 Professional services 4,433 3,413 Marketing and advertising expense 2,817 2,351 FDIC assessment premiums and other insurance 4,074 3,899 Franchise and other taxes 4,499 4,498 Loan-related expenses 1,619 1,552 Amortization of intangible assets 2,216 2,279 Other expenses 5,759 11,503 Total noninterest expenses $ 105,661 $ 108,274 Less: Amortization of intangible assets 2,216 2,279 Less: Strategic cost saving initiatives2 3,935 - Less: Legal reserve3 - 5,000 Total adjusted operating noninterest expense (non-GAAP)1 $ 99,510 $ 100,995 |
|
12 Q2 2023 Loan and Deposit Growth • At June 30, 2023, loans held for investment (net of deferred fees and costs) totaled $15.1 billion, an increase of $482.7 million or 13.3% (annualized) from the prior quarter driven by increases in commercial loan balances of $454.2 million and increases in consumer loan balances of $28.5 million • Commercial loans increased by 14.8% (annualized), primarily driven by increases in new loan production of commercial and industrial loans and commercial real estate – non-owner occupied loans. • Consumer loans balances increased by 4.9% (annualized), primarily driven by growth in residential 1-4 family consumer loans. • Average loan yields increased 27 basis points during the quarter, primarily due to variable rate loans repricing as short-term interest rates increased. • Total deposits decreased by $43.9 million or 1.1% (annualized) from the prior quarter • Demand deposits decreased by $267.7 million as customers moved funds from lower to higher costing deposit products. This decrease was partially offset by a $223.8 million increase in interest-bearing deposits, which includes an increase of $201.6 million in time deposits and $107.8 million in brokered deposits. • Low cost transaction accounts1 comprised 56% of total deposit balances at the end of the second quarter, in line with the prior quarter. • Interest checking accounts include approximately $1.2 billion of fully insured cash sweep (“ICS”) deposits. • The cost of deposits increased by 33 basis points compared to the prior quarter, primarily due to higher market interest rates, as well as changes in the deposit mix as depositors migrated to higher costing interest bearing deposit accounts. 1Total interest-checking accounts and demand deposit accounts Deposit Growth ($ thousands) 2Q2023 1Q2023 QTD Annualized Growth Interest checking accounts 4,824,192 4,714,366 9.3% Money market accounts 3,413,936 3,547,514 (15.1%) Savings accounts 986,081 1,047,914 (23.7%) Customer deposits of $250,000 and over 578,739 541,447 27.6% Other customer time deposits 1,813,031 1,648,747 40.0% Time deposits 2,391,770 2,190,194 36.9% Total interest-bearing customer deposits 11,615,979 11,499,988 4.0% Brokered deposits 485,702 377,913 114.4% Total interest-bearing deposits 12,101,681 11,877,901 7.6% Demand deposits 4,310,306 4,578,009 (23.5%) Total Deposits $ 16,411,987 $ 16,455,910 (1.1%) Average Cost of Deposits 1.61% 1.28% Loan to Deposit Ratio 91.8% 88.6% Loan Growth ($ thousands) 2Q2023 1Q2023 QTD Annualized Growth Commercial & Industrial $ 3,373,148 $ 3,082,478 37.8% Commercial real estate - owner occupied 1,952,189 1,956,585 (0.9%) Other Commercial 750,841 742,444 4.5% Total Commercial & Industrial 6,076,178 5,781,507 20.4% Commercial real estate - non-owner occupied 4,113,318 3,968,085 14.7% Construction and land development 1,231,720 1,179,872 17.6% Multifamily real estate 788,895 822,006 (16.2%) Residential 1-4 Family - Commercial 518,317 522,760 (3.4%) Total CRE & Construction 6,652,250 6,492,723 9.9% Total Commercial Loans 12,728,428 12,274,230 14.8% Residential 1-4 Family - Consumer 1,017,698 974,511 17.8% Residential 1-4 Family - Revolving 600,339 589,791 7.2% Auto 585,756 600,658 (10.0%) Consumer 134,709 145,090 (28.7%) Total Consumer Loans 2,338,502 2,310,050 4.9% Total Loans Held for Investment (net of deferred fees and costs) $ 15,066,930 $ 14,584,280 13.3% Average Loan Yield 5.62% 5.35% |
|
13 Capital Ratio Regulatory Well Capitalized Minimums Atlantic Union Bankshares Atlantic Union Bank Atlantic Union Bankshares Atlantic Union Bank Common Equity Tier 1 Ratio (CET1) 6.5% 9.9% 12.6% 7.5% 10.3% Tier 1 Capital Ratio 8.0% 10.8% 12.6% 8.4% 10.3% Total Risk Based Capital Ratio 10.0% 13.6% 13.3% 11.3% 10.9% Leverage Ratio 5.0% 9.6% 11.3% 7.3% 8.9% Tangible Equity to Tangible Assets (non-GAAP)2 - 7.5% 9.1% 7.3% 8.9% Tangible Common Equity Ratio (non-GAAP) 2 - 6.7% 9.1% 6.4% 8.9% Strong Capital Position at June 30, 2023 Figures may not foot due to rounding *Capital information presented herein is based on estimates and subject to change pending the Company’s filing of its regulatory reports 2) For non-GAAP financial measures, see reconciliation to most directly comparable GAAP measures in “Appendix – Reconciliation of Non-GAAP Disclosures” Capital Management Strategy Atlantic Union capital management objectives are to: • Maintain designation as a “well capitalized” institution. • Ensure capital levels are commensurate with the Company’s risk profile, capital stress test projections, and strategic plan objectives. The Company’s capital ratios are well above regulatory well capitalized levels as of June 30, 2023 • On a proforma basis, the Company would be well capitalized if unrealized losses on securities were realized at June 30, 2023 Capital Management Actions • During the second quarter, the Company paid dividends of $171.88 per outstanding share of Series A Preferred Stock and $0.30 per common share which is the same as the prior quarter’s and an approximately 7% increase from the prior year’s dividend. Quarterly Roll Forward Common Equity Tier 1 Ratio Tangible Common Equity Ratio Tangible Book Value per Share At 3/31/23 9.91% 6.91% 17.78 Pre-Provision Net Income 0.33% 0.29% 0.77 After-Tax Provision (0.03%) (0.03%) (0.07) Common Dividends (1) (0.13%) (0.11%) (0.30) AOCI --- (0.25%) (0.66) Goodwill & Intangibles 0.00% 0.01% 0.01 Other 0.02% 0.02% 0.04 Asset Growth (0.24%) (0.18%) --- At 6/30/23 – Reported 9.86% 6.66% 17.58 AOCI net losses --- 2.09% 5.51 At 6/30/23 – ex AOCI2 9.86% 8.75% 23.09 (1) 30 cents per share Reported Proforma including AOCI and HTM unrealized losses |
|
14 Cash and Cash Equivalents (unrestricted) $471 Unencumbered Securities $874 FHLB Borrowing Capacity $1,341 Fed Funds Lines $907 Discount Window (ex-Bank Term Funding Program) $300 Discount Window – Bank Term Funding Program $539 Secondary Sources* $1,344 ($ in millions) Liquidity Position at June 30, 2023 Total Liquidity Sources of $5.8 billion ~133% liquidity coverage ratio of uninsured/uncollateralized deposits of $4.3 billion * Includes brokered deposits and other sources of liquidity Liquidity Sources Total $5.8 billion |
|
15 Securities Portfolio at June 30, 2023 • Total securities portfolio of $3.0 billion with a total unrealized loss of $491.9 million • 72% of total portfolio in available-for-sale at an unrealized loss of $450.1 million • 28% of total portfolio designated as held-to-maturity with an unrealized loss of $41.8 million • Total duration of 6.7 years. Securities portfolio is used defensively to neutralize overall asset sensitive interest rate risk profile • ~39% municipals, ~56% treasuries, agency MBS/CMOs and ~5% corporates and other investments • Securities to total assets of 14.7% as of June 30, 2023, down from 17.5% on December 31, 2022 • $505.7 million in AFS securities sold January, February and early March at a pre-tax loss of $13.4 million. Accretive to forward earnings with a 2 year earnback. $3,732 $3,108 $3,032 2Q 2022 1Q 2023 2Q 2023 Investment Securities Balances (in millions) Total AFS (fair value) and HTM (carrying value) 2.87% Yield 3.32% Yield 3.34% Yield |
|
16 Financial Outlook1 1Key Economic Assumptions • Stabilizing Interest Rate environment • The Federal Reserve Bank fed funds rate increases to 5.50% and holds there for the rest of 2023 • Increased likelihood of soft landing • Expect relatively stable economy in AUB’s Virginia footprint in 2023 • Expect Virginia unemployment rate to remain low in 2023 Full Year 2023 Outlook versus FY 2022 Loan Growth Mid-single digits growth Net Interest Income (FTE) Growth Mid-single digits growth Net Interest Margin (FTE) ~3.35% – 3.45% Adjusted Operating Noninterest Income Mid-single digits decline Adjusted Operating Noninterest Expense Flat Positive Adjusted Operating Leverage Adjusted Operating Revenue Growth: Mid-single digits Adjusted Operating Noninterest Expense Growth: Flat Credit Outlook ACL to loans: ~90 basis points Net charge-off ratio: ~10 basis points 1) Information on this slide is presented as of July 25, 2023, reflects the Company’s updated financial outlook, certain of the company’s financial targets, and key economic assumptions, and will not be updated or affirmed unless and until the Company publicly announces such an update or affirmation. The adjusted operating noninterest expense growth rate outlook excludes charges associated with the Company's strategic cost saving initiatives in Q2 2023 and the impact of the legal reserve in Q1 2023 and the adjusted operating non-interest income growth excludes gains and losses on the sale of securities. The FY 2023 financial outlook and the key economic assumptions contain forward-looking statements and actual results or conditions may differ materially. See the information set forth below the heading “Forward Looking Statements” on slide 2 of this presentation. |
|
17 Appendix |
|
18 Granular Deposit Base Top 15 Commercial Deposits by NAICS as of 6/30/2023 NAICS Code/Title % of Total Deposits 52 - Finance and Insurance 8.7% 54 - Professional, Scientific, and Technical Services 6.2% 53 - Real Estate and Rental and Leasing 6.0% 81 - Other Services (except Public Administration) 5.8% 92 - Public Administration 5.6% 23 - Construction 4.4% 42 - Wholesale Trade 2.9% 62 - Health Care and Social Assistance 2.6% 72 - Accommodation and Food Services 1.2% 33 - Manufacturing 1.0% 44 - Retail Trade 1.0% 61 - Educational Services 0.9% 56 - Administrative and Support and Waste Management and Remediation Services 0.9% 71 - Arts, Entertainment, and Recreation 0.8% 45 - Retail Trade 0.6% 48.6% $18,000 $19,000 $18,000 $102,000 $99,000 $98,000 Q2 2022 Q1 2023 Q2 2023 Customer Deposit Granularity Retail Avg. Deposits Acct Size Business Avg. Deposits Acct Size 33% 35% 33% 28% 26% $5,351 $5,821 $5,299 $4,591 $4,343 Q2 2022 Q3 2022 Q4 2022 Q1 2023 Q2 2023 Period End Uninsured and Uncollateralized Deposits as a Percentage of Total Deposits ($ in Millions) |
|
19 Non-Owner-Occupied CRE Portfolio as of June 30, 2023 $ in millions Total Outstandings % of Portfolio Multi Family $789 5.2% Retail $859 5.7% Hotel/Motel B&B $747 5.0% Office $781 5.2% Industrial/Warehouse $693 4.6% Senior Living $367 2.4% Self Storage $346 2.3% Other $319 2.1% Total Non-Owner Occupied CRE $4,902 32.5% Non-Owner Occupied Office CRE 5.2% Non-Owner-Occupied Non-Office CRE 27.4% All Other Loans 67.5% $15.1B Total Loans Non-Owner-Occupied CRE By Type Numbers may not foot due to rounding. |
|
20 Non-Medical Office 77% Medical Offices 23% Medical vs Other Office By Market ($ millions) Key Portfolio Metrics Carolinas $231 Fredericksburg Area $134 Central VA $109 Northern VA/Maryland $73 Western VA $94 Eastern VA $51 Other $88 Total $781 Avg. Office Loan ($ millions) $1.9 Loan Loss Reserve / Office Loans 2.3% NCOs / Office Loans1 0.00% Delinquencies / Office Loans 0.27% NPL / Office Loans 0.03% Criticized Loans / Office Loans 3.13% Non-Owner-Occupied Office CRE Portfolio as of June 30, 2023 $781MM Non-Owner-Occupied Office Portfolio Non Owner-Occupied Office Portfolio Credit Quality Geographically Diverse Non-Owner Occupied Office Portfolio 1Trailing 4 Quarters Avg NCO/Trailing 4 Quarter Avg Office Portfolio |
|
21 Reconciliation of Non-GAAP Disclosures The Company has provided supplemental performance measures on a tax-equivalent, tangible, operating, adjusted, or pre-tax pre-provision basis. These non-GAAP financial measures are a supplement to GAAP, which is used to prepare the Company’s financial statements, and should not be considered in isolation or as a substitute for comparable measures calculated in accordance with GAAP. In addition, the Company’s non-GAAP financial measures may not be comparable to non-GAAP financial measures of other companies. The Company uses the non-GAAP financial measures discussed herein in its analysis of the Company’s performance. The Company’s management believes that these non-GAAP financial measures provide additional understanding of ongoing operations, enhance comparability of results of operations with prior periods and show the effects of significant gains and charges in the periods presented without the impact of items or events that may obscure trends in the Company’s underlying performance. |
|
22 Reconciliation of Non -GAAP Disclosures Adjusted operating measures exclude, as applicable, strategic cost saving initiatives (principally composed of severance charges related to headcount reductions and charges for exiting leases), a legal reserve associated with an ongoing regulatory matter previously disclosed, gains and losses on sale of securities, as well as the gain on sale of Dixon, Hubard, Feinour & Brown, Inc., (“DHFB”). The Company believes these non -GAAP adjusted measures provide investors with important information about the continuing economic results of the organization’s operations. Net interest income (FTE) and total adjusted revenue (FTE), which are used in computing net interest margin (FTE), efficiency ratio (FTE) and adjusted operating efficiency ratio (FTE), provide valuable additional insight into the net interest margin and the efficiency ratio by adjusting for differences in tax treatment of interest income sources. The entire FTE adjustment is attributable to interest income on earning assets, which is used in computing yield on earning assets. Interest expense and the related cost of interest - bearing liabilities and cost of funds ratios are not affected by the FTE components. The adjusted operating efficiency ratio (FTE) excludes, as applicable, the amortization of intangible assets, strategic cost saving initiatives, a legal reserve associated with an ongoing regulatory matter previously disclosed, gains and losses on sale of securities, as well as the gain on sale of DHFB. This measure is similar to the measure utilized by the Company when analyzing corporate performance and is also similar to the measure utilized for incentive compensation. The Company believes this adjusted measure provides investors with important information about the continuing economic results of the organization’s operations. (Dollars in thousands, except per share amounts) 2Q2023 1Q2023 2Q2022 QoQ YoY Net Income (GAAP) $ 55,241 $ 35,653 $ 62,226 Plus: Strategic cost saving initiatives, net of tax 3,109 - - Plus: Legal reserve, net of tax - 3,950 - Less: Gain (loss) on sale of securities, net of tax 2 (10,586) (2) Less: Gain on sale of DHFB, net of tax - - 7,984 Adjusted operating earnings (non-GAAP) $ 58,348 $ 50,189 $ 54,244 Less: Dividends on preferred stock 2,967 2,967 2,967 Adjusted operating earnings available to common shareholders (non-GAAP) $ 55,381 $ 47,222 $ 51,277 Weighted average common shares outstanding, diluted 74,995,557 74,835,514 74,849,871 EPS available to common shareholders, diluted (GAAP) $ 0.70 $ 0.44 $ 0.79 Adjusted operating EPS available to common shareholders (non-GAAP) $ 0.74 $ 0.63 $ 0.69 Noninterest expense (GAAP) $ 105,661 $ 108,274 $ 98,768 (2.41%) 6.98% Less: Amortization of intangible assets 2,216 2,279 2,915 Less: Strategic cost saving initiatives 3,935 - - Less: Legal reserve - 5,000 - Adjusted operating noninterest expense (non-GAAP) $ 99,510 $ 100,995 $ 95,853 (1.47%) 3.82% Noninterest income (GAAP) $ 24,197 $ 9,628 $ 38,286 Less: Gain (loss) on sale of securities 2 (13,400) (2) Less: Gain on sale of DHFB - - 9,082 Adjusted operating noninterest income (non-GAAP) $ 24,195 $ 23,028 $ 29,206 Net interest income (GAAP) $ 152,084 $ 153,443 $ 138,767 Noninterest income (GAAP) 24,197 9,628 38,286 Total revenue (GAAP) $ 176,281 $ 163,071 $ 177,053 8.10% (0.44%) Net interest income (FTE) (non-GAAP) $ 155,750 $ 157,231 $ 142,344 Adjusted operating noninterest income (non-GAAP) 24,195 23,028 29,206 Total adjusted revenue (FTE) (non-GAAP) 179,945 180,259 171,550 (0.17%) 4.89% Operating leverage ratio (GAAP) 10.51% (7.42%) Adjusted operating leverage ratio (non-GAAP) 1.30% 1.08% Efficiency ratio (GAAP) 59.94% 66.40% 55.78% Efficiency ratio FTE (non-GAAP) 58.72% 64.89% 54.68% Adjusted operating efficiency ratio (FTE) (non-GAAP) 55.30% 56.03% 55.88% 2Q23% Change ADJUSTED OPERATING EARNINGS, OPERATING LEVERAGE, AND EFFICIENCY RATIO For the three months ended |
|
23 Reconciliation of Non-GAAP Disclosures The Company believes net interest income (FTE), total revenue (FTE), and total adjusted revenue (FTE), which are used in computing net interest margin (FTE), efficiency ratio (FTE) and adjusted operating efficiency ratio (FTE), provide valuable additional insight into the net interest margin and the efficiency ratio by adjusting for differences in tax treatment of interest income sources. The entire FTE adjustment is attributable to interest income on earning assets, which is used in computing yield on earning assets. Interest expense and the related cost of interest-bearing liabilities and cost of funds ratios are not affected by the FTE components. (Dollars in thousands) 2Q2023 1Q2023 2Q2022 Net interest income (GAAP) $ 152,084 $ 153,443 $ 138,767 FTE adjustment 3,666 3,788 3,577 Net interest income (FTE) (non-GAAP) $ 155,750 $ 157,231 $ 142,344 Noninterest income (GAAP) 24,197 9,628 38,286 Total revenue (FTE) (non-GAAP) $ 179,947 $ 166,859 $ 180,630 Average earning assets $ 18,091,809 $18,238,088 $17,646,470 Net interest margin (GAAP) 3.37% 3.41% 3.15% Net interest margin (FTE) 3.45% 3.50% 3.24% NET INTEREST MARGIN For the three months ended |
|
24 Reconciliation of Non-GAAP Disclosures Tangible assets and tangible common equity are used in the calculation of certain profitability, capital, and per share ratios. The Company believes tangible assets, tangible common equity and the related ratios are meaningful measures of capital adequacy because they provide a meaningful base for period-to-period and company-to-company comparisons, which the Company believes will assist investors in assessing the capital of the Company and its ability to absorb potential losses. The Company believes tangible common equity is an important indication of its ability to grow organically and through business combinations, as well as its ability to pay dividends and to engage in various capital management strategies. The Company also calculates adjusted tangible common equity to tangible assets ratios to exclude AOCI, which is principally comprised of unrealized losses on AFS securities, and to include the impact of unrealized losses on HTM securities. The Company believes that each of these ratios enables investors to assess the Company's capital levels and capital adequacy without the effects of changes in AOCI, some of which are uncertain and difficult to predict, or assuming that the Company realized all previously unrealized losses on HTM securities at the end of the period, as applicable. (Dollars in thousands, except share data) Atlantic Union Bankshares Atlantic Union Bank Tangible Assets Ending Assets (GAAP) $ 20,602,332 $ 20,472,372 Less: Ending goodwill 925,211 925,211 Less: Ending amortizable intangibles 23,469 23,469 Ending tangible assets (non-GAAP) $ 19,653,652 $ 19,523,692 Tangible Common Equity Ending equity (GAAP) $ 2,424,470 $ 2,719,774 Less: Ending goodwill 925,211 925,211 Less: Ending amortizable intangibles 23,469 23,469 Less: Perpetual preferred stock 166,357 - Ending tangible common equity (non-GAAP) $ 1,309,433 $ 1,771,094 Net unrealized losses on HTM securities, net of tax $ (41,813) $ (41,813) Accumulated other comprehensive loss (AOCI) $ (410,867) $ (410,867) Common shares outstanding at end of period 74,998,075 Average equity (GAAP) $ 2,460,741 $ 2,750,102 Less: Average goodwill 925,211 925,211 Less: Average amortizable intangibles 23,748 23,748 Less: Average perpetual preferred stock 166,356 - Average tangible common equity (non-GAAP) $ 1,345,426 $ 1,801,143 Less: Perpetual preferred stock Common equity to total assets (GAAP) 11.0% 13.3% Tangible equity to tangible assets (non-GAAP) 7.5% 9.1% Tangible equity to tangible assets, incl net unrealized losses on HTM securities (non-GAAP) 7.3% 8.9% Tangible common equity to tangible assets (non-GAAP) 6.7% 9.1% Tangible common equity to tangible assets, incl net unrealized losses on HTM securities (non-GAAP) 6.4% 8.9% Tangible common equity to tangible assets, ex AOCI (non-GAAP)1 8.8% Book value per common share (GAAP) $ 30.31 Tangible book value per common share (non-GAAP) $ 17.58 Tangible book value per common share, ex AOCI (non-GAAP)1 $ 23.09 Leverage Ratio Tier 1 capital $ 1,889,891 $ 2,196,227 Total average assets for leverage ratio $ 19,605,263 $ 19,505,493 Leverage ratio 9.6% 11.3% Leverage ratio, incl AOCI and net unrealized losses on HTM securities (non-GAAP) 7.3% 8.9% 1Calculation excludes the impact of 496,053 unvested restricted stock awards (RSAs) outstanding as of June 30, 2023 TANGIBLE ASSETS, TANGIBLE COMMON EQUITY, AND LEVERAGE RATIO As of June 30, 2023 |
|
25 Reconciliation of Non-GAAP Disclosures All regulatory capital ratios at June 30, 2023 are estimates and subject to change pending the Company’s filing of its FR Y-9 C. In addition to these regulatory capital ratios, the Company adjusts certain regulatory capital ratios to include the impacts of AOCI, which the Company has elected to exclude from regulatory capital ratios under applicable regulations, and net unrealized losses on HTM securities, assuming that those unrealized losses were realized at the end of the period, as applicable. The Company believes that each of these ratios help investors to assess the Company's regulatory capital levels and capital adequacy. (Dollars in thousands) Atlantic Union Bankshares Atlantic Union Bank Risk-Based Capital Ratios Net unrealized losses on HTM securities, net of tax $ (41,813) $ (41,813) Accumulated other comprehensive loss (AOCI) $ (410,867) $ (410,867) Common equity tier 1 capital $ 1,723,535 $ 2,196,227 Tier 1 capital $ 1,889,891 $ 2,196,227 Total capital $ 2,384,408 $ 2,304,964 Total risk-weighted assets $ 17,480,064 $ 17,384,022 Common equity tier 1 capital ratio 9.9% 12.6% Common equity tier 1 capital ratio, incl AOCI and net unrealized losses on HTM securities (non-GAAP) 7.5% 10.3% Tier 1 capital ratio 10.8% 12.6% Tier 1 capital ratio, incl AOCI and net unrealized losses on HTM securities (non-GAAP) 8.4% 10.3% Total capital ratio 13.6% 13.3% Total capital ratio, incl AOCI and net unrealized losses on HTM securities (non-GAAP) 11.3% 10.9% RISK-BASED CAPITAL RATIOS As of June 30, 2023 |
|
26 Reconciliation of Non -GAAP Disclosures Tangible assets and tangible common equity are used in the calculation of certain profitability, capital, and per share ratios. The Company believes tangible assets, tangible common equity and the related ratios are meaningful measures of capital adequacy because they provide a meaningful base for period -to -period and company -to -company comparisons, which the Company believes will assist investors in assessing the capital of the Company and its ability to absorb potential losses. The Company believes tangible common equity is an important indication of its ability to grow organically and through business combinations as well as its ability to pay dividends and to engage in various capital management strategies. The Company believes that ROTCE is a meaningful supplement to GAAP financial measures and is useful to investors because it measures the performance of a business consistently across time without regard to whether components of the business were acquired or developed internally. Adjusted operating measures exclude, as applicable, strategic cost saving initiatives (principally composed of severance charges related to headcount reductions and charges for exiting leases), a legal reserve associated with an ongoing regulatory matter previously disclosed, gains and losses on sale of securities, as well as the gain on sale of DHFB. The Company believes these non - GAAP adjusted measures provide investors with important information about the continuing economic results of the organization’s operations. (Dollars in thousands) 2Q2023 1Q2023 2Q2022 Return on average assets (ROA) Average assets $ 20,209,687 $ 20,384,351 $ 19,719,402 ROA (GAAP) 1.10% 0.71% 1.27% Adjusted operating ROA (non-GAAP) 1.16% 1.00% 1.10% Return on average equity (ROE) Adjusted operating earnings available to common shareholders (non-GAAP) $ 55,381 $ 47,222 $ 51,277 Plus: Amortization of intangibles, tax effected 1,751 1,800 2,303 Adjusted operating earnings available to common shareholders before amortization of intangibles (non-GAAP) $ 57,132 $ 49,022 $ 53,580 Average equity (GAAP) $ 2,460,741 $ 2,423,600 $ 2,445,045 Less: Average goodwill 925,211 925,211 935,446 Less: Average amortizable intangibles 23,748 25,588 38,707 Less: Average perpetual preferred stock 166,356 166,356 166,356 Average tangible common equity (non-GAAP) $ 1,345,426 $ 1,306,445 $ 1,304,536 ROE (GAAP) 9.00% 5.97% 10.21% Return on tangible common equity (ROTCE) Net Income available to common shareholders (GAAP) $ 52,274 $ 32,686 $ 59,259 Plus: Amortization of intangibles, tax effected 1,751 1,800 2,303 Net Income available to common shareholders before amortization of intangibles (non-GAAP) $ 54,025 $ 34,486 $ 61,562 ROTCE (non-GAAP) 16.11% 10.71% 18.93% Adjusted operating ROTCE (non-GAAP) 17.03% 15.22% 16.47% For the three months ended OPERATING MEASURES |
|
27 Reconciliation of Non-GAAP Disclosures Pre-tax pre-provision adjusted earnings excludes, as applicable, the provision for credit losses, which can fluctuate significantly from period-to-period under the CECL methodology, income tax expense, strategic cost saving initiatives, a legal reserve associated with an ongoing regulatory matter previously disclosed, gains and losses on sale of securities, as well as the gain on sale of DHFB. The Company believes this adjusted measure provides investors with important information about the continuing economic results of the organization’s operations. (Dollars in thousands) 2Q2023 1Q2023 2Q2022 Net income (GAAP) $ 55,241 $ 35,653 $ 62,226 Plus: Provision for credit losses 6,069 11,850 3,559 Plus: Income tax expense 9,310 7,294 12,500 Plus: Strategic cost saving initiatives 3,935 - - Plus: Legal reserve - 5,000 - Less: Gain (loss) on sale of securities 2 (13,400) (2) Less: Gain on sale of DHFB - - 9,082 PTPP adjusted operating earnings (non-GAAP) 74,553 73,197 69,205 Less: Dividends on preferred stock 2,967 2,967 2,967 PTPP adjusted operating earnings available to common shareholders (non-GAAP) $ 71,586 $ 70,230 $ 66,238 Net income growth - QTD (GAAP) 54.94% PTPP adjusted operating earnings growth - QTD (non-GAAP) 1.85% Net income growth - YTD (GAAP) (11.23%) PTPP adjusted operating earnings growth - YTD (non-GAAP) 7.73% For the three months ended PRE-TAX PRE-PROVISION ADJUSTED OPERATING EARNINGS |