United States
SECURITIES AND EXCHANGE COMMISSION
Washington, D.C. 20549
FORM 8-K
CURRENT REPORT
Pursuant to Section 13 or 15(d) of The Securities Exchange Act of 1934
Date of Report (Date of earliest event reported): January 24, 2023
ATLANTIC UNION BANKSHARES CORPORATION
(Exact name of registrant as specified in its charter)
Virginia |
001-39325 |
54-1598552 |
(State or other jurisdiction |
(Commission |
(I.R.S. Employer |
of incorporation) |
File Number) |
Identification No.) |
|
|
|
1051 East Cary Street
Suite 1200
Richmond, Virginia 23219
(Address of principal executive offices, including Zip Code)
Registrant’s telephone number, including area code: (804) 633-5031
Check the appropriate box below if the Form 8-K filing is intended to simultaneously satisfy the filing obligation of the registrant under any of the following provisions (see General Instruction A.2. below):
☐ |
Written communications pursuant to Rule 425 under the Securities Act (17 CFR 230.425) |
☐ |
Soliciting material pursuant to Rule 14a-12 under the Exchange Act (17 CFR 240.14a-12) |
☐ |
Pre-commencement communications pursuant to Rule 14d-2(b) under the Exchange Act (17 CFR 240.14d-2(b)) |
☐ |
Pre-commencement communications pursuant to Rule 13e-4(c) under the Exchange Act (17 CFR 240.13e-4(c)) |
Securities registered pursuant to Section 12(b) of the Act:
Title of each class |
|
Trading Symbol(s) |
|
Name of each exchange on which registered |
Common Stock, par value $1.33 per share |
|
AUB |
|
New York Stock Exchange |
Depositary Shares, Each Representing a 1/400th Interest in a Share of 6.875% Perpetual Non-Cumulative Preferred Stock, Series A |
|
AUB.PRA |
|
New York Stock Exchange |
Indicate by check mark whether the registrant is an emerging growth company as defined in Rule 405 of the Securities Act of 1933 (§230.405 of this chapter) or Rule 12b-2 of the Securities Exchange Act of 1934 (§240.12b-2 of this chapter).
Emerging growth company |
☐ |
If an emerging growth company, indicate by check mark if the registrant has elected not to use the extended transition period for complying with any new or revised financial accounting standards provided pursuant to Section 13(a) of the Exchange Act. |
☐ |
Item 2.02 Results of Operations and Financial Condition.
On January 24, 2023, Atlantic Union Bankshares Corporation (the “Company”) issued a press release announcing its financial results for the fourth quarter and year ended December 31, 2022. A copy of the press release is being furnished as Exhibit 99.1 hereto and is incorporated herein by reference.
Attached as Exhibit 99.2 and incorporated herein by reference is a presentation that the Company will use in connection with a webcast and conference call for analysts at 9:00 a.m. Eastern Time on Tuesday, January 24, 2023. This presentation is also available under the Presentations link in the Investor Relations – News & Events section of the Company’s website at https://investors.atlanticunionbank.com.
The information disclosed in or incorporated by reference into this Item 2.02, including Exhibits 99.1 and 99.2, is furnished and shall not be deemed filed for purposes of Section 18 of the Securities Exchange Act of 1934.
Item 9.01 Financial Statements and Exhibits.
(d) Exhibits.
Exhibit No. |
|
Description of Exhibit |
99.1 |
|
Press release dated January 24, 2023 regarding the fourth quarter and fiscal year 2022 results. |
99.2 |
|
|
104 |
|
Cover Page Interactive Data File – the cover page iXBRL tags are embedded within the Inline XBRL document |
1
SIGNATURES
Pursuant to the requirements of the Securities Exchange Act of 1934, the registrant has duly caused this report to be signed on its behalf by the undersigned hereunto duly authorized.
|
ATLANTIC UNION BANKSHARES CORPORATION |
||
|
|
|
|
|
|
|
|
|
|
|
|
Date: January 24, 2023 |
By: |
/s/ Robert M. Gorman |
|
|
|
Robert M. Gorman |
|
|
|
Executive Vice President and |
|
|
|
Chief Financial Officer |
|
|
|
|
|
2
Exhibit 99.1

Contact: Robert M. Gorman - (804) 523-7828
Executive Vice President / Chief Financial Officer
ATLANTIC UNION BANKSHARES REPORTS FOURTH QUARTER FINANCIAL RESULTS
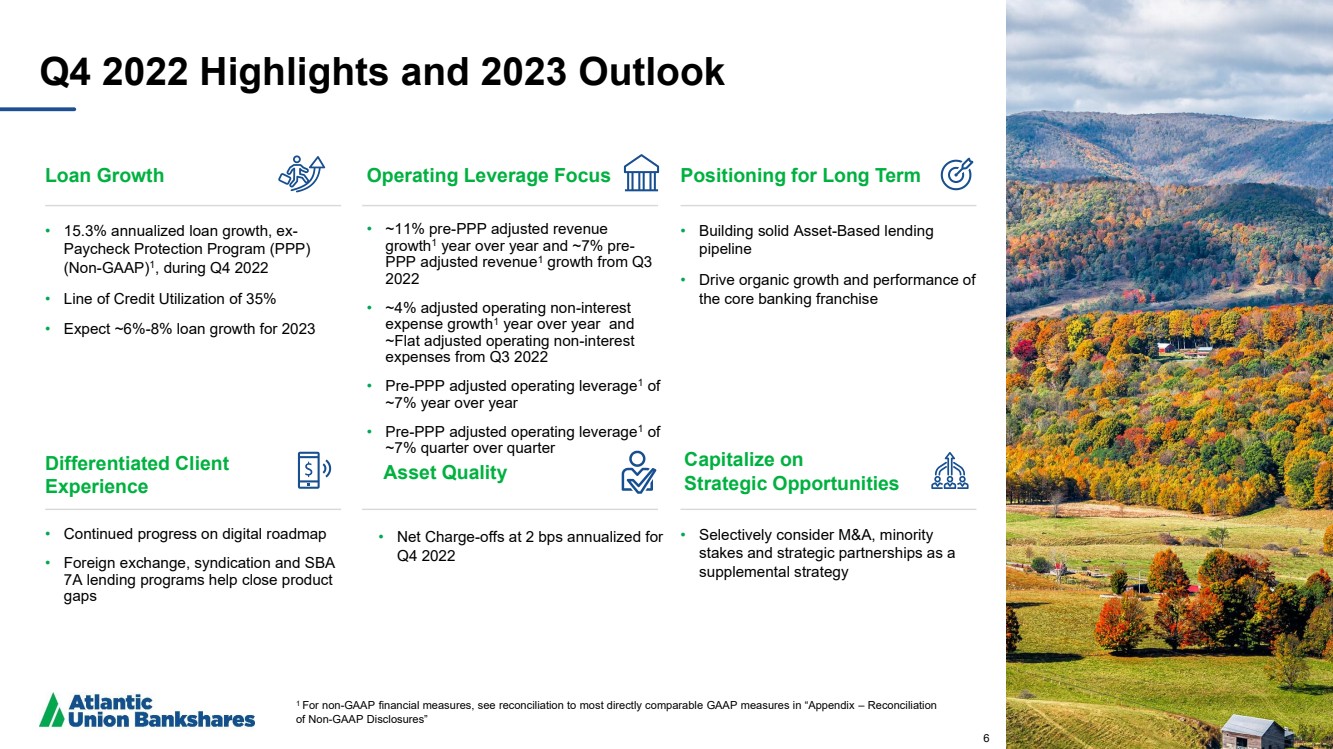
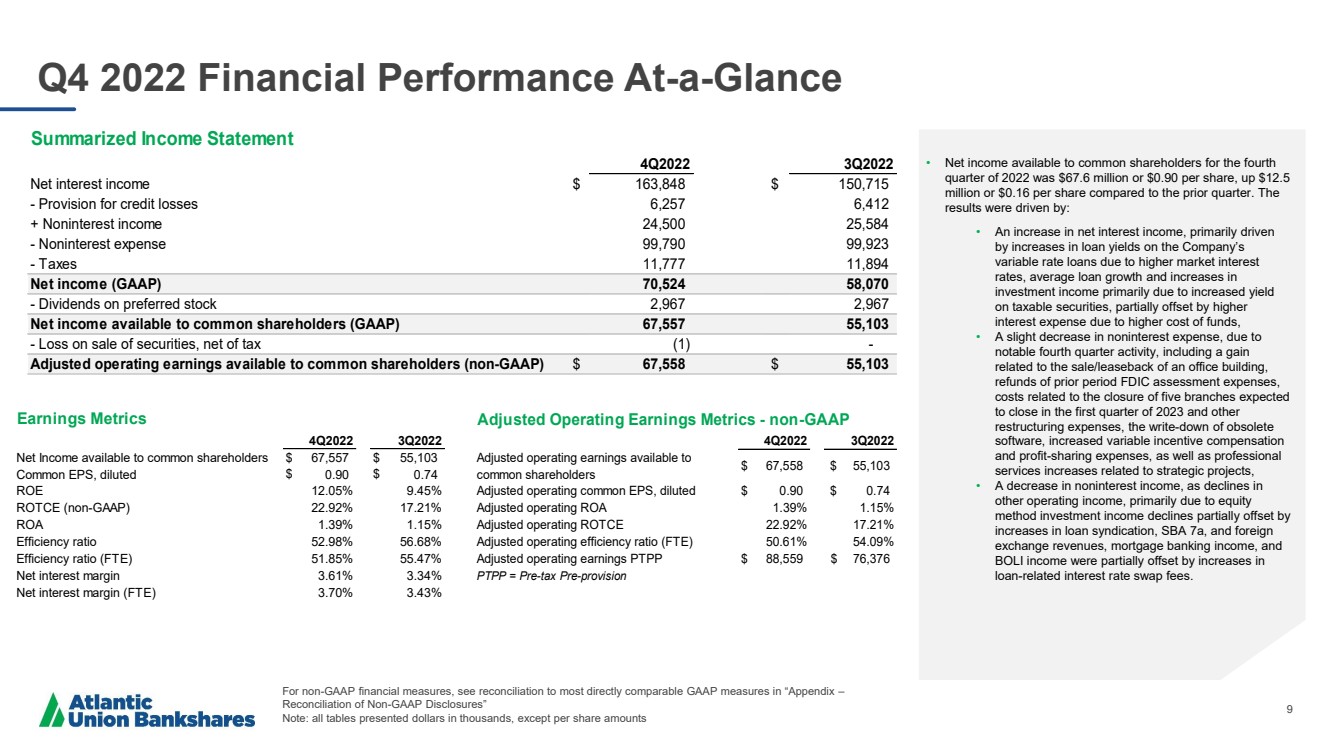
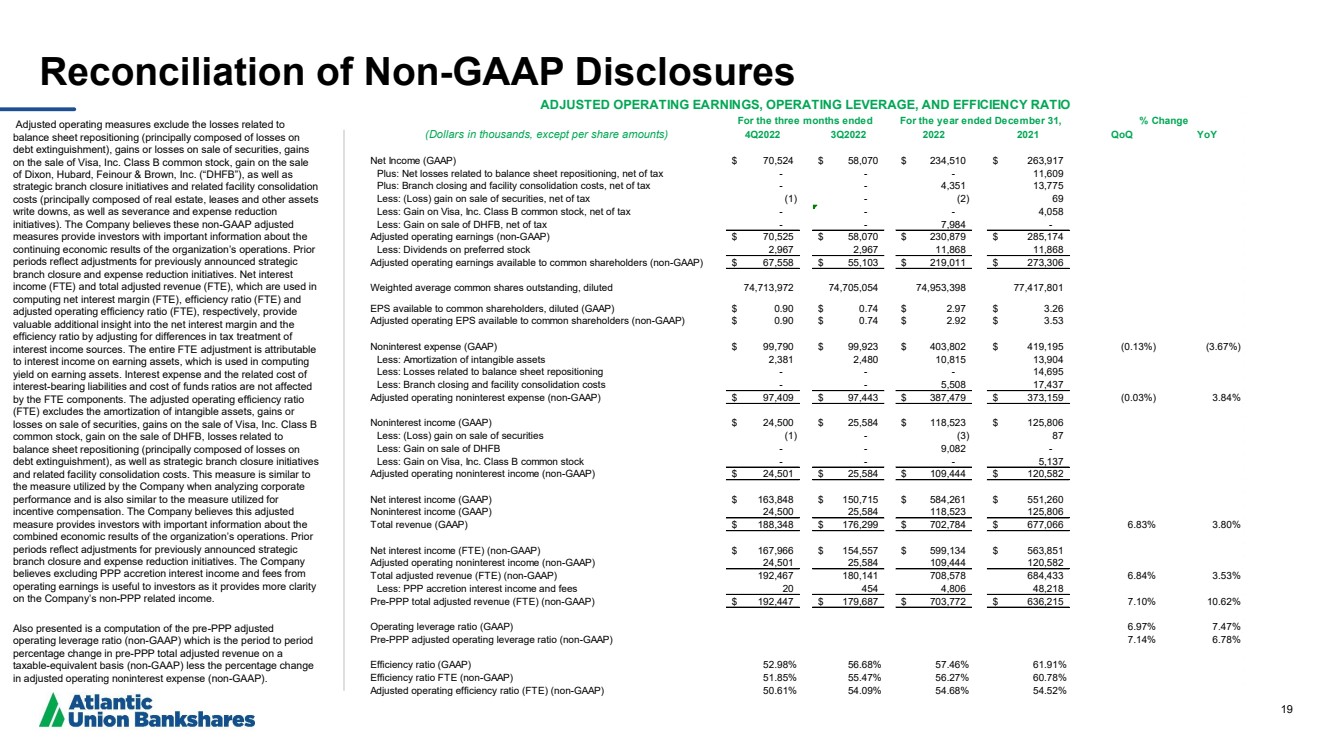
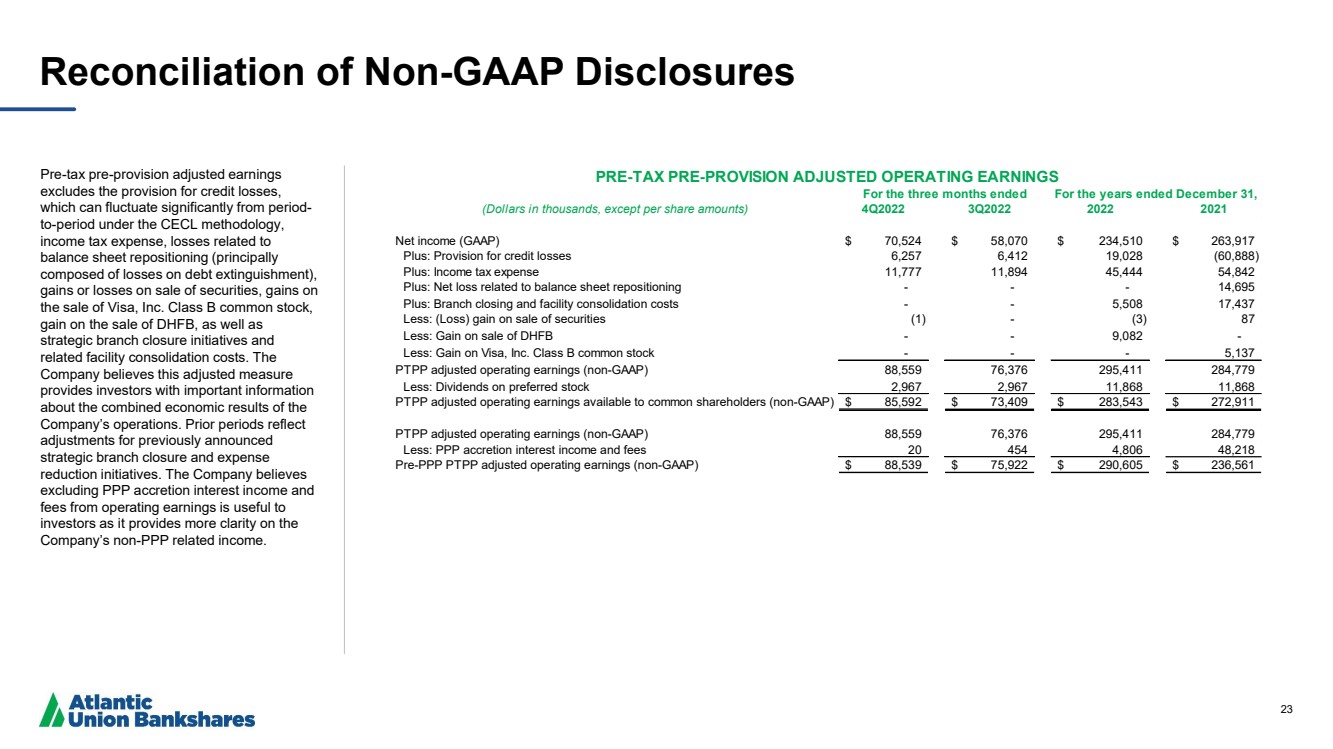
Richmond, Va., January 24, 2023 – Atlantic Union Bankshares Corporation (the “Company” or “Atlantic Union”) (NYSE: AUB) reported net income available to common shareholders and adjusted operating earnings available to common shareholders(1) of $67.6 million and basic and diluted earnings per common share of $0.90 for the fourth quarter ended December 31, 2022. Pre-tax pre-provision adjusted operating earnings available to common shareholders(1) totaled $85.6 million for the fourth quarter ended December 31, 2022.
“Atlantic Union Bankshares delivered strong fourth quarter financial results as we hit our profitability and efficiency targets - with low double-digit annualized loan growth, strong credit quality, an expanding net interest margin and positive operating leverage,” said John C. Asbury, president and chief executive officer of Atlantic Union. “Our markets continue to show resiliency and positive dynamics, which combined with our asset sensitivity lead us to believe we are well-positioned for 2023.”
“Operating under the mantra of soundness, profitability and growth – in that order of priority - Atlantic Union remains committed to generating sustainable, profitable growth and building long term value for our shareholders.”
NET INTEREST INCOME
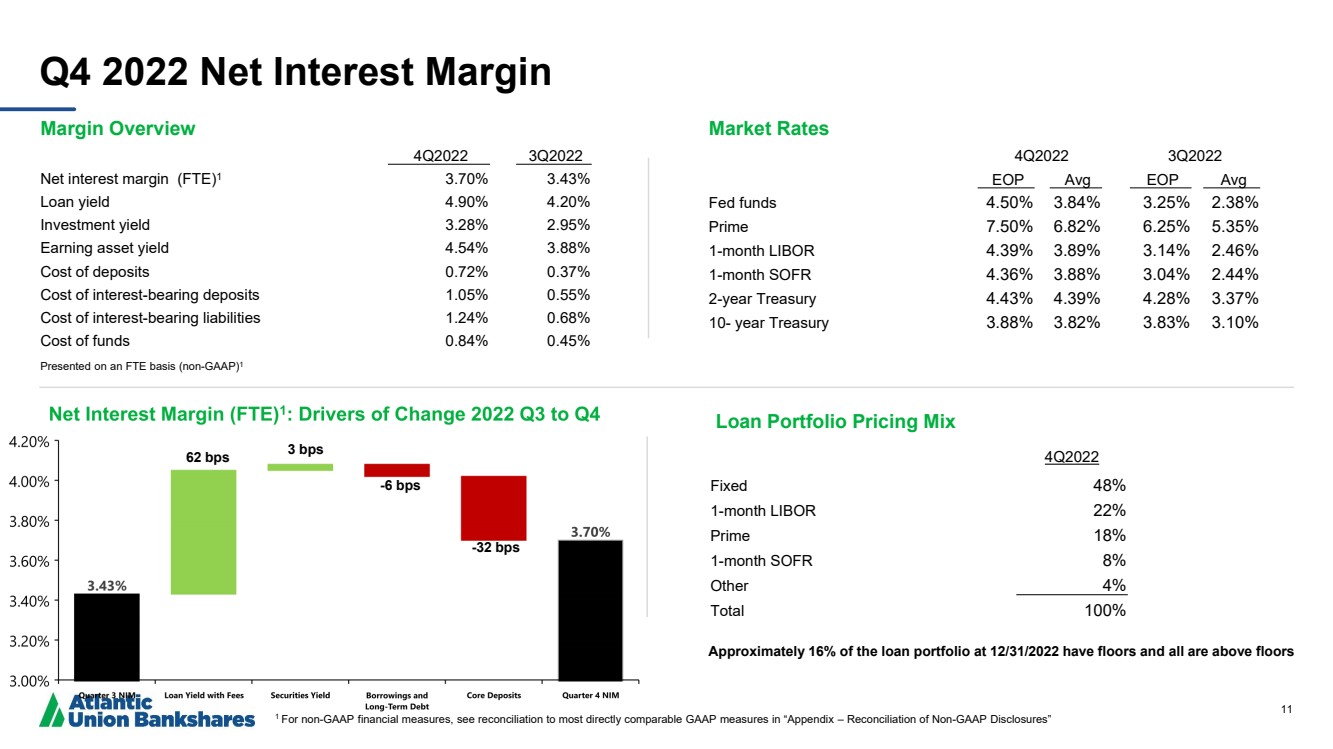
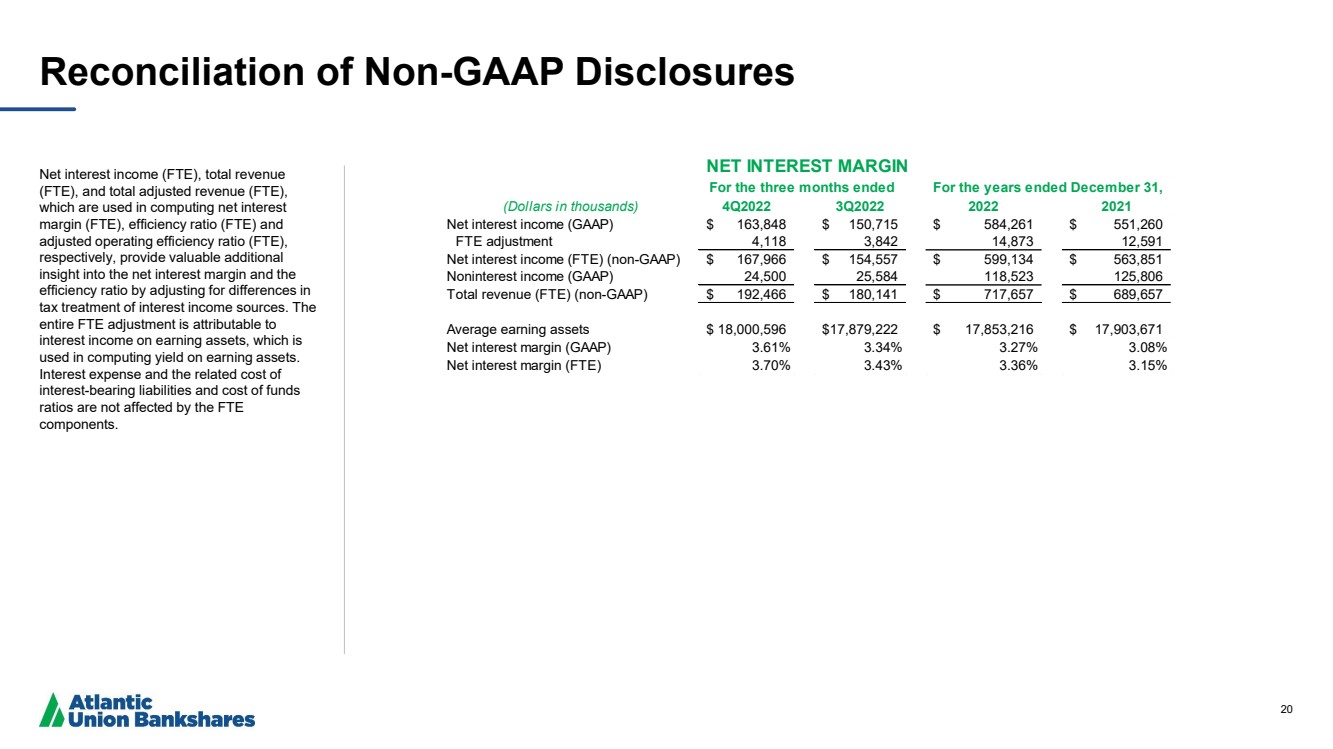
For the fourth quarter of 2022, net interest income was $163.8 million, an increase of $13.1 million from $150.7 million for the third quarter of 2022. Net interest income (FTE)(1) was $168.0 million in the fourth quarter of 2022, an increase of $13.4 million from the third quarter of 2022. The increases in net interest income and net interest income (FTE)(1) were primarily driven by higher loan yields on the Company’s variable rate loans due to rising market interest rates, average loan growth, and increases in investment income primarily due to higher yield on taxable securities. These increases were partially offset by an increase in interest expense due to higher cost of funds, primarily due to an increase in short-term interest rates on borrowings and deposits, increased use of short-term funding and higher average deposits from the prior quarter. The fourth quarter net interest margin and net interest margin (FTE)(1) increased 27 basis points from the prior quarter to 3.61% and 3.70%, respectively, at December 31, 2022. Earning asset yields increased by 66 basis points in the fourth quarter of 2022 compared to the third quarter of 2022 due to the impact of rising market interest rates on loans and investment securities yields. The cost of funds increased from the prior quarter by 39 basis points to 84 basis points at December 31, 2022, driven by higher deposit and borrowing costs as noted above.
The Company’s net interest margin (FTE) (1) includes the impact of acquisition accounting fair value adjustments. Net accretion related to acquisition accounting was $1.3 million for the quarter ended December 31, 2022, representing an increase of $157,000 from the prior quarter. The four quarters of 2022 and the remaining estimated net accretion impact are reflected in the following table (dollars in thousands):
|
|
|
|
|
|
|
|
|
|
|
|
|
|
|
Loan |
|
Deposit |
|
Borrowings |
|
|
|
|||
|
|
Accretion |
|
Amortization |
|
Amortization |
|
Total |
||||
For the quarter ended March 31, 2022 |
|
$ |
2,253 |
|
$ |
(10) |
|
$ |
(203) |
|
$ |
2,040 |
For the quarter ended June 30, 2022 |
|
|
2,879 |
|
|
(11) |
|
|
(207) |
|
|
2,661 |
For the quarter ended September 30, 2022 |
|
|
1,326 |
|
|
(11) |
|
|
(209) |
|
|
1,106 |
For the quarter ended December 31, 2022 |
|
|
1,484 |
|
|
(12) |
|
|
(209) |
|
|
1,263 |
Total for the year ended December 31, 2022 |
|
$ |
7,942 |
|
$ |
(44) |
|
$ |
(828) |
|
$ |
7,070 |
For the years ending (estimated): |
|
|
|
|
|
|
|
|
|
|
|
|
2023 |
|
|
3,169 |
|
|
(31) |
|
|
(852) |
|
|
2,286 |
2024 |
|
|
2,597 |
|
|
(4) |
|
|
(877) |
|
|
1,716 |
2025 |
|
|
2,036 |
|
|
(1) |
|
|
(900) |
|
|
1,135 |
2026 |
|
|
1,650 |
|
|
— |
|
|
(926) |
|
|
724 |
2027 |
|
|
1,259 |
|
|
— |
|
|
(953) |
|
|
306 |
Thereafter |
|
|
6,423 |
|
|
— |
|
|
(7,993) |
|
|
(1,570) |
Total remaining acquisition accounting fair value adjustments at December 31, 2022 |
|
$ |
17,134 |
|
$ |
(36) |
|
$ |
(12,501) |
|
$ |
4,597 |
ASSET QUALITY
Overview
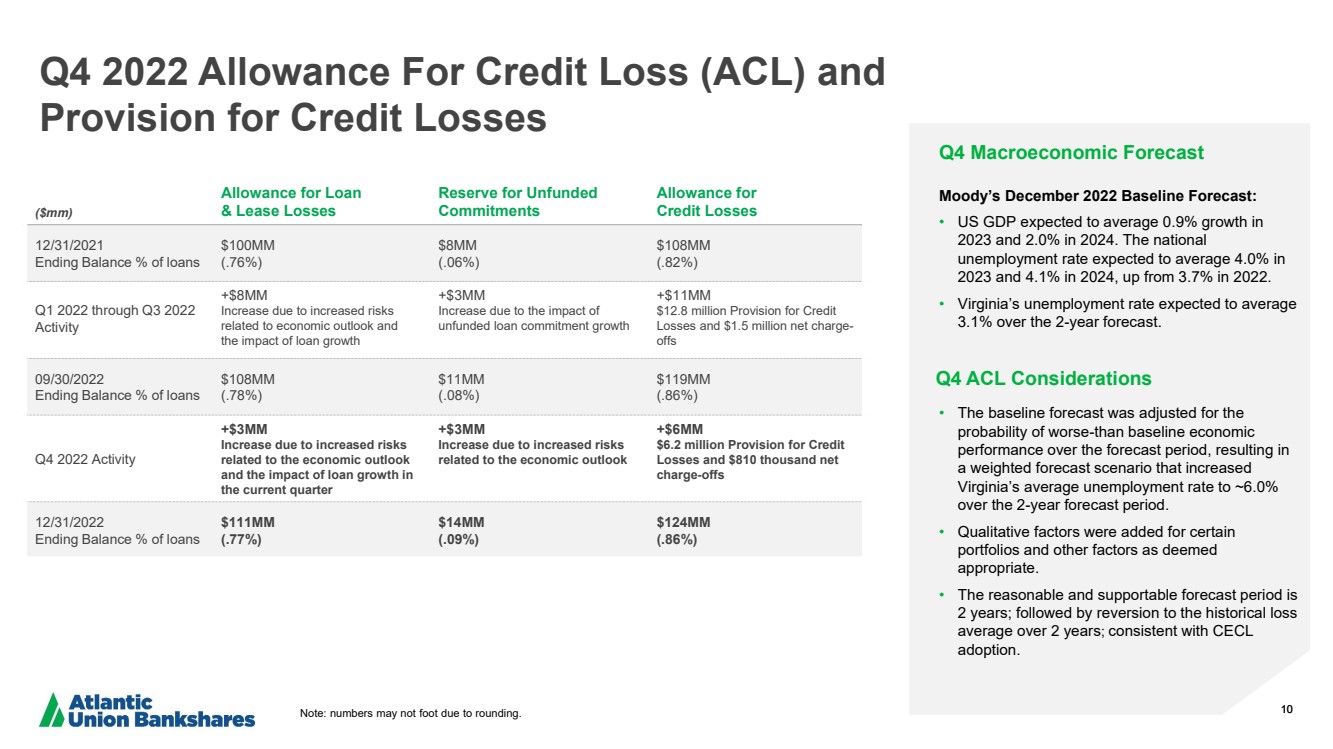
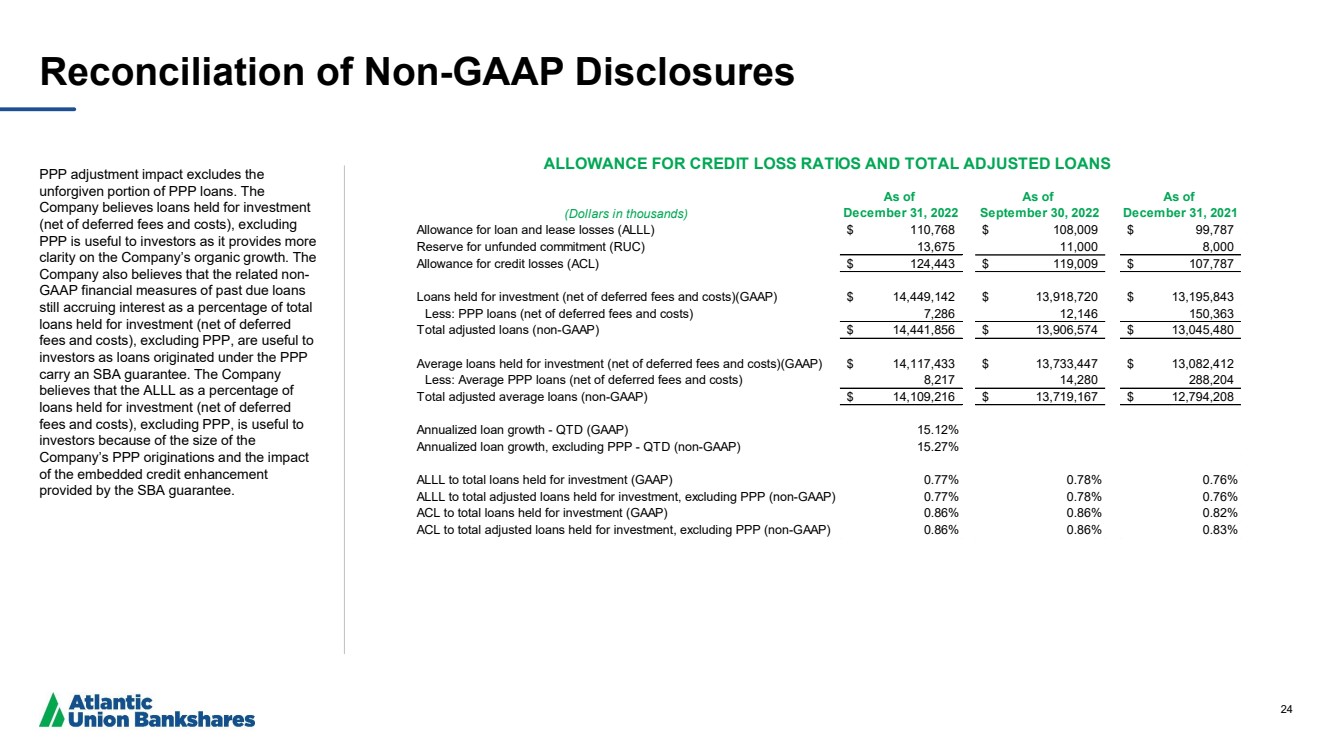
Nonperforming assets (“NPAs”) as a percentage of loans decreased 2 basis points to 0.19% at December 31, 2022, compared to the prior quarter. Accruing past due loan levels as a percentage of total loans held for investment at December 31, 2022 totaled 21 basis points, which is consistent with September 30, 2022, and represents a 2 basis point decrease from December 31, 2021. Net charge-off levels remained low at 0.02% of total average loans (annualized) for the fourth quarter of 2022, consistent with the quarters ended September 30, 2022 and December 31, 2021. The allowance for credit losses (“ACL”) totaled $124.4 million at December 31, 2022, a $5.4 million increase from the prior quarter.
Nonperforming Assets
At December 31, 2022, NPAs totaled $27.1 million, a decrease of $1.5 million from September 30, 2022. The following table shows a summary of NPA balances at the quarter ended (dollars in thousands):
|
|
December 31, |
|
September 30, |
|
June 30, |
|
March 31, |
|
December 31, |
|||||
|
|
2022 |
|
2022 |
|
2022 |
|
2022 |
|
2021 |
|||||
Nonaccrual loans |
|
$ |
27,038 |
|
$ |
26,500 |
|
$ |
29,070 |
|
$ |
29,032 |
|
$ |
31,100 |
Foreclosed properties |
|
|
76 |
|
|
2,087 |
|
|
2,065 |
|
|
1,696 |
|
|
1,696 |
Total nonperforming assets |
|
$ |
27,114 |
|
$ |
28,587 |
|
$ |
31,135 |
|
$ |
30,728 |
|
$ |
32,796 |
The following table shows the activity in nonaccrual loans for the quarter ended (dollars in thousands):
|
|
December 31, |
|
September 30, |
|
June 30, |
|
March 31, |
|
December 31, |
|||||
|
|
2022 |
|
2022 |
|
2022 |
|
2022 |
|
2021 |
|||||
Beginning Balance |
|
$ |
26,500 |
|
$ |
29,070 |
|
$ |
29,032 |
|
$ |
31,100 |
|
$ |
35,472 |
Net customer payments |
|
|
(1,805) |
|
|
(3,725) |
|
|
(2,472) |
|
|
(4,132) |
|
|
(5,068) |
Additions |
|
|
2,935 |
|
|
1,302 |
|
|
3,203 |
|
|
2,087 |
|
|
1,294 |
Charge-offs |
|
|
(461) |
|
|
(125) |
|
|
(311) |
|
|
(23) |
|
|
(598) |
Loans returning to accruing status |
|
|
(131) |
|
|
— |
|
|
— |
|
|
— |
|
|
— |
Transfers to foreclosed property |
|
|
— |
|
|
(22) |
|
|
(382) |
|
|
— |
|
|
— |
Ending Balance |
|
$ |
27,038 |
|
$ |
26,500 |
|
$ |
29,070 |
|
$ |
29,032 |
|
$ |
31,100 |
Past Due Loans
Past due loans still accruing interest totaled $30.0 million or 0.21% of total loans held for investment at December 31, 2022, compared to $29.0 million or 0.21% of total loans held for investment at September 30, 2022, and $29.9 million or 0.23% of total loans held for investment at December 31, 2021. Of the total past due loans still accruing interest, $7.5 million or 0.05% of total loans held for investment were loans past due 90 days or more at December 31, 2022, compared to $7.4 million or 0.05% of total loans held for investment at September 30, 2022, and $9.1 million or 0.07% of total loans held for investment at December 31, 2021.
Allowance for Credit Losses
At December 31, 2022, the ACL was $124.4 million and included an allowance for loan and lease losses (“ALLL”) of $110.8 million and a reserve for unfunded commitments (“RUC”) of $13.6 million. The ACL at December 31, 2022 increased $5.4 million from September 30, 2022 due to increased uncertainty in the macroeconomic outlook and the impact of loan growth in the fourth quarter of 2022.
The ACL as a percentage of total loans was 0.86% at December 31, 2022, consistent with September 30, 2022. The ALLL as a percentage of total loans was 0.77% at December 31, 2022, compared to 0.78% at September 30, 2022.
Net Charge-offs
Net charge-offs were $810,000 or 0.02% of total average loans on an annualized basis for the quarter ended December 31, 2022, compared to $587,000 or 0.02% (annualized) for the third quarter of 2022, and $511,000 or 0.02% (annualized) for the fourth quarter of 2021. On a year-to-date basis through December 31, 2022, net charge-offs totaled $2.3 million or 0.02% of total average loans.
Provision for Credit Losses
For the quarter ended December 31, 2022, the Company recorded a provision for credit losses of $6.3 million, compared to a provision for credit losses of $6.4 million in the previous quarter, and a negative provision for credit losses of $1.0 million in the fourth quarter of 2021. The provision for credit losses for the fourth quarter of 2022 reflected a provision of $3.6 million for loan losses and a $2.7 million provision for unfunded commitments.
NONINTEREST INCOME
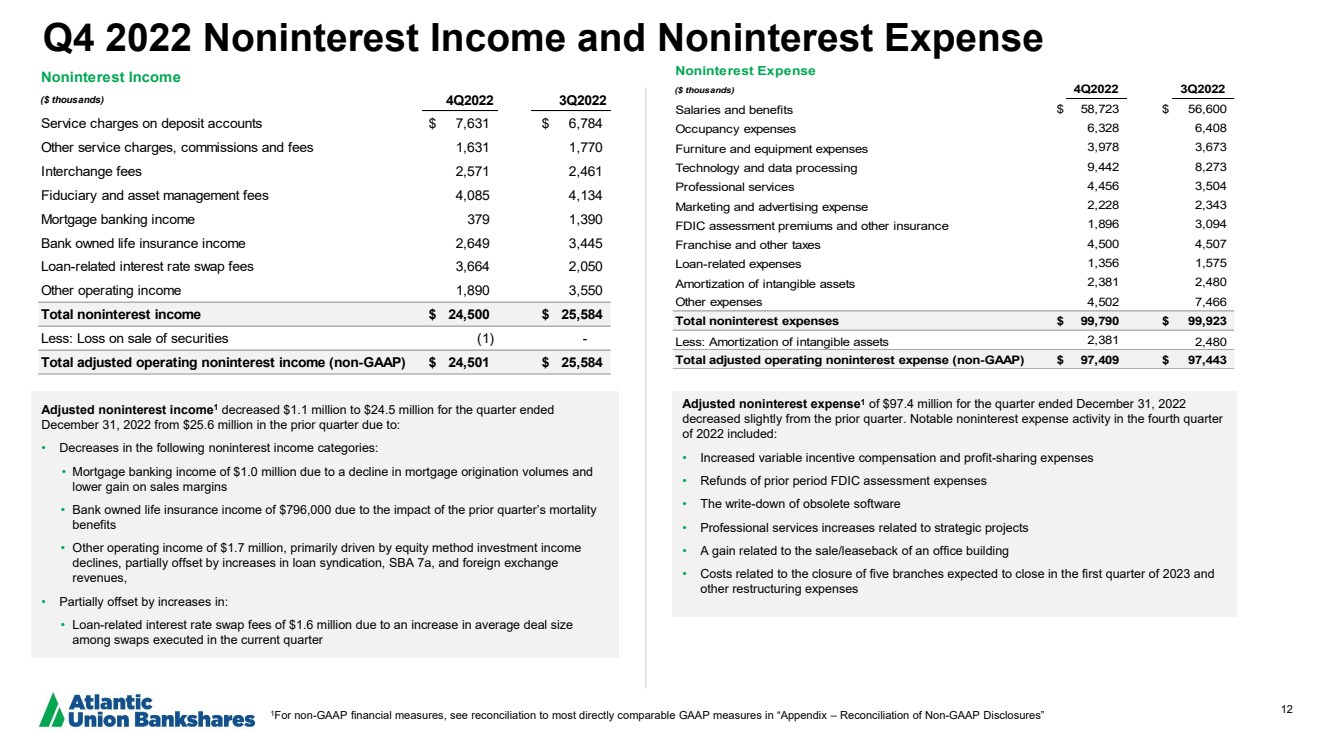
Noninterest income decreased $1.1 million to $24.5 million for the quarter ended December 31, 2022 from $25.6 million in the prior quarter primarily due to declines in equity method investment income, partially offset by increases in loan syndication, Small Business Administration (“SBA”) 7a, and foreign exchange revenues, each included within other operating income. In addition, mortgage banking income decreased $1.0 million from the prior quarter due to lower mortgage origination volumes and gain on sale margins, and bank owned life insurance income decreased $796,000, reflecting the impact of the prior quarter’s mortality benefit. These noninterest income category decreases were partially offset by increases in loan-related interest rate swap fees of $1.6 million due to an increase in average deal size among swaps executed in the current quarter.
NONINTEREST EXPENSE
Noninterest expense for the quarter ended December 31, 2022 decreased to $99.8 million from $99.9 million in the prior quarter. Notable noninterest expense activity in the fourth quarter of 2022 included a gain related to the sale and leaseback of an office building, refunds of prior period FDIC assessment expenses, costs related to the closure of five branches expected to close in the first quarter of 2023 and other restructuring expenses, the write-down of obsolete software, increased variable incentive compensation and profit-sharing expenses, as well as professional services increases related to strategic projects.
INCOME TAXES
The effective tax rate for the three months ended December 31, 2022 was 14.3%, compared to 17.0% for the three months ended September 30, 2022. The decrease in the effective tax rate reflects the impact of changes in the proportion of tax-exempt income to pre-tax income.
BALANCE SHEET
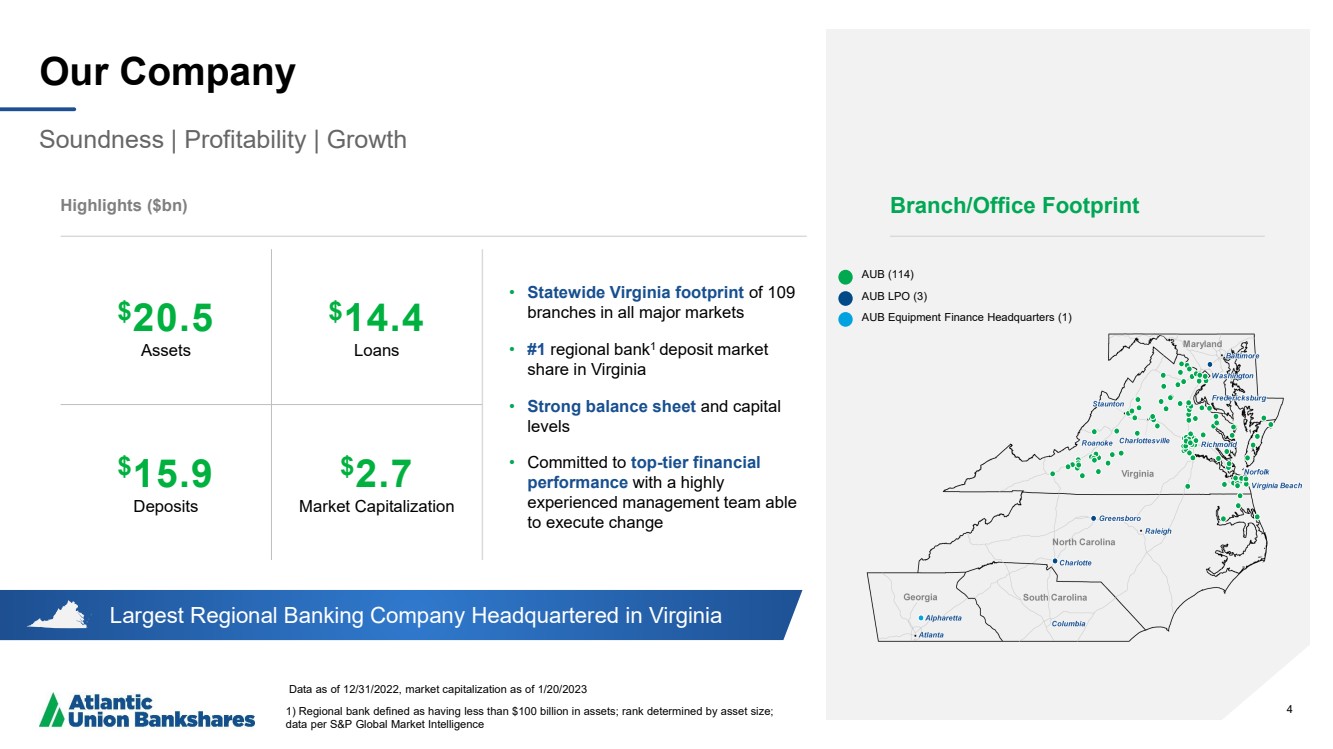
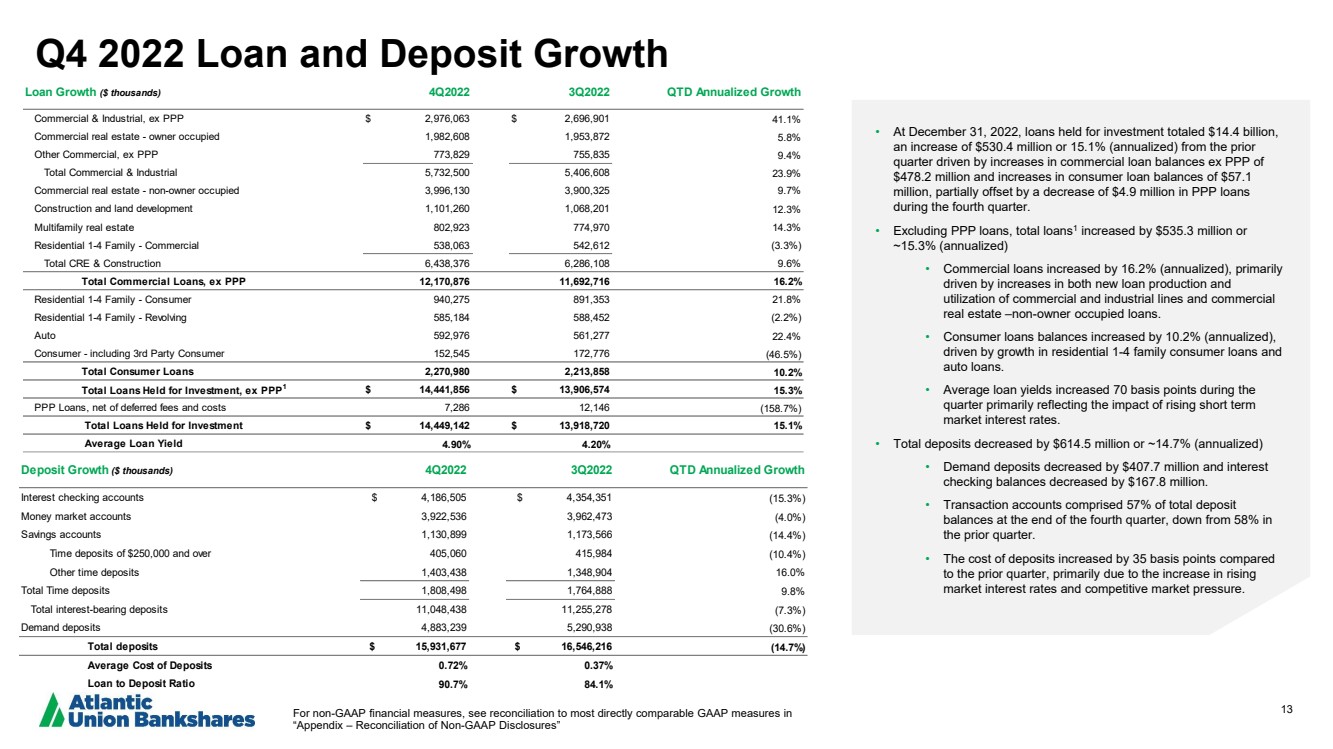
At December 31, 2022, total assets were $20.5 billion, an increase of $510.9 million or approximately 10.2% (annualized) from September 30, 2022, and an increase of $396.3 million or approximately 2.0% from December 31, 2021. Total assets increased from the prior quarter primarily due to the $530.4 million increase in total loans held for investment (net of deferred fees and costs) driven by loan growth, which was funded primarily by a $1.0 billion increase in short-term borrowings and partially by a $70.1 million decrease in cash and cash equivalents.
At December 31, 2022, loans held for investment (net of deferred fees and costs) totaled $14.4 billion, including $7.3 million in Paycheck Protection Program (“PPP”) loans, an increase of $530.4 million or 15.1% (annualized) from $13.9 billion, including $12.1 million in PPP loans, at September 30, 2022. Average loans held for investment (net of deferred fees and costs) totaled $14.1 billion at December 31, 2022, an increase of $384.0 million or 11.1% (annualized) from the prior quarter. Excluding PPP loans (net of deferred fees and costs)(1), adjusted loans held for investment (net of deferred fees and costs) at December 31, 2022 increased $535.3 million or 15.3% (annualized) from September 30, 2022 and adjusted average loans increased $390.0 million or 11.3% (annualized) from the prior quarter. At December 31, 2022, loans held for investment (net of deferred fees and costs) increased $1.3 billion or 9.5% from December 31, 2021, and quarterly average loans increased $1.0 billion or 7.9% from the same period in the prior year. Excluding PPP loans (net of deferred fees and costs)(1), adjusted loans held for investment (net of deferred fees and costs) at December 31, 2022 increased $1.4 billion or 10.7% from December 31, 2021, and adjusted quarterly average loans during the fourth quarter of 2022 increased $1.3 billion or 10.3% from the fourth quarter of 2021.
At December 31, 2022, total deposits were $15.9 billion, a decrease of $614.5 million or approximately 14.7% (annualized) from September 30, 2022. Average deposits at December 31, 2022 increased from the prior quarter by $123.5 million or 3.0% (annualized). Total deposits at December 31, 2022 decreased $679.4 million or 4.1% from December 31, 2021, and quarterly average deposits during the fourth quarter of 2022 also decreased $249.5 million or 1.5% from the fourth quarter of 2021. Total deposits decreased from the prior quarter and prior year primarily due to the impact of customer behavior in response to inflation and higher market interest rates, in addition to seasonal outflows.
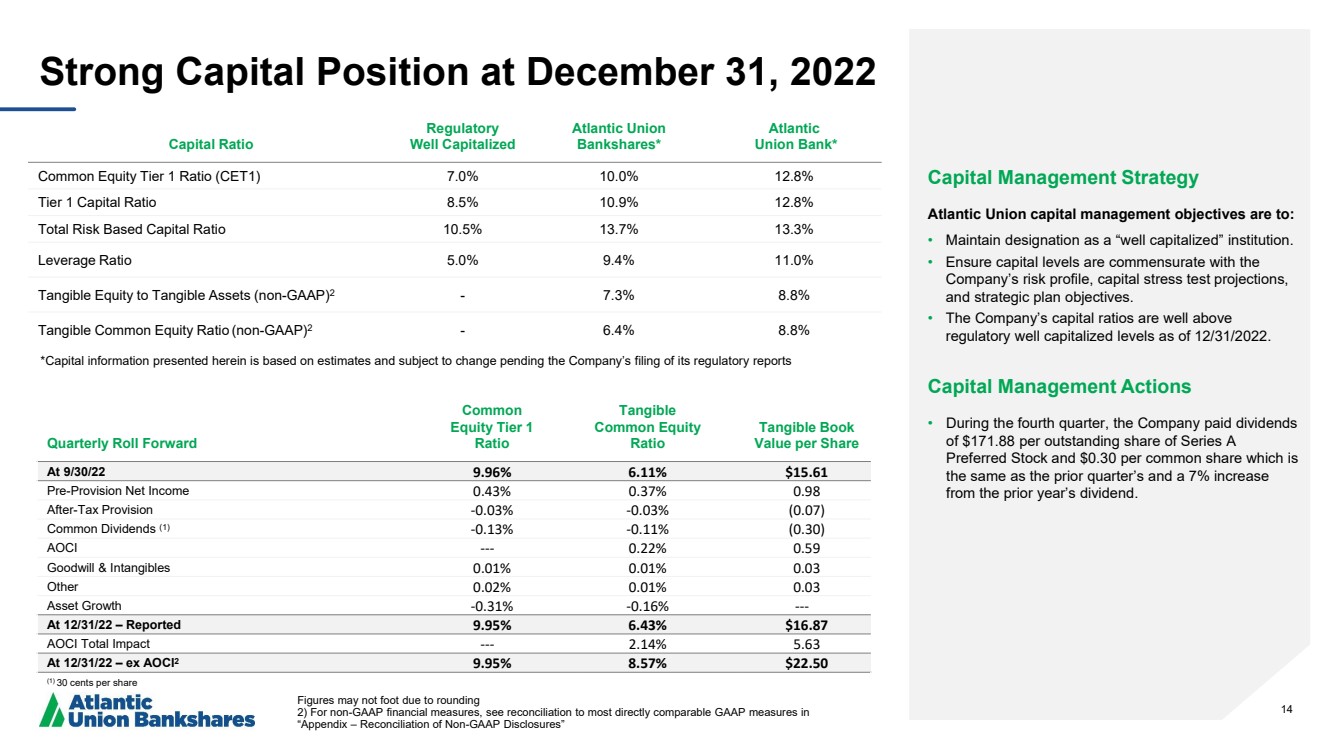
The following table shows the Company’s capital ratios at the quarters ended:
|
|
December 31, |
|
September 30, |
|
December 31, |
|
|
|
2022 |
|
2022 |
|
2021 |
|
Common equity Tier 1 capital ratio (2) |
|
9.95 |
% |
9.96 |
% |
10.24 |
% |
Tier 1 capital ratio (2) |
|
10.94 |
% |
10.98 |
% |
11.32 |
% |
Total capital ratio (2) |
|
13.70 |
% |
13.80 |
% |
14.17 |
% |
Leverage ratio (Tier 1 capital to average assets) (2) |
|
9.42 |
% |
9.32 |
% |
9.01 |
% |
Common equity to total assets |
|
10.78 |
% |
10.60 |
% |
12.68 |
% |
Tangible common equity to tangible assets (1) |
|
6.43 |
% |
6.11 |
% |
8.20 |
% |
At December 31, 2022, the Company’s common equity to total assets capital ratio and tangible common equity to tangible assets capital ratio decreased from the prior year primarily due to the unrealized losses on the available for sale (“AFS”) securities portfolio recorded in other comprehensive income due to market interest rate increases, while these ratios increased from the prior quarter due to the increase in the value of the AFS securities portfolio, as long-term rates decreased during the fourth quarter of 2022.
During the fourth quarter of 2022, the Company declared and paid a quarterly dividend on the outstanding shares of Series A Preferred Stock of $171.88 per share (equivalent to $0.43 per outstanding depositary share), consistent with the third quarter of 2022 and the fourth quarter of 2021. During the fourth quarter of 2022, the Company also declared and paid cash dividends of $0.30 per common share, consistent with the third quarter of 2022 and an increase of $0.02 or approximately 7.1% from the fourth quarter of 2021.
(1) These are financial measures not calculated in accordance with generally accepted accounting principles (“GAAP”). For a reconciliation of these non-GAAP financial measures, see Alternative Performance Measures (non-GAAP) section of the Key Financial Results.
(2) All ratios at December 31, 2022 are estimates and subject to change pending the Company’s filing of its FR Y9-C. All other periods are presented as filed.
ABOUT ATLANTIC UNION BANKSHARES CORPORATION
Headquartered in Richmond, Virginia, Atlantic Union Bankshares Corporation (NYSE: AUB) is the holding company for Atlantic Union Bank. Atlantic Union Bank has 114 branches and approximately 130 ATMs located throughout Virginia, and in portions of Maryland and North Carolina. Certain non-bank financial services affiliates of Atlantic Union Bank include: Atlantic Union Equipment Finance, Inc., which provides equipment financing; Atlantic Union Financial Consultants, LLC, which provides brokerage services; and Union Insurance Group, LLC, which offers various lines of insurance products.
On January 18, 2023, the Company completed the transfer of the listing of its common stock and its depositary shares, each representing a 1/400th interest in a share of the Company’s 6.875% Perpetual Non-Cumulative Preferred Stock, Series A, from The Nasdaq Stock Market LLC to the New York Stock Exchange, under the ticker symbols of “AUB” and “AUB.PRA”, respectively.
FOURTH QUARTER AND FISCAL YEAR 2022 EARNINGS RELEASE CONFERENCE CALL
The Company will hold a conference call and webcast for investors at 9:00 a.m. Eastern Time on Tuesday, January 24, 2023 during which management will review the financial results for the fourth quarter and fiscal year 2022 and provide an update on recent activities.
The listen-only webcast and the accompanying slides can be accessed at:
https://edge.media-server.com/mmc/p/d6afrqsq.
For analysts who wish to participate in the conference call, please register at the following URL:
https://register.vevent.com/register/BI10abddc24ec746bdb44736355d7d0588. To participate in the conference call, you must use the link to receive an audio dial-in number and an Access PIN.
A replay of the webcast, and the accompanying slides, will be available on the Company’s website for 90 days at: https://investors.atlanticunionbank.com/.
NON-GAAP FINANCIAL MEASURES
In reporting the results as of and for the periods ended December 31, 2022, the Company has provided supplemental performance measures on a tax-equivalent, tangible, operating, adjusted or pre-tax pre-provision basis. These non-GAAP financial measures are a supplement to GAAP, which is used to prepare the Company’s financial statements, and should not be considered in isolation or as a substitute for comparable measures calculated in accordance with GAAP. In addition, the Company’s non-GAAP financial measures may not be comparable to non-GAAP financial measures of other companies. The Company uses the non-GAAP financial measures discussed herein in its analysis of the Company’s performance. The Company’s management believes that these non-GAAP financial measures provide additional understanding of ongoing operations, enhance comparability of results of operations with prior periods and show the effects of significant gains and charges in the periods presented without the impact of items or events that may obscure trends in the Company’s underlying performance. For a reconciliation of these measures to their most directly comparable GAAP measures and additional information about these non-GAAP financial measures, see “Alternative Performance Measures (non-GAAP)” in the tables within the section “Key Financial Results.”
FORWARD-LOOKING STATEMENTS
This press release and statements by our management may constitute “forward-looking statements” within the meaning of the Private Securities Litigation Reform Act of 1995. Forward-looking statements are statements that include, without limitation, statements made in Mr. Asbury’s quotations, statements regarding future economic conditions and the impacts of the current economic uncertainties, estimates with respect to the remaining net accretion related to acquisition accounting, and statements that include other projections, predictions, expectations, or beliefs about future events or results, including the Company’s ability to meet its top tier financial targets, or otherwise are not statements of historical fact. Such forward-looking statements are based on certain assumptions as of the time they are made, and are inherently subject to known and unknown risks, uncertainties, and other factors, some of which cannot be predicted or quantified, that may cause actual results, performance, or achievements to be materially different from those expressed or implied by such forward-looking statements. Forward-looking statements are often characterized by the use of qualified words (and their derivatives) such as “expect,” “believe,” “estimate,” “plan,” “project,” “anticipate,” “intend,” “will,” “may,” “view,” “opportunity,” “potential,” “continue,” “confidence,” or words of similar meaning or other statements concerning opinions or judgment of the Company and its management about future events. Although the Company believes that its expectations with respect to forward-looking statements are based upon reasonable assumptions within the bounds of its existing knowledge of its business and operations, there can be no assurance that actual future results, performance, or achievements of, or trends affecting, the Company will not differ materially from any projected future results, performance, achievements or trends expressed or implied by such forward-looking statements. Actual future results, performance, achievements or trends may differ materially from historical results or those anticipated depending on a variety of factors, including, but not limited to the effects of or changes in:
| ● | market interest rates and their related impacts on macroeconomic conditions, customer and client behavior, the Company’s funding costs and the Company’s loan and securities portfolios; |
| ● | inflation and its impacts on economic growth and customer and client behavior; |
| ● | general economic and financial market conditions, in the United States generally and particularly in the markets in which the Company operates and which its loans are concentrated, including the effects of declines in real estate values, an increase in unemployment levels and slowdowns in economic growth; |
| ● | monetary and fiscal policies of the U.S. government, including policies of the U.S. Department of the Treasury and the Federal Reserve; |
| ● | the quality or composition of the Company’s loan or investment portfolios and changes therein; |
| ● | demand for loan products and financial services in the Company’s market areas; |
| ● | the Company’s ability to manage its growth or implement its growth strategy; |
| ● | the effectiveness of expense reduction plans; |
| ● | the introduction of new lines of business or new products and services; |
| ● | the Company’s ability to recruit and retain key employees; |
| ● | real estate values in the Company’s lending area; |
| ● | an insufficient ACL; |
| ● | changes in accounting principles, standards, rules, and interpretations, and the related impact on the Company’s financial statements; |
| ● | volatility in the ACL resulting from the CECL methodology, either alone or as that may be affected by conditions arising out of the COVID-19 pandemic, inflation, changing interest rates, or other factors; |
| ● | the Company’s liquidity and capital positions; |
| ● | concentrations of loans secured by real estate, particularly commercial real estate; |
| ● | the effectiveness of the Company’s credit processes and management of the Company’s credit risk; |
| ● | the Company’s ability to compete in the market for financial services and increased competition from fintech companies; |
| ● | technological risks and developments, and cyber threats, attacks, or events; |
| ● | operational, technological, cultural, regulatory, legal, credit, and other risks associated with the exploration, consummation and integration of potential future acquisitions, whether involving stock or cash considerations; |
| ● | the potential adverse effects of unusual and infrequently occurring events, such as weather-related disasters, terrorist acts, geopolitical conflicts (such as the ongoing conflict between Russia and Ukraine) or public health events (such as COVID-19), and of governmental and societal responses thereto; these potential adverse effects may include, without limitation, adverse effects on the ability of the Company's borrowers to satisfy their obligations to the Company, on the value of collateral securing loans, on the demand for the Company's loans or its other products and services, on supply chains and methods used to distribute products and services, on |
| incidents of cyberattack and fraud, on the Company’s liquidity or capital positions, on risks posed by reliance on third-party service providers, on other aspects of the Company's business operations and on financial markets and economic growth; |
| ● | the effect of steps the Company takes in response to the COVID-19 pandemic, the severity and duration of the pandemic, the uncertainty regarding new variants of COVID-19 that have emerged, the speed and efficacy of vaccine and treatment developments, the impact of loosening or tightening of government restrictions, the pace of recovery when the pandemic subsides and the heightened impact it has on many of the risks described herein; |
| ● | the discontinuation of LIBOR and its impact on the financial markets, and the Company’s ability to manage operational, legal and compliance risks related to the discontinuation of LIBOR and implementation of one or more alternate reference rates; |
| ● | performance by the Company’s counterparties or vendors; |
| ● | deposit flows; |
| ● | the availability of financing and the terms thereof; |
| ● | the level of prepayments on loans and mortgage-backed securities; |
| ● | legislative or regulatory changes and requirements; |
| ● | potential claims, damages, and fines related to litigation or government actions; |
| ● | the effects of changes in federal, state or local tax laws and regulations; |
| ● | any event or development that would cause the Company to conclude that there was an impairment of any asset, including intangible assets, such as goodwill; and |
| ● | other factors, many of which are beyond the control of the Company. |
Please also refer to such other factors as discussed throughout Part I, Item 1A. “Risk Factors” and Part II, Item 7, “Management’s Discussion and Analysis of Financial Condition and Results of Operations” of the Company’s Annual Report on Form 10-K for the year ended December 31, 2021 and related disclosures in other filings, which have been filed with the U.S. Securities and Exchange Commission (“SEC”) and are available on the SEC’s website at www.sec.gov. All risk factors and uncertainties described herein and therein should be considered in evaluating forward-looking statements, and all of the forward-looking statements are expressly qualified by the cautionary statements contained or referred to herein and therein. The actual results or developments anticipated may not be realized or, even if substantially realized, they may not have the expected consequences to or effects on the Company or its businesses or operations. Readers are cautioned not to rely too heavily on the forward-looking statements, and undue reliance should not be placed on such forward-looking statements. Forward-looking statements speak only as of the date they are made. The Company does not intend or assume any obligation to update, revise or clarify any forward-looking statements that may be made from time to time by or on behalf of the Company, whether as a result of new information, future events or otherwise.
ATLANTIC UNION BANKSHARES CORPORATION AND SUBSIDIARIES
KEY FINANCIAL RESULTS
(Dollars in thousands, except share data)
|
|
As of & For Three Months Ended |
|
As of & For Year Ended |
|
|||||||||||
|
|
12/31/22 |
|
09/30/22 |
|
12/31/21 |
|
12/31/22 |
|
12/31/21 |
|
|||||
|
|
(unaudited) |
|
(unaudited) |
|
(unaudited) |
|
(unaudited) |
|
(audited) |
|
|||||
Results of Operations |
|
|
|
|
|
|
|
|
|
|
|
|
|
|
|
|
Interest and dividend income |
|
$ |
202,068 |
|
$ |
171,156 |
|
$ |
147,456 |
|
$ |
660,435 |
|
$ |
592,359 |
|
Interest expense |
|
|
38,220 |
|
|
20,441 |
|
|
9,129 |
|
|
76,174 |
|
|
41,099 |
|
Net interest income |
|
|
163,848 |
|
|
150,715 |
|
|
138,327 |
|
|
584,261 |
|
|
551,260 |
|
Provision for credit losses |
|
|
6,257 |
|
|
6,412 |
|
|
(1,000) |
|
|
19,028 |
|
|
(60,888) |
|
Net interest income after provision for credit losses |
|
|
157,591 |
|
|
144,303 |
|
|
139,327 |
|
|
565,233 |
|
|
612,148 |
|
Noninterest income |
|
|
24,500 |
|
|
25,584 |
|
|
36,417 |
|
|
118,523 |
|
|
125,806 |
|
Noninterest expenses |
|
|
99,790 |
|
|
99,923 |
|
|
119,944 |
|
|
403,802 |
|
|
419,195 |
|
Income before income taxes |
|
|
82,301 |
|
|
69,964 |
|
|
55,800 |
|
|
279,954 |
|
|
318,759 |
|
Income tax expense |
|
|
11,777 |
|
|
11,894 |
|
|
8,021 |
|
|
45,444 |
|
|
54,842 |
|
Net income |
|
|
70,524 |
|
|
58,070 |
|
|
47,779 |
|
|
234,510 |
|
|
263,917 |
|
Dividends on preferred stock |
|
|
2,967 |
|
|
2,967 |
|
|
2,967 |
|
|
11,868 |
|
|
11,868 |
|
Net income available to common shareholders |
|
$ |
67,557 |
|
$ |
55,103 |
|
$ |
44,812 |
|
$ |
222,642 |
|
$ |
252,049 |
|
|
|
|
|
|
|
|
|
|
|
|
|
|
|
|
|
|
Interest earned on earning assets (FTE) (1) |
|
$ |
206,186 |
|
$ |
174,998 |
|
$ |
150,684 |
|
$ |
675,308 |
|
$ |
604,950 |
|
Net interest income (FTE) (1) |
|
|
167,966 |
|
|
154,557 |
|
|
141,555 |
|
|
599,134 |
|
|
563,851 |
|
Total revenue (FTE) (1) |
|
|
192,466 |
|
|
180,141 |
|
|
177,972 |
|
|
717,657 |
|
|
689,657 |
|
Pre-PPP total adjusted revenue (FTE) (1) (10) |
|
|
192,447 |
|
|
179,687 |
|
|
161,423 |
|
|
703,772 |
|
|
636,215 |
|
Pre-tax pre-provision adjusted operating earnings (8) |
|
|
88,559 |
|
|
76,376 |
|
|
66,199 |
|
|
295,411 |
|
|
284,779 |
|
Pre-PPP pre-tax pre-provision adjusted operating earnings (8) (10) |
|
|
88,539 |
|
|
75,922 |
|
|
54,787 |
|
|
290,605 |
|
|
236,561 |
|
|
|
|
|
|
|
|
|
|
|
|
|
|
|
|
|
|
Key Ratios |
|
|
|
|
|
|
|
|
|
|
|
|
|
|
|
|
Earnings per common share, diluted |
|
$ |
0.90 |
|
$ |
0.74 |
|
$ |
0.59 |
|
$ |
2.97 |
|
$ |
3.26 |
|
Return on average assets (ROA) |
|
|
1.39 |
% |
|
1.15 |
% |
|
0.94 |
% |
|
1.18 |
% |
|
1.32 |
% |
Return on average equity (ROE) |
|
|
12.05 |
% |
|
9.45 |
% |
|
6.98 |
% |
|
9.51 |
% |
|
9.68 |
% |
Return on average tangible common equity (ROTCE) (2) (3) |
|
|
22.92 |
% |
|
17.21 |
% |
|
11.98 |
% |
|
17.33 |
% |
|
16.72 |
% |
Efficiency ratio |
|
|
52.98 |
% |
|
56.68 |
% |
|
68.64 |
% |
|
57.46 |
% |
|
61.91 |
% |
Efficiency ratio (FTE) (1) |
|
|
51.85 |
% |
|
55.47 |
% |
|
67.39 |
% |
|
56.27 |
% |
|
60.78 |
% |
Net interest margin |
|
|
3.61 |
% |
|
3.34 |
% |
|
3.03 |
% |
|
3.27 |
% |
|
3.08 |
% |
Net interest margin (FTE) (1) |
|
|
3.70 |
% |
|
3.43 |
% |
|
3.10 |
% |
|
3.36 |
% |
|
3.15 |
% |
Yields on earning assets (FTE) (1) |
|
|
4.54 |
% |
|
3.88 |
% |
|
3.30 |
% |
|
3.78 |
% |
|
3.38 |
% |
Cost of interest-bearing liabilities |
|
|
1.24 |
% |
|
0.68 |
% |
|
0.30 |
% |
|
0.64 |
% |
|
0.34 |
% |
Cost of deposits |
|
|
0.72 |
% |
|
0.37 |
% |
|
0.12 |
% |
|
0.34 |
% |
|
0.16 |
% |
Cost of funds |
|
|
0.84 |
% |
|
0.45 |
% |
|
0.20 |
% |
|
0.42 |
% |
|
0.23 |
% |
|
|
|
|
|
|
|
|
|
|
|
|
|
|
|
|
|
Operating Measures (4) |
|
|
|
|
|
|
|
|
|
|
|
|
|
|
|
|
Adjusted operating earnings |
|
$ |
70,525 |
|
$ |
58,070 |
|
$ |
56,784 |
|
$ |
230,879 |
|
$ |
285,174 |
|
Adjusted operating earnings available to common shareholders |
|
|
67,558 |
|
|
55,103 |
|
|
53,817 |
|
|
219,011 |
|
|
273,306 |
|
Adjusted operating earnings per common share, diluted |
|
$ |
0.90 |
|
$ |
0.74 |
|
$ |
0.71 |
|
$ |
2.92 |
|
$ |
3.53 |
|
Adjusted operating ROA |
|
|
1.39 |
% |
|
1.15 |
% |
|
1.11 |
% |
|
1.16 |
% |
|
1.43 |
% |
Adjusted operating ROE |
|
|
12.05 |
% |
|
9.45 |
% |
|
8.30 |
% |
|
9.37 |
% |
|
10.46 |
% |
Adjusted operating ROTCE (2) (3) |
|
|
22.92 |
% |
|
17.21 |
% |
|
14.25 |
% |
|
17.06 |
% |
|
18.07 |
% |
Adjusted operating efficiency ratio (FTE) (1)(7) |
|
|
50.61 |
% |
|
54.09 |
% |
|
57.96 |
% |
|
54.68 |
% |
|
54.52 |
% |
|
|
|
|
|
|
|
|
|
|
|
|
|
|
|
|
|
Per Share Data |
|
|
|
|
|
|
|
|
|
|
|
|
|
|
|
|
Earnings per common share, basic |
|
$ |
0.90 |
|
$ |
0.74 |
|
$ |
0.59 |
|
$ |
2.97 |
|
$ |
3.26 |
|
Earnings per common share, diluted |
|
|
0.90 |
|
|
0.74 |
|
|
0.59 |
|
|
2.97 |
|
|
3.26 |
|
Cash dividends paid per common share |
|
|
0.30 |
|
|
0.30 |
|
|
0.28 |
|
|
1.16 |
|
|
1.09 |
|
Market value per share |
|
|
35.14 |
|
|
30.38 |
|
|
37.29 |
|
|
35.14 |
|
|
37.29 |
|
Book value per common share |
|
|
29.68 |
|
|
28.46 |
|
|
33.80 |
|
|
29.68 |
|
|
33.80 |
|
Tangible book value per common share (2) |
|
|
16.87 |
|
|
15.61 |
|
|
20.79 |
|
|
16.87 |
|
|
20.79 |
|
Price to earnings ratio, diluted |
|
|
9.79 |
|
|
10.37 |
|
|
15.93 |
|
|
11.83 |
|
|
11.44 |
|
Price to book value per common share ratio |
|
|
1.18 |
|
|
1.07 |
|
|
1.10 |
|
|
1.18 |
|
|
1.10 |
|
Price to tangible book value per common share ratio (2) |
|
|
2.08 |
|
|
1.95 |
|
|
1.79 |
|
|
2.08 |
|
|
1.79 |
|
Weighted average common shares outstanding, basic |
|
|
74,712,040 |
|
|
74,703,699 |
|
|
75,654,336 |
|
|
74,949,109 |
|
|
77,399,902 |
|
Weighted average common shares outstanding, diluted |
|
|
74,713,972 |
|
|
74,705,054 |
|
|
75,667,759 |
|
|
74,953,398 |
|
|
77,417,801 |
|
Common shares outstanding at end of period |
|
|
74,712,622 |
|
|
74,703,774 |
|
|
75,663,648 |
|
|
74,712,622 |
|
|
75,663,648 |
|
ATLANTIC UNION BANKSHARES CORPORATION AND SUBSIDIARIES
KEY FINANCIAL RESULTS
(Dollars in thousands, except share data)
|
|
As of & For Three Months Ended |
|
As of & For Year Ended |
|
|||||||||||
|
|
12/31/22 |
|
09/30/22 |
|
12/31/21 |
|
12/31/22 |
|
12/31/21 |
|
|||||
|
|
(unaudited) |
|
(unaudited) |
|
(unaudited) |
|
(unaudited) |
|
(audited) |
|
|||||
Capital Ratios |
|
|
|
|
|
|
|
|
|
|
|
|
|
|
|
|
Common equity Tier 1 capital ratio (5) |
|
|
9.95 |
% |
|
9.96 |
% |
|
10.24 |
% |
|
9.95 |
% |
|
10.24 |
% |
Tier 1 capital ratio (5) |
|
|
10.94 |
% |
|
10.98 |
% |
|
11.32 |
% |
|
10.94 |
% |
|
11.32 |
% |
Total capital ratio (5) |
|
|
13.70 |
% |
|
13.80 |
% |
|
14.17 |
% |
|
13.70 |
% |
|
14.17 |
% |
Leverage ratio (Tier 1 capital to average assets) (5) |
|
|
9.42 |
% |
|
9.32 |
% |
|
9.01 |
% |
|
9.42 |
% |
|
9.01 |
% |
Common equity to total assets |
|
|
10.78 |
% |
|
10.60 |
% |
|
12.68 |
% |
|
10.78 |
% |
|
12.68 |
% |
Tangible common equity to tangible assets (2) |
|
|
6.43 |
% |
|
6.11 |
% |
|
8.20 |
% |
|
6.43 |
% |
|
8.20 |
% |
|
|
|
|
|
|
|
|
|
|
|
|
|
|
|
|
|
Financial Condition |
|
|
|
|
|
|
|
|
|
|
|
|
|
|
|
|
Assets |
|
$ |
20,461,138 |
|
$ |
19,950,231 |
|
$ |
20,064,796 |
|
$ |
20,461,138 |
|
$ |
20,064,796 |
|
Loans held for investment (net of deferred fees and costs) |
|
|
14,449,142 |
|
|
13,918,720 |
|
|
13,195,843 |
|
|
14,449,142 |
|
|
13,195,843 |
|
Securities |
|
|
3,709,761 |
|
|
3,640,722 |
|
|
4,186,475 |
|
|
3,709,761 |
|
|
4,186,475 |
|
Earning Assets |
|
|
18,271,430 |
|
|
17,790,324 |
|
|
18,030,138 |
|
|
18,271,430 |
|
|
18,030,138 |
|
Goodwill |
|
|
925,211 |
|
|
925,211 |
|
|
935,560 |
|
|
925,211 |
|
|
935,560 |
|
Amortizable intangibles, net |
|
|
26,761 |
|
|
29,142 |
|
|
43,312 |
|
|
26,761 |
|
|
43,312 |
|
Deposits |
|
|
15,931,677 |
|
|
16,546,216 |
|
|
16,611,068 |
|
|
15,931,677 |
|
|
16,611,068 |
|
Borrowings |
|
|
1,708,700 |
|
|
669,558 |
|
|
506,594 |
|
|
1,708,700 |
|
|
506,594 |
|
Stockholders' equity |
|
|
2,372,737 |
|
|
2,281,150 |
|
|
2,710,071 |
|
|
2,372,737 |
|
|
2,710,071 |
|
Tangible common equity (2) |
|
|
1,254,408 |
|
|
1,160,440 |
|
|
1,564,842 |
|
|
1,254,408 |
|
|
1,564,842 |
|
|
|
|
|
|
|
|
|
|
|
|
|
|
|
|
|
|
Loans held for investment, net of deferred fees and costs |
|
|
|
|
|
|
|
|
|
|
|
|
|
|
|
|
Construction and land development |
|
$ |
1,101,260 |
|
$ |
1,068,201 |
|
$ |
862,236 |
|
$ |
1,101,260 |
|
$ |
862,236 |
|
Commercial real estate - owner occupied |
|
|
1,982,608 |
|
|
1,953,872 |
|
|
1,995,409 |
|
|
1,982,608 |
|
|
1,995,409 |
|
Commercial real estate - non-owner occupied |
|
|
3,996,130 |
|
|
3,900,325 |
|
|
3,789,377 |
|
|
3,996,130 |
|
|
3,789,377 |
|
Multifamily real estate |
|
|
802,923 |
|
|
774,970 |
|
|
778,626 |
|
|
802,923 |
|
|
778,626 |
|
Commercial & Industrial |
|
|
2,983,349 |
|
|
2,709,047 |
|
|
2,542,243 |
|
|
2,983,349 |
|
|
2,542,243 |
|
Residential 1-4 Family - Commercial |
|
|
538,063 |
|
|
542,612 |
|
|
607,337 |
|
|
538,063 |
|
|
607,337 |
|
Residential 1-4 Family - Consumer |
|
|
940,275 |
|
|
891,353 |
|
|
816,524 |
|
|
940,275 |
|
|
816,524 |
|
Residential 1-4 Family - Revolving |
|
|
585,184 |
|
|
588,452 |
|
|
560,796 |
|
|
585,184 |
|
|
560,796 |
|
Auto |
|
|
592,976 |
|
|
561,277 |
|
|
461,052 |
|
|
592,976 |
|
|
461,052 |
|
Consumer |
|
|
152,545 |
|
|
172,776 |
|
|
176,992 |
|
|
152,545 |
|
|
176,992 |
|
Other Commercial |
|
|
773,829 |
|
|
755,835 |
|
|
605,251 |
|
|
773,829 |
|
|
605,251 |
|
Total loans held for investment |
|
$ |
14,449,142 |
|
$ |
13,918,720 |
|
$ |
13,195,843 |
|
$ |
14,449,142 |
|
$ |
13,195,843 |
|
|
|
|
|
|
|
|
|
|
|
|
|
|
|
|
|
|
Deposits |
|
|
|
|
|
|
|
|
|
|
|
|
|
|
|
|
Interest checking accounts |
|
$ |
4,186,505 |
|
$ |
4,354,351 |
|
$ |
4,176,032 |
|
$ |
4,186,505 |
|
$ |
4,176,032 |
|
Money market accounts |
|
|
3,922,536 |
|
|
3,962,473 |
|
|
4,249,858 |
|
|
3,922,536 |
|
|
4,249,858 |
|
Savings accounts |
|
|
1,130,899 |
|
|
1,173,566 |
|
|
1,121,297 |
|
|
1,130,899 |
|
|
1,121,297 |
|
Time deposits of $250,000 and over |
|
|
405,060 |
|
|
415,984 |
|
|
452,193 |
|
|
405,060 |
|
|
452,193 |
|
Other time deposits |
|
|
1,403,438 |
|
|
1,348,904 |
|
|
1,404,364 |
|
|
1,403,438 |
|
|
1,404,364 |
|
Time deposits |
|
|
1,808,498 |
|
|
1,764,888 |
|
|
1,856,557 |
|
|
1,808,498 |
|
|
1,856,557 |
|
Total interest-bearing deposits |
|
$ |
11,048,438 |
|
$ |
11,255,278 |
|
$ |
11,403,744 |
|
$ |
11,048,438 |
|
$ |
11,403,744 |
|
Demand deposits |
|
|
4,883,239 |
|
|
5,290,938 |
|
|
5,207,324 |
|
|
4,883,239 |
|
|
5,207,324 |
|
Total deposits |
|
$ |
15,931,677 |
|
$ |
16,546,216 |
|
$ |
16,611,068 |
|
$ |
15,931,677 |
|
$ |
16,611,068 |
|
|
|
|
|
|
|
|
|
|
|
|
|
|
|
|
|
|
Averages |
|
|
|
|
|
|
|
|
|
|
|
|
|
|
|
|
Assets |
|
$ |
20,174,152 |
|
$ |
19,980,500 |
|
$ |
20,236,889 |
|
$ |
19,949,388 |
|
$ |
19,977,551 |
|
Loans held for investment (net of deferred fees and costs) |
|
|
14,117,433 |
|
|
13,733,447 |
|
|
13,082,412 |
|
|
13,671,714 |
|
|
13,639,325 |
|
Loans held for sale |
|
|
7,809 |
|
|
15,063 |
|
|
26,775 |
|
|
14,519 |
|
|
39,031 |
|
Securities |
|
|
3,644,196 |
|
|
3,818,607 |
|
|
3,998,058 |
|
|
3,896,337 |
|
|
3,579,378 |
|
Earning assets |
|
|
18,000,596 |
|
|
17,879,222 |
|
|
18,138,285 |
|
|
17,853,216 |
|
|
17,903,671 |
|
Deposits |
|
|
16,611,749 |
|
|
16,488,224 |
|
|
16,861,219 |
|
|
16,451,718 |
|
|
16,541,286 |
|
Time deposits |
|
|
1,764,596 |
|
|
1,745,224 |
|
|
1,941,420 |
|
|
1,735,983 |
|
|
2,201,039 |
|
Interest-bearing deposits |
|
|
11,415,032 |
|
|
11,163,945 |
|
|
11,489,510 |
|
|
11,172,759 |
|
|
11,485,130 |
|
Borrowings |
|
|
816,818 |
|
|
703,272 |
|
|
445,344 |
|
|
700,271 |
|
|
453,452 |
|
Interest-bearing liabilities |
|
|
12,231,850 |
|
|
11,867,217 |
|
|
11,934,854 |
|
|
11,873,030 |
|
|
11,938,582 |
|
Stockholders' equity |
|
|
2,321,208 |
|
|
2,436,999 |
|
|
2,715,610 |
|
|
2,465,049 |
|
|
2,725,330 |
|
Tangible common equity (2) |
|
|
1,201,732 |
|
|
1,315,085 |
|
|
1,568,828 |
|
|
1,333,751 |
|
|
1,573,415 |
|
ATLANTIC UNION BANKSHARES CORPORATION AND SUBSIDIARIES
KEY FINANCIAL RESULTS
(Dollars in thousands, except share data)
|
|
As of & For Three Months Ended |
|
As of & For Year Ended |
|
|||||||||||
|
|
12/31/22 |
|
09/30/22 |
|
12/31/21 |
|
12/31/22 |
|
12/31/21 |
|
|||||
|
|
(unaudited) |
|
(unaudited) |
|
(unaudited) |
|
(unaudited) |
|
(audited) |
|
|||||
Asset Quality |
|
|
|
|
|
|
|
|
|
|
|
|
|
|
|
|
Allowance for Credit Losses (ACL) |
|
|
|
|
|
|
|
|
|
|
|
|
|
|
|
|
Beginning balance, Allowance for loan and lease losses (ALLL) |
|
$ |
108,009 |
|
$ |
104,184 |
|
$ |
101,798 |
|
$ |
99,787 |
|
$ |
160,540 |
|
Add: Recoveries |
|
|
1,332 |
|
|
1,214 |
|
|
1,720 |
|
|
5,076 |
|
|
8,218 |
|
Less: Charge-offs |
|
|
2,142 |
|
|
1,801 |
|
|
2,231 |
|
|
7,409 |
|
|
10,083 |
|
Add: Provision for loan losses |
|
|
3,569 |
|
|
4,412 |
|
|
(1,500) |
|
|
13,314 |
|
|
(58,888) |
|
Ending balance, ALLL |
|
$ |
110,768 |
|
$ |
108,009 |
|
$ |
99,787 |
|
$ |
110,768 |
|
$ |
99,787 |
|
|
|
|
|
|
|
|
|
|
|
|
|
|
|
|
|
|
Beginning balance, Reserve for unfunded commitment (RUC) |
|
$ |
11,000 |
|
$ |
9,000 |
|
$ |
7,500 |
|
$ |
8,000 |
|
$ |
10,000 |
|
Add: Provision for unfunded commitments |
|
|
2,675 |
|
|
2,000 |
|
|
500 |
|
|
5,675 |
|
|
(2,000) |
|
Ending balance, RUC |
|
$ |
13,675 |
|
$ |
11,000 |
|
$ |
8,000 |
|
$ |
13,675 |
|
$ |
8,000 |
|
Total ACL |
|
$ |
124,443 |
|
$ |
119,009 |
|
$ |
107,787 |
|
$ |
124,443 |
|
$ |
107,787 |
|
|
|
|
|
|
|
|
|
|
|
|
|
|
|
|
|
|
ACL / total outstanding loans |
|
|
0.86 |
% |
|
0.86 |
% |
|
0.82 |
% |
|
0.86 |
% |
|
0.82 |
% |
ACL / total adjusted loans(9) |
|
|
0.86 |
% |
|
0.86 |
% |
|
0.83 |
% |
|
0.86 |
% |
|
0.83 |
% |
ALLL / total outstanding loans |
|
|
0.77 |
% |
|
0.78 |
% |
|
0.76 |
% |
|
0.77 |
% |
|
0.76 |
% |
ALLL / total adjusted loans(9) |
|
|
0.77 |
% |
|
0.78 |
% |
|
0.76 |
% |
|
0.77 |
% |
|
0.76 |
% |
Net charge-offs / total average loans |
|
|
0.02 |
% |
|
0.02 |
% |
|
0.02 |
% |
|
0.02 |
% |
|
0.01 |
% |
Net charge-offs / total adjusted average loans(9) |
|
|
0.02 |
% |
|
0.02 |
% |
|
0.02 |
% |
|
0.02 |
% |
|
0.01 |
% |
Provision for loan losses/ total average loans |
|
|
0.10 |
% |
|
0.13 |
% |
|
(0.05) |
% |
|
0.10 |
% |
|
(0.43) |
% |
Provision for loan losses/ total adjusted average loans(9) |
|
|
0.10 |
% |
|
0.13 |
% |
|
(0.05) |
% |
|
0.10 |
% |
|
(0.46) |
% |
|
|
|
|
|
|
|
|
|
|
|
|
|
|
|
|
|
Nonperforming Assets (6) |
|
|
|
|
|
|
|
|
|
|
|
|
|
|
|
|
Construction and land development |
|
$ |
307 |
|
$ |
421 |
|
$ |
2,697 |
|
$ |
307 |
|
$ |
2,697 |
|
Commercial real estate - owner occupied |
|
|
7,178 |
|
|
4,883 |
|
|
5,637 |
|
|
7,178 |
|
|
5,637 |
|
Commercial real estate - non-owner occupied |
|
|
1,263 |
|
|
1,923 |
|
|
3,641 |
|
|
1,263 |
|
|
3,641 |
|
Multifamily real estate |
|
|
— |
|
|
— |
|
|
113 |
|
|
— |
|
|
113 |
|
Commercial & Industrial |
|
|
1,884 |
|
|
2,289 |
|
|
1,647 |
|
|
1,884 |
|
|
1,647 |
|
Residential 1-4 Family - Commercial |
|
|
1,904 |
|
|
1,962 |
|
|
2,285 |
|
|
1,904 |
|
|
2,285 |
|
Residential 1-4 Family - Consumer |
|
|
10,846 |
|
|
11,121 |
|
|
11,397 |
|
|
10,846 |
|
|
11,397 |
|
Residential 1-4 Family - Revolving |
|
|
3,453 |
|
|
3,583 |
|
|
3,406 |
|
|
3,453 |
|
|
3,406 |
|
Auto |
|
|
200 |
|
|
318 |
|
|
223 |
|
|
200 |
|
|
223 |
|
Consumer |
|
|
3 |
|
|
— |
|
|
54 |
|
|
3 |
|
|
54 |
|
Nonaccrual loans |
|
$ |
27,038 |
|
$ |
26,500 |
|
$ |
31,100 |
|
$ |
27,038 |
|
$ |
31,100 |
|
Foreclosed property |
|
|
76 |
|
|
2,087 |
|
|
1,696 |
|
|
76 |
|
|
1,696 |
|
Total nonperforming assets (NPAs) |
|
$ |
27,114 |
|
$ |
28,587 |
|
$ |
32,796 |
|
$ |
27,114 |
|
$ |
32,796 |
|
Construction and land development |
|
$ |
100 |
|
$ |
115 |
|
$ |
299 |
|
$ |
100 |
|
$ |
299 |
|
Commercial real estate - owner occupied |
|
|
2,167 |
|
|
3,517 |
|
|
1,257 |
|
|
2,167 |
|
|
1,257 |
|
Commercial real estate - non-owner occupied |
|
|
607 |
|
|
621 |
|
|
433 |
|
|
607 |
|
|
433 |
|
Commercial & Industrial |
|
|
459 |
|
|
526 |
|
|
1,897 |
|
|
459 |
|
|
1,897 |
|
Residential 1-4 Family - Commercial |
|
|
275 |
|
|
308 |
|
|
990 |
|
|
275 |
|
|
990 |
|
Residential 1-4 Family - Consumer |
|
|
1,955 |
|
|
680 |
|
|
3,013 |
|
|
1,955 |
|
|
3,013 |
|
Residential 1-4 Family - Revolving |
|
|
1,384 |
|
|
1,255 |
|
|
882 |
|
|
1,384 |
|
|
882 |
|
Auto |
|
|
344 |
|
|
148 |
|
|
241 |
|
|
344 |
|
|
241 |
|
Consumer |
|
|
108 |
|
|
86 |
|
|
120 |
|
|
108 |
|
|
120 |
|
Other Commercial |
|
|
91 |
|
|
95 |
|
|
— |
|
|
91 |
|
|
— |
|
Loans ≥ 90 days and still accruing |
|
$ |
7,490 |
|
$ |
7,351 |
|
$ |
9,132 |
|
$ |
7,490 |
|
$ |
9,132 |
|
Total NPAs and loans ≥ 90 days |
|
$ |
34,604 |
|
$ |
35,938 |
|
$ |
41,928 |
|
$ |
34,604 |
|
$ |
41,928 |
|
NPAs / total outstanding loans |
|
|
0.19 |
% |
|
0.21 |
% |
|
0.25 |
% |
|
0.19 |
% |
|
0.25 |
% |
NPAs / total adjusted loans(9) |
|
|
0.19 |
% |
|
0.21 |
% |
|
0.25 |
% |
|
0.19 |
% |
|
0.25 |
% |
NPAs / total assets |
|
|
0.13 |
% |
|
0.14 |
% |
|
0.16 |
% |
|
0.13 |
% |
|
0.16 |
% |
ALLL / nonaccrual loans |
|
|
409.68 |
% |
|
407.58 |
% |
|
320.86 |
% |
|
409.68 |
% |
|
320.86 |
% |
ALLL/ nonperforming assets |
|
|
408.53 |
% |
|
377.83 |
% |
|
304.27 |
% |
|
408.53 |
% |
|
304.27 |
% |
ATLANTIC UNION BANKSHARES CORPORATION AND SUBSIDIARIES
KEY FINANCIAL RESULTS
(Dollars in thousands, except share data)
|
|
As of & For Three Months Ended |
|
As of & For Year Ended |
|
|||||||||||
|
|
12/31/22 |
|
09/30/22 |
|
12/31/21 |
|
12/31/22 |
|
12/31/21 |
|
|||||
|
|
(unaudited) |
|
(unaudited) |
|
(unaudited) |
|
(unaudited) |
|
(audited) |
|
|||||
Past Due Detail (6) |
|
|
|
|
|
|
|
|
|
|
|
|
|
|
|
|
Construction and land development |
|
$ |
1,253 |
|
$ |
120 |
|
$ |
1,357 |
|
$ |
1,253 |
|
$ |
1,357 |
|
Commercial real estate - owner occupied |
|
|
2,305 |
|
|
7,337 |
|
|
1,230 |
|
|
2,305 |
|
|
1,230 |
|
Commercial real estate - non-owner occupied |
|
|
1,121 |
|
|
— |
|
|
1,965 |
|
|
1,121 |
|
|
1,965 |
|
Multifamily real estate |
|
|
1,229 |
|
|
— |
|
|
84 |
|
|
1,229 |
|
|
84 |
|
Commercial & Industrial |
|
|
824 |
|
|
796 |
|
|
1,161 |
|
|
824 |
|
|
1,161 |
|
Residential 1-4 Family - Commercial |
|
|
1,231 |
|
|
1,410 |
|
|
1,844 |
|
|
1,231 |
|
|
1,844 |
|
Residential 1-4 Family - Consumer |
|
|
5,951 |
|
|
1,123 |
|
|
3,368 |
|
|
5,951 |
|
|
3,368 |
|
Residential 1-4 Family - Revolving |
|
|
1,843 |
|
|
1,115 |
|
|
1,493 |
|
|
1,843 |
|
|
1,493 |
|
Auto |
|
|
2,747 |
|
|
1,876 |
|
|
1,866 |
|
|
2,747 |
|
|
1,866 |
|
Consumer |
|
|
351 |
|
|
409 |
|
|
689 |
|
|
351 |
|
|
689 |
|
Other Commercial |
|
|
— |
|
|
— |
|
|
37 |
|
|
— |
|
|
37 |
|
Loans 30-59 days past due |
|
$ |
18,855 |
|
$ |
14,186 |
|
$ |
15,094 |
|
$ |
18,855 |
|
$ |
15,094 |
|
Construction and land development |
|
$ |
45 |
|
$ |
107 |
|
$ |
— |
|
$ |
45 |
|
$ |
— |
|
Commercial real estate - owner occupied |
|
|
635 |
|
|
763 |
|
|
152 |
|
|
635 |
|
|
152 |
|
Commercial real estate - non-owner occupied |
|
|
48 |
|
|
457 |
|
|
127 |
|
|
48 |
|
|
127 |
|
Commercial & Industrial |
|
|
174 |
|
|
3,128 |
|
|
1,438 |
|
|
174 |
|
|
1,438 |
|
Residential 1-4 Family - Commercial |
|
|
— |
|
|
97 |
|
|
272 |
|
|
— |
|
|
272 |
|
Residential 1-4 Family - Consumer |
|
|
1,690 |
|
|
1,449 |
|
|
2,925 |
|
|
1,690 |
|
|
2,925 |
|
Residential 1-4 Family - Revolving |
|
|
511 |
|
|
1,081 |
|
|
363 |
|
|
511 |
|
|
363 |
|
Auto |
|
|
450 |
|
|
257 |
|
|
249 |
|
|
450 |
|
|
249 |
|
Consumer |
|
|
125 |
|
|
101 |
|
|
186 |
|
|
125 |
|
|
186 |
|
Loans 60-89 days past due |
|
$ |
3,678 |
|
$ |
7,440 |
|
$ |
5,712 |
|
$ |
3,678 |
|
$ |
5,712 |
|
|
|
|
|
|
|
|
|
|
|
|
|
|
|
|
|
|
Past Due and still accruing |
|
$ |
30,023 |
|
$ |
28,977 |
|
$ |
29,938 |
|
$ |
30,023 |
|
$ |
29,938 |
|
Past Due and still accruing / total loans |
|
|
0.21 |
% |
|
0.21 |
% |
|
0.23 |
% |
|
0.21 |
% |
|
0.23 |
% |
|
|
|
|
|
|
|
|
|
|
|
|
|
|
|
|
|
Troubled Debt Restructurings |
|
|
|
|
|
|
|
|
|
|
|
|
|
|
|
|
Performing |
|
$ |
9,273 |
|
$ |
10,333 |
|
$ |
10,313 |
|
$ |
9,273 |
|
$ |
10,313 |
|
Nonperforming |
|
|
4,917 |
|
|
5,298 |
|
|
7,642 |
|
|
4,917 |
|
|
7,642 |
|
Total troubled debt restructurings |
|
$ |
14,190 |
|
$ |
15,631 |
|
$ |
17,955 |
|
$ |
14,190 |
|
$ |
17,955 |
|
|
|
|
|
|
|
|
|
|
|
|
|
|
|
|
|
|
Alternative Performance Measures (non-GAAP) |
|
|
|
|
|
|
|
|
|
|
|
|
|
|
|
|
Net interest income (FTE) (1) |
|
|
|
|
|
|
|
|
|
|
|
|
|
|
|
|
Net interest income (GAAP) |
|
$ |
163,848 |
|
$ |
150,715 |
|
$ |
138,327 |
|
$ |
584,261 |
|
$ |
551,260 |
|
FTE adjustment |
|
|
4,118 |
|
|
3,842 |
|
|
3,228 |
|
|
14,873 |
|
|
12,591 |
|
Net interest income (FTE) (non-GAAP) |
|
$ |
167,966 |
|
$ |
154,557 |
|
$ |
141,555 |
|
$ |
599,134 |
|
$ |
563,851 |
|
Noninterest income (GAAP) |
|
|
24,500 |
|
|
25,584 |
|
|
36,417 |
|
|
118,523 |
|
|
125,806 |
|
Total revenue (FTE) (non-GAAP) |
|
$ |
192,466 |
|
$ |
180,141 |
|
$ |
177,972 |
|
$ |
717,657 |
|
$ |
689,657 |
|
|
|
|
|
|
|
|
|
|
|
|
|
|
|
|
|
|
Average earning assets |
|
$ |
18,000,596 |
|
$ |
17,879,222 |
|
$ |
18,138,285 |
|
$ |
17,853,216 |
|
$ |
17,903,671 |
|
Net interest margin |
|
|
3.61 |
% |
|
3.34 |
% |
|
3.03 |
% |
|
3.27 |
% |
|
3.08 |
% |
Net interest margin (FTE) |
|
|
3.70 |
% |
|
3.43 |
% |
|
3.10 |
% |
|
3.36 |
% |
|
3.15 |
% |
|
|
|
|
|
|
|
|
|
|
|
|
|
|
|
|
|
Tangible Assets (2) |
|
|
|
|
|
|
|
|
|
|
|
|
|
|
|
|
Ending assets (GAAP) |
|
$ |
20,461,138 |
|
$ |
19,950,231 |
|
$ |
20,064,796 |
|
$ |
20,461,138 |
|
$ |
20,064,796 |
|
Less: Ending goodwill |
|
|
925,211 |
|
|
925,211 |
|
|
935,560 |
|
|
925,211 |
|
|
935,560 |
|
Less: Ending amortizable intangibles |
|
|
26,761 |
|
|
29,142 |
|
|
43,312 |
|
|
26,761 |
|
|
43,312 |
|
Ending tangible assets (non-GAAP) |
|
$ |
19,509,166 |
|
$ |
18,995,878 |
|
$ |
19,085,924 |
|
$ |
19,509,166 |
|
$ |
19,085,924 |
|
|
|
|
|
|
|
|
|
|
|
|
|
|
|
|
|
|
Tangible Common Equity (2) |
|
|
|
|
|
|
|
|
|
|
|
|
|
|
|
|
Ending equity (GAAP) |
|
$ |
2,372,737 |
|
$ |
2,281,150 |
|
$ |
2,710,071 |
|
$ |
2,372,737 |
|
$ |
2,710,071 |
|
Less: Ending goodwill |
|
|
925,211 |
|
|
925,211 |
|
|
935,560 |
|
|
925,211 |
|
|
935,560 |
|
Less: Ending amortizable intangibles |
|
|
26,761 |
|
|
29,142 |
|
|
43,312 |
|
|
26,761 |
|
|
43,312 |
|
Less: Perpetual preferred stock |
|
|
166,357 |
|
|
166,357 |
|
|
166,357 |
|
|
166,357 |
|
|
166,357 |
|
Ending tangible common equity (non-GAAP) |
|
$ |
1,254,408 |
|
$ |
1,160,440 |
|
$ |
1,564,842 |
|
$ |
1,254,408 |
|
$ |
1,564,842 |
|
|
|
|
|
|
|
|
|
|
|
|
|
|
|
|
|
|
Average equity (GAAP) |
|
$ |
2,321,208 |
|
$ |
2,436,999 |
|
$ |
2,715,610 |
|
$ |
2,465,049 |
|
$ |
2,725,330 |
|
Less: Average goodwill |
|
|
925,211 |
|
|
925,211 |
|
|
935,560 |
|
|
930,315 |
|
|
935,560 |
|
Less: Average amortizable intangibles |
|
|
27,909 |
|
|
30,347 |
|
|
44,866 |
|
|
34,627 |
|
|
49,999 |
|
Less: Average perpetual preferred stock |
|
|
166,356 |
|
|
166,356 |
|
|
166,356 |
|
|
166,356 |
|
|
166,356 |
|
Average tangible common equity (non-GAAP) |
|
$ |
1,201,732 |
|
$ |
1,315,085 |
|
$ |
1,568,828 |
|
$ |
1,333,751 |
|
$ |
1,573,415 |
|
|
|
|
|
|
|
|
|
|
|
|
|
|
|
|
|
|
ROTCE (2)(3) |
|
|
|
|
|
|
|
|
|
|
|
|
|
|
|
|
Net income available to common shareholders (GAAP) |
|
$ |
67,557 |
|
$ |
55,103 |
|
$ |
44,812 |
|
$ |
222,642 |
|
$ |
252,049 |
|
Plus: Amortization of intangibles, tax effected |
|
|
1,881 |
|
|
1,959 |
|
|
2,548 |
|
|
8,544 |
|
|
10,984 |
|
Net income available to common shareholders before amortization of intangibles (non-GAAP) |
|
$ |
69,438 |
|
$ |
57,062 |
|
$ |
47,360 |
|
$ |
231,186 |
|
$ |
263,033 |
|
|
|
|
|
|
|
|
|
|
|
|
|
|
|
|
|
|
Return on average tangible common equity (ROTCE) |
|
|
22.92 |
% |
|
17.21 |
% |
|
11.98 |
% |
|
17.33 |
% |
|
16.72 |
% |
ATLANTIC UNION BANKSHARES CORPORATION AND SUBSIDIARIES
KEY FINANCIAL RESULTS
(Dollars in thousands, except share data)
|
|
As of & For Three Months Ended |
|
As of & For Year Ended |
|
|||||||||||
|
|
12/31/22 |
|
09/30/22 |
|
12/31/21 |
|
12/31/22 |
|
12/31/21 |
|
|||||
|
|
(unaudited) |
|
(unaudited) |
|
(unaudited) |
|
(unaudited) |
|
(audited) |
|
|||||
Operating Measures (4) |
|
|
|
|
|
|
|
|
|
|
|
|
|
|
|
|
Net income (GAAP) |
|
$ |
70,524 |
|
$ |
58,070 |
|
$ |
47,779 |
|
$ |
234,510 |
|
$ |
263,917 |
|
Plus: Net loss related to balance sheet repositioning, net of tax |
|
|
— |
|
|
— |
|
|
— |
|
|
— |
|
|
11,609 |
|
Plus: Branch closing and facility consolidation costs, net of tax |
|
|
— |
|
|
— |
|
|
13,063 |
|
|
4,351 |
|
|
13,775 |
|
Less: (Loss) gain on sale of securities, net of tax |
|
|
(1) |
|
|
— |
|
|
— |
|
|
(2) |
|
|
69 |
|
Less: Gain on sale of DHFB, net of tax |
|
|
— |
|
|
— |
|
|
— |
|
|
7,984 |
|
|
— |
|
Less: Gain on Visa, Inc. Class B common stock, net of tax |
|
|
— |
|
|
— |
|
|
4,058 |
|
|
— |
|
|
4,058 |
|
Adjusted operating earnings (non-GAAP) |
|
|
70,525 |
|
|
58,070 |
|
|
56,784 |
|
|
230,879 |
|
|
285,174 |
|
Less: Dividends on preferred stock |
|
|
2,967 |
|
|
2,967 |
|
|
2,967 |
|
|
11,868 |
|
|
11,868 |
|
Adjusted operating earnings available to common shareholders (non-GAAP) |
|
$ |
67,558 |
|
$ |
55,103 |
|
$ |
53,817 |
|
$ |
219,011 |
|
$ |
273,306 |
|
|
|
|
|
|
|
|
|
|
|
|
|
|
|
|
|
|
Noninterest expense (GAAP) |
|
$ |
99,790 |
|
$ |
99,923 |
|
$ |
119,944 |
|
$ |
403,802 |
|
$ |
419,195 |
|
Less: Amortization of intangible assets |
|
|
2,381 |
|
|
2,480 |
|
|
3,225 |
|
|
10,815 |
|
|
13,904 |
|
Less: Losses related to balance sheet repositioning |
|
|
— |
|
|
— |
|
|
— |
|
|
— |
|
|
14,695 |
|
Less: Branch closing and facility consolidation costs |
|
|
— |
|
|
— |
|
|
16,536 |
|
|
5,508 |
|
|
17,437 |
|
Adjusted operating noninterest expense (non-GAAP) |
|
$ |
97,409 |
|
$ |
97,443 |
|
$ |
100,183 |
|
$ |
387,479 |
|
$ |
373,159 |
|
|
|
|
|
|
|
|
|
|
|
|
|
|
|
|
|
|
Noninterest income (GAAP) |
|
$ |
24,500 |
|
$ |
25,584 |
|
$ |
36,417 |
|
$ |
118,523 |
|
$ |
125,806 |
|
Less: (Loss) gain on sale of securities |
|
|
(1) |
|
|
— |
|
|
— |
|
|
(3) |
|
|
87 |
|
Less: Gain on sale of DHFB |
|
|
— |
|
|
— |
|
|
— |
|
|
9,082 |
|
|
— |
|
Less: Gain on Visa, Inc. Class B common stock |
|
|
— |
|
|
— |
|
|
5,137 |
|
|
— |
|
|
5,137 |
|
Adjusted operating noninterest income (non-GAAP) |
|
$ |
24,501 |
|
$ |
25,584 |
|
$ |
31,280 |
|
$ |
109,444 |
|
$ |
120,582 |
|
|
|
|
|
|
|
|
|
|
|
|
|
|
|
|
|
|
Net interest income (FTE) (non-GAAP) (1) |
|
$ |
167,966 |
|
$ |
154,557 |
|
$ |
141,555 |
|
$ |
599,134 |
|
$ |
563,851 |
|
Adjusted operating noninterest income (non-GAAP) |
|
|
24,501 |
|
|
25,584 |
|
|
31,280 |
|
|
109,444 |
|
|
120,582 |
|
Total adjusted revenue (FTE) (non-GAAP) (1) |
|
$ |
192,467 |
|
$ |
180,141 |
|
$ |
172,835 |
|
$ |
708,578 |
|
$ |
684,433 |
|
Less: PPP accretion interest income and fees |
|
|
20 |
|
|
454 |
|
|
11,412 |
|
|
4,806 |
|
|
48,218 |
|
Pre-PPP total adjusted revenue (FTE) (non-GAAP) (1) (10) |
|
$ |
192,447 |
|
$ |
179,687 |
|
$ |
161,423 |
|
$ |
703,772 |
|
$ |
636,215 |
|
|
|
|
|
|
|
|
|
|
|
|
|
|
|
|
|
|
Efficiency ratio |
|
|
52.98 |
% |
|
56.68 |
% |
|
68.64 |
% |
|
57.46 |
% |
|
61.91 |
% |
Efficiency ratio (FTE) (1) |
|
|
51.85 |
% |
|
55.47 |
% |
|
67.39 |
% |
|
56.27 |
% |
|
60.78 |
% |
Adjusted operating efficiency ratio (FTE) (1)(7) |
|
|
50.61 |
% |
|
54.09 |
% |
|
57.96 |
% |
|
54.68 |
% |
|
54.52 |
% |
|
|
|
|
|
|
|
|
|
|
|
|
|
|
|
|
|
Operating ROA & ROE (4) |
|
|
|
|
|
|
|
|
|
|
|
|
|
|
|
|
Adjusted operating earnings (non-GAAP) |
|
$ |
70,525 |
|
$ |
58,070 |
|
$ |
56,784 |
|
$ |
230,879 |
|
$ |
285,174 |
|
|
|
|
|
|
|
|
|
|
|
|
|
|
|
|
|
|
Average assets (GAAP) |
|
$ |
20,174,152 |
|
$ |
19,980,500 |
|
$ |
20,236,889 |
|
$ |
19,949,388 |
|
$ |
19,977,551 |
|
Return on average assets (ROA) (GAAP) |
|
|
1.39 |
% |
|
1.15 |
% |
|
0.94 |
% |
|
1.18 |
% |
|
1.32 |
% |
Adjusted operating return on average assets (ROA) (non-GAAP) |
|
|
1.39 |
% |
|
1.15 |
% |
|
1.11 |
% |
|
1.16 |
% |
|
1.43 |
% |
|
|
|
|
|
|
|
|
|
|
|
|
|
|
|
|
|
Average equity (GAAP) |
|
$ |
2,321,208 |
|
$ |
2,436,999 |
|
$ |
2,715,610 |
|
$ |
2,465,049 |
|
$ |
2,725,330 |
|
Return on average equity (ROE) (GAAP) |
|
|
12.05 |
% |
|
9.45 |
% |
|
6.98 |
% |
|
9.51 |
% |
|
9.68 |
% |
Adjusted operating return on average equity (ROE) (non-GAAP) |
|
|
12.05 |
% |
|
9.45 |
% |
|
8.30 |
% |
|
9.37 |
% |
|
10.46 |
% |
|
|
|
|
|
|
|
|
|
|
|
|
|
|
|
|
|
Operating ROTCE (2)(3)(4) |
|
|
|
|
|
|
|
|
|
|
|
|
|
|
|
|
Adjusted operating earnings available to common shareholders (non-GAAP) |
|
$ |
67,558 |
|
$ |
55,103 |
|
$ |
53,817 |
|
$ |
219,011 |
|
$ |
273,306 |
|
Plus: Amortization of intangibles, tax effected |
|
|
1,881 |
|
|
1,959 |
|
|
2,548 |
|
|
8,544 |
|
|
10,984 |
|
Adjusted operating earnings available to common shareholders before amortization of intangibles (non-GAAP) |
|
$ |
69,439 |
|
$ |
57,062 |
|
$ |
56,365 |
|
$ |
227,555 |
|
$ |
284,290 |
|
|
|
|
|
|
|
|
|
|
|
|
|
|
|
|
|
|
Average tangible common equity (non-GAAP) |
|
$ |
1,201,732 |
|
$ |
1,315,085 |
|
$ |
1,568,828 |
|
$ |
1,333,751 |
|
$ |
1,573,415 |
|
Adjusted operating return on average tangible common equity (non-GAAP) |
|
|
22.92 |
% |
|
17.21 |
% |
|
14.25 |
% |
|
17.06 |
% |
|
18.07 |
% |
|
|
|
|
|
|
|
|
|
|
|
|
|
|
|
|
|
Pre-tax pre-provision adjusted operating earnings (8) |
|
|
|
|
|
|
|
|
|
|
|
|
|
|
|
|
Net income (GAAP) |
|
$ |
70,524 |
|
$ |
58,070 |
|
$ |
47,779 |
|
$ |
234,510 |
|
$ |
263,917 |
|
Plus: Provision for credit losses |
|
|
6,257 |
|
|
6,412 |
|
|
(1,000) |
|
|
19,028 |
|
|
(60,888) |
|
Plus: Income tax expense |
|
|
11,777 |
|
|
11,894 |
|
|
8,021 |
|
|
45,444 |
|
|
54,842 |
|
Plus: Net loss related to balance sheet repositioning |
|
|
— |
|
|
— |
|
|
— |
|
|
— |
|
|
14,695 |
|
Plus: Branch closing and facility consolidation costs |
|
|
— |
|
|
— |
|
|
16,536 |
|
|
5,508 |
|
|
17,437 |
|
Less: (Loss) gain on sale of securities |
|
|
(1) |
|
|
— |
|
|
— |
|
|
(3) |
|
|
87 |
|
Less: Gain on sale of DHFB |
|
|
— |
|
|
— |
|
|
— |
|
|
9,082 |
|
|
— |
|
Less: Gain on Visa, Inc. Class B common stock |
|
|
— |
|
|
— |
|
|
5,137 |
|
|
— |
|
|
5,137 |
|
Pre-tax pre-provision adjusted operating earnings (non-GAAP) |
|
$ |
88,559 |
|
$ |
76,376 |
|
$ |
66,199 |
|
$ |
295,411 |
|
$ |
284,779 |
|
Less: Dividends on preferred stock |
|
|
2,967 |
|
|
2,967 |
|
|
2,967 |
|
|
11,868 |
|
|
11,868 |
|
Pre-tax pre-provision adjusted operating earnings available to common shareholders (non-GAAP) |
|
$ |
85,592 |
|
$ |
73,409 |
|
$ |
63,232 |
|
$ |
283,543 |
|
$ |
272,911 |
|
|
|
|
|
|
|
|
|
|
|
|
|
|
|
|
|
|
Pre-tax pre-provision adjusted operating earnings (non-GAAP) |
|
$ |
88,559 |
|
$ |
76,376 |
|
$ |
66,199 |
|
$ |
295,411 |
|
$ |
284,779 |
|
Less: PPP accretion interest income and fees |
|
|
20 |
|
|
454 |
|
|
11,412 |
|
|
4,806 |
|
|
48,218 |
|
Pre-PPP pre-tax pre-provision adjusted operating earnings (non-GAAP) (10) |
|
$ |
88,539 |
|
$ |
75,922 |
|
$ |
54,787 |
|
$ |
290,605 |
|
$ |
236,561 |
|
|
|
|
|
|
|
|
|
|
|
|
|
|
|
|
|
|
Weighted average common shares outstanding, diluted |
|
|
74,713,972 |
|
|
74,705,054 |
|
|
75,667,759 |
|
|
74,953,398 |
|
|
77,417,801 |
|
Pre-tax pre-provision earnings per common share, diluted |
|
$ |
1.15 |
|
$ |
0.98 |
|
$ |
0.84 |
|
$ |
3.78 |
|
$ |
3.53 |
|
ATLANTIC UNION BANKSHARES CORPORATION AND SUBSIDIARIES
KEY FINANCIAL RESULTS
(Dollars in thousands, except share data)
|
|
As of & For Three Months Ended |
|
As of & For Year Ended |
|
|||||||||||
|
|
12/31/22 |
|
09/30/22 |
|
12/31/21 |
|
12/31/22 |
|
12/31/21 |
|
|||||
|
|
(unaudited) |
|
(unaudited) |
|
(unaudited) |
|
(unaudited) |
|
(audited) |
|
|||||
Adjusted Loans (9) |
|
|
|
|
|
|
|
|
|
|
|
|
|
|
|
|
Loans held for investment (net of deferred fees and costs) (GAAP) |
|
$ |
14,449,142 |
|
$ |
13,918,720 |
|
$ |
13,195,843 |
|
$ |
14,449,142 |
|
$ |
13,195,843 |
|
Less: PPP loans (net of deferred fees and costs) |
|
|
7,286 |
|
|
12,146 |
|
|
150,363 |
|
|
7,286 |
|
|
150,363 |
|
Total adjusted loans (non-GAAP) |
|
$ |
14,441,856 |
|
$ |
13,906,574 |
|
$ |
13,045,480 |
|
$ |
14,441,856 |
|
$ |
13,045,480 |
|
|
|
|
|
|
|
|
|
|
|
|
|
|
|
|
|
|
Average loans held for investment (net of deferred fees and costs) (GAAP) |
|
$ |
14,117,433 |
|
$ |
13,733,447 |
|
$ |
13,082,412 |
|
$ |
13,671,714 |
|
$ |
13,639,325 |
|
Less: Average PPP loans (net of deferred fees and costs) |
|
|
8,217 |
|
|
14,280 |
|
|
288,204 |
|
|
41,896 |
|
|
864,814 |
|
Total adjusted average loans (non-GAAP) |
|
$ |
14,109,216 |
|
$ |
13,719,167 |
|
$ |
12,794,208 |
|
$ |
13,629,818 |
|
$ |
12,774,511 |
|
|
|
|
|
|
|
|
|
|
|
|
|
|
|
|
|
|
Mortgage Origination Held for Sale Volume |
|
|
|
|
|
|
|
|
|
|
|
|
|
|
|
|
Refinance Volume |
|
$ |
2,312 |
|
$ |
5,637 |
|
$ |
46,575 |
|
$ |
55,725 |
|
$ |
287,976 |
|
Purchase Volume |
|
|
29,262 |
|
|
66,360 |
|
|
71,969 |
|
|
238,310 |
|
|
322,492 |
|
Total Mortgage loan originations held for sale |
|
$ |
31,574 |
|
$ |
71,997 |
|
$ |
118,544 |
|
$ |
294,035 |
|
$ |
610,468 |
|
% of originations held for sale that are refinances |
|
|
7.3 |
% |
|
7.8 |
% |
|
39.3 |
% |
|
19.0 |
% |
|
47.2 |
% |
|
|
|
|
|
|
|
|
|
|
|
|
|
|
|
|
|
Wealth |
|
|
|
|
|
|
|
|
|
|
|
|
|
|
|
|
Assets under management ("AUM") |
|
$ |
4,271,728 |
|
$ |
4,065,059 |
|
$ |
6,741,022 |
|
$ |
4,271,728 |
|
$ |
6,741,022 |
|
|
|
|
|
|
|
|
|
|
|
|
|
|
|
|
|
|
Other Data |
|
|
|
|
|
|
|
|
|
|
|
|
|
|
|
|
End of period full-time employees |
|
|
1,877 |
|
|
1,890 |
|
|
1,876 |
|
|
1,877 |
|
|
1,876 |
|
Number of full-service branches |
|
|
114 |
|
|
114 |
|
|
130 |
|
|
114 |
|
|
130 |
|
Number of automatic transaction machines ("ATMs") |
|
|
131 |
|
|
131 |
|
|
148 |
|
|
131 |
|
|
148 |
|
| (1) | These are non-GAAP financial measures. Net interest income (FTE), total revenue (FTE), and total adjusted revenue (FTE), which are used in computing net interest margin (FTE), efficiency ratio (FTE) and adjusted operating efficiency ratio (FTE), provide valuable additional insight into the net interest margin and the efficiency ratio by adjusting for differences in tax treatment of interest income sources. The entire FTE adjustment is attributable to interest income on earning assets, which is used in computing yield on earning assets. Interest expense and the related cost of interest-bearing liabilities and cost of funds ratios are not affected by the FTE components. |
| (2) | These are non-GAAP financial measures. Tangible assets and tangible common equity are used in the calculation of certain profitability, capital, and per share ratios. The Company believes tangible assets, tangible common equity and the related ratios are meaningful measures of capital adequacy because they provide a meaningful base for period-to-period and company-to-company comparisons, which the Company believes will assist investors in assessing the capital of the Company and its ability to absorb potential losses. The Company believes tangible common equity is an important indication of its ability to grow organically and through business combinations as well as its ability to pay dividends and to engage in various capital management strategies. |
| (3) | These are non-GAAP financial measures. The Company believes that ROTCE is a meaningful supplement to GAAP financial measures and useful to investors because it measures the performance of a business consistently across time without regard to whether components of the business were acquired or developed internally. |
(4)
These are non-GAAP financial measures. Adjusted operating measures exclude the losses related to balance sheet repositioning (principally composed of losses on debt extinguishment), gains or losses on sale of securities, gains on the sale of Visa, Inc. Class B common stock, gain on the sale of Dixon, Hubard, Feinour & Brown, Inc. (“DHFB”), as well as strategic branch closure initiatives and related facility consolidation costs (principally composed of real estate, leases and other assets write downs, as well as severance and expense reduction initiatives). The Company believes these non-GAAP adjusted measures provide investors with important information about the continuing economic results of the organization’s operations. Prior periods reflect adjustments for previously announced strategic branch closure and expense reduction initiatives.
|
| (5) | All ratios at December 31, 2022 are estimates and subject to change pending the Company’s filing of its FR Y9-C. All other periods are presented as filed. |
| (6) | These balances reflect the impact of the Coronavirus Aid, Relief, and Economic Security Act and the joint guidance issued by the five federal bank regulatory agencies and the Conference of State Bank Supervisors on March 22, 2020, as subsequently revised on April 7, 2020, which provides relief for TDR designations and also provides guidance on past due reporting for modified loans made between March 1, 2020 and January 1, 2022. |
| (7) | The adjusted operating efficiency ratio (FTE) excludes the amortization of intangible assets, gains or losses on sale of securities, gains on the sale of Visa, Inc. Class B common stock, gain on the sale of DHFB, losses related to balance sheet repositioning (principally composed of losses on debt extinguishment), as well as strategic branch closure initiatives and related facility consolidation costs. This measure is similar to the measure utilized by the Company when analyzing corporate performance and is also similar to the measure utilized for incentive compensation. The Company believes this adjusted measure provides investors with important information about the combined economic results of the organization’s operations. Prior periods reflect adjustments for previously announced strategic branch closure and expense reduction initiatives. |
| (8) | These are non-GAAP financial measures. Pre-tax pre-provision adjusted earnings excludes the provision for credit losses, which can fluctuate significantly from period-to-period under the CECL methodology, income tax expense, losses related to balance sheet repositioning (principally composed of losses on debt extinguishment), gains or losses on sale of securities, gains on the sale of Visa, Inc. Class B common stock, gain on the sale of DHFB, as well as strategic branch closure initiatives and related facility consolidation costs. The Company believes this adjusted measure provides investors with important information about the combined economic results of the organization’s operations. Prior periods reflect adjustments for previously announced strategic branch closure and expense reduction initiatives. |
| (9) | These are non-GAAP financial measures. PPP adjustment impact excludes the unforgiven portion of PPP loans. The Company believes loans held for investment (net of deferred fees and costs), excluding PPP is useful to investors as it provides more clarity on the Company’s organic growth. The Company also believes that the related non-GAAP financial measures of past due loans still accruing interest as a percentage of total loans held for investment (net of deferred fees and costs), excluding PPP, are useful to investors as loans originated under the PPP carry a SBA guarantee. The Company believes that the ALLL as a percentage of loans held for investment (net of deferred fees and costs), excluding PPP, is useful to investors because of the size of the Company’s PPP originations and the impact of the embedded credit enhancement provided by the SBA guarantee. |
| (10) | These are non-GAAP financial measures. The Company believes excluding PPP accretion interest income and fees from operating earnings is useful to investors as it provides more clarity on the Company’s non-PPP related income. |
ATLANTIC UNION BANKSHARES CORPORATION AND SUBSIDIARIES
CONSOLIDATED BALANCE SHEETS
(Dollars in thousands, except share data)
|
December 31, |
|
September 30, |
|
December 31, |
|
|||
|
2022 |
|
2022 |
|
2021 |
|
|||
ASSETS |
|
(unaudited) |
|
|
(unaudited) |
|
|
(audited) |
|
Cash and cash equivalents: |
|
|
|
|
|
|
|
|
|
Cash and due from banks |
$ |
216,384 |
|
$ |
177,969 |
|
$ |
180,963 |
|
Interest-bearing deposits in other banks |
|
102,107 |
|
|
211,785 |
|
|
618,714 |
|
Federal funds sold |
|
1,457 |
|
|
1,188 |
|
|
2,824 |
|
Total cash and cash equivalents |
|
319,948 |
|
|
390,942 |
|
|
802,501 |
|
Securities available for sale, at fair value |
|
2,741,816 |
|
|
2,717,323 |
|
|
3,481,650 |
|
Securities held to maturity, at carrying value |
|
847,732 |
|
|
841,349 |
|
|
628,000 |
|
Restricted stock, at cost |
|
120,213 |
|
|
82,050 |
|
|
76,825 |
|
Loans held for sale, at fair value |
|
3,936 |
|
|
12,889 |
|
|
20,861 |
|
Loans held for investment, net of deferred fees and costs |
|
14,449,142 |
|
|
13,918,720 |
|
|
13,195,843 |
|
Less: allowance for loan and lease losses |
|
110,768 |
|
|
108,009 |
|
|
99,787 |
|
Total loans held for investment, net |
|
14,338,374 |
|
|
13,810,711 |
|
|
13,096,056 |
|
Premises and equipment, net |
|
118,243 |
|
|
126,374 |
|
|
134,808 |
|
Goodwill |
|
925,211 |
|
|
925,211 |
|
|
935,560 |
|
Amortizable intangibles, net |
|
26,761 |
|
|
29,142 |
|
|
43,312 |
|
Bank owned life insurance |
|
440,656 |
|
|
437,988 |
|
|
431,517 |
|
Other assets |
|
578,248 |
|
|
576,252 |
|
|
413,706 |
|
Total assets |
$ |
20,461,138 |
|
$ |
19,950,231 |
|
$ |
20,064,796 |
|
LIABILITIES |
|
|
|
|
|
|
|
|
|
Noninterest-bearing demand deposits |
$ |
4,883,239 |
|
$ |
5,290,938 |
|
$ |
5,207,324 |
|
Interest-bearing deposits |
|
11,048,438 |
|
|
11,255,278 |
|
|
11,403,744 |
|
Total deposits |
|
15,931,677 |
|
|
16,546,216 |
|
|
16,611,068 |
|
Securities sold under agreements to repurchase |
|
142,837 |
|
|
146,182 |
|
|
117,870 |
|
Other short-term borrowings |
|
1,176,000 |
|
|
133,800 |
|
|
— |
|
Long-term borrowings |
|
389,863 |
|
|
389,576 |
|
|
388,724 |
|
Other liabilities |
|
448,024 |
|
|
453,307 |
|
|
237,063 |
|
Total liabilities |
|
18,088,401 |
|
|
17,669,081 |
|
|
17,354,725 |
|
Commitments and contingencies |
|
|
|
|
|
|
|
|
|
STOCKHOLDERS' EQUITY |
|
|
|
|
|
|
|
|
|
Preferred stock, $10.00 par value |
|
173 |
|
|
173 |
|
|
173 |
|
Common stock, $1.33 par value |
|
98,873 |
|
|
98,845 |
|
|
100,101 |
|
Additional paid-in capital |
|
1,772,440 |
|
|
1,769,858 |
|
|
1,807,368 |
|
Retained earnings |
|
919,537 |
|
|
874,393 |
|
|
783,794 |
|
Accumulated other comprehensive income (loss) |
|
(418,286) |
|
|
(462,119) |
|
|
18,635 |
|
Total stockholders' equity |
|
2,372,737 |
|
|
2,281,150 |
|
|
2,710,071 |
|
Total liabilities and stockholders' equity |
$ |
20,461,138 |
|
$ |
19,950,231 |
|
$ |
20,064,796 |
|
|
|
|
|
|
|
|
|
|
|
Common shares outstanding |
|
74,712,622 |
|
|
74,703,774 |
|
|
75,663,648 |
|
Common shares authorized |
|
200,000,000 |
|
|
200,000,000 |
|
|
200,000,000 |
|
Preferred shares outstanding |
|
17,250 |
|
|
17,250 |
|
|
17,250 |
|
Preferred shares authorized |
|
500,000 |
|
|
500,000 |
|
|
500,000 |
|
ATLANTIC UNION BANKSHARES CORPORATION AND SUBSIDIARIES
CONSOLIDATED STATEMENTS OF INCOME
(Dollars in thousands, except share data)
|
Three Months Ended |
|
Year Ended |
|||||||||||
|
December 31, |
|
September 30, |
|
December 31, |
|
December 31, |
|
December 31, |
|||||
|
2022 |
|
2022 |
|
2021 |
|
2022 |
|
2021 |
|||||
|
(unaudited) |
|
(unaudited) |
|
(unaudited) |
|
(unaudited) |
|
(audited) |
|||||
Interest and dividend income: |
|
|
|
|
|
|
|
|
|
|
|
|
|
|
Interest and fees on loans |
$ |
173,475 |
|
$ |
144,673 |
|
$ |
125,195 |
|
$ |
555,614 |
|
$ |
508,770 |
Interest on deposits in other banks |
|
1,383 |
|
|
941 |
|
|
401 |
|
|
2,612 |
|
|
855 |
Interest and dividends on securities: |
|
|
|
|
|
|
|
|
|
|
|
|
|
|
Taxable |
|
16,196 |
|
|
14,750 |
|
|
11,757 |
|
|
59,306 |
|
|
43,859 |
Nontaxable |
|
11,014 |
|
|
10,792 |
|
|
10,103 |
|
|
42,903 |
|
|
38,875 |
Total interest and dividend income |
|
202,068 |
|
|
171,156 |
|
|
147,456 |
|
|
660,435 |
|
|
592,359 |
Interest expense: |
|
|
|
|
|
|
|
|
|
|
|
|
|
|
Interest on deposits |
|
30,236 |
|
|
15,386 |
|
|
4,915 |
|
|
56,201 |
|
|
27,117 |
Interest on short-term borrowings |
|
3,588 |
|
|
1,229 |
|
|
17 |
|
|
5,393 |
|
|
108 |
Interest on long-term borrowings |
|
4,396 |
|
|
3,826 |
|
|
4,197 |
|
|
14,580 |
|
|
13,874 |
Total interest expense |
|
38,220 |
|
|
20,441 |
|
|
9,129 |
|
|
76,174 |
|
|
41,099 |
Net interest income |
|
163,848 |
|
|
150,715 |
|
|
138,327 |
|
|
584,261 |
|
|
551,260 |
Provision for credit losses |
|
6,257 |
|
|
6,412 |
|
|
(1,000) |
|
|
19,028 |
|
|
(60,888) |
Net interest income after provision for credit losses |
|
157,591 |
|
|
144,303 |
|
|
139,327 |
|
|
565,233 |
|
|
612,148 |
Noninterest income: |
|
|
|
|
|
|
|
|
|
|
|
|
|
|
Service charges on deposit accounts |
|
7,631 |
|
|
6,784 |
|
|
7,808 |
|
|
30,052 |
|
|
27,122 |
Other service charges, commissions and fees |
|
1,631 |
|
|
1,770 |
|
|
1,625 |
|
|
6,765 |
|
|
6,595 |
Interchange fees |
|
2,571 |
|
|
2,461 |
|
|
2,027 |
|
|
9,110 |
|
|
8,279 |
Fiduciary and asset management fees |
|
4,085 |
|
|
4,134 |
|
|
7,239 |
|
|
22,414 |
|
|
27,562 |
Mortgage banking income |
|
379 |
|
|
1,390 |
|
|
3,330 |
|
|
7,085 |
|
|
21,022 |
Bank owned life insurance income |
|
2,649 |
|
|
3,445 |
|
|
3,286 |
|
|
11,507 |
|
|
11,488 |
Loan-related interest rate swap fees |
|
3,664 |
|
|
2,050 |
|
|
1,443 |
|
|
12,174 |
|
|
5,620 |
Other operating income |
|
1,890 |
|
|
3,550 |
|
|
9,659 |
|
|
19,416 |
|
|
18,118 |
Total noninterest income |
|
24,500 |
|
|
25,584 |
|
|
36,417 |
|
|
118,523 |
|
|
125,806 |
Noninterest expenses: |
|
|
|
|
|
|
|
|
|
|
|
|
|
|
Salaries and benefits |
|
58,723 |
|
|
56,600 |
|
|
57,970 |
|
|
228,926 |
|
|
214,929 |
Occupancy expenses |
|
6,328 |
|
|
6,408 |
|
|
7,013 |
|
|
26,013 |
|
|
28,718 |
Furniture and equipment expenses |
|
3,978 |
|
|
3,673 |
|
|
4,031 |
|
|
14,838 |
|
|
15,950 |
Technology and data processing |
|
9,442 |
|
|
8,273 |
|
|
8,543 |
|
|
33,372 |
|
|
30,200 |
Professional services |
|
4,456 |
|
|
3,504 |
|
|
4,680 |
|
|
16,730 |
|
|
17,841 |
Marketing and advertising expense |
|
2,228 |
|
|
2,343 |
|
|
2,545 |
|
|
9,236 |
|
|
9,875 |
FDIC assessment premiums and other insurance |
|
1,896 |
|
|
3,094 |
|
|
2,684 |
|
|
10,241 |
|
|
9,482 |
Franchise and other taxes |
|
4,500 |
|
|
4,507 |
|
|
4,436 |
|
|
18,006 |
|
|
17,740 |
Loan-related expenses |
|
1,356 |
|
|
1,575 |
|
|
1,715 |
|
|
6,574 |
|
|
7,004 |
Amortization of intangible assets |
|
2,381 |
|
|
2,480 |
|
|
3,225 |
|
|
10,815 |
|
|
13,904 |
Loss on debt extinguishment |
|
— |
|
|
— |
|
|
— |
|
|
— |
|
|
14,695 |
Other expenses |
|
4,502 |
|
|
7,466 |
|
|
23,102 |
|
|
29,051 |
|
|
38,857 |
Total noninterest expenses |
|
99,790 |
|
|
99,923 |
|
|
119,944 |
|
|
403,802 |
|
|
419,195 |
Income before income taxes |
|
82,301 |
|
|
69,964 |
|
|
55,800 |
|
|
279,954 |
|
|
318,759 |
Income tax expense |
|
11,777 |
|
|
11,894 |
|
|
8,021 |
|
|
45,444 |
|
|
54,842 |
Net income |
$ |
70,524 |
|
$ |
58,070 |
|
$ |
47,779 |
|
|
234,510 |
|
|
263,917 |
Dividends on preferred stock |
|
2,967 |
|
|
2,967 |
|
|
2,967 |
|
|
11,868 |
|
|
11,868 |
Net income available to common shareholders |
$ |
67,557 |
|
$ |
55,103 |
|
$ |
44,812 |
|
$ |
222,642 |
|
$ |
252,049 |
|
|
|
|
|
|
|
|
|
|
|
|
|
|
|
Basic earnings per common share |
$ |
0.90 |
|
$ |
0.74 |
|
$ |
0.59 |
|
$ |
2.97 |
|
$ |
3.26 |
Diluted earnings per common share |
$ |
0.90 |
|
$ |
0.74 |
|
$ |
0.59 |
|
$ |
2.97 |
|
$ |
3.26 |
AVERAGE BALANCES, INCOME AND EXPENSES, YIELDS AND RATES (TAXABLE EQUIVALENT BASIS) (UNAUDITED)
(Dollars in thousands)
|
For the Quarter Ended |
||||||||||||||
|
December 31, 2022 |
|
September 30, 2022 |
||||||||||||
|
Average |
|
Interest |
|
Yield / |
|
Average |
|
Interest |
|
Yield / |
||||
Assets: |
|
|
|
|
|
|
|
|
|
|
|
|
|
|
|
Securities: |
|
|
|
|
|
|
|
|
|
|
|
|
|
|
|
Taxable |
$ |
2,016,845 |
|
$ |
16,196 |
|
3.19% |
|
$ |
2,193,279 |
|
$ |
14,750 |
|
2.67% |
Tax-exempt |
|
1,627,351 |
|
|
13,942 |
|
3.40% |
|
|
1,625,328 |
|
|
13,661 |
|
3.33% |
Total securities |
|
3,644,196 |
|
|
30,138 |
|
3.28% |
|
|
3,818,607 |
|
|
28,411 |
|
2.95% |
Loans, net (3) |
|
14,117,433 |
|
|
174,531 |
|
4.90% |
|
|
13,733,447 |
|
|
145,433 |
|
4.20% |
Other earning assets |
|
238,967 |
|
|
1,517 |
|
2.52% |
|
|
327,168 |
|
|
1,154 |
|
1.40% |
Total earning assets |
|
18,000,596 |
|
$ |
206,186 |
|
4.54% |
|
|
17,879,222 |
|
$ |
174,998 |
|
3.88% |
Allowance for loan and lease losses |
|
(109,535) |
|
|
|
|
|
|
|
(104,746) |
|
|
|
|
|
Total non-earning assets |
|
2,283,091 |
|
|
|
|
|
|
|
2,206,024 |
|
|
|
|
|
Total assets |
$ |
20,174,152 |
|
|
|
|
|
|
$ |
19,980,500 |
|
|
|
|
|
|
|
|
|
|
|
|
|
|
|
|
|
|
|
|
|
Liabilities and Stockholders' Equity: |
|
|
|
|
|
|
|
|
|
|
|
|
|
|
|
Interest-bearing deposits: |
|
|
|
|
|
|
|
|
|
|
|
|
|
|
|
Transaction and money market accounts |
$ |
8,495,299 |
|
$ |
24,712 |
|
1.15% |
|
$ |
8,247,650 |
|
$ |
11,342 |
|
0.55% |
Regular savings |
|
1,155,137 |
|
|
110 |
|
0.04% |
|
|
1,171,071 |
|
|
64 |
|
0.02% |
Time deposits |
|
1,764,596 |
|
|
5,414 |
|
1.22% |
|
|
1,745,224 |
|
|
3,980 |
|
0.90% |
Total interest-bearing deposits |
|
11,415,032 |
|
|
30,236 |
|
1.05% |
|
|
11,163,945 |
|
|
15,386 |
|
0.55% |
Other borrowings |
|
816,818 |
|
|
7,984 |
|
3.88% |
|
|
703,272 |
|
|
5,055 |
|
2.85% |
Total interest-bearing liabilities |
$ |
12,231,850 |
|
$ |
38,220 |
|
1.24% |
|
$ |
11,867,217 |
|
$ |
20,441 |
|
0.68% |
|
|
|
|
|
|
|
|
|
|
|
|
|
|
|
|
Noninterest-bearing liabilities: |
|
|
|
|
|
|
|
|
|
|
|
|
|
|
|
Demand deposits |
|
5,196,717 |
|
|
|
|
|
|
|
5,324,279 |
|
|
|
|
|
Other liabilities |
|
424,377 |
|
|
|
|
|
|
|
352,005 |
|
|
|
|
|
Total liabilities |
|
17,852,944 |
|
|
|
|
|
|
|
17,543,501 |
|
|
|
|
|
Stockholders' equity |
|
2,321,208 |
|
|
|
|
|
|
|
2,436,999 |
|
|
|
|
|
Total liabilities and stockholders' equity |
$ |
20,174,152 |
|
|
|
|
|
|
$ |
19,980,500 |
|
|
|
|
|
Net interest income |
|
|
|
$ |
167,966 |
|
|
|
|
|
|
$ |
154,557 |
|
|
|
|
|
|
|
|
|
|
|
|
|
|
|
|
|
|
Interest rate spread |
|
|
|
|
|
|
3.30% |
|
|
|
|
|
|
|
3.20% |
Cost of funds |
|
|
|
|
|
|
0.84% |
|
|
|
|
|
|
|
0.45% |
Net interest margin |
|
|
|
|
|
|
3.70% |
|
|
|
|
|
|
|
3.43% |
| (1) | Income and yields are reported on a taxable equivalent basis using the statutory federal corporate tax rate of 21%. |
| (2) | Rates and yields are annualized and calculated from actual, not rounded amounts in thousands, which appear above. |
| (3) | Nonaccrual loans are included in average loans outstanding. |
|
4th Quarter and FY2022 Earnings Presentation NYSE: AUB January 24, 2023 |
|
2 Forward Looking Statements This presentation and statements by the Company’s management may constitute “forward - looking statements” within the meaning of t he Private Securities Litigation Reform Act of 1995. Forward - looking statements are statements that include, without limitation, statements on slides entitled “Financial Outlook” and “Top - Tier Financial Targets”, statements regarding the Company ’s strategic priorities, outlook on future economic conditions and the impacts of current economic uncertainties, and statements that include, projections, predictions, expectations, or beliefs about future events or results, including the Com pan y’s financial targets, or otherwise are not statements of historical fact. Such forward - looking statements are based on certain assumptions as of the time they are made, and are inherently subject to known and unknown risks, uncertainties, and other fac tor s, some of which cannot be predicted or quantified, that may cause actual results, performance, achievements, or trends to be materially different from those expressed or implied by such forward - looking statements. Such statements are often characteri zed by the use of qualified words (and their derivatives) such as “expect,” “believe,” “estimate,” “plan,” “project,” “antici pat e,” “intend,” “will,” “may,” “view,” “opportunity,” “potential,” or words of similar meaning or other statements concerning opini ons or judgment of the Company and its management about future events. Although the Company believes that its expectations with respect to forward - looking statements are based upon reasonable assumptions within the bounds of its existing knowledge of its b usiness and operations, there can be no assurance that actual future results, performance, or achievements of, or trends affecting, the Company will not differ materially from any projected future results, performance, achievements or trends expr ess ed or implied by such forward - looking statements. Actual future results, performance, achievements or trends may differ materially from historical results or those anticipated depending on a variety of factors, including, but not limited to the eff ects of or changes in: • market interest rates and their related impacts on macroeconomic conditions, customer and client behavior, the Company’s funding costs and the Company’s loan and securities portfolios; • inflation and its impacts on economic growth and customer and client behavior; • general economic and financial market conditions, in the United States generally and particularly in the markets in which the Company operates and which its loans are concentrated, including the effects of declines in real estate values, an increase in unemployment levels and slowdowns in economic growth; • monetary and fiscal policies of the U.S. government, including policies of the U.S. Department of the Treasury and the Federal Reserve; • the quality or composition of the Company’s loan or investment portfolios and changes therein; • demand for loan products and financial services in the Company’s market areas; • the Company’s ability to manage its growth or implement its growth strategy; • the effectiveness of expense reduction plans; • the introduction of new lines of business or new products and services; • the Company’s ability to recruit and retain key employees; • real estate values in the Company’s lending area; • an insufficient ACL; • changes in accounting principles, standards, rules, and interpretations, and the related impact on the Company’s financial statements; • volatility in the ACL resulting from the CECL methodology, either alone or as that may be affected by conditions arising out of the COVID - 19 pandemic, inflation, changing interest rates, or other factors; • the Company’s liquidity and capital positions; • concentrations of loans secured by real estate, particularly commercial real estate; • the effectiveness of the Company’s credit processes and management of the Company’s credit risk; • the Company’s ability to compete in the market for financial services and increased competition from fintech companies; • technological risks and developments, and cyber threats, attacks, or events; • operational, technological, cultural, regulatory, legal, credit, and other risks associated with the exploration, consummation and integration of potential future acquisitions, whether involving stock or cash considerations; • the potential adverse effects of unusual and infrequently occurring events, such as weather - related disasters, terrorist acts, geopolitical conflicts (such as the ongoing conflict between Russia and Ukraine) or public health events (such as COVID - 19), and of governmental and societal responses thereto; these potential adverse effects may include, without limitation, adverse effects on the ability of the Company's borrowers to satisfy their obligations to the Company, on the value of collateral securing loans, on the demand for the Company's loans or its other products and services, on supply chains and methods used to distribute products and services, on incidents of cyberattack and fraud, on the Company’s liquidity or capital positions, on risks posed by reliance on third - party service providers, on other aspects of the Company's business operations and on financial markets and economic growth; • the effect of steps the Company takes in response to the COVID - 19 pandemic, the severity and duration of the pandemic, the uncertainty regarding new variants of COVID - 19 that have emerged, the speed and efficacy of vaccine and treatment developments, the impact of loosening or tightening of government restrictions, the pace of recovery when the pandemic subsides and the heightened impact it has on many of the risks described herein; • the discontinuation of LIBOR and its impact on the financial markets, and the Company’s ability to manage operational, legal and compliance risks related to the discontinuation of LIBOR and implementation of one or more alternate reference rates; • performance by the Company’s counterparties or vendors; • deposit flows; • the availability of financing and the terms thereof; • the level of prepayments on loans and mortgage - backed securities; • legislative or regulatory changes and requirements; • potential claims, damages, and fines related to litigation or government actions; • the effects of changes in federal, state or local tax laws and regulations; • any event or development that would cause the Company to conclude that there was an impairment of any asset, including intangible assets, such as goodwill; and • other factors, many of which are beyond the control of the Company. Please also refer to such other factors as discussed throughout Part I, Item 1A. “Risk Factors” and Part II, Item 7, “Managem ent ’s Discussion and Analysis of Financial Condition and Results of Operations” of the Company’s Annual Report on Form 10 - K for the year ended December 31, 2021 and related disclosures in other filings, which have been filed with the U.S. Securities an d Exchange Commission (“SEC”) and are available on the SEC’s website at www.sec.gov. All risk factors and uncertainties described herein and therein should be considered in evaluating forward - looking statements, and all of the forward - looking state ments are expressly qualified by the cautionary statements contained or referred to herein and therein. The actual results or developments anticipated may not be realized or, even if substantially realized, they may not have the expected consequences to or effects on the Company or its businesses or operations. Readers are cautioned not to rely too heavily on the forward - looking statements, and undue reliance should not be placed on such forward - looking statements. Forward - looking statements speak only as of the date they are made. The Company does not intend or assume any obligation to update, revise or clarify any forward - looking statements that may be made from time to time by or on behalf of the Company, whether as a result of new inf ormation, future events or otherwise. |
|
3 Additional Information Non - GAAP Financial Measures This presentation contains certain financial information determined by methods other than in accordance with generally accepted accounting principles in the United States (“GAAP”). These non - GAAP financial measures are a supplement to GAAP, which is used to prepare the Company’s financial statements, and should not be considered in isolation or as a substitute for comparable measures calculated in accordance with GAAP. In addition, the Company’s non - GAAP financial measures may not be comparable to non - GAAP financial measures of other companies. The Company uses the non - GAAP financial measures discussed herein in its analysis of the Company’s performance. The Company’s management believes that these non - GAAP financial measures provide additional understanding of ongoing operations, enhance comparability of results of operations with prior periods and show the effects of significant gains and charges in the periods presented without the impact of items or events that may obscure trends in the Company’s underlying performance. Please see “Reconciliation of Non - GAAP Disclosures” at the end of this presentation for a reconciliation to the nearest GAAP financial measure. No Offer or Solicitation This presentation does not constitute an offer to sell or a solicitation of an offer to buy any securities. No offer of securities shall be made except by means of a prospectus meeting the requirements of the Securities Act of 1933, as amended, and no offer to sell or solicitation of an offer to buy shall be made in any jurisdiction in which such offer, solicitation or sale would be unlawful. About Atlantic Union Bankshares Corporation Headquartered in Richmond, Virginia, Atlantic Union Bankshares Corporation (NYSE: AUB) is the holding company for Atlantic Union Bank. Atlantic Union Bank has 114 branches and approximately 130 ATMs located throughout Virginia, and in portions of Maryland and North Carolina. Certain non - bank financial services affiliates of Atlantic Union Bank include: Atlantic Union Equipment Finance, Inc., which provides equipment financing; Atlantic Union Financial Consultants, LLC, which provides brokerage services; and Union Insurance Group, LLC, which offers various lines of insurance products. On January 18, 2023, the Company completed the transfer of the listing of its common stock and its depositary shares, each representing a 1/400th interest in a share of the Company’s 6.875% Perpetual Non - Cumulative Preferred Stock, Series A, from The Nasdaq Stock Market LLC to the New York Stock Exchange, under the ticker symbols of "AUB" and "AUB.PRA", respectively. |
|
4 Largest Regional Banking Company Headquartered in Virginia Our Company Soundness | Profitability | Growth Data as of 12/31/2022, market capitalization as of 1/20/2023 1) Regional bank defined as having less than $100 billion in assets; rank determined by asset size; data per S&P Global Market Intelligence Highlights ($bn) • Statewide Virginia footprint of 109 branches in all major markets • #1 regional bank 1 deposit market share in Virginia • Strong balance sheet and capital levels • Committed to top - tier financial performance with a highly experienced management team able to execute change 4 $ 20 .5 Assets $ 14.4 Loans $ 15.9 Deposits $ 2 .7 Market Capitalization Branch/Office Footprint AUB (114) AUB LPO (3) AUB Equipment Finance Headquarters (1) |
|
5 Our Shareholder Value Proposition Leading Regional Presence Dense, uniquely valuable presence across attractive markets Financial Strength Solid balance sheet & capital levels Attractive Financial Profile Solid dividend yield & payout ratio with earnings upside Strong Growth Potential Organic & acquisition opportunities Peer - Leading Performance Committed to top - tier financial performance |
|
6 Q4 2022 Highlights and 2023 Outlook Loan Growth • 15.3% annualized loan growth, ex - Paycheck Protection Program (PPP) (Non - GAAP) 1 , during Q4 2022 • Line of Credit Utilization of 35% • Expect ~6 % - 8% loan growth for 2023 Asset Quality • Net Charge - offs at 2 bps annualized for Q4 2022 Positioning for Long Term • Building solid Asset - Based lending pipeline • Drive organic growth and performance of the core banking franchise Differentiated Client Experience • Continued progress on digital roadmap • Foreign exchange, syndication and SBA 7A lending programs help close product gaps Operating Leverage Focus • ~11% pre - PPP adjusted revenue growth 1 year over year and ~7% pre - PPP adjusted revenue 1 growth from Q3 2022 • ~4% adjusted operating non - interest expense growth 1 year over year and ~Flat adjusted operating non - interest expenses from Q3 2022 • Pre - PPP adjusted operating leverage 1 of ~7% year over year • Pre - PPP adjusted operating leverage 1 of ~7% quarter over quarter Capitalize on Strategic Opportunities • Selectively consider M&A, minority stakes and strategic partnerships as a supplemental strategy 6 1 For non - GAAP financial measures, see reconciliation to most directly comparable GAAP measures in “Appendix – Reconciliation of Non - GAAP Disclosures” |
|
7 We are focused on three Strategic Priorities Organic Deliver Organic Growth • Overweighting opportunities in Wholesale Banking Group • Directing consumer efforts to market segments and delivery channels with the strongest value proposition • Prioritizing fee income growth • Maintaining a reliable low - cost deposit base • Maximizing operating leverage, productivity, efficiency, and scale • Attracting and retaining top talent in alignment with broader business goals and strategic priorities Innovate and Transform • Pressing the relationship model advantage where bankers provide advocacy and advice, form stickier relationships, and use technology to enable deeper relationships • Creating a frictionless experience for customers by integrating human interactions with digital capabilities • Eliminating low value tasks and enabling more high value interactions with customers • Eliminating legacy system constraints and accelerating modernization of technology while rationalizing operating costs and reengineering processes • Emphasizing robotics, automation and FinTech partnerships Inorganic Strategic Investments • Leveraging FinTech partnerships, strategic partner equity investments, as well as non - bank and whole - bank acquisition opportunities for step - change accelerants of growth • Acquisition philosophy remains: proactive, strategic, disciplined, and measured with an eye towards transactions that increase density and scarcity value, add contiguous markets, increase operating leverage, diversify revenue streams, and enable the reinvestment of cost savings into technology • Ensuring merger and acquisition activity complements, enables, and scales technology and the advancement of our customer value proposition, potentially including whole bank, non - bank, minority stakes, and partnerships |
|
8 We Believe We Are Well Positioned For The Current Environment And Optimistic About Our Future Top Tier Financial Performance Increased Shareholder Value Strong Credit Expense Management Actions Asset Sensitivity Growth Footing |
|
9 Q4 2022 Financial Performance At - a - Glance For non - GAAP financial measures, see reconciliation to most directly comparable GAAP measures in “Appendix – Reconciliation of Non - GAAP Disclosures” Note: all tables presented dollars in thousands, except per share amounts • Net income available to common shareholders for the fourth quarter of 2022 was $67.6 million or $0.90 per share, up $12.5 million or $0.16 per share compared to the prior quarter. The results were driven by: • An increase in net interest income, primarily driven by increases in loan yields on the Company’s variable rate loans due to higher market interest rates, average loan growth and increases in investment income primarily due to increased yield on taxable securities, partially offset by higher interest expense due to higher cost of funds, • A slight decrease in noninterest expense, due to notable fourth quarter activity, including a gain related to the sale/leaseback of an office building, refunds of prior period FDIC assessment expenses, costs related to the closure of five branches expected to close in the first quarter of 2023 and other restructuring expenses, the write - down of obsolete software, increased variable incentive compensation and profit - sharing expenses, as well as professional services increases related to strategic projects, • A decrease in noninterest income, as declines in other operating income, primarily due to equity method investment income declines partially offset by increases in loan syndication, SBA 7a, and foreign exchange revenues, mortgage banking income, and BOLI income were partially offset by increases in loan - related interest rate swap fees. 4Q2022 3Q2022 Net interest income $ 163,848 $ 150,715 - Provision for credit losses 6,257 6,412 + Noninterest income 24,500 25,584 - Noninterest expense 99,790 99,923 - Taxes 11,777 11,894 Net income (GAAP) 70,524 58,070 - Dividends on preferred stock 2,967 2,967 Net income available to common shareholders (GAAP) 67,557 55,103 - Loss on sale of securities, net of tax (1) - Adjusted operating earnings available to common shareholders (non-GAAP) $ 67,558 $ 55,103 Summarized Income Statement 4Q2022 3Q2022 Net Income available to common shareholders $ 67,557 $ 55,103 Common EPS, diluted $ 0.90 $ 0.74 ROE 12.05% 9.45% ROTCE (non-GAAP) 22.92% 17.21% ROA 1.39% 1.15% Efficiency ratio 52.98% 56.68% Efficiency ratio (FTE) 51.85% 55.47% Net interest margin 3.61% 3.34% Net interest margin (FTE) 3.70% 3.43% Earnings Metrics 4Q2022 3Q2022 Adjusted operating earnings available to common shareholders $ 67,558 $ 55,103 Adjusted operating common EPS, diluted $ 0.90 $ 0.74 Adjusted operating ROA 1.39% 1.15% Adjusted operating ROTCE 22.92% 17.21% Adjusted operating efficiency ratio (FTE) 50.61% 54.09% Adjusted operating earnings PTPP $ 88,559 $ 76,376 PTPP = Pre-tax Pre-provision Adjusted Operating Earnings Metrics - non-GAAP |
|
10 Q4 2022 Allowance For Credit Loss (ACL) and Provision for Credit Losses 10 Q4 Macroeconomic Forecast Moody’s December 2022 Baseline Forecast: • US GDP expecte d to average 0.9% growth in 2023 and 2.0% in 2024. The national unemployment rate expected to average 4.0% in 2023 and 4.1% in 2024, up from 3.7% in 2022. • Virginia’s unemployment rate expected to average 3.1% over the 2 - year forecast. Q4 ACL Considerations • The baseline forecast was adjusted for the probability of worse - than baseline economic performance over the forecast period, resulting in a weighted forecast scenario that increased Virginia’s average unemployment rate to ~6.0% over the 2 - year forecast period. • Qualitative factors were added for certain portfolios and other factors as deemed appropriate. • The reasonable and supportable forecast period is 2 years; followed by reversion to the historical loss average over 2 years ; consistent with CECL adoption. ($mm) Allowance for Loan & Lease Losses Reserve for Unfunded Commitments Allowance for Credit Losses 12/31/2021 Ending Balance % of loans $100MM (.76% ) $8MM (.06% ) $108MM (.82 %) Q1 2022 through Q3 2022 Activity +$8MM Increase due to increased risks related to economic outlook and the impact of loan growth +$3MM Increase due to the impact of unfunded loan commitment growth +$11MM $12.8 million Provision for Credit Losses and $1.5 million net charge - offs 09/30/2022 Ending Balance % of loans $108MM (.78%) $11MM (.08%) $119MM (.86%) Q4 2022 Activity +$3MM Increase due to increased risks related to the economic outlook and the impact of loan growth in the current quarter +$3MM Increase due to increased risks related to the economic outlook +$6MM $6.2 million Provision for Credit Losses and $810 thousand net charge - offs 12/31/2022 Ending Balance % of loans $111MM (.77%) $14MM (.09%) $124MM (.86%) Note: numbers may not foot due to rounding. |
|
11 Q4 2022 Net Interest Margin Market Rates 4Q2022 3Q2022 EOP Avg EOP Avg Fed funds 4.50% 3.84% 3.25% 2.38% Prime 7.50% 6.82% 6.25% 5.35% 1 - month LIBOR 4.39% 3.89% 3.14% 2.46% 1 - month SOFR 4.36% 3.88% 3.04% 2.44% 2 - year Treasury 4.43% 4.39% 4.28% 3.37% 10 - year Treasury 3.88% 3.82% 3.83% 3.10% Margin Overview 4Q2022 3Q2022 Net interest margin (FTE) 1 3.70% 3.43% Loan yield 4.90% 4.20% Investment yield 3.28% 2.95% Earning asset yield 4.54% 3.88% Cost of deposits 0.72% 0.37% Cost of interest - bearing deposits 1.05% 0.55% Cost of interest - bearing liabilities 1.24% 0.68% Cost of funds 0.84% 0.45% Presented on an FTE basis (non - GAAP) 1 Approximately 16% of the loan portfolio at 12/31/2022 have floors and all are above floors Loan Portfolio Pricing Mix 4Q2022 Fixed 48% 1 - month LIBOR 22% Prime 18% 1 - month SOFR 8% Other 4% Total 100% 1 For non - GAAP financial measures, see reconciliation to most directly comparable GAAP measures in “Appendix – Reconciliation of N on - GAAP Disclosures” 62 bps 3 bps - 6 bps - 32 bps |
|
12 Q4 2022 Noninterest Income and Noninterest Expense Adjusted noninterest income 1 decreased $ 1.1 million to $24.5 million for the quarter ended December 31, 2022 from $25.6 million in the prior quarter due to: • Decreases in the following noninterest income categories: • Mortgage banking income of $1.0 million due to a decline in mortgage origination volumes and lower gain on sales margins • Bank owned life insurance income of $796,000 due to the impact of the prior quarter’s mortality benefits • Other operating income of $1.7 million, primarily driven by equity method investment income declines, partially offset by increases in loan syndication, SBA 7a, and foreign exchange revenues, • Partially offset by increases in: • Loan - related interest rate swap fees of $1.6 million due to an increase in average deal size among swaps executed in the current quarter Adjusted noninterest expense 1 of $97.4 million for the quarter ended December 31, 2022 decreased slightly from the prior quarter. Notable noninterest expense activity in the fourth quarter of 2022 included: • Increased variable incentive compensation and profit - sharing expenses • Refunds of prior period FDIC assessment expenses • The write - down of obsolete software • Professional services increases related to strategic projects • A gain related to the sale/leaseback of an office building • Costs related to the closure of five branches expected to close in the first quarter of 2023 and other restructuring expenses 1 For non - GAAP financial measures, see reconciliation to most directly comparable GAAP measures in “Appendix – Reconciliation of N on - GAAP Disclosures” Noninterest Income ($ thousands) 4Q2022 3Q2022 Service charges on deposit accounts $ 7,631 $ 6,784 Other service charges, commissions and fees 1,631 1,770 Interchange fees 2,571 2,461 Fiduciary and asset management fees 4,085 4,134 Mortgage banking income 379 1,390 Bank owned life insurance income 2,649 3,445 Loan-related interest rate swap fees 3,664 2,050 Other operating income 1,890 3,550 Total noninterest income $ 24,500 $ 25,584 Less: Loss on sale of securities (1) - Total adjusted operating noninterest income (non-GAAP) $ 24,501 $ 25,584 Noninterest Expense ($ thousands) 4Q2022 3Q2022 Salaries and benefits $ 58,723 $ 56,600 Occupancy expenses 6,328 6,408 Furniture and equipment expenses 3,978 3,673 Technology and data processing 9,442 8,273 Professional services 4,456 3,504 Marketing and advertising expense 2,228 2,343 FDIC assessment premiums and other insurance 1,896 3,094 Franchise and other taxes 4,500 4,507 Loan-related expenses 1,356 1,575 Amortization of intangible assets 2,381 2,480 Other expenses 4,502 7,466 Total noninterest expenses $ 99,790 $ 99,923 Less: Amortization of intangible assets 2,381 2,480 Total adjusted operating noninterest expense (non-GAAP) $ 97,409 $ 97,443 |
|
13 Q4 2022 Loan and Deposit Growth • At December 31, 2022, loans held for investment totaled $14.4 billion, an increase of $530.4 million or 15.1% (annualized) from the prior quarter driven by increases in commercial loan balances ex PPP of $478.2 million and increases in consumer loan balances of $57.1 million, partially offset by a decrease of $4.9 million in PPP loans during the fourth quarter. • Excluding PPP loans, total loans 1 increased by $535.3 million or ~15.3% (annualized) • Commercial loans increased by 16.2 % (annualized), primarily driven by increases in both new loan production and utilization of commercial and industrial lines and commercial real estate – non - owner occupied loans. • Consumer loans balances increased by 10.2% (annualized), driven by growth in residential 1 - 4 family consumer loans and auto loans. • Average loan yields increased 70 basis points during the quarter primarily reflecting the impact of rising short term market interest rates. • Total deposits decreased by $614.5 million or ~ 14.7 % (annualized) • Demand deposits decreased by $407.7 million and interest checking balances decreased by $167.8 million. • Transaction accounts comprised 57% of total deposit balances at the end of the fourth quarter, down from 58% in the prior quarter. • The cost of deposits increased by 35 basis points compared to the prior quarter, primarily due to the increase in rising market interest rates and competitive market pressure. For non - GAAP financial measures, see reconciliation to most directly comparable GAAP measures in “Appendix – Reconciliation of Non - GAAP Disclosures” Loan Growth ($ thousands) 4Q2022 3Q2022 QTD Annualized Growth Commercial & Industrial, ex PPP $ 2,976,063 $ 2,696,901 41.1% Commercial real estate - owner occupied 1,982,608 1,953,872 5.8% Other Commercial, ex PPP 773,829 755,835 9.4% Total Commercial & Industrial 5,732,500 5,406,608 23.9% Commercial real estate - non-owner occupied 3,996,130 3,900,325 9.7% Construction and land development 1,101,260 1,068,201 12.3% Multifamily real estate 802,923 774,970 14.3% Residential 1-4 Family - Commercial 538,063 542,612 (3.3%) Total CRE & Construction 6,438,376 6,286,108 9.6% Total Commercial Loans, ex PPP 12,170,876 11,692,716 16.2% Residential 1-4 Family - Consumer 940,275 891,353 21.8% Residential 1-4 Family - Revolving 585,184 588,452 (2.2%) Auto 592,976 561,277 22.4% Consumer - including 3rd Party Consumer 152,545 172,776 (46.5%) Total Consumer Loans 2,270,980 2,213,858 10.2% Total Loans Held for Investment, ex PPP 1 $ 14,441,856 $ 13,906,574 15.3% PPP Loans, net of deferred fees and costs 7,286 12,146 (158.7%) Total Loans Held for Investment $ 14,449,142 $ 13,918,720 15.1% Average Loan Yield 4.90% 4.20% Deposit Growth ($ thousands) 4Q2022 3Q2022 QTD Annualized Growth Interest checking accounts $ 4,186,505 $ 4,354,351 (15.3%) Money market accounts 3,922,536 3,962,473 (4.0%) Savings accounts 1,130,899 1,173,566 (14.4%) Time deposits of $250,000 and over 405,060 415,984 (10.4%) Other time deposits 1,403,438 1,348,904 16.0% Total Time deposits 1,808,498 1,764,888 9.8% Total interest-bearing deposits 11,048,438 11,255,278 (7.3%) Demand deposits 4,883,239 5,290,938 (30.6%) Total deposits $ 15,931,677 $ 16,546,216 (14.7%) Average Cost of Deposits 0.72% 0.37% Loan to Deposit Ratio 90.7% 84.1% |
|
14 Strong Capital Position at December 31, 2022 Capital Ratio Regulatory Well Capitalized Atlantic Union Bankshares* Atlantic Union Bank* Common Equity Tier 1 Ratio (CET1) 7.0% 10.0% 12.8% Tier 1 Capital Ratio 8.5% 10.9% 12.8% Total Risk Based Capital Ratio 10.5% 13.7% 13.3% Leverage Ratio 5.0% 9.4% 11.0% Tangible Equity to Tangible Assets ( non - GAAP) 2 - 7.3% 8.8% Tangible Common Equity Ratio (non - GAAP) 2 - 6.4% 8.8% Figures may not foot due to rounding 2) For non - GAAP financial measures, see reconciliation to most directly comparable GAAP measures in “Appendix – Reconciliation of Non - GAAP Disclosures” Capital Management Strategy Atlantic Union capital management objectives are to: • Maintain designation as a “well capitalized” institution. • Ensure capital levels are commensurate with the Company’s risk profile, capital stress test projections, and strategic plan objectives. • The Company’s capital ratios are well above regulatory well capitalized levels as of 12/31/2022. Capital Management Actions • During the fourth quarter, the Company paid dividends of $171.88 per outstanding share of Series A Preferred Stock and $0.30 per common share which is the same as the prior quarter’s and a 7% increase from the prior year’s dividend. Quarterly Roll Forward Common Equity Tier 1 Ratio Tangible Common Equity Ratio Tangible Book Value per Share At 9/30/22 9.96% 6.11% $15.61 Pre - Provision Net Income 0.43% 0.37% 0.98 After - Tax Provision - 0.03% - 0.03% (0.07) Common Dividends (1) - 0.13% - 0.11% (0.30) AOCI --- 0.22% 0.59 Goodwill & Intangibles 0.01% 0.01% 0.03 Other 0.02% 0.01% 0.03 Asset Growth - 0.31% - 0.16% --- At 12/31/22 – Reported 9.95% 6.43% $16.87 AOCI Total Impact --- 2.14% 5.63 At 12/31/22 – ex AOCI 2 9.95% 8.57% $22.50 (1) 30 cents per share *Capital information presented herein is based on estimates and subject to change pending the Company’s filing of its regulat or y reports |
|
15 Top - Tier Financial Targets Committed to top - tier financial performance 1.3 % – 1.5 % Return on Assets ≤ 51 % (1) Efficiency Ratio (FTE) Atlantic Union is committed to achieving top tier financial performance and providing our shareholders with above average returns on their investment regardless of the operating environment Key financial performance operating metrics benchmarked against top quartile peers 15 (1 ) includes the approximately 2.4% efficiency ratio impact of the Virginia franchise tax expense (vs. state income tax). We expect to achieve these financial targets for the Full Year 2023 18 % – 20 % Return on Tangible Common Equity |
|
16 Financial Outlook 1 1 Key Economic Assumptions • Stabilizing Interest Rate environment • The Federal Reserve Bank fed funds rate increases to 5.0% • Mild recession in 2023 • Expect relatively stable economy in AUB’s Virginia footprint in 2023 • Expect Virginia unemployment rate to remain low in 2023 Full Year 2023 Targets versus FY 2022 Loan Growth ~6% - 8% Net Interest Income (FTE) Growth ~13% – 15% Net Interest Margin (FTE) ~3.70% – 3.75% Noninterest Income Mid - single digits decline Noninterest Expense Mid - single digits growth Positive Operating Leverage Revenue Growth: Low teens Operating Expense Growth: M id - single digits Credit Outlook ACL to loans: ~85 – 90 basis points Net charge - off ratio: ~10 basis points 1) Information on this slide is presented as of January 24, 2023, reflects the Company’s updated financial outlook, certain o f t he company’s financial targets, and key economic assumptions, and will not be updated or affirmed unless and until the Company publicly announces such an update or affirmation. The FY 2023 financial targets and the key economic assumptions contain forward - looking statements and actual results or conditions may differ materially. See the information set forth below the head ing “Forward Looking Statements” on slide 2 of this presentation. |
|
17 Appendix |
|
18 Reconciliation of Non - GAAP Disclosures The Company has provided supplemental performance measures on a tax - equivalent, tangible, operating, adjusted, or pre - tax pre - pr ovision basis. These non - GAAP financial measures are a supplement to GAAP, which is used to prepare the Company’s financial statements, and sho uld not be considered in isolation or as a substitute for comparable measures calculated in accordance with GAAP. In addition, the Compa ny’ s non - GAAP financial measures may not be comparable to non - GAAP financial measures of other companies. The Company uses the non - GAAP financ ial measures discussed herein in its analysis of the Company’s performance. The Company’s management believes that these non - GAAP fi nancial measures provide additional understanding of ongoing operations, enhance comparability of results of operations with prior pe rio ds and show the effects of significant gains and charges in the periods presented without the impact of items or events that may obscure tren ds in the Company’s underlying performance. |
|
19 Reconciliation of Non - GAAP Disclosures Adjusted operating measures exclude the losses related to balance sheet repositioning (principally composed of losses on debt extinguishment), gains or losses on sale of securities, gains on the sale of Visa, Inc. Class B common stock, gain on the sale of Dixon, Hubard, Feinour & Brown, Inc. (“DHFB”), as well as strategic branch closure initiatives and related facility consolidation costs (principally composed of real estate, leases and other assets write downs, as well as severance and expense reduction initiatives). The Company believes these non - GAAP adjusted measures provide investors with important information about the continuing economic results of the organization’s operations. Prior periods reflect adjustments for previously announced strategic branch closure and expense reduction initiatives. Net interest income (FTE) and total adjusted revenue (FTE), which are used in computing net interest margin (FTE), efficiency ratio (FTE) and adjusted operating efficiency ratio (FTE), respectively, provide valuable additional insight into the net interest margin and the efficiency ratio by adjusting for differences in tax treatment of interest income sources. The entire FTE adjustment is attributable to interest income on earning assets, which is used in computing yield on earning assets. Interest expense and the related cost of interest - bearing liabilities and cost of funds ratios are not affected by the FTE components. The adjusted operating efficiency ratio (FTE) excludes the amortization of intangible assets, gains or losses on sale of securities, gains on the sale of Visa, Inc. Class B common stock, gain on the sale of DHFB, losses related to balance sheet repositioning (principally composed of losses on debt extinguishment), as well as strategic branch closure initiatives and related facility consolidation costs. This measure is similar to the measure utilized by the Company when analyzing corporate performance and is also similar to the measure utilized for incentive compensation. The Company believes this adjusted measure provides investors with important information about the combined economic results of the organization’s operations. Prior periods reflect adjustments for previously announced strategic branch closure and expense reduction initiatives. The Company believes excluding PPP accretion interest income and fees from operating earnings is useful to investors as it provides more clarity on the Company’s non - PPP related income. Also presented is a computation of the pre - PPP adjusted operating leverage ratio (non - GAAP) which is the period to period percentage change in pre - PPP total adjusted revenue on a taxable - equivalent basis (non - GAAP) less the percentage change in adjusted operating noninterest expense (non - GAAP). (Dollars in thousands, except per share amounts) 4Q2022 3Q2022 2022 2021 QoQ YoY Net Income (GAAP) 70,524 $ 58,070 $ 234,510 $ 263,917 $ Plus: Net losses related to balance sheet repositioning, net of tax - - - 11,609 Plus: Branch closing and facility consolidation costs, net of tax - - 4,351 13,775 Less: (Loss) gain on sale of securities, net of tax (1) - (2) 69 Less: Gain on Visa, Inc. Class B common stock, net of tax - - - 4,058 Less: Gain on sale of DHFB, net of tax - - 7,984 - Adjusted operating earnings (non-GAAP) 70,525 $ 58,070 $ 230,879 $ 285,174 $ Less: Dividends on preferred stock 2,967 2,967 11,868 11,868 Adjusted operating earnings available to common shareholders (non-GAAP) 67,558 $ 55,103 $ 219,011 $ 273,306 $ Weighted average common shares outstanding, diluted 74,713,972 74,705,054 74,953,398 77,417,801 EPS available to common shareholders, diluted (GAAP) 0.90 $ 0.74 $ 2.97 $ 3.26 $ Adjusted operating EPS available to common shareholders (non-GAAP) 0.90 $ 0.74 $ 2.92 $ 3.53 $ Noninterest expense (GAAP) 99,790 $ 99,923 $ 403,802 $ 419,195 $ (0.13%) (3.67%) Less: Amortization of intangible assets 2,381 2,480 10,815 13,904 Less: Losses related to balance sheet repositioning - - - 14,695 Less: Branch closing and facility consolidation costs - - 5,508 17,437 Adjusted operating noninterest expense (non-GAAP) 97,409 $ 97,443 $ 387,479 $ 373,159 $ (0.03%) 3.84% Noninterest income (GAAP) 24,500 $ 25,584 $ 118,523 $ 125,806 $ Less: (Loss) gain on sale of securities (1) - (3) 87 Less: Gain on sale of DHFB - - 9,082 - Less: Gain on Visa, Inc. Class B common stock - - - 5,137 Adjusted operating noninterest income (non-GAAP) 24,501 $ 25,584 $ 109,444 $ 120,582 $ Net interest income (GAAP) 163,848 $ 150,715 $ 584,261 $ 551,260 $ Noninterest income (GAAP) 24,500 25,584 118,523 125,806 Total revenue (GAAP) 188,348 $ 176,299 $ 702,784 $ 677,066 $ 6.83% 3.80% Net interest income (FTE) (non-GAAP) 167,966 $ 154,557 $ 599,134 $ 563,851 $ Adjusted operating noninterest income (non-GAAP) 24,501 25,584 109,444 120,582 Total adjusted revenue (FTE) (non-GAAP) 192,467 180,141 708,578 684,433 6.84% 3.53% Less: PPP accretion interest income and fees 20 454 4,806 48,218 Pre-PPP total adjusted revenue (FTE) (non-GAAP) 192,447 $ 179,687 $ 703,772 $ 636,215 $ 7.10% 10.62% Operating leverage ratio (GAAP) 6.97% 7.47% Pre-PPP adjusted operating leverage ratio (non-GAAP) 7.14% 6.78% Efficiency ratio (GAAP) 52.98% 56.68% 57.46% 61.91% Efficiency ratio FTE (non-GAAP) 51.85% 55.47% 56.27% 60.78% Adjusted operating efficiency ratio (FTE) (non-GAAP) 50.61% 54.09% 54.68% 54.52% % Change ADJUSTED OPERATING EARNINGS, OPERATING LEVERAGE, AND EFFICIENCY RATIO For the three months ended For the year ended December 31, |
|
20 Reconciliation of Non - GAAP Disclosures Net interest income (FTE), total revenue (FTE), and total adjusted revenue (FTE), which are used in computing net interest margin (FTE), efficiency ratio (FTE) and adjusted operating efficiency ratio (FTE), respectively, provide valuable additional insight into the net interest margin and the efficiency ratio by adjusting for differences in tax treatment of interest income sources. The entire FTE adjustment is attributable to interest income on earning assets, which is used in computing yield on earning assets. Interest expense and the related cost of interest - bearing liabilities and cost of funds ratios are not affected by the FTE components. (Dollars in thousands) 4Q2022 3Q2022 2022 2021 Net interest income (GAAP) 163,848 $ 150,715 $ 584,261 $ 551,260 $ FTE adjustment 4,118 3,842 14,873 12,591 Net interest income (FTE) (non-GAAP) 167,966 $ 154,557 $ 599,134 $ 563,851 $ Noninterest income (GAAP) 24,500 25,584 118,523 125,806 Total revenue (FTE) (non-GAAP) 192,466 $ 180,141 $ 717,657 $ 689,657 $ Average earning assets 18,000,596 $ 17,879,222 $ 17,853,216 $ 17,903,671 $ Net interest margin (GAAP) 3.61% 3.34% 3.27% 3.08% Net interest margin (FTE) 3.70% 3.43% 3.36% 3.15% NET INTEREST MARGIN For the years ended December 31, For the three months ended |
|
21 Reconciliation of Non - GAAP Disclosures Tangible assets and tangible common equity are used in the calculation of certain profitability, capital, and per share ratios. The Company believes tangible assets, tangible common equity and the related ratios are meaningful measures of capital adequacy because they provide a meaningful base for period - to - period and company - to - company comparisons, which the Company believes will assist investors in assessing the capital of the Company and its ability to absorb potential losses. The Company believes tangible common equity is an important indication of its ability to grow organically and through business combinations, as well as its ability to pay dividends and to engage in various capital management strategies. (Dollars in thousands, except share data) Atlantic Union Bankshares Atlantic Union Bank Tangible Assets Ending Assets (GAAP) 20,461,138 $ 20,336,762 $ Less: Ending goodwill 925,211 925,211 Less: Ending amortizable intangibles 26,761 26,761 Amortizable intangibles, net Ending tangible assets (non-GAAP) 19,509,166 $ 19,384,790 $ Tangible Common Equity Total stockholders' equity Ending equity (GAAP) 2,372,737 $ 2,666,428 $ Less: Ending goodwill 925,211 925,211 Less: Ending amortizable intangibles 26,761 26,761 Less: Perpetual preferred stock 166,357 - Ending tangible common equity (non-GAAP) 1,254,408 $ 1,714,456 $ Accumulated other comprehensive loss (AOCI) (418,286) Common shares outstanding at end of period 74,712,622 Stockholders' equity Average equity (GAAP) 2,321,208 $ 2,607,050 $ Less: Average goodwill Less: Average goodwill 925,211 925,211 Less: Average amortizable intangibles Less: Average amortizable intangibles 27,909 27,909 Less: Average perpetual preferred stock Less: Average perpetual preferred stock 166,356 - Average tangible common equity (non-GAAP) 1,201,732 $ 1,653,930 $ Less: Perpetual preferred stock Common equity to total assets (GAAP) 10.8% 13.1% Tangible equity to tangible assets (non-GAAP) 7.3% 8.8% Tangible common equity to tangible assets (non-GAAP) 6.4% 8.8% Tangible common equity to tangible assets ex AOCI (non-GAAP) 1 8.6% Book Value per Common Share Book value per common share (GAAP) 29.68 $ Tangible Book Value per Share Tangible book value per common share (non-GAAP) 16.87 $ Tangible book value per common share ex AOCI (non-GAAP) 1 22.50 $ Leverage Ratio Tier 1 Capital 1,850,444 $ 2,154,595 $ Total average assets for leverage ratio 19,653,449 $ 19,547,089 $ Leverage Ratio 9.4% 11.0% 1 Calculation excludes the impact of 372,105 unvested restricted stock awards (RSAs) outstanding as of December 31, 2022 TANGIBLE ASSETS, TANGIBLE COMMON EQUITY, AND LEVERAGE RATIO As of December 31, 2022 |
|
22 Reconciliation of Non - GAAP Disclosures Tangible assets and tangible common equity are used in the calculation of certain profitability, capital, and per share ratios. The Company believes tangible assets, tangible common equity and the related ratios are meaningful measures of capital adequacy because they provide a meaningful base for period - to - period and company - to - company comparisons, which the Company believes will assist investors in assessing the capital of the Company and its ability to absorb potential losses. The Company believes tangible common equity is an important indication of its ability to grow organically and through business combinations as well as its ability to pay dividends and to engage in various capital management strategies. The Company believes that ROTCE is a meaningful supplement to GAAP financial measures and useful to investors because it measures the performance of a business consistently across time without regard to whether components of the business were acquired or developed internally. Adjusted operating measures exclude the losses related to balance sheet repositioning (principally composed of losses on debt extinguishment), gains or losses on sale of securities, gains on the sale of Visa, Inc. Class B common stock, gain on the sale of Dixon, Hubard, Feinour & Brown, Inc. (“DHFB”), as well as strategic branch closure initiatives and related facility consolidation costs (principally composed of real estate, leases and other assets write downs, as well as severance and expense reduction initiatives). The Company believes these non - GAAP adjusted measures provide investors with important information about the continuing economic results of the organization’s operations. Prior periods reflect adjustments for previously announced strategic branch closure and expense reduction initiatives. (Dollars in thousands, except per share amounts) 4Q2022 3Q2022 2022 2021 Return on average assets (ROA) Average assets 20,174,152 $ 19,980,500 $ 19,949,388 $ 19,977,551 $ ROA (GAAP) 1.39% 1.15% 1.18% 1.32% Adjusted operating ROA (non-GAAP) 1.39% 1.15% 1.16% 1.43% Return on average equity (ROE) Adjusted operating earnings available to common shareholders (non-GAAP) 67,558 $ 55,103 $ 219,011 $ 273,306 $ Plus: Amortization of intangibles, tax effected 1,881 1,959 8,544 10,984 Adjusted operating earnings available to common shareholders before amortization of intangibles (non-GAAP) 69,439 $ 57,062 $ 227,555 $ 284,290 $ Average common equity (GAAP) 2,321,208 $ 2,436,999 $ 2,465,049 $ 2,725,330 $ Less: Average goodwill 925,211 925,211 930,315 935,560 Less: Average amortizable intangibles 27,909 30,347 34,627 49,999 Less: Average perpetual preferred stock 166,356 166,356 166,356 166,356 Average tangible common equity (non-GAAP) 1,201,732 $ 1,315,085 $ 1,333,751 $ 1,573,415 $ ROE (GAAP) 12.05% 9.45% 9.51% 9.68% Return on tangible common equity (ROTCE) Net Income available to common shareholders (GAAP) 67,557 $ 55,103 $ 222,642 $ 252,049 $ Plus: Amortization of intangibles, tax effected 1,881 1,959 8,544 10,984 Net Income available to common shareholders before amortization of intangibles (non-GAAP) 69,438 $ 57,062 $ 231,186 $ 263,033 $ ROTCE 22.92% 17.21% 17.33% 16.72% Adjusted operating ROTCE (non-GAAP) 22.92% 17.21% 17.06% 18.07% For the three months ended OPERATING MEASURES For the years ended December 31, |
|
23 Reconciliation of Non - GAAP Disclosures Pre - tax pre - provision adjusted earnings excludes the provision for credit losses, which can fluctuate significantly from period - to - period under the CECL methodology, income tax expense, losses related to balance sheet repositioning (principally composed of losses on debt extinguishment), gains or losses on sale of securities, gains on the sale of Visa, Inc. Class B common stock, gain on the sale of DHFB, as well as strategic branch closure initiatives and related facility consolidation costs. The Company believes this adjusted measure provides investors with important information about the combined economic results of the Company’s operations. Prior periods reflect adjustments for previously announced strategic branch closure and expense reduction initiatives. The Company believes excluding PPP accretion interest income and fees from operating earnings is useful to investors as it provides more clarity on the Company’s non - PPP related income. (Dollars in thousands, except per share amounts) 4Q2022 3Q2022 2022 2021 Net income (GAAP) 70,524 $ 58,070 $ 234,510 $ 263,917 $ Plus: Provision for credit losses 6,257 6,412 19,028 (60,888) Plus: Income tax expense 11,777 11,894 45,444 54,842 Plus: Net loss related to balance sheet repositioning - - - 14,695 Plus: Branch closing and facility consolidation costs - - 5,508 17,437 Less: (Loss) gain on sale of securities (1) - (3) 87 Less: Gain on sale of DHFB - - 9,082 - Less: Gain on Visa, Inc. Class B common stock - - - 5,137 PTPP adjusted operating earnings (non-GAAP) 88,559 76,376 295,411 284,779 Less: Dividends on preferred stock 2,967 2,967 11,868 11,868 PTPP adjusted operating earnings available to common shareholders (non-GAAP) 85,592 $ 73,409 $ 283,543 $ 272,911 $ PTPP adjusted operating earnings (non-GAAP) 88,559 76,376 295,411 284,779 Less: PPP accretion interest income and fees 20 454 4,806 48,218 Pre-PPP PTPP adjusted operating earnings (non-GAAP) 88,539 $ 75,922 $ 290,605 $ 236,561 $ For the three months ended PRE-TAX PRE-PROVISION ADJUSTED OPERATING EARNINGS For the years ended December 31, |
|
24 Reconciliation of Non - GAAP Disclosures PPP adjustment impact excludes the unforgiven portion of PPP loans. The Company believes loans held for investment (net of deferred fees and costs), excluding PPP is useful to investors as it provides more clarity on the Company’s organic growth. The Company also believes that the related non - GAAP financial measures of past due loans still accruing interest as a percentage of total loans held for investment (net of deferred fees and costs), excluding PPP, are useful to investors as loans originated under the PPP carry an SBA guarantee. The Company believes that the ALLL as a percentage of loans held for investment (net of deferred fees and costs), excluding PPP, is useful to investors because of the size of the Company’s PPP originations and the impact of the embedded credit enhancement provided by the SBA guarantee. (Dollars in thousands) As of December 31, 2022 As of September 30, 2022 As of December 31, 2021 Allowance for loan and lease losses (ALLL) 110,768 $ 108,009 $ 99,787 $ Reserve for unfunded commitment (RUC) 13,675 11,000 8,000 Allowance for credit losses (ACL) 124,443 $ 119,009 $ 107,787 $ Loans held for investment (net of deferred fees and costs)(GAAP) 14,449,142 $ 13,918,720 $ 13,195,843 $ Less: PPP loans (net of deferred fees and costs) 7,286 12,146 150,363 Total adjusted loans (non-GAAP) 14,441,856 $ 13,906,574 $ 13,045,480 $ Average loans held for investment (net of deferred fees and costs)(GAAP) 14,117,433 $ 13,733,447 $ 13,082,412 $ Less: Average PPP loans (net of deferred fees and costs) 8,217 14,280 288,204 Total adjusted average loans (non-GAAP) 14,109,216 $ 13,719,167 $ 12,794,208 $ Annualized loan growth - QTD (GAAP) 15.12% Annualized loan growth, excluding PPP - QTD (non-GAAP) 15.27% ALLL to total loans held for investment (GAAP) 0.77% 0.78% 0.76% ALLL to total adjusted loans held for investment, excluding PPP (non-GAAP) 0.77% 0.78% 0.76% ACL to total loans held for investment (GAAP) 0.86% 0.86% 0.82% ACL to total adjusted loans held for investment, excluding PPP (non-GAAP) 0.86% 0.86% 0.83% ALLOWANCE FOR CREDIT LOSS RATIOS AND TOTAL ADJUSTED LOANS |