00008753572023FYFALSEhttp://fasb.org/us-gaap/2023#PropertyPlantAndEquipmentNethttp://fasb.org/us-gaap/2023#PropertyPlantAndEquipmentNethttp://fasb.org/us-gaap/2023#OtherLiabilities00008753572023-01-012023-12-3100008753572023-06-30iso4217:USD00008753572024-01-31xbrli:sharesiso4217:USDxbrli:shares00008753572022-01-012022-12-3100008753572021-01-012021-12-310000875357bokf:BrokerageandtradingrevenueMember2023-01-012023-12-310000875357bokf:BrokerageandtradingrevenueMember2022-01-012022-12-310000875357bokf:BrokerageandtradingrevenueMember2021-01-012021-12-310000875357bokf:TransactioncardrevenueMember2023-01-012023-12-310000875357bokf:TransactioncardrevenueMember2022-01-012022-12-310000875357bokf:TransactioncardrevenueMember2021-01-012021-12-310000875357us-gaap:FiduciaryAndTrustMember2023-01-012023-12-310000875357us-gaap:FiduciaryAndTrustMember2022-01-012022-12-310000875357us-gaap:FiduciaryAndTrustMember2021-01-012021-12-310000875357us-gaap:DepositAccountMember2023-01-012023-12-310000875357us-gaap:DepositAccountMember2022-01-012022-12-310000875357us-gaap:DepositAccountMember2021-01-012021-12-310000875357us-gaap:MortgageBankingMember2023-01-012023-12-310000875357us-gaap:MortgageBankingMember2022-01-012022-12-310000875357us-gaap:MortgageBankingMember2021-01-012021-12-310000875357us-gaap:FinancialServiceOtherMember2023-01-012023-12-310000875357us-gaap:FinancialServiceOtherMember2022-01-012022-12-310000875357us-gaap:FinancialServiceOtherMember2021-01-012021-12-3100008753572023-12-3100008753572022-12-310000875357us-gaap:CommonStockMember2020-12-310000875357us-gaap:AdditionalPaidInCapitalMember2020-12-310000875357us-gaap:RetainedEarningsMember2020-12-310000875357us-gaap:TreasuryStockCommonMember2020-12-310000875357us-gaap:AccumulatedOtherComprehensiveIncomeMember2020-12-310000875357us-gaap:ParentMember2020-12-310000875357us-gaap:NoncontrollingInterestMember2020-12-3100008753572020-12-310000875357us-gaap:RetainedEarningsMember2021-01-012021-12-310000875357us-gaap:ParentMember2021-01-012021-12-310000875357us-gaap:NoncontrollingInterestMember2021-01-012021-12-310000875357us-gaap:AccumulatedOtherComprehensiveIncomeMember2021-01-012021-12-310000875357us-gaap:TreasuryStockCommonMember2021-01-012021-12-310000875357us-gaap:CommonStockMember2021-01-012021-12-310000875357us-gaap:AdditionalPaidInCapitalMember2021-01-012021-12-310000875357us-gaap:CommonStockMember2021-12-310000875357us-gaap:AdditionalPaidInCapitalMember2021-12-310000875357us-gaap:RetainedEarningsMember2021-12-310000875357us-gaap:TreasuryStockCommonMember2021-12-310000875357us-gaap:AccumulatedOtherComprehensiveIncomeMember2021-12-310000875357us-gaap:ParentMember2021-12-310000875357us-gaap:NoncontrollingInterestMember2021-12-3100008753572021-12-310000875357us-gaap:RetainedEarningsMember2022-01-012022-12-310000875357us-gaap:ParentMember2022-01-012022-12-310000875357us-gaap:NoncontrollingInterestMember2022-01-012022-12-310000875357us-gaap:AccumulatedOtherComprehensiveIncomeMember2022-01-012022-12-310000875357us-gaap:TreasuryStockCommonMember2022-01-012022-12-310000875357us-gaap:CommonStockMember2022-01-012022-12-310000875357us-gaap:AdditionalPaidInCapitalMember2022-01-012022-12-310000875357us-gaap:CommonStockMember2022-12-310000875357us-gaap:AdditionalPaidInCapitalMember2022-12-310000875357us-gaap:RetainedEarningsMember2022-12-310000875357us-gaap:TreasuryStockCommonMember2022-12-310000875357us-gaap:AccumulatedOtherComprehensiveIncomeMember2022-12-310000875357us-gaap:ParentMember2022-12-310000875357us-gaap:NoncontrollingInterestMember2022-12-310000875357us-gaap:RetainedEarningsMember2023-01-012023-12-310000875357us-gaap:ParentMember2023-01-012023-12-310000875357us-gaap:NoncontrollingInterestMember2023-01-012023-12-310000875357us-gaap:AccumulatedOtherComprehensiveIncomeMember2023-01-012023-12-310000875357us-gaap:TreasuryStockCommonMember2023-01-012023-12-310000875357us-gaap:CommonStockMember2023-01-012023-12-310000875357us-gaap:AdditionalPaidInCapitalMember2023-01-012023-12-310000875357us-gaap:CommonStockMember2023-12-310000875357us-gaap:AdditionalPaidInCapitalMember2023-12-310000875357us-gaap:RetainedEarningsMember2023-12-310000875357us-gaap:TreasuryStockCommonMember2023-12-310000875357us-gaap:AccumulatedOtherComprehensiveIncomeMember2023-12-310000875357us-gaap:ParentMember2023-12-310000875357us-gaap:NoncontrollingInterestMember2023-12-310000875357srt:MinimumMember2023-12-310000875357srt:MaximumMember2023-12-310000875357srt:MinimumMemberus-gaap:BuildingAndBuildingImprovementsMember2023-12-310000875357us-gaap:BuildingAndBuildingImprovementsMembersrt:MaximumMember2023-12-310000875357us-gaap:SoftwareAndSoftwareDevelopmentCostsMembersrt:MinimumMember2023-12-310000875357us-gaap:SoftwareAndSoftwareDevelopmentCostsMembersrt:MaximumMember2023-12-310000875357srt:MinimumMemberus-gaap:FurnitureAndFixturesMember2023-12-310000875357us-gaap:FurnitureAndFixturesMembersrt:MaximumMember2023-12-310000875357us-gaap:RestrictedStockMember2023-01-012023-12-310000875357us-gaap:USTreasuryAndGovernmentMember2023-12-310000875357us-gaap:USTreasuryAndGovernmentMember2022-12-310000875357us-gaap:MortgageBackedSecuritiesIssuedByUSGovernmentSponsoredEnterprisesMember2023-12-310000875357us-gaap:MortgageBackedSecuritiesIssuedByUSGovernmentSponsoredEnterprisesMember2022-12-310000875357us-gaap:USStatesAndPoliticalSubdivisionsMember2023-12-310000875357us-gaap:USStatesAndPoliticalSubdivisionsMember2022-12-310000875357us-gaap:OtherDebtSecuritiesMember2023-12-310000875357us-gaap:OtherDebtSecuritiesMember2022-12-310000875357us-gaap:CommercialMortgageBackedSecuritiesMember2023-12-310000875357us-gaap:CommercialMortgageBackedSecuritiesMember2022-12-310000875357us-gaap:FixedIncomeSecuritiesMember2023-12-31xbrli:pure0000875357us-gaap:MortgageBackedSecuritiesIssuedByUSGovernmentSponsoredEnterprisesMember2023-01-012023-12-310000875357us-gaap:USTreasurySecuritiesMember2023-12-310000875357us-gaap:MortgageBackedSecuritiesIssuedByPrivateEnterprisesMember2023-12-310000875357us-gaap:USTreasurySecuritiesMember2022-12-310000875357us-gaap:MortgageBackedSecuritiesIssuedByPrivateEnterprisesMember2022-12-310000875357us-gaap:ResidentialMortgageBackedSecuritiesMember2023-12-310000875357us-gaap:ResidentialMortgageBackedSecuritiesMember2023-01-012023-12-310000875357us-gaap:AssetPledgedAsCollateralWithRightMember2023-12-310000875357us-gaap:AssetPledgedAsCollateralWithRightMember2022-12-310000875357us-gaap:NondesignatedMemberus-gaap:InterestRateSwapMember2023-12-310000875357us-gaap:NondesignatedMemberus-gaap:EnergyRelatedDerivativeMember2023-12-310000875357us-gaap:ForeignExchangeContractMemberus-gaap:NondesignatedMember2023-12-310000875357us-gaap:EquitySwapMemberus-gaap:NondesignatedMember2023-12-310000875357bokf:CustomerRiskManagementProgramsMemberus-gaap:NondesignatedMember2023-12-310000875357bokf:TradingMemberus-gaap:NondesignatedMember2023-12-310000875357bokf:InternalRiskManagementProgramsMemberus-gaap:NondesignatedMember2023-12-310000875357us-gaap:NondesignatedMember2023-12-310000875357us-gaap:NondesignatedMemberus-gaap:InterestRateSwapMember2022-12-310000875357us-gaap:NondesignatedMemberus-gaap:EnergyRelatedDerivativeMember2022-12-310000875357us-gaap:ForeignExchangeContractMemberus-gaap:NondesignatedMember2022-12-310000875357us-gaap:EquitySwapMemberus-gaap:NondesignatedMember2022-12-310000875357bokf:CustomerRiskManagementProgramsMemberus-gaap:NondesignatedMember2022-12-310000875357bokf:TradingMemberus-gaap:NondesignatedMember2022-12-310000875357bokf:InternalRiskManagementProgramsMemberus-gaap:NondesignatedMember2022-12-310000875357us-gaap:NondesignatedMember2022-12-310000875357us-gaap:NondesignatedMemberus-gaap:InterestRateSwapMember2023-01-012023-12-310000875357us-gaap:NondesignatedMemberus-gaap:InterestRateSwapMember2022-01-012022-12-310000875357us-gaap:NondesignatedMemberus-gaap:InterestRateSwapMember2021-01-012021-12-310000875357us-gaap:NondesignatedMemberus-gaap:EnergyRelatedDerivativeMember2023-01-012023-12-310000875357us-gaap:NondesignatedMemberus-gaap:EnergyRelatedDerivativeMember2022-01-012022-12-310000875357us-gaap:NondesignatedMemberus-gaap:EnergyRelatedDerivativeMember2021-01-012021-12-310000875357bokf:AgriculturalContractsMemberus-gaap:NondesignatedMember2023-01-012023-12-310000875357bokf:AgriculturalContractsMemberus-gaap:NondesignatedMember2022-01-012022-12-310000875357bokf:AgriculturalContractsMemberus-gaap:NondesignatedMember2021-01-012021-12-310000875357us-gaap:ForeignExchangeContractMemberus-gaap:NondesignatedMember2023-01-012023-12-310000875357us-gaap:ForeignExchangeContractMemberus-gaap:NondesignatedMember2022-01-012022-12-310000875357us-gaap:ForeignExchangeContractMemberus-gaap:NondesignatedMember2021-01-012021-12-310000875357bokf:CustomerRiskManagementProgramsMemberus-gaap:NondesignatedMember2023-01-012023-12-310000875357bokf:CustomerRiskManagementProgramsMemberus-gaap:NondesignatedMember2022-01-012022-12-310000875357bokf:CustomerRiskManagementProgramsMemberus-gaap:NondesignatedMember2021-01-012021-12-310000875357bokf:TradingMemberus-gaap:NondesignatedMember2023-01-012023-12-310000875357bokf:TradingMemberus-gaap:NondesignatedMember2022-01-012022-12-310000875357bokf:TradingMemberus-gaap:NondesignatedMember2021-01-012021-12-310000875357bokf:InternalRiskManagementProgramsMemberus-gaap:NondesignatedMember2023-01-012023-12-310000875357bokf:InternalRiskManagementProgramsMemberus-gaap:NondesignatedMember2022-01-012022-12-310000875357bokf:InternalRiskManagementProgramsMemberus-gaap:NondesignatedMember2021-01-012021-12-310000875357us-gaap:NondesignatedMember2023-01-012023-12-310000875357us-gaap:NondesignatedMember2022-01-012022-12-310000875357us-gaap:NondesignatedMember2021-01-012021-12-310000875357us-gaap:CommercialPortfolioSegmentMember2023-12-310000875357us-gaap:CommercialPortfolioSegmentMember2022-12-310000875357us-gaap:CommercialRealEstatePortfolioSegmentMember2023-12-310000875357us-gaap:CommercialRealEstatePortfolioSegmentMember2022-12-310000875357bokf:LoanstoindividualsMember2023-12-310000875357bokf:LoanstoindividualsMember2022-12-310000875357stpr:TXus-gaap:GeographicConcentrationRiskMember2023-12-310000875357us-gaap:GeographicConcentrationRiskMemberstpr:OK2023-12-310000875357us-gaap:GeographicConcentrationRiskMemberstpr:CO2023-12-310000875357stpr:TXus-gaap:GeographicConcentrationRiskMember2022-12-310000875357us-gaap:GeographicConcentrationRiskMemberstpr:OK2022-12-310000875357us-gaap:GeographicConcentrationRiskMemberstpr:CO2022-12-310000875357stpr:TXus-gaap:GeographicConcentrationRiskMemberus-gaap:CommercialPortfolioSegmentMember2023-12-310000875357us-gaap:GeographicConcentrationRiskMemberstpr:OKus-gaap:CommercialPortfolioSegmentMember2023-12-310000875357us-gaap:GeographicConcentrationRiskMemberstpr:COus-gaap:CommercialPortfolioSegmentMember2023-12-310000875357us-gaap:HealthCareMemberus-gaap:CreditConcentrationRiskMemberus-gaap:CommercialPortfolioSegmentMember2023-12-310000875357us-gaap:CreditConcentrationRiskMemberus-gaap:CommercialPortfolioSegmentMemberbokf:ServicesMember2023-12-310000875357bokf:ServicesMemberus-gaap:CommercialPortfolioSegmentMember2023-12-310000875357bokf:EnergyMemberus-gaap:CreditConcentrationRiskMemberus-gaap:CommercialPortfolioSegmentMember2023-12-310000875357us-gaap:CreditConcentrationRiskMemberbokf:EnergyProducersMemberus-gaap:CommercialPortfolioSegmentMember2023-12-310000875357stpr:TXus-gaap:GeographicConcentrationRiskMemberus-gaap:CommercialPortfolioSegmentMember2022-12-310000875357us-gaap:GeographicConcentrationRiskMemberstpr:OKus-gaap:CommercialPortfolioSegmentMember2022-12-310000875357us-gaap:GeographicConcentrationRiskMemberstpr:COus-gaap:CommercialPortfolioSegmentMember2022-12-310000875357us-gaap:HealthCareMemberus-gaap:CreditConcentrationRiskMemberus-gaap:CommercialPortfolioSegmentMember2022-12-310000875357us-gaap:CreditConcentrationRiskMemberus-gaap:CommercialPortfolioSegmentMemberbokf:ServicesMember2022-12-310000875357bokf:ServicesMemberus-gaap:CommercialPortfolioSegmentMember2022-12-310000875357bokf:EnergyMemberus-gaap:CreditConcentrationRiskMemberus-gaap:CommercialPortfolioSegmentMember2022-12-310000875357us-gaap:CreditConcentrationRiskMemberbokf:EnergyProducersMemberus-gaap:CommercialPortfolioSegmentMember2022-12-310000875357us-gaap:CommercialRealEstatePortfolioSegmentMemberstpr:TXus-gaap:GeographicConcentrationRiskMember2023-12-310000875357us-gaap:CommercialRealEstatePortfolioSegmentMemberus-gaap:GeographicConcentrationRiskMember2023-12-310000875357us-gaap:CommercialRealEstatePortfolioSegmentMemberstpr:TXus-gaap:GeographicConcentrationRiskMember2022-12-310000875357us-gaap:CommercialRealEstatePortfolioSegmentMemberus-gaap:GeographicConcentrationRiskMember2022-12-310000875357us-gaap:CommercialPortfolioSegmentMember2023-01-012023-12-310000875357us-gaap:CommercialRealEstatePortfolioSegmentMember2023-01-012023-12-310000875357bokf:LoanstoindividualsMember2023-01-012023-12-310000875357us-gaap:CommercialPortfolioSegmentMember2021-12-310000875357us-gaap:CommercialRealEstatePortfolioSegmentMember2021-12-310000875357bokf:LoanstoindividualsMember2021-12-310000875357us-gaap:CommercialPortfolioSegmentMember2022-01-012022-12-310000875357us-gaap:CommercialRealEstatePortfolioSegmentMember2022-01-012022-12-310000875357bokf:LoanstoindividualsMember2022-01-012022-12-310000875357us-gaap:CommercialPortfolioSegmentMember2020-12-310000875357us-gaap:CommercialRealEstatePortfolioSegmentMember2020-12-310000875357bokf:LoanstoindividualsMember2020-12-310000875357us-gaap:CommercialPortfolioSegmentMember2021-01-012021-12-310000875357us-gaap:CommercialRealEstatePortfolioSegmentMember2021-01-012021-12-310000875357bokf:LoanstoindividualsMember2021-01-012021-12-310000875357us-gaap:PassMemberus-gaap:PerformingFinancingReceivableMemberus-gaap:HealthCareMemberus-gaap:CommercialPortfolioSegmentMember2023-12-310000875357us-gaap:SpecialMentionMemberus-gaap:PerformingFinancingReceivableMemberus-gaap:HealthCareMemberus-gaap:CommercialPortfolioSegmentMember2023-12-310000875357us-gaap:SubstandardMemberus-gaap:PerformingFinancingReceivableMemberus-gaap:HealthCareMemberus-gaap:CommercialPortfolioSegmentMember2023-12-310000875357us-gaap:HealthCareMemberbokf:NonaccruingSubstandardAndDoubtfulMemberus-gaap:CommercialPortfolioSegmentMemberus-gaap:NonperformingFinancingReceivableMember2023-12-310000875357us-gaap:HealthCareMemberus-gaap:CommercialPortfolioSegmentMember2023-12-310000875357us-gaap:HealthCareMemberus-gaap:CommercialPortfolioSegmentMember2023-01-012023-12-310000875357bokf:EnergyMemberus-gaap:PassMemberus-gaap:PerformingFinancingReceivableMemberus-gaap:CommercialPortfolioSegmentMember2023-12-310000875357bokf:EnergyMemberus-gaap:SpecialMentionMemberus-gaap:PerformingFinancingReceivableMemberus-gaap:CommercialPortfolioSegmentMember2023-12-310000875357bokf:EnergyMemberus-gaap:SubstandardMemberus-gaap:PerformingFinancingReceivableMemberus-gaap:CommercialPortfolioSegmentMember2023-12-310000875357bokf:EnergyMemberbokf:NonaccruingSubstandardAndDoubtfulMemberus-gaap:CommercialPortfolioSegmentMemberus-gaap:NonperformingFinancingReceivableMember2023-12-310000875357bokf:EnergyMemberus-gaap:CommercialPortfolioSegmentMember2023-12-310000875357bokf:EnergyMemberus-gaap:CommercialPortfolioSegmentMember2023-01-012023-12-310000875357us-gaap:PassMemberus-gaap:PerformingFinancingReceivableMemberus-gaap:CommercialPortfolioSegmentMemberbokf:ServicesMember2023-12-310000875357us-gaap:SpecialMentionMemberus-gaap:PerformingFinancingReceivableMemberus-gaap:CommercialPortfolioSegmentMemberbokf:ServicesMember2023-12-310000875357us-gaap:SubstandardMemberus-gaap:PerformingFinancingReceivableMemberus-gaap:CommercialPortfolioSegmentMemberbokf:ServicesMember2023-12-310000875357bokf:NonaccruingSubstandardAndDoubtfulMemberus-gaap:CommercialPortfolioSegmentMemberbokf:ServicesMemberus-gaap:NonperformingFinancingReceivableMember2023-12-310000875357bokf:ServicesMemberus-gaap:CommercialPortfolioSegmentMember2023-01-012023-12-310000875357us-gaap:PassMemberus-gaap:PerformingFinancingReceivableMemberbokf:GeneralBusinessClassMemberus-gaap:CommercialPortfolioSegmentMember2023-12-310000875357us-gaap:SpecialMentionMemberus-gaap:PerformingFinancingReceivableMemberbokf:GeneralBusinessClassMemberus-gaap:CommercialPortfolioSegmentMember2023-12-310000875357us-gaap:SubstandardMemberus-gaap:PerformingFinancingReceivableMemberbokf:GeneralBusinessClassMemberus-gaap:CommercialPortfolioSegmentMember2023-12-310000875357bokf:GeneralBusinessClassMemberbokf:NonaccruingSubstandardAndDoubtfulMemberus-gaap:CommercialPortfolioSegmentMemberus-gaap:NonperformingFinancingReceivableMember2023-12-310000875357bokf:GeneralBusinessClassMemberus-gaap:CommercialPortfolioSegmentMember2023-12-310000875357bokf:GeneralBusinessClassMemberus-gaap:CommercialPortfolioSegmentMember2023-01-012023-12-310000875357us-gaap:PassMemberus-gaap:PerformingFinancingReceivableMemberus-gaap:CommercialRealEstatePortfolioSegmentMember2023-12-310000875357us-gaap:SpecialMentionMemberus-gaap:PerformingFinancingReceivableMemberus-gaap:CommercialRealEstatePortfolioSegmentMember2023-12-310000875357us-gaap:SubstandardMemberus-gaap:PerformingFinancingReceivableMemberus-gaap:CommercialRealEstatePortfolioSegmentMember2023-12-310000875357us-gaap:CommercialRealEstatePortfolioSegmentMemberbokf:NonaccruingSubstandardAndDoubtfulMemberus-gaap:NonperformingFinancingReceivableMember2023-12-310000875357us-gaap:PassMemberus-gaap:PerformingFinancingReceivableMemberbokf:LoanstoindividualsMemberus-gaap:ResidentialMortgageMember2023-12-310000875357us-gaap:SpecialMentionMemberus-gaap:PerformingFinancingReceivableMemberbokf:LoanstoindividualsMemberus-gaap:ResidentialMortgageMember2023-12-310000875357us-gaap:SubstandardMemberus-gaap:PerformingFinancingReceivableMemberbokf:LoanstoindividualsMemberus-gaap:ResidentialMortgageMember2023-12-310000875357bokf:LoanstoindividualsMemberus-gaap:ResidentialMortgageMemberbokf:NonaccruingSubstandardAndDoubtfulMemberus-gaap:NonperformingFinancingReceivableMember2023-12-310000875357us-gaap:ResidentialMortgageMemberbokf:LoanstoindividualsMember2023-12-310000875357us-gaap:ResidentialMortgageMemberbokf:LoanstoindividualsMember2023-01-012023-12-310000875357us-gaap:UsGovernmentAgencyInsuredLoansMemberus-gaap:PassMemberus-gaap:PerformingFinancingReceivableMemberbokf:LoanstoindividualsMemberus-gaap:ResidentialMortgageMember2023-12-310000875357us-gaap:UsGovernmentAgencyInsuredLoansMemberbokf:LoanstoindividualsMemberus-gaap:ResidentialMortgageMemberbokf:NonaccruingSubstandardAndDoubtfulMemberus-gaap:NonperformingFinancingReceivableMember2023-12-310000875357us-gaap:UsGovernmentAgencyInsuredLoansMemberbokf:LoanstoindividualsMemberus-gaap:ResidentialMortgageMember2023-12-310000875357us-gaap:PassMemberus-gaap:PerformingFinancingReceivableMemberbokf:LoanstoindividualsMemberus-gaap:ConsumerPortfolioSegmentMember2023-12-310000875357us-gaap:SpecialMentionMemberus-gaap:PerformingFinancingReceivableMemberbokf:LoanstoindividualsMemberus-gaap:ConsumerPortfolioSegmentMember2023-12-310000875357us-gaap:SubstandardMemberus-gaap:PerformingFinancingReceivableMemberbokf:LoanstoindividualsMemberus-gaap:ConsumerPortfolioSegmentMember2023-12-310000875357bokf:LoanstoindividualsMemberbokf:NonaccruingSubstandardAndDoubtfulMemberus-gaap:ConsumerPortfolioSegmentMemberus-gaap:NonperformingFinancingReceivableMember2023-12-310000875357bokf:LoanstoindividualsMemberus-gaap:ConsumerPortfolioSegmentMember2023-12-310000875357bokf:LoanstoindividualsMemberus-gaap:ConsumerPortfolioSegmentMember2023-01-012023-12-310000875357us-gaap:PassMemberus-gaap:PerformingFinancingReceivableMemberus-gaap:HealthCareMemberus-gaap:CommercialPortfolioSegmentMember2022-12-310000875357us-gaap:SpecialMentionMemberus-gaap:PerformingFinancingReceivableMemberus-gaap:HealthCareMemberus-gaap:CommercialPortfolioSegmentMember2022-12-310000875357us-gaap:SubstandardMemberus-gaap:PerformingFinancingReceivableMemberus-gaap:HealthCareMemberus-gaap:CommercialPortfolioSegmentMember2022-12-310000875357us-gaap:HealthCareMemberbokf:NonaccruingSubstandardAndDoubtfulMemberus-gaap:CommercialPortfolioSegmentMemberus-gaap:NonperformingFinancingReceivableMember2022-12-310000875357us-gaap:HealthCareMemberus-gaap:CommercialPortfolioSegmentMember2022-12-310000875357bokf:EnergyMemberus-gaap:PassMemberus-gaap:PerformingFinancingReceivableMemberus-gaap:CommercialPortfolioSegmentMember2022-12-310000875357bokf:EnergyMemberus-gaap:SubstandardMemberus-gaap:PerformingFinancingReceivableMemberus-gaap:CommercialPortfolioSegmentMember2022-12-310000875357bokf:EnergyMemberbokf:NonaccruingSubstandardAndDoubtfulMemberus-gaap:CommercialPortfolioSegmentMemberus-gaap:NonperformingFinancingReceivableMember2022-12-310000875357bokf:EnergyMemberus-gaap:CommercialPortfolioSegmentMember2022-12-310000875357us-gaap:PassMemberus-gaap:PerformingFinancingReceivableMemberus-gaap:CommercialPortfolioSegmentMemberbokf:ServicesMember2022-12-310000875357us-gaap:SpecialMentionMemberus-gaap:PerformingFinancingReceivableMemberus-gaap:CommercialPortfolioSegmentMemberbokf:ServicesMember2022-12-310000875357us-gaap:SubstandardMemberus-gaap:PerformingFinancingReceivableMemberus-gaap:CommercialPortfolioSegmentMemberbokf:ServicesMember2022-12-310000875357bokf:NonaccruingSubstandardAndDoubtfulMemberus-gaap:CommercialPortfolioSegmentMemberbokf:ServicesMemberus-gaap:NonperformingFinancingReceivableMember2022-12-310000875357us-gaap:PassMemberus-gaap:PerformingFinancingReceivableMemberbokf:GeneralBusinessClassMemberus-gaap:CommercialPortfolioSegmentMember2022-12-310000875357us-gaap:SpecialMentionMemberus-gaap:PerformingFinancingReceivableMemberbokf:GeneralBusinessClassMemberus-gaap:CommercialPortfolioSegmentMember2022-12-310000875357us-gaap:SubstandardMemberus-gaap:PerformingFinancingReceivableMemberbokf:GeneralBusinessClassMemberus-gaap:CommercialPortfolioSegmentMember2022-12-310000875357bokf:GeneralBusinessClassMemberbokf:NonaccruingSubstandardAndDoubtfulMemberus-gaap:CommercialPortfolioSegmentMemberus-gaap:NonperformingFinancingReceivableMember2022-12-310000875357bokf:GeneralBusinessClassMemberus-gaap:CommercialPortfolioSegmentMember2022-12-310000875357us-gaap:PassMemberus-gaap:PerformingFinancingReceivableMemberus-gaap:CommercialRealEstatePortfolioSegmentMember2022-12-310000875357us-gaap:SubstandardMemberus-gaap:PerformingFinancingReceivableMemberus-gaap:CommercialRealEstatePortfolioSegmentMember2022-12-310000875357us-gaap:CommercialRealEstatePortfolioSegmentMemberbokf:NonaccruingSubstandardAndDoubtfulMemberus-gaap:NonperformingFinancingReceivableMember2022-12-310000875357us-gaap:PassMemberus-gaap:PerformingFinancingReceivableMemberbokf:LoanstoindividualsMemberus-gaap:ResidentialMortgageMember2022-12-310000875357us-gaap:SpecialMentionMemberus-gaap:PerformingFinancingReceivableMemberbokf:LoanstoindividualsMemberus-gaap:ResidentialMortgageMember2022-12-310000875357us-gaap:SubstandardMemberus-gaap:PerformingFinancingReceivableMemberbokf:LoanstoindividualsMemberus-gaap:ResidentialMortgageMember2022-12-310000875357bokf:LoanstoindividualsMemberus-gaap:ResidentialMortgageMemberbokf:NonaccruingSubstandardAndDoubtfulMemberus-gaap:NonperformingFinancingReceivableMember2022-12-310000875357us-gaap:ResidentialMortgageMemberbokf:LoanstoindividualsMember2022-12-310000875357us-gaap:UsGovernmentAgencyInsuredLoansMemberus-gaap:PassMemberus-gaap:PerformingFinancingReceivableMemberbokf:LoanstoindividualsMemberus-gaap:ResidentialMortgageMember2022-12-310000875357us-gaap:UsGovernmentAgencyInsuredLoansMemberbokf:LoanstoindividualsMemberus-gaap:ResidentialMortgageMemberbokf:NonaccruingSubstandardAndDoubtfulMemberus-gaap:NonperformingFinancingReceivableMember2022-12-310000875357us-gaap:UsGovernmentAgencyInsuredLoansMemberbokf:LoanstoindividualsMemberus-gaap:ResidentialMortgageMember2022-12-310000875357us-gaap:PassMemberus-gaap:PerformingFinancingReceivableMemberbokf:LoanstoindividualsMemberus-gaap:ConsumerPortfolioSegmentMember2022-12-310000875357us-gaap:SpecialMentionMemberus-gaap:PerformingFinancingReceivableMemberbokf:LoanstoindividualsMemberus-gaap:ConsumerPortfolioSegmentMember2022-12-310000875357us-gaap:SubstandardMemberus-gaap:PerformingFinancingReceivableMemberbokf:LoanstoindividualsMemberus-gaap:ConsumerPortfolioSegmentMember2022-12-310000875357bokf:LoanstoindividualsMemberbokf:NonaccruingSubstandardAndDoubtfulMemberus-gaap:ConsumerPortfolioSegmentMemberus-gaap:NonperformingFinancingReceivableMember2022-12-310000875357bokf:LoanstoindividualsMemberus-gaap:ConsumerPortfolioSegmentMember2022-12-310000875357bokf:GeneralbusinessmemberMemberus-gaap:CommercialPortfolioSegmentMember2023-01-012023-12-310000875357us-gaap:UsGovernmentAgencyInsuredLoansMemberbokf:LoanstoindividualsMemberus-gaap:ResidentialMortgageMember2023-01-012023-12-310000875357bokf:HealthcareGeneralBusinessAndServicesMemberMemberus-gaap:CommercialPortfolioSegmentMemberus-gaap:ExtendedMaturityMember2023-01-012023-12-310000875357bokf:CommercialPortfolioSegmentAndLoansToIndividualsPortfolioSegmentMemberbokf:HealthcareAndResidentialMortgageMemberMemberus-gaap:ExtendedMaturityAndInterestRateReductionMember2023-01-012023-12-310000875357us-gaap:FinancialAssetNotPastDueMemberus-gaap:HealthCareMemberus-gaap:CommercialPortfolioSegmentMember2023-12-310000875357us-gaap:FinancingReceivables30To59DaysPastDueMemberus-gaap:HealthCareMemberus-gaap:CommercialPortfolioSegmentMember2023-12-310000875357us-gaap:FinancingReceivables60To89DaysPastDueMemberus-gaap:HealthCareMemberus-gaap:CommercialPortfolioSegmentMember2023-12-310000875357us-gaap:HealthCareMemberus-gaap:FinancingReceivablesEqualToGreaterThan90DaysPastDueMemberus-gaap:CommercialPortfolioSegmentMember2023-12-310000875357us-gaap:FinancialAssetNotPastDueMemberus-gaap:CommercialPortfolioSegmentMemberbokf:ServicesMember2023-12-310000875357us-gaap:FinancingReceivables30To59DaysPastDueMemberus-gaap:CommercialPortfolioSegmentMemberbokf:ServicesMember2023-12-310000875357us-gaap:FinancingReceivables60To89DaysPastDueMemberus-gaap:CommercialPortfolioSegmentMemberbokf:ServicesMember2023-12-310000875357us-gaap:FinancingReceivablesEqualToGreaterThan90DaysPastDueMemberus-gaap:CommercialPortfolioSegmentMemberbokf:ServicesMember2023-12-310000875357bokf:EnergyMemberus-gaap:FinancialAssetNotPastDueMemberus-gaap:CommercialPortfolioSegmentMember2023-12-310000875357bokf:EnergyMemberus-gaap:FinancingReceivables30To59DaysPastDueMemberus-gaap:CommercialPortfolioSegmentMember2023-12-310000875357bokf:EnergyMemberus-gaap:FinancingReceivables60To89DaysPastDueMemberus-gaap:CommercialPortfolioSegmentMember2023-12-310000875357bokf:EnergyMemberus-gaap:FinancingReceivablesEqualToGreaterThan90DaysPastDueMemberus-gaap:CommercialPortfolioSegmentMember2023-12-310000875357bokf:GeneralBusinessClassMemberus-gaap:FinancialAssetNotPastDueMemberus-gaap:CommercialPortfolioSegmentMember2023-12-310000875357us-gaap:FinancingReceivables30To59DaysPastDueMemberbokf:GeneralBusinessClassMemberus-gaap:CommercialPortfolioSegmentMember2023-12-310000875357us-gaap:FinancingReceivables60To89DaysPastDueMemberbokf:GeneralBusinessClassMemberus-gaap:CommercialPortfolioSegmentMember2023-12-310000875357bokf:GeneralBusinessClassMemberus-gaap:FinancingReceivablesEqualToGreaterThan90DaysPastDueMemberus-gaap:CommercialPortfolioSegmentMember2023-12-310000875357us-gaap:FinancialAssetNotPastDueMemberus-gaap:CommercialPortfolioSegmentMember2023-12-310000875357us-gaap:FinancingReceivables30To59DaysPastDueMemberus-gaap:CommercialPortfolioSegmentMember2023-12-310000875357us-gaap:FinancingReceivables60To89DaysPastDueMemberus-gaap:CommercialPortfolioSegmentMember2023-12-310000875357us-gaap:FinancingReceivablesEqualToGreaterThan90DaysPastDueMemberus-gaap:CommercialPortfolioSegmentMember2023-12-310000875357us-gaap:CommercialRealEstatePortfolioSegmentMemberus-gaap:FinancialAssetNotPastDueMember2023-12-310000875357us-gaap:FinancingReceivables30To59DaysPastDueMemberus-gaap:CommercialRealEstatePortfolioSegmentMember2023-12-310000875357us-gaap:FinancingReceivables60To89DaysPastDueMemberus-gaap:CommercialRealEstatePortfolioSegmentMember2023-12-310000875357us-gaap:CommercialRealEstatePortfolioSegmentMemberus-gaap:FinancingReceivablesEqualToGreaterThan90DaysPastDueMember2023-12-310000875357us-gaap:FinancialAssetNotPastDueMemberbokf:LoanstoindividualsMemberus-gaap:ResidentialMortgageMember2023-12-310000875357us-gaap:FinancingReceivables30To59DaysPastDueMemberbokf:LoanstoindividualsMemberus-gaap:ResidentialMortgageMember2023-12-310000875357us-gaap:FinancingReceivables60To89DaysPastDueMemberbokf:LoanstoindividualsMemberus-gaap:ResidentialMortgageMember2023-12-310000875357bokf:LoanstoindividualsMemberus-gaap:FinancingReceivablesEqualToGreaterThan90DaysPastDueMemberus-gaap:ResidentialMortgageMember2023-12-310000875357us-gaap:UsGovernmentAgencyInsuredLoansMemberus-gaap:FinancialAssetNotPastDueMemberbokf:LoanstoindividualsMemberus-gaap:ResidentialMortgageMember2023-12-310000875357us-gaap:FinancingReceivables30To59DaysPastDueMemberus-gaap:UsGovernmentAgencyInsuredLoansMemberbokf:LoanstoindividualsMemberus-gaap:ResidentialMortgageMember2023-12-310000875357us-gaap:UsGovernmentAgencyInsuredLoansMemberus-gaap:FinancingReceivables60To89DaysPastDueMemberbokf:LoanstoindividualsMemberus-gaap:ResidentialMortgageMember2023-12-310000875357us-gaap:UsGovernmentAgencyInsuredLoansMemberbokf:LoanstoindividualsMemberus-gaap:FinancingReceivablesEqualToGreaterThan90DaysPastDueMemberus-gaap:ResidentialMortgageMember2023-12-310000875357us-gaap:FinancialAssetNotPastDueMemberbokf:LoanstoindividualsMemberus-gaap:ConsumerPortfolioSegmentMember2023-12-310000875357us-gaap:FinancingReceivables30To59DaysPastDueMemberbokf:LoanstoindividualsMemberus-gaap:ConsumerPortfolioSegmentMember2023-12-310000875357us-gaap:FinancingReceivables60To89DaysPastDueMemberbokf:LoanstoindividualsMemberus-gaap:ConsumerPortfolioSegmentMember2023-12-310000875357bokf:LoanstoindividualsMemberus-gaap:FinancingReceivablesEqualToGreaterThan90DaysPastDueMemberus-gaap:ConsumerPortfolioSegmentMember2023-12-310000875357us-gaap:FinancialAssetNotPastDueMemberbokf:LoanstoindividualsMember2023-12-310000875357us-gaap:FinancingReceivables30To59DaysPastDueMemberbokf:LoanstoindividualsMember2023-12-310000875357us-gaap:FinancingReceivables60To89DaysPastDueMemberbokf:LoanstoindividualsMember2023-12-310000875357bokf:LoanstoindividualsMemberus-gaap:FinancingReceivablesEqualToGreaterThan90DaysPastDueMember2023-12-310000875357us-gaap:FinancialAssetNotPastDueMember2023-12-310000875357us-gaap:FinancingReceivables30To59DaysPastDueMember2023-12-310000875357us-gaap:FinancingReceivables60To89DaysPastDueMember2023-12-310000875357us-gaap:FinancingReceivablesEqualToGreaterThan90DaysPastDueMember2023-12-310000875357us-gaap:FinancialAssetNotPastDueMemberus-gaap:HealthCareMemberus-gaap:CommercialPortfolioSegmentMember2022-12-310000875357us-gaap:FinancingReceivables30To59DaysPastDueMemberus-gaap:HealthCareMemberus-gaap:CommercialPortfolioSegmentMember2022-12-310000875357us-gaap:FinancingReceivables60To89DaysPastDueMemberus-gaap:HealthCareMemberus-gaap:CommercialPortfolioSegmentMember2022-12-310000875357us-gaap:HealthCareMemberus-gaap:FinancingReceivablesEqualToGreaterThan90DaysPastDueMemberus-gaap:CommercialPortfolioSegmentMember2022-12-310000875357us-gaap:FinancialAssetNotPastDueMemberus-gaap:CommercialPortfolioSegmentMemberbokf:ServicesMember2022-12-310000875357us-gaap:FinancingReceivables30To59DaysPastDueMemberus-gaap:CommercialPortfolioSegmentMemberbokf:ServicesMember2022-12-310000875357us-gaap:FinancingReceivables60To89DaysPastDueMemberus-gaap:CommercialPortfolioSegmentMemberbokf:ServicesMember2022-12-310000875357us-gaap:FinancingReceivablesEqualToGreaterThan90DaysPastDueMemberus-gaap:CommercialPortfolioSegmentMemberbokf:ServicesMember2022-12-310000875357bokf:EnergyMemberus-gaap:FinancialAssetNotPastDueMemberus-gaap:CommercialPortfolioSegmentMember2022-12-310000875357bokf:EnergyMemberus-gaap:FinancingReceivables30To59DaysPastDueMemberus-gaap:CommercialPortfolioSegmentMember2022-12-310000875357bokf:EnergyMemberus-gaap:FinancingReceivables60To89DaysPastDueMemberus-gaap:CommercialPortfolioSegmentMember2022-12-310000875357bokf:EnergyMemberus-gaap:FinancingReceivablesEqualToGreaterThan90DaysPastDueMemberus-gaap:CommercialPortfolioSegmentMember2022-12-310000875357bokf:GeneralBusinessClassMemberus-gaap:FinancialAssetNotPastDueMemberus-gaap:CommercialPortfolioSegmentMember2022-12-310000875357us-gaap:FinancingReceivables30To59DaysPastDueMemberbokf:GeneralBusinessClassMemberus-gaap:CommercialPortfolioSegmentMember2022-12-310000875357us-gaap:FinancingReceivables60To89DaysPastDueMemberbokf:GeneralBusinessClassMemberus-gaap:CommercialPortfolioSegmentMember2022-12-310000875357bokf:GeneralBusinessClassMemberus-gaap:FinancingReceivablesEqualToGreaterThan90DaysPastDueMemberus-gaap:CommercialPortfolioSegmentMember2022-12-310000875357us-gaap:FinancialAssetNotPastDueMemberus-gaap:CommercialPortfolioSegmentMember2022-12-310000875357us-gaap:FinancingReceivables30To59DaysPastDueMemberus-gaap:CommercialPortfolioSegmentMember2022-12-310000875357us-gaap:FinancingReceivables60To89DaysPastDueMemberus-gaap:CommercialPortfolioSegmentMember2022-12-310000875357us-gaap:FinancingReceivablesEqualToGreaterThan90DaysPastDueMemberus-gaap:CommercialPortfolioSegmentMember2022-12-310000875357us-gaap:CommercialRealEstatePortfolioSegmentMemberus-gaap:FinancialAssetNotPastDueMember2022-12-310000875357us-gaap:FinancingReceivables30To59DaysPastDueMemberus-gaap:CommercialRealEstatePortfolioSegmentMember2022-12-310000875357us-gaap:FinancingReceivables60To89DaysPastDueMemberus-gaap:CommercialRealEstatePortfolioSegmentMember2022-12-310000875357us-gaap:CommercialRealEstatePortfolioSegmentMemberus-gaap:FinancingReceivablesEqualToGreaterThan90DaysPastDueMember2022-12-310000875357us-gaap:FinancialAssetNotPastDueMemberbokf:LoanstoindividualsMemberus-gaap:ResidentialMortgageMember2022-12-310000875357us-gaap:FinancingReceivables30To59DaysPastDueMemberbokf:LoanstoindividualsMemberus-gaap:ResidentialMortgageMember2022-12-310000875357us-gaap:FinancingReceivables60To89DaysPastDueMemberbokf:LoanstoindividualsMemberus-gaap:ResidentialMortgageMember2022-12-310000875357bokf:LoanstoindividualsMemberus-gaap:FinancingReceivablesEqualToGreaterThan90DaysPastDueMemberus-gaap:ResidentialMortgageMember2022-12-310000875357us-gaap:UsGovernmentAgencyInsuredLoansMemberus-gaap:FinancialAssetNotPastDueMemberbokf:LoanstoindividualsMemberus-gaap:ResidentialMortgageMember2022-12-310000875357us-gaap:FinancingReceivables30To59DaysPastDueMemberus-gaap:UsGovernmentAgencyInsuredLoansMemberbokf:LoanstoindividualsMemberus-gaap:ResidentialMortgageMember2022-12-310000875357us-gaap:UsGovernmentAgencyInsuredLoansMemberus-gaap:FinancingReceivables60To89DaysPastDueMemberbokf:LoanstoindividualsMemberus-gaap:ResidentialMortgageMember2022-12-310000875357us-gaap:UsGovernmentAgencyInsuredLoansMemberbokf:LoanstoindividualsMemberus-gaap:FinancingReceivablesEqualToGreaterThan90DaysPastDueMemberus-gaap:ResidentialMortgageMember2022-12-310000875357us-gaap:FinancialAssetNotPastDueMemberbokf:LoanstoindividualsMemberus-gaap:ConsumerPortfolioSegmentMember2022-12-310000875357us-gaap:FinancingReceivables30To59DaysPastDueMemberbokf:LoanstoindividualsMemberus-gaap:ConsumerPortfolioSegmentMember2022-12-310000875357us-gaap:FinancingReceivables60To89DaysPastDueMemberbokf:LoanstoindividualsMemberus-gaap:ConsumerPortfolioSegmentMember2022-12-310000875357bokf:LoanstoindividualsMemberus-gaap:FinancingReceivablesEqualToGreaterThan90DaysPastDueMemberus-gaap:ConsumerPortfolioSegmentMember2022-12-310000875357us-gaap:FinancialAssetNotPastDueMemberbokf:LoanstoindividualsMember2022-12-310000875357us-gaap:FinancingReceivables30To59DaysPastDueMemberbokf:LoanstoindividualsMember2022-12-310000875357us-gaap:FinancingReceivables60To89DaysPastDueMemberbokf:LoanstoindividualsMember2022-12-310000875357bokf:LoanstoindividualsMemberus-gaap:FinancingReceivablesEqualToGreaterThan90DaysPastDueMember2022-12-310000875357us-gaap:FinancialAssetNotPastDueMember2022-12-310000875357us-gaap:FinancingReceivables30To59DaysPastDueMember2022-12-310000875357us-gaap:FinancingReceivables60To89DaysPastDueMember2022-12-310000875357us-gaap:FinancingReceivablesEqualToGreaterThan90DaysPastDueMember2022-12-310000875357us-gaap:LandMember2023-12-310000875357us-gaap:LandMember2022-12-310000875357us-gaap:BuildingAndBuildingImprovementsMember2023-12-310000875357us-gaap:BuildingAndBuildingImprovementsMember2022-12-310000875357us-gaap:ComputerSoftwareIntangibleAssetMember2023-12-310000875357us-gaap:ComputerSoftwareIntangibleAssetMember2022-12-310000875357us-gaap:FurnitureAndFixturesMember2023-12-310000875357us-gaap:FurnitureAndFixturesMember2022-12-310000875357us-gaap:AssetUnderConstructionMember2023-12-310000875357us-gaap:AssetUnderConstructionMember2022-12-310000875357us-gaap:CoreDepositsMember2023-12-310000875357us-gaap:CoreDepositsMember2022-12-310000875357us-gaap:OtherIntangibleAssetsMember2023-12-310000875357us-gaap:OtherIntangibleAssetsMember2022-12-310000875357bokf:CommercialMember2021-12-310000875357bokf:ConsumerMember2021-12-310000875357bokf:WealthManagementMember2021-12-310000875357bokf:FundsManagementAndOtherMember2021-12-310000875357bokf:CommercialMember2022-12-310000875357bokf:ConsumerMember2022-12-310000875357bokf:WealthManagementMember2022-12-310000875357bokf:FundsManagementAndOtherMember2022-12-310000875357bokf:CommercialMember2023-12-310000875357bokf:ConsumerMember2023-12-310000875357bokf:WealthManagementMember2023-12-310000875357bokf:FundsManagementAndOtherMember2023-12-310000875357bokf:ResidentialMortgageLoanCommitmentsMemberus-gaap:NondesignatedMember2022-01-012022-12-310000875357bokf:ResidentialMortgageLoanCommitmentsMemberus-gaap:NondesignatedMember2023-01-012023-12-310000875357bokf:ForwardSalesContractsMemberus-gaap:NondesignatedMember2023-01-012023-12-310000875357bokf:ForwardSalesContractsMemberus-gaap:NondesignatedMember2022-01-012022-12-310000875357bokf:ResidentialMortgageLoanCommitmentsMemberus-gaap:NondesignatedMember2023-12-310000875357bokf:ResidentialMortgageLoanCommitmentsMemberus-gaap:NondesignatedMember2022-12-310000875357bokf:ForwardSalesContractsMemberus-gaap:NondesignatedMember2023-12-310000875357bokf:ForwardSalesContractsMemberus-gaap:NondesignatedMember2022-12-310000875357us-gaap:FederalFundsPurchasedMember2023-12-310000875357us-gaap:FederalFundsPurchasedMember2023-01-012023-12-310000875357us-gaap:SecuritiesSoldUnderAgreementsToRepurchaseMember2023-12-310000875357us-gaap:SecuritiesSoldUnderAgreementsToRepurchaseMember2023-01-012023-12-310000875357us-gaap:FederalHomeLoanBankAdvancesMember2023-12-310000875357us-gaap:FederalHomeLoanBankAdvancesMember2023-01-012023-12-310000875357bokf:GnmaRepurchaseLiabilityMember2023-12-310000875357bokf:GnmaRepurchaseLiabilityMember2023-01-012023-12-310000875357us-gaap:NotesPayableOtherPayablesMember2023-12-310000875357us-gaap:NotesPayableOtherPayablesMember2023-01-012023-12-310000875357bokf:OtherBorrowingsMember2023-12-310000875357bokf:OtherBorrowingsMember2023-01-012023-12-310000875357us-gaap:SubordinatedDebtMember2023-12-310000875357us-gaap:SubordinatedDebtMember2023-01-012023-12-310000875357us-gaap:FederalFundsPurchasedMember2022-12-310000875357us-gaap:FederalFundsPurchasedMember2022-01-012022-12-310000875357us-gaap:SecuritiesSoldUnderAgreementsToRepurchaseMember2022-12-310000875357us-gaap:SecuritiesSoldUnderAgreementsToRepurchaseMember2022-01-012022-12-310000875357us-gaap:FederalHomeLoanBankAdvancesMember2022-12-310000875357us-gaap:FederalHomeLoanBankAdvancesMember2022-01-012022-12-310000875357bokf:GnmaRepurchaseLiabilityMember2022-12-310000875357bokf:GnmaRepurchaseLiabilityMember2022-01-012022-12-310000875357us-gaap:NotesPayableOtherPayablesMember2022-12-310000875357us-gaap:NotesPayableOtherPayablesMember2022-01-012022-12-310000875357bokf:OtherBorrowingsMember2022-12-310000875357bokf:OtherBorrowingsMember2022-01-012022-12-310000875357us-gaap:SubordinatedDebtMember2022-12-310000875357us-gaap:SubordinatedDebtMember2022-01-012022-12-310000875357us-gaap:FederalFundsPurchasedMember2021-12-310000875357us-gaap:FederalFundsPurchasedMember2021-01-012021-12-310000875357us-gaap:SecuritiesSoldUnderAgreementsToRepurchaseMember2021-12-310000875357us-gaap:SecuritiesSoldUnderAgreementsToRepurchaseMember2021-01-012021-12-310000875357us-gaap:FederalHomeLoanBankAdvancesMember2021-12-310000875357us-gaap:FederalHomeLoanBankAdvancesMember2021-01-012021-12-310000875357bokf:GnmaRepurchaseLiabilityMember2021-12-310000875357bokf:GnmaRepurchaseLiabilityMember2021-01-012021-12-310000875357bokf:PaycheckProtectionProgramLiquidityFacilityMember2021-12-310000875357bokf:PaycheckProtectionProgramLiquidityFacilityMember2021-01-012021-12-310000875357us-gaap:NotesPayableOtherPayablesMember2021-12-310000875357us-gaap:NotesPayableOtherPayablesMember2021-01-012021-12-310000875357bokf:OtherBorrowingsMember2021-12-310000875357bokf:OtherBorrowingsMember2021-01-012021-12-310000875357us-gaap:SubordinatedDebtMember2021-12-310000875357us-gaap:SubordinatedDebtMember2021-01-012021-12-310000875357us-gaap:FederalFundsPurchasedMembersrt:SubsidiariesMember2023-01-012023-12-310000875357us-gaap:SecuritiesSoldUnderAgreementsToRepurchaseMembersrt:SubsidiariesMember2023-01-012023-12-310000875357us-gaap:FederalHomeLoanBankAdvancesMembersrt:SubsidiariesMember2023-12-310000875357bokf:Subordinateddebenturesacquired2015issuanceMemberus-gaap:SubordinatedDebtMember2023-12-310000875357bokf:Subordinateddebenturesacquired2015issuanceMemberus-gaap:SubordinatedDebtMember2023-01-012023-12-310000875357us-gaap:SubordinatedDebtMemberbokf:Juniorsubordinateddebenturesacquired2003issuanceMemberDomain2023-12-310000875357us-gaap:SubordinatedDebtMemberbokf:Juniorsubordinateddebenturesacquired2003issuanceMemberDomain2023-01-012023-12-310000875357us-gaap:SubordinatedDebtMemberbokf:Juniorsubordinateddebenturesacquired2004issuanceMember2023-12-310000875357us-gaap:SubordinatedDebtMemberbokf:Juniorsubordinateddebenturesacquired2004issuanceMember2023-01-012023-12-310000875357us-gaap:SubordinatedDebtMemberbokf:Juniorsubordinateddebenturesacquired2005issuanceMember2023-12-310000875357us-gaap:SubordinatedDebtMemberbokf:Juniorsubordinateddebenturesacquired2005issuanceMember2023-01-012023-12-310000875357bokf:BOKFinancialSecuritiesInc.Membersrt:SubsidiariesMemberus-gaap:NotesPayableOtherPayablesMember2022-12-310000875357bokf:BOKFinancialSecuritiesInc.Membersrt:SubsidiariesMemberus-gaap:NotesPayableOtherPayablesMember2023-12-310000875357bokf:BOKFinancial401kPlanMember2023-01-012023-12-310000875357srt:MinimumMemberbokf:BOKFinancial401kPlanMember2023-01-012023-12-310000875357bokf:BOKFinancial401kPlanMembersrt:MaximumMember2023-01-012023-12-310000875357bokf:BOKFinancial401kPlanMember2022-01-012022-12-310000875357bokf:BOKFinancial401kPlanMember2021-01-012021-12-310000875357us-gaap:RestrictedStockMember2020-12-310000875357us-gaap:RestrictedStockUnitsRSUMember2020-12-310000875357us-gaap:RestrictedStockMember2021-01-012021-12-310000875357us-gaap:RestrictedStockUnitsRSUMember2021-01-012021-12-310000875357us-gaap:RestrictedStockMember2021-12-310000875357us-gaap:RestrictedStockUnitsRSUMember2021-12-310000875357us-gaap:RestrictedStockMember2022-01-012022-12-310000875357us-gaap:RestrictedStockUnitsRSUMember2022-01-012022-12-310000875357us-gaap:RestrictedStockMember2022-12-310000875357us-gaap:RestrictedStockUnitsRSUMember2022-12-310000875357us-gaap:RestrictedStockUnitsRSUMember2023-01-012023-12-310000875357us-gaap:RestrictedStockMember2023-12-310000875357us-gaap:RestrictedStockUnitsRSUMember2023-12-310000875357srt:ManagementMember2022-12-310000875357srt:ManagementMember2021-12-310000875357srt:ManagementMember2023-01-012023-12-310000875357srt:ManagementMember2022-01-012022-12-310000875357srt:ManagementMember2023-12-310000875357bokf:BOKFNAMembersrt:SubsidiariesMembersrt:AffiliatedEntityMember2023-12-310000875357bokf:BOKFNAMembersrt:SubsidiariesMembersrt:AffiliatedEntityMember2022-12-310000875357srt:DirectorMember2023-01-012023-12-310000875357srt:DirectorMember2022-01-012022-12-310000875357srt:DirectorMember2021-01-012021-12-310000875357srt:ExecutiveOfficerMember2023-12-310000875357bokf:VisaMembershipMember2023-12-310000875357bokf:MisuseofRevenuesPledgedtoMunicipalBondsMemberus-gaap:JudicialRulingMember2023-01-012023-12-310000875357bokf:MisuseofRevenuesPledgedtoMunicipalBondsMemberus-gaap:PendingLitigationMember2023-01-012023-12-310000875357us-gaap:PendingLitigationMemberbokf:BankParticipationinFraudulentSaleofSecuritiesbyPrincipalsMember2023-01-012023-12-310000875357us-gaap:PendingLitigationMemberbokf:BankParticipationinFraudulentSaleofSecuritiesbyPrincipalsMember2023-12-310000875357us-gaap:SettledLitigationMemberbokf:BankBreachedVariousFiduciaryDutiesActingInItsCapacityAsTrusteeOfATrustThatWasACoGeneralPartnerOfThePartnershipMember2023-01-012023-12-310000875357us-gaap:SettledLitigationMemberbokf:BankBreachedVariousFiduciaryDutiesActingInItsCapacityAsTrusteeOfATrustThatWasACoGeneralPartnerOfThePartnershipMember2023-01-012023-01-310000875357us-gaap:OtherAssetsMember2023-12-310000875357us-gaap:OtherLiabilitiesMember2023-12-310000875357us-gaap:OtherAssetsMember2022-12-310000875357us-gaap:OtherLiabilitiesMember2022-12-310000875357us-gaap:PreferredStockMember2023-12-310000875357us-gaap:PreferredStockMember2023-01-012023-12-310000875357us-gaap:PreferredStockMember2021-12-310000875357us-gaap:PreferredStockMember2022-12-310000875357us-gaap:CommonStockMember2023-12-310000875357bokf:BOKFNAMembersrt:SubsidiariesMember2023-12-310000875357bokf:BOKFNAMembersrt:SubsidiariesMember2022-12-310000875357us-gaap:AccumulatedNetUnrealizedInvestmentGainLossMember2020-12-310000875357bokf:AccumulatedUnrealizedGainLossOnInvestmentSecuritiesTransferredFromAFSMember2020-12-310000875357us-gaap:AccumulatedDefinedBenefitPlansAdjustmentMember2020-12-310000875357us-gaap:AccumulatedNetUnrealizedInvestmentGainLossMember2021-01-012021-12-310000875357bokf:AccumulatedUnrealizedGainLossOnInvestmentSecuritiesTransferredFromAFSMember2021-01-012021-12-310000875357us-gaap:AccumulatedDefinedBenefitPlansAdjustmentMember2021-01-012021-12-310000875357us-gaap:AccumulatedNetUnrealizedInvestmentGainLossMember2021-12-310000875357bokf:AccumulatedUnrealizedGainLossOnInvestmentSecuritiesTransferredFromAFSMember2021-12-310000875357us-gaap:AccumulatedDefinedBenefitPlansAdjustmentMember2021-12-310000875357us-gaap:AccumulatedNetUnrealizedInvestmentGainLossMember2022-01-012022-12-310000875357bokf:AccumulatedUnrealizedGainLossOnInvestmentSecuritiesTransferredFromAFSMember2022-01-012022-12-310000875357us-gaap:AccumulatedDefinedBenefitPlansAdjustmentMember2022-01-012022-12-310000875357us-gaap:AccumulatedNetUnrealizedInvestmentGainLossMember2022-12-310000875357bokf:AccumulatedUnrealizedGainLossOnInvestmentSecuritiesTransferredFromAFSMember2022-12-310000875357us-gaap:AccumulatedDefinedBenefitPlansAdjustmentMember2022-12-310000875357us-gaap:AccumulatedNetUnrealizedInvestmentGainLossMember2023-01-012023-12-310000875357bokf:AccumulatedUnrealizedGainLossOnInvestmentSecuritiesTransferredFromAFSMember2023-01-012023-12-310000875357us-gaap:AccumulatedDefinedBenefitPlansAdjustmentMember2023-01-012023-12-310000875357us-gaap:AccumulatedNetUnrealizedInvestmentGainLossMember2023-12-310000875357bokf:AccumulatedUnrealizedGainLossOnInvestmentSecuritiesTransferredFromAFSMember2023-12-310000875357us-gaap:AccumulatedDefinedBenefitPlansAdjustmentMember2023-12-310000875357us-gaap:OperatingSegmentsMemberbokf:CommercialMember2023-01-012023-12-310000875357us-gaap:OperatingSegmentsMemberbokf:ConsumerMember2023-01-012023-12-310000875357us-gaap:OperatingSegmentsMemberbokf:WealthManagementMember2023-01-012023-12-310000875357us-gaap:CorporateNonSegmentMember2023-01-012023-12-310000875357us-gaap:OperatingSegmentsMemberbokf:CommercialMember2022-01-012022-12-310000875357us-gaap:OperatingSegmentsMemberbokf:ConsumerMember2022-01-012022-12-310000875357us-gaap:OperatingSegmentsMemberbokf:WealthManagementMember2022-01-012022-12-310000875357us-gaap:CorporateNonSegmentMember2022-01-012022-12-310000875357us-gaap:OperatingSegmentsMemberbokf:CommercialMember2021-01-012021-12-310000875357us-gaap:OperatingSegmentsMemberbokf:ConsumerMember2021-01-012021-12-310000875357us-gaap:OperatingSegmentsMemberbokf:WealthManagementMember2021-01-012021-12-310000875357us-gaap:CorporateNonSegmentMember2021-01-012021-12-310000875357us-gaap:OperatingSegmentsMemberbokf:CommercialMemberbokf:GainlossontradingMember2023-01-012023-12-310000875357us-gaap:OperatingSegmentsMemberbokf:ConsumerMemberbokf:GainlossontradingMember2023-01-012023-12-310000875357us-gaap:OperatingSegmentsMemberbokf:GainlossontradingMemberbokf:WealthManagementMember2023-01-012023-12-310000875357bokf:GainlossontradingMemberus-gaap:CorporateNonSegmentMember2023-01-012023-12-310000875357bokf:GainlossontradingMember2023-01-012023-12-310000875357us-gaap:OperatingSegmentsMemberbokf:CommercialMemberbokf:CustomerhedgingrevenueMember2023-01-012023-12-310000875357us-gaap:OperatingSegmentsMemberbokf:ConsumerMemberbokf:CustomerhedgingrevenueMember2023-01-012023-12-310000875357us-gaap:OperatingSegmentsMemberbokf:CustomerhedgingrevenueMemberbokf:WealthManagementMember2023-01-012023-12-310000875357bokf:CustomerhedgingrevenueMemberus-gaap:CorporateNonSegmentMember2023-01-012023-12-310000875357bokf:CustomerhedgingrevenueMember2023-01-012023-12-310000875357bokf:RetailbrokeragerevenueMemberus-gaap:OperatingSegmentsMemberbokf:CommercialMember2023-01-012023-12-310000875357bokf:RetailbrokeragerevenueMemberus-gaap:OperatingSegmentsMemberbokf:ConsumerMember2023-01-012023-12-310000875357bokf:RetailbrokeragerevenueMemberus-gaap:OperatingSegmentsMemberbokf:WealthManagementMember2023-01-012023-12-310000875357bokf:RetailbrokeragerevenueMemberus-gaap:CorporateNonSegmentMember2023-01-012023-12-310000875357bokf:RetailbrokeragerevenueMember2023-01-012023-12-310000875357bokf:InsurancebrokeragerevenueMemberus-gaap:OperatingSegmentsMemberbokf:CommercialMember2023-01-012023-12-310000875357bokf:InsurancebrokeragerevenueMemberus-gaap:OperatingSegmentsMemberbokf:ConsumerMember2023-01-012023-12-310000875357bokf:InsurancebrokeragerevenueMemberus-gaap:OperatingSegmentsMemberbokf:WealthManagementMember2023-01-012023-12-310000875357bokf:InsurancebrokeragerevenueMemberus-gaap:CorporateNonSegmentMember2023-01-012023-12-310000875357bokf:InsurancebrokeragerevenueMember2023-01-012023-12-310000875357us-gaap:OperatingSegmentsMemberbokf:CommercialMemberbokf:InvestmentbankingrevenueMember2023-01-012023-12-310000875357us-gaap:OperatingSegmentsMemberbokf:ConsumerMemberbokf:InvestmentbankingrevenueMember2023-01-012023-12-310000875357us-gaap:OperatingSegmentsMemberbokf:InvestmentbankingrevenueMemberbokf:WealthManagementMember2023-01-012023-12-310000875357bokf:InvestmentbankingrevenueMemberus-gaap:CorporateNonSegmentMember2023-01-012023-12-310000875357bokf:InvestmentbankingrevenueMember2023-01-012023-12-310000875357us-gaap:OperatingSegmentsMemberbokf:CommercialMemberbokf:BrokerageandtradingrevenueMember2023-01-012023-12-310000875357us-gaap:OperatingSegmentsMemberbokf:ConsumerMemberbokf:BrokerageandtradingrevenueMember2023-01-012023-12-310000875357us-gaap:OperatingSegmentsMemberbokf:BrokerageandtradingrevenueMemberbokf:WealthManagementMember2023-01-012023-12-310000875357bokf:BrokerageandtradingrevenueMemberus-gaap:CorporateNonSegmentMember2023-01-012023-12-310000875357us-gaap:OperatingSegmentsMemberbokf:TransFundEFTnetworkrevenueMemberbokf:CommercialMember2023-01-012023-12-310000875357us-gaap:OperatingSegmentsMemberbokf:ConsumerMemberbokf:TransFundEFTnetworkrevenueMember2023-01-012023-12-310000875357us-gaap:OperatingSegmentsMemberbokf:TransFundEFTnetworkrevenueMemberbokf:WealthManagementMember2023-01-012023-12-310000875357bokf:TransFundEFTnetworkrevenueMemberus-gaap:CorporateNonSegmentMember2023-01-012023-12-310000875357bokf:TransFundEFTnetworkrevenueMember2023-01-012023-12-310000875357bokf:MerchantservicesrevenueMemberus-gaap:OperatingSegmentsMemberbokf:CommercialMember2023-01-012023-12-310000875357bokf:MerchantservicesrevenueMemberus-gaap:OperatingSegmentsMemberbokf:ConsumerMember2023-01-012023-12-310000875357bokf:MerchantservicesrevenueMemberus-gaap:OperatingSegmentsMemberbokf:WealthManagementMember2023-01-012023-12-310000875357bokf:MerchantservicesrevenueMemberus-gaap:CorporateNonSegmentMember2023-01-012023-12-310000875357bokf:MerchantservicesrevenueMember2023-01-012023-12-310000875357bokf:CorporatecardrevenueMemberus-gaap:OperatingSegmentsMemberbokf:CommercialMember2023-01-012023-12-310000875357bokf:CorporatecardrevenueMemberus-gaap:OperatingSegmentsMemberbokf:ConsumerMember2023-01-012023-12-310000875357bokf:CorporatecardrevenueMemberus-gaap:OperatingSegmentsMemberbokf:WealthManagementMember2023-01-012023-12-310000875357bokf:CorporatecardrevenueMemberus-gaap:CorporateNonSegmentMember2023-01-012023-12-310000875357bokf:CorporatecardrevenueMember2023-01-012023-12-310000875357bokf:TransactioncardrevenueMemberus-gaap:OperatingSegmentsMemberbokf:CommercialMember2023-01-012023-12-310000875357bokf:TransactioncardrevenueMemberus-gaap:OperatingSegmentsMemberbokf:ConsumerMember2023-01-012023-12-310000875357bokf:TransactioncardrevenueMemberus-gaap:OperatingSegmentsMemberbokf:WealthManagementMember2023-01-012023-12-310000875357bokf:TransactioncardrevenueMemberus-gaap:CorporateNonSegmentMember2023-01-012023-12-310000875357us-gaap:OperatingSegmentsMemberbokf:CommercialMemberbokf:PersonaltrustrevenueMember2023-01-012023-12-310000875357us-gaap:OperatingSegmentsMemberbokf:ConsumerMemberbokf:PersonaltrustrevenueMember2023-01-012023-12-310000875357us-gaap:OperatingSegmentsMemberbokf:PersonaltrustrevenueMemberbokf:WealthManagementMember2023-01-012023-12-310000875357bokf:PersonaltrustrevenueMemberus-gaap:CorporateNonSegmentMember2023-01-012023-12-310000875357bokf:PersonaltrustrevenueMember2023-01-012023-12-310000875357us-gaap:OperatingSegmentsMemberbokf:CommercialMemberbokf:CorporatetrustrevenueMember2023-01-012023-12-310000875357us-gaap:OperatingSegmentsMemberbokf:ConsumerMemberbokf:CorporatetrustrevenueMember2023-01-012023-12-310000875357us-gaap:OperatingSegmentsMemberbokf:CorporatetrustrevenueMemberbokf:WealthManagementMember2023-01-012023-12-310000875357bokf:CorporatetrustrevenueMemberus-gaap:CorporateNonSegmentMember2023-01-012023-12-310000875357bokf:CorporatetrustrevenueMember2023-01-012023-12-310000875357us-gaap:OperatingSegmentsMemberbokf:CommercialMemberbokf:InstitutionaltrustretirementplanservicesrevenueMember2023-01-012023-12-310000875357us-gaap:OperatingSegmentsMemberbokf:ConsumerMemberbokf:InstitutionaltrustretirementplanservicesrevenueMember2023-01-012023-12-310000875357us-gaap:OperatingSegmentsMemberbokf:InstitutionaltrustretirementplanservicesrevenueMemberbokf:WealthManagementMember2023-01-012023-12-310000875357bokf:InstitutionaltrustretirementplanservicesrevenueMemberus-gaap:CorporateNonSegmentMember2023-01-012023-12-310000875357bokf:InstitutionaltrustretirementplanservicesrevenueMember2023-01-012023-12-310000875357us-gaap:OperatingSegmentsMemberbokf:CommercialMemberbokf:InvestmentmanagementservicesandotherMember2023-01-012023-12-310000875357us-gaap:OperatingSegmentsMemberbokf:ConsumerMemberbokf:InvestmentmanagementservicesandotherMember2023-01-012023-12-310000875357us-gaap:OperatingSegmentsMemberbokf:InvestmentmanagementservicesandotherMemberbokf:WealthManagementMember2023-01-012023-12-310000875357bokf:InvestmentmanagementservicesandotherMemberus-gaap:CorporateNonSegmentMember2023-01-012023-12-310000875357bokf:InvestmentmanagementservicesandotherMember2023-01-012023-12-310000875357us-gaap:FiduciaryAndTrustMemberus-gaap:OperatingSegmentsMemberbokf:CommercialMember2023-01-012023-12-310000875357us-gaap:FiduciaryAndTrustMemberus-gaap:OperatingSegmentsMemberbokf:ConsumerMember2023-01-012023-12-310000875357us-gaap:FiduciaryAndTrustMemberus-gaap:OperatingSegmentsMemberbokf:WealthManagementMember2023-01-012023-12-310000875357us-gaap:FiduciaryAndTrustMemberus-gaap:CorporateNonSegmentMember2023-01-012023-12-310000875357us-gaap:OperatingSegmentsMemberbokf:CommercialMemberbokf:CommercialaccountservicechargerevenueMember2023-01-012023-12-310000875357us-gaap:OperatingSegmentsMemberbokf:ConsumerMemberbokf:CommercialaccountservicechargerevenueMember2023-01-012023-12-310000875357us-gaap:OperatingSegmentsMemberbokf:CommercialaccountservicechargerevenueMemberbokf:WealthManagementMember2023-01-012023-12-310000875357bokf:CommercialaccountservicechargerevenueMemberus-gaap:CorporateNonSegmentMember2023-01-012023-12-310000875357bokf:CommercialaccountservicechargerevenueMember2023-01-012023-12-310000875357us-gaap:OperatingSegmentsMemberbokf:OverdraftfeerevenueMemberbokf:CommercialMember2023-01-012023-12-310000875357us-gaap:OperatingSegmentsMemberbokf:ConsumerMemberbokf:OverdraftfeerevenueMember2023-01-012023-12-310000875357us-gaap:OperatingSegmentsMemberbokf:OverdraftfeerevenueMemberbokf:WealthManagementMember2023-01-012023-12-310000875357bokf:OverdraftfeerevenueMemberus-gaap:CorporateNonSegmentMember2023-01-012023-12-310000875357bokf:OverdraftfeerevenueMember2023-01-012023-12-310000875357us-gaap:OperatingSegmentsMemberbokf:CommercialMemberbokf:CheckcardfeerevenueMember2023-01-012023-12-310000875357us-gaap:OperatingSegmentsMemberbokf:ConsumerMemberbokf:CheckcardfeerevenueMember2023-01-012023-12-310000875357us-gaap:OperatingSegmentsMemberbokf:CheckcardfeerevenueMemberbokf:WealthManagementMember2023-01-012023-12-310000875357bokf:CheckcardfeerevenueMemberus-gaap:CorporateNonSegmentMember2023-01-012023-12-310000875357bokf:CheckcardfeerevenueMember2023-01-012023-12-310000875357us-gaap:OperatingSegmentsMemberbokf:CommercialMemberbokf:AutomatedservicechargeandotherdepositfeerevenueMember2023-01-012023-12-310000875357us-gaap:OperatingSegmentsMemberbokf:ConsumerMemberbokf:AutomatedservicechargeandotherdepositfeerevenueMember2023-01-012023-12-310000875357us-gaap:OperatingSegmentsMemberbokf:AutomatedservicechargeandotherdepositfeerevenueMemberbokf:WealthManagementMember2023-01-012023-12-310000875357bokf:AutomatedservicechargeandotherdepositfeerevenueMemberus-gaap:CorporateNonSegmentMember2023-01-012023-12-310000875357bokf:AutomatedservicechargeandotherdepositfeerevenueMember2023-01-012023-12-310000875357us-gaap:DepositAccountMemberus-gaap:OperatingSegmentsMemberbokf:CommercialMember2023-01-012023-12-310000875357us-gaap:DepositAccountMemberus-gaap:OperatingSegmentsMemberbokf:ConsumerMember2023-01-012023-12-310000875357us-gaap:DepositAccountMemberus-gaap:OperatingSegmentsMemberbokf:WealthManagementMember2023-01-012023-12-310000875357us-gaap:DepositAccountMemberus-gaap:CorporateNonSegmentMember2023-01-012023-12-310000875357us-gaap:OperatingSegmentsMemberbokf:MortgageproductionrevenueMemberbokf:CommercialMember2023-01-012023-12-310000875357us-gaap:OperatingSegmentsMemberbokf:ConsumerMemberbokf:MortgageproductionrevenueMember2023-01-012023-12-310000875357us-gaap:OperatingSegmentsMemberbokf:MortgageproductionrevenueMemberbokf:WealthManagementMember2023-01-012023-12-310000875357bokf:MortgageproductionrevenueMemberus-gaap:CorporateNonSegmentMember2023-01-012023-12-310000875357bokf:MortgageproductionrevenueMember2023-01-012023-12-310000875357bokf:MortgageservicingrevenueMemberus-gaap:OperatingSegmentsMemberbokf:CommercialMember2023-01-012023-12-310000875357bokf:MortgageservicingrevenueMemberus-gaap:OperatingSegmentsMemberbokf:ConsumerMember2023-01-012023-12-310000875357bokf:MortgageservicingrevenueMemberus-gaap:OperatingSegmentsMemberbokf:WealthManagementMember2023-01-012023-12-310000875357bokf:MortgageservicingrevenueMemberus-gaap:CorporateNonSegmentMember2023-01-012023-12-310000875357bokf:MortgageservicingrevenueMember2023-01-012023-12-310000875357us-gaap:MortgageBankingMemberus-gaap:OperatingSegmentsMemberbokf:CommercialMember2023-01-012023-12-310000875357us-gaap:MortgageBankingMemberus-gaap:OperatingSegmentsMemberbokf:ConsumerMember2023-01-012023-12-310000875357us-gaap:MortgageBankingMemberus-gaap:OperatingSegmentsMemberbokf:WealthManagementMember2023-01-012023-12-310000875357us-gaap:MortgageBankingMemberus-gaap:CorporateNonSegmentMember2023-01-012023-12-310000875357us-gaap:OperatingSegmentsMemberus-gaap:FinancialServiceOtherMemberbokf:CommercialMember2023-01-012023-12-310000875357us-gaap:OperatingSegmentsMemberbokf:ConsumerMemberus-gaap:FinancialServiceOtherMember2023-01-012023-12-310000875357us-gaap:OperatingSegmentsMemberus-gaap:FinancialServiceOtherMemberbokf:WealthManagementMember2023-01-012023-12-310000875357us-gaap:FinancialServiceOtherMemberus-gaap:CorporateNonSegmentMember2023-01-012023-12-310000875357us-gaap:OperatingSegmentsMemberbokf:CommercialMemberbokf:FeesandcommissionsrevenueMember2023-01-012023-12-310000875357us-gaap:OperatingSegmentsMemberbokf:ConsumerMemberbokf:FeesandcommissionsrevenueMember2023-01-012023-12-310000875357us-gaap:OperatingSegmentsMemberbokf:FeesandcommissionsrevenueMemberbokf:WealthManagementMember2023-01-012023-12-310000875357us-gaap:CorporateNonSegmentMemberbokf:FeesandcommissionsrevenueMember2023-01-012023-12-310000875357bokf:FeesandcommissionsrevenueMember2023-01-012023-12-310000875357us-gaap:OperatingSegmentsMemberbokf:CommercialMemberbokf:GainlossontradingMember2022-01-012022-12-310000875357us-gaap:OperatingSegmentsMemberbokf:ConsumerMemberbokf:GainlossontradingMember2022-01-012022-12-310000875357us-gaap:OperatingSegmentsMemberbokf:GainlossontradingMemberbokf:WealthManagementMember2022-01-012022-12-310000875357bokf:GainlossontradingMemberus-gaap:CorporateNonSegmentMember2022-01-012022-12-310000875357bokf:GainlossontradingMember2022-01-012022-12-310000875357us-gaap:OperatingSegmentsMemberbokf:CommercialMemberbokf:CustomerhedgingrevenueMember2022-01-012022-12-310000875357us-gaap:OperatingSegmentsMemberbokf:ConsumerMemberbokf:CustomerhedgingrevenueMember2022-01-012022-12-310000875357us-gaap:OperatingSegmentsMemberbokf:CustomerhedgingrevenueMemberbokf:WealthManagementMember2022-01-012022-12-310000875357bokf:CustomerhedgingrevenueMemberus-gaap:CorporateNonSegmentMember2022-01-012022-12-310000875357bokf:CustomerhedgingrevenueMember2022-01-012022-12-310000875357bokf:RetailbrokeragerevenueMemberus-gaap:OperatingSegmentsMemberbokf:CommercialMember2022-01-012022-12-310000875357bokf:RetailbrokeragerevenueMemberus-gaap:OperatingSegmentsMemberbokf:ConsumerMember2022-01-012022-12-310000875357bokf:RetailbrokeragerevenueMemberus-gaap:OperatingSegmentsMemberbokf:WealthManagementMember2022-01-012022-12-310000875357bokf:RetailbrokeragerevenueMemberus-gaap:CorporateNonSegmentMember2022-01-012022-12-310000875357bokf:RetailbrokeragerevenueMember2022-01-012022-12-310000875357bokf:InsurancebrokeragerevenueMemberus-gaap:OperatingSegmentsMemberbokf:CommercialMember2022-01-012022-12-310000875357bokf:InsurancebrokeragerevenueMemberus-gaap:OperatingSegmentsMemberbokf:ConsumerMember2022-01-012022-12-310000875357bokf:InsurancebrokeragerevenueMemberus-gaap:OperatingSegmentsMemberbokf:WealthManagementMember2022-01-012022-12-310000875357bokf:InsurancebrokeragerevenueMemberus-gaap:CorporateNonSegmentMember2022-01-012022-12-310000875357bokf:InsurancebrokeragerevenueMember2022-01-012022-12-310000875357us-gaap:OperatingSegmentsMemberbokf:CommercialMemberbokf:InvestmentbankingrevenueMember2022-01-012022-12-310000875357us-gaap:OperatingSegmentsMemberbokf:ConsumerMemberbokf:InvestmentbankingrevenueMember2022-01-012022-12-310000875357us-gaap:OperatingSegmentsMemberbokf:InvestmentbankingrevenueMemberbokf:WealthManagementMember2022-01-012022-12-310000875357bokf:InvestmentbankingrevenueMemberus-gaap:CorporateNonSegmentMember2022-01-012022-12-310000875357bokf:InvestmentbankingrevenueMember2022-01-012022-12-310000875357us-gaap:OperatingSegmentsMemberbokf:CommercialMemberbokf:BrokerageandtradingrevenueMember2022-01-012022-12-310000875357us-gaap:OperatingSegmentsMemberbokf:ConsumerMemberbokf:BrokerageandtradingrevenueMember2022-01-012022-12-310000875357us-gaap:OperatingSegmentsMemberbokf:BrokerageandtradingrevenueMemberbokf:WealthManagementMember2022-01-012022-12-310000875357bokf:BrokerageandtradingrevenueMemberus-gaap:CorporateNonSegmentMember2022-01-012022-12-310000875357us-gaap:OperatingSegmentsMemberbokf:TransFundEFTnetworkrevenueMemberbokf:CommercialMember2022-01-012022-12-310000875357us-gaap:OperatingSegmentsMemberbokf:ConsumerMemberbokf:TransFundEFTnetworkrevenueMember2022-01-012022-12-310000875357us-gaap:OperatingSegmentsMemberbokf:TransFundEFTnetworkrevenueMemberbokf:WealthManagementMember2022-01-012022-12-310000875357bokf:TransFundEFTnetworkrevenueMemberus-gaap:CorporateNonSegmentMember2022-01-012022-12-310000875357bokf:TransFundEFTnetworkrevenueMember2022-01-012022-12-310000875357bokf:MerchantservicesrevenueMemberus-gaap:OperatingSegmentsMemberbokf:CommercialMember2022-01-012022-12-310000875357bokf:MerchantservicesrevenueMemberus-gaap:OperatingSegmentsMemberbokf:ConsumerMember2022-01-012022-12-310000875357bokf:MerchantservicesrevenueMemberus-gaap:OperatingSegmentsMemberbokf:WealthManagementMember2022-01-012022-12-310000875357bokf:MerchantservicesrevenueMemberus-gaap:CorporateNonSegmentMember2022-01-012022-12-310000875357bokf:MerchantservicesrevenueMember2022-01-012022-12-310000875357bokf:CorporatecardrevenueMemberus-gaap:OperatingSegmentsMemberbokf:CommercialMember2022-01-012022-12-310000875357bokf:CorporatecardrevenueMemberus-gaap:OperatingSegmentsMemberbokf:ConsumerMember2022-01-012022-12-310000875357bokf:CorporatecardrevenueMemberus-gaap:OperatingSegmentsMemberbokf:WealthManagementMember2022-01-012022-12-310000875357bokf:CorporatecardrevenueMemberus-gaap:CorporateNonSegmentMember2022-01-012022-12-310000875357bokf:CorporatecardrevenueMember2022-01-012022-12-310000875357bokf:TransactioncardrevenueMemberus-gaap:OperatingSegmentsMemberbokf:CommercialMember2022-01-012022-12-310000875357bokf:TransactioncardrevenueMemberus-gaap:OperatingSegmentsMemberbokf:ConsumerMember2022-01-012022-12-310000875357bokf:TransactioncardrevenueMemberus-gaap:OperatingSegmentsMemberbokf:WealthManagementMember2022-01-012022-12-310000875357bokf:TransactioncardrevenueMemberus-gaap:CorporateNonSegmentMember2022-01-012022-12-310000875357us-gaap:OperatingSegmentsMemberbokf:CommercialMemberbokf:PersonaltrustrevenueMember2022-01-012022-12-310000875357us-gaap:OperatingSegmentsMemberbokf:ConsumerMemberbokf:PersonaltrustrevenueMember2022-01-012022-12-310000875357us-gaap:OperatingSegmentsMemberbokf:PersonaltrustrevenueMemberbokf:WealthManagementMember2022-01-012022-12-310000875357bokf:PersonaltrustrevenueMemberus-gaap:CorporateNonSegmentMember2022-01-012022-12-310000875357bokf:PersonaltrustrevenueMember2022-01-012022-12-310000875357us-gaap:OperatingSegmentsMemberbokf:CommercialMemberbokf:CorporatetrustrevenueMember2022-01-012022-12-310000875357us-gaap:OperatingSegmentsMemberbokf:ConsumerMemberbokf:CorporatetrustrevenueMember2022-01-012022-12-310000875357us-gaap:OperatingSegmentsMemberbokf:CorporatetrustrevenueMemberbokf:WealthManagementMember2022-01-012022-12-310000875357bokf:CorporatetrustrevenueMemberus-gaap:CorporateNonSegmentMember2022-01-012022-12-310000875357bokf:CorporatetrustrevenueMember2022-01-012022-12-310000875357us-gaap:OperatingSegmentsMemberbokf:CommercialMemberbokf:InstitutionaltrustretirementplanservicesrevenueMember2022-01-012022-12-310000875357us-gaap:OperatingSegmentsMemberbokf:ConsumerMemberbokf:InstitutionaltrustretirementplanservicesrevenueMember2022-01-012022-12-310000875357us-gaap:OperatingSegmentsMemberbokf:InstitutionaltrustretirementplanservicesrevenueMemberbokf:WealthManagementMember2022-01-012022-12-310000875357bokf:InstitutionaltrustretirementplanservicesrevenueMemberus-gaap:CorporateNonSegmentMember2022-01-012022-12-310000875357bokf:InstitutionaltrustretirementplanservicesrevenueMember2022-01-012022-12-310000875357us-gaap:OperatingSegmentsMemberbokf:CommercialMemberbokf:InvestmentmanagementservicesandotherMember2022-01-012022-12-310000875357us-gaap:OperatingSegmentsMemberbokf:ConsumerMemberbokf:InvestmentmanagementservicesandotherMember2022-01-012022-12-310000875357us-gaap:OperatingSegmentsMemberbokf:InvestmentmanagementservicesandotherMemberbokf:WealthManagementMember2022-01-012022-12-310000875357bokf:InvestmentmanagementservicesandotherMemberus-gaap:CorporateNonSegmentMember2022-01-012022-12-310000875357bokf:InvestmentmanagementservicesandotherMember2022-01-012022-12-310000875357us-gaap:FiduciaryAndTrustMemberus-gaap:OperatingSegmentsMemberbokf:CommercialMember2022-01-012022-12-310000875357us-gaap:FiduciaryAndTrustMemberus-gaap:OperatingSegmentsMemberbokf:ConsumerMember2022-01-012022-12-310000875357us-gaap:FiduciaryAndTrustMemberus-gaap:OperatingSegmentsMemberbokf:WealthManagementMember2022-01-012022-12-310000875357us-gaap:FiduciaryAndTrustMemberus-gaap:CorporateNonSegmentMember2022-01-012022-12-310000875357us-gaap:OperatingSegmentsMemberbokf:CommercialMemberbokf:CommercialaccountservicechargerevenueMember2022-01-012022-12-310000875357us-gaap:OperatingSegmentsMemberbokf:ConsumerMemberbokf:CommercialaccountservicechargerevenueMember2022-01-012022-12-310000875357us-gaap:OperatingSegmentsMemberbokf:CommercialaccountservicechargerevenueMemberbokf:WealthManagementMember2022-01-012022-12-310000875357bokf:CommercialaccountservicechargerevenueMemberus-gaap:CorporateNonSegmentMember2022-01-012022-12-310000875357bokf:CommercialaccountservicechargerevenueMember2022-01-012022-12-310000875357us-gaap:OperatingSegmentsMemberbokf:OverdraftfeerevenueMemberbokf:CommercialMember2022-01-012022-12-310000875357us-gaap:OperatingSegmentsMemberbokf:ConsumerMemberbokf:OverdraftfeerevenueMember2022-01-012022-12-310000875357us-gaap:OperatingSegmentsMemberbokf:OverdraftfeerevenueMemberbokf:WealthManagementMember2022-01-012022-12-310000875357bokf:OverdraftfeerevenueMemberus-gaap:CorporateNonSegmentMember2022-01-012022-12-310000875357bokf:OverdraftfeerevenueMember2022-01-012022-12-310000875357us-gaap:OperatingSegmentsMemberbokf:CommercialMemberbokf:CheckcardfeerevenueMember2022-01-012022-12-310000875357us-gaap:OperatingSegmentsMemberbokf:ConsumerMemberbokf:CheckcardfeerevenueMember2022-01-012022-12-310000875357us-gaap:OperatingSegmentsMemberbokf:CheckcardfeerevenueMemberbokf:WealthManagementMember2022-01-012022-12-310000875357bokf:CheckcardfeerevenueMemberus-gaap:CorporateNonSegmentMember2022-01-012022-12-310000875357bokf:CheckcardfeerevenueMember2022-01-012022-12-310000875357us-gaap:OperatingSegmentsMemberbokf:CommercialMemberbokf:AutomatedservicechargeandotherdepositfeerevenueMember2022-01-012022-12-310000875357us-gaap:OperatingSegmentsMemberbokf:ConsumerMemberbokf:AutomatedservicechargeandotherdepositfeerevenueMember2022-01-012022-12-310000875357us-gaap:OperatingSegmentsMemberbokf:AutomatedservicechargeandotherdepositfeerevenueMemberbokf:WealthManagementMember2022-01-012022-12-310000875357bokf:AutomatedservicechargeandotherdepositfeerevenueMemberus-gaap:CorporateNonSegmentMember2022-01-012022-12-310000875357bokf:AutomatedservicechargeandotherdepositfeerevenueMember2022-01-012022-12-310000875357us-gaap:DepositAccountMemberus-gaap:OperatingSegmentsMemberbokf:CommercialMember2022-01-012022-12-310000875357us-gaap:DepositAccountMemberus-gaap:OperatingSegmentsMemberbokf:ConsumerMember2022-01-012022-12-310000875357us-gaap:DepositAccountMemberus-gaap:OperatingSegmentsMemberbokf:WealthManagementMember2022-01-012022-12-310000875357us-gaap:DepositAccountMemberus-gaap:CorporateNonSegmentMember2022-01-012022-12-310000875357us-gaap:OperatingSegmentsMemberbokf:MortgageproductionrevenueMemberbokf:CommercialMember2022-01-012022-12-310000875357us-gaap:OperatingSegmentsMemberbokf:ConsumerMemberbokf:MortgageproductionrevenueMember2022-01-012022-12-310000875357us-gaap:OperatingSegmentsMemberbokf:MortgageproductionrevenueMemberbokf:WealthManagementMember2022-01-012022-12-310000875357bokf:MortgageproductionrevenueMemberus-gaap:CorporateNonSegmentMember2022-01-012022-12-310000875357bokf:MortgageproductionrevenueMember2022-01-012022-12-310000875357bokf:MortgageservicingrevenueMemberus-gaap:OperatingSegmentsMemberbokf:CommercialMember2022-01-012022-12-310000875357bokf:MortgageservicingrevenueMemberus-gaap:OperatingSegmentsMemberbokf:ConsumerMember2022-01-012022-12-310000875357bokf:MortgageservicingrevenueMemberus-gaap:OperatingSegmentsMemberbokf:WealthManagementMember2022-01-012022-12-310000875357bokf:MortgageservicingrevenueMemberus-gaap:CorporateNonSegmentMember2022-01-012022-12-310000875357bokf:MortgageservicingrevenueMember2022-01-012022-12-310000875357us-gaap:MortgageBankingMemberus-gaap:OperatingSegmentsMemberbokf:CommercialMember2022-01-012022-12-310000875357us-gaap:MortgageBankingMemberus-gaap:OperatingSegmentsMemberbokf:ConsumerMember2022-01-012022-12-310000875357us-gaap:MortgageBankingMemberus-gaap:OperatingSegmentsMemberbokf:WealthManagementMember2022-01-012022-12-310000875357us-gaap:MortgageBankingMemberus-gaap:CorporateNonSegmentMember2022-01-012022-12-310000875357us-gaap:OperatingSegmentsMemberus-gaap:FinancialServiceOtherMemberbokf:CommercialMember2022-01-012022-12-310000875357us-gaap:OperatingSegmentsMemberbokf:ConsumerMemberus-gaap:FinancialServiceOtherMember2022-01-012022-12-310000875357us-gaap:OperatingSegmentsMemberus-gaap:FinancialServiceOtherMemberbokf:WealthManagementMember2022-01-012022-12-310000875357us-gaap:FinancialServiceOtherMemberus-gaap:CorporateNonSegmentMember2022-01-012022-12-310000875357us-gaap:OperatingSegmentsMemberbokf:CommercialMemberbokf:FeesandcommissionsrevenueMember2022-01-012022-12-310000875357us-gaap:OperatingSegmentsMemberbokf:ConsumerMemberbokf:FeesandcommissionsrevenueMember2022-01-012022-12-310000875357us-gaap:OperatingSegmentsMemberbokf:FeesandcommissionsrevenueMemberbokf:WealthManagementMember2022-01-012022-12-310000875357us-gaap:CorporateNonSegmentMemberbokf:FeesandcommissionsrevenueMember2022-01-012022-12-310000875357bokf:FeesandcommissionsrevenueMember2022-01-012022-12-310000875357us-gaap:OperatingSegmentsMemberbokf:CommercialMemberbokf:GainlossontradingMember2021-01-012021-12-310000875357us-gaap:OperatingSegmentsMemberbokf:ConsumerMemberbokf:GainlossontradingMember2021-01-012021-12-310000875357us-gaap:OperatingSegmentsMemberbokf:GainlossontradingMemberbokf:WealthManagementMember2021-01-012021-12-310000875357bokf:GainlossontradingMemberus-gaap:CorporateNonSegmentMember2021-01-012021-12-310000875357bokf:GainlossontradingMember2021-01-012021-12-310000875357us-gaap:OperatingSegmentsMemberbokf:CommercialMemberbokf:CustomerhedgingrevenueMember2021-01-012021-12-310000875357us-gaap:OperatingSegmentsMemberbokf:ConsumerMemberbokf:CustomerhedgingrevenueMember2021-01-012021-12-310000875357us-gaap:OperatingSegmentsMemberbokf:CustomerhedgingrevenueMemberbokf:WealthManagementMember2021-01-012021-12-310000875357bokf:CustomerhedgingrevenueMemberus-gaap:CorporateNonSegmentMember2021-01-012021-12-310000875357bokf:CustomerhedgingrevenueMember2021-01-012021-12-310000875357bokf:RetailbrokeragerevenueMemberus-gaap:OperatingSegmentsMemberbokf:CommercialMember2021-01-012021-12-310000875357bokf:RetailbrokeragerevenueMemberus-gaap:OperatingSegmentsMemberbokf:ConsumerMember2021-01-012021-12-310000875357bokf:RetailbrokeragerevenueMemberus-gaap:OperatingSegmentsMemberbokf:WealthManagementMember2021-01-012021-12-310000875357bokf:RetailbrokeragerevenueMemberus-gaap:CorporateNonSegmentMember2021-01-012021-12-310000875357bokf:RetailbrokeragerevenueMember2021-01-012021-12-310000875357bokf:InsurancebrokeragerevenueMemberus-gaap:OperatingSegmentsMemberbokf:CommercialMember2021-01-012021-12-310000875357bokf:InsurancebrokeragerevenueMemberus-gaap:OperatingSegmentsMemberbokf:ConsumerMember2021-01-012021-12-310000875357bokf:InsurancebrokeragerevenueMemberus-gaap:OperatingSegmentsMemberbokf:WealthManagementMember2021-01-012021-12-310000875357bokf:InsurancebrokeragerevenueMemberus-gaap:CorporateNonSegmentMember2021-01-012021-12-310000875357bokf:InsurancebrokeragerevenueMember2021-01-012021-12-310000875357us-gaap:OperatingSegmentsMemberbokf:CommercialMemberbokf:InvestmentbankingrevenueMember2021-01-012021-12-310000875357us-gaap:OperatingSegmentsMemberbokf:ConsumerMemberbokf:InvestmentbankingrevenueMember2021-01-012021-12-310000875357us-gaap:OperatingSegmentsMemberbokf:InvestmentbankingrevenueMemberbokf:WealthManagementMember2021-01-012021-12-310000875357bokf:InvestmentbankingrevenueMemberus-gaap:CorporateNonSegmentMember2021-01-012021-12-310000875357bokf:InvestmentbankingrevenueMember2021-01-012021-12-310000875357us-gaap:OperatingSegmentsMemberbokf:CommercialMemberbokf:BrokerageandtradingrevenueMember2021-01-012021-12-310000875357us-gaap:OperatingSegmentsMemberbokf:ConsumerMemberbokf:BrokerageandtradingrevenueMember2021-01-012021-12-310000875357us-gaap:OperatingSegmentsMemberbokf:BrokerageandtradingrevenueMemberbokf:WealthManagementMember2021-01-012021-12-310000875357bokf:BrokerageandtradingrevenueMemberus-gaap:CorporateNonSegmentMember2021-01-012021-12-310000875357us-gaap:OperatingSegmentsMemberbokf:TransFundEFTnetworkrevenueMemberbokf:CommercialMember2021-01-012021-12-310000875357us-gaap:OperatingSegmentsMemberbokf:ConsumerMemberbokf:TransFundEFTnetworkrevenueMember2021-01-012021-12-310000875357us-gaap:OperatingSegmentsMemberbokf:TransFundEFTnetworkrevenueMemberbokf:WealthManagementMember2021-01-012021-12-310000875357bokf:TransFundEFTnetworkrevenueMemberus-gaap:CorporateNonSegmentMember2021-01-012021-12-310000875357bokf:TransFundEFTnetworkrevenueMember2021-01-012021-12-310000875357bokf:MerchantservicesrevenueMemberus-gaap:OperatingSegmentsMemberbokf:CommercialMember2021-01-012021-12-310000875357bokf:MerchantservicesrevenueMemberus-gaap:OperatingSegmentsMemberbokf:ConsumerMember2021-01-012021-12-310000875357bokf:MerchantservicesrevenueMemberus-gaap:OperatingSegmentsMemberbokf:WealthManagementMember2021-01-012021-12-310000875357bokf:MerchantservicesrevenueMemberus-gaap:CorporateNonSegmentMember2021-01-012021-12-310000875357bokf:MerchantservicesrevenueMember2021-01-012021-12-310000875357bokf:CorporatecardrevenueMemberus-gaap:OperatingSegmentsMemberbokf:CommercialMember2021-01-012021-12-310000875357bokf:CorporatecardrevenueMemberus-gaap:OperatingSegmentsMemberbokf:ConsumerMember2021-01-012021-12-310000875357bokf:CorporatecardrevenueMemberus-gaap:OperatingSegmentsMemberbokf:WealthManagementMember2021-01-012021-12-310000875357bokf:CorporatecardrevenueMemberus-gaap:CorporateNonSegmentMember2021-01-012021-12-310000875357bokf:CorporatecardrevenueMember2021-01-012021-12-310000875357bokf:TransactioncardrevenueMemberus-gaap:OperatingSegmentsMemberbokf:CommercialMember2021-01-012021-12-310000875357bokf:TransactioncardrevenueMemberus-gaap:OperatingSegmentsMemberbokf:ConsumerMember2021-01-012021-12-310000875357bokf:TransactioncardrevenueMemberus-gaap:OperatingSegmentsMemberbokf:WealthManagementMember2021-01-012021-12-310000875357bokf:TransactioncardrevenueMemberus-gaap:CorporateNonSegmentMember2021-01-012021-12-310000875357us-gaap:OperatingSegmentsMemberbokf:CommercialMemberbokf:PersonaltrustrevenueMember2021-01-012021-12-310000875357us-gaap:OperatingSegmentsMemberbokf:ConsumerMemberbokf:PersonaltrustrevenueMember2021-01-012021-12-310000875357us-gaap:OperatingSegmentsMemberbokf:PersonaltrustrevenueMemberbokf:WealthManagementMember2021-01-012021-12-310000875357bokf:PersonaltrustrevenueMemberus-gaap:CorporateNonSegmentMember2021-01-012021-12-310000875357bokf:PersonaltrustrevenueMember2021-01-012021-12-310000875357us-gaap:OperatingSegmentsMemberbokf:CommercialMemberbokf:CorporatetrustrevenueMember2021-01-012021-12-310000875357us-gaap:OperatingSegmentsMemberbokf:ConsumerMemberbokf:CorporatetrustrevenueMember2021-01-012021-12-310000875357us-gaap:OperatingSegmentsMemberbokf:CorporatetrustrevenueMemberbokf:WealthManagementMember2021-01-012021-12-310000875357bokf:CorporatetrustrevenueMemberus-gaap:CorporateNonSegmentMember2021-01-012021-12-310000875357bokf:CorporatetrustrevenueMember2021-01-012021-12-310000875357us-gaap:OperatingSegmentsMemberbokf:CommercialMemberbokf:InstitutionaltrustretirementplanservicesrevenueMember2021-01-012021-12-310000875357us-gaap:OperatingSegmentsMemberbokf:ConsumerMemberbokf:InstitutionaltrustretirementplanservicesrevenueMember2021-01-012021-12-310000875357us-gaap:OperatingSegmentsMemberbokf:InstitutionaltrustretirementplanservicesrevenueMemberbokf:WealthManagementMember2021-01-012021-12-310000875357bokf:InstitutionaltrustretirementplanservicesrevenueMemberus-gaap:CorporateNonSegmentMember2021-01-012021-12-310000875357bokf:InstitutionaltrustretirementplanservicesrevenueMember2021-01-012021-12-310000875357us-gaap:OperatingSegmentsMemberbokf:CommercialMemberbokf:InvestmentmanagementservicesandotherMember2021-01-012021-12-310000875357us-gaap:OperatingSegmentsMemberbokf:ConsumerMemberbokf:InvestmentmanagementservicesandotherMember2021-01-012021-12-310000875357us-gaap:OperatingSegmentsMemberbokf:InvestmentmanagementservicesandotherMemberbokf:WealthManagementMember2021-01-012021-12-310000875357bokf:InvestmentmanagementservicesandotherMemberus-gaap:CorporateNonSegmentMember2021-01-012021-12-310000875357bokf:InvestmentmanagementservicesandotherMember2021-01-012021-12-310000875357us-gaap:FiduciaryAndTrustMemberus-gaap:OperatingSegmentsMemberbokf:CommercialMember2021-01-012021-12-310000875357us-gaap:FiduciaryAndTrustMemberus-gaap:OperatingSegmentsMemberbokf:ConsumerMember2021-01-012021-12-310000875357us-gaap:FiduciaryAndTrustMemberus-gaap:OperatingSegmentsMemberbokf:WealthManagementMember2021-01-012021-12-310000875357us-gaap:FiduciaryAndTrustMemberus-gaap:CorporateNonSegmentMember2021-01-012021-12-310000875357us-gaap:OperatingSegmentsMemberbokf:CommercialMemberbokf:CommercialaccountservicechargerevenueMember2021-01-012021-12-310000875357us-gaap:OperatingSegmentsMemberbokf:ConsumerMemberbokf:CommercialaccountservicechargerevenueMember2021-01-012021-12-310000875357us-gaap:OperatingSegmentsMemberbokf:CommercialaccountservicechargerevenueMemberbokf:WealthManagementMember2021-01-012021-12-310000875357bokf:CommercialaccountservicechargerevenueMemberus-gaap:CorporateNonSegmentMember2021-01-012021-12-310000875357bokf:CommercialaccountservicechargerevenueMember2021-01-012021-12-310000875357us-gaap:OperatingSegmentsMemberbokf:OverdraftfeerevenueMemberbokf:CommercialMember2021-01-012021-12-310000875357us-gaap:OperatingSegmentsMemberbokf:ConsumerMemberbokf:OverdraftfeerevenueMember2021-01-012021-12-310000875357us-gaap:OperatingSegmentsMemberbokf:OverdraftfeerevenueMemberbokf:WealthManagementMember2021-01-012021-12-310000875357bokf:OverdraftfeerevenueMemberus-gaap:CorporateNonSegmentMember2021-01-012021-12-310000875357bokf:OverdraftfeerevenueMember2021-01-012021-12-310000875357us-gaap:OperatingSegmentsMemberbokf:CommercialMemberbokf:CheckcardfeerevenueMember2021-01-012021-12-310000875357us-gaap:OperatingSegmentsMemberbokf:ConsumerMemberbokf:CheckcardfeerevenueMember2021-01-012021-12-310000875357us-gaap:OperatingSegmentsMemberbokf:CheckcardfeerevenueMemberbokf:WealthManagementMember2021-01-012021-12-310000875357bokf:CheckcardfeerevenueMemberus-gaap:CorporateNonSegmentMember2021-01-012021-12-310000875357bokf:CheckcardfeerevenueMember2021-01-012021-12-310000875357us-gaap:OperatingSegmentsMemberbokf:CommercialMemberbokf:AutomatedservicechargeandotherdepositfeerevenueMember2021-01-012021-12-310000875357us-gaap:OperatingSegmentsMemberbokf:ConsumerMemberbokf:AutomatedservicechargeandotherdepositfeerevenueMember2021-01-012021-12-310000875357us-gaap:OperatingSegmentsMemberbokf:AutomatedservicechargeandotherdepositfeerevenueMemberbokf:WealthManagementMember2021-01-012021-12-310000875357bokf:AutomatedservicechargeandotherdepositfeerevenueMemberus-gaap:CorporateNonSegmentMember2021-01-012021-12-310000875357bokf:AutomatedservicechargeandotherdepositfeerevenueMember2021-01-012021-12-310000875357us-gaap:DepositAccountMemberus-gaap:OperatingSegmentsMemberbokf:CommercialMember2021-01-012021-12-310000875357us-gaap:DepositAccountMemberus-gaap:OperatingSegmentsMemberbokf:ConsumerMember2021-01-012021-12-310000875357us-gaap:DepositAccountMemberus-gaap:OperatingSegmentsMemberbokf:WealthManagementMember2021-01-012021-12-310000875357us-gaap:DepositAccountMemberus-gaap:CorporateNonSegmentMember2021-01-012021-12-310000875357us-gaap:OperatingSegmentsMemberbokf:MortgageproductionrevenueMemberbokf:CommercialMember2021-01-012021-12-310000875357us-gaap:OperatingSegmentsMemberbokf:ConsumerMemberbokf:MortgageproductionrevenueMember2021-01-012021-12-310000875357us-gaap:OperatingSegmentsMemberbokf:MortgageproductionrevenueMemberbokf:WealthManagementMember2021-01-012021-12-310000875357bokf:MortgageproductionrevenueMemberus-gaap:CorporateNonSegmentMember2021-01-012021-12-310000875357bokf:MortgageproductionrevenueMember2021-01-012021-12-310000875357bokf:MortgageservicingrevenueMemberus-gaap:OperatingSegmentsMemberbokf:CommercialMember2021-01-012021-12-310000875357bokf:MortgageservicingrevenueMemberus-gaap:OperatingSegmentsMemberbokf:ConsumerMember2021-01-012021-12-310000875357bokf:MortgageservicingrevenueMemberus-gaap:OperatingSegmentsMemberbokf:WealthManagementMember2021-01-012021-12-310000875357bokf:MortgageservicingrevenueMemberus-gaap:CorporateNonSegmentMember2021-01-012021-12-310000875357bokf:MortgageservicingrevenueMember2021-01-012021-12-310000875357us-gaap:MortgageBankingMemberus-gaap:OperatingSegmentsMemberbokf:CommercialMember2021-01-012021-12-310000875357us-gaap:MortgageBankingMemberus-gaap:OperatingSegmentsMemberbokf:ConsumerMember2021-01-012021-12-310000875357us-gaap:MortgageBankingMemberus-gaap:OperatingSegmentsMemberbokf:WealthManagementMember2021-01-012021-12-310000875357us-gaap:MortgageBankingMemberus-gaap:CorporateNonSegmentMember2021-01-012021-12-310000875357us-gaap:OperatingSegmentsMemberus-gaap:FinancialServiceOtherMemberbokf:CommercialMember2021-01-012021-12-310000875357us-gaap:OperatingSegmentsMemberbokf:ConsumerMemberus-gaap:FinancialServiceOtherMember2021-01-012021-12-310000875357us-gaap:OperatingSegmentsMemberus-gaap:FinancialServiceOtherMemberbokf:WealthManagementMember2021-01-012021-12-310000875357us-gaap:FinancialServiceOtherMemberus-gaap:CorporateNonSegmentMember2021-01-012021-12-310000875357us-gaap:OperatingSegmentsMemberbokf:CommercialMemberbokf:FeesandcommissionsrevenueMember2021-01-012021-12-310000875357us-gaap:OperatingSegmentsMemberbokf:ConsumerMemberbokf:FeesandcommissionsrevenueMember2021-01-012021-12-310000875357us-gaap:OperatingSegmentsMemberbokf:FeesandcommissionsrevenueMemberbokf:WealthManagementMember2021-01-012021-12-310000875357us-gaap:CorporateNonSegmentMemberbokf:FeesandcommissionsrevenueMember2021-01-012021-12-310000875357bokf:FeesandcommissionsrevenueMember2021-01-012021-12-310000875357us-gaap:FairValueMeasurementsRecurringMemberus-gaap:USTreasuryAndGovernmentMember2023-12-310000875357us-gaap:FairValueMeasurementsRecurringMemberus-gaap:USTreasuryAndGovernmentMemberus-gaap:FairValueInputsLevel1Member2023-12-310000875357us-gaap:FairValueMeasurementsRecurringMemberus-gaap:USTreasuryAndGovernmentMemberus-gaap:FairValueInputsLevel2Member2023-12-310000875357us-gaap:FairValueMeasurementsRecurringMemberus-gaap:USTreasuryAndGovernmentMemberus-gaap:FairValueInputsLevel3Member2023-12-310000875357us-gaap:FairValueMeasurementsRecurringMemberus-gaap:MortgageBackedSecuritiesIssuedByUSGovernmentSponsoredEnterprisesMember2023-12-310000875357us-gaap:FairValueMeasurementsRecurringMemberus-gaap:MortgageBackedSecuritiesIssuedByUSGovernmentSponsoredEnterprisesMemberus-gaap:FairValueInputsLevel1Member2023-12-310000875357us-gaap:FairValueMeasurementsRecurringMemberus-gaap:MortgageBackedSecuritiesIssuedByUSGovernmentSponsoredEnterprisesMemberus-gaap:FairValueInputsLevel2Member2023-12-310000875357us-gaap:FairValueMeasurementsRecurringMemberus-gaap:MortgageBackedSecuritiesIssuedByUSGovernmentSponsoredEnterprisesMemberus-gaap:FairValueInputsLevel3Member2023-12-310000875357us-gaap:USStatesAndPoliticalSubdivisionsMemberus-gaap:FairValueMeasurementsRecurringMember2023-12-310000875357us-gaap:USStatesAndPoliticalSubdivisionsMemberus-gaap:FairValueMeasurementsRecurringMemberus-gaap:FairValueInputsLevel1Member2023-12-310000875357us-gaap:USStatesAndPoliticalSubdivisionsMemberus-gaap:FairValueMeasurementsRecurringMemberus-gaap:FairValueInputsLevel2Member2023-12-310000875357us-gaap:USStatesAndPoliticalSubdivisionsMemberus-gaap:FairValueMeasurementsRecurringMemberus-gaap:FairValueInputsLevel3Member2023-12-310000875357us-gaap:FairValueMeasurementsRecurringMemberbokf:OtherTradingSecuritiesMember2023-12-310000875357us-gaap:FairValueMeasurementsRecurringMemberbokf:OtherTradingSecuritiesMemberus-gaap:FairValueInputsLevel1Member2023-12-310000875357us-gaap:FairValueMeasurementsRecurringMemberus-gaap:FairValueInputsLevel2Memberbokf:OtherTradingSecuritiesMember2023-12-310000875357us-gaap:FairValueMeasurementsRecurringMemberbokf:OtherTradingSecuritiesMemberus-gaap:FairValueInputsLevel3Member2023-12-310000875357us-gaap:FairValueMeasurementsRecurringMember2023-12-310000875357us-gaap:FairValueMeasurementsRecurringMemberus-gaap:FairValueInputsLevel1Member2023-12-310000875357us-gaap:FairValueMeasurementsRecurringMemberus-gaap:FairValueInputsLevel2Member2023-12-310000875357us-gaap:FairValueMeasurementsRecurringMemberus-gaap:FairValueInputsLevel3Member2023-12-310000875357us-gaap:FairValueMeasurementsRecurringMemberus-gaap:USTreasurySecuritiesMember2023-12-310000875357us-gaap:FairValueMeasurementsRecurringMemberus-gaap:FairValueInputsLevel1Memberus-gaap:USTreasurySecuritiesMember2023-12-310000875357us-gaap:FairValueMeasurementsRecurringMemberus-gaap:FairValueInputsLevel2Memberus-gaap:USTreasurySecuritiesMember2023-12-310000875357us-gaap:FairValueMeasurementsRecurringMemberus-gaap:USTreasurySecuritiesMemberus-gaap:FairValueInputsLevel3Member2023-12-310000875357us-gaap:FairValueMeasurementsRecurringMemberus-gaap:MortgageBackedSecuritiesIssuedByPrivateEnterprisesMember2023-12-310000875357us-gaap:FairValueMeasurementsRecurringMemberus-gaap:MortgageBackedSecuritiesIssuedByPrivateEnterprisesMemberus-gaap:FairValueInputsLevel1Member2023-12-310000875357us-gaap:FairValueMeasurementsRecurringMemberus-gaap:FairValueInputsLevel2Memberus-gaap:MortgageBackedSecuritiesIssuedByPrivateEnterprisesMember2023-12-310000875357us-gaap:FairValueMeasurementsRecurringMemberus-gaap:MortgageBackedSecuritiesIssuedByPrivateEnterprisesMemberus-gaap:FairValueInputsLevel3Member2023-12-310000875357us-gaap:FairValueMeasurementsRecurringMemberus-gaap:CommercialMortgageBackedSecuritiesMember2023-12-310000875357us-gaap:FairValueMeasurementsRecurringMemberus-gaap:CommercialMortgageBackedSecuritiesMemberus-gaap:FairValueInputsLevel1Member2023-12-310000875357us-gaap:FairValueMeasurementsRecurringMemberus-gaap:FairValueInputsLevel2Memberus-gaap:CommercialMortgageBackedSecuritiesMember2023-12-310000875357us-gaap:FairValueMeasurementsRecurringMemberus-gaap:CommercialMortgageBackedSecuritiesMemberus-gaap:FairValueInputsLevel3Member2023-12-310000875357us-gaap:FairValueMeasurementsRecurringMemberus-gaap:OtherDebtSecuritiesMember2023-12-310000875357us-gaap:FairValueMeasurementsRecurringMemberus-gaap:OtherDebtSecuritiesMemberus-gaap:FairValueInputsLevel1Member2023-12-310000875357us-gaap:FairValueMeasurementsRecurringMemberus-gaap:OtherDebtSecuritiesMemberus-gaap:FairValueInputsLevel2Member2023-12-310000875357us-gaap:FairValueMeasurementsRecurringMemberus-gaap:OtherDebtSecuritiesMemberus-gaap:FairValueInputsLevel3Member2023-12-310000875357us-gaap:FairValueMeasurementsRecurringMemberus-gaap:USTreasuryAndGovernmentMember2022-12-310000875357us-gaap:FairValueMeasurementsRecurringMemberus-gaap:USTreasuryAndGovernmentMemberus-gaap:FairValueInputsLevel1Member2022-12-310000875357us-gaap:FairValueMeasurementsRecurringMemberus-gaap:USTreasuryAndGovernmentMemberus-gaap:FairValueInputsLevel2Member2022-12-310000875357us-gaap:FairValueMeasurementsRecurringMemberus-gaap:USTreasuryAndGovernmentMemberus-gaap:FairValueInputsLevel3Member2022-12-310000875357us-gaap:FairValueMeasurementsRecurringMemberus-gaap:MortgageBackedSecuritiesIssuedByUSGovernmentSponsoredEnterprisesMember2022-12-310000875357us-gaap:FairValueMeasurementsRecurringMemberus-gaap:MortgageBackedSecuritiesIssuedByUSGovernmentSponsoredEnterprisesMemberus-gaap:FairValueInputsLevel1Member2022-12-310000875357us-gaap:FairValueMeasurementsRecurringMemberus-gaap:MortgageBackedSecuritiesIssuedByUSGovernmentSponsoredEnterprisesMemberus-gaap:FairValueInputsLevel2Member2022-12-310000875357us-gaap:FairValueMeasurementsRecurringMemberus-gaap:MortgageBackedSecuritiesIssuedByUSGovernmentSponsoredEnterprisesMemberus-gaap:FairValueInputsLevel3Member2022-12-310000875357us-gaap:USStatesAndPoliticalSubdivisionsMemberus-gaap:FairValueMeasurementsRecurringMember2022-12-310000875357us-gaap:USStatesAndPoliticalSubdivisionsMemberus-gaap:FairValueMeasurementsRecurringMemberus-gaap:FairValueInputsLevel1Member2022-12-310000875357us-gaap:USStatesAndPoliticalSubdivisionsMemberus-gaap:FairValueMeasurementsRecurringMemberus-gaap:FairValueInputsLevel2Member2022-12-310000875357us-gaap:USStatesAndPoliticalSubdivisionsMemberus-gaap:FairValueMeasurementsRecurringMemberus-gaap:FairValueInputsLevel3Member2022-12-310000875357us-gaap:FairValueMeasurementsRecurringMemberbokf:OtherTradingSecuritiesMember2022-12-310000875357us-gaap:FairValueMeasurementsRecurringMemberbokf:OtherTradingSecuritiesMemberus-gaap:FairValueInputsLevel1Member2022-12-310000875357us-gaap:FairValueMeasurementsRecurringMemberus-gaap:FairValueInputsLevel2Memberbokf:OtherTradingSecuritiesMember2022-12-310000875357us-gaap:FairValueMeasurementsRecurringMemberbokf:OtherTradingSecuritiesMemberus-gaap:FairValueInputsLevel3Member2022-12-310000875357us-gaap:FairValueMeasurementsRecurringMember2022-12-310000875357us-gaap:FairValueMeasurementsRecurringMemberus-gaap:FairValueInputsLevel1Member2022-12-310000875357us-gaap:FairValueMeasurementsRecurringMemberus-gaap:FairValueInputsLevel2Member2022-12-310000875357us-gaap:FairValueMeasurementsRecurringMemberus-gaap:FairValueInputsLevel3Member2022-12-310000875357us-gaap:FairValueMeasurementsRecurringMemberus-gaap:USTreasurySecuritiesMember2022-12-310000875357us-gaap:FairValueMeasurementsRecurringMemberus-gaap:FairValueInputsLevel1Memberus-gaap:USTreasurySecuritiesMember2022-12-310000875357us-gaap:FairValueMeasurementsRecurringMemberus-gaap:FairValueInputsLevel2Memberus-gaap:USTreasurySecuritiesMember2022-12-310000875357us-gaap:FairValueMeasurementsRecurringMemberus-gaap:USTreasurySecuritiesMemberus-gaap:FairValueInputsLevel3Member2022-12-310000875357us-gaap:FairValueMeasurementsRecurringMemberus-gaap:MortgageBackedSecuritiesIssuedByPrivateEnterprisesMember2022-12-310000875357us-gaap:FairValueMeasurementsRecurringMemberus-gaap:MortgageBackedSecuritiesIssuedByPrivateEnterprisesMemberus-gaap:FairValueInputsLevel1Member2022-12-310000875357us-gaap:FairValueMeasurementsRecurringMemberus-gaap:FairValueInputsLevel2Memberus-gaap:MortgageBackedSecuritiesIssuedByPrivateEnterprisesMember2022-12-310000875357us-gaap:FairValueMeasurementsRecurringMemberus-gaap:MortgageBackedSecuritiesIssuedByPrivateEnterprisesMemberus-gaap:FairValueInputsLevel3Member2022-12-310000875357us-gaap:FairValueMeasurementsRecurringMemberus-gaap:CommercialMortgageBackedSecuritiesMember2022-12-310000875357us-gaap:FairValueMeasurementsRecurringMemberus-gaap:CommercialMortgageBackedSecuritiesMemberus-gaap:FairValueInputsLevel1Member2022-12-310000875357us-gaap:FairValueMeasurementsRecurringMemberus-gaap:FairValueInputsLevel2Memberus-gaap:CommercialMortgageBackedSecuritiesMember2022-12-310000875357us-gaap:FairValueMeasurementsRecurringMemberus-gaap:CommercialMortgageBackedSecuritiesMemberus-gaap:FairValueInputsLevel3Member2022-12-310000875357us-gaap:FairValueMeasurementsRecurringMemberus-gaap:OtherDebtSecuritiesMember2022-12-310000875357us-gaap:FairValueMeasurementsRecurringMemberus-gaap:OtherDebtSecuritiesMemberus-gaap:FairValueInputsLevel1Member2022-12-310000875357us-gaap:FairValueMeasurementsRecurringMemberus-gaap:OtherDebtSecuritiesMemberus-gaap:FairValueInputsLevel2Member2022-12-310000875357us-gaap:FairValueMeasurementsRecurringMemberus-gaap:OtherDebtSecuritiesMemberus-gaap:FairValueInputsLevel3Member2022-12-310000875357us-gaap:FairValueMeasurementsNonrecurringMemberus-gaap:FairValueInputsLevel1Memberbokf:FairValueNonaccruingLoansMember2023-12-310000875357us-gaap:FairValueInputsLevel2Memberus-gaap:FairValueMeasurementsNonrecurringMemberbokf:FairValueNonaccruingLoansMember2023-12-310000875357us-gaap:ValuationTechniqueDiscountedCashFlowMemberus-gaap:FairValueMeasurementsNonrecurringMemberbokf:ManagementKnowledgeOfIndustryAndNonRealEstateCollateralMemberbokf:FairValueNonaccruingLoansMemberus-gaap:FairValueInputsLevel3Member2023-12-310000875357us-gaap:FairValueMeasurementsNonrecurringMemberbokf:FairValueNonaccruingLoansMember2023-01-012023-12-310000875357us-gaap:FairValueMeasurementsNonrecurringMemberus-gaap:FairValueInputsLevel1Memberbokf:FairValueRealEstateAndOtherRepossessedAssetsMember2023-12-310000875357us-gaap:FairValueInputsLevel2Memberus-gaap:FairValueMeasurementsNonrecurringMemberbokf:FairValueRealEstateAndOtherRepossessedAssetsMember2023-12-310000875357us-gaap:ValuationTechniqueDiscountedCashFlowMemberus-gaap:FairValueMeasurementsNonrecurringMemberbokf:FairValueRealEstateAndOtherRepossessedAssetsMemberbokf:ManagementKnowledgeOfIndustryAndNonRealEstateCollateralIncludingButNotLimitedToRecoverableOilGasReservesForwardLookingCommodityPricesAndEstimatedOperatingCostsMemberus-gaap:FairValueInputsLevel3Member2023-12-310000875357us-gaap:FairValueMeasurementsNonrecurringMemberbokf:FairValueRealEstateAndOtherRepossessedAssetsMember2023-01-012023-12-310000875357us-gaap:FairValueMeasurementsNonrecurringMemberus-gaap:FairValueInputsLevel1Memberbokf:FairValueNonaccruingLoansMember2022-12-310000875357us-gaap:FairValueInputsLevel2Memberus-gaap:FairValueMeasurementsNonrecurringMemberbokf:FairValueNonaccruingLoansMember2022-12-310000875357us-gaap:ValuationTechniqueDiscountedCashFlowMemberus-gaap:FairValueMeasurementsNonrecurringMemberbokf:ManagementKnowledgeOfIndustryAndNonRealEstateCollateralIncludingButNotLimitedToRecoverableOilGasReservesForwardLookingCommodityPricesAndEstimatedOperatingCostsMemberbokf:FairValueNonaccruingLoansMemberus-gaap:FairValueInputsLevel3Member2022-12-310000875357us-gaap:FairValueMeasurementsNonrecurringMemberbokf:FairValueNonaccruingLoansMember2022-01-012022-12-310000875357us-gaap:FairValueMeasurementsNonrecurringMemberus-gaap:FairValueInputsLevel1Memberbokf:FairValueRealEstateAndOtherRepossessedAssetsMember2022-12-310000875357us-gaap:FairValueInputsLevel2Memberus-gaap:FairValueMeasurementsNonrecurringMemberbokf:FairValueRealEstateAndOtherRepossessedAssetsMember2022-12-310000875357us-gaap:ValuationTechniqueDiscountedCashFlowMemberus-gaap:FairValueMeasurementsNonrecurringMemberbokf:FairValueRealEstateAndOtherRepossessedAssetsMemberbokf:ManagementKnowledgeOfIndustryAndNonRealEstateCollateralIncludingButNotLimitedToRecoverableOilGasReservesForwardLookingCommodityPricesAndEstimatedOperatingCostsMemberus-gaap:FairValueInputsLevel3Member2022-12-310000875357us-gaap:FairValueMeasurementsNonrecurringMemberbokf:FairValueRealEstateAndOtherRepossessedAssetsMember2022-01-012022-12-310000875357srt:MinimumMemberus-gaap:FairValueMeasurementsNonrecurringMemberbokf:FairValueNonaccruingLoansMemberus-gaap:FairValueInputsLevel3Member2023-12-310000875357us-gaap:FairValueMeasurementsNonrecurringMemberbokf:FairValueNonaccruingLoansMemberus-gaap:FairValueInputsLevel3Membersrt:MaximumMember2023-12-310000875357srt:WeightedAverageMemberus-gaap:FairValueMeasurementsNonrecurringMemberbokf:FairValueNonaccruingLoansMemberus-gaap:FairValueInputsLevel3Member2023-12-310000875357srt:MinimumMemberus-gaap:FairValueMeasurementsNonrecurringMemberbokf:FairValueNonaccruingLoansMemberus-gaap:FairValueInputsLevel3Member2022-12-310000875357us-gaap:FairValueMeasurementsNonrecurringMemberbokf:FairValueNonaccruingLoansMemberus-gaap:FairValueInputsLevel3Membersrt:MaximumMember2022-12-310000875357srt:WeightedAverageMemberus-gaap:FairValueMeasurementsNonrecurringMemberbokf:FairValueNonaccruingLoansMemberus-gaap:FairValueInputsLevel3Member2022-12-310000875357us-gaap:CarryingReportedAmountFairValueDisclosureMember2023-12-310000875357us-gaap:EstimateOfFairValueFairValueDisclosureMember2023-12-310000875357us-gaap:EstimateOfFairValueFairValueDisclosureMemberus-gaap:FairValueInputsLevel1Member2023-12-310000875357us-gaap:EstimateOfFairValueFairValueDisclosureMemberus-gaap:FairValueInputsLevel2Member2023-12-310000875357us-gaap:EstimateOfFairValueFairValueDisclosureMemberus-gaap:FairValueInputsLevel3Member2023-12-310000875357us-gaap:USTreasuryAndGovernmentMemberus-gaap:CarryingReportedAmountFairValueDisclosureMember2023-12-310000875357us-gaap:EstimateOfFairValueFairValueDisclosureMemberus-gaap:USTreasuryAndGovernmentMember2023-12-310000875357us-gaap:EstimateOfFairValueFairValueDisclosureMemberus-gaap:USTreasuryAndGovernmentMemberus-gaap:FairValueInputsLevel1Member2023-12-310000875357us-gaap:EstimateOfFairValueFairValueDisclosureMemberus-gaap:USTreasuryAndGovernmentMemberus-gaap:FairValueInputsLevel2Member2023-12-310000875357us-gaap:EstimateOfFairValueFairValueDisclosureMemberus-gaap:USTreasuryAndGovernmentMemberus-gaap:FairValueInputsLevel3Member2023-12-310000875357us-gaap:CarryingReportedAmountFairValueDisclosureMemberus-gaap:MortgageBackedSecuritiesIssuedByUSGovernmentSponsoredEnterprisesMember2023-12-310000875357us-gaap:EstimateOfFairValueFairValueDisclosureMemberus-gaap:MortgageBackedSecuritiesIssuedByUSGovernmentSponsoredEnterprisesMember2023-12-310000875357us-gaap:EstimateOfFairValueFairValueDisclosureMemberus-gaap:MortgageBackedSecuritiesIssuedByUSGovernmentSponsoredEnterprisesMemberus-gaap:FairValueInputsLevel1Member2023-12-310000875357us-gaap:EstimateOfFairValueFairValueDisclosureMemberus-gaap:MortgageBackedSecuritiesIssuedByUSGovernmentSponsoredEnterprisesMemberus-gaap:FairValueInputsLevel2Member2023-12-310000875357us-gaap:EstimateOfFairValueFairValueDisclosureMemberus-gaap:MortgageBackedSecuritiesIssuedByUSGovernmentSponsoredEnterprisesMemberus-gaap:FairValueInputsLevel3Member2023-12-310000875357us-gaap:USStatesAndPoliticalSubdivisionsMemberus-gaap:CarryingReportedAmountFairValueDisclosureMember2023-12-310000875357us-gaap:USStatesAndPoliticalSubdivisionsMemberus-gaap:EstimateOfFairValueFairValueDisclosureMember2023-12-310000875357us-gaap:USStatesAndPoliticalSubdivisionsMemberus-gaap:EstimateOfFairValueFairValueDisclosureMemberus-gaap:FairValueInputsLevel1Member2023-12-310000875357us-gaap:USStatesAndPoliticalSubdivisionsMemberus-gaap:EstimateOfFairValueFairValueDisclosureMemberus-gaap:FairValueInputsLevel2Member2023-12-310000875357us-gaap:USStatesAndPoliticalSubdivisionsMemberus-gaap:EstimateOfFairValueFairValueDisclosureMemberus-gaap:FairValueInputsLevel3Member2023-12-310000875357us-gaap:CarryingReportedAmountFairValueDisclosureMemberbokf:OtherTradingSecuritiesMember2023-12-310000875357us-gaap:EstimateOfFairValueFairValueDisclosureMemberbokf:OtherTradingSecuritiesMember2023-12-310000875357us-gaap:EstimateOfFairValueFairValueDisclosureMemberbokf:OtherTradingSecuritiesMemberus-gaap:FairValueInputsLevel1Member2023-12-310000875357us-gaap:EstimateOfFairValueFairValueDisclosureMemberus-gaap:FairValueInputsLevel2Memberbokf:OtherTradingSecuritiesMember2023-12-310000875357us-gaap:EstimateOfFairValueFairValueDisclosureMemberbokf:OtherTradingSecuritiesMemberus-gaap:FairValueInputsLevel3Member2023-12-310000875357us-gaap:CarryingReportedAmountFairValueDisclosureMemberus-gaap:CommercialMortgageBackedSecuritiesMember2023-12-310000875357us-gaap:EstimateOfFairValueFairValueDisclosureMemberus-gaap:CommercialMortgageBackedSecuritiesMember2023-12-310000875357us-gaap:EstimateOfFairValueFairValueDisclosureMemberus-gaap:CommercialMortgageBackedSecuritiesMemberus-gaap:FairValueInputsLevel1Member2023-12-310000875357us-gaap:EstimateOfFairValueFairValueDisclosureMemberus-gaap:FairValueInputsLevel2Memberus-gaap:CommercialMortgageBackedSecuritiesMember2023-12-310000875357us-gaap:EstimateOfFairValueFairValueDisclosureMemberus-gaap:CommercialMortgageBackedSecuritiesMemberus-gaap:FairValueInputsLevel3Member2023-12-310000875357us-gaap:OtherDebtSecuritiesMemberus-gaap:CarryingReportedAmountFairValueDisclosureMember2023-12-310000875357us-gaap:EstimateOfFairValueFairValueDisclosureMemberus-gaap:OtherDebtSecuritiesMember2023-12-310000875357us-gaap:EstimateOfFairValueFairValueDisclosureMemberus-gaap:OtherDebtSecuritiesMemberus-gaap:FairValueInputsLevel1Member2023-12-310000875357us-gaap:EstimateOfFairValueFairValueDisclosureMemberus-gaap:OtherDebtSecuritiesMemberus-gaap:FairValueInputsLevel2Member2023-12-310000875357us-gaap:EstimateOfFairValueFairValueDisclosureMemberus-gaap:OtherDebtSecuritiesMemberus-gaap:FairValueInputsLevel3Member2023-12-310000875357us-gaap:CarryingReportedAmountFairValueDisclosureMemberus-gaap:USTreasurySecuritiesMember2023-12-310000875357us-gaap:EstimateOfFairValueFairValueDisclosureMemberus-gaap:USTreasurySecuritiesMember2023-12-310000875357us-gaap:EstimateOfFairValueFairValueDisclosureMemberus-gaap:FairValueInputsLevel1Memberus-gaap:USTreasurySecuritiesMember2023-12-310000875357us-gaap:EstimateOfFairValueFairValueDisclosureMemberus-gaap:FairValueInputsLevel2Memberus-gaap:USTreasurySecuritiesMember2023-12-310000875357us-gaap:EstimateOfFairValueFairValueDisclosureMemberus-gaap:USTreasurySecuritiesMemberus-gaap:FairValueInputsLevel3Member2023-12-310000875357us-gaap:CarryingReportedAmountFairValueDisclosureMemberus-gaap:MortgageBackedSecuritiesIssuedByPrivateEnterprisesMember2023-12-310000875357us-gaap:EstimateOfFairValueFairValueDisclosureMemberus-gaap:MortgageBackedSecuritiesIssuedByPrivateEnterprisesMember2023-12-310000875357us-gaap:EstimateOfFairValueFairValueDisclosureMemberus-gaap:MortgageBackedSecuritiesIssuedByPrivateEnterprisesMemberus-gaap:FairValueInputsLevel1Member2023-12-310000875357us-gaap:EstimateOfFairValueFairValueDisclosureMemberus-gaap:FairValueInputsLevel2Memberus-gaap:MortgageBackedSecuritiesIssuedByPrivateEnterprisesMember2023-12-310000875357us-gaap:EstimateOfFairValueFairValueDisclosureMemberus-gaap:MortgageBackedSecuritiesIssuedByPrivateEnterprisesMemberus-gaap:FairValueInputsLevel3Member2023-12-310000875357us-gaap:CarryingReportedAmountFairValueDisclosureMemberus-gaap:CommercialPortfolioSegmentMember2023-12-310000875357us-gaap:EstimateOfFairValueFairValueDisclosureMemberus-gaap:CommercialPortfolioSegmentMember2023-12-310000875357us-gaap:EstimateOfFairValueFairValueDisclosureMemberus-gaap:FairValueInputsLevel1Memberus-gaap:CommercialPortfolioSegmentMember2023-12-310000875357us-gaap:EstimateOfFairValueFairValueDisclosureMemberus-gaap:FairValueInputsLevel2Memberus-gaap:CommercialPortfolioSegmentMember2023-12-310000875357us-gaap:EstimateOfFairValueFairValueDisclosureMemberus-gaap:FairValueInputsLevel3Memberus-gaap:CommercialPortfolioSegmentMember2023-12-310000875357us-gaap:CommercialRealEstatePortfolioSegmentMemberus-gaap:CarryingReportedAmountFairValueDisclosureMember2023-12-310000875357us-gaap:CommercialRealEstatePortfolioSegmentMemberus-gaap:EstimateOfFairValueFairValueDisclosureMember2023-12-310000875357us-gaap:CommercialRealEstatePortfolioSegmentMemberus-gaap:EstimateOfFairValueFairValueDisclosureMemberus-gaap:FairValueInputsLevel1Member2023-12-310000875357us-gaap:CommercialRealEstatePortfolioSegmentMemberus-gaap:EstimateOfFairValueFairValueDisclosureMemberus-gaap:FairValueInputsLevel2Member2023-12-310000875357us-gaap:CommercialRealEstatePortfolioSegmentMemberus-gaap:EstimateOfFairValueFairValueDisclosureMemberus-gaap:FairValueInputsLevel3Member2023-12-310000875357us-gaap:CarryingReportedAmountFairValueDisclosureMemberbokf:LoanstoindividualsMember2023-12-310000875357us-gaap:EstimateOfFairValueFairValueDisclosureMemberbokf:LoanstoindividualsMember2023-12-310000875357us-gaap:EstimateOfFairValueFairValueDisclosureMemberbokf:LoanstoindividualsMemberus-gaap:FairValueInputsLevel1Member2023-12-310000875357us-gaap:EstimateOfFairValueFairValueDisclosureMemberbokf:LoanstoindividualsMemberus-gaap:FairValueInputsLevel2Member2023-12-310000875357us-gaap:EstimateOfFairValueFairValueDisclosureMemberbokf:LoanstoindividualsMemberus-gaap:FairValueInputsLevel3Member2023-12-310000875357us-gaap:CarryingReportedAmountFairValueDisclosureMember2022-12-310000875357us-gaap:EstimateOfFairValueFairValueDisclosureMember2022-12-310000875357us-gaap:EstimateOfFairValueFairValueDisclosureMemberus-gaap:FairValueInputsLevel1Member2022-12-310000875357us-gaap:EstimateOfFairValueFairValueDisclosureMemberus-gaap:FairValueInputsLevel2Member2022-12-310000875357us-gaap:EstimateOfFairValueFairValueDisclosureMemberus-gaap:FairValueInputsLevel3Member2022-12-310000875357us-gaap:USTreasuryAndGovernmentMemberus-gaap:CarryingReportedAmountFairValueDisclosureMember2022-12-310000875357us-gaap:EstimateOfFairValueFairValueDisclosureMemberus-gaap:USTreasuryAndGovernmentMember2022-12-310000875357us-gaap:EstimateOfFairValueFairValueDisclosureMemberus-gaap:USTreasuryAndGovernmentMemberus-gaap:FairValueInputsLevel1Member2022-12-310000875357us-gaap:EstimateOfFairValueFairValueDisclosureMemberus-gaap:USTreasuryAndGovernmentMemberus-gaap:FairValueInputsLevel2Member2022-12-310000875357us-gaap:EstimateOfFairValueFairValueDisclosureMemberus-gaap:USTreasuryAndGovernmentMemberus-gaap:FairValueInputsLevel3Member2022-12-310000875357us-gaap:CarryingReportedAmountFairValueDisclosureMemberus-gaap:MortgageBackedSecuritiesIssuedByUSGovernmentSponsoredEnterprisesMember2022-12-310000875357us-gaap:EstimateOfFairValueFairValueDisclosureMemberus-gaap:MortgageBackedSecuritiesIssuedByUSGovernmentSponsoredEnterprisesMember2022-12-310000875357us-gaap:EstimateOfFairValueFairValueDisclosureMemberus-gaap:MortgageBackedSecuritiesIssuedByUSGovernmentSponsoredEnterprisesMemberus-gaap:FairValueInputsLevel1Member2022-12-310000875357us-gaap:EstimateOfFairValueFairValueDisclosureMemberus-gaap:MortgageBackedSecuritiesIssuedByUSGovernmentSponsoredEnterprisesMemberus-gaap:FairValueInputsLevel2Member2022-12-310000875357us-gaap:EstimateOfFairValueFairValueDisclosureMemberus-gaap:MortgageBackedSecuritiesIssuedByUSGovernmentSponsoredEnterprisesMemberus-gaap:FairValueInputsLevel3Member2022-12-310000875357us-gaap:USStatesAndPoliticalSubdivisionsMemberus-gaap:CarryingReportedAmountFairValueDisclosureMember2022-12-310000875357us-gaap:USStatesAndPoliticalSubdivisionsMemberus-gaap:EstimateOfFairValueFairValueDisclosureMember2022-12-310000875357us-gaap:USStatesAndPoliticalSubdivisionsMemberus-gaap:EstimateOfFairValueFairValueDisclosureMemberus-gaap:FairValueInputsLevel1Member2022-12-310000875357us-gaap:USStatesAndPoliticalSubdivisionsMemberus-gaap:EstimateOfFairValueFairValueDisclosureMemberus-gaap:FairValueInputsLevel2Member2022-12-310000875357us-gaap:USStatesAndPoliticalSubdivisionsMemberus-gaap:EstimateOfFairValueFairValueDisclosureMemberus-gaap:FairValueInputsLevel3Member2022-12-310000875357us-gaap:CarryingReportedAmountFairValueDisclosureMemberbokf:OtherTradingSecuritiesMember2022-12-310000875357us-gaap:EstimateOfFairValueFairValueDisclosureMemberbokf:OtherTradingSecuritiesMember2022-12-310000875357us-gaap:EstimateOfFairValueFairValueDisclosureMemberbokf:OtherTradingSecuritiesMemberus-gaap:FairValueInputsLevel1Member2022-12-310000875357us-gaap:EstimateOfFairValueFairValueDisclosureMemberus-gaap:FairValueInputsLevel2Memberbokf:OtherTradingSecuritiesMember2022-12-310000875357us-gaap:EstimateOfFairValueFairValueDisclosureMemberbokf:OtherTradingSecuritiesMemberus-gaap:FairValueInputsLevel3Member2022-12-310000875357us-gaap:CarryingReportedAmountFairValueDisclosureMemberus-gaap:CommercialMortgageBackedSecuritiesMember2022-12-310000875357us-gaap:EstimateOfFairValueFairValueDisclosureMemberus-gaap:CommercialMortgageBackedSecuritiesMember2022-12-310000875357us-gaap:EstimateOfFairValueFairValueDisclosureMemberus-gaap:CommercialMortgageBackedSecuritiesMemberus-gaap:FairValueInputsLevel1Member2022-12-310000875357us-gaap:EstimateOfFairValueFairValueDisclosureMemberus-gaap:FairValueInputsLevel2Memberus-gaap:CommercialMortgageBackedSecuritiesMember2022-12-310000875357us-gaap:EstimateOfFairValueFairValueDisclosureMemberus-gaap:CommercialMortgageBackedSecuritiesMemberus-gaap:FairValueInputsLevel3Member2022-12-310000875357us-gaap:OtherDebtSecuritiesMemberus-gaap:CarryingReportedAmountFairValueDisclosureMember2022-12-310000875357us-gaap:EstimateOfFairValueFairValueDisclosureMemberus-gaap:OtherDebtSecuritiesMember2022-12-310000875357us-gaap:EstimateOfFairValueFairValueDisclosureMemberus-gaap:OtherDebtSecuritiesMemberus-gaap:FairValueInputsLevel1Member2022-12-310000875357us-gaap:EstimateOfFairValueFairValueDisclosureMemberus-gaap:OtherDebtSecuritiesMemberus-gaap:FairValueInputsLevel2Member2022-12-310000875357us-gaap:EstimateOfFairValueFairValueDisclosureMemberus-gaap:OtherDebtSecuritiesMemberus-gaap:FairValueInputsLevel3Member2022-12-310000875357us-gaap:CarryingReportedAmountFairValueDisclosureMemberus-gaap:USTreasurySecuritiesMember2022-12-310000875357us-gaap:EstimateOfFairValueFairValueDisclosureMemberus-gaap:USTreasurySecuritiesMember2022-12-310000875357us-gaap:EstimateOfFairValueFairValueDisclosureMemberus-gaap:FairValueInputsLevel1Memberus-gaap:USTreasurySecuritiesMember2022-12-310000875357us-gaap:EstimateOfFairValueFairValueDisclosureMemberus-gaap:FairValueInputsLevel2Memberus-gaap:USTreasurySecuritiesMember2022-12-310000875357us-gaap:EstimateOfFairValueFairValueDisclosureMemberus-gaap:USTreasurySecuritiesMemberus-gaap:FairValueInputsLevel3Member2022-12-310000875357us-gaap:CarryingReportedAmountFairValueDisclosureMemberus-gaap:MortgageBackedSecuritiesIssuedByPrivateEnterprisesMember2022-12-310000875357us-gaap:EstimateOfFairValueFairValueDisclosureMemberus-gaap:MortgageBackedSecuritiesIssuedByPrivateEnterprisesMember2022-12-310000875357us-gaap:EstimateOfFairValueFairValueDisclosureMemberus-gaap:MortgageBackedSecuritiesIssuedByPrivateEnterprisesMemberus-gaap:FairValueInputsLevel1Member2022-12-310000875357us-gaap:EstimateOfFairValueFairValueDisclosureMemberus-gaap:FairValueInputsLevel2Memberus-gaap:MortgageBackedSecuritiesIssuedByPrivateEnterprisesMember2022-12-310000875357us-gaap:EstimateOfFairValueFairValueDisclosureMemberus-gaap:MortgageBackedSecuritiesIssuedByPrivateEnterprisesMemberus-gaap:FairValueInputsLevel3Member2022-12-310000875357us-gaap:CarryingReportedAmountFairValueDisclosureMemberus-gaap:CommercialPortfolioSegmentMember2022-12-310000875357us-gaap:EstimateOfFairValueFairValueDisclosureMemberus-gaap:CommercialPortfolioSegmentMember2022-12-310000875357us-gaap:EstimateOfFairValueFairValueDisclosureMemberus-gaap:FairValueInputsLevel1Memberus-gaap:CommercialPortfolioSegmentMember2022-12-310000875357us-gaap:EstimateOfFairValueFairValueDisclosureMemberus-gaap:FairValueInputsLevel2Memberus-gaap:CommercialPortfolioSegmentMember2022-12-310000875357us-gaap:EstimateOfFairValueFairValueDisclosureMemberus-gaap:FairValueInputsLevel3Memberus-gaap:CommercialPortfolioSegmentMember2022-12-310000875357us-gaap:CommercialRealEstatePortfolioSegmentMemberus-gaap:CarryingReportedAmountFairValueDisclosureMember2022-12-310000875357us-gaap:CommercialRealEstatePortfolioSegmentMemberus-gaap:EstimateOfFairValueFairValueDisclosureMember2022-12-310000875357us-gaap:CommercialRealEstatePortfolioSegmentMemberus-gaap:EstimateOfFairValueFairValueDisclosureMemberus-gaap:FairValueInputsLevel1Member2022-12-310000875357us-gaap:CommercialRealEstatePortfolioSegmentMemberus-gaap:EstimateOfFairValueFairValueDisclosureMemberus-gaap:FairValueInputsLevel2Member2022-12-310000875357us-gaap:CommercialRealEstatePortfolioSegmentMemberus-gaap:EstimateOfFairValueFairValueDisclosureMemberus-gaap:FairValueInputsLevel3Member2022-12-310000875357us-gaap:CarryingReportedAmountFairValueDisclosureMemberbokf:LoanstoindividualsMember2022-12-310000875357us-gaap:EstimateOfFairValueFairValueDisclosureMemberbokf:LoanstoindividualsMember2022-12-310000875357us-gaap:EstimateOfFairValueFairValueDisclosureMemberbokf:LoanstoindividualsMemberus-gaap:FairValueInputsLevel1Member2022-12-310000875357us-gaap:EstimateOfFairValueFairValueDisclosureMemberbokf:LoanstoindividualsMemberus-gaap:FairValueInputsLevel2Member2022-12-310000875357us-gaap:EstimateOfFairValueFairValueDisclosureMemberbokf:LoanstoindividualsMemberus-gaap:FairValueInputsLevel3Member2022-12-310000875357srt:ParentCompanyMember2023-12-310000875357srt:ParentCompanyMember2022-12-310000875357bokf:DividendsinterestandfeesreceivedfrombanksusidiariesMembersrt:ParentCompanyMember2023-01-012023-12-310000875357bokf:DividendsinterestandfeesreceivedfrombanksusidiariesMembersrt:ParentCompanyMember2022-01-012022-12-310000875357bokf:DividendsinterestandfeesreceivedfrombanksusidiariesMembersrt:ParentCompanyMember2021-01-012021-12-310000875357bokf:DividendsInterestAndFeesReceivedFromNonBankSubsidiariesMembersrt:ParentCompanyMember2023-01-012023-12-310000875357bokf:DividendsInterestAndFeesReceivedFromNonBankSubsidiariesMembersrt:ParentCompanyMember2022-01-012022-12-310000875357bokf:DividendsInterestAndFeesReceivedFromNonBankSubsidiariesMembersrt:ParentCompanyMember2021-01-012021-12-310000875357us-gaap:FinancialServiceOtherMembersrt:ParentCompanyMember2023-01-012023-12-310000875357us-gaap:FinancialServiceOtherMembersrt:ParentCompanyMember2022-01-012022-12-310000875357us-gaap:FinancialServiceOtherMembersrt:ParentCompanyMember2021-01-012021-12-310000875357srt:ParentCompanyMember2023-01-012023-12-310000875357srt:ParentCompanyMember2022-01-012022-12-310000875357srt:ParentCompanyMember2021-01-012021-12-310000875357srt:ParentCompanyMember2021-12-310000875357srt:ParentCompanyMember2020-12-3100008753572023-10-012023-12-31
UNITED STATES
SECURITIES AND EXCHANGE COMMISSION
Washington, D.C. 20549
FORM 10-K
(Mark One)
|
|
|
|
|
|
|
|
|
| ☒ |
|
ANNUAL REPORT PURSUANT TO SECTION 13 OR 15(d) OF THE SECURITIES EXCHANGE ACT OF 1934 |
For the fiscal year ended December 31, 2023
OR
|
|
|
|
|
|
|
|
|
| ☐ |
|
TRANSITION REPORT PURSUANT TO SECTION 13 OR 15(d) OF THE SECURITIES EXCHANGE ACT OF 1934 |
For the transition period from _____________ to ______________
Commission File No. 001-37811
BOK FINANCIAL CORP
(Exact name of registrant as specified in its charter)
|
|
|
|
|
|
|
|
|
|
|
|
| OK |
|
73-1373454 |
(State or other jurisdiction
of incorporation or organization) |
|
(I.R.S. Employer
Identification No.) |
| |
|
|
|
| Bank of Oklahoma Tower |
|
|
| Boston Avenue at Second Street |
|
|
| Tulsa, |
OK |
|
74172 |
| (Address of Principal Executive Offices) |
|
(Zip Code) |
(918) 588-6000
(Registrant’s telephone number, including area code)
|
|
|
|
|
|
|
|
|
|
|
|
|
|
|
| Securities registered pursuant to Section 12(b) of the Act: |
| Title of each class |
|
Trading Symbol |
|
Name of each exchange on which registered |
| Common Stock, par value $0.00006 per share |
|
BOKF |
|
Nasdaq Stock Market |
Securities registered pursuant to Section 12 (g) of the Act: None
Indicate by check mark if the registrant is a well-known seasoned issuer, as defined in Rule 405 of the Securities Act. Yes ý No ☐
Indicate by check mark if the registrant is not required to file reports pursuant to Section 13 or Section 15(d) of the Act. Yes ¨ No ý
Indicate by check mark whether the registrant (1) has filed all reports required to be filed by Section 13 or 15(d) of the Securities Exchange Act of 1934 during the preceding 12 months (or for such shorter period that the registrant was required to file such reports), and (2) has been subject to such filing requirements for the past 90 days. Yes ý No ¨
Indicate by check mark whether the registrant has submitted electronically every Interactive Data File required to be submitted pursuant to Rule 405 of Regulation S-T (§232.405 of this chapter) during the preceding 12 months (or for such shorter period that the registrant was required to submit such files). Yes ý No ¨
Indicate by check mark whether the registrant is a large accelerated filer, an accelerated filer, a non-accelerated filer, a smaller reporting company, or an emerging growth company. See definitions of "larger accelerated filer," "accelerated filer," and "smaller reporting company," and "emerging growth company" in Rule 12b-2 of the Exchange Act.
Large accelerated filer ý Accelerated filer ¨ Non-accelerated filer ¨ Smaller reporting company ☐ Emerging growth company ☐
If an emerging growth company, indicate by check mark if the registrant has elected not to use the extended transition period for complying with any new or revised financial accounting standards provided pursuant to Section 13(a) of the Exchange Act. ¨
Indicate by check mark whether the registrant has filed a report on and attestation to its management’s assessment of the effectiveness of its internal control over financial reporting under Section 404(b) of the Sarbanes-Oxley Act (15 U.S.C. 7262(b)) by the registered public accounting firm that prepared or issued its audit report. ☒
If securities are registered pursuant to Section 12(b) of the Act, indicate by check mark whether the financial statements of the registrant included in the filing reflect the correction of an error to previously issued financial statements. ¨
Indicate by check mark whether any of those error corrections are restatements that required a recovery analysis of incentive-based compensation received by any of the registrant's executive officers during the relevant recovery period pursuant to §240.10D-1(b). ¨
Indicate by check mark whether the registrant is a shell company (as defined in Rule 12b-2 of the Act). Yes ☐ No ý
The aggregate market value of the registrant's common stock ("Common Stock") held by non-affiliates is approximately $2.3 billion (based on the June 30, 2023 closing price of Common Stock of $80.78 per share). As of January 31, 2024, there were 65,064,299 shares of Common Stock outstanding.
DOCUMENTS INCORPORATED BY REFERENCE
Parts II and III incorporate certain information by reference from the Registrant’s Proxy Statement for the 2024 Annual Meeting of Shareholders.
BOK Financial Corporation
Form 10-K
Year Ended December 31, 2023
Index
|
|
|
|
|
|
|
|
|
|
|
|
|
|
|
|
|
|
Item 1 |
|
|
| Item 1A |
|
|
| Item 1B |
|
|
Item 1C |
|
|
| Item 2 |
|
|
| Item 3 |
|
|
| Item 4 |
|
|
|
|
|
|
|
|
| Item 5 |
|
|
| Item 6 |
|
|
| Item 7 |
|
|
| Item 7A |
|
|
| Item 8 |
|
|
| Item 9 |
|
|
| Item 9A |
|
|
| Item 9B |
|
|
|
|
|
|
|
|
| Item 10 |
|
|
| Item 11 |
|
|
| Item 12 |
|
|
| Item 13 |
|
|
| Item 14 |
|
|
|
|
|
|
|
|
| Item 15 |
|
|
|
|
|
|
|
|
|
|
|
Exhibit 10.4.13 |
Amended and Restated Employment Agreement between BOK Financial and Marc C. Maun dated November 3, 2021 |
|
Exhibit 10.4.14 |
Employment Agreement between BOK Financial and Brad A. Vincent dated August 23, 2021 |
|
Exhibit 10.7.16 |
BOK Financial Corporation Omnibus Incentive Plan effective January 1, 2013 |
|
| Exhibit 21 |
Subsidiaries of the Registrant |
|
| Exhibit 23 |
Consent of Independent Registered Public Accounting Firm |
|
| Exhibit 31.1 |
Chief Executive Officer Section 302 Certification |
|
| Exhibit 31.2 |
Chief Financial Officer Section 302 Certification |
|
| Exhibit 32 |
Section 906 Certifications |
|
Exhibit 97 |
BOK Financial Clawback Policy |
|
GLOSSARY OF DEFINED TERMS
The following items may be used throughout this report, including the consolidated financial statements and related notes.
|
|
|
|
|
|
|
|
|
| Term |
|
Definition |
| AFS |
|
Available For Sale |
| AIRS® |
|
Advanced Internet Recruitment Strategies |
| AOCI |
|
Accumulated Other Comprehensive Income |
ASU |
|
Accounting Standards Update |
| ATM |
|
Automated Teller Machine |
| BCBS |
|
Basel Committee on Banking Supervision |
| BHCA |
|
Bank Holding Company Act of 1956 |
| Board |
|
Board of Directors of BOK Financial Corporation |
| BOK Financial |
|
BOK Financial Corporation |
| BOKF |
|
BOK Financial Corporation |
BOKF Insurance |
|
BOK Financial Insurance, Inc. |
| BSA |
|
Bank Secrecy Act |
| CECL |
|
Current Expected Credit Losses |
| CET1 |
|
Common Equity Tier 1 Capital |
| CFPB |
|
Consumer Financial Protection Bureau |
| CFTC |
|
Commodity Futures Trading Commission |
| CISO |
|
Chief Information Security Officer |
| Company |
|
BOK Financial Corporation |
| CoP |
|
Communities of Practice |
| COSO |
|
Committee of Sponsoring Organizations |
| CRA |
|
Community Reinvestment Act of 1977 |
CRE |
|
Commercial Real Estate |
| DEI |
|
Diversity, Equity and Inclusion |
| DIF |
|
Deposit Insurance Fund |
| Dodd-Frank Act |
|
Dodd-Frank Wall Street Reform and Consumer Protection Act |
| EFT |
|
Electronic Funds Transfer |
| FASB |
|
Financial Accounting Standards Board |
| FCA |
|
U.K Financial Conduct Authority |
| FDIC |
|
Federal Deposit Insurance Corporation |
| FDICIA |
|
Federal Deposit Insurance Corporation Improvement Act of 1991 |
| Federal Reserve Board |
|
Board of Governors of the Federal Reserve System |
FHLB |
|
Federal Home Loan Bank |
| FINRA |
|
Financial Industry Regulatory Authority |
| GAAP |
|
Generally Accepted Accounting Principles in the United States of America |
| GDP |
|
Gross Domestic Product |
| GNMA |
|
Government National Mortgage Association |
| HBCUs |
|
Historically Black Colleges and Universities |
| ISMS |
|
Information Security Management System |
| ISO |
|
International Organization for Standardization |
| KBW |
|
Keefe, Bruyette & Woods |
| LIBOR |
|
London Interbank Offered Rate |
| LIBOR Act |
|
Adjustable Interest Rate (LIBOR) Act |
MSR |
|
Mortgage Servicing Rights |
| NASDAQ |
|
National Association of Securities Dealers Automated Quotations |
| NIST |
|
National Institute of Standards and Technology |
|
|
|
|
|
|
|
|
|
| Term |
|
Definition |
| NYMEX |
|
New York Mercantile Exchange |
| OCC |
|
Office of the Comptroller of the Currency |
| PATRIOT Act |
|
USA PATRIOT Act of 2001 |
| PCAOB |
|
Public Company Accounting Oversight Board |
| Pension Plan |
|
BOK Financial Corporation sponsored defined benefit cash balance pension plan |
| PPNR |
|
Pre-Provision Net Revenue |
| RMHFS |
|
Residential Mortgages Held for Sale |
| RSUs |
|
Restricted Stock Units |
| S&P |
|
Standard & Poor's |
| SEC |
|
Securities and Exchange Commission |
| SOC |
|
Service Organization Controls |
| SOFR |
|
Secured Overnight Financing Rate |
| SVaR |
|
Stressed Value at Risk |
| TDRs |
|
Troubled Debt Restructurings |
| Thrift Plan |
|
BOK Financial Corporation sponsored defined contribution plan |
| Tier 2 |
|
Supplementary capital |
| TransFund |
|
BOKF's electronic funds transfer network |
| VA |
|
U.S. Department of Veterans Affairs |
| VaR |
|
Value at Risk |
| VIEs |
|
Variable Interest Entities |
| WTI |
|
West Texas Intermediate |
|
|
|
|
|
|
|
|
|
|
|
|
|
|
|
|
|
|
|
|
|
|
|
|
|
|
|
PART I
ITEM 1. BUSINESS
General
Developments relating to individual aspects of the business of BOK Financial are described below. Additional discussion of the Company’s activities during the current year appears within Item 7 "Management’s Discussion and Analysis of Financial Condition and Results of Operations."
Description of Business
BOK Financial is a financial holding company incorporated in the state of Oklahoma in 1990 whose activities are governed by the BHCA, as amended by the Financial Services Modernization Act or Gramm-Leach-Bliley Act and the Dodd-Frank Act. BOK Financial offers full service banking in Oklahoma, Texas, New Mexico, Northwest Arkansas, Colorado, Arizona, and Kansas/Missouri. At December 31, 2023, the Company reported total consolidated assets of $50 billion.
BOKF, NA is a wholly owned subsidiary bank of BOK Financial. BOKF, NA operates TransFund and Cavanal Hill Investment Management. BOKF, NA operates banking divisions across eight states: Bank of Albuquerque, Bank of Oklahoma, Bank of Texas and BOK Financial in Arizona, Arkansas, Colorado, Kansas and Missouri; as well as having limited purpose offices in Nebraska, Wisconsin, Connecticut and Tennessee. Other wholly owned subsidiaries of BOK Financial include BOK Financial Securities, Inc., a broker/dealer that primarily engages in retail and institutional securities sales and municipal bond underwriting; and BOK Financial Private Wealth, Inc., an investment adviser to high net worth clients. During the fourth quarter of 2023, BOK Financial sold its wholly owned subsidiary BOKF Insurance, a broker providing insurance services. Other non-bank subsidiary operations do not have a significant effect on the Company’s financial statements.
Our overall strategic objective is to emphasize growth in long-term value by building on our leadership position in Oklahoma through expansion into other high-growth markets in contiguous states. We operate primarily in the metropolitan areas of Tulsa and Oklahoma City, Oklahoma; Dallas, Fort Worth, Houston and San Antonio, Texas; Albuquerque, New Mexico; Denver, Colorado; Phoenix, Arizona, and Kansas City, Kansas/Missouri. Our acquisition strategy targets fairly priced quality organizations with demonstrated solid growth that would supplement our principal lines of business. We provide additional growth opportunities by hiring talent to enhance competitiveness, adding locations and broadening product offerings. Our operating philosophy embraces local decision-making in each of our geographic markets while adhering to common Company standards.
Our primary focus is to provide a comprehensive range of nationally competitive financial products and services in a personalized and responsive manner. Products and services include loans and deposits, cash management services, fiduciary services, mortgage banking and brokerage and trading services to middle-market businesses, financial institutions and consumers. Commercial banking represents a significant part of our business. Our credit culture emphasizes building relationships by making high quality loans and providing a full range of financial products and services to our customers. We also offer products that leverage our energy financing expertise and enable us to offer commodity derivatives for customers to use in their risk management. Our diversified base of revenue sources is designed to generate returns across a range of economic situations. Wealth management also continues to be a strategic focus. We provide liquidity to the mortgage markets through trading of U.S. government agency issued mortgage-backed securities and related derivative contracts and currently service approximately $100 billion of assets under management or administration.
BOK Financial’s corporate headquarters is located at Bank of Oklahoma Tower, Boston Avenue at Second Street, Tulsa, Oklahoma 74172.
The Company’s Annual Reports on Form 10-K, Quarterly Reports on Form 10-Q, Current Reports on Form 8-K and amendments to those reports are available on the Company’s website at www.bokf.com as soon as reasonably practicable after the Company electronically files such material with or furnishes it to the Securities and Exchange Commission.
Operating Segments
BOK Financial operates three principal lines of business: Commercial Banking, Consumer Banking and Wealth Management. Commercial Banking includes lending, treasury and cash management services and customer commodity risk management products for small businesses, middle market and larger commercial customers. Commercial Banking also includes the TransFund electronic funds network. Consumer Banking includes retail lending and deposit services, lending and deposit services to small business customers served through the retail branch network and all mortgage loan origination and servicing activities. Wealth Management engages in brokerage and trading activities mainly related to providing liquidity to the mortgage markets through trading of U.S. government agency mortgage-backed securities and related derivative contracts. Wealth Management also provides fiduciary services, private bank services and investment advisory services in all markets. Additionally, Wealth Management underwrites state and municipal securities. Discussion of these principal lines of business appears within the Lines of Business section of "Management's Discussion and Analysis of Financial Condition and Results of Operations."
Competition
BOK Financial and its operating segments face competition from other banks, thrifts, credit unions and other non-bank financial institutions such as investment banking firms, investment advisory firms, brokerage firms, investment companies, financial technology firms, government agencies, mortgage brokers and insurance companies. The Company competes largely on the basis of customer services, interest rates on loans and deposits, lending limits and customer convenience. Some operating segments face competition from institutions that are not as closely regulated as banks, and therefore are not limited by the same capital requirements and other restrictions. All market share information presented below is based upon share of deposits in specified areas according to the FDIC as of June 30, 2023.
We are the largest financial institution in the state of Oklahoma with 13% of the state’s total deposits. We have 30% and 12% of the market share in the Tulsa and Oklahoma City areas, respectively. We compete with two banks that have operations nationwide and have greater access to funds at lower costs, higher lending limits, and greater access to technology resources. We also compete with regional and locally-owned banks in both the Tulsa and Oklahoma City areas as well as in every other community in which we do business throughout the state.
We compete against numerous financial institutions in the state of Texas, including some of the largest in the United States, and have a market share of approximately 1% in the Dallas, Fort Worth area and less than 1% in the Houston area. We have a 9% market share in the Albuquerque area and compete with four large national banks, some regional banks and several locally-owned smaller community banks. Our market share is approximately 3% in the Denver area. We serve Benton and Washington counties in Arkansas with a market share of approximately 1%. Our market share is approximately 2% in the Kansas City, Missouri/Kansas area and approximately 1% in the Phoenix area. The Company’s ability to expand into additional states remains subject to various federal and state laws.
Human Capital Management and Practices
In order to continue leading the industry as a provider of financial solutions to businesses, institutions and individuals across the country, it is crucial that we attract, develop and retain top talent. To facilitate talent attraction and retention, we strive to make BOK Financial an inclusive workplace with opportunities for our employees to grow and develop in their careers. We support our employees with strong compensation, benefits, wellness programs and development resources. We also work to build connections between our employees and our communities. "Actively advancing the communities we serve" is one of our core values. Those familiar with BOK Financial will recognize the generosity of our employees in our communities as one of the hallmarks of our culture and a source of pride as we live out our purpose statement of "Achieving More Together."
Our talented workforce is the key to our success. At December 31, 2023, we had 4,966 full-time and part-time employees, the majority of which are full-time employees. None of the Company’s employees are represented by collective bargaining agreements. Management considers its employee relations to be good. Our employees are primarily distributed over our eight state footprint, to include: Oklahoma, Texas, Arkansas, Kansas, Missouri, Colorado, New Mexico and Arizona.
Diversity and Inclusion Efforts
Diversity, equity, and inclusion are essential to our vision and purpose and are a core leadership competency for BOK Financial. We believe our organization should reflect the diversity of the communities we serve.
Our DEI Council seeks to excel and grow our company by valuing and leveraging the power of diversity, equity, and inclusion. The DEI Council works to ensure our company continues to foster and support an environment that is inclusive of the diverse values, opinions, experiences, cultures, and needs of our employees, clients, and communities. The Council is chaired by Stacy Kymes, President and Chief Executive Officer, with membership comprising leaders and influencers representing divisions across the Company. Members each serve a three-year term.
We also recognize that for a diverse workforce to thrive, we must prioritize inclusion efforts. The following categories represent areas of focus for DEI: community engagement, senior leader engagement, Communities of Practice and diverse recruiting practices and education.
As of December 31, 2023, 55% of our overall workforce was female, and 32% of our overall workforce was comprised of people of color. In 2023, BOK Financial was again recognized by ‘Diversity, Inc.’ as one of the ‘Top Regional Companies’ with respect to scoring criteria related to DEI organizational practices.
Community Engagement
In 2023, the Company and the BOKF Foundation gave a combined $9.0 million to organizations making a difference in our communities. Since 2013, we have committed more than $1.0 billion in loan funding to support affordable housing projects and $391 million in affordable housing investments.
In 2023, our employees donated more than 50,000 volunteer hours, and more than 400 employees served in 732 leadership roles with 495 nonprofit organizations. BOK Financial is a certifying organization for the President’s Volunteer Service Award, a program to celebrate individual volunteerism and commitment to community service. For 2023, the company recognized 142 employees who volunteered 100 hours or more with numerous nonprofit organizations across our footprint.
Senior Leader Engagement
Our DEI Council is led by our CEO and President, Stacy Kymes, and includes other members of our executive leadership team as well as senior leaders throughout our footprint. We are members of the ‘CEO Action for Diversity and Inclusion’ Pledge. The pledge outlines our commitment to cultivating a trusting environment where all ideas are welcomed, and employees feel comfortable and empowered to have discussions about diversity and inclusion.
Mentorship Program
Our mentorship program launched in late 2020. We believe mentorship programs are a valuable tool for helping employees successfully shape their long-term career trajectory. Mentor matches are prioritized for females and people of color. In 2023, we launched Cohort 6 with 225 mentors/mentees participating in the program. In 2023, 34% of our participants were people of color and 50% were female.
Communities of Practice
In 2020, we introduced a concept from Harvard Business Review called ‘CoP’ as a way for our organization to build inclusive groups to harness the collective power of diverse skills, styles, strengths and experiences – and leverage those strengths into advancing our business. CoP also provide exposure opportunities for employees to interact with others across the organization at all levels. As of December 31, 2023, we had 21 active CoP, including: Advancing Minority Owned Businesses, Mentoring, Practicing Inclusion, Diverse Recruiting Practices, Engagement Practices and Culture Ambassadors. Any person from across the organization can join any CoP; these groups highlight our enterprise focus on inclusivity.
Diverse Recruiting Practices
Our recruiting organization is fully AIRS® Certified and held accountable to monthly recruitment outreach efforts to diverse organizations, including HBCUs. University recruiting has been a focal point for our diversity efforts. In 2023, 28% of our class of interns and early career associates identified as people of color.
Diversity Education
As we continue our DEI journey, our custom course of Leveraging Inclusion and Mitigating Unconscious Bias is assigned to all new managers to provide tools that support awareness of the automatic patterns of thinking as they learn to manage teams at BOK Financial. Our custom Conscious Inclusion Toolkit provides an opportunity for all employees to focus on inclusion through strategies, activities, and resources that deepen their knowledge and skills around inclusive conversations. We also partner with LinkedIn Learning® to ensure all employees across the Company have equal access to development opportunities, including two custom on demand learning paths focused on DEI concepts, and over 3,000 on demand DEI courses available as of December 2023.
Benefits and Compensation Offerings
BOK Financial is committed to the health and wellness of our employees. We provide our employees and their families with access to a variety of flexible and convenient health and wellness programs. We encourage engagement in healthy behaviors and offer options, where possible, to customize benefits to meet the needs of employees and their families. We provide robust compensation and benefits programs to help meet the needs of our employees. In addition to base salaries, these programs may include incentive compensation, discretionary bonuses, equity, 401(k), health and wellness benefits, health savings and flexible spending accounts, paid time off, family leave, flexible work schedules, employee assistance programs and tuition reimbursement.
Talent Development
Our talent development programs provide employees with resources they need to achieve their career goals. Development offerings are focused on supporting career development goals, increasing skill sets, and preparing employees to expand in their current role or develop for future roles. We offer a variety of learning resources, from on demand content from LinkedIn® and GetAbstract®, to interactive sessions facilitated by Talent Development Consultants. Our employees are provided many opportunities to advance their careers within our organization. During 2023, 31% of all of positions filled were with internal employees.
Connecting with Our Employees
Engagement is an important component of our culture. We encourage our employees to provide feedback in a survey format with the last one completed in 2023. In 2023, 94% of our workforce participated in the survey, and results were shared and discussed across the Company. We are proud to say the level of our employees' engagement is considered world class.
Connecting with Our Communities
Our employees are passionate about many causes, and the Company’s corporate giving and volunteering programs support and encourage employees by engaging with those causes. Our employee-led giving program allows employees to nominate and vote for nonprofit organizations across our footprint to receive financial benefit from the BOKF Foundation. During 2023, the Company launched Dollars for Doers, a program which rewards our employees for living our core value to actively advance the communities we serve. In 2023, the company matched employee volunteer hours with a total of $4,547 in contributions to employees' chosen non-profit organizations across our footprint. In 2023, over 1,500 employees nominated and voted on 112 nonprofit organizations to receive funding. We continue to strategically focus on charitable contributions to accelerate resources to underserved minority communities of color by supporting nonprofit organizations providing programs to help close gaps in two key areas – income inequality and workforce development – identified as the most crucial to help break the cycle of poverty and put people on the path for long term success, sustainability, and wealth creation.
Supervision and Regulation
BOK Financial and its subsidiaries are subject to extensive regulations under federal and state laws. Both the scope of the laws and regulations and the intensity of the supervision to which our business is subject have increased in recent years. Regulatory enforcement and fines have also increased across the banking and financial services sector. Many of these changes have occurred as a result of the Dodd-Frank Act and its implementing regulations, most of which are now in place. These regulations and others are designed to promote safety and soundness, protect consumers and ensure the stability of the banking system as a whole. The purpose of these regulations is not necessarily to protect shareholders and creditors. As detailed below, these regulations require the Company and its subsidiaries to maintain certain capital balances and require the Company to provide financial support to its subsidiaries. These regulations may restrict the Company’s ability to diversify, to acquire other institutions and to pay dividends on its capital stock. These regulations also include requirements on certain programs and services offered to our customers, including restrictions on fees charged for certain services. The Company expects that its business will remain subject to extensive regulation and supervision.
The following information summarizes certain existing laws and regulations that affect the Company’s operations. It does not summarize all provisions of these laws and regulations and does not include all laws and regulations that affect the Company presently or in the future.
General
As a financial holding company, BOK Financial is regulated under the BHCA and is subject to regular inspection, examination and supervision by the Federal Reserve Board. Under the BHCA, BOK Financial files quarterly reports and other information with the Federal Reserve Board.
BOKF, NA is organized as a national banking association under the National Banking Act, and is subject to regulation, supervision and examination by the OCC, the FDIC, the Federal Reserve Board, the CFPB and other federal and state regulatory agencies. The OCC has primary supervisory responsibility for national banks and must approve certain corporate or structural changes including changes in capitalization, payment of dividends, change of place of business, and establishment of a branch or operating subsidiary. The OCC performs examinations concerning safety and soundness, the quality of management and directors, information technology and compliance with applicable regulations. The National Banking Act authorizes the OCC to examine every national bank as often as necessary.
A financial holding company, and the companies under its control, are permitted to engage in activities considered "financial in nature" as defined by the BHCA, Gramm-Leach-Bliley Act and Federal Reserve Board interpretations. Activities that are "financial in nature" include securities underwriting and dealing, insurance underwriting, merchant banking, operating a mortgage company, performing certain data processing operations, servicing loans and other extensions of credit, providing investment and financial advice, owning and operating savings and loan associations, and leasing personal property on a full pay-out, non-operating basis. A financial holding company is required to notify the Federal Reserve Board within thirty days of engaging in new activities determined to be "financial in nature." BOK Financial is engaged in some of these activities and has notified the Federal Reserve Board.
In order for a financial holding company to commence any new activity permitted by the BHCA, each insured depository institution subsidiary of the financial holding company must be "well capitalized" and "well managed" and have received a rating of at least "satisfactory" in its most recent examination under the Community Reinvestment Act. A financial holding company and its depository institution subsidiaries are considered to be "well capitalized" if they meet the requirements discussed in the section captioned "Capital Adequacy and Prompt Corrective Action" which follows. A financial holding company and its depository institution subsidiaries are considered to be "well managed" if they receive a composite rating and management rating of at least "satisfactory" in their most recent examinations. If a financial holding company fails to meet these requirements, the Federal Reserve Board may impose limitations or conditions on the conduct of its activities and the company may not commence any new financial activities without prior approval.
The BHCA requires the Federal Reserve Board’s prior approval for the direct or indirect acquisition of more than five percent of any class of voting stock of any non-affiliated bank. Under the Federal Bank Merger Act, the prior approval of the OCC is required for a national bank to merge with another bank or purchase the assets or assume the deposits of another bank. In reviewing applications seeking approval of merger and acquisition transactions, the bank regulatory authorities consider, among other things, the competitive effect and public benefits of the transactions, the capital position of the combined organization, the applicant’s performance record under the Community Reinvestment Act and fair housing laws and the effectiveness of the subject organizations in combating money laundering activities.
A financial holding company and its subsidiaries are prohibited under the BHCA from engaging in certain tie-in arrangements in connection with the provision of any credit, property or services. Thus, a subsidiary of a financial holding company may not extend credit, lease or sell property, furnish any services or fix or vary the consideration for these activities on the condition that (1) the customer obtain or provide additional credit, property or services from or to the financial holding company or any subsidiary thereof, or (2) the customer may not obtain some other credit, property or services from a competitor, except to the extent reasonable conditions are imposed to insure the soundness of credit extended.
The Company and other non-bank subsidiaries are also subject to other federal and state laws and regulations. For example, BOK Financial Securities, Inc. is regulated by the SEC, the FINRA, the Federal Reserve Board, and state securities regulators. Such regulations generally include licensing of certain personnel, customer interactions and trading operations.
Enhanced Prudential Standards
The Dodd-Frank Act directed the Federal Reserve Board to monitor emerging risks to financial institutions and enacted enhanced supervision and prudential standards applicable to bank holding companies with consolidated assets of $50 billion or more and non-bank covered companies designated as systematically important to the Financial Stability Oversight Council (often referred to as systemically important financial institutions). The Dodd-Frank Act mandated that certain regulatory requirements applicable to systemically important financial institutions be more stringent than those applicable to other financial institutions.
Subsequent legislation raised the threshold for systemically important financial institutions from $50 billion to $250 billion while providing the Federal Reserve Board with authority to establish incremental prudential standards for banks between $100 billion and $250 billion. Current rules adopted by the OCC require heightened standards for financial institutions that report at least $50 billion of average consolidated assets over a four quarter period after an 18-month grace period. These heightened standards require establishing and implementing a risk governance framework to cover the bank's risk-taking activities.
Consumer Financial Protection
We are subject to a number of federal and state consumer protection laws that extensively govern our relationship with our customers. These laws include the Equal Credit Opportunity Act, the Fair Credit Reporting Act, the Truth in Lending Act, the Truth in Savings Act, the Electronic Fund Transfer Act, the Expedited Funds Availability Act, the Home Mortgage Disclosure Act, the Fair Housing Act, the Real Estate Settlement Procedures Act, the Fair Debt Collection Practices Act, the Service Members Civil Relief Act and these laws’ respective state-law counterparts, as well as state usury laws and laws regarding unfair and deceptive acts and practices. These and other federal laws, among other things, require disclosures of the cost of credit and terms of deposit accounts, provide substantive consumer rights, prohibit discrimination in credit transactions, regulate the use of credit report information, provide financial privacy protections, prohibit unfair, deceptive and abusive practices, restrict our ability to raise interest rates and subject us to substantial regulatory oversight. Violations of applicable consumer protection laws can result in significant potential liability from litigation brought by customers, including actual damages, restitution and attorneys’ fees. Federal bank regulators, state attorneys general and state and local consumer protection agencies may also seek to enforce consumer protection requirements and obtain these and other remedies, including regulatory sanctions, customer rescission rights, action by the state and local attorneys general in each jurisdiction in which we operate and civil money penalties. Failure to comply with consumer protection requirements may also damage our reputation and result in our failure to obtain any required bank regulatory approval for merger or acquisition transactions we may wish to pursue or our prohibition from engaging in such transactions even if approval is not required.
The CFPB has broad rule-making authority for a wide range of consumer financial laws that apply to all banks, including, among other things, the authority to prohibit "unfair, deceptive or abusive" acts and practices. Abusive acts or practices are defined as those that materially interfere with a consumer's ability to understand a term or condition of a consumer financial product or service or take unreasonable advantage of a consumer's (i) lack of financial savvy, (ii) inability to protect himself in the selection or use of consumer financial products or services, or (iii) reasonable reliance on a covered entity to act in the consumer’s interests. The CFPB can issue cease-and-desist orders against banks and other entities that violate consumer financial laws. The CFPB may also institute a civil action against an entity in violation of federal consumer financial laws in order to impose a civil penalty or injunction.
Community Reinvestment Act
The CRA requires depository institutions to assist in meeting the credit needs of their market areas consistent with safe and sound banking practices. Under the CRA, each depository institution is required to help meet the credit needs of its market areas by, among other things, providing credit to low- and moderate-income individuals and communities. Depository institutions are periodically examined for compliance with the CRA and are assigned ratings. In order for a financial holding company to commence any new activity permitted by the BHCA, or to acquire any company engaged in any new activity permitted by the BHCA, each insured depository institution subsidiary of the financial holding company must have received a rating of at least "satisfactory" in its most recent examination under the CRA. Furthermore, banking regulators take into account CRA ratings when considering a request for an approval of a proposed transaction. BOKF, NA received a rating of "outstanding" in its most recent CRA examination, which is above "satisfactory."
Financial Privacy
The federal banking regulators adopted rules that limit the ability of banks and other financial institutions to disclose non-public information about consumers to non-affiliated third parties. These limitations require disclosure of privacy policies to consumers and, in some circumstances, allow consumers to prevent disclosure of certain personal information to a non-affiliated third party. These regulations affect how consumer information is transmitted through diversified financial companies and is conveyed to outside parties.
Capital Adequacy and Prompt Corrective Action
The Federal Reserve Board, the OCC and the FDIC have issued substantially similar risk-based and leverage capital guidelines applicable to United States banking organizations to ensure capital adequacy based upon the risk levels of assets and off-balance sheet financial instruments. In addition, these regulatory agencies may from time to time require that a banking organization maintain capital above the minimum levels, whether because of its financial condition or actual or anticipated growth. Capital adequacy guidelines and prompt corrective action regulations involve quantitative measures of assets, liabilities, and certain off-balance sheet items calculated under regulatory accounting practices. Capital amounts and classifications are also subject to qualitative judgments by regulators regarding components, risk weighting and other factors.
Federal Reserve Board risk-based guidelines define four capital metrics based on three categories of regulatory capital. CET1 includes common shareholders' equity, less goodwill, most intangible assets and other adjustments. Tier 1 capital consists of CET1 capital plus certain additional capital instruments and related surplus. Tier 2 consists of preferred stock not qualifying as Tier 1 capital, qualifying mandatory convertible debt securities, limited amounts of subordinated debt, other qualifying term debt and allowances for credit losses, subject to limitations. Assets and off-balance sheet exposures are assigned to categories of risk-weights, based primarily upon relative credit risk. Risk-based capital ratios are calculated by dividing CET1, Tier 1 and total capital by risk-weighted assets. In addition to the risk-based capital ratios, the Company is also subject to the leverage ratio. The leverage ratio is determined by dividing Tier 1 capital by adjusted average total assets.
Additional capital rules were effective for banks and bank holding companies, including BOK Financial, on January 1, 2015 as part of a package of regulatory reforms developed by the BCBS to strengthen the regulation, supervision and risk management of the banking sector, commonly referred to as the Basel III framework.
Failure to meet minimum capital requirements would be subject to regulatory restrictions on capital distributions (including but not limited to dividends and share repurchases) and executive bonus payments.
The FDICIA, among other things, identifies five capital categories for insured depository institutions from well capitalized to critically under-capitalized and requires the respective federal regulatory agencies to implement systems for prompt corrective action for institutions failing to meet minimum capital requirements within such categories. FDICIA imposes progressively more restrictive covenants on operations, management and capital distributions, depending upon the category in which an institution is classified. The various regulatory agencies have adopted substantially similar regulations that define the five capital categories identified by FDICIA, using the total risk-based capital, Tier 1 risk-based capital and leverage capital ratios as the relevant capital measures. Such regulations establish various degrees of corrective action to be taken when an institution is considered under-capitalized.
Stress Testing
The Regulatory Relief Act eliminated the requirement for periodic company run capital stress tests known as the Dodd-Frank Act Stress Test for banks with assets less than $250 billion. Although the mandate has been lifted, the Company still continues to perform capital stress testing on a regular basis.
Executive and Incentive Compensation
Guidelines adopted by federal banking agencies prohibit excessive compensation as an unsafe and unsound practice and describe compensation as excessive when the amounts paid are unreasonable or disproportionate to the services performed by an executive officer, employee, director or principal shareholder. The Federal Reserve Board has issued comprehensive guidance on incentive compensation intended to ensure that the incentive compensation policies do not undermine safety and soundness by encouraging excessive risk taking. This guidance covers all employees that have the ability to materially affect the risk profile of an organization, either individually or as part of a group, based on key principles that (i) incentives do not encourage risk-taking beyond the organization's ability to identify and manage risk, (ii) compensation arrangements are compatible with effective internal controls and risk management, and (iii) compensation arrangements are supported by strong corporate governance, including active and effective board oversight. Deficiencies in compensation practices may affect supervisory ratings and enforcement actions may be taken if incentive compensation arrangements pose a risk to safety and soundness.
Deposit Insurance
Substantially all of the deposits held by the subsidiary banks are insured up to applicable limits by the DIF of the FDIC and are subject to deposit insurance assessments to maintain the DIF. The FDIC, as required under the Federal Deposit Insurance Act, established a plan in September 2020 to restore the DIF reserve ratio to meet or exceed the statutory minimum of 1.35 percent within eight years. This plan did not include an increase in the deposit insurance assessment rate. Based on the FDIC's recent projections, however, the FDIC determined that the DIF reserve ratio is at risk of not reaching the statutory minimum by the statutory deadline of September 30, 2028 without increasing the deposit insurance assessment rates. On October 18, 2022, the FDIC finalized a rule that increased the initial base deposit insurance assessment rates by 2 basis points beginning with the first quarterly assessment period of 2023. The increased assessment improves the likelihood that the DIF reserve ratio would reach the required minimum by the statutory deadline, consistent with the FDIC's Amended Restoration Plan. The rule became effective as of January 1, 2023.
On November 16, 2023, the FDIC approved a final rule to implement a special assessment on certain banking organizations with financial institution subsidiaries with more than $5 billion in assets in order to recover the costs associated with protecting uninsured depositors following the closures of Silicon Valley Bank and Signature Bank in March 2023. The special assessment will be collected beginning with the first quarterly assessment period of 2024 at an annual rate of approximately 13.4 basis points for an anticipated total of eight quarterly periods and is subject to periodic adjustments. The assessment base is equal to uninsured deposits reported as of December 31, 2022, adjusted to exclude the first $5 billion.
Dividends
A key source of liquidity for BOK Financial is dividends from BOKF, NA, which is limited by various banking regulations to net profits, as defined, for the year plus retained profits for the preceding two years. Dividends are further restricted by minimum capital requirements and the Company's internal capital policy. BOKF, NA's dividend limitations are discussed under the heading "Liquidity and Capital" within "Management's Discussion and Analysis of Financial Condition and Results of Operations."
Source of Strength Doctrine
According to Federal Reserve Board policy, a bank holding company is expected to act as a source of financial strength to each subsidiary bank and to commit resources to support each such subsidiary. This support may be required at times when a bank holding company may not be able to provide such support.
Transactions with Affiliates
The Federal Reserve Board regulates transactions between the Company and its subsidiaries. Generally, the Federal Reserve Act and Regulation W, as amended by the Dodd-Frank Act, limit the Company's banking subsidiary and its subsidiaries, to lending and other "covered transactions" with affiliates. The aggregate amount of covered transactions a banking subsidiary or its subsidiaries may enter into with an affiliate may not exceed 10% of the capital stock and surplus of the banking subsidiary. The aggregate amount of covered transactions with all affiliates may not exceed 20% of the capital stock and surplus of the banking subsidiary.
Covered transactions with affiliates are also subject to collateral requirements and must be conducted on arm's length terms. Covered transactions include (a) a loan or extension of credit by the banking subsidiary, including derivative contracts, (b) a purchase of securities issued to a banking subsidiary, (c) a purchase of assets by the banking subsidiary unless otherwise exempted by the Federal Reserve, (d) acceptance of securities issued by an affiliate to the banking subsidiary as collateral for a loan, and (e) the issuance of a guarantee, acceptance or letter of credit by the banking subsidiary on behalf of an affiliate.
Bank Secrecy Act and USA PATRIOT Act
The BSA and the PATRIOT Act impose many requirements on financial institutions in the interest of national security and law enforcement. BSA requires banks to maintain records and file suspicious activity reports that are of use to law enforcement and regulators in combating money laundering and other financial crimes. The PATRIOT Act is intended to deny terrorists and criminals the ability to access the U.S. financial services system and places significantly greater requirements on financial institutions. Financial institutions, such as the Company and its subsidiaries, must have a designated BSA Officer, internal controls, independent testing and training programs commensurate with their size and risk profile. As part of its internal control program, a financial institution is expected to have effective customer due diligence and enhanced due diligence requirements for high-risk customers, as well as processes to prohibit transactions with entities subject to Office of Foreign Asset Control sanctions. Documentation and recordkeeping requirements, as well as system requirements, aimed at identifying and reporting suspicious activity reporting, must increase with the institution's size and complexity. Failure to implement or maintain adequate programs and controls to combat terrorist financing and money laundering may have serious legal, financial and reputational consequences.
Volcker and Swap Rules
Title VI of the Dodd-Frank Act, commonly known as the Volcker Rule, prohibits the Company from (1) engaging in short-term proprietary trading for our own account, and (2) having certain ownership interests in or relationships with private equity or hedge funds. The fundamental prohibitions of the Volcker Rule apply to banking entities of any size, including the Company and its bank subsidiary. Trading activity remains largely unaffected by the Volcker Rule as most of our trading activity is exempted or excluded from the proprietary trading prohibitions.
Title VII of the Dodd-Frank Act, commonly known as the Swap Rule, subjects nearly all derivative transactions to the regulations of the CFTC or SEC. This includes registration, recordkeeping, reporting, capital, margin and business conduct requirements on swap dealers and major swap participants. Under CFTC and SEC rules, entities transacting in less than $8 billion in notional value of swaps over any 12 month period are exempt from the definition of and registration as a "swap dealer." The Company currently estimates that the nature and volume of its swaps activity will not require it to register as a swap dealer.
Governmental Policies and Economic Factors
The operations of BOK Financial and its subsidiaries are affected by legislative changes and by the policies of various regulatory authorities and, in particular, the policies of the Federal Reserve Board. The Federal Reserve Board has statutory objectives to maximize employment and maintain price stability. Among the instruments of monetary policy used by the Federal Reserve Board to implement these objectives are: open-market operations in U.S. government securities, changes in the discount rate and federal funds rate on bank borrowings, and changes in reserve requirements on bank deposits. The effect of future changes in such policies on the business and earnings of BOK Financial and its subsidiaries is uncertain.
In an effort to reduce the four-decade inflation high, the Federal Reserve continued raising the Federal Funds rate in 2023. Following the seven rate increases totaling 425 basis points in the prior year, the Federal Reserve raised the Federal Funds rate four more times through July 2023 totaling 100 basis points. This has slowed the housing market, but home prices remain elevated and supply remains constrained. Consumer spending also continues to remain steady despite the Federal Reserve's effort to decrease spending with increased rates. Oil prices have remained somewhat volatile this year with the Russia-Ukraine and Israel-Hamas conflicts, but are more stable than was experienced in 2022. Unemployment remains low, coming in at 3.7% for December 2023.
Our base case economic forecast for the fourth quarter of 2023 assumed geopolitical conflicts remain isolated. Inflation continues to improve from previous peaks and reaches 2.6% by the end of 2024. The federal funds rate target range of 5.25% to 5.50% is held flat for the remainder of 2024. Job openings revert to more normalized levels and overall hiring levels decline, causing the national unemployment rate to modestly increase over the next four quarters. Inflation pressures ease and help stabilize real household income compared to pre-pandemic levels, while a restrictive credit environment slows economic activity resulting in below-trend GDP growth. See "Summary of Credit Loss Experience" section in "Management's Discussion and Analysis" for further discussion around our economic forecast.
Foreign Operations
BOK Financial does not engage in operations in foreign countries, nor does it lend to foreign governments.
ITEM 1A. RISK FACTORS
BOK Financial Corporation and its subsidiaries could be adversely affected by risks and uncertainties that could have a material impact on its financial condition and results of operations, as well as on its common stock and other financial instruments. Risk factors which are significant to the Company include, but are not limited to:
Strategic, Compliance and Regulatory Risk Factors
Adverse factors could impact BOK Financial's ability to implement its operating strategy.
Although BOK Financial has developed an operating strategy which it expects to result in continuing improved financial performance, BOK Financial cannot ensure that it will be successful in fulfilling this strategy or that this operating strategy will be successful. Achieving success is dependent upon a number of factors, many of which are beyond BOK Financial's direct control. Factors that may adversely affect BOK Financial's ability to implement its operating strategy include:
•deterioration of BOK Financial's asset quality;
•deterioration in general economic conditions, especially in BOK Financial's core markets;
•inability to control BOK Financial's non-interest expenses;
•inability to increase non-interest income;
•inability to access capital;
•decreases in net interest margins;
•increases in competition;
•a breach in the security of BOK Financial's systems; and
•adverse regulatory developments.
Substantial competition could adversely affect BOK Financial.
Banking is a competitive business. BOK Financial competes actively for loan, deposit and other financial services business in the southwest region of the United States. BOK Financial's competitors include a large number of small and large local and national banks, savings and loan associations, credit unions, trust companies, broker-dealers and underwriters, as well as many financial and non-financial firms that offer services similar to those of BOK Financial. Large national financial institutions have substantial capital, technology and marketing resources. Such large financial institutions may have greater access to capital at a lower cost than BOK Financial does, which may adversely affect BOK Financial's ability to compete effectively.
BOK Financial has expanded into markets outside of Oklahoma, where it competes with a large number of financial institutions that have an established customer base and greater market share than BOK Financial. With respect to some of its services, BOK Financial competes with non-bank companies that are not subject to regulation. The absence of regulatory requirements may give non-banks a competitive advantage.
The increasingly competitive environment is in part a result of changes in regulation, changes in technology and product delivery systems and the accelerating pace of consolidation among financial service providers. Our success depends on our ability to respond to the threats and opportunities of financial technology innovations. Developments in "fintech" and crypto-currencies have the potential to disrupt the financial industry and change the way banks do business. Investment in new technology to stay competitive could result in significant costs and increased cybersecurity risk. Our success depends on our ability to adapt to the pace of the rapidly changing technological environment, which is important to retention and acquisition of customers.
Government regulations and political environment could adversely affect BOK Financial.
BOK Financial and BOKF, NA are subject to banking laws and regulations that limit the type of acquisitions and investments that we may make. In addition, certain permitted acquisitions and investments are subject to prior review and approval by banking regulators, including the Federal Reserve, OCC and FDIC. Banking regulators have broad discretion on whether to approve proposed acquisitions and investments. In deciding whether to approve a proposed acquisition, federal banking regulators will consider, among other things, the effect of the acquisition on competition; the convenience and needs of the communities to be served, including our record of compliance under the Community Reinvestment Act; and our effectiveness in combating money laundering. They will also consider our financial condition and our future prospects, including projected capital ratios and levels; the competence, experience, and integrity of our management; and our record of compliance with laws and regulations.
Regulatory authorities may change their interpretation of these statutes and regulations, including the OCC, our primary regulator, and the CFPB, our regulator for certain designated consumer laws and regulations. Violations of laws and regulations could limit the growth potential of BOK Financial's businesses. We have made extensive investments in human and technological resources to address enhanced regulatory expectations, including investments in the areas of risk management, compliance, and capital planning.
Political developments, including recent Federal executive and legislative changes, add additional uncertainty to the implementation, scope and timing of changes in the regulatory environment for the banking industry and for the broader economy. Concern regarding the ability of Congress and the President to reach agreement on federal budgetary matters, including the debt ceiling, or prolonged stalemates leading to total or partial governmental shutdowns may also have adverse economic consequences and create the risk of economic instability or market volatility, with potential negative consequences to our business and financial performance. Additionally, changes in fiscal, monetary or regulatory policy, including as a result of labor shortages, wage pressures, supply chain disruptions and higher inflation, could increase our compliance costs and adversely affect our business operations and results of operations.
Federal budget deficit concerns and the potential for political conflict over legislation to raise the U.S. government's debt limit may increase the possibility of a default by the U.S. government on its debt obligations, related credit-rating downgrades, or an economic recession in the United States. Many of our investment securities are issued by the U.S. government and government agencies and sponsored entities. As a result of uncertain domestic political conditions, including potential future federal government shutdowns, the possibility of the federal government defaulting on its obligations for a period of time due to debt ceiling limitations or other unresolved political issues, investments in financial instruments issued or guaranteed by the federal government pose liquidity risks. In connection with prior political disputes over U.S. fiscal and budgetary issues leading to the U.S. government shutdown in 2011, S&P lowered its long term sovereign credit rating on the U.S. from AAA to AA+. On August 1, 2023, Fitch Ratings announced its decision to downgrade the U.S. long-term credit ratings from AAA to AA+, but maintained the country credit ceiling at AAA. A further downgrade, or a downgrade by other rating agencies, as well as sovereign debt issues facing the governments of other countries, could have a material adverse impact on financial markets and economic conditions in the U.S. and worldwide.
The effects of climate change and resulting government regulations could adversely affect BOK Financial and BOK Financial customers.
The current and anticipated effects of climate change have resulted in increased political and social attention. Climate changes present physical and transition risks to BOK Financial, both of which are expected to increase over time. Physical risks relate to the harm of people or property arising from acute, climate-related disaster events such as hurricanes or tornadoes, as well as longer-term chronic phenomena such as higher average temperatures. Physical risks specific to BOK Financial include:
•Increases in extreme weather events could damage or destroy the property of BOK Financial or its customers, disrupting operations and causing significant expenditures.
•Significant damages to real properties securing our loans could cause the value of the loan portfolio to contract. Borrowers may be unable to make payments on loans increasing delinquency rates and average loan loss severity.
•Wide-ranging weather disasters, including but not limited to, long periods of drought and rising sea levels, could result in an economic downturn and a decline in market conditions. Liquidity risks could arise as operational needs change for both BOK Financial and its customers.
•We may not have adequate insurance coverage for some potential natural, catastrophic climate change-related events.
Transition risks relate to stresses arising from the shifts in regulatory policies, consumer or business sentiment, or technologies required to limit climate change. The U.S. Congress, state legislatures and federal and state regulatory agencies have continued to propose and advance numerous legislative and regulatory initiatives seeking to mitigate the effects of climate change. Transition risks specific to BOK Financial include:
•Compliance, operating, maintenance and remediation costs may require a significant amount of capital affecting BOK Financial's liquidity position.
•BOK Financial's credit portfolios include carbon-intensive industries, which could be adversely impacted by the transition to a low-carbon economy. BOK Financial has a long-standing relationship with the energy industry, and the local economies within BOK Financial's geographical footprint have a concentration in energy-related industries. The regulatory impacts on the energy industry could lead to sharp changes in the values of certain assets or liabilities, increase costs, hinder financial results and shrink the industry. These changes could have a significant effect on the general economic conditions within our footprint.
•Reputational risk may increase as stakeholders become more focused on climate risk.
Credit Risk Factors
Adverse regional economic developments could negatively affect BOK Financial's business.
At December 31, 2023, loans to businesses and individuals with collateral primarily located in Texas represented approximately 32% of the total loan portfolio, loans to businesses and individuals with collateral primarily located in Oklahoma represented approximately 14% of our total loan portfolio and loans to businesses and individuals with collateral primarily located in Colorado represented approximately 11% of our total loan portfolio. These geographic concentrations subject the loan portfolio to the general economic conditions within these areas. Poor economic conditions in Texas, Oklahoma, Colorado or other markets in the southwest region may cause BOK Financial to incur losses associated with higher default rates and decreased collateral values in BOK Financial's loan portfolio. A regional economic downturn could also adversely affect revenue from brokerage and trading activities, mortgage loan originations and other sources of fee-based revenue.
Extended oil and gas commodity price downturns could negatively affect BOK Financial customers.
At December 31, 2023, 14% of BOK Financial's total loan portfolio is comprised of loans to borrowers in the energy industry. The energy industry is historically cyclical, and prolonged periods of low oil and gas commodity prices could negatively impact borrowers' ability to pay. In addition, the Company does business in several major oil and natural gas producing states including Oklahoma, Texas and Colorado. The economies of these states could be negatively impacted by prolonged periods of low oil and gas commodity prices resulting in increased credit migration to classified and nonaccruing categories, higher loan loss provisions and risk of credit losses from both energy borrowers and businesses and individuals in those regional economies.
Other adverse economic factors affecting particular industries, including commercial real estate and healthcare, could have a negative effect on BOK Financial customers and their ability to make payments to BOK Financial.
Certain industry-specific economic factors also affect BOK Financial. For example, BOK Financial's loan portfolio includes commercial real estate loans. These types of loans may expose a lender to a higher degree of credit risk of non-payment or loss as commercial real estate loans are subject to cyclical downturns, are generally more sensitive to interest rates and usually do not fully amortize over the loan term. A downturn in the real estate industry in general or in certain segments of the commercial real estate industry could also have an adverse effect on BOK Financial's operations. The development of remote work or hybrid work models may cause volatility in vacancy rates and rents in certain urban markets. Weakening of the commercial real estate market may increase the likelihood of default of these loans, which could negatively impact our loan portfolio’s performance and asset quality. If we are required to liquidate the collateral securing a loan to satisfy the debt during a period of reduced real estate values, we could incur material losses.
Regulatory changes in healthcare may negatively affect our customers. Legislation affecting reimbursement rates along with the continued transition to managed care in place of fee for service payments could affect their ability to pay.
Liquidity, Price, and Interest Rate Risk Factors
Fluctuations in interest rates could adversely affect BOK Financial's business.
BOK Financial's business is highly sensitive to:
•the monetary policies implemented by the Federal Reserve Board, including the discount rate on bank borrowings and changes in reserve requirements, which affect BOK Financial's ability to make loans and the interest rates we may charge;
•changes in prevailing interest rates, due to the dependency of the subsidiary bank on interest income;
•changes in depositor behavior; and
•open market operations in U.S. government securities.
A significant increase in market interest rates, or the perception that an increase may occur, could adversely affect both BOK Financial's ability to originate new loans and BOK Financial's ability to grow. Conversely, a decrease in interest rates could result in acceleration in the payment of loans, including loans underlying BOK Financial's holdings of residential mortgage-backed securities and termination of BOK Financial's mortgage servicing rights. In addition, changes in market interest rates, changes in the relationships between short-term and long-term market interest rates or changes in the relationships between different interest rate indices, could affect the interest rates charged on interest-earning assets differently than the interest rates paid on interest-bearing liabilities. This difference could result in an increase in interest expense relative to interest income, which would reduce the Company's net interest revenue. In a rising interest rate environment, the composition of the deposit portfolio could shift resulting in a mix that is more sensitive to changes in interest rates than is the current mix. Deposit repricing behavior may also differ from our models or from previous rate increases. An increase in market interest rates also could adversely affect the ability of BOK Financial's floating-rate borrowers to meet their higher payment obligations. If this occurred, it could cause an increase in nonperforming assets and net charge-offs which could adversely affect BOK Financial's business.
Changes in mortgage interest rates could adversely affect mortgage banking operations along with mortgage servicing rights as well as BOK Financial's substantial holdings of residential mortgage-backed securities, and brokerage and trading revenue.
BOK Financial derives a substantial amount of revenue from mortgage banking activities, the production and sale of mortgage loans and the servicing of mortgage loans. In addition, as part of BOK Financial's mortgage banking business, BOK Financial has substantial holdings of mortgage servicing rights. Revenue generated from the production and sale of mortgage loans is affected by mortgage interest rates and government policies related to economic stimulus and home ownership. Falling interest rates tend to increase mortgage lending activities and related revenue while rising interest rates have an opposite effect.
Mortgage servicing revenue is a fee earned over the life of the related loan. However, mortgage servicing rights are assets that are carried at fair value, which are very sensitive to numerous factors with the primary factor being changes in market interest rates. Falling interest rates tend to increase loan prepayments, which may lead to a decrease in the value of related servicing rights. We attempt to manage this risk by maintaining an active hedging program. The primary objective of the Company's hedging program is to provide an offset to changes in the fair value of these rights due to hedgeable risks, primarily changes in market interest rates. Due to numerous unhedgeable factors, hedging strategies may not offset all changes in the fair value of the asset. Such unhedgeable factors include, but are not limited to, changes in customer prepayment or delinquency behavior that is inconsistent with historical actual performance in a similar market environment; changes in the long-term or short-term primary/secondary mortgage spreads; and changes in survey-driven assumptions such as the cost of servicing and discount rates.
We also hold a substantial portfolio of residential mortgage-backed securities issued by U.S. government agencies. The fair value of residential mortgage-backed securities is highly sensitive to changes in interest rates. A significant decrease in interest rates may lead mortgage holders to refinance the mortgages constituting the pool backing the securities subjecting BOK Financial to a risk of prepayment and decreased return on investment due to subsequent reinvestment at lower interest rates. A significant decrease in interest rates may also accelerate premium amortization. Conversely, a significant increase in interest rates may cause mortgage holders to extend the term over which they repay their loans, which delays the Company's opportunity to reinvest funds at higher rates. We mitigate this risk somewhat by investing principally in shorter duration mortgage products which are less sensitive to changes in interest rates; however this strategy may not be successful.
In addition, the Company actively engages in trading activities that provide U.S. government agency residential mortgage-backed securities and related derivative instruments to our customers. Trading activities generate net interest revenue and trading revenue. Trading revenue and customer hedging revenue varies in response to customer demand. The value of trading securities will increase in response to decreases in interest rates or decrease in response to increases in interest rates and other bond market factors. We mitigate the market risk of holding trading securities through appropriate economic hedging techniques, which may not be effective.
Models may fail to reasonably predict changes in values caused by changes in interest rates, prepayment speeds and other relevant stimuli, which could adversely affect our business or results of operations.
We use quantitative models to assist in measuring risk and predicting changes in the value of financial instruments. The outputs of these models are used to determine hedging strategy related to mortgage servicing rights, mortgage production pipeline and trading securities. We also use models to estimate the effects of changing interest rates and other market measures in order to adequately structure assets and liabilities to manage interest rate sensitivity. Inaccurate information obtained from these models could result in poor management decisions that lead to an elevated exposure to interest rates which could adversely affect our results of operations.
Market disruptions could impact BOK Financial's funding sources.
BOK Financial's subsidiary bank may rely on other financial institutions and the Federal Home Loan Bank of Topeka as a significant source of funds. Our ability to fund loans, manage our interest rate risk and meet other obligations depends on funds borrowed from these sources. The inability to borrow funds at market interest rates could have a material adverse effect on our operations. In addition, idiosyncratic factors, as well as other factors outside of BOK Financial’s control, such as a general market disruption or an operational problem that affects third parties, could impair the Company’s ability to access short-term funding or create an unforeseen outflow of cash due to, among other factors, draws on unfunded commitments or deposit attrition. Withdrawals of brokered or institutional deposits could require us to pay significantly higher interest rates on our retail deposits or on other wholesale funding sources, which would have an adverse impact on our net interest income and net income. Furthermore, changes to the FHLB’s underwriting guidelines for wholesale borrowings or lending policies may limit or restrict our ability to borrow, and therefore could have a significant adverse impact on our liquidity. In the event of future turmoil in the banking industry or other idiosyncratic events, there is no guarantee that the U.S. government will invoke the systemic risk exception, create additional liquidity programs, or take any other action to stabilize the banking industry or provide liquidity. The Company’s inability to monetize liquid assets or to access short-term funding or capital markets could constraint the Company’s ability to make new loans or meet existing lending commitments and could ultimately jeopardize BOK Financial’s overall liquidity and capitalization.
Loss of deposits or a change in deposit mix could increase BOK Financial’s funding costs.
Deposits are a low cost and stable source of funding. BOK Financial competes with banks and other financial institutions for deposits and as a result, the Company could lose deposits in the future, clients may shift their deposits into higher cost products, or the Company may need to raise interest rates to avoid deposit attrition. Funding costs may also increase if deposits lost are replaced with wholesale funding. Higher funding costs reduce BOK Financial’s net interest margin, net interest income and net income.
In addition, recent events impacting the banking industry, including the bank failures in March and April 2023, have resulted in significant disruption and volatility in the capital markets, reduced current valuations of bank securities, and decreased confidence in banks among depositors and other counterparties as well as investors. A decrease in the supply of deposits or significant increase in competition for deposits could result in substantial increases in costs to retain and service deposits. Increased adoption of consumer banking technology can result in reduced deposit stickiness due to the relative ease with which depositors may transfer deposits to a different depository institution in the event that confidence is lost in BOKF, NA. The cost of resolving the recent bank failures has also prompted the FDIC to issue a special assessment to recover costs to the Deposit Insurance Fund. For information on the FDIC’s special assessment, refer to the "Management’s Discussion and Analysis of Financial Condition and Results of Operations."
A downgrade in our credit ratings may increase our funding costs and limit our business activities.
We are regularly evaluated by ratings agencies. Our credit ratings are based on a number of factors such as the financial strength of BOKF and BOKF, NA and conditions generally affecting the financial services industry. Many qualitative and quantitative factors are used by the ratings agencies including capital adequacy, liquidity, asset quality, business mix, and earnings. These ratings are subject to change at any time and we may not be able to maintain our current credit ratings. Reductions in one or more of our credit ratings could adversely affect our ability to borrow funds and increase our cost of capital and limit the number of investors or counterparties willing to do business with or lend to us. This could also affect our ability to attract or retain customers, including deposits. In addition, if we were downgraded below investment grade, certain counterparty contracts may require renegotiation or require additional posting of collateral.
Operating and Transaction Risk Factors
Dependence on technology increases cybersecurity, data privacy and technology failure risk.
The Company is dependent on its technological ability to process, record and monitor a large number of customer transactions and store and protect a significant amount of sensitive customer information. Our customers' use of our internet-based services, and our customer and regulatory expectations regarding operational and information security and reliability have increased over time. We face compliance risks and costs relating to the data privacy laws existing in multiple jurisdictions. Congress and the legislatures of states in which we operate regularly consider legislation that would impose more stringent data privacy requirements resulting in increased compliance costs.
Cybersecurity risks for financial institutions have increased significantly in recent years in part because of the proliferation of new technologies, the increased use of the internet and mobile technologies to conduct financial transactions, and the increased sophistication and ever changing cyberattack techniques used by organized crime, hackers, terrorists, hostile foreign governments and other external parties to obtain confidential customer information and misappropriate customer funds, and may disrupt operations through Ransomware. Such parties may seek to gain access to our systems directly or use equipment or security passwords belonging to employees, customers, third-party services providers or other users of our systems. Accordingly, our operational systems and infrastructure must continue to be safeguarded and monitored for potential failures, disruptions, breakdowns and cyber attacks.
Our business, financial, accounting, data processing systems and other operating systems and facilities may stop operating properly or become disabled as a result of a number of factors that may be wholly or partially beyond our control. In addition to cyber attacks, there could be sudden increases in customer transaction volume, electrical or telecommunications outages, extended disruptions in operations or technology, natural disasters, pandemics, and events arising from political or social matters, including terrorist attacks. Third parties with whom we do business or that facilitate our business activities including exchanges, clearing houses, financial intermediaries or vendors that provide services or security solutions for our operations, could also be sources of operational or information security risk to the Company including breakdowns or failures of their own systems, capacity constraints or cyber attacks.
Cybersecurity risk management programs are expensive to maintain and will not protect the Company from all risks associated with maintaining the security of customer data from external and internal intrusions, disaster recovery and failures in controls used by our vendors. A material breach of customer data security or operational or system failure may negatively impact our business reputation and cause a loss of customers, result in increased expense to contain the event and/or require that we provide credit monitoring services for or reimburse affected customers, result in regulatory fines, penalties or intervention, or result in litigation, all of which could have a materially adverse effect on our results of operations and financial condition.
Although to date we have not experienced any material losses relating to cyber attacks or other information security breaches or operational failures, there can be no assurance that we will not suffer such losses in the future. Attempts to compromise our cybersecurity are regular and frequent. Our risk and exposure to these matters remains heightened, and as a result the continued development and enhancement of our controls, processes and practices designed to protect and facilitate the recovery of our systems, computers, software, data and networks from attack, damage or unauthorized access remains a high priority for us. As an additional layer of protection, we have purchased network and privacy liability risk insurance coverage. Our cybersecurity insurance may not provide sufficient coverage in the event of a breach or may not be available in the future on acceptable terms.
We depend on third parties for critical components of our infrastructure.
We outsource a significant portion of our information systems, communications, data management and transaction processing to third parties. We are heavily reliant on a single vendor for many of these functions. These third parties are sources of risk associated with operational errors, system interruptions or breaches, unauthorized disclosure of confidential information and misuse of intellectual property. If the service providers encounter any of these issues, we could be exposed to disruption of service, reputation damages, and litigation risk that could be material to our business.
We may be adversely affected and experience losses related to fraud or theft.
Attempts to commit fraud, including but not limited to, card fraud, check fraud, electronic fraud, wire fraud, social engineering and phishing attacks, are becoming increasingly more sophisticated and may go undetected by the systems and procedures we have in place to monitor our operations. We have experienced, and may experience again in the future, losses incurred due to customer, employee, or third-party fraud and theft. These losses may be material, negatively affect our results of operations, financial condition or prospects, and may lead to significant reputational risks and other effects. We continue to invest in fraud prevention in the form of people and systems designed to prevent, detect and mitigate the customer and financial impacts.
Recent events impacting the financial services industry could adversely affect BOK Financial's business.
Recent events affecting the financial services industry have generated significant market volatility among publicly traded bank holding companies with particular focus on regional banks. These events occurred following a period of rapidly rising interest rates, which resulted in unrealized losses in longer duration securities and loans held by banks as well as more competition for bank deposits. These recent events have, and may continue to adversely impact the market price and volatility of the Company’s stock. Potentially adverse changes to laws or regulations governing banks and bank holding companies may occur, including but not limited to, new regulations directed towards banks of similar size in areas such as deposit composition, the level of uninsured deposits, brokered deposits, unrealized losses in securities portfolios, liquidity, CRE composition and concentration and capital, which could increase the costs of doing business. The Company could also face increased scrutiny, or be viewed as higher risk, by regulators and the investor community, which could negatively affect our future results. As a result of recent bank failures the FDIC proposed and finalized a special assessment to replenish the Deposit Insurance Fund, which increased FDIC insurance premiums above the recently increased levels which will result in higher costs.
Risks Related to an Investment in Our Stock
Although publicly traded, BOK Financial's common stock has substantially less liquidity than the average trading market for a stock quoted on the NASDAQ National Market System.
A relatively small fraction of BOK Financial's outstanding common stock is actively traded. The risks of low liquidity include increased volatility of the price of BOK Financial's common stock. Low liquidity may also limit holders of BOK Financial's common stock in their ability to sell or transfer BOK Financial's shares at the price, time and quantity desired.
BOK Financial's principal shareholder controls a majority of BOK Financial's common stock.
Mr. George B. Kaiser owns approximately 58% of the outstanding shares of BOK Financial's common stock at December 31, 2023. Mr. Kaiser is able to elect all of BOK Financial's directors and effectively control the vote on all matters submitted to a vote of BOK Financial's common shareholders. Mr. Kaiser's ability to prevent an unsolicited bid for BOK Financial or any other change in control could have an adverse effect on the market price for BOK Financial's common stock. A substantial majority of BOK Financial's directors are not officers or employees of BOK Financial or any of its affiliates. However, because of Mr. Kaiser's control over the election of BOK Financial's directors, he could change the composition of BOK Financial's Board of Directors so that it would not have a majority of outside directors.
Possible future sales of shares by BOK Financial's principal shareholder could adversely affect the market price of BOK Financial's common stock.
Mr. Kaiser has the right to sell shares of BOK Financial's common stock in compliance with the federal securities laws at any time, or from time to time. The federal securities laws will be the only restrictions on Mr. Kaiser's ability to sell. Because of his current control of BOK Financial, Mr. Kaiser could sell large amounts of his shares of BOK Financial's common stock by causing BOK Financial to file a registration statement that would allow him to sell shares more easily. In addition, Mr. Kaiser could sell his shares of BOK Financial's common stock without registration under Rule 144 of the Securities Act. Although BOK Financial can make no predictions as to the effect, if any, that such sales would have on the market price of BOK Financial's common stock, sales of substantial amounts of BOK Financial's common stock, or the perception that such sales could occur, could adversely affect market prices. If Mr. Kaiser sells or transfers his shares of BOK Financial's common stock as a block, another person or entity could become BOK Financial's controlling shareholder.
Statutory restrictions on subsidiary dividends and other distributions and debts of BOK Financial's subsidiaries could limit amounts BOK Financial's subsidiaries may pay to BOK Financial.
A substantial portion of BOK Financial's cash flow typically comes from dividends paid by BOKF, NA. Statutory provisions and regulations restrict the amount of dividends BOKF, NA may pay to BOK Financial without regulatory approval. Management also developed, and the BOK Financial Board of Directors approved, an internal capital policy that is more restrictive than the regulatory capital standards. In the event of liquidation, creditors of the subsidiary banks and other non-bank subsidiaries of BOK Financial are entitled to receive distributions from the assets of that subsidiary before BOK Financial, as holder of an equity interest in the subsidiaries, is entitled to receive any distributions.
General Risk Factors
Our business may be adversely affected if we are unable to hire and retain qualified employees.
An increasing competitive factor in the financial services industry is the ability to attract and retain talented and diverse employees across several lines of business. The transition by many employers to remote work and work-from-home that occurred during the COVID-19 pandemic seems likely to continue. Employers, now less constrained by physical geography, particularly those in markets with elevated employee compensation, may increasingly compete for our employees.
Adverse global economic factors could have a negative effect on BOK Financial customers and counterparties.
Economic conditions globally could impact BOK Financial’s customers and counterparties with which we do business. Pandemics, such as the COVID-19 pandemic, may affect economies around the world. The Russia-Ukraine conflict and Israel-Hamas conflict have resulted in volatile oil prices as well as affected other global economic factors.
BOK Financial, its customers and counterparties may be negatively affected by the volatility and uncertainty related to inflation and the effects of inflation. Prolonged periods of inflation may impact our profitability by negatively affecting our fixed costs and expenses, including increasing funding costs and expenses related to talent acquisition and retention. Additionally, inflation may lead to a decrease in consumer purchasing power and negatively impact the need or demand for our products or services. If significant inflation continues, the creditworthiness of our borrowers and their ability to repay loans timely may be affected.
The Company, its customers and counterparties may also be adversely affected by global events, such as natural disasters, and other external events beyond our control, including public health issues, terrorist attacks and acts of war. These global events may significantly affect long-term and short-term interest rates, energy prices, the value of financial assets and ultimately economic activity in our primary markets. The adverse effect of these events on the Company may include narrowing of the spread between interest income and interest expense, a reduction in fee income, an increase in credit losses and a decrease in demand for loans and other products and services.
Our business, financial condition, liquidity and results of operations could be adversely affected by a health pandemic such as the COVID-19 pandemic or other health crisis.
A pandemic or other health crisis could destabilize the financial markets and the general economy. Forced shutdowns or regulations limiting business could have an adverse effect on our customers, limiting their ability to satisfy obligations and limiting growth or demand for our loans and other services, which could affect our liquidity, financial condition and results of operations.
ITEM 1B. UNRESOLVED STAFF COMMENTS
None.
ITEM 1C. CYBERSECURITY
Risk Management and Strategy
BOK Financial is committed to safeguarding company and client information through protections integrated into all lines of business, support functions and third-party relationships. To effectively manage cybersecurity risks mentioned in Item 1A, our cybersecurity risk management program evaluates the likelihood and potential damage of internal and external threats. We also evaluate the adequacy of our policies, procedures, and capabilities in place to mitigate cyber risk at least annually.
Each employee and contractor is responsible for the security and confidentiality of company and client information. This expectation is communicated at on boarding and through required annual data security and privacy trainings; frequent internal publications; and annual employee attestations to the Company’s Standards of Conduct. BOK Financial regularly conducts risk assessments to evaluate internal controls implemented to prevent and detect data breaches. These controls are aligned with ISO 27001:2013 and the NIST Cybersecurity Framework and are frequently monitored to ensure their effectiveness. The controls are routinely tested via tabletop exercises and reviewed by internal auditors.
Vulnerability and penetration assessments are also conducted at least annually by an independent third party. In addition to a strong set of internal controls, the company has implemented a robust due diligence process for third-party providers prior to executing an agreement. Risk assessments include evaluating the third-party’s security posture through intelligence feeds, SOC reports, ISO certifications and self-attestation questionnaires. Third parties processing customer data are contractually required to meet all legal obligations for protecting against anticipated security threats to client data, protecting against unauthorized access to client data, and ensuring proper disposal of client data.
An array of protective technologies have been implemented to detect and respond to indicators of malicious behavior before an incident ever takes place; however, should a cybersecurity incident occur, the Company has incident response and recovery procedures, which include determination of materiality and proper notification and reporting to the appropriate parties. These include legal and regulatory reporting requirements as well as notifications to impacted customers. The Company collaborates with peer financial institutions, local universities, threat intelligence organizations, third-party providers, law enforcement and our customers to share tactical threat intelligence and best practices in protecting against emerging threats.
Results of cybersecurity risk assessments and tabletop exercises are reported to governance committees and aid in the development of our cybersecurity strategy, which takes into account the Company's strategic objectives and our ability to navigate potential internal and external disruptions. The overarching objective of our cybersecurity strategy is to reduce risk and enhance the resilience of our assets. Four key components support this objective: enabling our cyber defense posture, creating and retaining cyber-aware customers, considering identities at system access, and preparing a cyber-resilient workforce. Our cybersecurity team operates under eight distinct programs, each led by a subject matter expert. Each program has its own strategy, projects, and initiatives designed to achieve the overall strategic objective and its key components.
The collective framework, regulatory compliance requirements, and associated controls are collectively referred to as the ISMS. The ISMS provides a comprehensive structure that supports the Information Security Program designed to safeguard information technology resources, maintain the confidentiality, integrity and availability of data, and manage the resources used to provide technology and security services to the organization.
To date, no cybersecurity threats or incidents have materially affected, or are reasonably likely to affect, the Company including its business strategy, results of operations, or financial condition.
Governance
The Company’s cybersecurity program is overseen by the Risk Committee of the Board, which is responsible for ensuring the program is well resourced and able to protect the security and confidentiality of our data and that of our clients. The program is managed by the CISO who reports to the chief risk officer and is reviewed by regulators, as well as internal auditors. The CISO provides quarterly information security updates to the Risk Committee as well as the Company’s executive-level Risk Council on cybersecurity programs, policies and controls; efforts to improve security; and responses to cybersecurity events. Annually, the CISO meets with the Risk Committee of the Board of Directors to communicate the Board's responsibilities for cybersecurity and privacy, as well as the cybersecurity program’s strategy for addressing emerging risks and regulatory requirements.
The Company’s CISO has over 26 years of building and operating enterprise security functions, security engineering, and security governance and program management. Prior to joining the Company, the CISO managed an Information Security and Risk Management program within a Fortune 500 energy company that handled a wide variety of information security issues including industrial control system security. The CISO has also served on the board of several academic institutions, professional service organizations, and local non-profits and contributed on many special committees for cybersecurity initiatives.
ITEM 2. PROPERTIES
BOK Financial and its subsidiaries own and lease improved real estate that is carried at $430 million, net of depreciation and amortization. The Company’s principal offices are located in leased premises in the Bank of Oklahoma Tower in Tulsa, Oklahoma. Banking offices are primarily located in Tulsa and Oklahoma City, Oklahoma; Dallas, Fort Worth, Houston and San Antonio, Texas; Albuquerque, New Mexico; Denver, Colorado; Phoenix, Arizona; and Kansas City, Kansas/Missouri. Primary operations facilities are located in Tulsa and Oklahoma City, Oklahoma; Dallas, Texas and Albuquerque, New Mexico. The Company's facilities are suitable for their respective uses and present needs.
The information set forth in Note 5 to the Company's Notes to Consolidated Financial Statements, which appear elsewhere herein, provides further discussion related to properties.
ITEM 3. LEGAL PROCEEDINGS
The information set forth in Note 14 to the Company's Notes to Consolidated Financial Statements, which appear elsewhere herein, provides discussion related to legal proceedings.
ITEM 4. MINE SAFETY DISCLOSURES
Not applicable.
PART II
ITEM 5. MARKET FOR REGISTRANT’S COMMON EQUITY, RELATED STOCKHOLDER MATTERS AND ISSUER PURCHASES OF EQUITY SECURITIES
BOK Financial's $0.00006 par value common stock is traded on the NASDAQ Stock Market under the symbol BOKF. As of January 31, 2024, common shareholders of record numbered 621 with 65,064,299 shares outstanding.
The highest and lowest quarterly closing bid price for shares and cash dividends declared per share of BOK Financial common stock follows:
|
|
|
|
|
|
|
|
|
|
|
|
|
|
|
|
|
|
|
|
|
|
|
|
|
|
|
| |
|
First |
|
Second |
|
Third |
|
Fourth |
| 2023: |
|
|
|
|
|
|
|
|
| Low |
|
$ |
81.54 |
|
|
$ |
75.61 |
|
|
$ |
78.38 |
|
|
$ |
63.93 |
|
| High |
|
105.14 |
|
|
90.40 |
|
|
91.54 |
|
|
86.27 |
|
| Cash dividends declared |
|
0.54 |
|
|
0.54 |
|
|
0.54 |
|
|
0.55 |
|
| 2022: |
|
|
|
|
|
|
|
|
| Low |
|
$ |
93.95 |
|
|
$ |
74.40 |
|
|
$ |
71.14 |
|
|
$ |
90.41 |
|
| High |
|
115.68 |
|
|
92.60 |
|
|
95.05 |
|
|
109.57 |
|
| Cash dividends declared |
|
0.53 |
|
|
0.53 |
|
|
0.53 |
|
|
0.54 |
|
The information set forth under the heading "Equity Compensation Plan Information" in BOK Financial's 2024 Annual Proxy Statement is incorporated herein by reference.
Shareholder Return Performance Graph
Set forth below is a line graph comparing the change in cumulative shareholder return of the NASDAQ Composite Index and the KBW NASDAQ Regional Banking Index for the period commencing December 31, 2018 and ending December 31, 2023.*
|
|
|
|
|
|
|
|
|
|
|
|
|
|
|
|
|
|
|
|
|
|
|
|
|
|
|
|
|
|
|
|
|
|
|
|
|
|
|
| |
|
Period Ending December 31, |
| Index |
|
2018 |
|
2019 |
|
2020 |
|
2021 |
|
2022 |
|
2023 |
| BOK Financial Corporation |
|
100.00 |
|
|
122.09 |
|
|
98.93 |
|
|
155.90 |
|
|
156.82 |
|
|
132.90 |
|
| NASDAQ Composite |
|
100.00 |
|
|
136.69 |
|
|
198.10 |
|
|
242.03 |
|
|
163.28 |
|
|
236.17 |
|
| KBW NASDAQ Regional Banking Index |
|
100.00 |
|
|
123.81 |
|
|
113.03 |
|
|
154.45 |
|
|
143.75 |
|
|
143.17 |
|
* Graph assumes value of an investment in the Company's Common Stock for each index was $100 on December 31, 2018. Cash dividends on Common Stock are assumed to have been reinvested in BOK Financial Common Stock.
The following table provides information with respect to purchases made by or on behalf of the Company or any "affiliated purchaser" (as defined in Rule 10b-18(a)(3) under the Securities Exchange Act of 1934), of the Company's common stock during the three months ended December 31, 2023.
|
|
|
|
|
|
|
|
|
|
|
|
|
|
|
|
|
|
|
|
|
|
|
|
|
|
|
|
Period
|
|
Total Number of Shares Purchased 2
|
|
Average Price Paid per Share
|
|
Total Number of Shares Purchased as Part of Publicly Announced Plans or Programs 1 |
|
Maximum Number of Shares that May Yet Be Purchased Under the Plans |
| October 1, 2023 to October 31, 2023 |
|
140,169 |
|
|
$ |
65.65 |
|
|
140,000 |
|
|
3,132,023 |
|
| November 1, 2023 to November 30, 2023 |
|
372,155 |
|
|
$ |
69.30 |
|
|
372,155 |
|
|
2,759,868 |
|
| December 1, 2023 to December 31, 2023 |
|
190,401 |
|
|
$ |
78.59 |
|
|
188,082 |
|
|
2,571,786 |
|
| Total |
|
702,725 |
|
|
|
|
700,237 |
|
|
|
1 On November 1, 2022, the Company's board of directors authorized the Company to repurchase up to five million shares of the Company's common stock. As of December 31, 2023, the Company had repurchased 2,428,214 shares under this plan. Future repurchases of the Company's common stock will vary based on market conditions, regulatory limitations and other factors.
2 The Company may repurchase shares from employees to cover the taxes in connection with employee equity compensation.
ITEM 6. [Reserved]
ITEM 7. Management’s Discussion and Analysis of Financial Condition and Results of Operations
|
|
|
|
|
|
|
|
|
|
|
|
|
|
|
|
|
|
Table 1 – Consolidated Selected Financial Data |
|
|
|
|
| |
December 31, |
|
2023 |
|
2022 |
|
2021 |
| Selected Financial Data |
|
|
|
|
|
Earnings per share (based on average equivalent shares): |
|
|
|
|
|
| Basic |
$ |
8.02 |
|
|
$ |
7.68 |
|
|
$ |
8.95 |
|
| Diluted |
8.02 |
|
|
7.68 |
|
|
8.95 |
|
| Percentages (based on daily averages): |
|
|
|
|
|
| Return on average assets |
1.10 |
% |
|
1.11 |
% |
|
1.23 |
% |
| Return on average shareholders' equity |
10.82 |
% |
|
10.81 |
% |
|
11.59 |
% |
| Dividend payout ratio |
27.00 |
% |
|
27.65 |
% |
|
23.29 |
% |
| Allowance for loan losses to loans |
1.16 |
% |
|
1.04 |
% |
|
1.27 |
% |
Combined allowance for credit losses to loans1 |
1.36 |
% |
|
1.31 |
% |
|
1.43 |
% |
1 Includes allowance for loan losses and accrual for off-balance sheet credit risk.
Management’s Assessment of Operations and Financial Condition
Overview
The following discussion is management's analysis to assist in the understanding and evaluation of the financial condition and results of operations of BOK Financial. This discussion should be read in conjunction with the Consolidated Financial Statements and footnotes and selected financial data presented elsewhere in this report. This section and other sections provide information about our recent financial performance. For information about results of operations for 2022 compared with 2021, see the respective sections in Management's Discussion and Analysis included in our 2022 Form 10-K filed on March 1, 2023.
Economic conditions continued to be volatile in 2023 with inflationary concerns, fluctuating oil prices caused by the Russia-Ukraine conflict and instability in the geopolitical environment. In order to combat rising inflation, the Federal Reserve began increasing the Federal Funds rate in March 2022 and continued to do so through the end of 2023 for a total 525 basis point increase. This has slowed the housing market, but home prices remain elevated. Consumer spending also continues to remain steady despite the Federal Reserve's effort to decrease spending with higher rates. Unemployment remains low, coming in at 3.7% for December 2023. See "Summary of Credit Loss Experience" section of Management's Discussion and Analysis for additional discussion around our economic forecast.
Performance Summary
Net income for the year ended December 31, 2023 totaled $530.7 million or $8.02 per diluted share compared with net income of $520.3 million or $7.68 per diluted share for the year ended December 31, 2022. PPNR, a non-GAAP measure, was $728.9 million for 2023 compared to $690.1 million in the prior year. 2023 included a 52 cent per share reduction as a result of the FDIC special assessment.
Highlights of 2023 included:
•Net interest revenue totaled $1.3 billion for 2023, an increase of $60.8 million over the prior year. Net interest margin was 2.93% for 2023 compared to 2.98% for 2022, primarily due to deposit repricing activity and liability mix-shift. Average earning assets were $43.0 billion for 2023, up $2.9 billion compared to 2022, largely due to higher loan balances.
•Fees and commissions revenue was $781.1 million for 2023, an increase of $123.9 million compared to 2022 led by a $99.6 million increase in brokerage and trading revenue. Trading revenue in 2022 was negatively affected by disruption in the fixed income markets. Fiduciary and asset management revenue increased $11.0 million with growth in Cavanal Hill fund fees, mutual fund fees, and trust business line fees.
•Other gains and losses, net increased $56.7 million. The fourth quarter of 2023 included a pre-tax $31.0 million gain, before related professional fees, on the sale of our insurance brokerage and consulting business, BOKF Insurance. We also recognized a $17.3 million increase in the value of deferred compensation investments, which are held to offset the cost of various employee benefit programs.
•Losses on available for sale securities totaled $30.6 million for the year ended December 31, 2023. We strategically repositioned a small portion of our portfolio throughout the year, mostly in the fourth quarter.
•Other operating expense increased $168.4 million to $1.3 billion. Personnel expense grew $95.7 million, reflecting a combination of annual merit increases and salary adjustments, higher sales activity, and business expansion. Non-personnel expense increased $72.7 million including the FDIC special assessment of $43.8 million. Increased data processing and communications, business promotion, ongoing FDIC assessment costs, and occupancy and equipment expenses were partially offset by lower mortgage banking costs.
•The net economic cost of the changes in the fair value of mortgage servicing rights and related economic hedges was $18.2 million during 2023 compared to $12.5 million during 2022 due to continued market volatility throughout 2023.
•The provision for credit losses was $46.0 million in 2023, primarily due to loan growth and changes in our economic forecast during the year, including a more challenging commercial real estate environment. Net charge-offs were $18.1 million or 0.08% of average loans on an annualized basis in 2023. We recorded a $30.0 million provision for expected credit losses in 2022. The combined allowance for credit losses totaled $326 million or 1.36% of outstanding loans at December 31, 2023. The combined allowance for credit losses was $297 million or 1.31% of outstanding loans at December 31, 2022.
•Nonperforming assets not guaranteed by U.S. government agencies increased $18 million over December 31, 2022. Potential problem loans increased $65 million and other loans especially mentioned increased $43 million.
•Average outstanding loan balances were $23.1 billion, a $1.8 billion increase, mostly driven by growth in commercial loans and commercial real estate loans secured by multifamily properties. Commercial loans increased $914 million and commercial real estate loans increased $818 million. Period-end outstanding loan balances increased $1.3 billion to $23.9 billion at December 31, 2023.
•Average deposits decreased $4.6 billion to $33.2 billion. Average demand deposits decreased $4.2 billion while average interest-bearing deposits decreased $487 million. Period-end deposits decreased $461 million to $34.0 billion. The loan to deposit ratio was 70% at December 31, 2023 and was 65% at December 31, 2022.
•Assets under management or administration totaled $104.7 billion at December 31, 2023, increasing $5.0 billion compared to December 31, 2022.
•The Company's tangible common equity ratio, a non-GAAP measure, was 8.29% at December 31, 2023 and 7.63% at December 31, 2022. The tangible common equity ratio is primarily based on total shareholders' equity, which includes unrealized gains and losses on available for sale securities. Adjusted for all securities portfolio losses, including the tax adjusted losses in the investment portfolio, the tangible common equity ratio would be 8.02% at December 31, 2023 and 7.36% at December 31, 2022.
•The Company's common equity Tier 1 capital ratio was 12.06% at December 31, 2023. In addition, the Tier 1 capital ratio was 12.07%, total capital ratio was 13.16% and leverage ratio was 9.45% at December 31, 2023. At December 31, 2022, the Tier 1 capital ratio was 11.71%, the total capital ratio was 12.67% and the leverage ratio was 9.91%.
•The Company repurchased 2,113,808 common shares at an average price of $82.85 per share during 2023 and 1,632,401 common shares at an average price of $94.88 during 2022.
•The Company paid cash dividends of $2.17 per common share during 2023 and $2.13 per common share in 2022.
Net income for the fourth quarter of 2023 totaled $82.6 million or $1.26 per diluted share, compared to $134.5 million or $2.04 per diluted share for the third quarter of 2023. The fourth quarter included a 52 cent per share reduction as a result of the FDIC special assessment.
Highlights of the fourth quarter of 2023 included:
•Net interest revenue totaled $296.7 million, a decrease of $4.2 million compared to the prior quarter. Net interest margin was 2.64% compared to 2.69%, primarily due to deposit repricing activity and liability mix-shift. For the fourth quarter of 2023, our core net interest margin excluding trading activities, a non-GAAP measure, was 3.03% compared to 3.14% in the prior quarter.
•Fees and commissions revenue was $196.8 million, largely consistent with the prior quarter. Lower brokerage and trading revenue and other revenue was offset by increased transaction card revenue.
•Other gains and losses, net increased $39.0 million to $40.5 million. The fourth quarter included a $31.0 million pre-tax gain, before related professional fees, on the sale of our insurance brokerage and consulting business, BOKF Insurance. The value of our deferred compensation investments also increased $5.9 million versus a decline of $427 thousand in the prior quarter.
•Losses on available for sale securities totaled $27.6 million in the fourth quarter. The gain on sale received from the disposition of BOKF Insurance was used to reposition a small portion of our available for sale securities portfolio.
•Operating expense increased $59.8 million to $384.1 million. Personnel expense grew $12.2 million with higher regular compensation, incentive compensation, including deferred compensation plans, and employee benefits expense. Non-personnel expense increased $47.5 million including the FDIC special assessment of $43.8 million. Increased professional fees and services, business promotion, and charitable expenses were partially offset by lower occupancy and equipment costs.
•The provision for credit losses of $6.0 million in the fourth quarter of 2023 reflects a stable economic forecast and continued loan growth. Net charge-offs were $4.1 million or 0.07% of average loans on an annualized basis in the fourth quarter.
Critical Accounting Policies & Estimates
The Consolidated Financial Statements and accompanying notes are prepared in accordance with GAAP. The Company's accounting policies are more fully described in Note 1 to the Consolidated Financial Statements. Management makes significant assumptions and estimates in the preparation of the Consolidated Financial Statements and accompanying notes in conformity with GAAP that may be highly subjective, complex and subject to variability. Actual results could differ significantly from these assumptions and estimates. The following discussion addresses the most critical areas where these assumptions and estimates could affect the financial condition, results of operations and cash flows of the Company. These critical accounting policies and estimates have been discussed with the appropriate committees of the Board of Directors.
Allowance for Loan Losses and Accrual for Off-Balance Sheet Credit Risk from Loan Commitments
The allowance for loan losses and accrual for off-balance sheet credit risk from unfunded loan commitments represent the portion of amortized cost basis of loans and related unfunded commitments we do not expect to collect over the asset’s contractual life, considering past events, current conditions, as well as reasonable and supportable forecasts of future economic conditions. Quarterly, a senior management Allowance Committee assesses the appropriateness of the allowance for loan losses and accrual for off-balance sheet credit risk. This assessment requires judgment about effects of uncertain matters, resulting in a subjective calculation which is inherently imprecise. Because of the subjective forward-looking nature of the calculation, changes in these measures may not directly correlate with actual economic events. In future periods, management judgment may consider new or changed information which may cause significant changes in these allowances in those future periods.
See Note 4 to the Consolidated Financial Statements for the description of the expected credit losses calculation of the allowance for loan losses and accrual for off-balance sheet credit risk from unfunded loan commitments.
For the majority of risk-graded loans, the accruing loan's expected credit loss estimate is sensitive to management judgment, particularly probability of default and loss given default assumptions, changes in specific macroeconomic factor forecasts and the probability weight assigned to each economic scenario, and appropriate adjustments.
Significant assumptions and estimates affecting the allowance for loan losses and accrual for off-balance sheet credit risk include:
•Probability of default and loss given default measurements are based on historical data that may not be a good predictor of future performance or actual losses.
•Probability of default is based on risk grades, a subjective measurement of the risk of a loan. This subjective assessment of risk may not reflect actual risk of loss.
•The forecast for each relevant economic loss driver and the probability weighting of economic scenarios are overseen by a senior management Economic Forecast Committee which includes members independent of the allowance process.
•The Allowance Committee may increase or decrease the allowance to reflect risks not captured in the quantitative component. Examples of circumstances that may result in adjustments include, but are not limited to, new lines of business, market conditions that have not been previously encountered, observed changes in credit risk that are not yet reflected in macroeconomic factors, or economic conditions that impact loss given default assumptions.
Although the resulting expected credit loss estimate represents management's best estimates at the time, actual credit losses will differ from management's estimate. Portfolio composition will change over time, actual economic conditions will differ from probability-weighted assumptions, borrower-specific circumstances will change, as well as other factors. Differences between actual losses and management's estimates may materially affect the Company's results of operations.
We describe critical elements affecting our estimate of expected credit loss in the "Summary of Credit Loss Experience" section of Management's Discussion and Analysis. While it is challenging to evaluate the allowance impact for a change in a particular input, results of such an analysis demonstrate how the quantitative element of the allowance behaves under different conditions. The sensitivity to management's economic scenario weighting may be quantified by comparing the results of weighting each economic scenario at 100%. For example, compared to a 100% Base Case scenario, a 100% Downside case would result in an additional $172 million in quantitative reserve, while a 100% Upside Case would result in $19 million less in quantitative reserve at December 31, 2023. Such sensitivity calculations do not necessarily reflect the nature and extent of future changes in the related allowance for a number of reasons including (1) management's weighting of multiple forecasted economic scenarios in estimating expected credit losses; (2) management's predictions of future economic trends and relationships among the scenarios may differ from actual events; and (3) management's application of subjective measures to modeled results when appropriate.
Fair Value Measurement
Certain assets and liabilities are recorded at fair value in the Consolidated Financial Statements. Fair value is defined by applicable accounting guidance as the price to sell an asset or transfer a liability in an orderly transaction between market participants in the principal markets for the given asset or liability at the measurement date based on market conditions at that date. An orderly transaction assumes exposure to the market for a customary period for marketing activities prior to the measurement date and not a forced liquidation or distressed sale.
A hierarchy for fair value has been established that prioritizes the inputs of valuation techniques used to measure fair value into three broad categories: unadjusted quoted prices in active markets for identical assets or liabilities (Level 1), other observable inputs that can be observed either directly or indirectly (Level 2) and unobservable inputs for assets or liabilities (Level 3). Fair value may be recorded for certain assets and liabilities every reporting period on a recurring basis or under certain circumstances on a non-recurring basis. Fair value measurements of significant assets or liabilities that are based on unobservable inputs (Level 3) are considered Critical Accounting Policies and Estimates. Additional discussion of fair value measurement and disclosure is included in Notes 7 and 19 to the Consolidated Financial Statements.
Mortgage Servicing Rights
We have a significant investment in MSRs. Our MSRs are primarily retained from sales in the secondary market of residential mortgage loans we have originated or purchased from correspondent lenders. MSRs may be purchased from other lenders. Both originated and purchased MSRs are initially recognized at fair value. We carry all MSRs at fair value. Changes in fair value are recognized in earnings as they occur.
MSRs are not traded in active markets. The fair value of MSRs is determined by discounting the projected cash flows. Certain significant assumptions and estimates used in valuing MSRs are based on current market sources including projected prepayment speeds, assumed servicing costs, earnings on escrow deposits, ancillary income and discount rates. Assumptions used to value our MSRs are considered significant unobservable inputs and represent our best estimate of assumptions that market participants would use to value this asset. A separate third-party model is used to estimate prepayment speeds based on interest rates, housing turnover rates, estimated loan curtailment, anticipated defaults and other relevant factors. The prepayment model is updated periodically for changes in market conditions and adjusted to better correlate with actual performance of our servicing portfolio. The discount rate is based on benchmark rates for mortgage loans plus a market spread expected by investors in servicing rights. Significant assumptions used to determine the fair value of our MSRs are presented in Note 7 to the Consolidated Financial Statements. At least quarterly, we request estimates of fair value from outside sources to corroborate the results of the valuation model.
The assumptions used in this model are primarily based on mortgage interest rates. Evaluation of the effect of a change in one assumption without considering the effect of that change on other assumptions is not meaningful. Considering all related assumptions, we expect a 50 basis point parallel rate shock to increase the fair value of our servicing rights by $8.0 million. We expect a $9.9 million decrease in the fair value of our MSRs from a 50 basis point parallel rate shock.
Results of Operations
Net Interest Revenue and Net Interest Margin
2023 Net Interest Revenue
Net interest revenue is the interest earned on debt securities, loans and other interest-earning assets less interest paid for interest-bearing deposits and other borrowings. The net interest margin is calculated by dividing tax-equivalent net interest revenue by average interest-earning assets. Net interest spread is the difference between the average rate earned on interest-earning assets and the average rate paid on interest-bearing liabilities. Net interest margin is typically greater than net interest spread due to interest income earned on assets funded by non-interest bearing liabilities such as demand deposits and equity.
Tax-equivalent net interest revenue totaled $1.3 billion for 2023, an increase of $61.1 million over the prior year. Net interest revenue increased $139.6 million due to changes in interest rates and decreased $78.5 million from increased average borrowing levels partially offset by growth in earning assets. Table 3 shows the effects on net interest revenue due to changes in average balances and interest rates for the various types of earning assets and interest-bearing liabilities. In addition, see the Annual Financial Summary of consolidated daily average balances, yields and rates as shown in Table 2.
Net interest margin was 2.93% for 2023 and 2.98% for 2022. Our core net interest margin excluding trading activities, a non-GAAP measure, was 3.31% compared to 3.26% in the prior year. In response to rising inflation, the Federal Reserve increased the federal funds rate 525 basis points since the beginning of 2022. The resulting impact on market interest rates increased net interest margin at first as our earning assets, led by our significant percentage of variable-rate commercial loans, repriced at a higher rate and faster pace than our interest-bearing liabilities. Throughout 2023, we have experienced margin compression reflecting deposit repricing activity. The tax-equivalent yield on earning assets was 5.38% for 2023 compared to 3.42% in 2022. Loan yields increased 246 basis points to 7.08%. The available for sale securities portfolio yield increased 99 basis points to 3.06%. The yield on trading securities grew 250 basis points to 4.74% and the yield on interest-bearing cash and cash equivalents increased 368 basis points to 5.12%.
Funding costs increased 273 basis points compared to 2022. The cost of interest-bearing deposits increased 226 basis points. The cost of other short-term borrowings increased 322 basis points. The benefit to net interest margin from earning assets funded by non-interest bearing liabilities was 98 basis points for 2023, up from 26 basis points for 2022.
Average earning assets for 2023 increased $2.9 billion or 7% compared 2022. Average loans, net of allowance for loan losses, increased $1.8 billion, largely due to growth in commercial and commercial real estate loans. The average balance of investment securities increased $875 million while the average balance of available for sale securities, which consists largely of residential and commercial mortgage-backed securities guaranteed by U.S. government agencies, increased $298 million. In the second quarter 2022, we transferred $2.4 billion of U.S. government agency mortgage-backed securities from available for sale to the investment securities portfolio to limit the effect of future rate increases on the tangible common equity ratio. Average interest-bearing cash and cash equivalents decreased $169 million and average trading securities balances decreased $164 million.
Total average deposits decreased $4.6 billion compared to the prior year as customers redeploy capital. Lower average demand deposit balances of $4.2 billion and average interest-bearing transaction account balances of $1.3 billion were partially offset by higher average time deposits of $908 million. Average short-term borrowings increased $5.7 billion.
Our overall objective is to manage the Company's balance sheet for changes in interest rates as described in the Market Risk section of this report. Approximately 81% of our commercial and commercial real estate loan portfolios are either variable rate loans or fixed rate loans that will reprice within one year. These loans are funded primarily by deposit accounts that are either non-interest bearing or that reprice more slowly than the loans. The result is a balance sheet that would be asset-sensitive which means that assets generally reprice more quickly than liabilities. One of the strategies that we use to manage toward a relative rate-neutral position is to purchase fixed rate residential mortgage-backed securities issued primarily by U.S. government agencies and fund them with market rate sensitive liabilities. The liability-sensitive nature of this strategy provides an offset to the asset-sensitive characteristics of our loan portfolio. We also may use derivative instruments to manage our interest rate risk.
The effectiveness of these strategies is reflected in the overall change in net interest revenue due to changes in interest rates as shown in Table 3 and in the interest rate sensitivity projections as shown in the Market Risk section of this report.
Table 2 - Annual Financial Summary
Consolidated Daily Average Balances, Average Yields and Rates
|
|
|
|
|
|
|
|
|
|
|
|
|
|
|
|
|
|
|
|
|
| (Dollars in thousands, except per share data) |
|
Year Ended |
| |
|
December 31, 2023 |
|
|
Average
Balance |
|
Revenue/
Expense |
|
Yield/
Rate |
| Assets |
|
|
|
|
|
|
| Interest-bearing cash and cash equivalents |
|
$ |
632,289 |
|
|
$ |
32,353 |
|
|
5.12 |
% |
| Trading securities |
|
4,559,012 |
|
|
216,269 |
|
|
4.74 |
% |
| Investment securities |
|
2,368,749 |
|
|
34,043 |
|
|
1.44 |
% |
| Available for sale securities |
|
11,941,222 |
|
|
388,755 |
|
|
3.06 |
% |
| Fair value option securities |
|
150,847 |
|
|
7,760 |
|
|
5.06 |
% |
| Restricted equity securities |
|
387,224 |
|
|
29,683 |
|
|
7.67 |
% |
| Residential mortgage loans held for sale |
|
69,280 |
|
|
4,341 |
|
|
6.12 |
% |
| Loans |
|
23,125,349 |
|
|
1,638,071 |
|
|
7.08 |
% |
| Allowance for loan losses |
|
(258,300) |
|
|
|
|
|
| Loans, net of allowance |
|
22,867,049 |
|
|
1,638,071 |
|
|
7.16 |
% |
Total earning assets |
|
42,975,672 |
|
|
2,351,275 |
|
|
5.38 |
% |
| Receivable on unsettled securities sales |
|
222,004 |
|
|
|
|
|
| Cash and other assets |
|
5,046,478 |
|
|
|
|
|
| Total assets |
|
$ |
48,244,154 |
|
|
|
|
|
|
|
|
|
|
|
|
| Liabilities and equity |
|
|
|
|
|
|
| Interest-bearing deposits: |
|
|
|
|
|
|
| Transaction |
|
$ |
19,223,863 |
|
|
$ |
540,068 |
|
|
2.81 |
% |
| Savings |
|
901,008 |
|
|
2,913 |
|
|
0.32 |
% |
| Time |
|
2,354,511 |
|
|
83,616 |
|
|
3.55 |
% |
| Total interest-bearing deposits |
|
22,479,382 |
|
|
626,597 |
|
|
2.79 |
% |
Funds purchased and repurchase agreements
|
|
2,653,654 |
|
|
119,018 |
|
|
4.49 |
% |
| Other borrowings |
|
5,979,095 |
|
|
315,717 |
|
|
5.28 |
% |
| Subordinated debentures |
|
131,155 |
|
|
8,952 |
|
|
6.83 |
% |
| Total interest-bearing liabilities |
|
31,243,286 |
|
|
1,070,284 |
|
|
3.43 |
% |
| Non-interest bearing demand deposits |
|
10,725,452 |
|
|
|
|
|
| Due on unsettled securities purchases |
|
388,353 |
|
|
|
|
|
| Other liabilities |
|
979,685 |
|
|
|
|
|
| Total equity |
|
4,907,378 |
|
|
|
|
|
| Total liabilities and equity |
|
$ |
48,244,154 |
|
|
|
|
|
|
|
|
|
|
|
|
| Tax-equivalent net interest revenue |
|
|
|
$ |
1,280,991 |
|
|
1.95 |
% |
| Tax-equivalent net interest revenue to earning assets |
|
|
|
|
|
2.93 |
% |
| Less tax-equivalent adjustment |
|
|
|
8,811 |
|
|
|
| Net interest revenue |
|
|
|
1,272,180 |
|
|
|
Provision for credit losses |
|
|
|
46,000 |
|
|
|
| Other operating revenue |
|
|
|
789,949 |
|
|
|
| Other operating expense |
|
|
|
1,332,881 |
|
|
|
| Net income before taxes |
|
|
|
683,248 |
|
|
|
| Federal and state income taxes |
|
|
|
152,115 |
|
|
|
| Net income |
|
|
|
531,133 |
|
|
|
| Net income attributable to non-controlling interests |
|
|
|
387 |
|
|
|
| Net income attributable to BOK Financial Corporation shareholders |
|
|
|
$ |
530,746 |
|
|
|
| Earnings Per Average Common Share Equivalent: |
|
|
|
|
|
|
| Net income: |
|
|
|
|
|
|
| Basic |
|
|
|
$ |
8.02 |
|
|
|
| Diluted |
|
|
|
$ |
8.02 |
|
|
|
Yield calculations are shown on a tax equivalent basis at the statutory federal and state rates for the periods presented. The yield calculations exclude security trades that have been recorded on trade date with no corresponding interest income and the unrealized gains and losses. The yield calculation also includes average loan balances for which the accrual of interest has been discontinued and are net of unearned income. Yield/rate calculations are generally based on the conventions that determine how interest income and expense is accrued.
Table 2 - Annual Financial Summary (continued)
Consolidated Daily Average Balances, Average Yields and Rates
|
|
|
|
|
|
|
|
|
|
|
|
|
|
|
|
|
|
|
|
|
|
|
|
|
|
|
|
|
|
|
|
|
|
|
|
|
|
|
| (Dollars in thousands, Except Per Share Data) |
|
Year Ended |
|
|
December 31, 2022 |
|
December 31, 2021 |
|
|
Average
Balance |
|
Revenue/
Expense |
|
Yield/
Rate |
|
Average
Balance |
|
Revenue/
Expense |
|
Yield/
Rate |
| Assets |
|
|
|
|
|
|
|
|
|
|
|
|
| Interest-bearing cash and cash equivalents |
|
$ |
801,180 |
|
|
$ |
11,552 |
|
|
1.44 |
% |
|
$ |
816,425 |
|
|
$ |
1,060 |
|
|
0.13 |
% |
| Trading securities |
|
4,723,130 |
|
|
115,295 |
|
|
2.24 |
% |
|
7,823,705 |
|
|
156,214 |
|
|
1.98 |
% |
| Investment securities |
|
1,493,322 |
|
|
24,490 |
|
|
1.64 |
% |
|
222,426 |
|
|
11,065 |
|
|
4.97 |
% |
| Available for sale securities |
|
11,643,103 |
|
|
249,361 |
|
|
2.07 |
% |
|
13,342,526 |
|
|
230,698 |
|
|
1.80 |
% |
| Fair value option securities |
|
64,776 |
|
|
2,145 |
|
|
3.40 |
% |
|
67,881 |
|
|
1,542 |
|
|
2.38 |
% |
| Restricted equity securities |
|
180,760 |
|
|
8,282 |
|
|
4.58 |
% |
|
195,488 |
|
|
5,703 |
|
|
2.92 |
% |
| Residential mortgage loans held for sale |
|
139,553 |
|
|
6,027 |
|
|
4.31 |
% |
|
188,888 |
|
|
5,465 |
|
|
2.93 |
% |
| Loans |
|
21,279,187 |
|
|
983,413 |
|
|
4.62 |
% |
|
21,495,156 |
|
|
777,124 |
|
|
3.62 |
% |
| Allowance for loan losses |
|
(245,915) |
|
|
|
|
|
|
(326,121) |
|
|
|
|
|
| Loans, net of allowance |
|
21,033,272 |
|
|
983,413 |
|
|
4.68 |
% |
|
21,169,035 |
|
|
777,124 |
|
|
3.67 |
% |
Total earning assets |
|
40,079,096 |
|
|
1,400,565 |
|
|
3.42 |
% |
|
43,826,374 |
|
|
1,188,871 |
|
|
2.74 |
% |
| Receivable on unsettled securities sales |
|
310,974 |
|
|
|
|
|
|
667,149 |
|
|
|
|
|
| Cash and other assets |
|
6,634,566 |
|
|
|
|
|
|
5,658,180 |
|
|
|
|
|
| Total assets |
|
$ |
47,024,636 |
|
|
|
|
|
|
$ |
50,151,703 |
|
|
|
|
|
|
|
|
|
|
|
|
|
|
|
|
|
|
| Liabilities and equity |
|
|
|
|
|
|
|
|
|
|
|
|
| Interest-bearing deposits: |
|
|
|
|
|
|
|
|
|
|
|
|
| Transaction |
|
$ |
20,550,624 |
|
|
$ |
108,956 |
|
|
0.53 |
% |
|
$ |
21,673,472 |
|
|
$ |
21,961 |
|
|
0.10 |
% |
| Savings |
|
969,279 |
|
|
489 |
|
|
0.05 |
% |
|
865,245 |
|
|
374 |
|
|
0.04 |
% |
| Time |
|
1,446,613 |
|
|
12,304 |
|
|
0.85 |
% |
|
1,876,901 |
|
|
11,149 |
|
|
0.59 |
% |
| Total interest-bearing deposits |
|
22,966,516 |
|
|
121,749 |
|
|
0.53 |
% |
|
24,415,618 |
|
|
33,484 |
|
|
0.14 |
% |
| Funds purchased and repurchase agreements |
|
1,265,045 |
|
|
13,158 |
|
|
1.04 |
% |
|
2,238,702 |
|
|
8,084 |
|
|
0.36 |
% |
| Other borrowings |
|
1,628,972 |
|
|
39,325 |
|
|
2.41 |
% |
|
2,599,861 |
|
|
9,793 |
|
|
0.38 |
% |
| Subordinated debentures |
|
131,206 |
|
|
6,490 |
|
|
4.95 |
% |
|
224,058 |
|
|
10,535 |
|
|
4.70 |
% |
| Total interest-bearing liabilities |
|
25,991,739 |
|
|
180,722 |
|
|
0.70 |
% |
|
29,478,239 |
|
|
61,896 |
|
|
0.21 |
% |
| Non-interest bearing demand deposits |
|
14,884,765 |
|
|
|
|
|
|
13,505,359 |
|
|
|
|
|
| Due on unsettled securities purchases |
|
451,530 |
|
|
|
|
|
|
800,667 |
|
|
|
|
|
| Other liabilities |
|
879,691 |
|
|
|
|
|
|
1,013,050 |
|
|
|
|
|
| Total equity |
|
4,816,911 |
|
|
|
|
|
|
5,354,388 |
|
|
|
|
|
| Total liabilities and equity |
|
$ |
47,024,636 |
|
|
|
|
|
|
$ |
50,151,703 |
|
|
|
|
|
|
|
|
|
|
|
|
|
|
|
|
|
|
| Tax-equivalent net interest revenue |
|
|
|
$ |
1,219,843 |
|
|
2.72 |
% |
|
|
|
$ |
1,126,975 |
|
|
2.53 |
% |
| Tax-equivalent net interest revenue to earning assets |
|
|
|
|
|
2.98 |
% |
|
|
|
|
|
2.60 |
% |
| Less tax-equivalent adjustment |
|
|
|
8,463 |
|
|
|
|
|
|
8,942 |
|
|
|
| Net interest revenue |
|
|
|
1,211,380 |
|
|
|
|
|
|
1,118,033 |
|
|
|
Provision for credit losses |
|
|
|
30,000 |
|
|
|
|
|
|
(100,000) |
|
|
|
| Other operating revenue |
|
|
|
643,257 |
|
|
|
|
|
|
755,775 |
|
|
|
| Other operating expense |
|
|
|
1,164,480 |
|
|
|
|
|
|
1,177,708 |
|
|
|
| Net income before taxes |
|
|
|
660,157 |
|
|
|
|
|
|
796,100 |
|
|
|
| Federal and state income taxes |
|
|
|
139,864 |
|
|
|
|
|
|
179,775 |
|
|
|
| Net income |
|
|
|
520,293 |
|
|
|
|
|
|
616,325 |
|
|
|
| Net income (loss) attributable to non-controlling interests |
|
|
|
20 |
|
|
|
|
|
|
(1,796) |
|
|
|
| Net income attributable to BOK Financial Corporation shareholders |
|
|
|
$ |
520,273 |
|
|
|
|
|
|
$ |
618,121 |
|
|
|
| Earnings Per Average Common Share Equivalent: |
|
|
|
|
|
|
|
|
|
|
|
|
| Net income: |
|
|
|
|
|
|
|
|
|
|
|
|
| Basic |
|
|
|
$ |
7.68 |
|
|
|
|
|
|
$ |
8.95 |
|
|
|
| Diluted |
|
|
|
$ |
7.68 |
|
|
|
|
|
|
$ |
8.95 |
|
|
|
|
|
|
|
|
|
|
|
|
|
|
|
|
Table 3 – Annual Volume/Rate Analysis
(In thousands)
|
|
|
|
|
|
|
|
|
|
|
|
|
|
|
|
|
|
|
|
|
|
|
|
|
|
|
|
|
|
|
|
|
|
|
|
|
|
|
|
|
Year Ended |
|
Year Ended |
|
|
December 31, 2023 / 2022 |
|
December 31, 2022 / 2021 |
| |
|
|
|
Change Due To1 |
|
|
|
Change Due To1 |
|
|
Change |
|
Volume |
|
Yield /
Rate |
|
Change |
|
Volume |
|
Yield /
Rate |
| Tax-equivalent interest revenue: |
|
|
|
|
|
|
|
|
|
|
|
|
| Interest-bearing cash and cash equivalents |
|
$ |
20,801 |
|
|
$ |
(5,557) |
|
|
$ |
26,358 |
|
|
$ |
10,492 |
|
|
$ |
(111) |
|
|
$ |
10,603 |
|
| Trading securities |
|
100,974 |
|
|
(20,136) |
|
|
121,110 |
|
|
(40,919) |
|
|
(58,095) |
|
|
17,176 |
|
|
|
|
|
|
|
|
|
|
|
|
|
|
|
|
|
|
|
|
|
|
|
|
|
|
|
|
|
|
|
|
|
|
|
|
|
|
|
|
| Investment securities |
|
9,553 |
|
|
12,559 |
|
|
(3,006) |
|
|
13,425 |
|
|
43,575 |
|
|
(30,150) |
|
|
|
|
|
|
|
|
|
|
|
|
|
|
|
|
|
|
|
|
|
|
|
|
|
|
|
|
|
|
|
|
|
|
|
|
|
|
|
|
Available for sale securities |
|
139,394 |
|
|
16,127 |
|
|
123,267 |
|
|
18,663 |
|
|
(14,377) |
|
|
33,040 |
|
| Fair value option securities |
|
5,615 |
|
|
3,815 |
|
|
1,800 |
|
|
603 |
|
|
(50) |
|
|
653 |
|
Restricted equity securities |
|
21,401 |
|
|
13,269 |
|
|
8,132 |
|
|
2,579 |
|
|
(476) |
|
|
3,055 |
|
Residential mortgage loans held for sale |
|
(1,686) |
|
|
(3,592) |
|
|
1,906 |
|
|
562 |
|
|
(1,696) |
|
|
2,258 |
|
| Loans |
|
654,658 |
|
|
108,241 |
|
|
546,417 |
|
|
206,289 |
|
|
(8,240) |
|
|
214,529 |
|
| Total tax-equivalent interest revenue |
|
950,710 |
|
|
124,726 |
|
|
825,984 |
|
|
211,694 |
|
|
(39,470) |
|
|
251,164 |
|
| Interest expense: |
|
|
|
|
|
|
|
|
|
|
|
|
| Transaction deposits |
|
431,112 |
|
|
(22,237) |
|
|
453,349 |
|
|
86,995 |
|
|
(3,662) |
|
|
90,657 |
|
| Savings deposits |
|
2,424 |
|
|
(114) |
|
|
2,538 |
|
|
115 |
|
|
35 |
|
|
80 |
|
| Time deposits |
|
71,312 |
|
|
19,985 |
|
|
51,327 |
|
|
1,155 |
|
|
(3,132) |
|
|
4,287 |
|
| Funds purchased and repurchase agreements |
|
105,860 |
|
|
38,329 |
|
|
67,531 |
|
|
5,074 |
|
|
(6,827) |
|
|
11,901 |
|
| Other borrowings |
|
276,392 |
|
|
167,239 |
|
|
109,153 |
|
|
29,532 |
|
|
(13,467) |
|
|
42,999 |
|
| Subordinated debentures |
|
2,462 |
|
|
(4) |
|
|
2,466 |
|
|
(4,045) |
|
|
(4,485) |
|
|
440 |
|
| Total interest expense |
|
889,562 |
|
|
203,198 |
|
|
686,364 |
|
|
118,826 |
|
|
(31,538) |
|
|
150,364 |
|
| Tax-equivalent net interest revenue |
|
61,148 |
|
|
(78,472) |
|
|
139,620 |
|
|
92,868 |
|
|
(7,932) |
|
|
100,800 |
|
| Change in tax-equivalent adjustment |
|
348 |
|
|
|
|
|
|
(479) |
|
|
|
|
|
| Net interest revenue |
|
$ |
60,800 |
|
|
|
|
|
|
$ |
93,347 |
|
|
|
|
|
1 Changes attributable to both volume and yield/rate are allocated to both volume and yield/rate on an equal basis.
Fourth Quarter 2023 Net Interest Revenue
Tax-equivalent net interest revenue totaled $298.8 million for the fourth quarter of 2023, a decrease of $4.3 million compared to the third quarter of 2023. Net interest margin was 2.64% for the fourth quarter of 2023 compared to 2.69% for the third quarter of 2023. For the fourth quarter of 2023, our core net interest margin excluding trading activities, a non-GAAP measure, was 3.03% compared to 3.14% in the prior quarter. The Federal Reserve increased the federal funds rate 100 basis points in 2023 following a 425 basis point increase in 2022. While the resulting market interest rates increased net interest margin in the beginning of the rising rate cycle, largely due to our significant percentage of variable-rate commercial loans, deposit and funding repricing outpaced the increase in net interest income in the fourth quarter.
Average earning assets for the fourth quarter of 2023 increased $315 million over the third quarter of 2023. Average loans, net of allowance for loan losses, increased $284 million, largely due to growth in commercial and commercial real estate loans. Available for sale securities increased $138 million while investment securities decreased $67 million. Average interest-bearing deposits increased $1.2 billion as deposits continue to shift from demand to interest-bearing. Funds purchased and repurchase agreements declined $222 million while average other borrowings increased $153 million.
The tax-equivalent yield on earning assets was 5.64% for the fourth quarter of 2023, an increase of 15 basis points compared to the third quarter of 2023. Loan yields increased 11 basis points to 7.36% while the yield on available for sale securities increased 16 basis points to 3.27%. The yield on trading securities was up 29 basis points to 5.05%.
Funding costs were 3.98%, an increase of 17 basis points compared to the third quarter of 2023. The cost of interest-bearing deposits increased 26 basis points to 3.43% while the cost of other short-term borrowings increased 6 basis points to 5.35%. The cost of other borrowings was up 7 basis points to 5.55%. The cost of funds purchased and repurchase agreements decreased 2 basis points to 4.79%. The benefit to net interest margin from earning assets funded by non-interest bearing liabilities was 98 basis points in the fourth quarter of 2023 and 101 basis points in the third quarter of 2023.
Table 4 - Quarterly Financial Summary
Consolidated Daily Average Balances, Average Yields and Rates
|
|
|
|
|
|
|
|
|
|
|
|
|
|
|
|
|
|
|
|
|
|
|
|
|
|
|
|
|
|
|
|
|
|
|
|
|
|
|
| (In thousands, except per share data) |
|
Three Months Ended |
| |
|
December 31, 2023 |
|
September 30, 2023 |
|
|
Average
Balance |
|
Revenue/
Expense |
|
Yield/
Rate |
|
Average
Balance |
|
Revenue/
Expense |
|
Yield/
Rate |
| Assets |
|
|
|
|
|
|
|
|
|
|
|
|
| Interest-bearing cash and cash equivalents |
|
$ |
605,839 |
|
|
$ |
8,096 |
|
|
5.30 |
% |
|
$ |
598,734 |
|
|
$ |
8,199 |
|
|
5.43 |
% |
| Trading securities |
|
5,448,403 |
|
|
69,013 |
|
|
5.05 |
% |
|
5,444,587 |
|
|
65,301 |
|
|
4.76 |
% |
| Investment securities |
|
2,264,194 |
|
|
8,058 |
|
|
1.42 |
% |
|
2,331,595 |
|
|
8,309 |
|
|
1.43 |
% |
| Available for sale securities |
|
12,063,398 |
|
|
105,556 |
|
|
3.27 |
% |
|
11,925,800 |
|
|
99,238 |
|
|
3.11 |
% |
| Fair value option securities |
|
20,086 |
|
|
199 |
|
|
3.57 |
% |
|
41,741 |
|
|
552 |
|
|
4.61 |
% |
| Restricted equity securities |
|
432,780 |
|
|
8,670 |
|
|
8.01 |
% |
|
445,532 |
|
|
8,776 |
|
|
7.88 |
% |
| Residential mortgage loans held for sale |
|
61,146 |
|
|
1,036 |
|
|
6.59 |
% |
|
77,208 |
|
|
1,234 |
|
|
6.27 |
% |
| Loans |
|
23,705,108 |
|
|
439,808 |
|
|
7.36 |
% |
|
23,414,308 |
|
|
427,649 |
|
|
7.25 |
% |
| Allowance for loan losses |
|
(273,717) |
|
|
|
|
|
|
(267,205) |
|
|
|
|
|
| Loans, net of allowance |
|
23,431,391 |
|
|
439,808 |
|
|
7.45 |
% |
|
23,147,103 |
|
|
427,649 |
|
|
7.33 |
% |
Total earning assets |
|
44,327,237 |
|
|
640,436 |
|
|
5.64 |
% |
|
44,012,300 |
|
|
619,258 |
|
|
5.49 |
% |
| Receivable on unsettled securities sales |
|
276,856 |
|
|
|
|
|
|
268,344 |
|
|
|
|
|
| Cash and other assets |
|
5,109,577 |
|
|
|
|
|
|
5,038,908 |
|
|
|
|
|
| Total assets |
|
$ |
49,713,670 |
|
|
|
|
|
|
$ |
49,319,552 |
|
|
|
|
|
| Liabilities and equity |
|
|
|
|
|
|
|
|
|
|
|
|
| Interest-bearing deposits: |
|
|
|
|
|
|
|
|
|
|
|
|
| Transaction |
|
$ |
20,449,370 |
|
|
$ |
177,475 |
|
|
3.44 |
% |
|
$ |
19,415,599 |
|
|
$ |
155,385 |
|
|
3.18 |
% |
| Savings |
|
845,705 |
|
|
1,132 |
|
|
0.53 |
% |
|
874,530 |
|
|
1,043 |
|
|
0.47 |
% |
| Time |
|
3,002,252 |
|
|
31,242 |
|
|
4.13 |
% |
|
2,839,947 |
|
|
28,380 |
|
|
3.96 |
% |
| Total interest-bearing deposits |
|
24,297,327 |
|
|
209,849 |
|
|
3.43 |
% |
|
23,130,076 |
|
|
184,808 |
|
|
3.17 |
% |
| Funds purchased and repurchase agreements |
|
2,476,973 |
|
|
29,915 |
|
|
4.79 |
% |
|
2,699,027 |
|
|
32,748 |
|
|
4.81 |
% |
| Other borrowings |
|
7,120,963 |
|
|
99,542 |
|
|
5.55 |
% |
|
6,968,309 |
|
|
96,271 |
|
|
5.48 |
% |
| Subordinated debentures |
|
131,151 |
|
|
2,343 |
|
|
7.09 |
% |
|
131,151 |
|
|
2,321 |
|
|
7.02 |
% |
| Total interest-bearing liabilities |
|
34,026,414 |
|
|
341,649 |
|
|
3.98 |
% |
|
32,928,563 |
|
|
316,148 |
|
|
3.81 |
% |
| Non-interest bearing demand deposits |
|
9,378,886 |
|
|
|
|
|
|
10,157,821 |
|
|
|
|
|
| Due on unsettled securities purchases |
|
363,358 |
|
|
|
|
|
|
435,927 |
|
|
|
|
|
| Other liabilities |
|
1,008,035 |
|
|
|
|
|
|
891,675 |
|
|
|
|
|
| Total equity |
|
4,936,977 |
|
|
|
|
|
|
4,905,566 |
|
|
|
|
|
| Total liabilities and equity |
|
$ |
49,713,670 |
|
|
|
|
|
|
$ |
49,319,552 |
|
|
|
|
|
| Tax-equivalent net interest revenue |
|
|
|
$ |
298,787 |
|
|
1.66 |
% |
|
|
|
$ |
303,110 |
|
|
1.68 |
% |
| Tax-equivalent net interest revenue to earning assets |
|
|
|
|
|
2.64 |
% |
|
|
|
|
|
2.69 |
% |
| Less tax-equivalent adjustment |
|
|
|
2,112 |
|
|
|
|
|
|
2,214 |
|
|
|
| Net interest revenue |
|
|
|
296,675 |
|
|
|
|
|
|
300,896 |
|
|
|
Provision for credit losses |
|
|
|
6,000 |
|
|
|
|
|
|
7,000 |
|
|
|
| Other operating revenue |
|
|
|
204,883 |
|
|
|
|
|
|
198,152 |
|
|
|
| Other operating expense |
|
|
|
384,083 |
|
|
|
|
|
|
324,313 |
|
|
|
| Net income before taxes |
|
|
|
111,475 |
|
|
|
|
|
|
167,735 |
|
|
|
| Federal and state income taxes |
|
|
|
28,953 |
|
|
|
|
|
|
33,256 |
|
|
|
| Net income |
|
|
|
82,522 |
|
|
|
|
|
|
134,479 |
|
|
|
| Net income (loss) attributable to non-controlling interests |
|
|
|
(53) |
|
|
|
|
|
|
(16) |
|
|
|
Net income attributable to BOK Financial Corp. shareholders |
|
|
|
$ |
82,575 |
|
|
|
|
|
|
$ |
134,495 |
|
|
|
| Earnings Per Average Common Share Equivalent: |
|
|
|
|
|
|
|
|
|
|
|
|
| Basic |
|
|
|
$ |
1.26 |
|
|
|
|
|
|
$ |
2.04 |
|
|
|
| Diluted |
|
|
|
$ |
1.26 |
|
|
|
|
|
|
$ |
2.04 |
|
|
|
Yield calculations are shown on a tax equivalent basis at the statutory federal and state rates for the periods presented. The yield calculations exclude security trades that have been recorded on trade date with no corresponding interest income and the unrealized gains and losses. The yield calculation also includes average loan balances for which the accrual of interest has been discontinued and are net of unearned income. Yield/rate calculations are generally based on the conventions that determine how interest income and expense is accrued
Table 4 - Quarterly Financial Summary (continued)
Consolidated Daily Average Balances, Average Yields and Rates
|
|
|
|
|
|
|
|
|
|
|
|
|
|
|
|
|
|
|
|
|
|
|
|
|
|
|
|
|
|
|
|
|
|
|
|
|
|
|
|
|
|
|
|
|
|
|
|
|
|
|
| Three Months Ended |
| June 30, 2023 |
|
March 31, 2023 |
|
December 31, 2022 |
| Average Balance |
|
Revenue /Expense |
|
Yield / Rate |
|
Average Balance |
|
Revenue / Expense |
|
Yield / Rate |
|
Average Balance |
|
Revenue / Expense |
|
Yield / Rate |
|
|
|
|
|
|
|
|
|
|
|
|
|
|
|
|
|
| $ |
708,475 |
|
|
$ |
9,552 |
|
|
5.41 |
% |
|
$ |
616,596 |
|
|
$ |
6,506 |
|
|
4.28 |
% |
|
$ |
568,307 |
|
|
$ |
5,822 |
|
|
4.06 |
% |
| 4,274,803 |
|
|
47,882 |
|
|
4.50 |
% |
|
3,031,969 |
|
|
34,073 |
|
|
4.52 |
% |
|
3,086,985 |
|
|
28,473 |
|
|
3.70 |
% |
| 2,408,122 |
|
|
8,659 |
|
|
1.44 |
% |
|
2,473,796 |
|
|
9,017 |
|
|
1.46 |
% |
|
2,535,305 |
|
|
9,223 |
|
|
1.46 |
% |
| 12,033,597 |
|
|
94,849 |
|
|
3.00 |
% |
|
11,738,693 |
|
|
89,112 |
|
|
2.87 |
% |
|
10,953,851 |
|
|
73,317 |
|
|
2.54 |
% |
| 245,469 |
|
|
3,116 |
|
|
5.07 |
% |
|
300,372 |
|
|
3,893 |
|
|
5.17 |
% |
|
92,012 |
|
|
931 |
|
|
4.40 |
% |
| 351,944 |
|
|
6,429 |
|
|
7.31 |
% |
|
316,724 |
|
|
5,808 |
|
|
7.34 |
% |
|
216,673 |
|
|
3,088 |
|
|
5.70 |
% |
| 72,959 |
|
|
1,092 |
|
|
5.85 |
% |
|
65,769 |
|
|
979 |
|
|
5.79 |
% |
|
98,613 |
|
|
1,390 |
|
|
5.56 |
% |
| 22,889,054 |
|
|
400,988 |
|
|
7.03 |
% |
|
22,476,247 |
|
|
369,626 |
|
|
6.67 |
% |
|
21,976,004 |
|
|
331,649 |
|
|
5.99 |
% |
| (252,890) |
|
|
|
|
|
|
(238,909) |
|
|
|
|
|
|
(242,450) |
|
|
|
|
|
| 22,636,164 |
|
|
400,988 |
|
|
7.10 |
% |
|
22,237,338 |
|
|
369,626 |
|
|
6.74 |
% |
|
21,733,554 |
|
|
331,649 |
|
|
6.06 |
% |
| 42,731,533 |
|
|
572,567 |
|
|
5.29 |
% |
|
40,781,257 |
|
|
519,014 |
|
|
5.06 |
% |
|
39,285,300 |
|
|
453,893 |
|
|
4.53 |
% |
| 163,903 |
|
|
|
|
|
|
177,312 |
|
|
|
|
|
|
194,996 |
|
|
|
|
|
| 5,012,671 |
|
|
|
|
|
|
5,023,899 |
|
|
|
|
|
|
5,729,322 |
|
|
|
|
|
| $ |
47,908,107 |
|
|
|
|
|
|
$ |
45,982,468 |
|
|
|
|
|
|
$ |
45,209,618 |
|
|
|
|
|
|
|
|
|
|
|
|
|
|
|
|
|
|
|
|
|
|
|
|
|
|
|
|
|
|
|
|
|
|
|
|
|
|
|
| $ |
18,368,592 |
|
|
$ |
119,272 |
|
|
2.60 |
% |
|
$ |
18,639,900 |
|
|
$ |
87,936 |
|
|
1.91 |
% |
|
$ |
18,898,315 |
|
|
$ |
60,893 |
|
|
1.28 |
% |
| 926,882 |
|
|
490 |
|
|
0.21 |
% |
|
958,443 |
|
|
248 |
|
|
0.10 |
% |
|
969,275 |
|
|
205 |
|
|
0.08 |
% |
| 2,076,037 |
|
|
16,904 |
|
|
3.27 |
% |
|
1,477,720 |
|
|
7,090 |
|
|
1.95 |
% |
|
1,417,606 |
|
|
4,476 |
|
|
1.25 |
% |
| 21,371,511 |
|
|
136,666 |
|
|
2.56 |
% |
|
21,076,063 |
|
|
95,274 |
|
|
1.83 |
% |
|
21,285,196 |
|
|
65,574 |
|
|
1.22 |
% |
| 3,670,994 |
|
|
41,905 |
|
|
4.58 |
% |
|
1,759,237 |
|
|
14,450 |
|
|
3.33 |
% |
|
1,046,447 |
|
|
5,407 |
|
|
2.05 |
% |
| 5,275,291 |
|
|
67,316 |
|
|
5.12 |
% |
|
4,512,280 |
|
|
52,588 |
|
|
4.73 |
% |
|
2,523,195 |
|
|
25,961 |
|
|
4.08 |
% |
| 131,153 |
|
|
2,219 |
|
|
6.79 |
% |
|
131,166 |
|
|
2,069 |
|
|
6.40 |
% |
|
131,180 |
|
|
2,038 |
|
|
6.16 |
% |
| 30,448,949 |
|
|
248,106 |
|
|
3.27 |
% |
|
27,478,746 |
|
|
164,381 |
|
|
2.43 |
% |
|
24,986,018 |
|
|
98,980 |
|
|
1.57 |
% |
| 10,998,201 |
|
|
|
|
|
|
12,406,408 |
|
|
|
|
|
|
14,176,189 |
|
|
|
|
|
| 436,353 |
|
|
|
|
|
|
316,738 |
|
|
|
|
|
|
575,957 |
|
|
|
|
|
| 1,079,692 |
|
|
|
|
|
|
939,553 |
|
|
|
|
|
|
853,134 |
|
|
|
|
|
| 4,944,912 |
|
|
|
|
|
|
4,841,023 |
|
|
|
|
|
|
4,618,320 |
|
|
|
|
|
| $ |
47,908,107 |
|
|
|
|
|
|
$ |
45,982,468 |
|
|
|
|
|
|
$ |
45,209,618 |
|
|
|
|
|
|
|
$ |
324,461 |
|
|
2.02 |
% |
|
|
|
$ |
354,633 |
|
|
2.63 |
% |
|
|
|
$ |
354,913 |
|
|
2.96 |
% |
|
|
|
|
3.00 |
% |
|
|
|
|
|
3.45 |
% |
|
|
|
|
|
3.54 |
% |
|
|
2,200 |
|
|
|
|
|
|
2,285 |
|
|
|
|
|
|
2,287 |
|
|
|
|
|
322,261 |
|
|
|
|
|
|
352,348 |
|
|
|
|
|
|
352,626 |
|
|
|
|
|
17,000 |
|
|
|
|
|
|
16,000 |
|
|
|
|
|
|
15,000 |
|
|
|
|
|
209,049 |
|
|
|
|
|
|
177,865 |
|
|
|
|
|
|
197,086 |
|
|
|
|
|
318,673 |
|
|
|
|
|
|
305,812 |
|
|
|
|
|
|
318,456 |
|
|
|
|
|
195,637 |
|
|
|
|
|
|
208,401 |
|
|
|
|
|
|
216,256 |
|
|
|
|
|
44,001 |
|
|
|
|
|
|
45,905 |
|
|
|
|
|
|
47,864 |
|
|
|
|
|
151,636 |
|
|
|
|
|
|
162,496 |
|
|
|
|
|
|
168,392 |
|
|
|
|
|
328 |
|
|
|
|
|
|
128 |
|
|
|
|
|
|
(37) |
|
|
|
|
|
$ |
151,308 |
|
|
|
|
|
|
$ |
162,368 |
|
|
|
|
|
|
$ |
168,429 |
|
|
|
|
|
|
|
|
|
|
|
|
|
|
|
|
|
|
|
|
|
|
$ |
2.27 |
|
|
|
|
|
|
$ |
2.43 |
|
|
|
|
|
|
$ |
2.51 |
|
|
|
|
|
$ |
2.27 |
|
|
|
|
|
|
$ |
2.43 |
|
|
|
|
|
|
$ |
2.51 |
|
|
|
Table 5 – Quarterly Volume/Rate Analysis
(In thousands)
|
|
|
|
|
|
|
|
|
|
|
|
|
|
|
|
|
|
|
|
|
|
|
Three Months Ended |
|
|
Dec. 31, 2023 / Sep. 30, 2023 |
| |
|
|
|
Change Due To1 |
|
|
Change |
|
Volume |
|
Yield /
Rate |
| Tax-equivalent interest revenue: |
|
|
|
|
|
|
| Interest-bearing cash and cash equivalents |
|
$ |
(103) |
|
|
$ |
95 |
|
|
$ |
(198) |
|
| Trading securities |
|
3,712 |
|
|
(282) |
|
|
3,994 |
|
|
|
|
|
|
|
|
|
|
|
|
|
|
|
|
|
|
|
|
|
|
| Investment securities |
|
(251) |
|
|
(249) |
|
|
(2) |
|
|
|
|
|
|
|
|
|
|
|
|
|
|
|
|
|
|
|
|
|
|
Available for sale securities |
|
6,318 |
|
|
1,469 |
|
|
4,849 |
|
| Fair value option securities |
|
(353) |
|
|
(262) |
|
|
(91) |
|
Restricted equity securities |
|
(106) |
|
|
(193) |
|
|
87 |
|
Residential mortgage loans held for sale |
|
(198) |
|
|
(256) |
|
|
58 |
|
| Loans |
|
12,159 |
|
|
5,491 |
|
|
6,668 |
|
| Total tax-equivalent interest revenue |
|
21,178 |
|
|
5,813 |
|
|
15,365 |
|
| Interest expense: |
|
|
|
|
|
|
| Transaction deposits |
|
22,090 |
|
|
8,826 |
|
|
13,264 |
|
| Savings deposits |
|
89 |
|
|
(39) |
|
|
128 |
|
| Time deposits |
|
2,862 |
|
|
1,633 |
|
|
1,229 |
|
| Funds purchased and repurchase agreements |
|
(2,833) |
|
|
(2,695) |
|
|
(138) |
|
| Other borrowings |
|
3,271 |
|
|
2,075 |
|
|
1,196 |
|
| Subordinated debentures |
|
22 |
|
|
(1) |
|
|
23 |
|
| Total interest expense |
|
25,501 |
|
|
9,799 |
|
|
15,702 |
|
| Tax-equivalent net interest revenue |
|
(4,323) |
|
|
(3,986) |
|
|
(337) |
|
| Change in tax-equivalent adjustment |
|
(102) |
|
|
|
|
|
| Net interest revenue |
|
$ |
(4,221) |
|
|
|
|
|
1 Changes attributable to both volume and yield/rate are allocated to both volume and yield/rate on an equal basis.
Other Operating Revenue
2023 Other Operating Revenue
Other operating revenue was $789.9 million for 2023, an increase of $146.7 million or 23% compared to 2022.
Table 6 – Other Operating Revenue
(Dollars in thousands)
|
|
|
|
|
|
|
|
|
|
|
|
|
|
|
|
|
|
|
|
|
|
|
|
|
|
|
|
|
|
|
|
|
|
|
|
|
|
|
|
|
|
| |
Year Ended
December 31, |
|
2023
vs.
2022
|
|
2023
vs.
2022
|
|
Year Ended December 31, |
|
2022
vs.
2021
|
|
2022
vs.
2021
|
| |
2023 |
|
2022 |
|
Increase (Decrease) |
|
%
Increase (Decrease)
|
|
2021 |
|
Increase (Decrease) |
|
%
Increase (Decrease)
|
Brokerage and trading revenue |
$ |
240,610 |
|
|
$ |
140,978 |
|
|
$ |
99,632 |
|
|
71 |
% |
|
$ |
112,989 |
|
|
$ |
27,989 |
|
|
25 |
% |
| Transaction card revenue |
106,858 |
|
|
104,266 |
|
|
2,592 |
|
|
2 |
% |
|
96,983 |
|
|
7,283 |
|
|
8 |
% |
Fiduciary and asset management revenue |
207,318 |
|
|
196,326 |
|
|
10,992 |
|
|
6 |
% |
|
178,274 |
|
|
18,052 |
|
|
10 |
% |
Deposit service charges and fees |
108,514 |
|
|
110,636 |
|
|
(2,122) |
|
|
(2) |
% |
|
104,217 |
|
|
6,419 |
|
|
6 |
% |
| Mortgage banking revenue |
55,698 |
|
|
49,365 |
|
|
6,333 |
|
|
13 |
% |
|
105,896 |
|
|
(56,531) |
|
|
(53) |
% |
| Other revenue |
62,120 |
|
|
55,642 |
|
|
6,478 |
|
|
12 |
% |
|
69,950 |
|
|
(14,308) |
|
|
(20) |
% |
| Total fees and commissions revenue |
781,118 |
|
|
657,213 |
|
|
123,905 |
|
|
19 |
% |
|
668,309 |
|
|
(11,096) |
|
|
(2) |
% |
| Other gains, net |
56,795 |
|
|
123 |
|
|
56,672 |
|
|
N/A |
|
63,742 |
|
|
(63,619) |
|
|
N/A |
| Loss on derivatives, net |
(9,921) |
|
|
(73,011) |
|
|
63,090 |
|
|
N/A |
|
(19,378) |
|
|
(53,633) |
|
|
N/A |
| Loss on fair value option securities, net |
(4,292) |
|
|
(20,358) |
|
|
16,066 |
|
|
N/A |
|
(2,239) |
|
|
(18,119) |
|
|
N/A |
Change in fair value of mortgage servicing rights |
(3,115) |
|
|
80,261 |
|
|
(83,376) |
|
|
N/A |
|
41,637 |
|
|
38,624 |
|
|
N/A |
| Gain (loss) on available for sale securities, net |
(30,636) |
|
|
(971) |
|
|
(29,665) |
|
|
N/A |
|
3,704 |
|
|
(4,675) |
|
|
N/A |
|
|
|
|
|
|
|
|
|
|
|
|
|
|
|
|
|
|
|
|
|
|
|
|
|
|
|
|
|
|
|
|
|
|
|
|
|
|
|
|
|
|
Total other operating revenue |
$ |
789,949 |
|
|
$ |
643,257 |
|
|
$ |
146,692 |
|
|
23 |
% |
|
$ |
755,775 |
|
|
$ |
(112,518) |
|
|
(15) |
% |
Fees and commissions revenue
Diversified sources of fees and commissions revenue are a significant part of our business strategy and represented 38% of combined net interest revenue before provision for credit losses and fees and commission revenue. We believe that a variety of fee revenue sources provides diversification to changes resulting from market or economic conditions such as interest rates, values in the equity markets, commodity prices and consumer spending, all of which can be volatile. Many of these economic factors, such as decreasing interest rates, that we expect will result in a decline in net interest revenue or fiduciary and asset management revenue may also increase mortgage banking production volumes and related trading. The velocity of changes in market conditions and interest rates may result in timing differences between when offsetting impacts and benefits are realized. Generally, for operating revenues not as directly related to movement in interest rates, we expect growth to come through offering new products and services and by further development of our presence in other markets. However, current and future economic conditions, regulatory constraints, increased competition and saturation in our existing markets could affect the rate of future increases.
Brokerage and trading revenue, which includes revenues from trading, customer hedging, retail brokerage and investment banking, increased $99.6 million or 71% over the prior year.
Trading revenue includes net realized and unrealized gains and losses primarily related to sales of residential mortgage-backed securities guaranteed by U.S. government agencies and related derivative instruments that enable our mortgage banking customers to manage their production risk. Trading revenue also includes net realized and unrealized gains and losses on municipal securities and other financial instruments that we sell to institutional customers, along with changes in the fair value of financial instruments we hold as economic hedges against market risk of our trading securities. Trading revenue was $134.5 million for 2023, an increase of $114.2 million compared to 2022. Trading revenue was negatively affected by the disruption of the fixed income markets early in 2022. See additional discussion in "Lines of Business" section of Management's Discussion and Analysis.
Customer hedging revenue is based primarily on realized and unrealized changes in the fair value of derivative contracts held for customer risk management programs. As more fully discussed under Customer Derivative Programs in Note 6 to the Consolidated Financial Statements, we offer commodity, interest rate, foreign exchange and equity derivatives to our customers. Derivative contracts executed with customers are offset with contracts between selected counterparties and exchanges to minimize market risk from changes in commodity prices, interest rates or foreign exchange rates. Customer hedging revenue, which is largely volume driven, totaled $36.5 million for 2023, a decrease of $9.2 million or 20% compared to 2022 and was primarily attributed to our energy and interest rate derivative customers. Customer hedging revenue includes credit valuation adjustments of the fair value of derivatives to reflect the risk of counterparty default.
Investment banking, which includes fees earned upon completion of underwriting, financial advisory services and loan syndication fees, totaled $43.0 million for 2023, a decrease of $2.7 million or 6% compared to 2022, largely related to the timing and volume of transactions.
Revenue earned from retail brokerage transactions totaled $15.9 million for 2023, consistent with prior year. Retail brokerage revenue is primarily based on fees and commissions earned on sales of fixed income securities, annuities, mutual funds and other financial instruments to retail customers. Revenue is primarily based on the volume of customer transactions and applicable commission rate for each type of product.
Insurance brokerage fees were $10.7 million for 2023, a decrease of $2.2 million or 17% compared to 2022, reflecting lower revenue trends combined with the sale of this business in the fourth quarter of 2023.
Transaction card revenue depends largely on the volume and amount of transactions processed, the number of TransFund ATM locations and the number of merchants served. Transaction card revenue totaled $106.9 million for 2023, a $2.6 million or 2% increase over 2022. Revenues from the processing of transactions on behalf of the members of our TransFund EFT network totaled $89.5 million, up $4.9 million or 6% over 2022. The number of TransFund ATM locations totaled 2,713 at December 31, 2023 compared to 2,774 at December 31, 2022. Merchant services fees paid by customers for account management and electronic processing of card transactions totaled $9.2 million, a decrease of $3.2 million or 26%.
Fiduciary and asset management revenue is earned through managing or holding of assets for customers and executing transactions or providing related services. Fiduciary and asset management revenue is largely based on the fair value of assets. Rates applied to those asset values vary based on the nature of the relationship. Fiduciary and managed asset relationships generally have a higher fee rate than non-fiduciary and/or managed relationships.
Fiduciary and asset management revenue increased $11.0 million or 6% compared to 2022, primarily due to increases in Cavanal Hill fund fees, mutual fund fees, and trust business line fees. During the height of the COVID-19 pandemic, we voluntarily waived certain administration fees on the Cavanal Hill money market funds in order to maintain positive yields on these funds in the low short-term interest rate environment. This practice subsided in 2022 with $3.1 million in fee waivers during 2022.
A distribution of assets under management or administration and related fiduciary and asset management revenue follows:
Table 7 – Assets Under Management or Administration
(Dollars in thousands)
|
|
|
|
|
|
|
|
|
|
|
|
|
|
|
|
|
|
|
|
|
|
|
|
|
|
|
|
|
|
|
|
|
|
|
|
|
|
|
|
|
|
|
|
|
|
|
|
|
|
|
|
|
|
|
|
Year Ended December 31, |
|
|
2023 |
|
2022 |
|
2021 |
|
| |
Balance1 |
|
Revenue2 |
|
Margin3 |
|
Balance1 |
|
Revenue2 |
|
Margin3 |
|
Balance1 |
|
Revenue2 |
|
Margin3 |
|
| Managed fiduciary assets: |
|
| Personal |
$ |
10,951,951 |
|
|
$ |
103,626 |
|
|
0.95 |
% |
|
$ |
10,317,729 |
|
|
$ |
107,325 |
|
|
1.04 |
% |
|
$ |
12,739,289 |
|
|
$ |
110,052 |
|
|
0.86 |
% |
|
| Institutional |
19,310,826 |
|
|
34,995 |
|
|
0.18 |
% |
|
17,229,041 |
|
|
33,482 |
|
|
0.19 |
% |
|
17,477,280 |
|
|
29,286 |
|
|
0.17 |
% |
|
| Total managed fiduciary assets |
30,262,777 |
|
|
138,621 |
|
|
0.46 |
% |
|
27,546,770 |
|
|
140,807 |
|
|
0.51 |
% |
|
30,216,569 |
|
|
139,338 |
|
|
0.46 |
% |
|
|
|
|
|
|
|
|
|
|
|
|
|
|
|
|
|
|
|
|
| Non-managed assets: |
|
| Fiduciary |
29,535,915 |
|
|
57,114 |
|
|
0.19 |
% |
|
28,513,725 |
|
|
43,220 |
|
|
0.15 |
% |
|
34,320,264 |
|
|
28,645 |
|
|
0.08 |
% |
|
| Non-fiduciary |
19,670,248 |
|
|
11,583 |
|
|
0.06 |
% |
|
19,467,202 |
|
|
12,299 |
|
|
0.06 |
% |
|
20,253,072 |
|
|
10,291 |
|
|
0.05 |
% |
|
Safekeeping and brokerage assets under administration |
25,268,059 |
|
|
— |
|
|
— |
% |
|
24,207,343 |
|
|
— |
|
|
— |
% |
|
20,127,816 |
|
|
— |
|
|
— |
% |
|
| Total non-managed assets |
74,474,222 |
|
|
68,697 |
|
|
0.09 |
% |
|
72,188,270 |
|
|
55,519 |
|
|
0.08 |
% |
|
74,701,152 |
|
|
38,936 |
|
|
0.05 |
% |
|
|
|
|
|
|
|
|
|
|
|
|
|
|
|
|
|
|
|
|
| Total assets under management or administration |
$ |
104,736,999 |
|
|
$ |
207,318 |
|
|
0.20 |
% |
|
$ |
99,735,040 |
|
|
$ |
196,326 |
|
|
0.20 |
% |
|
$ |
104,917,721 |
|
|
$ |
178,274 |
|
|
0.17 |
% |
|
1 Assets under management or administration balance excludes certain assets under custody held by a sub-custodian where minimal revenue is recognized. $19 billion, $17 billion and $22 billion of such assets are excluded from the 2023, 2022 and 2021 assets under management or administration balances, respectively.
2 Fiduciary and asset management revenue includes asset-based and other fees associated with the assets.
3 Revenue divided by period-end balance.
A summary of changes in assets under management or administration for the year ended December 31, 2023, 2022, and 2021 follows:
Table 8 – Changes in Assets Under Management or Administration
(In thousands)
|
|
|
|
|
|
|
|
|
|
|
|
|
|
|
|
|
|
|
|
|
|
|
|
|
|
Year Ended December 31, |
|
|
|
2023 |
|
2022 |
|
2021 |
|
|
|
| Beginning balance |
|
$ |
99,735,040 |
|
|
$ |
104,917,721 |
|
|
$ |
91,592,247 |
|
|
|
|
| Net inflows (outflows) |
|
(3,105,170) |
|
|
572,812 |
|
|
4,786,237 |
|
|
|
|
|
|
|
|
|
|
|
|
|
|
| Net change in fair value |
|
8,107,129 |
|
|
(5,755,493) |
|
|
8,539,237 |
|
|
|
|
| Ending balance |
|
$ |
104,736,999 |
|
|
$ |
99,735,040 |
|
|
$ |
104,917,721 |
|
|
|
|
Assets under management as of December 31, 2023 consist of 42% fixed income, 33% equities, 16% cash and 9% alternative investments. Net outflows from assets under management increased during 2023, largely due to larger disbursements related to retirement plans. The increase in fair value of $8.1 billion mainly resulted from improvements in the equity markets in 2023.
Deposit service charges and fees totaled $108.5 million for 2023, a $2.1 million or 2% decrease compared to 2022. Overdraft fees and non-sufficient fund fees earned primarily on consumer deposit accounts totaled $21.0 million for 2023, a decrease of $4.4 million or 17% compared to 2022. Changes were implemented in the fourth quarter of 2022 to eliminate non-sufficient funds fees and reduce consumer overdraft fees. Service charges earned primarily on commercial deposit accounts totaled $57.7 million, a $1.1 million or 2% increase over the previous year. Automated service charges totaled $6.3 million, a $1.1 million or 20% increase over 2022. Check card revenue totaled $23.5 million, relatively unchanged from 2022.
Mortgage banking revenue totaled $55.7 million for 2023, a $6.3 million or 13% increase over 2022. Mortgage servicing revenue was $61.0 million, a $9.8 million increase compared to the prior year. The average outstanding principal balance of mortgage loans serviced for others totaled $20.8 billion at December 31, 2023, a $2.9 billion increase compared to December 31, 2022. During 2023, we acquired $2.8 billion in unpaid principal balance of mortgage servicing rights. This, combined with purchases in 2022 of mortgage servicing rights with an unpaid principal balance of $3.8 billion, led to higher mortgage servicing revenue in 2023. Mortgage production losses were $5.3 million, increasing $3.5 million, largely related to qualifying residential mortgage loans guaranteed by U.S. government agencies previously in forbearance that have been resold into GNMA pools following the applicable performance period specified by the programs. Rising mortgage interest rates, low inventory, and home price affordability continued to place pressure on mortgage loan originations and margins in 2023. Production volume was down $399 million and production revenue as a percentage of production volume also decreased 64 basis points to (0.81)%. Mortgage refinancing activity was 9% of total production in 2023 compared to 24% in 2022.
Table 9 – Mortgage Banking Revenue
(Dollars in thousands)
|
|
|
|
|
|
|
|
|
|
|
|
|
|
|
|
|
|
| |
Year Ended December 31, |
| |
2023 |
|
2022 |
|
2021 |
Mortgage production revenue |
$ |
(5,339) |
|
|
$ |
(1,838) |
|
|
$ |
60,712 |
|
|
|
|
|
|
|
Mortgage loans funded for sale |
$ |
666,391 |
|
|
$ |
1,180,403 |
|
|
$ |
2,818,789 |
|
Add: Current year end outstanding commitments |
34,783 |
|
|
45,492 |
|
|
171,412 |
|
Less: Prior year end outstanding commitments |
45,492 |
|
|
171,412 |
|
|
380,637 |
|
Total mortgage production volume |
$ |
655,682 |
|
|
$ |
1,054,483 |
|
|
$ |
2,609,564 |
|
|
|
|
|
|
|
| Production revenue as a percentage of production volume |
(0.81) |
% |
|
(0.17) |
% |
|
2.33 |
% |
| Realized margin on funded mortgage loans |
(0.75) |
% |
|
0.63 |
% |
|
2.71 |
% |
Mortgage loan refinances to mortgage loans funded for sale |
9 |
% |
|
24 |
% |
|
54 |
% |
Primary mortgage interest rates: |
|
|
|
|
|
Average |
6.79 |
% |
|
5.34 |
% |
|
2.96 |
% |
Period end |
6.42 |
% |
|
6.41 |
% |
|
3.11 |
% |
|
|
|
|
|
|
Mortgage servicing revenue |
$ |
61,037 |
|
|
$ |
51,203 |
|
|
$ |
45,184 |
|
Average outstanding principal balance of mortgage loans serviced for others |
20,779,627 |
|
|
17,871,306 |
|
|
15,404,548 |
|
Average mortgage servicing fee rates |
0.29 |
% |
|
0.29 |
% |
|
0.29 |
% |
Primary rates disclosed in Table 9 above represent rates generally available to borrowers on 30 year conforming mortgage loans.
Other revenue totaled $62.1 million for 2023, an increase of $6.5 million or 12% compared to 2022, largely due to increased revenue on bank-owned life insurance and increased margin interest fees.
Other gains, net and net gains on securities and derivatives
Other gains, net increased $56.7 million compared to 2022. The fourth quarter of 2023 included a pre-tax $31.0 million gain, before related professional fees, on the sale of our insurance brokerage and consulting business, BOKF Insurance. We also recognized a $17.3 million increase in the value of deferred compensation investments, which are held to offset the cost of various employee benefit programs. The increase was principally due to improvements in the equity markets in 2023.
We also recognized a $30.6 million loss on the sale of available for sale securities in 2023.
As discussed in the Market Risk section following, the fair value of our MSRs changes in response to changes in primary mortgage loan rates and other assumptions. We attempt to mitigate the earnings volatility caused by changes in the fair value of MSRs by designating certain financial instruments, generally U.S. government agency residential mortgage-backed securities for which we have elected the fair value option, as an economic hedge. Changes in the fair value of these instruments are generally expected to partially offset changes in the fair value of MSRs.
Table 10 – Gain (Loss) on Mortgage Servicing Rights, Net of Economic Hedge
(In thousands)
|
|
|
|
|
|
|
|
|
|
|
|
|
|
|
|
|
|
| |
Year Ended December 31, |
| |
2023 |
|
2022 |
|
2021 |
| Loss on mortgage hedge derivative contracts, net |
$ |
(10,514) |
|
|
$ |
(72,987) |
|
|
$ |
(19,632) |
|
| Loss on fair value option securities, net |
(4,292) |
|
|
(20,358) |
|
|
(2,239) |
|
| Loss on economic hedge of mortgage servicing rights |
(14,806) |
|
|
(93,345) |
|
|
(21,871) |
|
| Gain (loss) on change in fair value of mortgage servicing rights |
(3,115) |
|
|
80,261 |
|
|
41,637 |
|
Gain (loss) on changes in fair value of mortgage servicing rights, net of economic hedges included in other operating revenue |
(17,921) |
|
|
(13,084) |
|
|
19,766 |
|
Net interest revenue (expense) on fair value option securities1 |
(258) |
|
|
569 |
|
|
1,279 |
|
Total economic benefit (cost) of changes in the fair value of mortgage servicing rights, net of economic hedges |
$ |
(18,179) |
|
|
$ |
(12,515) |
|
|
$ |
21,045 |
|
1 Actual interest earned on fair value option securities less internal transfer-priced cost of funds.
Fourth Quarter 2023 Other Operating Revenue
Table 11 – Fourth Quarter 2023 Other Operating Revenue
(Dollars in thousands)
|
|
|
|
|
|
|
|
|
|
|
|
|
|
|
|
|
|
|
|
|
|
|
|
|
Three Months Ended |
|
|
|
|
|
Dec. 31, 2023 |
|
Sep. 30, 2023 |
|
Increase (Decrease) |
|
% Increase (Decrease) |
Brokerage and trading revenue |
$ |
60,896 |
|
|
$ |
62,312 |
|
|
$ |
(1,416) |
|
|
(2) |
% |
| Transaction card revenue |
28,847 |
|
|
26,387 |
|
|
2,460 |
|
|
9 |
% |
Fiduciary and asset management revenue |
51,408 |
|
|
52,256 |
|
|
(848) |
|
|
(2) |
% |
Deposit service charges and fees |
27,770 |
|
|
27,676 |
|
|
94 |
|
|
— |
% |
| Mortgage banking revenue |
12,834 |
|
|
13,356 |
|
|
(522) |
|
|
(4) |
% |
| Other revenue |
15,035 |
|
|
15,865 |
|
|
(830) |
|
|
(5) |
% |
| Total fees and commissions revenue |
196,790 |
|
|
197,852 |
|
|
(1,062) |
|
|
(1) |
% |
| Other gains, net |
40,452 |
|
|
1,474 |
|
|
38,978 |
|
|
N/A |
| Gain (loss) on derivatives, net |
8,592 |
|
|
(9,010) |
|
|
17,602 |
|
|
N/A |
| Gain (loss) on fair value option securities, net |
1,031 |
|
|
(203) |
|
|
1,234 |
|
|
N/A |
Change in fair value of mortgage servicing rights |
(14,356) |
|
|
8,039 |
|
|
(22,395) |
|
|
N/A |
| Loss on available for sale securities, net |
(27,626) |
|
|
— |
|
|
(27,626) |
|
|
N/A |
|
|
|
|
|
|
|
|
| Total other operating revenue |
$ |
204,883 |
|
|
$ |
198,152 |
|
|
$ |
6,731 |
|
|
3 |
% |
Other operating revenue was $204.9 million for the fourth quarter of 2023, a $6.7 million or 3% increase over the third quarter of 2023.
Brokerage and trading revenue decreased $1.4 million to $60.9 million. Investment banking revenue decreased $2.4 million to $11.5 million following a record third quarter from our Public and Corporate Finance group, which underwrites municipal bonds. Trading revenue grew $1.1 million to $35.5 million, largely related to our municipal bond trading activity. Insurance brokerage fees decreased $890 thousand to $1.8 million in conjunction with the sale of this business in the fourth quarter. Transaction card revenue grew $2.5 million to $28.8 million as a result of fourth quarter transaction activity. All other fee businesses performed consistently with the prior quarter.
Other gains, net, increased $39.0 million to $40.5 million. The fourth quarter included a $31.0 million pre-tax gain, before related professional fees, on the sale of our insurance brokerage and consulting business, BOKF Insurance. The value of our deferred compensation investments also increased $5.9 million versus a decline of $427 thousand in the prior quarter due to performance of the equity markets in the fourth quarter. We also recognized a $27.6 million loss on the sale of available for sale securities in the fourth quarter. The gain on sale received from the disposition of BOKF Insurance was used to reposition a small portion of our available for sale securities portfolio.
Other Operating Expense
2023 Other Operating Expense
Other operating expense for 2023 totaled $1.3 billion, a $168.4 million or 14% increase compared to the prior year. Personnel expense increased $95.7 million or 14%. Excluding the $43.8 million impact from the FDIC special assessment, non-personnel expense increased $28.9 million or 6% over the prior year.
Table 12 – Other Operating Expense
(Dollars in thousands)
|
|
|
|
|
|
|
|
|
|
|
|
|
|
|
|
|
|
|
|
|
|
|
|
|
|
|
|
|
|
|
|
|
|
|
|
|
|
|
|
|
|
|
Year Ended
December 31, |
|
2023
vs.
2022
|
|
2023
vs.
2022
|
|
Year Ended December 31, |
|
2022
vs.
2021
|
|
2022
vs.
2021
|
| |
2023 |
|
2022 |
|
Increase (Decrease) |
|
%
Increase (Decrease)
|
|
2021 |
|
Increase (Decrease) |
|
%
Increase (Decrease)
|
Regular compensation |
$ |
439,987 |
|
|
$ |
399,107 |
|
|
$ |
40,880 |
|
|
10 |
% |
|
$ |
384,808 |
|
|
$ |
14,299 |
|
|
4 |
% |
| Incentive compensation: |
|
|
|
|
|
|
|
|
|
|
|
|
|
| Cash-based compensation |
196,368 |
|
|
172,595 |
|
|
23,773 |
|
|
14 |
% |
|
187,974 |
|
|
(15,379) |
|
|
(8) |
% |
| Share-based compensation |
15,358 |
|
|
9,565 |
|
|
5,793 |
|
|
61 |
% |
|
13,246 |
|
|
(3,681) |
|
|
(28) |
% |
| Deferred compensation |
9,818 |
|
|
(6,235) |
|
|
16,053 |
|
|
N/A |
|
9,789 |
|
|
(16,024) |
|
|
N/A |
| Total incentive compensation |
221,544 |
|
|
175,925 |
|
|
45,619 |
|
|
26 |
% |
|
211,009 |
|
|
(35,084) |
|
|
(17) |
% |
| Employee benefits |
105,079 |
|
|
95,886 |
|
|
9,193 |
|
|
10 |
% |
|
99,565 |
|
|
(3,679) |
|
|
(4) |
% |
| Total personnel expense |
766,610 |
|
|
670,918 |
|
|
95,692 |
|
|
14 |
% |
|
695,382 |
|
|
(24,464) |
|
|
(4) |
% |
| Business promotion |
31,796 |
|
|
26,435 |
|
|
5,361 |
|
|
20 |
% |
|
16,289 |
|
|
10,146 |
|
|
62 |
% |
Charitable contributions to BOKF Foundation |
2,707 |
|
|
2,500 |
|
|
207 |
|
|
8 |
% |
|
9,000 |
|
|
(6,500) |
|
|
(72) |
% |
Professional fees and services |
55,337 |
|
|
56,342 |
|
|
(1,005) |
|
|
(2) |
% |
|
50,906 |
|
|
5,436 |
|
|
11 |
% |
| Net occupancy and equipment |
121,502 |
|
|
116,867 |
|
|
4,635 |
|
|
4 |
% |
|
108,587 |
|
|
8,280 |
|
|
8 |
% |
FDIC and other insurance |
30,780 |
|
|
17,994 |
|
|
12,786 |
|
|
71 |
% |
|
15,881 |
|
|
2,113 |
|
|
13 |
% |
| FDIC special assessment |
43,773 |
|
|
— |
|
|
43,773 |
|
|
100 |
% |
|
— |
|
|
— |
|
|
— |
% |
| Data processing & communications |
181,365 |
|
|
165,907 |
|
|
15,458 |
|
|
9 |
% |
|
151,614 |
|
|
14,293 |
|
|
9 |
% |
| Printing, postage and supplies |
15,225 |
|
|
15,857 |
|
|
(632) |
|
|
(4) |
% |
|
14,218 |
|
|
1,639 |
|
|
12 |
% |
| Amortization of intangible assets |
13,882 |
|
|
15,692 |
|
|
(1,810) |
|
|
(12) |
% |
|
18,311 |
|
|
(2,619) |
|
|
(14) |
% |
| Mortgage banking costs |
30,524 |
|
|
35,834 |
|
|
(5,310) |
|
|
(15) |
% |
|
42,698 |
|
|
(6,864) |
|
|
(16) |
% |
| Other expense |
39,380 |
|
|
40,134 |
|
|
(754) |
|
|
(2) |
% |
|
54,822 |
|
|
(14,688) |
|
|
(27) |
% |
| Total other operating expense |
$ |
1,332,881 |
|
|
$ |
1,164,480 |
|
|
$ |
168,401 |
|
|
14 |
% |
|
$ |
1,177,708 |
|
|
$ |
(13,228) |
|
|
(1) |
% |
|
|
|
|
|
|
|
|
|
|
|
|
|
|
Average number of employees (full-time equivalent) |
4,877 |
|
|
4,759 |
|
|
118 |
|
|
2 |
% |
|
4,816 |
|
|
(57) |
|
|
(1) |
% |
Personnel expense
Personnel expense was $766.6 million in 2023, including $9.8 million in deferred compensation expense. Deferred compensation expense increased $16.1 million as the deferred compensation liabilities mirror the performance of the deferred compensation investments, which increased due to performance of the equity markets in 2023. Excluding deferred compensation costs, personnel expense increased $79.6 million. Regular compensation increased $40.9 million or 10% due to a combination of annual merit increases commencing in the first quarter, salary adjustments and business expansion. Cash-based incentive compensation plans, which are either intended to provide current rewards to employees who generate long-term business opportunities for the Company based on growth in loans, deposits, customer relationships and other measurable metrics or intended to compensate employees with commissions on completed transactions, increased $23.8 million or 14% compared to 2022, primarily related to higher loan and trading volumes. Changes in assumptions of certain performance-based equity awards led to a $5.8 million or 61% increase in share-based compensation expense. Employee benefits expense increased $9.2 million or 10%. The prior year included a $3.5 million decrease related to the termination of the Pension Plan. The remaining increase is primarily related to higher payroll tax expense and retirement plan costs.
Non-personnel expense
Excluding the FDIC special assessment, non-personnel expense was $52.5 million, an increase of $28.9 million or 6% over the prior year.
Data processing and communications expense increased $15.5 million or 9%, largely affected by on-going technology project costs. Insurance expense increased $12.8 million or 71% due to higher ongoing assessment costs. On October 18, 2022, the FDIC finalized a rule that increased the initial base deposit insurance assessment rates by 2 basis points beginning with the first quarterly assessment period of 2023. Higher travel and advertising costs driven largely by business expansion led to a $5.4 million or 20% increase in business promotion expense. Occupancy and equipment expense was also up $4.6 million or 4%, primarily driven by the retirement of certain ATMs as we upgrade our network.
Mortgage banking costs decreased $5.3 million or 15%, primarily due to a decrease in prepayments.
Fourth Quarter 2023 Operating Expenses
Table 13 – Fourth Quarter 2023 Other Operating Expense
(Dollars in thousands)
|
|
|
|
|
|
|
|
|
|
|
|
|
|
|
|
|
|
|
|
|
|
|
|
|
Three Months Ended |
|
|
|
|
|
Dec. 31, 2023 |
|
Sep. 30, 2023 |
|
Increase (Decrease) |
|
% Increase (Decrease) |
Regular compensation |
$ |
114,435 |
|
|
$ |
111,237 |
|
|
$ |
3,198 |
|
|
3 |
% |
| Incentive compensation: |
|
|
|
|
|
|
|
| Cash-based compensation |
55,163 |
|
|
51,139 |
|
|
4,024 |
|
|
8 |
% |
| Share-based compensation |
2,046 |
|
|
3,489 |
|
|
(1,443) |
|
|
(41) |
% |
| Deferred compensation |
5,363 |
|
|
60 |
|
|
5,303 |
|
|
N/A |
| Total incentive compensation |
62,572 |
|
|
54,688 |
|
|
7,884 |
|
|
14 |
% |
| Employee benefits |
26,015 |
|
|
24,866 |
|
|
1,149 |
|
|
5 |
% |
| Total personnel expense |
203,022 |
|
|
190,791 |
|
|
12,231 |
|
|
6 |
% |
| Business promotion |
8,629 |
|
|
6,958 |
|
|
1,671 |
|
|
24 |
% |
| Charitable contributions to BOKF Foundation |
1,542 |
|
|
23 |
|
|
1,519 |
|
|
N/A |
Professional fees and services |
16,288 |
|
|
13,224 |
|
|
3,064 |
|
|
23 |
% |
| Net occupancy and equipment |
30,355 |
|
|
32,583 |
|
|
(2,228) |
|
|
(7) |
% |
| Insurance |
8,495 |
|
|
7,996 |
|
|
499 |
|
|
6 |
% |
| FDIC special assessment |
43,773 |
|
|
— |
|
|
43,773 |
|
|
100 |
% |
| Data processing & communications |
45,584 |
|
|
45,672 |
|
|
(88) |
|
|
— |
% |
| Printing, postage and supplies |
3,844 |
|
|
3,760 |
|
|
84 |
|
|
2 |
% |
| Amortization of intangible assets |
3,543 |
|
|
3,474 |
|
|
69 |
|
|
2 |
% |
| Mortgage banking costs |
8,085 |
|
|
8,357 |
|
|
(272) |
|
|
(3) |
% |
| Other expense |
10,923 |
|
|
11,475 |
|
|
(552) |
|
|
(5) |
% |
| Total other operating expense |
$ |
384,083 |
|
|
$ |
324,313 |
|
|
$ |
59,770 |
|
|
18 |
% |
Other operating expense for the fourth quarter of 2023 totaled $384.1 million, an increase of $59.8 million or 18% over the third quarter of 2023, primarily driven by the $43.8 million FDIC special assessment.
Personnel expense was $203.0 million, including $5.4 million of deferred compensation expense. Excluding deferred compensation costs, personnel expense increased $6.9 million or 4% over the prior quarter. Regular compensation increased $3.2 million or 3%, primarily due to compensation related to business expansion and transaction related employee costs on the BOKF Insurance sale. Higher sales activity led to a $4.0 million or 8% increase in cash based incentive compensation. Employee benefits expense increased $1.1 million or 5%, primarily due to seasonal employee healthcare costs.
Excluding the FDIC special assessment, non-personnel expense was $137.3 million, an increase of $3.8 million or 3%. A $3.1 million or 23% increase in professional fees and services was largely attributable to fees associated with the sale of BOKF Insurance. The fourth quarter of 2023 included a $1.5 million charitable donation to the BOKF Foundation as we continue to focus on the communities we serve. Occupancy and equipment costs decreased $2.2 million driven by the retirement of certain ATMs in the third quarter.
Income Taxes
Income tax expense was $152.1 million or 22.3% of net income before taxes for 2023 and $139.9 million or 21.2% of net income before taxes for 2022.
Net deferred tax assets totaled $269.6 million at December 31, 2023 compared to net deferred tax assets of $321.3 million at December 31, 2022. We have evaluated the recoverability of our deferred tax assets based on the generation of future taxable income during the periods in which those temporary differences become deductible and determined that no valuation allowance was required in 2023 or 2022.
Income tax expense was $29.0 million or 26.0% of net income before taxes for the fourth quarter of 2023 compared to $33.3 million or 19.8% of net income before taxes for the third quarter of 2023. The fourth quarter of 2023 included an acceleration of $3.1 million of tax expense as a result of exiting three low income housing tax credit investments.
Lines of Business
We operate three principal lines of business: Commercial Banking, Consumer Banking and Wealth Management. Commercial Banking includes lending, treasury and cash management services and customer risk management products for small businesses, middle market and larger commercial customers. Commercial Banking also includes the TransFund EFT network. Consumer Banking includes retail lending and deposit services, lending and deposit services to small business customers served through our consumer branch network and all mortgage loan origination and servicing activities. Wealth Management provides fiduciary services, private bank services, insurance and investment advisory services in all markets. Wealth Management also underwrites state and municipal securities and engages in brokerage and trading activities.
In addition to our lines of business, we have a Funds Management unit. The primary purpose of this unit is to manage our overall liquidity needs and interest rate risk. Each line of business borrows funds from and provides funds to the Funds Management unit as needed to support their operations. Operating results for Funds Management and other include the effect of interest rate risk positions and risk management activities, securities gains and losses, the provision for credit losses in excess of net loans charged off, tax planning strategies and certain executive compensation costs that are not attributed to the lines of business. The Funds Management unit also initially recognizes accruals for loss contingencies when losses become probable. Actual losses are recognized by the lines of business if the accruals are settled.
We allocate resources and evaluate the performance of our lines of business using the net direct contribution, which includes the allocation of funds and capital costs. Credit costs are attributed to the lines of business based on net loans charged off or recovered. The difference between credit costs attributed to the lines of business and the consolidated provision for credit losses is attributed to Funds Management. In addition, we measure the performance of our business lines after allocations of certain indirect expenses and taxes based on statutory rates.
Net interest income in our lines of business reflects our internal funds transfer pricing methodology. The funds transfer pricing methodology is the process by which the Company allocates interest income and expense to the lines of business and transfers the primary interest rate risk and liquidity risk to the Funds Management unit. The funds transfer pricing methodology considers the interest rate and liquidity risk characteristics of assets and liabilities. Periodically, the methodology and assumptions utilized in transfer pricing are adjusted to reflect economic conditions and other factors, which may impact the allocation of net interest income to the lines of business.
As a result of the rising interest rate environment that began in 2022 and continued into 2023, the cost of funds for assets and the credits earned for liabilities have generally increased, impacting the business lines' net interest revenue. During the period ended December 31, 2023, this has resulted in a higher cost of funds for loans and contributed to margin expansion on deposits.
Economic capital is assigned to the business units by a capital allocation model that reflects management's assessment of risk. This model assigns capital based upon credit, operating, interest rate and other market risk inherent in our business lines and recognizes the diversification benefits among the units. The level of assigned economic capital is a combination of the risk taken by each business line, based on its actual exposures and calibrated to its own loss history where possible. Average invested capital includes economic capital and amounts we have invested in the lines of business.
As shown in Table 14 following, net income attributable to our lines of business increased $528.1 million or 92% compared to the prior year. Net interest revenue grew by $599.4 million over the prior year, primarily due to an increase in the spread on deposits. Net charge-offs decreased $3.7 million compared to the prior year. Other operating revenue increased $173.4 million. primarily due to growth in brokerage and trading revenues as the prior year was negatively affected by the disruption in the fixed income markets. The current year included the sale of BOKF Insurance that resulted in a $31.0 million pre-tax gain. Other operating expense increased $66.6 million with a $46.3 million increase in personnel expense and $20.3 million increase in non-personnel expense. The decrease in net income attributed to Funds Management and other is largely due to the full year impact of increased deposit credit rates to the business units from the Funding Center as market rates were rising, which exceeded the pace of rate increases the business lines passed through to their deposit products.
Table 14 – Net Income by Line of Business
(In thousands)
|
|
|
|
|
|
|
|
|
|
|
|
|
|
|
|
|
|
|
Year Ended December 31, |
| |
2023 |
|
2022 |
|
2021 |
| Commercial Banking |
$ |
664,461 |
|
|
$ |
461,536 |
|
|
$ |
326,513 |
|
| Consumer Banking |
221,590 |
|
|
5,889 |
|
|
27,643 |
|
| Wealth Management |
215,483 |
|
|
106,020 |
|
|
113,246 |
|
| Subtotal |
1,101,534 |
|
|
573,445 |
|
|
467,402 |
|
| Funds Management and other |
(570,788) |
|
|
(53,172) |
|
|
150,719 |
|
| Total |
$ |
530,746 |
|
|
$ |
520,273 |
|
|
$ |
618,121 |
|
2023 Commercial Banking
Commercial Banking contributed $664.5 million to consolidated net income in 2023, an increase of $202.9 million or 44% compared to the prior year.
Table 15 – Commercial Banking
(In thousands)
|
|
|
|
|
|
|
|
|
|
|
|
|
|
|
|
|
|
|
|
|
|
|
|
|
|
|
|
|
|
|
|
|
|
|
|
|
|
|
|
|
|
|
Year Ended
December 31, |
|
2023
vs.
2022
|
|
2023
vs.
2022
|
|
Year Ended December 31, |
|
2022
vs.
2021
|
|
2022
vs.
2021
|
| |
2023 |
|
2022 |
|
Increase (Decrease) |
|
% Increase (Decrease) |
|
2021 |
|
Increase (Decrease) |
|
% Increase (Decrease) |
Net interest revenue from external sources |
$ |
1,179,336 |
|
|
$ |
818,213 |
|
|
$ |
361,123 |
|
|
44 |
% |
|
$ |
606,902 |
|
|
$ |
211,311 |
|
|
35 |
% |
Net interest expense from internal sources |
(146,965) |
|
|
(73,764) |
|
|
(73,201) |
|
|
(99) |
% |
|
(71,167) |
|
|
(2,597) |
|
|
(4) |
% |
| Total net interest revenue |
1,032,371 |
|
|
744,449 |
|
|
287,922 |
|
|
39 |
% |
|
535,735 |
|
|
208,714 |
|
|
39 |
% |
| Net loans charged off |
13,967 |
|
|
17,726 |
|
|
(3,759) |
|
|
(21) |
% |
|
31,128 |
|
|
(13,402) |
|
|
(43) |
% |
Net interest revenue after net loans charged off |
1,018,404 |
|
|
726,723 |
|
|
291,681 |
|
|
40 |
% |
|
504,607 |
|
|
222,116 |
|
|
44 |
% |
|
|
|
|
|
|
|
|
|
|
|
|
|
|
| Fees and commissions revenue |
234,334 |
|
|
233,873 |
|
|
461 |
|
|
— |
% |
|
227,081 |
|
|
6,792 |
|
|
3 |
% |
Other gains, net |
11,891 |
|
|
7,721 |
|
|
4,170 |
|
|
N/A |
|
35,321 |
|
|
(27,600) |
|
|
N/A |
| Other operating revenue |
246,225 |
|
|
241,594 |
|
|
4,631 |
|
|
2 |
% |
|
262,402 |
|
|
(20,808) |
|
|
(8) |
% |
|
|
|
|
|
|
|
|
|
|
|
|
|
|
| Personnel expense |
189,430 |
|
|
173,309 |
|
|
16,121 |
|
|
9 |
% |
|
166,940 |
|
|
6,369 |
|
|
4 |
% |
| Non-personnel expense |
123,364 |
|
|
115,934 |
|
|
7,430 |
|
|
6 |
% |
|
112,631 |
|
|
3,303 |
|
|
3 |
% |
| Other operating expense |
312,794 |
|
|
289,243 |
|
|
23,551 |
|
|
8 |
% |
|
279,571 |
|
|
9,672 |
|
|
3 |
% |
|
|
|
|
|
|
|
|
|
|
|
|
|
|
| Net direct contribution |
951,835 |
|
|
679,074 |
|
|
272,761 |
|
|
40 |
% |
|
487,438 |
|
|
191,636 |
|
|
39 |
% |
| Gain on financial instruments, net |
378 |
|
|
1 |
|
|
377 |
|
|
N/A |
|
154 |
|
|
(153) |
|
|
N/A |
| Gain (loss) on repossessed assets, net |
398 |
|
|
(1,903) |
|
|
2,301 |
|
|
N/A |
|
13,001 |
|
|
(14,904) |
|
|
N/A |
| Corporate expense allocations |
74,976 |
|
|
67,278 |
|
|
7,698 |
|
|
11 |
% |
|
54,146 |
|
|
13,132 |
|
|
24 |
% |
| Income before taxes |
877,635 |
|
|
609,894 |
|
|
267,741 |
|
|
44 |
% |
|
446,447 |
|
|
163,447 |
|
|
37 |
% |
| Federal and state income taxes |
213,174 |
|
|
148,358 |
|
|
64,816 |
|
|
44 |
% |
|
119,934 |
|
|
28,424 |
|
|
24 |
% |
| Net income |
$ |
664,461 |
|
|
$ |
461,536 |
|
|
$ |
202,925 |
|
|
44 |
% |
|
$ |
326,513 |
|
|
$ |
135,023 |
|
|
41 |
% |
|
|
|
|
|
|
|
|
|
|
|
|
|
|
| Average assets |
$ |
28,630,716 |
|
|
$ |
29,084,957 |
|
|
$ |
(454,241) |
|
|
(2) |
% |
|
$ |
28,536,881 |
|
|
$ |
548,076 |
|
|
2 |
% |
| Average loans |
19,374,791 |
|
|
17,553,398 |
|
|
1,821,393 |
|
|
10 |
% |
|
16,853,006 |
|
|
700,392 |
|
|
4 |
% |
| Average deposits |
15,311,654 |
|
|
18,323,412 |
|
|
(3,011,758) |
|
|
(16) |
% |
|
17,659,695 |
|
|
663,717 |
|
|
4 |
% |
| Average invested capital |
2,182,622 |
|
|
2,057,560 |
|
|
125,062 |
|
|
6 |
% |
|
2,082,488 |
|
|
(24,928) |
|
|
(1) |
% |
Net interest revenue and fee revenue increased $287.9 million or 39%, primarily due to an increase in the spread on deposits combined with loan growth. Net loans charged off decreased $3.8 million to $14.0 million in 2023.
Fees and commissions revenue was consistent with the prior year. Growth in other revenue of $6.1 million and transaction card revenue of $2.3 million was completely offset by decreases in underwriting fees and customer hedging revenue.
Operating expense increased $23.6 million or 8% over 2022. Personnel expense increased $16.1 million or 9%, reflecting a combination of annual merit increases and salary adjustments, along with increased incentive compensation costs associated with growth in loans. Non-personnel expense increased $7.4 million or 6%, driven primarily by ongoing technology projects, retirement of certain ATMs and increased insurance assessment costs. Corporate expense allocations increased $7.7 million or 11% compared to the prior year due to growth in lending activity.
The average outstanding balance of loans attributed to Commercial Banking increased $1.8 billion or 10% over 2022 to $19.4 billion. See the Loans section of Management's Discussion and Analysis of Financial Condition following for additional discussion of changes in commercial and commercial real estate loans, which are primarily attributed to the Commercial Banking segment.
Average deposits attributed to Commercial Banking were $15.3 billion for 2023, a $3.0 billion or 16% decrease compared to the prior year. See Management's Discussion and Analysis of Financial Condition and Results of Operations - Liquidity and Capital for further discussion of this change.
Fourth Quarter 2023 Commercial Banking
Table 16 - Commercial Banking - Fourth Quarter 2023
(Dollars in thousands)
|
|
|
|
|
|
|
|
|
|
|
|
|
|
|
|
|
|
|
|
|
|
|
|
|
Three Months Ended |
|
|
|
|
| |
Dec. 31,
2023
|
|
Sep. 30,
2023
|
|
Increase
(Decrease) |
|
%
Increase
(Decrease) |
Net interest revenue from external sources |
$ |
293,073 |
|
|
$ |
298,293 |
|
|
$ |
(5,220) |
|
|
(2) |
% |
Net interest expense from internal sources |
(42,422) |
|
|
(43,829) |
|
|
1,407 |
|
|
3 |
% |
| Total net interest revenue |
250,651 |
|
|
254,464 |
|
|
(3,813) |
|
|
(1) |
% |
| Net loans charged off |
2,987 |
|
|
4,904 |
|
|
(1,917) |
|
|
(39) |
% |
| Net interest revenue after net loans charged off |
247,664 |
|
|
249,560 |
|
|
(1,896) |
|
|
(1) |
% |
|
|
|
|
|
|
|
|
| Fees and commissions revenue |
60,937 |
|
|
57,858 |
|
|
3,079 |
|
|
5 |
% |
Other gains, net |
462 |
|
|
1,295 |
|
|
(833) |
|
|
N/A |
| Other operating revenue |
61,399 |
|
|
59,153 |
|
|
2,246 |
|
|
4 |
% |
|
|
|
|
|
|
|
|
| Personnel expense |
51,805 |
|
|
48,823 |
|
|
2,982 |
|
|
6 |
% |
| Non-personnel expense |
28,625 |
|
|
32,928 |
|
|
(4,303) |
|
|
(13) |
% |
| Other operating expense |
80,430 |
|
|
81,751 |
|
|
(1,321) |
|
|
(2) |
% |
|
|
|
|
|
|
|
|
| Net direct contribution |
228,633 |
|
|
226,962 |
|
|
1,671 |
|
|
1 |
% |
| Gain (loss) on financial instruments, net |
216 |
|
|
(11) |
|
|
227 |
|
|
N/A |
| Loss on repossessed assets, net |
(601) |
|
|
(268) |
|
|
(333) |
|
|
N/A |
| Corporate expense allocations |
18,020 |
|
|
17,834 |
|
|
186 |
|
|
1 |
% |
| Income before taxes |
210,228 |
|
|
208,849 |
|
|
1,379 |
|
|
1 |
% |
| Federal and state income taxes |
51,182 |
|
|
50,919 |
|
|
263 |
|
|
1 |
% |
| Net income |
$ |
159,046 |
|
|
$ |
157,930 |
|
|
$ |
1,116 |
|
|
1 |
% |
|
|
|
|
|
|
|
|
| Average assets |
$ |
29,324,296 |
|
|
$ |
28,849,597 |
|
|
$ |
474,699 |
|
|
2 |
% |
| Average loans |
19,928,574 |
|
|
19,645,259 |
|
|
283,315 |
|
|
1 |
% |
| Average deposits |
15,471,827 |
|
|
15,098,038 |
|
|
373,789 |
|
|
2 |
% |
| Average invested capital |
2,187,780 |
|
|
2,178,908 |
|
|
8,872 |
|
|
— |
% |
Commercial Banking contributed $159.0 million to consolidated net income in the fourth quarter of 2023, an increase of $1.1 million over the third quarter of 2023. Net interest revenue decreased $3.8 million resulting from a shift in deposit balances from demand to interest-bearing transaction accounts. Fees and commissions revenue increased $3.1 million, primarily driven by growth in transaction card revenue. Net loans charged off decreased $1.9 million to $3.0 million in the fourth quarter of 2023. Personnel expense increased $3.0 million led by increases in cash-based incentive compensation and regular compensation. Non-personnel expense decreased $4.3 million as the prior quarter included the retirement of certain ATMs.
2023 Consumer Banking
Consumer Banking services are provided through four primary distribution channels: traditional branches, the 24-hour ExpressBank call center, internet banking and mobile banking. Consumer Banking also conducts mortgage banking activities through offices located outside our Consumer Banking markets.
Net income attributed to Consumer Banking totaled $221.6 million for 2023 compared to $5.9 million in the prior year.
Table 17 – Consumer Banking
(In thousands)
|
|
|
|
|
|
|
|
|
|
|
|
|
|
|
|
|
|
|
|
|
|
|
|
|
|
|
|
|
|
|
|
|
|
|
|
|
|
|
|
|
|
|
Year Ended
December 31, |
|
2023
vs.
2022
|
|
2023
vs.
2022
|
|
Year Ended December 31, |
|
2022
vs.
2021
|
|
2022
vs.
2021
|
| |
2023 |
|
2022 |
|
Increase (Decrease) |
|
% Increase (Decrease) |
|
2021 |
|
Increase (Decrease) |
|
% Increase (Decrease) |
Net interest revenue from external sources |
$ |
59,985 |
|
|
$ |
69,646 |
|
|
$ |
(9,661) |
|
|
(14) |
% |
|
$ |
67,856 |
|
|
$ |
1,790 |
|
|
3 |
% |
Net interest revenue from internal sources |
389,791 |
|
|
88,603 |
|
|
301,188 |
|
|
340 |
% |
|
35,671 |
|
|
52,932 |
|
|
148 |
% |
| Total net interest revenue |
449,776 |
|
|
158,249 |
|
|
291,527 |
|
|
184 |
% |
|
103,527 |
|
|
54,722 |
|
|
53 |
% |
| Net loans charged off |
5,157 |
|
|
5,260 |
|
|
(103) |
|
|
(2) |
% |
|
4,009 |
|
|
1,251 |
|
|
31 |
% |
Net interest revenue after net loans charged off |
444,619 |
|
|
152,989 |
|
|
291,630 |
|
|
191 |
% |
|
99,518 |
|
|
53,471 |
|
|
54 |
% |
|
|
|
|
|
|
|
|
|
|
|
|
|
|
| Fees and commissions revenue |
123,732 |
|
|
121,926 |
|
|
1,806 |
|
|
1 |
% |
|
173,364 |
|
|
(51,438) |
|
|
(30) |
% |
Other losses, net |
(54) |
|
|
(107) |
|
|
53 |
|
|
N/A |
|
(23) |
|
|
(84) |
|
|
N/A |
| Other operating revenue |
123,678 |
|
|
121,819 |
|
|
1,859 |
|
|
2 |
% |
|
173,341 |
|
|
(51,522) |
|
|
(30) |
% |
|
|
|
|
|
|
|
|
|
|
|
|
|
|
| Personnel expense |
89,472 |
|
|
87,183 |
|
|
2,289 |
|
|
3 |
% |
|
85,989 |
|
|
1,194 |
|
|
1 |
% |
| Other non-personnel expense |
122,642 |
|
|
122,027 |
|
|
615 |
|
|
1 |
% |
|
123,607 |
|
|
(1,580) |
|
|
(1) |
% |
| Total other operating expense |
212,114 |
|
|
209,210 |
|
|
2,904 |
|
|
1 |
% |
|
209,596 |
|
|
(386) |
|
|
— |
% |
|
|
|
|
|
|
|
|
|
|
|
|
|
|
| Net direct contribution |
356,183 |
|
|
65,598 |
|
|
290,585 |
|
|
443 |
% |
|
63,263 |
|
|
2,335 |
|
|
4 |
% |
| Loss on financial instruments, net |
(14,806) |
|
|
(93,346) |
|
|
78,540 |
|
|
N/A |
|
(21,871) |
|
|
(71,475) |
|
|
N/A |
| Change in fair value of mortgage servicing rights |
(3,115) |
|
|
80,261 |
|
|
(83,376) |
|
|
N/A |
|
41,637 |
|
|
38,624 |
|
|
N/A |
| Gain on repossessed assets, net |
36 |
|
|
139 |
|
|
(103) |
|
|
N/A |
|
85 |
|
|
54 |
|
|
N/A |
| Corporate expense allocations |
48,565 |
|
|
44,965 |
|
|
3,600 |
|
|
8 |
% |
|
46,010 |
|
|
(1,045) |
|
|
(2) |
% |
| Net income before taxes |
289,733 |
|
|
7,687 |
|
|
282,046 |
|
|
3669 |
% |
|
37,104 |
|
|
(29,417) |
|
|
(79) |
% |
| Federal and state income taxes |
68,143 |
|
|
1,798 |
|
|
66,345 |
|
|
3690 |
% |
|
9,461 |
|
|
(7,663) |
|
|
(81) |
% |
| Net income |
$ |
221,590 |
|
|
$ |
5,889 |
|
|
$ |
215,701 |
|
|
3663 |
% |
|
$ |
27,643 |
|
|
$ |
(21,754) |
|
|
(79) |
% |
|
|
|
|
|
|
|
|
|
|
|
|
|
|
| Average assets |
$ |
9,561,512 |
|
|
$ |
10,230,437 |
|
|
$ |
(668,925) |
|
|
(7) |
% |
|
$ |
10,029,687 |
|
|
$ |
200,750 |
|
|
2 |
% |
| Average loans |
1,800,320 |
|
|
1,688,697 |
|
|
111,623 |
|
|
7 |
% |
|
1,769,384 |
|
|
(80,687) |
|
|
(5) |
% |
| Average deposits |
8,014,159 |
|
|
8,763,046 |
|
|
(748,887) |
|
|
(9) |
% |
|
8,439,577 |
|
|
323,469 |
|
|
4 |
% |
| Average invested capital |
285,997 |
|
|
250,546 |
|
|
35,451 |
|
|
14 |
% |
|
250,554 |
|
|
(8) |
|
|
— |
% |
Net interest revenue from Consumer Banking activities increased by $291.5 million or 184% compared to 2022, largely due to an increase in the spread on deposits sold to our Funds Management unit.
Fees and commissions revenue increased $1.8 million or 1% compared to the prior year. Mortgage banking revenue increased $6.7 million, primarily due to growth in mortgage servicing revenue driven by recent purchases of mortgage servicing rights, partially offset by a decline in mortgage production volumes due to a combination of factors largely attributed to reduced mortgage loan production volume combined with narrowing margins. Mortgage production volume decreased $399 million or 38% and production revenue as a percentage of production volume, which includes unrealized gains and losses on our mortgage commitment pipeline and related hedges, decreased 64 basis points to (0.81)%. Deposit service charges and fees decreased $3.7 million as non-sufficient funds fees were eliminated and consumer overdraft fees were reduced in the fourth quarter of 2022.
Operating expense increased $2.9 million or 1% led by higher regular compensation. Corporate expense allocations increased $3.6 million or 8% compared to the prior year.
Average loans attributed to Consumer Banking increased $112 million or 7% to $1.8 billion. Average consumer deposits declined $749 million or 9% to $8.0 billion. See Management's Discussion and Analysis of Financial Condition and Results of Operations - Liquidity and Capital for further discussion of the changes.
The net cost of the change in fair value of mortgage servicing rights and related economic hedges, as more fully presented in Table 10, was $18.2 million for 2023 compared to a net cost of $12.5 million in 2022.
Fourth Quarter 2023 Consumer Banking
Table 18 - Consumer Banking - Fourth Quarter 2023
(Dollars in thousands)
|
|
|
|
|
|
|
|
|
|
|
|
|
|
|
|
|
|
|
|
|
|
|
|
|
Three Months Ended |
|
|
|
|
| |
Dec. 31,
2023
|
|
Sep. 30,
2023
|
|
Increase
(Decrease) |
|
%
Increase
(Decrease) |
Net interest revenue from external sources |
$ |
9,625 |
|
|
$ |
11,386 |
|
|
$ |
(1,761) |
|
|
(15) |
% |
| Net interest revenue from internal sources |
104,771 |
|
|
101,222 |
|
|
3,549 |
|
|
4 |
% |
| Total net interest revenue |
114,396 |
|
|
112,608 |
|
|
1,788 |
|
|
2 |
% |
| Net loans charged off (recovered) |
1,443 |
|
|
1,402 |
|
|
41 |
|
|
(3) |
% |
Net interest revenue after net loans charged off |
112,953 |
|
|
111,206 |
|
|
1,747 |
|
|
2 |
% |
|
|
|
|
|
|
|
|
| Fees and commissions revenue |
30,075 |
|
|
30,715 |
|
|
(640) |
|
|
(2) |
% |
| Other gains, net |
— |
|
|
1 |
|
|
(1) |
|
|
N/A |
| Other operating revenue |
30,075 |
|
|
30,716 |
|
|
(641) |
|
|
(2) |
% |
|
|
|
|
|
|
|
|
| Personnel expense |
23,051 |
|
|
22,591 |
|
|
460 |
|
|
2 |
% |
| Non-personnel expense |
32,028 |
|
|
31,906 |
|
|
122 |
|
|
— |
% |
| Other operating expense |
55,079 |
|
|
54,497 |
|
|
582 |
|
|
1 |
% |
|
|
|
|
|
|
|
|
| Net direct contribution |
87,949 |
|
|
87,425 |
|
|
524 |
|
|
1 |
% |
| Gain (loss) on financial instruments, net |
9,307 |
|
|
(9,183) |
|
|
18,490 |
|
|
N/A |
| Change in fair value of mortgage servicing rights |
(14,356) |
|
|
8,039 |
|
|
(22,395) |
|
|
N/A |
| Gain on repossessed assets, net |
11 |
|
|
11 |
|
|
— |
|
|
N/A |
| Corporate expense allocations |
12,705 |
|
|
11,920 |
|
|
785 |
|
|
7 |
% |
| Income before taxes |
70,206 |
|
|
74,372 |
|
|
(4,166) |
|
|
(6) |
% |
| Federal and state income taxes |
16,511 |
|
|
17,491 |
|
|
(980) |
|
|
(6) |
% |
| Net income |
$ |
53,695 |
|
|
$ |
56,881 |
|
|
$ |
(3,186) |
|
|
(6) |
% |
|
|
|
|
|
|
|
|
| Average assets |
$ |
9,342,840 |
|
|
$ |
9,379,478 |
|
|
$ |
(36,638) |
|
|
— |
% |
| Average loans |
1,877,303 |
|
|
1,812,606 |
|
|
64,697 |
|
|
4 |
% |
| Average deposits |
7,890,032 |
|
|
7,936,186 |
|
|
(46,154) |
|
|
(1) |
% |
| Average invested capital |
291,705 |
|
|
285,325 |
|
|
6,380 |
|
|
2 |
% |
Consumer Banking contributed $53.7 million to net income in the fourth quarter of 2023, a decrease of $3.2 million compared to the third quarter of 2023. The net cost of changes in the fair value of mortgage servicing rights and related economic hedges was $5.2 million compared to $1.3 million for the third quarter of 2023. Net interest revenue increased $1.8 million, mainly due to an increase in the funds credit on deposit balances. Fees and commissions revenue and operating expense were consistent with the prior quarter.
2023 Wealth Management
Wealth Management contributed $215.5 million to consolidated net income in 2023, an increase of $109.5 million or 103% compared to the prior year. The current year included a pre-tax gain of $31.0 million, before related professional fees, on the sale of our insurance brokerage and consulting business, BOKF Insurance.
Table 19 – Wealth Management
(In thousands)
|
|
|
|
|
|
|
|
|
|
|
|
|
|
|
|
|
|
|
|
|
|
|
|
|
|
|
|
|
|
|
|
|
|
|
|
|
|
|
|
|
|
|
Year Ended
December 31, |
|
2023
vs.
2022
|
|
2023
vs.
2022
|
|
Year Ended December 31, |
|
2022
vs.
2021
|
|
2022
vs.
2021
|
| |
2023 |
|
2022 |
|
Increase (Decrease) |
|
% Increase (Decrease) |
|
2021 |
|
Increase (Decrease) |
|
% Increase (Decrease) |
Net interest revenue from external sources |
$ |
39,198 |
|
|
$ |
155,974 |
|
|
$ |
(116,776) |
|
|
(75) |
% |
|
$ |
214,458 |
|
|
$ |
(58,484) |
|
|
(27) |
% |
| Net interest revenue (expense) from internal sources |
142,340 |
|
|
5,623 |
|
|
136,717 |
|
|
2431 |
% |
|
(386) |
|
|
6,009 |
|
|
(1557) |
% |
| Total net interest revenue |
181,538 |
|
|
161,597 |
|
|
19,941 |
|
|
12 |
% |
|
214,072 |
|
|
(52,475) |
|
|
(25) |
% |
| Net loans recovered |
(50) |
|
|
(175) |
|
|
125 |
|
|
71 |
% |
|
(223) |
|
|
48 |
|
|
(22) |
% |
Net interest revenue after net loans recovered |
181,588 |
|
|
161,772 |
|
|
19,816 |
|
|
12 |
% |
|
214,295 |
|
|
(52,523) |
|
|
(25) |
% |
|
|
|
|
|
|
|
|
|
|
|
|
|
|
| Fees and commissions revenue |
475,447 |
|
|
339,538 |
|
|
135,909 |
|
|
40 |
% |
|
298,765 |
|
|
40,773 |
|
|
14 |
% |
Other gains (losses), net |
31,000 |
|
|
(37) |
|
|
31,037 |
|
|
N/A |
|
197 |
|
|
(234) |
|
|
N/A |
| Other operating revenue |
506,447 |
|
|
339,501 |
|
|
166,946 |
|
|
49 |
% |
|
298,962 |
|
|
40,539 |
|
|
14 |
% |
|
|
|
|
|
|
|
|
|
|
|
|
|
|
| Personnel expense |
251,644 |
|
|
223,718 |
|
|
27,926 |
|
|
12 |
% |
|
234,031 |
|
|
(10,313) |
|
|
(4) |
% |
| Other non-personnel expense |
100,896 |
|
|
88,659 |
|
|
12,237 |
|
|
14 |
% |
|
86,695 |
|
|
1,964 |
|
|
2 |
% |
| Other operating expense |
352,540 |
|
|
312,377 |
|
|
40,163 |
|
|
13 |
% |
|
320,726 |
|
|
(8,349) |
|
|
(3) |
% |
|
|
|
|
|
|
|
|
|
|
|
|
|
|
| Net direct contribution |
335,495 |
|
|
188,896 |
|
|
146,599 |
|
|
78 |
% |
|
192,531 |
|
|
(3,635) |
|
|
(2) |
% |
| Gain on financial instruments, net |
— |
|
|
4 |
|
|
(4) |
|
|
N/A |
|
— |
|
|
4 |
|
|
N/A |
|
|
|
|
|
|
|
|
|
|
|
|
|
|
|
|
|
|
|
|
|
|
|
|
|
|
|
|
| Corporate expense allocations |
53,463 |
|
|
50,241 |
|
|
3,222 |
|
|
6 |
% |
|
40,341 |
|
|
9,900 |
|
|
25 |
% |
| Net income before taxes |
282,032 |
|
|
138,659 |
|
|
143,373 |
|
|
103 |
% |
|
152,190 |
|
|
(13,531) |
|
|
(9) |
% |
| Federal and state income tax |
66,549 |
|
|
32,639 |
|
|
33,910 |
|
|
104 |
% |
|
38,944 |
|
|
(6,305) |
|
|
(16) |
% |
| Net income |
$ |
215,483 |
|
|
$ |
106,020 |
|
|
$ |
109,463 |
|
|
103 |
% |
|
$ |
113,246 |
|
|
$ |
(7,226) |
|
|
(6) |
% |
|
|
|
|
|
|
|
|
|
|
|
|
|
|
| Average assets |
$ |
13,570,153 |
|
|
$ |
16,209,684 |
|
|
$ |
(2,639,531) |
|
|
(16) |
% |
|
$ |
19,425,475 |
|
|
$ |
(3,215,791) |
|
|
(17) |
% |
| Average loans |
2,201,614 |
|
|
2,166,231 |
|
|
35,383 |
|
|
2 |
% |
|
1,981,159 |
|
|
185,072 |
|
|
9 |
% |
| Average deposits |
7,739,490 |
|
|
8,491,377 |
|
|
(751,887) |
|
|
(9) |
% |
|
9,426,771 |
|
|
(935,394) |
|
|
(10) |
% |
| Average invested capital |
333,157 |
|
|
279,939 |
|
|
53,218 |
|
|
19 |
% |
|
310,627 |
|
|
(30,688) |
|
|
(10) |
% |
Combined net interest revenue and fees and commission revenue attributed to the Wealth Management segment totaled $657.0 million for 2023, an increase of $155.9 million, primarily driven by an increase in the spread on deposits combined with growth in brokerage and trading revenues. The prior year was negatively affected by the disruption in the fixed income markets. Fiduciary and asset management revenue increased $10.8 million led by higher Cavanal Hill fund fees, mutual fund fees, and trust business line fees. Other revenue increased $8.9 million, largely due to higher derivative margin use fees.
Average Wealth Management loans grew by $35 million or 2% to $2.2 billion. Average deposits attributed to Wealth Management decreased $752 million or 9% to $7.7 billion in 2023.
Operating expense increased $40.2 million or 13% over the prior year. Personnel expense increased $27.9 million or 12% due to a combination of higher trading volumes and business expansion. Non-personnel expense increased $12.2 million or 14% due to increased professional fees and services from the sale of BOKF Insurance combined with higher data processing and communications expense from ongoing technology projects. Corporate expense allocations increased $3.2 million or 6% over the prior year.
Fourth Quarter 2023 Wealth Management
Table 20 - Wealth Management - Fourth Quarter 2023
(Dollars in thousands)
|
|
|
|
|
|
|
|
|
|
|
|
|
|
|
|
|
|
|
|
|
|
|
|
|
Three Months Ended |
|
|
|
|
| |
Dec. 31,
2023
|
|
Sep. 30,
2023
|
|
Increase
(Decrease) |
|
%
Increase
(Decrease) |
Net interest revenue from external sources |
$ |
6,221 |
|
|
$ |
7,622 |
|
|
$ |
(1,401) |
|
|
(18) |
% |
| Net interest revenue from internal sources |
35,422 |
|
|
28,815 |
|
|
6,607 |
|
|
23 |
% |
| Total net interest revenue |
41,643 |
|
|
36,437 |
|
|
5,206 |
|
|
14 |
% |
| Net loans charged off |
10 |
|
|
9 |
|
|
1 |
|
|
11 |
% |
| Net interest revenue after net loans recovered |
41,633 |
|
|
36,428 |
|
|
5,205 |
|
|
14 |
% |
|
|
|
|
|
|
|
|
| Fees and commissions revenue |
119,872 |
|
|
123,614 |
|
|
(3,742) |
|
|
(3) |
% |
| Other gains, net |
31,007 |
|
|
— |
|
|
31,007 |
|
|
N/A |
| Other operating revenue |
150,879 |
|
|
123,614 |
|
|
27,265 |
|
|
22 |
% |
|
|
|
|
|
|
|
|
| Personnel expense |
66,151 |
|
|
63,706 |
|
|
2,445 |
|
|
4 |
% |
| Non-personnel expense |
30,124 |
|
|
25,661 |
|
|
4,463 |
|
|
17 |
% |
| Other operating expense |
96,275 |
|
|
89,367 |
|
|
6,908 |
|
|
8 |
% |
|
|
|
|
|
|
|
|
| Net direct contribution |
96,237 |
|
|
70,675 |
|
|
25,562 |
|
|
36 |
% |
|
|
|
|
|
|
|
|
|
|
|
|
|
|
|
|
| Corporate expense allocations |
14,198 |
|
|
14,331 |
|
|
(133) |
|
|
(1) |
% |
| Income before taxes |
82,039 |
|
|
56,344 |
|
|
25,695 |
|
|
46 |
% |
| Federal and state income taxes |
19,349 |
|
|
13,315 |
|
|
6,034 |
|
|
45 |
% |
| Net income |
$ |
62,690 |
|
|
$ |
43,029 |
|
|
$ |
19,661 |
|
|
46 |
% |
|
|
|
|
|
|
|
|
| Average assets |
$ |
14,879,450 |
|
|
$ |
14,740,641 |
|
|
$ |
138,809 |
|
|
1 |
% |
| Average loans |
2,154,416 |
|
|
2,219,829 |
|
|
(65,413) |
|
|
(3) |
% |
| Average deposits |
8,085,643 |
|
|
7,886,962 |
|
|
198,681 |
|
|
3 |
% |
| Average invested capital |
333,179 |
|
|
329,856 |
|
|
3,323 |
|
|
1 |
% |
Wealth Management contributed $62.7 million to net income in the fourth quarter of 2023, an increase of $19.7 million compared to the third quarter of 2023. The fourth quarter included a pre-tax gain of $31.0 million, before related professional fees, on the sale of BOKF Insurance. Combined net interest and fee revenue totaled $161.5 million, an increase of $1.5 million. Total revenue from institutional trading activities increased $4.1 million due to favorable market opportunities, largely related to our municipal bond trading activity. Investment banking revenue decreased $3.3 million following a record third quarter from our Public and Corporate Finance group. Operating expense increased $6.9 million. Personnel expense increased $2.4 million due to increased cash-based incentive compensation driven by growth in trading activities and transaction related employee costs on the BOKF Insurance sale. Non-personnel expense increased $4.5 million with $2.5 million in professional fees directly related to the sale of BOKF Insurance and the remainder primarily resulting from settlement of certain disputed matters.
Financial Condition
Securities
We maintain a securities portfolio to enhance profitability, manage interest rate risk, provide liquidity and comply with regulatory requirements. Securities are classified as trading, held for investment, or available for sale. See Note 2 to the Consolidated Financial Statements for the composition of the securities portfolio as of December 31, 2023 and December 31, 2022.
We hold an inventory of trading securities in support of sales to a variety of customers including banks, corporations, insurance companies, money managers and others. Trading securities totaled $5.2 billion at December 31, 2023, an increase of $729 million compared to December 31, 2022. As discussed in the Market Risk section of this report, trading activities involve risk of loss from adverse price movements. We mitigate this risk within board-approved value-at-risk limits through the use of derivative contracts, short-sales and other techniques.
At December 31, 2023, the carrying value of investment (held-to-maturity) securities was $2.2 billion, including a $336 thousand allowance for expected credit losses, compared to $2.5 billion at December 31, 2022 with a $558 thousand allowance for expected credit losses. The fair value of investment securities was $2.1 billion at December 31, 2023 and $2.3 billion at December 31, 2022. Investment securities consist primarily of residential mortgage-backed securities issued by U.S. government agencies, intermediate and long-term, fixed rate Oklahoma and Texas municipal bonds, and taxable Texas school construction bonds. The investment security portfolio is diversified among issuers. During the second quarter of 2022, the Company transferred certain U.S. government agency mortgage-backed securities from the available for sale portfolio to the investment securities portfolio to limit the effect of future rate increases on the tangible common equity ratio. No gains or losses were recognized in the Consolidated Statements of Earnings at the time of the transfer. At the time of transfer, the fair value totaled $2.4 billion, amortized cost totaled $2.7 billion and the pretax unrealized loss totaled $268 million. Transfers of debt securities into the investment securities portfolio are made at fair value at the date of transfer. The unrealized holding gain or loss at the date of transfer is retained in Accumulated Other Comprehensive Income and in the carrying value of the investment securities portfolio. Such amounts are amortized over the estimated remaining lives of the securities as an adjustment to yield, offsetting the related amortization of the premium or accretion of the discount on the transferred securities.
Available for sale securities, which may be sold prior to maturity, are carried at fair value. Unrealized gains or losses, net of deferred taxes, are recorded as Accumulated Other Comprehensive Income in shareholders’ equity. At December 31, 2023, the fair value of available for sale securities was $12.3 billion, an increase of $793 million compared to December 31, 2022. The amortized cost of available for sale securities totaled $12.9 billion at December 31, 2023, an increase of $544 million compared to December 31, 2022. Available for sale securities consist primarily of U.S. government agency residential mortgage-backed securities and U.S. government agency commercial mortgage-backed securities. Both residential and commercial mortgage-backed securities have credit risk from delinquency or default of the underlying loans. We mitigate this risk by primarily investing in securities issued by U.S. government agencies for which the principal and interest payments on the underlying loans are fully guaranteed. Commercial mortgage-backed securities have prepayment penalties similar to commercial loans. At December 31, 2023, residential mortgage-backed securities represented 62% of total fair value of available for sale securities.
A primary risk of holding residential mortgage-backed securities comes from extension during periods of rising interest rates or prepayment during periods of falling interest rates. We evaluate this risk through extensive modeling of risk both before making an investment and throughout the life of the security. Our best estimate of the effective duration of the combined residential mortgage-backed securities portfolio held in investment and available for sale securities portfolios at December 31, 2023 is 3.4 years. Management estimates the combined portfolios' duration extends to 3.8 years assuming an immediate 200 basis point upward shock. The estimated duration contracts to 2.5 years assuming a 200 basis point decline in the current rate environment.
The aggregate gross amount of unrealized losses on available for sale securities totaled $669 million at December 31, 2023, a $225 million decrease compared to December 31, 2022. On a quarterly basis, we perform an evaluation on debt securities to determine if the unrealized losses are temporary as more fully described in Note 2 to the Consolidated Financial Statements. No credit impairment of available for sale securities was identified in 2023.
Certain residential mortgage-backed securities issued by U.S. government agencies and included in Fair value option securities on the Consolidated Balance Sheets have been segregated and designated as economic hedges of changes in the fair value of our mortgage servicing rights. We have elected to carry these securities at fair value with changes in fair value recognized in current period income. These securities are held with the intent that gains or losses will offset changes in the fair value of mortgage servicing rights and related derivative contracts. Fair value option securities totaled $21 million, a decrease of $276 million compared to 2022. See Market Risk section for further details.
At December 31, 2023, we hold 252,233 non-transferable Class B-1 (formerly class B) shares of Visa, Inc. in connection with a restructuring and public offering by Visa U.S.A. As a member of Visa U.S.A., we received the Class B shares based on our interest in Visa U.S.A. On September 13, 2023, Visa, Inc. announced its intent to engage with common stockholders on a potential proposal that would result in the release of certain transfer restrictions on a portion of Visa Class B-1 common stock. The proposal was approved by a majority of voting common stockholders on January 23, 2024. As approved, the proposal is expected to provide us the option to convert up to 50% of our Class B-1 shares to Visa Class C shares and subsequently to freely transferable Visa Class A common shares. The details regarding the exchange process are undetermined as of February 21, 2024. The per share closing price of a Visa Class A common share was $260.35 at December 31, 2023. In light of uncertainties associated with certain ongoing litigation matters involving Visa and the timing and outcome of the aforementioned proposal, the ultimate impact of this gain contingency is unknown.
Bank-Owned Life Insurance
We have approximately $410 million of bank-owned life insurance at December 31, 2023. This investment is expected to provide a long-term source of earnings to support existing employee benefit programs. Approximately $314 million is held in separate accounts and $96 million represents the cash surrender value of policies held in general accounts and other amounts due from various insurance companies. Our separate account holdings are invested in diversified portfolios of investment-grade fixed income securities and cash equivalents, including U.S. Treasury and agency securities, residential mortgage-backed securities, corporate debt, asset-backed and commercial mortgage-backed securities. The portfolios are managed by unaffiliated professional managers within parameters established in the portfolio’s investment guidelines. The cash surrender value of certain life insurance policies is further supported by a stable value wrap which protects against changes in the fair value of the investments. As of December 31, 2023, the fair value of investments held in separate accounts covered by the stable value wrap was approximately $289 million. Since the underlying fair value of the investments held in separate accounts at December 31, 2023 was below the net book value of the investments, $22 million of cash surrender value was supported by the stable value wrap. The remaining $2 million of fair value held in separate accounts is not supported by the stable value wrap. Future rate increases may cause write-downs in the current period. The stable value wrap is provided by an investment grade financial institution.
Loans
The aggregate loan portfolio before allowance for loan losses totaled $23.9 billion at December 31, 2023, an increase of $1.3 billion compared to December 31, 2022, driven by growth in commercial loans, commercial real estate loans and loans to individuals.
Table 21 – Loans
(In thousands)
|
|
|
|
|
|
|
|
|
|
|
|
|
|
|
|
|
December 31, |
|
|
2023 |
|
2022 |
| Commercial: |
|
|
|
|
| Healthcare |
|
$ |
4,143,233 |
|
|
$ |
3,845,017 |
|
| Services |
|
3,576,223 |
|
|
3,431,521 |
|
| Energy |
|
3,437,101 |
|
|
3,424,790 |
|
| General business |
|
3,647,212 |
|
|
3,511,171 |
|
| Total commercial |
|
14,803,769 |
|
|
14,212,499 |
|
|
|
|
|
|
| Commercial real estate: |
|
|
|
|
| Multifamily |
|
1,872,760 |
|
|
1,212,883 |
|
| Industrial |
|
1,475,165 |
|
|
1,221,501 |
|
| Office |
|
909,442 |
|
|
1,053,331 |
|
| Retail |
|
592,632 |
|
|
620,518 |
|
| Residential construction and land development |
|
95,052 |
|
|
95,684 |
|
| Other commercial real estate |
|
392,596 |
|
|
402,860 |
|
| Total commercial real estate |
|
5,337,647 |
|
|
4,606,777 |
|
|
|
|
|
|
| Loans to individuals: |
|
|
|
|
| Residential mortgage |
|
2,160,640 |
|
|
1,890,784 |
|
| Residential mortgage guaranteed by U.S. government agencies |
|
149,807 |
|
|
245,940 |
|
| Personal |
|
1,453,105 |
|
|
1,601,150 |
|
| Total loans to individuals |
|
3,763,552 |
|
|
3,737,874 |
|
|
|
|
|
|
| Total |
|
$ |
23,904,968 |
|
|
$ |
22,557,150 |
|
Commercial
Commercial loans represent loans for working capital, facilities acquisition or expansion, purchases of equipment and other needs of commercial customers primarily located within our geographical footprint. Commercial loans are underwritten individually and represent ongoing relationships based on a thorough knowledge of the customer, the customer’s industry and market. While commercial loans are generally secured by the customer’s assets including real property, inventory, accounts receivable, operating equipment, interests in mineral rights and other property and may also include personal guarantees of the owners and related parties, the primary source of repayment of the loans is the ongoing cash flow from operations of the customer’s business. Inherent lending risks are centrally monitored on a continuous basis from underwriting throughout the life of the loan for compliance with commercial lending policies.
Commercial loans totaled $14.8 billion or 62% of the loan portfolio at December 31, 2023, increasing $591 million or 4% compared to December 31, 2022, led by growth in healthcare loan balances, with services, general business and energy loans also increasing.
Approximately 70% of commercial loans are located within our geographic footprint, based on collateral location. Loans for which the collateral location is less relevant, such as unsecured loans and reserve-based energy loans, are categorized by the borrower's primary operating location. The largest concentration of loans in this segment outside of our footprint is California, totaling 5% of the segment.
Supporting the energy industry with loans to producers and other energy-related entities has been a hallmark of the Company since its founding and represents a large portion of our commercial loan portfolio. In addition, energy production and related industries have a significant impact on the economy in our primary markets. Loans collateralized by oil and gas properties are subject to semi-annual engineering reviews by our internal staff of petroleum engineers. These reviews are used as the basis for developing the expected cash flows supporting the loan amount. The projected cash flows are discounted according to risk characteristics of the underlying oil and gas properties. Loans are evaluated to demonstrate with reasonable certainty that crude oil, natural gas and natural gas liquids can be recovered from known oil and gas reservoirs under existing economic and operating conditions at current pricing levels and with existing conventional equipment and operating methods and costs. As part of our evaluation of credit quality, we analyze rigorous stress tests over a range of commodity prices and take proactive steps to mitigate risk when appropriate.
Outstanding energy loans totaled $3.4 billion or 14% of total loans at December 31, 2023. Approximately $2.7 billion or 78% of energy loans were to oil and gas producers, largely unchanged compared to December 31, 2022. The majority of this portfolio is first lien, senior secured, reserve-based lending, which we believe is the lowest risk form of energy lending. Approximately 69% of the committed production loans are secured by properties primarily producing oil and 31% of the committed production loans are secured by properties primarily producing natural gas.
Loans to midstream oil and gas companies totaled $551 million or 16% of energy loans, a decrease of $24 million compared to the prior year. Loans to borrowers that provide services to the energy industry totaled $182 million or 5% of energy loans, a $25 million increase during 2023. Loans to other energy borrowers, including those engaged in wholesale or retail energy sales, totaled $47 million or 1% of energy loans, a $20 million increase over the prior year.
Unfunded energy loan commitments were $4.5 billion at December 31, 2023, up $687 million over December 31, 2022. Utilization levels remain low, providing ample capacity for growth from our current customer base.
The healthcare sector of the loan portfolio totaled $4.1 billion or 17% of total loans. Healthcare loans increased $298 million over December 31, 2022, primarily due to growth in loans to senior housing and other medical practices. Healthcare sector loans consist primarily of loans for the development and operation of senior housing and care facilities including independent living, assisted living and skilled nursing. Generally, we loan to borrowers with a portfolio of multiple facilities that serves to help diversify risks specific to a single facility.
The services sector of the loan portfolio increased $145 million to $3.6 billion or 15% of total loans. Service sector loans consist of a large number of loans to a variety of businesses including Native American tribal and state and local municipal government entities, Native American tribal casino operations, educational services, foundations and not-for-profit organizations and specialty trade contractors. Approximately $1.6 billion of the services category is made up of loans with individual balances of less than $10 million. Service sector loans are generally secured by the assets of the borrower with repayment coming from the cash flows of ongoing operations of the customer’s business.
General business loans increased $136 million to $3.6 billion or 15% of total loans. General business loans primarily consist of $2.2 billion of wholesale/retail loans and $1.4 billion of loans from other commercial industries.
We participate in shared national credits when appropriate to obtain or maintain business relationships with local customers. Shared national credits are defined by banking regulators as credits of more than $100 million and with three or more non-affiliated banks as participants. At December 31, 2023, the outstanding principal balance of these loans totaled $5.7 billion, including $2.5 billion in the energy sector. Based on dollars committed, approximately 79% of shared national credits are to borrowers with local market relationships and we serve as the agent lender in approximately 22% of our shared national credits. We hold shared national credits to the same standard of analysis and perform the same level of review as internally originated credits. Our lending policies generally avoid loans in which we do not have the opportunity to maintain or achieve other business relationships with the customer. In addition to management’s quarterly assessment of credit risk, banking regulators annually review a sample of shared national credits for proper risk grading.
Commercial Real Estate
Commercial real estate represents loans for the construction of buildings or other improvements to real estate and property held by borrowers for investment purposes generally within our geographical footprint. We require collateral values in excess of the loan amounts, demonstrated cash flows in excess of expected debt service requirements, equity investment in the project and a portion of the project already sold, leased or permanent financing already secured. The expected cash flows from all significant new or renewed income producing property commitments are stress tested to reflect the risks in varying interest rates, vacancy rates and rental rates. As with commercial loans, inherent lending risks are centrally monitored on a continuous basis from underwriting throughout the life of the loan for compliance with applicable lending policies.
The outstanding balance of commercial real estate loans totaled $5.3 billion or 22% of the loan portfolio, an increase of $731 million over December 31, 2022. Loans secured by multifamily real estate totaled $1.9 billion or 8% of total loans, a $660 million increase over the prior year. Loans secured by industrial facilities were $1.5 billion or 6% of total loans, a $254 million increase over the prior year. Loans secured by office facilities decreased $144 million to $909 million or 4% of total loans. Loans secured by retail facilities decreased $28 million to $593 million or 2% of total loans.
Approximately 66% of commercial real estate loans are in our geographic footprint based on collateral location. The largest concentration of loans in this segment outside our footprint is Utah, totaling 9% of the segment. All other states represent less than 5% individually.
Unfunded commercial real estate loan commitments were $1.8 billion at December 31, 2023, a $1.3 billion decrease compared to the prior year. We take a disciplined approach to managing our concentration of total commercial real estate loan commitments as a percentage of Tier 1 Capital. We have ample opportunity for continued modest growth in our outstanding commercial real estate balances as loans fund up.
Loans to Individuals
Loans to individuals include residential mortgage and personal loans. Residential mortgage loans provide funds for our customers to purchase or refinance their primary residence or to borrow against the equity in their home. These loans are secured by a first or second mortgage on the customer's primary residence. Personal loans consist primarily of loans to Wealth Management clients secured by the cash surrender value of insurance policies and marketable securities. It also includes direct loans secured by and for the purchase of automobiles, recreational and marine equipment as well as unsecured loans. These loans are made in accordance with underwriting policies we believe to be conservative and are fully documented. Loans may be individually underwritten or credit scored based on size and other criteria. Credit scoring is assessed based on significant credit characteristics including credit history, residential and employment stability.
In general, we sell the majority of our conforming fixed rate mortgage loan originations in the secondary market and retain the majority of our non-conforming and adjustable rate mortgage loans. Our mortgage loan portfolio does not include payment option adjustable rate mortgage loans or adjustable rate mortgage loans with initial rates that are below market. Home equity loans are primarily first-lien and fully amortizing.
Residential mortgage loans guaranteed by U.S. government agencies have limited credit exposure because of the underlying agency guarantee. This amount includes residential mortgage loans previously sold into GNMA mortgage pools that the Company may repurchase when certain defined delinquency criteria are met. Because of this repurchase right, the Company is deemed to have regained effective control over these loans and must include them on the Consolidated Balance Sheet.
Loans to individuals totaled $3.8 billion or 16% of the loan portfolio, growing $26 million over December 31, 2022. Approximately 91% of loans to individuals are secured by collateral located within our geographical footprint. Loans for which the collateral location is less relevant, such as unsecured loans, are categorized by the borrower’s primary operating location.
The Company secondarily evaluates loan portfolio performance based on the primary geographical market managing the loan. Loans attributed to a geographical market may not represent the location of the borrower or the collateral. All permanent mortgage loans serviced by our mortgage banking unit and held for investment by the Company are centrally managed by the Oklahoma market.
Table 22 – Loans Managed by Primary Geographical Market
(In thousands)
|
|
|
|
|
|
|
|
|
|
|
|
|
|
|
|
|
December 31, |
|
|
2023 |
|
2022 |
| Texas: |
|
|
|
|
| Commercial |
|
$ |
7,384,107 |
|
|
$ |
6,878,618 |
|
| Commercial real estate |
|
1,987,037 |
|
|
1,555,508 |
|
| Loans to individuals |
|
914,134 |
|
|
982,700 |
|
| Total Texas |
|
10,285,278 |
|
|
9,416,826 |
|
|
|
|
|
|
| Oklahoma: |
|
|
|
|
| Commercial |
|
3,275,907 |
|
|
3,382,577 |
|
| Commercial real estate |
|
606,515 |
|
|
582,109 |
|
| Loans to individuals |
|
2,147,782 |
|
|
2,077,124 |
|
| Total Oklahoma |
|
6,030,204 |
|
|
6,041,810 |
|
|
|
|
|
|
| Colorado: |
|
|
|
|
| Commercial |
|
2,273,179 |
|
|
2,149,199 |
|
| Commercial real estate |
|
769,329 |
|
|
613,912 |
|
| Loans to individuals |
|
228,257 |
|
|
241,902 |
|
| Total Colorado |
|
3,270,765 |
|
|
3,005,013 |
|
|
|
|
|
|
| Arizona: |
|
|
|
|
| Commercial |
|
1,143,682 |
|
|
1,124,289 |
|
| Commercial real estate |
|
1,003,331 |
|
|
860,947 |
|
| Loans to individuals |
|
248,873 |
|
|
229,872 |
|
| Total Arizona |
|
2,395,886 |
|
|
2,215,108 |
|
|
|
|
|
|
| Kansas/Missouri: |
|
|
|
|
| Commercial |
|
331,179 |
|
|
310,715 |
|
| Commercial real estate |
|
511,947 |
|
|
479,968 |
|
| Loans to individuals |
|
144,958 |
|
|
131,307 |
|
| Total Kansas/Missouri |
|
988,084 |
|
|
921,990 |
|
|
|
|
|
|
| New Mexico: |
|
|
|
|
| Commercial |
|
291,736 |
|
|
263,349 |
|
| Commercial real estate |
|
389,106 |
|
|
417,008 |
|
| Loans to individuals |
|
67,485 |
|
|
67,163 |
|
| Total New Mexico |
|
748,327 |
|
|
747,520 |
|
|
|
|
|
|
| Arkansas: |
|
|
|
|
| Commercial |
|
103,979 |
|
|
103,752 |
|
| Commercial real estate |
|
70,382 |
|
|
97,325 |
|
| Loans to individuals |
|
12,063 |
|
|
7,806 |
|
| Total Arkansas |
|
186,424 |
|
|
208,883 |
|
|
|
|
|
|
| Total BOK Financial loans |
|
$ |
23,904,968 |
|
|
$ |
22,557,150 |
|
Table 23 – Loan Maturity and Interest Rate Sensitivity at December 31, 2023
(In thousands)
|
|
|
|
|
|
|
|
|
|
|
|
|
|
|
|
|
|
|
|
|
|
|
|
|
|
|
|
|
|
|
|
|
|
|
| |
|
|
|
Remaining Maturities of Selected Loans |
|
|
| |
|
Total |
|
Within 1 Year |
|
1-5 Years |
|
5 - 15 Years |
|
After 15 Years |
|
|
| Loan maturity: |
|
|
|
|
|
|
|
|
|
|
|
|
| Commercial |
|
$ |
14,803,769 |
|
|
$ |
3,008,401 |
|
|
$ |
9,820,829 |
|
|
$ |
1,895,537 |
|
|
$ |
79,002 |
|
|
|
| Commercial real estate |
|
5,337,647 |
|
|
2,229,303 |
|
|
2,857,824 |
|
|
233,925 |
|
|
16,595 |
|
|
|
| Loans to individuals |
|
3,763,552 |
|
|
651,718 |
|
|
1,004,315 |
|
|
524,789 |
|
|
1,582,730 |
|
|
|
| Total |
|
$ |
23,904,968 |
|
|
$ |
5,889,422 |
|
|
$ |
13,682,968 |
|
|
$ |
2,654,251 |
|
|
$ |
1,678,327 |
|
|
|
| Interest rate sensitivity for selected loans with: |
|
|
|
|
|
|
|
|
|
|
|
|
| Predetermined interest rates |
|
$ |
6,688,861 |
|
|
$ |
542,790 |
|
|
$ |
2,771,028 |
|
|
$ |
2,077,614 |
|
|
$ |
1,297,429 |
|
|
|
| Floating or adjustable interest rates |
|
17,216,107 |
|
|
5,346,632 |
|
|
10,911,940 |
|
|
576,637 |
|
|
380,898 |
|
|
|
| Total |
|
$ |
23,904,968 |
|
|
$ |
5,889,422 |
|
|
$ |
13,682,968 |
|
|
$ |
2,654,251 |
|
|
$ |
1,678,327 |
|
|
|
Off-Balance Sheet Commitments
We enter into certain off-balance sheet arrangements in the normal course of business as shown in Table 24. Loan commitments may be unconditional obligations to provide financing or conditional obligations that depend on the borrower’s financial condition, collateral value or other factors. Standby letters of credit are unconditional commitments to guarantee the performance of our customer to a third party. Since some of these commitments are expected to expire before being drawn upon, the total commitment amounts do not necessarily represent future cash requirements.
We have off-balance sheet commitments related to certain residential mortgage loans sold into mortgage-backed securities as part of our mortgage banking activities. We retain off-balance sheet credit risk related to losses in excess of amounts guaranteed by the VA.
We also have off-balance sheet credit risk related to certain residential mortgage loans primarily originated under community development loan programs that were sold to a U.S. government agency with full recourse prior to 2007. We are obligated to repurchase these loans for the life of these loans in the event of foreclosure for the unpaid principal and interest at the time of foreclosure. The majority of our conforming fixed rate loan originations are sold in the secondary market, and we only retain repurchase obligations under standard underwriting representations and warranties.
Table 24 – Off-Balance Sheet Credit Commitments
(In thousands)
|
|
|
|
|
|
|
|
|
|
|
|
|
|
|
| |
|
December 31, |
| |
|
2023 |
|
2022 |
| Loan commitments |
|
$ |
14,793,025 |
|
|
$ |
15,424,431 |
|
| Standby letters of credit |
|
710,543 |
|
|
740,039 |
|
Unpaid principal balance of residential mortgage loans sold with recourse |
|
39,333 |
|
|
44,742 |
|
Unpaid principal balance of residential mortgage loans transferred into mortgage-backed securities guaranteed by U.S. Dept. of Veteran's Affairs |
|
959,256 |
|
|
1,005,368 |
|
Customer Derivative Programs
We offer programs that permit our customers to hedge various risks including fluctuations in energy, interest rates, foreign exchange rates, and other commodities. Each of these programs work essentially the same way. Derivative contracts are executed between the customers and the Company. Offsetting contracts are executed between the Company and selected counterparties or exchanges to minimize market risk to us from changes in commodity prices, interest rates or foreign exchange rates. The counterparty contracts are identical to the customer contracts except for a fixed pricing spread or a fee paid to us as compensation for administrative costs, credit risk and profit.
The customer derivative programs create credit risk for potential amounts due to the Company from our customers and from the counterparties. Customer credit risk is monitored through existing credit policies and procedures. The effects of changes in commodity prices, interest rates or foreign exchange rates are evaluated across a range of possible options to determine the maximum exposure we are willing to have individually to any customer. Customers may also be required to provide cash margin or other collateral in conjunction with our credit agreements to further limit our credit risk.
Counterparty credit risk is evaluated through existing policies and procedures. This evaluation considers the total relationship between BOK Financial and each of the counterparties. Individual limits are established by management, approved by Credit Administration and reviewed by the Asset/Liability Committee. Margin collateral is required if the exposure between the Company and any counterparty exceeds established limits. Based on declines in the counterparties’ credit ratings, these limits may be reduced and additional margin collateral may be required.
A deterioration of the credit standing of one or more of the customers or counterparties to these contracts may result in BOK Financial recognizing a loss as the fair value of the affected contracts may no longer move in tandem with the offsetting contracts. This occurs if the credit standing of the customer or counterparty deteriorates such that either the fair value of underlying collateral no longer supports the contract or the customer or counterparty’s ability to provide margin collateral becomes impaired. Credit losses on customer derivatives reduce brokerage and trading revenue in the Consolidated Statements of Earnings.
Derivative contracts are carried at fair value. At December 31, 2023, the net fair values of derivative contracts, before consideration of cash margin, reported as assets under these programs totaled $593 million compared to $1.0 billion at December 31, 2022. Derivative contracts carried as assets include energy contracts with fair values of $437 million, interest rate swaps primarily sold to loan customers with fair values of $102 million and foreign exchange contracts with fair values of $54 million. Before consideration of cash margin paid to counterparties, the aggregate net fair values of derivative contracts held under these programs reported as liabilities totaled $587 million.
At December 31, 2023, total derivative assets were reduced by $265 million of cash collateral received from counterparties, and total derivative liabilities were reduced by $6.4 million of cash collateral paid to counterparties related to instruments executed with the same counterparty under a master netting agreement. Derivative contracts executed with customers may be secured by non-cash collateral in conjunction with a credit agreement with that customer such as proven producing oil and gas properties. Access to this collateral in the event of default is reasonably assured.
A table showing the notional and fair value of derivative assets and liabilities on both a gross and net basis is presented in Note 6 to the Consolidated Financial Statements.
The fair value of derivative contracts reported as assets under these programs, net of cash margin held by the Company, by category of debtor at December 31, 2023 follows in Table 25.
Table 25 – Fair Value of Derivative Contracts
(In thousands)
|
|
|
|
|
|
|
|
|
| Exchanges and clearing organizations |
|
$ |
236,373 |
|
| Customers |
|
51,774 |
|
| Banks and other financial institutions |
|
40,022 |
|
| Fair value of customer hedge asset derivative contracts, net |
|
$ |
91,796 |
|
The largest exposure to a single counterparty was to an exchange for $186 million of net derivative positions, net of cash collateral, at December 31, 2023.
Our customer derivative program also introduces liquidity and capital risk. We are required to provide cash margin to certain counterparties when the net negative fair value of the contracts exceeds established limits. Also, changes in commodity prices affect the amount of regulatory capital we are required to hold as support for the fair value of our derivative assets. These risks are modeled as part of the management of these programs. Based on current prices, a decrease in market prices down to an equivalent of $54.72 per barrel of oil would decrease the fair value of derivative assets by $11 million with lending customers comprising the bulk of the assets. An increase in prices up to the equivalent of $88.58 per barrel of oil would increase the fair value of derivative assets by $397 million. Liquidity requirements of this program are also affected by our credit rating. A decrease in our credit rating to below investment grade would increase our obligation to post cash margin on existing contracts by approximately $10 million. The fair value of our to-be-announced residential mortgage-backed securities and interest rate swap derivative contracts is affected by changes in interest rates. Based on our assessment as of December 31, 2023, changes in interest rates would not materially impact regulatory capital or liquidity needed to support this portion of our customer derivative program.
Summary of Credit Loss Experience
Table 26 – Summary of Credit Loss Experience
(In thousands)
|
|
|
|
|
|
|
|
|
|
|
|
|
Year Ended |
|
Dec. 31, 2023 |
|
Dec. 31, 2022 |
| Allowance for loan losses: |
|
|
|
| Beginning balance |
$ |
235,704 |
|
|
$ |
256,421 |
|
| Loans charged off |
(27,316) |
|
|
(28,746) |
|
| Recoveries of loans previously charged off |
9,217 |
|
|
7,601 |
|
| Net loans charged off |
(18,099) |
|
|
(21,145) |
|
Provision for credit losses |
59,518 |
|
|
428 |
|
| Ending balance |
$ |
277,123 |
|
|
$ |
235,704 |
|
|
|
|
|
| Accrual for off-balance sheet credit risk from unfunded loan commitments: |
|
|
|
| Beginning balance |
$ |
60,919 |
|
|
32,977 |
|
Provision for credit losses |
(11,942) |
|
|
27,942 |
|
| Ending balance |
$ |
48,977 |
|
|
$ |
60,919 |
|
|
|
|
|
Accrual for off-balance sheet credit risk associated with mortgage banking activities: |
|
|
|
Beginning balance |
$ |
4,904 |
|
|
$ |
3,382 |
|
Net loans charged off |
(58) |
|
|
(105) |
|
Provision for credit losses |
(1,354) |
|
|
1,627 |
|
Ending balance |
$ |
3,492 |
|
|
$ |
4,904 |
|
|
|
|
|
Allowance for credit losses related to held-to-maturity (investment) securities: |
|
|
|
Beginning balance |
$ |
558 |
|
|
$ |
555 |
|
Provision for credit losses |
(222) |
|
|
3 |
|
| Ending balance |
$ |
336 |
|
|
$ |
558 |
|
|
|
|
|
Total provision for credit losses |
$ |
46,000 |
|
|
$ |
30,000 |
|
|
|
|
|
|
|
|
|
|
|
|
|
| Average loans by portfolio segment : |
|
|
|
| Commercial |
$ |
14,320,970 |
|
|
$ |
13,407,297 |
|
| Commercial real estate |
5,163,569 |
|
|
4,345,783 |
|
| Loans to individuals |
3,640,810 |
|
|
3,526,107 |
|
| Net charge-offs (annualized) to average loans |
0.08 |
% |
|
0.10 |
% |
| Net charge-offs (annualized) to average loans by portfolio segment: |
|
|
|
| Commercial |
0.07 |
% |
|
0.13 |
% |
| Commercial real estate |
0.10 |
% |
|
— |
% |
| Loans to individuals |
0.09 |
% |
|
0.10 |
% |
Recoveries to gross charge-offs |
33.74 |
% |
|
26.44 |
% |
Provision for loan losses (annualized) to average loans |
0.26 |
% |
|
— |
% |
Allowance for loan losses to loans outstanding at period-end |
1.16 |
% |
|
1.04 |
% |
Accrual for unfunded loan commitments to loan commitments |
0.33 |
% |
|
0.39 |
% |
Combined allowance for loan losses and accrual for off-balance sheet credit risk from unfunded loan commitments to loans outstanding at period-end |
1.36 |
% |
|
1.31 |
% |
Allowance for Loan Losses and Accrual for Off-Balance Sheet Credit Risk from Unfunded Loan Commitments
Expected credit losses on assets carried at amortized cost are recognized over their expected lives based on models that measure the probability of default and loss given default over a 12-month reasonable and supportable forecast period. Models incorporate base case, downside, and upside macroeconomic variables such as real GDP growth, civilian unemployment rate and WTI oil prices on a probability weighted basis. See Note 4 to the Consolidated Financial Statements for additional discussion of methodology of allowance for loan losses.
A $46.0 million provision for credit losses was recorded for the year ended December 31, 2023, primarily due to loan growth and changes in our economic forecast during the year, including a more challenging commercial real estate environment.
Non-pass grade loans, which include loans especially mentioned, accruing substandard and nonaccruing loans, increased $132 million to $453 million at December 31, 2023. Non-pass grade loans were composed primarily of $174 million or 4% of commercial healthcare loans, $124 million or 3% of commercial general business loans, $49 million or 1% of energy loans, $38 million or 1% of commercial services loans, $36 million or 1% of loans to individuals and $33 million or 1% of commercial real estate loans. A summary of outstanding loan balances by risk grade is included in Note 4 to the Consolidated Financial Statements.
The provision for credit losses of $6.0 million in the fourth quarter of 2023 reflects a stable economic environment, continued loan growth and the impact of net charge-offs for the quarter.
At December 31, 2023, the allowance for loan losses totaled $277 million or 1.16% of outstanding loans. Excluding residential mortgage loans guaranteed by U.S. government agencies, the allowance for loan losses was 204% of nonaccruing loans. The combined allowance for loan losses and accrual for off-balance sheet credit risk from unfunded loan commitments was $326 million or 1.36% of outstanding loans and 240% of nonaccruing loans at December 31, 2023.
A $30.0 million provision for credit losses was recorded for the year ended December 31, 2022 primarily due to strong growth in loans and loan commitments, partially offset by improvement in credit quality metrics. The uncertainty in our economic forecast increased resulting in an increase in the probability weighting of the downside scenario. In addition, some key economic factors were less favorable to growth across all scenarios.
At December 31, 2022, the allowance for loan losses was $236 million or 1.04% of outstanding loans. Excluding loans guaranteed by U.S. government agencies, the allowance for loan losses was 221% of nonaccruing loans. The combined allowance for loan losses and accrual for off-balance sheet credit risk from unfunded loan commitments was $297 million or 1.31% of outstanding loans and 278% of nonaccruing loans.
A summary of macroeconomic variables considered in developing our estimate of expected credit losses at December 31, 2023 follows:
|
|
|
|
|
|
|
|
|
|
|
|
|
Base |
Downside |
Upside |
| Scenario probability weighting |
50% |
35% |
15% |
| Economic outlook |
Geopolitical conflicts remain isolated.
The federal funds rate target range of 5.25% to 5.50% is held flat for the forecast horizon. Core inflation continues to improve from the previous peaks and reaches 2.6% by the fourth quarter of 2024.
Job openings revert to more normalized levels, and overall hiring levels decline causing the national unemployment rate to modestly increase over the next four quarters. Inflation pressures ease and help stabilize household income. A restrictive credit environment slows economic activity and results in below-trend GDP growth.
|
Geopolitical conflicts remain isolated.
The Federal Reserve is forced to adopt an accomodative monetary policy and cut the federal funds rate significantly to encourage economic activity and job creation to help limit the depth of a recession. In total, there are ten rate cuts in 2024 bringing the target range to 2.75% to 3.00% by the fourth quarter of 2024.
Tight monetary conditions result in declines in consumer spending while a restrictive credit environment decreases private sector investment. This pushes the United States into a recession with a contraction in economic activity and a sharp increase in the unemployment rate.
|
Geopolitical conflicts remain isolated.
There is one federal funds rate cut in each quarter of 2024, bringing the target range to 4.25% to 4.50% by the fourth quarter of 2024. Core inflation continues to improve from the previous peaks and reaches 2.3% by the fourth quarter of 2024.
Labor force participants continue to re-enter the job market to help fill the elevated level of job openings. This increase in employment helps real household income continue to grow above its pre-pandemic trend. This supports consumer spending and maintains GDP growth consistent with pre-pandemic levels. |
| Macro-economic factors |
–GDP is forecasted to grow by 1.6% over the next 12 months.
–Civilian unemployment rate of 3.9% in the first quarter of 2024 increasing to 4.2% by the fourth quarter of 2024.
–WTI oil prices are projected to generally follow the NYMEX forward curve that existed at the end of December 2023 and are expected to average $71.34 per barrel over the next 12 months.
|
–GDP is forecasted to contract 1.8% over the next 12 months.
–Civilian unemployment rate of 4.7% in the first quarter of 2024 worsens to 6.1% by the fourth quarter of 2024.
–WTI oil prices are projected to average $54.46 per barrel over the next twelve months, with a peak of $62.44 in the first quarter of 2024 and falling 22% over the following three quarters.
|
–GDP is forecasted to grow by 1.9% over the next 12 months.
–Civilian unemployment rate of 3.8% in the first quarter of 2024 increases slightly to 4.0% by the fourth quarter of 2024.
–WTI oil prices are projected to average $74.75 per barrel over the next 12 months.
|
Net Loans Charged Off
In 2023, net loans charged off totaled $18 million or 0.08%, down from $21 million or 0.10% of average loans in 2022.
In 2023, net charge-offs of commercial loans were $9.7 million, primarily related to a single services borrower and a single general business borrower in the wholesale/retail sector. Net commercial real estate loan charge-offs were $5.1 million primarily related to a single office loan. Net loan charge-offs of loans to individuals were $3.4 million. Net charge-offs of loans to individuals include deposit account overdraft losses.
Nonperforming Assets
As more fully described in Note 1 to the Consolidated Financial Statements, loans are generally classified as nonaccruing when it becomes probable that we will not collect the full contractual principal and interest. Accruing renegotiated loans guaranteed by U.S. government agencies represent residential mortgage loans that have been modified in troubled debt restructurings. Interest continues to accrue based on the modified terms of the loan and loans may be sold once they become eligible according to U.S. government agency guidelines. Real estate and other repossessed assets are assets acquired in partial or total forgiveness of loans. The assets are carried at the lower of cost, as determined by fair value at the date of foreclosure, or current fair value, less estimated selling costs. A summary of nonperforming assets follows in Table 27:
Table 27 - Nonperforming Assets
(Dollars in thousands)
|
|
|
|
|
|
|
|
|
|
|
|
|
|
|
|
|
December 31, |
|
|
2023 |
|
2022 |
| Nonaccruing loans: |
|
|
|
|
| Commercial |
|
|
|
|
| Healthcare |
|
$ |
81,529 |
|
|
$ |
41,034 |
|
| Energy |
|
17,843 |
|
|
1,399 |
|
| Services |
|
3,616 |
|
|
16,228 |
|
| General business |
|
7,143 |
|
|
1,636 |
|
| Total commercial |
|
110,131 |
|
|
60,297 |
|
|
|
|
|
|
| Commercial real estate |
|
7,320 |
|
|
16,570 |
|
|
|
|
|
|
| Loans to individuals |
|
|
|
|
| Residential mortgage |
|
18,056 |
|
|
29,791 |
|
| Residential mortgage guaranteed by U.S. government agencies |
|
9,709 |
|
|
15,005 |
|
| Personal |
|
253 |
|
|
134 |
|
| Total loans to individuals |
|
28,018 |
|
|
44,930 |
|
| Total nonaccruing loans |
|
145,469 |
|
|
121,797 |
|
Accruing renegotiated loans guaranteed by U.S. government agencies1 |
|
— |
|
|
163,535 |
|
| Real estate and other repossessed assets |
|
2,875 |
|
|
14,304 |
|
| Total nonperforming assets |
|
$ |
148,344 |
|
|
$ |
299,636 |
|
| Total nonperforming assets excluding those guaranteed by U.S. government agencies |
|
$ |
138,635 |
|
|
$ |
121,096 |
|
|
|
|
|
|
Allowance for loan losses to nonaccruing loans2 |
|
204.13 |
% |
|
220.71 |
% |
Combined allowance for loan losses and accrual for off-balance sheet credit risk from unfunded loan commitments to nonaccruing loans2 |
|
240.20 |
% |
|
277.76 |
% |
Nonperforming assets to outstanding loans and repossessed assets |
|
0.62 |
% |
|
1.33 |
% |
Nonperforming assets to outstanding loans and repossessed assets2 |
|
0.58 |
% |
|
0.54 |
% |
| Nonaccruing loans to outstanding loans |
|
0.61 |
% |
|
0.54 |
% |
Nonaccruing commercial loans to outstanding commercial loans |
|
0.74 |
% |
|
0.42 |
% |
Nonaccruing commercial real estate loans to outstanding commercial real estate loans |
|
0.14 |
% |
|
0.36 |
% |
Nonaccruing loans to individuals to outstanding loans to individuals2 |
|
0.51 |
% |
|
0.86 |
% |
Accruing loans 90 days or more past due2 |
|
$ |
170 |
|
|
$ |
510 |
|
1 The Company adopted FASB Accounting Standards Update No. 2022-02, Financial Instruments - Credit Losses (Topic 326): Troubled Debt Restructurings and Vintage Disclosures, which eliminates designation of these loans as troubled debt restructurings effective January 1, 2023.
2 Excludes residential mortgages guaranteed by U.S. government agencies.
Excluding loans guaranteed by U.S. government agencies, nonperforming assets increased $18 million compared to December 31, 2022, primarily due to a $40 million increase in nonaccruing healthcare loans and a $16 million increase in nonaccruing energy loans. These increases were partially offset by a $13 million decrease in nonaccruing service sector loans, a $12 million decrease in nonaccruing residential real estate mortgage loans and a $9.3 million decrease in nonaccruing commercial real estate loans. Newly identified nonaccruing loans totaled $119 million, offset by $51 million in payments, $27 million of charge-offs, $12 million of loans returning to accrual status and $4.6 million in foreclosures of loans guaranteed by U.S. government agencies. The Company generally retains nonperforming assets to maximize potential recovery, which may cause future nonperforming assets to decrease more slowly.
A rollforward of nonperforming assets for the years ended December 31, 2023 and December 31, 2022 follows in Table 28.
Table 28 – Rollforward of Nonperforming Assets
(In thousands)
|
|
|
|
|
|
|
|
|
|
|
|
|
|
|
|
|
|
|
|
|
|
|
|
|
|
|
|
|
|
|
|
|
|
|
|
|
|
|
|
|
|
|
|
|
|
|
Year Ended December 31, 2023 |
|
|
Nonaccruing Loans |
|
|
|
|
|
|
| |
|
Commercial |
|
Commercial Real Estate |
|
Loan to Individuals |
|
Total |
|
Renegotiated Loans
|
|
Real Estate and Other Repossessed Assets |
|
Total Nonperforming Assets |
| Balance, December 31, 2022 |
|
$ |
60,297 |
|
|
$ |
16,570 |
|
|
$ |
44,930 |
|
|
$ |
121,797 |
|
|
$ |
163,535 |
|
|
$ |
14,304 |
|
|
$ |
299,636 |
|
| Change in accounting standard |
|
— |
|
|
— |
|
|
— |
|
|
— |
|
|
(163,535) |
|
|
— |
|
|
(163,535) |
|
| Additions |
|
95,586 |
|
|
7,459 |
|
|
15,789 |
|
|
118,834 |
|
|
— |
|
|
— |
|
|
118,834 |
|
|
|
|
|
|
|
|
|
|
|
|
|
|
|
|
| Payments |
|
(32,296) |
|
|
(8,263) |
|
|
(10,887) |
|
|
(51,446) |
|
|
— |
|
|
— |
|
|
(51,446) |
|
| Charge-offs |
|
(12,898) |
|
|
(8,446) |
|
|
(5,972) |
|
|
(27,316) |
|
|
— |
|
|
— |
|
|
(27,316) |
|
| Net gains (losses) and write-downs |
|
— |
|
|
— |
|
|
— |
|
|
— |
|
|
— |
|
|
622 |
|
|
622 |
|
| Foreclosure of nonaccruing loans |
|
— |
|
|
— |
|
|
(787) |
|
|
(787) |
|
|
— |
|
|
787 |
|
|
— |
|
| Foreclosure of loans guaranteed by U.S. government agencies |
|
— |
|
|
— |
|
|
(4,634) |
|
|
(4,634) |
|
|
— |
|
|
— |
|
|
(4,634) |
|
| Proceeds from sales |
|
— |
|
|
— |
|
|
— |
|
|
— |
|
|
— |
|
|
(12,838) |
|
|
(12,838) |
|
|
|
|
|
|
|
|
|
|
|
|
|
|
|
|
|
|
|
|
|
|
|
|
|
|
|
|
|
|
|
| Net transfers to nonaccruing loans |
|
— |
|
|
— |
|
|
662 |
|
|
662 |
|
|
— |
|
|
— |
|
|
662 |
|
| Return to accrual status |
|
(558) |
|
|
— |
|
|
(11,083) |
|
|
(11,641) |
|
|
— |
|
|
— |
|
|
(11,641) |
|
| Other, net |
|
— |
|
|
— |
|
|
— |
|
|
— |
|
|
— |
|
|
— |
|
|
— |
|
| Balance, December 31, 2023 |
|
$ |
110,131 |
|
|
$ |
7,320 |
|
|
$ |
28,018 |
|
|
$ |
145,469 |
|
|
$ |
— |
|
|
$ |
2,875 |
|
|
$ |
148,344 |
|
|
|
|
|
|
|
|
|
|
|
|
|
|
|
|
|
|
Year Ended December 31, 2022 |
|
|
Nonaccruing Loans |
|
|
|
|
|
|
|
|
Commercial |
|
Commercial Real Estate |
|
Loan to Individuals |
|
Total |
|
Renegotiated Loans
|
|
Real Estate and Other Repossessed Assets |
|
Total Nonperforming Assets |
| Balance, December 31, 2021 |
|
$ |
74,104 |
|
|
$ |
14,262 |
|
|
$ |
45,693 |
|
|
$ |
134,059 |
|
|
$ |
210,618 |
|
|
$ |
24,589 |
|
|
$ |
369,266 |
|
| Additions |
|
58,822 |
|
|
20,683 |
|
|
17,372 |
|
|
96,877 |
|
|
38,644 |
|
|
— |
|
|
135,521 |
|
|
|
|
|
|
|
|
|
|
|
|
|
|
|
|
| Payments |
|
(42,484) |
|
|
(944) |
|
|
(12,049) |
|
|
(55,477) |
|
|
(6,382) |
|
|
— |
|
|
(61,859) |
|
| Charge-offs |
|
(22,382) |
|
|
(269) |
|
|
(6,095) |
|
|
(28,746) |
|
|
— |
|
|
— |
|
|
(28,746) |
|
| Net gains (losses) and write-downs |
|
— |
|
|
— |
|
|
— |
|
|
— |
|
|
— |
|
|
(1,194) |
|
|
(1,194) |
|
| Foreclosure of nonaccruing loans |
|
(7,960) |
|
|
(3,956) |
|
|
(410) |
|
|
(12,326) |
|
|
— |
|
|
12,326 |
|
|
— |
|
| Foreclosure of loans guaranteed by U.S. government agencies |
|
— |
|
|
— |
|
|
(4,929) |
|
|
(4,929) |
|
|
(3,431) |
|
|
— |
|
|
(8,360) |
|
| Proceeds from sales |
|
— |
|
|
— |
|
|
— |
|
|
— |
|
|
(71,520) |
|
|
(21,417) |
|
|
(92,937) |
|
|
|
|
|
|
|
|
|
|
|
|
|
|
|
|
|
|
|
|
|
|
|
|
|
|
|
|
|
|
|
| Net transfers to nonaccruing loans |
|
— |
|
|
— |
|
|
5,774 |
|
|
5,774 |
|
|
(5,774) |
|
|
— |
|
|
— |
|
| Return to accrual status |
|
197 |
|
|
(13,206) |
|
|
(426) |
|
|
(13,435) |
|
|
— |
|
|
— |
|
|
(13,435) |
|
| Other, net |
|
— |
|
|
— |
|
|
— |
|
|
— |
|
|
1,380 |
|
|
— |
|
|
1,380 |
|
| Balance, December 31, 2022 |
|
$ |
60,297 |
|
|
$ |
16,570 |
|
|
$ |
44,930 |
|
|
$ |
121,797 |
|
|
$ |
163,535 |
|
|
$ |
14,304 |
|
|
$ |
299,636 |
|
|
|
|
|
|
|
|
|
|
|
|
|
|
|
|
|
|
|
|
|
|
|
|
|
|
|
|
|
|
|
|
|
|
|
|
|
|
|
|
|
|
|
|
|
|
|
|
|
|
|
|
|
|
|
|
|
|
|
|
|
|
|
|
|
|
|
|
|
|
|
|
|
|
|
|
|
|
|
|
|
|
|
|
|
|
|
|
|
|
|
|
|
|
|
|
|
|
|
|
|
|
|
|
|
|
|
|
|
|
|
|
|
|
|
|
|
|
|
|
|
|
|
|
|
|
|
|
|
|
|
|
|
|
|
|
|
|
|
|
|
|
|
|
|
|
|
|
|
|
|
|
|
|
|
|
|
|
|
|
|
|
|
|
|
|
|
|
|
|
|
|
|
|
|
|
|
|
|
|
|
|
|
|
|
|
|
|
|
|
|
|
|
|
|
|
|
|
|
|
|
|
|
|
|
|
|
|
|
|
|
|
|
|
|
|
|
|
|
|
|
|
|
|
|
|
|
|
|
|
|
|
|
|
|
|
|
|
|
|
|
|
|
|
|
|
|
|
|
|
|
|
|
We foreclose on loans guaranteed by U.S. government agencies in accordance with agency guidelines. Generally these loans are not eligible for modification programs or have failed to comply with modified loan terms. Principal is guaranteed by agencies of the U.S. government, subject to limitations, and credit risk is limited. These properties will be conveyed to the agencies and receivables collected once applicable criteria have been met.
Real Estate and Other Repossessed Assets
Real estate and other repossessed assets totaled $2.9 million at December 31, 2023, composed primarily of $2.1 million of developed commercial real estate. Real estate and other repossessed assets decreased $11 million compared to December 31, 2022, primarily related to the sale of developed commercial real estate and oil and gas properties.
Liquidity and Capital
BOK Financial has numerous material cash requirements in the normal course of business. These obligations include deposits and other borrowed funds, leased premises, commitments to extend credit to borrowers and to purchase securities, derivative contracts and contracts for services such as data processing that are integral to our operations. Additional information on loan commitments can be found in the "Loan Commitments" section of Management's Discussion and Analysis while the distribution of time deposit balances can be located in Note 8, "Deposits," and information related to Other Borrowings can be located in Note 9, "Other Borrowings."
Our funding sources, which primarily include deposits and borrowings from the Federal Home Loan Banks, provide adequate liquidity to meet our operating needs. Based on the average balances for 2023, approximately 69% of our funding was provided by deposit accounts, 18% from borrowed funds, less than 1% from long-term subordinated debt and 10% from equity. The loan to deposit ratio increased to 70% at December 31, 2023 from 65% at December 31, 2022, and continues to provide significant on-balance sheet liquidity to meet future loan demand and contractual obligations. BOK Financial, similar to the banking industry as a whole, saw deposits continue to decline in 2023 as customers redeployed capital and moved to other off-balance sheet alternatives seeking higher yields in the rising interest rate environment.
Subsidiary Bank
Deposits and borrowed funds are the primary sources of liquidity for BOKF, NA the wholly owned subsidiary bank of BOK Financial. We compete for retail and commercial deposits by offering a broad range of products and services and focusing on customer convenience. Retail deposit growth is supported through personal and small business checking, online bill paying services, mobile banking services, an extensive network of branch locations and ATMs and our ExpressBank call center. Commercial deposit growth is supported by offering treasury management and lockbox services. We also acquire brokered deposits when the cost of funds is advantageous to other funding sources.
Table 29 - Average Deposits by Line of Business
(In thousands)
|
|
|
|
|
|
|
|
|
|
|
|
|
Year Ended December 31, |
| |
2023 |
|
2022 |
| Commercial Banking |
$ |
15,311,654 |
|
|
$ |
18,323,412 |
|
| Consumer Banking |
8,014,159 |
|
|
8,763,046 |
|
| Wealth Management |
7,739,490 |
|
|
8,491,377 |
|
| Subtotal |
31,065,303 |
|
|
35,577,835 |
|
| Funds Management and other |
2,139,531 |
|
|
2,273,446 |
|
| Total |
$ |
33,204,834 |
|
|
$ |
37,851,281 |
|
Average deposits for 2023 totaled $33.2 billion, a decrease of $4.6 billion compared to the prior year. Demand deposits decreased $4.2 billion while interest-bearing transaction deposit account balances decreased $1.3 billion. Average time deposits increased $908 million.
Average deposits attributed to Commercial Banking were $15.3 billion for 2023, a $3.0 billion or 16% decrease compared to 2022. Demand deposit balances decreased $3.4 billion or 36% and time deposit balances decreased $83 million or 28%. Interest-bearing transaction account balances increased $521 million or 6%. Our Commercial deposit portfolio is highly diversified across industries and customers. The highest concentration by industry within our commercial deposit portfolio is with our energy customers representing 7% of our total average deposits.
Average Consumer Banking deposit balances decreased $749 million or 9% compared to the prior year. Average interest-bearing transaction account balances decreased $630 million or 15%. Average demand deposit account balances decreased by $245 million or 8% while savings deposits decreased $63 million or 7%. Time deposit balances increased $189 million or 28%.
Average Wealth Management deposit balances decreased by $752 million or 9% compared to the prior year. Interest-bearing transaction balances decreased $632 million or 10%. Non-interest-bearing demand deposits decreased $482 million or 30% and time deposit balances were up $366 million or 78%.
Total brokered deposits represented 2% of total average deposits in 2023. Average interest-bearing transaction accounts for 2023 included $336 million of brokered deposits, a $499 million decrease compared to 2022. Average time deposits included $460 million of brokered deposits for 2023, a $409 million increase over 2022.
The distribution of our period end deposit account balances among principal markets follows in Table 30.
Table 30 - Period End Deposits by Principal Market Area
(In thousands)
|
|
|
|
|
|
|
|
|
|
|
|
|
|
|
|
|
December 31, |
|
|
2023 |
|
2022 |
| Oklahoma: |
|
|
|
|
| Demand |
|
$ |
3,586,091 |
|
|
$ |
4,585,963 |
|
| Interest-bearing: |
|
|
|
|
| Transaction |
|
10,929,704 |
|
|
9,475,528 |
|
| Savings |
|
500,313 |
|
|
555,407 |
|
| Time |
|
1,984,336 |
|
|
794,002 |
|
| Total interest-bearing |
|
13,414,353 |
|
|
10,824,937 |
|
| Total Oklahoma |
|
17,000,444 |
|
|
15,410,900 |
|
|
|
|
|
|
| Texas: |
|
|
|
|
| Demand |
|
2,306,334 |
|
|
3,873,759 |
|
| Interest-bearing: |
|
|
|
|
| Transaction |
|
5,035,856 |
|
|
4,878,482 |
|
| Savings |
|
155,652 |
|
|
178,356 |
|
| Time |
|
492,753 |
|
|
356,538 |
|
| Total interest-bearing |
|
5,684,261 |
|
|
5,413,376 |
|
| Total Texas |
|
7,990,595 |
|
|
9,287,135 |
|
|
|
|
|
|
| Colorado: |
|
|
|
|
| Demand |
|
1,633,672 |
|
|
2,462,891 |
|
| Interest-bearing: |
|
|
|
|
| Transaction |
|
1,921,605 |
|
|
2,123,218 |
|
| Savings |
|
67,646 |
|
|
77,961 |
|
| Time |
|
201,393 |
|
|
135,043 |
|
| Total interest-bearing |
|
2,190,644 |
|
|
2,336,222 |
|
| Total Colorado |
|
3,824,316 |
|
|
4,799,113 |
|
|
|
|
|
|
| New Mexico: |
|
|
|
|
| Demand |
|
794,467 |
|
|
1,141,958 |
|
| Interest-bearing: |
|
|
|
|
| Transaction |
|
886,089 |
|
|
691,915 |
|
| Savings |
|
95,453 |
|
|
112,430 |
|
| Time |
|
258,195 |
|
|
133,625 |
|
| Total interest-bearing |
|
1,239,737 |
|
|
937,970 |
|
| Total New Mexico |
|
2,034,204 |
|
|
2,079,928 |
|
|
|
|
|
|
|
|
|
|
|
|
|
|
|
|
|
|
|
|
|
|
|
December 31, |
|
|
2023 |
|
2022 |
| Arizona: |
|
|
|
|
| Demand |
|
524,167 |
|
|
844,327 |
|
| Interest-bearing: |
|
|
|
|
| Transaction |
|
1,174,715 |
|
|
739,628 |
|
| Savings |
|
11,636 |
|
|
16,496 |
|
| Time |
|
41,884 |
|
|
24,846 |
|
| Total interest-bearing |
|
1,228,235 |
|
|
780,970 |
|
| Total Arizona |
|
1,752,402 |
|
|
1,625,297 |
|
|
|
|
|
|
| Kansas/Missouri: |
|
|
|
|
| Demand |
|
326,496 |
|
|
436,259 |
|
| Interest-bearing: |
|
|
|
|
| Transaction |
|
966,166 |
|
|
694,163 |
|
| Savings |
|
13,821 |
|
|
20,678 |
|
| Time |
|
23,955 |
|
|
12,963 |
|
| Total interest-bearing |
|
1,003,942 |
|
|
727,804 |
|
| Total Kansas/Missouri |
|
1,330,438 |
|
|
1,164,063 |
|
|
|
|
|
|
| Arkansas: |
|
|
|
|
| Demand |
|
25,266 |
|
|
50,180 |
|
| Interest-bearing: |
|
|
|
|
| Transaction |
|
49,966 |
|
|
56,181 |
|
| Savings |
|
2,564 |
|
|
3,083 |
|
| Time |
|
9,506 |
|
|
4,825 |
|
| Total interest-bearing |
|
62,036 |
|
|
64,089 |
|
| Total Arkansas |
|
87,302 |
|
|
114,269 |
|
| Total BOK Financial deposits |
|
$ |
34,019,701 |
|
|
$ |
34,480,705 |
|
Estimated uninsured deposits totaled $18.7 billion or 55% of total deposits at December 31, 2023 and $21.3 billion or 62% of total deposits at December 31, 2022. In addition to insured deposits, we also hold $4.6 billion of collateralized deposits. Municipalities, Native American tribal governments and certain trust-related deposits are all required to be collateralized. Excluding the impact of collateralized deposits and deposits related to consolidated subsidiaries, our uninsured and uncollateralized deposit level is $12.9 billion or 38% of total deposits at December 31, 2023. The portion of time deposits in excess of the FDIC limit, as applied without regard to other deposit balances held by the depositor, were $465 million at December 31, 2023 and $373 million at December 31, 2022.
In addition to deposits, liquidity for the subsidiary bank is provided primarily by federal funds purchased, securities repurchase agreements and Federal Home Loan Bank borrowings. Federal funds purchased consist primarily of unsecured, overnight funds acquired from other financial institutions. Funds are primarily purchased from bankers’ banks and Federal Home Loan Banks from across the country. The largest source of wholesale federal funds purchased totaled $250 million at December 31, 2023. There were no wholesale federal funds purchased outstanding at December 31, 2022. Securities repurchase agreements generally mature within 90 days and are secured by certain trading or available for sale securities. Federal Home Loan Bank borrowings are generally short term and are secured by a blanket pledge of eligible collateral (generally unencumbered U.S. Treasury and mortgage-backed securities, 1-4 family residential mortgage loans, multifamily and other qualifying commercial real estate loans). Amounts borrowed from the Federal Home Loan Bank of Topeka averaged $5.9 billion during 2023 and $1.6 billion during 2022. Increased borrowings from the Federal Home Loan Bank were primarily related to higher average total assets and slightly lower average deposit balances.
At December 31, 2023, management estimates a total potential secured borrowing capacity of approximately $23.1 billion. This includes current available secured capacity of $18.3 billion from the use of programs available to U.S. banks from the Federal Home Loan Banks and Federal Reserve Banks and an estimated $4.8 billion of other sources that could be converted into additional secured capacity.
BOKF, NA also has a liability related to the repurchase of certain delinquent residential mortgage loans previously sold in GNMA mortgage pools. Interest is payable monthly at rates contractually due to investors.
See Note 9 to the Consolidated Financial Statements for a summary of other borrowings.
Parent Company and Other Non-Bank Subsidiaries
The primary sources of liquidity for BOK Financial are cash on hand and dividends from the subsidiary bank. Cash and cash equivalents totaled $204 million at December 31, 2023. Dividends from the subsidiary bank are limited by various banking regulations to net profits, as defined, for the year plus retained profits for the two preceding years. Dividends are further restricted by minimum capital requirements. At December 31, 2023, based on the most restrictive limitations as well as management’s internal capital policy, BOKF, NA could declare up to $405 million of dividends without regulatory approval. Dividend constraints may be alleviated through increases in retained earnings, capital issuances or changes in risk weighted assets. Future losses or increases in required regulatory capital could also affect its ability to pay dividends to the parent company.
As a result of the acquisition of CoBiz Financial, we obtained $60 million of subordinated debt issued in June 2015 that will mature on June 25, 2030. This debt bears interest at the rate of 5.625% through June 25, 2025 and thereafter, the notes will bear an annual floating rate equal to 3-month SOFR plus 317 basis points and a 26 basis point tenor adjustment. We also acquired $72 million of junior subordinated debentures. Interest is based on spreads over 3-month SOFR ranging from 145 basis points to 295 basis points with a tenor adjustment of 26 basis points and mature September 17, 2033 through September 30, 2035. The junior subordinated debentures are subject to early redemption prior to maturity.
Shareholders' equity at December 31, 2023 was $5.1 billion, an increase of $460 million compared to December 31, 2022. Net income less cash dividends paid increased equity $387 million during 2023. Changes in interest rates resulted in an accumulated other comprehensive loss of $599 million at December 31, 2023, compared to an accumulated comprehensive loss of $837 million at December 31, 2022. We also repurchased $177 million of common shares during 2023. Capital is managed to maximize long-term value to the shareholders. Factors considered in managing capital include projections of future earnings, asset growth and acquisition strategies, and regulatory and debt covenant requirements. Capital management may include subordinated debt issuance, share repurchase and stock and cash dividends.
On November 1, 2022, the Company's board of directors authorized the Company to repurchase up to five million shares of the Company's common stock, subject to market conditions, securities laws and other regulatory compliance limitations. As of December 31, 2023, the Company had repurchased 2,428,214 shares under this authorization. The Company repurchased 2,113,808 shares during 2023 at an average price of $82.85 per share, net of the 1% excise tax on share purchases. We view share buybacks opportunistically, but within the context of maintaining our strong capital position.
BOK Financial and the subsidiary bank are subject to various capital requirements administered by federal agencies. Failure to meet minimum capital requirements, including a capital conservation buffer, can result in certain mandatory and additional discretionary actions by regulators that could have a material impact on operations including restrictions on capital distributions from dividends and share repurchases and executive bonus payments. These capital requirements include quantitative measures of assets, liabilities and off-balance sheet items. The capital standards are also subject to qualitative judgments by the regulators.
A summary of minimum capital requirements and other performance ratios follows for BOK Financial on a consolidated basis in Table 31.
Table 31 – Capital and Performance Ratios
|
|
|
|
|
|
|
|
|
|
|
|
|
|
|
|
|
|
|
|
|
|
|
|
|
|
|
|
|
|
|
Minimum Capital Requirement |
|
Capital Conservation Buffer |
|
Minimum Capital Requirement Including Capital Conservation Buffer |
|
|
|
|
|
|
|
|
|
|
|
|
|
|
|
|
|
|
|
|
|
|
December 31, |
|
|
|
2023 |
|
2022 |
Capital: |
|
|
|
|
|
|
|
|
|
| Common equity Tier 1 |
4.50 |
% |
|
2.50 |
% |
|
7.00 |
% |
|
12.06 |
% |
|
11.69 |
% |
| Tier 1 capital |
6.00 |
% |
|
2.50 |
% |
|
8.50 |
% |
|
12.07 |
% |
|
11.71 |
% |
| Total capital |
8.00 |
% |
|
2.50 |
% |
|
10.50 |
% |
|
13.16 |
% |
|
12.67 |
% |
| Tier 1 Leverage |
4.00 |
% |
|
N/A |
|
4.00 |
% |
|
9.45 |
% |
|
9.91 |
% |
| Average total equity to average assets |
|
|
|
|
|
|
10.17 |
% |
|
10.24 |
% |
Tangible common equity ratio1 |
|
|
|
|
|
|
8.29 |
% |
|
7.63 |
% |
Adjusted tangible common equity ratio1 |
|
|
|
|
|
|
8.02 |
% |
|
7.36 |
% |
|
|
|
|
|
|
|
|
|
|
Performance Ratios: |
|
|
|
|
|
|
|
|
|
Return on average equity |
|
|
|
|
|
|
10.82 |
% |
|
10.81 |
% |
Return on average tangible common equity1 |
|
|
|
|
|
|
14.00 |
% |
|
14.12 |
% |
1 See Explanation and Reconciliation of Non-GAAP Measures following.
In March 2020, in response to the impact on the financial markets by the COVID-19 pandemic, the banking agencies issued an interim final rule permitting banking organizations that implement CECL the option to delay for two years an estimate of the CECL methodology's effect on regulatory capital, followed by a three-year transition period. The estimate includes the implementation date adjustment as of January 1, 2020 plus an estimate of the impact of the change for a two year period following implementation of CECL. We elected to delay the regulatory capital impact of the transition in accordance with the interim final rule. Deferral of the impact of CECL added 6 basis points to the Company's Common equity Tier 1 capital at December 31, 2023.
Non-GAAP Measures
In this report we may sometimes use non-GAAP financial measures. Please note that although non-GAAP financial measures provide useful insight to analysts, investors and regulators, they should not be considered in isolation or relied upon as a substitute for analysis using GAAP measures.
Table 32 provides a reconciliation of the non-GAAP measures with financial measures defined by GAAP.
Table 32 – Non-GAAP Measures
(Dollars in thousands)
|
|
|
|
|
|
|
|
|
|
|
|
|
|
|
|
|
December 31, |
|
|
2023 |
|
2022 |
| Reconciliation of tangible common equity ratio and adjusted tangible common equity ratio: |
|
|
|
|
| Total shareholders' equity |
|
$ |
5,142,442 |
|
|
$ |
4,682,649 |
|
| Less: Goodwill and intangible assets, net |
|
1,104,728 |
|
|
1,120,880 |
|
| Tangible common equity |
|
4,037,714 |
|
|
3,561,769 |
|
| Add: Unrealized gain (loss) on investment securities, net |
|
(171,903) |
|
|
(167,477) |
|
| Add: Tax effect on unrealized gain (loss) on investment securities, net |
|
40,430 |
|
|
39,196 |
|
| Adjusted tangible common equity |
|
$ |
3,906,241 |
|
|
$ |
3,433,488 |
|
|
|
|
|
|
| Total assets |
|
$ |
49,824,830 |
|
|
$ |
47,790,642 |
|
| Less: Goodwill and intangible assets, net |
|
1,104,728 |
|
|
1,120,880 |
|
| Tangible assets |
|
$ |
48,720,102 |
|
|
$ |
46,669,762 |
|
|
|
|
|
|
| Tangible common equity ratio |
|
8.29 |
% |
|
7.63 |
% |
| Adjusted tangible common equity ratio |
|
8.02 |
% |
|
7.36 |
% |
|
|
|
|
|
| Reconciliation of return on average tangible common equity: |
|
|
|
|
| Total average shareholders' equity |
|
$ |
4,903,998 |
|
|
$ |
4,812,677 |
|
| Less: Average goodwill and intangible assets, net |
|
1,113,701 |
|
|
1,128,469 |
|
| Average tangible common equity |
|
$ |
3,790,297 |
|
|
$ |
3,684,208 |
|
|
|
|
|
|
| Net Income |
|
$ |
530,746 |
|
|
$ |
520,273 |
|
|
|
|
|
|
| Return on average tangible common equity |
|
14.00 |
% |
|
14.12 |
% |
|
|
|
|
|
| Reconciliation of pre-provision net revenue: |
|
|
|
|
| Net income before taxes |
|
$ |
683,248 |
|
|
$ |
660,157 |
|
| Add: Provision for expected credit losses |
|
46,000 |
|
|
30,000 |
|
| Less: Net income attributable to non-controlling interests |
|
387 |
|
|
20 |
|
| Pre-provision net revenue |
|
$ |
728,861 |
|
|
$ |
690,137 |
|
|
|
|
|
|
|
|
|
|
|
|
|
|
|
|
|
|
|
|
|
|
|
December 31, |
|
|
2023 |
|
2022 |
Calculation of efficiency ratio and efficiency ratio excluding adjustments: |
|
|
|
|
| Total other operating expense |
|
$ |
1,332,881 |
|
|
$ |
1,164,480 |
|
| Less: Amortization of intangible assets |
|
13,882 |
|
|
15,692 |
|
| Adjusted total other operating expense |
|
1,318,999 |
|
|
1,148,788 |
|
| Less: FDIC special assessment |
|
43,773 |
|
|
— |
|
| Less: Expenses related to sale of BOKF Insurance |
|
3,436 |
|
|
— |
|
Adjusted total other operating expense excluding adjustments |
|
$ |
1,271,790 |
|
|
$ |
1,148,788 |
|
|
|
|
|
|
| Net interest revenue |
|
$ |
1,272,180 |
|
|
$ |
1,211,380 |
|
| Tax-equivalent adjustment |
|
8,811 |
|
|
8,463 |
|
| Tax-equivalent net interest revenue |
|
1,280,991 |
|
|
1,219,843 |
|
| Total other operating revenue |
|
789,949 |
|
|
643,257 |
|
| Less: Gain (loss) on available for sale securities, net |
|
(30,636) |
|
|
(971) |
|
| Adjusted revenue |
|
2,101,576 |
|
|
1,864,071 |
|
Less: Gain on sale of BOKF Insurance |
|
31,007 |
|
|
— |
|
Adjusted revenue excluding adjustments |
|
$ |
2,070,569 |
|
|
$ |
1,864,071 |
|
|
|
|
|
|
| Efficiency ratio |
|
62.76 |
% |
|
61.63 |
% |
Efficiency ratio excluding adjustments |
|
61.42 |
% |
|
61.63 |
% |
|
|
|
|
|
| Information on net interest revenue and net interest margin excluding trading activities: |
|
|
|
|
| Net interest revenue |
|
$ |
1,272,180 |
|
|
$ |
1,211,380 |
|
| Less: Trading activities net interest revenue |
|
(14,202) |
|
|
53,855 |
|
| Net interest revenue excluding trading activities |
|
1,286,382 |
|
|
1,157,525 |
|
| Tax-equivalent adjustment |
|
8,811 |
|
|
8,463 |
|
| Tax-equivalent net interest revenue excluding trading activities |
|
$ |
1,295,193 |
|
|
$ |
1,165,988 |
|
|
|
|
|
|
| Average interest-earning assets |
|
$ |
42,975,672 |
|
|
$ |
40,079,096 |
|
| Less: Average trading activities interest-earning assets |
|
4,559,012 |
|
|
4,723,130 |
|
| Average interest-earning assets excluding trading activities |
|
$ |
38,416,660 |
|
|
$ |
35,355,966 |
|
|
|
|
|
|
| Net interest margin on average interest-earning assets |
|
2.93 |
% |
|
2.98 |
% |
| Net interest margin on average trading activities interest-earning assets |
|
(0.31) |
% |
|
1.05 |
% |
| Net interest margin on average interest-earning assets excluding trading activities |
|
3.31 |
% |
|
3.26 |
% |
Explanation of Non-GAAP Measures
The tangible common equity ratio and return on average tangible common equity are primarily based on total shareholders' equity, which includes unrealized gains and losses on available for sale securities, less intangible assets and equity that do not benefit common shareholders. The adjusted tangible common equity ratio also includes unrealized gains and losses on the investment portfolio. These measures are valuable indicators of a financial institution's capital strength since they eliminate intangible assets from shareholders' equity and retain the effect of unrealized losses on securities and other components of accumulated other comprehensive income in shareholders' equity.
Pre-provision net revenue is a measure of revenue less expenses and is calculated before provision for credit losses and income tax expense. This financial measure is frequently used by investors and analysts and enables them to assess a company's ability to generate earnings to cover credit losses through a credit cycle. It also provides an additional basis for comparing the results of operations between periods by isolating the impact of the provision for credit losses, which can vary significantly between periods.
The efficiency ratio measures the Company's ability to use its assets and manage its liabilities effectively in the current period.
Net interest revenue and net interest margin excluding trading activities remove the effect of trading activities on these metrics allowing management and investors to assess the performance of the Company's core lending and deposit activities without the associated volatility from trading activities.
Off-Balance Sheet Arrangements
See Note 14 to the Consolidated Financial Statements for a discussion of the Company’s significant off-balance sheet commitments.
Recently Issued Accounting Standards
See Note 1 to the Consolidated Financial Statements for disclosure of newly adopted and pending accounting standards.
Forward-Looking Statements
This 10-K contains forward-looking statements that are based on management's beliefs, assumptions, current expectations, estimates and projections about BOK Financial, the financial services industry, the economy generally and the related responses of the government, consumers, and others, on our business, financial condition and results of operations. Words such as "anticipates," "believes," "estimates," "expects," "forecasts," "plans," "projects," "will," "intends," variations of such words and similar expressions are intended to identify such forward-looking statements. Management judgments relating to and discussion of the provision and allowance for credit losses, allowance for uncertain tax positions, accruals for loss contingencies and valuation of mortgage servicing rights involve judgments as to expected events and are inherently forward-looking statements. Assessments that acquisitions and growth endeavors will be profitable are necessary statements of belief as to the outcome of future events based in part on information provided by others which BOK Financial has not independently verified. These various forward-looking statements are not guarantees of future performance and involve certain risks, uncertainties, and assumptions which are difficult to predict with regard to timing, extent, likelihood and degree of occurrence. Therefore, actual results and outcomes may materially differ from what is expected, implied or forecasted in such forward-looking statements. Internal and external factors that might cause such a difference include, but are not limited to changes in commodity prices, interest rates and interest rate relationships, inflation, demand for products and services, the degree of competition by traditional and nontraditional competitors, changes in banking regulations, tax laws, prices, levies and assessments, the impact of technological advances, and trends in customer behavior as well as their ability to repay loans. BOK Financial and its affiliates undertake no obligation to update, amend or clarify forward-looking statements, whether as a result of new information, future events or otherwise.
Annualized, pro forma, projected and estimated numbers are used for illustrative purpose only, are not forecasts and may not reflect actual results.
Legal Notice
As used in this report, the term "BOK Financial" and such terms as "the Company," "the Corporation," "our," "we" and "us" may refer to one or more of the consolidated subsidiaries or all of them taken as a whole. All these terms are used for convenience only and are not intended as a precise description of any of the separate companies, each of which manages its own affairs.
ITEM 7A. QUANTITATIVE AND QUALITATIVE DISCLOSURES ABOUT MARKET RISK
Market Risk
Market risk is a broad term for the risk of economic loss due to adverse changes in the fair value of a financial instrument. These changes may be the result of various factors, including interest rates, foreign exchange rates, commodity prices or equity prices. Financial instruments that are subject to market risk can be classified either as held for trading or held for purposes other than trading. Market risk excludes changes in fair value due to credit of the individual issuers of financial instruments.
BOK Financial is subject to market risk primarily through the effect of changes in interest rates on both its assets held for purposes other than trading and trading assets. The effects of other changes such as foreign exchange rates, commodity prices or equity prices do not pose significant market risk to BOK Financial. BOK Financial has no material investments in assets that are affected by changes in foreign exchange rates or equity prices. Energy and other commodity derivative contracts, which are affected by changes in commodity prices, are matched against offsetting contracts as previously discussed.
The Asset/Liability Committee is responsible for managing market risk in accordance with policy limits established by the Board of Directors. The Committee monitors projected variation in net interest revenue, net income and economic value of equity due to specified changes in interest rates. These limits also set maximum levels for short-term borrowings, short-term assets, public funds and brokered deposits and establish minimum levels for unpledged assets, among other things. Further, the Board has approved market risk limits for fixed income trading, mortgage pipeline and mortgage servicing assets inclusive of economic hedge benefits. Exposure is measured daily and compliance is reviewed monthly. Deviations from the Board approved limits, which periodically occur throughout the reporting period, may require management to develop and execute plans to reduce exposure. These plans are subject to escalation to and approval by the Board.
The simulations used to manage market risk are based on numerous assumptions regarding the effects of changes in interest rates on the timing and extent of repricing characteristics, future cash flows and customer behavior. These assumptions are inherently uncertain and, as a result, models cannot precisely estimate or precisely predict the impact of higher or lower interest rates. Actual results will differ from simulated results due to timing, magnitude and frequency of interest rate changes, market conditions and management strategies, among other factors.
Interest Rate Risk – Other than Trading
As previously noted in the Net Interest Revenue section of this report, management has implemented strategies to manage the Company’s balance sheet exposure to changes in interest rates over a twelve-month period within established policy limits. The effectiveness of these strategies in managing the overall interest rate risk is evaluated through the use of an asset/liability model. BOK Financial performs a sensitivity analysis to identify more dynamic interest rate risk exposures, including embedded option positions, on net interest revenue. A simulation model is used to estimate the effect of changes in interest rates on our performance across multiple interest rate scenarios. Our current internal policy limit for net interest revenue variation due to a 200 basis point parallel change in market interest rates over twelve months is a maximum decline of 6.5%. Management also reviews alternative rate changes and time periods.
The FCA ceased publication of the principal tenors of the U.S. dollar LIBOR immediately following the final publication on June 30, 2023. The Company ceased production of new LIBOR-based exposure as of December 31, 2021 and now offers floating rate products in various alternative reference rates, with the majority of volume being observed thus far in term rate versions of SOFR. Before the June 30, 2023 deadline, the Company mitigated its remaining LIBOR exposure, with any outstanding or committed exposure being proactively moved to an alternative rate or falling back per the terms of their contract or as per the LIBOR Act.
The Company's primary interest rate exposures include the Federal Funds rate, which affects short-term borrowings, and the prime lending rate, SOFR, which is the basis for much of the variable rate loan pricing. Additionally, residential mortgage rates directly affect the prepayment speeds for residential mortgage-backed securities and mortgage servicing rights. Derivative financial instruments and other financial instruments used for purposes other than trading are included in this simulation. In addition, the impact on the level and composition of demand deposit accounts and other core deposit balances resulting from a significant increase in short-term market interest rates and the overall interest rate environment is likely to be material. The simulation incorporates assumptions regarding the effects of such changes based on a combination of historical analysis and expected behavior. The impact of planned growth and new business activities is factored into the simulation model.
The interest rate sensitivity in Table 33 indicates management’s estimation of the impact of rate changes on net interest revenue. Should deposit costs be 10% more sensitive to changes in rates, the variation in net interest revenue over the next twelve months would be 0.00%, or flat for the 100 basis point decrease scenario. Alternatively, should deposit funding costs be 10% less sensitive to changes in rates, the variation in net interest revenue over the next twelve months would be (1.32)%, or ($15.8 million) for the 100 basis point decrease scenario. Additionally, in a flattening yield curve scenario where long-term rates increase by 100 basis points and short-term rates increase by 200 basis points, net interest revenue would decrease approximately 5.86%, or $69.8 million.
Table 33 – Interest Rate Sensitivity
(Dollars in thousands)
|
|
|
|
|
|
|
|
|
|
|
|
|
|
|
|
|
|
|
|
|
|
|
|
|
|
|
|
|
|
|
|
|
|
|
|
|
|
|
|
|
|
|
|
|
|
|
|
|
|
|
| |
|
December 31, 2023 |
|
December 31, 2022 |
| |
|
200 bp Increase |
|
100 bp Increase |
|
100 bp Decrease |
|
200 bp Decrease |
|
200 bp Increase |
|
100 bp Increase |
|
100 bp Decrease |
|
200 bp Decrease |
| Anticipated impact over the next twelve months on net interest revenue |
|
$ |
(36,100) |
|
|
$ |
(8,900) |
|
|
$ |
(7,900) |
|
|
$ |
(2,900) |
|
|
$(10,980) |
|
$8,440 |
|
$(42,660) |
|
$(73,772) |
| |
|
(3.03) |
% |
|
(0.75) |
% |
|
(0.66) |
% |
|
(0.24) |
% |
|
(0.71)% |
|
0.54% |
|
(2.75)% |
|
(4.76)% |
| Anticipated impact over months twelve through twenty-four |
|
$ |
(9,600) |
|
|
$ |
15,300 |
|
|
$ |
(53,700) |
|
|
$ |
(84,900) |
|
|
$4,090 |
|
$40,190 |
|
$(129,900) |
|
$(239,320) |
|
|
(0.74) |
% |
|
1.18 |
% |
|
(4.16) |
% |
|
(6.57) |
% |
|
0.24% |
|
2.39% |
|
(7.71)% |
|
(14.21)% |
BOK Financial is also subjected to market risk through changes in the fair value of mortgage servicing rights. Changes in the fair value of mortgage servicing rights are highly dependent on changes in primary mortgage rates offered to borrowers, intermediate-term interest rates that affect the value of custodial funds, and assumptions about servicing revenues, servicing costs and discount rates. As primary mortgage rates increase, prepayment speeds slow and the value of our mortgage servicing rights increases. As primary mortgage rates fall, prepayment speeds increase and the value of our mortgage servicing rights decreases.
We maintain a portfolio of financial instruments which may include debt securities issued by the U.S. government or its agencies and interest rate derivative contracts held as an economic hedge of the changes in the fair value of our mortgage servicing rights. Composition of this portfolio will change based on our assessment of market risk. Changes in the fair value of residential mortgage-backed securities are highly dependent on changes in secondary mortgage rates required by investors, and interest rate derivative contracts are highly dependent on changes in other market interest rates. While primary and secondary mortgage rates generally move in the same direction, the spread between them may widen and narrow due to market conditions and government intervention. Changes in the forward-looking spread between the primary and secondary rates can cause significant earnings volatility.
Management performs a stress test to measure market risk due to changes in interest rates inherent in its MSR portfolio and hedges. The stress test shocks applicable interest rates up and down 50 basis points and calculates an estimated change in fair value, net of economic hedging activity, that may result. The Board has approved a $20 million market risk limit for mortgage servicing rights, net of economic hedges.
Table 34 - MSR Asset and Hedge Sensitivity Analysis
(In thousands)
|
|
|
|
|
|
|
|
|
|
|
|
|
|
|
|
|
|
|
|
|
|
|
|
|
|
|
|
|
December 31, |
| |
|
2023 |
|
2022 |
|
|
Up 50 bp |
|
Down 50 bp |
|
Up 50 bp |
|
Down 50 bp |
| MSR Asset |
|
$ |
7,974 |
|
|
$ |
(9,877) |
|
|
$ |
6,100 |
|
|
$ |
(8,195) |
|
| MSR Hedge |
|
(8,444) |
|
|
8,606 |
|
|
(7,400) |
|
|
6,810 |
|
| Net Exposure |
|
$ |
(470) |
|
|
$ |
(1,271) |
|
|
$ |
(1,300) |
|
|
$ |
(1,385) |
|
Trading Activities
The Company bears market risk by originating residential mortgages held for sale. RMHFS are generally outstanding for 60 to 90 days, which represents the typical period from commitment to originate a loan to sale of the closed loan to an investor. Primary mortgage interest rate changes during this period affect the value of RMHFS commitments and loans. We use forward sale contracts to mitigate market risk on all closed mortgage loans held for sale and on an estimate of mortgage loan commitments that are expected to result in closed loans.
A variety of methods are used to monitor market risk of mortgage origination activities. These methods include daily marking of all positions to market value, independent verification of inventory pricing and revenue sensitivity limits.
Management performs a stress test to measure market risk due to changes in interest rates inherent in the mortgage production pipeline. The stress test shocks applicable interest rates up and down 50 basis points and calculates an estimated change in fair value, net of economic hedging activity that may result. The Board has approved a $7 million market risk limit for the mortgage production pipeline, net of forward sale contracts.
Table 35 - Mortgage Pipeline Sensitivity Analysis
(In thousands)
|
|
|
|
|
|
|
|
|
|
|
|
|
|
|
|
|
|
|
|
|
|
|
|
|
|
|
|
|
Year Ended
December 31, |
| |
|
2023 |
|
2022 |
|
|
Up 50 bp |
|
Down 50 bp |
|
Up 50 bp |
|
Down 50 bp |
Average1 |
|
$ |
(61) |
|
|
$ |
(38) |
|
|
$ |
(75) |
|
|
$ |
(183) |
|
Low2 |
|
49 |
|
|
61 |
|
|
381 |
|
|
91 |
|
High3 |
|
(186) |
|
|
(168) |
|
|
(402) |
|
|
(779) |
|
| Period End |
|
14 |
|
|
(41) |
|
|
(71) |
|
|
(30) |
|
1 Average represents the simple average of each daily value observed during the reporting period.
2 Low represents least risk of loss in fair value measured as the smallest negative value or the largest positive value observed daily during the reporting period.
3 High represents the greatest risk of loss in fair value measured as the largest negative value or the smallest positive value observed daily during the reporting period.
BOK Financial enters into trading activities both as an intermediary for customers and for its own account. As an intermediary, we take positions in securities, generally residential mortgage-backed securities, government agency securities and municipal bonds. These securities are purchased for resale to customers, which include individuals, corporations, foundations and financial institutions. On a limited basis, we may also take trading positions in U.S. Treasury securities, residential mortgage-backed securities and municipal bonds to enhance returns on securities portfolios. Both of these activities involve interest rate risk, liquidity risk and price risk. BOK Financial has an insignificant exposure to foreign exchange risk and does not take positions in commodity derivatives.
A variety of methods are used to monitor and manage the market risk of trading activities. These methods include daily marking of all positions to market value, independent verification of inventory pricing and position limits for each trading activity. Risk management tools include VaR, stress testing and sensitivity analysis. Economic hedges in either the futures or cash markets may be used to reduce the risk associated with some trading programs. Basis risk can result when trading asset values and the instruments used to hedge them move at different rates.
VaR measures the potential loss of a given position or portfolio of positions at a specified confidence level and time horizon. BOK Financial utilizes a historical VaR methodology to measure and aggregate risks across its covered trading positions. For Market Risk Rule purposes, the Company calculates VaR using a historical simulation approach and measures the potential trading losses using a 10-day holding period and a 99% confidence level.
Due to inherent limitations of the VaR methodology, including its reliance on past market behavior which might not be indicative of future market performance, VaR is only one of several tools used to measure and manage market risk. Other tools used to actively manage market risk include stress testing (SVaR) and sensitivity analysis.
SVaR is calculated using the same internal models as used for the VaR-based measure. SVaR is calculated over a ten-day holding period at a one-tail, 99% confidence level and employs a historical simulation approach based on a continuous twelve-month historical window selected to reflect a period of significant financial stress for the Company’s trading portfolio.
The trading portfolio’s VaR and SVaR profiles are influenced by a variety of factors, including the size and composition of the portfolio, market volatility and the correlation between different positions. A portfolio of trading positions is typically less risky than the sum of the risk from each of the individual sub-portfolios because, under normal market conditions, risk within each category partially offsets the exposure to other risk categories. Table 36 below summarizes certain VaR- and SVaR-based measures for the three months ended December 31, 2023, September 30, 2023, December 31, 2022 and September 30, 2022. In the fourth quarter of 2023, the period-end VaR and SVaR measures decreased relative to the previous quarter mainly due to a decrease in interest rate risk exposure in the trading businesses.
Table 36 - VaR and SVaR Measures
(In thousands)
|
|
|
|
|
|
|
|
|
|
|
|
|
|
|
|
|
|
|
|
|
|
|
|
|
|
|
|
|
|
|
|
|
|
|
|
|
|
|
|
|
|
|
|
|
|
|
|
|
|
|
|
|
Three Months Ended |
|
Three Months Ended |
| |
|
Dec. 31, 2023 |
|
Sep. 30, 2023 |
|
Dec. 31, 2022 |
|
Sep. 30, 2022 |
|
|
10 day 99% VaR |
|
10 day 99% SVaR |
|
10 day 99% VaR |
|
10 day 99% SVaR |
|
10 day 99% VaR |
|
10 day 99% SVaR |
|
10 day 99% VaR |
|
10 day 99% SVaR |
Average1 |
|
$ |
4,757 |
|
|
$ |
8,154 |
|
|
$ |
5,954 |
|
|
$ |
6,118 |
|
|
$ |
3,927 |
|
|
$ |
7,091 |
|
|
$ |
2,644 |
|
|
$ |
7,555 |
|
| Low |
|
2,338 |
|
|
4,067 |
|
|
3,893 |
|
|
4,027 |
|
|
933 |
|
|
3,210 |
|
|
1,044 |
|
|
4,051 |
|
| High |
|
7,776 |
|
|
13,045 |
|
|
9,312 |
|
|
9,312 |
|
|
9,077 |
|
|
15,396 |
|
|
5,930 |
|
|
14,030 |
|
| Period End |
|
2,977 |
|
|
4,925 |
|
|
6,455 |
|
|
6,455 |
|
|
8,000 |
|
|
13,819 |
|
|
1,584 |
|
|
5,478 |
|
1 Average represents the simple average of each daily value observed during the reporting period.
The Company monitors the accuracy of internal VaR models and modeling processes by back-testing model performance. The Company updates historical data used by the VaR model on a regular basis and model validators independent of business lines perform regular modeled validations to access model input, processing and reporting components. These models are required to be independently validated and approved prior to implementation.
Limit Structure
Beyond VaR and SVaR described above, management also performs a sensitivity analysis to measure market risk from changes in interest rates on its trading portfolio. Applicable interest rates are shocked up and down 50 basis points, calculating an estimated change in fair value, net of economic hedging activity that may result. The Board has approved an $11 million interest rate risk limit for the trading portfolio, net of economic hedges.
Table 37 - Trading Securities Sensitivity Analysis
(In thousands)
|
|
|
|
|
|
|
|
|
|
|
|
|
|
|
|
|
|
|
|
|
|
|
|
|
|
|
|
|
Year Ended
December 31, |
| |
|
2023 |
|
2022 |
|
|
Up 50 bp |
|
Down 50 bp |
|
Up 50 bp |
|
Down 50 bp |
Average1 |
|
$ |
(1,144) |
|
|
$ |
1,881 |
|
|
$ |
790 |
|
|
$ |
280 |
|
Low2 |
|
4,513 |
|
|
8,955 |
|
|
8,643 |
|
|
12,277 |
|
High3 |
|
(8,223) |
|
|
(4,538) |
|
|
(11,253) |
|
|
(6,325) |
|
| Period End |
|
(527) |
|
|
1,920 |
|
|
3,507 |
|
|
(3,458) |
|
1 Average represents the simple average of each daily value observed during the reporting period.
2 Low represents least risk of loss in fair value measured as the smallest negative value or the largest positive value observed daily during the reporting period.
3 High represents the greatest risk of loss in fair value measured as the largest negative value or the smallest positive value observed daily during the reporting period.
Model Risk Management
BOK Financial has an internal independent Model Risk Management staff that validates models to verify they are conceptually sound, computationally accurate, are performing as expected and are in line with their intended use. Model Risk Management staff also enforces the Company's model risk governance program that defines roles and responsibilities, including the authority to levy findings requiring remediation and to restrict model usage.
Model Validation
Model validation staff maintain independence from both the developers and users of the models. Models are validated through an evaluation process that assesses the data, theory, implementation, outcomes and governance of each scenario. Each model receives a model risk score, which determines the frequency and scope of validation activities. Validations comprise an assessment of model performance as well as a model's potential limitations given its particular assumptions or weaknesses. Based on the results of the review, the team determines whether the use case for the model is appropriate. The ultimate validation results may require remediation actions from the business line. Model validation results are communicated with one of the following three outcomes: "Approved for use," "Approved with findings" or "Unapproved." Management of BOK Financial Corporation is responsible for establishing and maintaining adequate internal control over financial reporting and for assessing the effectiveness of internal control over financial reporting, as such term is defined in Exchange Act Rules 13a-15(f) and 15d-15(f), as amended.
ITEM 8. FINANCIAL STATEMENTS AND SUPPLEMENTARY DATA
Report of Management on Internal Control over Financial Reporting
Management has assessed the effectiveness of the Company’s internal control over financial reporting based on the criteria established in "Internal Control – Integrated Framework," issued by the COSO of the Treadway Commission in 2013. Based on that assessment and criteria, management has determined that the Company maintained effective internal control over financial reporting as of December 31, 2023.
Ernst & Young LLP (PCAOB ID: 42), the independent registered public accounting firm that audited the Consolidated Financial Statements of the Company included in this annual report, has issued an audit report on the effectiveness of the Company’s internal control over financial reporting as of December 31, 2023. Their report, which expresses an unqualified opinion on the effectiveness of the Company’s internal control over financial reporting as of December 31, 2023, is included in this annual report.
Report of Independent Registered Public Accounting Firm
To the Shareholders and the Board of Directors of BOK Financial Corporation
Opinion on Internal Control Over Financial Reporting
We have audited BOK Financial Corporation’s internal control over financial reporting as of December 31, 2023, based on criteria established in Internal Control—Integrated Framework issued by the Committee of Sponsoring Organizations of the Treadway Commission (2013 framework) (the COSO criteria). In our opinion, BOK Financial Corporation (the Company) maintained, in all material respects, effective internal control over financial reporting as of December 31, 2023, based on the COSO criteria.
We also have audited, in accordance with the standards of the Public Company Accounting Oversight Board (United States) (PCAOB), the consolidated balance sheets of the Company as of December 31, 2023 and 2022, the related consolidated statements of earnings, comprehensive income, changes in equity and cash flows for each of the three years in the period ended December 31, 2023, and the related notes and our report dated February 21, 2024 expressed an unqualified opinion thereon.
Basis for Opinion
The Company’s management is responsible for maintaining effective internal control over financial reporting and for its assessment of the effectiveness of internal control over financial reporting included in the accompanying Report of Management on Internal Control over Financial Reporting. Our responsibility is to express an opinion on the Company’s internal control over financial reporting based on our audit. We are a public accounting firm registered with the PCAOB and are required to be independent with respect to the Company in accordance with the U.S. federal securities laws and the applicable rules and regulations of the Securities and Exchange Commission and the PCAOB.
We conducted our audit in accordance with the standards of the PCAOB. Those standards require that we plan and perform the audit to obtain reasonable assurance about whether effective internal control over financial reporting was maintained in all material respects.
Our audit included obtaining an understanding of internal control over financial reporting, assessing the risk that a material weakness exists, testing and evaluating the design and operating effectiveness of internal control based on the assessed risk, and performing such other procedures as we considered necessary in the circumstances. We believe that our audit provides a reasonable basis for our opinion.
Definition and Limitations of Internal Control over Financial Reporting
A company’s internal control over financial reporting is a process designed to provide reasonable assurance regarding the reliability of financial reporting and the preparation of financial statements for external purposes in accordance with generally accepted accounting principles. A company’s internal control over financial reporting includes those policies and procedures that (1) pertain to the maintenance of records that, in reasonable detail, accurately and fairly reflect the transactions and dispositions of the assets of the company; (2) provide reasonable assurance that transactions are recorded as necessary to permit preparation of financial statements in accordance with generally accepted accounting principles, and that receipts and expenditures of the company are being made only in accordance with authorizations of management and directors of the company; and (3) provide reasonable assurance regarding prevention or timely detection of unauthorized acquisition, use, or disposition of the company’s assets that could have a material effect on the financial statements.
Because of its inherent limitations, internal control over financial reporting may not prevent or detect misstatements. Also, projections of any evaluation of effectiveness to future periods are subject to the risk that controls may become inadequate because of changes in conditions, or that the degree of compliance with the policies or procedures may deteriorate.
/s/ Ernst & Young LLP
Tulsa, Oklahoma
February 21, 2024
Report of Independent Registered Public Accounting Firm
To the Shareholders and the Board of Directors of BOK Financial Corporation
Opinion on the Financial Statements
We have audited the accompanying consolidated balance sheets of BOK Financial Corporation (the Company) as of December 31, 2023 and 2022, the related consolidated statements of earnings, comprehensive income, changes in equity and cash flows for each of the three years in the period ended December 31, 2023, and the related notes (collectively referred to as the “consolidated financial statements”). In our opinion, the consolidated financial statements present fairly, in all material respects, the financial position of the Company at December 31, 2023 and 2022, and the results of its operations and its cash flows for each of the three years in the period ended December 31, 2023, in conformity with U.S. generally accepted accounting principles.
We also have audited, in accordance with the standards of the Public Company Accounting Oversight Board (United States) (PCAOB), the Company’s internal control over financial reporting as of December 31, 2023, based on the criteria established in Internal Control—Integrated Framework issued by the Committee of Sponsoring Organizations of the Treadway Commission (2013 framework), and our report dated February 21, 2024 expressed an unqualified opinion thereon.
Basis for Opinion
These financial statements are the responsibility of the Company’s management. Our responsibility is to express an opinion on the Company’s financial statements based on our audits. We are a public accounting firm registered with the PCAOB and are required to be independent with respect to the Company in accordance with the U.S. federal securities laws and the applicable rules and regulations of the Securities and Exchange Commission and the PCAOB.
We conducted our audits in accordance with the standards of the PCAOB. Those standards require that we plan and perform the audit to obtain reasonable assurance about whether the financial statements are free of material misstatement, whether due to error or fraud. Our audits included performing procedures to assess the risks of material misstatement of the financial statements, whether due to error or fraud, and performing procedures that respond to those risks. Such procedures included examining, on a test basis, evidence regarding the amounts and disclosures in the financial statements. Our audits also included evaluating the accounting principles used and significant estimates made by management, as well as evaluating the overall presentation of the financial statements. We believe that our audits provide a reasonable basis for our opinion.
Critical Audit Matter
The critical audit matter communicated below is a matter arising from the current period audit of the financial statements that was communicated or required to be communicated to the audit committee and that: (1) relates to accounts or disclosures that are material to the financial statements and (2) involved our especially challenging, subjective or complex judgments. The communication of the critical audit matter does not alter in any way our opinion on the consolidated financial statements, taken as a whole, and we are not, by communicating the critical audit matter below, providing a separate opinion on the critical audit matter or on the accounts or disclosures to which it relates.
|
|
|
|
|
|
|
|
|
|
|
Allowance for credit losses |
| Description of the Matter |
|
The Company’s loan portfolio totaled $23.9 billion as of December 31, 2023, and the associated allowance for credit losses (ACL) was $326 million. A $46 million provision for credit losses was recorded for the year ended December 31, 2023. As discussed in Note 1 and 4 to the consolidated financial statements, management’s estimate for the expected credit losses within the loan portfolio represents the portion of amortized cost basis of loans and related unfunded commitments they do not expect to collect over the asset’s contractual life, considering past events, current conditions, as well as reasonable and supportable forecasts of future economic conditions. The allowance for credit losses consists of specific allowances attributed to certain individual loans, generally non-accruing loans, with dissimilar risk characteristics that have not yet been charged down to amounts they expect to recover, general allowances for estimated credit losses on pools of loans that share similar risk characteristics, and qualitative reserves with the estimated impact of factors that are not captured in the modeled results or historical experience.
Auditing management’s estimate of the ACL and related provision for credit losses was complex due to the allowance models used, high degree of subjectivity in evaluating management’s development of forecasts of future economic conditions (“economic scenarios”), probability weighting of economic scenarios, and qualitative reserves used in the general allowance.
|
| How We Addressed the Matter in Our Audit |
|
We obtained an understanding, evaluated the design and tested the operating effectiveness of internal controls over the ACL process, including, among others, controls over the development, operation, and monitoring of economic scenarios, probability weighting of economic scenarios and qualitative reserves used in the allowance results.
We involved EY specialists in testing management’s models including evaluating model methodology, model performance and testing key modeling assumptions as well as controls covering the economic scenarios used by the ACL models. Additionally, with the support of EY specialists, we assessed the economic scenarios and related probability weights by evaluating management’s methodology and agreeing a sample of key economic variables used to external sources. We also performed various sensitivity analyses and analytical procedures, including comparison of a sample of the key economic variables to alternative external sources and historical statistics.
With respect to general ACL models, with the support of EY specialists, we evaluated model design and re-performed the calculation for a sample of models. We also tested the appropriateness of key inputs and assumptions used in these models by agreeing a sample of inputs to source documentation.
We evaluated the overall ACL amount, including model estimates, qualitative reserves, and whether the recorded ACL appropriately reflects expected credit losses. We performed analytical procedures on the ACL, charge-off and delinquency rates, and coverage ratios of the allowance. Our audit response also included specific substantive tests of management’s process to measure qualitative reserves, including those related to the significant judgments made by management. We compared calculations to industry peer data and compared qualitative reserves to prior periods and prior economic cycles. We also evaluated if the qualitative reserves were applied based on a comprehensive framework and that available information was considered, well-documented, and consistently applied. We searched for and evaluated information that corroborates or contradicts management’s economic scenarios and related probability weights as well as identification and measurement of qualitative reserves.
|
/s/ Ernst & Young LLP
We have served as the Company’s auditor since 1990.
Tulsa, Oklahoma
February 21, 2024
Consolidated Statements of Earnings
|
|
|
|
|
|
|
|
|
|
|
|
|
|
|
|
|
|
|
|
|
| (In thousands, except share and per share data) |
|
|
|
|
|
|
|
|
Year Ended December 31, |
| Interest and dividend revenue |
|
2023 |
|
2022 |
|
2021 |
| Loans |
|
$ |
1,630,620 |
|
|
$ |
976,653 |
|
|
$ |
769,357 |
|
| Residential mortgage loans held for sale |
|
4,341 |
|
|
6,027 |
|
|
5,465 |
|
| Trading securities |
|
215,994 |
|
|
115,048 |
|
|
155,989 |
|
| Investment securities |
|
33,822 |
|
|
24,072 |
|
|
10,430 |
|
| Available for sale securities |
|
387,891 |
|
|
248,323 |
|
|
230,383 |
|
| Fair value option securities |
|
7,760 |
|
|
2,145 |
|
|
1,542 |
|
| Restricted equity securities |
|
29,683 |
|
|
8,282 |
|
|
5,703 |
|
| Interest-bearing cash and cash equivalents |
|
32,353 |
|
|
11,552 |
|
|
1,060 |
|
| Total interest and dividend revenue |
|
2,342,464 |
|
|
1,392,102 |
|
|
1,179,929 |
|
| Interest expense |
|
|
|
|
|
|
| Deposits |
|
626,597 |
|
|
121,749 |
|
|
33,484 |
|
| Borrowed funds |
|
434,735 |
|
|
52,483 |
|
|
17,877 |
|
| Subordinated debentures |
|
8,952 |
|
|
6,490 |
|
|
10,535 |
|
| Total interest expense |
|
1,070,284 |
|
|
180,722 |
|
|
61,896 |
|
| Net interest and dividend revenue |
|
1,272,180 |
|
|
1,211,380 |
|
|
1,118,033 |
|
| Provision for credit losses |
|
46,000 |
|
|
30,000 |
|
|
(100,000) |
|
Net interest and dividend revenue after provision for credit losses |
|
1,226,180 |
|
|
1,181,380 |
|
|
1,218,033 |
|
| Other operating revenue |
|
|
|
|
|
|
| Brokerage and trading revenue |
|
240,610 |
|
|
140,978 |
|
|
112,989 |
|
| Transaction card revenue |
|
106,858 |
|
|
104,266 |
|
|
96,983 |
|
| Fiduciary and asset management revenue |
|
207,318 |
|
|
196,326 |
|
|
178,274 |
|
| Deposit service charges and fees |
|
108,514 |
|
|
110,636 |
|
|
104,217 |
|
| Mortgage banking revenue |
|
55,698 |
|
|
49,365 |
|
|
105,896 |
|
| Other revenue |
|
62,120 |
|
|
55,642 |
|
|
69,950 |
|
| Total fees and commissions |
|
781,118 |
|
|
657,213 |
|
|
668,309 |
|
| Other gains, net |
|
56,795 |
|
|
123 |
|
|
63,742 |
|
| Loss on derivatives, net |
|
(9,921) |
|
|
(73,011) |
|
|
(19,378) |
|
| Loss on fair value option securities, net |
|
(4,292) |
|
|
(20,358) |
|
|
(2,239) |
|
| Change in fair value of mortgage servicing rights |
|
(3,115) |
|
|
80,261 |
|
|
41,637 |
|
| Gain (loss) on available for sale securities, net |
|
(30,636) |
|
|
(971) |
|
|
3,704 |
|
|
|
|
|
|
|
|
|
|
|
|
|
|
|
|
|
|
|
|
|
|
| Total other operating revenue |
|
789,949 |
|
|
643,257 |
|
|
755,775 |
|
| Other operating expense |
|
|
|
|
|
|
| Personnel |
|
766,610 |
|
|
670,918 |
|
|
695,382 |
|
| Business promotion |
|
31,796 |
|
|
26,435 |
|
|
16,289 |
|
| Charitable contributions to BOKF Foundation |
|
2,707 |
|
|
2,500 |
|
|
9,000 |
|
| Professional fees and services |
|
55,337 |
|
|
56,342 |
|
|
50,906 |
|
| Net occupancy and equipment |
|
121,502 |
|
|
116,867 |
|
|
108,587 |
|
FDIC and other insurance |
|
30,780 |
|
|
17,994 |
|
|
15,881 |
|
| FDIC special assessment |
|
43,773 |
|
|
— |
|
|
— |
|
| Data processing and communications |
|
181,365 |
|
|
165,907 |
|
|
151,614 |
|
| Printing, postage and supplies |
|
15,225 |
|
|
15,857 |
|
|
14,218 |
|
| Amortization of intangible assets |
|
13,882 |
|
|
15,692 |
|
|
18,311 |
|
| Mortgage banking costs |
|
30,524 |
|
|
35,834 |
|
|
42,698 |
|
| Other expense |
|
39,380 |
|
|
40,134 |
|
|
54,822 |
|
| Total other operating expense |
|
1,332,881 |
|
|
1,164,480 |
|
|
1,177,708 |
|
| Net income before taxes |
|
683,248 |
|
|
660,157 |
|
|
796,100 |
|
| Federal and state income taxes |
|
152,115 |
|
|
139,864 |
|
|
179,775 |
|
| Net income |
|
531,133 |
|
|
520,293 |
|
|
616,325 |
|
| Net income (loss) attributable to non-controlling interests |
|
387 |
|
|
20 |
|
|
(1,796) |
|
| Net income attributable to BOK Financial Corporation shareholders |
|
$ |
530,746 |
|
|
$ |
520,273 |
|
|
$ |
618,121 |
|
| Earnings per share: |
|
|
|
|
|
|
| Basic |
|
$ |
8.02 |
|
|
$ |
7.68 |
|
|
$ |
8.95 |
|
| Diluted |
|
$ |
8.02 |
|
|
$ |
7.68 |
|
|
$ |
8.95 |
|
| Average shares used in computation: |
|
|
|
|
|
|
| Basic |
|
65,651,569 |
|
|
67,212,728 |
|
|
68,591,920 |
|
| Diluted |
|
65,651,569 |
|
|
67,212,735 |
|
|
68,594,322 |
|
| Dividends declared per share |
|
$ |
2.17 |
|
|
$ |
2.13 |
|
|
$ |
2.09 |
|
See accompanying notes to Consolidated Financial Statements.
|
|
|
|
|
|
|
|
|
|
|
|
|
|
|
|
|
|
|
|
|
| Consolidated Statements of Comprehensive Income |
|
|
| (In thousands) |
|
|
|
|
|
|
|
|
Year Ended December 31, |
| |
|
2023 |
|
2022 |
|
2021 |
| Net income |
|
$ |
531,133 |
|
|
$ |
520,293 |
|
|
$ |
616,325 |
|
| Other comprehensive income (loss) before income taxes: |
|
|
|
|
|
|
| Net change in unrealized gain (loss) |
|
218,293 |
|
|
(1,227,414) |
|
|
(341,369) |
|
| Reclassification adjustments included in earnings: |
|
|
|
|
|
|
| Interest revenue, Investment securities |
|
60,394 |
|
|
42,514 |
|
|
— |
|
| Operating expense, Personnel |
|
— |
|
|
(3,483) |
|
|
— |
|
| Loss (gain) on available for sale securities, net |
|
30,636 |
|
|
971 |
|
|
(3,704) |
|
| Other comprehensive gain (loss), before income taxes |
|
309,323 |
|
|
(1,187,412) |
|
|
(345,073) |
|
| Federal and state income taxes |
|
71,468 |
|
|
(278,086) |
|
|
(81,576) |
|
| Other comprehensive gain (loss), net of income taxes |
|
237,855 |
|
|
(909,326) |
|
|
(263,497) |
|
| Comprehensive income (loss) |
|
768,988 |
|
|
(389,033) |
|
|
352,828 |
|
| Comprehensive income (loss) attributable to non-controlling interests |
|
387 |
|
|
20 |
|
|
(1,796) |
|
| Comprehensive income (loss) attributable to BOK Financial Corp. shareholders |
|
$ |
768,601 |
|
|
$ |
(389,053) |
|
|
$ |
354,624 |
|
See accompanying notes to Consolidated Financial Statements.
Consolidated Balance Sheets
|
|
|
|
|
|
|
|
|
|
|
|
|
|
|
| (In thousands, except share data) |
|
|
|
|
|
|
December 31, |
| |
|
2023 |
|
2022 |
| Assets |
|
|
|
|
| Cash and due from banks |
|
$ |
947,613 |
|
|
$ |
943,810 |
|
| Interest-bearing cash and cash equivalents |
|
400,652 |
|
|
457,906 |
|
| Trading securities |
|
5,193,505 |
|
|
4,464,161 |
|
Investment securities, net of allowance (fair value: 2023 – $2,072,586; 2022 – $2,346,768) |
|
2,244,153 |
|
|
2,513,687 |
|
| Available for sale securities |
|
12,286,681 |
|
|
11,493,860 |
|
| Fair value option securities |
|
20,671 |
|
|
296,590 |
|
| Restricted equity securities |
|
423,099 |
|
|
299,651 |
|
| Residential mortgage loans held for sale |
|
56,935 |
|
|
75,272 |
|
| Loans |
|
23,904,968 |
|
|
22,557,150 |
|
| Allowance for loan losses |
|
(277,123) |
|
|
(235,704) |
|
| Loans, net of allowance |
|
23,627,845 |
|
|
22,321,446 |
|
| Premises and equipment, net |
|
622,223 |
|
|
565,175 |
|
| Receivables |
|
317,922 |
|
|
273,815 |
|
| Goodwill |
|
1,044,749 |
|
|
1,044,749 |
|
| Intangible assets, net |
|
59,979 |
|
|
76,131 |
|
| Mortgage servicing rights |
|
293,884 |
|
|
277,608 |
|
Real estate and other repossessed assets, net of allowance (2023 – $5,355; 2022 – $10,115) |
|
2,875 |
|
|
14,304 |
|
| Derivative contracts, net |
|
410,304 |
|
|
880,343 |
|
| Cash surrender value of bank-owned life insurance |
|
409,548 |
|
|
406,751 |
|
| Receivable on unsettled securities sales |
|
391,910 |
|
|
31,004 |
|
| Other assets |
|
1,070,282 |
|
|
1,354,379 |
|
| Total assets |
|
$ |
49,824,830 |
|
|
$ |
47,790,642 |
|
|
|
|
|
|
| Liabilities and Equity |
|
|
|
|
| Liabilities: |
|
|
|
|
| Noninterest-bearing demand deposits |
|
$ |
9,196,493 |
|
|
$ |
13,395,337 |
|
| Interest-bearing deposits: |
|
|
|
|
| Transaction |
|
20,964,101 |
|
|
18,659,115 |
|
| Savings |
|
847,085 |
|
|
964,411 |
|
| Time |
|
3,012,022 |
|
|
1,461,842 |
|
| Total deposits |
|
34,019,701 |
|
|
34,480,705 |
|
| Funds purchased and repurchase agreements |
|
1,122,748 |
|
|
2,270,377 |
|
| Other borrowings |
|
7,701,552 |
|
|
4,736,908 |
|
| Subordinated debentures |
|
131,150 |
|
|
131,205 |
|
| Accrued interest, taxes and expense |
|
338,996 |
|
|
296,870 |
|
| Derivative contracts, net |
|
587,473 |
|
|
554,900 |
|
| Due on unsettled securities purchases |
|
254,057 |
|
|
147,470 |
|
| Other liabilities |
|
523,734 |
|
|
484,849 |
|
| Total liabilities |
|
44,679,411 |
|
|
43,103,284 |
|
| Shareholders' equity: |
|
|
|
|
Common stock ($0.00006 par value; 2,500,000,000 shares authorized; shares issued and outstanding: 2023 – 76,593,292; 2022 – 76,423,345) |
|
5 |
|
|
5 |
|
| Capital surplus |
|
1,406,745 |
|
|
1,390,395 |
|
| Retained earnings |
|
5,211,512 |
|
|
4,824,164 |
|
Treasury stock (shares at cost: 2023 – 11,626,115; 2022 – 9,464,711) |
|
(876,720) |
|
|
(694,960) |
|
| Accumulated other comprehensive income (loss) |
|
(599,100) |
|
|
(836,955) |
|
| Total shareholders’ equity |
|
5,142,442 |
|
|
4,682,649 |
|
| Non-controlling interests |
|
2,977 |
|
|
4,709 |
|
| Total equity |
|
5,145,419 |
|
|
4,687,358 |
|
| Total liabilities and equity |
|
$ |
49,824,830 |
|
|
$ |
47,790,642 |
|
See accompanying notes to Consolidated Financial Statements.
Consolidated Statements of Changes in Equity
|
|
|
|
|
|
|
|
|
|
|
|
|
|
|
|
|
|
|
|
|
|
|
|
|
|
|
|
|
|
|
|
|
|
|
|
|
|
|
|
|
|
|
|
|
|
|
|
|
|
|
|
|
|
|
|
|
|
|
|
|
|
|
| (In thousands) |
|
|
|
|
|
|
|
|
|
Accumulated Other Comprehensive Income (Loss) |
|
|
|
|
|
|
| |
|
Common Stock |
|
Capital
Surplus |
|
Retained
Earnings |
|
Treasury Stock |
|
|
Total
Shareholders’
Equity |
|
Non-
Controlling
Interests |
|
Total Equity |
| |
|
Shares |
|
Amount |
|
|
|
Shares |
|
Amount |
|
|
|
|
| Balance, December 31, 2020 |
|
75,995 |
|
|
$ |
5 |
|
|
$ |
1,368,062 |
|
|
$ |
3,973,675 |
|
|
6,358 |
|
|
$ |
(411,344) |
|
|
$ |
335,868 |
|
|
$ |
5,266,266 |
|
|
$ |
25,295 |
|
|
$ |
5,291,561 |
|
|
|
|
|
|
|
|
|
|
|
|
|
|
|
|
|
|
|
|
|
|
|
|
|
|
|
|
|
|
|
|
|
|
|
|
|
|
|
|
|
|
|
| Net income (loss) |
|
— |
|
|
— |
|
|
— |
|
|
618,121 |
|
|
— |
|
|
— |
|
|
— |
|
|
618,121 |
|
|
(1,796) |
|
|
616,325 |
|
| Other comprehensive loss |
|
— |
|
|
— |
|
|
— |
|
|
— |
|
|
— |
|
|
— |
|
|
(263,497) |
|
|
(263,497) |
|
|
— |
|
|
(263,497) |
|
| Repurchase of common stock |
|
— |
|
|
— |
|
|
— |
|
|
— |
|
|
1,360 |
|
|
(117,938) |
|
|
— |
|
|
(117,938) |
|
|
— |
|
|
(117,938) |
|
| Share-based compensation plans: |
|
|
|
|
|
|
|
|
|
|
|
|
|
|
|
|
|
|
|
|
| Stock options exercised |
|
17 |
|
|
— |
|
|
973 |
|
|
— |
|
|
— |
|
|
— |
|
|
— |
|
|
973 |
|
|
— |
|
|
973 |
|
| Non-vested shares awarded, net |
|
242 |
|
|
— |
|
|
— |
|
|
— |
|
|
— |
|
|
— |
|
|
— |
|
|
— |
|
|
— |
|
|
— |
|
| Vesting of non-vested shares |
|
— |
|
|
— |
|
|
— |
|
|
— |
|
|
68 |
|
|
(5,847) |
|
|
— |
|
|
(5,847) |
|
|
— |
|
|
(5,847) |
|
| Share-based compensation |
|
— |
|
|
— |
|
|
9,759 |
|
|
— |
|
|
— |
|
|
— |
|
|
— |
|
|
9,759 |
|
|
— |
|
|
9,759 |
|
| Cash dividends on common stock |
|
— |
|
|
— |
|
|
— |
|
|
(144,105) |
|
|
— |
|
|
— |
|
|
— |
|
|
(144,105) |
|
|
— |
|
|
(144,105) |
|
| Capital calls and distributions, net |
|
— |
|
|
— |
|
|
— |
|
|
— |
|
|
— |
|
|
— |
|
|
— |
|
|
— |
|
|
(18,860) |
|
|
(18,860) |
|
|
|
|
|
|
|
|
|
|
|
|
|
|
|
|
|
|
|
|
|
|
|
|
|
|
|
|
|
|
|
|
|
|
|
|
|
|
|
|
|
|
|
| Balance, December 31, 2021 |
|
76,254 |
|
|
$ |
5 |
|
|
$ |
1,378,794 |
|
|
$ |
4,447,691 |
|
|
7,786 |
|
|
$ |
(535,129) |
|
|
$ |
72,371 |
|
|
$ |
5,363,732 |
|
|
$ |
4,639 |
|
|
$ |
5,368,371 |
|
|
|
|
|
|
|
|
|
|
|
|
|
|
|
|
|
|
|
|
|
|
|
|
|
|
|
|
|
|
|
|
|
|
|
|
|
|
|
|
|
|
|
| Net income (loss) |
|
— |
|
|
— |
|
|
— |
|
|
520,273 |
|
|
— |
|
|
— |
|
|
— |
|
|
520,273 |
|
|
20 |
|
|
520,293 |
|
| Other comprehensive loss |
|
— |
|
|
— |
|
|
— |
|
|
— |
|
|
— |
|
|
— |
|
|
(909,326) |
|
|
(909,326) |
|
|
— |
|
|
(909,326) |
|
| Repurchase of common stock |
|
— |
|
|
— |
|
|
— |
|
|
— |
|
|
1,633 |
|
|
(154,887) |
|
|
— |
|
|
(154,887) |
|
|
— |
|
|
(154,887) |
|
| Share-based compensation plans: |
|
|
|
|
|
|
|
|
|
|
|
|
|
|
|
|
|
|
|
|
| Stock options exercised |
|
1 |
|
|
— |
|
|
37 |
|
|
— |
|
|
— |
|
|
— |
|
|
— |
|
|
37 |
|
|
— |
|
|
37 |
|
| Non-vested shares awarded, net |
|
168 |
|
|
— |
|
|
— |
|
|
— |
|
|
— |
|
|
— |
|
|
— |
|
|
— |
|
|
— |
|
|
— |
|
| Vesting of non-vested shares |
|
— |
|
|
— |
|
|
— |
|
|
— |
|
|
46 |
|
|
(4,944) |
|
|
— |
|
|
(4,944) |
|
|
— |
|
|
(4,944) |
|
| Share-based compensation |
|
— |
|
|
— |
|
|
11,564 |
|
|
— |
|
|
— |
|
|
— |
|
|
— |
|
|
11,564 |
|
|
— |
|
|
11,564 |
|
| Cash dividends on common stock |
|
— |
|
|
— |
|
|
— |
|
|
(143,800) |
|
|
— |
|
|
— |
|
|
— |
|
|
(143,800) |
|
|
— |
|
|
(143,800) |
|
|
|
|
|
|
|
|
|
|
|
|
|
|
|
|
|
|
|
|
|
|
| Capital calls and distributions, net |
|
— |
|
|
— |
|
|
— |
|
|
— |
|
|
— |
|
|
— |
|
|
— |
|
|
— |
|
|
50 |
|
|
50 |
|
|
|
|
|
|
|
|
|
|
|
|
|
|
|
|
|
|
|
|
|
|
|
|
|
|
|
|
|
|
|
|
|
|
|
|
|
|
|
|
|
|
|
| Balance, December 31, 2022 |
|
76,423 |
|
|
$ |
5 |
|
|
$ |
1,390,395 |
|
|
$ |
4,824,164 |
|
|
9,465 |
|
|
$ |
(694,960) |
|
|
$ |
(836,955) |
|
|
$ |
4,682,649 |
|
|
$ |
4,709 |
|
|
$ |
4,687,358 |
|
|
|
|
|
|
|
|
|
|
|
|
|
|
|
|
|
|
|
|
|
|
|
|
|
|
|
|
|
|
|
|
|
|
|
|
|
|
|
|
|
|
|
|
|
|
|
|
|
|
|
|
|
|
|
|
|
|
|
|
|
|
|
|
|
|
|
|
|
|
|
|
|
|
|
|
|
|
|
|
|
|
|
|
|
|
|
|
|
|
|
|
|
|
|
|
|
|
|
|
|
|
|
|
|
|
| (In thousands) |
|
|
|
|
|
|
|
|
|
Accumulated Other Comprehensive Income (Loss) |
|
|
|
|
|
|
| |
|
Common Stock |
|
Capital
Surplus |
|
Retained
Earnings |
|
Treasury Stock |
|
|
Total
Shareholders’
Equity |
|
Non-
Controlling
Interests |
|
Total Equity |
| |
|
Shares |
|
Amount |
|
|
|
Shares |
|
Amount |
|
|
|
|
| Balance, December 31, 2022 |
|
76,423 |
|
|
$ |
5 |
|
|
$ |
1,390,395 |
|
|
$ |
4,824,164 |
|
|
9,465 |
|
|
$ |
(694,960) |
|
|
$ |
(836,955) |
|
|
$ |
4,682,649 |
|
|
$ |
4,709 |
|
|
$ |
4,687,358 |
|
| Net income (loss) |
|
— |
|
|
— |
|
|
— |
|
|
530,746 |
|
|
— |
|
|
— |
|
|
— |
|
|
530,746 |
|
|
387 |
|
|
531,133 |
|
| Other comprehensive income |
|
— |
|
|
— |
|
|
— |
|
|
— |
|
|
— |
|
|
— |
|
|
237,855 |
|
|
237,855 |
|
|
— |
|
|
237,855 |
|
| Repurchase of common stock |
|
— |
|
|
— |
|
|
— |
|
|
— |
|
|
2,114 |
|
|
(176,819) |
|
|
— |
|
|
(176,819) |
|
|
— |
|
|
(176,819) |
|
| Share-based compensation plans: |
|
|
|
|
|
|
|
|
|
|
|
|
|
|
|
|
|
|
|
|
|
|
|
|
|
|
|
|
|
|
|
|
|
|
|
|
|
|
|
|
|
| Non-vested shares awarded, net |
|
170 |
|
|
— |
|
|
— |
|
|
— |
|
|
— |
|
|
— |
|
|
— |
|
|
— |
|
|
— |
|
|
— |
|
| Vesting of non-vested shares |
|
— |
|
|
— |
|
|
— |
|
|
— |
|
|
47 |
|
|
(4,941) |
|
|
— |
|
|
(4,941) |
|
|
— |
|
|
(4,941) |
|
| Share-based compensation |
|
— |
|
|
— |
|
|
16,350 |
|
|
— |
|
|
— |
|
|
— |
|
|
— |
|
|
16,350 |
|
|
— |
|
|
16,350 |
|
| Cash dividends on common stock |
|
— |
|
|
— |
|
|
— |
|
|
(143,398) |
|
|
— |
|
|
— |
|
|
— |
|
|
(143,398) |
|
|
— |
|
|
(143,398) |
|
| Capital calls and distributions, net |
|
— |
|
|
— |
|
|
— |
|
|
— |
|
|
— |
|
|
— |
|
|
— |
|
|
— |
|
|
(2,119) |
|
|
(2,119) |
|
|
|
|
|
|
|
|
|
|
|
|
|
|
|
|
|
|
|
|
|
|
|
|
|
|
|
|
|
|
|
|
|
|
|
|
|
|
|
|
|
|
|
| Balance, December 31, 2023 |
|
76,593 |
|
|
$ |
5 |
|
|
$ |
1,406,745 |
|
|
$ |
5,211,512 |
|
|
11,626 |
|
|
$ |
(876,720) |
|
|
$ |
(599,100) |
|
|
$ |
5,142,442 |
|
|
$ |
2,977 |
|
|
$ |
5,145,419 |
|
See accompanying notes to Consolidated Financial Statements.
Consolidated Statements of Cash Flows
(In thousands)
|
|
|
|
|
|
|
|
|
|
|
|
|
|
|
|
|
|
|
|
|
|
|
Year Ended |
| |
|
2023 |
|
2022 |
|
2021 |
| Cash Flows From Operating Activities: |
|
|
|
|
|
|
| Net income |
|
$ |
531,133 |
|
|
$ |
520,293 |
|
|
$ |
616,325 |
|
| Adjustments to reconcile net income to net cash provided by (used in) operating activities: |
|
|
|
|
|
|
| Provision for credit losses |
|
46,000 |
|
|
30,000 |
|
|
(100,000) |
|
| Change in fair value of mortgage servicing rights due to market changes |
|
3,115 |
|
|
(80,261) |
|
|
(41,637) |
|
| Change in fair value of mortgage servicing rights due to principal payments |
|
27,343 |
|
|
31,741 |
|
|
38,761 |
|
| Net unrealized losses (gains) from derivative contracts |
|
133,118 |
|
|
(52,214) |
|
|
30,201 |
|
| Share-based compensation |
|
16,350 |
|
|
11,564 |
|
|
9,759 |
|
| Depreciation and amortization |
|
109,893 |
|
|
107,563 |
|
|
102,468 |
|
| Net amortization of discounts and premiums |
|
(19,985) |
|
|
9,215 |
|
|
18,293 |
|
| Net losses (gains) on financial instruments and other losses (gains), net |
|
(26,162) |
|
|
846 |
|
|
(67,446) |
|
| Net loss (gain) on mortgage loans held for sale |
|
4,483 |
|
|
(2,948) |
|
|
(70,464) |
|
| Mortgage loans originated for sale |
|
(666,391) |
|
|
(1,180,403) |
|
|
(2,818,789) |
|
| Proceeds from sale of mortgage loans held for sale |
|
679,389 |
|
|
1,295,588 |
|
|
2,939,522 |
|
| Capitalized mortgage servicing rights |
|
(12,141) |
|
|
(18,215) |
|
|
(31,132) |
|
|
|
|
|
|
|
|
| Change in trading and fair value option securities |
|
(453,340) |
|
|
4,419,761 |
|
|
(4,357,950) |
|
| Change in receivables |
|
(316,819) |
|
|
(34,301) |
|
|
39,183 |
|
| Change in other assets |
|
89,930 |
|
|
13,205 |
|
|
(12,568) |
|
| Change in other liabilities |
|
(79,733) |
|
|
50,836 |
|
|
12,897 |
|
| Net cash provided by (used in) operating activities |
|
66,183 |
|
|
5,122,270 |
|
|
(3,692,577) |
|
| Cash Flows From Investing Activities: |
|
|
|
|
|
|
| Proceeds from maturities or redemptions of investment securities |
|
268,263 |
|
|
157,796 |
|
|
33,865 |
|
| Proceeds from maturities or redemptions of available for sale securities |
|
1,558,160 |
|
|
2,192,200 |
|
|
3,500,081 |
|
| Purchases of investment securities |
|
(2,504) |
|
|
(10,000) |
|
|
— |
|
| Purchases of available for sale securities |
|
(2,951,422) |
|
|
(4,533,892) |
|
|
(4,607,199) |
|
| Proceeds from sales of available for sale securities |
|
834,704 |
|
|
307,481 |
|
|
622,881 |
|
| Change in amount receivable on unsettled available for sale securities transactions |
|
(86,110) |
|
|
9,629 |
|
|
(10,406) |
|
| Loans originated, net of principal collected |
|
(1,349,900) |
|
|
(2,348,586) |
|
|
2,853,326 |
|
| Net payments or proceeds on derivative asset contracts |
|
154,602 |
|
|
(7,099) |
|
|
161,093 |
|
Proceeds from sale of BOKF Insurance |
|
32,601 |
|
|
— |
|
|
— |
|
| Net change in restricted equity securities |
|
(123,448) |
|
|
(216,538) |
|
|
88,278 |
|
| Proceeds from disposition of assets |
|
39,708 |
|
|
60,769 |
|
|
165,040 |
|
| Purchases of assets |
|
(165,918) |
|
|
(215,046) |
|
|
(204,287) |
|
| Net cash provided by (used in) investing activities |
|
(1,791,264) |
|
|
(4,603,286) |
|
|
2,602,672 |
|
| Cash Flows From Financing Activities: |
|
|
|
|
|
|
| Net change in demand deposits, transaction deposits and savings accounts |
|
(2,011,184) |
|
|
(6,518,868) |
|
|
5,360,979 |
|
| Net change in time deposits |
|
1,550,180 |
|
|
(242,486) |
|
|
(262,800) |
|
| Net change in other borrowed funds |
|
1,802,549 |
|
|
4,609,824 |
|
|
(1,269,241) |
|
| Repayment of subordinated debentures |
|
— |
|
|
— |
|
|
(150,000) |
|
|
|
|
|
|
|
|
| Change in amount due on unsettled security purchases |
|
190,085 |
|
|
(17,782) |
|
|
(117,452) |
|
| Issuance of common and treasury stock, net |
|
(4,941) |
|
|
(4,907) |
|
|
(4,874) |
|
| Net change in derivative margin accounts |
|
631,433 |
|
|
519,797 |
|
|
(467,865) |
|
| Net payments or proceeds on derivative liability contracts |
|
(166,275) |
|
|
(1,569) |
|
|
(79,962) |
|
|
|
|
|
|
|
|
| Repurchase of common stock |
|
(176,819) |
|
|
(154,887) |
|
|
(117,938) |
|
| Dividends paid |
|
(143,398) |
|
|
(143,800) |
|
|
(144,105) |
|
| Net cash provided by (used in) financing activities |
|
1,671,630 |
|
|
(1,954,678) |
|
|
2,746,742 |
|
| Net increase (decrease) in cash and cash equivalents |
|
(53,451) |
|
|
(1,435,694) |
|
|
1,656,837 |
|
| Cash and cash equivalents at beginning of period |
|
1,401,716 |
|
|
2,837,410 |
|
|
1,180,573 |
|
| Cash and cash equivalents at end of period |
|
$ |
1,348,265 |
|
|
$ |
1,401,716 |
|
|
$ |
2,837,410 |
|
|
|
|
|
|
|
|
| Supplemental Cash Flow Information: |
|
|
|
|
|
|
| Cash paid for interest |
|
$ |
1,044,950 |
|
|
$ |
176,081 |
|
|
$ |
68,775 |
|
| Cash paid for taxes |
|
$ |
173,916 |
|
|
$ |
79,532 |
|
|
$ |
135,331 |
|
| Net loans and bank premises transferred to repossessed real estate and other assets |
|
$ |
787 |
|
|
$ |
12,326 |
|
|
$ |
8,320 |
|
| Transfer of available for sale securities to investment securities |
|
$ |
— |
|
|
$ |
2,454,273 |
|
|
$ |
— |
|
Residential mortgage loans guaranteed by U.S. government agencies that became eligible for repurchase during the period |
|
$ |
14,466 |
|
|
$ |
34,259 |
|
|
$ |
87,087 |
|
Conveyance of other real estate owned guaranteed by U.S. government agencies |
|
$ |
5,534 |
|
|
$ |
8,451 |
|
|
$ |
6,376 |
|
| Right-of-use assets obtained in exchange for operating lease liabilities |
|
$ |
71,865 |
|
|
$ |
22,059 |
|
|
$ |
40,798 |
|
See accompanying notes to Consolidated Financial Statements.
Notes to Consolidated Financial Statements
(1) Significant Accounting Policies
Basis of Presentation
The Consolidated Financial Statements of BOK Financial have been prepared in conformity with U.S. GAAP, including interpretations of U.S. GAAP issued by federal banking regulators and general practices of the banking industry. The Consolidated Financial Statements include the accounts of BOK Financial and its subsidiaries, principally BOKF, NA, BOK Financial Securities, Inc., BOK Financial Private Wealth, Inc. and Cavanal Hill Distributors, Inc. All significant intercompany transactions are eliminated in consolidation.
The Consolidated Financial Statements include the assets, liabilities, non-controlling interests and results of operations of VIEs when BOK Financial is determined to be the primary beneficiary. Variable interest entities are generally defined as entities that either do not have sufficient equity to finance their activities without support from other parties or whose equity investors lack a controlling financial interest. Determination that the Company is the primary beneficiary considers the power to direct the activities that most significantly impact the variable interest's economic performance and the obligation to absorb losses of the variable interest or the right to receive benefits of the variable interest that could be significant to the variable interest.
Certain prior year amounts have been reclassified to conform to current year presentation.
Nature of Operations
BOK Financial, through its subsidiaries, provides a wide range of financial services to commercial and industrial customers, other financial institutions, municipalities and consumers. These services include depository and cash management; lending and lease financing; mortgage banking; securities brokerage, trading and underwriting; and personal and corporate trust.
BOKF, NA operates as Bank of Oklahoma primarily in the Tulsa and Oklahoma City metropolitan areas of the state of Oklahoma and Bank of Texas primarily in the Dallas, Fort Worth, Houston and San Antonio metropolitan areas of the state of Texas. In addition, BOKF, NA does business as BOK Financial in the metropolitan areas of Phoenix, Arizona; Northwest Arkansas; Denver, Colorado; Kansas City, Missouri/Kansas; and as Bank of Albuquerque in Albuquerque, New Mexico. BOKF, NA also operates the TransFund electronic funds network and Cavanal Hill Investment Management.
Use of Estimates
Preparation of BOK Financial's Consolidated Financial Statements requires management to make estimates of future economic activities, including loan collectability, loss contingencies, prepayments and cash flows from customer accounts. These estimates are based upon current conditions and information available to management. Actual results may differ significantly from these estimates.
Acquisitions
Assets and liabilities acquired, including identifiable intangible assets, are recorded at fair value on the acquisition date. The purchase price includes consideration paid at closing and the estimated fair value of contingent consideration that will be paid in the future, subject to achieving defined performance criteria. Premiums and discounts assigned to interest-earning assets and interest-bearing liabilities are amortized over the lives of the acquired assets and liabilities on either an individual instrument or pool basis. Goodwill is recognized as the excess of the purchase price over the net fair value of assets acquired and liabilities assumed.
Acquired loans with more than an insignificant credit deterioration since inception are recorded at fair value plus a gross-up amount which is offset by an allowance for credit losses. Acquired loans without a more than insignificant credit deterioration since inception are recorded at fair value. An allowance for credit losses is recognized through a provision for credit losses, similar to origination loans.
The Consolidated Statements of Earnings include the results of operations from the acquisition date.
Goodwill and Intangible Assets
Goodwill for each reporting unit is evaluated for impairment annually as of October 1st or more frequently if conditions indicate that impairment may have occurred. The evaluation of possible goodwill impairment involves significant judgment based upon short-term and long-term projections of future performance. Reporting units are defined by the Company as significant lines of business within each operating segment. This definition is consistent with the manner in which the chief operating decision maker assesses the performance of the Company and makes decisions concerning the allocation of resources.
During the evaluation for impairment, management qualitatively assesses whether it is more likely than not that the fair value of the reporting units is less than their carrying value. Reporting unit carrying value includes sufficient capital to exceed regulatory requirements plus goodwill. This assessment includes consideration of relevant events and circumstances including, but not limited to, macroeconomic conditions, industry and market conditions, the financial and stock performance of the Company and other relevant factors. Specifically, the analysis may include:
•General economic conditions including overall economic activity, consumer spending and mobility, unemployment rates, consumer confidence, and duration and severity of any current market moving instability.
•Global health concerns including ongoing pandemics or potential for widespread health issues, the future course of a pandemic and the potential for medical advances.
•Regional economic conditions including demand for oil and price stability of oil, other overarching conditions that may be affecting any of the Company's primary states such as weather or other catastrophes, pandemics and health related lockdowns, or other state mandates.
•Industry conditions including federal funds rate movement by the Federal Reserve, the interest rate environment and the resulting effect on net interest revenue and operating revenue, and regulatory mandates that hinder or provide relief to the financial services industry.
•Company specific conditions including current and forecasted income, changes in stock price, the Company's stock price compared to peers and other indexes, book value per share compared to fair value per share, goodwill compared to total shareholders' equity, current capital and liquidity position, demand for products and services, health of the loan portfolio and other credit related factors, and current credit ratings with the ratings agencies, and regulatory ratings.
•Reporting unit performance and forecasts including any event that may significantly impact a reporting unit.
If management concludes based on the qualitative assessment that goodwill may be impaired, a quantitative impairment test will be applied to goodwill at all reporting units. The quantitative analysis compares the fair value of the reporting unit with its carrying value. The fair value of each reporting unit is estimated by the discounted future earnings method. Goodwill is considered impaired if the fair value of the reporting unit is less than the carrying value of the reporting unit, including goodwill.
Both the qualitative assessment and quantitative analysis require significant management judgment, including estimates of changes in future economic conditions and their underlying causes and duration, the reasonableness and effectiveness of management's responses to those changes, changes in governmental fiscal and monetary policies, and fair value measurements based largely on significant unobservable inputs. The results of these judgments may have a significant impact on the Company's reported results of operations.
Intangible assets are generally composed of customer relationships, naming rights, non-compete agreements and core deposit premiums. They are amortized using accelerated or straight-line methods, as appropriate, over the estimated benefit periods. These periods range from 3 years to 20 years. The net book values of identifiable intangible assets are evaluated for impairment when economic conditions indicate impairment may exist.
Cash Equivalents
Due from banks, funds sold (generally federal funds sold for one day), resell agreements (which generally mature within one day to 30 days) and investments in money market funds are considered cash equivalents.
Securities
Securities are identified as trading, investment (held-to-maturity) or available for sale at the time of purchase based upon the intent of management, liquidity and capital requirements, regulatory limitations and other relevant factors. Trading securities, which are acquired for profit through resale, are carried at fair value with unrealized gains and losses included in current period earnings. Investment securities are carried at amortized cost. Amortization is computed by methods that approximate level yield and is adjusted for changes in prepayment estimates. Securities identified as available for sale are carried at fair value. Unrealized gains and losses are recorded, net of deferred income taxes, as accumulated other comprehensive income in shareholders' equity. Available for sale securities are separately identified as pledged to creditors if the creditor has the right to sell or repledge the collateral.
The purchase or sale of securities is recognized on a trade date basis. Realized gains and losses on sales of securities are based upon specific identification of the security sold. A receivable or payable is recognized for subsequent transaction settlement.
On a quarterly basis, the Company performs separate evaluations of debt investment and available for sale securities for the presence of impairment. We assess whether impairment is present on an individual security basis when the fair value of a debt security is less than the amortized cost.
Management determines whether it intends to sell or if it is more likely than not that it will be required to sell impaired securities. This determination considers current and forecasted liquidity requirements and securities portfolio management. If the Company intends to sell or it is more likely than not that it will be required to sell the impaired debt security, a charge is recognized against earnings for the entire unrealized loss. For all impaired debt securities for which there is no intent or expected requirement to sell, the evaluation considers all available evidence to assess whether it is more likely than not that all amounts due would not be collected according to the security's contractual terms and whether there is any impairment attributable to credit-related factors. If an impairment exists, the amount attributed to credit-related factors is measured and an allowance for credit loss is recognized. Declines in fair value that are not recorded in the allowance are recorded in other comprehensive income, net of taxes.
BOK Financial may elect to carry certain securities that are not held for trading purposes at fair value with changes in fair value recognized in current period income. These securities are held with the intent that gains or losses will offset changes in the fair value of mortgage servicing rights or other financial instruments.
Restricted equity securities represent equity interests the Company is required to hold in the Federal Reserve Banks and Federal Home Loan Banks. Restricted equity securities are carried at cost as these securities do not have a readily determined fair value because ownership of these shares is restricted and they lack a market.
The fair value of our securities portfolio is generally based on a single price for each financial instrument provided to us by a third-party pricing service determined by one or more of the following:
•quoted prices for similar, but not identical, assets or liabilities in active markets;
•quoted prices for identical or similar assets or liabilities in inactive markets;
•inputs other than quoted prices that are observable, such as interest rate and yield curves, volatilities, prepayment speeds, loss severities, credit risks and default rates; and
•other inputs derived from or corroborated by observable market inputs.
The underlying methods used by the third-party pricing services are considered in determining the primary inputs used to determine fair values. We evaluate the methodologies employed by the third-party pricing services by comparing the price provided by the pricing service with other sources, including brokers' quotes, sales or purchases of similar instruments and discounted cash flows to establish a basis for reliance on the pricing service values. Significant differences between the pricing service provided value and other sources are discussed with the pricing service to understand the basis for their values. Based on all observable inputs, management may adjust prices obtained from third-party pricing services to more appropriately reflect the prices that would be received to sell assets or paid to transfer liabilities in orderly transactions in the current market.
Derivative Instruments
Derivative instruments may be used by the Company as part of its internal risk management programs or may be offered to customers. All derivative instruments are carried at fair value and changes in fair value are generally reported in income as they occur. The determination of fair value of derivative instruments considers changes in interest rates, commodity prices and foreign exchange rates. Fair values for exchange-traded contracts are based on quoted prices in an active market for identical instruments. Fair values for over-the-counter contracts are generated internally using third-party valuation models. Inputs used in third-party valuation models to determine fair values are considered significant other observable inputs. Credit risk is also considered in determining fair value. Deterioration in the credit rating of customers or other counterparties reduces the fair value of asset contracts. Deterioration of our credit rating could decrease the fair value of our derivative liabilities.
When bilateral netting agreements or similar agreements exist between the Company and its counterparties that create a single legal claim or obligation to pay or receive the net amount in settlement of the individual derivative contracts, the Company reports derivative assets and liabilities on a net by derivative contract by counterparty basis.
Derivative contracts may also require the Company to provide or receive cash margin as collateral for derivative assets and liabilities. Derivative assets and liabilities are reported net of cash margin when certain conditions are met. In addition, derivative contracts executed with customers under Customer Risk Management Programs may be secured by non-cash collateral in conjunction with a credit agreement with that customer. Access to collateral in the event of default is reasonably assured.
BOK Financial offers programs that permit its customers to manage various risks, including fluctuations in energy, interest rates, foreign exchange rates and other commodities with derivative contracts. Customers may also manage interest rate risk through interest rate swaps used by the borrower to modify interest rate terms of their loans. Derivative contracts are executed between the customers and BOK Financial. Offsetting contracts are executed between BOK Financial and other selected counterparties to minimize market risk from changes in commodity prices, interest rates or foreign exchange rates. The counterparty contracts are identical to customer contracts, except for a fixed pricing spread or fee paid to BOK Financial as profit and compensation for administrative costs and credit risk which is recognized over the life of the contracts and included in Other Operating Revenue - Brokerage and trading revenue in the Consolidated Statements of Earnings.
BOK Financial may offer derivative instruments such as to-be-announced U.S. agency residential mortgage-backed securities to mortgage banking customers to enable them to manage their market risk or to mitigate the Company's market risk of holding trading securities. Changes in the fair value of derivative instruments for trading purposes or used to mitigate the market risk of holding trading securities are included in Other Operating Revenue - Brokerage and trading revenue in the Consolidated Statements of Earnings.
BOK Financial may use derivative instruments in managing its interest rate sensitivity as part of its economic hedge of the changes in the fair value of mortgage servicing rights. Changes in the fair value of derivative instruments used in managing interest rate sensitivity and as part of its economic hedge of changes in the fair value of mortgage servicing rights are included in Other Operating Revenue - Gain (loss) on derivatives, net in the Consolidated Statements of Earnings.
BOK Financial also enters into mortgage loan commitments that are considered derivative contracts. Forward sales contracts that have not been designated as hedging instruments are used to economically hedge these mortgage loan commitments as well as mortgage loans held for sale. Mortgage loan commitments, forward sales contracts and residential mortgage loans held for sale are carried at fair value. Changes in the fair value are reported in Other Operating Revenue - Mortgage banking revenue in the Consolidated Statements of Earnings.
Loans
Loans are either secured or unsecured based on the type of loan and the financial condition of the borrower. Repayment is generally expected from cash flow or proceeds from the sale of selected assets of the borrower. BOK Financial is exposed to risk of loss on loans due to the borrower's financial difficulties, which may arise from any number of factors, including problems within the respective industry or local economic conditions. Access to collateral, in the event of borrower default, is reasonably assured through adherence to applicable lending laws and through sound lending standards and credit review procedures. Accounting policies for all loans, excluding residential mortgage loans guaranteed by U.S. government agencies, are as follows.
Interest is accrued at the applicable interest rate on the outstanding principal amount. Loans are placed on nonaccruing status when, in the opinion of management, full collection of principal or interest is uncertain. Internally risk graded loans are individually evaluated for nonaccruing status quarterly. Non-risk graded loans are generally placed on nonaccruing status when 90 days or more past due or within 60 days of being notified of the borrower's bankruptcy filing. Interest previously accrued but not collected is charged against interest income when the loan is placed on nonaccruing status. Payments received on nonaccruing loans are applied to principal or recognized as interest income, according to management's judgment as to the collectability of principal. Loans may be returned to accruing status when, in the opinion of management, full collection of principal and interest, including principal previously charged off, is probable based on improvements in the borrower's financial condition or a sustained period of performance.
For loans acquired with no evidence of credit deterioration, discounts are accreted on either an individual basis for loans with unique characteristics or on a pool basis for groups of homogeneous loans. Accretion is discontinued when a loan with an individually attributed discount is placed on nonaccruing status.
Modifications of loans to existing borrowers generally consist of interest rate reductions, extension of payment terms or a combination of these. Modifications may arise either voluntarily through negotiations with the borrower or involuntarily through court order. Payment deferrals up to six months are generally considered to be short-term modifications. Generally, principal and accrued but unpaid interest is not voluntarily forgiven. A change to the allowance for credit losses is generally not recorded upon modification because the effect of most modifications made to borrowers experiencing financial difficulty is already included in the allowance methodology.
Performing loans may be renewed under the then current collateral, debt service ratio and other underwriting standards. Nonaccruing loans may also be renewed and will remain classified as nonaccruing.
Occasionally, loans, other than residential mortgage loans, may be held for sale in order to manage credit concentration. These loans are carried at the lower of cost or fair value with gains or losses recognized in gain (loss) on assets.
All loans are charged off when the loan balance or a portion of the loan balance is no longer supported by the paying capacity of the borrower or when the required cash flow is reduced in a modification. The charge-off amount is determined through an evaluation of available cash resources and collateral value. Internally risk graded loans are evaluated quarterly and charge-offs are taken in the quarter in which the loss is identified. Non-risk graded loans that are past due between 60 days and 180 days, based on the loan product type, are charged off. Loans to borrowers whose personal obligation has been discharged through Chapter 7 bankruptcy proceedings are charged off within 60 days of notice of the bankruptcy filing, regardless of payment status.
Loan origination and commitment fees and direct loan acquisition and origination costs are deferred and amortized as an adjustment to yield over the life of the loan or over the commitment period, as applicable. Amortization does not anticipate loan prepayments. Net unamortized fees are recognized in full at time of payoff.
We sell qualifying residential mortgage loans guaranteed by U.S. government agencies into GNMA pools. GNMA optional repurchase programs allow financial institutions to buy back individual delinquent mortgage loans that meet certain criteria from the securitized loan pool for which the institution provides servicing. At the servicer's option and without GNMA's prior authorization, the servicer may repurchase a delinquent loan for an amount equal to 100% of the remaining principal balance of the loan. These loans no longer qualify for sale accounting and are recognized in the Consolidated Balance Sheets. A portion of the principal balance continues to be guaranteed; however, interest accrues at a curtailed rate as specified in the programs. The carrying value of these loans is reduced based on an estimate of expected cash flows discounted at the original note rate plus a liquidity spread. These loans may be modified in accordance with U.S. government agency guidelines. Interest continues to accrue at the modified rate. Loans repurchased from GNMA under the program may either be resold into GNMA pools after a performance period specified by the program or foreclosed and conveyed to the guarantors.
Loans are disaggregated into portfolio segments and further disaggregated into classes. The portfolio segment is the level at which the Company develops and documents a systematic method for determining its allowance for credit losses. Classes are based on the risk characteristics of the loans and the Company's method for monitoring and assessing credit risk.
Allowances for Credit Losses and Accrual for Off-balance Sheet Credit Risk from Unfunded Loans Commitments
The allowance for loan losses and accrual for off-balance sheet credit risk from unfunded loan commitments represent the portion of the amortized cost basis of loans and related unfunded commitments that we do not expect to collect over the asset’s contractual life, considering past events, current conditions and reasonable and supportable forecasts of future economic conditions. Quarterly, a senior management Allowance Committee assesses the appropriateness of the allowance for loan losses and accrual for off-balance sheet credit risk. This assessment requires judgment about effects of uncertain matters, resulting in a subjective calculation which is inherently imprecise. Because of the subjective forward-looking nature of the calculation, changes in these measures may not directly correlate with actual economic events. In future periods, management judgment may consider new or changed information which may cause significant changes in these allowances in those future periods.
The allowance for loan losses consists of specific allowances attributed to certain individual loans, generally nonaccruing loans, with dissimilar risk characteristics that have not yet been charged down to amounts we expect to recover and general allowances for estimated credit losses on pools of loans that share similar risk characteristics.
When full collection of principal or interest is uncertain, the loan’s risk characteristics have changed and we exclude the loan from the general allowance pool, typically designating it as nonaccruing. For these loans, a specific allowance reflects the expected credit loss.
We measure specific allowances for loans excluded from the general allowance pool by an evaluation of estimated future cash flows discounted at the loan's initial effective interest rate or the fair value of collateral for certain collateral-dependent loans. For a non-collateral-dependent loan, the specific allowance is the amount by which the loan’s amortized cost basis exceeds its net realizable value. We measure the specific allowance for collateral-dependent loans as the amount by which the loan’s amortized cost basis exceeds its fair value. When repayment is expected to be provided substantially through the sale of collateral, we deduct estimated selling costs from the collateral’s fair value. Generally, third-party appraisals that conform to Uniform Standards of Professional Appraisal Practice serve as the basis for the fair value of real property held as collateral. These appraised values are on an "as is" basis and generally are not adjusted by the Company. We obtain updated appraisals at least annually or more frequently if market conditions indicate collateral values may have declined. For energy loans, our internal staff of engineers generally determines collateral value of mineral rights based on projected cash flows from proven oil and gas reserves under existing economic and operating conditions. Our special assets staff generally determines the value of other collateral based on projected liquidation cash flows under current market conditions. We evaluate collateral values and available cash resources quarterly. Historical statistics may be used to estimate specific allowances in limited situations, such as when a collateral-dependent loan is removed from the general allowance pool near the end of a reporting period until an appraisal of collateral value is received or a full assessment of future cash flows is completed.
General allowances estimate expected credit losses on pools of loans sharing similar risk characteristics that are expected to occur over the loan’s estimated remaining life. The loan’s estimated remaining life represents the contractual term adjusted for amortization, estimates of prepayments and borrower-owned extension options. Approximately 90% of the committed dollars in the loan portfolio is risk graded loans with general allowance model inputs that include probability of default, loss given default and exposure at default. Probability of default is based on the migration of loans from performing to nonperforming using historical life of loan analysis periods. Loss given default is based on the aggregate losses incurred, net of estimated recoveries. Exposure at default represents an estimate of the outstanding amount of credit exposure at the time a default may occur.
Charge-off migration is used to calculate the general allowance for the majority of non-risk graded loans to individuals. The expected credit loss on less than 10% of the committed dollars in the portfolio is calculated using charge-off migration.
The expected credit loss on approximately 1% of the committed dollars in the portfolio is calculated using a non-modeled approach. Specifically, the calculation applies a long-term net charge-off rate to the loan balances, adjusted for the weighted average remaining maturity of each portfolio.
In estimating the expected credit losses for general allowances on performing risk-graded loans, each portfolio class is assigned relevant economic loss drivers which best explain variations in portfolio net loss rates. The probability of default estimates for each portfolio class are adjusted for current and forecasted economic conditions. The result is applied to the exposure at default and loss given default to calculate the lifetime expected credit loss estimate. Selection of relevant economic loss drivers is re-evaluated periodically and involves statistical analysis as well as management judgment. The unemployment rate factors significantly in the allowance for loan losses calculation, affecting commercial and loans to individuals segments. Other primary factors impacting the commercial portfolio include BBB corporate spreads, real gross domestic product growth rate and energy commodity prices. The primary commercial real estate variables are vacancy rate and BBB corporate spreads. In addition to the unemployment rate, the forecast for loans to individuals is tied to home price index. The forecasts may include regional economic factors when localized conditions diverge from national conditions.
An Economic Forecast Committee, consisting of senior management with members largely independent of the allowance process, develops a twelve-month forward-looking forecast for the relevant economic loss drivers. Management develops these forecasts based on external data as well as a view of future economic conditions, which may include adjustments for regional conditions. The forecast includes three economic scenarios and probability weights for each scenario. The base forecast represents management's view of the most likely outcome, while the downside forecast reflects reasonably possible worsening economic conditions, and the upside forecast projects reasonably possible improving conditions.
At the end of the one-year reasonable and supportable forecast period, we transition from shorter-term expected losses to long-term loss averages for the loan’s estimated remaining life. The difference between short-term loss forecasts and long-term loss averages is run-off over the reversion horizon, up to three years, depending on the forecasted economic scenarios.
General allowances also consider the estimated impact of factors that are not captured in the modeled results or historical experience. These factors may increase or decrease modeled results by amounts determined by the Allowance Committee. Factors not captured in modeled results or historical experience may include, for example, new lines of business, market conditions that have not been previously encountered, observed changes in credit risk that are not yet reflected in macro-economic factors or economic conditions that impact loss given default assumptions.
The accrual for off-balance sheet credit risk is maintained at a level that is appropriate to cover estimated losses associated with credit instruments that are not currently recognized as assets such as loan commitments, standby letters of credit or guarantees that are not unconditionally cancellable by the bank. This accrual is included in other liabilities in the Consolidated Balance Sheets. The appropriateness of the accrual is determined in the same manner as the allowance for loan losses, with the added consideration of commitment usage over the remaining life for those loans that the bank cannot unconditionally cancel.
A provision for credit losses is charged against or credited to earnings in amounts necessary to maintain an appropriate allowance for credit losses. Recoveries of loans previously charged off are added to the allowance when received.
Real Estate and Other Repossessed Assets
Real estate and other repossessed assets are acquired in partial or total forgiveness of loans. These assets are carried at the lower of cost, which is the fair value at date of foreclosure less estimated disposal costs, or current fair value less estimated disposal costs. Decreases in fair value below cost are recognized as asset-specific valuation allowances which may be reversed when supported by future increases in fair value. Subsequent increases in fair value may be used to reduce the valuation allowance but not below zero.
Fair values of real estate are based on "as is" appraisals which are updated at least annually or more frequently for certain asset types or assets located in certain distressed markets. Fair values based on appraisals are generally considered to be based on significant other observable inputs. The Company also considers decreases in listing price and other relevant information in quarterly evaluations and reduces the carrying value of real estate and other repossessed assets when necessary. Fair values based on list prices and other relevant information are generally considered to be based on significant unobservable inputs. Additional costs incurred to complete real estate and other repossessed assets may increase the carrying value, up to current fair value based on "as completed" appraisals. The fair value of mineral rights included in repossessed assets is generally determined by our internal staff of engineers based on projected cash flows from proven oil and gas reserves under existing economic and operating conditions. Proven oil and gas reserves are estimated quantities that geological and engineering data demonstrate, with reasonable certainty, to be recoverable in future years from known reservoirs using existing prices and costs. Projected cash flows incorporate assumptions related to a number of factors including production, sales prices, operating expenses, severance, ad valorem taxes, capital costs and appropriate discount rate. Fair values determined through this process are considered to be based on Level 3 inputs. The value of other repossessed assets is generally determined by our special assets staff based on projected liquidation cash flows under current market conditions.
Income generated by these assets is recognized as received. Operating expenses are recognized as incurred. Gains or losses on sales of real estate and other repossessed assets are based on the cash proceeds received less the cost basis of the asset, net of any valuation allowances. The estimated disposal costs of real estate and other repossessed assets are evaluated by the Company on an annual basis based on actual results.
Transfers of Financial Assets
BOK Financial regularly transfers financial assets as part of its mortgage banking activities and periodically may transfer other financial assets. Transfers are recorded as sales when the criteria for surrender of control are met.
The Company has elected to carry certain residential mortgage loans held for sale at fair value under the fair value option. Changes in fair value are recognized in net income as they occur. These loans are reported separately in the Consolidated Balance Sheets and changes in fair value are recorded in Other operating revenue - Mortgage banking revenue in the Consolidated Statements of Earnings.
Fair value of conforming residential mortgage loans that will be sold to U.S. government agencies is based on sales commitments or market quotes considered Level 2 inputs. Fair value of mortgage loans that are unable to be sold to U.S. government agencies is based on Level 3 inputs using quoted prices of loans that are sold in securitization transactions with a liquidity discount applied. The fair value is corroborated with an independent third party on at least an annual basis.
BOK Financial retains a repurchase obligation under underwriting representations and warranties related to residential mortgage loans transferred and generally retains the right to service the loans. These are not credit obligations. The Company may incur a recourse obligation in limited circumstances. Separate accruals are recognized in Other liabilities in the Consolidated Balance Sheets for repurchase and recourse obligations. These reserves reflect the estimated amount of probable loss the Company will incur as a result of repurchasing a loan, indemnifications, and other settlement resolutions.
Repurchases of loans with an origination defect that are also credit impaired are considered collateral-dependent and are initially recognized at net realizable value (appraised value less the cost to sell). The difference between unpaid principal balance and net realizable value is not accreted. Repurchases of loans with an origination defect that are not credit impaired are carried at fair value as of the repurchase date. Interest income continues to accrue on these loans and the discount is accreted over the estimated life of the loan.
The Company may also choose to purchase GNMA loans once certain mandated delinquency criteria are met. The loans that are eligible and are chosen to be repurchased are initially recognized at fair value based on expected cash flows discounted using the average agency guaranteed debenture rates, average actual principal loss rates and liquidity premium.
The Company may also retain a residual interest in excess cash flows generated by the assets. All assets obtained, including cash, servicing rights and residual interests, and all liabilities incurred, including recourse obligations, are initially recognized at fair value. All assets transferred are derecognized and any gain or loss on the sale is recognized in earnings. Subsequently, servicing rights and residual interest are carried at fair value with changes in fair value recognized in earnings as they occur.
Mortgage Servicing Rights
Mortgage servicing rights may be purchased or may be recognized when mortgage loans are originated and sold with servicing rights retained. All mortgage servicing rights are carried at fair value. Changes in the fair value are recognized in earnings as they occur.
Mortgage servicing rights are not traded in active markets. A cash flow model is used to determine fair value. Key assumptions and estimates, including projected prepayment speeds and assumed servicing costs, earnings on escrow deposits, ancillary income and discount rates, used by this model are based on current market sources. Assumptions used to value mortgage servicing rights are considered significant unobservable inputs. A separate third-party model is used to estimate prepayment speeds based on interest rates, housing turnover rates, estimated loan curtailment, anticipated defaults and other relevant factors. The prepayment model is updated daily for changes in market conditions and adjusted to better correlate with actual performance of BOK Financial's servicing portfolio. Fair value estimates from outside sources are received at least quarterly to corroborate the results of the valuation model.
Premises and Equipment
Premises and equipment are carried at cost, including capitalized interest when appropriate, less accumulated depreciation and amortization. Depreciation and amortization are computed on a straight-line basis over the estimated useful lives of the assets or, for leasehold improvements, over the shorter of the estimated useful lives or remaining lease terms. Useful lives range from 5 years to 40 years for buildings and improvements, 3 years to 10 years for software and related implementation costs, and 3 years to 10 years for furniture and equipment. Construction in progress represents facilities construction and data processing systems projects underway that have not yet been placed into service. Depreciation and amortization begin once the assets are placed into service.
Repair and maintenance costs, including software maintenance and enhancement costs, are charged to expense as incurred. Software licensing costs are generally charged to expense as incurred. Software licensing costs are capitalized if the contractual right to take possession of the software exists and it is feasible to take possession without significant penalty. Capitalized costs are amortized over the shorter of the estimated useful life of the software or remaining contractual life of the license.
Premises no longer used by the Company are transferred to real estate and other repossessed assets. The transferred amount is the lower of cost less accumulated depreciation or fair value less estimated disposal costs as of the transfer date.
Premises and equipment includes rights to use leased facilities and equipment. Right-of-use assets are initially measured by the present value of future rent payments over lease terms, adjusted for rent concessions. Rent payments exclude both payments made for non-lease components such as services and variable lease payments other than payments dependent on an index at lease commencement. Lease term includes options reasonably certain to be exercised. The right-of-use assets and lease liabilities are amortized to achieve straight-line expense over the lease term. Upon lease modification, the right-of-use asset and liability are reassessed and remeasured. Right-of-use assets are evaluated for impairment when facts and circumstances change that indicate an impairment may be necessary. Leases less than twelve months are excluded from capitalization.
Ongoing technology projects of significant size or length are reviewed at least annually for impairment. Accumulated costs are reviewed for projects or components of projects that do not support the value of the asset being developed. Findings of obsolescence, duplicate effort or other conditions that do not support the recorded value are impaired, with the cost of the impaired components being charged to current-year earnings.
Federal and State Income Taxes
Determination of income tax expense and related assets and liabilities is complex and requires estimates and judgments when applying tax laws, rules, regulations and interpretations. It also requires judgments as to future earnings and the timing of future events. Accrued income taxes represent an estimate of net amounts due to or from taxing jurisdictions based upon these estimates, interpretations and judgments.
BOK Financial and its subsidiaries file consolidated tax returns. The subsidiaries provide for income taxes on a separate return basis and remit to BOK Financial amounts determined to be currently payable. BOK Financial is an agent for its subsidiaries under the Company's tax sharing agreements and has no ownership rights to any refunds received for the benefit of its subsidiaries.
Management evaluates the Company's current tax expense or benefit based upon estimates of taxable income, tax credits and statutory federal and state income tax rates. The amount of current income tax expense or benefit recognized in any period may differ from amounts reported to taxing authorities. Annually, we file tax returns with each jurisdiction where we conduct business and adjust recognized income tax expense or benefit to filed tax returns.
Deferred tax assets and liabilities are recognized based upon the differences between the values of assets and liabilities as recognized in the financial statements and their related tax basis using enacted tax rates in effect for the year in which the differences are expected to be recovered or settled. The effect of changes in statutory tax rates on the measurement of deferred tax assets and liabilities is recognized through income tax expense in the period the change is enacted. A valuation allowance is provided when it is more likely than not that some portion of the entire deferred tax asset may not be realized.
BOK Financial also recognizes the benefit of uncertain tax positions when based upon all relevant evidence, it is more-likely-than-not that our position would prevail upon examination, including resolution of related appeals or litigation, based upon the technical merits of the position. Unrecognized tax benefits, including estimated interest and penalties, are assessed quarterly and are part of our current accrued income tax liability. These may be adjusted through current income tax expense in future periods based on changing facts and circumstances, completion of examinations by taxing authorities or expiration of a statute of limitations. Estimated penalties and interest are recognized in income tax expense. Income tax expense in future periods may decrease if an uncertain tax position is favorably resolved, generally upon completion of an examination by the taxing authorities, expiration of a statute of limitations, or changes in facts and circumstances.
Employee Benefit Plans
BOK Financial sponsors a Thrift Plan and a Pension Plan. Employer contributions to the Thrift Plan, which matches employee contributions subject to percentage and years of service limits, are expensed when incurred. Pension Plan benefits were curtailed as of April 1, 2006. At December 31, 2022, the Pension Plan has been terminated, all benefits have been paid and all obligations settled. Prior to termination, BOK Financial recognized the funded status of its Pension Plan and related Plan costs, which were based upon actuarial computations of current costs, were expensed annually. Adjustments required to recognize the Pension Plan's net funded status were made through accumulated other comprehensive income, net of deferred income taxes. See Note 11, "Employee Benefit Plans" for further discussion.
Share-Based Compensation Plans
BOK Financial awards non-vested common shares and stock options as compensation to certain officers. The grant date fair value of non-vested shares is based on the then-current market value of BOK Financial common stock. Non-vested shares generally cliff vest in 3 years and are subject to a holding period after vesting of 2 years.
Compensation cost is initially based on the grant date fair value of the award and recognized as expense over the service period, which is generally the vesting period. Expense is reduced for estimated forfeitures over the vesting period and adjusted for actual forfeitures as they occur. Share-based compensation awarded to certain officers has performance conditions that affect the number of awards granted. Compensation cost is adjusted based on the probable outcome of the performance conditions.
RSUs may also be awarded for certain executives who have elected to defer income recognition upon vesting of their awards. RSUs are subject to the same vesting criteria as non-vested shares. Upon vesting and meeting other relevant conditions, RSUs are settled through cash distributions. The value of the awards will vary in amounts equal to changes in the fair value of an equal number of BOK Financial common shares.
Tax effects of share-based payments are recognized through tax expense. Dividends on non-vested shares are charged to retained earnings. Dividend equivalents on RSUs are charged to expense.
Other Operating Revenue
Fees and commissions revenue is generated through the sales of products, consisting primarily of financial instruments, and the performance of services for customers under contractual obligations. Revenue from providing services for customers is recognized at the time services are provided in an amount that reflects the consideration we expect to be entitled to for those services. Revenue is recognized based on the application of five steps:
•Identify the contract with a customer.
•Identify the performance obligations in the contract.
•Determine the transaction price.
•Allocate the transaction price to the performance obligations in the contract.
•Recognize revenue when (or as) the Company satisfies a performance obligation.
For contracts with multiple performance obligations, individual performance obligations are accounted for separately if the customer can benefit from the good or service on its own or with other resources readily available to the customer and the promise to transfer goods and services to the customer is separately identifiable in the contract. The transaction price is allocated to the performance obligations based on relative standalone selling prices.
Revenue is recognized on a gross basis whenever we have primary responsibility and risk in providing the services or products to our customers and have discretion in establishing the price for the services or products. Revenue is recognized on a net basis whenever we act as an agent for products or services of others.
Brokerage and trading revenue includes revenues from trading, customer hedging, retail brokerage, investment banking and insurance brokerage. Trading revenue includes net realized and unrealized gains primarily related to sales of securities to institutional customers and related derivative contracts. Customer hedging revenue includes realized and unrealized changes in the fair value of derivative contracts held for customer risk management programs including credit valuation adjustments, as necessary. We offer commodity, interest rate, foreign exchange and equity derivatives to our customers. These customer contracts are offset with contracts with selected counterparties and exchanges to minimize changes in market risk from changes in commodity prices, interest rates or foreign exchange rates. Retail brokerage revenue represents fees and commissions earned on sales of fixed income securities, annuities, mutual funds and other financial instruments to retail customers. Investment banking revenue includes fees earned upon completion of underwriting and financial advisory services. Investment banking revenue also includes fees earned in conjunction with loan syndications. Insurance brokerage revenues represent fees and commissions earned on placement of insurance products with carriers for property and casualty and health coverage.
Transaction card revenue includes merchant discount fees and electronic funds transfer network fees, net of interchange fees paid to card issuers and assessments paid to card networks. Merchant discount fees represent fees paid by customers for account management and electronic processing of card transactions. Merchant discount fees are recognized at the time the customer’s transactions are processed or other services are performed. The Company also maintains TransFund for the benefit of its members, which includes BOKF, NA. Electronic funds transfer fees are recognized as electronic transactions and are processed on behalf of its members.
Fiduciary and asset management revenue includes fees from asset management, custody, recordkeeping, investment advisory and administration services. Revenue is recognized on an accrual basis at the time the services are performed and may be based on either the fair value of the account or the service provided.
Deposit service charges and fees include commercial account service charges, overdraft fees, check card fee revenue and automated service charges and other deposit service fees. Fees are recognized at least quarterly in accordance with published deposit account agreements and disclosure statements for retail accounts or contractual agreements for commercial accounts. Item charges for overdraft or non-sufficient funds items are recognized as items are presented for payment. Account balance charges and activity fees are accrued monthly and collected in arrears. Commercial account activity fees may be offset by an earnings credit based on account balances. Check card fees represent interchange fees paid by a merchant bank for transactions processed from cards issued by the Company. Check card fees are recognized when transactions are processed.
Mortgage banking revenue includes revenues recognized in conjunction with the origination, marketing and servicing of conventional and government-sponsored residential mortgage loans. Mortgage production revenue includes net realized gains (losses) on sales of residential mortgage loans in the secondary market and the net change in unrealized gains (losses) on residential mortgage loans held for sale. Mortgage production revenue also includes changes in the fair value of derivative contracts not designated as hedging instruments related to residential mortgage loan commitments and forward sales contracts. Mortgage servicing revenue includes servicing fee income and late charges on loans serviced for others.
Newly Adopted and Pending Accounting Pronouncements
The following is a summary of newly adopted and pending accounting pronouncements that may have a more than insignificant effect on the Company's financial statements.
Financial Accounting Standards Board
FASB ASU 2022-02, Financial Instruments - Credit Losses (Topic 326): Troubled Debt Restructurings and Vintage Disclosures
On March 31, 2022, the FASB issued ASU 2022-02 which eliminates the accounting guidance on TDRs for creditors in ASC 310-40, while also no longer requiring an entity to consider renewals, modifications, and extensions that result from reasonably expected TDRs in their calculation of the allowance for credit losses. For receivables for which there has been a modification in their contractual cash flows, ASU 2022-02 requires disclosure by class of financing receivable, of the types of modifications, the financial effects of those modifications, and the performance of these modified receivables, along with receivables that had a payment default during the current period and had modifications to the contractual cash flows within 12 months prior to the default. Further, ASU 2022-02 requires entities to disclose gross write-offs recorded in the current period by year of origination in the vintage disclosures on a year-to-date basis. ASU 2022-02 was effective for the Company January 1, 2023. Amendments related to TDR recognition and measurement and vintage disclosures were applied prospectively and are included in Note 4 to the Consolidated Financial Statements. Adoption of this standard did not have a material effect on the Company's financial condition or results of operations.
FASB ASU 2023-01, Leases (Topic 842): Common Control Arrangements
On March 27, 2023, the FASB issued ASU 2023-01 which, in part, amends the accounting for leasehold improvements in common-control arrangements. Under previous guidance, a lessee is generally required to amortize leasehold improvements that it owns over the shorter of the useful life of those improvements or the lease term. However, due to the nature of leasehold improvements made under leases between entities under common control, ASU 2023-01 requires a lessee in a common-control arrangement to amortize such leasehold improvements that it owns over the improvements' useful lives to the common control group, regardless of the lease term. ASU 2023-01 is effective for fiscal years beginning after December 15, 2023, including interim periods within those fiscal years. Adoption of ASU 2023-01 is not expected to have a material impact on the Company's financial statements.
FASB ASU 2023-02, Investments - Equity Method and Joint Ventures (Topic 323): Accounting for Investments in Tax Credit Structures Using the Proportional Amortization Method
On March 29, 2023, the FASB issued ASU 2023-02 which amends previous guidance to allow entities to account for qualifying tax equity investments using the proportional amortization method regardless of the program giving rise to the related income tax credits, as opposed to only being allowed to apply this method to qualifying tax equity investments in low-income housing tax credit structures, as was the case under previous guidance. ASU 2023-02 is effective for fiscal years beginning after December 15, 2023, including interim periods within those fiscal years. On June 30, 2023, the Company early adopted ASU 2023-02 as of January 1, 2023 using the modified retrospective approach, which did not have a material impact on the Company's financial statements. The Company transitioned from the equity method of accounting and began applying the proportional amortization method of accounting to its qualifying new markets tax credit and historic tax credit investments in addition to its low income housing tax credit partnerships already subject to the proportional amortization method.
FASB ASU 2023-07, Segment Reporting (Topic 280): Improvements to Reportable Segment Disclosures
The FASB issued ASU 2023-07 on November 27, 2023 which is intended to improve reportable segment disclosure requirements. Under previous guidance, while entities were required to disclose segment revenue and measure of profit or loss, there has been limited disclosure around the reporting of segment expenses. In addition to enhanced disclosures about significant segment expenses, the amendments enhance interim disclosure requirements, clarify circumstances in which an entity can disclose multiple segment measures of profit or loss, provide new segment disclosure requirements for entities with a single reportable segment, and contain other disclosure requirements. The purpose of the amendments is to enable investors to better understand an entity’s overall performance and assess potential future cash flows. ASU 2023-07 is effective for fiscal years beginning after December 15, 2023, and interim periods within fiscal years beginning after December 15, 2024. The Company is evaluating the requirements of the expanded segment disclosures but does not expect the additional disclosures to have a material impact on the reported segment information.
FASB ASU 2023-09, Income Taxes (Topic 740): Improvements to Income Tax Disclosures
The FASB issued ASU 2023-09 on December 14, 2023 which amends income tax disclosures to provide information to better assess how an entity’s operations and related tax risks and tax planning and operational opportunities affect its tax rate and prospects for future cash flows. The new guidance requires the entity to disclose specific categories in the rate reconciliation and provide additional information for reconciling items that meet a quantitative threshold. ASU 2023-09 is effective for annual periods beginning after December 15, 2024. The Company is currently assessing the impact ASU 2023-09 will have on its income tax disclosures.
(2) Securities
Trading Securities
The fair value and net unrealized gain (loss) included in trading securities is as follows (in thousands):
|
|
|
|
|
|
|
|
|
|
|
|
|
|
|
|
|
|
|
|
|
|
|
|
|
|
|
| |
|
December 31, 2023 |
|
December 31, 2022 |
| |
|
Fair Value |
|
Net Unrealized Gain (Loss) |
|
Fair Value |
|
Net Unrealized Gain (Loss) |
| U.S. government securities |
|
$ |
10,959 |
|
|
$ |
28 |
|
|
$ |
9,823 |
|
|
$ |
(16) |
|
Residential agency mortgage-backed securities |
|
5,105,137 |
|
|
98,124 |
|
|
4,406,848 |
|
|
4 |
|
| Municipal securities |
|
37,413 |
|
|
323 |
|
|
21,484 |
|
|
(136) |
|
| Other trading securities |
|
39,996 |
|
|
160 |
|
|
26,006 |
|
|
(175) |
|
| Total trading securities |
|
$ |
5,193,505 |
|
|
$ |
98,635 |
|
|
$ |
4,464,161 |
|
|
$ |
(323) |
|
Investment Securities
The amortized cost and fair values of investment securities are as follows (in thousands):
|
|
|
|
|
|
|
|
|
|
|
|
|
|
|
|
|
|
|
|
|
|
|
|
|
|
|
|
|
|
|
|
|
| |
|
December 31, 2023 |
| |
|
Amortized |
|
Carrying |
|
Fair |
|
Gross Unrealized |
| |
|
Cost |
|
Value1 |
|
Value |
|
Gain |
|
Loss |
| Municipal securities |
|
$ |
120,705 |
|
|
$ |
120,705 |
|
|
$ |
125,525 |
|
|
$ |
5,014 |
|
|
$ |
(194) |
|
| Mortgage-backed securities: |
|
|
|
|
|
|
|
|
|
|
| Residential agency |
|
2,255,340 |
|
|
2,092,083 |
|
|
1,917,810 |
|
|
125 |
|
|
(174,398) |
|
| Commercial agency |
|
17,258 |
|
|
15,914 |
|
|
15,067 |
|
|
— |
|
|
(847) |
|
| Other debt securities |
|
15,787 |
|
|
15,787 |
|
|
14,184 |
|
|
— |
|
|
(1,603) |
|
| Total investment securities |
|
2,409,090 |
|
|
2,244,489 |
|
|
2,072,586 |
|
|
5,139 |
|
|
(177,042) |
|
| Allowance for credit losses |
|
(336) |
|
|
(336) |
|
|
— |
|
|
— |
|
|
— |
|
| Investment securities, net of allowance |
|
$ |
2,408,754 |
|
|
$ |
2,244,153 |
|
|
$ |
2,072,586 |
|
|
$ |
5,139 |
|
|
$ |
(177,042) |
|
1 Carrying value includes $165 million of net unrealized loss which remains in AOCI in the Consolidated Balance Sheets related to certain securities transferred during the second quarter of 2022 from the Available for Sale securities portfolio to the Investment securities portfolio.
|
|
|
|
|
|
|
|
|
|
|
|
|
|
|
|
|
|
|
|
|
|
|
|
|
|
|
|
|
|
|
|
|
| |
|
December 31, 2022 |
| |
|
Amortized |
|
Carrying |
|
Fair |
|
Gross Unrealized |
| |
|
Cost |
|
Value1 |
|
Value |
|
Gain |
|
Loss |
| Municipal securities |
|
$ |
170,629 |
|
|
$ |
170,629 |
|
|
$ |
176,621 |
|
|
$ |
6,456 |
|
|
$ |
(464) |
|
| Mortgage-backed securities: |
|
|
|
|
|
|
|
|
|
|
| Residential agency |
|
2,538,565 |
|
|
2,315,219 |
|
|
2,143,360 |
|
|
155 |
|
|
(172,014) |
|
| Commercial agency |
|
17,259 |
|
|
15,609 |
|
|
14,588 |
|
|
— |
|
|
(1,021) |
|
| Other debt securities |
|
12,788 |
|
|
12,788 |
|
|
12,199 |
|
|
— |
|
|
(589) |
|
| Total investment securities |
|
2,739,241 |
|
|
2,514,245 |
|
|
2,346,768 |
|
|
6,611 |
|
|
(174,088) |
|
| Allowance for credit losses |
|
(558) |
|
|
(558) |
|
|
— |
|
|
— |
|
|
— |
|
| Investment securities, net of allowance |
|
$ |
2,738,683 |
|
|
$ |
2,513,687 |
|
|
$ |
2,346,768 |
|
|
$ |
6,611 |
|
|
$ |
(174,088) |
|
1 Carrying value includes $225 million of net unrealized loss which remains in AOCI in the Consolidated Balance Sheets related to certain securities transferred during the second quarter of 2022 from the Available for Sale securities portfolio to the Investment securities portfolio.
The amortized cost and fair values of investment securities at December 31, 2023, by contractual maturity, are as shown in the following table (dollars in thousands):
|
|
|
|
|
|
|
|
|
|
|
|
|
|
|
|
|
|
|
|
|
|
|
|
|
|
|
|
|
|
|
|
|
|
|
|
|
|
|
|
|
Less than
One Year |
|
One to
Five Years |
|
Six to
Ten Years |
|
Over
Ten Years |
|
Total |
|
Weighted
Average
Maturity1
|
| Fixed maturity debt securities: |
|
|
|
|
|
|
|
|
|
|
|
|
| Carrying value |
|
$ |
17,262 |
|
|
$ |
108,343 |
|
|
$ |
26,788 |
|
|
$ |
13 |
|
|
$ |
152,406 |
|
|
3.29 |
|
| Fair value |
|
17,314 |
|
|
112,140 |
|
|
25,309 |
|
|
13 |
|
|
154,776 |
|
|
|
|
|
|
|
|
|
|
|
|
|
|
|
|
| Residential mortgage-backed securities: |
|
|
|
|
|
|
|
|
|
|
|
|
| Carrying value |
|
|
|
|
|
|
|
|
|
$ |
2,092,083 |
|
|
2 |
| Fair value |
|
|
|
|
|
|
|
|
|
1,917,810 |
|
|
|
|
|
|
|
|
|
|
|
|
|
|
|
|
| Total investment securities: |
|
|
|
|
|
|
|
|
|
|
|
|
| Carrying value |
|
|
|
|
|
|
|
|
|
$ |
2,244,489 |
|
|
|
| Fair value |
|
|
|
|
|
|
|
|
|
2,072,586 |
|
|
|
|
|
|
|
|
|
|
|
|
|
|
|
|
1Expected maturities may differ from contractual maturities because borrowers may have the right to call or prepay obligations with or without penalty.
2The average expected lives of residential mortgage-backed securities were 5.0 years based upon current prepayment assumptions.
Temporarily Impaired Investment Securities
(In thousands):
|
|
|
|
|
|
|
|
|
|
|
|
|
|
|
|
|
|
|
|
|
|
|
|
|
|
|
|
|
|
|
|
|
|
|
|
|
|
|
|
|
|
|
|
|
|
|
December 31, 2023 |
| |
|
Number of Securities |
|
Less Than 12 Months |
|
12 Months or Longer |
|
Total |
|
|
|
Fair
Value |
|
Unrealized
Loss |
|
Fair
Value |
|
Unrealized
Loss |
|
Fair
Value |
|
Unrealized
Loss |
| Investment: |
|
|
|
|
|
|
|
|
|
|
|
|
|
|
| Municipal securities |
|
13 |
|
|
$ |
1,931 |
|
|
$ |
5 |
|
|
$ |
6,600 |
|
|
$ |
189 |
|
|
$ |
8,531 |
|
|
$ |
194 |
|
| Mortgage-backed securities: |
|
|
|
|
|
|
|
|
|
|
|
|
|
|
| Residential agency |
|
116 |
|
|
— |
|
|
— |
|
|
1,916,732 |
|
|
174,398 |
|
|
1,916,732 |
|
|
174,398 |
|
| Commercial agency |
|
2 |
|
|
— |
|
|
— |
|
|
15,067 |
|
|
847 |
|
|
15,067 |
|
|
847 |
|
| Other debt securities |
|
3 |
|
|
— |
|
|
— |
|
|
8,672 |
|
|
1,603 |
|
|
8,672 |
|
|
1,603 |
|
| Total investment securities |
|
134 |
|
|
$ |
1,931 |
|
|
$ |
5 |
|
|
$ |
1,947,071 |
|
|
$ |
177,037 |
|
|
$ |
1,949,002 |
|
|
$ |
177,042 |
|
|
|
|
|
|
|
|
|
|
|
|
|
|
|
|
|
|
|
|
|
|
|
|
|
|
|
|
|
|
|
|
|
|
|
|
|
|
|
|
|
|
|
|
|
|
|
|
December 31, 2022 |
| |
|
Number of Securities |
|
Less Than 12 Months |
|
12 Months or Longer |
|
Total |
|
|
|
Fair
Value |
|
Unrealized
Loss |
|
Fair
Value |
|
Unrealized
Loss |
|
Fair
Value |
|
Unrealized
Loss |
| Investment: |
|
|
|
|
|
|
|
|
|
|
|
|
|
|
| Municipal securities |
|
22 |
|
|
$ |
18,037 |
|
|
$ |
406 |
|
|
$ |
544 |
|
|
$ |
58 |
|
|
$ |
18,581 |
|
|
$ |
464 |
|
| Mortgage-backed securities: |
|
|
|
|
|
|
|
|
|
|
|
|
|
|
| Residential agency |
|
116 |
|
|
2,142,114 |
|
|
172,014 |
|
|
— |
|
|
— |
|
|
2,142,114 |
|
|
172,014 |
|
| Commercial agency |
|
2 |
|
|
14,588 |
|
|
1,021 |
|
|
— |
|
|
— |
|
|
14,588 |
|
|
1,021 |
|
| Other debt securities |
|
3 |
|
|
9,428 |
|
|
571 |
|
|
257 |
|
|
18 |
|
|
9,685 |
|
|
589 |
|
| Total investment securities |
|
143 |
|
|
$ |
2,184,167 |
|
|
$ |
174,012 |
|
|
$ |
801 |
|
|
$ |
76 |
|
|
$ |
2,184,968 |
|
|
$ |
174,088 |
|
Available for Sale Securities
The amortized cost and fair value of available for sale securities are as follows (in thousands):
|
|
|
|
|
|
|
|
|
|
|
|
|
|
|
|
|
|
|
|
|
|
|
|
|
|
|
|
|
| |
|
December 31, 2023 |
| |
|
Amortized |
|
Fair |
|
Gross Unrealized |
|
|
| |
|
Cost |
|
Value |
|
Gain |
|
Loss |
|
|
| U.S. Treasury |
|
$ |
1,000 |
|
|
$ |
925 |
|
|
$ |
— |
|
|
$ |
(75) |
|
|
|
| Municipal securities |
|
544,707 |
|
|
502,833 |
|
|
1 |
|
|
(41,875) |
|
|
|
| Mortgage-backed securities: |
|
|
|
|
|
|
|
|
|
|
| Residential agency |
|
7,066,645 |
|
|
6,834,720 |
|
|
36,983 |
|
|
(268,908) |
|
|
|
| Residential non-agency |
|
833,535 |
|
|
799,877 |
|
|
12,865 |
|
|
(46,523) |
|
|
|
| Commercial agency |
|
4,456,918 |
|
|
4,147,853 |
|
|
2,972 |
|
|
(312,037) |
|
|
|
| Other debt securities |
|
500 |
|
|
473 |
|
|
— |
|
|
(27) |
|
|
|
| Total available for sale securities |
|
$ |
12,903,305 |
|
|
$ |
12,286,681 |
|
|
$ |
52,821 |
|
|
$ |
(669,445) |
|
|
|
|
|
|
|
|
|
|
|
|
|
|
|
|
|
|
|
|
|
|
|
|
|
|
|
|
|
|
|
|
| |
|
December 31, 2022 |
| |
|
Amortized |
|
Fair |
|
Gross Unrealized |
|
|
| |
|
Cost |
|
Value |
|
Gain |
|
Loss |
|
|
| U.S. Treasury |
|
$ |
1,000 |
|
|
$ |
898 |
|
|
$ |
— |
|
|
$ |
(102) |
|
|
|
| Municipal securities |
|
687,875 |
|
|
624,500 |
|
|
321 |
|
|
(63,696) |
|
|
|
| Mortgage-backed securities: |
|
|
|
|
|
|
|
|
|
|
| Residential agency |
|
6,161,358 |
|
|
5,814,496 |
|
|
13,085 |
|
|
(359,947) |
|
|
|
| Residential non-agency |
|
616,423 |
|
|
577,576 |
|
|
11,776 |
|
|
(50,623) |
|
|
|
| Commercial agency |
|
4,892,257 |
|
|
4,475,917 |
|
|
3,479 |
|
|
(419,819) |
|
|
|
| Other debt securities |
|
500 |
|
|
473 |
|
|
— |
|
|
(27) |
|
|
|
| Total available for sale securities |
|
$ |
12,359,413 |
|
|
$ |
11,493,860 |
|
|
$ |
28,661 |
|
|
$ |
(894,214) |
|
|
|
The amortized cost and fair values of available for sale securities at December 31, 2023, by contractual maturity, are as shown in the following table (dollars in thousands):
|
|
|
|
|
|
|
|
|
|
|
|
|
|
|
|
|
|
|
|
|
|
|
|
|
|
|
|
|
|
|
|
|
|
|
|
|
Less than
One Year |
|
One to
Five Years |
|
Six to
Ten Years |
|
Over
Ten Years |
|
Total |
|
Weighted
Average
Maturity1
|
| Fixed maturity debt securities: |
|
|
|
|
|
|
|
|
|
|
|
| Amortized cost |
$ |
397,083 |
|
|
$ |
3,008,053 |
|
|
$ |
1,122,067 |
|
|
$ |
475,922 |
|
|
$ |
5,003,125 |
|
|
5.28 |
|
| Fair value |
392,254 |
|
|
2,764,659 |
|
|
1,040,314 |
|
|
454,857 |
|
|
4,652,084 |
|
|
|
| Residential mortgage-backed securities: |
|
|
|
|
|
|
|
|
|
|
|
| Amortized cost |
|
|
|
|
|
|
|
|
$ |
7,900,180 |
|
|
2 |
| Fair value |
|
|
|
|
|
|
|
|
7,634,597 |
|
|
|
Total available for sale securities: |
|
|
|
|
|
|
|
|
|
|
|
| Amortized cost |
|
|
|
|
|
|
|
|
$ |
12,903,305 |
|
|
|
| Fair value |
|
|
|
|
|
|
|
|
12,286,681 |
|
|
|
1Expected maturities may differ from contractual maturities, because borrowers may have the right to call or prepay obligations with or without penalty.
2The average expected lives of residential mortgage-backed securities were 4.0 years based upon current prepayment assumptions.
Sales of available for sale securities resulted in gains and losses as follows (in thousands):
|
|
|
|
|
|
|
|
|
|
|
|
|
|
|
|
|
|
|
Year Ended December 31, |
| |
2023 |
|
2022 |
|
2021 |
| Proceeds |
$ |
834,704 |
|
|
$ |
307,481 |
|
|
$ |
622,881 |
|
| Gross realized gains |
1,180 |
|
|
5,054 |
|
|
5,702 |
|
| Gross realized losses |
(31,816) |
|
|
(6,025) |
|
|
(1,998) |
|
Related federal and state income tax expense (benefit) |
(7,206) |
|
|
(227) |
|
|
889 |
|
The fair value of debt securities pledged as collateral for repurchase agreements, public trust funds on deposit and for other purposes, as required by law was $13.9 billion at December 31, 2023 and $11.2 billion at December 31, 2022. The secured parties do not have the right to sell or repledge these securities.
Temporarily Impaired Available for Sale Securities
(In thousands)
|
|
|
|
|
|
|
|
|
|
|
|
|
|
|
|
|
|
|
|
|
|
|
|
|
|
|
|
|
|
|
|
|
|
|
|
|
|
|
|
|
|
|
|
|
|
|
December 31, 2023 |
| |
|
Number of Securities |
|
Less Than 12 Months |
|
12 Months or Longer |
|
Total |
|
|
|
Fair
Value |
|
Unrealized
Loss |
|
Fair
Value |
|
Unrealized
Loss |
|
Fair
Value |
|
Unrealized
Loss |
| Available for sale: |
|
|
|
|
|
|
|
|
|
|
|
|
|
|
U.S. Treasury |
|
1 |
|
|
$ |
— |
|
|
$ |
— |
|
|
$ |
925 |
|
|
$ |
75 |
|
|
$ |
925 |
|
|
$ |
75 |
|
| Municipal securities |
|
190 |
|
|
6,799 |
|
|
410 |
|
|
494,955 |
|
|
41,465 |
|
|
501,754 |
|
|
41,875 |
|
| Mortgage-backed securities: |
|
|
|
|
|
|
|
|
|
|
|
|
|
|
| Residential agency |
|
630 |
|
|
690,118 |
|
|
3,689 |
|
|
3,717,975 |
|
|
265,219 |
|
|
4,408,093 |
|
|
268,908 |
|
| Residential non-agency |
|
32 |
|
|
116,077 |
|
|
1,244 |
|
|
451,370 |
|
|
45,279 |
|
|
567,447 |
|
|
46,523 |
|
Commercial agency |
|
269 |
|
|
392,828 |
|
|
2,626 |
|
|
3,421,757 |
|
|
309,411 |
|
|
3,814,585 |
|
|
312,037 |
|
| Other debt securities |
|
1 |
|
|
— |
|
|
— |
|
|
473 |
|
|
27 |
|
|
473 |
|
|
27 |
|
| Total available for sale securities |
|
1,123 |
|
|
$ |
1,205,822 |
|
|
$ |
7,969 |
|
|
$ |
8,087,455 |
|
|
$ |
661,476 |
|
|
$ |
9,293,277 |
|
|
$ |
669,445 |
|
|
|
|
|
|
|
|
|
|
|
|
|
|
|
|
|
|
|
|
|
|
|
|
|
|
|
|
|
|
|
|
|
|
|
|
|
|
|
|
|
|
|
|
|
|
|
|
December 31, 2022 |
|
|
Number of Securities |
|
Less Than 12 Months |
|
12 Months or Longer |
|
Total |
|
|
|
Fair
Value |
|
Unrealized
Loss |
|
Fair
Value |
|
Unrealized
Loss |
|
Fair
Value |
|
Unrealized
Loss |
| Available for sale: |
|
|
|
|
|
|
|
|
|
|
|
|
|
|
U.S. Treasury |
|
1 |
|
|
$ |
— |
|
|
$ |
— |
|
|
$ |
899 |
|
|
$ |
102 |
|
|
$ |
899 |
|
|
$ |
102 |
|
| Municipal securities |
|
227 |
|
|
146,634 |
|
|
5,301 |
|
|
428,248 |
|
|
58,395 |
|
|
574,882 |
|
|
63,696 |
|
Mortgage-backed securities: |
|
|
|
|
|
|
|
|
|
|
|
|
|
|
| Residential agency |
|
613 |
|
|
3,879,582 |
|
|
256,973 |
|
|
863,732 |
|
|
102,974 |
|
|
4,743,314 |
|
|
359,947 |
|
| Residential non-agency |
|
26 |
|
|
499,716 |
|
|
50,623 |
|
|
— |
|
|
— |
|
|
499,716 |
|
|
50,623 |
|
Commercial agency |
|
285 |
|
|
1,647,778 |
|
|
63,701 |
|
|
2,535,816 |
|
|
356,118 |
|
|
4,183,594 |
|
|
419,819 |
|
| Other debt securities |
|
1 |
|
|
— |
|
|
— |
|
|
473 |
|
|
27 |
|
|
473 |
|
|
27 |
|
| Total available for sale securities |
|
1,153 |
|
|
$ |
6,173,710 |
|
|
$ |
376,598 |
|
|
$ |
3,829,168 |
|
|
$ |
517,616 |
|
|
$ |
10,002,878 |
|
|
$ |
894,214 |
|
No credit impairment of available for sale securities was identified in 2023. Unrealized losses are related to changes in interest rates subsequent to purchase and are not attributable to credit. Based on evaluations of impaired securities as of December 31, 2023, the Company does not intend to sell any impaired available for sale securities before fair value recovers to the current amortized cost, and it is more-likely-than-not that the Company will not be required to sell impaired securities before fair value recovers, which may be maturity.
Fair Value Option Securities
Fair value option securities represent securities which the Company has elected to carry at fair value and are separately identified on the Consolidated Balance Sheets with changes in the fair value recognized in earnings as they occur. Certain residential mortgage-backed securities issued by U.S. government agencies and derivative contracts are held as an economic hedge of the mortgage servicing rights.
The fair value and net unrealized gain (loss) included in fair value option securities is as follows (in thousands):
|
|
|
|
|
|
|
|
|
|
|
|
|
|
|
|
|
|
|
|
|
|
|
|
|
|
|
| |
|
December 31, 2023 |
|
December 31, 2022 |
| |
|
Fair Value |
|
Net Unrealized Gain (Loss) |
|
Fair Value |
|
Net Unrealized Gain (Loss) |
|
|
|
|
|
|
|
|
|
| Residential agency mortgage-backed securities |
|
$ |
20,671 |
|
|
$ |
(1,406) |
|
|
$ |
296,590 |
|
|
$ |
338 |
|
|
|
|
|
|
|
|
|
|
(3) Derivatives
The following table summarizes the fair values of derivative contracts recorded as "derivative contracts" assets and liabilities in the balance sheet at December 31, 2023 (in thousands):
|
|
|
|
|
|
|
|
|
|
|
|
|
|
|
|
|
|
|
|
|
|
|
|
|
|
|
|
|
|
|
|
|
|
|
|
|
|
|
|
|
Assets |
| |
|
Notional1 |
|
Gross Fair Value |
|
Netting Adjustments |
|
Net Fair Value Before Cash Collateral |
|
Cash Collateral |
|
Fair Value Net of Cash Collateral |
| Customer risk management programs: |
|
|
|
|
|
|
|
|
|
|
|
|
| Interest rate contracts |
|
$ |
2,754,476 |
|
|
$ |
108,450 |
|
|
$ |
(6,810) |
|
|
$ |
101,640 |
|
|
$ |
(94,608) |
|
|
$ |
7,032 |
|
| Energy contracts |
|
7,846,190 |
|
|
836,425 |
|
|
(399,148) |
|
|
437,277 |
|
|
(169,141) |
|
|
268,136 |
|
|
|
|
|
|
|
|
|
|
|
|
|
|
| Foreign exchange contracts |
|
54,999 |
|
|
53,863 |
|
|
— |
|
|
53,863 |
|
|
(872) |
|
|
52,991 |
|
| Equity option contracts |
|
3,316 |
|
|
54 |
|
|
— |
|
|
54 |
|
|
(44) |
|
|
10 |
|
| Total customer risk management programs |
|
10,658,981 |
|
|
998,792 |
|
|
(405,958) |
|
|
592,834 |
|
|
(264,665) |
|
|
328,169 |
|
| Trading |
|
16,264,818 |
|
|
118,545 |
|
|
(37,111) |
|
|
81,434 |
|
|
(6,996) |
|
|
74,438 |
|
| Interest rate risk management programs |
|
425,014 |
|
|
7,697 |
|
|
— |
|
|
7,697 |
|
|
— |
|
|
7,697 |
|
| Total derivative contracts |
|
$ |
27,348,813 |
|
|
$ |
1,125,034 |
|
|
$ |
(443,069) |
|
|
$ |
681,965 |
|
|
$ |
(271,661) |
|
|
$ |
410,304 |
|
|
|
|
|
|
|
|
|
|
|
|
|
|
|
|
Liabilities |
| |
|
Notional¹ |
|
Gross Fair Value |
|
Netting Adjustments |
|
Net Fair Value Before Cash Collateral |
|
Cash Collateral |
|
Fair Value Net of Cash Collateral |
| Customer risk management programs: |
|
|
|
|
|
|
|
|
|
|
|
|
| Interest rate contracts |
|
$ |
2,754,476 |
|
|
$ |
108,402 |
|
|
$ |
(6,810) |
|
|
$ |
101,592 |
|
|
$ |
— |
|
|
$ |
101,592 |
|
| Energy contracts |
|
8,254,004 |
|
|
831,467 |
|
|
(399,148) |
|
|
432,319 |
|
|
(6,441) |
|
|
425,878 |
|
|
|
|
|
|
|
|
|
|
|
|
|
|
| Foreign exchange contracts |
|
54,405 |
|
|
53,065 |
|
|
— |
|
|
53,065 |
|
|
— |
|
|
53,065 |
|
| Equity option contracts |
|
3,316 |
|
|
54 |
|
|
— |
|
|
54 |
|
|
— |
|
|
54 |
|
| Total customer risk management programs |
|
11,066,201 |
|
|
992,988 |
|
|
(405,958) |
|
|
587,030 |
|
|
(6,441) |
|
|
580,589 |
|
| Trading |
|
20,644,156 |
|
|
224,648 |
|
|
(37,111) |
|
|
187,537 |
|
|
(181,917) |
|
|
5,620 |
|
| Interest rate risk management programs |
|
2,244 |
|
|
1,264 |
|
|
— |
|
|
1,264 |
|
|
— |
|
|
1,264 |
|
| Total derivative contracts |
|
$ |
31,712,601 |
|
|
$ |
1,218,900 |
|
|
$ |
(443,069) |
|
|
$ |
775,831 |
|
|
$ |
(188,358) |
|
|
$ |
587,473 |
|
1 Notional amounts for commodity contracts are converted into dollar-equivalent amounts based on dollar prices at the inception of the contract.
The following table summarizes the fair values of derivative contracts recorded as "derivative contracts" assets and liabilities in the balance sheet at December 31, 2022 (in thousands):
|
|
|
|
|
|
|
|
|
|
|
|
|
|
|
|
|
|
|
|
|
|
|
|
|
|
|
|
|
|
|
|
|
|
|
|
|
|
|
|
|
Assets |
| |
|
Notional1 |
|
Gross Fair Value |
|
Netting Adjustments |
|
Net Fair Value Before Cash Collateral |
|
Cash Collateral |
|
Fair Value Net of Cash Collateral |
| Customer risk management programs: |
|
|
|
|
|
|
|
|
|
|
|
|
| Interest rate contracts |
|
$ |
2,629,318 |
|
|
$ |
158,825 |
|
|
$ |
— |
|
|
$ |
158,825 |
|
|
$ |
(114,955) |
|
|
$ |
43,870 |
|
| Energy contracts |
|
7,918,020 |
|
|
1,232,283 |
|
|
(594,543) |
|
|
637,740 |
|
|
(67,024) |
|
|
570,716 |
|
|
|
|
|
|
|
|
|
|
|
|
|
|
| Foreign exchange contracts |
|
219,791 |
|
|
216,569 |
|
|
— |
|
|
216,569 |
|
|
— |
|
|
216,569 |
|
| Equity option contracts |
|
21,102 |
|
|
193 |
|
|
— |
|
|
193 |
|
|
(109) |
|
|
84 |
|
| Total customer risk management programs |
|
10,788,231 |
|
|
1,607,870 |
|
|
(594,543) |
|
|
1,013,327 |
|
|
(182,088) |
|
|
831,239 |
|
| Trading |
|
17,400,037 |
|
|
126,910 |
|
|
(74,647) |
|
|
52,263 |
|
|
(4,646) |
|
|
47,617 |
|
| Internal risk management programs |
|
85,000 |
|
|
1,500 |
|
|
(13) |
|
|
1,487 |
|
|
— |
|
|
1,487 |
|
| Total derivative contracts |
|
$ |
28,273,268 |
|
|
$ |
1,736,280 |
|
|
$ |
(669,203) |
|
|
$ |
1,067,077 |
|
|
$ |
(186,734) |
|
|
$ |
880,343 |
|
|
|
|
|
|
|
|
|
|
|
|
|
|
|
|
Liabilities |
| |
|
Notional¹ |
|
Gross Fair Value |
|
Netting Adjustments |
|
Net Fair Value Before Cash Collateral |
|
Cash Collateral |
|
Fair Value Net of Cash Collateral |
| Customer risk management programs: |
|
|
|
|
|
|
|
|
|
|
|
|
| Interest rate contracts |
|
$ |
2,629,122 |
|
|
$ |
158,816 |
|
|
$ |
— |
|
|
$ |
158,816 |
|
|
$ |
— |
|
|
$ |
158,816 |
|
| Energy contracts |
|
8,696,060 |
|
|
1,242,058 |
|
|
(594,543) |
|
|
647,515 |
|
|
(484,319) |
|
|
163,196 |
|
|
|
|
|
|
|
|
|
|
|
|
|
|
| Foreign exchange contracts |
|
214,855 |
|
|
211,233 |
|
|
— |
|
|
211,233 |
|
|
(7) |
|
|
211,226 |
|
| Equity option contracts |
|
21,102 |
|
|
193 |
|
|
— |
|
|
193 |
|
|
— |
|
|
193 |
|
| Total customer risk management programs |
|
11,561,139 |
|
|
1,612,300 |
|
|
(594,543) |
|
|
1,017,757 |
|
|
(484,326) |
|
|
533,431 |
|
| Trading |
|
14,038,906 |
|
|
94,958 |
|
|
(74,647) |
|
|
20,311 |
|
|
(423) |
|
|
19,888 |
|
| Internal risk management programs |
|
178,806 |
|
|
1,594 |
|
|
(13) |
|
|
1,581 |
|
|
— |
|
|
1,581 |
|
| Total derivative contracts |
|
$ |
25,778,851 |
|
|
$ |
1,708,852 |
|
|
$ |
(669,203) |
|
|
$ |
1,039,649 |
|
|
$ |
(484,749) |
|
|
$ |
554,900 |
|
1 Notional amounts for commodity contracts are converted into dollar-equivalent amounts based on dollar prices at the inception of the contract.
The following summarizes the pre-tax net gains (losses) on derivative instruments and where they are recorded in the Consolidated Statements of Earnings (in thousands):
|
|
|
|
|
|
|
|
|
|
|
|
|
|
|
|
|
|
|
|
|
|
|
|
|
|
|
|
|
|
|
|
|
|
|
|
|
|
|
| |
|
Year Ended December 31, |
|
|
2023 |
|
2022 |
|
2021 |
| |
|
Brokerage
and Trading Revenue |
|
Gain (Loss)
on Derivatives, Net |
|
Brokerage
and Trading
Revenue |
|
Gain (Loss)
on Derivatives,
Net |
|
Brokerage
and Trading
Revenue |
|
Gain (Loss)
on Derivatives,
Net |
| Customer risk management programs: |
|
|
|
|
|
|
|
|
|
|
|
|
| Interest rate contracts |
|
$ |
5,531 |
|
|
$ |
— |
|
|
$ |
10,690 |
|
|
$ |
— |
|
|
$ |
5,503 |
|
|
$ |
— |
|
| Energy contracts |
|
30,715 |
|
|
— |
|
|
34,435 |
|
|
— |
|
|
14,190 |
|
|
— |
|
| Agricultural contracts |
|
— |
|
|
— |
|
|
— |
|
|
— |
|
|
27 |
|
|
— |
|
| Foreign exchange contracts |
|
276 |
|
|
— |
|
|
591 |
|
|
— |
|
|
712 |
|
|
— |
|
|
|
|
|
|
|
|
|
|
|
|
|
|
| Total customer risk management programs |
|
36,522 |
|
|
— |
|
|
45,716 |
|
|
— |
|
|
20,432 |
|
|
— |
|
Trading1 |
|
(139,235) |
|
|
— |
|
|
48,616 |
|
|
— |
|
|
(11,453) |
|
|
— |
|
Internal risk management programs |
|
— |
|
|
(9,921) |
|
|
— |
|
|
(73,011) |
|
|
— |
|
|
(19,378) |
|
| Total derivative contracts |
|
$ |
(102,713) |
|
|
$ |
(9,921) |
|
|
$ |
94,332 |
|
|
$ |
(73,011) |
|
|
$ |
8,979 |
|
|
$ |
(19,378) |
|
1 Includes changes in fair value of to-be-announced U.S. agency residential mortgage-backed securities and other derivative instruments offered to mortgage banking customers to manage their market risk or held to mitigate market risk of trading securities portfolio, which is offset by changes in fair value of trading securities also included in Brokerage and trading revenue in the Consolidated Statements of Earnings.
As discussed in Note 7, certain derivative contracts not designated as hedging instruments related to mortgage loan commitments and forward sales contracts are included in Residential mortgage loans held for sale on the Consolidated Balance Sheets. See Note 7 for additional discussion of notional, fair value and impact on earnings of these contracts.
No derivative contracts have been designated as hedging instruments for financial reporting purposes.
(4) Loans and Allowances for Credit Losses
The portfolio segments of the loan portfolio are as follows (in thousands):
|
|
|
|
|
|
|
|
|
|
|
|
|
|
|
|
|
|
|
|
|
|
|
|
|
|
|
|
|
|
|
|
|
|
|
|
|
|
|
|
|
|
|
|
|
|
|
|
|
|
|
|
|
|
|
|
|
|
|
| |
|
December 31, 2023 |
|
December 31, 2022 |
|
|
|
|
Fixed
Rate |
|
Variable
Rate |
|
Non-accrual |
|
Total |
|
Fixed
Rate |
|
Variable
Rate |
|
Non-
accrual
|
|
Total |
|
|
|
|
|
|
|
|
| Commercial |
|
$ |
3,558,563 |
|
|
$ |
11,135,075 |
|
|
$ |
110,131 |
|
|
$ |
14,803,769 |
|
|
$ |
3,392,422 |
|
|
$ |
10,759,780 |
|
|
$ |
60,297 |
|
|
$ |
14,212,499 |
|
|
|
|
|
|
|
|
|
Commercial real estate |
|
791,757 |
|
|
4,538,570 |
|
|
7,320 |
|
|
5,337,647 |
|
|
874,716 |
|
|
3,715,491 |
|
|
16,570 |
|
|
4,606,777 |
|
|
|
|
|
|
|
|
|
| Loans to individuals |
|
2,282,914 |
|
|
1,452,620 |
|
|
28,018 |
|
|
3,763,552 |
|
|
2,099,165 |
|
|
1,593,779 |
|
|
44,930 |
|
|
3,737,874 |
|
|
|
|
|
|
|
|
|
| Total |
|
$ |
6,633,234 |
|
|
$ |
17,126,265 |
|
|
$ |
145,469 |
|
|
$ |
23,904,968 |
|
|
$ |
6,366,303 |
|
|
$ |
16,069,050 |
|
|
$ |
121,797 |
|
|
$ |
22,557,150 |
|
|
|
|
|
|
|
|
|
Foregone interest on nonaccrual loans |
|
|
|
|
|
|
|
$ |
7,863 |
|
|
|
|
|
|
|
|
$ |
6,796 |
|
|
|
|
|
|
|
|
|
At December 31, 2023, loans to businesses and individuals with collateral primarily located in Texas totaled $7.6 billion or 32% of the total loan portfolio. Loans to businesses and individuals with collateral primarily located in Oklahoma totaled $3.3 billion or 14% of our total loan portfolio. Loans to businesses and individuals with collateral primarily located in Colorado totaled $2.7 billion or 11% of our total loan portfolio. Loans for which the collateral location is not relevant, such as unsecured loans and reserve-based energy loans, are distributed by the borrower’s primary operating location. These geographic concentrations subject the loan portfolio to the general economic conditions within these areas.
At December 31, 2022, loans to businesses and individuals with collateral primarily located in Texas totaled $7.3 billion or 32% of the loan portfolio, loans to businesses and individuals with collateral primarily located in Oklahoma totaled $3.5 billion or 16% of the loan portfolio and loans to businesses and individuals with collateral primarily located in Colorado totaled $2.5 billion or 11% of the loan portfolio.
Commercial
Commercial loans represent loans for working capital, facilities acquisition or expansion, purchases of equipment and other needs of commercial customers primarily located within our geographical footprint. Commercial loans are underwritten individually and represent on-going relationships based on a thorough knowledge of the customer, the customer’s industry and market. While commercial loans are generally secured by the customer’s assets including real property, inventory, accounts receivable, operating equipment, interest in mineral rights and other property and may also include personal guarantees of the owners and related parties, the primary source of repayment of the loans is the on-going cash flow from operations of the customer’s business. Inherent lending risk is centrally monitored on a continuous basis from underwriting throughout the life of the loan for compliance with commercial lending policies.
At December 31, 2023, commercial loans with collateral primarily located in Texas totaled $4.8 billion or 33% of the commercial loan portfolio segment. Commercial loans with collateral primarily located in Oklahoma totaled $1.8 billion or 12% of the commercial loan portfolio segment. Commercial loans with collateral primarily located in Colorado totaled $1.8 billion or 12% of the commercial loan portfolio segment. The commercial loan portfolio segment is further divided into loan classes. The healthcare loan class totaled $4.1 billion or 17% of total loans. The healthcare loan class consists primarily of loans for the development and operation of senior housing and care facilities, including independent living, assisted living and skilled nursing. Healthcare also includes loans to hospitals and other medical service providers. The services loan class totaled $3.6 billion or 15% of total loans. Approximately $1.6 billion of loans in the services class consisted of loans with individual balances of less than $10 million. Businesses included in the services class include Native American tribal and state and local municipal government entities, Native American tribal casino operations, educational services, foundations and not-for-profit organizations and specialty trade contractors. The energy loan class totaled $3.4 billion or 14% of total loans, including $2.7 billion of outstanding loans to energy producers. Approximately 69% of the committed production loans are secured by properties primarily producing oil and 31% of the committed production loans are secured by properties primarily producing natural gas.
At December 31, 2022, commercial loans with collateral primarily located in Texas totaled $4.7 billion or 33% of the commercial loan portfolio segment, commercial loans with collateral primarily located in Oklahoma totaled $2.1 billion or 15% of the commercial loan portfolio segment and commercial loans with collateral primarily located in Colorado totaled $1.8 billion or 12% of the commercial loan portfolio segment. The healthcare loan class totaled $3.8 billion or 17% of total loans. The services loan class totaled $3.4 billion or 15% of total loans. Approximately $1.6 billion of loans in the services category consisted of loans with individual balances of less than $10 million. The energy loan class totaled $3.4 billion or 15% of total loans, including $2.7 billion of outstanding loans to energy producers. At December 31, 2022, approximately 72% of committed production loans were secured by properties primarily producing oil and 28% were secured by properties producing natural gas.
Commercial Real Estate
Commercial real estate loans are for the construction of buildings or other improvements to real estate and property held by borrowers for investment purposes primarily within our geographical footprint. We require collateral values in excess of the loan amounts, demonstrated cash flows in excess of expected debt service requirements, equity investment in the project and a portion of the project already sold, leased or permanent financing already secured. The expected cash flows from all significant new or renewed income producing property commitments are stress tested to reflect the risks in varying interest rates, vacancy rates and rental rates. As with commercial loans, inherent lending risks are centrally monitored on a continuous basis from underwriting throughout the life of the loan for compliance with applicable lending policies.
At December 31, 2023, 31% of commercial real estate loans were secured by properties primarily located in the Dallas and Houston metropolitan areas of Texas while concentrations in all other states were less than 10%. At December 31, 2022, 30% of commercial real estate loans are secured by properties primarily located in the Dallas and Houston metropolitan areas of Texas while concentrations in all other states were less than 10%.
Loans to Individuals
Loans to individuals include residential mortgage and personal loans. Residential mortgage loans provide funds for our customers to purchase or refinance their primary residence or to borrow against the equity in their home. These loans are secured by a first or second mortgage on the customer's primary residence. Personal loans consist primarily of loans to Wealth Management clients secured by the cash surrender value of insurance policies and marketable securities. Personal loans also include direct loans secured by and for the purchase of automobiles, recreational and marine equipment as well as unsecured loans. These loans are made in accordance with underwriting policies we believe to be conservative and are fully documented. Loans may be individually underwritten or credit scored based on size and other criteria. Credit scoring is assessed based on significant credit characteristics including credit history, residential and employment stability.
In general, we sell the majority of our conforming fixed rate residential mortgage loan originations in the secondary market and retain the majority of our non-conforming and adjustable-rate mortgage loans. Our mortgage loan portfolio does not include payment option adjustable rate mortgage loans or adjustable rate mortgage loans with initial rates that are below market. Home equity loans are primarily first-lien and fully amortizing.
Residential mortgage loans guaranteed by U.S. government agencies have limited credit exposure because of the agency guarantee. This amount includes residential mortgage loans previously sold into GNMA mortgage pools that the Company may repurchase when certain defined delinquency criteria are met. Because of this repurchase right, the Company is deemed to have regained effective control over these loans and must include them on the Consolidated Balance Sheet.
Approximately 91% of the loans in this segment are secured by collateral located within our geographical footprint. Loans for which the collateral location is less relevant, such as unsecured loans, are categorized by the borrower’s primary location.
Credit Commitments
Commitments to extend credit are agreements to lend to a customer as long as there is no violation of conditions established in the contract. Commitments generally have fixed expiration dates or other termination clauses and may require payment of a fee. At December 31, 2023, outstanding commitments totaled $14.8 billion. Because some commitments are expected to expire before being drawn upon, the total commitment amounts do not necessarily represent future cash requirements. BOK Financial uses the same credit policies in making commitments as it does loans.
The amount of collateral obtained, if deemed necessary, is based upon management’s credit evaluation of the borrower.
Standby letters of credit are conditional commitments issued to guarantee the performance of a customer to a third party. Because the credit risk involved in issuing standby letters of credit is essentially the same as that involved in extending loan commitments, BOK Financial uses the same credit policies in evaluating the creditworthiness of the customer. Additionally, BOK Financial uses the same evaluation process in obtaining collateral on standby letters of credit as it does for loan commitments. The term of these standby letters of credit is defined in each commitment and typically corresponds with the underlying loan commitment. At December 31, 2023, outstanding standby letters of credit totaled $711 million.
Allowances for Credit Losses and Accrual for Off-balance Sheet Credit Risk from Unfunded Loans Commitments
BOK Financial maintains an allowance for loan losses and accrual for off-balance sheet credit risk from unfunded commitments. The allowance consists of specific allowances attributed to certain individual loans, generally nonaccruing loans, with dissimilar risk characteristics that have not yet been charged down to amounts we expect to recover and general allowances for estimated credit losses on pools of loans that share similar risk characteristics based on probability of default, loss given default and exposure at default for each loan class developed based on current and forecasted relevant economic loss drivers.
The accrual for off-balance sheet credit risk is maintained at a level that is appropriate to cover estimated losses associated with credit instruments that are not currently recognized as assets such as loan commitments, standby letters of credit or guarantees that are not unconditionally cancellable by the bank.
The activity in the allowance for loan losses and the allowance for off-balance sheet credit losses related to loan commitments and standby letters of credit for the year ended December 31, 2023 is summarized as follows (in thousands):
|
|
|
|
|
|
|
|
|
|
|
|
|
|
|
|
|
|
|
|
|
|
|
|
|
|
|
|
|
|
|
| |
|
Commercial |
|
Commercial Real Estate |
|
|
|
Loans to
Individuals |
|
|
|
Total |
| Allowance for loan losses: |
|
|
|
|
|
|
|
|
|
|
|
|
| Beginning balance |
|
$ |
131,586 |
|
|
$ |
57,648 |
|
|
|
|
$ |
46,470 |
|
|
|
|
$ |
235,704 |
|
|
|
|
|
|
|
|
|
|
|
|
|
|
|
|
|
|
|
|
|
|
|
|
|
|
|
| Provision for loan losses |
|
19,308 |
|
|
42,151 |
|
|
|
|
(1,941) |
|
|
|
|
59,518 |
|
| Loans charged off |
|
(12,898) |
|
|
(8,446) |
|
|
|
|
(5,972) |
|
|
|
|
(27,316) |
|
| Recoveries of loans previously charged off |
|
3,236 |
|
|
3,365 |
|
|
|
|
2,616 |
|
|
|
|
9,217 |
|
| Ending balance |
|
$ |
141,232 |
|
|
$ |
94,718 |
|
|
|
|
$ |
41,173 |
|
|
|
|
$ |
277,123 |
|
|
|
|
|
|
|
|
|
|
|
|
|
|
| Allowance for off-balance sheet credit risk from unfunded loan commitments: |
|
|
|
|
|
|
|
|
|
|
|
|
| Beginning balance |
|
$ |
18,246 |
|
|
$ |
40,490 |
|
|
|
|
$ |
2,183 |
|
|
|
|
$ |
60,919 |
|
|
|
|
|
|
|
|
|
|
|
|
|
|
|
|
|
|
|
|
|
|
|
|
|
|
|
Provision for off-balance sheet credit risk |
|
1,516 |
|
|
(13,051) |
|
|
|
|
(407) |
|
|
|
|
(11,942) |
|
| Ending balance |
|
$ |
19,762 |
|
|
$ |
27,439 |
|
|
|
|
$ |
1,776 |
|
|
|
|
$ |
48,977 |
|
A $46.0 million provision for credit losses was recorded for the year ended December 31, 2023, primarily due to loan growth and changes in our economic forecast during the year, including a more challenging commercial real estate environment.
The activity in the allowance for loan losses and the allowance for off-balance sheet credit losses related to loan commitments and standby letters of credit for the year ended December 31, 2022 is summarized as follows (in thousands):
|
|
|
|
|
|
|
|
|
|
|
|
|
|
|
|
|
|
|
|
|
|
|
|
|
|
|
|
|
|
|
| |
|
Commercial |
|
Commercial Real Estate |
|
|
|
Loans to
Individuals |
|
|
|
Total |
| Allowance for loan losses: |
|
|
|
|
|
|
|
|
|
|
|
|
| Beginning balance |
|
$ |
162,056 |
|
|
$ |
58,553 |
|
|
|
|
$ |
35,812 |
|
|
|
|
$ |
256,421 |
|
|
|
|
|
|
|
|
|
|
|
|
|
|
|
|
|
|
|
|
|
|
|
|
|
|
|
| Provision for loan losses |
|
(12,782) |
|
|
(813) |
|
|
|
|
14,023 |
|
|
|
|
428 |
|
| Loans charged off |
|
(22,382) |
|
|
(269) |
|
|
|
|
(6,095) |
|
|
|
|
(28,746) |
|
| Recoveries of loans previously charged off |
|
4,694 |
|
|
177 |
|
|
|
|
2,730 |
|
|
|
|
7,601 |
|
| Ending balance |
|
$ |
131,586 |
|
|
$ |
57,648 |
|
|
|
|
$ |
46,470 |
|
|
|
|
$ |
235,704 |
|
|
|
|
|
|
|
|
|
|
|
|
|
|
| Allowance for off-balance sheet credit risk from unfunded loan commitments: |
|
|
|
|
|
|
|
|
|
|
|
|
| Beginning balance |
|
$ |
13,812 |
|
|
$ |
17,442 |
|
|
|
|
$ |
1,723 |
|
|
|
|
$ |
32,977 |
|
|
|
|
|
|
|
|
|
|
|
|
|
|
|
|
|
|
|
|
|
|
|
|
|
|
|
Provision for off-balance sheet credit risk |
|
4,434 |
|
|
23,048 |
|
|
|
|
460 |
|
|
|
|
27,942 |
|
| Ending balance |
|
$ |
18,246 |
|
|
$ |
40,490 |
|
|
|
|
$ |
2,183 |
|
|
|
|
$ |
60,919 |
|
The activity in the allowance for loan losses and the allowance for off-balance sheet credit losses related to loan commitments and standby letters of credit is for the year ended December 31, 2021 summarized as follows (in thousands):
|
|
|
|
|
|
|
|
|
|
|
|
|
|
|
|
|
|
|
|
|
|
|
|
|
|
|
|
|
|
|
| |
|
Commercial |
|
Commercial Real Estate |
|
|
|
Loans to Individuals |
|
|
|
Total |
| Allowance for loan losses: |
|
|
|
|
|
|
|
|
|
|
|
|
| Beginning balance |
|
$ |
254,934 |
|
|
$ |
86,558 |
|
|
|
|
$ |
47,148 |
|
|
|
|
$ |
388,640 |
|
|
|
|
|
|
|
|
|
|
|
|
|
|
|
|
|
|
|
|
|
|
|
|
|
|
|
| Provision for loan losses |
|
(59,326) |
|
|
(26,522) |
|
|
|
|
(9,354) |
|
|
|
|
(95,202) |
|
| Loans charged off |
|
(43,956) |
|
|
(2,485) |
|
|
|
|
(4,910) |
|
|
|
|
(51,351) |
|
| Recoveries |
|
10,404 |
|
|
1,002 |
|
|
|
|
2,928 |
|
|
|
|
14,334 |
|
| Ending balance |
|
$ |
162,056 |
|
|
$ |
58,553 |
|
|
|
|
$ |
35,812 |
|
|
|
|
$ |
256,421 |
|
|
|
|
|
|
|
|
|
|
|
|
|
|
| Allowance for off-balance sheet credit risk from unfunded loan commitments: |
|
|
|
|
|
|
|
|
|
|
|
|
| Beginning balance |
|
$ |
14,422 |
|
|
$ |
20,571 |
|
|
|
|
$ |
1,928 |
|
|
|
|
$ |
36,921 |
|
|
|
|
|
|
|
|
|
|
|
|
|
|
|
|
|
|
|
|
|
|
|
|
|
|
|
| Provision for off-balance sheet credit losses |
|
(610) |
|
|
(3,129) |
|
|
|
|
(205) |
|
|
|
|
(3,944) |
|
| Ending balance |
|
$ |
13,812 |
|
|
$ |
17,442 |
|
|
|
|
$ |
1,723 |
|
|
|
|
$ |
32,977 |
|
|
|
|
|
|
|
|
|
|
|
|
|
|
|
|
|
|
|
|
|
|
|
|
|
|
|
The allowance for loan losses and recorded investment of the related loans by portfolio segment for each impairment measurement method at December 31, 2023 is as follows (in thousands):
|
|
|
|
|
|
|
|
|
|
|
|
|
|
|
|
|
|
|
|
|
|
|
|
|
|
|
|
|
|
|
|
|
|
|
|
|
|
|
| |
|
Collectively Measured
for General Allowances |
|
Individually Measured
for Specific Allowances |
|
Total |
| |
|
Recorded Investment |
|
Related Allowance |
|
Recorded Investment |
|
Related Allowance |
|
Recorded Investment |
|
Related
Allowance |
| Commercial |
|
$ |
14,693,638 |
|
|
$ |
138,540 |
|
|
$ |
110,131 |
|
|
$ |
2,692 |
|
|
$ |
14,803,769 |
|
|
$ |
141,232 |
|
| Commercial real estate |
|
5,330,327 |
|
|
94,718 |
|
|
7,320 |
|
|
— |
|
|
5,337,647 |
|
|
94,718 |
|
| Loans to individuals |
|
3,735,534 |
|
|
41,173 |
|
|
28,018 |
|
|
— |
|
|
3,763,552 |
|
|
41,173 |
|
| Total |
|
$ |
23,759,499 |
|
|
$ |
274,431 |
|
|
$ |
145,469 |
|
|
$ |
2,692 |
|
|
$ |
23,904,968 |
|
|
$ |
277,123 |
|
The allowance for loan losses and recorded investment of the related loans by portfolio segment for each impairment measurement method at December 31, 2022 is as follows (in thousands):
|
|
|
|
|
|
|
|
|
|
|
|
|
|
|
|
|
|
|
|
|
|
|
|
|
|
|
|
|
|
|
|
|
|
|
|
|
|
|
| |
|
Collectively Measured
for General Allowances |
|
Individually Measured
for Specific Allowances |
|
Total |
| |
|
Recorded Investment |
|
Related Allowance |
|
Recorded Investment |
|
Related Allowance |
|
Recorded Investment |
|
Related
Allowance |
| Commercial |
|
$ |
14,152,202 |
|
|
$ |
127,566 |
|
|
$ |
60,297 |
|
|
$ |
4,020 |
|
|
$ |
14,212,499 |
|
|
$ |
131,586 |
|
| Commercial real estate |
|
4,590,207 |
|
|
56,098 |
|
|
16,570 |
|
|
1,550 |
|
|
4,606,777 |
|
|
57,648 |
|
| Loans to individuals |
|
3,692,944 |
|
|
46,470 |
|
|
44,930 |
|
|
— |
|
|
3,737,874 |
|
|
46,470 |
|
| Total |
|
$ |
22,435,353 |
|
|
$ |
230,134 |
|
|
$ |
121,797 |
|
|
$ |
5,570 |
|
|
$ |
22,557,150 |
|
|
$ |
235,704 |
|
Credit Quality Indicators
The Company utilizes risk grading as primary credit quality indicators as it influences the probability of default which is a key attribute in the expected credit losses calculation. Substantially all commercial as well as commercial real estate loans and certain loans to individuals are risk graded based on a quarterly evaluation of the borrowers’ ability to repay the loans. Certain commercial loans and most loans to individuals are small, homogeneous pools that are not risk-graded. The credit quality of these loans is based on past due days in accordance with regulatory guidelines.
We have included in the credit quality indicator "pass" loans that are in compliance with the original terms of the agreement and currently exhibit no factors that cause management to have doubts about the borrowers’ ability to remain in compliance with the original terms of the agreement, which is consistent with the regulatory guideline of "pass." This also includes past due residential mortgages that are guaranteed by agencies of the U.S. government that continue to accrue interest based on criteria of the guarantors’ programs.
Other loans especially mentioned ("Special Mention") are currently performing in compliance with the original terms of the agreement but may have a potential weakness that deserves management’s close attention, consistent with regulatory guidelines. Non-graded loans 30 to 59 days past due are categorized as Special Mention.
The risk grading process identifies certain loans that have a well-defined weakness (for example, inadequate debt service coverage or liquidity or marginal capitalization; repayment may depend on collateral or other risk mitigation) that may jeopardize liquidation of the debt and represent a greater risk due to deterioration in the financial condition of the borrower. This is consistent with the regulatory guideline for "substandard." Because the borrowers are still performing in accordance with the original terms of the loan agreements, these loans remain on accruing status. Non-graded loans 60 to 89 days past due are categorized as Accruing Substandard.
Nonaccruing loans represent loans for which full collection of principal and interest is uncertain. This includes certain loans considered "substandard" and all loans considered "doubtful" by regulatory guidelines. Non-graded loans 90 or more days past due are categorized as Nonaccrual.
Probability of default is lowest for pass graded loans and increases for each credit quality indicator, Special Mention, and Accruing Substandard.
Vintage represents the year of origination, except for revolving loans which are considered in aggregate. Loans that were once revolving but have converted to term loans without additional underwriting appear in a separate vintage column.
The following table summarizes the Company's loan portfolio at December 31, 2023 by the risk grade categories and vintage (in thousands):
|
|
|
|
|
|
|
|
|
|
|
|
|
|
|
|
|
|
|
|
|
|
|
|
|
|
|
|
|
|
|
Origination Year |
|
|
|
|
2023 |
2022 |
2021 |
2020 |
2019 |
Prior |
Revolving Loans |
Revolving Loans Converted to Term Loans |
Total |
| Commercial: |
|
|
|
|
|
|
|
|
|
| Healthcare |
|
|
|
|
|
|
|
|
|
| Pass |
$ |
650,768 |
|
$ |
895,602 |
|
$ |
590,736 |
|
$ |
409,001 |
|
$ |
331,897 |
|
$ |
809,858 |
|
$ |
281,378 |
|
$ |
15 |
|
$ |
3,969,255 |
|
| Special Mention |
— |
|
— |
|
— |
|
21,791 |
|
— |
|
31,235 |
|
5 |
|
— |
|
53,031 |
|
| Accruing Substandard |
— |
|
2,128 |
|
18,508 |
|
6,911 |
|
— |
|
10,896 |
|
975 |
|
— |
|
39,418 |
|
| Nonaccrual |
— |
|
— |
|
— |
|
30,290 |
|
23,129 |
|
28,110 |
|
— |
|
— |
|
81,529 |
|
| Total healthcare |
650,768 |
|
897,730 |
|
609,244 |
|
467,993 |
|
355,026 |
|
880,099 |
|
282,358 |
|
15 |
|
4,143,233 |
|
Loans charged off, year-to-date |
— |
|
— |
|
— |
|
— |
|
2,500 |
|
— |
|
— |
|
— |
|
2,500 |
|
|
|
|
|
|
|
|
|
|
|
|
|
|
|
|
|
|
|
|
|
| Energy |
|
|
|
|
|
|
|
|
|
| Pass |
190,122 |
|
100,006 |
|
43,769 |
|
7,876 |
|
9,562 |
|
11,583 |
|
3,025,590 |
|
— |
|
3,388,508 |
|
| Special Mention |
— |
|
— |
|
— |
|
— |
|
— |
|
— |
|
13,950 |
|
— |
|
13,950 |
|
| Accruing Substandard |
— |
|
— |
|
— |
|
— |
|
— |
|
— |
|
16,800 |
|
— |
|
16,800 |
|
| Nonaccrual |
— |
|
— |
|
— |
|
— |
|
— |
|
99 |
|
17,744 |
|
— |
|
17,843 |
|
| Total energy |
190,122 |
|
100,006 |
|
43,769 |
|
7,876 |
|
9,562 |
|
11,682 |
|
3,074,084 |
|
— |
|
3,437,101 |
|
Loans charged off, year-to-date |
— |
|
— |
|
— |
|
— |
|
— |
|
— |
|
— |
|
— |
|
— |
|
|
|
|
|
|
|
|
|
|
|
|
|
|
|
|
|
|
|
|
|
| Services |
|
|
|
|
|
|
|
|
|
| Pass |
900,090 |
|
526,776 |
|
401,872 |
|
228,818 |
|
106,112 |
|
643,477 |
|
730,729 |
|
595 |
|
3,538,469 |
|
| Special Mention |
— |
|
1,085 |
|
1,520 |
|
1,341 |
|
534 |
|
4,522 |
|
81 |
|
— |
|
9,083 |
|
| Accruing Substandard |
— |
|
13,712 |
|
178 |
|
326 |
|
3,972 |
|
3,746 |
|
3,108 |
|
13 |
|
25,055 |
|
| Nonaccrual |
— |
|
— |
|
1,635 |
|
338 |
|
— |
|
— |
|
1,643 |
|
— |
|
3,616 |
|
| Total services |
900,090 |
|
541,573 |
|
405,205 |
|
230,823 |
|
110,618 |
|
651,745 |
|
735,561 |
|
608 |
|
3,576,223 |
|
Loans charged off, year-to-date |
— |
|
— |
|
3,060 |
|
— |
|
— |
|
— |
|
2,642 |
|
— |
|
5,702 |
|
|
|
|
|
|
|
|
|
|
|
|
|
|
|
|
|
|
|
|
|
| General business |
|
|
|
|
|
|
|
|
|
| Pass |
942,468 |
|
436,832 |
|
224,735 |
|
138,951 |
|
101,100 |
|
287,744 |
|
1,389,128 |
|
2,164 |
|
3,523,122 |
|
| Special Mention |
10,264 |
|
16,167 |
|
8,420 |
|
1,253 |
|
321 |
|
8,295 |
|
897 |
|
— |
|
45,617 |
|
| Accruing Substandard |
4,401 |
|
33,194 |
|
1,716 |
|
27 |
|
— |
|
— |
|
31,992 |
|
— |
|
71,330 |
|
| Nonaccrual |
— |
|
1,134 |
|
— |
|
— |
|
— |
|
48 |
|
5,956 |
|
5 |
|
7,143 |
|
| Total general business |
957,133 |
|
487,327 |
|
234,871 |
|
140,231 |
|
101,421 |
|
296,087 |
|
1,427,973 |
|
2,169 |
|
3,647,212 |
|
Loans charged off, year-to-date |
— |
|
— |
|
4,598 |
|
2 |
|
— |
|
48 |
|
10 |
|
38 |
|
4,696 |
|
|
|
|
|
|
|
|
|
|
|
|
|
|
|
|
|
|
|
|
|
| Total commercial |
2,698,113 |
|
2,026,636 |
|
1,293,089 |
|
846,923 |
|
576,627 |
|
1,839,613 |
|
5,519,976 |
|
2,792 |
|
14,803,769 |
|
|
|
|
|
|
|
|
|
|
|
| Commercial real estate: |
|
|
|
|
|
|
|
|
|
| Pass |
396,891 |
|
1,941,913 |
|
1,194,759 |
|
416,647 |
|
513,555 |
|
705,092 |
|
136,095 |
|
— |
|
5,304,952 |
|
| Special Mention |
— |
|
476 |
|
— |
|
— |
|
— |
|
19,171 |
|
— |
|
— |
|
19,647 |
|
Accruing Substandard |
2,992 |
|
— |
|
3 |
|
— |
|
— |
|
2,733 |
|
— |
|
— |
|
5,728 |
|
| Nonaccrual |
— |
|
— |
|
— |
|
— |
|
7,170 |
|
150 |
|
— |
|
— |
|
7,320 |
|
| Total commercial real estate |
399,883 |
|
1,942,389 |
|
1,194,762 |
|
416,647 |
|
520,725 |
|
727,146 |
|
136,095 |
|
— |
|
5,337,647 |
|
Loans charged off, year-to-date |
— |
|
— |
|
— |
|
— |
|
— |
|
8,446 |
|
— |
|
— |
|
8,446 |
|
|
|
|
|
|
|
|
|
|
|
|
|
|
|
|
|
|
|
|
|
|
|
|
|
|
|
|
|
|
|
|
|
|
|
|
|
|
|
|
|
|
|
|
|
|
|
|
|
|
|
|
|
|
|
|
|
|
|
|
|
|
Origination Year |
|
|
|
|
2023 |
2022 |
2021 |
2020 |
2019 |
Prior |
Revolving Loans |
Revolving Loans Converted to Term Loans |
Total |
| Loans to individuals: |
|
|
|
|
|
|
|
|
|
Residential mortgage |
|
|
|
|
|
|
|
|
|
| Pass |
426,089 |
|
320,733 |
|
342,927 |
|
349,742 |
|
54,801 |
|
243,356 |
|
375,739 |
|
23,895 |
|
2,137,282 |
|
| Special Mention |
157 |
|
140 |
|
131 |
|
1,361 |
|
18 |
|
134 |
|
2,982 |
|
93 |
|
5,016 |
|
| Accruing Substandard |
— |
|
150 |
|
— |
|
— |
|
37 |
|
49 |
|
50 |
|
— |
|
286 |
|
| Nonaccrual |
79 |
|
1,419 |
|
237 |
|
544 |
|
344 |
|
12,381 |
|
2,387 |
|
665 |
|
18,056 |
|
| Total residential mortgage |
426,325 |
|
322,442 |
|
343,295 |
|
351,647 |
|
55,200 |
|
255,920 |
|
381,158 |
|
24,653 |
|
2,160,640 |
|
Loans charged off, year-to-date |
— |
|
— |
|
51 |
|
4 |
|
— |
|
17 |
|
— |
|
1 |
|
73 |
|
|
|
|
|
|
|
|
|
|
|
|
|
|
|
|
|
|
|
|
|
| Residential mortgage guaranteed by U.S. government agencies |
|
|
|
|
|
|
|
|
|
| Pass |
633 |
|
1,788 |
|
2,220 |
|
4,297 |
|
6,441 |
|
124,719 |
|
— |
|
— |
|
140,098 |
|
|
|
|
|
|
|
|
|
|
|
|
|
|
|
|
|
|
|
|
|
| Nonaccrual |
— |
|
— |
|
— |
|
280 |
|
375 |
|
9,054 |
|
— |
|
— |
|
9,709 |
|
Total residential mortgage guaranteed by U.S. government agencies |
633 |
|
1,788 |
|
2,220 |
|
4,577 |
|
6,816 |
|
133,773 |
|
— |
|
— |
|
149,807 |
|
|
|
|
|
|
|
|
|
|
|
|
|
|
|
|
|
|
|
|
|
|
|
|
|
|
|
|
|
|
|
| Personal |
|
|
|
|
|
|
|
|
|
| Pass |
218,401 |
|
229,580 |
|
149,291 |
|
136,215 |
|
75,348 |
|
137,629 |
|
503,841 |
|
145 |
|
1,450,450 |
|
| Special Mention |
66 |
|
39 |
|
106 |
|
30 |
|
8 |
|
— |
|
1,918 |
|
3 |
|
2,170 |
|
| Accruing Substandard |
— |
|
64 |
|
12 |
|
9 |
|
144 |
|
— |
|
3 |
|
— |
|
232 |
|
| Nonaccrual |
4 |
|
51 |
|
9 |
|
16 |
|
3 |
|
12 |
|
158 |
|
— |
|
253 |
|
| Total personal |
218,471 |
|
229,734 |
|
149,418 |
|
136,270 |
|
75,503 |
|
137,641 |
|
505,920 |
|
148 |
|
1,453,105 |
|
Loans charged off, year-to-date1 |
5,636 |
|
82 |
|
96 |
|
43 |
|
— |
|
10 |
|
6 |
|
26 |
|
5,899 |
|
|
|
|
|
|
|
|
|
|
|
|
|
|
|
|
|
|
|
|
|
| Total loans to individuals |
645,429 |
|
553,964 |
|
494,933 |
|
492,494 |
|
137,519 |
|
527,334 |
|
887,078 |
|
24,801 |
|
3,763,552 |
|
| Total loans |
$ |
3,743,425 |
|
$ |
4,522,989 |
|
$ |
2,982,784 |
|
$ |
1,756,064 |
|
$ |
1,234,871 |
|
$ |
3,094,093 |
|
$ |
6,543,149 |
|
$ |
27,593 |
|
$ |
23,904,968 |
|
1 Includes charge-offs on deposit overdrafts, which are generally charged off at 60 days past due.
The following table summarizes the Company's loan portfolio at December 31, 2022 by the risk grade categories and vintage (in thousands):
|
|
|
|
|
|
|
|
|
|
|
|
|
|
|
|
|
|
|
|
|
|
|
|
|
|
|
|
|
|
|
Origination Year |
|
|
|
|
2022 |
2021 |
2020 |
2019 |
2018 |
Prior |
Revolving Loans |
Revolving Loans Converted to Term Loans |
Total |
| Commercial: |
|
|
|
|
|
|
|
|
|
| Healthcare |
|
|
|
|
|
|
|
|
|
| Pass |
$ |
932,097 |
|
$ |
604,886 |
|
$ |
476,854 |
|
$ |
404,204 |
|
$ |
464,989 |
|
$ |
618,163 |
|
$ |
245,898 |
|
$ |
20 |
|
$ |
3,747,111 |
|
| Special Mention |
— |
|
— |
|
— |
|
20,071 |
|
— |
|
18,859 |
|
4 |
|
— |
|
38,934 |
|
| Accruing Substandard |
— |
|
— |
|
— |
|
— |
|
— |
|
14,304 |
|
3,634 |
|
— |
|
17,938 |
|
| Nonaccrual |
— |
|
— |
|
— |
|
26,480 |
|
6,373 |
|
8,181 |
|
— |
|
— |
|
41,034 |
|
| Total healthcare |
932,097 |
|
604,886 |
|
476,854 |
|
450,755 |
|
471,362 |
|
659,507 |
|
249,536 |
|
20 |
|
3,845,017 |
|
|
|
|
|
|
|
|
|
|
|
|
|
|
|
|
|
|
|
|
|
|
|
|
|
|
|
|
|
|
|
| Energy |
|
|
|
|
|
|
|
|
|
| Pass |
157,745 |
|
76,951 |
|
30,284 |
|
12,783 |
|
5,992 |
|
4,980 |
|
3,104,906 |
|
— |
|
3,393,641 |
|
|
|
|
|
|
|
|
|
|
|
| Accruing Substandard |
— |
|
— |
|
— |
|
664 |
|
385 |
|
683 |
|
28,018 |
|
— |
|
29,750 |
|
| Nonaccrual |
— |
|
— |
|
— |
|
— |
|
— |
|
159 |
|
1,240 |
|
— |
|
1,399 |
|
| Total energy |
157,745 |
|
76,951 |
|
30,284 |
|
13,447 |
|
6,377 |
|
5,822 |
|
3,134,164 |
|
— |
|
3,424,790 |
|
|
|
|
|
|
|
|
|
|
|
|
|
|
|
|
|
|
|
|
|
|
|
|
|
|
|
|
|
|
|
| Services |
|
|
|
|
|
|
|
|
|
| Pass |
821,785 |
|
496,510 |
|
286,085 |
|
193,481 |
|
156,736 |
|
696,300 |
|
722,371 |
|
639 |
|
3,373,907 |
|
| Special Mention |
502 |
|
5,139 |
|
989 |
|
771 |
|
894 |
|
1,345 |
|
8,668 |
|
— |
|
18,308 |
|
| Accruing Substandard |
— |
|
— |
|
— |
|
2,459 |
|
43 |
|
2,789 |
|
17,665 |
|
122 |
|
23,078 |
|
| Nonaccrual |
— |
|
5,570 |
|
449 |
|
— |
|
— |
|
2,389 |
|
7,820 |
|
— |
|
16,228 |
|
| Total services |
822,287 |
|
507,219 |
|
287,523 |
|
196,711 |
|
157,673 |
|
702,823 |
|
756,524 |
|
761 |
|
3,431,521 |
|
|
|
|
|
|
|
|
|
|
|
|
|
|
|
|
|
|
|
|
|
|
|
|
|
|
|
|
|
|
|
| General business |
|
|
|
|
|
|
|
|
|
| Pass |
725,894 |
|
361,839 |
|
198,274 |
|
172,878 |
|
139,140 |
|
283,694 |
|
1,570,536 |
|
2,329 |
|
3,454,584 |
|
| Special Mention |
17,759 |
|
13,065 |
|
208 |
|
71 |
|
7 |
|
2,291 |
|
7,094 |
|
26 |
|
40,521 |
|
| Accruing Substandard |
— |
|
2,169 |
|
66 |
|
4,130 |
|
4,680 |
|
3,287 |
|
94 |
|
4 |
|
14,430 |
|
| Nonaccrual |
— |
|
— |
|
1,052 |
|
14 |
|
72 |
|
5 |
|
485 |
|
8 |
|
1,636 |
|
| Total general business |
743,653 |
|
377,073 |
|
199,600 |
|
177,093 |
|
143,899 |
|
289,277 |
|
1,578,209 |
|
2,367 |
|
3,511,171 |
|
|
|
|
|
|
|
|
|
|
|
|
|
|
|
|
|
|
|
|
|
|
|
|
|
|
|
|
|
|
|
| Total commercial |
2,655,782 |
|
1,566,129 |
|
994,261 |
|
838,006 |
|
779,311 |
|
1,657,429 |
|
5,718,433 |
|
3,148 |
|
14,212,499 |
|
|
|
|
|
|
|
|
|
|
|
| Commercial real estate: |
|
|
|
|
|
|
|
|
|
| Pass |
1,188,483 |
|
1,158,002 |
|
552,616 |
|
641,102 |
|
247,625 |
|
633,304 |
|
161,616 |
|
— |
|
4,582,748 |
|
|
|
|
|
|
|
|
|
|
|
| Accruing Substandard |
— |
|
— |
|
— |
|
7,459 |
|
— |
|
— |
|
— |
|
— |
|
7,459 |
|
| Nonaccrual |
— |
|
— |
|
— |
|
— |
|
— |
|
16,570 |
|
— |
|
— |
|
16,570 |
|
| Total commercial real estate |
1,188,483 |
|
1,158,002 |
|
552,616 |
|
648,561 |
|
247,625 |
|
649,874 |
|
161,616 |
|
— |
|
4,606,777 |
|
|
|
|
|
|
|
|
|
|
|
|
|
|
|
|
|
|
|
|
|
|
|
|
|
|
|
|
|
|
|
|
|
|
|
|
|
|
|
|
|
|
|
|
|
|
|
|
|
|
|
|
|
|
|
|
|
|
|
|
|
|
|
|
|
|
|
|
|
|
|
|
Origination Year |
|
|
|
|
2022 |
2021 |
2020 |
2019 |
2018 |
Prior |
Revolving Loans |
Revolving Loans Converted to Term Loans |
Total |
| Loans to individuals: |
|
|
|
|
|
|
|
|
|
Residential mortgage |
|
|
|
|
|
|
|
|
|
| Pass |
354,497 |
|
373,190 |
|
393,002 |
|
63,142 |
|
40,525 |
|
260,625 |
|
352,126 |
|
22,176 |
|
1,859,283 |
|
| Special Mention |
— |
|
81 |
|
42 |
|
— |
|
142 |
|
388 |
|
527 |
|
87 |
|
1,267 |
|
| Accruing Substandard |
— |
|
— |
|
187 |
|
— |
|
— |
|
138 |
|
117 |
|
1 |
|
443 |
|
| Nonaccrual |
32 |
|
1,656 |
|
2,717 |
|
362 |
|
1,904 |
|
20,139 |
|
2,216 |
|
765 |
|
29,791 |
|
| Total residential mortgage |
354,529 |
|
374,927 |
|
395,948 |
|
63,504 |
|
42,571 |
|
281,290 |
|
354,986 |
|
23,029 |
|
1,890,784 |
|
|
|
|
|
|
|
|
|
|
|
|
|
|
|
|
|
|
|
|
|
|
|
|
|
|
|
|
|
|
|
| Residential mortgage guaranteed by U.S. government agencies |
|
|
|
|
|
|
|
|
|
| Pass |
289 |
|
2,254 |
|
9,000 |
|
10,722 |
|
17,244 |
|
191,426 |
|
— |
|
— |
|
230,935 |
|
|
|
|
|
|
|
|
|
|
|
|
|
|
|
|
|
|
|
|
|
| Nonaccrual |
— |
|
— |
|
299 |
|
1,460 |
|
2,319 |
|
10,927 |
|
— |
|
— |
|
15,005 |
|
Total residential mortgage guaranteed by U.S. government agencies |
289 |
|
2,254 |
|
9,299 |
|
12,182 |
|
19,563 |
|
202,353 |
|
— |
|
— |
|
245,940 |
|
|
|
|
|
|
|
|
|
|
|
|
|
|
|
|
|
|
|
|
|
|
|
|
|
|
|
|
|
|
|
| Personal |
|
|
|
|
|
|
|
|
|
| Pass |
254,497 |
|
193,095 |
|
154,887 |
|
172,114 |
|
68,871 |
|
201,278 |
|
549,187 |
|
332 |
|
1,594,261 |
|
| Special Mention |
47 |
|
28 |
|
40 |
|
12 |
|
17 |
|
— |
|
6,003 |
|
4 |
|
6,151 |
|
| Accruing Substandard |
— |
|
444 |
|
— |
|
160 |
|
— |
|
— |
|
— |
|
— |
|
604 |
|
| Nonaccrual |
38 |
|
7 |
|
12 |
|
22 |
|
14 |
|
18 |
|
23 |
|
— |
|
134 |
|
| Total personal |
254,582 |
|
193,574 |
|
154,939 |
|
172,308 |
|
68,902 |
|
201,296 |
|
555,213 |
|
336 |
|
1,601,150 |
|
|
|
|
|
|
|
|
|
|
|
|
|
|
|
|
|
|
|
|
|
|
|
|
|
|
|
|
|
|
|
| Total loans to individuals |
609,400 |
|
570,755 |
|
560,186 |
|
247,994 |
|
131,036 |
|
684,939 |
|
910,199 |
|
23,365 |
|
3,737,874 |
|
| Total loans |
$ |
4,453,665 |
|
$ |
3,294,886 |
|
$ |
2,107,063 |
|
$ |
1,734,561 |
|
$ |
1,157,972 |
|
$ |
2,992,242 |
|
$ |
6,790,248 |
|
$ |
26,513 |
|
$ |
22,557,150 |
|
Nonaccruing Loans
A summary of nonaccruing loans as of December 31, 2023 follows (in thousands):
|
|
|
|
|
|
|
|
|
|
|
|
|
|
|
|
|
|
|
|
|
|
|
|
| |
Total |
|
With No
Allowance |
|
With Allowance |
|
Related Allowance |
| Commercial: |
|
|
|
|
|
|
|
| Healthcare |
$ |
81,529 |
|
|
$ |
40,372 |
|
|
$ |
41,157 |
|
|
$ |
1,478 |
|
| Energy |
17,843 |
|
|
17,843 |
|
|
— |
|
|
— |
|
| Services |
3,616 |
|
|
1,684 |
|
|
1,932 |
|
|
1,214 |
|
| General business |
7,143 |
|
|
7,143 |
|
|
— |
|
|
— |
|
| Total commercial |
110,131 |
|
|
67,042 |
|
|
43,089 |
|
|
2,692 |
|
|
|
|
|
|
|
|
|
| Commercial real estate |
7,320 |
|
|
7,320 |
|
|
— |
|
|
— |
|
|
|
|
|
|
|
|
|
| Loans to individuals: |
|
|
|
|
|
|
|
| Residential mortgage |
18,056 |
|
|
18,056 |
|
|
— |
|
|
— |
|
Residential mortgage guaranteed by U.S. government agencies |
9,709 |
|
|
9,709 |
|
|
— |
|
|
— |
|
| Personal |
253 |
|
|
253 |
|
|
— |
|
|
— |
|
| Total loans to individuals |
28,018 |
|
|
28,018 |
|
|
— |
|
|
— |
|
|
|
|
|
|
|
|
|
| Total |
$ |
145,469 |
|
|
$ |
102,380 |
|
|
$ |
43,089 |
|
|
$ |
2,692 |
|
A summary of nonaccruing loans as of December 31, 2022 follows (in thousands):
|
|
|
|
|
|
|
|
|
|
|
|
|
|
|
|
|
|
|
|
|
|
|
|
| |
Total |
|
With No
Allowance |
|
With Allowance |
|
Related Allowance |
| Commercial: |
|
|
|
|
|
|
|
| Healthcare |
$ |
41,034 |
|
|
$ |
34,661 |
|
|
$ |
6,373 |
|
|
$ |
946 |
|
Energy |
1,399 |
|
|
1,399 |
|
|
— |
|
|
— |
|
| Services |
16,228 |
|
|
7,835 |
|
|
8,393 |
|
|
3,074 |
|
| General business |
1,636 |
|
|
1,636 |
|
|
— |
|
|
— |
|
| Total commercial |
60,297 |
|
|
45,531 |
|
|
14,766 |
|
|
4,020 |
|
|
|
|
|
|
|
|
|
| Commercial real estate |
16,570 |
|
|
393 |
|
|
16,177 |
|
|
1,550 |
|
|
|
|
|
|
|
|
|
| Loans to individuals: |
|
|
|
|
|
|
|
| Residential mortgage |
29,791 |
|
|
29,791 |
|
|
— |
|
|
— |
|
Residential mortgage guaranteed by U.S. government agencies |
15,005 |
|
|
15,005 |
|
|
— |
|
|
— |
|
| Personal |
134 |
|
|
134 |
|
|
— |
|
|
— |
|
| Total loans to individuals |
44,930 |
|
|
44,930 |
|
|
— |
|
|
— |
|
|
|
|
|
|
|
|
|
| Total |
$ |
121,797 |
|
|
$ |
90,854 |
|
|
$ |
30,943 |
|
|
$ |
5,570 |
|
Loan Modifications to Borrowers Experiencing Financial Difficulty
At December 31, 2023 the Company had $130 million of loan modifications to borrowers experiencing financial difficulty, including $67 million of general business loans, $47 million of healthcare loans and $13 million of residential mortgage loans guaranteed by U.S. government agencies. Modifications generally consist of interest rate reductions, an other than insignificant payment delay, term extension or a combination. Approximately $93 million of the modifications are term extensions of general business, healthcare and services loans, and $36 million are combination modifications to healthcare loans and residential mortgage loans guaranteed by U.S. government agencies. During the twelve months ended December 31, 2023, $4.8 million of residential mortgage loans guaranteed by U.S. government agencies were modified and subsequently defaulted. A payment default is defined as being 30 or more days past due after modification.
Past Due Loans
Past due status for all loan classes is based on the actual number of days since the last payment was due according to the contractual terms of the loans, as modified for short-term payment deferral forbearance.
A summary of loans currently performing and past due as of December 31, 2023 is as follows (in thousands):
|
|
|
|
|
|
|
|
|
|
|
|
|
|
|
|
|
|
|
|
|
|
|
|
|
|
|
|
|
|
|
|
|
|
|
|
|
|
|
| |
|
|
|
Past Due |
|
|
|
|
| |
|
Current |
|
30 to 59
Days |
|
60 to 89
Days |
|
90 Days
or More |
|
Total |
|
Past Due 90 Days or More and Accruing |
| Commercial: |
|
|
|
|
|
|
|
|
|
|
|
|
| Healthcare |
|
$ |
4,071,336 |
|
|
$ |
18,019 |
|
|
$ |
30,290 |
|
|
$ |
23,588 |
|
|
$ |
4,143,233 |
|
|
$ |
— |
|
| Services |
|
3,575,787 |
|
|
2 |
|
|
— |
|
|
434 |
|
|
3,576,223 |
|
|
— |
|
| Energy |
|
3,437,101 |
|
|
— |
|
|
— |
|
|
— |
|
|
3,437,101 |
|
|
— |
|
| General business |
|
3,639,775 |
|
|
412 |
|
|
1,157 |
|
|
5,868 |
|
|
3,647,212 |
|
|
— |
|
| Total commercial |
|
14,723,999 |
|
|
18,433 |
|
|
31,447 |
|
|
29,890 |
|
|
14,803,769 |
|
|
— |
|
|
|
|
|
|
|
|
|
|
|
|
|
|
| Commercial real estate |
|
5,327,481 |
|
|
2,992 |
|
|
— |
|
|
7,174 |
|
|
5,337,647 |
|
|
3 |
|
|
|
|
|
|
|
|
|
|
|
|
|
|
|
|
|
|
|
|
|
|
|
|
|
|
|
|
|
|
|
|
|
|
|
|
|
|
|
|
| Loans to individuals: |
|
|
|
|
|
|
|
|
|
|
|
|
| Permanent mortgage |
|
2,149,927 |
|
|
6,340 |
|
|
1,494 |
|
|
2,879 |
|
|
2,160,640 |
|
|
36 |
|
Permanent mortgages guaranteed by U.S. government agencies |
|
54,122 |
|
|
25,085 |
|
|
17,053 |
|
|
53,547 |
|
|
149,807 |
|
|
48,201 |
|
| Personal |
|
1,450,302 |
|
|
2,561 |
|
|
88 |
|
|
154 |
|
|
1,453,105 |
|
|
131 |
|
| Total loans to individuals |
|
3,654,351 |
|
|
33,986 |
|
|
18,635 |
|
|
56,580 |
|
|
3,763,552 |
|
|
48,368 |
|
|
|
|
|
|
|
|
|
|
|
|
|
|
| Total |
|
$ |
23,705,831 |
|
|
$ |
55,411 |
|
|
$ |
50,082 |
|
|
$ |
93,644 |
|
|
$ |
23,904,968 |
|
|
$ |
48,371 |
|
A summary of loans currently performing and past due as of December 31, 2022 is as follows (in thousands):
|
|
|
|
|
|
|
|
|
|
|
|
|
|
|
|
|
|
|
|
|
|
|
|
|
|
|
|
|
|
|
|
|
|
|
|
|
|
|
| |
|
|
|
Past Due |
|
|
|
|
| |
|
Current |
|
30 to 59
Days |
|
60 to 89
Days |
|
90 Days
or More |
|
Total |
|
Past Due 90 Days or More and Accruing |
| Commercial: |
|
|
|
|
|
|
|
|
|
|
|
|
| Healthcare |
|
$ |
3,812,164 |
|
|
$ |
5,914 |
|
|
$ |
26,480 |
|
|
$ |
459 |
|
|
$ |
3,845,017 |
|
|
$ |
— |
|
| Services |
|
3,423,042 |
|
|
1,060 |
|
|
2,461 |
|
|
4,958 |
|
|
3,431,521 |
|
|
— |
|
| Energy |
|
3,424,766 |
|
|
24 |
|
|
— |
|
|
— |
|
|
3,424,790 |
|
|
— |
|
| General business |
|
3,509,094 |
|
|
257 |
|
|
1,424 |
|
|
396 |
|
|
3,511,171 |
|
|
396 |
|
| Total commercial |
|
14,169,066 |
|
|
7,255 |
|
|
30,365 |
|
|
5,813 |
|
|
14,212,499 |
|
|
396 |
|
|
|
|
|
|
|
|
|
|
|
|
|
|
| Commercial real estate |
|
4,606,029 |
|
|
531 |
|
|
— |
|
|
217 |
|
|
4,606,777 |
|
|
— |
|
|
|
|
|
|
|
|
|
|
|
|
|
|
|
|
|
|
|
|
|
|
|
|
|
|
|
|
|
|
|
|
|
|
|
|
|
|
|
|
| Loans to individuals: |
|
|
|
|
|
|
|
|
|
|
|
|
| Permanent mortgage |
|
1,872,155 |
|
|
10,632 |
|
|
1,828 |
|
|
6,169 |
|
|
1,890,784 |
|
|
114 |
|
Permanent mortgages guaranteed by U.S. government agencies |
|
108,019 |
|
|
36,119 |
|
|
19,400 |
|
|
82,402 |
|
|
245,940 |
|
|
75,604 |
|
| Personal |
|
1,600,595 |
|
|
502 |
|
|
21 |
|
|
32 |
|
|
1,601,150 |
|
|
— |
|
| Total loans to individuals |
|
3,580,769 |
|
|
47,253 |
|
|
21,249 |
|
|
88,603 |
|
|
3,737,874 |
|
|
75,718 |
|
|
|
|
|
|
|
|
|
|
|
|
|
|
| Total |
|
$ |
22,355,864 |
|
|
$ |
55,039 |
|
|
$ |
51,614 |
|
|
$ |
94,633 |
|
|
$ |
22,557,150 |
|
|
$ |
76,114 |
|
(5) Premises and Equipment and Leases
Premises and equipment at December 31 are summarized as follows (in thousands):
|
|
|
|
|
|
|
|
|
|
|
|
|
|
|
| |
|
December 31, |
| |
|
2023 |
|
2022 |
| Land |
|
$ |
69,121 |
|
|
$ |
69,944 |
|
| Buildings and improvements |
|
525,941 |
|
|
469,001 |
|
| Software and related integration |
|
219,646 |
|
|
198,057 |
|
| Furniture and equipment |
|
211,082 |
|
|
201,830 |
|
| Construction in progress |
|
68,412 |
|
|
35,736 |
|
| Premises and equipment |
|
1,094,202 |
|
|
974,568 |
|
| Less: Accumulated depreciation |
|
471,979 |
|
|
409,393 |
|
| Premises and equipment, net of accumulated depreciation |
|
$ |
622,223 |
|
|
$ |
565,175 |
|
Depreciation expense of premises and equipment was $68.7 million, $68.4 million and $63.4 million for the years ended December 31, 2023, 2022 and 2021, respectively.
Premises and equipment include right-of-use assets for leased office space and facilities. Leases are at market rates at inception and may contain escalations based on consumer price index or similar benchmarks and options to renew at then market rates.
Right-of-use assets of $221 million at December 31, 2023 and $177 million at December 31, 2022 are included in buildings and improvements, and related right-of-use liabilities are included in other liabilities. At December 31, 2023, the weighted-average remaining lease term was 9.4 years and the weighted average discount rate on operating leases was 3.1%.
At December 31, 2023, undiscounted operating lease liabilities are scheduled to mature as follows (in thousands):
|
|
|
|
|
|
|
|
|
| 2024 |
|
$ |
34,000 |
|
| 2025 |
|
33,351 |
|
| 2026 |
|
32,844 |
|
| 2027 |
|
30,416 |
|
| 2028 |
|
28,930 |
|
| Thereafter |
|
182,273 |
|
| Total undiscounted lease payments |
|
341,814 |
|
| Less: Interest |
|
85,512 |
|
| Lease liabilities |
|
$ |
256,302 |
|
Total lease expense for BOK Financial was $42.2 million in 2023, $41.7 million in 2022 and $35.8 million in 2021. Rent expense and right-of-use asset amortization recognized as occupancy and equipment expense was $25.3 million in 2023, $24.5 million in 2022 and $23.4 million in 2021. Operating cash flows from operating leases were $26.8 million, $23.3 million and $25.3 million for the years ended December 31, 2023, 2022 and 2021, respectively. Operating expenses related to leased assets and short-term lease costs totaled $15.6 million, $13.0 million and $11.5 million for the years ended December 31, 2023, 2022 and 2021, respectively.
BOKF, NA is obligated under a long-term lease for its bank premises in downtown Tulsa. The original lease dated November 1, 1976 was renegotiated on July 1, 2019. The new lease will terminate on December 31, 2034. The Company has the option to renew for an additional 10 years. Premises leases may include options to renew at then current market rates and may include escalation provisions based upon changes in consumer price index or similar benchmarks.
The Company may lease owned properties or sublease unoccupied leased facilities. Income on these leases is immaterial.
(6) Goodwill and Intangible Assets
The following table presents the original cost and accumulated amortization of intangible assets (in thousands):
|
|
|
|
|
|
|
|
|
|
|
|
|
|
|
| |
|
Dec. 31, |
| |
|
2023 |
|
2022 |
| Core deposit premiums |
|
$ |
103,200 |
|
|
$ |
103,200 |
|
| Less: Accumulated amortization |
|
65,275 |
|
|
55,130 |
|
| Net core deposit premiums |
|
37,925 |
|
|
48,070 |
|
|
|
|
|
|
| Other identifiable intangible assets |
|
67,151 |
|
|
78,154 |
|
| Less: Accumulated amortization |
|
45,097 |
|
|
50,093 |
|
| Net other identifiable intangible assets |
|
22,054 |
|
|
28,061 |
|
|
|
|
|
|
| Total intangible assets, net |
|
$ |
59,979 |
|
|
$ |
76,131 |
|
Expected amortization expense for intangible assets that will continue to be amortized (in thousands):
|
|
|
|
|
|
|
|
|
|
|
|
|
|
|
|
|
|
|
|
|
|
|
Core
Deposit
Premiums |
|
Other
Identifiable
Intangible Assets |
|
Total |
| 2024 |
|
$ |
9,379 |
|
|
$ |
2,163 |
|
|
$ |
11,542 |
|
| 2025 |
|
8,675 |
|
|
1,817 |
|
|
10,492 |
|
| 2026 |
|
7,986 |
|
|
1,498 |
|
|
9,484 |
|
| 2027 |
|
6,956 |
|
|
1,313 |
|
|
8,269 |
|
| 2028 |
|
4,929 |
|
|
1,022 |
|
|
5,951 |
|
| Thereafter |
|
— |
|
|
14,241 |
|
|
14,241 |
|
Total |
|
$ |
37,925 |
|
|
$ |
22,054 |
|
|
$ |
59,979 |
|
The changes in the carrying value of goodwill by operating segment are as follows (in thousands):
|
|
|
|
|
|
|
|
|
|
|
|
|
|
|
|
|
|
|
|
|
|
|
|
|
|
|
|
|
|
|
|
|
| |
|
Commercial Banking |
|
Consumer Banking |
|
Wealth
Management |
|
Funds Management and Other |
|
Total |
|
|
|
|
|
|
|
|
|
|
|
|
|
|
|
|
|
|
|
|
|
|
|
|
|
|
|
|
|
|
|
|
|
| Balance, December 31, 2021 |
|
$ |
910,589 |
|
|
$ |
43,458 |
|
|
$ |
90,702 |
|
|
$ |
— |
|
|
$ |
1,044,749 |
|
|
|
|
|
|
|
|
|
|
|
|
|
|
|
|
|
|
|
|
|
|
|
|
|
|
|
|
|
|
|
|
|
|
|
|
|
|
|
|
|
|
|
|
|
|
|
|
|
|
|
|
|
|
|
|
|
|
|
|
|
|
|
|
|
|
|
|
|
|
|
|
|
|
|
|
|
|
|
|
|
|
|
|
|
|
|
|
|
| Balance, December 31, 2022 |
|
910,589 |
|
|
43,458 |
|
|
90,702 |
|
|
— |
|
|
1,044,749 |
|
|
|
|
|
|
|
|
|
|
|
|
|
|
|
|
|
|
|
|
|
|
|
|
|
|
|
|
|
|
|
|
|
|
|
|
|
|
|
|
|
|
|
|
|
|
|
|
|
|
|
|
|
|
|
|
|
|
|
|
|
|
|
|
|
|
|
|
|
|
|
|
|
|
|
|
|
|
|
|
|
|
|
|
|
|
|
|
|
|
|
|
|
|
|
|
|
|
|
|
| Balance, December 31, 2023 |
|
910,589 |
|
|
43,458 |
|
|
90,702 |
|
|
— |
|
|
1,044,749 |
|
At October 1, 2023, the Company performed a qualitative impairment assessment of goodwill based on factors including, but not limited to, general economic conditions, financial services industry considerations, regional economic conditions, global health concerns and related medical developments, general BOKF Financial performance and reporting unit performance. No impairment was indicated for any reporting unit.
(7) Mortgage Banking Activities
Residential Mortgage Loan Production
The Company originates, markets and services conventional and government-sponsored residential mortgage loans. Generally, conforming fixed rate residential mortgage loans are held for sale in the secondary market and non-conforming and adjustable-rate residential mortgage loans are held for investment. The volume of mortgage loans originated for sale and secondary market prices are the primary drivers of originating and marketing revenue.
Residential mortgage loan commitments are generally outstanding for 60 to 90 days which represents the typical period from commitment to originate a residential mortgage loan to when the closed loan is sold to an investor. Residential mortgage loan commitments are subject to both credit and interest rate risk. Credit risk is managed through underwriting policies and procedures, including collateral requirements, which are generally accepted by the secondary loan markets. Exposure to interest rate fluctuations is partially managed through forward sales of residential mortgage-backed securities and forward sales contracts. These latter contracts set the price for loans that will be delivered in the next 60 to 90 days.
The unpaid principal balance of residential mortgage loans held for sale, notional amounts of derivative contracts related to residential mortgage loan commitments and forward contract sales and their related fair values included in Mortgage loans held for sale on the Consolidated Balance Sheets were (in thousands):
|
|
|
|
|
|
|
|
|
|
|
|
|
|
|
|
|
|
|
|
|
|
|
|
|
|
|
| |
|
December 31, 2023 |
|
December 31, 2022 |
| |
|
Unpaid Principal Balance/
Notional |
|
Fair Value |
|
Unpaid Principal Balance/
Notional |
|
Fair Value |
| Residential mortgage loans held for sale |
|
$ |
56,922 |
|
|
$ |
56,457 |
|
|
$ |
74,941 |
|
|
$ |
73,938 |
|
| Residential mortgage loan commitments |
|
34,783 |
|
|
1,379 |
|
|
45,492 |
|
|
1,054 |
|
| Forward sales contracts |
|
75,448 |
|
|
(901) |
|
|
109,469 |
|
|
280 |
|
| |
|
|
|
$ |
56,935 |
|
|
|
|
$ |
75,272 |
|
No residential mortgage loans held for sale were 90 days or more past due or considered impaired as of December 31, 2023 or December 31, 2022. No credit losses were recognized on residential mortgage loans held for sale for the years ended December 31, 2023, 2022 and 2021.
Mortgage banking revenue was as follows (in thousands):
|
|
|
|
|
|
|
|
|
|
|
|
|
|
|
|
|
|
|
|
|
| |
|
Year Ended |
| |
|
2023 |
|
2022 |
|
2021 |
| Production revenue: |
|
|
|
|
|
|
| Net realized gain (loss) on sales of mortgage loans |
|
$ |
(5,021) |
|
|
$ |
7,416 |
|
|
$ |
76,282 |
|
| Net change in unrealized gain on mortgage loans held for sale |
|
538 |
|
|
(4,468) |
|
|
(5,818) |
|
| Net change in the fair value of mortgage loan commitments |
|
325 |
|
|
(5,113) |
|
|
(14,268) |
|
| Net change in the fair value of forward sales contracts |
|
(1,181) |
|
|
327 |
|
|
4,516 |
|
| Total mortgage production revenue |
|
(5,339) |
|
|
(1,838) |
|
|
60,712 |
|
| Servicing revenue |
|
61,037 |
|
|
51,203 |
|
|
45,184 |
|
| Total mortgage banking revenue |
|
$ |
55,698 |
|
|
$ |
49,365 |
|
|
$ |
105,896 |
|
Mortgage production revenue includes gain (loss) on residential mortgage loans held for sale and changes in the fair value of derivative contracts not designated as hedging instruments related to residential mortgage loan commitments and forward sales contracts. Servicing revenue includes servicing fee income and late charges on loans serviced for others.
Residential Mortgage Servicing
The Company generally retains the right to service residential mortgage loans sold and may purchase mortgage servicing rights. The unpaid principal balance of loans serviced for others is the primary driver of servicing revenue.
The following represents a summary of mortgage servicing rights (dollars in thousands):
|
|
|
|
|
|
|
|
|
|
|
|
|
|
|
|
|
|
|
|
|
|
|
December 31, |
| |
|
2023 |
|
2022 |
|
2021 |
| Number of residential mortgage loans serviced for others |
|
115,967 |
|
|
110,541 |
|
|
102,008 |
|
| Outstanding principal balance of residential mortgage loans serviced for others |
|
$ |
20,382,192 |
|
|
$ |
18,863,201 |
|
|
$ |
16,442,446 |
|
| Weighted average interest rate |
|
3.64 |
% |
|
3.59 |
% |
|
3.58 |
% |
| Remaining contractual term (in months) |
|
280 |
|
283 |
|
281 |
Activity in capitalized mortgage servicing rights during the three years ended December 31, 2023 is as follows (in thousands):
|
|
|
|
|
|
|
|
|
|
|
|
| Balance, December 31, 2020 |
|
$ |
101,172 |
|
| Additions |
|
31,132 |
|
| Acquisitions |
|
28,018 |
|
|
|
|
| Change in fair value due to loan runoff |
|
(38,761) |
|
| Change in fair value due to market changes |
|
41,637 |
|
| Balance, December 31, 2021 |
|
163,198 |
|
| Additions |
|
18,215 |
|
| Acquisitions |
|
47,675 |
|
|
|
|
| Change in fair value due to loan runoff |
|
(31,741) |
|
| Change in fair value due to market changes |
|
80,261 |
|
| Balance, December 31, 2022 |
|
277,608 |
|
| Additions |
|
12,142 |
|
| Acquisitions |
|
34,593 |
|
|
|
|
| Change in fair value due to loan runoff |
|
(27,344) |
|
| Change in fair value due to market changes |
|
(3,115) |
|
| Balance, December 31, 2023 |
|
$ |
293,884 |
|
Changes in the fair value of mortgage servicing rights due to market changes are included in Other operating revenue in the Consolidated Statements of Earnings. Changes in fair value due to loan runoff are included in Mortgage banking costs.
Mortgage servicing rights are not traded in active markets. Fair value is determined by discounting the projected net cash flows. Significant assumptions used to determine fair value considered to be significant unobservable inputs were as follows:
|
|
|
|
|
|
|
|
|
|
|
|
|
|
|
|
|
December 31, |
| |
|
2023 |
|
2022 |
| Discount rate – risk-free rate plus a market premium |
|
9.72% |
|
9.51% |
| Prepayment rate - based upon loan interest rate, original term and loan type |
|
7.34% |
|
7.54% |
| Loan servicing costs – annually per loan based upon loan type: |
|
|
|
|
Performing loans |
|
$69 - $94 |
|
$69 - $94 |
Delinquent loans |
|
$150 - $500 |
|
$150 - $500 |
Loans in foreclosure |
|
$875 - $8,000 |
|
$875 - $8,000 |
Primary/secondary mortgage rate spread |
|
105 bps |
|
105 bps |
| Escrow earnings rate – indexed to rates paid on deposit accounts with a comparable average life |
|
3.90% |
|
4.06% |
Delinquency rate |
|
2.06% |
|
2.33% |
Changes in primary residential mortgage interest rates directly affect the prepayment speeds used in valuing our mortgage servicing rights. A separate third-party model is used to estimate prepayment speeds based on interest rates, housing turnover rates, estimated loan curtailment, anticipated defaults and other relevant factors. The prepayment model is updated periodically for changes in market conditions and adjusted to better correlate with actual performance of BOK Financial’s servicing portfolio.
(8) Deposits
Interest expense on deposits is summarized as follows (in thousands):
|
|
|
|
|
|
|
|
|
|
|
|
|
|
|
|
|
|
|
|
|
|
|
Year Ended December 31, |
| |
|
2023 |
|
2022 |
|
2021 |
| Transaction deposits |
|
$ |
540,068 |
|
|
$ |
108,956 |
|
|
$ |
21,961 |
|
| Savings |
|
2,913 |
|
|
489 |
|
|
374 |
|
|
|
|
|
|
|
|
|
|
|
|
|
|
|
|
|
|
|
|
|
|
|
|
|
|
|
|
|
| Total time |
|
83,616 |
|
|
12,304 |
|
|
11,149 |
|
| Total |
|
$ |
626,597 |
|
|
$ |
121,749 |
|
|
$ |
33,484 |
|
The aggregate amounts of time deposits in denominations of $250,000 or more at December 31, 2023 and 2022 were $1.1 billion and $470 million, respectively.
Time deposit maturities are as follows: 2024 – $2.4 billion, 2025 – $258 million, 2026 – $120 million, 2027 – $79 million, 2028 – $42 million and $91 million thereafter.
The aggregate amount of overdrawn customer transaction deposits that have been reclassified as loan balances was $5.7 million at December 31, 2023 and $10 million at December 31, 2022.
(9) Other Borrowed Funds
Information relating to other borrowings is summarized as follows (dollars in thousands):
|
|
|
|
|
|
|
|
|
|
|
|
|
|
|
|
|
|
|
|
|
|
|
|
|
|
|
|
|
|
|
|
|
| |
|
As of |
|
Year Ended |
|
|
December 31, 2023 |
|
December 31, 2023 |
|
|
Balance |
|
Rate |
|
Average Balance |
|
Rate |
|
Maximum
Outstanding
At Any
Month End |
| Funds purchased |
|
$ |
515,747 |
|
|
5.17 |
% |
|
$ |
847,676 |
|
|
4.83 |
% |
|
$ |
1,711,580 |
|
| Repurchase agreements |
|
607,001 |
|
|
1.70 |
% |
|
1,805,978 |
|
|
4.32 |
% |
|
4,433,480 |
|
| Other borrowings: |
|
|
|
|
|
|
|
|
|
|
| Federal Home Loan Bank advances |
|
7,675,000 |
|
|
5.51 |
% |
|
5,948,863 |
|
|
5.28 |
% |
|
7,875,000 |
|
| GNMA repurchase liability |
|
11,660 |
|
|
4.13 |
% |
|
11,224 |
|
|
4.04 |
% |
|
12,414 |
|
|
|
|
|
|
|
|
|
|
|
|
|
|
|
|
|
|
|
|
|
|
|
| Other |
|
14,892 |
|
|
5.50 |
% |
|
19,008 |
|
|
3.91 |
% |
|
26,311 |
|
| Total other borrowings |
|
7,701,552 |
|
|
|
|
5,979,095 |
|
|
5.28 |
% |
|
|
Subordinated debentures1 |
|
131,150 |
|
|
6.93 |
% |
|
131,155 |
|
|
6.83 |
% |
|
131,164 |
|
| Total other borrowed funds |
|
$ |
8,955,450 |
|
|
|
|
$ |
8,763,904 |
|
|
5.06 |
% |
|
|
|
|
|
|
|
|
|
|
|
|
|
|
|
|
|
|
|
|
|
|
|
|
|
|
|
|
|
|
|
|
|
|
|
| |
|
As of |
|
Year Ended |
|
|
December 31, 2022 |
|
December 31, 2022 |
|
|
Balance |
|
Rate |
|
Average Balance |
|
Rate |
|
Maximum
Outstanding
At Any
Month End |
| Funds purchased |
|
$ |
99,843 |
|
|
0.05 |
% |
|
$ |
266,344 |
|
|
1.12 |
% |
|
$ |
444,069 |
|
| Repurchase agreements |
|
2,170,534 |
|
|
4.42 |
% |
|
998,701 |
|
|
1.02 |
% |
|
3,034,312 |
|
| Other borrowings: |
|
|
|
|
|
|
|
|
|
|
| Federal Home Loan Bank advances |
|
4,700,000 |
|
|
4.48 |
% |
|
1,593,699 |
|
|
2.37 |
% |
|
4,700,000 |
|
| GNMA repurchase liability |
|
10,608 |
|
|
4.06 |
% |
|
6,692 |
|
|
4.38 |
% |
|
11,011 |
|
|
|
|
|
|
|
|
|
|
|
|
|
|
|
|
|
|
|
|
|
|
|
| Other |
|
26,300 |
|
|
3.20 |
% |
|
28,581 |
|
|
3.12 |
% |
|
30,382 |
|
| Total other borrowings |
|
4,736,908 |
|
|
|
|
1,628,972 |
|
|
2.41 |
% |
|
|
Subordinated debentures1 |
|
131,205 |
|
|
6.34 |
% |
|
131,206 |
|
|
4.95 |
% |
|
131,230 |
|
| Total other borrowed funds |
|
$ |
7,138,490 |
|
|
|
|
$ |
3,025,223 |
|
|
1.95 |
% |
|
|
|
|
|
|
|
|
|
|
|
|
|
|
|
|
|
|
|
|
|
|
|
|
|
|
|
|
|
|
|
|
|
|
|
|
|
As of |
|
Year Ended |
|
|
December 31, 2021 |
|
December 31, 2021 |
|
|
Balance |
|
Rate |
|
Average Balance |
|
Rate |
|
Maximum
Outstanding
At Any
Month End |
| Funds purchased |
|
$ |
199,513 |
|
|
0.05 |
% |
|
$ |
543,183 |
|
|
0.46 |
% |
|
$ |
542,465 |
|
| Repurchase agreements |
|
2,126,936 |
|
|
0.08 |
% |
|
1,695,519 |
|
|
0.33 |
% |
|
2,920,728 |
|
| Other borrowings: |
|
|
|
|
|
|
|
|
|
|
| Federal Home Loan Bank advances |
|
— |
|
|
— |
% |
|
1,679,315 |
|
|
0.27 |
% |
|
2,600,000 |
|
| GNMA repurchase liability |
|
7,420 |
|
|
4.36 |
% |
|
11,956 |
|
|
4.06 |
% |
|
23,856 |
|
|
|
|
|
|
|
|
|
|
|
|
| Paycheck protection program liquidity facility |
|
— |
|
|
— |
% |
|
879,145 |
|
|
0.35 |
% |
|
1,662,598 |
|
| Other |
|
29,333 |
|
|
3.23 |
% |
|
29,445 |
|
|
4.18 |
% |
|
31,875 |
|
| Total other borrowings |
|
36,753 |
|
|
|
|
2,599,861 |
|
|
0.38 |
% |
|
|
Subordinated debentures1 |
|
131,226 |
|
|
3.95 |
% |
|
224,058 |
|
|
4.70 |
% |
|
276,049 |
|
| Total other borrowed funds |
|
$ |
2,494,428 |
|
|
|
|
$ |
5,062,621 |
|
|
0.56 |
% |
|
|
1 Parent Company only.
Aggregate annual principal repayments at December 31, 2023 are as follows (in thousands):
|
|
|
|
|
|
|
|
|
|
|
|
|
|
|
|
| 2024 |
|
|
|
$ |
8,637,633 |
|
| 2025 |
|
|
|
178,225 |
|
| 2026 |
|
|
|
3,225 |
|
| 2027 |
|
|
|
1,775 |
|
| 2028 |
|
|
|
— |
|
| Thereafter |
|
|
|
134,592 |
|
| Total |
|
|
|
$ |
8,955,450 |
|
Funds purchased are unsecured and generally mature within one day to ninety days from the transaction date. Securities repurchase agreements are recorded as secured borrowings that generally mature within ninety days and are secured by certain available for sale securities.
Borrowings from the Federal Home Loan Banks are used for funding purposes. In accordance with policies of the Federal Home Loan Banks, BOK Financial has granted a blanket pledge of eligible assets (generally unencumbered U.S. Treasury and residential mortgage-backed securities, 1-4 family loans and multifamily loans) as collateral for these advances. The Federal Home Loan Banks have issued letters of credit totaling $513 million to secure BOK Financial’s obligations to depositors of public funds. The unused credit available to BOK Financial at December 31, 2023 pursuant to the Federal Home Loan Bank’s collateral policies is $2.8 billion.
As a result of the acquisition of CoBiz Financial in 2018, we obtained $60 million of subordinated debt issued in June 2015 that will mature on June 25, 2030. This debt bears interest at the rate of 5.625% through June 2025 and thereafter, the notes will bear interest at an annual floating rate equal to three-month SOFR plus 0.26% tenor spread adjustment plus 3.17%. The debt contains a call option that allows for repayment prior to contractual maturity. The call option is available on June 25, 2025 and quarterly thereafter at 100% of the principal amount.
Also through CoBiz Financial, we acquired junior subordinated debentures split across three issuance tranches. Junior subordinated debentures of $21 million will mature September 17, 2033 and bear an interest rate of three-month SOFR plus 0.26% tenor spread adjustment plus 2.95% that resets quarterly. Junior subordinated debentures of $31 million will mature on July 23, 2034 and bear an interest rate of three-month SOFR plus 0.26% tenor spread adjustment plus 2.60% that resets quarterly. Junior subordinated debentures of $20 million will mature on September 30, 2035 and bear an interest rate of three-month SOFR plus 0.26% tenor spread adjustment plus 1.45% that resets quarterly. The junior subordinated debentures are subject to early redemption prior to maturity.
BOK Financial Securities, Inc. may borrow funds from Pershing, LLC, a clearing broker/dealer and a wholly owned subsidiary of Bank of New York Mellon, for the purposes of financing securities purchases or to facilitate funding of investment banking activities on terms to be negotiated at the time of the borrowing. BOK Financial Securities, Inc. had no borrowings outstanding at December 31, 2023 and December 31, 2022.
The Company has a liability related to the repurchase of certain delinquent residential mortgage loans previously sold into GNMA mortgage pools. Interest is payable at rates contractually due to investors.
(10) Federal and State Income Taxes
Deferred income taxes reflect the net tax effects of temporary differences between the carrying amounts of assets and liabilities for financial reporting purposes and the amounts used for income tax purposes. Significant components of deferred tax assets and liabilities are as follows (in thousands):
|
|
|
|
|
|
|
|
|
|
|
|
|
December 31, |
|
2023 |
|
2022 |
| Deferred tax assets: |
|
|
|
| Available for sale securities mark to market |
$ |
183,724 |
|
|
$ |
255,244 |
|
| Credit loss reserves |
76,361 |
|
|
69,385 |
|
| Lease liability |
61,204 |
|
|
49,839 |
|
| Deferred compensation |
41,350 |
|
|
34,645 |
|
| Unearned fees |
12,682 |
|
|
12,915 |
|
| Purchased loan discount |
3,546 |
|
|
4,955 |
|
| Share-based compensation |
6,068 |
|
|
4,625 |
|
| Valuation adjustments |
4,860 |
|
|
5,792 |
|
|
|
|
|
| Other |
47,169 |
|
|
42,808 |
|
| Total deferred tax assets |
436,964 |
|
|
480,208 |
|
|
|
|
|
| Deferred tax liabilities: |
|
|
|
| Right-of-use asset |
51,943 |
|
|
40,741 |
|
| Mortgage servicing rights |
47,646 |
|
|
49,001 |
|
|
|
|
|
| Acquired identifiable intangible |
8,166 |
|
|
11,280 |
|
| Depreciation |
4,578 |
|
|
7,163 |
|
| Lease financing |
12,148 |
|
|
12,333 |
|
| Other |
42,887 |
|
|
38,357 |
|
| Total deferred tax liabilities |
167,368 |
|
|
158,875 |
|
Net deferred tax assets |
$ |
269,596 |
|
|
$ |
321,333 |
|
No valuation allowance was necessary on deferred tax assets as of December 31, 2023 and 2022.
The significant components of the provision for income taxes attributable to continuing operations for BOK Financial are shown below (in thousands):
|
|
|
|
|
|
|
|
|
|
|
|
|
|
|
|
|
|
|
Year Ended December 31, |
|
2023 |
|
2022 |
|
2021 |
| Current income tax expense: |
|
|
|
|
|
| Federal |
$ |
152,600 |
|
|
$ |
127,144 |
|
|
$ |
121,196 |
|
| State |
19,298 |
|
|
18,185 |
|
|
21,065 |
|
| Total current income tax expense |
171,898 |
|
|
145,329 |
|
|
142,261 |
|
|
|
|
|
|
|
| Deferred income tax expense (benefit): |
|
|
|
|
|
| Federal |
(17,973) |
|
|
(4,700) |
|
|
29,777 |
|
| State |
(1,810) |
|
|
(765) |
|
|
7,737 |
|
| Total deferred income tax expense (benefit) |
(19,783) |
|
|
(5,465) |
|
|
37,514 |
|
| Total income tax expense |
$ |
152,115 |
|
|
$ |
139,864 |
|
|
$ |
179,775 |
|
The reconciliations of income attributable to continuing operations at the U.S. federal statutory tax rate to income tax expense are as follows (in thousands):
|
|
|
|
|
|
|
|
|
|
|
|
|
|
|
|
|
|
|
Year Ended December 31, |
| |
2023 |
|
2022 |
|
2021 |
| Amount: |
|
|
|
|
|
| Federal statutory tax |
$ |
143,482 |
|
|
$ |
138,633 |
|
|
$ |
167,181 |
|
| Tax exempt revenue |
(5,786) |
|
|
(5,714) |
|
|
(6,084) |
|
| Effect of state income taxes, net of federal benefit |
13,330 |
|
|
13,490 |
|
|
22,489 |
|
Utilization of tax credits, net of proportional amortization of low-income housing, new market, and historical tax credits |
(2,673) |
|
|
(8,883) |
|
|
(8,801) |
|
|
|
|
|
|
|
|
|
|
|
|
|
|
|
|
|
|
|
|
|
|
|
|
|
|
|
|
|
|
|
| Other, net |
3,762 |
|
|
2,338 |
|
|
4,990 |
|
| Total income tax expense |
$ |
152,115 |
|
|
$ |
139,864 |
|
|
$ |
179,775 |
|
|
|
|
|
|
|
|
|
|
|
|
|
|
|
|
|
|
|
|
Year Ended December 31, |
| |
2023 |
|
2022 |
|
2021 |
| Percent of pretax income: |
|
|
|
|
|
| Federal statutory tax |
21.0 |
% |
|
21.0 |
% |
|
21.0 |
% |
| Tax exempt revenue |
(0.8) |
|
|
(0.8) |
|
|
(0.7) |
|
| Effect of state income taxes, net of federal benefit |
2.0 |
|
|
2.0 |
|
|
2.8 |
|
Utilization of tax credits, net of proportional amortization of low-income housing, new market, and historical tax credits |
(0.4) |
|
|
(1.4) |
|
|
(1.1) |
|
|
|
|
|
|
|
|
|
|
|
|
|
|
|
|
|
|
|
| Other, net |
0.5 |
|
|
0.4 |
|
|
0.6 |
|
| Total |
22.3 |
% |
|
21.2 |
% |
|
22.6 |
% |
A reconciliation of the beginning and ending amount of unrecognized tax benefits is as follows (in thousands):
|
|
|
|
|
|
|
|
|
|
|
|
|
|
|
|
|
|
|
2023 |
|
2022 |
|
2021 |
| Balance as of January 1 |
$ |
19,583 |
|
|
$ |
21,092 |
|
|
$ |
22,902 |
|
| Additions for tax for current year positions |
3,239 |
|
|
3,465 |
|
|
3,961 |
|
| Settlements during the period |
— |
|
|
— |
|
|
(1,754) |
|
| Lapses of applicable statute of limitations |
(4,865) |
|
|
(4,974) |
|
|
(4,017) |
|
| Balance as of December 31 |
$ |
17,957 |
|
|
$ |
19,583 |
|
|
$ |
21,092 |
|
Of the above unrecognized tax benefits, $14.1 million, if recognized, would have affected the effective tax rate.
BOK Financial recognizes interest and penalties accrued related to unrecognized tax benefits in income tax expense. The Company recognized $1.6 million for 2023, $1.8 million for 2022 and $2.3 million for 2021 in interest and penalties. The Company had approximately $5.7 million and $6.0 million accrued for the payment of interest and penalties at December 31, 2023 and 2022, respectively. Federal statutes remain open for federal tax returns filed in the previous three reporting periods. Various state income tax statutes remain open for the previous three to six reporting periods.
(11) Employee Benefits
Employee contributions to the Thrift Plan are eligible for Company matching equal to 6% of base compensation, as defined in the Plan. The Company-provided matching contribution rates range from 50% for employees with less than 4 years of service to 200% for employees with 15 or more years of service. Additionally, a maximum Company-provided, non-elective annual contribution of up to $600 per participant is provided for employees whose annual base compensation is less than $60,000. Participants may direct investments in their accounts to a variety of options, including a BOK Financial common stock fund and Cavanal Hill funds. Employer contributions, which are invested in accordance with the participant’s investment options, vest over five years. Thrift Plan expenses were $32.9 million for 2023, $31.7 million for 2022 and $30.5 million for 2021.
(12) Share-Based Compensation Plans
The shareholders and Board of Directors of BOK Financial have approved various share-based compensation plans. An independent compensation committee of the Board of Directors determines the number of awards granted to the Chief Executive Officer and other senior executives. Share-based compensation is granted to other officers and employees as determined by the Chief Executive Officer.
The Company awards restricted stock to certain officers and employees and RSUs to certain executives, (collectively "non-vested shares"). Vesting of all non-vested shares is subject to service requirements. Additionally, vesting of certain non-vested shares is subject to performance criteria based on changes in the Company's earnings per share relative to defined peers. The following represents a summary of the non-vested shares for the three years ended December 31, 2023 (in thousands):
|
|
|
|
|
|
|
|
|
|
|
|
|
|
|
|
|
|
|
|
|
|
|
|
|
|
|
|
|
Restricted Stock |
|
Restricted Stock Units |
| |
|
Shares |
|
Weighted
Average
Grant Date
Fair Value |
|
Units |
|
Weighted
Average
Grant Date
Fair Value |
| Non-vested at January 1, 2021 |
|
420,234 |
|
|
|
|
69,669 |
|
|
|
| Granted |
|
247,917 |
|
|
$ |
73.01 |
|
|
17,570 |
|
|
$ |
88.25 |
|
| Vested |
|
(166,965) |
|
|
94.96 |
|
|
— |
|
|
— |
|
| Forfeited |
|
(11,632) |
|
|
75.83 |
|
|
— |
|
|
— |
|
| Non-vested at December 31, 2021 |
|
489,554 |
|
|
|
|
87,239 |
|
|
|
| Granted |
|
183,809 |
|
|
$ |
108.23 |
|
|
25,416 |
|
|
$ |
103.79 |
|
| Vested |
|
(139,859) |
|
|
76.80 |
|
|
(61,645) |
|
|
91.38 |
|
| Forfeited |
|
(40,620) |
|
|
79.60 |
|
|
— |
|
|
— |
|
| Non-vested at December 31, 2022 |
|
492,884 |
|
|
|
|
51,010 |
|
|
|
| Granted |
|
180,178 |
|
|
$ |
97.56 |
|
|
7,275 |
|
|
$ |
102.35 |
|
| Vested |
|
(103,515) |
|
|
82.85 |
|
|
(6,894) |
|
|
77.36 |
|
| Forfeited |
|
(30,557) |
|
|
95.17 |
|
|
— |
|
|
— |
|
| Non-vested at December 31, 2023 |
|
538,990 |
|
|
|
|
51,391 |
|
|
|
Compensation expense recognized on non-vested restricted stock totaled $14.8 million for 2023, $9.0 million for 2022 and $9.3 million for 2021. Unrecognized compensation cost of non-vested restricted stock totaled $22.5 million at December 31, 2023. We expect to recognize compensation expense of $13.0 million in 2024, $8.4 million in 2025, and $1.0 million in 2026 on the non-vested shares of restricted stock. Vesting of 136,006 shares of non-vested restricted stock may be increased or decreased based on performance criteria defined in the Plan documents. The fair value of restricted shares vested totaled $10.3 million, $15.0 million and $13.0 million during the years ended December 31, 2023, 2022 and 2021, respectively.
Compensation expense recognized on non-vested restricted stock units totaled $572 thousand for 2023, $597 thousand for 2022 and $4.0 million for 2021. Compensation cost for restricted stock units is variable based on the current fair value of BOK Financial common shares. Unrecognized compensation cost of non-vested restricted stock units totaled $1.7 million at December 31, 2023. We expect to recognize compensation expense of $926 thousand in 2024, $704 thousand in 2025 and $25 thousand in 2026 on the non-vested restricted stock units. Vesting of 25,210 non-vested restricted stock units may be increased or decreased based on performance criteria defined in the Plan documents. The intrinsic value of share-based liabilities paid in 2023 and 2022 was $709 thousand and $6.3 million, respectively. No share-based liabilities were paid in 2021.
(13) Related Parties
In compliance with applicable banking regulations, the Company may extend credit to certain executive officers, directors, principal shareholders and their affiliates (collectively referred to as "related parties") in the ordinary course of business. The Company’s loans to related parties do not involve more than the normal credit risk.
Activity in loans to related parties is summarized as follows (in thousands):
|
|
|
|
|
|
|
|
|
|
|
|
|
|
|
|
|
Year Ended December 31, |
| |
|
2023 |
|
2022 |
| Beginning balance |
|
$ |
54,479 |
|
|
$ |
95,219 |
|
| Advances |
|
1,424,041 |
|
|
731,664 |
|
| Payments |
|
(1,281,323) |
|
|
(770,808) |
|
Adjustments1 |
|
7,212 |
|
|
(1,596) |
|
| Ending balance |
|
$ |
204,409 |
|
|
$ |
54,479 |
|
1 Adjustments generally consist of changes in status as a related party.
As defined by banking regulations, loan commitments and equity investments from the subsidiary banks to a single affiliate may not exceed 10% of unimpaired capital and surplus while loan commitments and equity investments to all affiliates may not exceed 20% of unimpaired capital and surplus. Loans to affiliates must be fully secured by eligible collateral. At December 31, 2023, loan commitments and equity investments were limited to $473 million to a single affiliate and $946 million to all affiliates. The largest loan commitment and equity investment to a single affiliate was $255 million, and the aggregate loan commitments and equity investments to all affiliates were $315 million. The largest outstanding amount to a single affiliate at December 31, 2023 was $1.1 million, and the total outstanding amounts to all affiliates were $1.1 million. At December 31, 2022, total loan commitments and equity investments to all affiliates were $344 million, and the total outstanding amounts to all affiliates were $3.9 million.
Certain related parties are customers of the Company for services other than loans, including consumer banking, corporate banking, risk management, wealth management, brokerage and trading, or fiduciary/trust services. The Company engages in transactions with related parties in the ordinary course of business in compliance with applicable regulations.
QuikTrip Corporation has entered into a fee sharing agreement with TransFund with respect to transactions completed at TransFund automated teller machines placed in QuikTrip locations. Pursuant to this agreement, BOKF paid QuikTrip approximately $11.4 million in 2023, $10.7 million in 2022 and $10.4 million in 2021. A BOK Financial director is Chief Executive Officer, Chairman, and a significant shareholder of QuikTrip Corporation.
Cavanal Hill Investment Management, Inc., a wholly-owned subsidiary of BOKF, NA, is the administrator to and investment advisor for the Cavanal Hill Funds, a diversified, open-ended investment company established as a business trust under the Investment Company Act of 1940. BOKF, NA is custodian and Cavanal Hill Distributors, Inc. is distributor for the Cavanal Hill Funds. The Cavanal Hill Funds' products are offered to customers, employee benefit plans, trusts and the general public in the ordinary course of business. Approximately 82% of the Cavanal Hill Funds’ assets of $5.0 billion are held for the Company's clients. A Company executive officer serves on the Cavanal Hill Funds' board of trustees, and officers of BOKF, NA serve as president and secretary of the funds. A majority of the members of the Cavanal Hill Funds’ board of trustees are, however, independent of the Company and the Cavanal Hill Funds are managed by its board of trustees.
(14) Commitments and Contingent Liabilities
Litigation Contingencies
As a member of Visa, BOK Financial is obligated for a proportionate share of certain covered litigation losses incurred by Visa under a retrospective responsibility plan. A contingent liability was recognized for the Company’s share of Visa’s covered litigation liabilities. Visa funded an escrow account to cover litigation claims, including covered litigation losses under the retrospective responsibility plan, with proceeds from its initial public offering in 2008 and from available cash.
BOK Financial currently owns 252,233 Visa Class B-1 shares (formerly Class B) which are convertible into 400,420 shares of Visa Class A shares after the final settlement of all covered litigation. Class B-1 shares may be diluted in the future if the escrow fund is not adequate to cover future covered litigation costs. No value has been currently assigned to the Class B-1 shares. On September 13, 2023, Visa, Inc. announced its intent to engage with common stockholders on a potential proposal that would result in the release of certain transfer restrictions on a portion of Visa Class B-1 common stock. The proposal was approved by a majority of voting common stockholders on January 23, 2024. As approved the proposal is expected to provide the option to convert up to 50% of our Class B-1 shares to Visa Class C shares and subsequently to freely transferable Visa Class A common shares. Conversion of Class B-1 shares would not reduce our proportionate share of the covered litigation losses.
On June 24, 2015, BOKF, NA received a complaint that an employee had colluded with a bond issuer and an individual in misusing revenues pledged to municipal bonds for which BOKF, NA served as trustee under the bond indenture. The Company conducted an investigation and concluded that employees in one of its Corporate Trust offices had, with respect to a single group of affiliated bond issuances, violated Company policies and procedures. The relationship manager was terminated. The Company reported the circumstances to, and cooperated with an investigation by, the SEC. On September 7, 2016, BOKF, NA agreed to, and the SEC entered, a consent order finding that BOKF, NA had violated Section 17(a) of the Securities Act of 1933 and Section 10(b) of the Securities Exchange Act and required BOKF, NA to disgorge $1,067,721 of fees and pay a civil penalty of $600,000. BOKF, NA disgorged the fees and paid the penalty. On August 26, 2016, BOKF, NA was sued in the United States District Court for New Jersey by two bondholders in a putative class action alleging BOKF, NA participated in the fraudulent sale of securities by the principals. The action remains stayed with no current deadlines pending but was reassigned to a new District Judge after the previously assigned Judge took senior status. On September 14, 2016, BOKF, NA was sued in the District Court of Tulsa County, Oklahoma by 19 bondholders also alleging BOKF, NA participated in the fraudulent sale of securities by the principals. The Tulsa County District Court recently granted in part and denied in part BOKF, NA’s motion to dismiss the plaintiffs’ Third Amended Petition and BOKF is preparing to respond. Management is advised by counsel that a loss is not probable and that the loss, if any, cannot be reasonably estimated.
On December 28, 2015, in an action brought by the SEC, the New Jersey District Court entered a Consent Judgment against the principals involved in issuing the bonds. On January 8, 2020, the Court entered Final Judgment against the principal individual and his wife for $36,805,051 in principal amount and $10,937,831 in pre-judgment interest. The SEC continues to aggressively pursue collection of the judgment. If the individual principal and his wife cannot pay the bonds, a bondholder loss could become probable. Management has been advised by counsel that BOKF, NA has valid defenses to claims of bondholders and that no loss to the Company is probable. No provision for losses has been made at this time. BOKF, NA estimates that, upon sale of all remaining collateral securing payment of the bonds, approximately $33 million will remain outstanding. A reasonable estimate cannot be made of the amount of any bondholder loss, though the amount of bondholder loss could be material to the Company in the event a loss to the Company becomes probable.
As previously reported, a limited liability partnership sued BOKF, NA in the Colorado District Court in 2019 alleging that the Bank breached various fiduciary duties as trustee of a trust that was a co-general partner of the partnership and claiming in excess of $60 million in damages. In January 2023, the action was settled at no cost to BOKF, NA in excess of the cost of defense.
In the ordinary course of business, BOK Financial and its subsidiaries are subject to legal actions and complaints. Management believes, based upon the opinion of counsel, that the actions and liability or loss, if any, resulting from the final outcomes of the proceedings will not have a material effect on the Company’s financial condition, results of operations or cash flows.
Alternative Investment Commitments
The Company invests in several tax credit entities and other funds as permitted by banking regulations. Consolidation of these investments is based on the variable interest model.
At December 31, 2023, the Company had $413 million in interests in various alternative investments generally consisting of unconsolidated limited partnership interests in entities for which investment return is in the form of low income housing tax credits or other investments in merchant banking activities. The investment balance also includes $100 million in unfunded commitments included in Other liabilities on the Consolidated Balance Sheets. At December 31, 2022, the Company had $390 million in interests in various alternative investments and included $81 million in unfunded commitments in Other liabilities.
Other Commitments and Contingencies
Cavanal Hill Funds’ assets include U.S. Treasury and government securities money market funds. Assets of these funds consist of highly-rated, short-term obligations of the U.S. Treasury and Agencies. The net asset value of units in these funds was $1.00 at December 31, 2023. An investment in these funds is not insured by the FDIC or guaranteed by BOK Financial or any of its subsidiaries. BOK Financial may, but is not obligated to purchase assets from these funds to maintain the net asset value at $1.00. No assets were purchased from the Cavanal Hill Funds in 2023 or 2022 in order to maintain the net asset value at $1.00.
The Federal Reserve Bank requires member banks to maintain certain minimum average cash balances. Member banks may satisfy reserve balance requirements through holdings of vault cash and balances maintained directly with a Federal Reserve Bank. The combined average balance of vault cash and balances held at the Federal Reserve Bank was $717 million for the year ended December 31, 2023 and $890 million for the year ended December 31, 2022.
(15) Shareholders' Equity
Preferred Stock
One billion shares of preferred stock with a par value of $0.00005 per share are authorized. The Series A Preferred Stock has no voting rights except as otherwise provided by Oklahoma corporate law and may be converted into one share of Common Stock for each 36 shares of Series A Preferred Stock at the option of the holder. Dividends are cumulative at an annual rate of ten percent of the $0.06 per share liquidation preference value when declared and are payable in cash. Aggregate liquidation preference is $15 million. No Series A Preferred Stock was outstanding in 2023, 2022 or 2021.
Common Stock
Common stock consists of 2.5 billion authorized shares with a $0.00006 par value. Holders of common shares are entitled to one vote per share at the election of the Board of Directors and on any question arising at any shareholders’ meeting and to receive dividends when and as declared. Additionally, regulations restrict the ability of national banks and bank holding companies to pay dividends.
Subsidiary Bank
The amounts of dividends that BOK Financial’s subsidiary bank can declare and the amounts of loans the subsidiary bank can extend to affiliates are limited by various federal banking regulations and state corporate law. Generally, dividends declared during a calendar year are limited to net profits, as defined, for the year plus retained profits for the preceding two years. Dividends are further restricted by minimum capital requirements.
Regulatory Capital
BOK Financial and the subsidiary bank are subject to various capital requirements administered by the federal banking agencies. Failure to meet minimum capital requirements can initiate certain mandatory and additional discretionary actions by regulators that could have a material effect on BOK Financial's operations. These capital requirements include quantitative measures of assets, liabilities and certain off-balance sheet items. The capital standards are also subject to qualitative judgments by the regulators.
A bank falling below the minimum capital requirements, including the capital conservation buffer, would be subject to regulatory restrictions on capital distributions (including but not limited to dividends and share repurchases) and executive bonus payments. For a banking institution to qualify as well capitalized, Common Equity Tier 1, Tier I, Total and Leverage capital ratios must be at least 6.5%, 8%, 10% and 5%, respectively. Tier I capital consists primarily of common stockholders' equity, excluding unrealized gains or losses on available for sale securities, less goodwill, core deposit premiums and certain other intangible assets. Total capital consists primarily of Tier I capital plus preferred stock, subordinated debt and allowances for credit losses, subject to certain limitations. The subsidiary bank exceeded the regulatory definition of well capitalized as of December 31, 2023 and December 31, 2022.
A summary of regulatory capital minimum requirements and levels follows (dollars in thousands):
|
|
|
|
|
|
|
|
|
|
|
|
|
|
|
|
|
|
|
|
|
|
|
|
|
|
|
|
|
|
|
|
|
|
|
|
|
|
|
|
|
|
|
|
|
|
|
|
|
|
|
|
|
Minimum Capital Requirement |
|
Capital Conservation Buffer |
|
Minimum Capital Requirement Including Capital Conservation Buffer |
|
Well Capitalized Bank Requirement |
|
December 31, 2023 |
|
December 31, 2022 |
Common Equity Tier 1 Capital (to Risk Weighted Assets): |
|
|
|
|
|
|
|
|
|
|
|
|
|
|
|
|
| Consolidated |
|
4.50% |
|
2.50% |
|
7.00% |
|
N/A |
|
$ |
4,683,510 |
|
|
12.06 |
% |
|
$ |
4,460,054 |
|
|
11.69 |
% |
| BOKF, NA |
|
4.50% |
|
N/A |
|
4.50% |
|
6.50% |
|
4,370,891 |
|
|
11.37 |
% |
|
4,176,978 |
|
|
11.05 |
% |
Tier I Capital (to Risk Weighted Assets): |
|
|
|
|
|
|
|
|
|
|
|
|
|
|
|
|
| Consolidated |
|
6.00% |
|
2.50% |
|
8.50% |
|
N/A |
|
$ |
4,686,487 |
|
|
12.07 |
% |
|
$ |
4,464,763 |
|
|
11.71 |
% |
| BOKF, NA |
|
6.00% |
|
N/A |
|
6.00% |
|
8.00% |
|
4,370,891 |
|
|
11.37 |
% |
|
4,178,531 |
|
|
11.06 |
% |
Total Capital (to Risk Weighted Assets): |
|
|
|
|
|
|
|
|
|
|
|
|
|
|
|
|
Consolidated |
|
8.00% |
|
2.50% |
|
10.50% |
|
N/A |
|
$ |
5,110,471 |
|
|
13.16 |
% |
|
$ |
4,830,827 |
|
|
12.67 |
% |
BOKF, NA |
|
8.00% |
|
N/A |
|
8.00% |
|
10.00% |
|
4,728,876 |
|
|
12.30 |
% |
|
4,478,559 |
|
|
11.85 |
% |
Leverage (Tier I Capital to Average Assets): |
|
|
|
|
|
|
|
|
|
|
|
|
|
|
|
|
| Consolidated |
|
4.00% |
|
N/A |
|
4.00% |
|
N/A |
|
$ |
4,686,487 |
|
|
9.45 |
% |
|
$ |
4,464,763 |
|
|
9.91 |
% |
| BOKF, NA |
|
4.00% |
|
N/A |
|
4.00% |
|
5.00% |
|
4,370,891 |
|
|
8.86 |
% |
|
4,178,531 |
|
|
9.31 |
% |
Accumulated Other Comprehensive Income (Loss)
AOCI includes unrealized gains and losses on AFS securities. AOCI also includes unrealized losses on AFS securities that were transferred from AFS to investment securities in the second quarter of 2022. Such amounts are being amortized over the estimated remaining life of the security as an adjustment to yield, offsetting the related amortization of premium on the transferred securities. Gains and losses in AOCI are net of deferred income taxes.
A rollforward of the components of accumulated other comprehensive income (loss) is included as follows (in thousands):
|
|
|
|
|
|
|
|
|
|
|
|
|
|
|
|
|
|
|
|
|
|
|
|
|
|
|
Unrealized Gain (Loss) on |
|
|
|
|
|
Available for Sale Securities |
|
Investment Securities Transferred from AFS |
|
Employee Benefit Plans |
|
|
|
Total |
| Balance, December 31, 2020 |
$ |
335,032 |
|
|
$ |
— |
|
|
$ |
836 |
|
|
|
|
$ |
335,868 |
|
| Net change in unrealized gain (loss) |
(343,730) |
|
|
— |
|
|
2,361 |
|
|
|
|
(341,369) |
|
Reclassification adjustments included in earnings: |
|
|
|
|
|
|
|
|
|
|
|
|
|
|
|
|
|
|
|
|
|
|
|
|
|
|
|
|
|
|
|
|
|
|
|
|
|
|
|
| Gain on available for sale securities, net |
(3,704) |
|
|
— |
|
|
— |
|
|
|
|
(3,704) |
|
Other comprehensive income (loss), before income taxes |
(347,434) |
|
|
— |
|
|
2,361 |
|
|
|
|
(345,073) |
|
| Federal and state income tax |
(82,177) |
|
|
— |
|
|
601 |
|
|
|
|
(81,576) |
|
| Other comprehensive income (loss), net of income taxes |
(265,257) |
|
|
— |
|
|
1,760 |
|
|
|
|
(263,497) |
|
| Balance, December 31, 2021 |
69,775 |
|
|
— |
|
|
2,596 |
|
|
|
|
72,371 |
|
Net change in unrealized gain (loss) |
(1,227,414) |
|
|
— |
|
|
— |
|
|
|
|
(1,227,414) |
|
| Transfer of net unrealized loss from AFS to investment securities |
267,509 |
|
|
(267,509) |
|
|
— |
|
|
|
|
— |
|
Reclassification adjustments included in earnings: |
|
|
|
|
|
|
|
|
|
| Interest revenue, Investment securities |
— |
|
|
42,514 |
|
|
— |
|
|
|
|
42,514 |
|
| Operating expense, Personnel |
— |
|
|
— |
|
|
(3,483) |
|
|
|
|
(3,483) |
|
|
|
|
|
|
|
|
|
|
|
| Loss on available for sale securities, net |
971 |
|
|
— |
|
|
— |
|
|
|
|
971 |
|
Other comprehensive income (loss), before income taxes |
(958,934) |
|
|
(224,995) |
|
|
(3,483) |
|
|
|
|
(1,187,412) |
|
| Federal and state income tax |
(224,541) |
|
|
(52,658) |
|
|
(887) |
|
|
|
|
(278,086) |
|
| Other comprehensive income (loss), net of income taxes |
(734,393) |
|
|
(172,337) |
|
|
(2,596) |
|
|
|
|
(909,326) |
|
| Balance, December 31, 2022 |
(664,618) |
|
|
(172,337) |
|
|
— |
|
|
|
|
(836,955) |
|
Net change in unrealized gain (loss) |
218,293 |
|
|
— |
|
|
— |
|
|
|
|
218,293 |
|
|
|
|
|
|
|
|
|
|
|
Reclassification adjustments included in earnings: |
|
|
|
|
|
|
|
|
|
| Interest revenue, Investment securities |
— |
|
|
60,394 |
|
|
— |
|
|
|
|
60,394 |
|
|
|
|
|
|
|
|
|
|
|
|
|
|
|
|
|
|
|
|
|
| Loss on available for sale securities, net |
30,636 |
|
|
— |
|
|
— |
|
|
|
|
30,636 |
|
Other comprehensive income (loss), before income taxes |
248,929 |
|
|
60,394 |
|
|
— |
|
|
|
|
309,323 |
|
| Federal and state income tax |
57,523 |
|
|
13,945 |
|
|
— |
|
|
|
|
71,468 |
|
| Other comprehensive income (loss), net of income taxes |
191,406 |
|
|
46,449 |
|
|
— |
|
|
|
|
237,855 |
|
| Balance, December 31, 2023 |
$ |
(473,212) |
|
|
$ |
(125,888) |
|
|
$ |
— |
|
|
|
|
$ |
(599,100) |
|
(16) Earnings Per Share
The following table presents the computation of basic and diluted earnings per share (dollars in thousands, except per share data):
|
|
|
|
|
|
|
|
|
|
|
|
|
|
|
|
|
|
|
|
|
|
|
Year Ended |
|
|
2023 |
|
2022 |
|
2021 |
| Numerator: |
|
|
|
|
|
|
| Net income attributable to BOK Financial Corp. shareholders |
|
$ |
530,746 |
|
|
$ |
520,273 |
|
|
$ |
618,121 |
|
| Less: Earnings allocated to participating securities |
|
4,253 |
|
|
3,803 |
|
|
4,299 |
|
Numerator for basic earnings per share – income available to common shareholders |
|
526,493 |
|
|
516,470 |
|
|
613,822 |
|
| Effect of reallocating undistributed earnings of participating securities |
|
— |
|
|
— |
|
|
— |
|
Numerator for diluted earnings per share – income available to common shareholders |
|
$ |
526,493 |
|
|
$ |
516,470 |
|
|
$ |
613,822 |
|
|
|
|
|
|
|
|
| Denominator: |
|
|
|
|
|
|
| Weighted average shares outstanding |
|
66,184,832 |
|
|
67,706,014 |
|
|
69,071,511 |
|
| Less: Participating securities included in weighted average shares outstanding |
|
533,263 |
|
|
493,286 |
|
|
479,591 |
|
| Denominator for basic earnings per common share |
|
65,651,569 |
|
|
67,212,728 |
|
|
68,591,920 |
|
| Dilutive effect of employee stock compensation plans |
|
— |
|
|
7 |
|
|
2,402 |
|
| Denominator for diluted earnings per common share |
|
65,651,569 |
|
|
67,212,735 |
|
|
68,594,322 |
|
|
|
|
|
|
|
|
| Basic earnings per share |
|
$ |
8.02 |
|
|
$ |
7.68 |
|
|
$ |
8.95 |
|
| Diluted earnings per share |
|
$ |
8.02 |
|
|
$ |
7.68 |
|
|
$ |
8.95 |
|
|
|
|
|
|
|
|
(17) Reportable Segments
BOK Financial operates three principal lines of business: Commercial Banking, Consumer Banking and Wealth Management. Commercial Banking includes lending, treasury and cash management services and customer risk management products to small businesses, middle market and larger commercial customers. Commercial Banking also includes the TransFund EFT network. Consumer Banking includes retail lending and deposit services, lending and deposit services to small business customers served through the consumer branch network and all mortgage banking activities. Wealth Management provides fiduciary services, private bank services and investment advisory services in all markets. Insurance services were provided through November 30, 2023 when BOKF Insurance was sold. Wealth Management also underwrites state and municipal securities and engages in brokerage and trading activities.
In addition to its lines of business, BOK Financial has a Funds Management unit. The primary purpose of this unit is to manage overall liquidity needs and interest rate risk. Each line of business borrows funds from and provides funds to the Funds Management unit as needed to support their operations. Operating results for Funds Management and Other include the effect of interest rate risk positions and risk management activities, securities gains and losses including impairment charges, the provision for credit losses in excess of net loans charged off, tax planning strategies and certain executive compensation costs that are not attributed to the lines of business.
BOK Financial allocates resources and evaluates performance of its lines of business after allocation of funds and capital costs. Credit costs are attributed to the lines of business based on net loans charged off or recovered. In addition, we measure the performance of our business lines after allocation of certain indirect expenses and taxes at statutory rates. The allocation for the prior comparable periods have been revised on a comparable basis.
The cost of funds borrowed from the Funds Management unit by the operating lines of business is transfer priced at rates that approximate market rates for funds with similar duration. Market rates are generally based on the applicable wholesale borrowing rates or interest rate swap rates adjusted for prepayment risk. This method of transfer pricing funds that support assets of the operating lines of business tends to insulate them from interest rate risk.
The value of funds provided by the operating lines of business to the Funds Management unit is based on rates which approximate the wholesale market rates for funds with similar duration and repricing characteristics. Market rates are generally based on a proxy of wholesale borrowing rates or interest rate swap rates. The funds credit formula applied to deposit products with indeterminate maturities is established based on their repricing characteristics reflected in a combination of the short-term wholesale funding rate and a moving average of an intermediate term swap rate, with an appropriate spread applied to both. Shorter duration products are weighted towards the short-term wholesale funding rates and longer duration products are weighted towards intermediate swap rates. The expected duration ranges from 30 days for certain rate sensitive deposits to five years.
Substantially all revenue is from domestic customers. No single external customer accounts for more than 10% of total revenue.
Net loans charged off and provision for credit losses represents net loans charged off or recovered as attributed to the lines of business. The provision for credit losses in excess of net charge-offs or recoveries is attributed to Funds Management and Other.
Reportable segments reconciliation to the Consolidated Financial Statements for the year ended December 31, 2023 is as follows (in thousands):
|
|
|
|
|
|
|
|
|
|
|
|
|
|
|
|
|
|
|
|
|
|
|
|
|
|
|
|
|
|
|
|
|
| |
|
Commercial |
|
Consumer |
|
Wealth
Management |
|
Funds Management and Other |
|
BOK
Financial
Consolidated |
Net interest and dividend revenue from external sources |
|
$ |
1,179,336 |
|
|
$ |
59,985 |
|
|
$ |
39,198 |
|
|
$ |
(6,339) |
|
|
$ |
1,272,180 |
|
Net interest revenue (expense) from internal sources |
|
(146,965) |
|
|
389,791 |
|
|
142,340 |
|
|
(385,166) |
|
|
— |
|
| Net interest and dividend revenue |
|
1,032,371 |
|
|
449,776 |
|
|
181,538 |
|
|
(391,505) |
|
|
1,272,180 |
|
| Net loans charged off and provision for credit losses |
|
13,967 |
|
|
5,157 |
|
|
(50) |
|
|
26,926 |
|
|
46,000 |
|
Net interest and dividend revenue after provision for credit losses |
|
1,018,404 |
|
|
444,619 |
|
|
181,588 |
|
|
(418,431) |
|
|
1,226,180 |
|
| Other operating revenue |
|
246,225 |
|
|
123,678 |
|
|
506,447 |
|
|
(86,401) |
|
|
789,949 |
|
| Other operating expense |
|
312,794 |
|
|
212,114 |
|
|
352,540 |
|
|
455,433 |
|
|
1,332,881 |
|
| Net direct contribution |
|
951,835 |
|
|
356,183 |
|
|
335,495 |
|
|
(960,265) |
|
|
683,248 |
|
| Gain (loss) on financial instruments, net |
|
378 |
|
|
(14,806) |
|
|
— |
|
|
14,428 |
|
|
— |
|
Change in fair value of mortgage servicing rights |
|
— |
|
|
(3,115) |
|
|
— |
|
|
3,115 |
|
|
— |
|
| Gain (loss) on repossessed assets, net |
|
398 |
|
|
36 |
|
|
— |
|
|
(434) |
|
|
— |
|
| Corporate expense allocations |
|
74,976 |
|
|
48,565 |
|
|
53,463 |
|
|
(177,004) |
|
|
— |
|
| Net income before taxes |
|
877,635 |
|
|
289,733 |
|
|
282,032 |
|
|
(766,152) |
|
|
683,248 |
|
| Federal and state income taxes |
|
213,174 |
|
|
68,143 |
|
|
66,549 |
|
|
(195,751) |
|
|
152,115 |
|
| Net income |
|
664,461 |
|
|
221,590 |
|
|
215,483 |
|
|
(570,401) |
|
|
531,133 |
|
Net income attributable to non-controlling interests |
|
— |
|
|
— |
|
|
— |
|
|
387 |
|
|
387 |
|
Net income attributable to BOK Financial Corp. shareholders |
|
$ |
664,461 |
|
|
$ |
221,590 |
|
|
$ |
215,483 |
|
|
$ |
(570,788) |
|
|
$ |
530,746 |
|
|
|
|
|
|
|
|
|
|
|
|
| Average assets |
|
$ |
28,630,716 |
|
|
$ |
9,561,512 |
|
|
$ |
13,570,153 |
|
|
$ |
(3,518,227) |
|
|
$ |
48,244,154 |
|
Reportable segments reconciliation to the Consolidated Financial Statements for the year ended December 31, 2022 is as follows (in thousands):
|
|
|
|
|
|
|
|
|
|
|
|
|
|
|
|
|
|
|
|
|
|
|
|
|
|
|
|
|
|
|
|
|
| |
|
Commercial |
|
Consumer |
|
Wealth
Management |
|
Funds Management and Other |
|
BOK
Financial
Consolidated |
Net interest and dividend revenue from external sources |
|
$ |
818,213 |
|
|
$ |
69,646 |
|
|
$ |
155,974 |
|
|
$ |
167,547 |
|
|
$ |
1,211,380 |
|
Net interest revenue (expense) from internal sources |
|
(73,764) |
|
|
88,603 |
|
|
5,623 |
|
|
(20,462) |
|
|
— |
|
| Net interest and dividend revenue |
|
744,449 |
|
|
158,249 |
|
|
161,597 |
|
|
147,085 |
|
|
1,211,380 |
|
| Net loans charged off and provision for credit losses |
|
17,726 |
|
|
5,260 |
|
|
(175) |
|
|
7,189 |
|
|
30,000 |
|
Net interest and dividend revenue after provision for credit losses |
|
726,723 |
|
|
152,989 |
|
|
161,772 |
|
|
139,896 |
|
|
1,181,380 |
|
| Other operating revenue |
|
241,594 |
|
|
121,819 |
|
|
339,501 |
|
|
(59,657) |
|
|
643,257 |
|
| Other operating expense |
|
289,243 |
|
|
209,210 |
|
|
312,377 |
|
|
353,650 |
|
|
1,164,480 |
|
| Net direct contribution |
|
679,074 |
|
|
65,598 |
|
|
188,896 |
|
|
(273,411) |
|
|
660,157 |
|
| Gain (loss) on financial instruments, net |
|
1 |
|
|
(93,346) |
|
|
4 |
|
|
93,341 |
|
|
— |
|
Change in fair value of mortgage servicing rights |
|
— |
|
|
80,261 |
|
|
— |
|
|
(80,261) |
|
|
— |
|
| Gain (loss) on repossessed assets, net |
|
(1,903) |
|
|
139 |
|
|
— |
|
|
1,764 |
|
|
— |
|
| Corporate expense allocations |
|
67,278 |
|
|
44,965 |
|
|
50,241 |
|
|
(162,484) |
|
|
— |
|
| Net income before taxes |
|
609,894 |
|
|
7,687 |
|
|
138,659 |
|
|
(96,083) |
|
|
660,157 |
|
| Federal and state income taxes |
|
148,358 |
|
|
1,798 |
|
|
32,639 |
|
|
(42,931) |
|
|
139,864 |
|
| Net income |
|
461,536 |
|
|
5,889 |
|
|
106,020 |
|
|
(53,152) |
|
|
520,293 |
|
| Net income attributable to non-controlling interests |
|
— |
|
|
— |
|
|
— |
|
|
20 |
|
|
20 |
|
Net income attributable to BOK Financial Corp. shareholders |
|
$ |
461,536 |
|
|
$ |
5,889 |
|
|
$ |
106,020 |
|
|
$ |
(53,172) |
|
|
$ |
520,273 |
|
|
|
|
|
|
|
|
|
|
|
|
| Average assets |
|
$ |
29,084,957 |
|
|
$ |
10,230,437 |
|
|
$ |
16,209,684 |
|
|
$ |
(8,500,442) |
|
|
$ |
47,024,636 |
|
Reportable segments reconciliation to the Consolidated Financial Statements for the year ended December 31, 2021 is as follows (in thousands):
|
|
|
|
|
|
|
|
|
|
|
|
|
|
|
|
|
|
|
|
|
|
|
|
|
|
|
|
|
|
|
|
|
| |
|
Commercial |
|
Consumer |
|
Wealth
Management |
|
Funds Management and Other |
|
BOK
Financial
Consolidated |
Net interest and dividend revenue from external sources |
|
$ |
606,902 |
|
|
$ |
67,856 |
|
|
$ |
214,458 |
|
|
$ |
228,817 |
|
|
$ |
1,118,033 |
|
Net interest revenue (expense) from internal sources |
|
(71,167) |
|
|
35,671 |
|
|
(386) |
|
|
35,882 |
|
|
— |
|
| Net interest and dividend revenue |
|
535,735 |
|
|
103,527 |
|
|
214,072 |
|
|
264,699 |
|
|
1,118,033 |
|
| Net loans charged off and provision for credit losses |
|
31,128 |
|
|
4,009 |
|
|
(223) |
|
|
(134,914) |
|
|
(100,000) |
|
Net interest and dividend revenue after provision for credit losses |
|
504,607 |
|
|
99,518 |
|
|
214,295 |
|
|
399,613 |
|
|
1,218,033 |
|
| Other operating revenue |
|
262,402 |
|
|
173,341 |
|
|
298,962 |
|
|
21,070 |
|
|
755,775 |
|
| Other operating expense |
|
279,571 |
|
|
209,596 |
|
|
320,726 |
|
|
367,815 |
|
|
1,177,708 |
|
| Net direct contribution |
|
487,438 |
|
|
63,263 |
|
|
192,531 |
|
|
52,868 |
|
|
796,100 |
|
| Gain (loss) on financial instruments, net |
|
154 |
|
|
(21,871) |
|
|
— |
|
|
21,717 |
|
|
— |
|
Change in fair value of mortgage servicing rights |
|
— |
|
|
41,637 |
|
|
— |
|
|
(41,637) |
|
|
— |
|
| Gain (loss) on repossessed assets, net |
|
13,001 |
|
|
85 |
|
|
— |
|
|
(13,086) |
|
|
— |
|
| Corporate expense allocations |
|
54,146 |
|
|
46,010 |
|
|
40,341 |
|
|
(140,497) |
|
|
— |
|
| Net income before taxes |
|
446,447 |
|
|
37,104 |
|
|
152,190 |
|
|
160,359 |
|
|
796,100 |
|
| Federal and state income taxes |
|
119,934 |
|
|
9,461 |
|
|
38,944 |
|
|
11,436 |
|
|
179,775 |
|
| Net income |
|
326,513 |
|
|
27,643 |
|
|
113,246 |
|
|
148,923 |
|
|
616,325 |
|
| Net loss attributable to non-controlling interests |
|
— |
|
|
— |
|
|
— |
|
|
(1,796) |
|
|
(1,796) |
|
Net income attributable to BOK Financial Corp. shareholders |
|
$ |
326,513 |
|
|
$ |
27,643 |
|
|
$ |
113,246 |
|
|
$ |
150,719 |
|
|
$ |
618,121 |
|
|
|
|
|
|
|
|
|
|
|
|
| Average assets |
|
$ |
28,536,881 |
|
|
$ |
10,029,687 |
|
|
$ |
19,425,475 |
|
|
$ |
(7,840,340) |
|
|
$ |
50,151,703 |
|
(18) Fees and Commissions Revenue
Fees and commissions revenue by reportable segment and primary service line is as follows for the year ended December 31, 2023 (in thousands):
|
|
|
|
|
|
|
|
|
|
|
|
|
|
|
|
|
|
|
|
|
|
|
|
|
|
|
|
|
|
|
|
|
|
|
|
|
|
|
|
|
|
|
Commercial |
|
Consumer |
|
Wealth Management |
|
Funds Management and Other |
|
Consolidated |
|
Out of Scope1 |
|
In Scope2 |
| Trading revenue |
$ |
— |
|
|
$ |
— |
|
|
$ |
134,511 |
|
|
$ |
— |
|
|
$ |
134,511 |
|
|
$ |
134,511 |
|
|
$ |
— |
|
Customer hedging revenue |
33,307 |
|
|
— |
|
|
(102) |
|
|
3,317 |
|
|
36,522 |
|
|
36,522 |
|
|
— |
|
Retail brokerage revenue |
— |
|
|
— |
|
|
15,908 |
|
|
— |
|
|
15,908 |
|
|
— |
|
|
15,908 |
|
Insurance brokerage revenue |
— |
|
|
— |
|
|
10,679 |
|
|
— |
|
|
10,679 |
|
|
— |
|
|
10,679 |
|
Investment banking revenue |
17,079 |
|
|
— |
|
|
25,911 |
|
|
— |
|
|
42,990 |
|
|
15,525 |
|
|
27,465 |
|
Brokerage and trading revenue |
50,386 |
|
|
— |
|
|
186,907 |
|
|
3,317 |
|
|
240,610 |
|
|
186,558 |
|
|
54,052 |
|
| TransFund EFT network revenue |
86,046 |
|
|
3,513 |
|
|
(69) |
|
|
6 |
|
|
89,496 |
|
|
— |
|
|
89,496 |
|
| Merchant services revenue |
9,172 |
|
|
34 |
|
|
— |
|
|
— |
|
|
9,206 |
|
|
— |
|
|
9,206 |
|
| Corporate card revenue |
7,014 |
|
|
— |
|
|
713 |
|
|
429 |
|
|
8,156 |
|
|
— |
|
|
8,156 |
|
| Transaction card revenue |
102,232 |
|
|
3,547 |
|
|
644 |
|
|
435 |
|
|
106,858 |
|
|
— |
|
|
106,858 |
|
| Personal trust revenue |
— |
|
|
— |
|
|
95,070 |
|
|
— |
|
|
95,070 |
|
|
— |
|
|
95,070 |
|
| Corporate trust revenue |
— |
|
|
— |
|
|
31,228 |
|
|
— |
|
|
31,228 |
|
|
— |
|
|
31,228 |
|
Institutional trust & retirement plan services revenue |
— |
|
|
— |
|
|
58,692 |
|
|
— |
|
|
58,692 |
|
|
— |
|
|
58,692 |
|
Investment management services and other |
— |
|
|
— |
|
|
22,349 |
|
|
(21) |
|
|
22,328 |
|
|
— |
|
|
22,328 |
|
Fiduciary and asset management revenue |
— |
|
|
— |
|
|
207,339 |
|
|
(21) |
|
|
207,318 |
|
|
— |
|
|
207,318 |
|
Commercial account service charge revenue |
53,670 |
|
|
2,070 |
|
|
1,969 |
|
|
— |
|
|
57,709 |
|
|
— |
|
|
57,709 |
|
| Overdraft fee revenue |
109 |
|
|
20,753 |
|
|
139 |
|
|
3 |
|
|
21,004 |
|
|
— |
|
|
21,004 |
|
Check card revenue |
— |
|
|
23,463 |
|
|
— |
|
|
— |
|
|
23,463 |
|
|
— |
|
|
23,463 |
|
Automated service charge and other deposit fee revenue |
1,056 |
|
|
5,076 |
|
|
206 |
|
|
— |
|
|
6,338 |
|
|
— |
|
|
6,338 |
|
Deposit service charges and fees |
54,835 |
|
|
51,362 |
|
|
2,314 |
|
|
3 |
|
|
108,514 |
|
|
— |
|
|
108,514 |
|
| Mortgage production revenue |
— |
|
|
(5,339) |
|
|
— |
|
|
— |
|
|
(5,339) |
|
|
(5,339) |
|
|
— |
|
| Mortgage servicing revenue |
— |
|
|
63,431 |
|
|
— |
|
|
(2,394) |
|
|
61,037 |
|
|
61,037 |
|
|
— |
|
| Mortgage banking revenue |
— |
|
|
58,092 |
|
|
— |
|
|
(2,394) |
|
|
55,698 |
|
|
55,698 |
|
|
— |
|
| Other revenue |
26,881 |
|
|
10,731 |
|
|
78,243 |
|
|
(53,735) |
|
|
62,120 |
|
|
34,282 |
|
|
27,838 |
|
Total fees and commissions revenue |
$ |
234,334 |
|
|
$ |
123,732 |
|
|
$ |
475,447 |
|
|
$ |
(52,395) |
|
|
$ |
781,118 |
|
|
$ |
276,538 |
|
|
$ |
504,580 |
|
1 Out of scope revenue generally relates to financial instruments or contractual rights and obligations within the scope of other applicable accounting guidance.
2 In scope revenue represents revenue subject to FASB ASC Topic 606, Revenue from Contracts with Customers.
Fees and commissions revenue by reportable segment and primary service line is as follows for the year ended December 31, 2022 (in thousands):
|
|
|
|
|
|
|
|
|
|
|
|
|
|
|
|
|
|
|
|
|
|
|
|
|
|
|
|
|
|
|
|
|
|
|
|
|
|
|
|
|
|
|
Commercial |
|
Consumer |
|
Wealth Management |
|
Funds Management and Other |
|
Consolidated |
|
Out of Scope1 |
|
In Scope2 |
| Trading revenue |
$ |
— |
|
|
$ |
— |
|
|
$ |
20,332 |
|
|
$ |
— |
|
|
$ |
20,332 |
|
|
$ |
20,332 |
|
|
$ |
— |
|
Customer hedging revenue |
34,676 |
|
|
— |
|
|
1,053 |
|
|
9,987 |
|
|
45,716 |
|
|
45,716 |
|
|
— |
|
Retail brokerage revenue |
— |
|
|
— |
|
|
16,403 |
|
|
— |
|
|
16,403 |
|
|
— |
|
|
16,403 |
|
Insurance brokerage revenue |
— |
|
|
— |
|
|
12,879 |
|
|
— |
|
|
12,879 |
|
|
— |
|
|
12,879 |
|
Investment banking revenue |
25,048 |
|
|
— |
|
|
20,600 |
|
|
— |
|
|
45,648 |
|
|
23,730 |
|
|
21,918 |
|
Brokerage and trading revenue |
59,724 |
|
|
— |
|
|
71,267 |
|
|
9,987 |
|
|
140,978 |
|
|
89,778 |
|
|
51,200 |
|
| TransFund EFT network revenue |
81,097 |
|
|
3,560 |
|
|
(73) |
|
|
6 |
|
|
84,590 |
|
|
— |
|
|
84,590 |
|
| Merchant services revenue |
12,397 |
|
|
37 |
|
|
— |
|
|
— |
|
|
12,434 |
|
|
— |
|
|
12,434 |
|
| Corporate card revenue |
6,440 |
|
|
— |
|
|
410 |
|
|
392 |
|
|
7,242 |
|
|
— |
|
|
7,242 |
|
| Transaction card revenue |
99,934 |
|
|
3,597 |
|
|
337 |
|
|
398 |
|
|
104,266 |
|
|
— |
|
|
104,266 |
|
| Personal trust revenue |
— |
|
|
— |
|
|
99,075 |
|
|
— |
|
|
99,075 |
|
|
— |
|
|
99,075 |
|
| Corporate trust revenue |
— |
|
|
— |
|
|
23,775 |
|
|
— |
|
|
23,775 |
|
|
— |
|
|
23,775 |
|
Institutional trust & retirement plan services revenue |
— |
|
|
— |
|
|
50,404 |
|
|
— |
|
|
50,404 |
|
|
— |
|
|
50,404 |
|
Investment management services and other |
— |
|
|
— |
|
|
23,242 |
|
|
(170) |
|
|
23,072 |
|
|
— |
|
|
23,072 |
|
Fiduciary and asset management revenue |
— |
|
|
— |
|
|
196,496 |
|
|
(170) |
|
|
196,326 |
|
|
— |
|
|
196,326 |
|
Commercial account service charge revenue |
52,779 |
|
|
1,884 |
|
|
1,965 |
|
|
— |
|
|
56,628 |
|
|
— |
|
|
56,628 |
|
| Overdraft fee revenue |
115 |
|
|
25,229 |
|
|
77 |
|
|
5 |
|
|
25,426 |
|
|
— |
|
|
25,426 |
|
Check card revenue |
— |
|
|
23,312 |
|
|
— |
|
|
— |
|
|
23,312 |
|
|
— |
|
|
23,312 |
|
Automated service charge and other deposit fee revenue |
556 |
|
|
4,612 |
|
|
102 |
|
|
— |
|
|
5,270 |
|
|
— |
|
|
5,270 |
|
Deposit service charges and fees |
53,450 |
|
|
55,037 |
|
|
2,144 |
|
|
5 |
|
|
110,636 |
|
|
— |
|
|
110,636 |
|
| Mortgage production revenue |
— |
|
|
(1,838) |
|
|
— |
|
|
— |
|
|
(1,838) |
|
|
(1,838) |
|
|
— |
|
| Mortgage servicing revenue |
— |
|
|
53,236 |
|
|
— |
|
|
(2,033) |
|
|
51,203 |
|
|
51,203 |
|
|
— |
|
| Mortgage banking revenue |
— |
|
|
51,398 |
|
|
— |
|
|
(2,033) |
|
|
49,365 |
|
|
49,365 |
|
|
— |
|
| Other revenue |
20,765 |
|
|
11,894 |
|
|
69,294 |
|
|
(46,311) |
|
|
55,642 |
|
|
25,844 |
|
|
29,798 |
|
Total fees and commissions revenue |
$ |
233,873 |
|
|
$ |
121,926 |
|
|
$ |
339,538 |
|
|
$ |
(38,124) |
|
|
$ |
657,213 |
|
|
$ |
164,987 |
|
|
$ |
492,226 |
|
1 Out of scope revenue generally relates to financial instruments or contractual rights and obligations within the scope of other applicable accounting guidance.
2 In scope revenue represents revenue subject to FASB ASC Topic 606, Revenue from Contracts with Customers.
Fees and commissions revenue by reportable segment and primary service line is as follows for the year ended December 31, 2021 (in thousands):
|
|
|
|
|
|
|
|
|
|
|
|
|
|
|
|
|
|
|
|
|
|
|
|
|
|
|
|
|
|
|
|
|
|
|
|
|
|
|
|
|
|
|
Commercial |
|
Consumer |
|
Wealth Management |
|
Funds Management and Other |
|
Consolidated |
|
Out of Scope1 |
|
In Scope2 |
| Trading revenue |
$ |
— |
|
|
$ |
— |
|
|
$ |
27,595 |
|
|
$ |
— |
|
|
$ |
27,595 |
|
|
$ |
27,595 |
|
|
$ |
— |
|
Customer hedging revenue |
23,424 |
|
|
— |
|
|
300 |
|
|
(3,292) |
|
|
20,432 |
|
|
20,432 |
|
|
— |
|
Retail brokerage revenue |
— |
|
|
— |
|
|
18,762 |
|
|
— |
|
|
18,762 |
|
|
— |
|
|
18,762 |
|
Insurance brokerage revenue |
— |
|
|
— |
|
|
11,765 |
|
|
— |
|
|
11,765 |
|
|
— |
|
|
11,765 |
|
Investment banking revenue |
19,129 |
|
|
— |
|
|
16,742 |
|
|
(1,436) |
|
|
34,435 |
|
|
16,272 |
|
|
18,163 |
|
Brokerage and trading revenue |
42,553 |
|
|
— |
|
|
75,164 |
|
|
(4,728) |
|
|
112,989 |
|
|
64,299 |
|
|
48,690 |
|
| TransFund EFT network revenue |
76,603 |
|
|
3,591 |
|
|
(67) |
|
|
6 |
|
|
80,133 |
|
|
— |
|
|
80,133 |
|
| Merchant services revenue |
11,806 |
|
|
55 |
|
|
— |
|
|
— |
|
|
11,861 |
|
|
— |
|
|
11,861 |
|
| Corporate card revenue |
4,502 |
|
|
— |
|
|
169 |
|
|
318 |
|
|
4,989 |
|
|
— |
|
|
4,989 |
|
| Transaction card revenue |
92,911 |
|
|
3,646 |
|
|
102 |
|
|
324 |
|
|
96,983 |
|
|
— |
|
|
96,983 |
|
| Personal trust revenue |
— |
|
|
— |
|
|
97,582 |
|
|
— |
|
|
97,582 |
|
|
— |
|
|
97,582 |
|
| Corporate trust revenue |
— |
|
|
— |
|
|
14,805 |
|
|
— |
|
|
14,805 |
|
|
— |
|
|
14,805 |
|
Institutional trust & retirement plan services revenue |
— |
|
|
— |
|
|
50,765 |
|
|
— |
|
|
50,765 |
|
|
— |
|
|
50,765 |
|
Investment management services and other |
— |
|
|
— |
|
|
15,300 |
|
|
(178) |
|
|
15,122 |
|
|
— |
|
|
15,122 |
|
Fiduciary and asset management revenue |
— |
|
|
— |
|
|
178,452 |
|
|
(178) |
|
|
178,274 |
|
|
— |
|
|
178,274 |
|
Commercial account service charge revenue |
50,213 |
|
|
1,821 |
|
|
2,326 |
|
|
— |
|
|
54,360 |
|
|
— |
|
|
54,360 |
|
| Overdraft fee revenue |
104 |
|
|
21,439 |
|
|
70 |
|
|
9 |
|
|
21,622 |
|
|
— |
|
|
21,622 |
|
Check card revenue |
— |
|
|
23,714 |
|
|
— |
|
|
— |
|
|
23,714 |
|
|
— |
|
|
23,714 |
|
Automated service charge and other deposit fee revenue |
94 |
|
|
4,340 |
|
|
87 |
|
|
— |
|
|
4,521 |
|
|
— |
|
|
4,521 |
|
Deposit service charges and fees |
50,411 |
|
|
51,314 |
|
|
2,483 |
|
|
9 |
|
|
104,217 |
|
|
— |
|
|
104,217 |
|
| Mortgage production revenue |
— |
|
|
60,712 |
|
|
— |
|
|
— |
|
|
60,712 |
|
|
60,712 |
|
|
— |
|
| Mortgage servicing revenue |
— |
|
|
47,055 |
|
|
— |
|
|
(1,871) |
|
|
45,184 |
|
|
45,184 |
|
|
— |
|
| Mortgage banking revenue |
— |
|
|
107,767 |
|
|
— |
|
|
(1,871) |
|
|
105,896 |
|
|
105,896 |
|
|
— |
|
| Other revenue |
41,206 |
|
|
10,637 |
|
|
42,564 |
|
|
(24,457) |
|
|
69,950 |
|
|
54,349 |
|
|
15,601 |
|
Total fees and commissions revenue |
$ |
227,081 |
|
|
$ |
173,364 |
|
|
$ |
298,765 |
|
|
$ |
(30,901) |
|
|
$ |
668,309 |
|
|
$ |
224,544 |
|
|
$ |
443,765 |
|
1 Out of scope revenue generally relates to financial instruments or contractual rights and obligations within the scope of other applicable accounting guidance.
2 In scope revenue represents revenue subject to FASB ASC Topic 606, Revenue from Contracts with Customers.
(19) Fair Value Measurements
Fair value is defined by applicable accounting guidance as the price to sell an asset or transfer a liability in an orderly transaction between market participants in the principal market for the given asset or liability at the measurement date based on market conditions at that date. An orderly transaction assumes exposure to the market for a customary period for marketing activities prior to the measurement date and not a forced liquidation or distressed sale. Certain assets and liabilities are recorded in the Company’s financial statements at fair value. Some are recorded on a recurring basis and some on a non-recurring basis.
For some assets and liabilities, observable market transactions and market information might be available. For other assets and liabilities, observable market transactions and market information might not be available. A hierarchy for fair value has been established which categorizes into three levels the inputs to valuation techniques used to measure fair value. The three levels are as follows:
Quoted Prices in Active Markets for Identical Assets or Liabilities (Level 1) - fair value is based on unadjusted quoted prices in active markets for identical assets or liabilities.
Significant Other Observable Inputs (Level 2) - fair value is based on significant other observable inputs which are generally determined based on a single price for each financial instrument provided to us by an applicable third-party pricing service and is based on one or more of the following:
•quoted prices for similar, but not identical, assets or liabilities in active markets;
•quoted prices for identical or similar assets or liabilities in inactive markets;
•inputs other than quoted prices that are observable, such as interest rate and yield curves, volatilities, prepayment speeds, loss severities, credit risks and default rates;
•other inputs derived from or corroborated by observable market inputs.
Significant Unobservable Inputs (Level 3) - fair value is based upon model-based valuation techniques for which at least one significant assumption is not observable in the market.
Transfers between levels are recognized as of the end of the reporting period. There were no transfers in or out of quoted prices in active markets for identical instruments to significant other observable inputs or significant unobservable inputs during the years ended December 31, 2023 and 2022, respectively. Transfers between significant other observable inputs and significant unobservable inputs during the years ended December 31, 2023 and 2022 were immaterial.
The underlying methods used by the third-party pricing services are considered in determining the primary inputs used to determine fair values. Management has evaluated the methodologies employed by the third-party pricing services by comparing the price provided by the pricing service with other sources, including brokers' quotes, sales or purchases of similar instruments and discounted cash flows to establish a basis for reliance on the pricing service values. Significant differences between the pricing service provided value and other sources are discussed with the pricing service to understand the basis for their values. Based on all observable inputs, management may adjust prices obtained from third-party pricing services to more appropriately reflect the prices that would be received to sell assets or paid to transfer liabilities in orderly transactions in the current market. No significant adjustments were made to prices provided by third-party pricing services at December 31, 2023 and 2022.
Assets and Liabilities Measured at Fair Value on a Recurring Basis
The fair value of financial assets and liabilities that are measured on a recurring basis is as follows as of December 31, 2023 (in thousands):
|
|
|
|
|
|
|
|
|
|
|
|
|
|
|
|
|
|
|
|
|
|
|
|
|
|
|
| |
|
Total |
|
Quoted Prices in Active Markets for Identical Instruments |
|
Significant Other Observable Inputs |
|
Significant Unobservable Inputs |
| Assets: |
|
|
|
|
|
|
|
|
| Trading securities: |
|
|
|
|
|
|
|
|
| U.S. government securities |
|
$ |
10,959 |
|
|
$ |
9,017 |
|
|
$ |
1,942 |
|
|
$ |
— |
|
| Residential agency mortgage-backed securities |
|
5,105,137 |
|
|
— |
|
|
5,105,137 |
|
|
— |
|
| Municipal securities |
|
37,413 |
|
|
— |
|
|
37,413 |
|
|
— |
|
| Other trading securities |
|
39,996 |
|
|
— |
|
|
39,996 |
|
|
— |
|
| Total trading securities |
|
5,193,505 |
|
|
9,017 |
|
|
5,184,488 |
|
|
— |
|
| Available for sale securities: |
|
|
|
|
|
|
|
|
| U.S. Treasury |
|
925 |
|
|
925 |
|
|
— |
|
|
— |
|
| Municipal securities |
|
502,833 |
|
|
— |
|
|
502,833 |
|
|
— |
|
| Residential agency mortgage-backed securities |
|
6,834,720 |
|
|
— |
|
|
6,834,720 |
|
|
— |
|
| Residential non-agency mortgage-backed securities |
|
799,877 |
|
|
— |
|
|
799,877 |
|
|
— |
|
| Commercial agency mortgage-backed securities |
|
4,147,853 |
|
|
— |
|
|
4,147,853 |
|
|
— |
|
| Other debt securities |
|
473 |
|
|
— |
|
|
— |
|
|
473 |
|
| Total available for sale securities |
|
12,286,681 |
|
|
925 |
|
|
12,285,283 |
|
|
473 |
|
|
|
|
|
|
|
|
|
|
|
|
|
|
|
|
|
|
|
|
|
|
|
|
|
|
|
|
| Fair value option securities — Residential agency mortgage-backed securities |
|
20,671 |
|
|
— |
|
|
20,671 |
|
|
— |
|
Residential mortgage loans held for sale1 |
|
56,935 |
|
|
— |
|
|
49,749 |
|
|
7,186 |
|
Mortgage servicing rights, net2 |
|
293,884 |
|
|
— |
|
|
— |
|
|
293,884 |
|
Derivative contracts, net of cash margin3 |
|
410,304 |
|
|
— |
|
|
410,304 |
|
|
— |
|
| Liabilities: |
|
|
|
|
|
|
|
|
Derivative contracts, net of cash margin3 |
|
587,473 |
|
|
2,607 |
|
|
584,866 |
|
|
— |
|
1Residential mortgage loans held for sale measured at fair value on a recurring basis using significant unobservable inputs (Level 3) consist of residential mortgage loans intended for sale to U.S. government agencies that fail to meet conforming standards and are valued at 77.74% of the unpaid principal balance.
2A reconciliation of the beginning and ending fair value of mortgage servicing rights and disclosures of significant assumptions used to determine fair value are presented in Note 7, Mortgage Banking Activities.
3See Note 3 for detail of fair value of derivative contracts by contract type. Derivative contracts in asset and liability positions that were valued based on quoted prices in active markets for identical instruments (Level 1) are primarily exchange-traded interest rate derivative contracts held for trading purposes.
The fair value of financial assets and liabilities that are measured on a recurring basis is as follows as of December 31, 2022 (in thousands):
|
|
|
|
|
|
|
|
|
|
|
|
|
|
|
|
|
|
|
|
|
|
|
|
|
|
|
| |
|
Total |
|
Quoted Prices in Active Markets for Identical Instruments |
|
Significant Other Observable Inputs |
|
Significant Unobservable Inputs |
| Assets: |
|
|
|
|
|
|
|
|
| Trading securities: |
|
|
|
|
|
|
|
|
| U.S. government securities |
|
$ |
9,823 |
|
|
$ |
4,970 |
|
|
$ |
4,853 |
|
|
$ |
— |
|
| Residential agency mortgage-backed securities |
|
4,406,848 |
|
|
— |
|
|
4,406,848 |
|
|
— |
|
| Municipal securities |
|
21,484 |
|
|
— |
|
|
21,484 |
|
|
— |
|
| Other trading securities |
|
26,006 |
|
|
— |
|
|
26,006 |
|
|
— |
|
| Total trading securities |
|
4,464,161 |
|
|
4,970 |
|
|
4,459,191 |
|
|
— |
|
| Available for sale securities: |
|
|
|
|
|
|
|
|
| U.S. Treasury |
|
898 |
|
|
898 |
|
|
— |
|
|
— |
|
| Municipal securities |
|
624,500 |
|
|
— |
|
|
624,500 |
|
|
— |
|
| Residential agency mortgage-backed securities |
|
5,814,496 |
|
|
— |
|
|
5,814,496 |
|
|
— |
|
| Residential non-agency mortgage-backed securities |
|
577,576 |
|
|
— |
|
|
577,576 |
|
|
— |
|
| Commercial agency mortgage-backed securities |
|
4,475,917 |
|
|
— |
|
|
4,475,917 |
|
|
— |
|
| Other debt securities |
|
473 |
|
|
— |
|
|
— |
|
|
473 |
|
| Total available for sale securities |
|
11,493,860 |
|
|
898 |
|
|
11,492,489 |
|
|
473 |
|
|
|
|
|
|
|
|
|
|
|
|
|
|
|
|
|
|
|
| Fair value option securities — Residential agency mortgage-backed securities |
|
296,590 |
|
|
— |
|
|
296,590 |
|
|
— |
|
|
|
|
|
|
|
|
|
|
Residential mortgage loans held for sale1 |
|
75,272 |
|
|
— |
|
|
68,054 |
|
|
7,218 |
|
Mortgage servicing rights, net2 |
|
277,608 |
|
|
— |
|
|
— |
|
|
277,608 |
|
Derivative contracts, net of cash margin3 |
|
880,343 |
|
|
2,110 |
|
|
878,233 |
|
|
— |
|
| Liabilities: |
|
|
|
|
|
|
|
|
Derivative contracts, net of cash margin3 |
|
554,900 |
|
|
16 |
|
|
554,884 |
|
|
— |
|
1Residential mortgage loans held for sale measured at fair value on a recurring basis using significant unobservable inputs (Level 3) consist of residential mortgage loans intended for sale to U.S. government agencies that fail to meet conforming standards and are valued at 77.55% of the unpaid principal balance.
2A reconciliation of the beginning and ending fair value of mortgage servicing rights and disclosures of significant assumptions used to determine fair value are presented in Note 7, Mortgage Banking Activities.
3See Note 3 for detail of fair value of derivative contracts by contract type. Derivative contracts in asset and liability positions that were valued based on quoted prices in active markets for identical instruments (Level 1) are primarily exchange-traded interest rate derivative contracts held for trading purposes.
Following is a description of the Company's valuation methodologies used for assets and liabilities measured on a recurring basis:
Securities
The fair values of trading, available for sale and fair value option securities are based on quoted prices for identical instruments in active markets, when available. If quoted prices for identical instruments are not available, fair values are based on significant other observable inputs such as quoted prices of comparable instruments or interest rates and credit spreads, yield curves, volatilities, prepayment speeds and loss severities.
The fair value of certain available for sale and held-to-maturity municipal and other debt securities may be based on significant unobservable inputs. These significant unobservable inputs include limited observed trades, projected cash flows, current credit rating of the issuers and, when applicable, the insurers of the debt and observed trades of similar debt. Discount rates are primarily based on reference to interest rate spreads on comparable securities of similar duration and credit rating as determined by the nationally-recognized rating agencies adjusted for a lack of trading volume. Significant unobservable inputs are developed by investment securities professionals involved in the active trading of similar securities. A summary of significant inputs used to value these securities follows. A management committee composed of senior members from the Company's Corporate Treasury, Risk Management and Finance departments assess the appropriateness of these inputs quarterly.
Derivatives
All derivative instruments are carried on the balance sheet at fair value. Fair values for exchange-traded contracts are based on quoted prices. Fair values for over-the-counter interest rate, commodity and foreign exchange contracts are based on valuations provided either by third-party dealers in the contracts, quotes provided by independent pricing services, or a third-party provided pricing model that uses significant other observable market inputs.
Credit risk is considered in determining the fair value of derivative instruments. Management determines fair value adjustments based on various risk factors including but not limited to counterparty credit rating or equivalent loan grading, derivative contract notional size, price volatility of the underlying commodity, duration of the derivative contracts and expected loss severity. Expected loss severity is based on historical losses for similarly risk graded commercial loan customers. Decreases in counterparty credit rating or grading and increases in price volatility and expected loss severity all tend to increase the credit quality adjustment which reduces the fair value of asset contracts.
We also consider our own credit risk in determining the fair value of derivative contracts. Changes in our credit rating could affect the fair value of our derivative liabilities. In the event of a credit downgrade, the fair value of our derivative liabilities could increase.
Residential Mortgage Loans Held for Sale
Residential mortgage loans held for sale are carried on the balance sheet at fair value. The fair values of conforming residential mortgage loans held for sale are based upon quoted market prices of such loans sold in securitization transactions, including related unfunded loan commitments. The fair value of mortgage loans that are unable to be sold to U.S. government agencies is determined using quoted prices of loans that are sold in securitization transactions with a liquidity discount applied.
Fair Value of Assets and Liabilities Measured on a Non-Recurring Basis
Assets measured at fair value on a non-recurring basis include collateral for certain nonaccruing loans and real property and other assets acquired to satisfy loans, which are based primarily on comparisons to completed sales of similar assets.
The following represents the carrying value of assets measured at fair value on a non-recurring basis and related losses recorded during the year. The carrying value represents only those assets at the balance sheet date for which the fair value was adjusted during the year:
|
|
|
|
|
|
|
|
|
|
|
|
|
|
|
|
|
|
|
|
|
|
|
|
|
|
|
|
|
|
| |
Carrying Value at December 31, 2023 |
|
Fair Value Adjustments for the Year Ended December 31, 2023 Recognized In: |
| |
Quoted Prices
in Active Markets for Identical Instruments |
|
Significant
Other
Observable
Inputs |
|
Significant
Unobservable
Inputs |
|
Gross charge-offs against allowance for loan losses |
|
Other gains (losses), net |
| Nonaccruing loans |
$ |
— |
|
|
$ |
— |
|
|
$ |
23,225 |
|
|
$ |
3,159 |
|
|
$ |
— |
|
Real estate and other repossessed assets |
— |
|
|
2,116 |
|
|
— |
|
|
— |
|
|
(1,108) |
|
|
|
|
|
|
|
|
|
|
|
|
|
|
|
|
|
|
|
|
|
|
|
|
|
|
|
|
|
|
|
| |
Carrying Value at December 31, 2022 |
|
Fair Value Adjustments for the Year Ended December 31, 2022 Recognized In: |
| |
Quoted Prices
in Active Markets for Identical Instruments |
|
Significant
Other
Observable
Inputs |
|
Significant
Unobservable
Inputs |
|
Gross charge-offs against allowance for loan losses |
|
Other gains (losses), net |
| Nonaccruing loans |
$ |
— |
|
|
$ |
57 |
|
|
$ |
4,998 |
|
|
$ |
16,399 |
|
|
$ |
— |
|
| Real estate and other repossessed assets |
— |
|
|
3,873 |
|
|
1,699 |
|
|
— |
|
|
(6,437) |
|
The fair value of collateral-dependent nonaccruing loans and real estate and other repossessed assets and the related fair value adjustments are generally based on unadjusted third-party appraisals. Our appraisal review policies require appraised values to be supported by observed inputs derived principally from or corroborated by observable market data. Appraisals that are not based on observable inputs or that require significant adjustments or fair value measurements that are not based on third-party appraisals are considered to be based on significant unobservable inputs. Non-recurring fair value measurements of collateral-dependent nonaccruing loans and real estate and other repossessed assets based on significant unobservable inputs are generally due to estimates of current fair values between appraisal dates. Significant unobservable inputs include listing prices for comparable assets, uncorroborated expert opinions or management's knowledge of the collateral or industry. Non-recurring fair value measurements of collateral-dependent loans secured by mineral rights are generally determined by our internal staff of engineers on projected cash flows under current market conditions and are based on significant unobservable inputs. Projected cash flows are discounted according to risk characteristics of the underlying oil and gas properties. Assets are evaluated to demonstrate with reasonable certainty that crude oil, natural gas and natural gas liquids can be recovered from known oil and gas reservoirs under existing economic and operating conditions at current prices with existing conventional equipment, operating methods and costs. Significant unobservable inputs are developed by asset management and workout professionals and approved by senior Credit Administration executives.
A summary of quantitative information about Non-recurring Fair Value Measurements based on Significant Unobservable Inputs (Level 3) as of December 31, 2023 follows (in thousands):
|
|
|
|
|
|
|
|
|
|
|
|
|
|
|
|
|
|
|
|
|
|
|
|
|
|
|
| Quantitative Information about Level 3 Non-recurring Fair Value Measurements |
|
|
Fair Value |
|
Valuation Technique(s) |
|
Significant Unobservable Input |
|
Range
(Weighted Average) |
| Nonaccruing loans |
|
$ |
23,225 |
|
|
Discounted cash flows |
|
Management knowledge of industry and non-real estate collateral. |
|
13% - 90% (88%)1 |
|
|
|
|
|
|
|
|
|
1 Represents fair value as a percentage of the unpaid principal balance.
A summary of quantitative information about Non-recurring Fair Value Measurements based on Significant Unobservable Inputs (Level 3) as of December 31, 2022 follows (in thousands):
|
|
|
|
|
|
|
|
|
|
|
|
|
|
|
|
|
|
|
|
|
|
|
|
|
|
|
| Quantitative Information about Level 3 Non-recurring Fair Value Measurements |
|
|
Fair Value |
|
Valuation Technique(s) |
|
Significant Unobservable Input |
|
Range
(Weighted Average) |
| Nonaccruing loans |
|
$ |
4,998 |
|
|
Discounted cash flows |
|
Management knowledge of industry and non-real estate collateral including but not limited to recoverable oil & gas reserves, forward looking commodity prices, and estimated operating costs. |
|
9% - 24% (23%)1 |
| Real estate and other repossessed assets |
|
1,699 |
|
|
Discounted cash flows |
|
Management knowledge of industry and non-real estate collateral including but not limited to recoverable oil & gas reserves, forward looking commodity prices, and estimated operating costs. |
|
N/A |
1 Represents fair value as a percentage of the unpaid principal balance.
Fair Value of Financial Instruments
The following table presents the carrying values and estimated fair values of all financial instruments, including those financial assets and liabilities that are not measured and reported at fair value on a recurring basis or are measured at fair value on a non-recurring basis (dollars in thousands):
|
|
|
|
|
|
|
|
|
|
|
|
|
|
|
|
|
|
|
|
|
|
|
|
|
|
|
|
|
|
|
|
|
|
|
December 31, 2023 |
|
|
Carrying
Value |
|
Estimated Fair Value |
|
Quoted Prices in Active Markets for Identical Instruments (Level 1) |
|
Significant Other Observable Inputs (Level 2) |
|
Significant Unobservable Inputs
(Level 3)
|
| Cash and due from banks |
|
$ |
947,613 |
|
|
$ |
947,613 |
|
|
$ |
947,613 |
|
|
$ |
— |
|
|
$ |
— |
|
| Interest-bearing cash and cash equivalents |
|
400,652 |
|
|
400,652 |
|
|
400,652 |
|
|
— |
|
|
— |
|
| Trading securities: |
|
|
|
|
|
|
|
|
|
|
| U.S. government securities |
|
10,959 |
|
|
10,959 |
|
|
9,017 |
|
|
1,942 |
|
|
— |
|
Residential agency mortgage-backed securities |
|
5,105,137 |
|
|
5,105,137 |
|
|
— |
|
|
5,105,137 |
|
|
— |
|
| Municipal securities |
|
37,413 |
|
|
37,413 |
|
|
— |
|
|
37,413 |
|
|
— |
|
| Other trading securities |
|
39,996 |
|
|
39,996 |
|
|
— |
|
|
39,996 |
|
|
— |
|
| Total trading securities |
|
5,193,505 |
|
|
5,193,505 |
|
|
9,017 |
|
|
5,184,488 |
|
|
— |
|
| Investment securities: |
|
|
|
|
|
|
|
|
|
|
| Municipal securities |
|
120,705 |
|
|
125,525 |
|
|
— |
|
|
12,305 |
|
|
113,220 |
|
Residential agency mortgage-backed securities |
|
2,092,083 |
|
|
1,917,810 |
|
|
— |
|
|
1,917,810 |
|
|
— |
|
Commercial agency mortgage-backed securities |
|
15,914 |
|
|
15,067 |
|
|
— |
|
|
15,067 |
|
|
— |
|
| Other debt securities |
|
15,787 |
|
|
14,184 |
|
|
— |
|
|
14,184 |
|
|
— |
|
| Total investment securities |
|
2,244,489 |
|
|
2,072,586 |
|
|
— |
|
|
1,959,366 |
|
|
113,220 |
|
| Allowance for credit losses |
|
(336) |
|
|
— |
|
|
— |
|
|
— |
|
|
— |
|
| Investment securities, net of allowance |
|
2,244,153 |
|
|
2,072,586 |
|
|
— |
|
|
1,959,366 |
|
|
113,220 |
|
| Available for sale securities: |
|
|
|
|
|
|
|
|
|
|
| U.S. Treasury |
|
925 |
|
|
925 |
|
|
925 |
|
|
— |
|
|
— |
|
| Municipal securities |
|
502,833 |
|
|
502,833 |
|
|
— |
|
|
502,833 |
|
|
— |
|
Residential agency mortgage-backed securities |
|
6,834,720 |
|
|
6,834,720 |
|
|
— |
|
|
6,834,720 |
|
|
— |
|
Residential non-agency mortgage-backed securities |
|
799,877 |
|
|
799,877 |
|
|
— |
|
|
799,877 |
|
|
— |
|
Commercial agency mortgage-backed securities |
|
4,147,853 |
|
|
4,147,853 |
|
|
— |
|
|
4,147,853 |
|
|
— |
|
| Other debt securities |
|
473 |
|
|
473 |
|
|
— |
|
|
— |
|
|
473 |
|
| Total available for sale securities |
|
12,286,681 |
|
|
12,286,681 |
|
|
925 |
|
|
12,285,283 |
|
|
473 |
|
|
|
|
|
|
|
|
|
|
|
|
|
|
|
|
|
|
|
|
|
|
|
|
|
|
|
|
|
|
|
|
|
|
Fair value option securities - Residential agency mortgage-backed securities |
|
20,671 |
|
|
20,671 |
|
|
— |
|
|
20,671 |
|
|
— |
|
| Residential mortgage loans held for sale |
|
56,935 |
|
|
56,935 |
|
|
— |
|
|
49,749 |
|
|
7,186 |
|
| Loans: |
|
|
|
|
|
|
|
|
|
|
| Commercial |
|
14,803,769 |
|
|
14,862,873 |
|
|
— |
|
|
— |
|
|
14,862,873 |
|
| Commercial real estate |
|
5,337,647 |
|
|
5,270,657 |
|
|
— |
|
|
— |
|
|
5,270,657 |
|
| Loans to individuals |
|
3,763,552 |
|
|
3,634,855 |
|
|
— |
|
|
— |
|
|
3,634,855 |
|
| Total loans |
|
23,904,968 |
|
|
23,768,385 |
|
|
— |
|
|
— |
|
|
23,768,385 |
|
| Allowance for loan losses |
|
(277,123) |
|
|
— |
|
|
— |
|
|
— |
|
|
— |
|
| Loans, net of allowance |
|
23,627,845 |
|
|
23,768,385 |
|
|
— |
|
|
— |
|
|
23,768,385 |
|
| Mortgage servicing rights |
|
293,884 |
|
|
293,884 |
|
|
— |
|
|
— |
|
|
293,884 |
|
Derivative instruments with positive fair value, net of cash margin |
|
410,304 |
|
|
410,304 |
|
|
— |
|
|
410,304 |
|
|
— |
|
| Deposits with no stated maturity |
|
31,007,679 |
|
|
31,007,679 |
|
|
— |
|
|
— |
|
|
31,007,679 |
|
| Time deposits |
|
3,012,022 |
|
|
2,993,685 |
|
|
— |
|
|
— |
|
|
2,993,685 |
|
| Other borrowed funds |
|
8,824,300 |
|
|
8,824,299 |
|
|
— |
|
|
— |
|
|
8,824,299 |
|
| Subordinated debentures |
|
131,150 |
|
|
115,798 |
|
|
— |
|
|
115,798 |
|
|
— |
|
Derivative instruments with negative fair value, net of cash margin |
|
587,473 |
|
|
587,473 |
|
|
2,607 |
|
|
584,866 |
|
|
— |
|
|
|
|
|
|
|
|
|
|
|
|
|
|
|
|
|
|
|
|
|
|
|
|
|
|
|
|
|
|
|
|
|
|
|
|
December 31, 2022 |
|
|
Carrying
Value |
|
Estimated Fair Value |
|
Quoted Prices in Active Markets for Identical Instruments (Level 1) |
|
Significant Other Observable Inputs (Level 2) |
|
Significant Unobservable Inputs
(Level 3)
|
| Cash and due from banks |
|
$ |
943,810 |
|
|
$ |
943,810 |
|
|
$ |
943,810 |
|
|
$ |
— |
|
|
$ |
— |
|
| Interest-bearing cash and cash equivalents |
|
457,906 |
|
|
457,906 |
|
|
457,906 |
|
|
— |
|
|
— |
|
| Trading securities: |
|
|
|
|
|
|
|
|
|
|
| U.S. government securities |
|
9,823 |
|
|
9,823 |
|
|
4,970 |
|
|
4,853 |
|
|
— |
|
Residential agency mortgage-backed securities |
|
4,406,848 |
|
|
4,406,848 |
|
|
— |
|
|
4,406,848 |
|
|
— |
|
| Municipal securities |
|
21,484 |
|
|
21,484 |
|
|
— |
|
|
21,484 |
|
|
— |
|
| Other trading securities |
|
26,006 |
|
|
26,006 |
|
|
— |
|
|
26,006 |
|
|
— |
|
| Total trading securities |
|
4,464,161 |
|
|
4,464,161 |
|
|
4,970 |
|
|
4,459,191 |
|
|
— |
|
| Investment securities: |
|
|
|
|
|
|
|
|
|
|
| Municipal securities |
|
170,629 |
|
|
176,621 |
|
|
— |
|
|
38,106 |
|
|
138,515 |
|
Residential agency mortgage-backed securities |
|
2,315,219 |
|
|
2,143,360 |
|
|
— |
|
|
2,143,360 |
|
|
— |
|
| Commercial agency mortgage-backed securities |
|
15,609 |
|
|
14,588 |
|
|
— |
|
|
14,588 |
|
|
— |
|
| Other debt securities |
|
12,788 |
|
|
12,199 |
|
|
— |
|
|
12,199 |
|
|
— |
|
| Total investment securities |
|
2,514,245 |
|
|
2,346,768 |
|
|
— |
|
|
2,208,253 |
|
|
138,515 |
|
| Allowance for credit losses |
|
(558) |
|
|
— |
|
|
— |
|
|
— |
|
|
— |
|
| Investment securities, net of allowance |
|
2,513,687 |
|
|
2,346,768 |
|
|
— |
|
|
2,208,253 |
|
|
138,515 |
|
| Available for sale securities: |
|
|
|
|
|
|
|
|
|
|
| U.S. Treasury securities |
|
898 |
|
|
898 |
|
|
898 |
|
|
— |
|
|
— |
|
| Municipal securities |
|
624,500 |
|
|
624,500 |
|
|
— |
|
|
624,500 |
|
|
— |
|
Residential agency mortgage-backed securities |
|
5,814,496 |
|
|
5,814,496 |
|
|
— |
|
|
5,814,496 |
|
|
— |
|
Residential non-agency mortgage-backed securities |
|
577,576 |
|
|
577,576 |
|
|
— |
|
|
577,576 |
|
|
— |
|
Commercial agency mortgage-backed securities |
|
4,475,917 |
|
|
4,475,917 |
|
|
— |
|
|
4,475,917 |
|
|
— |
|
| Other debt securities |
|
473 |
|
|
473 |
|
|
— |
|
|
— |
|
|
473 |
|
| Total available for sale securities |
|
11,493,860 |
|
|
11,493,860 |
|
|
898 |
|
|
11,492,489 |
|
|
473 |
|
|
|
|
|
|
|
|
|
|
|
|
|
|
|
|
|
|
|
|
|
|
|
|
|
|
|
|
|
|
|
|
|
|
Fair value option securities - Residential agency mortgage-backed securities |
|
296,590 |
|
|
296,590 |
|
|
— |
|
|
296,590 |
|
|
— |
|
| Residential mortgage loans held for sale |
|
75,272 |
|
|
75,272 |
|
|
— |
|
|
68,054 |
|
|
7,218 |
|
| Loans: |
|
|
|
|
|
|
|
|
|
|
| Commercial |
|
14,212,499 |
|
|
13,905,765 |
|
|
— |
|
|
— |
|
|
13,905,765 |
|
| Commercial real estate |
|
4,606,777 |
|
|
4,454,048 |
|
|
— |
|
|
— |
|
|
4,454,048 |
|
| Loans to individuals |
|
3,737,874 |
|
|
3,531,410 |
|
|
— |
|
|
— |
|
|
3,531,410 |
|
| Total loans |
|
22,557,150 |
|
|
21,891,223 |
|
|
— |
|
|
— |
|
|
21,891,223 |
|
| Allowance for loan losses |
|
(235,704) |
|
|
— |
|
|
— |
|
|
— |
|
|
— |
|
| Loans, net of allowance |
|
22,321,446 |
|
|
21,891,223 |
|
|
— |
|
|
— |
|
|
21,891,223 |
|
| Mortgage servicing rights |
|
277,608 |
|
|
277,608 |
|
|
— |
|
|
— |
|
|
277,608 |
|
Derivative instruments with positive fair value, net of cash margin |
|
880,343 |
|
|
880,343 |
|
|
2,110 |
|
|
878,233 |
|
|
— |
|
| Deposits with no stated maturity |
|
33,018,863 |
|
|
33,018,863 |
|
|
— |
|
|
— |
|
|
33,018,863 |
|
| Time deposits |
|
1,461,842 |
|
|
1,431,245 |
|
|
— |
|
|
— |
|
|
1,431,245 |
|
| Other borrowed funds |
|
7,007,285 |
|
|
7,005,305 |
|
|
— |
|
|
— |
|
|
7,005,305 |
|
| Subordinated debentures |
|
131,205 |
|
|
121,497 |
|
|
— |
|
|
121,497 |
|
|
— |
|
Derivative instruments with negative fair value, net of cash margin |
|
554,900 |
|
|
554,900 |
|
|
16 |
|
|
554,884 |
|
|
— |
|
Because no market exists for certain of these financial instruments and management does not intend to sell these financial instruments, the fair values shown in the tables above may not represent values at which the respective financial instruments could be sold individually or in the aggregate at the given reporting date.
Fair Value Election
As more fully disclosed in Note 2 and Note 7 to the Consolidated Financial Statements, the Company has elected to carry all securities held as economic hedges against changes in the fair value of mortgage servicing rights and all residential mortgage loans originated for sale at fair value. Changes in the fair value of these financial instruments are recognized in earnings.
(20) Parent Company Only Financial Statements
Summarized financial information for BOK Financial – Parent Company Only follows:
Balance Sheets
(In thousands)
|
|
|
|
|
|
|
|
|
|
|
|
|
|
|
|
|
December 31, |
| |
|
2023 |
|
2022 |
| Assets |
|
|
|
|
| Cash and cash equivalents |
|
$ |
203,808 |
|
|
$ |
165,395 |
|
|
|
|
|
|
| Loan to bank subsidiary |
|
65,151 |
|
|
65,169 |
|
| Investment in bank subsidiary |
|
4,785,453 |
|
|
4,351,280 |
|
| Investment in non-bank subsidiaries |
|
216,200 |
|
|
217,011 |
|
| Other assets |
|
17,984 |
|
|
18,302 |
|
| Total assets |
|
$ |
5,288,596 |
|
|
$ |
4,817,157 |
|
|
|
|
|
|
| Liabilities and Shareholders’ Equity |
|
|
|
|
| Liabilities: |
|
|
|
|
| Other liabilities |
|
$ |
15,004 |
|
|
$ |
3,303 |
|
| Subordinated debentures |
|
131,150 |
|
|
131,205 |
|
| Total liabilities |
|
146,154 |
|
|
134,508 |
|
| Shareholders’ equity: |
|
|
|
|
| Common stock |
|
5 |
|
|
5 |
|
| Capital surplus |
|
1,406,745 |
|
|
1,390,395 |
|
| Retained earnings |
|
5,211,512 |
|
|
4,824,164 |
|
| Treasury stock |
|
(876,720) |
|
|
(694,960) |
|
| Accumulated other comprehensive income (loss) |
|
(599,100) |
|
|
(836,955) |
|
| Total shareholders’ equity |
|
5,142,442 |
|
|
4,682,649 |
|
| Total liabilities and shareholders’ equity |
|
$ |
5,288,596 |
|
|
$ |
4,817,157 |
|
Statements of Earnings
(In thousands)
|
|
|
|
|
|
|
|
|
|
|
|
|
|
|
|
|
|
|
|
|
|
|
Year Ended December 31, |
|
|
2023 |
|
2022 |
|
2021 |
| Dividends, interest and fees received from bank subsidiary |
|
$ |
329,429 |
|
|
$ |
228,689 |
|
|
$ |
483,868 |
|
| Dividends, interest and fees received from non-bank subsidiaries |
|
8,000 |
|
|
43,281 |
|
|
8,030 |
|
| Other revenue |
|
1,162 |
|
|
1,172 |
|
|
767 |
|
|
|
|
|
|
|
|
| Total revenue |
|
338,591 |
|
|
273,142 |
|
|
492,665 |
|
| Interest expense |
|
8,952 |
|
|
6,490 |
|
|
10,535 |
|
| Other operating expense |
|
5,674 |
|
|
3,005 |
|
|
2,914 |
|
| Total expense |
|
14,626 |
|
|
9,495 |
|
|
13,449 |
|
Net income before taxes, other losses, net, and equity in undistributed income of subsidiaries |
|
323,965 |
|
|
263,647 |
|
|
479,216 |
|
| Other gains (losses), net |
|
32,656 |
|
|
(4,279) |
|
|
(3,415) |
|
Net income before taxes and equity in undistributed income of subsidiaries |
|
356,621 |
|
|
259,368 |
|
|
475,801 |
|
| Federal and state income taxes |
|
5,410 |
|
|
(1,776) |
|
|
(4,202) |
|
| Net income before equity in undistributed income of subsidiaries |
|
351,211 |
|
|
261,144 |
|
|
480,003 |
|
| Equity in undistributed income of bank subsidiaries |
|
181,487 |
|
|
300,330 |
|
|
126,380 |
|
| Equity in undistributed income of non-bank subsidiaries |
|
(1,952) |
|
|
(41,201) |
|
|
11,738 |
|
Net income attributable to BOK Financial shareholders |
|
$ |
530,746 |
|
|
$ |
520,273 |
|
|
$ |
618,121 |
|
Statements of Cash Flows
(In thousands)
|
|
|
|
|
|
|
|
|
|
|
|
|
|
|
|
|
|
|
|
|
|
|
Year Ended December 31, |
| |
|
2023 |
|
2022 |
|
2021 |
| Cash Flows From Operating Activities: |
|
|
|
|
|
|
| Net income |
|
$ |
530,746 |
|
|
$ |
520,273 |
|
|
$ |
618,121 |
|
Adjustments to reconcile net income to net cash provided by operating activities: |
|
|
|
|
|
|
| Equity in undistributed income of bank subsidiaries |
|
(181,487) |
|
|
(300,330) |
|
|
(126,380) |
|
| Equity in undistributed income of non-bank subsidiaries |
|
1,952 |
|
|
41,201 |
|
|
(11,738) |
|
| Other losses (gains), net |
|
(32,656) |
|
|
4,279 |
|
|
3,415 |
|
| Change in other assets |
|
1,986 |
|
|
1,317 |
|
|
1,160 |
|
| Change in other liabilities |
|
13,404 |
|
|
543 |
|
|
389 |
|
| Net cash provided by operating activities |
|
333,945 |
|
|
267,283 |
|
|
484,967 |
|
| Cash Flows From Investing Activities: |
|
|
|
|
|
|
| Investment in subsidiaries |
|
(2,975) |
|
|
(31,552) |
|
|
(25,665) |
|
| Sale of subsidiary |
|
32,601 |
|
|
— |
|
|
— |
|
| Dissolution of subsidiaries |
|
— |
|
|
2,611 |
|
|
4,457 |
|
|
|
|
|
|
|
|
| Net cash provided by (used in) investing activities |
|
29,626 |
|
|
(28,941) |
|
|
(21,208) |
|
| Cash Flows From Financing Activities: |
|
|
|
|
|
|
| Repayment of subordinated debentures |
|
— |
|
|
— |
|
|
(150,000) |
|
| Issuance of common and treasury stock, net |
|
(4,941) |
|
|
(4,907) |
|
|
(4,874) |
|
| Dividends paid |
|
(143,398) |
|
|
(143,800) |
|
|
(144,105) |
|
| Repurchase of common stock |
|
(176,819) |
|
|
(154,887) |
|
|
(117,938) |
|
| Net cash used in financing activities |
|
(325,158) |
|
|
(303,594) |
|
|
(416,917) |
|
| Net increase (decrease) in cash and cash equivalents |
|
38,413 |
|
|
(65,252) |
|
|
46,842 |
|
| Cash and cash equivalents at beginning of period |
|
165,395 |
|
|
230,647 |
|
|
183,805 |
|
| Cash and cash equivalents at end of period |
|
$ |
203,808 |
|
|
$ |
165,395 |
|
|
$ |
230,647 |
|
| Cash paid for interest |
|
$ |
8,479 |
|
|
$ |
6,203 |
|
|
$ |
10,559 |
|
(21) Subsequent Events
The Company evaluated events from the date of the Consolidated Financial Statements on December 31, 2023 through the issuance of those consolidated financial statements included in this Annual Report on Form 10-K. No events were identified requiring recognition in and/or disclosure in the Consolidated Financial Statements.
ITEM 9. CHANGES IN AND DISAGREEMENTS WITH ACCOUNTANTS ON ACCOUNTING AND FINANCIAL DISCLOSURE
None.
ITEM 9A. CONTROLS AND PROCEDURES
As of the end of the period covered by this report and pursuant to Rule 13a-15 of the Securities Exchange Act of 1934 (the "Exchange Act"), the Company's management, including the Chief Executive Officer and Chief Financial Officer, conducted an evaluation of the effectiveness and design of the Company's disclosure controls and procedures (as that term is defined in Rules 13a-15(e) and 15d-15(e) of the Exchange Act). Based upon that evaluation, the Company's Chief Executive Officer and Chief Financial Officer concluded, as of the end of the period covered by this report, that the Company's disclosure controls and procedures were effective in recording, processing, summarizing and reporting information required to be disclosed by the Company, within the time periods specified in the Securities and Exchange Commission's rules and forms.
In addition and as of the end of the period covered by this report, there have been no changes in internal control over financial reporting (as defined in Rule 13a-15(f) and 15d-15(f), as amended, of the Exchange Act) during the Company's fourth fiscal quarter that have materially affected, or are reasonably likely to materially affect, the internal control over financial reporting.
Management's Report on Internal Control over Financial Reporting appears within Item 8, "Financial Statements and Supplementary Data." The independent registered public accounting firm, Ernst & Young LLP, has audited the financial statements included in Item 8 and has issued an audit report on the Company's internal control over financial reporting, which appears therein.
ITEM 9B. OTHER INFORMATION
Trading Plans
No Company director or officer (as defined in Exchange Act Rule 16a-1(f)) has adopted, modified or terminated any trading arrangements during the fourth quarter of 2023.
Certain of our officers or directors have made elections to participate in, and are participating in, our dividend reinvestment plan and 401(k) plan, and have made, and may from time to time make, elections to have shares withheld to cover withholding taxes on issuances of shares to such officers or directors, which may be designed to satisfy the affirmative defense conditions of Rule 10b5-1 under the Exchange Act or may constitute non-Rule 10b5-1 trading arrangements (as defined in Item 408(c) of Regulation S-K).
PART III
ITEM 10. DIRECTORS, EXECUTIVE OFFICERS AND CORPORATE GOVERNANCE
The information set forth under the headings "Election of Directors," "Executive Officers," "Insider Reporting," "Director Nominations," and "Report of the Audit Committee" in BOK Financial's 2024 Annual Proxy Statement is incorporated herein by reference.
The Company has a Code of Ethics which is applicable to all directors, officers and employees of the Company, including the Chief Executive Officer and the Chief Financial Officer, the principal executive officer and principal financial and accounting officer, respectively. A copy of the Code of Ethics will be provided without charge to any person who requests it by writing to the Company's headquarters at Bank of Oklahoma Tower, P.O. Box 2300, Tulsa, Oklahoma 74192 or telephoning the Chief Risk Officer at (918) 588-6000. The Company will also make available amendments to or waivers from its Code of Ethics applicable to directors or executive officers, including the Chief Executive Officer and the Chief Financial Officer, in accordance with all applicable laws and regulations.
There are no material changes to the procedures by which security holders may recommend nominees to the Company's Board of Directors since the Company's 2023 Annual Proxy Statement to Shareholders.
ITEM 11. EXECUTIVE COMPENSATION
The information set forth under the heading "Compensation Discussion and Analysis," "Compensation Committee Interlocks and Insider Participation," "Compensation Committee Report," "Executive Compensation Tables," and "Director Compensation" in BOK Financial's 2024 Annual Proxy Statement is incorporated herein by reference.
ITEM 12. SECURITY OWNERSHIP OF CERTAIN BENEFICIAL OWNERS AND MANAGEMENT AND RELATED STOCKHOLDER MATTERS
The information set forth under the headings "Security Ownership of Certain Beneficial Owners and Management" and "Election of Directors" in BOK Financial's 2024 Annual Proxy Statement is incorporated herein by reference.
ITEM 13. CERTAIN RELATIONSHIPS AND RELATED TRANSACTIONS, AND DIRECTOR INDEPENDENCE
Information regarding related parties is set forth in Note 13 to the Company's Notes to Consolidated Financial Statements which appears elsewhere herein. Additionally, the information set forth under the headings "Certain Transactions," "Director Independence" and "Related Party Transaction Review and Approval Process" in BOK Financial's 2024 Annual Proxy Statement is incorporated herein by reference.
ITEM 14. PRINCIPAL ACCOUNTANT FEES AND SERVICES
The information set forth under the heading "Principal Accountant Fees and Services" in BOK Financial's 2024 Annual Proxy Statement is incorporated herein by reference.
PART IV
ITEM 15. EXHIBITS, FINANCIAL STATEMENT SCHEDULES
(a) (1) Financial Statements
The following financial statements of BOK Financial Corporation are filed as part of this Form 10-K in Item 8:
Consolidated Statements of Earnings for the years ended December 31, 2023, 2022 and 2021
Consolidated Statements of Comprehensive Income for the years ended December 31, 2023, 2022 and 2021
Consolidated Balance Sheets as of December 31, 2023 and 2022
Consolidated Statements of Changes in Equity for the years ended December 31, 2023, 2022 and 2021
Consolidated Statements of Cash Flows for the years ended December 31, 2023, 2022 and 2021
Notes to Consolidated Financial Statements
Reports of Independent Registered Public Accounting Firm
(a) (2) Financial Statement Schedules
The schedules to the Consolidated Financial Statements required by Regulation S-X are not required under the related instructions or are inapplicable and are therefore omitted.
(a) (3) Exhibits
|
|
|
|
|
|
| Exhibit Number |
Description of Exhibit |
| |
|
| 3.0 |
The Articles of Incorporation of BOK Financial, incorporated by reference to (i) Amended and Restated Certificate of Incorporation of BOK Financial filed with the Oklahoma Secretary of State on May 28, 1991, filed as Exhibit 3.0 to S-1 Registration Statement No. 33-90450, and (ii) Amendment attached as Exhibit A to Information Statement and Prospectus Supplement filed November 20, 1991. |
| |
|
| 3.1 |
|
| |
|
| 4.0 |
The rights of the holders of the Common Stock of BOK Financial are set forth in its Certificate of Incorporation. |
|
|
| 4.3 |
|
|
|
| 4.4 |
|
|
|
| 10.4 |
Employment and Compensation Agreements. |
| |
|
| 10.4.7 |
|
|
|
| 10.4.10 |
|
|
|
| 10.4.11 |
|
|
|
| 10.4.12 |
|
|
|
10.4.13 |
|
|
|
10.4.14 |
|
|
|
| 10.7.7 |
|
| |
|
| 10.7.8 |
BOK Financial Corporation Directors' Stock Compensation Plan, incorporated by reference to Exhibit 4.0 of S-8 Registration Statement No. 33-79836. |
| |
|
| 10.7.9 |
Bank of Oklahoma Thrift Plan (Amended and Restated Effective as of January 1, 1995), incorporated by reference to Exhibit 10.7.6 of Form 10-K for the year ended December 31, 1994. |
| |
|
| 10.7.10 |
Trust Agreement for the Bank of Oklahoma Thrift Plan (December 30, 1994), incorporated by reference to Exhibit 10.7.7 of Form 10-K for the year ended December 31, 1994. |
| |
|
| 10.7.11 |
|
| |
|
| 10.7.12 |
|
| |
|
| 10.7.14 |
|
|
|
| 10.7.16 |
|
|
|
| 10.8 |
|
|
|
|
|
|
|
|
|
| Exhibit Number |
Description of Exhibit |
| 10.8.1 |
|
|
|
| 21 |
|
| |
|
| 23 |
|
|
|
| 31.1 |
|
| |
|
| 31.2 |
|
| |
|
| 32 |
|
|
|
| 97 |
|
| |
|
| 99 |
Additional Exhibits. |
| |
|
| 101 |
Interactive data files pursuant to Rule 405 of Regulation S-T: (i) the Cover Page, (ii) the Consolidated Balance Sheets, (iii) the Consolidated Statements of Earnings, (iv) the Consolidated Statements of Changes in Equity, (v) the Consolidated Statement of Cash Flows and (vi) the Notes to the Consolidated Financial Statements, filed herewith. The XBRL instance document does not appear in the Interactive Data File because its XBRL tags are embedded within the Inline XBRL document. |
|
|
| 104 |
Cover Page Interactive Data File (formatted as Inline XBRL and contained in Exhibit 101). |
(b) Exhibits
See Item 15 (a) (3) above.
(c) Financial Statement Schedules
See Item 15 (a) (2) above.
SIGNATURES
Pursuant to the requirements of Section 13 or 15(d) of the Securities Exchange Act of 1934, the registrant has duly caused this report to be signed on its behalf by the undersigned, thereunto duly authorized.
|
|
|
|
|
|
|
|
|
|
|
|
|
|
|
|
|
|
|
|
|
BOK FINANCIAL CORPORATION |
|
|
|
|
|
|
|
DATE: |
February 21, 2024 |
BY: |
/s/ George B. Kaiser |
|
|
|
|
George B. Kaiser |
|
|
|
|
Chairman of the Board of Directors |
|
Pursuant to the requirements of the Securities Exchange Act of 1934, this report has been signed below on February 21, 2024, by the following persons on behalf of the registrant and in the capacities indicated.
OFFICERS
|
|
|
|
|
|
|
|
|
| /s/ George B. Kaiser |
|
/s/ Stacy C. Kymes |
George B. Kaiser
Chairman of the Board of Directors
|
|
Stacy C. Kymes
Director, President and Chief Executive Officer
|
| /s/ Martin E. Grunst |
|
/s/ Michael J. Rogers |
Martin E. Grunst
Director, Executive Vice President and
Chief Financial Officer |
|
Michael J. Rogers
Senior Vice President and
Chief Accounting Officer |
DIRECTORS
|
|
|
|
|
|
|
|
|
| /s/ Alan S. Armstrong |
|
/s/ E. Carey Joullian, IV |
Alan S. Armstrong
|
|
E. Carey Joullian, IV |
| /s/ Steven Bangert |
|
/s/ Stanley A. Lybarger |
Steven Bangert
|
|
Stanley A. Lybarger |
| /s/ Chester E. Cadieux, III |
|
/s/ Steven J. Malcolm |
| Chester E. Cadieux, III |
|
Steven J. Malcolm |
| /s/ John W. Coffey |
|
/s/ Emmet C. Richards |
| John W. Coffey |
|
Emmet C. Richards |
/s/ Joseph W. Craft, III |
|
/s/ Claudia San Pedro |
| Joseph W. Craft, III |
|
Claudia San Pedro |
| /s/ David F. Griffin |
|
/s/ Peggy I. Simmons |
| David F. Griffin |
|
Peggy I. Simmons |
|
|
/s/ Michael C. Turpen |
| V. Burns Hargis |
|
Michael C. Turpen |
|
|
/s/ Rose M. Washington |
| Douglas D. Hawthorne |
|
Rose M. Washington |
|
|
|
| Kimberley D. Henry |
|
|
|
|
|
|
|
|
|
|
|
|
|
|
|
|
|
|
|
|
|
|
|
|
|
|
EX-10.4 13
2
a20231231ex10413.htm
EX-10.4 13
Document
Exhibit 10.4.13
AMENDED AND RESTATED EMPLOYMENT AGREEMENT
November 3, 2021
This Amended and Restated Employment Agreement (“Agreement”) is made this 3rd day of November, 2021 (the “Agreement Date”) between the following parties (“Parties”):
(i)BOK Financial Corporation, an Oklahoma corporation (“BOK Financial”); and,
(ii)Marc Maun, an individual currently residing in Nichols Hills, Oklahoma (the “Executive”).
BOK Financial and Executive, in consideration of the promises and covenants set forth herein (the receipt and adequacy of which are hereby acknowledged) and intending to be legally bound hereby, agree as follows:
(1)Purpose of This Agreement. The purpose of this Agreement is as follows:
(a)BOK Financial is a financial holding company, subject to regulation by the Board of Governors of the Federal Reserve System. The subsidiaries of BOK Financial include BOKF, NA, a national association engaged in banking and BOSC, Inc., a registered broker-dealer.
(b)The Executive has extensive prior experience in financial services and banking and is currently employed as the Executive Vice President and Chief Credit Officer of BOK Financial and BOKF, NA, reporting to the Chief Executive Officer.
(c)The purpose of this Agreement is to set forth the terms and conditions on which BOK Financial shall employ the Executive and the Executive shall serve as an officer of BOK Financial, BOKF, NA, and other of their affiliates.
(2)Prior Agreement Superseded. This agreement supersedes, from and after the Effective Date, any employment agreement between Executive and BOK Financial and/or BOKF, NA (excluding, for avoidance of doubt, any rights of Executive arising under the BOK Financial 2003 Stock Option Plan or, the BOK Financial 2009 Omnibus Incentive Plan.
(3)Employment. Effective as of the Agreement Date, BOK Financial hereby employs the Executive, and the Executive hereby accepts employment with BOK Financial, on the following terms and conditions:
(a)Executive shall serve as Executive Vice President, Regional Banking of BOK Financial and BOKF, NA. Executive shall be responsible for those divisions and business lines of BOK Financial and BOKF, NA as the Chief Executive has heretofore established and as may hereafter be established by the Chief Executive Officer from time to time.
(b)Executive shall devote all time and attention reasonably necessary to the affairs of BOK Financial and BOKF, NA and shall serve BOK Financial and BOKF, NA diligently, loyally, and to the best of his ability.
(c)Executive shall serve in such other or additional positions as an officer and/or director of BOK Financial and BOKF, NA or any of their affiliates as the Chief Executive Officer of BOK Financial may reasonably request; provided, however, Executive’s residence and place of work shall be in the Tulsa, Oklahoma area.
(d)Notwithstanding anything herein to the contrary, Executive shall not be precluded from engaging in any charitable, civic, political or community activity or membership in any professional organization.
(4)Compensation. As the sole, full and complete compensation to the Executive for the performance of all duties of Executive under this Agreement and for all services rendered by Executive to BOK Financial and/or to any affiliate of BOK Financial:
(a)BOK Financial shall pay the Executive an annual salary (the “Annual Salary”) equal to Executive’s Annual Salary in effect as of the Agreement Date during the Term (as hereafter defined). The Annual Salary shall be payable in installments in arrears, less usual and customary payroll deductions for FICA, federal and state withholding, and the like, at the times and in the manner in effect in accordance with the usual and customary payroll policies generally in effect from time to time at BOK Financial.
(b)The Annual Salary shall not be decreased at any time during the Term of this Agreement. The Annual Salary may be increased annually in accordance with BOK Financial’s compensation review practices in effect from time to time for senior executives.
(c)BOK Financial shall pay and provide to Executive pension, thrift, medical insurance, disability insurance plan benefits, and other fringe benefits, on the same terms and conditions generally in effect for senior executive employees of the BOK Financial and its affiliates (the “Additional Benefits”).
(d)BOK Financial may, from time to time in BOK Financial’s sole discretion consistent with the practices generally in effect for senior executive employees of the BOK Financial and its affiliates, pay or provide, or agree to pay or provide Executive a bonus, stock option, restricted stock, other incentive or performance based compensation.
(i)BOKF Financial shall provide annual incentive and long term incentive awards to Executive in accordance with BOK Financial’s Executive Incentive Compensation Plan as adopted by the BOK Financial’s Board of Directors from time to time.
(ii)All such bonus, stock option, restricted stock, or other incentive or performance based compensation, regardless of its nature (hereinafter called “Performance Compensation”) shall not constitute Annual Salary.
(e)BOK Financial shall reimburse Executive for reasonable and necessary entertainment, travel and other expenses in accordance with BOK Financial’s standard policies in general effect for senior executives of BOK Financial.
(f)Executive shall be allowed vacation, holidays, and other employee benefits not described above in accordance with BOK Financial’s standard policy in general effect for BOK Financial’s senior executives. Executive shall be entitled to four weeks paid vacation each year.
(g)BOK Financial shall permit Executive to participate in a deferred compensation plan on the terms and conditions established by BOK Financial for senior executives.
(h)Executive hereby agrees to accept the foregoing compensation as the sole, full and complete compensation to Executive for the performance of all duties of Executive under this Agreement and for all services rendered by Executive to BOK Financial or any affiliate of BOK Financial.
(5)Term of Employment. The term (the “Term”) of Executive’s employment (“Employment”) pursuant to this Agreement shall commence on the Agreement Date (the “Commencement”) and shall continue thereafter provided that upon ninety days prior written notice, either Party may terminate this Agreement.
(6)Termination of Employment. Notwithstanding the provisions of paragraph 5 of this Agreement, the Employment may be terminated on the following terms and conditions:
(a)Termination by BOK Financial Without Cause. In the event BOK Financial terminates Employment of Executive without cause during the Term or upon termination of this Agreement as provided in Paragraph 5:
(i)BOK Financial shall forthwith upon such termination (A) pay to Executive BOK Financial’s standard severance pay for senior executives in effect at the time of termination and, in addition, an amount equal to Executive’s then Annual Salary payable in one lump sum payment, (B) the Executive shall be entitled to receive any Additional Benefits accrued through, but not beyond the effective date of such termination which are payable under the terms and provisions of benefit plans then in effect in accordance with paragraph 4(c) above, (C) Executive shall be entitled to receive pay for vacation in accordance with BOK Financial’s then existing policy for terminating senior executives, (D) options held by Executive under the BOKF 2003 Stock Option Plan and the BOKF 2009 Omnibus Incentive Plan shall vest and shall be exercisable for a period of ninety days following such termination as provided in such plans, (E) Restricted stock held by Executive shall continue to be owned by the Executive, but shall remain subject to all restrictions applicable to the restricted stock as provided under the Executive Incentive Plan and the 2009 Omnibus Incentive Plan, and (F) Executive shall be entitled to receive those amounts due Executive pursuant to paragraph 8(b) and shall be bound by the Non-Solicitation Agreement (as hereafter defined).
(ii)If Executive is terminated for any reason other than for cause following a Change of Control (as hereafter defined), BOK Financial shall pay Executive upon such termination in one lump sum payment an amount equal to two times Executive’s then Annual Salary at the time of termination in addition to an amount equal to Executive’s then Annual Salary through, but not beyond the effective date of the termination. This payment shall be in lieu of any payment that would otherwise be paid pursuant to paragraph 6(a)(i)(A), but Executive shall be entitled to the benefit of the other provisions of paragraph 6(a)(i). As used herein, a Change of Control shall be deemed to have occurred if, and only if:
(A)George B. Kaiser, affiliates of George B. Kaiser, George B. Kaiser Foundation, George Kaiser Family Foundation, and/or members of the family of George B. Kaiser collectively cease to own more shares of the voting capital stock of BOK Financial than any other shareholder (or group of shareholders acting in concert to control BOK Financial to the exclusion of George B. Kaiser, affiliates of George B. Kaiser, George B. Kaiser Foundation, George Kaiser Family Foundation, and/or members of the family of George B. Kaiser); or,
(B)BOK Financial shall cease to own directly and indirectly more than fifty percent (50%) of the voting capital stock of BOKF, NA.
(b)Termination by BOK Financial for Cause. BOK Financial may terminate the Employment for cause on the following terms and conditions:
(i)BOK Financial shall be deemed to have cause to terminate Executive’s Employment only in one or more of the following events:
(A)The Executive shall fail to substantially perform his obligations under this Agreement (except as a result of Executive’s incapacity due to physical or mental illness) after having first received notice of such failure and thirty days within which to correct the failure;
(B)The Executive commits any act which is reasonably deemed to have been intended by Executive to injure BOK Financial or any of its affiliates;
(C)The Executive is charged, indicted or convicted of any criminal act or act involving moral turpitude which BOK Financial reasonably deems adversely affects the suitability of Executive to serve BOK Financial or any of its affiliates;
(D)The Executive commits any dishonest or fraudulent act which BOK Financial reasonably deems material to BOK Financial or any of its affiliates, including the reputation of BOK Financial or any of its affiliates; or,
(E)Any refusal by Executive to obey orders or instructions of the Chief Executive Officer of BOK Financial or BOKF, NA, unless such instructions would require Executive to commit an illegal act, could subject Executive to personal liability, would require Executive to violate the terms of this Agreement, are inconsistent with recognized ethical standards, or would otherwise be inconsistent with the duties of an officer of a bank.
(ii)BOK Financial shall be deemed to have cause to terminate Executive’s Employment only when a majority of the members of the Board of Directors of BOK Financial finds that, in the good faith opinion of such majority, the Executive committed one or more of the acts set forth in clauses (A) through (E) of the preceding subparagraph, such finding to have been made after at least twenty (20) business days’ notice to the Executive and an opportunity for the Executive, together with his counsel, to be heard before such majority. The determination of such majority, made as set forth above, shall be binding upon BOK Financial and the Executive.
(iii)The effective date of a termination for cause shall be the date of the action of such majority finding the termination was with cause. In the event BOK Financial terminates Executive’s Employment for cause, (A) BOK Financial shall pay Executive the Executive’s then Annual Salary through, but not beyond, the effective date of the termination and (B) the Executive shall receive those Additional Benefits accrued through but not beyond the effective date of such termination which are payable under the terms and provisions of benefit plans then in effect in accordance with paragraph 4(c) above, (C) BOK Financial shall pay the Executive for vacation in accordance with BOK Financial’s then existing policy for senior executives, and (D)Executive shall be entitled to receive those amounts due Executive pursuant to paragraph 8(b) and Executive shall be bound by the provisions of the Non-Solicitation Agreement.
(7)Provisions Respecting Illness and Death. In the event Executive becomes disabled as defined in Section 409A(a)(2)(C) of the Internal Revenue Code, BOK Financial may terminate Executive’s Employment without further or additional compensation being due the Executive from BOK Financial except Annual Salary accrued through the date of termination, Additional Benefits accrued through the date of such termination under benefit plans then in effect in accordance with paragraph 4(c) above, and vacation in accordance with BOK Financial’s then existing policy for senior executives, and the provisions of paragraph 8 shall apply. Without limiting the generality of paragraph 4(c), Executive shall upon such termination receive those benefits provided in BOK Financial’s long term disability policy then in effect. In the event of the death of the Executive, the Employment of the Executive shall automatically terminate as of the date of death without further or additional compensation being due the Executive, except BOK Financial shall pay to the estate of the Executive the Annual Salary in effect on the date of death and accrued through the date of termination and the Additional Benefits accrued through the date of such termination under benefit plans then in effect in accordance with paragraph 4(c) above. BOK Financial shall make the payments due Executive in one lump sum within forty-five days following the date of termination.
(8)Agreement Not to Solicit. The provisions of this paragraph are hereafter called the “Non-Solicitation Agreement”.
(a)Executive agrees that, for a period of two (2) years following any termination of the Employment for cause, and for a period of one (1) year following any termination of the Employment for any reason other than cause (including expiration of the Term), Executive shall not directly or indirectly (whether as an officer, director, employee, partner, stockholder, creditor or agent, or representative of other persons or entities) contact or solicit, in any manner indirectly or directly, individuals or entities who were at any time during the original or any extended Term clients of BOK Financial or any of its affiliates for the purpose of providing banking, trust, investment, or other services provided by BOK Financial or any of its affiliates during the Term or contact or solicit employees of BOK Financial or any affiliates of BOK Financial to seek employment with any person or entity except BOK Financial and its affiliates. This Non-Solicitation Agreement shall not apply to ownership by Executive of up to ten percent (10%) of the common stock of a corporation traded on the facilities of a national securities exchange engaged in the banking business of which Executive is not a director, officer, employee, agent or representative.
(b)BOK Financial shall pay Executive, in addition to any other amounts which may be due Executive, during each year in which the Non-Solicitation Agreement is in effect, $3,000 payable in installments in arrears, less usual and customary payroll deductions for FICA, federal and state withholding, and the like, at the times and in the manner in effect in accordance with the usual and customary payroll policies generally in effect from time to time at BOK Financial. Notwithstanding the foregoing, the amounts due for the first six months of the Non-Competition Agreement shall be paid in a lump sum as soon as administratively possible following such six month period if Executive is determined to be a "specified employee as defined in Section 409A(a)(2)(B)(i).
(c)Executive agrees that the Non-Solicitation Agreement and all the restrictions set forth in this Non-Solicitation Agreement are fair and reasonable.
(d)Executive agrees that (i) any remedy at law for any breach of this Non- Agreement would be inadequate, (ii) in the event of any breach of this Non-Solicitation Agreement, the terms of this Non-Solicitation Agreement shall constitute incontrovertible evidence of irreparable injury to BOK Financial, and (iii) BOK Financial shall be entitled to both immediate and permanent injunctive relief without the necessity of establishing or posting any bond therefor to preclude any such breach (in addition to any remedies of law to which BOK Financial may be entitled).
(9)Confidential Information. All references in this Section 9 to BOK Financial shall include BOK Financial’s affiliates.
(a)Executive acknowledges that, during the Term and prior to the Term, Executive has had and will have access to Confidential Information (as hereinafter defined), all of which shall be made accessible to Executive only in strict confidence; that unauthorized disclosure of Confidential Information will damage BOK Financial’s business; that Confidential Information would be susceptible to immediate competitive application by a competitor of BOK Financial; that BOK Financial’s business is substantially dependent on access to and the continuing secrecy of Confidential Information; that Confidential Information is unique to BOK Financial and known only to Executive and certain key employees and contractors of BOK Financial; that BOK Financial shall at all times retain ownership and control of all Confidential Information; and that the restrictions contained in this Section 9 are reasonable and necessary for the protection of BOK Financial’s business.
(b)All documents or other records containing or reflecting Confidential Information (“Confidential Documents”) prepared by or to which Executive has access are and shall remain the property of BOK Financial. Executive shall not copy or use any Confidential Document for any purpose not relating directly to Executive’s Employment on BOK Financial’s behalf, or use or disclose any Confidential Document to any party other than BOK Financial or its employees and shall not sell Confidential Documents to any party. Upon the termination of this Agreement or upon BOK Financial’s request before or after such termination, Executive shall immediately deliver to BOK Financial or its designee (and shall not keep in Executive’s possession or deliver to anyone else) all Confidential Documents and all other property belonging to BOK Financial. This paragraph shall not bar Employee from complying with any subpoena or court order, provided that Executive shall at the earliest practicable date provide a copy of the subpoena or court order to BOK Financial’s Chief Executive Officer.
(c)During the Term and for a period of four (4) years thereafter, regardless of the reason for termination of Executive’s employment, (i) Executive shall not disclose any Confidential Information to any third party and (ii) Executive shall use Confidential Information only in connection with and in furtherance of Executive’s Employment by BOK Financial and on behalf of its affiliates.
(d)As used herein, Confidential Information means all nonpublic information concerning or arising from BOK Financial’s business, including particularly but not by way of limitation trade secrets used, developed or acquired by BOK Financial in connection with its business; information concerning the manner and details of BOK Financial’s operations, organization and management; financial information and/or documents and nonpublic policies, procedures and other printed or written material generated or used in connection with BOK Financial’s business; BOK Financial’s business plans and strategies; electronic files or documents prepared by BOK Financial or Executive containing the identities of BOK Financial’s customers (including their addresses and telephone numbers), the nature and amounts of their assets and liabilities, and the specific individual customer needs being addressed by BOK Financial; the nature of fees and charges assessed by BOK Financial; nonpublic forms, contracts and other documents used in BOK Financial’s business; the nature and content of any proprietary computer software used in BOK Financial’s business, whether owned by BOK Financial or used by BOK Financial under license from a third party; and all other nonpublic information concerning BOK Financial’s concepts, prospects, customers, employees, contractors, earnings, products, services, equipment, systems, and/or prospective and executed contracts and other business arrangements. Confidential Information shall not include (i) general skills and general knowledge of the industry obtained by reason of Executive’s association with BOK Financial; (ii) information that is or becomes public knowledge through no fault or action of Executive; (iii) any information received from an independent third party who is under no duty of confidentiality with respect to the information; or (iv) any information that, on advice of counsel, Executive is required to disclose by law or regulation.
(10)Surrender of Records and Property. Upon termination of Executive’s employment with BOK Financial for whatever reason, in addition to Executive’s obligations pursuant to Paragraph 9(b), Executive shall deliver promptly to BOK Financial all records, manuals, books, blank forms, documents, letters, memoranda, notes, notebooks, reports, data, tables, calculations or copies thereof that relate in any way to the business, products, practices or techniques of BOK Financial or any of its affiliates, and all other information of BOK Financial or any of its affiliates, including, but not limited to, all documents that in whole or in part contain any information which is defined in this Agreement as Confidential Information and which is in the possession or under the control of Executive.
(11)Compliance with Section 409A. This Agreement is subject to the following provisions in order to ensure compliance with Section 409A of the Internal Revenue Code of 1986, as amended (Section 409A”).
(a)If any payment, compensation or other benefit provided to the Executive in connection with his employment termination is determined, in whole or in part, to constitute “nonqualified deferred compensation” within the meaning of Section 409A and the Executive is a specified employee as defined in Section 409A(2)(B)(i), no part of such payments shall be paid before the day that is six (6) months plus one (1) day after the date of termination.
(b)The Parties acknowledge and agree that Section 409A and its application, if any, to the terms of this Agreement may be subject to change as additional guidance and regulations become available. Anything to the contrary herein notwithstanding, all benefits or payments provided by the Company to the Executive that would be deemed to constitute “nonqualified deferred compensation” within the meaning of Section 409A are intended to comply with Section 409A. If, however, any such benefit or payment is deemed to not comply with Section 409A, the Company and the Executive agree to renegotiate in good faith any such benefit or payment (including, without limitation, as to the timing of any severance payments payable hereof) so that either (i) Section 409A will not apply or (ii) compliance with Section 409A will be achieved.
(c)All payments required to be made by Bank hereunder to the Executive may be adjusted to the withholding of such amounts, if any, relating to tax and other payroll deductions as the Bank may reasonably determine should be withheld pursuant to any applicable law or regulation.
(12)Miscellaneous Provisions. The following miscellaneous provisions shall apply to this Agreement:
(a)All notices or advices required or permitted to be given by or pursuant to this Agreement, shall be given in writing. All such notices and advices shall be (i) delivered personally or (ii) delivered for overnight delivery by a nationally recognized overnight courier service. Such notices and advices shall be deemed to have been given (i) the first business day following the date of delivery if delivered personally or (ii) on the date of receipt if delivered for overnight delivery by a nationally recognized overnight courier service. All such notices and advices and all other communications related to this Agreement shall be given as follows:
If to BOK Financial:
BOK Financial Corporation
Attn: Steven G. Bradshaw
Bank of Oklahoma Tower
P.O. Box 2300
Tulsa, Oklahoma 74192
Telephone No.: (918) 588-6218
Facsimile No.: (918) 588-8691
sbradshaw@mail.bok.com
and
Chief Human Resources Officer
Attn: Stephen D. Grossi
Bank of Oklahoma Tower
P.O. Box 2300
Tulsa, Oklahoma 74192
Telephone No. 918- 595-3153
With a Copy to: Frederic Dorwart
Old City Hall
124 East Fourth Street
Tulsa, OK 74103-5010
Telephone No.: (918) 583-9945
Facsimile No.: (918) 583-8251
FDorwart@FDLaw.com
If to Executive: Mark C. Maun
1413 Glenbrook Terrace
Nichols Hills, OK 73116
Telephone No.: ***
Facsimile No.: ***
Personal Email: ***
or to such other address as the Party may have furnished to the other Parties in accordance herewith, except that notice of change of addresses shall be effective only upon receipt.
(b)This Agreement is made and executed in Tulsa, Oklahoma and all actions or proceedings with respect to, arising directly or indirectly in connection with, out of, related to or from this Agreement, shall be litigated in courts having situs in Tulsa, Oklahoma.
(c)This Agreement shall be subject to, and interpreted by and in accordance with, the laws of the State of Oklahoma without regard to its conflict of law provisions.
(d)This Agreement is the entire Agreement of the Parties respecting the subject matter hereof. There are no other agreements, representations or warranties, whether oral or written, respecting the subject matter hereof, except as stated in this Agreement.
(e)This Agreement, and all the provisions of this Agreement, shall be deemed drafted by all of the Parties hereto.
(f)This Agreement shall not be interpreted strictly for or against any Party, but solely in accordance with the fair meaning of the provisions hereof to effectuate the purposes and interest of this Agreement.
(g)Each Party hereto has entered into this Agreement based solely upon the agreements, representations and warranties expressly set forth herein and upon her or his own knowledge and investigation. Neither Party has relied upon any representation or warranty of any other Party hereto except any such representations or warranties as are expressly set forth herein.
(h)Each of the persons signing below on behalf of a Party hereto represents and warrants that he or she has full requisite power and authority to execute and deliver this Agreement on behalf of the Parties for whom he or she is signing and to bind such Party to the terms and conditions of this Agreement.
(i)This Agreement may be executed in counterparts, each of which shall be deemed an original. This Agreement shall become effective only when all of the Parties hereto shall have executed the original or counterpart hereof. This Agreement may be executed and delivered by a facsimile transmission of a counterpart signature page hereof.
(j)In any action brought by a Party hereto to enforce the obligations of any other Party hereto, the prevailing Party shall be entitled to collect from the opposing Party to such action such Party’s reasonable litigation costs and attorney’s fees and expenses (including court costs, reasonable fees of accountants and experts, and other expenses incidental to the litigation).
(k)This Agreement shall be binding upon and shall inure to the benefit of the Parties and their respective heirs, personal representatives, successors and assigns.
(l)This is not a third party beneficiary contract, except BOK Financial (including each affiliate thereof) shall be a third party beneficiary of this Agreement.
(m)This Agreement may be amended or modified only in writing, as agreed to by the Parties hereto, which specifically references this Agreement.
(n)A Party to this Agreement may decide or fail to require full or timely performance of any obligation arising under this Agreement. The decision or failure of a Party hereto to require full or timely performance of any obligation arising under this Agreement (whether on a single occasion or on multiple occasions) shall not be deemed a waiver of any such obligation. No such decisions or failures shall give rise to any claim of estoppel, laches, course of dealing, amendment of this Agreement by course of dealing, or other defense of any nature to any obligation arising hereunder.
(o)In the event any provision of this Agreement, or the application of such provision to any person or set of circumstances, shall be determined to be invalid, unlawful, or unenforceable to any extent for any reason, the remainder of this Agreement, and the application of such provision to persons or circumstances other than those as to which it is determined to be invalid, unlawful, or unenforceable, shall not be affected and shall continue to be enforceable to the fullest extent permitted by law.
(p)None of the compensation or other payments to Executive provided for in, or that may be made pursuant to, this Agreement are intended by the Parties to be deferred compensation within the meaning of Section 409A. If, however, the Executive is a " specified employee" as defined in Section 409A(a)(2)(B)(i), then the other provisions of this Agreement notwithstanding, no compensation that is "deferred compensation" within the meaning of Section 409A shall be paid to Executive sooner than six months and one day following the date of Executive’s separation from service from the Company, as such date is determined in accordance with Section 409A.
Dated as of the Agreement Date.
|
|
|
|
|
|
|
BOK Financial Corporation |
|
/s/ Steven Bradshaw |
|
Name: Steven Bradshaw |
|
Title: President and Chief Executive
Officer
|
|
|
|
Executive |
|
|
|
/s/ Marc Maun |
|
Marc Maun, Individually |
EX-10.4 14
3
a20231231ex10414.htm
EX-10.4 14
Document
Exhibit 10.4.14
EMPLOYMENT AGREEMENT
This Employment Agreement ("Agreement") is made this 23rd day of August, 2021 (the "Agreement Date") between the following parties ("Parties"):
(i)BOK Financial Corporation, an Oklahoma corporation ("BOK
Financial"); and,
(ii)Brad A. Vincent, an individual currently residing in Tulsa, Oklahoma (the "Executive").
BOK Financial and Executive, in consideration of the promises and covenants set forth herein (the receipt and adequacy of which are hereby acknowledged) and intending to be legally bound hereby, agree as follows:
(1)Purpose of This Agreement. The purpose of this Agreement is as follows:
(a)BOK Financial is a financial holding company, subject to regulation by the Board of Governors of the Federal Reserve System. The subsidiaries of BOK Financial include BOKF, NA, a national association engaged in banking and BOK Financial Securities, Inc., a registered broker-dealer.
(b)The Executive has extensive prior experience in financial services and banking and is currently employed as Executive Director, Healthcare Banking reporting to the Chief Operating Officer.
(c)The purpose of this Agreement is to set forth the terms and conditions on which BOK Financial shall employ the Executive and the Executive shall serve as an officer BOKF, NA, and other of its affiliates.
(2)Employment. Effective as September 1, 2021 (the “Commencement Date”), BOK Financial hereby employs the Executive, and the Executive hereby accepts employment with BOK Financial, on the following terms and conditions:
(a)Executive shall serve as Executive Vice President, Specialized Industries Banking of BOK Financial and BOKF, NA.
(b)Executive shall devote all time and attention reasonably necessary to the affairs of BOK Financial and BOKF, NA and shall serve BOK Financial and BOKF, NA diligently, loyally, and to the best of his ability.
(c)Executive shall serve in such other or additional positions as an officer and/or director of BOK Financial and BOKF, NA or any of their affiliates as the Chief Executive Officer of BOK Financial may reasonably request; provided, however, Executive's residence and place of work shall be in the Tulsa, Oklahoma area.
(d)Notwithstanding anything herein to the contrary, Executive shall not be precluded from engaging in any charitable, civic, political or community activity or membership in any professional organization.
(3)Compensation. As the sole, full and complete compensation to the Executive for the performance of all duties of Executive under this Agreement and for all services rendered by Executive to BOK Financial and/or to any affiliate of BOK Financial:
(a)BOK Financial shall pay the Executive an annual salary (the "Annual Salary") in an amount not less than Executive's Annual Salary in effect as of the Commencement Date during the Term (as hereafter defined). The Annual Salary shall be payable in installments in arrears, less usual and customary payroll deductions for FICA, federal and state withholding, and the like, at the times and in the manner in effect in accordance with the usual and customary payroll policies generally in effect from time to time at BOK Financial.
(b)The Annual Salary shall not be decreased at any time during the Term of this Agreement. The Annual Salary may be increased annually in accordance with BOK Financial's compensation review practices in effect from time to time for senior executives.
(c)BOK Financial shall pay and provide to Executive pension, thrift, medical insurance, disability insurance plan benefits, and other fringe benefits, on the same terms and conditions generally in effect for senior executive employees of the BOK Financial and its affiliates (the "Additional Benefits").
(d)BOK Financial may, from time to time in BOK Financial's sole discretion consistent with the practices generally in effect for senior executive employees of BOK Financial and its affiliates, pay or provide, or agree to pay or provide Executive a bonus, stock option, restricted stock, other incentive or performance based compensation.
(i)BOKF Financial shall provide annual incentive and long term incentive awards to Executive in accordance with BOK Financial's Executive Incentive Compensation Plan as adopted by the BOK Financial's Board of Directors from time to time.
(ii)All such bonus, stock option, restricted stock, or other incentive or performance based compensation, regardless of its nature (hereinafter called "Performance Compensation") shall not constitute Annual Salary.
(e)BOK Financial shall reimburse Executive for reasonable and necessary entertainment, travel and other expenses in accordance with BOK Financial's standard policies in general effect for senior executives of BOK Financial.
(f)Executive shall be allowed vacation, holidays, and other employee benefits not described above in accordance with BOK Financial's standard policy in general effect for BOK Financial's senior executives. Executive shall be entitled to four weeks paid vacation each year.
(g)BOK Financial shall permit Executive to participate in a deferred compensation plan on the terms and conditions established by BOK Financial for senior executives.
(h)Executive hereby agrees to accept the foregoing compensation as the sole, full and complete compensation to Executive for the performance of all duties of Executive under this Agreement and for all services rendered by Executive to BOK Financial or any affiliate of BOK Financial.
(4)Term of Employment. The term (the "Term") of Executive's employment ("Employment") pursuant to this Agreement shall commence on the Commencement Date (the "Commencement") and shall continue thereafter provided that upon ninety days prior written notice, either Party may terminate this Agreement.
(5)Termination of Employment. Notwithstanding the provisions of paragraph 4 of this Agreement, the Employment may be terminated on the following terms and conditions:
(a)Termination by BOK Financial Without Cause. In the event BOK Financial terminates Employment of Executive without cause during the Term or upon termination of this Agreement as provided in Paragraph 4:
(i)BOK Financial shall forthwith upon such termination (A) pay to Executive BOK Financial's standard severance pay for senior executives in effect at the time of termination and, in addition, an amount equal to Executive's then Annual Salary payable in one lump sum payment, (B) the Executive shall be entitled to receive any Additional Benefits accrued through, but not beyond the effective date of such termination which are payable under the terms and provisions of benefit plans then in effect in accordance with paragraph 4(c) above, (C) Executive shall be entitled to receive pay for vacation in accordance with BOK Financial's then existing policy for terminating senior executives, (D) options held by Executive under the BOKF 2003 Stock Option Plan and the BOKF 2009 Omnibus Incentive Plan shall vest shall be exercisable for a period of ninety days following such termination as provided in such plans, (E) Restricted stock held by Executive shall continue to be owned by the Executive, but shall remain subject to all restrictions applicable to the restricted stock as provided under the Executive Incentive Plan and the 2009 Omnibus Incentive Plan, and (F) Executive shall be entitled to receive those amounts due Executive pursuant to paragraph 6(b) and shall be bound by the Non-Solicitation Agreement (as hereafter defined).
(ii)If Executive is terminated for any reason other than for cause following a Change of Control (as hereafter defined), BOK Financial shall pay Executive upon such termination in one lump sum payment an amount equal to two times Executive's then Annual Salary at the time of termination in addition to an amount equal to Executive's then Annual Salary through, but not beyond the effective date of the termination. This payment shall be in lieu of any payment that would otherwise be paid pursuant to paragraph 5(a)(i)(A), but Executive shall be entitled to the benefit of the other provisions of paragraph 5(a)(i). As used herein, a Change of Control shall be deemed to have occurred if, and only if:
(A)George B. Kaiser, affiliates of George B. Kaiser, George B. Kaiser Foundation, George Kaiser Family Foundation, and/or members of the family of George B. Kaiser collectively cease to own more shares of the voting capital stock of BOK Financial than any other shareholder (or group of shareholders acting in concert to control BOK Financial to the exclusion of George B. Kaiser, affiliates of George B. Kaiser, George B. Kaiser Foundation, George Kaiser Family Foundation, and/or members of the family of George B. Kaiser); or,
(B)BOK Financial shall cease to own directly and indirectly more than fifty percent (50%) of the voting capital stock of BOKF, NA.
(b)Termination by BOK Financial for Cause. BOK Financial may terminate the Employment for cause on the following terms and conditions:
(i)BOK Financial shall be deemed to have cause to terminate Executive's Employment only in one or more of the following events:
(A)The Executive shall fail to substantially perform his obligations under this Agreement (except as a result of Executive's incapacity due to physical or mental illness) after having first received notice of such failure and thirty days within which to correct the failure;
(B)The Executive commits any act which is reasonably deemed to have been intended by Executive to injure BOK Financial or any of its affiliates;
(C)The Executive is charged, indicted or convicted of any criminal act or act involving moral turpitude which BOK Financial reasonably deems adversely affects the suitability of Executive to serve BOK Financial or any of its affiliates;
(D)The Executive commits any dishonest or fraudulent act which BOK Financial reasonably deems material to BOK Financial or any of its affiliates, including the reputation of BOK Financial or any of its affiliates; or,
(E)Any refusal by Executive to obey orders or instructions of the Chief Executive Officer of BOK Financial or BOKF, NA, unless such instructions would require Executive to commit an illegal act, could subject Executive to personal liability, would require Executive to violate the terms of this Agreement, are inconsistent with recognized ethical standards, or would otherwise be inconsistent with the duties of an officer of a bank.
(ii)BOK Financial shall be deemed to have cause to terminate Executive's Employment only when a majority of the members of the Board of Directors of BOK Financial finds that, in the good faith opinion of such majority, the Executive committed one or more of the acts set forth in clauses (A) through (E) of the preceding subparagraph, such finding to have been made after at least twenty (20) business days' notice to the Executive and an opportunity for the Executive, together with his counsel, to be heard before such majority. The determination of such majority, made as set forth above, shall be binding upon BOK Financial and the Executive.
(iii)The effective date of a termination for cause shall be the date of the action of such majority finding the termination was with cause. In the event BOK Financial terminates Executive's Employment for cause, (A) BOK Financial shall pay Executive the Executive's then Annual Salary through, but not beyond, the effective date of the termination and (B) the Executive shall receive those Additional Benefits accrued through but not beyond the effective date of such termination which are payable under the terms and provisions of benefit plans then in effect in accordance with paragraph 4(c) above, (C) BOK Financial shall pay the Executive for vacation in accordance with BOK Financial's then existing policy for senior executives, and (D) Executive shall be entitled to receive those amounts due Executive pursuant to paragraph 6(b) and Executive shall be bound by the provisions of the Non-Solicitation Agreement.
(c)Respecting Illness and Death. In the event Executive becomes disabled as defined in Section 409A(a)(2)(C) of the Internal Revenue Code, BOK Financial may terminate Executive's Employment without further or additional compensation being due the Executive from BOK Financial except Annual Salary accrued through the date of termination, Additional Benefits accrued through the date of such termination under benefit plans then in effect in accordance with paragraph 3(c) above, and vacation in accordance with BOK Financial's then existing policy for senior executives, and the provisions of paragraph 6 shall apply. Without limiting the generality of paragraph 3(c), Executive shall upon such termination receive those benefits provided in BOK Financial's long term disability policy then in effect. In the event of the death of the Executive, the Employment of the Executive shall automatically terminate as of the date of death without further or additional compensation being due the Executive, except BOK Financial shall pay to the estate of the Executive the Annual Salary in effect on the date of death and accrued through the date of termination and the Additional Benefits accrued through the date of such termination under benefit plans then in effect in accordance with paragraph 3(c) above. BOK Financial shall make the payments due Executive in one lump sum within forty-five days following the date of termination.
(6)Agreement Not to Solicit. The provisions of this paragraph are hereafter called the "Non-Solicitation Agreement".
(a)Executive agrees that, for a period of two (2) years following any termination of the Employment for cause, and for a period of one (1) year following any termination of the Employment for any reason other than cause (including expiration of the Term), Executive shall not directly or indirectly (whether as an officer, director, employee, partner, stockholder, creditor or agent, or representative of other persons or entities) contact or solicit, in any manner indirectly or directly, individuals or entities who were at any time during the original or any extended Term clients of BOK Financial or any of its affiliates for the purpose of providing banking, trust, investment, or other services provided by BOK Financial or any of its affiliates during the Term or contact or solicit employees of BOK Financial or any affiliates of BOK Financial to seek employment with any person or entity except BOK Financial and its affiliates. This Non-Solicitation Agreement shall not apply to ownership by Executive of up to ten percent (10%) of the common stock of a corporation traded on the facilities of a national securities exchange engaged in the banking business of which Executive is not a director, officer, employee, agent or representative.
(b)BOK Financial shall pay Executive, in addition to any other amounts which may be due Executive, during each year in which the Non-Solicitation Agreement is in effect, $3,000 payable in installments in arrears, less usual and customary payroll deductions for FICA, federal and state withholding, and the like, at the times and in the manner in effect in accordance with the usual and customary payroll policies generally in effect from time to time at BOK Financial. Notwithstanding the foregoing, the amounts due for the first six months of the Non-Competition Agreement shall be paid in a lump sum as soon administratively possible following such six month period if Executive is determined to be a "specified employee as defined in Section 409A(a)(2)(B)(i).
(c)Executive agrees that the Non-Solicitation Agreement and all the restrictions set forth in this Non-Solicitation Agreement are fair and reasonable.
(d)Executive agrees that (i) any remedy at law for any breach of this Non-Solicitation Agreement would be inadequate, (ii) in the event of any breach of this Non-Solicitation Agreement, the terms of this Non-Solicitation Agreement shall constitute incontrovertible evidence of irreparable injury to BOK Financial, and (iii) BOK Financial shall be entitled to both immediate and permanent injunctive relief without the necessity of establishing or posting any bond therefor to preclude any such breach (in addition to any remedies of law to which BOK Financial may be entitled).
(7)Confidential Information. All references in this Section 7 to BOK Financial shall include BOK Financial's affiliates.
(a)Executive acknowledges that, during the Term and prior to the Term, Executive has had and will have access to Confidential Information (as hereinafter defined), all of which shall be made accessible to Executive only in strict confidence; that unauthorized disclosure of Confidential Information will damage BOK Financial's business; that Confidential Information would be susceptible to immediate competitive application by a competitor of BOK Financial; that BOK Financial's business is substantially dependent on access to and the continuing secrecy of Confidential Information; that Confidential Information is unique to BOK Financial and known only to Executive and certain key employees and contractors of BOK Financial; that BOK Financial shall at all times retain ownership and control of all Confidential Information; and that the restrictions contained in this Section 9 are reasonable and necessary for the protection of BOK Financial 's business.
(b)All documents or other records containing or reflecting Confidential Information ("Confidential Documents") prepared by or to which Executive has access are and shall remain the property of BOK Financial. Executive shall not copy or use any Confidential Document for any purpose not relating directly to Executive's Employment on BOK Financial's behalf, or use or disclose any Confidential Document to any party other than BOK Financial or its employees and shall not sell Confidential Documents to any party. Upon the termination of this Agreement or upon BOK Financial's request before or after such termination, Executive shall immediately deliver to BOK Financial or its designee (and shall not keep in Executive's possession or deliver to anyone else) all Confidential Documents and all other property belonging to BOK Financial. This paragraph shall not bar Employee from complying with any subpoena or court order, provided that Executive shall at the earliest practicable date provide a copy of the subpoena or court order to BOK Financial's Chief Executive Officer.
(c)During the Term and for a period of four (4) years thereafter, regardless of the reason for termination of Executive's employment, (i) Executive shall not disclose any Confidential Information to any third party and (ii) Executive shall use Confidential Information only in connection with and in furtherance of Executive's Employment by BOK Financial and on behalf of its affiliates.
(d)As used herein, Confidential Information means all nonpublic information concerning or arising from BOK Financial's business, including particularly but not by way of limitation trade secrets used, developed or acquired by BOK Financial in connection with its business; information concerning the manner and details of BOK Financial's operations, organization and management; financial information and/or documents and nonpublic policies, procedures and other printed or written material generated or used in connection with BOK Financial's business; BOK Financial's business plans and strategies; electronic files or documents prepared by BOK Financial or Executive containing the identities of BOK Financial's customers (including their addresses and telephone numbers), the nature and amounts of their assets and liabilities, and the specific individual customer needs being addressed by BOK Financial; the nature of fees and charges assessed by BOK Financial; nonpublic forms, contracts and other documents used in BOK Financial's business; the nature and content of any proprietary computer software used in BOK Financial's business, whether owned by BOK Financial or used by BOK Financial under license from a third party; and all other nonpublic information concerning BOK Financial's concepts, prospects, customers, employees, contractors, earnings, products, services, equipment, systems, and/or prospective and executed contracts and other business arrangements. Confidential Information shall not include (i) general skills and general knowledge of the industry obtained by reason of Executive's association with BOK Financial; (ii) information that is or becomes public knowledge through no fault or action of Executive; (iii) any information received from an independent third party who is under no duty of confidentiality with respect to the information; or (iv) any information that, on advice of counsel, Executive is required to disclose by law or regulation.
(8)Surrender of Records and Property. Upon termination of Executive's employment with BOK Financial for whatever reason, in addition to Executive's obligations pursuant to Paragraph 7(b), Executive shall deliver promptly to BOK Financial all records, manuals, books, blank forms, documents, letters, memoranda, notes, notebooks, reports, data, tables, calculations or copies thereof that relate in any way to the business, products, practices or techniques of BOK Financial or any of its affiliates, and all other information of BOK Financial or any of its affiliates, including, but not limited to, all documents that in whole or in part contain any information which is defined in this Agreement as Confidential Information and which is in the possession or under the control of Executive.
(9)Compliance with Section 409A. This Agreement is subject to the following provisions in order to ensure compliance with Section 409A of the Internal Revenue Code of 1986, as amended (Section 409A").
(a)If any payment, compensation or other benefit provided to the Executive in connection with his employment termination is determined, in whole or in part, to constitute "nonqualified deferred compensation" within the meaning of Section 409A and the Executive is a specified employee as defined in Section 409A(2)(B)(i), no part of such payments shall be paid before the day that is six (6) months plus one (l) day after the date of termination.
(b)The Parties acknowledge and agree that Section 409A and its application, if any, to the terms of this Agreement may be subject to change as additional guidance and regulations become available. Anything to the contrary herein notwithstanding, all benefits or payments provided by the Company to the Executive that would be deemed to constitute "nonqualified deferred compensation" within the meaning of Section 409A are intended to comply with Section 409A. If, however, any such benefit or payment is deemed to not comply with Section 409A, the Company and the Executive agree to renegotiate in good faith any such benefit or payment (including, without limitation, as to the timing of any severance payments payable hereof) so that either (i) Section 409A will not apply or (ii) compliance with Section 409A will be achieved.
(c)All payments required to be made by Bank hereunder to the Executive may be adjusted to the withholding of such amounts, if any, relating to tax and other payroll deductions as the Bank may reasonably determine should be withheld pursuant to any applicable law or regulation.
(10)Miscellaneous Provisions. The following miscellaneous provisions shall apply to this Agreement:
(a)All notices or advices required or permitted to be given by or pursuant to this Agreement, shall be given in writing. All such notices and advices shall be (i) delivered personally or (ii) delivered for overnight delivery by a nationally recognized overnight courier service. Such notices and advices shall be deemed to have been given (i) the first business day following the date of delivery if delivered personally or (ii) on the date of receipt if delivered for overnight delivery by a nationally recognized overnight courier service. All such notices and advices and all other communications related to this Agreement shall be given as follows:
If to BOK Financial:
BOK Financial Corporation
Attn: Stacy C. Kymes
Bank of Oklahoma Tower
P.O. Box 2300
Tulsa, Oklahoma 74192
skymes@bokf.com and
Chief Human Resources Officer
Attn: Kelley Weil
Bank of Oklahoma Tower
P.O. Box 2300
Tulsa, Oklahoma 74192
Kweil@bokf.com
With a Copy to:
Tamara R. Wagman
Old City Hall
124 East Fourth Street
Tulsa, OK 74103-5010
twagman@FDLaw.com
If to Executive:
Brad A. Vincent
11705 S. Richmond Ave.
Tulsa, OK 74137
bvincent@bokf.com
or to such other address as the Party may have furnished to the other Parties in accordance herewith, except that notice of change of addresses shall be effective only upon receipt.
(b)This Agreement is made and executed in Tulsa, Oklahoma and all actions or proceedings with respect to, arising directly or indirectly in connection with, out of, related to or from this Agreement, shall be litigated in courts having situs in Tulsa, Oklahoma.
(c)This Agreement shall be subject to, and interpreted by and in accordance with, the laws of the State of Oklahoma without regard to its conflict of law provisions.
(d)This Agreement is the entire Agreement of the Parties respecting the subject matter hereof. There are no other agreements, representations or warranties, whether oral or written, respecting the subject matter hereof, except as stated in this Agreement.
(e)This Agreement, and all the provisions of this Agreement, shall be deemed drafted by all of the Parties hereto.
(f)This Agreement shall not be interpreted strictly for or against any Party, but solely in accordance with the fair meaning of the provisions hereof to effectuate the purposes and interest of this Agreement.
(g)Each Party hereto has entered into this Agreement based solely upon the agreements, representations and warranties expressly set forth herein and upon her or his own knowledge and investigation. Neither Party has relied upon any representation or warranty of any other Party hereto except any such representations or warranties as are expressly set forth herein.
(h)Each of the persons signing below on behalf of a Party hereto represents and warrants that he or she has full requisite power and authority to execute and deliver this Agreement on behalf of the Parties for whom he or she is signing and to bind such Party to the terms and conditions of this Agreement.
(i)This Agreement may be executed in counterparts, each of which shall be deemed an original. This Agreement shall become effective only when all of the Parties hereto shall have executed the original or counterpart hereof. This Agreement may be executed and delivered by electronic transmission of a counterpart signature page hereof.
(j)In any action brought by a Party hereto to enforce the obligations of any other Party hereto, the prevailing Party shall be entitled to collect from the opposing Party to such action such Party's reasonable litigation costs and attorneys fees and expenses (including court costs, reasonable fees of accountants and experts, and other expenses incidental to the litigation).
(k)This Agreement shall be binding upon and shall inure to the benefit of the Parties and their respective heirs, personal representatives, successors and assigns.
(l)This is not a third party beneficiary contract, except BOK Financial (including each affiliate thereof) shall be a third party beneficiary of this Agreement.
(m)This Agreement may be amended or modified only in a writing, as agreed to by the Parties hereto, which specifically references this Agreement.
(n)A Party to this Agreement may decide or fail to require full or timely performance of any obligation arising under this Agreement. The decision or failure of a Party hereto to require full or timely performance of any obligation arising under this Agreement (whether on a single occasion or on multiple occasions) shall not be deemed a waiver of any such obligation. No such decisions or failures shall give rise to any claim of estoppel, laches, course of dealing, amendment of this Agreement by course of dealing, or other defense of any nature to any obligation arising hereunder.
(o)In the event any provision of this Agreement, or the application of such provision to any person or set of circumstances, shall be determined to be invalid, unlawful, or unenforceable to any extent for any reason, the remainder of this Agreement, and the application of such provision to persons or circumstances other than those as to which it is determined to be invalid, unlawful, or unenforceable, shall not be affected and shall continue to be enforceable to the fullest extent permitted by law.
(p)None of the compensation or other payments to Executive provided for in, or that may be made pursuant to, this Agreement are intended by the Parties to be deferred compensation within the meaning of Section 409A. If, however, the Executive is a "specified employee" as defined in Section 409A(a)(2)(B)(i), then the other provisions of this Agreement notwithstanding, no compensation that is "deferred compensation" within the meaning of Section 409A shall be paid to Executive sooner than six months and one day following the date of Executive s separation from service from the Company, as such date is determined in accordance with Section 409A.
Dated as of the Agreement Date.
BOK Financial Corporation
/s/ Stacy C. Kymes
Name: Stacy C. Kymes
Title: Chief Operating Officer
Executive
/s/ Brad A. Vincent
Brad A. Vincent, Individually
EX-10.7 16
4
a20231231ex10716.htm
EX-10.7 16
Document
Exhibit 10.7.16
BOK FINANCIAL CORPORATION
OMNIBUS INCENTIVE PLAN
THIS OMNIBUS INCENTIVE PLAN (the “Plan”) of BOK Financial Corporation (the “Company”), an Oklahoma corporation with its principal office in Tulsa, Oklahoma, sets forth the terms and conditions under which restricted stock may be granted from time to time to its officers, executives, and key employees, subject to the following provisions:
1. Purpose. The purpose of the Plan is to advance the interests of the Company by awarding to certain officers, executives, and other key employees of the Company and its subsidiaries who make exceptional contributions to the Company by their ability, loyalty, industry, and innovativeness based upon the common capital stock of the Company, par value of $0.00006 per share (“Common Stock): (a) restricted shares of the Common Stock (“Restricted Stock”), and/or (b) hypothetical Common Stock units (“Restricted Stock Units”) having a value equal to the Fair Market Value of an identical number of shares of Common Stock. For purposes of this Plan, “Restricted Awards” include both Restricted Stock and Restricted Stock Units. The Company intends that the Plan will closely associate the interests of officers, executives, and key employees with those of the Company’s shareholders and will facilitate securing, retaining, and motivating officers, executives, and employees of high caliber and potential.
2. Administration.
(a) Restricted Awards pursuant to the Executive Incentive Plan. Restricted Awards awarded pursuant to the 2003 Executive Incentive Plan, as amended (the “EIP”) shall be administered by the Compensation Committee of the Board of Directors (the “Committee”) of the Company (the “EIP Awards”). With regard to the EIP Awards, the Committee shall have full and final authority in its discretion to interpret conclusively the provisions of the Plan; to decide all questions of fact arising in its application; to determine the employees to whom awards shall be made under the Plan; to determine the award to be made and the amount, size, terms and restrictions of each such award; to determine the time when awards will be granted; and to make all other determinations necessary or advisable for the administration of the Plan.
(b) Restricted Awards outside of the Executive Incentive Plan. Restricted Awards awarded other than pursuant to the EIP shall be administered by the Chief Executive Officer (the “CEO”) (the “Non-EIP Awards”). With regard to the Non-EIP Awards, the CEO shall have full and final authority in his discretion to interpret conclusively the provisions of the Plan; to decide all questions of fact arising in its application; to determine the employees to whom awards shall be made under the Plan; to determine the award to be made and the amount, size, terms and restrictions of each such award; to determine the time when awards will be granted; and to make all other determinations necessary or advisable for the administration of the Plan.
3. Shares Subject to Plan. The awards issued under the Plan shall not exceed in the aggregate six million (6,000,000) shares (or share equivalents) of Common Stock. Such shares shall be authorized and unissued shares. Any awards (or share equivalents) which are awarded hereunder and subsequently forfeited shall again be available under the Plan.
4. Participants. Persons eligible to participate in the Plan and to receive Restricted Awards under the Plan shall be limited to full–time employees of the Company and its subsidiaries who, in the judgment of the Committee or the CEO, make a significant impact upon the profitability of the Company through their decisions, actions and counsel. Those employees to whom Restricted Awards are granted (“Participants”) shall be notified by a letter of award (“Award Letter”), which shall bear the date on which the Award Letter is issued (the “Award Date”).
5. Maximum Shares Per Participant. No more than 150,000 shares of Restricted Awards shall be issued to a single Participant in any single year.
6. The Restricted Awards. Restricted Awards may be issued pursuant to the Plan in the form of “Service-Based Restricted Awards” or “Performance-Based Restricted Awards”.
(a)Service-Based Restricted Awards. Service-Based Restricted Awards. Subject to (i) the provisions of Section 7(b) and (e) and (ii) for EIP Awards, Sections 8 and 10 of the EIP, Service-Based Restricted Awards shall vest in accordance with the vesting schedule determined by the Committee and may not be transferred by the Participant (except as provided in Section 7(a)) until two years after vesting (the “Service-Based Restricted Awards Period”); provided however, that the foregoing shall not limit the authority of the CEO provided in Section 2(b) herein to authorize the issuance of Non-EIP Service-Based Restricted Awards with vesting schedules, Service-Based Restrict Awards Periods and other terms differing from the foregoing, such vesting schedules, Service Based Restricted Awards Periods and other terms to be determined by the CEO at the time of grant of the Non-EIP Service-Based Restricted Award. Dividends on Service-Based Restricted Awards shall be vested and paid commencing with the date of grant.
(b) Performance-Based Restricted Awards. Subject to the provision of Section 7(b), (d) and (e), Performance-Based Restrictive Stock shall vest after being earned in accordance with, Sections 9 and 10 of the EIP with respect to EIP Awards and Sections 6(b)(i) and (ii) below with respect to Non-EIP Awards, and may not be transferred by the Participant (except as provided in Section 7(a)) until two years after vesting (the “Performance-Based Restricted Awards Period”). Performance- Based Restricted Awards shall be issued to Non-EIP Participants as follows:
(i) Targets for Non-EIP Awards of Performance-Based Restricted Awards. Prior to awarding Performance-Based Restricted Awards to Non-EIP Participants, the Chief Human Resources Officer shall determine, and the Chief Executive Officer shall approve, the target performance incentive compensation for each Non-EIP Participant (the “Non-EIP Performance Incentive Compensation Target”).
(ii) Performance-Based Compensation Measures for Non-EIP Awards of Performance-Based Restricted Awards.
A. “Restricted-Award EPS Performance” is the percentile ranking of the Company after (a) calculating the trailing three-year period earnings per share growth (determined as of the second anniversary of the end of the year in respect of which the Performance-Based Restricted Awards were awarded) (the “Three Year EPS Average Growth”) for each Performance Peer (as defined below) and for the Company and (b) ranking the Company’s Three Year EPS Average Growth compared to the Peers’ Three Year EPS Growth Average, starting with the highest Three Year EPS Average Growth and ending with the lowest Three Year EPS Average Growth.
B. Each annual award of Performance-Based Restricted Awards shall be reviewed for performance as of the second year-end anniversary of the year in respect of which the performance-based restricted shares were awarded (the “Reviewed Restricted Awards”). A Participant shall earn Reviewed Restricted Awards using a linear interpolation pursuant to which 0% of the Reviewed Restricted Awards shall be earned if the Restricted Award EPS Performance is below the 30th percentile, 33% of the Reviewed Restricted Awards shall be earned if the Restricted Award EPS Performance is at the 30th percentile, 100% of the Reviewed Restricted Awards shall be earned if the Restricted Award EPS Performance is at the 50th percentile, and 200% of the Reviewed Restricted Awards shall be earned if the Restricted Award EPS Performance is at the 80th percentile or above as illustrated in the following matrix:
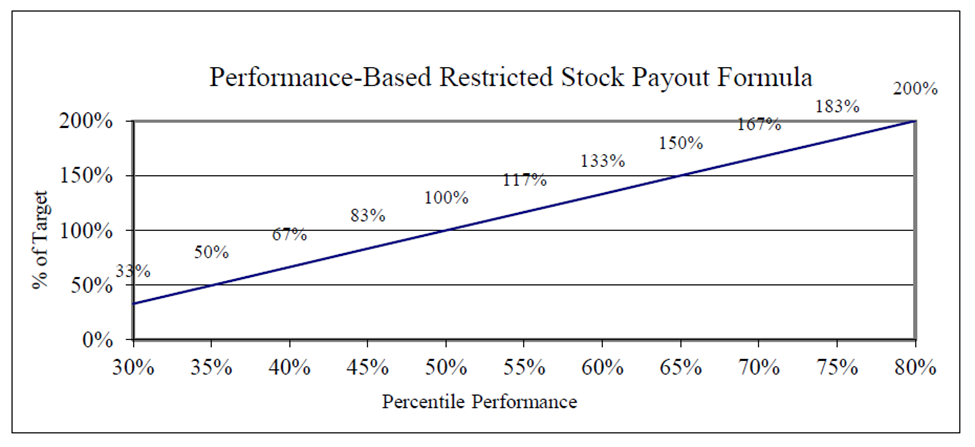
In the event that the Restricted Award EPS Performance is such that performance exceeds the target grant (e.g. 120% of target), Participant shall receive an additional grant of Performance-Based Restricted Awards that equals the difference between the number of Performance-Based Restricted Awards that was granted at target and that which was earned pursuant to this Section 6(b)(ii) (e.g. 20%) (the “Shares Exceeding Target”). The vesting and transfer restrictions on the Shares Exceeding Target shall be equal in duration to the Reviewed Restricted Awards earned pursuant to this Section 6(b)(ii).
(iii) Dividends. Dividends on Non-EIP Awards of Performance-Based Restricted Stock shall accrue, vest and in accordance with the vesting schedule determined by the Committee and subject to the vesting of the underlying Performance-Based Restricted Stock in accordance with Section 6(b)(ii) above. In the event a Non-EIP Participant receives Shares Exceeding Target, the Participant shall receive an amount equal to the dividend value that would have been received if the Shares Exceeding Target has been granted at the beginning of the performance period. The Company shall accrue the equivalent value of dividends on Deferred Stock Units (as defined in Section 6(e) below) which shall be paid upon settlement of the Deferred Stock Units, subject to the vesting and payment of the underlying Deferred Stock Units for which the dividends were accrued.
(iv) Forfeiture. Non-EIP Awards of Performance-Based Restricted Awards, and any corresponding dividends, shall be subject to forfeiture to the extent not earned pursuant to Section 6(b)(ii) above.
(v) Peer Groups. The peer banks which shall be used to earnings per share comparisons for Non-EIP Awards under the Plan shall be determined as follows:
A. The peer groups shall include only publicly traded, SEC registered, United States = banking institutions as reported in the S&P Global Market Intelligence SNL Platform or financial market data.
B. The “Performance Peers” shall include banking institutions which are up to two times in asset size larger than the Company and down to one-half in asset size smaller than the Company and designated by the Committee on an annual basis. The Committee may exclude from the Peers, in its discretion, a banking institution (or any number of banking institutions) whose business is largely dissimilar from the Company’s business. The Performance Peers shall be identified by the Committee each year on or before March 15. Notwithstanding the foregoing or anything to the contrary in this Plan, in the event the Peers contain a banking institution that does not have sufficient compensation data to complete the contemplated calculation under this Plan (a “Disqualified Peer”), the Disqualified Peer shall be eliminated from the Peers. Asset size means total assets reported in a banking institution’s most recent Annual Report on Form 10-K filed with the Securities and Exchange Commission (the “SEC”).
C. Unless otherwise provided by the Committee, the source for peer information shall be a reliable third-party vendor which obtains information from public information, primarily through periodic SEC filings and company press releases.
D. The earnings per share (“EPS”) amounts shall be diluted EPS as defined by generally accepted accounting principles.
E. The EPS growth is calculated as a simple average of the percentage change in EPS from one period to the next.
F. In the event of a bank acquisition or failure involving a Performance Peer, the following shall apply:
1.If the Acquiring Entity (as defined below) was itself a Performance Peer prior to the transaction, such Acquiring Entity shall continue to be a Performance Peer regardless of asset size;
2. If the Acquiring Entity was not a Performance Peer prior to the transaction, such Acquiring Entity (and the prior Performance Peer) shall be excluded from the Performance Peer group;
3.If one Performance Peer is acquired by another Performance Peer, the Acquiring Entity shall remain a Performance Peer with the non-Acquiring Entity being excluded from the Performance Peer group;
4.If a Performance Peer is closed by the FDIC or otherwise permanently ceases operations, such Performance Peer shall remain as a Performance Peer for the current year’s incentive calculation, but shall be excluded from the Performance Peer group for future years’ incentive calculations.
5.For purposes of this Plan, “Acquiring Entity” shall mean that entity determined to be the legal acquirer according to the purchase and sale agreement or other transaction document.
(c) Special Grants. The CEO, at his option, may issue special grants of Service-Based or Performance-Based Restricted Awards for hiring and retention purposes (“Special Grants”). The Award Letter provided to the Participant shall specify the terms and conditions upon which restrictions on Special Grants shall lapse (the “Special Grant Restricted Awards Period”).
(d) Book Entry. Service-Based and Performance-Based Restricted Stock shall be issued and outstanding on the shareholder ledgers maintained by the Company’s transfer agent. No ph1ysical certificates shall be issued for the Restricted Stock. The Company, without further action by a Participant, may cancel such Participant’s Restricted Stock in accordance with the Plan, the EIP, Award Letters, or Employment Agreements.
(e) Voting. Restricted Stockholders shall be entitled to vote Restricted Stock held by the Participant. A Participant shall have no voting rights with respect to any Restricted Stock Units granted hereunder.
7. Restrictions and Forfeiture. All Restricted Awards granted under the Plan shall be evidenced by the Award Letter provided to the Participant, and be subject to its terms and to the terms of this Plan, including the following restrictions and forfeitures:
(a) Non-Transferability
Restricted Awards awarded, and the right to vote Restricted Stock, and to receive dividends thereon, may not be sold, assigned, transferred, exchanged, pledged, hypothecated, or otherwise encumbered during the applicable Service-Based Restricted Awards Period or Performance-Based Restricted Awards Period specified herein, other than by will, by the laws of descent and distribution, or by court order or decree; provided however, that a participant may forfeit an amount of Restricted Awards equal in value to the tax withholding amount arising from the vesting of Restricted Shares.
(b) Forfeiture. All Restricted Awards (regardless of issue date), will terminate and be forfeited if the Participant’s employment with the Company or its subsidiaries is terminated for any reason, including death, disability, retirement, resignation or involuntary termination (whether such involuntary termination is with or without cause), provided:
(i) In the event (A) a Participant has provided the Company with at least one year’s prior written notice of his or her intent to retire and (B) the Participant has reached a minimum age of 60 and has a combined age and years of service with the Company that equals or is greater than 70 then (C) Service-Based Restricted Awards held by the Participant at the time of retirement shall not be automatically forfeited, but shall vest on a prorated basis based upon the amount of time the Participant was employed with the Company during the three year vesting period applicable to a Service-Based Restricted Awards grant (e.g. 50% of a Service-Based Restricted Awards grant would vest for a Participant who retired 18 months following the grant date) and such vested Service-Based Restricted Awards must continue to be held by the Participant during the Service-Based Restricted Awards Period and(D) Performance-Based Restricted Awards held by the Participant at the time of retirement shall not be automatically forfeited, but shall have the opportunity to vest on a daily prorated basis based upon the amount of time the Participant was employed by the Company during the three year performance period and attaining the performance goals set forth in Section 6 for Non-EIP Awards and Section 9 of the EIP for EIP Awards (e.g. 50% of a Performance-Based Restricted Awards grant would be eligible for vesting (if performance goals were met) for a Participant who retired 18 months following a grant of Performance-Based Restricted Awards), and any such vested Performance-Based Restricted Awards must continue to be held during the Performance-Based Restricted Awards Period;
(ii) In the event of the termination of employment of a Participant by reason of death or disability, the Participant (or in the event of death, the personal representative of the Participant) (A) shall be entitled to all Service-Based Restricted Awards held by the Participant at the time of death or disability which shall immediately vest and become unrestricted and(B) shall be entitled to receive Performance-Based Restricted Awards in an amount equal to the plan target amount which shall immediately vest and become unrestricted; (iii) In the event a Participant's employment is involuntarily terminated by the Company without cause (as described below) and such involuntary termination without cause is within one year following a Change of Control (as defined below), all the restrictions on the Participant’s Restricted Awards shall lapse.
(v) A “Change of Control” shall be deemed to have occurred if, and only if: (A) George B. Kaiser, affiliates of George B. Kaiser, and/or members of the family of George B. Kaiser and/or the George Kaiser Family Foundation and/or any charitable trust (including any charitable income trust), or other charitable legal entity created by George B. Kaiser collectively cease to own more shares of the voting capital stock of Company than any other shareholder (or group of shareholders acting in concert to control the Company to the exclusion of George B. Kaiser, affiliates of George B. Kaiser, members of the family of George B. Kaiser or the George Kaiser Family Foundation); or, (B) the Company shall cease to own more than 50% of the voting capital stock of BOKF, National Association.
(vi) Unless otherwise provided in a Participant’s employment agreement, a Participant shall be deemed to have been terminated “with cause” if the Company determines (in its sole discretion provided only that such discretion is exercised with honesty in fact) that the Participant was terminated by reason of (A) any failure to substantially perform Participant's employment obligations to the Company in a satisfactory manner, (B) any intentional act materially injurious to the Company, (C) any act of moral turpitude, (D) any material dishonest or fraudulent act, or (E) any refusal to obey orders or instructions of the Participant's appropriate supervisors or seniors.
(vii) A Participant shall be deemed employed by the Company so long as and only so long as the employee is in the employment of BOK Financial Corporation or a direct or indirect subsidiary of BOK Financial Corporation in which BOK Financial Corporation owns, directly or indirectly, more shares of the voting capital stock than any other shareholder (or group of shareholders acting in concert to control such subsidiary to the exclusion of the Company).
(viii) Dividends paid on the Restricted Stock prior to forfeiture will not be forfeited or otherwise need to be refunded to the Company, even if the shares themselves have been forfeited.
(c) Resale. Common Stock acquired by a Participant pursuant to the Plan may be resold only pursuant to the provisions of Section 18 hereof.
(d) EIP Restrictions. Restricted Awards awarded pursuant to the EIP are subject to the performance measures and terms of the EIP. In the event there is a conflict between this Plan and/or an Award Letter and the EIP, the EIP shall control.
(e) Individual Employment Agreements. Restricted Awards issued pursuant to, or governed by, an individual employment agreement between a Participant and the Company or one of its affiliates (an “Employment Agreement”) shall be subject to the terms of such Employment Agreement. In the event of a conflict between the Plan and an Employment Agreement, the Employment Agreement shall prevail.
8. Fair market value. Fair market value as of any date shall be the closing price at which shares of Company Common Stock were sold on the valuation day as quoted by NASDAQ or, if there were no sales on that date, then on the last day prior to the valuation day during which there were sales (the “Fair Market Value”).
9. Rights to Terminate Employment. Nothing in the Plan or in any Award Letter shall confer upon any Participant the right to continue in the employment of the Company, nor affect any right which the Company may have to terminate the employment of such Participant.
10. Withholding. Whenever the Company proposes or is required to issue or transfer shares of Common Stock under the Plan, the Company shall have the right to withhold from sums due the Participant, or to require the Participant to remit to the Company, any amount sufficient to satisfy any federal, state and/or local withholding tax requirements prior to the delivery of any certificate for such shares.
11. Tax Effects.
(a) The Plan is not qualified under Section 401(a) of the Internal Revenue Code.
(b) Unless otherwise allowed or required by tax law, the Company will be entitled to an income tax deduction (i) with regard to Restricted Awards when the Restricted Awards vests and (ii) with regard to Deferred Stock Units, at the time of distribution in accordance with the Deferred Compensation Plan. The amount of the deduction will be equal to (i) with regard to Restricted Awards, the Fair Market Value of the Restricted Awards on the vesting date and (ii) with regard to Deferred Stock Units, the Fair Market Value of the Deferred Stock Units at the time of distribution in accordance with the Deferred Compensation Plan.
(c) Participants should consult their tax advisors as to the tax effect of Restricted Awards received under the Plan as individual circumstances and changes to tax laws and regulations may change the tax treatment of the Restricted Awards. Generally, Participants will recognize income (i) with regard to Restricted Awards, on the vesting date (unless the Participant elects to recognize income on the date of grant or defers the Restricted Award) and (ii) with regard to Deferred Stock Units at the time if distribution in accordance with the Deferred Compensation Plan, in an amount equal to the deduction allowed to the Company, as Section 11(b) above. Income recognized due to the vesting of Restricted Awards will be subject to withholding and reported to the employee on form W-2. Generally, participants will not be subject to any further income recognition until a taxable transaction occurs involving the vested stock, in the case of Restricted Awards, or the purchase of stock. The basis in the stock is equal to the (i) the Fair Market Value at the date of vesting for the Restricted Awards (unless deferred) and (ii) the Fair Market Value on the date of distribution for the Deferred Stock Units. Future transactions will be subject to capital asset rules. However, the amount of taxable income and the basis on the Restricted Awards will also depend on whether the Participant makes an 83(b) election under the Internal Revenue Service code.
12. Non-Uniform Determinations. The determinations by the Committee or the CEO under the Plan (including, without limitation, determinations of the persons to receive awards, the form, amount and the timing of such awards, and the terms and provisions of such awards) need not be uniform and may be made by it selectively among persons who receive, or are eligible to receive, awards under the Plan, regardless of whether such persons are similarly situated.
13. Adjustments. In the event of any change in the outstanding Common Stock by reason of a stock dividend or distribution, recapitalization, merger, consolidation, split-up, combination, exchange of shares or the like, the Committee and/or the CEO shall appropriately adjust the number and class of shares which may be issued under the Plan and shall provide for corresponding equitable adjustments in shares previously awarded and still subject to restrictions hereunder.
14. Amendment. The Board of Directors (or a Committee of the Board of Directors)of the Company may discontinue, suspend or amend the Plan at any time, except that without shareholder approval, the Board of Directors (or a Committee of the Board of Directors) may modify the Plan in a way which, by law or regulation, would require shareholder approval.
15. Effect on Other Plans. Participation in the Plan shall not affect an employee’s eligibility to participate in any other benefit or incentive plan of the Company, and any awards made pursuant to the Plan shall not be used in determining the benefits provided under any other plan of the Company, unless specifically provided in such other plan.
16. Duration of the Plan. Upon shareholder approval at the 2013 Annual Meeting of Shareholders, this Plan shall be effective as of January 1, 2013 (the "Effective Date"). The Plan shall remain in effect until all Restricted Awards awarded under the Plan are free of restrictions imposed by the Plan and applicable Award Letters, whichever is later, but no award shall be made more than twenty years after the Effective Date.
17. Successors. This Plan shall bind any successor of the Company, its assets or its businesses (whether direct or indirect, by purchase, merger, consolidation or otherwise), in the same manner and to the same extent that the Company would be obligated under this Plan if no succession had taken place. In the case of any transaction in which a successor would not by the foregoing provision or by operation of law be bound by this Plan, the Company shall require such successor expressly and unconditionally to assume and agree to perform the Company's obligations under this Plan, in the same manner and to the same extent that the Company would be required to perform if no such succession had taken place. The term “Company,” as used in the Plan, shall mean the Company as hereinbefore defined and any successor or assignee to the business or assets which by reason hereof becomes bound by this Plan.
18. Deferral of Awards. The Committee may establish one or more programs under the Plan to permit selected Participants the opportunity to elect to defer receipt of consideration upon exercise of an award, satisfaction of Performance Criteria, or another event that absent the election would entitle the Participant to payment or receipt of shares of Common Stock or other consideration under the Award. The Committee may establish the election procedures, the timing of such elections, the mechanisms for payment of, and accrual of interest or other earnings, if any on amounts, shares or other consideration so deferred, and such other terms, conditions, rules and procedures the Committee deems advisable for the administration of any such deferral program.
19. Reoffer or Resale of Common Stock Acquired Pursuant to the Plan. The reoffer or resale of Company Common Stock acquired by a Participant pursuant to the Plan shall be subject to the following terms and conditions:
(a) If the Participant is an affiliate of the Company, the reoffer or resale of Company Common Stock may be made by the Participant only (i) by means of a reoffer prospectus pursuant to an effective registration statement on Form S-8 or (ii) in accordance with the provisions of SEC Rule 144 or (iii) pursuant to the determination of the Company's general counsel that there is an available exemption under the federal and state securities laws.
(b) If the Participant is not an affiliate of the Company, the reoffer or resale is not subject to restriction, except as set forth in Section 19(c) of this Plan.
(c) Prior to reoffering or reselling any Company Common Stock acquired pursuant to this Plan, the Participant shall advise the Compensation Department of Human Resources of BOKF, National Association which shall refer the matter to the Company’s general counsel. The Company’s general counsel shall determine whether the Participant is an affiliate or a non-affiliate of Company. If the Company’s general counsel determines Participant is an affiliate, the Participant shall offer and sell the Company Common Stock only as provided by Section 19(a).
20. Miscellaneous Provisions. The following miscellaneous provisions shall apply to the Plan:
(a) This Plan is made and executed in Tulsa County, Oklahoma;
(b) This Plan shall be subject to, and interpreted in accordance with, the laws of the State of Oklahoma;
(c) This Plan is the entire agreement of the parties respecting the subject matter hereof. There are no other agreements, whether oral or written, respecting the subject matter hereof;
(d) Headings used in the Plan are for convenience only, do not modify or affect the meaning of any provision herein, and shall not serve as a basis for interpretation or construction of the Plan;
(e) Rights and obligations arising under the Plan may not be assigned; and
(f) In any action brought by a party hereto to enforce the obligations of any other party hereto, the prevailing party shall be entitled to collect from the opposing party to such action such party's reasonable litigation costs and attorneys’ fees and expenses (including court costs, reasonable fees of accountants and experts, and other expenses incidental to the litigation).
21. Additional Information.
(a) The Plan is not subject to the provisions of the Employee Retirement Income Security Act.
(b) No reports shall be required to be delivered to the Participants as to the status of their participation in the Plan. However, a Participant may contact the Compensation Department of Human Resources of BOKF, National Association to determine information regarding status of restrictions on shares issued pursuant to the Plan.
22. Incorporation of Certain Documents by Reference. The Company is subject to the information reporting requirements of the Securities Exchange Act of 1934 and, in accordance therewith, files reports and other information with the Securities and Exchange Commission (the “Commission”). The following documents filed with the Commission are incorporated in this Plan by reference:
(a) The Company’s latest annual report on Form 10-K (including, if applicable, information specifically incorporated by reference into our Form 10-K from our definitive proxy statement);
(b)All other reports filed by the Company pursuant to Section 13(a) or 15(d) of the Exchange Act (other than those portions of Current Reports on Form 8-K furnished pursuant to Item 2.02 or Item 7.01 of Form 8-K, including any related exhibits, unless otherwise indicated therein) since the end of the fiscal year covered by the latest annual report on Form 10-K; and
(c)The description of the Company’s common stock contained in the Company’s Articles of Incorporation, incorporated by reference to the (i) Amended and Restated Certificate of Incorporation of BOK Financial Corporation filed with the Oklahoma Secretary of State on May 28, 1991, filed as Exhibit 3.0 to S-1 Registration Statement No. 33-90450 (the “Registration Statement”), and (ii) Amendment attached as Exhibit A to the Information Statement and Prospectus Supplement filed November 20, 1991.
In addition to the foregoing, all documents subsequently filed by the Company with the SEC pursuant to Sections 13(a), 13(c), 14 and 15(d) of the Exchange Act (other than those portions of Current Reports on Form 8-K furnished pursuant to Item 2.02 or Item 7.01 of Form 8-K, including any related exhibits, unless otherwise indicated therein), prior to the filing of a post-effective amendment which indicates that all securities offered under the Registration Statement have been sold or which deregisters all securities then remaining unsold, shall be deemed to be incorporated by reference into this Plan and to be a part of this Plan from the date of filing of such documents.
You can request a copy of these filings, as well as any other documents required to be delivered to you pursuant to Rule 428(b) under the Securities Act, at no cost, by writing or telephoning us at the following address:
BOKF Employee Resource Center
P.O. Box 2300
Tulsa, OK 74192
Phone: 855-269-2653
Email: employeeresourcecenter@bokf.com
EX-21
5
a20231231bokfex21.htm
EX-21
Document
Exhibit 21
BOK FINANCIAL CORPORATION
SUBSIDIARIES OF THE REGISTRANT
Banking Subsidiaries
BOKF, National Association (1)
Other subsidiaries of BOK Financial Corporation
BOKF Capital Corporation
BOKF-CC (Collision Works), LLC
BOKFCC (Cyber), LLC
BOKFCC (FDS), LLC
BOKFCC (Fixed Income II), LLC
BOKF-CC (FSE), LLC
BOKF-CC (HD Repair), LLC
BOKF-CC (IPS), LLC
BOKF-CC (O2 Concepts), LLC
BOKF-CC (QRC), LLC
BOKF-CC (SSP), LLC
BOKF-CC (Switchgrass), LLC
BOKF-CC (VFP), LLC
BOKFCC Merchant Banking Fund I, LLC
BOKFCC MB II, LLC
BOKFCC MB III, LLC
BOKF Energy Fund Investment I, LLC
BOK Financial Private Wealth, Inc. (5)
BOK Financial Securities, Inc.
Cavanal Hill Distributors, Inc.
Industrial Pipe & Supply, LLC Subsidiaries of BOKF, National Association (1)
Lumifi Holdco, LLC
RMA Holdings, Inc. (5)
Switchgrass I, LLC
Switchgrass II, LLC
Switchgrass III, LLC
Switchgrass IV, LLC
Switchgrass V, LLC
Switchgrass VI, LLC
Switchgrass Holdings, LLC
Switchgrass Management, LLC
Switchgrass Properties, LLC
Switchgrass Properties-II, LLC
Affiliated BancServices, Inc.
Affiliated Financial Holding Co.
Affiliated Financial Insurance Agency, Inc.
BancOklahoma Agri-Service Corporation
BOK Delaware, Inc. (3)
BOK Financial Equipment Finance, Inc.
BOK Financial Public Finance, Inc. (5)
BOK Funding Trust (3)
BOKF Community Development Fund, LLC
BOKF Community Development Fund II
BOKF Community Development Corporation
BOKF Investment Fund II, LLC
BOKF Petro Holding, LLC
BOKF Petro Holdings II, LLC
BOKF Petro Holdings III, LLC
BOKF Petro Holdings IV, LLC
BOSC Agency, Inc. (Oklahoma)
BOSC Agency, Inc. (New Mexico) (4)
BOSC Agency, Inc. (Texas) (2)
Cavanal Hill Investment Management, Inc.
Cottonwood Valley Ventures, Inc.
CVV Management, Inc.
CVV Partnership, an Oklahoma General Partnership
All Subsidiaries listed above were incorporated in Oklahoma, except as noted.
(1)Chartered by the United States Government
(2)Incorporated in Texas
(3)Incorporated in Delaware
(4)Incorporated in New Mexico
(5)Incorporated in Colorado
EX-23
6
a20231231bokfex23.htm
EX-23
Document
Exhibit 23
Consent of Independent Registered Public Accounting Firm
We consent to the incorporation by reference in the following Registration Statements:
•Registration Statement (Form S-8, No. 33-44121) pertaining to the Reoffer Prospectus of the Bank of Oklahoma Master Thrift Plan and Trust Agreement as amended October 6, 2008.
•Registration Statement (Form S-8, No. 333-40280) pertaining to the Reoffer Prospectus of the BOK Financial Corporation Master Thrift Plan for Hourly Employees as amended October 6, 2008.
•Registration Statement (Form S-8, No. 33-79836) pertaining to the Reoffer Prospectus of the BOK Financial Corporation Directors' Stock Compensation Plan.
•Registration Statement (Form S-8, No. 333-62578) pertaining to the Reoffer Prospectus of the BOK Financial Corporation 2001 Stock Option Plan.
•Registration Statement (Form S-8, No. 333-106530) pertaining to the Reoffer Prospectus of the BOK Financial Corporation 2003 Executive Incentive Plan.
•Registration Statement (Form S-8, No. 333-106531) pertaining to the Reoffer Prospectus of the BOK Financial Corporation 2003 Stock Option Plan.
•Registration Statement (Form S-8, No. 333-135224) pertaining to the Reoffer Prospectus of the BOK Financial Corporation 2003 Stock Option Plan.
•Registration Statement (Form S-8, No. 333-158846) pertaining to the Reoffer Prospectus of the BOK Financial Corporation 2009 Omnibus Incentive Plan.
•Registration Statement (Form S-4, No. 333-226211) pertaining to the Registration Statement for the registration of BOK Financial Corporation's common stock.
•Registration Statement (Form S-8, No. 333-266398) pertaining to the Registration Statement for the registration of the BOK Financial Corporation 401(k) plan.
of our reports dated February 21, 2024, with respect to the consolidated financial statements of BOK Financial Corporation and the effectiveness of internal control over financial reporting of BOK Financial Corporation included in this Annual Report (Form 10-K) of BOK Financial Corporation for the year ended December 31, 2023.
/s/ Ernst & Young LLP
Tulsa, Oklahoma
February 21, 2024
EX-31.1
7
a20231231bokfex311.htm
EX-31.1
Document
Exhibit 31.1
CERTIFICATION PURSUANT TO
SECTION 302
OF THE SARBANES-OXLEY ACT OF 2002
FOR THE CHIEF EXECUTIVE OFFICER
I, Stacy C. Kymes, President and Chief Executive Officer of BOK Financial Corporation (“BOK Financial”), certify that:
1.I have reviewed this Annual Report on Form 10-K of BOK Financial;
2.Based on my knowledge, this report does not contain any untrue statement of a material fact or omit to state a material fact necessary to make the statements made, in light of the circumstances under which such statements were made, not misleading with respect to the period covered by this report;
3.Based on my knowledge, the financial statements, and other financial information included in this report, fairly present in all material respects the financial condition, results of operations and cash flows of the registrant as of, and for, the periods presented in this report;
4.The registrant's other certifying officer(s) and I are responsible for establishing and maintaining disclosure controls and procedures (as defined in Exchange Act Rules 13a-15(e) and 15d-15(e)) and internal control over financial reporting (as defined in Exchange Act Rules 13a-15(f) and 15d-15(f)) for the registrant and have:
a.Designed such disclosure controls and procedures, or caused such disclosure controls and procedures to be designed under our supervision, to ensure that material information relating to the registrant, including its consolidated subsidiaries, is made known to us by others within those entities, particularly during the period in which this report is being prepared;
b.Designed such internal control over financial reporting, or caused such internal control over financial reporting to be designed under our supervision, to provide reasonable assurance regarding the reliability of financial reporting and the preparation of financial statements for external purposes in accordance with generally accepted accounting principles;
c.Evaluated the effectiveness of the registrant's disclosure controls and procedures and presented in this report our conclusions about the effectiveness of the disclosure controls and procedures, as of the end of the period covered by this report based on such evaluation; and
d.Disclosed in this report any change in the registrant's internal control over financial reporting that occurred during the registrant's most recent fiscal quarter (the registrant's fourth fiscal quarter in the case of an annual report) that has materially affected, or is reasonably likely to materially affect, the registrant's internal control over financial reporting; and
5.The registrant's other certifying officer(s) and I have disclosed, based on our most recent evaluation of internal control over financial reporting, to the registrant's auditors and the audit committee of the registrant's board of directors (or persons performing the equivalent functions):
a.All significant deficiencies and material weaknesses in the design or operation of internal control over financial reporting which are reasonably likely to adversely affect the registrant's ability to record, process, summarize and report financial information; and
b.Any fraud, whether or not material, that involves management or other employees who have a significant role in the registrant's internal control over financial reporting.
Date: February 21, 2024
|
|
|
| /s/ Stacy C. Kymes |
| Stacy C. Kymes |
| President |
| Chief Executive Officer |
| BOK Financial Corporation |
EX-31.2
8
a20231231bokfex312.htm
EX-31.2
Document
Exhibit 31.2
CERTIFICATION PURSUANT TO
SECTION 302
OF THE SARBANES-OXLEY ACT OF 2002
FOR THE CHIEF FINANCIAL OFFICER
I, Martin E. Grunst, Chief Financial Officer of BOK Financial Corporation (“BOK Financial”), certify that:
1.I have reviewed this Annual Report on Form 10-K of BOK Financial;
2.Based on my knowledge, this report does not contain any untrue statement of a material fact or omit to state a material fact necessary to make the statements made, in light of the circumstances under which such statements were made, not misleading with respect to the period covered by this report;
3.Based on my knowledge, the financial statements, and other financial information included in this report, fairly present in all material respects the financial condition, results of operations and cash flows of the registrant as of, and for, the periods presented in this report;
4.The registrant's other certifying officer(s) and I are responsible for establishing and maintaining disclosure controls and procedures (as defined in Exchange Act Rules 13a-15(e) and 15d-15(e)) and internal control over financial reporting (as defined in Exchange Act Rules 13a-15(f) and 15d-15(f)) for the registrant and have:
a.Designed such disclosure controls and procedures, or caused such disclosure controls and procedures to be designed under our supervision, to ensure that material information relating to the registrant, including its consolidated subsidiaries, is made known to us by others within those entities, particularly during the period in which this report is being prepared;
b.Designed such internal control over financial reporting, or caused such internal control over financial reporting to be designed under our supervision, to provide reasonable assurance regarding the reliability of financial reporting and the preparation of financial statements for external purposes in accordance with generally accepted accounting principles;
c. Evaluated the effectiveness of the registrant's disclosure controls and procedures and presented in this report our conclusions about the effectiveness of the disclosure controls and procedures, as of the end of the period covered by this report based on such evaluation; and
d. Disclosed in this report any change in the registrant's internal control over financial reporting that occurred during the registrant's most recent fiscal quarter (the registrant's fourth fiscal quarter in the case of an annual report) that has materially affected, or is reasonably likely to materially affect, the registrant's internal control over financial reporting; and
5.The registrant's other certifying officer(s) and I have disclosed, based on our most recent evaluation of internal control over financial reporting, to the registrant's auditors and the audit committee of the registrant's board of directors (or persons performing the equivalent functions):
a.All significant deficiencies and material weaknesses in the design or operation of internal control over financial reporting which are reasonably likely to adversely affect the registrant's ability to record, process, summarize and report financial information; and
b. Any fraud, whether or not material, that involves management or other employees who have a significant role in the registrant's internal control over financial reporting.
Date: February 21, 2024
|
|
|
| /s/ Martin E. Grunst |
| Martin E. Grunst |
| Executive Vice President |
| Chief Financial Officer |
| BOK Financial Corporation |
EX-32
9
a20231231bokfex32.htm
EX-32
Document
Exhibit 32
CERTIFICATION PURSUANT TO
18 U.S.C. SECTION 1350,
AS ADOPTED PURSUANT TO
SECTION 906 OF THE SARBANES-OXLEY ACT OF 2002
In connection with the Annual Report of BOK Financial Corporation (“BOK Financial”) on Form 10-K for the fiscal period ending December 31, 2023 as filed with the Securities and Exchange Commission on the date hereof (the “Report”), we, Stacy C. Kymes and Martin E. Grunst, Chief Executive Officer and Chief Financial Officer, respectively, of BOK Financial, certify, pursuant to 18 U.S.C. § 1350, as adopted pursuant to § 906 of the Sarbanes-Oxley Act of 2002, that to our knowledge:
1.The Report fully complies with the requirements of Section 13(a) or 15(d) of the Securities Exchange Act of 1934; and
2.The information contained in the Report fairly presents, in all material respects, the financial condition and results of operations of BOK Financial as of, and for, the periods presented.
February 21, 2024
|
|
|
| /s/ Stacy C. Kymes |
| Stacy C. Kymes |
| President |
| Chief Executive Officer |
| BOK Financial Corporation |
|
|
|
| /s/ Martin E. Grunst |
| Martin E. Grunst |
| Executive Vice President |
| Chief Financial Officer |
| BOK Financial Corporation |
EX-97
10
a20231231bokfex97.htm
EX-97
Document
Exhibit 97
Clawback Policy
This policy is applicable to BOK Financial Corporation, BOKF, NA and its divisions, affiliates and subsidiaries.
|
|
|
|
|
|
|
|
|
|
|
|
|
|
|
| 1 |
|
|
|
| 2 |
|
|
|
| 3 |
|
|
|
| 4 |
|
|
|
| 5 |
|
|
|
| 6 |
|
|
|
| 7 |
|
|
|
|
7.1 |
|
|
|
|
7.2 |
|
|
|
|
7.3 |
|
|
|
| 8 |
|
|
|
| 9 |
|
|
|
| 10 |
|
|
|
| 11 |
|
|
|
| 12 |
|
|
|
| 13 |
|
|
|
| 14 |
|
|
|
1.TITLE
This policy is known as the Clawback Policy. It is sometimes referred to herein as the “Policy”.
2.CORPORATE POLICY
BOKF and its Board of Directors believe that it is in the best interests of BOKF and its shareholders to adopt this Policy, which provides for the recovery of certain incentive compensation in the event of an Accounting Error (as defined below). This Policy is designed to comply with Section 10D of the Securities Exchange Act of 1934, as amended (the “Exchange Act”), Rule 10D-1 promulgated under the Exchange Act (“Rule 10D-1”) and Nasdaq Listing Rule 5608 (the “Listing Standards”).
3.POLICY STATEMENT
BOKF will recover improper Incentive-Based Compensation (as defined below) from Covered Executives (as defined below) in the event of an Accounting Error.
4.PURPOSE
The purpose of this Policy is to outline BOKF’s rules for recovery of improper Incentive-Based Compensation from Covered Executives in the event of an Accounting Error.
5.SCOPE
This Policy applies to Incentive-Based Compensation received by a Covered Executive (a) after beginning services as a Covered Executive; (b) if that person served as a Covered Executive at any time during the performance period for such Incentive-Based Compensation; and (c) while BOKF had a listed class of securities on a national securities exchange.
6.DEFINITIONS
For purposes of this policy, the following terms are defined as provided below.
|
|
|
|
|
|
| Term |
Meaning |
Accounting Error
|
Means incorrect financial information or results, including incorrect financial information or results in previous periods. An “Accounting Error” necessarily includes an accounting restatement of BOKF’s financial statements due to BOKF’s material noncompliance with any financial reporting requirement under the securities laws, including any required accounting restatement to correct an error in previously issued financial statements that is material to the previously issued financial statements, or that would result in a material misstatement if the error were corrected in the current period or left uncorrected in the current period |
| Applicable Period |
Means the three completed fiscal years immediately preceding the date on which BOKF identifies an Accounting Error, as well as any transition period (that results from a change in BOKF’s fiscal year) within or immediately following those three completed fiscal years (except that a transition period that comprises a period of at least nine months shall count as a completed fiscal year).
The “date on which BOKF identifies an Accounting Error” is the earlier to occur of (a) the date the Board of Directors of BOKF concludes that an Accounting Error has occurred or (b) the date a court, regulator or other legally authorized body notifies BOKF of an identified Accounting Error, in each case regardless of if or when the financial statements are filed.
|
|
|
|
|
|
|
| Compensation Committee of the Board of Directors |
The Compensation Committee is a committee composed of Board members that is governed by a committee charter outlining its duties and responsibilities, including the administration of this Policy. |
| Covered Executive |
Means BOKF’s current and former president, principal financial officer, principal accounting officer, any vice-president in charge of a principal business unit, division or function and any other person (including executive officers of a parent or subsidiary) who performs similar policy-making functions for BOKF. |
| Erroneously Awarded Compensation |
Has the meaning set forth in Section 7.2 of this Policy. |
| Financial Reporting Measure |
Means any measure that is determined and presented in accordance with the accounting principles used in preparing BOKF’s financial statements, and any measure that is derived wholly or in part from such measure. Financial Reporting Measures include but are not limited to the following (and any measures derived from the following): BOKF stock price; total shareholder return (“TSR”); revenues; net income; operating income; profitability of one or more reportable segments; financial ratios (e.g., accounts receivable turnover and inventory turnover rates); earnings before interest, taxes, depreciation and amortization (“EBITDA”); funds from operations and adjusted funds from operations; liquidity measures (e.g., working capital, operating cash flow); return measures (e.g., return on invested capital, return on assets); earnings measures (e.g., earnings per share); any of such financial reporting measures relative to a peer group, where BOKF’s financial reporting measure is subject to an Accounting Error; and tax basis income. A Financial Reporting Measure need not be presented within BOKF’s financial statements or included in a filing with the Securities Exchange Commission. |
| Incentive Based Compensation |
Means any compensation that is granted, earned or vested based wholly or in part upon the attainment of a Financial Reporting Measure. Incentive-Based Compensation is “received” for purposes of this Policy in BOKF’s fiscal period during which the Financial Reporting Measure specified in the Incentive-Based Compensation award is attained, even if the payment or grant of such Incentive-Based Compensation occurs after the end of that period. |
7.RECOUPMENT OF ERRONEOUSLY AWARDED COMPENSATION
7.1 REQUIRED RECOUPMENT OF ERRONEOUSLY AWARDED COMPENSATION IN THE EVENT OF AN ACCOUNTING ERROR
In the event BOKF identifies an Accounting Error, BOKF shall promptly recoup the amount of any Erroneously Awarded Compensation received by any Covered Executive, as calculated pursuant to Section 7.2 hereof, during the Applicable Period.
7.2 ERRONEOUSLY AWARDED COMPENSATION: AMOUNT SUBJECT TO RECOVERY
The amount of “Erroneously Awarded Compensation” subject to recovery under the Policy, as determined by the Compensation Committee of the Board of Directors, is the amount of Incentive-Based Compensation received by the Covered Executive that exceeds the amount of Incentive Based Compensation that would have been received by the Covered Executive had it been determined based on the restated amounts.
Erroneously Awarded Compensation shall be computed by the Compensation Committee of the Board of Directors without regard to any taxes paid by the Covered Executive in respect of the Erroneously Awarded Compensation.
By way of example, with respect to any compensation plans or programs that take into account Incentive-Based Compensation, the amount of Erroneously Awarded Compensation subject to recovery hereunder includes, but is not limited to, the amount contributed to any notional account based on Erroneously Awarded Compensation and any earnings accrued to date on that notional amount.
For Incentive-Based Compensation based on stock price or TSR: (a) the Compensation Committee of the Board of Directors shall determine the amount of Erroneously Awarded Compensation based on a reasonable estimate of the effect of the Accounting Error on the stock price or TSR upon which the Incentive-Based Compensation was received; and (b) BOKF shall maintain documentation of the determination of that reasonable estimate and provide such documentation to The Nasdaq Stock Market (“Nasdaq”).
7.3 METHOD OF RECOUPMENT
The Compensation Committee of the Board of Directors shall determine, in its sole discretion, the timing and method for promptly recouping Erroneously Awarded Compensation hereunder, which may include without limitation (a) seeking reimbursement of all or part of any cash or equity-based award, (b) cancelling prior cash or equity-based awards, whether vested or unvested or paid or unpaid, (c) cancelling or offsetting against any planned future cash or equity-based awards, (d) forfeiture of deferred compensation, subject to compliance with Section 409A of the Internal Revenue Code and the regulations promulgated thereunder and (e) any other method authorized by applicable law or contract. Subject to compliance with any applicable law, the Compensation Committee of the Board of Directors may affect recovery under this Policy from any amount otherwise payable to the Covered Executive, including amounts payable to such individual under any otherwise applicable BOKF plan or program, including base salary, bonuses or commissions and compensation previously deferred by the Covered Executive.
BOKF is authorized and directed pursuant to this Policy to recoup Erroneously Awarded Compensation in compliance with this Policy unless the Compensation Committee of the Board of Directors has determined that recovery would be impracticable solely for the following limited reasons, and subject to the following procedural and disclosure requirements:
•The direct expense paid to a third party to assist in enforcing the Policy would exceed the amount to be recovered. Before concluding that it would be impracticable to recover any amount of Erroneously Awarded Compensation based on expense of enforcement, the Compensation Committee of the Board of Directors must make a reasonable attempt to recover such erroneously awarded compensation, document such reasonable attempt(s) to recover and provide that documentation to Nasdaq;
•Recovery would violate home country law of BOKF where that law was adopted prior to November 28, 2022. Before concluding that it would be impracticable to recover any amount of Erroneously Awarded Compensation based on violation of home country law of the issuer, the Compensation Committee of the Board of Directors must satisfy the applicable opinion and disclosure requirements of Rule 10D-1 and the Listing Standards; or
•Recovery would likely cause an otherwise tax-qualified retirement plan, under which benefits are broadly available to employees of BOKF, to fail to meet the requirements of 26 U.S.C. 401(a)(13) or 26 U.S.C. 411(a) and regulations thereunder.
8.NO INDEMNIFICATION OF COVERED EXECUTIVES
Notwithstanding the terms of any indemnification or insurance policy or any contractual arrangement with any Covered Executive that may be interpreted to the contrary, BOKF shall not indemnify any Covered Executives against the loss of any Erroneously Awarded Compensation, including any payment or reimbursement for the cost of third-party insurance purchased by any Covered Executives to fund potential clawback obligations under this Policy.
9.INDEMNIFICATION OF COMPENSATION COMMITTEE MEMBERS
Any members of the Compensation Committee of the Board of Directors, and any other members of the Board who assist in the administration of this Policy, shall not be personally liable for any action, determination or interpretation made with respect to this Policy and shall be fully indemnified by BOKF to the fullest extent under applicable law and BOKF policy with respect to any such action, determination or interpretation. The foregoing sentence shall not limit any other rights to indemnification of the members of the Board under applicable law or BOKF policy.
10.EFFECTIVE DATE: RETROACTIVE APPLICATION
This Policy shall be effective as of December 1, 2023 (the “Effective Date”). The terms of this Policy shall apply to any Incentive-Based Compensation that is received by Covered Executives on or after the Effective Date, even if such Incentive-Based Compensation was approved, awarded, granted or paid to Covered Executives prior to the Effective Date. Without limiting the generality of Section 7 hereof, and subject to applicable law, the Compensation Committee of the Board of Directors may affect recovery under this Policy from any amount of compensation approved, awarded, granted, payable or paid to the Covered Executive prior to, on or after the Effective Date.
11.AMENDMENT: TERMINATION
The Compensation Committee of the Board of Directors may amend, modify, supplement, rescind or replace all or any portion of this Policy at any time and from time to time in its discretion, and shall amend this Policy as it deems necessary to comply with applicable law or any rules or standards adopted by a national securities exchange on which BOKF’s securities are listed.
12.OTHER RECOUPMENT RIGHTS: COMPANY CLAIMS
This Policy shall be applied to the fullest extent of the law. Any right of recoupment under this Policy is in addition to, and not in lieu of, any other remedies or rights of recoupment that may be available to BOKF under applicable law or pursuant to the terms of any similar policy in any employment agreement, equity award agreement, or similar agreement and any other legal remedies available to BOKF.
Nothing contained in this Policy, and no recoupment or recovery as contemplated by this Policy, shall limit any claims, damages or other legal remedies BOKF or any of its affiliates may have against a Covered Executive arising out of or resulting from any actions or omissions by the Covered Executive.
13.SUCCESSORS
This Policy shall be binding and enforceable against all Covered Executives and their beneficiaries, heirs, executors, administrators or other legal representatives.
14.EXHIBIT FILING REQUIREMENTS
A copy of this Policy and any amendments thereto shall be posted on BOKF’s website and filed as an exhibit to BOKF’s annual report on Form 10-K.