FORM |
10-Q |
|||||||
| ☒ | QUARTERLY REPORT PURSUANT TO SECTION 13 OR 15(d) OF THE SECURITIES EXCHANGE ACT OF 1934 | ||||
| ☐ | TRANSITION REPORT PURSUANT TO SECTION 13 OR 15(d) OF THE SECURITIES EXCHANGE ACT OF 1934 | ||||
Commission File Number: |
1-10777 |
|||||||

| AMBAC FINANCIAL GROUP, INC. | ||
| Delaware | 13-3621676 | |||||||||||||
| (State of incorporation) | (I.R.S. employer identification no.) | |||||||||||||
| One World Trade Center | New York | NY | 10007 | |||||||||||
| (Address of principal executive offices) | (Zip code) | |||||||||||||
(212) |
658-7470 |
||||||||||
| (Registrant's telephone number, including area code) | |||||||||||
| Securities registered pursuant to Section 12(b) of the Act: | ||||||||||||||
| Title of each class | Trading Symbol | Name of each exchange on which registered | ||||||||||||
| Common stock par value $0.01 per share | AMBC | New York Stock Exchange | ||||||||||||
| Large accelerated filer | ☒ | Accelerated filer | ☐ | Non-accelerated filer | ☐ | Smaller reporting company | ☐ | Emerging growth company | ☐ | ||||||||||||||||||||
| Cautionary Statement Pursuant to the Private Securities Litigation Reform Act of 1995 | ||||||||||||||||||||
| Item Number | Page | Item Number | Page | |||||||||||||||||
| PART I. FINANCIAL INFORMATION | PART I (CONTINUED) | |||||||||||||||||||
| 1 | Unaudited Consolidated Financial Statements of Ambac Financial Group, Inc. and Subsidiaries | U.S. Insurance Statutory Basis Financial Results
|
||||||||||||||||||
| 3 | ||||||||||||||||||||
| 4 | ||||||||||||||||||||
| 2 | PART II. OTHER INFORMATION | |||||||||||||||||||
| 1 | ||||||||||||||||||||
| 1A | ||||||||||||||||||||
| 2 | ||||||||||||||||||||
| 3 | ||||||||||||||||||||
| 5 | Other Information | |||||||||||||||||||
| 6 | Exhibits | |||||||||||||||||||
| September 30, | December 31, | ||||||||||
| (Dollars in millions, except share data) (September 30, 2023 (Unaudited)) | 2023 | 2022 | |||||||||
| Assets: | |||||||||||
| Investments: | |||||||||||
Fixed maturity securities - available-for-sale, at fair value (amortized cost of $1,651 and $1,469) |
$ | 1,556 | $ | 1,395 | |||||||
| Fixed maturity securities - trading, at fair value | 28 | 59 | |||||||||
Short-term investments, at fair value (amortized cost of $421 and $507) |
421 | 507 | |||||||||
Short-term investments pledged as collateral, at fair value (amortized cost of $27 and $64) |
27 | 64 | |||||||||
Other investments (includes $449 and $556 at fair value) |
461 | 568 | |||||||||
Total investments (net of allowance for credit losses of $2 and $0) |
2,492 | 2,593 | |||||||||
Cash and cash equivalents (including $13 and $14 of restricted cash) |
46 | 44 | |||||||||
Premium receivables (net of allowance for credit losses of $4 and $5) |
278 | 269 | |||||||||
Reinsurance recoverable on paid and unpaid losses (net of allowance for credit losses of $0 and $0) |
172 | 115 | |||||||||
| Deferred ceded premium | 205 | 124 | |||||||||
| Deferred acquisition costs | 8 | 3 | |||||||||
| Subrogation recoverable | 179 | 271 | |||||||||
| Derivative assets | 15 | 27 | |||||||||
| Intangible assets, less accumulated amortization | 312 | 326 | |||||||||
| Goodwill | 70 | 61 | |||||||||
| Other assets | 94 | 84 | |||||||||
| Variable interest entity assets: | |||||||||||
| Fixed maturity securities, at fair value | 1,948 | 1,967 | |||||||||
| Restricted cash | 256 | 17 | |||||||||
| Loans, at fair value | 1,551 | 1,829 | |||||||||
| Derivative and other assets | 220 | 241 | |||||||||
| Total assets | $ | 7,847 | $ | 7,973 | |||||||
| Liabilities and Stockholders’ Equity: | |||||||||||
| Liabilities: | |||||||||||
| Unearned premiums | $ | 407 | $ | 372 | |||||||
| Loss and loss adjustment expense reserves | 850 | 805 | |||||||||
| Ceded premiums payable | 95 | 39 | |||||||||
| Deferred program fees and reinsurance commissions | 7 | 5 | |||||||||
| Long-term debt | 505 | 639 | |||||||||
| Accrued interest payable | 462 | 427 | |||||||||
| Derivative liabilities | 22 | 38 | |||||||||
| Other liabilities | 168 | 163 | |||||||||
| Variable interest entity liabilities: | |||||||||||
Long-term debt (includes $2,535 and $2,788 at fair value) |
2,699 | 3,107 | |||||||||
| Derivative liabilities | 1,038 | 1,048 | |||||||||
| Other liabilities | 255 | 5 | |||||||||
| Total liabilities | 6,507 | 6,647 | |||||||||
| Commitments and contingencies (See Note 14) | |||||||||||
| Redeemable noncontrolling interest | 22 | 20 | |||||||||
| Stockholders’ equity: | |||||||||||
Preferred stock, par value $0.01 per share;20,000,000 shares authorized shares; issued and outstanding shares—none |
— | — | |||||||||
Common stock, par value $0.01 per share; 130,000,000 shares authorized; issued shares: 46,659,144 and 46,658,990 |
— | — | |||||||||
| Additional paid-in capital | 286 | 274 | |||||||||
| Accumulated other comprehensive income (loss) | (262) | (253) | |||||||||
| Retained earnings | 1,257 | 1,245 | |||||||||
Treasury stock, shares at cost: 1,471,817 and 1,685,233 |
(17) | (15) | |||||||||
| Total Ambac Financial Group, Inc. stockholders’ equity | 1,265 | 1,252 | |||||||||
| Nonredeemable noncontrolling interest | 53 | 53 | |||||||||
| Total stockholders’ equity | 1,318 | 1,305 | |||||||||
| Total liabilities, redeemable noncontrolling interest and stockholders’ equity | $ | 7,847 | $ | 7,973 | |||||||
| Three Months Ended September 30, | Nine Months Ended September 30, | |||||||||||||||||||||||||
| (Dollars in millions, except share data) | 2023 | 2022 | 2023 | 2022 | ||||||||||||||||||||||
| Revenues: | ||||||||||||||||||||||||||
| Net premiums earned | $ | 18 | $ | 11 | $ | 47 | 39 | |||||||||||||||||||
| Commission income | 15 | 7 | 39 | 22 | ||||||||||||||||||||||
| Program fees | 2 | 1 | 6 | 2 | ||||||||||||||||||||||
| Net investment income (loss) | 30 | 11 | 100 | (6) | ||||||||||||||||||||||
| Net investment gains (losses), including impairments | 1 | 14 | (7) | 31 | ||||||||||||||||||||||
| Net gains (losses) on derivative contracts | 4 | 37 | 1 | 124 | ||||||||||||||||||||||
| Net realized gains on extinguishment of debt | — | — | — | 57 | ||||||||||||||||||||||
| Other income | 2 | — | 7 | 3 | ||||||||||||||||||||||
| Income (loss) on variable interest entities | 1 | (1) | — | 14 | ||||||||||||||||||||||
| Total revenues and other income | 74 | 80 | 194 | 286 | ||||||||||||||||||||||
| Expenses: | ||||||||||||||||||||||||||
| Losses and loss adjustment expenses | (76) | (353) | (51) | (341) | ||||||||||||||||||||||
| Amortization of deferred acquisition costs, net | 2 | 1 | 5 | 2 | ||||||||||||||||||||||
| Commission expense | 8 | 4 | 22 | 13 | ||||||||||||||||||||||
| General and administrative expenses | 49 | 31 | 122 | 90 | ||||||||||||||||||||||
| Intangible amortization | 7 | 6 | 21 | 34 | ||||||||||||||||||||||
| Interest expense | 16 | 49 | 48 | 138 | ||||||||||||||||||||||
| Total expenses | 6 | (262) | 166 | (66) | ||||||||||||||||||||||
| Pretax income | 68 | 342 | 28 | 352 | ||||||||||||||||||||||
| Provision for income taxes | 1 | 2 | 7 | 4 | ||||||||||||||||||||||
| Net income | 66 | 340 | 21 | 348 | ||||||||||||||||||||||
| Less: net (gain) loss attributable to noncontrolling interest | — | — | (1) | (1) | ||||||||||||||||||||||
| Net income attributable to common stockholders | $ | 66 | $ | 340 | $ | 19 | $ | 347 | ||||||||||||||||||
| Other comprehensive income (loss), after tax | ||||||||||||||||||||||||||
| Net income | $ | 66 | $ | 340 | $ | 21 | $ | 348 | ||||||||||||||||||
Unrealized gains (losses) on securities, net of income tax provision (benefit) of $0, $(3), $(2) and $(8) |
(23) | (59) | (19) | (236) | ||||||||||||||||||||||
Gains (losses) on foreign currency translation, net of income tax provision (benefit) of $0, $0, $0 and $0 |
(29) | (58) | 8 | (136) | ||||||||||||||||||||||
Credit risk changes of fair value option liabilities, net of income tax provision (benefit) of $0, $0, $0 and $0 |
— | (1) | — | — | ||||||||||||||||||||||
Changes to postretirement benefit, net of income tax provision (benefit) of $0, $0, $0 and $0 |
— | — | 2 | (1) | ||||||||||||||||||||||
| Total other comprehensive income (loss), net of income tax | (53) | (118) | (9) | (372) | ||||||||||||||||||||||
| Total comprehensive income (loss), net of income tax | 14 | 222 | 11 | (24) | ||||||||||||||||||||||
| Less: comprehensive (gain) loss attributable to the noncontrolling interest | — | — | (1) | (1) | ||||||||||||||||||||||
| Total comprehensive income (loss) attributable to common stockholders | $ | 13 | $ | 222 | $ | 10 | $ | (25) | ||||||||||||||||||
| Net income (loss) per share attributable to common stockholders: | ||||||||||||||||||||||||||
| Basic | $ | 1.44 | $ | 7.50 | $ | 0.42 | $ | 7.56 | ||||||||||||||||||
| Diluted | $ | 1.41 | $ | 7.41 | $ | 0.41 | $ | 7.48 | ||||||||||||||||||
| Weighted average number of common shares outstanding: | ||||||||||||||||||||||||||
| Basic | 45,635,373 | 45,307,019 | 45,652,555 | 45,847,306 | ||||||||||||||||||||||
| Diluted | 46,810,735 | 45,846,405 | 46,786,443 | 46,356,094 | ||||||||||||||||||||||
| Three months ended September 30, 2023 and 2022 | |||||||||||||||||||||||||||||||||||||||||||||||
| Ambac Financial Group, Inc. | |||||||||||||||||||||||||||||||||||||||||||||||
| (Dollars in millions) | Total | Preferred Stock |
Common Stock |
Additional Paid-in Capital |
Accumulated Other Comprehensive Income |
Retained Earnings |
Common Stock Held in Treasury, at Cost |
Nonredeemable Noncontrolling Interest |
|||||||||||||||||||||||||||||||||||||||
| Balance at June 30, 2023 | $ | 1,303 | $ | — | $ | — | $ | 283 | $ | (209) | $ | 1,191 | $ | (15) | $ | 53 | |||||||||||||||||||||||||||||||
| Total comprehensive income (loss) | 13 | — | — | — | (53) | 66 | — | — | |||||||||||||||||||||||||||||||||||||||
| Stock-based compensation | 4 | 4 | |||||||||||||||||||||||||||||||||||||||||||||
| Cost of shares repurchased | (2) | (2) | |||||||||||||||||||||||||||||||||||||||||||||
| Cost of shares (acquired) issued under equity plan | — | — | — | — | — | — | — | — | |||||||||||||||||||||||||||||||||||||||
| Changes to noncontrolling interest | — | — | — | ||||||||||||||||||||||||||||||||||||||||||||
| Balance at September 30, 2023 | $ | 1,318 | $ | — | $ | — | $ | 286 | $ | (262) | $ | 1,257 | $ | (17) | $ | 53 | |||||||||||||||||||||||||||||||
| Balance at June 30, 2022 | $ | 846 | $ | — | $ | — | $ | 267 | $ | (196) | $ | 728 | $ | (16) | $ | 62 | |||||||||||||||||||||||||||||||
| Total comprehensive income (loss) | 222 | — | — | — | (118) | 340 | — | — | |||||||||||||||||||||||||||||||||||||||
| Stock-based compensation | 4 | 4 | |||||||||||||||||||||||||||||||||||||||||||||
| Cost of shares (acquired) issued under equity plan | — | — | — | — | (1) | — | |||||||||||||||||||||||||||||||||||||||||
| Changes to noncontrolling interest | — | — | — | ||||||||||||||||||||||||||||||||||||||||||||
| Balance at September 30, 2022 | $ | 1,071 | $ | — | $ | — | $ | 270 | $ | (315) | $ | 1,068 | $ | (15) | $ | 62 | |||||||||||||||||||||||||||||||
| Nine months ended September 30, 2023 and 2022 | |||||||||||||||||||||||||||||||||||||||||||||||
| Ambac Financial Group, Inc. | |||||||||||||||||||||||||||||||||||||||||||||||
| (Dollars in millions) | Total | Preferred Stock |
Common Stock |
Additional Paid-in Capital |
Accumulated Other Comprehensive Income |
Retained Earnings |
Common Stock Held in Treasury, at Cost |
Nonredeemable Noncontrolling Interest |
|||||||||||||||||||||||||||||||||||||||
| Balance at January 1, 2023 | $ | 1,305 | $ | — | $ | — | $ | 274 | $ | (253) | $ | 1,245 | $ | (15) | $ | 53 | |||||||||||||||||||||||||||||||
| Total comprehensive income (loss) | 10 | — | — | — | (9) | 19 | — | — | |||||||||||||||||||||||||||||||||||||||
| Stock-based compensation | 12 | 12 | |||||||||||||||||||||||||||||||||||||||||||||
| Cost of shares repurchased | (5) | (5) | |||||||||||||||||||||||||||||||||||||||||||||
| Cost of shares (acquired) issued under equity plan | (5) | — | — | — | — | (8) | 3 | — | |||||||||||||||||||||||||||||||||||||||
| Changes to noncontrolling interest | — | — | — | ||||||||||||||||||||||||||||||||||||||||||||
| Balance at September 30, 2023 | $ | 1,318 | $ | — | $ | — | $ | 286 | $ | (262) | $ | 1,257 | $ | (17) | $ | 53 | |||||||||||||||||||||||||||||||
| Balance at January 1, 2022 | $ | 1,098 | $ | — | $ | — | $ | 257 | $ | 58 | $ | 726 | $ | (3) | $ | 60 | |||||||||||||||||||||||||||||||
| Total comprehensive income (loss) | (25) | — | — | — | (372) | 347 | — | — | |||||||||||||||||||||||||||||||||||||||
| Stock-based compensation | 13 | 13 | |||||||||||||||||||||||||||||||||||||||||||||
| Cost of shares repurchased | (14) | (14) | |||||||||||||||||||||||||||||||||||||||||||||
| Cost of shares (acquired) issued under equity plan | (4) | — | — | — | — | (5) | 2 | — | |||||||||||||||||||||||||||||||||||||||
| Changes to noncontrolling interest | — | — | — | ||||||||||||||||||||||||||||||||||||||||||||
| Issuance of common stock | — | — | |||||||||||||||||||||||||||||||||||||||||||||
| Sale of noncontrolling interest in subsidiary | 2 | 2 | |||||||||||||||||||||||||||||||||||||||||||||
| Balance at September 30, 2022 | $ | 1,071 | $ | — | $ | — | $ | 270 | $ | (315) | $ | 1,068 | $ | (15) | $ | 62 | |||||||||||||||||||||||||||||||
| Nine Months Ended September 30, | ||||||||||||||
| (Dollars in millions) | 2023 | 2022 | ||||||||||||
| Cash flows from operating activities: | ||||||||||||||
| Net income attributable to common stockholders | $ | 19 | $ | 347 | ||||||||||
| Redeemable noncontrolling interest | (1) | (1) | ||||||||||||
| Net income | 21 | 348 | ||||||||||||
| Adjustments to reconcile net income to net cash used in operating activities: | ||||||||||||||
| Depreciation | 1 | 1 | ||||||||||||
| Amortization of bond premium and discount | (10) | (8) | ||||||||||||
| Share-based compensation | 12 | 13 | ||||||||||||
| Unearned premiums, net | (46) | (47) | ||||||||||||
| Losses and loss expenses, net | 66 | (328) | ||||||||||||
| Ceded premiums payable | 56 | — | ||||||||||||
| Premium receivables | (8) | 57 | ||||||||||||
| Accrued interest payable | (13) | 72 | ||||||||||||
| Amortization of intangible assets | 21 | 34 | ||||||||||||
| Net investment gains (losses), including impairments | 7 | (31) | ||||||||||||
| (Gain) loss on extinguishment of debt | — | (57) | ||||||||||||
| Variable interest entity activities | — | (14) | ||||||||||||
| Derivative assets and liabilities | 21 | (62) | ||||||||||||
| Other, net | (14) | 83 | ||||||||||||
| Net cash provided by (used in) operating activities | 112 | 59 | ||||||||||||
| Cash flows from investing activities: | ||||||||||||||
| Proceeds from sales of bonds | 113 | 454 | ||||||||||||
| Proceeds from matured bonds | 58 | 83 | ||||||||||||
| Purchases of bonds | (291) | (273) | ||||||||||||
| Proceeds from sales of other invested assets | 189 | 142 | ||||||||||||
| Purchases of other invested assets | (62) | (99) | ||||||||||||
| Change in short-term investments | 125 | (58) | ||||||||||||
| Change in cash collateral | (29) | 60 | ||||||||||||
| Change in consolidated VIE cash collateral | 254 | — | ||||||||||||
| Proceeds from paydowns of consolidated VIE assets | 161 | 126 | ||||||||||||
| Acquisitions, net of cash acquired | (7) | — | ||||||||||||
| Other, net | 8 | — | ||||||||||||
| Net cash provided by (used in) investing activities | 521 | 435 | ||||||||||||
| Cash flows from financing activities: | ||||||||||||||
| Payments for purchases of common stock | (5) | (14) | ||||||||||||
| Payments for purchase of surplus notes | — | (58) | ||||||||||||
| Payments for redemption of Tier 2 Notes | (97) | — | ||||||||||||
| Tax payments related to shares withheld for share-based compensation plans | (5) | (4) | ||||||||||||
| Distributions to noncontrolling interest holders | (1) | 1 | ||||||||||||
| Payments of consolidated VIE liabilities | (285) | (404) | ||||||||||||
| Net cash used in financing activities | (392) | (479) | ||||||||||||
| Effect of foreign exchange on cash, cash equivalents and restricted cash | — | (1) | ||||||||||||
| Net cash flow | 241 | 14 | ||||||||||||
| Cash, cash equivalents, and restricted cash at beginning of period | 61 | 23 | ||||||||||||
| Cash, cash equivalents, and restricted cash at end of period | $ | 302 | $ | 38 | ||||||||||
| Note 1. Background and Business Description | Note 8. Goodwill and Intangible Assets | |||||||||||||||||||
| Note 2. Basis of Presentation and Significant Accounting Policies | Note 9. Variable Interest Entities | |||||||||||||||||||
| Note 3. Segment Information | Note 10. Revenues From Contracts with Customers | |||||||||||||||||||
| Note 4. Investments | Note 11. Comprehensive Income | |||||||||||||||||||
| Note 5. Fair Value Measurements | Note 12. Net Income Per Share | |||||||||||||||||||
| Note 6. Insurance Contracts | Note 13. Income Taxes | |||||||||||||||||||
| Note 7. Derivative Instruments | Note 14. Commitments and Contingencies | |||||||||||||||||||
| Nine Months Ended September 30, | 2023 | 2022 | ||||||||||||
| Beginning balance | $ | 20 | $ | 18 | ||||||||||
| Fair value of redeemable noncontrolling interest at acquisition date | 2 | — | ||||||||||||
| Net income attributable to redeemable noncontrolling interest (ASC 810) | 1 | 1 | ||||||||||||
| Distributions | (1) | (1) | ||||||||||||
| Adjustment to redemption value (ASC 480) | — | — | ||||||||||||
| Ending balance | $ | 22 | $ | 18 | ||||||||||
| Supplemental Disclosure of Cash Flow Information | Nine Months Ended September 30, | |||||||||||||
| 2023 | 2022 | |||||||||||||
Cash paid during the period for: |
||||||||||||||
| Income taxes | $ | 9 | $ | 6 | ||||||||||
Interest on long-term debt |
50 | 51 | ||||||||||||
Non-cash investing and financing activities: |
||||||||||||||
| Exchange of investments in Puerto Rico bonds for new securities issued in the restructuring transactions | $ | — | $ | 185 | ||||||||||
| Securities acquired (transferred) in transactions related to Puerto Rico restructurings | (1) | — | ||||||||||||
| Decrease in VIE loans as a result of de-consolidations | 133 | — | ||||||||||||
| Decrease in VIE long-term debt as a result of de-consolidations | 133 | — | ||||||||||||
| September 30, | ||||||||||||||
| 2023 | 2022 | |||||||||||||
| Reconciliation of cash, cash equivalents, and restricted cash reported within the Consolidated Balance Sheets to the Consolidated Statements of Cash Flows: |
||||||||||||||
Cash and cash equivalents |
$ | 32 | $ | 29 | ||||||||||
| Restricted cash | 13 | 6 | ||||||||||||
| Variable Interest Entity restricted cash | 256 | 2 | ||||||||||||
| Total cash, cash equivalents, and restricted cash shown on the Consolidated Statements of Cash Flows | $ | 302 | $ | 38 | ||||||||||
| Three Months Ended September 30, 2023 | Three Months Ended September 30, 2022 | |||||||||||||||||||||||||||||||||||||||||||||||||||||||||||||
| Legacy Financial Guarantee Insurance | Specialty Property & Casualty Insurance | Insurance Distribution | Corporate & Other | Consoli-dated (2) |
Legacy Financial Guarantee Insurance | Specialty Property & Casualty Insurance | Insurance Distribution | Corporate & Other | Consoli-dated (2) | |||||||||||||||||||||||||||||||||||||||||||||||||||||
| Revenues: | ||||||||||||||||||||||||||||||||||||||||||||||||||||||||||||||
| Net premiums earned | $ | 6 | $ | 12 | $ | 18 | $ | 7 | $ | 4 | $ | 11 | ||||||||||||||||||||||||||||||||||||||||||||||||||
| Commission income | $ | 15 | 15 | $ | 7 | 7 | ||||||||||||||||||||||||||||||||||||||||||||||||||||||||
| Program fees | 2 | 2 | 1 | 1 | ||||||||||||||||||||||||||||||||||||||||||||||||||||||||||
| Net investment income (loss) | 27 | 1 | $ | 3 | 30 | 9 | — | — | $ | 1 | 11 | |||||||||||||||||||||||||||||||||||||||||||||||||||
| Net investment gains (losses), including impairments | 1 | — | — | 1 | 14 | — | — | 14 | ||||||||||||||||||||||||||||||||||||||||||||||||||||||
| Net gains (losses) on derivative contracts | 4 | — | 4 | 37 | — | 37 | ||||||||||||||||||||||||||||||||||||||||||||||||||||||||
Other (1) |
3 | — | — | — | 3 | (1) | — | — | — | (1) | ||||||||||||||||||||||||||||||||||||||||||||||||||||
Total revenues (2) |
41 | 16 | 15 | 3 | 74 | 67 | 6 | 7 | 1 | 80 | ||||||||||||||||||||||||||||||||||||||||||||||||||||
| Expenses: | ||||||||||||||||||||||||||||||||||||||||||||||||||||||||||||||
| Losses and loss adjustment expenses | (86) | 10 | (76) | (356) | 3 | (353) | ||||||||||||||||||||||||||||||||||||||||||||||||||||||||
| Amortization of deferred acquisition costs, net | — | 2 | 2 | — | 1 | 1 | ||||||||||||||||||||||||||||||||||||||||||||||||||||||||
| Commission expenses | 8 | 8 | 4 | 4 | ||||||||||||||||||||||||||||||||||||||||||||||||||||||||||
General and administrative expenses (3) |
35 | 4 | 3 | 7 | 49 | 20 | 3 | 1 | 6 | 31 | ||||||||||||||||||||||||||||||||||||||||||||||||||||
Depreciation expense (3) |
— | — | — | — | — | — | — | — | — | — | ||||||||||||||||||||||||||||||||||||||||||||||||||||
| Intangible amortization | 6 | 1 | 7 | 5 | 1 | 6 | ||||||||||||||||||||||||||||||||||||||||||||||||||||||||
| Interest expense | 16 | 16 | 49 | 49 | ||||||||||||||||||||||||||||||||||||||||||||||||||||||||||
Total expenses (2) |
(28) | 15 | 12 | 7 | 6 | (282) | 7 | 6 | 6 | (262) | ||||||||||||||||||||||||||||||||||||||||||||||||||||
| Pretax income | $ | 69 | $ | — | $ | 2 | $ | (4) | $ | 68 | $ | 349 | $ | (1) | $ | 1 | $ | (6) | $ | 342 | ||||||||||||||||||||||||||||||||||||||||||
Total assets (2) |
$ | 7,018 | $ | 457 | $ | 160 | $ | 213 | $ | 7,847 | $ | 8,902 | $ | 259 | $ | 94 | $ | 157 | $ | 9,412 | ||||||||||||||||||||||||||||||||||||||||||
| Nine Months Ended September 30, 2023 | Nine Months Ended September 30, 2022 | |||||||||||||||||||||||||||||||||||||||||||||||||||||||||||||
| Legacy Financial Guarantee Insurance | Specialty Property & Casualty Insurance | Insurance Distribution | Corporate & Other | Consoli-dated (2) |
Legacy Financial Guarantee Insurance | Specialty Property & Casualty Insurance | Insurance Distribution | Corporate & Other | Consoli-dated (2) | |||||||||||||||||||||||||||||||||||||||||||||||||||||
| Revenues: | ||||||||||||||||||||||||||||||||||||||||||||||||||||||||||||||
| Net premiums earned | $ | 20 | $ | 27 | $ | 47 | 31 | 8 | 39 | |||||||||||||||||||||||||||||||||||||||||||||||||||||
| Commission income | 39 | 39 | 22 | 22 | ||||||||||||||||||||||||||||||||||||||||||||||||||||||||||
| Program fees | 6 | 6 | 2 | 2 | ||||||||||||||||||||||||||||||||||||||||||||||||||||||||||
| Net investment income (loss) | 90 | 3 | 7 | 100 | (9) | 1 | 2 | (6) | ||||||||||||||||||||||||||||||||||||||||||||||||||||||
| Net investment gains (losses), including impairments | (7) | — | — | (7) | 31 | — | — | 31 | ||||||||||||||||||||||||||||||||||||||||||||||||||||||
| Net gains (losses) on derivative contracts | 2 | — | 1 | 123 | 1 | 124 | ||||||||||||||||||||||||||||||||||||||||||||||||||||||||
| Net realized gains on extinguishment of debt | — | — | 57 | 57 | ||||||||||||||||||||||||||||||||||||||||||||||||||||||||||
Other (1) |
7 | — | — | — | 7 | 17 | — | — | — | 17 | ||||||||||||||||||||||||||||||||||||||||||||||||||||
Total revenues (2) |
112 | 35 | 39 | 7 | 194 | 250 | 11 | 22 | 2 | 286 | ||||||||||||||||||||||||||||||||||||||||||||||||||||
| Expenses: | ||||||||||||||||||||||||||||||||||||||||||||||||||||||||||||||
| Losses and loss adjustment expenses | (71) | 20 | (51) | (347) | 5 | (341) | ||||||||||||||||||||||||||||||||||||||||||||||||||||||||
| Amortization of deferred acquisition costs, net | — | 5 | 5 | — | 1 | 2 | ||||||||||||||||||||||||||||||||||||||||||||||||||||||||
| Commission expenses | 22 | 22 | 13 | 13 | ||||||||||||||||||||||||||||||||||||||||||||||||||||||||||
General and administrative expenses (3) |
87 | 12 | 7 | 14 | 120 | 64 | 10 | 4 | 11 | 88 | ||||||||||||||||||||||||||||||||||||||||||||||||||||
Depreciation expense (3) |
1 | — | — | — | 1 | 1 | — | — | — | 1 | ||||||||||||||||||||||||||||||||||||||||||||||||||||
| Intangible amortization | 18 | 3 | 21 | 32 | 2 | 34 | ||||||||||||||||||||||||||||||||||||||||||||||||||||||||
| Interest expense | 48 | 48 | 138 | 138 | ||||||||||||||||||||||||||||||||||||||||||||||||||||||||||
Total expenses (2) |
83 | 36 | 33 | 14 | 166 | (112) | 16 | 19 | 11 | (66) | ||||||||||||||||||||||||||||||||||||||||||||||||||||
| Pretax income (loss) | 29 | (1) | 7 | (8) | 28 | 362 | (5) | 3 | (8) | 352 | ||||||||||||||||||||||||||||||||||||||||||||||||||||
| September 30, 2023: | December 31, 2022: | |||||||||||||||||||||||||||||||||||||||||||||||||||||||||||||
| Amortized Cost |
Allowance for Credit Losses (2) |
Gross Unrealized | Estimated Fair Value |
Amortized Cost |
Allowance for Credit Losses | Gross Unrealized | Estimated Fair Value |
|||||||||||||||||||||||||||||||||||||||||||||||||||||||
| Gains | Losses | Gains | Losses | |||||||||||||||||||||||||||||||||||||||||||||||||||||||||||
| Fixed maturity securities: | ||||||||||||||||||||||||||||||||||||||||||||||||||||||||||||||
| Municipal obligations | $ | 70 | $ | — | $ | — | $ | 3 | $ | 67 | $ | 44 | — | $ | — | $ | 2 | $ | 43 | |||||||||||||||||||||||||||||||||||||||||||
| Corporate obligations | 736 | — | — | 65 | 671 | 659 | — | 1 | 63 | 598 | ||||||||||||||||||||||||||||||||||||||||||||||||||||
| Foreign obligations | 101 | — | — | 9 | 92 | 85 | — | — | 9 | 76 | ||||||||||||||||||||||||||||||||||||||||||||||||||||
| U.S. government obligations | 77 | — | — | 4 | 73 | 68 | — | — | 4 | 65 | ||||||||||||||||||||||||||||||||||||||||||||||||||||
| Residential mortgage-backed securities | 234 | 2 | 23 | 28 | 227 | 230 | — | 28 | 19 | 238 | ||||||||||||||||||||||||||||||||||||||||||||||||||||
| Commercial mortgage-backed securities | 18 | — | — | 1 | 18 | 15 | — | — | — | 15 | ||||||||||||||||||||||||||||||||||||||||||||||||||||
| Collateralized debt obligations | 143 | — | — | 1 | 142 | 141 | — | — | 4 | 137 | ||||||||||||||||||||||||||||||||||||||||||||||||||||
Other asset-backed securities (1) |
273 | — | 3 | 11 | 265 | 227 | — | 2 | 5 | 224 | ||||||||||||||||||||||||||||||||||||||||||||||||||||
| 1,653 | 2 | 27 | 122 | 1,556 | 1,469 | — | 31 | 106 | 1,395 | |||||||||||||||||||||||||||||||||||||||||||||||||||||
| Short-term | 421 | — | — | — | 421 | 507 | — | — | — | 507 | ||||||||||||||||||||||||||||||||||||||||||||||||||||
| 2,074 | 2 | 27 | 122 | 1,977 | 1,977 | — | 31 | 106 | 1,902 | |||||||||||||||||||||||||||||||||||||||||||||||||||||
| Fixed maturity securities pledged as collateral: | ||||||||||||||||||||||||||||||||||||||||||||||||||||||||||||||
| Short-term | 27 | — | — | — | 27 | 64 | — | — | — | 64 | ||||||||||||||||||||||||||||||||||||||||||||||||||||
| 27 | — | — | — | 27 | 64 | — | — | — | 64 | |||||||||||||||||||||||||||||||||||||||||||||||||||||
| Total available-for-sale investments | $ | 2,100 | $ | 2 | $ | 27 | $ | 122 | $ | 2,004 | $ | 2,041 | $ | — | $ | 31 | $ | 106 | $ | 1,966 | ||||||||||||||||||||||||||||||||||||||||||
| Amortized Cost |
Estimated Fair Value |
|||||||||||||
| Due in one year or less | $ | 514 | $ | 512 | ||||||||||
| Due after one year through five years | 562 | 529 | ||||||||||||
| Due after five years through ten years | 292 | 255 | ||||||||||||
| Due after ten years | 65 | 54 | ||||||||||||
| 1,432 | 1,351 | |||||||||||||
| Residential mortgage-backed securities | 234 | 227 | ||||||||||||
| Commercial mortgage-backed securities | 18 | 18 | ||||||||||||
| Collateralized debt obligations | 143 | 142 | ||||||||||||
| Other asset-backed securities | 273 | 265 | ||||||||||||
| Total | $ | 2,100 | $ | 2,004 | ||||||||||
| September 30, 2023 | December 31, 2022 | |||||||||||||||||||||||||||||||||||||||||||||||||||||||||||||||||||||||||
| Less Than 12 Months | 12 Months or More | Total | Less Than 12 Months | 12 Months or More | Total | |||||||||||||||||||||||||||||||||||||||||||||||||||||||||||||||||||||
| Fair Value |
Gross Unrealized Loss |
Fair Value |
Gross Unrealized Loss |
Fair Value |
Gross Unrealized Loss |
Fair Value |
Gross Unrealized Loss |
Fair Value |
Gross Unrealized Loss |
Fair Value |
Gross Unrealized Loss |
|||||||||||||||||||||||||||||||||||||||||||||||||||||||||||||||
| Fixed maturity securities: | ||||||||||||||||||||||||||||||||||||||||||||||||||||||||||||||||||||||||||
| Municipal obligations | $ | 50 | $ | 1 | $ | 16 | $ | 2 | $ | 65 | $ | 3 | $ | 21 | $ | 1 | $ | 7 | $ | 1 | $ | 28 | $ | 2 | ||||||||||||||||||||||||||||||||||||||||||||||||||
| Corporate obligations | 150 | 5 | 497 | 60 | 648 | 65 | 280 | 21 | 279 | 42 | 559 | 63 | ||||||||||||||||||||||||||||||||||||||||||||||||||||||||||||||
| Foreign obligations | 25 | 1 | 52 | 9 | 77 | 9 | 27 | 2 | 47 | 7 | 73 | 9 | ||||||||||||||||||||||||||||||||||||||||||||||||||||||||||||||
| U.S. government obligations | 28 | 2 | 37 | 3 | 64 | 4 | 40 | 3 | 19 | 1 | 58 | 4 | ||||||||||||||||||||||||||||||||||||||||||||||||||||||||||||||
| Residential mortgage-backed securities | 58 | 2 | 107 | 25 | 165 | 28 | 132 | 19 | — | — | 132 | 19 | ||||||||||||||||||||||||||||||||||||||||||||||||||||||||||||||
| Commercial mortgage-backed securities | 18 | 1 | — | — | 18 | 1 | 3 | — | — | — | 3 | — | ||||||||||||||||||||||||||||||||||||||||||||||||||||||||||||||
| Collateralized debt obligations | 7 | — | 107 | 1 | 114 | 1 | 90 | 3 | 36 | 1 | 126 | 4 | ||||||||||||||||||||||||||||||||||||||||||||||||||||||||||||||
| Other asset-backed securities | 120 | 9 | 34 | 2 | 154 | 11 | 198 | 4 | 5 | 1 | 203 | 5 | ||||||||||||||||||||||||||||||||||||||||||||||||||||||||||||||
| 456 | 20 | 849 | 102 | 1,306 | 122 | 791 | 53 | 392 | 53 | 1,183 | 106 | |||||||||||||||||||||||||||||||||||||||||||||||||||||||||||||||
| Short-term | 19 | — | — | — | 19 | — | 78 | — | 8 | — | 86 | — | ||||||||||||||||||||||||||||||||||||||||||||||||||||||||||||||
| Total temporarily impaired securities | $ | 476 | $ | 20 | $ | 849 | $ | 102 | $ | 1,325 | $ | 122 | $ | 869 | $ | 53 | $ | 400 | $ | 53 | $ | 1,269 | $ | 106 | ||||||||||||||||||||||||||||||||||||||||||||||||||
| Three Months Ended September 30, | Nine Months Ended September 30, | |||||||||||||||||||||||||
| 2023 | 2022 | 2023 | 2022 | |||||||||||||||||||||||
| Fixed maturity securities | $ | 20 | $ | 16 | $ | 55 | $ | 45 | ||||||||||||||||||
| Short-term investments | 5 | 3 | 16 | 4 | ||||||||||||||||||||||
| Investment expense | (1) | (2) | (4) | (4) | ||||||||||||||||||||||
| Securities available-for-sale and short-term | 24 | 17 | 67 | 44 | ||||||||||||||||||||||
| Fixed maturity securities - trading | — | (1) | 5 | (22) | ||||||||||||||||||||||
| Other investments | 6 | (5) | 28 | (28) | ||||||||||||||||||||||
| Total net investment income (loss) | $ | 30 | $ | 11 | $ | 100 | $ | (6) | ||||||||||||||||||
| Three Months Ended September 30, | Nine Months Ended September 30, | |||||||||||||||||||||||||
| 2023 | 2022 | 2023 | 2022 | |||||||||||||||||||||||
| Gross realized gains on securities | $ | — | $ | 6 | $ | 1 | $ | 29 | ||||||||||||||||||
| Gross realized losses on securities | (1) | (1) | (4) | (17) | ||||||||||||||||||||||
| Foreign exchange gains (losses) | 2 | 9 | (2) | 20 | ||||||||||||||||||||||
| Credit impairments | (1) | — | (2) | — | ||||||||||||||||||||||
| Intent / requirement to sell impairments | — | — | — | — | ||||||||||||||||||||||
| Net investment gains (losses), including impairments | $ | 1 | $ | 14 | $ | (7) | $ | 31 | ||||||||||||||||||
| Municipal Obligations |
Mortgage and Asset- backed Securities |
Total | Weighted Average Underlying Rating (1) |
||||||||||||||||||||
| September 30, 2023 | $ | 9 | $ | 419 | $ | 427 | B- | ||||||||||||||||
| December 31, 2022 | $ | 10 | $ | 394 | $ | 403 | B | ||||||||||||||||
| Fair Value | ||||||||||||||||||||||||||
| Class of Funds | September 30, 2023 |
December 31, 2022 | Redemption Frequency | Redemption Notice Period | ||||||||||||||||||||||
Hedge funds (1) |
$ | 109 | $ | 186 | quarterly or semi-annually | 90 days | ||||||||||||||||||||
Private credit (2) |
85 | 84 | quarterly if permitted | 180 days if permitted | ||||||||||||||||||||||
High yields and leveraged loans (3) (10) |
78 | 80 | daily | 0 - 30 days | ||||||||||||||||||||||
Equity market investments (4) (10) |
53 | 64 | daily or quarterly | 0 - 90 days | ||||||||||||||||||||||
Investment grade floating rate income (5) |
40 | 63 | weekly | 0 days | ||||||||||||||||||||||
Private equity (6) |
62 | 47 | quarterly if permitted | 90 days if permitted | ||||||||||||||||||||||
Real estate properties (7) |
21 | 22 | see footnote (7) |
see footnote (7) |
||||||||||||||||||||||
Convertible bonds (8)(10) |
— | 8 | daily | 0 days | ||||||||||||||||||||||
Insurance-linked investments (9) |
1 | 1 | see footnote (9) |
see footnote (9) |
||||||||||||||||||||||
| Total equity investments in pooled funds | $ | 449 | $ | 556 | ||||||||||||||||||||||
| Three Months Ended September 30, | Nine Months Ended September 30, | |||||||||||||||||||||||||
| 2023 | 2022 | 2023 | 2022 | |||||||||||||||||||||||
| Net gains (losses) recognized during the period on trading and equity securities | $ | — | $ | (7) | $ | 16 | $ | (49) | ||||||||||||||||||
| Less: net gains (losses) recognized during the reporting period on trading and equity securities sold during the period | — | (1) | 10 | (27) | ||||||||||||||||||||||
| Unrealized gains (losses) recognized during the reporting period on trading and equity securities still held at the reporting date | $ | — | $ | (6) | $ | 6 | $ | (22) | ||||||||||||||||||
| l | Level 1 | Quoted prices for identical instruments in active markets. Assets and liabilities classified as Level 1 include US Treasury and other foreign government obligations traded in highly liquid and transparent markets, certain highly liquid pooled fund investments, exchange traded futures contracts and money market funds. | |||||||||
| l | Level 2 | Quoted prices for similar instruments in active markets; quoted prices for identical or similar instruments in markets that are not active; and model-derived valuations in which all significant inputs and significant value drivers are observable in active markets. Assets and liabilities classified as Level 2 generally include investments in fixed maturity securities representing municipal, asset-backed and corporate obligations, certain interest rate swap contracts and most long-term debt of variable interest entities consolidated under the Consolidation Topic of the ASC. | |||||||||
| l | Level 3 | Model derived valuations in which one or more significant inputs or significant value drivers are unobservable. This hierarchy requires the use of observable market data when available. Assets and liabilities classified as Level 3 include certain uncollateralized interest rate swap contracts and certain investments in fixed maturity securities. Additionally, Level 3 assets and liabilities generally include loan receivables, and certain long-term debt of variable interest entities consolidated under the Consolidation Topic of the ASC. | |||||||||
| September 30, 2023 | December 31, 2022 | |||||||||||||||||||||||||||||||||||||||||||||||||||||||||||||
| Carrying Amount |
Total Fair Value |
Fair Value Measurements Categorized as: | Carrying Amount |
Total Fair Value |
Fair Value Measurements Categorized as: | |||||||||||||||||||||||||||||||||||||||||||||||||||||||||
| Level 1 | Level 2 | Level 3 | Level 1 | Level 2 | Level 3 | |||||||||||||||||||||||||||||||||||||||||||||||||||||||||
| Financial assets: | ||||||||||||||||||||||||||||||||||||||||||||||||||||||||||||||
| Fixed maturity securities: | ||||||||||||||||||||||||||||||||||||||||||||||||||||||||||||||
| Municipal obligations | $ | 95 | $ | 95 | $ | — | $ | 95 | $ | — | $ | 102 | $ | 102 | $ | — | $ | 102 | $ | — | ||||||||||||||||||||||||||||||||||||||||||
| Corporate obligations | 671 | 671 | — | 652 | 19 | 598 | 598 | — | 585 | 12 | ||||||||||||||||||||||||||||||||||||||||||||||||||||
| Foreign obligations | 92 | 92 | 92 | — | — | 76 | 76 | 76 | — | — | ||||||||||||||||||||||||||||||||||||||||||||||||||||
| U.S. government obligations | 73 | 73 | 73 | — | — | 65 | 65 | 65 | — | — | ||||||||||||||||||||||||||||||||||||||||||||||||||||
| Residential mortgage-backed securities | 227 | 227 | — | 227 | — | 238 | 238 | — | 238 | — | ||||||||||||||||||||||||||||||||||||||||||||||||||||
| Commercial mortgage-backed securities | 18 | 18 | — | 18 | — | 15 | 15 | — | 15 | — | ||||||||||||||||||||||||||||||||||||||||||||||||||||
| Collateralized debt obligations | 142 | 142 | — | 142 | — | 137 | 137 | — | 137 | — | ||||||||||||||||||||||||||||||||||||||||||||||||||||
| Other asset-backed securities | 265 | 265 | — | 197 | 68 | 224 | 224 | — | 157 | 67 | ||||||||||||||||||||||||||||||||||||||||||||||||||||
| Fixed maturity securities, pledged as collateral: | ||||||||||||||||||||||||||||||||||||||||||||||||||||||||||||||
| Short-term | 27 | 27 | 27 | — | — | 64 | 64 | 64 | — | — | ||||||||||||||||||||||||||||||||||||||||||||||||||||
| Short term investments | 421 | 421 | 415 | 5 | — | 507 | 507 | 506 | 1 | — | ||||||||||||||||||||||||||||||||||||||||||||||||||||
Other investments (1) |
461 | 449 | 87 | — | — | 568 | 556 | 61 | — | — | ||||||||||||||||||||||||||||||||||||||||||||||||||||
| Cash, cash equivalents and restricted cash | 46 | 46 | 46 | — | — | 44 | 44 | 43 | 1 | — | ||||||||||||||||||||||||||||||||||||||||||||||||||||
| Derivative assets: | ||||||||||||||||||||||||||||||||||||||||||||||||||||||||||||||
| Interest rate swaps—asset position | 14 | 14 | — | — | 14 | 27 | 27 | — | 1 | 26 | ||||||||||||||||||||||||||||||||||||||||||||||||||||
| Warrants | 1 | 1 | — | — | 1 | 1 | 1 | — | — | 1 | ||||||||||||||||||||||||||||||||||||||||||||||||||||
| Other assets-Loans | 2 | 2 | — | — | 2 | 10 | 10 | — | — | 10 | ||||||||||||||||||||||||||||||||||||||||||||||||||||
| Variable interest entity assets: | ||||||||||||||||||||||||||||||||||||||||||||||||||||||||||||||
| Fixed maturity securities: Corporate obligations, fair value option | 1,857 | 1,857 | — | — | 1,857 | 1,828 | 1,828 | — | — | 1,828 | ||||||||||||||||||||||||||||||||||||||||||||||||||||
| Fixed maturity securities: Municipal obligation, trading | — | — | — | — | — | 43 | 43 | — | 43 | — | ||||||||||||||||||||||||||||||||||||||||||||||||||||
| Fixed maturity securities: Municipal obligations, available-for-sale | 91 | 91 | — | 91 | — | 96 | 96 | — | 96 | — | ||||||||||||||||||||||||||||||||||||||||||||||||||||
| Restricted cash | 256 | 256 | 256 | — | 17 | 17 | 17 | — | — | |||||||||||||||||||||||||||||||||||||||||||||||||||||
| Loans | 1,551 | 1,551 | — | — | 1,551 | 1,829 | 1,829 | — | — | 1,829 | ||||||||||||||||||||||||||||||||||||||||||||||||||||
| Derivative assets: Interest rate swaps—asset position | 177 | 177 | — | 177 | — | 190 | 190 | — | 190 | — | ||||||||||||||||||||||||||||||||||||||||||||||||||||
| Derivative assets: Currency swaps—asset position | 42 | 42 | — | 42 | — | 49 | 49 | — | 49 | — | ||||||||||||||||||||||||||||||||||||||||||||||||||||
| Total financial assets | $ | 6,530 | $ | 6,518 | $ | 997 | $ | 1,647 | $ | 3,512 | $ | 6,726 | $ | 6,715 | $ | 833 | $ | 1,615 | $ | 3,772 | ||||||||||||||||||||||||||||||||||||||||||
| Financial liabilities: | ||||||||||||||||||||||||||||||||||||||||||||||||||||||||||||||
| Long term debt, including accrued interest | $ | 967 | $ | 769 | $ | — | $ | 754 | $ | 15 | $ | 1,065 | $ | 878 | $ | — | $ | 864 | $ | 14 | ||||||||||||||||||||||||||||||||||||||||||
| Derivative liabilities: | ||||||||||||||||||||||||||||||||||||||||||||||||||||||||||||||
| Interest rate swaps—liability position | 22 | 22 | — | 22 | — | 38 | 38 | — | 38 | — | ||||||||||||||||||||||||||||||||||||||||||||||||||||
|
Liabilities for net financial guarantees
written (2)
|
238 | 646 | — | — | 646 | 159 | 476 | — | — | 476 | ||||||||||||||||||||||||||||||||||||||||||||||||||||
| Variable interest entity liabilities: | ||||||||||||||||||||||||||||||||||||||||||||||||||||||||||||||
| Long-term debt | 2,699 | 2,662 | — | 2,558 | 104 | 3,107 | 3,145 | — | 2,992 | 154 | ||||||||||||||||||||||||||||||||||||||||||||||||||||
| Derivative liabilities: Interest rate swaps—liability position | 1,038 | 1,038 | — | 1,038 | — | 1,048 | 1,048 | — | 1,048 | — | ||||||||||||||||||||||||||||||||||||||||||||||||||||
| Total financial liabilities | $ | 4,964 | $ | 5,137 | $ | — | $ | 4,372 | $ | 765 | $ | 5,418 | $ | 5,586 | $ | — | $ | 4,942 | $ | 644 | ||||||||||||||||||||||||||||||||||||||||||
| September 30, 2023: | |||||
| a. Coupon rate: | 5.98% | ||||
| b. Average Life: | 12.97 years | ||||
| c. Yield: | 12.00% | ||||
| December 31, 2022: | |||||
| a. Coupon rate: | 5.98% | ||||
| b. Average Life: | 13.46 years | ||||
| c. Yield: | 12.60% | ||||
| Level 3 - Financial Assets and Liabilities Accounted for at Fair Value | ||||||||||||||||||||||||||||||||
| VIE Assets | ||||||||||||||||||||||||||||||||
| Investments | Derivatives | Investments | Loans | Total | ||||||||||||||||||||||||||||
| Three Months Ended September 30, 2023: | ||||||||||||||||||||||||||||||||
| Balance, beginning of period | $ | 81 | $ | 25 | $ | 1,952 | $ | 1,772 | $ | 3,831 | ||||||||||||||||||||||
| Total gains/(losses) realized and unrealized: | ||||||||||||||||||||||||||||||||
| Included in earnings | — | (11) | (21) | 48 | 17 | |||||||||||||||||||||||||||
| Included in other comprehensive income | — | — | (74) | (62) | (137) | |||||||||||||||||||||||||||
| Purchases | 6 | — | — | — | 6 | |||||||||||||||||||||||||||
| Settlements | — | — | — | (73) | (73) | |||||||||||||||||||||||||||
| Deconsolidation of VIEs | — | — | — | (133) | (133) | |||||||||||||||||||||||||||
| Balance, end of period | $ | 87 | $ | 15 | $ | 1,857 | $ | 1,551 | $ | 3,510 | ||||||||||||||||||||||
| The amount of total gains/(losses) included in earnings attributable to the change in unrealized gains or losses relating to assets and liabilities still held at the reporting date | $ | — | $ | (11) | $ | (21) | $ | 48 | $ | 17 | ||||||||||||||||||||||
| The amount of total gains/(losses) included in other comprehensive income attributable to the change in unrealized gains or losses relating to assets and liabilities still held at the reporting date | $ | — | $ | — | $ | (74) | $ | (62) | $ | (137) | ||||||||||||||||||||||
| Three Months Ended September 30, 2022: | ||||||||||||||||||||||||||||||||
| Balance, beginning of period | $ | 81 | $ | 38 | $ | 2,533 | $ | 2,144 | $ | 4,795 | ||||||||||||||||||||||
| Total gains/(losses) realized and unrealized: | ||||||||||||||||||||||||||||||||
| Included in earnings | — | (11) | (312) | (231) | (553) | |||||||||||||||||||||||||||
| Included in other comprehensive income | (4) | — | (194) | (162) | (360) | |||||||||||||||||||||||||||
| Settlements | — | (1) | — | (69) | (71) | |||||||||||||||||||||||||||
| Balance, end of period | $ | 78 | $ | 26 | $ | 2,026 | $ | 1,682 | $ | 3,812 | ||||||||||||||||||||||
| The amount of total gains/(losses) included in earnings attributable to the change in unrealized gains or losses relating to assets and liabilities still held at the reporting date | $ | — | $ | (11) | $ | (312) | $ | (231) | $ | (553) | ||||||||||||||||||||||
| The amount of total gains/(losses) included in other comprehensive income attributable to the change in unrealized gains or losses relating to assets and liabilities still held at the reporting date | $ | (4) | $ | — | $ | (194) | $ | (162) | $ | (360) | ||||||||||||||||||||||
Level 3 - Financial Assets and Liabilities Accounted for at Fair Value |
||||||||||||||||||||||||||||||||
| VIE Assets | ||||||||||||||||||||||||||||||||
| Investments | Derivatives | Investments | Loans | Total | ||||||||||||||||||||||||||||
| Nine Months Ended September 30, 2023: | ||||||||||||||||||||||||||||||||
| Balance, beginning of period | $ | 79 | $ | 26 | $ | 1,828 | $ | 1,829 | $ | 3,762 | ||||||||||||||||||||||
| Total gains/(losses) realized and unrealized: | ||||||||||||||||||||||||||||||||
| Included in earnings | 1 | (11) | 59 | 40 | 89 | |||||||||||||||||||||||||||
| Included in other comprehensive income | 3 | — | (18) | 30 | 15 | |||||||||||||||||||||||||||
| Purchases | 6 | — | — | — | 6 | |||||||||||||||||||||||||||
| Settlements | (1) | — | (12) | (214) | (228) | |||||||||||||||||||||||||||
| Deconsolidation of VIEs | — | — | — | (133) | (133) | |||||||||||||||||||||||||||
| Balance, end of period | $ | 87 | $ | 15 | $ | 1,857 | $ | 1,551 | $ | 3,510 | ||||||||||||||||||||||
| The amount of total gains/(losses) included in earnings attributable to the change in unrealized gains or losses relating to assets and liabilities still held at the reporting date | $ | 1 | $ | (11) | $ | 59 | $ | 37 | $ | 86 | ||||||||||||||||||||||
| The amount of total gains/(losses) included in other comprehensive income attributable to the change in unrealized gains or losses relating to assets and liabilities still held at the reporting date | $ | 3 | $ | — | $ | (18) | $ | 28 | $ | 13 | ||||||||||||||||||||||
| Nine Months Ended September 30, 2022: | ||||||||||||||||||||||||||||||||
| Balance, beginning of period | $ | 91 | $ | 70 | $ | 3,320 | $ | 2,718 | $ | 6,199 | ||||||||||||||||||||||
| Total gains/(losses) realized and unrealized: | ||||||||||||||||||||||||||||||||
| Included in earnings | 1 | (39) | (770) | (409) | (1,217) | |||||||||||||||||||||||||||
| Included in other comprehensive income | (13) | — | (505) | (413) | (932) | |||||||||||||||||||||||||||
| Purchases | 1 | — | — | — | 1 | |||||||||||||||||||||||||||
| Settlements | (1) | (5) | (18) | (214) | (239) | |||||||||||||||||||||||||||
| Balance, end of period | $ | 78 | $ | 26 | $ | 2,026 | $ | 1,682 | $ | 3,812 | ||||||||||||||||||||||
| The amount of total gains/(losses) included in earnings attributable to the change in unrealized gains or losses relating to assets and liabilities still held at the reporting date | $ | 1 | $ | (40) | $ | (770) | $ | (409) | $ | (1,218) | ||||||||||||||||||||||
| The amount of total gains/(losses) included in other comprehensive income attributable to the change in unrealized gains or losses relating to assets and liabilities still held at the reporting date | $ | (13) | $ | — | $ | (505) | $ | (413) | (932) | |||||||||||||||||||||||
| Three Months Ended September 30, 2023 | Three Months Ended September 30, 2022 | |||||||||||||||||||||||||||||||||||||||||||||||||
| Net Investment Income |
Net Gains (Losses) on Derivative Contracts |
Income (Loss) on Variable Interest Entities |
Other Income or (Expense) |
Net Investment Income |
Net Gains (Losses) on Derivative Contracts |
Income (Loss) on Variable Interest Entities |
Other Income or (Expense) |
|||||||||||||||||||||||||||||||||||||||||||
| Total gains (losses) included in earnings for the period | $ | — | $ | (11) | $ | 27 | $ | — | $ | — | $ | (11) | $ | (543) | $ | — | ||||||||||||||||||||||||||||||||||
| Changes in unrealized gains (losses) relating to financial instruments still held at the reporting date | — | (11) | 27 | — | — | (11) | (543) | — | ||||||||||||||||||||||||||||||||||||||||||
| Nine Months Ended September 30, 2023 | Nine Months Ended September 30, 2022 | |||||||||||||||||||||||||||||||||||||||||||||||||
| Net Investment Income |
Net Gains (Losses) on Derivative Contracts |
Income (Loss) on Variable Interest Entities |
Other Income or (Expense) |
Net Investment Income |
Net Gains (Losses) on Derivative Contracts |
Income (Loss) on Variable Interest Entities |
Other Income or (Expense) |
|||||||||||||||||||||||||||||||||||||||||||
| Total gains or losses included in earnings for the period | $ | 1 | $ | (11) | $ | 99 | $ | — | $ | 1 | $ | (39) | $ | (1,179) | $ | — | ||||||||||||||||||||||||||||||||||
| Changes in unrealized gains or losses included in earnings relating to the assets and liabilities still held at the reporting date | — | (11) | 96 | — | — | (40) | (1,179) | — | ||||||||||||||||||||||||||||||||||||||||||
| Three Months Ended September 30, | |||||||||||||||||||||||
| 2023 | 2022 | ||||||||||||||||||||||
| Written | Earned | Written | Earned | ||||||||||||||||||||
| Direct | $ | 65 | $ | 59 | $ | 16 | $ | 30 | |||||||||||||||
| Assumed | 14 | 3 | — | — | |||||||||||||||||||
| Ceded | 52 | 45 | 17 | 19 | |||||||||||||||||||
Net premiums |
$ | 27 | $ | 18 | $ | — | $ | 11 | |||||||||||||||
| Nine Months Ended September 30, | |||||||||||||||||||||||
| 2023 | 2022 | ||||||||||||||||||||||
| Written | Earned | Written | Earned | ||||||||||||||||||||
| Direct | $ | 181 | $ | 157 | $ | 83 | $ | 83 | |||||||||||||||
| Assumed | 14 | 3 | — | — | |||||||||||||||||||
| Ceded | 195 | 113 | 63 | 43 | |||||||||||||||||||
| Net premiums | $ | — | $ | 47 | $ | 21 | $ | 39 | |||||||||||||||
| Three Months Ended September 30, | Nine Months Ended September 30, | ||||||||||||||||||||||
| 2023 | 2022 | 2023 | 2022 | ||||||||||||||||||||
| United States | $ | 15 | $ | 7 | $ | 38 | $ | 27 | |||||||||||||||
| United Kingdom | 3 | 3 | 8 | 10 | |||||||||||||||||||
| Other international | — | 1 | 2 | 2 | |||||||||||||||||||
| Total | $ | 18 | $ | 11 | $ | 47 | $ | 39 | |||||||||||||||
| Surveillance Categories as of September 30, 2023 | Surveillance Categories as of December 31, 2022 | |||||||||||||||||||||||||||||||||||||||||||||||||||||||||||||||||||||||||
| Type of Guaranteed Bond | I | IA | II | III | IV | Total | I | IA | II | III | IV | Total | ||||||||||||||||||||||||||||||||||||||||||||||||||||||||||||||
| Public Finance: | ||||||||||||||||||||||||||||||||||||||||||||||||||||||||||||||||||||||||||
| Housing revenue | $ | 134 | $ | 3 | $ | 5 | $ | — | $ | — | $ | 142 | $ | 140 | $ | 3 | $ | 5 | $ | — | $ | — | $ | 148 | ||||||||||||||||||||||||||||||||||||||||||||||||||
| Other | 1 | — | — | — | — | 1 | 2 | — | — | — | — | 2 | ||||||||||||||||||||||||||||||||||||||||||||||||||||||||||||||
| Total Public Finance | 136 | 3 | 5 | — | — | 143 | 142 | 3 | 5 | — | — | 150 | ||||||||||||||||||||||||||||||||||||||||||||||||||||||||||||||
| Structured Finance: | ||||||||||||||||||||||||||||||||||||||||||||||||||||||||||||||||||||||||||
| Mortgage-backed and home equity | — | — | — | — | 10 | 11 | — | — | — | — | 11 | 11 | ||||||||||||||||||||||||||||||||||||||||||||||||||||||||||||||
| Student loan | — | — | — | 7 | — | 8 | 1 | 1 | — | 7 | — | 8 | ||||||||||||||||||||||||||||||||||||||||||||||||||||||||||||||
| Other | 4 | — | — | — | — | 4 | 4 | — | — | — | — | 4 | ||||||||||||||||||||||||||||||||||||||||||||||||||||||||||||||
| Total Structured Finance | 4 | — | — | 7 | 10 | 22 | 5 | 1 | — | 7 | 11 | 24 | ||||||||||||||||||||||||||||||||||||||||||||||||||||||||||||||
| International: | ||||||||||||||||||||||||||||||||||||||||||||||||||||||||||||||||||||||||||
| Sovereign/sub-sovereign | 50 | 14 | — | — | — | 64 | 49 | 7 | — | 9 | — | 64 | ||||||||||||||||||||||||||||||||||||||||||||||||||||||||||||||
| Investor-owned and public utilities | 17 | — | — | — | — | 17 | 18 | — | — | — | — | 18 | ||||||||||||||||||||||||||||||||||||||||||||||||||||||||||||||
| Other | 3 | — | — | — | — | 3 | 2 | — | — | — | — | 2 | ||||||||||||||||||||||||||||||||||||||||||||||||||||||||||||||
| Total International | 70 | 14 | — | — | — | 84 | 70 | 7 | — | 9 | — | 85 | ||||||||||||||||||||||||||||||||||||||||||||||||||||||||||||||
Total (1) (2) |
$ | 209 | $ | 18 | $ | 5 | $ | 7 | $ | 10 | $ | 249 | $ | 217 | $ | 10 | $ | 5 | $ | 16 | $ | 11 | $ | 259 | ||||||||||||||||||||||||||||||||||||||||||||||||||
| Three Months Ended September 30, | Nine Months Ended September 30, | |||||||||||||||||||||||||
| 2023 | 2022 | 2023 | 2022 | |||||||||||||||||||||||
| Beginning balance | $ | 5 | $ | 6 | $ | 5 | $ | 9 | ||||||||||||||||||
| Current period provision (benefit) | — | (1) | (1) | (3) | ||||||||||||||||||||||
| Write-offs of the allowance | — | — | — | — | ||||||||||||||||||||||
| Recoveries of previously written-off amounts | — | — | — | — | ||||||||||||||||||||||
Ending balance (1) |
$ | 4 | $ | 6 | $ | 4 | $ | 6 | ||||||||||||||||||
| Nine Months Ended September 30, | 2023 | 2022 | ||||||||||||
| Beginning premium receivable | $ | 254 | $ | 320 | ||||||||||
| Premium receipts | (22) | (30) | ||||||||||||
Adjustments for changes in expected and contractual cash flows for contracts (1) |
6 | (21) | ||||||||||||
| Accretion of premium receivable discount for contracts | 6 | 6 | ||||||||||||
| Changes to allowance for credit losses | 1 | 3 | ||||||||||||
Other adjustments (including foreign exchange) (2) |
1 | (20) | ||||||||||||
Ending premium receivable (3) |
$ | 245 | $ | 259 | ||||||||||
|
Future Premiums
to be Collected (1)
|
Future Premiums to be Earned Net of Reinsurance (2) |
||||||||||
| Three months ended: | |||||||||||
| December 31, 2023 | 6 | 4 | |||||||||
| Twelve months ended: | |||||||||||
| December 31, 2024 | 26 | 15 | |||||||||
| December 31, 2025 | 25 | 15 | |||||||||
| December 31, 2026 | 24 | 15 | |||||||||
| December 31, 2027 | 24 | 14 | |||||||||
| Five years ended: | |||||||||||
| December 31, 2032 | 99 | 57 | |||||||||
| December 31, 2037 | 62 | 32 | |||||||||
| December 31, 2042 | 29 | 11 | |||||||||
| December 31, 2047 | 14 | 4 | |||||||||
| December 31, 2052 | 4 | 1 | |||||||||
| December 31, 2057 | — | — | |||||||||
| Total | $ | 313 | $ | 169 | |||||||
| September 30, 2023 | December 31, 2022 | |||||||||||||||||||||||||||||||||||||||||||||||||||||||||||||
| Specialty Property and Casualty | Legacy Financial Guarantee | Specialty Property and Casualty | Legacy Financial Guarantee | |||||||||||||||||||||||||||||||||||||||||||||||||||||||||||
| Present Value of Expected Net Cash Flows | Present Value of Expected Net Cash Flows | |||||||||||||||||||||||||||||||||||||||||||||||||||||||||||||
| Balance Sheet Line Item | Gross Loss and Loss Expense Reserves |
Claims and Loss Expenses |
Recoveries | Unearned Premium Revenue |
Gross Loss and Loss Expense Reserves |
Gross Loss and Loss Expense Reserves |
Claims and Loss Expenses |
Recoveries | Unearned Premium Revenue |
Gross Loss and Loss Expense Reserves |
||||||||||||||||||||||||||||||||||||||||||||||||||||
| Loss and loss expense reserves | $ | 160 | $ | 769 | $ | (50) | $ | (29) | $ | 850 | $ | 90 | $ | 787 | $ | (44) | $ | (28) | $ | 805 | ||||||||||||||||||||||||||||||||||||||||||
| Subrogation recoverable | — | 4 | (183) | — | (179) | — | 5 | (276) | — | (271) | ||||||||||||||||||||||||||||||||||||||||||||||||||||
| Totals | $ | 160 | $ | 773 | $ | (234) | $ | (29) | $ | 670 | $ | 90 | $ | 791 | $ | (319) | $ | (28) | $ | 534 | ||||||||||||||||||||||||||||||||||||||||||
| Nine Months Ended September 30, | 2023 | 2022 | |||||||||
| Beginning gross loss and loss expense reserves | $ | 534 | $ | (522) | |||||||
| Reinsurance recoverable | 115 | 56 | |||||||||
| Beginning balance of net loss and loss expense reserves | 419 | (578) | |||||||||
| Losses and loss expenses (benefit): | |||||||||||
| Current year | 20 | 6 | |||||||||
| Prior years | (71) | (347) | |||||||||
Total (1) (2) |
(51) | (341) | |||||||||
| Loss and loss expenses paid (recovered): | |||||||||||
| Current year | 2 | (1) | |||||||||
| Prior years | (139) | (195) | |||||||||
| Total | (137) | (195) | |||||||||
| Foreign exchange effect | — | (3) | |||||||||
| Ending net loss and loss expense reserves | 506 | (727) | |||||||||
| Impact of VIE consolidation | — | (292) | |||||||||
Reinsurance recoverable (3) |
165 | 79 | |||||||||
| Ending gross loss and loss expense reserves | $ | 670 | $ | (940) | |||||||
| Surveillance Categories as of September 30, 2023 | |||||||||||||||||||||||||||||||||||||||||
| I | IA | II | III | IV | V | Total | |||||||||||||||||||||||||||||||||||
| Number of policies | 27 | 12 | 10 | 13 | 95 | 5 | 162 | ||||||||||||||||||||||||||||||||||
Remaining weighted-average contract period (in years) (1) |
9 | 10 | 13 | 14 | 12 | 7 | 12 | ||||||||||||||||||||||||||||||||||
| Gross insured contractual payments outstanding: | |||||||||||||||||||||||||||||||||||||||||
| Principal | $ | 492 | $ | 1,185 | $ | 455 | $ | 401 | $ | 1,516 | $ | 28 | $ | 4,076 | |||||||||||||||||||||||||||
| Interest | 115 | 354 | 275 | 143 | 607 | 18 | 1,512 | ||||||||||||||||||||||||||||||||||
| Total | $ | 606 | $ | 1,539 | $ | 730 | $ | 543 | $ | 2,123 | $ | 46 | $ | 5,588 | |||||||||||||||||||||||||||
| Gross undiscounted claim liability | $ | 2 | $ | 26 | $ | 42 | $ | 432 | $ | 778 | $ | 46 | $ | 1,325 | |||||||||||||||||||||||||||
| Discount, gross claim liability | — | (4) | (8) | (172) | (363) | (10) | (557) | ||||||||||||||||||||||||||||||||||
| Gross claim liability before all subrogation and before reinsurance | 1 | 22 | 34 | 259 | 415 | 36 | 769 | ||||||||||||||||||||||||||||||||||
| Less: | |||||||||||||||||||||||||||||||||||||||||
Gross other subrogation (2) |
(13) | (2) | — | (28) | (257) | (12) | (313) | ||||||||||||||||||||||||||||||||||
| Discount, other subrogation | 3 | — | — | 5 | 67 | 4 | 79 | ||||||||||||||||||||||||||||||||||
| Discounted other subrogation, before reinsurance | (10) | (2) | — | (23) | (190) | (8) | (234) | ||||||||||||||||||||||||||||||||||
| Gross claim liability, net of all subrogation and discounts, before reinsurance | (9) | 20 | 34 | 236 | 225 | 29 | 535 | ||||||||||||||||||||||||||||||||||
| Less: Unearned premium revenue | (1) | (13) | (4) | — | (10) | (1) | (29) | ||||||||||||||||||||||||||||||||||
| Plus: Loss expense reserves | — | 3 | — | 1 | 1 | — | 4 | ||||||||||||||||||||||||||||||||||
| Gross loss and loss expense reserves | $ | (10) | $ | 9 | $ | 30 | $ | 236 | $ | 217 | $ | 28 | $ | 510 | |||||||||||||||||||||||||||
Reinsurance recoverable reported on Balance Sheet (3) |
$ | 1 | $ | — | $ | 8 | $ | 20 | $ | 3 | $ | — | $ | 32 | |||||||||||||||||||||||||||
| Surveillance Categories as of December 31, 2022 | |||||||||||||||||||||||||||||||||||||||||
| I | IA | II | III | IV | V | Total | |||||||||||||||||||||||||||||||||||
| Number of policies | 37 | 6 | 9 | 12 | 93 | 5 | 162 | ||||||||||||||||||||||||||||||||||
Remaining weighted-average contract period (in years) (1) |
7 | 19 | 14 | 14 | 12 | 7 | 14 | ||||||||||||||||||||||||||||||||||
| Gross insured contractual payments outstanding: | |||||||||||||||||||||||||||||||||||||||||
| Principal | $ | 709 | $ | 200 | $ | 459 | $ | 1,000 | $ | 1,646 | $ | 34 | $ | 4,047 | |||||||||||||||||||||||||||
| Interest | 526 | 198 | 286 | 156 | 565 | 19 | 1,750 | ||||||||||||||||||||||||||||||||||
| Total | $ | 1,235 | $ | 399 | $ | 745 | $ | 1,156 | $ | 2,210 | $ | 53 | $ | 5,797 | |||||||||||||||||||||||||||
| Gross undiscounted claim liability | $ | 4 | $ | 4 | $ | 43 | $ | 446 | $ | 729 | $ | 53 | $ | 1,279 | |||||||||||||||||||||||||||
| Discount, gross claim liability | (1) | (1) | (7) | (162) | (316) | (9) | (496) | ||||||||||||||||||||||||||||||||||
| Gross claim liability before all subrogation and before reinsurance | 3 | 3 | 36 | 284 | 413 | 43 | 783 | ||||||||||||||||||||||||||||||||||
| Less: | |||||||||||||||||||||||||||||||||||||||||
Gross RMBS subrogation (2) |
— | — | — | — | (140) | — | (140) | ||||||||||||||||||||||||||||||||||
| Discount, RMBS subrogation | — | — | — | — | — | — | — | ||||||||||||||||||||||||||||||||||
| Discounted RMBS subrogation, before reinsurance | — | — | — | — | (140) | — | (140) | ||||||||||||||||||||||||||||||||||
| Less: | |||||||||||||||||||||||||||||||||||||||||
Gross other subrogation (3) |
(14) | (4) | — | (31) | (172) | (12) | (233) | ||||||||||||||||||||||||||||||||||
| Discount, other subrogation | 2 | — | — | 5 | 42 | 4 | 54 | ||||||||||||||||||||||||||||||||||
| Discounted other subrogation, before reinsurance | (12) | (3) | — | (26) | (130) | (8) | (179) | ||||||||||||||||||||||||||||||||||
| Gross claim liability, net of all subrogation and discounts, before reinsurance | (9) | — | 36 | 258 | 143 | 35 | 464 | ||||||||||||||||||||||||||||||||||
| Less: Unearned premium revenue | (2) | (2) | (5) | (8) | (10) | (1) | (28) | ||||||||||||||||||||||||||||||||||
| Plus: Loss expense reserves | 1 | 1 | — | 2 | 4 | — | 8 | ||||||||||||||||||||||||||||||||||
| Gross loss and loss expense reserves | $ | (10) | $ | (2) | $ | 32 | $ | 252 | $ | 137 | $ | 34 | $ | 444 | |||||||||||||||||||||||||||
Reinsurance recoverable reported on Balance Sheet (4) |
$ | 1 | $ | — | $ | 8 | $ | 21 | $ | 3 | $ | — | $ | 33 | |||||||||||||||||||||||||||
| Reinsurers | Type of Insurance |
Rating
(1)
|
Reinsurance
Recoverable
(2)
|
Unsecured
Recoverable
(3)
|
|||||||||||||||||||
| General Reinsurance Company | Specialty P&C | A++ | $ | 67 | $ | 57 | |||||||||||||||||
| QBE Insurance Corporation | Specialty P&C | A | 39 | 39 | |||||||||||||||||||
| Assured Guaranty Re Ltd. | Financial Guarantee |
AA | 27 | — | |||||||||||||||||||
|
All other
reinsurers
|
39 | 14 | |||||||||||||||||||||
Total recoverables |
$ | 172 | $ | 110 | |||||||||||||||||||
| September 30, 2023 | December 31, 2022 | ||||||||||||||||||||||||||||||||||||||||||||||||||||||||||
| Gross Amounts of Recognized Assets / Liabilities |
Gross Amounts Offset in the Consolidated Balance Sheet |
Net Amounts of Assets/ Liabilities Presented in the Consolidated Balance Sheet |
Gross Amount of Collateral Received / Pledged Not Offset in the Consolidated Balance Sheet |
Net Amount |
Gross Amounts of Recognized Assets / Liabilities |
Gross Amounts Offset in the Consolidated Balance Sheet |
Net Amounts of Assets/ Liabilities Presented in the Consolidated Balance Sheet |
Gross Amount of Collateral Received / Pledged Not Offset in the Consolidated Balance Sheet |
Net Amount |
||||||||||||||||||||||||||||||||||||||||||||||||||
| Derivative Assets: | |||||||||||||||||||||||||||||||||||||||||||||||||||||||||||
| Interest rate swaps | $ | 14 | $ | — | $ | 14 | $ | — | $ | 14 | $ | 27 | $ | — | $ | 27 | $ | — | $ | 27 | |||||||||||||||||||||||||||||||||||||||
| Warrants | 1 | — | 1 | — | 1 | 1 | — | 1 | — | 1 | |||||||||||||||||||||||||||||||||||||||||||||||||
| Total non-VIE derivative assets | $ | 15 | $ | — | $ | 15 | $ | — | $ | 15 | $ | 28 | $ | — | $ | 27 | $ | — | $ | 27 | |||||||||||||||||||||||||||||||||||||||
| Derivative Liabilities: | |||||||||||||||||||||||||||||||||||||||||||||||||||||||||||
| Interest rate swaps | $ | 22 | $ | — | $ | 22 | $ | 21 | $ | — | $ | 38 | $ | — | $ | 38 | $ | 38 | $ | — | |||||||||||||||||||||||||||||||||||||||
| Total non-VIE derivative liabilities | $ | 22 | $ | — | $ | 22 | $ | 21 | $ | — | $ | 38 | $ | — | $ | 38 | $ | 38 | $ | — | |||||||||||||||||||||||||||||||||||||||
| Variable Interest Entities Derivative Assets: | |||||||||||||||||||||||||||||||||||||||||||||||||||||||||||
| Interest rate swaps | $ | 177 | $ | — | $ | 177 | $ | 177 | $ | — | $ | 190 | $ | — | $ | 190 | $ | — | $ | 190 | |||||||||||||||||||||||||||||||||||||||
| Currency swaps | 42 | — | 42 | 42 | — | 49 | — | 49 | — | 49 | |||||||||||||||||||||||||||||||||||||||||||||||||
| Total VIE derivative assets | $ | 219 | $ | — | $ | 219 | $ | 219 | $ | — | $ | 239 | $ | — | $ | 239 | $ | — | $ | 239 | |||||||||||||||||||||||||||||||||||||||
| Variable Interest Entities Derivative Liabilities: | |||||||||||||||||||||||||||||||||||||||||||||||||||||||||||
| Interest rate swaps | $ | 1,038 | $ | — | $ | 1,038 | $ | — | $ | 1,038 | $ | 1,048 | $ | — | $ | 1,048 | $ | — | $ | 1,048 | |||||||||||||||||||||||||||||||||||||||
| Total VIE derivative liabilities | $ | 1,038 | $ | — | $ | 1,038 | $ | — | $ | 1,038 | $ | 1,048 | $ | — | $ | 1,048 | $ | — | $ | 1,048 | |||||||||||||||||||||||||||||||||||||||
| Location of Gain (Loss) Recognized in Consolidated Statements of Total Comprehensive Income (Loss) |
Amount of Gain (Loss) Recognized in Consolidated Statement of Total Comprehensive Income (Loss) | ||||||||||||||||||||||||||||
| Three Months Ended September 30, | Nine Months Ended September 30, | ||||||||||||||||||||||||||||
| 2023 | 2022 | 2023 | 2022 | ||||||||||||||||||||||||||
| Non-VIE derivatives: | |||||||||||||||||||||||||||||
| Interest rate swaps | Net gains (losses) on derivative contracts | 4 | 16 | 2 | 63 | ||||||||||||||||||||||||
| Warrants | Net gains (losses) on derivative contracts | — | — | — | 1 | ||||||||||||||||||||||||
| Futures contracts | Net gains (losses) on derivative contracts | — | 22 | — | 59 | ||||||||||||||||||||||||
| Total Non-VIE derivatives | $ | 4 | $ | 37 | 1 | 124 | |||||||||||||||||||||||
| Variable Interest Entities: | |||||||||||||||||||||||||||||
| Currency swaps | Income (loss) on variable interest entities | $ | 7 | $ | 17 | 4 | 37 | ||||||||||||||||||||||
| Interest rate swaps | Income (loss) on variable interest entities | 26 | 250 | 24 | 519 | ||||||||||||||||||||||||
| Total Variable Interest Entities | 33 | 267 | 28 | 556 | |||||||||||||||||||||||||
| Total derivative contracts | $ | 38 | $ | 304 | $ | 29 | $ | 680 | |||||||||||||||||||||
| Notional | ||||||||||||||
| Type of Derivative | September 30, 2023 |
December 31, 2022 |
||||||||||||
| Interest rate swaps—pay-fixed/receive-variable | $ | 141 | $ | 989 | ||||||||||
| Interest rate swaps—receive-fixed/pay-variable | 168 | 337 | ||||||||||||
| Notional | ||||||||||||||
| Type of VIE Derivative | September 30, 2023 |
December 31, 2022 |
||||||||||||
| Interest rate swaps—receive-fixed/pay-variable | $ | 1,592 | $ | 1,573 | ||||||||||
| Interest rate swaps—pay-fixed/receive-variable | 846 | 887 | ||||||||||||
| Currency swaps | 156 | 176 | ||||||||||||
| September 30, 2023 |
December 31, 2022 |
|||||||||||||
| Beginning balance | $ | 61 | $ | 46 | ||||||||||
| Business acquisitions | 9 | 15 | ||||||||||||
| Impairments | — | — | ||||||||||||
| Ending balance | $ | 70 | $ | 61 | ||||||||||
| September 30, 2023 |
December 31, 2022 |
|||||||||||||
| Finite-lived Intangible Assets: | ||||||||||||||
| Insurance intangible: | ||||||||||||||
| Gross carrying value | $ | 1,249 | $ | 1,247 | ||||||||||
| Accumulated amortization | 1,000 | 981 | ||||||||||||
| Net insurance intangible asset | 249 | 266 | ||||||||||||
| Other intangibles: | ||||||||||||||
| Gross carrying value | 57 | 52 | ||||||||||||
| Accumulated amortization | 9 | 6 | ||||||||||||
| Net other intangible assets | 48 | 47 | ||||||||||||
| Total finite-lived intangible assets | 298 | 312 | ||||||||||||
| Indefinite-lived Intangible Assets: | ||||||||||||||
| Insurance licenses | 14 | 14 | ||||||||||||
| Total intangible assets | $ | 312 | $ | 326 | ||||||||||
| September 30, 2023 | December 31, 2022 | |||||||||||||||||||||||||||||||||||||
| Ambac UK | Ambac Assurance | Total VIEs | Ambac UK | Ambac Assurance | Total VIEs | |||||||||||||||||||||||||||||||||
| ASSETS: | ||||||||||||||||||||||||||||||||||||||
| Fixed maturity securities, at fair value: | ||||||||||||||||||||||||||||||||||||||
| Corporate obligations, fair value option | $ | 1,857 | $ | — | $ | 1,857 | $ | 1,828 | $ | — | $ | 1,828 | ||||||||||||||||||||||||||
| Municipal obligations, trading | — | — | — | — | 43 | 43 | ||||||||||||||||||||||||||||||||
Municipal obligations, available-for-sale (1) |
— | 91 | 91 | — | 96 | 96 | ||||||||||||||||||||||||||||||||
| Total FG VIE fixed maturity securities, at fair value | 1,857 | 91 | 1,948 | 1,828 | 139 | 1,967 | ||||||||||||||||||||||||||||||||
| Restricted cash | 255 | 1 | 256 | 1 | 16 | 17 | ||||||||||||||||||||||||||||||||
Loans, at fair value (2) |
1,551 | — | 1,551 | 1,829 | — | 1,829 | ||||||||||||||||||||||||||||||||
| Derivative assets | 219 | — | 219 | 239 | — | 239 | ||||||||||||||||||||||||||||||||
| Other assets | — | 1 | 1 | — | 2 | 2 | ||||||||||||||||||||||||||||||||
| Total FG VIE assets | $ | 3,883 | $ | 94 | $ | 3,976 | $ | 3,896 | $ | 157 | $ | 4,054 | ||||||||||||||||||||||||||
| LIABILITIES: | ||||||||||||||||||||||||||||||||||||||
| Long-term debt: | ||||||||||||||||||||||||||||||||||||||
Long-term debt, at fair value (3) |
$ | 2,535 | $ | — | $ | 2,535 | $ | 2,788 | $ | — | $ | 2,788 | ||||||||||||||||||||||||||
| Long-term debt, at par less unamortized discount | — | 164 | 164 | — | 319 | 319 | ||||||||||||||||||||||||||||||||
| Total long-term debt | 2,535 | 164 | 2,699 | 2,788 | 319 | 3,107 | ||||||||||||||||||||||||||||||||
| Derivative liabilities | 1,038 | — | 1,038 | 1,048 | — | 1,048 | ||||||||||||||||||||||||||||||||
| Cash collateral payable | 254 | — | 254 | — | — | — | ||||||||||||||||||||||||||||||||
| Other liabilities | — | — | 1 | — | 5 | 5 | ||||||||||||||||||||||||||||||||
| Total FG VIE liabilities | $ | 3,827 | $ | 165 | $ | 3,992 | $ | 3,836 | $ | 324 | $ | 4,160 | ||||||||||||||||||||||||||
| Number of FG VIEs consolidated | 3 | 4 | 7 | 5 | 4 | 9 | ||||||||||||||||||||||||||||||||
| Three Months Ended September 30, | Nine Months Ended September 30, | |||||||||||||||||||||||||
| 2023 | 2022 | 2023 | 2022 | |||||||||||||||||||||||
| Net change in fair value of VIE assets and liabilities reported under the fair value option | $ | 1 | $ | (3) | $ | 4 | $ | (2) | ||||||||||||||||||
| Less: Credit risk changes of fair value option long-term debt reported through other comprehensive income (loss) | — | 1 | — | (1) | ||||||||||||||||||||||
| Net change in fair value of VIE assets and liabilities reported in earnings under the fair value option | 1 | (2) | 4 | (3) | ||||||||||||||||||||||
| Investment income (loss) | 1 | 1 | 6 | (4) | ||||||||||||||||||||||
| Net realized investment gains (losses) on available-for-sale securities | — | 1 | — | 2 | ||||||||||||||||||||||
| Interest expense on long-term debt carried at par less unamortized cost | (2) | (1) | (10) | (8) | ||||||||||||||||||||||
| Other expenses | — | — | (1) | (1) | ||||||||||||||||||||||
| Gain (loss) from consolidating VIEs | — | — | — | 28 | ||||||||||||||||||||||
| Income (loss) on variable interest entities | $ | 1 | $ | (1) | $ | — | $ | 14 | ||||||||||||||||||
| September 30, 2023: | December 31, 2022: | ||||||||||||||||||||||||||||||||||||||||||||||
| Carrying Value of Assets and Liabilities | Carrying Value of Assets and Liabilities | ||||||||||||||||||||||||||||||||||||||||||||||
Maximum Exposure To Loss (1) |
Insurance Assets (2) |
Insurance Liabilities (3) |
Net Derivative Assets (Liabilities) (4) |
Maximum Exposure To Loss (1) |
Insurance Assets (2) |
Insurance Liabilities (3) |
Net Derivative Assets (Liabilities) (4) |
||||||||||||||||||||||||||||||||||||||||
| Global structured finance: | |||||||||||||||||||||||||||||||||||||||||||||||
| Mortgage-backed—residential | $ | 2,441 | $ | 175 | $ | 396 | $ | — | $ | 2,559 | $ | 266 | $ | 400 | $ | — | |||||||||||||||||||||||||||||||
| Other consumer asset-backed | 566 | 5 | 227 | — | 652 | 6 | 225 | — | |||||||||||||||||||||||||||||||||||||||
| Other | 421 | 2 | 2 | — | 430 | 2 | 2 | 1 | |||||||||||||||||||||||||||||||||||||||
| Total global structured finance | 3,428 | 182 | 624 | — | 3,642 | 274 | 628 | 1 | |||||||||||||||||||||||||||||||||||||||
| Global public finance | 17,543 | 210 | 208 | — | 17,997 | 216 | 212 | — | |||||||||||||||||||||||||||||||||||||||
| Total | $ | 20,971 | $ | 392 | $ | 833 | $ | — | $ | 21,639 | $ | 490 | $ | 840 | $ | 1 | |||||||||||||||||||||||||||||||
| Three Months Ended September 30, | Nine Months Ended September 30, | ||||||||||||||||||||||
| 2023 | 2022 | 2023 | 2022 | ||||||||||||||||||||
| Employer Stop Loss | $ | 3 | $ | 2 | $ | 9 | $ | 7 | |||||||||||||||
| Affinity Products | 6 | 5 | 16 | 14 | |||||||||||||||||||
| Specialty Commercial Auto | 4 | — | 10 | — | |||||||||||||||||||
| Other | 2 | — | 4 | — | |||||||||||||||||||
| Total | $ | 15 | $ | 7 | $ | 39 | $ | 22 | |||||||||||||||
| September 30, 2023 | December 31, 2022 | ||||||||||
| Premiums and commissions receivable | $ | 11 | $ | 7 | |||||||
| Contract assets | 9 | 5 | |||||||||
| Contract liabilities | 1 | 1 | |||||||||
| Three Months Ended September 30, 2023: | Three Months Ended September 30, 2022: | |||||||||||||||||||||||||||||||||||||||||||||||||||||||||||||
Unrealized Gains (Losses) on Available for Sale Securities (1) |
Amortization
of
Postretirement
Benefit (1)
|
Gain (Loss) on Foreign
Currency
Translation (1) |
Credit Risk Changes of Fair Value Option Liabilities
(1) (2)
|
Total | Unrealized Gains (Losses) on Available for Sale Securities (1) |
Amortization
of
Postretirement
Benefit (1)
|
Gain (Loss) on Foreign
Currency
Translation (1) |
Credit Risk Changes of Fair Value Option Liabilities
(1) (2)
|
Total | |||||||||||||||||||||||||||||||||||||||||||||||||||||
| Beginning Balance | $ | (67) | $ | 6 | $ | (147) | $ | (1) | $ | (209) | $ | (23) | $ | 4 | $ | (177) | $ | — | $ | (196) | ||||||||||||||||||||||||||||||||||||||||||
| Other comprehensive income (loss) before reclassifications | (23) | — | (29) | — | (52) | (53) | — | (58) | — | (111) | ||||||||||||||||||||||||||||||||||||||||||||||||||||
| Amounts reclassified from accumulated other comprehensive income (loss) | — | — | — | — | (1) | (6) | — | — | (1) | (7) | ||||||||||||||||||||||||||||||||||||||||||||||||||||
| Net current period other comprehensive income (loss) | (23) | — | (29) | — | (53) | (59) | — | (58) | (1) | (118) | ||||||||||||||||||||||||||||||||||||||||||||||||||||
| Ending Balance | $ | (90) | $ | 5 | $ | (176) | $ | (1) | $ | (262) | $ | (82) | $ | 4 | $ | (235) | $ | (1) | $ | (315) | ||||||||||||||||||||||||||||||||||||||||||
| Nine Months Ended September 30, 2023 | Nine Months Ended September 30, 2022 | |||||||||||||||||||||||||||||||||||||||||||||||||||||||||||||
Unrealized Gains (Losses) on Available for Sale Securities (1) |
Amortization
of
Postretirement
Benefit (1)
|
Gain (Loss) on Foreign
Currency
Translation (1) |
Credit Risk Changes of Fair Value Option Liabilities
(1) (2)
|
Total | Unrealized Gains (Losses) on Available for Sale Securities (1) |
Amortization
of
Postretirement
Benefit (1)
|
Gain (Loss) on Foreign
Currency
Translation (1) |
Credit Risk Changes of Fair Value Option Liabilities
(1) (2)
|
Total | |||||||||||||||||||||||||||||||||||||||||||||||||||||
| Beginning Balance | $ | (71) | $ | 3 | $ | (184) | $ | (1) | $ | (253) | $ | 154 | $ | 4 | $ | (100) | $ | (1) | $ | 58 | ||||||||||||||||||||||||||||||||||||||||||
| Other comprehensive income before reclassifications | (24) | 3 | 8 | — | (13) | (224) | — | (136) | — | (360) | ||||||||||||||||||||||||||||||||||||||||||||||||||||
| Amounts reclassified from accumulated other comprehensive income | 6 | (1) | — | — | 4 | (12) | — | — | — | (12) | ||||||||||||||||||||||||||||||||||||||||||||||||||||
| Net current period other comprehensive income | (19) | 2 | 8 | — | (9) | (236) | (1) | (136) | — | (372) | ||||||||||||||||||||||||||||||||||||||||||||||||||||
| Ending Balance | $ | (90) | $ | 5 | $ | (176) | $ | (1) | $ | (262) | $ | (82) | $ | 4 | $ | (235) | $ | (1) | $ | (315) | ||||||||||||||||||||||||||||||||||||||||||
| Details about Accumulated Other Comprehensive Income Components |
Amount Reclassified from Accumulated Other Comprehensive Income |
Affected Line Item in the Consolidated Statement of Total Comprehensive Income (Loss) |
||||||||||||||||||||||||||||||
| Three Months Ended September 30, | Nine Months Ended September 30, | |||||||||||||||||||||||||||||||
| 2023 | 2022 | 2023 | 2022 | |||||||||||||||||||||||||||||
| Unrealized Gains (Losses) on Available-for-Sale Securities | ||||||||||||||||||||||||||||||||
| $ | (1) | $ | (8) | $ | 7 | $ | (17) | Net realized investment gains (losses) | ||||||||||||||||||||||||
| — | 2 | (1) | 5 | Provision for income taxes | ||||||||||||||||||||||||||||
| $ | — | $ | (6) | $ | 6 | $ | (12) | Net of tax and noncontrolling interest | ||||||||||||||||||||||||
| Amortization of Postretirement Benefit | ||||||||||||||||||||||||||||||||
| Prior service cost | $ | — | $ | — | $ | (1) | $ | — | Other income |
|||||||||||||||||||||||
| Actuarial (losses) | — | — | — | — | Other income |
|||||||||||||||||||||||||||
| — | — | (1) | — | Total before tax | ||||||||||||||||||||||||||||
| — | — | — | — | Provision for income taxes | ||||||||||||||||||||||||||||
| $ | — | $ | — | $ | (1) | $ | — | Net of tax and noncontrolling interest | ||||||||||||||||||||||||
| Credit Risk Changes of Fair Value Option Liabilities | ||||||||||||||||||||||||||||||||
| $ | — | $ | (1) | $ | — | $ | — | Credit risk changes of fair value option liabilities | ||||||||||||||||||||||||
| — | — | — | — | Provision for income taxes | ||||||||||||||||||||||||||||
| $ | — | $ | (1) | $ | — | $ | — | Net of tax and noncontrolling interest | ||||||||||||||||||||||||
| Total reclassifications for the period | $ | (1) | $ | (7) | $ | 4 | $ | (12) | Net of tax and noncontrolling interest | |||||||||||||||||||||||
| Three Months Ended September 30, | Nine Months Ended September 30, | |||||||||||||||||||||||||
| 2023 | 2022 | 2023 | 2022 | |||||||||||||||||||||||
| Net income (loss) attributable to common stockholders | $ | 66 | $ | 340 | $ | 19 | 347 | |||||||||||||||||||
| Adjustment to redemption value (ASC 480) | — | — | — | — | ||||||||||||||||||||||
| Numerator of basic and diluted EPS | $ | 66 | $ | 340 | $ | 19 | 347 | |||||||||||||||||||
| Per Share: | ||||||||||||||||||||||||||
| Basic | $ | 1.44 | $ | 7.50 | $ | 0.42 | $ | 7.56 | ||||||||||||||||||
| Diluted | $ | 1.41 | $ | 7.41 | $ | 0.41 | $ | 7.48 | ||||||||||||||||||
| Three Months Ended September 30, | Nine Months Ended September 30, | |||||||||||||||||||||||||
| 2023 | 2022 | 2023 | 2022 | |||||||||||||||||||||||
| Basic weighted average shares outstanding denominator | 45,635,373 | 45,307,019 | 45,652,555 | 45,847,306 | ||||||||||||||||||||||
| Effect of potential dilutive shares : | ||||||||||||||||||||||||||
| Restricted stock units | 125,035 | 179,293 | 152,431 | 105,114 | ||||||||||||||||||||||
Performance stock units (1) |
1,050,327 | 360,093 | 981,457 | 403,674 | ||||||||||||||||||||||
| Diluted weighted average shares outstanding denominator | 46,810,735 | 45,846,405 | 46,786,443 | 46,356,094 | ||||||||||||||||||||||
| Anti-dilutive shares excluded from the above reconciliation: | ||||||||||||||||||||||||||
Warrants |
— | 4,877,617 | — | 4,877,617 | ||||||||||||||||||||||
Restricted stock units |
125,035 | 157,991 | 127,149 | 214,941 | ||||||||||||||||||||||
Performance stock units (1) |
— | — | 51,909 | — | ||||||||||||||||||||||
| Jurisdiction | Tax Year | ||||
| United States | 2010 | ||||
| New York State | 2013 | ||||
| New York City | 2018 | ||||
| United Kingdom | 2019 | ||||
| Italy | 2018 | ||||
| Three Months Ended September 30, | Nine Months Ended September 30, | ||||||||||||||||||||||
| 2023 | 2022 | 2023 | 2022 | ||||||||||||||||||||
| U.S. | $ | 59 | $ | 329 | $ | (7) | $ | 338 | |||||||||||||||
| Foreign | 8 | 14 | 34 | 13 | |||||||||||||||||||
| Total | $ | 68 | $ | 342 | $ | 28 | $ | 352 | |||||||||||||||
| Three Months Ended September 30, | Nine Months Ended September 30, | ||||||||||||||||||||||
| 2023 | 2022 | 2023 | 2022 | ||||||||||||||||||||
| Current taxes | |||||||||||||||||||||||
| U. S. federal | $ | — | $ | — | $ | 1 | $ | — | |||||||||||||||
| U.S. state and local | — | — | — | — | |||||||||||||||||||
| Foreign | 4 | 4 | 6 | 6 | |||||||||||||||||||
| Total Current taxes | 4 | 4 | 8 | 6 | |||||||||||||||||||
| Deferred taxes | |||||||||||||||||||||||
| U.S.federal | (2) | — | (2) | — | |||||||||||||||||||
| Foreign | (1) | (2) | 1 | (2) | |||||||||||||||||||
| Total Deferred taxes | (3) | (2) | (1) | (2) | |||||||||||||||||||
| Provision for income taxes | $ | 1 | $ | 2 | $ | 7 | $ | 4 | |||||||||||||||
| Page | |||||
| Executive Summary | |||||
| Critical Accounting Estimates | |||||
| Financial Guarantees in Force | |||||
| Results of Operations | |||||
| Liquidity and Capital Resources | |||||
| Balance Sheet | |||||
| Variable Interest Entities | |||||
| Accounting Standards | |||||
| U.S. Insurance Statutory Basis Financial Results | |||||
| Ambac UK Financial Results under UK Accounting Principles | |||||
| Non-GAAP Financial Measures | |||||
| Cash and short-term investments | $ | 159 | ||||||
Other investments (1) |
31 | |||||||
| Other net assets | 19 | |||||||
| Total | $ | 209 | ||||||
| Three Months Ended September 30, 2023 | Three Months Ended September 30, 2022 | |||||||||||||||||||||||||||||||||||||||||||||||||||||||||||||
| ($ in millions) | Legacy Financial Guarantee Insurance | Specialty Property & Casualty Insurance | Insurance Distribution |
Corporate & Other | Consoli-dated | Legacy Financial Guarantee Insurance | Specialty Property & Casualty Insurance | Insurance Distribution |
Corporate & Other | Consoli-dated | ||||||||||||||||||||||||||||||||||||||||||||||||||||
| Premiums placed | $ | 62 | 62 | $ | 28 | 28 | ||||||||||||||||||||||||||||||||||||||||||||||||||||||||
| Gross premiums written | $ | 2 | $ | 77 | $ | 80 | $ | (13) | $ | 30 | $ | 16 | ||||||||||||||||||||||||||||||||||||||||||||||||||
| Net premiums written | 2 | 25 | 27 | (6) | 6 | — | ||||||||||||||||||||||||||||||||||||||||||||||||||||||||
| Total revenues | 41 | 16 | 15 | $ | 3 | 74 | 67 | 6 | 7 | $ | 1 | 80 | ||||||||||||||||||||||||||||||||||||||||||||||||||
| Total expenses | (28) | 15 | 12 | 7 | 6 | (282) | 7 | 6 | 6 | (262) | ||||||||||||||||||||||||||||||||||||||||||||||||||||
| Pretax income (loss) | 69 | — | 2 | (4) | 68 | 349 | (1) | 1 | (6) | 342 | ||||||||||||||||||||||||||||||||||||||||||||||||||||
Ambac Stockholders’ Equity (1) |
836 | 116 | 103 | 210 | 1,265 | 681 | 110 | 64 | 154 | 1,009 | ||||||||||||||||||||||||||||||||||||||||||||||||||||
| Non-redeemable noncontrolling interest | 51 | 2 | 53 | 60 | 2 | 62 | ||||||||||||||||||||||||||||||||||||||||||||||||||||||||
| Total stockholders’ equity | $ | 887 | $ | 118 | $ | 103 | $ | 210 | $ | 1,318 | $ | 741 | $ | 112 | $ | 64 | $ | 154 | $ | 1,071 | ||||||||||||||||||||||||||||||||||||||||||
| Nine Months Ended September 30, 2023 | Nine Months Ended September 30, 2022 | |||||||||||||||||||||||||||||||||||||||||||||||||||||||||||||
| Legacy Financial Guarantee Insurance | Specialty Property & Casualty Insurance | Insurance Distribution |
Corporate & Other | Consoli-dated | Legacy Financial Guarantee Insurance | Specialty Property & Casualty Insurance | Insurance Distribution |
Corporate & Other | Consoli-dated | |||||||||||||||||||||||||||||||||||||||||||||||||||||
| Premiums placed | $ | 180 | $ | 180 | $ | 97 | $ | 97 | ||||||||||||||||||||||||||||||||||||||||||||||||||||||
| Gross premiums written | $ | 12 | $ | 183 | $ | 195 | $ | (12) | $ | 95 | $ | 83 | ||||||||||||||||||||||||||||||||||||||||||||||||||
| Net premiums written | $ | (43) | $ | 43 | $ | — | $ | 2 | $ | 19 | $ | 21 | ||||||||||||||||||||||||||||||||||||||||||||||||||
| Total revenues | $ | 112 | $ | 35 | $ | 39 | $ | 7 | $ | 194 | $ | 250 | $ | 11 | $ | 22 | $ | 2 | $ | 286 | ||||||||||||||||||||||||||||||||||||||||||
| Total expenses | $ | 83 | $ | 36 | $ | 33 | $ | 14 | $ | 166 | $ | (112) | $ | 16 | $ | 19 | $ | 11 | $ | (66) | ||||||||||||||||||||||||||||||||||||||||||
| Pretax income (loss) | $ | 29 | $ | (1) | $ | 7 | $ | (8) | $ | 28 | $ | 362 | $ | (5) | $ | 3 | $ | (8) | $ | 352 | ||||||||||||||||||||||||||||||||||||||||||
| September 30, 2023 |
December 31, 2022 |
Decrease | |||||||||||||||||||||
| Total | $ | 19,541 | $ | 22,613 | $ | (3,072) | (11) | % | |||||||||||||||
| ACC | 4,247 | 4,735 | (488) | (10) | % | ||||||||||||||||||
| Watch list | 1,564 | 3,044 | (1,480) | (49) | % | ||||||||||||||||||
Net income (1) |
$ | (2) | ||||||
| Gain (loss) on foreign currency translation (net of tax), included in other comprehensive income | 8 | |||||||
| Foreign currency impact on unrealized gains (losses) on non-functional currency available-for-sale securities (net of tax), included in other comprehensive income | (2) | |||||||
| Impact on total comprehensive income (loss) | $ | 4 | ||||||
| September 30, 2023 |
December 31, 2022 |
||||||||||
Public Finance (1) |
$ | 7,820 | $ | 10,547 | |||||||
| Structured Finance | 3,380 | 3,612 | |||||||||
| International Finance | 8,341 | 8,454 | |||||||||
| Total net par outstanding | $ | 19,541 | $ | 22,613 | |||||||
| Sector | Co. | Bond Kind | Country-Bond Type |
Ambac
Ratings (1)
|
Ultimate Maturity Year |
Net Par Outstanding |
% of Total
Net Par
Outstanding
|
|||||||||||||||||||||||||||||||
| IF | AUK | Investor Owned Utility Gas - unsecured | UK-Utility | BBB+ | 2037 | $ | 856 | 4.4 | % | |||||||||||||||||||||||||||||
| IF | AUK | PFI - Hospitals | UK-Infrastructure | BBB+ | 2046 | 708 | 3.6 | % | ||||||||||||||||||||||||||||||
| IF | AUK | PFI - Accommodation | UK-Infrastructure | A- | 2040 | 708 | 3.6 | % | ||||||||||||||||||||||||||||||
| IF | AUK | Other Asset Securitizations | UK-Asset Securitizations | BBB | 2033 | 693 | 3.5 | % | ||||||||||||||||||||||||||||||
| IF | AUK | Investor Owned Utility Other - unsecured | UK-Utility | A- | 2035 | 652 | 3.3 | % | ||||||||||||||||||||||||||||||
| IF | AUK | Investor Owned Utility Electric - unsecured | UK-Utility | BBB+ | 2036 | 591 | 3.0 | % | ||||||||||||||||||||||||||||||
| IF | AUK | Sub-Sovereign | Italy-Sub-Sovereign | BIG | 2035 | 568 | 2.9 | % | ||||||||||||||||||||||||||||||
| IF | AUK | PFI - Accommodation | UK-Infrastructure | A- | 2038 | 458 | 2.3 | % | ||||||||||||||||||||||||||||||
| PF | AAC | US State Lease/Appropriation | US-Lease and Tax-backed Revenue | BBB- | 2036 | 428 | 2.2 | % | ||||||||||||||||||||||||||||||
| IF | AUK | PFI - Roads | UK-Infrastructure | BIG | 2039 | 301 | 1.5 | % | ||||||||||||||||||||||||||||||
| Total | $ | 5,963 | 30.3 | % | ||||||||||||||||||||||||||||||||||
| PF = Public Finance, SF = Structured Finance, IF = International Finance AAC = Ambac Assurance, AUK = Ambac UK |
||||||||||||||||||||||||||||||||||||||
| Currency | Net Par Amount Outstanding in Base Currency |
Net Par Amount Outstanding in U.S. Dollars |
||||||||||||
| U.S. Dollars | $ | 11,369 | $ | 11,369 | ||||||||||
| British Pounds | £ | 5,777 | 7,052 | |||||||||||
| Euros | € | 822 | 869 | |||||||||||
| Australian Dollars | A$ | 391 | 251 | |||||||||||
| Total | $ | 19,541 | ||||||||||||
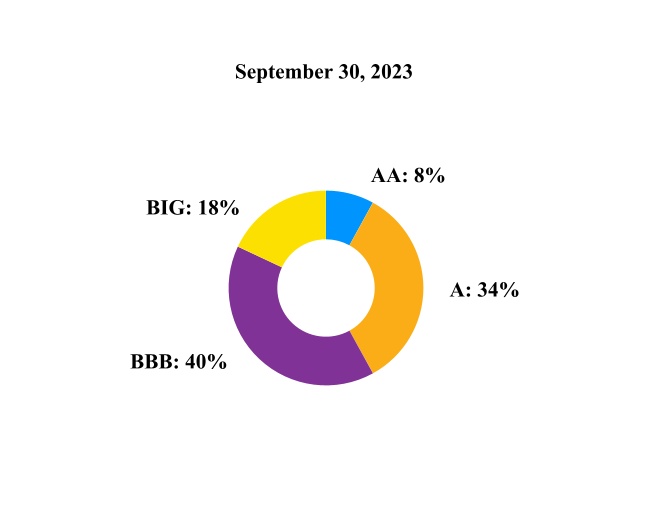

| Net Par Outstanding | ||||||||||||||
| Bond Type | September 30, 2023 |
December 31, 2022 |
||||||||||||
| Public Finance: | ||||||||||||||
| Military Housing | $ | 362 | $ | 366 | ||||||||||
| General Obligations | 95 | 151 | ||||||||||||
| Lease and Tax-Backed Revenue | 83 | 252 | ||||||||||||
| Other | 37 | 54 | ||||||||||||
| Total Public Finance | 577 | 823 | ||||||||||||
| Structured Finance: | ||||||||||||||
| RMBS | 1,687 | 1,841 | ||||||||||||
| Student Loans | 267 | 275 | ||||||||||||
| Total Structured Finance | 1,954 | 2,117 | ||||||||||||
| International Finance: | ||||||||||||||
| Sovereign/sub-sovereign | 680 | 701 | ||||||||||||
| Transportation | 301 | 310 | ||||||||||||
| Other | 1 | 2 | ||||||||||||
| Total International Finance | 982 | 1,013 | ||||||||||||
| Total | $ | 3,513 | $ | 3,953 | ||||||||||
| Three Months Ended September 30, | Nine Months Ended September 30, | |||||||||||||||||||||||||
| 2023 | 2022 | 2023 | 2022 | |||||||||||||||||||||||
| Gross premiums written | $ | 80 | $ | 16 | $ | 195 | $ | 83 | ||||||||||||||||||
| Revenues: | ||||||||||||||||||||||||||
| Net premiums earned | $ | 18 | $ | 11 | $ | 47 | $ | 39 | ||||||||||||||||||
| Commission income | 15 | 7 | 39 | 22 | ||||||||||||||||||||||
| Program fees | 2 | 1 | 6 | 2 | ||||||||||||||||||||||
| Net investment income (loss) | 30 | 11 | 100 | (6) | ||||||||||||||||||||||
| Net investment gains (losses), including impairments | 1 | 14 | (7) | 31 | ||||||||||||||||||||||
| Net gains (losses) on derivative contracts | 4 | 37 | 1 | 124 | ||||||||||||||||||||||
| Net realized gains on extinguishment of debt | — | — | — | 57 | ||||||||||||||||||||||
| Income (loss) on variable interest entities | 1 | (1) | — | 14 | ||||||||||||||||||||||
| Other income | 2 | — | 7 | 3 | ||||||||||||||||||||||
| Expenses: | ||||||||||||||||||||||||||
| Losses and loss adjustment expenses | (76) | (353) | (51) | (341) | ||||||||||||||||||||||
| Amortization of deferred acquisition costs, net | 2 | 1 | 5 | 2 | ||||||||||||||||||||||
| Commission expense | 8 | 4 | 22 | 13 | ||||||||||||||||||||||
| General and administrative expenses | 49 | 31 | 122 | 90 | ||||||||||||||||||||||
| Intangible amortization | 7 | 6 | 21 | 34 | ||||||||||||||||||||||
| Interest expense | 16 | 49 | 48 | 138 | ||||||||||||||||||||||
| Provision for income taxes | 1 | 2 | 7 | 4 | ||||||||||||||||||||||
| Net income | 66 | 340 | 21 | 348 | ||||||||||||||||||||||
| Less: net (gain) loss attributable to noncontrolling interest | — | — | (1) | (1) | ||||||||||||||||||||||
| Net income attributable to common stockholders | $ | 66 | $ | 340 | $ | 19 | $ | 347 | ||||||||||||||||||
| Three Months Ended September 30, | Nine Months Ended September 30, | |||||||||||||||||||||||||
| 2023 | 2022 | 2023 | 2022 | |||||||||||||||||||||||
| Legacy Financial Guaranty Insurance | $ | 2 | $ | (13) | $ | 12 | $ | (12) | ||||||||||||||||||
| Specialty Property & Casualty Insurance | 77 | 30 | 183 | 95 | ||||||||||||||||||||||
| Total | $ | 80 | $ | 16 | $ | 195 | $ | 83 | ||||||||||||||||||
| Three Months Ended September 30, | Nine Months Ended September 30, | |||||||||||||||||||||||||
| 2023 | 2022 | 2023 | 2022 | |||||||||||||||||||||||
| Legacy Financial Guaranty Insurance | $ | 6 | $ | 7 | $ | 20 | $ | 31 | ||||||||||||||||||
| Specialty Property & Casualty Insurance | 12 | 4 | 27 | 8 | ||||||||||||||||||||||
| Total | $ | 18 | $ | 11 | $ | 47 | $ | 39 | ||||||||||||||||||
| Three Months Ended September 30, | Nine Months Ended September 30, | ||||||||||||||||||||||
| 2023 | 2022 | 2023 | 2022 | ||||||||||||||||||||
| Securities available-for-sale and short-term other than Ambac-insured | $ | 18 | $ | 11 | 50 | 26 | |||||||||||||||||
| Other investments (includes trading securities) | 6 | (7) | 33 | (50) | |||||||||||||||||||
| Securities available-for-sale: Ambac-insured (including secured notes) | 6 | 6 | $ | 17 | $ | 19 | |||||||||||||||||
| Net investment income (loss) | $ | 30 | $ | 11 | $ | 100 | $ | (6) | |||||||||||||||
| Three Months Ended September 30, | Nine Months Ended September 30, | |||||||||||||||||||||||||
| 2023 | 2022 | 2023 | 2022 | |||||||||||||||||||||||
| Net gains (losses) on securities sold or called | $ | (1) | $ | 5 | $ | (3) | $ | 12 | ||||||||||||||||||
| Net foreign exchange gains (losses) | 2 | 9 | (2) | 20 | ||||||||||||||||||||||
| Credit impairments | (1) | — | (2) | — | ||||||||||||||||||||||
| Intent / requirement to sell impairments | — | — | — | — | ||||||||||||||||||||||
| Net investment gains (losses), including impairments | $ | 1 | $ | 14 | $ | (7) | $ | 31 | ||||||||||||||||||
| Three Months Ended September 30, | Nine Months Ended September 30, | |||||||||||||||||||||||||
| 2023 | 2022 | 2023 | 2022 | |||||||||||||||||||||||
| Legacy financial guarantee | $ | (86) | (356) | $ | (71) | (347) | ||||||||||||||||||||
| Specialty property and casualty insurance | 10 | 3 | 20 | 5 | ||||||||||||||||||||||
| (76) | (353) | (51) | (341) | |||||||||||||||||||||||
| Three Months Ended September 30, | Nine Months Ended September 30, | |||||||||||||||||||||||||
| 2023 | 2022 | 2023 | 2022 | |||||||||||||||||||||||
| Compensation | $ | 18 | $ | 17 | $ | 52 | $ | 49 | ||||||||||||||||||
| Non-compensation | 31 | 14 | 70 | 41 | ||||||||||||||||||||||
| Total G&A expenses | 49 | 31 | 122 | 90 | ||||||||||||||||||||||
| Three Months Ended September 30, | Nine Months Ended September 30, | |||||||||||||||||||||||||
| 2023 | 2022 | 2023 | 2022 | |||||||||||||||||||||||
| Surplus notes | $ | 16 | $ | 20 | $ | 47 | $ | 61 | ||||||||||||||||||
| Sitka AAC note | — | 21 | — | 55 | ||||||||||||||||||||||
| Tier 2 Notes | — | 7 | 1 | 22 | ||||||||||||||||||||||
| Other | — | — | 1 | 1 | ||||||||||||||||||||||
| Total interest expense | $ | 16 | $ | 49 | $ | 48 | $ | 138 | ||||||||||||||||||
| Three Months Ended September 30, | Nine Months Ended September 30, | |||||||||||||||||||||||||
| 2023 | 2022 | 2023 | 2022 | |||||||||||||||||||||||
| Revenues: | ||||||||||||||||||||||||||
| Net premiums earned | $ | 6 | $ | 7 | $ | 20 | $ | 31 | ||||||||||||||||||
| Net investment income | 27 | 9 | 90 | (9) | ||||||||||||||||||||||
| Net investment gains (losses), including impairments | 1 | 14 | (7) | 31 | ||||||||||||||||||||||
| Net gains on derivative contracts | 4 | 37 | 2 | 123 | ||||||||||||||||||||||
| Net realized gains on extinguishment of debt | — | — | — | 57 | ||||||||||||||||||||||
| Other income | 3 | (1) | 7 | 17 | ||||||||||||||||||||||
| Total | 41 | 67 | 112 | 250 | ||||||||||||||||||||||
| Expenses: | ||||||||||||||||||||||||||
| Loss and loss expenses (benefit) | (86) | (356) | (71) | (347) | ||||||||||||||||||||||
| General and administrative expenses | 35 | 20 | 87 | 64 | ||||||||||||||||||||||
| Total | (50) | (336) | 16 | (283) | ||||||||||||||||||||||
Earnings before interest, taxes, depreciation and amortization (1) |
91 | 403 | 96 | 533 | ||||||||||||||||||||||
| Interest expense | 16 | 49 | 48 | 138 | ||||||||||||||||||||||
| Depreciation | — | — | 1 | 1 | ||||||||||||||||||||||
| Intangible amortization | 6 | 5 | 18 | 32 | ||||||||||||||||||||||
| Pretax income (loss) | $ | 69 | $ | 349 | $ | 29 | $ | 362 | ||||||||||||||||||
Stockholders equity (2) |
$ | 836 | $ | 681 | ||||||||||||||||||||||
| Three Months Ended September 30, | Nine Months Ended September 30, | |||||||||||||||||||||||||
| 2023 | 2022 | 2023 | 2022 | |||||||||||||||||||||||
| Structured Finance | $ | (80) | $ | (351) | $ | (59) | $ | (150) | ||||||||||||||||||
| Domestic Public Finance | (8) | (1) | (7) | (194) | ||||||||||||||||||||||
| Other, including International Finance | 2 | (4) | (5) | (3) | ||||||||||||||||||||||
| Totals | $ | (86) | $ | (356) | $ | (71) | $ | (347) | ||||||||||||||||||
| Three Months Ended September 30, | Nine Months Ended September 30, | |||||||||||||||||||||||||
| 2023 | 2022 | 2023 | 2022 | |||||||||||||||||||||||
| Gross premiums written | $ | 77 | $ | 30 | $ | 183 | $ | 95 | ||||||||||||||||||
| Net premiums written | 25 | 6 | 43 | 19 | ||||||||||||||||||||||
| Revenues: | ||||||||||||||||||||||||||
| Net premiums earned | $ | 12 | $ | 4 | $ | 27 | $ | 8 | ||||||||||||||||||
| Program fees | 2 | 1 | 6 | 2 | ||||||||||||||||||||||
| Investment income | 1 | — | 3 | 1 | ||||||||||||||||||||||
| Net investment gains (losses), including impairments | — | — | — | — | ||||||||||||||||||||||
| Total | 16 | 6 | 35 | 11 | ||||||||||||||||||||||
| Expenses: | ||||||||||||||||||||||||||
| Losses and loss expenses incurred | 10 | 3 | 20 | 5 | ||||||||||||||||||||||
| Amortization of deferred acquisition costs, net | 2 | 1 | 5 | 1 | ||||||||||||||||||||||
| General and administrative expenses | 4 | 3 | 12 | 10 | ||||||||||||||||||||||
| Total | 15 | 7 | 36 | 16 | ||||||||||||||||||||||
| EBITDA | — | $ | (1) | (1) | $ | (5) | ||||||||||||||||||||
| Pretax income (loss) | $ | — | $ | (1) | $ | (1) | $ | (5) | ||||||||||||||||||
Retention Ratio (1) |
32.0% | 18.9% | 23.6% | 19.6% | ||||||||||||||||||||||
Loss and LAE Ratio (2) |
78.0% | 65.2% | 73.8% | 65.7% | ||||||||||||||||||||||
Combined Ratio (3) |
106.5% | 147.8% | 112.3% | 178.8% | ||||||||||||||||||||||
|
Ambac's stockholders
equity (4)
|
$ | 116 | $ | 110 | ||||||||||||||||||||||
| Three Months Ended September 30, | Nine Months Ended September 30, | |||||||||||||||||||||||||
| 2023 | 2022 | 2023 | 2022 | |||||||||||||||||||||||
| Premiums placed | $ | 62 | $ | 28 | $ | 180 | $ | 97 | ||||||||||||||||||
| Commission income | $ | 15 | $ | 7 | $ | 39 | $ | 22 | ||||||||||||||||||
| Commission expense | 8 | 4 | 22 | 13 | ||||||||||||||||||||||
| Net commissions | 6 | 3 | 17 | 9 | ||||||||||||||||||||||
| Expenses: | ||||||||||||||||||||||||||
General and administrative expenses (1) |
3 | 1 | 7 | 4 | ||||||||||||||||||||||
| EBITDA | 4 | 2 | 10 | 5 | ||||||||||||||||||||||
Depreciation (1) |
— | — | — | — | ||||||||||||||||||||||
| Intangible amortization | 1 | 1 | 3 | 2 | ||||||||||||||||||||||
| Pretax income (loss) | $ | 2 | $ | 1 | $ | 7 | $ | 3 | ||||||||||||||||||
|
Ambac's stockholders
equity (2)
|
$ | 103 | $ | 64 | ||||||||||||||||||||||
| Nine Months Ended September 30, | 2023 | 2022 | |||||||||
| Cash provided by (used in): | |||||||||||
| Operating activities | $ | 112 | $ | 59 | |||||||
| Investing activities | 521 | 435 | |||||||||
Financing activities (1) |
(392) | (479) | |||||||||
| Foreign exchange impact on cash and cash equivalents | — | (1) | |||||||||
| Net cash flow | $ | 241 | $ | 14 | |||||||
| Nine Months Ended September 30, | 2023 | 2022 | |||||||||
| Net loss and loss expenses paid (recovered): | |||||||||||
| Net losses paid | $ | 23 | $ | 239 | |||||||
Net subrogation received (1) |
(169) | (233) | |||||||||
| Net loss expenses paid | 7 | 18 | |||||||||
| Net cash flow | $ | (139) | $ | 24 | |||||||
| September 30, 2023 | December 31, 2022 | |||||||||||||||||||||||||||||||||||||||||||||||||||||||||||||
| Legacy Financial Guarantee Insurance | Specialty Property & Casualty Insurance | Insurance Distribution | Corporate & Other | Consolidated | Legacy Financial Guarantee Insurance | Specialty Property & Casualty Insurance | Insurance Distribution | Corporate & Other | Consolidated | |||||||||||||||||||||||||||||||||||||||||||||||||||||
| Fixed maturity securities | $ | 1,427 | $ | 115 | $ | — | $ | 14 | $ | 1,556 | $ | 1,281 | $ | 102 | $ | — | $ | 12 | $ | 1,395 | ||||||||||||||||||||||||||||||||||||||||||
| Fixed maturity securities - trading | 28 | — | — | — | 28 | 59 | — | — | — | 59 | ||||||||||||||||||||||||||||||||||||||||||||||||||||
| Short-term | 231 | 33 | 4 | 152 | 420 | 303 | 29 | — | 175 | 507 | ||||||||||||||||||||||||||||||||||||||||||||||||||||
| Other investments | 443 | — | — | 18 | 461 | 552 | — | — | 16 | 568 | ||||||||||||||||||||||||||||||||||||||||||||||||||||
| Fixed maturity securities pledged as collateral | 27 | — | — | — | 27 | 64 | — | — | — | 64 | ||||||||||||||||||||||||||||||||||||||||||||||||||||
Total investments (1) |
$ | 2,156 | $ | 148 | $ | 4 | $ | 184 | $ | 2,492 | $ | 2,259 | $ | 131 | $ | — | $ | 203 | $ | 2,593 | ||||||||||||||||||||||||||||||||||||||||||
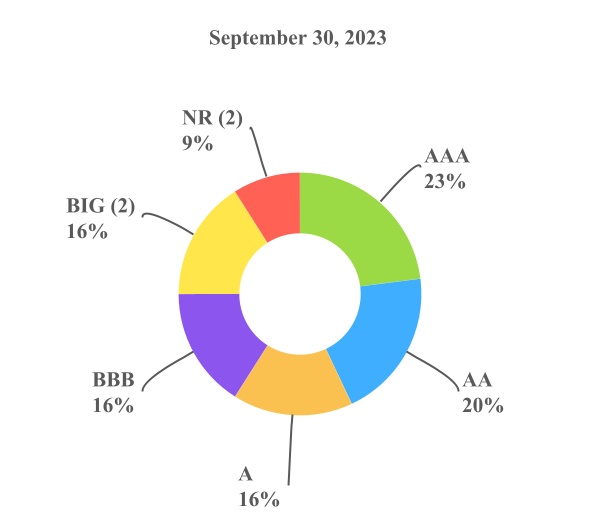
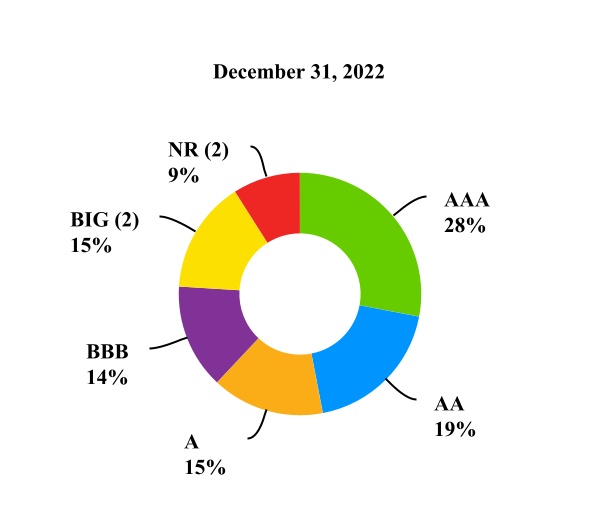
| Currency | Premium Receivable in Payment Currency |
Premium Receivable in U.S. Dollars |
||||||||||||
| U.S. Dollars | $ | 194 | $ | 194 | ||||||||||
| British Pounds | £ | 58 | 71 | |||||||||||
| Euros | € | 13 | 13 | |||||||||||
| Total | $ | 278 | ||||||||||||
| September 30, 2023: | December 31, 2022: | |||||||||||||||||||||||||||||||||||||||||||||||||||||||||||||
| Specialty Property and Casualty | Legacy Financial Guarantee | Specialty Property and Casualty | Legacy Financial Guarantee | |||||||||||||||||||||||||||||||||||||||||||||||||||||||||||
| Present Value of Expected Net Cash Flows |
Unearned Premium Revenue |
Gross Loss and Loss Expense Reserves |
Present Value of Expected Net Cash Flows |
Unearned Premium Revenue |
Gross Loss and Loss Expense Reserves |
|||||||||||||||||||||||||||||||||||||||||||||||||||||||||
| Balance Sheet Line Item | Gross Loss and Loss Expense Reserves |
Claims and Loss Expenses |
Recoveries (1) |
Gross Loss and Loss Expense Reserves |
Claims and Loss Expenses |
Recoveries (1) |
||||||||||||||||||||||||||||||||||||||||||||||||||||||||
| Loss and loss expense reserves | $ | 160 | $ | 769 | $ | (50) | $ | (29) | $ | 850 | $ | 90 | $ | 787 | $ | (44) | $ | (28) | $ | 805 | ||||||||||||||||||||||||||||||||||||||||||
| Subrogation recoverable | — | 4 | (183) | — | (179) | — | 5 | (276) | — | (271) | ||||||||||||||||||||||||||||||||||||||||||||||||||||
| Totals | $ | 160 | $ | 773 | $ | (234) | $ | (29) | $ | 670 | $ | 90 | $ | 791 | $ | (319) | $ | (28) | $ | 534 | ||||||||||||||||||||||||||||||||||||||||||
| September 30, 2023: | December 31, 2022: | |||||||||||||||||||||||||||||||||||||||||||||||||||||||||||||
|
Gross Par
Outstanding (1)
|
Present Value of Expected Net Cash Flows |
Unearned Premium Revenue |
Gross Loss and Loss Expense Reserves (1)(2) |
Gross Par
Outstanding (1)
|
Present Value of Expected Net Cash Flows |
Unearned Premium Revenue |
Gross Loss and Loss Expense Reserves (1)(2) |
|||||||||||||||||||||||||||||||||||||||||||||||||||||||
| Claims and Loss Expenses |
Recoveries | Claims and Loss Expenses |
Recoveries | |||||||||||||||||||||||||||||||||||||||||||||||||||||||||||
| Structured Finance | $ | 1,918 | $ | 670 | $ | (213) | $ | (10) | $ | 447 | $ | 2,050 | $ | 664 | $ | (296) | $ | (10) | $ | 358 | ||||||||||||||||||||||||||||||||||||||||||
| Domestic Public Finance | 992 | 78 | (8) | (8) | 62 | 1,215 | 96 | (11) | (10) | 75 | ||||||||||||||||||||||||||||||||||||||||||||||||||||
| Other, including International finance | 1,166 | 21 | (13) | (11) | (3) | 782 | 23 | (12) | (8) | 3 | ||||||||||||||||||||||||||||||||||||||||||||||||||||
| Loss expenses | — | 4 | — | — | 4 | — | 8 | — | — | 8 | ||||||||||||||||||||||||||||||||||||||||||||||||||||
| Totals | $ | 4,076 | $ | 773 | $ | (234) | $ | (29) | $ | 510 | $ | 4,047 | $ | 791 | $ | (319) | $ | (28) | $ | 444 | ||||||||||||||||||||||||||||||||||||||||||
| September 30, 2023 |
December 31, 2022 | |||||||||||||
| Surplus notes | $ | 488 | $ | 477 | ||||||||||
| Tier 2 notes | — | 146 | ||||||||||||
| Ambac UK debt | 17 | 16 | ||||||||||||
| Total Long-term Debt | $ | 505 | $ | 639 | ||||||||||
| Three Months Ended September 30, 2023 | Three Months Ended September 30, 2022 | |||||||||||||||||||||||||||||||||||||||||||||||||||||||||||||
| Legacy Financial Guarantee Insurance | Specialty Property & Casualty Insurance | Insurance Distribution | Corporate & Other | Consoli-dated | Legacy Financial Guarantee Insurance | Specialty Property & Casualty Insurance | Insurance Distribution | Corporate & Other | Consoli-dated | |||||||||||||||||||||||||||||||||||||||||||||||||||||
| Net income (loss) | $ | 66 | $ | — | $ | 2 | $ | (2) | $ | 66 | $ | 346 | $ | (2) | $ | 1 | $ | (6) | $ | 340 | ||||||||||||||||||||||||||||||||||||||||||
| Adjustments: | ||||||||||||||||||||||||||||||||||||||||||||||||||||||||||||||
| Interest expense | 16 | — | — | — | 16 | 49 | — | — | — | 49 | ||||||||||||||||||||||||||||||||||||||||||||||||||||
| Income taxes | 3 | — | — | (2) | 1 | 2 | — | — | — | 2 | ||||||||||||||||||||||||||||||||||||||||||||||||||||
| Depreciation | — | — | — | — | — | — | — | — | — | — | ||||||||||||||||||||||||||||||||||||||||||||||||||||
| Amortization of intangible assets | 6 | — | 1 | — | 7 | 5 | — | 1 | — | 6 | ||||||||||||||||||||||||||||||||||||||||||||||||||||
EBITDA (1) |
$ | 91 | $ | — | $ | 4 | $ | (4) | $ | 91 | $ | 403 | $ | (1) | $ | 2 | $ | (6) | $ | 397 | ||||||||||||||||||||||||||||||||||||||||||
| Nine Months Ended September 30, 2023 | Nine Months Ended September 30, 2022 | |||||||||||||||||||||||||||||||||||||||||||||||||||||||||||||
| Legacy Financial Guarantee Insurance | Specialty Property & Casualty Insurance | Insurance Distribution | Corporate & Other | Consoli-dated | Legacy Financial Guarantee Insurance | Specialty Property & Casualty Insurance | Insurance Distribution | Corporate & Other | Consoli-dated | |||||||||||||||||||||||||||||||||||||||||||||||||||||
Net income (loss) |
$ | 21 | $ | (1) | $ | 7 | $ | (6) | $ | 21 | $ | 358 | $ | (6) | $ | 3 | $ | (8) | $ | 348 | ||||||||||||||||||||||||||||||||||||||||||
| Adjustments: | ||||||||||||||||||||||||||||||||||||||||||||||||||||||||||||||
| Interest expense | 48 | — | — | — | 48 | 138 | — | — | — | 138 | ||||||||||||||||||||||||||||||||||||||||||||||||||||
| Income taxes | 8 | — | — | (1) | 7 | 4 | — | — | — | 4 | ||||||||||||||||||||||||||||||||||||||||||||||||||||
| Depreciation | 1 | — | — | — | 1 | 1 | — | — | — | 1 | ||||||||||||||||||||||||||||||||||||||||||||||||||||
| Amortization of intangible assets | 18 | — | 3 | — | 21 | 32 | — | 2 | — | 34 | ||||||||||||||||||||||||||||||||||||||||||||||||||||
EBITDA (1) |
$ | 96 | $ | (1) | $ | 10 | $ | (8) | $ | 98 | $ | 533 | $ | (5) | $ | 5 | $ | (8) | $ | 524 | ||||||||||||||||||||||||||||||||||||||||||
| Three Months Ended September 30, | |||||||||||||||||||||||
| 2023 | 2022 | ||||||||||||||||||||||
| ($ in millions, except share data) | $ Amount | Per Share | $ Amount | Per Share | |||||||||||||||||||
| Net income (loss) attributable to common shareholders | $ | 66 | $ | 1.41 | $ | 340 | 7.41 | ||||||||||||||||
| Adjustments: | |||||||||||||||||||||||
| Net investment (gains) losses, including impairments | (1) | (0.02) | (14) | (0.31) | |||||||||||||||||||
| Intangible amortization | 7 | 0.15 | 6 | 0.13 | |||||||||||||||||||
| Litigation costs | 21 | 0.44 | 4 | 0.08 | |||||||||||||||||||
| Foreign exchange (gains) losses | 1 | 0.01 | 2 | 0.05 | |||||||||||||||||||
| Workforce change costs | — | — | — | 0.01 | |||||||||||||||||||
| Pretax adjusted net income (loss) | 94 | $ | 1.99 | 338 | $ | 7.37 | |||||||||||||||||
| Income tax effects | — | 0.01 | 2 | 0.03 | |||||||||||||||||||
| Net (gains) attributable to noncontrolling interests | — | — | — | — | |||||||||||||||||||
| Adjusted Net Income (Loss) | $ | 94 | $ | 2.00 | $ | 339 | $ | 7.40 | |||||||||||||||
| Nine Months Ended September 30, | |||||||||||||||||||||||
| 2023 | 2022 | ||||||||||||||||||||||
| ($ in millions, except share data) | $ Amount | Per Share | $ Amount | Per Share | |||||||||||||||||||
| Net income (loss) attributable to common shareholders | $ | 19 | $ | 0.41 | $ | 347 | $ | 7.48 | |||||||||||||||
| Adjustments: | |||||||||||||||||||||||
| Net investment (gains) losses, including impairments | 7 | 0.15 | (31) | (0.67) | |||||||||||||||||||
| Intangible amortization | 21 | 0.44 | 34 | 0.73 | |||||||||||||||||||
| Litigation costs | 37 | 0.79 | 11 | 0.23 | |||||||||||||||||||
| Foreign exchange (gains) losses | — | — | 6 | 0.13 | |||||||||||||||||||
| Workforce change costs | 1 | 0.02 | 1 | 0.02 | |||||||||||||||||||
| Net (gain) loss on extinguishment of debt | — | — | (57) | (1.23) | |||||||||||||||||||
| Pretax adjusted net income (loss) | 85 | $ | 1.81 | 310 | $ | 6.69 | |||||||||||||||||
| Income tax effects | (1) | (0.03) | 3 | 0.06 | |||||||||||||||||||
| Net (gains) attributable to noncontrolling interests | (1) | (0.01) | — | (0.01) | |||||||||||||||||||
| Adjusted Net Income (Loss) | $ | 83 | $ | 1.77 | $ | 312 | $ | 6.74 | |||||||||||||||
| September 30, 2023 | December 31, 2022 | ||||||||||||||||||||||
| ($ in millions, except share data) | $ Amount | Per Share | $ Amount | Per Share | |||||||||||||||||||
| Total Ambac Financial Group, Inc. stockholders’ equity | $ | 1,265 | $ | 28.00 | $ | 1,252 | $ | 27.85 | |||||||||||||||
| Adjustments: | |||||||||||||||||||||||
| Insurance intangible asset | (249) | (5.51) | (266) | (5.91) | |||||||||||||||||||
| Net unearned premiums and fees in excess of expected losses | 155 | 3.42 | 214 | 4.76 | |||||||||||||||||||
| Net unrealized investment (gains) losses in Accumulated Other Comprehensive Income | 90 | 1.99 | 71 | 1.59 | |||||||||||||||||||
| Adjusted book value | $ | 1,261 | $ | 27.90 | $ | 1,272 | $ | 28.29 | |||||||||||||||
| Jul-2023 | Aug-2023 | Sep-2023 | Third Quarter 2023 | ||||||||||||||||||||
| Total Shares Purchased | — | 120,068 | 1,908 | 121,976 | |||||||||||||||||||
| Average Price Paid Per Share | $ | — | $ | 12.91 | $ | 13.16 | $ | 12.94 | |||||||||||||||
| Total Number of Shares Purchased as Part of Publicly Announced Plan | — | 120,068 | — | 120,068 | |||||||||||||||||||
| Approximate Dollar Value of Shares That may Yet be Purchased Under the Plan (in millions) | $ | 18 | $ | 16 | $ | 16 | $ | 16 | |||||||||||||||
| Exhibit Number |
Description | |||||||
| Other exhibits, filed or furnished, as indicated: | ||||||||
| 10.1 | ||||||||
| 10.2+ | ||||||||
| 31.1+ | ||||||||
| 31.2+ | ||||||||
| 32.1++ | ||||||||
| 101.INS | XBRL Instance Document - the instance document does not appear in the interactive Data File because its XBRL tags are embedded within the Inline XBRL document. |
|||||||
| 101.SCH | XBRL Taxonomy Extension Schema Document. |
|||||||
| 101.CAL | XBRL Taxonomy Extension Calculation Linkbase Document. |
|||||||
| 101.LAB | XBRL Taxonomy Extension Label Linkbase Document. |
|||||||
| 101.PRE | XBRL Taxonomy Extension Presentation Linkbase Document. |
|||||||
| 101.DEF | XBRL Taxonomy Extension Definition Linkbase Document. |
|||||||
| 104 | Cover Page Interactive Data File - The cover page interactive data file does not appear in the Interactive Data File because its XBRL tags or embedded within the Inline XBRL document |
|||||||
+ Filed herewith. ++ Furnished herewith. |
||||||||
| AMBAC FINANCIAL GROUP, INC. | |||||||||||
| Dated: | November 7, 2023 | By: | /s/ DAVID TRICK | ||||||||
| Name: | David Trick | ||||||||||
| Title: | Chief Financial Officer and Treasurer (Duly Authorized Officer and Principal Financial Officer) |
||||||||||
| AMBAC FINANCIAL GROUP, INC. | |||||
| /s/ Claude LeBlanc | |||||
| Claude LeBlanc | |||||
| President and Chief Executive Officer | |||||
| AMBAC ASSURANCE CORPORATION | |||||
| /s/ Claude LeBlanc | |||||
| Claude LeBlanc | |||||
| President and Chief Executive Officer | |||||
| EXECUTIVE | |||||
| /s/ Daniel McGinnis | |||||
| Daniel McGinnis | |||||
| AGREED: | ||||||||||||||||||||
|
_________________
Daniel McGinnis
|
_______________
Date
|
|||||||||||||||||||
| Dated: | November 7, 2023 | By: | /s/ Claude LeBlanc | ||||||||
| Claude LeBlanc President and Chief Executive Officer |
|||||||||||
| Dated: | November 7, 2023 | By: | /s/ David Trick | ||||||||
| David Trick Chief Financial Officer and Treasurer |
|||||||||||
| By: | /s/ Claude LeBlanc | ||||||||||
| Name: | Claude LeBlanc |
||||||||||
| Title: | President and Chief Executive Officer | ||||||||||
| By: | /s/ David Trick | ||||||||||
| Name: | David Trick | ||||||||||
| Title: | Chief Financial Officer and Treasurer | ||||||||||
| Dated: | November 7, 2023 | ||||||||||