00008578552023FYfalsehttp://fasb.org/us-gaap/2023#OtherAssetshttp://fasb.org/us-gaap/2023#OtherAssetshttp://fasb.org/us-gaap/2023#AccruedLiabilitiesAndOtherLiabilitieshttp://fasb.org/us-gaap/2023#AccruedLiabilitiesAndOtherLiabilities0.00100008578552023-01-012023-12-310000857855us-gaap:CommonStockMember2023-01-012023-12-310000857855ucbi:DepositaryShareOnUCBISeriesINonCumulativePreferredStockMember2023-01-012023-12-3100008578552023-06-30iso4217:USD00008578552024-01-31xbrli:shares00008578552023-12-3100008578552022-12-31iso4217:USDxbrli:shares00008578552022-01-012022-12-3100008578552021-01-012021-12-310000857855us-gaap:DepositAccountMember2023-01-012023-12-310000857855us-gaap:DepositAccountMember2022-01-012022-12-310000857855us-gaap:DepositAccountMember2021-01-012021-12-310000857855us-gaap:MortgageBankingMember2023-01-012023-12-310000857855us-gaap:MortgageBankingMember2022-01-012022-12-310000857855us-gaap:MortgageBankingMember2021-01-012021-12-310000857855us-gaap:CommonStockMember2020-12-310000857855us-gaap:PreferredStockMember2020-12-310000857855ucbi:CommonStockIssuableMember2020-12-310000857855us-gaap:AdditionalPaidInCapitalMember2020-12-310000857855us-gaap:RetainedEarningsMember2020-12-310000857855us-gaap:AccumulatedOtherComprehensiveIncomeMember2020-12-3100008578552020-12-310000857855us-gaap:RetainedEarningsMember2021-01-012021-12-310000857855us-gaap:AccumulatedOtherComprehensiveIncomeMember2021-01-012021-12-310000857855us-gaap:CommonStockMember2021-01-012021-12-310000857855us-gaap:AdditionalPaidInCapitalMember2021-01-012021-12-310000857855us-gaap:CommonStockMemberus-gaap:CommonStockMember2021-01-012021-12-310000857855us-gaap:CommonStockMemberus-gaap:AdditionalPaidInCapitalMember2021-01-012021-12-310000857855us-gaap:CommonStockMember2021-01-012021-12-310000857855ucbi:CommonStockIssuableMember2021-01-012021-12-310000857855us-gaap:CommonStockMember2021-12-310000857855us-gaap:PreferredStockMember2021-12-310000857855ucbi:CommonStockIssuableMember2021-12-310000857855us-gaap:AdditionalPaidInCapitalMember2021-12-310000857855us-gaap:RetainedEarningsMember2021-12-310000857855us-gaap:AccumulatedOtherComprehensiveIncomeMember2021-12-3100008578552021-12-310000857855us-gaap:RetainedEarningsMember2022-01-012022-12-310000857855us-gaap:AccumulatedOtherComprehensiveIncomeMember2022-01-012022-12-310000857855us-gaap:CommonStockMember2022-01-012022-12-310000857855us-gaap:AdditionalPaidInCapitalMember2022-01-012022-12-310000857855ucbi:CommonStockIssuableMember2022-01-012022-12-310000857855us-gaap:CommonStockMember2022-12-310000857855us-gaap:PreferredStockMember2022-12-310000857855ucbi:CommonStockIssuableMember2022-12-310000857855us-gaap:AdditionalPaidInCapitalMember2022-12-310000857855us-gaap:RetainedEarningsMember2022-12-310000857855us-gaap:AccumulatedOtherComprehensiveIncomeMember2022-12-310000857855us-gaap:RetainedEarningsMember2023-01-012023-12-310000857855us-gaap:AccumulatedOtherComprehensiveIncomeMember2023-01-012023-12-310000857855us-gaap:CommonStockMember2023-01-012023-12-310000857855us-gaap:AdditionalPaidInCapitalMember2023-01-012023-12-310000857855us-gaap:PreferredStockMemberus-gaap:PreferredStockMember2023-01-012023-12-310000857855us-gaap:PreferredStockMemberus-gaap:AdditionalPaidInCapitalMember2023-01-012023-12-310000857855us-gaap:RetainedEarningsMemberus-gaap:PreferredStockMember2023-01-012023-12-310000857855us-gaap:PreferredStockMember2023-01-012023-12-310000857855ucbi:CommonStockIssuableMember2023-01-012023-12-310000857855us-gaap:CommonStockMember2023-12-310000857855us-gaap:PreferredStockMember2023-12-310000857855ucbi:CommonStockIssuableMember2023-12-310000857855us-gaap:AdditionalPaidInCapitalMember2023-12-310000857855us-gaap:RetainedEarningsMember2023-12-310000857855us-gaap:AccumulatedOtherComprehensiveIncomeMember2023-12-31ucbi:numberOfSegment0000857855us-gaap:CreditConcentrationRiskMemberucbi:RealEstateValuationMemberucbi:LoanPortfolioMember2023-01-012023-12-31xbrli:pure0000857855us-gaap:BuildingAndBuildingImprovementsMembersrt:MinimumMember2023-12-310000857855srt:MaximumMemberus-gaap:BuildingAndBuildingImprovementsMember2023-12-310000857855us-gaap:LandImprovementsMember2023-12-310000857855srt:MinimumMemberus-gaap:FurnitureAndFixturesMember2023-12-310000857855srt:MaximumMemberus-gaap:FurnitureAndFixturesMember2023-12-310000857855ucbi:FirstMiamiBancorpIncMember2023-07-01ucbi:branch0000857855ucbi:FirstMiamiBancorpIncMember2023-01-012023-12-310000857855ucbi:FirstMiamiBancorpIncMember2023-07-012023-07-010000857855ucbi:FirstMiamiBancorpIncMemberus-gaap:FinancialAssetAcquiredWithCreditDeteriorationMember2023-07-012023-07-010000857855ucbi:FirstMiamiBancorpIncMemberus-gaap:CoreDepositsMember2023-07-012023-07-010000857855ucbi:ProgressBankTrustMember2023-01-03ucbi:office0000857855ucbi:ProgressBankTrustMember2023-01-012023-12-3100008578552023-01-030000857855ucbi:ProgressBankTrustMember2023-01-032023-01-030000857855us-gaap:FinancialAssetAcquiredWithCreditDeteriorationMemberucbi:ProgressBankTrustMember2023-01-032023-01-030000857855ucbi:ProgressBankTrustMemberus-gaap:CoreDepositsMember2023-01-032023-01-030000857855ucbi:ReliantBancorpIncMember2022-01-010000857855ucbi:ReliantBancorpIncMember2023-01-012023-12-310000857855ucbi:ReliantBancorpIncMember2022-01-012022-01-010000857855ucbi:ReliantBancorpIncMember2021-10-012021-10-010000857855ucbi:ReliantBancorpIncMemberus-gaap:FinancialAssetAcquiredWithCreditDeteriorationMember2022-01-012022-01-010000857855ucbi:ReliantBancorpIncMemberus-gaap:CoreDepositsMember2022-01-012022-01-010000857855us-gaap:AcquisitionRelatedCostsMemberucbi:FirstMiamiBancorpIncMember2022-01-012022-12-310000857855us-gaap:AcquisitionRelatedCostsMemberucbi:ProgressBankTrustMember2022-01-012022-12-310000857855us-gaap:AcquisitionRelatedCostsMemberucbi:ReliantBancorpIncMember2021-01-012021-12-310000857855us-gaap:AcquisitionRelatedCostsMemberucbi:AquestaFinancialHoldingsIncMember2020-01-012020-12-310000857855us-gaap:AcquisitionRelatedCostsMemberucbi:FinTrustMember2020-01-012020-12-310000857855ucbi:ReliantBancorpIncMember2022-01-012022-12-310000857855ucbi:AquestaFinancialHoldingsIncMember2021-01-012021-12-310000857855ucbi:FinTrustMember2021-01-012021-12-310000857855us-gaap:CommonStockMember2023-01-012023-12-310000857855us-gaap:CommonStockMember2022-01-012022-12-310000857855us-gaap:CommonStockMember2021-01-012021-12-310000857855us-gaap:USTreasurySecuritiesMember2023-12-310000857855us-gaap:USGovernmentSponsoredEnterprisesDebtSecuritiesMember2023-12-310000857855us-gaap:USStatesAndPoliticalSubdivisionsMember2023-12-310000857855ucbi:ResidentialMortgageBackedSecuritiesIssuedByUSGovernmentSponsoredEnterprisesMember2023-12-310000857855ucbi:CommercialMortgageBackedSecuritiesIssuedByUSGovernmentSponsoredEnterprisesMember2023-12-310000857855us-gaap:OtherDebtSecuritiesMember2023-12-310000857855us-gaap:USTreasurySecuritiesMember2022-12-310000857855us-gaap:USGovernmentSponsoredEnterprisesDebtSecuritiesMember2022-12-310000857855us-gaap:USStatesAndPoliticalSubdivisionsMember2022-12-310000857855ucbi:ResidentialMortgageBackedSecuritiesIssuedByUSGovernmentSponsoredEnterprisesMember2022-12-310000857855ucbi:CommercialMortgageBackedSecuritiesIssuedByUSGovernmentSponsoredEnterprisesMember2022-12-310000857855us-gaap:OtherDebtSecuritiesMember2022-12-310000857855ucbi:ResidentialMortgageBackedSecuritiesIssuedByPrivateEnterprisesMember2023-12-310000857855ucbi:CommercialMortgageBackedSecuritiesIssuedByPrivateEnterprisesMember2023-12-310000857855us-gaap:CorporateDebtSecuritiesMember2023-12-310000857855us-gaap:AssetBackedSecuritiesMember2023-12-310000857855ucbi:ResidentialMortgageBackedSecuritiesIssuedByPrivateEnterprisesMember2022-12-310000857855ucbi:CommercialMortgageBackedSecuritiesIssuedByPrivateEnterprisesMember2022-12-310000857855us-gaap:CorporateDebtSecuritiesMember2022-12-310000857855us-gaap:AssetBackedSecuritiesMember2022-12-310000857855us-gaap:AssetPledgedAsCollateralMemberus-gaap:DepositsMember2023-12-310000857855us-gaap:AssetPledgedAsCollateralMemberus-gaap:DepositsMember2022-12-31ucbi:security0000857855ucbi:DebtSecuritiesHeldToMaturityMember2023-12-310000857855ucbi:DebtSecuritiesHeldToMaturityMember2022-12-310000857855ucbi:DebtSecuritiesAvailableForSaleMember2023-12-310000857855ucbi:DebtSecuritiesAvailableForSaleMember2022-12-310000857855us-gaap:ResidentialMortgageBackedSecuritiesMember2023-12-310000857855us-gaap:CommercialMortgageBackedSecuritiesMember2023-12-310000857855us-gaap:CommercialPortfolioSegmentMemberus-gaap:LoansReceivableMemberucbi:OwnerOccupiedCommercialRealEstateMember2023-12-310000857855us-gaap:CommercialPortfolioSegmentMemberus-gaap:LoansReceivableMemberucbi:OwnerOccupiedCommercialRealEstateMember2022-12-310000857855us-gaap:CommercialPortfolioSegmentMemberucbi:IncomeProducingCommercialRealEstateMemberus-gaap:LoansReceivableMember2023-12-310000857855us-gaap:CommercialPortfolioSegmentMemberucbi:IncomeProducingCommercialRealEstateMemberus-gaap:LoansReceivableMember2022-12-310000857855us-gaap:CommercialPortfolioSegmentMemberucbi:CommercialAndIndustrialClassificationMemberus-gaap:LoansReceivableMember2023-12-310000857855us-gaap:CommercialPortfolioSegmentMemberucbi:CommercialAndIndustrialClassificationMemberus-gaap:LoansReceivableMember2022-12-310000857855us-gaap:CommercialPortfolioSegmentMemberus-gaap:LoansReceivableMemberus-gaap:ConstructionLoansMember2023-12-310000857855us-gaap:CommercialPortfolioSegmentMemberus-gaap:LoansReceivableMemberus-gaap:ConstructionLoansMember2022-12-310000857855us-gaap:CommercialPortfolioSegmentMemberucbi:EquipmentFinancingMemberus-gaap:LoansReceivableMember2023-12-310000857855us-gaap:CommercialPortfolioSegmentMemberucbi:EquipmentFinancingMemberus-gaap:LoansReceivableMember2022-12-310000857855us-gaap:CommercialPortfolioSegmentMemberus-gaap:LoansReceivableMember2023-12-310000857855us-gaap:CommercialPortfolioSegmentMemberus-gaap:LoansReceivableMember2022-12-310000857855us-gaap:ResidentialMortgageMemberus-gaap:LoansReceivableMemberus-gaap:ResidentialPortfolioSegmentMember2023-12-310000857855us-gaap:ResidentialMortgageMemberus-gaap:LoansReceivableMemberus-gaap:ResidentialPortfolioSegmentMember2022-12-310000857855us-gaap:LoansReceivableMemberus-gaap:HomeEquityMemberus-gaap:ResidentialPortfolioSegmentMember2023-12-310000857855us-gaap:LoansReceivableMemberus-gaap:HomeEquityMemberus-gaap:ResidentialPortfolioSegmentMember2022-12-310000857855us-gaap:LoansReceivableMemberus-gaap:ConstructionLoansMemberus-gaap:ResidentialPortfolioSegmentMember2023-12-310000857855us-gaap:LoansReceivableMemberus-gaap:ConstructionLoansMemberus-gaap:ResidentialPortfolioSegmentMember2022-12-310000857855ucbi:ManufacturedHousingLoanMemberus-gaap:LoansReceivableMemberus-gaap:ResidentialPortfolioSegmentMember2023-12-310000857855ucbi:ManufacturedHousingLoanMemberus-gaap:LoansReceivableMemberus-gaap:ResidentialPortfolioSegmentMember2022-12-310000857855us-gaap:LoansReceivableMemberus-gaap:ConsumerPortfolioSegmentMember2023-12-310000857855us-gaap:LoansReceivableMemberus-gaap:ConsumerPortfolioSegmentMember2022-12-310000857855us-gaap:ConsumerPortfolioSegmentMember2023-12-310000857855us-gaap:ConsumerPortfolioSegmentMember2022-12-310000857855us-gaap:LoansReceivableMember2023-12-310000857855us-gaap:LoansReceivableMember2022-12-310000857855ucbi:SBAUSDAGuaranteedLoansMember2023-01-012023-12-310000857855ucbi:SBAUSDAGuaranteedLoansMember2022-01-012022-12-310000857855ucbi:SBAUSDAGuaranteedLoansMember2021-01-012021-12-310000857855ucbi:EquipmentFinancingMember2023-01-012023-12-310000857855ucbi:EquipmentFinancingMember2022-01-012022-12-310000857855ucbi:EquipmentFinancingMember2021-01-012021-12-310000857855ucbi:EquipmentFinancingMember2023-12-310000857855ucbi:EquipmentFinancingMember2022-12-310000857855us-gaap:FinancialAssetNotPastDueMemberus-gaap:CommercialPortfolioSegmentMemberus-gaap:LoansReceivableMemberucbi:OwnerOccupiedCommercialRealEstateMember2023-12-310000857855us-gaap:CommercialPortfolioSegmentMemberus-gaap:LoansReceivableMemberus-gaap:FinancingReceivables30To59DaysPastDueMemberucbi:OwnerOccupiedCommercialRealEstateMember2023-12-310000857855us-gaap:CommercialPortfolioSegmentMemberus-gaap:LoansReceivableMemberucbi:OwnerOccupiedCommercialRealEstateMemberus-gaap:FinancingReceivables60To89DaysPastDueMember2023-12-310000857855us-gaap:CommercialPortfolioSegmentMemberus-gaap:FinancingReceivablesEqualToGreaterThan90DaysPastDueMemberus-gaap:LoansReceivableMemberucbi:OwnerOccupiedCommercialRealEstateMember2023-12-310000857855us-gaap:FinancialAssetNotPastDueMemberus-gaap:CommercialPortfolioSegmentMemberucbi:IncomeProducingCommercialRealEstateMemberus-gaap:LoansReceivableMember2023-12-310000857855us-gaap:CommercialPortfolioSegmentMemberucbi:IncomeProducingCommercialRealEstateMemberus-gaap:LoansReceivableMemberus-gaap:FinancingReceivables30To59DaysPastDueMember2023-12-310000857855us-gaap:CommercialPortfolioSegmentMemberucbi:IncomeProducingCommercialRealEstateMemberus-gaap:LoansReceivableMemberus-gaap:FinancingReceivables60To89DaysPastDueMember2023-12-310000857855us-gaap:CommercialPortfolioSegmentMemberus-gaap:FinancingReceivablesEqualToGreaterThan90DaysPastDueMemberucbi:IncomeProducingCommercialRealEstateMemberus-gaap:LoansReceivableMember2023-12-310000857855us-gaap:FinancialAssetNotPastDueMemberus-gaap:CommercialPortfolioSegmentMemberucbi:CommercialAndIndustrialClassificationMemberus-gaap:LoansReceivableMember2023-12-310000857855us-gaap:CommercialPortfolioSegmentMemberucbi:CommercialAndIndustrialClassificationMemberus-gaap:LoansReceivableMemberus-gaap:FinancingReceivables30To59DaysPastDueMember2023-12-310000857855us-gaap:CommercialPortfolioSegmentMemberucbi:CommercialAndIndustrialClassificationMemberus-gaap:LoansReceivableMemberus-gaap:FinancingReceivables60To89DaysPastDueMember2023-12-310000857855us-gaap:CommercialPortfolioSegmentMemberus-gaap:FinancingReceivablesEqualToGreaterThan90DaysPastDueMemberucbi:CommercialAndIndustrialClassificationMemberus-gaap:LoansReceivableMember2023-12-310000857855us-gaap:FinancialAssetNotPastDueMemberus-gaap:CommercialPortfolioSegmentMemberus-gaap:LoansReceivableMemberus-gaap:ConstructionLoansMember2023-12-310000857855us-gaap:CommercialPortfolioSegmentMemberus-gaap:LoansReceivableMemberus-gaap:FinancingReceivables30To59DaysPastDueMemberus-gaap:ConstructionLoansMember2023-12-310000857855us-gaap:CommercialPortfolioSegmentMemberus-gaap:LoansReceivableMemberus-gaap:ConstructionLoansMemberus-gaap:FinancingReceivables60To89DaysPastDueMember2023-12-310000857855us-gaap:CommercialPortfolioSegmentMemberus-gaap:FinancingReceivablesEqualToGreaterThan90DaysPastDueMemberus-gaap:LoansReceivableMemberus-gaap:ConstructionLoansMember2023-12-310000857855us-gaap:FinancialAssetNotPastDueMemberus-gaap:CommercialPortfolioSegmentMemberucbi:EquipmentFinancingMemberus-gaap:LoansReceivableMember2023-12-310000857855us-gaap:CommercialPortfolioSegmentMemberucbi:EquipmentFinancingMemberus-gaap:LoansReceivableMemberus-gaap:FinancingReceivables30To59DaysPastDueMember2023-12-310000857855us-gaap:CommercialPortfolioSegmentMemberucbi:EquipmentFinancingMemberus-gaap:LoansReceivableMemberus-gaap:FinancingReceivables60To89DaysPastDueMember2023-12-310000857855us-gaap:CommercialPortfolioSegmentMemberus-gaap:FinancingReceivablesEqualToGreaterThan90DaysPastDueMemberucbi:EquipmentFinancingMemberus-gaap:LoansReceivableMember2023-12-310000857855us-gaap:FinancialAssetNotPastDueMemberus-gaap:CommercialPortfolioSegmentMemberus-gaap:LoansReceivableMember2023-12-310000857855us-gaap:CommercialPortfolioSegmentMemberus-gaap:LoansReceivableMemberus-gaap:FinancingReceivables30To59DaysPastDueMember2023-12-310000857855us-gaap:CommercialPortfolioSegmentMemberus-gaap:LoansReceivableMemberus-gaap:FinancingReceivables60To89DaysPastDueMember2023-12-310000857855us-gaap:CommercialPortfolioSegmentMemberus-gaap:FinancingReceivablesEqualToGreaterThan90DaysPastDueMemberus-gaap:LoansReceivableMember2023-12-310000857855us-gaap:FinancialAssetNotPastDueMemberus-gaap:ResidentialMortgageMemberus-gaap:LoansReceivableMemberus-gaap:ResidentialPortfolioSegmentMember2023-12-310000857855us-gaap:ResidentialMortgageMemberus-gaap:LoansReceivableMemberus-gaap:FinancingReceivables30To59DaysPastDueMemberus-gaap:ResidentialPortfolioSegmentMember2023-12-310000857855us-gaap:ResidentialMortgageMemberus-gaap:LoansReceivableMemberus-gaap:FinancingReceivables60To89DaysPastDueMemberus-gaap:ResidentialPortfolioSegmentMember2023-12-310000857855us-gaap:FinancingReceivablesEqualToGreaterThan90DaysPastDueMemberus-gaap:ResidentialMortgageMemberus-gaap:LoansReceivableMemberus-gaap:ResidentialPortfolioSegmentMember2023-12-310000857855us-gaap:FinancialAssetNotPastDueMemberus-gaap:LoansReceivableMemberus-gaap:HomeEquityMemberus-gaap:ResidentialPortfolioSegmentMember2023-12-310000857855us-gaap:LoansReceivableMemberus-gaap:FinancingReceivables30To59DaysPastDueMemberus-gaap:HomeEquityMemberus-gaap:ResidentialPortfolioSegmentMember2023-12-310000857855us-gaap:LoansReceivableMemberus-gaap:FinancingReceivables60To89DaysPastDueMemberus-gaap:HomeEquityMemberus-gaap:ResidentialPortfolioSegmentMember2023-12-310000857855us-gaap:FinancingReceivablesEqualToGreaterThan90DaysPastDueMemberus-gaap:LoansReceivableMemberus-gaap:HomeEquityMemberus-gaap:ResidentialPortfolioSegmentMember2023-12-310000857855us-gaap:FinancialAssetNotPastDueMemberus-gaap:LoansReceivableMemberus-gaap:ConstructionLoansMemberus-gaap:ResidentialPortfolioSegmentMember2023-12-310000857855us-gaap:LoansReceivableMemberus-gaap:FinancingReceivables30To59DaysPastDueMemberus-gaap:ConstructionLoansMemberus-gaap:ResidentialPortfolioSegmentMember2023-12-310000857855us-gaap:LoansReceivableMemberus-gaap:ConstructionLoansMemberus-gaap:FinancingReceivables60To89DaysPastDueMemberus-gaap:ResidentialPortfolioSegmentMember2023-12-310000857855us-gaap:FinancingReceivablesEqualToGreaterThan90DaysPastDueMemberus-gaap:LoansReceivableMemberus-gaap:ConstructionLoansMemberus-gaap:ResidentialPortfolioSegmentMember2023-12-310000857855us-gaap:FinancialAssetNotPastDueMemberucbi:ManufacturedHousingLoanMemberus-gaap:LoansReceivableMemberus-gaap:ResidentialPortfolioSegmentMember2023-12-310000857855ucbi:ManufacturedHousingLoanMemberus-gaap:LoansReceivableMemberus-gaap:FinancingReceivables30To59DaysPastDueMemberus-gaap:ResidentialPortfolioSegmentMember2023-12-310000857855ucbi:ManufacturedHousingLoanMemberus-gaap:LoansReceivableMemberus-gaap:FinancingReceivables60To89DaysPastDueMemberus-gaap:ResidentialPortfolioSegmentMember2023-12-310000857855us-gaap:FinancingReceivablesEqualToGreaterThan90DaysPastDueMemberucbi:ManufacturedHousingLoanMemberus-gaap:LoansReceivableMemberus-gaap:ResidentialPortfolioSegmentMember2023-12-310000857855us-gaap:FinancialAssetNotPastDueMemberus-gaap:LoansReceivableMemberus-gaap:ConsumerPortfolioSegmentMember2023-12-310000857855us-gaap:LoansReceivableMemberus-gaap:FinancingReceivables30To59DaysPastDueMemberus-gaap:ConsumerPortfolioSegmentMember2023-12-310000857855us-gaap:LoansReceivableMemberus-gaap:ConsumerPortfolioSegmentMemberus-gaap:FinancingReceivables60To89DaysPastDueMember2023-12-310000857855us-gaap:FinancingReceivablesEqualToGreaterThan90DaysPastDueMemberus-gaap:LoansReceivableMemberus-gaap:ConsumerPortfolioSegmentMember2023-12-310000857855us-gaap:FinancialAssetNotPastDueMemberus-gaap:LoansReceivableMember2023-12-310000857855us-gaap:LoansReceivableMemberus-gaap:FinancingReceivables30To59DaysPastDueMember2023-12-310000857855us-gaap:LoansReceivableMemberus-gaap:FinancingReceivables60To89DaysPastDueMember2023-12-310000857855us-gaap:FinancingReceivablesEqualToGreaterThan90DaysPastDueMemberus-gaap:LoansReceivableMember2023-12-310000857855us-gaap:FinancialAssetNotPastDueMemberus-gaap:CommercialPortfolioSegmentMemberus-gaap:LoansReceivableMemberucbi:OwnerOccupiedCommercialRealEstateMember2022-12-310000857855us-gaap:CommercialPortfolioSegmentMemberus-gaap:LoansReceivableMemberus-gaap:FinancingReceivables30To59DaysPastDueMemberucbi:OwnerOccupiedCommercialRealEstateMember2022-12-310000857855us-gaap:CommercialPortfolioSegmentMemberus-gaap:LoansReceivableMemberucbi:OwnerOccupiedCommercialRealEstateMemberus-gaap:FinancingReceivables60To89DaysPastDueMember2022-12-310000857855us-gaap:CommercialPortfolioSegmentMemberus-gaap:FinancingReceivablesEqualToGreaterThan90DaysPastDueMemberus-gaap:LoansReceivableMemberucbi:OwnerOccupiedCommercialRealEstateMember2022-12-310000857855us-gaap:FinancialAssetNotPastDueMemberus-gaap:CommercialPortfolioSegmentMemberucbi:IncomeProducingCommercialRealEstateMemberus-gaap:LoansReceivableMember2022-12-310000857855us-gaap:CommercialPortfolioSegmentMemberucbi:IncomeProducingCommercialRealEstateMemberus-gaap:LoansReceivableMemberus-gaap:FinancingReceivables30To59DaysPastDueMember2022-12-310000857855us-gaap:CommercialPortfolioSegmentMemberucbi:IncomeProducingCommercialRealEstateMemberus-gaap:LoansReceivableMemberus-gaap:FinancingReceivables60To89DaysPastDueMember2022-12-310000857855us-gaap:CommercialPortfolioSegmentMemberus-gaap:FinancingReceivablesEqualToGreaterThan90DaysPastDueMemberucbi:IncomeProducingCommercialRealEstateMemberus-gaap:LoansReceivableMember2022-12-310000857855us-gaap:FinancialAssetNotPastDueMemberus-gaap:CommercialPortfolioSegmentMemberucbi:CommercialAndIndustrialClassificationMemberus-gaap:LoansReceivableMember2022-12-310000857855us-gaap:CommercialPortfolioSegmentMemberucbi:CommercialAndIndustrialClassificationMemberus-gaap:LoansReceivableMemberus-gaap:FinancingReceivables30To59DaysPastDueMember2022-12-310000857855us-gaap:CommercialPortfolioSegmentMemberucbi:CommercialAndIndustrialClassificationMemberus-gaap:LoansReceivableMemberus-gaap:FinancingReceivables60To89DaysPastDueMember2022-12-310000857855us-gaap:CommercialPortfolioSegmentMemberus-gaap:FinancingReceivablesEqualToGreaterThan90DaysPastDueMemberucbi:CommercialAndIndustrialClassificationMemberus-gaap:LoansReceivableMember2022-12-310000857855us-gaap:FinancialAssetNotPastDueMemberus-gaap:CommercialPortfolioSegmentMemberus-gaap:LoansReceivableMemberus-gaap:ConstructionLoansMember2022-12-310000857855us-gaap:CommercialPortfolioSegmentMemberus-gaap:LoansReceivableMemberus-gaap:FinancingReceivables30To59DaysPastDueMemberus-gaap:ConstructionLoansMember2022-12-310000857855us-gaap:CommercialPortfolioSegmentMemberus-gaap:LoansReceivableMemberus-gaap:ConstructionLoansMemberus-gaap:FinancingReceivables60To89DaysPastDueMember2022-12-310000857855us-gaap:CommercialPortfolioSegmentMemberus-gaap:FinancingReceivablesEqualToGreaterThan90DaysPastDueMemberus-gaap:LoansReceivableMemberus-gaap:ConstructionLoansMember2022-12-310000857855us-gaap:FinancialAssetNotPastDueMemberus-gaap:CommercialPortfolioSegmentMemberucbi:EquipmentFinancingMemberus-gaap:LoansReceivableMember2022-12-310000857855us-gaap:CommercialPortfolioSegmentMemberucbi:EquipmentFinancingMemberus-gaap:LoansReceivableMemberus-gaap:FinancingReceivables30To59DaysPastDueMember2022-12-310000857855us-gaap:CommercialPortfolioSegmentMemberucbi:EquipmentFinancingMemberus-gaap:LoansReceivableMemberus-gaap:FinancingReceivables60To89DaysPastDueMember2022-12-310000857855us-gaap:CommercialPortfolioSegmentMemberus-gaap:FinancingReceivablesEqualToGreaterThan90DaysPastDueMemberucbi:EquipmentFinancingMemberus-gaap:LoansReceivableMember2022-12-310000857855us-gaap:FinancialAssetNotPastDueMemberus-gaap:CommercialPortfolioSegmentMemberus-gaap:LoansReceivableMember2022-12-310000857855us-gaap:CommercialPortfolioSegmentMemberus-gaap:LoansReceivableMemberus-gaap:FinancingReceivables30To59DaysPastDueMember2022-12-310000857855us-gaap:CommercialPortfolioSegmentMemberus-gaap:LoansReceivableMemberus-gaap:FinancingReceivables60To89DaysPastDueMember2022-12-310000857855us-gaap:CommercialPortfolioSegmentMemberus-gaap:FinancingReceivablesEqualToGreaterThan90DaysPastDueMemberus-gaap:LoansReceivableMember2022-12-310000857855us-gaap:FinancialAssetNotPastDueMemberus-gaap:ResidentialMortgageMemberus-gaap:LoansReceivableMemberus-gaap:ResidentialPortfolioSegmentMember2022-12-310000857855us-gaap:ResidentialMortgageMemberus-gaap:LoansReceivableMemberus-gaap:FinancingReceivables30To59DaysPastDueMemberus-gaap:ResidentialPortfolioSegmentMember2022-12-310000857855us-gaap:ResidentialMortgageMemberus-gaap:LoansReceivableMemberus-gaap:FinancingReceivables60To89DaysPastDueMemberus-gaap:ResidentialPortfolioSegmentMember2022-12-310000857855us-gaap:FinancingReceivablesEqualToGreaterThan90DaysPastDueMemberus-gaap:ResidentialMortgageMemberus-gaap:LoansReceivableMemberus-gaap:ResidentialPortfolioSegmentMember2022-12-310000857855us-gaap:FinancialAssetNotPastDueMemberus-gaap:LoansReceivableMemberus-gaap:HomeEquityMemberus-gaap:ResidentialPortfolioSegmentMember2022-12-310000857855us-gaap:LoansReceivableMemberus-gaap:FinancingReceivables30To59DaysPastDueMemberus-gaap:HomeEquityMemberus-gaap:ResidentialPortfolioSegmentMember2022-12-310000857855us-gaap:LoansReceivableMemberus-gaap:FinancingReceivables60To89DaysPastDueMemberus-gaap:HomeEquityMemberus-gaap:ResidentialPortfolioSegmentMember2022-12-310000857855us-gaap:FinancingReceivablesEqualToGreaterThan90DaysPastDueMemberus-gaap:LoansReceivableMemberus-gaap:HomeEquityMemberus-gaap:ResidentialPortfolioSegmentMember2022-12-310000857855us-gaap:FinancialAssetNotPastDueMemberus-gaap:LoansReceivableMemberus-gaap:ConstructionLoansMemberus-gaap:ResidentialPortfolioSegmentMember2022-12-310000857855us-gaap:LoansReceivableMemberus-gaap:FinancingReceivables30To59DaysPastDueMemberus-gaap:ConstructionLoansMemberus-gaap:ResidentialPortfolioSegmentMember2022-12-310000857855us-gaap:LoansReceivableMemberus-gaap:ConstructionLoansMemberus-gaap:FinancingReceivables60To89DaysPastDueMemberus-gaap:ResidentialPortfolioSegmentMember2022-12-310000857855us-gaap:FinancingReceivablesEqualToGreaterThan90DaysPastDueMemberus-gaap:LoansReceivableMemberus-gaap:ConstructionLoansMemberus-gaap:ResidentialPortfolioSegmentMember2022-12-310000857855us-gaap:FinancialAssetNotPastDueMemberucbi:ManufacturedHousingLoanMemberus-gaap:LoansReceivableMemberus-gaap:ResidentialPortfolioSegmentMember2022-12-310000857855ucbi:ManufacturedHousingLoanMemberus-gaap:LoansReceivableMemberus-gaap:FinancingReceivables30To59DaysPastDueMemberus-gaap:ResidentialPortfolioSegmentMember2022-12-310000857855ucbi:ManufacturedHousingLoanMemberus-gaap:LoansReceivableMemberus-gaap:FinancingReceivables60To89DaysPastDueMemberus-gaap:ResidentialPortfolioSegmentMember2022-12-310000857855us-gaap:FinancingReceivablesEqualToGreaterThan90DaysPastDueMemberucbi:ManufacturedHousingLoanMemberus-gaap:LoansReceivableMemberus-gaap:ResidentialPortfolioSegmentMember2022-12-310000857855us-gaap:FinancialAssetNotPastDueMemberus-gaap:LoansReceivableMemberus-gaap:ConsumerPortfolioSegmentMember2022-12-310000857855us-gaap:LoansReceivableMemberus-gaap:FinancingReceivables30To59DaysPastDueMemberus-gaap:ConsumerPortfolioSegmentMember2022-12-310000857855us-gaap:LoansReceivableMemberus-gaap:ConsumerPortfolioSegmentMemberus-gaap:FinancingReceivables60To89DaysPastDueMember2022-12-310000857855us-gaap:FinancingReceivablesEqualToGreaterThan90DaysPastDueMemberus-gaap:LoansReceivableMemberus-gaap:ConsumerPortfolioSegmentMember2022-12-310000857855us-gaap:FinancialAssetNotPastDueMemberus-gaap:LoansReceivableMember2022-12-310000857855us-gaap:LoansReceivableMemberus-gaap:FinancingReceivables30To59DaysPastDueMember2022-12-310000857855us-gaap:LoansReceivableMemberus-gaap:FinancingReceivables60To89DaysPastDueMember2022-12-310000857855us-gaap:FinancingReceivablesEqualToGreaterThan90DaysPastDueMemberus-gaap:LoansReceivableMember2022-12-310000857855us-gaap:CommercialPortfolioSegmentMemberus-gaap:PassMemberucbi:OwnerOccupiedCommercialRealEstateMember2023-12-310000857855us-gaap:CommercialPortfolioSegmentMemberucbi:OwnerOccupiedCommercialRealEstateMemberus-gaap:SpecialMentionMember2023-12-310000857855us-gaap:SubstandardMemberus-gaap:CommercialPortfolioSegmentMemberucbi:OwnerOccupiedCommercialRealEstateMember2023-12-310000857855us-gaap:CommercialPortfolioSegmentMemberucbi:OwnerOccupiedCommercialRealEstateMember2023-12-310000857855us-gaap:CommercialPortfolioSegmentMemberucbi:OwnerOccupiedCommercialRealEstateMember2023-01-012023-12-310000857855us-gaap:CommercialPortfolioSegmentMemberucbi:IncomeProducingCommercialRealEstateMemberus-gaap:PassMember2023-12-310000857855us-gaap:CommercialPortfolioSegmentMemberucbi:IncomeProducingCommercialRealEstateMemberus-gaap:SpecialMentionMember2023-12-310000857855us-gaap:SubstandardMemberus-gaap:CommercialPortfolioSegmentMemberucbi:IncomeProducingCommercialRealEstateMember2023-12-310000857855ucbi:IncomeProducingCommercialRealEstateMemberus-gaap:CommercialPortfolioSegmentMember2023-12-310000857855us-gaap:CommercialPortfolioSegmentMemberucbi:IncomeProducingCommercialRealEstateMemberus-gaap:SpecialMentionMember2023-01-012023-12-310000857855us-gaap:CommercialPortfolioSegmentMemberus-gaap:PassMemberucbi:CommercialAndIndustrialClassificationMember2023-12-310000857855us-gaap:CommercialPortfolioSegmentMemberucbi:CommercialAndIndustrialClassificationMemberus-gaap:SpecialMentionMember2023-12-310000857855us-gaap:SubstandardMemberus-gaap:CommercialPortfolioSegmentMemberucbi:CommercialAndIndustrialClassificationMember2023-12-310000857855us-gaap:CommercialPortfolioSegmentMemberucbi:CommercialAndIndustrialClassificationMember2023-12-310000857855us-gaap:CommercialPortfolioSegmentMemberucbi:CommercialAndIndustrialClassificationMember2023-01-012023-12-310000857855us-gaap:CommercialPortfolioSegmentMemberus-gaap:PassMemberus-gaap:ConstructionLoansMember2023-12-310000857855us-gaap:CommercialPortfolioSegmentMemberus-gaap:ConstructionLoansMemberus-gaap:SpecialMentionMember2023-12-310000857855us-gaap:SubstandardMemberus-gaap:CommercialPortfolioSegmentMemberus-gaap:ConstructionLoansMember2023-12-310000857855us-gaap:CommercialPortfolioSegmentMemberus-gaap:ConstructionLoansMember2023-12-310000857855us-gaap:CommercialPortfolioSegmentMemberus-gaap:ConstructionLoansMember2023-01-012023-12-310000857855us-gaap:CommercialPortfolioSegmentMemberus-gaap:PassMemberucbi:EquipmentFinancingMember2023-12-310000857855us-gaap:SubstandardMemberus-gaap:CommercialPortfolioSegmentMemberucbi:EquipmentFinancingMember2023-12-310000857855us-gaap:CommercialPortfolioSegmentMemberucbi:EquipmentFinancingMember2023-12-310000857855us-gaap:CommercialPortfolioSegmentMemberucbi:EquipmentFinancingMember2023-01-012023-12-310000857855us-gaap:PassMemberus-gaap:ResidentialMortgageMemberus-gaap:ResidentialPortfolioSegmentMember2023-12-310000857855us-gaap:SubstandardMemberus-gaap:ResidentialMortgageMemberus-gaap:ResidentialPortfolioSegmentMember2023-12-310000857855us-gaap:ResidentialMortgageMemberus-gaap:ResidentialPortfolioSegmentMember2023-12-310000857855us-gaap:ResidentialMortgageMemberus-gaap:ResidentialPortfolioSegmentMember2023-01-012023-12-310000857855us-gaap:PassMemberus-gaap:HomeEquityMemberus-gaap:ResidentialPortfolioSegmentMember2023-12-310000857855us-gaap:SubstandardMemberus-gaap:HomeEquityMemberus-gaap:ResidentialPortfolioSegmentMember2023-12-310000857855us-gaap:HomeEquityMemberus-gaap:ResidentialPortfolioSegmentMember2023-12-310000857855us-gaap:HomeEquityMemberus-gaap:ResidentialPortfolioSegmentMember2023-01-012023-12-310000857855us-gaap:PassMemberus-gaap:ConstructionLoansMemberus-gaap:ResidentialPortfolioSegmentMember2023-12-310000857855us-gaap:SubstandardMemberus-gaap:ConstructionLoansMemberus-gaap:ResidentialPortfolioSegmentMember2023-12-310000857855us-gaap:ConstructionLoansMemberus-gaap:ResidentialPortfolioSegmentMember2023-12-310000857855us-gaap:ConstructionLoansMemberus-gaap:ResidentialPortfolioSegmentMember2023-01-012023-12-310000857855us-gaap:PassMemberucbi:ManufacturedHousingLoanMemberus-gaap:ResidentialPortfolioSegmentMember2023-12-310000857855us-gaap:SubstandardMemberucbi:ManufacturedHousingLoanMemberus-gaap:ResidentialPortfolioSegmentMember2023-12-310000857855ucbi:ManufacturedHousingLoanMemberus-gaap:ResidentialPortfolioSegmentMember2023-12-310000857855ucbi:ManufacturedHousingLoanMemberus-gaap:ResidentialPortfolioSegmentMember2023-01-012023-12-310000857855us-gaap:PassMemberus-gaap:ConsumerPortfolioSegmentMember2023-12-310000857855us-gaap:SubstandardMemberus-gaap:ConsumerPortfolioSegmentMember2023-12-310000857855us-gaap:ConsumerPortfolioSegmentMember2023-01-012023-12-310000857855us-gaap:CommercialPortfolioSegmentMemberus-gaap:PassMemberucbi:OwnerOccupiedCommercialRealEstateMember2022-12-310000857855us-gaap:CommercialPortfolioSegmentMemberucbi:IncomeProducingCommercialRealEstateMemberus-gaap:PassMember2022-12-310000857855us-gaap:CommercialPortfolioSegmentMemberus-gaap:PassMemberucbi:CommercialAndIndustrialClassificationMember2022-12-310000857855us-gaap:CommercialPortfolioSegmentMemberus-gaap:PassMemberus-gaap:ConstructionLoansMember2022-12-310000857855us-gaap:CommercialPortfolioSegmentMemberus-gaap:PassMemberucbi:EquipmentFinancingMember2022-12-310000857855us-gaap:CommercialPortfolioSegmentMemberus-gaap:PassMember2022-12-310000857855us-gaap:PassMemberus-gaap:ResidentialMortgageMemberus-gaap:ResidentialPortfolioSegmentMember2022-12-310000857855us-gaap:PassMemberus-gaap:HomeEquityMemberus-gaap:ResidentialPortfolioSegmentMember2022-12-310000857855us-gaap:PassMemberus-gaap:ConstructionLoansMemberus-gaap:ResidentialPortfolioSegmentMember2022-12-310000857855us-gaap:PassMemberucbi:ManufacturedHousingLoanMemberus-gaap:ResidentialPortfolioSegmentMember2022-12-310000857855us-gaap:PassMemberus-gaap:ConsumerPortfolioSegmentMember2022-12-310000857855us-gaap:PassMember2022-12-310000857855us-gaap:CommercialPortfolioSegmentMemberucbi:OwnerOccupiedCommercialRealEstateMemberus-gaap:SpecialMentionMember2022-12-310000857855us-gaap:CommercialPortfolioSegmentMemberucbi:IncomeProducingCommercialRealEstateMemberus-gaap:SpecialMentionMember2022-12-310000857855us-gaap:CommercialPortfolioSegmentMemberucbi:CommercialAndIndustrialClassificationMemberus-gaap:SpecialMentionMember2022-12-310000857855us-gaap:CommercialPortfolioSegmentMemberus-gaap:ConstructionLoansMemberus-gaap:SpecialMentionMember2022-12-310000857855us-gaap:CommercialPortfolioSegmentMemberucbi:EquipmentFinancingMemberus-gaap:SpecialMentionMember2022-12-310000857855us-gaap:CommercialPortfolioSegmentMemberus-gaap:SpecialMentionMember2022-12-310000857855us-gaap:ResidentialMortgageMemberus-gaap:SpecialMentionMemberus-gaap:ResidentialPortfolioSegmentMember2022-12-310000857855us-gaap:SpecialMentionMemberus-gaap:HomeEquityMemberus-gaap:ResidentialPortfolioSegmentMember2022-12-310000857855us-gaap:ConstructionLoansMemberus-gaap:SpecialMentionMemberus-gaap:ResidentialPortfolioSegmentMember2022-12-310000857855ucbi:ManufacturedHousingLoanMemberus-gaap:SpecialMentionMemberus-gaap:ResidentialPortfolioSegmentMember2022-12-310000857855us-gaap:ConsumerPortfolioSegmentMemberus-gaap:SpecialMentionMember2022-12-310000857855us-gaap:SpecialMentionMember2022-12-310000857855us-gaap:SubstandardMemberus-gaap:CommercialPortfolioSegmentMemberucbi:OwnerOccupiedCommercialRealEstateMember2022-12-310000857855us-gaap:SubstandardMemberus-gaap:CommercialPortfolioSegmentMemberucbi:IncomeProducingCommercialRealEstateMember2022-12-310000857855us-gaap:SubstandardMemberus-gaap:CommercialPortfolioSegmentMemberucbi:CommercialAndIndustrialClassificationMember2022-12-310000857855us-gaap:SubstandardMemberus-gaap:CommercialPortfolioSegmentMemberus-gaap:ConstructionLoansMember2022-12-310000857855us-gaap:SubstandardMemberus-gaap:CommercialPortfolioSegmentMemberucbi:EquipmentFinancingMember2022-12-310000857855us-gaap:SubstandardMemberus-gaap:CommercialPortfolioSegmentMember2022-12-310000857855us-gaap:SubstandardMemberus-gaap:ResidentialMortgageMemberus-gaap:ResidentialPortfolioSegmentMember2022-12-310000857855us-gaap:SubstandardMemberus-gaap:HomeEquityMemberus-gaap:ResidentialPortfolioSegmentMember2022-12-310000857855us-gaap:SubstandardMemberus-gaap:ConstructionLoansMemberus-gaap:ResidentialPortfolioSegmentMember2022-12-310000857855us-gaap:SubstandardMemberucbi:ManufacturedHousingLoanMemberus-gaap:ResidentialPortfolioSegmentMember2022-12-310000857855us-gaap:SubstandardMemberus-gaap:ConsumerPortfolioSegmentMember2022-12-310000857855us-gaap:SubstandardMember2022-12-310000857855us-gaap:ExtendedMaturityMemberus-gaap:CommercialPortfolioSegmentMemberus-gaap:LoansReceivableMemberucbi:OwnerOccupiedCommercialRealEstateMember2023-01-012023-12-310000857855us-gaap:CommercialPortfolioSegmentMemberus-gaap:PaymentDeferralMemberus-gaap:LoansReceivableMemberucbi:OwnerOccupiedCommercialRealEstateMember2023-01-012023-12-310000857855us-gaap:CommercialPortfolioSegmentMemberus-gaap:ExtendedMaturityAndInterestRateReductionMemberus-gaap:LoansReceivableMemberucbi:OwnerOccupiedCommercialRealEstateMember2023-01-012023-12-310000857855us-gaap:CommercialPortfolioSegmentMemberus-gaap:LoansReceivableMemberucbi:PaymentDelayAndExtensionMemberucbi:OwnerOccupiedCommercialRealEstateMember2023-01-012023-12-310000857855us-gaap:CommercialPortfolioSegmentMemberus-gaap:LoansReceivableMemberucbi:OwnerOccupiedCommercialRealEstateMember2023-01-012023-12-310000857855us-gaap:ExtendedMaturityMemberus-gaap:CommercialPortfolioSegmentMemberucbi:IncomeProducingCommercialRealEstateMemberus-gaap:LoansReceivableMember2023-01-012023-12-310000857855us-gaap:CommercialPortfolioSegmentMemberucbi:IncomeProducingCommercialRealEstateMemberus-gaap:PaymentDeferralMemberus-gaap:LoansReceivableMember2023-01-012023-12-310000857855us-gaap:CommercialPortfolioSegmentMemberucbi:IncomeProducingCommercialRealEstateMemberus-gaap:ExtendedMaturityAndInterestRateReductionMemberus-gaap:LoansReceivableMember2023-01-012023-12-310000857855us-gaap:CommercialPortfolioSegmentMemberucbi:IncomeProducingCommercialRealEstateMemberus-gaap:LoansReceivableMemberucbi:PaymentDelayAndExtensionMember2023-01-012023-12-310000857855us-gaap:CommercialPortfolioSegmentMemberucbi:IncomeProducingCommercialRealEstateMemberus-gaap:LoansReceivableMember2023-01-012023-12-310000857855us-gaap:ExtendedMaturityMemberus-gaap:CommercialPortfolioSegmentMemberucbi:CommercialAndIndustrialClassificationMemberus-gaap:LoansReceivableMember2023-01-012023-12-310000857855us-gaap:CommercialPortfolioSegmentMemberus-gaap:PaymentDeferralMemberucbi:CommercialAndIndustrialClassificationMemberus-gaap:LoansReceivableMember2023-01-012023-12-310000857855us-gaap:CommercialPortfolioSegmentMemberus-gaap:ExtendedMaturityAndInterestRateReductionMemberucbi:CommercialAndIndustrialClassificationMemberus-gaap:LoansReceivableMember2023-01-012023-12-310000857855us-gaap:CommercialPortfolioSegmentMemberucbi:CommercialAndIndustrialClassificationMemberus-gaap:LoansReceivableMemberucbi:PaymentDelayAndExtensionMember2023-01-012023-12-310000857855us-gaap:CommercialPortfolioSegmentMemberucbi:CommercialAndIndustrialClassificationMemberus-gaap:LoansReceivableMember2023-01-012023-12-310000857855us-gaap:ExtendedMaturityMemberus-gaap:CommercialPortfolioSegmentMemberus-gaap:LoansReceivableMemberus-gaap:ConstructionLoansMember2023-01-012023-12-310000857855us-gaap:CommercialPortfolioSegmentMemberus-gaap:PaymentDeferralMemberus-gaap:LoansReceivableMemberus-gaap:ConstructionLoansMember2023-01-012023-12-310000857855us-gaap:CommercialPortfolioSegmentMemberus-gaap:ExtendedMaturityAndInterestRateReductionMemberus-gaap:LoansReceivableMemberus-gaap:ConstructionLoansMember2023-01-012023-12-310000857855us-gaap:CommercialPortfolioSegmentMemberus-gaap:LoansReceivableMemberucbi:PaymentDelayAndExtensionMemberus-gaap:ConstructionLoansMember2023-01-012023-12-310000857855us-gaap:CommercialPortfolioSegmentMemberus-gaap:LoansReceivableMemberus-gaap:ConstructionLoansMember2023-01-012023-12-310000857855us-gaap:ExtendedMaturityMemberus-gaap:CommercialPortfolioSegmentMemberucbi:EquipmentFinancingMemberus-gaap:LoansReceivableMember2023-01-012023-12-310000857855us-gaap:CommercialPortfolioSegmentMemberus-gaap:PaymentDeferralMemberucbi:EquipmentFinancingMemberus-gaap:LoansReceivableMember2023-01-012023-12-310000857855us-gaap:CommercialPortfolioSegmentMemberus-gaap:ExtendedMaturityAndInterestRateReductionMemberucbi:EquipmentFinancingMemberus-gaap:LoansReceivableMember2023-01-012023-12-310000857855us-gaap:CommercialPortfolioSegmentMemberucbi:EquipmentFinancingMemberus-gaap:LoansReceivableMemberucbi:PaymentDelayAndExtensionMember2023-01-012023-12-310000857855us-gaap:CommercialPortfolioSegmentMemberucbi:EquipmentFinancingMemberus-gaap:LoansReceivableMember2023-01-012023-12-310000857855us-gaap:ExtendedMaturityMemberus-gaap:CommercialPortfolioSegmentMemberus-gaap:LoansReceivableMember2023-01-012023-12-310000857855us-gaap:CommercialPortfolioSegmentMemberus-gaap:PaymentDeferralMemberus-gaap:LoansReceivableMember2023-01-012023-12-310000857855us-gaap:CommercialPortfolioSegmentMemberus-gaap:ExtendedMaturityAndInterestRateReductionMemberus-gaap:LoansReceivableMember2023-01-012023-12-310000857855us-gaap:CommercialPortfolioSegmentMemberus-gaap:LoansReceivableMemberucbi:PaymentDelayAndExtensionMember2023-01-012023-12-310000857855us-gaap:CommercialPortfolioSegmentMemberus-gaap:LoansReceivableMember2023-01-012023-12-310000857855us-gaap:ExtendedMaturityMemberus-gaap:ResidentialMortgageMemberus-gaap:LoansReceivableMemberus-gaap:ResidentialPortfolioSegmentMember2023-01-012023-12-310000857855us-gaap:PaymentDeferralMemberus-gaap:ResidentialMortgageMemberus-gaap:LoansReceivableMemberus-gaap:ResidentialPortfolioSegmentMember2023-01-012023-12-310000857855us-gaap:ExtendedMaturityAndInterestRateReductionMemberus-gaap:ResidentialMortgageMemberus-gaap:LoansReceivableMemberus-gaap:ResidentialPortfolioSegmentMember2023-01-012023-12-310000857855us-gaap:ResidentialMortgageMemberus-gaap:LoansReceivableMemberucbi:PaymentDelayAndExtensionMemberus-gaap:ResidentialPortfolioSegmentMember2023-01-012023-12-310000857855us-gaap:ResidentialMortgageMemberus-gaap:LoansReceivableMemberus-gaap:ResidentialPortfolioSegmentMember2023-01-012023-12-310000857855us-gaap:ExtendedMaturityMemberus-gaap:LoansReceivableMemberus-gaap:HomeEquityMemberus-gaap:ResidentialPortfolioSegmentMember2023-01-012023-12-310000857855us-gaap:PaymentDeferralMemberus-gaap:LoansReceivableMemberus-gaap:HomeEquityMemberus-gaap:ResidentialPortfolioSegmentMember2023-01-012023-12-310000857855us-gaap:ExtendedMaturityAndInterestRateReductionMemberus-gaap:LoansReceivableMemberus-gaap:HomeEquityMemberus-gaap:ResidentialPortfolioSegmentMember2023-01-012023-12-310000857855us-gaap:LoansReceivableMemberucbi:PaymentDelayAndExtensionMemberus-gaap:HomeEquityMemberus-gaap:ResidentialPortfolioSegmentMember2023-01-012023-12-310000857855us-gaap:LoansReceivableMemberus-gaap:HomeEquityMemberus-gaap:ResidentialPortfolioSegmentMember2023-01-012023-12-310000857855us-gaap:ExtendedMaturityMemberus-gaap:LoansReceivableMemberus-gaap:ConstructionLoansMemberus-gaap:ResidentialPortfolioSegmentMember2023-01-012023-12-310000857855us-gaap:PaymentDeferralMemberus-gaap:LoansReceivableMemberus-gaap:ConstructionLoansMemberus-gaap:ResidentialPortfolioSegmentMember2023-01-012023-12-310000857855us-gaap:ExtendedMaturityAndInterestRateReductionMemberus-gaap:LoansReceivableMemberus-gaap:ConstructionLoansMemberus-gaap:ResidentialPortfolioSegmentMember2023-01-012023-12-310000857855us-gaap:LoansReceivableMemberucbi:PaymentDelayAndExtensionMemberus-gaap:ConstructionLoansMemberus-gaap:ResidentialPortfolioSegmentMember2023-01-012023-12-310000857855us-gaap:LoansReceivableMemberus-gaap:ConstructionLoansMemberus-gaap:ResidentialPortfolioSegmentMember2023-01-012023-12-310000857855us-gaap:ExtendedMaturityMemberucbi:ManufacturedHousingLoanMemberus-gaap:LoansReceivableMemberus-gaap:ResidentialPortfolioSegmentMember2023-01-012023-12-310000857855us-gaap:PaymentDeferralMemberucbi:ManufacturedHousingLoanMemberus-gaap:LoansReceivableMemberus-gaap:ResidentialPortfolioSegmentMember2023-01-012023-12-310000857855us-gaap:ExtendedMaturityAndInterestRateReductionMemberucbi:ManufacturedHousingLoanMemberus-gaap:LoansReceivableMemberus-gaap:ResidentialPortfolioSegmentMember2023-01-012023-12-310000857855ucbi:ManufacturedHousingLoanMemberus-gaap:LoansReceivableMemberucbi:PaymentDelayAndExtensionMemberus-gaap:ResidentialPortfolioSegmentMember2023-01-012023-12-310000857855ucbi:ManufacturedHousingLoanMemberus-gaap:LoansReceivableMemberus-gaap:ResidentialPortfolioSegmentMember2023-01-012023-12-310000857855us-gaap:ExtendedMaturityMemberus-gaap:LoansReceivableMemberus-gaap:ConsumerPortfolioSegmentMember2023-01-012023-12-310000857855us-gaap:PaymentDeferralMemberus-gaap:LoansReceivableMemberus-gaap:ConsumerPortfolioSegmentMember2023-01-012023-12-310000857855us-gaap:ExtendedMaturityAndInterestRateReductionMemberus-gaap:LoansReceivableMemberus-gaap:ConsumerPortfolioSegmentMember2023-01-012023-12-310000857855us-gaap:LoansReceivableMemberus-gaap:ConsumerPortfolioSegmentMemberucbi:PaymentDelayAndExtensionMember2023-01-012023-12-310000857855us-gaap:LoansReceivableMemberus-gaap:ConsumerPortfolioSegmentMember2023-01-012023-12-310000857855us-gaap:ExtendedMaturityMemberus-gaap:LoansReceivableMember2023-01-012023-12-310000857855us-gaap:PaymentDeferralMemberus-gaap:LoansReceivableMember2023-01-012023-12-310000857855us-gaap:ExtendedMaturityAndInterestRateReductionMemberus-gaap:LoansReceivableMember2023-01-012023-12-310000857855us-gaap:LoansReceivableMemberucbi:PaymentDelayAndExtensionMember2023-01-012023-12-310000857855us-gaap:LoansReceivableMember2023-01-012023-12-31ucbi:extension0000857855us-gaap:CommercialPortfolioSegmentMemberus-gaap:ExtendedMaturityAndInterestRateReductionMemberus-gaap:LoansReceivableMemberucbi:ResidentialMortgageAndManufacturedHousingMember2023-01-012023-12-310000857855us-gaap:CommercialPortfolioSegmentMemberus-gaap:LoansReceivableMemberucbi:OwnerOccupiedCommercialRealEstateMember2021-12-310000857855us-gaap:CommercialPortfolioSegmentMemberus-gaap:LoansReceivableMemberucbi:OwnerOccupiedCommercialRealEstateMember2022-01-012022-12-310000857855us-gaap:CommercialPortfolioSegmentMemberucbi:IncomeProducingCommercialRealEstateMemberus-gaap:LoansReceivableMember2021-12-310000857855us-gaap:CommercialPortfolioSegmentMemberucbi:IncomeProducingCommercialRealEstateMemberus-gaap:LoansReceivableMember2022-01-012022-12-310000857855us-gaap:CommercialPortfolioSegmentMemberucbi:CommercialAndIndustrialClassificationMemberus-gaap:LoansReceivableMember2021-12-310000857855us-gaap:CommercialPortfolioSegmentMemberucbi:CommercialAndIndustrialClassificationMemberus-gaap:LoansReceivableMember2022-01-012022-12-310000857855us-gaap:CommercialPortfolioSegmentMemberus-gaap:LoansReceivableMemberus-gaap:ConstructionLoansMember2021-12-310000857855us-gaap:CommercialPortfolioSegmentMemberus-gaap:LoansReceivableMemberus-gaap:ConstructionLoansMember2022-01-012022-12-310000857855us-gaap:CommercialPortfolioSegmentMemberucbi:EquipmentFinancingMemberus-gaap:LoansReceivableMember2021-12-310000857855us-gaap:CommercialPortfolioSegmentMemberucbi:EquipmentFinancingMemberus-gaap:LoansReceivableMember2022-01-012022-12-310000857855us-gaap:ResidentialMortgageMemberus-gaap:LoansReceivableMemberus-gaap:ResidentialPortfolioSegmentMember2021-12-310000857855us-gaap:ResidentialMortgageMemberus-gaap:LoansReceivableMemberus-gaap:ResidentialPortfolioSegmentMember2022-01-012022-12-310000857855us-gaap:LoansReceivableMemberus-gaap:HomeEquityMemberus-gaap:ResidentialPortfolioSegmentMember2021-12-310000857855us-gaap:LoansReceivableMemberus-gaap:HomeEquityMemberus-gaap:ResidentialPortfolioSegmentMember2022-01-012022-12-310000857855us-gaap:LoansReceivableMemberus-gaap:ConstructionLoansMemberus-gaap:ResidentialPortfolioSegmentMember2021-12-310000857855us-gaap:LoansReceivableMemberus-gaap:ConstructionLoansMemberus-gaap:ResidentialPortfolioSegmentMember2022-01-012022-12-310000857855ucbi:ManufacturedHousingLoanMemberus-gaap:LoansReceivableMemberus-gaap:ResidentialPortfolioSegmentMember2021-12-310000857855ucbi:ManufacturedHousingLoanMemberus-gaap:LoansReceivableMemberus-gaap:ResidentialPortfolioSegmentMember2022-01-012022-12-310000857855us-gaap:LoansReceivableMemberus-gaap:ConsumerPortfolioSegmentMember2021-12-310000857855us-gaap:LoansReceivableMemberus-gaap:ConsumerPortfolioSegmentMember2022-01-012022-12-310000857855us-gaap:CommercialPortfolioSegmentMemberus-gaap:LoansReceivableMemberucbi:OwnerOccupiedCommercialRealEstateMember2020-12-310000857855us-gaap:CommercialPortfolioSegmentMemberus-gaap:LoansReceivableMemberucbi:OwnerOccupiedCommercialRealEstateMember2021-01-012021-12-310000857855us-gaap:CommercialPortfolioSegmentMemberucbi:IncomeProducingCommercialRealEstateMemberus-gaap:LoansReceivableMember2020-12-310000857855us-gaap:CommercialPortfolioSegmentMemberucbi:IncomeProducingCommercialRealEstateMemberus-gaap:LoansReceivableMember2021-01-012021-12-310000857855us-gaap:CommercialPortfolioSegmentMemberucbi:CommercialAndIndustrialClassificationMemberus-gaap:LoansReceivableMember2020-12-310000857855us-gaap:CommercialPortfolioSegmentMemberucbi:CommercialAndIndustrialClassificationMemberus-gaap:LoansReceivableMember2021-01-012021-12-310000857855us-gaap:CommercialPortfolioSegmentMemberus-gaap:LoansReceivableMemberus-gaap:ConstructionLoansMember2020-12-310000857855us-gaap:CommercialPortfolioSegmentMemberus-gaap:LoansReceivableMemberus-gaap:ConstructionLoansMember2021-01-012021-12-310000857855us-gaap:CommercialPortfolioSegmentMemberucbi:EquipmentFinancingMemberus-gaap:LoansReceivableMember2020-12-310000857855us-gaap:CommercialPortfolioSegmentMemberucbi:EquipmentFinancingMemberus-gaap:LoansReceivableMember2021-01-012021-12-310000857855us-gaap:ResidentialMortgageMemberus-gaap:LoansReceivableMemberus-gaap:ResidentialPortfolioSegmentMember2020-12-310000857855us-gaap:ResidentialMortgageMemberus-gaap:LoansReceivableMemberus-gaap:ResidentialPortfolioSegmentMember2021-01-012021-12-310000857855us-gaap:LoansReceivableMemberus-gaap:HomeEquityMemberus-gaap:ResidentialPortfolioSegmentMember2020-12-310000857855us-gaap:LoansReceivableMemberus-gaap:HomeEquityMemberus-gaap:ResidentialPortfolioSegmentMember2021-01-012021-12-310000857855us-gaap:LoansReceivableMemberus-gaap:ConstructionLoansMemberus-gaap:ResidentialPortfolioSegmentMember2020-12-310000857855us-gaap:LoansReceivableMemberus-gaap:ConstructionLoansMemberus-gaap:ResidentialPortfolioSegmentMember2021-01-012021-12-310000857855us-gaap:LoansReceivableMemberus-gaap:ConsumerPortfolioSegmentMember2020-12-310000857855us-gaap:LoansReceivableMemberus-gaap:ConsumerPortfolioSegmentMember2021-01-012021-12-310000857855us-gaap:LandAndLandImprovementsMember2023-12-310000857855us-gaap:LandAndLandImprovementsMember2022-12-310000857855us-gaap:BuildingAndBuildingImprovementsMember2023-12-310000857855us-gaap:BuildingAndBuildingImprovementsMember2022-12-310000857855us-gaap:FurnitureAndFixturesMember2023-12-310000857855us-gaap:FurnitureAndFixturesMember2022-12-310000857855us-gaap:ConstructionInProgressMember2023-12-310000857855us-gaap:ConstructionInProgressMember2022-12-310000857855ucbi:InterestRateContractSubordinatedDebtMemberus-gaap:DesignatedAsHedgingInstrumentMember2023-12-310000857855us-gaap:DerivativeFinancialInstrumentsAssetsMemberucbi:InterestRateContractSubordinatedDebtMemberus-gaap:DesignatedAsHedgingInstrumentMember2023-12-310000857855ucbi:InterestRateContractSubordinatedDebtMemberus-gaap:DerivativeFinancialInstrumentsLiabilitiesMemberus-gaap:DesignatedAsHedgingInstrumentMember2023-12-310000857855ucbi:InterestRateContractSubordinatedDebtMemberus-gaap:DesignatedAsHedgingInstrumentMember2022-12-310000857855us-gaap:DerivativeFinancialInstrumentsAssetsMemberucbi:InterestRateContractSubordinatedDebtMemberus-gaap:DesignatedAsHedgingInstrumentMember2022-12-310000857855ucbi:InterestRateContractSubordinatedDebtMemberus-gaap:DerivativeFinancialInstrumentsLiabilitiesMemberus-gaap:DesignatedAsHedgingInstrumentMember2022-12-310000857855ucbi:TrustPreferredSecuritiesHedgeMemberus-gaap:DesignatedAsHedgingInstrumentMember2023-12-310000857855us-gaap:DerivativeFinancialInstrumentsAssetsMemberucbi:TrustPreferredSecuritiesHedgeMemberus-gaap:DesignatedAsHedgingInstrumentMember2023-12-310000857855us-gaap:DerivativeFinancialInstrumentsLiabilitiesMemberucbi:TrustPreferredSecuritiesHedgeMemberus-gaap:DesignatedAsHedgingInstrumentMember2023-12-310000857855ucbi:TrustPreferredSecuritiesHedgeMemberus-gaap:DesignatedAsHedgingInstrumentMember2022-12-310000857855us-gaap:DerivativeFinancialInstrumentsAssetsMemberucbi:TrustPreferredSecuritiesHedgeMemberus-gaap:DesignatedAsHedgingInstrumentMember2022-12-310000857855us-gaap:DerivativeFinancialInstrumentsLiabilitiesMemberucbi:TrustPreferredSecuritiesHedgeMemberus-gaap:DesignatedAsHedgingInstrumentMember2022-12-310000857855ucbi:DebtSecuritiesAvailableForSaleMemberus-gaap:DesignatedAsHedgingInstrumentMember2023-12-310000857855ucbi:DebtSecuritiesAvailableForSaleMemberus-gaap:DerivativeFinancialInstrumentsAssetsMemberus-gaap:DesignatedAsHedgingInstrumentMember2023-12-310000857855ucbi:DebtSecuritiesAvailableForSaleMemberus-gaap:DerivativeFinancialInstrumentsLiabilitiesMemberus-gaap:DesignatedAsHedgingInstrumentMember2023-12-310000857855ucbi:DebtSecuritiesAvailableForSaleMemberus-gaap:DesignatedAsHedgingInstrumentMember2022-12-310000857855ucbi:DebtSecuritiesAvailableForSaleMemberus-gaap:DerivativeFinancialInstrumentsAssetsMemberus-gaap:DesignatedAsHedgingInstrumentMember2022-12-310000857855ucbi:DebtSecuritiesAvailableForSaleMemberus-gaap:DerivativeFinancialInstrumentsLiabilitiesMemberus-gaap:DesignatedAsHedgingInstrumentMember2022-12-310000857855ucbi:EquipmentFinancingLoansMemberus-gaap:DesignatedAsHedgingInstrumentMember2023-12-310000857855ucbi:EquipmentFinancingLoansMemberus-gaap:DerivativeFinancialInstrumentsAssetsMemberus-gaap:DesignatedAsHedgingInstrumentMember2023-12-310000857855ucbi:EquipmentFinancingLoansMemberus-gaap:DerivativeFinancialInstrumentsLiabilitiesMemberus-gaap:DesignatedAsHedgingInstrumentMember2023-12-310000857855ucbi:EquipmentFinancingLoansMemberus-gaap:DesignatedAsHedgingInstrumentMember2022-12-310000857855ucbi:EquipmentFinancingLoansMemberus-gaap:DerivativeFinancialInstrumentsAssetsMemberus-gaap:DesignatedAsHedgingInstrumentMember2022-12-310000857855ucbi:EquipmentFinancingLoansMemberus-gaap:DerivativeFinancialInstrumentsLiabilitiesMemberus-gaap:DesignatedAsHedgingInstrumentMember2022-12-310000857855us-gaap:DesignatedAsHedgingInstrumentMember2023-12-310000857855us-gaap:DerivativeFinancialInstrumentsAssetsMemberus-gaap:DesignatedAsHedgingInstrumentMember2023-12-310000857855us-gaap:DerivativeFinancialInstrumentsLiabilitiesMemberus-gaap:DesignatedAsHedgingInstrumentMember2023-12-310000857855us-gaap:DesignatedAsHedgingInstrumentMember2022-12-310000857855us-gaap:DerivativeFinancialInstrumentsAssetsMemberus-gaap:DesignatedAsHedgingInstrumentMember2022-12-310000857855us-gaap:DerivativeFinancialInstrumentsLiabilitiesMemberus-gaap:DesignatedAsHedgingInstrumentMember2022-12-310000857855us-gaap:NondesignatedMemberucbi:CustomerSwapPositionMember2023-12-310000857855us-gaap:NondesignatedMemberus-gaap:DerivativeFinancialInstrumentsAssetsMemberucbi:CustomerSwapPositionMember2023-12-310000857855us-gaap:NondesignatedMemberus-gaap:DerivativeFinancialInstrumentsLiabilitiesMemberucbi:CustomerSwapPositionMember2023-12-310000857855us-gaap:NondesignatedMemberucbi:CustomerSwapPositionMember2022-12-310000857855us-gaap:NondesignatedMemberus-gaap:DerivativeFinancialInstrumentsAssetsMemberucbi:CustomerSwapPositionMember2022-12-310000857855us-gaap:NondesignatedMemberus-gaap:DerivativeFinancialInstrumentsLiabilitiesMemberucbi:CustomerSwapPositionMember2022-12-310000857855ucbi:DealerOffsetToCustomerSwapPositionMemberus-gaap:NondesignatedMember2023-12-310000857855us-gaap:NondesignatedMemberucbi:DealerOffsetToCustomerSwapPositionMemberus-gaap:DerivativeFinancialInstrumentsAssetsMember2023-12-310000857855us-gaap:NondesignatedMemberucbi:DealerOffsetToCustomerSwapPositionMemberus-gaap:DerivativeFinancialInstrumentsLiabilitiesMember2023-12-310000857855ucbi:DealerOffsetToCustomerSwapPositionMemberus-gaap:NondesignatedMember2022-12-310000857855us-gaap:NondesignatedMemberucbi:DealerOffsetToCustomerSwapPositionMemberus-gaap:DerivativeFinancialInstrumentsAssetsMember2022-12-310000857855us-gaap:NondesignatedMemberucbi:DealerOffsetToCustomerSwapPositionMemberus-gaap:DerivativeFinancialInstrumentsLiabilitiesMember2022-12-310000857855us-gaap:NondesignatedMemberucbi:RiskParticipationsMember2023-12-310000857855us-gaap:NondesignatedMemberus-gaap:DerivativeFinancialInstrumentsAssetsMemberucbi:RiskParticipationsMember2023-12-310000857855us-gaap:NondesignatedMemberucbi:RiskParticipationsMemberus-gaap:DerivativeFinancialInstrumentsLiabilitiesMember2023-12-310000857855us-gaap:NondesignatedMemberucbi:RiskParticipationsMember2022-12-310000857855us-gaap:NondesignatedMemberus-gaap:DerivativeFinancialInstrumentsAssetsMemberucbi:RiskParticipationsMember2022-12-310000857855us-gaap:NondesignatedMemberucbi:RiskParticipationsMemberus-gaap:DerivativeFinancialInstrumentsLiabilitiesMember2022-12-310000857855us-gaap:NondesignatedMemberucbi:MortgageBankingLoanCommitmentMember2023-12-310000857855us-gaap:NondesignatedMemberucbi:MortgageBankingLoanCommitmentMemberus-gaap:DerivativeFinancialInstrumentsAssetsMember2023-12-310000857855us-gaap:NondesignatedMemberucbi:MortgageBankingLoanCommitmentMemberus-gaap:DerivativeFinancialInstrumentsLiabilitiesMember2023-12-310000857855us-gaap:NondesignatedMemberucbi:MortgageBankingLoanCommitmentMember2022-12-310000857855us-gaap:NondesignatedMemberucbi:MortgageBankingLoanCommitmentMemberus-gaap:DerivativeFinancialInstrumentsAssetsMember2022-12-310000857855us-gaap:NondesignatedMemberucbi:MortgageBankingLoanCommitmentMemberus-gaap:DerivativeFinancialInstrumentsLiabilitiesMember2022-12-310000857855us-gaap:NondesignatedMemberucbi:MortgageBankingForwardSalesCommitmentMember2023-12-310000857855us-gaap:NondesignatedMemberus-gaap:DerivativeFinancialInstrumentsAssetsMemberucbi:MortgageBankingForwardSalesCommitmentMember2023-12-310000857855us-gaap:NondesignatedMemberus-gaap:DerivativeFinancialInstrumentsLiabilitiesMemberucbi:MortgageBankingForwardSalesCommitmentMember2023-12-310000857855us-gaap:NondesignatedMemberucbi:MortgageBankingForwardSalesCommitmentMember2022-12-310000857855us-gaap:NondesignatedMemberus-gaap:DerivativeFinancialInstrumentsAssetsMemberucbi:MortgageBankingForwardSalesCommitmentMember2022-12-310000857855us-gaap:NondesignatedMemberus-gaap:DerivativeFinancialInstrumentsLiabilitiesMemberucbi:MortgageBankingForwardSalesCommitmentMember2022-12-310000857855us-gaap:NondesignatedMemberucbi:BifurcatedEmbeddedDerivativeMember2023-12-310000857855us-gaap:NondesignatedMemberucbi:BifurcatedEmbeddedDerivativeMemberus-gaap:DerivativeFinancialInstrumentsAssetsMember2023-12-310000857855us-gaap:NondesignatedMemberucbi:BifurcatedEmbeddedDerivativeMemberus-gaap:DerivativeFinancialInstrumentsLiabilitiesMember2023-12-310000857855us-gaap:NondesignatedMemberucbi:BifurcatedEmbeddedDerivativeMember2022-12-310000857855us-gaap:NondesignatedMemberucbi:BifurcatedEmbeddedDerivativeMemberus-gaap:DerivativeFinancialInstrumentsAssetsMember2022-12-310000857855us-gaap:NondesignatedMemberucbi:BifurcatedEmbeddedDerivativeMemberus-gaap:DerivativeFinancialInstrumentsLiabilitiesMember2022-12-310000857855us-gaap:NondesignatedMemberucbi:DealerOffsetsToBifurcatedEmbeddedDerivativesMember2023-12-310000857855us-gaap:NondesignatedMemberucbi:DealerOffsetsToBifurcatedEmbeddedDerivativesMemberus-gaap:DerivativeFinancialInstrumentsAssetsMember2023-12-310000857855us-gaap:NondesignatedMemberucbi:DealerOffsetsToBifurcatedEmbeddedDerivativesMemberus-gaap:DerivativeFinancialInstrumentsLiabilitiesMember2023-12-310000857855us-gaap:NondesignatedMemberucbi:DealerOffsetsToBifurcatedEmbeddedDerivativesMember2022-12-310000857855us-gaap:NondesignatedMemberucbi:DealerOffsetsToBifurcatedEmbeddedDerivativesMemberus-gaap:DerivativeFinancialInstrumentsAssetsMember2022-12-310000857855us-gaap:NondesignatedMemberucbi:DealerOffsetsToBifurcatedEmbeddedDerivativesMemberus-gaap:DerivativeFinancialInstrumentsLiabilitiesMember2022-12-310000857855us-gaap:NondesignatedMember2023-12-310000857855us-gaap:NondesignatedMemberus-gaap:DerivativeFinancialInstrumentsAssetsMember2023-12-310000857855us-gaap:NondesignatedMemberus-gaap:DerivativeFinancialInstrumentsLiabilitiesMember2023-12-310000857855us-gaap:NondesignatedMember2022-12-310000857855us-gaap:NondesignatedMemberus-gaap:DerivativeFinancialInstrumentsAssetsMember2022-12-310000857855us-gaap:NondesignatedMemberus-gaap:DerivativeFinancialInstrumentsLiabilitiesMember2022-12-310000857855us-gaap:DerivativeFinancialInstrumentsAssetsMember2023-12-310000857855us-gaap:DerivativeFinancialInstrumentsLiabilitiesMember2023-12-310000857855us-gaap:DerivativeFinancialInstrumentsAssetsMember2022-12-310000857855us-gaap:DerivativeFinancialInstrumentsLiabilitiesMember2022-12-310000857855us-gaap:InterestExpenseMemberus-gaap:DepositsMemberus-gaap:FairValueHedgingMember2023-01-012023-12-310000857855us-gaap:InterestExpenseMemberus-gaap:DepositsMemberus-gaap:FairValueHedgingMember2022-01-012022-12-310000857855us-gaap:InterestExpenseMemberus-gaap:DepositsMemberus-gaap:FairValueHedgingMember2021-01-012021-12-310000857855us-gaap:SecuritiesInvestmentMemberus-gaap:InterestIncomeMemberus-gaap:FairValueHedgingMember2023-01-012023-12-310000857855us-gaap:SecuritiesInvestmentMemberus-gaap:InterestIncomeMemberus-gaap:FairValueHedgingMember2022-01-012022-12-310000857855us-gaap:SecuritiesInvestmentMemberus-gaap:InterestIncomeMemberus-gaap:FairValueHedgingMember2021-01-012021-12-310000857855us-gaap:LoansMemberus-gaap:InterestIncomeMemberus-gaap:FairValueHedgingMember2023-01-012023-12-310000857855us-gaap:LoansMemberus-gaap:InterestIncomeMemberus-gaap:FairValueHedgingMember2022-01-012022-12-310000857855us-gaap:LoansMemberus-gaap:InterestIncomeMemberus-gaap:FairValueHedgingMember2021-01-012021-12-310000857855us-gaap:InterestExpenseMemberus-gaap:LongTermDebtMemberus-gaap:CashFlowHedgingMember2023-01-012023-12-310000857855us-gaap:InterestExpenseMemberus-gaap:LongTermDebtMemberus-gaap:CashFlowHedgingMember2022-01-012022-12-310000857855us-gaap:InterestExpenseMemberus-gaap:LongTermDebtMemberus-gaap:CashFlowHedgingMember2021-01-012021-12-310000857855us-gaap:InterestExpenseMemberus-gaap:CashFlowHedgingMember2021-01-012021-12-310000857855us-gaap:InterestExpenseMemberus-gaap:CashFlowHedgingMember2022-01-012022-12-310000857855us-gaap:InterestExpenseMemberus-gaap:CashFlowHedgingMember2023-01-012023-12-310000857855us-gaap:FairValueHedgingMemberus-gaap:DebtSecuritiesMember2023-12-310000857855us-gaap:DebtSecuritiesMemberus-gaap:FairValueHedgingMember2023-12-310000857855us-gaap:LoansMemberus-gaap:FairValueHedgingMember2023-12-310000857855us-gaap:LoansMemberus-gaap:FairValueHedgingMember2023-12-310000857855us-gaap:NotDesignatedAsHedgingInstrumentEconomicHedgeMemberus-gaap:InterestRateSwapMember2023-12-31ucbi:contract0000857855us-gaap:NondesignatedMemberucbi:CustomerDerivativesAndDealerOffsetsMember2023-01-012023-12-310000857855us-gaap:NondesignatedMemberucbi:CustomerDerivativesAndDealerOffsetsMember2022-01-012022-12-310000857855us-gaap:NondesignatedMemberucbi:CustomerDerivativesAndDealerOffsetsMember2021-01-012021-12-310000857855us-gaap:NondesignatedMemberucbi:BifurcatedEmbeddedDerivativesAndDealerOffsetsMember2023-01-012023-12-310000857855us-gaap:NondesignatedMemberucbi:BifurcatedEmbeddedDerivativesAndDealerOffsetsMember2022-01-012022-12-310000857855us-gaap:NondesignatedMemberucbi:BifurcatedEmbeddedDerivativesAndDealerOffsetsMember2021-01-012021-12-310000857855us-gaap:NondesignatedMemberucbi:MortgageBankingDerivativesMember2023-01-012023-12-310000857855us-gaap:NondesignatedMemberucbi:MortgageBankingDerivativesMember2022-01-012022-12-310000857855us-gaap:NondesignatedMemberucbi:MortgageBankingDerivativesMember2021-01-012021-12-310000857855us-gaap:NondesignatedMemberucbi:RiskParticipationsMember2023-01-012023-12-310000857855us-gaap:NondesignatedMemberucbi:RiskParticipationsMember2022-01-012022-12-310000857855us-gaap:NondesignatedMemberucbi:RiskParticipationsMember2021-01-012021-12-310000857855us-gaap:NondesignatedMember2023-01-012023-12-310000857855us-gaap:NondesignatedMember2022-01-012022-12-310000857855us-gaap:NondesignatedMember2021-01-012021-12-310000857855us-gaap:CoreDepositsMember2023-12-310000857855us-gaap:CoreDepositsMember2022-12-310000857855us-gaap:CustomerRelationshipsMember2023-12-310000857855us-gaap:CustomerRelationshipsMember2022-12-310000857855ucbi:ProgressBankTrustMemberus-gaap:CoreDepositsMember2023-01-030000857855ucbi:FirstMiamiBancorpIncMemberus-gaap:CoreDepositsMember2023-07-010000857855ucbi:ReliantAcquisitionMemberus-gaap:CoreDepositsMember2023-01-012023-12-310000857855us-gaap:LoansInsuredOrGuaranteedByUsGovernmentAuthoritiesMember2022-12-310000857855us-gaap:LoansInsuredOrGuaranteedByUsGovernmentAuthoritiesMember2021-12-310000857855us-gaap:LoansInsuredOrGuaranteedByUsGovernmentAuthoritiesMember2020-12-310000857855us-gaap:LoansInsuredOrGuaranteedByUsGovernmentAuthoritiesMember2023-01-012023-12-310000857855us-gaap:LoansInsuredOrGuaranteedByUsGovernmentAuthoritiesMember2022-01-012022-12-310000857855us-gaap:LoansInsuredOrGuaranteedByUsGovernmentAuthoritiesMember2021-01-012021-12-310000857855us-gaap:LoansInsuredOrGuaranteedByUsGovernmentAuthoritiesMember2023-12-310000857855srt:WeightedAverageMemberus-gaap:LoansInsuredOrGuaranteedByUsGovernmentAuthoritiesMember2023-01-012023-12-310000857855srt:WeightedAverageMemberus-gaap:LoansInsuredOrGuaranteedByUsGovernmentAuthoritiesMember2022-01-012022-12-310000857855srt:MinimumMemberus-gaap:LoansInsuredOrGuaranteedByUsGovernmentAuthoritiesMember2023-01-012023-12-310000857855srt:MaximumMemberus-gaap:LoansInsuredOrGuaranteedByUsGovernmentAuthoritiesMember2023-01-012023-12-310000857855srt:MinimumMemberus-gaap:LoansInsuredOrGuaranteedByUsGovernmentAuthoritiesMember2022-01-012022-12-310000857855srt:MaximumMemberus-gaap:LoansInsuredOrGuaranteedByUsGovernmentAuthoritiesMember2022-01-012022-12-310000857855us-gaap:ResidentialMortgageMember2022-12-310000857855us-gaap:ResidentialMortgageMember2021-12-310000857855us-gaap:ResidentialMortgageMember2020-12-310000857855us-gaap:ResidentialMortgageMember2023-01-012023-12-310000857855us-gaap:ResidentialMortgageMember2022-01-012022-12-310000857855us-gaap:ResidentialMortgageMember2021-01-012021-12-310000857855us-gaap:ResidentialMortgageMember2023-12-310000857855srt:WeightedAverageMemberus-gaap:ResidentialMortgageMember2023-01-012023-12-310000857855srt:WeightedAverageMemberus-gaap:ResidentialMortgageMember2022-01-012022-12-310000857855us-gaap:ResidentialMortgageMembersrt:MinimumMember2023-01-012023-12-310000857855srt:MaximumMemberus-gaap:ResidentialMortgageMember2023-01-012023-12-310000857855us-gaap:ResidentialMortgageMembersrt:MinimumMember2022-01-012022-12-310000857855srt:MaximumMemberus-gaap:ResidentialMortgageMember2022-01-012022-12-310000857855ucbi:EquipmentFinancingMember2023-12-310000857855ucbi:EquipmentFinancingMember2022-12-310000857855us-gaap:USTreasurySecuritiesMemberus-gaap:MaturityOvernightMember2022-12-310000857855us-gaap:USTreasurySecuritiesMemberus-gaap:MaturityUpTo30DaysMember2022-12-310000857855us-gaap:USTreasurySecuritiesMemberus-gaap:Maturity30To90DaysMember2022-12-310000857855us-gaap:USTreasurySecuritiesMemberus-gaap:MaturityOver90DaysMember2022-12-310000857855us-gaap:MaturityOvernightMember2022-12-310000857855us-gaap:MaturityUpTo30DaysMember2022-12-310000857855us-gaap:Maturity30To90DaysMember2022-12-310000857855us-gaap:MaturityOver90DaysMember2022-12-310000857855srt:MinimumMember2022-12-310000857855srt:MaximumMember2022-12-310000857855ucbi:TwoThousandTwentySevenSeniorDebenturesMemberus-gaap:SeniorNotesMember2023-12-310000857855ucbi:TwoThousandTwentySevenSeniorDebenturesMemberus-gaap:SeniorNotesMember2022-12-310000857855ucbi:TwoThousandTwentySevenSeniorDebenturesMemberus-gaap:SeniorNotesMember2023-01-012023-12-310000857855us-gaap:SeniorNotesMemberucbi:TwoThousandThirtySeniorDebenturesMember2023-12-310000857855us-gaap:SeniorNotesMemberucbi:TwoThousandThirtySeniorDebenturesMember2022-12-310000857855us-gaap:SeniorNotesMemberucbi:TwoThousandThirtySeniorDebenturesMember2023-01-012023-12-310000857855us-gaap:SeniorNotesMember2023-12-310000857855us-gaap:SeniorNotesMember2022-12-310000857855us-gaap:SubordinatedDebtMemberucbi:TwoThousandTwentyEightSubordinatedDebenturesMember2023-12-310000857855us-gaap:SubordinatedDebtMemberucbi:TwoThousandTwentyEightSubordinatedDebenturesMember2022-12-310000857855us-gaap:SubordinatedDebtMemberucbi:TwoThousandTwentyEightSubordinatedDebenturesMember2023-01-012023-12-310000857855ucbi:TwoThousandTwentyNineSubordinatedDebenturesMemberus-gaap:SubordinatedDebtMember2023-12-310000857855ucbi:TwoThousandTwentyNineSubordinatedDebenturesMemberus-gaap:SubordinatedDebtMember2022-12-310000857855ucbi:TwoThousandTwentyNineSubordinatedDebenturesMemberus-gaap:SubordinatedDebtMember2023-01-012023-12-310000857855us-gaap:SubordinatedDebtMember2023-12-310000857855us-gaap:SubordinatedDebtMember2022-12-310000857855ucbi:TrustPreferredSecuritiesMemberucbi:TidelandsStatutoryTrustOneMember2023-12-310000857855ucbi:TrustPreferredSecuritiesMemberucbi:TidelandsStatutoryTrustOneMember2022-12-310000857855ucbi:TrustPreferredSecuritiesMemberucbi:TidelandsStatutoryTrustOneMember2023-01-012023-12-310000857855ucbi:TrustPreferredSecuritiesMemberucbi:FourOaksStatutoryTrustIMember2023-12-310000857855ucbi:TrustPreferredSecuritiesMemberucbi:FourOaksStatutoryTrustIMember2022-12-310000857855ucbi:TrustPreferredSecuritiesMemberucbi:FourOaksStatutoryTrustIMember2023-01-012023-12-310000857855ucbi:TrustPreferredSecuritiesMemberucbi:CommunityFirstCapitalTrustOneMember2023-12-310000857855ucbi:TrustPreferredSecuritiesMemberucbi:CommunityFirstCapitalTrustOneMember2022-12-310000857855ucbi:TrustPreferredSecuritiesMemberucbi:CommunityFirstCapitalTrustOneMember2023-01-012023-12-310000857855ucbi:TrustPreferredSecuritiesMemberucbi:CommunityFirstCapitalTrustTwoMember2023-12-310000857855ucbi:TrustPreferredSecuritiesMemberucbi:CommunityFirstCapitalTrustTwoMember2022-12-310000857855ucbi:TrustPreferredSecuritiesMemberucbi:CommunityFirstCapitalTrustTwoMember2023-01-012023-12-310000857855ucbi:CommunityFirstCapitalTrustThreeMemberucbi:TrustPreferredSecuritiesMember2023-12-310000857855ucbi:CommunityFirstCapitalTrustThreeMemberucbi:TrustPreferredSecuritiesMember2022-12-310000857855ucbi:CommunityFirstCapitalTrustThreeMemberucbi:TrustPreferredSecuritiesMember2023-01-012023-12-310000857855ucbi:TrustPreferredSecuritiesMember2023-12-310000857855ucbi:TrustPreferredSecuritiesMember2022-12-310000857855srt:ScenarioForecastMemberucbi:TwoThousandTwentySevenSeniorDebenturesMemberucbi:LondonInterbankOfferedRateLIBOR1Memberus-gaap:SeniorNotesMember2025-08-012025-08-310000857855srt:ScenarioForecastMemberucbi:TwoThousandTwentySevenSeniorDebenturesMemberus-gaap:SeniorNotesMember2025-08-010000857855ucbi:FirstMiamiAndProgressMember2023-01-012023-12-310000857855ucbi:FinTrustAndAquestaMember2021-01-012021-12-310000857855us-gaap:USTreasurySecuritiesMemberus-gaap:FairValueInputsLevel1Memberus-gaap:FairValueMeasurementsRecurringMember2023-12-310000857855us-gaap:USTreasurySecuritiesMemberus-gaap:FairValueMeasurementsRecurringMemberus-gaap:FairValueInputsLevel2Member2023-12-310000857855us-gaap:USTreasurySecuritiesMemberus-gaap:FairValueMeasurementsRecurringMemberus-gaap:FairValueInputsLevel3Member2023-12-310000857855us-gaap:USTreasurySecuritiesMemberus-gaap:FairValueMeasurementsRecurringMember2023-12-310000857855us-gaap:FairValueInputsLevel1Memberus-gaap:FairValueMeasurementsRecurringMemberus-gaap:USGovernmentSponsoredEnterprisesDebtSecuritiesMember2023-12-310000857855us-gaap:FairValueMeasurementsRecurringMemberus-gaap:FairValueInputsLevel2Memberus-gaap:USGovernmentSponsoredEnterprisesDebtSecuritiesMember2023-12-310000857855us-gaap:FairValueMeasurementsRecurringMemberus-gaap:FairValueInputsLevel3Memberus-gaap:USGovernmentSponsoredEnterprisesDebtSecuritiesMember2023-12-310000857855us-gaap:FairValueMeasurementsRecurringMemberus-gaap:USGovernmentSponsoredEnterprisesDebtSecuritiesMember2023-12-310000857855us-gaap:FairValueInputsLevel1Memberus-gaap:FairValueMeasurementsRecurringMemberus-gaap:USStatesAndPoliticalSubdivisionsMember2023-12-310000857855us-gaap:FairValueMeasurementsRecurringMemberus-gaap:USStatesAndPoliticalSubdivisionsMemberus-gaap:FairValueInputsLevel2Member2023-12-310000857855us-gaap:FairValueMeasurementsRecurringMemberus-gaap:USStatesAndPoliticalSubdivisionsMemberus-gaap:FairValueInputsLevel3Member2023-12-310000857855us-gaap:FairValueMeasurementsRecurringMemberus-gaap:USStatesAndPoliticalSubdivisionsMember2023-12-310000857855us-gaap:ResidentialMortgageBackedSecuritiesMemberus-gaap:FairValueInputsLevel1Memberus-gaap:FairValueMeasurementsRecurringMember2023-12-310000857855us-gaap:ResidentialMortgageBackedSecuritiesMemberus-gaap:FairValueMeasurementsRecurringMemberus-gaap:FairValueInputsLevel2Member2023-12-310000857855us-gaap:ResidentialMortgageBackedSecuritiesMemberus-gaap:FairValueMeasurementsRecurringMemberus-gaap:FairValueInputsLevel3Member2023-12-310000857855us-gaap:ResidentialMortgageBackedSecuritiesMemberus-gaap:FairValueMeasurementsRecurringMember2023-12-310000857855us-gaap:CommercialMortgageBackedSecuritiesMemberus-gaap:FairValueInputsLevel1Memberus-gaap:FairValueMeasurementsRecurringMember2023-12-310000857855us-gaap:CommercialMortgageBackedSecuritiesMemberus-gaap:FairValueMeasurementsRecurringMemberus-gaap:FairValueInputsLevel2Member2023-12-310000857855us-gaap:CommercialMortgageBackedSecuritiesMemberus-gaap:FairValueMeasurementsRecurringMemberus-gaap:FairValueInputsLevel3Member2023-12-310000857855us-gaap:CommercialMortgageBackedSecuritiesMemberus-gaap:FairValueMeasurementsRecurringMember2023-12-310000857855us-gaap:FairValueInputsLevel1Memberus-gaap:FairValueMeasurementsRecurringMemberus-gaap:CorporateDebtSecuritiesMember2023-12-310000857855us-gaap:FairValueMeasurementsRecurringMemberus-gaap:CorporateDebtSecuritiesMemberus-gaap:FairValueInputsLevel2Member2023-12-310000857855us-gaap:FairValueMeasurementsRecurringMemberus-gaap:CorporateDebtSecuritiesMemberus-gaap:FairValueInputsLevel3Member2023-12-310000857855us-gaap:FairValueMeasurementsRecurringMemberus-gaap:CorporateDebtSecuritiesMember2023-12-310000857855us-gaap:FairValueInputsLevel1Memberus-gaap:FairValueMeasurementsRecurringMemberus-gaap:AssetBackedSecuritiesMember2023-12-310000857855us-gaap:FairValueMeasurementsRecurringMemberus-gaap:AssetBackedSecuritiesMemberus-gaap:FairValueInputsLevel2Member2023-12-310000857855us-gaap:FairValueMeasurementsRecurringMemberus-gaap:AssetBackedSecuritiesMemberus-gaap:FairValueInputsLevel3Member2023-12-310000857855us-gaap:FairValueMeasurementsRecurringMemberus-gaap:AssetBackedSecuritiesMember2023-12-310000857855us-gaap:FairValueInputsLevel1Memberus-gaap:FairValueMeasurementsRecurringMember2023-12-310000857855us-gaap:FairValueMeasurementsRecurringMemberus-gaap:FairValueInputsLevel2Member2023-12-310000857855us-gaap:FairValueMeasurementsRecurringMemberus-gaap:FairValueInputsLevel3Member2023-12-310000857855us-gaap:FairValueMeasurementsRecurringMember2023-12-310000857855us-gaap:USTreasurySecuritiesMemberus-gaap:FairValueInputsLevel1Memberus-gaap:FairValueMeasurementsRecurringMember2022-12-310000857855us-gaap:USTreasurySecuritiesMemberus-gaap:FairValueMeasurementsRecurringMemberus-gaap:FairValueInputsLevel2Member2022-12-310000857855us-gaap:USTreasurySecuritiesMemberus-gaap:FairValueMeasurementsRecurringMemberus-gaap:FairValueInputsLevel3Member2022-12-310000857855us-gaap:USTreasurySecuritiesMemberus-gaap:FairValueMeasurementsRecurringMember2022-12-310000857855us-gaap:FairValueInputsLevel1Memberus-gaap:FairValueMeasurementsRecurringMemberus-gaap:USGovernmentSponsoredEnterprisesDebtSecuritiesMember2022-12-310000857855us-gaap:FairValueMeasurementsRecurringMemberus-gaap:FairValueInputsLevel2Memberus-gaap:USGovernmentSponsoredEnterprisesDebtSecuritiesMember2022-12-310000857855us-gaap:FairValueMeasurementsRecurringMemberus-gaap:FairValueInputsLevel3Memberus-gaap:USGovernmentSponsoredEnterprisesDebtSecuritiesMember2022-12-310000857855us-gaap:FairValueMeasurementsRecurringMemberus-gaap:USGovernmentSponsoredEnterprisesDebtSecuritiesMember2022-12-310000857855us-gaap:FairValueInputsLevel1Memberus-gaap:FairValueMeasurementsRecurringMemberus-gaap:USStatesAndPoliticalSubdivisionsMember2022-12-310000857855us-gaap:FairValueMeasurementsRecurringMemberus-gaap:USStatesAndPoliticalSubdivisionsMemberus-gaap:FairValueInputsLevel2Member2022-12-310000857855us-gaap:FairValueMeasurementsRecurringMemberus-gaap:USStatesAndPoliticalSubdivisionsMemberus-gaap:FairValueInputsLevel3Member2022-12-310000857855us-gaap:FairValueMeasurementsRecurringMemberus-gaap:USStatesAndPoliticalSubdivisionsMember2022-12-310000857855us-gaap:ResidentialMortgageBackedSecuritiesMemberus-gaap:FairValueInputsLevel1Memberus-gaap:FairValueMeasurementsRecurringMember2022-12-310000857855us-gaap:ResidentialMortgageBackedSecuritiesMemberus-gaap:FairValueMeasurementsRecurringMemberus-gaap:FairValueInputsLevel2Member2022-12-310000857855us-gaap:ResidentialMortgageBackedSecuritiesMemberus-gaap:FairValueMeasurementsRecurringMemberus-gaap:FairValueInputsLevel3Member2022-12-310000857855us-gaap:ResidentialMortgageBackedSecuritiesMemberus-gaap:FairValueMeasurementsRecurringMember2022-12-310000857855us-gaap:CommercialMortgageBackedSecuritiesMemberus-gaap:FairValueInputsLevel1Memberus-gaap:FairValueMeasurementsRecurringMember2022-12-310000857855us-gaap:CommercialMortgageBackedSecuritiesMemberus-gaap:FairValueMeasurementsRecurringMemberus-gaap:FairValueInputsLevel2Member2022-12-310000857855us-gaap:CommercialMortgageBackedSecuritiesMemberus-gaap:FairValueMeasurementsRecurringMemberus-gaap:FairValueInputsLevel3Member2022-12-310000857855us-gaap:CommercialMortgageBackedSecuritiesMemberus-gaap:FairValueMeasurementsRecurringMember2022-12-310000857855us-gaap:FairValueInputsLevel1Memberus-gaap:FairValueMeasurementsRecurringMemberus-gaap:CorporateDebtSecuritiesMember2022-12-310000857855us-gaap:FairValueMeasurementsRecurringMemberus-gaap:CorporateDebtSecuritiesMemberus-gaap:FairValueInputsLevel2Member2022-12-310000857855us-gaap:FairValueMeasurementsRecurringMemberus-gaap:CorporateDebtSecuritiesMemberus-gaap:FairValueInputsLevel3Member2022-12-310000857855us-gaap:FairValueMeasurementsRecurringMemberus-gaap:CorporateDebtSecuritiesMember2022-12-310000857855us-gaap:FairValueInputsLevel1Memberus-gaap:FairValueMeasurementsRecurringMemberus-gaap:AssetBackedSecuritiesMember2022-12-310000857855us-gaap:FairValueMeasurementsRecurringMemberus-gaap:AssetBackedSecuritiesMemberus-gaap:FairValueInputsLevel2Member2022-12-310000857855us-gaap:FairValueMeasurementsRecurringMemberus-gaap:AssetBackedSecuritiesMemberus-gaap:FairValueInputsLevel3Member2022-12-310000857855us-gaap:FairValueMeasurementsRecurringMemberus-gaap:AssetBackedSecuritiesMember2022-12-310000857855us-gaap:FairValueInputsLevel1Memberus-gaap:FairValueMeasurementsRecurringMember2022-12-310000857855us-gaap:FairValueMeasurementsRecurringMemberus-gaap:FairValueInputsLevel2Member2022-12-310000857855us-gaap:FairValueMeasurementsRecurringMemberus-gaap:FairValueInputsLevel3Member2022-12-310000857855us-gaap:FairValueMeasurementsRecurringMember2022-12-310000857855ucbi:DerivativeAssetMemberus-gaap:FairValueMeasurementsRecurringMemberus-gaap:FairValueInputsLevel3Member2020-12-310000857855us-gaap:DerivativeFinancialInstrumentsLiabilitiesMemberus-gaap:FairValueMeasurementsRecurringMemberus-gaap:FairValueInputsLevel3Member2020-12-310000857855us-gaap:CorporateDebtSecuritiesMemberus-gaap:FairValueMeasurementsRecurringMemberus-gaap:FairValueInputsLevel3Member2020-12-310000857855ucbi:DerivativeAssetMemberus-gaap:FairValueMeasurementsRecurringMemberus-gaap:FairValueInputsLevel3Member2021-01-012021-12-310000857855us-gaap:DerivativeFinancialInstrumentsLiabilitiesMemberus-gaap:FairValueMeasurementsRecurringMemberus-gaap:FairValueInputsLevel3Member2021-01-012021-12-310000857855us-gaap:CorporateDebtSecuritiesMemberus-gaap:FairValueMeasurementsRecurringMemberus-gaap:FairValueInputsLevel3Member2021-01-012021-12-310000857855ucbi:DerivativeAssetMemberus-gaap:FairValueMeasurementsRecurringMemberus-gaap:FairValueInputsLevel3Member2021-12-310000857855us-gaap:DerivativeFinancialInstrumentsLiabilitiesMemberus-gaap:FairValueMeasurementsRecurringMemberus-gaap:FairValueInputsLevel3Member2021-12-310000857855us-gaap:CorporateDebtSecuritiesMemberus-gaap:FairValueMeasurementsRecurringMemberus-gaap:FairValueInputsLevel3Member2021-12-310000857855ucbi:DerivativeAssetMemberus-gaap:FairValueMeasurementsRecurringMemberus-gaap:FairValueInputsLevel3Member2022-01-012022-12-310000857855us-gaap:DerivativeFinancialInstrumentsLiabilitiesMemberus-gaap:FairValueMeasurementsRecurringMemberus-gaap:FairValueInputsLevel3Member2022-01-012022-12-310000857855us-gaap:CorporateDebtSecuritiesMemberus-gaap:FairValueMeasurementsRecurringMemberus-gaap:FairValueInputsLevel3Member2022-01-012022-12-310000857855ucbi:DerivativeAssetMemberus-gaap:FairValueMeasurementsRecurringMemberus-gaap:FairValueInputsLevel3Member2022-12-310000857855us-gaap:DerivativeFinancialInstrumentsLiabilitiesMemberus-gaap:FairValueMeasurementsRecurringMemberus-gaap:FairValueInputsLevel3Member2022-12-310000857855us-gaap:CorporateDebtSecuritiesMemberus-gaap:FairValueMeasurementsRecurringMemberus-gaap:FairValueInputsLevel3Member2022-12-310000857855ucbi:DerivativeAssetMemberus-gaap:FairValueMeasurementsRecurringMemberus-gaap:FairValueInputsLevel3Member2023-01-012023-12-310000857855us-gaap:DerivativeFinancialInstrumentsLiabilitiesMemberus-gaap:FairValueMeasurementsRecurringMemberus-gaap:FairValueInputsLevel3Member2023-01-012023-12-310000857855us-gaap:CorporateDebtSecuritiesMemberus-gaap:FairValueMeasurementsRecurringMemberus-gaap:FairValueInputsLevel3Member2023-01-012023-12-310000857855ucbi:DerivativeAssetMemberus-gaap:FairValueMeasurementsRecurringMemberus-gaap:FairValueInputsLevel3Member2023-12-310000857855us-gaap:DerivativeFinancialInstrumentsLiabilitiesMemberus-gaap:FairValueMeasurementsRecurringMemberus-gaap:FairValueInputsLevel3Member2023-12-310000857855us-gaap:CorporateDebtSecuritiesMemberus-gaap:FairValueMeasurementsRecurringMemberus-gaap:FairValueInputsLevel3Member2023-12-310000857855ucbi:DerivativeAssetsMortgageMemberus-gaap:FairValueMeasurementsRecurringMembersrt:MinimumMemberus-gaap:FairValueInputsLevel3Memberucbi:MeasurementInputPullThroughRateMember2023-12-310000857855srt:MaximumMemberucbi:DerivativeAssetsMortgageMemberus-gaap:FairValueMeasurementsRecurringMemberus-gaap:FairValueInputsLevel3Memberucbi:MeasurementInputPullThroughRateMember2023-12-310000857855ucbi:DerivativeAssetsMortgageMembersrt:WeightedAverageMemberus-gaap:FairValueMeasurementsRecurringMemberus-gaap:FairValueInputsLevel3Memberucbi:MeasurementInputPullThroughRateMember2023-12-310000857855ucbi:DerivativeAssetsMortgageMemberus-gaap:FairValueMeasurementsRecurringMembersrt:MinimumMemberus-gaap:FairValueInputsLevel3Memberucbi:MeasurementInputPullThroughRateMember2022-12-310000857855srt:MaximumMemberucbi:DerivativeAssetsMortgageMemberus-gaap:FairValueMeasurementsRecurringMemberus-gaap:FairValueInputsLevel3Memberucbi:MeasurementInputPullThroughRateMember2022-12-310000857855ucbi:DerivativeAssetsMortgageMembersrt:WeightedAverageMemberus-gaap:FairValueMeasurementsRecurringMemberus-gaap:FairValueInputsLevel3Memberucbi:MeasurementInputPullThroughRateMember2022-12-310000857855us-gaap:MeasurementInputDiscountRateMemberus-gaap:CorporateDebtSecuritiesMemberus-gaap:FairValueMeasurementsRecurringMembersrt:MinimumMemberus-gaap:FairValueInputsLevel3Member2023-12-310000857855srt:MaximumMemberus-gaap:MeasurementInputDiscountRateMemberus-gaap:CorporateDebtSecuritiesMemberus-gaap:FairValueMeasurementsRecurringMemberus-gaap:FairValueInputsLevel3Member2023-12-310000857855srt:WeightedAverageMemberus-gaap:MeasurementInputDiscountRateMemberus-gaap:CorporateDebtSecuritiesMemberus-gaap:FairValueMeasurementsRecurringMemberus-gaap:FairValueInputsLevel3Member2023-12-310000857855us-gaap:MeasurementInputDiscountRateMemberus-gaap:CorporateDebtSecuritiesMemberus-gaap:FairValueMeasurementsRecurringMembersrt:MinimumMemberus-gaap:FairValueInputsLevel3Member2022-12-310000857855srt:MaximumMemberus-gaap:MeasurementInputDiscountRateMemberus-gaap:CorporateDebtSecuritiesMemberus-gaap:FairValueMeasurementsRecurringMemberus-gaap:FairValueInputsLevel3Member2022-12-310000857855srt:WeightedAverageMemberus-gaap:MeasurementInputDiscountRateMemberus-gaap:CorporateDebtSecuritiesMemberus-gaap:FairValueMeasurementsRecurringMemberus-gaap:FairValueInputsLevel3Member2022-12-310000857855us-gaap:FairValueInputsLevel1Memberus-gaap:FairValueMeasurementsNonrecurringMember2023-12-310000857855us-gaap:FairValueMeasurementsNonrecurringMemberus-gaap:FairValueInputsLevel2Member2023-12-310000857855us-gaap:FairValueMeasurementsNonrecurringMemberus-gaap:FairValueInputsLevel3Member2023-12-310000857855us-gaap:FairValueMeasurementsNonrecurringMember2023-12-310000857855us-gaap:FairValueInputsLevel1Memberus-gaap:FairValueMeasurementsNonrecurringMember2022-12-310000857855us-gaap:FairValueMeasurementsNonrecurringMemberus-gaap:FairValueInputsLevel2Member2022-12-310000857855us-gaap:FairValueMeasurementsNonrecurringMemberus-gaap:FairValueInputsLevel3Member2022-12-310000857855us-gaap:FairValueMeasurementsNonrecurringMember2022-12-310000857855us-gaap:CarryingReportedAmountFairValueDisclosureMember2023-12-310000857855us-gaap:EstimateOfFairValueFairValueDisclosureMemberus-gaap:FairValueInputsLevel1Member2023-12-310000857855us-gaap:EstimateOfFairValueFairValueDisclosureMemberus-gaap:FairValueInputsLevel2Member2023-12-310000857855us-gaap:EstimateOfFairValueFairValueDisclosureMemberus-gaap:FairValueInputsLevel3Member2023-12-310000857855us-gaap:EstimateOfFairValueFairValueDisclosureMember2023-12-310000857855us-gaap:CarryingReportedAmountFairValueDisclosureMember2022-12-310000857855us-gaap:EstimateOfFairValueFairValueDisclosureMemberus-gaap:FairValueInputsLevel1Member2022-12-310000857855us-gaap:EstimateOfFairValueFairValueDisclosureMemberus-gaap:FairValueInputsLevel2Member2022-12-310000857855us-gaap:EstimateOfFairValueFairValueDisclosureMemberus-gaap:FairValueInputsLevel3Member2022-12-310000857855us-gaap:EstimateOfFairValueFairValueDisclosureMember2022-12-310000857855us-gaap:CommonStockMember2023-11-300000857855us-gaap:CommonStockMember2022-01-012022-12-310000857855ucbi:UCBISeriesINonCumulativePreferredStockMember2023-01-012023-12-310000857855ucbi:UCBISeriesINonCumulativePreferredStockMember2020-12-310000857855ucbi:DepositaryShareOnUCBISeriesINonCumulativePreferredStockMember2020-12-310000857855ucbi:UCBISeriesINonCumulativePreferredStockMember2023-12-310000857855ucbi:UCBISeriesINonCumulativePreferredStockMember2022-12-310000857855us-gaap:PreferredStockMemberucbi:DepositaryShares11000thOfPreferredShareMember2023-05-310000857855us-gaap:PreferredStockMemberucbi:DepositaryShares11000thOfPreferredShareMember2023-12-310000857855us-gaap:PreferredStockMemberucbi:DepositaryShares11000thOfPreferredShareMember2023-01-012023-12-310000857855ucbi:UCBISeriesINonCumulativePreferredStockMember2020-01-012020-12-310000857855us-gaap:RestrictedStockUnitsRSUMember2020-12-310000857855us-gaap:RestrictedStockUnitsRSUMember2021-01-012021-12-310000857855us-gaap:RestrictedStockUnitsRSUMember2021-12-310000857855us-gaap:RestrictedStockUnitsRSUMember2022-01-012022-12-310000857855us-gaap:RestrictedStockUnitsRSUMember2022-12-310000857855us-gaap:RestrictedStockUnitsRSUMember2023-01-012023-12-310000857855us-gaap:RestrictedStockUnitsRSUMember2023-12-310000857855us-gaap:EmployeeStockOptionMember2022-01-012022-12-310000857855us-gaap:EmployeeStockOptionMember2023-01-012023-12-310000857855us-gaap:EmployeeStockOptionMember2021-01-012021-12-310000857855ucbi:PerformanceBasedRestrictedStockUnitsMember2023-12-310000857855us-gaap:RestrictedStockUnitsRSUMemberus-gaap:OtherOperatingIncomeExpenseMember2023-01-012023-12-310000857855us-gaap:RestrictedStockUnitsRSUMemberus-gaap:OtherOperatingIncomeExpenseMember2022-01-012022-12-310000857855us-gaap:RestrictedStockUnitsRSUMemberus-gaap:OtherOperatingIncomeExpenseMember2021-01-012021-12-310000857855us-gaap:AccumulatedNetUnrealizedInvestmentGainLossMemberus-gaap:ReclassificationOutOfAccumulatedOtherComprehensiveIncomeMember2023-01-012023-12-310000857855us-gaap:AccumulatedNetUnrealizedInvestmentGainLossMemberus-gaap:ReclassificationOutOfAccumulatedOtherComprehensiveIncomeMember2022-01-012022-12-310000857855us-gaap:AccumulatedNetUnrealizedInvestmentGainLossMemberus-gaap:ReclassificationOutOfAccumulatedOtherComprehensiveIncomeMember2021-01-012021-12-310000857855ucbi:AccumulatedAmortizationOfGainsIncludedInNetIncomeOnAvailableForSaleSecuritiesTransferredToHeldToMaturityMemberus-gaap:ReclassificationOutOfAccumulatedOtherComprehensiveIncomeMember2023-01-012023-12-310000857855ucbi:AccumulatedAmortizationOfGainsIncludedInNetIncomeOnAvailableForSaleSecuritiesTransferredToHeldToMaturityMemberus-gaap:ReclassificationOutOfAccumulatedOtherComprehensiveIncomeMember2022-01-012022-12-310000857855ucbi:AccumulatedAmortizationOfGainsIncludedInNetIncomeOnAvailableForSaleSecuritiesTransferredToHeldToMaturityMemberus-gaap:ReclassificationOutOfAccumulatedOtherComprehensiveIncomeMember2021-01-012021-12-310000857855us-gaap:ReclassificationOutOfAccumulatedOtherComprehensiveIncomeMemberus-gaap:AccumulatedGainLossNetCashFlowHedgeParentMember2023-01-012023-12-310000857855us-gaap:ReclassificationOutOfAccumulatedOtherComprehensiveIncomeMemberus-gaap:AccumulatedGainLossNetCashFlowHedgeParentMember2022-01-012022-12-310000857855us-gaap:ReclassificationOutOfAccumulatedOtherComprehensiveIncomeMemberus-gaap:AccumulatedGainLossNetCashFlowHedgeParentMember2021-01-012021-12-310000857855us-gaap:ReclassificationOutOfAccumulatedOtherComprehensiveIncomeMemberus-gaap:AccumulatedDefinedBenefitPlansAdjustmentNetPriorServiceCostCreditMember2023-01-012023-12-310000857855us-gaap:ReclassificationOutOfAccumulatedOtherComprehensiveIncomeMemberus-gaap:AccumulatedDefinedBenefitPlansAdjustmentNetPriorServiceCostCreditMember2022-01-012022-12-310000857855us-gaap:ReclassificationOutOfAccumulatedOtherComprehensiveIncomeMemberus-gaap:AccumulatedDefinedBenefitPlansAdjustmentNetPriorServiceCostCreditMember2021-01-012021-12-310000857855us-gaap:ReclassificationOutOfAccumulatedOtherComprehensiveIncomeMemberus-gaap:AccumulatedDefinedBenefitPlansAdjustmentNetUnamortizedGainLossMember2023-01-012023-12-310000857855us-gaap:ReclassificationOutOfAccumulatedOtherComprehensiveIncomeMemberus-gaap:AccumulatedDefinedBenefitPlansAdjustmentNetUnamortizedGainLossMember2022-01-012022-12-310000857855us-gaap:ReclassificationOutOfAccumulatedOtherComprehensiveIncomeMemberus-gaap:AccumulatedDefinedBenefitPlansAdjustmentNetUnamortizedGainLossMember2021-01-012021-12-310000857855us-gaap:ReclassificationOutOfAccumulatedOtherComprehensiveIncomeMemberus-gaap:AccumulatedDefinedBenefitPlansAdjustmentMember2023-01-012023-12-310000857855us-gaap:ReclassificationOutOfAccumulatedOtherComprehensiveIncomeMemberus-gaap:AccumulatedDefinedBenefitPlansAdjustmentMember2022-01-012022-12-310000857855us-gaap:ReclassificationOutOfAccumulatedOtherComprehensiveIncomeMemberus-gaap:AccumulatedDefinedBenefitPlansAdjustmentMember2021-01-012021-12-310000857855us-gaap:ReclassificationOutOfAccumulatedOtherComprehensiveIncomeMember2023-01-012023-12-310000857855us-gaap:ReclassificationOutOfAccumulatedOtherComprehensiveIncomeMember2022-01-012022-12-310000857855us-gaap:ReclassificationOutOfAccumulatedOtherComprehensiveIncomeMember2021-01-012021-12-310000857855us-gaap:StateAndLocalJurisdictionMemberucbi:NetOperatingLossCarryForwardsBeginToExpireInTwoZeroTwoSixMember2023-12-310000857855us-gaap:StateAndLocalJurisdictionMemberucbi:NetOperatingLossCarryForwardsBeginToExpireInTwoZeroTwoFiveMember2023-12-310000857855us-gaap:DomesticCountryMemberucbi:NetOperatingLossCarryForwardsBeginToExpireInTwoZeroTwoSevenMember2023-12-310000857855ucbi:NetOperatingLossCarryForwardsBeginToExpireInTwoZeroTwoThreeMemberus-gaap:StateAndLocalJurisdictionMember2023-12-310000857855ucbi:ExecutiveOfficersCertainKeyEmployeesBoardOfDirectorsMember2023-01-012023-12-310000857855ucbi:ExecutiveOfficersCertainKeyEmployeesBoardOfDirectorsMember2022-01-012022-12-310000857855ucbi:ExecutiveOfficersCertainKeyEmployeesBoardOfDirectorsMember2021-01-012021-12-310000857855ucbi:ModifiedRetirementPlanMember2023-12-310000857855ucbi:ModifiedRetirementPlanMember2022-12-310000857855ucbi:ModifiedRetirementPlanMember2023-01-012023-12-310000857855ucbi:ModifiedRetirementPlanMember2022-01-012022-12-310000857855ucbi:ModifiedRetirementPlanMember2021-12-310000857855ucbi:ModifiedRetirementPlanMember2021-01-012021-12-310000857855srt:SubsidiariesMember2023-12-310000857855srt:SubsidiariesMember2022-12-310000857855us-gaap:CommitmentsToExtendCreditMember2023-12-310000857855us-gaap:CommitmentsToExtendCreditMember2022-12-310000857855us-gaap:LetterOfCreditMember2023-12-310000857855us-gaap:LetterOfCreditMember2022-12-310000857855ucbi:InvestmentsInLIHTCMemberus-gaap:OtherAssetsMember2023-12-310000857855ucbi:InvestmentsInLIHTCMemberus-gaap:OtherAssetsMember2022-12-310000857855ucbi:InvestmentsInLIHTCMemberus-gaap:OtherLiabilitiesMember2023-12-310000857855ucbi:InvestmentsInLIHTCMemberus-gaap:OtherLiabilitiesMember2022-12-310000857855us-gaap:OtherAssetsMemberucbi:RenewableEnergyInvestmentsMember2023-12-310000857855us-gaap:OtherAssetsMemberucbi:RenewableEnergyInvestmentsMember2022-12-310000857855us-gaap:OtherLiabilitiesMemberucbi:RenewableEnergyInvestmentsMember2023-12-310000857855us-gaap:OtherLiabilitiesMemberucbi:RenewableEnergyInvestmentsMember2022-12-310000857855ucbi:FintechAndOtherFundsMemberus-gaap:OtherAssetsMember2023-12-310000857855ucbi:FintechAndOtherFundsMemberus-gaap:OtherAssetsMember2022-12-310000857855ucbi:FintechAndOtherFundsMemberus-gaap:OtherLiabilitiesMember2023-12-310000857855ucbi:FintechAndOtherFundsMemberus-gaap:OtherLiabilitiesMember2022-12-310000857855ucbi:FintechAndOtherFundsMember2023-12-310000857855ucbi:FintechAndOtherFundsMember2022-12-310000857855srt:ParentCompanyMember2023-12-310000857855srt:ParentCompanyMember2022-12-310000857855srt:ParentCompanyMember2023-01-012023-12-310000857855srt:ParentCompanyMember2022-01-012022-12-310000857855srt:ParentCompanyMember2021-01-012021-12-310000857855srt:ParentCompanyMember2021-12-310000857855srt:ParentCompanyMember2020-12-310000857855us-gaap:SubsequentEventMemberucbi:UCBISeriesINonCumulativePreferredStockMember2024-02-062024-02-060000857855us-gaap:SubsequentEventMemberucbi:DepositaryShareOnUCBISeriesINonCumulativePreferredStockMember2024-02-062024-02-060000857855us-gaap:SubsequentEventMemberus-gaap:CommonStockMember2024-02-222024-02-2200008578552023-10-012023-12-31
UNITED STATES
SECURITIES AND EXCHANGE COMMISSION
Washington, D.C. 20549
FORM 10-K
☒ ANNUAL REPORT PURSUANT TO SECTION 13 OR 15(d) OF THE SECURITIES EXCHANGE ACT OF 1934
For the Fiscal Year Ended December 31, 2023
☐ TRANSITION REPORT PURSUANT TO SECTION 13 OR 15(d) OF THE SECURITIES EXCHANGE ACT OF 1934
For the transition period from ______ to ______
Commission File Number 001-35095
UNITED COMMUNITY BANKS, INC.
(Exact name of registrant as specified in its charter)
|
|
|
|
|
|
|
|
|
| Georgia |
|
58-1807304 |
| (State of incorporation) |
|
(I.R.S. Employer Identification No.) |
|
|
|
|
|
|
|
|
|
| 125 Highway 515 East |
|
|
Blairsville, Georgia |
|
30512 |
| (Address of principal executive offices) |
|
(Zip code) |
Registrant’s telephone number, including area code: (706) 781-2265
|
|
|
|
|
|
|
|
|
| Securities registered pursuant to Section 12(b) of the Act: |
|
|
|
| Title of Each Class |
Trading Symbol(s) |
Name of Each Exchange on Which Registered |
| Common stock, par value $1 per share |
UCBI |
Nasdaq Global Select Market |
| Depositary shares, each representing 1/1000th interest in a share of Series I Non-Cumulative Preferred Stock |
UCBIO |
Nasdaq Global Select Market |
Securities registered pursuant to Section 12(g) of the Act: None
Indicate by check mark if the registrant is a well-known seasoned issuer, as defined in Rule 405 of the Securities Act. Yes ☒ No ☐
Indicate by check mark if the registrant is not required to file reports pursuant to Section 13 or Section 15(d) of the Act. Yes ☐ No ☒
Indicate by check mark whether the registrant (1) has filed all reports required to be filed by Section 13 or Section 15(d) of the Securities Exchange Act of 1934 during the preceding 12 months (or for such shorter period that the registrant was required to file such reports), and (2) has been subject to such filing requirements for the past 90 days. Yes ☒ No ☐
Indicate by check mark whether the registrant has submitted electronically every Interactive Data File required to be submitted pursuant to Rule 405 of Regulation S-T (§232.405 of this chapter) during the preceding 12 months (or for such shorter period that the registrant was required to submit such files). Yes ☒ No ☐
Indicate by check mark whether the registrant is a large accelerated filer, an accelerated filer, a non-accelerated filer, a smaller reporting company, or an emerging growth company. See definitions of “large accelerated filer,” “accelerated filer,” “smaller reporting company” and “emerging growth company” in Rule 12b-2 of the Exchange Act.
|
|
|
|
|
|
|
|
|
|
|
|
|
|
|
| Large accelerated filer |
☒ |
|
Accelerated filer |
☐ |
| Non-accelerated filer |
☐ |
|
Smaller reporting company |
☐ |
|
|
|
Emerging growth company |
☐ |
If an emerging growth company, indicate by check mark if the registrant has elected not to use the extended transition period for complying with any new or revised financial accounting standards provided pursuant to Section 13(a) of the Exchange Act. ☐
Indicate by check mark whether the registrant has filed a report on and attestation to its management’s assessment of the effectiveness of its internal control over financial reporting under Section 404(b) of the Sarbanes-Oxley Act (15 U.S.C.7262(b)) by the registered public accounting firm that prepared or issued its audit report. ☒
If securities are registered pursuant to Section 12(b) of the Act, indicate by check mark whether the financial statements of the registrant included in the filing reflect the correction of an error to previously issued financial statements. ☐
Indicate by check mark whether any of those error corrections are restatements that required a recovery analysis of incentive-based compensation received by any of the registrant’s executive officers during the relevant recovery period pursuant to §240.10D-1(b). ☐
Indicate by check mark whether the registrant is a shell company (as defined in Rule 12b-2 of the Exchange Act). Yes ☐ No ☒
The aggregate market value of the registrant’s voting and non-voting common equity held by non-affiliates, computed by reference to the closing price ($24.99 per share) of such common equity, as of June 30, 2023 (the last business day of the registrant’s most recently completed second fiscal quarter) was $2,869,067,214.
As of January 31, 2024, there were 119,080,859 shares of United Community Banks, Inc.’s common stock issued and outstanding.
DOCUMENTS INCORPORATED BY REFERENCE
Portions of the registrant’s Proxy Statement for the 2024 Annual Meeting of Shareholders to be held on May 15, 2024 (the “2024 Proxy Statement”) are incorporated herein into Part III by reference.
|
|
|
|
|
|
|
|
|
| UNITED COMMUNITY BANKS, INC. |
| FORM 10-K |
| INDEX |
|
|
|
|
|
|
|
|
|
|
|
|
|
|
|
|
|
|
|
|
|
|
|
|
|
|
|
|
|
|
|
| |
|
|
|
| |
|
|
|
|
|
|
|
|
|
|
|
|
|
|
|
|
|
|
|
|
|
|
|
|
|
|
|
|
|
|
|
|
|
|
|
|
|
|
| |
|
|
|
|
|
| |
|
|
|
|
|
|
|
|
|
|
|
|
|
|
|
|
|
| |
|
|
|
|
|
| |
|
|
|
|
|
|
|
|
| |
|
|
|
|
|
Glossary of Defined Terms
The following terms may be used throughout this report, including the consolidated financial statements and related notes.
|
|
|
|
|
|
|
|
|
| Term |
|
Definition |
| ACL |
|
Allowance for credit losses |
| Affected Benchmarks |
|
LIBOR and other benchmark rates dependent on the availability of LIBOR |
| AFS |
|
Available-for-sale |
| ALCO |
|
Asset/Liability Management Committee |
| AOCI |
|
Accumulated other comprehensive income (loss) |
| Aquesta |
|
Aquesta Financial Holdings, Inc. and its wholly-owned subsidiary, Aquesta Bank |
| ARR |
|
Alternative reference rate |
| ASC |
|
Accounting Standards Codification |
| ASC 326 |
|
ASC Topic 326, Financial Instruments - Credit Losses |
| ASU |
|
Accounting standards update |
| BHC Act |
|
Bank Holding Company Act of 1956, as amended |
| Bank |
|
United Community Bank |
| Board |
|
United Community Banks, Inc., Board of Directors |
| BOLI |
|
Bank owned life insurance |
|
|
|
| BSBY |
|
Bloomberg Short-Term Bank Yield Index |
|
|
|
| CECL |
|
Current expected credit loss model |
| CET1 |
|
Common equity tier 1 |
| CFPB |
|
Consumer Financial Protection Bureau |
| CME |
|
Chicago Mercantile Exchange |
|
|
|
| Company |
|
United Community Banks, Inc. (interchangeable with "United" below) |
| CRA |
|
Community Reinvestment Act |
| CVA |
|
Credit valuation adjustment |
| Dodd-Frank Act |
|
Dodd-Frank Wall Street Reform and Consumer Protection Act |
| DRIP |
|
Dividend Reinvestment and Stock Purchase Plan |
| DTA |
|
Deferred tax asset |
| DTL |
|
Deferred tax liability |
|
|
|
| Fannie Mae |
|
Federal National Mortgage Association |
| FASB |
|
Financial Accounting Standards Board |
|
|
|
| FDIC |
|
Federal Deposit Insurance Corporation |
FDM |
|
Modification made to borrowers experiencing financial difficulty |
| Federal Reserve |
|
Federal Reserve System |
| FHLB |
|
Federal Home Loan Bank |
| FinCEN |
|
Financial Crimes Enforcement Network |
| FINRA |
|
Financial Industry Regulatory Authority |
| FinTrust |
|
FinTrust Capital Partners, LLC, and its operating subsidiaries, FinTrust Capital Advisors, LLC, FinTrust Capital Benefits Group, LLC and FinTrust Brokerage Services, LLC |
|
|
|
|
|
|
| First Miami |
|
First Miami Bancorp, Inc. and its wholly-owned subsidiary, First National Bank of South Miami |
| Freddie Mac |
|
Federal Home Loan Mortgage Corporation |
| FTE |
|
Fully taxable equivalent |
|
|
|
| GADBF |
|
Georgia Department of Banking and Finance |
| GAAP |
|
Accounting principles generally accepted in the United States of America |
|
|
|
|
|
|
|
|
|
| GLB Act |
|
Gramm-Leach-Bliley Act |
| GSE |
|
U.S. government-sponsored enterprise |
|
|
|
| Holding Company |
|
United Community Banks, Inc. on an unconsolidated basis |
|
|
|
| HTM |
|
Held-to-maturity |
|
|
|
|
|
|
| LIBOR |
|
United States Dollar London Interbank Offered Rate |
| LIHTC |
|
Low income housing tax credits |
|
|
|
| MBS |
|
Mortgage-backed securities |
| MD&A |
|
Management's Discussion and Analysis of Financial Condition and Results of Operations |
| Modified Retirement Plan |
|
United's unfunded noncontributory defined benefit pension plan |
| Nasdaq |
|
National Association of Securities Dealers Automated Quotations Stock Market |
| Navitas |
|
Navitas Credit Corp. |
| NOW |
|
Negotiable order of withdrawal |
| NPA |
|
Nonperforming asset |
| OCI |
|
Other comprehensive income |
| OREO |
|
Other real estate owned |
|
|
|
| Patriot Act |
|
Uniting and Strengthening America by Providing Appropriate Tools Required to Intercept and Obstruct Terrorism Act of 2001 |
| PCD |
|
Purchased credit deteriorated loans |
|
|
|
| Progress |
|
Progress Financial Corporation and its wholly-owned subsidiary, Progress Bank & Trust |
| PSU |
|
Performance based restricted stock unit awards with market conditions |
| Reliant |
|
Reliant Bancorp, Inc. and its wholly-owned subsidiary, Reliant Bank |
| Report |
|
Annual Report on Form 10-K |
| ROU asset |
|
Right-of-use asset |
| RWA |
|
Risk-weighted assets |
| SBA |
|
United States Small Business Administration |
| SCBFI |
|
South Carolina Board of Financial Institutions |
|
|
|
| SEC |
|
Securities and Exchange Commission |
| SOFR |
|
Secured Overnight Financing Rate |
| SIPC |
|
Securities Investor Protection Corporation |
Term SOFR |
|
Forward-looking term rate based on SOFR |
| TDR |
|
Troubled debt restructuring |
|
|
|
|
|
|
| U.S. Treasury |
|
United States Department of the Treasury |
| UCBI |
|
United Community Banks, Inc. and its direct and indirect subsidiaries |
| UCMS |
|
United Community Mortgage Services |
| UCPS |
|
United Community Payment Systems, LLC |
| United |
|
United Community Banks, Inc. and its direct and indirect subsidiaries |
| USDA |
|
United States Department of Agriculture |
Cautionary Note Regarding Forward-Looking Statements
This Report contains forward-looking statements within the meaning of the Private Securities Litigation Reform Act of 1995. In particular, information appearing under “Business,” “Risk Factors,” and “Management’s Discussion and Analysis of Financial Condition and Results of Operations” includes forward-looking statements. Forward-looking statements are neither statements of historical fact nor assurance of future performance and generally can be identified by the use of forward-looking terminology such as “believes”, “expects”, “may”, “will”, “could”, “should”, “projects”, “plans”, “goal”, “targets”, “potential”, “estimates”, “pro forma”, “seeks”, “intends”, or “anticipates”, or similar expressions. Forward-looking statements include discussions of strategy, financial projections, guidance and estimates (including their underlying assumptions), statements regarding plans, objectives, expectations or consequences of various transactions or events, and statements about our future performance, operations, products and services, and should be viewed with caution.
Because forward-looking statements relate to the future, they are subject to known and unknown risks, uncertainties, assumptions and changes in circumstances, many of which are out of our control, and that are difficult to predict as to timing, extent, likelihood and degree of occurrence, and that could cause actual results to differ materially from the results implied or anticipated by the statements. Except as required by law, we expressly disclaim any obligations to publicly update any forward-looking statements whether written or oral, that may be made from time to time, whether as a result of new information, future developments or otherwise. Important factors that could cause our actual results and financial condition to differ materially from those indicated in the forward-looking statements, in addition to those described in detail under Item 1A of this Report - “Risk Factors” - include, but are not limited to the following:
•negative economic and political conditions that adversely affect the general economy, the banking sector, housing prices, the real estate market, the job market, consumer confidence, the financial condition of our borrowers and consumer spending habits, which may affect, among other things, the levels of NPAs, charge-offs and provision expense;
•changes in loan underwriting, credit review or loss policies associated with economic conditions, examination conclusions or regulatory developments;
•the potential effects of pandemics or public health conditions on the economic and business environments in which we operate, including the impact of actions taken by governmental authorities to address these situations;
•strategic, market, operational, liquidity and interest rate risks associated with our business;
•potential fluctuations or unanticipated changes in the interest rate environment, including interest rate changes made by the Federal Reserve, replacements or reform of interest rate benchmarks, as well as cash flow reassessments may reduce net interest margin and/or the volumes and values of loans made or held as well as the value of other financial assets;
•any unanticipated or greater than anticipated adverse conditions in the national or local economies in which we operate;
•our loan concentration in industries or sectors that may experience unanticipated or greater than anticipated adverse conditions than other industries or sectors in the national or local economies in which we operate;
•the risks of expansion into new geographic or product markets;
•risks with respect to our ability to identify and complete future mergers or acquisitions as well as our ability to successfully expand and integrate those businesses and operations that we acquire;
•our ability to attract and retain key employees;
•competition from financial institutions and other financial service providers including non-bank financial technology providers and our ability to attract customers from other financial institutions;
•losses due to fraudulent and negligent conduct of our customers, third party service providers or employees;
•cybersecurity risks and the vulnerability of our network and online banking portals, and the systems or parties with whom we contract, to unauthorized access, computer viruses, phishing schemes, spam attacks, human error, natural disasters, power loss and other security breaches that could adversely affect our business and financial performance or reputation;
•our reliance on third parties to provide key components of our business infrastructure and services required to operate our business;
•the risk that we may be required to make substantial expenditures to keep pace with regulatory initiatives and the rapid technological changes in the financial services market;
•the availability of and access to capital, particularly if there were to be increased capital requirements or enhanced regulatory supervision;
•legislative, regulatory or accounting changes that may adversely affect us;
•volatility in the ACL resulting from the CECL methodology, either alone or as that may be affected by conditions affecting our business;
•adverse results (including judgments, costs, fines, reputational harm, inability to obtain necessary approvals and/or other negative effects) from current or future litigation, regulatory proceedings, examinations, investigations, or similar matters, or developments related thereto;
•any matter that would cause us to conclude that there was impairment of any asset, including intangible assets, such as goodwill;
•limitations on our ability to declare and pay dividends and other distributions from the Bank to the Holding Company, which could affect Holding Company liquidity, including its ability to pay dividends to shareholders or take other capital actions;
•the potential effects of events beyond our control that may have a destabilizing effect on financial markets and the economy, such as inflation or recession, terrorist activities, wars and other foreign conflicts, climate change, disruptions in our customers’ supply chains, disruptions in transportation, essential utility outages or trade disputes and related tariffs; and
•other risks and uncertainties disclosed in documents filed or furnished by us with or to the SEC, any of which could cause actual results to differ materially from future results expressed, implied or otherwise anticipated by such forward-looking statements.
PART I
Unless the context otherwise requires, the terms “we,” “our,” or “us” refer to United Community Banks, Inc. and its direct and indirect subsidiaries, including United Community Bank.
United Community Banks, Inc. is a Georgia corporation incorporated in 1987 and headquartered in Blairsville, Georgia. We are a bank holding company under the BHC Act and a financial holding company under the GLB Act. We provide diversified financial services primarily through our principal subsidiary, United Community Bank. The Bank was founded in 1950 as a Georgia state-chartered bank and converted to a South Carolina state-chartered bank effective on July 1, 2021. We have grown through a combination of acquisitions and strategic growth throughout Georgia, South Carolina, North Carolina, Tennessee, Florida and Alabama as well as nationally through our SBA/USDA lending and equipment finance businesses. As of December 31, 2023 we had consolidated total assets of $27.3 billion.
As a financial holding company, we coordinate the financial resources of the consolidated enterprise and maintain systems of financial, operational, and administrative control intended to coordinate selected policies and activities, including as described in Item 9A of Part II.
Recent Developments
Acquisition of Progress
On January 3, 2023, we completed the acquisition of Progress, a bank headquartered in Huntsville, Alabama. Progress operated 13 branches in Alabama and the Florida Panhandle. In this acquisition, we acquired total assets of $1.90 billion, including total loans of $1.44 billion, and total liabilities of $1.60 billion, including deposits of $1.33 billion.
Acquisition of First Miami
On July 1, 2023, we completed the acquisition of First Miami, a bank headquartered in South Miami, Florida. First Miami operated 3 offices in the Miami metropolitan area. In this acquisition, we acquired total assets of $1.02 billion, including total loans of $577 million, and total liabilities of $931 million, including total deposits of $865 million. In addition, the First Miami acquisition enhanced our offerings of non-traditional bank products - private banking, trust and wealth management.
Principal Businesses and Services We Provide
We provide a wide range of financial products and services to the commercial, retail, governmental, educational, energy, health care and real estate sectors. This includes a variety of deposit products, secured and unsecured loans, mortgage loans, payment and commerce solutions, equipment finance services, wealth management, trust services, private banking, investment advisory services, insurance services, and other related financial services. These products and services are delivered through a variety of channels including our branches, other offices, the internet, and mobile applications.
Our business model combines the commitment to exceptional customer service of a local bank with the products and expertise of a larger institution. We have a strong culture focused on what we call “The Golden Rule of Banking” – treating each other and our customers the way we would want to be treated. We exist to serve our customers, and we are committed to making lives better through outstanding products, dedication to our customers, and serving the communities in which we operate.
We operate as a locally-focused community bank, supplemented by experienced, centralized support to deliver products and services to our larger, more sophisticated, customers. Our organizational structure reflects these strengths, with local leaders for each market and market advisory boards operating in partnership with the product experts of our Commercial Banking Solutions unit. We believe that this combination of service and expertise sets us apart and is instrumental in our strategy to build long-term relationships.
Lending Activities
We offer a full range of lending services, including real estate, consumer and commercial loans, to individuals, small businesses, mid-sized commercial businesses and non-profit organizations. We also originate loans partially guaranteed by the SBA and to a lesser extent by the USDA loan programs. Our consolidated loans at December 31, 2023 were $18.3 billion, or 67% of total consolidated assets. The interest rates that we charge on loans vary with the degree of risk, maturity and amount of the loan, and are further subject to competitive pressures, deposit costs, availability of funds and government regulations.
The most significant categories of our loans are those to finance owner occupied real estate, commercial income property, commercial and industrial equipment and operating loans, and consumer loans secured by personal residences. A majority of our loans are made on a secured basis.
The majority of our loans are to customers located in the immediate market areas of our banking locations in Georgia, South Carolina, North Carolina, Tennessee, Florida and Alabama, including customers who have a seasonal residence in our market areas. We originate a significant portion of our SBA/USDA and equipment finance loans on a national basis, to customers outside of our immediate market areas.
Our full-service retail mortgage lending division, UCMS, is approved as a seller/servicer for the Fannie Mae and the Freddie Mac and provides fixed and adjustable-rate home mortgages. During 2023, the Bank originated $903 million in residential mortgage loans for the purchase of homes and to refinance existing mortgage debt. Approximately 50% of these mortgages were sold into the secondary market without recourse to us, other than for breaches of warranties. We have retained the servicing on most of our mortgage loans sold.
For additional information regarding our lending activity, see the section captioned “Loans” in the “Balance Sheet Review” section of Part II, Item 7. MD&A of this Report.
Deposit Activities
Deposits are the major source of our funds for lending and other investment activities. We offer our customers a variety of deposit products, including checking accounts, savings accounts, money market accounts and other deposit accounts. Generally, we attempt to maintain the rates paid on our deposits at a competitive level. We generate the majority of our deposits from customers in our local markets. For additional information regarding our deposit accounts, see the section captioned “Deposits” in Part II, Item 7. MD&A of this Report.
Investments
We use our investment portfolio to provide for the investment of excess funds at acceptable risk levels while providing liquidity to fund loan demand or to offset fluctuations in deposits. Our portfolio consists primarily of residential and commercial mortgage-backed securities, asset-backed securities, U.S. Treasury, U.S. agency and municipal obligations. Many of the securities are classified by us as AFS and recorded on our balance sheet at fair value at each balance sheet date. Changes in fair value on AFS securities are generally recorded directly in our shareholders’ equity account and are not recognized in our income statement.
Wealth Management, Trust, and Insurance
Through our Wealth Management division, we provide financial planning services, customized portfolio management and investment advice utilizing an open architecture approach to the selection of asset managers. We also offer trust services to manage fiduciary assets. Seaside Capital Management, Inc. and FinTrust Capital Advisors, LLC are registered investment advisors that offer investment advisory services for clients who wish to utilize an independent custodian. FinTrust Insurance and Benefits, Inc. operates as an independent insurance agency for our clients. We also operate FinTrust Brokerage Services, LLC, a registered broker dealer.
Through our United Community Advisory Services division, we generate fee revenue through the sale of non-deposit investment products and insurance products, including life insurance, long-term care insurance and tax-deferred annuities, to our customers. We have an affiliation with a third party broker/dealer, LPL Financial, to facilitate this line of business.
Reinsurance and Merchant Services
We own a captive insurance subsidiary, NLFC Reinsurance Corp., which provides reinsurance on a property insurance contract covering equipment financed by our equipment financing division.
We provide payment processing services for our commercial and small business customers through UCPS. UCPS is a joint venture between the Bank and Clover, a merchant services provider and subsidiary of Fiserv, Inc.
|
|
|
| Other General Information |
Subsidiaries
Our consolidated operating subsidiaries at December 31, 2023 are listed in Exhibit 21 of this Report. Technical and regulatory details follow:
•The Bank is supervised and regulated as described in Supervision and Regulation in this Item below.
•FinTrust Capital Advisors, LLC and Seaside Capital Management, Inc. are registered with the SEC as investment advisers.
•Seaside Capital Management, Inc. is registered with the State of Florida as an investment adviser.
•FinTrust Brokerage Services, LLC is registered as a broker-dealer with the SEC and all states in which it conducts business for which registration is required and is a Member FINRA/SIPC.
•FinTrust Insurance and Benefits, Inc. is licensed as an insurance agency in all states in which it conducts business for which licensing is required.
Strategic Transactions - Acquisitions and Expansion
An element of our business strategy is to consider opportunities to expand into or enhance our presence in attractive markets in which we believe our operating model will be successful. We have entered new markets and expanded our product offerings both by establishing new branches and service locations and also by selective acquisitions of existing market participants. We have developed a number of commercial lending businesses organically, which provide local commercial real estate, middle market, senior living, renewable energy, builder finance and asset-based lending services. We generally seek acquisition partners that share a similar culture and commitment to customer service. Acquisitions typically involve the payment of a premium over book and market values and, therefore, some dilution to our book value may occur with any future transactions. Our goal is to maintain a reasonable earn-back period of any tangible book value dilution, using realistic growth and expense reduction assumptions, as well as to achieve an attractive return on investment. Our ability to engage in any potential acquisition will depend upon the review and approval from various bank regulatory authorities.
Client Concentration
Neither we nor any of our significant subsidiaries is dependent upon a single client or very few clients.
Calendar-Year Seasonality
We do not experience material seasonality; however, we do experience seasonal variation in certain revenues, expenses, and credit trends. Historically, these variations have somewhat increased certain expenses and diminished certain revenues in the commercial banking business, principally in the first quarter each year.
In addition, we experience seasonal variation in certain business efforts that affect our income and our asset and liability balances. Our mortgage business tends to be seasonally strong in the second and third quarters correlating with home buying trends. Our commercial lending businesses (including SBA and Navitas) tend to be seasonally weaker in the first quarter and seasonally stronger in the fourth quarter. In addition, our government deposit balances tend to be strongest in the third and fourth quarters correlating with their tax receipts.
Cyclicality
Banking
Financial services facilitate commercial and consumer economic activities in critical ways. As a result, in many ways, the performance of the financial services industry tends to reflect that of the economies it serves. As a result, our banking business is broadly and strongly dependent on the size and strength of the U.S. economy.
Generally, when the U.S. economy is in an expansionary phase of the business cycle, we experience loan growth, income from lending tends to rise (assuming static interest rates), credit losses tend to fall, and fee income tends to increase. In a contracting phase, those patterns tend to reverse. The impact of those factors on our operating results can be substantial, especially if they consistently move up or down at the same time.
Our banking business is highly dependent on the level of interest rates, whether federal monetary policy is easing or tightening, and on the shape of the interest rate yield curve. These factors also are cyclical, and are related in complex ways with the business cycle mentioned above.
These factors, and their impacts on us, often are mixed rather than consistently positive or negative. For example, low interest rates reduce the interest income we earn, reduce our costs of funding, tend to stimulate economic activity and loan growth, and, through lower debt service, tend to ease financial pressure on clients, reducing default risk. A steeper yield curve, one with long-term interest rates noticeably higher than short-term rates, is generally positive for our net interest margin as lower short rates will keep our deposit costs down while higher long rates will support the rates we can charge on lending. But if short-term rates are expected to fall, that expectation may be reflected in the longer-term rates resulting in a flattened or inverted yield curve, causing our margins to suffer. Moreover, the Federal Reserve tends to lower rates in response to, or to avoid, a weakening economy. Economic weakness tends to diminish client borrowing and other activities that otherwise benefit our performance.
Further information on these topics is presented: within Item 1A, Risk Factors under the headings: Risks from Changes in Economic Conditions, Risks Associated with Monetary Events, Liquidity and Funding Risk, and Interest Rate and Yield Curve Risks.
Mortgage Origination and Related Services
The strength of consumer mortgage lending activity in the United States impacts our mortgage origination and related services line of business. Mortgage lending activity is strongly linked to economic strength and interest rate cycles. Activity tends to be inversely related to prevailing mortgage rates: when rates are high, home-buying and refinancing decrease, and when rates are low, home-buying and refinancing increase. Moreover, expectations about near-term future mortgage rates can accelerate or delay those impacts, as borrowers rush to avoid future rate increases or wait for future rate decreases.
|
|
|
| Human Resources Management |
As of December 31, 2023 we had 3,121 full-time equivalent employees compared to 2,843 at December 31, 2022. None of our employees are represented by a union, collective bargaining agreement or similar arrangement, and we have not experienced any labor disputes or strikes arising from any organized labor groups. Our employees support our vision to follow what we call “The Golden Rule of Banking” – to treat each other, and our customers, the way we would like to be treated. We believe that our ability to earn the trust of our customers and deliver exceptional customer service hinges on our culture, which in turn depends upon the dedication and engagement of our employees. When employees are dedicated and engaged, they take extra steps for our customers. We have a community bank mindset, empowering employees to make decisions at the local level, while arming our employees with the products, services, and centralized support of a larger institution. We are committed to attracting and retaining talented employees whose values align with our customer service mission, creating meaningful opportunities for training and advancement, and being an extraordinary place to work.
Diversity and Inclusion
We strive to foster an open, supportive workplace in which our employees can grow professionally and achieve their potential. We pride ourselves on maintaining workplaces that are intended to inspire employees to voice their ideas and openly express opinions for the betterment of the Bank, our employees, and our customers. We desire that all employees feel that they are operating in an inclusive environment that welcomes and supports differences. We believe that encouraging input from all perspectives allows us to provide our customers with creative ideas and solutions for operating effectively in a complex, ever-changing marketplace.
In 2020, we formed the “Power of U,” an advisory group comprised of a cross functional representation of non-management employees. The Power of U offers two-way communication between employees from across the organization and between employees and management, adding social factors contributing to a culture of belonging, reward, recognition and engagement. It provides alternative channels of communication for team members to ensure that ideas, suggestions, and issues that come from the ground floor are shared with senior leadership.
Oversight and Management
Our Board and its Talent and Compensation Committee provide oversight on human capital matters, including overall compensation philosophy, equity award programs, diversity and inclusion and succession planning. Our Human Resources, Legal and Compliance departments develop policies associated with our labor and human capital practices, identify risks, and implement practices to mitigate those risks, under the oversight of the Board and its committees. At the management level, our Employee Retirement Plan Committee is responsible for reviewing and approving our 401(k) retirement program. Our Incentive Compensation Committee is responsible for overseeing, reviewing and approving the non-executive incentive compensation plans for our employees and for assessing the risks associated with those incentive compensation plans.
Compensation and Benefits
We are committed to providing competitive compensation and benefits programs designed to attract, retain, motivate and reward employees for matching the right products with our customers’ needs, while also staying within our risk tolerance. We offer a variety of group health plans for our employees, including prescription drug coverage, comprehensive dental and vision plans, disability and life insurance and health care accounts, which help our employees reduce the costs of medical and dependent care by allowing them to set aside pre-tax dollars. Employees are eligible to contribute to our 401(k) Retirement Plan beginning the first of the month following their date of employment and may earn a company match on 5% of pay after 90 days of service.
Talent Development
Through our talent development initiatives, such as the Manager Development Program, our internal team and subject matter experts provide our employees with quality continuing education on a variety of topics. Participation in continuing education is expected and supported so our employees stay informed and up to date on information, skills and systems.
Through our memberships with the American Bankers Association, the Risk Management Association, the Mid-Size Bank Coalition of America, and state bankers associations, our employees have access to resources, online training, conferences, and discussion groups designed for bankers at all levels in all roles. We encourage our employees to utilize these resources, and we support our employees’ involvement with these organizations for training, to advance their knowledge and skills sets, and to develop leadership skills. Many of our employees are actively engaged in leadership roles, forums, task forces and other groups within these organizations.
To encourage, support, and equip our rising leaders with relevant skills, we offer our Leadership Academy, an annual program for a selected group of individuals who exemplify the qualities of a next generation leader. The program is designed to empower emerging leaders with the knowledge and skills necessary to lead our Bank. Participants are selected annually for the multi-month program and engage in strategic projects, leadership and business development sessions and executive and senior leadership roundtable mentoring. This is intended to allow our future leaders with the highest potential to enhance their knowledge and skills, grow in understanding of our culture and how we do business, and be challenged with assignments that strategically impact the Bank.
Employee Engagement Surveys
The Best Banks to Work For program, initiated in 2013 by American Banker and Best Companies Group, identifies and recognizes U.S. banks for outstanding employee satisfaction. We are honored to have been named one of American Banker’s 2023 Best Banks to Work For, an award we’ve received for seven consecutive years.
We believe that an engaged workforce is one of our most valuable assets in sustaining our success and that we are on this list because we listen to our employees and respond to their concerns. We periodically conduct employee engagement surveys, facilitated by a third-party provider, to seek input and feedback from all of our employees across our entire footprint. Among other things, the survey asks employees to rate and comment on the Bank’s strategies and priorities, customer focus, operations, individual roles and responsibilities, competitiveness for compensation and benefits, work environment and employee engagement. The survey includes questions that ask employees to score certain questions, as well as allowing employees to provide open-ended feedback responses.
The employee engagement survey results are reviewed and discussed by both executive management and our Board. Our leadership analyzes the survey feedback for areas of improvement, progress and emphasis, and action plans are developed with cross functional bank representatives to address areas of opportunity. Our leadership takes the survey feedback into account in developing and prioritizing the Bank’s strategic plans and initiatives. We also share an overview of the survey results with our employees and communicate the changes we make in response to the survey to meet our employees’ needs, to enhance our employees’ experience and to continue to make our company an employer of choice.
Serving the needs of all the members of our communities also remains an important part of our strategy. We know employees want to work for companies that give back and, as an organization, we believe in the power of coming together for good. Through our “Together for Good Council,” a group of employees who help to coordinate volunteer efforts, guide charitable giving and lead each of our “Good Days” of service, we are continuing our efforts to enhance our community engagement initiatives and involvement with our local communities.
Our profitability depends principally on our ability to effectively compete in the markets in which we conduct business. We experience strong competition in all aspects of the businesses in which we engage from both bank and non-bank competitors. Broadly speaking, we compete with national banks, super-regional banks, smaller community banks, credit unions, non-traditional internet-based banks and insurance companies and agencies. We also compete with other financial intermediaries and investment alternatives such as mortgage companies, credit card issuers, leasing companies, finance companies, money market mutual funds, brokerage firms, governmental and corporate bond issuers, and other securities firms. Many of these non-bank competitors are not subject to the same regulatory oversight, which can provide them with a competitive advantage in some instances. In many cases, our competitors have substantially greater resources and offer certain services that we are unable to provide to our customers.
We encounter strong pricing competition in providing our services, particularly in making loans and attracting deposits. The larger national and super-regional banks may have significantly greater lending limits and may offer additional products. We attempt to compete successfully with our competitors, regardless of their size, by emphasizing customer service while continuing to provide a wide variety of services.
We expect competition in the industry to continue to increase mainly as a result of the improvement in financial technology used by both existing and new banking and financial services firms. Competition may further intensify as additional companies (both banks and non-banks) enter the markets where we conduct business, competitors combine to present more formidable challengers, and we enter mature markets in accordance with our expansion strategy.
|
|
|
| Supervision and Regulation |
Scope of this Section
This section describes certain material aspects of the regulatory framework applicable to banks and financial holding companies and their subsidiaries and to companies engaged in securities and insurance activities. To the extent that the following information describes statutory or regulatory provisions, it is qualified in its entirety by express reference to each of the particular statutory and regulatory provisions, and you should refer to the full text of the statutes, regulations, and corresponding guidance for more information. These statutes and regulations are subject to change, and additional statutes, regulations, and corresponding guidance may be adopted. We are unable to predict these future changes or the effects, if any, that these changes could have on our business. Finally, investors should be aware that the regulatory framework governing banks and the financial services industry is intended primarily to protect depositors and the Deposit Insurance Fund – not to protect our Bank or our security holders.
Overview
The Holding Company
The Holding Company is a bank holding company and financial holding company within the meaning of the BHC Act and is registered with the Federal Reserve. We are subject to the regulation and supervision of, and to examination by, the Federal Reserve (under the BHC Act). We are required to file with the Federal Reserve annual reports and such additional information as the Federal Reserve may require pursuant to the BHC Act.
Effective July 1, 2021, the Holding Company elected to become a financial holding company, which allows for engagement in a broader range of financial activities. A bank holding company that is not a financial holding company is limited to engaging in “banking” and activities found by the Federal Reserve to be “closely related to banking.” Eligible bank holding companies that elect to become financial holding companies may affiliate with securities firms and insurance companies and engage in activities that are “financial in nature.” “Financial” activities are broader in scope than those which are “closely related to banking.” See Financial Activities other than Banking in this Item.
The BHC Act requires every bank holding company to obtain the Federal Reserve’s prior approval before (1) acquiring direct or indirect ownership or control of more than 5% of the voting shares of any bank that it does not already control; (2) acquiring all or substantially all of the assets of a bank; and (3) subject to certain exceptions, merging or consolidating with any other bank holding company. In addition, a bank holding company is generally prohibited from engaging in, or acquiring a direct or indirect interest in or control of more than 5% of the voting shares of any company engaged in non-banking activities. This prohibition does not apply to activities listed in the BHC Act or found by the Federal Reserve, by order or regulation, to be closely related to banking or managing or controlling banks as to be a proper incident thereto. The Federal Reserve also may approve an application by a bank holding company to acquire a bank located outside the acquirer’s principal state of operations without regard to whether the transaction is prohibited under state law, although state law may still impose certain requirements. See Interstate Branching and Mergers in this Item for further information.
The Holding Company is an “affiliate” of the Bank under the Federal Reserve Act, which imposes certain restrictions on (1) loans by the Bank to the Holding Company, (2) investments in the stock or securities of the Holding Company by the Bank, (3) the Bank taking the stock or securities of an “affiliate” as collateral for loans by the Bank to a borrower and (4) the purchase of assets from the Holding Company by the Bank. Further, a bank holding company and its subsidiaries are prohibited from engaging in certain tie-in arrangements in connection with any extension of credit, lease or sale of property or furnishing of services. See Transactions with Affiliates discussed below.
The Bank
United Community Bank, our most significant subsidiary, is a South Carolina state-chartered bank subject to the regulation and supervision of, and to examination by, the SCBFI. Effective July 1, 2021, the Bank moved its headquarters from Blairsville, Georgia to Greenville, South Carolina and became a South Carolina state-chartered bank subject to examination and reporting requirements of the SCBFI. Prior to that date, the Bank was a Georgia state-chartered bank subject to examination and reporting requirements of the GADBF. In addition to general supervision and examination powers, the SCBFI has the power to approve mergers with the Bank, the Bank’s issuance of preferred stock or capital notes, the establishment of branches, and many other corporate actions. We are not required to obtain the approval of the SCBFI prior to acquiring the capital stock of a national bank, but we must notify them at least 15 days prior to doing so. We must receive the SCBFI’s approval prior to engaging in the acquisition of a South Carolina state-chartered bank or another South Carolina bank holding company.
The Bank is subject to examination and reporting requirements of the FDIC, the SCBFI and the CFPB. The financial statements and information contained herein have not been reviewed, or confirmed for accuracy or relevance, by the FDIC or any other regulator.
The Bank is insured by, and subject to regulation by, the FDIC and is subject to regulation in certain respects by the CFPB. The Bank is also subject to various requirements and restrictions under federal and state law, including requirements to maintain reserves against deposits, restrictions on the types and amounts of loans that may be made and the interest that may be charged, limitations on the types of investments that may be made, activities that may be engaged in, and types of services that may be offered. Various consumer laws and regulations also affect the operations of the Bank.
In addition to the impact of regulation, commercial banks are affected significantly by the actions of the Federal Reserve as it attempts to control money supply and credit availability in order to influence the economy. Also, the Bank and certain of its affiliates are prohibited from engaging in certain tie-in arrangements in connection with extensions of credit, leases or sales of property, or furnishing products or services.
Payment of Dividends
The Holding Company is a legal entity separate and distinct from the Bank and other subsidiaries. The Holding Company’s principal source of cash flow, including cash flow to pay dividends on our stock or to pay principal (including premium, if any) and interest on debt securities is dividends paid to it by the Bank. There are statutory and regulatory requirements applicable to the payment of dividends and other distributions by the Bank, as well as by the Holding Company to its shareholders.
During 2023, 2022 and 2021, the Bank paid dividends to the Holding Company of $198 million, $133 million and $217 million, respectively. The Holding Company declared quarterly cash dividends on its common stock in 2023, 2022 and 2021 totaling $0.92, $0.86 and $0.78 per share, respectively.
The Holding Company
Under Georgia corporate law, we may not pay cash dividends if, after giving effect to such payment, we would not be able to pay our debts as they become due in the usual course of business or our total assets would be less than the sum of our total liabilities plus any amounts needed to satisfy any preferential rights if we were dissolving. In addition, in deciding whether or not to declare a dividend of any particular size, our Board must consider our current and prospective capital, liquidity, and other needs, including the needs of the Bank which we are obligated to support.
The Federal Reserve has issued a policy statement on the payment of cash dividends by bank holding companies, which expresses the Federal Reserve’s view that a bank holding company generally should pay cash dividends only to the extent that the holding company’s net income for the past year is sufficient to cover both the cash dividends and a rate of earnings retention that is consistent with the holding company’s capital needs, asset quality, and overall financial condition. The Federal Reserve has also indicated that a bank holding company should not maintain a level of cash dividends that places undue pressure on the capital of its bank subsidiaries, or that can be funded only through additional borrowings or other arrangements that undermine the bank holding company’s ability to act as a source of strength to its bank subsidiaries. The Holding Company and the Bank must also maintain the CET1 capital conservation buffer of 2.5% to avoid becoming subject to restrictions on capital distributions, including dividends, as described below under Capital Adequacy-Basel III Capital Standards.
The Bank
As a South Carolina state-chartered bank, the Bank is permitted to pay a dividend of up to 100% of its current year earnings without requesting approval of the SCBFI, provided certain conditions are met. All other cash dividends require approval of the SCBFI. The application of those restrictions to the Bank is discussed in more detail in Note 1, Summary of Significant Accounting Policies, of Part II, Item 8. Financial Statements, which is incorporated into this Item 1 by reference.
Other Factors Affecting Dividends
If, in the opinion of the applicable regulatory authority, the Holding Company or the Bank are engaged in or about to engage in an unsafe or unsound practice (which, depending on the financial condition of the Holding Company or the Bank, could include the payment of dividends), such authority may require us or the Bank to cease and desist from that practice. The federal banking agencies have indicated that paying dividends that deplete a depository institution’s or holding company’s capital base to an inadequate level would be an unsafe and unsound banking practice.
In addition, under the Federal Deposit Insurance Act, an FDIC-insured depository institution (such as the Bank) may not make any capital distributions, pay any management fees to its holding company, or pay any dividend if it is undercapitalized or if such payment would cause it to become undercapitalized.
The payment of dividends by the Holding Company and the Bank may also be affected or limited by other factors, such as the requirement to maintain adequate capital above regulatory guidelines imposed by regulators or debt covenants. For example, as discussed under Capital Adequacy below, our ability to pay dividends would be restricted if our capital ratios fell below minimum regulatory requirements plus a capital conservation buffer.
The Federal Reserve generally requires bank holding companies to pay dividends only out of current operating earnings. The Federal Reserve has released a supervisory letter advising, among other things, that a bank holding company should inform the Federal Reserve and should eliminate, defer, or significantly reduce its dividends if (i) the bank holding company’s net income available to shareholders for the past four quarters, net of dividends previously paid during that period, is not sufficient to fully fund the dividends; (ii) the bank holding company’s prospective rate of earnings is not consistent with the bank holding company’s capital needs and overall current and prospective financial condition; or (iii) the bank holding company will not meet, or is in danger of not meeting, its minimum regulatory capital adequacy ratios.
Transactions with Affiliates
Federal banking laws restrict transactions between a bank and its affiliates, including a parent BHC. The Bank is subject to these restrictions, which include quantitative and qualitative limits on the amounts and types of permissible transactions, including extensions of credit to affiliates, investments in the stock or securities of affiliates, purchases of assets from affiliates and certain other transactions with affiliates.
These restrictions also require that credit transactions with affiliates be collateralized and that transactions with affiliates must be on terms substantially the same, or at least as favorable, as those prevailing at the time for comparable transactions with or involving nonaffiliates. In the absence of such comparable transactions, any transaction between banks and their affiliates must be on terms and under circumstances, including credit standards, which in good faith would be offered to or would apply to nonaffiliates. Generally, a bank’s covered transactions with any one affiliate are limited to 10% of the bank’s capital stock and surplus and covered transactions with all affiliates are limited to 20% of the bank’s capital stock and surplus. The Dodd-Frank Act expanded the scope of these regulations, including by applying them to the credit exposure arising under derivative transactions, repurchase and reverse repurchase agreements, and securities borrowing and lending transactions. Federal banking laws also place similar restrictions on loans and other extensions of credit by FDIC-insured banks, such as the Bank, and their subsidiaries to their directors, executive officers, and principal shareholders.
Capital Adequacy
Banks and bank holding companies are subject to various regulatory capital requirements administered by state and federal banking agencies. Capital adequacy guidelines involve quantitative measures of assets, liabilities and certain off-balance-sheet items calculated under regulatory accounting practices. Capital amounts and classifications are also subject to qualitative judgments by regulators about components, risk weighting and other factors.
Basel III Capital Standards
Federal financial industry regulators require that regulated financial institutions, including the Holding Company and the Bank maintain minimum capital levels. The capital requirements in the United States are based on international standards known as “Basel III.”, which require the following:
|
|
|
|
|
|
|
|
|
|
|
|
|
|
|
|
|
|
|
|
|
|
|
|
|
Ratio Description |
|
Minimum Capital |
|
|
|
Minimum Capital Plus Capital Conservation Buffer |
| Risk-based ratios: |
|
|
|
|
|
|
|
|
| CET1 capital |
|
Common Equity Tier 1 Capital to RWA |
|
4.5 |
% |
|
|
|
7.0% |
| Tier 1 capital |
|
Tier 1 Capital to RWA |
|
6.0 |
|
|
|
|
8.5 |
| Total capital |
|
Total Capital to RWA |
|
8.0 |
|
|
|
|
10.5 |
| Leverage ratio |
|
Tier 1 Capital divided by quarterly average assets net of goodwill, certain other intangible assets, and certain required deduction items |
|
4.0 |
|
|
|
|
N/A |
Tier 1 capital includes two components: CET1 capital and additional Tier 1 capital. The highest form of capital, CET1 capital, consists of common shareholders’ equity, excluding AOCI, intangible assets, net of associated net deferred tax liabilities, and disallowed deferred tax assets. Additional Tier 1 capital includes non-cumulative perpetual preferred stock.
Tier 2 capital includes the allowable portion of the ACL up to 1.25% of RWA as well as qualifying subordinated debt and trust preferred securities.
In addition, a banking organization must maintain a 2.5% capital conservation buffer on top of its minimum risk-based capital requirements in order to avoid restrictions on capital distributions or discretionary bonus payments to executives. This buffer must consist solely of Tier 1 Common Equity, but the buffer applies to all three risk-based measurements (CET1, Tier 1 capital and total capital).
Failure to meet capital guidelines could subject a bank to a variety of enforcement remedies, including the termination of deposit insurance by the FDIC, and to certain restrictions on its business and in certain circumstances to the appointment of a conservator or receiver. See Prompt Corrective Action immediately below for additional information.
In addition, the Bank is required to have a capital structure that the SCBFI determines is adequate, based on SCBFI’s assessment of the Bank’s businesses and risks. The SCBFI may require the Bank to increase its capital, if found to be inadequate.
Prompt Corrective Action
Federal banking regulators must take “prompt corrective action” regarding FDIC-insured depository institutions that do not meet minimum capital requirements. For this purpose, insured depository institutions are divided into five capital categories, the specific regulatory requirements for which are set forth in the following table.
|
|
|
|
|
|
|
|
|
|
|
|
|
|
|
|
|
|
|
Risk-Based Ratios |
|
| Category |
Total Capital |
Tier 1
Capital |
CET1
Capital |
Leverage
Ratio |
Tangible Equity to Total Assets |
| Well-capitalized |
at least 10% |
at least 8% |
at least 6.5% |
at least 5% |
|
| Adequately capitalized |
at least 8% |
at least 6% |
at least 4.5% |
at least 4% |
|
| Undercapitalized |
under 8% |
under 6% |
under 4.5% |
under 4% |
|
| Significantly undercapitalized |
under 6% |
under 4% |
under 3% |
under 3% |
|
| Critically undercapitalized |
|
|
|
|
2% or less |
As of December 31, 2023, the Bank qualified as “well-capitalized” under the regulatory capital requirements discussed above. An institution may be deemed to be in a capitalization category that is lower than is indicated by its actual capital position if it receives an unsatisfactory examination rating. Institutions generally are not allowed to publicly disclose examination results.
Federal banking regulators are required to take various mandatory supervisory actions and are authorized to take other discretionary actions with respect to institutions in the three undercapitalized categories. The severity of the action depends upon the capital category in which the institution is placed. Institutions in any of the three undercapitalized categories are prohibited from declaring dividends or making capital distributions. In addition, an institution that is categorized in the three undercapitalized categories is required to submit an acceptable capital restoration plan to its appropriate federal banking agency, which, for the Bank, is the FDIC. Generally, subject to a narrow exception, banking regulators must appoint a receiver or conservator for an institution that is “critically undercapitalized.” The FDIC regulations also allow it to “downgrade” an institution to a lower capital category based on supervisory factors other than capital.
Holding Company Structure and Support of Subsidiary Banks
Because we are a holding company, our right to participate in the assets of any subsidiary upon the latter’s liquidation or reorganization will be subject to the prior claims of the subsidiary’s creditors (including depositors in the case of the Bank) except to the extent that we may be a creditor with recognized claims against the subsidiary. In addition, depositors of a bank, and the FDIC as their subrogee, would be entitled to priority over the other creditors in the event of liquidation of the bank.
Under Federal Reserve policy, now codified in the Dodd-Frank Act, we are expected to act as a source of financial strength to, and to commit resources to support, the Bank. This support may be required at times even if, absent such Federal Reserve policy, we might not wish to provide it or have the resources to provide it. In addition, any capital loans by a bank holding company to any of its subsidiary banks are subordinate in right of payment to deposits and to certain other indebtedness of the subsidiary bank. In the event of a bank holding company’s bankruptcy, any commitment by the bank holding company to a federal bank regulatory agency to maintain the capital of a subsidiary bank will be assumed by the bankruptcy trustee and entitled to a priority of payment.
Consumer Protection Laws
In connection with its lending activities, the Bank is subject to a number of federal and state laws designed to protect borrowers and promote lending to various sectors of the economy and population. These laws include the Equal Credit Opportunity Act, the Fair Credit Reporting Act, the Truth in Lending Act, the Home Mortgage Disclosure Act, the Real Estate Settlement Procedure Act and their respective state law counterparts.
Volcker Rule
The Volcker rule (1) generally prohibits banks from engaging in proprietary trading, which is engaging as principal (for the bank’s own account) in any purchase or sale of one or more of certain types of financial instruments, and (2) limits banks’ ability to invest in or sponsor hedge funds or private equity funds.
CFPB
The Dodd-Frank Act created the CFPB, which is granted broad rulemaking, supervisory and enforcement powers under various federal consumer financial protection laws, including the Equal Credit Opportunity Act, Truth in Lending Act, Real Estate Settlement Procedures Act, Fair Credit Reporting Act, Fair Debt Collection Practices Act, the Consumer Financial Privacy provisions of the GLB Act and certain other statutes. The CFPB has examination and primary enforcement authority with respect to depository institutions with $10 billion or more in assets, including the Bank. The CFPB has authority to prevent unfair, deceptive or abusive practices in connection with the offering of consumer financial products.
The CFPB has issued a number of regulations related to the origination of mortgages, foreclosures, and overdrafts as well as many other consumer issues. Additionally, the CFPB has proposed, or may propose, additional regulations or modifications to existing regulations that directly relate to our business. New CFPB regulations, and changes to CFPB regulations and enforcement priorities, may have a material impact on our compliance costs, compliance risk, and operations of the Bank.
FDIC Insurance Assessments; Deposit Insurance Fund
The Bank’s deposits are insured by the FDIC up to $250,000 per depositor subject to applicable limitations through the Deposit Insurance Fund. As a result, the Bank must pay deposit insurance assessments to the FDIC. The FDIC imposes a risk-based deposit premium assessment system to determine assessments based on a number of factors to measure the risk each institution poses to the Deposit Insurance Fund. The assessment rate is applied to our total average assets less tangible equity. Under the current system, premiums are assessed quarterly and could increase if, for example, criticized loans and/or other higher risk assets increase or balance sheet liquidity decreases. Because the Bank exceeds $10 billion in assets, the FDIC uses a “scorecard” system to calculate our assessments. Key factors include: the institution’s risk category; whether the institution is deemed large and highly complex; whether the institution qualifies for an unsecured debt adjustment; and whether the institution is burdened with a brokered deposit adjustment. Other factors can impact the base against which the applicable rate is applied, including (for example) whether a net loss is realized. The FDIC also has the ability to make discretionary adjustments to the total score based upon significant risk factors that are not adequately captured in the calculations. In October 2022, the FDIC announced a uniform 2 basis point increase in the deposit insurance assessment rate beginning in the first quarterly assessment period of 2023, with the intended purpose of having the Deposit Insurance Fund reach its statutory limit of 1.35 percent by the statutory deadline of September 30, 2028. During the fourth quarter of 2023, the FDIC implemented a special assessment to recover the loss to the Deposit Insurance Fund arising from the protection of uninsured depositors following the closures of Silicon Valley Bank and Signature Bank. In accordance with the special assessment, United will pay $10.0 million over eight quarters beginning with the first quarterly assessment period of 2024.
The FDIC may also terminate deposit insurance upon a finding that the institution has engaged in unsafe and unsound practices, is in an unsafe or unsound condition to continue operations, or has violated any applicable law, regulation, rule, order or condition imposed by the FDIC.
Interchange Fee Restrictions
We are subject to regulations that severely cap interchange fees which the Bank may charge merchants for debit card transactions. These restrictions were required by a statutory provision known as the Durbin Amendment of the Dodd-Frank Act. The Federal Reserve’s final rules implementing the Durbin Amendment capped interchange fees for debit card transactions at $0.21 plus five basis points in order to be eligible for a safe harbor such that the fee is conclusively determined to be reasonable and proportionate. Another related rule also permits an additional $0.01 per transaction “fraud prevention adjustment” to the interchange fee if certain Federal Reserve standards are implemented, including an annual review of fraud prevention policies and procedures. With respect to network exclusivity and merchant routing restrictions, all debit cards must now participate in at least two unaffiliated networks so that the transactions initiated using those debit cards will have at least two independent routing channels.
Incentive Compensation and Risk Management
In addition to the potential restrictions on discretionary bonus compensation under the Basel III rules, the federal bank regulatory agencies have issued guidance on incentive compensation policies (the “Incentive Compensation Guidance”) intended to ensure that the incentive compensation policies of financial institutions do not undermine the safety and soundness of such institutions by encouraging excessive risk-taking. The Incentive Compensation Guidance, which covers all employees who have the ability to materially affect the risk profile of an institution, either individually or as part of a group, is based upon the key principles that a financial institution’s incentive compensation arrangements should (i) provide incentives that do not encourage risk-taking beyond the institution’s ability to effectively identify and manage risks, (ii) be compatible with effective internal controls and risk management and (iii) be supported by strong corporate governance, including active and effective oversight by the institution’s board of directors. We operate a risk management process for assessing risk in incentive compensation plans.
The Federal Reserve reviews, as part of its regular, risk-focused examination process, the incentive compensation arrangements of financial institutions, including us, that are not “large, complex banking organizations.” These reviews are tailored to each financial institution based on the scope and complexity of the institution’s activities and the prevalence of incentive compensation arrangements. The findings of the supervisory initiatives are included in reports of examination. Deficiencies are incorporated into the financial institution’s supervisory ratings, which can affect the institution’s ability to make acquisitions and take other actions. Enforcement actions may be taken against a financial institution if its incentive compensation arrangements, or related risk-management control or governance processes, pose a risk to the institution’s safety and soundness and the institution is not taking prompt and effective measures to correct the deficiencies.
The scope and content of federal bank regulatory agencies’ policies on executive compensation are continuing to develop and are likely to continue evolving in the future. We cannot predict what future policies may be adopted, nor how they may be implemented and, therefore, it cannot be determined at this time whether compliance with such policies will adversely affect our ability to hire, retain and motivate our key employees.
Real Estate Lending
Inter-agency guidelines adopted by federal bank regulatory agencies mandate that financial institutions establish real estate lending policies with maximum allowable real estate loan-to-value limits, subject to an allowable amount of non-conforming loans as a percentage of capital. In addition, the federal bank regulatory agencies, including the FDIC, restrict concentrations in commercial real estate lending and have noted that increases in banks’ commercial real estate concentrations can create safety and soundness concerns. The regulatory guidance mandates certain minimal risk management practices and categorizes banks with defined levels of such concentrations as banks requiring elevated examiner scrutiny.
Cross-Guarantee Liability
A depository institution insured by the FDIC can be held liable for any loss incurred by, or reasonably expected to be incurred by, the FDIC in connection with (i) the default of a commonly controlled FDIC-insured depository institution or (ii) any assistance provided by the FDIC to any commonly controlled FDIC-insured depository institution “in danger of default.” “Default” is defined generally as the appointment of a conservator or receiver and “in danger of default” is defined generally as the existence of certain conditions indicating that a default is likely to occur in the absence of regulatory assistance. Any FDIC damage claim is superior to claims of shareholders of the insured depository institution or its holding company but is subordinate to claims of depositors, secured creditors, and holders of subordinated debt (other than affiliates) of the commonly controlled insured depository institution. Currently the Bank is our only depository institution subsidiary. If we were to own or operate another depository institution, any loss suffered by the FDIC in respect of one subsidiary bank would likely result in assertion of the cross-guarantee provisions, the assessment of estimated losses against our other subsidiary bank(s), and a potential loss of our investment in our subsidiary banks.
Interstate Branching and Mergers
As previously mentioned, the Bank generally must have SCBFI’s approval to establish a new branch. For a new branch located outside of South Carolina, South Carolina law requires the Bank to comply with branching laws applicable to the state where the new branch will be located. Federal law allows the Bank to establish or acquire a branch in another state to the same extent as a bank chartered in that other state would be allowed to establish or acquire a branch in South Carolina.
For an interstate merger or acquisition: the acquiring bank must be well-capitalized and well-managed; concentration limits on liabilities and deposits may not be exceeded; regulators must assess the transaction for incremental systemic risk; and the acquiring bank must have at least “satisfactory” standing under the federal Community Reinvestment Act (discussed immediately below). Once a bank has established branches in a state through de novo or acquired branching or through an interstate merger transaction, the bank may then establish or acquire additional branches within that state to the same extent that a bank chartered in that state is allowed to establish or acquire branches within the state.
Community Reinvestment Act
The CRA requires each U.S. bank, consistent with safe and sound operation, to help meet the credit needs of each community where the bank accepts deposits, including low- and moderate-income communities. Federal banking regulators periodically assess the Bank for CRA compliance and that assessment is made public. The Bank’s low- and moderate-income community operations and activities traditionally are critical focal points in those assessments.
For purposes of CRA examinations, federal banking regulators rate each institution’s compliance with the CRA as “Outstanding,” “Satisfactory,” “Needs to Improve” or “Substantial Noncompliance.” A CRA rating below “Satisfactory” can slow or halt a bank’s plans to expand by branching, acquisition, or merger, and can prevent a bank holding company from becoming a financial holding company. In its most recent CRA examination, the Bank received a “Satisfactory” rating.
The Federal Reserve, the OCC, and the FDIC have adopted revised CRA regulations based upon rules adopted jointly by the agencies in 1995. These rules were effective January 1, 2022.
Financial Activities other than Banking
Permitted Activities. Under the BHC Act, a bank holding company is generally permitted to engage in, or acquire direct or indirect control of more than 5% of the voting shares of any company engaged in, the following activities:
•banking or managing or controlling banks;
•furnishing services to or performing services for our subsidiaries; and
•any activity that the Federal Reserve determines to be so closely related to banking as to be a proper incident to the business of banking.
Activities that the Federal Reserve has found to be so closely related to banking as to be a proper incident to the business of banking include:
•factoring accounts receivable;
•making, acquiring, brokering or servicing loans and usual related activities;
•leasing personal or real property;
•operating a non-bank depository institution, such as a savings association;
•trust company functions;
•financial and investment advisory activities;
•conducting discount securities brokerage activities;
•underwriting and dealing in government obligations and money market instruments;
•providing specified management consulting and counseling activities;
•performing selected data processing services and support services;
•acting as agent or broker in selling credit life insurance and other types of insurance in connection with credit transactions; and
•performing selected insurance underwriting activities.
Federal law generally allows financial holding companies broad authority to engage in activities that are financial in nature or incidental to a financial activity. These include: insurance underwriting and brokerage; merchant banking; securities underwriting, dealing, and market-making; real estate development; and such additional activities as the Federal Reserve in consultation with the Secretary of the Treasury determines to be financial in nature or incidental. A bank holding company may engage in these activities directly or through subsidiaries by qualifying as a “financial holding company.” To qualify as a financial holding company, a bank holding company must file an initial declaration with the Federal Reserve, certifying that all of its subsidiary depository institutions are well-managed and well-capitalized.
Federal law also permits banks to engage in certain of these activities through financial subsidiaries. To control or hold an interest in a financial subsidiary, a bank must meet the following requirements:
•The bank must receive approval from its primary federal regulator for the financial subsidiary to engage in the activities.
•The bank and its depository institution affiliates must each be well-capitalized and well-managed.
•The aggregate consolidated total assets of all of the bank’s financial subsidiaries must not exceed the lesser of: 45% of the bank’s consolidated total assets; or $50 billion (subject to indexing for inflation).
•The bank must have in place adequate policies and procedures to identify and manage financial and operational risks and to preserve the separate identities and limited liability of the bank and the financial subsidiary.
•If the bank is among the 100 largest banks, the bank must meet the long-term debt rating or alternative standards adopted by the Federal Reserve and the U.S. Secretary of the Treasury from time to time. If this fifth requirement ceases to be met after a bank controls or holds an interest in a financial subsidiary, the bank cannot invest additional capital in that subsidiary until the requirement again is met.
No new activity may be commenced unless the bank and all of its depository institution affiliates have at least “Satisfactory” CRA ratings. Certain restrictions apply if the bank holding company or the bank fails to continue to meet one or more of the requirements listed above. In addition, federal law contains a number of other provisions that may affect the Bank’s operations, including limitations on the use and disclosure to third parties of client information.
As of December 31, 2023, we are a financial holding company and we have a number of financial subsidiaries, as discussed in Subsidiaries in this Item.
Privacy and Data Security
The Federal Reserve, FDIC and other bank regulatory agencies have adopted guidelines for safeguarding confidential, personal customer information. These guidelines require each financial institution, under the supervision and ongoing oversight of its board of directors or an appropriate committee thereof, to create, implement and maintain a comprehensive written information security program designed to ensure the security and confidentiality of customer information, protect against any anticipated threats or hazards to the security or integrity of such information and protect against unauthorized access to or use of such information that could result in substantial harm or inconvenience to any customer. In addition, various federal regulators, including the Federal Reserve and the SEC, have increased their focus on cyber-security through guidance, examinations and regulations. The Bank has adopted a customer information security program that has been approved by its Board of Directors.
The GLB Act requires financial institutions to implement policies regarding the disclosure of non-public personal information about consumers to nonaffiliated third parties. In general, the statute requires explanations to consumers on policies and procedures regarding the disclosure of such nonpublic information and, except as otherwise required by law, prohibits disclosing such information except as provided in a banking subsidiary’s policies and procedures. The Bank has implemented a privacy policy.
States are also increasingly proposing or enacting legislation that relates to data privacy and data protection such as the California Consumer Privacy Act which went into effect on January 1, 2020. We continue to assess the requirements of such laws and proposed legislation and their applicability to us. Moreover, these laws, and proposed legislation, are still subject to revision or formal guidance and they may be interpreted or applied in a manner inconsistent with our understanding.
Like other lenders, the Bank and other of our subsidiaries use credit bureau data in their underwriting activities. Use of such data is regulated under the Fair Credit Reporting Act, which regulates the reporting of information to credit bureaus, prescreening individuals for credit offers, sharing of information between affiliates, and using affiliate data for marketing purposes. Similar state laws may impose additional requirements on the Bank and its subsidiaries.
Anti-Money Laundering Initiatives, the USA Patriot Act and the Office of Foreign Asset Control
We are subject to federal laws that are designed to combat terrorist financing, money laundering and transactions with persons, companies or foreign governments sanctioned by the United States. These include the Bank Secrecy Act, the Money Laundering Control Act, the International Emergency Economic Powers Act and the Trading with the Enemy Act, as administered by the United States Treasury Department’s Office of Foreign Assets Control. These regulations obligate depositary institutions and broker-dealers to verify the identity of their customers, conduct customer due diligence, report on suspicious activity, file reports of transactions in currency and conduct enhanced due diligence on certain accounts. They also prohibit U.S. persons from engaging in transactions with certain designated restricted countries and persons. Depository institutions and broker-dealers are required by their federal regulators to maintain robust policies and procedures in order to ensure compliance with these obligations.
Failure of a financial institution to maintain and implement adequate programs to combat terrorist financing, or to comply with all of the relevant laws or regulations, can lead to significant monetary penalties and could have other serious legal and reputational consequences for the institution. Federal regulators evaluate the effectiveness of an applicant in combating money laundering when determining whether to approve a proposed bank merger, acquisition, restructuring, or other expansionary activity. There have been a number of significant enforcement actions by regulators, as well as state attorneys general and the Department of Justice, against banks, broker-dealers and non-bank financial institutions with respect to these laws and some have resulted in substantial penalties, including criminal pleas. Our Board has approved policies and procedures that it believes comply with these laws.
Depositor Preference
Federal law provides that deposits and certain claims for administrative expenses and associate compensation against an insured depository institution would be afforded a priority over other general unsecured claims against such an institution, including federal funds and letters of credit, in the “liquidation or other resolution” of such an institution by any receiver.
Securities Regulation
Certain of our subsidiaries are subject to various securities laws and regulations and capital adequacy requirements promulgated by the regulatory and exchange authorities of the jurisdictions in which they operate.
Our registered broker-dealer subsidiary is subject to the SEC’s net capital rule, Rule 15c3-1. That rule requires the maintenance of minimum net capital and limits the ability of the broker-dealer to transfer large amounts of capital to a parent company or affiliate. Compliance with the rule could limit operations that require intensive use of capital, such as underwriting and trading.
Certain of our subsidiaries are registered investment advisers which are regulated under the Investment Advisers Act of 1940. Advisory contracts with clients automatically terminate under these laws upon an assignment of the contract by the investment adviser unless appropriate consents are obtained.
Insurance Activities
Certain of our subsidiaries sell various types of insurance as agent in a number of states. Insurance activities are subject to regulation by the states in which such business is transacted. Although most of such regulation focuses on insurance companies and their insurance products, insurance agents and their activities are also subject to regulation by the states, including, among other things, licensing and marketing and sales practices.
Federal and state legislators as well as regulatory agencies may introduce or enact new laws and rules, or amend existing laws and rules that may affect the regulation of United and its subsidiaries in substantial and unpredictable ways, and, if enacted, could increase or decrease the cost of doing business, limit or expand permissible activities or affect the industry’s competitive balance. We are not able to predict what, if any, legislative and regulatory changes affecting financial institutions will be enacted or implemented in the future, nor the impact that those actions will have upon us. Any such changes, however, could materially and adversely affect our business, financial condition and results of operations.
|
|
|
| Source and Availability of Funds |
Our revenue is primarily derived from interest on and fees received in connection with the loans we make and from interest and dividends from our investment securities and short-term investments. The principal sources of funds for our lending activities are customer deposits, repayment of loans, and the sale and maturity of investment securities. Our principal expenses are interest paid on deposits and other borrowings and operating and general administrative expenses.
Our internet website address is www.ucbi.com. We file with or furnish to the SEC annual reports on Form 10-K, quarterly reports on Form 10-Q, current reports on Form 8-K and amendments to those reports, proxy statements and annual reports to shareholders and, from time to time, registration statements and other documents. These documents are available free of charge to the public on or through the “Investor Relations” section of our website as soon as reasonably practicable after we electronically file them with or furnish them to the SEC. The SEC maintains an internet site that contains reports, proxy and information statements and other information that we file electronically with, or furnish to, the SEC. The address of that website is www.sec.gov. The information on any website referenced in this Report is not incorporated by reference into, and is not a part of this Report. Further, our references to website URLs are intended to be inactive textual references only.
This Item outlines specific risks that could affect the ability of our various businesses to compete, change our risk profile or materially affect our financial condition or results of operations. Our operating environment continues to evolve and new risks continue to emerge. To address that challenge we have a risk management governance structure that oversees processes for monitoring evolving risks and oversees various initiatives designed to manage and control our potential exposure. This Item highlights risks that could affect us in material ways by causing future results to differ materially from past results, by causing future results to differ materially from current expectations, or by causing material changes in our financial condition.
Some of these risks are interrelated and the occurrence of one or more of them may exacerbate the effect of others.
|
|
|
| TRADITIONAL COMPETITION RISKS |
We are subject to intense competition for clients and the nature of that competition is rapidly evolving.
Our primary areas of competition include: consumer and commercial deposits, commercial loans, consumer loans including home mortgages and lines of credit, financial planning and wealth management and other consumer and commercial financial products and services. Our competitors in these areas include national, state and non-U.S. banks, credit unions, savings and loan associations, consumer finance companies, mortgage banking firms, trust companies, securities brokerage firms, investment counseling firms, insurance companies and agencies, money market funds and other mutual funds, hedge funds and other financial services companies that serve in our markets. The emergence of non-traditional, disruptive service providers (see Industry Disruption section below) has intensified this competitive environment. In addition, as customer preferences and expectations continue to evolve, technology has lowered barriers to entry and made it possible for nonbanks to offer products and services traditionally provided by banks, such as check-cashing, automatic transfer and automatic payment systems and “peer-to-peer” lending in which investors provide debt financing and/or capital directly to borrowers. While traditional banks are subject to the same regulatory framework as we are, nonbanks experience a significantly different or reduced degree of regulation as well as lower cost structures. We may face a competitive disadvantage as a result of our smaller size, more limited geographic diversification and inability to spread costs across broader markets. In addition, larger institutions may have the advantage of being perceived by the public as more secure in times of financial uncertainty as evidenced by the migration of deposits to large banks in response to recent bank failures. Although we compete by concentrating marketing efforts in our primary markets with local advertisements, personal contacts and greater flexibility and responsiveness in working with local customers, customer loyalty can be easily influenced by a competitor’s new products and our strategy may or may not continue to be successful. Failure to perform in any of these areas could significantly weaken our competitive position, which could adversely affect our growth and profitability which, in turn, could have a material adverse effect on our business, financial condition and results of operations. We may also be affected by the marketplace loosening of credit underwriting standards and structures.
|
|
|
| STRATEGIC AND MACRO RISKS |
We may be unable to successfully implement our strategy to grow our commercial and consumer banking businesses.
Although our current strategy is expected to evolve as business conditions change, in 2024 our strategy is to continue to invest resources in our banking businesses and operations as we integrate the businesses and operations of our recent acquisitions, including Progress and First Miami, and seek to exploit opportunities for cost and revenue synergies. In the future, we expect to continue to nurture profitable organic growth as well as pursue acquisitions or strategic transactions if appropriate opportunities, within or outside of our current markets, present themselves. Our failure or inability to successfully implement those strategies could have a material and adverse effect on our results of operation and financial condition.
Failure to achieve one or more key elements needed for successful business acquisitions (including the integration of those businesses) could adversely affect our business and earnings.
Expanding in our current markets and selecting attractive new growth markets by opening additional branches and service locations or through acquisitions of all or part of other financial institutions involve risks, any one of which could result in a material and adverse effect upon our results of operation or financial condition. These risks include, without limitation, the following:
•our inability to identify and expand into suitable markets;
•our inability to identify and acquire suitable sites for new branches and service locations;
•our inability to identify and execute potential acquisition targets;
•our inability to develop accurate estimates and judgments to evaluate asset values and credit, operations, management and market risks with respect to an acquired branch or institution, a new branch office or a new market;
•our inability to realize certain assumptions and estimates to preserve the expected financial benefits of the transaction;
•our inability to avoid the diversion of our management’s attention from existing operations during the negotiation of a transaction;
•our inability to manage successful entry into new markets where we have limited or no direct prior experience;
•our inability to obtain regulatory and other approvals, or obtain such approvals without restrictive conditions;
•our inability to integrate the acquired business’ operations, clients, and properties quickly and cost-effectively;
•our inability to manage cultural assimilation risks associated with growth through acquisitions, which can be an often-overlooked and often-critical failure point in mergers;
•our inability to combine the franchise values of businesses that we acquire with those of ours without significant loss of employees or customers from re-branding and other similar changes; or
•our inability to retain core clients and key employees.
Failure to achieve one or more key elements needed for successful organic growth could adversely affect our business and earnings.
There are a number of risks to the successful execution of our organic growth strategy that could result in a material and adverse effect upon our results of operation and financial condition. These risks include, without limitation, the following:
•our inability to attract and retain clients in our banking market areas, particularly as we integrate our recent acquisitions, including Progress and First Miami;
•our inability to achieve and maintain growth in our earnings while pursuing new business opportunities;
•our inability to maintain a high level of client service while optimizing our physical branch count due to changing client demand, all while expanding our remote banking services and expanding or enhancing our information processing, technology, compliance, and other operational infrastructures effectively and efficiently;
•our inability to maintain loan quality while, at the same time, creating loan growth;
•our inability to attract sufficient deposits and capital to fund anticipated loan growth;
•our inability to maintain adequate common equity and regulatory capital while managing the liquidity and capital requirements associated with growth, especially organic growth and cash-funded acquisitions;
•our inability to hire or retain adequate management personnel and systems to oversee and support such growth;
•our inability to implement additional policies, procedures and operating systems required to support our growth;
•our inability to manage effectively and efficiently the changes and adaptations necessitated by a complex, burdensome, and evolving regulatory environment.
Although we have in place strategies designed to achieve those elements that are significant to us at present, our challenge is to execute those strategies and adjust them, or adopt new strategies, as conditions change.
Failure to keep pace with technological changes could adversely affect our business.
The financial services industry is continually undergoing rapid technological change with frequent introductions of new technology-driven products and services. The effective use of technology increases efficiency and enables financial institutions to better serve customers and to reduce costs. Our future success depends, in part, upon our ability to address the needs of our customers by using technology to provide products and services that will satisfy customer demands, as well as to create additional efficiencies in our operations. Many of our competitors have substantially greater resources to invest in technological improvements. We may not be able to effectively implement new technology-driven products and services or be successful in marketing these products and services to our customers. Failure to successfully keep pace with technological change affecting the financial services industry could have a material adverse effect on our business, financial condition and results of operations.
Failure to keep pace with changing customer habits regarding the manner in which customers use financial services could hinder ongoing customer acquisition and retention efforts.
We provide a large number of services remotely (online and mobile), and physical branch utilization has been in long-term decline throughout the industry for many years. Technology has helped us reduce costs and improve service, but also has weakened traditional geographic and relationship ties, and has allowed disruptors to enter traditional banking areas by providing payment and exchange services that compete directly with banks in ways not previously possible. Through digital marketing and service platforms, many banks are making client inroads unrelated to physical presence. This competitive risk is especially pronounced from the largest U.S. banks, and from online-only banks, due in part to the investments they are able to sustain in their digital platforms.
The nature of technology-driven disruption to our industry is changing, in some cases seeking to displace traditional financial service providers rather than merely enhance traditional services or their delivery.
A number of recent technologies have worked with the existing financial system and traditional banks, such as the evolution of ATM cards into debit/credit cards and the evolution of debit/credit cards into smart phones. These sorts of technologies often have expanded the market for banking services overall while siphoning a portion of the revenues from those services away from banks and disrupting prior methods of delivering those services. Additionally, some recent innovations may tend to replace traditional banks as financial service providers rather than merely augmenting those services. For example, companies which claim to offer applications and services based on artificial intelligence are beginning to compete much more directly with traditional financial services companies in areas involving personal advice, including high-margin services such as financial planning and wealth management. The low-cost, high-speed nature of these “robo-advisor” services can be especially attractive to younger, less-affluent clients and potential clients, as well as persons interested in “self-service” investment management. Other industry changes, such as zero-commission trading offered by certain large firms able to use trading as a loss-leader, may amplify this trend. Similarly, inventions based on blockchain technology eventually may be the foundation for greatly enhancing transactional security throughout the banking industry, but also eventually may reduce the need for banks as secure deposit-keepers and intermediaries.
Fraud is a major, and increasing, operational risk for us and all banks.
Deposit and loan fraud continue to be major sources of fraud attempts and loss. The sophistication and methods used to perpetrate fraud continue to evolve as technology changes. In addition to cybersecurity risk (discussed below), new technologies have made it easier for bad actors to obtain and use client personal information, mimic signatures and otherwise create false documents that look genuine. The industry fraud threat continues to evolve, including but not limited to card fraud, check fraud, social engineering and phishing attacks for identity theft and account takeover. Additionally, the use of artificial intelligence and quantum computing could exacerbate many of these risks. Our anti-fraud measures are both preventive and, when necessary, responsive; however, some level of fraud loss is unavoidable, and the risk of a major loss cannot be eliminated.
Our ability to conduct and grow our businesses depends in part upon our ability to create, maintain, expand, and evolve an appropriate operational and organizational infrastructure, manage expenses, and recruit and retain personnel with the ability to manage a complex business.
Operational risk can arise in many ways, including: errors related to failed or inadequate physical, operational, information technology, or other processes; faulty or disabled computer or other technology systems; fraud, theft, physical security breaches, electronic data and related security breaches, or other criminal conduct by associates or third parties; and exposure to other external events. Inadequacies may present themselves in myriad ways. Actions taken to manage one risk may be ineffective against others. For example, information technology systems may be sufficiently redundant to withstand a fire, incursion, malware, or other major casualty, but they may be insufficiently adaptable to new business conditions or opportunities. Efforts to make systems more robust may make them less adaptable, and vice-versa. Also, our effort to maximize operating leverage, which is a significant priority for us, increases our operational challenges as we strive to maintain high quality client service and compliance.
A serious information technology security (cybersecurity) breach can cause significant damage and at the same time be difficult to detect even after it occurs.
Our operations rely on the secure processing, storage and transmission of confidential and other information in our computer systems and networks as well as through the internet through digital and mobile technologies. Although we take protective measures and endeavor to modify these systems as circumstances warrant, the advances in technology increase the risk of information security breaches. We provide our customers the ability to bank remotely, including over the internet or through their mobile device. The secure transmission of confidential information is a critical element of remote and mobile banking. Any failure, interruption or breach in security of these systems could result in disruptions to our accounting, deposit, loan and other systems, and adversely affect our customer relationships.
There have been increasing efforts on the part of third parties, including through cyber-attacks, to breach data security at financial institutions or with respect to financial transactions. There have been several recent instances involving financial services, credit bureaus and consumer-based companies reporting the unauthorized disclosure of client or customer information or the destruction or theft of corporate data, by both private individuals and foreign governments. In addition, because the techniques used to cause such security breaches change frequently, often are not recognized until launched against a target and may originate from less regulated and remote areas around the world, we may be unable to proactively address these techniques or to implement adequate preventative measures. Our network, and the systems of parties with whom we contract, could be vulnerable to unauthorized access, computer viruses, phishing schemes, spam attacks, human error, natural disasters, power loss and other security breaches.
Cyber threats are rapidly evolving and we may not be able to anticipate or prevent all such attacks. Among other things, damage can occur due to outright theft or extortion of our funds, fraud or identity theft perpetrated on clients, or adverse publicity associated with a breach and its potential effects. Perpetrators potentially can be associates, clients, and certain vendors, all of whom legitimately have access to some portion of our systems, as well as outsiders with no legitimate access. These risks are heightened through the increasing use of digital and mobile solutions which allow for rapid money movement and increase the difficulty to detect and prevent fraudulent transactions. Additionally, the use of artificial intelligence and quantum computing could exacerbate many of these risks. We may be required to spend significant capital and other resources to protect against the threat of security breaches and computer viruses, or to alleviate problems caused by security breaches or viruses. To the extent that our activities or the activities of our customers involve the storage and transmission of confidential information, security breaches (including breaches of security of customer systems and networks) and viruses could expose us to claims, litigation and other possible liabilities. Any inability to prevent security breaches or computer viruses could also cause existing customers to lose confidence in our systems and could adversely affect our reputation, results of operations and ability to attract and maintain customers and businesses. In addition, a security breach could also subject us to additional regulatory scrutiny, expose us to civil litigation and possible financial liability and cause reputational damage.
We rely on information technology and telecommunications systems and certain third-party service providers, the operational functions of which may experience disruptions that could adversely affect us and over which we may have limited or no control.
Our business is highly dependent on the successful and uninterrupted functioning of our information technology and telecommunications systems, third-party accounting systems and mobile and online banking platforms. We outsource many of our major systems, such as data processing, loan servicing and deposit processing systems and online banking platforms. While we have selected these vendors carefully, we do not control their actions. The failure of these systems, or the termination of a third-party software license or service agreement on which any of these systems is based, could interrupt our operations. Financial or operational difficulties of a vendor could also damage our operations if those difficulties interfere with the vendor’s ability to serve us. Furthermore, our vendors could also be sources of operational and information security risk to us, including from breakdowns or failures of their own systems or capacity constraints. Replacing these third-party vendors could also create significant delay and expense. Because our information technology and telecommunications systems interface with and depend on third-party systems, we could experience service denials if demand for such services exceeds capacity or such third-party systems fail or experience interruptions. If sustained or repeated, a system failure or service denial could result in a deterioration of our ability to process new and renewed loans, gather deposits and provide customer service, compromise our ability to operate effectively, damage our reputation, result in a loss of customer business and/or subject us to additional regulatory scrutiny and possible financial liability, any of which could have a material adverse effect on our financial condition and results of operations. Our ability to recoup our losses may be limited legally or practically in many situations.
Our risk management framework may not be effective in mitigating risks and/or losses.
We have implemented a risk management framework to mitigate our risk and loss exposure. This framework is comprised of various processes, systems and strategies, and is designed to identify, measure, monitor, report and manage the types of risk to which we are subject, including, among others, credit risk, interest rate risk, liquidity risk, legal and regulatory risk, cybersecurity risk, compliance risk, strategic risk, reputational risk and operational risk related to its employees, systems and vendors, among others. Any system of control and any system to reduce risk exposure, however well designed and operated, is based in part on certain assumptions and can provide only reasonable, not absolute, assurances that the objectives of the system are met and will be effective under all circumstances or that it will adequately identify, manage or mitigate any risk or loss to us. Additionally, instruments, systems and strategies used to hedge or otherwise manage exposure to various types of interest rate, price, legal and regulatory compliance, credit, liquidity, operational and business risks and enterprise-wide risk could be less effective than anticipated. As a result, we may not be able to effectively mitigate our risk exposures in particular market environments or against particular types of risk. If our risk management framework is not effective, we could suffer unexpected losses and become subject to litigation, negative regulatory consequences, or reputational damage among other adverse consequences, any of which could result in our business, financial condition, results of operations or prospects being materially adversely affected.
Competition for talent is substantial and increasing. Moreover, revenue growth in some business lines increasingly depends upon top talent.
In recent years, our cost of hiring and retaining top revenue-producing talent has increased, and that trend is likely to continue. We have assembled a management team which has substantial background and experience in banking and financial services in our markets. Moreover, much of our organic loan growth in recent years was the result of our ability to attract experienced financial services professionals who have been able to attract customers from other financial institutions. We anticipate deploying a similar hiring strategy in the future. It is also not uncommon for other financial institutions to deploy this strategy as well and there is a risk that teams of our employees may be recruited by other financial institutions. Additionally, operating our technology systems requires employees with specialized skills that are not readily available in the general employee candidate pool.
Inability to retain these key personnel (including key personnel of the businesses we have acquired) or to continue to attract experienced lenders with established books of business could negatively affect our growth because of the loss of these individuals’ skills and customer relationships and/or the potential difficulty of promptly replacing them. Moreover, the higher costs we must pay to hire and retain these experienced individuals could cause our noninterest expense levels to rise and negatively impact our results of operations.
Our accounting estimates and risk management processes rely on analytical and forecasting models.
The processes we use to estimate our expected credit losses and to measure the fair value of financial instruments, as well as the processes used to estimate the effects of changing interest rates and other market measures on our financial condition and results of operations, depends upon the use of analytical and forecasting models. These models reflect assumptions that may not be accurate, particularly in times of market stress or other unforeseen circumstances. If the assumptions used in our model for measuring interest sensitivity and asset-liability management fail to appropriately anticipate customer response to changing interest rates, our earnings and / or liquidity position could be threatened. Although we model multiple scenarios assuming differing interest rate curves and economic events, it is not possible that our modeling can anticipate every scenario or how one assumption may be influenced by changes in another assumption.
Even if these assumptions are adequate, the models may prove to be inadequate or inaccurate because of other flaws in their design or their implementation, including flaws caused by failures in controls, data management, human error or from the reliance on technology. If the models we use for interest rate risk and asset-liability management are inadequate, we may incur increased or unexpected losses upon changes in market interest rates or other market measures. If the models we use for estimating our expected credit losses are inadequate, the allowance for credit losses may not be sufficient to support future charge-offs. If the models we use to measure the fair value of financial instruments are inadequate, the fair value of such financial instruments may fluctuate unexpectedly or may not accurately reflect what we could realize upon sale or settlement of such financial instruments. Any such failure in our analytical or forecasting models could have a material adverse effect on our business, financial condition and results of operations.
|
|
|
| RISKS FROM CHANGES IN ECONOMIC CONDITIONS |
Inflationary pressures present a potential threat to our results of operations and financial condition.
The United States generally and the regions in which we operate specifically have recently experienced, for the first time in decades, significant inflationary pressures, evidenced by higher gas prices, higher food prices and other consumer items. Inflation represents a loss in purchasing power because the value of investments often does not keep up with inflation and erodes the purchasing power of money and the potential value of investments over time. Accordingly, inflation can result in material adverse effects upon our customers, their businesses (as a result of rising costs, including labor) and, as a result, our financial position and results of operations. Inflation also can and does generally lead to higher interest rates, which have their own separate risks. See Risks Associated With Monetary Events and Interest Rate and Yield Curve Risks in this Item 1A of this Report.
Generally, in periods of economic downturns, including periods of rising interest rates and recessions, our realized credit losses increase, demand for our products and services declines, and the credit quality of our loan portfolio declines.
Our success depends significantly upon local, national and global economic and political conditions, as well as governmental monetary policies and trade relations. Our financial performance generally, and in particular the ability of borrowers to pay interest on and repay principal of outstanding loans and the value of collateral securing those loans, as well as demand for loans and other products and services we offer, is highly dependent upon the business environment in the markets where we operate and in the United States as a whole. Unlike banks that are more geographically diversified, we are a regional bank that provides services to customers primarily in Georgia, South Carolina, North Carolina, Tennessee, Florida and Alabama. The market conditions in these markets may be different from, and could be worse than, the economic conditions in the United States as a whole. As discussed elsewhere in this Item 1A, inflationary pressures have caused the Federal Reserve to increase interest rates. Increases in interest rates in the past have led to recessions of various lengths and intensities and might lead to such a recession in the near future. Such a recession or any other adverse changes in business and economic conditions generally or specifically in the markets in which we operate could affect our business, including causing one or more of the following negative developments:
•a decrease in the demand for loans and other products and services offered by us;
•a decrease in the value of the collateral securing our residential or commercial real estate loans;
•a permanent impairment of our assets; or
•an increase in the number of customers or other counterparties who default on their loans or other obligations to us, which could result in a higher level of NPAs, net charge-offs and provision for loan losses.
|
|
|
| RISKS ASSOCIATED WITH MONETARY EVENTS |
The Federal Reserve has implemented significant economic strategies that have affected interest rates, inflation, asset values, and the shape of the yield curve. These strategies have had, and will continue to have, a significant impact on our business and on many of our clients.
In 2022 and much of 2023, in response to inflationary pressures, the Federal Reserve increased interest rates substantially. Fluctuations in interest rates have had and can continue to have significant and sometimes adverse effects upon our business as well as the business of many of our customers. See Risks Associated With Monetary Events and Interest Rate and Yield Curve Risks in this Item 1A of this Report.
Federal Reserve strategies can, and often are intended to, affect the domestic money supply, inflation, interest rates, and the shape of the yield curve.
Effects on the yield curve often are most pronounced at the short end of the curve, which is of particular importance to us and other banks. Among other things, easing strategies are intended to lower interest rates, expand the money supply, and stimulate economic activity, while tightening strategies are intended to increase interest rates, tighten the money supply, and restrain economic activity. Many external factors may interfere with the effects of these plans or cause them to be changed, sometimes quickly. Such factors include significant economic trends or events as well as significant international monetary policies and events. Such strategies also can affect the U.S. and world-wide financial systems in ways that may be difficult to predict. Risks associated with interest rates and the yield curve are discussed in this Item 1A under the caption Interest Rate and Yield Curve Risks.
Our ability to conduct and grow our businesses, and to obtain and retain clients, is highly dependent upon external perceptions of our business practices and financial stability.
Our reputation is a key asset for us. Reputation risk, or the risk to our earnings, liquidity and capital from negative public opinion, is inherent in our business. Our reputation is affected principally by our business practices and how those practices are perceived and understood by others. Negative public opinion could adversely affect our ability to keep and attract customers and expose us to adverse legal and regulatory consequences. Negative public opinion could result from our actual or alleged conduct in any number of activities, including lending practices, corporate governance, regulatory compliance, securities compliance, mergers and acquisitions, from sharing or inadequate protection of customer information and from actions taken by government regulators and community organizations in response to that conduct. Negative public opinion could also result from adverse news or publicity that impairs the reputation of the financial services industry generally, such as recent bank failures, or that relates to parties with whom we have important relationships. Because we conduct most of our business under the “United” brand, negative public opinion about one business could affect our other businesses.
|
|
|
| CREDIT AND COUNTERPARTY RISK |
We face the risk that our clients may not repay their loans or other obligations and that the realizable value of collateral may be insufficient to avoid a charge-off.
We also face risks that other counterparties, in a wide range of situations, may fail to honor their obligations to pay us. In our business some level of credit charge-offs is unavoidable and overall levels of credit charge-offs can vary substantially over time. Lending activities are inherently risky. When we lend money or commit to lend, we incur credit risk or the risk of loss if borrowers do not repay their loans or other credit obligations. Credit risk includes, among other things, the quality of our underwriting, the impact of increases in interest rates and changes in the economic conditions in the markets where we operate as well as across the United States.
Rising interest rates, inflation and a weakening economy adversely affect the ability of some borrowers to repay outstanding loans as well as the value of the collateral securing some of these loans. If loan customers with significant loan balances fail to repay their loans, our results of operations, financial condition and capital levels will suffer.
We are exposed to higher credit and concentration risk from our commercial real estate, commercial and industrial and commercial construction lending.
Our credit risk and credit losses can increase if our loans become concentrated to borrowers engaged in the same or similar activities or to borrowers who as a group may be uniquely or disproportionately affected by economic or market conditions. As of December 31, 2023, approximately 73% of our loan portfolio consisted of commercial loans, including commercial and industrial, equipment financing, commercial construction and commercial real estate mortgage loans.
Our borrowers under these loans tend to be small to medium-sized businesses. These types of loans are typically larger than residential real estate loans or consumer loans. During periods of lower economic growth or challenging economic periods, small to medium-sized businesses may be impacted more severely and more quickly than larger businesses. Consequently, the ability of such businesses to repay their loans may deteriorate, and in some cases this deterioration may occur quickly, which would adversely affect our results of operations and financial condition. An increase in non-performing loans could result in a net loss of earnings from these loans, an increase in the provision for loan losses and an increase in loan charge-offs, all of which could have a material adverse effect on our business, financial condition and results of operations.
Deterioration in economic conditions, housing conditions and commodity and real estate values and an increase in unemployment in certain states or locations could result in materially higher credit losses if loans are concentrated in those locations. Our loans are heavily concentrated in our primary markets of Georgia, South Carolina, North Carolina, Tennessee, Florida and Alabama. These markets may have different or weaker performance than other areas of the country and our portfolio may be more negatively impacted than a financial services company with wider geographic diversity.
See the section captioned “Loans” in the “Balance Sheet Review” section of Part II, Item 7. MD&A of this Report for further discussion related to commercial and industrial, construction and commercial real estate loans.
If our allowance for credit losses was required to be increased because it is not large enough to cover expected losses in our loan portfolio, our results of operations and financial condition could be materially and adversely affected.
We maintain an ACL, which is a reserve established through a provision for credit losses charged to expense. The ACL reflects our assessment of the current expected losses over the life of the loan using historical experience, current conditions and reasonable and supportable forecasts. CECL has created more volatility in the level of our ACL because it relies on macroeconomic forecasts. It is possible that CECL may increase the cost of lending in the industry and result in slower loan growth and lower levels of net income. The level of the allowance reflects our continuing evaluation of factors including current economic forecasts, historical loss experience, the volume and types of loans, and specific credit risks. The determination of the appropriate level of the ACL inherently involves subjectivity in our modeling and requires us to make estimates of current credit risks and future trends, all of which may undergo material changes or vary from our historical experience. Deterioration in economic conditions affecting borrowers, changing economic forecasts, new information regarding existing loans, identification of additional problem loans and other factors, both within and outside of our control, may require an increase in the ACL. If we are required to materially increase our level of ACL for any reason, such increase could adversely affect our business, financial condition and results of operations.
In addition, bank regulatory agencies periodically review our ACL and may require an increase in the provision for credit losses or the recognition of further loan charge-offs, based on judgments different than those of management. Furthermore, if charge-offs in future periods exceed the ACL, we will need additional provisions to increase the ACL. Any increases in the ACL will result in a decrease in net income and, possibly, capital, and may have a material adverse effect on our business, financial condition and results of operations.
See the section captioned “Allowance for Credit Losses” in Part II, Item 7. MD&A of this Report for further discussion related to our process for determining the appropriate level of the ACL.
|
|
|
| REGULATORY, LEGISLATIVE AND LEGAL RISKS |
We are subject to a challenging regulatory environment that restricts our activities.
We operate in heavily regulated industries. Our regulatory burdens, including both operating restrictions and ongoing compliance costs, are substantial. We are subject to many banking, deposit, insurance, securities brokerage and underwriting, and consumer lending regulations in addition to the rules applicable to all companies whose securities are publicly traded in the U.S. securities markets. Failure to comply with applicable regulations could result in financial, structural, and operational penalties. In addition, efforts to comply with applicable regulations may increase our costs and/or limit our ability to pursue certain business opportunities. See Supervision and Regulation in Item 1 of this Report for additional information concerning financial industry regulations. Federal and state regulations significantly limit the types of activities in which we, as a financial institution, may engage. In addition, we are subject to a wide array of other regulations that govern other aspects of how we conduct our business, such as in the areas of employment and intellectual property. Federal and state legislative and regulatory authorities often change these regulations or adopt new ones. Actions could be taken that would further limit the amount of interest or fees we can charge, further restrict our ability to collect loans or realize on collateral, affect the terms or profitability of the products and services we offer, or materially and adversely affect us in other ways. The following paragraphs highlight certain specific important risk areas related to regulatory matters currently. These paragraphs do not describe these risks exhaustively, and they do not describe all such risks that we face currently. Moreover, the importance of specific risks will grow or diminish as circumstances change.
Failure to maintain certain regulatory capital levels and ratios could result in regulatory actions that would be materially adverse to our shareholders.
U.S. capital standards are discussed under the captions Capital Adequacy and Prompt Corrective Action in Item 1 of this Report and the caption “Capital Resources and Dividends” in Item 7 of this report. Pressures to maintain appropriate capital levels and address business needs in a changing economy could result in certain mandatory and possible additional discretionary actions by regulators that, if undertaken, could be dilutive or otherwise have an adverse effect on our shareholders. Such actions could include: reduction or elimination of dividends; the issuance of common or preferred stock, or securities convertible into stock; or the issuance of any class of stock having rights that are adverse to those of the holders of our existing classes of common or preferred stock. In addition, these requirements could have a negative impact on our ability to lend, grow deposit balances, make acquisitions or make share repurchases or redemptions. Higher capital levels could also lower our return on equity. Additional information concerning these risks and our management of them, all of which is incorporated into this Item 1A by this reference, appears: under the captions Capital Adequacy and Prompt Corrective Action in Item 1 of this report; under the caption “Capital Resources and Dividends” of Part II, Item 7. MD&A; and Note 22 Regulatory Matters, of Part II, Item 8. Financial Statements.
Political dysfunction and volatility within the federal government, both at the regulatory and Congressional level, creates significant potential for major and abrupt shifts in federal policy regarding bank regulation, taxes, and the economy, any of which could have significant and adverse impacts on our business and financial performance.
Certain of our operations and customers are dependent on the regular operation of the federal or state government or programs they administer For example, our SBA lending program depends on interaction with the SBA, an independent agency of the federal government. During a lapse in funding, such as has occurred during previous federal government “shutdowns”, the SBA may not be able to engage in such interaction. Similarly, loans we make through USDA lending programs may be delayed or adversely affected by lapses in funding for the USDA. In addition, customers who depend directly or indirectly on providing goods and services to federal or state governments or their agencies may reduce their business with us or delay repayment of loans due to lost or delayed revenue from those relationships. If funding for these lending programs or federal spending generally is reduced as part of the appropriations process or by administrative decision, demand for our services may be reduced. Any of these developments could have a material adverse effect on our financial condition, results of operations or liquidity.
Legal disputes are an unavoidable part of business, and the outcome of pending or threatened litigation cannot be predicted with any certainty.
We face the risk of litigation from clients, associates, vendors, contractual parties, and other persons, either singly or in class actions, and from federal or state regulators. We manage those risks through internal controls, personnel training, insurance, litigation management, our compliance and ethics processes, and other means. However, the commencement, outcome, and magnitude of litigation cannot be predicted or controlled with any certainty. Substantial legal liability or significant regulatory action against us could have material adverse financial effects or cause significant reputational harm to us, which in turn could seriously harm our business prospects.
Data privacy is becoming a major political concern. The laws governing it are new, and are likely to evolve and expand.
Many non-regulated, non-banking companies have gathered large amounts of personal details about millions of people, and have the ability to analyze that data and act on that analysis very quickly. This situation has prompted governmental responses. Two prominent responses are the European Union General Data Protection Regulation and the California Consumer Privacy Act. Neither is a banking industry regulation, but both apply to banks in relation to certain clients. Further general regulation to protect data privacy appears likely, and banking industry regulations might be enlarged as well.
|
|
|
| LIQUIDITY AND FUNDING RISK |
Liquidity is essential to our business model and a lack of liquidity, or an increase in the cost of liquidity, could materially impair our ability to fund our operations and jeopardize our results of operation, financial condition and cash flows.
Liquidity represents an institution’s ability to provide funds to satisfy demands from depositors, borrowers and other creditors by either converting assets into cash or accessing new or existing sources of incremental funds. Liquidity risk arises from the possibility that we may be unable to satisfy current or future funding requirements and needs.
Deposit levels may be affected by several factors, including rates paid by competitors, general interest rate levels, returns available to customers on alternative investments, general economic and market conditions, customer concerns about the safety and soundness of our bank, whether real or perceived, or the U.S. banking system in general and other factors.
Loan repayments are a relatively stable source of funds but are subject to the borrowers’ ability to repay loans, which can be adversely affected by a number of factors including changes in general economic conditions, adverse trends or events affecting business industry groups or specific businesses, declines in real estate values or markets, business closings or lay-offs, inclement weather, natural disasters and other factors. Furthermore, loans generally are not readily convertible to cash.
We anticipate we will continue to rely primarily on deposits, loan repayments, and cash flows from our investment securities to provide liquidity. However, from time to time, secondary sources may be used to augment our primary funding sources. Such secondary sources may include FHLB advances, brokered deposits, repurchase agreements, secured and unsecured federal funds lines of credit from correspondent banks, Federal Reserve borrowings and/or accessing the equity or debt capital markets. The availability of these secondary funding sources is subject to broad economic conditions, to regulation and to investor assessment of our financial strength and, as such, the cost of funds may fluctuate significantly and/or the availability of such funds may be restricted, thus impacting our net interest income, our immediate liquidity and/or our access to additional liquidity. Additionally, if we fail to remain “well-capitalized” our ability to utilize brokered deposits may be restricted.
An inability to maintain or raise funds (including the inability to access secondary funding sources) in amounts necessary to meet our liquidity needs would have a substantial negative effect, individually or collectively, on our liquidity. Our access to funding sources in amounts adequate to finance our activities, or on terms attractive to us, could be impaired by factors that affect us specifically or the financial services industry in general. For example, factors that could detrimentally impact our access to liquidity sources include our financial results, a decrease in the level of our business activity due to a market downturn or adverse regulatory action against us, a reduction in our credit rating, any damage to our reputation, counterparty availability, changes in the activities of our business partners, changes affecting our loan portfolio or other assets, or any other event that could cause a decrease in depositor or investor confidence in our creditworthiness and business. Our access to liquidity could also be impaired by factors that are not specific to us, such as general business conditions, interest rate fluctuations, severe volatility or disruption of the financial markets or negative views and expectations about the prospects for the financial services industry as a whole, or legal, regulatory, accounting, and tax environments governing our funding transactions. In addition, our ability to raise funds is strongly affected by the general state of the U.S. and world economies and financial markets as well as the policies and capabilities of the U.S. government and its agencies, and may remain or become increasingly difficult due to economic and other factors beyond our control. Any such event or failure to manage our liquidity effectively could affect our competitive position, increase our borrowing costs and the interest rates we pay on deposits, limit our access to the capital markets, or cause us to sell investment securities and incur losses from those sales, any or all of which could have a material adverse effect on our results of operations or financial condition.
A downgrade of our credit rating could limit our access to borrowings or increase our borrowing costs.
Credit ratings are subject to ongoing review by rating agencies, which consider a number of factors, including our financial strength, performance, prospects and operations as well as factors not under our control. Rating agencies could make adjustments to our credit ratings at any time, and there can be no assurance that they will maintain our ratings at current levels or that downgrades will not occur. If rating agencies were to downgrade our credit rating, our borrowing costs would increase or the availability of borrowing sources could be limited. Additionally, a downgrade could occur at a time that is disadvantageous when our need for borrowings is high, further increasing our overall cost of funds. If the downgrade is due to lower earnings performance, elevated credit losses, capital deficiencies or other factors, collateral requirements for secured borrowings could also be elevated which could further limit our borrowing capacity and increase our borrowing costs.
The proportion of our deposit account balances that exceed FDIC insurance limits may expose us to enhanced liquidity risk in times of financial distress.
Uninsured deposits historically have been viewed by the FDIC as less stable than insured deposits. According to statements made by the FDIC staff and the leadership of the federal banking agencies, customers with larger uninsured deposit account balances often are small- and mid-sized businesses that rely upon deposit funds for payment of operational expenses and, as a result, are more likely to closely monitor the financial condition and performance of their depository institutions. As a result, in the event of financial distress, uninsured depositors historically have been more likely to withdraw their deposits.
If a significant portion of our deposits were to be withdrawn within a short period of time such that additional sources of funding would be required to meet withdrawal demands, we may be unable to obtain funding at favorable terms, which may have an adverse effect on our net interest margin. Moreover, obtaining adequate funding to meet our deposit obligations may be more challenging during periods of elevated prevailing interest rates, such as the present period. Our ability to attract depositors during a time of actual or perceived distress or instability in the marketplace may be limited. Further, interest rates paid for borrowings generally exceed the interest rates paid on deposits. This spread may be exacerbated by higher prevailing interest rates. In addition, because our investment securities lose value when interest rates rise, after-tax proceeds resulting from the sale of such assets may be diminished during periods when interest rates are elevated. Under such circumstances, we may be required to access funding from sources such as the Federal Reserve’s discount window or the Bank Term Funding Program in order to manage our liquidity risk.
|
|
|
| INTEREST RATE AND YIELD CURVE RISKS |
We are subject to interest rate risk because a significant portion of our business involves borrowing and lending money, and investing in financial instruments.
A considerable amount of our profitability is dependent on net interest income, which is the difference between interest income earned on loans, leases and investment securities and interest expense paid on deposits, other borrowings, senior debt and subordinated notes. The absolute level of interest rates as well as changes in interest rates, including changes to the shape of the yield curve, may affect our level of interest income, the primary component of our gross revenue, as well as the level of our interest expense. In a period of changing interest rates, interest expense may increase at different rates than the interest earned on assets, impacting our net interest income. Interest rate fluctuations are caused by many factors which, for the most part, are not under our control. For example, national monetary policy implemented by the Federal Reserve plays a significant role in the determination of interest rates. Additionally, competitor pricing and the resulting negotiations that occur with our customers also impact the rates we collect on loans and the rates we pay on deposits.
Because of significant competitive pressures in our markets and the negative impact of these pressures on our deposit and loan pricing, coupled with the fact that a significant portion of our loan portfolio has variable rate pricing that moves in concert with changes to benchmark rates, our net interest margin may be negatively impacted if these short-term rates begin to decrease and we are unable to lower deposit pricing commensurately. However, if short-term interest rates continue to rise, our results of operations may also be negatively impacted if we are unable to increase the rates we charge on loans or earn on our investment securities in excess of the increases we must pay on deposits and our other funding sources. As interest rates change, we expect that we will periodically experience “gaps” in the interest rate sensitivities of our assets and liabilities, meaning that either our interest-bearing liabilities (usually deposits and borrowings) will be more sensitive to changes in market interest rates than our interest-earning assets (usually loans and investment securities), or vice versa. In either event, if market interest rates should move contrary to our position, this “gap” may work against us, and our results of operations and financial condition may be negatively affected.
We have entered into certain hedging transactions, including interest rate swaps, which are designed to lessen elements of our interest rate exposure. If interest rates do not change in the manner anticipated, such transactions may not be effective and our results of operations may be adversely affected.
A flat or inverted yield curve may reduce our net interest margin and adversely affect our loan and investment portfolios.
The yield curve is a reflection of interest rates applicable to short and long-term debt. The yield curve is steep when short-term rates are much lower than long-term rates; it is flat when short-term rates and long-term rates are nearly the same; and it is inverted when short-term rates exceed long-term rates. Historically, the yield curve is usually upward sloping (higher rates for longer terms). However, the yield curve can be relatively flat or inverted (downward sloping), which has happened several times in the past few years. A flat or inverted yield curve, which tends to decrease net interest margin, would adversely impact our lending businesses and investment portfolio. In 2022 and through most of 2023, the Federal Reserve increased rates in response to inflation and, during much of this time, the yield curve was inverted. We cannot predict how long those conditions will exist. See Risks Associated with Monetary Events within this section of the Report for additional information.
Discontinuance of, and transition away from, certain reference rates may adversely affect our reputation, business, financial condition and results of operations.
As a result of the cessation of publication of LIBOR on a representative basis, we no longer make loans referencing Affected Benchmarks. New floating rate contracts reference ARRs. Legacy contracts referencing Affected Benchmarks have transitioned to ARRs, principally Term SOFR.
BSBY was among the ARRs we utilized as part of the transition away from Affected Benchmarks. On November 15, 2023, the Bloomberg Index Services Limited announced that the permanent cessation of BSBY and all its tenors will be effective on November 15, 2024. Accordingly, we no longer originate loans that reference BSBY and are in the process of transitioning BSBY-indexed contracts to other ARRs, principally Term SOFR.
The discontinuance of, and transition away from, Affected Benchmarks, BSBY or other reference rates could adversely affect our business, financial condition and results of operations, including as a result of changes in the pricing of affected floating rate contracts and disputes or other actions related to our interpretation or enforcement of affected floating rate contracts. Uncertainties associated with ARRs also may affect our ability to effectively manage interest rate risk.
The preparation of our consolidated financial statements in conformity with U.S. GAAP requires management to make significant assumptions, estimates and judgments that affect the financial statements.
Management must make significant assumptions and estimates and exercise significant judgment in selecting and applying accounting and reporting policies. In some cases, management must select a policy from two or more alternatives, any of which may be reasonable under the circumstances, which may result in reporting materially different results than would have been reported under a different alternative. The estimate that is consistently one of our most critical is the level of the allowance for credit losses. However, other estimates can be highly significant at discrete times or during periods of varying length, for example the valuation (or impairment) of our deferred tax assets. Estimates are made at specific points in time. As actual events unfold, estimates are adjusted accordingly. Due to the inherent nature of these estimates, it is possible that, at some time in the future, we may significantly increase the allowance for credit losses and/or sustain credit losses that are significantly higher than the provided allowance, or we may recognize a significant provision for impairment of assets, or we may make some other adjustment that will differ materially from the estimates that we make today. Moreover, in some cases, especially concerning litigation and other contingency matters where critical information is inadequate, often we are unable to make estimates until fairly late in a lengthy process.
In addition, changes in accounting standards or interpretations could negatively impact our reported earnings and financial condition.
The accounting standard setters, including the FASB, the SEC and other regulatory agencies, periodically change the financial accounting and reporting standards that govern the preparation of our consolidated financial statements. For additional information, refer to Note 2 to our consolidated financial statements contained in this Report. These changes can be difficult to predict and can materially impact how we record and report our financial condition and results of operations. In some cases, we could be required to apply a new or revised standard retroactively, which would result in the recasting of our prior period financial statements.
We could be subject to changes in tax laws, regulations and interpretations or challenges to our income tax provision.
We compute our income tax provision based on enacted tax rates in the jurisdictions in which we operate. Any change in enacted tax laws, rules or regulatory or judicial interpretations, any adverse outcome in connection with tax audits in any jurisdiction or any change in the pronouncements relating to accounting for income taxes could adversely affect our effective tax rate, tax payments and results of operations.
Our internal controls and procedures may fail or be circumvented.
Maintaining and adapting our internal controls over financial reporting, disclosure controls and procedures and effective corporate governance policies and procedures (“controls and procedures”) is expensive and requires significant management attention. Moreover, as we continue to grow, our controls and procedures may become more complex and require additional resources to ensure they remain effective amid dynamic regulatory and other guidance. Failure to implement effective controls and procedures or circumvention of our controls and procedures could harm our business, results of operations and financial condition or cause us to fail to meet our public reporting obligations.
|
|
|
| GEOGRAPHIC AND CLIMATE RISKS |
We are subject to risks of operating in various jurisdictions.
Our success is also influenced heavily by population growth, income levels, loans and deposits and on stability in real estate values in our markets. To a significant degree our banking business is exposed to economic, regulatory, natural disaster, and other risks that primarily impact the southeastern U.S. states where we do most of our traditional banking business. If that region of the U.S. did not grow or was to experience adversity not shared by other parts of the country, for example the risk of hurricanes in Florida and the Carolina coasts, we would likely experience adversity to a degree not shared by those competitors which have a broader or different regional footprint. If market and economic conditions deteriorate, this may lead to valuation adjustments on our loan portfolio and losses on defaulted loans and on the sale of other real estate owned. Additionally, such adverse economic conditions in our market areas, specifically decreases in real estate property values due to the nature of our loan portfolio, the majority of which is secured by real estate, could reduce our growth rate, affect the ability of our customers to repay their loans and generally affect our financial condition and results of operations. We are less able than larger institutions to spread the risks of unfavorable local economic conditions across a larger number of more diverse economies.
Natural disasters and weather-related events exacerbated by climate change could have a negative impact on our results of operations and financial condition.
We operate in markets in which natural disasters, including tornadoes, severe storms, fires, floods, hurricanes and earthquakes have occurred. Such natural disasters could significantly affect the local population and economies, the activities of many of our customers and clients, and our business, and could pose physical risks to our properties. Although our banking offices are geographically dispersed throughout portions of the southeastern United States and we maintain insurance coverage for such events, a significant natural disaster in or near one or more of our markets could have a material adverse effect on our financial condition, results of operations or liquidity.
The markets in which we operate also are exposed to the adverse impacts of climate change, as well as uncertainties related to the transition to a low-carbon economy. Climate change presents both immediate and long-term risks to us and our customers and clients, with the risks expected to increase over time.
Climate risks can arise from both physical risks (those risks related to the physical effects of climate change) and transition risks (risks related to regulatory, compliance, technological, stakeholder and legal changes from a transition to a low-carbon economy). The physical and transition risks can manifest themselves differently across our risk categories in the short, medium and long terms.
The physical risk from climate change could result from increased frequency and/or severity of adverse weather events. For example, adverse weather events could damage or destroy our properties or our counterparties’ properties and other assets and disrupt operations, making it more difficult for counterparties to repay their obligations, whether due to reduced profitability, asset devaluations or otherwise. These events could also increase the volatility in financial markets and increase our counterparty exposures and other financial risks, which may result in lower revenues and higher cost of credit. For example, the cost of property and flood insurance in Florida has increased significantly in recent years, which has increased the cost of doing business. This can hinder profitability of existing customers and creates a higher barrier to entry for new businesses, which could decrease demand for borrowing for potential and existing customers.
Transition risks may arise from changes in regulations or market preferences toward a low-carbon economy, which in turn could have negative impacts on asset values, results of operations or our reputation or that of our customers and clients. For example, our corporate credit exposures include industries that may experience reduced demand for carbon-intensive products due to the transition to a low-carbon economy. Moreover, banking regulators and others are increasingly focusing on the issue of climate risk at financial institutions, both directly and with respect to their clients. As an example, although not currently applicable to us, on December 16, 2021, the OCC requested feedback on draft principles designed to support the identification and management of climate-related financial risks at institutions with more than $100 billion in total consolidated assets.
Even as regulators, such as the SEC, begin to propose or mandate additional disclosure of climate-related information by companies across sectors, there may continue to be a lack of information for more robust climate-related risk analyses. Third party exposures to climate-related risks and other data generally are limited in availability and variable in quality. Modeling capabilities to analyze climate-related risks and interconnections are improving but remain incomplete. Legislative or regulatory uncertainties and changes regarding climate-related risk management and disclosures are likely to result in higher regulatory, compliance, credit, reputational and other risks and costs (for additional information, see Regulatory, Legislative and Legal Risks above). In addition, we could face increased regulatory, reputational and legal scrutiny as a result of climate risk.
|
|
|
| STOCK HOLDING AND GOVERNANCE RISKS |
The inability of our subsidiaries to declare and pay dividends or other distributions to the Holding Company could adversely affect its liquidity and ability to declare and pay dividends.
While our Board, since 2013, has approved the payment of a quarterly cash dividend on our common stock, there can be no assurance whether or when we may pay dividends in the future. Future dividends, if any, will be declared and paid at the Board’s discretion and will depend on a number of factors including, among others, asset quality, earnings performance, liquidity and capital requirements. Our principal source of funds used to pay cash dividends on our common and preferred stock is dividends that we receive from the Bank. As a South Carolina state-chartered bank, the Bank is subject to limitations on the amount of dividends that it is permitted to pay, as described under “Supervision and Regulation - Payment of Dividends” in Part I, Item 1 of this Report. The federal banking agencies have also issued policy statements which provide that bank holding companies and insured banks should generally only pay dividends out of current earnings. The Federal Reserve may also prevent the payment of a dividend by the Bank if it determines that the payment would be an unsafe and unsound banking practice. The Holding Company and the Bank must also maintain the CET1 capital conservation buffer of 2.5% to avoid becoming subject to restrictions on capital distributions, including dividends. If the Bank is not permitted to pay cash dividends to the Holding Company, it is unlikely that we would be able to continue to pay dividends on our common stock or to pay interest on our indebtedness.
Holders of our indebtedness and of depositary shares related to our Series I preferred stock have rights that are senior to those of our common shareholders.
At December 31, 2023, we had outstanding senior debentures, subordinated debentures, trust preferred securities and accompanying subordinated debentures and preferred stock totaling $413 million. Payments of the principal and interest on the senior debentures, subordinated debentures and the subordinated debentures accompanying the trust preferred securities and dividends on the preferred stock are senior to payments with respect to shares of our common stock. We also conditionally guarantee payments of the principal and interest on the trust preferred securities. As a result, we must make payments on these debt instruments (including the related trust preferred securities) and preferred shares before any dividends can be paid on our common stock and, in the event of bankruptcy, dissolution or liquidation, the holders of the debt and preferred shares must be satisfied before any distributions can be made on our common stock. We have the right to defer distributions on the subordinated debentures related to the trust preferred securities (and the related guarantee of payments on the trust preferred securities) for up to five years, during which time no dividends may be paid on our common stock. If our financial condition deteriorates or if we do not receive required regulatory approvals, we may be required to defer distributions on the subordinated debentures related to the trust preferred securities (and the related guarantee of payments on the trust preferred securities).
We may from time to time issue additional senior or subordinated indebtedness or preferred stock that would have to be repaid before our shareholders would be entitled to receive any of our assets.
Our stock price can be volatile.
Stock price volatility may make it more difficult for you to resell your common stock when you want and at prices you find attractive. Our stock price can fluctuate significantly in response to a variety of factors, some of which are unrelated to our financial performance, including, among other things:
•actual or anticipated variations in quarterly results of operations;
•recommendations by securities analysts;
•operating and stock price performance of other companies that investors deem comparable to us;
•news reports relating to trends, concerns and other issues in the financial services industry;
•perceptions in the marketplace regarding us and/or our competitors;
•new technology used, or services offered, by competitors;
•significant acquisitions or business combinations, strategic partnerships, joint ventures or capital commitments by or involving us or our competitors;
•failure to integrate acquisitions or realize anticipated benefits from acquisitions;
•changes in government regulations; or
•geopolitical conditions such as acts or threats of war, terrorism, military conflicts, the effects (or perceived effects) of pandemics and trade relations.
General market fluctuations, including real or anticipated changes in the strength of the local economy; industry factors and general economic and political conditions and events, such as economic slowdowns or recessions; interest rate changes, oil price volatility or credit loss trends could also cause our stock price to decrease regardless of our operating results.
United’s corporate organizational documents and the provisions of Georgia law to which we are subject contain certain provisions that could have an anti-takeover effect and may delay, make more difficult or prevent an attempted acquisition of United that you may favor.
United’s amended and restated articles of incorporation, as amended (our “articles”), and bylaws, as amended (our “bylaws”), contain various provisions that could have an anti-takeover effect and may delay, discourage or prevent an attempted acquisition or change of control of United. These provisions include:
•a provision allowing the Board to consider the interests of our employees, customers, suppliers and creditors when considering an acquisition proposal;
•a provision that all amendments to the articles and bylaws must be approved by a majority of the outstanding shares of our capital stock entitled to vote;
•a provision requiring that any business combination involving United be approved by 75% of the outstanding shares of United’s common stock excluding shares held by stockholders who are deemed to have an interest in the transaction unless the business combination is approved by 75% of United’s directors;
•a provision restricting removal of directors except for cause and upon the approval of two-thirds of the outstanding shares of our capital stock entitled to vote;
•a provision that any special meeting of shareholders may be called only by the chairman, chief executive officer, president, chief financial officer, board of directors or the holders of 25% of the outstanding shares of United’s capital stock entitled to vote; and
•a provision establishing certain advance notice procedures for matters to be considered at an annual meeting of shareholders.
Additionally, United’s articles authorize the Board to issue shares of preferred stock without shareholder approval and upon such terms as the Board may determine. The issuance of our preferred stock, while providing desirable flexibility in connection with possible acquisitions, financings and other corporate purposes, could have the effect of making it more difficult for a third party to acquire, or of discouraging a third party from acquiring, a controlling interest in us. In addition, certain provisions of Georgia law, including a provision which restricts certain business combinations between a Georgia corporation and certain affiliated shareholders, may delay, discourage or prevent an attempted acquisition or change in control of United.
Our stockholders may suffer dilution if we raise capital through public or private equity financings to fund our operations, to increase our capital, or to expand.
If we raise funds by issuing equity securities or instruments that are convertible into equity securities, the percentage ownership of our current common stockholders will be reduced, the new equity securities may have rights and preferences superior to those of our common or outstanding preferred stock, and additional issuances could be at a sales price which is dilutive to current stockholders. We may issue or be required to issue additional shares of common stock, or securities convertible into, exchangeable for or representing rights to acquire shares of common stock in order to maintain capital at desired or regulatory-required levels. We could also issue additional equity securities directly as consideration in acquisitions of other financial institutions or other investments that we may make that would be dilutive to stockholders in terms of voting power and share-of-ownership, and could be dilutive financially or economically.
|
|
|
RISKS RELATED TO PUBLIC HEALTH ISSUES |
Pandemics and outbreaks of communicable diseases may lead to periods of significant volatility in financial and other markets, and could adversely affect our ability to conduct normal business, our clients, and could harm our businesses, financial condition and results of operations.
Pandemics and widespread outbreaks of communicable diseases may cause significant disruption in the international and United States economies and financial markets and could have an adverse effect on our business and results of operations. The spread of these diseases may result in quarantines, cancellation of events and travel, business and school shutdowns, reduction in business activity and financial transactions, supply chain interruptions, and overall economic and financial market instability. Governments of the states in which we have operations may take preventative or protective actions, such as imposing restrictions on travel and business operations, advising or requiring individuals to limit or forego their time outside of their homes, and ordering temporary closures of businesses that have been deemed to be non-essential. These restrictions and other consequences of public health issues may result in significant adverse effects for many different types of businesses, including, among others, those in the hospitality (including hotels and lodging) and restaurant industries, and result in layoffs and furloughs of employees nationwide, including the regions in which we operate.
ITEM 1B. UNRESOLVED STAFF COMMENTS
None.
ITEM 1C. CYBERSECURITY
Policy statements and regulations by state and federal bank regulators indicate that financial institutions should design multiple layers of security controls to establish lines of defense and to ensure that their risk management processes also address the risk posed by compromised customer credentials, including security measures to reliably authenticate customers accessing internet-based services of the financial institution. For example, a financial institution’s management is expected to maintain sufficient business continuity planning processes to ensure the rapid recovery, resumption and maintenance of the institution’s operations after a cyberattack involving destructive malware.
On April 1, 2022, a final rule issued by federal financial regulatory agencies became effective – that rule imposes upon banking organizations and their service providers notification requirements for significant cybersecurity incidents. Specifically, the rule requires banking organizations to notify their primary federal regulator as soon as possible and no later than 36 hours after the discovery of a “computer-security incident” that rises to the level of a “notification incident” as those terms are defined in the rule. Banks’ service providers are required under that rule to notify any affected bank to or on behalf of which the service provider provides services “as soon as possible” after determining that it has experienced an incident that materially disrupts or degrades, or is reasonably likely to materially disrupt or degrade, covered services provided to such bank for as much as four hours.
Additionally, effective December 9, 2022, amendments to the GLB Act’s Safeguards Rule went into effect. That rule requires financial institutions to: (i) appoint a qualified individual to oversee and implement their information security programs; (ii) implement additional criteria for information security risk assessments; (iii) implement safeguards identified by assessments, including access controls, data inventory, data disposal, change management, and monitoring, among other things; (iv) implement information system monitoring in the form of either “continuous monitoring” or “periodic penetration testing;” (v) implement additional controls including training for security personnel, periodic assessment of service providers, written incident response plans, and periodic reports from the qualified individual to the board of directors. Additionally, multiple states and Congress are considering laws or regulations which could create new individual privacy rights and impose increased obligations on companies handling personal data.
Risk management and strategy
The regulatory requirements referenced above recognize that, in the ordinary course of business, we rely on electronic communications and information systems to conduct our operations and store sensitive data. “Information systems” means electronic information resources that we own or use, including physical or virtual infrastructure controlled by these information resources, or components thereof, organized for the collection, processing, maintenance, use, sharing, dissemination, or disposition of the information necessary to maintain or support our operations. We face significant and persistent cybersecurity risks due to: the breadth of geographies, networks, and systems we must defend against cybersecurity attacks; the complexity, technical sophistication, value, and widespread use of our systems, products and processes; the attractiveness of our systems, products and processes to threat actors (including state-sponsored organizations) seeking to inflict harm on us or our customers; the substantial level of harm that could occur to us and our customers were we to suffer impacts of a material cybersecurity incident; and our use of third-party products, services and components. Because cybersecurity threats continue to evolve, we have been required and may continue to be required to expend significant resources to continue to implement, modify or enhance our protective measures or to investigate and remediate any information security vulnerabilities. Financial expenditures may also be required to meet regulatory changes in the information security and cybersecurity domains. Risks and exposures related to cybersecurity attacks are expected to remain significant for the foreseeable future due to the rapidly evolving nature and sophistication of these threats, as well as the expanding use of internet banking, mobile banking and other technology-based products and services by us and our customers. See “Item 1A. – Risk Factors” in this Report for a further discussion of risks related to cybersecurity.
The underlying controls of our cyber risk management program are based on recognized best practices and standards for cybersecurity and information technology, including frameworks such as the Center for Internet Security’s Critical Security Controls and the Federal Financial Institutions Examination Council’s Cybersecurity Assessment. We periodically engage third-parties to assess our cyber risk program and technical controls. To address cybersecurity threats (defined as potential unauthorized occurrences on or conducted through our information systems that may result in adverse effects on the confidentiality, integrity, or availability of those systems or any information residing in those systems therein), we have implemented an incident and event response program. That program, which is designed to identify, assess, manage, mitigate, and respond to cybersecurity threats, is integrated within our overall enterprise risk management and business continuity frameworks. We employ an in-depth, layered, defensive approach that leverages people, processes and technology to manage and maintain cybersecurity controls. We also employ a variety of preventative and detective tools to monitor, block, and provide alerts regarding suspicious activity relative to our information systems, as well as to report on any suspected advanced persistent threats. An ongoing enterprise-wide security awareness training program is in place to help protect our data, systems, and networks from malicious attacks and cyber threats. The program is designed to allow for the detection and timely and efficient recovery from cybersecurity incidents (defined as unauthorized occurrences, or a series of related unauthorized occurrences, on or conducted through our information systems that jeopardize the confidentiality, integrity, or availability of those systems or any information residing therein) and events by providing a well-defined, organized approach for handling any potential threats to the confidentiality, integrity, and/or availability of our information systems.
In many instances we rely on third-party providers to facilitate providing products and services to our customers. As a part of our overall cybersecurity risk management framework and, in addition to assessing our own cybersecurity preparedness, we also have a process in place to manage cybersecurity risks associated with third-party service providers. To help mitigate adverse impacts from a cybersecurity incident, we assess third-party vendors as a part of our vendor onboarding and continued due diligence which includes processes to assess information security posture. Depending upon the level of perceived security risk, we may impose security requirements upon a supplier, including: maintaining an effective security management program; abiding by information handling and asset management requirements; and notifying us in the event of any known or suspected cyber incident. We periodically conduct (or engage a third party to conduct) reviews of third-party hosted applications with a specific focus on any sensitive data shared with third parties. The internal business owners of hosted applications, depending upon the level of risk, are required to provide a report as to their controls (e.g., a System and Organization Controls (SOC) 2 or ISO 27001 (Information and Security Certification) or similar report).
Our information security team in combination with other third-party vendors monitor our information systems for suspicious activity, such as unauthorized intrusions. Suspected or confirmed threats, incidents, or events, however, also may be reported by bank employees, customers, intrusion detection systems, third-party servicers, or government entities. Once reported, cybersecurity incidents are to be brought to the attention of our Information Technology and Security Team. Depending upon the nature and perceived threat level of the reported event, our overall enterprise risk management process would require the involvement of other management and response teams representing other groups (e.g., Information Technology, Information Security, Legal/Compliance, Corporate Security, Internal Audit, Human Resources, Finance/Accounting, Corporate Communications, Designated Cyber Coach) within our organization.
Incident and risk event levels each vary from no (or low) risk to crisis (high) risk. The determination of the incident and risk level will dictate the level of personnel that will be responsible for addressing the incident, controlling the effects of the incident and formulating the response to the incident. Responses may include, when appropriate and/or required, notification to regulatory agencies (e.g., FDIC, FinCEN, SEC), authorities (e.g., F.B.I., Department of Justice), customers, third parties or internal personnel.
Each of the management and response teams, within its assigned level, is responsible for providing an orderly response to security incidents and risk events; preventing a serious loss of profits, public confidence, or information assets by providing an immediate, effective, and skillful response to any unexpected event which negatively impacts the confidentiality, integrity, and/or availability of our systems, network, or the non-public personal information of its customers, interruptions to customers’ experiences, or other anomalous situations; taking the steps it deems necessary to contain, mitigate, or resolve a security incident or risk event; and investigating suspected security incidents and risk events in a timely and cost effective manner, reporting findings to management, determining an appropriate course of action, and coordinating communications to customers, regulatory authorities, and law enforcement agencies as necessary.
Following a cybersecurity incident, and during its investigation and the formulation of a response, our processes also envision measures designed to contain and/or eradicate the incident and prevent further effects. Once it is determined that the incident has been resolved, we then work to establish appropriate controls (if applicable) to address similar future events and/or prevent another similar event from occurring in the future. We have experienced, and will continue to experience, cyber incidents in the normal course of business. To date, however, we have not experienced any previous cybersecurity incidents that have materially affected or are reasonably likely to materially affect our business strategy, results of operations, or financial condition.
Governance
Our cybersecurity program is headed by our Chief Information Security Officer (CISO), who reports to our Chief Information Officer. Our CISO is informed about and monitors prevention, detection, mitigation and remediation efforts through regular communication and reporting from professionals in the information security team, several of whom have extensive records of service in financial institutions and cybersecurity. Our CISO has over 20 years of experience in IT operations/security roles in the financial services industry and holds a cybersecurity certification as a Certified Information Systems Security Professional (“CISSP”). Other members of his team also hold CISSP certifications as well as CompTIA Security+, SANS Institute Cloud Security Essentials, SANS Institute GIAC Certified Enterprise Defender, SANS Institute Security Awareness Professional, Certified Information Security Manager, GIAC Certified Incident Handler, Certified in Risk and Information Systems Control, and GIAC Cyber Threat Intelligence certifications.
As part of its oversight responsibilities over the Company risks and controls, the Board ultimately is responsible for overseeing our cyber and information security risks. The Board has delegated this responsibility to its Risk Committee. At each quarterly meeting of the Risk Committee, our CISO reports to the Risk Committee regarding security testing, training, audits, key cybersecurity metrics, and our efforts to identify, prepare for, prevent, and respond to critical threats. The Risk Committee receives regular updates on the status of our information security program, penetration testing results, infrastructure assessments, threat environment, security operations, operational events, vendor and supply chain security, and application/data security. On an annual basis, the CISO presents a cybersecurity program update to the Risk Committee.
ITEM 2. PROPERTIES
The Holding Company’s principal offices, which we own, are located at 125 Highway 515 East, Blairsville, Georgia. The Bank’s headquarters, which is a leased premises, is located at 2 West Washington Street, Suite 700, Greenville, South Carolina. As of December 31, 2023, we had a 207 branch network located throughout Georgia, South Carolina, North Carolina, Tennessee, Florida and Alabama. We do not own or lease any single physical property that we consider to be materially important to our financial condition or results from operations. Our retail branches, ATMs, loan and mortgage production offices, wealth management and administrative offices remain important to our ability to deliver financial services to a large portion of our clients. For many years, branch usage by clients has slowly declined, and for many years we have slowly consolidated branch locations in response to changing utilization patterns. We expect that long-term trend to continue. We consider our properties to be suitable and adequate for operating our banking business. Notes 7 and 14 to our consolidated financial statements include additional information regarding investments in premises and equipment and leased properties.
ITEM 3. LEGAL PROCEEDINGS
In the ordinary course of operations, we are parties to various legal proceedings and periodic regulatory examinations and investigations. There are no material pending legal proceedings to which we or any of our properties are subject.
ITEM 4. MINE SAFETY DISCLOSURES
Not applicable.
PART II
ITEM 5. MARKET FOR UNITED’S COMMON EQUITY, RELATED STOCKHOLDER MATTERS AND ISSUER PURCHASES OF EQUITY SECURITIES
Stock. United’s common stock trades on the Nasdaq Global Select Market under the symbol “UCBI”. At January 31, 2024, there were 8,497 record shareholders of United’s common stock.
Dividends. Our Board declared cash dividends totaling $0.92 and $0.86 per share on our common stock in 2023 and 2022, respectively. We currently intend to continue to pay comparable quarterly cash dividends on our common stock, subject to approval by our Board, although we may elect not to pay dividends or to change the amount of such dividends. The payment of dividends is a decision of our Board based upon then-existing circumstances, including our rate of growth, profitability, financial condition, existing and anticipated capital requirements, the amount of funds legally available for the payment of cash dividends, regulatory constraints and such other factors as the Board determines relevant.
Additional information regarding dividends is included in this Report in Note 22 to our consolidated financial statements in Part II Item 8 Financial Statements and Supplementary Data, under the heading of “Supervision and Regulation” in Part I Item 1. Business and under the heading “Capital Resources and Dividends” in Part II, Item 7. MD&A.
Share Repurchases.
The following table contains information regarding purchases of our preferred stock made during the quarter ended December 31, 2023 by or on behalf of United or any “affiliated purchaser,” as defined by Rule 10b-18(a)(3) of the Exchange Act. We made no common stock repurchases during the fourth quarter of 2023.
|
|
|
|
|
|
|
|
|
|
|
|
|
|
|
|
|
|
|
|
|
|
|
|
|
|
|
Preferred Stock Depositary Share Repurchases |
| (Dollars in thousands, except for per share amounts) |
|
Total Number of Depositary Shares
Purchased |
|
Average
Price Paid
per Depositary Share |
|
Total Number of
Depositary Shares Purchased
as Part of Publicly
Announced Plans
or Programs |
|
Approximate Dollar
Value of Shares that May
Yet Be Purchased Under
the Plans or Programs
|
|
|
|
|
|
|
|
|
|
|
|
|
|
|
|
|
|
|
|
|
|
|
|
|
|
|
|
|
|
|
|
|
|
|
|
|
|
|
|
|
|
|
|
|
|
|
|
|
|
|
|
|
|
|
| October 1, 2023 - October 31, 2023 |
|
83,670 |
|
|
$ |
21.97 |
|
|
83,670 |
|
|
$ |
17,850 |
|
| November 1, 2023 - November 30, 2023 |
|
— |
|
|
— |
|
|
— |
|
|
18,400 |
|
| December 1, 2023 - December 31, 2023 |
|
— |
|
|
— |
|
|
— |
|
|
18,400 |
|
| Total |
|
83,670 |
|
|
$ |
21.97 |
|
|
83,670 |
|
|
|
In May 2023, our Board approved a preferred stock repurchase program, authorizing the repurchase up to $25.0 million of our outstanding Series I Non-Cumulative Preferred Stock directly or through the repurchase of depositary shares representing 1/1000th of a share of Series I Non-Cumulative Preferred Stock through December 31, 2023. In November 2023, our Board approved an extension of this program, authorizing the repurchase of up to $18.4 million of shares. The extended repurchase authorization will expire on December 31, 2024.
In November 2023, our Board re-authorized the existing common stock repurchase plan to allow the repurchase of up to $50 million of our common stock. The program is scheduled to expire on the earlier of the repurchase of our common stock having an aggregate purchase price of $50 million or December 31, 2024.
Under both programs, shares may be repurchased in open market transactions at prevailing market prices or in privately negotiated transactions, from time to time, or by other means in accordance with federal securities laws, and the program may be suspended or discontinued at any time without notice. The actual timing, number and value of shares repurchased under the programs will be determined by management at its discretion and will depend on a number of factors, including the market price of our stock, general market and economic conditions, and applicable legal requirements. Repurchased shares will become treasury shares and may be utilized for general corporate purposes.
Performance Graph. Set forth below is a line graph comparing the yearly percentage change in the cumulative total shareholder return on our common stock against the cumulative total return on the Nasdaq Stock Market (U.S. Companies) Index, the Nasdaq Bank Index and the KBW Nasdaq Regional Banking Index for the five-year period commencing December 31, 2018 and ending on December 31, 2023. In 2023, we added the KBW Nasdaq Regional Banking Index to the performance graph below as it is comprised of banks more representative of our size and business composition compared to those in the Nasdaq Bank Index. The following performance graph does not constitute soliciting material and should not be deemed filed or incorporated by reference into any other Company filing under the Securities Act of 1933 or the Securities Exchange Act of 1934, except to the extent that we specifically incorporate the performance graphs by reference therein.
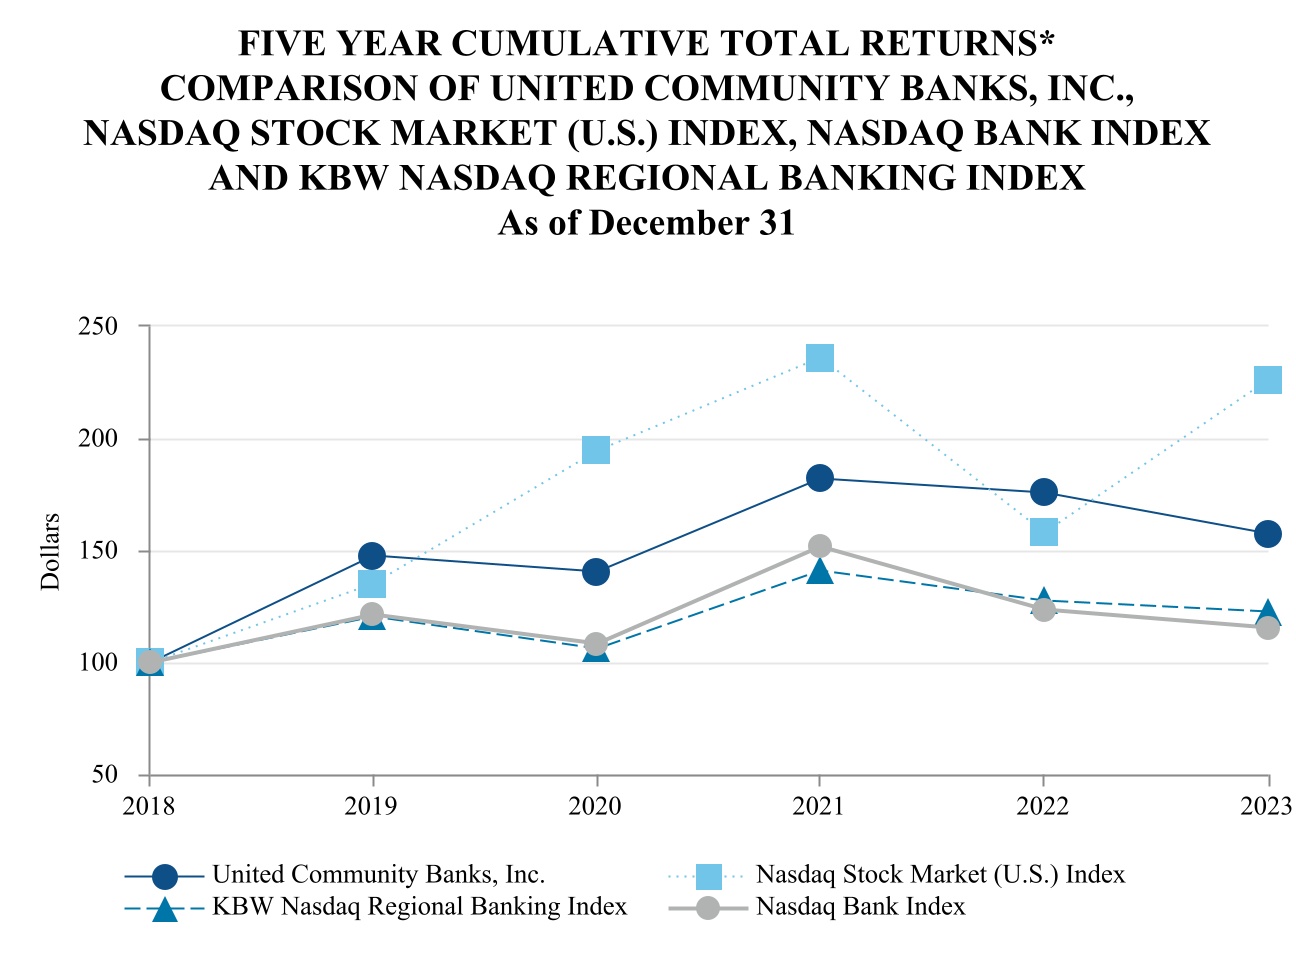
|
|
|
|
|
|
|
|
|
|
|
|
|
|
|
|
|
|
|
|
|
|
|
|
|
|
|
|
|
|
|
|
|
|
|
|
| |
Cumulative Total Return* |
| |
2018 |
|
2019 |
|
2020 |
|
2021 |
|
2022 |
|
2023 |
| United Community Banks, Inc. |
$ |
100 |
|
|
$ |
147 |
|
|
$ |
141 |
|
|
$ |
182 |
|
|
$ |
176 |
|
|
$ |
157 |
|
| Nasdaq Stock Market (U.S.) Index |
100 |
|
|
135 |
|
|
194 |
|
|
236 |
|
|
158 |
|
|
226 |
|
| Nasdaq Bank Index |
100 |
|
121 |
|
108 |
|
151 |
|
124 |
|
115 |
| KBW Nasdaq Regional Banking Index |
100 |
|
|
120 |
|
|
106 |
|
|
141 |
|
|
128 |
|
|
123 |
|
* Assumes $100 invested on December 31, 2018 in our common stock and above noted indexes. Total return includes reinvestment of dividends at the closing stock price of the common stock on the dividend payment date and the closing values of stock and indexes as of December 31 of each year.
ITEM 6. RESERVED
ITEM 7. MANAGEMENT’S DISCUSSION AND ANALYSIS OF FINANCIAL CONDITION AND RESULTS OF OPERATIONS
The following discussion and analysis of our financial condition and results of operations should be read in conjunction with the consolidated financial statements and accompanying notes. The discussion of the components of our results of operations focuses on financial trends and events occurring between 2022 and 2023.
For additional information related to financial trends between 2022 and 2021 please see the information under the caption “Management’s Discussion and Analysis of Financial Condition and Results of Operations” in our Annual Report on Form 10-K for the fiscal year ended December 31, 2022, filed with the SEC on February 24, 2023, which information under that caption is incorporated herein by this reference. Historical results of operations are not necessarily predictive of future results.
GAAP Reconciliation and Explanation
This Report contains financial information determined by methods other than in accordance with GAAP. Such non-GAAP financial information includes the following measures: “tangible book value per common share” and “tangible common equity to tangible assets.” In addition, management presents non-GAAP operating performance measures, which exclude merger-related and other items that are not part of our core business operations. Operating performance measures include “net income – operating,” “diluted net income per common share – operating,” “return on common equity – operating,” “return on tangible common equity – operating,” “return on assets – operating” and “efficiency ratio – operating.” Management has developed internal processes and procedures to accurately capture and account for merger-related and other charges and those charges are reviewed with the Audit Committee of our Board each quarter. Management uses these non-GAAP measures because it believes they may provide useful supplemental information for evaluating our operations and performance over periods of time, as well as in managing and evaluating our business and in discussions about our operations and performance. Management believes these non-GAAP measures may also provide users of our financial information with a meaningful measure for assessing our financial results and credit trends, as well as a comparison to financial results for prior periods. These non-GAAP measures should be viewed in addition to, and not as an alternative to or substitute for, measures determined in accordance with GAAP and are not necessarily comparable to other similarly titled measures used by other companies. To the extent applicable, reconciliations of these non-GAAP measures to the most directly comparable measures as reported in accordance with GAAP are included in Table 1 of MD&A.
Overview
We offer a wide array of commercial and consumer banking services and investment advisory services, which as of December 31, 2023, was comprised of a 207 branch network located throughout Georgia, South Carolina, North Carolina, Tennessee, Florida and Alabama. Our equipment finance and SBA/USDA lending businesses operate throughout the United States. At December 31, 2023, we had consolidated total assets of $27.3 billion and 3,121 full-time equivalent employees.
Recent Developments
Mergers and Acquisitions
In the past two years, we have continued to expand through acquisitions as follows:
•On July 1, 2023, we completed the acquisition of First Miami, which operated three offices in the Miami metropolitan area. We acquired $1.02 billion of assets and assumed $931 million of liabilities in the acquisition, which included $577 million in loans and $865 million in deposits. In addition to traditional banking products, First Miami offered private banking, trust and wealth management services.
•On January 3, 2023, we completed the acquisition of Progress, which operated 13 offices primarily located in Alabama and the Florida Panhandle. We acquired $1.90 billion of assets and assumed $1.60 billion of liabilities in the acquisition, which included 1.44 billion in loans and $1.33 billion in deposits.
•On January 1, 2022, we acquired Reliant, a bank which operated a 25-branch network primarily located in Middle Tennessee. In this acquisition, we acquired $3.25 billion of assets and assumed $2.66 billion of liabilities, which included $2.32 billion in loans and $2.50 billion in deposits.
The acquired entities’ results are included in our consolidated results beginning on the respective acquisition dates. We continue to evaluate potential transactions as opportunities arise.
Discontinuance of Affected Benchmarks and BSBY
As a result of the cessation of publication of all tenors of LIBOR on a representative basis, we no longer make loans referencing Affected Benchmarks. Legacy contracts referencing Affected Benchmarks have transitioned to ARRs. Additionally, publication of BSBY, one of the ARRs we utilized as part of the transition away from Affected Benchmarks, will cease effective on November 15, 2024. We no longer make loans referencing BSBY and are in the process of transitioning BSBY-indexed contracts to other ARRs, principally Term SOFR.
For more information on the replacement of Affected Benchmarks and BSBY, see Part I, Item 1A. Risk Factors – Interest Rate and Yield Curve Risks of this Report.
Results of Operations
We reported net income of $188 million in 2023 compared to $277 million in 2022. The following provides highlights of our financial results for 2023:
•We recorded a provision for credit losses of $89.4 million compared to $63.9 million for 2022. The increase in provision expense correlated with the increase in net charge-offs of $42.6 million, which was primarily driven by one commercial loan relationship charge-off of $19.0 million and an increase in equipment financing net charge-offs. Provision expense for 2023 included $14.5 million related to the establishment of the ACL for the acquired First Miami and Progress non-PCD loans and unfunded commitments. Provision expense for 2022 included $18.3 million related to the establishment of the ACL for the acquired Reliant non-PCD loans and unfunded commitments. See section titled Provision for Credit Losses of MD&A for further detail.
•Net interest revenue increased $65.4 million, which reflects the impact of rising interest rates, organic loan growth and the acquisitions of First Miami and Progress. During 2023, our net interest margin decreased three basis points to 3.35%, which reflects steeper increases in deposit rates compared to that of loans as the Federal Reserve increased the target federal funds rate by 525 basis points starting in March 2022 through the third quarter of 2023. See section titled Net Interest Revenue and Tables 2 and 3 of MD&A for further detail on net interest revenue.
•Noninterest income for 2023 was down $62.2 million, or 45%, compared to 2022, which was mostly attributable to an AFS bond portfolio restructuring loss of $51.7 million. In addition, mortgage loan gains and related fees decreased $13.3 million as mortgage origination demand remained low in 2023 as mortgage rates increased. See Tables 4 through 6 of MD&A for further detail on noninterest income.
•Noninterest expenses increased $101 million, or 22%, compared to 2022. Most notably, salaries and employee benefits increased $42.3 million, primarily due to growth in our employee base from acquisitions and lower deferred loan origination costs, partially offset by lower commissions expense resulting from the decrease in mortgage originations. FDIC assessment and other regulatory charges increased $17.6 million as a result of a $10.0 million one-time special assessment implemented by the FDIC resulting from the bank failures that occurred during the year, a two basis point assessment rate increase that became effective on January 1, 2023 and an increased assessment base. Amortization of intangibles increased $8.35 million, which reflects additional core deposit intangible expense resulting from the core deposit intangibles recorded in connection with the Progress and First Miami acquisitions. Merger-related and other charges were up $7.84 million compared to 2022, which mostly reflects First Miami and Progress merger costs, including systems conversions. See Table 7 of MD&A for further detail on noninterest expense.
Critical Accounting Estimates
Our accounting and reporting policies are in accordance with GAAP and conform to general practices within the banking industry. Application of these principles requires management to make estimates, assumptions or judgments that affect the amounts reported in the financial statements and the accompanying notes. These estimates are based on information available as of the date of the financial statements; accordingly, as this information changes, the financial statements could reflect different estimates or judgments.
Estimates, assumptions or judgments are necessary when assets and liabilities are required to be recorded at fair value, when a decline in the value of an asset not carried on the financial statements at fair value warrants an impairment write-down or valuation reserve to be established, or when an asset or liability needs to be recorded contingent upon future events. Carrying assets and liabilities at fair value results in more financial statement volatility. The fair values and the information used to record the valuation adjustments for certain assets and liabilities are based either on quoted market prices or are provided by other third-party sources, when available. When third-party information is not available, valuation adjustments are estimated in good faith by management primarily through the use of internal cash flow modeling techniques.
Certain policies inherently have a greater reliance on the use of estimates, assumptions or judgments and as such, have a greater possibility of producing results that could be materially different than originally reported.
We have identified the determination of our ACL and fair value measurements to be the accounting areas that require the most subjective or complex judgments, estimates and assumptions, and where changes in those judgments, estimates and assumptions (based on new or additional information, changes in the economic climate and/or market interest rates, etc.) could have a significant effect on our financial statements. Therefore, we consider these policies, discussed below, to be critical accounting estimates and discuss them directly with the Audit Committee of our Board.
Our most significant accounting policies are presented in Note 1 to the accompanying consolidated financial statements. These policies, along with the disclosures presented in the other notes to the consolidated financial statements and in this MD&A, provide information on how significant assets and liabilities are valued in the financial statements and how those values are determined.
Allowance for Credit Losses
The ACL represents management’s current estimate of credit losses for the remaining estimated life of financial instruments, with particular applicability on our balance sheet to loans and unfunded loan commitments. Estimating the amount of the ACL requires significant judgment and the use of estimates related to historical experience, current conditions, reasonable and supportable forecasts, and the value of collateral on collateral-dependent loans. The loan portfolio also represents the largest asset type on our consolidated balance sheet. Loan losses are charged against the allowance, while recoveries of amounts previously charged off are credited to the allowance. A provision for credit losses is charged to operations based on management’s periodic evaluation of the factors previously mentioned, as well as other pertinent factors.
There are many factors affecting the ACL; some are quantitative while others require qualitative judgment. For example, our ACL model is particularly sensitive to our recent charge-off experience and changes in the forecasted unemployment rate. Although management believes its process for determining the allowance adequately considers all the potential factors that could potentially result in credit losses, the process includes subjective elements and is susceptible to significant change. To the extent actual outcomes are worse than management estimates, additional provision for credit losses could be required that could adversely affect our earnings or financial position in future periods.
Additional information on the loan portfolio and ACL can be found in the sections of MD&A titled “Asset Quality and Risk Elements” and “Nonperforming Assets.” Note 1 to the consolidated financial statements includes additional information on accounting policies related to the ACL.
Fair Value Measurements
For business combinations, we measure and record assets acquired and liabilities assumed at fair value at the date of acquisition, including identifiable intangible assets. Note 1 to the consolidated financial statements includes additional information on accounting policies and estimates related to acquisition activities.
At December 31, 2023, the percentage of our total assets measured at fair value on a recurring basis was 13%, the majority of which are based on either quoted market prices or market prices for similar instruments. See Note 15 “Fair Value Measurements” in the consolidated financial statements herein for additional disclosures regarding the fair value of our assets and liabilities, including a description of the fair value hierarchy.
The fair values for AFS and HTM securities are generally based upon quoted market prices or observable market prices for similar instruments. Management utilizes a third-party pricing service to assist with determining the fair value of our securities portfolio. The pricing service uses observable inputs when available including benchmark yields, reported trades, broker-dealer quotes, issuer spreads, benchmark securities, bids and offers. These values take into account recent market activity as well as other market observable data such as interest rate, spread and prepayment information. When market observable data is not available, which generally occurs due to the lack of liquidity for certain securities, the valuation of the security is subjective and may involve substantial judgment by management.
We have elected the fair value option for the majority of our portfolio of mortgage loans held for sale in order to reduce certain timing differences and better match changes in fair values of the loans with changes in the value of derivative instruments used to economically hedge them. The fair value of mortgage loans held for sale is determined using quoted prices for a similar asset, adjusted for specific attributes of that loan, and as such is categorized as level 2.
We use derivatives primarily to manage our interest rate risk or to help our customers manage their interest rate risk. The fair values of derivative financial instruments are determined based on quoted market prices, dealer quotes and internal pricing models that are primarily sensitive to market observable data.
However, we do evaluate the level of these observable inputs and there are some instances where we have determined that the inputs are not directly observable.
We recognize a servicing rights asset upon the sale of residential mortgage loans and SBA/USDA loans sold with servicing retained. Servicing right assets are carried at fair value. Given the nature of these SBA/USDA and residential mortgage servicing assets, the key valuation inputs are unobservable and we disclose them as a level 3 item.
As of December 31, 2023, we had level 3 assets, those valued using unobservable inputs, of $54.2 million. The total level 3 assets consisted of $35.9 million in residential mortgage servicing rights, $10.6 million in derivative assets, $5.44 million in servicing rights for SBA/USDA loans and $2.21 million of AFS debt securities. We also had level 3 derivative liabilities totaling $11.2 million.
From time to time, we may record assets at fair value on a nonrecurring basis, usually as a result of the write-downs of individual assets due to impairment. In particular, nonaccrual loans may be carried at the fair value of collateral if repayment is expected solely from the collateral. Although management believes its processes for determining the fair value of collateral-dependent loans are appropriate, the processes require management judgment and assumptions and the value of such assets at the time they are revalued or divested may be significantly different from management’s determination of fair value.
UNITED COMMUNITY BANKS, INC.
Table 1 Selected Financial Information
For the Years Ended December 31,
(in thousands, except per share data)
|
|
|
|
|
|
|
|
|
|
|
|
|
|
|
|
|
|
|
|
|
|
|
2023 |
|
2022 |
|
2021 |
| INCOME SUMMARY |
|
|
|
|
|
|
| Interest revenue |
|
$ |
1,237,107 |
|
|
$ |
813,155 |
|
|
$ |
578,794 |
|
| Interest expense |
|
419,342 |
|
|
60,798 |
|
|
29,760 |
|
| Net interest revenue |
|
817,765 |
|
|
752,357 |
|
|
549,034 |
|
| Provision for credit losses |
|
89,430 |
|
|
63,913 |
|
|
(37,550) |
|
| Noninterest income |
|
75,483 |
|
|
137,707 |
|
|
157,818 |
|
| Total revenue |
|
803,818 |
|
|
826,151 |
|
|
744,402 |
|
| Noninterest expenses |
|
571,273 |
|
|
470,149 |
|
|
396,639 |
|
| Income before income tax expense |
|
232,545 |
|
|
356,002 |
|
|
347,763 |
|
| Income tax expense |
|
45,001 |
|
|
78,530 |
|
|
77,962 |
|
| Net income |
|
187,544 |
|
|
277,472 |
|
|
269,801 |
|
| Non-operating items |
|
88,894 |
|
|
19,375 |
|
|
13,970 |
|
| Income tax benefit of non-operating items |
|
(21,489) |
|
|
(4,246) |
|
|
(3,174) |
|
|
|
|
|
|
|
|
|
|
|
|
|
|
|
|
|
|
|
|
|
|
Net income - operating (1)* |
|
$ |
254,949 |
|
|
$ |
292,601 |
|
|
$ |
280,597 |
|
|
|
|
|
|
|
|
| PERFORMANCE MEASURES |
|
|
|
|
|
|
| Per common share: |
|
|
|
|
|
|
| Diluted net income - GAAP |
|
$ |
1.54 |
|
|
$ |
2.52 |
|
|
$ |
2.97 |
|
Diluted net income - operating (1)* |
|
2.11 |
|
|
2.66 |
|
|
3.09 |
|
| Common stock cash dividends declared |
|
0.92 |
|
|
0.86 |
|
|
0.78 |
|
| Book value |
|
26.52 |
|
|
24.38 |
|
|
23.63 |
|
Tangible book value (3)* |
|
18.39 |
|
|
17.13 |
|
|
18.42 |
|
| Key Performance Ratios: |
|
|
|
|
|
|
Return on common equity - GAAP (2) |
|
5.34 |
% |
|
9.54 |
% |
|
13.14 |
% |
Return on common equity - operating (1)(2)* |
|
7.33 |
|
|
10.07 |
|
|
13.68 |
|
Return on tangible common equity - operating (1)(2)(3)* |
|
10.63 |
|
|
14.04 |
|
|
17.33 |
|
| Return on assets - GAAP |
|
0.68 |
|
|
1.13 |
|
|
1.37 |
|
Return on assets - operating (1)* |
|
0.94 |
|
|
1.19 |
|
|
1.42 |
|
|
|
|
|
|
|
|
|
|
|
|
|
|
|
| Net interest margin (FTE) |
|
3.35 |
|
|
3.38 |
|
|
3.07 |
|
| Efficiency ratio - GAAP |
|
60.09 |
|
|
52.31 |
|
|
55.80 |
|
Efficiency ratio - operating (1)* |
|
56.17 |
|
|
50.16 |
|
|
53.83 |
|
| Equity to total assets |
|
11.95 |
|
|
11.25 |
|
|
10.61 |
|
Tangible common equity to tangible assets (3)* |
|
8.36 |
|
|
7.88 |
|
|
8.09 |
|
|
|
|
|
|
|
|
|
|
|
|
|
|
|
|
|
|
|
|
|
|
| ASSET QUALITY |
|
|
|
|
|
|
|
|
|
|
|
|
|
|
|
|
|
|
|
|
| Total NPAs |
|
$ |
92,877 |
|
|
$ |
44,281 |
|
|
$ |
32,855 |
|
| ACL - loans |
|
208,071 |
|
|
159,357 |
|
|
102,532 |
|
| Net charge-offs |
|
52,243 |
|
|
9,654 |
|
|
38 |
|
| ACL - loans to loans |
|
1.14 |
% |
|
1.04 |
% |
|
0.87 |
% |
| Net charge-offs to average loans |
|
0.30 |
|
|
0.07 |
|
|
— |
|
|
|
|
|
|
|
|
| NPAs to total assets |
|
0.34 |
|
|
0.18 |
|
|
0.16 |
|
|
|
|
|
|
|
|
|
|
|
|
|
|
|
|
|
|
|
|
|
|
|
|
|
|
|
|
|
|
|
|
|
|
|
|
|
|
|
|
|
|
|
|
|
|
|
|
|
|
|
|
|
|
|
|
|
|
|
|
|
|
|
|
|
|
|
|
|
|
|
|
|
|
|
|
|
|
AT PERIOD END ($ in millions) |
|
|
|
|
|
|
| Loans |
|
$ |
18,319 |
|
|
$ |
15,335 |
|
|
$ |
11,760 |
|
| Investment securities |
|
5,822 |
|
|
6,228 |
|
|
5,653 |
|
| Total assets |
|
27,297 |
|
|
24,009 |
|
|
20,947 |
|
| Deposits |
|
23,311 |
|
|
19,877 |
|
|
18,241 |
|
| Shareholders’ equity |
|
3,262 |
|
|
2,701 |
|
|
2,222 |
|
Common shares outstanding (thousands) |
|
119,010 |
|
|
106,223 |
|
|
89,350 |
|
(1) Excludes non-operating items as detailed on Non-GAAP Performance Measures Reconciliation on next page.(2) Net income less preferred stock dividends, divided by average realized common equity, which excludes AOCI. (3) Excludes effect of acquisition related intangibles and associated amortization.
* Represents a non-GAAP measure. See reconciliation of non-GAAP measures to related GAAP financial measures on the following page. For more information, see “GAAP Reconciliation and Explanation” in the MD&A section of this Report.
UNITED COMMUNITY BANKS, INC.
Table 1 (Continued) - Non-GAAP Performance Measures Reconciliation
Selected Financial Information
For the Years Ended December 31,
(in thousands, except per share data)
|
|
|
|
|
|
|
|
|
|
|
|
|
|
|
|
|
|
|
|
|
|
|
|
|
|
2023 |
|
2022 |
|
2021 |
|
|
|
|
|
|
|
|
|
|
|
|
|
|
|
|
|
|
|
|
|
|
|
|
|
|
|
|
|
|
|
|
|
|
|
|
|
|
|
|
|
|
|
|
|
|
|
|
|
| Net income reconciliation |
|
|
|
|
|
|
| Net income (GAAP) |
|
$ |
187,544 |
|
|
$ |
277,472 |
|
|
$ |
269,801 |
|
Bond portfolio restructuring loss |
|
51,689 |
|
|
— |
|
|
— |
|
| FDIC special assessment |
|
9,995 |
|
|
— |
|
|
— |
|
| Merger-related and other charges |
|
27,210 |
|
|
19,375 |
|
|
13,970 |
|
Income tax benefit of non-operating items |
|
(21,489) |
|
|
(4,246) |
|
|
(3,174) |
|
|
|
|
|
|
|
|
|
|
|
|
|
|
|
|
|
|
|
|
|
|
| Net income - operating |
|
$ |
254,949 |
|
|
$ |
292,601 |
|
|
$ |
280,597 |
|
|
|
|
|
|
|
|
|
|
|
|
|
|
|
| Diluted income per common share reconciliation |
|
|
|
|
|
|
| Diluted income per common share (GAAP) |
|
$ |
1.54 |
|
|
$ |
2.52 |
|
|
$ |
2.97 |
|
| Bond portfolio restructuring loss |
|
0.33 |
|
|
— |
|
|
— |
|
| FDIC special assessment |
|
0.06 |
|
|
— |
|
|
— |
|
| Merger-related and other charges |
|
0.18 |
|
|
0.14 |
|
|
0.12 |
|
|
|
|
|
|
|
|
|
|
|
|
|
|
|
|
|
|
|
|
|
|
| Diluted income per common share - operating |
|
$ |
2.11 |
|
|
$ |
2.66 |
|
|
$ |
3.09 |
|
|
|
|
|
|
|
|
|
|
|
|
|
|
|
| Book value per common share reconciliation |
|
|
|
|
|
|
| Book value per common share (GAAP) |
|
$ |
26.52 |
|
|
$ |
24.38 |
|
|
$ |
23.63 |
|
| Effect of goodwill and other intangibles |
|
(8.13) |
|
|
(7.25) |
|
|
(5.21) |
|
| Tangible book value per common share |
|
$ |
18.39 |
|
|
$ |
17.13 |
|
|
$ |
18.42 |
|
|
|
|
|
|
|
|
|
|
|
|
|
|
|
| Return on tangible common equity reconciliation |
|
|
|
|
|
|
| Return on common equity (GAAP) |
|
5.34 |
% |
|
9.54 |
% |
|
13.14 |
% |
| Bond portfolio restructuring loss |
|
1.15 |
|
|
— |
|
|
— |
|
| FDIC special assessment |
|
0.22 |
|
|
— |
|
|
— |
|
| Merger-related and other charges |
|
0.62 |
|
|
0.53 |
|
|
0.54 |
|
|
|
|
|
|
|
|
|
|
|
|
|
|
|
|
|
|
|
|
|
|
| Return on common equity - operating |
|
7.33 |
|
|
10.07 |
|
|
13.68 |
|
| Effect of goodwill and other intangibles |
|
3.30 |
|
|
3.97 |
|
|
3.65 |
|
| Return on tangible common equity - operating |
|
10.63 |
% |
|
14.04 |
% |
|
17.33 |
% |
|
|
|
|
|
|
|
|
|
|
|
|
|
|
| Return on assets reconciliation |
|
|
|
|
|
|
| Return on assets (GAAP) |
|
0.68 |
% |
|
1.13 |
% |
|
1.37 |
% |
| Bond portfolio restructuring loss |
|
0.15 |
|
|
— |
|
|
— |
|
| FDIC special assessment |
|
0.03 |
|
|
— |
|
|
— |
|
| Merger-related and other charges |
|
0.08 |
|
|
0.06 |
|
|
0.05 |
|
|
|
|
|
|
|
|
|
|
|
|
|
|
|
|
|
|
|
|
|
|
| Return on assets - operating |
|
0.94 |
% |
|
1.19 |
% |
|
1.42 |
% |
|
|
|
|
|
|
|
|
|
|
|
|
|
|
|
|
|
|
|
|
|
|
|
|
|
|
|
|
|
|
|
|
|
|
|
|
|
|
|
|
|
|
|
|
|
|
|
|
|
|
|
|
|
|
|
|
|
|
|
|
|
|
|
|
|
|
|
|
|
|
| Efficiency ratio reconciliation |
|
|
|
|
|
|
| Efficiency ratio (GAAP) |
|
60.09 |
% |
|
52.31 |
% |
|
55.80 |
% |
| FDIC special assessment |
|
(1.05) |
|
|
— |
|
|
— |
|
| Merger-related and other charges |
|
(2.87) |
|
|
(2.15) |
|
|
(1.97) |
|
| Efficiency ratio - operating |
|
56.17 |
% |
|
50.16 |
% |
|
53.83 |
% |
|
|
|
|
|
|
|
| Tangible common equity to tangible assets reconciliation |
|
|
|
|
|
|
| Equity to assets (GAAP) |
|
11.95 |
% |
|
11.25 |
% |
|
10.61 |
% |
| Effect of goodwill and other intangibles |
|
(3.27) |
|
|
(2.97) |
|
|
(2.06) |
|
|
|
|
|
|
|
|
| Effect of preferred equity |
|
(0.32) |
|
|
(0.40) |
|
|
(0.46) |
|
| Tangible common equity to tangible assets |
|
8.36 |
% |
|
7.88 |
% |
|
8.09 |
% |
|
|
|
|
|
|
|
|
|
|
|
|
|
|
|
|
|
|
|
|
|
|
|
|
|
|
|
|
|
|
|
|
|
|
|
|
|
|
|
|
|
|
|
|
|
|
|
|
|
Net Interest Revenue
Net interest revenue, which is the difference between the interest earned on assets and the interest paid on deposits and borrowed funds, is the single largest component of revenue. Management seeks to optimize this revenue while balancing interest rate, credit, and liquidity risks. The banking industry uses two key ratios to measure relative profitability of net interest revenue, which are the net interest spread and the net interest margin. The net interest spread measures the difference between the average yield on interest-earning assets and the average rate paid on interest-bearing liabilities. The net interest spread eliminates the effect of noninterest-earning assets as well as noninterest-bearing deposits and other noninterest-bearing funding sources and gives a direct perspective on the effect of market interest rate movements. The net interest margin is an indication of the profitability of a company’s balance sheet and is defined as net interest revenue as a percentage of total average interest-earning assets, which includes the positive effect of funding a portion of interest-earning assets with noninterest-bearing deposits and shareholders’ equity.
Net interest revenue for 2023 was $818 million, compared to $752 million for 2022. The net interest spread was 2.40% and 3.18% for 2023 and 2022, respectively, while the net interest margin was 3.35% and 3.38%, respectively. The following tables indicate the relationship between interest revenue and expense and the average amounts of assets and liabilities, which provide further insight into net interest spread and net interest margin for the periods indicated. The following discussion provides additional detail on the average balances and net interest revenue for the years ended December 31, 2023 and 2022.
For 2023, we reported a $423 million, or 52%, increase in FTE interest revenue compared to 2022. The main driver of the increase was the impact of rising interest rates as the Federal Reserve raised the targeted federal funds rate a total of 525 basis points beginning in March 2022 through the third quarter of 2023. Growth in average loans for the year ended December 31, 2023 of $3.00 billion, or 21%, compared to 2022 also contributed to the increase in interest revenue. The acquisitions of Progress and First Miami contributed $1.79 billion combined to the increase in average loans. Loan interest revenue includes purchased loan accretion, which increased $9.82 million in 2023 compared to 2022 largely driven by the 2023 acquisitions. In addition, we also earned $36.9 million more in interest income on our investment portfolio, which also benefited from higher interest rates and included $8.02 million additional interest revenue from the fair value hedges on our AFS securities portfolio.
Interest expense increased $359 million in 2023 compared to 2022, as a result of several factors including the continued rising interest rate environment, deposit growth, strong deposit competition, a less favorable deposit mix composition and increased utilization of wholesale funding, including brokered deposits. The average balance of interest-bearing deposits increased $2.64 billion for the year ended December 31, 2023 compared to 2022, $1.15 billion of which was attributable to the acquisitions of Progress and First Miami. To address deposit balance attrition, we raised deposit pricing, which contributed to an increase in non-brokered deposit interest expense of $331 million in 2023 compared to 2022. Our average deposit composition shifted toward more costly customer time deposits, comprising 14% of total average deposits during 2023 compared to 8% in 2022.
As noted above, we continued to use wholesale funding sources in 2023 to meet our short-term liquidity needs. Average wholesale funding balances for 2023 increased $317 million compared to 2022, which contributed an additional $11.1 million in interest expense. However, at December 31, 2023, we had no FHLB advances or short-term borrowings outstanding.
Our net interest spread decreased 78 basis points while our net interest margin decreased three basis points. The decreases in the interest rate spread and margin reflect a steeper increase in rates paid on deposits compared to rates earned on loans, partially mitigated by higher purchased loan accretion and gains on fair value hedges of our AFS portfolio. In addition, our net interest margin benefited from a more favorable interest earning asset mix, with 72% being comprised of loans, which generally have higher yields than other earning assets, compared to 65% for 2022.
Table 2 - Average Consolidated Balance Sheets and Net Interest Margin Analysis
For the Years Ended December 31,
(in thousands, FTE)
|
|
|
|
|
|
|
|
|
|
|
|
|
|
|
|
|
|
|
|
|
|
|
|
|
|
|
|
|
|
|
|
|
|
|
|
|
|
|
|
|
|
|
|
|
|
|
|
|
|
|
|
|
|
| |
2023 |
|
2022 |
|
2021 |
|
Average
Balance |
|
Interest |
|
Avg.
Rate |
|
Average
Balance |
|
Interest |
|
Avg.
Rate |
|
Average
Balance |
|
Interest |
|
Avg.
Rate |
| Assets: |
|
|
|
|
|
|
|
|
|
|
|
|
|
|
|
|
|
| Interest-earning assets: |
|
|
|
|
|
|
|
|
|
|
|
|
|
|
|
|
|
Loans, net of unearned income (FTE) (1)(2) |
$ |
17,576,424 |
|
|
$ |
1,042,578 |
|
|
5.93 |
% |
|
$ |
14,571,746 |
|
|
$ |
673,491 |
|
|
4.62 |
% |
|
$ |
11,485,876 |
|
|
$ |
504,015 |
|
|
4.39 |
% |
Taxable securities (3) |
5,929,687 |
|
|
162,505 |
|
|
2.74 |
|
|
6,284,603 |
|
|
121,501 |
|
|
1.93 |
|
|
4,446,712 |
|
|
61,994 |
|
|
1.39 |
|
Tax-exempt securities (FTE) (1)(3) |
381,731 |
|
|
9,796 |
|
|
2.57 |
|
|
496,327 |
|
|
13,865 |
|
|
2.79 |
|
|
382,915 |
|
|
12,059 |
|
|
3.15 |
|
| Federal funds sold and other interest-earning assets |
642,499 |
|
|
26,397 |
|
|
4.11 |
|
|
1,065,057 |
|
|
9,104 |
|
|
0.85 |
|
|
1,680,151 |
|
|
4,784 |
|
|
0.28 |
|
| Total interest-earning assets (FTE) |
24,530,341 |
|
|
1,241,276 |
|
|
5.06 |
|
|
22,417,733 |
|
|
817,961 |
|
|
3.65 |
|
|
17,995,654 |
|
|
582,852 |
|
|
3.24 |
|
| Noninterest-earning assets: |
|
|
|
|
|
|
|
|
|
|
|
|
|
|
|
|
|
| Allowance for credit losses |
(191,016) |
|
|
|
|
|
|
(135,144) |
|
|
|
|
|
|
(121,586) |
|
|
|
|
|
| Cash and due from banks |
239,574 |
|
|
|
|
|
|
204,852 |
|
|
|
|
|
|
139,728 |
|
|
|
|
|
| Premises and equipment |
355,139 |
|
|
|
|
|
|
288,044 |
|
|
|
|
|
|
230,276 |
|
|
|
|
|
Other assets (3) |
1,517,940 |
|
|
|
|
|
|
1,275,263 |
|
|
|
|
|
|
1,013,956 |
|
|
|
|
|
| Total assets |
$ |
26,451,978 |
|
|
|
|
|
|
$ |
24,050,748 |
|
|
|
|
|
|
$ |
19,258,028 |
|
|
|
|
|
| Liabilities and Shareholders’ Equity: |
|
|
|
|
|
|
|
|
|
|
|
|
|
|
|
|
|
| Interest-bearing liabilities: |
|
|
|
|
|
|
|
|
|
|
|
|
|
|
|
|
|
| Interest-bearing deposits: |
|
|
|
|
|
|
|
|
|
|
|
|
|
|
|
|
|
| NOW and interest-bearing demand |
$ |
5,161,071 |
|
|
125,336 |
|
|
2.43 |
|
|
$ |
4,486,263 |
|
|
17,312 |
|
|
0.39 |
|
|
$ |
3,610,601 |
|
|
5,468 |
|
|
0.15 |
|
| Money market |
5,462,677 |
|
|
156,397 |
|
|
2.86 |
|
|
4,900,667 |
|
|
18,274 |
|
|
0.37 |
|
|
3,972,358 |
|
|
5,380 |
|
|
0.14 |
|
| Savings deposits |
1,312,469 |
|
|
2,866 |
|
|
0.22 |
|
|
1,482,599 |
|
|
693 |
|
|
0.05 |
|
|
1,095,071 |
|
|
217 |
|
|
0.02 |
|
| Time deposits |
3,106,989 |
|
|
100,973 |
|
|
3.25 |
|
|
1,693,307 |
|
|
5,152 |
|
|
0.30 |
|
|
1,529,072 |
|
|
3,663 |
|
|
0.24 |
|
| Brokered time deposits |
224,914 |
|
|
10,002 |
|
|
4.45 |
|
|
61,636 |
|
|
668 |
|
|
1.08 |
|
|
67,230 |
|
|
117 |
|
|
0.17 |
|
| Total interest-bearing deposits |
15,268,120 |
|
|
395,574 |
|
|
2.59 |
|
|
12,624,472 |
|
|
42,099 |
|
|
0.33 |
|
|
10,274,332 |
|
|
14,845 |
|
|
0.14 |
|
Federal funds purchased and other
borrowings |
75,965 |
|
|
3,195 |
|
|
4.21 |
|
|
13,004 |
|
|
507 |
|
|
3.90 |
|
|
44 |
|
|
— |
|
|
— |
|
| FHLB advances |
124,425 |
|
|
5,761 |
|
|
4.63 |
|
|
34,027 |
|
|
1,424 |
|
|
4.18 |
|
|
1,195 |
|
|
3 |
|
|
0.25 |
|
| Long-term debt |
324,753 |
|
|
14,812 |
|
|
4.56 |
|
|
323,102 |
|
|
16,768 |
|
|
5.19 |
|
|
276,492 |
|
|
14,912 |
|
|
5.39 |
|
| Total borrowed funds |
525,143 |
|
|
23,768 |
|
|
4.53 |
|
|
370,133 |
|
|
18,699 |
|
|
5.05 |
|
|
277,731 |
|
|
14,915 |
|
|
5.37 |
|
| Total interest-bearing liabilities |
15,793,263 |
|
|
419,342 |
|
|
2.66 |
|
|
12,994,605 |
|
|
60,798 |
|
|
0.47 |
|
|
10,552,063 |
|
|
29,760 |
|
|
0.28 |
|
| Noninterest-bearing liabilities: |
|
|
|
|
|
|
|
|
|
|
|
|
|
|
|
|
|
| Noninterest-bearing deposits |
7,091,034 |
|
|
|
|
|
|
7,967,321 |
|
|
|
|
|
|
6,276,094 |
|
|
|
|
|
| Other liabilities |
397,337 |
|
|
|
|
|
|
377,221 |
|
|
|
|
|
|
322,566 |
|
|
|
|
|
| Total liabilities |
23,281,634 |
|
|
|
|
|
|
21,339,147 |
|
|
|
|
|
|
17,150,723 |
|
|
|
|
|
| Shareholders’ equity |
3,170,344 |
|
|
|
|
|
|
2,711,601 |
|
|
|
|
|
|
2,107,305 |
|
|
|
|
|
| Total liabilities and shareholders’ equity |
$ |
26,451,978 |
|
|
|
|
|
|
$ |
24,050,748 |
|
|
|
|
|
|
$ |
19,258,028 |
|
|
|
|
|
| Net interest revenue (FTE) |
|
|
$ |
821,934 |
|
|
|
|
|
|
$ |
757,163 |
|
|
|
|
|
|
$ |
553,092 |
|
|
|
| Net interest-rate spread (FTE) |
|
|
|
|
2.40 |
% |
|
|
|
|
|
3.18 |
% |
|
|
|
|
|
2.96 |
% |
Net interest margin (FTE) (4) |
|
|
|
|
3.35 |
% |
|
|
|
|
|
3.38 |
% |
|
|
|
|
|
3.07 |
% |
(1)Interest revenue on tax-exempt securities and loans has been increased to reflect comparable interest on taxable securities and loans. The rate used for each year was 26% reflecting the statutory federal rate and the federal tax adjusted state tax rate.
(2)Included in the average balance of loans outstanding are loans where the accrual of interest has been discontinued.
(3)Unrealized gains and losses on AFS securities, including those related to the transfer from AFS to HTM, have been reclassified to other assets. Pretax unrealized losses of $424 million and $277 million in 2023 and 2022, respectively, and pretax unrealized gains of $28.7 million in 2021 are included in other assets for purposes of this presentation.
(4)Net interest margin is taxable equivalent net interest revenue divided by average interest-earning assets.
The following table shows the relative effect on net interest revenue resulting from changes in the average outstanding balances (volume) of interest-earning assets and interest-bearing liabilities and the rates we earned and paid on such assets and liabilities.
Table 3 - Change in Interest Revenue and Interest Expense
(in thousands, FTE)
|
|
|
|
|
|
|
|
|
|
|
|
|
|
|
|
|
|
|
|
|
|
|
|
|
|
|
|
|
|
|
|
|
|
|
|
|
2023 Compared to 2022 |
|
2022 Compared to 2021 |
|
Increase (decrease) due to changes in |
|
Total |
|
Increase (decrease) due to changes in |
|
Total |
| |
Volume |
|
Rate |
|
Change |
|
Volume |
|
Rate |
|
Change |
| Interest-earning assets: |
|
|
|
|
|
|
|
|
|
|
|
| Loans |
$ |
155,447 |
|
|
$ |
213,640 |
|
|
$ |
369,087 |
|
|
$ |
141,433 |
|
|
$ |
28,043 |
|
|
$ |
169,476 |
|
| Taxable securities |
(7,235) |
|
|
48,239 |
|
|
41,004 |
|
|
30,742 |
|
|
28,765 |
|
|
59,507 |
|
| Tax-exempt securities |
(3,009) |
|
|
(1,060) |
|
|
(4,069) |
|
|
3,280 |
|
|
(1,474) |
|
|
1,806 |
|
| Federal funds sold and other interest-earning assets |
(4,910) |
|
|
22,203 |
|
|
17,293 |
|
|
(2,293) |
|
|
6,613 |
|
|
4,320 |
|
| Total interest-earning assets |
140,293 |
|
|
283,022 |
|
|
423,315 |
|
|
173,162 |
|
|
61,947 |
|
|
235,109 |
|
| Interest-bearing liabilities: |
|
|
|
|
|
|
|
|
|
|
|
| Interest-bearing deposits: |
|
|
|
|
|
|
|
|
|
|
|
| NOW and interest-bearing demand |
2,985 |
|
|
105,039 |
|
|
108,024 |
|
|
1,604 |
|
|
10,240 |
|
|
11,844 |
|
| Money market |
2,332 |
|
|
135,791 |
|
|
138,123 |
|
|
1,517 |
|
|
11,377 |
|
|
12,894 |
|
| Savings deposits |
(88) |
|
|
2,261 |
|
|
2,173 |
|
|
98 |
|
|
378 |
|
|
476 |
|
| Time deposits |
7,610 |
|
|
88,211 |
|
|
95,821 |
|
|
423 |
|
|
1,066 |
|
|
1,489 |
|
Brokered time deposits |
4,299 |
|
|
5,035 |
|
|
9,334 |
|
|
(11) |
|
|
562 |
|
|
551 |
|
| Total interest-bearing deposits |
17,138 |
|
|
336,337 |
|
|
353,475 |
|
|
3,631 |
|
|
23,623 |
|
|
27,254 |
|
Federal funds purchased and other short-term
borrowings |
2,645 |
|
|
43 |
|
|
2,688 |
|
|
507 |
|
|
— |
|
|
507 |
|
| FHLB advances |
4,170 |
|
|
167 |
|
|
4,337 |
|
|
905 |
|
|
516 |
|
|
1,421 |
|
| Long-term debt |
84 |
|
|
(2,040) |
|
|
(1,956) |
|
|
2,437 |
|
|
(581) |
|
|
1,856 |
|
| Total borrowed funds |
6,899 |
|
|
(1,830) |
|
|
5,069 |
|
|
3,849 |
|
|
(65) |
|
|
3,784 |
|
| Total interest-bearing liabilities |
24,037 |
|
|
334,507 |
|
|
358,544 |
|
|
7,480 |
|
|
23,558 |
|
|
31,038 |
|
| Increase in net interest revenue |
$ |
116,256 |
|
|
$ |
(51,485) |
|
|
$ |
64,771 |
|
|
$ |
165,682 |
|
|
$ |
38,389 |
|
|
$ |
204,071 |
|
Any variance attributable jointly to volume and rate changes is allocated to the volume and rate variance in proportion to the relationship of the absolute dollar amount of the change in each.
Provision for Credit Losses
The ACL represents management’s estimate of life of loan credit losses in the loan portfolio and unfunded loan commitments. Management’s estimate of credit losses under CECL is determined using a model that relies on reasonable and supportable forecasts and historical loss information to determine the balance of the ACL and resulting provision for credit losses. We recorded a provision for credit losses of $89.4 million in 2023, compared to $63.9 million in 2022. The amount of provision recorded in each period was the amount required such that the total ACL reflected the appropriate balance as determined by management reflecting expected life of loan losses.
The increase in provision expense during 2023 was primarily driven by the increase in net charge-offs of $42.6 million compared to 2022. The increase in net charge-offs was mostly attributable to higher equipment financing net charge-offs, mostly related to long haul trucking equipment loans, and one commercial relationship charge-off totaling $19.0 million. See Table 12 Net Charge-offs in MD&A for further detail.
Additionally, during 2023, we recorded the initial provisions for credit losses on Progress and First Miami non-PCD loans and unfunded commitments totaling $14.5 million compared to 2022, which included $18.3 million related to the acquisition of Reliant.
Additional discussion on credit quality and the ACL is included in the “Asset Quality and Risk Elements” and “Critical Accounting Estimates” sections of this Report, as well as Note 1 to the consolidated financial statements.
Noninterest Income
The following table presents the components of noninterest income for the periods indicated.
|
|
|
|
|
|
|
|
|
|
|
|
|
|
|
|
|
|
|
|
|
|
|
|
| Table 4 - Noninterest Income |
|
|
|
|
|
|
|
| For the Years Ended December 31, |
|
|
|
|
|
|
|
| (in thousands) |
|
|
|
|
|
|
Change |
| |
2023 |
|
2022 |
|
2021 |
|
2023-2022 |
| Service charge and fees: |
|
|
|
|
|
|
|
| Overdraft fees |
$ |
11,737 |
|
|
$ |
10,822 |
|
|
$ |
10,137 |
|
|
8 |
% |
| ATM and debit card interchange fees |
15,431 |
|
|
16,132 |
|
|
13,737 |
|
|
(4) |
|
| Other service charges and fees |
11,244 |
|
|
11,209 |
|
|
9,994 |
|
|
— |
|
| Total service charges and fees |
38,412 |
|
|
38,163 |
|
|
33,868 |
|
|
1 |
|
| Mortgage loan gains and related fees |
19,220 |
|
|
32,524 |
|
|
58,446 |
|
|
(41) |
|
| Wealth management fees |
23,740 |
|
|
23,594 |
|
|
18,998 |
|
|
1 |
|
| Gains from sales of other loans, net |
9,146 |
|
|
10,730 |
|
|
11,267 |
|
|
(15) |
|
| Other lending and loan servicing fees |
13,973 |
|
|
10,005 |
|
|
9,427 |
|
|
40 |
|
| Securities (losses) gains, net |
(53,333) |
|
|
(3,872) |
|
|
83 |
|
|
|
| Other noninterest income: |
|
|
|
|
|
|
|
| Customer derivatives |
2,517 |
|
|
2,180 |
|
|
3,198 |
|
|
15 |
|
| Other investment gains |
(7) |
|
|
2,023 |
|
|
4,886 |
|
|
|
| BOLI |
8,030 |
|
|
6,603 |
|
|
3,552 |
|
|
22 |
|
| Treasury management income |
5,064 |
|
|
3,758 |
|
|
2,910 |
|
|
35 |
|
| Other |
8,721 |
|
|
11,999 |
|
|
11,183 |
|
|
(27) |
|
| Total other noninterest income |
24,325 |
|
|
26,563 |
|
|
25,729 |
|
|
(8) |
|
| Total noninterest income |
$ |
75,483 |
|
|
$ |
137,707 |
|
|
$ |
157,818 |
|
|
(45) |
|
Mortgage loan gains and related fees consist primarily of fees earned on mortgage originations, gains on the sale of mortgages in the secondary market, mortgage derivative hedging gains and losses, fair value adjustments to our mortgage loans held for sale and fees earned from servicing mortgages for others, including fair value adjustments on our mortgage servicing asset. The change in mortgage income is strongly tied to the interest rate environment and industry conditions. We recognize the majority of income on mortgages when customers enter into mortgage rate lock commitments, making our mortgage rate lock volume a significant driver of mortgage gains in any given period.
The decrease in mortgage loan gains and related fees was mostly driven by fluctuations in the fair value of our mortgage servicing rights asset between 2022 and 2023. During 2023, we recorded negative fair value adjustments, including decay, totaling $3.87 million compared to $6.35 million in positive fair value adjustments, including decay, in 2022. The higher interest rate environment continued into 2023 which reduced mortgage origination and rate lock demand as reflected in the following table.
|
|
|
|
|
|
|
|
|
|
|
|
|
|
|
|
|
|
|
|
|
|
|
|
|
|
| Table 5 - Selected Mortgage Metrics |
|
|
|
|
|
|
|
|
| For the Years Ended December 31, |
|
|
|
|
|
|
|
|
| (dollars in thousands) |
|
|
|
|
|
|
|
|
|
|
|
2023 |
|
2022 |
|
|
|
Change |
|
|
Mortgage rate locks |
$ |
1,166,823 |
|
|
$ |
2,174,664 |
|
|
|
|
(46) |
% |
|
|
# of mortgage rate locks |
3,340 |
|
|
5,562 |
|
|
|
|
(40) |
|
|
|
|
|
|
|
|
|
|
|
|
|
Mortgage loans sold |
$ |
443,316 |
|
|
$ |
528,231 |
|
|
|
|
(16) |
|
|
|
# of mortgage loans sold |
1,550 |
|
2,086 |
|
|
|
(26) |
|
|
|
|
|
|
|
|
|
|
|
|
|
Mortgage loans originated |
|
|
|
|
|
|
|
|
|
Purchases |
$ |
789,869 |
|
|
$ |
1,193,713 |
|
|
|
|
(34) |
|
|
|
Refinances |
113,151 |
|
|
336,649 |
|
|
|
|
(66) |
|
|
|
Total |
$ |
903,020 |
|
|
$ |
1,530,362 |
|
|
|
|
(41) |
|
|
|
|
|
|
|
|
|
|
|
|
|
# of mortgage loans originated |
2,520 |
|
|
3,921 |
|
|
|
|
(36) |
|
|
Our SBA/USDA lending strategy includes selling a portion of the loan production each quarter. The amount of loans sold depends on several variables including the current lending environment and balance sheet management activities. From time to time, we also sell certain equipment financing receivables based on market conditions. The following table presents loans sold and corresponding gains recognized on SBA/USDA loans and other loans sold for the periods indicated.
|
|
|
|
|
|
|
|
|
|
|
|
|
|
|
|
|
|
|
|
|
|
|
|
|
|
|
|
|
|
| Table 6 - Other Loan Sales |
|
|
|
|
|
|
|
|
| For the Years Ended December 31, |
|
|
|
|
|
|
|
|
| (in thousands) |
2023 |
|
2022 |
|
|
|
Loans Sold |
|
Gain |
|
Loans Sold |
|
Gain |
|
|
Guaranteed portion of SBA/USDA loans |
$ |
94,758 |
|
|
$ |
6,004 |
|
|
$ |
104,813 |
|
|
$ |
8,090 |
|
|
|
Equipment financing receivables |
105,293 |
|
|
3,142 |
|
|
89,850 |
|
|
2,640 |
|
|
|
|
|
|
|
|
|
|
|
|
|
Total |
$ |
200,051 |
|
|
$ |
9,146 |
|
|
$ |
194,663 |
|
|
$ |
10,730 |
|
|
Lending and loan servicing fees for 2023 increased $3.97 million compared to 2022 mostly due to volume-driven fee income from our equipment finance business and more favorable negative fair value adjustments to our SBA/USDA servicing asset.
During the fourth quarter of 2023, we sold $316 million in AFS securities for a loss of $51.7 million with the strategic rationale of reducing long duration securities with lower yields and replacing them with higher yielding shorter duration securities to mitigate interest rate risk in the current rising rate environment.
The change in other noninterest income for 2023 compared to 2022 was primarily driven by the following factors:
•During 2023, we recorded unrealized gains on deferred compensation plan assets, CRA investments and limited partnership investments, which were offset by unrealized losses on our other equity investments. During 2022, we recorded unrealized gains on equity securities and limited partnership investments that were partially offset by unrealized losses in our deferred compensation plan assets.
•The increase in BOLI income is mostly due to the additional policies that were obtained in connection with the Progress acquisition as well as death benefits recognized.
•Treasury management income increased 35% compared to 2022, resulting from an increase in customers enrolled. This is reflective of our continued investment in this product, as we increased our Treasury Management headcount throughout our geographic footprint.
•The decrease in other income was driven primarily by an increase in collateral charges related to our derivative positions, which totaled $4.97 million in 2023 compared to $866,000 in 2022. In addition, we recognized a $1.00 million loss on the disposal of two of our Tennessee branches. The loss mainly resulted from a $656,000 write down of our core deposit intangible associated with deposits sold in the transaction as well as losses on the buildings. These reductions of income were partially offset by a gain on sale of a commercial insurance book of business of $1.59 million.
Noninterest Expenses
The following table presents the components of noninterest expenses for the periods indicated.
|
|
|
|
|
|
|
|
|
|
|
|
|
|
|
|
|
|
|
|
|
|
|
|
| Table 7 - Noninterest Expenses |
|
|
|
|
|
|
|
| For the Years Ended December 31, |
|
|
|
|
|
|
|
| (in thousands) |
|
|
|
|
|
|
Change |
| |
2023 |
|
2022 |
|
2021 |
|
2023-2022 |
| Salaries and employee benefits |
$ |
318,464 |
|
|
$ |
276,205 |
|
|
$ |
241,443 |
|
|
15 |
% |
| Occupancy |
42,640 |
|
|
36,247 |
|
|
28,619 |
|
|
18 |
|
| Communications and equipment |
43,264 |
|
|
38,234 |
|
|
29,829 |
|
|
13 |
|
| Professional fees |
26,732 |
|
|
20,166 |
|
|
20,589 |
|
|
33 |
|
| Lending and loan servicing expense |
9,722 |
|
|
9,350 |
|
|
10,859 |
|
|
4 |
|
| Outside services - electronic banking |
11,577 |
|
|
12,583 |
|
|
9,481 |
|
|
(8) |
|
| Postage, printing and supplies |
9,467 |
|
|
8,749 |
|
|
7,110 |
|
|
8 |
|
| Advertising and public relations |
9,473 |
|
|
8,384 |
|
|
5,910 |
|
|
13 |
|
| FDIC assessments and other regulatory charges |
27,449 |
|
|
9,894 |
|
|
7,398 |
|
|
177 |
|
| Amortization of intangibles |
15,175 |
|
|
6,826 |
|
|
4,045 |
|
|
122 |
|
| Merger-related and other charges |
27,210 |
|
|
19,375 |
|
|
13,970 |
|
|
40 |
|
| Other |
30,100 |
|
|
24,136 |
|
|
17,386 |
|
|
25 |
|
| Total noninterest expenses |
$ |
571,273 |
|
|
$ |
470,149 |
|
|
$ |
396,639 |
|
|
22 |
|
|
|
|
|
|
|
|
|
|
|
|
|
|
|
|
|
Noninterest expenses for 2023 totaled $571 million, up 22% from 2022. The addition of Progress and First Miami’s operating expenses since their respective acquisition dates of January 3, 2023 and July 1, 2023 contributed to the increase, particularly in salaries and benefits and occupancy costs.
Salaries and employee benefits for 2023 increased $42.3 million compared to 2022. Full time equivalent headcount totaled 3,121 at December 31, 2023, up 10% from 2,843 at December 31, 2022. In addition to the growth in our employee base from acquisitions, the increase in salaries was also attributable to merit increases awarded during the second quarter of 2023. Lower deferred loan origination costs, resulting from decreased loan production, and higher deferred compensation plan expense, driven by unrealized gains on the plan investments, also contributed to the increase in salaries and benefits expense. These increases were partially offset by decreases in commissions expense, primarily driven by the decrease in mortgage production, and a reduction in bonus expense.
Occupancy costs increased 18% in 2023 compared to 2022, primarily due to higher rent expense resulting from the addition of acquired leased premises. We operated 207 branches at December 31, 2023, compared to 192 branches at December 31, 2022.
Communications and equipment expense increased primarily due to incremental software contract costs and the growth in our network with the addition of recent acquisitions.
The increase in professional fees is most a result of increased legal and consulting fees. The increase also reflects pre-conversion systems expense from the Progress and First Miami acquisitions.
The increase in FDIC assessments and other regulatory charges was partly driven by the 2 basis point assessment rate increase that went into effect for all banks on January 1, 2023 and an increase in our assessment base, partly resulting from the Progress and First Miami acquisitions. In addition, 2023 expense includes $10.0 million related to the FDIC special assessment implemented in the fourth quarter of 2023 to recover losses resulting from the bank failures that occurred in 2023.
Amortization of intangibles increased with the additional customer deposit intangibles recorded as a result of the Progress and First Miami acquisitions.
The increase in other noninterest expense in 2023 was primarily due to an increase in travel and meals expense, as well as increases in fraud losses.
Merger-related and other charges for 2023 were primarily related to the acquisition of Progress and First Miami, including system conversions. Merger-related and other charges for 2022 primarily consisted of merger costs related to the acquisitions of Reliant, including its system conversion during the second quarter of 2022.
Balance Sheet Review
Total assets at December 31, 2023 were $27.3 billion, an increase of $3.29 billion, or 14%, from December 31, 2022. Total liabilities at December 31, 2023 were $24.0 billion, an increase of $2.73 billion, or 13% from December 31, 2022. Shareholders’ equity totaled $3.26 billion and $2.70 billion at December 31, 2023 and 2022, respectively. The following discussion of the major components of our balance sheet highlights significant activity resulting in the change in our financial condition between December 31, 2022 and December 31, 2023.
Loans
Our loan portfolio is our largest category of interest-earning assets. At December 31, 2023, total loans were $18.3 billion compared to $15.3 billion at December 31, 2022, an increase of 19%. The net increase in loans was primarily attributable to organic growth and loans acquired in the Progress and First Miami transactions of $1.44 billion and $577 million, respectively. The following presents the composition of our loan portfolio as of the dates indicated.
Table 8 - Loan Portfolio Composition
As of December 31, 2023
As of December 31, 2023, 23% of our loan portfolio was comprised of income producing commercial real estate loans, which is further disaggregated in the following chart. Common risks for this loan category are declines in general economic conditions, declines in real estate value, declines in occupancy rates, and lack of suitable alternative use for the property. In the current environment where inflation is high and interest rates have been rising over the past two years, the cost of renting commercial real estate has risen substantially. This can increase the risk of lower occupancy rates to our borrowers. In addition, in the post-COVID era, demand for office space has seen some decline as many companies have reduced the sizes of their offices to account for hybrid and remote work arrangements. We monitor our income producing commercial real estate portfolio through debt covenant monitoring and performing annual review procedures.
Table 9 - Commercial Real Estate - Income Producing Portfolio Composition
As of December 31, 2023
The following table sets forth the maturity distribution of our loan portfolio, including the interest rate sensitivity for loans maturing after one year.
Table 10 - Loan Portfolio Maturity
As of December 31, 2023
(in thousands)
|
|
|
|
|
|
|
|
|
|
|
|
|
|
|
|
|
|
|
|
|
|
|
|
|
|
|
|
|
|
|
|
|
|
|
|
|
|
|
|
|
|
|
Maturity |
|
Rate Structure for
Loans Maturing Over
One Year (1)
|
|
One Year
or Less |
|
2 - 5
Years |
|
6 - 15
Years |
|
After 15
Years |
|
Total |
|
Fixed
Rate |
|
Variable Rate |
| Owner occupied commercial real estate |
$ |
249,416 |
|
|
$ |
1,350,357 |
|
|
$ |
1,489,908 |
|
|
$ |
174,370 |
|
|
$ |
3,264,051 |
|
|
$ |
2,177,552 |
|
|
$ |
837,083 |
|
| Income producing commercial real estate |
732,801 |
|
|
2,199,709 |
|
|
1,128,462 |
|
|
202,980 |
|
|
4,263,952 |
|
|
2,044,647 |
|
|
1,486,504 |
|
| Commercial & industrial |
618,718 |
|
|
1,117,298 |
|
|
599,972 |
|
|
75,057 |
|
|
2,411,045 |
|
|
925,600 |
|
|
866,727 |
|
| Commercial construction |
467,220 |
|
|
995,259 |
|
|
308,134 |
|
|
88,925 |
|
|
1,859,538 |
|
|
471,034 |
|
|
921,284 |
|
| Equipment financing |
70,603 |
|
|
1,152,025 |
|
|
318,492 |
|
|
— |
|
|
1,541,120 |
|
|
1,470,517 |
|
|
— |
|
| Total commercial |
2,138,758 |
|
|
6,814,648 |
|
|
3,844,968 |
|
|
541,332 |
|
|
13,339,706 |
|
|
7,089,350 |
|
|
4,111,598 |
|
| Residential mortgage |
16,039 |
|
|
35,733 |
|
|
188,828 |
|
|
2,958,328 |
|
|
3,198,928 |
|
|
1,090,288 |
|
|
2,092,601 |
|
| Home equity |
11,660 |
|
|
49,443 |
|
|
84,290 |
|
|
813,594 |
|
|
958,987 |
|
|
1,952 |
|
|
945,375 |
|
| Residential construction |
246,799 |
|
|
11,789 |
|
|
35,360 |
|
|
7,702 |
|
|
301,650 |
|
|
17,821 |
|
|
37,030 |
|
| Manufactured housing |
8 |
|
|
520 |
|
|
52,876 |
|
|
283,070 |
|
|
336,474 |
|
|
336,212 |
|
|
254 |
|
| Consumer |
32,298 |
|
|
122,802 |
|
|
24,390 |
|
|
1,627 |
|
|
181,117 |
|
|
146,365 |
|
|
2,454 |
|
Total |
$ |
2,445,562 |
|
|
$ |
7,034,935 |
|
|
$ |
4,230,712 |
|
|
$ |
4,605,653 |
|
|
$ |
18,316,862 |
|
|
$ |
8,681,988 |
|
|
$ |
7,189,312 |
|
(1) The fixed versus variable determination does not reflect the portfolio layer fair value hedge on certain equipment financing loans.
As of December 31, 2023, our 25 largest credit relationships consisted of loans and loan commitments ranging from $38.9 million to $81.6 million, with an aggregate total credit exposure of $1.16 billion, including $332 million in unfunded commitments and $832 million in balances outstanding, excluding participations sold.
Our manufactured housing loan portfolio, which we acquired in the Reliant acquisition, is comprised of loans mostly outside our footprint, predominantly in Louisiana, Mississippi and Texas. As of December 31, 2023, 87% of loans were collateralized by chattel and the remaining 13% were collateralized by real estate.
During the fourth quarter of 2023, we ceased originating new manufactured housing loans.
Asset Quality and Risk Elements
We manage asset quality and control credit risk through review and oversight of the loan portfolio as well as adherence to policies designed to promote sound underwriting and loan monitoring practices. Our credit administration function is responsible for monitoring asset quality and Board approved portfolio concentration limits, establishing credit policies and procedures and enforcing the consistent application of these policies and procedures.
We conduct reviews of classified performing and non-performing loans, FDMs, past due loans and portfolio concentrations on a regular basis to identify risk migration and potential charges to the ACL. These items are discussed in a series of meetings attended by Credit Risk Management leadership and leadership from various lending groups. In addition to the reviews mentioned above, an independent loan review team reviews the portfolio to ensure consistent application of risk rating policies and procedures.
The ACL reflects management’s assessment of the life of loan expected credit losses in the loan portfolio and unfunded loan commitments. This assessment involves uncertainty and judgment and is subject to change in future periods. The amount of any changes could be significant if the assessment of loan quality or collateral values changes substantially with respect to one or more loan relationships or portfolios or if there is a significant change in the reasonable and supportable forecast used to model our expected credit losses. The allocation of the ACL is based on reasonable and supportable forecasts, historical data, subjective judgment and estimates and therefore, may not be predictive of the specific amounts or loan categories in which charge-offs may ultimately occur. In addition, bank regulatory authorities, as part of their periodic examination of the Bank, may require adjustments to the provision for credit losses in future periods if, in their opinion, the results of their review warrant such additions. See the Critical Accounting Estimates section for additional information on the ACL.
The ACL, which includes a portion related to unfunded commitments, totaled $224 million at December 31, 2023 compared with $181 million at December 31, 2022. At December 31, 2023, the ACL for loans was $208 million, or 1.14% of total loans, compared with $159 million, or 1.04%, of loans at December 31, 2022.
The increase in the ACL since December 31, 2022 reflects loan growth and a higher level of charge-offs, which raised the initial expected default rates in the model. In addition, the acquisitions of Progress and First Miami added $20.9 million to the ACL as of the acquisition date. Of this amount, $6.42 million was reclassified from the amortized cost basis of PCD loans with no impact to earnings.
The following table summarizes the allocation of the ACL for each of the past three years.
Table 11 - Allocation of ACL
As of December 31,
(in thousands)
|
|
|
|
|
|
|
|
|
|
|
|
|
|
|
|
|
|
|
|
|
|
|
|
|
|
|
|
|
|
|
|
|
|
|
|
|
2023 |
|
2022 |
|
2021 |
|
ACL |
|
% of loans in each category to total loans |
|
ACL |
|
% of loans in each category to total loans |
|
ACL |
|
% of loans in each category to total loans |
| Owner occupied commercial real estate |
$ |
23,542 |
|
|
18 |
|
|
$ |
19,834 |
|
|
18 |
|
|
$ |
14,282 |
|
|
20 |
|
| Income producing commercial real estate |
47,755 |
|
|
23 |
|
|
32,082 |
|
|
21 |
|
|
24,156 |
|
|
22 |
|
| Commercial & industrial |
30,890 |
|
|
13 |
|
|
23,504 |
|
|
15 |
|
|
16,592 |
|
|
16 |
|
| Commercial construction |
21,741 |
|
|
10 |
|
|
20,120 |
|
|
10 |
|
|
9,956 |
|
|
9 |
|
| Equipment financing |
33,383 |
|
|
9 |
|
|
23,395 |
|
|
9 |
|
|
16,290 |
|
|
9 |
|
| Total commercial |
157,311 |
|
|
73 |
|
|
118,935 |
|
|
73 |
|
|
81,276 |
|
|
76 |
|
| Residential mortgage |
28,219 |
|
|
17 |
|
|
20,809 |
|
|
15 |
|
|
12,390 |
|
|
14 |
|
Home equity |
9,647 |
|
|
5 |
|
|
8,707 |
|
|
6 |
|
|
6,568 |
|
|
6 |
|
| Residential construction |
1,833 |
|
|
2 |
|
|
2,049 |
|
|
3 |
|
|
1,847 |
|
|
3 |
|
| Manufactured housing |
10,339 |
|
|
2 |
|
|
8,098 |
|
|
2 |
|
|
— |
|
|
— |
|
| Consumer |
722 |
|
|
1 |
|
|
759 |
|
|
1 |
|
|
451 |
|
|
1 |
|
|
|
|
|
|
|
|
|
|
|
|
|
| Total ACL - loans |
208,071 |
|
|
100 |
|
|
159,357 |
|
|
100 |
|
|
102,532 |
|
|
100 |
|
| ACL - unfunded commitments |
16,057 |
|
|
|
|
21,163 |
|
|
|
|
10,992 |
|
|
|
| Total ACL |
$ |
224,128 |
|
|
|
|
$ |
180,520 |
|
|
|
|
$ |
113,524 |
|
|
|
|
|
|
|
|
|
|
|
|
|
|
|
| ACL- loans as a percentage of total loans |
1.14 |
% |
|
|
|
1.04 |
% |
|
|
|
0.87 |
% |
|
|
The following table summarizes net charge-offs to average loans for each of the past three years.
Table 12 - Net Charge-offs
Years Ended December 31,
(in thousands)
|
|
|
|
|
|
|
|
|
|
|
|
|
|
|
|
|
|
|
|
|
|
|
|
|
|
|
|
|
|
|
|
|
|
|
|
|
|
|
|
|
|
|
|
|
|
|
|
|
|
|
|
|
|
|
2023 |
|
2022 |
|
2021 |
|
Average Loans |
|
Net Charge-Offs (Recoveries) |
|
Net Charge-Offs to Average Loans |
|
Average Loans |
|
Net Charge-Offs (Recoveries) |
|
Net Charge-Offs to Average Loans |
|
Average Loans |
|
Net Charge-Offs (Recoveries) |
|
Net Charge-Offs to Average Loans |
| Owner occupied commercial real estate |
$ |
3,166,495 |
|
|
$ |
503 |
|
|
0.02 |
% |
|
$ |
2,662,600 |
|
|
$ |
(1,761) |
|
|
(0.07) |
% |
|
$ |
2,159,153 |
|
|
$ |
316 |
|
|
0.01 |
% |
| Income producing commercial real estate |
3,834,585 |
|
|
5,939 |
|
|
0.15 |
|
|
3,283,107 |
|
|
(343) |
|
|
(0.01) |
|
|
2,571,923 |
|
|
(229) |
|
|
(0.01) |
|
| Commercial & industrial |
2,483,931 |
|
|
21,059 |
|
|
0.85 |
|
|
2,271,279 |
|
|
6,460 |
|
|
0.28 |
|
|
2,242,764 |
|
|
(2,499) |
|
|
(0.11) |
|
| Commercial construction |
1,800,307 |
|
|
(157) |
|
|
(0.01) |
|
|
1,502,093 |
|
|
(584) |
|
|
(0.04) |
|
|
958,791 |
|
|
(747) |
|
|
(0.08) |
|
| Equipment financing |
1,503,826 |
|
|
20,162 |
|
|
1.34 |
|
|
1,217,993 |
|
|
3,953 |
|
|
0.32 |
|
|
971,355 |
|
|
3,105 |
|
|
0.32 |
|
| Residential mortgage |
2,900,916 |
|
|
(246) |
|
|
(0.01) |
|
|
2,007,843 |
|
|
(247) |
|
|
(0.01) |
|
|
1,462,421 |
|
|
(220) |
|
|
(0.02) |
|
Home equity |
935,596 |
|
|
(2,878) |
|
|
(0.31) |
|
|
802,674 |
|
|
(618) |
|
|
(0.08) |
|
|
675,873 |
|
|
(405) |
|
|
(0.06) |
|
| Residential construction |
436,513 |
|
|
936 |
|
|
0.21 |
|
|
394,413 |
|
|
(231) |
|
|
(0.06) |
|
|
301,591 |
|
|
(147) |
|
|
(0.05) |
|
| Manufactured housing |
337,712 |
|
|
3,859 |
|
|
1.14 |
|
|
285,556 |
|
|
765 |
|
|
0.27 |
|
|
— |
|
|
— |
|
|
— |
|
| Consumer |
176,543 |
|
|
3,066 |
|
|
1.74 |
|
|
144,188 |
|
|
2,260 |
|
|
1.57 |
|
|
142,005 |
|
|
864 |
|
|
0.61 |
|
|
$ |
17,576,424 |
|
|
$ |
52,243 |
|
|
0.30 |
|
|
$ |
14,571,746 |
|
|
$ |
9,654 |
|
|
0.07 |
|
|
$ |
11,485,876 |
|
|
$ |
38 |
|
|
— |
|
The increase in net charge-offs in 2023 was mostly attributable to higher equipment financing net charge-offs, mostly related to long haul trucking equipment loans, and one commercial relationship charge-off totaling $19.0 million. The commercial borrower, a wholesale oil distributor, was part of a $218 million nationally syndicated credit, in which United’s participation was 8.7%. The borrower filed for Chapter 11 bankruptcy in March of 2023, at which time we placed the credit on nonaccrual status and included it in NPAs.
When the bankruptcy converted to a Chapter 7 liquidation in August of 2023, the loan was charged off in full with no significant recovery expected. In regards to the increase in equipment finance charge-offs, the long haul trucking equipment segment, which drove the increase, comprises a small portion of the equipment finance portfolio and is not deemed to be indicative of the current credit quality of the entire equipment financing portfolio.
Nonperforming Assets
The following table presents NPAs, which consist of nonaccrual loans and OREO and repossessed assets, for the periods indicated.
Table 13 - NPAs
As of December 31,
(in thousands)
|
|
|
|
|
|
|
|
|
|
|
|
|
|
|
|
|
|
|
|
|
|
|
|
|
|
2023 |
|
2022 |
|
2021 |
|
|
Nonaccrual loans held for investment |
$ |
91,687 |
|
|
$ |
44,232 |
|
|
$ |
32,812 |
|
|
|
|
|
|
|
|
|
|
|
OREO and repossessed assets |
1,190 |
|
|
49 |
|
|
43 |
|
|
|
Total NPAs |
$ |
92,877 |
|
|
$ |
44,281 |
|
|
$ |
32,855 |
|
|
|
|
|
|
|
|
|
|
|
Nonaccrual loans to total loans |
0.50 |
% |
|
0.29 |
% |
|
0.28 |
% |
|
|
NPAs to total assets |
0.34 |
|
|
0.18 |
|
|
0.16 |
|
|
|
|
|
|
|
|
|
|
|
ACL - loans to nonaccrual loans coverage ratio |
2.27 |
|
3.60 |
|
3.12 |
|
The increase in nonaccrual loans since December 31, 2022 is primarily driven by a small population of large commercial loans that moved to nonaccrual status, which contributed $45.8 million of the increase. Additionally, the balance at December 31, 2023 included $13.2 million and $8.08 million, respectively, of manufactured housing and equipment financing loans that moved to nonaccrual status during 2023. These additions were partially offset by reductions in nonaccrual loans resulting from repayments, payoffs, and charge-offs as well as loans returning to accrual status.
Investment Securities
The composition of our investment securities portfolio reflects our investment strategy of maintaining an appropriate level of liquidity while providing a relatively stable source of revenue. The investment securities portfolio also provides a balance to interest rate risk in other categories of the balance sheet, while providing a vehicle for the investment of available funds, furnishing liquidity, and supplying securities to pledge as required collateral for certain deposits and borrowings. The following table presents a summary of our investment securities portfolio as of the dates indicated.
Table 14 - Investment Securities
As of December 31,
(in thousands)
|
|
|
|
|
|
|
|
|
|
|
|
|
|
|
|
|
|
|
|
|
|
|
|
|
|
|
|
|
|
|
|
|
|
|
|
|
|
2023 |
|
2022 |
|
|
|
|
|
Carrying Value |
|
% of portfolio |
|
Carrying Value |
|
% of portfolio |
|
2023 - 2022
$ Change
|
|
|
AFS |
$ |
3,331,084 |
|
|
57 |
% |
|
$ |
3,614,333 |
|
|
58 |
% |
|
$ |
(283,249) |
|
|
|
HTM |
2,490,848 |
|
|
43 |
|
|
2,613,648 |
|
|
42 |
|
|
(122,800) |
|
|
|
Total investment securities |
$ |
5,821,932 |
|
|
|
|
$ |
6,227,981 |
|
|
|
|
$ |
(406,049) |
|
|
|
|
|
|
|
|
|
|
|
|
|
|
|
Investment securities as a % of total assets |
21 |
% |
|
|
|
26 |
% |
|
|
|
|
|
|
Weighted average life |
6.2 years |
|
|
|
6.7 years |
|
|
|
|
|
|
Effective duration (1) |
4.0 |
% |
|
|
|
4.7 |
% |
|
|
|
|
|
(1) Effective duration is presented net of the AFS fair value hedge entered into during 2023. The effective duration excluding the AFS fair value hedge was 4.4% as of December 31, 2023.
During the fourth quarter of 2023, we sold $316 million in AFS securities for a loss of $51.7 million with the strategic rationale of reducing long duration securities with lower yields and replacing them with higher yielding shorter duration securities to mitigate interest rate risk in the current rising rate environment. Securities sold yielded 1.46% with a 5.1% effective duration. Proceeds from the sales were reinvested in AFS securities yielding 5.36% with a 1.5% effective duration.
During the second quarter of 2023, we entered into a fair value hedge on a portion of our AFS securities portfolio in order to mitigate the impact of any potential future unrealized losses on our tangible common equity. The notional value of the securities hedged totaled $656 million as of December 31, 2023. Gains and losses related to the hedge and hedged item are reflected in investment securities interest income. During 2023, the change in the fair value of the hedge and the hedged item substantially offset each other. See Note 8 to the consolidated financial statements for further detail.
During 2022, we transferred AFS debt securities to HTM with a fair value on the transfer date of $1.29 billion, which included unrealized losses recorded in AOCI totaling $87.4 million. Transfer date unrealized losses are amortized and reclassified out of AOCI as a yield adjustment, which is offset by discount accretion of the transferred HTM securities. Amortization of transfer date unrealized losses and discount accretion are recognized over the remaining life of the securities.
At December 31, 2023, HTM debt securities had a fair value of $2.10 billion, indicating net unrealized losses of $395 million. Additional unrealized losses on HTM debt securities of $68.2 million (pre-tax) were included in AOCI as a result of the transfer of AFS debt securities to HTM in 2022. Unrealized losses were primarily attributable to changes in interest rates.
Table 15 - Investment Securities Portfolio Composition
As of December 31, 2023
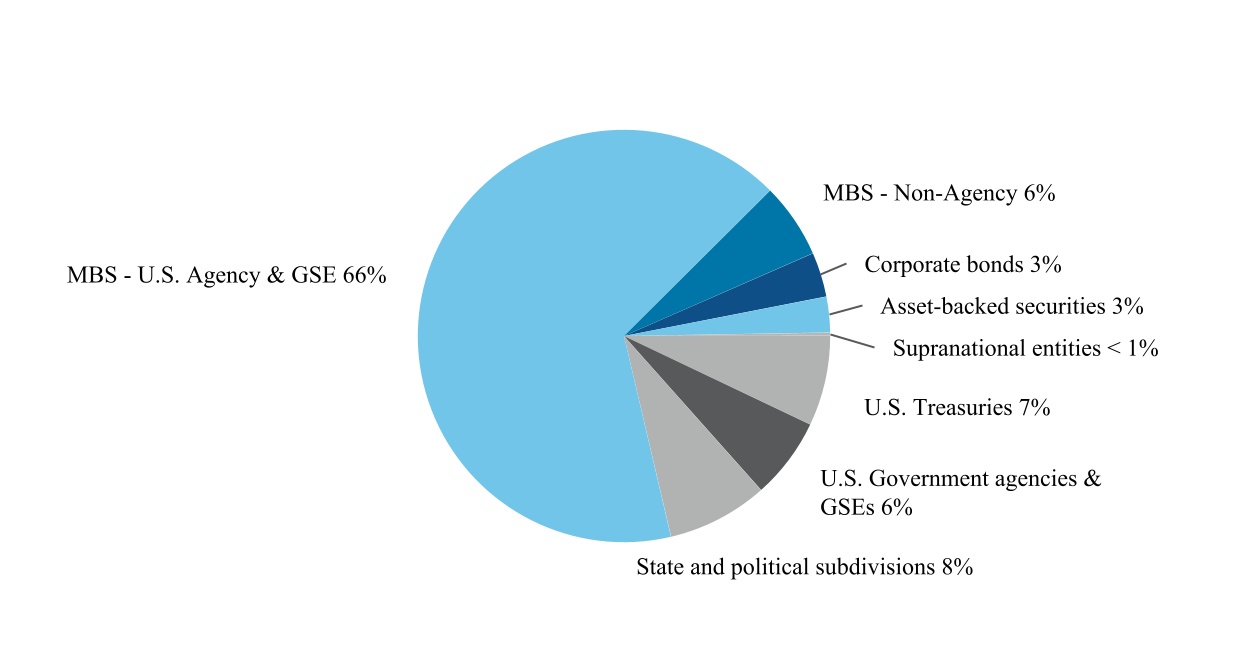
Mortgage-backed securities, which include both U.S. government sponsored agency and non-agency securities, make up the largest portion of our investment securities portfolio. These securities rely on the underlying pools of mortgage loans to provide a cash flow of principal and interest. The actual maturities of these securities will differ from the contractual maturities because the loans underlying the securities can prepay. Decreases in interest rates will generally cause an acceleration of prepayment levels. In a declining or prolonged low interest rate environment, we may not be able to reinvest the proceeds from these prepayments in assets that have comparable yields. In a rising rate environment, the opposite may occur. Prepayments tend to slow and the weighted average life extends. This is referred to as extension risk, which can lead to lower levels of liquidity due to the delay of cash receipts, and can result in the holding of a below market yielding asset for a longer period of time.
As shown in the chart above, 79% of our investment securities portfolio is comprised of U.S. government, U.S. government agency and GSE securities. In addition, as of December 31, 2023, our state and political subdivision securities were all high quality investment grade. As a reflection of the high credit quality of the portfolio, at December 31, 2023 and 2022, no ACL for HTM or AFS debt securities was recorded. See Note 5 to the consolidated financial statements for further discussion of the investment portfolio and related fair value information.
The following table presents the amortized cost of securities by contractual maturity of investment securities and weighted-average yields on a FTE basis. Weighted-average yield for each maturity range includes coupon interest, discount accretion and premium amortization and has been calculated using the amortized cost of each security in that range. The composition and maturity / repricing distribution of the securities portfolio is subject to change depending on rate sensitivity, capital and liquidity needs. Expected maturities may differ from contractual maturities because issuers and borrowers may have the right to call or prepay obligations.
Table 16 - Contractual Maturity and Weighted-Average Yield of AFS and HTM Debt Securities
As of December 31, 2023
(in thousands)
|
|
|
|
|
|
|
|
|
|
|
|
|
|
|
|
|
|
|
|
|
|
|
|
|
|
|
|
|
|
|
|
|
|
|
|
|
|
|
|
|
|
|
|
|
|
|
|
|
|
|
|
|
|
|
|
|
|
|
|
| |
Maturity By Years |
|
|
| |
1 or Less |
|
1 to 5 |
|
6 to 10 |
|
Over 10 |
|
Total |
|
Amortized Cost |
|
WA Yield |
|
Amortized Cost |
|
WA Yield |
|
Amortized Cost |
|
WA Yield |
|
Amortized Cost |
|
WA Yield |
|
Amortized Cost |
|
WA Yield |
| AFS |
|
|
|
|
|
|
|
|
|
|
|
|
|
|
|
|
|
|
|
| U.S. Treasuries |
$ |
182,660 |
|
5.38 |
% |
|
$ |
215,361 |
|
2.38 |
% |
|
$ |
— |
|
— |
% |
|
$ |
— |
|
— |
% |
|
$ |
398,021 |
|
3.76 |
% |
| U.S. Government agencies & GSEs |
283 |
|
1.23 |
|
|
39,362 |
|
1.79 |
|
|
90,259 |
|
3.72 |
|
|
151,804 |
|
5.71 |
|
|
281,708 |
|
4.52 |
|
| State and political subdivisions |
3,159 |
|
2.05 |
|
|
27,827 |
|
2.27 |
|
|
51,941 |
|
1.56 |
|
|
99,619 |
|
1.61 |
|
|
182,546 |
|
1.70 |
|
| Residential MBS, Agency & GSE |
2 |
|
1.86 |
|
|
4,738 |
|
2.45 |
|
|
19,481 |
|
2.45 |
|
|
1,290,843 |
|
3.24 |
|
|
1,315,064 |
|
3.22 |
|
| Residential MBS, Non-agency |
— |
|
— |
|
|
— |
|
— |
|
|
— |
|
— |
|
|
339,330 |
|
4.62 |
|
|
339,330 |
|
4.62 |
|
| Commercial MBS, Agency & GSE |
3,007 |
|
2.14 |
|
|
300,022 |
|
3.73 |
|
|
121,114 |
|
2.14 |
|
|
231,861 |
|
3.21 |
|
|
656,004 |
|
3.25 |
|
| Commercial MBS, Non-agency |
12,663 |
|
9.07 |
|
|
— |
|
— |
|
|
— |
|
— |
|
|
11,606 |
|
4.22 |
|
|
24,269 |
|
6.75 |
|
| Corporate bonds |
10,379 |
|
1.08 |
|
|
161,480 |
|
1.63 |
|
|
45,618 |
|
3.10 |
|
|
808 |
|
7.95 |
|
|
218,285 |
|
1.93 |
|
| Asset-backed securities |
243 |
|
0.37 |
|
|
35,566 |
|
0.38 |
|
|
7,798 |
|
6.32 |
|
|
121,121 |
|
6.42 |
|
|
164,728 |
|
5.10 |
|
| Total AFS securities |
$ |
212,396 |
|
5.28 |
|
|
$ |
784,356 |
|
2.62 |
|
|
$ |
336,211 |
|
2.72 |
|
|
$ |
2,246,992 |
|
3.72 |
|
|
$ |
3,579,955 |
|
3.48 |
|
|
|
|
|
|
|
|
|
|
|
|
|
|
|
|
|
|
|
|
|
|
|
|
|
|
|
|
|
|
|
|
|
|
|
|
|
|
|
|
|
|
|
|
|
|
|
|
|
|
|
|
|
|
|
|
|
|
|
|
|
| HTM |
|
|
|
|
|
|
|
|
|
|
|
|
|
|
|
|
|
|
|
| U.S. Treasuries |
$ |
— |
|
— |
% |
|
$ |
19,864 |
|
1.41 |
% |
|
$ |
— |
|
— |
% |
|
$ |
— |
|
— |
% |
|
$ |
19,864 |
|
1.41 |
% |
| U.S. Government agencies & GSEs |
— |
|
— |
|
|
— |
|
— |
|
|
72,632 |
|
1.52 |
|
|
26,420 |
|
2.63 |
|
|
99,052 |
|
1.82 |
|
| State and political subdivisions |
1,200 |
|
4.54 |
|
|
27,257 |
|
2.66 |
|
|
50,205 |
|
2.21 |
|
|
214,043 |
|
2.52 |
|
|
292,705 |
|
2.49 |
|
| Residential MBS, Agency & GSE |
42 |
|
3.35 |
|
|
1,338 |
|
3.60 |
|
|
19,929 |
|
2.20 |
|
|
1,361,985 |
|
1.87 |
|
|
1,383,294 |
|
1.87 |
|
|
|
|
|
|
|
|
|
|
|
|
|
|
|
|
|
|
|
|
|
| Commercial MBS, Agency & GSE |
— |
|
— |
|
|
26,229 |
|
2.04 |
|
|
208,500 |
|
1.34 |
|
|
446,204 |
|
2.23 |
|
|
680,933 |
|
1.95 |
|
|
|
|
|
|
|
|
|
|
|
|
|
|
|
|
|
|
|
|
|
| Supranational entities |
— |
|
— |
|
|
— |
|
— |
|
|
15,000 |
|
1.70 |
|
|
— |
|
— |
|
|
15,000 |
|
1.70 |
|
| Total HTM securities |
$ |
1,242 |
|
4.50 |
|
|
$ |
74,688 |
|
2.12 |
|
|
$ |
366,266 |
|
1.56 |
|
|
$ |
2,048,652 |
|
2.02 |
|
|
$ |
2,490,848 |
|
1.96 |
|
|
|
|
|
|
|
|
|
|
|
|
|
|
|
|
|
|
|
|
|
|
|
|
|
|
|
|
|
|
|
|
|
|
|
|
|
|
|
|
|
|
|
|
|
|
|
|
|
|
|
|
|
|
|
|
|
|
|
|
|
|
|
|
|
|
|
|
|
|
|
|
|
|
|
|
|
|
|
|
|
|
|
|
|
|
|
|
|
|
|
|
|
|
|
|
|
|
|
|
|
|
|
|
|
|
|
|
|
|
|
|
|
|
|
|
|
|
|
|
|
|
|
|
|
|
|
|
|
|
|
|
|
|
|
|
|
|
|
|
|
|
|
|
|
|
|
|
|
|
|
|
|
|
|
|
|
|
|
|
|
|
|
|
|
|
|
|
|
|
|
|
|
|
|
|
|
|
|
|
|
|
|
|
|
|
|
|
|
|
|
|
|
|
|
|
|
|
|
|
|
|
|
|
|
|
|
|
|
|
|
|
|
|
|
|
|
|
|
|
|
|
|
|
|
|
|
|
|
|
|
|
|
|
|
|
|
|
|
|
|
|
|
|
|
|
|
|
|
|
|
|
|
|
|
|
|
|
|
|
|
|
|
|
|
|
|
|
|
|
|
|
|
|
|
|
|
|
|
|
|
|
|
|
|
|
|
|
|
|
|
|
|
|
|
|
|
|
|
|
|
|
|
|
|
|
|
|
|
|
|
|
|
|
|
|
|
|
|
|
|
Goodwill and Other Intangible Assets
Goodwill represents the premium paid for acquired companies above the net fair value of the assets acquired and liabilities assumed, including separately identifiable intangible assets. Management evaluates goodwill annually, or more frequently if necessary, to determine if any impairment exists. At December 31, 2023 and December 31, 2022, the net carrying amount of goodwill was $920 million and $751 million, respectively.
We also have core deposit and customer relationship intangible assets, representing the value of acquired deposit and customer relationships, respectively, which are amortizing intangible assets. Amortizing intangible assets are required to be tested for impairment only when events or circumstances indicate that impairment may exist.
In connection with the acquisition of Progress in the first quarter of 2023, we recorded goodwill and a core deposit intangible of $146 million and $40.0 million, respectively. In connection with the acquisition of First Miami in the third quarter of 2023, we recorded goodwill and a core deposit intangible of $23.2 million and $18.0 million, respectively. See Note 3 to the financial statements for further information about these acquisitions. Also during the third quarter of 2023, United reduced its core deposit intangible related to the Reliant acquisition by $656,000 as a result of the sale of two acquired branches and related deposits.
In 2022, in connection with the acquisition of Reliant, we recorded goodwill and a core deposit intangible of $299 million and $14.5 million, respectively.
Deposits
Customer deposits are the primary source of funding for our earning assets. In addition to organic growth, the increase in deposits since December 31, 2022 was primarily driven by the deposits assumed in the Progress and First Miami transactions, which had a balance of $1.33 billion and $865 million, respectively, as of their respective acquisition dates. As of December 31, 2023 we had approximately $9.24 billion in uninsured deposits, of which $3.10 billion was collateralized by investment securities. The following table sets forth the deposit composition for the periods indicated.
Table 17 - Deposits
As of December 31,
(in thousands)
|
|
|
|
|
|
|
|
|
|
|
|
|
|
|
|
|
|
|
|
|
|
|
|
|
|
|
|
|
|
|
|
2023 |
|
2022 |
|
|
|
Balance |
|
Customer Deposit Composition |
|
Balance |
|
Customer Deposit Composition |
|
|
Noninterest-bearing demand |
$ |
6,534,307 |
|
|
28 |
% |
|
$ |
7,643,081 |
|
|
39 |
% |
|
|
NOW and interest-bearing demand |
6,155,193 |
|
|
27 |
|
|
4,350,878 |
|
|
22 |
|
|
|
Money market and savings |
6,808,394 |
|
|
29 |
|
|
5,967,017 |
|
|
30 |
|
|
|
Time |
3,649,498 |
|
|
16 |
|
|
1,781,482 |
|
|
9 |
|
|
|
Total customer deposits |
23,147,392 |
|
|
100 |
% |
|
19,742,458 |
|
|
100 |
% |
|
|
Brokered deposits |
163,219 |
|
|
|
|
134,049 |
|
|
|
|
|
Total deposits |
$ |
23,310,611 |
|
|
|
|
$ |
19,876,507 |
|
|
|
|
The following table sets forth the scheduled maturities of time deposits greater than $250,000.
Table 18 - Maturities of Time Deposits Greater than $250,000
As of December 31, 2023
(in thousands)
|
|
|
|
|
|
|
|
|
|
|
|
|
|
|
|
|
Three months or less |
$ |
382,802 |
|
|
|
Over three through six months |
308,274 |
|
|
|
Over six months through twelve months |
412,776 |
|
|
|
Over one year |
47,886 |
|
|
|
Total |
$ |
1,151,738 |
|
|
|
|
|
|
|
|
|
|
|
|
|
|
|
|
|
|
|
|
|
|
|
|
|
|
Liquidity Management
Liquidity is defined as the ability to convert assets into cash or cash equivalents without significant loss and to raise additional funds by increasing liabilities. Liquidity management involves maintaining the ability to meet the daily cash flow requirements of customers, both depositors and borrowers. The primary objective is to ensure that sufficient funding is available, at a reasonable cost, to meet ongoing operational cash needs and to take advantage of revenue producing opportunities as they arise. While the desired level of liquidity will vary depending upon a variety of factors, our primary goal is to maintain a sufficient level of liquidity in all expected economic environments. To assist in determining the adequacy of our liquidity, we perform a variety of liquidity stress tests. We maintain an unencumbered liquid asset reserve to help ensure our ability to meet our obligations under normal conditions for at least a 12-month period and under severely adverse liquidity conditions for a minimum of 30 days.
An important part of the Bank’s liquidity resides in the asset portion of the balance sheet, which provides liquidity primarily through loan interest and principal repayments and the maturities and sales of securities, as well as the ability to use these assets as collateral for borrowings on a secured basis.
The Bank’s main source of liquidity is customer interest-bearing and noninterest-bearing deposit accounts, which we are able to attract by competing more aggressively on pricing. Liquidity is also available from wholesale funding sources consisting primarily of Federal funds purchased, securities sold under agreements to repurchase, FHLB advances and brokered deposits. These sources of liquidity are generally short-term in nature and are used as necessary to fund asset growth and meet other short-term liquidity needs. In response to bank failures in early 2023, we have focused on maximizing the amount of securities and loans available as collateral for contingent liquidity sources as well as reevaluated the assumptions in our liquidity stress test. At December 31, 2023, we had sufficient qualifying collateral to support additional borrowings, which is detailed in the table below.
|
|
|
|
|
|
|
|
|
|
|
|
| Table 19 - Borrowing Capacity |
|
|
As of December 31, 2023 |
|
|
|
| (in thousands) |
|
|
|
|
|
|
|
|
FHLB |
$ |
1,843,827 |
|
|
|
Federal Reserve |
|
|
|
Discount Window |
2,698,507 |
|
|
|
Bank Term Funding Program (1) |
1,265,066 |
|
|
|
Total borrowing capacity |
$ |
5,807,400 |
|
|
|
|
|
|
|
Unpledged securities available as collateral for additional borrowings |
$ |
1,706,264 |
|
|
(1) The Bank Term Funding Program expires March 11, 2024.
Since the second half of 2022 there has been strong competition for deposits in the banking industry as the rising interest rate environment has provided customers with alternatives for achieving higher returns on cash outside of the banking system. As a result, during the second half of 2022, we experienced some deposit attrition, which was not unique to us but was part of an industry-wide trend. In response to this deposit balance attrition, we suspended investment securities purchases and allowed cash flows from maturing securities to meet a portion of our funding needs. We also temporarily used short-term borrowings to supplement our near-term funding requirements. In 2023, we raised deposit pricing in an effort to stem deposit attrition and attract deposits back to the Bank. These efforts were successful and we were able to suspend our use of short-term borrowings. At the end of 2023, we had no outstanding short-term borrowings and the balance of cash and cash equivalents was $1.00 billion. In addition to on-balance sheet liquidity, we have significant sources of liquidity through secured borrowings and other unsecured funding sources as noted above.
In addition, because the Holding Company is a separate entity and apart from the Bank, it must provide for its own liquidity. The Holding Company is responsible for the payment of dividends declared for its common and preferred shareholders, and interest and principal on any outstanding debt or trust preferred securities. The Holding Company currently has internal capital resources to meet these obligations. While the Holding Company has access to the capital markets, the ultimate sources of its liquidity are subsidiary service fees and dividends from the Bank, which are limited by applicable law and regulations. In 2023 and 2022, the Bank paid dividends of $198 million and $133 million, respectively, to the Holding Company. Holding Company liquidity is managed to a minimum of 15-months of positive cash flow after considering all of its liquidity needs over this period.
Significant uses and sources of cash during the year ended December 31, 2023 are summarized below. See the consolidated statement of cash flows in this Report for further detail.
•Net cash provided by operating activities of $294 million reflects net income of $188 million adjusted for non-cash transactions, gains and losses on sales of other loans and securities and changes in other assets and liabilities. Significant non-cash transactions for the period included provision for credit losses of $89.4 million and depreciation, amortization and accretion of $45.0 million.
•Net cash used in investing activities of $163 million consisted primarily of $857 million of purchases of AFS debt securities and a $997 million net increase in loans, offset by $1.66 billion proceeds from securities sales, maturities and calls and $208 million in net cash received from acquisitions.
•Net cash provided by financing activities of $226 million consisted primarily of a net increase in deposits of $1.34 billion, partially offset by net repayments of FHLB advances and other short-term borrowings of $993 million and $112 million in common and preferred stock dividends.
In the opinion of management, our liquidity position at December 31, 2023 was sufficient to meet our expected cash requirements.
Contractual Obligations and Other Commitments
The following discussion provides an overview of our significant contractual obligations and other commitments.
Long-term Debt
At December 31, 2023 and 2022, we had long-term debt outstanding of $325 million, which included senior debentures, subordinated debentures, and trust preferred securities. The following table provides long-term debt outstanding by maturity in five year increments. During 2022, as part of the Reliant acquisition, we assumed subordinated debt and trust preferred securities with an acquisition date fair value totaling $76.7 million.
Additional information regarding debt instruments is provided in Note 13 to the consolidated financial statements.
Table 20 - Long-term Debt by Maturity Category
As of December 31, 2023
(in thousands)
|
|
|
|
|
|
|
|
|
|
|
|
|
|
|
|
|
|
|
|
|
|
Next 5 years |
$ |
135,000 |
|
|
|
6 - 10 years |
163,093 |
|
|
|
11 - 15 years |
31,239 |
|
|
|
|
329,332 |
|
|
|
Less discount |
(4,509) |
|
|
|
Total long-term debt |
$ |
324,823 |
|
|
Operating Lease Obligations
We are party to operating lease agreements for many of our branch locations, ATMs, loan production offices and operation centers. For qualifying leases with a term exceeding one year, we record a lease liability and ROU asset on our balance sheet. As of December 31, 2023, the lease liability and ROU asset totaled $44.1 million and $42.8 million, respectively, compared to $41.7 million and $40.0 million, respectively, at December 31, 2022. During 2023, we obtained $18.0 million in ROU assets in exchange for operating lease liabilities of approximately the same amount, $10.4 million of which were acquired in the First Miami and Progress transactions. Leases assumed were for retail branch locations and office spaces.
As of December 31, 2023, the remaining terms of our leases ranged from a few months to 10 years. Certain of our leases contain options to renew the lease at the end of the current term. Unless we have determined we are reasonably likely to renew the lease, these options have been excluded from the calculation of our lease liability and ROU asset. Additional information regarding operating leases is provided in Note 14 to the consolidated financial statements.
Off-Balance Sheet Arrangements
We are a party to financial instruments with off-balance sheet risk in the normal course of business to meet the financing needs of customers. These financial instruments included commitments to extend credit and letters of credit, which totaled $4.37 billion at December 31, 2023.
A commitment to extend credit is an agreement to lend to a customer as long as there is no violation of any condition established in the contract. Commitments generally have fixed expiration dates or other termination clauses and may require payment of a fee. Letters of credit and financial guarantees are conditional commitments issued to guarantee a customer’s performance to a third party and have essentially the same credit risk as extending loan facilities to customers. Those commitments are primarily issued to local businesses.
The exposure to credit loss in the event of nonperformance by the other party to the commitments to extend credit, letters of credit and financial guarantees is represented by the contractual amount of these instruments. We use the same credit underwriting procedures for making commitments, letters of credit and financial guarantees as we use for underwriting on-balance sheet instruments. Management evaluates each customer’s creditworthiness on a case-by-case basis and the amount of the collateral, if deemed necessary, is based on the credit evaluation. Collateral held varies, but may include unimproved and improved real estate, certificates of deposit, personal property or other acceptable collateral.
All of these instruments involve, to varying degrees, elements of credit risk in excess of the amount recognized in the balance sheet. The total amount of these instruments does not necessarily represent future cash requirements because a significant portion of these instruments expire without being used. We believe that we have adequate sources of liquidity to fund commitments that are drawn upon by borrowers.
In addition, we hold investments in certain limited partnerships for tax credit and CRA purposes. As of December 31, 2023, for certain of these investments, we had committed to fund an additional $11.3 million related to future capital calls that has not been reflected in the consolidated balance sheet. As of December 31, 2023, we also had $13.7 million in commitments for future capital calls to fintech fund limited partnerships that have not been reflected in the consolidated balance sheet.
We are not involved in off-balance sheet contractual relationships, other than those disclosed in this Report, that could result in liquidity needs or other commitments, or that could significantly affect earnings. See Note 23 to the consolidated financial statements for additional information on off-balance sheet arrangements.
Capital Resources and Dividends
The maintenance and management of capital levels is one of management’s significant priorities. Shareholders’ equity at December 31, 2023 was $3.26 billion, an increase of $561 million from December 31, 2022. The increase was primarily a result of net income of $188 million, the issuance of $394 million of common stock in connection with the Progress and First Miami acquisitions and other comprehensive income of $90.3 million mostly driven by unrealized holding gains on AFS debt securities. These increases were partially offset by dividends on common and preferred stock of $116 million.
Under the risk-based capital guidelines of Basel III, assets and credit equivalent amounts of derivatives and off-balance sheet items are assigned to one of several broad risk categories according to the obligor, or, if relevant, the guarantor or the nature of the collateral. The aggregate dollar amount in each risk category is then multiplied by the risk weight associated with the category. The resulting weighted values from each of the risk categories are added together, and generally this sum is our total RWAs. RWAs for purposes of our capital ratios are calculated under these guidelines.
CET1 capital consists of common shareholders’ equity, excluding AOCI, intangible assets (goodwill, deposit-based intangibles and certain other intangibles, including certain servicing assets), net of associated deferred tax liabilities, and disallowed deferred tax assets. Tier 1 capital consists of CET1 plus non-cumulative perpetual preferred stock. Tier 2 capital includes the allowable portion of the ACL up to 1.25% of RWA as well as qualifying subordinated debt and trust preferred securities. Tier 1 capital plus Tier 2 capital is referred to as Total risk-based capital.
We have outstanding junior subordinated debentures related to trust preferred securities totaling $34.3 million at December 31, 2023, of which $33.0 million (excluding common securities) qualified as Tier 2 capital. Further information on trust preferred securities is provided in Note 13 to the consolidated financial statements.
The following table outlines the minimum ratios required for capital adequacy purposes, as well as the thresholds for a categorization of “well-capitalized”.
Table 21 - Capital Ratios
As of December 31,
|
|
|
|
|
|
|
|
|
|
|
|
|
|
|
|
|
|
|
|
|
|
|
|
|
|
|
|
|
|
|
|
|
|
|
|
|
|
|
|
|
|
|
|
|
|
|
|
|
United Community Banks, Inc. (consolidated) |
|
United Community Bank |
|
Minimum Capital |
|
Well-Capitalized |
|
Minimum Capital Plus Capital Conservation Buffer |
|
2023 |
|
2022 |
|
2023 |
|
2022 |
| Risk-based ratios: |
|
|
|
|
|
|
|
|
|
|
|
|
|
| CET1 capital |
4.5 |
% |
|
6.5 |
% |
|
7.0 |
% |
|
12.16 |
% |
|
12.26 |
% |
|
12.22 |
% |
|
12.83 |
% |
| Tier 1 capital |
6.0 |
|
|
8.0 |
|
|
8.5 |
|
|
12.60 |
|
|
12.81 |
|
|
12.22 |
|
|
12.83 |
|
| Total capital |
8.0 |
|
|
10.0 |
|
|
10.5 |
|
|
14.49 |
|
|
14.79 |
|
|
13.23 |
|
|
13.70 |
|
| Leverage ratio |
4.0 |
|
|
5.0 |
|
|
N/A |
|
9.47 |
|
|
9.69 |
|
|
9.17 |
|
|
9.69 |
|
Additional information related to capital ratios, as calculated under regulatory guidelines, is provided in Note 22 to the consolidated financial statements. As of December 31, 2023 and 2022, both United and the Bank were characterized as “well-capitalized”.
Effect of Inflation and Changing Prices
A bank’s asset and liability structure is substantially different from that of an industrial firm, because primarily all assets and liabilities of a bank are monetary in nature, with relatively little investment in fixed assets or inventories. Inflation has an important effect on the growth of total assets and the resulting need to increase equity capital at higher than nominal rates in order to maintain an appropriate equity to assets ratio.
Our management believes the effect of inflation on financial results depends on our ability to react to changes in interest rates and, by such reaction, reduce the inflationary effect on performance. We have an asset/liability management program to monitor and manage our interest rate sensitivity position.
In addition, periodic reviews of banking services and products are conducted to adjust pricing in view of current and expected costs.
ITEM 7A. QUANTITATIVE AND QUALITATIVE DISCLOSURES ABOUT MARKET RISK
Interest Rate Sensitivity Management
Interest rate sensitivity is a function of the repricing characteristics of the portfolio of assets and liabilities. These repricing characteristics are the time frames within which the interest-earning assets and interest-bearing liabilities are subject to change in interest rates either at replacement, repricing or maturity. Interest rate sensitivity management focuses on the maturity structure of assets and liabilities and their repricing characteristics during periods of changes in market interest rates. Effective interest rate sensitivity management seeks to ensure that both assets and liabilities respond to changes in interest rates on a net basis within an acceptable timeframe, thereby minimizing the potentially adverse effect of interest rate changes on net interest revenue.
The absolute level and volatility of interest rates can have a significant effect on profitability. The objective of interest rate risk management is to identify and manage the sensitivity of net interest revenue to changing interest rates, consistent with our overall financial goals. Based on economic conditions, asset quality and various other considerations, management establishes tolerance ranges for interest rate sensitivity and manages within these ranges.
Net interest revenue and the fair value of financial instruments are influenced by changes in the level of interest rates. We limit our exposure to fluctuations in interest rates through policies established by our ALCO and approved by the Board. ALCO meets periodically and has responsibility for formulating and recommending asset/liability management policies to the Board, formulating and implementing strategies to improve balance sheet positioning and/or earnings, and reviewing interest rate sensitivity.
One of the tools management uses to estimate and manage the sensitivity of net interest revenue to changes in interest rates is an asset/liability simulation model. Resulting estimates are based upon several assumptions for each scenario, including loan and deposit re-pricing characteristics and the rate of prepayments. ALCO periodically reviews the assumptions for reasonableness based on historical data and future expectations; however, actual net interest revenue may differ from model results. The primary objective of the simulation model is to measure the potential change in net interest revenue over time using multiple interest rate scenarios. The base scenario assumes rates remain flat and is the scenario to which all others are compared in order to measure the change in net interest revenue. Policy limits are based on immediate rate shock scenarios, as well as gradually rising and falling rate scenarios, which are all compared to the base scenario. Other scenarios analyzed may include delayed rate shocks, yield curve steepening or flattening, or other variations in rate movements. While the primary policy scenarios focus on a 12-month time frame, longer time horizons are also modeled.
Our policy is based on the 12-month impact on net interest revenue of interest rate shocks and ramps that increase from 100 to 400 basis points or decrease 100 to 200 basis points from the base scenario. In the shock scenarios, rates immediately change the full amount at the scenario onset. In the ramp scenarios, rates change by 25 basis points per month. Our policy limits the projected change in net interest revenue over the first 12 months to an 8% decrease for each 100 basis point change in the increasing and decreasing rate ramp and shock scenarios. The following table presents our interest sensitivity position at the dates indicated.
Table 22 - Interest Sensitivity
|
|
|
|
|
|
|
|
|
|
|
|
|
|
|
|
|
|
|
|
|
|
|
|
|
|
|
|
|
|
|
|
|
|
|
|
Increase (Decrease) in Net Interest Revenue from Base Scenario at
December 31, |
|
|
|
|
2023 |
|
2022 |
|
|
Change in Rates |
|
Shock |
|
Ramp |
|
Shock |
|
Ramp |
|
|
200 basis point increase |
|
(0.88) |
% |
|
(1.70) |
% |
|
6.97 |
% |
|
4.33 |
% |
|
|
100 basis point increase |
|
(0.38) |
|
|
(0.88) |
|
|
3.53 |
|
|
2.85 |
|
|
|
100 basis point decrease |
|
(0.60) |
|
|
0.14 |
|
|
(3.78) |
|
|
(3.12) |
|
|
|
200 basis point decrease |
|
(2.89) |
|
|
0.10 |
|
|
(8.39) |
|
|
(5.07) |
|
|
The current environment is marked by the most rapid rate increases in decades, which, in part, has made non-bank products, such as U.S. Treasuries and money market funds, more attractive to our deposit customers. For this and other reasons such as the Federal Reserve’s quantitative tightening and the aftermath of COVID stimulus, the banking industry’s deposit base has been shrinking since the first half of 2022. This industry-wide outflow of deposits has increased price competition for bank deposits. As such, industry deposit betas, including ours, have been increasing at a faster pace relative to the last rising rate cycle. Deposit beta is a measure of the change in a bank’s average rate paid on deposits to the change in the federal funds rate.
Our cumulative total deposit beta for the current rising rate cycle increased to 42% in the fourth quarter of 2023. Our cumulative total deposit beta in the last upward rate cycle from November 2015 to July 2019 was 22%.
Our interest sensitivity model includes significant key assumptions which may change over time. Although our model generally assumes no change in deposit portfolio size or composition, we have included an assumption for the runoff of surge deposits since 2021. In the second quarter of 2023, in response to the rapid rate increases mentioned above, we increased the beta assumption in our model. As of December 31, 2023, the modeled total deposit beta, which is measured as the change in our overall deposit rate as a percentage of the change in the targeted Federal Funds rate in a rising rate environment, was 43%. A higher total deposit beta assumption generally indicates a less asset sensitive balance sheet and lowers the expected increase in net interest revenue in the increasing rate scenarios. At December 31, 2023, compared to December 31, 2022, our deposit composition was more heavily comprised of time deposits and other rate sensitive non-maturity deposits and we had less noninterest-bearing demand deposits, which reduced our asset sensitivity to a more neutral position. As a result, the impacts of optionality, such as prepayments and loan caps, were more visible in the rate increase scenarios.
ITEM 8. FINANCIAL STATEMENTS AND SUPPLEMENTARY DATA
The consolidated financial statements of the registrant and report of independent registered public accounting firm are included herein on the pages that follow.
MANAGEMENT’S REPORT ON INTERNAL CONTROL OVER FINANCIAL REPORTING
The management of United Community Banks, Inc. is responsible for establishing and maintaining adequate internal control over financial reporting. Internal control over financial reporting is defined in Rule 13a-15(f) promulgated under the Securities Exchange Act of 1934 as a process designed by, or under the supervision of, the company’s principal executive and principal financial officers and affected by the company’s board of directors, management and other personnel, to provide reasonable assurance regarding the reliability of financial reporting and the preparation of financial statements for external purposes in accordance with generally accepted accounting principles and includes those policies and procedures that:
•Pertain to the maintenance of records that in reasonable detail accurately and fairly reflect the transactions and dispositions of the assets of the company;
•Provide reasonable assurance that transactions are recorded as necessary to permit preparation of financial statements in accordance with accounting principles generally accepted in the United States of America, and that receipts and expenditures of the company are being made only in accordance with authorizations of management and directors of the company; and
•Provide reasonable assurance regarding prevention or timely detection of unauthorized acquisition, use or disposition of the company’s assets that could have a material effect on the financial statements.
Because of its inherent limitations, internal control over financial reporting may not prevent or detect misstatements. Also, projections of any evaluation of effectiveness to future periods are subject to the risk that controls may become inadequate because of changes in conditions, or that the degree of compliance with the policies or procedures may deteriorate.
Management has assessed the effectiveness of the internal control over financial reporting as of December 31, 2023. In making this assessment, we used the criteria established in Internal Control – Integrated Framework (2013) issued by the Committee of Sponsoring Organizations of the Treadway Commission (COSO). Management also conducted an assessment of requirements pertaining to Section 112 of the Federal Deposit Insurance Corporation Improvement Act. This section relates to management’s evaluation of internal control over financial reporting, including controls over the preparation of financial statements in accordance with the instructions to the Consolidated Financial Statements for Bank Holding Companies (Form FR Y-9C) and in compliance with laws and regulations. Our evaluation included a review of the documentation of controls, evaluations of the design of the internal control system and tests of the effectiveness of internal controls.
Based on our assessment, management concluded that as of December 31, 2023, United Community Banks, Inc.’s internal control over financial reporting is effective based on those criteria.
The effectiveness of the Company’s internal control over financial reporting as of December 31, 2023 has been audited by PricewaterhouseCoopers LLP, an independent registered public accounting firm, as stated in their report which appears herein.
|
|
|
|
|
|
|
|
|
|
|
|
|
|
|
|
/s/ H. Lynn Harton |
|
/s/ Jefferson L. Harralson |
|
|
H. Lynn Harton |
|
Jefferson L. Harralson |
|
|
President and Chief Executive Officer |
|
Executive Vice President and |
|
|
|
|
Chief Financial Officer |
|
Report of Independent Registered Public Accounting Firm
To the Board of Directors and Shareholders of United Community Banks, Inc.
Opinions on the Financial Statements and Internal Control over Financial Reporting
We have audited the accompanying consolidated balance sheets of United Community Banks, Inc. and its subsidiaries (the “Company”) as of December 31, 2023 and 2022, and the related consolidated statements of income, of comprehensive income (loss), of changes in shareholders' equity and of cash flows for each of the three years in the period ended December 31, 2023, including the related notes (collectively referred to as the “consolidated financial statements”). We also have audited the Company's internal control over financial reporting as of December 31, 2023, based on criteria established in Internal Control - Integrated Framework (2013) issued by the Committee of Sponsoring Organizations of the Treadway Commission (COSO).
In our opinion, the consolidated financial statements referred to above present fairly, in all material respects, the financial position of the Company as of December 31, 2023 and 2022, and the results of its operations and its cash flows for each of the three years in the period ended December 31, 2023 in conformity with accounting principles generally accepted in the United States of America. Also in our opinion, the Company maintained, in all material respects, effective internal control over financial reporting as of December 31, 2023, based on criteria established in Internal Control - Integrated Framework (2013) issued by the COSO.
Basis for Opinions
The Company's management is responsible for these consolidated financial statements, for maintaining effective internal control over financial reporting, and for its assessment of the effectiveness of internal control over financial reporting, included in Management’s Report on Internal Control Over Financial Reporting appearing under Item 9A. Our responsibility is to express opinions on the Company’s consolidated financial statements and on the Company's internal control over financial reporting based on our audits. We are a public accounting firm registered with the Public Company Accounting Oversight Board (United States) (PCAOB) and are required to be independent with respect to the Company in accordance with the U.S. federal securities laws and the applicable rules and regulations of the Securities and Exchange Commission and the PCAOB.
We conducted our audits in accordance with the standards of the PCAOB. Those standards require that we plan and perform the audits to obtain reasonable assurance about whether the consolidated financial statements are free of material misstatement, whether due to error or fraud, and whether effective internal control over financial reporting was maintained in all material respects.
Our audits of the consolidated financial statements included performing procedures to assess the risks of material misstatement of the consolidated financial statements, whether due to error or fraud, and performing procedures that respond to those risks. Such procedures included examining, on a test basis, evidence regarding the amounts and disclosures in the consolidated financial statements. Our audits also included evaluating the accounting principles used and significant estimates made by management, as well as evaluating the overall presentation of the consolidated financial statements. Our audit of internal control over financial reporting included obtaining an understanding of internal control over financial reporting, assessing the risk that a material weakness exists, and testing and evaluating the design and operating effectiveness of internal control based on the assessed risk. Our audits also included performing such other procedures as we considered necessary in the circumstances. We believe that our audits provide a reasonable basis for our opinions.
Definition and Limitations of Internal Control over Financial Reporting
A company’s internal control over financial reporting is a process designed to provide reasonable assurance regarding the reliability of financial reporting and the preparation of financial statements for external purposes in accordance with generally accepted accounting principles. Management's assessment and our audit of United Community Banks, Inc.’s internal control over financial reporting also included controls over the preparation of financial statements in accordance with the instructions to the Consolidated Financial Statements for Bank Holding Companies (Form FR Y-9C) to comply with the reporting requirements of Section 112 of the Federal Deposit Insurance Corporation Improvement Act (FDICIA). A company’s internal control over financial reporting includes those policies and procedures that (i) pertain to the maintenance of records that, in reasonable detail, accurately and fairly reflect the transactions and dispositions of the assets of the company; (ii) provide reasonable assurance that transactions are recorded as necessary to permit preparation of financial statements in accordance with generally accepted accounting principles, and that receipts and expenditures of the company are being made only in accordance with authorizations of management and directors of the company; and (iii) provide reasonable assurance regarding prevention or timely detection of unauthorized acquisition, use, or disposition of the company’s assets that could have a material effect on the financial statements.
Because of its inherent limitations, internal control over financial reporting may not prevent or detect misstatements. Also, projections of any evaluation of effectiveness to future periods are subject to the risk that controls may become inadequate because of changes in conditions, or that the degree of compliance with the policies or procedures may deteriorate.
Critical Audit Matters
The critical audit matters communicated below are matters arising from the current period audit of the consolidated financial statements that were communicated or required to be communicated to the audit committee and that (i) relate to accounts or disclosures that are material to the consolidated financial statements and (ii) involved our especially challenging, subjective, or complex judgments. The communication of critical audit matters does not alter in any way our opinion on the consolidated financial statements, taken as a whole, and we are not, by communicating the critical audit matters below, providing separate opinions on the critical audit matters or on the accounts or disclosures to which they relate.
Allowance for Credit Losses – Model Overlays for Certain Portfolio Segments and Qualitative Adjustments for Certain Portfolio Segments
As described in Notes 1 and 6 to the consolidated financial statements, the allowance for credit losses – loans and leases (collectively referred to as “ACL”) of $208 million as of December 31, 2023 represents management’s estimate of expected credit losses for the remaining estimated life of loans and leases, a portion of which relates to model overlays and qualitative adjustments. Management determined the ACL using relevant available information from internal and external sources relating to past events, current conditions, and reasonable and supportable forecasts. Expected credit losses were estimated using a regression model for each segment based on historical data from peer banks combined with a third party vendor’s baseline economic forecast to predict the change in credit losses. These estimates were then combined with a starting value that was based on the Company’s recent charge-off experience to produce an expected default rate, with the results subject to a floor. For the majority of loans and leases, the ACL is calculated using a discounted cash flow methodology applied at a loan level, with loss rates, prepayment assumptions and curtailment assumptions driven by each loan’s collateral type. As of December 31, 2023, management applied a model overlay to adjust the expected default rate for the commercial construction, income producing commercial real estate, multifamily loans (which are included in income producing commercial real estate), and commercial & industrial loans portfolio segments (“model overlays for certain portfolio segments”). Management also applied qualitative adjustments to the model output for the residential mortgage, income producing commercial real estate, and equipment financing loan portfolio segments (“qualitative adjustments for certain portfolio segments”).
The principal considerations for our determination that performing procedures relating to the model overlays for certain portfolio segments and qualitative adjustments for certain portfolio segments is a critical audit matter are (i) the significant judgment by management when developing the estimate of expected credit losses; (ii) a high degree of auditor judgment, subjectivity and effort in performing procedures and evaluating audit evidence related to (a) the model overlays for certain portfolio segments and (b) the qualitative adjustments for certain portfolio segments; and (iii) the audit effort involved the use of professionals with specialized skill and knowledge.
Addressing the matter involved performing procedures and evaluating audit evidence in connection with forming our overall opinion on the consolidated financial statements. These procedures included testing the effectiveness of controls relating to the Company’s ACL estimation process, including controls over the model overlays for certain portfolio segments and qualitative adjustments for certain portfolio segments. These procedures also included, among others, (i) testing management’s process for developing the estimate of expected credit losses; (ii) evaluating the appropriateness of management’s methodology; (iii) testing the completeness and accuracy of the data used by management; and (iv) evaluating the reasonableness of model overlays and qualitative adjustments for certain portfolio segments. Professionals with specialized skill and knowledge were used to assist in evaluating (i) the appropriateness of management’s methodology; and (ii) the reasonableness of the model overlays and qualitative adjustments for certain portfolio segments.
Initial Valuations of Acquired Loans – Progress Bank and First Miami Bank
As described in Notes 1 and 3 to the consolidated financial statements, during 2023 the Company completed the acquisitions of Progress Bank and First Miami Bank. The acquisitions included fair value of acquired loans balances of $1.443 billion and $577 million for Progress Bank and First Miami Bank, respectively. Purchased loans are measured and recorded at fair value on the date of acquisition. Fair values for acquired loans are generally based on a discounted cash flow methodology that considers credit loss expectations, market interest rates, and other market factors such as liquidity from the perspective of a market participant. The probability of default, loss given default and prepayment assumptions are the key factors driving credit losses which are embedded into the estimated cash flows. These assumptions are informed by internal data on loan characteristics, historical loss experience, and current and forecasted economic conditions. The interest and liquidity component of the estimate was determined by discounting interest and principal cash flows through the expected life of each loan. The discount rates used for loans are based on current market rates for new originations of comparable loans and include adjustments for liquidity.
The principal considerations for our determination that performing procedures relating to the initial valuations of loans acquired in the acquisitions of Progress Bank and First Miami Bank is a critical audit matter are (i) the significant judgment by management when developing the fair value estimate of the acquired loans; (ii) a high degree of auditor judgment, subjectivity and effort in performing procedures and evaluating audit evidence related to the discount rate, probability of default, loss given default and prepayment significant assumptions used by management; and (iii) the audit effort involved the use of professionals with specialized skill and knowledge.
Addressing the matter involved performing procedures and evaluating audit evidence in connection with forming our overall opinion on the consolidated financial statements. These procedures included testing the effectiveness of controls relating to management’s initial valuation of the acquired loans, including controls over the discount rate, probability of default, loss given default and prepayment significant assumptions used in the discounted cash flow methodology. These procedures also included, among others, (i) testing the completeness and accuracy of data provided by management and (ii) the involvement of professionals with specialized skill and knowledge to assist with evaluating the reasonableness of management’s estimate by (a) developing independent ranges of fair value for a sample of acquired loan portfolios and (b) comparing the independent ranges to management’s estimate. Developing the independent ranges of fair value involved independently developing the discount rate, probability of default, loss given default, and prepayment assumptions using contractual loan terms and external market data.
/s/ PricewaterhouseCoopers LLP
Atlanta, Georgia
February 23, 2024
We have served as the Company’s auditor since 2013.
UNITED COMMUNITY BANKS, INC. AND SUBSIDIARIES
Consolidated Balance Sheets
As of December 31, 2023 and 2022
(in thousands, except share data)
|
|
|
|
|
|
|
|
|
|
|
|
| |
2023 |
|
2022 |
| ASSETS |
|
|
|
| Cash and due from banks |
$ |
200,781 |
|
|
$ |
195,771 |
|
| Interest-bearing deposits in banks |
803,094 |
|
|
316,082 |
|
| Federal funds and other short-term investments |
— |
|
|
135,000 |
|
| Cash and cash equivalents |
1,003,875 |
|
|
646,853 |
|
| Debt securities available-for-sale |
3,331,084 |
|
|
3,614,333 |
|
Debt securities held-to-maturity (fair value $2,095,620 and $2,191,073, respectively) |
2,490,848 |
|
|
2,613,648 |
|
| Loans held for sale |
33,008 |
|
|
13,600 |
|
| Loans and leases held for investment |
18,318,755 |
|
|
15,334,627 |
|
| Less allowance for credit losses - loans and leases |
(208,071) |
|
|
(159,357) |
|
| Loans and leases, net |
18,110,684 |
|
|
15,175,270 |
|
| Premises and equipment, net |
378,421 |
|
|
298,456 |
|
| Bank owned life insurance |
345,371 |
|
|
299,297 |
|
| Accrued interest receivable |
87,782 |
|
|
72,807 |
|
| Net deferred tax asset |
113,214 |
|
|
129,313 |
|
| Derivative financial instruments |
50,352 |
|
|
50,636 |
|
| Goodwill and other intangible assets, net |
990,087 |
|
|
779,248 |
|
| Other assets |
362,525 |
|
|
315,423 |
|
| Total assets |
$ |
27,297,251 |
|
|
$ |
24,008,884 |
|
| LIABILITIES AND SHAREHOLDERS’ EQUITY |
|
|
|
| Liabilities: |
|
|
|
| Deposits: |
|
|
|
| Noninterest-bearing demand |
$ |
6,534,307 |
|
|
$ |
7,643,081 |
|
|
|
|
|
|
|
|
|
|
|
|
|
|
|
|
|
|
|
|
|
| Interest-bearing deposits |
16,776,304 |
|
|
12,233,426 |
|
| Total deposits |
23,310,611 |
|
|
19,876,507 |
|
| Short-term borrowings |
— |
|
|
158,933 |
|
| Federal Home Loan Bank advances |
— |
|
|
550,000 |
|
| Long-term debt |
324,823 |
|
|
324,663 |
|
| Derivative financial instruments |
84,811 |
|
|
99,543 |
|
| Accrued expenses and other liabilities |
315,481 |
|
|
298,564 |
|
| Total liabilities |
24,035,726 |
|
|
21,308,210 |
|
|
|
|
|
| Commitments and contingencies |
|
|
|
|
|
|
|
| Shareholders' equity: |
|
|
|
|
Preferred stock, $1 par value: 10,000,000 shares authorized; 3,662 and 4,000 shares Series I issued and
outstanding, respectively; $25,000 per share liquidation preference
|
88,266 |
|
|
96,422 |
|
Common stock, $1 par value; 200,000,000 shares authorized, 119,010,319 and 106,222,758 shares issued and outstanding, respectively |
119,010 |
|
|
106,223 |
|
Common stock issuable; 620,108 and 607,128 shares, respectively |
13,110 |
|
|
12,307 |
|
| Capital surplus |
2,699,112 |
|
|
2,306,366 |
|
| Retained earnings |
581,219 |
|
|
508,844 |
|
| Accumulated other comprehensive loss |
(239,192) |
|
|
(329,488) |
|
| Total shareholders’ equity |
3,261,525 |
|
|
2,700,674 |
|
| Total liabilities and shareholders’ equity |
$ |
27,297,251 |
|
|
$ |
24,008,884 |
|
See accompanying notes to consolidated financial statements.
UNITED COMMUNITY BANKS, INC. AND SUBSIDIARIES
Consolidated Statements of Income
For the Years Ended December 31, 2023, 2022 and 2021
(in thousands, except per share data)
|
|
|
|
|
|
|
|
|
|
|
|
|
|
|
|
|
|
|
2023 |
|
2022 |
|
2021 |
| Interest revenue: |
|
|
|
|
|
| Loans, including fees |
$ |
1,042,605 |
|
|
$ |
673,402 |
|
|
$ |
505,734 |
|
| Investment securities: |
|
|
|
|
|
| Taxable |
162,505 |
|
|
121,501 |
|
|
61,994 |
|
| Tax exempt |
7,295 |
|
|
10,323 |
|
|
8,978 |
|
| Deposits in banks and short-term investments |
24,702 |
|
|
7,929 |
|
|
2,088 |
|
| Total interest revenue |
1,237,107 |
|
|
813,155 |
|
|
578,794 |
|
| Interest expense: |
|
|
|
|
|
|
|
|
|
|
|
|
|
|
|
|
|
|
|
|
|
|
|
|
|
|
|
|
|
|
|
|
|
|
|
| Deposits |
395,574 |
|
|
42,099 |
|
|
14,845 |
|
| Short-term borrowings |
3,195 |
|
|
507 |
|
|
— |
|
| Federal Home Loan Bank advances |
5,761 |
|
|
1,424 |
|
|
3 |
|
| Long-term debt |
14,812 |
|
|
16,768 |
|
|
14,912 |
|
| Total interest expense |
419,342 |
|
|
60,798 |
|
|
29,760 |
|
| Net interest revenue |
817,765 |
|
|
752,357 |
|
|
549,034 |
|
| Provision for credit losses |
89,430 |
|
|
63,913 |
|
|
(37,550) |
|
| Net interest revenue after provision for credit losses |
728,335 |
|
|
688,444 |
|
|
586,584 |
|
| Noninterest income: |
|
|
|
|
|
| Service charges and fees |
38,412 |
|
|
38,163 |
|
|
33,868 |
|
| Mortgage loan gains and related fees |
19,220 |
|
|
32,524 |
|
|
58,446 |
|
| Wealth management fees |
23,740 |
|
|
23,594 |
|
|
18,998 |
|
| Gains from other loan sales |
9,146 |
|
|
10,730 |
|
|
11,267 |
|
| Other lending and loan servicing fees |
13,973 |
|
|
10,005 |
|
|
9,427 |
|
| Securities (losses) gains, net |
(53,333) |
|
|
(3,872) |
|
|
83 |
|
| Other |
24,325 |
|
|
26,563 |
|
|
25,729 |
|
| Total noninterest income |
75,483 |
|
|
137,707 |
|
|
157,818 |
|
| Total revenue |
803,818 |
|
|
826,151 |
|
|
744,402 |
|
| Noninterest expenses: |
|
|
|
|
|
| Salaries and employee benefits |
318,464 |
|
|
276,205 |
|
|
241,443 |
|
| Occupancy |
42,640 |
|
|
36,247 |
|
|
28,619 |
|
| Communications and equipment |
43,264 |
|
|
38,234 |
|
|
29,829 |
|
| Professional fees |
26,732 |
|
|
20,166 |
|
|
20,589 |
|
| Lending and loan servicing expense |
9,722 |
|
|
9,350 |
|
|
10,859 |
|
| Outside services - electronic banking |
11,577 |
|
|
12,583 |
|
|
9,481 |
|
| Postage, printing and supplies |
9,467 |
|
|
8,749 |
|
|
7,110 |
|
| Advertising and public relations |
9,473 |
|
|
8,384 |
|
|
5,910 |
|
| FDIC assessments and other regulatory charges |
27,449 |
|
|
9,894 |
|
|
7,398 |
|
| Amortization of intangibles |
15,175 |
|
|
6,826 |
|
|
4,045 |
|
| Merger-related and other charges |
27,210 |
|
|
19,375 |
|
|
13,970 |
|
| Other |
30,100 |
|
|
24,136 |
|
|
17,386 |
|
| Total noninterest expenses |
571,273 |
|
|
470,149 |
|
|
396,639 |
|
| Income before income taxes |
232,545 |
|
|
356,002 |
|
|
347,763 |
|
| Income tax expense |
45,001 |
|
|
78,530 |
|
|
77,962 |
|
| Net income |
$ |
187,544 |
|
|
$ |
277,472 |
|
|
$ |
269,801 |
|
|
|
|
|
|
|
| Net income available to common shareholders |
$ |
180,847 |
|
|
$ |
269,135 |
|
|
$ |
261,269 |
|
|
|
|
|
|
|
| Income per common share: |
|
|
|
|
|
| Basic |
$ |
1.54 |
|
|
$ |
2.52 |
|
|
$ |
2.97 |
|
| Diluted |
1.54 |
|
|
2.52 |
|
|
2.97 |
|
| Weighted average common shares outstanding: |
|
|
|
|
|
| Basic |
117,603 |
|
|
106,661 |
|
|
87,940 |
|
| Diluted |
117,745 |
|
|
106,778 |
|
|
88,097 |
|
See accompanying notes to consolidated financial statements.
UNITED COMMUNITY BANKS, INC. AND SUBSIDIARIES
Consolidated Statements of Comprehensive Income (Loss)
For the Years Ended December 31, 2023, 2022 and 2021
(in thousands, except per share data)
|
|
|
|
|
|
|
|
|
|
|
|
|
|
|
|
|
|
|
|
|
|
|
|
|
|
|
|
|
|
|
|
|
|
|
|
|
|
|
|
|
|
|
|
|
|
|
|
|
|
|
|
|
|
| |
2023 |
|
2022 |
|
2021 |
| |
Before-tax Amount |
|
Tax (Expense) Benefit |
|
Net of Tax Amount |
|
Before-tax Amount |
|
Tax (Expense) Benefit |
|
Net of Tax Amount |
|
Before-tax Amount |
|
Tax (Expense) Benefit |
|
Net of Tax Amount |
| Net income |
$ |
232,545 |
|
|
$ |
(45,001) |
|
|
$ |
187,544 |
|
|
$ |
356,002 |
|
|
$ |
(78,530) |
|
|
$ |
277,472 |
|
|
$ |
347,763 |
|
|
$ |
(77,962) |
|
|
$ |
269,801 |
|
| Other comprehensive income (loss): |
|
|
|
|
|
|
|
|
|
|
|
|
|
|
|
|
|
| Unrealized gains (losses) on available-for-sale securities: |
|
|
|
|
|
|
|
|
|
|
|
|
|
|
|
|
|
| Unrealized holding gains (losses) |
59,462 |
|
|
(14,077) |
|
|
45,385 |
|
|
(428,605) |
|
|
101,344 |
|
|
(327,261) |
|
|
(92,231) |
|
|
23,294 |
|
|
(68,937) |
|
| Reclassification of securities from available-for-sale to held-to-maturity |
— |
|
|
— |
|
|
— |
|
|
87,444 |
|
|
(20,770) |
|
|
66,674 |
|
|
— |
|
|
— |
|
|
— |
|
| Realized losses (gains) included in net income |
53,333 |
|
|
(13,575) |
|
|
39,758 |
|
|
3,872 |
|
|
(1,026) |
|
|
2,846 |
|
|
(83) |
|
|
(46) |
|
|
(129) |
|
| Net unrealized gains (losses) |
112,795 |
|
|
(27,652) |
|
|
85,143 |
|
|
(337,289) |
|
|
79,548 |
|
|
(257,741) |
|
|
(92,314) |
|
|
23,248 |
|
|
(69,066) |
|
| Unrealized losses on held-to-maturity securities transferred from available-for-sale: |
|
|
|
|
|
|
|
|
|
|
|
|
|
|
|
|
|
| Reclassification of unrealized losses |
— |
|
|
— |
|
|
— |
|
|
(87,444) |
|
|
20,770 |
|
|
(66,674) |
|
|
— |
|
|
— |
|
|
— |
|
| Amortization of unrealized losses |
10,203 |
|
|
(2,452) |
|
|
7,751 |
|
|
9,049 |
|
|
(2,167) |
|
|
6,882 |
|
|
— |
|
|
— |
|
|
— |
|
| Net activity |
10,203 |
|
|
(2,452) |
|
|
7,751 |
|
|
(78,395) |
|
|
18,603 |
|
|
(59,792) |
|
|
— |
|
|
— |
|
|
— |
|
| Derivative instruments designated as cash flow hedges: |
|
|
|
|
|
|
|
|
|
|
|
|
|
|
|
|
|
|
|
|
|
|
|
|
|
|
|
|
|
|
|
|
|
|
|
| Unrealized holding gains on derivatives |
1,611 |
|
|
(411) |
|
|
1,200 |
|
|
12,721 |
|
|
(3,249) |
|
|
9,472 |
|
|
3,837 |
|
|
(979) |
|
|
2,858 |
|
| (Gains) losses on derivative instruments realized in net income |
(4,719) |
|
|
1,205 |
|
|
(3,514) |
|
|
269 |
|
|
(69) |
|
|
200 |
|
|
608 |
|
|
(156) |
|
|
452 |
|
| Net cash flow hedge activity |
(3,108) |
|
|
794 |
|
|
(2,314) |
|
|
12,990 |
|
|
(3,318) |
|
|
9,672 |
|
|
4,445 |
|
|
(1,135) |
|
|
3,310 |
|
| Defined benefit pension plan activity: |
|
|
|
|
|
|
|
|
|
|
|
|
|
|
|
|
|
|
|
|
|
|
|
|
|
|
|
|
|
|
|
|
|
|
|
|
|
|
|
|
|
|
|
|
|
|
|
|
|
|
|
|
|
| Net actuarial (loss) gain on defined benefit pension plans |
(625) |
|
|
159 |
|
|
(466) |
|
|
5,833 |
|
|
(1,490) |
|
|
4,343 |
|
|
1,066 |
|
|
(273) |
|
|
793 |
|
| Amortization of defined benefit pension plan net periodic pension cost components |
244 |
|
|
(62) |
|
|
182 |
|
|
680 |
|
|
(174) |
|
|
506 |
|
|
1,044 |
|
|
(267) |
|
|
777 |
|
| Net defined benefit pension plan activity |
(381) |
|
|
97 |
|
|
(284) |
|
|
6,513 |
|
|
(1,664) |
|
|
4,849 |
|
|
2,110 |
|
|
(540) |
|
|
1,570 |
|
| Total other comprehensive income (loss) |
119,509 |
|
|
(29,213) |
|
|
90,296 |
|
|
(396,181) |
|
|
93,169 |
|
|
(303,012) |
|
|
(85,759) |
|
|
21,573 |
|
|
(64,186) |
|
| Comprehensive income (loss) |
$ |
352,054 |
|
|
$ |
(74,214) |
|
|
$ |
277,840 |
|
|
$ |
(40,179) |
|
|
$ |
14,639 |
|
|
$ |
(25,540) |
|
|
$ |
262,004 |
|
|
$ |
(56,389) |
|
|
$ |
205,615 |
|
See accompanying notes to consolidated financial statements.
UNITED COMMUNITY BANKS, INC. AND SUBSIDIARIES
Consolidated Statements of Changes in Shareholders’ Equity
For the Years Ended December 31, 2023, 2022 and 2021
(in thousands except share data)
|
|
|
|
|
|
|
|
|
|
|
|
|
|
|
|
|
|
|
|
|
|
|
|
|
|
|
|
|
|
|
|
|
|
|
|
|
|
|
|
|
|
|
|
|
|
|
|
|
Shares of Common Stock |
|
Preferred Stock |
|
Common Stock |
|
Common Stock Issuable |
|
Capital Surplus |
|
Retained Earnings |
|
Accumulated Other Comprehensive Income (Loss) |
|
Total |
| December 31, 2020 |
86,675,279 |
|
|
$ |
96,422 |
|
|
$ |
86,675 |
|
|
$ |
10,855 |
|
|
$ |
1,638,999 |
|
|
$ |
136,869 |
|
|
$ |
37,710 |
|
|
$ |
2,007,530 |
|
| Net income |
|
|
|
|
|
|
|
|
|
|
269,801 |
|
|
|
|
269,801 |
|
| Other comprehensive loss |
|
|
|
|
|
|
|
|
|
|
|
|
(64,186) |
|
|
(64,186) |
|
|
|
|
|
|
|
|
|
|
|
|
|
|
|
|
|
| Common stock issued for acquisitions |
2,863,734 |
|
|
|
|
2,864 |
|
|
|
|
92,661 |
|
|
|
|
|
|
95,525 |
|
| Purchases of common stock |
(492,744) |
|
|
|
|
(493) |
|
|
|
|
(14,608) |
|
|
|
|
|
|
(15,101) |
|
| Preferred stock dividends |
|
|
|
|
|
|
|
|
|
|
(6,876) |
|
|
|
|
(6,876) |
|
Common stock dividends ($0.78 per share) |
|
|
|
|
|
|
|
|
|
|
(69,140) |
|
|
|
|
(69,140) |
|
| Impact of equity-based compensation awards |
224,706 |
|
|
|
|
225 |
|
|
1,061 |
|
|
2,406 |
|
|
|
|
|
|
3,692 |
|
| Impact of other equity plans |
78,851 |
|
|
|
|
79 |
|
|
(628) |
|
|
1,549 |
|
|
|
|
|
|
1,000 |
|
| December 31, 2021 |
89,349,826 |
|
|
96,422 |
|
|
89,350 |
|
|
11,288 |
|
|
1,721,007 |
|
|
330,654 |
|
|
(26,476) |
|
|
2,222,245 |
|
| Net income |
|
|
|
|
|
|
|
|
|
|
277,472 |
|
|
|
|
277,472 |
|
| Other comprehensive loss |
|
|
|
|
|
|
|
|
|
|
|
|
(303,012) |
|
|
(303,012) |
|
|
|
|
|
|
|
|
|
|
|
|
|
|
|
|
|
| Common stock issued for acquisitions |
16,571,545 |
|
|
|
|
16,571 |
|
|
|
|
579,805 |
|
|
|
|
|
|
596,376 |
|
|
|
|
|
|
|
|
|
|
|
|
|
|
|
|
|
| Preferred stock dividends |
|
|
|
|
|
|
|
|
|
|
(6,875) |
|
|
|
|
(6,875) |
|
Common stock dividends ($0.86 per share) |
|
|
|
|
|
|
|
|
|
|
(92,407) |
|
|
|
|
(92,407) |
|
| Impact of equity-based compensation awards |
233,489 |
|
|
|
|
234 |
|
|
2,046 |
|
|
4,661 |
|
|
|
|
|
|
6,941 |
|
| Impact of other equity plans |
67,898 |
|
|
|
|
68 |
|
|
(1,027) |
|
|
893 |
|
|
|
|
|
|
(66) |
|
|
|
|
|
|
|
|
|
|
|
|
|
|
|
|
|
| December 31, 2022 |
106,222,758 |
|
|
96,422 |
|
|
106,223 |
|
|
12,307 |
|
|
2,306,366 |
|
|
508,844 |
|
|
(329,488) |
|
|
2,700,674 |
|
| Net income |
|
|
|
|
|
|
|
|
|
|
187,544 |
|
|
|
|
187,544 |
|
| Other comprehensive income |
|
|
|
|
|
|
|
|
|
|
|
|
90,296 |
|
|
90,296 |
|
|
|
|
|
|
|
|
|
|
|
|
|
|
|
|
|
| Common stock issued for acquisitions |
12,279,135 |
|
|
|
|
12,279 |
|
|
|
|
381,861 |
|
|
|
|
|
|
394,140 |
|
| Purchases of preferred stock |
|
|
(8,156) |
|
|
|
|
|
|
35 |
|
|
970 |
|
|
|
|
(7,151) |
|
| Preferred stock dividends |
|
|
|
|
|
|
|
|
|
|
(6,635) |
|
|
|
|
(6,635) |
|
Common stock dividends ($0.92 per share) |
|
|
|
|
|
|
|
|
|
|
(109,504) |
|
|
|
|
(109,504) |
|
| Impact of equity-based compensation awards |
461,601 |
|
|
|
|
461 |
|
|
1,207 |
|
|
10,151 |
|
|
|
|
|
|
11,819 |
|
| Impact of other equity plans |
46,825 |
|
|
|
|
47 |
|
|
(404) |
|
|
699 |
|
|
|
|
|
|
342 |
|
|
|
|
|
|
|
|
|
|
|
|
|
|
|
|
|
| December 31, 2023 |
119,010,319 |
|
|
$ |
88,266 |
|
|
$ |
119,010 |
|
|
$ |
13,110 |
|
|
$ |
2,699,112 |
|
|
$ |
581,219 |
|
|
$ |
(239,192) |
|
|
$ |
3,261,525 |
|
See accompanying notes to consolidated financial statements
UNITED COMMUNITY BANKS, INC. AND SUBSIDIARIES
Consolidated Statements of Cash Flows
For the Years Ended December 31, 2023, 2022 and 2021
(in thousands)
|
|
|
|
|
|
|
|
|
|
|
|
|
|
|
|
|
|
| |
2023 |
|
2022 |
|
2021 |
| Operating activities: |
|
|
|
|
|
| Net income |
$ |
187,544 |
|
|
$ |
277,472 |
|
|
$ |
269,801 |
|
| Adjustments to reconcile net income to net cash provided by operating activities: |
|
|
|
|
|
| Depreciation, amortization and accretion, net |
44,963 |
|
|
46,700 |
|
|
(2,063) |
|
| Provision for credit losses |
89,430 |
|
|
63,913 |
|
|
(37,550) |
|
| Stock-based compensation |
8,932 |
|
|
8,705 |
|
|
6,554 |
|
| Deferred income tax expense |
6,389 |
|
|
10,918 |
|
|
20,787 |
|
| Securities losses (gains), net |
53,333 |
|
|
3,872 |
|
|
(83) |
|
Gains from other loan sales |
(9,146) |
|
|
(10,730) |
|
|
(11,267) |
|
| Changes in assets and liabilities: |
|
|
|
|
|
| (Increase) decrease in other assets |
(20,504) |
|
|
(14,694) |
|
|
53,416 |
|
(Decrease) increase in other liabilities |
(49,649) |
|
|
76,614 |
|
|
(1,599) |
|
(Increase) decrease in loans held for sale |
(17,321) |
|
|
144,537 |
|
|
61,324 |
|
| Net cash provided by operating activities |
293,971 |
|
|
607,307 |
|
|
359,320 |
|
|
|
|
|
|
|
| Investing activities: |
|
|
|
|
|
| Debt securities held-to-maturity: |
|
|
|
|
|
| Proceeds from maturities and calls |
129,873 |
|
|
205,140 |
|
|
68,319 |
|
| Purchases |
— |
|
|
(326,494) |
|
|
(806,405) |
|
| Debt securities available-for-sale: |
|
|
|
|
|
| Proceeds from sales |
880,224 |
|
|
318,457 |
|
|
288,986 |
|
| Proceeds from maturities and calls |
646,108 |
|
|
706,285 |
|
|
974,721 |
|
| Purchases |
(856,531) |
|
|
(1,667,466) |
|
|
(2,587,420) |
|
| Net (increase) decrease in loans |
(996,520) |
|
|
(1,228,675) |
|
|
178,234 |
|
Payments for other investments |
(143,645) |
|
|
(68,185) |
|
|
(15,595) |
|
Proceeds from other investments |
124,427 |
|
|
31,535 |
|
|
8,481 |
|
| Net cash received in acquisitions |
207,566 |
|
|
35,243 |
|
|
103,065 |
|
| Purchases of premises and equipment |
(72,485) |
|
|
(42,704) |
|
|
(26,483) |
|
| Proceeds from sales of premises and equipment |
4,665 |
|
|
9,743 |
|
|
4,247 |
|
Net cash paid for branch disposal |
(93,613) |
|
|
— |
|
|
— |
|
| Other investing outflows |
— |
|
|
— |
|
|
(610) |
|
| Other investing inflows |
6,642 |
|
|
6,940 |
|
|
4,057 |
|
| Net cash used in investing activities |
(163,289) |
|
|
(2,020,181) |
|
|
(1,806,403) |
|
|
|
|
|
|
|
| Financing activities: |
|
|
|
|
|
Net increase (decrease) in deposits |
1,338,641 |
|
|
(866,929) |
|
|
2,353,451 |
|
Net (decrease) increase in short-term borrowings |
(347,615) |
|
|
158,933 |
|
|
— |
|
| Proceeds from Federal Home Loan Bank advances |
2,225,000 |
|
|
790,000 |
|
|
10,000 |
|
| Repayment of Federal Home Loan Bank advances |
(2,870,000) |
|
|
(240,000) |
|
|
(34,509) |
|
| Repayment of long-term debt |
— |
|
|
— |
|
|
(80,632) |
|
| Repurchase of common stock |
— |
|
|
— |
|
|
(15,101) |
|
| Repurchase of preferred stock |
(7,151) |
|
|
— |
|
|
— |
|
| Cash dividends on common stock |
(105,085) |
|
|
(86,883) |
|
|
(66,914) |
|
| Cash dividends on preferred stock |
(6,635) |
|
|
(6,875) |
|
|
(6,876) |
|
| Other financing inflows |
5,500 |
|
|
1,125 |
|
|
737 |
|
| Other financing outflows |
(6,315) |
|
|
(8,154) |
|
|
(3,182) |
|
Net cash provided by (used in) financing activities |
226,340 |
|
|
(258,783) |
|
|
2,156,974 |
|
|
|
|
|
|
|
| Net change in cash and cash equivalents |
357,022 |
|
|
(1,671,657) |
|
|
709,891 |
|
| Cash and cash equivalents at beginning of year |
646,853 |
|
|
2,318,510 |
|
|
1,608,619 |
|
| Cash and cash equivalents at end of year |
$ |
1,003,875 |
|
|
$ |
646,853 |
|
|
$ |
2,318,510 |
|
|
|
|
|
|
|
|
|
|
|
|
|
|
|
|
|
|
|
|
|
|
|
|
|
|
|
|
|
|
|
See accompanying notes to consolidated financial statements.
UNITED COMMUNITY BANKS, INC. AND SUBSIDIARIES
Notes to Consolidated Financial Statements
(1) Summary of Significant Accounting Policies
See the Glossary of Defined Terms at the beginning of this Report for terms used herein. The accounting principles followed by United and the methods of applying these principles conform with GAAP and with general practices within the banking industry. The following is a description of the significant policies.
Organization and Basis of Presentation
The Holding Company is a bank holding company under the BHC Act and, as of July 1, 2021, a financial holding company under the GLB Act. Financial holding company status allows for engagement in a broader range of financial activities. The Holding Company’s principal business is conducted by its wholly-owned commercial bank subsidiary, United Community Bank. United is subject to regulation under the BHC Act. The consolidated financial statements include the accounts of the Holding Company, the Bank and other wholly-owned subsidiaries. All significant intercompany accounts and transactions have been eliminated in consolidation.
Effective July 1, 2021, the Bank moved its headquarters from Blairsville, Georgia to Greenville, South Carolina and became a South Carolina state-chartered bank subject to examination and reporting requirements of the SCBFI. Prior to that date, the Bank was a Georgia state-chartered bank subject to examination and reporting requirements of the GADBF. The Bank serves both rural and metropolitan markets in Georgia, South Carolina, North Carolina, Tennessee, Florida and Alabama and provides a full range of banking services. The Bank is insured by and subject to the regulation of the FDIC.
Use of Estimates
In preparing the consolidated financial statements, management is required to make estimates and assumptions that affect the reported amounts of assets and liabilities as of the dates of the balance sheet and revenue and expenses for the years then ended. Actual results could differ significantly from those estimates. Material estimates that are particularly susceptible to significant change are the determination of the ACL, the valuation of acquired loans, the valuation of real estate acquired in connection with foreclosures or in satisfaction of loans, the valuation of goodwill and separately identifiable intangible assets associated with mergers and acquisitions, and the valuation of deferred tax assets.
Operating Segments
Operating segments are components of a business about which separate financial information is available and evaluated regularly by the chief operating decision maker in deciding how to allocate resources and assessing performance. Public companies are required to report certain financial information about operating segments in interim and annual financial statements. United’s community banking operations are divided among geographic regions and local community banks within those regions. Those regions and banks have similar economic characteristics and products and are therefore considered to be one operating segment.
Cash and Cash Equivalents
Cash equivalents include amounts due from banks, interest-bearing deposits in banks, federal funds sold, commercial paper, reverse repurchase agreements and short-term investments and are carried at cost. Federal funds are generally sold for one-day periods, interest-bearing deposits in banks are available on demand and commercial paper investments and reverse repurchase agreements mature within a period of less than 90 days.
Investments
Debt Securities: Debt securities are classified as HTM and carried at amortized cost when management has the positive intent and ability to hold them to maturity. Debt securities are classified as AFS when they may be sold before maturity. AFS securities are carried at fair value, with unrealized holding gains and losses reported in OCI, net of tax.
Interest income includes amortization of purchase premiums or discounts. Premiums and discounts on securities are generally amortized or accreted on the level-yield method without anticipating prepayments, except for mortgage-backed securities where prepayments are anticipated. Premiums on callable debt securities are amortized to their earliest call date. Gains and losses on sales are recorded on the trade date and determined using the specific identification method.
Transfers of securities between categories are recorded at fair value at the date of transfer. Unrealized holding gains or losses associated with transfers of securities from AFS to HTM are included in the balance of AOCI in the consolidated balance sheets. These unrealized holding gains or losses are amortized/accreted into income over the remaining life of the security as an
UNITED COMMUNITY BANKS, INC. AND SUBSIDIARIES
Notes to Consolidated Financial Statements
(1) Summary of Significant Accounting Policies, continued
adjustment to the yield in a manner consistent with the amortization or accretion of the original purchase premium or discount on the associated security.
A debt security is placed on nonaccrual status at the time any principal or interest payments become 90 days delinquent. Interest accrued but not received for a security placed on nonaccrual is reversed against interest income.
The CECL framework requires an estimate of expected credit losses for the remaining estimated life of the financial asset using historical experience, current conditions, and reasonable and supportable forecasts. The following discussion provides a description of the methodology applied to calculate the ACL under CECL.
ACL - HTM Debt Securities: Management measures current expected credit losses on HTM debt securities on a collective basis by major security type. The estimate of current expected credit losses considers historical credit loss information that is adjusted for current conditions and reasonable and supportable forecasts. Management classifies the HTM portfolio into the following major security types: U.S. Treasuries, U.S. Government agencies and GSEs, state and political subdivisions, residential mortgage-backed, agency and GSEs, commercial mortgage-backed, agency and GSEs and supranational entities. Accrued interest receivable on HTM debt is excluded from the estimate of credit losses.
All of the residential and commercial mortgage-backed securities held by United as HTM are issued by U.S. Government agencies and GSEs. These securities are either explicitly or implicitly guaranteed by the U.S. government, are highly rated by major rating agencies and have a long history of no credit losses. The state and political subdivision securities are highly rated by major rating agencies.
ACL - AFS Debt Securities: For AFS debt securities in an unrealized loss position, United first assesses whether it intends to sell, or whether it is more likely than not that it will be required to sell the security before recovery of its amortized cost basis. If either of the criteria regarding intent or requirement to sell is met, the security's amortized cost basis is written down to fair value through income. For AFS debt securities that do not meet the aforementioned criteria, United evaluates whether the decline in fair value has resulted from credit losses or other factors. In making this assessment, management considers the extent to which fair value is less than amortized cost, any changes to the rating of the security by a rating agency, and adverse conditions specifically related to the security, among other factors. If this assessment indicates that a credit loss exists, the present value of cash flows expected to be collected from the security are compared to the amortized cost basis of the security. If the present value of cash flows expected to be collected is less than the amortized cost basis, a credit loss exists and an ACL is recorded for the credit loss, limited by the amount that the fair value is less than the amortized cost basis. Any amount of unrealized loss that has not been recorded through an ACL is recognized in OCI. Accrued interest receivable on AFS debt securities is excluded from the estimate of credit losses.
Changes in the ACL are recorded as provision for (or reversal of) credit loss expense. Losses are charged against the ACL when management believes the uncollectibility of an AFS security is confirmed or when either of the criteria regarding intent or requirement to sell is met.
Equity investments: Equity investments are included in other assets on the consolidated balance sheets. Those with readily determinable fair values are carried at fair value with changes in fair value recognized in other noninterest income. Those without readily determinable fair values include, among others, FHLB stock, which is held to meet FHLB requirements related to outstanding advances and accounted for using the cost method of accounting. As conditions warrant, management reviews investments for impairment and adjusts the carrying value of the investment if it is deemed to be impaired.
Loans Held for Sale
United has elected the fair value option for the majority of newly originated mortgage loans held for sale in order to reduce certain timing differences and match changes in fair values of the loans with changes in the fair value of derivative instruments used to economically hedge them. As of December 31, 2022, United had certain mortgage loans held for sale that were acquired from Reliant for which the fair value option was not elected; these loans were carried at the lower of aggregate cost or fair value. These loans were subsequently sold in 2023.
Loans and Leases
Loans that management has the intent and ability to hold for the foreseeable future or until maturity or payoff are reported at amortized cost. Amortized cost is the principal balance outstanding, net of purchase premiums and discounts and deferred fees
UNITED COMMUNITY BANKS, INC. AND SUBSIDIARIES
Notes to Consolidated Financial Statements
(1) Summary of Significant Accounting Policies, continued
and costs. Interest income is accrued on the unpaid principal balance. Loan origination fees, net of certain direct origination costs, are deferred and recognized in interest income over the life of the loan.
Equipment Financing Lease Receivables: Equipment financing lease receivables, which are classified as sales-type or direct financing leases, are recorded as the sum of the future minimum lease payments, initial deferred costs and, if applicable, estimated or contractual residual values less unearned income and security deposits. For lease receivables with a residual value, the determination of such value is derived from a variety of sources including equipment valuation services, appraisals, and publicly available market data on recent sales transactions on similar equipment. The length of time until contract termination, the cyclical nature of equipment values and the limited marketplace for re-sale of certain leased assets are important variables considered in making this determination. Interest income, which is included in loan interest revenue in the consolidated statements of income, is recognized as earned using the effective interest method. Direct fees and costs associated with the origination of leases are deferred and included as a component of equipment financing receivables. Net deferred fees or costs are recognized as an adjustment to interest income over the contractual life of the lease using the effective interest method. These lease agreements may include options to renew and for the lessee to purchase the leased equipment at the end of the lease term. United excludes sales tax from consideration in these lease contracts.
PCD Loans: In acquisitions, United may acquire loans, some of which have experienced more than insignificant credit deterioration since origination. In those cases, United will consider internal loan grades, delinquency status and other relevant factors in assessing whether purchased loans are PCD. PCD loans are recorded at their fair value at the acquisition date. An initial ACL is determined using the same methodology as other loans held for investment and recognized as an adjustment to the acquisition price of the asset; thus, the sum of the loan's purchase price and ACL becomes its initial amortized cost basis. The difference between the initial amortized cost basis and the par value of the loan is a noncredit discount or premium, which is amortized into interest income over the life of the loan. Subsequent to initial recognition, PCD loans are subject to the same interest income recognition and impairment model as non-PCD loans, with changes to the ACL recorded through provision expense.
Nonaccrual Loans: The accrual of interest is generally discontinued when a loan becomes 90 days past due or when management believes, after considering economic and business conditions and collection efforts, that the principal or interest will not be collectable in the normal course of business. A loan may continue to accrue interest after 90 days if it is well collateralized and in the process of collection. Past due status is based on contractual terms of the loan.
All interest accrued but not received for loans placed on nonaccrual is reversed against interest income. Interest received on such loans is accounted for using the cost-recovery method, until qualifying for return to accrual. Under the cost-recovery method, interest payments are reflected as a reduction of the carrying amount of the loan and interest income is not recognized until the loan balance is reduced to zero. Loans are returned to accrual status when all the principal and interest amounts contractually due are brought current, there is a sustained period of repayment performance and future payments are reasonably assured.
FDMs: As discussed in Note 2, effective January 1, 2023, United adopted ASU No. 2022-02, which updated the guidance on modifications to financing receivables by effectively replacing the concept of TDRs with a new concept, loan modifications to borrowers experiencing financial difficulty. A loan for which the terms have been modified as a result of the borrower experiencing financial difficulty is generally considered to be a FDM. Modified terms that result in a FDM include one or a combination of the following: a reduction of the stated interest rate of the loan, an extension of the term or amortization period, a more than insignificant payment delay or principal forgiveness. The ACL on FDMs is calculated using the same method as other loans held for investment.
Concentration of Credit Risk: Most of United’s business activity is with customers located within the markets where it has banking operations. Therefore, United’s exposure to credit risk is significantly affected by changes in the economy within its markets. Approximately 76% of United’s loan portfolio is secured by real estate and is therefore susceptible to changes in real estate valuations.
ACL- Loans
The CECL framework requires an estimate of expected credit losses for the remaining estimated life of the financial asset using historical experience, current conditions, and reasonable and supportable forecasts. The following discussion provides a description of the methodology applied to calculate the ACL under CECL.
UNITED COMMUNITY BANKS, INC. AND SUBSIDIARIES
Notes to Consolidated Financial Statements
(1) Summary of Significant Accounting Policies, continued
The ACL is a valuation account that is deducted from the loans' amortized cost basis to present the net amount expected to be collected on the loans. Loans are charged off against the ACL when management believes the uncollectibility of a loan balance is confirmed. Accrued interest receivable is excluded from the estimate of credit losses.
Management determines the ACL balance using relevant available information from internal and external sources, relating to past events, current conditions, and reasonable and supportable forecasts. Historical credit behaviors along with model judgments provide the basis for the estimation of expected credit losses. Adjustments to modeled loss estimates may be made for differences in current loan-specific risk characteristics such as differences in underwriting standards, portfolio mix, delinquency level, or term as well as for changes in environmental conditions, such as changes in economic conditions, property values, or other relevant factors. For the majority of loans and leases the ACL is calculated using a discounted cash flow methodology applied at a loan level with a one-year reasonable and supportable forecast period and a two-year straight-line reversion period. When the discounted cash flow method is used to determine the ACL, management adjusts the effective interest rate used to discount expected cash flows to incorporate expected prepayments.
The ACL-loans is measured on a collective basis when similar risk characteristics exist. United has identified the following portfolio segments and calculates the ACL for each using a discounted cash flow methodology at the loan level, with loss rates, prepayment assumptions and curtailment assumptions driven by each loan’s collateral type:
Owner occupied commercial real estate - Loans in this category are susceptible to business failure and general economic conditions.
Income producing commercial real estate - Common risks for this loan category are declines in general economic conditions, declines in real estate value which may be caused by rapidly increasing interest rates or other factors, declines in occupancy rates, and lack of suitable alternative use for the property.
Commercial & industrial - Risks to this loan category include the inability to monitor the condition of the collateral, which often consists of inventory, accounts receivable and other non-real estate assets. Equipment and inventory obsolescence can also pose a risk. Declines in general economic conditions and other events can cause cash flows to fall to levels insufficient to service debt.
Commercial construction - Risks common to commercial construction loans are cost overruns, changes in market demand for property, inadequate long-term financing arrangements and declines in real estate values which may be caused by rapidly increasing interest rates or other factors.
Equipment financing - Risks associated with equipment financing are similar to those described for commercial and industrial loans, including general economic conditions, as well as appropriate lien priority on equipment, equipment obsolescence and the general mobility of the collateral.
Residential mortgage - Residential mortgage loans are susceptible to weakening general economic conditions, increases in unemployment rates and declining real estate values which may be caused by rapidly increasing interest rates or other factors affecting demand for residential real estate.
Home equity - Risks common to home equity loans and lines of credit are general economic conditions, including an increase in unemployment rates, and declining real estate values that reduce or eliminate the borrower’s home equity.
Residential construction - Residential construction loans are susceptible to the same risks as residential mortgage loans. Changes in market demand for property lead to longer marketing times resulting in higher carrying costs and declining values.
Manufactured housing - Risks associated with manufactured housing are similar to those described for residential mortgage loans, including general economic conditions and unemployment rates, as well as appropriate lien priority and the general mobility of the collateral as the majority of loans in this category are secured by chattel.
Consumer - Risks common to consumer direct loans include unemployment and changes in local economic conditions as well as the inability to monitor collateral consisting of personal property.
UNITED COMMUNITY BANKS, INC. AND SUBSIDIARIES
Notes to Consolidated Financial Statements
(1) Summary of Significant Accounting Policies, continued
When management determines that foreclosure is probable or when the borrower is experiencing financial difficulty at the reporting date and repayment is expected to be provided substantially through the operation or sale of the collateral, expected credit losses are based on the fair value of the collateral at the reporting date, adjusted for selling costs as appropriate.
Determining the Contractual Term: Expected credit losses are estimated over the contractual term of the loans, adjusted for expected prepayments when appropriate. The contractual term excludes expected extensions, renewals, and modifications unless the extension or renewal options are included in the original or modified contract at the reporting date and are not unconditionally cancellable by United.
ACL - Off-Balance Sheet Credit Exposures
Management estimates expected credit losses on commitments to extend credit over the contractual period during which United is exposed to credit risk on the underlying commitments. The ACL on off-balance sheet credit exposures is adjusted as a provision for credit loss expense. The estimate includes consideration of the likelihood that funding will occur and an estimate of expected credit losses on commitments expected to be funded over its estimated life. The ACL is calculated using the same aggregate reserve rates calculated for the funded portion of loans at the portfolio level applied to the amount of commitments expected to fund.
Premises and Equipment
Premises and equipment are stated at cost less accumulated depreciation. Depreciation is computed primarily using the straight line method over the estimated useful lives of the related assets. Costs incurred for maintenance and repairs are expensed as incurred. The range of estimated useful lives for buildings and improvements is 10 to 40 years, for land improvements, 10 years, and for furniture and equipment, 3 to 10 years. United periodically reviews the carrying value of premises and equipment for impairment whenever events or circumstances indicate that the carrying amount of such assets may not be fully recoverable.
Foreclosed Properties (OREO) and Repossessed Assets
Foreclosed property and repossessed assets are initially recorded at fair value, less cost to sell. If the fair value, less cost to sell at the time of foreclosure or repossession is less than the loan balance, the deficiency is recorded as a loan charge-off against the ACL. If the fair value, less cost to sell, of the foreclosed/repossessed property decreases during the holding period, a valuation allowance is established with a charge to operating expenses. When the foreclosed/repossessed property is sold, a gain or loss is recognized on the sale for the difference between the sales proceeds and the carrying amount of the property.
Goodwill and Other Intangible Assets
Goodwill is an asset representing the future economic benefits from other assets acquired that are not individually identified and separately recognized. Goodwill is measured as the excess of the consideration transferred, net of the fair value of identifiable assets acquired and liabilities assumed at the acquisition date. Goodwill is not amortized, but instead is tested for impairment annually or more frequently if events or circumstances exist that indicate a goodwill impairment test should be performed.
Other intangible assets, which are initially recorded at fair value, consist of core deposit and customer list intangibles resulting from acquisitions. Core deposit intangible assets are amortized over their estimated useful lives using the sum-of-the-years-digits method. Customer list intangibles are amortized over their estimated useful lives using the straight-line method.
Management evaluates other intangible assets for impairment whenever events or changes in circumstances indicate the carrying amount of the asset may not be recoverable.
Transfers of Financial Assets
Transfers of financial assets are accounted for as sales when control over the assets has been relinquished. Control over transferred assets is deemed to be surrendered when the assets have been isolated from United, the transferee obtains the right, free of conditions that constrain it from taking advantage of that right, to pledge or exchange the transferred assets and United does not maintain effective control over the transferred assets through an agreement to repurchase them before maturity.
Servicing Rights
United records a separate servicing asset for SBA loans, USDA loans, and residential mortgage loans when the loan is sold but servicing is retained. This asset represents the right to service the loans and receive a fee in compensation. Servicing assets are initially recorded at their fair value as a component of the sale proceeds. The fair value of the servicing assets is based on an analysis of discounted cash flows that incorporates estimates of (1) market servicing costs, (2) market-based prepayment rates, and (3) market profit margins. Servicing assets are included in other assets.
UNITED COMMUNITY BANKS, INC. AND SUBSIDIARIES
Notes to Consolidated Financial Statements
(1) Summary of Significant Accounting Policies, continued
United has elected to subsequently measure the servicing assets for government guaranteed loans and residential mortgage loans at fair value. The rate of prepayment of loans serviced is the most significant estimate involved in the measurement process. Estimates of prepayment rates are based on market expectations of future prepayment rates, industry trends, and other considerations. Actual prepayment rates will differ from those projected by management due to changes in a variety of economic factors, including prevailing interest rates and the availability of alternative financing sources to borrowers. If actual prepayments of the loans being serviced were to occur more quickly than projected, the carrying value of servicing assets might have to be written down through a charge to earnings in the current period. If actual prepayments of the loans being serviced were to occur more slowly than had been projected, the carrying value of servicing assets could increase, and servicing income would exceed previously projected amounts.
United accounts for the servicing liabilities associated with sold equipment financing loans using the amortization method. Servicing liabilities are included in accrued expenses and other liabilities.
BOLI
United has purchased life insurance policies on certain key executives and members of management. United has also received life insurance policies on members of acquired bank management teams and board members through acquisitions of other banks. BOLI is recorded at the amount that can be realized under the insurance contract at the balance sheet date, which is the cash surrender value adjusted for other changes or other amounts due that are probable at settlement.
Operating Leases
United records a ROU asset, included in other assets, and a related lease liability, included in other liabilities, for eligible operating leases for which it is the lessee, which include leases for land, buildings, and equipment. At lease commencement, United records the ROU asset and related lease liability based on the present value of lease payments over the lease term. Absent a readily determinable interest rate in the lease agreement, United utilizes the Bank’s incremental borrowing rate for secured borrowings as the discount rate used in the present value calculation. Payments related to these leases consist primarily of base rent and, in the case of building leases, additional operating costs associated with the leased property such as common area maintenance and utilities. In most cases, these operating costs vary over the term of the lease, and therefore are classified as variable lease costs, which are recognized as incurred in the consolidated statement of income. In addition, certain operating leases include costs such as property taxes and insurance, which are recognized as incurred in the consolidated statement of income. Many of United’s operating leases contain renewal options, which are included in the measurement of the ROU asset and lease liability to the extent they are reasonably certain to be exercised. United also subleases and leases certain real estate properties to third parties under operating leases. United does not recognize a lease liability or ROU asset on the consolidated balance sheet related to short-term leases with a term of less than one year. Lease payments for short-term leases are recognized as expense over the lease term. Operating lease costs, variable lease costs and short-term lease costs are included in occupancy expense and communications and equipment expense in the consolidated statement of income.
Loan Commitments and Related Financial Instruments
Financial instruments include off-balance sheet credit instruments such as commitments to make loans and commercial letters of credit issued to meet customer financing needs. The face amount for these items represents the exposure to loss before considering customer collateral or ability to repay. Such financial instruments are recorded when they are funded.
VIEs
United holds investments in certain legal entities that are considered VIEs. VIEs are legal entities in which equity investors do not have sufficient equity at risk for the entity to independently finance its activities, or as a group, the holders of the equity investment at risk lack the power through voting or similar rights to direct the activities of the entity that most significantly impact its economic performance, or do not have the obligation to absorb the expected losses of the entity or the right to receive expected residual returns of the entity. Consolidation of a VIE is required if a reporting entity is the primary beneficiary of the VIE.
Investments in VIEs are evaluated to determine if United is the primary beneficiary. This evaluation gives appropriate consideration to the design of the entity and the variability that the entity was designed to create and pass along, the relative power of each party, and to United’s obligation to absorb losses or receive residual returns of the entity. United has variable interests in certain entities that are not required to be consolidated, including LIHTC, renewable energy and other partnership interests. Refer to Note 23, Commitments and Contingencies, for additional disclosures regarding United’s VIEs.
UNITED COMMUNITY BANKS, INC. AND SUBSIDIARIES
Notes to Consolidated Financial Statements
(1) Summary of Significant Accounting Policies, continued
With the exception of LIHTC partnerships, investments in entities for which United has the ability to exercise significant influence, but not control, over operating and financing decisions are accounted for using the equity method of accounting. Equity method investments are included in other assets in the consolidated balance sheets at cost, adjusted to reflect United’s portion of income, loss, or dividends of the investee. United records its portion of income or loss in other noninterest income in the consolidated statements of income. These investments are periodically evaluated for impairment.
LIHTC investments are accounted for using the proportional amortization method of accounting for qualified affordable housing investments, which results in the amortization being reported as a component of income tax expense. Obligations related to unfunded commitments for LIHTC and renewable energy investments are reported in other liabilities. Investment tax credits related to renewable energy are accounted for using the deferral method, such that the investment tax credits are recognized as a reduction to the related investment.
Revenue from Contracts with Customers
In addition to lending and related activities, United offers various services to customers that generate revenue, certain of which are governed by ASC Topic 606 Revenue from Contracts with Customers. United’s services that fall within the scope of this topic are presented within noninterest income and include service charges and fees, wealth management fees, and other transaction-based fees. Revenue is recognized when the transactions occur or as services are performed over primarily monthly or quarterly periods. Payment is typically received in the period the transactions occur. Fees may be fixed or, where applicable, based on a percentage of transaction size.
Income Taxes
DTAs and DTLs are recorded for the future tax consequences attributable to differences between the financial statement carrying amounts of existing assets and liabilities and their respective tax bases. Future tax benefits are recognized to the extent that realization of such benefits is more likely than not. DTAs and DTLs are measured using enacted tax rates expected to apply to taxable income in the years in which the assets and liabilities are expected to be recovered or settled. The effect of a change in tax rates on DTAs and DTLs is recognized in income tax expense during the period that includes the enactment date.
In the event the future tax consequences of differences between the financial reporting bases and the tax bases of assets and liabilities results in DTAs, an evaluation of the probability of being able to realize the future benefits indicated by such asset is required. A valuation allowance is provided for the portion of the DTA when it is more likely than not that some or all of the DTA will not be realized. In assessing the realizability of the DTAs, management considers the scheduled reversals of DTLs, projected future taxable earnings and prudent and feasible tax planning strategies. Management weighs both the positive and negative evidence, giving more weight to evidence that can be objectively verified.
The income tax benefit or expense is the total of the current year income tax due or refundable and the change in DTAs and DTLs.
A tax position is recognized as a benefit only if it is “more likely than not” that the tax position would be sustained in a tax examination, with a tax examination being presumed to occur. The amount recognized is the largest amount of tax benefit that is greater than 50 percent likely of being realized on examination. For tax positions not meeting the “more likely than not” test, no tax benefit is recorded.
United recognizes interest and / or penalties related to income tax matters in income tax expense.
Derivative Instruments and Hedging Activities
United’s interest rate risk management strategy incorporates the use of derivative instruments to minimize fluctuations in net income that are caused by interest rate volatility. The objective is to manage interest rate sensitivity by modifying the repricing or maturity characteristics of certain balance sheet assets and liabilities so that net interest revenue and certain interest sensitive components of noninterest revenue are not, on a material basis, adversely affected by movements in interest rates. United views this strategy as a prudent management of interest rate risk, such that net income is not exposed to undue risk presented by changes in interest rates. In carrying out this part of its interest rate risk management strategy, management uses derivatives, primarily interest rate swaps and caps. Interest rate swaps generally involve the exchange of fixed- and variable-rate interest payments between two parties, based on a common notional principal amount and maturity date.
UNITED COMMUNITY BANKS, INC. AND SUBSIDIARIES
Notes to Consolidated Financial Statements
(1) Summary of Significant Accounting Policies, continued
By using derivative instruments, United is exposed to credit and market risk. If the counterparty fails to perform, credit risk is represented by the fair value gain in a derivative. When the fair value of a derivative contract is positive, this situation generally indicates that the counterparty is obligated to pay United, and, therefore, creates a repayment risk for United. When the fair value of a derivative contract is negative, United is obligated to pay the counterparty and, therefore, has no repayment risk. United minimizes the credit risk in non-customer derivative instruments by entering into transactions with high-quality counterparties that are reviewed periodically by management. United also requires non-customer counterparties to pledge cash as collateral to cover the net exposure. All new non-customer derivatives that can be cleared are cleared through a central clearinghouse, which reduces counterparty exposure.
United classifies its derivative financial instruments as either (1) a hedge of an exposure to changes in the fair value of a recorded asset or liability (“fair value hedge”), (2) a hedge of an exposure to changes in the cash flows of a recognized asset, liability or forecasted transaction (“cash flow hedge”), or (3) derivatives not designated as accounting hedges. Changes in the fair value of derivatives not designated as hedges are recognized in current period earnings. United has master netting agreements with the derivatives dealers with which it does business, but, in accordance with its election not to offset, reflects gross assets and liabilities at fair value on the consolidated balance sheets.
Fair Value Hedges of Interest Rate Risk
United is exposed to changes in the fair value of certain of its fixed-rate financial instruments due to changes in interest rates. United uses interest rate swaps to manage its exposure to changes in fair value on these instruments attributable to changes in interest rates. For derivatives designated and that qualify as fair value hedges, the gain or loss on the derivative as well as the offsetting loss or gain on the hedged item attributable to the hedged risk are recognized in earnings. United includes the gain or loss on the hedged items in the same income statement line item as the offsetting loss or gain on the related derivatives.
Cash Flow Hedges of Interest Rate Risk
United enters into cash flow hedges to mitigate exposure to the variability of future cash flows or other forecasted transactions. At December 31, 2023 and 2022, United utilized interest rate caps and swaps to hedge the variability of cash flows due to changes in interest rates on certain of its variable-rate subordinated debt and trust preferred securities. United considers these derivatives to be highly effective at achieving offsetting changes in cash flows attributable to changes in interest rates. Therefore, changes in the fair value of these derivative instruments are recognized in OCI. Gains and losses related to changes in fair value are reclassified into earnings in the periods the hedged forecasted transactions occur. Losses representing amortization of the premium recorded on cash flow hedges, which is a component excluded from the assessment of effectiveness, are recognized in earnings on a straight-line basis in the same financial statement line as the hedged item over the term of the hedge.
Derivatives Not Designated as Hedging Instruments
Customer derivative positions include swaps, caps, and collars between United and certain commercial loan customers with offsetting positions to dealers under a back-to-back program.
United originates certain residential mortgage loans with the intention of selling these loans. Between the time United enters into an interest-rate lock commitment to originate a residential mortgage loan that is to be held for sale and the time the loan is funded and eventually sold, the Company is subject to the risk of variability in market prices. United also enters into forward sale agreements to mitigate risk and to protect the expected gain on the eventual loan sale. The commitments to originate residential mortgage loans and forward loan sales commitments are freestanding derivative instruments which are entered into as part of an economic hedging strategy to manage exposure related to mortgage loans held for sale. Fair value adjustments on these derivative instruments are recorded within mortgage loan gains and related fees in the consolidated statements of income.
United also has interest rate swap contracts that are economic hedges of market-linked brokered certificates of deposit, but are not designated as hedging instruments. The market-linked brokered certificates of deposit contain embedded derivatives that are bifurcated from the host instruments and marked to market through earnings. The fair value marks on the market linked swaps and the bifurcated embedded derivatives tend to move in opposite directions and therefore provide an economic hedge.
In addition, United occasionally enters into credit risk participation agreements with counterparty banks to accept or transfer a portion of the credit risk related to interest rate swaps. These agreements, which are typically executed in conjunction with a participation in a loan with the same customer, allow customers to execute an interest rate swap with one bank while allowing for the distribution of the credit risk among participating members. These agreements provide for reimbursement of losses resulting from a third party default on the underlying swap. Collateral used to support the credit risk for the underlying lending relationship is also available to offset the risk of the credit risk participation.
UNITED COMMUNITY BANKS, INC. AND SUBSIDIARIES
Notes to Consolidated Financial Statements
(1) Summary of Significant Accounting Policies, continued
Hedge Effectiveness
United assesses hedge effectiveness at inception and over the life of the hedge. Management documents, at inception, its analysis of actual and expected hedge effectiveness. This analysis includes techniques such as regression analysis and hypothetical derivatives to demonstrate that the hedge is expected to be highly effective in offsetting corresponding changes in the fair value or cash flows of the hedged item. At least quarterly thereafter, the terms of the hedging instrument and the hedged item are assessed to determine whether a material change has occurred relating to the hedge relationship. If it is determined that a change has occurred, a quantitative analysis as described will occur to determine whether the hedge is expected to be highly effective in offsetting future corresponding changes in the fair value or cash flows of the hedged item. For a qualifying fair value hedge, the changes in the value of derivatives are recognized in current period earnings along with the corresponding changes in the fair value of the designated hedged item attributable to the risk being hedged. For a qualifying cash flow hedge, the changes in the fair value of the derivatives that have been highly effective are recognized in OCI until the related cash flows from the hedged item are recognized in earnings.
For fair value hedges and cash flow hedges, ineffectiveness is recognized in the same income statement line as interest accruals on the hedged item to the extent that changes in the value of the derivative instruments do not perfectly offset changes in the value of the hedged items. If the hedge ceases to be highly effective, United discontinues hedge accounting and recognizes the changes in fair value in current period earnings. If a derivative that qualifies as a fair value or cash flow hedge is terminated or the designation removed, the realized or then unrealized gain or loss is recognized into income over the life of the hedged item (fair value hedge) or over the time when the hedged item was forecasted to impact earnings (cash flow hedge). Immediate recognition in earnings is required upon sale or extinguishment of the hedged item (fair value hedge) or if it is probable that the hedged cash flows will not occur (cash flow hedge).
Acquisition Activities
United accounts for business combinations under the acquisition method of accounting. Assets acquired and liabilities assumed are measured and recorded at fair value at the date of acquisition, including identifiable intangible assets. If the fair value of net assets purchased exceeds the fair value of consideration paid, a bargain purchase gain is recognized at the date of acquisition. Conversely, if the consideration paid exceeds the fair value of the net assets acquired, goodwill is recognized at the acquisition date. Fair values are subject to refinement for a period not to exceed one year after the closing date of an acquisition as information relative to closing date fair values becomes available.
Fair values for acquired loans are generally based on a discounted cash flow methodology that considers credit loss expectations, market interest rates and other market factors such as liquidity from the perspective of a market participant. Loans are grouped together according to similar characteristics and are generally treated in the aggregate when applying various valuation techniques. The probability of default, loss given default and prepayment assumptions are the key factors driving credit losses which are embedded into the estimated cash flows. These assumptions are informed by internal data on loan characteristics, historical loss experience, and current and forecasted economic conditions. The interest and liquidity component of the estimate is determined by discounting interest and principal cash flows through the expected life of each loan. The discount rates used for loans are based on current market rates for new originations of comparable loans and include adjustments for liquidity. The discount rate does not include a factor for credit losses as that has been included as a reduction to the estimated cash flows. For additional information about the accounting for purchased loans see PCD Loans under the Loans and Leases section of this footnote.
All identifiable intangible assets that are acquired in a business combination are recognized at fair value on the acquisition date. Identifiable intangible assets are recognized separately if they arise from contractual or other legal rights or if they are separable (i.e., capable of being sold, transferred, licensed, rented, or exchanged separately from the entity). Deposit liabilities and the related depositor relationship intangible assets may be exchanged in observable exchange transactions. As a result, the depositor relationship intangible asset is considered identifiable, because the separability criterion has been met.
Earnings Per Common Share
Basic earnings per common share is net income available to common shareholders divided by the weighted average number of shares of common stock outstanding during the period. All outstanding unvested share-based payment awards that contain rights to nonforfeitable dividends are considered participating securities for this calculation. Additionally, shares issuable to participants in United’s deferred compensation plan are considered to be participating securities for purposes of calculating basic earnings per share. Accordingly, net income available to common shareholders is calculated pursuant to the two-class method, whereby net income after adjusting for preferred stock dividends and any discount or premium on preferred shares repurchased is allocated between common shareholders and participating securities. Diluted earnings per common share includes the dilutive effect of
UNITED COMMUNITY BANKS, INC. AND SUBSIDIARIES
Notes to Consolidated Financial Statements
(1) Summary of Significant Accounting Policies, continued
additional potential shares of common stock issuable under stock options, unvested restricted stock units without nonforfeitable rights to dividends, warrants and securities convertible into common stock.
Loss Contingencies
Loss contingencies, including claims and legal actions arising in the ordinary course of business, are recorded as liabilities when the likelihood of loss is probable and an amount or range of loss can be reasonably estimated. Management does not believe there are such matters that will have a material effect on the financial statements.
Dividend Restrictions
Banking regulations require maintaining certain capital levels and may limit dividends paid by the Bank to the Holding Company or by the Holding Company to shareholders. As a South Carolina state-chartered bank, the Bank is permitted to pay a dividend of up to 100% of its current year earnings without requesting approval of the SCBFI, provided certain conditions are met. Prior to July 1, 2021, as a Georgia state-chartered bank, the Board could declare dividends from the Bank to the Holding Company out of retained earnings of up to 50% of the Bank’s net income from the previous year without notifying or seeking approval from the GADBF, provided certain conditions were met.
Fair Value of Financial Instruments
Fair values of financial instruments are estimated using relevant market information and other assumptions as more fully disclosed in Note 15. Fair value estimates involve uncertainties and matters of significant judgment regarding interest rates, credit risk, prepayments, and other factors, especially in the absence of broad markets for particular items. Changes in assumptions or in market conditions could significantly affect these estimates.
Stock-Based Compensation
United uses the fair value method of recognizing expense for stock-based compensation based on the fair value of option and restricted stock unit awards at the date of grant. United accounts for forfeitures as they occur.
(2) Accounting Standards Updates and Recently Adopted Standards
Recently Adopted Standards
In October 2021, the FASB issued ASU No. 2021-08, Business Combinations (Topic 805): Accounting for Contract Assets and Contract Liabilities from contracts with Customers. The update requires that an acquiring entity apply the guidance from Revenue from Contracts with Customers (Topic 606) to recognize and measure contract assets and contract liabilities in a business combination, rather than fair value. Adoption of this update as of January 1, 2023 did not have a material impact on the consolidated financial statements.
In March 2022, the FASB issued ASU No. 2022-01, Derivatives and Hedging (Topic 815): Fair Value Hedging - Portfolio Layer Method. The update expands the current last-of-layer method to a portfolio layer method which allows multiple hedged layers of a single closed portfolio and non-prepayable financial assets. In addition, the update specifies that eligible hedging instruments may include spot-starting or forward-starting swaps and that the number of hedged layers corresponds with the number of hedges designated. Finally, the update provides additional guidance on the accounting for and disclosure of hedge basis adjustments. Adoption of this update as of January 1, 2023 did not have a material impact on the consolidated financial statements.
In March 2022, the FASB issued ASU No. 2022-02, Financial Instruments - Credit Losses (Topic 326): Troubled Debt Restructurings and Vintage Disclosures. The update eliminates the previous accounting guidance for TDRs by creditors, while enhancing disclosure requirements for certain loan refinancings and restructurings when a borrower is experiencing financial difficulty. The update also requires that an entity disclose current-period gross charge-offs by year of origination. United adopted this update using a modified retrospective transition method as of January 1, 2023. The quantitative impact of adoption related to the CECL calculation for FDMs was not material; thus, no corresponding cumulative effect adjustment to retained earnings was recorded.
Accounting Standards Updates Not Yet Adopted as of December 31, 2023
In June 2022, the FASB issued ASU No. 2022-03, Fair Value Measurement (Topic 820) - Fair Value Measurement of Equity Securities Subject to Contractual Sale Restrictions. The update clarifies that a contractual restriction on the sale of an equity security is not considered part of the unit of account and, therefore, is not considered in measuring fair value. Adoption of this update as of January 1, 2024 did not have a material impact on the consolidated financial statements.
UNITED COMMUNITY BANKS, INC. AND SUBSIDIARIES
Notes to Consolidated Financial Statements
(2) Accounting Standards Updates and Recently Adopted Standards, continued
In March 2023, the FASB issued ASU No. 2023-02, Investments - Equity Method and Joint Ventures (Topic 323): Accounting for Investments in Tax Credit Structures Using the Proportional Amortization Method. The update broadens the application of the proportional amortization method to tax equity investments other than LIHTC, providing certain conditions are met. The election to apply the proportional amortization method must be made on a tax-credit-program by tax-credit-program basis rather than at the reporting entity level or to individual investments. The update also requires certain disclosures related to those investments for which the proportional amortization method has been applied. Adoption of this update as of January 1, 2024 did not have a material impact on the consolidated financial statements.
In August 2023, the FASB issued ASU No. 2023-05, Business Combinations - Joint Venture Formations (Subtopic 805-60): Recognition and Initial Measurement. The update addresses the accounting for contributions made to a joint venture, upon formation, in a joint venture’s separate financial statements. Specifically, a joint venture must apply a new basis of accounting upon formation and will initially measure its assets and liabilities at fair value. This guidance is effective prospectively for all joint venture formations dated on or after January 1, 2025. United does not expect the new guidance to have a material impact on its consolidated financial statements.
In October 2023, the FASB issued ASU No. 2023-06, Disclosure Improvements - Codification Amendments in Response to the SEC’s Disclosure Update and Simplification Initiative. The update clarifies or improves disclosure and presentation requirements for a variety of topics, including cash flows from derivative instruments, methods used in the diluted earnings per share computation and weighted-average interest rates on short term borrowings, This guidance is effective prospectively from the date on which the SEC’s removal of that related disclosure from Regulation S-X or Regulation S-K becomes effective. United does not expect the new guidance to have a material impact on its consolidated financial statements.
In November 2023, the FASB issued ASU No. 2023-07, Segment Reporting (Topic 280): Improvements to Reportable Segment Disclosures. The update requires enhanced disclosures, primarily about significant segment expenses, and requires that a public entity that has a single reportable segment provide all required disclosures. Adoption of this update as of January 1, 2024 did not have a material impact on the consolidated financial statements; required disclosures will be included in the December 31, 2024 financial statements and interim periods beginning in 2025.
In December 2023, the FASB issued ASU No. 2023-09, Income Taxes (Topic 740): Improvements to Income Tax Disclosures. The update requires disclosure of specific categories in the rate reconciliation and information for reconciling items that meet a quantitative threshold. In addition, the update requires disaggregated disclosure of income taxes paid and income tax expense by jurisdiction. This guidance is effective for annual periods beginning after December 31, 2024. United does not expect the new guidance to have a material impact on its consolidated financial statements.
(3) Acquisitions
The following note details acquisitions accounted for as business combinations during the periods covered by this Report. Accordingly, assets acquired and liabilities assumed are presented at fair value as of the acquisition date. The determination of fair value requires management to make estimates about discount rates, future expected cash flows, market conditions and other future events that are highly subjective in nature and subject to change. Goodwill is established when the fair value of consideration paid exceeds the fair value of the identifiable assets acquired and liabilities assumed. Fair values are considered preliminary for a period not to exceed one year after the acquisition date and are subject to refinement as information relative to closing date fair values becomes available.
UNITED COMMUNITY BANKS, INC. AND SUBSIDIARIES
Notes to Consolidated Financial Statements
(3) Acquisitions, continued
Acquisition of First Miami
On July 1, 2023, United acquired all of the outstanding common stock of First Miami in a stock transaction. First Miami operated three branches in the Miami metropolitan area, which facilitated United’s expansion within that market. United’s operating results for the year ended December 31, 2023 include the operating results of the acquired business for the period subsequent to the acquisition date of July 1, 2023.
The following table presents purchased assets and assumed liabilities recorded at their acquisition date fair values and consideration transferred as well as supplementary information related to the acquired loan portfolio at the acquisition date (in thousands).
|
|
|
|
|
|
|
|
|
|
|
|
|
First National Bank of South Miami |
|
|
|
|
|
|
Fair Value Recorded by United |
|
|
|
July 1, 2023 |
|
|
Assets |
|
|
|
Cash and cash equivalents |
$ |
150,467 |
|
|
|
Debt securities |
216,703 |
|
|
|
Loans held for investment |
577,183 |
|
|
|
Premises and equipment |
11,905 |
|
|
|
Core deposit intangible |
17,950 |
|
|
|
Other assets |
20,909 |
|
|
|
Total assets acquired |
995,117 |
|
|
|
Liabilities |
|
|
|
Deposits |
865,387 |
|
|
|
Short-term borrowings |
47,664 |
|
|
|
Other liabilities |
17,581 |
|
|
|
Total liabilities assumed |
930,632 |
|
|
|
Total identifiable net assets |
64,485 |
|
|
|
Consideration transferred |
|
|
|
Cash |
2 |
|
|
|
Common stock issued (3,508,604 shares) |
87,679 |
|
|
|
Total fair value of consideration transferred |
87,681 |
|
|
|
Goodwill |
$ |
23,196 |
|
|
|
|
|
|
|
Supplementary Information on Acquired Loans |
|
|
|
July 1, 2023 |
|
|
PCD loans: |
|
|
|
Par value |
$ |
94,902 |
|
|
|
ACL at acquisition |
(3,717) |
|
|
|
Non-credit discount |
(6,607) |
|
|
|
Purchase price |
$ |
84,578 |
|
|
|
|
|
|
|
Non-PCD loans: |
|
|
|
Fair value |
$ |
492,605 |
|
|
|
Gross contractual amounts receivable |
622,181 |
|
|
|
Estimate of contractual cash flows not expected to be collected |
7,012 |
|
|
Goodwill represents the intangible value of First Miami’s business and reputation within the markets it served and is not expected to be deductible for income tax purposes. The First Miami core deposit intangible will be amortized over its expected useful life of 10 years using the sum-of-the-years-digits method.
UNITED COMMUNITY BANKS, INC. AND SUBSIDIARIES
Notes to Consolidated Financial Statements
(3) Acquisitions, continued
Acquisition of Progress
On January 3, 2023, United acquired all of the outstanding common stock of Progress in a stock transaction. Progress operated 13 offices primarily located in Alabama and the Florida Panhandle, which facilitated United’s growth into those markets. United’s operating results for the year ended December 31, 2023 include the operating results of the acquired business for the period subsequent to the acquisition date of January 3, 2023.
The purchased assets and assumed liabilities were recorded at their acquisition date fair values and are summarized in the table below (dollars in thousands).
|
|
|
|
|
|
|
|
|
|
|
|
|
Progress |
|
|
|
|
|
|
Fair Value Recorded by United |
|
|
|
January 3, 2023 |
|
|
Assets |
|
|
|
Cash and cash equivalents |
$ |
57,548 |
|
|
|
Debt securities |
111,006 |
|
|
|
Loans held for sale |
2,087 |
|
|
|
Loans held for investment |
1,442,959 |
|
|
|
Premises and equipment |
21,118 |
|
|
|
BOLI |
40,723 |
|
|
|
Core deposit intangible |
39,980 |
|
|
|
Other assets |
42,965 |
|
|
|
Total assets acquired |
1,758,386 |
|
|
|
Liabilities |
|
|
|
Deposits |
1,334,476 |
|
|
|
Short-term borrowings |
141,017 |
|
|
|
Federal Home Loan Bank advances |
95,000 |
|
|
|
Other liabilities |
26,529 |
|
|
|
Total liabilities assumed |
1,597,022 |
|
|
|
Total identifiable net assets |
161,364 |
|
|
|
Consideration transferred |
|
|
|
Cash |
447 |
|
|
|
Common stock issued (8,770,531 shares) |
296,444 |
|
|
|
Options converted |
10,017 |
|
|
|
Total fair value of consideration transferred |
306,908 |
|
|
|
Goodwill |
$ |
145,544 |
|
|
|
|
|
|
|
Supplementary Information on Acquired Loans |
|
|
|
January 3, 2023 |
|
|
PCD loans: |
|
|
|
Par value |
$ |
64,913 |
|
|
|
ACL at acquisition |
(2,704) |
|
|
|
Non-credit discount |
(150) |
|
|
|
Purchase price |
$ |
62,059 |
|
|
|
|
|
|
|
Non-PCD loans: |
|
|
|
Fair value |
$ |
1,380,900 |
|
|
|
Gross contractual amounts receivable |
1,626,243 |
|
|
|
Estimate of contractual cash flows not expected to be collected |
9,287 |
|
|
Goodwill represents the intangible value of Progress’ business and reputation within the markets it served and is not expected to be deductible for income tax purposes. The Progress core deposit intangible will be amortized over its expected useful life of 10 years using the sum-of-the-years-digits method.
UNITED COMMUNITY BANKS, INC. AND SUBSIDIARIES
Notes to Consolidated Financial Statements
(3) Acquisitions, continued
Reliant
On January 1, 2022, United acquired all of the outstanding common stock of Reliant in a stock transaction. Reliant operated a 25-branch network primarily located in Middle Tennessee, which facilitated United’s growth into those markets. United’s operating results for the year ended December 31, 2022 include the operating results of the acquired business for the period subsequent to the acquisition date of January 1, 2022. The following table presents purchased assets and assumed liabilities recorded at their acquisition date fair values and consideration transferred as well as supplementary information related to the acquired loan portfolio at the acquisition date (in thousands).
|
|
|
|
|
|
|
|
|
|
|
|
|
Reliant |
|
|
|
|
|
|
Fair Value Recorded by United |
|
|
|
January 1, 2022 |
|
|
Assets |
|
|
|
Cash and cash equivalents |
$ |
62,867 |
|
|
|
Debt securities |
249,107 |
|
|
|
Loans held for sale |
116,406 |
|
|
|
Loans held for investment |
2,320,737 |
|
|
|
Premises and equipment |
35,631 |
|
|
|
BOLI |
78,170 |
|
|
|
Accrued interest receivable |
12,027 |
|
|
|
Net deferred tax asset |
5,793 |
|
|
|
Core deposit intangible |
14,500 |
|
|
|
Other assets |
59,768 |
|
|
|
Total assets acquired |
2,955,006 |
|
|
|
Liabilities |
|
|
|
Deposits |
2,504,823 |
|
|
|
Short-term borrowings |
27,000 |
|
|
|
Long-term debt |
76,730 |
|
|
|
Other liabilities |
48,620 |
|
|
|
Total liabilities assumed |
2,657,173 |
|
|
|
Total identifiable net assets |
297,833 |
|
|
|
Consideration transferred |
|
|
|
Cash |
624 |
|
|
|
Common stock issued (16,571,545 shares) |
595,581 |
|
|
|
Options converted |
795 |
|
|
|
Total fair value of consideration transferred |
597,000 |
|
|
|
Goodwill |
$ |
299,167 |
|
|
|
|
|
|
|
Supplementary Information on Acquired Loans |
|
|
|
January 1, 2022 |
|
|
PCD loans: |
|
|
|
Par value |
$ |
258,462 |
|
|
|
ACL at acquisition |
(12,737) |
|
|
|
Non-credit discount |
(3,294) |
|
|
|
Purchase price |
$ |
242,431 |
|
|
|
|
|
|
|
Non-PCD loans: |
|
|
|
Fair value |
$ |
2,078,306 |
|
|
|
Gross contractual amounts receivable |
2,355,205 |
|
|
|
Estimate of contractual cash flows not expected to be collected |
25,990 |
|
|
Goodwill represents the intangible value of Reliant’s business and reputation within the markets it served and is not expected to be deductible for income tax purposes. The Reliant core deposit intangible will be amortized over its expected useful life of 10 years using the sum-of-the-years-digits method.
UNITED COMMUNITY BANKS, INC. AND SUBSIDIARIES
Notes to Consolidated Financial Statements
(3) Acquisitions, continued
Pro forma information - unaudited
The following table discloses the impact of the mergers with First Miami and Progress in 2023 and Reliant in 2022 since the respective acquisition dates through December 31 of the year of acquisition. The table also presents certain pro forma information as if First Miami and Progress had been acquired on January 1, 2022, Reliant had been acquired on January 1, 2021 and Aquesta and FinTrust had been acquired on January 1, 2020. These results combine the historical results of the acquired entities with United’s consolidated statements of income and, while adjustments were made for the estimated impact of certain fair value adjustments and other acquisition-related activity, they are not necessarily indicative of what would have occurred had the acquisitions taken place in earlier years.
For purposes of pro forma information, merger-related costs incurred in the year of acquisition are excluded from the actual acquisition year results and included in the pro forma acquisition year results. As a result, merger-related costs related to the acquisitions of First Miami and Progress of $11.6 million and $9.81 million, respectively, are reflected in 2022 pro forma information and merger related costs related to the acquisition of Reliant of $15.7 million are reflected in 2021 pro forma information. Merger related costs related to the acquisitions of Aquesta and FinTrust of $9.00 million and $518,000, respectively, were previously reported in 2020 pro forma information, which is not presented in the following table.
The following table presents the actual results and pro forma information for the periods indicated (in thousands).
|
|
|
|
|
|
|
|
|
|
|
|
|
(Unaudited)
Year Ended December 31,
|
| |
Revenue |
|
Net Income |
| 2023 |
|
|
|
| Actual Progress results included in statement of income since acquisition date |
$ |
58,924 |
|
|
$ |
20,836 |
|
| Actual First Miami results included in statement of income since acquisition date |
9,595 |
|
|
(2,179) |
|
| Supplemental consolidated pro forma as if First Miami and Progress had been acquired January 1, 2022 |
831,404 |
|
|
214,568 |
|
|
|
|
|
| 2022 |
|
|
|
| Actual Reliant results included in statement of income since acquisition date |
$ |
100,529 |
|
|
$ |
48,926 |
|
|
|
|
|
| Supplemental consolidated pro forma as if First Miami and Progress had been acquired January 1, 2022 and Reliant had been acquired January 1, 2021 |
945,711 |
|
|
302,264 |
|
|
|
|
|
| 2021 |
|
|
|
| Actual Aquesta results included in statement of income since acquisition date |
$ |
2,122 |
|
|
$ |
(282) |
|
| Actual FinTrust results included in statement of income since acquisition date |
4,326 |
|
|
(26) |
|
| Supplemental consolidated pro forma as if Reliant had been acquired January 1, 2021 and Aquesta and FinTrust had been acquired January 1, 2020 |
909,353 |
|
|
295,864 |
|
UNITED COMMUNITY BANKS, INC. AND SUBSIDIARIES
Notes to Consolidated Financial Statements
(4) Supplemental Cash Flow Information
The supplemental schedule of cash and noncash activities for the periods indicated is as follows (in thousands). See Note 14, Operating Leases, for information regarding noncash transactions related to ROU assets and lease liabilities.
|
|
|
|
|
|
|
|
|
|
|
|
|
|
|
|
|
|
|
2023 |
|
2022 |
|
2021 |
| Cash paid during the period for: |
|
|
|
|
|
| Interest |
$ |
408,532 |
|
|
$ |
58,713 |
|
|
$ |
32,000 |
|
| Income taxes |
57,956 |
|
|
50,499 |
|
|
55,754 |
|
|
|
|
|
|
|
| Significant non-cash investing and financing transactions: |
|
|
|
|
|
|
|
|
|
|
|
| Transfers of AFS securities to HTM securities |
$ |
— |
|
|
$ |
1,288,982 |
|
|
$ |
— |
|
|
|
|
|
|
|
|
|
|
|
|
|
|
|
|
|
|
|
|
|
|
|
|
|
|
|
|
|
|
|
|
|
|
|
|
|
| Acquisitions: |
|
|
|
|
|
| Assets acquired |
2,922,243 |
|
|
3,254,173 |
|
|
848,806 |
|
| Liabilities assumed |
2,527,654 |
|
|
2,657,173 |
|
|
695,420 |
|
| Net assets acquired |
394,589 |
|
|
597,000 |
|
|
153,386 |
|
| Value of common stock issued |
384,123 |
|
|
595,581 |
|
|
94,046 |
|
Other non-cash consideration (1) |
10,017 |
|
|
795 |
|
|
9,178 |
|
|
|
|
|
|
|
|
|
|
|
|
|
|
|
|
|
|
|
(1) See Note 3, Acquisitions, for further detail.
(5) Investments
The cost basis, unrealized gains and losses, and fair value of HTM debt securities as of the dates indicated are as follows (in thousands):
|
|
|
|
|
|
|
|
|
|
|
|
|
|
|
|
|
|
|
|
|
|
|
|
|
Amortized Cost |
|
Gross Unrealized Gains |
|
Gross Unrealized Losses |
|
Fair Value |
| As of December 31, 2023 |
|
|
|
|
|
|
|
| U.S. Treasuries |
$ |
19,864 |
|
|
$ |
— |
|
|
$ |
1,914 |
|
|
$ |
17,950 |
|
| U.S. Government agencies & GSEs |
99,052 |
|
|
— |
|
|
15,689 |
|
|
83,363 |
|
| State and political subdivisions |
292,705 |
|
|
171 |
|
|
50,437 |
|
|
242,439 |
|
| Residential MBS, Agency & GSE |
1,383,294 |
|
|
24 |
|
|
206,344 |
|
|
1,176,974 |
|
|
|
|
|
|
|
|
|
| Commercial MBS, Agency & GSE |
680,933 |
|
|
— |
|
|
118,539 |
|
|
562,394 |
|
|
|
|
|
|
|
|
|
| Supranational entities |
15,000 |
|
|
— |
|
|
2,500 |
|
|
12,500 |
|
| Total |
$ |
2,490,848 |
|
|
$ |
195 |
|
|
$ |
395,423 |
|
|
$ |
2,095,620 |
|
|
|
|
|
|
|
|
|
| As of December 31, 2022 |
|
|
|
|
|
|
|
| U.S. Treasuries |
$ |
19,834 |
|
|
$ |
— |
|
|
$ |
2,417 |
|
|
$ |
17,417 |
|
| U.S. Government agencies & GSEs |
99,679 |
|
|
— |
|
|
18,169 |
|
|
81,510 |
|
| State and political subdivisions |
295,945 |
|
|
56 |
|
|
64,340 |
|
|
231,661 |
|
| Residential MBS, Agency & GSE |
1,488,028 |
|
|
35 |
|
|
223,566 |
|
|
1,264,497 |
|
|
|
|
|
|
|
|
|
| Commercial MBS, Agency & GSE |
695,162 |
|
|
— |
|
|
111,586 |
|
|
583,576 |
|
|
|
|
|
|
|
|
|
| Supranational entities |
15,000 |
|
|
— |
|
|
2,588 |
|
|
12,412 |
|
| Total |
$ |
2,613,648 |
|
|
$ |
91 |
|
|
$ |
422,666 |
|
|
$ |
2,191,073 |
|
During 2022, United transferred AFS debt securities to HTM with a fair value on the transfer date of $1.29 billion, which included unrealized losses recorded in AOCI totaling $87.4 million. Transfer date unrealized losses are amortized and reclassified out of AOCI as a yield adjustment, which is offset by discount accretion of the transferred HTM securities. Amortization of transfer date unrealized losses and discount accretion are recognized over the remaining life of the securities.
UNITED COMMUNITY BANKS, INC. AND SUBSIDIARIES
Notes to Consolidated Financial Statements
(5) Investments, continued
The cost basis, unrealized gains and losses, and fair value of AFS debt securities as of the dates indicated are presented below (in thousands). During 2023, United entered into fair value hedges on stated amounts of a closed portfolio of AFS debt securities using the portfolio layer method, which is further explained in Note 8.
|
|
|
|
|
|
|
|
|
|
|
|
|
|
|
|
|
|
|
|
|
|
|
|
|
Amortized Cost |
|
Gross Unrealized Gains |
|
Gross Unrealized Losses |
|
Fair Value |
| As of December 31, 2023 |
|
|
|
|
|
|
|
| U.S. Treasuries |
$ |
398,021 |
|
|
$ |
39 |
|
|
$ |
10,711 |
|
|
$ |
387,349 |
|
| U.S. Government agencies & GSEs |
281,708 |
|
|
269 |
|
|
14,477 |
|
|
267,500 |
|
| State and political subdivisions |
182,546 |
|
|
5 |
|
|
18,502 |
|
|
164,049 |
|
| Residential MBS, Agency & GSE |
1,315,064 |
|
|
300 |
|
|
125,012 |
|
|
1,190,352 |
|
| Residential MBS, Non-agency |
339,330 |
|
|
— |
|
|
22,084 |
|
|
317,246 |
|
| Commercial MBS, Agency & GSE |
656,004 |
|
|
1,073 |
|
|
39,017 |
|
|
618,060 |
|
| Commercial MBS, Non-agency |
24,269 |
|
|
— |
|
|
675 |
|
|
23,594 |
|
|
|
|
|
|
|
|
|
| Corporate bonds |
218,285 |
|
|
64 |
|
|
17,127 |
|
|
201,222 |
|
| Asset-backed securities |
164,728 |
|
|
— |
|
|
3,016 |
|
|
161,712 |
|
|
|
|
|
|
|
|
|
| Total |
$ |
3,579,955 |
|
|
$ |
1,750 |
|
|
$ |
250,621 |
|
|
$ |
3,331,084 |
|
|
|
|
|
|
|
|
|
| As of December 31, 2022 |
|
|
|
|
|
|
|
| U.S. Treasuries |
$ |
163,972 |
|
|
$ |
— |
|
|
$ |
14,620 |
|
|
$ |
149,352 |
|
| U.S. Government agencies & GSEs |
266,347 |
|
|
463 |
|
|
16,694 |
|
|
250,116 |
|
| State and political subdivisions |
329,723 |
|
|
151 |
|
|
26,126 |
|
|
303,748 |
|
| Residential MBS, Agency & GSE |
1,609,442 |
|
|
13 |
|
|
160,636 |
|
|
1,448,819 |
|
| Residential MBS, Non-agency |
374,535 |
|
|
— |
|
|
27,873 |
|
|
346,662 |
|
| Commercial MBS, Agency & GSE |
720,282 |
|
|
471 |
|
|
79,407 |
|
|
641,346 |
|
| Commercial MBS, Non-agency |
31,624 |
|
|
— |
|
|
1,058 |
|
|
30,566 |
|
|
|
|
|
|
|
|
|
| Corporate bonds |
236,181 |
|
|
34 |
|
|
23,763 |
|
|
212,452 |
|
| Asset-backed securities |
239,220 |
|
|
— |
|
|
7,948 |
|
|
231,272 |
|
| Total |
$ |
3,971,326 |
|
|
$ |
1,132 |
|
|
$ |
358,125 |
|
|
$ |
3,614,333 |
|
At December 31, 2023 and 2022, securities with a carrying value of $4.12 billion and $2.53 billion, respectively, were pledged primarily to secure public deposits and provide contingent liquidity through the Bank Term Funding Program at the Federal Reserve Bank.
UNITED COMMUNITY BANKS, INC. AND SUBSIDIARIES
Notes to Consolidated Financial Statements
(5) Investments, continued
The following summarizes HTM debt securities in an unrealized loss position as of the dates indicated (in thousands):
|
|
|
|
|
|
|
|
|
|
|
|
|
|
|
|
|
|
|
|
|
|
|
|
|
|
|
|
|
|
|
|
|
|
|
|
| |
Less than 12 Months |
|
12 Months or More |
|
Total |
|
Fair Value |
|
Unrealized
Loss |
|
Fair Value |
|
Unrealized
Loss |
|
Fair Value |
|
Unrealized
Loss |
| As of December 31, 2023 |
|
|
|
|
|
|
|
|
|
|
|
| U.S. Treasuries |
$ |
— |
|
|
$ |
— |
|
|
$ |
17,951 |
|
|
$ |
1,914 |
|
|
$ |
17,951 |
|
|
$ |
1,914 |
|
| U.S. Government agencies & GSEs |
— |
|
|
— |
|
|
83,363 |
|
|
15,689 |
|
|
83,363 |
|
|
15,689 |
|
| State and political subdivisions |
2,986 |
|
|
13 |
|
|
217,547 |
|
|
50,424 |
|
|
220,533 |
|
|
50,437 |
|
| Residential MBS, Agency & GSE |
311 |
|
|
2 |
|
|
1,175,263 |
|
|
206,342 |
|
|
1,175,574 |
|
|
206,344 |
|
|
|
|
|
|
|
|
|
|
|
|
|
| Commercial MBS, Agency & GSE |
6,533 |
|
|
115 |
|
|
555,861 |
|
|
118,424 |
|
|
562,394 |
|
|
118,539 |
|
|
|
|
|
|
|
|
|
|
|
|
|
| Supranational entities |
— |
|
|
— |
|
|
12,500 |
|
|
2,500 |
|
|
12,500 |
|
|
2,500 |
|
| Total unrealized loss position |
$ |
9,830 |
|
|
$ |
130 |
|
|
$ |
2,062,485 |
|
|
$ |
395,293 |
|
|
$ |
2,072,315 |
|
|
$ |
395,423 |
|
|
|
|
|
|
|
|
|
|
|
|
|
| As of December 31, 2022 |
|
|
|
|
|
|
|
|
|
|
|
| U.S. Treasuries |
$ |
17,417 |
|
|
$ |
2,417 |
|
|
$ |
— |
|
|
$ |
— |
|
|
$ |
17,417 |
|
|
$ |
2,417 |
|
| U.S. Government agencies & GSEs |
$ |
10,687 |
|
|
$ |
1,813 |
|
|
$ |
70,823 |
|
|
$ |
16,356 |
|
|
$ |
81,510 |
|
|
$ |
18,169 |
|
| State and political subdivisions |
104,243 |
|
|
20,639 |
|
|
117,115 |
|
|
43,701 |
|
|
221,358 |
|
|
64,340 |
|
| Residential MBS, Agency & GSE |
296,673 |
|
|
38,289 |
|
|
965,785 |
|
|
185,277 |
|
|
1,262,458 |
|
|
223,566 |
|
|
|
|
|
|
|
|
|
|
|
|
|
| Commercial MBS, Agency & GSE |
176,848 |
|
|
24,497 |
|
|
406,728 |
|
|
87,089 |
|
|
583,576 |
|
|
111,586 |
|
|
|
|
|
|
|
|
|
|
|
|
|
| Supranational entities |
12,412 |
|
|
2,588 |
|
|
— |
|
|
— |
|
|
12,412 |
|
|
2,588 |
|
| Total unrealized loss position |
$ |
618,280 |
|
|
$ |
90,243 |
|
|
$ |
1,560,451 |
|
|
$ |
332,423 |
|
|
$ |
2,178,731 |
|
|
$ |
422,666 |
|
The following summarizes AFS debt securities in an unrealized loss position as of the dates indicated (in thousands):
|
|
|
|
|
|
|
|
|
|
|
|
|
|
|
|
|
|
|
|
|
|
|
|
|
|
|
|
|
|
|
|
|
|
|
|
| |
Less than 12 Months |
|
12 Months or More |
|
Total |
|
Fair Value |
|
Unrealized
Loss |
|
Fair Value |
|
Unrealized
Loss |
|
Fair Value |
|
Unrealized
Loss |
| As of December 31, 2023 |
|
|
|
|
|
|
|
|
|
|
|
| U.S. Treasuries |
$ |
100,369 |
|
|
$ |
39 |
|
|
$ |
103,535 |
|
|
$ |
10,672 |
|
|
$ |
203,904 |
|
|
$ |
10,711 |
|
| U.S. Government agencies & GSEs |
41,960 |
|
|
141 |
|
|
184,184 |
|
|
14,336 |
|
|
226,144 |
|
|
14,477 |
|
| State and political subdivisions |
— |
|
|
— |
|
|
163,278 |
|
|
18,502 |
|
|
163,278 |
|
|
18,502 |
|
| Residential MBS, Agency & GSE |
50,014 |
|
|
672 |
|
|
1,108,290 |
|
|
124,340 |
|
|
1,158,304 |
|
|
125,012 |
|
| Residential MBS, Non-agency |
— |
|
|
— |
|
|
317,247 |
|
|
22,084 |
|
|
317,247 |
|
|
22,084 |
|
| Commercial MBS, Agency & GSE |
98,052 |
|
|
2,494 |
|
|
342,390 |
|
|
36,523 |
|
|
440,442 |
|
|
39,017 |
|
| Commercial MBS, Non-agency |
— |
|
|
— |
|
|
23,594 |
|
|
675 |
|
|
23,594 |
|
|
675 |
|
| Corporate bonds |
4,016 |
|
|
116 |
|
|
195,329 |
|
|
17,011 |
|
|
199,345 |
|
|
17,127 |
|
| Asset-backed securities |
11,855 |
|
|
53 |
|
|
149,857 |
|
|
2,963 |
|
|
161,712 |
|
|
3,016 |
|
| Total unrealized loss position |
$ |
306,266 |
|
|
$ |
3,515 |
|
|
$ |
2,587,704 |
|
|
$ |
247,106 |
|
|
$ |
2,893,970 |
|
|
$ |
250,621 |
|
|
|
|
|
|
|
|
|
|
|
|
|
| As of December 31, 2022 |
|
|
|
|
|
|
|
|
|
|
|
| U.S. Treasuries |
$ |
49,259 |
|
|
$ |
724 |
|
|
$ |
100,093 |
|
|
$ |
13,896 |
|
|
$ |
149,352 |
|
|
$ |
14,620 |
|
| U.S. Government agencies & GSEs |
93,015 |
|
|
2,124 |
|
|
108,093 |
|
|
14,570 |
|
|
201,108 |
|
|
16,694 |
|
| State and political subdivisions |
207,749 |
|
|
9,906 |
|
|
62,606 |
|
|
16,220 |
|
|
270,355 |
|
|
26,126 |
|
| Residential MBS, Agency & GSE |
1,049,648 |
|
|
102,852 |
|
|
392,288 |
|
|
57,784 |
|
|
1,441,936 |
|
|
160,636 |
|
| Residential MBS, Non-agency |
338,399 |
|
|
27,095 |
|
|
8,263 |
|
|
778 |
|
|
346,662 |
|
|
27,873 |
|
| Commercial MBS, Agency & GSE |
288,787 |
|
|
17,304 |
|
|
332,088 |
|
|
62,103 |
|
|
620,875 |
|
|
79,407 |
|
| Commercial MBS, Non-agency |
30,566 |
|
|
1,058 |
|
|
— |
|
|
— |
|
|
30,566 |
|
|
1,058 |
|
| Corporate bonds |
83,010 |
|
|
7,776 |
|
|
127,603 |
|
|
15,987 |
|
|
210,613 |
|
|
23,763 |
|
| Asset-backed securities |
97,705 |
|
|
2,664 |
|
|
133,567 |
|
|
5,284 |
|
|
231,272 |
|
|
7,948 |
|
| Total unrealized loss position |
$ |
2,238,138 |
|
|
$ |
171,503 |
|
|
$ |
1,264,601 |
|
|
$ |
186,622 |
|
|
$ |
3,502,739 |
|
|
$ |
358,125 |
|
At December 31, 2023, there were 638 AFS debt securities and 309 HTM debt securities that were in an unrealized loss position. Management does not intend to sell nor believes it will be required to sell securities in an unrealized loss position prior to the recovery of its amortized cost basis. Unrealized losses at December 31, 2023 and 2022 were primarily attributable to changes in interest rates.
UNITED COMMUNITY BANKS, INC. AND SUBSIDIARIES
Notes to Consolidated Financial Statements
(5) Investments, continued
At December 31, 2023 and 2022, calculated credit losses and, thus, the related ACL on HTM debt securities were de minimis due to the high credit quality of the portfolio, which included securities issued or guaranteed by the U.S. Treasury, U.S. Government agencies, GSEs, high credit quality municipalities and supranational entities. As a result, no ACL was recorded on the HTM portfolio at December 31, 2023 and 2022. In addition, based on the assessment performed as of December 31, 2023 and 2022, there was no ACL required related to the AFS portfolio. See Note 1 for additional details on the ACL as it relates to the securities portfolio.
The following table presents accrued interest receivable for the periods indicated on HTM and AFS debt securities (in thousands), which was excluded from the estimate of credit losses.
|
|
|
|
|
|
|
|
|
|
|
|
|
|
|
|
|
|
|
|
Accrued Interest Receivable |
|
|
|
December 31, |
|
|
|
2023 |
|
2022 |
|
|
HTM |
$ |
6,143 |
|
|
$ |
7,234 |
|
|
|
AFS |
12,568 |
|
|
15,281 |
|
|
Realized gains and losses are derived using the specific identification method for determining the cost of the securities sold. The following summarizes securities sales activities for the years ended December 31 (in thousands):
|
|
|
|
|
|
|
|
|
|
|
|
|
|
|
|
|
|
|
|
|
|
|
|
|
|
2023 |
|
2022 |
|
2021 |
|
|
Proceeds from sales |
$ |
880,224 |
|
|
$ |
318,457 |
|
|
$ |
288,986 |
|
|
|
|
|
|
|
|
|
|
|
Gross gains on sales |
$ |
1,373 |
|
|
$ |
1,009 |
|
|
$ |
2,346 |
|
|
|
Gross losses on sales |
(54,706) |
|
|
(4,881) |
|
|
(2,263) |
|
|
|
Net gains (losses) on sales of securities |
$ |
(53,333) |
|
|
$ |
(3,872) |
|
|
$ |
83 |
|
|
|
|
|
|
|
|
|
|
|
Income tax benefit attributable to sales |
$ |
(13,575) |
|
|
$ |
(1,026) |
|
|
$ |
(46) |
|
|
UNITED COMMUNITY BANKS, INC. AND SUBSIDIARIES
Notes to Consolidated Financial Statements
(5) Investments, continued
The amortized cost and fair value of AFS and HTM debt securities at December 31, 2023, by contractual maturity, are presented in the following table (in thousands).
|
|
|
|
|
|
|
|
|
|
|
|
|
|
|
|
|
|
|
|
|
|
|
|
|
AFS |
|
HTM |
|
Amortized Cost |
|
Fair Value |
|
Amortized Cost |
|
Fair Value |
| Within 1 year: |
|
|
|
|
|
|
|
| U.S. Treasuries |
$ |
182,660 |
|
|
$ |
182,681 |
|
|
$ |
— |
|
|
$ |
— |
|
| U.S. Government agencies & GSEs |
283 |
|
|
282 |
|
|
— |
|
|
— |
|
| State and political subdivisions |
3,159 |
|
|
3,097 |
|
|
1,200 |
|
|
1,195 |
|
| Corporate bonds |
10,379 |
|
|
10,189 |
|
|
— |
|
|
— |
|
|
196,481 |
|
|
196,249 |
|
|
1,200 |
|
|
1,195 |
|
| 1 to 5 years: |
|
|
|
|
|
|
|
| U.S. Treasuries |
215,361 |
|
|
204,668 |
|
|
19,864 |
|
|
17,950 |
|
| U.S. Government agencies & GSEs |
39,362 |
|
|
36,652 |
|
|
— |
|
|
— |
|
| State and political subdivisions |
27,827 |
|
|
25,797 |
|
|
27,257 |
|
|
25,757 |
|
| Corporate bonds |
161,480 |
|
|
149,885 |
|
|
— |
|
|
— |
|
|
444,030 |
|
|
417,002 |
|
|
47,121 |
|
|
43,707 |
|
| 5 to 10 years: |
|
|
|
|
|
|
|
| U.S. Treasuries |
— |
|
|
— |
|
|
— |
|
|
— |
|
| U.S. Government agencies & GSEs |
90,259 |
|
|
83,095 |
|
|
72,632 |
|
|
61,964 |
|
| State and political subdivisions |
51,941 |
|
|
43,843 |
|
|
50,205 |
|
|
42,956 |
|
| Corporate bonds |
45,618 |
|
|
40,288 |
|
|
— |
|
|
— |
|
| Supranational entities |
— |
|
|
— |
|
|
15,000 |
|
|
12,500 |
|
|
187,818 |
|
|
167,226 |
|
|
137,837 |
|
|
117,420 |
|
| More than 10 years: |
|
|
|
|
|
|
|
|
|
|
|
|
|
|
|
| U.S. Government agencies & GSEs |
151,804 |
|
|
147,471 |
|
|
26,420 |
|
|
21,399 |
|
| State and political subdivisions |
99,619 |
|
|
91,312 |
|
|
214,043 |
|
|
172,531 |
|
| Corporate bonds |
808 |
|
|
860 |
|
|
— |
|
|
— |
|
|
252,231 |
|
|
239,643 |
|
|
240,463 |
|
|
193,930 |
|
| Debt securities not due at a single maturity: |
|
|
|
|
|
|
|
| Asset-backed securities |
164,728 |
|
|
161,712 |
|
|
— |
|
|
— |
|
| Residential MBS |
1,654,394 |
|
|
1,507,598 |
|
|
1,383,294 |
|
|
1,176,974 |
|
| Commercial MBS |
680,273 |
|
|
641,654 |
|
|
680,933 |
|
|
562,394 |
|
|
|
|
|
|
|
|
|
|
|
|
|
|
|
|
|
| Total |
$ |
3,579,955 |
|
|
$ |
3,331,084 |
|
|
$ |
2,490,848 |
|
|
$ |
2,095,620 |
|
Expected maturities may differ from contractual maturities because issuers and borrowers may have the right to call or prepay obligations.
Equity Investments
The table below reflects the carrying value of certain equity investments, which are included in other assets on the consolidated balance sheet, as of December 31 (in thousands).
|
|
|
|
|
|
|
|
|
|
|
|
|
|
|
|
|
|
|
|
December 31, |
|
|
|
2023 |
|
2022 |
|
|
|
|
|
|
|
|
FHLB Stock |
$ |
18,104 |
|
|
$ |
33,828 |
|
|
|
Equity securities with readily determinable fair values |
7,395 |
|
|
13,637 |
|
|
|
|
|
|
|
|
|
|
|
|
|
|
|
|
|
|
|
|
UNITED COMMUNITY BANKS, INC. AND SUBSIDIARIES
Notes to Consolidated Financial Statements
(6) Loans and Leases and Allowance for Credit Losses
Major classifications of the loan and lease portfolio (collectively referred to as the “loan portfolio” or “loans”) are summarized as of the dates indicated as follows (in thousands):
|
|
|
|
|
|
|
|
|
|
|
|
|
|
|
|
|
|
|
|
December 31, |
|
|
|
2023 |
|
2022 |
|
|
Owner occupied commercial real estate |
$ |
3,264,051 |
|
|
$ |
2,734,666 |
|
|
|
Income producing commercial real estate |
4,263,952 |
|
|
3,261,626 |
|
|
|
Commercial & industrial |
2,411,045 |
|
|
2,252,322 |
|
|
|
Commercial construction |
1,859,538 |
|
|
1,597,848 |
|
|
|
Equipment financing |
1,541,120 |
|
|
1,374,251 |
|
|
|
Total commercial |
13,339,706 |
|
|
11,220,713 |
|
|
|
Residential mortgage |
3,198,928 |
|
|
2,355,061 |
|
|
|
Home equity |
958,987 |
|
|
850,269 |
|
|
|
Residential construction |
301,650 |
|
|
442,553 |
|
|
|
Manufactured housing |
336,474 |
|
|
316,741 |
|
|
|
Consumer |
181,117 |
|
|
149,290 |
|
|
|
Total loans excluding fair value hedge basis adjustment (1) |
18,316,862 |
|
|
15,334,627 |
|
|
|
Fair value hedge basis adjustment |
1,893 |
|
|
— |
|
|
|
Total loans |
18,318,755 |
|
|
15,334,627 |
|
|
|
Less ACL - loans |
(208,071) |
|
|
(159,357) |
|
|
|
Loans, net |
$ |
18,110,684 |
|
|
$ |
15,175,270 |
|
|
(1) As of December 31, 2023 certain equipment financing loans are included in fair value hedging relationships using the portfolio layer method. See Note 8 for further detail.
At December 31, 2023 and 2022, $2.00 million and $2.04 million, respectively, in overdrawn deposit accounts were reclassified as consumer loans.
Accrued interest receivable related to loans totaled $67.0 million and $52.0 million at December 31, 2023 and 2022, respectively, and was reported in accrued interest receivable on the consolidated balance sheets.
At December 31, 2023, the loan portfolio included certain loans specifically pledged to the Federal Reserve as well as loans covered by a blanket lien on qualifying loan types with the FHLB to secure contingent funding sources.
The following table presents the amortized cost of certain loans held for investment that were sold in the periods presented (in thousands). The gains on these loan sales were included in noninterest income on the consolidated statements of income.
|
|
|
|
|
|
|
|
|
|
|
|
|
|
|
|
|
|
|
|
|
|
|
|
|
|
Loans Sold |
|
|
|
2023 |
|
2022 |
|
2021 |
|
|
Guaranteed portion of SBA/USDA loans |
$ |
94,758 |
|
|
$ |
104,813 |
|
|
$ |
90,903 |
|
|
|
Equipment financing receivables |
105,293 |
|
|
89,850 |
|
|
59,097 |
|
|
|
Total |
$ |
200,051 |
|
|
$ |
194,663 |
|
|
$ |
150,000 |
|
|
UNITED COMMUNITY BANKS, INC. AND SUBSIDIARIES
Notes to Consolidated Financial Statements
(6) Loans and Leases and Allowance for Credit Losses, continued
At December 31, 2023 and 2022, equipment financing assets included leases of $68.9 million and $46.0 million, respectively. The components of the net investment in leases, which included both sales-type and direct financing, are presented below (in thousands).
|
|
|
|
|
|
|
|
|
|
|
|
|
|
|
|
|
|
|
|
December 31, |
|
|
|
2023 |
|
2022 |
|
|
Minimum future lease payments receivable |
$ |
75,198 |
|
|
$ |
49,723 |
|
|
|
Estimated residual value of leased equipment |
4,445 |
|
|
2,804 |
|
|
|
Initial direct costs |
1,402 |
|
|
767 |
|
|
|
Security deposits |
(413) |
|
|
(429) |
|
|
|
|
|
|
|
|
|
Unearned income |
(11,711) |
|
|
(6,877) |
|
|
|
Net investment in leases |
$ |
68,921 |
|
|
$ |
45,988 |
|
|
Minimum future lease payments expected to be received from equipment financing lease contracts as of December 31, 2023 were as follows (in thousands):
|
|
|
|
|
|
|
|
|
|
|
|
|
Year |
|
|
|
2024 |
$ |
24,968 |
|
|
|
2025 |
20,860 |
|
|
|
2026 |
15,405 |
|
|
|
2027 |
10,234 |
|
|
|
2028 |
3,585 |
|
|
|
Thereafter |
146 |
|
|
|
Total |
$ |
75,198 |
|
|
UNITED COMMUNITY BANKS, INC. AND SUBSIDIARIES
Notes to Consolidated Financial Statements
(6) Loans and Leases and Allowance for Credit Losses, continued
Nonaccrual and Past Due Loans
The following table presents the amortized cost basis in loans by aging category and accrual status as of December 31, 2023 and 2022 (in thousands).
|
|
|
|
|
|
|
|
|
|
|
|
|
|
|
|
|
|
|
|
|
|
|
|
|
|
|
|
|
|
|
|
|
|
|
|
|
|
|
Accruing |
|
|
|
|
|
|
| |
|
|
Loans Past Due |
|
|
|
|
|
Current Loans |
|
30 - 59 Days |
|
60 - 89 Days |
|
> 90 Days |
|
|
|
Nonaccrual Loans |
|
Total Loans |
| As of December 31, 2023 |
|
|
|
|
|
|
|
|
|
|
|
|
|
| Owner occupied commercial real estate |
$ |
3,258,015 |
|
|
$ |
2,942 |
|
|
$ |
— |
|
|
$ |
— |
|
|
|
|
$ |
3,094 |
|
|
$ |
3,264,051 |
|
| Income producing commercial real estate |
4,230,140 |
|
|
3,684 |
|
|
— |
|
|
— |
|
|
|
|
30,128 |
|
|
4,263,952 |
|
| Commercial & industrial |
2,388,076 |
|
|
8,129 |
|
|
1,373 |
|
|
— |
|
|
|
|
13,467 |
|
|
2,411,045 |
|
| Commercial construction |
1,857,660 |
|
|
— |
|
|
— |
|
|
— |
|
|
|
|
1,878 |
|
|
1,859,538 |
|
| Equipment financing |
1,522,962 |
|
|
5,895 |
|
|
3,758 |
|
|
— |
|
|
|
|
8,505 |
|
|
1,541,120 |
|
| Total commercial |
13,256,853 |
|
|
20,650 |
|
|
5,131 |
|
|
— |
|
|
|
|
57,072 |
|
|
13,339,706 |
|
| Residential mortgage |
3,179,329 |
|
|
4,622 |
|
|
1,033 |
|
|
— |
|
|
|
|
13,944 |
|
|
3,198,928 |
|
Home equity |
950,841 |
|
|
4,106 |
|
|
268 |
|
|
— |
|
|
|
|
3,772 |
|
|
958,987 |
|
| Residential construction |
299,230 |
|
|
1,255 |
|
|
221 |
|
|
— |
|
|
|
|
944 |
|
|
301,650 |
|
| Manufactured housing |
304,794 |
|
|
12,622 |
|
|
3,197 |
|
|
— |
|
|
|
|
15,861 |
|
|
336,474 |
|
| Consumer |
180,245 |
|
|
686 |
|
|
92 |
|
|
— |
|
|
|
|
94 |
|
|
181,117 |
|
Total |
$ |
18,171,292 |
|
|
$ |
43,941 |
|
|
$ |
9,942 |
|
|
$ |
— |
|
|
|
|
$ |
91,687 |
|
|
$ |
18,316,862 |
|
|
|
|
|
|
|
|
|
|
|
|
|
|
|
| As of December 31, 2022 |
|
|
|
|
|
|
|
|
|
|
|
|
|
| Owner occupied commercial real estate |
$ |
2,731,574 |
|
|
$ |
1,522 |
|
|
$ |
1,047 |
|
|
$ |
— |
|
|
|
|
$ |
523 |
|
|
$ |
2,734,666 |
|
| Income producing commercial real estate |
3,257,232 |
|
|
468 |
|
|
41 |
|
|
— |
|
|
|
|
3,885 |
|
|
3,261,626 |
|
| Commercial & industrial |
2,234,284 |
|
|
3,288 |
|
|
274 |
|
|
6 |
|
|
|
|
14,470 |
|
|
2,252,322 |
|
| Commercial construction |
1,597,268 |
|
|
447 |
|
|
— |
|
|
— |
|
|
|
|
133 |
|
|
1,597,848 |
|
| Equipment financing |
1,362,622 |
|
|
4,285 |
|
|
1,906 |
|
|
— |
|
|
|
|
5,438 |
|
|
1,374,251 |
|
| Total commercial |
11,182,980 |
|
|
10,010 |
|
|
3,268 |
|
|
6 |
|
|
|
|
24,449 |
|
|
11,220,713 |
|
| Residential mortgage |
2,342,196 |
|
|
1,939 |
|
|
7 |
|
|
— |
|
|
|
|
10,919 |
|
|
2,355,061 |
|
Home equity |
844,888 |
|
|
2,709 |
|
|
784 |
|
|
— |
|
|
|
|
1,888 |
|
|
850,269 |
|
| Residential construction |
441,673 |
|
|
20 |
|
|
455 |
|
|
— |
|
|
|
|
405 |
|
|
442,553 |
|
Manufactured housing |
302,386 |
|
|
6,913 |
|
|
924 |
|
|
— |
|
|
|
|
6,518 |
|
|
316,741 |
|
| Consumer |
148,943 |
|
|
237 |
|
|
48 |
|
|
9 |
|
|
|
|
53 |
|
|
149,290 |
|
Total |
$ |
15,263,066 |
|
|
$ |
21,828 |
|
|
$ |
5,486 |
|
|
$ |
15 |
|
|
|
|
$ |
44,232 |
|
|
$ |
15,334,627 |
|
The following table presents nonaccrual loans by loan class for the periods indicated (in thousands).
|
|
|
|
|
|
|
|
|
|
|
|
|
|
|
|
|
|
|
|
|
|
|
|
|
|
|
|
|
|
|
|
|
|
|
|
|
Nonaccrual loans |
| |
December 31, 2023 |
|
December 31, 2022 |
|
With no allowance |
|
With an allowance |
|
Total |
|
With no allowance |
|
With an allowance |
|
Total |
| Owner occupied commercial real estate |
$ |
2,451 |
|
|
$ |
643 |
|
|
$ |
3,094 |
|
|
$ |
276 |
|
|
$ |
247 |
|
|
$ |
523 |
|
| Income producing commercial real estate |
11,003 |
|
|
19,125 |
|
|
30,128 |
|
|
3,798 |
|
|
87 |
|
|
3,885 |
|
| Commercial & industrial |
11,940 |
|
|
1,527 |
|
|
13,467 |
|
|
13,917 |
|
|
553 |
|
|
14,470 |
|
| Commercial construction |
1,784 |
|
|
94 |
|
|
1,878 |
|
|
69 |
|
|
64 |
|
|
133 |
|
| Equipment financing |
57 |
|
|
8,448 |
|
|
8,505 |
|
|
85 |
|
|
5,353 |
|
|
5,438 |
|
| Total commercial |
27,235 |
|
|
29,837 |
|
|
57,072 |
|
|
18,145 |
|
|
6,304 |
|
|
24,449 |
|
| Residential mortgage |
1,836 |
|
|
12,108 |
|
|
13,944 |
|
|
2,159 |
|
|
8,760 |
|
|
10,919 |
|
Home equity |
1,276 |
|
|
2,496 |
|
|
3,772 |
|
|
430 |
|
|
1,458 |
|
|
1,888 |
|
| Residential construction |
398 |
|
|
546 |
|
|
944 |
|
|
311 |
|
|
94 |
|
|
405 |
|
| Manufactured housing |
— |
|
|
15,861 |
|
|
15,861 |
|
|
— |
|
|
6,518 |
|
|
6,518 |
|
| Consumer |
2 |
|
|
92 |
|
|
94 |
|
|
3 |
|
|
50 |
|
|
53 |
|
| Total |
$ |
30,747 |
|
|
$ |
60,940 |
|
|
$ |
91,687 |
|
|
$ |
21,048 |
|
|
$ |
23,184 |
|
|
$ |
44,232 |
|
UNITED COMMUNITY BANKS, INC. AND SUBSIDIARIES
Notes to Consolidated Financial Statements
(6) Loans and Leases and Allowance for Credit Losses, continued
Risk Ratings
United categorizes commercial loans, with the exception of equipment financing receivables, into risk categories based on relevant information about the ability of borrowers to service their debt such as: current financial information, historical payment experience, credit documentation, public information, and current industry and economic trends, among other factors. United analyzes loans individually by classifying the loans as to credit risk. This analysis is performed on a continual basis. United uses the following definitions for its risk ratings:
Pass. Loans in this category are considered to have a low probability of default and do not meet the criteria of the risk categories below.
Special Mention. Loans in this category are presently protected from apparent loss, however weaknesses exist that could cause future impairment, including the deterioration of financial ratios, past due status and questionable management capabilities. These loans require more than the ordinary amount of supervision. Collateral values generally afford adequate coverage, but may not be immediately marketable.
Substandard. These loans are inadequately protected by the current net worth and paying capacity of the obligor or by the collateral pledged. Specific and well-defined weaknesses exist that may include poor liquidity and deterioration of financial ratios. The loan may be past due and related deposit accounts experiencing overdrafts. There is the distinct possibility that United will sustain some loss if deficiencies are not corrected. If possible, immediate corrective action is taken.
Doubtful. Specific weaknesses characterized as Substandard that are severe enough to make collection in full highly questionable and improbable. There is no reliable secondary source of full repayment.
Loss. Loans categorized as Loss have the same characteristics as Doubtful; however probability of loss is certain. Loans classified as Loss are charged off.
Equipment Financing Receivables and Consumer Purpose Loans. United applies a pass / fail grading system to all equipment financing receivables and consumer purpose loans. Under this system, loans that are on nonaccrual status, become past due 90 days or are in bankruptcy are classified as “fail” and all other loans are classified as “pass”. For reporting purposes, loans classified as “fail” are reported as “substandard” and all other loans are reported as “pass”.
UNITED COMMUNITY BANKS, INC. AND SUBSIDIARIES
Notes to Consolidated Financial Statements
(6) Loans and Leases and Allowance for Credit Losses, continued
The following tables present the risk category of term loans by vintage year, which is the year of origination or most recent renewal, as of the date indicated (in thousands).
|
|
|
|
|
|
|
|
|
|
|
|
|
|
|
|
|
|
|
|
|
|
|
|
|
|
|
|
|
|
|
|
|
|
|
|
|
|
|
|
|
|
|
|
|
|
|
|
|
|
|
|
|
|
|
Term Loans by Origination Year |
|
Revolvers |
|
Revolvers converted to term loans |
|
Total |
| As of December 31, 2023 |
2023 |
|
2022 |
|
2021 |
|
2020 |
|
2019 |
|
Prior |
|
|
|
| Owner occupied commercial real estate |
|
|
|
|
|
|
|
|
|
|
|
|
|
|
|
|
|
| Pass |
$ |
643,752 |
|
|
$ |
681,834 |
|
|
$ |
615,571 |
|
|
$ |
553,047 |
|
|
$ |
202,068 |
|
|
$ |
337,495 |
|
|
$ |
117,212 |
|
|
$ |
18,671 |
|
|
$ |
3,169,650 |
|
| Special Mention |
2,409 |
|
|
7,877 |
|
|
7,070 |
|
|
4,815 |
|
|
9,221 |
|
|
2,245 |
|
|
100 |
|
|
254 |
|
|
33,991 |
|
| Substandard |
11,128 |
|
|
8,929 |
|
|
15,405 |
|
|
7,104 |
|
|
5,395 |
|
|
8,340 |
|
|
1,421 |
|
|
2,688 |
|
|
60,410 |
|
|
|
|
|
|
|
|
|
|
|
|
|
|
|
|
|
|
|
| Total owner occupied commercial real estate |
$ |
657,289 |
|
|
$ |
698,640 |
|
|
$ |
638,046 |
|
|
$ |
564,966 |
|
|
$ |
216,684 |
|
|
$ |
348,080 |
|
|
$ |
118,733 |
|
|
$ |
21,613 |
|
|
$ |
3,264,051 |
|
| Current period gross charge-offs |
207 |
|
|
48 |
|
|
— |
|
|
819 |
|
|
— |
|
|
— |
|
|
— |
|
|
— |
|
|
1,074 |
|
| Income producing commercial real estate |
|
|
|
|
|
|
|
|
|
|
|
|
|
|
|
|
|
| Pass |
661,093 |
|
|
931,559 |
|
|
851,529 |
|
|
750,415 |
|
|
302,845 |
|
|
419,111 |
|
|
50,659 |
|
|
13,247 |
|
|
3,980,458 |
|
| Special Mention |
48,358 |
|
|
26,751 |
|
|
18,989 |
|
|
25,964 |
|
|
6,387 |
|
|
6,173 |
|
|
— |
|
|
— |
|
|
132,622 |
|
| Substandard |
68,032 |
|
|
9,998 |
|
|
2,523 |
|
|
21,037 |
|
|
28,877 |
|
|
20,351 |
|
|
— |
|
|
54 |
|
|
150,872 |
|
|
|
|
|
|
|
|
|
|
|
|
|
|
|
|
|
|
|
| Total income producing commercial real estate |
$ |
777,483 |
|
|
$ |
968,308 |
|
|
$ |
873,041 |
|
|
$ |
797,416 |
|
|
$ |
338,109 |
|
|
$ |
445,635 |
|
|
$ |
50,659 |
|
|
$ |
13,301 |
|
|
$ |
4,263,952 |
|
| Current period gross charge-offs |
3,033 |
|
|
2,534 |
|
|
— |
|
|
— |
|
|
— |
|
|
2,291 |
|
|
— |
|
|
— |
|
|
7,858 |
|
| Commercial & industrial |
|
|
|
|
|
|
|
|
|
|
|
|
|
|
|
|
|
| Pass |
610,288 |
|
|
425,626 |
|
|
299,170 |
|
|
130,586 |
|
|
82,710 |
|
|
130,190 |
|
|
581,871 |
|
|
13,332 |
|
|
2,273,773 |
|
| Special Mention |
6,459 |
|
|
2,068 |
|
|
472 |
|
|
5,430 |
|
|
5,473 |
|
|
718 |
|
|
14,861 |
|
|
274 |
|
|
35,755 |
|
| Substandard |
10,906 |
|
|
5,713 |
|
|
22,635 |
|
|
8,557 |
|
|
4,499 |
|
|
1,610 |
|
|
46,282 |
|
|
1,315 |
|
|
101,517 |
|
|
|
|
|
|
|
|
|
|
|
|
|
|
|
|
|
|
|
| Total commercial & industrial |
$ |
627,653 |
|
|
$ |
433,407 |
|
|
$ |
322,277 |
|
|
$ |
144,573 |
|
|
$ |
92,682 |
|
|
$ |
132,518 |
|
|
$ |
643,014 |
|
|
$ |
14,921 |
|
|
$ |
2,411,045 |
|
| Current period gross charge-offs |
5,999 |
|
|
1,627 |
|
|
13,153 |
|
|
2,377 |
|
|
400 |
|
|
157 |
|
|
— |
|
|
1,825 |
|
|
25,538 |
|
| Commercial construction |
|
|
|
|
|
|
|
|
|
|
|
|
|
|
|
|
|
| Pass |
665,792 |
|
|
638,761 |
|
|
293,276 |
|
|
95,046 |
|
|
59,471 |
|
|
24,698 |
|
|
62,370 |
|
|
966 |
|
|
1,840,380 |
|
| Special Mention |
28 |
|
|
124 |
|
|
6 |
|
|
— |
|
|
— |
|
|
— |
|
|
— |
|
|
— |
|
|
158 |
|
| Substandard |
16,253 |
|
|
1,784 |
|
|
31 |
|
|
723 |
|
|
127 |
|
|
82 |
|
|
— |
|
|
— |
|
|
19,000 |
|
|
|
|
|
|
|
|
|
|
|
|
|
|
|
|
|
|
|
| Total commercial construction |
$ |
682,073 |
|
|
$ |
640,669 |
|
|
$ |
293,313 |
|
|
$ |
95,769 |
|
|
$ |
59,598 |
|
|
$ |
24,780 |
|
|
$ |
62,370 |
|
|
$ |
966 |
|
|
$ |
1,859,538 |
|
| Current period gross charge-offs |
— |
|
|
60 |
|
|
— |
|
|
— |
|
|
— |
|
|
— |
|
|
— |
|
|
— |
|
|
60 |
|
| Equipment financing |
|
|
|
|
|
|
|
|
|
|
|
|
|
|
|
|
|
| Pass |
673,201 |
|
|
496,336 |
|
|
233,422 |
|
|
83,507 |
|
|
41,053 |
|
|
3,722 |
|
|
— |
|
|
— |
|
|
1,531,241 |
|
| Substandard |
1,471 |
|
|
4,141 |
|
|
2,487 |
|
|
960 |
|
|
817 |
|
|
3 |
|
|
— |
|
|
— |
|
|
9,879 |
|
|
|
|
|
|
|
|
|
|
|
|
|
|
|
|
|
|
|
| Total equipment financing |
$ |
674,672 |
|
|
$ |
500,477 |
|
|
$ |
235,909 |
|
|
$ |
84,467 |
|
|
$ |
41,870 |
|
|
$ |
3,725 |
|
|
$ |
— |
|
|
$ |
— |
|
|
$ |
1,541,120 |
|
| Current period gross charge-offs |
474 |
|
|
10,902 |
|
|
9,764 |
|
|
1,960 |
|
|
786 |
|
|
320 |
|
|
— |
|
|
— |
|
|
24,206 |
|
| Residential mortgage |
|
|
|
|
|
|
|
|
|
|
|
|
|
|
|
|
|
| Pass |
839,825 |
|
|
955,592 |
|
|
734,078 |
|
|
318,886 |
|
|
84,736 |
|
|
245,648 |
|
|
6 |
|
|
3,415 |
|
|
3,182,186 |
|
| Substandard |
2,001 |
|
|
3,078 |
|
|
2,715 |
|
|
1,074 |
|
|
1,331 |
|
|
6,295 |
|
|
— |
|
|
248 |
|
|
16,742 |
|
| Total residential mortgage |
$ |
841,826 |
|
|
$ |
958,670 |
|
|
$ |
736,793 |
|
|
$ |
319,960 |
|
|
$ |
86,067 |
|
|
$ |
251,943 |
|
|
$ |
6 |
|
|
$ |
3,663 |
|
|
$ |
3,198,928 |
|
| Current period gross charge-offs |
— |
|
|
51 |
|
|
— |
|
|
— |
|
|
— |
|
|
38 |
|
|
— |
|
|
— |
|
|
89 |
|
| Home equity |
|
|
|
|
|
|
|
|
|
|
|
|
|
|
|
|
|
| Pass |
— |
|
|
— |
|
|
— |
|
|
— |
|
|
— |
|
|
— |
|
|
926,596 |
|
|
28,412 |
|
|
955,008 |
|
| Substandard |
— |
|
|
— |
|
|
— |
|
|
— |
|
|
— |
|
|
— |
|
|
— |
|
|
3,979 |
|
|
3,979 |
|
| Total home equity |
$ |
— |
|
|
$ |
— |
|
|
$ |
— |
|
|
$ |
— |
|
|
$ |
— |
|
|
$ |
— |
|
|
$ |
926,596 |
|
|
$ |
32,391 |
|
|
$ |
958,987 |
|
| Current period gross charge-offs |
— |
|
|
— |
|
|
— |
|
|
— |
|
|
— |
|
|
— |
|
|
— |
|
|
167 |
|
|
167 |
|
| Residential construction |
|
|
|
|
|
|
|
|
|
|
|
|
|
|
|
|
|
| Pass |
208,798 |
|
|
70,011 |
|
|
9,827 |
|
|
5,201 |
|
|
1,046 |
|
|
5,614 |
|
|
— |
|
|
93 |
|
|
300,590 |
|
| Substandard |
878 |
|
|
31 |
|
|
— |
|
|
6 |
|
|
38 |
|
|
107 |
|
|
— |
|
|
— |
|
|
1,060 |
|
| Total residential construction |
$ |
209,676 |
|
|
$ |
70,042 |
|
|
$ |
9,827 |
|
|
$ |
5,207 |
|
|
$ |
1,084 |
|
|
$ |
5,721 |
|
|
$ |
— |
|
|
$ |
93 |
|
|
$ |
301,650 |
|
| Current period gross charge-offs |
— |
|
|
1,111 |
|
|
— |
|
|
— |
|
|
— |
|
|
— |
|
|
— |
|
|
— |
|
|
1,111 |
|
| Manufactured housing |
|
|
|
|
|
|
|
|
|
|
|
|
|
|
|
|
|
| Pass |
45,065 |
|
|
69,424 |
|
|
48,814 |
|
|
43,735 |
|
|
31,321 |
|
|
80,284 |
|
|
— |
|
|
— |
|
|
318,643 |
|
| Substandard |
1,078 |
|
|
4,665 |
|
|
3,601 |
|
|
3,020 |
|
|
1,291 |
|
|
4,176 |
|
|
— |
|
|
— |
|
|
17,831 |
|
| Total consumer |
$ |
46,143 |
|
|
$ |
74,089 |
|
|
$ |
52,415 |
|
|
$ |
46,755 |
|
|
$ |
32,612 |
|
|
$ |
84,460 |
|
|
$ |
— |
|
|
$ |
— |
|
|
$ |
336,474 |
|
| Current period gross charge-offs |
38 |
|
|
1,503 |
|
|
985 |
|
|
419 |
|
|
279 |
|
|
690 |
|
|
— |
|
|
— |
|
|
3,914 |
|
| Consumer |
|
|
|
|
|
|
|
|
|
|
|
|
|
|
|
|
|
| Pass |
86,142 |
|
|
39,593 |
|
|
16,191 |
|
|
10,350 |
|
|
1,212 |
|
|
623 |
|
|
26,239 |
|
|
534 |
|
|
180,884 |
|
| Substandard |
50 |
|
|
55 |
|
|
53 |
|
|
25 |
|
|
5 |
|
|
13 |
|
|
32 |
|
|
— |
|
|
233 |
|
| Total consumer |
$ |
86,192 |
|
|
$ |
39,648 |
|
|
$ |
16,244 |
|
|
$ |
10,375 |
|
|
$ |
1,217 |
|
|
$ |
636 |
|
|
$ |
26,271 |
|
|
$ |
534 |
|
|
$ |
181,117 |
|
| Current period gross charge-offs |
3,245 |
|
|
241 |
|
|
233 |
|
|
38 |
|
|
15 |
|
|
1 |
|
|
5 |
|
|
204 |
|
|
3,982 |
|
|
|
|
|
|
|
|
|
|
|
|
|
|
|
|
|
|
|
UNITED COMMUNITY BANKS, INC. AND SUBSIDIARIES
Notes to Consolidated Financial Statements
(6) Loans and Leases and Allowance for Credit Losses, continued
|
|
|
|
|
|
|
|
|
|
|
|
|
|
|
|
|
|
|
|
|
|
|
|
|
|
|
|
|
|
|
|
|
|
|
|
|
|
|
|
|
|
|
|
|
|
|
|
|
|
|
|
|
|
|
|
|
|
|
Term Loans |
|
Revolvers |
|
Revolvers converted to term loans |
|
Total |
| As of December 31, 2022 |
|
2022 |
|
2021 |
|
2020 |
|
2019 |
|
2018 |
|
Prior |
|
|
|
| Pass |
|
|
|
|
|
|
|
|
|
|
|
|
|
|
|
|
|
|
| Owner occupied commercial real estate |
|
$ |
669,451 |
|
|
$ |
671,395 |
|
|
$ |
611,900 |
|
|
$ |
204,990 |
|
|
$ |
127,738 |
|
|
$ |
253,890 |
|
|
$ |
114,975 |
|
|
$ |
5,779 |
|
|
$ |
2,660,118 |
|
| Income producing commercial real estate |
|
812,804 |
|
|
753,936 |
|
|
733,946 |
|
|
248,259 |
|
|
171,108 |
|
|
255,485 |
|
|
50,026 |
|
|
9,953 |
|
|
3,035,517 |
|
| Commercial & industrial |
|
535,594 |
|
|
388,851 |
|
|
186,292 |
|
|
134,789 |
|
|
119,547 |
|
|
71,503 |
|
|
670,161 |
|
|
15,880 |
|
|
2,122,617 |
|
| Commercial construction |
|
732,147 |
|
|
391,963 |
|
|
256,087 |
|
|
78,778 |
|
|
11,977 |
|
|
19,973 |
|
|
70,819 |
|
|
1,433 |
|
|
1,563,177 |
|
| Equipment financing |
|
714,044 |
|
|
374,030 |
|
|
162,463 |
|
|
93,690 |
|
|
22,753 |
|
|
1,214 |
|
|
— |
|
|
— |
|
|
1,368,194 |
|
| Total commercial |
|
3,464,040 |
|
|
2,580,175 |
|
|
1,950,688 |
|
|
760,506 |
|
|
453,123 |
|
|
602,065 |
|
|
905,981 |
|
|
33,045 |
|
|
10,749,623 |
|
| Residential mortgage |
|
894,960 |
|
|
742,821 |
|
|
329,762 |
|
|
91,300 |
|
|
55,785 |
|
|
223,846 |
|
|
8 |
|
|
3,133 |
|
|
2,341,615 |
|
| Home equity |
|
— |
|
|
— |
|
|
— |
|
|
— |
|
|
— |
|
|
— |
|
|
824,153 |
|
|
23,948 |
|
|
848,101 |
|
| Residential construction |
|
344,443 |
|
|
82,289 |
|
|
4,478 |
|
|
1,742 |
|
|
1,545 |
|
|
7,549 |
|
|
— |
|
|
31 |
|
|
442,077 |
|
| Manufactured Housing |
|
78,097 |
|
|
54,976 |
|
|
48,908 |
|
|
34,836 |
|
|
31,060 |
|
|
61,148 |
|
|
— |
|
|
— |
|
|
309,025 |
|
| Consumer |
|
71,899 |
|
|
29,322 |
|
|
15,406 |
|
|
3,987 |
|
|
1,837 |
|
|
588 |
|
|
25,963 |
|
|
126 |
|
|
149,128 |
|
|
|
4,853,439 |
|
|
3,489,583 |
|
|
2,349,242 |
|
|
892,371 |
|
|
543,350 |
|
|
895,196 |
|
|
1,756,105 |
|
|
60,283 |
|
|
14,839,569 |
|
| Special Mention |
|
|
|
|
|
|
|
|
|
|
|
|
|
|
|
|
|
|
| Owner occupied commercial real estate |
|
4,236 |
|
|
8,036 |
|
|
4,641 |
|
|
10,299 |
|
|
1,232 |
|
|
11,596 |
|
|
3,875 |
|
|
279 |
|
|
44,194 |
|
| Income producing commercial real estate |
|
41,423 |
|
|
1,137 |
|
|
44,802 |
|
|
32,821 |
|
|
21,647 |
|
|
50 |
|
|
805 |
|
|
— |
|
|
142,685 |
|
| Commercial & industrial |
|
1,695 |
|
|
21,745 |
|
|
2,686 |
|
|
1,047 |
|
|
1,244 |
|
|
167 |
|
|
10,449 |
|
|
309 |
|
|
39,342 |
|
| Commercial construction |
|
850 |
|
|
33 |
|
|
1,640 |
|
|
13,237 |
|
|
4,891 |
|
|
28 |
|
|
— |
|
|
— |
|
|
20,679 |
|
| Equipment financing |
|
— |
|
|
— |
|
|
— |
|
|
— |
|
|
— |
|
|
— |
|
|
— |
|
|
— |
|
|
— |
|
| Total commercial |
|
48,204 |
|
|
30,951 |
|
|
53,769 |
|
|
57,404 |
|
|
29,014 |
|
|
11,841 |
|
|
15,129 |
|
|
588 |
|
|
246,900 |
|
| Residential mortgage |
|
— |
|
|
— |
|
|
— |
|
|
— |
|
|
— |
|
|
— |
|
|
— |
|
|
— |
|
|
— |
|
| Home equity |
|
— |
|
|
— |
|
|
— |
|
|
— |
|
|
— |
|
|
— |
|
|
— |
|
|
— |
|
|
— |
|
| Residential construction |
|
— |
|
|
— |
|
|
— |
|
|
— |
|
|
— |
|
|
— |
|
|
— |
|
|
— |
|
|
— |
|
| Manufactured Housing |
|
— |
|
|
— |
|
|
— |
|
|
— |
|
|
— |
|
|
— |
|
|
— |
|
|
— |
|
|
— |
|
| Consumer |
|
— |
|
|
— |
|
|
— |
|
|
— |
|
|
— |
|
|
— |
|
|
— |
|
|
— |
|
|
— |
|
|
|
48,204 |
|
|
30,951 |
|
|
53,769 |
|
|
57,404 |
|
|
29,014 |
|
|
11,841 |
|
|
15,129 |
|
|
588 |
|
|
246,900 |
|
| Substandard |
|
|
|
|
|
|
|
|
|
|
|
|
|
|
|
|
|
|
| Owner occupied commercial real estate |
|
9,835 |
|
|
77 |
|
|
2,873 |
|
|
4,490 |
|
|
1,204 |
|
|
8,055 |
|
|
209 |
|
|
3,611 |
|
|
30,354 |
|
| Income producing commercial real estate |
|
52,384 |
|
|
1,357 |
|
|
1,867 |
|
|
4,180 |
|
|
13,209 |
|
|
10,365 |
|
|
— |
|
|
62 |
|
|
83,424 |
|
| Commercial & industrial |
|
10,431 |
|
|
19,477 |
|
|
3,880 |
|
|
4,557 |
|
|
11,019 |
|
|
1,189 |
|
|
39,333 |
|
|
477 |
|
|
90,363 |
|
| Commercial construction |
|
133 |
|
|
— |
|
|
45 |
|
|
2 |
|
|
3,876 |
|
|
9,693 |
|
|
— |
|
|
243 |
|
|
13,992 |
|
| Equipment financing |
|
1,625 |
|
|
2,160 |
|
|
1,303 |
|
|
705 |
|
|
236 |
|
|
28 |
|
|
— |
|
|
— |
|
|
6,057 |
|
| Total commercial |
|
74,408 |
|
|
23,071 |
|
|
9,968 |
|
|
13,934 |
|
|
29,544 |
|
|
29,330 |
|
|
39,542 |
|
|
4,393 |
|
|
224,190 |
|
| Residential mortgage |
|
1,195 |
|
|
964 |
|
|
1,364 |
|
|
1,836 |
|
|
2,589 |
|
|
5,296 |
|
|
— |
|
|
202 |
|
|
13,446 |
|
| Home equity |
|
— |
|
|
— |
|
|
— |
|
|
— |
|
|
— |
|
|
— |
|
|
93 |
|
|
2,075 |
|
|
2,168 |
|
| Residential construction |
|
32 |
|
|
268 |
|
|
— |
|
|
20 |
|
|
3 |
|
|
153 |
|
|
— |
|
|
— |
|
|
476 |
|
| Manufactured Housing |
|
1,130 |
|
|
1,267 |
|
|
1,427 |
|
|
990 |
|
|
1,188 |
|
|
1,714 |
|
|
— |
|
|
— |
|
|
7,716 |
|
| Consumer |
|
20 |
|
|
77 |
|
|
34 |
|
|
1 |
|
|
25 |
|
|
4 |
|
|
1 |
|
|
— |
|
|
162 |
|
|
|
76,785 |
|
|
25,647 |
|
|
12,793 |
|
|
16,781 |
|
|
33,349 |
|
|
36,497 |
|
|
39,636 |
|
|
6,670 |
|
|
248,158 |
|
|
|
|
|
|
|
|
|
|
|
|
|
|
|
|
|
|
|
|
| Total |
|
$ |
4,978,428 |
|
|
$ |
3,546,181 |
|
|
$ |
2,415,804 |
|
|
$ |
966,556 |
|
|
$ |
605,713 |
|
|
$ |
943,534 |
|
|
$ |
1,810,870 |
|
|
$ |
67,541 |
|
|
$ |
15,334,627 |
|
UNITED COMMUNITY BANKS, INC. AND SUBSIDIARIES
Notes to Consolidated Financial Statements
(6) Loans and Leases and Allowance for Credit Losses, continued
Modifications to Borrowers Experiencing Financial Difficulty
The period-end amortized cost of loans modified under the terms of a FDM during the year ended December 31, 2023 are presented in the table below (in thousands).
|
|
|
|
|
|
|
|
|
|
|
|
|
|
|
|
|
|
|
|
|
|
|
|
|
|
|
|
|
|
|
|
|
|
|
|
|
|
|
|
|
|
|
|
|
|
|
|
|
| |
|
|
|
|
|
New FDMs |
|
|
| |
|
|
|
|
|
Amortized Cost
by Type of Modification |
|
|
|
|
| Year Ended December 31, 2023 |
|
|
|
|
Extension |
|
Payment Delay |
|
Rate Reduction & Extension |
|
Payment Delay & Extension |
|
|
|
Total |
|
% of Total Class of Receivable |
|
FDMs defaulted within 12 months of modification |
| Owner occupied commercial real estate |
|
|
|
|
|
$ |
3,561 |
|
|
$ |
276 |
|
|
$ |
— |
|
|
$ |
— |
|
|
|
|
$ |
3,837 |
|
|
0.1 |
% |
|
$ |
— |
|
| Income producing commercial real estate |
|
|
|
|
|
48,752 |
|
|
— |
|
|
35,172 |
|
|
— |
|
|
|
|
83,924 |
|
|
2.0 |
|
|
— |
|
| Commercial & industrial |
|
|
|
|
|
32,869 |
|
|
12,428 |
|
|
— |
|
|
1,663 |
|
|
|
|
46,960 |
|
|
1.9 |
|
|
637 |
|
| Commercial construction |
|
|
|
|
|
67 |
|
|
366 |
|
|
— |
|
|
— |
|
|
|
|
433 |
|
|
— |
|
|
— |
|
| Equipment financing |
|
|
|
|
|
16,245 |
|
|
— |
|
|
— |
|
|
1,898 |
|
|
|
|
18,143 |
|
|
1.2 |
|
|
928 |
|
| Total commercial |
|
|
|
|
|
101,494 |
|
|
13,070 |
|
|
35,172 |
|
|
3,561 |
|
|
|
|
153,297 |
|
|
1.1 |
|
|
1,565 |
|
| Residential mortgage |
|
|
|
|
|
21 |
|
|
— |
|
|
1,071 |
|
|
— |
|
|
|
|
1,092 |
|
|
— |
|
|
— |
|
| Home equity |
|
|
|
|
|
— |
|
|
— |
|
|
— |
|
|
— |
|
|
|
|
— |
|
|
— |
|
|
— |
|
| Residential construction |
|
|
|
|
|
— |
|
|
— |
|
|
46 |
|
|
— |
|
|
|
|
46 |
|
|
— |
|
|
— |
|
| Manufactured housing |
|
|
|
|
|
— |
|
|
— |
|
|
254 |
|
|
— |
|
|
|
|
254 |
|
|
0.1 |
|
|
106 |
|
| Consumer |
|
|
|
|
|
— |
|
|
— |
|
|
— |
|
|
— |
|
|
|
|
— |
|
|
— |
|
|
— |
|
| Total |
|
|
|
|
|
$ |
101,515 |
|
|
$ |
13,070 |
|
|
$ |
36,543 |
|
|
$ |
3,561 |
|
|
|
|
$ |
154,689 |
|
|
0.8 |
|
|
$ |
1,671 |
|
|
|
|
|
|
|
|
|
|
|
|
|
|
|
|
|
|
|
|
|
|
|
|
|
|
|
|
|
|
|
|
|
|
|
|
|
|
|
|
|
|
|
|
|
|
|
|
|
|
|
|
|
|
|
|
|
|
|
|
|
|
|
|
|
|
|
|
|
|
|
|
|
|
|
|
|
|
|
|
|
|
|
|
|
|
|
|
|
|
|
|
|
|
|
|
|
|
|
|
|
|
|
|
|
|
|
|
|
|
|
|
|
|
|
|
|
|
|
|
|
|
|
|
|
|
|
|
|
|
|
|
|
|
|
|
|
|
|
|
|
|
|
|
|
|
|
|
|
|
|
|
|
|
|
|
|
|
|
|
|
|
|
|
|
|
|
|
|
|
|
|
|
|
|
|
|
|
|
|
|
|
|
|
|
|
|
|
|
|
|
|
|
|
|
|
|
|
|
|
|
|
|
|
|
|
|
|
|
|
|
|
|
|
|
|
|
|
|
|
|
|
|
|
|
|
|
|
|
|
|
|
|
|
|
|
|
|
|
|
|
|
|
|
|
|
|
|
|
|
|
|
|
|
|
|
|
|
|
|
|
|
|
|
|
|
|
|
|
|
|
|
|
|
|
|
|
|
|
|
|
|
|
|
|
|
|
|
|
|
|
|
|
|
|
|
|
|
|
|
|
|
|
|
|
|
|
|
|
|
|
|
|
|
|
|
|
|
|
|
|
|
|
|
|
|
|
|
|
|
|
|
|
|
|
|
|
|
|
|
|
|
|
|
|
|
|
|
|
|
|
|
|
|
|
|
|
|
|
|
|
|
|
|
|
|
|
|
|
|
|
|
|
|
|
|
|
|
|
|
|
|
|
|
|
|
|
|
|
|
|
|
|
|
|
|
|
|
|
|
|
|
|
|
|
|
|
|
|
|
|
|
|
|
|
|
|
|
|
|
|
|
|
|
|
|
|
|
|
|
|
|
|
|
|
|
|
|
|
|
|
|
|
|
|
|
|
|
|
|
|
|
|
|
|
|
|
|
|
|
|
|
|
|
|
|
|
|
|
|
|
|
|
|
|
|
|
|
|
|
|
|
|
|
|
|
|
|
|
|
|
|
|
|
|
|
|
|
|
|
|
|
|
|
|
|
|
|
|
|
|
|
|
|
|
|
|
|
|
|
|
|
|
|
|
|
|
|
|
|
|
|
|
|
|
|
|
|
|
|
|
|
|
|
|
|
|
|
|
|
|
|
|
|
|
|
|
|
|
|
|
|
|
|
|
|
|
|
|
|
|
|
|
|
|
|
|
|
|
Equipment financing FDMs typically consist of extensions and/or payment delays in which the borrower receives one or more three-month payment delays and/or extensions beyond the original maturity. For the remainder of extension FDMs occurring during 2023, the weighted average extension granted was approximately nine months.
Non-equipment financing payment delay FDMs had a weighted average payment delay of approximately three months. $2.79 million of commercial and industrial payment delay FDMs are in bankruptcy status and were excluded from the weighted average payment delay calculation.
Commercial and industrial payment delay and extension FDMs received a weighted average payment delay and extension of approximately eleven months.
Income producing commercial real estate FDMs categorized as rate reduction and extensions resulted in a decrease in weighted average interest rate of 144 basis points and extended the weighted average maturity by approximately two years. Residential loan type rate reduction and extension FDMs resulted in a decrease in weighted average interest rate of 614 basis points and extended the weighted average maturity by approximately 18 years.
Allowance for Credit Losses
For all periods presented, United used a one-year reasonable and supportable forecast period. Expected credit losses were estimated using a regression model for each segment based on historical data from peer banks combined with a third party vendor’s baseline economic forecast to predict the change in credit losses. These estimates were then combined with a starting value that was based on United’s recent charge-off experience to produce an expected default rate, with the results subject to a floor. In the case of commercial construction, income producing commercial real estate, multifamily loans (included in income producing commercial real estate) and commercial & industrial loans, at December 31, 2023, the expected default rate was adjusted by a model overlay based on expectations of future performance.
At December 31, 2023, the third party vendor’s baseline forecast was slightly better than at December 31, 2022. However, the increase in United’s charge-offs raised the initial expected default rates and thus contributed to a higher ACL level at December 31, 2023. At December 31, 2023, United applied qualitative adjustments to the model output for the residential mortgage and income producing commercial real estate portfolios to account for the ongoing performance stability of these two portfolios. United also applied qualitative adjustments to the equipment finance portfolio due to an elevated default rate that resulted from a higher level of recent charge-offs that was mostly coming from the long-haul trucking equipment segment comprising a small portion of the portfolio deemed not representative of the entire equipment financing portfolio.
UNITED COMMUNITY BANKS, INC. AND SUBSIDIARIES
Notes to Consolidated Financial Statements
(6) Loans and Leases and Allowance for Credit Losses, continued
For periods beyond the reasonable and supportable forecast period of one year, United reverted to historical credit loss information on a straight line basis over two years. For most collateral types, United reverted to through-the-cycle average default rates using peer data from 2000 to 2017. For loans secured by residential mortgages and manufactured housing, the peer data was adjusted for changes in lending practices designed to mitigate the magnitude of losses observed during the 2008 mortgage crisis.
At December 31, 2023, United had $48.5 million in loans for which repayment is expected to be provided substantially through the operation or sale of the collateral. Estimated credit losses for these loans are based on the fair value of the collateral relative to the amortized cost of the loan. The majority of these loans are income producing commercial real estate and commercial and industrial loans.
UNITED COMMUNITY BANKS, INC. AND SUBSIDIARIES
Notes to Consolidated Financial Statements
(6) Loans and Leases and Allowance for Credit Losses, continued
The following table presents the balance and activity in the ACL by portfolio segment for the periods indicated (in thousands):
|
|
|
|
|
|
|
|
|
|
|
|
|
|
|
|
|
|
|
|
|
|
|
|
|
|
|
|
|
|
|
|
|
|
|
|
|
|
|
| Year Ended December 31, 2023 |
|
Beginning
Balance |
|
Initial ACL- PCD loans(1) |
|
Charge-Offs |
|
Recoveries |
|
Provision |
|
Ending
Balance |
| Owner occupied commercial real estate |
|
$ |
19,834 |
|
|
$ |
273 |
|
|
$ |
(1,074) |
|
|
$ |
571 |
|
|
$ |
3,938 |
|
|
$ |
23,542 |
|
| Income producing commercial real estate |
|
32,082 |
|
|
3,399 |
|
|
(7,858) |
|
|
1,919 |
|
|
18,213 |
|
|
47,755 |
|
| Commercial & industrial |
|
23,504 |
|
|
1,891 |
|
|
(25,538) |
|
|
4,479 |
|
|
26,554 |
|
|
30,890 |
|
| Commercial construction |
|
20,120 |
|
|
39 |
|
|
(60) |
|
|
217 |
|
|
1,425 |
|
|
21,741 |
|
| Equipment financing |
|
23,395 |
|
|
— |
|
|
(24,206) |
|
|
4,044 |
|
|
30,150 |
|
|
33,383 |
|
| Residential mortgage |
|
20,809 |
|
|
157 |
|
|
(89) |
|
|
335 |
|
|
7,007 |
|
|
28,219 |
|
Home equity |
|
8,707 |
|
|
534 |
|
|
(167) |
|
|
3,045 |
|
|
(2,472) |
|
|
9,647 |
|
| Residential construction |
|
2,049 |
|
|
124 |
|
|
(1,111) |
|
|
175 |
|
|
596 |
|
|
1,833 |
|
| Manufactured housing |
|
8,098 |
|
|
— |
|
|
(3,914) |
|
|
55 |
|
|
6,100 |
|
|
10,339 |
|
| Consumer |
|
759 |
|
|
4 |
|
|
(3,982) |
|
|
916 |
|
|
3,025 |
|
|
722 |
|
| ACL - loans |
|
159,357 |
|
|
6,421 |
|
|
(67,999) |
|
|
15,756 |
|
|
94,536 |
|
|
208,071 |
|
| ACL - unfunded commitments |
|
21,163 |
|
|
— |
|
|
— |
|
|
— |
|
|
(5,106) |
|
|
16,057 |
|
| Total ACL |
|
$ |
180,520 |
|
|
$ |
6,421 |
|
|
$ |
(67,999) |
|
|
$ |
15,756 |
|
|
$ |
89,430 |
|
|
$ |
224,128 |
|
(1) Represents the initial ACL related to PCD loans acquired in the Progress and First Miami transactions.
|
|
|
|
|
|
|
|
|
|
|
|
|
|
|
|
|
|
|
|
|
|
|
|
|
|
|
|
|
|
|
|
|
|
|
|
|
|
|
| Year Ended December 31, 2022 |
|
Beginning
Balance |
|
Initial ACL- PCD loans(1) |
|
Charge-Offs |
|
Recoveries |
|
Provision |
|
Ending
Balance |
| Owner occupied commercial real estate |
|
$ |
14,282 |
|
|
$ |
266 |
|
|
$ |
(6) |
|
|
$ |
1,767 |
|
|
$ |
3,525 |
|
|
$ |
19,834 |
|
| Income producing commercial real estate |
|
24,156 |
|
|
4,366 |
|
|
(606) |
|
|
949 |
|
|
3,217 |
|
|
32,082 |
|
| Commercial & industrial |
|
16,592 |
|
|
2,337 |
|
|
(10,284) |
|
|
3,824 |
|
|
11,035 |
|
|
23,504 |
|
| Commercial construction |
|
9,956 |
|
|
2,857 |
|
|
(41) |
|
|
625 |
|
|
6,723 |
|
|
20,120 |
|
| Equipment financing |
|
16,290 |
|
|
— |
|
|
(6,980) |
|
|
3,027 |
|
|
11,058 |
|
|
23,395 |
|
| Residential mortgage |
|
12,390 |
|
|
385 |
|
|
(55) |
|
|
302 |
|
|
7,787 |
|
|
20,809 |
|
Home equity |
|
6,568 |
|
|
60 |
|
|
(69) |
|
|
687 |
|
|
1,461 |
|
|
8,707 |
|
| Residential construction |
|
1,847 |
|
|
1 |
|
|
— |
|
|
231 |
|
|
(30) |
|
|
2,049 |
|
Manufactured Housing |
|
— |
|
|
2,438 |
|
|
(794) |
|
|
29 |
|
|
6,425 |
|
|
8,098 |
|
| Consumer |
|
451 |
|
|
27 |
|
|
(3,460) |
|
|
1,200 |
|
|
2,541 |
|
|
759 |
|
| ACL - loans |
|
102,532 |
|
|
12,737 |
|
|
(22,295) |
|
|
12,641 |
|
|
53,742 |
|
|
159,357 |
|
| ACL - unfunded commitments |
|
10,992 |
|
|
— |
|
|
— |
|
|
— |
|
|
10,171 |
|
|
21,163 |
|
| Total ACL |
|
$ |
113,524 |
|
|
$ |
12,737 |
|
|
$ |
(22,295) |
|
|
$ |
12,641 |
|
|
$ |
63,913 |
|
|
$ |
180,520 |
|
(1) Represents the initial ACL related to PCD loans acquired in the Reliant transaction.
|
|
|
|
|
|
|
|
|
|
|
|
|
|
|
|
|
|
|
|
|
|
|
|
|
|
|
|
|
|
|
|
|
|
|
|
|
|
|
|
|
|
| Year Ended December 31, 2021 |
|
Beginning Balance |
|
Initial ACL- PCD loans(1) |
|
Charge-Offs |
|
Recoveries |
|
Provision |
|
Ending
Balance |
Owner occupied commercial
real estate |
|
$ |
20,673 |
|
|
$ |
280 |
|
|
$ |
(1,640) |
|
|
$ |
1,324 |
|
|
$ |
(6,355) |
|
|
$ |
14,282 |
|
Income producing commercial
real estate |
|
41,737 |
|
|
982 |
|
|
(267) |
|
|
496 |
|
|
(18,792) |
|
|
24,156 |
|
| Commercial & industrial |
|
22,019 |
|
|
312 |
|
|
(4,776) |
|
|
7,275 |
|
|
(8,238) |
|
|
16,592 |
|
| Commercial construction |
|
10,952 |
|
|
1,969 |
|
|
(334) |
|
|
1,081 |
|
|
(3,712) |
|
|
9,956 |
|
| Equipment financing |
|
16,820 |
|
|
— |
|
|
(5,724) |
|
|
2,619 |
|
|
2,575 |
|
|
16,290 |
|
| Residential mortgage |
|
15,341 |
|
|
— |
|
|
(344) |
|
|
564 |
|
|
(3,171) |
|
|
12,390 |
|
Home equity |
|
8,417 |
|
|
1 |
|
|
(112) |
|
|
517 |
|
|
(2,255) |
|
|
6,568 |
|
| Residential construction |
|
764 |
|
|
— |
|
|
(10) |
|
|
157 |
|
|
936 |
|
|
1,847 |
|
| Consumer |
|
287 |
|
|
— |
|
|
(2,066) |
|
|
1,202 |
|
|
1,028 |
|
|
451 |
|
|
|
|
|
|
|
|
|
|
|
|
|
|
| ACL - loans |
|
137,010 |
|
|
3,544 |
|
|
(15,273) |
|
|
15,235 |
|
|
(37,984) |
|
|
102,532 |
|
| ACL - unfunded commitments |
|
10,558 |
|
|
— |
|
|
— |
|
|
— |
|
|
434 |
|
|
10,992 |
|
| Total ACL |
|
$ |
147,568 |
|
|
$ |
3,544 |
|
|
$ |
(15,273) |
|
|
$ |
15,235 |
|
|
$ |
(37,550) |
|
|
$ |
113,524 |
|
(1) Represents the initial ACL related to PCD loans acquired in the Aquesta transaction.
UNITED COMMUNITY BANKS, INC. AND SUBSIDIARIES
Notes to Consolidated Financial Statements
(7) Premises and Equipment
Premises and equipment are summarized as follows as of the dates indicated (in thousands):
|
|
|
|
|
|
|
|
|
|
|
|
|
|
|
|
|
|
|
|
December 31, |
|
|
|
2023 |
|
2022 |
|
|
Land and land improvements |
$ |
114,368 |
|
|
$ |
101,187 |
|
|
|
Buildings and improvements |
232,321 |
|
|
210,018 |
|
|
|
Furniture and equipment |
138,155 |
|
|
115,569 |
|
|
|
Construction in progress |
71,435 |
|
|
34,669 |
|
|
|
|
556,279 |
|
|
461,443 |
|
|
|
Less accumulated depreciation |
(177,858) |
|
|
(162,987) |
|
|
|
Premises and equipment, net |
$ |
378,421 |
|
|
$ |
298,456 |
|
|
Depreciation expense was $19.0 million, $17.0 million and $15.7 million for 2023, 2022 and 2021, respectively.
(8) Derivatives and Hedging Activities
The table below presents the fair value of derivative financial instruments as of the dates indicated as well as their classification on the consolidated balance sheets (in thousands):
|
|
|
|
|
|
|
|
|
|
|
|
|
|
|
|
|
|
|
|
|
|
|
|
|
|
|
|
|
|
|
|
|
|
|
|
|
|
|
|
|
December 31, 2023 |
|
December 31, 2022 |
|
|
Notional Amount |
|
Fair Value |
|
Notional Amount |
|
Fair Value |
|
|
|
Derivative Assets |
|
Derivative Liabilities |
|
|
Derivative Assets |
|
Derivative Liabilities |
| Derivatives designated as hedging instruments: |
|
|
|
|
|
|
|
|
|
|
|
|
| Cash flow hedge of subordinated debt |
|
$ |
100,000 |
|
|
$ |
13,168 |
|
|
$ |
— |
|
|
$ |
100,000 |
|
|
$ |
16,191 |
|
|
$ |
— |
|
| Cash flow hedge of trust preferred securities |
|
20,000 |
|
|
— |
|
|
— |
|
|
20,000 |
|
|
— |
|
|
— |
|
|
|
|
|
|
|
|
|
|
|
|
|
|
| Fair value hedge of AFS debt securities |
|
655,511 |
|
|
— |
|
|
— |
|
|
— |
|
|
— |
|
|
— |
|
| Fair value hedge of equipment financing loans |
|
150,000 |
|
|
— |
|
|
— |
|
|
— |
|
|
— |
|
|
— |
|
| Total |
|
925,511 |
|
|
13,168 |
|
|
— |
|
|
120,000 |
|
|
16,191 |
|
|
— |
|
|
|
|
|
|
|
|
|
|
|
|
|
|
Derivatives not designated as hedging instruments: |
|
|
|
|
|
|
|
|
|
|
|
|
| Customer derivative positions |
|
1,177,275 |
|
|
3,461 |
|
|
68,384 |
|
|
1,097,578 |
|
|
341 |
|
|
86,358 |
|
| Dealer offsets to customer derivative positions |
|
1,197,364 |
|
|
23,061 |
|
|
4,597 |
|
|
1,097,578 |
|
|
22,393 |
|
|
274 |
|
| Risk participations |
|
90,597 |
|
|
1 |
|
|
8 |
|
|
88,586 |
|
|
15 |
|
|
1 |
|
| Mortgage banking - loan commitment |
|
48,452 |
|
|
1,089 |
|
|
— |
|
|
19,685 |
|
|
394 |
|
|
— |
|
| Mortgage banking - forward sales commitment |
|
81,671 |
|
|
20 |
|
|
658 |
|
|
49,750 |
|
|
198 |
|
|
71 |
|
| Bifurcated embedded derivatives |
|
51,935 |
|
|
9,552 |
|
|
— |
|
|
51,935 |
|
|
11,104 |
|
|
— |
|
| Dealer offsets to bifurcated embedded derivatives |
|
51,935 |
|
|
— |
|
|
11,164 |
|
|
51,935 |
|
|
— |
|
|
12,839 |
|
| Total |
|
2,699,229 |
|
|
37,184 |
|
|
84,811 |
|
|
2,457,047 |
|
|
34,445 |
|
|
99,543 |
|
|
|
|
|
|
|
|
|
|
|
|
|
|
| Total derivatives |
|
$ |
3,624,740 |
|
|
$ |
50,352 |
|
|
$ |
84,811 |
|
|
$ |
2,577,047 |
|
|
$ |
50,636 |
|
|
$ |
99,543 |
|
|
|
|
|
|
|
|
|
|
|
|
|
|
| Total gross derivative instruments |
|
|
|
$ |
50,352 |
|
|
$ |
84,811 |
|
|
|
|
$ |
50,636 |
|
|
$ |
99,543 |
|
| Less: Amounts subject to master netting agreements |
|
|
|
(4,683) |
|
|
(4,683) |
|
|
|
|
(346) |
|
|
(346) |
|
| Less: Cash collateral received/pledged |
|
|
|
(33,921) |
|
|
(11,330) |
|
|
|
|
(38,386) |
|
|
(13,089) |
|
| Net amount |
|
|
|
$ |
11,748 |
|
|
$ |
68,798 |
|
|
|
|
$ |
11,904 |
|
|
$ |
86,108 |
|
United clears certain derivatives centrally through the CME. CME rules legally characterize variation margin payments for centrally cleared derivatives as settlements of the derivatives’ exposure rather than as collateral. As a result, the variation margin payment and the related derivative instruments are considered a single unit of account for accounting purposes. Variation margin, as determined by the CME, is settled daily. As a result, derivative contracts that clear through the CME have an estimated fair value of zero.
UNITED COMMUNITY BANKS, INC. AND SUBSIDIARIES
Notes to Consolidated Financial Statements
(8) Derivatives and Hedging Activities, continued
Hedging Derivatives
Cash Flow Hedges of Interest Rate Risk
At December 31, 2023 and 2022, United utilized interest rate caps and swaps to hedge the variability of cash flows due to changes in interest rates on certain of its variable-rate subordinated debt and trust preferred securities. Gains and losses related to changes in fair value are reclassified into earnings in the periods the hedged forecasted transactions occur. Over the next twelve months, United expects to reclassify $5.10 million of gains from AOCI into earnings related to these agreements.
Fair Value Hedges of Interest Rate Risk
United uses interest rate swaps to manage its exposure to changes in fair value attributable to changes in interest rates on certain of its fixed-rate financial instruments. During 2023, United entered into fair value hedges on stated amounts of closed portfolios of AFS debt securities and equipment financing loans using the portfolio layer method. During 2022, a hedged brokered deposit and the associated designated interest rate swap matured. The swap involved the receipt of fixed-rate amounts from a counterparty in exchange for United making variable rate payments over the life of the agreement.
The table below presents the effect of derivatives in hedging relationships on the consolidated statements of income (in thousands).
|
|
|
|
|
|
|
|
|
|
|
|
|
|
|
|
|
|
|
|
|
|
|
|
|
|
|
Year Ended December 31, |
|
Affected Income Statement Line Item |
|
2023 |
|
2022 |
|
2021 |
|
|
|
|
|
|
|
|
|
|
|
|
|
|
|
|
|
|
|
|
|
|
|
|
|
|
|
|
|
|
|
|
Fair value hedges: |
|
|
|
|
|
|
|
Brokered time deposits: |
|
|
|
|
|
|
|
|
|
|
|
|
|
|
|
|
|
|
|
|
|
|
|
|
|
|
|
|
|
|
|
| Net income recognized on fair value hedges |
Interest expense- deposits |
|
$ |
— |
|
|
$ |
28 |
|
|
$ |
210 |
|
AFS securities: |
|
|
|
|
|
|
|
Amounts related to interest settlements on derivatives |
|
|
$ |
8,682 |
|
|
$ |
— |
|
|
$ |
— |
|
Gain recognized on derivatives |
|
|
4,005 |
|
|
— |
|
|
— |
|
Loss recognized on hedged items |
|
|
(4,673) |
|
|
— |
|
|
— |
|
| Net income recognized on AFS fair value hedges |
Interest revenue - investment securities |
|
$ |
8,014 |
|
|
$ |
— |
|
|
$ |
— |
|
| Loans: |
|
|
|
|
|
|
|
Amounts related to interest settlements on derivatives |
|
|
$ |
113 |
|
|
$ |
— |
|
|
$ |
— |
|
Loss recognized on derivatives |
|
|
(1,874) |
|
|
— |
|
|
— |
|
Gain recognized on hedged items |
|
|
1,893 |
|
|
— |
|
|
— |
|
Net income recognized on loan fair value hedges |
Interest revenue - loans, including fees |
|
$ |
132 |
|
|
$ |
— |
|
|
$ |
— |
|
|
|
|
|
|
|
|
|
Cash flow hedges: |
|
|
|
|
|
|
|
|
|
|
|
|
|
|
|
|
|
|
|
|
|
|
|
Long-term debt (1) |
Interest expense - long term debt |
|
$ |
4,719 |
|
|
$ |
(269) |
|
|
$ |
(608) |
|
(1) Includes $472,000 of premium amortization expense excluded from the assessment of hedge effectiveness for each of the years ended December 31, 2023, 2022 and 2021, respectively.
The table below presents the carrying amount of hedged items and cumulative fair value hedging basis adjustments for the periods presented (in thousands). All fair value hedges of AFS debt securities and loans at December 31, 2023 were designated under the portfolio layer method. There were no fair value hedges outstanding at December 31, 2022.
|
|
|
|
|
|
|
|
|
|
|
|
|
|
|
|
|
|
|
|
|
|
|
December 31, 2023 |
Balance Sheet Location |
|
Carrying Amount |
|
Hedge Accounting Basis Adjustment |
|
Hedged Portfolio Layer |
Debt securities AFS (1) |
|
$ |
789,908 |
|
|
$ |
(4,673) |
|
|
$ |
655,511 |
|
Loans |
|
1,017,379 |
|
|
1,893 |
|
|
150,000 |
|
(1) Carrying amount for AFS debt securities reflects amortized cost, which excludes the hedge accounting basis adjustment.
Derivatives Not Designated as Hedging Instruments
Customer derivative positions include swaps, caps, and collars between United and certain commercial loan customers with offsetting positions to dealers under a back-to-back program. In addition, United occasionally enters into credit risk participation agreements with counterparty banks to accept or transfer a portion of the credit risk related to interest rate swaps.
UNITED COMMUNITY BANKS, INC. AND SUBSIDIARIES
Notes to Consolidated Financial Statements
(8) Derivatives and Hedging Activities, continued
United also has three interest rate swap contracts that are economic hedges of market-linked brokered certificates of deposit, which contain embedded derivatives that are bifurcated from the host instruments. The fair value marks on the swaps and the bifurcated embedded derivatives tend to move in opposite directions and therefore provide an economic hedge.
In addition, in connection with residential mortgage loans that are originated with the intention of selling, United enters into commitments to originate residential mortgage loans and forward loan sales commitments.
The table below presents the gains and losses recognized in income on derivatives not designated as hedging instruments for the periods indicated (in thousands).
|
|
|
|
|
|
|
|
|
|
|
|
|
|
|
|
|
|
|
|
|
|
|
|
| |
Income Statement Location |
|
Year Ended December 31, |
| |
|
2023 |
|
2022 |
|
2021 |
| Customer derivatives and dealer offsets |
Other noninterest income |
|
$ |
2,186 |
|
|
$ |
2,063 |
|
|
$ |
3,302 |
|
| Bifurcated embedded derivatives and dealer offsets |
Other noninterest income |
|
(2,245) |
|
|
90 |
|
|
433 |
|
|
|
|
|
|
|
|
|
|
|
|
|
|
|
|
|
| Mortgage banking derivatives |
Mortgage loan gains and related fees |
|
1,280 |
|
|
8,144 |
|
|
(1,805) |
|
| Risk participations |
Other noninterest income |
|
229 |
|
|
104 |
|
|
(90) |
|
| Total gains and losses |
|
|
$ |
1,450 |
|
|
$ |
10,401 |
|
|
$ |
1,840 |
|
Credit-risk-related Contingent Features
United manages its credit exposure on derivative transactions by entering into a bilateral credit support agreement with each non-customer counterparty. The credit support agreements require collateralization of exposures beyond specified minimum threshold amounts. The details of these agreements, including the minimum thresholds, vary by counterparty.
United’s agreements with each of its derivative counterparties contain a provision where if either party defaults on any of its indebtedness, then it could also be declared in default on its derivative obligations. The agreements with derivative counterparties also include provisions that if not met, could result in United being declared in default. United has agreements with certain of its derivative counterparties that provide that if United fails to maintain its status as a well-capitalized institution or is subject to a prompt corrective action directive, the counterparty could terminate the derivative positions and United would be required to settle its obligations under the agreements. Derivatives that are centrally cleared do not have credit-risk-related features that require additional collateral if United’s credit rating were downgraded.
(9) Goodwill and Other Intangible Assets
The carrying amount of goodwill and other intangible assets is summarized below as of the dates indicated (in thousands):
|
|
|
|
|
|
|
|
|
|
|
|
|
|
|
|
|
|
|
|
December 31, |
|
|
|
2023 |
|
2022 |
|
|
Core deposit intangible |
$ |
104,174 |
|
|
$ |
46,900 |
|
|
|
Less: accumulated amortization |
(40,495) |
|
|
(26,112) |
|
|
|
Net core deposit intangible |
63,679 |
|
|
20,788 |
|
|
|
Customer relationship intangible |
8,400 |
|
|
8,400 |
|
|
|
Less: accumulated amortization |
(1,906) |
|
|
(1,114) |
|
|
|
Net customer relationship intangible |
6,494 |
|
|
7,286 |
|
|
|
Total intangibles subject to amortization, net |
70,173 |
|
|
28,074 |
|
|
|
Goodwill |
919,914 |
|
|
751,174 |
|
|
|
Total goodwill and other intangible assets, net |
$ |
990,087 |
|
|
$ |
779,248 |
|
|
During 2023, as a result of the Progress and First Miami acquisitions, United recorded core deposit intangibles of $40.0 million. and $18.0 million, respectively. See Note 3 for further details. Also during 2023, United reduced its core deposit intangible related to the Reliant acquisition by $656,000 as a result of the sale of core deposits in connection with the disposal of two acquired branches.
UNITED COMMUNITY BANKS, INC. AND SUBSIDIARIES
Notes to Consolidated Financial Statements
(9) Goodwill and Other Intangible Assets, continued
The following is a summary of changes in the carrying amounts of goodwill for the years indicated (in thousands):
|
|
|
|
|
|
|
|
|
|
|
|
|
|
|
|
|
|
|
|
|
|
|
|
Goodwill (1) |
|
|
December 31, 2021 |
|
|
|
|
452,007 |
|
|
|
Acquisition of Reliant |
|
|
|
|
299,167 |
|
|
|
December 31, 2022 |
|
|
|
|
751,174 |
|
|
|
Acquisition of Progress |
|
|
|
|
145,544 |
|
|
|
Acquisition of First Miami |
|
|
|
|
23,196 |
|
|
|
December 31, 2023 |
|
|
|
|
$ |
919,914 |
|
|
(1) Goodwill balances presented are shown net of accumulated impairment losses of $306 million incurred prior to 2021.
The estimated aggregate amortization expense for future periods for finite lived intangibles is as follows (in thousands):
|
|
|
|
|
|
|
|
|
|
|
|
|
Year |
|
|
|
2024 |
$ |
14,847 |
|
|
|
2025 |
12,774 |
|
|
|
2026 |
10,896 |
|
|
|
2027 |
9,018 |
|
|
|
2028 |
7,236 |
|
|
|
Thereafter |
15,402 |
|
|
|
Total |
$ |
70,173 |
|
|
(10) Servicing Assets and Liabilities
Servicing Rights for SBA/USDA Loans
United accounts for servicing rights for SBA/USDA loans at fair value. The following table summarizes the changes in SBA/USDA servicing rights for the years indicated (in thousands).
|
|
|
|
|
|
|
|
|
|
|
|
|
|
|
|
|
|
| |
2023 |
|
2022 |
|
2021 |
| Beginning of period |
$ |
5,188 |
|
|
$ |
6,513 |
|
|
$ |
6,462 |
|
| Acquired servicing rights |
95 |
|
|
— |
|
|
581 |
|
| Originated servicing rights capitalized upon sale of loans |
1,906 |
|
|
2,114 |
|
|
2,005 |
|
| Disposals |
(1,082) |
|
|
(2,062) |
|
|
(1,430) |
|
| Changes in fair value due to change in inputs or assumptions used in the valuation |
(663) |
|
|
(1,377) |
|
|
(1,105) |
|
| End of period |
$ |
5,444 |
|
|
$ |
5,188 |
|
|
$ |
6,513 |
|
The portfolio of SBA/USDA loans serviced for others, which is not included in the accompanying balance sheets, was $419 million and $426 million, respectively, at December 31, 2023 and 2022. The amount of contractually specified servicing fees earned by United on these servicing rights during the years ended December 31, 2023, 2022 and 2021 was $3.97 million, $4.05 million and $3.90 million, respectively.
UNITED COMMUNITY BANKS, INC. AND SUBSIDIARIES
Notes to Consolidated Financial Statements
(10) Servicing Assets and Liabilities, continued
A summary of the key characteristics, inputs, and economic assumptions used in the discounted cash flow method utilized to estimate the fair value of the servicing asset for SBA/USDA loans and the sensitivity of the fair values to immediate adverse changes in those assumptions are shown in the table below as of the dates indicated (dollars in thousands):
|
|
|
|
|
|
|
|
|
|
|
|
|
|
|
|
|
|
|
|
December 31, |
|
|
|
2023 |
|
2022 |
|
|
Fair value of retained servicing assets |
$ |
5,444 |
|
|
$ |
5,188 |
|
|
|
Prepayment rate assumption: |
|
|
|
|
|
Weighted average |
18.5 |
% |
|
16.4 |
% |
|
|
Range |
3.5% - 37.4% |
|
0.0% - 35.4% |
|
|
10% adverse change |
$ |
(246) |
|
|
$ |
(201) |
|
|
|
20% adverse change |
(473) |
|
|
(387) |
|
|
|
Discount rate: |
|
|
|
|
|
Weighted average |
16.2 |
% |
|
17.5 |
% |
|
|
Range |
8.4% - 25.0% |
|
11.9% - 25.0% |
|
|
100 bps adverse change |
$ |
(116) |
|
|
$ |
(107) |
|
|
|
200 bps adverse change |
(228) |
|
|
(210) |
|
|
|
|
|
|
|
|
|
|
|
|
|
|
|
|
|
|
|
|
|
|
|
|
|
|
|
|
|
|
|
|
|
|
|
|
|
|
The above sensitivities are hypothetical and changes in fair value based on variations in assumptions generally cannot be extrapolated because the relationship of the change in assumption to the change in fair value may not be linear. Also, in this table, the effect of a variation in a particular assumption is calculated without changing any other assumption. In reality, changes in one factor may result in changes in another, which might magnify or counteract the sensitivities.
Residential Mortgage Servicing Rights
United accounts for residential mortgage servicing rights at fair value. The following table summarizes the changes in residential mortgage servicing rights for the years indicated (in thousands).
|
|
|
|
|
|
|
|
|
|
|
|
|
|
|
|
|
|
| |
2023 |
|
2022 |
|
2021 |
| Beginning of period |
$ |
36,559 |
|
|
$ |
25,161 |
|
|
$ |
16,216 |
|
|
|
|
|
|
|
|
|
|
|
|
|
| Originated servicing rights capitalized upon sale of loans |
3,217 |
|
|
5,051 |
|
|
12,510 |
|
|
|
|
|
|
|
| Disposals |
(1,926) |
|
|
(2,360) |
|
|
(4,275) |
|
|
|
|
|
|
|
|
|
|
|
|
|
|
|
|
|
|
|
|
|
|
|
|
|
| Changes in fair value due to change in inputs or assumptions used in the valuation |
(1,953) |
|
|
8,707 |
|
|
710 |
|
| End of period |
$ |
35,897 |
|
|
$ |
36,559 |
|
|
$ |
25,161 |
|
The portfolio of residential mortgage loans serviced for others, which is not included in the consolidated balance sheets, was $2.92 billion and $2.88 billion, respectively, at December 31, 2023 and 2022. The amount of contractually specified servicing fees earned by United on these servicing rights during the years ended December 31, 2023, 2022 and 2021 was $7.15 million, $7.24 million and $6.48 million, respectively.
A summary of the key characteristics, inputs, and economic assumptions used to estimate the fair value of the servicing asset for residential mortgage loans and the sensitivity of the fair values to immediate adverse changes in those assumptions are shown in the table below as of the dates indicated (in thousands):
|
|
|
|
|
|
|
|
|
|
|
|
|
|
|
|
|
|
|
|
December 31, |
|
|
|
2023 |
|
2022 |
|
|
Fair value of retained servicing assets |
$ |
35,897 |
|
|
$ |
36,559 |
|
|
|
Prepayment rate assumption: |
|
|
|
|
|
Weighted average |
8.0 |
% |
|
7.5 |
% |
|
|
Range |
6.5% - 29.9% |
|
7.0% - 31.2% |
|
|
10% adverse change |
$ |
(1,225) |
|
|
$ |
(1,236) |
|
|
|
20% adverse change |
(2,381) |
|
|
(2,404) |
|
|
|
Discount rate: |
|
|
|
|
|
Weighted average |
10.0 |
% |
|
9.5 |
% |
|
|
Range |
10.0% - 15.0% |
|
9.5% - 11.5% |
|
|
100 bps adverse change |
$ |
(1,486) |
|
|
$ |
(1,488) |
|
|
|
200 bps adverse change |
(2,860) |
|
|
(2,865) |
|
|
UNITED COMMUNITY BANKS, INC. AND SUBSIDIARIES
Notes to Consolidated Financial Statements
(10) Servicing Assets and Liabilities, continued
The above sensitivities are hypothetical and changes in fair value based on variations in assumptions generally cannot be extrapolated because the relationship of the change in assumption to the change in fair value may not be linear. Also, in this table, the effect of a variation in a particular assumption is calculated without changing any other assumption. In reality, changes in one factor may result in changes in another, which might magnify or counteract the sensitivities.
Servicing Liabilities for Equipment Financing Loans
United accounts for servicing liabilities associated with sold equipment finance loans using the amortization method. The portfolio of equipment financing loans serviced for others, which is not included in the accompanying balance sheets, was $170 million and $125 million at December 31, 2023 and 2022, respectively. The servicing liabilities related to these loans totaled $1.47 million and $1.12 million at December 31, 2023 and 2022, respectively.
(11) Time Deposits
At December 31, 2023, the contractual maturities of time deposits, including brokered time deposits, are summarized as follows (in thousands):
|
|
|
|
|
|
|
|
|
|
|
|
|
2024 |
$ |
3,495,186 |
|
|
|
2025 |
101,250 |
|
|
|
2026 |
24,081 |
|
|
|
2027 |
10,240 |
|
|
|
2028 |
18,716 |
|
|
|
Thereafter |
50,590 |
|
|
|
Total time deposits |
$ |
3,700,063 |
|
|
At December 31, 2023 and 2022, time deposits, excluding brokered time deposits, that met or exceeded the FDIC insurance limit of $250,000 totaled $1.18 billion and $454 million, respectively.
(12) Short-term Borrowings and Federal Home Loan Bank Advances
At December 31, 2023, United had no short-term borrowings outstanding. As of December 31, 2022, short-term borrowings consisted of repurchase agreements, which are borrowings secured by investment securities. The following table presents the remaining contractual maturity of repurchase agreements by collateral pledged as of December 31, 2022 (in thousands).
|
|
|
|
|
|
|
|
|
|
|
|
|
|
|
|
|
|
|
|
|
|
|
|
|
|
|
|
|
|
|
|
|
|
|
Remaining Contractual Maturity of the Agreements |
|
|
|
|
Overnight and Continuous |
|
Up to 30 Days |
|
30-90 Days |
|
Greater than 90 days |
|
Total |
| U.S. Treasuries |
|
$ |
158,933 |
|
|
$ |
— |
|
|
$ |
— |
|
|
$ |
— |
|
|
$ |
158,933 |
|
|
|
|
|
|
|
|
|
|
|
|
|
|
|
|
|
|
|
|
|
|
|
|
|
|
|
|
|
|
|
|
|
|
|
|
|
|
|
|
|
|
|
|
|
|
|
|
|
|
|
|
|
|
|
|
|
|
|
|
|
|
|
|
|
|
|
|
|
|
|
|
|
|
|
|
|
|
| Total |
|
$ |
158,933 |
|
|
$ |
— |
|
|
$ |
— |
|
|
$ |
— |
|
|
$ |
158,933 |
|
United is obligated to promptly transfer additional securities if the market value of the securities falls below the repurchase agreement price. United manages this risk by maintaining an unpledged securities portfolio that it believes is sufficient to cover a decline in the market value of the securities sold under agreements to repurchase. At December 31, 2022, repurchase agreements were collateralized by securities with a carrying amount of $163 million.
At December 31, 2023, United had no FHLB advances outstanding. As of December 31, 2022, United had $550 million of FHLB advances outstanding with maturities in 2023 and interest rates ranging from 4.11% to 4.17%. The FHLB advances are collateralized by a blanket lien on owner occupied and income producing commercial real estate and residential mortgage loans.
UNITED COMMUNITY BANKS, INC. AND SUBSIDIARIES
Notes to Consolidated Financial Statements
(13) Long-term Debt
Long-term debt consisted of the following (in thousands). All debt instruments are obligations of the Holding Company.
|
|
|
|
|
|
|
|
|
|
|
|
|
|
|
|
|
|
|
|
|
|
|
|
|
|
|
|
|
|
|
|
|
|
|
|
|
|
|
|
| |
December 31, |
|
|
|
Stated Maturity Date |
|
Earliest Call Date |
|
Interest Rate Type |
|
|
|
Interest Rate at
December 31, 2023
|
| |
2023 |
|
2022 |
|
|
|
|
|
|
|
|
|
|
|
|
|
|
|
|
|
|
|
|
|
|
|
|
|
|
|
|
|
|
|
|
|
|
|
|
|
|
|
|
|
|
|
|
|
|
|
|
|
|
|
|
|
|
|
|
|
|
|
|
|
|
|
|
|
|
|
|
|
|
|
|
|
|
|
|
|
|
|
|
|
|
|
|
|
|
|
|
|
|
|
|
|
|
|
|
|
|
|
|
|
|
|
|
|
|
|
|
|
|
|
|
|
|
|
|
|
|
|
|
|
|
|
|
|
|
|
|
|
|
|
|
|
|
|
| 2027 senior debentures |
$ |
35,000 |
|
|
$ |
35,000 |
|
|
|
|
2027 |
|
2025 |
|
Fixed (1) |
|
|
|
5.50% |
| 2030 senior debentures |
100,000 |
|
|
100,000 |
|
|
|
|
2030 |
|
2025 |
|
Fixed to floating; will become floating at earliest call date |
|
|
|
5.00 |
| Total senior debentures |
135,000 |
|
|
135,000 |
|
|
|
|
|
|
|
|
|
|
|
|
|
|
|
|
|
|
|
|
|
|
|
|
|
|
|
|
|
| 2028 subordinated debentures |
100,000 |
|
|
100,000 |
|
|
|
|
2028 |
|
* |
|
Floating |
|
|
|
7.77 |
| 2029 subordinated debentures |
60,000 |
|
|
60,000 |
|
|
|
|
2029 |
|
2024 |
|
Fixed to floating; will become floating at earliest call date |
|
|
|
5.125 |
| Total subordinated debentures |
160,000 |
|
|
160,000 |
|
|
|
|
|
|
|
|
|
|
|
|
|
|
|
|
|
|
|
|
|
|
|
|
|
|
|
|
|
| Tidelands Statutory Trust I |
8,248 |
|
|
8,248 |
|
|
|
|
2036 |
|
* |
|
Floating |
|
|
|
6.97 |
| Four Oaks Statutory Trust I |
12,372 |
|
|
12,372 |
|
|
|
|
2036 |
|
* |
|
Floating |
|
|
|
6.99 |
| Community First Capital Trust I |
3,093 |
|
|
3,093 |
|
|
|
|
2032 |
|
* |
|
Floating |
|
|
|
9.50 |
| Community First Capital Trust II |
5,155 |
|
|
5,155 |
|
|
|
|
2035 |
|
* |
|
Floating |
|
|
|
7.15 |
| Community First Capital Trust III |
5,464 |
|
|
5,464 |
|
|
|
|
2037 |
|
* |
|
Floating |
|
|
|
8.65 |
| Total trust preferred securities |
34,332 |
|
|
34,332 |
|
|
|
|
|
|
|
|
|
|
|
|
|
| Less net discount |
(4,509) |
|
|
(4,669) |
|
|
|
|
|
|
|
|
|
|
|
|
|
| Total long-term debt |
$ |
324,823 |
|
|
$ |
324,663 |
|
|
|
|
|
|
|
|
|
|
|
|
|
* Indicates currently redeemable
(1) Previously set to migrate to 3-month LIBOR plus 3.71% in August of 2025, but will now migrate to 6.00% through the end of the term as 3-month LIBOR ceased to be published effective July 1, 2023.
Interest is currently paid at least semiannually for all senior and subordinated debentures and trust preferred securities. Floating rate debentures are based off 3-month Term SOFR or Prime plus a spread. Interest rates above exclude the effect of any fair value hedges on hedged debt instruments. See Note 8 for further detail.
(14) Operating Leases
The following table presents the balances of the ROU asset and corresponding operating lease liability and supplemental lease information as of the dates indicated (in thousands).
|
|
|
|
|
|
|
|
|
|
|
|
|
|
|
|
|
|
|
|
|
|
|
|
|
|
December 31, |
|
|
|
|
|
2023 |
|
2022 |
|
|
ROU asset |
|
|
$ |
42,810 |
|
|
$ |
40,003 |
|
|
|
Operating lease liability |
|
|
44,146 |
|
|
41,688 |
|
|
|
|
|
|
|
|
|
|
|
Weighted average remaining lease term |
|
|
5.0 years |
|
5.1 years |
|
|
Weighted average discount rate |
|
|
2.8 |
% |
|
1.8 |
% |
|
During 2023, ROU assets obtained in exchange for an increase in the lease liability totaled $18.0 million, including leases assumed as part of the First Miami and Progress transactions of $10.4 million. During 2023, cash payments for amounts related to the lease liability totaled $15.2 million. During 2022, ROU assets obtained in exchange for an increase in the lease liability totaled $23.9 million, including leases assumed as part of the Reliant transaction of $14.3 million. During 2021, ROU assets obtained in exchange for an increase in the lease liability totaled $4.49 million, including leases assumed as part of the FinTrust and Aquesta transactions of $2.87 million.
UNITED COMMUNITY BANKS, INC. AND SUBSIDIARIES
Notes to Consolidated Financial Statements
(14) Operating Leases, continued
The table below presents the operating lease income and expense recognized for the periods indicated (in thousands).
|
|
|
|
|
|
|
|
|
|
|
|
|
|
|
|
|
|
|
|
|
|
|
|
|
|
|
|
|
|
|
|
2023 |
|
2022 |
|
2021 |
|
|
Operating lease cost |
|
|
$ |
14,953 |
|
|
$ |
12,161 |
|
|
$ |
8,186 |
|
|
|
Variable lease cost |
|
|
2,174 |
|
|
1,583 |
|
|
1,066 |
|
|
|
Short-term lease cost |
|
|
63 |
|
|
169 |
|
|
85 |
|
|
|
Total lease cost |
|
|
$ |
17,190 |
|
|
$ |
13,913 |
|
|
$ |
9,337 |
|
|
|
|
|
|
|
|
|
|
|
|
|
Sublease income and rental income from owned properties under operating leases |
|
|
$ |
1,338 |
|
|
$ |
1,372 |
|
|
$ |
976 |
|
|
|
|
|
|
|
|
|
|
|
|
|
|
|
|
|
|
|
|
|
|
|
|
|
|
|
|
|
|
|
|
As of December 31, 2023, future minimum lease payments under operating leases were as follows (in thousands):
|
|
|
|
|
|
|
|
|
|
|
|
|
Year |
|
|
|
2024 |
$ |
11,415 |
|
|
|
2025 |
9,807 |
|
|
|
2026 |
8,207 |
|
|
|
2027 |
7,259 |
|
|
|
2028 |
4,424 |
|
|
|
Thereafter |
6,333 |
|
|
|
Total |
47,445 |
|
|
|
Less discount |
(3,299) |
|
|
|
Present value of lease liability |
$ |
44,146 |
|
|
(15) Fair Value Measurements
Fair value measurements are determined based on the assumptions that market participants would use in pricing the asset or liability. As a basis for considering market participant assumptions in fair value measurements, United uses a fair value hierarchy that distinguishes between market participant assumptions based on market data obtained from sources independent of the reporting entity (observable inputs that are classified within Levels 1 and 2 of the hierarchy) and the reporting entity’s own assumptions about market participant assumptions (unobservable inputs classified within Level 3 of the hierarchy). United has processes in place to review the significant valuation inputs and to reassess how the instruments are classified in the valuation framework.
Fair Value Hierarchy
Level 1 Valuation is based upon quoted prices (unadjusted) in active markets for identical assets or liabilities that United has the ability to access.
Level 2 Valuation is based upon quoted prices for similar assets and liabilities in active markets, as well as inputs that are observable for the asset or liability (other than quoted prices), such as interest rates, foreign exchange rates, and yield curves that are observable at commonly quoted intervals.
Level 3 Valuation is generated from model-based techniques that use at least one significant assumption based on unobservable inputs for the asset or liability, which are typically based on an entity’s own assumptions, as there is little, if any, related market activity.
In instances where the determination of the fair value measurement is based on inputs from different levels of the fair value hierarchy, the level in the fair value hierarchy within which the entire fair value measurement falls is based on the lowest level input that is significant to the fair value measurement in its entirety. United’s assessment of the significance of a particular input to the fair value measurement in its entirety requires judgment, and considers factors specific to the asset or liability.
The following is a description of the valuation methodologies used for assets and liabilities recorded at fair value.
UNITED COMMUNITY BANKS, INC. AND SUBSIDIARIES
Notes to Consolidated Financial Statements
(15) Fair Value Measurements, continued
Investment Securities
AFS debt securities and equity securities with readily determinable fair values are recorded at fair value on a recurring basis. Fair value measurement is based upon quoted prices, if available. If quoted prices are not available, fair values are measured using independent pricing models or other model-based valuation techniques such as the present value of future cash flows, adjusted for the security’s credit rating, prepayment assumptions and other factors such as credit loss assumptions. Level 1 securities include those traded on an active exchange, such as the New York Stock Exchange, U.S. Treasury securities that are traded by dealers or brokers in active over-the-counter markets and money market funds. Level 2 securities include mortgage-backed securities issued by government sponsored entities, municipal bonds, corporate debt securities and asset-backed securities and are valued based on observable inputs that include: quoted market prices for similar assets, quoted market prices that are not in an active market or other inputs that are observable in the market and can be corroborated by observable market data for substantially the full term of the securities. Securities classified as Level 3 include those traded in less liquid markets and are valued based on estimates obtained from broker-dealers that are not directly observable.
Deferred Compensation Plan Assets and Liabilities
Included in other assets in the consolidated balance sheets are assets related to employee deferred compensation plans. The assets associated with these plans are invested in mutual funds and classified as Level 1. Deferred compensation liabilities, also classified as Level 1, are carried at the fair value of the obligation to the employee, which mirrors the fair value of the invested assets and is included in other liabilities in the consolidated balance sheet.
Mortgage Loans Held for Sale
United has elected the fair value option for newly originated mortgage loans held for sale in order to reduce certain timing differences and better match changes in fair values of the loans with changes in the value of derivative instruments used to economically hedge them. The fair value of mortgage loans held for sale is determined using quoted prices for a similar asset, adjusted for specific attributes of that loan and are classified as Level 2. As of December 31, 2022, United had certain mortgage loans held for sale that were acquired from Reliant for which the fair value option was not elected; these loans were carried at the lower of aggregate cost or fair value. These loans were subsequently sold in 2023.
Derivative Financial Instruments
United uses derivatives to manage interest rate risk. The valuation of these instruments is typically determined using widely accepted valuation techniques including discounted cash flow analysis on the expected cash flows of each derivative. This analysis reflects the contractual terms of the derivatives, including the period to maturity, and uses observable market-based inputs, including interest rate curves and implied volatilities. The fair values of interest rate swaps are determined using the market standard methodology of netting the discounted future fixed cash receipts and the discounted expected variable cash payments. The variable cash payments are based on an expectation of future interest rates (forward curves) derived from observable market interest rate curves. United also uses best effort and mandatory delivery forward loan sale commitments to hedge risk in its mortgage lending business.
United incorporates CVAs as necessary to appropriately reflect the respective counterparty’s nonperformance risk in the fair value measurements. In adjusting the fair value of its derivative contracts for the effect of nonperformance risk, United has considered the effect of netting and any applicable credit enhancements, such as collateral postings, thresholds and guarantees.
Management has determined that the majority of the inputs used to value its derivatives fall within Level 2 of the fair value hierarchy. However, the CVAs associated with these derivatives utilize Level 3 inputs, such as estimates of current credit spreads, to evaluate the likelihood of default by itself and its counterparties. Generally, management’s assessment of the significance of the CVAs has indicated that they are not a significant input to the overall valuation of the derivatives. In cases where management’s assessment indicates that the CVA is a significant input, the related derivative is disclosed as a Level 3 value.
Other derivatives classified as Level 3 include structured derivatives for which broker quotes, used as a key valuation input, were not observable. Risk participation agreements are classified as Level 3 instruments due to the incorporation of significant Level 3 inputs used to evaluate the probability of funding and the likelihood of customer default. Interest rate lock commitments, which relate to mortgage loan commitments, are categorized as Level 3 instruments as the fair value of these instruments is based on unobservable inputs for commitments that United does not expect to fund.
UNITED COMMUNITY BANKS, INC. AND SUBSIDIARIES
Notes to Consolidated Financial Statements
(15) Fair Value Measurements, continued
Servicing Rights for Residential Mortgage and SBA/USDA Loans
United recognizes servicing rights upon the sale of residential mortgage and SBA/USDA loans sold with servicing retained. Management has elected to carry these assets at fair value. Given the nature of the assets, the key valuation inputs are unobservable and management considers these Level 3 assets. For disclosure regarding the fair value of servicing rights, see Note 10.
Assets and Liabilities Measured at Fair Value on a Recurring Basis
The table below presents United’s assets and liabilities measured at fair value on a recurring basis, aggregated by the level in the fair value hierarchy within which those measurements fall (in thousands):
|
|
|
|
|
|
|
|
|
|
|
|
|
|
|
|
|
|
|
|
|
|
|
|
|
|
|
| December 31, 2023 |
|
Level 1 |
|
Level 2 |
|
Level 3 |
|
Total |
| Assets: |
|
|
|
|
|
|
|
|
| AFS debt securities: |
|
|
|
|
|
|
|
|
| U.S. Treasuries |
|
$ |
387,349 |
|
|
$ |
— |
|
|
$ |
— |
|
|
$ |
387,349 |
|
| U.S. Government agencies & GSEs |
|
— |
|
|
267,500 |
|
|
— |
|
|
267,500 |
|
| State and political subdivisions |
|
— |
|
|
164,049 |
|
|
— |
|
|
164,049 |
|
| Residential MBS |
|
— |
|
|
1,507,598 |
|
|
— |
|
|
1,507,598 |
|
| Commercial MBS |
|
— |
|
|
641,654 |
|
|
— |
|
|
641,654 |
|
| Corporate bonds |
|
— |
|
|
199,017 |
|
|
2,205 |
|
|
201,222 |
|
| Asset-backed securities |
|
— |
|
|
161,712 |
|
|
— |
|
|
161,712 |
|
| Equity securities with readily determinable fair values |
|
5,767 |
|
|
1,628 |
|
|
— |
|
|
7,395 |
|
| Mortgage loans held for sale |
|
— |
|
|
33,008 |
|
|
— |
|
|
33,008 |
|
| Deferred compensation plan assets |
|
12,791 |
|
|
— |
|
|
— |
|
|
12,791 |
|
| Servicing rights for SBA/USDA loans |
|
— |
|
|
— |
|
|
5,444 |
|
|
5,444 |
|
| Residential mortgage servicing rights |
|
— |
|
|
— |
|
|
35,897 |
|
|
35,897 |
|
| Derivative financial instruments |
|
— |
|
|
39,710 |
|
|
10,642 |
|
|
50,352 |
|
| Total assets |
|
$ |
405,907 |
|
|
$ |
3,015,876 |
|
|
$ |
54,188 |
|
|
$ |
3,475,971 |
|
|
|
|
|
|
|
|
|
|
| Liabilities: |
|
|
|
|
|
|
|
|
| Deferred compensation plan liability |
|
$ |
12,838 |
|
|
$ |
— |
|
|
$ |
— |
|
|
$ |
12,838 |
|
| Derivative financial instruments |
|
— |
|
|
73,639 |
|
|
11,172 |
|
|
84,811 |
|
| Total liabilities |
|
$ |
12,838 |
|
|
$ |
73,639 |
|
|
$ |
11,172 |
|
|
$ |
97,649 |
|
|
|
|
|
|
|
|
|
|
|
|
|
|
|
|
|
|
|
|
|
|
|
|
|
|
|
|
| December 31, 2022 |
|
Level 1 |
|
Level 2 |
|
Level 3 |
|
Total |
| Assets: |
|
|
|
|
|
|
|
|
| AFS debt securities: |
|
|
|
|
|
|
|
|
| U.S. Treasuries |
|
$ |
149,352 |
|
|
$ |
— |
|
|
$ |
— |
|
|
$ |
149,352 |
|
| U.S. Government agencies & GSEs |
|
— |
|
|
250,116 |
|
|
— |
|
|
250,116 |
|
| State and political subdivisions |
|
— |
|
|
303,748 |
|
|
— |
|
|
303,748 |
|
| Residential MBS |
|
— |
|
|
1,795,481 |
|
|
— |
|
|
1,795,481 |
|
| Commercial MBS |
|
— |
|
|
671,912 |
|
|
— |
|
|
671,912 |
|
| Corporate bonds |
|
— |
|
|
210,240 |
|
|
2,212 |
|
|
212,452 |
|
| Asset-backed securities |
|
— |
|
|
231,272 |
|
|
— |
|
|
231,272 |
|
| Equity securities with readily determinable fair values |
|
12,278 |
|
|
1,359 |
|
|
— |
|
|
13,637 |
|
| Mortgage loans held for sale |
|
— |
|
|
11,794 |
|
|
— |
|
|
11,794 |
|
| Deferred compensation plan assets |
|
11,436 |
|
|
— |
|
|
— |
|
|
11,436 |
|
| Servicing rights for SBA/USDA loans |
|
— |
|
|
— |
|
|
5,188 |
|
|
5,188 |
|
| Residential mortgage servicing rights |
|
— |
|
|
— |
|
|
36,559 |
|
|
36,559 |
|
| Derivative financial instruments |
|
— |
|
|
39,123 |
|
|
11,513 |
|
|
50,636 |
|
| Total assets |
|
$ |
173,066 |
|
|
$ |
3,515,045 |
|
|
$ |
55,472 |
|
|
$ |
3,743,583 |
|
|
|
|
|
|
|
|
|
|
| Liabilities: |
|
|
|
|
|
|
|
|
| Deferred compensation plan liability |
|
$ |
11,460 |
|
|
$ |
— |
|
|
$ |
— |
|
|
$ |
11,460 |
|
| Derivative financial instruments |
|
— |
|
|
86,703 |
|
|
12,840 |
|
|
99,543 |
|
| Total liabilities |
|
$ |
11,460 |
|
|
$ |
86,703 |
|
|
$ |
12,840 |
|
|
$ |
111,003 |
|
UNITED COMMUNITY BANKS, INC. AND SUBSIDIARIES
Notes to Consolidated Financial Statements
(15) Fair Value Measurements, continued
For disclosure regarding the fair value of servicing rights, see Note 10. The following table shows a reconciliation of the beginning and ending balances for all other assets and liabilities measured at fair value on a recurring basis using significant unobservable inputs that are classified as Level 3 values (in thousands):
|
|
|
|
|
|
|
|
|
|
|
|
|
|
|
|
|
|
|
|
|
|
|
|
|
|
Derivative
Asset |
|
Derivative
Liability |
|
Corporate Bonds |
|
|
December 31, 2020 |
$ |
10,779 |
|
|
$ |
2,408 |
|
|
$ |
1,750 |
|
|
|
|
|
|
|
|
|
|
|
Transfers into Level 3 (1) |
74 |
|
|
— |
|
|
— |
|
|
|
Additions |
261 |
|
|
170 |
|
|
500 |
|
|
|
|
|
|
|
|
|
|
|
Fair value adjustments included in OCI |
— |
|
|
— |
|
|
145 |
|
|
|
Fair value adjustments included in earnings |
(4,356) |
|
|
2,470 |
|
|
— |
|
|
|
December 31, 2021 |
6,758 |
|
|
5,048 |
|
|
2,395 |
|
|
|
Transfers from Level 3 (1) |
(290) |
|
|
— |
|
|
— |
|
|
|
Additions |
12 |
|
|
99 |
|
|
— |
|
|
|
Sales and settlements |
— |
|
|
(1) |
|
|
— |
|
|
|
Fair value adjustments included in OCI |
— |
|
|
— |
|
|
(183) |
|
|
|
Fair value adjustments included in earnings |
5,033 |
|
|
7,694 |
|
|
— |
|
|
|
December 31, 2022 |
11,513 |
|
|
12,840 |
|
|
2,212 |
|
|
|
|
|
|
|
|
|
|
|
|
|
|
|
|
|
|
|
Additions |
— |
|
|
241 |
|
|
— |
|
|
|
Sales and settlements |
(11) |
|
|
— |
|
|
— |
|
|
|
Fair value adjustments included in OCI |
— |
|
|
— |
|
|
(7) |
|
|
|
Fair value adjustments included in earnings |
(860) |
|
|
(1,909) |
|
|
— |
|
|
|
December 31, 2023 |
$ |
10,642 |
|
|
$ |
11,172 |
|
|
$ |
2,205 |
|
|
(1) Certain derivative assets were transferred between Level 2 and Level 3 of the fair value hierarchy due to a change in the assessment of significance of the CVA.
The following table presents quantitative information about recurring Level 3 fair value measurements, excluding servicing rights which are detailed in Note 10:
|
|
|
|
|
|
|
|
|
|
|
|
|
|
|
|
|
|
|
|
|
|
|
|
|
|
|
|
|
|
|
|
|
|
|
|
|
|
|
|
|
|
|
|
|
|
|
|
|
|
| Level 3 Assets and Liabilities |
|
Valuation Technique |
|
|
|
December 31, |
|
|
Significant Unobservable Inputs |
|
2023 |
|
|
|
2022 |
|
|
|
|
|
|
Range |
|
Weighted Average |
|
|
|
Range |
|
Weighted Average |
| Derivative assets - mortgage |
|
Internal model |
|
Pull through rate |
|
60.0% - 100% |
|
90.5% |
|
|
|
26.5% - 100% |
|
90.7% |
|
|
|
|
|
|
|
|
|
|
|
|
|
|
|
|
|
|
|
|
|
|
|
|
|
|
|
|
|
|
|
|
|
|
|
|
|
|
|
|
|
|
|
|
|
|
|
|
|
|
|
|
|
|
|
|
|
|
|
|
| Derivative assets & liabilities - other |
|
Dealer priced |
|
Dealer priced |
|
N/A |
|
N/A |
|
|
|
N/A |
|
N/A |
| Corporate bonds |
|
Discounted cash flow |
|
Discount rate |
|
6.1 - 6.7 |
|
6.5 |
|
|
|
|
6.1 - 6.4 |
|
6.3 |
|
Fair Value Option
United generally records mortgage loans held for sale at fair value under the fair value option. Interest income on these loans is calculated based on the note rate of the loan and is recorded in interest revenue. In connection with the Reliant acquisition, United acquired mortgage loans held for sale accounted for under the lower of cost or fair value method. These loans are separately disclosed under the heading “Assets and Liabilities Measured at Fair Value on a Nonrecurring Basis” within this footnote. The following tables present the fair value and outstanding principal balance of loans accounted for under the fair value option, as well as the gain or loss recognized from the change in fair value for the periods indicated (in thousands).
|
|
|
|
|
|
|
|
|
|
|
|
|
|
|
|
|
|
|
|
Mortgage Loans Held for Sale |
|
|
|
December 31, |
|
|
|
2023 |
|
2022 |
|
|
Outstanding principal balance |
$ |
31,788 |
|
|
$ |
11,473 |
|
|
|
Fair value |
33,008 |
|
|
11,794 |
|
|
UNITED COMMUNITY BANKS, INC. AND SUBSIDIARIES
Notes to Consolidated Financial Statements
(15) Fair Value Measurements, continued
|
|
|
|
|
|
|
|
|
|
|
|
|
|
|
|
|
|
|
|
|
|
|
|
|
|
|
|
|
Amount of Gain (Loss) Recognized on
Mortgage Loans Held for Sale |
|
|
Location |
2023 |
|
2022 |
|
2021 |
|
|
|
Mortgage loan gains and other related fees |
$ |
900 |
|
|
$ |
(1,207) |
|
|
$ |
(4,159) |
|
|
|
Changes in fair value were mostly offset by hedging activities. An immaterial portion of these amounts was attributable to changes in instrument-specific credit risk.
Assets and Liabilities Measured at Fair Value on a Nonrecurring Basis
United may be required, from time to time, to measure certain assets at fair value on a nonrecurring basis. These adjustments to fair value usually result from the application of lower of amortized cost or fair value accounting or write-downs of individual assets due to impairment.
The following table presents the fair value hierarchy and carrying value of all assets that were still held as of December 31, 2023 and 2022, for which a nonrecurring fair value adjustment was recorded during the periods presented (in thousands).
|
|
|
|
|
|
|
|
|
|
|
|
|
|
|
|
|
|
|
|
|
|
|
|
|
|
|
|
|
|
|
|
|
|
December 31, 2023 |
|
Level 1 |
|
Level 2 |
|
Level 3 |
|
Total |
|
|
Loans held for investment |
|
$ |
— |
|
|
$ |
— |
|
|
$ |
36,984 |
|
|
$ |
36,984 |
|
|
|
|
|
|
|
|
|
|
|
|
|
|
|
|
|
|
|
|
|
|
|
|
|
December 31, 2022 |
|
|
|
|
|
|
|
|
|
|
Loans held for investment |
|
$ |
— |
|
|
$ |
— |
|
|
$ |
7,808 |
|
|
$ |
7,808 |
|
|
|
Mortgage loans held for sale |
|
$ |
— |
|
|
$ |
— |
|
|
$ |
1,806 |
|
|
$ |
1,806 |
|
|
As of December 31, 2022, mortgage loans held for sale that were acquired from Reliant were subject to a nonrecurring fair value adjustment resulting from the application of the lower of the amortized cost or fair value accounting. As of December 31, 2022, these loans were classified as nonrecurring Level 3 because the valuation of these loans was based on indicative bids provided by a broker, not corroborated by market transactions. These loans were subsequently sold during 2023.
Loans held for investment that are reported above as being measured at fair value on a nonrecurring basis are generally impaired loans that have either been partially charged off or have been assigned a specific reserve. Nonaccrual loans that are collateral dependent are generally written down to net realizable value, which reflects fair values less the estimated costs to sell. Specific reserves that are established based on appraised value of collateral are considered nonrecurring fair value adjustments as well. When the fair value of the collateral is based on an observable market price or a current appraised value, United records the impaired loan as nonrecurring Level 2. When an appraised value is not available or management determines the fair value is further impaired below the appraised value and there is no observable market price, United records the impaired loan as nonrecurring Level 3.
Assets and Liabilities Not Measured at Fair Value
For financial instruments that have quoted market prices, those quotes are used to determine fair value. Financial instruments that have no defined maturity, have a remaining maturity of 180 days or less, or reprice frequently to a market rate are assumed to have a fair value that approximates reported book value, after taking into consideration any applicable credit risk. If no market quotes are available, financial instruments are valued by discounting the expected cash flows using an estimated current market interest rate for the financial instrument. For off-balance sheet derivative instruments, fair value is estimated as the amount that United would receive or pay to terminate the contracts at the reporting date, taking into account the current unrealized gains or losses on open contracts.
Cash and cash equivalents and repurchase agreements have short maturities and therefore the carrying value approximates fair value. Due to the short-term settlement of accrued interest receivable and payable, the carrying amount closely approximates fair value.
Fair value estimates are made at a specific point in time, based on relevant market information and information about the financial instrument. These estimates do not reflect the premium or discount on any particular financial instrument that could result from the sale of United’s entire holdings. All estimates are inherently subjective in nature. Changes in assumptions could significantly affect the estimates.
UNITED COMMUNITY BANKS, INC. AND SUBSIDIARIES
Notes to Consolidated Financial Statements
(15) Fair Value Measurements, continued
Fair value estimates are based on existing on and off-balance sheet financial instruments without attempting to estimate the value of anticipated future business and the value of assets and liabilities that are not considered financial instruments. Significant assets and liabilities that are not considered financial instruments include the mortgage banking operation, wealth management network, deferred income taxes, premises and equipment and goodwill. In addition, the tax ramifications related to the realization of the unrealized gains and losses can have a significant effect on fair value estimates and have not been considered in the estimates.
Off-balance sheet instruments (commitments to extend credit and standby letters of credit) for which draws can be reasonably predicted are generally short-term and at variable rates. Therefore, both the carrying amount and the estimated fair value associated with these instruments are immaterial.
The carrying amount and fair values for other financial instruments that are not measured at fair value on a recurring basis in United’s consolidated balance sheets are as follows (in thousands):
|
|
|
|
|
|
|
|
|
|
|
|
|
|
|
|
|
|
|
|
|
|
|
|
|
|
|
|
|
|
|
|
|
| |
|
Carrying Amount |
|
Fair Value Level |
| December 31, 2023 |
|
|
Level 1 |
|
Level 2 |
|
Level 3 |
|
Total |
| Assets: |
|
|
|
|
|
|
|
|
|
|
| HTM debt securities |
|
$ |
2,490,848 |
|
|
$ |
17,950 |
|
|
$ |
2,077,670 |
|
|
$ |
— |
|
|
$ |
2,095,620 |
|
| Loans, net |
|
18,110,684 |
|
|
— |
|
|
— |
|
|
17,585,073 |
|
|
17,585,073 |
|
|
|
|
|
|
|
|
|
|
|
|
| Liabilities: |
|
|
|
|
|
|
|
|
|
|
| Deposits |
|
23,310,611 |
|
|
— |
|
|
23,305,223 |
|
|
— |
|
|
23,305,223 |
|
|
|
|
|
|
|
|
|
|
|
|
| Long-term debt |
|
324,823 |
|
|
— |
|
|
— |
|
|
310,060 |
|
|
310,060 |
|
|
|
|
|
|
|
|
|
|
|
|
| December 31, 2022 |
|
|
|
|
|
|
|
|
|
|
| Assets: |
|
|
|
|
|
|
|
|
|
|
| HTM debt securities |
|
$ |
2,613,648 |
|
|
$ |
17,417 |
|
|
$ |
2,173,656 |
|
|
$ |
— |
|
|
$ |
2,191,073 |
|
| Loans, net |
|
15,175,270 |
|
|
— |
|
|
— |
|
|
14,609,239 |
|
|
14,609,239 |
|
|
|
|
|
|
|
|
|
|
|
|
| Liabilities: |
|
|
|
|
|
|
|
|
|
|
| Deposits |
|
19,876,507 |
|
|
— |
|
|
19,863,380 |
|
|
— |
|
|
19,863,380 |
|
| Federal Home Loan Bank advances |
|
550,000 |
|
|
— |
|
|
— |
|
|
549,913 |
|
|
549,913 |
|
| Long-term debt |
|
324,663 |
|
|
— |
|
|
— |
|
|
313,380 |
|
|
313,380 |
|
(16) Common and Preferred Stock
Common Stock
In November of 2023, United’s Board re-authorized its common stock repurchase program to permit the repurchase of up to $50 million of its common stock. The program is scheduled to expire on the earlier of United’s repurchase of its common stock having an aggregate purchase price of $50 million or December 31, 2024. Under the program, shares may be repurchased in open market transactions or in privately negotiated transactions, from time to time, subject to market conditions. During 2023 and 2022, no shares were repurchased under the program. During 2021, 492,744 shares were repurchased. As of December 31, 2023, United had remaining authorization to repurchase up to $50.0 million of outstanding common stock.
United sponsors a DRIP that allows participants who already own United’s common stock to purchase additional shares directly from the Company. The DRIP also allows participants to automatically reinvest their quarterly dividends in additional shares of common stock without a commission. In 2023, 2022 and 2021, 11,307, 8,941 and 10,081 shares, respectively, were issued under the DRIP.
Preferred Stock
United’s Series I perpetual non-cumulative preferred stock (“Preferred Stock”) and corresponding depositary shares each representing a 1/1,000th interest in one share of Preferred Stock have a dividend rate of 6.875% per annum. If declared, dividends are payable quarterly in arrears. The Preferred Stock has no stated maturity and redemption is solely at the option of United in whole, but not in part, upon the occurrence of a regulatory capital treatment event, as defined. In addition, the Preferred Stock may be redeemed on or after September 15, 2025 at a cash redemption price equal to $25,000 per share (equivalent to $25 per depositary share) plus any declared and unpaid dividends. As of December 31, 2023 and 2022, the Preferred Stock had a carrying amount of $88.3 million and $96.4 million, respectively.
UNITED COMMUNITY BANKS, INC. AND SUBSIDIARIES
Notes to Consolidated Financial Statements
(16) Common and Preferred Stock, continued
In May 2023, United’s Board of Directors approved a preferred stock repurchase program, authorizing United to repurchase up to $25.0 million of its outstanding Series I Non-Cumulative Preferred Stock directly or through the repurchase of depositary shares representing 1/1000th of a share of Series I Non-Cumulative Preferred Stock. The program was originally scheduled to expire on the earlier of the repurchase of preferred stock having an aggregate purchase price of $25.0 million or December 31, 2023. In November 2023, the Board approved an extension of this program through December 31, 2024. During the twelve months ended December 31, 2023, 338,350 depositary shares were repurchased. As of December 31, 2023, United had remaining authorization to repurchase up to $18.4 million of outstanding preferred stock under the program.
(17) Equity Compensation Plans
United has an equity compensation plan that allows for grants of various stock-based compensation. The general terms of the plan include a vesting period (usually four years) with an exercisable period not to exceed ten years. Certain options and restricted stock unit awards provide for accelerated vesting if there is a change in control of United or certain other conditions are met (as defined in the plan document). As of December 31, 2023, 2.28 million additional awards could be granted under the plan.
Restricted stock units and options outstanding and activity for the years ended December 31 consisted of the following:
|
|
|
|
|
|
|
|
|
|
|
|
|
|
|
|
|
|
|
|
|
|
|
|
|
|
|
|
|
|
|
|
|
|
|
|
|
|
|
|
|
|
| |
Restricted Stock Units |
|
Options |
|
Shares |
|
Weighted Average Grant Date Fair Value |
|
Aggregate
Intrinsic
Value (000’s) |
|
Shares |
|
Weighted Average Exercise Price |
|
Weighted Average Remaining Term (Yrs.) |
|
Aggregate Intrinsic Value (000’s) |
| December 31, 2020 |
893,431 |
|
|
$ |
23.75 |
|
|
|
|
— |
|
|
$ |
— |
|
|
|
|
|
| Granted |
302,701 |
|
|
30.34 |
|
|
|
|
62,743 |
|
|
8.30 |
|
|
|
|
|
| Vested / Exercised |
(330,598) |
|
|
26.13 |
|
|
|
|
(27,283) |
|
|
8.20 |
|
|
|
|
|
|
|
|
|
|
|
|
|
|
|
|
|
|
|
| Cancelled |
(57,060) |
|
|
25.15 |
|
|
|
|
— |
|
|
— |
|
|
|
|
|
| December 31, 2021 |
808,474 |
|
|
25.15 |
|
|
|
|
35,460 |
|
|
8.38 |
|
|
|
|
|
| Granted |
343,526 |
|
|
32.92 |
|
|
|
|
48,239 |
|
|
20.88 |
|
|
|
|
|
| Vested / Exercised |
(340,691) |
|
|
25.74 |
|
|
|
|
(43,361) |
|
|
19.02 |
|
|
|
|
|
|
|
|
|
|
|
|
|
|
|
|
|
|
|
| Cancelled |
(32,623) |
|
|
26.12 |
|
|
|
|
— |
|
|
— |
|
|
|
|
|
| December 31, 2022 |
778,686 |
|
|
28.28 |
|
|
|
|
40,338 |
|
|
11.88 |
|
|
|
|
|
Granted/Assumed |
542,388 |
|
|
28.98 |
|
|
|
|
643,298 |
|
|
20.91 |
|
|
|
|
|
| Vested / Exercised |
(311,219) |
|
|
26.95 |
|
|
$ |
9,047 |
|
|
(272,279) |
|
|
19.06 |
|
|
|
|
$ |
2,377 |
|
|
|
|
|
|
|
|
|
|
|
|
|
|
|
| Cancelled |
(80,488) |
|
|
31.21 |
|
|
|
|
(4,620) |
|
|
25.97 |
|
|
|
|
|
| December 31, 2023 |
929,367 |
|
|
28.85 |
|
|
27,166 |
|
|
406,737 |
|
|
21.19 |
|
|
5.2 |
|
3,284 |
|
| Vested / Exercisable |
|
|
|
|
|
|
|
|
|
|
|
|
|
| at December 31, 2023 |
— |
|
|
— |
|
|
— |
|
|
406,737 |
|
|
21.19 |
|
|
5.2 |
|
3,284 |
|
Options granted or assumed in 2023, 2022 and 2021 were related to the Progress, Reliant and Aquesta acquisitions, respectively, with the weighted average exercise price of the acquired institution’s fully vested converted options determined pursuant to the purchase agreement. The value of the options was determined using a Black-Scholes model and was included in each acquisition’s purchase price. No compensation expense relating to options was included in earnings for 2023, 2022 or 2021.
Compensation expense for restricted stock units without market conditions is based on the market value of United’s common stock on the date of grant. United recognizes the impact of forfeitures as they occur. The value of restricted stock unit awards is amortized into expense over the service period.
In addition to time-based restricted stock unit awards, the Board has also approved performance-based restricted stock units (“PSUs”), which vest based on achieving certain performance and market targets relative to a bank peer group. Achievement of the target-level performance and market criteria for all applicable periods will result in the issuance of 174,130 shares, which are included in the outstanding balance as of December 31, 2023 in the table above. The actual number of shares issued related to the vesting of PSUs may be greater or less than target depending on the achievement of the performance and market criteria during any applicable performance period. The grant date per share fair market value of PSUs is estimated using the Monte Carlo Simulation valuation model.
UNITED COMMUNITY BANKS, INC. AND SUBSIDIARIES
Notes to Consolidated Financial Statements
(17) Equity Compensation Plans, continued
Compensation expense recognized in the consolidated statements of income for employee restricted stock unit awards in 2023, 2022 and 2021 was $8.21 million, $8.17 million and $6.07 million, respectively, which was recognized in salaries and employee benefits expense. In addition, in 2023, 2022 and 2021, $725,000, $540,000 and $489,000, respectively, was recognized in other operating expenses for restricted stock unit awards granted to members of the Board. Deferred income tax benefits related to stock-based compensation expense of $2.28 million, $2.22 million and $1.67 million were included in the determination of income tax expense in 2023, 2022 and 2021, respectively. As of December 31, 2023, there was $20.7 million of unrecognized compensation cost related to restricted stock units granted under the plan. The cost is expected to be recognized over a weighted-average period of 2.6 years.
(18) Reclassifications Out of AOCI
The following presents the details regarding amounts reclassified out of AOCI (in thousands). Amounts shown above in parentheses reduce earnings.
|
|
|
|
|
|
|
|
|
|
|
|
|
|
|
|
|
|
|
|
|
|
|
|
|
|
|
|
|
|
|
|
Amounts Reclassified from AOCI For the Years Ended December 31, |
|
|
|
|
Details about AOCI Components |
|
|
Affected Line Item in the Statement Where Net Income is Presented |
|
|
|
2023 |
|
2022 |
|
2021 |
|
|
|
|
|
|
|
|
|
|
|
|
|
|
Realized (losses) gains on AFS securities: |
|
|
|
|
|
|
|
|
$ |
(53,333) |
|
|
$ |
(3,872) |
|
|
$ |
83 |
|
|
Securities (losses) gains, net |
|
|
|
|
13,575 |
|
|
1,026 |
|
|
46 |
|
|
Income tax expense |
|
|
|
|
$ |
(39,758) |
|
|
$ |
(2,846) |
|
|
$ |
129 |
|
|
Net of tax |
|
|
|
|
|
|
|
|
|
|
|
|
|
Amortization of unrealized losses on HTM securities transferred from AFS: |
|
|
|
|
$ |
(10,203) |
|
|
$ |
(9,049) |
|
|
$ |
— |
|
|
Investment securities interest revenue |
|
|
|
|
2,452 |
|
|
2,167 |
|
|
— |
|
|
Income tax expense |
|
|
|
|
$ |
(7,751) |
|
|
$ |
(6,882) |
|
|
$ |
— |
|
|
Net of tax |
|
|
|
|
|
|
|
|
|
|
|
|
|
Gains (losses) on derivative instruments accounted for as cash flow hedges: |
|
|
|
|
|
|
|
|
|
|
|
|
|
|
|
Interest rate contracts |
|
$ |
4,719 |
|
|
$ |
(269) |
|
|
$ |
(608) |
|
|
Long-term debt interest expense |
|
|
|
|
(1,205) |
|
|
69 |
|
|
156 |
|
|
Income tax expense |
|
|
|
|
$ |
3,514 |
|
|
$ |
(200) |
|
|
$ |
(452) |
|
|
Net of tax |
|
|
|
|
|
|
|
|
|
|
|
|
|
|
|
|
|
|
|
|
|
|
|
|
|
|
|
|
|
|
|
|
|
|
|
|
|
|
|
|
Amortization of defined benefit pension plan net periodic pension cost components: |
|
|
|
|
Prior service cost |
|
$ |
(244) |
|
|
$ |
(313) |
|
|
$ |
(469) |
|
|
Salaries and employee benefits expense |
|
|
Actuarial losses |
|
— |
|
|
(367) |
|
|
(575) |
|
|
Other expense |
|
|
|
|
|
|
|
|
|
|
|
|
|
|
|
(244) |
|
|
(680) |
|
|
(1,044) |
|
|
Total before tax |
|
|
|
|
62 |
|
|
174 |
|
|
267 |
|
|
Income tax expense |
|
|
|
|
$ |
(182) |
|
|
$ |
(506) |
|
|
$ |
(777) |
|
|
Net of tax |
|
|
|
|
|
|
|
|
|
|
|
|
|
Total reclassifications for the period |
|
$ |
(44,177) |
|
|
$ |
(10,434) |
|
|
$ |
(1,100) |
|
|
Net of tax |
|
UNITED COMMUNITY BANKS, INC. AND SUBSIDIARIES
Notes to Consolidated Financial Statements
(19) Earnings Per Share
The following table sets forth the computation of basic and diluted net income per common share for the years indicated (in thousands, except per share data):
|
|
|
|
|
|
|
|
|
|
|
|
|
|
|
|
|
|
| |
Year Ended December 31, |
| |
2023 |
|
2022 |
|
2021 |
| Net income |
$ |
187,544 |
|
|
$ |
277,472 |
|
|
$ |
269,801 |
|
| Earnings allocated to participating securities |
(1,032) |
|
|
(1,462) |
|
|
(1,657) |
|
Discount on preferred shares repurchased |
970 |
|
|
— |
|
|
— |
|
| Dividends on preferred stock |
(6,635) |
|
|
(6,875) |
|
|
(6,875) |
|
| Net income available to common stockholders |
$ |
180,847 |
|
|
$ |
269,135 |
|
|
$ |
261,269 |
|
| Net income per common share: |
|
|
|
|
|
| Basic |
$ |
1.54 |
|
|
$ |
2.52 |
|
|
$ |
2.97 |
|
| Diluted |
1.54 |
|
|
2.52 |
|
|
2.97 |
|
| Weighted average common shares: |
|
|
|
|
|
| Basic |
117,603 |
|
|
106,661 |
|
|
87,940 |
|
| Effect of dilutive securities: |
|
|
|
|
|
| Stock options |
121 |
|
|
39 |
|
|
9 |
|
| Restricted stock units |
21 |
|
|
78 |
|
|
148 |
|
| Diluted |
117,745 |
|
|
106,778 |
|
|
88,097 |
|
At December 31, 2023, United excluded from the computation 1,968 potentially dilutive shares of common stock issuable upon exercise of stock options because of their antidilutive effect. At December 31, 2022 and 2021, United had no potentially dilutive instruments outstanding that were not included in the above analysis.
(20) Income Taxes
Income tax expense is as follows for the years indicated (in thousands):
|
|
|
|
|
|
|
|
|
|
|
|
|
|
|
|
|
|
| |
Year Ended December 31, |
| |
2023 |
|
2022 |
|
2021 |
| Current |
$ |
38,612 |
|
|
$ |
67,612 |
|
|
$ |
57,175 |
|
| Deferred |
6,389 |
|
|
10,918 |
|
|
20,787 |
|
|
|
|
|
|
|
|
|
|
|
|
|
| Total income tax expense |
$ |
45,001 |
|
|
$ |
78,530 |
|
|
$ |
77,962 |
|
The differences between the provision for income taxes and the amount computed by applying the statutory federal income tax rate of 21% in 2023, 2022 and 2021 to income before income taxes are as follows for the years indicated (in thousands):
|
|
|
|
|
|
|
|
|
|
|
|
|
|
|
|
|
|
| |
Year Ended December 31, |
| |
2023 |
|
2022 |
|
2021 |
| Income tax expense on pretax income at statutory rates |
$ |
48,834 |
|
|
$ |
74,760 |
|
|
$ |
73,030 |
|
| Add (deduct): |
|
|
|
|
|
| State taxes, net of federal benefit |
3,164 |
|
|
7,096 |
|
|
9,188 |
|
| BOLI earnings |
(1,685) |
|
|
(1,379) |
|
|
(745) |
|
| Adjustment to reserve for uncertain tax positions |
110 |
|
|
430 |
|
|
153 |
|
| Tax-exempt interest revenue |
(2,781) |
|
|
(3,015) |
|
|
(2,520) |
|
| Equity compensation |
(781) |
|
|
(1,313) |
|
|
(891) |
|
| Transaction costs |
467 |
|
|
296 |
|
|
117 |
|
| Tax credit investments |
(4,389) |
|
|
(694) |
|
|
(598) |
|
| BOLI surrender |
— |
|
|
1,746 |
|
|
— |
|
| FDIC premium expense |
1,539 |
|
|
704 |
|
|
388 |
|
|
|
|
|
|
|
|
|
|
|
|
|
|
|
|
|
|
|
| Other |
523 |
|
|
(101) |
|
|
(160) |
|
| Total income tax expense |
$ |
45,001 |
|
|
$ |
78,530 |
|
|
$ |
77,962 |
|
UNITED COMMUNITY BANKS, INC. AND SUBSIDIARIES
Notes to Consolidated Financial Statements
(20) Income Taxes, continued
The following summarizes the sources and expected tax consequences of future taxable deductions (revenue) which comprise the net DTA as of the dates indicated (in thousands):
|
|
|
|
|
|
|
|
|
|
|
|
| |
December 31, |
| |
2023 |
|
2022 |
| DTAs: |
|
|
|
| ACL |
$ |
50,163 |
|
|
$ |
38,409 |
|
| Net operating loss carryforwards |
14,649 |
|
|
15,170 |
|
| Deferred compensation |
12,179 |
|
|
11,181 |
|
| Loan purchase accounting adjustments |
17,707 |
|
|
5,223 |
|
|
|
|
|
| Nonqualified share based compensation |
1,802 |
|
|
1,253 |
|
| Accrued expenses |
10,577 |
|
|
10,369 |
|
| Investment in partnerships |
2,359 |
|
|
— |
|
|
|
|
|
| Unrealized losses on AFS securities |
74,947 |
|
|
103,960 |
|
|
|
|
|
| Derivatives |
— |
|
|
86 |
|
| Deferred gains on SBA/USDA loan sales |
1,651 |
|
|
1,683 |
|
| Lease liability |
10,710 |
|
|
10,105 |
|
| Other |
4,986 |
|
|
2,884 |
|
| Total DTAs |
201,730 |
|
|
200,323 |
|
| DTLs: |
|
|
|
|
|
|
|
| Unrealized gains on cash flow hedges |
4,804 |
|
|
4,507 |
|
| Acquired intangible assets |
15,528 |
|
|
4,707 |
|
| Premises and equipment |
12,806 |
|
|
9,314 |
|
| Loan origination costs |
11,500 |
|
|
8,855 |
|
| True tax leases |
12,656 |
|
|
8,748 |
|
| Servicing assets |
8,774 |
|
|
9,243 |
|
| Derivatives |
166 |
|
|
— |
|
| ROU asset |
10,460 |
|
|
9,807 |
|
| Securities purchase accounting adjustments |
3,057 |
|
|
4,150 |
|
| BOLI |
1,748 |
|
|
1,746 |
|
| Trust preferred securities debt issuance |
1,552 |
|
|
1,606 |
|
| Uncertain tax positions |
2,382 |
|
|
1,891 |
|
| Other |
2,044 |
|
|
5,514 |
|
| Total DTLs |
87,477 |
|
|
70,088 |
|
| Less valuation allowance |
1,039 |
|
|
922 |
|
| Net DTA |
$ |
113,214 |
|
|
$ |
129,313 |
|
The change in the net DTA in 2023 includes an increase of $19.5 million due to current year merger and acquisition activity.
At December 31, 2023, United had:
•$20.3 million of state net operating loss carryforwards subject to annual limitation under IRC Section 382 that begin to expire in 2026, if not previously utilized.
•$24.8 million of state net operating loss carryforwards that begin to expire in 2025, if not previously utilized.
•$48.8 million in federal net operating loss carryforwards subject to annual limitation under IRC Section 382 that begin to expire in 2027, if not previously utilized.
•$3.40 million of state tax credits that begin to expire in 2024, if not previously utilized.
Management assesses the valuation allowance recorded against DTAs at each reporting period. The determination of whether a valuation allowance for DTAs is appropriate is subject to considerable judgment and requires an evaluation of all the positive and negative evidence. ASC 740 requires that companies assess whether a valuation allowance should be established against their DTAs based on the consideration of all available evidence using a “more likely than not” standard.
At December 31, 2023 and 2022, based on the assessment of all the positive and negative evidence, management concluded that it is more likely than not that nearly all of the net DTA will be realized based upon future taxable income.
UNITED COMMUNITY BANKS, INC. AND SUBSIDIARIES
Notes to Consolidated Financial Statements
(20) Income Taxes, continued
The valuation allowance of $1.04 million and $922,000, respectively, was related to specific state income tax credits that have short carryforward periods and certain acquired state net operating losses, both of which are expected to expire unused.
The valuation allowance could fluctuate in future periods based on the assessment of the positive and negative evidence. Management’s conclusion at December 31, 2023 that it was more likely than not that the net DTA of $113 million will be realized is based on management’s estimate of future taxable income. Management’s estimate of future taxable income is based on internal forecasts which consider historical performance, various internal estimates and assumptions, as well as certain external data all of which management believes to be reasonable although inherently subject to significant judgment. If actual results differ significantly from the current estimates of future taxable income, even if caused by adverse macro-economic conditions, the valuation allowance may need to be increased for some or all of the net DTA.
A reconciliation of the beginning and ending unrecognized tax benefit related to uncertain tax positions is as follows for the years indicated (in thousands):
|
|
|
|
|
|
|
|
|
|
|
|
|
|
|
|
|
|
| |
2023 |
|
2022 |
|
2021 |
| Balance at beginning of year |
$ |
2,848 |
|
|
$ |
2,356 |
|
|
$ |
2,163 |
|
| Additions based on tax positions related to the current year |
939 |
|
|
962 |
|
|
634 |
|
| Decreases resulting from a lapse in the applicable statute of limitations |
(831) |
|
|
(470) |
|
|
(441) |
|
|
|
|
|
|
|
| Balance at end of year |
$ |
2,956 |
|
|
$ |
2,848 |
|
|
$ |
2,356 |
|
Approximately $2.34 million of the unrecognized tax benefit at December 31, 2023 would increase income from continuing operations, and thus affect United’s effective tax rate, if ultimately recognized into income.
It is United’s policy to recognize interest and penalties accrued relative to unrecognized tax benefits in their respective federal or state income taxes accounts. There were no penalties and interest related to income taxes recorded in the income statement in 2023, 2022 or 2021. No amounts were accrued for interest and penalties on the balance sheet at December 31, 2023 or 2022.
United and its subsidiaries file a consolidated U.S. federal income tax return, as well as various state returns in the states where it operates. United’s federal and state income tax returns are generally no longer subject to examination by taxing authorities for years before 2020.
(21) Benefit Plans
Defined Contribution Benefit Plans
401(k) Plan
United offers a defined contribution safe harbor 401(k) plan (the “401(k) Plan”) that covers substantially all employees meeting certain minimum service requirements. The 401(k) Plan allows employees to make pre-tax contributions to the 401(k) Plan and United matches 100% of employee contributions up to 5% of eligible compensation. Employees begin to receive matching contributions after completing 90 days of service. Under safe harbor provisions, United is required to provide a matching contribution and participants are immediately 100% vested in safe harbor matching contributions.
United’s 401(k) Plan is administered in accordance with applicable laws and regulations. Compensation expense related to the 401(k) Plan totaled $10.9 million, $9.60 million and $7.31 million in 2023, 2022 and 2021, respectively.
Deferred Compensation Plan
United also sponsors a non-qualified deferred compensation plan for its executive officers, certain other key employees and members of the Board and its community banks’ advisory boards of directors. The deferred compensation plan provides for the pre-tax deferral of compensation, fees and other specified benefits. Specifically, the deferred compensation plan permits each employee participant to elect to defer a portion of base salary, bonus or vested restricted stock units and permits each eligible director participant to elect to defer all or a portion of director’s fees. Further, the deferred compensation plan allows for additional contributions by an employee, with matching contributions by United, for amounts that exceed the allowable amounts under the 401(k) Plan. The deferred compensation plan is an unfunded obligation of United with participants of the plan being general unsecured creditors of United.
UNITED COMMUNITY BANKS, INC. AND SUBSIDIARIES
Notes to Consolidated Financial Statements
(21) Benefit Plans, continued
During 2023, 2022 and 2021, United recognized $85,000, $104,000 and $73,000, respectively, in matching contributions for this provision of the deferred compensation plan. The Board may also elect to make a discretionary contribution to any or all participants. No discretionary contributions were made in 2023, 2022 or 2021.
In addition to common stock related to elected deferrals of vested restricted stock units, United offers its common stock as an investment option for cash contributions to the deferred compensation plan. The common stock component is accounted for as an equity instrument and is reflected in the consolidated balance sheets as common stock issuable. The deferred compensation plan does not allow for diversification once an election is made to invest in United stock and settlement must be accomplished in shares at the time the deferral period is completed. At December 31, 2023 and 2022, United had 620,108 shares and 607,128 shares, respectively, of its common stock that were issuable under the deferred compensation plan.
Defined Benefit Pension Plan
United has an unfunded noncontributory defined benefit pension plan, or the Modified Retirement Plan, that covers certain executive officers and other key employees. The Modified Retirement Plan provides a fixed annual retirement benefit to plan participants.
Weighted-average assumptions used to determine the pension benefit obligation of the Modified Retirement Plan at year end and net periodic pension cost are shown in the table below:
|
|
|
|
|
|
|
|
|
|
|
|
|
|
|
|
|
|
|
|
|
|
|
|
|
|
2023 |
|
|
|
2022 |
|
|
Discount rate for disclosures |
4.95 |
% |
|
|
|
5.15 |
% |
|
|
Discount rate for net periodic benefit cost |
5.15 |
% |
|
|
|
2.90 |
% |
|
|
Measurement date |
12/31/2023 |
|
|
|
12/31/2022 |
|
Discount rates are determined in consultation with the third-party actuary and are set by matching the projected benefit cash flow to a notional yield curve developed by reference to high-quality fixed income investments. The discount rates are determined as the rate which would provide the same present value as the plan cash flows discounted to the measurement date using the full series of spot rates along the notional yield curve as of the measurement date.
United recognizes the unfunded status of the Modified Retirement Plan as a liability in the consolidated balance sheets. Information about changes in obligations and plan assets follows (in thousands):
|
|
|
|
|
|
|
|
|
|
|
|
|
|
|
|
|
|
|
|
|
|
|
|
2023 |
|
2022 |
|
|
Accumulated benefit obligation: |
|
|
|
|
|
Accumulated benefit obligation - beginning of year |
$ |
20,674 |
|
|
$ |
26,261 |
|
|
|
Service cost |
463 |
|
|
626 |
|
|
|
Interest cost |
1,035 |
|
|
744 |
|
|
|
|
|
|
|
|
|
Actuarial losses (gains) |
623 |
|
|
(5,833) |
|
|
|
Benefits paid |
(1,154) |
|
|
(1,124) |
|
|
|
Accumulated benefit obligation - end of year |
21,641 |
|
|
20,674 |
|
|
|
Change in plan assets, at fair value: |
|
|
|
|
|
Beginning plan assets |
— |
|
|
— |
|
|
|
|
|
|
|
|
|
Employer contribution |
1,154 |
|
|
1,124 |
|
|
|
Benefits paid |
(1,154) |
|
|
(1,124) |
|
|
|
Plan assets - end of year |
— |
|
|
— |
|
|
|
Funded status - end of year (plan assets less benefit obligations) |
$ |
(21,641) |
|
|
$ |
(20,674) |
|
|
UNITED COMMUNITY BANKS, INC. AND SUBSIDIARIES
Notes to Consolidated Financial Statements
(21) Benefit Plans, continued
Components of net periodic benefit cost and other amounts recognized in other comprehensive income related to the Modified Retirement Plan are as follows (in thousands):
|
|
|
|
|
|
|
|
|
|
|
|
|
|
|
|
|
|
|
|
|
|
|
|
|
|
|
|
|
|
2023 |
2022 |
2021 |
|
|
Service cost |
$ |
463 |
|
|
$ |
626 |
|
|
$ |
659 |
|
|
|
Interest cost |
1,035 |
|
|
744 |
|
|
676 |
|
|
|
|
|
|
|
|
|
|
|
Amortization of prior service cost |
244 |
|
|
313 |
|
|
469 |
|
|
|
Amortization of net actuarial losses |
— |
|
|
367 |
|
|
576 |
|
|
|
Net periodic benefit cost |
$ |
1,742 |
|
|
$ |
2,050 |
|
|
$ |
2,380 |
|
|
The following table summarizes the estimated future benefit payments expected to be paid from the Modified Retirement Plan for the periods indicated (in thousands).
|
|
|
|
|
|
|
|
|
|
|
|
|
2024 |
$ |
1,216 |
|
|
|
2025 |
1,229 |
|
|
|
2026 |
1,250 |
|
|
|
2027 |
1,475 |
|
|
|
2028 |
1,506 |
|
|
|
2029-2033 |
8,125 |
|
|
|
|
|
|
Other United sponsored benefit plans
United's Employee Stock Purchase Program (“ESPP”), which was terminated during 2021, allowed eligible employees to purchase shares of common stock at a discount (10%), with no commission charges. During 2021, United issued 6,676 shares through the ESPP.
(22) Regulatory Matters
Capital Requirements
United and the Bank are subject to various regulatory capital requirements administered by the federal banking agencies. Failure to meet minimum capital requirements can initiate certain mandatory and possibly additional discretionary action by regulators that, if undertaken, could have a direct material effect on United. Under capital adequacy guidelines and the regulatory framework for prompt corrective action, United and the Bank must meet specific capital guidelines that involve quantitative measures of assets, liabilities, and certain off-balance sheet items as calculated under regulatory accounting practices. The capital amounts and classification are also subject to qualitative judgments by the regulators about components, risk weightings, and other factors. Quantitative measures (as defined) established by regulation to ensure capital adequacy require United and the Bank to maintain minimum amounts and ratios of total capital, Tier 1 capital, and CET1 to RWAs, and of Tier 1 capital to average assets.
United and the Bank are also subject to a “capital conservation buffer,” which is designed to absorb losses during periods of economic stress. Banking organizations with a ratio of CET1 to RWAs above the minimum but below the conservation buffer (or below the combined capital conservation buffer and counter-cyclical capital buffer, when the latter is applied) will face constraints on dividends, equity repurchases and discretionary bonus compensation based on the amount of the shortfall.
As of December 31, 2023, United and the Bank were categorized as well-capitalized under the regulatory framework for prompt corrective action in effect at such time. To be categorized as well-capitalized, United and the Bank must have exceeded the well-capitalized guideline ratios in effect at such time, as set forth in the table below, and have met certain other requirements. Management believes that United and the Bank exceeded all well-capitalized requirements at December 31, 2023, and there have been no conditions or events since year-end that would change the status of well-capitalized.
United has adopted relief provided by federal banking regulatory agencies for the delay of the adverse capital impact of CECL. This optional two-year delay, which ended December 31, 2021, is followed by an optional three-year transition period to phase out the aggregate amount of capital benefit provided during the initial two-year delay. Under the transition provision, the amount of aggregate capital benefit is phased out by 25% each year with the full impact of adoption completely recognized by 2025.
UNITED COMMUNITY BANKS, INC. AND SUBSIDIARIES
Notes to Consolidated Financial Statements
(22) Regulatory Matters, continued
Regulatory capital ratios at December 31, 2023 and 2022, along with the minimum amounts required for capital adequacy purposes and to be well-capitalized under prompt corrective action provisions in effect at such times are presented below for United and the Bank (dollars in thousands):
|
|
|
|
|
|
|
|
|
|
|
|
|
|
|
|
|
|
|
|
|
|
|
|
|
|
|
|
|
|
|
|
|
|
|
|
| |
Basel III Guidelines |
|
United Community Banks, Inc.
(consolidated) |
|
United Community Bank |
|
Minimum (1) |
|
Well
Capitalized |
|
2023 |
|
2022 |
|
2023 |
|
2022 |
| Risk-based ratios: |
|
|
|
|
|
|
|
|
|
|
|
| CET1 capital |
4.5 |
% |
|
6.5 |
% |
|
12.16 |
% |
|
12.26 |
% |
|
12.22 |
% |
|
12.83 |
% |
| Tier 1 capital |
6.0 |
|
|
8.0 |
|
|
12.60 |
|
|
12.81 |
|
|
12.22 |
|
|
12.83 |
|
| Total capital |
8.0 |
|
|
10.0 |
|
|
14.49 |
|
|
14.79 |
|
|
13.23 |
|
|
13.70 |
|
| Tier 1 leverage ratio |
4.0 |
|
|
5.0 |
|
|
9.47 |
|
|
9.69 |
|
|
9.17 |
|
|
9.69 |
|
| CET1 capital |
|
|
|
|
$ |
2,432,518 |
|
|
$ |
2,164,211 |
|
|
$ |
2,435,962 |
|
|
$ |
2,255,337 |
|
| Tier 1 capital |
|
|
|
|
2,520,784 |
|
|
2,260,633 |
|
|
2,435,962 |
|
|
2,255,337 |
|
| Total capital |
|
|
|
|
2,898,474 |
|
|
2,610,216 |
|
|
2,638,009 |
|
|
2,408,895 |
|
| RWAs |
|
|
|
|
20,007,236 |
|
|
17,648,573 |
|
|
19,933,429 |
|
|
17,583,347 |
|
| Average total assets |
|
|
|
|
26,621,561 |
|
|
23,322,018 |
|
|
26,563,946 |
|
|
23,285,253 |
|
(1) As of December 31, 2023 and 2022, the additional capital conservation buffer in effect was 2.50%.
Cash, Dividend, Loan and Other Restrictions
Federal and state banking regulations place certain restrictions on dividends paid by the Bank to the Holding Company. During 2023 and 2022, the Bank paid dividends to the Holding Company of $198 million and $133 million, respectively.
The Federal Reserve Act requires that extensions of credit by the Bank to certain affiliates, including the Holding Company, be secured by specific collateral, that the extension of credit to any one affiliate be limited to 10% of capital and surplus (as defined), and that extensions of credit to all such affiliates be limited to 20% of capital and surplus.
The Bank is a party to financial instruments with off-balance sheet risk in the normal course of business to meet the financing needs of customers. These financial instruments include commitments to extend credit and letters of credit. These instruments involve, to varying degrees, elements of credit risk in excess of the amount recognized in the consolidated balance sheets. The contract amounts of these instruments reflect the extent of involvement the Bank has in particular classes of financial instruments.
The exposure to credit loss in the event of nonperformance by the other party to the financial instrument for commitments to extend credit and letters of credit written is represented by the contractual amount of these instruments. United uses the same credit policies in making commitments and conditional obligations as it uses for underwriting on-balance sheet instruments. In most cases, collateral or other security is required to support financial instruments with credit risk.
(23) Commitments and Contingencies
The following table summarizes, as of the dates indicated, the contract amount of certain off-balance sheet instruments (in thousands):
|
|
|
|
|
|
|
|
|
|
|
|
|
December 31, |
| |
2023 |
|
2022 |
| Financial instruments whose contract amounts represent credit risk: |
|
|
|
| Commitments to extend credit |
$ |
4,305,483 |
|
|
$ |
4,683,790 |
|
| Letters of credit |
61,808 |
|
|
46,896 |
|
|
|
|
|
Commitments to extend credit are agreements to lend to a customer as long as there is no violation of any condition established in the contract. Commitments generally have fixed expiration dates or other termination clauses and may require payment of a fee. Since many of the commitments may expire without being drawn on, the total commitment amounts do not necessarily represent future cash requirements.
UNITED COMMUNITY BANKS, INC. AND SUBSIDIARIES
Notes to Consolidated Financial Statements
(23) Commitments and Contingencies, continued
Letters of credit are conditional commitments issued by United and could result in the commitment being drawn on when the underlying transaction is consummated between the customer and the third party or upon the non-performance of the customer. Those guarantees are primarily issued to local businesses and government agencies. The credit risk involved in issuing letters of credit is essentially the same as that involved in extending loan facilities to customers. In most cases, the Bank holds real estate, certificates of deposit, and other acceptable collateral as security supporting those commitments for which collateral is deemed necessary. The extent of collateral held for those commitments varies.
United maintains an ACL for these unfunded commitments, which is included in other liabilities in the consolidated balance sheets. The ACL for unfunded loan commitments is determined as part of the quarterly ACL analysis. See Note 1 for further detail.
United, in the normal course of business, is subject to various pending and threatened lawsuits in which claims for monetary damages are asserted. Although it is not possible to predict the outcome of these lawsuits, or the range of any possible loss, management, after consultation with legal counsel, does not anticipate that the ultimate aggregate liability, if any, arising from these lawsuits will have a material adverse effect on financial position or results of operations.
Tax Credit and Certain Equity Investments
United invests in certain LIHTC partnerships throughout its market area as a means of supporting local communities, as well as in entities that promote renewable energy sources. United receives tax credits related to these investments. For certain of the investments, United provides financing during the construction and development phase of the related projects and/or permanent financing upon completion of the project. United has concluded that these partnerships are VIEs of which it is not the primary beneficiary because it does not have the power to direct the activities that most significantly impact the VIEs' financial performance and, therefore, is not required to consolidate these VIEs. United's maximum potential exposure to losses relative to investments in these VIEs is generally limited to the sum of the outstanding balance, future funding commitments and any related loans to the entity. Loans to these entities are underwritten in substantially the same manner as other loans and are generally secured.
United also has investments in and future funding commitments related to fintech fund limited partnerships, other community development entities and certain other equity method investments. United has concluded that these partnerships are VIEs of which it is not the primary beneficiary because it does not have the power to direct the activities that most significantly impact the VIEs' financial performance and, therefore, is not required to consolidate these VIEs. The risk exposure relating to such commitments is generally limited to the amount of investments and future funding commitments made.
The following table summarizes, as of the dates indicated, tax credit and certain equity method investments (in thousands):
|
|
|
|
|
|
|
|
|
|
|
|
|
|
|
|
|
|
|
|
|
December 31, |
|
Balance Sheet Location |
|
2023 |
|
2022 |
| Investments in LIHTC: |
|
|
|
|
|
| Carrying amount |
Other assets |
|
$ |
48,867 |
|
|
$ |
50,054 |
|
| Amount of future funding commitments included in carrying amount |
Other liabilities |
|
14,176 |
|
|
18,090 |
|
| Renewable energy investments: |
|
|
|
|
|
| Carrying amount |
Other assets |
|
18,631 |
|
|
19,617 |
|
| Amount of future funding commitments included in carrying amount |
Other liabilities |
|
14,406 |
|
|
18,781 |
|
| Fintech funds and certain other equity method investments: |
|
|
|
|
|
| Carrying amount |
Other assets |
|
33,720 |
|
|
27,569 |
|
| Amount of future funding commitments included in carrying amount |
Other liabilities |
|
— |
|
|
470 |
|
| Amount of future funding commitments not included in carrying amount |
N/A |
|
25,008 |
|
|
23,690 |
|
UNITED COMMUNITY BANKS, INC. AND SUBSIDIARIES
Notes to Consolidated Financial Statements
(24) Condensed Financial Statements of United Community Banks, Inc. (Holding Company Only)
Balance Sheets
As of December 31, 2023 and 2022
(in thousands)
|
|
|
|
|
|
|
|
|
|
|
|
| |
2023 |
|
2022 |
| Assets |
|
|
|
| Cash and cash equivalents |
$ |
395,523 |
|
|
$ |
322,353 |
|
| Investment in Bank |
3,145,899 |
|
|
2,661,884 |
|
| Investment in other subsidiaries |
39,516 |
|
|
37,325 |
|
| Other assets |
119,946 |
|
|
76,898 |
|
| Total assets |
$ |
3,700,884 |
|
|
$ |
3,098,460 |
|
| Liabilities and Shareholders’ Equity |
|
|
|
| Long-term debt |
$ |
334,823 |
|
|
$ |
334,663 |
|
| Other liabilities |
104,536 |
|
|
63,123 |
|
| Total liabilities |
439,359 |
|
|
397,786 |
|
| Shareholders’ equity |
3,261,525 |
|
|
2,700,674 |
|
| Total liabilities and shareholders’ equity |
$ |
3,700,884 |
|
|
$ |
3,098,460 |
|
Statements of Income
For the Years Ended December 31, 2023, 2022 and 2021
(in thousands)
|
|
|
|
|
|
|
|
|
|
|
|
|
|
|
|
|
|
| |
2023 |
|
2022 |
|
2021 |
| Dividends from Bank |
$ |
197,900 |
|
|
$ |
132,688 |
|
|
$ |
217,000 |
|
| Dividends from other subsidiaries |
— |
|
|
2,788 |
|
|
— |
|
| Shared service fees from subsidiaries |
18,892 |
|
|
16,335 |
|
|
12,402 |
|
| Other |
303 |
|
|
566 |
|
|
3,167 |
|
| Total income |
217,095 |
|
|
152,377 |
|
|
232,569 |
|
| Interest expense |
15,650 |
|
|
17,250 |
|
|
14,324 |
|
| Other expense |
22,256 |
|
|
18,058 |
|
|
16,417 |
|
| Total expenses |
37,906 |
|
|
35,308 |
|
|
30,741 |
|
| Income tax benefit |
5,227 |
|
|
3,251 |
|
|
6,908 |
|
| Income before equity in undistributed earnings of subsidiaries |
184,416 |
|
|
120,320 |
|
|
208,736 |
|
| Equity in undistributed earnings of subsidiaries |
3,128 |
|
|
157,152 |
|
|
61,065 |
|
| Net income |
$ |
187,544 |
|
|
$ |
277,472 |
|
|
$ |
269,801 |
|
UNITED COMMUNITY BANKS, INC. AND SUBSIDIARIES
Notes to Consolidated Financial Statements
(24) Condensed Financial Statements of United Community Banks, Inc. (Holding Company Only), continued
Statements of Cash Flows
For the Years Ended December 31, 2023, 2022 and 2021
(in thousands)
|
|
|
|
|
|
|
|
|
|
|
|
|
|
|
|
|
|
|
2023 |
|
2022 |
|
2021 |
| Operating activities: |
|
|
|
|
|
| Net income |
$ |
187,544 |
|
|
$ |
277,472 |
|
|
$ |
269,801 |
|
| Adjustments to reconcile net income to net cash provided by operating activities: |
|
|
|
|
|
| Equity in undistributed earnings of the subsidiaries |
(3,128) |
|
|
(157,152) |
|
|
(61,065) |
|
|
|
|
|
|
|
|
|
|
|
|
|
| Stock-based compensation |
8,932 |
|
|
8,705 |
|
|
6,554 |
|
| Change in assets and liabilities: |
|
|
|
|
|
| Other assets |
(38,844) |
|
|
6,094 |
|
|
(7,800) |
|
| Other liabilities |
32,206 |
|
|
7,736 |
|
|
6,353 |
|
| Net cash provided by operating activities |
186,710 |
|
|
142,855 |
|
|
213,843 |
|
| Investing activities: |
|
|
|
|
|
Net cash received (paid) for acquisition |
11,338 |
|
|
(47) |
|
|
(47,785) |
|
|
|
|
|
|
|
| Purchases of debt securities available-for-sale and equity securities with readily determinable fair values |
(1,869) |
|
|
(19,060) |
|
|
(1,500) |
|
|
|
|
|
|
|
| Proceeds from sales and maturities of debt securities available-for-sale and equity securities with readily determinable fair values |
482 |
|
|
4,473 |
|
|
1,253 |
|
|
|
|
|
|
|
| Other investing inflows |
— |
|
|
19 |
|
|
860 |
|
| Other investing outflows |
(3,805) |
|
|
(3,676) |
|
|
(630) |
|
|
|
|
|
|
|
Net cash provided by (used in) investing activities |
6,146 |
|
|
(18,291) |
|
|
(47,802) |
|
| Financing activities: |
|
|
|
|
|
| Repayment of long-term debt |
— |
|
|
— |
|
|
(65,632) |
|
|
|
|
|
|
|
|
|
|
|
|
|
| Cash paid for shares withheld to cover payroll taxes related to equity instruments |
(3,015) |
|
|
(3,494) |
|
|
(3,182) |
|
| Proceeds from issuance of common stock for dividend reinvestment and employee benefit plans |
309 |
|
|
301 |
|
|
506 |
|
| Proceeds from exercise of stock options and warrants |
5,191 |
|
|
824 |
|
|
231 |
|
Repurchase of preferred stock |
(7,151) |
|
|
— |
|
|
— |
|
| Repurchase of common stock |
— |
|
|
— |
|
|
(15,101) |
|
| Cash dividends on preferred stock |
(6,635) |
|
|
(6,875) |
|
|
(6,876) |
|
| Cash dividends on common stock |
(105,085) |
|
|
(86,883) |
|
|
(66,914) |
|
| Other financing outflows |
(3,300) |
|
|
(4,400) |
|
|
— |
|
Net cash used in financing activities |
(119,686) |
|
|
(100,527) |
|
|
(156,968) |
|
| Net change in cash |
73,170 |
|
|
24,037 |
|
|
9,073 |
|
| Cash at beginning of year |
322,353 |
|
|
298,316 |
|
|
289,243 |
|
| Cash at end of year |
$ |
395,523 |
|
|
$ |
322,353 |
|
|
$ |
298,316 |
|
UNITED COMMUNITY BANKS, INC. AND SUBSIDIARIES
Notes to Consolidated Financial Statements
(25) Subsequent Events
Dividends Declared
On February 6, 2024 the Board approved a preferred stock dividend of $429.6875 per preferred share (equivalent to $0.4296875 per depositary share, or 1/1000 interest per share). The preferred stock dividend is payable March 15, 2024, to preferred shareholders of record on February 29, 2024.
On February 22, 2024, the Board approved a regular quarterly cash dividend of $0.23 per common share payable April 5, 2024, to common shareholders of record on March 15, 2024.
ITEM 9. CHANGES IN AND DISAGREEMENTS WITH ACCOUNTANTS ON ACCOUNTING AND FINANCIAL DISCLOSURE
None.
ITEM 9A. CONTROLS AND PROCEDURES
Evaluation of Disclosure Controls and Procedures
Under the supervision and with the participation of our management, including our principal executive officer and principal financial officer, we conducted an evaluation of our disclosure controls and procedures (as such term is defined in Exchange Act Rule 13a-15(e)) as of December 31, 2023. Based on that evaluation, our principal executive officer and chief financial officer concluded that our disclosure controls and procedures were effective as of the end of the period covered by this report.
Changes in Internal Control Over Financial Reporting
No changes were made to our internal control over financial reporting (as such term is defined in Exchange Act Rule 13a-15(f)) during the fourth quarter of 2023 that materially affected, or are reasonably likely to materially affect, United’s internal control over financial reporting.
Management’s Report on Internal Control Over Financial Reporting
Management is responsible for establishing and maintaining adequate internal control over financial reporting. Management’s assessment of the effectiveness of our internal control over financial reporting as of December 31, 2023 is included in Part II, Item 8 of this Report under the heading “Management’s Report on Internal Control Over Financial Reporting.”
Our independent auditors have issued an audit report on management’s assessment of internal controls over financial reporting. This report is included in Part II, Item 8 of this Report under the heading “Report of Independent Registered Public Accounting Firm.”
ITEM 9B. OTHER INFORMATION
During the three months ended December 31, 2023, no director or officer of the Company adopted or terminated a “Rule 10b5-1 trading arrangement” or “non-Rule 10b5-1 trading arrangement,” as each term is defined in Item 408(a) of Regulation S-K.
ITEM 9C. DISCLOSURE REGARDING FOREIGN JURISDICTIONS THAT PREVENT INSPECTIONS
Not applicable.
ITEM 10. DIRECTORS, EXECUTIVE OFFICERS AND CORPORATE GOVERNANCE
(a) Information Regarding Directors and Executive Officers. Information required by this Item 10 regarding our directors and director nominees contained under the caption “Director Nominees for Election” under the heading “Proposal 1: Election of Directors” in the 2024 Proxy Statement is incorporated herein by reference. Information required by this Item 10 regarding our executive officers contained under the heading “Executive Officers” in the 2024 Proxy Statement is incorporated herein by reference.
(b) Compliance with Section 16(a) of the Exchange Act. If applicable, information required by this Item 10 regarding compliance with Section 16(a) of the Exchange Act contained under the caption “Delinquent Section 16(a) Reports” under the heading “Security Ownership” in the 2024 Proxy Statement is incorporated herein by reference.
(c) Code of Business Conduct and Ethics. We have adopted a Code of Ethical Conduct (“Code”). This Code is posted on the “Corporate Governance” section of our Internet website at www.ucbi.com. If we choose to no longer post such Code, we will provide a free copy to any person upon written request to Corporate Secretary, United Community Banks, Inc., 2 West Washington Street, Suite 700, Greenville, South Carolina 29601. We intend to provide any required disclosure of any amendment to or waiver from such Code that applies to our principal executive officer, principal financial officer, principal accounting officer or controller, or persons performing similar functions, on our Internet website located at www.ucbi.com promptly following the amendment or waiver. We may elect to disclose any such amendment or waiver in a Current Report on Form 8-K filed with the SEC either in addition to or in lieu of the website disclosure. The information contained on or connected to our Internet website is not incorporated by reference into this Report and should not be considered part of this or any other report that we file with or furnish to the SEC.
(d) Procedures for Shareholders to Recommend Director Nominees. There have been no material changes to the procedures by which security holders may recommend nominees to our Board.
(e) Audit Committee Information. Information required by this Item 10 regarding our Audit Committee and our audit committee financial experts is contained under the caption “Audit Committee Financial Expert,” under the heading “Corporate Governance” in the 2024 Proxy Statement is incorporated herein by reference.
ITEM 11. EXECUTIVE COMPENSATION
Information required by this Item 11 regarding director and executive officer compensation, the Compensation Committee Report, the risks arising from our compensation policies and practices for employees, pay ratio disclosure, and compensation committee interlocks and insider participation contained under the headings “Director Compensation” and “Executive Compensation” in the 2024 Proxy Statement is incorporated herein by reference.
ITEM 12. SECURITY OWNERSHIP OF CERTAIN BENEFICIAL OWNERS AND MANAGEMENT AND RELATED STOCKHOLDER MATTERS
Information contained under the heading “Security Ownership” and under the caption “Equity Compensation Plan Information” under the heading “Executive Compensation” in the 2024 Proxy Statement is incorporated herein by reference.
ITEM 13. CERTAIN RELATIONSHIPS AND RELATED TRANSACTIONS, AND DIRECTOR INDEPENDENCE
Information required by this Item 13 regarding certain relationships and related transactions contained under the heading “Transactions With Management and Others” in the 2024 Proxy Statement is incorporated herein by reference. Information required by this Item 13 regarding director independence contained under the caption “Director Independence” under the heading “Corporate Governance” in the 2024 Proxy Statement is incorporated herein by reference.
ITEM 14. PRINCIPAL ACCOUNTING FEES AND SERVICES
Information required by Item 14 regarding fees we paid to our principal accountant and the pre-approval policies and procedures established by the Audit Committee of our Board contained under the heading “Fees Paid to Auditors” in the 2024 Proxy Statement is incorporated herein by reference.
ITEM 15. EXHIBITS, FINANCIAL STATEMENT SCHEDULES
|
|
|
|
|
|
|
|
|
| (a) |
The following is a list of documents filed as a part of this Report: |
|
1. |
Financial Statements. |
| |
|
The following consolidated financial statements of United and its subsidiaries and related reports of our independent registered public accounting firm are located in Item 8 of this Report: |
| |
|
Report of Independent Registered Public Accounting Firm |
|
|
Consolidated Balance Sheets - December 31, 2023 and 2022 |
| |
|
Consolidated Statements of Income - Years ended December 31, 2023, 2022, and 2021 |
|
|
Consolidated Statements of Comprehensive Income - Years ended December 31, 2023, 2022, and 2021 |
| |
|
Consolidated Statements of Changes in Shareholders’ Equity - Years ended December 31, 2023, 2022, and 2021 |
| |
|
Consolidated Statements of Cash Flows - Years ended December 31, 2023, 2022, and 2021 |
| |
|
Notes to Consolidated Financial Statements |
|
|
|
|
2. |
Financial Statement Schedules. |
|
|
|
|
|
Schedules to the consolidated financial statements are omitted, as the required information is not applicable. |
|
|
|
|
3. |
Exhibits. |
|
|
|
|
|
The exhibits required to be filed with this Report by Item 601 of Regulation S-K are listed in the Exhibit Index below: |
|
|
|
|
|
|
|
|
|
| EXHIBIT INDEX |
| Exhibit No. |
|
Exhibit |
|
|
|
|
|
|
|
|
|
|
|
|
|
|
|
|
|
|
|
|
|
|
|
|
|
|
|
|
|
|
|
|
|
|
|
|
|
|
|
|
|
Indenture, dated August 14, 2015, by and between United Community Banks, Inc. and The Bank of New York Mellon Trust Company, N.A., Trustee (incorporated herein by reference to Exhibit 4.1 to United Community Banks, Inc.’s Current Report on Form 8-K, File No. 001-35095, filed with the SEC on August 14, 2015). |
|
|
|
|
|
First Supplemental Indenture to the Indenture, dated August 14, 2015, by and between United Community Banks, Inc. and The Bank of New York Mellon Trust Company, N.A., Trustee (incorporated herein by reference to Exhibit 4.2 to United Community Banks, Inc.’s Current Report on Form 8-K, File No. 001-35095, filed with the SEC on August 14, 2015). |
|
|
|
|
|
|
|
|
|
|
|
|
|
|
|
|
|
|
|
|
|
|
|
|
|
|
|
|
|
|
|
|
|
|
|
|
|
|
|
|
|
|
|
|
|
|
|
|
|
|
|
|
|
|
|
|
|
|
|
|
|
|
|
| -- |
|
Pursuant to Item 601(b)(4)(iii)(A), other instruments that define the rights of holders of the long-term indebtedness of United Community Banks, Inc. and its subsidiaries that does not exceed 10% of United’s consolidated assets have not been filed; however, United agrees to furnish a copy of any such agreement to the SEC upon request. |
|
|
|
|
|
|
|
|
|
|
|
|
|
|
|
|
|
|
|
|
|
|
|
|
|
|
|
|
|
|
|
|
|
|
|
|
|
|
|
|
|
|
|
|
|
|
|
|
|
|
|
|
|
|
| 101.INS** |
|
Inline XBRL Instance Document - the instance document does not appear in the Interactive Data File because its XBRL tags are embedded within the Inline XBRL document |
|
|
|
| 101.SCH** |
|
Inline XBRL Taxonomy Extension Schema Document |
|
|
|
| 101.CAL** |
|
Inline XBRL Taxonomy Calculation Linkbase Document |
|
|
|
| 101.LAB** |
|
Inline XBRL Taxonomy Label Linkbase Document |
|
|
|
| 101.PRE** |
|
Inline XBRL Presentation Linkbase Document |
|
|
|
| 101.DEF** |
|
Inline XBRL Taxonomy Extension Definition Linkbase Document |
|
|
|
| 104 |
|
Cover Page Interactive Data File (formatted in Inline XBRL and contained in Exhibit 101) |
# Management contract or compensatory plan or arrangement.
** Indicates filed or furnished herewith.
ITEM 16. FORM 10-K SUMMARY
None.
SIGNATURES
Pursuant to the requirements of Section 13 or 15(d) of the Securities Exchange Act of 1934, United has duly caused this annual report on Form 10-K, to be signed on its behalf by the undersigned, thereunto duly authorized, on the 23th day of February, 2024.
UNITED COMMUNITY BANKS, INC.
(Registrant)
|
|
|
|
|
|
|
|
|
| /s/ H. Lynn Harton |
|
/s/ Jefferson L. Harralson |
| H. Lynn Harton |
|
Jefferson L. Harralson |
| President and Chief Executive Officer |
|
Executive Vice President and Chief Financial Officer |
| (Principal Executive Officer) |
|
(Principal Financial Officer) |
| |
|
|
| /s/ Alan H. Kumler |
|
|
| Alan H. Kumler |
|
|
| Senior Vice President, Chief Accounting Officer |
|
|
| (Principal Accounting Officer) |
|
|
POWER OF ATTORNEY AND SIGNATURES
Know all men by these presents, that each person whose signature appears below constitutes and appoints H. Lynn Harton and Thomas A. Richlovsky, or either of them, as attorney-in-fact, with each having the power of substitution, for him in any and all capacities, to sign any amendments to this annual report on Form 10-K and to file the same, with exhibits thereto, and other documents in connection therewith, with the Securities and Exchange Commission, hereby ratifying and confirming all that each of said attorneys-in-fact, or his substitute or substitutes, may do or cause to be done by virtue hereof.
Pursuant to the requirements of the Securities Exchange Act of 1934, this annual report on Form 10-K has been signed below by the following persons on behalf of United and in the capacities set forth and on the 21st day of February, 2024.
|
|
|
|
|
|
|
|
|
| /s/ H. Lynn Harton |
|
/s/ Kenneth L. Daniels |
| H. Lynn Harton |
|
Kenneth L. Daniels |
| Chairman, President, and Chief Executive Officer |
|
Director |
| (Principal Executive Officer) |
|
|
| |
|
/s/ Lance F. Drummond |
| /s/ Jefferson L. Harralson |
|
Lance F. Drummond |
| Jefferson L. Harralson |
|
Director |
| Executive Vice President and Chief Financial Officer |
|
|
| (Principal Financial Officer) |
|
/s/ John M. James |
| |
|
John M. James |
| /s/ Alan H. Kumler |
|
Director |
| Alan H. Kumler |
|
|
| Senior Vice President, Chief Accounting Officer |
|
/s/ Jennifer Mann |
| (Principal Accounting Officer) |
|
Jennifer Mann |
| |
|
Director |
| /s/ Thomas A. Richlovsky |
|
|
| Thomas A. Richlovsky |
|
/s/ David C. Shaver |
| Lead Independent Director |
|
David C. Shaver |
| |
|
Director |
| /s/ Jennifer M. Bazante |
|
|
| Jennifer M. Bazante |
|
/s/ Tim Wallis |
| Director |
|
Tim Wallis |
|
|
Director |
| /s/ George Bell |
|
|
| George Bell |
|
/s/ David H. Wilkins |
| Director |
|
David H. Wilkins |
|
|
Director |
| /s/ James P. Clements |
|
|
| James P. Clements |
|
|
| Director |
|
|
EX-10.3
2
ucbi1231202310kex103prsu.htm
EX-10.3
Document
UNITED COMMUNITY BANKS, INC.
2022 OMNIBUS EQUITY PLAN
PERFORMANCE-BASED
RESTRICTED STOCK UNIT AWARD AGREEMENT
(Key Employee)
|
|
|
|
|
|
| Grantee: |
|
|
|
| Target Number of Performance-Based Restricted Stock Units Granted: |
______________ Target PSUs, subject to increase based on level of achievement of performance criteria in accordance with this Agreement |
|
|
| Date of Grant: |
|
|
|
| Vesting Schedule for Performance-Based Restricted Stock Units: |
See Schedule A |
THIS AGREEMENT (the “Agreement”) is entered into as of the _____day of ______, _________, by and between UNITED COMMUNITY BANKS, INC., a Georgia corporation (the “Company”), and the individual designated above (the “Grantee”).
WHEREAS, the Company maintains the United Community Banks, Inc. 2022 Omnibus Equity Plan (the “Plan”), and the Grantee has been selected by the Committee to receive a Performance-Based Restricted Stock Unit Award under the Plan, vesting in four equal annual installments based upon the Grantee’s continued employment with the Company and the fulfillment of the performance criteria as set forth in Schedule A attached hereto with respect to each Performance Period (as defined below); and
WHEREAS, the performance criteria, if any, shall be established as reasonable and achievable goals consistent with the safe and sound operation of the Company;
NOW, THEREFORE, IT IS AGREED, by and between the Company and the Grantee, as follows:
1.Award of Restricted Stock Units
1.1Grant. The Company hereby grants to the Grantee an award of Performance-Based Restricted Stock Units (“PSUs”) at target-level performance in the amount set forth above, subject to, and in accordance with, the restrictions, terms, and conditions set forth in this Agreement and the Plan. The grant date of this award of PSUs is set forth above (the “Date of Grant”).
1.2Construction. This Agreement (including Schedule A attached hereto, if applicable) shall be construed in accordance and consistent with, and subject to, the provisions of the Plan (the provisions of which are incorporated herein by reference) and, except as otherwise expressly set forth herein, the capitalized terms used in this Agreement shall have the same definitions as set forth in the Plan.
1.3Execution of the Agreement. This Award is conditioned on the Grantee’s execution of this Agreement. By executing this Agreement, the Grantee agrees to the terms set forth in this Agreement (and the provisions of the Plan incorporated herein). If this Agreement is not executed by the Grantee and returned to the Company within thirty (30) days of the Date of Grant, it may be canceled by the Committee, resulting in the immediate forfeiture of all PSUs granted hereunder.
2.Vesting and Termination of Employment
2.1Vesting. Subject to this Section 2 and Section 7, the earned amount of PSUs, determined based on the level of achievement of the performance criteria (as set forth on Schedule A) at the completion of each Performance Period as certified by the Committee (the “Earned PSUs”), shall vest on the applicable vesting date for such Performance Period contingent upon the Grantee’s continuous employment by the Company through such applicable vesting date for such Performance Period as specified on Schedule A (the “Vesting Date”). “Performance Period” means the fiscal year period with respect to which the performance criteria are measured as set forth on Schedule A. Except as otherwise provided herein, as soon as practicable (and no later than thirty (30) days) after the Vesting Date following completion of the applicable Performance Period (or such earlier vesting date in the event of a termination of employment as provided herein), a number of Shares equal to the Earned PSUs for such Performance Period (or such other amount in the event of a termination of employment or a Change in Control as provided herein) shall be issued to the Grantee (or, if the Grantee has died, to his or her surviving spouse or, if none, to the Grantee’s estate) free and clear of all restrictions imposed by this Agreement (except those imposed by Sections 3.3 and 7 below). For purposes of this Agreement, employment with a Subsidiary of the Company or service as a member of the Board of Directors of the Company or a Subsidiary shall be considered employment with the Company.
2.2Termination of Employment Due to Death or Disability. If the Grantee’s employment is terminated by the Company as a result of death or Disability (as defined in the Plan) and (i) if the Date of Termination occurs prior to a Change in Control, (a) for any completed Performance Period that ended prior to the Date of Termination (but for which the Vesting Date has not occurred or the level of achievement of performance has not been determined), the Earned PSUs, as determined by the Committee on the same basis as applies to other PSU Award holders, shall vest in full immediately as of the Date of Termination (or, if later, as of the date the Committee certifies the level of achievement of performance for such Performance Period), and (b) for any incomplete or remaining Performance Periods, the number of Shares that would have been earned assuming the performance criteria (as set forth on Schedule A) are achieved at target performance level shall vest in full immediately as of the Date of Termination; and (ii) if the Date of Termination occurs on or after a Change in Control, the number of CIC Earned PSUs (as defined below) as determined by the Committee in connection with such Change in Control in accordance with Section 2.4.1 shall vest in full immediately as of the Date of Termination. Shares equal to the Earned PSUs determined hereunder or the CIC Earned PSUs, as applicable, shall be issued to the Grantee (or, if the Grantee has died, to his or her surviving spouse or, if none, to the Grantee’s estate) as soon as practicable (and no later than thirty (30) days) after the Date of Termination (or, if later, the date the Committee certifies the level of achievement of performance for such Performance Period) free and clear of all restrictions imposed by this Agreement (except those imposed by Sections 3.3 and 7 below).
2.3Termination of Employment by the Company Without Cause or by the Grantee for Good Reason Prior to a Change in Control. If, prior to a Change in Control, the Grantee’s employment is terminated and such termination is either (i) an involuntary termination by the Company without Cause (as defined herein) and does not arise as a result of the Grantee’s death or Disability or (ii) a termination by the Grantee for Good Reason (as defined herein), (a) for any completed Performance Period that ended prior to the Date of Termination (but for which the Vesting Date has not occurred or the level of achievement of performance has not been determined), the Earned PSUs, as determined by the Committee on the same basis as applies to other PSU Award holders, shall vest in full immediately as of the Date of Termination (or, if later, as of the date the Committee certifies the level of achievement of performance for such Performance Period), and (b) for the Performance Period in which the Date of Termination occurs, the PSUs for such Performance Period shall remain outstanding and continue to be eligible to be earned based on the level of achievement of the performance criteria (as set forth on Schedule A), as determined by the Committee on the same basis as applies to other PSU Award holders, with the number of Earned PSUs that vest to equal to the product of (1) the Earned PSUs and (2) a fraction, the numerator of which is the number of days the Grantee was employed by the Company during the applicable Performance Period prior to the Date of Termination, and the denominator of which is the total number of days in the Performance Period (i.e., the applicable fiscal year). All other outstanding unvested PSUs shall immediately be forfeited as of the Date of Termination. Shares equal to the Earned PSUs determined hereunder shall be issued to the Grantee (or, if the Grantee has died, to his or her surviving spouse or, if none, to the Grantee’s estate) as soon as practicable (and no later than thirty (30) days) after the Date of Termination (or, if later, the date the Committee certifies the level of achievement of performance for such Performance Period) free and clear of all restrictions imposed by this Agreement (except those imposed by Sections 3.3 and 7 below).
2.4Treatment upon a Change in Control.
2.4.1Determination of Level of Achievement of Performance Criteria. Upon a Change in Control, for any Performance Period applicable to the PSUs for which the measurement of the performance criteria has not been previously certified by the Committee (including, for the avoidance of doubt, any incomplete or remaining Performance Periods), the performance criteria applicable to any unvested PSUs shall be deemed achieved at the greater of the target and actual level of performance (the number of such Earned PSUs, the “CIC Earned PSUs”). The Committee shall make all determinations pursuant to this Section 2.4.1 in its sole discretion and consistent with Section 13.2 of the Plan. Following a Change in Control, subject to the Grantee’s continued employment through the applicable Vesting Date as set forth on Schedule A and except as otherwise provided herein, the CIC Earned PSUs will continue to vest on the Vesting Date corresponding to each Performance Period that has not yet been completed as of the Change in Control (notwithstanding the prior determination of performance), and no other performance terms shall apply to the vesting of the CIC Earned PSUs.
2.4.2Termination of Employment by the Company Without Cause or by the Grantee for Good Reason on or Following a Change in Control. If on or after a Change in Control the Grantee’s employment with the Company is terminated and such termination is either (i) an involuntary termination by the Company without Cause (as defined herein) and does not arise as a result of the Grantee’s death or Disability or (ii) a termination by the Grantee for Good Reason (as defined herein), the Grantee shall immediately and fully vest as of the Date of Termination in the number of CIC Earned PSUs. Shares equal to the CIC Earned PSUs determined hereunder shall be issued to the Grantee (or, if the Grantee has died, to his or her surviving spouse or, if none, to the Grantee’s estate) as soon as practicable (and no later than thirty (30) days) after the Date of Termination free and clear of all restrictions imposed by this Agreement (except those imposed by Sections 3.3 and 7 below).
2.5Definitions.
2.5.1Cause. For purposes of this Agreement (except as otherwise provided in Section 2.5.3), (i) on or after a Change in Control, the term “Cause” shall have the meaning set forth in the Plan (without regard to the last sentence thereof), and (ii) prior to a Change in Control, the term “Cause” shall mean (a) the Grantee’s continued intentional failure or refusal to perform substantially the Grantee’s assigned duties (other than as a result of total or partial mental or physical incapacity); (b) the Grantee’s engagement in willful misconduct, including without limitation, fraud, embezzlement, theft, or dishonesty, in the course of the Grantee’s employment with the Company; (c) the Grantee’s conviction of, or plea of guilty or nolo contendere to, a felony or a crime (other than a felony) that involves moral turpitude or a breach of trust or fiduciary duty owed to the Company or any of its affiliates; (d) a material breach of the restrictive covenants applicable to the Grantee, including those set forth in this Agreement; or (e) a material breach of the Company’s Code of Conduct or another written policy of the Company applicable to the Grantee that does, or could reasonably be expected to, result in material harm to the Company, including reputational harm.
2.5.2Good Reason. For purposes of this Agreement (except as otherwise provided in Section 2.5.3), “Good Reason” for termination by the Grantee of the Grantee’s employment shall mean the occurrence (without the Grantee’s express written consent) of any one of the following acts by the Company:
(i)a material adverse reduction in the Grantee’s responsibilities at the Company;
(ii)the required relocation of the Grantee’s employment to a primary worksite location that is more than thirty-five (35) miles from the Grantee’s primary worksite location and increases the distance between the Grantee’s home location and primary worksite location by more than thirty-five (35) miles;
(iii)a reduction in the Grantee’s base salary (other than a temporary reduction in connection with a specific circumstance that is consistently applied to other similarly situated executives of the Company); or
(iv)a material reduction in the Grantee’s target annual incentive compensation opportunity or target long-term incentive compensation opportunity (other than a reduction in connection with a change to the incentive compensation program of the Company that is consistently applied to other similarly situated executives of the Company).
The Grantee must give the Company notice of any event or condition that would constitute Good Reason within ninety (90) days of the initial existence of the event or condition, and upon receipt of such notice, the Company shall have thirty (30) days to remedy such event or condition. If such event or condition is not remedied within such thirty (30)-day period, any termination of employment by the Grantee for Good Reason must occur, if at all, within six (6) months of the Grantee’s learning of the initial existence of the condition or event in order for such termination as a result of such condition to constitute a termination for Good Reason. The Grantee’s right to terminate employment for Good Reason shall not be affected by the Grantee’s incapacity due to physical or mental illness, except for a Disability. The Grantee’s continued employment shall not constitute consent to, or a waiver of rights with respect to, any act or failure to act constituting Good Reason hereunder.
2.5.3Alternative Definitions and Procedures. Notwithstanding anything contained herein to the contrary, if the Grantee has entered into an employment or similar agreement that applies prior to a Change in Control (or a term of similar meaning) or a severance or similar agreement that applies on or after a Change in Control (or a term of similar meaning) and if such agreement defines “Good Reason,” and/or provides procedures and/or standards for determining whether Cause or Good Reason exists, such definition of “Good Reason” and the procedures and/or standards for determining the existence of Cause or Good Reason, as applicable, shall apply as if set forth in this Agreement; provided that, in the case of such an agreement that applies on or after a Change in Control (or a term of similar meaning) such alternative definitions and procedures and/or standards, as applicable, shall apply with respect to the applicable period under such agreement from and after a Change in Control (or a term of similar meaning). Notwithstanding anything contained herein to the contrary, nothing herein shall limit the right to de novo review of certain determinations as provided in Section 3.5 of the Plan.
2.6Termination of Employment for Other Reasons. If the Grantee’s employment is terminated by the Company or by the Grantee prior to a Vesting Date for any reason other than as set forth in Sections 2.2, 2.3 and 2.4, the outstanding unvested PSUs shall immediately be forfeited as of the Date of Termination.
2.7Nontransferability. The PSUs may not be sold, assigned, transferred, pledged, or otherwise encumbered prior to the date the Grantee becomes vested in the PSUs and the Shares are issued.
2.8Section 409A Compliance. To the extent applicable, this Agreement shall at all times be interpreted and operated in compliance with the requirements of Section 409A of the Code and the standards, regulations, or other guidance promulgated thereunder (“Section 409A”). Any action that may be taken (and, to the extent possible, any action actually taken) by the Company shall not be taken (or shall be void and without effect) if such action violates the requirements of Section 409A. Any provision in this Agreement that is determined to violate the requirements of Section 409A shall be void and without effect. In addition, any provision that is required to appear in this Agreement in accordance with Section 409A that is not expressly set forth herein shall be deemed to be set forth herein, and the Agreement shall be administered in all respects as if such provision were expressly set forth. To the extent required under the provisions of Section 409A to avoid the imposition of additional income and other taxes, the provisions of Section 11.2(b) of the Plan shall apply to the PSUs. For purposes of this Agreement, termination of employment shall be construed consistent with the meaning of a separation from service within the meaning of Section 409A, and to the extent required under the provisions of Section 409A to avoid the imposition of additional income and other taxes, the Date of Termination as used for purposes of the settlement of any vested PSUs shall not occur prior to the Grantee’s separation from service.
3.Rights as a Shareholder; Dividends; Change in Capitalization; Deferral Rights
3.1The Grantee shall have no rights as a shareholder until such date as the Shares are delivered in settlement of vested Earned PSUs; provided, however, that following the Date of Grant of the PSUs through the date that is the earlier of (i) the date that the Earned PSUs are vested and Shares in settlement thereof are transferred to the Grantee pursuant to this Agreement or (ii) the date that the PSUs are forfeited, the Grantee shall be credited with dividend equivalents with respect to cash dividends (other than an extraordinary dividend for which an adjustment is made pursuant to Section 4.3(b) of the Plan) declared on the Shares represented by the PSUs, which dividend equivalents shall vest or be forfeited on the same basis as applies to the underlying PSUs. Within thirty (30) days after a Vesting Date (or such earlier date on which the Earned PSUs vest in accordance with the terms of this Agreement), Grantee shall be paid in cash the dividend equivalents with respect to the vested Earned PSUs to which the dividend equivalents relate, less applicable withholdings. For the avoidance of doubt, reference to the term Earned PSUs in Section 3 shall include the term CIC Earned PSUs, as the context requires.
3.2In the event of a change in capitalization, the Committee shall make appropriate adjustments in accordance with Section 4.3 of the Plan to reflect the change in capitalization, provided that any such additional Shares or additional or different shares or securities reflected in any such adjustment shall remain subject to the restrictions in this Agreement.
3.3The Grantee represents and warrants that the Grantee is acquiring the Shares under this Agreement for investment purposes only, and not with a view to distribution thereof. The Grantee is aware that the Shares may not be registered under the federal or any state securities laws and that for that reason, in addition to the other restrictions on the Shares, they will not be able to be transferred unless an exemption from registration is available or the Shares are registered. By making this award of PSUs, the Company is not undertaking any obligation to register the PSUs under the federal or any state securities laws.
3.4To the extent the Grantee makes a valid and timely deferral election with respect to the Shares deliverable upon vesting of the PSUs consistent with Section 11.1 of the Plan, the terms of such election and any applicable deferred compensation plan shall govern the delivery of the Shares and accrued dividend equivalents in respect of vested Earned PSUs subject to such election.
4.No Right to Continued Employment
Nothing in this Agreement or the Plan shall be interpreted or construed to confer upon the Grantee any right with respect to continuance of employment by the Company, nor shall this Agreement or the Plan interfere in any way with the right of the Company to terminate the Grantee’s employment at any time. The Grantee is employed by the Company “at will,” which means that either the Grantee or the Company may terminate the Grantee’s employment at any time, for any reason.
5.Taxes and Withholding
The Grantee shall be responsible for all federal, state, and local income taxes payable with respect to this award of PSUs and any dividends and dividend equivalents paid on such PSUs. The Company and the Grantee agree to report the value of the PSUs and any dividends and dividend equivalents in respect thereof in a consistent manner for federal income tax purposes. The Company shall have the right to retain and withhold from any payment of Shares (for the minimum required withholdings or such other amounts as will not result in adverse accounting treatment to the Company) or cash the amount of taxes required by any government to be withheld or otherwise deducted and paid with respect to such payment. At its discretion, the Company may require the Grantee to reimburse the Company for any such taxes required to be withheld and may withhold any distribution in whole or in part until the Company is so reimbursed. In lieu thereof, the Company shall have the right to withhold from any other cash amounts due to the Grantee an amount equal to such taxes required to be withheld or withhold and cancel (for the minimum required withholdings or such other amounts as will not result in adverse accounting treatment to the Company) (in whole or in part) a number of Shares having a Fair Market Value not less than the amount of such taxes.
6.The Grantee Bound by the Plan
The Grantee hereby acknowledges receipt of a copy of the Plan and the prospectus for the Plan, and agrees to be bound by all the terms and provisions thereof.
7.Restrictive Covenants
7.1In consideration for the grant of the PSUs, continued employment with the Company, and other good and valuable consideration, the Grantee agrees to the following:
(a)During the Grantee’s employment with the Company or any Subsidiary and for a one (1)-year period after the Date of Termination, the Grantee will not directly or indirectly, individually, or on behalf of any Person other than the Company or a Subsidiary:
(i)solicit, or attempt to solicit, any customers or Prospective Customers of the Company with whom Grantee had Material Contact for the purpose of providing products or services that are competitive with the Company’s Business;
(ii)recruit, solicit, or induce, or in any manner attempt to recruit, solicit, or induce, anywhere within the Territory any Person employed by the Company or any Subsidiary with whom Grantee had Material Contact or about whom Grantee received Confidential Information during the one (1) year period preceding the Date of Termination, to end his or her employment with the Company or any Subsidiary, whether or not such employment is pursuant to a written contract with the Company or any Subsidiary or is at will. “Territory” is defined as New Jersey, as well as any state in which the Company has a branch location, to include the following, North Carolina, South Carolina, Georgia, Tennessee, Florida, and Alabama. If Grantee had no such specifically assigned geographic territory, then “Territory” means: (i) the United States; and, (ii) the state and county where Grantee resides. Because of Grantee’s position with the Company, Grantee is presumed to have participated in the Company’s business and/or had Confidential Information about the Company’s business throughout the United States (including state and state-equivalents and county and county-equivalents therein). The Grantee will not be deemed to have violated this Section if employees respond to general advertisements for employment or if the Company provides prior written consent to the activities of the Grantee; or
(iii)make any disparaging or derogatory statements, whether verbally, in writing, or in any other manner, about the Company that is intended to cause or that reasonably would be expected to cause a person to whom it is communicated to have a lowered opinion of the Company, including a lowered opinion of the services and products offered and provided by the Company or its business practices. Notwithstanding the foregoing, this Section shall not in any way limit Grantee’s ability to provide truthful testimony or information in response to a subpoena, court order, or valid request by a government agency, or as otherwise required or permitted by law.
(b)During the Grantee’s employment with the Company or any Subsidiary and at all times thereafter, the Grantee will not disclose or use Confidential Information, except as necessary to carry out Grantee’s duties as an employee of the Company or any Subsidiary.
(c)Upon termination or expiration of the Grantee’s employment with the Company for any reason whatsoever or at any time, the Grantee will immediately return to the Company all materials (including electronically stored materials), documents, plans, records, notes, or other papers, and any copies in the Grantee’s possession or control, relating in any way to the Company’s Business, which at all times shall be the property of the Company.
7.2For purposes of this Agreement, the following terms shall have the meanings specified below:
(a)“Company’s Business” means the unique and highly competitive business of the Company, which, as of the Effective Date, consists of banking and trust services, including the offering of commercial or consumer loans and extensions of credit, letters of credit, commercial and consumer deposits and deposit accounts, treasury management services, money transfer and bill payment services, internet or electronic banking, automated teller machines, IRA and retirement accounts, mortgage loans, home equity lines of credit, equipment financing, and financial advisory services.
(b)“Material Contact” means the contact between the Grantee and each existing employee, customer or Prospective Customer (a) with whom or which the Grantee dealt on behalf of the Company, (b) whose dealings with the Company were managed, coordinated, or supervised by the Grantee, (c) about whom the Grantee obtained Confidential Information or trade secrets in the ordinary course of business as a result of the Grantee’s association with the Company, or (d) who receives products or services authorized by the Company, the sale or provision of which results or resulted in compensation, commissions, or earnings for the Grantee within one (1) year prior to the end of the Grantee’s employment with the Company.
(c)“Confidential Information” means information, without regard to form, relating to the Company’s or any Subsidiary’s customers, operation, finances, and business that has value to the Company or any Subsidiary, is not generally known to competitors of the Company or a Subsidiary and that the Grantee became aware of due to Grantee’s employment with the Company. Confidential Information includes, but is not limited to, technical or non-technical data (including personnel data), formulas, patterns, compilations (including compilations of customer information), programs, devices, methods, techniques, processes, financial data or lists of actual or potential customers (including identifying information about customers), whether or not in writing. Confidential Information includes information disclosed to the Company or any Subsidiary by third parties that the Company or any Subsidiary is obligated to maintain as confidential. Confidential Information subject to this Agreement may include information that is not a trade secret under applicable law.
(d)“Prospective Customer” means any Person who was actively and directly solicited by the Company during the one (1) year prior to the end of the Grantee’s employment with the Company.
(e)“Date of Termination” means the date upon which the Grantee’s employment with the Company or any Subsidiary ceases for any reason.
(f)“Person” means any individual, corporation, bank, partnership, joint venture, association, joint-stock company, trust, unincorporated organization or other entity.
7.3If the Grantee violates the restrictive covenants set forth in Section 7.1, then the Company shall be entitled to all remedies available in law or equity. In addition (and without limiting the foregoing), if the Grantee violates the restrictive covenants set forth in Section 7.1, the Committee shall, notwithstanding any other provision in this Agreement to the contrary, (i) cancel the outstanding PSUs that are not yet vested or with respect to which Shares have not yet been issued to the Grantee, and (ii) require the Grantee to return to the Company any Shares issued to the Grantee pursuant to vesting of the PSUs (or to pay to the Company the greater of the then-current value of any such Shares or the value of the shares as of the applicable Vesting Date) that occurred (or will occur) during the period six (6) months prior to and one (1) year after the Date of Termination.
7.4The Grantee acknowledges and agrees that the provisions of Section 7.1 are reasonable as to time, scope, and territory given the Company’s need to protect its and its Subsidiaries’ Confidential Information and its and their relationships and goodwill with its and their customers, suppliers, employees, and contractors, all of which have been developed at great time and expense to the Company. The Grantee represents that the Grantee has the skills and abilities to obtain alternative employment after the Date of Termination that would not violate the covenants in Section 7.1 and that these covenants do not pose an undue hardship on the Grantee. The Grantee further acknowledges that the Grantee’s breach of any of the covenants in Section 7.1 would likely cause irreparable injury to the Company, and therefore entitles the Company to injunctive relief, in addition to any other remedies available in law or equity.
7.5The Defend Trade Secrets Act (18 U.S.C. § 1833(b)) states: “An individual shall not be held criminally or civilly liable under any federal or state trade secret law for the disclosure of a trade secret that (A) is made (i) in confidence to a federal, state, or local government official, either directly or indirectly, or to an attorney; and (ii) solely for the purpose of reporting or investigating a suspected violation of law; or (B) is made in a complaint or other document filed in a lawsuit or other proceeding, if such filing is made under seal.” Accordingly, Grantee shall have the right to disclose in confidence trade secrets to federal, state, and local government officials, or to an attorney, for the sole purpose of reporting or investigating a suspected violation of law. Grantee shall also have the right to disclose trade secrets in a document filed in a lawsuit or other proceeding, but only if the filing is made under seal and protected from public disclosure. Nothing in this Agreement is intended to conflict with 18 U.S.C. § 1833(b) or create liability for disclosures of trade secrets that are expressly allowed by 18 U.S.C. § 1833(b). In addition, nothing in this Agreement shall impair the Grantee’s right under the whistleblower provisions of any applicable federal law or regulation or, for the avoidance of doubt, limit the Grantee’s right to receive an award for the information provided to any government authority under such law or regulation.
8. Modification of Agreement; Severability
If any provision of this Agreement is held by a court of competent jurisdiction to be overly broad or unenforceable for any reason, the parties authorize such court to modify and enforce such provision to the extent the court deems reasonable. If any provision of this Agreement is found by a court to be overbroad or otherwise unenforceable and not capable of modification, it shall be severed and the remaining covenants and clauses enforced in accordance with the tenor of this Agreement. The parties may modify, amend, suspend, or terminate this Agreement or may waive any terms or conditions of this Agreement but only by a written instrument executed by the parties hereto.
9. Governing Law and Forum
The validity, interpretation, construction, and performance of this Agreement shall be governed by the laws of the state of Georgia without giving effect to the conflicts of laws principles thereof. The parties agree that they will not file any action arising out of or relating in any way to this Agreement other than in the United States District Court for the Northern District of Georgia or the Superior Court of Union County, Georgia. The parties consent to personal jurisdiction and venue solely within these forums and waive all possible objections thereto.
10. Successors in Interest
This Agreement shall inure to the benefit of, and be binding upon, the Company and its successors and assigns, whether by merger, consolidation, reorganization, sale of assets, or otherwise. This Agreement shall inure to the benefit of the Grantee’s legal representatives. All obligations imposed upon the Grantee and all rights granted to the Company under this Agreement shall be final, binding, and conclusive upon the Grantee’s heirs, executors, administrators, and successors.
11. Entire Agreement
This Agreement and the Plan contain the entire agreement and understanding of the parties hereto with respect to the subject matter contained herein and supersede all prior communications, representations, and negotiations in respect thereto. Wherever appropriate in this Agreement, personal pronouns shall be deemed to include the other genders and the singular to include the plural. Wherever used in this Agreement, the term “including” means “including, without limitation.”
12. Resolution of Disputes
Any dispute or disagreement which may arise under, or as a result of, or in any way relate to, the interpretation, construction, or application of this Agreement and the Plan shall be determined by the Committee. Except as otherwise provided in Section 3.5 of the Plan with respect to certain determinations following a Change in Control, any determination made by the Committee shall be final, binding, and conclusive on the Grantee and the Company and their successors, assigns, heirs, executors, administrators, and legal representatives for all purposes.
[EXECUTION PAGE FOLLOWS]
IN WITNESS WHEREOF, the parties have executed this Agreement as of the date first above written.
|
|
|
|
|
|
|
|
|
|
|
|
|
|
|
|
|
UNITED COMMUNITY BANKS, INC., |
|
|
|
|
|
|
|
|
|
|
|
By: |
|
|
|
|
Name: |
|
|
|
|
Title: |
|
|
By accepting this Agreement, the Grantee hereby accepts the PSU grant subject to all its terms and provisions and agrees to be bound by the terms and provisions of this Agreement, including Section 7, the Plan and Schedule A attached hereto. Except as otherwise provided under Section 3.5 of the Plan with respect to certain determinations following a Change in Control, the Grantee hereby agrees to accept as binding, conclusive, and final all decisions or interpretations of the Board of Directors of the Company, or the Talent and Compensation Committee or other Committee responsible for the administration of the Plan, upon any questions arising under the Plan.
By accepting this Agreement, the Grantee hereby acknowledges that notwithstanding any other provision herein, and in addition to other restrictions stated herein, any award, or any payment related thereto paid to the Grantee, shall be limited to the extent required by the federal or state regulatory agency having authority over the Company. The Grantee agrees that compliance by the Company with such regulatory restrictions, even to the extent that payments are limited, shall not be a breach of this Agreement by the Company.
By accepting this Agreement, the Grantee hereby consents to the holding and processing of personal data provided by the Grantee to the Company for all purposes necessary for the operation of the Plan. These include, but are not limited to:
(a) administering and maintaining Plan records;
(b) providing information to any registrars, brokers, or third-party administrators of the Plan; and
(c) providing information to future purchasers of the Company or the business in which the Grantee works.
|
|
|
|
|
|
|
|
|
|
|
|
|
|
|
|
|
GRANTEE |
|
|
|
|
|
|
|
|
|
|
|
Signature: |
|
|
|
|
Name: |
|
|
|
|
Date: |
|
|
EX-10.4
3
ucbi1231202310kex104trsu.htm
EX-10.4
Document
UNITED COMMUNITY BANKS, INC.
2022 OMNIBUS EQUITY PLAN
RESTRICTED STOCK UNIT AWARD AGREEMENT
(Key Employee)
|
|
|
|
|
|
|
|
|
| Grantee: |
|
|
|
|
|
| Number of RSUs: |
|
RSUs |
|
|
|
| Date of Grant: |
|
|
|
|
|
| Vesting Schedule: |
Vesting Date |
Vest Quantity |
|
|
|
|
|
|
|
|
|
THIS AGREEMENT (the “Agreement”) is entered into as of the ____ day of ______, _________, by and between UNITED COMMUNITY BANKS, INC., a Georgia corporation (the “Company”), and the individual designated above (the “Grantee”).
WHEREAS, the Company maintains the United Community Banks, Inc. 2022 Omnibus Equity Plan (the “Plan”), and the Grantee has been selected by the Committee to receive a Restricted Stock Unit Award under the Plan, vesting based upon the passage of time as specified above.
NOW, THEREFORE, IT IS AGREED, by and between the Company and the Grantee, as follows:
1.Award of Restricted Stock Units
1.1Grant. The Company hereby grants to the Grantee an award of Restricted Stock Units (“RSUs”) in the amount set forth above, subject to, and in accordance with, the restrictions, terms, and conditions set forth in this Agreement and the Plan. The grant date of this award of RSUs is set forth above (the “Date of Grant”).
1.2Construction. This Agreement shall be construed in accordance and consistent with, and subject to, the provisions of the Plan (the provisions of which are incorporated herein by reference), and, except as otherwise expressly set forth herein, the capitalized terms used in this Agreement shall have the same definitions as set forth in the Plan.
1.3Execution of the Agreement. This Award is conditioned on the Grantee’s execution of this Agreement. By executing this Agreement, the Grantee agrees to the terms set forth in this Agreement (and the provisions of the Plan incorporated herein). If this Agreement is not executed by the Grantee and returned to the Company within thirty (30) days of the Date of Grant, it may be canceled by the Committee, resulting in the immediate forfeiture of all RSUs granted hereunder.
2.Vesting and Settlement; Termination of Employmen
2.1 Vesting. Subject to this Section 2 and Section 7, if the Grantee remains employed by the Company through the Vesting Date set forth above (the “Vesting Date”), the RSUs shall vest in accordance with the vesting schedule set forth above. Except as otherwise provided herein, as soon as practicable (and no later than thirty (30) days after the Vesting Date (or such earlier vesting date in the event of a termination of employment as provided in Sections 2.2 and 2.3)), a number of Shares equal to the number of vested RSUs shall be issued to the Grantee (or, if the Grantee has died, to his or her surviving spouse or, if none, to the Grantee’s estate) free and clear of all restrictions imposed by this Agreement (except those imposed by Sections 3.3 and 7 below). For purposes of this Agreement, employment with a Subsidiary of the Company or service as a member of the Board of Directors of the Company or a Subsidiary shall be considered employment with the Company.
2.2 Termination of Employment Due to Death or Disability. If the Grantee’s employment is terminated by the Company as a result of death or Disability, the unvested RSUs shall fully vest immediately as of the Date of Termination, and a number of Shares equal to the number of such vested RSUs shall be issued to the Grantee (or the Grantee’s surviving spouse or estate) in the manner and at the time provided under Section 2.1.
2.3 Termination of Employment by the Company Without Cause or by the Grantee for Good Reason.
2.3.1 If the Grantee’s employment is terminated and such termination is either (i) an involuntary termination by the Company without Cause (as defined herein), and the termination does not arise as a result of the Grantee’s death or Disability, or (ii) a termination by the Grantee for Good Reason (as defined herein), the unvested RSUs shall fully vest immediately upon the Date of Termination, and a number of Shares equal to the number of such vested RSUs shall be issued to the Grantee in the manner and at the time provided under in Section 2.1.
2.3.2 For purposes of this Agreement (except as otherwise provided in Section 2.3.4), (i) on or after a Change in Control, the term “Cause” shall have the meaning set forth in the Plan (without regard to the last sentence thereof), and (ii) prior to a Change in Control, the term “Cause” shall mean (a) the Grantee’s continued intentional failure or refusal to perform substantially the Grantee’s assigned duties (other than as a result of total or partial mental or physical incapacity); (b) the Grantee’s engagement in willful misconduct, including without limitation, fraud, embezzlement, theft or dishonesty, in the course of the Grantee’s employment with the Company; (c) the Grantee’s conviction of, or plea of guilty or nolo contendere to a felony or a crime (other than a felony) that involves moral turpitude or a breach of trust or fiduciary duty owed to the Company or any of its affiliates; (d) a material breach of the restrictive covenants applicable to the Grantee, including those set forth in this Agreement; or (e) a material breach of the Company’s Code of Conduct or another written policy of the Company applicable to the Grantee, that does, or could reasonably be expected to, result in material harm to the Company, including reputational harm.
2.3.3 For purposes of this Agreement (except as otherwise provided in Section 2.3.4), “Good Reason” for termination by the Grantee of the Grantee’s employment shall mean the occurrence (without the Grantee’s express written consent) of any one of the following acts by the Company:
(a)a material adverse reduction in the Grantee’s responsibilities at the Company;
(b)the required relocation of the Grantee’s employment to a primary worksite location that is more than thirty-five (35) miles from the Grantee’s primary worksite location and increases the distance between the Grantee’s home location and primary worksite location by more than thirty-five (35) miles;
(c)a reduction in the Grantee’s base salary (other than a temporary reduction in connection with a specific circumstance that is consistently applied to other similarly situated executives of the Company); or
(d)a material reduction in the Grantee’s target annual incentive compensation opportunity or target long-term incentive compensation opportunity (other than a reduction in connection with a change to the incentive compensation program of the Company that is consistently applied to other similarly situated executives of the Company).
The Grantee must give the Company notice of any event or condition that would constitute Good Reason within ninety (90) days of the initial existence of the event or condition, and upon receipt of such notice, the Company shall have thirty (30) days to remedy such event or condition. If such event or condition is not remedied within such thirty (30)-day period, any termination of employment by the Grantee for Good Reason must occur, if at all, within six (6) months of the Grantee learning of the initial existence of the condition or event in order for such termination as a result of such condition to constitute a termination for Good Reason. The Grantee’s right to terminate employment for Good Reason shall not be affected by the Grantee’s incapacity due to physical or mental illness, except for a Disability. The Grantee’s continued employment shall not constitute consent to, or a waiver of rights with respect to, any act or failure to act constituting Good Reason hereunder.
2.3.4 Notwithstanding anything contained herein to the contrary, if the Grantee has entered into an employment or similar agreement that applies prior to a Change in Control (or a term of similar meaning) or a severance or similar agreement that applies on or after a Change in Control (or a term of similar meaning) and, if such agreement defines “Good Reason,” and/or provides procedures and/or standards for determining whether Cause or Good Reason exists, such definition of Good Reason and the procedures and/or standards for determining the existence of Cause or Good Reason, as applicable, shall apply as if set forth in this Agreement; provided that, in the case of such an agreement that applies on or after a Change in Control (or a term of similar meaning) such alternative definitions and procedures and/or standards, as applicable, shall apply with respect to the applicable period under such agreement from and after a Change in Control (or a term of similar meaning). Notwithstanding anything contained herein to the contrary, nothing herein shall limit the right to de novo review of certain determinations as provided in Section 3.5 of the Plan.
2.4 Termination of Employment for Other Reasons. If the Grantee’s employment is terminated by the Company or by the Grantee prior to the Vesting Date for any reason other than as set forth in Sections 2.2 and 2.3, the outstanding unvested RSUs shall immediately be forfeited as of the Date of Termination.
2.5 Nontransferability. The RSUs may not be sold, assigned, transferred, pledged, or otherwise encumbered prior to the date the Grantee becomes vested in the RSUs and the Shares are issued.
2.6 Section 409A Compliance. To the extent applicable, this Agreement shall at all times be interpreted and operated in compliance with the requirements of Section 409A of the Code and the standards, regulations or other guidance promulgated thereunder (“Section 409A”). Any action that may be taken (and, to the extent possible, any action actually taken) by the Company shall not be taken (or shall be void and without effect), if such action violates the requirements of Section 409A. Any provision in this Agreement that is determined to violate the requirements of Section 409A shall be void and without effect. In addition, any provision that is required to appear in this Agreement in accordance with Section 409A that is not expressly set forth herein shall be deemed to be set forth herein, and the Agreement shall be administered in all respects as if such provision were expressly set forth. To the extent required under the provisions of Section 409A to avoid the imposition of additional income and other taxes, the provisions of Section 11.2(b) of the Plan shall apply to the RSUs. For purposes of this Agreement, termination of employment shall be construed consistent with the meaning of a separation from service within the meaning of Section 409A and to the extent required under the provisions of Section 409A to avoid the imposition of additional income and other taxes, the Date of Termination as used for purposes of the settlement of any vested RSUs shall not occur prior to the Grantee’s separation from service.
3.Rights as a Shareholder; Dividends; Change in Capitalization; Deferral Rights
3.1 The Grantee shall have no rights as a shareholder until such date as the Shares are delivered in settlement of vested RSUs; provided, however, that following the Date of Grant of the RSUs through the date that is the earlier of (i) the date that the RSUs are vested and Shares in settlement thereof are transferred to the Grantee pursuant to Section 2.1 or (ii) the date that the RSUs are forfeited, the Grantee shall be credited with dividend equivalents with respect to ordinary cash dividends (other than an extraordinary dividend for which an adjustment is made pursuant to Section 4.3(b) of the Plan) declared on the Shares represented by the RSU, which dividend equivalents shall vest or be forfeited on the same basis as applies to the underlying RSUs. Within thirty (30) days after a Vesting Date (or such earlier date on which the RSUs vest in accordance with the terms of this Agreement), the Grantee shall be paid in cash the dividend equivalents with respect to the vested RSUs to which the dividend equivalents relate, less applicable withholdings.
3.2 In the event of a change in capitalization, the Committee shall make appropriate adjustments in accordance with Section 4.3 of the Plan to reflect the change in capitalization; provided that any such additional Shares or additional or different shares or securities reflected in any such adjustment shall remain subject to the restrictions in this Agreement.
3.3 The Grantee represents and warrants that the Grantee is acquiring the Shares under this Agreement for investment purposes only, and not with a view to distribution thereof. The Grantee is aware that the Shares may not be registered under the federal or any state securities laws and that for that reason, in addition to the other restrictions on the Shares, they will not be able to be transferred unless an exemption from registration is available or the Shares are registered. By making this award of RSUs, the Company is not undertaking any obligation to register the RSUs under the federal or any state securities laws.
3.4 To the extent the Grantee makes a valid and timely deferral election with respect to the Shares deliverable upon vesting of the RSUs consistent with Section 11.1 of the Plan, the terms of such election and any applicable deferred compensation plan shall govern the delivery of the Shares and accrued dividend equivalents in respect of vested RSUs subject to such election.
4.No Right to Continued Employment
Nothing in this Agreement or the Plan shall be interpreted or construed to confer upon the Grantee any right with respect to continuance of employment by the Company, nor shall this Agreement or the Plan interfere in any way with the right of the Company to terminate the Grantee’s employment at any time. The Grantee is employed by the Company “at will,” which means that either the Grantee or the Company may terminate the Grantee’s employment at any time, for any reason.
5.Taxes and Withholding
The Grantee shall be responsible for all federal, state, and local income taxes payable with respect to this award of RSUs and any dividends or dividend equivalents paid on such RSUs. The Company and the Grantee agree to report the value of the RSUs and any dividends or dividend equivalents in respect thereof in a consistent manner for federal income tax purposes. The Company shall have the right to retain and withhold from any payment of Shares (for the minimum required withholdings or such other amounts as will not result in adverse accounting treatment to the Company) or cash the amount of taxes required by any government to be withheld or otherwise deducted and paid with respect to such payment. At its discretion, the Company may require the Grantee to reimburse the Company for any such taxes required to be withheld and may withhold any distribution in whole or in part until the Company is so reimbursed. In lieu thereof, the Company shall have the right to withhold from any other cash amounts due to the Grantee an amount equal to such taxes required to be withheld or to withhold and cancel (for the minimum required withholdings or such other amounts as will not result in adverse accounting treatment to the Company) (in whole or in part) a number of Shares having a Fair Market Value not less than the amount of such taxes.
6.The Grantee Bound by the Plan
The Grantee hereby acknowledges receipt of a copy of the Plan and the prospectus for the Plan, and agrees to be bound by all the terms and provisions thereof.
7.Restrictive Covenants
7.1 In consideration for the grant of the RSUs, continued employment with the Company, and other good and valuable consideration, the Grantee agrees to the following:
(a)During the Grantee’s employment with the Company or any Subsidiary and for a one (1)-year period after the Date of Termination, the Grantee will not directly or indirectly, individually, or on behalf of any Person other than the Company or a Subsidiary:
(i)solicit, or attempt to solicit, any customers or Prospective Customers of the Company with whom Grantee had Material Contact for the purpose of providing products or services that are competitive with the Company’s Business;
(ii)recruit, solicit, or induce, or in any manner attempt to recruit, solicit, or induce, anywhere within the Territory any Person employed by the Company or any Subsidiary with whom Grantee had Material Contact or about whom Grantee received Confidential Information during the one (1) year period preceding the Date of Termination, to end his or her employment with the Company or any Subsidiary, whether or not such employment is pursuant to a written contract with the Company or any Subsidiary or is at will. “Territory” is defined as New Jersey, as well as any state in which the Company has a branch location, to include the following, North Carolina, South Carolina, Georgia, Tennessee, Florida, and Alabama. If Grantee had no such specifically assigned geographic territory, then “Territory” means: (i) the United States; and, (ii) the state and county where Grantee resides. Because of Grantee’s position with the Company, Grantee is presumed to have participated in the Company’s business and/or had Confidential Information about the Company’s business throughout the United States (including state and state-equivalents and county and county-equivalents therein). The Grantee will not be deemed to have violated this Section if employees respond to general advertisements for employment or if the Company provides prior written consent to the activities of the Grantee; or
(iii)make any disparaging or derogatory statements, whether verbally, in writing, or in any other manner, about the Company that is intended to cause or that reasonably would be expected to cause a person to whom it is communicated to have a lowered opinion of the Company, including a lowered opinion of the services and products offered and provided by the Company or its business practices. Notwithstanding the foregoing, this Section shall not in any way limit Grantee’s ability to provide truthful testimony or information in response to a subpoena, court order, or valid request by a government agency, or as otherwise required or permitted by law.
(b)During the Grantee’s employment with the Company or any Subsidiary and at all times thereafter, the Grantee will not disclose or use Confidential Information, except as necessary to carry out Grantee’s duties as an employee of the Company or any Subsidiary.
(c)Upon termination or expiration of the Grantee’s employment with the Company for any reason whatsoever or at any time, the Grantee will immediately return to the Company all materials (including electronically stored materials), documents, plans, records, notes, or other papers, and any copies in the Grantee’s possession or control, relating in any way to the Company’s Business, which at all times shall be the property of the Company.
7.2 For purposes of this Agreement, the following terms shall have the meanings specified below:
(a)“Company’s Business” means the unique and highly competitive business of the Company, which, as of the Effective Date, consists of banking and trust services, including the offering of commercial or consumer loans and extensions of credit, letters of credit, commercial and consumer deposits and deposit accounts, treasury management services, money transfer and bill payment services, internet or electronic banking, automated teller machines, IRA and retirement accounts, mortgage loans, home equity lines of credit, equipment financing, and financial advisory services.
(b)“Material Contact” means the contact between the Grantee and each existing employee, customer or Prospective Customer (a) with whom or which the Grantee dealt on behalf of the Company, (b) whose dealings with the Company were managed, coordinated, or supervised by the Grantee, (c) about whom the Grantee obtained Confidential Information or trade secrets in the ordinary course of business as a result of the Grantee’s association with the Company, or (d) who receives products or services authorized by the Company, the sale or provision of which results or resulted in compensation, commissions, or earnings for the Grantee within one (1) year prior to the end of the Grantee’s employment with the Company.
(c)“Confidential Information” means information, without regard to form, relating to the Company’s or any Subsidiary’s customers, operation, finances, and business that has value to the Company or any Subsidiary, is not generally known to competitors of the Company or a Subsidiary and that the Grantee became aware of due to Grantee’s employment with the Company. Confidential Information includes, but is not limited to, technical or non-technical data (including personnel data), formulas, patterns, compilations (including compilations of customer information), programs, devices, methods, techniques, processes, financial data or lists of actual or potential customers (including identifying information about customers), whether or not in writing. Confidential Information includes information disclosed to the Company or any Subsidiary by third parties that the Company or any Subsidiary is obligated to maintain as confidential. Confidential Information subject to this Agreement may include information that is not a trade secret under applicable law.
(d)“Prospective Customer” means any Person who was actively and directly solicited by the Company during the one (1) year prior to the end of the Grantee’s employment with the Company.
(e)“Date of Termination” means the date upon which the Grantee’s employment with the Company or any Subsidiary ceases for any reason.
(f)“Person” means any individual, corporation, bank, partnership, joint venture, association, joint-stock company, trust, unincorporated organization or other entity.
7.3 If the Grantee violates the restrictive covenants set forth in Section 7.1, then the Company shall be entitled to all remedies available in law or equity. In addition (and without limiting the foregoing), if the Grantee violates the restrictive covenants set forth in Section 7.1, the Committee shall, notwithstanding any other provision in this Agreement to the contrary, (i) cancel the outstanding RSUs that are not yet vested or with respect to which Shares have not yet been issued to the Grantee, and (ii) require the Grantee to return to the Company any Shares issued to the Grantee pursuant to vesting of the RSUs (or to pay to the Company the greater of the then-current value of any such Shares or the value of the shares as of the applicable Vesting Date) that occurred (or will occur) during the period six (6) months prior to and one (1) year after the Date of Termination.
7.4 The Grantee acknowledges and agrees that the provisions of Section 7.1 are reasonable as to time, scope and territory given the Company’s need to protect its and its Subsidiaries’ Confidential Information and its and their relationships and goodwill with its and their customers, suppliers, employees, and contractors, all of which have been developed at great time and expense to the Company. The Grantee represents that the Grantee has the skills and abilities to obtain alternative employment after the Date of Termination that would not violate the covenants in Section 7.1 and that these covenants do not pose an undue hardship on the Grantee. The Grantee further acknowledges that the Grantee’s breach of any of the covenants in Section 7.1 would likely cause irreparable injury to the Company, and therefore entitles the Company to injunctive relief, in addition to any other remedies available in law or equity.
7.5 The Defend Trade Secrets Act (18 U.S.C. § 1833(b)) states: “An individual shall not be held criminally or civilly liable under any federal or state trade secret law for the disclosure of a trade secret that (A) is made (i) in confidence to a federal, state, or local government official, either directly or indirectly, or to an attorney; and (ii) solely for the purpose of reporting or investigating a suspected violation of law; or (B) is made in a complaint or other document filed in a lawsuit or other proceeding, if such filing is made under seal.” Accordingly, Grantee shall have the right to disclose in confidence trade secrets to federal, state, and local government officials, or to an attorney, for the sole purpose of reporting or investigating a suspected violation of law. Grantee shall also have the right to disclose trade secrets in a document filed in a lawsuit or other proceeding, but only if the filing is made under seal and protected from public disclosure. Nothing in this Agreement is intended to conflict with 18 U.S.C. § 1833(b) or create liability for disclosures of trade secrets that are expressly allowed by 18 U.S.C. § 1833(b). In addition, nothing in this Agreement shall impair the Grantee’s right under the whistleblower provisions of any applicable federal law or regulation or, for the avoidance of doubt, limit the Grantee’s right to receive an award for the information provided to any government authority under such law or regulation.
8. Modification of Agreement; Severability
If any provision of this Agreement is held by a court of competent jurisdiction to be overly broad or unenforceable for any reason, the parties authorize such court to modify and enforce such provision to the extent the court deems reasonable. If any provision of this Agreement is found by a court to be overbroad or otherwise unenforceable and not capable of modification, it shall be severed and the remaining covenants and clauses enforced in accordance with the tenor of this Agreement. The parties may modify, amend, suspend, or terminate this Agreement or may waive any terms or conditions of this Agreement but only by a written instrument executed by the parties hereto.
9. Governing Law and Forum
The validity, interpretation, construction, and performance of this Agreement shall be governed by the laws of the state of Georgia without giving effect to the conflicts of laws principles thereof. The parties agree that they will not file any action arising out of or relating in any way to this Agreement other than in the United States District Court for the Northern District of Georgia or the Superior Court of Union County, Georgia.
The parties consent to personal jurisdiction and venue solely within these forums and waive all possible objections thereto.
10. Successors in Interest
This Agreement shall inure to the benefit of, and be binding upon, the Company and its successors and assigns, whether by merger, consolidation, reorganization, sale of assets, or otherwise. This Agreement shall inure to the benefit of the Grantee’s legal representatives. All obligations imposed upon the Grantee and all rights granted to the Company under this Agreement shall be final, binding, and conclusive upon the Grantee’s heirs, executors, administrators, and successors.
11. Entire Agreement
This Agreement and the Plan contain the entire agreement and understanding of the parties hereto with respect to the subject matter contained herein and supersede all prior communications, representations, and negotiations in respect thereto. Wherever appropriate in this Agreement, personal pronouns shall be deemed to include the other genders and the singular to include the plural. Wherever used in this Agreement, the term “including” means “including, without limitation.”
12. Resolution of Disputes
Any dispute or disagreement which may arise under, or as a result of, or in any way relate to, the interpretation, construction, or application of this Agreement and the Plan shall be determined by the Committee. Except as otherwise provided in Section 3.5 of the Plan with respect to certain determinations following a Change in Control, any determination made by the Committee shall be final, binding, and conclusive on the Grantee and the Company and their successors, assigns, heirs, executors, administrators, and legal representatives for all purposes.
[EXECUTION PAGE FOLLOWS]
IN WITNESS WHEREOF, the parties have executed this Agreement as of the date first above written.
|
|
|
|
|
|
|
|
|
|
|
|
|
|
|
|
|
UNITED COMMUNITY BANKS, INC., |
|
|
|
|
|
|
|
|
|
|
|
By: |
|
|
|
|
Name: |
|
|
|
|
Title: |
|
|
By accepting this Agreement, the Grantee hereby accepts the RSU grant subject to all its terms and provisions and agrees to be bound by the terms and provisions of this Agreement, including Section 7, and the Plan. Except as otherwise provided under Section 3.5 of the Plan with respect to certain determinations following a Change in Control, the Grantee hereby agrees to accept as binding, conclusive, and final all decisions or interpretations of the Board of Directors of the Company, or the Talent and Compensation Committee or other Committee responsible for the administration of the Plan, upon any questions arising under the Plan.
By accepting this Agreement, the Grantee hereby acknowledges that notwithstanding any other provision herein, and in addition to other restrictions stated herein, any award, or any payment related thereto paid to the Grantee, shall be limited to the extent required by the federal or state regulatory agency having authority over the Company. The Grantee agrees that compliance by the Company with such regulatory restrictions, even to the extent that payments are limited, shall not be a breach of this Agreement by the Company.
By accepting this Agreement, the Grantee hereby consents to the holding and processing of personal data provided by the Grantee to the Company for all purposes necessary for the operation of the Plan. These include, but are not limited to:
(a)administering and maintaining Plan records;
(b)providing information to any registrars, brokers, or third-party administrators of the Plan; and
(c)providing information to future purchasers of the Company or the business in which the Grantee works.
|
|
|
|
|
|
|
|
|
|
|
|
|
|
|
|
|
GRANTEE |
|
|
|
|
|
|
|
|
|
|
|
Signature: |
|
|
|
|
Name: |
|
|
|
|
Date: |
|
|
EX-21
4
ucbi1231202310kex21.htm
EX-21
Document
EXHIBIT 21
Subsidiaries of United Community Banks, Inc. as of December 31, 2023.
|
|
|
|
|
|
| Subsidiary |
State of Organization |
| |
|
| United Community Bank |
South Carolina |
|
|
| Navitas Credit Corp. |
Florida |
|
|
| NLFC Reinsurance Corp. |
Tennessee |
|
|
| UCB Investments, Inc. |
North Carolina |
|
|
| UCB Funding Corp. |
Georgia |
|
|
| United Community Development Corporation |
Georgia |
|
|
| UCBI Georgia Credits LLC |
Georgia |
|
|
| United Community Payment Systems, LLC (50% owned by United Community Bank) |
Delaware |
|
|
| TFG Holdings, LLC |
Delaware |
|
|
| FNBSM The Falls, LLC |
Florida |
|
|
| Seaside Capital Management, Inc. |
Florida |
|
|
| FinTrust Brokerage Services, LLC |
North Carolina |
|
|
| United Community Insurance, Inc. (formerly FinTrust Insurance and Benefits, Inc.) |
Florida |
|
|
| FinTrust Capital Advisors, LLC |
Georgia |
|
|
| Community First Trups Holding Company |
Tennessee |
|
|
| Community First Capital Trust I |
Delaware |
|
|
| Community First Capital Trust II |
Delaware |
|
|
| Community First Capital Trust III |
Delaware |
|
|
| Tidelands Statutory Trust I |
Delaware |
|
|
| Four Oaks Statutory Trust I |
Delaware |
EX-23
5
ucbi1231202310kex23.htm
EX-23
Document
EXHIBIT 23
CONSENT OF INDEPENDENT REGISTERED PUBLIC ACCOUNTING FIRM
We hereby consent to the incorporation by reference in the Registration Statements on Form S-3 (Nos. 333-268788) and S-8 (Nos. 333-265839, 333-269144) of United Community Banks, Inc. of our report dated February 23, 2024 relating to the financial statements and the effectiveness of internal control over financial reporting, which appears in this Form 10-K.
|
|
|
| /s/ PricewaterhouseCoopers LLP |
| Atlanta, Georgia |
| February 23, 2024 |
EX-31.1
6
ucbi1231202310kex311.htm
EX-31.1
Document
EXHIBIT 31.1
I, H. Lynn Harton, certify that:
1. I have reviewed this annual report on Form 10-K of United Community Banks, Inc. (the “Registrant”);
2. Based on my knowledge, this report does not contain any untrue statement of a material fact or omit to state a material fact necessary to make the statements made, in light of the circumstances under which such statements were made, not misleading with respect to the period covered by this report;
3. Based on my knowledge, the financial statements, and other financial information included in this report, fairly present in all material respects the financial condition, results of operations and cash flows of the registrant as of, and for, the periods presented in this report;
4. The registrant’s other certifying officer and I are responsible for establishing and maintaining disclosure controls and procedures (as defined in Exchange Act Rules 13a-15(e) and 15d-15(e)) and internal control over financial reporting (as defined in Exchange Act Rules 13a - 15(f) and 15d - 15(f)) for the registrant and have:
a) Designed such disclosure controls and procedures, or caused such disclosure controls and procedures to be designed under our supervision, to ensure that material information relating to the registrant, including its consolidated subsidiaries, is made known to us by others within those entities, particularly during the period in which this report is being prepared;
b) Designed such internal control over financial reporting, or caused such internal control over financial reporting to be designed under our supervision, to provide reasonable assurance regarding the reliability of financial reporting and the preparation of financial statements for external purposes in accordance with generally accepted accounting principles;
c) Evaluated the effectiveness of the registrant’s disclosure controls and procedures and presented in this report our conclusions about the effectiveness of the disclosure controls and procedures, as of the end of the period covered by this report based on such evaluation; and
d) Disclosed in this report any change in the registrant’s internal control over financial reporting that occurred during the registrant’s most recent fiscal quarter (the registrant’s fourth fiscal quarter in the case of an annual report) that has materially affected, or is reasonably likely to materially affect, the registrant’s internal control over financial reporting; and
5. The registrant’s other certifying officer and I have disclosed, based on our most recent evaluation of internal control over financial reporting, to the registrant’s auditors and the audit committee of the registrant’s board of directors:
a) All significant deficiencies and material weaknesses in the design or operation of internal control over financial reporting which are reasonably likely to adversely affect the registrant’s ability to record, process, summarize and report financial information; and
b) Any fraud, whether or not material, that involves management or other employees who have a significant role in the registrant’s internal control over financial reporting.
|
|
|
|
|
|
|
|
|
| By: |
/s/ H. Lynn Harton |
|
| |
H. Lynn Harton |
|
| |
President and Chief Executive Officer |
|
| |
|
|
| Date: |
February 23, 2024 |
|
| |
|
|
EX-31.2
7
ucbi1231202310kex312.htm
EX-31.2
Document
EXHIBIT 31.2
I, Jefferson L. Harralson, certify that:
1. I have reviewed this annual report on Form 10-K of United Community Banks, Inc. (the “Registrant”);
2. Based on my knowledge, this report does not contain any untrue statement of a material fact or omit to state a material fact necessary to make the statements made, in light of the circumstances under which such statements were made, not misleading with respect to the period covered by this report;
3. Based on my knowledge, the financial statements, and other financial information included in this report, fairly present in all material respects the financial condition, results of operations and cash flows of the registrant as of, and for, the periods presented in this report;
4. The registrant’s other certifying officer and I are responsible for establishing and maintaining disclosure controls and procedures (as defined in Exchange Act Rules 13a-15(e) and 15d-15(e)) and internal control over financial reporting (as defined in Exchange Act Rules 13a - 15(f) and 15d - 15(f)) for the registrant and have:
a) Designed such disclosure controls and procedures, or caused such disclosure controls and procedures to be designed under our supervision, to ensure that material information relating to the registrant, including its consolidated subsidiaries, is made known to us by others within those entities, particularly during the period in which this report is being prepared;
b) Designed such internal control over financial reporting, or caused such internal control over financial reporting to be designed under our supervision, to provide reasonable assurance regarding the reliability of financial reporting and the preparation of financial statements for external purposes in accordance with generally accepted accounting principles;
c) Evaluated the effectiveness of the registrant’s disclosure controls and procedures and presented in this report our conclusions about the effectiveness of the disclosure controls and procedures, as of the end of the period covered by this report based on such evaluation; and
d) Disclosed in this report any change in the registrant’s internal control over financial reporting that occurred during the registrant’s most recent fiscal quarter (the registrant’s fourth fiscal quarter in the case of an annual report) that has materially affected, or is reasonably likely to materially affect, the registrant’s internal control over financial reporting; and
5. The registrant’s other certifying officer and I have disclosed, based on our most recent evaluation of internal control over financial reporting, to the registrant’s auditors and the audit committee of the registrant’s board of directors:
a) All significant deficiencies and material weaknesses in the design or operation of internal control over financial reporting which are reasonably likely to adversely affect the registrant’s ability to record, process, summarize and report financial information; and
b) Any fraud, whether or not material, that involves management or other employees who have a significant role in the registrant’s internal control over financial reporting.
|
|
|
|
|
|
|
|
|
| By: |
/s/ Jefferson L. Harralson |
|
| |
Jefferson L. Harralson |
|
| |
Executive Vice President and |
|
| |
Chief Financial Officer |
|
| |
|
|
| Date: |
February 23, 2024 |
|
| |
|
|
EX-32
8
ucbi1231202310kex32.htm
EX-32
Document
EXHIBIT 32
CERTIFICATION PURSUANT TO
18 U.S.C. SECTION 1350,
AS ADOPTED PURSUANT TO
SECTION 906 OF THE SARBANES-OXLEY ACT OF 2002
In connection with the Annual Report of United Community Banks, Inc. (“United”) on Form 10-K for the period ending December 31, 2023 filed with the Securities and Exchange Commission on the date hereof (the “Report”), I, H. Lynn Harton, President and Chief Executive Officer of United, and I, Jefferson L. Harralson, Executive Vice President and Chief Financial Officer of United, certify, pursuant to 18 U.S.C. Section 1350, as adopted pursuant to Section 906 of the Sarbanes-Oxley Act of 2002, that:
(1)The Report fully complies with the requirements of section 13(a) or 15(d) of the Securities Exchange Act of 1934; and
(2)The information contained in the Report fairly presents, in all material respects, the financial condition and result of operations of United.
|
|
|
|
|
|
|
|
|
| By: |
/s/ H. Lynn Harton |
|
| |
H. Lynn Harton |
|
| |
President and Chief Executive Officer |
|
| |
|
|
| By: |
/s/ Jefferson L. Harralson |
|
| |
Jefferson L. Harralson |
|
| |
Executive Vice President and Chief Financial Officer |
|
| |
|
|
| |
Date: February 23, 2024 |
|
| |
|
|
EX-97
9
ucbi12312023ex97ucbicompen.htm
EX-97
Document
|
|
|
|
|
|
|
|
|
|
|
|
|
United Community Banks, Inc. |
| Document Title |
Compensation Recovery Policy |
Version No. |
1 |
| Effective Date |
August 1, 2023 |
| Date of Last Revision |
N/A |
| Approving Body |
Board Talent and Compensation Committee |
1.Effective Date. This United Community Banks, Inc. Compensation Recovery Policy (this “Policy”) has been adopted by United Community Banks, Inc. (the “Company”) effective as of August 1, 2023 and shall supplement the bonus recoupment policy set forth in the Company’s Corporate Governance Guidelines.
2.Recovery of Erroneously Awarded Compensation. Pursuant to this Policy, the Company shall recover erroneously awarded compensation to its executive officers to the extent required by Section 10D of the Securities Exchange Act of 1934, as amended and Nasdaq Listing Rule 5608 (collectively, the “Compensation Recovery Rules”) and shall otherwise comply in all respects with the Compensation Recovery Rules, as in effect from time to time. The Committee (as defined below) shall determine, in its sole and exclusive discretion, the method or methods for recovering any erroneously awarded compensation, which methods need not be the same, or applied in the same manner, to each executive officer, provided that any such method shall provide for reasonably prompt recovery and otherwise comply with any requirements of the Nasdaq Stock Market.
3.Authority of Committee. This Policy shall be administered and interpreted by the Talent and Compensation Committee (the “Committee”) of the Board of Directors (the “Board”) of the Company in accordance with the Compensation Recovery Rules and other applicable Federal securities laws and regulations. Except as limited by applicable law, and subject to the provisions of this Policy, the Committee shall have full power, authority and sole and exclusive discretion to construe, interpret and administer this Policy, and to delegate its authority pursuant to this Policy. In addition, the Committee shall have full and exclusive power to adopt such rules, regulations and guidelines for carrying out this Policy and to amend this Policy, in each case, as it may deem necessary or proper. Except as otherwise required by the Compensation Recover Rules, this Policy also may be administered by the Board, and references in this Policy to the “Committee” shall be understood to refer to the full Board.
4.Decisions Binding. In making any determination or in taking or not taking any action under this Policy, the Committee may obtain and rely on the advice of experts, including employees of, and professional advisors to, the Company. Any action taken by, or inaction of, the Committee or its delegates relating to or pursuant to this Policy shall be within the absolute discretion of the Committee or its delegates. Such action or inaction of the Committee or its delegates shall be conclusive and binding on the Company and any current or former executive officer affected by such action or inaction.
5.Policy Not Exclusive. Any right of recovery under this Policy is in addition to, and not in lieu of, any other remedies or rights of recovery, recoupment, forfeiture or offset that may be available to the Company pursuant to the terms of any other applicable Company policy, compensation or benefit plan, agreement or arrangement or other agreement or applicable law; provided, however, that there shall be no duplication of recovery of the same compensation.
|
|
|
|
|
|
|
|
|
|
|
|
|
|
|
| Review Date |
Reviewed By |
Review or Revision Description |
Approved or Adopted |
Approved or Adopted Date |
| August 1, 2023 |
Board Talent and Compensation Committee |
New Policy |
Adopted |
08/01/2023 |