UNITED STATES
SECURITIES AND EXCHANGE COMMISSION
Washington, D.C. 20549
FORM 8-K
CURRENT REPORT
Pursuant to Section 13 or 15(d) of the Securities Exchange Act of 1934
Date of Report (date of earliest event reported): October 30, 2025

Merit Medical Systems, Inc.
(Exact name of registrant as specified in its charter)
Utah |
|
0-18592 |
|
87-0447695 |
(State or other jurisdiction of |
|
(Commission |
|
(I.R.S. Employer |
incorporation or organization) |
|
File Number) |
|
Identification No.) |
1600 West Merit Parkway |
|
|
South Jordan, Utah |
|
84095 |
(Address of principal executive offices) |
|
(Zip Code) |
(801) 253-1600
(Registrant's telephone number, including area code)
N/A
(Former name or former address, if changed since last report)
Check the appropriate box below if the Form 8-K filing is intended to simultaneously satisfy the filing obligation of the registrant under any of the following provisions:
☐ Written communications pursuant to Rule 425 under the Securities Act (17 CFR 230.425)
☐ Soliciting material pursuant to Rule 14a-12 under the Exchange Act (17 CFR 240.14a-12)
☐ Pre-commencement communications pursuant to Rule 14d-2(b) under the Exchange Act (17 CFR 240.14d-2(b))
☐ Pre-commencement communications pursuant to Rule 13e-4(c) under the Exchange Act (17 CFR 240.13e-4(c))
Securities registered pursuant to Section 12(b) of the Act:
Title of each class |
|
Trading Symbol(s) |
|
Name of each exchange on which registered |
Common Stock, no par value |
|
MMSI |
|
NASDAQ Global Select Market System |
Indicate by check mark whether the registrant is an emerging growth company as defined in Rule 405 of the Securities Act of 1933 (§230.405 of this chapter) or Rule 12b-2 of the Securities Exchange Act of 1934 (§240.12b-2 of this chapter).
Emerging growth company ☐
If an emerging growth company, indicate by check mark if the registrant has elected not to use the extended transition period for complying with any new or revised financial accounting standards provided pursuant to Section 13(a) of the Exchange Act. ☐
Item 2.02. Results of Operations and Financial Condition.
On October 30, 2025, Merit Medical Systems, Inc. (“Merit”) issued a press release announcing its operating and financial results for the quarter ended September 30, 2025. A copy of the press release is furnished as Exhibit 99.1 to this report and incorporated herein by reference.
Item 7.01. Regulation FD Disclosure.
On October 30, 2025, Merit is conducting a conference call to discuss its operating and financial results for the quarter ended September 30, 2025. A live webcast and slide presentation will also be available for the conference call on the Merit’s website. A copy of the slide presentation is furnished as Exhibit 99.2 to this report and incorporated herein by reference.
The information contained in Item 2.02 and Item 7.01 of this Current Report on Form 8-K (including the exhibits attached hereto) is furnished pursuant to General Instruction B.2. of Form 8-K and shall not be deemed to be “filed” for purposes of Section 18 of the Securities Exchange Act of 1934, as amended (the “Exchange Act”), or otherwise subject to the liabilities of that section, nor shall it be deemed incorporated by reference in any filing made by Merit under the Securities Act of 1933, as amended, or the Exchange Act.
In addition to disclosing results that are determined in accordance with Generally Accepted Accounting Principles (“GAAP”), Merit is disclosing non-GAAP financial information in both the press release announcing its operating and financial results and the conference call presentation. Reconciliations of certain of these non-GAAP financial measures to the comparable GAAP financial measures are included in the press release and conference call presentation attached as Exhibit 99.1 and 99.2, respectively, to this report. Merit does not provide guidance for GAAP reported financial measures (other than revenue) or a reconciliation of forward-looking non-GAAP financial measures to the most directly comparable GAAP reported financial measures (other than revenue) because Merit is unable to predict with reasonable certainty the financial impact of items such as expenses related to acquisitions or other extraordinary transactions, non-cash expenses related to amortization or write-off of previously acquired tangible and intangible assets, certain severance expenses, performance-based stock compensation expenses, expenses resulting from non-ordinary course litigation or administrative proceedings and resulting settlements, governmental proceedings, and changes in governmental or industry regulations. These items are uncertain, depend on various factors, and could have a material impact on GAAP reported results for the guidance period. For the same reasons, Merit is unable to address the significance of the unavailable information, which could be material to future results. Specifically, Merit is not, without unreasonable effort, able to reliably predict the impact of these items and Merit believes inclusion of a reconciliation of these forward-looking non-GAAP figures to their GAAP counterparts could be confusing to investors or cause undue reliance.
Item 9.01. Financial Statements and Exhibits.
(d) Exhibits
EXHIBIT NUMBER |
|
DESCRIPTION |
|
|
|
99.1 |
|
|
99.2 |
|
|
104 |
|
The cover page from this Current Report on Form 8-K, formatted in Inline XBRL |
2
SIGNATURES
Pursuant to the requirements of the Securities Exchange Act of 1934, as amended, the registrant has duly caused this report to be signed on its behalf by the undersigned hereunto duly authorized.
|
MERIT MEDICAL SYSTEMS, INC. |
|
|
|
|
|
|
|
Date: October 30, 2025 |
By: |
/s/ Brian G. Lloyd |
|
|
Brian G. Lloyd |
|
|
Chief Legal Officer and Corporate Secretary |
3
Exhibit 99.1
|
|
Contacts: |
|
|
|
PR/Media Inquiries: Sarah Comstock Merit Medical |
Investor Inquiries: Mike Piccinino, CFA, IRC ICR Healthcare |
|
|
+1-801-432-2864 |
+1-443-213-0509 |
|
|
sarah.comstock@merit.com |
mike.piccinino@icrhealthcare.com |
|
|
|
|
|
FOR IMMEDIATE RELEASE
MERIT MEDICAL REPORTS THIRD QUARTER 2025 RESULTS AND UPDATES FULL-YEAR GUIDANCE
Highlights†
| ● | Reported revenue of $384.2 million, up 13.0% |
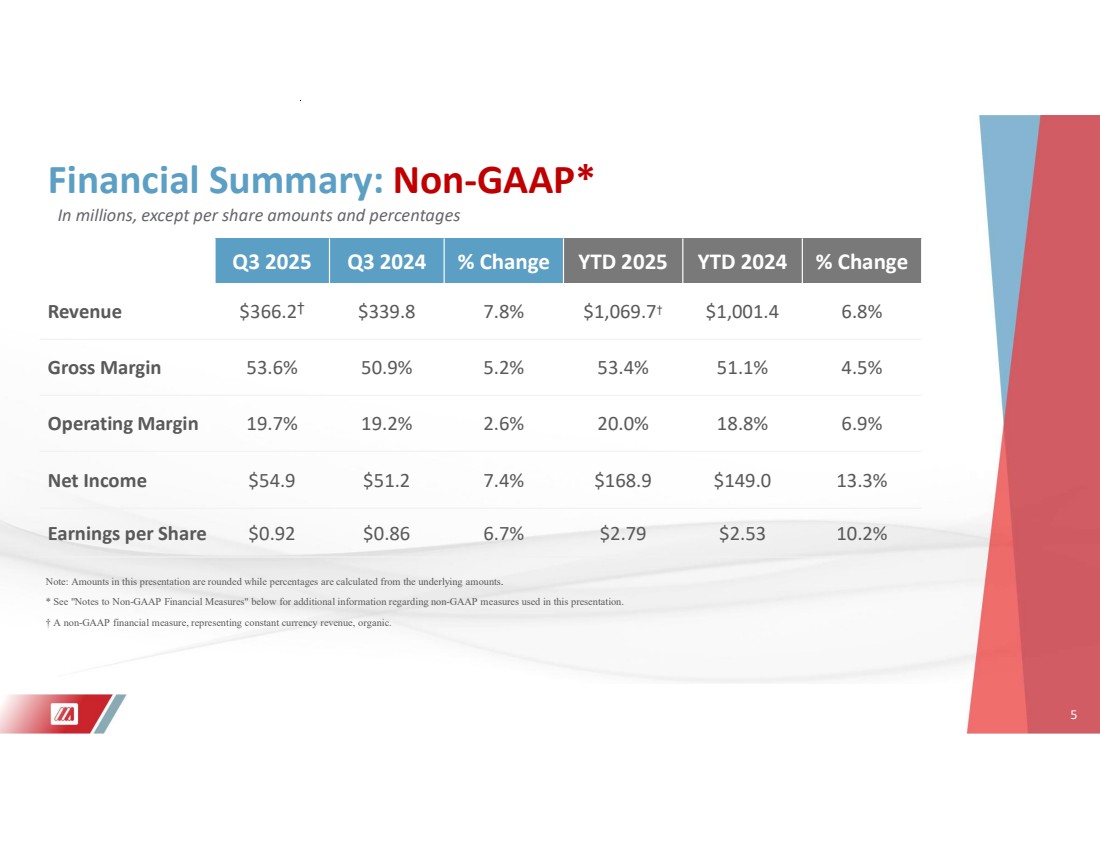
| ● | Constant currency revenue* and constant currency revenue, organic* up 12.5% and up 7.8%, respectively |
| ● | GAAP operating margin of 11.1%, compared to 11.0% in prior year period |
| ● | Non-GAAP operating margin* of 19.7%, compared to 19.2% in prior year period |
| ● | GAAP EPS $0.46, down 3.0% |
| ● | Non-GAAP EPS* $0.92, up 6.7% |
| ● | Free cash flow* generation of $141.6 million over first nine months of 2025, up 17.6% year-over-year |
† Comparisons above are calculated for the current quarter compared with the third quarter of 2024, unless otherwise specified. Amounts stated in this release are rounded, while percentages are calculated from the underlying amounts.
* Constant currency revenue; constant currency revenue, organic; non-GAAP gross profit and margin; non-GAAP operating income and margin; non-GAAP net income; non-GAAP EPS; and free cash flow figures (used here and below) are non-GAAP financial measures. A reconciliation of these financial measures to their most directly comparable GAAP financial measures is included under the heading “Non-GAAP Financial Measures” below.
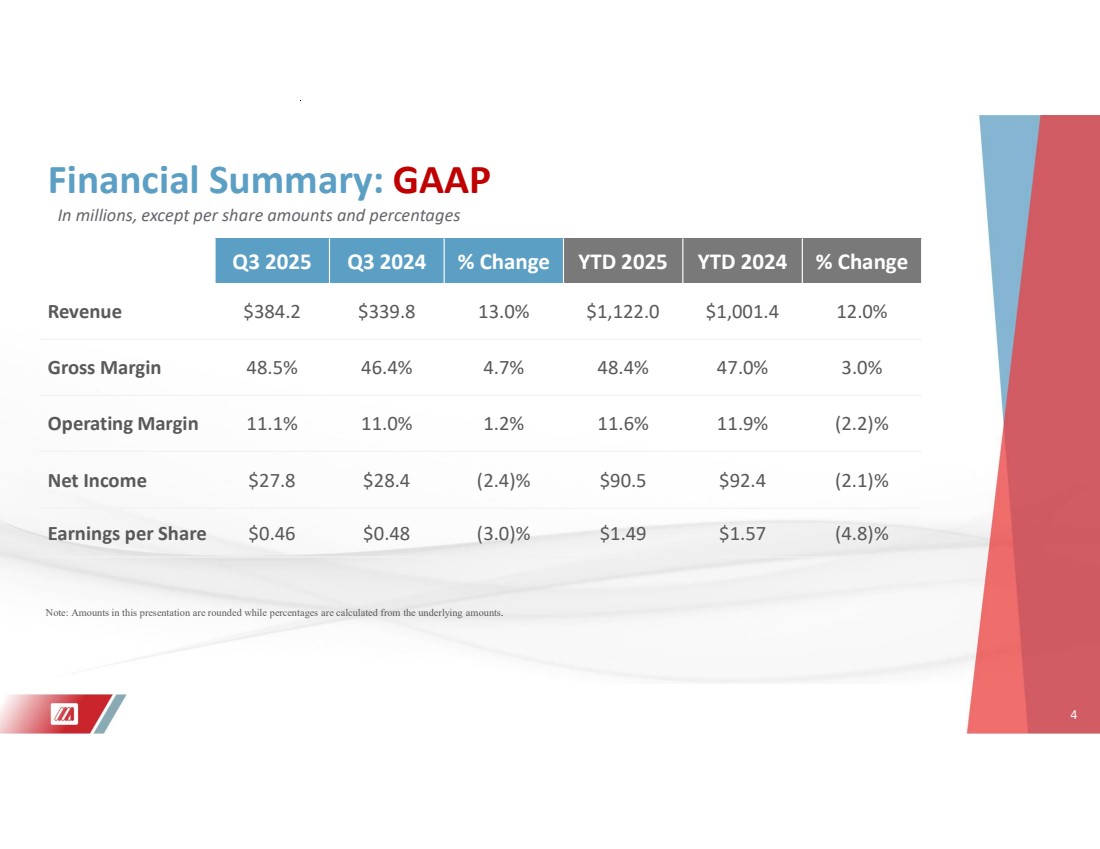
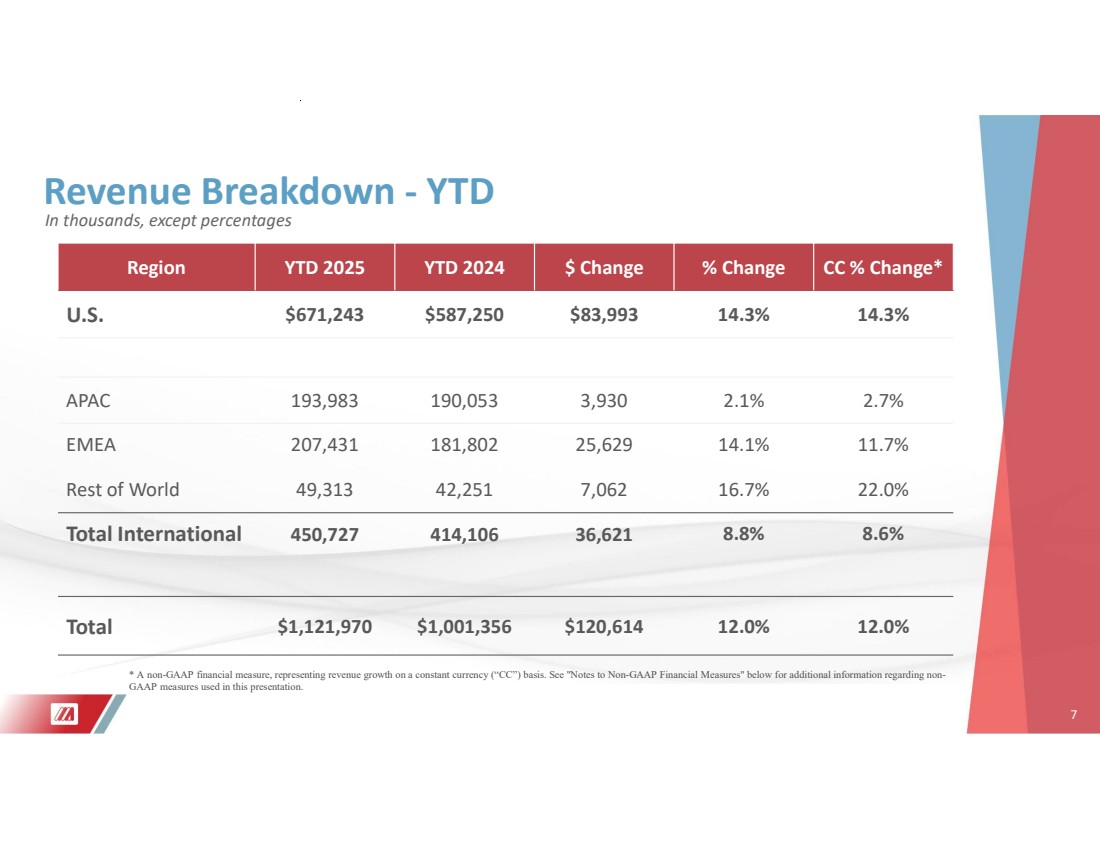
SOUTH JORDAN, Utah, October 30, 2025 -- Merit Medical Systems, Inc. (NASDAQ: MMSI), a leading global manufacturer and marketer of healthcare technology, today announced revenue of $384.2 million for the quarter ended September 30, 2025, an increase of 13.0% compared to the quarter ended September 30, 2024. Constant currency revenue for the third quarter of 2025 increased 12.5% compared to the prior year period and constant currency revenue, organic, for the third quarter of 2025 increased 7.8% compared to the prior year period.
1
“Merit delivered better-than-expected financial performance in the third quarter, with top and bottom-line results exceeding the high-end of the company’s expectations,” said Martha G. Aronson, Merit’s President and CEO. “We have increased our 2025 revenue and non-GAAP earnings per share guidance to reflect the stronger-than-expected third quarter results and remain confident in our team’s ability to deliver strong execution, stable constant currency growth, improving profitability and solid cash flow generation this year.”
Ms. Aronson continued: “I am proud to join the Merit Medical team and am committed to working closely with the executive leadership team, Fred and the rest of Merit’s Board of Directors to achieve a smooth transition and continued strong execution towards our Continued Growth Initiatives Program and related financial targets for the three-year period ending December 31, 2026.”
Merit’s revenue by operating segment and product category for the three and nine-month periods ended September 30, 2025 and 2024 was as follows (unaudited; in thousands, except for percentages):
|
|
Three Months Ended |
||||||||||||||||
|
|
Reported |
|
|
|
|
Constant Currency* |
|||||||||||
|
|
September 30, |
|
|
|
|
Impact of foreign |
|
September 30, |
|
|
|
||||||
|
|
2025 |
|
2024(1) |
|
% Change |
|
exchange |
|
2025 |
|
% Change |
||||||
Cardiovascular |
|
|
|
|
|
|
|
|
|
|
|
|
|
|
|
|
|
|
Peripheral Intervention |
|
$ |
144,781 |
|
$ |
133,083 |
|
8.8 |
% |
|
$ |
(602) |
|
$ |
144,179 |
|
8.3 |
% |
Cardiac Intervention |
|
|
116,682 |
|
|
90,240 |
|
29.3 |
% |
|
|
(719) |
|
|
115,963 |
|
28.5 |
% |
Custom Procedural Solutions |
|
|
54,136 |
|
|
50,455 |
|
7.3 |
% |
|
|
(441) |
|
|
53,695 |
|
6.4 |
% |
OEM |
|
|
50,826 |
|
|
49,077 |
|
3.6 |
% |
|
|
(150) |
|
|
50,676 |
|
3.3 |
% |
Total |
|
|
366,425 |
|
|
322,855 |
|
13.5 |
% |
|
|
(1,912) |
|
|
364,513 |
|
12.9 |
% |
|
|
|
|
|
|
|
|
|
|
|
|
|
|
|
|
|
|
|
Endoscopy |
|
|
|
|
|
|
|
|
|
|
|
|
|
|
|
|
|
|
Endoscopy Devices |
|
|
17,732 |
|
|
16,990 |
|
4.4 |
% |
|
|
(14) |
|
|
17,718 |
|
4.3 |
% |
|
|
|
|
|
|
|
|
|
|
|
|
|
|
|
|
|
|
|
Total |
|
$ |
384,157 |
|
$ |
339,845 |
|
13.0 |
% |
|
$ |
(1,926) |
|
$ |
382,231 |
|
12.5 |
% |
|
|
Nine Months Ended |
||||||||||||||||
|
|
Reported |
|
|
|
|
Constant Currency * |
|||||||||||
|
|
September 30, |
|
|
|
|
Impact of foreign |
|
September 30, |
|
|
|
||||||
|
|
2025 |
|
2024(1) |
|
% Change |
|
exchange |
|
2025 |
|
% Change |
||||||
Cardiovascular |
|
|
|
|
|
|
|
|
|
|
|
|
|
|
|
|
|
|
Peripheral Intervention |
|
$ |
424,907 |
|
$ |
397,535 |
|
6.9 |
% |
|
$ |
444 |
|
$ |
425,351 |
|
7.0 |
% |
Cardiac Intervention |
|
|
331,674 |
|
|
273,723 |
|
21.2 |
% |
|
|
(330) |
|
|
331,344 |
|
21.1 |
% |
Custom Procedural Solutions |
|
|
155,712 |
|
|
149,110 |
|
4.4 |
% |
|
|
(666) |
|
|
155,046 |
|
4.0 |
% |
OEM |
|
|
156,870 |
|
|
143,676 |
|
9.2 |
% |
|
|
(221) |
|
|
156,649 |
|
9.0 |
% |
Total |
|
|
1,069,163 |
|
|
964,044 |
|
10.9 |
% |
|
|
(773) |
|
|
1,068,390 |
|
10.8 |
% |
|
|
|
|
|
|
|
|
|
|
|
|
|
|
|
|
|
|
|
Endoscopy |
|
|
|
|
|
|
|
|
|
|
|
|
|
|
|
|
|
|
Endoscopy Devices |
|
|
52,807 |
|
|
37,312 |
|
41.5 |
% |
|
|
(5) |
|
|
52,802 |
|
41.5 |
% |
|
|
|
|
|
|
|
|
|
|
|
|
|
|
|
|
|
|
|
Total |
|
$ |
1,121,970 |
|
$ |
1,001,356 |
|
12.0 |
% |
|
$ |
(778) |
|
$ |
1,121,192 |
|
12.0 |
% |
| (1) | Commencing January 1, 2025, we reorganized our sales teams and product categories to include revenues from the sale of our spine devices under our OEM product category. Revenue figures for 2024 have been recast to reflect this realignment of our portfolio of spine products, representing approximately $5.7 million and $16.7 million in revenue for the three and nine-month periods ended September 30, 2024, within the OEM product category to provide comparability between the reported periods. |
Merit’s GAAP gross margin for the third quarter of 2025 was 48.5%, compared to GAAP gross margin of 46.4% for the third quarter of 2024. Merit’s non-GAAP gross margin* for the third quarter of 2025 was 53.6%, compared to non-GAAP gross margin* of 50.9% for the third quarter of 2024.
2
Merit’s GAAP net income for the third quarter of 2025 was $27.8 million, or $0.46 per share, compared to GAAP net income of $28.4 million, or $0.48 per share, for the third quarter of 2024. Merit’s non-GAAP net income* for the third quarter of 2025 was $54.9 million, or $0.92 per share, compared to non-GAAP net income* of $51.2 million, or $0.86 per share, for the third quarter of 2024.
As of September 30, 2025, Merit had cash and cash equivalents of $392.5 million and total debt obligations of $747.5 million, compared to cash and cash equivalents of $376.7 million and total debt obligations of $747.5 million as of December 31, 2024. Merit had available borrowing capacity of approximately $697 million as of September 30, 2025.
Fiscal Year 2025 Financial Guidance
Based upon the information currently available to Merit’s management, for the year ending December 31, 2025, absent the potential impact of trade policies and related actions implemented by the U.S. and other countries subsequent to today’s date, material acquisitions, non-recurring transactions or other factors beyond Merit’s current expectations, Merit anticipates the following financial results:
Revenue and Earnings Guidance*
|
|
Updated Guidance |
Prior Guidance(2) |
||
Financial Measure |
|
Year Ending |
% Change |
Year Ending |
% Change |
|
|
December 31, 2025 |
Y/Y |
December 31, 2025 |
Y/Y |
|
|
|
|
|
|
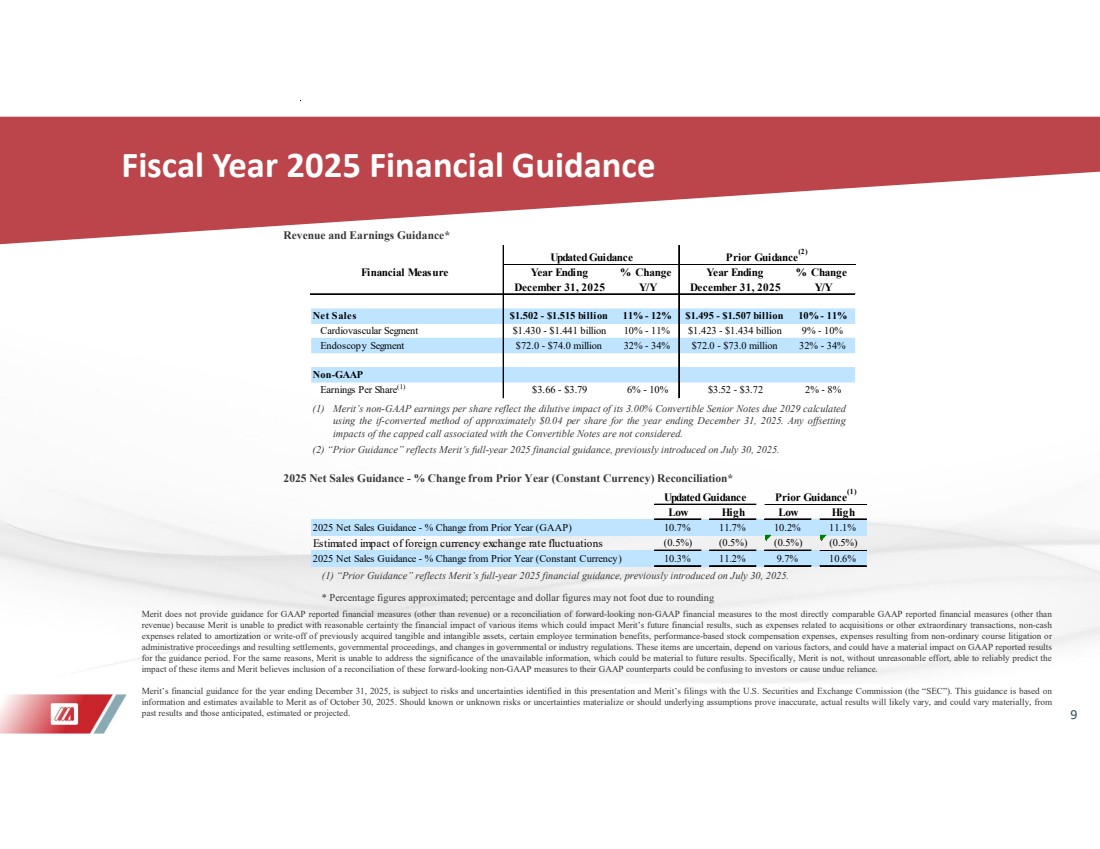
Net Sales |
|
$1.502 - $1.515 billion |
11% - 12% |
$1.495 - $1.507 billion |
10% - 11% |
Cardiovascular Segment |
|
$1.430 - $1.441 billion |
10% - 11% |
$1.423 - $1.434 billion |
9% - 10% |
Endoscopy Segment |
|
$72.0 - $74.0 million |
32% - 34% |
$72.0 - $73.0 million |
32% - 34% |
|
|
|
|
|
|
Non-GAAP |
|
|
|
|
|
Earnings Per Share(1) |
|
$3.66 - $3.79 |
6% - 10% |
$3.52 - $3.72 |
2% - 8% |
*Percentage figures approximated; dollar figures may not foot due to rounding
(1) Merit’s non-GAAP earnings per share reflect the dilutive impact of its 3.00% Convertible Senior Notes due 2029 (the “Convertible Notes”) calculated using the if-converted method of approximately $0.04 per share for the year ending December 31, 2025. Any offsetting impacts of the capped call associated with the Convertible Notes are not considered.
(2) “Prior Guidance” reflects Merit’s full-year 2025 financial guidance, previously introduced on July 30, 2025.
2025 Net Sales Guidance - % Change from Prior Year (Constant Currency) Reconciliation*
|
|
Updated Guidance |
|
Prior Guidance(1) |
||||
|
|
Low |
|
High |
|
Low |
|
High |
2025 Net Sales Guidance - % Change from Prior Year (GAAP) |
|
10.7% |
|
11.7% |
|
10.2% |
|
11.1% |
Estimated impact of foreign currency exchange rate fluctuations |
|
(0.5%) |
|
(0.5%) |
|
(0.5%) |
|
(0.5%) |
2025 Net Sales Guidance - % Change from Prior Year (Constant Currency) |
|
10.3% |
|
11.2% |
|
9.7% |
|
10.6% |
*Percentage figures approximated and may not foot due to rounding
(1)“Prior Guidance” reflects Merit’s full-year 2025 financial guidance, previously introduced on July 30, 2025.
Merit does not provide guidance for GAAP reported financial measures (other than revenue) or a reconciliation of forward-looking non-GAAP financial measures to the most directly comparable GAAP reported financial measures (other than revenue) because Merit is unable to predict with reasonable certainty the financial impact of various items which could impact Merit’s future financial results, such as expenses attributable to acquisitions or other extraordinary transactions, non-cash expenses related to amortization or write-off of previously acquired tangible and intangible assets, certain employee termination benefits, performance-based stock compensation expenses, expenses resulting from non-ordinary course litigation or administrative proceedings and resulting settlements, governmental proceedings, and changes in governmental or industry regulations. These items are uncertain, depend on various factors, and could have a material impact on GAAP reported results for the guidance period. For the same reasons, Merit is unable to address the significance of the unavailable information, which could be material to future results. Specifically, Merit is not, without unreasonable effort, able to reliably predict the impact of these items and Merit believes inclusion of a reconciliation of these forward-looking non-GAAP measures to their GAAP counterparts could be confusing to investors or cause undue reliance.
3
Merit’s financial guidance for the year ending December 31, 2025 is subject to risks and uncertainties identified in this release and Merit’s filings with the U.S. Securities and Exchange Commission (the “SEC”). This guidance is based on information and estimates available to Merit as of October 30, 2025. Should known or unknown risks or uncertainties materialize or should underlying assumptions prove inaccurate, actual results will likely vary, and could vary materially, from past results and those anticipated, estimated or projected.
CONFERENCE CALL
Merit will hold its investor conference call today, Thursday, October 30, 2025, at 5:00 p.m., Eastern Time. To access the conference call, please pre-register using the following link. Registrants will receive confirmation with dial-in details. A live webcast and slide deck will also be available at merit.com.
4
CONSOLIDATED BALANCE SHEETS
(in thousands)
|
|
September 30, |
|
|
|
|
|
|
2025 |
|
December 31, |
||
|
|
(Unaudited) |
|
2024 |
||
ASSETS |
|
|
|
|
|
|
Current Assets |
|
|
|
|
|
|
Cash and cash equivalents |
|
$ |
392,457 |
|
$ |
376,715 |
Trade receivables, net |
|
|
210,292 |
|
|
190,243 |
Other receivables |
|
|
19,062 |
|
|
16,588 |
Inventories |
|
|
326,550 |
|
|
306,063 |
Prepaid expenses and other assets |
|
|
31,369 |
|
|
28,544 |
Prepaid income taxes |
|
|
3,651 |
|
|
3,286 |
Income tax refund receivables |
|
|
2,152 |
|
|
2,335 |
Total current assets |
|
|
985,533 |
|
|
923,774 |
|
|
|
|
|
|
|
Property and equipment, net |
|
|
418,004 |
|
|
386,165 |
Intangible assets, net |
|
|
538,400 |
|
|
498,265 |
Goodwill |
|
|
507,427 |
|
|
463,511 |
Deferred income tax assets |
|
|
16,284 |
|
|
16,044 |
Operating lease right-of-use assets |
|
|
88,496 |
|
|
65,508 |
Other assets |
|
|
76,854 |
|
|
65,336 |
Total Assets |
|
$ |
2,630,998 |
|
$ |
2,418,603 |
|
|
|
|
|
|
|
LIABILITIES AND STOCKHOLDERS' EQUITY |
|
|
|
|
|
|
Current Liabilities |
|
|
|
|
|
|
Trade payables |
|
$ |
64,746 |
|
$ |
68,502 |
Accrued expenses |
|
|
147,377 |
|
|
134,077 |
Current operating lease liabilities |
|
|
10,612 |
|
|
10,331 |
Income taxes payable |
|
|
7,740 |
|
|
3,492 |
Total current liabilities |
|
|
230,475 |
|
|
216,402 |
|
|
|
|
|
|
|
Long-term debt |
|
|
732,916 |
|
|
729,551 |
Deferred income tax liabilities |
|
|
26,707 |
|
|
240 |
Liabilities related to unrecognized tax benefits |
|
|
2,169 |
|
|
2,118 |
Deferred compensation payable |
|
|
17,083 |
|
|
19,197 |
Deferred credits |
|
|
1,424 |
|
|
1,502 |
Long-term operating lease liabilities |
|
|
77,624 |
|
|
54,783 |
Other long-term obligations |
|
|
13,192 |
|
|
15,451 |
Total liabilities |
|
|
1,101,590 |
|
|
1,039,244 |
|
|
|
|
|
|
|
Stockholders' Equity |
|
|
|
|
|
|
Common stock |
|
|
747,103 |
|
|
703,219 |
Retained earnings |
|
|
786,024 |
|
|
695,541 |
Accumulated other comprehensive loss |
|
|
(3,719) |
|
|
(19,401) |
Total stockholders' equity |
|
|
1,529,408 |
|
|
1,379,359 |
Total Liabilities and Stockholders' Equity |
|
$ |
2,630,998 |
|
$ |
2,418,603 |
5
CONSOLIDATED STATEMENTS OF INCOME
(Unaudited, in thousands except per share amounts)
|
|
Three Months Ended |
|
Nine Months Ended |
||||||||
|
|
September 30, |
|
September 30, |
||||||||
|
|
2025 |
|
2024 |
|
2025 |
|
2024 |
||||
Net sales |
|
$ |
384,157 |
|
$ |
339,845 |
|
$ |
1,121,970 |
|
$ |
1,001,356 |
Cost of sales |
|
|
197,746 |
|
|
182,310 |
|
|
579,052 |
|
|
531,006 |
Gross profit |
|
|
186,411 |
|
|
157,535 |
|
|
542,918 |
|
|
470,350 |
|
|
|
|
|
|
|
|
|
|
|
|
|
Operating expenses: |
|
|
|
|
|
|
|
|
|
|
|
|
Selling, general and administrative |
|
|
119,801 |
|
|
99,644 |
|
|
340,384 |
|
|
288,657 |
Research and development |
|
|
23,966 |
|
|
20,527 |
|
|
70,811 |
|
|
62,272 |
Contingent consideration expense |
|
|
32 |
|
|
103 |
|
|
1,198 |
|
|
292 |
Total operating expenses |
|
|
143,799 |
|
|
120,274 |
|
|
412,393 |
|
|
351,221 |
|
|
|
|
|
|
|
|
|
|
|
|
|
Income from operations |
|
|
42,612 |
|
|
37,261 |
|
|
130,525 |
|
|
119,129 |
|
|
|
|
|
|
|
|
|
|
|
|
|
Other income (expense): |
|
|
|
|
|
|
|
|
|
|
|
|
Interest income |
|
|
3,615 |
|
|
6,652 |
|
|
11,166 |
|
|
21,489 |
Interest expense |
|
|
(6,754) |
|
|
(7,501) |
|
|
(20,097) |
|
|
(23,226) |
Other income (expense) — net |
|
|
(933) |
|
|
245 |
|
|
(1,717) |
|
|
(544) |
Total other expense — net |
|
|
(4,072) |
|
|
(604) |
|
|
(10,648) |
|
|
(2,281) |
|
|
|
|
|
|
|
|
|
|
|
|
|
Income before income taxes |
|
|
38,540 |
|
|
36,657 |
|
|
119,877 |
|
|
116,848 |
|
|
|
|
|
|
|
|
|
|
|
|
|
Income tax expense |
|
|
10,785 |
|
|
8,213 |
|
|
29,394 |
|
|
24,438 |
|
|
|
|
|
|
|
|
|
|
|
|
|
Net income |
|
$ |
27,755 |
|
$ |
28,444 |
|
$ |
90,483 |
|
$ |
92,410 |
|
|
|
|
|
|
|
|
|
|
|
|
|
Earnings per common share |
|
|
|
|
|
|
|
|
|
|
|
|
Basic |
|
$ |
0.47 |
|
$ |
0.49 |
|
$ |
1.53 |
|
$ |
1.59 |
Diluted |
|
$ |
0.46 |
|
$ |
0.48 |
|
$ |
1.49 |
|
$ |
1.57 |
|
|
|
|
|
|
|
|
|
|
|
|
|
Weighted average shares outstanding |
|
|
|
|
|
|
|
|
|
|
|
|
Basic |
|
|
59,245 |
|
|
58,231 |
|
|
59,095 |
|
|
58,110 |
Diluted |
|
|
59,919 |
|
|
59,537 |
|
|
60,604 |
|
|
58,948 |
6
CONSOLIDATED STATEMENTS OF CASH FLOWS
(Unaudited, in thousands)
|
|
Nine Months Ended |
||||
|
|
September 30, |
||||
|
|
2025 |
|
2024 |
||
CASH FLOWS FROM OPERATING ACTIVITIES: |
|
|
|
|
||
Net income |
|
$ |
90,483 |
|
$ |
92,410 |
Adjustments to reconcile net income to net cash provided by operating activities: |
|
|
|
|
|
|
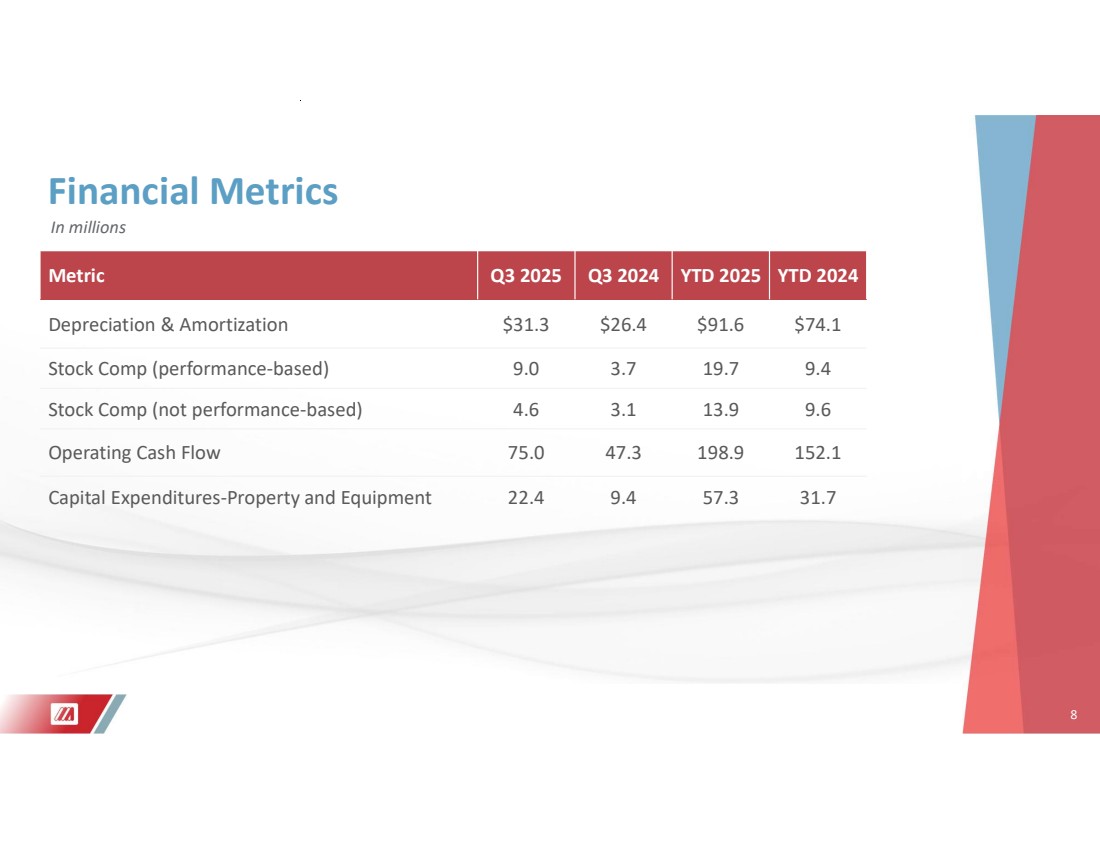
Depreciation and amortization |
|
|
91,629 |
|
|
74,093 |
Gain on disposition of a business |
|
|
(249) |
|
|
— |
Write-off of certain intangible assets and other long-term assets |
|
|
152 |
|
|
401 |
Amortization of right-of-use operating lease assets |
|
|
8,693 |
|
|
9,043 |
Fair value adjustments related to contingent consideration liabilities |
|
|
1,198 |
|
|
292 |
Stock-based compensation expense |
|
|
33,563 |
|
|
18,958 |
Other adjustments |
|
|
4,711 |
|
|
4,569 |
Changes in operating assets and liabilities, net of acquisitions |
|
|
(31,319) |
|
|
(47,711) |
Total adjustments |
|
|
108,378 |
|
|
59,645 |
Net cash, cash equivalents, and restricted cash provided by operating activities |
|
|
198,861 |
|
|
152,055 |
|
|
|
|
|
|
|
CASH FLOWS FROM INVESTING ACTIVITIES: |
|
|
|
|
|
|
Capital expenditures for property and equipment |
|
|
(57,252) |
|
|
(31,668) |
Cash paid for notes receivable and other investments |
|
|
(14,936) |
|
|
(10,223) |
Cash paid in acquisitions, net of cash acquired |
|
|
(122,834) |
|
|
(110,182) |
Other investing, net |
|
|
(2,029) |
|
|
(2,133) |
Net cash, cash equivalents, and restricted cash used in investing activities |
|
|
(197,051) |
|
|
(154,206) |
|
|
|
|
|
|
|
CASH FLOWS FROM FINANCING ACTIVITIES: |
|
|
|
|
||
Proceeds from issuance of common stock |
|
|
22,179 |
|
|
15,424 |
Proceeds from (payments on) long-term debt |
|
|
— |
|
|
(76,063) |
Contingent payments related to acquisitions |
|
|
(2,645) |
|
|
(209) |
Payment of taxes related to an exchange of common stock |
|
|
(8,597) |
|
|
(1,592) |
Net cash, cash equivalents, and restricted cash provided by (used in) financing activities |
|
|
10,937 |
|
|
(62,440) |
Effect of exchange rates on cash |
|
|
3,047 |
|
|
724 |
Net increase (decrease) in cash, cash equivalents and restricted cash |
|
|
15,794 |
|
|
(63,867) |
|
|
|
|
|
|
|
CASH, CASH EQUIVALENTS AND RESTRICTED CASH: |
|
|
|
|
|
|
Beginning of period |
|
|
378,767 |
|
|
589,144 |
End of period |
|
$ |
394,561 |
|
$ |
525,277 |
|
|
|
|
|
|
|
RECONCILIATION OF CASH, CASH EQUIVALENTS AND RESTRICTED CASH TO THE CONSOLIDATED BALANCE SHEETS: |
|
|
|
|
|
|
Cash and cash equivalents |
|
|
392,457 |
|
|
523,128 |
Restricted cash reported in prepaid expenses and other current assets |
|
|
2,104 |
|
|
2,149 |
Total cash, cash equivalents and restricted cash |
|
$ |
394,561 |
|
$ |
525,277 |
7
Non-GAAP Financial Measures
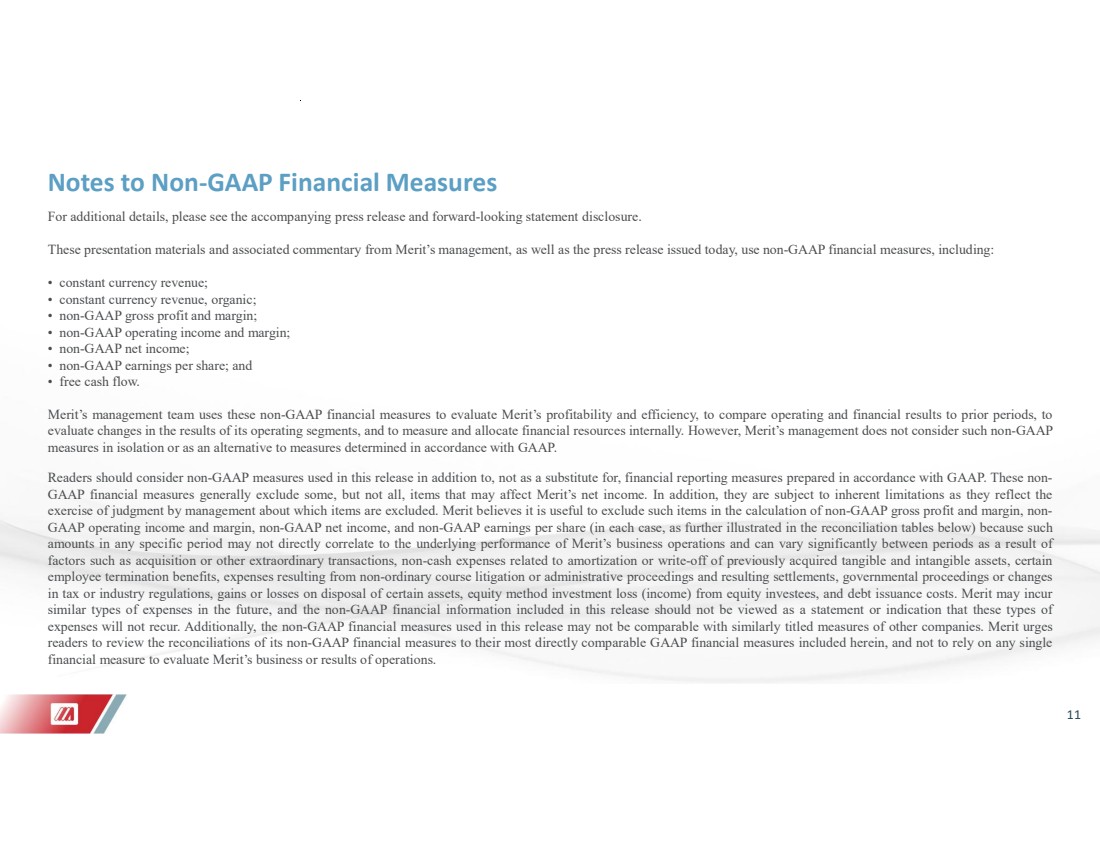
Although Merit’s financial statements are prepared in accordance with accounting principles generally accepted in the United States of America (“GAAP”), Merit’s management believes that the non-GAAP financial measures referenced in this release may provide investors with useful information regarding the underlying business trends and performance of Merit’s ongoing operations and can be useful for period-over-period comparisons of such operations. Non-GAAP financial measures used in this release include:
| ● | constant currency revenue; |
| ● | constant currency revenue, organic; |
| ● | non-GAAP gross profit and margin; |
| ● | non-GAAP operating income and margin; |
| ● | non-GAAP net income; |
| ● | non-GAAP earnings per share; and |
| ● | free cash flow. |
Merit’s management team uses these non-GAAP financial measures to evaluate Merit’s profitability and efficiency, to compare operating and financial results to prior periods, to evaluate changes in the results of its operating segments, and to measure and allocate financial resources internally. However, Merit’s management does not consider such non-GAAP measures in isolation or as an alternative to measures determined in accordance with GAAP.
Readers should consider non-GAAP measures used in this release in addition to, not as a substitute for, financial reporting measures prepared in accordance with GAAP. These non-GAAP financial measures generally exclude some, but not all, items that may affect Merit’s net income. In addition, they are subject to inherent limitations as they reflect the exercise of judgment by management about which items are excluded. Merit believes it is useful to exclude such items in the calculation of non-GAAP gross profit and margin, non-GAAP operating income and margin, non-GAAP net income, and non-GAAP earnings per share (in each case, as further illustrated in the reconciliation tables below) because such amounts in any specific period may not directly correlate to the underlying performance of Merit’s business operations and can vary significantly between periods as a result of factors such as acquisition or other extraordinary transactions, non-cash expenses related to amortization or write-off of previously acquired tangible and intangible assets, certain employee termination benefits, expenses resulting from non-ordinary course litigation or administrative proceedings and resulting settlements, governmental proceedings or changes in tax or industry regulations, gains or losses on disposal of certain assets, equity method investment loss (income) from equity investees, and debt issuance costs. Merit may incur similar types of expenses in the future, and the non-GAAP financial information included in this release should not be viewed as a statement or indication that these types of expenses will not recur. Additionally, the non-GAAP financial measures used in this release may not be comparable with similarly titled measures of other companies. Merit urges readers to review the reconciliations of its non-GAAP financial measures to their most directly comparable GAAP financial measures included herein, and not to rely on any single financial measure to evaluate Merit’s business or results of operations.
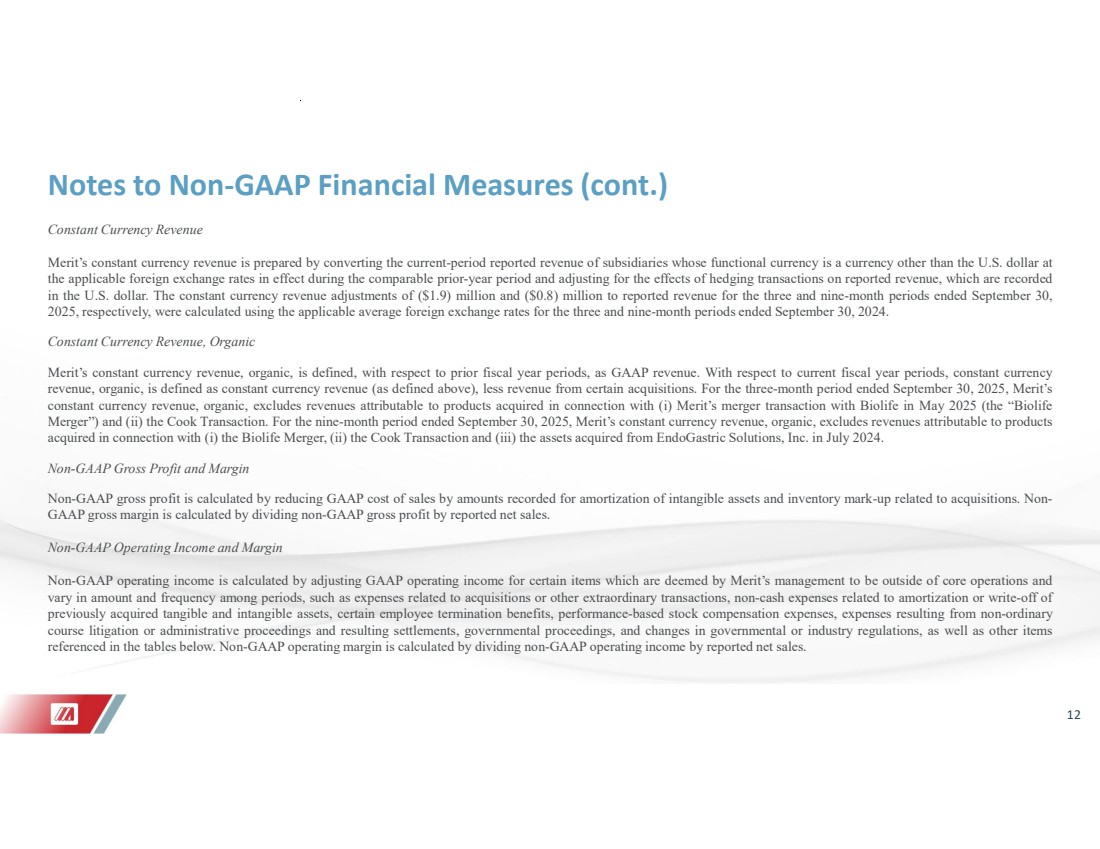
Constant Currency Revenue
Merit’s constant currency revenue is prepared by converting the current-period reported revenue of subsidiaries whose functional currency is a currency other than the U.S. dollar at the applicable foreign exchange rates in effect during the comparable prior-year period and adjusting for the effects of hedging transactions on reported revenue, which are recorded in the U.S. dollar. The constant currency revenue adjustments of ($1.9) million and $ (0.8) million to reported revenue for the three and nine-month periods ended September 30, 2025, respectively, were calculated using the applicable average foreign exchange rates for the three and nine-month periods ended September 30, 2024.
8
Constant Currency Revenue, Organic
Merit’s constant currency revenue, organic, is defined, with respect to prior fiscal year periods, as GAAP revenue. With respect to current fiscal year periods, constant currency revenue, organic, is defined as constant currency revenue (as defined above), less revenue from certain acquisitions. For the three-month period ended September 30, 2025, Merit’s constant currency revenue, organic, excludes revenues attributable to products acquired in connection with (i) Merit’s merger transaction with Biolife Delaware, L.L.C. (“Biolife”) in May 2025 (the “Biolife Merger”) and (ii) the assets acquired from Cook Medical Holdings LLC in November 2024 (the “Cook Transaction”). For the nine-month period ended September 30, 2025, Merit’s constant currency revenue, organic, excludes revenues attributable to products acquired in connection with (i) the Biolife Merger, (ii) the Cook Transaction and (iii) the assets acquired from EndoGastric Solutions, Inc. in July 2024.
Non-GAAP Gross Profit and Margin
Non-GAAP gross profit is calculated by reducing GAAP cost of sales by amounts recorded for amortization of intangible assets and inventory mark-up related to acquisitions. Non-GAAP gross margin is calculated by dividing non-GAAP gross profit by reported net sales.
Non-GAAP Operating Income and Margin
Non-GAAP operating income is calculated by adjusting GAAP operating income for certain items which are deemed by Merit’s management to be outside of core operations and vary in amount and frequency among periods, such as expenses related to acquisitions or other extraordinary transactions, non-cash expenses related to amortization or write-off of previously acquired tangible and intangible assets, certain employee termination benefits, performance-based stock compensation expenses, expenses resulting from non-ordinary course litigation or administrative proceedings and resulting settlements, governmental proceedings, and changes in governmental or industry regulations, as well as other items referenced in the tables below. Non-GAAP operating margin is calculated by dividing non-GAAP operating income by reported net sales.
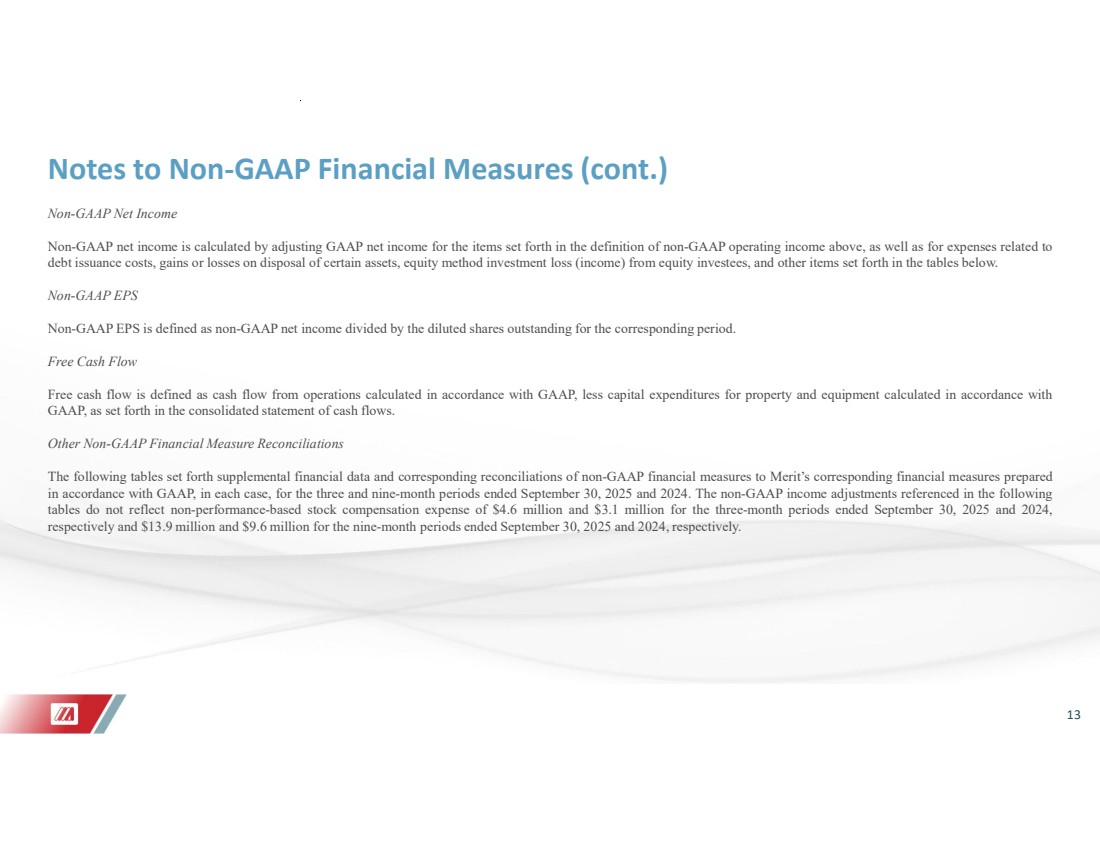
Non-GAAP Net Income
Non-GAAP net income is calculated by adjusting GAAP net income for the items set forth in the definition of non-GAAP operating income above, as well as for expenses related to debt issuance costs, gains or losses on disposal of certain assets, equity method investment loss (income) from equity investees, and other items set forth in the tables below.
Non-GAAP EPS
Non-GAAP EPS is defined as non-GAAP net income divided by the diluted shares outstanding for the corresponding period.
Free Cash Flow
Free cash flow is defined as cash flow from operations calculated in accordance with GAAP, less capital expenditures for property and equipment calculated in accordance with GAAP, as set forth in the consolidated statement of cash flows.
Other Non-GAAP Financial Measure Reconciliations
The following tables set forth supplemental financial data and corresponding reconciliations of non-GAAP financial measures to Merit’s corresponding financial measures prepared in accordance with GAAP, in each case, for the three and nine-month periods ended September 30, 2025 and 2024. The non-GAAP income adjustments referenced in the following tables do not reflect non-performance-based stock compensation expense of $4.6 million and $3.1 million for the three-month periods ended September 30, 2025 and 2024, respectively and $13.9 million and $9.6 million for the nine-month periods ended September 30, 2025 and 2024, respectively.
9
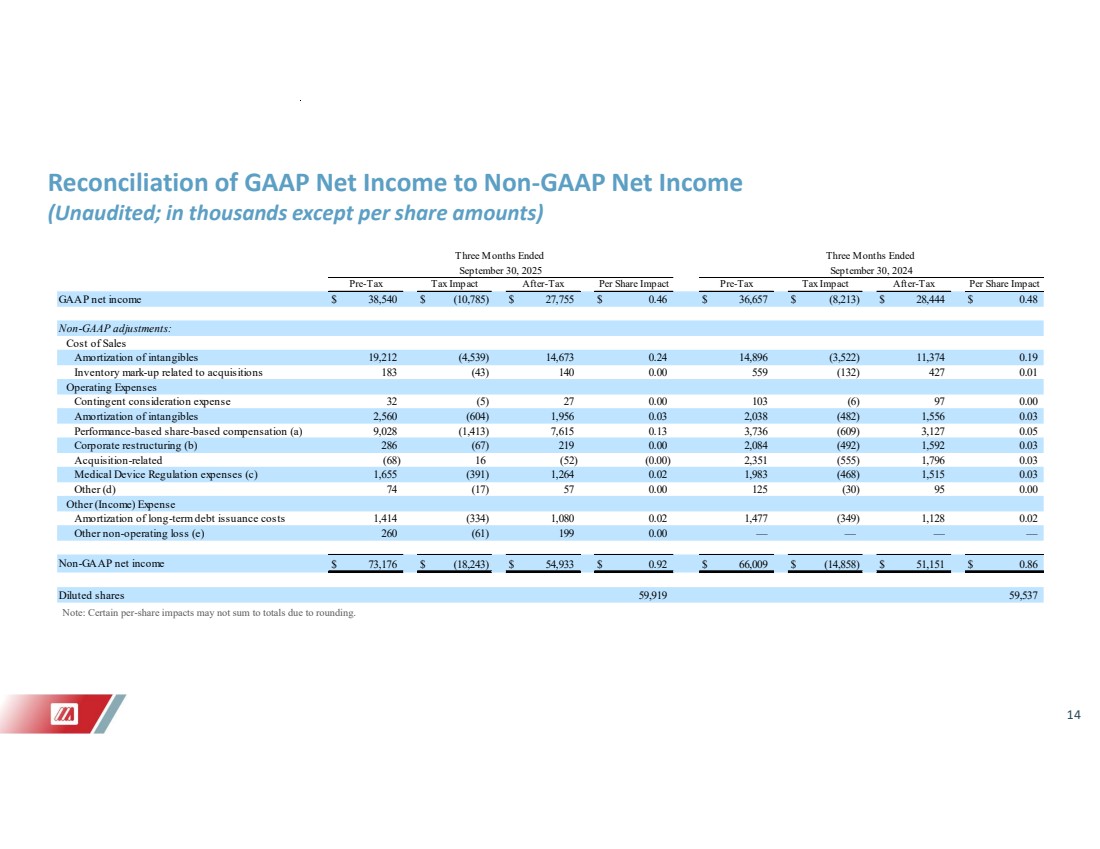
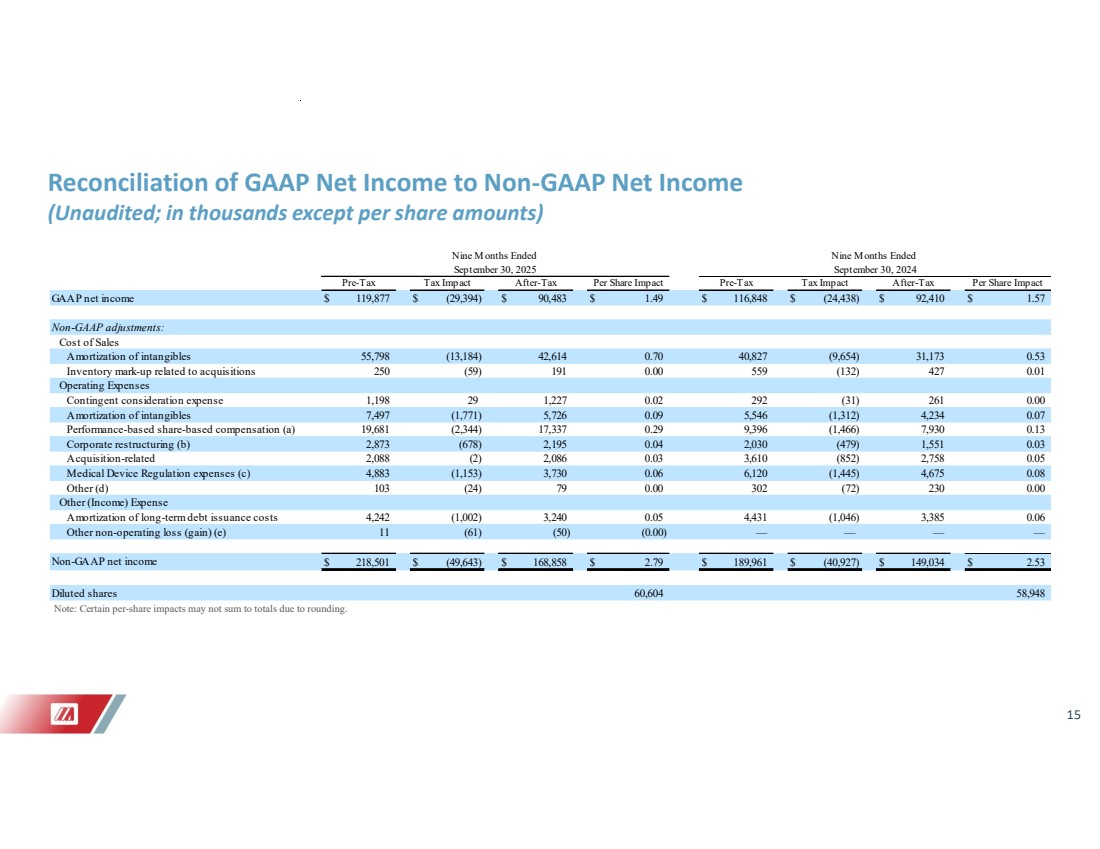
Reconciliation of GAAP Net Income to Non-GAAP Net Income
(Unaudited, in thousands except per share amounts)
|
|
Three Months Ended |
||||||||||
|
|
September 30, 2025 |
||||||||||
|
|
Pre-Tax |
|
Tax Impact |
|
After-Tax |
|
Per Share Impact |
||||
GAAP net income |
|
$ |
38,540 |
|
$ |
(10,785) |
|
$ |
27,755 |
|
$ |
0.46 |
|
|
|
|
|
|
|
|
|
|
|
|
|
Non-GAAP adjustments: |
|
|
|
|
|
|
|
|
|
|
|
|
Cost of Sales |
|
|
|
|
|
|
|
|
|
|
|
|
Amortization of intangibles |
|
|
19,212 |
|
|
(4,539) |
|
|
14,673 |
|
|
0.24 |
Inventory mark-up related to acquisitions |
|
|
183 |
|
|
(43) |
|
|
140 |
|
|
0.00 |
Operating Expenses |
|
|
|
|
|
|
|
|
|
|
|
|
Contingent consideration expense |
|
|
32 |
|
|
(5) |
|
|
27 |
|
|
0.00 |
Amortization of intangibles |
|
|
2,560 |
|
|
(604) |
|
|
1,956 |
|
|
0.03 |
Performance-based share-based compensation (a) |
|
|
9,028 |
|
|
(1,413) |
|
|
7,615 |
|
|
0.13 |
Corporate restructuring (b) |
|
|
286 |
|
|
(67) |
|
|
219 |
|
|
0.00 |
Acquisition-related |
|
|
(68) |
|
|
16 |
|
|
(52) |
|
|
(0.00) |
Medical Device Regulation expenses (c) |
|
|
1,655 |
|
|
(391) |
|
|
1,264 |
|
|
0.02 |
Other (d) |
|
|
74 |
|
|
(17) |
|
|
57 |
|
|
0.00 |
Other (Income) Expense |
|
|
|
|
|
|
|
|
|
|
|
|
Amortization of long-term debt issuance costs |
|
|
1,414 |
|
|
(334) |
|
|
1,080 |
|
|
0.02 |
Other non-operating loss (e) |
|
|
260 |
|
|
(61) |
|
|
199 |
|
|
0.00 |
|
|
|
|
|
|
|
|
|
|
|
|
|
Non-GAAP net income |
|
$ |
73,176 |
|
$ |
(18,243) |
|
$ |
54,933 |
|
$ |
0.92 |
|
|
|
|
|
|
|
|
|
|
|
|
|
Diluted shares |
|
|
|
|
|
|
|
|
|
|
|
59,919 |
|
|
Three Months Ended |
||||||||||
|
|
September 30, 2024 |
||||||||||
|
|
Pre-Tax |
|
Tax Impact |
|
After-Tax |
|
Per Share Impact |
||||
GAAP net income |
|
$ |
36,657 |
|
$ |
(8,213) |
|
$ |
28,444 |
|
$ |
0.48 |
|
|
|
|
|
|
|
|
|
|
|
|
|
Non-GAAP adjustments: |
|
|
|
|
|
|
|
|
|
|
|
|
Cost of Sales |
|
|
|
|
|
|
|
|
|
|
|
|
Amortization of intangibles |
|
|
14,896 |
|
|
(3,522) |
|
|
11,374 |
|
|
0.19 |
Inventory mark-up related to acquisitions |
|
|
559 |
|
|
(132) |
|
|
427 |
|
|
0.01 |
Operating Expenses |
|
|
|
|
|
|
|
|
|
|
|
|
Contingent consideration expense |
|
|
103 |
|
|
(6) |
|
|
97 |
|
|
0.00 |
Amortization of intangibles |
|
|
2,038 |
|
|
(482) |
|
|
1,556 |
|
|
0.03 |
Performance-based share-based compensation (a) |
|
|
3,736 |
|
|
(609) |
|
|
3,127 |
|
|
0.05 |
Corporate restructuring (b) |
|
|
2,084 |
|
|
(492) |
|
|
1,592 |
|
|
0.03 |
Acquisition-related |
|
|
2,351 |
|
|
(555) |
|
|
1,796 |
|
|
0.03 |
Medical Device Regulation expenses (c) |
|
|
1,983 |
|
|
(468) |
|
|
1,515 |
|
|
0.03 |
Other (d) |
|
|
125 |
|
|
(30) |
|
|
95 |
|
|
0.00 |
Other (Income) Expense |
|
|
|
|
|
|
|
|
|
|
|
|
Amortization of long-term debt issuance costs |
|
|
1,477 |
|
|
(349) |
|
|
1,128 |
|
|
0.02 |
|
|
|
|
|
|
|
|
|
|
|
|
|
Non-GAAP net income |
|
$ |
66,009 |
|
$ |
(14,858) |
|
$ |
51,151 |
|
$ |
0.86 |
|
|
|
|
|
|
|
|
|
|
|
|
|
Diluted shares |
|
|
|
|
|
|
|
|
|
|
|
59,537 |
Note: Certain per-share impacts may not sum to totals due to rounding.
10
Reconciliation of GAAP Net Income to Non-GAAP Net Income
(Unaudited, in thousands except per share amounts)
|
|
Nine Months Ended |
||||||||||
|
|
September 30, 2025 |
||||||||||
|
|
Pre-Tax |
|
Tax Impact |
|
After-Tax |
|
Per Share Impact |
||||
GAAP net income |
|
$ |
119,877 |
|
$ |
(29,394) |
|
$ |
90,483 |
|
$ |
1.49 |
|
|
|
|
|
|
|
|
|
|
|
|
|
Non-GAAP adjustments: |
|
|
|
|
|
|
|
|
|
|
|
|
Cost of Sales |
|
|
|
|
|
|
|
|
|
|
|
|
Amortization of intangibles |
|
|
55,798 |
|
|
(13,184) |
|
|
42,614 |
|
|
0.70 |
Inventory mark-up related to acquisitions |
|
|
250 |
|
|
(59) |
|
|
191 |
|
|
0.00 |
Operating Expenses |
|
|
|
|
|
|
|
|
|
|
|
|
Contingent consideration expense |
|
|
1,198 |
|
|
29 |
|
|
1,227 |
|
|
0.02 |
Amortization of intangibles |
|
|
7,497 |
|
|
(1,771) |
|
|
5,726 |
|
|
0.09 |
Performance-based share-based compensation (a) |
|
|
19,681 |
|
|
(2,344) |
|
|
17,337 |
|
|
0.29 |
Corporate restructuring (b) |
|
|
2,873 |
|
|
(678) |
|
|
2,195 |
|
|
0.04 |
Acquisition-related |
|
|
2,088 |
|
|
(2) |
|
|
2,086 |
|
|
0.03 |
Medical Device Regulation expenses (c) |
|
|
4,883 |
|
|
(1,153) |
|
|
3,730 |
|
|
0.06 |
Other (d) |
|
|
103 |
|
|
(24) |
|
|
79 |
|
|
0.00 |
Other (Income) Expense |
|
|
|
|
|
|
|
|
|
|
|
|
Amortization of long-term debt issuance costs |
|
|
4,242 |
|
|
(1,002) |
|
|
3,240 |
|
|
0.05 |
Other non-operating loss (gain) (e) |
|
|
11 |
|
|
(61) |
|
|
(50) |
|
|
(0.00) |
|
|
|
|
|
|
|
|
|
|
|
|
|
Non-GAAP net income |
|
$ |
218,501 |
|
$ |
(49,643) |
|
$ |
168,858 |
|
$ |
2.79 |
|
|
|
|
|
|
|
|
|
|
|
|
|
Diluted shares |
|
|
|
|
|
|
|
|
|
|
|
60,604 |
|
|
Nine Months Ended |
||||||||||
|
|
September 30, 2024 |
||||||||||
|
|
Pre-Tax |
|
Tax Impact |
|
After-Tax |
|
Per Share Impact |
||||
GAAP net income |
|
$ |
116,848 |
|
$ |
(24,438) |
|
$ |
92,410 |
|
$ |
1.57 |
|
|
|
|
|
|
|
|
|
|
|
|
|
Non-GAAP adjustments: |
|
|
|
|
|
|
|
|
|
|
|
|
Cost of Sales |
|
|
|
|
|
|
|
|
|
|
|
|
Amortization of intangibles |
|
|
40,827 |
|
|
(9,654) |
|
|
31,173 |
|
|
0.53 |
Inventory mark-up related to acquisitions |
|
|
559 |
|
|
(132) |
|
|
427 |
|
|
0.01 |
Operating Expenses |
|
|
|
|
|
|
|
|
|
|
|
|
Contingent consideration expense |
|
|
292 |
|
|
(31) |
|
|
261 |
|
|
0.00 |
Amortization of intangibles |
|
|
5,546 |
|
|
(1,312) |
|
|
4,234 |
|
|
0.07 |
Performance-based share-based compensation (a) |
|
|
9,396 |
|
|
(1,466) |
|
|
7,930 |
|
|
0.13 |
Corporate restructuring (b) |
|
|
2,030 |
|
|
(479) |
|
|
1,551 |
|
|
0.03 |
Acquisition-related |
|
|
3,610 |
|
|
(852) |
|
|
2,758 |
|
|
0.05 |
Medical Device Regulation expenses (c) |
|
|
6,120 |
|
|
(1,445) |
|
|
4,675 |
|
|
0.08 |
Other (d) |
|
|
302 |
|
|
(72) |
|
|
230 |
|
|
0.00 |
Other (Income) Expense |
|
|
|
|
|
|
|
|
|
|
|
|
Amortization of long-term debt issuance costs |
|
|
4,431 |
|
|
(1,046) |
|
|
3,385 |
|
|
0.06 |
|
|
|
|
|
|
|
|
|
|
|
|
|
Non-GAAP net income |
|
$ |
189,961 |
|
$ |
(40,927) |
|
$ |
149,034 |
|
$ |
2.53 |
|
|
|
|
|
|
|
|
|
|
|
|
|
Diluted shares |
|
|
|
|
|
|
|
|
|
|
|
58,948 |
Note: Certain per-share impacts may not sum to totals due to rounding.
11
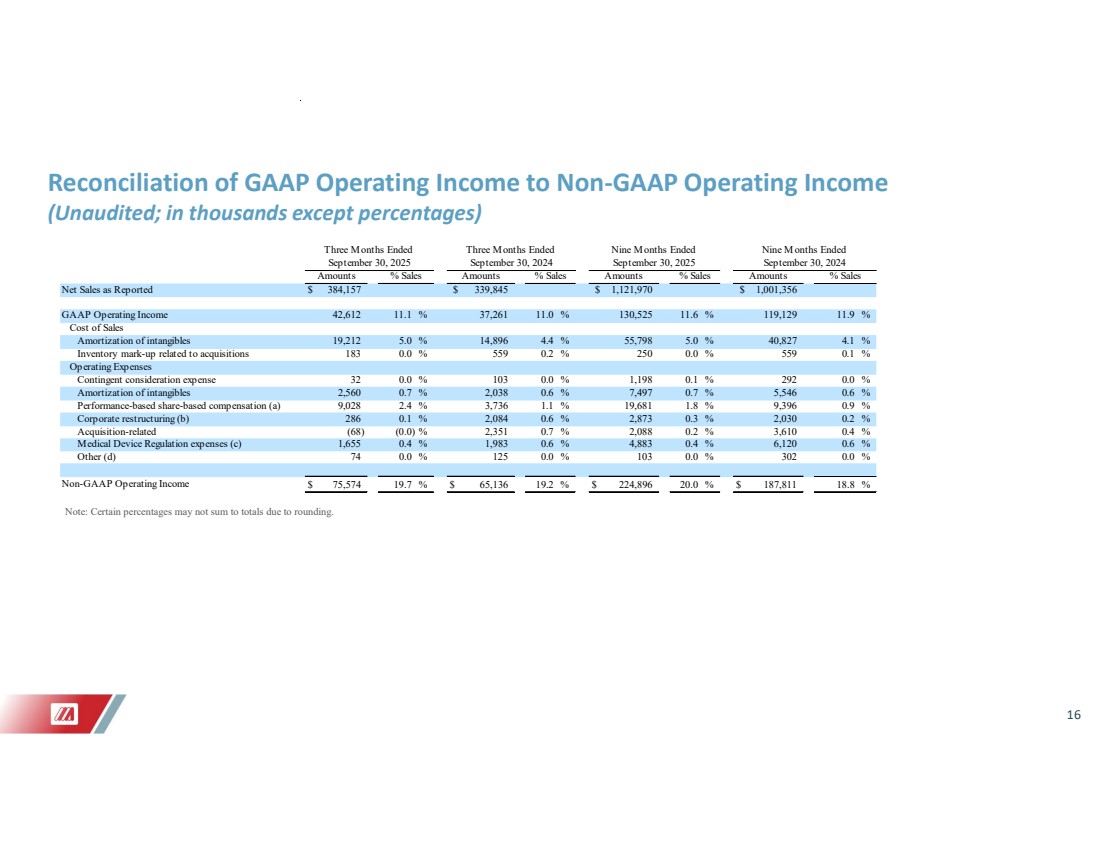
Reconciliation of Reported Operating Income to Non-GAAP Operating Income
(Unaudited, in thousands except percentages)
|
|
Three Months Ended |
|
Three Months Ended |
|
Nine Months Ended |
|
Nine Months Ended |
||||||||||||||||
|
|
September 30, 2025 |
|
September 30, 2024 |
|
September 30, 2025 |
|
September 30, 2024 |
||||||||||||||||
|
|
Amounts |
|
% Sales |
|
Amounts |
|
% Sales |
|
Amounts |
|
% Sales |
|
Amounts |
|
% Sales |
||||||||
Net Sales as Reported |
|
$ |
384,157 |
|
|
|
|
$ |
339,845 |
|
|
|
|
$ |
1,121,970 |
|
|
|
|
$ |
1,001,356 |
|
|
|
|
|
|
|
|
|
|
|
|
|
|
|
|
|
|
|
|
|
|
|
|
|
|
|
|
GAAP Operating Income |
|
|
42,612 |
|
11.1 |
% |
|
|
37,261 |
|
11.0 |
% |
|
|
130,525 |
|
11.6 |
% |
|
|
119,129 |
|
11.9 |
% |
Cost of Sales |
|
|
|
|
|
|
|
|
|
|
|
|
|
|
|
|
|
|
|
|
|
|
|
|
Amortization of intangibles |
|
|
19,212 |
|
5.0 |
% |
|
|
14,896 |
|
4.4 |
% |
|
|
55,798 |
|
5.0 |
% |
|
|
40,827 |
|
4.1 |
% |
Inventory mark-up related to acquisitions |
|
|
183 |
|
0.0 |
% |
|
|
559 |
|
0.2 |
% |
|
|
250 |
|
0.0 |
% |
|
|
559 |
|
0.1 |
% |
Operating Expenses |
|
|
|
|
|
|
|
|
|
|
|
|
|
|
|
|
|
|
|
|
|
|
|
|
Contingent consideration expense |
|
|
32 |
|
0.0 |
% |
|
|
103 |
|
0.0 |
% |
|
|
1,198 |
|
0.1 |
% |
|
|
292 |
|
0.0 |
% |
Amortization of intangibles |
|
|
2,560 |
|
0.7 |
% |
|
|
2,038 |
|
0.6 |
% |
|
|
7,497 |
|
0.7 |
% |
|
|
5,546 |
|
0.6 |
% |
Performance-based share-based compensation (a) |
|
|
9,028 |
|
2.4 |
% |
|
|
3,736 |
|
1.1 |
% |
|
|
19,681 |
|
1.8 |
% |
|
|
9,396 |
|
0.9 |
% |
Corporate restructuring (b) |
|
|
286 |
|
0.1 |
% |
|
|
2,084 |
|
0.6 |
% |
|
|
2,873 |
|
0.3 |
% |
|
|
2,030 |
|
0.2 |
% |
Acquisition-related |
|
|
(68) |
|
(0.0) |
% |
|
|
2,351 |
|
0.7 |
% |
|
|
2,088 |
|
0.2 |
% |
|
|
3,610 |
|
0.4 |
% |
Medical Device Regulation expenses (c) |
|
|
1,655 |
|
0.4 |
% |
|
|
1,983 |
|
0.6 |
% |
|
|
4,883 |
|
0.4 |
% |
|
|
6,120 |
|
0.6 |
% |
Other (d) |
|
|
74 |
|
0.0 |
% |
|
|
125 |
|
0.0 |
% |
|
|
103 |
|
0.0 |
% |
|
|
302 |
|
0.0 |
% |
|
|
|
|
|
|
|
|
|
|
|
|
|
|
|
|
|
|
|
|
|
|
|
|
|
Non-GAAP Operating Income |
|
$ |
75,574 |
|
19.7 |
% |
|
$ |
65,136 |
|
19.2 |
% |
|
$ |
224,896 |
|
20.0 |
% |
|
$ |
187,811 |
|
18.8 |
% |
Note: Certain percentages may not sum to totals due to rounding.
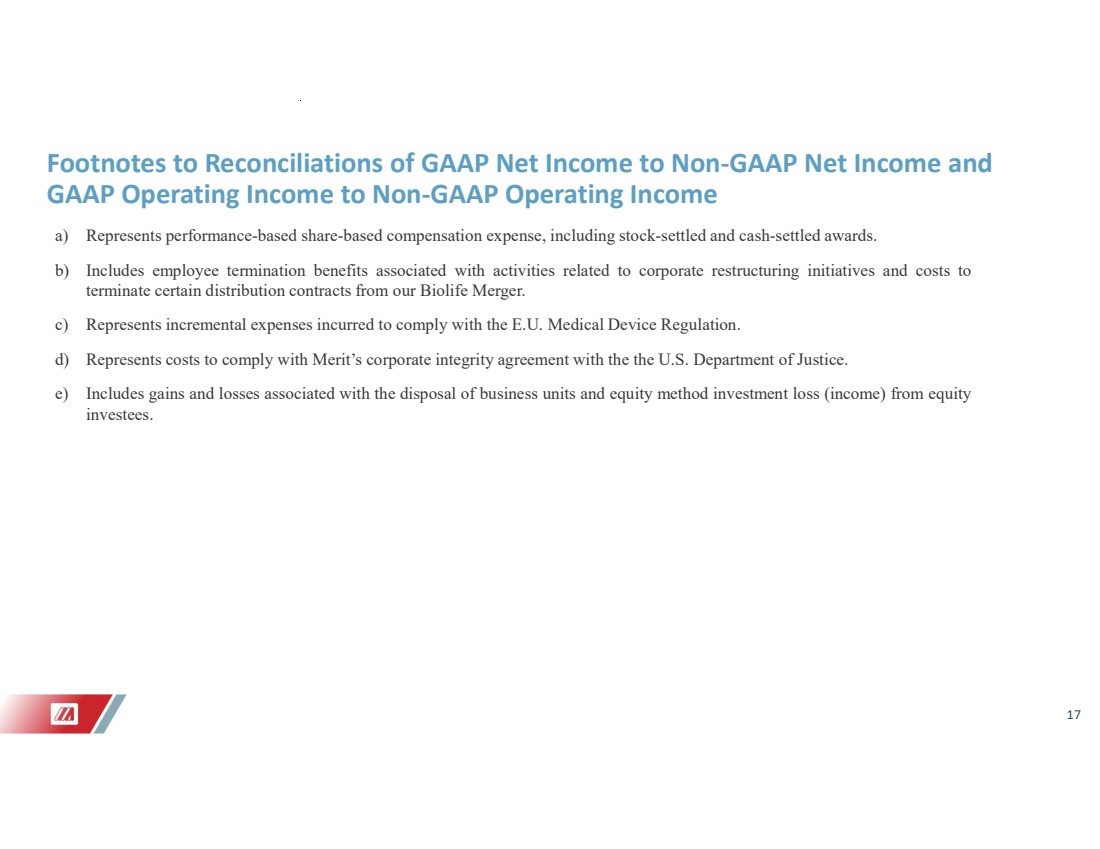
| (a) | Represents performance-based share-based compensation expense, including stock-settled and cash-settled awards. |
| (b) | Includes employee termination benefits associated with activities related to corporate restructuring initiatives and costs to terminate certain distribution contracts from our Biolife Merger. |
| (c) | Represents incremental expenses incurred to comply with the E.U. Medical Device Regulation. |
| (d) | Represents costs to comply with Merit’s corporate integrity agreement with the U.S. Department of Justice (the “DOJ”). |
| (e) | Includes gains and losses associated with the disposal of business units and equity method investment loss (income) from equity investees. |
12
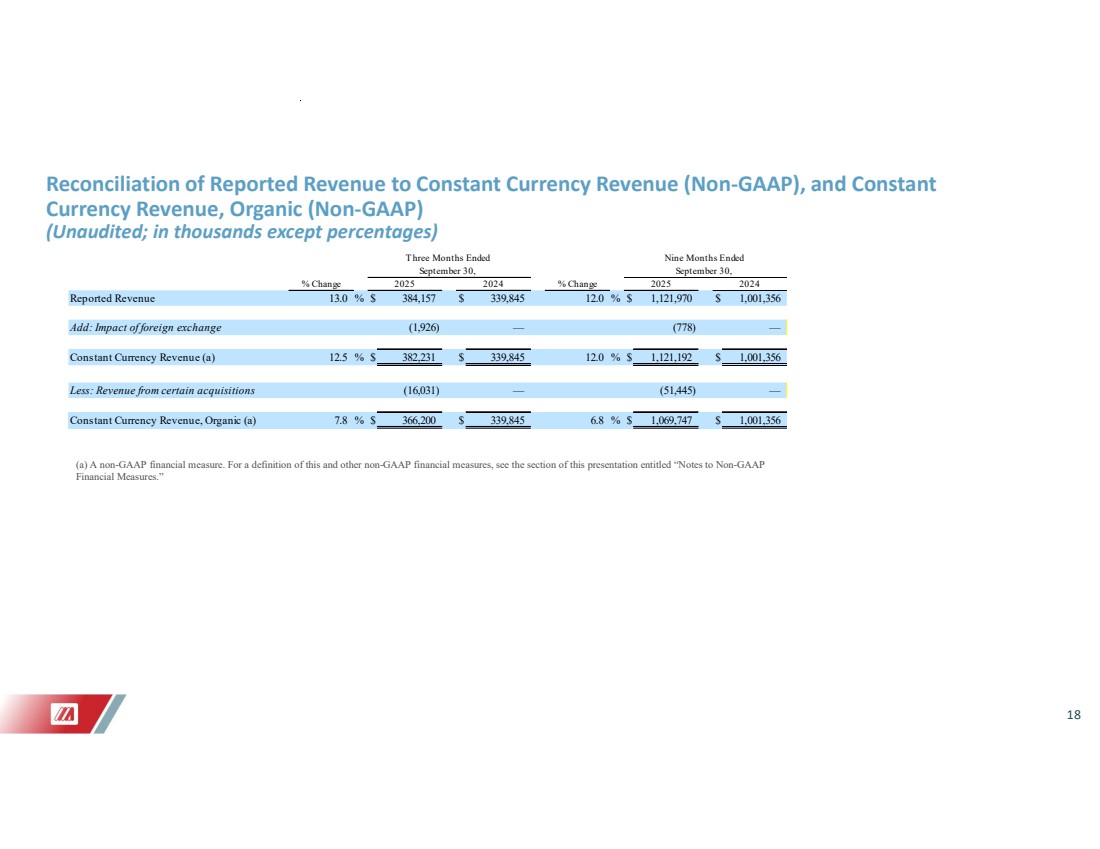
Reconciliation of Reported Revenue to Constant Currency Revenue (Non-GAAP), and Constant Currency Revenue, Organic (Non-GAAP)
(Unaudited, in thousands except percentages)
|
|
|
|
Three Months Ended |
|
|
|
Nine Months Ended |
||||||||
|
|
|
|
September 30, |
|
|
|
September 30, |
||||||||
|
|
% Change |
|
2025 |
|
2024 |
|
% Change |
|
2025 |
|
2024 |
||||
Reported Revenue |
|
13.0 |
% |
$ |
384,157 |
|
$ |
339,845 |
|
12.0 |
% |
$ |
1,121,970 |
|
$ |
1,001,356 |
|
|
|
|
|
|
|
|
|
|
|
|
|
|
|
|
|
Add: Impact of foreign exchange |
|
|
|
|
(1,926) |
|
|
— |
|
|
|
|
(778) |
|
|
— |
|
|
|
|
|
|
|
|
|
|
|
|
|
|
|
|
|
Constant Currency Revenue (a) |
|
12.5 |
% |
$ |
382,231 |
|
$ |
339,845 |
|
12.0 |
% |
$ |
1,121,192 |
|
$ |
1,001,356 |
|
|
|
|
|
|
|
|
|
|
|
|
|
|
|
|
|
Less: Revenue from certain acquisitions |
|
|
|
|
(16,031) |
|
|
— |
|
|
|
|
(51,445) |
|
|
— |
|
|
|
|
|
|
|
|
|
|
|
|
|
|
|
|
|
Constant Currency Revenue, Organic (a) |
|
7.8 |
% |
$ |
366,200 |
|
$ |
339,845 |
|
6.8 |
% |
$ |
1,069,747 |
|
$ |
1,001,356 |
| (a) | A non-GAAP financial measure. For a definition of this and other non-GAAP financial measures, see the section of this release entitled “Non-GAAP Financial Measures.” |
13
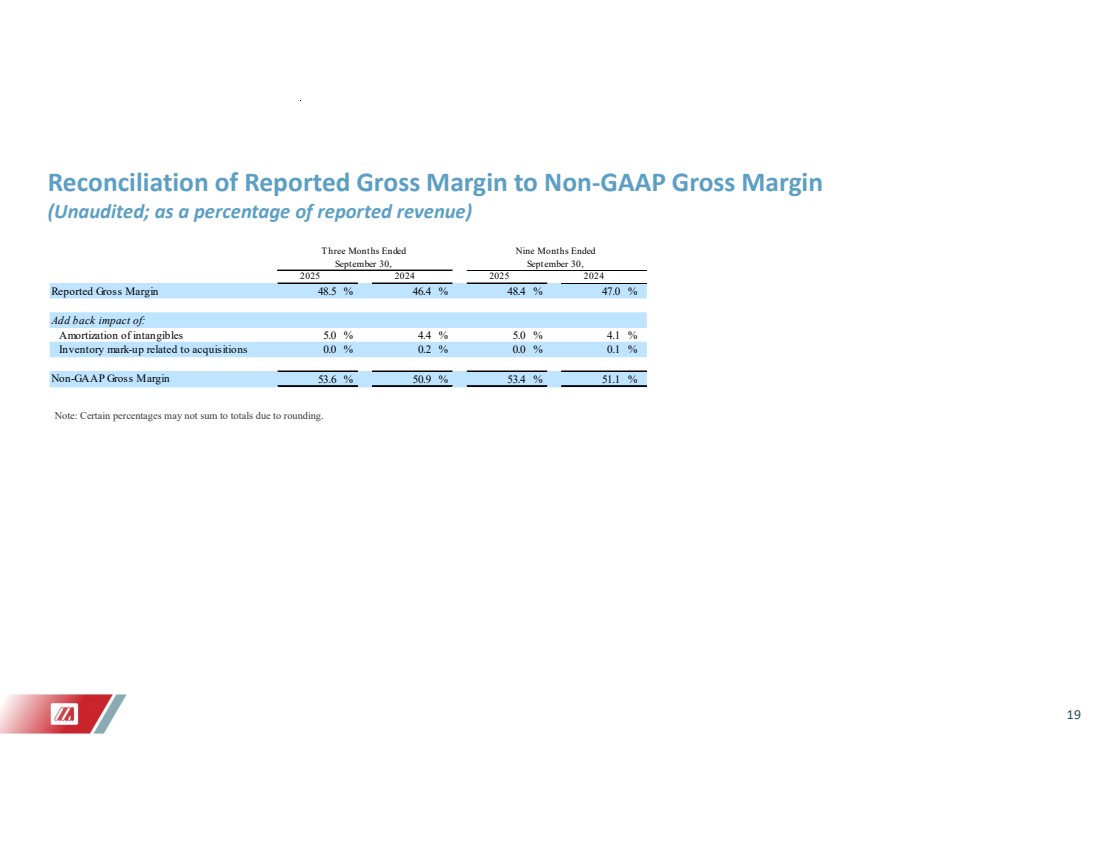
Reconciliation of Reported Gross Margin to Non-GAAP Gross Margin (Non-GAAP)
(Unaudited, as a percentage of reported revenue)
|
|
Three Months Ended |
|
Nine Months Ended |
||||||||
|
|
September 30, |
|
September 30, |
||||||||
|
|
2025 |
|
|
2024 |
|
|
2025 |
|
|
2024 |
|
Reported Gross Margin |
|
48.5 |
% |
|
46.4 |
% |
|
48.4 |
% |
|
47.0 |
% |
|
|
|
|
|
|
|
|
|
|
|
|
|
Add back impact of: |
|
|
|
|
|
|
|
|
|
|
|
|
Amortization of intangibles |
|
5.0 |
% |
|
4.4 |
% |
|
5.0 |
% |
|
4.1 |
% |
Inventory mark-up related to acquisitions |
|
0.0 |
% |
|
0.2 |
% |
|
0.0 |
% |
|
0.1 |
% |
|
|
|
|
|
|
|
|
|
|
|
|
|
Non-GAAP Gross Margin |
|
53.6 |
% |
|
50.9 |
% |
|
53.4 |
% |
|
51.1 |
% |
Note: Certain percentages may not sum to totals due to rounding.
14
|
|
ABOUT MERIT
Founded in 1987, Merit is engaged in the development, manufacture, and distribution of proprietary medical devices used in interventional, diagnostic, and therapeutic procedures, particularly in cardiology, radiology, oncology, critical care, and endoscopy. Merit serves customers worldwide with a domestic and international sales force and clinical support team totaling more than 800 individuals. Merit employs approximately 7,400 people worldwide.
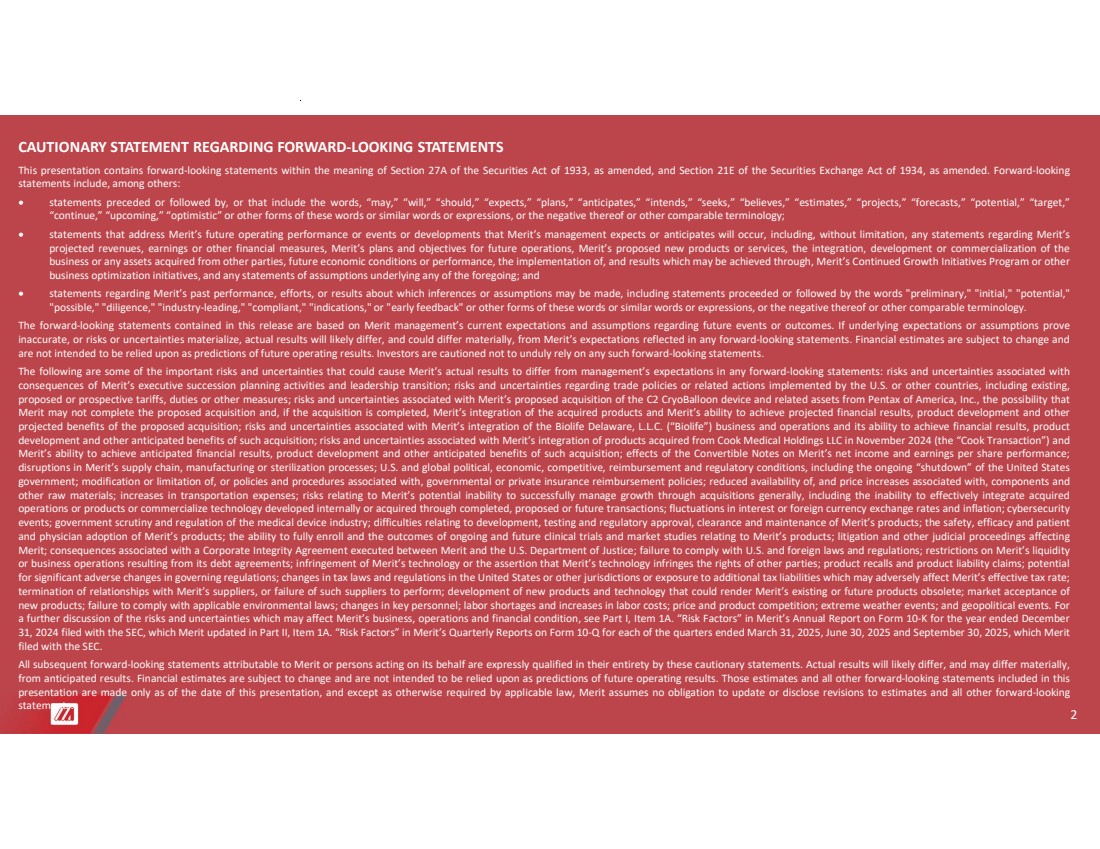
CAUTIONARY STATEMENT REGARDING FORWARD-LOOKING STATEMENTS
This release contains forward-looking statements within the meaning of Section 27A of the Securities Act of 1933, as amended, and Section 21E of the Securities Exchange Act of 1934, as amended. Forward-looking statements include, among others:
| ● | statements preceded or followed by, or that include the words, “may,” “will,” “should,” “expects,” “plans,” “anticipates,” “intends,” “seeks,” “believes,” “estimates,” “projects,” “forecasts,” “potential,” “target,” “continue,” “upcoming,” “optimistic” or other forms of these words or similar words or expressions, or the negative thereof or other comparable terminology; |
| ● | statements that address Merit’s future operating performance or events or developments that Merit’s management expects or anticipates will occur, including, without limitation, any statements regarding Merit’s projected revenues, earnings or other financial measures, Merit’s plans and objectives for future operations, Merit’s proposed new products or services, the integration, development or commercialization of the business or any assets acquired from other parties, future economic conditions or performance, the implementation of, and results which may be achieved through, Merit’s Continued Growth Initiatives Program or other business optimization initiatives, and any statements of assumptions underlying any of the foregoing; and |
| ● | statements regarding Merit’s past performance, efforts, or results about which inferences or assumptions may be made, including statements proceeded or followed by the words "preliminary," "initial," "potential," "possible," "diligence," "industry-leading," "compliant," "indications," or "early feedback" or other forms of these words or similar words or expressions, or the negative thereof or other comparable terminology. |
The forward-looking statements contained in this release are based on Merit management’s current expectations and assumptions regarding future events or outcomes. If underlying expectations or assumptions prove inaccurate, or risks or uncertainties materialize, actual results will likely differ, and could differ materially, from Merit’s expectations reflected in any forward-looking statements. Financial estimates are subject to change and are not intended to be relied upon as predictions of future operating results. Investors are cautioned not to unduly rely on any such forward-looking statements.
The following are some of the important risks and uncertainties that could cause Merit’s actual results to differ from management’s expectations in any forward-looking statements: risks and uncertainties associated with consequences of Merit’s executive succession planning activities and leadership transition; risks and uncertainties regarding trade policies or related actions implemented by the U.S. or other countries, including existing, proposed or prospective tariffs, duties or other measures; risks and uncertainties associated with Merit’s proposed acquisition of the C2 CryoBalloon device and related assets from Pentax of America, Inc., the possibility that Merit may not complete the proposed acquisition and, if the acquisition is completed, Merit’s integration of the acquired products and Merit’s ability to achieve projected financial results, product development and other projected benefits of the proposed acquisition; risks and uncertainties associated with Merit’s integration of the Biolife business and operations and its ability to achieve financial results, product development and other anticipated benefits of such acquisition; risks and uncertainties associated with Merit’s integration of products acquired in the Cook Transaction and Merit’s ability to achieve anticipated financial results, product development and other anticipated benefits of such acquisition; effects of the Convertible Notes on Merit’s net income and earnings per share performance; disruptions in Merit’s supply chain, manufacturing or sterilization processes; U.S.
15
and global political, economic, competitive, reimbursement and regulatory conditions, including the ongoing “shutdown” of the United States government; modification or limitation of, or policies and procedures associated with, governmental or private insurance reimbursement policies; reduced availability of, and price increases associated with, components and other raw materials; increases in transportation expenses; risks relating to Merit’s potential inability to successfully manage growth through acquisitions generally, including the inability to effectively integrate acquired operations or products or commercialize technology developed internally or acquired through completed, proposed or future transactions; fluctuations in interest or foreign currency exchange rates and inflation; cybersecurity events; government scrutiny and regulation of the medical device industry; difficulties relating to development, testing and regulatory approval, clearance and maintenance of Merit’s products; the safety, efficacy and patient and physician adoption of Merit’s products; the ability to fully enroll and the outcomes of ongoing and future clinical trials and market studies relating to Merit’s products; litigation and other judicial proceedings affecting Merit; consequences associated with a Corporate Integrity Agreement executed between Merit and the U.S. Department of Justice; failure to comply with U.S. and foreign laws and regulations; restrictions on Merit’s liquidity or business operations resulting from its debt agreements; infringement of Merit’s technology or the assertion that Merit’s technology infringes the rights of other parties; product recalls and product liability claims; potential for significant adverse changes in governing regulations; changes in tax laws and regulations in the United States or other jurisdictions or exposure to additional tax liabilities which may adversely affect Merit’s effective tax rate; termination of relationships with Merit’s suppliers, or failure of such suppliers to perform; development of new products and technology that could render Merit’s existing or future products obsolete; market acceptance of new products; failure to comply with applicable environmental laws; changes in key personnel; labor shortages and increases in labor costs; price and product competition; extreme weather events; and geopolitical events. For a further discussion of the risks and uncertainties which may affect Merit’s business, operations and financial condition, see Part I, Item 1A. “Risk Factors” in Merit’s Annual Report on Form 10-K for the year ended December 31, 2024 filed with the SEC, which Merit updated in Part II, Item 1A. “Risk Factors” in Merit’s Quarterly Reports on Form 10-Q for each of the quarters ended March 31, 2025, June 30, 2025 and September 30, 2025, which Merit filed with the SEC.
All subsequent forward-looking statements attributable to Merit or persons acting on its behalf are expressly qualified in their entirety by these cautionary statements. Actual results will likely differ, and may differ materially, from anticipated results. Financial estimates are subject to change and are not intended to be relied upon as predictions of future operating results. Those estimates and all other forward-looking statements included in this release are made only as of the date of this release, and except as otherwise required by applicable law, Merit assumes no obligation to update or disclose revisions to estimates and all other forward-looking statements.
TRADEMARKS
Unless noted otherwise, trademarks and registered trademarks used in this release are the property of Merit Medical Systems, Inc., its subsidiaries, or its licensors.
# # #
16
|
1 Merit Medical Investor Call October 30, 2025 Third Quarter 2025 Results Martha Aronson President and CEO Raul Parra CFO |
|
2 CAUTIONARY STATEMENT REGARDING FORWARD-LOOKING STATEMENTS This presentation contains forward-looking statements within the meaning of Section 27A of the Securities Act of 1933, as amended, and Section 21E of the Securities Exchange Act of 1934, as amended. Forward-looking statements include, among others: statements preceded or followed by, or that include the words, “may,” “will,” “should,” “expects,” “plans,” “anticipates,” “intends,” “seeks,” “believes,” “estimates,” “projects,” “forecasts,” “potential,” “target,” “continue,” “upcoming,” “optimistic” or other forms of these words or similar words or expressions, or the negative thereof or other comparable terminology; statements that address Merit’s future operating performance or events or developments that Merit’s management expects or anticipates will occur, including, without limitation, any statements regarding Merit’s projected revenues, earnings or other financial measures, Merit’s plans and objectives for future operations, Merit’s proposed new products or services, the integration, development or commercialization of the business or any assets acquired from other parties, future economic conditions or performance, the implementation of, and results which may be achieved through, Merit’s Continued Growth Initiatives Program or other business optimization initiatives, and any statements of assumptions underlying any of the foregoing; and statements regarding Merit’s past performance, efforts, or results about which inferences or assumptions may be made, including statements proceeded or followed by the words "preliminary," "initial," "potential," "possible," "diligence," "industry-leading," "compliant," "indications," or "early feedback" or other forms of these words or similar words or expressions, or the negative thereof or other comparable terminology. The forward-looking statements contained in this release are based on Merit management’s current expectations and assumptions regarding future events or outcomes. If underlying expectations or assumptions prove inaccurate, or risks or uncertainties materialize, actual results will likely differ, and could differ materially, from Merit’s expectations reflected in any forward-looking statements. Financial estimates are subject to change and are not intended to be relied upon as predictions of future operating results. Investors are cautioned not to unduly rely on any such forward-looking statements. The following are some of the important risks and uncertainties that could cause Merit’s actual results to differ from management’s expectations in any forward-looking statements: risks and uncertainties associated with consequences of Merit’s executive succession planning activities and leadership transition; risks and uncertainties regarding trade policies or related actions implemented by the U.S. or other countries, including existing, proposed or prospective tariffs, duties or other measures; risks and uncertainties associated with Merit’s proposed acquisition of the C2 CryoBalloon device and related assets from Pentax of America, Inc., the possibility that Merit may not complete the proposed acquisition and, if the acquisition is completed, Merit’s integration of the acquired products and Merit’s ability to achieve projected financial results, product development and other projected benefits of the proposed acquisition; risks and uncertainties associated with Merit’s integration of the Biolife Delaware, L.L.C. (“Biolife”) business and operations and its ability to achieve financial results, product development and other anticipated benefits of such acquisition; risks and uncertainties associated with Merit’s integration of products acquired from Cook Medical Holdings LLC in November 2024 (the “Cook Transaction”) and Merit’s ability to achieve anticipated financial results, product development and other anticipated benefits of such acquisition; effects of the Convertible Notes on Merit’s net income and earnings per share performance; disruptions in Merit’s supply chain, manufacturing or sterilization processes; U.S. and global political, economic, competitive, reimbursement and regulatory conditions, including the ongoing “shutdown” of the United States government; modification or limitation of, or policies and procedures associated with, governmental or private insurance reimbursement policies; reduced availability of, and price increases associated with, components and other raw materials; increases in transportation expenses; risks relating to Merit’s potential inability to successfully manage growth through acquisitions generally, including the inability to effectively integrate acquired operations or products or commercialize technology developed internally or acquired through completed, proposed or future transactions; fluctuations in interest or foreign currency exchange rates and inflation; cybersecurity events; government scrutiny and regulation of the medical device industry; difficulties relating to development, testing and regulatory approval, clearance and maintenance of Merit’s products; the safety, efficacy and patient and physician adoption of Merit’s products; the ability to fully enroll and the outcomes of ongoing and future clinical trials and market studies relating to Merit’s products; litigation and other judicial proceedings affecting Merit; consequences associated with a Corporate Integrity Agreement executed between Merit and the U.S. Department of Justice; failure to comply with U.S. and foreign laws and regulations; restrictions on Merit’s liquidity or business operations resulting from its debt agreements; infringement of Merit’s technology or the assertion that Merit’s technology infringes the rights of other parties; product recalls and product liability claims; potential for significant adverse changes in governing regulations; changes in tax laws and regulations in the United States or other jurisdictions or exposure to additional tax liabilities which may adversely affect Merit’s effective tax rate; termination of relationships with Merit’s suppliers, or failure of such suppliers to perform; development of new products and technology that could render Merit’s existing or future products obsolete; market acceptance of new products; failure to comply with applicable environmental laws; changes in key personnel; labor shortages and increases in labor costs; price and product competition; extreme weather events; and geopolitical events. For a further discussion of the risks and uncertainties which may affect Merit’s business, operations and financial condition, see Part I, Item 1A. “Risk Factors” in Merit’s Annual Report on Form 10-K for the year ended December 31, 2024 filed with the SEC, which Merit updated in Part II, Item 1A. “Risk Factors” in Merit’s Quarterly Reports on Form 10-Q for each of the quarters ended March 31, 2025, June 30, 2025 and September 30, 2025, which Merit filed with the SEC. All subsequent forward-looking statements attributable to Merit or persons acting on its behalf are expressly qualified in their entirety by these cautionary statements. Actual results will likely differ, and may differ materially, from anticipated results. Financial estimates are subject to change and are not intended to be relied upon as predictions of future operating results. Those estimates and all other forward-looking statements included in this presentation are made only as of the date of this presentation, and except as otherwise required by applicable law, Merit assumes no obligation to update or disclose revisions to estimates and all other forward-looking statements. |
|
3 NON-GAAP FINANCIAL MEASURES Although Merit’s financial statements are prepared in accordance with accounting principles generally accepted in the United States of America (“GAAP”), Merit’s management believes that certain non-GAAP financial measures provide investors with useful information regarding the underlying business trends and performance of Merit’s ongoing operations and can be useful for period-over-period comparisons of such operations. Certain financial measures included in this presentation, or which may be referenced in management’s discussion of Merit’s historical and future operations and financial results, have not been calculated in accordance with GAAP, and, therefore, are referenced as non-GAAP financial measures. Readers should consider non-GAAP measures used in this presentation in addition to, not as a substitute for, financial reporting measures prepared in accordance with GAAP. These non-GAAP financial measures generally exclude some, but not all, items that may affect Merit's net income. In addition, they are subject to inherent limitations as they reflect the exercise of judgment by management about which items are excluded. Additionally, non-GAAP financial measures used in this presentation may not be comparable with similarly titled measures of other companies. Merit urges readers to review the reconciliations of its non-GAAP financial measures to the comparable GAAP financial measures, and not to rely on any single financial measure to evaluate Merit’s business or results of operations. Please refer to “Notes to Non-GAAP Financial Measures” at the end of these materials for more information. TRADEMARKS Unless noted otherwise, trademarks and registered trademarks used in this presentation are the property of Merit Medical Systems, Inc., its subsidiaries, or its licensors. |
|
4 Q3 2025 Q3 2024 % Change YTD 2025 YTD 2024 % Change Revenue $384.2 $339.8 13.0% $1,122.0 $1,001.4 12.0% Gross Margin 48.5% 46.4% 4.7% 48.4% 47.0% 3.0% Operating Margin 11.1% 11.0% 1.2% 11.6% 11.9% (2.2)% Net Income $27.8 $28.4 (2.4)% $90.5 $92.4 (2.1)% Earnings per Share $0.46 $0.48 (3.0)% $1.49 $1.57 (4.8)% Financial Summary: GAAP 4 Note: Amounts in this presentation are rounded while percentages are calculated from the underlying amounts. In millions, except per share amounts and percentages |
|
5 Q3 2025 Q3 2024 % Change YTD 2025 YTD 2024 % Change Revenue $366.2† $339.8 7.8% $1,069.7† $1,001.4 6.8% Gross Margin 53.6% 50.9% 5.2% 53.4% 51.1% 4.5% Operating Margin 19.7% 19.2% 2.6% 20.0% 18.8% 6.9% Net Income $54.9 $51.2 7.4% $168.9 $149.0 13.3% Earnings per Share $0.92 $0.86 6.7% $2.79 $2.53 10.2% Financial Summary: Non-GAAP* 5 Note: Amounts in this presentation are rounded while percentages are calculated from the underlying amounts. * See "Notes to Non-GAAP Financial Measures" below for additional information regarding non-GAAP measures used in this presentation. † A non-GAAP financial measure, representing constant currency revenue, organic. In millions, except per share amounts and percentages |
|
6 Revenue Breakdown – Q3 Region Q3 2025 Q3 2024 $ Change % Change CC % Change* U.S. $230,597 $206,492 $24,105 11.7% 12.1% APAC 64,855 60,382 4,473 7.4% 7.7% EMEA 71,531 58,474 13,057 22.3% 17.5% Rest of World 17,174 14,497 2,677 18.5% 17.8% Total International 153,560 133,353 20,207 15.2% 13.1% Total $384,157 $339,845 $44,312 13.0% 12.5% 6 * A non-GAAP financial measure, representing revenue growth on a constant currency (“CC”) basis. See "Notes to Non-GAAP Financial Measures" below for additional information regarding non-GAAP measures used in this presentation. In thousands, except percentages |
|
7 Revenue Breakdown - YTD Region YTD 2025 YTD 2024 $ Change % Change CC % Change* U.S. $671,243 $587,250 $83,993 14.3% 14.3% APAC 193,983 190,053 3,930 2.1% 2.7% EMEA 207,431 181,802 25,629 14.1% 11.7% Rest of World 49,313 42,251 7,062 16.7% 22.0% Total International 450,727 414,106 36,621 8.8% 8.6% Total $1,121,970 $1,001,356 $120,614 12.0% 12.0% 7 * A non-GAAP financial measure, representing revenue growth on a constant currency (“CC”) basis. See "Notes to Non-GAAP Financial Measures" below for additional information regarding non-GAAP measures used in this presentation. In thousands, except percentages |
|
8 Financial Metrics Metric Q3 2025 Q3 2024 YTD 2025 YTD 2024 Depreciation & Amortization $31.3 $26.4 $91.6 $74.1 Stock Comp (performance-based) 9.0 3.7 19.7 9.4 Stock Comp (not performance-based) 4.6 3.1 13.9 9.6 Operating Cash Flow 75.0 47.3 198.9 152.1 Capital Expenditures-Property and Equipment 22.4 9.4 57.3 31.7 8 In millions |
|
9 Fiscal Year 2025 Financial Guidance Merit does not provide guidance for GAAP reported financial measures (other than revenue) or a reconciliation of forward-looking non-GAAP financial measures to the most directly comparable GAAP reported financial measures (other than revenue) because Merit is unable to predict with reasonable certainty the financial impact of various items which could impact Merit’s future financial results, such as expenses related to acquisitions or other extraordinary transactions, non-cash expenses related to amortization or write-off of previously acquired tangible and intangible assets, certain employee termination benefits, performance-based stock compensation expenses, expenses resulting from non-ordinary course litigation or administrative proceedings and resulting settlements, governmental proceedings, and changes in governmental or industry regulations. These items are uncertain, depend on various factors, and could have a material impact on GAAP reported results for the guidance period. For the same reasons, Merit is unable to address the significance of the unavailable information, which could be material to future results. Specifically, Merit is not, without unreasonable effort, able to reliably predict the impact of these items and Merit believes inclusion of a reconciliation of these forward-looking non-GAAP measures to their GAAP counterparts could be confusing to investors or cause undue reliance. Merit’s financial guidance for the year ending December 31, 2025, is subject to risks and uncertainties identified in this presentation and Merit’s filings with the U.S. Securities and Exchange Commission (the “SEC”). This guidance is based on information and estimates available to Merit as of October 30, 2025. Should known or unknown risks or uncertainties materialize or should underlying assumptions prove inaccurate, actual results will likely vary, and could vary materially, from past results and those anticipated, estimated or projected. (1) “Prior Guidance” reflects Merit’s full-year 2025 financial guidance, previously introduced on July 30, 2025. Financial Measure Year Ending % Change Year Ending % Change December 31, 2025 Y/Y December 31, 2025 Y/Y Net S ales $1.502 - $1.515 billion 11% - 12% $1.495 - $1.507 billion 10% - 11% Cardiovascular Segment $1.430 - $1.441 billion 10% - 11% $1.423 - $1.434 billion 9% - 10% Endoscopy Segment $72.0 - $74.0 million 32% - 34% $72.0 - $73.0 million 32% - 34% Non-GAAP Earnings Per Share(1) $3.66 - $3.79 6% - 10% $3.52 - $3.72 2% - 8% Updated Guidance Prior Guidance(2) * Percentage figures approximated; percentage and dollar figures may not foot due to rounding 2025 Net Sales Guidance - % Change from Prior Year (Constant Currency) Reconciliation* Revenue and Earnings Guidance* (1) Merit’s non-GAAP earnings per share reflect the dilutive impact of its 3.00% Convertible Senior Notes due 2029 calculated using the if-converted method of approximately $0.04 per share for the year ending December 31, 2025. Any offsetting impacts of the capped call associated with the Convertible Notes are not considered. (2) “Prior Guidance” reflects Merit’s full-year 2025 financial guidance, previously introduced on July 30, 2025. Low High Low High 2025 Net Sales Guidance - % Change from Prior Year (GAAP) 10.7% 11.7% 10.2% 11.1% Estimated impact of foreign currency exchange rate fluctuations (0.5%) (0.5%) (0.5%) (0.5%) 2025 Net Sales Guidance - % Change from Prior Year (Constant Currency) 10.3% 11.2% 9.7% 10.6% Updated Guidance Prior Guidance(1) |
|
10 Appendix |
|
11 Notes to Non-GAAP Financial Measures For additional details, please see the accompanying press release and forward-looking statement disclosure. These presentation materials and associated commentary from Merit’s management, as well as the press release issued today, use non-GAAP financial measures, including: • constant currency revenue; • constant currency revenue, organic; • non-GAAP gross profit and margin; • non-GAAP operating income and margin; • non-GAAP net income; • non-GAAP earnings per share; and • free cash flow. Merit’s management team uses these non-GAAP financial measures to evaluate Merit’s profitability and efficiency, to compare operating and financial results to prior periods, to evaluate changes in the results of its operating segments, and to measure and allocate financial resources internally. However, Merit’s management does not consider such non-GAAP measures in isolation or as an alternative to measures determined in accordance with GAAP. Readers should consider non-GAAP measures used in this release in addition to, not as a substitute for, financial reporting measures prepared in accordance with GAAP. These non-GAAP financial measures generally exclude some, but not all, items that may affect Merit’s net income. In addition, they are subject to inherent limitations as they reflect the exercise of judgment by management about which items are excluded. Merit believes it is useful to exclude such items in the calculation of non-GAAP gross profit and margin, non-GAAP operating income and margin, non-GAAP net income, and non-GAAP earnings per share (in each case, as further illustrated in the reconciliation tables below) because such amounts in any specific period may not directly correlate to the underlying performance of Merit’s business operations and can vary significantly between periods as a result of factors such as acquisition or other extraordinary transactions, non-cash expenses related to amortization or write-off of previously acquired tangible and intangible assets, certain employee termination benefits, expenses resulting from non-ordinary course litigation or administrative proceedings and resulting settlements, governmental proceedings or changes in tax or industry regulations, gains or losses on disposal of certain assets, equity method investment loss (income) from equity investees, and debt issuance costs. Merit may incur similar types of expenses in the future, and the non-GAAP financial information included in this release should not be viewed as a statement or indication that these types of expenses will not recur. Additionally, the non-GAAP financial measures used in this release may not be comparable with similarly titled measures of other companies. Merit urges readers to review the reconciliations of its non-GAAP financial measures to their most directly comparable GAAP financial measures included herein, and not to rely on any single financial measure to evaluate Merit’s business or results of operations. |
|
12 Notes to Non-GAAP Financial Measures (cont.) Constant Currency Revenue Merit’s constant currency revenue is prepared by converting the current-period reported revenue of subsidiaries whose functional currency is a currency other than the U.S. dollar at the applicable foreign exchange rates in effect during the comparable prior-year period and adjusting for the effects of hedging transactions on reported revenue, which are recorded in the U.S. dollar. The constant currency revenue adjustments of ($1.9) million and ($0.8) million to reported revenue for the three and nine-month periods ended September 30, 2025, respectively, were calculated using the applicable average foreign exchange rates for the three and nine-month periods ended September 30, 2024. Constant Currency Revenue, Organic Merit’s constant currency revenue, organic, is defined, with respect to prior fiscal year periods, as GAAP revenue. With respect to current fiscal year periods, constant currency revenue, organic, is defined as constant currency revenue (as defined above), less revenue from certain acquisitions. For the three-month period ended September 30, 2025, Merit’s constant currency revenue, organic, excludes revenues attributable to products acquired in connection with (i) Merit’s merger transaction with Biolife in May 2025 (the “Biolife Merger”) and (ii) the Cook Transaction. For the nine-month period ended September 30, 2025, Merit’s constant currency revenue, organic, excludes revenues attributable to products acquired in connection with (i) the Biolife Merger, (ii) the Cook Transaction and (iii) the assets acquired from EndoGastric Solutions, Inc. in July 2024. Non-GAAP Gross Profit and Margin Non-GAAP gross profit is calculated by reducing GAAP cost of sales by amounts recorded for amortization of intangible assets and inventory mark-up related to acquisitions. Non-GAAP gross margin is calculated by dividing non-GAAP gross profit by reported net sales. Non-GAAP Operating Income and Margin Non-GAAP operating income is calculated by adjusting GAAP operating income for certain items which are deemed by Merit’s management to be outside of core operations and vary in amount and frequency among periods, such as expenses related to acquisitions or other extraordinary transactions, non-cash expenses related to amortization or write-off of previously acquired tangible and intangible assets, certain employee termination benefits, performance-based stock compensation expenses, expenses resulting from non-ordinary course litigation or administrative proceedings and resulting settlements, governmental proceedings, and changes in governmental or industry regulations, as well as other items referenced in the tables below. Non-GAAP operating margin is calculated by dividing non-GAAP operating income by reported net sales. |
|
13 Notes to Non-GAAP Financial Measures (cont.) Non-GAAP Net Income Non-GAAP net income is calculated by adjusting GAAP net income for the items set forth in the definition of non-GAAP operating income above, as well as for expenses related to debt issuance costs, gains or losses on disposal of certain assets, equity method investment loss (income) from equity investees, and other items set forth in the tables below. Non-GAAP EPS Non-GAAP EPS is defined as non-GAAP net income divided by the diluted shares outstanding for the corresponding period. Free Cash Flow Free cash flow is defined as cash flow from operations calculated in accordance with GAAP, less capital expenditures for property and equipment calculated in accordance with GAAP, as set forth in the consolidated statement of cash flows. Other Non-GAAP Financial Measure Reconciliations The following tables set forth supplemental financial data and corresponding reconciliations of non-GAAP financial measures to Merit’s corresponding financial measures prepared in accordance with GAAP, in each case, for the three and nine-month periods ended September 30, 2025 and 2024. The non-GAAP income adjustments referenced in the following tables do not reflect non-performance-based stock compensation expense of $4.6 million and $3.1 million for the three-month periods ended September 30, 2025 and 2024, respectively and $13.9 million and $9.6 million for the nine-month periods ended September 30, 2025 and 2024, respectively. |
|
14 Reconciliation of GAAP Net Income to Non-GAAP Net Income (Unaudited; in thousands except per share amounts) Note: Certain per-share impacts may not sum to totals due to rounding. GAAP net income $ 38,540 $ (10,785) $ 27,755 $ 0.46 $ 36,657 $ (8,213) $ 28,444 $ 0.48 Non-GAAP adjustments: Cost of Sales Amortization of intangibles 19,212 (4,539) 14,673 0.24 14,896 (3,522) 11,374 0.19 Inventory mark-up related to acquisitions 183 (43) 140 0.00 559 (132) 427 0.01 Operating Expenses Contingent consideration expense 32 (5) 27 0.00 103 (6) 97 0.00 Amortization of intangibles 2,560 (604) 1,956 0.03 2,038 (482) 1,556 0.03 Performance-based share-based compensation (a) 9,028 (1,413) 7,615 0.13 3,736 (609) 3,127 0.05 Corporate restructuring (b) 286 (67) 219 0.00 2,084 (492) 1,592 0.03 Acquisition-related (68) 16 (52) (0.00) 2,351 (555) 1,796 0.03 Medical Device Regulation expenses (c) 1,655 (391) 1,264 0.02 1,983 (468) 1,515 0.03 Other (d) 74 (17) 57 0.00 125 (30) 95 0.00 Other (Income) Expense Amortization of long-term debt issuance costs 1,414 (334) 1,080 0.02 1,477 (349) 1,128 0.02 Other non-operating loss (e) 260 (61) 199 0.00 — — — — Non-GAAP net income $ 73,176 $ (18,243) $ 54,933 $ 0.92 $ 66,009 $ (14,858) $ 51,151 $ 0.86 Diluted shares 59,919 59,537 Three Months Ended Three Months Ended September 30, 2025 September 30, 2024 Pre-Tax Tax Impact After-Tax Per Share Impact Pre-Tax Tax Impact After-Tax Per Share Impact |
|
15 Reconciliation of GAAP Net Income to Non-GAAP Net Income (Unaudited; in thousands except per share amounts) Note: Certain per-share impacts may not sum to totals due to rounding. GAAP net income $ 119,877 $ (29,394) $ 90,483 $ 1.49 $ 116,848 $ (24,438) $ 92,410 $ 1.57 Non-GAAP adjustments: Cost of Sales Amortization of intangibles 55,798 (13,184) 42,614 0.70 40,827 (9,654) 31,173 0.53 Inventory mark-up related to acquisitions 250 (59) 191 0.00 559 (132) 427 0.01 Operating Expenses Contingent consideration expense 1,198 29 1,227 0.02 292 (31) 261 0.00 Amortization of intangibles 7,497 (1,771) 5,726 0.09 5,546 (1,312) 4,234 0.07 Performance-based share-based compensation (a) 19,681 (2,344) 17,337 0.29 9,396 (1,466) 7,930 0.13 Corporate restructuring (b) 2,873 (678) 2,195 0.04 2,030 (479) 1,551 0.03 Acquisition-related 2,088 (2) 2,086 0.03 3,610 (852) 2,758 0.05 Medical Device Regulation expenses (c) 4,883 (1,153) 3,730 0.06 6,120 (1,445) 4,675 0.08 Other (d) 103 (24) 79 0.00 302 (72) 230 0.00 Other (Income) Expense Amortization of long-term debt issuance costs 4,242 (1,002) 3,240 0.05 4,431 (1,046) 3,385 0.06 Other non-operating loss (gain) (e) 11 (61) (50) (0.00) — — — — Non-GAAP net income $ 218,501 $ (49,643) $ 168,858 $ 2.79 $ 189,961 $ (40,927) $ 149,034 $ 2.53 Diluted shares 60,604 58,948 Nine Months Ended Nine Months Ended September 30, 2025 September 30, 2024 Pre-Tax Tax Impact After-Tax Per Share Impact Pre-Tax Tax Impact After-Tax Per Share Impact |
|
16 Reconciliation of GAAP Operating Income to Non-GAAP Operating Income (Unaudited; in thousands except percentages) Note: Certain percentages may not sum to totals due to rounding. Net Sales as Reported $ 384,157 $ 339,845 $ 1,121,970 $ 1,001,356 GAAP Operating Income 42,612 11.1 % 37,261 11.0 % 130,525 11.6 % 119,129 11.9 % Cost of Sales Amortization of intangibles 19,212 5.0 % 14,896 4.4 % 55,798 5.0 % 40,827 4.1 % Inventory mark-up related to acquisitions 183 0.0 % 559 0.2 % 250 0.0 % 559 0.1 % Operating Expenses Contingent consideration expense 32 0.0 % 103 0.0 % 1,198 0.1 % 292 0.0 % Amortization of intangibles 2,560 0.7 % 2,038 0.6 % 7,497 0.7 % 5,546 0.6 % Performance-based share-based compensation (a) 9,028 2.4 % 3,736 1.1 % 19,681 1.8 % 9,396 0.9 % Corporate restructuring (b) 286 0.1 % 2,084 0.6 % 2,873 0.3 % 2,030 0.2 % Acquisition-related (68) (0.0) % 2,351 0.7 % 2,088 0.2 % 3,610 0.4 % Medical Device Regulation expenses (c) 1,655 0.4 % 1,983 0.6 % 4,883 0.4 % 6,120 0.6 % Other (d) 74 0.0 % 125 0.0 % 103 0.0 % 302 0.0 % Non-GAAP Operating Income $ 75,574 19.7 % $ 65,136 19.2 % $ 224,896 20.0 % $ 187,811 18.8 % Three Months Ended Three Months Ended Nine Months Ended Nine Months Ended September 30, 2025 September 30, 2024 September 30, 2025 September 30, 2024 Amounts % Sales Amounts % Sales Amounts % Sales Amounts % Sales |
|
17 Footnotes to Reconciliations of GAAP Net Income to Non-GAAP Net Income and GAAP Operating Income to Non-GAAP Operating Income a) Represents performance-based share-based compensation expense, including stock-settled and cash-settled awards. b) Includes employee termination benefits associated with activities related to corporate restructuring initiatives and costs to terminate certain distribution contracts from our Biolife Merger. c) Represents incremental expenses incurred to comply with the E.U. Medical Device Regulation. d) Represents costs to comply with Merit’s corporate integrity agreement with the the U.S. Department of Justice. e) Includes gains and losses associated with the disposal of business units and equity method investment loss (income) from equity investees. |
|
18 Reconciliation of Reported Revenue to Constant Currency Revenue (Non-GAAP), and Constant Currency Revenue, Organic (Non-GAAP) (Unaudited; in thousands except percentages) (a) A non-GAAP financial measure. For a definition of this and other non-GAAP financial measures, see the section of this presentation entitled “Notes to Non-GAAP Financial Measures.” % Change % Change Reported Revenue 13.0 % $ 384,157 $ 339,845 12.0 % $ 1,121,970 $ 1,001,356 Add: Impact of foreign exchange (1,926) — (778) — Constant Currency Revenue (a) 12.5 % $ 382,231 $ 339,845 12.0 % $ 1,121,192 $ 1,001,356 Less: Revenue from certain acquisitions — (16,031) (51,445) — Constant Currency Revenue, Organic (a) 7.8 % $ 366,200 $ 339,845 6.8 % $ 1,069,747 $ 1,001,356 T hree Months Ended Nine Months Ended September 30, September 30, 2025 2024 2025 2024 |
|
19 Reconciliation of Reported Gross Margin to Non-GAAP Gross Margin (Unaudited; as a percentage of reported revenue) Note: Certain percentages may not sum to totals due to rounding. 2025 2024 2025 2024 Reported Gross Margin 48.5 % 46.4 % 48.4 % 47.0 % Add back impact of: Amortization of intangibles 5.0 % 4.4 % 5.0 % 4.1 % Inventory mark-up related to acquisitions 0.0 % 0.2 % 0.0 % 0.1 % Non-GAAP Gross Margin % 50.9 53.6 % 53.4 % 51.1 % September 30, Three Months Ended Nine Months Ended September 30, |
|