株探米国株
エドガーで原本を確認する
0000845877falseX100008458772026-02-192026-02-190000845877us-gaap:CommonClassAMember2026-02-192026-02-190000845877us-gaap:CommonClassCMember2026-02-192026-02-190000845877us-gaap:SeriesDPreferredStockMember2026-02-192026-02-190000845877us-gaap:SeriesEPreferredStockMember2026-02-192026-02-190000845877us-gaap:SeriesFPreferredStockMember2026-02-192026-02-190000845877us-gaap:SeriesGPreferredStockMember2026-02-192026-02-190000845877us-gaap:SeriesHPreferredStockMember2026-02-192026-02-19

UNITED STATES
SECURITIES AND EXCHANGE COMMISSION
Washington, D.C. 20549
________________

FORM 8-K

CURRENT REPORT
PURSUANT TO SECTION 13 OR 15(d) OF THE
SECURITIES EXCHANGE ACT OF 1934

Date of Report (Date of earliest event reported): February 19, 2026

FEDERAL AGRICULTURAL MORTGAGE CORPORATION
(Exact name of registrant as specified in its charter)
Federally chartered instrumentality
of the United States
001-14951 52-1578738
(State or Other Jurisdiction
of Incorporation)
(Commission
File Number)
(IRS Employer Identification No.)
2100 Pennsylvania Avenue, N.W., Suite 450N, 20037
Washington, DC
(Address of Principal Executive Offices) (Zip Code)
Registrant’s telephone number, including area code (202) 872-7700
No change
(Former name or former address, if changed since last report) 

Check the appropriate box below if the Form 8-K filing is intended to simultaneously satisfy the filing obligation of the registrant under any of the following provisions (see General Instruction A.2. below):
☐ Written communications pursuant to Rule 425 under the Securities Act (17 CFR 230.425)
☐ Soliciting material pursuant to Rule 14a-12 under the Exchange Act (17 CFR 240.14a-12)
☐ Pre-commencement communications pursuant to Rule 14d-2(b) under the Exchange Act (17 CFR 240.14d-2(b))
☐ Pre-commencement communications pursuant to Rule 13e-4(c) under the Exchange Act (17 CFR 240.13e-4(c))


Securities registered pursuant to Section 12(b) of the Act:
Title of each class Trading symbol   Exchange on which registered
Class A voting common stock AGM.A   New York Stock Exchange
Class C non-voting common stock AGM   New York Stock Exchange
5.700% Non-Cumulative Preferred Stock, Series D AGM.PRD New York Stock Exchange
5.750% Non-Cumulative Preferred Stock, Series E AGM.PRE New York Stock Exchange
5.250% Non-Cumulative Preferred Stock, Series F AGM.PRF New York Stock Exchange
4.875% Non-Cumulative Preferred Stock, Series G AGM.PRG New York Stock Exchange
6.500% Non-Cumulative Preferred Stock, Series H AGM.PRH New York Stock Exchange


Indicate by check mark whether the registrant is an emerging growth company as defined in Rule 405 of the Securities Act of 1933 (17 CFR §230.405) or Rule 12b-2 of the Securities Exchange Act of 1934 (17 CFR §240.12b-2). Emerging growth company ☐
If an emerging growth company, indicate by check mark if the registrant has elected not to use the extended transition period for complying with any new or revised financial accounting standards provided pursuant to Section 13(a) of the Exchange Act. ☐


Item 2.02    Results of Operations and Financial Condition.

On February 19, 2026, the Federal Agricultural Mortgage Corporation (“Farmer Mac”) issued a press release to announce (1) its financial results for the annual period ended December 31, 2025 and (2) a conference call to discuss those results and Farmer Mac’s Annual Report on Form 10-K for the fiscal year ended December 31, 2025. A copy of the press release is attached as Exhibit 99.1 and is incorporated by reference into this report. All references to www.farmermac.com in Exhibit 99.1 are inactive textual references only, and the information contained on that website is not incorporated by reference into this report.

The information furnished in this Item 2.02, including Exhibit 99.1, shall not be deemed “filed” for purposes of Section 18 of the Securities Exchange Act of 1934, as amended (“Exchange Act”), or otherwise subject to the liabilities of that Section, nor will any of such information or Exhibit be deemed incorporated by reference into any filing under the Exchange Act or the Securities Act of 1933, as amended (“Securities Act”), except as shall be expressly set forth by specific reference in such filing.


Item 7.01    Regulation FD Disclosure.

On February 19, 2026, Farmer Mac posted an investor slide presentation for equity investors to its website at www.farmermac.com under the tab “Investors — Events and Presentations.” Farmer Mac expects to use the slide presentation in connection with future investor presentations to analysts and investors. The slide presentation is attached as Exhibit 99.2 and is incorporated by reference into this report. All references to www.farmermac.com in Exhibit 99.2 are inactive textual references only, and the information contained on that website is not incorporated by reference into this report.

The information furnished in this Item 7.01, including Exhibit 99.2, shall not be deemed “filed” for purposes of Section 18 of the Exchange Act, or otherwise subject to the liabilities of that Section, nor will any of such information or Exhibit be deemed incorporated by reference into any filing under the Exchange Act or the Securities Act, except as shall be expressly set forth by specific reference in such filing.


Item 8.01    Other Events.

On February 19, 2026, Farmer Mac issued a press release to announce that its Board of Directors (“Board”) had declared a quarterly dividend on each of Farmer Mac’s three classes of common stock – Class A Voting Common Stock, Class B Voting Common Stock, and Class C Non-Voting Common Stock. The quarterly dividend of $1.60 per share of common stock will be payable on March 31, 2026, to holders of record of Farmer Mac’s common stock as of March 16, 2026.

The press release also announced that the Board declared a dividend on each of Farmer Mac’s five classes of preferred stock – 5.700% Non-Cumulative Preferred Stock, Series D (“Series D Preferred Stock”), 5.750% Non-Cumulative Preferred Stock, Series E (“Series E Preferred Stock”), 5.250% Non-Cumulative Preferred Stock, Series F (“Series F Preferred Stock”), 4.875% Non-Cumulative Preferred Stock, Series G (“Series G Preferred Stock”), and 6.500% Non-Cumulative Preferred Stock, Series H (“Series H Preferred Stock” and together with the Series D Preferred Stock, Series E Preferred Stock, Series F Preferred Stock, Series G Preferred Stock and Series H Preferred Stock, the “Preferred Stock”). The quarterly dividend of $ 0.3562500 per share of Series D Preferred Stock, $0.3593750 per share of Series E Preferred Stock, $0.3281250 per share of Series F Preferred Stock, $0.3046875 per share of Series G Preferred Stock, and $0.4062500 per share of Series H Preferred Stock is for the period from but not including January 17, 2026, to and including April 17, 2026. The dividends on the Preferred Stock will be payable on April 17, 2026, to holders of record of those classes of Preferred Stock as of April 1, 2026. Each share of Preferred Stock has a par value and liquidation preference of $25.00 per share.

A copy of the press release is attached to this report as Exhibit 99.1 and the portion of the press release included under the heading "Dividends" is incorporated by reference into this report. All references to www.farmermac.com in Exhibit 99.1 are inactive textual references only, and the information contained on Farmer Mac’s website is not incorporated by reference into this report.


Item 9.01    Financial Statements and Exhibits.

(d)    Exhibits

99.1    Press Release dated February 19, 2026
99.2    Equity investor slide presentation
104    Cover Page Inline Interactive Data File - the cover page interactive data file does not appear in the Interactive Data File because its XBRL tags are embedded within the Inline XBRL document included as Exhibit 101


SIGNATURES

Pursuant to the requirements of the Securities Exchange Act of 1934, the registrant has duly caused this report to be signed on its behalf by the undersigned thereunto duly authorized.


FEDERAL AGRICULTURAL MORTGAGE CORPORATION                    


By: /s/ Geraldine I. Hayhurst            
Name: Geraldine I. Hayhurst
Title: Executive Vice President – Chief Legal Officer

Dated: February 19, 2026


EX-99.1 2 a2025q4pressrelease.htm EX-99.1 Document

farmermaclogo.jpg

Farmer Mac Reports 2025 Results
- Announces 7% Dividend Increase -
- Outstanding Business Volume of $33.4 Billion -

WASHINGTON, D.C., February 19, 2026 — The Federal Agricultural Mortgage Corporation (Farmer Mac; NYSE: AGM and AGM.A), the nation's secondary market provider that increases the accessibility of financing to provide vital liquidity for American agriculture and rural infrastructure, today announced its results for the fiscal quarter and year ended December 31, 2025.

“Farmer Mac delivered another strong year in 2025, highlighted by record net effective spread and outstanding business volumes, and our tenth consecutive year of record annual core earnings results," said Chief Executive Officer, Brad Nordholm. "While a few borrower‑specific credit events affected Core Earnings, particularly in the fourth quarter, these were isolated in nature and do not change the positive trajectory of our underlying performance. With a resilient business model, disciplined balance‑sheet and risk management, and a highly talented and capable management team, we are well‑positioned for the future and confident in our ability to continue delivering meaningful value to rural America and our shareholders.”

Full Year 2025 and Recent Highlights
•Record outstanding business volume growth of $3.8 billion, reflecting 13% growth year-over-year
•Provided $10.5 billion in liquidity and lending capacity to lenders serving rural America
•Net interest income grew 10% year-over-year to $390.7 million
•Net effective spread1 increased 13% from the prior-year period to a record $383.0 million
•Net income attributable to common stockholders of $182.5 million, or $16.62 per diluted share
•Record core earnings1 of $182.9 million, or $16.66 per diluted share, reflecting 7% growth year-over-year
•Total core capital of $1.7 billion and a Tier 1 Capital Ratio of 13.3% as of December 31, 2025
•On February 18, 2026, Farmer Mac's Board of Directors raised the quarterly common stock dividend by 7% to $1.60 per share, the fifteenth consecutive annual increase

$ in thousands, except per share amounts Quarter Ended Year Ended
December 31, 2025 December 31, 2024 YoY %
Change
December 31, 2025 December 31, 2024 %
Change
Net Change in
Business Volume
$2,232,407 $1,054,727 N/A $3,828,539 $1,052,006 N/A
Net Interest Income (GAAP) $104,521 $93,368 12% $390,734 $353,867 10%
Net Effective Spread
(Non-GAAP)
$101,389 $87,528 16% $383,041 $339,564 13%
Diluted EPS (GAAP) $3.71 $4.63 (20)% $16.62 $16.44 1%
Diluted Core EPS (Non-GAAP) $3.66 $3.97 (8)% $16.66 $15.64 7%

1 Non-GAAP Measure
1


Dividends

On February 18, 2026, Farmer Mac's Board of Directors declared a quarterly dividend of $1.60 per share on all three classes of common stock – Class A voting common stock (NYSE: AGM.A), Class B voting common stock (not listed on any exchange), and Class C non-voting common stock (NYSE: AGM). This quarterly dividend, which represents an increase of 7% in Farmer Mac's quarterly dividend rate on a year-over-year basis, will be payable on March 31, 2026 to holders of record of common stock as of March 16, 2026. This is the fifteenth consecutive year that Farmer Mac has increased its quarterly common stock dividend, and this increase is supported by Farmer Mac's previous and expected earnings growth and overall capital position.

Farmer Mac's Board of Directors also declared a dividend on each of Farmer Mac's five classes of preferred stock. The quarterly dividend of $0.35625 per share of 5.700% Non-Cumulative Preferred Stock, Series D (NYSE: AGM.PR.D), $0.359375 per share of 5.750% Non-Cumulative Preferred Stock, Series E (NYSE: AGM.PR.E), $0.328125 per share of 5.250% Non-Cumulative Preferred Stock, Series F (NYSE: AGM.PR.F), $0.3046875 per share of 4.875% Non-Cumulative Preferred Stock, Series G (AGM.PR.G), and $0.40625 per share of 6.500% Non-Cumulative Preferred Stock, Series H (AGM.PR.H), is for the period from but not including January 17, 2026 to and including April 17, 2026. The preferred dividends will be payable on April 17, 2026 to holders of record as of April 1, 2026.

Earnings Conference Call Information

The conference call to discuss Farmer Mac's fourth quarter and full year 2025 financial results will be held beginning at 4:30 p.m. eastern time on Thursday, February 19, 2026, and can be accessed by telephone or live webcast as follows:

Telephone (Domestic): (888) 880-3330
Telephone (International): (646) 357-8766
Webcast: https://www.farmermac.com/investors/events-presentations/

When dialing in to the call, please ask for the "Farmer Mac Earnings Conference Call." The call can be heard live and will also be available for replay on Farmer Mac’s website for one week following the conclusion of the call.

More complete information about Farmer Mac's performance for 2025 is in Farmer Mac's
Annual Report on Form 10-K for the year ended December 31, 2025, filed today with the SEC.


2


Use of Non-GAAP Measures

We use "non-GAAP measures" in our analysis of financial information. Non-GAAP measures represent measures of financial performance that are not presented in accordance with GAAP. Specifically, we use the following non-GAAP measures: (1) "core earnings," (2) "core earnings per common share," and (3) "net effective spread," in both dollars and percentage yield or spread. In our view, these non-GAAP measures are useful alternative measures in understanding our economic performance, transaction economics, and business trends. Our non-GAAP financial measures may not be comparable to similarly labeled non-GAAP financial measures disclosed by other companies. Our disclosure of non-GAAP measures is intended to be supplemental in nature and is not meant to be considered in isolation from, as a substitute for, or as more important than, the related financial information prepared in accordance with GAAP.

Core Earnings and Core Earnings Per Share

The main difference between core earnings and core earnings per common share ("Core EPS"), which are non-GAAP measures, and net income attributable to common stockholders and earnings per common share ("EPS"), which are GAAP measures, is that those non-GAAP measures exclude the effects of fair value fluctuations. These fluctuations are not expected to have a cumulative net impact on our financial condition or results of operations reported in accordance with GAAP if the related financial instruments are held to maturity, as is expected. Additionally, these two non-GAAP measures exclude specified infrequent or unusual transactions that we believe are not indicative of future operating results and that may not reflect the trends and economic financial performance of our core business.

Net Effective Spread

We use Net Effective Spread ("NES") to measure the net spread earned between interest-earning assets and the related net funding costs, including any associated derivatives, whether or not they are designated in a hedge accounting relationship.

NES excludes the following:
•Interest income and interest expense associated with single-class consolidated trusts with beneficial interests owned by third parties and for which we guarantees all classes of securities issued ("single-class consolidated trusts") and reclassifies that activity to guarantee and commitment fees in determining our core earnings. This reclassification reflects our view that the net interest income earned on single-class consolidated trusts is effectively a guarantee fee.
•Fair value changes of financial derivatives and corresponding financial assets or liabilities designated in fair value hedge accounting relationships because they are not expected to have an economic effect on our financial performance, as we expect to hold the financial derivatives and corresponding hedged items to maturity.
•The amortization of premiums and discounts on assets consolidated at fair value.

NES includes the following:
•Income and expense related to the contractual amounts due on financial derivatives that are not designated in hedge accounting relationships ("undesignated financial derivatives"). For undesignated financial derivatives, we record the income or expense related to the accrual of the contractual amounts due in "(Losses)/gains on financial derivatives" on the Consolidated Statements of Operations.
3


•The net effects of terminations or net settlements on undesignated financial derivatives, which consist of: (1) the net effects of cash settlements on agency forward contracts on the debt of other government-sponsored enterprises ("GSEs") and U.S. Treasury security futures that we use as short-term economic hedges on the issuance of debt; and (2) the net effects of initial cash payments that we receive upon the inception of certain swaps. For GAAP purposes, realized gains or losses on settlements of these contracts are reported in the Consolidated Statements of Operations in the period in which they occur. For NES, these realized gains or losses are deferred and amortized as net yield adjustments over the term of the related debt, which generally ranges from 3 to 15 years.

More information about Farmer Mac’s use of non-GAAP measures is available in "Management's Discussion and Analysis of Financial Condition and Results of Operations—Results of Operations" in Farmer Mac's Annual Report on Form 10-K for the year ended December 31, 2025, filed today with the SEC. For a reconciliation of Farmer Mac's net income attributable to common stockholders to core earnings and of earnings per common share to core earnings per share, and net interest income and net interest yield to net effective spread, see "Reconciliations" below.

Forward-Looking Statements

Management's expectations for Farmer Mac's future necessarily involve assumptions, estimates, and the evaluation of risks and uncertainties. Various factors or events, both known and unknown, could cause our actual results to differ materially from the expectations as expressed or implied by the forward-looking statements in this release, including uncertainties about:

•the availability to Farmer Mac of debt and equity financing and, if available, the reasonableness of rates and terms;
•legislative, regulatory, or current or future political developments that could affect Farmer Mac, its sources of business, or agricultural or infrastructure industries;
•fluctuations in the fair value of assets held by Farmer Mac and its subsidiaries;
•the level of lender interest in Farmer Mac's products and the secondary market provided by Farmer Mac;
•the general rate of growth in agricultural mortgage and infrastructure indebtedness;
•the effect of economic conditions stemming from disruptive global events or otherwise on agricultural mortgage or infrastructure lending, borrower repayment capacity, or collateral values, including inflation, fluctuations in interest rates, changes in U.S. trade policies (including tariffs and trade restrictions), fluctuations in export demand for U.S. agricultural products and foreign currency exchange rates, supply chain disruptions, increases in input costs, labor availability, and volatility in commodity prices;
•the degree to which Farmer Mac is exposed to interest rate risk resulting from fluctuations in Farmer Mac's borrowing costs relative to market indices;
•developments in the financial markets, including possible investor, analyst, and rating agency reactions to events involving GSEs, including Farmer Mac;
•the effects of the Federal Reserve’s efforts to achieve monetary policy normalization to respond to inflation and employment levels; and
•other factors that could hinder agricultural mortgage lending or borrower repayment capacity, including the effects of severe weather, flooding and drought, or fluctuations in agricultural real estate values.

Other risk factors are discussed in "Risk Factors" in Part I, Item 1A in Farmer Mac's Annual Report on Form 10-K for the year ended December 31, 2025, filed today with the SEC. Considering these potential risks and uncertainties, no undue reliance should be placed on any forward-looking statements expressed in this release.
4


The forward-looking statements contained in this release represent management's expectations as of the date of this release. Farmer Mac undertakes no obligation to release publicly the results of revisions to any forward-looking statements included in this release to reflect new information or any future events or circumstances, except as otherwise required by applicable law. The information in this release is not necessarily indicative of future results.

About Farmer Mac

Farmer Mac is driven by its mission to increase the accessibility of financing to provide vital
liquidity for American agriculture and rural infrastructure. The secondary market served by Farmer Mac provides liquidity to our nation’s agricultural and infrastructure businesses, supporting a vibrant and strong rural America. We offer a wide range of solutions to help meet financial institutions’ growth, liquidity, risk management, and capital relief needs across diverse markets, including agriculture,
agribusiness, broadband infrastructure, power and utilities, and renewable energy. We are
uniquely positioned to facilitate competitive access to financing that fuels growth, innovation, and
prosperity in America’s rural and agricultural communities. Additional information about Farmer
Mac is available on our website at www.farmermac.com.

CONTACT:     Jalpa Nazareth, Investor Relations
Lisa Meyer, Media Inquiries
(202) 872-7700

* * * *

5


FEDERAL AGRICULTURAL MORTGAGE CORPORATION AND SUBSIDIARIES
CONSOLIDATED BALANCE SHEETS

As of
  December 31, 2025 December 31, 2024
  (in thousands)
Assets:    
Cash and cash equivalents (includes restricted cash of $24,475 and $16,190, respectively) $ 931,067  $ 1,024,007 
Investment securities:  
Available-for-sale, at fair value (amortized cost of $13,813,551 and $11,940,774, respectively)
13,580,285  11,467,560 
Held-to-maturity, at amortized cost 3,954,223  5,097,492 
Other investments 15,871  11,835 
Total Investment Securities 17,550,379  16,576,887 
Loans:  
Loans held for sale, at lower of cost or fair value —  6,170 
Loans held for investment, at amortized cost 13,877,051  11,183,408 
Loans held for investment in consolidated trusts, at amortized cost 2,482,010  2,038,283 
Allowance for losses (37,785) (23,223)
Total loans, net of allowance 16,321,276  13,204,638 
Financial derivatives, at fair value 44,875  27,789 
Accrued interest receivable (includes $40,945 and $28,563, respectively, related to consolidated trusts) 357,155  310,592 
Guarantee and commitment fees receivable 57,214  50,499 
Deferred tax asset, net 173  1,544 
Prepaid expenses and other assets 108,018  128,786 
Total Assets $ 35,370,157  $ 31,324,742 
Liabilities and Equity:    
Liabilities:    
Notes payable $ 30,822,570  $ 27,371,174 
Debt securities of consolidated trusts held by third parties 2,365,435  1,929,628 
Financial derivatives, at fair value 21,618  77,326 
Accrued interest payable (includes $15,795 and $12,387, respectively, related to consolidated trusts) 233,714  195,113 
Guarantee and commitment obligation 54,770  48,326 
Other liabilities 153,101  214,149 
Total Liabilities 33,651,208  29,835,716 
Commitments and Contingencies
Equity:    
Preferred stock:    
Series D, par value $25 per share, 4,000,000 shares authorized, issued and outstanding 96,659  96,659 
Series E, par value $25 per share, 3,180,000 shares authorized, issued and outstanding
77,003  77,003 
Series F, par value $25 per share, 4,800,000 shares authorized, issued and outstanding 116,160  116,160 
Series G, par value $25 per share, 5,000,000 shares authorized, issued and outstanding 121,327  121,327 
Series H, par value $25 per share, 4,000,000 shares authorized, issued and outstanding
96,844  — 
Common stock:
Class A Voting, $1 par value, no maximum authorization, 1,030,780 shares outstanding 1,031  1,031 
Class B Voting, $1 par value, no maximum authorization, 500,301 shares outstanding 500  500 
Class C Non-Voting, $1 par value, no maximum authorization, 9,325,556 shares and 9,360,083 shares outstanding, respectively
9,326  9,360 
Additional paid-in capital 139,370  135,894 
Accumulated other comprehensive income/(loss), net of tax 13,382  (12,147)
Retained earnings 1,047,347  943,239 
Total Equity 1,718,949  1,489,026 
Total Liabilities and Equity $ 35,370,157  $ 31,324,742 


6


FEDERAL AGRICULTURAL MORTGAGE CORPORATION AND SUBSIDIARIES
CONSOLIDATED STATEMENTS OF OPERATIONS

For the Three Months Ended
For the Year Ended
  December 31, 2025 December 31, 2024 December 31, 2025 December 31, 2024
  (in thousands, except per share amounts)
Interest income:
Investment securities and cash equivalents $ 205,926  $ 226,510  $ 846,441  $ 974,329 
Loans 210,544  169,255  765,806  629,187 
Total interest income 416,470  395,765  1,612,247  1,603,516 
Total interest expense 311,949  302,397  1,221,513  1,249,649 
Net interest income 104,521  93,368  390,734  353,867 
Provision for losses (15,986) (3,773) (32,860) (11,579)
Net interest income after provision for losses 88,535  89,595  357,874  342,288 
Non-interest income/(expense):
Guarantee and commitment fees 5,259  4,009  19,575  15,738 
(Losses)/gains on financial derivatives
(1,502) 4,290  (5,120) 2,636 
Other income (821) (411) 3,183  2,827 
Non-interest income 2,936  7,888  17,638  21,201 
Operating expenses:
Compensation and employee benefits 18,199  15,641  71,325  63,975 
General and administrative 11,944  12,452  44,613  38,236 
Regulatory fees 863  1,000  3,863  3,175 
Operating expenses 31,006  29,093  119,801  105,386 
Income before income taxes 60,465  68,390  255,711  258,103 
Income tax expense 12,541  11,876  48,296  50,910 
Net income 47,924  56,514  207,415  207,193 
Preferred stock dividends (7,286) (5,666) (24,922) (25,146)
Loss on retirement of preferred stock —  —  —  (1,619)
Net income attributable to common stockholders $ 40,638  $ 50,848  $ 182,493  $ 180,428 
Earnings per common share:
Basic earnings per common share $ 3.73  $ 4.67  $ 16.73  $ 16.59 
Diluted earnings per common share $ 3.71  $ 4.63  $ 16.62  $ 16.44 

7


Reconciliations
Reconciliations of Farmer Mac's net income attributable to common stockholders to core earnings and core earnings per share are presented in the following tables along with information about the composition of core earnings for the periods indicated:
Reconciliation of Net Income Attributable to Common Stockholders to Core Earnings
  For the Three Months Ended
  December 31, 2025 September 30, 2025 December 31, 2024
  (in thousands, except per share amounts)
Net income attributable to common stockholders $ 40,638  $ 48,700  $ 50,848 
Less reconciling items:
Gains on undesignated financial derivatives due to fair value changes 447  882  3,084 
Gains/(losses) on hedging activities due to fair value changes
3,107  (137) 5,737 
Unrealized losses on trading assets (66) (4) (83)
Net effects of amortization of premiums/discounts and deferred gains on assets consolidated at fair value(1)
24  26  (39)
Net effects of terminations or net settlements on financial derivatives (2,699) (1,934) 534 
Issuance costs on the retirement of preferred stock —  —  — 
Income tax effect related to reconciling items (171) 245  (1,939)
Sub-total 642  (922) 7,294 
Core earnings $ 39,996  $ 49,622  $ 43,554 
Composition of Core Earnings:
Revenues:
Net effective spread(2)
$ 101,389  $ 97,769  $ 87,528 
Guarantee and commitment fees(3)
6,298  6,132  5,086 
Other(4)
224  1,185  (491)
Total revenues 107,911  105,086  92,123 
Credit related expense/(income) (GAAP):
Provision for losses 15,986  7,477  3,773 
Other credit related expense/(income) 1,267  (44) 99 
Total credit related expense/(income) 17,253  7,433  3,872 
Operating expenses (GAAP):
Compensation and employee benefits 18,199  17,743  15,641 
General and administrative 11,944  11,052  12,452 
Regulatory fees 863  1,000  1,000 
Total operating expenses 31,006  29,795  29,093 
Net earnings 59,652  67,858  59,158 
Income tax expense(5)
12,370  11,933  9,938 
Preferred stock dividends (GAAP) 7,286  6,303  5,666 
Core earnings $ 39,996  $ 49,622  $ 43,554 
Core earnings per share:
  Basic $ 3.68  $ 4.54  $ 4.00 
  Diluted $ 3.66  $ 4.52  $ 3.97 
(1)Reflects the amortization recorded during the reporting period on those assets for which the premium, discount, or deferred gain was a result of consolidation accounting rather than a cash transaction.
(2)Net effective spread is a non-GAAP measure. See "Use of Non-GAAP Measures" above for an explanation of net effective spread. See below for a reconciliation of net interest income to net effective spread.
(3)Includes net interest income of $1.0 million for both the three months ended December 31, 2025 and 2024, related to consolidated trusts owned by third parties reclassified from net interest income to guarantee and commitment fees.
8


(4)Reflects reconciling adjustments for the reclassification to exclude expenses related to undesignated financial derivatives and terminations or net settlements on financial derivatives, and reconciling adjustments to exclude fair value adjustments on financial derivatives and trading assets and the recognition of deferred gains over the estimated lives of certain Farmer Mac Guaranteed Securities and USDA Securities.
(5)Includes the tax impact of non-GAAP reconciling items between net income attributable to common stockholders and core earnings.

Reconciliation of Net Income Attributable to Common Stockholders to Core Earnings
  For the Years Ended
  December 31, 2025 December 31, 2024
  (in thousands, except per share amounts)
Net income attributable to common stockholders $ 182,493  $ 180,428 
Less reconciling items:
(Losses)/gains on undesignated financial derivatives due to fair value changes (1,883) 3,344 
Gains on hedging activities due to fair value changes 6,778  11,548 
Unrealized losses on trading assets (126) (85)
Net effects of amortization of premiums/discounts and deferred gains on assets consolidated at fair value(1)
103  45 
Net effects of terminations or net settlements on financial derivatives (5,448) (1,666)
Issuance costs on the retirement of preferred stock —  (1,619)
Income tax effect related to reconciling items 120  (2,769)
Sub-total (456) 8,798 
Core earnings $ 182,949  $ 171,630 
Composition of Core Earnings:
Revenues:
Net effective spread(2)
$ 383,041  $ 339,564 
Guarantee and commitment fees(3)
23,792  20,321 
Other(4)
3,466  2,105 
Total revenues 410,299  361,990 
Credit related expense (GAAP):
Provision for losses 32,860  11,579 
Other credit related expense 1,350  107 
Total credit related expense 34,210  11,686 
Operating expenses (GAAP):
Compensation and employee benefits 71,325  63,975 
General and administrative 44,613  38,236 
Regulatory fees 3,863  3,175 
Total operating expenses 119,801  105,386 
Net earnings 256,288  244,918 
Income tax expense(5)
48,417  48,142 
Preferred stock dividends (GAAP) 24,922  25,146 
Core earnings $ 182,949  $ 171,630 
Core earnings per share:
  Basic $ 16.77  $ 15.78 
  Diluted $ 16.66  $ 15.64 
(1)Reflects the amortization recorded during the reporting period on those assets for which the premium, discount, or deferred gain was a result of consolidation accounting rather than a cash transaction.
(2)Net effective spread is a non-GAAP measure. See "Use of Non-GAAP Measures" above for an explanation of net effective spread. See below for a reconciliation of net interest income to net effective spread.
(3)Includes net interest income of $4.1 million and $4.5 million for the years ended December 31, 2025 and 2024, respectively, related to consolidated trusts owned by third parties reclassified from net interest income to guarantee and commitment fees.
9


(4)Reflects reconciling adjustments for the reclassification to exclude expenses related to undesignated financial derivatives and terminations or net settlements on financial derivatives, and reconciling adjustments to exclude fair value adjustments on financial derivatives and trading assets and the recognition of deferred gains over the estimated lives of certain Farmer Mac Guaranteed Securities and USDA Securities.
(5)Includes the tax impact of non-GAAP reconciling items between net income attributable to common stockholders and core earnings.

10


Reconciliation of GAAP Basic Earnings Per Share to Core Earnings Basic Earnings Per Share
   For the Three Months Ended
For the Year Ended
   December 31, 2025 September 30,
2025
December 31, 2024 December 31, 2025 December 31, 2024
(in thousands, except per share amounts)
GAAP - Basic EPS $ 3.73  $ 4.45  $ 4.67  $ 16.73  $ 16.59 
Less reconciling items:
Gains/(losses) on undesignated financial derivatives due to fair value changes 0.04  0.08  0.28  (0.17) 0.31 
Gains/(losses) on hedging activities due to fair value changes 0.29  (0.01) 0.53  0.62  1.06 
Unrealized losses on trading securities (0.01) —  (0.01) (0.01) (0.01)
Net effects of amortization of premiums/discounts and deferred gains on assets consolidated at fair value —  —  —  0.01  — 
Net effects of terminations or net settlements on financial derivatives (0.25) (0.18) 0.05  (0.50) (0.15)
Issuance costs on the retirement of preferred stock —  —  —  —  (0.15)
Income tax effect related to reconciling items (0.02) 0.02  (0.18) 0.01  (0.25)
Sub-total 0.05  (0.09) 0.67  (0.04) 0.81 
Core Earnings - Basic EPS $ 3.68  $ 4.54  $ 4.00  $ 16.77  $ 15.78 
Shares used in per share calculation (GAAP and Core Earnings) 10,882  10,934  10,889  10,911  10,874 

Reconciliation of GAAP Diluted Earnings Per Share to Core Earnings Diluted Earnings Per Share
   For the Three Months Ended
For the Year Ended
   December 31, 2025 September 30,
2025
December 31, 2024 December 31, 2025 December 31, 2024
(in thousands, except per share amounts)
GAAP - Diluted EPS $ 3.71  $ 4.44  $ 4.63  $ 16.62  $ 16.44 
Less reconciling items:
Gains/(losses) on undesignated financial derivatives due to fair value changes 0.04  0.08  0.28  (0.17) 0.30 
Gains/(losses) on hedging activities due to fair value changes 0.29  (0.01) 0.52  0.62  1.05 
Unrealized losses on trading securities (0.01) —  (0.01) (0.01) (0.01)
Net effects of amortization of premiums/discounts and deferred gains on assets consolidated at fair value —  —  —  0.01  — 
Net effects of terminations or net settlements on financial derivatives (0.25) (0.17) 0.05  (0.50) (0.14)
Issuance costs on the retirement of preferred stock —  —  —  —  (0.15)
Income tax effect related to reconciling items (0.02) 0.02  (0.18) 0.01  (0.25)
Sub-total 0.05  (0.08) 0.66  (0.04) 0.80 
Core Earnings - Diluted EPS $ 3.66  $ 4.52  $ 3.97  $ 16.66  $ 15.64 
Shares used in per share calculation (GAAP and Core Earnings) 10,943  10,972  10,982  10,983  10,975 

11


The following table presents a reconciliation of net interest income and net yield to net effective spread for the periods indicated:
Reconciliation of GAAP Net Interest Income/Yield to Net Effective Spread
   For the Three Months Ended
For the Year Ended
  December 31, 2025 September 30,
2025
December 31, 2024 December 31, 2025 December 31, 2024
  Dollars Yield Dollars Yield Dollars Yield Dollars Yield Dollars Yield
  (dollars in thousands)
Net interest income $ 104,521  1.23  % $ 98,477  1.18  % $ 93,368  1.21  % $ 390,734  1.19  % $ 353,867  1.16  %
Net effects of consolidated trusts (973) 0.02  % (1,102) 0.02  % (989) 0.02  % (4,072) 0.02  % (4,477) 0.02  %
Expense related to undesignated financial derivatives 156  —  % (707) (0.01) % —  % (441) —  % (1,377) —  %
Amortization of premiums/discounts on assets consolidated at fair value (22) —  % (23) —  % 42  —  % (92) —  % (29) —  %
Amortization of losses due to terminations or net settlements on financial derivatives 814  0.01  % 987  0.01  % 842  0.01  % 3,690  0.01  % 3,128  0.01  %
Fair value changes on fair value hedge relationships (3,107) (0.04) % 137  —  % (5,737) (0.08) % (6,778) (0.02) % (11,548) (0.04) %
Net effective spread $ 101,389  1.22  % $ 97,769  1.20  % $ 87,528  1.16  % $ 383,041  1.20  % $ 339,564  1.15  %

12


The following table presents core earnings for Farmer Mac's reportable operating segments and a reconciliation to consolidated net income for the three months ended December 31, 2025:
Core Earnings by Business Segment
For the Three Months Ended December 31, 2025
Agricultural Finance Infrastructure Finance Treasury
Farm & Ranch Corporate AgFinance
Power &
Utilities
Broadband Infrastructure
Renewable Energy Funding Investments
Total
  (in thousands)
Interest income
$ 158,412  $ 25,171  $ 71,312  $ 15,742  $ 31,851  $ 32,288  $ 81,694  $ 416,470 
Interest expense(1)
(121,262) (16,570) (65,128) (10,132) (22,856) 3,543  (79,544) (311,949)
Less: reconciling adjustments(2)(3)
(970) —  (25) —  —  (2,137) —  (3,132)
Net effective spread 36,180  8,601  6,159  5,610  8,995  33,694  2,150  101,389 
Guarantee and commitment fees(3)
4,550  278  202  851  417  —  —  6,298 
Other income/(expense)
(766) (16) —  —  —  —  (163) (945)
(Provision for)/release of losses (268) (11,096) (190) (4,658) 106  —  21  (16,085)
Operating expenses(1)
(7,328) (2,730) (1,174) (1,415) (1,716) (3,129) (899) (18,391)
Income tax (expense)/benefit (6,797) 1,042  (1,049) (81) (1,638) (6,419) (233) (15,175)
Segment core earnings
$ 25,571  $ (3,921) $ 3,948  $ 307  $ 6,164  $ 24,146  $ 876  $ 57,091 
Reconciliation to net income:
Net effects of derivatives and trading securities
$ 789 
Unallocated (expenses)/income
(12,590)
Income tax effect related to reconciling items 2,634 
 Net income
$ 47,924 
Total Assets:
Total on- and off-balance sheet segment assets at principal balance
$ 19,564,916  $ 1,950,536  $ 7,860,622  $ 1,532,206  $ 2,443,289  $ —  $ —  $ 33,351,569 
Off-balance sheet assets under management
(5,765,446)
Unallocated assets
7,784,034 
Total assets on the consolidated balance sheets
$ 35,370,157 
(1)The significant expense categories and amounts align with the segment-level information that is regularly provided to the Chief Operating Decision Maker.
(2)Includes the amortization of premiums and discounts on assets consolidated at fair value, originally included in interest income, to reflect core earnings amounts; the reclassification of interest expense related to interest rate swaps not designated as hedges, which are included in "(Losses)/gains on financial derivatives" on the consolidated financial statements, to determine the effective funding cost for each operating segment; and excludes the fair value changes of financial derivatives and the corresponding assets or liabilities designated in fair value hedge accounting relationships.
(3)Includes the reclassification of interest income and interest expense from consolidated trusts owned by third parties to guarantee and commitment fees, to reflect management's view that the net interest income Farmer Mac earns is effectively a guarantee fee.

13


Supplemental Information
The following table sets forth information about outstanding volume in each of Farmer Mac's lines of business as of the dates indicated:

Outstanding Business Volume
On or Off
Balance Sheet
As of December 31, 2025 As of December 31, 2024
(in thousands)
Agricultural Finance:
Farm & Ranch:
Loans On-balance sheet $ 6,002,738  $ 5,414,732 
Loans held in consolidated trusts:
Single-class consolidated trusts(1)
On-balance sheet 829,391  885,295 
Structured consolidated trusts(1)
On-balance sheet 1,652,619  1,152,988 
IO-FMGS(2)
On-balance sheet 8,040  8,710 
USDA Securities On-balance sheet 2,443,432  2,402,423 
AgVantage Securities(2)
On-balance sheet 4,270,000  4,720,000 
LTSPCs and unfunded loan commitments Off-balance sheet 3,591,079  3,070,554 
Other Farmer Mac Guaranteed Securities(3)
Off-balance sheet 386,057  426,310 
Loans serviced for others Off-balance sheet 381,560  525,956 
Total Farm & Ranch $ 19,564,916  $ 18,606,968 
Corporate AgFinance:
Loans On-balance sheet $ 1,460,691  $ 1,381,674 
AgVantage Securities(2)
On-balance sheet 190,977  280,297 
Unfunded loan commitments Off-balance sheet 298,868  225,734 
Total Corporate AgFinance $ 1,950,536  $ 1,887,705 
Total Agricultural Finance $ 21,515,452  $ 20,494,673 
Infrastructure Finance:
Power & Utilities:
Loans On-balance sheet $ 3,548,523  $ 2,886,576 
AgVantage Securities(2)
On-balance sheet 3,967,154  3,521,143 
LTSPCs and unfunded loan commitments Off-balance sheet 344,945  401,647 
Total Power & Utilities
$ 7,860,622  $ 6,809,366 
Broadband Infrastructure:
Loans On-balance sheet $ 1,009,890  $ 622,207 
Unfunded loan commitments
Off-balance sheet 522,316  180,259 
Total Broadband Infrastructure $ 1,532,206  $ 802,466 
Renewable Energy:
Loans On-balance sheet $ 2,202,668  $ 1,265,700 
Unfunded loan commitments Off-balance sheet 240,621  150,825 
Total Renewable Energy $ 2,443,289  $ 1,416,525 
Total Infrastructure Finance $ 11,836,117  $ 9,028,357 
Total $ 33,351,569  $ 29,523,030 
(1)The securities issued by these trusts are referred to as Farmer Mac Guaranteed Securities.
(2)These categories are referred to as Farmer Mac Guaranteed Securities.
(3)Other categories of Farmer Mac Guaranteed Securities that were sold by Farmer Mac to third parties.


14


The following table presents the quarterly net effective spread by segment:
Net Effective Spread
Agricultural Finance  Infrastructure Finance Treasury
Farm &
Ranch
Corporate AgFinance Power & Utilities Broadband Infrastructure Renewable Energy Funding Investments Net Effective Spread
Dollars
Yield
Dollars
Yield
Dollars
Yield
Dollars
Yield
Dollars
Yield
Dollars
Yield
Dollars
Yield
Dollars
Yield
(dollars in thousands)
For the quarter ended:
December 31, 2025 $ 36,180  $ 8,601  $ 6,159  $ 5,610  $ 8,995  $ 33,694  $ 2,150  $ 101,389 
1.06  % 2.07  % 0.34  % 2.42  % 1.74  % 0.41  % 0.11  % 1.22  %
September 30, 2025 34,840  9,047  5,910  4,379  7,730  34,777  1,086  97,769 
1.04  % 2.16  % 0.34  % 2.30  % 1.75  % 0.43  % 0.05  % 1.20  %
June 30, 2025 35,710  8,609  5,636  3,932  6,227  31,668  2,111  93,893 
1.07  % 2.07  % 0.33  % 2.24  % 1.68  % 0.40  % 0.11  % 1.19  %
March 31, 2025 33,885  8,640  5,329  3,566  5,112  31,604  1,854  89,990 
1.01  % 2.09  % 0.32  % 2.27  % 1.55  % 0.41  % 0.10  % 1.17  %
December 31, 2024 32,556  7,891  5,059  3,414  4,859  31,242  2,507  87,528 
0.96  % 1.95  % 0.32  % 2.34  % 1.76  % 0.42  % 0.15  % 1.16  %
September 30, 2024 35,755  6,397  4,785  2,794  3,810  30,912  943  85,396 
1.05  % 1.56  % 0.30  % 2.21  % 1.78  % 0.42  % 0.05  % 1.16  %
June 30, 2024 34,156  7,866  5,253  2,393  2,999  30,268  661  83,596 
0.98  % 1.91  % 0.32  % 2.16  % 1.86  % 0.41  % 0.04  % 1.14  %
March 31, 2024 32,843  7,971  4,890  2,342  2,049  32,474  475  83,044 
0.95  % 2.05  % 0.30  % 2.08  % 1.75  % 0.45  % 0.03  % 1.14  %
December 31, 2023
33,329  8,382  4,916  2,426  1,540  33,361  597  84,551 
0.98  % 2.06  % 0.31  % 2.06  % 1.69  % 0.47  % 0.04  % 1.19  %

15


The following table presents quarterly core earnings reconciled to net income attributable to common stockholders:
Core Earnings by Quarter Ended
December 2025 September 2025 June 2025 March 2025 December 2024 September 2024 June 2024 March 2024 December 2023
(in thousands)
Revenues:
Net effective spread $ 101,389  $ 97,769  $ 93,893  $ 89,990  $ 87,528  $ 85,396  $ 83,596  $ 83,044  $ 84,551 
Guarantee and commitment fees 6,298  6,132  5,874  5,488  5,086  4,997  5,256  4,982  4,865 
Other 224  1,185  742  1,315  (491) 1,133  386  1,077  767 
Total revenues 107,911  105,086  100,509  96,793  92,123  91,526  89,238  89,103  90,183 
Credit related expense/(income):
Provision for/(release of) losses 15,986  7,477  7,713  1,684  3,773  3,428  6,179  (1,801) (626)
Other credit related expense/(income) 1,267  (44) 160  (33) 99  26  51  (69) 51 
Total credit related expense/(income) 17,253  7,433  7,873  1,651  3,872  3,454  6,230  (1,870) (575)
Operating expenses:
Compensation and employee benefits 18,199  17,743  17,631  17,752  15,641  15,237  14,840  18,257  15,523 
General and administrative 11,944  11,052  10,859  10,758  12,452  8,625  8,904  8,255  8,916 
Regulatory fees 863  1,000  1,000  1,000  1,000  725  725  725  725 
Total operating expenses 31,006  29,795  29,490  29,510  29,093  24,587  24,469  27,237  25,164 
Net earnings 59,652  67,858  63,146  65,632  59,158  63,485  58,539  63,736  65,594 
Income tax expense 12,370  11,933  10,114  14,000  9,938  12,681  11,970  13,553  13,881 
Preferred stock dividends 7,286  6,303  5,667  5,666  5,666  5,897  6,792  6,791  6,791 
Core earnings $ 39,996  $ 49,622  $ 47,365  $ 45,966  $ 43,554  $ 44,907  $ 39,777  $ 43,392  $ 44,922 
Reconciling items:
Gains/(losses) on undesignated financial derivatives due to fair value changes $ 447  $ 882  $ (639) $ (2,573) $ 3,084  $ (1,064) $ (359) $ 1,683  $ (836)
Gains/(losses) on hedging activities due to fair value changes 3,107  (137) 2,709  1,099  5,737  205  2,604  3,002  (3,598)
Unrealized (losses)/gains on trading assets (66) (4) (65) (83) 99  (87) (14) (37)
Net effects of amortization of premiums/discounts and deferred gains on assets consolidated at fair value 24  26  25  28  (39) 27  26  31  88 
Net effects of terminations or net settlements on financial derivatives (2,699) (1,934) 255  (1,070) 534  (503) (1,505) (192) (800)
Issuance costs on the retirement of preferred stock —  —  —  —  —  (1,619) —  —  — 
Income tax effect related to reconciling items (171) 245  (480) 526  (1,939) 260  (143) (947) 1,089 
Net income attributable to common stockholders $ 40,638  $ 48,700  $ 49,170  $ 43,985  $ 50,848  $ 42,312  $ 40,313  $ 46,955  $ 40,828 

16
EX-99.2 3 a4q25equitypresentationf.htm EX-99.2 a4q25equitypresentationf
Equity Investor Presentation Fourth Quarter 2025


Forward-Looking Statements 2 This presentation contains “forward-looking statements” within the meaning of the Private Securities Litigation Reform Act of 1995. Such statements include, but are not limited to, statements about Farmer Mac's plans, objectives, expectations, beliefs and intentions and other statements including words such as “may,” “potential,” “believe,” “expect,” “consider,” “intend,” “should,” “could,” “continue,” and “commit,” or the negative of these terms or other comparable terminology. Such statements are based upon the current beliefs and expectations of management of Farmer Mac and are subject to many risks and uncertainties. Actual results may differ materially from the results anticipated in the forward-looking statements and the assumptions and estimates used as a basis for the forward-looking statements. Considering these potential risks and uncertainties, no undue reliance should be placed on any forward-looking statements expressed in this presentation. Various factors or events, both known and unknown, could cause Farmer Mac’s actual results to differ materially from the expectations as expressed or implied by the forward-looking statements in this presentation, including uncertainties about: the availability to Farmer Mac of debt and equity financing and, if available, the reasonableness of rates and terms; legislative, regulatory, or current or future political developments that could affect Farmer Mac, its sources of business, or agricultural or infrastructure industries; fluctuations in the fair value of assets held by Farmer Mac and its subsidiaries; the level of lender interest in Farmer Mac's products and the secondary market provided by Farmer Mac; the general rate of growth in agricultural mortgage and infrastructure indebtedness; the effect of economic conditions stemming from disruptive global events or otherwise on agricultural mortgage or infrastructure lending, borrower repayment capacity, or collateral values, including inflation, fluctuations in interest rates, changes in U.S. trade policies (including tariffs and trade restrictions), fluctuations in export demand for U.S. agricultural products and foreign currency exchange rates, supply chain disruptions, increases in input costs, labor availability, and volatility in commodity prices; the degree to which Farmer Mac is exposed to interest rate risk resulting from fluctuations in Farmer Mac's borrowing costs relative to market indexes; developments in the financial markets, including possible investor, analyst, and rating agency reactions to events involving government-sponsored enterprises, including Farmer Mac; the effects of the Federal Reserve’s efforts to achieve monetary policy normalization to respond to inflation and employment levels; and other factors that could hinder agricultural mortgage lending or borrower repayment capacity, including the effects of severe weather, flooding and drought, or fluctuations in agricultural real estate values. More information about potential factors that could cause results to differ materially from those anticipated in the forward-looking statements include, but are not limited to, those stated in Farmer Mac’s filings from time to time with the Securities and Exchange Commission (the "SEC"), including in Farmer Mac’s Annual Reports on Form 10-K and Quarterly Reports on Form 10- Q, each of which is filed with the SEC, including in the “Risk Factors” section of those filings, as well as Farmer Mac’s other filings with the SEC (including Current Reports on Form 8-K) available at the SEC’s website (www.sec.gov). These reports are also available on Farmer Mac’s website (www.farmermac.com). All forward-looking statements are based on information available to Farmer Mac on the date hereof, and Farmer Mac assumes no obligation to update or revise any forward-looking statements, whether as a result of new information, future events or otherwise, except as required by applicable law. NO OFFER OR SOLICITATION OF SECURITIES This presentation does not constitute an offer to sell or a solicitation of an offer to buy any Farmer Mac security. Farmer Mac securities are offered only in jurisdictions where permissible by offering documents available through qualified securities dealers. Any investor who is considering purchasing a Farmer Mac security should consult the applicable offering documents for the security and their own financial and legal advisors for information about and analysis of the security, the risks associated with the security, and the suitability of the investment for the investor’s particular circumstances. Copyright © 2026 by Farmer Mac. No part of this document may be duplicated, reproduced, distributed, or displayed in public in any manner or by any means without the written permission of Farmer Mac.


Use of Non-Generally Accepted Accounting Principles (GAAP) Financial Measures 3 This presentation is for general informational purposes only, is current only as of December 31, 2025 and should be read in conjunction with Farmer Mac’s Annual Report on Form 10-K filed with the SEC on February 19, 2026. In the accompanying analysis of its financial information, Farmer Mac uses the following non-GAAP financial measures: core earnings, core earnings per share, and net effective spread. Farmer Mac uses these non-GAAP measures to measure corporate economic performance and develop financial plans because, in management's view, they are useful alternative measures in understanding Farmer Mac's economic performance, transaction economics, and business trends. The non-GAAP financial measures that Farmer Mac uses may not be comparable to similarly labeled non-GAAP financial measures disclosed by other companies. Farmer Mac's disclosure of these non-GAAP financial measures is intended to be supplemental in nature and is not meant to be considered in isolation from, as a substitute for, or as more important than, the related financial information prepared in accordance with GAAP. For a reconciliation of core earnings to GAAP net income attributable to common stockholders and a reconciliation of net effective spread to GAAP net interest income, please refer to pages 23-24 of the Appendix. Core earnings and core earnings per share principally differ from net income attributable to common stockholders and earnings per common share, respectively, by excluding the effects of fair value fluctuations. These fluctuations are not expected to have a cumulative net impact on Farmer Mac's financial condition or results of operations reported in accordance with GAAP if the related financial instruments are held to maturity, as is expected. Core earnings and core earnings per share also differ from net income attributable to common stockholders and earnings per common share, respectively, by excluding specified infrequent or unusual transactions that Farmer Mac believes are not indicative of future operating results and that may not reflect the trends and economic financial performance of Farmer Mac's core business. Farmer Mac uses net effective spread to measure the net spread Farmer Mac earns between its interest-earning assets and the related net funding costs of these assets. Net effective spread differs from net interest income and net interest yield because it excludes: (1) the interest income and interest expense associated with the consolidated trusts and the average balance of the loans underlying these trusts; and (2) the fair value changes of financial derivatives and the corresponding assets or liabilities designated in fair value hedge accounting relationships. Net effective spread also principally differs from net interest income and net interest yield because it includes the accrual of income and expense related to the contractual amounts due on financial derivatives that are not designated in hedge accounting relationships ("undesignated financial derivatives") and the net effects of terminations or net settlements on financial derivatives, which consists of: the net effects of cash settlements on agency forward contracts on the debt of other government-sponsored enterprises (“GSEs”) and U.S. Treasury security futures that we use as short-term economic hedges on the issuance of debt; and the net effects of initial cash payments that Farmer Mac receives upon the inception of certain swaps.


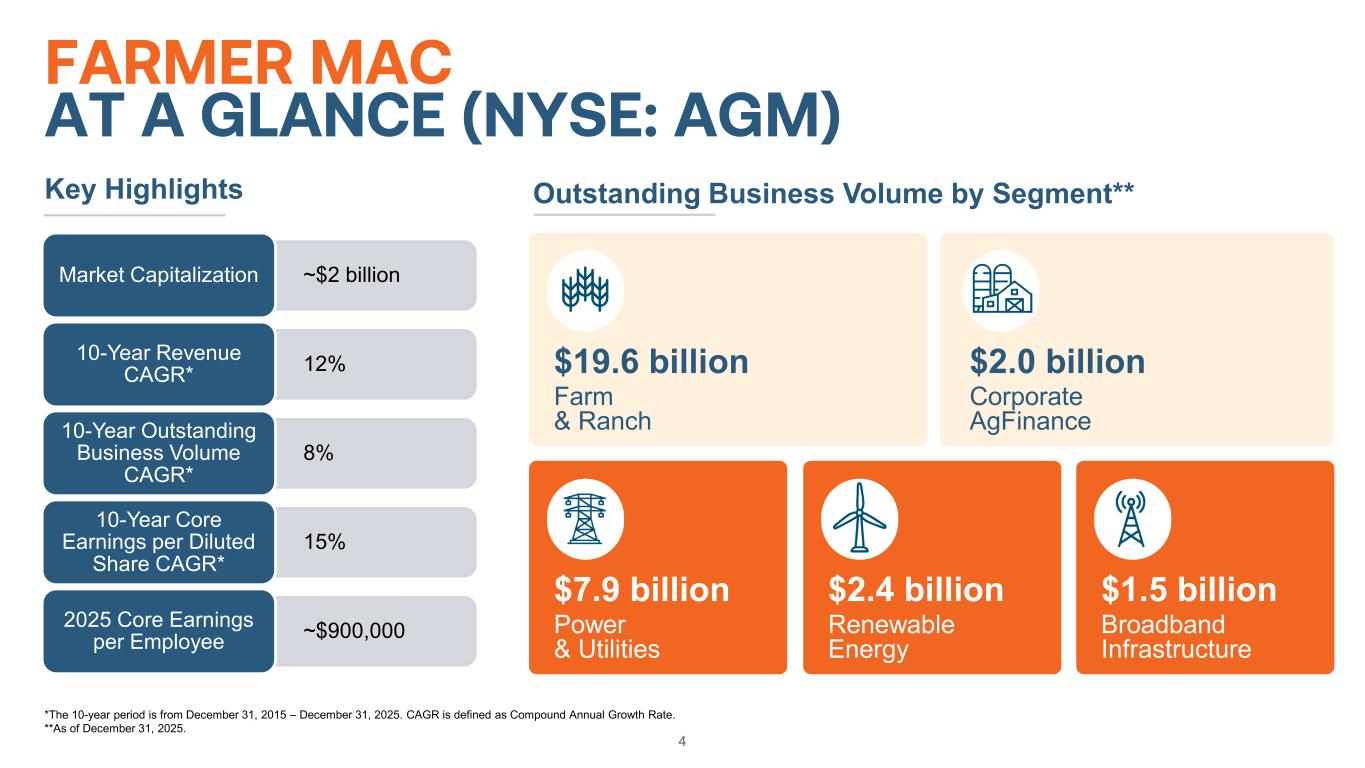
4 FARMER MAC AT A GLANCE (NYSE: AGM) *The 10-year period is from December 31, 2015 – December 31, 2025. CAGR is defined as Compound Annual Growth Rate. **As of December 31, 2025. $19.6 billion Farm & Ranch $2.0 billion Corporate AgFinance $7.9 billion Power & Utilities $2.4 billion Renewable Energy $1.5 billion Broadband Infrastructure Outstanding Business Volume by Segment**Key Highlights ~$2 billionMarket Capitalization 12%10-Year Revenue CAGR* 8% 10-Year Outstanding Business Volume CAGR* 15% 10-Year Core Earnings per Diluted Share CAGR* ~$900,0002025 Core Earnings per Employee


A MISSION-DRIVEN COMPANY 5 TODAY1999 Listed on NYSE (Ticker: AGM) 1990 Charter Amendment: USDA guaranteed securities 1988 Farmer Mac initially chartered as a GSE to create a secondary market for agricultural loans. 1996 Charter Amendment: direct loan purchases 2008 Charter Amendment: rural infrastructure loans With outstanding business volume of over $33 billion, Farmer Mac remains resolute in its commitment to growth, innovation, and mission fulfillment


Unique, Mission-Driven Operating Model directly supports American agriculture and rural infrastructure Nationwide secondary market provider across diverse markets, including agriculture, agribusinesses, broadband infrastructure, power and utilities, and renewable energy GSE funding advantage and disciplined asset liability management Strong safety and soundness oversight from Farm Credit Administration (FCA) through its Office of Secondary Market Oversight (OSMO) 6 HOW WE OPERATE AS A SECONDARY MARKET Operating model excludes issued agricultural mortgage-backed securities and long-term standby purchase commitment credit protection components of our business. Our Operating Model


7 STRONG, DIVERSIFIED VOLUME GROWTH POSITIVE SPREAD EXPANSION $21.9 $23.6 $25.9 $28.5 $29.5 $33.4 0.93% 0.98% 1.02% 1.18% 1.15% 1.20% 0.00% 0.20% 0.40% 0.60% 0.80% 1.00% 1.20% 1.40% $0.0 $5.0 $10.0 $15.0 $20.0 $25.0 $30.0 $35.0 2020 2021 2022 2023 2024 2025 N et Effective Spread (% ) $ in B illi on s Farm & Ranch Corporate AgFinance Power & Utilities Renewable Energy Broadband Infrastructure Total Net Effective Spread


SEGMENT OVERVIEW* 8 % OF OUTSTANDING VOLUME SEGMENT BUSINESS VOLUME* CUSTOMER / MARKET Q4 NET EFFECTIVE SPREAD (%)** Q4 Risk Adjusted Gross Return on Allocated Capital (%) YOY VOLUME GROWTH Agricultural Finance 65% Farm & Ranch $19.6 billion Traditional agricultural real estate mortgage liquidity and wholesale finance liquidity 1.06% 27% 5% Corporate AgFinance $2.0 billion More complex farming operations, agribusinesses focused on food, fuel, and fiber processing, and other agriculture supply chain production 2.07% 20% 3% Infrastructure Finance 35% Power & Utilities $7.9 billion Rural electric generation and transmission cooperatives, distribution cooperatives, and wholesale finance liquidity 0.34% 17% 15% Renewable Energy $2.4 billion Renewable energy generation and storage projects 1.74% 27% 72% Broadband Infrastructure $1.5 billion Rural telecommunication companies including broadband, fiber, wireless, data centers, etc. 2.42% 29% 91% Total $33.4 billion 1.22% 13% *As of December 31, 2025. Each business segment is comprised of both Net Effective Spread and fee income products: Loan Purchases (spread), Wholesale Funding (spread), Purchase Commitments (fee), Loans Serviced for Others (fee). **Net Effective Spread and fees are determined by a variety of factors, including economic factors, market and segment dynamics, credit profile, and asset-liability management.


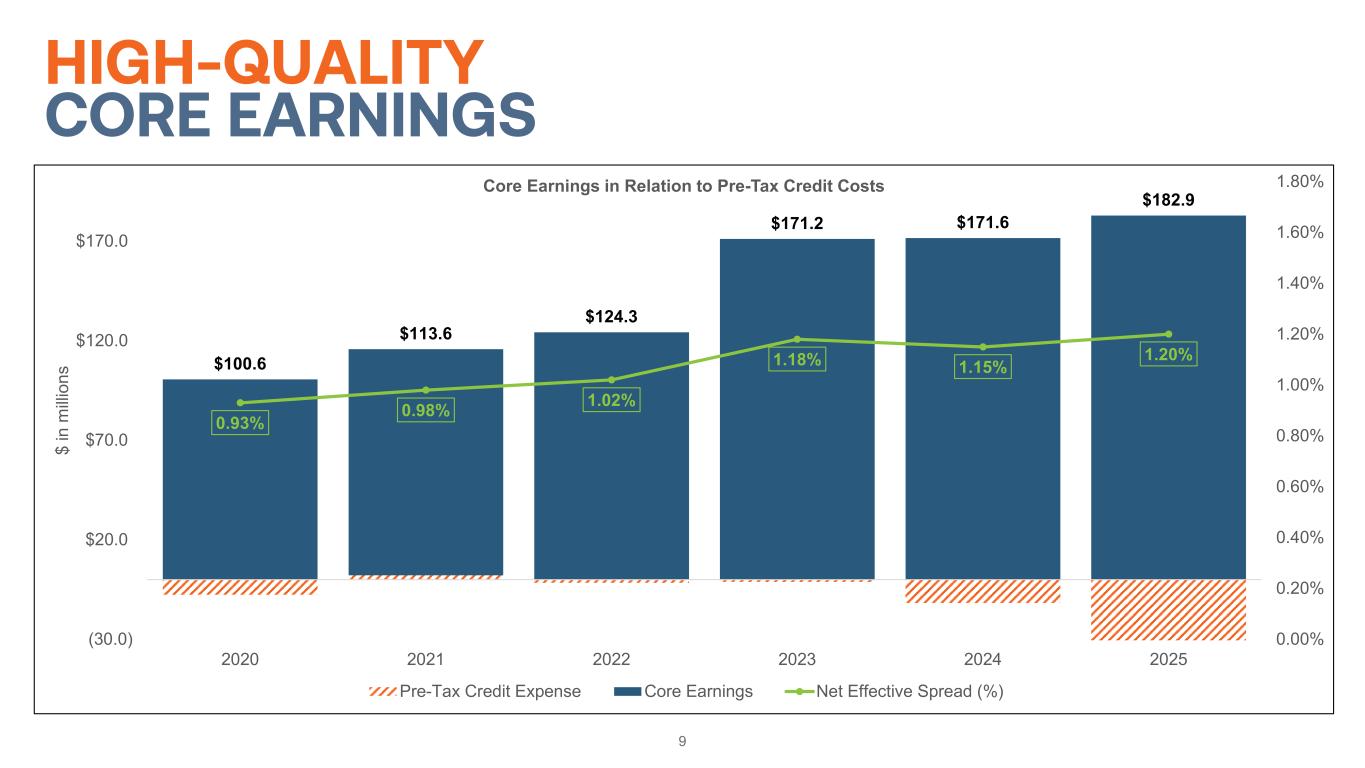
9 HIGH-QUALITY CORE EARNINGS $100.6 $113.6 $124.3 $171.2 $171.6 $182.9 0.93% 0.98% 1.02% 1.18% 1.15% 1.20% 0.00% 0.20% 0.40% 0.60% 0.80% 1.00% 1.20% 1.40% 1.60% 1.80% (30.0) $20.0 $70.0 $120.0 $170.0 2020 2021 2022 2023 2024 2025 $ in m illi on s Core Earnings in Relation to Pre-Tax Credit Costs Pre-Tax Credit Expense Core Earnings Net Effective Spread (%)


10 STRONG UNDERWRITING SUPPORTED BY THOUGHTFUL CREDIT FRAMEWORK $115.0 $126.8 $79.0 $65.2 $168.9 $238.0 15% 13% 22% 28% 15% 17% 0% 5% 10% 15% 20% 25% 30% 35% 40% $- $50 $100 $150 $200 $250 2020 2021 2022 2023 2024 2025 $ in m illi on s Portfolio Performance Nonaccrual - Agricultural Finance Nonaccrual - Infrastructure Finance % Allowance Industry-leading credit evaluation focused on repayment capacity through economic cycles Disciplined due diligence and underwriting approach for counterparties and loan exposures Rigorous underwriting supported by a comprehensive credit framework that aligns with business volume growth


Crops 50% Permanent Plantings 19% Livestock 21% Part-Time Farm 3% Agricultural Storage & Processing 7% By Commodity Type* 11 AGRICULTURAL FINANCE LOAN PORTFOLIO DIVERSIFICATION Northwest 11% Southwest 27% Mid-North 26% Mid-South 20% Northeast 4% Southeast 12% By Geographic Region* $14.0B $14.0B Agricultural Update** • USDA’s Economic Research Service estimates $158.5 billion in net cash incomes in 2026, an increase from the forecasted 2025 and actual 2024 incomes. * As of December 31, 2025. **USDA, Economic Research Service U.S. and State-Level Farm Income and Wealth Statistic (https://www.ers.usda.gov/data-products/farm-income-and-wealth-statistics/data-files-us-and-state-level-farm-income-and-wealth-statistics/).


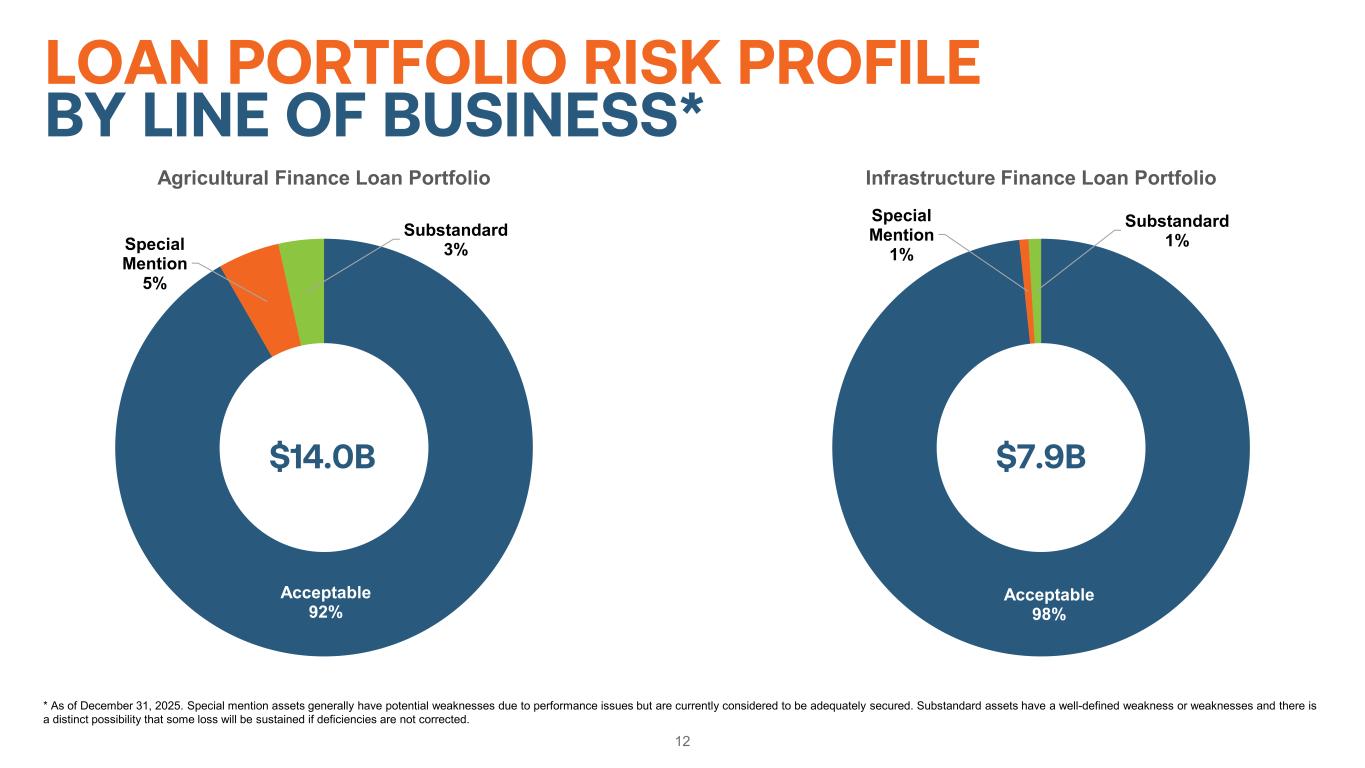
Acceptable 92% Special Mention 5% Substandard 3% Agricultural Finance Loan Portfolio 12 LOAN PORTFOLIO RISK PROFILE BY LINE OF BUSINESS* Acceptable 98% Special Mention 1% Substandard 1% Infrastructure Finance Loan Portfolio $14.0B $7.9B * As of December 31, 2025. Special mention assets generally have potential weaknesses due to performance issues but are currently considered to be adequately secured. Substandard assets have a well-defined weakness or weaknesses and there is a distinct possibility that some loss will be sustained if deficiencies are not corrected.


13 LIQUIDITY- INVESTMENT PORTFOLIO Farmer Mac maintains an investment portfolio to provide back-up source of liquidity in excess of regulatory requirements • Minimum of 90 days of liquidity required by regulation $7.8 billion investment portfolio on December 31, 2025 • Cash and high-quality investment securities • Conservative portfolio goals • Minimize exposure to market volatility • Preservation of capital • Ready access to cash • Provided 277 days of liquidity as of December 31, 2025 Farmer Mac also has $1.5 billion line of credit with U.S. Treasury • Supports Farmer Mac’s guarantee obligations • Farmer Mac has not utilized this line of credit Cash & Equiv. 12% Guaranteed By GSEs and U.S. Gov't Agencies 88% Liquidity Portfolio* $7.8B *As of December 31, 2025. Percentages may not add to 100 due to rounding


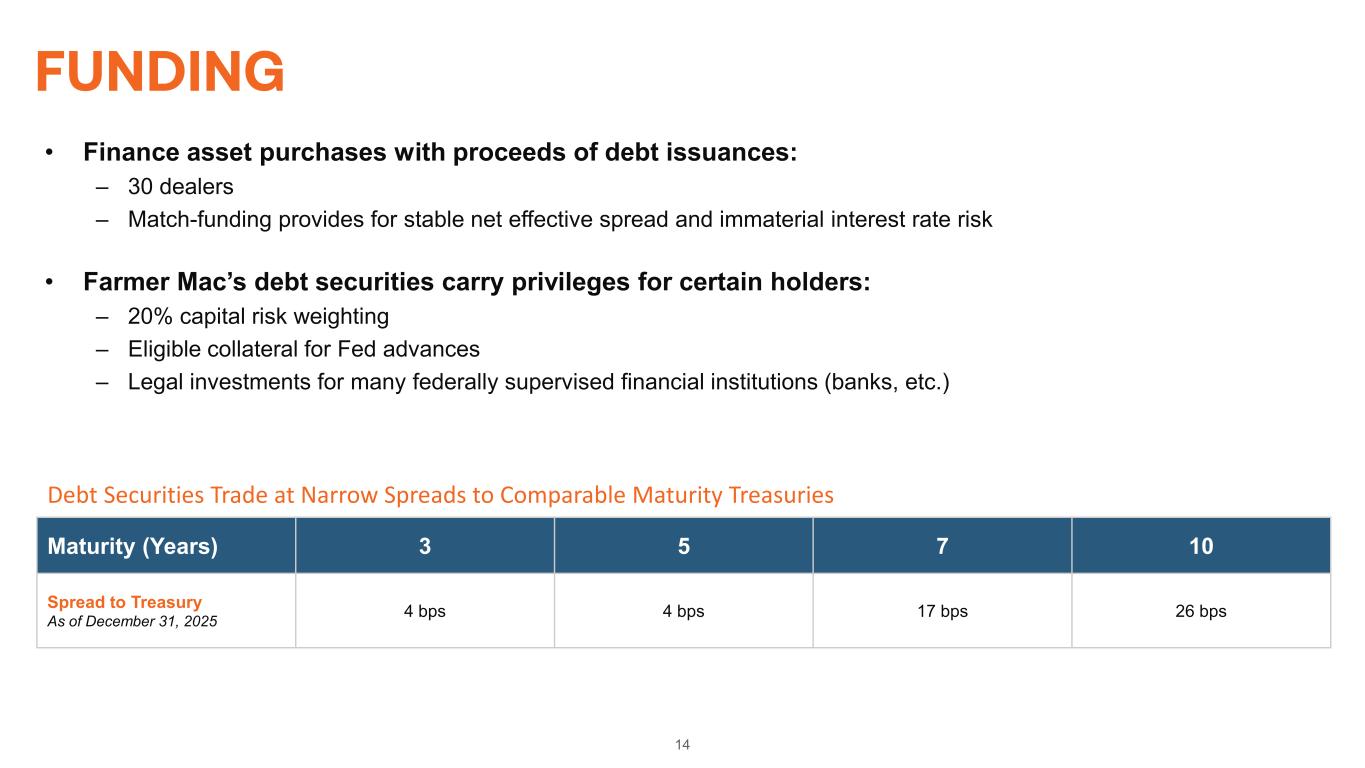
14 FUNDING • Finance asset purchases with proceeds of debt issuances: – 30 dealers – Match-funding provides for stable net effective spread and immaterial interest rate risk • Farmer Mac’s debt securities carry privileges for certain holders: – 20% capital risk weighting – Eligible collateral for Fed advances – Legal investments for many federally supervised financial institutions (banks, etc.) Debt Securities Trade at Narrow Spreads to Comparable Maturity Treasuries Maturity (Years) 3 5 7 10 Spread to Treasury As of December 31, 2025 4 bps 4 bps 17 bps 26 bps


Consistent and strong earnings contribute to a robust capital base, further supporting future volume growth and shareholder returns Opportunistic access to low-cost Preferred Stock has strengthened Tier 1 capital position • Preferred Series D in May 2019 @ 5.700% • Preferred Series E in May 2020 @ 5.750% • Preferred Series F in August 2020 @ 5.250% • Preferred Series G in May 2021 @ 4.875% • Preferred Series H in August 2025 @ 6.500% 15 *Statutory Minimum Core Capital defined as total stockholders’ equity less accumulated other comprehensive income. $1,006 $1,210 $1,323 $1,452 $1,501 $1,706 14.1% 14.7% 14.9% 15.4% 14.2% 13.3% 0.0% 5.0% 10.0% 15.0% 20.0% 25.0% 30.0% $0 $400 $800 $1,200 $1,600 $2,000 2020 2021 2022 2023 2024 2025 Tier 1 Capital Ratio (% ) Co re C ap ita l ($ in m ill io ns ) Core Capital Amount Above Statutory Minimum Capital Statutory Minimum Core Capital* Tier 1 Capital Ratio STRONG CAPITAL BASE SUPPORTING GROWTH


16 QUALITY EARNINGS DRIVE STRONG SHAREHOLDER RETURNS $35 $38 $41 $48 $61 $78 34% 33% 33% 28% 36% 36% 0% 10% 20% 30% 40% 50% 60% 70% 80% 90% 100% $0 $10 $20 $30 $40 $50 $60 $70 $80 2020 2021 2022 2023 2024 2025 Core Earnings Payout Ratio (% ) $ in m ill io ns Common Stock Dividends Share Repurchase Payout Ratio Strong earnings and consistent capital position support continued dividend growth • 2026 marks the 15th consecutive year of increased quarterly dividends for Farmer Mac Farmer Mac is committed to strong shareholder returns, including responsible dividend growth • Previous and expected future earnings growth • An adequate level of capital that exceeds our requirements • Expectations for future business volume growth Dividend Yield (as of 12/31/2025) Dividend CAGR (2021 - 2026) Farmer Mac 3.4% 12.7% S&P 500 1.1% 5.5% Russell 2000 1.3% 8.5%


KEY TAKEAWAYS Unique, mission-driven operating model directly supports American agriculture and rural infrastructure Nationwide secondary market provider across diverse markets, including agriculture, agribusinesses, broadband infrastructure, power and utilities, and renewable energy GSE funding advantage & disciplined asset liability management Quality assets with minimal lifetime losses of only 0.15% on total cumulative business volume of $43 billion Resilient business model supports consistent dividend growth 17 16% 16% 19% 17% 16% 0% 5% 10% 15% 20% 25% 2021 2022 2023 2024 2025 *The 10-year period is from December 31, 2015 – December 31, 2025. CAGR is defined as Compound Annual Growth Rate. **Core Return on Common Equity is defined as core earnings divided by average common equity. ~$2 BillionMarket Capitalization 12%10-Year Revenue CAGR* 8%10-Year Outstanding Business Volume CAGR* 15%10-Year Core Earnings per Share CAGR* ~$900,0002025 Core Earnings per Employee Core Return on Common Equity** Investment Highlights


Jalpa Nazareth Senior Director – Investor Relations & Finance Strategy Phone: (202) 872-5570 Email: jnazareth@farmermac.com CONTACT INVESTOR RELATIONS


APPENDIX


20 KEY COMPANY METRICS* ($ in thousands, except per share amounts) 2025 2024 2023 2022 2021 2020 Core Earnings $182,949 $171,630 $171,156 $124,314 $113,570 $100,612 Core Earnings per Diluted Share $16.66 $15.64 $15.65 $11.42 $10.47 $9.33 Net Effective Spread ($) $383,041 $339,564 $326,980 $255,529 $220,668 $196,956 Net Effective Spread (%) 1.20% 1.15% 1.18% 1.02% 0.98% 0.93% Guarantee & Commitment Fees $23,792 $20,321 $18,928 $18,144 $17,533 $19,150 Core Capital Above Statutory Minimum $677,695 $583,527 $589,400 $516,900 $496,800 $331,400 Common Stock Dividends per Share $6.00 $5.60 $4.40 $3.80 $3.52 $3.20 Outstanding Business Volume $33,351,569 $29,523,030 $28,471,024 $25,922,082 $23,614,463 $21,929,095 90-Day Delinquencies 0.40% 0.37% 0.12% 0.17% 0.20% 0.21% Recovery/(Credit Losses) ($19,824) ($4,694) $0 ($903) $1,054 ($5,759) Book Value per Share** $112.77 $97.85 $89.24 $77.61 $67.37 $60.41 Core Earnings Return on Equity 16% 17% 19% 16% 16% 16% *Core earnings, core earnings per diluted share, and net effective spread are non-GAAP measures. For more information on the use of these non-GAAP measures, please see page 3. **Book Value per Share excludes accumulated other comprehensive income.


21 EQUITY CAPITAL STRUCTURE *Common stock dividend annualized divided by quarter-end closing price. **Par value of annual dividend for preferred stock. Summary Stratifications NYSE Ticker Dividend Yield Shares Outstanding COMMON STOCK CLASS A VOTING COMMON STOCK • Ownership restricted to non-Farm Credit System financial institutions AGM.A 4.53%* 1.0 million CLASS B VOTING COMMON STOCK • Ownership restricted to Farm Credit System institutions – – 0.5 million CLASS C NON-VOTING COMMON STOCK • No ownership restrictions AGM 3.42%* 9.4 million PREFERRED STOCK SERIES D NON-CUMULATIVE PREFERRED STOCK • Option to redeem on any payment date on or after July 17, 2024 • Redemption Value: $25 per share AGM.PR.D 5.700%** 4.0 million SERIES E NON-CUMULATIVE PREFERRED STOCK • Option to redeem on any payment date on or after July 17, 2025 • Redemption Value: $25 per share AGM.PR.E 5.750%** 3.2 million SERIES F NON-CUMULATIVE PREFERRED STOCK • Option to redeem on any payment date on or after October 18, 2025 • Redemption Value: $25 per share AGM.PR.F 5.250%** 4.8 million SERIES G NON-CUMULATIVE PREFERRED STOCK • Option to redeem on any payment date on or after July 17, 2026 • Redemption Value: $25 per share AGM.PR.G 4.875%** 5.0 million SERIES H NON-CUMULATIVE PREFERRED STOCK • Option to redeem on any payment date on or after October 17, 2030 • Redemption Value: $25 per share AGM.PR.H 6.500%** 4.0 million As of December 31, 2025


Summary Stratifications FARM 2025-2 FARM 2025-1 FARM 2024-2 FARM 2024-1 FARM 2023-1 FARM 2022-1 FARM 2021-1 Number of Loans 343 350 450 443 408 450 384 Aggregate Original Principal Balance $316,818,115 $303,752,169 $333,180,875 $319,217,162 $295,304,891 $306,580,153 $312,087,524 Average Original Principal Balance $923,668 $867,752 $740,401 $720,581 $723,787 $681,289 $812,728 Aggregate Current Principal Balance $313,508,080 $300,090,019 $323,224,686 $308,090,132 $283,591,174.54 $301,105,804.00 $302,744,110.69 Average Current Principal Balance $914,018 $857,400 $718,277 $695,463 $695,076 $669,124 $788,396 Product Type 5yr VRM (70.25%) Fixed (20.42%) 10yr VRM (8.31%) 15yr VRM (1.02%) 5yr VRM (79.53%) Fixed (15.44%) 10yr VRM (3.52%) 15yr VRM (1.51%) 5yr VRM (62.04%) Fixed (22.53%) 15yr VRM (8.58%) 10yr VRM (6.84%) Fixed (41.02%) 5yr VRM (37.44%) 10yr VRM (14.12%) 15yr VRM (7.43%) Fixed (80.02%) 15yr VRM (19.98%) Fixed (82.35%) 15yr VRM (17.65%) Fixed (82.41%) 15yr VRM (17.59%) Non-Zero Weighted Average Debt Coverage Ratio 1.81x 2.14x 1.66x 1.93x 2.05x 2.04x 1.56x Non-Zero Weighted Average Debt-to-Asset Ratio 32.95% 35.57% 31.88% 30.35% 32.33% 33.12% 33.74% Weighted Average Original LTV 53.36% 50.68% 47.50% 50.54% 49.44% 49.21% 41.55% Weighted Average Current LTV 52.99% 50.24% 46.29% 49.01% 47.59% 48.39% 43.23% Weighted Average Current Net Rate 5.70% 5.63% 5.58% 5.12% 3.03% 2.94% 3.25% Weighted Average Current Gross Rate 6.76% 6.72% 6.63% 6.07% 3.89% 3.88% 4.24% Top 5 States (by Aggregate Principal Balance) CA (16.27%) MN (10.37%) MO (9.98%) OR (8.54%) TX (6.74%) CA (21.32%) TX (13.14%) MN (7.51%) IL (7.00%) SD (6.32%) CA (21.61%) TX (8.87%) MN (6.67%) MO (5.78%) NE (5.42%) CA (24.07%) NE (10.01%) OR (7.60%) TX (7.46%) SD (4.97%) MN (16.55%) CA (10.76%) MO (9.46%) IL (9.28%) NE (8.40%) MN (16.65%) CA (13.11%) NE (9.14%) MO (7.78%) IL (6.78%) CA (17.45%) MN (15.00%) OR (8.65%) MO (8.29%) IL (8.02%) Values indicated are as of each transaction’s respective cut-off date at issuance. FARM SECURITIZATION COLLATERAL COMPARISON 22


23 RECONCILIATION OF NET INCOME TO CORE EARNINGS Core Earnings by Period Ended $ in thousands 2025 2024 2023 2022 2021 2020 Net income attributable to common stockholders $182,493 $180,428 $172,838 $150,979 $111,413 $89,176 Less reconciling items (Losses)/gains on undesignated financial derivatives due to fair value changes (1,883) 3,344 5,142 13,495 (1,430) (3,691) Gains/(losses) on hedging activities due to fair value changes 6,778 11,548 (5,394) 5,343 (1,809) (10,019) Unrealized (losses)/gains on trading securities (126) (85) 1,979 (917) (115) 51 Net effects of amortization of premiums/discounts and deferred gains on assets consolidated at fair value 103 45 175 39 130 58 Net effects of terminations or net settlements on financial derivatives (5,448) (1,666) 227 15,794 494 1,236 Issuance costs on retirement of preferred stock - (1,619) - - - (1,667) Income tax effect related to reconciling items 120 (2,769) (447) (7,089) 573 2,596 Sub-total (456) 8,798 1,682 26,665 (2,157) (11,436) Core earnings $182,949 $171,630 $171,156 $124,314 $113,570 $100,612 As of December 31, 2025


24 RECONCILIATION OF NET INTEREST INCOME TO NET EFFECTIVE SPREAD 2025 2024 2023 2022 2021 2020 $ in thousands Dollars Yield Dollars Yield Dollars Yield Dollars Yield Dollars Yield Dollars Yield Net interest income/yield $390,734 1.19% $353,867 1.16% $327,547 1.15% $270,940 1.04% $221,951 0.87% $190,588 0.85% Net effects of consolidated trusts (4,072) 0.02% (4,477) 0.02% (4,171) 0.02% (4,239) 0.02% (4,864) 0.02% (6,601) 0.02% Expense related to undesignated financial derivatives (441) 0.00% (1,377) 0.00% (4,845) -0.02% (7,756) -0.03% 2,841 0.02% 3,468 0.02% Amortization of premiums/discounts on assets consolidated at fair value (92) 0.00% (29) 0.00% (175) 0.00% (24) 0.00% (45) 0.00% 197 0.00% Amortization of losses due to terminations or net settlements on financial derivatives 3,690 0.01% 3,128 0.01% 3,230 0.01% 2,413 0.01% 446 0.00% 120 0.00% Fair Value Changes on fair value hedge relationships (6,778) -0.02% (11,548) -0.04% 5,394 0.02% (5,805) -0.02% 339 0.02% 9,184 0.04% Net Effective Spread $383,041 1.20% $339,564 1.15% $326,980 1.18% $255,529 1.02% $220,668 0.93% $196,956 0.93% As of December 31, 2025


25