|
Federally chartered instrumentality
of the United States
|
001-14951 | 52-1578738 | ||||||||||||
|
(State or Other Jurisdiction
of Incorporation)
|
(Commission
File Number)
|
(IRS Employer Identification No.) | ||||||||||||
| 1999 K Street, N.W., 4th Floor, | 20006 | |||||||||||||
| Washington, | DC | |||||||||||||
| (Address of Principal Executive Offices) | (Zip Code) | |||||||||||||
| Title of each class | Trading symbol | Exchange on which registered | ||||||||||||
| Class A voting common stock | AGM.A | New York Stock Exchange | ||||||||||||
| Class C non-voting common stock | AGM | New York Stock Exchange | ||||||||||||
| 5.700% Non-Cumulative Preferred Stock, Series D | AGM.PRD | New York Stock Exchange | ||||||||||||
| 5.750% Non-Cumulative Preferred Stock, Series E | AGM.PRE | New York Stock Exchange | ||||||||||||
| 5.250% Non-Cumulative Preferred Stock, Series F | AGM.PRF | New York Stock Exchange | ||||||||||||
| 4.875% Non-Cumulative Preferred Stock, Series G | AGM.PRG | New York Stock Exchange | ||||||||||||

| $ in thousands, except per share amounts | Quarter Ended | ||||||||||||||||
| June 30, 2024 | March 31, 2024 | June 30, 2023 | Sequential % Change | YOY % Change | |||||||||||||
| Net Change in Business Volume |
$(88,891) | $376,206 | $252,934 | N/A | N/A | ||||||||||||
| Net Interest Income (GAAP) | $87,340 | $86,368 | $78,677 | 1% | 11% | ||||||||||||
| Net Effective Spread (Non-GAAP) |
$83,596 | $83,044 | $81,832 | 1% | 2% | ||||||||||||
| Diluted EPS (GAAP) | $3.68 | $4.28 | $3.70 | (14)% | (1)% | ||||||||||||
| Core EPS (Non-GAAP) | $3.63 | $3.96 | $3.86 | (8)% | (6)% | ||||||||||||
| As of | |||||||||||
| June 30, 2024 | December 31, 2023 | ||||||||||
| (in thousands) | |||||||||||
| Assets: | |||||||||||
| Cash and cash equivalents | $ | 922,961 | $ | 888,707 | |||||||
| Investment securities: | |||||||||||
| Available-for-sale, at fair value (amortized cost of $5,410,032 and $5,060,135, respectively) | 5,248,715 | 4,918,931 | |||||||||
| Held-to-maturity, at amortized cost | 9,270 | 53,756 | |||||||||
| Other investments | 7,398 | 6,817 | |||||||||
| Total Investment Securities | 5,265,383 | 4,979,504 | |||||||||
| Farmer Mac Guaranteed Securities: | |||||||||||
| Available-for-sale, at fair value (amortized cost of $5,755,298 and $5,825,433, respectively) | 5,399,151 | 5,532,479 | |||||||||
| Held-to-maturity, at amortized cost | 3,929,068 | 4,213,069 | |||||||||
| Total Farmer Mac Guaranteed Securities | 9,328,219 | 9,745,548 | |||||||||
| USDA Securities: | |||||||||||
| Trading, at fair value | 1,026 | 1,241 | |||||||||
| Held-to-maturity, at amortized cost | 2,330,535 | 2,354,171 | |||||||||
| Total USDA Securities | 2,331,561 | 2,355,412 | |||||||||
| Loans: | |||||||||||
| Loans held for investment, at amortized cost | 10,041,653 | 9,623,119 | |||||||||
| Loans held for investment in consolidated trusts, at amortized cost | 1,761,355 | 1,432,261 | |||||||||
| Allowance for losses | (16,500) | (16,031) | |||||||||
| Total loans, net of allowance | 11,786,508 | 11,039,349 | |||||||||
| Financial derivatives, at fair value | 53,686 | 37,478 | |||||||||
| Accrued interest receivable (includes $21,711 and $16,764, respectively, related to consolidated trusts) | 285,774 | 287,128 | |||||||||
| Guarantee and commitment fees receivable | 46,754 | 49,832 | |||||||||
| Deferred tax asset, net | — | 8,470 | |||||||||
| Prepaid expenses and other assets | 173,468 | 132,954 | |||||||||
| Total Assets | $ | 30,194,314 | $ | 29,524,382 | |||||||
| Liabilities and Equity: | |||||||||||
| Liabilities: | |||||||||||
| Notes payable | $ | 26,542,671 | $ | 26,336,542 | |||||||
| Debt securities of consolidated trusts held by third parties | 1,662,549 | 1,351,069 | |||||||||
| Financial derivatives, at fair value | 118,421 | 117,131 | |||||||||
| Accrued interest payable (includes $10,275 and $9,407, respectively, related to consolidated trusts) | 194,171 | 181,841 | |||||||||
| Guarantee and commitment obligation | 44,758 | 47,563 | |||||||||
| Accounts payable and accrued expenses | 125,267 | 76,662 | |||||||||
| Deferred tax liability, net | 3,804 | — | |||||||||
| Reserve for losses | 1,694 | 1,711 | |||||||||
| Total Liabilities | 28,693,335 | 28,112,519 | |||||||||
| Commitments and Contingencies | |||||||||||
| Equity: | |||||||||||
| Preferred stock: | |||||||||||
| Series C, par value $25 per share, 3,000,000 shares authorized, issued and outstanding | 73,382 | 73,382 | |||||||||
| Series D, par value $25 per share, 4,000,000 shares authorized, issued and outstanding | 96,659 | 96,659 | |||||||||
Series E, par value $25 per share, 3,180,000 shares authorized, issued and outstanding |
77,003 | 77,003 | |||||||||
| Series F, par value $25 per share, 4,800,000 shares authorized, issued and outstanding | 116,160 | 116,160 | |||||||||
| Series G, par value $25 per share, 5,000,000 shares authorized, issued and outstanding | 121,327 | 121,327 | |||||||||
| Common stock: | |||||||||||
| Class A Voting, $1 par value, no maximum authorization, 1,030,780 shares outstanding | 1,031 | 1,031 | |||||||||
| Class B Voting, $1 par value, no maximum authorization, 500,301 shares outstanding | 500 | 500 | |||||||||
| Class C Non-Voting, $1 par value, no maximum authorization, 9,350,240 shares and 9,310,872 shares outstanding, respectively | 9,350 | 9,311 | |||||||||
| Additional paid-in capital | 134,143 | 132,919 | |||||||||
| Accumulated other comprehensive loss, net of tax | (9,141) | (40,145) | |||||||||
| Retained earnings | 880,565 | 823,716 | |||||||||
| Total Equity | 1,500,979 | 1,411,863 | |||||||||
| Total Liabilities and Equity | $ | 30,194,314 | $ | 29,524,382 | |||||||
| For the Three Months Ended | For the six months ended | ||||||||||||||||||||||
| June 30, 2024 | June 30, 2023 | June 30, 2024 | June 30, 2023 | ||||||||||||||||||||
| (in thousands, except per share amounts) | |||||||||||||||||||||||
| Interest income: | |||||||||||||||||||||||
| Investments and cash equivalents | $ | 84,538 | $ | 69,779 | $ | 169,462 | $ | 129,482 | |||||||||||||||
| Farmer Mac Guaranteed Securities and USDA Securities | 166,063 | 144,761 | 332,876 | 281,298 | |||||||||||||||||||
| Loans | 153,105 | 129,292 | 297,685 | 248,324 | |||||||||||||||||||
| Total interest income | 403,706 | 343,832 | 800,023 | 659,104 | |||||||||||||||||||
| Total interest expense | 316,366 | 265,155 | 626,315 | 501,369 | |||||||||||||||||||
| Net interest income | 87,340 | 78,677 | 173,708 | 157,735 | |||||||||||||||||||
| Provision for losses | (6,179) | (1,073) | (4,378) | (1,620) | |||||||||||||||||||
| Net interest income after provision for losses | 81,161 | 77,604 | 169,330 | 156,115 | |||||||||||||||||||
| Non-interest income/(expense): | |||||||||||||||||||||||
| Guarantee and commitment fees | 3,797 | 3,489 | 7,714 | 7,422 | |||||||||||||||||||
| (Losses)/gains on financial derivatives | (1,799) | 1,693 | 280 | 2,092 | |||||||||||||||||||
| Losses on sale of mortgage loans | (1,147) | — | (1,147) | — | |||||||||||||||||||
| Gains on sale of available-for-sale investment securities | 1,052 | — | 1,052 | — | |||||||||||||||||||
| (Provision for)/release of reserve for losses | (51) | (69) | 18 | (272) | |||||||||||||||||||
| Other income | 674 | 758 | 1,923 | 1,984 | |||||||||||||||||||
| Non-interest income | 2,526 | 5,871 | 9,840 | 11,226 | |||||||||||||||||||
| Operating expenses: | |||||||||||||||||||||||
| Compensation and employee benefits | 14,840 | 13,937 | 33,097 | 29,288 | |||||||||||||||||||
| General and administrative | 8,904 | 9,420 | 17,159 | 16,947 | |||||||||||||||||||
| Regulatory fees | 725 | 831 | 1,450 | 1,666 | |||||||||||||||||||
| Operating expenses | 24,469 | 24,188 | 51,706 | 47,901 | |||||||||||||||||||
| Income before income taxes | 59,218 | 59,287 | 127,464 | 119,440 | |||||||||||||||||||
| Income tax expense | 12,113 | 12,075 | 26,613 | 25,193 | |||||||||||||||||||
| Net income | 47,105 | 47,212 | 100,851 | 94,247 | |||||||||||||||||||
| Preferred stock dividends | (6,792) | (6,791) | (13,583) | (13,582) | |||||||||||||||||||
| Net income attributable to common stockholders | $ | 40,313 | $ | 40,421 | $ | 87,268 | $ | 80,665 | |||||||||||||||
| Earnings per common share: | |||||||||||||||||||||||
| Basic earnings per common share | $ | 3.71 | $ | 3.73 | $ | 8.04 | $ | 7.46 | |||||||||||||||
| Diluted earnings per common share | $ | 3.68 | $ | 3.70 | $ | 7.96 | $ | 7.39 | |||||||||||||||
| Reconciliation of Net Income Attributable to Common Stockholders to Core Earnings | |||||||||||||||||
| For the Three Months Ended | |||||||||||||||||
| June 30, 2024 | March 31, 2024 | June 30, 2023 | |||||||||||||||
| (in thousands, except per share amounts) | |||||||||||||||||
| Net income attributable to common stockholders | $ | 40,313 | $ | 46,955 | $ | 40,421 | |||||||||||
| Less reconciling items: | |||||||||||||||||
| (Losses)/gains on undesignated financial derivatives due to fair value changes | (359) | 1,683 | 2,141 | ||||||||||||||
| Gains/(losses) on hedging activities due to fair value changes | 2,604 | 3,002 | (4,901) | ||||||||||||||
| Unrealized losses on trading assets | (87) | (14) | (57) | ||||||||||||||
| Net effects of amortization of premiums/discounts and deferred gains on assets consolidated at fair value | 26 | 31 | 29 | ||||||||||||||
| Net effects of terminations or net settlements on financial derivatives | (1,505) | (192) | 583 | ||||||||||||||
| Income tax effect related to reconciling items | (143) | (947) | 464 | ||||||||||||||
| Sub-total | 536 | 3,563 | (1,741) | ||||||||||||||
| Core earnings | $ | 39,777 | $ | 43,392 | $ | 42,162 | |||||||||||
| Composition of Core Earnings: | |||||||||||||||||
| Revenues: | |||||||||||||||||
Net effective spread(1) |
$ | 83,596 | $ | 83,044 | $ | 81,832 | |||||||||||
Guarantee and commitment fees(2) |
5,256 | 4,982 | 4,581 | ||||||||||||||
| Gain on sale of investment securities (GAAP) | 1,052 | — | — | ||||||||||||||
| Loss on sale of mortgage loan (GAAP) | (1,147) | — | — | ||||||||||||||
Other(3) |
481 | 1,077 | 409 | ||||||||||||||
| Total revenues | 89,238 | 89,103 | 86,822 | ||||||||||||||
| Credit related expense (GAAP): | |||||||||||||||||
| Provision for/(release of) losses | 6,230 | (1,870) | 1,142 | ||||||||||||||
| Total credit related expense | 6,230 | (1,870) | 1,142 | ||||||||||||||
| Operating expenses (GAAP): | |||||||||||||||||
| Compensation and employee benefits | 14,840 | 18,257 | 13,937 | ||||||||||||||
| General and administrative | 8,904 | 8,255 | 9,420 | ||||||||||||||
| Regulatory fees | 725 | 725 | 831 | ||||||||||||||
| Total operating expenses | 24,469 | 27,237 | 24,188 | ||||||||||||||
| Net earnings | 58,539 | 63,736 | 61,492 | ||||||||||||||
Income tax expense(4) |
11,970 | 13,553 | 12,539 | ||||||||||||||
| Preferred stock dividends (GAAP) | 6,792 | 6,791 | 6,791 | ||||||||||||||
| Core earnings | $ | 39,777 | $ | 43,392 | $ | 42,162 | |||||||||||
| Core earnings per share: | |||||||||||||||||
| Basic | $ | 3.66 | $ | 4.00 | $ | 3.89 | |||||||||||
| Diluted | $ | 3.63 | $ | 3.96 | $ | 3.86 | |||||||||||
| Reconciliation of Net Income Attributable to Common Stockholders to Core Earnings | |||||||||||
| For the Six Months Ended | |||||||||||
| June 30, 2024 | June 30, 2023 | ||||||||||
| (in thousands, except per share amounts) | |||||||||||
| Net income attributable to common stockholders | $ | 87,268 | $ | 80,665 | |||||||
| Less reconciling items: | |||||||||||
| Gains on undesignated financial derivatives due to fair value changes | 1,324 | 3,057 | |||||||||
| Gains/(losses) on hedging activities due to fair value changes | 5,606 | (5,006) | |||||||||
| Unrealized (losses)/gains on trading assets | (101) | 302 | |||||||||
| Net effects of amortization of premiums/discounts and deferred gains on assets consolidated at fair value | 57 | 58 | |||||||||
| Net effects of terminations or net settlements on financial derivatives | (1,697) | 1,106 | |||||||||
| Income tax effect related to reconciling items | (1,090) | 102 | |||||||||
| Sub-total | 4,099 | (381) | |||||||||
| Core earnings | $ | 83,169 | $ | 81,046 | |||||||
| Composition of Core Earnings: | |||||||||||
| Revenues: | |||||||||||
Net effective spread(1) |
$ | 166,640 | $ | 159,005 | |||||||
Guarantee and commitment fees(2) |
10,238 | 9,235 | |||||||||
| Gain on sale of investment securities (GAAP) | 1,052 | — | |||||||||
| Loss on sale of mortgage loan (GAAP) | (1,147) | — | |||||||||
Other(3) |
1,558 | 1,476 | |||||||||
| Total revenues | 178,341 | 169,716 | |||||||||
| Credit related expense (GAAP): | |||||||||||
| Provision for losses | 4,360 | 1,892 | |||||||||
| Total credit related expense | 4,360 | 1,892 | |||||||||
| Operating expenses (GAAP): | |||||||||||
| Compensation and employee benefits | 33,097 | 29,288 | |||||||||
| General and administrative | 17,159 | 16,947 | |||||||||
| Regulatory fees | 1,450 | 1,666 | |||||||||
| Total operating expenses | 51,706 | 47,901 | |||||||||
| Net earnings | 122,275 | 119,923 | |||||||||
Income tax expense(4) |
25,523 | 25,295 | |||||||||
| Preferred stock dividends (GAAP) | 13,583 | 13,582 | |||||||||
| Core earnings | $ | 83,169 | $ | 81,046 | |||||||
| Core earnings per share: | |||||||||||
| Basic | $ | 7.66 | $ | 7.49 | |||||||
| Diluted | $ | 7.59 | $ | 7.42 | |||||||
| Reconciliation of GAAP Basic Earnings Per Share to Core Earnings Basic Earnings Per Share | |||||||||||||||||||||||||||||
| For the Three Months Ended | For the Six Months Ended | ||||||||||||||||||||||||||||
| June 30, 2024 | March 31, 2024 | June 30, 2023 | June 30, 2024 | June 30, 2023 | |||||||||||||||||||||||||
| (in thousands, except per share amounts) | |||||||||||||||||||||||||||||
| GAAP - Basic EPS | $ | 3.71 | $ | 4.33 | $ | 3.73 | $ | 8.04 | $ | 7.46 | |||||||||||||||||||
| Less reconciling items: | |||||||||||||||||||||||||||||
| (Losses)/gains on undesignated financial derivatives due to fair value changes | (0.03) | 0.16 | 0.20 | 0.12 | 0.28 | ||||||||||||||||||||||||
| Gains/(losses) on hedging activities due to fair value changes | 0.24 | 0.28 | (0.45) | 0.52 | (0.46) | ||||||||||||||||||||||||
| Unrealized (losses)/gains on trading securities | (0.01) | — | — | (0.01) | 0.03 | ||||||||||||||||||||||||
| Net effects of amortization of premiums/discounts and deferred gains on assets consolidated at fair value | — | — | — | 0.01 | 0.01 | ||||||||||||||||||||||||
| Net effects of terminations or net settlements on financial derivatives | (0.14) | (0.02) | 0.05 | (0.16) | 0.10 | ||||||||||||||||||||||||
| Income tax effect related to reconciling items | (0.01) | (0.09) | 0.04 | (0.10) | 0.01 | ||||||||||||||||||||||||
| Sub-total | 0.05 | 0.33 | (0.16) | 0.38 | (0.03) | ||||||||||||||||||||||||
| Core Earnings - Basic EPS | $ | 3.66 | $ | 4.00 | $ | 3.89 | $ | 7.66 | $ | 7.49 | |||||||||||||||||||
| Shares used in per share calculation (GAAP and Core Earnings) | 10,879 | 10,847 | 10,833 | 10,863 | 10,817 | ||||||||||||||||||||||||
| Reconciliation of GAAP Diluted Earnings Per Share to Core Earnings Diluted Earnings Per Share | |||||||||||||||||||||||||||||
| For the Three Months Ended | For the Six Months Ended | ||||||||||||||||||||||||||||
| June 30, 2024 | March 31, 2024 | June 30, 2023 | June 30, 2024 | June 30, 2023 | |||||||||||||||||||||||||
| (in thousands, except per share amounts) | |||||||||||||||||||||||||||||
| GAAP - Diluted EPS | $ | 3.68 | $ | 4.28 | $ | 3.70 | $ | 7.96 | $ | 7.39 | |||||||||||||||||||
| Less reconciling items: | |||||||||||||||||||||||||||||
| (Losses)/gains on undesignated financial derivatives due to fair value changes | (0.03) | 0.15 | 0.20 | 0.12 | 0.28 | ||||||||||||||||||||||||
| Gains/(losses) on hedging activities due to fair value changes | 0.24 | 0.28 | (0.45) | 0.51 | (0.46) | ||||||||||||||||||||||||
| Unrealized (losses)/gains on trading securities | (0.01) | — | — | (0.01) | 0.03 | ||||||||||||||||||||||||
| Net effects of amortization of premiums/discounts and deferred gains on assets consolidated at fair value | — | — | — | 0.01 | 0.01 | ||||||||||||||||||||||||
| Net effects of terminations or net settlements on financial derivatives | (0.14) | (0.02) | 0.05 | (0.16) | 0.10 | ||||||||||||||||||||||||
| Income tax effect related to reconciling items | (0.01) | (0.09) | 0.04 | (0.10) | 0.01 | ||||||||||||||||||||||||
| Sub-total | 0.05 | 0.32 | (0.16) | 0.37 | (0.03) | ||||||||||||||||||||||||
| Core Earnings - Diluted EPS | $ | 3.63 | $ | 3.96 | $ | 3.86 | $ | 7.59 | $ | 7.42 | |||||||||||||||||||
| Shares used in per share calculation (GAAP and Core Earnings) | 10,956 | 10,969 | 10,916 | 10,966 | 10,917 | ||||||||||||||||||||||||
| Reconciliation of GAAP Net Interest Income/Yield to Net Effective Spread | |||||||||||||||||||||||||||||||||||||||||||||||||||||||||||
| For the Three Months Ended | For the Six Months Ended | ||||||||||||||||||||||||||||||||||||||||||||||||||||||||||
| June 30, 2024 | March 31, 2024 | June 30, 2023 | June 30, 2024 | June 30, 2023 | |||||||||||||||||||||||||||||||||||||||||||||||||||||||
| Dollars | Yield | Dollars | Yield | Dollars | Yield | Dollars | Yield | Dollars | Yield | ||||||||||||||||||||||||||||||||||||||||||||||||||
| (dollars in thousands) | |||||||||||||||||||||||||||||||||||||||||||||||||||||||||||
| Net interest income/yield | $ | 87,340 | 1.15 | % | $ | 86,368 | 1.15 | % | $ | 78,677 | 1.12 | % | $ | 173,708 | 1.15 | % | $ | 157,735 | 1.13 | % | |||||||||||||||||||||||||||||||||||||||
| Net effects of consolidated trusts | (1,371) | 0.02 | % | (1,052) | 0.02 | % | (1,044) | 0.02 | % | (2,423) | 0.02 | % | (2,099) | 0.02 | % | ||||||||||||||||||||||||||||||||||||||||||||
| Expense related to undesignated financial derivatives | (486) | (0.01) | % | (34) | — | % | (1,568) | (0.02) | % | (521) | — | % | (3,193) | (0.02) | % | ||||||||||||||||||||||||||||||||||||||||||||
| Amortization of premiums/discounts on assets consolidated at fair value | (21) | — | % | (27) | — | % | (24) | — | % | (48) | — | % | (48) | — | % | ||||||||||||||||||||||||||||||||||||||||||||
| Amortization of losses due to terminations or net settlements on financial derivatives | 738 | 0.01 | % | 791 | 0.01 | % | 890 | 0.01 | % | 1,530 | 0.01 | % | 1,604 | 0.01 | % | ||||||||||||||||||||||||||||||||||||||||||||
| Fair value changes on fair value hedge relationships | (2,604) | (0.03) | % | (3,002) | (0.04) | % | 4,901 | 0.07 | % | (5,606) | (0.04) | % | 5,006 | 0.03 | % | ||||||||||||||||||||||||||||||||||||||||||||
| Net effective spread | $ | 83,596 | 1.14 | % | $ | 83,044 | 1.14 | % | $ | 81,832 | 1.20 | % | $ | 166,640 | 1.14 | % | $ | 159,005 | 1.17 | % | |||||||||||||||||||||||||||||||||||||||
| Core Earnings by Business Segment | |||||||||||||||||||||||||||||||||||||||||||||||||||||
For the Three Months Ended June 30, 2024 | |||||||||||||||||||||||||||||||||||||||||||||||||||||
| Agricultural Finance | Rural Infrastructure | Treasury | Corporate | ||||||||||||||||||||||||||||||||||||||||||||||||||
| Farm & Ranch | Corporate AgFinance |
Rural
Utilities
|
Renewable Energy | Funding | Investments | Reconciling Adjustments |
Consolidated Net Income | ||||||||||||||||||||||||||||||||||||||||||||||
| (in thousands) | |||||||||||||||||||||||||||||||||||||||||||||||||||||
| Net interest income | $ | 35,522 | $ | 7,866 | $ | 7,672 | $ | 2,999 | $ | 32,620 | $ | 661 | $ | — | $ | — | $ | 87,340 | |||||||||||||||||||||||||||||||||||
Less: reconciling adjustments(1)(2)(3) |
(1,366) | — | (26) | — | (2,352) | — | — | 3,744 | — | ||||||||||||||||||||||||||||||||||||||||||||
| Net effective spread | 34,156 | 7,866 | 7,646 | 2,999 | 30,268 | 661 | — | 3,744 | — | ||||||||||||||||||||||||||||||||||||||||||||
| Guarantee and commitment fees | 4,612 | 127 | 301 | 216 | — | — | — | (1,459) | 3,797 | ||||||||||||||||||||||||||||||||||||||||||||
| Gain on sale of investment securities | — | — | — | — | — | 1,052 | — | — | 1,052 | ||||||||||||||||||||||||||||||||||||||||||||
| Loss on sale of mortgage loans | — | (1,147) | — | — | — | — | — | — | (1,147) | ||||||||||||||||||||||||||||||||||||||||||||
Other income/(expense)(3) |
517 | (5) | — | — | — | 7 | (38) | (1,606) | (1,125) | ||||||||||||||||||||||||||||||||||||||||||||
| Total revenues | 39,285 | 6,841 | 7,947 | 3,215 | 30,268 | 1,720 | (38) | 679 | 89,917 | ||||||||||||||||||||||||||||||||||||||||||||
| (Provision for)/release of losses | (211) | (5,354) | 502 | (1,117) | — | 1 | — | — | (6,179) | ||||||||||||||||||||||||||||||||||||||||||||
| Release of reserve for losses | (36) | — | (15) | — | — | — | — | — | (51) | ||||||||||||||||||||||||||||||||||||||||||||
| Operating expenses | — | — | — | — | — | — | (24,469) | — | (24,469) | ||||||||||||||||||||||||||||||||||||||||||||
| Total non-interest expense | (36) | — | (15) | — | — | — | (24,469) | — | (24,520) | ||||||||||||||||||||||||||||||||||||||||||||
| Core earnings before income taxes | 39,038 | 1,487 | 8,434 | 2,098 | 30,268 | 1,721 | (24,507) | 679 | (4) |
59,218 | |||||||||||||||||||||||||||||||||||||||||||
| Income tax (expense)/benefit | (8,198) | (312) | (1,771) | (441) | (6,355) | (362) | 5,469 | (143) | (12,113) | ||||||||||||||||||||||||||||||||||||||||||||
| Core earnings before preferred stock dividends | 30,840 | 1,175 | 6,663 | 1,657 | 23,913 | 1,359 | (19,038) | 536 | (4) |
47,105 | |||||||||||||||||||||||||||||||||||||||||||
| Preferred stock dividends | — | — | — | — | — | — | (6,792) | — | (6,792) | ||||||||||||||||||||||||||||||||||||||||||||
| Segment core earnings/(losses) | $ | 30,840 | $ | 1,175 | $ | 6,663 | $ | 1,657 | $ | 23,913 | $ | 1,359 | $ | (25,830) | $ | 536 | (4) |
$ | 40,313 | ||||||||||||||||||||||||||||||||||
| Total Assets | $ | 14,962,357 | $ | 1,660,154 | $ | 7,135,581 | $ | 736,936 | $ | — | $ | 5,560,800 | $ | 138,486 | $ | — | $ | 30,194,314 | |||||||||||||||||||||||||||||||||||
| Total on- and off-balance sheet program assets at principal balance | $ | 18,504,501 | $ | 1,816,893 | $ | 7,561,473 | $ | 875,472 | $ | — | $ | — | $ | — | $ | — | $ | 28,758,339 | |||||||||||||||||||||||||||||||||||
| Outstanding Business Volume | ||||||||||||||||||||
| On or Off Balance Sheet |
As of June 30, 2024 | As of December 31, 2023 | ||||||||||||||||||
| (in thousands) | ||||||||||||||||||||
| Agricultural Finance: | ||||||||||||||||||||
| Farm & Ranch: | ||||||||||||||||||||
| Loans | On-balance sheet | $ | 5,138,819 | $ | 5,133,450 | |||||||||||||||
| Loans held in consolidated trusts: | ||||||||||||||||||||
Beneficial interests owned by third-party investors (single-class)(1) |
On-balance sheet | 908,600 | 870,912 | |||||||||||||||||
Beneficial interests owned by third-party investors (structured)(1) |
On-balance sheet | 852,755 | 561,349 | |||||||||||||||||
IO-FMGS(2) |
On-balance sheet | 9,062 | 9,409 | |||||||||||||||||
| USDA Securities | On-balance sheet | 2,359,450 | 2,368,872 | |||||||||||||||||
AgVantage Securities(1) |
On-balance sheet | 5,435,000 | 5,835,000 | |||||||||||||||||
| LTSPCs and unfunded loan commitments | Off-balance sheet | 2,807,324 | 2,999,943 | |||||||||||||||||
Other Farmer Mac Guaranteed Securities(3) |
Off-balance sheet | 436,822 | 452,602 | |||||||||||||||||
| Loans serviced for others | Off-balance sheet | 556,669 | 577,264 | |||||||||||||||||
| Total Farm & Ranch | $ | 18,504,501 | $ | 18,808,801 | ||||||||||||||||
| Corporate AgFinance: | ||||||||||||||||||||
| Loans | On-balance sheet | $ | 1,286,167 | $ | 1,259,723 | |||||||||||||||
AgVantage Securities(1) |
On-balance sheet | 359,627 | 288,879 | |||||||||||||||||
| Unfunded loan commitments | Off-balance sheet | 171,099 | 145,377 | |||||||||||||||||
| Total Corporate AgFinance | $ | 1,816,893 | $ | 1,693,979 | ||||||||||||||||
| Total Agricultural Finance | $ | 20,321,394 | $ | 20,502,780 | ||||||||||||||||
| Rural Infrastructure Finance: | ||||||||||||||||||||
| Rural Utilities: | ||||||||||||||||||||
| Loans | On-balance sheet | $ | 3,240,660 | $ | 3,094,477 | |||||||||||||||
AgVantage Securities(1) |
On-balance sheet | 3,860,014 | 3,898,468 | |||||||||||||||||
| LTSPCs and unfunded loan commitments | Off-balance sheet | 460,799 | 487,778 | |||||||||||||||||
| Total Rural Utilities | $ | 7,561,473 | $ | 7,480,723 | ||||||||||||||||
| Renewable Energy: | ||||||||||||||||||||
| Loans | On-balance sheet | $ | 738,578 | $ | 440,286 | |||||||||||||||
| Unfunded loan commitments | Off-balance sheet | 136,894 | 47,235 | |||||||||||||||||
| Total Renewable Energy | $ | 875,472 | $ | 487,521 | ||||||||||||||||
| Total Rural Infrastructure Finance | $ | 8,436,945 | $ | 7,968,244 | ||||||||||||||||
| Total | $ | 28,758,339 | $ | 28,471,024 | ||||||||||||||||
Net Effective Spread(1) |
|||||||||||||||||||||||||||||||||||||||||||||||||||||||||||||||||||||||||||||||||||
| Agricultural Finance | Rural Infrastructure Finance | Treasury | |||||||||||||||||||||||||||||||||||||||||||||||||||||||||||||||||||||||||||||||||
| Farm & Ranch | Corporate AgFinance | Rural Utilities | Renewable Energy | Funding | Investments | Net Effective Spread | |||||||||||||||||||||||||||||||||||||||||||||||||||||||||||||||||||||||||||||
| Dollars | Yield | Dollars | Yield | Dollars | Yield | Dollars | Yield | Dollars | Yield | Dollars | Yield | Dollars | Yield | ||||||||||||||||||||||||||||||||||||||||||||||||||||||||||||||||||||||
| (dollars in thousands) | |||||||||||||||||||||||||||||||||||||||||||||||||||||||||||||||||||||||||||||||||||
| For the quarter ended: | |||||||||||||||||||||||||||||||||||||||||||||||||||||||||||||||||||||||||||||||||||
June 30, 2024(2) |
$ | 34,156 | 0.98 | % | $ | 7,866 | 1.91 | % | $ | 7,646 | 0.44 | % | $ | 2,999 | 1.86 | % | $ | 30,268 | 0.41 | % | $ | 661 | 0.04 | % | $ | 83,596 | 1.14 | % | |||||||||||||||||||||||||||||||||||||||||||||||||||||||
| March 31, 2024 | 32,843 | 0.95 | % | 7,971 | 2.05 | % | 7,232 | 0.42 | % | 2,049 | 1.75 | % | 32,474 | 0.45 | % | 475 | 0.03 | % | 83,044 | 1.14 | % | ||||||||||||||||||||||||||||||||||||||||||||||||||||||||||||||
| December 31, 2023 | 33,329 | 0.98 | % | 8,382 | 2.06 | % | 7,342 | 0.43 | % | 1,540 | 1.69 | % | 33,361 | 0.47 | % | 597 | 0.04 | % | 84,551 | 1.19 | % | ||||||||||||||||||||||||||||||||||||||||||||||||||||||||||||||
| September 30, 2023 | 32,718 | 0.97 | % | 8,250 | 2.05 | % | 6,362 | 0.39 | % | 1,150 | 1.46 | % | 34,412 | 0.49 | % | 532 | 0.04 | % | 83,424 | 1.20 | % | ||||||||||||||||||||||||||||||||||||||||||||||||||||||||||||||
| June 30, 2023 | 34,388 | 1.03 | % | 7,444 | 1.92 | % | 5,808 | 0.38 | % | 1,100 | 1.47 | % | 32,498 | 0.48 | % | 594 | 0.04 | % | 81,832 | 1.20 | % | ||||||||||||||||||||||||||||||||||||||||||||||||||||||||||||||
| March 31, 2023 | 32,465 | 0.97 | % | 7,148 | 1.94 | % | 5,507 | 0.36 | % | 858 | 1.53 | % | 31,738 | 0.47 | % | (543) | (0.04) | % | 77,173 | 1.15 | % | ||||||||||||||||||||||||||||||||||||||||||||||||||||||||||||||
| December 31, 2022 | 32,770 | 0.98 | % | 7,471 | 1.94 | % | 4,960 | 0.34 | % | 935 | 1.76 | % | 27,656 | 0.42 | % | (2,689) | (0.19) | % | 71,103 | 1.07 | % | ||||||||||||||||||||||||||||||||||||||||||||||||||||||||||||||
| September 30, 2022 | 33,343 | 1.04 | % | 7,600 | 1.99 | % | 4,220 | 0.30 | % | 705 | 1.97 | % | 22,564 | 0.36 | % | (2,791) | (0.21) | % | 65,641 | 1.03 | % | ||||||||||||||||||||||||||||||||||||||||||||||||||||||||||||||
| June 30, 2022 | 32,590 | 1.05 | % | 6,929 | 1.87 | % | 3,733 | 0.27 | % | 468 | 1.78 | % | 18,508 | 0.30 | % | (1,282) | (0.10) | % | 60,946 | 0.99 | % | ||||||||||||||||||||||||||||||||||||||||||||||||||||||||||||||
| Core Earnings by Quarter Ended | |||||||||||||||||||||||||||||||||||||||||||||||||||||
| June 2024 | March 2024 | December 2023 | September 2023 | June 2023 | March 2023 | December 2022 | September 2022 | June 2022 | |||||||||||||||||||||||||||||||||||||||||||||
| (in thousands) | |||||||||||||||||||||||||||||||||||||||||||||||||||||
| Revenues: | |||||||||||||||||||||||||||||||||||||||||||||||||||||
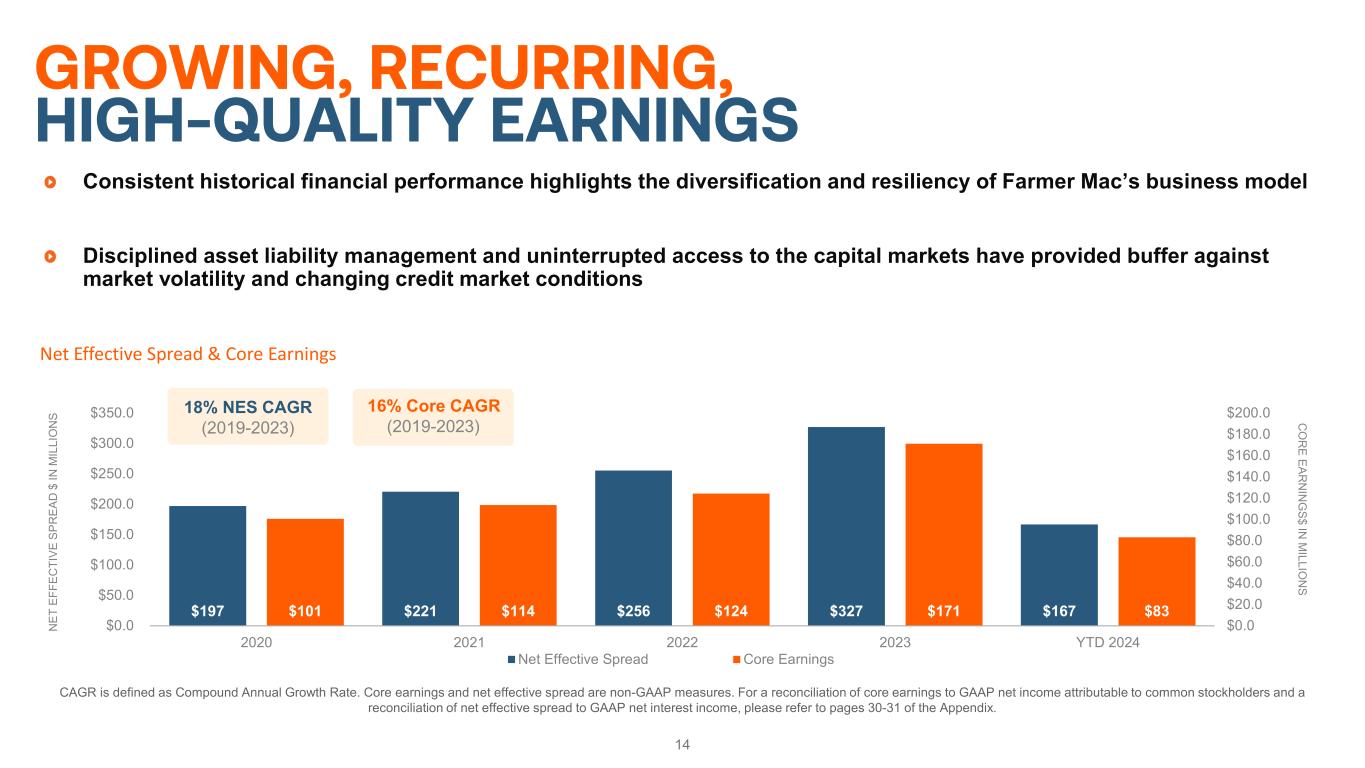
| Net effective spread | $ | 83,596 | $ | 83,044 | $ | 84,551 | $ | 83,424 | $ | 81,832 | $ | 77,173 | $ | 71,103 | $ | 65,641 | $ | 60,946 | |||||||||||||||||||||||||||||||||||
| Guarantee and commitment fees | 5,256 | 4,982 | 4,865 | 4,828 | 4,581 | 4,654 | 4,677 | 4,201 | 4,709 | ||||||||||||||||||||||||||||||||||||||||||||
| Gain on sale of investment securities | 1,052 | — | — | — | — | — | — | — | — | ||||||||||||||||||||||||||||||||||||||||||||
| Loss on sale of mortgage loan | (1,147) | — | — | — | — | — | — | — | — | ||||||||||||||||||||||||||||||||||||||||||||
| Other | 481 | 1,077 | 767 | 1,056 | 409 | 1,067 | 390 | 473 | 307 | ||||||||||||||||||||||||||||||||||||||||||||
| Total revenues | 89,238 | 89,103 | 90,183 | 89,308 | 86,822 | 82,894 | 76,170 | 70,315 | 65,962 | ||||||||||||||||||||||||||||||||||||||||||||
| Credit related expense/(income): | |||||||||||||||||||||||||||||||||||||||||||||||||||||
| Provision for/(release of) losses | 6,230 | (1,870) | (575) | (181) | 1,142 | 750 | 1,945 | 450 | (1,535) | ||||||||||||||||||||||||||||||||||||||||||||
| REO operating expenses | — | — | — | — | — | — | 819 | — | — | ||||||||||||||||||||||||||||||||||||||||||||
| Total credit related expense/(income) | 6,230 | (1,870) | (575) | (181) | 1,142 | 750 | 2,764 | 450 | (1,535) | ||||||||||||||||||||||||||||||||||||||||||||
| Operating expenses: | |||||||||||||||||||||||||||||||||||||||||||||||||||||
| Compensation and employee benefits | 14,840 | 18,257 | 15,523 | 14,103 | 13,937 | 15,351 | 12,105 | 11,648 | 11,715 | ||||||||||||||||||||||||||||||||||||||||||||
| General and administrative | 8,904 | 8,255 | 8,916 | 9,100 | 9,420 | 7,527 | 8,055 | 6,919 | 7,520 | ||||||||||||||||||||||||||||||||||||||||||||
| Regulatory fees | 725 | 725 | 725 | 831 | 831 | 835 | 832 | 812 | 813 | ||||||||||||||||||||||||||||||||||||||||||||
| Total operating expenses | 24,469 | 27,237 | 25,164 | 24,034 | 24,188 | 23,713 | 20,992 | 19,379 | 20,048 | ||||||||||||||||||||||||||||||||||||||||||||
| Net earnings | 58,539 | 63,736 | 65,594 | 65,455 | 61,492 | 58,431 | 52,414 | 50,486 | 47,449 | ||||||||||||||||||||||||||||||||||||||||||||
| Income tax expense | 11,970 | 13,553 | 13,881 | 13,475 | 12,539 | 12,756 | 11,210 | 10,303 | 9,909 | ||||||||||||||||||||||||||||||||||||||||||||
| Preferred stock dividends | 6,792 | 6,791 | 6,791 | 6,792 | 6,791 | 6,791 | 6,791 | 6,791 | 6,792 | ||||||||||||||||||||||||||||||||||||||||||||
| Core earnings | $ | 39,777 | $ | 43,392 | $ | 44,922 | $ | 45,188 | $ | 42,162 | $ | 38,884 | $ | 34,413 | $ | 33,392 | $ | 30,748 | |||||||||||||||||||||||||||||||||||
| Reconciling items: | |||||||||||||||||||||||||||||||||||||||||||||||||||||
| (Losses)/gains on undesignated financial derivatives due to fair value changes | $ | (359) | $ | 1,683 | $ | (836) | $ | 2,921 | $ | 2,141 | $ | 916 | $ | 1,596 | $ | 6,441 | $ | 2,846 | |||||||||||||||||||||||||||||||||||
| Gains/(losses) on hedging activities due to fair value changes | 2,604 | 3,002 | (3,598) | 3,210 | (4,901) | (105) | (148) | (624) | 428 | ||||||||||||||||||||||||||||||||||||||||||||
| Unrealized (losses)/gains on trading assets | (87) | (14) | (37) | 1,714 | (57) | 359 | 31 | (757) | (285) | ||||||||||||||||||||||||||||||||||||||||||||
| Net effects of amortization of premiums/discounts and deferred gains on assets consolidated at fair value | 26 | 31 | 88 | 29 | 29 | 29 | 57 | 24 | (62) | ||||||||||||||||||||||||||||||||||||||||||||
| Net effects of terminations or net settlements on financial derivatives | (1,505) | (192) | (800) | (79) | 583 | 523 | 1,268 | (3,522) | 2,536 | ||||||||||||||||||||||||||||||||||||||||||||
| Income tax effect related to reconciling items | (143) | (947) | 1,089 | (1,638) | 464 | (362) | (590) | (327) | (1,148) | ||||||||||||||||||||||||||||||||||||||||||||
| Net income attributable to common stockholders | $ | 40,313 | $ | 46,955 | $ | 40,828 | $ | 51,345 | $ | 40,421 | $ | 40,244 | $ | 36,627 | $ | 34,627 | $ | 35,063 | |||||||||||||||||||||||||||||||||||


