UNITED STATES
SECURITIES AND EXCHANGE COMMISSION
Washington, D.C. 20549
FORM 8-K
CURRENT REPORT
Pursuant to Section 13 or 15(d) of the Securities Exchange Act of 1934
Date of Report (Date of earliest event reported): October 29, 2024
Commission |
|
Exact Name of Registrant |
|
State or Other Jurisdiction of |
|
IRS Employer |
1-9936 |
|
EDISON INTERNATIONAL |
|
California |
|
95-4137452 |
1-2313 |
|
SOUTHERN CALIFORNIA EDISON COMPANY |
|
California |
|
95-1240335 |
Check the appropriate box below if the Form 8-K filing is intended to simultaneously satisfy the filing obligation of the registrant under any of the following provisions:
[ ☐ ] Written communications pursuant to Rule 425 under the Securities Act (17 CFR 230.425)
[ ☐ ] Soliciting material pursuant to Rule 14a-12 under the Exchange Act (17 CFR 240.14a-12)
[ ☐ ] Pre-commencement communications pursuant to Rule 14d-2(b) under the Exchange Act (17 CFR 240.14d-2(b))
[ ☐ ] Pre-commencement communications pursuant to Rule 13e-4(c) under the Exchange Act (17 CFR 240.13e-4(c))
Securities registered pursuant to Section 12(b) of the Act:
Edison International:
Southern California Edison Company: None
Indicate by check mark whether the registrant is an emerging growth company as defined in Rule 405 of the Securities Act of 1933 (§230.405 of this chapter) or Rule 12b-2 of the Securities Exchange Act of 1934 (§240.12b-2 of this chapter).
If an emerging growth company, indicate by check mark if the registrant has elected not to use the extended transition period for complying with any new or revised financial accounting standards provided pursuant to Section 13(a) of the Exchange Act.
This current report and its exhibits include forward-looking statements. Edison International and Southern California Edison Company ("SCE") based these forward-looking statements on their current expectations and projections about future events in light of their knowledge of facts as of the date of this current report and their assumptions about future circumstances. These forward-looking statements are subject to various risks and uncertainties that may be outside the control of Edison International and SCE. Edison International and SCE have no obligation to publicly update or revise any forward-looking statements, whether due to new information, future events, or otherwise. This current report should be read with Edison International's and SCE's combined Annual Report on Form 10-K for the year ended December 31, 2023 and subsequent quarterly Reports on Form 10-Q. Additionally, Edison International and SCE provide direct links to Edison International and SCE presentations, documents and other information at www.edisoninvestor.com (Presentations and Updates) in order to publicly disseminate such information.
Item 2.02Results of Operations and Financial Condition
On October 29, 2024, Edison International issued a press release reporting its financial results and the financial results for its subsidiary, Southern California Edison Company, for the quarter ended September 30, 2024. A copy of the press release is attached as Exhibit 99.1. On the same day, members of Edison International's management will speak to investors via a financial teleconference. Senior management's prepared remarks and accompanying presentation are attached as Exhibit 99.2 and Exhibit 99.3 to this report. The information furnished in this Item 2.02 and Exhibits 99.1, 99.2, and 99.3 shall not be deemed to be “filed” for purposes of the Securities Exchange Act of 1934, nor shall it be deemed to be incorporated by reference in any filing under the Securities Act of 1933.
Item 7.01Regulation FD Disclosure
Members of Edison International management will use the information in the presentation furnished as Exhibit 99.3 to this report in meetings with institutional investors and analysts and at investor conferences. The attached presentation will also be posted on www.edisoninvestor.com.
Item 9.01Financial Statements and Exhibits
(d) |
Exhibits |
EXHIBIT INDEX
|
|
|
Exhibit No. |
|
Description |
|
|
|
99.1 |
|
|
|
|
|
99.2 |
|
|
|
|
|
99.3 |
|
Edison International Q3 2024 Financial Results Conference Call Presentation dated October 29, 2024 |
|
|
|
104 |
|
Cover Page Interactive Data File (embedded within the Inline XBRL document) |
SIGNATURES
Pursuant to the requirements of the Securities Exchange Act of 1934, the registrants have duly caused this report to be signed on its behalf by the undersigned hereunto duly authorized.
Date: October 29, 2024
Date: October 29, 2024
Exhibit 99.1
Investor Relations: Sam Ramraj, (626) 302-2540
Media Relations: (626) 302-2255
News@sce.com
Edison International Reports Third-Quarter 2024 Results
| ● | Third-quarter 2024 GAAP EPS of $1.33; Core EPS of $1.51 |
| ● | Significant progress in resolving legacy wildfires: Settlement agreement reached on TKM; cost recovery application on Woolsey Fire filed with CPUC |
| ● | Narrows 2024 core EPS guidance to $4.80-$5.00 |
| ● | Reiterates long-term core EPS growth rate targets of 5%-7% for 2021-2025 and 5%-7% for 2025-2028 |
ROSEMEAD, Calif., Oct. 29, 2024 — Edison International (NYSE: EIX) today reported third-quarter net income of $516 million, or $1.33 per share, compared to net income of $155 million, or $0.40 per share, in the third quarter of last year. As adjusted, third-quarter core earnings were $582 million, or $1.51 per share, compared to core earnings of $531 million, or $1.38 per share, in the third quarter of last year.
Southern California Edison’s third-quarter 2024 core earnings per share (EPS) increased year over year, primarily due to higher revenue authorized in Track 4 of SCE’s 2021 General Rate Case and an increase in the authorized rate of return resulting from the cost of capital adjustment mechanism. This was partially offset by higher interest expense.
Edison International Parent and Other’s third quarter core loss per share was in line with the same period last year.
“With strong year-to-date performance, we are confident in narrowing our 2024 core EPS guidance,” said Pedro J. Pizarro, president and CEO of Edison International. “Our team has achieved remarkable success over the last several years managing unprecedented climate challenges, making our operations more resilient and positioning us strongly for the growth ahead.”
Pizarro added, “SCE continues to demonstrate its ability to navigate the regulatory landscape and is in the final stages of two key proceedings, which will solidify our financial outlook through 2028. Capital investment enabled by SCE’s General Rate Case is the driver for the growth and customer benefits necessary to ensure the grid is reliable, resilient and ready to achieve the clean energy transition.”
Edison International uses core earnings internally for financial planning and analysis of performance. Core earnings are also used when communicating with investors and analysts regarding Edison International’s earnings results to facilitate comparisons of the company’s performance from period to period. Please see the attached tables to reconcile core earnings to basic GAAP earnings.
2024 Earnings Guidance
The company narrowed its earnings guidance range for 2024 as summarized in the following chart. See the presentation accompanying the company’s conference call for further information and assumptions.
|
|
|
|
|
|
|
|
|
|
|
|
|
|
|
2024 Earnings Guidance |
|
2024 Earnings Guidance |
||||||||
|
|
as of July 25, 2024 |
|
as of Oct. 29, 2024 |
||||||||
|
|
Low |
|
High |
|
Low |
|
High |
||||
EIX Basic EPS |
|
$ |
3.49 |
|
$ |
3.79 |
|
$ |
3.37 |
|
$ |
3.57 |
Less: Non-core Items* |
|
|
(1.26) |
|
|
(1.26) |
|
|
(1.43) |
|
|
(1.43) |
EIX Core EPS |
|
$ |
4.75 |
|
$ |
5.05 |
|
$ |
4.80 |
|
$ |
5.00 |
* There were ($551) million, or ($1.43) per share, of non-core items recorded for the nine months ending Sept. 30, 2024. Basic EIX EPS guidance only incorporates non-core items to Sept. 30, 2024.
Third-Quarter 2024 Earnings Conference Call and Webcast Details
When: |
|
Tuesday, Oct. 29, 1:30-2:30 p.m. (PDT) |
Telephone Numbers: |
|
1-888-673-9780 (U.S.) and 1-312-470-0178 (Int'l) — Passcode: Edison |
Telephone Replay: |
|
1-800-685-6667 (U.S.) and 1-203-369-3864 (Int’l) — Passcode: 9413 |
|
|
Telephone replay available through Nov. 11 at 6 p.m. (PST) |
Webcast: |
|
www.edisoninvestor.com |
Edison International has posted its earnings conference call prepared remarks by the CEO and CFO, the teleconference presentation and Form 10-Q to the company’s investor relations website. These materials are available at www.edisoninvestor.com.
About Edison International
Edison International (NYSE: EIX) is one of the nation’s largest electric utility holding companies, focused on providing clean and reliable energy and energy services through its independent companies. Headquartered in Rosemead, California, Edison International is the parent company of Southern California Edison Company, a utility delivering electricity to 15 million people across Southern, Central and Coastal California. Edison International is also the parent company of Trio (formerly Edison Energy), a portfolio of nonregulated competitive businesses providing integrated sustainability and energy advisory services to large commercial, industrial and institutional organizations in North America and Europe.
Appendix
Use of Non-GAAP Financial Measures
Edison International’s earnings are prepared in accordance with generally accepted accounting principles used in the United States and represent the company’s earnings as reported to the Securities and Exchange Commission. Our management uses core earnings and core earnings per share (EPS) internally for financial planning and for analysis of performance of Edison International and Southern California Edison. We also use core earnings and core EPS when communicating with analysts and investors regarding our earnings results to facilitate comparisons of the Company’s performance from period to period. Financial measures referred to as net income, basic EPS, core earnings, or core EPS also apply to the description of earnings or earnings per share.
Core earnings and core EPS are non-GAAP financial measures and may not be comparable to those of other companies. Core earnings and core EPS are defined as basic earnings and basic EPS excluding income or loss from discontinued operations and income or loss from significant discrete items that management does not consider representative of ongoing earnings. Basic earnings and losses refer to net income or losses attributable to Edison International shareholders. Core earnings are reconciled to basic earnings in the attached tables. The impact of participating securities (vested awards that earn dividend equivalents that may participate in undistributed earnings with common stock) for the principal operating subsidiary is not material to the principal operating subsidiary’s EPS and is therefore reflected in the results of the Edison International holding company, which is included in Edison International Parent and Other.
Safe Harbor Statement
Statements contained in this release about future performance, including, without limitation, operating results, capital expenditures, rate base growth, dividend policy, financial outlook, and other statements that are not purely historical, are forward-looking statements. These forward-looking statements reflect our current expectations; however, such statements involve risks and uncertainties. Actual results could differ materially from current expectations. These forward-looking statements represent our expectations only as of the date of this release, and Edison International assumes no duty to update them to reflect new information, events or circumstances. Important factors that could cause different results include, but are not limited to the:
| ● | ability of SCE to recover its costs through regulated rates, timely or at all, including uninsured wildfire-related and debris flow-related costs (including amounts paid for self-insured retention and co-insurance), costs incurred to mitigate the risk of utility equipment causing future wildfires, and increased costs due to supply chain constraints, inflation and rising interest rates; |
| ● | impact of affordability of customer rates on SCE's ability to execute its strategy, including the impact of affordability on the regulatory approval of operations and maintenance expenses, and proposed capital investment projects; |
| ● | ability of SCE to implement its operational and strategic plans, including its Wildfire Mitigation Plan and capital investment program; |
| ● | risks of regulatory or legislative restrictions that would limit SCE's ability to implement operational measures to mitigate wildfire risk, including Public Safety Power Shutoff (“PSPS”) and fast curve settings, when conditions warrant or would otherwise limit SCE's operational practices relative to wildfire risk mitigation; |
| ● | ability of SCE to obtain safety certifications from the Office of Energy Infrastructure Safety of the California Natural Resources Agency (“OEIS”); |
| ● | risk that California Assembly Bill 1054 (“AB 1054”) does not effectively mitigate the significant exposure faced by California investor-owned utilities related to liability for damages arising from catastrophic wildfires where utility facilities are alleged to be a substantial cause, including the longevity of the Wildfire Insurance Fund and the California Public Utilities Commission (“CPUC”) interpretation of and actions under AB 1054, including its interpretation of the prudency standard clarified by AB 1054; |
| ● | risks associated with the operation of electrical facilities, including worker and public safety issues, the risk of utility assets causing or contributing to wildfires, failure, availability, efficiency, and output of equipment and facilities, and availability and cost of spare parts; |
| ● | physical security of Edison International’s and SCE’s critical assets and personnel and the cybersecurity of Edison International’s and SCE’s critical information technology systems for grid control, and business, employee and customer data; |
| ● | ability of Edison International and SCE to effectively attract, manage, develop and retain a skilled workforce, including its contract workers; |
| ● | decisions and other actions by the CPUC, the Federal Energy Regulatory Commission, and the United States Nuclear Regulatory Commission and other governmental authorities, including decisions and actions related to nationwide or statewide crisis, approval of regulatory proceeding settlements, determinations of authorized rates of return or return on equity, the recoverability of wildfire-related and debris flow-related costs, issuance of SCE's wildfire safety certification, wildfire mitigation efforts, approval and implementation of electrification programs, and delays in executive, regulatory and legislative actions; |
| ● | potential for penalties or disallowances for non-compliance with applicable laws and regulations, including fines, penalties and disallowances related to wildfires where SCE's equipment is alleged to be associated with ignition; |
| ● | extreme weather-related incidents (including events caused, or exacerbated, by climate change, such as wildfires, debris flows, flooding, droughts, high wind events and extreme heat events) and other natural disasters (such as earthquakes), which could cause, among other things, worker and public safety issues, property damage, rotating outages and other operational issues (such as issues due to damaged infrastructure), PSPS activations and unanticipated costs; |
| ● | cost and availability of labor, equipment and materials, including as a result of supply chain constraints and inflation; |
| ● | ability of Edison International or SCE to borrow funds and access bank and capital markets on reasonable terms; |
| ● | risks associated with the decommissioning of San Onofre, including those related to worker and public safety, public opposition, permitting, governmental approvals, on-site storage of spent nuclear fuel and other radioactive material, delays, contractual disputes, and cost overruns; |
| ● | risks associated with cost allocation resulting in higher rates for utility bundled service customers because of possible customer bypass or departure for other electricity providers such as Community Choice Aggregators (“CCA,” which are cities, counties, and certain other public agencies with the authority to generate and/or purchase electricity for their local residents and businesses) and Electric Service Providers (entities that offer electric power and ancillary services to retail customers, other than electrical corporations (like SCE) and CCAs); |
| ● | risks inherent in SCE’s capital investment program, including those related to project site identification, public opposition, environmental mitigation, construction, permitting, contractor performance, changes in the California Independent System Operator’s transmission plans, and governmental approvals; and |
| ● | actions by credit rating agencies to downgrade Edison International or SCE’s credit ratings or to place those ratings on negative watch or negative outlook. |
Additional information about risks and uncertainties is contained in Edison International and SCE’s most recent combined Annual Report on Form 10-K for the year ended December 31, 2023, and subsequent Quarterly Report(s) on Form 10-Q filed with the Securities and Exchange commission, including the "Risk Factors" sections. Readers are urged to read this entire release as well as the most recent Form 10-K and Form 10-Q (including information incorporated by reference), and carefully consider the risks, uncertainties, and other factors that affect Edison International's and SCE's businesses. Edison International and SCE post or provide direct links (i) to certain SCE and other parties' regulatory filings and documents with the CPUC and the FERC and certain agency rulings and notices in open proceedings in a section titled "SCE Regulatory Highlights," (ii) to certain documents and information related to Southern California wildfires which may be of interest to investors in a section titled "Southern California Wildfires," and (iii) to presentations, documents and other information that may be of interest to investors in a section titled "Presentations and Updates" at www.edisoninvestor.com in order to publicly disseminate such information.
These forward-looking statements represent our expectations only as of the date of this news release, and Edison International assumes no duty to update them to reflect new information, events or circumstances. Readers should review future reports filed by Edison International and SCE with the SEC.
Third Quarter Reconciliation of Basic Earnings Per Share to Core Earnings Per Share
|
|
Three months ended |
|
|
|
|
Nine months ended |
|
|
|
||||||||
|
|
September 30, |
|
|
|
|
September 30, |
|
|
|
||||||||
|
|
2024 |
|
2023 |
|
Change |
|
2024 |
|
2023 |
|
Change |
||||||
Earnings (loss) per share available to Edison International |
|
|
|
|
|
|
|
|
|
|
|
|
|
|
|
|
|
|
SCE |
|
$ |
1.56 |
|
$ |
0.62 |
|
$ |
0.94 |
|
$ |
3.09 |
|
$ |
2.69 |
|
$ |
0.40 |
Edison International Parent and Other |
|
|
(0.23) |
|
|
(0.22) |
|
|
(0.01) |
|
|
(0.64) |
|
|
(0.55) |
|
|
(0.09) |
Edison International |
|
|
1.33 |
|
|
0.40 |
|
|
0.93 |
|
|
2.45 |
|
|
2.14 |
|
|
0.31 |
Less: Non-core items |
|
|
|
|
|
|
|
|
|
|
|
|
|
|
|
|
|
|
SCE |
|
|
(0.18) |
|
|
(0.98) |
|
|
0.80 |
|
|
(1.43) |
|
|
(1.43) |
|
|
- |
Edison International Parent and Other |
|
|
— |
|
|
— |
|
|
— |
|
|
— |
|
|
0.09 |
|
|
(0.09) |
Total non-core items |
|
|
(0.18) |
|
|
(0.98) |
|
|
0.80 |
|
|
(1.43) |
|
|
(1.34) |
|
|
(0.09) |
Core earnings (loss) per share |
|
|
|
|
|
|
|
|
|
|
|
|
|
|
|
|
|
|
SCE |
|
|
1.74 |
|
|
1.60 |
|
|
0.14 |
|
|
4.52 |
|
|
4.12 |
|
|
0.40 |
Edison International Parent and Other |
|
|
(0.23) |
|
|
(0.22) |
|
|
(0.01) |
|
|
(0.64) |
|
|
(0.64) |
|
|
— |
Edison International |
|
$ |
1.51 |
|
$ |
1.38 |
|
$ |
0.13 |
|
$ |
3.88 |
|
$ |
3.48 |
|
$ |
0.40 |
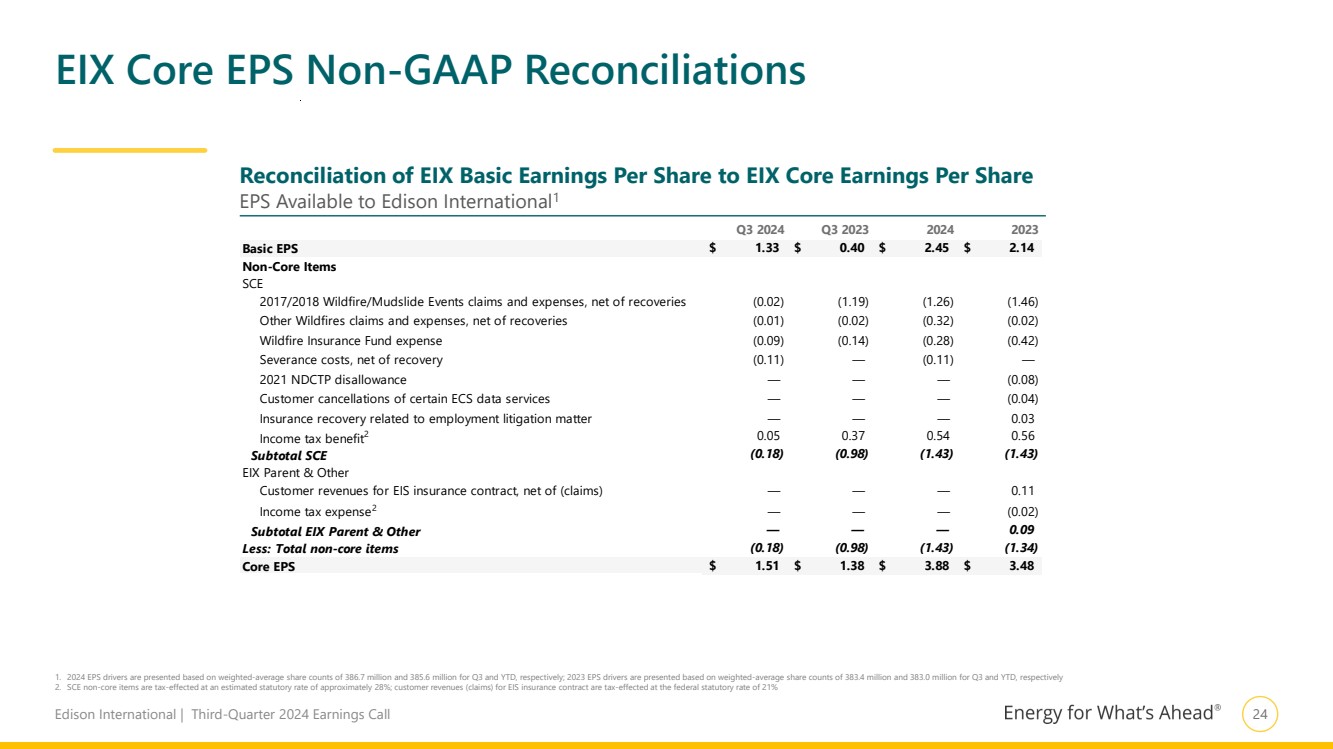
Note: Diluted earnings were $1.32 and $0.40 per share for the three months ended September 30, 2024 and 2023, respectively. Diluted earnings were $2.44 and $2.13 per share for the nine months ended September 30, 2024 and 2023, respectively.
Third Quarter Reconciliation of Basic Earnings Per Share to Core Earnings (in millions)
|
|
Three months ended |
|
|
|
|
Nine months ended |
|
|
|
||||||||
|
|
September 30, |
|
|
|
|
September 30, |
|
|
|
||||||||
(in millions) |
|
2024 |
|
2023 |
|
Change |
|
2024 |
|
2023 |
|
Change |
||||||
Net income (loss) available to Edison International |
|
|
|
|
|
|
|
|
|
|
|
|
|
|
|
|
|
|
SCE |
|
$ |
602 |
|
$ |
239 |
|
$ |
363 |
|
$ |
1,190 |
|
$ |
1,029 |
|
$ |
161 |
Edison International Parent and Other |
|
|
(86) |
|
|
(84) |
|
|
(2) |
|
|
(246) |
|
|
(210) |
|
|
(36) |
Edison International |
|
|
516 |
|
|
155 |
|
|
361 |
|
|
944 |
|
|
819 |
|
|
125 |
Less: Non-core items |
|
|
|
|
|
|
|
|
|
|
|
|
|
|
|
|
|
|
SCE1,2,3,4,5,6,7 |
|
|
(65) |
|
|
(374) |
|
|
309 |
|
|
(549) |
|
|
(549) |
|
|
— |
Edison International Parent and Other8 |
|
|
(1) |
|
|
(2) |
|
|
1 |
|
|
(2) |
|
|
33 |
|
|
(35) |
Total non-core items |
|
|
(66) |
|
|
(376) |
|
|
310 |
|
|
(551) |
|
|
(516) |
|
|
(35) |
Core earnings (loss) |
|
|
|
|
|
|
|
|
|
|
|
|
|
|
|
|
|
|
SCE |
|
|
667 |
|
|
613 |
|
|
54 |
|
|
1,739 |
|
|
1,578 |
|
|
161 |
Edison International Parent and Other |
|
|
(85) |
|
|
(82) |
|
|
(3) |
|
|
(244) |
|
|
(243) |
|
|
(1) |
Edison International |
|
$ |
582 |
|
$ |
531 |
|
$ |
51 |
|
$ |
1,495 |
|
$ |
1,335 |
|
$ |
160 |
1 |
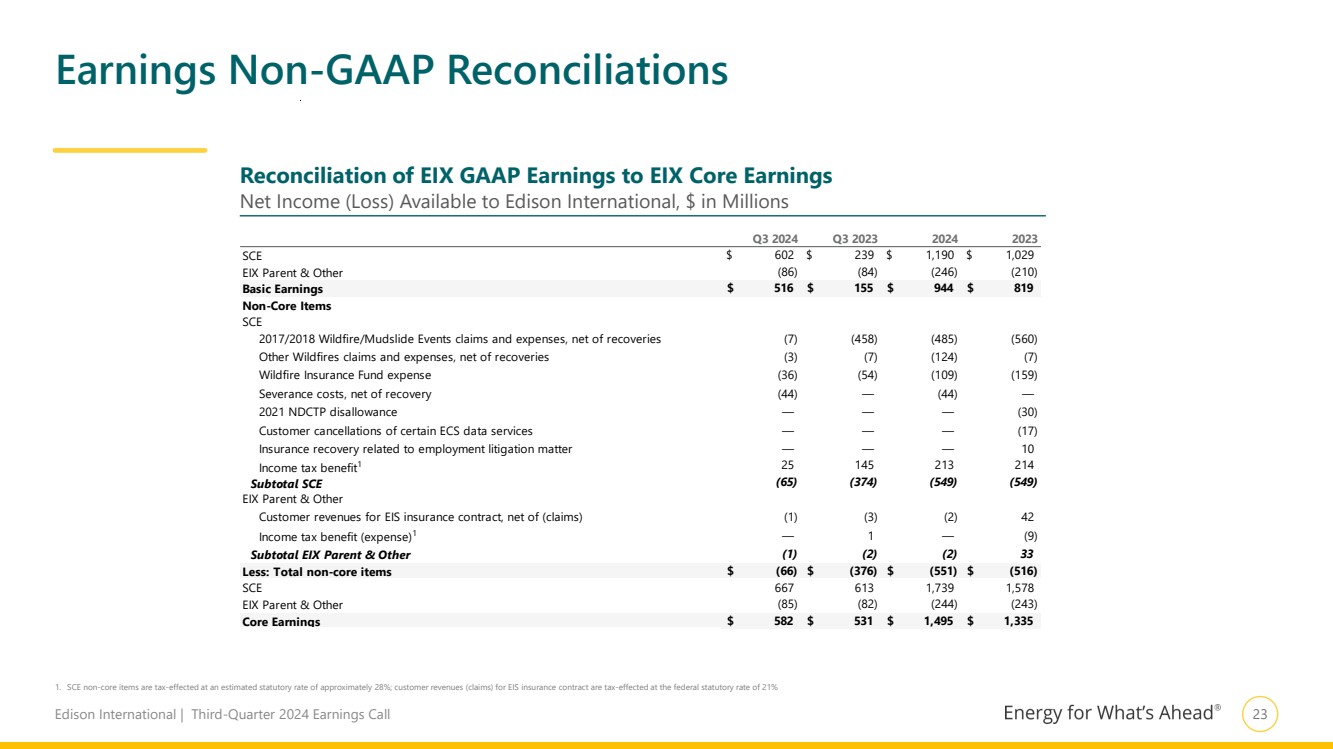
Includes charges for 2017/2018 Wildfire/Mudslide Events claims and related legal expenses, net of expected FERC recoveries of $7 million ($5 million after-tax) and $459 million ($330 million after-tax) for the three months ended September 30, 2024 and 2023, respectively, and $485 million ($349 million after-tax) and $560 million ($404 million after-tax) for the nine months ended September 30, 2024 and 2023, respectively. |
2 |
Includes charges for Other Wildfires claims and related legal expenses, net of expected insurance and regulatory recoveries of $3 million ($2 million after-tax) and $7 million ($5 million after-tax) for the three months ended September 30, 2024 and 2023, respectively, and $124 million ($90 million after-tax) and $7 million ($5 million after-tax) for the nine months ended September 30, 2024 and 2023, respectively. |
3 |
Includes amortization of SCE's Wildfire Insurance Fund expenses of $36 million ($26 million after-tax) and $54 million ($39 million after-tax) for the three months ended September 30, 2024 and 2023, respectively, and $109 million ($78 million after-tax) and $159 million ($114 million after-tax) for the nine months ended September 30, 2024 and 2023, respectively. |
4 |
Severance costs of $44 million ($32 million after-tax), net of expected FERC recovery, recorded in the third quarter of 2024 due to current and probable reductions in workforce. |
5 |
Includes a charge of $30 million ($21 million after-tax) for a disallowance related to the 2021 NDCTP for the nine months ended September 30, 2023. |
6 |
Includes an insurance recovery of $10 million ($7 million after-tax) related to settlement of an employment litigation matter for the nine months ended September 30, 2023. |
7 |
Includes a charge of $17 million ($12 million after-tax) related to customer cancellations of certain ECS data services for the nine months ended September 30, 2023. |
8 |
Includes expected wildfire claims of $(1) million ($(1) million after-tax) and $(3) million ($(2) million after-tax) insured by EIS for the three months ended September 30, 2024 and 2023, respectively, and expected wildfire claims of $(2) million ($(2) million after-tax) insured by EIS and net earnings of $42 million ($33 million after-tax) related to customer revenues for an EIS insurance contract offset by expected wildfire claims insured by EIS for the nine months ended September 30, 2024 and 2023, respectively. |
Consolidated Statements of Income |
|
Edison International |
||||||||||
|
|
|
|
|
|
|
|
|
|
|
|
|
|
|
Three months ended |
|
Nine months ended |
||||||||
|
|
September 30, |
|
September 30, |
||||||||
(in millions, except per-share amounts) |
|
2024 |
|
2023 |
|
2024 |
|
2023 |
||||
Operating revenue |
|
$ |
5,201 |
|
$ |
4,702 |
|
$ |
13,615 |
|
$ |
12,632 |
Purchased power and fuel |
|
|
1,898 |
|
|
1,988 |
|
|
4,140 |
|
|
4,453 |
Operation and maintenance |
|
|
1,393 |
|
|
882 |
|
|
3,995 |
|
|
3,207 |
Wildfire-related claims, net of insurance recoveries |
|
|
1 |
|
|
482 |
|
|
616 |
|
|
578 |
Wildfire Insurance Fund expense |
|
|
36 |
|
|
54 |
|
|
109 |
|
|
159 |
Depreciation and amortization |
|
|
710 |
|
|
665 |
|
|
2,138 |
|
|
1,971 |
Property and other taxes |
|
|
168 |
|
|
139 |
|
|
477 |
|
|
428 |
Total operating expenses |
|
|
4,206 |
|
|
4,210 |
|
|
11,475 |
|
|
10,796 |
Operating income |
|
|
995 |
|
|
492 |
|
|
2,140 |
|
|
1,836 |
Interest expense |
|
|
(477) |
|
|
(433) |
|
|
(1,401) |
|
|
(1,186) |
Other income, net |
|
|
127 |
|
|
130 |
|
|
413 |
|
|
377 |
Income before income taxes |
|
|
645 |
|
|
189 |
|
|
1,152 |
|
|
1,027 |
Income tax expense (benefit) |
|
|
68 |
|
|
(23) |
|
|
14 |
|
|
41 |
Net income |
|
|
577 |
|
|
212 |
|
|
1,138 |
|
|
986 |
Less: Net income attributable to noncontrolling interests - preference stock of SCE |
|
|
39 |
|
|
30 |
|
|
129 |
|
|
88 |
Preferred stock dividend requirements of Edison International |
|
|
22 |
|
|
27 |
|
|
65 |
|
|
79 |
Net income available to Edison International common shareholders |
|
$ |
516 |
|
|
155 |
|
$ |
944 |
|
|
819 |
Basic earnings per share: |
|
|
|
|
|
|
|
|
|
|
|
|
Weighted average shares of common stock outstanding |
|
|
387 |
|
|
383 |
|
|
386 |
|
|
383 |
Basic earnings per common share available to Edison International common shareholders |
|
$ |
1.33 |
|
|
0.40 |
|
$ |
2.45 |
|
$ |
2.14 |
Diluted earnings per share: |
|
|
|
|
|
|
|
|
|
|
|
|
Weighted average shares of common stock outstanding, including effect of dilutive securities |
|
|
390 |
|
|
385 |
|
|
388 |
|
|
385 |
Diluted earnings per common share available to Edison International common shareholders |
|
$ |
1.32 |
|
|
0.40 |
|
$ |
2.44 |
|
$ |
2.13 |
Consolidated Balance Sheets |
|
Edison International |
||||
|
|
|
|
|
|
|
|
|
|
September 30, |
|
|
December 31, |
(in millions) |
|
2024 |
|
2023 |
||
ASSETS |
|
|
|
|
|
|
Cash and cash equivalents |
|
$ |
200 |
|
$ |
345 |
Receivables, less allowances of $341 and $360 for uncollectible accounts at respective dates |
|
|
2,780 |
|
|
2,016 |
Accrued unbilled revenue |
|
|
1,202 |
|
|
742 |
Inventory |
|
|
533 |
|
|
527 |
Prepaid expenses |
|
|
104 |
|
|
112 |
Regulatory assets |
|
|
2,168 |
|
|
2,524 |
Wildfire Insurance Fund contributions |
|
|
138 |
|
|
204 |
Other current assets |
|
|
319 |
|
|
341 |
Total current assets |
|
|
7,444 |
|
|
6,811 |
Nuclear decommissioning trusts |
|
|
4,424 |
|
|
4,173 |
Other investments |
|
|
50 |
|
|
54 |
Total investments |
|
|
4,474 |
|
|
4,227 |
Utility property, plant and equipment, less accumulated depreciation and amortization of $13,833 and $12,910 at respective dates |
|
|
58,092 |
|
|
55,877 |
Nonutility property, plant and equipment, less accumulated depreciation of $122 and $114 at respective dates |
|
|
206 |
|
|
207 |
Total property, plant and equipment |
|
|
58,298 |
|
|
56,084 |
Regulatory assets (include $1,524 and $1,558 related to a Variable Interest Entity "VIE" at respective dates) |
|
|
8,660 |
|
|
8,897 |
Wildfire Insurance Fund contributions |
|
|
1,913 |
|
|
1,951 |
Operating lease right-of-use assets |
|
|
1,180 |
|
|
1,221 |
Long-term insurance receivables |
|
|
386 |
|
|
501 |
Other long-term assets |
|
|
2,394 |
|
|
2,066 |
Total long-term assets |
|
|
14,533 |
|
|
14,636 |
|
|
|
|
|
|
|
Total assets |
|
$ |
84,749 |
|
$ |
81,758 |
Consolidated Balance Sheets |
|
Edison International |
||||
|
|
|
|
|
|
|
|
|
September 30, |
|
|
December 31, |
|
(in millions, except share amounts) |
|
2024 |
|
2023 |
||
LIABILITIES AND EQUITY |
|
|
|
|
|
|
Short-term debt |
|
$ |
568 |
|
$ |
1,077 |
Current portion of long-term debt |
|
|
2,548 |
|
|
2,697 |
Accounts payable |
|
|
2,185 |
|
|
1,983 |
Wildfire-related claims |
|
|
39 |
|
|
30 |
Customer deposits |
|
|
452 |
|
|
390 |
Regulatory liabilities |
|
|
874 |
|
|
763 |
Current portion of operating lease liabilities |
|
|
124 |
|
|
120 |
Other current liabilities |
|
|
1,717 |
|
|
1,538 |
Total current liabilities |
|
|
8,507 |
|
|
8,598 |
Long-term debt (include $1,492 and $1,515 related to VIEs at respective dates) |
|
|
32,303 |
|
|
30,316 |
Deferred income taxes and credits |
|
|
6,967 |
|
|
6,672 |
Pensions and benefits |
|
|
403 |
|
|
415 |
Asset retirement obligations |
|
|
2,531 |
|
|
2,666 |
Regulatory liabilities |
|
|
10,310 |
|
|
9,420 |
Operating lease liabilities |
|
|
1,056 |
|
|
1,101 |
Wildfire-related claims |
|
|
1,055 |
|
|
1,368 |
Other deferred credits and other long-term liabilities |
|
|
3,510 |
|
|
3,258 |
Total deferred credits and other liabilities |
|
|
25,832 |
|
|
24,900 |
Total liabilities |
|
|
66,642 |
|
|
63,814 |
Preferred stock (50,000,000 shares authorized; 1,159,317 and 1,159,317 shares of Series A and 503,454 and 532,454 shares of Series B issued and outstanding at respective dates) |
|
|
1,645 |
|
|
1,673 |
Common stock, no par value (800,000,000 shares authorized; 387,148,995 and 383,924,912 shares issued and outstanding at respective dates) |
|
|
6,538 |
|
|
6,338 |
Accumulated other comprehensive loss |
|
|
(6) |
|
|
(9) |
Retained earnings |
|
|
7,486 |
|
|
7,499 |
Total Edison International's shareholders' equity |
|
|
15,663 |
|
|
15,501 |
Noncontrolling interests – preference stock of SCE |
|
|
2,444 |
|
|
2,443 |
Total equity |
|
|
18,107 |
|
|
17,944 |
|
|
|
|
|
|
|
Total liabilities and equity |
|
$ |
84,749 |
|
$ |
81,758 |
Consolidated Statements of Cash Flows |
|
Edison International |
||||
|
|
|
|
|
|
|
|
|
|
||||
|
|
Nine months ended September 30, |
||||
(in millions) |
|
2024 |
|
2023 |
||
Cash flows from operating activities: |
|
|
|
|
|
|
Net income |
|
$ |
1,138 |
|
$ |
986 |
Adjustments to reconcile to net cash provided by operating activities: |
|
|
|
|
|
|
Depreciation and amortization |
|
|
2,183 |
|
|
2,034 |
Allowance for equity during construction |
|
|
(143) |
|
|
(116) |
Deferred income taxes |
|
|
(42) |
|
|
53 |
Wildfire Insurance Fund amortization expense |
|
|
109 |
|
|
159 |
Other |
|
|
43 |
|
|
32 |
Nuclear decommissioning trusts |
|
|
(118) |
|
|
(94) |
Changes in operating assets and liabilities: |
|
|
|
|
|
|
Receivables |
|
|
(847) |
|
|
(692) |
Inventory |
|
|
(9) |
|
|
(40) |
Accounts payable |
|
|
336 |
|
|
(186) |
Tax receivables and payables |
|
|
198 |
|
|
127 |
Other current assets and liabilities |
|
|
(492) |
|
|
(214) |
Derivative assets and liabilities, net |
|
|
(2) |
|
|
(139) |
Regulatory assets and liabilities, net |
|
|
1,557 |
|
|
705 |
Wildfire-related insurance receivable |
|
|
115 |
|
|
(84) |
Wildfire-related claims |
|
|
(304) |
|
|
(75) |
Other noncurrent assets and liabilities |
|
|
122 |
|
|
90 |
Net cash provided by operating activities |
|
|
3,844 |
|
|
2,546 |
Cash flows from financing activities: |
|
|
|
|
|
|
Long-term debt issued, net of discount and issuance costs of $37 and $48 for the respective periods |
|
|
4,713 |
|
|
4,678 |
Long-term debt repaid |
|
|
(2,176) |
|
|
(1,867) |
Short-term debt issued |
|
|
— |
|
|
851 |
Short-term debt repaid |
|
|
(401) |
|
|
(1,944) |
Common stock issued |
|
|
12 |
|
|
16 |
Preferred and preference stock issued, net of issuance cost |
|
|
345 |
|
|
— |
Preferred and preference stock repurchased or redeemed |
|
|
(378) |
|
|
— |
Commercial paper (repyaments), borrowing, net |
|
|
(817) |
|
|
74 |
Dividends and distribution to noncontrolling interests |
|
|
(130) |
|
|
(87) |
Common stock dividends paid |
|
|
(896) |
|
|
(833) |
Preferred stock dividends paid |
|
|
(88) |
|
|
(105) |
Other |
|
|
180 |
|
|
97 |
Net cash provided by financing activities |
|
|
364 |
|
|
880 |
Cash flows from investing activities: |
|
|
|
|
|
|
Capital expenditures |
|
|
(4,211) |
|
|
(3,991) |
Proceeds from sale of nuclear decommissioning trust investments |
|
|
3,558 |
|
|
3,223 |
Purchases of nuclear decommissioning trust investments |
|
|
(3,488) |
|
|
(3,129) |
Other |
|
|
44 |
|
|
3 |
Net cash used in investing activities |
|
|
(4,097) |
|
|
(3,894) |
Net increase (decrease) in cash, cash equivalents and restricted cash |
|
|
111 |
|
|
(468) |
Cash, cash equivalents and restricted cash at beginning of period |
|
|
532 |
|
|
917 |
Cash, cash equivalents and restricted cash at end of period |
|
$ |
643 |
|
$ |
449 |
Exhibit 99.2
Prepared Remarks of Edison International CEO and CFO
Third Quarter 2024 Earnings Teleconference
October 29, 2024, 1:30 p.m. (PT)
Pedro Pizarro, President and Chief Executive Officer, Edison International
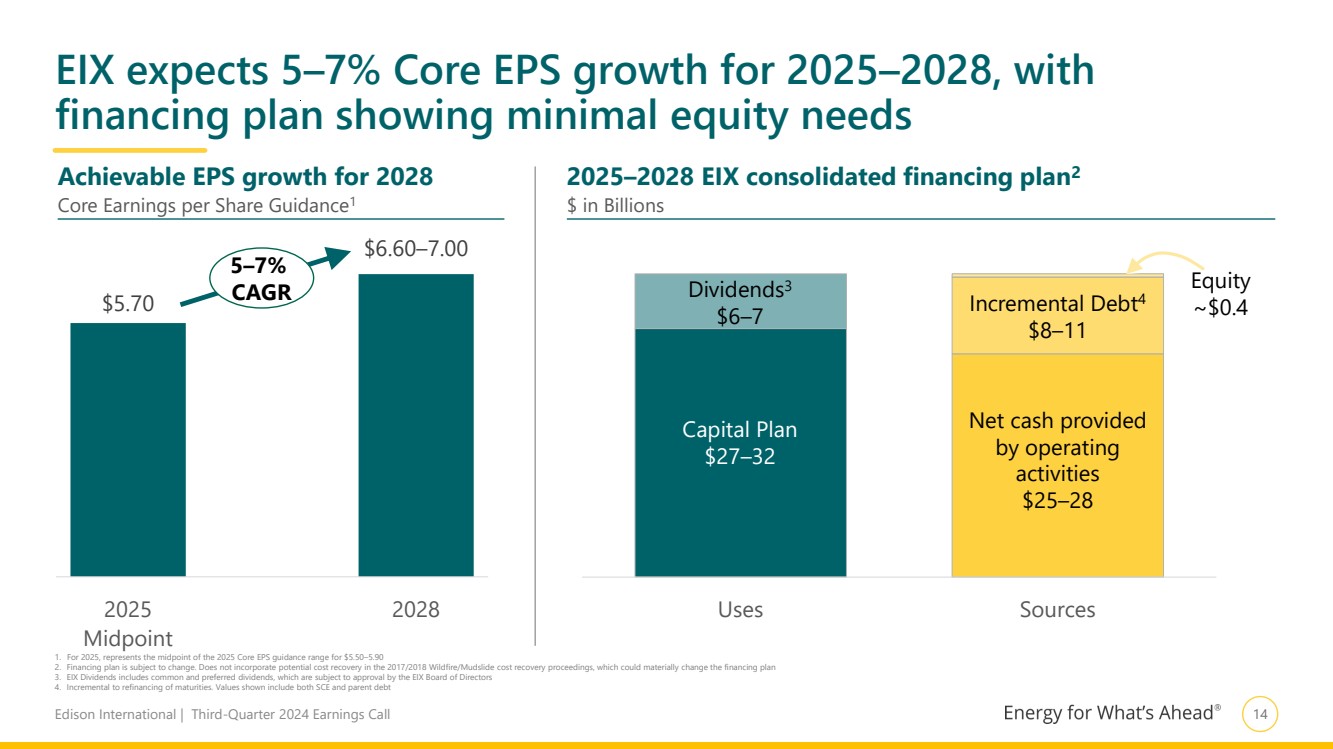
Edison International’s core EPS for third quarter 2024 was $1.51, bringing year-to-date core EPS to $3.88. With this strong year-to-date performance, we are confident in narrowing our 2024 core EPS guidance to $4.80 to $5.00. Additionally, we remain confident in our ability to meet our 2025 EPS guidance and delivering a 5 to 7% EPS CAGR through 2028.
My remarks today include three important takeaways:
| ● | First, SCE continues to demonstrate its ability to navigate the regulatory landscape and is in the final stages of two key regulatory proceedings, reaching a settlement agreement in the TKM cost recovery application and awaiting a proposed decision in the 2025 GRC, which will solidify our financial outlook through 2028. |
| ● | Second, our team has achieved remarkable success over the last several years managing unprecedented external risks, making our operations more resilient and positioning us strongly for the growth ahead. |
| ● | Third, we recently reaffirmed our net-zero commitment in our latest white paper. Reaching net-zero GHG emissions by 2045 is a core pillar of our climate-related risk management. |
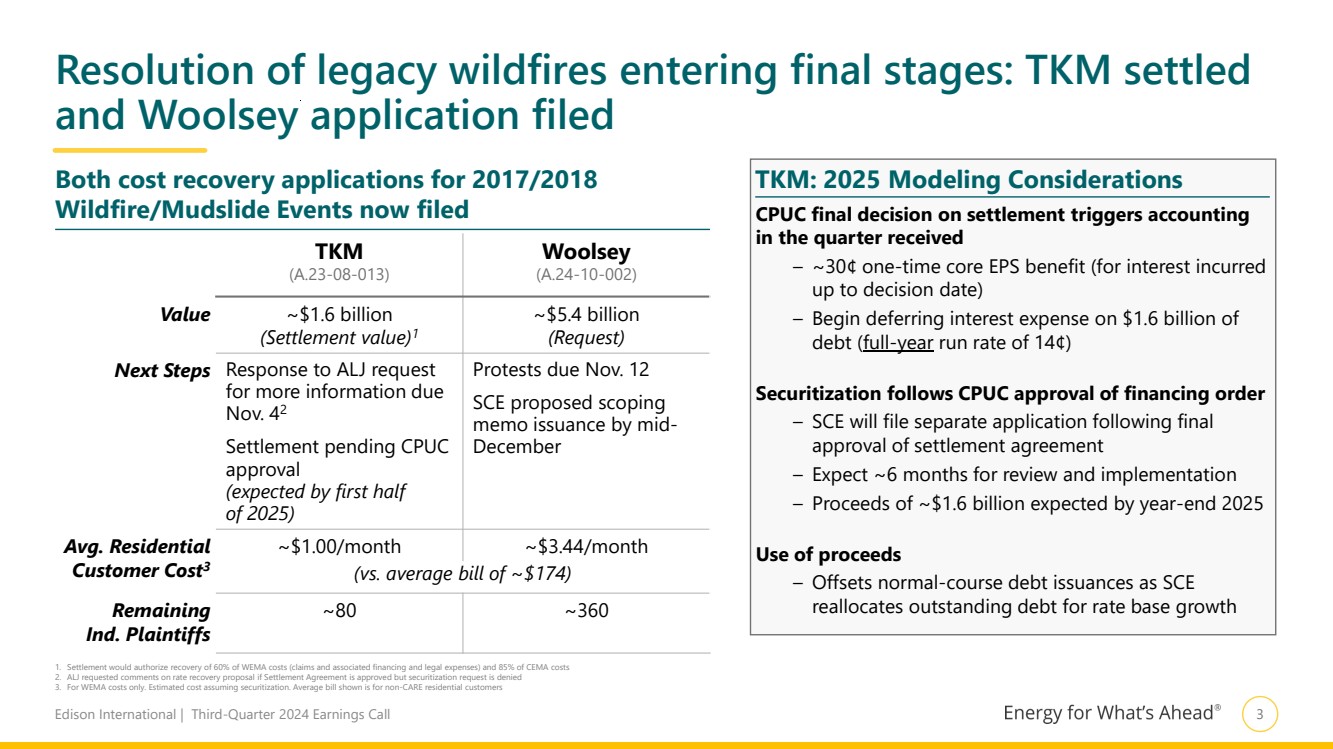
Starting with a couple of constructive updates on the regulatory front, SCE is in the final stages of resolving the legacy wildfires. We have provided an update on page 3. You saw that in August the utility reached an agreement with Cal Advocates to settle the TKM application. Once approved by the CPUC, the settlement would authorize recovery of 60% of the costs, or $1.6 billion. This settlement marks a significant milestone and is a good compromise all around. Customers and the state benefit from the demonstration of a strong regulatory framework and constructive negotiations with intervenors, as do you, our owners.
It is also another clear indication of the utility’s ability to navigate the complex regulatory landscape. SCE recently filed the Woolsey cost recovery application, which we expect to take about 18 months to complete. SCE made a strong case supporting the prudency of its operations and the claims settlement process; but, with the proceeding just underway, it is premature to speculate about the ultimate outcome. As a reminder, we have not factored cost recovery for these legacy events into our earnings targets, thus the TKM settlement and the eventual outcome in Woolsey will be additive to our core operational growth.
SCE’s rapid response to mitigate wildfire risk also resulted in numerous regulatory applications. These included 2021 GRC tracks 2 and 3, a couple of WEMA applications, several CEMAs, three AB 1054 securitizations, and several others. SCE has achieved strong regulatory outcomes, recovering substantial amounts of prior spending in rates and expecting another $3 billion of incremental cash flow over the coming years.
Upcoming on the regulatory calendar are decisions on the TKM settlement and the 2025 GRC, both of which we believe could happen in the first half of next year. The decisions will solidify our financial outlook through 2028. Capital investment enabled by the GRC is the driver for the growth and customer benefits necessary to ensure the grid is reliable, resilient, and ready to achieve the clean energy transition. We are confident in getting a strong outcome for SCE’s customers that will also enable us to deliver on our commitment of a 5 to 7% EPS CAGR through 2028 with minimal equity needs.
Staying with the California regulatory environment, a couple of weeks ago, the Commission changed the cost of capital mechanism and the investor-owned utilities’ 2025 ROEs. While it only applies to 2025, we believe the decision is unfortunate and the process was disappointing. That said, this is just one of numerous business and regulatory outcomes that we manage in delivering on our commitments. I reiterate our confidence in delivering on our 2025 EPS and long-term EPS growth commitments.
2
Moving on to SCE’s core operations, I am proud of our team’s ability to manage unprecedented climate challenges and navigate the numerous associated regulatory applications over the last several years. As you can see on page 5, we have made remarkable strides in reinforcing our operational resilience and financial stability. Our robust performance is a testament to our strategic initiatives and the dedication of our workforce. To address the climate challenges, you have seen the results of SCE’s industry-leading wildfire mitigation plan for several years now. Wildfires will always be a part of California, exacerbated by climate change, and the number of acres burned so far this year is roughly in line with the five-year average. What is important is that SCE has adapted its operations and managed the risk.
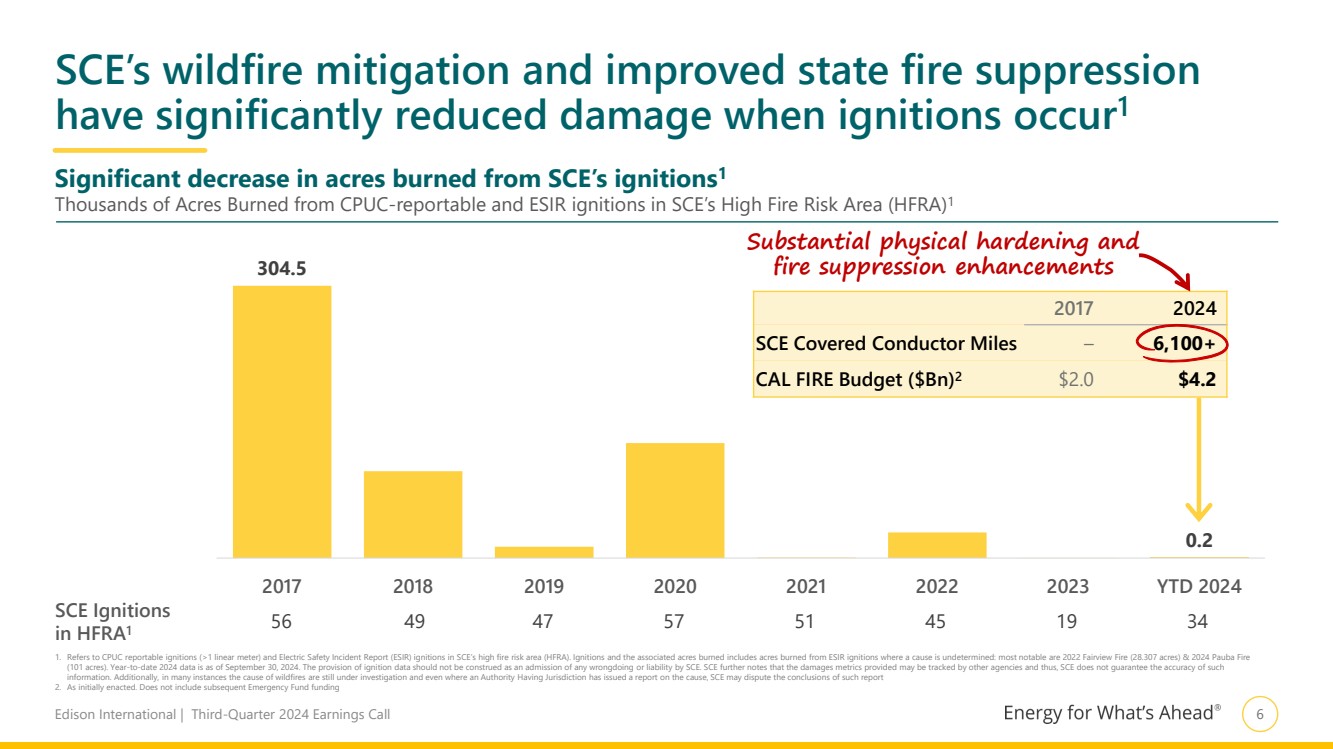
To drive this point home, page 6 shows the significant reduction in acres burned from SCE’s ignitions in high fire risk areas since 2017, and that this has happened while ignitions have been relatively flat, despite several of these years having been extremely high fire risk periods. This is due to SCE’s strong wildfire mitigation plan execution and increased state fire suppression. Importantly, none of the ignitions are from the failure of covered conductor, the cornerstone of SCE’s grid hardening strategy. Now, with more than 6,100 miles of covered conductor deployed, SCE has physically hardened 85% of its distribution grid in high fire risk areas. Consequently, SCE’s grid is more resilient, reliable, and well-positioned to focus on the growth ahead as we lead the clean energy transition. California will also continue to benefit from improved state fire suppression support and as other utilities in the state increase their grid hardening action.
Moving to the bigger picture, wildfires are just one way that climate change is impacting California’s health, economy, and quality of life. Edison International is acting to create a safer, more affordable future with cleaner air and reduced risk of climate disasters. Reaching net-zero greenhouse gas emissions by 2045 is a core pillar of our climate-related risk management. We recently unveiled our latest white paper, Reaching Net Zero, which builds on our previous analysis of what is needed for California to reach carbon neutrality. The publication focuses on Edison International’s net-zero plan and reaffirms our net-zero commitment.
3
As you see on page 7, this plan is centered around delivering 100% carbon-free power to SCE’s customers, as 85% of enterprise-wide emissions are associated with power delivery. In addition, we will reduce operational emissions, primarily by reducing those from the supply chain. Lastly, we project about two million tons of emissions will remain across all scopes in 2045. To fully decarbonize we will need to neutralize those emissions, preferably through high-quality carbon removal solutions or offsets.
As always, we take a pragmatic approach to our analysis and findings. A key point of emphasis is that the state will need substantial deployment of clean firm generation to safely, reliably, and affordably supply power 24/7 in any weather. So, one of the big—and maybe surprising—conclusions is that California must retain its existing natural gas generation fleet as insurance against delays in new technology development and deployment, though the generators will run significantly less often. The bottom line is that to reach net zero, nearly every sector of the economy will need to incorporate clean electricity. It will take much investment and cooperation between industry and government. The effort will be worth it for customers, who will see a projected 40% reduction in their total energy costs by 2045.
Maria Rigatti, Executive Vice President and Chief Financial Officer, Edison International
In my comments today, I would like to emphasize three key financial messages:
First, we are very pleased with EIX’s year-to-date financial performance, which reinforces our confidence in delivering yet another year of solid results. Second, on the regulatory front, SCE continues to generate cash flow by recovering past costs tracked in memo accounts and is making strong progress through the final stages of resolving the legacy wildfires. Third, we remain confident in our ability to deliver on our commitments for 2025 and beyond. I will note that we plan to update our projections next year following a final decision in SCE’s GRC.
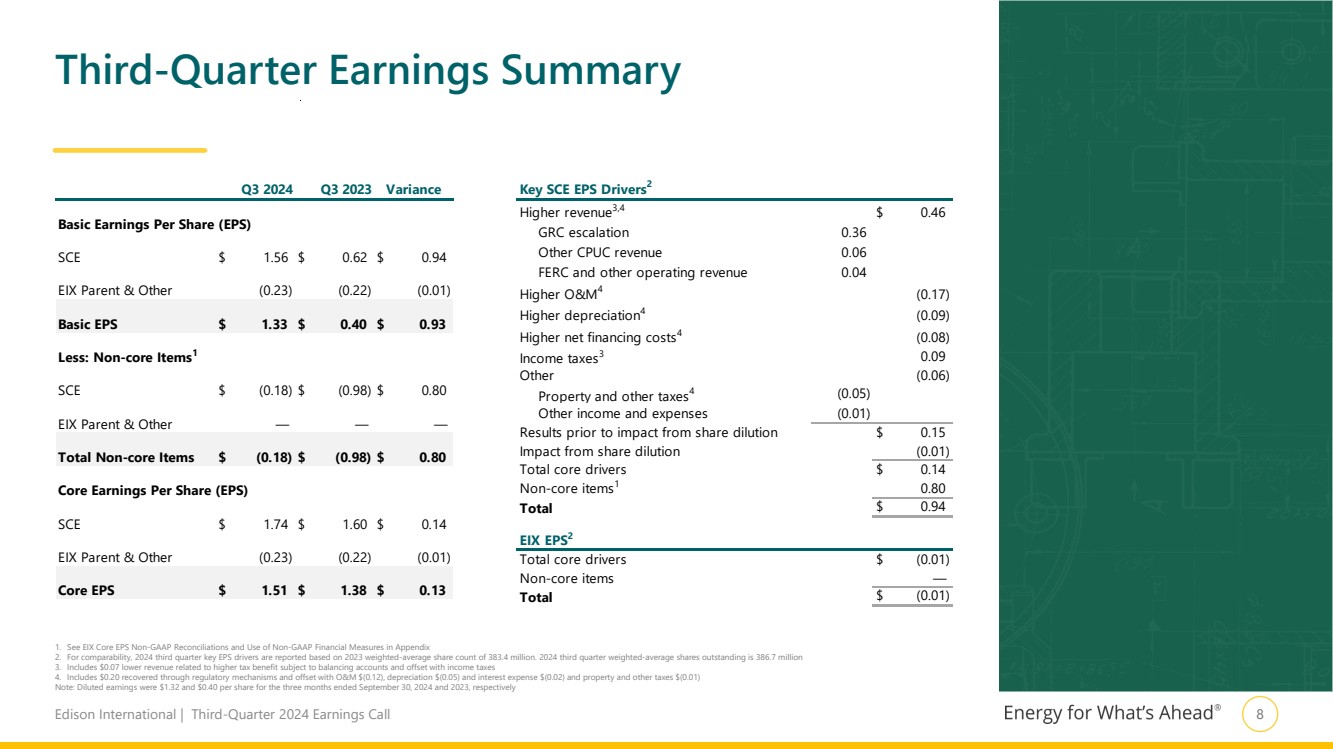
Let’s start with a brief review of our third quarter results. EIX reported core EPS of $1.51. As you can see from the year-over-year quarterly variance analysis shown on page 8, core earnings grew by 13 cents.
4
This EPS growth was primarily due to higher CPUC revenue authorized in Track 4 of the 2021 GRC and higher authorized rates of return. Partially offsetting these drivers was higher interest expense associated with debt for wildfire claims payments. EIX Parent and Other was in line with the same period last year. Our quarterly results bring year-to-date EPS to $3.88, and this strong performance is largely driven by O&M, benefitting from a combination of efficient execution and timing.
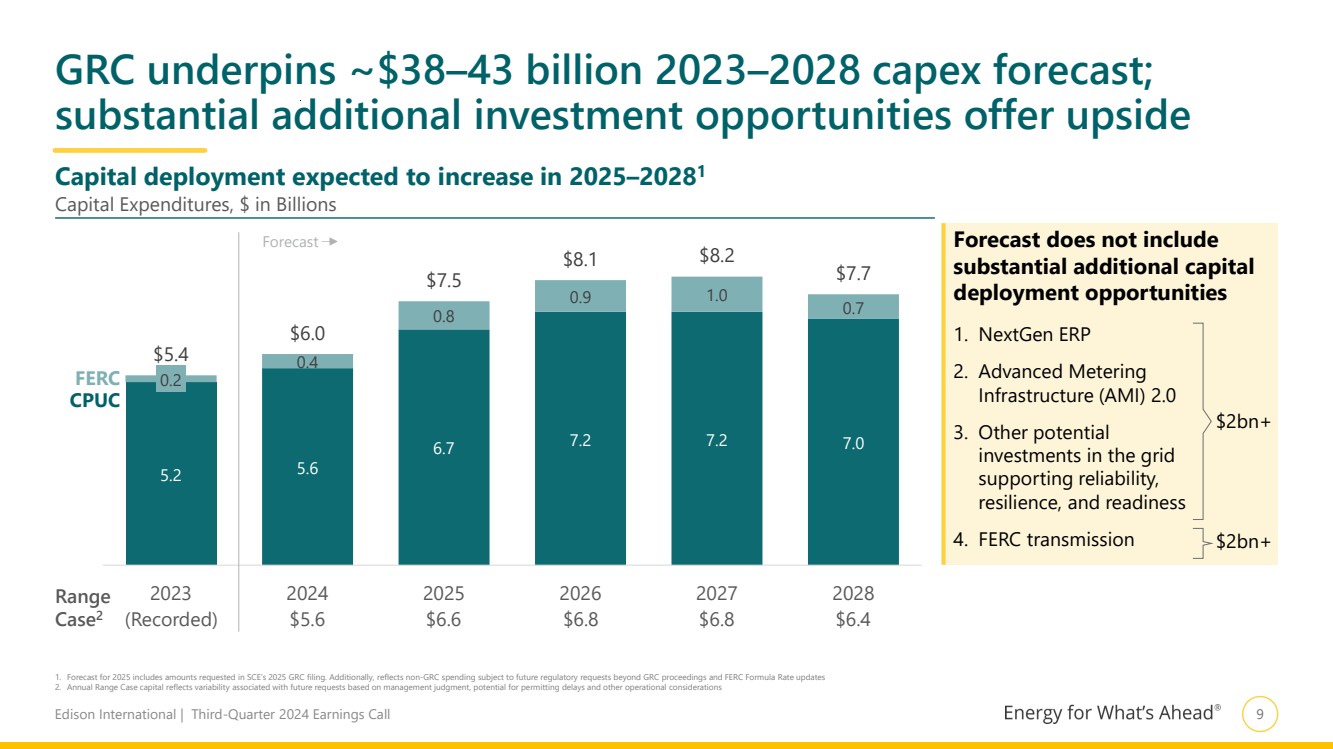
Pages 9 and 10 show SCE’s capital and rate base forecasts, which are consistent with last quarter’s disclosures. We expect our next major update to the capital plan will follow a final decision in SCE’s 2025 GRC. In addition to the capital investment supported by the GRC, the utility is working on the standalone application for its next generation enterprise resource planning system, which is expected to be filed in the next six months. Further, SCE expects to file the advanced metering infrastructure 2.0 application toward the end of 2025. Combined, these represent over $2 billion of CPUC-jurisdictional capital investment. SCE also has more than $2 billion of FERC transmission projects in development. Both the incremental CPUC and FERC spending are upside to our current capital plan.
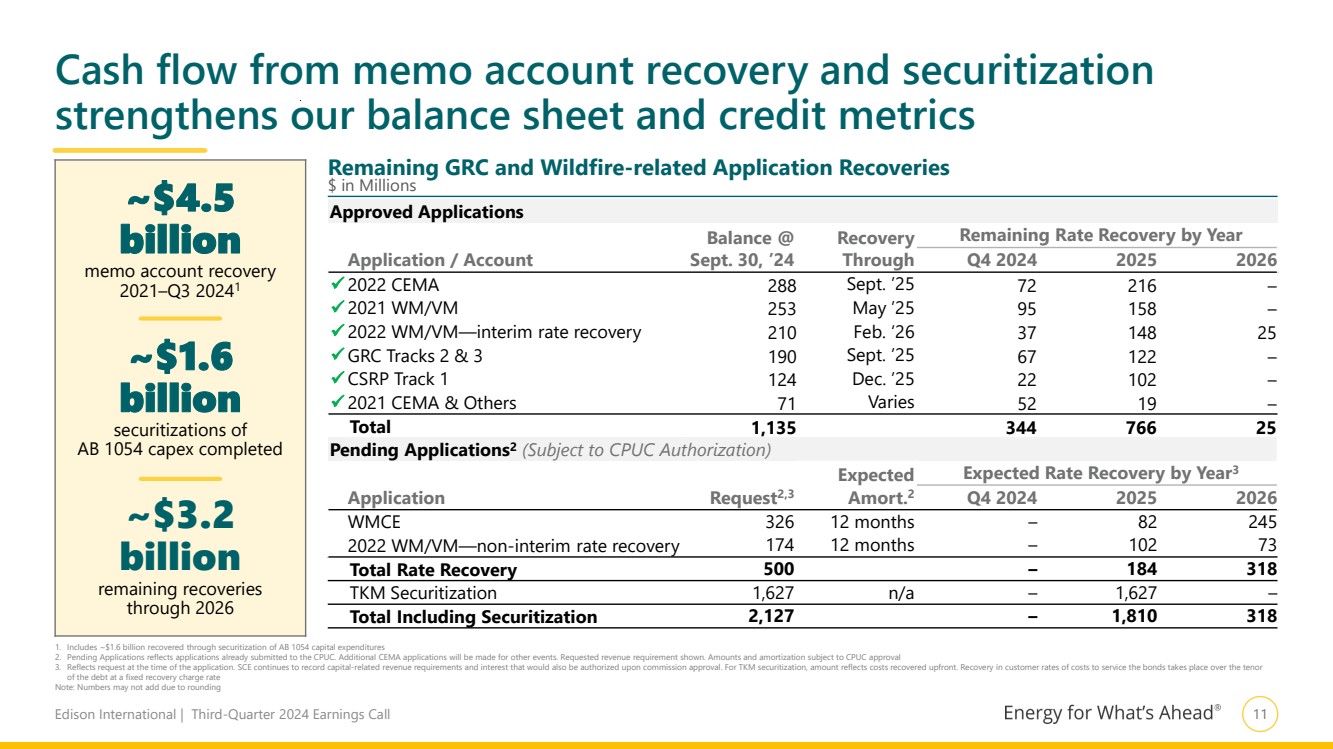
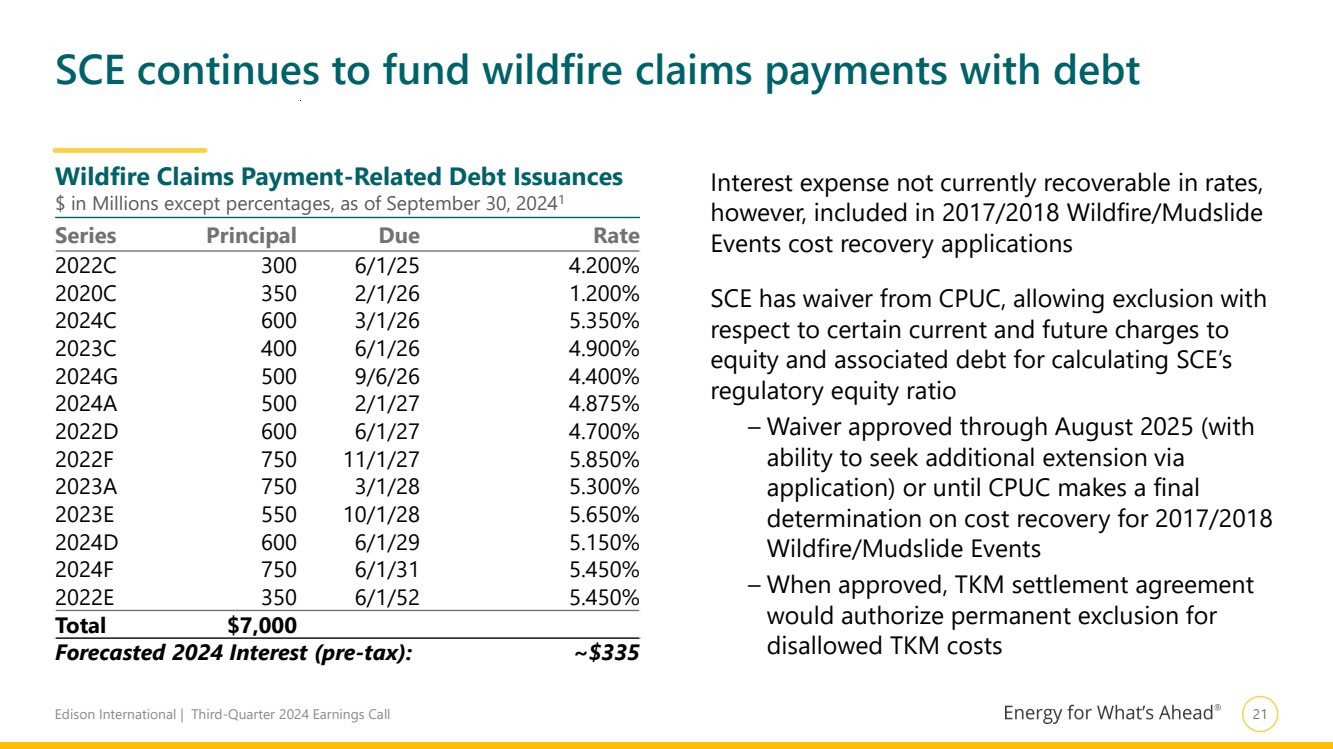
Turning to page 11, following strong regulatory outcomes in recent years, SCE has recovered about $4.5 billion since 2021. In this quarter’s update, you will notice one new item—the securitization that we expect will follow approval of the TKM settlement agreement. After a final decision on the settlement, SCE will file an application to request approval to securitize the $1.6 billion recovery, targeting completion of a financing by year-end 2025. In total, the cash flow already received and expected over the next couple of years significantly strengthens our balance sheet and credit metrics. Not only that, but we should also see the amounts recovered through memo accounts decline over time as these activities are built into SCE’s GRCs going forward, simplifying the regulatory process.
I would like to now expand on the status of fully resolving the legacy wildfires. SCE has now received demands for 95% of TKM and 94% of Woolsey outstanding individual plaintiff claims and the utility continues to work swiftly to resolve them. Under the settlement agreement, the same 60% recovery ratio will apply to the remaining TKM costs, net of a previously agreed to disallowance.
5
For Woolsey, SCE also proposed a process to recover claims paid after the date the application was filed. The best estimate of total losses remained unchanged this quarter as additional settlements have been in line with expectations.
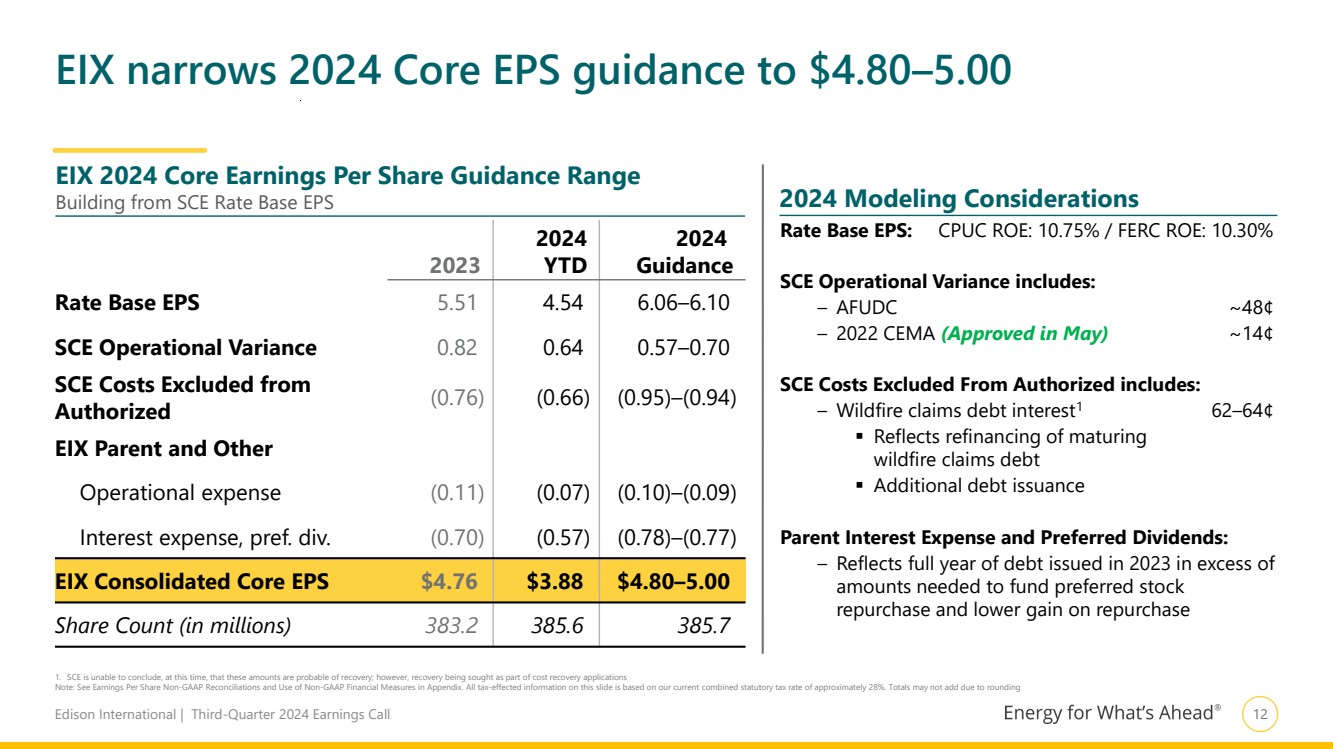
Turning to EPS guidance, page 12 shows our 2024 core EPS guidance and modeling considerations. We are pleased with our very strong year-to-date performance, which also gives us the opportunity to continue pulling forward O&M for the benefit of customers. With nine months of results behind us and based on our outlook for the remainder of the year, we are very comfortable with narrowing our EPS guidance to $4.80 to $5.00.
Turning to page 13, we have refreshed the modeling considerations for 2025. I’ll note a couple of items. First, we’ve updated rate base EPS to reflect the CPUC decision on cost of capital that Pedro mentioned. Secondly, continuing the trend, we see favorable cost management flexibility, driven by the pace of O&M reinvestment and financing benefits. Lastly, I want to emphasize that we have not incorporated the benefits from the TKM settlement agreement into this refresh, which would be incremental to our forecasts.
I will now discuss the plan for updating our guidance and long-term outlook. At a macro level, let me note that the moderating interest rate environment removes a financing headwind we have faced in recent years. Additionally, cost recovery in the legacy wildfire proceedings provides a tailwind. Looking at our core operations, SCE’s GRC is the driver for our high-quality earnings growth. As Pedro mentioned, we are hoping to see a CPUC decision in the first half of next year. Once SCE gets a final decision from the CPUC on the GRC, we will update our capital plan, financing plan, 2025 EPS guidance, and EPS growth forecast, factoring in the TKM settlement.
So, what gives us confidence in achieving our 2025 core EPS guidance of $5.50 to $5.90 and growing earnings by 5 to 7% through 2028? There are two key factors. First is the strength of SCE’s GRC and progress throughout the proceeding. SCE made a strong case and even based on intervenors’ positions SCE’s rate base growth would still be in line with its range case forecast of 6%.
6
Second is our ability to manage the numerous variables in the business, as we’ve demonstrated year in and year out over the last two decades. Additionally, it is important to reiterate that our guidance does not incorporate the upside from the TKM settlement. As you saw on page 3, that total upside to 2025 core EPS is about 44 cents, and the ongoing annual benefit beyond 2025 is 14 cents.
I’ll conclude by saying that our strong financial discipline enables us to deliver not only on our financial targets, but also to continue SCE’s cost leadership for customers, given that affordability is a key component of the clean energy transition.
7
|
OCTOBER 29, 2024 THIRD-QUARTER 2024 FINANCIAL RESULTS |
|
Edison International | Third-Quarter 2024 Earnings Call 1 Statements contained in this presentation about future performance, including, without limitation, operating results, capital expenditures, rate base growth, dividend policy, financial outlook, and other statements that are not purely historical, are forward-looking statements. These forward-looking statements reflect our current expectations; however, such statements involve risks and uncertainties. Actual results could differ materially from current expectations. These forward-looking statements represent our expectations only as of the date of this presentation, and Edison International assumes no duty to update them to reflect new information, events or circumstances. Important factors that could cause different results include, but are not limited to the: • ability of SCE to recover its costs through regulated rates, timely or at all, including uninsured wildfire-related and debris flow-related costs (including amounts paid for self-insured retention and co-insurance), costs incurred to mitigate the risk of utility equipment causing future wildfires, and increased costs due to supply chain constraints, inflation and rising interest rates; • impact of affordability of customer rates on SCE's ability to execute its strategy, including the impact of affordability on the regulatory approval of operations and maintenance expenses, and proposed capital investment projects; • ability of SCE to implement its operational and strategic plans, including its Wildfire Mitigation Plan and capital investment program; • risks of regulatory or legislative restrictions that would limit SCE's ability to implement operational measures to mitigate wildfire risk, including Public Safety Power Shutoff (“PSPS”) and fast curve settings, when conditions warrant or would otherwise limit SCE's operational practices relative to wildfire risk mitigation; • ability of SCE to obtain safety certifications from the Office of Energy Infrastructure Safety of the California Natural Resources Agency (“OEIS“) • risk that California Assembly Bill 1054 (“AB 1054“) does not effectively mitigate the significant exposure faced by California investor-owned utilities related to liability for damages arising from catastrophic wildfires where utility facilities are alleged to be a substantial cause, including the longevity of the Wildfire Insurance Fund and the California Public Utilities Commission (“CPUC”) interpretation of and actions under AB 1054, including its interpretation of the prudency standard clarified by AB 1054; • risks associated with the operation of electrical facilities, including worker and public safety issues, the risk of utility assets causing or contributing to wildfires, failure, availability, efficiency, and output of equipment and facilities, and availability and cost of spare parts; • physical security of Edison International’s and SCE’s critical assets and personnel and the cybersecurity of Edison International’s and SCE’s critical information technology systems for grid control, and business, employee and customer data; • ability of Edison International and SCE to effectively attract, manage, develop and retain a skilled workforce, including its contract workers; • decisions and other actions by the CPUC, the Federal Energy Regulatory Commission, and the United States Nuclear Regulatory Commission and other governmental authorities, including decisions and actions related to nationwide or statewide crisis, approval of regulatory proceeding settlements, determinations of authorized rates of return or return on equity, the recoverability of wildfire-related and debris flow-related costs, issuance of SCE's wildfire safety certification, wildfire mitigation efforts, approval and implementation of electrification programs, and delays in executive, regulatory and legislative actions; • potential for penalties or disallowances for non-compliance with applicable laws and regulations, including fines, penalties and disallowances related to wildfires where SCE's equipment is alleged to be associated with ignition; • extreme weather-related incidents (including events caused, or exacerbated, by climate change, such as wildfires, debris flows, flooding, droughts, high wind events and extreme heat events) and other natural disasters (such as earthquakes), which could cause, among other things, worker and public safety issues, property damage, rotating outages and other operational issues (such as issues due to damaged infrastructure), PSPS activations and unanticipated costs; • cost and availability of labor, equipment and materials, including as a result of supply chain constraints and inflation; • ability of Edison International or SCE to borrow funds and access bank and capital markets on reasonable terms; • risks associated with the decommissioning of San Onofre, including those related to worker and public safety, public opposition, permitting, governmental approvals, on-site storage of spent nuclear fuel and other radioactive material, delays, contractual disputes, and cost overruns; • risks associated with cost allocation resulting in higher rates for utility bundled service customers because of possible customer bypass or departure for other electricity providers such as Community Choice Aggregators (“CCA,” which are cities, counties, and certain other public agencies with the authority to generate and/or purchase electricity for their local residents and businesses) and Electric Service Providers (entities that offer electric power and ancillary services to retail customers, other than electrical corporations (like SCE) and CCAs); • risks inherent in SCE’s capital investment program, including those related to project site identification, public opposition, environmental mitigation, construction, permitting, contractor performance, changes in the California Independent System Operator’s transmission plans, and governmental approvals; and • actions by credit rating agencies to downgrade Edison International or SCE’s credit ratings or to place those ratings on negative watch or negative outlook. Other important factors are discussed under the headings “Forward-Looking Statements”, “Risk Factors” and “Management’s Discussion and Analysis” in Edison International’s Form 10-K and other reports filed with the Securities and Exchange Commission, which are available on our website: www.edisoninvestor.com. These filings also provide additional information on historical and other factual data contained in this presentation. Forward-Looking Statements |
|
Edison International | Third-Quarter 2024 Earnings Call 2 Third Quarter Key Messages $1.33 Q3 2024 GAAP EPS $1.51 Q3 2024 Core EPS1 Reiterated 5–7% Core EPS CAGR 2025–20283 Reiterated 5–7% Core EPS CAGR 2021–20252 Narrowed $4.80–5.00 2024 Core EPS Guidance1 Continued strong quarterly results; narrowing 2024 Core EPS guidance In final stages of two key regulatory proceedings: awaiting proposed decisions on TKM settlement agreement and 2025 GRC Reaffirmed commitment, and released detailed plan, to reach net-zero emissions by 2045 1. See Earnings Per Share Non-GAAP Reconciliations and Use of Non-GAAP Financial Measures in Appendix 2. Compound annual growth rate (CAGR) based on the midpoint of the initial 2021 EPS guidance range of $4.42–4.62 3. Compound annual growth rate (CAGR) based on the midpoint of the 2025 EPS guidance range of $5.50–5.90 2 Continued confidence in delivering on 5–7% Core EPS growth for 2021–2025 and 2025–2028 1 2 3 5 4 Remarkable success over last several years managing unprecedented climate challenges |
|
Edison International | Third-Quarter 2024 Earnings Call 3 Resolution of legacy wildfires entering final stages: TKM settled and Woolsey application filed TKM (A.23-08-013) Woolsey (A.24-10-002) Value ~$1.6 billion (Settlement value)1 ~$5.4 billion (Request) Next Steps Response to ALJ request for more information due Nov. 42 Settlement pending CPUC approval (expected by first half of 2025) Protests due Nov. 12 SCE proposed scoping memo issuance by mid-December Avg. Residential Customer Cost3 ~$1.00/month ~$3.44/month (vs. average bill of ~$174) Remaining Ind. Plaintiffs ~80 ~360 Both cost recovery applications for 2017/2018 TKM: 2025 Modeling Considerations Wildfire/Mudslide Events now filed 1. Settlement would authorize recovery of 60% of WEMA costs (claims and associated financing and legal expenses) and 85% of CEMA costs 2. ALJ requested comments on rate recovery proposal if Settlement Agreement is approved but securitization request is denied 3. For WEMA costs only. Estimated cost assuming securitization. Average bill shown is for non-CARE residential customers CPUC final decision on settlement triggers accounting in the quarter received – ~30¢ one-time core EPS benefit (for interest incurred up to decision date) – Begin deferring interest expense on $1.6 billion of debt (full-year run rate of 14¢) Securitization follows CPUC approval of financing order – SCE will file separate application following final approval of settlement agreement – Expect ~6 months for review and implementation – Proceeds of ~$1.6 billion expected by year-end 2025 Use of proceeds – Offsets normal-course debt issuances as SCE reallocates outstanding debt for rate base growth |
|
Edison International | Third-Quarter 2024 Earnings Call 4 2025 GRC record complete — now awaiting proposed decision 1. Does not reflect updates to 2025 cost of capital 2. Refers to stipulated agreements entered into the GRC’s procedural record and the CPUC-approved Joint Motion For Early Decision Extending The Wildfire Liability Customer-Funded Self-Insurance Program All steps by parties complete. Awaiting issuance of proposed decision ✓ Partial settlements2 with intervenors ✓ covering 12 areas – Represents ~19% of O&M and ~8% of capital request – Would approve ~96% of requests in respective areas Annual GRC Revenue Requirement Increases1 $ Millions 2025 2026 2027 2028 ~$1,900 ~$670 ~$750 ~$730 Event Date Reply Briefs August 5, 2024 Proposed Decision (PD) TBD Oral Arguments TBD Final Decision ≥30 days after PD ✓ Wildfire Liability Customer-funded Self-insurance ✓ Billing Services, Credit and Payment Services ✓ Business Customer Services and Communications, Education, and Outreach ✓ Customer Experience Management ✓ Customer Programs Management ✓ Customer Contacts ✓ Environmental Services ✓ Employee Support ✓ Capital Forecast for Enterprise Technology and OU Capitalized Software (Technology Solutions) ✓ Training & Development ✓ Non-Wildfire Insurance ✓ Cybersecurity and Physical Security *Final decision will be retroactive to January 1, 2025 |
|
Edison International | Third-Quarter 2024 Earnings Call 5 “Our team has achieved remarkable success over the last several years managing unprecedented climate challenges, making our operations more resilient and positioning us strongly for the growth ahead” - Pedro Pizarro, president and CEO Strong regulatory decisions and cost recovery in increasingly constructive CPUC environment ✓ Industry-leading wildfire mitigation plan execution, with 85% of high fire risk areas physically hardened ✓ Upcoming regulatory actions on TKM settlement and 2025 GRC will further strengthen financial outlook ✓ |
|
Edison International | Third-Quarter 2024 Earnings Call 6 SCE’s wildfire mitigation and improved state fire suppression have significantly reduced damage when ignitions occur1 SCE Ignitions in HFRA1 56 49 47 57 51 45 19 34 1. Refers to CPUC reportable ignitions (>1 linear meter) and Electric Safety Incident Report (ESIR) ignitions in SCE’s high fire risk area (HFRA). Ignitions and the associated acres burned includes acres burned from ESIR ignitions where a cause is undetermined: most notable are 2022 Fairview Fire (28.307 acres) & 2024 Pauba Fire (101 acres). Year-to-date 2024 data is as of September 30, 2024. The provision of ignition data should not be construed as an admission of any wrongdoing or liability by SCE. SCE further notes that the damages metrics provided may be tracked by other agencies and thus, SCE does not guarantee the accuracy of such information. Additionally, in many instances the cause of wildfires are still under investigation and even where an Authority Having Jurisdiction has issued a report on the cause, SCE may dispute the conclusions of such report 2. As initially enacted. Does not include subsequent Emergency Fund funding Significant decrease in acres burned from SCE’s ignitions1 Thousands of Acres Burned from CPUC-reportable and ESIR ignitions in SCE’s High Fire Risk Area (HFRA)1 304.5 0.2 2017 2018 2019 2020 2021 2022 2023 YTD 2024 2017 2024 SCE Covered Conductor Miles – 6,100+ CAL FIRE Budget ($Bn)2 $2.0 $4.2 Substantial physical hardening and fire suppression enhancements |
|
Edison International | Third-Quarter 2024 Earnings Call 7 Neutralize remaining emissions: Mostly from natural gas generation supporting reliability and affordability EIX is directly contributing to California’s clean energy transition by taking steps to reach net zero Deliver Carbon-Free Power to SCE’s Customers: Increase clean power procurement and decrease natural gas generation use, in line with commitment to deliver 100% carbon-free power by 2045 1 2 3 Reduce Operational Emissions: Engaging vendors to reduce supply chain emissions, phasing out older technology, and continuing to electrify vehicle fleet Source: EIX’s Reaching Net Zero analysis. See EIX’s Reaching Net Zero paper for additional information on the analysis and its methodology 10.3 (7.2) (1.1) (2.0) 2020 Emissions Power Delivery-related Operational Neutralized Our Net-Zero Action Plan Reducing Scope 1, 2, and 3 Emissions Reaching net-zero GHG Emissions by 2045 GHG Emissions Reductions by 2045 (MMT CO2e) Net Zero by 2045 |
|
Edison International | Third-Quarter 2024 Earnings Call 8 Key SCE EPS Drivers2 Higher revenue3,4 $ 0.46 GRC escalation 0.36 Other CPUC revenue 0.06 FERC and other operating revenue 0.04 Higher O&M4 (0.17) Higher depreciation4 (0.09) Higher net financing costs4 (0.08) Income taxes3 0.09 Other (0.06) Property and other taxes4 (0.05) Other income and expenses (0.01) Results prior to impact from share dilution $ 0.15 Impact from share dilution (0.01) Total core drivers $ 0.14 Non-core items1 0.80 Total $ 0.94 Total core drivers $ (0.01) Non-core items — Total $ (0.01) EIX EPS2 Q3 2024 Q3 2023 Variance Basic Earnings Per Share (EPS) SCE $ 1.56 $ 0.62 $ 0.94 EIX Parent & Other (0.23) (0.22) (0.01) Basic EPS $ 1.33 $ 0.40 $ 0.93 Less: Non-core Items1 SCE $ (0.18) $ (0.98) $ 0.80 EIX Parent & Other — — — Total Non-core Items $ (0.18) $ (0.98) $ 0.80 Core Earnings Per Share (EPS) SCE $ 1.74 $ 1.60 $ 0.14 EIX Parent & Other (0.23) (0.22) (0.01) Core EPS $ 1.51 $ 1.38 $ 0.13 Third-Quarter Earnings Summary 1. See EIX Core EPS Non-GAAP Reconciliations and Use of Non-GAAP Financial Measures in Appendix 2. For comparability, 2024 third quarter key EPS drivers are reported based on 2023 weighted-average share count of 383.4 million. 2024 third quarter weighted-average shares outstanding is 386.7 million 3. Includes $0.07 lower revenue related to higher tax benefit subject to balancing accounts and offset with income taxes 4. Includes $0.20 recovered through regulatory mechanisms and offset with O&M $(0.12), depreciation $(0.05) and interest expense $(0.02) and property and other taxes $(0.01) Note: Diluted earnings were $1.32 and $0.40 per share for the three months ended September 30, 2024 and 2023, respectively |
|
Edison International | Third-Quarter 2024 Earnings Call 9 5.2 5.6 6.7 7.2 7.2 7.0 0.2 0.4 0.8 0.9 1.0 0.7 $5.4 $6.0 $7.5 $8.1 $8.2 $7.7 2023 2024 2025 2026 2027 2028 Capital deployment expected to increase in 2025–20281 Range Case2 (Recorded) $5.6 $6.6 $6.8 $6.8 $6.4 GRC underpins ~$38–43 billion 2023–2028 capex forecast; substantial additional investment opportunities offer upside CPUC FERC Capital Expenditures, $ in Billions Forecast does not include substantial additional capital deployment opportunities 1. NextGen ERP 2. Advanced Metering Infrastructure (AMI) 2.0 3. Other potential investments in the grid supporting reliability, resilience, and readiness 4. FERC transmission $2bn+ $2bn+ Forecast 1. Forecast for 2025 includes amounts requested in SCE’s 2025 GRC filing. Additionally, reflects non-GRC spending subject to future regulatory requests beyond GRC proceedings and FERC Formula Rate updates 2. Annual Range Case capital reflects variability associated with future requests based on management judgment, potential for permitting delays and other operational considerations |
|
Edison International | Third-Quarter 2024 Earnings Call 10 33.6 35.9 41.8 45.3 48.7 51.8 7.6 7.5 7.6 7.7 8.1 8.8 $41.2 $43.4 $49.4 $53.0 $56.8 $60.6 2023 2024 2025 2026 2027 2028 Projected ~6–8% rate base growth 2023–2028; substantial additional investment opportunities offer upside CPUC FERC ~8% CAGR 2023–2028 Rate Base1 , $ in Billions Strong rate base growth driven by wildfire mitigation and important grid work to support California’s leading role in clean energy transition Range Case2 (Recorded) $43.0 $48.1 $50.4 $52.8 $55.3 Forecast does not include substantial additional capital deployment opportunities 1. NextGen ERP 2. Advanced Metering Infrastructure (AMI) 2.0 3. Other potential investments in the grid supporting reliability, resilience, and readiness 4. FERC transmission $2bn+ $2bn+ 1. Weighted-average year basis 2. Range Case rate base reflects only changes in forecast capital expenditures |
|
Edison International | Third-Quarter 2024 Earnings Call 11 ~$4.5 billion memo account recovery 2021–Q3 20241 ~$1.6 billion securitizations of AB 1054 capex completed ~$3.2 billion remaining recoveries through 2026 Cash flow from memo account recovery and securitization strengthens our balance sheet and credit metrics Approved Applications Application / Account Balance @ Sept. 30, ’24 Recovery Through Remaining Rate Recovery by Year Q4 2024 2025 2026 ✓ 2022 CEMA 288 Sept. ’25 72 216 – ✓ 2021 WM/VM 253 May ’25 95 158 – ✓ 2022 WM/VM—interim rate recovery 210 Feb. ‘26 37 148 25 ✓ GRC Tracks 2 & 3 190 Sept. ’25 67 122 – ✓ CSRP Track 1 124 Dec. ’25 22 102 – ✓ 2021 CEMA & Others 71 Varies 52 19 – Total 1,135 344 766 25 Pending Applications2 (Subject to CPUC Authorization) Application Request2,3 Expected Amort.2 Expected Rate Recovery by Year3 Q4 2024 2025 2026 WMCE 326 12 months – 82 245 2022 WM/VM—non-interim rate recovery 174 12 months – 102 73 Total Rate Recovery 500 – 184 318 TKM Securitization 1,627 n/a – 1,627 – Total Including Securitization 2,127 – 1,810 318 1. Includes ~$1.6 billion recovered through securitization of AB 1054 capital expenditures 2. Pending Applications reflects applications already submitted to the CPUC. Additional CEMA applications will be made for other events. Requested revenue requirement shown. Amounts and amortization subject to CPUC approval 3. Reflects request at the time of the application. SCE continues to record capital-related revenue requirements and interest that would also be authorized upon commission approval. For TKM securitization, amount reflects costs recovered upfront. Recovery in customer rates of costs to service the bonds takes place over the tenor of the debt at a fixed recovery charge rate Note: Numbers may not add due to rounding Remaining GRC and Wildfire-related Application Recoveries $ in Millions |
|
Edison International | Third-Quarter 2024 Earnings Call 12 EIX narrows 2024 Core EPS guidance to $4.80–5.00 1. SCE is unable to conclude, at this time, that these amounts are probable of recovery; however, recovery being sought as part of cost recovery applications Note: See Earnings Per Share Non-GAAP Reconciliations and Use of Non-GAAP Financial Measures in Appendix. All tax-effected information on this slide is based on our current combined statutory tax rate of approximately 28%. Totals may not add due to rounding 2023 2024 YTD 2024 Guidance Rate Base EPS 5.51 4.54 6.06–6.10 SCE Operational Variance 0.82 0.64 0.57–0.70 SCE Costs Excluded from Authorized (0.76) (0.66) (0.95)–(0.94) EIX Parent and Other Operational expense (0.11) (0.07) (0.10)–(0.09) Interest expense, pref. div. (0.70) (0.57) (0.78)–(0.77) EIX Consolidated Core EPS $4.76 $3.88 $4.80–5.00 Share Count (in millions) 383.2 385.6 385.7 EIX 2024 Core Earnings Per Share Guidance Range Building from SCE Rate Base EPS 2024 Modeling Considerations Rate Base EPS: CPUC ROE: 10.75% / FERC ROE: 10.30% SCE Operational Variance includes: – AFUDC ~48¢ – 2022 CEMA (Approved in May) ~14¢ SCE Costs Excluded From Authorized includes: – Wildfire claims debt interest1 62–64¢ ▪ Reflects refinancing of maturing wildfire claims debt ▪ Additional debt issuance Parent Interest Expense and Preferred Dividends: – Reflects full year of debt issued in 2023 in excess of amounts needed to fund preferred stock repurchase and lower gain on repurchase |
|
Edison International | Third-Quarter 2024 Earnings Call 13 EIX reaffirms 5–7% 2021–2025 Core EPS growth rate target, which would result in 2025 Core EPS of $5.50–5.901 1. Based on the midpoint of initial 2021 Core EPS guidance range of $4.42–4.62 established September 16, 2021. Growth in any given year can be outside the range Component Modeling Considerations Rate Base EPS (based on capex levels) 6.60–6.80 •CPUC ROE of 10.33% and FERC ROE 10.30% •Reflects reduction in 2025 ROE from Cost of Capital Phase 2 decision SCE Op. Variance 0.75–0.95 •AFUDC is the largest contributor: ~$0.40 • Timing of regulatory decisions and other variances from authorized • Financing benefits (timing and market environment) SCE Costs Excluded from Authorized (1.00)–(0.90) •Primarily wildfire claims payment-related debt •Current interest rate assumption of 5.3% (sensitivity: ~0.5¢ per ±50bps change) EIX Parent & Other (0.88)–(0.93) •Current interest rate assumption of 6.1% (sensitivity: ~0.5¢ per ±50bps change) 2025 Core Earnings per Share Component Ranges Does not incorporate upside from TKM settlement |
|
Edison International | Third-Quarter 2024 Earnings Call 14 EIX expects 5–7% Core EPS growth for 2025–2028, with financing plan showing minimal equity needs 1. For 2025, represents the midpoint of the 2025 Core EPS guidance range for $5.50–5.90 2. Financing plan is subject to change. Does not incorporate potential cost recovery in the 2017/2018 Wildfire/Mudslide cost recovery proceedings, which could materially change the financing plan 3. EIX Dividends includes common and preferred dividends, which are subject to approval by the EIX Board of Directors 4. Incremental to refinancing of maturities. Values shown include both SCE and parent debt $5.70 $6.60–7.00 2025 Midpoint 2028 Achievable EPS growth for 2028 Core Earnings per Share Guidance1 5–7% CAGR Uses Sources 2025–2028 EIX consolidated financing plan2 $ in Billions Capital Plan $27–32 Dividends3 $6–7 Net cash provided by operating activities $25–28 Incremental Debt4 $8–11 Equity ~$0.4 |
|
Edison International | Third-Quarter 2024 Earnings Call 15 EIX offers double-digit total return potential 1. Compound annual growth rate (CAGR) based on the midpoint of the 2021 Core EPS guidance range of $4.42–4.62 established on September 16, 2021; CAGR for 2025–2028 based on the midpoint of 2025 Core EPS guidance range of $5.50–5.90 2. Based on EIX stock price on October 28, 2024 3. At current P/E multiple. Excludes changes in P/E multiple 4. Risk reduction based on mitigations through December 31, 2023 5–7% Core EPS CAGR1 2021–2025 and 2025–2028 Underpinned by strong rate base growth of ~6–8% $38–43 billion 2023–2028 capital program ~4% current dividend yield2 20 consecutive years of dividend growth Target dividend payout of 45–55% of SCE core earnings Investments in safety and reliability of the grid Wildfire mitigation execution reduces risk for customers Creates strong foundation for climate adaptation and the clean energy transition One of the strongest electrification profiles in the industry Industry-leading programs for transportation electrification Expected 35% load growth by 2035 and 80% by 2045 9–11% total return opportunity3 before potential P/E multiple expansion driven by estimated 85–90%+ wildfire risk reduction4 , and ongoing utility and government wildfire mitigation efforts |
|
ADDITIONAL INFORMATION |
|
Edison International | Third-Quarter 2024 Earnings Call 17 YTD 2024 YTD 2023 Variance Basic Earnings Per Share (EPS) SCE $ 3.09 $ 2.69 $ 0.40 EIX Parent & Other (0.64) (0.55) (0.09) Basic EPS $ 2.45 $ 2.14 $ 0.31 Less: Non-core Items1 SCE $ (1.43) $ (1.43) $ — EIX Parent & Other — 0.09 (0.09) Total Non-core Items $ (1.43) $ (1.34) $ (0.09) Core Earnings Per Share (EPS) SCE $ 4.52 $ 4.12 $ 0.40 EIX Parent & Other (0.64) (0.64) — Core EPS $ 3.88 $ 3.48 $ 0.40 Key SCE EPS Drivers2 Higher revenue3,4 $ 1.65 GRC escalation 1.00 Other CPUC revenue 0.63 FERC and other operating revenue 0.02 Higher O&M4 (0.61) Wildfire-related claims 0.01 Higher depreciation4 (0.31) Higher net financing costs4 (0.37) Income taxes3 0.13 Other (0.07) Property and other taxes4 (0.10) Other income and expenses 0.03 Results prior to impact from share dilution $ 0.43 Impact from share dilution (0.03) Total core drivers $ 0.40 Non-core items1 - Total $ 0.40 Total core drivers $ — Non-core items1 (0.09) Total $ (0.09) EIX EPS2 Year-to-Date Earnings Summary 1. See EIX Core EPS Non-GAAP Reconciliations and Use of Non-GAAP Financial Measures in Appendix 2. For comparability, 2024 year-to-date key EPS drivers are reported based on 2023 weighted-average share count of 383.0 million. 2024 year-to-date weighted-average shares outstanding is 385.6 million 3. Includes $0.12 lower revenue related to higher tax benefit subject to balancing accounts and offset with income taxes 4. Includes $0.83 recovered through regulatory mechanisms and offset with O&M $(0.55), depreciation $(0.15), interest expense $(0.08) and property and other taxes $(0.05) Note: Diluted earnings were $2.44 and $2.13 per share for the nine months ended September 30, 2024 and 2023, respectively |
|
Edison International | Third-Quarter 2024 Earnings Call 18 Key Takeaways of TKM Settlement Agreement Authorized Amounts 60% of claims, financing, and legal costs (~$1.6 billion WEMA recovery) 85% of restoration costs (~$55 million CEMA recovery) Permanent Capital Structure Exclusion Permanently exclude after-tax charges to equity and associated debt from SCE’s CPUC regulatory capital structure Cost Recovery SCE will file separate application seeking approval to recover authorized WEMA amounts through issuance of securitized bonds CEMA amounts will be recovered through normal course recovery (i.e., rate base) Next Steps Response to ALJ request for more information due Nov. 41 SCE anticipates proposed decision by first half of 2025 Following final settlement approval, separate application to issue securitized bonds expected to take 6 months for CPUC review SCE anticipates securitized bond proceeds would be received by end of 20252 1. ALJ requested comments on rate recovery proposal if Settlement Agreement is approved but securitization request is denied 2. Assuming securitization approved |
|
Edison International | Third-Quarter 2024 Earnings Call 19 SCE Key Regulatory Proceedings Proceeding Description Next Steps Base Rates 2025 GRC (A.23-05-010) Sets CPUC base revenue requirement for 2025–2028. For more information, see the Investor Guide to SCE’s 2025 GRC Awaiting proposed decision Wildfire TKM Cost Recovery (A.23-08-013) Requesting approval of settlement agreement with Cal Advocates that would result in recovery of $1.6 billion of costs to resolve claims associated with the Thomas Fire and Montecito Mudslides and $55 million of restoration costs Comments on ALJ request for more information — Nov. 4–13 Awaiting proposed decision on motion for approval of settlement agreement Woolsey Cost Recovery (A.24-10-002) Request recovery of $5.4 billion of costs to resolve claims associated with the Woolsey fire and $84 million of restoration costs Protests due November 12 SCE requested prehearing conference and scoping ruling in December 2022 Wildfire Mitigation & Vegetation Management (A.23-10-001) Requesting approval of ~$384MM of rev. req. for incremental 2022 wildfire mitigation capex and O&M, and incremental 2022 veg. management O&M; Interim rate recovery of $210 million over 17-month period approved by CPUC in July 2024 Evidentiary hearings (if needed) scheduled for November 19 & 20 Opening briefs due December 17 Wildfire Mitigation & Vegetation Management, Catastrophic Events (WMCE) (A.24-04-005) Requesting approval of $326MM of rev. req. for incremental 2023 wildfire mitigation capex and O&M, incremental 2023 veg. management O&M, cumulative 2019–2023 incremental wildfire covered conductor program capex, storm-related costs associated with certain 2020–2022 events, and certain wildfire liability insurance premium expenses Intervenor testimony due December 6; All parties’ rebuttal testimony due January 15 |
|
Edison International | Third-Quarter 2024 Earnings Call 20 Woolsey Cost Recovery Proposed Schedule Event SCE Proposed Date ✓ Application Filed October 8, 2024 Protests and responses November 12, 2024 SCE’s reply to protests November 22, 2024 Prehearing Conference Early December 2024 Scoping ruling issued Mid-December 2024 Intervenors’ prepared direct testimony Mid-March 2025 Rebuttal testimony Mid-May 2025 Evidentiary Hearings Mid-August 2025 Opening Briefs Mid-October 2025 Reply Briefs Mid-November 2025 Proposed Decision (PD) February 2026 Final Decision March 2026 20 |
|
Edison International | Third-Quarter 2024 Earnings Call 21 SCE continues to fund wildfire claims payments with debt Series Principal Due Rate 2022C 300 6/1/25 4.200% 2020C 350 2/1/26 1.200% 2024C 600 3/1/26 5.350% 2023C 400 6/1/26 4.900% 2024G 500 9/6/26 4.400% 2024A 500 2/1/27 4.875% 2022D 600 6/1/27 4.700% 2022F 750 11/1/27 5.850% 2023A 750 3/1/28 5.300% 2023E 550 10/1/28 5.650% 2024D 600 6/1/29 5.150% 2024F 750 6/1/31 5.450% 2022E 350 6/1/52 5.450% Total $7,000 Forecasted 2024 Interest (pre-tax): ~$335 Wildfire Claims Payment-Related Debt Issuances $ in Millions except percentages, as of September 30, 20241 Interest expense not currently recoverable in rates, however, included in 2017/2018 Wildfire/Mudslide Events cost recovery applications SCE has waiver from CPUC, allowing exclusion with respect to certain current and future charges to equity and associated debt for calculating SCE’s regulatory equity ratio – Waiver approved through August 2025 (with ability to seek additional extension via application) or until CPUC makes a final determination on cost recovery for 2017/2018 Wildfire/Mudslide Events – When approved, TKM settlement agreement would authorize permanent exclusion for disallowed TKM costs |
|
Edison International | Third-Quarter 2024 Earnings Call 22 Key 2028 Earnings Sensitivities Variable Sensitivity 2028 EPS1 (“Per year” amounts refer to 2025–2028) Capex & Rate Base Rate Base $100 million/year of capex ~5¢ AFUDC Annual capex of $200 million 1¢ Requested ~$400 million increase in depreciation in 2025 GRC If requested increase not authorized +15–35¢ (on range case) Rates & Financing CPUC ROE (Currently 10.33%) 10 bps 7¢2 FERC ROE (Currently 10.30%) 10 bps 1¢2 Wildfire Debt Rate (4.6% weighted average portfolio) 20 bps 2¢ EIX Parent Debt Rate (5.0% weighted average portfolio) 20 bps 2¢ Equity (~$100 million/year 2025–2028) For each $10 million/year reduction +1¢ 1. Assumes ~390 million shares outstanding for 2028 2. Based on a CPUC / FERC rate base mix of 86% CPUC / 14% FERC and current authorized capital structures |
|
Edison International | Third-Quarter 2024 Earnings Call 23 Earnings Non-GAAP Reconciliations 1. SCE non-core items are tax-effected at an estimated statutory rate of approximately 28%; customer revenues (claims) for EIS insurance contract are tax-effected at the federal statutory rate of 21% Reconciliation of EIX GAAP Earnings to EIX Core Earnings Net Income (Loss) Available to Edison International, $ in Millions Q3 2024 Q3 2023 2024 2023 SCE $ 602 $ 239 $ 1,190 $ 1,029 EIX Parent & Other (86) (84) (246) (210) Basic Earnings $ 516 $ 155 $ 944 $ 819 Non-Core Items SCE 2017/2018 Wildfire/Mudslide Events claims and expenses, net of recoveries (7) (458) (485) (560) Other Wildfires claims and expenses, net of recoveries (3) (7) (124) (7) Wildfire Insurance Fund expense (36) (54) (109) (159) Severance costs, net of recovery (44) — (44) — 2021 NDCTP disallowance — — — (30) Customer cancellations of certain ECS data services — — — (17) Insurance recovery related to employment litigation matter — — — 10 Income tax benefit1 25 145 213 214 Subtotal SCE (65) (374) (549) (549) EIX Parent & Other Customer revenues for EIS insurance contract, net of (claims) (1) (3) (2) 42 Income tax benefit (expense)1 — 1 — (9) Subtotal EIX Parent & Other (1) (2) (2) 33 Less: Total non-core items $ (66) $ (376) $ (551) $ (516) SCE 667 613 1,739 1,578 EIX Parent & Other (85) (82) (244) (243) Core Earnings $ 582 $ 531 $ 1,495 $ 1,335 |
|
Edison International | Third-Quarter 2024 Earnings Call 24 EIX Core EPS Non-GAAP Reconciliations 1. 2024 EPS drivers are presented based on weighted-average share counts of 386.7 million and 385.6 million for Q3 and YTD, respectively; 2023 EPS drivers are presented based on weighted-average share counts of 383.4 million and 383.0 million for Q3 and YTD, respectively 2. SCE non-core items are tax-effected at an estimated statutory rate of approximately 28%; customer revenues (claims) for EIS insurance contract are tax-effected at the federal statutory rate of 21% Reconciliation of EIX Basic Earnings Per Share to EIX Core Earnings Per Share EPS Available to Edison International1 Q3 2024 Q3 2023 2024 2023 Basic EPS $ 1.33 $ 0.40 $ 2.45 $ 2.14 Non-Core Items SCE 2017/2018 Wildfire/Mudslide Events claims and expenses, net of recoveries (0.02) (1.19) (1.26) (1.46) Other Wildfires claims and expenses, net of recoveries (0.01) (0.02) (0.32) (0.02) Wildfire Insurance Fund expense (0.09) (0.14) (0.28) (0.42) Severance costs, net of recovery (0.11) — (0.11) — 2021 NDCTP disallowance — — — (0.08) Customer cancellations of certain ECS data services — — — (0.04) Insurance recovery related to employment litigation matter — — — 0.03 Income tax benefit2 0.05 0.37 0.54 0.56 Subtotal SCE (0.18) (0.98) (1.43) (1.43) EIX Parent & Other Customer revenues for EIS insurance contract, net of (claims) — — — 0.11 Income tax expense2 — — — (0.02) Subtotal EIX Parent & Other — — — 0.09 Less: Total non-core items (0.18) (0.98) (1.43) (1.34) Core EPS $ 1.51 $ 1.38 $ 3.88 $ 3.48 |
|
Edison International | Third-Quarter 2024 Earnings Call 25 Low High Basic EIX EPS $3.37 $3.57 Total Non-Core Items1 (1.43) (1.43) Core EIX EPS $4.80 $5.00 1. Non-core items are presented as they are recorded Earnings Per Share Non-GAAP Reconciliations Reconciliation of EIX Basic Earnings Per Share Guidance to EIX Core Earnings Per Share Guidance 2024 EPS Available to Edison International |
|
Edison International | Third-Quarter 2024 Earnings Call 26 Use of Non-GAAP Financial Measures EIX Investor Relations Contact Sam Ramraj, Vice President Derek Matsushima, Principal Manager (626) 302-2540 (626) 302-3625 Sam.Ramraj@edisonintl.com Derek.Matsushima@edisonintl.com Edison International's earnings are prepared in accordance with generally accepted accounting principles used in the United States. Management uses core earnings (loss) internally for financial planning and for analysis of performance. Core earnings (loss) are also used when communicating with investors and analysts regarding Edison International's earnings results to facilitate comparisons of the company's performance from period to period. Core earnings (loss) are a non-GAAP financial measure and may not be comparable to those of other companies. Core earnings (loss) are defined as earnings attributable to Edison International shareholders less non-core items. Non-core items include income or loss from discontinued operations and income or loss from significant discrete items that management does not consider representative of ongoing earnings, such as write downs, asset impairments, wildfire-related claims, and other income and expense related to changes in law, outcomes in tax, regulatory or legal proceedings, and exit activities, including sale of certain assets and other activities that are no longer continuing. A reconciliation of Non-GAAP information to GAAP information is included either on the slide where the information appears or on another slide referenced in this presentation. |