UNITED STATES
SECURITIES AND EXCHANGE COMMISSION
Washington, D.C. 20549
FORM 8-K
CURRENT REPORT
Pursuant to Section 13 or 15(d) of the Securities Exchange Act of 1934
Date of Report (Date of earliest event reported): February 22, 2024
Commission |
|
Exact Name of Registrant |
|
State or Other Jurisdiction of |
|
IRS Employer |
1-9936 |
|
EDISON INTERNATIONAL |
|
California |
|
95-4137452 |
1-2313 |
|
SOUTHERN CALIFORNIA EDISON COMPANY |
|
California |
|
95-1240335 |
Check the appropriate box below if the Form 8-K filing is intended to simultaneously satisfy the filing obligation of the registrant under any of the following provisions:
[ ☐ ] Written communications pursuant to Rule 425 under the Securities Act (17 CFR 230.425)
[ ☐ ] Soliciting material pursuant to Rule 14a-12 under the Exchange Act (17 CFR 240.14a-12)
[ ☐ ] Pre-commencement communications pursuant to Rule 14d-2(b) under the Exchange Act (17 CFR 240.14d-2(b))
[ ☐ ] Pre-commencement communications pursuant to Rule 13e-4(c) under the Exchange Act (17 CFR 240.13e-4(c))
Securities registered pursuant to Section 12(b) of the Act:
Edison International:
Southern California Edison Company: None
Indicate by check mark whether the registrant is an emerging growth company as defined in Rule 405 of the Securities Act of 1933 (§230.405 of this chapter) or Rule 12b-2 of the Securities Exchange Act of 1934 (§240.12b-2 of this chapter).
If an emerging growth company, indicate by check mark if the registrant has elected not to use the extended transition period for complying with any new or revised financial accounting standards provided pursuant to Section 13(a) of the Exchange Act.
This current report and its exhibits include forward-looking statements. Edison International and Southern California Edison Company ("SCE") based these forward-looking statements on their current expectations and projections about future events in light of their knowledge of facts as of the date of this current report and their assumptions about future circumstances. These forward-looking statements are subject to various risks and uncertainties that may be outside the control of Edison International and SCE. Edison International and SCE have no obligation to publicly update or revise any forward-looking statements, whether due to new information, future events, or otherwise. This current report should be read with Edison International's and SCE's combined Annual Report on Form 10-K for the year ended December 31, 2023. Additionally, Edison International and SCE provide direct links to Edison International and SCE presentations, documents and other information at www.edisoninvestor.com (Presentations and Updates) in order to publicly disseminate such information.
Item 2.02Results of Operations and Financial Condition
On February 22, 2024, Edison International issued a press release reporting its financial results and the financial results for its subsidiary, Southern California Edison Company, for the quarter and year ended December 31, 2023. A copy of the press release is attached as Exhibit 99.1. On the same day, members of Edison International's management will speak to investors via a financial teleconference. Senior management's prepared remarks and accompanying presentation are attached as Exhibit 99.2 and Exhibit 99.3 to this report. The information furnished in this Item 2.02 and Exhibits 99.1, 99.2, and 99.3 shall not be deemed to be “filed” for purposes of the Securities Exchange Act of 1934, nor shall it be deemed to be incorporated by reference in any filing under the Securities Act of 1933.
Item 7.01Regulation FD Disclosure
Members of Edison International management will use the information in the presentation furnished as Exhibit 99.3 to this report in meetings with institutional investors and analysts and at investor conferences. The attached presentation will also be posted on www.edisoninvestor.com.
Item 9.01Financial Statements and Exhibits
(d) |
Exhibits |
EXHIBIT INDEX
|
|
|
Exhibit No. |
|
Description |
|
|
|
99.1 |
|
|
|
|
|
99.2 |
|
|
|
|
|
99.3 |
|
|
|
|
|
104 |
|
Cover Page Interactive Data File (embedded within the Inline XBRL document) |
SIGNATURES
Pursuant to the requirements of the Securities Exchange Act of 1934, the registrants have duly caused this report to be signed on its behalf by the undersigned hereunto duly authorized.
Date: February 22, 2024
Date: February 22, 2024
Exhibit 99.1
Investor Relations: Sam Ramraj, (626) 302-2540
Media Relations: (626) 302-2255
News@sce.com
Edison International Reports Fourth-Quarter and Full-Year 2023 Results
| ● | Fourth-quarter 2023 GAAP earnings per share of $0.99; Core EPS of $1.28 |
| ● | Full-year 2023 GAAP EPS of $3.12; Core EPS of $4.76 |
| ● | SCE exceeds WMP covered conductor target of 1,100 miles; total deployment of more than 5,580 miles |
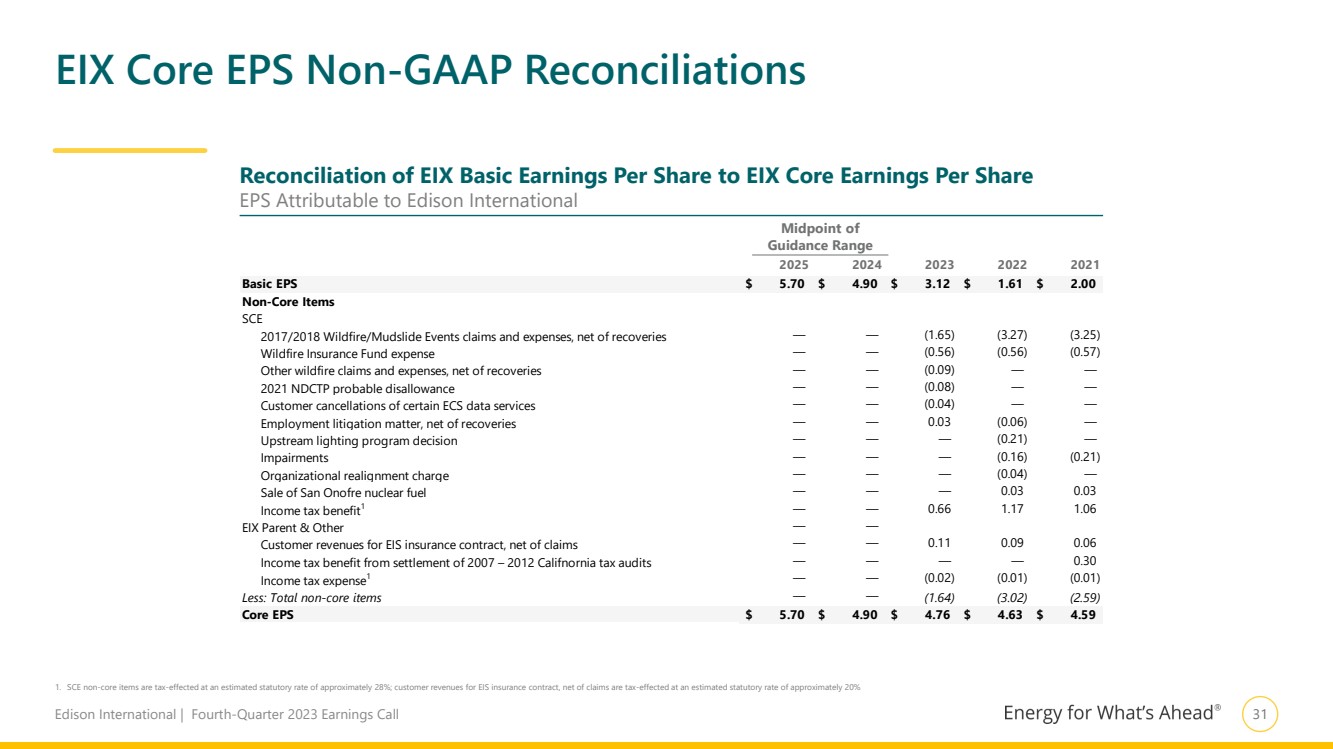
| ● | EIX introduces 2024 EPS guidance of $4.75-$5.05 |
| ● | EIX reiterates long-term core EPS growth rate targets of 5%-7% for 2021-2025 and 5%-7% for 2025-2028 |
ROSEMEAD, Calif., Feb. 22, 2024 — Edison International (NYSE: EIX) today reported fourth-quarter net income of $378 million, or $0.99 per share, compared to net income of $415 million, or $1.09 per share, in the fourth quarter of last year. As adjusted, fourth-quarter core earnings were $490 million, or $1.28 per share, compared to core earnings of $437 million, or $1.15 per share, in the fourth quarter of last year.
Southern California Edison’s fourth-quarter 2023 core earnings per share (EPS) increased year over year, primarily due to higher revenue from the escalation mechanism set forth in the 2021 General Rate Case (GRC) final decision and lower operation and maintenance expenses, partially offset by higher interest expense.
Edison International Parent and Other’s fourth-quarter 2023 core loss per share decreased year over year, primarily due to gains on preferred stock repurchases.
“Delivering core EPS above the midpoint of our guidance range demonstrates our ability to successfully manage variability in the business,” said Pedro J. Pizarro, president and CEO of Edison International. “Our 2023 annual dividend increase of 5.8% reflects the board and management’s continued commitment to delivering on our EPS growth targets. Looking ahead, we reiterate the strong confidence we have in our long-term EPS growth targets of 5% to 7% for 2021 through 2025 and 2025 through 2028.”
Pizarro added, “SCE’s industry-leading covered conductor program continues to make tremendous progress. In just five years, SCE has installed more than 5,580 circuit miles of covered conductor. When combined with enhanced vegetation management, asset inspections and other programs, this has significantly reduced the need for Public Safety Power Shutoffs.”
Full-Year Earnings
For 2023, Edison International reported net income of $1,197 million, or $3.12 per share, compared to $612 million, or
$1.61 per share, for 2022. As adjusted, Edison International’s core earnings were $1,825 million, or $4.76 per share,
compared to $1,765 million, or $4.63 per share, in 2022.
SCE’s full-year core EPS was higher, primarily due to higher revenue from the escalation mechanism set forth in the 2021 GRC final decision and higher interest income on balancing account undercollections, partially offset by higher interest expense.
Edison International Reports Fourth-Quarter and Full-Year 2023 Financial Results
Edison International Parent and Other’s full-year loss per share increased primarily due to higher interest expense, partially offset by gains on preferred stock repurchases.
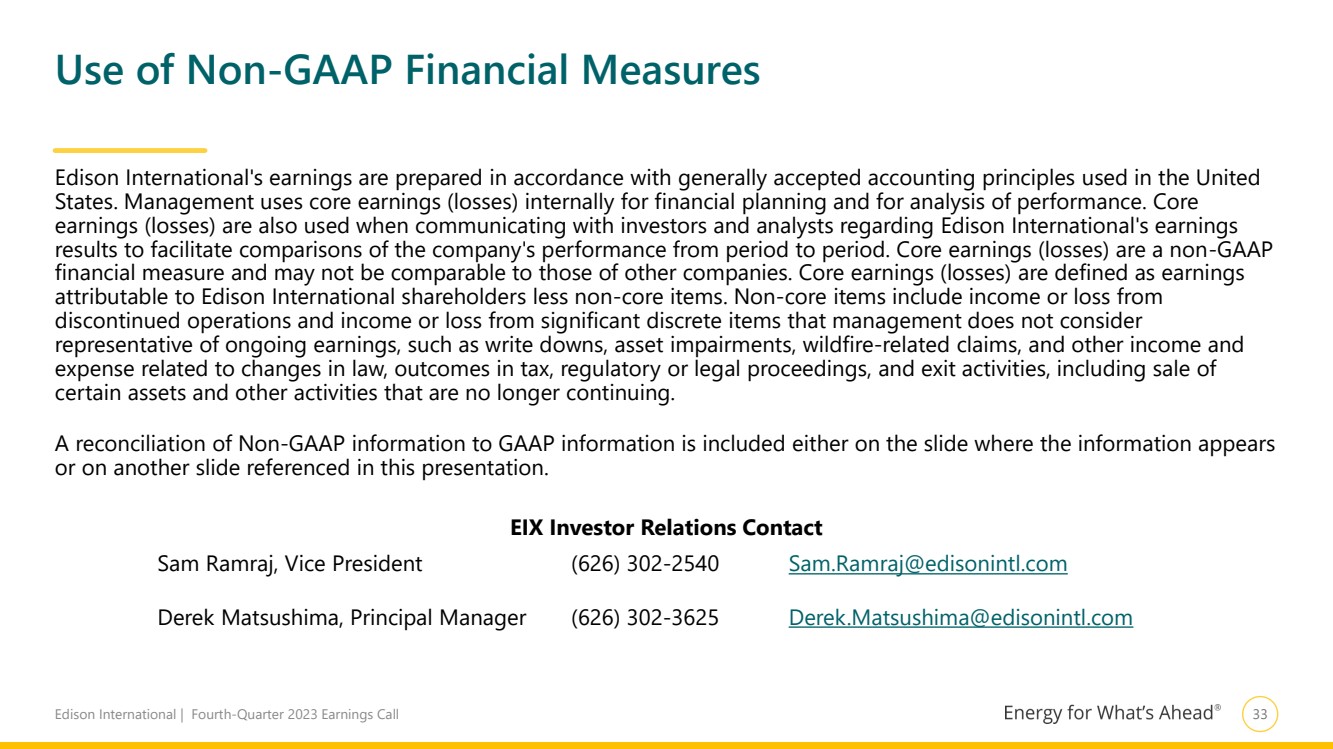
Edison International uses core earnings internally for financial planning and analysis of performance. Core earnings are also used when communicating with investors and analysts regarding Edison International’s earnings results to facilitate comparisons of the company’s performance from period to period. Please see the attached tables to reconcile core earnings to basic GAAP earnings.
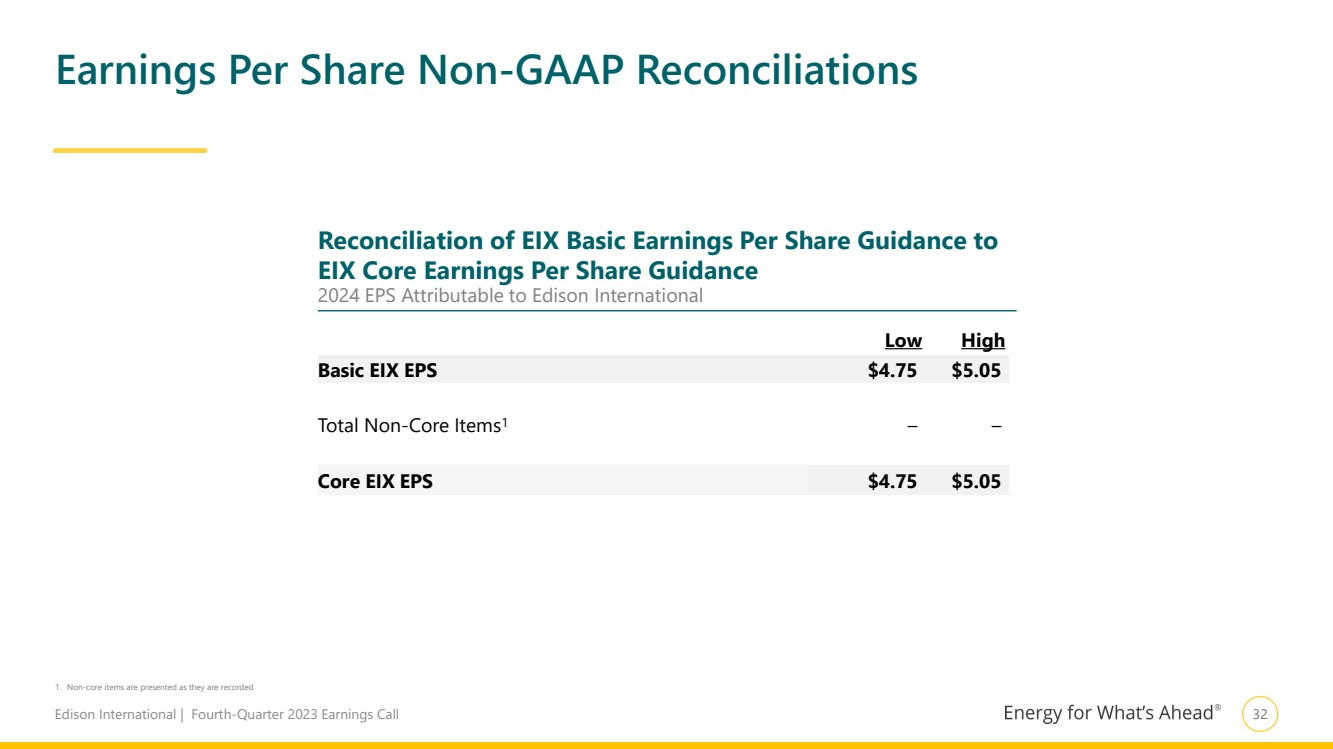
2024 Earnings Guidance
The company announced its earnings guidance range for 2024 as summarized in the following chart. See the presentation accompanying the company’s conference call for further information and assumptions.
|
|
2024 Earnings Guidance |
|
||||
|
|
as of Feb. 22, 2024 |
|
||||
|
|
Low |
|
High |
|
||
EIX Basic EPS |
|
$ |
4.75 |
|
$ |
5.05 |
|
Less: Non-core Items |
|
|
– |
|
|
– |
|
EIX Core EPS |
|
$ |
4.75 |
|
$ |
5.05 |
|
Edison International and Southern California Edison Declare Dividends
Today, the board of directors of Edison International declared a quarterly common stock dividend of $0.78 per share,
payable on April 30, 2024, to shareholders of record on March 28, 2024. It also declared dividends on preferred
stock. Additionally, the board of directors of Southern California Edison Company today declared dividends on
preference stock. For more information, please see the related news release at www.edisoninvestor.com.
Fourth Quarter and Full-Year 2023 Earnings Conference Call and Webcast Details
When: |
|
Thursday, Feb. 22, 1:30-2:30 p.m. (PST) |
Telephone Numbers: |
|
1-888-673-9780 (U.S.) and 1-312-470-0178 (Int'l) — Passcode: Edison |
Telephone Replay: |
|
1-866-363-4001 (U.S.) and 1-203-369-0204 (Int’l) — Passcode: 5730 |
|
|
Telephone replay available through March 6 at 6 p.m. (PST) |
Webcast: |
|
www.edisoninvestor.com |
Edison International has posted its earnings conference call prepared remarks by the CEO and CFO, the teleconference presentation and Form 10-K to the company’s investor relations website. These materials are available at www.edisoninvestor.com.
About Edison International
Edison International (NYSE: EIX) is one of the nation’s largest electric utility holding companies, providing clean and reliable energy and energy services through its independent companies. Headquartered in Rosemead, California, Edison International is the parent company of Southern California Edison Company, a utility that delivers electricity to 15 million people across Southern, Central and Coastal California. Edison International is also the parent company of Edison Energy LLC, a global energy advisory firm providing integrated sustainability and energy solutions to commercial, industrial and institutional customers.
Edison International Reports Fourth-Quarter and Full-Year 2023 Financial Results
Appendix
Use of Non-GAAP Financial Measures
Edison International’s earnings are prepared in accordance with generally accepted accounting principles used in the United States and represent the company’s earnings as reported to the Securities and Exchange Commission. Our management uses core earnings and core earnings per share (EPS) internally for financial planning and for analysis of performance of Edison International and Southern California Edison. We also use core earnings and core EPS when communicating with analysts and investors regarding our earnings results to facilitate comparisons of the Company’s performance from period to period. Financial measures referred to as net income, basic EPS, core earnings, or core EPS also apply to the description of earnings or earnings per share.
Core earnings and core EPS are non-GAAP financial measures and may not be comparable to those of other companies. Core earnings and core EPS are defined as basic earnings and basic EPS excluding income or loss from discontinued operations and income or loss from significant discrete items that management does not consider representative of ongoing earnings. Basic earnings and losses refer to net income or losses attributable to Edison International shareholders. Core earnings are reconciled to basic earnings in the attached tables. The impact of participating securities (vested awards that earn dividend equivalents that may participate in undistributed earnings with common stock) for the principal operating subsidiary is not material to the principal operating subsidiary’s EPS and is therefore reflected in the results of the Edison International holding company, which is included in Edison International Parent and Other.
Safe Harbor Statement
Statements contained in this presentation about future performance, including, without limitation, operating results, capital expenditures, rate base growth, dividend policy, financial outlook, and other statements that are not purely historical, are forward-looking statements. These forward-looking statements reflect our current expectations; however, such statements involve risks and uncertainties. Actual results could differ materially from current expectations. These forward-looking statements represent our expectations only as of the date of this presentation, and Edison International assumes no duty to update them to reflect new information, events or circumstances. Important factors that could cause different results include, but are not limited to the:
| ● | ability of SCE to recover its costs through regulated rates, timely or at all, including uninsured wildfire-related and debris flow-related costs (including amounts paid for self-insured retention and co-insurance), costs incurred to mitigate the risk of utility equipment causing future wildfires, costs incurred as a result of the COVID-19 pandemic, and increased costs due to supply chain constraints, inflation and rising interest rates; |
| ● | impact of affordability of customer rates on SCE's ability to execute its strategy, including the impact of affordability on the approval of operations and maintenance expenses, and proposed capital investment projects; |
| ● | ability of SCE to implement its operational and strategic plans, including its Wildfire Mitigation Plan and capital program; |
| ● | risks of regulatory or legislative restrictions that would limit SCE's ability to implement operational measures to mitigate wildfire risk, including Public Safety Power Shutoff (“PSPS”) and fast curve settings, when conditions warrant or would otherwise limit SCE's operational practices relative to wildfire risk mitigation; |
| ● | ability of SCE to obtain safety certifications from the Office of Energy Infrastructure Safety of the California Natural Resources Agency (“OEIS”); |
| ● | risk that California Assembly Bill 1054 (“AB 1054”) does not effectively mitigate the significant exposure faced by California investor-owned utilities related to liability for damages arising from catastrophic wildfires where utility facilities are alleged to be a substantial cause, including the longevity of the Wildfire Insurance Fund and the California Public Utilities Commission (“CPUC”) interpretation of and actions under AB 1054, including its interpretation of the prudency standard clarified by AB 1054; |
| ● | risks associated with the operation of electrical facilities, including worker and public safety issues, the risk of utility assets causing or contributing to wildfires, failure, availability, efficiency, and output of equipment and facilities, and availability and cost of spare parts; |
Edison International Reports Fourth-Quarter and Full-Year 2023 Financial Results
| ● | physical security of Edison International’s and SCE’s critical assets and personnel and the cybersecurity of Edison International’s and SCE’s critical information technology systems for grid control, and business, employee and customer data; |
| ● | ability of Edison International and SCE to effectively attract, manage, develop and retain a skilled workforce, including its contract workers; |
| ● | decisions and other actions by the CPUC, the Federal Energy Regulatory Commission, and the United States Nuclear Regulatory Commission and other governmental authorities, including decisions and actions related to nationwide or statewide crisis, determinations of authorized rates of return or return on equity, the recoverability of wildfire-related and debris flow-related costs, issuance of SCE's wildfire safety certification, wildfire mitigation efforts, approval and implementation of electrification programs, and delays in executive, regulatory and legislative actions; |
| ● | potential for penalties or disallowances for non-compliance with applicable laws and regulations, including fines, penalties and disallowances related to wildfires where SCE's equipment is alleged to be associated with ignition; |
| ● | extreme weather-related incidents (including events caused, or exacerbated, by climate change, such as wildfires, debris flows, flooding, droughts, high wind events and extreme heat events) and other natural disasters (such as earthquakes), which could cause, among other things, public safety issues, property damage, rotating outages and other operational issues (such as issues due to damaged infrastructure), PSPS activations and unanticipated costs; |
| ● | cost and availability of labor, equipment and materials, including as a result of supply chain constraints and inflation; |
| ● | ability of Edison International or SCE to borrow funds and access bank and capital markets on reasonable terms; |
| ● | risks associated with the decommissioning of San Onofre, including those related to worker and public safety, public opposition, permitting, governmental approvals, on-site storage of spent nuclear fuel and other radioactive material, delays, contractual disputes, and cost overruns; |
| ● | risks associated with cost allocation resulting in higher rates for utility bundled service customers because of possible customer bypass or departure for other electricity providers such as Community Choice Aggregators (“CCA,” which are cities, counties, and certain other public agencies with the authority to generate and/or purchase electricity for their local residents and businesses) and Electric Service Providers (entities that offer electric power and ancillary services to retail customers, other than electrical corporations (like SCE) and CCAs); |
| ● | risks inherent in SCE’s capital investment program, including those related to project site identification, public opposition, environmental mitigation, construction, permitting, contractor performance, changes in the California Independent System Operator’s transmission plans, and governmental approvals; and |
| ● | actions by credit rating agencies to downgrade Edison International or SCE’s credit ratings or to place those ratings on negative watch or negative outlook. |
Additional information about risks and uncertainties, including more detail about the factors described in this release, is contained in Edison International and SCE’s 2023 Form 10-K, including the "Risk Factors" sections. Readers are urged to read this entire release including information incorporated by reference, as well as the 2023 Form 10-K, and carefully consider the risks, uncertainties, and other factors that affect Edison International's and SCE's businesses. Edison International and SCE post or provide direct links (i) to certain SCE and other parties' regulatory filings and documents with the CPUC and the FERC and certain agency rulings and notices in open proceedings in a section titled "SCE Regulatory Highlights," (ii) to certain documents and information related to Southern California wildfires which may be of interest to investors in a section titled "Southern California Wildfires," and (iii) to presentations, documents and other information that may be of interest to investors in a section titled "Presentations and Updates" at www.edisoninvestor.com in order to publicly disseminate such information.
These forward-looking statements represent our expectations only as of the date of this news release, and Edison International assumes no duty to update them to reflect new information, events or circumstances. Readers should review future reports filed by Edison International and SCE with the SEC.
Edison International Reports Fourth-Quarter and Full-Year 2023 Financial Results
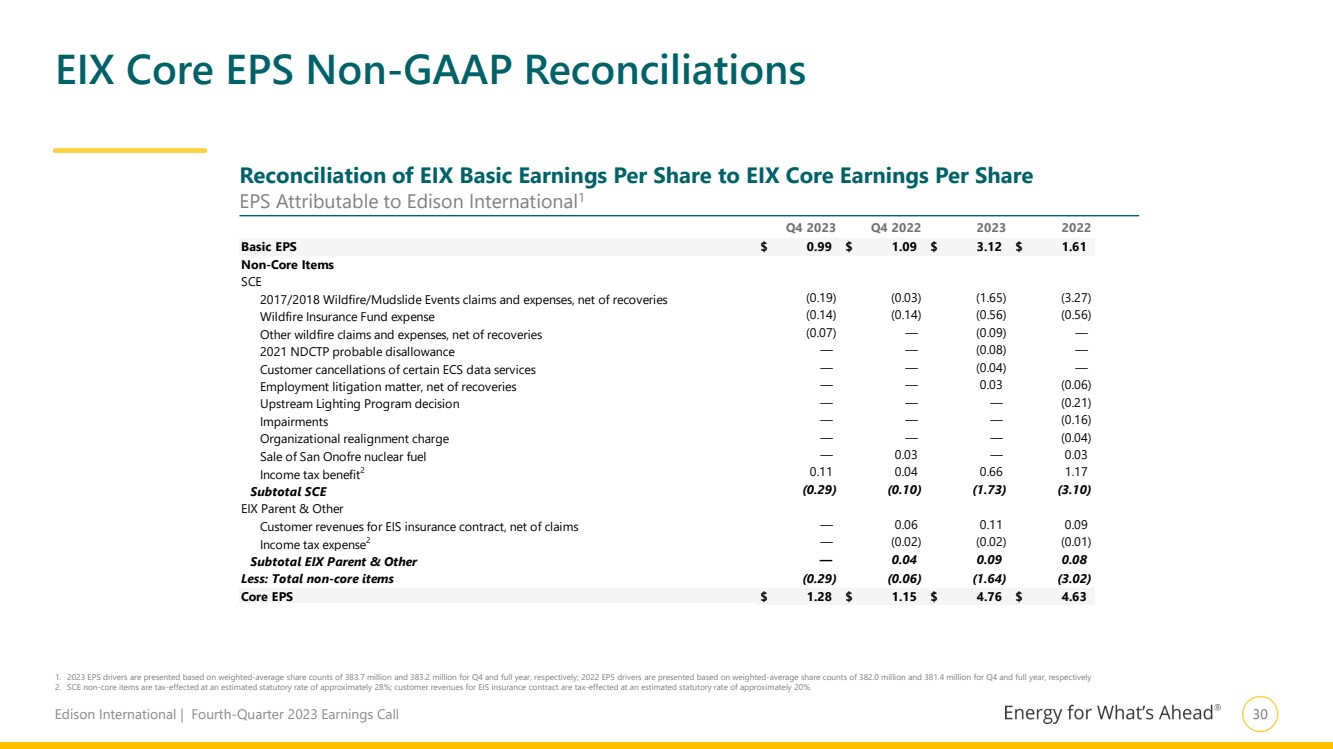
Fourth Quarter Reconciliation of Basic Earnings Per Share to Core Earnings Per Share
|
|
Three months ended |
|
|
|
|
Year ended |
|
|
|
||||||||
|
|
December 31, |
|
|
|
|
December 31, |
|
|
|
||||||||
|
|
2023 |
|
2022 |
|
Change |
|
2023 |
|
2022 |
|
Change |
||||||
Earnings (loss) per share attributable to Edison International |
|
|
|
|
|
|
|
|
|
|
|
|
|
|
|
|
|
|
SCE |
|
$ |
1.16 |
|
$ |
1.26 |
|
$ |
(0.10) |
|
$ |
3.84 |
|
$ |
2.23 |
|
$ |
1.61 |
Edison International Parent and Other |
|
|
(0.17) |
|
|
(0.17) |
|
|
— |
|
|
(0.72) |
|
|
(0.62) |
|
|
(0.10) |
Edison International |
|
|
0.99 |
|
|
1.09 |
|
|
(0.10) |
|
|
3.12 |
|
|
1.61 |
|
|
1.51 |
Less: Non-core items |
|
|
|
|
|
|
|
|
|
|
|
|
|
|
|
|
|
|
SCE |
|
|
(0.29) |
|
|
(0.10) |
|
|
(0.19) |
|
|
(1.73) |
|
|
(3.10) |
|
|
1.37 |
Edison International Parent and Other |
|
|
— |
|
|
0.04 |
|
|
(0.04) |
|
|
0.09 |
|
|
0.08 |
|
|
0.01 |
Total non-core items |
|
|
(0.29) |
|
|
(0.06) |
|
|
(0.23) |
|
|
(1.64) |
|
|
(3.02) |
|
|
1.38 |
Core earnings (loss) per share |
|
|
|
|
|
|
|
|
|
|
|
|
|
|
|
|
|
|
SCE |
|
|
1.45 |
|
|
1.36 |
|
|
0.09 |
|
|
5.57 |
|
|
5.33 |
|
|
0.24 |
Edison International Parent and Other |
|
|
(0.17) |
|
|
(0.21) |
|
|
0.04 |
|
|
(0.81) |
|
|
(0.70) |
|
|
(0.11) |
Edison International |
|
$ |
1.28 |
|
$ |
1.15 |
|
$ |
0.13 |
|
$ |
4.76 |
|
$ |
4.63 |
|
$ |
0.13 |
Note: Diluted earnings were $0.98 and $1.08 per share for the three months ended December 31, 2023 and 2022, respectively. Diluted earnings were $3.11 and $1.60 per share for the twelve months ended December 31, 2023 and 2022, respectively.
Fourth Quarter Reconciliation of Basic Earnings Per Share to Core Earnings (in millions)
|
|
Three months ended |
|
|
|
|
Year ended |
|
|
|
||||||||
|
|
December 31, |
|
|
|
|
December 31, |
|
|
|
||||||||
(in millions) |
|
2023 |
|
2022 |
|
Change |
|
2023 |
|
2022 |
|
Change |
||||||
Net income (loss) attributable to Edison International |
|
|
|
|
|
|
|
|
|
|
|
|
|
|
|
|
|
|
SCE |
|
$ |
445 |
|
$ |
478 |
|
$ |
(33) |
|
$ |
1,474 |
|
$ |
847 |
|
$ |
627 |
Edison International Parent and Other |
|
|
(67) |
|
|
(63) |
|
|
(4) |
|
|
(277) |
|
|
(235) |
|
|
(42) |
Edison International |
|
|
378 |
|
|
415 |
|
|
(37) |
|
|
1,197 |
|
|
612 |
|
|
585 |
Less: Non-core items |
|
|
|
|
|
|
|
|
|
|
|
|
|
|
|
|
|
|
SCE1,2,3,4,5,6,7,8,9,10 |
|
|
(112) |
|
|
(40) |
|
|
(72) |
|
|
(661) |
|
|
(1,182) |
|
|
521 |
Edison International Parent and Other11 |
|
|
— |
|
|
18 |
|
|
(18) |
|
|
33 |
|
|
29 |
|
|
4 |
Total non-core items |
|
|
(112) |
|
|
(22) |
|
|
(90) |
|
|
(628) |
|
|
(1,153) |
|
|
525 |
Core earnings (losses) |
|
|
|
|
|
|
|
|
|
|
|
|
|
|
|
|
|
|
SCE |
|
|
557 |
|
|
518 |
|
|
39 |
|
|
2,135 |
|
|
2,029 |
|
|
106 |
Edison International Parent and Other |
|
|
(67) |
|
|
(81) |
|
|
14 |
|
|
(310) |
|
|
(264) |
|
|
(46) |
Edison International |
|
$ |
490 |
|
$ |
437 |
|
$ |
53 |
|
$ |
1,825 |
|
$ |
1,765 |
|
$ |
60 |
1 |
Includes charges for 2017/2018 Wildfire/Mudslide Events claims and expenses, net of recoveries of $74 million ($53 million after-tax) and $11 million ($8 million after-tax) for the three months ended December 31, 2023 and 2022, and $634 million ($457 million after-tax) and $1.2 billion ($899 million after-tax) for the twelve months ended December 31, 2023 and 2022, respectively. |
2 |
Includes amortization of SCE's Wildfire Insurance Fund expenses of $54 million ($39 million after-tax) for both the three months ended December 2023 and 2022, and $213 million ($153 million after-tax) and $214 million ($154 million after-tax) for the twelve months ended December 31, 2023 and 2022, respectively. |
3 |
Includes charges for wildfire claims and expenses, net of expected recoveries from FERC customers, related to the Post-2018 Wildfires of $27 million ($19 million after-tax) and $34 million ($25 million after-tax) for the three months and the twelve months ended December 31, 2023, respectively. |
4 |
Includes a charge of probable disallowance related to the reasonableness review of recorded San Onofre Units 2 and 3 decommissioning costs in the 2021 NDCTP of $30 million ($21 million after-tax) for the twelve months ended December 31, 2023. |
5 |
Includes a charge related to customer cancellations of certain ECS data services of $17 million ($12 million after-tax) for the twelve months ended December 31, 2023. |
6 |
Includes an insurance recovery of $10 million ($7 million after-tax) and a charge of $23 million ($16 million after-tax) after net of estimated insurance recoveries related to settlement of an employment litigation matter for the twelve months ended December 31, 2023 and 2022, respectively. |
7 |
Includes a charge of $81 million ($64 million after-tax) related to the Presiding Officer's Decision ("POD") in September 2022 related to SCE's Upstream Lighting Program for the twelve months ended December 31, 2022. |
Edison International Reports Fourth-Quarter and Full-Year 2023 Financial Results
8 |
Includes impairment charges of $64 million ($46 million after-tax) for the twelve months ended December 31, 2022, including $47 million ($34 million after-tax) related to SCE's CSRP settlement agreement and $17 million ($12 million after-tax) related to historical capital expenditures disallowed in SCE's track 3 of the 2021 GRC final decision. |
9 |
Includes a charge related to organizational realignment services of $14 million ($10 million after-tax) for the twelve months ended December 31, 2022. |
10 |
Includes a gain of $10 million ($7 million after-tax) from SCE's sale of San Onofre nuclear fuel for both the three months and the twelve months ended December 31, 2022. |
11 |
Includes net earnings related to customer revenues for an EIS insurance contract offset by expected wildfire claims insured by EIS of $23 million ($18 million after-tax) for the three months ended December 31, 2022, and $42 million ($33 million after-tax) and $36 million ($29 million after-tax) for the twelve months ended December 31, 2023 and 2022, respectively. |
Edison International Reports Fourth-Quarter and Full-Year 2023 Financial Results
Consolidated Statements of Income |
|
Edison International |
||||
|
|
|
|
|
|
|
|
|
Year ended |
||||
|
|
December 31, |
||||
(in millions, except per-share amounts) |
|
2023 |
|
2022 |
||
Operating revenue |
|
$ |
16,338 |
|
$ |
17,220 |
Purchased power and fuel |
|
|
5,486 |
|
|
6,375 |
Operation and maintenance |
|
|
4,138 |
|
|
4,724 |
Wildfire-related claims, net of insurance recoveries |
|
|
667 |
|
|
1,313 |
Wildfire Insurance Fund expense |
|
|
213 |
|
|
214 |
Depreciation and amortization |
|
|
2,635 |
|
|
2,561 |
Property and other taxes |
|
|
571 |
|
|
501 |
Impairment, net of other operating income |
|
|
1 |
|
|
49 |
Total operating expenses |
|
|
13,711 |
|
|
15,737 |
Operating income |
|
|
2,627 |
|
|
1,483 |
Interest expense |
|
|
(1,612) |
|
|
(1,169) |
Other income, net |
|
|
500 |
|
|
348 |
Income before income taxes |
|
|
1,515 |
|
|
662 |
Income tax expense (benefit) |
|
|
108 |
|
|
(162) |
Net income |
|
|
1,407 |
|
|
824 |
Less: Preference stock dividend requirements of SCE |
|
|
123 |
|
|
107 |
Preferred stock dividend requirements of Edison International |
|
|
87 |
|
|
105 |
Net income attributable to Edison International common shareholders |
|
$ |
1,197 |
|
|
612 |
Basic earnings per share: |
|
|
|
|
|
|
Weighted average shares of common stock outstanding |
|
|
383 |
|
|
381 |
Basic earnings per common share attributable to Edison International common shareholders |
|
$ |
3.12 |
|
$ |
1.61 |
Diluted earnings per share: |
|
|
|
|
|
|
Weighted average shares of common stock outstanding, including effect of dilutive securities |
|
|
385 |
|
|
383 |
Diluted earnings per common share attributable to Edison International common shareholders |
|
$ |
3.11 |
|
$ |
1.60 |
Edison International Reports Fourth-Quarter and Full-Year 2023 Financial Results
Consolidated Balance Sheets |
|
Edison International |
||||
|
|
|
|
|
|
|
|
|
December 31, |
||||
(in millions) |
|
2023 |
|
2022 |
||
ASSETS |
|
|
|
|
|
|
Cash and cash equivalents |
|
$ |
345 |
|
$ |
914 |
Receivables, less allowances of $360 and $347 for uncollectible accounts at respective dates |
|
|
2,016 |
|
|
1,695 |
Accrued unbilled revenue |
|
|
742 |
|
|
641 |
Inventory |
|
|
527 |
|
|
474 |
Prepaid expenses |
|
|
112 |
|
|
248 |
Regulatory assets |
|
|
2,524 |
|
|
2,497 |
Wildfire Insurance Fund contributions |
|
|
204 |
|
|
204 |
Other current assets |
|
|
341 |
|
|
397 |
Total current assets |
|
|
6,811 |
|
|
7,070 |
Nuclear decommissioning trusts |
|
|
4,173 |
|
|
3,948 |
Other investments |
|
|
54 |
|
|
55 |
Total investments |
|
|
4,227 |
|
|
4,003 |
Utility property, plant and equipment, less accumulated depreciation and amortization of $12,910 and $12,260 at respective dates |
|
|
55,877 |
|
|
53,274 |
Nonutility property, plant and equipment, less accumulated depreciation of $114 and $106 at respective dates |
|
|
207 |
|
|
212 |
Total property, plant and equipment |
|
|
56,084 |
|
|
53,486 |
Regulatory assets (include $1,558 and $834 related to Variable Interest Entities "VIEs" at respective dates) |
|
|
8,897 |
|
|
8,181 |
Wildfire Insurance Fund contributions |
|
|
1,951 |
|
|
2,155 |
Operating lease right-of-use assets |
|
|
1,221 |
|
|
1,442 |
Long-term insurance receivables |
|
|
501 |
|
|
465 |
Other long-term assets |
|
|
2,066 |
|
|
1,239 |
Total long-term assets |
|
|
14,636 |
|
|
13,482 |
|
|
|
|
|
|
|
Total assets |
|
$ |
81,758 |
|
$ |
78,041 |
Edison International Reports Fourth-Quarter and Full-Year 2023 Financial Results
Consolidated Balance Sheets |
|
Edison International |
||||
|
|
|
|
|
|
|
|
|
December 31, |
||||
(in millions, except share amounts) |
|
2023 |
|
2022 |
||
LIABILITIES AND EQUITY |
|
|
|
|
|
|
Short-term debt |
|
$ |
1,077 |
|
$ |
2,015 |
Current portion of long-term debt |
|
|
2,697 |
|
|
2,614 |
Accounts payable |
|
|
1,983 |
|
|
2,359 |
Wildfire-related claims |
|
|
30 |
|
|
121 |
Customer deposits |
|
|
177 |
|
|
167 |
Regulatory liabilities |
|
|
763 |
|
|
964 |
Current portion of operating lease liabilities |
|
|
120 |
|
|
506 |
Other current liabilities |
|
|
1,751 |
|
|
1,601 |
Total current liabilities |
|
|
8,598 |
|
|
10,347 |
Long-term debt (include $1,515 and $809 related to VIEs at respective dates) |
|
|
30,316 |
|
|
27,025 |
Deferred income taxes and credits |
|
|
6,672 |
|
|
6,149 |
Pensions and benefits |
|
|
415 |
|
|
422 |
Asset retirement obligations |
|
|
2,666 |
|
|
2,754 |
Regulatory liabilities |
|
|
9,420 |
|
|
8,211 |
Operating lease liabilities |
|
|
1,101 |
|
|
936 |
Wildfire-related claims |
|
|
1,368 |
|
|
1,687 |
Other deferred credits and other long-term liabilities |
|
|
3,258 |
|
|
2,988 |
Total deferred credits and other liabilities |
|
|
24,900 |
|
|
23,147 |
Total liabilities |
|
|
63,814 |
|
|
60,519 |
Preferred stock (50,000,000 shares authorized; 1,159,317 and 1,250,000 shares of Series A and 532,454 and 750,000 shares of Series B issued and outstanding at respective dates) |
|
|
1,673 |
|
|
1,978 |
Common stock, no par value (800,000,000 shares authorized; 383,924,912 and 382,208,498 shares issued and outstanding at respective dates) |
|
|
6,338 |
|
|
6,200 |
Accumulated other comprehensive loss |
|
|
(9) |
|
|
(11) |
Retained earnings |
|
|
7,499 |
|
|
7,454 |
Total Edison International's shareholders' equity |
|
|
15,501 |
|
|
15,621 |
Noncontrolling interests – preference stock of SCE |
|
|
2,443 |
|
|
1,901 |
Total equity |
|
|
17,944 |
|
|
17,522 |
|
|
|
|
|
|
|
Total liabilities and equity |
|
$ |
81,758 |
|
$ |
78,041 |
Edison International Reports Fourth-Quarter and Full-Year 2023 Financial Results
Consolidated Statements of Cash Flows |
|
Edison International |
|||||||
|
|
|
|
|
|
|
|
|
|
|
|
|
|||||||
|
|
Years ended December 31, |
|||||||
(in millions) |
|
2023 |
|
2022 |
|
2021 |
|||
Cash flows from operating activities: |
|
|
|
|
|
|
|
|
|
Net income |
|
$ |
1,407 |
|
$ |
824 |
|
$ |
925 |
Adjustments to reconcile to net cash provided by operating activities: |
|
|
|
|
|
|
|
|
|
Depreciation and amortization |
|
|
2,721 |
|
|
2,633 |
|
|
2,288 |
Allowance for equity during construction |
|
|
(157) |
|
|
(137) |
|
|
(118) |
Impairment and other expense |
|
|
1 |
|
|
54 |
|
|
71 |
Deferred income taxes |
|
|
108 |
|
|
(177) |
|
|
43 |
Wildfire Insurance Fund amortization expense |
|
|
213 |
|
|
214 |
|
|
215 |
Other |
|
|
57 |
|
|
75 |
|
|
40 |
Nuclear decommissioning trusts |
|
|
(180) |
|
|
(123) |
|
|
(256) |
Proceeds from Morongo Transmission LLC |
|
|
— |
|
|
— |
|
|
400 |
Contributions to Wildfire Insurance Fund |
|
|
(95) |
|
|
(95) |
|
|
(95) |
Changes in operating assets and liabilities: |
|
|
|
|
|
|
|
|
|
Receivables |
|
|
(349) |
|
|
(252) |
|
|
(514) |
Inventory |
|
|
(63) |
|
|
(58) |
|
|
(21) |
Accounts payable |
|
|
(408) |
|
|
367 |
|
|
138 |
Tax receivables and payables |
|
|
9 |
|
|
18 |
|
|
13 |
Other current assets and liabilities |
|
|
185 |
|
|
207 |
|
|
(321) |
Derivative assets and liabilities, net |
|
|
(174) |
|
|
115 |
|
|
(12) |
Regulatory assets and liabilities, net |
|
|
576 |
|
|
(51) |
|
|
(720) |
Wildfire-related insurance receivable |
|
|
(36) |
|
|
(390) |
|
|
708 |
Wildfire-related claims |
|
|
(410) |
|
|
(56) |
|
|
(2,648) |
Other noncurrent assets and liabilities |
|
|
(4) |
|
|
48 |
|
|
(123) |
Net cash provided by operating activities |
|
|
3,401 |
|
|
3,216 |
|
|
11 |
Cash flows from financing activities: |
|
|
|
|
|
|
|
|
|
Long-term debt issued, net of discount and issuance costs of $54, $62 and $43 for the respective years |
|
|
5,121 |
|
|
5,971 |
|
|
5,412 |
Long-term debt repaid |
|
|
(2,498) |
|
|
(1,085) |
|
|
(1,037) |
Short-term debt issued |
|
|
1,076 |
|
|
1,000 |
|
|
2,654 |
Short-term debt repaid |
|
|
(2,407) |
|
|
(1,543) |
|
|
(2,255) |
Common stock issued |
|
|
20 |
|
|
13 |
|
|
32 |
Preferred and preference stock issued, net of issuance cost |
|
|
542 |
|
|
— |
|
|
1,977 |
Preferred stock repurchased |
|
|
(289) |
|
|
— |
|
|
— |
Commercial paper borrowing (repayments), net |
|
|
1,102 |
|
|
(317) |
|
|
(254) |
Dividends and distribution to noncontrolling interests |
|
|
(117) |
|
|
(110) |
|
|
(106) |
Common stock dividends paid |
|
|
(1,112) |
|
|
(1,050) |
|
|
(988) |
Preferred stock dividends paid |
|
|
(108) |
|
|
(99) |
|
|
(35) |
Other |
|
|
117 |
|
|
101 |
|
|
45 |
Net cash provided by financing activities |
|
|
1,447 |
|
|
2,881 |
|
|
5,445 |
Cash flows from investing activities: |
|
|
|
|
|
|
|
|
|
Capital expenditures |
|
|
(5,448) |
|
|
(5,778) |
|
|
(5,505) |
Proceeds from sale of nuclear decommissioning trust investments |
|
|
4,597 |
|
|
4,177 |
|
|
3,961 |
Purchases of nuclear decommissioning trust investments |
|
|
(4,417) |
|
|
(4,054) |
|
|
(3,705) |
Other |
|
|
35 |
|
|
81 |
|
|
98 |
Net cash used in investing activities |
|
|
(5,233) |
|
|
(5,574) |
|
|
(5,151) |
Net (decrease) increase in cash, cash equivalents and restricted cash |
|
|
(385) |
|
|
523 |
|
|
305 |
Cash, cash equivalents and restricted cash at beginning of year |
|
|
917 |
|
|
394 |
|
|
89 |
Cash, cash equivalents and restricted cash at end of year |
|
$ |
532 |
|
$ |
917 |
|
$ |
394 |
Exhibit 99.2
Prepared Remarks of Edison International CEO and CFO
Fourth Quarter and Full Year 2023 Earnings Teleconference
February 22, 2024, 1:30 p.m. (PT)
Pedro Pizarro, President and Chief Executive Officer, Edison International
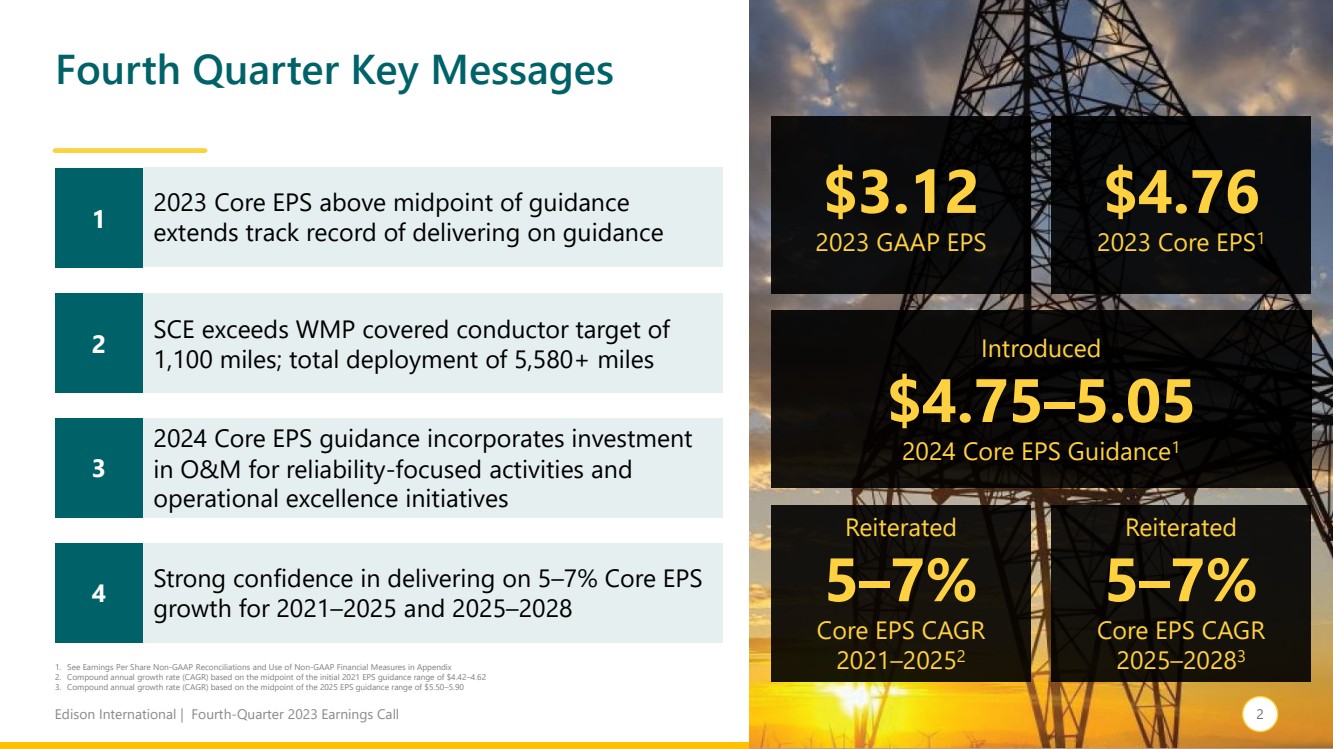
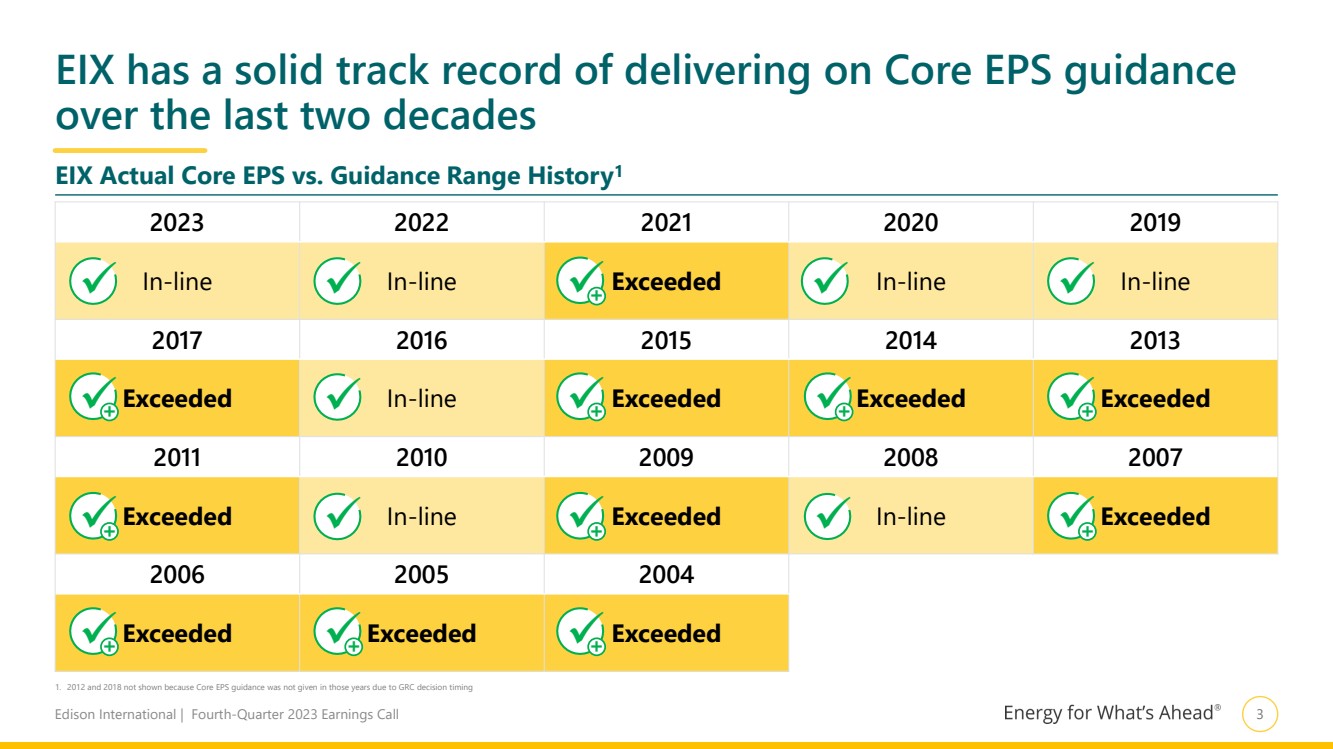
I am pleased to report that Edison International’s core EPS for 2023 was $4.76, which was above the midpoint of our guidance range despite the pending CEMA decision shifting into 2024. This strong performance demonstrates our ability to manage the business and extends our track record of meeting annual EPS guidance over the last two decades, as shown on page 3. Today, we are introducing 2024 EPS guidance of $4.75 to $5.05. This range incorporates a planned investment in O&M for reliability-focused activities and redeploys savings from prior years into operational excellence initiatives. This spending will benefit customers and therefore shareholders in the long run. I also reaffirm the strong confidence we have in our long-term EPS growth targets of 5 to 7% for 2021 through 2025, and 2025 through 2028. Maria will discuss our financial performance and outlook later on the call.
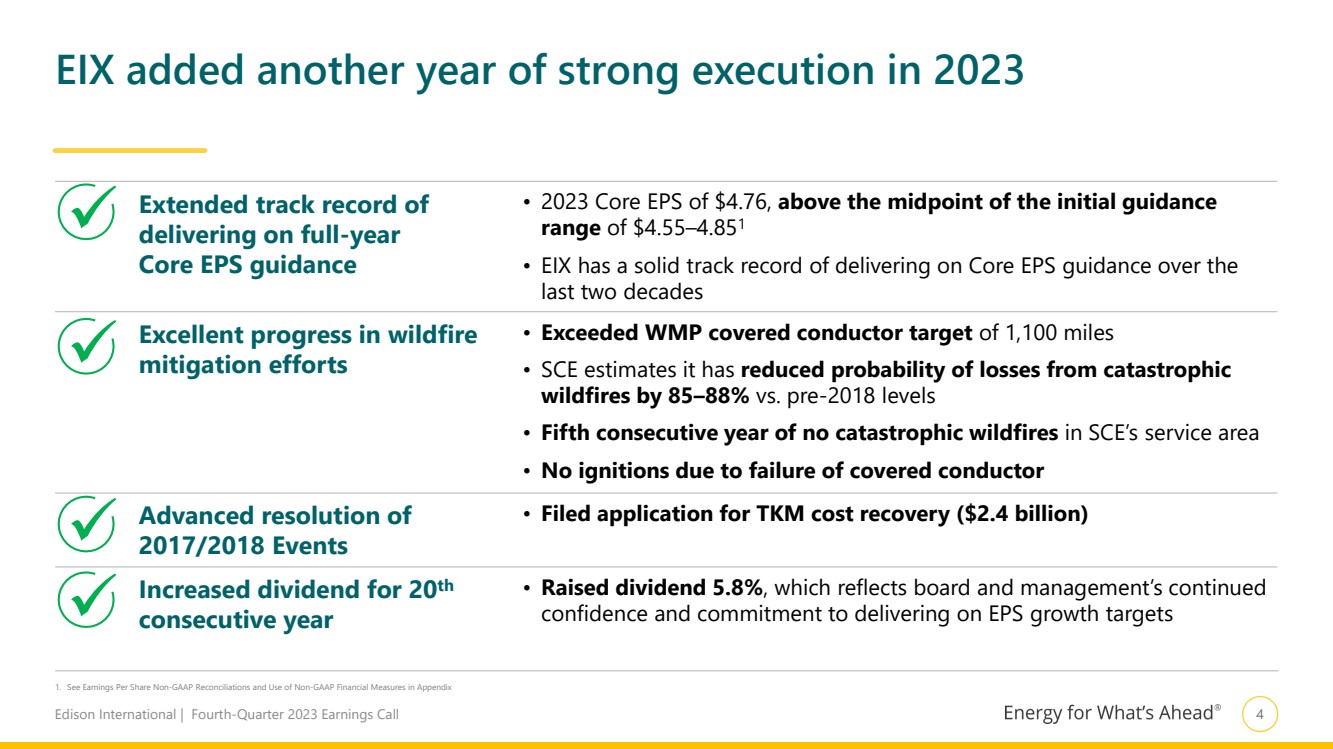
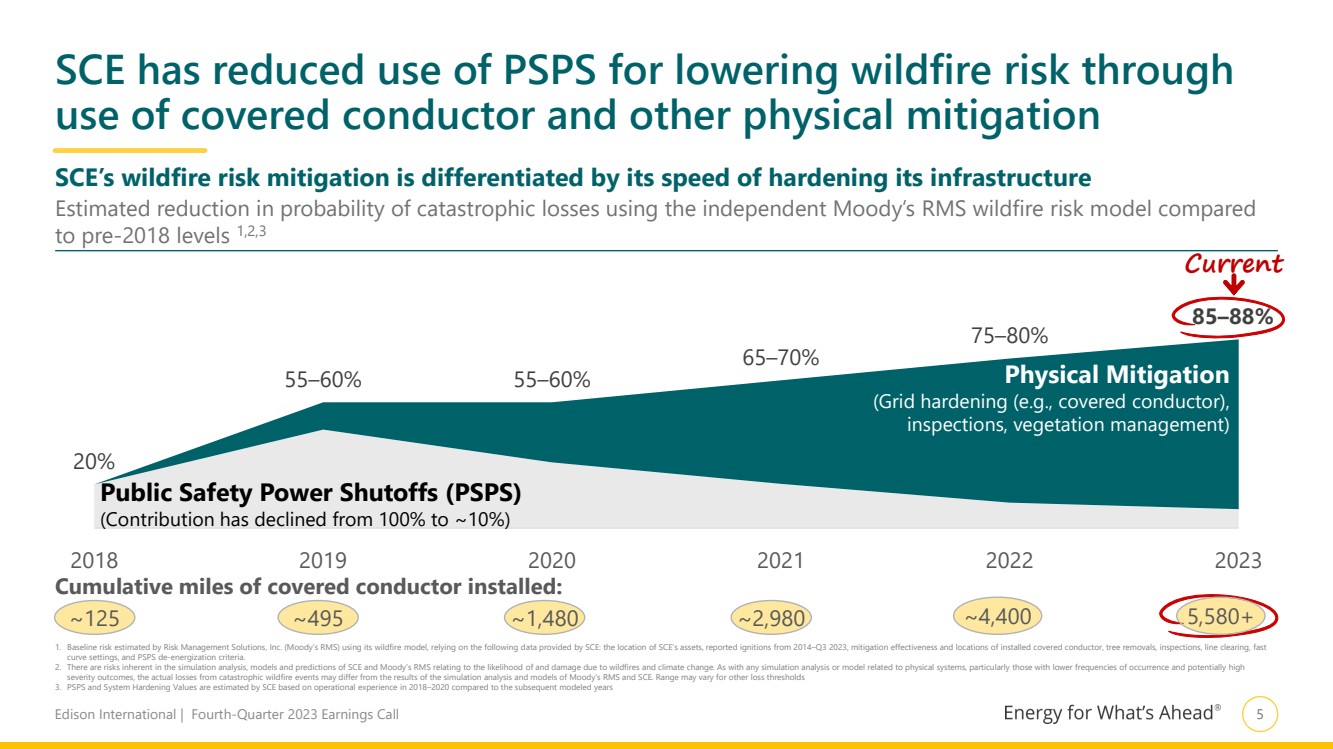
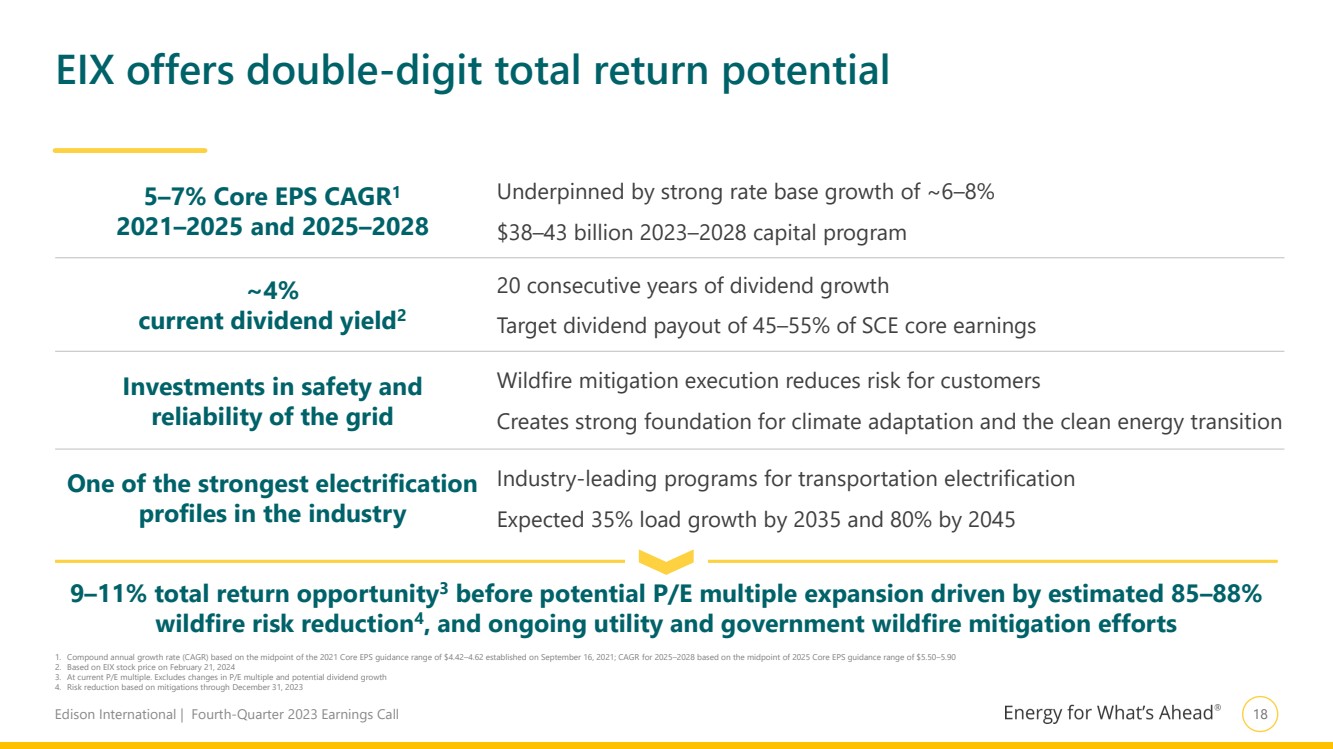
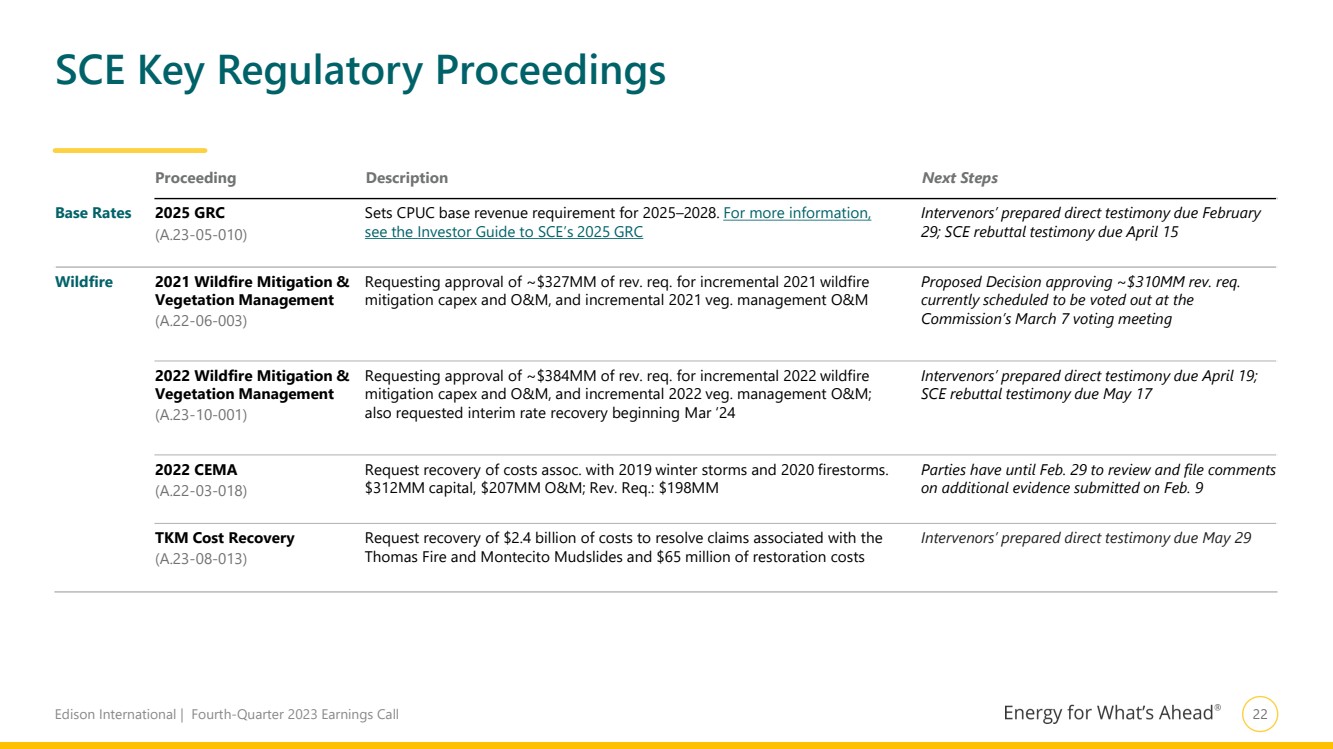
Page 4 shows our accomplishments in 2023. First, we once again delivered on our annual EPS guidance. Second, SCE exceeded its wildfire mitigation plan target to install 1,100 circuit miles of covered conductor, bringing the total to more than 5,580 in just five years. We are proud of this progress, which, combined with enhanced vegetation management, asset inspections, and other programs, has significantly reduced the need for public safety power shutoffs. Incorporating this progress into the independent wildfire risk model managed by Moody’s RMS, you can see on page 5 that SCE has achieved 85 to 88% risk reduction as compared to pre-2018 levels. Third, SCE filed its cost recovery application for the TKM events, requesting $2.4 billion. SCE provided a compelling case that it prudently designed, managed, and operated its equipment, and that the associated costs were reasonably incurred. Lastly, we raised our annual dividend by 5.8%, reflecting the board and management’s continued confidence and commitment to delivering on our EPS growth targets. Our dividend yield is in excess of 4% and remains a key component of our total return proposition. This marked the 20th consecutive annual increase in Edison International’s dividend.
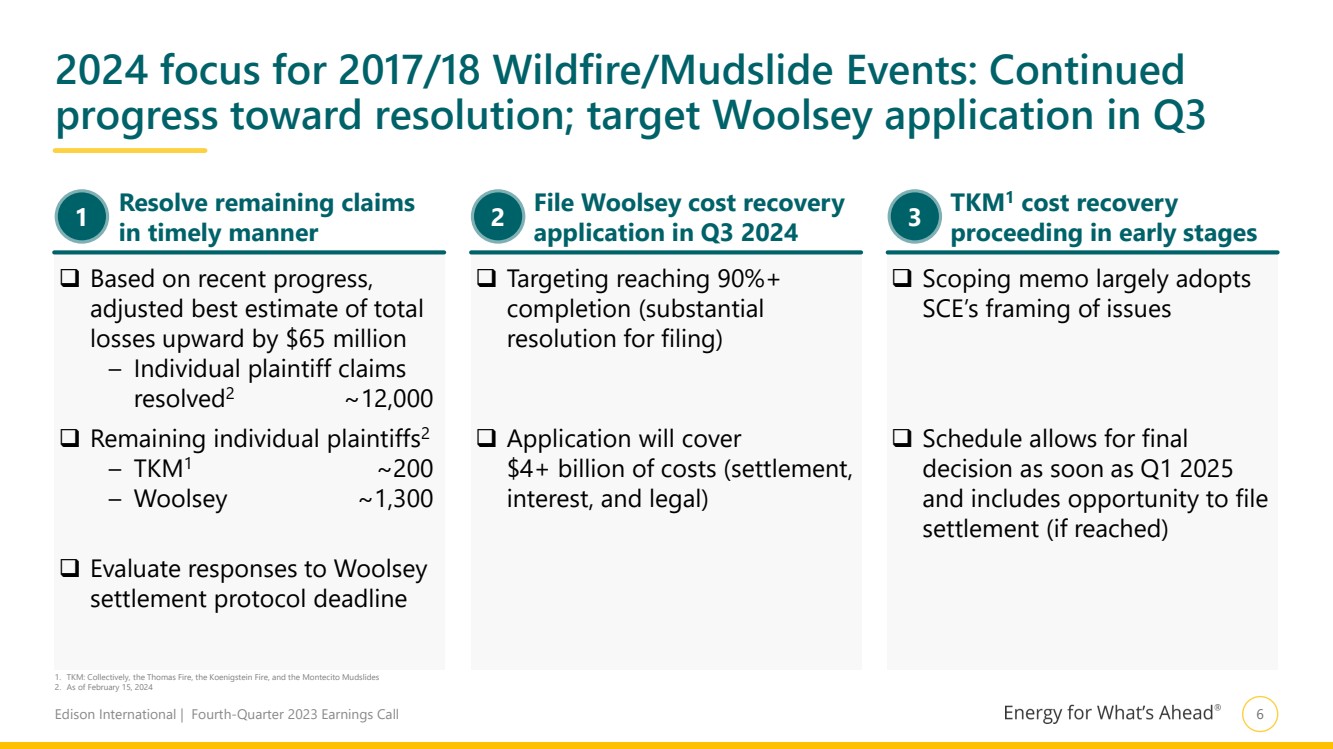
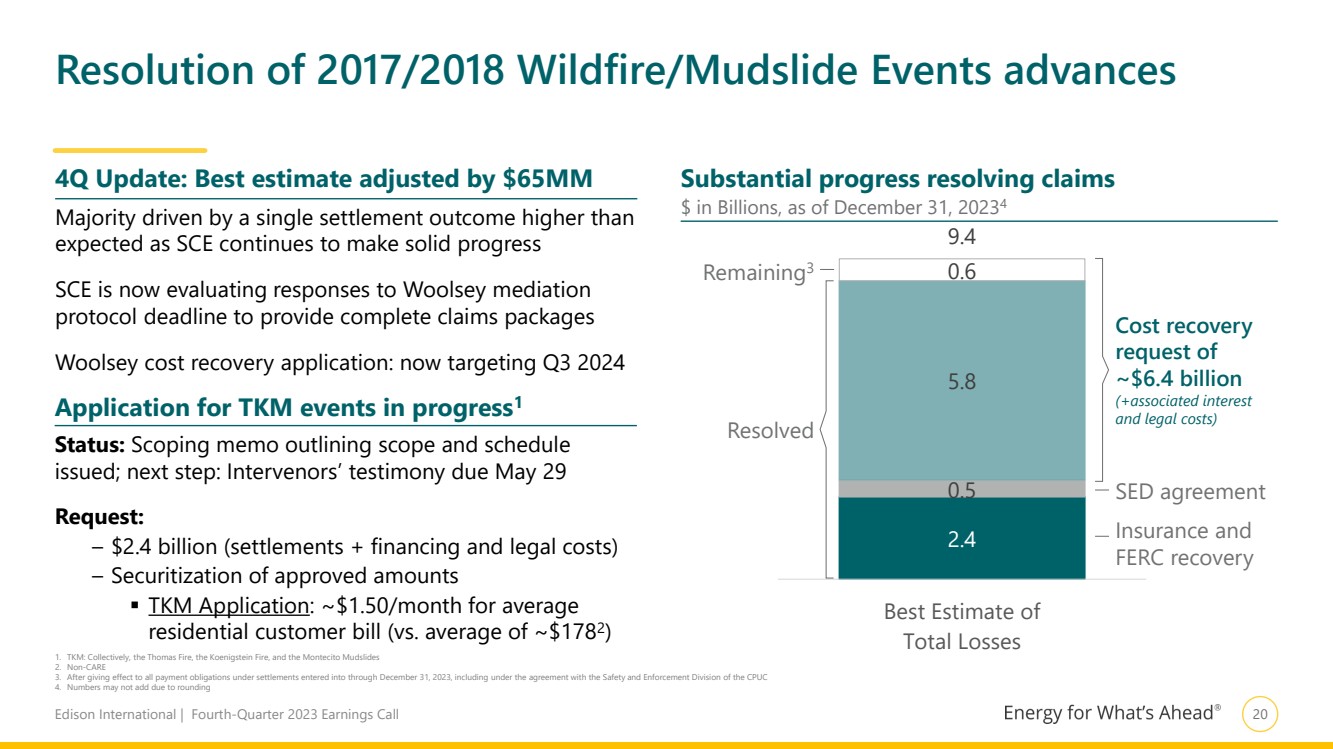
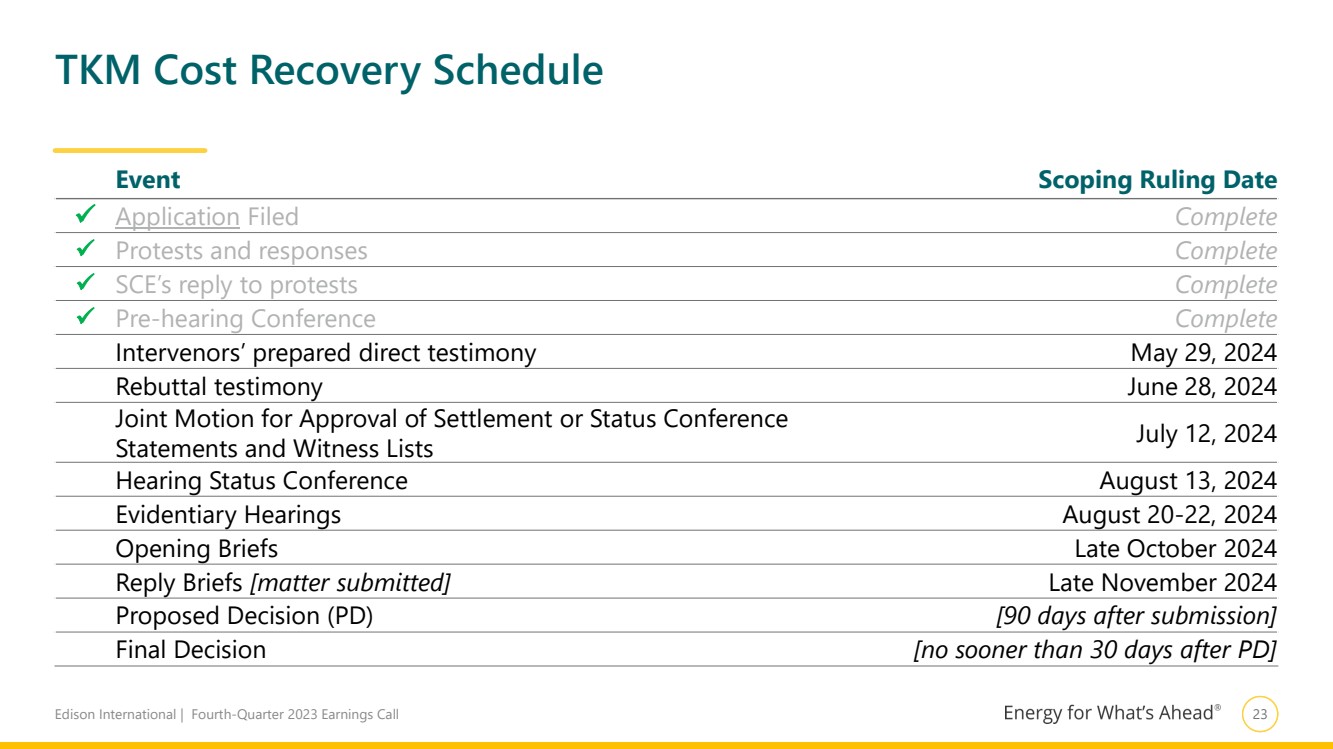
Page 6 provides an update on the 2017/2018 wildfire resolution and our approach for 2024. I would like to emphasize three takeaways. First, SCE continues to make solid progress and overall claims are settling in line with expectations. SCE revised the best estimate of total losses upward by $65 million, with the majority of this based on a single settlement. The deadline in the Woolsey settlement protocol to provide complete claims packages was yesterday and SCE is now evaluating the responses. Second, the utility targets resolving more than 90% of Woolsey claims and filing the cost recovery application in Q3. Third, CPUC President Reynolds issued the scoping memo earlier this month for the TKM proceeding, which largely adopts SCE’s framing of the issues. We are encouraged by this ruling because the issues will be handled in a single phase, allowing for a final decision as soon as Q1 2025. Also, the schedule provides an opportunity for parties to submit a settlement agreement. I would like to remind you that our financial assumptions for 2025 and beyond do not factor in the cost recovery applications, which would represent substantial value for the company and SCE’s customers.
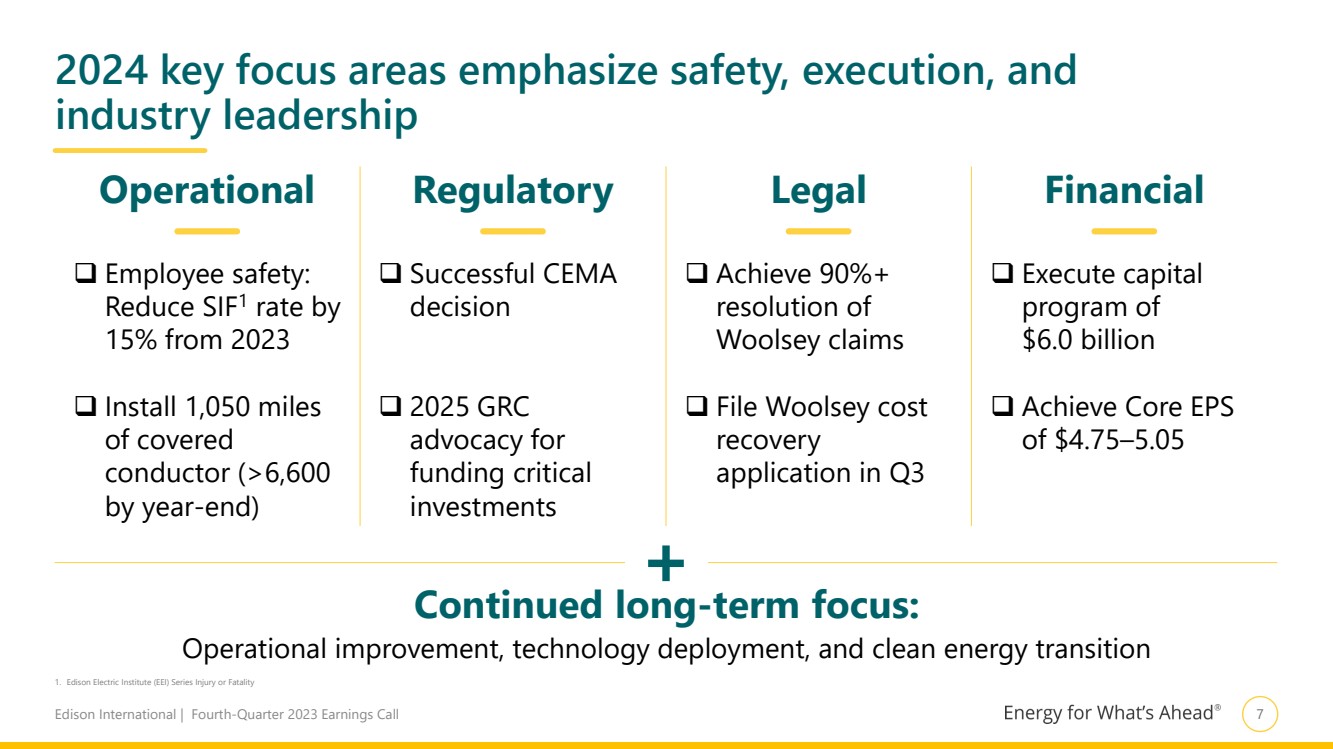
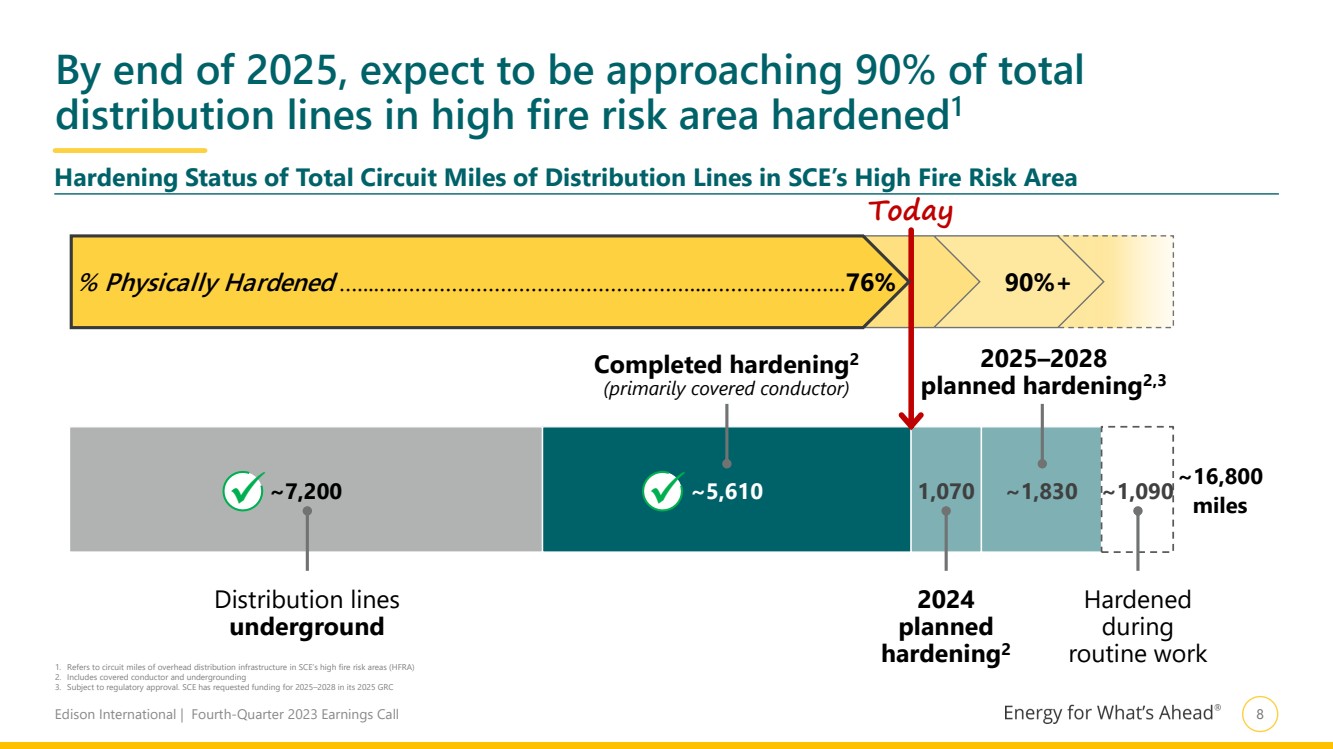
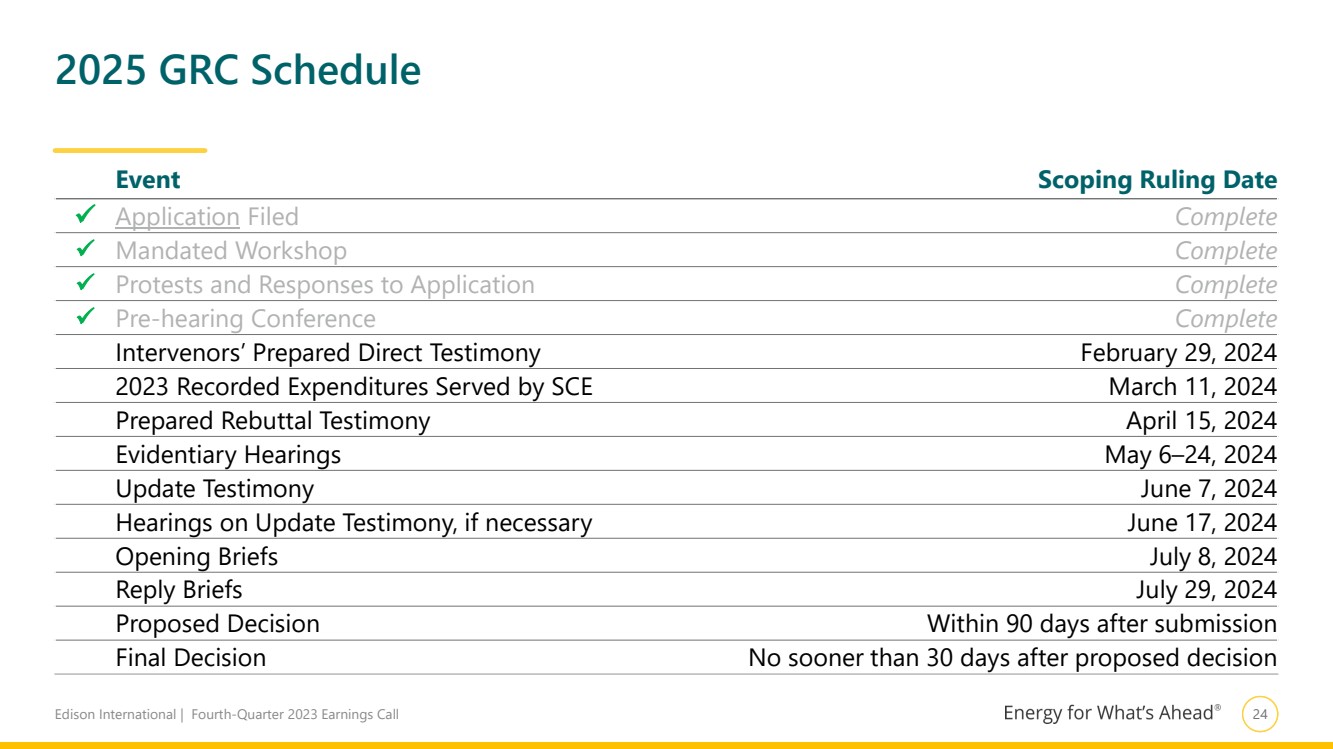
Page 7 summarizes the key management focus areas for 2024. On the wildfire mitigation front, SCE plans to install an additional 1,050 miles of covered conductor in 2024, after which this program will start to ramp down. By the end of next year, SCE will be approaching a significant milestone — 90% hardening of its total distribution lines in its high fire risk area. You can see this depicted on page 8. Also, SCE will continue its GRC advocacy for funding critical investments that will enable efficient electrification and the state’s clean energy transition. I want to emphasize that distribution grid investment accounts for more than 85% of SCE’s capital plan, and these investments are crucial for ensuring reliability, resiliency, and readiness. The CPUC has consistently approved this type of spending in previous GRCs, reinforcing our confidence in SCE’s request. As for the legal and financial categories, I just discussed our legal approach, including filing the Woolsey application in the third quarter, and Maria will discuss our financial targets shortly.
We at Edison are equally focused on the long term. As we have highlighted in several industry-leading white papers, the grid will be a key enabler for realizing California’s pathway to net zero.
2
To get there, it will be critical to rapidly expand the high-voltage transmission system and localized distribution networks that serve customers. This aligns well with the underlying drivers of our investment outlook. As more and more vehicles and buildings are electrified, the electricity demand will increase by 80% over the next 20 years, which will benefit customer affordability through a 40% decrease in their total energy costs across electricity, gasoline, and natural gas. After years of flat demand, SCE is projecting an uptick in electricity usage of about 2% annually over the coming years.
To accelerate the development of new markets over time, SCE has developed innovative proposals, including its nation-leading suite of transportation electrification programs. Recently, although the CPUC denied SCE’s building electrification application due to near-term affordability pressures, it acknowledged SCE’s leadership in proposing programs to accelerate much-needed building decarbonization. The utility will continue to evaluate the results of other building electrification pilots it has in progress and look for different ways to support the state in advancing its clean energy priorities.
Another area where we continue to innovate is building our digital and AI capabilities to drive greater efficiency. We are investing in technologies to improve our data analytics skills to enhance decision-making and strengthen operational excellence. For example, we are using generative AI to improve inspections, customer experience, and grid planning. Today, our team is also using AI for research, workflow automations, and code development. In SCE’s customer service operations, AI is enabling call center agents to retrieve information faster, performing speech and sentiment analytics, and supporting billing operations. We will continue this proactive approach to capture value using new technology.
To conclude, our operational agenda is driven by safety, reliability, affordability, and resiliency in our overall utility operations, including SCE’s wildfire mitigation and industry-leading covered conductor program. Our financial agenda is very clear — deliver on our 2024 EPS guidance and achieve our EPS target for 2025. Our team and I are committed to executing strongly and we will continue to share our progress.
3
Maria Rigatti, Executive Vice President and Chief Financial Officer, Edison International
In my comments today, I will discuss fourth quarter and full year 2023 results, SCE’s capex and rate base opportunities, and 2024 EPS guidance. I want to reaffirm our unwavering confidence in achieving our long-term EPS growth target of 5 to 7% from 2021 to 2025. I’ll elaborate on the factors underpinning this confidence shortly.
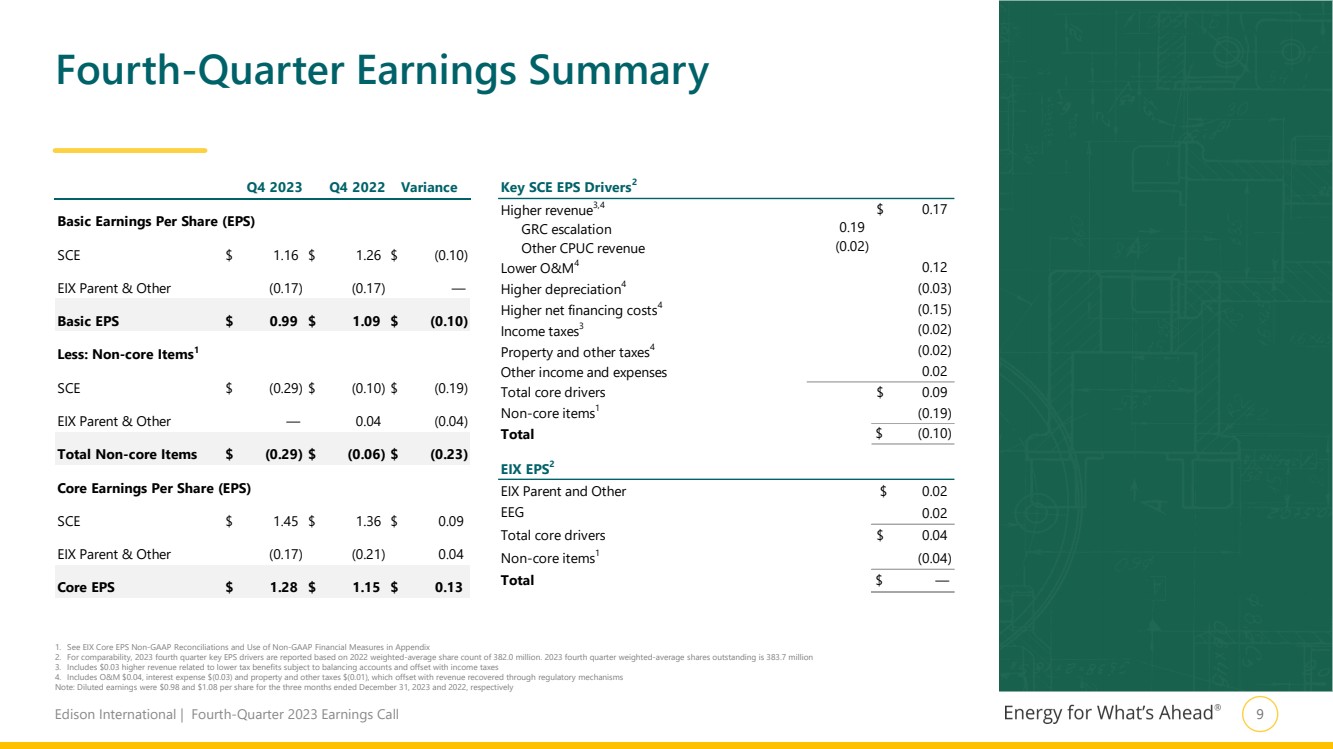
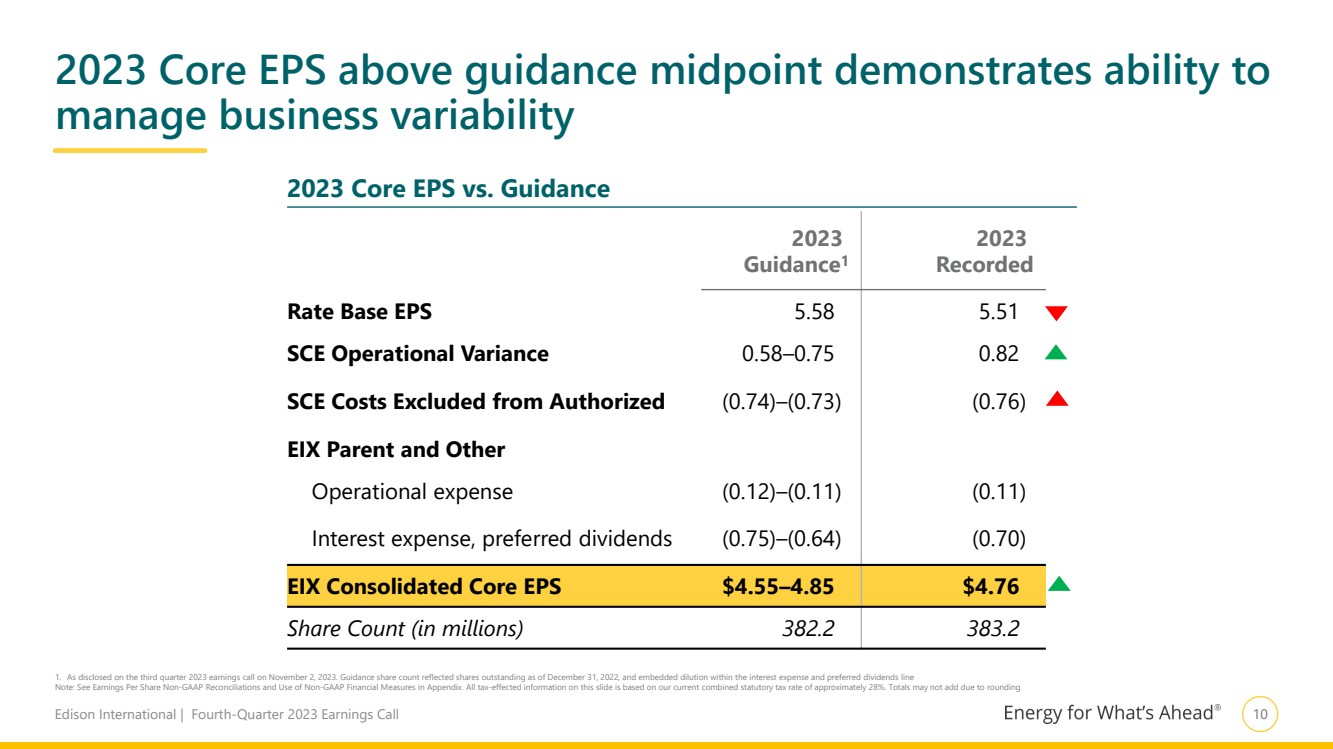
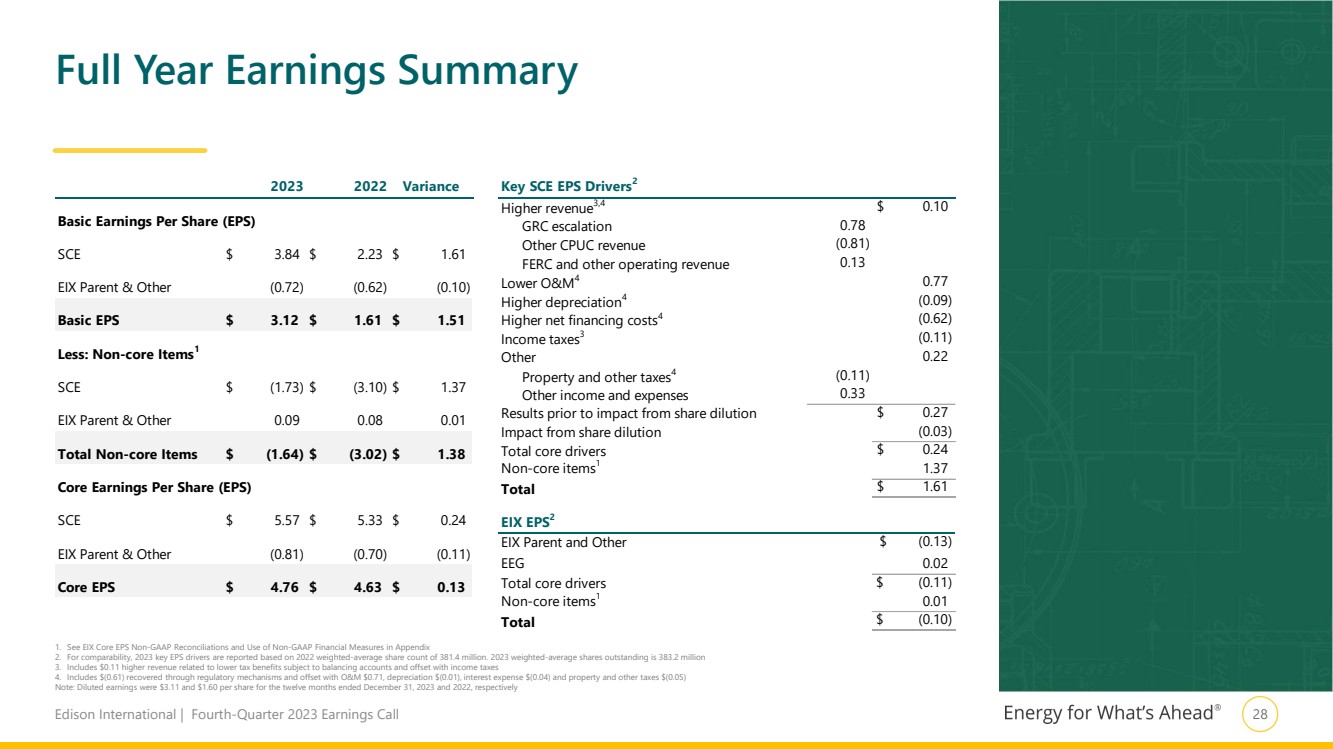
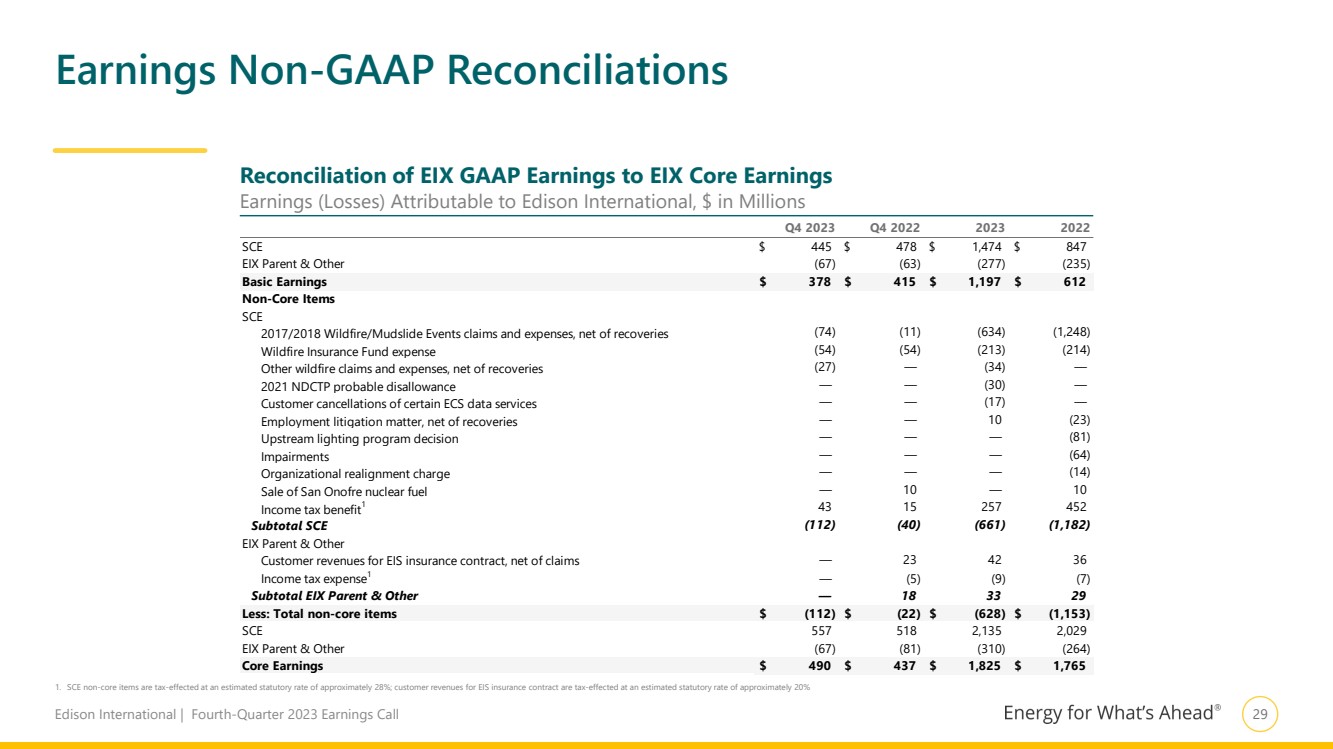
Let me begin with fourth quarter results. EIX reported core EPS of $1.28. As you can see from the year-over-year quarterly variance analysis shown on page 9, core earnings grew by 13 cents primarily due to higher GRC revenue and lower O&M, partially offset by an increase in interest expense. The parent company also had a gain on preferred stock repurchases. For the full year, EIX’s core EPS of $4.76 was above the midpoint of our guidance range. For context, you’ll recall that we identified two specific items in this guidance — the pending CEMA decision and the tender offer for EIX’s preferred stock. The CEMA decision shifted into 2024 and the gain on the preferred stock repurchase was 4 cents. I’m also pleased to inform you that our operational excellence initiatives are off to a solid start, and we are seeing this translate into higher operating efficiency throughout the business. This was reflected in better-than-expected SCE operational variances. Summing up our 2023 performance, the key takeaway is that we continued to manage the variability in the business and yet again deliver core EPS above the midpoint. Page 10 shows the components of our performance versus guidance.
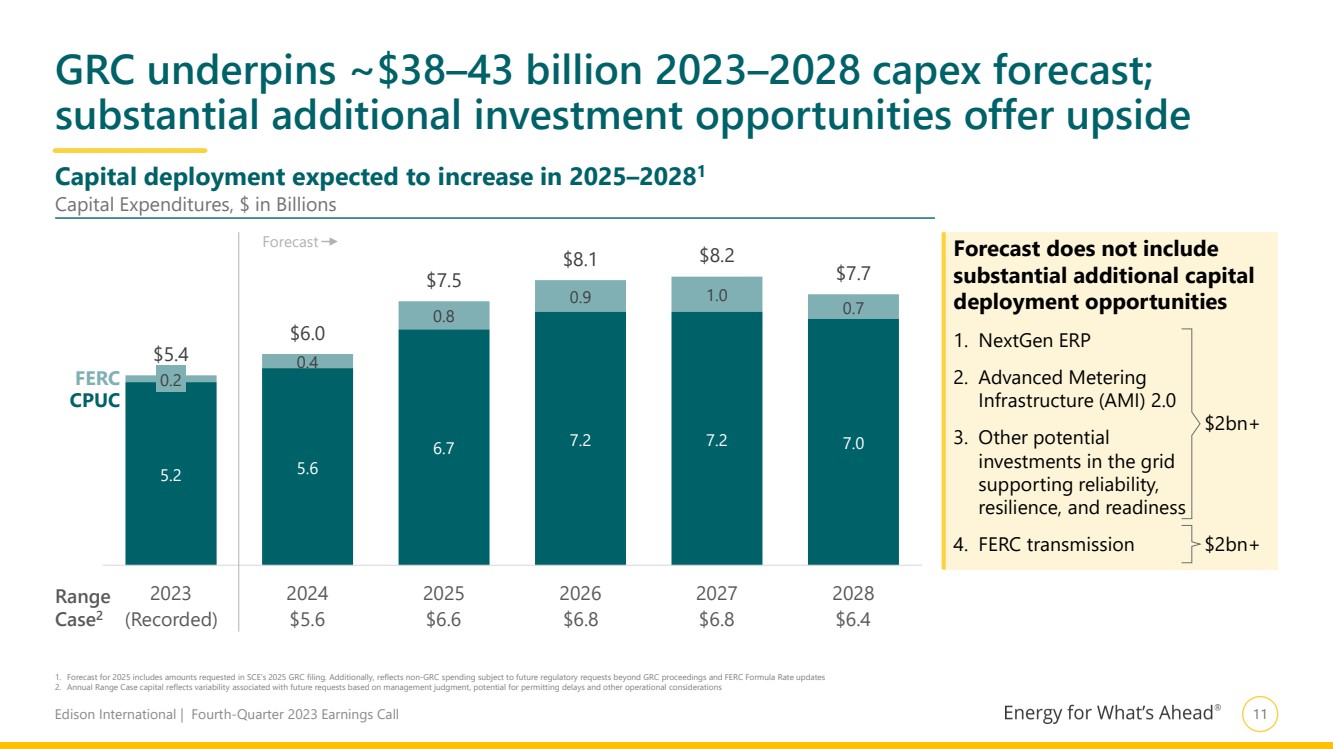
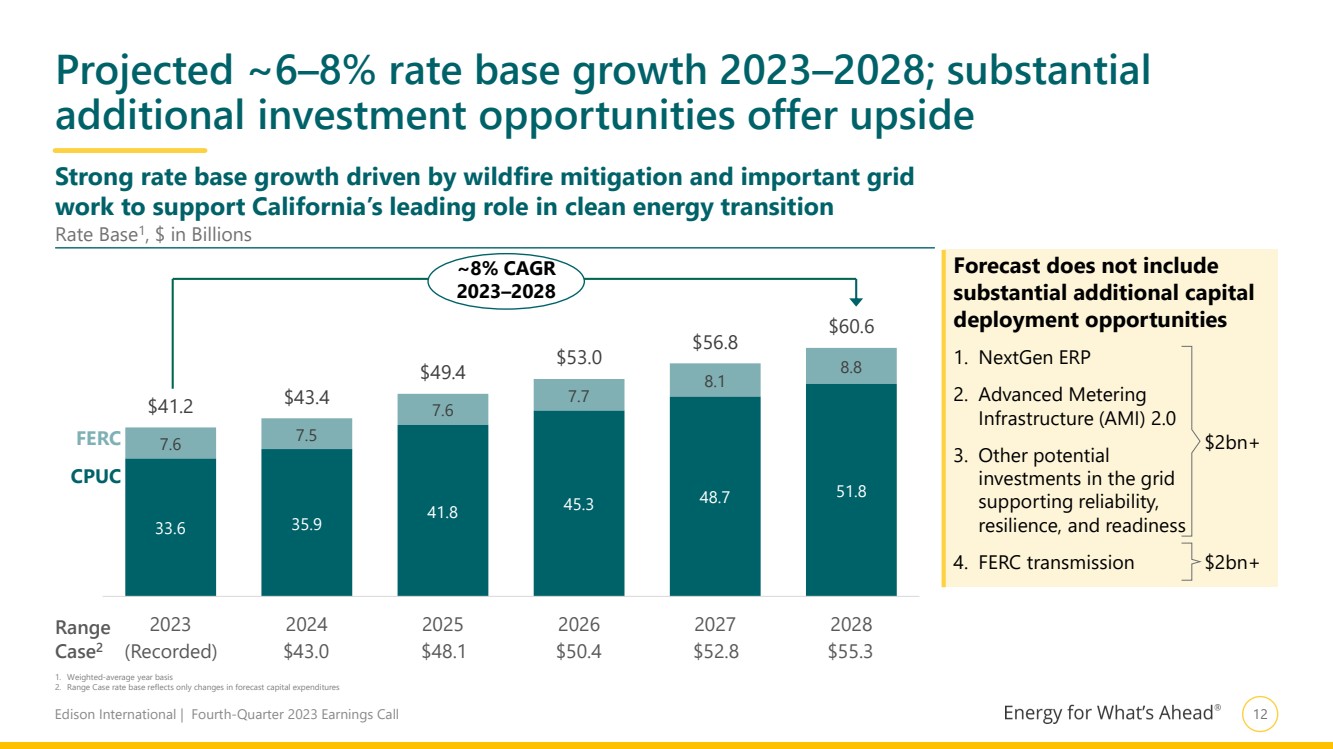
Turning to SCE’s capital and rate base forecasts shown on pages 11 and 12, I want to emphasize two messages. First, SCE has a robust and high-quality capital investment plan for 2023 through 2028. The utility plans to invest $38 to $43 billion, the majority of which is in the distribution grid. This spending covers several critical areas, including infrastructure replacement, wildfire mitigation, load growth, new service connections, and inspections and maintenance. This type of spending has been approved in prior GRCs, so we view these as high-quality and lower-risk. Moreover, they directly support California’s leading role in transitioning to a carbon-free economy. Second, these forecasts do not incorporate substantial additional long-term capex opportunities in several areas. The utility will file standalone applications with the CPUC for the NextGen ERP and AMI 2.0 programs once they have been fully developed.
4
On the FERC side, SCE is the incumbent transmission owner for 17 projects approved in CAISO’s transmission plan, which we expect will result in more than $2 billion of investment.
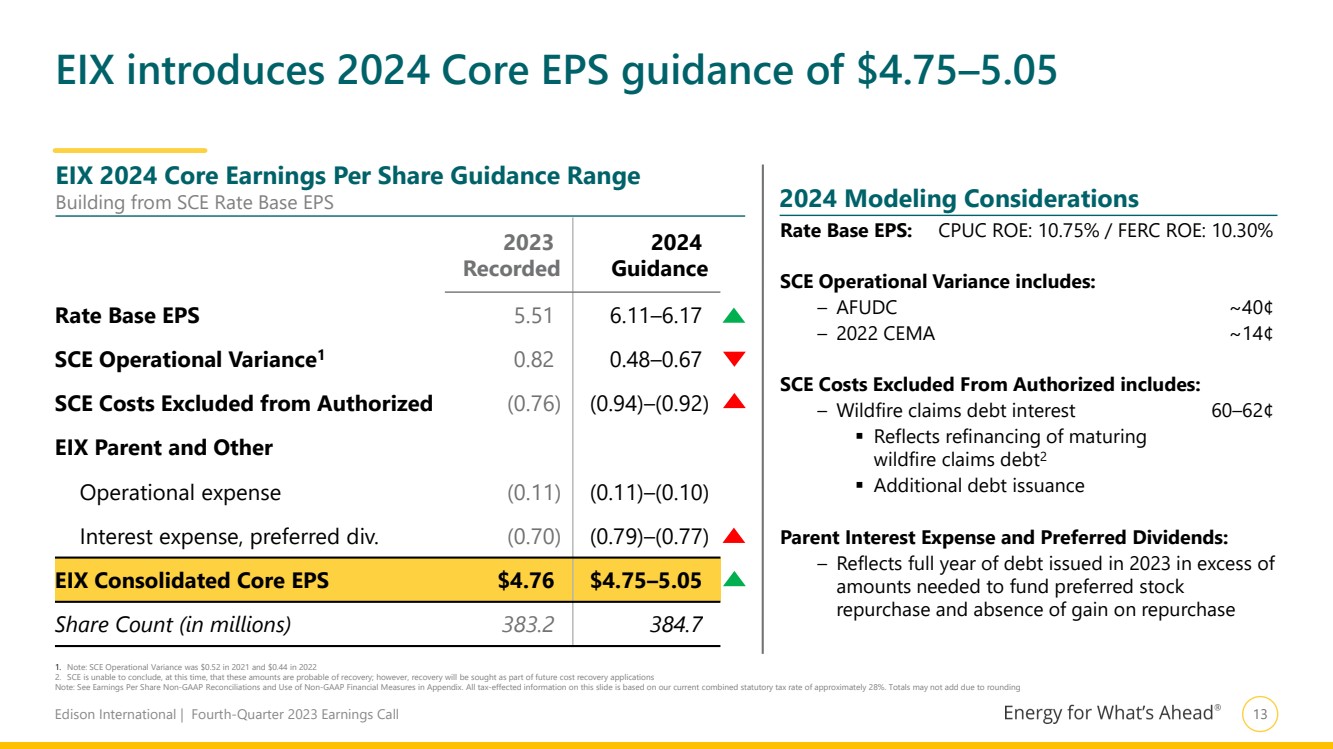
Turning to 2024 EPS guidance, the range of $4.75 to $5.05 and modeling considerations are outlined on page 13. As you can see, rate base earnings growth is strong, though our EPS guidance implies modest growth for the year. There are three primary reasons for this.
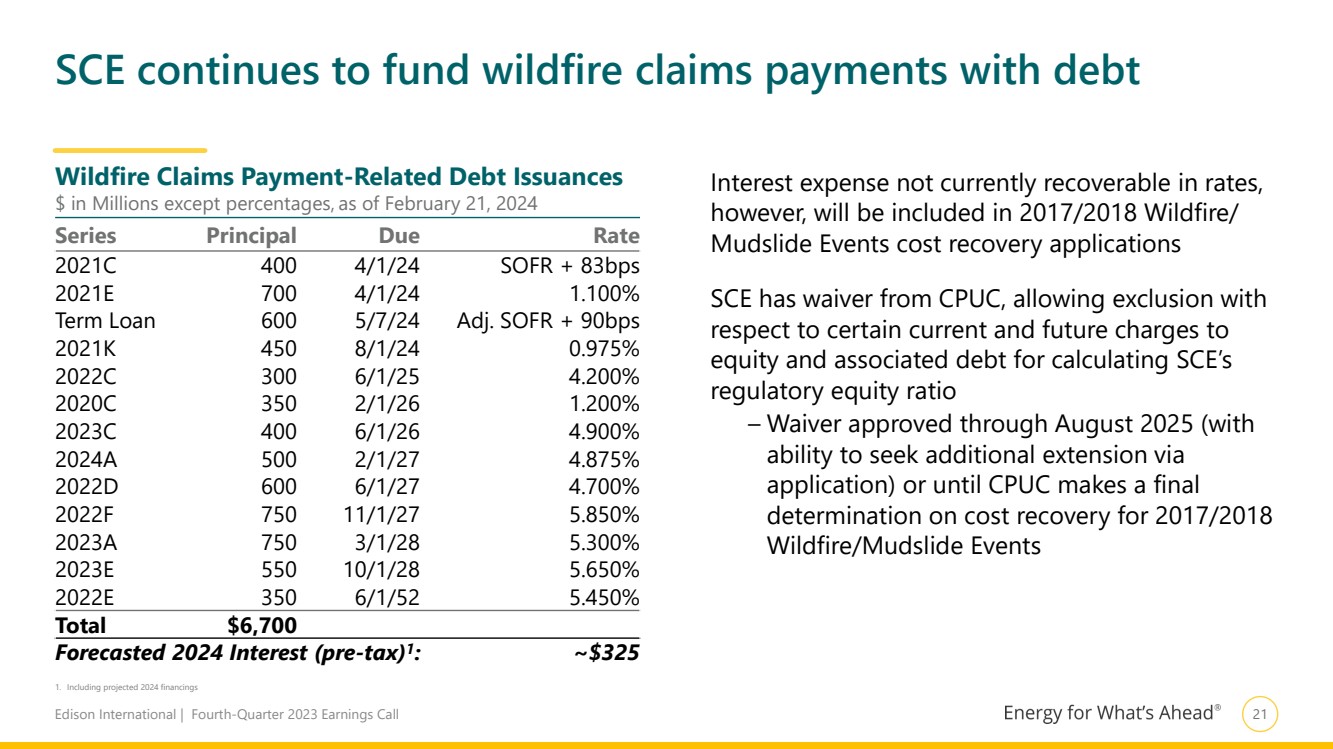
| ● | First, interest expense on wildfire settlement-related debt grows by about 16 cents, driven by refinancing $2.1 billion of maturities and issuing additional debt to fund the balance of the claims resolutions. I want to be very clear that the utility expects to seek full CPUC cost recovery of all eligible claims payments, including financing costs. |
| ● | Second, SCE Operational Variance is 15 to 34 cents lower year-over-year. As we’ve noted, this captures SCE’s variations from authorized levels, including such items as AFUDC, O&M, depreciation, financing, and true-ups from regulatory approvals. Pedro talked earlier about the planned increase in O&M as SCE spends on targeted reliability-focused activities and redeploys savings into operational excellence initiatives. This accounts for 15 to 20 cents of the total year-over-year change. The utility continues to spend in its operations, including Distribution, Customer Service, and IT, to support reliability and benefit customers in the long run. |
| ● | Third, Parent & Other costs are higher, primarily due to the absence of the gain on last year’s preferred stock repurchase, and also having a full year of interest on the junior subordinated notes issued in excess of the amounts needed to fund the repurchase. |
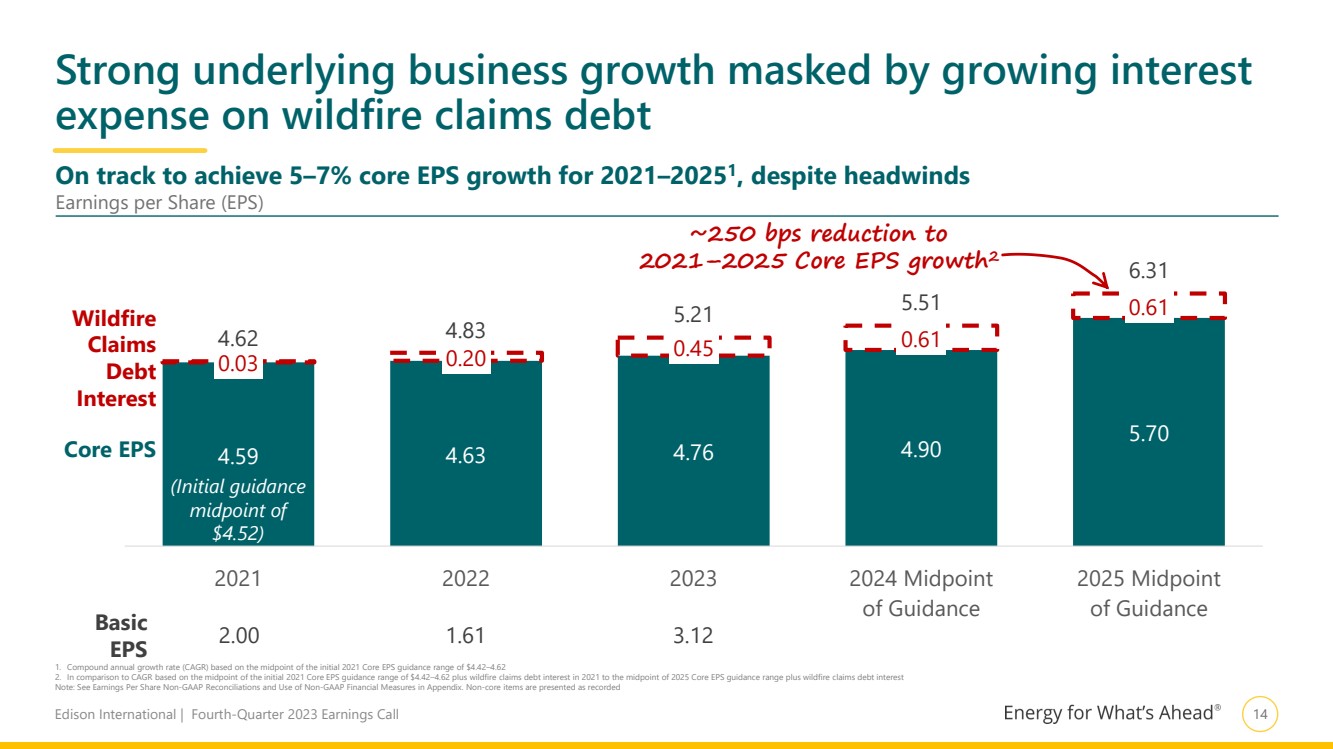
Turning to page 14, I want to emphasize the strong underlying business growth that is being masked by the growing interest expense on wildfire claims debt. As you see on the chart, we are on track to achieve 5 to 7% core EPS growth for 2021 through 2025. This is despite the burden of about $325 million of pre-tax interest, or 61 cents per share, which reduces our core EPS growth by 250‑basis points over this period.
5
On the other hand, this illustrates the substantial potential value from successful resolution of the cost recovery proceedings.
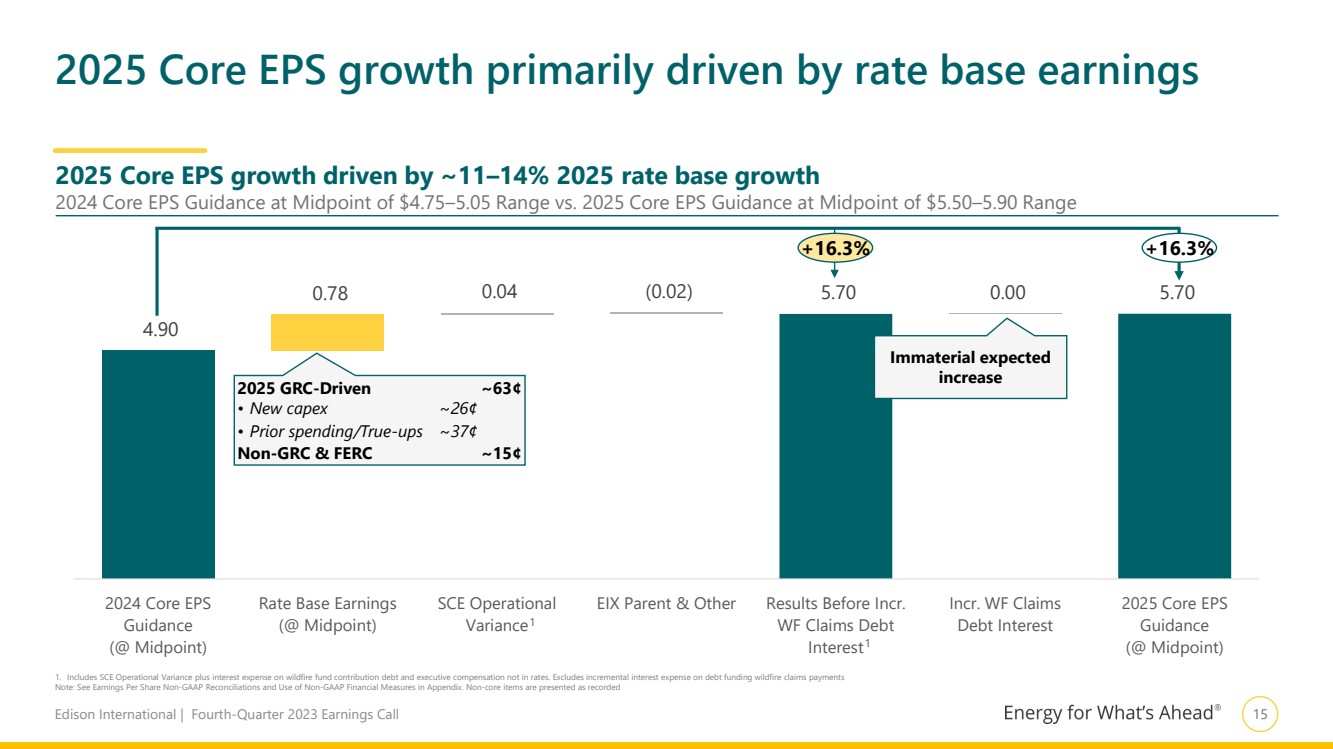
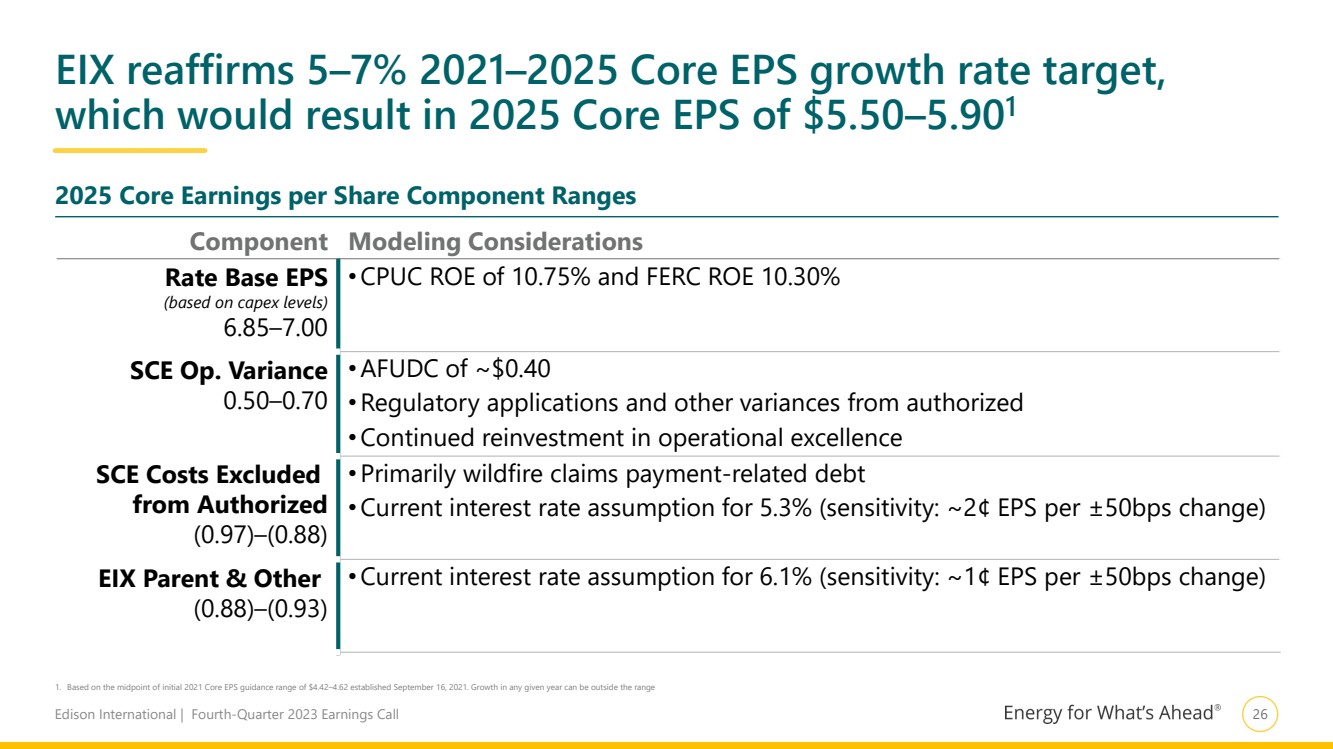
I would now like to address the big increase in 2025 core EPS and share some insight into what makes us confident in delivering on our commitment. To do this, we are going beyond our typical one-year forward guidance and providing a bridge between the midpoints of 2024 and 2025 core EPS guidance, which is on page 15. The biggest contributor to earnings growth comes from an increase in rate base earnings. You will recall that for the last several years we’ve been projecting rate base to increase by 11 to 14% in 2025. This step-up has two components. The first relates to the 2025 GRC which in total drives 63 cents of the change. The drivers for this increase are 2025 capex and rate base true-ups, including differences in the timing and mix of capital deployed over the prior rate case cycle. The second component relates to non-GRC applications to recover past wildfire mitigation and other spending, as well as FERC-jurisdictional investment. This represents the remaining 15 cents. A significant portion of this relates to covered conductor installation and other mitigation spending above what was authorized in SCE’s 2021 GRC.
Outside the rate base EPS, I want to underscore that operational variances are not a key driver, and its contribution is in line with historical levels. Further, we see wildfire interest expense moderating as the claims settlement process should be substantially complete and SCE has only $300 million of wildfire debt maturing in 2025. Let me summarize by saying that our confidence is underpinned by these growth drivers, further bolstered by the fact that headwinds in 2024 are expected to moderate going into 2025.
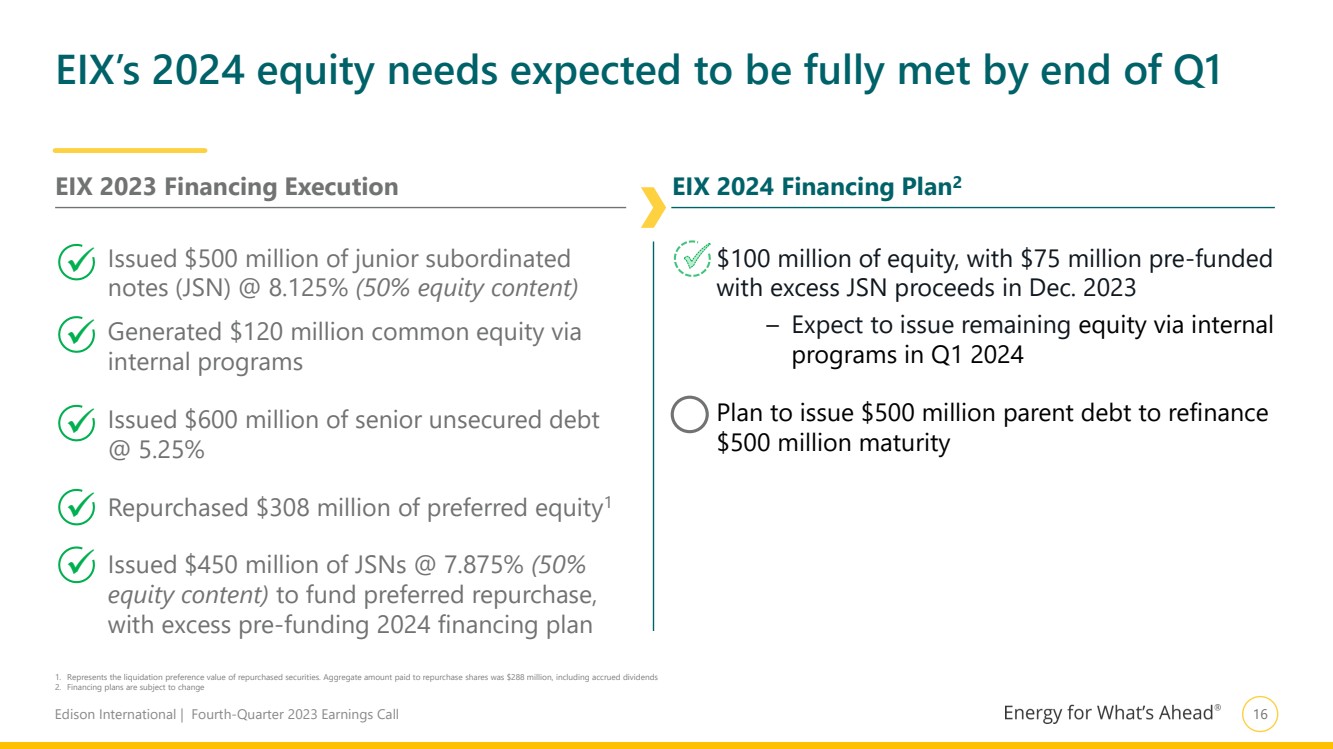
Turn to page 16. Following an active year of capital market execution in 2023, our planned 2024 financing activities are minimal. In December, EIX pre-funded $75 million of the $100 million annual equity need with our junior subordinated notes offering. The remainder will be addressed through internal programs by the end of Q1. As for the rest of the parent’s funding needs, we expect to issue $500 million of debt to refinance a maturity.
6
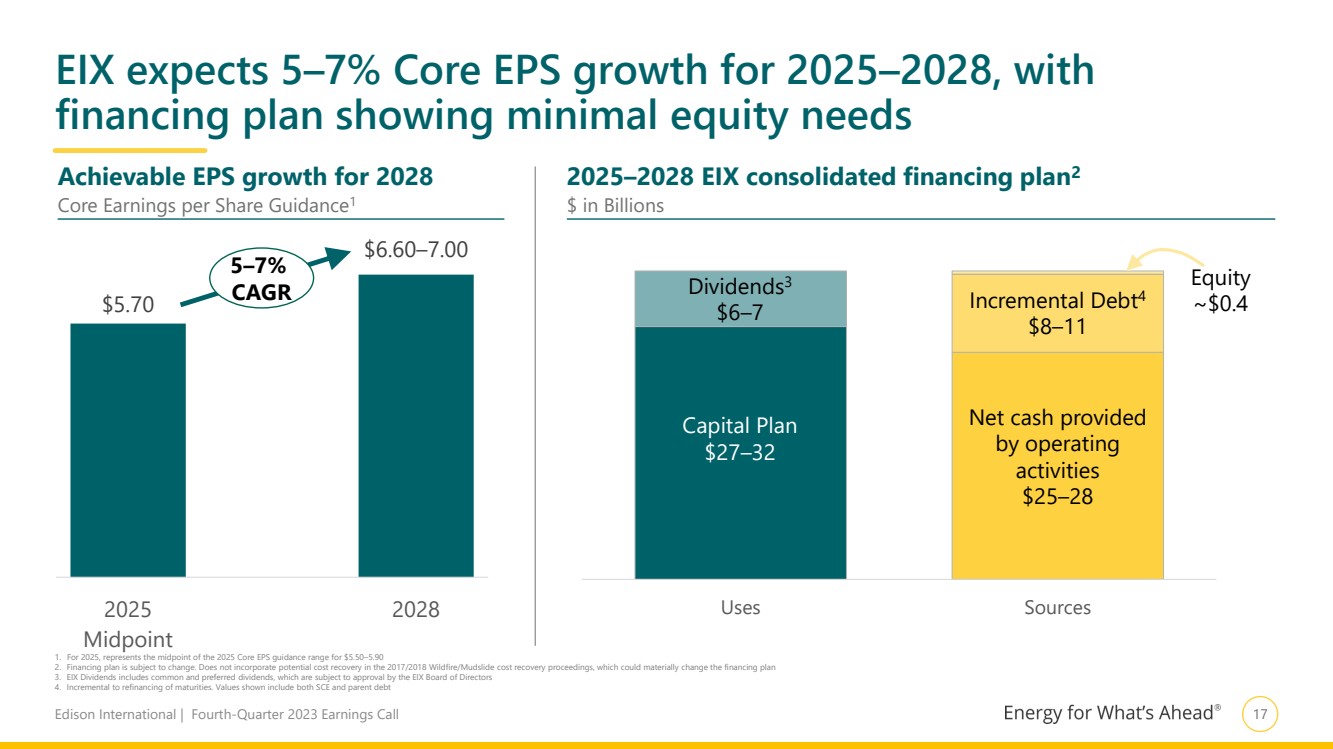
Turning to page 17, we are also reiterating our core EPS growth target of 5 to 7% for 2025 through 2028, which only requires $100 million of equity per year. On the right side of the page, we’ve now laid out the consolidated sources and uses for this period.
Let me conclude by saying our confidence in meeting our 2024 and 2025 EPS targets remains strong. Additionally, there are also potential value creation opportunities that are not factored into our guidance metrics or the company’s equity value. These are:
| ● | Cost recovery for the 2017 and 2018 events, |
| ● | Successfully executing our operational excellence program, the cornerstone for SCE’s cost leadership and lowest system average rate among major IOUs in California, and |
| ● | Incremental CPUC and FERC growth investment opportunities. |
We look forward to executing on our plans and sharing progress on the next quarterly earnings call.
7
|
FEBRUARY 22, 2024 FOURTH-QUARTER AND FULL-YEAR 2023 FINANCIAL RESULTS |
|
Edison International | Fourth-Quarter 2023 Earnings Call 1 Statements contained in this presentation about future performance, including, without limitation, operating results, capital expenditures, rate base growth, dividend policy, financial outlook, and other statements that are not purely historical, are forward-looking statements. These forward-looking statements reflect our current expectations; however, such statements involve risks and uncertainties. Actual results could differ materially from current expectations. These forward-looking statements represent our expectations only as of the date of this presentation, and Edison International assumes no duty to update them to reflect new information, events or circumstances. Important factors that could cause different results include, but are not limited to the: • ability of SCE to recover its costs through regulated rates, timely or at all, including uninsured wildfire-related and debris flow-related costs (including amounts paid for self-insured retention and co-insurance), costs incurred to mitigate the risk of utility equipment causing future wildfires, costs incurred as a result of the COVID-19 pandemic, and increased costs due to supply chain constraints, inflation and rising interest rates; • impact of affordability of customer rates on SCE's ability to execute its strategy, including the impact of affordability on the approval of operations and maintenance expenses, and proposed capital investment projects; • ability of SCE to implement its operational and strategic plans, including its Wildfire Mitigation Plan and capital program; • risks of regulatory or legislative restrictions that would limit SCE's ability to implement operational measures to mitigate wildfire risk, including Public Safety Power Shutoff (“PSPS”) and fast curve settings, when conditions warrant or would otherwise limit SCE's operational practices relative to wildfire risk mitigation; • ability of SCE to obtain safety certifications from the Office of Energy Infrastructure Safety of the California Natural Resources Agency (“OEIS“) • risk that California Assembly Bill 1054 (“AB 1054“) does not effectively mitigate the significant exposure faced by California investor-owned utilities related to liability for damages arising from catastrophic wildfires where utility facilities are alleged to be a substantial cause, including the longevity of the Wildfire Insurance Fund and the California Public Utilities Commission (“CPUC”) interpretation of and actions under AB 1054, including its interpretation of the prudency standard clarified by AB 1054; • risks associated with the operation of electrical facilities, including worker and public safety issues, the risk of utility assets causing or contributing to wildfires, failure, availability, efficiency, and output of equipment and facilities, and availability and cost of spare parts; • physical security of Edison International’s and SCE’s critical assets and personnel and the cybersecurity of Edison International’s and SCE’s critical information technology systems for grid control, and business, employee and customer data; • ability of Edison International and SCE to effectively attract, manage, develop and retain a skilled workforce, including its contract workers; • decisions and other actions by the CPUC, the Federal Energy Regulatory Commission, and the United States Nuclear Regulatory Commission and other governmental authorities, including decisions and actions related to nationwide or statewide crisis, determinations of authorized rates of return or return on equity, the recoverability of wildfire-related and debris flow-related costs, issuance of SCE's wildfire safety certification, wildfire mitigation efforts, approval and implementation of electrification programs, and delays in executive, regulatory and legislative actions; • potential for penalties or disallowances for non-compliance with applicable laws and regulations, including fines, penalties and disallowances related to wildfires where SCE's equipment is alleged to be associated with ignition; • extreme weather-related incidents (including events caused, or exacerbated, by climate change, such as wildfires, debris flows, flooding, droughts, high wind events and extreme heat events) and other natural disasters (such as earthquakes), which could cause, among other things, public safety issues, property damage, rotating outages and other operational issues (such as issues due to damaged infrastructure), PSPS activations and unanticipated costs; • cost and availability of labor, equipment and materials, including as a result of supply chain constraints and inflation; • ability of Edison International or SCE to borrow funds and access bank and capital markets on reasonable terms; • risks associated with the decommissioning of San Onofre, including those related to worker and public safety, public opposition, permitting, governmental approvals, on-site storage of spent nuclear fuel and other radioactive material, delays, contractual disputes, and cost overruns; • risks associated with cost allocation resulting in higher rates for utility bundled service customers because of possible customer bypass or departure for other electricity providers such as Community Choice Aggregators (“CCA,” which are cities, counties, and certain other public agencies with the authority to generate and/or purchase electricity for their local residents and businesses) and Electric Service Providers (entities that offer electric power and ancillary services to retail customers, other than electrical corporations (like SCE) and CCAs); • risks inherent in SCE’s capital investment program, including those related to project site identification, public opposition, environmental mitigation, construction, permitting, contractor performance, changes in the California Independent System Operator’s transmission plans, and governmental approvals; and • actions by credit rating agencies to downgrade Edison International or SCE’s credit ratings or to place those ratings on negative watch or negative outlook. Other important factors are discussed under the headings “Forward-Looking Statements”, “Risk Factors” and “Management’s Discussion and Analysis” in Edison International’s Form 10-K and other reports filed with the Securities and Exchange Commission, which are available on our website: www.edisoninvestor.com. These filings also provide additional information on historical and other factual data contained in this presentation. Forward-Looking Statements |
|
Edison International | Fourth-Quarter 2023 Earnings Call 2 Fourth Quarter Key Messages $3.12 2023 GAAP EPS $4.76 2023 Core EPS1 Reiterated 5–7% Core EPS CAGR 2025–20283 Reiterated 5–7% Core EPS CAGR 2021–20252 1 Introduced $4.75–5.05 2024 Core EPS Guidance1 2023 Core EPS above midpoint of guidance extends track record of delivering on guidance 2 SCE exceeds WMP covered conductor target of 1,100 miles; total deployment of 5,580+ miles 3 2024 Core EPS guidance incorporates investment in O&M for reliability-focused activities and operational excellence initiatives 4 Strong confidence in delivering on 5–7% Core EPS growth for 2021–2025 and 2025–2028 1. See Earnings Per Share Non-GAAP Reconciliations and Use of Non-GAAP Financial Measures in Appendix 2. Compound annual growth rate (CAGR) based on the midpoint of the initial 2021 EPS guidance range of $4.42–4.62 3. Compound annual growth rate (CAGR) based on the midpoint of the 2025 EPS guidance range of $5.50–5.90 2 |
|
Edison International | Fourth-Quarter 2023 Earnings Call 3 EIX has a solid track record of delivering on Core EPS guidance over the last two decades 2023 2022 2021 2020 2019 In-line In-line Exceeded In-line In-line 2017 2016 2015 2014 2013 Exceeded In-line Exceeded Exceeded Exceeded 2011 2010 2009 2008 2007 Exceeded In-line Exceeded In-line Exceeded 2006 2005 2004 Exceeded Exceeded Exceeded EIX Actual Core EPS vs. Guidance Range History1 ✓ ✓ ✓ ✓ ✓ ✓ ✓ 1. 2012 and 2018 not shown because Core EPS guidance was not given in those years due to GRC decision timing ✓+ ✓+ ✓+ ✓+ ✓+ ✓+ ✓+ ✓+ ✓+ ✓+ ✓+ |
|
Edison International | Fourth-Quarter 2023 Earnings Call 4 EIX added another year of strong execution in 2023 ✓ Extended track record of delivering on full-year Core EPS guidance • 2023 Core EPS of $4.76, above the midpoint of the initial guidance range of $4.55–4.851 • EIX has a solid track record of delivering on Core EPS guidance over the last two decades Excellent progress in wildfire mitigation efforts • Exceeded WMP covered conductor target of 1,100 miles • SCE estimates it has reduced probability of losses from catastrophic wildfires by 85–88% vs. pre-2018 levels • Fifth consecutive year of no catastrophic wildfires in SCE’s service area • No ignitions due to failure of covered conductor Advanced resolution of 2017/2018 Events • Filed application for TKM cost recovery ($2.4 billion) Increased dividend for 20th consecutive year • Raised dividend 5.8%, which reflects board and management’s continued confidence and commitment to delivering on EPS growth targets ✓ ✓ 1. See Earnings Per Share Non-GAAP Reconciliations and Use of Non-GAAP Financial Measures in Appendix ✓ |
|
Edison International | Fourth-Quarter 2023 Earnings Call 5 SCE has reduced use of PSPS for lowering wildfire risk through use of covered conductor and other physical mitigation 1. Baseline risk estimated by Risk Management Solutions, Inc. (Moody’s RMS) using its wildfire model, relying on the following data provided by SCE: the location of SCE’s assets, reported ignitions from 2014–Q3 2023, mitigation effectiveness and locations of installed covered conductor, tree removals, inspections, line clearing, fast curve settings, and PSPS de-energization criteria. 2. There are risks inherent in the simulation analysis, models and predictions of SCE and Moody’s RMS relating to the likelihood of and damage due to wildfires and climate change. As with any simulation analysis or model related to physical systems, particularly those with lower frequencies of occurrence and potentially high severity outcomes, the actual losses from catastrophic wildfire events may differ from the results of the simulation analysis and models of Moody’s RMS and SCE. Range may vary for other loss thresholds 3. PSPS and System Hardening Values are estimated by SCE based on operational experience in 2018–2020 compared to the subsequent modeled years SCE’s wildfire risk mitigation is differentiated by its speed of hardening its infrastructure Estimated reduction in probability of catastrophic losses using the independent Moody’s RMS wildfire risk model compared to pre-2018 levels 1,2,3 20% 55–60% 55–60% 65–70% 75–80% 85–88% 2018 2019 2020 2021 2022 2023 Public Safety Power Shutoffs (PSPS) (Contribution has declined from 100% to ~10%) Physical Mitigation (Grid hardening (e.g., covered conductor), inspections, vegetation management) ~125 ~495 ~1,480 ~2,980 ~4,400 Cumulative miles of covered conductor installed: Current 5,580+ |
|
Edison International | Fourth-Quarter 2023 Earnings Call 6 2024 focus for 2017/18 Wildfire/Mudslide Events: Continued progress toward resolution; target Woolsey application in Q3 1. TKM: Collectively, the Thomas Fire, the Koenigstein Fire, and the Montecito Mudslides 2. As of February 15, 2024 Resolve remaining claims in timely manner File Woolsey cost recovery application in Q3 2024 TKM1 cost recovery proceeding in early stages 1 2 3 ❑ Based on recent progress, adjusted best estimate of total losses upward by $65 million – Individual plaintiff claims resolved2 ~12,000 ❑ Targeting reaching 90%+ completion (substantial resolution for filing) ❑ Scoping memo largely adopts SCE’s framing of issues ❑ Remaining individual plaintiffs2 – TKM1 ~200 – Woolsey ~1,300 ❑ Application will cover $4+ billion of costs (settlement, interest, and legal) ❑ Schedule allows for final decision as soon as Q1 2025 and includes opportunity to file settlement (if reached) ❑ Evaluate responses to Woolsey settlement protocol deadline |
|
Edison International | Fourth-Quarter 2023 Earnings Call 7 2024 key focus areas emphasize safety, execution, and industry leadership Operational Regulatory Legal Financial ❑ Employee safety: Reduce SIF1 rate by 15% from 2023 ❑ Install 1,050 miles of covered conductor (>6,600 by year-end) ❑ Execute capital program of $6.0 billion ❑ Achieve Core EPS of $4.75–5.05 ❑ Achieve 90%+ resolution of Woolsey claims ❑ File Woolsey cost recovery application in Q3 ❑ Successful CEMA decision ❑ 2025 GRC advocacy for funding critical investments 1. Edison Electric Institute (EEI) Series Injury or Fatality + Continued long-term focus: Operational improvement, technology deployment, and clean energy transition |
|
Edison International | Fourth-Quarter 2023 Earnings Call 8 By end of 2025, expect to be approaching 90% of total distribution lines in high fire risk area hardened1 ~7,200 ~5,610 1,070 ~1,830 ~1,090 ~16,800 miles Distribution lines underground Completed hardening2 (primarily covered conductor) 2024 planned hardening2 2025–2028 planned hardening2,3 Hardened during routine work 1. Refers to circuit miles of overhead distribution infrastructure in SCE’s high fire risk areas (HFRA) 2. Includes covered conductor and undergrounding 3. Subject to regulatory approval. SCE has requested funding for 2025–2028 in its 2025 GRC Hardening Status of Total Circuit Miles of Distribution Lines in SCE’s High Fire Risk Area Today ✓ ✓ % Physically Hardened ….......…………………………………………...…………………..76% 90%+ |
|
Edison International | Fourth-Quarter 2023 Earnings Call 9 Key SCE EPS Drivers2 Higher revenue3,4 $ 0.17 GRC escalation 0.19 Other CPUC revenue (0.02) Lower O&M4 0.12 Higher depreciation4 (0.03) Higher net financing costs4 (0.15) Income taxes3 (0.02) Property and other taxes4 (0.02) Other income and expenses 0.02 Total core drivers $ 0.09 Non-core items1 (0.19) Total $ (0.10) $ 0.02 0.02 Total core drivers $ 0.04 Non-core items1 (0.04) Total $ — EIX EPS2 EIX Parent and Other EEG Q4 2023 Q4 2022 Variance Basic Earnings Per Share (EPS) SCE $ 1.16 $ 1.26 $ (0.10) EIX Parent & Other (0.17) (0.17) — Basic EPS $ 0.99 $ 1.09 $ (0.10) Less: Non-core Items1 SCE $ (0.29) $ (0.10) $ (0.19) EIX Parent & Other — 0.04 (0.04) Total Non-core Items $ (0.29) $ (0.06) $ (0.23) Core Earnings Per Share (EPS) SCE $ 1.45 $ 1.36 $ 0.09 EIX Parent & Other (0.17) (0.21) 0.04 Core EPS $ 1.28 $ 1.15 $ 0.13 Fourth-Quarter Earnings Summary 1. See EIX Core EPS Non-GAAP Reconciliations and Use of Non-GAAP Financial Measures in Appendix 2. For comparability, 2023 fourth quarter key EPS drivers are reported based on 2022 weighted-average share count of 382.0 million. 2023 fourth quarter weighted-average shares outstanding is 383.7 million 3. Includes $0.03 higher revenue related to lower tax benefits subject to balancing accounts and offset with income taxes 4. Includes O&M $0.04, interest expense $(0.03) and property and other taxes $(0.01), which offset with revenue recovered through regulatory mechanisms Note: Diluted earnings were $0.98 and $1.08 per share for the three months ended December 31, 2023 and 2022, respectively |
|
Edison International | Fourth-Quarter 2023 Earnings Call 10 2023 Core EPS above guidance midpoint demonstrates ability to manage business variability 2023 Core EPS vs. Guidance 2023 Guidance1 2023 Recorded Rate Base EPS 5.58 5.51 SCE Operational Variance 0.58–0.75 0.82 SCE Costs Excluded from Authorized (0.74)–(0.73) (0.76) EIX Parent and Other Operational expense (0.12)–(0.11) (0.11) Interest expense, preferred dividends (0.75)–(0.64) (0.70) EIX Consolidated Core EPS $4.55–4.85 $4.76 Share Count (in millions) 382.2 383.2 1. As disclosed on the third quarter 2023 earnings call on November 2, 2023. Guidance share count reflected shares outstanding as of December 31, 2022, and embedded dilution within the interest expense and preferred dividends line Note: See Earnings Per Share Non-GAAP Reconciliations and Use of Non-GAAP Financial Measures in Appendix. All tax-effected information on this slide is based on our current combined statutory tax rate of approximately 28%. Totals may not add due to rounding |
|
Edison International | Fourth-Quarter 2023 Earnings Call 11 5.2 5.6 6.7 7.2 7.2 7.0 0.2 0.4 0.8 0.9 1.0 0.7 $5.4 $6.0 $7.5 $8.1 $8.2 $7.7 2023 2024 2025 2026 2027 2028 Capital deployment expected to increase in 2025–20281 Range Case2 (Recorded) $5.6 $6.6 $6.8 $6.8 $6.4 GRC underpins ~$38–43 billion 2023–2028 capex forecast; substantial additional investment opportunities offer upside 1. Forecast for 2025 includes amounts requested in SCE’s 2025 GRC filing. Additionally, reflects non-GRC spending subject to future regulatory requests beyond GRC proceedings and FERC Formula Rate updates 2. Annual Range Case capital reflects variability associated with future requests based on management judgment, potential for permitting delays and other operational considerations CPUC FERC Capital Expenditures, $ in Billions Forecast does not include substantial additional capital deployment opportunities 1. NextGen ERP 2. Advanced Metering Infrastructure (AMI) 2.0 3. Other potential investments in the grid supporting reliability, resilience, and readiness 4. FERC transmission $2bn+ $2bn+ Forecast |
|
Edison International | Fourth-Quarter 2023 Earnings Call 12 33.6 35.9 41.8 45.3 48.7 51.8 7.6 7.5 7.6 7.7 8.1 8.8 $41.2 $43.4 $49.4 $53.0 $56.8 $60.6 2023 2024 2025 2026 2027 2028 Projected ~6–8% rate base growth 2023–2028; substantial additional investment opportunities offer upside 1. Weighted-average year basis 2. Range Case rate base reflects only changes in forecast capital expenditures CPUC FERC ~8% CAGR 2023–2028 Rate Base1 , $ in Billions Strong rate base growth driven by wildfire mitigation and important grid work to support California’s leading role in clean energy transition Range Case2 (Recorded) $43.0 $48.1 $50.4 $52.8 $55.3 Forecast does not include substantial additional capital deployment opportunities 1. NextGen ERP 2. Advanced Metering Infrastructure (AMI) 2.0 3. Other potential investments in the grid supporting reliability, resilience, and readiness 4. FERC transmission $2bn+ $2bn+ |
|
Edison International | Fourth-Quarter 2023 Earnings Call 13 EIX introduces 2024 Core EPS guidance of $4.75–5.05 1. Note: SCE Operational Variance was $0.52 in 2021 and $0.44 in 2022 2. SCE is unable to conclude, at this time, that these amounts are probable of recovery; however, recovery will be sought as part of future cost recovery applications Note: See Earnings Per Share Non-GAAP Reconciliations and Use of Non-GAAP Financial Measures in Appendix. All tax-effected information on this slide is based on our current combined statutory tax rate of approximately 28%. Totals may not add due to rounding 2023 Recorded 2024 Guidance Rate Base EPS 5.51 6.11–6.17 SCE Operational Variance1 0.82 0.48–0.67 SCE Costs Excluded from Authorized (0.76) (0.94)–(0.92) EIX Parent and Other Operational expense (0.11) (0.11)–(0.10) Interest expense, preferred div. (0.70) (0.79)–(0.77) EIX Consolidated Core EPS $4.76 $4.75–5.05 Share Count (in millions) 383.2 384.7 EIX 2024 Core Earnings Per Share Guidance Range Building from SCE Rate Base EPS 2024 Modeling Considerations Rate Base EPS: CPUC ROE: 10.75% / FERC ROE: 10.30% SCE Operational Variance includes: – AFUDC ~40¢ – 2022 CEMA ~14¢ SCE Costs Excluded From Authorized includes: – Wildfire claims debt interest 60–62¢ ▪ Reflects refinancing of maturing wildfire claims debt2 ▪ Additional debt issuance Parent Interest Expense and Preferred Dividends: – Reflects full year of debt issued in 2023 in excess of amounts needed to fund preferred stock repurchase and absence of gain on repurchase |
|
Edison International | Fourth-Quarter 2023 Earnings Call 14 Strong underlying business growth masked by growing interest expense on wildfire claims debt 1. Compound annual growth rate (CAGR) based on the midpoint of the initial 2021 Core EPS guidance range of $4.42–4.62 2. In comparison to CAGR based on the midpoint of the initial 2021 Core EPS guidance range of $4.42–4.62 plus wildfire claims debt interest in 2021 to the midpoint of 2025 Core EPS guidance range plus wildfire claims debt interest Note: See Earnings Per Share Non-GAAP Reconciliations and Use of Non-GAAP Financial Measures in Appendix. Non-core items are presented as recorded On track to achieve 5–7% core EPS growth for 2021–20251 , despite headwinds Earnings per Share (EPS) 4.59 4.63 4.76 4.90 5.70 0.03 0.20 0.45 0.61 0.61 4.62 4.83 5.21 5.51 6.31 2021 2022 2023 2024 Midpoint of Guidance 2025 Midpoint of Guidance Core EPS Wildfire Claims Debt Interest (Initial guidance midpoint of $4.52) ~250 bps reduction to 2021–2025 Core EPS growth2 Basic EPS 2.00 1.61 3.12 |
|
Edison International | Fourth-Quarter 2023 Earnings Call 15 4.90 0.78 0.04 (0.02) 5.70 0.00 5.70 2024 Core EPS Guidance (@ Midpoint) Rate Base Earnings (@ Midpoint) SCE Operational Variance EIX Parent & Other Results Before Incr. WF Claims Debt Interest Incr. WF Claims Debt Interest 2025 Core EPS Guidance (@ Midpoint) 2025 Core EPS growth primarily driven by rate base earnings 1. Includes SCE Operational Variance plus interest expense on wildfire fund contribution debt and executive compensation not in rates. Excludes incremental interest expense on debt funding wildfire claims payments Note: See Earnings Per Share Non-GAAP Reconciliations and Use of Non-GAAP Financial Measures in Appendix. Non-core items are presented as recorded 2025 Core EPS growth driven by ~11–14% 2025 rate base growth 2024 Core EPS Guidance at Midpoint of $4.75–5.05 Range vs. 2025 Core EPS Guidance at Midpoint of $5.50–5.90 Range +16.3% +16.3% 1 1 2025 GRC-Driven ~63¢ • New capex ~26¢ • Prior spending/True-ups ~37¢ Non-GRC & FERC ~15¢ Immaterial expected increase |
|
Edison International | Fourth-Quarter 2023 Earnings Call 16 EIX’s 2024 equity needs expected to be fully met by end of Q1 1. Represents the liquidation preference value of repurchased securities. Aggregate amount paid to repurchase shares was $288 million, including accrued dividends 2. Financing plans are subject to change EIX 2023 Financing Execution EIX 2024 Financing Plan2 $100 million of equity, with $75 million pre-funded with excess JSN proceeds in Dec. 2023 – Expect to issue remaining equity via internal programs in Q1 2024 Plan to issue $500 million parent debt to refinance $500 million maturity Issued $500 million of junior subordinated ✓ notes (JSN) @ 8.125% (50% equity content) Generated $120 million common equity via internal programs Issued $600 million of senior unsecured debt @ 5.25% Repurchased $308 million of preferred equity1 Issued $450 million of JSNs @ 7.875% (50% equity content) to fund preferred repurchase, with excess pre-funding 2024 financing plan ✓ ✓ ✓ ✓ ✓ |
|
Edison International | Fourth-Quarter 2023 Earnings Call 17 EIX expects 5–7% Core EPS growth for 2025–2028, with financing plan showing minimal equity needs 1. For 2025, represents the midpoint of the 2025 Core EPS guidance range for $5.50–5.90 2. Financing plan is subject to change. Does not incorporate potential cost recovery in the 2017/2018 Wildfire/Mudslide cost recovery proceedings, which could materially change the financing plan 3. EIX Dividends includes common and preferred dividends, which are subject to approval by the EIX Board of Directors 4. Incremental to refinancing of maturities. Values shown include both SCE and parent debt $5.70 $6.60–7.00 2025 Midpoint 2028 Achievable EPS growth for 2028 Core Earnings per Share Guidance1 5–7% CAGR Uses Sources 2025–2028 EIX consolidated financing plan2 $ in Billions Capital Plan $27–32 Dividends3 $6–7 Net cash provided by operating activities $25–28 Incremental Debt4 $8–11 Equity ~$0.4 |
|
Edison International | Fourth-Quarter 2023 Earnings Call 18 EIX offers double-digit total return potential 1. Compound annual growth rate (CAGR) based on the midpoint of the 2021 Core EPS guidance range of $4.42–4.62 established on September 16, 2021; CAGR for 2025–2028 based on the midpoint of 2025 Core EPS guidance range of $5.50–5.90 2. Based on EIX stock price on February 21, 2024 3. At current P/E multiple. Excludes changes in P/E multiple and potential dividend growth 4. Risk reduction based on mitigations through December 31, 2023 5–7% Core EPS CAGR1 2021–2025 and 2025–2028 Underpinned by strong rate base growth of ~6–8% $38–43 billion 2023–2028 capital program ~4% current dividend yield2 20 consecutive years of dividend growth Target dividend payout of 45–55% of SCE core earnings Investments in safety and reliability of the grid Wildfire mitigation execution reduces risk for customers Creates strong foundation for climate adaptation and the clean energy transition One of the strongest electrification profiles in the industry Industry-leading programs for transportation electrification Expected 35% load growth by 2035 and 80% by 2045 9–11% total return opportunity3 before potential P/E multiple expansion driven by estimated 85–88% wildfire risk reduction4 , and ongoing utility and government wildfire mitigation efforts |
|
ADDITIONAL INFORMATION |
|
Edison International | Fourth-Quarter 2023 Earnings Call 20 Resolution of 2017/2018 Wildfire/Mudslide Events advances 2.4 0.5 5.8 0.6 9.4 Best Estimate of Total Losses 1. TKM: Collectively, the Thomas Fire, the Koenigstein Fire, and the Montecito Mudslides 2. Non-CARE 3. After giving effect to all payment obligations under settlements entered into through December 31, 2023, including under the agreement with the Safety and Enforcement Division of the CPUC 4. Numbers may not add due to rounding Substantial progress resolving claims $ in Billions, as of December 31, 20234 Application for TKM events in progress1 Remaining3 Status: Scoping memo outlining scope and schedule issued; next step: Intervenors’ testimony due May 29 Request: – $2.4 billion (settlements + financing and legal costs) – Securitization of approved amounts ▪ TKM Application: ~$1.50/month for average residential customer bill (vs. average of ~$1782 ) Resolved Cost recovery request of ~$6.4 billion (+associated interest and legal costs) SED agreement Insurance and FERC recovery 4Q Update: Best estimate adjusted by $65MM Majority driven by a single settlement outcome higher than expected as SCE continues to make solid progress SCE is now evaluating responses to Woolsey mediation protocol deadline to provide complete claims packages Woolsey cost recovery application: now targeting Q3 2024 |
|
Edison International | Fourth-Quarter 2023 Earnings Call 21 SCE continues to fund wildfire claims payments with debt Series Principal Due Rate 2021C 400 4/1/24 SOFR + 83bps 2021E 700 4/1/24 1.100% Term Loan 600 5/7/24 Adj. SOFR + 90bps 2021K 450 8/1/24 0.975% 2022C 300 6/1/25 4.200% 2020C 350 2/1/26 1.200% 2023C 400 6/1/26 4.900% 2024A 500 2/1/27 4.875% 2022D 600 6/1/27 4.700% 2022F 750 11/1/27 5.850% 2023A 750 3/1/28 5.300% 2023E 550 10/1/28 5.650% 2022E 350 6/1/52 5.450% Total $6,700 Forecasted 2024 Interest (pre-tax)1: ~$325 Wildfire Claims Payment-Related Debt Issuances $ in Millions except percentages, as of February 21, 2024 Interest expense not currently recoverable in rates, however, will be included in 2017/2018 Wildfire/ Mudslide Events cost recovery applications SCE has waiver from CPUC, allowing exclusion with respect to certain current and future charges to equity and associated debt for calculating SCE’s regulatory equity ratio – Waiver approved through August 2025 (with ability to seek additional extension via application) or until CPUC makes a final determination on cost recovery for 2017/2018 Wildfire/Mudslide Events 1. Including projected 2024 financings |
|
Edison International | Fourth-Quarter 2023 Earnings Call 22 SCE Key Regulatory Proceedings Proceeding Description Next Steps Base Rates 2025 GRC (A.23-05-010) Sets CPUC base revenue requirement for 2025–2028. For more information, see the Investor Guide to SCE’s 2025 GRC Intervenors’ prepared direct testimony due February 29; SCE rebuttal testimony due April 15 Wildfire 2021 Wildfire Mitigation & Vegetation Management (A.22-06-003) Requesting approval of ~$327MM of rev. req. for incremental 2021 wildfire mitigation capex and O&M, and incremental 2021 veg. management O&M Proposed Decision approving ~$310MM rev. req. currently scheduled to be voted out at the Commission’s March 7 voting meeting 2022 Wildfire Mitigation & Vegetation Management (A.23-10-001) Requesting approval of ~$384MM of rev. req. for incremental 2022 wildfire mitigation capex and O&M, and incremental 2022 veg. management O&M; also requested interim rate recovery beginning Mar ‘24 Intervenors’ prepared direct testimony due April 19; SCE rebuttal testimony due May 17 2022 CEMA (A.22-03-018) Request recovery of costs assoc. with 2019 winter storms and 2020 firestorms. $312MM capital, $207MM O&M; Rev. Req.: $198MM Parties have until Feb. 29 to review and file comments on additional evidence submitted on Feb. 9 TKM Cost Recovery (A.23-08-013) Request recovery of $2.4 billion of costs to resolve claims associated with the Thomas Fire and Montecito Mudslides and $65 million of restoration costs Intervenors’ prepared direct testimony due May 29 |
|
Edison International | Fourth-Quarter 2023 Earnings Call 23 TKM Cost Recovery Schedule Event Scoping Ruling Date ✓ Application Filed Complete ✓ Protests and responses Complete ✓ SCE’s reply to protests Complete ✓ Pre-hearing Conference Complete Intervenors’ prepared direct testimony May 29, 2024 Rebuttal testimony June 28, 2024 Joint Motion for Approval of Settlement or Status Conference Statements and Witness Lists July 12, 2024 Hearing Status Conference August 13, 2024 Evidentiary Hearings August 20-22, 2024 Opening Briefs Late October 2024 Reply Briefs [matter submitted] Late November 2024 Proposed Decision (PD) [90 days after submission] Final Decision [no sooner than 30 days after PD] 23 |
|
Edison International | Fourth-Quarter 2023 Earnings Call 24 2025 GRC Schedule Event Scoping Ruling Date ✓ Application Filed Complete ✓ Mandated Workshop Complete ✓ Protests and Responses to Application Complete ✓ Pre-hearing Conference Complete Intervenors’ Prepared Direct Testimony February 29, 2024 2023 Recorded Expenditures Served by SCE March 11, 2024 Prepared Rebuttal Testimony April 15, 2024 Evidentiary Hearings May 6–24, 2024 Update Testimony June 7, 2024 Hearings on Update Testimony, if necessary June 17, 2024 Opening Briefs July 8, 2024 Reply Briefs July 29, 2024 Proposed Decision Within 90 days after submission Final Decision No sooner than 30 days after proposed decision 24 |
|
Edison International | Fourth-Quarter 2023 Earnings Call 25 Cash flow from memo account recovery and securitization strengthens our balance sheet and credit metrics Approved Applications Application / Account Balance @ Dec. 31, 2023 Recovery Through Remaining Rate Recovery by Year 2024 2025 2026 ✓ GRC Track 3 234 Sept. ’25 134 100 – ✓ CSRP Track 1 189 Dec. ’25 87 102 – ✓ GRC Track 2 156 Feb. ’25 134 22 – ✓ 2021 CEMA 137 Dec. ’24 137 – – ✓ WEMA2 86 May ’24 86 – – ✓ Others1 132 Varies 113 19 – Total 935 691 244 – Pending Applications2 (Subject to CPUC Authorization) Application Request2 Expected Amort.2 Expected Rate Recovery by Year 2024 2025 2026 2022 Wildfire Mitigation & Vegetation Mgmt. (WM/VM) 384 12 months – 384 – ✓ (PD) 2021 Wildfire Mitigation & Vegetation Mgmt. (WM/VM) 327 12 months 191 136 – 2022 CEMA3 198 12 months 116 83 – Total 909 306 602 – 1. Includes 2020-2023 Residential Uncollectibles, CSRP Track 2, and Vegetation Management Z-Factor 2. Pending Applications reflects applications already submitted to the CPUC. Additional CEMA applications will be made for other events. Requested revenue requirement shown. Amounts and amortization subject to CPUC approval 3. Reflects request at the time of the application. SCE continues to record capital-related revenue requirements and interest in CEMA that would also be authorized upon commission approval Note: Numbers may not add due to rounding GRC, Wildfire-related, and Wildfire Insurance Applications $ in Millions |
|
Edison International | Fourth-Quarter 2023 Earnings Call 26 EIX reaffirms 5–7% 2021–2025 Core EPS growth rate target, which would result in 2025 Core EPS of $5.50–5.901 1. Based on the midpoint of initial 2021 Core EPS guidance range of $4.42–4.62 established September 16, 2021. Growth in any given year can be outside the range Component Modeling Considerations Rate Base EPS (based on capex levels) 6.85–7.00 •CPUC ROE of 10.75% and FERC ROE 10.30% SCE Op. Variance 0.50–0.70 •AFUDC of ~$0.40 •Regulatory applications and other variances from authorized •Continued reinvestment in operational excellence SCE Costs Excluded from Authorized (0.97)–(0.88) •Primarily wildfire claims payment-related debt •Current interest rate assumption for 5.3% (sensitivity: ~2¢ EPS per ±50bps change) EIX Parent & Other (0.88)–(0.93) •Current interest rate assumption for 6.1% (sensitivity: ~1¢ EPS per ±50bps change) 2025 Core Earnings per Share Component Ranges |
|
Edison International | Fourth-Quarter 2023 Earnings Call 27 Key 2028 Earnings Sensitivities Variable Sensitivity 2028 EPS1 (“Per year” amounts refer to 2025–2028) Capex & Rate Base Rate Base $100 million/year of capex ~5¢ AFUDC Annual capex of $200 million 1¢ Requested ~$400 million increase in depreciation in 2025 GRC If requested increase not authorized +15–35¢ (on range case) Rates & Financing CPUC ROE (Currently 10.75%) 10 bps 7¢2 FERC ROE (Currently 10.30%) 10 bps 1¢2 Wildfire Debt Rate (4.6% weighted average portfolio) 20 bps 2¢ EIX Parent Debt Rate (5.0% weighted average portfolio) 20 bps 2¢ Equity (~$100 million/year 2025–2028) For each $10 million/year reduction +1¢ 1. Assumes ~390 million shares outstanding for 2028 2. Based on a CPUC / FERC rate base mix of 86% CPUC / 14% FERC and current authorized capital structures |
|
Edison International | Fourth-Quarter 2023 Earnings Call 28 Full Year Earnings Summary 1. See EIX Core EPS Non-GAAP Reconciliations and Use of Non-GAAP Financial Measures in Appendix 2. For comparability, 2023 key EPS drivers are reported based on 2022 weighted-average share count of 381.4 million. 2023 weighted-average shares outstanding is 383.2 million 3. Includes $0.11 higher revenue related to lower tax benefits subject to balancing accounts and offset with income taxes 4. Includes $(0.61) recovered through regulatory mechanisms and offset with O&M $0.71, depreciation $(0.01), interest expense $(0.04) and property and other taxes $(0.05) Note: Diluted earnings were $3.11 and $1.60 per share for the twelve months ended December 31, 2023 and 2022, respectively 2023 2022 Variance Basic Earnings Per Share (EPS) SCE $ 3.84 $ 2.23 $ 1.61 EIX Parent & Other (0.72) (0.62) (0.10) Basic EPS $ 3.12 $ 1.61 $ 1.51 Less: Non-core Items1 SCE $ (1.73) $ (3.10) $ 1.37 EIX Parent & Other 0.09 0.08 0.01 Total Non-core Items $ (1.64) $ (3.02) $ 1.38 Core Earnings Per Share (EPS) SCE $ 5.57 $ 5.33 $ 0.24 EIX Parent & Other (0.81) (0.70) (0.11) Core EPS $ 4.76 $ 4.63 $ 0.13 Key SCE EPS Drivers2 Higher revenue3,4 $ 0.10 GRC escalation 0.78 Other CPUC revenue (0.81) FERC and other operating revenue 0.13 Lower O&M4 0.77 Higher depreciation4 (0.09) Higher net financing costs4 (0.62) Income taxes3 (0.11) Other 0.22 Property and other taxes4 (0.11) Other income and expenses 0.33 Results prior to impact from share dilution $ 0.27 Impact from share dilution (0.03) Total core drivers $ 0.24 Non-core items1 1.37 Total $ 1.61 $ (0.13) 0.02 Total core drivers $ (0.11) Non-core items1 0.01 Total $ (0.10) EIX EPS2 EIX Parent and Other EEG |
|
Edison International | Fourth-Quarter 2023 Earnings Call 29 Earnings Non-GAAP Reconciliations 1. SCE non-core items are tax-effected at an estimated statutory rate of approximately 28%; customer revenues for EIS insurance contract are tax-effected at an estimated statutory rate of approximately 20% Reconciliation of EIX GAAP Earnings to EIX Core Earnings Earnings (Losses) Attributable to Edison International, $ in Millions Q4 2023 Q4 2022 2023 2022 SCE $ 445 $ 478 $ 1,474 $ 847 EIX Parent & Other (67) (63) (277) (235) Basic Earnings $ 378 $ 415 $ 1,197 $ 612 Non-Core Items SCE 2017/2018 Wildfire/Mudslide Events claims and expenses, net of recoveries (74) (11) (634) (1,248) Wildfire Insurance Fund expense (54) (54) (213) (214) Other wildfire claims and expenses, net of recoveries (27) — (34) — 2021 NDCTP probable disallowance — — (30) — Customer cancellations of certain ECS data services — — (17) — Employment litigation matter, net of recoveries — — 10 (23) Upstream lighting program decision — — — (81) Impairments — — — (64) Organizational realignment charge — — — (14) Sale of San Onofre nuclear fuel — 10 — 10 Income tax benefit1 43 15 257 452 Subtotal SCE (112) (40) (661) (1,182) EIX Parent & Other Customer revenues for EIS insurance contract, net of claims — 23 42 36 Income tax expense1 — (5) (9) (7) Subtotal EIX Parent & Other — 1 8 3 3 2 9 Less: Total non-core items $ (112) $ (22) $ (628) $ (1,153) SCE 557 518 2,135 2,029 EIX Parent & Other (67) (81) (310) (264) Core Earnings $ 490 $ 437 $ 1,825 $ 1,765 |
|
Edison International | Fourth-Quarter 2023 Earnings Call 30 EIX Core EPS Non-GAAP Reconciliations 1. 2023 EPS drivers are presented based on weighted-average share counts of 383.7 million and 383.2 million for Q4 and full year, respectively; 2022 EPS drivers are presented based on weighted-average share counts of 382.0 million and 381.4 million for Q4 and full year, respectively 2. SCE non-core items are tax-effected at an estimated statutory rate of approximately 28%; customer revenues for EIS insurance contract are tax-effected at an estimated statutory rate of approximately 20% Q4 2023 Q4 2022 2023 2022 Basic EPS $ 0.99 $ 1.09 $ 3.12 $ 1.61 Non-Core Items SCE 2017/2018 Wildfire/Mudslide Events claims and expenses, net of recoveries (0.19) (0.03) (1.65) (3.27) Wildfire Insurance Fund expense (0.14) (0.14) (0.56) (0.56) Other wildfire claims and expenses, net of recoveries (0.07) — (0.09) — 2021 NDCTP probable disallowance — — (0.08) — Customer cancellations of certain ECS data services — — (0.04) — Employment litigation matter, net of recoveries — — 0.03 (0.06) Upstream Lighting Program decision — — — (0.21) Impairments — — — (0.16) Organizational realignment charge — — — (0.04) Sale of San Onofre nuclear fuel — 0.03 — 0.03 Income tax benefit2 0.11 0.04 0.66 1.17 Subtotal SCE (0.29) (0.10) (1.73) (3.10) EIX Parent & Other Customer revenues for EIS insurance contract, net of claims — 0.06 0.11 0.09 Income tax expense2 — (0.02) (0.02) (0.01) Subtotal EIX Parent & Other — 0.04 0.09 0.08 Less: Total non-core items (0.29) (0.06) (1.64) (3.02) Core EPS $ 1.28 $ 1.15 $ 4.76 $ 4.63 Reconciliation of EIX Basic Earnings Per Share to EIX Core Earnings Per Share EPS Attributable to Edison International1 |
|
Edison International | Fourth-Quarter 2023 Earnings Call 31 EIX Core EPS Non-GAAP Reconciliations 1. SCE non-core items are tax-effected at an estimated statutory rate of approximately 28%; customer revenues for EIS insurance contract, net of claims are tax-effected at an estimated statutory rate of approximately 20% Midpoint of Guidance Range 2025 2024 2023 2022 2021 Basic EPS $ 5.70 $ 4.90 $ 3.12 $ 1.61 $ 2.00 Non-Core Items SCE 2017/2018 Wildfire/Mudslide Events claims and expenses, net of recoveries — — (1.65) (3.27) (3.25) Wildfire Insurance Fund expense — — (0.56) (0.56) (0.57) Other wildfire claims and expenses, net of recoveries — — (0.09) — — 2021 NDCTP probable disallowance — — (0.08) — — Customer cancellations of certain ECS data services — — (0.04) — — Employment litigation matter, net of recoveries — — 0.03 (0.06) — Upstream lighting program decision — — — (0.21) — Impairments — — — (0.16) (0.21) Organizational realignment charge — — — (0.04) — Sale of San Onofre nuclear fuel — — — 0.03 0.03 Income tax benefit1 — — 0.66 1.17 1.06 EIX Parent & Other — — Customer revenues for EIS insurance contract, net of claims — — 0.11 0.09 0.06 Income tax benefit from settlement of 2007 – 2012 Califnornia tax audits — — — — 0.30 Income tax expense1 — — (0.02) (0.01) (0.01) Less: Total non-core items — — (1.64) (3.02) (2.59) Core EPS $ 5.70 $ 4.90 $ 4.76 $ 4.63 $ 4.59 Reconciliation of EIX Basic Earnings Per Share to EIX Core Earnings Per Share EPS Attributable to Edison International |
|
Edison International | Fourth-Quarter 2023 Earnings Call 32 Low High Basic EIX EPS $4.75 $5.05 Total Non-Core Items1 – – Core EIX EPS $4.75 $5.05 1. Non-core items are presented as they are recorded Earnings Per Share Non-GAAP Reconciliations Reconciliation of EIX Basic Earnings Per Share Guidance to EIX Core Earnings Per Share Guidance 2024 EPS Attributable to Edison International |
|
Edison International | Fourth-Quarter 2023 Earnings Call 33 Use of Non-GAAP Financial Measures Edison International's earnings are prepared in accordance with generally accepted accounting principles used in the United States. Management uses core earnings (losses) internally for financial planning and for analysis of performance. Core earnings (losses) are also used when communicating with investors and analysts regarding Edison International's earnings results to facilitate comparisons of the company's performance from period to period. Core earnings (losses) are a non-GAAP financial measure and may not be comparable to those of other companies. Core earnings (losses) are defined as earnings attributable to Edison International shareholders less non-core items. Non-core items include income or loss from discontinued operations and income or loss from significant discrete items that management does not consider representative of ongoing earnings, such as write downs, asset impairments, wildfire-related claims, and other income and expense related to changes in law, outcomes in tax, regulatory or legal proceedings, and exit activities, including sale of certain assets and other activities that are no longer continuing. A reconciliation of Non-GAAP information to GAAP information is included either on the slide where the information appears or on another slide referenced in this presentation. EIX Investor Relations Contact Sam Ramraj, Vice President Derek Matsushima, Principal Manager (626) 302-2540 (626) 302-3625 Sam.Ramraj@edisonintl.com Derek.Matsushima@edisonintl.com |