UNITED STATES
SECURITIES AND EXCHANGE COMMISSION
Washington, D.C. 20549
FORM 8-K
CURRENT REPORT
Pursuant to Section 13 or 15(d) of the Securities Exchange Act of 1934
Date of Report (Date of earliest event reported): November 1, 2022
Commission |
|
Exact Name of Registrant |
|
State or Other Jurisdiction of |
|
IRS Employer |
1-9936 |
|
EDISON INTERNATIONAL |
|
California |
|
95-4137452 |
1-2313 |
|
SOUTHERN CALIFORNIA EDISON COMPANY |
|
California |
|
95-1240335 |
Check the appropriate box below if the Form 8-K filing is intended to simultaneously satisfy the filing obligation of the registrant under any of the following provisions:
[ ☐ ] Written communications pursuant to Rule 425 under the Securities Act (17 CFR 230.425)
[ ☐ ] Soliciting material pursuant to Rule 14a-12 under the Exchange Act (17 CFR 240.14a-12)
[ ☐ ] Pre-commencement communications pursuant to Rule 14d-2(b) under the Exchange Act (17 CFR 240.14d-2(b))
[ ☐ ] Pre-commencement communications pursuant to Rule 13e-4(c) under the Exchange Act (17 CFR 240.13e-4(c))
Securities registered pursuant to Section 12(b) of the Act:
Edison International:
Southern California Edison Company: None
Indicate by check mark whether the registrant is an emerging growth company as defined in Rule 405 of the Securities Act of 1933 (§230.405 of this chapter) or Rule 12b-2 of the Securities Exchange Act of 1934 (§240.12b-2 of this chapter).
If an emerging growth company, indicate by check mark if the registrant has elected not to use the extended transition period for complying with any new or revised financial accounting standards provided pursuant to Section 13(a) of the Exchange Act.
This current report and its exhibits include forward-looking statements. Edison International and Southern California Edison Company ("SCE") based these forward-looking statements on their current expectations and projections about future events in light of their knowledge of facts as of the date of this current report and their assumptions about future circumstances. These forward-looking statements are subject to various risks and uncertainties that may be outside the control of Edison International and SCE. Edison International and SCE have no obligation to publicly update or revise any forward-looking statements, whether due to new information, future events, or otherwise. This current report should be read with Edison International's and SCE's combined Annual Report on Form 10-K for the year ended December 31, 2021 and subsequent Quarterly Reports on Form 10-Q. Additionally, Edison International and SCE provide direct links to Edison International and SCE presentations, documents and other information at www.edisoninvestor.com (Presentations and Updates) in order to publicly disseminate such information.
Item 2.02Results of Operations and Financial Condition
On November 1, 2022, Edison International issued a press release reporting its financial results and the financial results for its subsidiary, Southern California Edison Company, for the quarter ended September 30, 2022. A copy of the press release is attached as Exhibit 99.1. On the same day, members of Edison International's management will speak to investors via a financial teleconference. Senior management's prepared remarks and accompanying presentation are attached as Exhibit 99.2 and Exhibit 99.3 to this report. The information furnished in this Item 2.02 and Exhibits 99.1, 99.2, and 99.3 shall not be deemed to be “filed” for purposes of the Securities Exchange Act of 1934, nor shall it be deemed to be incorporated by reference in any filing under the Securities Act of 1933.
Item 7.01Regulation FD Disclosure
Members of Edison International management will use the information in the presentation furnished as Exhibit 99.3 to this report in meetings with institutional investors and analysts and at investor conferences. The attached presentation will also be posted on www.edisoninvestor.com.
Item 9.01Financial Statements and Exhibits
(d) |
Exhibits |
EXHIBIT INDEX
|
|
|
Exhibit No. |
|
Description |
|
|
|
99.1 |
|
|
|
|
|
99.2 |
|
|
|
|
|
99.3 |
|
Edison International Q3 2022 Financial Results Conference Call Presentation dated November 1, 2022 |
|
|
|
104 |
|
Cover Page Interactive Data File (embedded within the Inline XBRL document) |
SIGNATURES
Pursuant to the requirements of the Securities Exchange Act of 1934, the registrants have duly caused this report to be signed on its behalf by the undersigned hereunto duly authorized.
Date: November 1, 2022
Date: November 1, 2022
Exhibit 99.1
FOR IMMEDIATE RELEASE |
Investor Relations: Sam Ramraj, (626) 302-2540 |
||
|
Media Contact: Jeff Monford, (626) 476-8120 |
||
Edison International Reports Third Quarter 2022 Results
| ● | Third Quarter 2022 GAAP loss per share of $0.33; Core EPS of $1.48 |
| ● | SCE continues excellent WMP progress; on pace to complete 4,300 miles of covered conductor by year-end |
| ● | Revises best estimate of expected losses for 2017/2018 Wildfire/Mudslide Events, resulting in net after-tax charge of $598 million |
| ● | Narrows 2022 EPS guidance to $4.48–4.68. Also reiterates long-term EPS growth rate target of 5–7% |
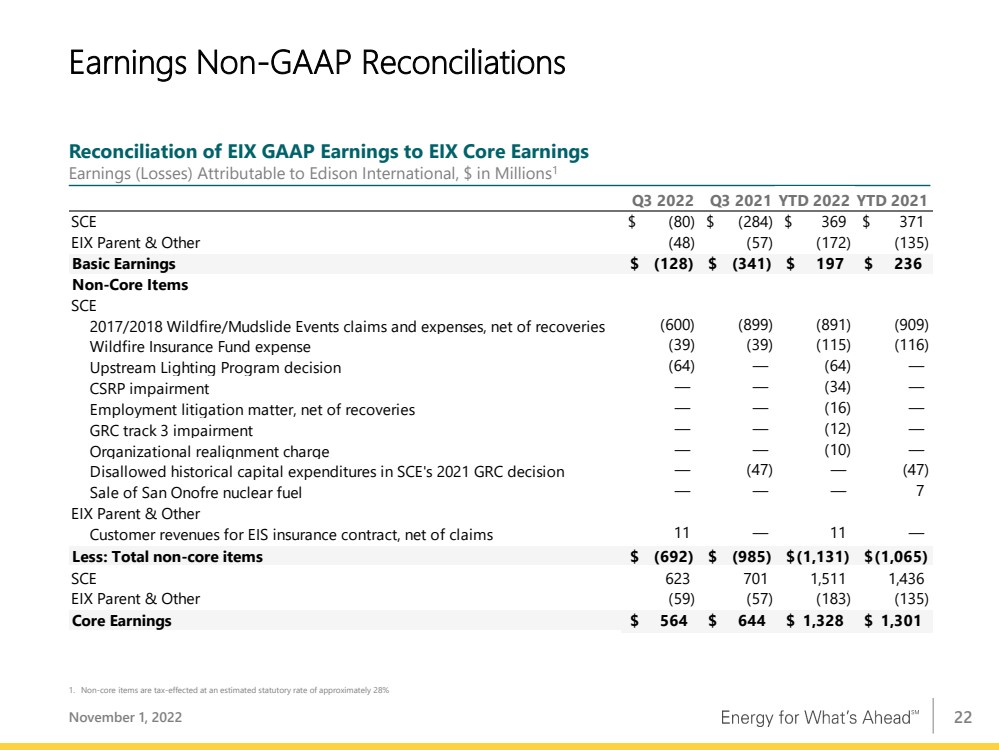
ROSEMEAD, Calif., November 1, 2022 — Edison International (NYSE: EIX) today reported third quarter 2022 net loss of $128 million, or $0.33 per share, compared to net loss of $341 million, or $0.90 per share, in the third quarter of 2021. As adjusted, third quarter 2022 core earnings were $564 million, or $1.48 per share, compared to core earnings of $644 million, or $1.69 per share, in the third quarter of 2021.
Southern California Edison’s (SCE) third quarter 2022 core earnings per share (EPS) decreased year-over-year, primarily due to a 35-cent true-up recorded in the third quarter of 2021 on implementation of the 2021 General Rate Case (GRC) final decision. This true-up recognized the results of the GRC for the first sixth months of 2021. This reduction was partially offset by recognition of return on rate base related to the Customer Service Re-Platform decision and an increase in CPUC-related revenue due to the escalation mechanism set forth in the 2021 GRC final decision.
Edison International Parent and Other's third quarter 2022 core loss per share was in line with same period in the prior year.
“SCE is making excellent progress in executing its wildfire mitigation plan. The utility is rapidly deploying covered conductor and is on pace to complete 4,300 miles, or 43%, of its overhead miles in high fire risk areas by year-end,” said Pedro J. Pizarro, president and CEO of Edison International. “SCE’s diverse portfolio of mitigation activities has substantially decreased the impact of wildfires associated with utility equipment.”
Pizarro added, “We’re pleased to see several recent state and federal clean energy actions in support of electrification, which are consistent with our vision to lead the electric utility industry through the clean energy transition. We are excited about working in partnership with state and federal governments and with other stakeholders, including the communities we serve, to advance policies that rapidly cut GHG emissions.”
Edison International uses core earnings, which is a non-GAAP financial measure that adjusts for significant discrete items that management does not consider representative of ongoing earnings. Edison International management believes that core earnings provide more meaningful comparisons of performance from period to period. Please see the attached tables for a reconciliation of core earnings to basic GAAP earnings.
Edison International Reports Third Quarter 2022 Financial Results
Page 2 of 10
Revision to Best Estimate of Losses for 2017/2018 Wildfire/Mudslide Events
Each reporting period, management reviews its loss estimates for remaining alleged and potential claims related to the 2017/2018 Wildfire/Mudslide Events. Management’s third quarter 2022 review included a review of information obtained after the statute of limitations for individual plaintiffs for the Woolsey Fire expired, including information regarding the nature of claims remaining in the Woolsey Fire litigation. Management also reviewed information obtained from settling a substantial portion of the claims in the 2017/2018 Wildfire/Mudslide Events litigations, including higher than expected costs to settle claims. As a result of management’s third quarter 2022 review, SCE recorded an $880 million increase in estimated losses for the 2017/2018 Wildfire/Mudslide Events as of September 30, 2022, which increase is related to the Woolsey Fire. As a result, SCE also recorded expected recoveries through FERC electric rates of $50 million against the charge, and the resulting net charge to earnings was $830 million ($598 million after-tax).
2022 Earnings Guidance
The company narrowed its earnings guidance range for 2022 as summarized in the following chart. See the presentation accompanying the company’s conference call for further information and assumptions.
|
|
2022 Earnings Guidance |
|
2022 Earnings Guidance |
||||||||
|
|
as of July 28, 2022 |
|
as of November 1, 2022 |
||||||||
|
|
Low |
|
High |
|
Low |
|
High |
||||
EIX Basic EPS |
|
$ |
3.25 |
|
$ |
3.55 |
|
$ |
1.51 |
|
$ |
1.71 |
Less: Non-core Items* |
|
|
(1.15) |
|
|
(1.15) |
|
|
(2.97) |
|
|
(2.97) |
EIX Core EPS |
|
$ |
4.40 |
|
$ |
4.70 |
|
$ |
4.48 |
|
$ |
4.68 |
* There were ($1,131) million, or ($2.97) per share of non-core items recorded for the nine months ended September 30, 2022, calculated based on an assumed weighted average share count for 2022. Basic EIX EPS guidance only incorporates non-core items to September 30, 2022.
Third Quarter 2022 Earnings Conference Call and Webcast Details
When: |
|
Tuesday, November 1, 2022, 1:30 – 2:30 p.m. (Pacific Time) |
Telephone Numbers: |
|
1-888-673-9780 (US) and 1-312-470-0178 (Int'l) - Passcode: Edison |
Telephone Replay: |
|
1-800-819-5743 (US) and 1-203-369-3828 (Int’l) - Passcode: 8542 |
|
|
Telephone replay available through November 16, 2022 at 5:00 p.m. (Pacific Time) |
Webcast: |
|
www.edisoninvestor.com |
Edison International has posted its earnings conference call prepared remarks by the CEO and CFO, the teleconference presentation, and Form 10-Q to the company's investor relations website. These materials are available at www.edisoninvestor.com.
About Edison International
Edison International (NYSE: EIX) is one of the nation’s largest electric utility holding companies, providing clean and reliable energy and energy services through its independent companies. Headquartered in Rosemead, California, Edison International is the parent company of Southern California Edison Company, a utility that delivers electricity to 15 million people across Southern, Central and Coastal California. Edison International is also the parent company of Edison Energy LLC, a global energy advisory firm engaged in the business of providing integrated decarbonization and energy solutions to commercial, industrial and institutional customers.
Edison International Reports Third Quarter 2022 Financial Results
Page 3 of 10
Appendix
Use of Non-GAAP Financial Measures
Edison International’s earnings are prepared in accordance with generally accepted accounting principles used in the United States and represent the company’s earnings as reported to the Securities and Exchange Commission. Our management uses core earnings and core earnings per share (EPS) internally for financial planning and for analysis of performance of Edison International and Southern California Edison. We also use core earnings and core EPS when communicating with analysts and investors regarding our earnings results to facilitate comparisons of the Company’s performance from period to period. Financial measures referred to as net income, basic EPS, core earnings, or core EPS also apply to the description of earnings or earnings per share.
Core earnings and core EPS are non-GAAP financial measures and may not be comparable to those of other companies. Core earnings and core EPS are defined as basic earnings and basic EPS excluding income or loss from discontinued operations and income or loss from significant discrete items that management does not consider representative of ongoing earnings. Basic earnings and losses refer to net income or losses attributable to Edison International shareholders. Core earnings are reconciled to basic earnings in the attached tables. The impact of participating securities (vested awards that earn dividend equivalents that may participate in undistributed earnings with common stock) for the principal operating subsidiary is not material to the principal operating subsidiary’s EPS and is therefore reflected in the results of the Edison International holding company, which is included in Edison International Parent and Other.
Safe Harbor Statement
Statements contained in this release about future performance, including, without limitation, operating results, capital expenditures, rate base growth, dividend policy, financial outlook, and other statements that are not purely historical, are forward-looking statements. These forward-looking statements reflect our current expectations; however, such statements involve risks and uncertainties. Actual results could differ materially from current expectations. These forward-looking statements represent our expectations only as of the date of this release, and Edison International assumes no duty to update them to reflect new information, events or circumstances. Important factors that could cause different results include, but are not limited to the:
| • | ability of SCE to recover its costs through regulated rates, including uninsured wildfire-related and debris flow-related costs, costs incurred to mitigate the risk of utility equipment causing future wildfires, costs incurred as a result of the COVID-19 pandemic, and increased labor and materials costs due to supply chain constraints and inflation; |
| • | ability of SCE to implement its Wildfire Mitigation Plan and capital program; |
| • | risks of regulatory or legislative restrictions that would limit SCE’s ability to implement operational measures to mitigate wildfire risk, including Public Safety Power Shutoff (“PSPS”) and fast curve settings, when conditions warrant or would otherwise limit SCE’s operational practices relative to wildfire risk mitigation; |
| • | risks associated with implementing PSPS, including regulatory fines and penalties, claims for damages and reputational harm; |
| • | ability of SCE to maintain a valid safety certification; |
| • | ability to obtain sufficient insurance at a reasonable cost, including insurance relating to wildfire-related claims, and to recover the costs of such insurance or, in the event liabilities exceed insured amounts, the ability to recover uninsured losses from customers or other parties; |
| • | extreme weather-related incidents (including events caused, or exacerbated, by climate change, such as wildfires, debris flows, droughts, high wind events and extreme heat events) and other natural disasters (such as earthquakes), which could cause, among other things, public safety issues, property damage, rotating outages and other operational issues (such as issues due to damaged infrastructure), PSPS activations and unanticipated costs; |
Edison International Reports Third Quarter 2022 Financial Results
Page 4 of 10
| • | risk that California Assembly Bill 1054 ("AB 1054") does not effectively mitigate the significant exposure faced by California investor-owned utilities related to liability for damages arising from catastrophic wildfires where utility facilities are alleged to be a substantial cause, including the longevity of the Wildfire Insurance Fund and the CPUC's interpretation of and actions under AB 1054, including its interpretation of the prudency standard established under AB 1054; |
| • | ability of Edison International and SCE to effectively attract, manage, develop and retain a skilled workforce, including its contract workers; |
| • | decisions and other actions by the California Public Utilities Commission, the Federal Energy Regulatory Commission, the Nuclear Regulatory Commission and other governmental authorities, including decisions and actions related to nationwide or statewide crisis, determinations of authorized rates of return or return on equity, the recoverability of wildfire-related and debris flow-related costs, issuance of SCE's wildfire safety certification, wildfire mitigation efforts, approval and implementation of electrification programs, and delays in executive, regulatory and legislative actions; |
| • | cost and availability of labor, equipment and materials, including as a result of supply chain constraints; |
| • | ability of Edison International or SCE to borrow funds and access bank and capital markets on reasonable terms; |
| • | risks associated with the decommissioning of San Onofre, including those related to worker and public safety, public opposition, permitting, governmental approvals, on-site storage of spent nuclear fuel and other radioactive material, delays, contractual disputes, and cost overruns; |
| • | pandemics, such as COVID-19, and other events that cause regional, statewide, national or global disruption, which could impact, among other things, Edison International's and SCE's business, operations, cash flows, liquidity and/or financial results and cause Edison International and SCE to incur unanticipated costs; |
| • | physical security of Edison International's and SCE's critical assets and personnel and the cybersecurity of Edison International's and SCE's critical information technology systems for grid control, and business, employee and customer data; |
| • | risks associated with cost allocation resulting in higher rates for utility bundled service customers because of possible customer bypass or departure for other electricity providers such as Community Choice Aggregators ("CCA," which are cities, counties, and certain other public agencies with the authority to generate and/or purchase electricity for their local residents and businesses) and Electric Service Providers (entities that offer electric power and ancillary services to retail customers, other than electrical corporations (like SCE) and CCAs); |
| • | risks inherent in SCE's capital investment program, including those related to project site identification, public opposition, environmental mitigation, construction, permitting, changes in the California Independent System Operator's transmission plans, and governmental approvals; and |
| ● | risks associated with the operation of electrical facilities, including worker and public safety issues, the risk of utility assets causing or contributing to wildfires, failure, availability, efficiency, and output of equipment and facilities, and availability and cost of spare parts. |
Additional information about risks and uncertainties is contained in Edison International and SCE’s most recent combined Form 10-Q and Form 10-K filed with the Securities and Exchange Commission, including the "Risk Factors" sections. Readers are urged to read this entire release as well as the most recent Form 10-Q and Form 10-K (including information incorporated by reference), and carefully consider the risks, uncertainties, and other factors that affect Edison International's and SCE's businesses. Edison International and SCE post or provide direct links (i) to certain SCE and other parties' regulatory filings and documents with the CPUC and the FERC and certain agency rulings and notices in open proceedings in a section titled "SCE Regulatory Highlights," (ii) to certain documents and information related to Southern California wildfires which may be of interest to investors in a section titled "Southern California Wildfires," and (iii) to presentations, documents and other information that may be of interest to investors in a section titled "Presentations and Updates" at www.edisoninvestor.com in order to publicly disseminate such information.
These forward-looking statements represent our expectations only as of the date of this news release, and Edison International assumes no duty to update them to reflect new information, events or circumstances. Readers should review future reports filed by Edison International and SCE with the SEC.
Edison International Reports Third Quarter 2022 Financial Results
Page 5 of 10
Third Quarter Reconciliation of Basic Earnings Per Share to Core Earnings Per Share
|
|
Three months ended |
|
|
|
|
Nine months ended |
|
|
|
||||||||
|
|
September 30, |
|
|
|
|
September 30, |
|
|
|
||||||||
|
|
2022 |
|
2021 |
|
Change |
|
2022 |
|
2021 |
|
Change |
||||||
(Losses) earnings per share attributable to Edison International |
|
|
|
|
|
|
|
|
|
|
|
|
|
|
|
|
|
|
SCE |
|
$ |
(0.21) |
|
$ |
(0.75) |
|
$ |
0.54 |
|
$ |
0.97 |
|
$ |
0.98 |
|
$ |
(0.01) |
Edison International Parent and Other |
|
|
(0.12) |
|
|
(0.15) |
|
|
0.03 |
|
|
(0.45) |
|
|
(0.36) |
|
|
(0.09) |
Edison International |
|
|
(0.33) |
|
|
(0.90) |
|
|
0.57 |
|
|
0.52 |
|
|
0.62 |
|
|
(0.10) |
Less: Non-core items |
|
|
|
|
|
|
|
|
|
|
|
|
|
|
|
|
|
|
SCE |
|
|
(1.84) |
|
|
(2.59) |
|
|
0.75 |
|
|
(3.00) |
|
|
(2.81) |
|
|
(0.19) |
Edison International Parent and Other |
|
|
0.03 |
|
|
— |
|
|
0.03 |
|
|
0.03 |
|
|
— |
|
|
0.03 |
Total non-core items |
|
|
(1.81) |
|
|
(2.59) |
|
|
0.78 |
|
|
(2.97) |
|
|
(2.81) |
|
|
(0.16) |
Core earnings (losses) |
|
|
|
|
|
|
|
|
|
|
|
|
|
|
|
|
|
|
SCE |
|
|
1.63 |
|
|
1.84 |
|
|
(0.21) |
|
|
3.97 |
|
|
3.79 |
|
|
0.18 |
Edison International Parent and Other |
|
|
(0.15) |
|
|
(0.15) |
|
|
— |
|
|
(0.48) |
|
|
(0.36) |
|
|
(0.12) |
Edison International |
|
$ |
1.48 |
|
$ |
1.69 |
|
$ |
(0.21) |
|
$ |
3.49 |
|
$ |
3.43 |
|
$ |
0.06 |
Note: Diluted losses were $0.33 and $0.90 per share for the three months ended September 30, 2022 and 2021, respectively. Diluted earnings were $0.52 and $0.62 per share for the nine months ended September 30, 2022 and 2021, respectively.
Third Quarter Reconciliation of Basic Earnings Per Share to Core Earnings (in millions)
|
|
Three months ended |
|
|
|
|
Nine months ended |
|
|
|
||||||||
|
|
September 30, |
|
|
|
|
September 30, |
|
|
|
||||||||
(in millions) |
|
2022 |
|
2021 |
|
Change |
|
2022 |
|
2021 |
|
Change |
||||||
Net (loss) income attributable to Edison International |
|
|
|
|
|
|
|
|
|
|
|
|
|
|
|
|
|
|
SCE |
|
$ |
(80) |
|
$ |
(284) |
|
$ |
204 |
|
$ |
369 |
|
$ |
371 |
|
$ |
(2) |
Edison International Parent and Other |
|
|
(48) |
|
|
(57) |
|
|
9 |
|
|
(172) |
|
|
(135) |
|
|
(37) |
Edison International |
|
|
(128) |
|
|
(341) |
|
|
213 |
|
|
197 |
|
|
236 |
|
|
(39) |
Less: Non-core items |
|
|
|
|
|
|
|
|
|
|
|
|
|
|
|
|
|
|
SCE1,2,3,4,5,6,7,8,9,10 |
|
|
(703) |
|
|
(985) |
|
|
282 |
|
|
(1,142) |
|
|
(1,065) |
|
|
(77) |
Edison International Parent and Other |
|
|
11 |
|
|
— |
|
|
11 |
|
|
11 |
|
|
— |
|
|
11 |
Total non-core items |
|
|
(692) |
|
|
(985) |
|
|
293 |
|
|
(1,131) |
|
|
(1,065) |
|
|
(66) |
Core earnings (losses) |
|
|
|
|
|
|
|
|
|
|
|
|
|
|
|
|
|
|
SCE |
|
|
623 |
|
|
701 |
|
|
(78) |
|
|
1,511 |
|
|
1,436 |
|
|
75 |
Edison International Parent and Other |
|
|
(59) |
|
|
(57) |
|
|
(2) |
|
|
(183) |
|
|
(135) |
|
|
(48) |
Edison International |
|
$ |
564 |
|
$ |
644 |
|
$ |
(80) |
|
$ |
1,328 |
|
$ |
1,301 |
|
$ |
27 |
1 |
Includes amortization of SCE’s Wildfire Insurance Fund expenses of $54 million ($39 million after-tax) for both the three months ended September 30, 2022 and 2021. Includes $160 million ($115 million after-tax) and $161 million ($116 million after-tax) for the nine months ended September 30, 2022 and 2021, respectively. |
2 |
Includes charges for 2017/2018 Wildfire/Mudslide Events claims and expenses, net of recoveries of $834 million ($600 million after-tax) and $1,206 million ($899 million after-tax) recorded for the three months ended September 30, 2022 and 2021, respectively. Includes charges of $1.2 billion ($891 million after-tax) and $1.2 billion ($909 million after-tax) for the nine months ended September 30, 2022 and 2021, respectively. |
3 |
Includes GRC track 3 impairment of $17 million ($12 million after-tax) for the nine months ended September 30, 2022. |
4 |
Includes CSRP impairment of $47 million ($34 million after-tax) for the nine months ended September 30, 2022. |
5 |
Includes charge for employment litigation matter, net of recoveries, of $23 million ($16 million after-tax) for the nine months ended September 30, 2022. |
6 |
Includes organizational realignment charge of $14 million ($10 million after-tax) for the nine months ended September 30, 2022. |
Edison International Reports Third Quarter 2022 Financial Results
Page 6 of 10
7 |
Includes gain from sale of San Onofre nuclear fuel of $10 million ($7 million after-tax) for the nine months ended September 30, 2021. |
8 |
Includes charge related to the Presiding Officer's Decision ("POD") in September 2022 on SCE's Upstream Lighting Program for the Upstream Lighting Program of $81 million ($64 million after-tax) for both the three months and the nine months ended September 30, 2022. |
9 |
Includes customer revenues for EIS insurance contract, net of claims of $14 million ($11 million after-tax) for both the three months and the nine months ended September 30, 2022. |
10 |
Includes GRC disallowances related to pole replacements of $79 million ($47 million after-tax) for both the three months and the nine months ended September 30, 2021. |
Edison International Reports Third Quarter 2022 Financial Results
Page 7 of 10
Consolidated Statements of Income |
|
Edison International |
||||||||||
|
|
|
|
|
|
|
|
|
|
|
|
|
|
|
Three months ended |
|
Nine months ended |
||||||||
|
|
September 30, |
|
September 30, |
||||||||
(in millions, except per-share amounts) |
|
2022 |
|
2021 |
|
2022 |
|
2021 |
||||
Total operating revenue |
|
$ |
5,228 |
|
$ |
5,299 |
|
$ |
13,204 |
|
$ |
11,574 |
Purchased power and fuel |
|
|
2,485 |
|
|
2,088 |
|
|
4,826 |
|
|
4,384 |
Operation and maintenance |
|
|
979 |
|
|
1,222 |
|
|
3,827 |
|
|
2,817 |
Wildfire-related claims, net of insurance recoveries |
|
|
889 |
|
|
1,273 |
|
|
1,316 |
|
|
1,276 |
Wildfire Insurance Fund expense |
|
|
54 |
|
|
54 |
|
|
160 |
|
|
161 |
Depreciation and amortization |
|
|
738 |
|
|
599 |
|
|
1,922 |
|
|
1,657 |
Property and other taxes |
|
|
128 |
|
|
113 |
|
|
374 |
|
|
356 |
Impairment, net of other operating income |
|
|
(1) |
|
|
78 |
|
|
60 |
|
|
67 |
Total operating expenses |
|
|
5,272 |
|
|
5,427 |
|
|
12,485 |
|
|
10,718 |
Operating (loss) income |
|
|
(44) |
|
|
(128) |
|
|
719 |
|
|
856 |
Interest expense |
|
|
(302) |
|
|
(245) |
|
|
(819) |
|
|
(694) |
Other income |
|
|
85 |
|
|
47 |
|
|
219 |
|
|
195 |
(Loss) income before income taxes |
|
|
(261) |
|
|
(326) |
|
|
119 |
|
|
357 |
Income tax (benefit) expense |
|
|
(187) |
|
|
(29) |
|
|
(235) |
|
|
3 |
Net (loss) income |
|
|
(74) |
|
|
(297) |
|
|
354 |
|
|
354 |
Preference stock dividend requirements of SCE |
|
|
27 |
|
|
27 |
|
|
78 |
|
|
80 |
Preferred stock dividend requirement of Edison International |
|
|
27 |
|
|
17 |
|
|
79 |
|
|
38 |
Net (loss) income attributable to Edison International common shareholders |
|
$ |
(128) |
|
$ |
(341) |
|
$ |
197 |
|
$ |
236 |
Basic (losses) earnings per share: |
|
|
|
|
|
|
|
|
|
|
|
|
Weighted average shares of common stock outstanding |
|
|
382 |
|
|
380 |
|
|
381 |
|
|
380 |
Basic (losses) earnings per common share attributable to Edison International common shareholders |
|
$ |
(0.33) |
|
$ |
(0.90) |
|
$ |
0.52 |
|
$ |
0.62 |
Diluted (losses) earnings per share: |
|
|
|
|
|
|
|
|
|
|
|
|
Weighted average shares of common stock outstanding, including effect of dilutive securities |
|
|
383 |
|
|
380 |
|
|
382 |
|
|
380 |
Diluted (losses) earnings per common share attributable to Edison International common shareholders |
|
$ |
(0.33) |
|
$ |
(0.90) |
|
$ |
0.52 |
|
$ |
0.62 |
Edison International Reports Third Quarter 2022 Financial Results
Page 8 of 10
Consolidated Balance Sheets |
|
Edison International |
||||
|
|
|
|
|
|
|
|
|
September 30, |
|
December 31, |
||
(in millions) |
|
2022 |
|
2021 |
||
ASSETS |
|
|
|
|
|
|
Cash and cash equivalents |
|
$ |
232 |
|
$ |
390 |
Receivables, less allowances of $391 and $193 for uncollectible accounts at respective dates |
|
|
2,259 |
|
|
1,398 |
Accrued unbilled revenue |
|
|
1,298 |
|
|
794 |
Inventory |
|
|
439 |
|
|
420 |
Prepaid expenses |
|
|
278 |
|
|
258 |
Regulatory assets |
|
|
1,497 |
|
|
1,778 |
Wildfire Insurance Fund contributions |
|
|
204 |
|
|
204 |
Other current assets |
|
|
234 |
|
|
249 |
Total current assets |
|
|
6,441 |
|
|
5,491 |
Nuclear decommissioning trusts |
|
|
3,823 |
|
|
4,870 |
Marketable securities |
|
|
7 |
|
|
12 |
Other investments |
|
|
70 |
|
|
39 |
Total investments |
|
|
3,900 |
|
|
4,921 |
Utility property, plant and equipment, less accumulated depreciation and amortization of $12,152 and $11,407 at respective dates |
|
|
52,386 |
|
|
50,497 |
Nonutility property, plant and equipment, less accumulated depreciation of $109 and $98 at respective dates |
|
|
213 |
|
|
203 |
Total property, plant and equipment |
|
|
52,599 |
|
|
50,700 |
Receivables, less allowances of $35 and $116 uncollectible accounts at respective dates |
|
|
20 |
|
|
122 |
Regulatory assets (includes $840 and $325 related to Variable Interest Entities "VIEs" at respective dates) |
|
|
8,033 |
|
|
7,660 |
Wildfire Insurance Fund contributions |
|
|
2,206 |
|
|
2,359 |
Operating lease right-of-use assets |
|
|
1,530 |
|
|
1,932 |
Long-term insurance receivable |
|
|
458 |
|
|
75 |
Other long-term assets |
|
|
1,522 |
|
|
1,485 |
Total long-term assets |
|
|
13,769 |
|
|
13,633 |
|
|
|
|
|
|
|
Total assets |
|
$ |
76,709 |
|
$ |
74,745 |
Edison International Reports Third Quarter 2022 Financial Results
Page 9 of 10
Consolidated Balance Sheets |
|
Edison International |
||||
|
|
|
|
|
|
|
|
|
September 30, |
|
December 31, |
||
(in millions, except share amounts) |
|
2022 |
|
2021 |
||
LIABILITIES AND EQUITY |
|
|
|
|
|
|
Short-term debt |
|
$ |
3,011 |
|
$ |
2,354 |
Current portion of long-term debt |
|
|
2,175 |
|
|
1,077 |
Accounts payable |
|
|
2,348 |
|
|
2,002 |
Wildfire-related claims |
|
|
173 |
|
|
131 |
Customer deposits |
|
|
163 |
|
|
193 |
Regulatory liabilities |
|
|
702 |
|
|
603 |
Current portion of operating lease liabilities |
|
|
541 |
|
|
582 |
Other current liabilities |
|
|
1,707 |
|
|
1,667 |
Total current liabilities |
|
|
10,820 |
|
|
8,609 |
Long-term debt (Includes $823 and $314 related to VIEs at respective dates) |
|
|
25,145 |
|
|
24,170 |
Deferred income taxes and credits |
|
|
5,976 |
|
|
5,740 |
Pensions and benefits |
|
|
460 |
|
|
496 |
Asset retirement obligations |
|
|
2,785 |
|
|
2,772 |
Regulatory liabilities |
|
|
8,348 |
|
|
8,981 |
Operating lease liabilities |
|
|
989 |
|
|
1,350 |
Wildfire-related claims |
|
|
1,962 |
|
|
1,733 |
Other deferred credits and other long-term liabilities |
|
|
2,931 |
|
|
3,105 |
Total deferred credits and other liabilities |
|
|
23,451 |
|
|
24,177 |
Total liabilities |
|
|
59,416 |
|
|
56,956 |
Commitments and contingencies |
|
|
|
|
|
|
Preferred stock (50,000,000 shares authorized; 1,250,000 shares of Series A and 750,000 shares of Series B issued and outstanding at respective dates) |
|
|
1,977 |
|
|
1,977 |
Common stock, no par value (800,000,000 shares authorized; 381,873,341 and 380,378,145 shares issued and outstanding at respective dates) |
|
|
6,167 |
|
|
6,071 |
Accumulated other comprehensive loss |
|
|
(47) |
|
|
(54) |
Retained earnings |
|
|
7,295 |
|
|
7,894 |
Total Edison International's shareholders' equity |
|
|
15,392 |
|
|
15,888 |
Noncontrolling interests – preference stock of SCE |
|
|
1,901 |
|
|
1,901 |
Total equity |
|
|
17,293 |
|
|
17,789 |
|
|
|
|
|
|
|
Total liabilities and equity |
|
$ |
76,709 |
|
$ |
74,745 |
Edison International Reports Third Quarter 2022 Financial Results
Page 10 of 10
Consolidated Statements of Cash Flows |
|
Edison International |
||||
|
|
|
|
|
|
|
|
|
Nine months ended September 30, |
||||
(in millions) |
|
2022 |
|
2021 |
||
Cash flows from operating activities: |
|
|
|
|
|
|
Net income |
|
$ |
354 |
|
$ |
354 |
Adjustments to reconcile to net cash provided by operating activities: |
|
|
|
|
|
|
Depreciation and amortization |
|
|
1,977 |
|
|
1,709 |
Allowance for equity during construction |
|
|
(91) |
|
|
(92) |
Impairment and other expense |
|
|
60 |
|
|
67 |
Deferred income taxes |
|
|
(237) |
|
|
(1) |
Wildfire Insurance Fund amortization expense |
|
|
160 |
|
|
161 |
Other |
|
|
50 |
|
|
34 |
Nuclear decommissioning trusts |
|
|
(81) |
|
|
(204) |
Proceeds from Morongo Transmission LLC |
|
|
— |
|
|
400 |
Changes in operating assets and liabilities: |
|
|
|
|
|
|
Receivables |
|
|
(807) |
|
|
(706) |
Inventory |
|
|
(20) |
|
|
(10) |
Accounts payable |
|
|
363 |
|
|
282 |
Tax receivables and payables |
|
|
171 |
|
|
204 |
Other current assets and liabilities |
|
|
(681) |
|
|
(716) |
Regulatory assets and liabilities, net |
|
|
1,032 |
|
|
(484) |
Wildfire-related insurance receivable |
|
|
(383) |
|
|
707 |
Wildfire-related claims |
|
|
271 |
|
|
(2,120) |
Other noncurrent assets and liabilities |
|
|
(26) |
|
|
(1) |
Net cash provided by (used in) operating activities |
|
|
2,112 |
|
|
(416) |
Cash flows from financing activities: |
|
|
|
|
|
|
Long-term debt issued, plus premium and net of discount and issuance costs of $36 and $40 for the respective periods |
|
|
3,347 |
|
|
4,798 |
Long-term debt repaid |
|
|
(773) |
|
|
(1,031) |
Short-term debt issued |
|
|
600 |
|
|
2,105 |
Short-term debt repaid |
|
|
(993) |
|
|
(1,355) |
Common stock issued |
|
|
10 |
|
|
28 |
Preferred stock issued, net |
|
|
— |
|
|
1,235 |
Commercial paper repayments, net of borrowing |
|
|
529 |
|
|
(435) |
Dividends and distribution to noncontrolling interests |
|
|
(83) |
|
|
(85) |
Common stock dividends paid |
|
|
(787) |
|
|
(741) |
Preferred stock dividends paid |
|
|
(99) |
|
|
(35) |
Other |
|
|
81 |
|
|
22 |
Net cash provided by financing activities |
|
|
1,832 |
|
|
4,506 |
Cash flows from investing activities: |
|
|
|
|
|
|
Capital expenditures |
|
|
(4,206) |
|
|
(3,948) |
Proceeds from sale of nuclear decommissioning trust investments |
|
|
3,120 |
|
|
3,218 |
Purchases of nuclear decommissioning trust investments |
|
|
(3,039) |
|
|
(3,014) |
Other |
|
|
20 |
|
|
90 |
Net cash used in investing activities |
|
|
(4,105) |
|
|
(3,654) |
Net (decrease) increase in cash, cash equivalents and restricted cash |
|
|
(161) |
|
|
436 |
Cash, cash equivalents and restricted cash at beginning of period |
|
|
394 |
|
|
89 |
Cash, cash equivalents and restricted cash at end of period |
|
$ |
233 |
|
$ |
525 |
Exhibit 99.2
Prepared Remarks of Edison International CEO and CFO
Third Quarter 2022 Earnings Teleconference
November 1, 2022, 1:30 p.m. (PT)
Pedro Pizarro, President and Chief Executive Officer, Edison International
Edison International reported core earnings per share of $1.48 for the third quarter and $3.49 for the first nine months of the year. Based on our year-to-date performance and outlook for the remainder of the year, we are narrowing our 2022 core EPS guidance range to $4.48 to $4.68, from our prior range of $4.40 to $4.70. We are fully committed to delivering our long-term EPS growth rate target of 5 to 7% through 2025.
In my remarks, I will focus on three key messages. First, SCE’s excellent progress reducing wildfire risk. Second, we’ve updated the 2017/2018 Wildfire and Mudslide Events reserve. Third, the increasing alignment between California’s clean energy actions and SCE’s vision to lead the transformation of the electric power industry.
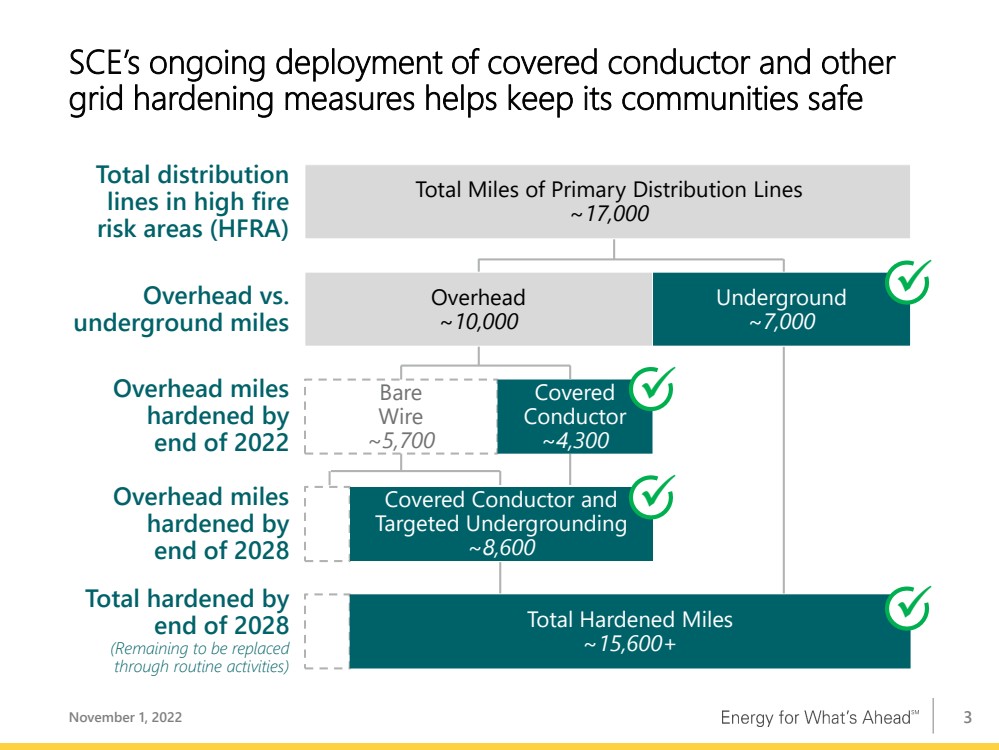
SCE is making excellent progress in executing its wildfire mitigation plan. As I’ve mentioned before, when we look across all 17,000 circuit miles of distribution lines in SCE’s high fire risk area, or HFRA, over 7,000 miles are already underground and the utility’s grid hardening measures are focused on the remaining approximately 10,000 miles above ground. SCE is rapidly deploying covered conductor and is on pace to complete 4,300 miles, or 43%, of its overhead miles in HFRA by year-end. As depicted on page 3, SCE plans to continue hardening the grid through its next rate case cycle, which would result in about 8,400 overhead miles hardened. Additionally, SCE has continued to reduce the impact of PSPS. With the acceleration of grid hardening activities on frequently impacted PSPS circuits this year, SCE anticipates reducing PSPS outage duration by over 44 million customer minutes of interruption, or more than 17%, compared to the last two years, assuming the same weather and fuel conditions.
As analysts, investors, rating agencies, and members of the CPUC have observed from visits to SCE’s Emergency Operations Center this year, SCE has made marked advancements in its wildfire mitigation and emergency preparedness capabilities.
Additionally, we continue to share extensive data on SCE’s wildfire mitigation efforts on the Investor Relations website.
Turning to the 2017 and 2018 Wildfire and Mudslide Events, in the third quarter, SCE paid about $350 million towards settlement of claims. Driven by this significant new information obtained through the litigation process following the closing of the Woolsey fire statute of limitations in May and our thorough evaluation of such information, the utility increased the best estimate of total losses by $880 million to a total of $8.8 billion. As summarized on page 4, I would like to share with you some additional background on the reasons for this large estimate revision. Claims resolution is a long and challenging process, and we appreciate your patience as SCE works through it in a prudent manner, which will ultimately support the utility’s strong cost recovery applications.
With the statute of limitations for Woolsey individual plaintiffs behind us, we now know the actual number of plaintiffs bringing claims in connection with that event and have obtained important additional information on the nature of the claims for many of these remaining plaintiffs, though still not for all of them. To give you more visibility into the process, we now have more information regarding the type of claim a plaintiff has — for example, whether a plaintiff has a claim for smoke and ash damage, damaged property, entire property loss, or a business. Based on now having a defined number of claimants and more clarity on the nature of their respective claims, the reserve was adjusted to reflect our experience to date settling similar types of claims, including higher than expected costs to settle several types of claims.
The continued progress settling claims enables us to move further along in resolving these historical 2017 and 2018 events. I want to be clear that we still expect SCE to file the application for TKM cost recovery by late 2023, and to seek full CPUC cost recovery of claims payments, excluding amounts recoverable from insurance or FERC, or foregone under the agreement with the Safety Enforcement Division. I will also note that our financial assumptions for 2025 and beyond do not factor in any potential upside from this cost recovery application.
2
My final comments focus on California’s clean energy actions and Edison International’s vision to lead the electric utility industry through the clean energy transition. In August, the California Air Resources Board, or CARB, approved a rule requiring 100% of new cars sold in California to be zero-emission vehicles by 2035. The regulation codifies the light-duty vehicle goals set out in an executive order earlier this year. In September, CARB voted to ban the sale of new gas furnaces and water heaters beginning in 2030. This built on the CPUC’s unanimous decision a week earlier to eliminate subsidies for new natural gas hookups beginning July 2023. At the federal level, the administration is proceeding with multiple implementation actions for the Bipartisan Infrastructure Bill, the Inflation Reduction Act, and the CHIPS Act. Just this week, the US EPA announced the first $965 million tranche of funding for the electric school bus program authorized by the infrastructure bill, with about $35 million supporting school districts in SCE’s area.
We’re pleased to see this state and federal support for electrification, which is also consistent with our vision laid out in our Pathway 2045 white paper. SCE is a leader in electrification, with the country’s largest suite of transportation electrification programs led by an investor-owned utility, which benefit SCE in a differentiated manner. Electric vehicle adoption continues to accelerate here in California. Over the last three months, EVs accounted for roughly 20% of new car sales in California. SCE’s service area has about 400,000 of the 3 million EVs in the country. EV charging accounts for over 2.5 million megawatt hours, or about 3% of SCE’s projected 2022 retail sales. By 2045, this could grow to about 50 million megawatt hours. Meanwhile, we await CPUC review of SCE’s $677 million building electrification application, which will help catalyze this market in tandem with California’s plans to include around $1 billion in state budgets over the next 5 years. We are excited about working in partnership with state and federal governments and with other stakeholders, including the communities we serve, to advance policies that rapidly cut GHG emissions.
3
Maria Rigatti, Executive Vice President and Chief Financial Officer, Edison International
In my comments today, I will highlight that we had strong third quarter results and have narrowed our 2022 EPS guidance range to $4.48 to $4.68. Before I move to that, there are three additional takeaways for today’s call. First, we remain committed to delivering on our 5 to 7% growth target through 2025. Second, our near-term maturities are manageable. Finally, SCE’s current operational excellence program, which we call “Catalyst,” is off to a strong start and we have high expectations for the program.
Let’s move to third quarter results, as shown on page 5. Edison International reported core earnings of $1.48 per share. Recall that in third quarter 2021, SCE received its 2021 GRC final decision, and recorded a 35-cent true-up. This results in an unfavorable year-over-year comparison for this quarter. I will highlight two additional key variances — SCE’s earnings were driven by an increase in CPUC-related revenue in 2022 due to the GRC escalation mechanism and previously unrecognized return related to the Customer Service Re-Platform project final decision.
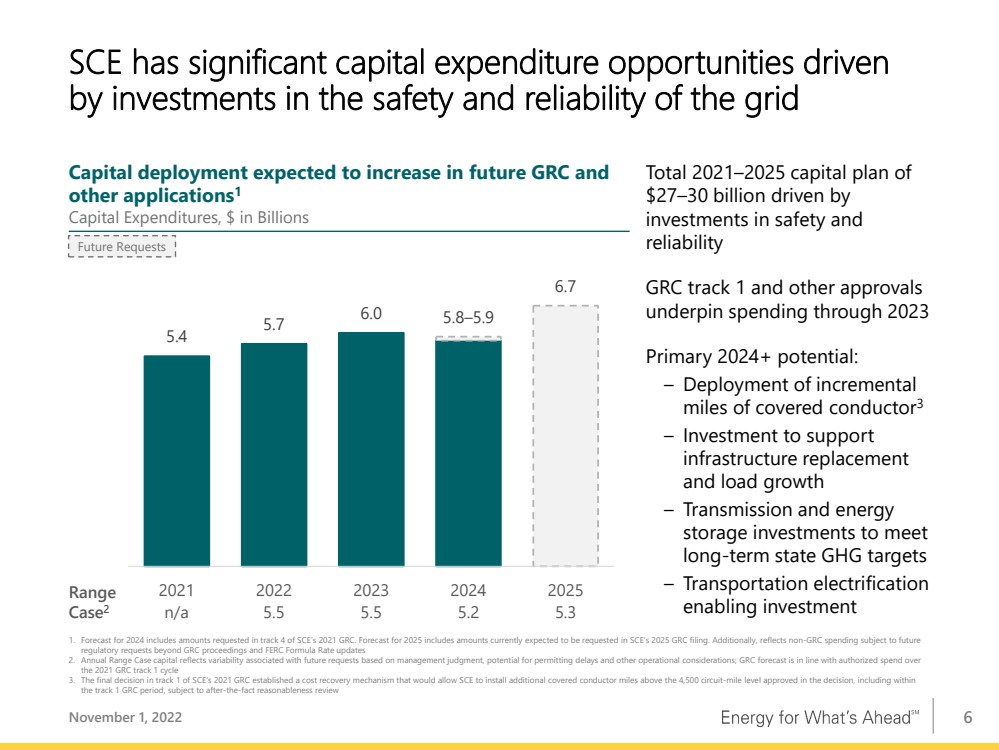
Moving to page 6, SCE’s capital forecast has been updated slightly, primarily to reflect the timing of spending related to the utility-owned storage project. The project is now expected to be online before summer 2023 and, consequently, some of the capital spending has shifted to 2023.
As shown on page 7, our capital forecast continues to result in projected rate base growth of 7 to 9% from 2021 to 2025. This forecast incorporates SCE’s current view of the requests to be made in the 2025 GRC, and other applications.
With respect to 2022 guidance, as shown on page 8, we are narrowing our 2022 core EPS guidance range to $4.48 to $4.68 from $4.40 to $4.70. Based on our year-to-date performance and outlook for the rest of the year, we are confident we will deliver results within this narrowed range.
4
I would now like to provide a brief update on our 2022 financing plan, as outlined on page 9. We continue to expect to refinance the last $300 million of parent debt maturing this year with new debt. Recall that we completed a $400 million refinancing in August. Combined, these will complete the refinancing of $700 million of parent debt. On the equity side, we expect that internal programs will generate about $100 million of our 2022 need of $300 to $400 million of equity content. In April, we entered into a $600 million term loan maturing in April 2023, which provides execution timing flexibility for the equity content we identified in our original guidance. If we defer into 2023, we will incorporate any remaining amount into the 2023 EIX financing plan. In all, we will share our 2023 financing plan on our Q4 earnings call.
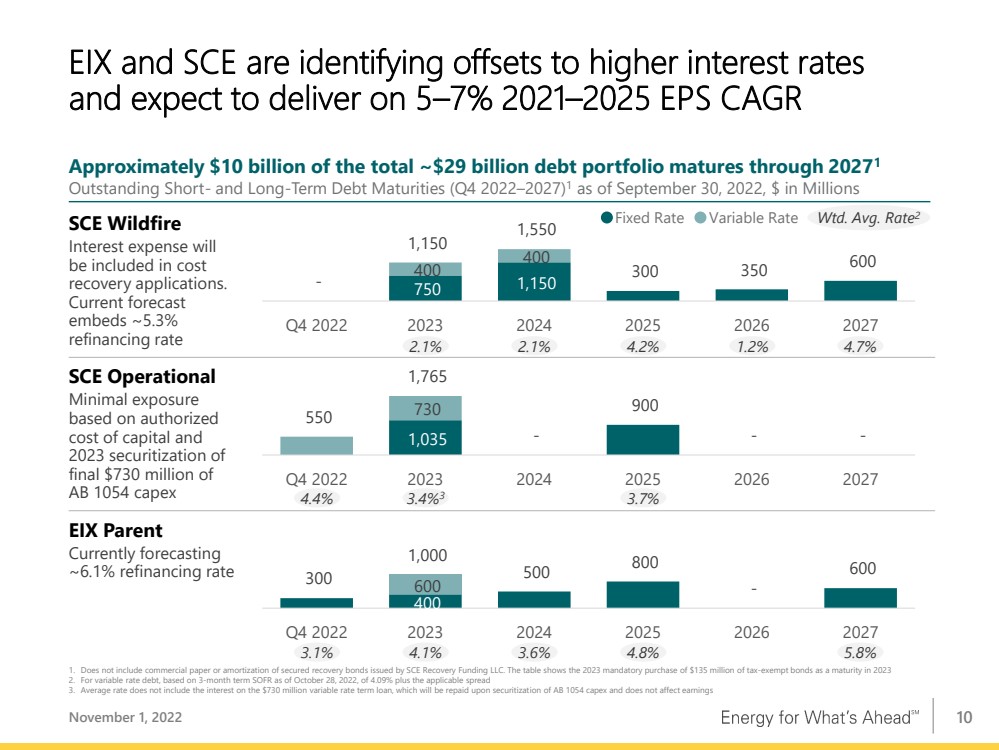
Turning to the current interest rate environment, I would like to frame the company’s interest rate exposure that factors into our 2025 EPS guidance and address how we plan to mitigate the impact from higher interest rates. Page 10 shows Edison’s debt maturities over the next five years. There are three categories to consider. The first category is the debt that funds 2017/18 Wildfire and Mudslide claims resolution. Pedro and I have been clear and consistent that SCE plans to apply for full cost recovery of eligible losses. SCE’s cost recovery application will also include the interest on the debt that funds the claims payments. None of this potential upside is built into our financial forecast.
The second category is SCE operational debt. The interest rate exposure is minimal as we updated the estimated cost of debt and preferred in September as part of our 2023 cost of capital application. The third category is EIX parent debt. We are currently forecasting the incremental cost of debt at approximately 6.1% and to the extent rates go higher over the next several years, we have headwinds to manage.
Across the organization, we are always looking for operational efficiencies, underpinned by a continuous improvement mindset. Over multiple rate case cycles, the utility has a distinguished track record of implementing operational excellence initiatives focused on enterprise-wide efforts to improve performance in safety, reliability, affordability, customer experience, and quality. This has also enabled SCE to have the lowest system average rate among California IOUs.
5
In the current program, Catalyst, the portfolio includes over 600 employee-driven ideas with capital efficiency and O&M benefits. These ideas span SCE’s operations and major themes include work planning, procurement, and technology as shown on page 11. The expected benefits should progressively increase as we accelerate implementation through 2024, further benefiting affordability for SCE’s customers. Additionally, we evaluate one-off opportunities. For instance, we have been evaluating our real estate portfolio for efficiencies. Reducing our footprint and managing these facilities costs will benefit customers in the longer term.
We have high expectations for the Catalyst program and the ability to deliver value for customers. We expect to identify additional opportunities in the core areas of safety, reliability, affordability, and quality as part of the multi-year program. We look forward to sharing success stories from the front-line as we go along.
Moving to page 12, we have provided you with our long-term EPS guidance, rooted in the significant investment opportunities aligned with our objectives of decarbonization and electrification. In this regard, I will emphasize two key points. First, we have incorporated the current interest rate environment and updated other assumptions. Second, we have identified tailwinds and headwinds that may drive variability around these ranges and provided sensitivities where applicable. As you can see from individual details on the page, we believe that the combination of drivers and strong execution will deliver the 5 to 7% growth.
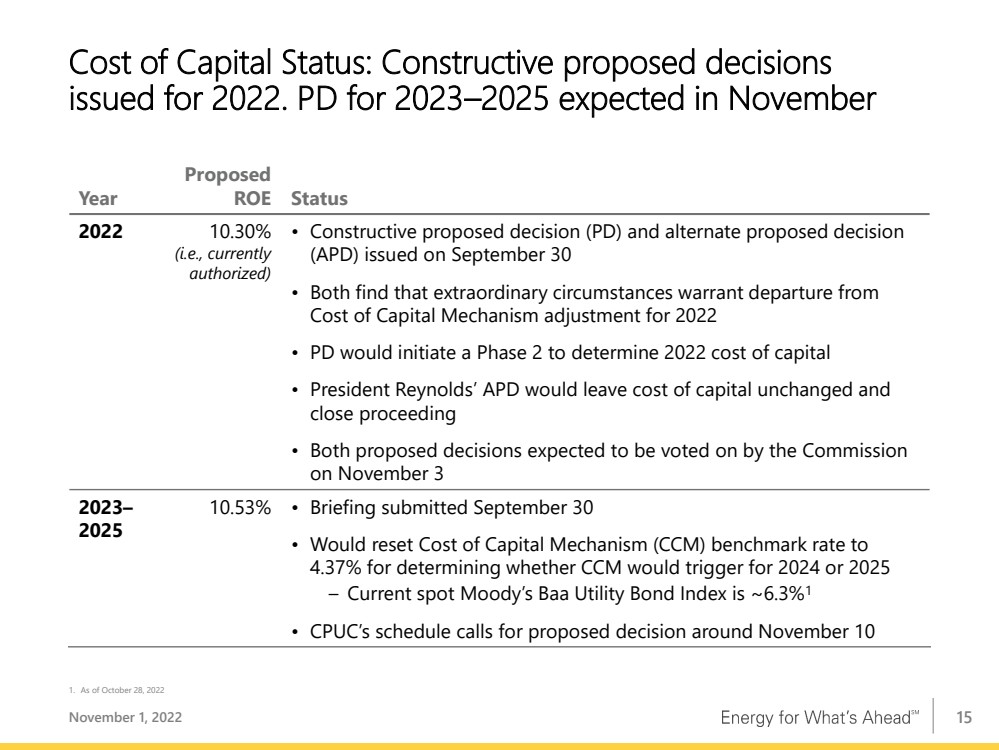
Let me highlight a few areas. One is operational variances which include the Catalyst work that I have described, among other items. Also, I would like to point out that embedded in our guidance is SCE’s current ROE of 10.3%. In the 2023 proceeding, SCE has requested an ROE of 10.53%, which is strongly supported by SCE’s analysis and the current interest rate environment. The 2023 proceeding also includes resetting the benchmark for the cost of capital mechanism to about 4.4%. If the bond index rates exceed the 100-basis point deadband, the mechanism would trigger, which in turn would result in updating the cost of debt and adjusting the ROE starting with the following year.
6
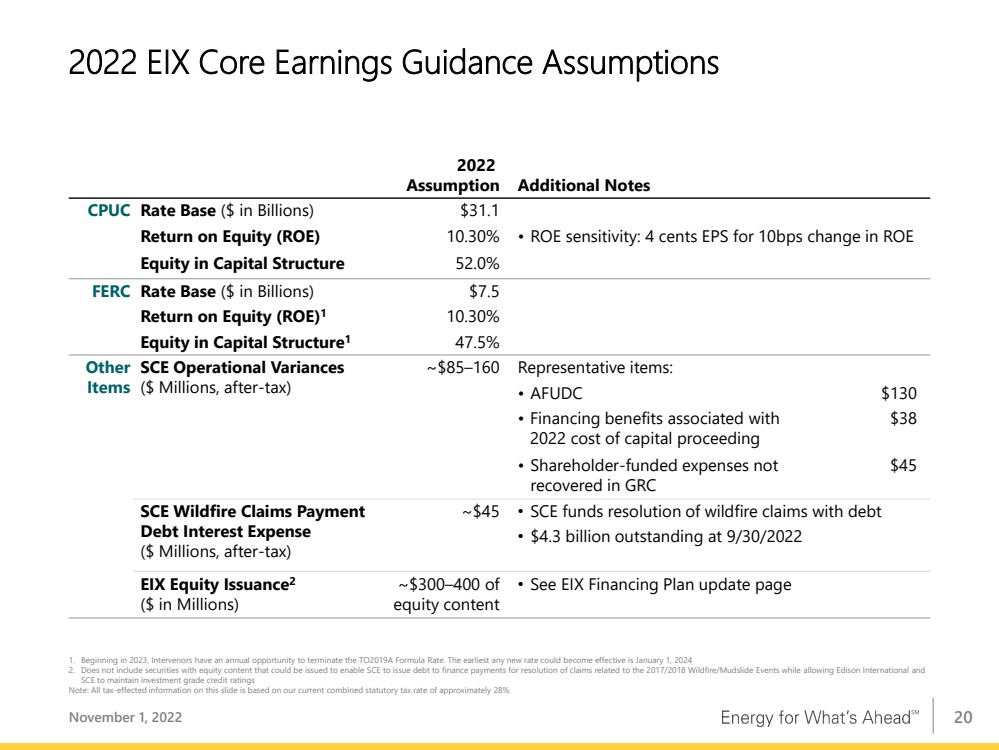
For sensitivity analysis, we expect each 10 basis points of ROE changes EPS by about 5 cents in 2025.
Additionally, the range around the parent expense we’ve shown you in the past also incorporates a range of equity content needs, of up to $250 million per year on average, and the amount will vary with rate base growth.
To conclude, we are reiterating our 5 to 7% EPS growth rate guidance from 2021 through 2025. My management team and I are fully committed to delivering on this target.
7
|
November 1, 2022 Third Quarter 2022 Financial Results |
|
1 Statements contained in this presentation about future performance, including, without limitation, operating results, capital ex penditures, rate base growth, dividend policy, financial outlook, and other statements that are not purely historical, are forward - looking statements. These forward - looking statements r eflect our current expectations; however, such statements involve risks and uncertainties. Actual results could differ materially from current expectations. These forward - looking stateme nts represent our expectations only as of the date of this presentation, and Edison International assumes no duty to update them to reflect new information, events or circumstances. Im por tant factors that could cause different results include, but are not limited to the: • ability of SCE to recover its costs through regulated rates, including uninsured wildfire - related and debris flow - related costs, costs incurred to mitigate the risk of utility equipment causing future wildfires, costs incurred as a result of the COVID - 19 pandemic, and increased labor and materials costs due to su pply chain constraints and inflation; • ability of SCE to implement its Wildfire Mitigation Plan and capital program; • risks of regulatory or legislative restrictions that would limit SCE's ability to implement operational measures to mitigate wil dfire risk, including Public Safety Power Shutoff (“PSPS”) and fast curve settings, when conditions warrant or would otherwise limit SCE's operational practices relative to wildfire risk m iti gation; • risks associated with implementing PSPS, including regulatory fines and penalties, claims for damages and reputational harm; • ability of SCE to maintain a valid safety certification; • ability to obtain sufficient insurance at a reasonable cost, including insurance relating to wildfire - related claims, and to rec over the costs of such insurance or, in the event liabilities exceed insured amounts, the ability to recover uninsured losses from customers or other parties; • extreme weather - related incidents (including events caused, or exacerbated, by climate change, such as wildfires, debris flows, droughts, high wind events and extreme heat events) and other natural disasters (such as earthquakes), which could cause, among other things, public safety issues, property damage, rot ating outages and other operational issues (such as issues due to damaged infrastructure), PSPS activations and unanticipated costs; • risk that California Assembly Bill 1054 (“AB 1054”) does not effectively mitigate the significant exposure faced by Californi a i nvestor - owned utilities related to liability for damages arising from catastrophic wildfires where utility facilities are alleged to be a substantial cause, including the longevity o f t he Wildfire Insurance Fund and the CPUC's interpretation of and actions under AB 1054, including its interpretation of the prudency standard established under AB 1054; • ability of Edison International and SCE to effectively attract, manage, develop and retain a skilled workforce, including its co ntract workers; • decisions and other actions by the California Public Utilities Commission, the Federal Energy Regulatory Commission, the Nucl ear Regulatory Commission and other governmental authorities, including decisions and actions related to nationwide or statewide crisis, determinations of authorized rates of re turn or return on equity, the recoverability of wildfire - related and debris flow - related costs, issuance of SCE's wildfire safety certification, wildfire mitigation efforts, approval an d implementation of electrification programs, and delays in executive, regulatory and legislative actions; • cost and availability of labor, equipment and materials, including as a result of supply chain constraints; • ability of Edison International or SCE to borrow funds and access bank and capital markets on reasonable terms; • risks associated with the decommissioning of San Onofre, including those related to worker and public safety, public oppositi on, permitting, governmental approvals, on - site storage of spent nuclear fuel and other radioactive material, delays, contractual disputes, and cost overruns; • pandemics, such as COVID - 19, and other events that cause regional, statewide, national or global disruption, which could impact, among other things, Edison International's and SCE's business, operations, cash flows, liquidity and/or financial results and cause Edison International and SCE to incur unantici pat ed costs; • physical security of Edison International's and SCE's critical assets and personnel and the cybersecurity of Edison Internati ona l's and SCE's critical information technology systems for grid control, and business, employee and customer data; • risks associated with cost allocation resulting in higher rates for utility bundled service customers because of possible cus tom er bypass or departure for other electricity providers such as Community Choice Aggregators (“CCA,” which are cities, counties, and certain other public agencies with the authority to g ene rate and/or purchase electricity for their local residents and businesses) and Electric Service Providers (entities that offer electric power and ancillary services to retail customers , o ther than electrical corporations (like SCE) and CCAs); • risks inherent in SCE’s capital investment program, including those related to project site identification, public opposition , e nvironmental mitigation, construction, permitting, changes in the California Independent System Operator’s transmission plans, and governmental approvals; and • risks associated with the operation of electrical facilities, including worker and public safety issues, the risk of utility ass ets causing or contributing to wildfires, failure, availability, efficiency, and output of equipment and facilities, and availability and cost of spare parts. Other important factors are discussed under the headings “Forward - Looking Statements”, “Risk Factors” and “Management’s Discussi on and Analysis” in Edison International’s Form 10 - K and other reports filed with the Securities and Exchange Commission, which are available on our website: www.edisoninvestor.c om. These filings also provide additional information on historical and other factual data contained in this presentation. Forward - Looking Statements November 1, 2022 |
|
2 Edison International Third Quarter Update Q3 2022 core EPS driven primarily by rate base earnings and CSRP final decision GAAP EPS: ($0.33) Core EPS 1 : $1.48 EIX narrows 2022 EPS guidance $ 4.48 – 4.68 2022 Core EPS 1 SCE continues excellent WMP progress On pace to complete 4,300 miles of covered conductor by year - end In Q3, SCE resolved ~$350 million of claims for 2017/2018 Wildfire/Mudslide Events; revised best estimate ($598 million charge, after - tax) Expects first cost recovery filing by late 2023 EIX reiterates long - term EPS growth rate 5 – 7% EPS CAGR 2021 – 2025 2 1. See Earnings Per Share Non - GAAP Reconciliations and Use of Non - GAAP Financial Measures in Appendix 2. Compound annual growth rate (CAGR) based on the midpoint of the initial 2021 EPS guidance range of $4.42 – 4.62 established Septem ber 16, 2021 November 1, 2022 |
|
3 SCE’s ongoing deployment of covered conductor and other grid hardening measures helps keep its communities safe November 1, 2022 Total Miles of Primary Distribution Lines ~17,000 Underground ~7,000 Overhead ~10,000 Bare Wire ~5,700 Covered Conductor ~4,300 Total distribution lines in high fire risk areas (HFRA) Overhead vs. underground miles Overhead miles hardened by end of 2022 Overhead miles hardened by end of 2028 Covered Conductor and Targeted Undergrounding ~8,600 Total hardened by end of 2028 (Remaining to be replaced through routine activities) ✓ Total Hardened Miles ~15,600+ ✓ ✓ ✓ |
|
4 SCE revises best estimate of expected losses for 2017/2018 Wildfire/Mudslide Events by $880 million, to $8.8 billion November 1, 2022 Change driven by new information • Statute of limitations for individual plaintiffs in Woolsey fire is now closed – Actual number of plaintiffs bringing claims now certain – Have obtained important additional information about claims • Now estimating higher costs to settle remaining claims, informed by experience to date Have better understanding of claims types • Now have a better sense for nature of claims (e.g., whether plaintiff has claim for smoke and ash damage, damaged property, entire property loss, or a business) Recent trends • Trends experienced in settlements have resulted in higher settlement values for various claims including: – Higher rebuild costs due in part to longer rebuild timelines – Increased inflation – More extensive landscaping damage Increased reserve related to Woolsey; reiterate TKM cost recovery application timeline — target filing by late 2023 |
|
5 Third Quarter Earnings Summary November 1, 2022 1. See EIX Core EPS Non - GAAP Reconciliations and Use of Non - GAAP Financial Measures in Appendix 2. For comparability, 2022 second quarter key EPS drivers are reported based on 2021 weighted - average share count of 379.8 million. 2022 third quarter weighted - average shares outstanding is 381.6 million 3. 2021 GRC true - up in Q3 2021 of $(0.35) including $(0.19) in revenue ($(0.33) in GRC authorized revenue), $(0.23) in O&M and $0.0 7 in depreciation 4. Includes $0.45 of higher tax benefits related to balancing accounts, which are offset in revenue 5. Includes $0.37 previously deferred operating expenses recovered through a regulatory mechanism and offset in revenue, primari ly related to the CSRP Decision Note: Diluted earnings were $(0.33) and ($0.90) per share for the three months ended September 30, 2022 and 2021, respectivel y Q3 2022 Q3 2021 Variance Basic Earnings Per Share (EPS) SCE (0.21) $ (0.75) $ 0.54 $ EIX Parent & Other (0.12) (0.15) 0.03 Basic EPS (0.33) $ (0.90) $ 0.57 $ Less: Non-core Items 1 SCE (1.84) $ (2.59) $ 0.75 $ EIX Parent & Other 0.03 — 0.03 Total Non-core Items (1.81) $ (2.59) $ 0.78 $ Core Earnings Per Share (EPS) SCE 1.63 $ 1.84 $ (0.21) $ EIX Parent & Other (0.15) (0.15) — Core EPS 1.48 $ 1.69 $ (0.21) $ Key SCE EPS Drivers 2 2021 GRC true-up in Q3 2021 3 (0.35) $ Higher revenue 0.30 CPUC revenue - GRC escalation 0.19 CPUC revenue - Other 4,5 0.08 FERC and other operating revenue 0.03 Higher O&M 5 (0.18) Wildfire-related claims 0.01 Higher depreciation 5 (0.33) Higher net financing costs 5 (0.08) Income taxes 4 0.43 Other — Property and other taxes 5 (0.03) Other income and expenses 0.03 Results prior to impact from share dilution (0.20) $ Impact from share dilution (0.01) Total core drivers (0.21) $ Non-core items 1 0.75 Total 0.54 $ Total core drivers — $ Non-core items 1 0.03 Total 0.03 $ Key EIX EPS Drivers 2 |
|
6 Range Case 2 n/a 5.5 5.5 5.2 5.3 5.4 5.7 6.0 5.8 – 5.9 6.7 2021 2022 2023 2024 2025 SCE has significant capital expenditure opportunities driven by investments in the safety and reliability of the grid November 1, 2022 Capital deployment expected to increase in future GRC and other applications 1 Capital Expenditures, $ in Billions Total 2021 – 2025 capital plan of $27 – 30 billion driven by investments in safety and reliability GRC track 1 and other approvals underpin spending through 2023 Primary 2024+ potential: – Deployment of incremental miles of covered conductor 3 – Investment to support infrastructure replacement and load growth – Transmission and energy storage investments to meet long - term state GHG targets – Transportation electrification enabling investment 1. Forecast for 2024 includes amounts requested in track 4 of SCE’s 2021 GRC. Forecast for 2025 includes amounts currently expec ted to be requested in SCE’s 2025 GRC filing. Additionally, reflects non - GRC spending subject to future regulatory requests beyond GRC proceedings and FERC Formula Rate updates 2. Annual Range Case capital reflects variability associated with future requests based on management judgment, potential for pe rmi tting delays and other operational considerations; GRC forecast is in line with authorized spend over the 2021 GRC track 1 cycle 3. The final decision in track 1 of SCE’s 2021 GRC established a cost recovery mechanism that would allow SCE to install additio nal covered conductor miles above the 4,500 circuit - mile level approved in the decision, including within the track 1 GRC period, subject to after - the - fact reasonableness review Future Requests |
|
7 Range Case 2 n/a 38.4 41.2 43.6 46.7 2021 GRC track 1 decision provides rate base visibility through 2023; future applications expected to extend growth November 1, 2022 1. Weighted - average year basis. Excludes rate base associated with ~$1.6 billion of wildfire mitigation - related spend that shall no t earn an equity return under AB 1054 2. Range Case rate base reflects capital expenditure Range Case forecast 3. The final decision in track 1 of SCE’s 2021 GRC established a cost recovery mechanism that would allow SCE to install additio nal covered conductor miles above the 4,500 circuit - mile level approved in the decision, including within the track 1 GRC period, subject to after - the - fact reasonableness review From a 2021 base, rate base growth forecast of 7 – 9% through 2025, reflecting future incremental investment Rate Base 1 , $ in Billions Forecast includes recovery of utility - owned storage and SCE’s building electrification request Substantial longer - term rate base growth potential from: – Deployment of incremental miles of covered conductor 3 – Investment to support infrastructure replacement and load growth – Transmission and energy storage investments to meet long - term state GHG targets – Transportation electrification enabling investment 35.3 38.6 41.9 44.8 – 45.0 49.5 2021 2022 2023 2024 2025 ~9 % 2021 – 2025 CAGR Future Requests |
|
8 EIX narrows 2022 core EPS guidance to $4.48 – 4.68 from $4.40 – 4.70 November 1, 2022 1. YTD results as of September 30, 2022, based on 2022 YTD weighted average shares of 381.2 million; 2022 guidance based on weig hte d average shares assumption of 381.5 million 2. SCE is unable to conclude, at this time, that these amounts are probable of recovery; however, recovery will be sought as par t o f future cost recovery applications Note: See Earnings Per Share Non - GAAP Reconciliations and Use of Non - GAAP Financial Measures in Appendix. All tax - effected infor mation on this slide is based on our current combined statutory tax rate of approximately 28%. Totals may not add due to rounding YTD Recorded 1 2022 Guidance 1 SCE 2022 Rate Base EPS 3.97 5.33 SCE Operational Variances 0.25 0.23 – 0.42 EIX Parent and Other (0.48 ) (0.71) – (0.70 ) EIX Operational Results 3.74 4.85 – 5.05 SCE Costs Excluded from Authorized (0.25 ) (0.37 ) EIX Consolidated Core EPS $3.49 $4.48 – 4.68 EIX 2022 Core Earnings Per Share Guidance Range Building from SCE Rate Base EPS Key components of variances from SCE rate base EPS 1 Rate Base EPS Recording at current cost of capital pending 2022 cost of capital decision SCE Operational Variances Includes financing benefits associated with 2022 cost of capital proceeding 0.10 EIX Parent and Other Operating expense, other (0.14) – (0.13 ) EIX interest expense / preferred dividends (0.57 ) SCE Costs Excluded from Authorized Wildfire Insurance Fund contribution interest expense (0.09 ) Wildfire claims payment debt interest expense 2 (0.12 ) Short - and long - term incentive comp not in rates; SB 901 disallowed exec comp (0.16 ) |
|
9 EIX is executing on its 2022 financing plan and has flexibility to defer equity content issuances to 2023 November 1, 2022 EIX 2022 Financing Plan 1 Q2 Update Q3 Update Maturity Refinancing Expect to refinance $700 million of parent debt with new debt issuances Completed $400 million parent refinancing in August Expect to refinance $300 million maturity with new debt Equity Content 2 Expect to issue securities with $300 – 400 million in combination of: – Preferred equity (50% equity content) – $100 million common equity via internal programs (100% equity content) – If needed, use of at - the - market (ATM) program (100% equity content) Need of $300 – 400 million of equity content: – $100 million common equity via internal programs ($75 million YTD) – Potential to complete remaining $200 – 300 million need with ATM program or preferred equity Execution Timing Issued $600 million term loan in April (maturing April 2023), providing flexibility for 2022 financing plan Flexibility to defer equity content securities issuance to 2023 – If deferred, will incorporate into 2023 financing plan to be shared on Q4 2022 earnings call ✓ ✓ 1. Financing plans are subject to change 2. Edison International expects to issue securities containing up to $250 million of equity content annually, on average from 20 22 through 2025. The higher - than - average equity content expected in 2022 is driven by the anticipated capital expenditures associated with SCE's utility owned storage projects |
|
10 SCE Wildfire Interest expense will be included in cost recovery applications. Current forecast embeds ~5.3% refinancing rate SCE Operational Minimal exposure based on authorized cost of capital and 2023 securitization of final $730 million of AB 1054 capex EIX Parent Currently forecasting ~6.1% refinancing rate EIX and SCE are identifying offsets to higher interest rates and expect to deliver on 5 – 7% 2021 – 2025 EPS CAGR November 1, 2022 Approximately $10 billion of the total ~$29 billion debt portfolio matures through 2027 1 Outstanding Short - and Long - Term Debt Maturities (Q4 2022 – 2027) 1 as of September 30, 2022, $ in Millions 1,035 730 550 1,765 - 900 - - Q4 2022 2023 2024 2025 2026 2027 1. Does not include commercial paper or amortization of secured recovery bonds issued by SCE Recovery Funding LLC. The table sho ws the 2023 mandatory purchase of $135 million of tax - exempt bonds as a maturity in 2023 2. For variable rate debt, based on 3 - month term SOFR as of October 28, 2022, of 4.09% plus the applicable spread 3. Average rate does not include the interest on the $730 million variable rate term loan, which will be repaid upon securitizat ion of AB 1054 capex and does not affect earnings 750 1,150 400 400 - 1,150 1,550 300 350 600 Q4 2022 2023 2024 2025 2026 2027 400 600 300 1,000 500 800 - 600 Q4 2022 2023 2024 2025 2026 2027 4.4% 3.4% 3 3.7% 2.1% 2.1% 4.2% 1.2% 4.7% 4.1% 3.6% 4.8% 5.8% 3.1% Wtd . Avg. Rate 2 Fixed Rate Variable Rate |
|
11 SCE’s operational excellence program, Catalyst , includes >600 employee - driven ideas with capital and O&M benefits 1 November 1, 2022 Major Themes Example High Impact Ideas Work Planning • Improve O&M cost efficiency by bundling work activities across inspections and repairs to reduce number of visits to the same asset • Optimize use of SCE's crews vs. contractors to perform construction and other tasks to manage costs while also developing employees' skills Procurement • Expand use of strategic sourcing to additional spend categories to secure better pricing • Optimize insourcing vs. outsourcing mix for certain work activities • Leverage reduced costs from vegetation management contractors to improve competitive bidding • Revise material management process at contractor warehouses Technology and Tools • Implement a single work management tool for vegetation management to optimize contractor assignments • Improve customer experience and lower service operating costs through self - service and optimized website Highest impact ideas show breadth of opportunity across operations, including affordability, safety, quality, and customer experience 1. Financial benefits include O&M, costs recovered through balancing accounts, and capital expenditures |
|
12 EIX reaffirms 5 – 7% 2021 – 2025 EPS growth rate target, which would result in 2025 EPS of $5.50 – 5.90 1 November 1, 2022 1. Based on the midpoint of initial 2021 Core EPS guidance range of $4.42 – 4.62 established September 16, 2021. Annual core EPS grow th during the period expected to be non - linear. Growth in any given year can be outside the range 2. Components are rounded to the nearest 5 cents and based on EIX 2022 guidance share count of 381.5 million shares. For the pur pos es of this illustration, all costs and dilution associated with any equity content issued beyond 2022 are reflected in the EIX Parent and Other line. Actual financing activity may vary and is subject to change 3. Based on SCE’s currently - authorized CPUC ROE of 10.3%. SCE has filed an application requesting a CPUC ROE for 2023 of 10.53% Component Tailwinds ( ▲ ) and Headwinds ( ▼ ) Rate Base EPS 3 (based on capex levels) 6.50 – 6.90 ▲ Non - GRC incremental capex opportunities ▲ ROE above / ( ▼ below) 10.30% ▲ Cost of capital mechanism ( ~ 5¢ EPS per 10bps change in CPUC ROE) SCE Op. Variances (including AFUDC) 0.50 – 0.60 ▲ Operational efficiencies ▲ Actual financing costs below / ( ▼ above) authorized EIX Parent & Other (including dilution) (0.80) – (0.95) ▼ Higher interest rates on refinancing (~1¢ EPS per ± 20bps change vs. current assumption of 6.1%) ▲ Lower total equity content issued SCE Costs Excluded from Authorized (primarily wildfire claims payment - related debt) (0.70) – (0.65) ▼ Higher interest rates on refinancing (~1¢ EPS per ± 20bps change vs. current assumption of 5.3%) ▼ Higher / ( ▲ Lower) actual losses from 2017/2018 Wildfire/Mudslide Events Pursuing opportunities to deliver 5 – 7% growth rate 2025 Core Earnings per Share Component Ranges 2 Company incorporates current interest rate and macroeconomic environment into guidance ranges Combinations of tailwinds and headwinds give us ability to achieve EPS growth target Committed to deliver on 2021 – 2025 EPS growth rate target Key Takeaways |
|
13 EIX has double - digit total return potential, supported by leadership role in clean energy transition November 1, 2022 9 – 11% total return o pportunity 4 before potential P/E multiple expansion driven by estimated 65 – 70% wildfire risk reduction 5 , a nd ongoing utility and government wildfire mitigation efforts 1. Compound annual growth rate (CAGR) based on the midpoint of the 2021 Core EPS guidance range of $4.42 – 4.62 established on Septem ber 16, 2021 2. Based on EIX stock price on October 31, 2022 3. Building electrification programs subject to CPUC approval 4. At current P/E multiple. Excludes changes in P/E multiple and potential dividend growth 5. Risk reduction based on mitigations through June 30, 2022 5 – 7% core EPS CAGR 1 2021 to 2025 Underpinned by strong rate base growth of ~7 – 9% $27 – 30 billion 2021 – 2025 capital program ~4%+ current dividend yield 2 18 consecutive years of dividend growth Target dividend payout of 45 – 55% of SCE core earnings Investments in safety and reliability of the grid Wildfire mitigation execution reduces risk for customers Creates strong foundation for climate adaptation and the clean energy transition One of the strongest electrification profiles in the industry Industry - leading programs for transportation electrification and building electrification 3 Potential for 60% load growth by 2045 |
|
Appendix |
|
15 Cost of Capital Status: Constructive proposed decisions issued for 2022. PD for 2023 – 2025 expected in November November 1, 2022 Year Proposed ROE Status 2022 10.30% (i.e., currently authorized) • Constructive proposed decision (PD) and alternate proposed decision (APD) issued on September 30 • Both find that extraordinary circumstances warrant departure from Cost of Capital Mechanism adjustment for 2022 • PD would initiate a Phase 2 to determine 2022 cost of capital • President Reynolds’ APD would leave cost of capital unchanged and close proceeding • Both proposed decisions expected to be voted on by the Commission on November 3 2023 – 2025 10.53% • Briefing submitted September 30 • Would reset Cost of Capital Mechanism (CCM) benchmark rate to 4.37% for determining whether CCM would trigger for 2024 or 2025 – Current spot Moody’s Baa Utility Bond Index is ~6.3% 1 • CPUC’s schedule calls for proposed decision around November 10 1. As of October 28, 2022 |
|
16 2017/2018 Wildfire/Mudslide Events Update: ~85% of best estimate resolved. Anticipate cost recovery filing by late 2023 November 1, 2022 7.5 1.2 8.8 Best Estimate of Total Losses ~85% of best estimate has been resolved 1. After giving effect to all payment obligations under settlements entered into through September 30, 2022, including under the ag reement with the Safety and Enforcement Division of the CPUC 2. TKM: Collectively, the Thomas Fire, the Koenigstein Fire, and the Montecito Mudslides SCE continues to make substantial progress resolving claims… $ in Billions, as of September 30, 2022 …and SCE will seek CPUC recovery of prudently - incurred actual losses and related costs in excess of insurance Remaining Expected Potential Losses 1 SCE currently expects to seek cost recovery for ~$6 billion in separate applications for TKM 2 and Woolsey – Excludes insurance recoveries, FERC recoveries, and other ineligible amounts – SCE will include interest on debt issued to finance claims payments in recovery requests SCE continues to anticipate filing first application for cost recovery by late 2023 , assuming relevant proceedings progress as expected Application timing will account for several factors, including: – Substantial resolution of claims (90%+ of value) in each of TKM 2 and Woolsey – Status of remaining estimated claims at time of filing – Other litigation activities Considerations for Future CPUC Cost Recovery Applications |
|
17 Edison’s near - term debt maturities are manageable with ~33% tied to SCE’s operations or AB 1054 securitization Q4 2022 2023 2024 2025 2026 2027 Variable Rate (SOFR+) SCE: Operational 2 550 – – – – – SCE: AB 1054 Bridge 2 – 730 – – – – SCE: Wildfire Claims – 400 400 – – – EIX Parent 2 – 600 – – – – Total Variable Rate 550 1,730 400 – – – Fixed Rate SCE: Operational – 1,035 – 900 – – SCE: Wildfire Claims – 750 1,150 300 350 600 EIX Parent 300 400 500 800 – 600 Total Fixed Rate 300 2,185 1,650 2,000 350 1,200 Total Debt 1 SCE: Operational 550 1,035 – 900 – – SCE: AB 1054 Bridge – 730 – – – – SCE: Wildfire Claims – 1,150 1,550 300 350 600 EIX Parent 300 1,000 500 800 – 600 Total Debt 850 3,915 2,050 2,000 350 1,200 Currently Outstanding Debt Maturities (Q4 2022 – 2027) 1 $ in Millions, as of September 30, 2022 SCE term loan bridges to 2023 securitization of AB 1054 capex; does not affect earnings EIX term loan provides flexibility for 2022 financing plan execution SCE will seek cost recovery of claims settlements and associated interest 3 November 1, 2022 1. Does not include commercial paper borrowings, amortization of secured recovery bonds issued by SCE Recovery Funding LLC. The tab le shows the 2023 mandatory purchase of $135 million of tax - exempt bonds as a maturity in 2023. The company may choose to remarket the tax - exempt bonds at that time. The bonds mature in 2033 2. Classified as short - term debt on the balance sheet 3. Refers to CPUC recovery of prudently - incurred actual losses and related costs in excess of insurance. Excludes insurance recover ies, FERC recoveries, and other ineligible amounts. SCE will include interest on debt issued to finance claims payments in recovery requests |
|
18 SCE continues to fund wildfire claims payments above insurance and FERC rate recoveries with debt November 1, 2022 Series Principal Due Rate 2021B 400 4/3/23 SOFR + 64bps 2021D 350 4/3/23 0.700% 2021J 400 8/1/23 0.700% 2021C 400 4/1/24 SOFR + 83bps 2021E 700 4/1/24 1.100% 2021K 450 8/1/24 0.975% 2022C 300 6/1/25 4.200% 2020C 350 2/1/26 1.200% 2022D 600 6/1/27 4.700% 2022E 350 6/1/52 5.450% Total $4,300 Annualized Interest 1 : ~$120 Wildfire Claims Payment - Related Debt Issuances $ in Millions except percentages, as of September 30, 2022 Total issuance of $4.3 billion to - date; additional debt to be issued as more claims settled Interest expense not currently recoverable in rates, however, will be included in cost recovery applications for the 2017/2018 Wildfire/Mudslide Events 2 SCE has waiver from CPUC, allowing exclusion with respect to certain non - cash charges to equity and associated debt for calculating SCE’s regulatory equity ratio – Extension of waiver pending decision from CPUC 1. Based on SOFR of 4.09% as of October 28, 2022 2. Excluding the carrying cost associated with the $375 million of wildfire claims payments foreclosed from cost recovery under an agreement with the Safety and Enforcement Division of the CPUC |
|
19 Cash flow from memo account recovery and securitization strengthens our balance sheet and credit metrics November 1, 2022 Approved Applications Application / Account Balance @ Sept. 30 Recovery Through Remaining Rate Recovery by Year Q4 2022 2023 2024 2025 ✓ GRC Track 1 (Jan. – Sept. 2021 Balance) 401 Dec. ’23 80 321 – – ✓ GRC Track 3 401 Sept. ’25 33 134 134 100 ✓ CSRP Track 1 388 Dec. 25 – 199 87 102 ✓ GRC Track 2 324 Feb. ’25 34 134 134 22 ✓ 2020 – 2021 Residential Uncollectibles 2 86 Feb. ’25 22 34 26 4 Total 1,600 168 822 381 229 Pending & Future Applications (Subject to CPUC Authorization) Application Request 3 Expected Amort. 3 Expected Rate Recovery by Year Q4 2022 2023 2024 2025 Wildfire Mitigation & Vegetation Mgmt. 327 12 months – 191 136 – WEMA2 215 12 months – 215 – – 2022 CEMA 198 12 months – – 198 – 2021 CEMA 132 12 months – 77 55 – Total 872 – 483 389 – Expected Securitizations 4,5 AB 1054 Capital Included In: Amount Q4 2022 2023 2024 2025 GRC Tracks 1 & 3 730 – 730 – – Total 730 – 730 – – 1. Numbers may not add due to rounding 2. 2020 – 2021 Residential Uncollectibles are tracked in a balancing account authorized by the CPUC and implemented in rates without a separate application 3. Requested revenue requirement. Amounts and amortization subject to CPUC approval 4. Amounts refer to securitization of AB 1054 capex. Actual timing will depend on the timing of CPUC authorizations and implemen tat ion in customer rates or execution of securitization transactions 5. Amounts reflect capital costs recovered upfront via securitization. Recovery in customer rates of costs to service the bonds tak es place over the tenor of the debt at a fixed recovery charge rate GRC, Uncollectibles, Wildfire - related, and Wildfire Insurance Applications $ in Millions 1 |
|
20 2022 EIX Core Earnings Guidance Assumptions November 1, 2022 1. Beginning in 2023, Intervenors have an annual opportunity to terminate the TO2019A Formula Rate. The earliest any new rate co uld become effective is January 1, 2024 2. Does not include securities with equity content that could be issued to enable SCE to issue debt to finance payments for reso lut ion of claims related to the 2017/2018 Wildfire/Mudslide Events while allowing Edison International and SCE to maintain investment grade credit ratings Note: All tax - effected information on this slide is based on our current combined statutory tax rate of approximately 28% 2022 Assumption Additional Notes CPUC Rate Base ($ in Billions) $31.1 Return on Equity (ROE) 10.30% • ROE sensitivity: 4 cents EPS for 10bps change in ROE Equity in Capital Structure 52.0% FERC Rate Base ($ in Billions) $7.5 Return on Equity (ROE) 1 10.30% Equity in Capital Structure 1 47.5% Other Items SCE Operational Variances ($ Millions, after - tax) ~$85 – 160 Representative items: • AFUDC $130 • Financing benefits associated with 2022 cost of capital proceeding $38 • Shareholder - funded expenses not recovered in GRC $45 SCE Wildfire Claims Payment Debt Interest Expense ($ Millions, after - tax) ~$45 • SCE funds resolution of wildfire claims with debt • $4.3 billion outstanding at 9/30/2022 EIX Equity Issuance 2 ($ in Millions) ~$300 – 400 of equity content • See EIX Financing Plan update page |
|
21 Year - to - Date Earnings Summary November 1, 2022 1. See EIX Core EPS Non - GAAP Reconciliations and Use of Non - GAAP Financial Measures in Appendix 2. For comparability, 2022 key EPS drivers are reported based on 2021 weighted - average share count of 379.5 million. 2022 weighted - average shares outstanding is 381.2 million 3. Includes $0.39 of higher tax benefits related to balancing accounts, which are offset in revenue 4. Includes $1.22 previously deferred operating expenses recovered through a regulatory mechanism and offset in revenue, primari ly related to 2021 GRC track 2 and track 3 approvals and the CSRP Decision Note: Diluted earnings were $0.52 and $0.62 per share for the nine months ended September 30, 2022 and 2021, respectively YTD YTD 2022 2021 Variance Basic Earnings Per Share (EPS) SCE 0.97 $ 0.98 $ (0.01) $ EIX Parent & Other (0.45) (0.36) (0.09) Basic EPS 0.52 $ 0.62 $ (0.10) $ Less: Non-core Items 1 SCE (3.00) $ (2.81) $ (0.19) $ EIX Parent & Other 0.03 — 0.03 Total Non-core Items (2.97) $ (2.81) $ (0.16) $ Core Earnings Per Share (EPS) SCE 3.97 $ 3.79 $ 0.18 $ EIX Parent & Other (0.48) (0.36) (0.12) Core EPS 3.49 $ 3.43 $ 0.06 $ Key SCE EPS Drivers 2 Higher revenue 1.64 $ CPUC revenue - GRC escalation 0.53 CPUC revenue - Other 3,4 1.01 FERC and other operating revenue 0.10 Higher O&M 4 (1.19) Higher depreciation 4 (0.49) Higher net financing costs 4 (0.20) Income taxes 3 0.41 Other 0.02 Property and other taxes 4 (0.02) Other income and expenses 0.04 Results prior to impact from share dilution 0.19 $ Impact from share dilution (0.01) Total core drivers 0.18 $ Non-core items 1 (0.19) Total (0.01) $ (0.12) Total core drivers (0.12) $ Non-core items 1 0.03 Total (0.09) $ Key EIX EPS Drivers 2 EIX Parent and Other |
|
22 Earnings Non - GAAP Reconciliations November 1, 2022 1. Non - core items are tax - effected at an estimated statutory rate of approximately 28% Reconciliation of EIX GAAP Earnings to EIX Core Earnings Earnings (Losses) Attributable to Edison International, $ in Millions 1 Q3 2022 Q3 2021 YTD 2022 YTD 2021 SCE (80) $ (284) $ 369 $ 371 $ EIX Parent & Other (48) (57) (172) (135) Basic Earnings (128) $ (341) $ 197 $ 236 $ Non-Core Items SCE 2017/2018 Wildfire/Mudslide Events claims and expenses, net of recoveries (600) (899) (891) (909) Wildfire Insurance Fund expense (39) (39) (115) (116) Upstream Lighting Program decision (64) — (64) — CSRP impairment — — (34) — Employment litigation matter, net of recoveries — — (16) — GRC track 3 impairment — — (12) — Organizational realignment charge — — (10) — Disallowed historical capital expenditures in SCE's 2021 GRC decision — (47) — (47) Sale of San Onofre nuclear fuel — — — 7 EIX Parent & Other Customer revenues for EIS insurance contract, net of claims 11 — 11 — Less: Total non-core items (692) $ (985) $ (1,131) $ (1,065) $ SCE 623 701 1,511 1,436 EIX Parent & Other (59) (57) (183) (135) Core Earnings 564 $ 644 $ 1,328 $ 1,301 $ |
|
23 EIX Core EPS Non - GAAP Reconciliations November 1, 2022 1. 2022 EPS are reported based on weighted - average share counts of 381.6 million for third quarter and 381.2 million for year - to - da te; 2021 EPS are reported based on weighted - average share counts of 379.8 million for third quarter and 379.5 million for year - to - date Reconciliation of EIX Basic Earnings Per Share to EIX Core Earnings Per Share EPS Attributable to Edison International 1 Q3 2022 Q3 2021 YTD 2022 YTD 2021 Basic EPS (0.33) $ (0.90) $ 0.52 $ 0.62 $ Non-Core Items SCE 2017/2018 Wildfire/Mudslide Events claims and expenses, net of recoveries (1.57) (2.37) (2.34) (2.40) Wildfire Insurance Fund expense (0.10) (0.10) (0.30) (0.31) Upstream Lighting Program decision (0.17) — (0.17) — CSRP impairment — — (0.09) — Employment litigation matter, net of recoveries — — (0.04) — GRC track 3 impairment — — (0.03) — Organizational realignment charge — — (0.03) — Disallowed historical capital expenditures in SCE's 2021 GRC decision — (0.12) — (0.12) Sale of San Onofre nuclear fuel — — — 0.02 EIX Parent & Other Customer revenues for EIS insurance contract, net of claims 0.03 — 0.03 — Less: Total non-core items (1.81) (2.59) (2.97) (2.81) Core EPS 1.48 $ 1.69 $ 3.49 $ 3.43 $ |
|
24 Low High Basic EIX EPS $1.51 $1.71 Total Non - Core Items 2 (2.97 ) (2.97) Core EIX EPS $4.48 $4.68 1. EPS is calculated on the assumed weighted - average share count for 2022 of 381.5 million 2. Non - core items are presented as they are recorded Earnings Per Share Non - GAAP Reconciliations November 1, 2022 Reconciliation of EIX Basic Earnings Per Share Guidance to EIX Core Earnings Per Share Guidance 1 2022 EPS Attributable to Edison International |
|
25 Edison International's earnings are prepared in accordance with generally accepted accounting principles used in the United States. Management uses core earnings (losses) internally for financial planning and for analysis of performance. Core earnings (losses) are also used when communicating with investors and analysts regarding Edison International's earnings results to facilitate comparisons of the company's performance from period to period. Core earnings (losses) are a non - GAAP financial measure and may not be comparable to those of other companies. Core earnings (losses) are defined as earnings attributable to Edison International shareholders less non - core items. Non - core items include income or loss from discontinued operations and income or loss from significant discrete items that management does not consider representative of ongoing earnings, such as write downs, asset impairments and other income and expense related to changes in law, outcomes in tax, regulatory or legal proceedings, and exit activities, including sale of certain assets and other activities that are no longer continuing. A reconciliation of Non - GAAP information to GAAP information is included either on the slide where the information appears or on another slide referenced in this presentation. EIX Investor Relations Contact Sam Ramraj, Vice President Derek Matsushima, Senior Manager (626) 302 - 2540 (626) 302 - 3625 Sam.Ramraj@edisonintl.com Derek.Matsushima@edisonintl.com Use of Non - GAAP Financial Measures November 1, 2022 |