UNITED STATES
SECURITIES AND EXCHANGE COMMISSION
Washington, D.C. 20549
FORM 8-K
CURRENT REPORT
Pursuant to Section 13 or 15(d) of the Securities Exchange Act of 1934
Date of Report (Date of earliest event reported): July 28, 2022
Commission |
|
Exact Name of Registrant |
|
State or Other Jurisdiction of |
|
IRS Employer |
1-9936 |
|
EDISON INTERNATIONAL |
|
California |
|
95-4137452 |
1-2313 |
|
SOUTHERN CALIFORNIA EDISON COMPANY |
|
California |
|
95-1240335 |
Check the appropriate box below if the Form 8-K filing is intended to simultaneously satisfy the filing obligation of the registrant under any of the following provisions:
[ ☐ ] Written communications pursuant to Rule 425 under the Securities Act (17 CFR 230.425)
[ ☐ ] Soliciting material pursuant to Rule 14a-12 under the Exchange Act (17 CFR 240.14a-12)
[ ☐ ] Pre-commencement communications pursuant to Rule 14d-2(b) under the Exchange Act (17 CFR 240.14d-2(b))
[ ☐ ] Pre-commencement communications pursuant to Rule 13e-4(c) under the Exchange Act (17 CFR 240.13e-4(c))
Securities registered pursuant to Section 12(b) of the Act:
Edison International:
Southern California Edison Company: None
Indicate by check mark whether the registrant is an emerging growth company as defined in Rule 405 of the Securities Act of 1933 (§230.405 of this chapter) or Rule 12b-2 of the Securities Exchange Act of 1934 (§240.12b-2 of this chapter).
If an emerging growth company, indicate by check mark if the registrant has elected not to use the extended transition period for complying with any new or revised financial accounting standards provided pursuant to Section 13(a) of the Exchange Act.
This current report and its exhibits include forward-looking statements. Edison International and Southern California Edison Company ("SCE") based these forward-looking statements on their current expectations and projections about future events in light of their knowledge of facts as of the date of this current report and their assumptions about future circumstances. These forward-looking statements are subject to various risks and uncertainties that may be outside the control of Edison International and SCE. Edison International and SCE have no obligation to publicly update or revise any forward-looking statements, whether due to new information, future events, or otherwise. This current report should be read with Edison International's and SCE's combined Annual Report on Form 10-K for the year ended December 31, 2021 and subsequent Quarterly Reports on Form 10-Q. Additionally, Edison International and SCE provide direct links to EIX and SCE presentations, documents and other information at www.edisoninvestor.com (Presentations and Updates) in order to publicly disseminate such information.
Item 2.02Results of Operations and Financial Condition
On July 28, 2022, Edison International issued a press release reporting its financial results and the financial results for its subsidiary, Southern California Edison Company, for the quarter ended June 30, 2022. A copy of the press release is attached as Exhibit 99.1. On the same day, members of Edison International's management will speak to investors via a financial teleconference. Senior management's prepared remarks and accompanying presentation are attached as Exhibit 99.2 and Exhibit 99.3 to this report. The information furnished in this Item 2.02 and Exhibits 99.1, 99.2, and 99.3 shall not be deemed to be “filed” for purposes of the Securities Exchange Act of 1934, nor shall it be deemed to be incorporated by reference in any filing under the Securities Act of 1933.
Item 7.01Regulation FD Disclosure
Members of Edison International management will use the information in the presentation furnished as Exhibit 99.3 to this report in meetings with institutional investors and analysts and at investor conferences. The attached presentation will also be posted on www.edisoninvestor.com.
Item 9.01Financial Statements and Exhibits
(d) |
Exhibits |
EXHIBIT INDEX
|
|
|
Exhibit No. |
|
Description |
|
|
|
99.1 |
|
|
|
|
|
99.2 |
|
Edison International Q2 2022 Financial Results Conference Call Prepared Remarks dated July 28, 2022 |
|
|
|
99.3 |
|
Edison International Q2 2022 Financial Results Conference Call Presentation dated July 28, 2022 |
|
|
|
104 |
|
Cover Page Interactive Data File (embedded within the Inline XBRL document) |
SIGNATURES
Pursuant to the requirements of the Securities Exchange Act of 1934, the registrants have duly caused this report to be signed on its behalf by the undersigned hereunto duly authorized.
Date: July 28, 2022
Date: July 28, 2022
Exhibit 99.1
FOR IMMEDIATE RELEASE |
Investor Relations: Sam Ramraj, (626) 302-2540 |
||
|
Media Contact: Jeff Monford, (626) 476-8120 |
||
Edison International Reports Second Quarter 2022 Results
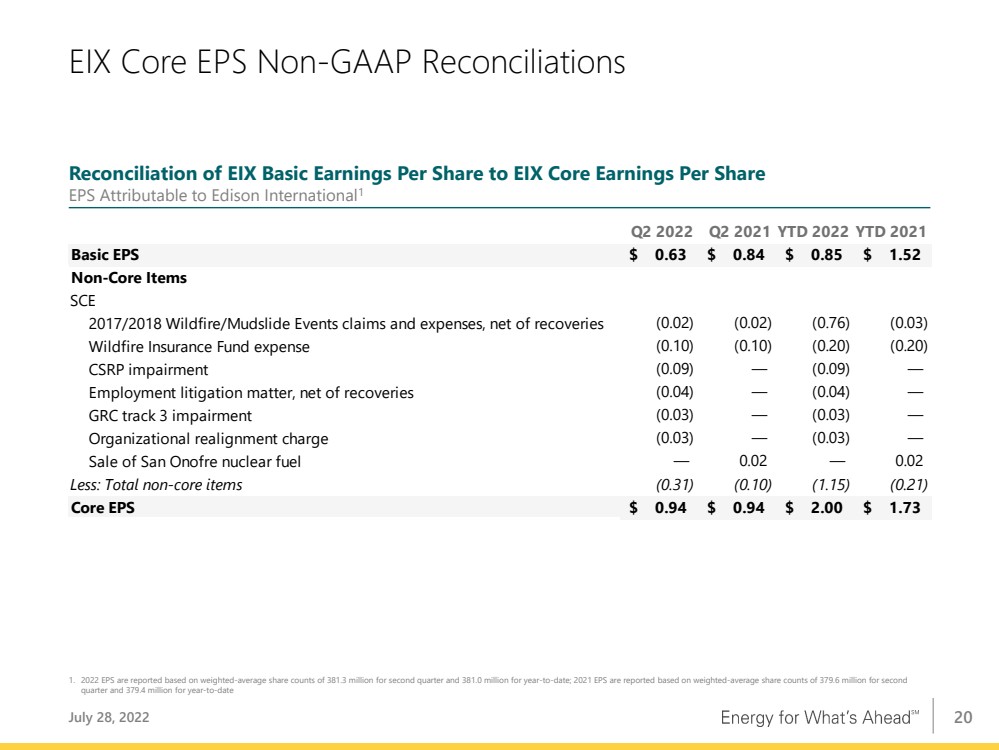
| ● | Second Quarter 2022 GAAP earnings per share of $0.63; Core EPS of $0.94 |
| ● | Installed more than 3,500 circuit miles of covered conductor to-date, just 3.5 years after initiating program |
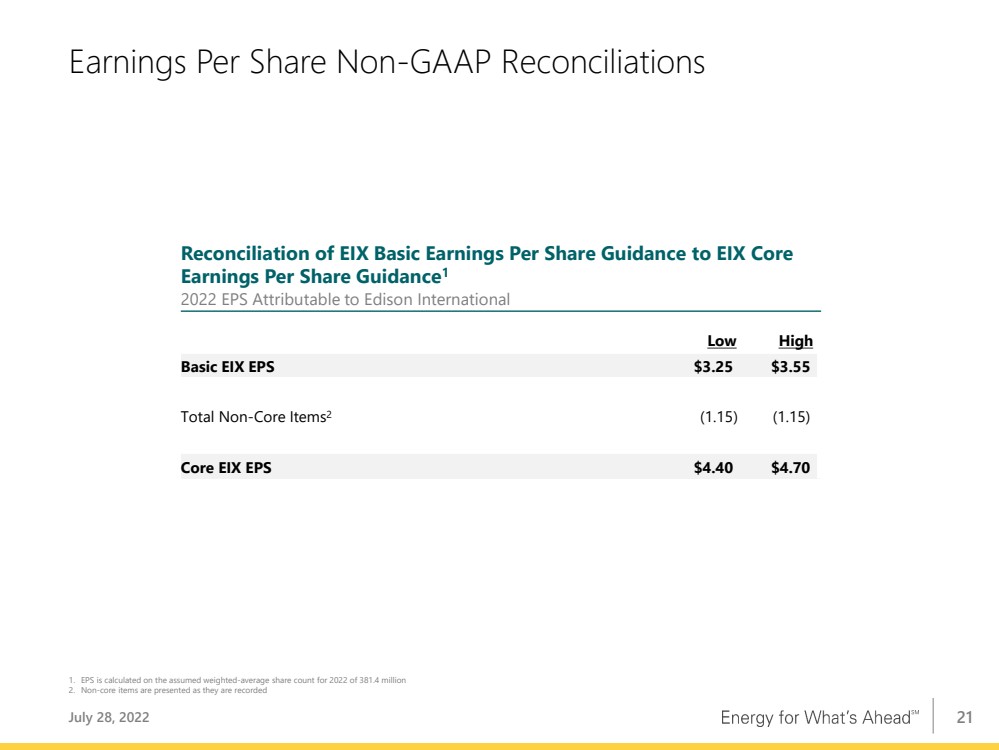
| ● | Reaffirms 2022 EPS guidance of $4.40–4.70. Also reiterates long-term EPS growth rate target of 5–7% |
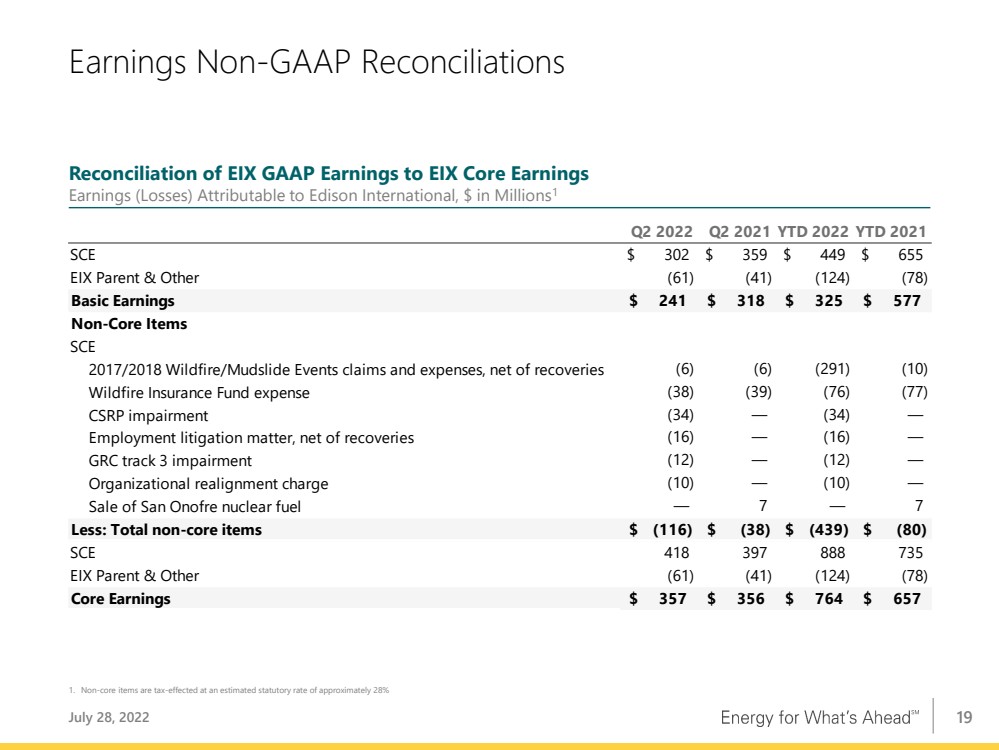
ROSEMEAD, Calif., July 28, 2022 — Edison International (NYSE: EIX) today reported second quarter 2022 net income of $241 million, or $0.63 per share, compared to net income of $318 million, or $0.84 per share, in the second quarter of 2021. As adjusted, second quarter 2022 core earnings were $357 million, or $0.94 per share, compared to core earnings of $356 million, or $0.94 per share, in the second quarter of 2021.
Southern California Edison’s (SCE) second quarter 2022 core earnings per share (EPS) increased year-over-year, primarily due to the adoption of the 2021 General Rate Case final decision in the third quarter of 2021, partially offset by higher operation and maintenance expenses.
Edison International Parent and Other's second quarter 2022 loss per share increased year-over-year primarily due to higher preferred dividends and unrealized losses on investment in 2022 compared to unrealized gains in 2021.
“SCE has made tremendous progress in wildfire mitigation, achieving a significant grid hardening milestone of replacing over 3,500 circuit miles of bare wire with covered conductor in just over three and a half years,” said Pedro J. Pizarro, president and CEO of Edison International. “Further, the utility plans to continue its current pace of installing about 1,200 miles per year of covered conductor for the next couple of years. I am confident that SCE’s covered conductor program has and will continue to substantially improve safety for customers.”
Pizarro added, “Investing in wildfire risk mitigation is a core component in adapting to climate change. We also have a continuing focus on sustainability, since this underlies the company’s strategy. I’m proud of the meaningful progress we make every year to advance our clean energy strategy and provide value to our stakeholders. One highlight is that SCE has the lowest system average rate among the large California IOUs, primarily due to more than a decade of committed focus on operational excellence and cost management.”
Edison International uses core earnings, which is a non-GAAP financial measure that adjusts for significant discrete items that management does not consider representative of ongoing earnings. Edison International management believes that core earnings provide more meaningful comparisons of performance from period to period. Please see the attached tables for a reconciliation of core earnings to basic GAAP earnings.
Edison International Reports Second Quarter 2022 Financial Results
Page 2 of 10
2022 Earnings Guidance
The company reaffirmed its earnings guidance range for 2022 as summarized in the following chart. See the presentation accompanying the company’s conference call for further information and assumptions.
|
|
2022 Earnings Guidance |
|
2022 Earnings Guidance |
||||||||
|
|
as of May 3, 2022 |
|
as of July 28, 2022 |
||||||||
|
|
Low |
|
High |
|
Low |
|
High |
||||
EIX Basic EPS |
|
$ |
3.55 |
|
$ |
3.85 |
|
$ |
3.25 |
|
$ |
3.55 |
Less: Non-core Items* |
|
|
(0.85) |
|
|
(0.85) |
|
|
(1.15) |
|
|
(1.15) |
EIX Core EPS |
|
$ |
4.40 |
|
$ |
4.70 |
|
$ |
4.40 |
|
$ |
4.70 |
* There were ($439) million, or ($1.15) per share of non-core items recorded for the six months ended June 30, 2022, calculated based on an assumed weighted average share count for 2022. Basic EIX EPS guidance only incorporates non-core items to June 30, 2022.
Second Quarter 2022 Earnings Conference Call and Webcast Details
When: |
|
Thursday, July 28, 2022, 1:30 – 2:30 p.m. (Pacific Time) |
Telephone Numbers: |
|
1-888-673-9780 (US) and 1-312-470-0178 (Int'l) - Passcode: Edison |
Telephone Replay: |
|
1-866-430-4723 (US) and 1-203-369-0925 (Int’l) - Passcode: 4276 |
|
|
Telephone replay available through August 12, 2022 at 6:00 p.m. (Pacific Time) |
Webcast: |
|
www.edisoninvestor.com |
Edison International has posted its earnings conference call prepared remarks by the CEO and CFO, the teleconference presentation, and Form 10-Q to the company's investor relations website. These materials are available at www.edisoninvestor.com.
About Edison International
Edison International (NYSE: EIX) is one of the nation’s largest electric utility holding companies, providing clean and reliable energy and energy services through its independent companies. Headquartered in Rosemead, California, Edison International is the parent company of Southern California Edison Company, a utility that delivers electricity to 15 million people across Southern, Central and Coastal California. Edison International is also the parent company of Edison Energy LLC, a global energy advisory firm engaged in the business of providing integrated decarbonization and energy solutions to commercial, industrial and institutional customers.
Edison International Reports Second Quarter 2022 Financial Results
Page 3 of 10
Appendix
Use of Non-GAAP Financial Measures
Edison International’s earnings are prepared in accordance with generally accepted accounting principles used in the United States and represent the company’s earnings as reported to the Securities and Exchange Commission. Our management uses core earnings and core earnings per share (EPS) internally for financial planning and for analysis of performance of Edison International and Southern California Edison. We also use core earnings and core EPS when communicating with analysts and investors regarding our earnings results to facilitate comparisons of the Company’s performance from period to period. Financial measures referred to as net income, basic EPS, core earnings, or core EPS also apply to the description of earnings or earnings per share.
Core earnings and core EPS are non-GAAP financial measures and may not be comparable to those of other companies. Core earnings and core EPS are defined as basic earnings and basic EPS excluding income or loss from discontinued operations and income or loss from significant discrete items that management does not consider representative of ongoing earnings. Basic earnings and losses refer to net income or losses attributable to Edison International shareholders. Core earnings are reconciled to basic earnings in the attached tables. The impact of participating securities (vested awards that earn dividend equivalents that may participate in undistributed earnings with common stock) for the principal operating subsidiary is not material to the principal operating subsidiary’s EPS and is therefore reflected in the results of the Edison International holding company, which is included in Edison International Parent and Other.
Safe Harbor Statement
Statements contained in this release about future performance, including, without limitation, operating results, capital expenditures, rate base growth, dividend policy, financial outlook, and other statements that are not purely historical, are forward-looking statements. These forward-looking statements reflect our current expectations; however, such statements involve risks and uncertainties. Actual results could differ materially from current expectations. These forward-looking statements represent our expectations only as of the date of this release, and Edison International assumes no duty to update them to reflect new information, events or circumstances. Important factors that could cause different results include, but are not limited to the:
| • | ability of SCE to recover its costs through regulated rates, including uninsured wildfire-related and debris flow-related costs, costs incurred to mitigate the risk of utility equipment causing future wildfires, costs incurred as a result of the COVID-19 pandemic, and increased labor and materials costs due to supply chain constraints and inflation; |
| • | ability of SCE to implement its Wildfire Mitigation Plan and capital program; |
| • | risks of regulatory or legislative restrictions that would limit SCE's ability to implement Public Safety Power Shutoff ("PSPS") when conditions warrant or would otherwise limit SCE's operational PSPS practices; |
| • | risks associated with implementing PSPS, including regulatory fines and penalties, claims for damages and reputational harm; |
| • | ability of SCE to maintain a valid safety certification; |
| • | ability to obtain sufficient insurance at a reasonable cost, including insurance relating to wildfire-related claims, and to recover the costs of such insurance or, in the event liabilities exceed insured amounts, the ability to recover uninsured losses from customers or other parties; |
| • | extreme weather-related incidents (including events caused, or exacerbated, by climate change, such as wildfires, debris flows, droughts, high wind events and extreme heat events) and other natural disasters (such as earthquakes), which could cause, among other things, public safety issues, property damage, operational issues (such as rotating outages and issues due to damaged infrastructure), PSPS activations and unanticipated costs; |
| • | risk that California Assembly Bill 1054 ("AB 1054") does not effectively mitigate the significant exposure faced by California investor-owned utilities related to liability for damages arising from catastrophic wildfires where utility facilities are alleged to be a substantial cause, including the longevity of the Wildfire Insurance Fund and |
Edison International Reports Second Quarter 2022 Financial Results
Page 4 of 10
| the CPUC's interpretation of and actions under AB 1054, including its interpretation of the prudency standard established under AB 1054; |
| • | ability of Edison International and SCE to effectively attract, manage, develop and retain a skilled workforce, including its contract workers; |
| • | decisions and other actions by the California Public Utilities Commission, the Federal Energy Regulatory Commission, the Nuclear Regulatory Commission and other governmental authorities, including decisions and actions related to nationwide or statewide crisis, determinations of authorized rates of return or return on equity, the recoverability of wildfire-related and debris flow-related costs, issuance of SCE's wildfire safety certification, wildfire mitigation efforts, approval and implementation of electrification programs, and delays in executive, regulatory and legislative actions; |
| • | cost and availability of labor, equipment and materials, including as a result of supply chain constraints; |
| • | ability of Edison International or SCE to borrow funds and access bank and capital markets on reasonable terms; |
| • | risks associated with the decommissioning of San Onofre, including those related to worker and public safety, public opposition, permitting, governmental approvals, on-site storage of spent nuclear fuel and other radioactive material, delays, contractual disputes, and cost overruns; |
| • | pandemics, such as COVID-19, and other events that cause regional, statewide, national or global disruption, which could impact, among other things, Edison International's and SCE's business, operations, cash flows, liquidity and/or financial results and cause Edison International and SCE to incur unanticipated costs; |
| • | physical security of Edison International's and SCE's critical assets and personnel and the cybersecurity of Edison International's and SCE's critical information technology systems for grid control, and business, employee and customer data; |
| • | risks associated with cost allocation resulting in higher rates for utility bundled service customers because of possible customer bypass or departure for other electricity providers such as Community Choice Aggregators ("CCA," which are cities, counties, and certain other public agencies with the authority to generate and/or purchase electricity for their local residents and businesses) and Electric Service Providers (entities that offer electric power and ancillary services to retail customers, other than electrical corporations (like SCE) and CCAs); |
| • | risks inherent in SCE's capital investment program, including those related to project site identification, public opposition, environmental mitigation, construction, permitting, changes in the California Independent System Operator's transmission plans, and governmental approvals; and |
| • | risks associated with the operation of electrical facilities, including worker and public safety issues, the risk of utility assets causing or contributing to wildfires, failure, availability, efficiency, and output of equipment and facilities, and availability and cost of spare parts. |
Additional information about risks and uncertainties is contained in Edison International and SCE’s most recent combined Form 10-Q and Form 10-K filed with the Securities and Exchange Commission, including the "Risk Factors" sections. Readers are urged to read this entire release as well as the most recent Form 10-Q and Form 10-K (including information incorporated by reference), and carefully consider the risks, uncertainties, and other factors that affect Edison International's and SCE's businesses. Edison International and SCE post or provide direct links (i) to certain SCE and other parties' regulatory filings and documents with the CPUC and the FERC and certain agency rulings and notices in open proceedings in a section titled "SCE Regulatory Highlights," (ii) to certain documents and information related to Southern California wildfires which may be of interest to investors in a section titled "Southern California Wildfires," and (iii) to presentations, documents and other information that may be of interest to investors in a section titled "Presentations and Updates" at www.edisoninvestor.com in order to publicly disseminate such information.
These forward-looking statements represent our expectations only as of the date of this news release, and Edison International assumes no duty to update them to reflect new information, events or circumstances. Readers should review future reports filed by Edison International and SCE with the SEC.
Edison International Reports Second Quarter 2022 Financial Results
Page 5 of 10
Second Quarter Reconciliation of Basic Earnings Per Share to Core Earnings Per Share
|
|
Three months ended |
|
|
|
|
Six months ended |
|
|
|
||||||||
|
|
June 30, |
|
|
|
|
June 30, |
|
|
|
||||||||
|
|
2022 |
|
2021 |
|
Change |
|
2022 |
|
2021 |
|
Change |
||||||
Earnings (loss) per share attributable to Edison International |
|
|
|
|
|
|
|
|
|
|
|
|
|
|
|
|
|
|
SCE |
|
$ |
0.79 |
|
$ |
0.95 |
|
$ |
(0.16) |
|
$ |
1.18 |
|
$ |
1.73 |
|
$ |
(0.55) |
Edison International Parent and Other |
|
|
(0.16) |
|
|
(0.11) |
|
|
(0.05) |
|
|
(0.33) |
|
|
(0.21) |
|
|
(0.12) |
Edison International |
|
|
0.63 |
|
|
0.84 |
|
|
(0.21) |
|
|
0.85 |
|
|
1.52 |
|
|
(0.67) |
Less: Non-core items |
|
|
|
|
|
|
|
|
|
|
|
|
|
|
|
|
|
|
SCE |
|
|
(0.31) |
|
|
(0.10) |
|
|
(0.21) |
|
|
(1.15) |
|
|
(0.21) |
|
|
(0.94) |
Edison International Parent and Other |
|
|
— |
|
|
— |
|
|
— |
|
|
— |
|
|
— |
|
|
— |
Total non-core items |
|
|
(0.31) |
|
|
(0.10) |
|
|
(0.21) |
|
|
(1.15) |
|
|
(0.21) |
|
|
(0.94) |
Core earnings (losses) |
|
|
|
|
|
|
|
|
|
|
|
|
|
|
|
|
|
|
SCE |
|
|
1.10 |
|
|
1.05 |
|
|
0.05 |
|
|
2.33 |
|
|
1.94 |
|
|
0.39 |
Edison International Parent and Other |
|
|
(0.16) |
|
|
(0.11) |
|
|
(0.05) |
|
|
(0.33) |
|
|
(0.21) |
|
|
(0.12) |
Edison International |
|
$ |
0.94 |
|
$ |
0.94 |
|
$ |
— |
|
$ |
2.00 |
|
$ |
1.73 |
|
$ |
0.27 |
Note: Diluted earnings were $0.63 and $0.84 per share for the three months ended June 30, 2022 and 2021, respectively. Diluted earnings were $0.85 and $1.52 per share for the six months ended June 30, 2022 and 2021, respectively.
Second Quarter Reconciliation of Basic Earnings Per Share to Core Earnings (in millions)
|
|
Three months ended |
|
|
|
|
Six months ended |
|
|
|
||||||||
|
|
June 30, |
|
|
|
|
June 30, |
|
|
|
||||||||
(in millions) |
|
2022 |
|
2021 |
|
Change |
|
2022 |
|
2021 |
|
Change |
||||||
Net income (loss) attributable to Edison International |
|
|
|
|
|
|
|
|
|
|
|
|
|
|
|
|
|
|
SCE |
|
$ |
302 |
|
$ |
359 |
|
$ |
(57) |
|
$ |
449 |
|
$ |
655 |
|
$ |
(206) |
Edison International Parent and Other |
|
|
(61) |
|
|
(41) |
|
|
(20) |
|
|
(124) |
|
|
(78) |
|
|
(46) |
Edison International |
|
|
241 |
|
|
318 |
|
|
(77) |
|
|
325 |
|
|
577 |
|
|
(252) |
Less: Non-core items |
|
|
|
|
|
|
|
|
|
|
|
|
|
|
|
|
|
|
SCE1,2,3,4,5,6,7 |
|
|
(116) |
|
|
(38) |
|
|
(78) |
|
|
(439) |
|
|
(80) |
|
|
(359) |
Edison International Parent and Other |
|
|
— |
|
|
— |
|
|
— |
|
|
— |
|
|
— |
|
|
— |
Total non-core items |
|
|
(116) |
|
|
(38) |
|
|
(78) |
|
|
(439) |
|
|
(80) |
|
|
(359) |
Core earnings (losses) |
|
|
|
|
|
|
|
|
|
|
|
|
|
|
|
|
|
|
SCE |
|
|
418 |
|
|
397 |
|
|
21 |
|
|
888 |
|
|
735 |
|
|
153 |
Edison International Parent and Other |
|
|
(61) |
|
|
(41) |
|
|
(20) |
|
|
(124) |
|
|
(78) |
|
|
(46) |
Edison International |
|
$ |
357 |
|
$ |
356 |
|
$ |
1 |
|
$ |
764 |
|
$ |
657 |
|
$ |
107 |
1 |
Includes amortization of SCE’s Wildfire Insurance Fund expenses of $53 million ($38 million after tax) and $54 million ($39 million after tax) for the three months ended June 30, 2022 and 2021, respectively. It also includes $106 million ($76 million after tax) and $107 million ($77 million after tax) for the six months ended June 30, 2022 and 2021, respectively. |
2 |
Includes charges for 2017/2018 Wildfire/Mudslide Events claims and expenses, net of recoveries of $8 million ($6 million after tax) and $9 million ($6 million after tax) recorded for the three months ended June 30, 2022 and 2021, respectively. Includes charges of $404 million ($291 million after tax) and $14 million ($10 million after tax) for the six months ended June 30, 2022 and 2021, respectively. |
3 |
Includes GRC track 3 impairment of $17 million ($12 million after tax) for both the three months ended and the six months ended June 30, 2022. |
4 |
Includes CSRP impairment of $47 million ($34 million after tax) for both the three months ended and the six months ended June 30, 2022. |
5 |
Includes charge for employment litigation matter, net of recoveries, of $23 million ($16 million after tax) for both the three months ended and the six months ended June 30, 2022. |
Edison International Reports Second Quarter 2022 Financial Results
Page 6 of 10
6 |
Includes organizational realignment charge of $14 million ($10 million after tax) for both the three months ended and the six months ended June 30, 2022. |
7 |
Includes gain from sale of San Onofre nuclear fuel of $10 million ($7 million after tax) for both the three months ended and the six months ended June 30, 2021. |
Edison International Reports Second Quarter 2022 Financial Results
Page 7 of 10
Consolidated Statements of Income |
|
Edison International |
||||||||||
|
|
|
|
|
|
|
|
|
|
|
|
|
|
|
Three months ended |
|
Six months ended |
||||||||
|
|
June 30, |
|
June 30, |
||||||||
(in millions, except per-share amounts) |
|
2022 |
|
2021 |
|
2022 |
|
2021 |
||||
Total operating revenue |
|
$ |
4,008 |
|
$ |
3,315 |
|
$ |
7,976 |
|
$ |
6,275 |
Purchased power and fuel |
|
|
1,304 |
|
|
1,283 |
|
|
2,341 |
|
|
2,296 |
Operation and maintenance |
|
|
1,361 |
|
|
754 |
|
|
2,848 |
|
|
1,595 |
Wildfire-related claims, net of insurance recoveries |
|
|
2 |
|
|
— |
|
|
427 |
|
|
3 |
Wildfire Insurance Fund expense |
|
|
53 |
|
|
54 |
|
|
106 |
|
|
107 |
Depreciation and amortization |
|
|
601 |
|
|
533 |
|
|
1,184 |
|
|
1,058 |
Property and other taxes |
|
|
120 |
|
|
117 |
|
|
246 |
|
|
243 |
Impairment, net of other operating income |
|
|
63 |
|
|
(11) |
|
|
61 |
|
|
(11) |
Total operating expenses |
|
|
3,504 |
|
|
2,730 |
|
|
7,213 |
|
|
5,291 |
Operating income |
|
|
504 |
|
|
585 |
|
|
763 |
|
|
984 |
Interest expense |
|
|
(271) |
|
|
(232) |
|
|
(517) |
|
|
(449) |
Other income |
|
|
66 |
|
|
76 |
|
|
134 |
|
|
148 |
Income before income taxes |
|
|
299 |
|
|
429 |
|
|
380 |
|
|
683 |
Income tax expense (benefit) |
|
|
7 |
|
|
68 |
|
|
(48) |
|
|
32 |
Net income |
|
|
292 |
|
|
361 |
|
|
428 |
|
|
651 |
Preference stock dividend requirements of SCE |
|
|
25 |
|
|
26 |
|
|
51 |
|
|
53 |
Preferred stock dividend requirement of Edison International |
|
|
26 |
|
|
17 |
|
|
52 |
|
|
21 |
Net income attributable to Edison International common shareholders |
|
$ |
241 |
|
$ |
318 |
|
$ |
325 |
|
$ |
577 |
Basic earnings per share: |
|
|
|
|
|
|
|
|
|
|
|
|
Weighted average shares of common stock outstanding |
|
|
381 |
|
|
380 |
|
|
381 |
|
|
379 |
Basic earnings per common share attributable to Edison International common shareholders |
|
$ |
0.63 |
|
$ |
0.84 |
|
$ |
0.85 |
|
$ |
1.52 |
Diluted earnings per share: |
|
|
|
|
|
|
|
|
|
|
|
|
Weighted average shares of common stock outstanding, including effect of dilutive securities |
|
|
383 |
|
|
380 |
|
|
382 |
|
|
380 |
Diluted earnings per common share attributable to Edison International common shareholders |
|
$ |
0.63 |
|
$ |
0.84 |
|
$ |
0.85 |
|
$ |
1.52 |
Edison International Reports Second Quarter 2022 Financial Results
Page 8 of 10
Consolidated Balance Sheets |
|
Edison International |
||||
|
|
|
|
|
|
|
|
|
June 30, |
|
December 31, |
||
(in millions) |
|
2022 |
|
2021 |
||
ASSETS |
|
|
|
|
|
|
Cash and cash equivalents |
|
$ |
122 |
|
$ |
390 |
Receivables, less allowances of $347 and $193 for uncollectible accounts at respective dates |
|
|
1,547 |
|
|
1,398 |
Accrued unbilled revenue |
|
|
1,096 |
|
|
794 |
Inventory |
|
|
438 |
|
|
420 |
Prepaid expenses |
|
|
50 |
|
|
258 |
Regulatory assets |
|
|
2,030 |
|
|
1,778 |
Wildfire Insurance Fund contributions |
|
|
204 |
|
|
204 |
Other current assets |
|
|
166 |
|
|
249 |
Total current assets |
|
|
5,653 |
|
|
5,491 |
Nuclear decommissioning trusts |
|
|
4,039 |
|
|
4,870 |
Marketable securities |
|
|
6 |
|
|
12 |
Other investments |
|
|
52 |
|
|
39 |
Total investments |
|
|
4,097 |
|
|
4,921 |
Utility property, plant and equipment, less accumulated depreciation and amortization of $11,926 and $11,407 at respective dates |
|
|
51,485 |
|
|
50,497 |
Nonutility property, plant and equipment, less accumulated depreciation of $106 and $98 at respective dates |
|
|
210 |
|
|
203 |
Total property, plant and equipment |
|
|
51,695 |
|
|
50,700 |
Receivables, less allowances of $34 and $116 uncollectible accounts at respective dates |
|
|
21 |
|
|
122 |
Regulatory assets (includes $845 and $325 related to Variable Interest Entities "VIEs" at respective dates) |
|
|
7,854 |
|
|
7,660 |
Wildfire Insurance Fund contributions |
|
|
2,258 |
|
|
2,359 |
Operating lease right-of-use assets |
|
|
1,751 |
|
|
1,932 |
Long-term insurance receivable |
|
|
214 |
|
|
75 |
Other long-term assets |
|
|
1,502 |
|
|
1,485 |
Total long-term assets |
|
|
13,600 |
|
|
13,633 |
|
|
|
|
|
|
|
Total assets |
|
$ |
75,045 |
|
$ |
74,745 |
Edison International Reports Second Quarter 2022 Financial Results
Page 9 of 10
Consolidated Balance Sheets |
|
Edison International |
||||
|
|
|
|
|
|
|
|
|
June 30, |
|
December 31, |
||
(in millions, except share amounts) |
|
2022 |
|
2021 |
||
LIABILITIES AND EQUITY |
|
|
|
|
|
|
Short-term debt |
|
$ |
1,985 |
|
$ |
2,354 |
Current portion of long-term debt |
|
|
2,175 |
|
|
1,077 |
Accounts payable |
|
|
2,080 |
|
|
2,002 |
Wildfire-related claims |
|
|
86 |
|
|
131 |
Customer deposits |
|
|
165 |
|
|
193 |
Regulatory liabilities |
|
|
523 |
|
|
603 |
Current portion of operating lease liabilities |
|
|
607 |
|
|
582 |
Other current liabilities |
|
|
1,641 |
|
|
1,667 |
Total current liabilities |
|
|
9,262 |
|
|
8,609 |
Long-term debt (Includes $823 and $314 related to VIEs at respective dates) |
|
|
25,143 |
|
|
24,170 |
Deferred income taxes and credits |
|
|
5,889 |
|
|
5,740 |
Pensions and benefits |
|
|
471 |
|
|
496 |
Asset retirement obligations |
|
|
2,837 |
|
|
2,772 |
Regulatory liabilities |
|
|
8,376 |
|
|
8,981 |
Operating lease liabilities |
|
|
1,144 |
|
|
1,350 |
Wildfire-related claims |
|
|
1,169 |
|
|
1,733 |
Other deferred credits and other long-term liabilities |
|
|
3,079 |
|
|
3,105 |
Total deferred credits and other liabilities |
|
|
22,965 |
|
|
24,177 |
Total liabilities |
|
|
57,370 |
|
|
56,956 |
Commitments and contingencies |
|
|
|
|
|
|
Preferred stock (50,000,000 shares authorized; 1,250,000 shares of Series A and 750,000 shares of Series B issued and outstanding at respective dates) |
|
|
1,977 |
|
|
1,977 |
Common stock, no par value (800,000,000 shares authorized; 381,397,456 and 380,378,145 shares issued and outstanding at respective dates) |
|
|
6,129 |
|
|
6,071 |
Accumulated other comprehensive loss |
|
|
(48) |
|
|
(54) |
Retained earnings |
|
|
7,716 |
|
|
7,894 |
Total Edison International's shareholders' equity |
|
|
15,774 |
|
|
15,888 |
Noncontrolling interests – preference stock of SCE |
|
|
1,901 |
|
|
1,901 |
Total equity |
|
|
17,675 |
|
|
17,789 |
|
|
|
|
|
|
|
Total liabilities and equity |
|
$ |
75,045 |
|
$ |
74,745 |
Edison International Reports Second Quarter 2022 Financial Results
Page 10 of 10
Consolidated Statements of Cash Flows |
|
Edison International |
||||
|
|
|
|
|
|
|
|
|
Six months ended June 30, |
||||
(in millions) |
|
2022 |
|
2021 |
||
Cash flows from operating activities: |
|
|
|
|
|
|
Net income |
|
$ |
428 |
|
$ |
651 |
Adjustments to reconcile to net cash provided by operating activities: |
|
|
|
|
|
|
Depreciation and amortization |
|
|
1,216 |
|
|
1,090 |
Allowance for equity during construction |
|
|
(61) |
|
|
(60) |
Impairment and other expense (income) |
|
|
64 |
|
|
(11) |
Deferred income taxes |
|
|
(48) |
|
|
30 |
Wildfire Insurance Fund amortization expense |
|
|
106 |
|
|
107 |
Other |
|
|
40 |
|
|
11 |
Nuclear decommissioning trusts |
|
|
(65) |
|
|
(127) |
Changes in operating assets and liabilities: |
|
|
|
|
|
|
Receivables |
|
|
(81) |
|
|
(293) |
Inventory |
|
|
(19) |
|
|
(3) |
Accounts payable |
|
|
143 |
|
|
128 |
Tax receivables and payables |
|
|
58 |
|
|
91 |
Other current assets and liabilities |
|
|
(229) |
|
|
(244) |
Regulatory assets and liabilities, net |
|
|
372 |
|
|
(574) |
Wildfire-related insurance receivable |
|
|
(139) |
|
|
708 |
Wildfire-related claims |
|
|
(609) |
|
|
(2,852) |
Other noncurrent assets and liabilities |
|
|
62 |
|
|
(26) |
Net cash provided by (used in) operating activities |
|
|
1,238 |
|
|
(1,374) |
Cash flows from financing activities: |
|
|
|
|
|
|
Long-term debt issued, plus premium and net of discount and issuance costs of $34 and $36 for the respective periods |
|
|
2,949 |
|
|
3,953 |
Long-term debt repaid |
|
|
(372) |
|
|
(991) |
Short-term debt issued |
|
|
600 |
|
|
2,106 |
Short-term debt repaid |
|
|
(993) |
|
|
(1,355) |
Common stock issued |
|
|
6 |
|
|
25 |
Preferred stock issued, net |
|
|
— |
|
|
1,235 |
Commercial paper repayments, net of borrowing |
|
|
(497) |
|
|
(656) |
Dividends and distribution to noncontrolling interests |
|
|
(57) |
|
|
(53) |
Common stock dividends paid |
|
|
(524) |
|
|
(494) |
Preferred stock dividends paid |
|
|
(46) |
|
|
— |
Other |
|
|
53 |
|
|
12 |
Net cash provided by financing activities |
|
|
1,119 |
|
|
3,782 |
Cash flows from investing activities: |
|
|
|
|
|
|
Capital expenditures |
|
|
(2,708) |
|
|
(2,593) |
Proceeds from sale of nuclear decommissioning trust investments |
|
|
2,106 |
|
|
2,542 |
Purchases of nuclear decommissioning trust investments |
|
|
(2,041) |
|
|
(2,415) |
Other |
|
|
15 |
|
|
54 |
Net cash used in investing activities |
|
|
(2,628) |
|
|
(2,412) |
Net decrease in cash, cash equivalents and restricted cash |
|
|
(271) |
|
|
(4) |
Cash, cash equivalents and restricted cash at beginning of period |
|
|
394 |
|
|
89 |
Cash, cash equivalents and restricted cash at end of period |
|
$ |
123 |
|
$ |
85 |
Exhibit 99.2
Prepared Remarks of Edison International CEO and CFO
Second Quarter 2022 Earnings Teleconference
July 28, 2022, 1:30 p.m. (PT)
Pedro Pizarro, President and Chief Executive Officer, Edison International
Edison International reported core earnings per share of $0.94 compared to $0.94 a year ago. Based on our year-to-date performance and outlook for the remainder of the year, we are reaffirming our 2022 core EPS guidance range of $4.40 to $4.70. I also want to emphasize that we remain fully confident in our long-term EPS growth target of 5 to 7% through 2025. Maria will discuss our financial performance in her remarks.
I would like to begin with an update on the tremendous progress SCE has made in wildfire mitigation. In preparing for this year’s peak wildfire season, SCE has a higher level of confidence in its ability to mitigate wildfires associated with its equipment. During the quarter, SCE achieved a significant grid hardening milestone — it has now replaced over 3,500 circuit miles of bare wire with covered conductor in just over three and a half years. SCE expects to have covered approximately 40% of its overhead distribution power lines in high fire risk areas, or HFRA, by the end of 2022. In many locations throughout SCE’s service area, covered conductor is the primary grid hardening tool since it balances risk reduction, cost, and timely execution. SCE plans to continue its current pace of installing about 1,200 miles per year of covered conductor for the next couple of years. I am pleased with the utility’s execution of this program, which has and will continue to substantially improve safety for customers.
SCE has achieved the majority of wildfire risk reduction through covered conductor and other system hardening measures, vegetation management and equipment inspections. Public Safety Power Shutoffs, or PSPS, provide additional risk reduction that is critical during extreme weather and fuel conditions. SCE also continues to implement cutting-edge technologies to mitigate against high impact wildfires. For example, the utility is leveraging machine learning to improve the accuracy of wind-speed forecasts at around 500 SCE weather station locations, which will help better predict which areas may reach or exceed PSPS thresholds.
The state of California continues to allocate substantial funding in support of forest resiliency and fire suppression, including CAL FIRE crews and aerial resources. SCE is also supporting the readiness and response efforts of local fire agencies. For the fourth consecutive year, SCE is providing aerial suppression resources to local fire agencies to help quickly extinguish wildfires when they do start. SCE is contributing $18 million to lease the Quick Reaction Force of water and retardant dropping helitankers to Orange, Los Angeles, and Ventura County fire agencies. The QRF’s most critical feature is that it can continue to hover-fill and make retardant drops at night, making it the world’s first fully nocturnal aerial task force. In addition, SCE’s wildfire camera network provides visibility to growing wildfires for fire agencies, and the utility continues to explore adding artificial intelligence technology and new data sources that can detect and confirm new ignitions. Before I leave this topic, I would like to remind investors that we are hosting an in-person meeting on August 18th at SCE’s Emergency Operations Center and Energy Education Center. Our leadership team and I look forward to discussing ongoing wildfire mitigation activities and SCE’s opportunities in California’s clean energy transition.
Last week, SCE received a final decision from the Office of Energy Infrastructure Safety approving its 2022 Wildfire Mitigation Plan Update. This is a prerequisite to submit the annual safety certification request, which allows SCE to benefit from the presumption of prudency and the liability cap under AB 1054. This decision recognized the progress SCE has made in mitigating wildfire risk and in increasing the overall maturity of its wildfire mitigation portfolio and strategies.
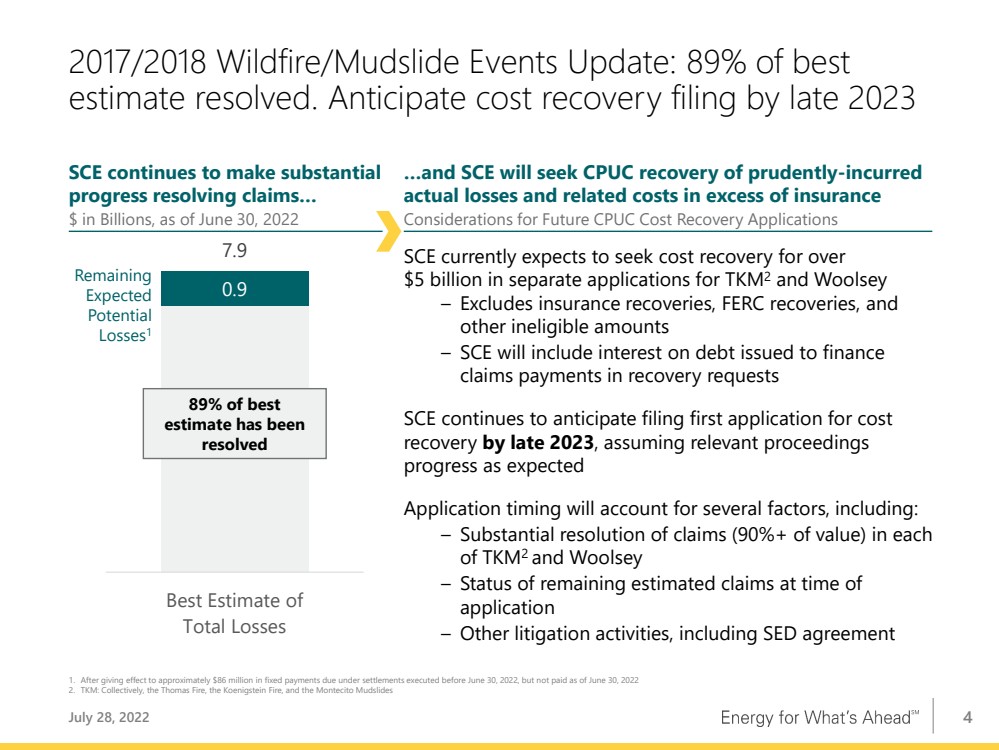
Turning to wildfire-related settlements, we are pleased with SCE’s progress in further resolving 2017 and 2018 Wildfire and Mudslide Events claims. In the second quarter, SCE resolved approximately $400 million of claims. In total, the utility has resolved nearly 90% of its best estimate of expected losses and continues to make steady progress in resolving remaining claims. SCE is well on its way to reaching substantial resolution of claims in the TKM matter and remains on track to file the first application for cost recovery by late 2023. I would like to be clear that SCE currently expects to seek full CPUC cost recovery of claims payments, excluding amounts recoverable from insurance or FERC, or foregone under the agreement with the Safety Enforcement Division.
2
We will keep you updated on our progress on this front.
Shifting topics, I would like to briefly address a lawsuit brought by two former employees of Southern California Edison. As some of you may be aware, a jury awarded substantial damages to the plaintiffs. We don’t believe that the jury’s decision was consistent with the facts and the law, and it does not reflect who we are or what we stand for. Rather than engage in a protracted legal challenge, we reached a settlement in July for which we took a net after-tax charge of $16 million. Edison International and SCE did not admit liability or fault as part of the settlement.
Most of my comments covered a lot about wildfire risk mitigation, which is a core component in adapting to climate change. I also want to emphasize our continuing focus on sustainability, since this underlies the company’s strategy. We recently published our annual Sustainability Report, which details 2021 achievements. These are covered on pages 5 and 6. Let me highlight that SCE has the lowest system average rate among the large California IOUs, primarily due to more than a decade of committed focus on operational excellence and cost management. Further, as you see on page 7, the total energy burden in 2021—that is, the total cost of electricity, natural gas, and gasoline relative to median household income—for customers in SCE’s service area was below the median for customers in other states across the country. We see the potential for that to continue to decline with increasing levels of electrification; our analysis shows the greater efficiency of electric motors and appliances will reduce customers’ total costs across all energy commodities by one-third by 2045.
Let me conclude by saying that Edison International is a nationally recognized leader in the clean energy transition. In alignment with climate actions planned by the state, as we announced last year, our goal is to achieve net-zero GHG emissions across Scopes 1, 2, and 3 by 2045, which covers the power SCE delivers to customers and Edison International’s enterprise-wide operations, including supply chain.
3
Maria Rigatti, Executive Vice President and Chief Financial Officer, Edison International
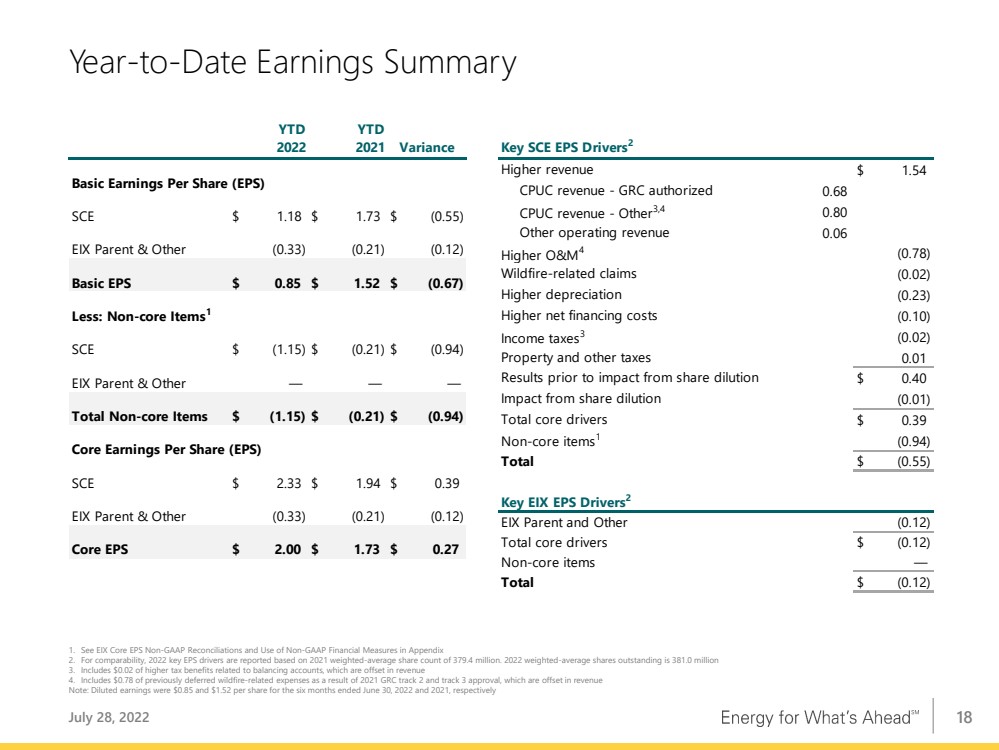
Edison International reported core earnings of $0.94 per share for the second quarter. Core EPS at SCE increased year-over-year primarily due to the adoption of the 2021 GRC final decision in the third quarter of 2021, partially offset by higher O&M expenses. At EIX Parent and Other, the core loss was 5 cents higher in the second quarter. This was primarily due to higher preferred dividends and unrealized losses on investments in the second quarter of 2022 compared to unrealized gains recognized in the same period last year.
On page 8, you can see SCE’s key second quarter EPS drivers on the right-hand side. I will highlight a few. Authorized revenue from the 2021 GRC was higher by 34 cents for two reasons. First, the escalation mechanism for 2022 contributed 18 cents to the variance. Second, because SCE did not have a GRC final decision in the second quarter of last year, it was recording revenue at 2020 levels. This timing difference contributed 16 cents to year-over-year Q2 revenue growth.
Other CPUC revenue was 26 cents higher, primarily related to the approval of GRC track 3. With this approval, SCE recognized revenue for costs previously deferred to memo accounts. Because the costs were also recognized, there was no net earnings impact from this revenue growth. The remaining O&M variance for this quarter was primarily driven by the timing of wildfire mitigation activity expense recognition.
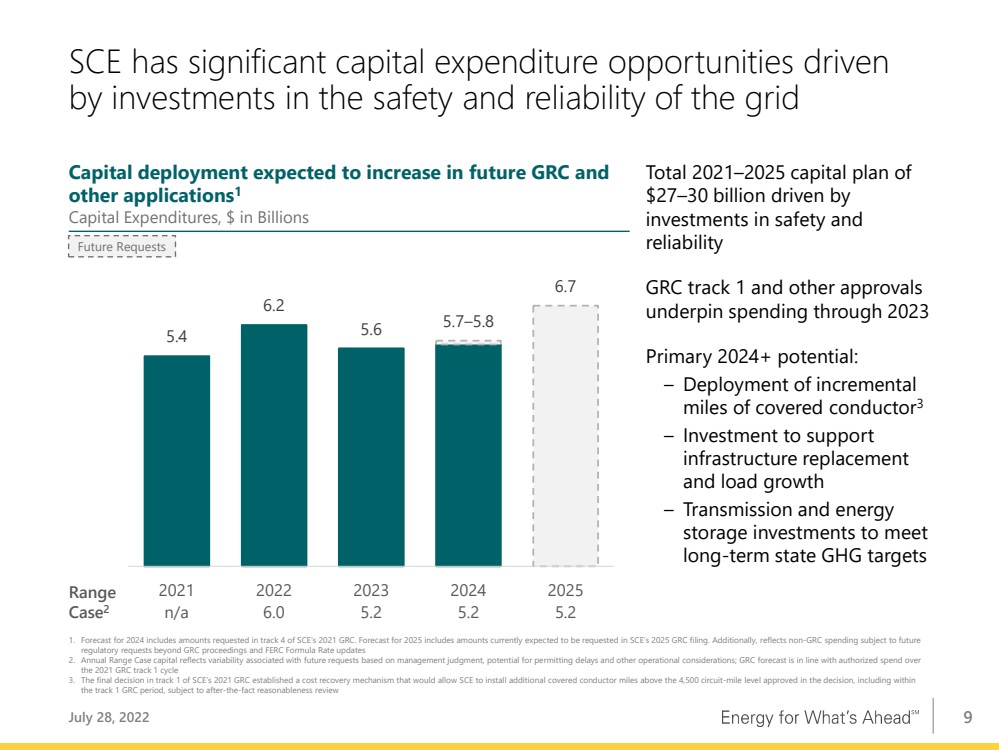
Moving to page 9, SCE’s capital forecast is unchanged from last quarter, when we reflected the capital expenditures SCE requested in track 4 of its GRC. During the second quarter, SCE submitted its track 4 request, which covers funding for 2024—the third attrition year of SCE’s 2021 GRC. In addition to requesting a revenue increase driven by the GRC attrition mechanism and inflation, SCE proposed deploying another 1,200 miles of covered conductor, which would bring the utility to a total of about 6,500 miles installed by the end of 2024, or about two-thirds of its overhead distribution miles in high fire risk areas.
4
As shown on page 10, our capital forecast continues to result in projected rate base growth of 7 to 9% from 2021 to 2025. This forecast incorporates SCE’s current view of the requests to be made in the 2025 GRC, and other applications. We see strong potential for SCE to continue deploying capital and achieving 7 to 9% rate base growth through 2025.
Before turning to guidance, I would like to share a couple of positive developments from the quarter. First, SCE recently completed its annual wildfire insurance negotiations for policies that run from July 2022 through June 2023. In view of the measures SCE has implemented to reduce wildfire risk, the company’s insurance carriers have further reduced premiums this year. Second, during the quarter, both Moody’s and Fitch affirmed EIX and SCE’s credit ratings and raised their outlooks to positive from stable. Both of these positive outlook changes were driven by recognition of the utility’s significant progress addressing wildfire risk combined with the constructive AB 1054 framework.
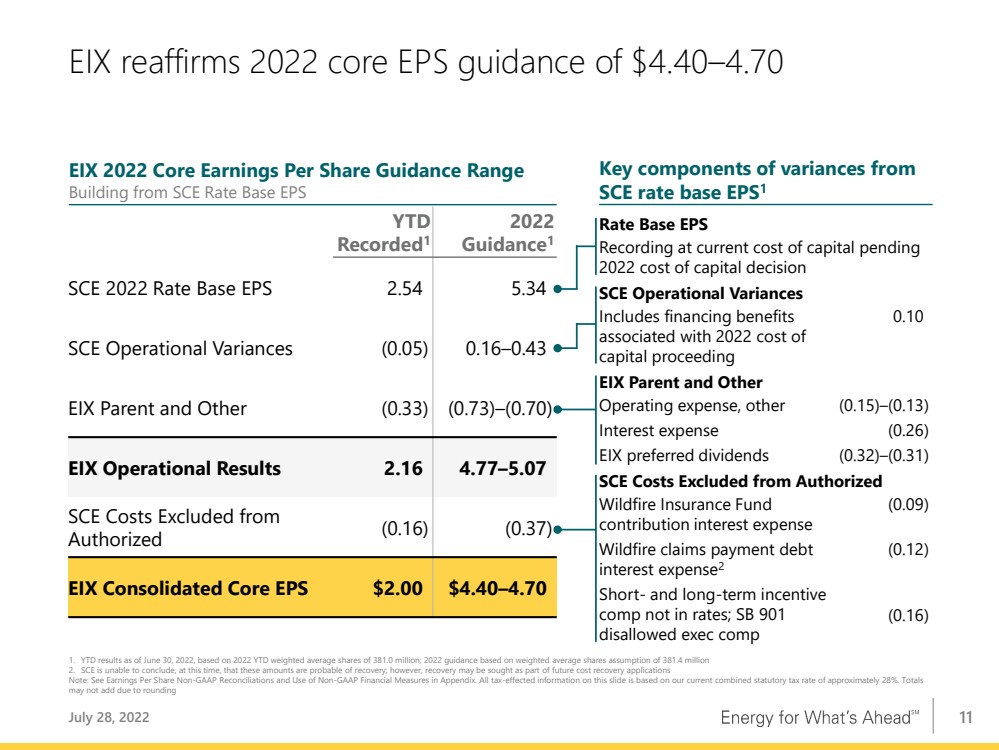
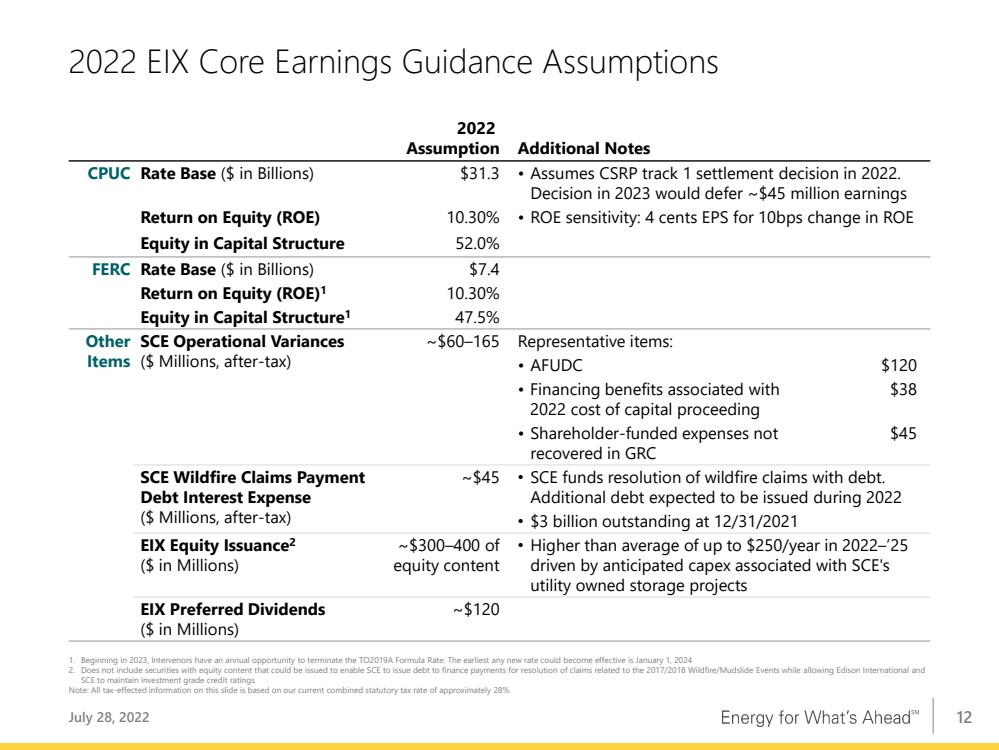
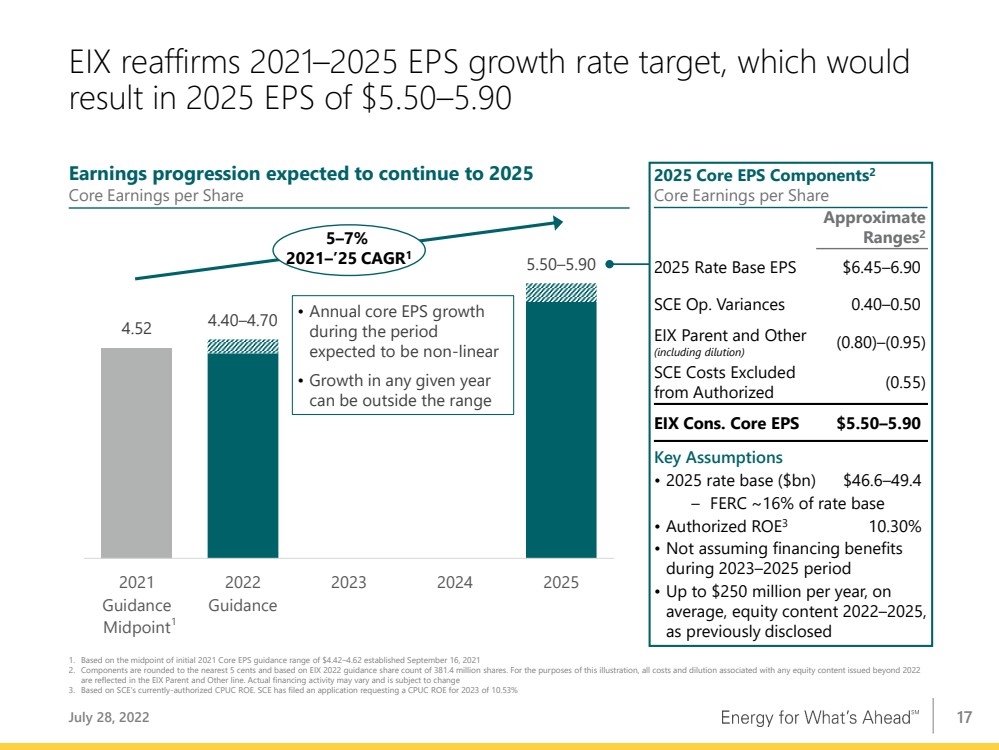
Turning to guidance, pages 11 and 12 show our 2022 guidance and the key assumptions for modeling purposes. We are reaffirming our 2022 core EPS guidance range of $4.40 to $4.70. We are awaiting resolution of whether the cost of capital will remain unchanged for 2022, and after receiving a CPUC final decision, we will provide an update on guidance to incorporate any changes, and our outlook for the rest of the year. In the 2023 cost of capital proceeding, the administrative law judge recently issued a scoping ruling with two positive components that I want to point out. First, the proceeding schedule calls for a proposed decision to be issued in mid-November, which could allow for a final decision to be made by year-end. Second, consistent with SCE’s request and past proceedings, the schedule calls for updating the costs of debt and preferred in September, which will allow SCE to reflect more up-to-date interest rate forecasts. SCE has made a strong case for its requested ROE of 10.53% and we will incorporate the final decision in our 2023 earnings guidance, which we will introduce on our Q4 earnings call. At that time, we will also update you on our long-term EPS growth rate target. We remain confident in our ability to achieve EPS growth of 5 to 7% from 2021 to 2025, which results in a 2025 EPS range of $5.50 to $5.90.
5
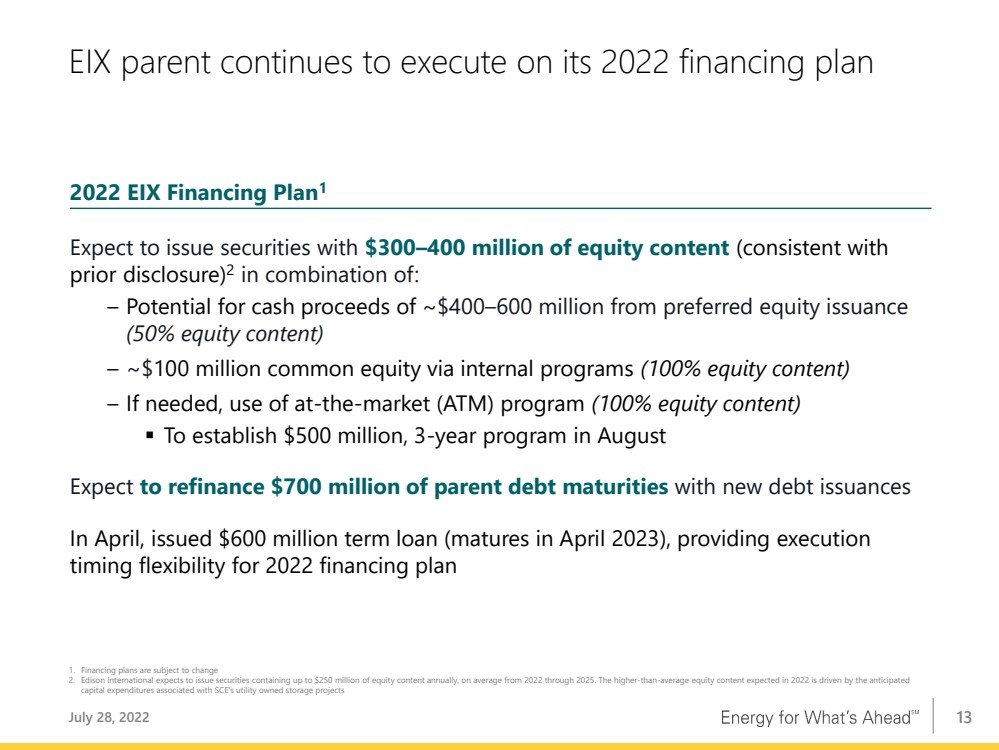
I would now like to provide a brief update on our 2022 financing plan, shown on page 13. Our overall plan remains consistent with what we shared with you previously. In April, the parent borrowed $600 million under a term loan agreement, which matures in 2023. This transaction provides flexibility for issuing the previously disclosed debt and equity content securities later this year or in 2023. We will continue to monitor market conditions to optimize our capital structure, which, as we have said in the past, may include issuance of preferred equity, or common equity through the use of internal and at-the-market programs. Our prior 3-year ATM program expired earlier this year and we plan to establish a replacement program in the coming weeks.
Let me conclude by building on Pedro's earlier comments on sustainability. I will emphasize the strong alignment between the strategy and drivers of the EIX business and the clean energy transition that is underway. Since publishing the sustainable financing framework last June, SCE has issued $2.1 billion of sustainability bonds under that framework, with strong demand from investors recognizing the environmental and social benefits related to projects funded by these bonds. Our large capital investment plan focused on the grid provides ample opportunity for continued issuance of securities under this framework, which is aligned with the company’s sustainability-oriented strategy and vision.
6
|
July 28, 2022 Second Quarter 2022 Financial Results |
|
1 Statements contained in this presentation about future performance, including, without limitation, operating results, capital ex penditures, rate base growth, dividend policy, financial outlook, and other statements that are not purely historical, are forward - looking statements. These forward - looking statements r eflect our current expectations; however, such statements involve risks and uncertainties. Actual results could differ materially from current expectations. These forward - looking stateme nts represent our expectations only as of the date of this presentation, and Edison International assumes no duty to update them to reflect new information, events or circumstances. Im por tant factors that could cause different results include, but are not limited to the: • ability of SCE to recover its costs through regulated rates, including uninsured wildfire - related and debris flow - related costs, costs incurred to mitigate the risk of utility equipment causing future wildfires, costs incurred as a result of the COVID - 19 pandemic, and increased labor and materials costs due to su pply chain constraints and inflation; • ability of SCE to implement its Wildfire Mitigation Plan and capital program; • risks of regulatory or legislative restrictions that would limit SCE’s ability to implement Public Safety Power Shutoff (“PSP S”) when conditions warrant or would otherwise limit SCE’s operational PSPS practices; • risks associated with implementing PSPS, including regulatory fines and penalties, claims for damages and reputational harm; • ability of SCE to maintain a valid safety certification; • ability to obtain sufficient insurance at a reasonable cost, including insurance relating to wildfire - related claims, and to rec over the costs of such insurance or, in the event liabilities exceed insured amounts, the ability to recover uninsured losses from customers or other parties; • extreme weather - related incidents (including events caused, or exacerbated, by climate change, such as wildfires, debris flows, droughts, high wind events and extreme heat events) and other natural disasters (such as earthquakes), which could cause, among other things, public safety issues, property damage, ope rational issues (such as rotating outages and issues due to damaged infrastructure), PSPS activations and unanticipated costs; • risk that California Assembly Bill 1054 (“AB 1054”) does not effectively mitigate the significant exposure faced by Californi a i nvestor - owned utilities related to liability for damages arising from catastrophic wildfires where utility facilities are alleged to be a substantial cause, including the longevity o f t he Wildfire Insurance Fund and the CPUC's interpretation of and actions under AB 1054, including its interpretation of the prudency standard established under AB 1054; • ability of Edison International and SCE to effectively attract, manage, develop and retain a skilled workforce, including its co ntract workers; • decisions and other actions by the California Public Utilities Commission, the Federal Energy Regulatory Commission, the Nucl ear Regulatory Commission and other governmental authorities, including decisions and actions related to nationwide or statewide crisis, determinations of authorized rates of re turn or return on equity, the recoverability of wildfire - related and debris flow - related costs, issuance of SCE's wildfire safety certification, wildfire mitigation efforts, approval an d implementation of electrification programs, and delays in executive, regulatory and legislative actions; • cost and availability of labor, equipment and materials, including as a result of supply chain constraints; • ability of Edison International or SCE to borrow funds and access bank and capital markets on reasonable terms; • risks associated with the decommissioning of San Onofre, including those related to worker and public safety, public oppositi on, permitting, governmental approvals, on - site storage of spent nuclear fuel and other radioactive material, delays, contractual disputes, and cost overruns; • pandemics, such as COVID - 19, and other events that cause regional, statewide, national or global disruption, which could impact, among other things, Edison International's and SCE's business, operations, cash flows, liquidity and/or financial results and cause Edison International and SCE to incur unantici pat ed costs; • physical security of Edison International's and SCE's critical assets and personnel and the cybersecurity of Edison Internati ona l's and SCE's critical information technology systems for grid control, and business, employee and customer data; • risks associated with cost allocation resulting in higher rates for utility bundled service customers because of possible cus tom er bypass or departure for other electricity providers such as Community Choice Aggregators (“CCA,” which are cities, counties, and certain other public agencies with the authority to g ene rate and/or purchase electricity for their local residents and businesses) and Electric Service Providers (entities that offer electric power and ancillary services to retail customers , o ther than electrical corporations (like SCE) and CCAs); • risks inherent in SCE’s capital investment program, including those related to project site identification, public opposition , e nvironmental mitigation, construction, permitting, changes in the California Independent System Operator’s transmission plans, and governmental approvals; and • risks associated with the operation of electrical facilities, including worker and public safety issues, the risk of utility ass ets causing or contributing to wildfires, failure, availability, efficiency, and output of equipment and facilities, and availability and cost of spare parts. Other important factors are discussed under the headings “Forward - Looking Statements”, “Risk Factors” and “Management’s Discussi on and Analysis” in Edison International’s Form 10 - K and other reports filed with the Securities and Exchange Commission, which are available on our website: www.edisoninvestor.c om. These filings also provide additional information on historical and other factual data contained in this presentation. Forward - Looking Statements July 28, 2022 |
|
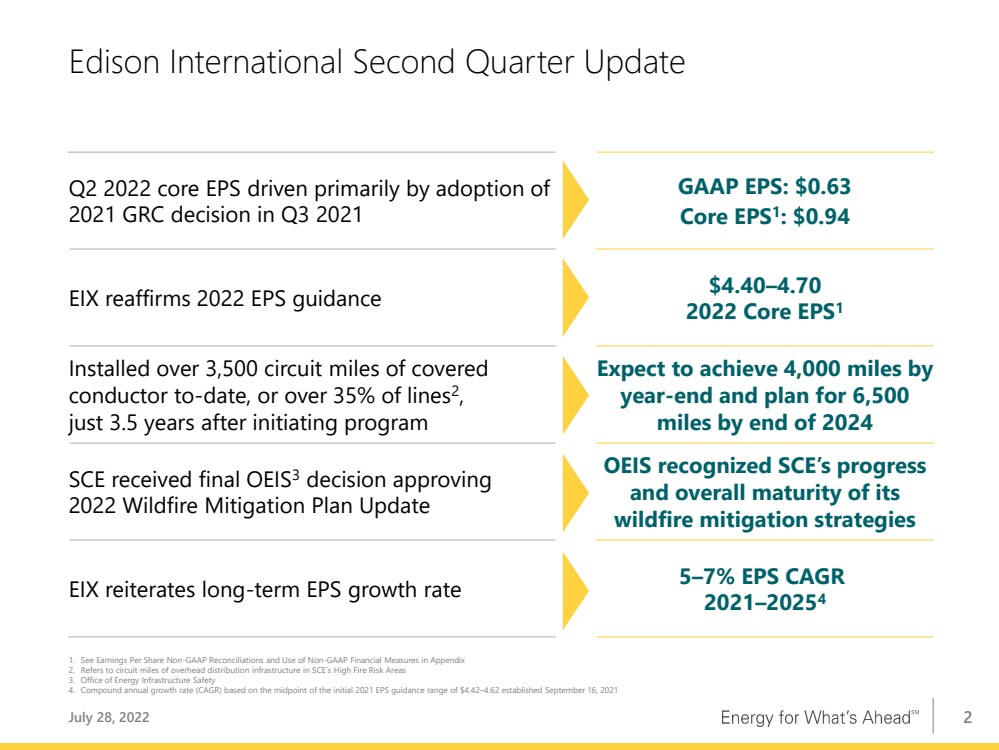
2 Edison International Second Quarter Update Q2 2022 core EPS driven primarily by adoption of 2021 GRC decision in Q3 2021 GAAP EPS: $0.63 Core EPS 1 : $0.94 EIX reaffirms 2022 EPS guidance $4.40 – 4.70 2022 Core EPS 1 Installed over 3,500 circuit miles of covered conductor to - date, or over 35% of lines 2 , just 3.5 years after initiating program Expect to achieve 4,000 miles by year - end and plan for 6,500 miles by end of 2024 SCE received final OEIS 3 decision approving 2022 Wildfire Mitigation Plan Update OEIS recognized SCE’s progress and overall maturity of its wildfire mitigation strategies EIX reiterates long - term EPS growth rate 5 – 7% EPS CAGR 2021 – 2025 4 1. See Earnings Per Share Non - GAAP Reconciliations and Use of Non - GAAP Financial Measures in Appendix 2. Refers to circuit miles of overhead distribution infrastructure in SCE’s High Fire Risk Areas 3. Office of Energy Infrastructure Safety 4. Compound annual growth rate (CAGR) based on the midpoint of the initial 2021 EPS guidance range of $4.42 – 4.62 established Septem ber 16, 2021 July 28, 2022 |
|
3 SCE’s execution of its wildfire mitigation strategy is reducing risk of wildfires associated with utility infrastructure Installed ~3,630 circuit miles of covered conductor to - date, or 37% of lines 1 SCE is providing aerial suppression resources to local fire agencies for fourth consecutive year Contributing $18 million to lease helitankers to Orange, Los Angeles and Ventura county fire agencies Speed of deployment enabled company to reach this level in ~3.5 years July 28, 2022 Leveraging machine learning to improve the accuracy of wind - speed forecasts at around 500 SCE weather station locations Network of 1,570+ weather stations providing real - time weather data 1. Refers to circuit miles of overhead distribution infrastructure in SCE’s High Fire Risk Areas |
|
4 2017/2018 Wildfire/Mudslide Events Update: 89% of best estimate resolved. Anticipate cost recovery filing by late 2023 July 28, 2022 7.0 0.9 7.9 Best Estimate of Total Losses 89% of best estimate has been resolved 1. After giving effect to approximately $86 million in fixed payments due under settlements executed before June 30, 2022, but n ot paid as of June 30, 2022 2. TKM: Collectively, the Thomas Fire, the Koenigstein Fire, and the Montecito Mudslides SCE continues to make substantial progress resolving claims… $ in Billions, as of June 30, 2022 …and SCE will seek CPUC recovery of prudently - incurred actual losses and related costs in excess of insurance Remaining Expected Potential Losses 1 SCE currently expects to seek cost recovery for over $5 billion in separate applications for TKM 2 and Woolsey – Excludes insurance recoveries, FERC recoveries, and other ineligible amounts – SCE will include interest on debt issued to finance claims payments in recovery requests SCE continues to anticipate filing first application for cost recovery by late 2023 , assuming relevant proceedings progress as expected Application timing will account for several factors, including: – Substantial resolution of claims (90%+ of value) in each of TKM 2 and Woolsey – Status of remaining estimated claims at time of application – Other litigation activities, including SED agreement Considerations for Future CPUC Cost Recovery Applications |
|
5 Edison’s 2021 sustainability achievements advanced our clean energy strategy and enhanced value to our stakeholders July 28, 2022 Completed construction at 21 additional sites to install electric vehicle (EV) charging infrastructure for medium - and heavy - duty vehicles through SCE’s $356 million Charge Ready Transport p rogram Climate Change Diversity, Equity & Inclusion Over 80% of $20 million i n annual Philanthropic fundin g went to organizations and initiatives focused on diverse and underserved communities Mind the Gap polic y paper publishe d by Ediso n Intern a tional, highlighting the accelerated rate of annual GHG emissions reductions needed across the California economy to achieve the state’s 2030 climate goals Climat e commitment extende d t o net - zero GH G emission s across Scope s 1 , 2 an d 3 b y 2045 Propose d a $6 7 7 million investmen t between 2024 – 202 7 t o instal l roughly 250,000 electric heat pumps an d provid e 65,000 household s wit h electrical servic e pane l an d circui t upgrades, a ke y ste p i n th e implementation of SCE’s Building Electri fi catio n strategy Edison Energy has advised on more than 8,000 MW of renewable energy power purchase agreements , including 1,475 MW of deals in 2021 1,500 miles of overhead power lines replace d with covered conductor in high fire risk areas (HFRA), with covered conductor covering approximately 30% of overhead distribution wires in HFRA through year - end 2021 ~3,400 hazardous trees mitigated in 2021 Planned addition of 535 megawatts of battery energy storage at three strategically located SCE substations to increase grid reliability Lowest syste m average rat e amon g large California investor - owned utilities at SCE Majority o f board directors are diverse in terms of gender, race, ethnicity and/or LGBTQ+ self - identification, with eight of 11 diverse in representation and gender parity achieved among independent directors in spring 2022 88% o f employees acros s the enterprise participating in our employee engagement survey said they are proud to work for Edison Operational Excellence |
|
6 Edison International’s industry - leading ESG profile received wide - ranging recognition and awards in 2021 July 28, 2022 Best Place to Work for LGBTQ+ Equality ( Human Rights Campaign Foundation – Corporate Equality Index) Best Companies for Latinos ( Latino Leaders Magazine ) Best Places to Work ( Disability Equality Index — Disability:IN ) HACR CII 5 Star Company ( Hispanic Association of Corporate Responsibility ) Top 15 Employee Resource Groups of the Year Latinos for Engagement, Advancement and Development (LEAD), SCE’s Latino business resource group ( LATINA Style Magazine ) “Trendsetter” (Highest Rating) 97.1 score on the CPA - Zicklin Index of Corporate Political Disclosure and Accountability ( Center for Political Accountability ) Top - rated governance score ( Institutional Shareholder Services — ISS) Commitment to diverse leadership Edison International board members Pedro Pizarro and Michael Camuñez ( Latino Leaders Magazine ) Most Influential Black Corporate Directors Edison International board chair Peter Taylor ( Savoy Magazine ) "3+" corporation ( 50/50 Women on Boards ) Climate Change Ediso n Award Ediso n Internationa l and SC E fo r th e advancemen t of transportatio n electri fi cation. ( Ediso n Electri c Institut e — EEI) Gree n Growt h 50 #1 0 ( Forbes ) Drive Electric Utility Award SCE ( Plug In America ) Innovativ e Sta r of Energy Efficiency Award SCE’s Clean Energy Optimization Pilot ( Alliance to Save Energy ) Utility Transformation Leaderboard Utilities SCE ( Smart Electric Power Alliance — SEPA) Diversity, Equity & Inclusion Governance “A” rating ( Global Listed Infrastructure Organisation — GLIO) Top Innovative Practice Award SCE ( Nuclear Energy Institute ) related to safe storage of spent nuclear fuel Operational Excellence |
|
7 0% 2% 4% 6% 8% West Virginia Mississippi Tennessee Alabama Oklahoma Kentucky Arkansas South Carolina Indiana Vermont Michigan Maine Kansas Louisiana Missouri Georgia Arizona South Dakota North Carolina Rhode Island Ohio Oregon Connecticut Montana Nebraska Nevada Idaho Florida North Dakota SCE Wisconsin Delaware Pennsylvania Washington New Mexico Iowa New Hampshire Wyoming Virginia Massachusetts New York Colorado Illinois Minnesota Utah Maryland New Jersey Total 2021 energy burden in SCE’s service area was below median and can decrease with higher levels of electrification July 28, 2022 1. EIX analysis and assumptions based on representative utilities in each state, median household income data from U.S. Census B ure au, electricity expenditure data from EIA, natural gas expenditure data from AGA and EIA, and estimated share of income spent on vehicle fuel by state presented in the DOE’s Vehicle Technologies Office Figure of the Wee k # 1176, which does not include estimates for Hawaii or Alaska. Data not available for Texas 2. All rates include California Climate Credit 3. Sources: SCE Advice 4796 - E effective June 1, 2022, PG&E Advice 6603 - E effective June 1, 2022, SDG&E Advice 4004 - E effective June 1, 2022 24.3 28.0 30.5 SCE PG&E SDG&E …and among California IOUs, SCE has the lowest system average rate System Average Rate 2,3 Cents per kWh Electricity and total energy burdens in SCE’s service area tend to be lower than those in other states… 2021 Est. Average Residential Customer Energy Burden (% of Income) 1 +15% vs. SCE +26% vs. SCE Electricity Nat. Gas Gasoline For customers of large utilities in: |
|
8 Second Quarter Earnings Summary July 28, 2022 1. See EIX Core EPS Non - GAAP Reconciliations and Use of Non - GAAP Financial Measures in Appendix 2. For comparability, 2022 second quarter key EPS drivers are reported based on 2021 weighted - average share count of 379.6 million. 2022 second quarter weighted - average shares outstanding is 381.3 million 3. Includes $0.07 of higher tax benefits related to balancing accounts, which are offset in revenue 4. Includes $0.32 of previously deferred wildfire - related expenses as a result of 2021 GRC track 3 approval, which are offset in re venue Note: Diluted earnings were $0.63 and $0.84 per share for the three months ended June 30, 2022 and 2021, respectively Q2 2022 Q2 2021 Variance Basic Earnings Per Share (EPS) SCE 0.79 $ 0.95 $ (0.16) $ EIX Parent & Other (0.16) (0.11) (0.05) Basic EPS 0.63 $ 0.84 $ (0.21) $ Less: Non-core Items 1 SCE (0.31) $ (0.10) $ (0.21) $ EIX Parent & Other — — — Total Non-core Items (0.31) $ (0.10) $ (0.21) $ Core Earnings Per Share (EPS) SCE 1.10 $ 1.05 $ 0.05 $ EIX Parent & Other (0.16) (0.11) (0.05) Core EPS 0.94 $ 0.94 $ — $ Key SCE EPS Drivers 2 Higher revenue 0.63 $ CPUC revenue - GRC authorized 0.34 CPUC revenue - Other 3,4 0.26 Other operating revenue 0.03 Higher O&M 4 (0.46) Higher depreciation (0.12) Higher net financing costs (0.05) Income taxes 3 0.06 Other income and expenses (0.01) Total core drivers 0.05 $ Non-core items 1 (0.21) Total (0.16) $ (0.06) 0.01 Total core drivers (0.05) $ Non-core items — Total (0.05) $ Key EIX EPS Drivers 2 EIX Parent and Other EEG |
|
9 Range Case 2 n/a 6.0 5. 2 5.2 5.2 5.4 6.2 5.6 5.7 – 5.8 6.7 2021 2022 2023 2024 2025 SCE has significant capital expenditure opportunities driven by investments in the safety and reliability of the grid July 28, 2022 Capital deployment expected to increase in future GRC and other applications 1 Capital Expenditures, $ in Billions Total 2021 – 2025 capital plan of $27 – 30 billion driven by investments in safety and reliability GRC track 1 and other approvals underpin spending through 2023 Primary 2024+ potential: – Deployment of incremental miles of covered conductor 3 – Investment to support infrastructure replacement and load growth – Transmission and energy storage investments to meet long - term state GHG targets 1. Forecast for 2024 includes amounts requested in track 4 of SCE’s 2021 GRC. Forecast for 2025 includes amounts currently expec ted to be requested in SCE’s 2025 GRC filing. Additionally, reflects non - GRC spending subject to future regulatory requests beyond GRC proceedings and FERC Formula Rate updates 2. Annual Range Case capital reflects variability associated with future requests based on management judgment, potential for pe rmi tting delays and other operational considerations; GRC forecast is in line with authorized spend over the 2021 GRC track 1 cycle 3. The final decision in track 1 of SCE’s 2021 GRC established a cost recovery mechanism that would allow SCE to install additio nal covered conductor miles above the 4,500 circuit - mile level approved in the decision, including within the track 1 GRC period, subject to after - the - fact reasonableness review Future Requests |
|
10 Range Case 2 n/a 38.5 41.5 43.4 46.6 2021 GRC track 1 decision provides rate base visibility through 2023; future applications expected to extend growth July 28, 2022 1. Weighted - average year basis. Excludes rate base associated with ~$1.6 billion of wildfire mitigation - related spend that shall no t earn an equity return under AB 1054 2. Range Case rate base reflects capital expenditure Range Case forecast 3. The final decision in track 1 of SCE’s 2021 GRC established a cost recovery mechanism that would allow SCE to install additio nal covered conductor miles above the 4,500 circuit - mile level approved in the decision, including within the track 1 GRC period, subject to after - the - fact reasonableness review From a 2021 base, rate base growth forecast of 7 – 9% through 2025, reflecting future incremental investment Rate Base 1 , $ in Billions Forecast includes recovery of utility - owned storage for summer 2022 reliability and SCE’s building electrification request Substantial longer - term rate base growth potential from: – Deployment of incremental miles of covered conductor 3 – Investment to support infrastructure replacement and load growth – Transmission and energy storage investments to meet long - term state GHG targets 35.3 38.7 42.1 44.5 – 44.8 49.4 2021 2022 2023 2024 2025 ~9 % 2021 – 2025 CAGR Future Requests |
|
11 EIX reaffirms 2022 core EPS guidance of $4.40 – 4.70 July 28, 2022 YTD Recorded 1 2022 Guidance 1 SCE 2022 Rate Base EPS 2.54 5.34 SCE Operational Variances (0.05 ) 0.16 – 0.43 EIX Parent and Other (0.33 ) (0.73) – (0.70 ) EIX Operational Results 2.16 4.77 – 5.07 SCE Costs Excluded from Authorized (0.16 ) (0.37 ) EIX Consolidated Core EPS $2.00 $4.40 – 4.70 EIX 2022 Core Earnings Per Share Guidance Range Building from SCE Rate Base EPS Key components of variances from SCE rate base EPS 1 Rate Base EPS Recording at current cost of capital pending 2022 cost of capital decision SCE Operational Variances Includes financing benefits associated with 2022 cost of capital proceeding 0.10 EIX Parent and Other Operating expense, other (0.15) – (0.13 ) Interest expense (0.26 ) EIX preferred dividends (0.32) – (0.31 ) SCE Costs Excluded from Authorized Wildfire Insurance Fund contribution interest expense (0.09 ) Wildfire claims payment debt interest expense 2 (0.12 ) Short - and long - term incentive comp not in rates; SB 901 disallowed exec comp (0.16 ) 1. YTD results as of June 30, 2022, based on 2022 YTD weighted average shares of 381.0 million; 2022 guidance based on weighted ave rage shares assumption of 381.4 million 2. SCE is unable to conclude, at this time, that these amounts are probable of recovery; however, recovery may be sought as part of future cost recovery applications Note: See Earnings Per Share Non - GAAP Reconciliations and Use of Non - GAAP Financial Measures in Appendix. All tax - effected infor mation on this slide is based on our current combined statutory tax rate of approximately 28%. Totals may not add due to rounding |
|
12 2022 EIX Core Earnings Guidance Assumptions July 28, 2022 1. Beginning in 2023, Intervenors have an annual opportunity to terminate the TO2019A Formula Rate. The earliest any new rate co uld become effective is January 1, 2024 2. Does not include securities with equity content that could be issued to enable SCE to issue debt to finance payments for reso lut ion of claims related to the 2017/2018 Wildfire/Mudslide Events while allowing Edison International and SCE to maintain investment grade credit ratings Note: All tax - effected information on this slide is based on our current combined statutory tax rate of approximately 28% 2022 Assumption Additional Notes CPUC Rate Base ($ in Billions) $31.3 • Assumes CSRP track 1 settlement decision in 2022. Decision in 2023 would defer ~$45 million earnings Return on Equity (ROE) 10.30% • ROE sensitivity: 4 cents EPS for 10bps change in ROE Equity in Capital Structure 52.0% FERC Rate Base ($ in Billions) $7.4 Return on Equity (ROE) 1 10.30% Equity in Capital Structure 1 47.5% Other Items SCE Operational Variances ($ Millions, after - tax) ~$60 – 165 Representative items: • AFUDC $120 • Financing benefits associated with 2022 cost of capital proceeding $38 • Shareholder - funded expenses not recovered in GRC $45 SCE Wildfire Claims Payment Debt Interest Expense ($ Millions, after - tax) ~$45 • SCE funds resolution of wildfire claims with debt. Additional debt expected to be issued during 2022 • $3 billion outstanding at 12/31/2021 EIX Equity Issuance 2 ($ in Millions) ~$300 – 400 of equity content • Higher than average of up to $250/year in 2022 – ’25 driven by anticipated capex associated with SCE's utility owned storage projects EIX Preferred Dividends ($ in Millions) ~$120 |
|
13 EIX parent continues to execute on its 2022 financing plan July 28, 2022 1. Financing plans are subject to change 2. Edison International expects to issue securities containing up to $250 million of equity content annually, on average from 20 22 through 2025. The higher - than - average equity content expected in 2022 is driven by the anticipated capital expenditures associated with SCE's utility owned storage projects 2022 EIX Financing Plan 1 Expect to issue securities with $300 – 400 million of equity content (consistent with prior disclosure) 2 in combination of: – Potential for cash proceeds of ~$400 – 600 million from preferred equity issuance (50% equity content) – ~$ 100 million common equity via internal programs (100% equity content) – If needed, use of at - the - market (ATM) program (100% equity content) ▪ To establish $500 million, 3 - year program in August Expect to refinance $700 million of parent debt maturities with new debt issuances In April, issued $600 million term loan (matures in April 2023), providing execution timing flexibility for 2022 financing plan |
|
14 EIX has double - digit total return potential, supported by leadership role in clean energy transition July 28, 2022 9 – 11% total return o pportunity 4 before potential P/E multiple expansion driven by estimated 65 – 70% wildfire risk reduction 5 , a nd ongoing utility and government wildfire mitigation efforts 1. Compound annual growth rate (CAGR) based on the midpoint of the 2021 Core EPS guidance range of $4.42 – 4.62 established on Septem ber 16, 2021 2. Based on EIX stock price on July 27, 2022 3. Building electrification programs subject to CPUC approval 4. At current P/E multiple. Excludes changes in P/E multiple and potential dividend growth 5. Risk reduction based on mitigations through June 30, 2022 5 – 7% core EPS CAGR 1 2021 to 2025 Underpinned by strong rate base growth of ~7 – 9% $27 – 30 billion 2021 – 2025 capital program ~4% current dividend yield 2 18 consecutive years of dividend growth Target dividend payout of 45 – 55% of SCE core earnings Investments in safety and reliability of the grid Wildfire mitigation execution reduces risk for customers Creates strong foundation for climate adaptation and the clean energy transition One of the strongest electrification profiles in the industry Industry - leading programs for transportation electrification and building electrification 3 Potential for 60% load growth by 2045 |
|
Appendix |
|
16 Cash flow from memo account recovery and securitization strengthens our balance sheet and credit metrics July 28, 2022 Approved Applications Application / Account Balance @ June 30 Recovery Through Remaining Rate Recovery by Year 2022 2023 2024 2025 ✓ GRC Track 1 (Jan. – Sept. 2021 Balance) 503 Dec. ’23 182 321 – – ✓ GRC Track 3 401 Sept. ’25 33 134 134 100 ✓ GRC Track 2 368 Feb. ’25 78 134 134 22 ✓ 2020 – 2021 Residential Uncollectibles 1 114 Feb. ’25 50 34 26 4 ✓ WEMA1 84 Sept. ’22 84 – – – ✓ 2019 CEMA 28 Sept. ’22 28 – – – Total 1,498 455 623 294 126 Pending & Future Applications (Subject to CPUC Authorization) Application Request 2 Expected Amort. 2 Expected Rate Recovery by Year 2022 2023 2024 2025 Wildfire Mitigation & Vegetation Mgmt. 327 12 months – – 327 – WEMA2 215 12 months 54 161 – – 2022 CEMA 198 12 months – – 198 – 2021 CEMA 132 12 months – 77 55 – Total 872 54 238 580 – Expected Securitizations 3,4 AB 1054 Capital Included In: Amount 2022 2023 2024 2025 ✓ GRC Tracks 1 & 2 (completed) 518 518 – – – GRC Tracks 1 & 3 730 – 730 – – Total 1,248 518 730 – – 1. 2020 – 2021 Residential Uncollectibles are tracked in a balancing account authorized by the CPUC and implemented in rates without a separate application 2. Requested revenue requirement. Amounts and amortization subject to CPUC approval 3. Amounts refer to securitization of AB 1054 capex. Actual timing will depend on the timing of CPUC authorizations and implemen tat ion in customer rates or execution of securitization transactions 4. Amounts reflect capital costs recovered upfront via securitization. Recovery in customer rates of costs to service the bonds tak es place over the tenor of the debt at a fixed recovery charge rate GRC, Uncollectibles, Wildfire - related, and Wildfire Insurance Applications $ in Millions |
|
17 4.52 4.40 – 4.70 5.50 – 5.90 2021 Guidance Midpoint 2022 Guidance 2023 2024 2025 EIX reaffirms 2021 – 2025 EPS growth rate target, which would result in 2025 EPS of $5.50 – 5.90 July 28, 2022 Earnings progression expected to continue to 2025 Core Earnings per Share 1. Based on the midpoint of initial 2021 Core EPS guidance range of $4.42 – 4.62 established September 16, 2021 2. Components are rounded to the nearest 5 cents and based on EIX 2022 guidance share count of 381.4 million shares. For the pur pos es of this illustration, all costs and dilution associated with any equity content issued beyond 2022 are reflected in the EIX Parent and Other line. Actual financing activity may vary and is subject to change 3. Based on SCE’s currently - authorized CPUC ROE. SCE has filed an application requesting a CPUC ROE for 2023 of 10.53% 5 – 7% 2021 – ’25 CAGR 1 • Annual core EPS growth during the period expected to be non - linear • Growth in any given year can be outside the range 1 2025 Core EPS Components 2 Core Earnings per Share Key Assumptions • 2025 rate base ($bn) $46.6 – 49.4 – FERC ~16% of rate base • Authorized ROE 3 10.30% • Not assuming financing benefits during 2023 – 2025 period • Up to $250 million per year, on average, equity content 2022 – 2025, as previously disclosed Approximate Ranges 2 2025 Rate Base EPS $6.45 – 6.90 SCE Op. Variances 0.40 – 0.50 EIX Parent and Other (including dilution) (0.80) – (0.95 ) SCE Costs Excluded from Authorized (0.55 ) EIX Cons. Core EPS $5.50 – 5.90 |
|
18 Year - to - Date Earnings Summary July 28, 2022 1. See EIX Core EPS Non - GAAP Reconciliations and Use of Non - GAAP Financial Measures in Appendix 2. For comparability, 2022 key EPS drivers are reported based on 2021 weighted - average share count of 379.4 million. 2022 weighted - average shares outstanding is 381.0 million 3. Includes $0.02 of higher tax benefits related to balancing accounts, which are offset in revenue 4. Includes $0.78 of previously deferred wildfire - related expenses as a result of 2021 GRC track 2 and track 3 approval, which are offset in revenue Note: Diluted earnings were $0.85 and $1.52 per share for the six months ended June 30, 2022 and 2021, respectively YTD YTD 2022 2021 Variance Basic Earnings Per Share (EPS) SCE 1.18 $ 1.73 $ (0.55) $ EIX Parent & Other (0.33) (0.21) (0.12) Basic EPS 0.85 $ 1.52 $ (0.67) $ Less: Non-core Items 1 SCE (1.15) $ (0.21) $ (0.94) $ EIX Parent & Other — — — Total Non-core Items (1.15) $ (0.21) $ (0.94) $ Core Earnings Per Share (EPS) SCE 2.33 $ 1.94 $ 0.39 $ EIX Parent & Other (0.33) (0.21) (0.12) Core EPS 2.00 $ 1.73 $ 0.27 $ Key SCE EPS Drivers 2 Higher revenue 1.54 $ CPUC revenue - GRC authorized 0.68 CPUC revenue - Other 3,4 0.80 Other operating revenue 0.06 Higher O&M 4 (0.78) Wildfire-related claims (0.02) Higher depreciation (0.23) Higher net financing costs (0.10) Income taxes 3 (0.02) Property and other taxes 0.01 Results prior to impact from share dilution 0.40 $ Impact from share dilution (0.01) Total core drivers 0.39 $ Non-core items 1 (0.94) Total (0.55) $ (0.12) Total core drivers (0.12) $ Non-core items — Total (0.12) $ Key EIX EPS Drivers 2 EIX Parent and Other |
|
19 Earnings Non - GAAP Reconciliations July 28, 2022 Q2 2022 Q2 2021 YTD 2022 YTD 2021 SCE 302 $ 359 $ 449 $ 655 $ EIX Parent & Other (61) (41) (124) (78) Basic Earnings 241 $ 318 $ 325 $ 577 $ Non-Core Items SCE 2017/2018 Wildfire/Mudslide Events claims and expenses, net of recoveries (6) (6) (291) (10) Wildfire Insurance Fund expense (38) (39) (76) (77) CSRP impairment (34) — (34) — Employment litigation matter, net of recoveries (16) — (16) — GRC track 3 impairment (12) — (12) — Organizational realignment charge (10) — (10) — Sale of San Onofre nuclear fuel — 7 — 7 Less: Total non-core items (116) $ (38) $ (439) $ (80) $ SCE 418 397 888 735 EIX Parent & Other (61) (41) (124) (78) Core Earnings 357 $ 356 $ 764 $ 657 $ 1. Non - core items are tax - effected at an estimated statutory rate of approximately 28% Reconciliation of EIX GAAP Earnings to EIX Core Earnings Earnings (Losses) Attributable to Edison International, $ in Millions 1 |
|
20 EIX Core EPS Non - GAAP Reconciliations July 28, 2022 1. 2022 EPS are reported based on weighted - average share counts of 381.3 million for second quarter and 381.0 million for year - to - d ate; 2021 EPS are reported based on weighted - average share counts of 379.6 million for second quarter and 379.4 million for year - to - date Reconciliation of EIX Basic Earnings Per Share to EIX Core Earnings Per Share EPS Attributable to Edison International 1 Q2 2022 Q2 2021 YTD 2022 YTD 2021 Basic EPS 0.63 $ 0.84 $ 0.85 $ 1.52 $ Non-Core Items SCE 2017/2018 Wildfire/Mudslide Events claims and expenses, net of recoveries (0.02) (0.02) (0.76) (0.03) Wildfire Insurance Fund expense (0.10) (0.10) (0.20) (0.20) CSRP impairment (0.09) — (0.09) — Employment litigation matter, net of recoveries (0.04) — (0.04) — GRC track 3 impairment (0.03) — (0.03) — Organizational realignment charge (0.03) — (0.03) — Sale of San Onofre nuclear fuel — 0.02 — 0.02 Less: Total non-core items (0.31) (0.10) (1.15) (0.21) Core EPS 0.94 $ 0.94 $ 2.00 $ 1.73 $ |
|
21 Low High Basic EIX EPS $3.25 $3.55 Total Non - Core Items 2 (1.15 ) (1.15) Core EIX EPS $4.40 $4.70 1. EPS is calculated on the assumed weighted - average share count for 2022 of 381.4 million 2. Non - core items are presented as they are recorded Earnings Per Share Non - GAAP Reconciliations July 28, 2022 Reconciliation of EIX Basic Earnings Per Share Guidance to EIX Core Earnings Per Share Guidance 1 2022 EPS Attributable to Edison International |
|
22 Edison International's earnings are prepared in accordance with generally accepted accounting principles used in the United States. Management uses core earnings (losses) internally for financial planning and for analysis of performance. Core earnings (losses) are also used when communicating with investors and analysts regarding Edison International's earnings results to facilitate comparisons of the company's performance from period to period. Core earnings (losses) are a non - GAAP financial measure and may not be comparable to those of other companies. Core earnings (losses) are defined as earnings attributable to Edison International shareholders less non - core items. Non - core items include income or loss from discontinued operations and income or loss from significant discrete items that management does not consider representative of ongoing earnings, such as write downs, asset impairments and other income and expense related to changes in law, outcomes in tax, regulatory or legal proceedings, and exit activities, including sale of certain assets and other activities that are no longer continuing. A reconciliation of Non - GAAP information to GAAP information is included either on the slide where the information appears or on another slide referenced in this presentation. EIX Investor Relations Contact Sam Ramraj, Vice President Derek Matsushima, Senior Manager (626) 302 - 2540 (626) 302 - 3625 Sam.Ramraj@edisonintl.com Derek.Matsushima@edisonintl.com Use of Non - GAAP Financial Measures July 28, 2022 |