| ORRSTOWN FINANCIAL SERVICES, INC. | ||
| (Exact name of registrant as specified in its charter) | ||
| Pennsylvania | 001-34292 | 23-2530374 | |||||||||||||||
| (State or other jurisdiction of incorporation) | (Commission File Number) | (IRS Employer Identification No.) | |||||||||||||||
| 4750 Lindle Road, | Harrisburg, | Pennsylvania | 17111 | ||||||||||||||
| (Address of Principal Executive Offices) | (Zip Code) | ||||||||||||||||
| Registrant’s Telephone Number, Including Area Code: | (717) | 532-6114 | |||||||||||||||
| Not Applicable | |||||||||||||||||
| (Former name or former address, if changed since last report) | |||||||||||||||||
| Check the appropriate box below if the Form 8-K filing is intended to simultaneously satisfy the filing obligation of the registrant under any of the following provisions: | |||||
| ☐ | Written communications pursuant to Rule 425 under the Securities Act (17 CFR 230.425) | ||||
| ☐ | Soliciting material pursuant to Rule 14a-12 under the Exchange Act (17 CFR 240.14a-12) | ||||
| ☐ | Pre-commencement communications pursuant to Rule 14d-2(b) under the Exchange Act (17 CFR 240.14d-2(b)) | ||||
| ☐ | Pre-commencement communications pursuant to Rule 13e-4(c) under the Exchange Act (17 CFR 240.13e-4(c)). | ||||
| Securities registered pursuant to Section 12(b) of the Act: | ||||||||||||||
| Title of each class | Trading symbol(s) | Name of each exchange on which registered | ||||||||||||
| Common Stock, no par value | ORRF | Nasdaq Stock Market | ||||||||||||
| Indicate by check mark whether the registrant is an emerging growth company as defined in Rule 405 of the Securities Act of 1933 (§230.405 of this chapter) or Rule 12b-2 of the Securities Exchange Act of 1934 (§240.12b-2 of this chapter). | |||||
| ☐ | Emerging growth company | ||||
| ☐ | If an emerging growth company, indicate by check mark if the registrant has elected not to use the extended transition period for complying with any new or revised financial accounting standards provided pursuant to Section 13(a) of the Exchange Act. | ||||
| Exhibit No. | Description | |||||||
| 99.1 | ||||||||
| 99.2 | ||||||||
| 104 | Cover Page Interactive Data File (embedded within the inline XBRL document) | |||||||
| SIGNATURES | |||||||||||
| Pursuant to the requirements of the Securities Exchange Act of 1934, the Registrant has duly caused this Report to be signed on its behalf by the undersigned hereunto duly authorized. | |||||||||||
| ORRSTOWN FINANCIAL SERVICES, INC. | |||||||||||
| Date: April 23, 2025 | By: | /s/ Neelesh Kalani | |||||||||
|
Neelesh Kalani
Executive Vice President and Chief Financial Officer
(Duly Authorized Representative)
|
|||||||||||

| Investor Relations Contact: | ||
| Neelesh Kalani | ||
| Executive Vice President, Chief Financial Officer | ||
| Phone (717) 510-7097 | ||
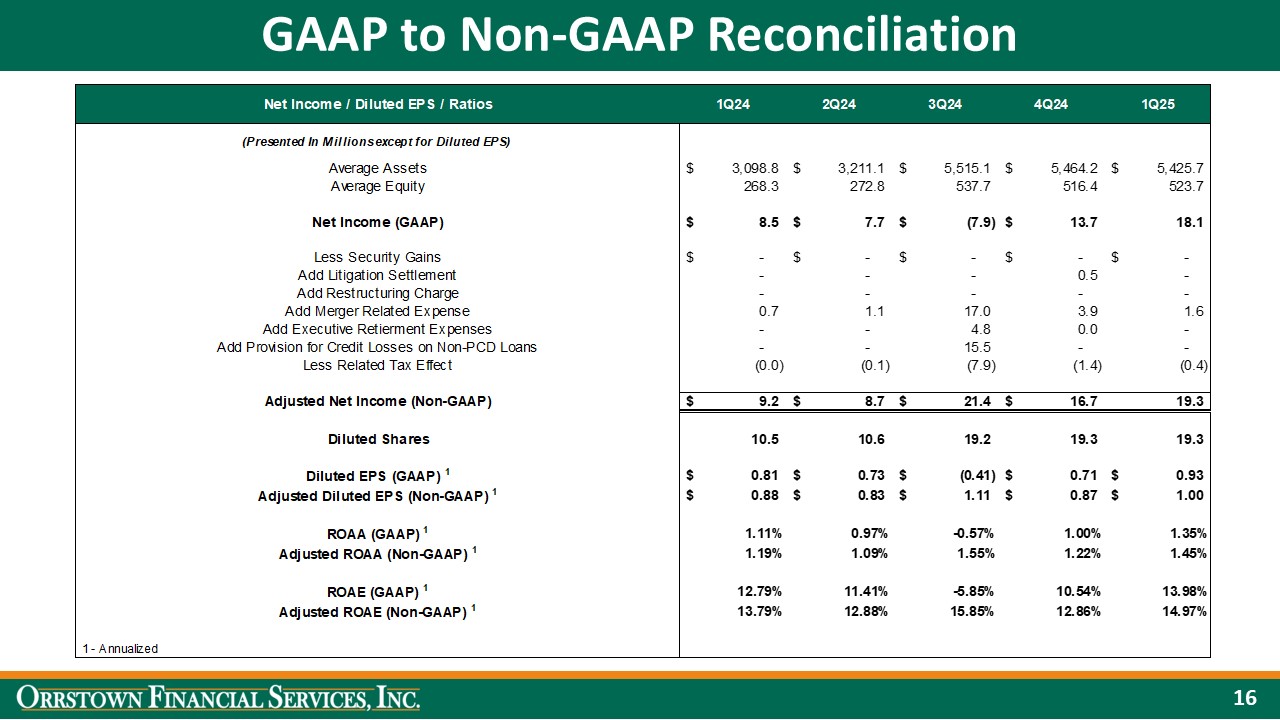
| FINANCIAL HIGHLIGHTS (Unaudited) | ||||||||||||||
Three Months Ended |
||||||||||||||
| March 31, | March 31, | |||||||||||||
| (In thousands) | 2025 | 2024 | ||||||||||||
| Profitability for the period: | ||||||||||||||
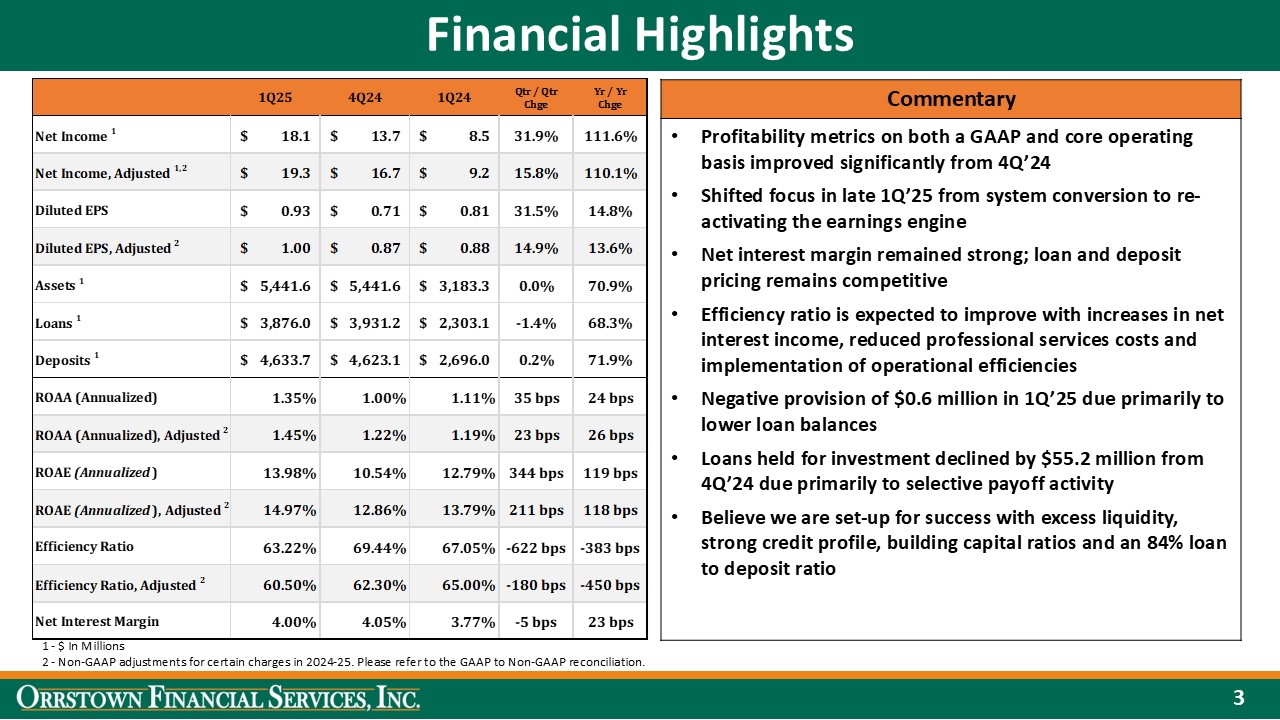
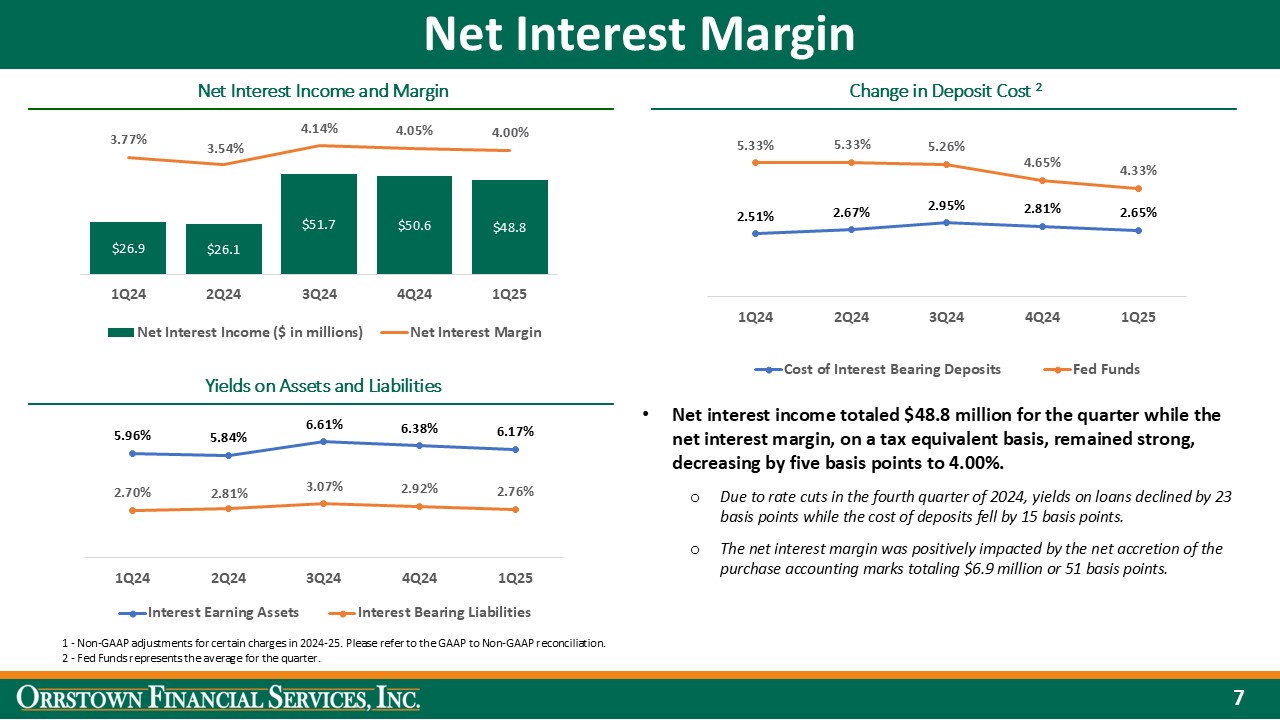
| Net interest income | $ | 48,761 | $ | 26,881 | ||||||||||
(Recovery of) Provision for credit losses |
(554) | 298 | ||||||||||||
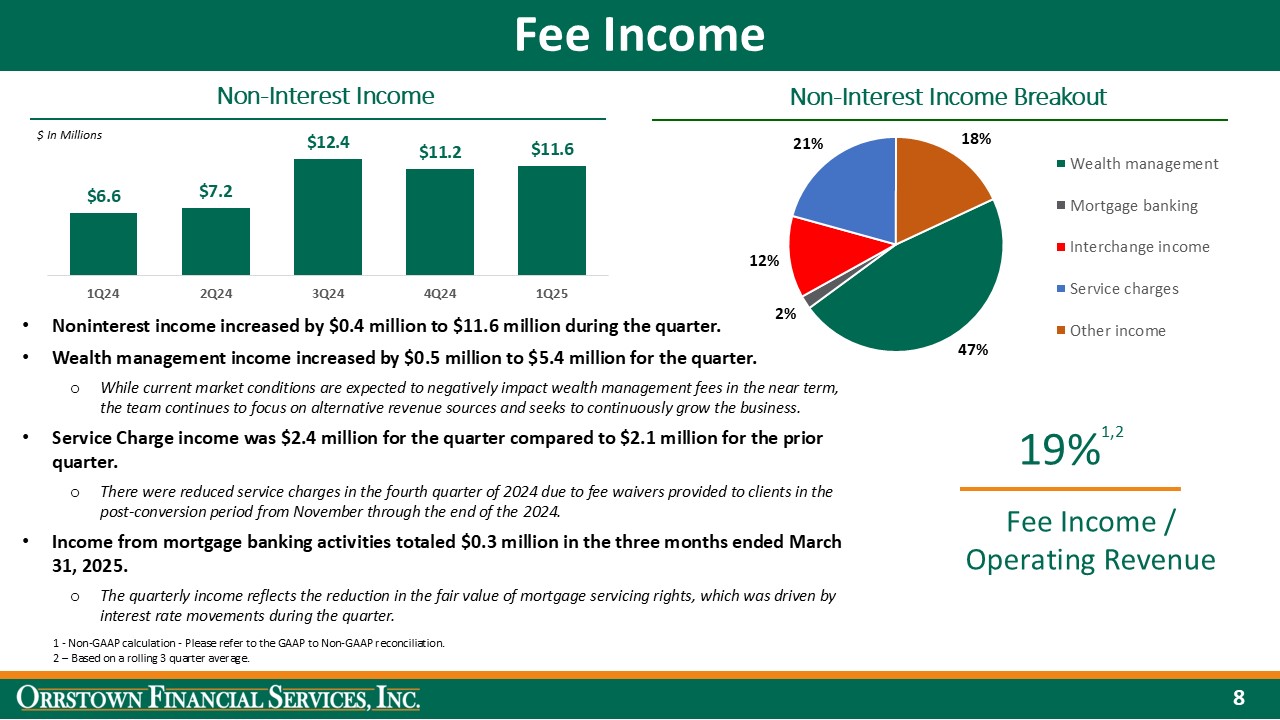
| Noninterest income | 11,624 | 6,630 | ||||||||||||
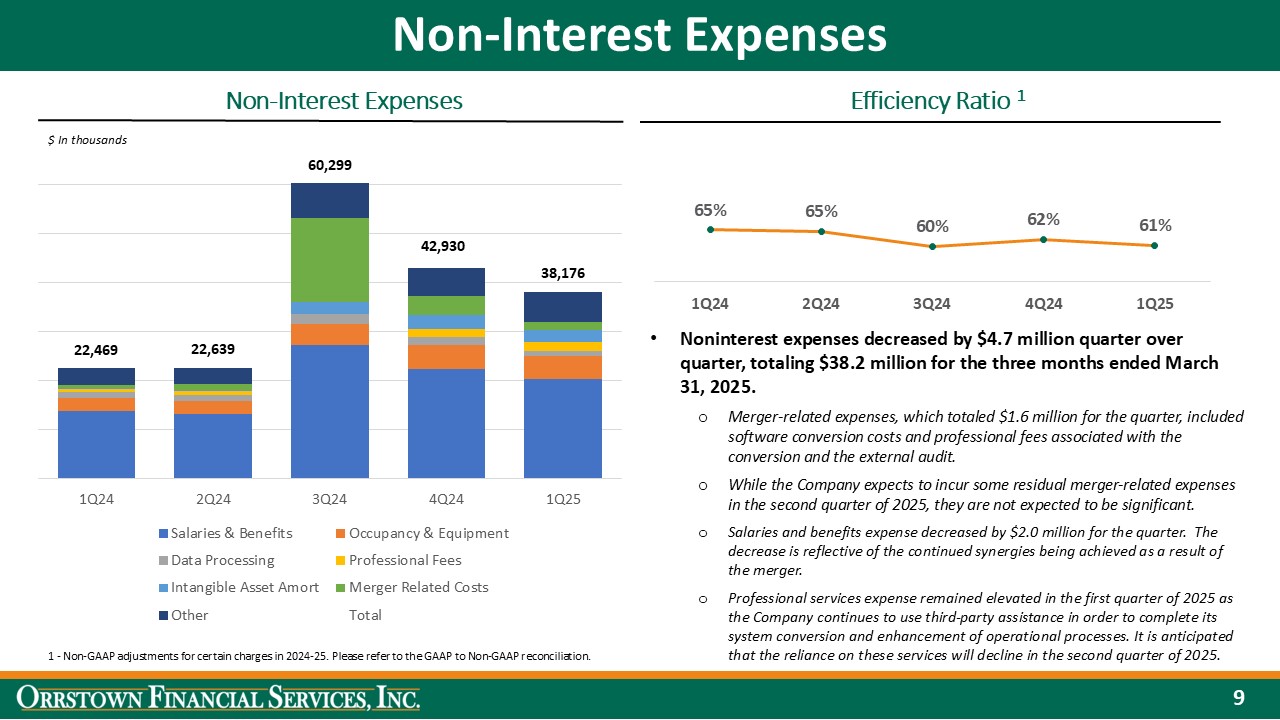
| Noninterest expenses | 38,176 | 22,469 | ||||||||||||
| Income before income tax expense | 22,763 | 10,744 | ||||||||||||
| Income tax expense | 4,712 | 2,213 | ||||||||||||
| Net income available to common shareholders | $ | 18,051 | $ | 8,531 | ||||||||||
| Financial ratios: | ||||||||||||||
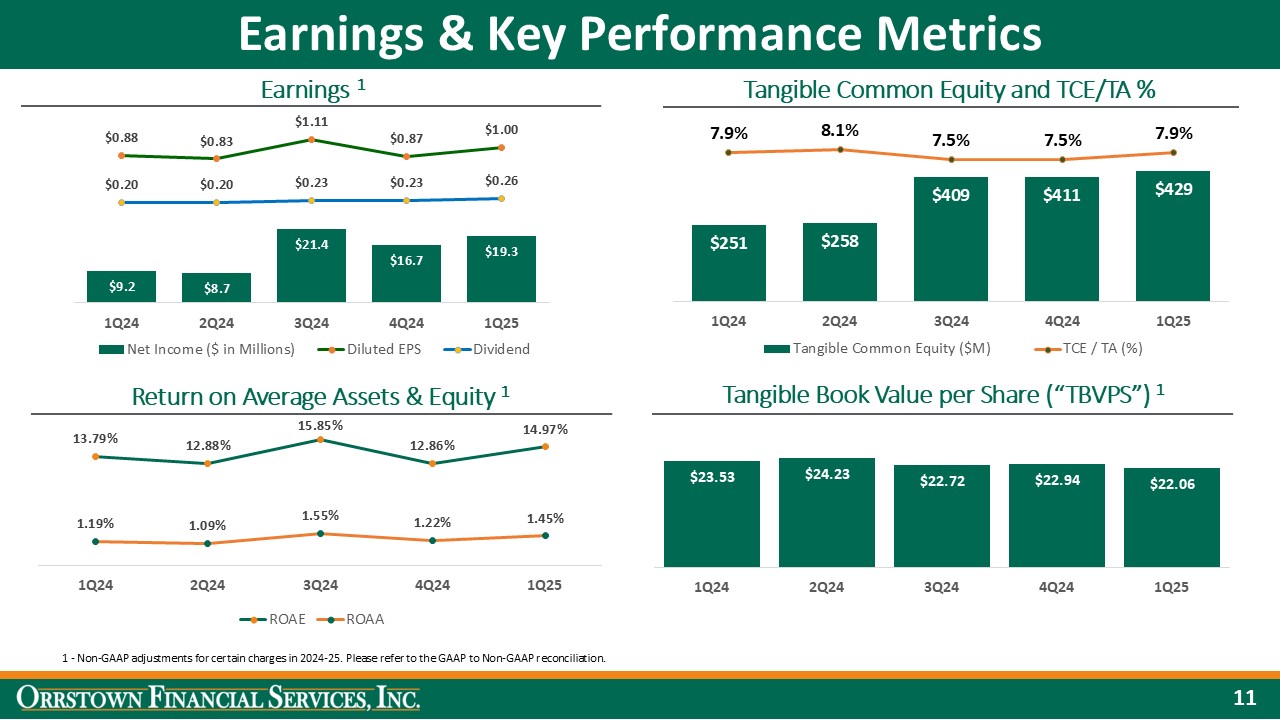
Return on average assets (1) |
1.35 | % | 1.11 | % | ||||||||||
Return on average assets, adjusted (1) (2) (3) |
1.45 | % | 1.19 | % | ||||||||||
Return on average equity (1) |
13.98 | % | 12.79 | % | ||||||||||
Return on average equity, adjusted (1) (2) (3) |
14.97 | % | 13.79 | % | ||||||||||
Net interest margin (1) |
4.00 | % | 3.77 | % | ||||||||||
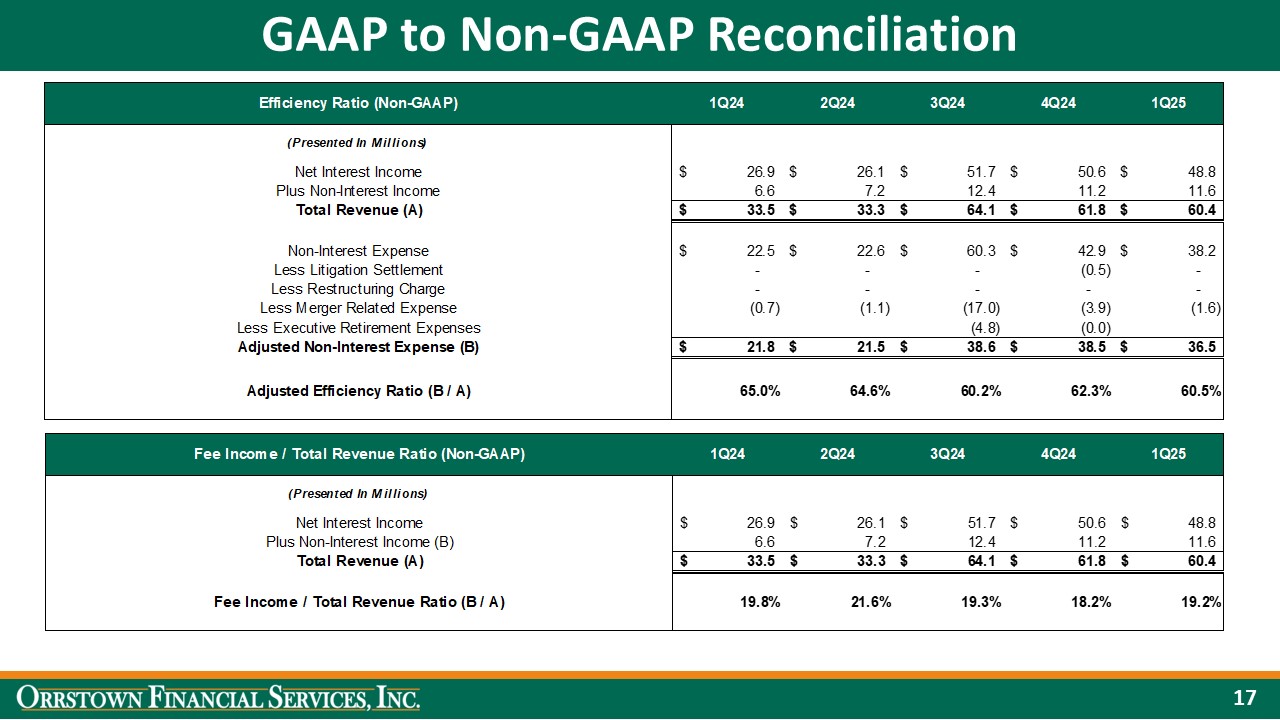
| Efficiency ratio | 63.2 | % | 67.0 | % | ||||||||||
Efficiency ratio, adjusted (2) (3) |
60.5 | % | 65.0 | % | ||||||||||
| Income per common share: | ||||||||||||||
| Basic | $ | 0.94 | $ | 0.82 | ||||||||||
Basic, adjusted (2) (3) |
$ | 1.01 | $ | 0.89 | ||||||||||
| Diluted | $ | 0.93 | $ | 0.81 | ||||||||||
Diluted, adjusted (2) (3) |
$ | 1.00 | $ | 0.88 | ||||||||||
| Average equity to average assets | 9.65 | % | 8.66 | % | ||||||||||
(1) Annualized for the three months ended March 31, 2025 and 2024. | ||||||||||||||
(2) Ratio has been adjusted for the non-recurring charges for all periods presented. | ||||||||||||||
(3) Non-GAAP based financial measure. Please refer to Appendix A - Supplemental Reporting of Non-GAAP Measures and GAAP to Non-GAAP Reconciliations for a discussion of our use of non-GAAP based financial measures, including tables reconciling GAAP and non-GAAP financial measures appearing herein. | ||||||||||||||
FINANCIAL HIGHLIGHTS (Unaudited) |
|||||||||||
| (continued) | |||||||||||
| March 31, | December 31, | ||||||||||
| (Dollars in thousands, except per share amounts) | 2025 | 2024 | |||||||||
| At period-end: | |||||||||||
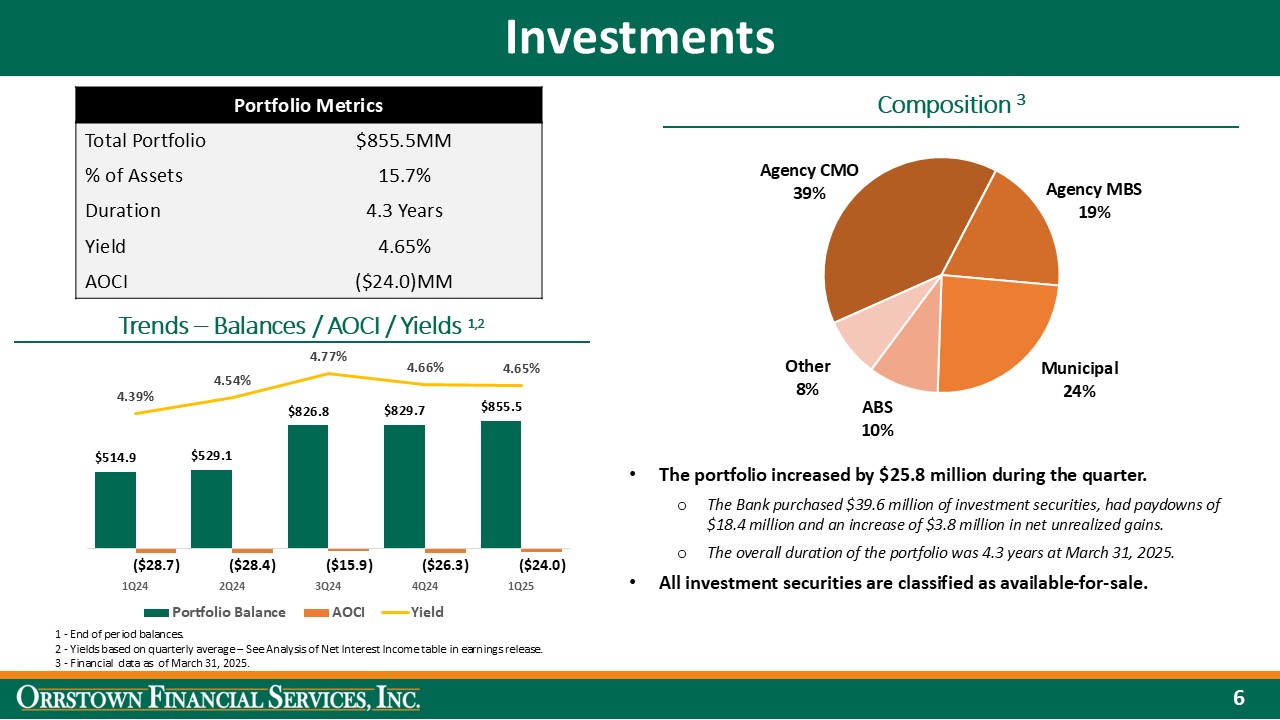
| Total assets | $ | 5,441,586 | $ | 5,441,589 | |||||||
| Loans, net of allowance for credit losses | 3,828,181 | 3,882,525 | |||||||||
| Loans held-for-sale, at fair value | 5,261 | 6,614 | |||||||||
| Securities available for sale, at fair value | 855,456 | 829,711 | |||||||||
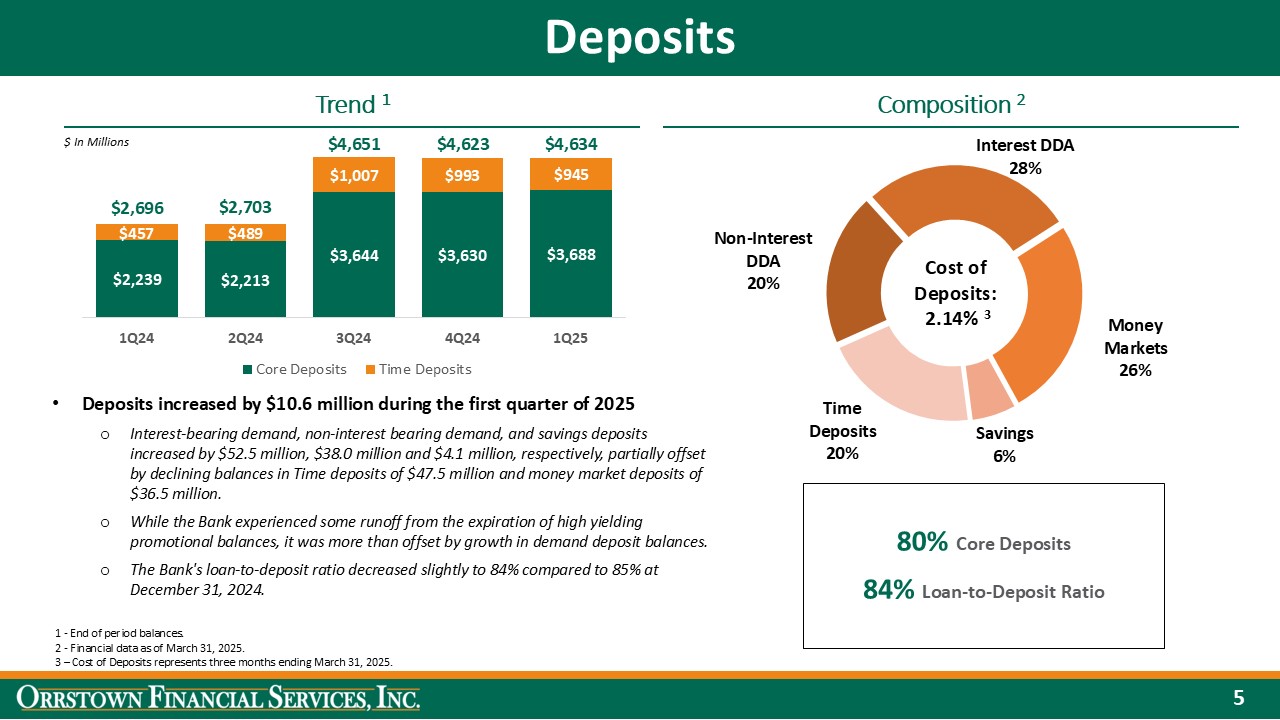
| Total deposits | 4,633,716 | 4,623,096 | |||||||||
| FHLB advances and other borrowings and Securities sold under agreements to repurchase | 123,480 | 141,227 | |||||||||
| Subordinated notes and trust preferred debt | 68,850 | 68,680 | |||||||||
| Shareholders' equity | 532,936 | 516,682 | |||||||||
Credit quality and capital ratios (1): |
|||||||||||
| Allowance for credit losses to total loans | 1.23 | % | 1.24 | % | |||||||
| Total nonaccrual loans to total loans | 0.59 | % | 0.61 | % | |||||||
| Nonperforming assets to total assets | 0.42 | % | 0.45 | % | |||||||
| Allowance for credit losses to nonaccrual loans | 210 | % | 202 | % | |||||||
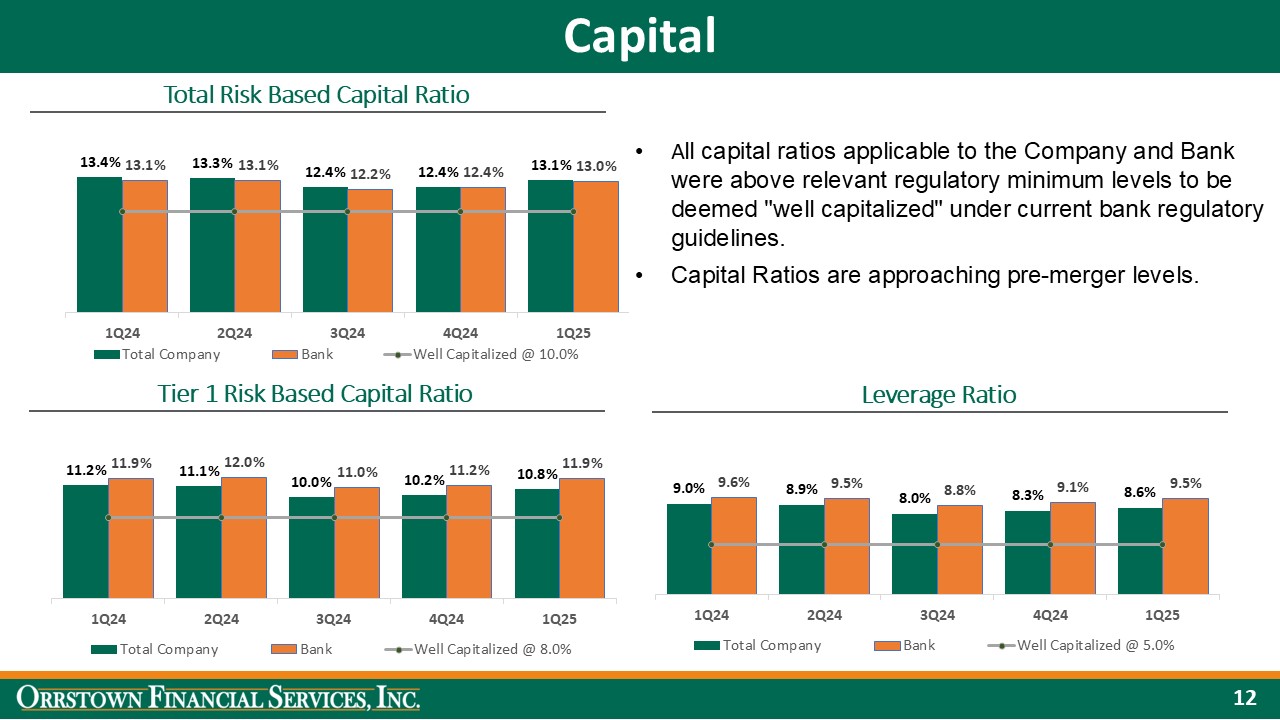
| Total risk-based capital: | |||||||||||
| Orrstown Financial Services, Inc. | 13.1 | % | 12.4 | % | |||||||
| Orrstown Bank | 13.0 | % | 12.4 | % | |||||||
| Tier 1 risk-based capital: | |||||||||||
| Orrstown Financial Services, Inc. | 10.8 | % | 10.2 | % | |||||||
| Orrstown Bank | 11.9 | % | 11.2 | % | |||||||
| Tier 1 common equity risk-based capital: | |||||||||||
| Orrstown Financial Services, Inc. | 10.6 | % | 10.0 | % | |||||||
| Orrstown Bank | 11.9 | % | 11.2 | % | |||||||
| Tier 1 leverage capital: | |||||||||||
| Orrstown Financial Services, Inc. | 8.6 | % | 8.3 | % | |||||||
| Orrstown Bank | 9.5 | % | 9.1 | % | |||||||
| Book value per common share | $ | 27.32 | $ | 26.65 | |||||||
(1) Capital ratios are estimated for the current period, subject to regulatory filings. The Company elected the three-year phase in option for the day-one impact of ASU 2016-13 for current expected credit losses ("CECL") to regulatory capital. Beginning in 2023, the Company adjusted retained earnings, allowance for credit losses includable in tier 2 capital and the deferred tax assets from temporary differences in risk weighted assets by the permitted percentage of the day-one impact from adopting the CECL standard. |
|||||||||||
CONSOLIDATED BALANCE SHEETS (Unaudited) |
|||||||||||
| (Dollars in thousands, except per share amounts) | March 31, 2025 | December 31, 2024 | |||||||||
| Assets | |||||||||||
| Cash and due from banks | $ | 64,376 | $ | 51,026 | |||||||
| Interest-bearing deposits with banks | 222,744 | 197,848 | |||||||||
| Cash and cash equivalents | 287,120 | 248,874 | |||||||||
| Restricted investments in bank stocks | 19,693 | 20,232 | |||||||||
Securities available for sale (amortized cost of $886,782 and $864,920 at March 31, 2025 and December 31, 2024, respectively) |
855,456 | 829,711 | |||||||||
| Loans held for sale, at fair value | 5,261 | 6,614 | |||||||||
| Loans | 3,875,985 | 3,931,214 | |||||||||
| Less: Allowance for credit losses | (47,804) | (48,689) | |||||||||
| Net loans | 3,828,181 | 3,882,525 | |||||||||
| Premises and equipment, net | 51,729 | 50,217 | |||||||||
| Cash surrender value of life insurance | 144,798 | 143,854 | |||||||||
| Goodwill | 68,106 | 68,106 | |||||||||
| Other intangible assets, net | 45,230 | 47,765 | |||||||||
| Accrued interest receivable | 19,893 | 21,058 | |||||||||
| Deferred tax assets, net | 36,206 | 42,647 | |||||||||
| Other assets | 79,913 | 79,986 | |||||||||
| Total assets | $ | 5,441,586 | $ | 5,441,589 | |||||||
| Liabilities | |||||||||||
| Deposits: | |||||||||||
| Noninterest-bearing | $ | 932,152 | $ | 894,176 | |||||||
| Interest-bearing | 3,701,564 | 3,728,920 | |||||||||
| Total deposits | 4,633,716 | 4,623,096 | |||||||||
| Securities sold under agreements to repurchase and federal funds purchased | 23,131 | 25,863 | |||||||||
| FHLB advances and other borrowings | 100,349 | 115,364 | |||||||||
| Subordinated notes and trust preferred debt | 68,850 | 68,680 | |||||||||
| Other liabilities | 82,604 | 91,904 | |||||||||
| Total liabilities | 4,908,650 | 4,924,907 | |||||||||
| Shareholders’ Equity | |||||||||||
Preferred stock, $1.25 par value per share; 500,000 shares authorized; no shares issued or outstanding |
— | — | |||||||||
Common stock, no par value—$0.05205 stated value per share; 50,000,000 shares authorized; 19,721,340 shares issued and 19,509,642 outstanding at March 31, 2025; 19,722,640 shares issued and 19,389,967 outstanding at December 31, 2024 |
1,026 | 1027 | |||||||||
| Additional paid—in capital | 421,445 | 423,274 | |||||||||
| Retained earnings | 139,547 | 126,540 | |||||||||
| Accumulated other comprehensive loss | (24,024) | (26,316) | |||||||||
Treasury stock— 211,698 and 332,673 shares, at cost at March 31, 2025 and December 31, 2024, respectively |
(5,058) | (7,843) | |||||||||
| Total shareholders’ equity | 532,936 | 516,682 | |||||||||
| Total liabilities and shareholders’ equity | $ | 5,441,586 | $ | 5,441,589 | |||||||
| ORRSTOWN FINANCIAL SERVICES, INC. | ||||||||||||||
CONDENSED CONSOLIDATED STATEMENTS OF INCOME (Unaudited) | ||||||||||||||
Three Months Ended |
||||||||||||||
| March 31, | March 31, | |||||||||||||
| (Dollars in thousands, except per share amounts) | 2025 | 2024 | ||||||||||||
| Interest income | ||||||||||||||
| Loans | $ | 63,432 | $ | 36,233 | ||||||||||
| Investment securities - taxable | 8,944 | 4,584 | ||||||||||||
| Investment securities - tax-exempt | 875 | 877 | ||||||||||||
| Short-term investments | 2,268 | 956 | ||||||||||||
| Total interest income | 75,519 | 42,650 | ||||||||||||
| Interest expense | ||||||||||||||
| Deposits | 24,260 | 13,516 | ||||||||||||
| Securities sold under agreements to repurchase and federal funds purchased | 84 | 25 | ||||||||||||
| FHLB advances and other borrowings | 1,118 | 1,474 | ||||||||||||
| Subordinated notes and trust preferred debt | 1,296 | 754 | ||||||||||||
| Total interest expense | 26,758 | 15,769 | ||||||||||||
| Net interest income | 48,761 | 26,881 | ||||||||||||
(Recovery of) Provision for credit losses |
(554) | 298 | ||||||||||||
Net interest income after (recovery of) provision for credit losses |
49,315 | 26,583 | ||||||||||||
| Noninterest income | ||||||||||||||
| Service charges | 2,395 | 1,200 | ||||||||||||
| Interchange income | 1,427 | 911 | ||||||||||||
| Swap fee income | 394 | 199 | ||||||||||||
| Wealth management income | 5,415 | 3,102 | ||||||||||||
| Mortgage banking activities | 302 | 458 | ||||||||||||
| Investment securities gains (losses) | 13 | (5) | ||||||||||||
| Other income | 1,678 | 765 | ||||||||||||
| Total noninterest income | 11,624 | 6,630 | ||||||||||||
| Noninterest expenses | ||||||||||||||
| Salaries and employee benefits | 20,388 | 13,752 | ||||||||||||
| Occupancy, furniture and equipment | 4,675 | 2,639 | ||||||||||||
| Data processing | 924 | 1,265 | ||||||||||||
| Advertising and bank promotions | 499 | 398 | ||||||||||||
| FDIC insurance | 824 | 441 | ||||||||||||
| Professional services | 1,826 | 631 | ||||||||||||
| Taxes other than income | 942 | 494 | ||||||||||||
| Intangible asset amortization | 2,535 | 225 | ||||||||||||
Merger-related expenses |
1,649 | 672 | ||||||||||||
| Restructuring expenses | 91 | — | ||||||||||||
| Other operating expenses | 3,823 | 1,952 | ||||||||||||
| Total noninterest expenses | 38,176 | 22,469 | ||||||||||||
| Income before income tax expense | 22,763 | 10,744 | ||||||||||||
| Income tax expense | 4,712 | 2,213 | ||||||||||||
| Net income | $ | 18,051 | $ | 8,531 | ||||||||||
continued | ||||||||||||||
Three Months Ended |
||||||||||||||
| March 31, | March 31, | |||||||||||||
| 2025 | 2024 | |||||||||||||
| Share information: | ||||||||||||||
| Basic earnings per share | $ | 0.94 | $ | 0.82 | ||||||||||
| Diluted earnings per share | $ | 0.93 | $ | 0.81 | ||||||||||
| Dividends paid per share | $ | 0.26 | $ | 0.20 | ||||||||||
| Weighted average shares - basic | 19,157 | 10,349 | ||||||||||||
| Weighted average shares - diluted | 19,328 | 10,482 | ||||||||||||
| ANALYSIS OF NET INTEREST INCOME | |||||||||||||||||||||||||||||||||||||||||||||||||||||||||||||||||||||||||||||||||||||||||
Average Balances and Interest Rates, Taxable-Equivalent Basis (Unaudited) |
|||||||||||||||||||||||||||||||||||||||||||||||||||||||||||||||||||||||||||||||||||||||||
| Three Months Ended | |||||||||||||||||||||||||||||||||||||||||||||||||||||||||||||||||||||||||||||||||||||||||
| 3/31/2025 | 12/31/2024 | 9/30/2024 | 6/30/2024 | 3/31/2024 | |||||||||||||||||||||||||||||||||||||||||||||||||||||||||||||||||||||||||||||||||||||
| Taxable- | Taxable- | Taxable- | Taxable- | Taxable- | Taxable- | Taxable- | Taxable- | Taxable- | Taxable- | ||||||||||||||||||||||||||||||||||||||||||||||||||||||||||||||||||||||||||||||||
| Average | Equivalent | Equivalent | Average | Equivalent | Equivalent | Average | Equivalent | Equivalent | Average | Equivalent | Equivalent | Average | Equivalent | Equivalent | |||||||||||||||||||||||||||||||||||||||||||||||||||||||||||||||||||||||||||
| (In thousands) | Balance | Interest | Rate | Balance | Interest | Rate | Balance | Interest | Rate | Balance | Interest | Rate | Balance | Interest | Rate | ||||||||||||||||||||||||||||||||||||||||||||||||||||||||||||||||||||||||||
| Assets | |||||||||||||||||||||||||||||||||||||||||||||||||||||||||||||||||||||||||||||||||||||||||
| Federal funds sold & interest-bearing bank balances | $ | 203,347 | $ | 2,268 | 4.52 | % | $ | 199,236 | $ | 2,492 | 4.96 | % | $ | 184,465 | $ | 2,452 | 5.29 | % | $ | 142,868 | $ | 1,864 | 5.25 | % | $ | 74,523 | $ | 956 | 5.16 | % | |||||||||||||||||||||||||||||||||||||||||||||||||||||||||||
Investment securities (1)(2) |
865,126 | 10,052 | 4.65 | 849,389 | 9,887 | 4.66 | 849,700 | 10,123 | 4.77 | 538,451 | 6,114 | 4.54 | 519,851 | 5,694 | 4.39 | ||||||||||||||||||||||||||||||||||||||||||||||||||||||||||||||||||||||||||
Loans (1)(3)(4)(5)(6) |
3,909,694 | 63,641 | 6.59 | 3,961,269 | 68,073 | 6.82 | 3,989,259 | 70,849 | 7.07 | 2,324,942 | 35,690 | 6.17 | 2,308,103 | 36,382 | 6.34 | ||||||||||||||||||||||||||||||||||||||||||||||||||||||||||||||||||||||||||
| Total interest-earning assets | 4,978,167 | 75,961 | 6.17 | 5,009,894 | 80,452 | 6.38 | 5,023,424 | 83,424 | 6.61 | 3,006,261 | 43,668 | 5.84 | 2,902,477 | 43,032 | 5.96 | ||||||||||||||||||||||||||||||||||||||||||||||||||||||||||||||||||||||||||
| Other assets | 447,530 | 454,271 | 491,719 | 204,863 | 196,295 | ||||||||||||||||||||||||||||||||||||||||||||||||||||||||||||||||||||||||||||||||||||
| Total assets | $ | 5,425,697 | $ | 5,464,165 | $ | 5,515,143 | $ | 3,211,124 | $ | 3,098,772 | |||||||||||||||||||||||||||||||||||||||||||||||||||||||||||||||||||||||||||||||
| Liabilities and Shareholders' Equity | |||||||||||||||||||||||||||||||||||||||||||||||||||||||||||||||||||||||||||||||||||||||||
Interest-bearing demand deposits(7) |
$ | 2,473,543 | 14,156 | 2.32 | $ | 2,522,885 | 15,575 | 2.45 | $ | 2,554,743 | 16,165 | 2.52 | $ | 1,649,753 | 10,118 | 2.47 | $ | 1,570,622 | 9,192 | 2.35 | |||||||||||||||||||||||||||||||||||||||||||||||||||||||||||||||||||||
Savings deposits(7) |
273,313 | 165 | 0.25 | 272,718 | 166 | 0.24 | 283,337 | 148 | 0.21 | 165,467 | 140 | 0.34 | 170,005 | 144 | 0.34 | ||||||||||||||||||||||||||||||||||||||||||||||||||||||||||||||||||||||||||
| Time deposits | 970,588 | 9,939 | 4.15 | 998,963 | 11,109 | 4.41 | 1,014,628 | 12,290 | 4.82 | 481,721 | 5,007 | 4.18 | 428,443 | 4,180 | 3.92 | ||||||||||||||||||||||||||||||||||||||||||||||||||||||||||||||||||||||||||
| Total interest-bearing deposits | 3,717,444 | 24,260 | 2.65 | 3,794,566 | 26,850 | 2.81 | 3,852,708 | 28,603 | 2.95 | 2,296,941 | 15,265 | 2.67 | 2,169,070 | 13,516 | 2.51 | ||||||||||||||||||||||||||||||||||||||||||||||||||||||||||||||||||||||||||
| Securities sold under agreements to repurchase and federal funds purchased | 26,163 | 84 | 1.30 | 21,572 | 67 | 1.23 | 23,075 | 96 | 1.66 | 13,412 | 27 | 0.81 | 12,010 | 25 | 0.85 | ||||||||||||||||||||||||||||||||||||||||||||||||||||||||||||||||||||||||||
| FHLB advances and other borrowings | 112,859 | 1,118 | 4.02 | 115,373 | 1,165 | 4.01 | 115,388 | 1,154 | 3.98 | 115,000 | 1,152 | 4.03 | 137,505 | 1,474 | 4.31 | ||||||||||||||||||||||||||||||||||||||||||||||||||||||||||||||||||||||||||
| Subordinated notes and trust preferred debt | 68,739 | 1,296 | 7.65 | 68,571 | 1,360 | 7.88 | 68,399 | 1,437 | 8.36 | 32,118 | 734 | 9.19 | 32,100 | 754 | 9.45 | ||||||||||||||||||||||||||||||||||||||||||||||||||||||||||||||||||||||||||
| Total interest-bearing liabilities | 3,925,205 | 26,758 | 2.76 | 4,000,082 | 29,442 | 2.92 | 4,059,570 | 31,290 | 3.07 | 2,457,471 | 17,178 | 2.81 | 2,350,685 | 15,769 | 2.70 | ||||||||||||||||||||||||||||||||||||||||||||||||||||||||||||||||||||||||||
| Noninterest-bearing demand deposits | 887,726 | 849,999 | 807,886 | 423,037 | 417,469 | ||||||||||||||||||||||||||||||||||||||||||||||||||||||||||||||||||||||||||||||||||||
| Other liabilities | 89,077 | 97,685 | 110,017 | 57,828 | 62,329 | ||||||||||||||||||||||||||||||||||||||||||||||||||||||||||||||||||||||||||||||||||||
| Total liabilities | 4,902,008 | 4,947,766 | 4,977,473 | 2,938,336 | 2,830,483 | ||||||||||||||||||||||||||||||||||||||||||||||||||||||||||||||||||||||||||||||||||||
| Shareholders' equity | 523,689 | 516,399 | 537,670 | 272,788 | 268,289 | ||||||||||||||||||||||||||||||||||||||||||||||||||||||||||||||||||||||||||||||||||||
| Total | $ | 5,425,697 | $ | 5,464,165 | $ | 5,515,143 | $ | 3,211,124 | $ | 3,098,772 | |||||||||||||||||||||||||||||||||||||||||||||||||||||||||||||||||||||||||||||||
| Taxable-equivalent net interest income / net interest spread | 49,203 | 3.41 | % | 51,010 | 3.46 | % | 52,134 | 3.55 | % | 26,490 | 3.02 | % | 27,263 | 3.26 | % | ||||||||||||||||||||||||||||||||||||||||||||||||||||||||||||||||||||||||||
| Taxable-equivalent net interest margin | 4.00 | % | 4.05 | % | 4.14 | % | 3.54 | % | 3.77 | % | |||||||||||||||||||||||||||||||||||||||||||||||||||||||||||||||||||||||||||||||
| Taxable-equivalent adjustment | (442) | (437) | (437) | (387) | (382) | ||||||||||||||||||||||||||||||||||||||||||||||||||||||||||||||||||||||||||||||||||||
| Net interest income | $ | 48,761 | $ | 50,573 | $ | 51,697 | $ | 26,103 | $ | 26,881 | |||||||||||||||||||||||||||||||||||||||||||||||||||||||||||||||||||||||||||||||
| Ratio of average interest-earning assets to average interest-bearing liabilities | 127 | % | 125 | % | 124 | % | 122 | % | 123 | % | |||||||||||||||||||||||||||||||||||||||||||||||||||||||||||||||||||||||||||||||
| NOTES: | |||||||||||||||||||||||||||||||||||||||||||||||||||||||||||||||||||||||||||||||||||||||||
(1) Yields and interest income on tax-exempt assets have been computed on a taxable-equivalent basis assuming a 21% tax rate. | |||||||||||||||||||||||||||||||||||||||||||||||||||||||||||||||||||||||||||||||||||||||||
(2) Average balance of investment securities is computed at fair value. | |||||||||||||||||||||||||||||||||||||||||||||||||||||||||||||||||||||||||||||||||||||||||
(3) Average balances include nonaccrual loans. | |||||||||||||||||||||||||||||||||||||||||||||||||||||||||||||||||||||||||||||||||||||||||
(4) Interest income on loans includes prepayment and late fees, where applicable. | |||||||||||||||||||||||||||||||||||||||||||||||||||||||||||||||||||||||||||||||||||||||||
(5) Interest income on loans includes interest recovered of $1.6 million from the payoff of a commercial real estate loan on nonaccrual status in the three months ended March 31, 2024. | |||||||||||||||||||||||||||||||||||||||||||||||||||||||||||||||||||||||||||||||||||||||||
(6) Interest income on loans includes accretion on purchase accounting marks of $6.6 million, $7.6 million, $7.3 million, $0.2 million, and $0.1 million for the three months ended March 31, 2025, December 31, 2024, September 30, 2024, June 30, 2024 and March 31, 2024, respectively. | |||||||||||||||||||||||||||||||||||||||||||||||||||||||||||||||||||||||||||||||||||||||||
| ORRSTOWN FINANCIAL SERVICES, INC. | |||||||||||||||||||||||||||||
HISTORICAL TRENDS IN QUARTERLY FINANCIAL DATA (Unaudited) |
|||||||||||||||||||||||||||||
| (In thousands) | March 31, 2025 |
December 31, 2024 |
September 30, 2024 |
June 30, 2024 |
March 31, 2024 |
||||||||||||||||||||||||
| Profitability for the quarter: | |||||||||||||||||||||||||||||
| Net interest income | $ | 48,761 | $ | 50,573 | $ | 51,697 | $ | 26,103 | $ | 26,881 | |||||||||||||||||||
(Recovery of) Provision for credit losses |
(554) | 1,755 | 13,681 | 812 | 298 | ||||||||||||||||||||||||
| Noninterest income | 11,624 | 11,247 | 12,386 | 7,172 | 6,630 | ||||||||||||||||||||||||
| Noninterest expenses | 38,176 | 42,930 | 60,299 | 22,639 | 22,469 | ||||||||||||||||||||||||
| Income (loss) before income taxes | 22,763 | 17,135 | (9,897) | 9,824 | 10,744 | ||||||||||||||||||||||||
| Income tax expense (benefit) | 4,712 | 3,451 | (1,994) | 2,086 | 2,213 | ||||||||||||||||||||||||
| Net income (loss) | $ | 18,051 | $ | 13,684 | $ | (7,903) | $ | 7,738 | $ | 8,531 | |||||||||||||||||||
| Financial ratios: | |||||||||||||||||||||||||||||
Return on average assets (1) |
1.35 | % | 1.00 | % | (0.57) | % | 0.97 | % | 1.11 | % | |||||||||||||||||||
Return on average assets, adjusted (1)(2)(3) |
1.45 | % | 1.22 | % | 1.55 | % | 1.09 | % | 1.19 | % | |||||||||||||||||||
Return on average equity (1) |
13.98 | % | 10.54 | % | (5.85) | % | 11.41 | % | 12.79 | % | |||||||||||||||||||
Return on average equity, adjusted (1)(2)(3) |
14.97 | % | 12.86 | % | 15.85 | % | 12.88 | % | 13.79 | % | |||||||||||||||||||
Net interest margin (1) |
4.00 | % | 4.05 | % | 4.14 | % | 3.54 | % | 3.77 | % | |||||||||||||||||||
| Efficiency ratio | 63.2 | % | 69.4 | % | 94.1 | % | 68.0 | % | 67.0 | % | |||||||||||||||||||
Efficiency ratio, adjusted (2)(3) |
60.5 | % | 62.3 | % | 60.2 | % | 64.6 | % | 65.0 | % | |||||||||||||||||||
| Per share information: | |||||||||||||||||||||||||||||
| Income (loss) per common share: | |||||||||||||||||||||||||||||
| Basic | $ | 0.94 | $ | 0.72 | $ | (0.41) | $ | 0.74 | $ | 0.82 | |||||||||||||||||||
Basic, adjusted (2)(3) |
1.01 | 0.87 | 1.12 | 0.84 | 0.89 | ||||||||||||||||||||||||
| Diluted | 0.93 | 0.71 | (0.41) | 0.73 | 0.81 | ||||||||||||||||||||||||
Diluted, adjusted (2)(3) |
1.00 | 0.87 | 1.11 | 0.83 | 0.88 | ||||||||||||||||||||||||
| Book value | 27.32 | 26.65 | 26.65 | 25.97 | 25.38 | ||||||||||||||||||||||||
Book value, adjusted (2) (3) |
27.38 | 28.40 | 28.24 | 26.12 | 25.44 | ||||||||||||||||||||||||
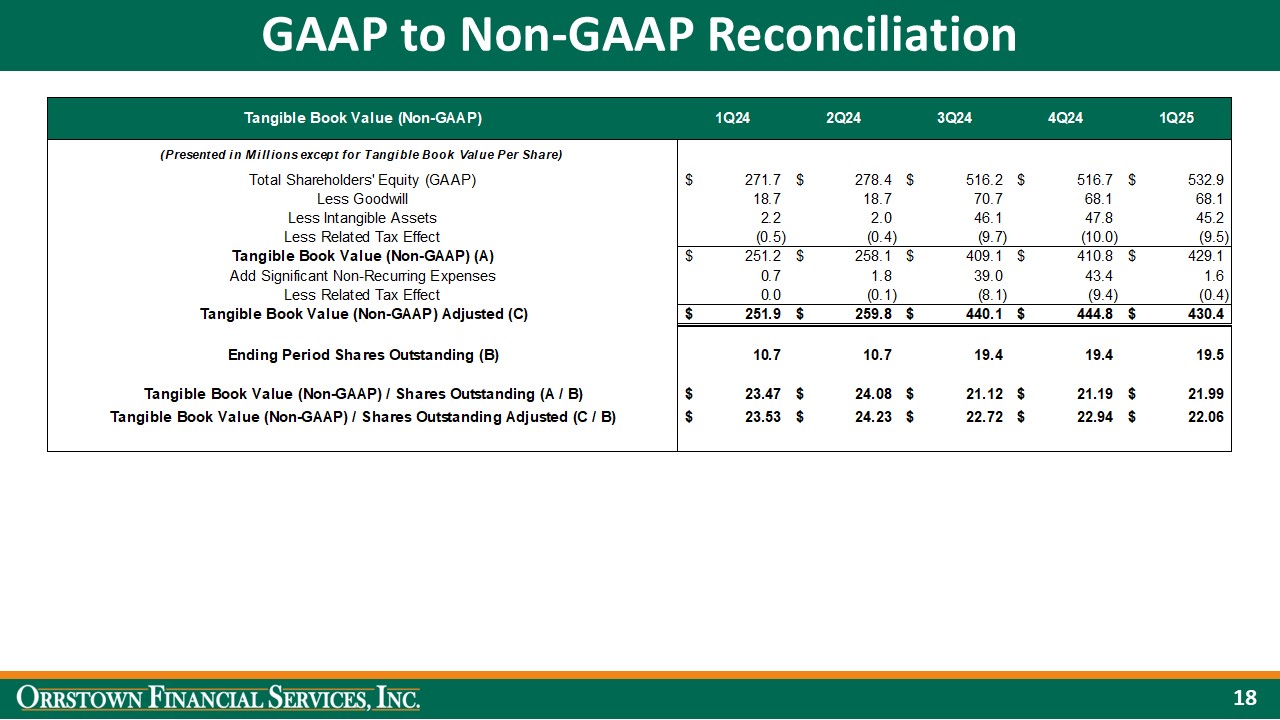
Tangible book value(3) |
21.99 | 21.19 | 21.12 | 24.08 | 23.47 | ||||||||||||||||||||||||
Tangible book value, adjusted (2) (3) |
22.06 | 22.94 | 22.72 | 24.23 | 23.53 | ||||||||||||||||||||||||
| Cash dividends paid | 0.26 | 0.23 | 0.23 | 0.20 | 0.20 | ||||||||||||||||||||||||
| Average basic shares | 19,157 | 19,118 | 19,088 | 10,393 | 10,349 | ||||||||||||||||||||||||
| Average diluted shares | 19,328 | 19,300 | 19,226 | 10,553 | 10,482 | ||||||||||||||||||||||||
(1) Annualized. | |||||||||||||||||||||||||||||
(2) Ratio has been adjusted for non-recurring expenses for all periods presented. | |||||||||||||||||||||||||||||
(3) Non-GAAP based financial measure. Please refer to Appendix A - Supplemental Reporting of Non-GAAP Measures and GAAP to Non-GAAP Reconciliations for a discussion of our use of non-GAAP based financial measures, including tables reconciling GAAP and non-GAAP financial measures appearing herein. | |||||||||||||||||||||||||||||
| ORRSTOWN FINANCIAL SERVICES, INC. | |||||||||||||||||||||||||||||
HISTORICAL TRENDS IN QUARTERLY FINANCIAL DATA (Unaudited) |
|||||||||||||||||||||||||||||
| (continued) | |||||||||||||||||||||||||||||
| (In thousands) | March 31, 2025 |
December 31, 2024 |
September 30, 2024 |
June 30, 2024 |
March 31, 2024 |
||||||||||||||||||||||||
| Noninterest income: | |||||||||||||||||||||||||||||
| Service charges | $ | 2,395 | $ | 2,050 | $ | 2,360 | $ | 1,283 | $ | 1,200 | |||||||||||||||||||
| Interchange income | 1,427 | 1,608 | 1,779 | 961 | 911 | ||||||||||||||||||||||||
| Swap fee income | 394 | 597 | 505 | 375 | 199 | ||||||||||||||||||||||||
| Wealth management income | 5,415 | 4,902 | 5,037 | 3,312 | 3,102 | ||||||||||||||||||||||||
| Mortgage banking activities | 302 | 517 | 491 | 369 | 458 | ||||||||||||||||||||||||
| Other income | 1,678 | 1,578 | 1,943 | 884 | 765 | ||||||||||||||||||||||||
| Investment securities gains (losses) | 13 | (5) | 271 | (12) | (5) | ||||||||||||||||||||||||
| Total noninterest income | $ | 11,624 | $ | 11,247 | $ | 12,386 | $ | 7,172 | $ | 6,630 | |||||||||||||||||||
| Noninterest expenses: | |||||||||||||||||||||||||||||
| Salaries and employee benefits | $ | 20,388 | $ | 22,444 | $ | 27,190 | $ | 13,195 | $ | 13,752 | |||||||||||||||||||
| Occupancy, furniture and equipment | 4,675 | 4,893 | 4,333 | 2,705 | 2,639 | ||||||||||||||||||||||||
| Data processing | 924 | 1,540 | 2,046 | 1,237 | 1,265 | ||||||||||||||||||||||||
| Advertising and bank promotions | 499 | 878 | 537 | 774 | 398 | ||||||||||||||||||||||||
| FDIC insurance | 824 | 955 | 862 | 419 | 441 | ||||||||||||||||||||||||
| Professional services | 1,826 | 1,591 | 1,119 | 801 | 631 | ||||||||||||||||||||||||
| Taxes other than income | 942 | (312) | 503 | 49 | 494 | ||||||||||||||||||||||||
| Intangible asset amortization | 2,535 | 2,838 | 2,464 | 215 | 225 | ||||||||||||||||||||||||
| Provision for legal settlement | — | 478 | — | — | — | ||||||||||||||||||||||||
Merger-related expenses |
1,649 | 3,887 | 16,977 | 1,135 | 672 | ||||||||||||||||||||||||
| Restructuring expenses | 91 | 39 | 257 | — | — | ||||||||||||||||||||||||
| Other operating expenses | 3,823 | 3,699 | 4,011 | 2,109 | 1,952 | ||||||||||||||||||||||||
| Total noninterest expenses | $ | 38,176 | $ | 42,930 | $ | 60,299 | $ | 22,639 | $ | 22,469 | |||||||||||||||||||
HISTORICAL TRENDS IN QUARTERLY FINANCIAL DATA (Unaudited) |
|||||||||||||||||||||||||||||
| (continued) | |||||||||||||||||||||||||||||
| (In thousands) | March 31, 2025 |
December 31, 2024 |
September 30, 2024 |
June 30, 2024 |
March 31, 2024 |
||||||||||||||||||||||||
| Balance Sheet at quarter end: | |||||||||||||||||||||||||||||
| Cash and cash equivalents | $ | 287,120 | $ | 248,874 | $ | 236,780 | $ | 132,509 | $ | 182,722 | |||||||||||||||||||
| Restricted investments in bank stocks | 19,693 | 20,232 | 20,247 | 11,147 | 11,453 | ||||||||||||||||||||||||
| Securities available for sale | 855,456 | 829,711 | 826,828 | 529,082 | 514,909 | ||||||||||||||||||||||||
| Loans held for sale, at fair value | 5,261 | 6,614 | 3,561 | 1,562 | 535 | ||||||||||||||||||||||||
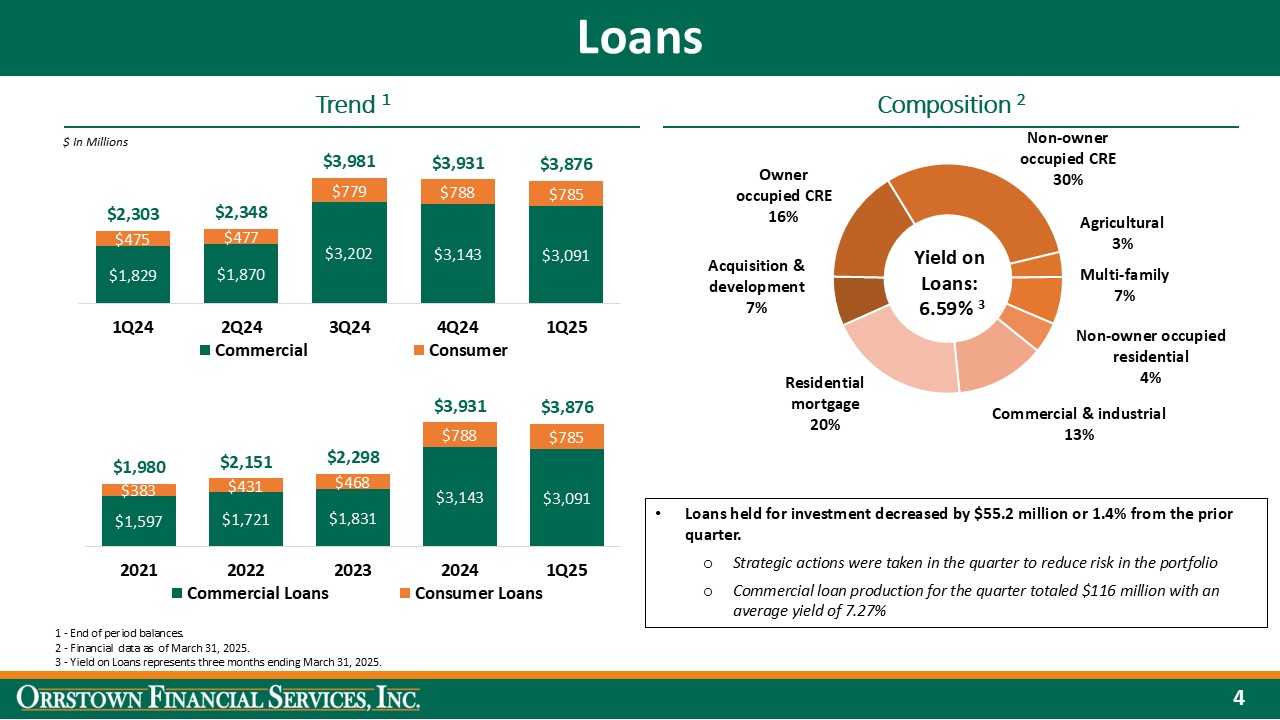
| Loans: | |||||||||||||||||||||||||||||
| Commercial real estate: | |||||||||||||||||||||||||||||
| Owner occupied | 617,854 | 633,567 | 622,726 | 371,301 | 364,280 | ||||||||||||||||||||||||
| Non-owner occupied | 1,157,383 | 1,160,238 | 1,164,501 | 710,477 | 707,871 | ||||||||||||||||||||||||
| Multi-family | 257,724 | 274,135 | 276,296 | 151,542 | 147,773 | ||||||||||||||||||||||||
| Non-owner occupied residential | 168,354 | 179,512 | 190,786 | 89,156 | 91,858 | ||||||||||||||||||||||||
| Agricultural | 134,916 | 125,156 | 129,486 | 25,551 | 25,909 | ||||||||||||||||||||||||
Commercial and industrial |
455,494 | 451,384 | 471,983 | 349,425 | 339,615 | ||||||||||||||||||||||||
| Acquisition and development: | |||||||||||||||||||||||||||||
| 1-4 family residential construction | 40,621 | 47,432 | 56,383 | 32,439 | 22,277 | ||||||||||||||||||||||||
| Commercial and land development | 227,434 | 241,424 | 262,317 | 129,883 | 118,010 | ||||||||||||||||||||||||
| Municipal | 30,780 | 30,044 | 27,960 | 10,594 | 10,925 | ||||||||||||||||||||||||
| Total commercial loans | 3,090,560 | 3,142,892 | 3,202,438 | 1,870,368 | 1,828,518 | ||||||||||||||||||||||||
| Residential mortgage: | |||||||||||||||||||||||||||||
| First lien | 464,642 | 460,297 | 451,195 | 271,153 | 270,748 | ||||||||||||||||||||||||
| Home equity – term | 9,224 | 5,988 | 6,508 | 4,633 | 4,966 | ||||||||||||||||||||||||
| Home equity – lines of credit | 295,820 | 303,561 | 303,165 | 192,736 | 189,966 | ||||||||||||||||||||||||
| Installment and other loans | 15,739 | 18,476 | 18,131 | 8,713 | 8,875 | ||||||||||||||||||||||||
| Total loans | 3,875,985 | 3,931,214 | 3,981,437 | 2,347,603 | 2,303,073 | ||||||||||||||||||||||||
Allowance for credit losses |
(47,804) | (48,689) | (49,630) | (29,864) | (29,165) | ||||||||||||||||||||||||
| Net loans held for investment | 3,828,181 | 3,882,525 | 3,931,807 | 2,317,739 | 2,273,908 | ||||||||||||||||||||||||
| Goodwill | 68,106 | 68,106 | 70,655 | 18,724 | 18,724 | ||||||||||||||||||||||||
| Other intangible assets, net | 45,230 | 47,765 | 46,144 | 1,974 | 2,189 | ||||||||||||||||||||||||
| Total assets | 5,441,586 | 5,441,589 | 5,470,589 | 3,198,782 | 3,183,331 | ||||||||||||||||||||||||
| Total deposits | 4,633,716 | 4,623,096 | 4,650,853 | 2,702,884 | 2,695,951 | ||||||||||||||||||||||||
| FHLB advances and other borrowings and Securities sold under agreements to repurchase | 123,480 | 141,227 | 137,310 | 129,625 | 127,099 | ||||||||||||||||||||||||
| Subordinated notes and trust preferred debt | 68,850 | 68,680 | 68,510 | 32,128 | 32,111 | ||||||||||||||||||||||||
| Total shareholders' equity | 532,936 | 516,682 | 516,206 | 278,376 | 271,682 | ||||||||||||||||||||||||
HISTORICAL TRENDS IN QUARTERLY FINANCIAL DATA (Unaudited) |
|||||||||||||||||||||||||||||
| (continued) | |||||||||||||||||||||||||||||
| March 31, 2025 |
December 31, 2024 |
September 30, 2024 |
June 30, 2024 |
March 31, 2024 |
|||||||||||||||||||||||||
Capital and credit quality measures(1): |
|||||||||||||||||||||||||||||
| Total risk-based capital: | |||||||||||||||||||||||||||||
| Orrstown Financial Services, Inc. | 13.1 | % | 12.4 | % | 12.4 | % | 13.3 | % | 13.4 | % | |||||||||||||||||||
| Orrstown Bank | 13.0 | % | 12.4 | % | 12.2 | % | 13.1 | % | 13.1 | % | |||||||||||||||||||
| Tier 1 risk-based capital: | |||||||||||||||||||||||||||||
| Orrstown Financial Services, Inc. | 10.8 | % | 10.2 | % | 10.0 | % | 11.1 | % | 11.2 | % | |||||||||||||||||||
| Orrstown Bank | 11.9 | % | 11.2 | % | 11.0 | % | 12.0 | % | 11.9 | % | |||||||||||||||||||
| Tier 1 common equity risk-based capital: | |||||||||||||||||||||||||||||
| Orrstown Financial Services, Inc. | 10.6 | % | 10.0 | % | 9.8 | % | 11.1 | % | 11.2 | % | |||||||||||||||||||
| Orrstown Bank | 11.9 | % | 11.2 | % | 11.0 | % | 12.0 | % | 11.9 | % | |||||||||||||||||||
| Tier 1 leverage capital: | |||||||||||||||||||||||||||||
| Orrstown Financial Services, Inc. | 8.6 | % | 8.3 | % | 8.0 | % | 8.9 | % | 9.0 | % | |||||||||||||||||||
| Orrstown Bank | 9.5 | % | 9.1 | % | 8.8 | % | 9.5 | % | 9.6 | % | |||||||||||||||||||
| Average equity to average assets | 9.65 | % | 9.45 | % | 9.75 | % | 8.50 | % | 8.66 | % | |||||||||||||||||||
| Allowance for credit losses to total loans | 1.23 | % | 1.24 | % | 1.25 | % | 1.27 | % | 1.27 | % | |||||||||||||||||||
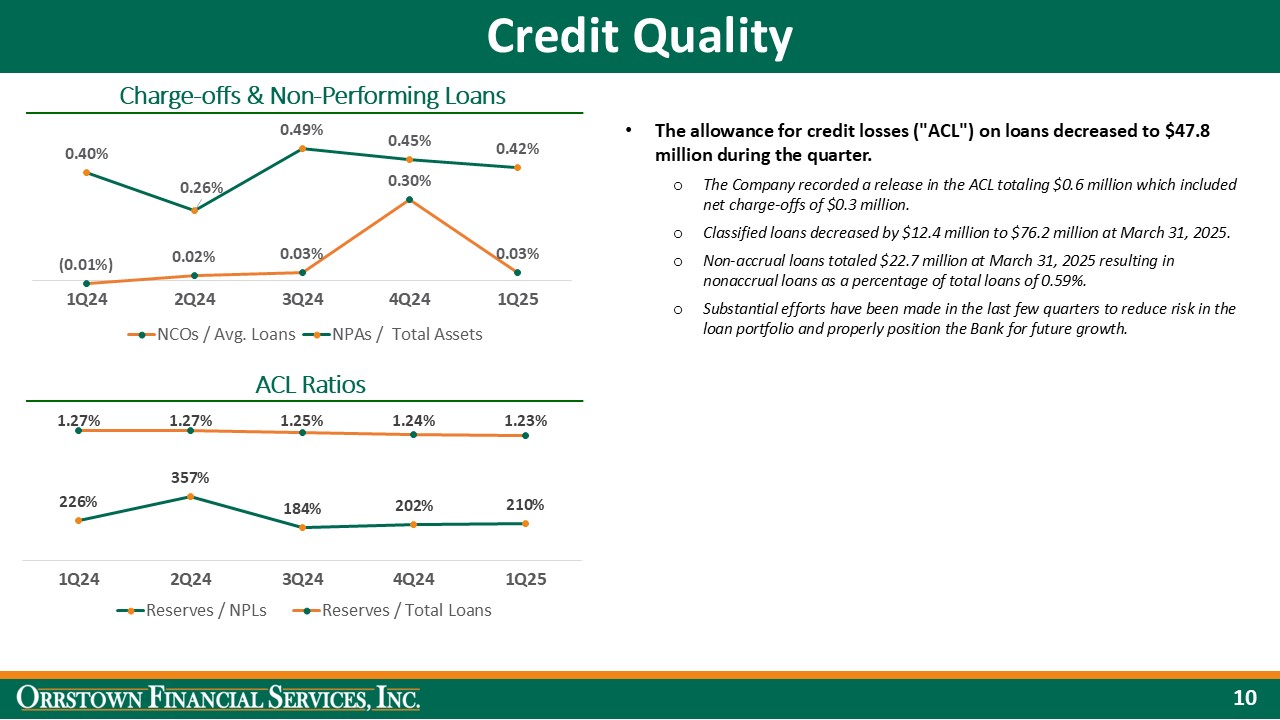
| Total nonaccrual loans to total loans | 0.59 | % | 0.61 | % | 0.68 | % | 0.36 | % | 0.56 | % | |||||||||||||||||||
| Nonperforming assets to total assets | 0.42 | % | 0.45 | % | 0.49 | % | 0.26 | % | 0.40 | % | |||||||||||||||||||
| Allowance for credit losses to nonaccrual loans | 210 | % | 202 | % | 184 | % | 357 | % | 226 | % | |||||||||||||||||||
| Other information: | |||||||||||||||||||||||||||||
| Net charge-offs (recoveries) | $ | 331 | $ | 3,002 | $ | 269 | $ | 113 | $ | (42) | |||||||||||||||||||
| Classified loans | 76,211 | 88,628 | 105,465 | 48,722 | 48,997 | ||||||||||||||||||||||||
| Nonperforming and other risk assets: | |||||||||||||||||||||||||||||
| Nonaccrual loans | 22,727 | 24,111 | 26,927 | 8,363 | 12,886 | ||||||||||||||||||||||||
| Other real estate owned | 138 | 138 | 138 | — | — | ||||||||||||||||||||||||
| Total nonperforming assets | 22,865 | 24,249 | 27,065 | 8,363 | 12,886 | ||||||||||||||||||||||||
Financial difficulty modifications still accruing |
5,127 | 4,897 | 9,497 | — | — | ||||||||||||||||||||||||
| Loans past due 90 days or more and still accruing | 400 | 641 | 337 | 187 | 99 | ||||||||||||||||||||||||
| Total nonperforming and other risk assets | $ | 28,392 | $ | 29,787 | $ | 36,899 | $ | 8,550 | $ | 12,985 | |||||||||||||||||||
(1) Capital ratios are estimated for the current period, subject to regulatory filings. The Company elected the three-year phase in option for the day-one impact of ASU 2016-13 for current expected credit losses ("CECL") to regulatory capital. Beginning in 2023, the Company adjusted retained earnings, allowance for credit losses includable in tier 2 capital and the deferred tax assets from temporary differences in risk weighted assets by the permitted percentage of the day-one impact from adopting the new CECL standard. | |||||||||||||||||||||||||||||
| Tangible Book Value per Common Share | March 31, 2025 |
December 31, 2024 |
September 30, 2024 |
June 30, 2024 |
March 31, 2024 |
|||||||||||||||||||||||||||
| Shareholders' equity (most directly comparable GAAP-based measure) | $ | 532,936 | $ | 516,682 | $ | 516,206 | $ | 278,376 | $ | 271,682 | ||||||||||||||||||||||
| Less: Goodwill | 68,106 | 68,106 | 70,655 | 18,724 | 18,724 | |||||||||||||||||||||||||||
| Other intangible assets | 45,230 | 47,765 | 46,144 | 1,974 | 2,189 | |||||||||||||||||||||||||||
| Related tax effect | (9,498) | (10,031) | (9,690) | (415) | (460) | |||||||||||||||||||||||||||
| Tangible common equity (non-GAAP) | $ | 429,098 | $ | 410,842 | $ | 409,097 | $ | 258,093 | $ | 251,229 | ||||||||||||||||||||||
| Common shares outstanding | 19,510 | 19,390 | 19,373 | 10,720 | 10,705 | |||||||||||||||||||||||||||
| Book value per share (most directly comparable GAAP-based measure) | $ | 27.32 | $ | 26.65 | $ | 26.65 | $ | 25.97 | $ | 25.38 | ||||||||||||||||||||||
| Intangible assets per share | 5.33 | 5.46 | 5.53 | 1.89 | 1.91 | |||||||||||||||||||||||||||
| Tangible book value per share (non-GAAP) | $ | 21.99 | $ | 21.19 | $ | 21.12 | $ | 24.08 | $ | 23.47 | ||||||||||||||||||||||
(In thousands) |
Three Months Ended | ||||||||||||||||||||||||||||
| Adjusted Ratios for Non-recurring Charges | March 31, 2025 |
December 31, 2024 | September 30, 2024 |
June 30, 2024 |
March 31, 2024 |
||||||||||||||||||||||||
| Net income (loss) (A) - most directly comparable GAAP-based measure | $ | 18,051 | $ | 13,684 | $ | (7,903) | $ | 7,738 | $ | 8,531 | |||||||||||||||||||
| Plus: Merger-related expenses (B) | 1,649 | 3,887 | 16,977 | 1,135 | 672 | ||||||||||||||||||||||||
| Plus: Executive retirement expenses (B) | — | 35 | 4,758 | — | — | ||||||||||||||||||||||||
| Plus: Provision for credit losses on non-PCD loans (B) | — | — | 15,504 | — | — | ||||||||||||||||||||||||
| Plus: Provision for legal settlement (B) | — | 478 | — | — | — | ||||||||||||||||||||||||
| Less: Related tax effect (C) | (368) | (1,386) | (7,915) | (139) | (1) | ||||||||||||||||||||||||
| Adjusted net income (D=A+B-C) - Non-GAAP | $ | 19,332 | $ | 16,698 | $ | 21,421 | $ | 8,734 | $ | 9,202 | |||||||||||||||||||
| Average assets (E) | $5,425,697 | $5,464,165 | $5,515,143 | $3,211,124 | $3,098,772 | ||||||||||||||||||||||||
Return on average assets (= A / E) - most directly comparable GAAP-based measure (1) |
1.35 | % | 1.00 | % | (0.57) | % | 0.97 | % | 1.11 | % | |||||||||||||||||||
Return on average assets, adjusted (= D / E) - Non-GAAP (1) |
1.45 | % | 1.22 | % | 1.55 | % | 1.09 | % | 1.19 | % | |||||||||||||||||||
| Average equity (F) | $ | 523,689 | $ | 516,399 | $ | 537,670 | $ | 272,788 | $ | 268,289 | |||||||||||||||||||
Return on average equity (= A / F) - most directly comparable GAAP-based measure (1) |
13.98 | % | 10.54 | % | (5.85) | % | 11.41 | % | 12.79 | % | |||||||||||||||||||
Return on average equity, adjusted (= D / F) - Non-GAAP (1) |
14.97 | % | 12.86 | % | 15.85 | % | 12.88 | % | 13.79 | % | |||||||||||||||||||
| Weighted average shares - basic (G) - most directly comparable GAAP-based measure | 19,157 | 19,118 | 19,088 | 10,393 | 10,349 | ||||||||||||||||||||||||
| Basic earnings (loss) per share (= A / G) - most directly comparable GAAP-based measure | $ | 0.94 | $ | 0.72 | $ | (0.41) | $ | 0.74 | $ | 0.82 | |||||||||||||||||||
| Basic earnings per share, adjusted (= D / G) - Non-GAAP | $ | 1.01 | $ | 0.87 | $ | 1.12 | $ | 0.84 | $ | 0.89 | |||||||||||||||||||
| Weighted average shares - diluted (H) - most directly comparable GAAP-based measure | 19,328 | 19,300 | 19,226 | 10,553 | 10,482 | ||||||||||||||||||||||||
| Diluted earnings (loss) per share (= A / H) - most directly comparable GAAP-based measure | $ | 0.93 | $ | 0.71 | $ | (0.41) | $ | 0.73 | $ | 0.81 | |||||||||||||||||||
| Diluted earnings per share, adjusted (= D / H) - Non-GAAP | $ | 1.00 | $ | 0.87 | $ | 1.11 | $ | 0.83 | $ | 0.88 | |||||||||||||||||||
| continued | |||||||||||||||||||||||||||||
| (1) Annualized | |||||||||||||||||||||||||||||
| Three Months Ended | |||||||||||||||||||||||||||||
| March 31, 2025 |
December 31, 2024 | September 30, 2024 |
June 30, 2024 |
March 31, 2024 |
|||||||||||||||||||||||||
| Noninterest expense (I) - most directly comparable GAAP-based measure | $ | 38,176 | $ | 42,930 | $ | 60,299 | $ | 22,639 | $ | 22,469 | |||||||||||||||||||
| Less: Merger-related expenses (B) | (1,649) | (3,887) | (16,977) | (1,135) | (672) | ||||||||||||||||||||||||
| Less: Executive retirement expenses (B) | — | (35) | (4,758) | — | — | ||||||||||||||||||||||||
| Less: Provision for legal settlement (B) | — | (478) | — | — | — | ||||||||||||||||||||||||
| Adjusted noninterest expense (J = I - B) - Non-GAAP | $ | 36,527 | $ | 38,531 | $ | 38,564 | $ | 21,504 | $ | 21,797 | |||||||||||||||||||
| Net interest income (K) | $ | 48,761 | $ | 50,573 | $ | 51,697 | $ | 26,103 | $ | 26,881 | |||||||||||||||||||
| Noninterest income (L) | 11,624 | 11,247 | 12,386 | 7,172 | 6,630 | ||||||||||||||||||||||||
| Total operating income (M = K + L) | $ | 60,385 | $ | 61,820 | $ | 64,083 | $ | 33,275 | $ | 33,511 | |||||||||||||||||||
| Efficiency ratio (= I / M) - most directly comparable GAAP-based measure | 63.2 | % | 69.4 | % | 94.1 | % | 68.0 | % | 67.0 | % | |||||||||||||||||||
| Efficiency ratio, adjusted (= J / M) - Non-GAAP | 60.5 | % | 62.3 | % | 60.2 | % | 64.6 | % | 65.0 | % | |||||||||||||||||||
| (1) Annualized | |||||||||||||||||||||||||||||
| Sector | Portfolio Mix | Amortized Book | Fair Value | Credit Enhancement | AAA | AA | A | BBB | BB | NR | Collateral / Guarantee Type | ||||||||||||||||||||||||||||||||||||||||||||||||||||||
| Unsecured ABS | — | % | $ | 2,952 | $ | 2,768 | 27 | % | — | % | — | % | — | % | — | % | — | % | 100 | % | Unsecured Consumer Debt | ||||||||||||||||||||||||||||||||||||||||||||
| Student Loan ABS | — | 3,808 | 3,792 | 28 | — | — | — | — | — | 100 | Seasoned Student Loans | ||||||||||||||||||||||||||||||||||||||||||||||||||||||
| Federal Family Education Loan ABS | 9 | 78,231 | 77,955 | 11 | 1 | 47 | 33 | 7 | 12 | — | Federal Family Education Loan (1) |
||||||||||||||||||||||||||||||||||||||||||||||||||||||
| PACE Loan ABS | — | 1,943 | 1,710 | 7 | 100 | — | — | — | — | — | PACE Loans (2) |
||||||||||||||||||||||||||||||||||||||||||||||||||||||
| Non-Agency CMBS | 2 | 13,966 | 14,022 | 30 | — | — | — | — | — | 100 | |||||||||||||||||||||||||||||||||||||||||||||||||||||||
| Non-Agency RMBS | 2 | 16,323 | 14,726 | 16 | 100 | — | — | — | — | — | Reverse Mortgages (3) |
||||||||||||||||||||||||||||||||||||||||||||||||||||||
| Municipal - General Obligation | 11 | 99,248 | 89,952 | 17 | 76 | 7 | — | — | — | ||||||||||||||||||||||||||||||||||||||||||||||||||||||||
| Municipal - Revenue | 14 | 120,676 | 107,154 | — | 82 | 12 | — | — | 6 | ||||||||||||||||||||||||||||||||||||||||||||||||||||||||
SBA ReRemic (5) |
— | 2,095 | 2,087 | — | 100 | — | — | — | — | SBA Guarantee (4) |
|||||||||||||||||||||||||||||||||||||||||||||||||||||||
| Small Business Administration | 1 | 5,511 | 5,629 | — | 100 | — | — | — | — | SBA Guarantee (4) |
|||||||||||||||||||||||||||||||||||||||||||||||||||||||
| Agency MBS | 19 | 164,144 | 162,334 | — | 100 | — | — | — | — | Residential Mortgages (4) |
|||||||||||||||||||||||||||||||||||||||||||||||||||||||
| Agency CMO | 40 | 355,699 | 352,729 | — | 100 | — | — | — | — | ||||||||||||||||||||||||||||||||||||||||||||||||||||||||
| U.S. Treasury securities | 2 | 20,040 | 18,417 | — | 100 | — | — | — | — | U.S. Government Guarantee (4) |
|||||||||||||||||||||||||||||||||||||||||||||||||||||||
| Corporate bonds | — | 1,939 | 1,974 | — | — | 52 | 48 | — | — | ||||||||||||||||||||||||||||||||||||||||||||||||||||||||
| 100 | % | $ | 886,575 | $ | 855,249 | 4 | % | 87 | % | 5 | % | 1 | % | — | % | 3 | % | ||||||||||||||||||||||||||||||||||||||||||||||||
(1) 97% guaranteed by U.S. government | |||||||||||||||||||||||||||||||||||||||||||||||||||||||||||||||||
(2) PACE acronym represents Property Assessed Clean Energy loans | |||||||||||||||||||||||||||||||||||||||||||||||||||||||||||||||||
(3) Non-agency reverse mortgages with current structural credit enhancements | |||||||||||||||||||||||||||||||||||||||||||||||||||||||||||||||||
(4) Guaranteed by U.S. government or U.S. government agencies | |||||||||||||||||||||||||||||||||||||||||||||||||||||||||||||||||
(5) SBA ReRemic acronym represents Re-Securitization of Real Estate Mortgage Investment Conduits | |||||||||||||||||||||||||||||||||||||||||||||||||||||||||||||||||
| Note: Ratings in table are the lowest of the six rating agencies (Standard & Poor's, Moody's, Fitch, Morningstar, DBRS and Kroll Bond Rating Agency). Standard & Poor's rates U.S. government obligations at AA+. | |||||||||||||||||||||||||||||||||||||||||||||||||||||||||||||||||