0000791963false00007919632022-05-022022-05-02
As filed with the Securities and Exchange Commission on July 31, 2023
___________________________________________________
UNITED STATES
SECURITIES AND EXCHANGE COMMISSION
WASHINGTON, D.C. 20549
FORM 8-K
CURRENT REPORT
Pursuant to Section 13 or 15(d) of the Securities Exchange Act of 1934
Date of report (Date of earliest event reported): July 31, 2023
OPPENHEIMER HOLDINGS INC.
(Exact name of registrant as specified in its charter)
Commission File Number 1-12043
|
|
|
|
|
|
|
|
|
| Delaware |
|
98-0080034 |
| (State or other jurisdiction of |
|
(I.R.S. Employer |
| incorporation or organization) |
|
Identification No.) |
85 Broad Street
New York, New York 10004
(Address of principal executive offices) (Zip Code)
(212) 668-8000
(Registrant's telephone number, including area code)
(Former name or former address, if changed since last report)
Check the appropriate box below if the Form 8-K filing is intended to simultaneously satisfy the filing obligation of the registrant under any of the following provisions (see General Instruction A.2. below):
☐ Written communications pursuant to Rule 425 under the Securities Act (17 CFR 230.425)
☐ Soliciting material pursuant to Rule 14a-12 under the Exchange Act (17 CRF 240.14a-12)
☐ Pre-commencement communications pursuant to Rule 14d-2(b) under the Exchange Act (17 CFR 240.14d-2(b))
☐ Pre-commencement communications pursuant to Rule 13e-4(c) under the Exchange Act (17 CFR 240.13e-4(c))
Securities registered pursuant to Section 12(b) of the Act:
|
|
|
|
|
|
|
|
|
| Title of each class |
Trading Symbol |
Name of each exchange on which registered |
| Class A non-voting common stock |
OPY |
The New York Stock Exchange |
Indicate by check mark whether the registrant is an emerging growth company as defined in Rule 405 of the Securities Act of 1933 (§230.405 of this chapter) or Rule 12b-2 of the Securities Exchange Act of 1934 (§240.12b-2 of this chapter). Emerging growth company ☐
If an emerging growth company, indicate by check mark if the registrant has elected not to use the extended transition period for complying with any new or revised financial accounting standards provided pursuant to Section 13(a) of the Exchange Act. ☐
SECTION 7 – REGULATION FD
ITEM 7.01 Regulation FD Disclosure.
On July 31, 2023, Oppenheimer Holdings Inc. (the “Company”) posted to the Investor Relations page of its website, www.oppenheimer.com, a presentation to investors regarding the Company in the form of the slides containing the information attached to this Current Report on Form 8-K as Exhibit 99.1 (the “Slides”). The Company may use the Slides, in whole or in part, and possibly with minor modifications, in connection with presentations to investors after such date.
By filing this Current Report on Form 8-K and furnishing the information contained herein, the Company makes no admission as to the materiality of any information in this report that is required to be disclosed solely by reason of Regulation FD.
The information contained in the Slides is summary information that is intended to be considered in the context of the Company’s Securities and Exchange Commission (“SEC”) filings and other public announcements that the Company may make, by press release or otherwise, from time to time. The Company undertakes no duty or obligation to publicly update or revise the information contained in this report, although it may do so from time to time as its management believes is warranted. Any such updating may be made through the filing of other reports or documents with the SEC, through press releases or through other public disclosure.
In accordance with General Instruction B.2 of this Current Report on Form 8-K, the information presented in Item 7.01 of this Current Report on Form 8-K and Exhibit 99.1 shall not be deemed to be “filed” for purposes of Section 18 of the Securities Exchange Act of 1934, as amended (the “Exchange Act”), or otherwise subject to the liabilities of that section, unless the Company specifically states that the information is to be considered “filed” under the Exchange Act or incorporates it by reference into a filing under the Securities Act of 1933, as amended, or the Exchange Act.
SECTION 9 – FINANCIAL STATEMENTS AND EXHIBITS
ITEM 9.01. Financial Statements and Exhibits.
(d)Exhibits:
The following Exhibit is submitted herewith:
99.1 Investor Presentation (Second Quarter 2023 Investor Update) posted on July 31, 2023
SIGNATURES
Pursuant to the requirements of the Securities Exchange Act of 1934, the Registrant has duly caused this report to be signed on its behalf by the undersigned hereunto duly authorized.
Oppenheimer Holdings Inc.
|
|
|
By: /s/ Brad M. Watkins
---------------------------------
Brad M. Watkins
Chief Financial Officer
(Duly Authorized Officer and Principal Financial and Accounting Officer) |
EXHIBIT INDEX
|
|
|
|
|
|
| Exhibit Number |
Description |
|
|
EX-99.1
2
opyq2-2023investorpresen.htm
EX-99.1
opyq2-2023investorpresen
Oppenheimer Holdings Inc. Second Quarter 2023 Investor Update
Safe Harbor Statement This presentation and other written or oral statements made from time to time by representatives of Oppenheimer Holdings Inc. ("Oppenheimer” or the “company”) may contain “forward-looking statements” within the meaning of Section 27A of the Securities Act of 1933, as amended, and Section 21E of the Securities Exchange Act of 1934, as amended. These forward-looking statements may relate to such matters as anticipated financial performance, future revenues or earnings, business prospects, new products or services, anticipated market performance and similar matters. The Private Securities Litigation Reform Act of 1995 provides a safe harbor for forward-looking statements. Forward-looking statements are neither historical facts nor assurances of future performance. Instead, they are based only on the company’s current beliefs, expectations and assumptions regarding the future of the company’s business, future plans and strategies, projections, anticipated events and trends, the economy and other future conditions. Because forward-looking statements relate to the future, they are subject to inherent uncertainties, risks and changes in circumstances that are difficult to predict and many of which are outside of the company’s control. The company cautions that a variety of factors could cause the company’s actual results to differ materially from the anticipated results or other expectations expressed in the company’s forwarding-looking statements. These risks and uncertainties include, but are not limited to, those risk factors discussed in Part I, “Item 1A. Risk Factors” of our Annual Report on Form 10-K for the year ended December 31, 2022 filed with the Securities and Exchange Commission (the “SEC”) on February 28, 2023 (the “2022 10-K”) and Quarterly Report on Form 10-Q for the quarter-ended June 30, 2023 filed with the SEC on July 28, 2023 (the “2023 10-Q2”). In addition, important factors that could cause actual results to differ materially from those in the forward-looking statements include those factors discussed in Part I, “Item 2. Management’s Discussion & Analysis of Financial Condition and Results of Operations – Factors Affecting ‘Forward-Looking Statements’” of the 2023 10-Q2. Any forward-looking statements herein are qualified in their entirety by reference to all such factors discussed in the 2022 10-K, the 2023 10-Q2 and the company’s other SEC filings. There can be no assurance that the company has correctly or completely identified and assessed all of the factors affecting the company’s business. Therefore, you should not rely on any of these forward-looking statements. Any forward- looking statement made by the company in this presentation is based only on information currently available to the company and speaks only as of the date on which it is made. The company does not undertake any obligation to publicly update or revise any forward- looking statements, whether written or oral, that may be made from time to time, whether as a result of new information, future developments or otherwise. 2
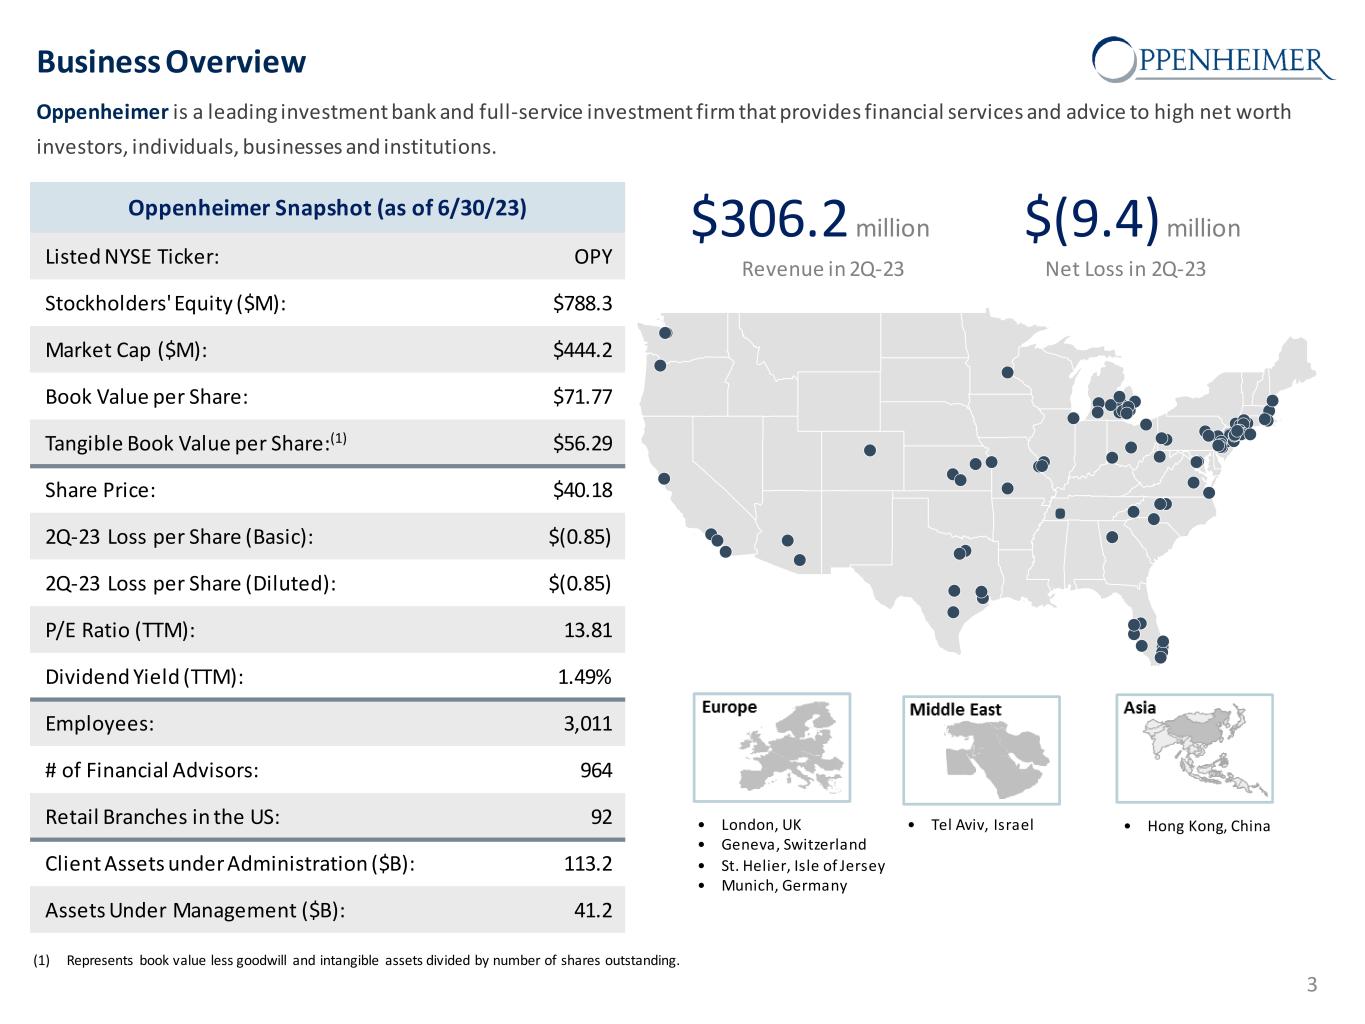
Oppenheimer is a leading investment bank and full-service investment firm that provides financial services and advice to high net worth investors, individuals, businesses and institutions. 3 • Hong Kong, China• London, UK • Geneva, Switzerland • St. Helier, Isle of Jersey • Munich, Germany • Tel Aviv, Israel (1) Represents book value less goodwill and intangible assets divided by number of shares outstanding. $(9.4) million Net Loss in 2Q-23 $306.2 million Revenue in 2Q-23 Business Overview Oppenheimer Snapshot (as of 6/30/23) Listed NYSE Ticker: OPY Stockholders' Equity ($M): $788.3 Market Cap ($M): $444.2 Book Value per Share: $71.77 Tangible Book Value per Share:(1) $56.29 Share Price: $40.18 2Q-23 Loss per Share (Basic): $(0.85) 2Q-23 Loss per Share (Diluted): $(0.85) P/E Ratio (TTM): 13.81 Dividend Yield (TTM): 1.49% Employees: 3,011 # of Financial Advisors: 964 Retail Branches in the US: 92 Client Assets under Administration ($B): 113.2 Assets Under Management ($B): 41.2 .
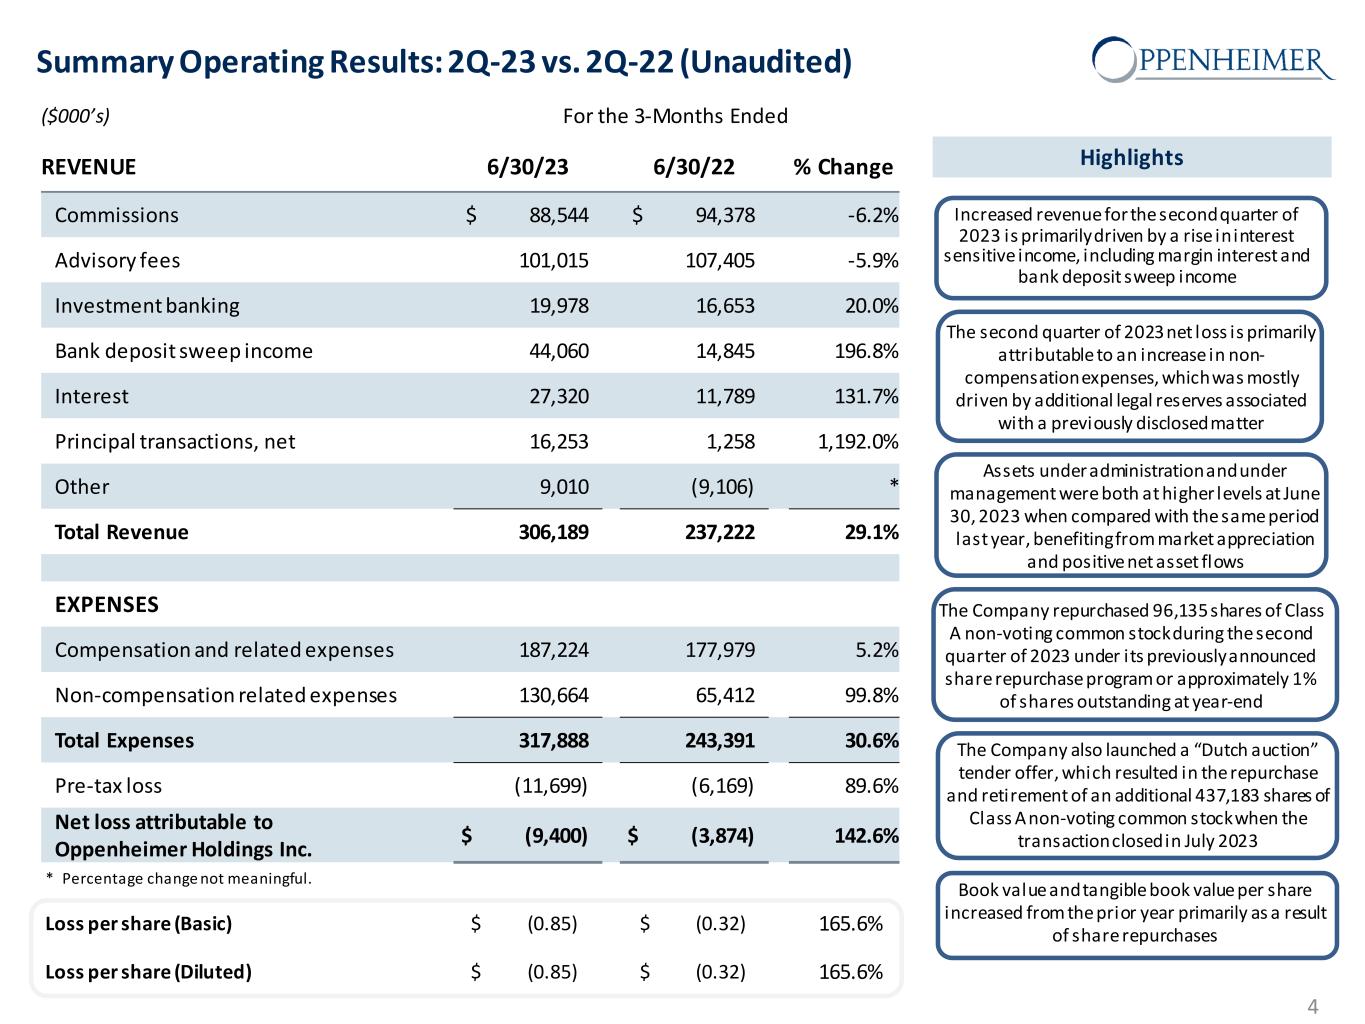
Loss per share (Basic) $ (0.85) $ (0.32) 165.6% Loss per share (Diluted) $ (0.85) $ (0.32) 165.6% Summary Operating Results: 2Q-23 vs. 2Q-22 (Unaudited) 4 Highlights ($000’s) For the 3-Months Ended REVENUE 6/30/23 6/30/22 % Change Commissions $ 88,544 $ 94,378 -6.2% Advisory fees 101,015 107,405 -5.9% Investment banking 19,978 16,653 20.0% Bank deposit sweep income 44,060 14,845 196.8% Interest 27,320 11,789 131.7% Principal transactions, net 16,253 1,258 1,192.0% Other 9,010 (9,106) * Total Revenue 306,189 237,222 29.1% EXPENSES Compensation and related expenses 187,224 177,979 5.2% Non-compensation related expenses 130,664 65,412 99.8% Total Expenses 317,888 243,391 30.6% Pre-tax loss (11,699) (6,169) 89.6% Net loss attributable to Oppenheimer Holdings Inc. $ (9,400) $ (3,874) 142.6% Increased revenue for the second quarter of 2023 is primarily driven by a rise in interest sensitive income, including margin interest and bank deposit sweep income The second quarter of 2023 net loss is primarily attributable to an increase in non- compensation expenses, which was mostly driven by additional legal reserves associated with a previously disclosed matter Assets under administration and under management were both at higher levels at June 30, 2023 when compared with the same period last year, benefiting from market appreciation and positive net asset flows The Company repurchased 96,135 shares of Class A non-voting common stock during the second quarter of 2023 under its previously announced share repurchase program or approximately 1% of shares outstanding at year-end The Company also launched a “Dutch auction” tender offer, which resulted in the repurchase and retirement of an additional 437,183 shares of Class A non-voting common stock when the transaction closed in July 2023 Book value and tangible book value per share increased from the prior year primarily as a result of share repurchases * Percentage change not meaningful.
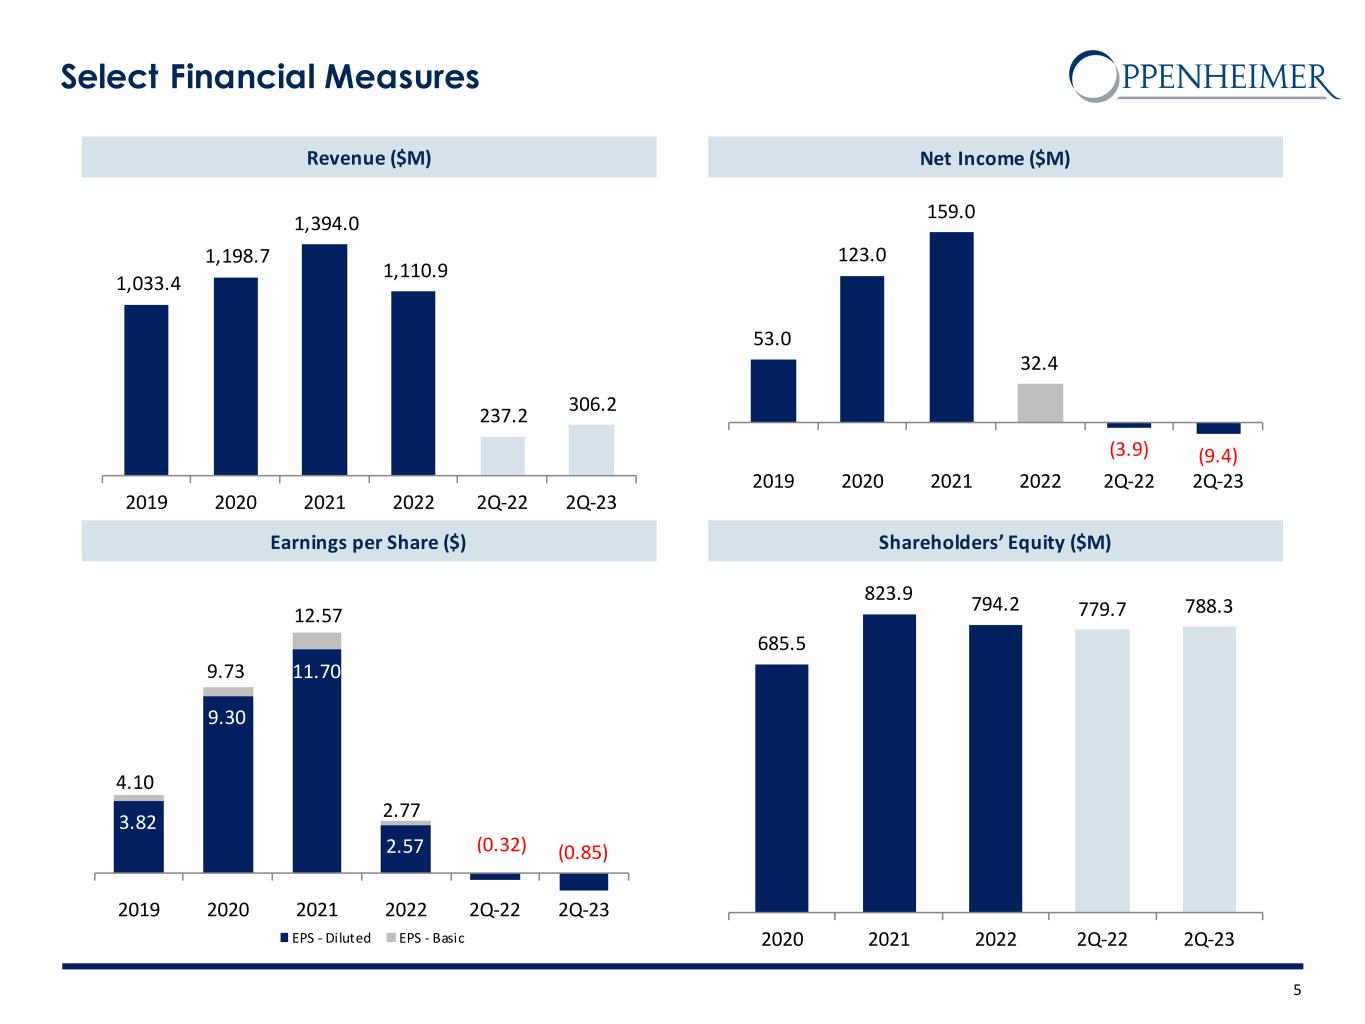
5 Select Financial Measures Earnings per Share ($) Net Income ($M)Revenue ($M) Shareholders’ Equity ($M) (0.85)(0.32) 2.77 12.57 9.73 4.10 1,033.4 1,198.7 1,394.0 1,110.9 237.2 306.2 2019 2020 2021 2022 2Q-22 2Q-23 3.82 9.30 11.70 2.57 -0.32 -0.85 2019 2020 2021 2022 2Q-22 2Q-23 EPS - Diluted EPS - Basic 53.0 123.0 159.0 32.4 (3.9) (9.4) 2019 2020 2021 2022 2Q-22 2Q-23 685.5 823.9 794.2 779.7 788.3 2020 2021 2022 2Q-22 2Q-23
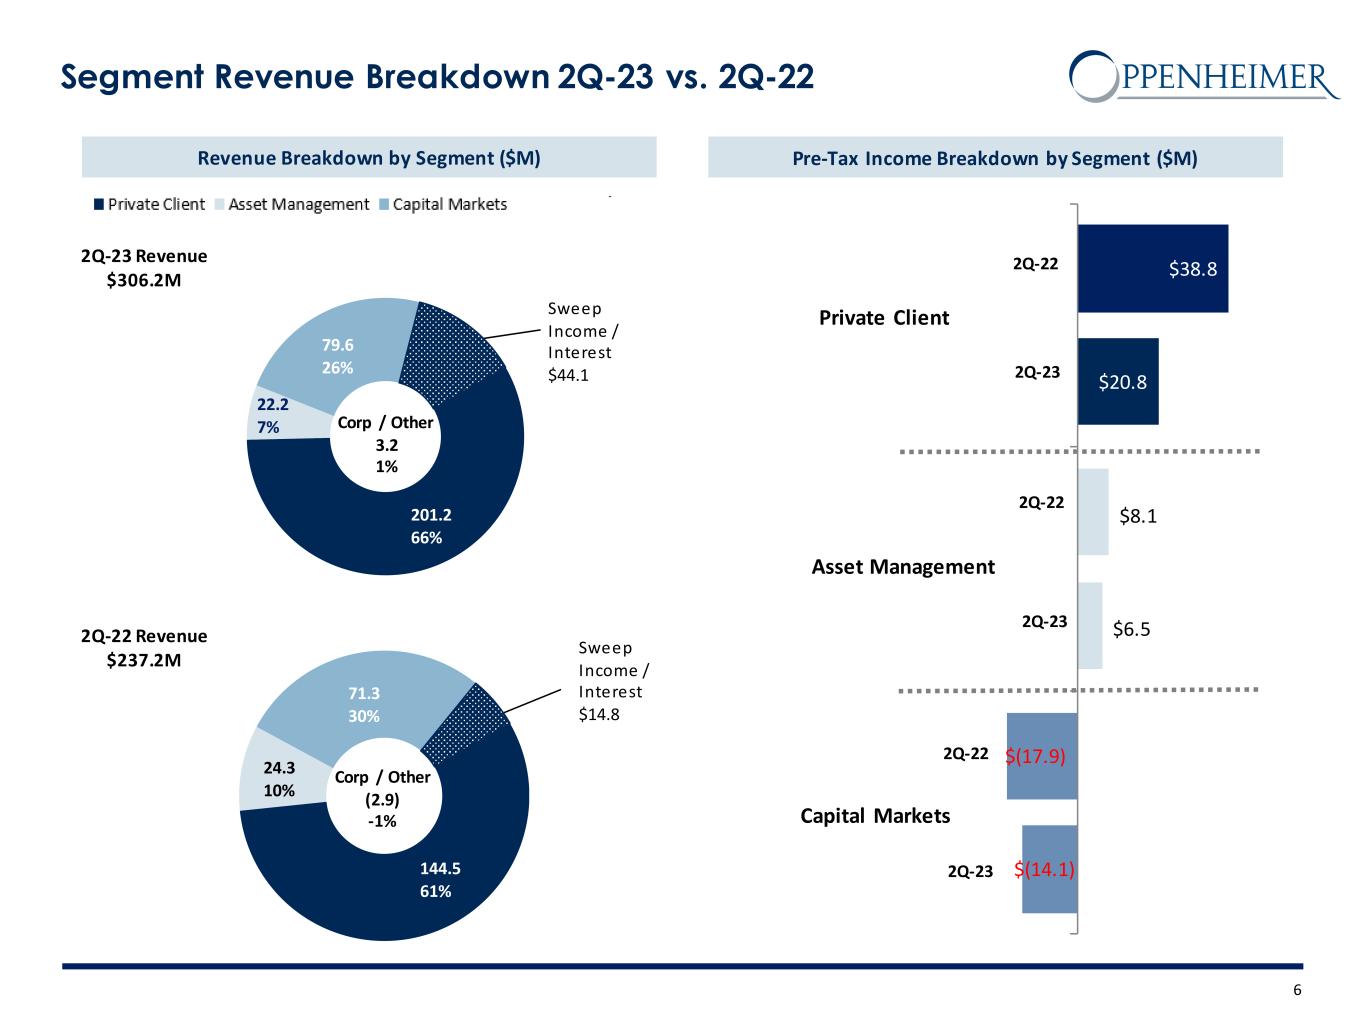
6 Segment Revenue Breakdown 2Q-23 vs. 2Q-22 Pre-Tax Income Breakdown by Segment ($M)Revenue Breakdown by Segment ($M) Private Client Asset Management Capital Markets 2Q-23 Revenue $306.2M 2Q-22 Revenue $237.2M 2Q-22 2Q-22 2Q-22 2Q-23 2Q-23 2Q-23 203.4 63% 150.8 57% 203.4 63% 90.3 28% $54.5 144.5 61% 71.3 30% Sweep Income / Interest $14.8 Corp / Other (2.9) -1% 22.2 7% 144.5 61% 71.3 30% 24.3 10% 201.2 66% 79.6 26% Sweep Income / Interest $44.1 Corp / Other 3.2 1% $(14.1) $6.5 $20.8 $(17.9) $8.1 $38.8
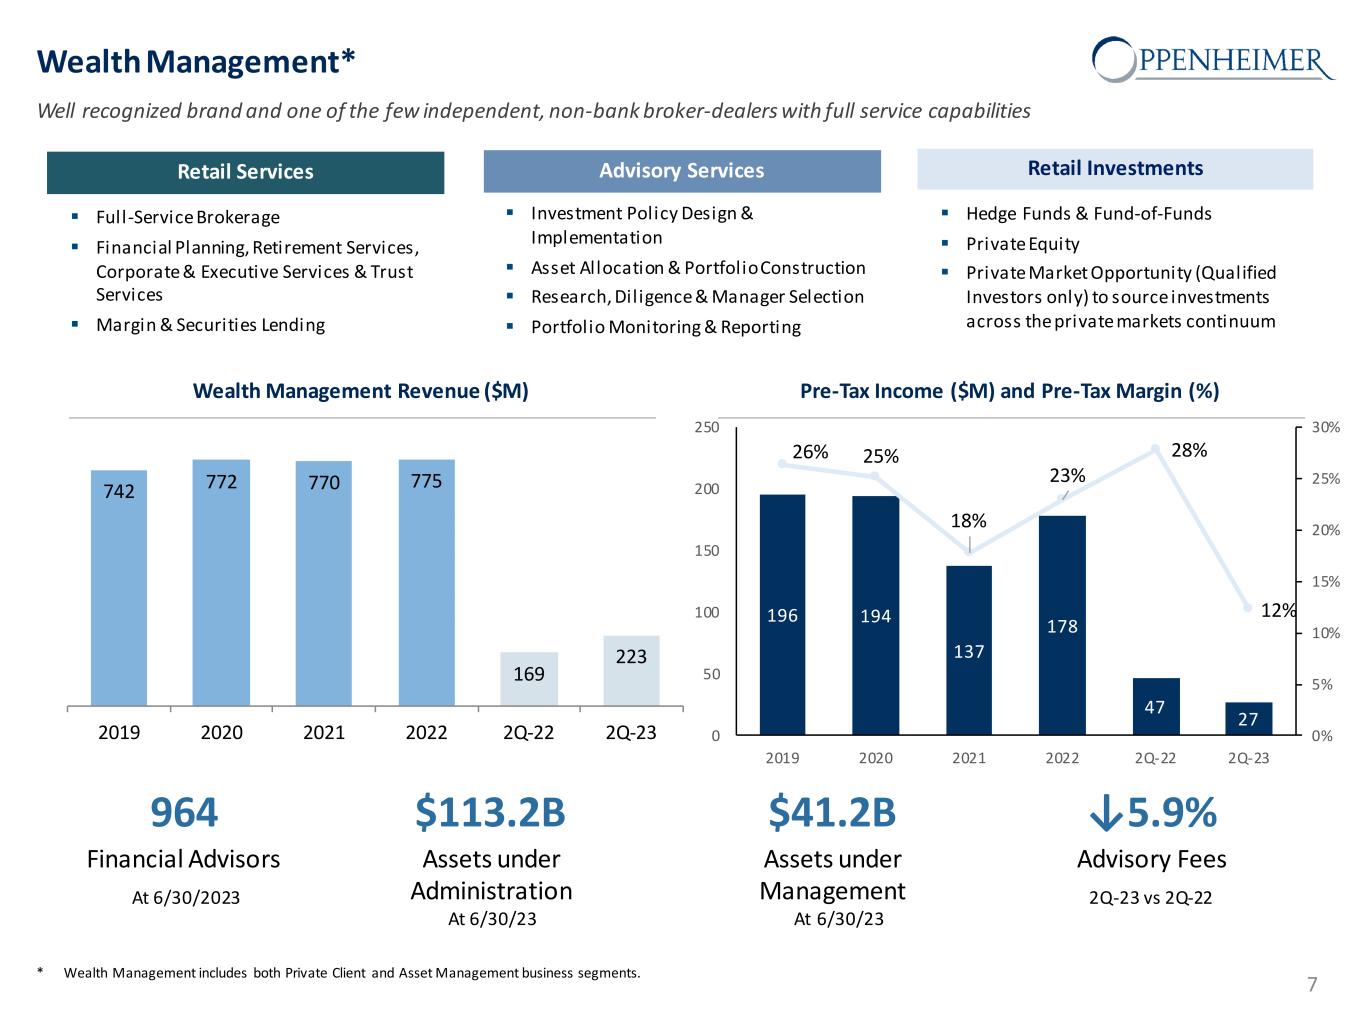
Wealth Management* Well recognized brand and one of the few independent, non-bank broker-dealers with full service capabilities Retail Services Full-Service Brokerage Financial Planning, Retirement Services, Corporate & Executive Services & Trust Services Margin & Securities Lending Advisory Services Investment Policy Design & Implementation Asset Allocation & Portfolio Construction Research, Dil igence & Manager Selection Portfolio Monitoring & Reporting Retail Investments Hedge Funds & Fund-of-Funds Private Equity Private Market Opportunity (Qualified Investors only) to source investments across the private markets continuum Wealth Management Revenue ($M) Pre-Tax Income ($M) and Pre-Tax Margin (%) 964 Financial Advisors At 6/30/2023 $113.2B Assets under Administration At 6/30/23 $41.2B Assets under Management At 6/30/23 ↓5.9% Advisory Fees 2Q-23 vs 2Q-22 * Wealth Management includes both Private Client and Asset Management business segments. 7 742 772 770 775 169 223 2019 2020 2021 2022 2Q-22 2Q-23 196 194 137 178 47 27 26% 25% 18% 23% 28% 12% 0% 5% 10% 15% 20% 25% 30% 0 50 100 150 200 250 2019 2020 2021 2022 2Q-22 2Q-23
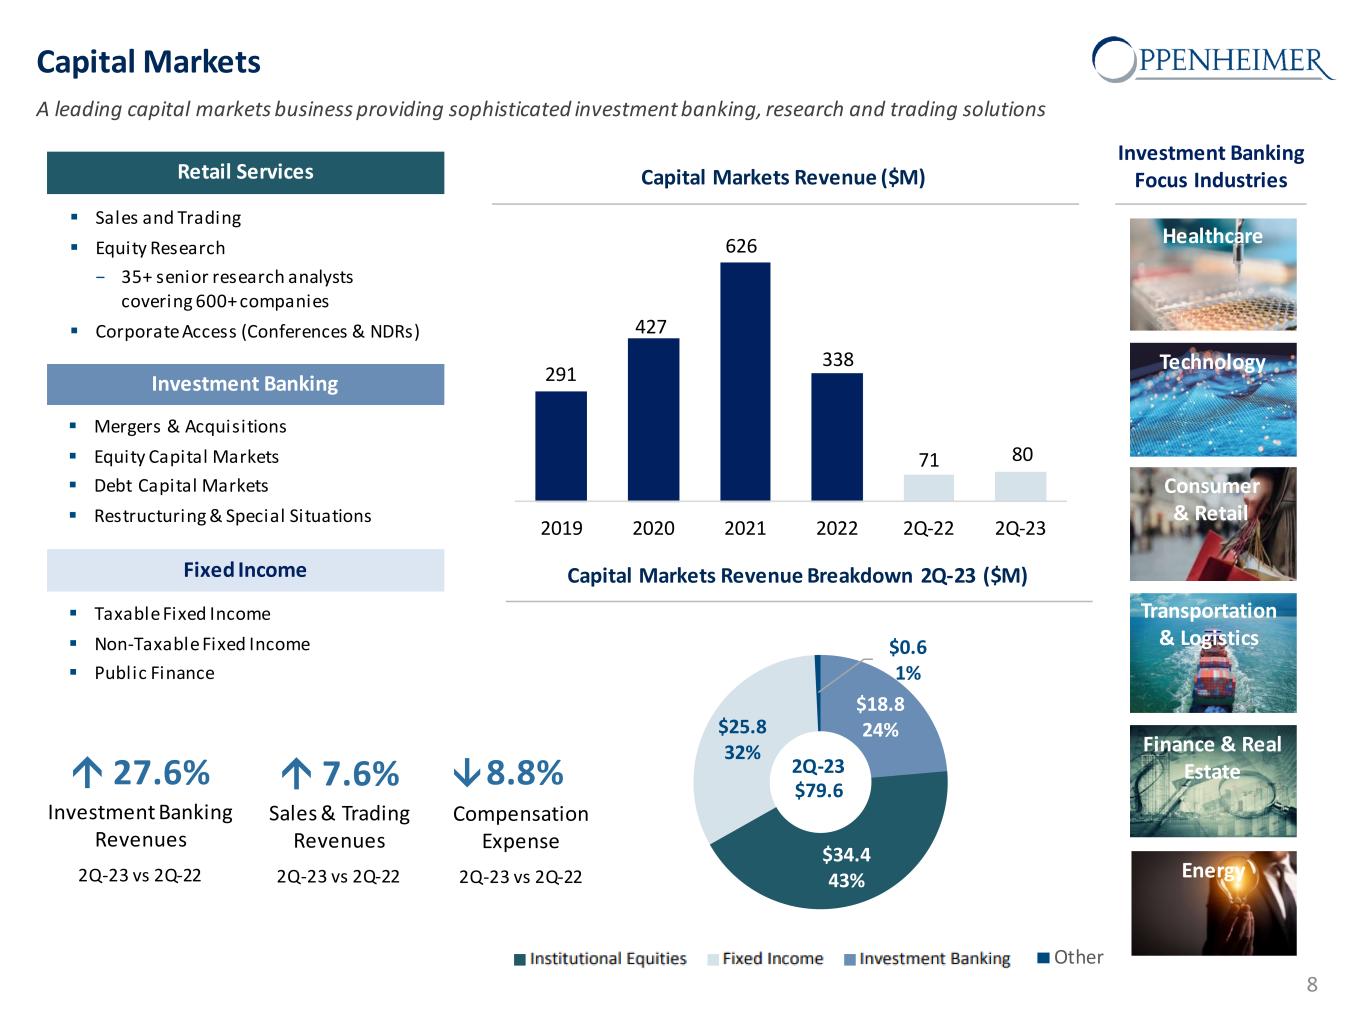
7.6% Sales & Trading Revenues 2Q-23 vs 2Q-22 Capital Markets A leading capital markets business providing sophisticated investment banking, research and trading solutions Healthcare Technology Transportation & Logistics Finance & Real Estate Consumer & Retail Energy Capital Markets Revenue Breakdown 2Q-23 ($M) Capital Markets Revenue ($M) Investment Banking Focus Industries 8 Institutional Equities Sales and Trading Equity Research − 35+ senior research analysts covering 600+ companies Corporate Access (Conferences & NDRs) Investment Banking Mergers & Acquisitions Equity Capital Markets Debt Capital Markets Restructuring & Special Situations Fixed Income Taxable Fixed Income Non-Taxable Fixed Income Public Finance Retail Services $18.8 24% $34.4 43% $25.8 32% $0.6 1% Other 2Q-23 $79.6 27.6% Investment Banking Revenues 2Q-23 vs 2Q-22 8.8% Compensation Expense 2Q-23 vs 2Q-22 291 427 626 338 71 80 2019 2020 2021 2022 2Q-22 2Q-23
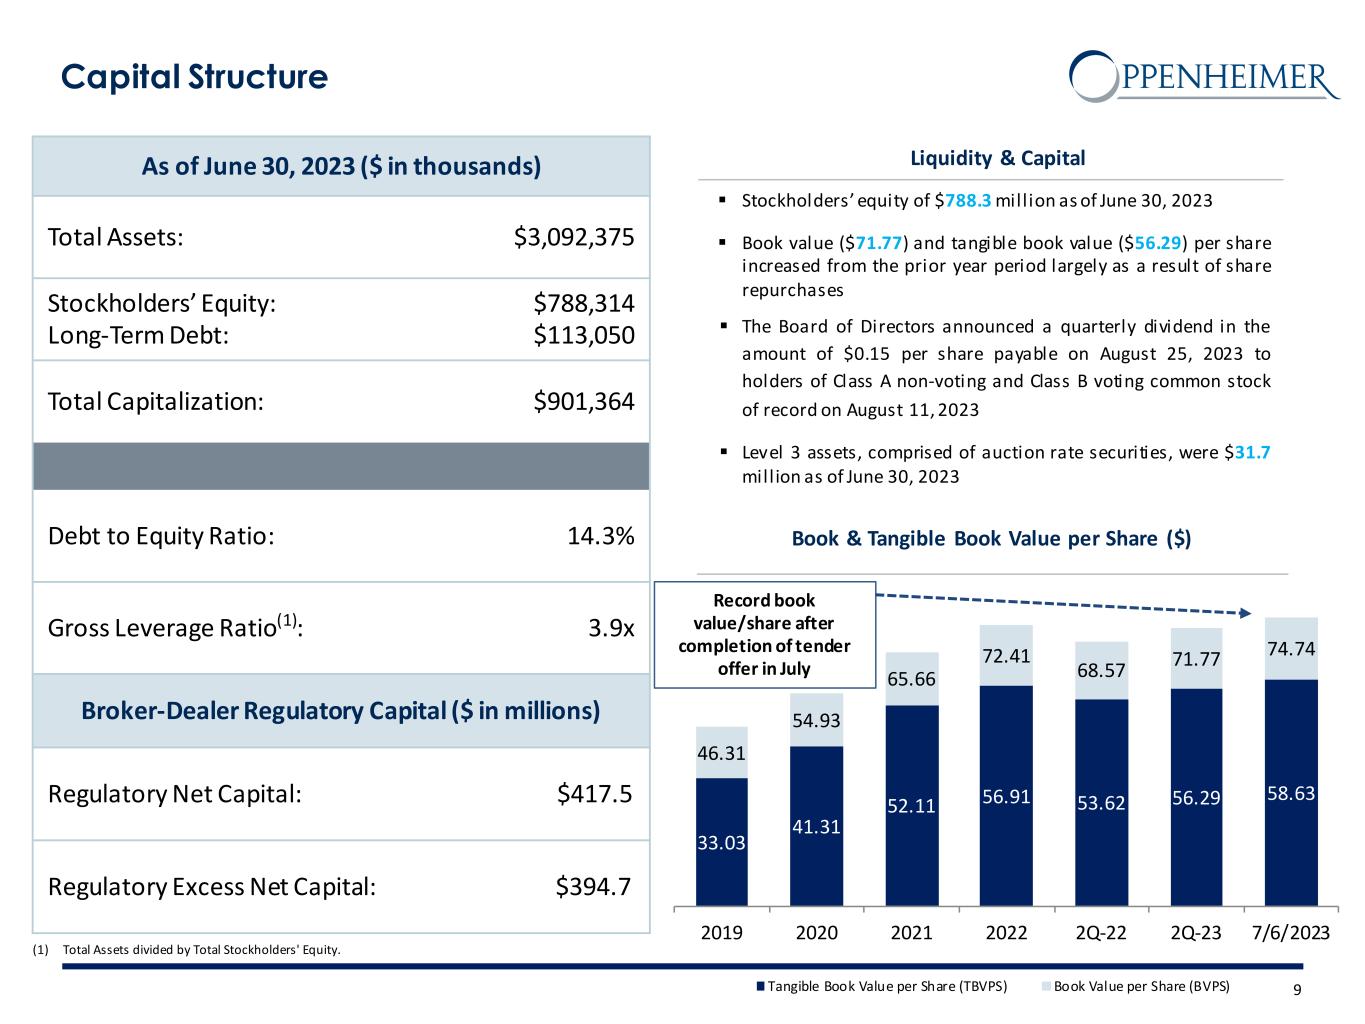
9 Capital Structure Book & Tangible Book Value per Share ($) Liquidity & Capital (1) Total Assets divided by Total Stockholders' Equity. Stockholders’ equity of $788.3 million as of June 30, 2023 Book value ($71.77) and tangible book value ($56.29) per share increased from the prior year period largely as a result of share repurchases The Board of Directors announced a quarterly dividend in the amount of $0.15 per share payable on August 25, 2023 to holders of Class A non-voting and Class B voting common stock of record on August 11, 2023 Level 3 assets, comprised of auction rate securities, were $31.7 million as of June 30, 2023 As of June 30, 2023 ($ in thousands) Total Assets: $3,092,375 Stockholders’ Equity: Long-Term Debt: $788,314 $113,050 Total Capitalization: $901,364 Debt to Equity Ratio: 14.3% Gross Leverage Ratio(1): 3.9x Broker-Dealer Regulatory Capital ($ in millions) Regulatory Net Capital: $417.5 Regulatory Excess Net Capital: $394.7 33.03 41.31 52.11 56.91 53.62 56.29 58.63 46.31 54.93 65.66 72.41 68.57 71.77 74.74 2019 2020 2021 2022 2Q-22 2Q-23 7/6/2023 Tangible Book Value per Share (TBVPS) Book Value per Share (BVPS) Record book value/share after completion of tender offer in July
For more information contact Investor Relations at info@opco.com


