00007899332023FYfalsehttp://fasb.org/us-gaap/2023#OtherNonoperatingIncomeExpenseP3YP3YP5YP3YP3YP3Y1111http://fasb.org/us-gaap/2023#PropertyPlantAndEquipmentAndFinanceLeaseRightOfUseAssetAfterAccumulatedDepreciationAndAmortizationhttp://fasb.org/us-gaap/2023#PropertyPlantAndEquipmentAndFinanceLeaseRightOfUseAssetAfterAccumulatedDepreciationAndAmortizationhttp://fasb.org/us-gaap/2023#OtherLiabilitiesCurrenthttp://fasb.org/us-gaap/2023#OtherLiabilitiesCurrenthttp://fasb.org/us-gaap/2023#LongTermDebtAndCapitalLeaseObligationsCurrenthttp://fasb.org/us-gaap/2023#LongTermDebtAndCapitalLeaseObligationsCurrenthttp://fasb.org/us-gaap/2023#LongTermDebtAndCapitalLeaseObligationshttp://fasb.org/us-gaap/2023#LongTermDebtAndCapitalLeaseObligations00007899332023-01-012023-12-3100007899332023-06-30iso4217:USD0000789933us-gaap:CommonClassAMember2024-02-29xbrli:shares0000789933us-gaap:CommonClassBMember2024-02-290000789933nacco:A2023StockRepurchaseProgramMember2023-11-0700007899332022-01-012022-12-31iso4217:USDxbrli:shares00007899332023-12-3100007899332022-12-310000789933us-gaap:NonrelatedPartyMember2023-12-310000789933us-gaap:NonrelatedPartyMember2022-12-310000789933srt:AffiliatedEntityMember2023-12-310000789933srt:AffiliatedEntityMember2022-12-310000789933us-gaap:CommonClassAMember2023-12-310000789933us-gaap:CommonClassAMember2022-12-310000789933us-gaap:CommonClassBMember2022-12-310000789933us-gaap:CommonClassBMember2023-12-31xbrli:pure00007899332021-12-310000789933us-gaap:CommonClassAMemberus-gaap:CommonStockMember2021-12-310000789933us-gaap:CommonClassBMemberus-gaap:CommonStockMember2021-12-310000789933us-gaap:AdditionalPaidInCapitalMember2021-12-310000789933us-gaap:RetainedEarningsMember2021-12-310000789933us-gaap:AccumulatedDefinedBenefitPlansAdjustmentMember2021-12-310000789933us-gaap:CommonClassAMemberus-gaap:CommonStockMember2022-01-012022-12-310000789933us-gaap:AdditionalPaidInCapitalMember2022-01-012022-12-310000789933us-gaap:CommonClassBMemberus-gaap:CommonStockMember2022-01-012022-12-310000789933us-gaap:RetainedEarningsMember2022-01-012022-12-310000789933us-gaap:AccumulatedDefinedBenefitPlansAdjustmentMember2022-01-012022-12-310000789933us-gaap:CommonClassAMemberus-gaap:CommonStockMember2022-12-310000789933us-gaap:CommonClassBMemberus-gaap:CommonStockMember2022-12-310000789933us-gaap:AdditionalPaidInCapitalMember2022-12-310000789933us-gaap:RetainedEarningsMember2022-12-310000789933us-gaap:AccumulatedDefinedBenefitPlansAdjustmentMember2022-12-310000789933us-gaap:CommonClassAMemberus-gaap:CommonStockMember2023-01-012023-12-310000789933us-gaap:AdditionalPaidInCapitalMember2023-01-012023-12-310000789933us-gaap:RetainedEarningsMember2023-01-012023-12-310000789933us-gaap:AccumulatedDefinedBenefitPlansAdjustmentMember2023-01-012023-12-310000789933us-gaap:CommonClassAMemberus-gaap:CommonStockMember2023-12-310000789933us-gaap:CommonClassBMemberus-gaap:CommonStockMember2023-12-310000789933us-gaap:AdditionalPaidInCapitalMember2023-12-310000789933us-gaap:RetainedEarningsMember2023-12-310000789933us-gaap:AccumulatedDefinedBenefitPlansAdjustmentMember2023-12-31nacco:segment00007899332023-10-012023-12-310000789933nacco:MineralAndRoyaltyInterestMember2023-01-012023-12-310000789933nacco:MineralAndRoyaltyInterestMember2022-01-012022-12-31utr:acre0000789933us-gaap:PensionPlansDefinedBenefitMember2023-01-012023-12-310000789933nacco:CoalMiningMembernacco:TheFalkirkMiningCompanyMember2022-01-012022-12-310000789933nacco:CoalMiningMembernacco:TheFalkirkMiningCompanyMember2022-05-022022-05-020000789933nacco:CoalMiningMembernacco:TheFalkirkMiningCompanyMember2022-05-020000789933us-gaap:PrivateEquityFundsMember2022-01-012022-12-310000789933nacco:HLCPEthanolHoldcoLLCMember2022-12-012022-12-010000789933nacco:HLCPEthanolHoldcoLLCMember2022-01-012022-12-310000789933nacco:HLCPEthanolHoldcoLLCMember2023-01-012023-12-310000789933us-gaap:BuildingAndBuildingImprovementsMember2023-12-310000789933srt:MinimumMemberus-gaap:MachineryAndEquipmentMember2023-12-310000789933srt:MaximumMemberus-gaap:MachineryAndEquipmentMember2023-12-310000789933nacco:MississippiLigniteMiningCompanyMember2023-10-012023-12-310000789933us-gaap:StockCompensationPlanMemberus-gaap:CommonClassAMembersrt:ExecutiveOfficerMembernacco:ParticipantsRetirementDateMember2023-01-012023-12-310000789933us-gaap:StockCompensationPlanMembersrt:MinimumMemberus-gaap:CommonClassAMembersrt:ExecutiveOfficerMembernacco:AwardDateMember2023-01-012023-12-310000789933us-gaap:StockCompensationPlanMemberus-gaap:CommonClassAMembersrt:ExecutiveOfficerMembernacco:AwardDateMember2023-01-012023-12-310000789933us-gaap:StockCompensationPlanMembersrt:MaximumMemberus-gaap:CommonClassAMembersrt:ExecutiveOfficerMembernacco:AwardDateMember2023-01-012023-12-310000789933us-gaap:StockCompensationPlanMemberus-gaap:CommonClassAMembersrt:ExecutiveOfficerMember2023-01-012023-12-310000789933us-gaap:StockCompensationPlanMemberus-gaap:CommonClassAMembersrt:ExecutiveOfficerMember2022-01-012022-12-310000789933us-gaap:StockCompensationPlanMemberus-gaap:CommonClassAMembersrt:ExecutiveOfficerMember2023-12-310000789933us-gaap:CommonClassAMemberus-gaap:RestrictedStockMembersrt:DirectorMember2023-01-012023-12-310000789933us-gaap:CommonClassAMemberus-gaap:RestrictedStockMembersrt:DirectorMember2022-01-012022-12-310000789933srt:BoardOfDirectorsChairmanMemberus-gaap:CommonClassAMemberus-gaap:RestrictedStockMember2022-01-012022-12-310000789933srt:BoardOfDirectorsChairmanMemberus-gaap:CommonClassAMemberus-gaap:RestrictedStockMember2023-01-012023-12-310000789933us-gaap:StockCompensationPlanMemberus-gaap:CommonClassAMembersrt:DirectorMembernacco:AwardDateMember2023-01-012023-12-310000789933us-gaap:StockCompensationPlanMemberus-gaap:CommonClassAMembernacco:ParticipantsRetirementFromBoardOfDirectorsMembersrt:DirectorMember2023-01-012023-12-310000789933us-gaap:StockCompensationPlanMemberus-gaap:CommonClassAMembersrt:DirectorMembernacco:MinimumAgeOfDirectorUponRetirementFromBoardMember2023-01-012023-12-310000789933us-gaap:CommonClassAMembernacco:VoluntarySharesMembersrt:DirectorMember2023-12-310000789933us-gaap:CommonClassAMembernacco:VoluntarySharesMembersrt:DirectorMember2023-01-012023-12-310000789933us-gaap:CommonClassAMembernacco:VoluntarySharesMembersrt:DirectorMember2022-01-012022-12-310000789933us-gaap:StockCompensationPlanMemberus-gaap:CommonClassAMembersrt:DirectorMember2023-12-310000789933us-gaap:StockCompensationPlanMemberus-gaap:CommonClassAMembersrt:DirectorMember2023-01-012023-12-310000789933us-gaap:StockCompensationPlanMemberus-gaap:CommonClassAMembersrt:DirectorMember2022-01-012022-12-310000789933srt:MinimumMember2023-01-012023-12-310000789933srt:MaximumMember2023-01-012023-12-310000789933srt:MaximumMembernacco:ThackerPassMember2023-01-012023-12-310000789933nacco:ThackerPassMemberus-gaap:EquipmentMember2023-01-012023-12-310000789933nacco:ThackerPassMember2023-01-012023-12-310000789933nacco:ThackerPassMember2023-12-310000789933nacco:CoalMiningMemberus-gaap:OperatingSegmentsMember2023-01-012023-12-310000789933nacco:CoalMiningMemberus-gaap:OperatingSegmentsMember2022-01-012022-12-310000789933us-gaap:OperatingSegmentsMembernacco:NorthAmericanMiningMember2023-01-012023-12-310000789933us-gaap:OperatingSegmentsMembernacco:NorthAmericanMiningMember2022-01-012022-12-310000789933us-gaap:OperatingSegmentsMembernacco:MineralsManagementMember2023-01-012023-12-310000789933us-gaap:OperatingSegmentsMembernacco:MineralsManagementMember2022-01-012022-12-310000789933us-gaap:CorporateNonSegmentMember2023-01-012023-12-310000789933us-gaap:CorporateNonSegmentMember2022-01-012022-12-310000789933srt:ConsolidationEliminationsMember2023-01-012023-12-310000789933srt:ConsolidationEliminationsMember2022-01-012022-12-310000789933us-gaap:TransferredAtPointInTimeMember2023-01-012023-12-310000789933us-gaap:TransferredAtPointInTimeMember2022-01-012022-12-310000789933us-gaap:TransferredOverTimeMember2023-01-012023-12-310000789933us-gaap:TransferredOverTimeMember2022-01-012022-12-310000789933us-gaap:TradeAccountsReceivableMember2022-12-310000789933us-gaap:TradeAccountsReceivableMember2023-12-310000789933us-gaap:TradeAccountsReceivableMember2023-01-012023-12-3100007899332024-01-012023-12-3100007899332025-01-012023-12-3100007899332026-01-012023-12-3100007899332027-01-012023-12-310000789933nacco:CoalLandsAndRealEstateMember2023-12-310000789933nacco:CoalLandsAndRealEstateMember2022-12-310000789933nacco:MineralInterestsMember2023-12-310000789933nacco:MineralInterestsMember2022-12-310000789933nacco:PlantAndEquipmentMember2023-12-310000789933nacco:PlantAndEquipmentMember2022-12-310000789933us-gaap:CoalSupplyAgreementsMember2023-12-310000789933us-gaap:CoalSupplyAgreementsMember2022-12-310000789933nacco:CoalMiningMemberus-gaap:OperatingSegmentsMember2021-12-310000789933us-gaap:CorporateNonSegmentMember2021-12-310000789933nacco:CoalMiningMemberus-gaap:OperatingSegmentsMember2022-12-310000789933us-gaap:CorporateNonSegmentMember2022-12-310000789933nacco:CoalMiningMemberus-gaap:OperatingSegmentsMember2023-12-310000789933us-gaap:CorporateNonSegmentMember2023-12-310000789933nacco:CaddoCreekMember2023-12-310000789933nacco:BellaireCorporationMember2021-12-310000789933nacco:BellaireCorporationMember2023-12-310000789933nacco:BellaireCorporationMember2022-12-310000789933nacco:NacoalMemberus-gaap:SecuredDebtMember2023-12-310000789933nacco:NacoalMember2022-12-310000789933nacco:NacoalMember2023-12-310000789933us-gaap:BaseRateMembernacco:NacoalMemberus-gaap:SecuredDebtMember2023-01-012023-12-310000789933nacco:NacoalMembernacco:SecuredOvernightFinancingRateMemberus-gaap:SecuredDebtMember2023-01-012023-12-310000789933nacco:NacoalMemberus-gaap:SecuredDebtMember2023-01-012023-12-310000789933us-gaap:SecuredDebtMember2023-01-012023-12-310000789933nacco:NacoalMemberus-gaap:SecuredDebtMember2022-12-310000789933srt:MaximumMembernacco:NacoalMemberus-gaap:SecuredDebtMember2023-01-012023-12-310000789933srt:MinimumMembernacco:NacoalMemberus-gaap:SecuredDebtMember2023-01-012023-12-310000789933nacco:NacoalMembernacco:DemandNotePayableToUnconsolidatedSubsidiaryMemberus-gaap:SecuredDebtMember2023-12-310000789933nacco:NacoalMembernacco:DemandNotePayableToUnconsolidatedSubsidiaryMemberus-gaap:SecuredDebtMember2022-12-310000789933nacco:NacoalMemberus-gaap:SecuredDebtMembernacco:NotesPayableMaturingAtVariousDatesThrough2029Member2023-12-31nacco:notePayablenacco:unitOfEquipment0000789933srt:ScenarioForecastMembernacco:NacoalMembernacco:NotesPayableMaturingDecember2026Memberus-gaap:SecuredDebtMember2026-12-150000789933nacco:NacoalMemberus-gaap:SecuredDebtMembernacco:NotesPayableMaturingAtVariousDatesThrough2029Member2022-12-310000789933us-gaap:EstimateOfFairValueFairValueDisclosureMemberus-gaap:FairValueMeasurementsRecurringMember2023-12-310000789933us-gaap:FairValueInputsLevel1Memberus-gaap:FairValueMeasurementsRecurringMember2023-12-310000789933us-gaap:FairValueInputsLevel2Memberus-gaap:FairValueMeasurementsRecurringMember2023-12-310000789933us-gaap:FairValueInputsLevel3Memberus-gaap:FairValueMeasurementsRecurringMember2023-12-310000789933us-gaap:EstimateOfFairValueFairValueDisclosureMemberus-gaap:FairValueMeasurementsRecurringMember2022-12-310000789933us-gaap:FairValueInputsLevel1Memberus-gaap:FairValueMeasurementsRecurringMember2022-12-310000789933us-gaap:FairValueInputsLevel2Memberus-gaap:FairValueMeasurementsRecurringMember2022-12-310000789933us-gaap:FairValueInputsLevel3Memberus-gaap:FairValueMeasurementsRecurringMember2022-12-310000789933us-gaap:FairValueInputsLevel1Membernacco:BellaireCorporationMemberus-gaap:FairValueMeasurementsRecurringMember2023-01-012023-12-310000789933us-gaap:FairValueInputsLevel1Membernacco:BellaireCorporationMemberus-gaap:FairValueMeasurementsRecurringMember2022-01-012022-12-310000789933us-gaap:FairValueInputsLevel1Memberus-gaap:CarryingReportedAmountFairValueDisclosureMemberus-gaap:FairValueMeasurementsRecurringMember2021-12-310000789933us-gaap:FairValueInputsLevel1Memberus-gaap:FairValueMeasurementsRecurringMember2023-01-012023-12-310000789933us-gaap:FairValueInputsLevel1Memberus-gaap:FairValueMeasurementsRecurringMember2022-01-012022-12-310000789933nacco:MississippiLigniteMiningCompanyMemberus-gaap:FairValueMeasurementsNonrecurringMember2023-01-012023-12-310000789933nacco:CoalMiningMemberus-gaap:FairValueMeasurementsNonrecurringMember2023-01-012023-12-310000789933nacco:MineralManagementMemberus-gaap:FairValueMeasurementsNonrecurringMember2023-01-012023-12-310000789933us-gaap:FairValueInputsLevel3Memberus-gaap:FairValueMeasurementsNonrecurringMember2022-09-300000789933nacco:MineralManagementMemberus-gaap:FairValueInputsLevel3Memberus-gaap:FairValueMeasurementsNonrecurringMember2022-07-012022-09-300000789933us-gaap:FairValueInputsLevel2Member2023-12-310000789933us-gaap:FairValueInputsLevel2Member2022-12-310000789933us-gaap:CommonClassAMember2023-01-012023-12-31nacco:vote0000789933us-gaap:CommonClassBMember2023-01-012023-12-310000789933nacco:A2021StockRepurchaseProgramMemberus-gaap:CommonClassAMember2023-01-012023-12-310000789933us-gaap:CommonClassAMembernacco:A2023StockRepurchaseProgramMember2023-01-012023-12-310000789933nacco:A2021StockRepurchaseProgramMember2022-01-012022-12-310000789933us-gaap:StateAndLocalJurisdictionMember2023-12-310000789933us-gaap:StateAndLocalJurisdictionMember2022-12-310000789933srt:MinimumMemberus-gaap:PensionPlansDefinedBenefitMember2023-12-310000789933srt:MaximumMemberus-gaap:PensionPlansDefinedBenefitMember2023-12-310000789933srt:MinimumMemberus-gaap:PensionPlansDefinedBenefitMember2022-12-310000789933srt:MaximumMemberus-gaap:PensionPlansDefinedBenefitMember2022-12-310000789933srt:MinimumMemberus-gaap:PensionPlansDefinedBenefitMember2023-01-012023-12-310000789933srt:MaximumMemberus-gaap:PensionPlansDefinedBenefitMember2023-01-012023-12-310000789933srt:MinimumMemberus-gaap:PensionPlansDefinedBenefitMember2022-01-012022-12-310000789933srt:MaximumMemberus-gaap:PensionPlansDefinedBenefitMember2022-01-012022-12-310000789933us-gaap:PensionPlansDefinedBenefitMember2022-01-012022-12-310000789933us-gaap:PensionPlansDefinedBenefitMember2022-12-310000789933us-gaap:PensionPlansDefinedBenefitMember2021-12-310000789933us-gaap:PensionPlansDefinedBenefitMember2023-12-310000789933us-gaap:PensionPlansDefinedBenefitMemberus-gaap:FixedIncomeSecuritiesMember2023-12-310000789933us-gaap:PensionPlansDefinedBenefitMemberus-gaap:FixedIncomeSecuritiesMember2022-12-310000789933srt:MinimumMemberus-gaap:PensionPlansDefinedBenefitMemberus-gaap:FixedIncomeSecuritiesMember2023-12-310000789933srt:MaximumMemberus-gaap:PensionPlansDefinedBenefitMemberus-gaap:FixedIncomeSecuritiesMember2023-12-310000789933us-gaap:CashEquivalentsMemberus-gaap:PensionPlansDefinedBenefitMember2023-12-310000789933us-gaap:CashEquivalentsMemberus-gaap:PensionPlansDefinedBenefitMember2022-12-310000789933srt:MinimumMemberus-gaap:CashEquivalentsMemberus-gaap:PensionPlansDefinedBenefitMember2023-12-310000789933srt:MaximumMemberus-gaap:CashEquivalentsMemberus-gaap:PensionPlansDefinedBenefitMember2023-12-310000789933us-gaap:MoneyMarketFundsMemberus-gaap:PensionPlansDefinedBenefitMember2023-12-310000789933us-gaap:MoneyMarketFundsMemberus-gaap:PensionPlansDefinedBenefitMember2022-12-310000789933srt:MinimumMemberus-gaap:MoneyMarketFundsMemberus-gaap:PensionPlansDefinedBenefitMember2023-12-310000789933srt:MaximumMemberus-gaap:MoneyMarketFundsMemberus-gaap:PensionPlansDefinedBenefitMember2023-12-310000789933us-gaap:DefinedBenefitPlanEquitySecuritiesUsMemberus-gaap:PensionPlansDefinedBenefitMember2023-12-310000789933us-gaap:DefinedBenefitPlanEquitySecuritiesUsMemberus-gaap:PensionPlansDefinedBenefitMember2022-12-310000789933us-gaap:DefinedBenefitPlanEquitySecuritiesUsMembersrt:MinimumMemberus-gaap:PensionPlansDefinedBenefitMember2023-12-310000789933us-gaap:DefinedBenefitPlanEquitySecuritiesUsMembersrt:MaximumMemberus-gaap:PensionPlansDefinedBenefitMember2023-12-310000789933us-gaap:DefinedBenefitPlanEquitySecuritiesNonUsMemberus-gaap:PensionPlansDefinedBenefitMember2023-12-310000789933us-gaap:DefinedBenefitPlanEquitySecuritiesNonUsMemberus-gaap:PensionPlansDefinedBenefitMember2022-12-310000789933srt:MinimumMemberus-gaap:DefinedBenefitPlanEquitySecuritiesNonUsMemberus-gaap:PensionPlansDefinedBenefitMember2023-12-310000789933srt:MaximumMemberus-gaap:DefinedBenefitPlanEquitySecuritiesNonUsMemberus-gaap:PensionPlansDefinedBenefitMember2023-12-310000789933us-gaap:FairValueInputsLevel1Memberus-gaap:PensionPlansDefinedBenefitMemberus-gaap:FixedIncomeSecuritiesMember2023-12-310000789933us-gaap:FairValueInputsLevel1Memberus-gaap:PensionPlansDefinedBenefitMemberus-gaap:FixedIncomeSecuritiesMember2022-12-310000789933us-gaap:FairValueInputsLevel1Memberus-gaap:CashEquivalentsMemberus-gaap:PensionPlansDefinedBenefitMember2023-12-310000789933us-gaap:FairValueInputsLevel1Memberus-gaap:CashEquivalentsMemberus-gaap:PensionPlansDefinedBenefitMember2022-12-310000789933us-gaap:FairValueInputsLevel1Memberus-gaap:MoneyMarketFundsMemberus-gaap:PensionPlansDefinedBenefitMember2023-12-310000789933us-gaap:FairValueInputsLevel1Memberus-gaap:MoneyMarketFundsMemberus-gaap:PensionPlansDefinedBenefitMember2022-12-310000789933us-gaap:DefinedBenefitPlanEquitySecuritiesUsMemberus-gaap:FairValueInputsLevel1Memberus-gaap:PensionPlansDefinedBenefitMember2023-12-310000789933us-gaap:DefinedBenefitPlanEquitySecuritiesUsMemberus-gaap:FairValueInputsLevel1Memberus-gaap:PensionPlansDefinedBenefitMember2022-12-310000789933us-gaap:FairValueInputsLevel1Memberus-gaap:DefinedBenefitPlanEquitySecuritiesNonUsMemberus-gaap:PensionPlansDefinedBenefitMember2023-12-310000789933us-gaap:FairValueInputsLevel1Memberus-gaap:DefinedBenefitPlanEquitySecuritiesNonUsMemberus-gaap:PensionPlansDefinedBenefitMember2022-12-310000789933us-gaap:FairValueInputsLevel1Memberus-gaap:PensionPlansDefinedBenefitMember2023-12-310000789933us-gaap:FairValueInputsLevel1Memberus-gaap:PensionPlansDefinedBenefitMember2022-12-310000789933us-gaap:OtherPostretirementBenefitPlansDefinedBenefitMember2023-12-310000789933us-gaap:OtherPostretirementBenefitPlansDefinedBenefitMember2022-12-310000789933us-gaap:OtherPostretirementBenefitPlansDefinedBenefitMember2023-01-012023-12-310000789933us-gaap:OtherPostretirementBenefitPlansDefinedBenefitMember2022-01-012022-12-310000789933srt:MinimumMemberus-gaap:OtherPostretirementBenefitPlansDefinedBenefitMember2023-12-310000789933srt:MaximumMemberus-gaap:OtherPostretirementBenefitPlansDefinedBenefitMember2023-12-310000789933srt:MinimumMemberus-gaap:OtherPostretirementBenefitPlansDefinedBenefitMember2022-12-310000789933srt:MaximumMemberus-gaap:OtherPostretirementBenefitPlansDefinedBenefitMember2022-12-310000789933srt:MinimumMemberus-gaap:OtherPostretirementBenefitPlansDefinedBenefitMember2023-01-012023-12-310000789933srt:MaximumMemberus-gaap:OtherPostretirementBenefitPlansDefinedBenefitMember2023-01-012023-12-310000789933us-gaap:OtherPostretirementBenefitPlansDefinedBenefitMember2021-12-310000789933nacco:CoalMiningMembernacco:CoalMiningCustomerMemberus-gaap:RevenueFromContractWithCustomerMemberus-gaap:CustomerConcentrationRiskMember2023-01-012023-12-310000789933nacco:CoalMiningMembernacco:CoalMiningCustomerMemberus-gaap:RevenueFromContractWithCustomerMemberus-gaap:CustomerConcentrationRiskMember2022-01-012022-12-310000789933us-gaap:RevenueFromContractWithCustomerMembernacco:NorthAmericanMiningMembernacco:NAMiningCustomerMemberus-gaap:CustomerConcentrationRiskMember2023-01-012023-12-310000789933us-gaap:RevenueFromContractWithCustomerMembernacco:NorthAmericanMiningMembernacco:NAMiningCustomerMemberus-gaap:CustomerConcentrationRiskMember2022-01-012022-12-310000789933nacco:UnconsolidatedMinesMembernacco:NacoalMember2023-12-310000789933nacco:UnconsolidatedMinesMembernacco:NacoalMember2022-12-310000789933nacco:NacoalMembernacco:UnconsolidatedMinesMember2023-12-310000789933nacco:NacoalMembernacco:UnconsolidatedMinesMember2022-12-310000789933nacco:NacoalMemberus-gaap:VariableInterestEntityNotPrimaryBeneficiaryMembernacco:UnconsolidatedMinesMember2023-01-012023-12-310000789933nacco:NacoalMemberus-gaap:VariableInterestEntityNotPrimaryBeneficiaryMembernacco:UnconsolidatedMinesMember2022-01-012022-12-310000789933nacco:NacoalMemberus-gaap:VariableInterestEntityNotPrimaryBeneficiaryMembernacco:UnconsolidatedMinesMember2023-12-310000789933nacco:NacoalMemberus-gaap:VariableInterestEntityNotPrimaryBeneficiaryMembernacco:UnconsolidatedMinesMember2022-12-310000789933nacco:UnconsolidatedMinesMembernacco:NacoalMember2023-01-012023-12-310000789933nacco:UnconsolidatedMinesMembernacco:NacoalMember2022-01-012022-12-310000789933nacco:JonesDayMember2023-01-012023-12-310000789933nacco:JonesDayMember2022-01-012022-12-310000789933nacco:AlfredM.RankinJr.Member2022-01-012022-12-310000789933nacco:AlfredM.RankinJr.Member2023-01-012023-12-310000789933srt:OilReservesMember2023-12-31utr:bbl0000789933srt:NaturalGasLiquidsReservesMember2023-12-310000789933nacco:ResidualGasMember2023-12-31utr:Mcf0000789933srt:OilReservesMember2022-12-310000789933srt:NaturalGasLiquidsReservesMember2022-12-310000789933nacco:ResidualGasMember2022-12-310000789933srt:OilReservesMember2023-01-012023-12-310000789933srt:NaturalGasLiquidsReservesMember2023-01-012023-12-310000789933nacco:ResidualGasMember2023-01-012023-12-310000789933nacco:CushingOKMember2023-01-012023-12-31iso4217:USDutr:bbl0000789933nacco:CushingOKMember2022-01-012022-12-31iso4217:USDutr:MMBTU0000789933us-gaap:ValuationAllowanceOfDeferredTaxAssetsMember2022-12-310000789933us-gaap:ValuationAllowanceOfDeferredTaxAssetsMember2023-01-012023-12-310000789933us-gaap:ValuationAllowanceOfDeferredTaxAssetsMember2023-12-310000789933us-gaap:ValuationAllowanceOfDeferredTaxAssetsMember2021-12-310000789933us-gaap:ValuationAllowanceOfDeferredTaxAssetsMember2022-01-012022-12-31
UNITED STATES
SECURITIES AND EXCHANGE COMMISSION
WASHINGTON, DC 20549
FORM 10-K
|
|
|
|
|
|
|
|
|
|
|
|
| (Mark One) |
|
|
|
| ☑ |
|
ANNUAL REPORT PURSUANT TO SECTION 13 OR 15(d) OF THE SECURITIES EXCHANGE ACT OF 1934 |
|
|
For the fiscal year ended |
December 31, 2023 |
or
|
|
|
|
|
|
|
|
|
| ☐ |
|
TRANSITION REPORT PURSUANT TO SECTION 13 OR 15(d) OF THE SECURITIES EXCHANGE ACT OF 1934 |
Commission File No. 1-9172
NACCO INDUSTRIES, INC.
(Exact name of registrant as specified in its charter)
|
|
|
|
|
|
|
|
|
|
|
|
|
|
|
|
|
|
|
|
|
|
|
|
|
Delaware |
|
34-1505819 |
|
|
(State or other jurisdiction of incorporation or organization) |
|
(I.R.S. Employer Identification No.) |
|
| |
|
|
|
|
|
|
|
|
5875 Landerbrook Drive, |
Suite 220 |
|
|
|
|
Cleveland, |
Ohio |
|
|
|
44124-4069 |
|
|
(Address of principal executive offices) |
|
(Zip Code) |
|
Registrant's telephone number, including area code: (440) 229-5151
Securities registered pursuant to Section 12(b) of the Act
|
|
|
|
|
|
|
|
|
|
|
|
|
|
|
Title of each class
|
|
Trading Symbol
|
|
Name of each exchange on which registered
|
| Class A Common Stock, $1 par value per share |
|
NC |
|
New York Stock Exchange |
Securities registered pursuant to Section 12(g) of the Act: Class B Common Stock, $1 par value per share. Class B Common Stock is not publicly listed for trade on any exchange or market system; however, Class B Common Stock is convertible into Class A Common Stock on a share-for-share basis.
Indicate by check mark if the registrant is a well-known seasoned issuer, as defined in Rule 405 of the Securities Act. Yes ¨ No þ
Indicate by check mark if the registrant is not required to file reports pursuant to Section 13 or Section 15(d) of the Act. Yes ¨ No þ
Indicate by check mark whether the registrant (1) has filed all reports required to be filed by Section 13 or 15(d) of the Securities Exchange Act of 1934 during the preceding 12 months (or for such shorter period that the registrant was required to file such reports), and (2) has been subject to such filing requirements for the past 90 days. Yes þ No £
Indicate by check mark whether the registrant has submitted electronically every Interactive Data File required to be submitted pursuant to Rule 405 of Regulation S-T (§ 232.405 of this chapter) during the preceding 12 months (or for such shorter period that the registrant was required to submit such files).
Yes þ No £
Indicate by check mark whether the registrant is a large accelerated filer, an accelerated filer, a non-accelerated filer, a smaller reporting company or an emerging growth company. See definitions of “large accelerated filer,” “accelerated filer,” “smaller reporting company” and "emerging growth company" in Rule 12b-2 of the Exchange Act.
|
|
|
|
|
|
|
|
|
|
|
|
|
|
|
|
|
|
|
|
|
|
|
|
|
|
|
|
|
|
| Large accelerated filer |
☐ |
Accelerated filer |
☑ |
Non-accelerated filer |
☐ |
Smaller reporting company |
☑ |
Emerging growth company |
☐ |
If an emerging growth company, indicate by check mark if the registrant has elected not to use the extended transition period for complying with any new or revised financial accounting standards provided pursuant to Section 13(a) of the Exchange Act. o
Indicate by check mark whether the registrant has filed a report on and attestation to its management's assessment of the effectiveness of its internal control over financial reporting under Section 404(b) of the Sarbanes-Oxley Act (15 U.S.C. 7262(b)) by the registered public accounting firm that prepared or issued its audit report. ☑
If securities are registered pursuant to Section 12(b) of the Act, indicate by check mark whether the financial statements of the registrant included in the filing reflect the correction of an error to previously issued financial statements. ☐
Indicate by check mark whether any of those error corrections are restatements that required a recovery analysis of incentive-based compensation received by any of the registrant’s executive officers during the relevant recovery period pursuant to §240.10D-1(b). ☐
Indicate by check mark whether the registrant is a shell company (as defined in Rule 12b-2 of the Exchange Act) Yes ☐ No ☑
Aggregate market value of Class A Common Stock and Class B Common Stock held by non-affiliates as of June 30, 2023 (the last business day of the registrant's most recently completed second fiscal quarter): 156,415,693
Number of shares of Class A Common Stock outstanding at February 29, 2024: 5,929,944
Number of shares of Class B Common Stock outstanding at February 29, 2024: 1,565,685
DOCUMENTS INCORPORATED BY REFERENCE
Portions of the Company's Proxy Statement for its 2024 annual meeting of stockholders are incorporated herein by reference in Part III of this Form 10-K.
NACCO INDUSTRIES, INC.
TABLE OF CONTENTS
PART I
Item 1. BUSINESS
General
NACCO Industries, Inc.® (“NACCO” or the “Company”) brings natural resources to life by delivering aggregates, minerals, reliable fuels and environmental solutions through its robust portfolio of NACCO Natural Resources® businesses. The Company operates under three business segments: Coal Mining, North American Mining® ("NAMining") and Minerals Management. The Coal Mining segment operates surface coal mines for power generation companies. The NAMining segment is a trusted mining partner for producers of aggregates, activated carbon, lithium and other industrial minerals. The Minerals Management segment, which includes the Catapult Mineral Partners (“Catapult”) business, acquires and promotes the development of mineral interests. Mitigation Resources of North America® (“Mitigation Resources”) provides stream and wetland mitigation solutions.
The Company has items not directly attributable to a reportable segment that are not included in the reported financial results of the operating segment. These items primarily include administrative costs related to public company reporting requirements, including management and board compensation, and the financial results of Bellaire Corporation ("Bellaire"), Mitigation Resources and other developing businesses. Bellaire manages the Company’s long-term liabilities related to former Eastern U.S. underground mining activities.
NACCO was incorporated as a Delaware corporation in 1986 in connection with the formation of a holding company structure for a predecessor corporation organized in 1913.
Business Strategy
NACCO’s portfolio of businesses operates under the umbrella of NACCO Natural Resources. Management continues to view the long-term business outlook for NACCO positively. The Company is pursuing growth and diversification by strategically leveraging its core mining and natural resources management skills to build a strong portfolio of affiliated businesses.
The Minerals Management segment, through the Company’s Catapult business unit, is focused on maximizing the value of existing mineral and royalty assets while it continues to pursue expansion of its asset base through acquisitions of additional mineral and royalty interests. The goal is to construct a high-quality diversified portfolio of oil and gas mineral and royalty interests in the United States that delivers near-term cash flow yields and long-term projected growth. The Company believes this business will provide unlevered after-tax returns on invested capital in the mid-teens as this business model matures. This business model can deliver higher average operating margins over the life of a reserve than traditional oil and gas companies that bear the cost of exploration, production and/or development as these costs are borne entirely by third-party exploration and development companies that lease the minerals. The Company is also considering additional investment opportunities, including non-operating working interests, as it continues to pursue diversification of revenue streams.
NAMining continues to focus on profit improvement initiatives as well as growth through additional business development activities. NAMining is targeting potential customers who require a broad range of minerals and materials where it can leverage the Company’s core mining skills. The goal is to build NAMining into a leading provider of contract mining services for customers who produce a wide variety of minerals and materials. NAMining intends to be a substantial contributor to operating profit over time, including in its Sawtooth Mining subsidiary when production commences at Thacker Pass, which is targeting initial production in late 2026. Once production commences, Sawtooth Mining Company, LLC ("Sawtooth") will receive a management fee per metric ton of lithium delivered. The pace of achieving substantially improved results at NAMining will depend on the execution and successful implementation of profit improvement initiatives in the aggregates operations, and the mix and scale of new projects. A number of initiatives have already delivered improved financial results.
Mitigation Resources continues to develop its business, which creates and sells stream and wetland mitigation credits, provides services to those engaged in permittee-responsible mitigation and provides mine reclamation and other environmental restoration services. This business offers an opportunity for growth and diversification in an industry where the Company has substantial knowledge and expertise and a strong reputation. Mitigation Resources is making strong progress toward its goal of becoming a top ten provider of stream and wetland mitigation services in the southeastern United States. The Company believes that Mitigation Resources can provide solid rates of return on capital employed as this business matures.
The Company also continues to pursue activities which can strengthen the resiliency of its existing coal mining operations. The Company remains focused on managing coal production costs and maximizing efficiencies and operating capacity at mine locations to help customers with management fee contracts be more competitive. These activities benefit both customers and the Company's Coal Mining segment, as fuel cost is a significant driver for power plant dispatch. Increased power plant dispatch results in increased demand for coal by the Coal Mining segment's customers. Fluctuating natural gas prices, weather and availability of renewable energy sources, such as wind and solar, could affect the amount of electricity dispatched from coal-fired power plants. While the Company realizes the coal mining industry faces political and regulatory challenges and demand for coal is projected to decline over the longer-term, the Company believes coal should be an essential part of the energy mix in the United States for the foreseeable future.
The Company continues to look for ways to create additional value by utilizing its core mining competencies around reclamation and permitting through the development of utility-scale solar projects. Reclaimed mining properties offer large tracts of land that could be well-suited for solar and other energy-related projects. These projects could be developed by the Company itself or through joint ventures that include partners with expertise in energy development projects.
The Company is committed to maintaining a conservative capital structure as it continues to grow and diversify, while avoiding unnecessary risk. Strategic diversification is designed to generate cash that can be re-invested to strengthen and expand the businesses. The Company also continues to maintain the highest levels of customer service and operational excellence with an unwavering focus on safety and environmental stewardship.
Business Developments
On December 18, 2023, Mississippi Lignite Mining Company ("MLMC") received a force majeure event notice from its customer related to an issue that began on December 15, 2023 and impacted one of two boilers at the Red Hills Power Plant. The notice did not provide a timeline for resolution of the issue. As of March 6, 2024, the impacted boiler is still not operational. The prolonged mechanical issue is expected to result in a reduction in customer demand and will have a significant impact on the Company's results of operations during 2024. The Company determined the anticipated reduction in customer demand caused by this issue was an indicator of potential impairment. The Company reviewed MLMC's long-lived assets for impairment as of December 31, 2023 and determined the carrying amount of its long-lived assets were not recoverable. As a result, the Company recorded a non-cash, long-lived asset impairment charge of $65.9 million in 2023. See Note 9 to the Consolidated Financial Statements in this Form 10-K for further information on the impairment analysis.
During 2023, Minerals Management, through Catapult, completed an acquisition of $36.7 million of mineral and royalty interests in the Texas portion of the Permian Basin. During 2022, Catapult acquired $11.4 million of mineral and royalty interests in the Texas portion of the Permian Basin and the Wyoming portion of the Powder River Basin as well as a small acquisition of mineral interests in the New Mexico portion of the Permian Basin.
During December 2023, NAMining executed a 15-year contract to mine phosphate at a quarry in central Florida. Production is expected to commence in the first half of 2024 once relocation and commissioning of a dragline is complete. NAMining also amended and extended existing limestone contracts with two customers and expanded the scope of work with another customer.
The Sabine Mining Company (“Sabine”) operates the Sabine Mine in Texas. All production from Sabine was delivered to
Southwestern Electric Power Company's (“SWEPCO”) Henry W. Pirkey Plant (the “Pirkey Plant”). SWEPCO is an American
Electric Power (“AEP”) company. As a result of the early retirement of the Pirkey Plant, Sabine ceased deliveries and final reclamation began on April 1, 2023. Funding for mine reclamation is the responsibility of SWEPCO, and Sabine receives compensation for providing mine reclamation services. Sabine will provide mine reclamation services through September 30, 2026. On October 1, 2026, SWEPCO will acquire all of the capital stock of Sabine and complete the remaining mine reclamation.
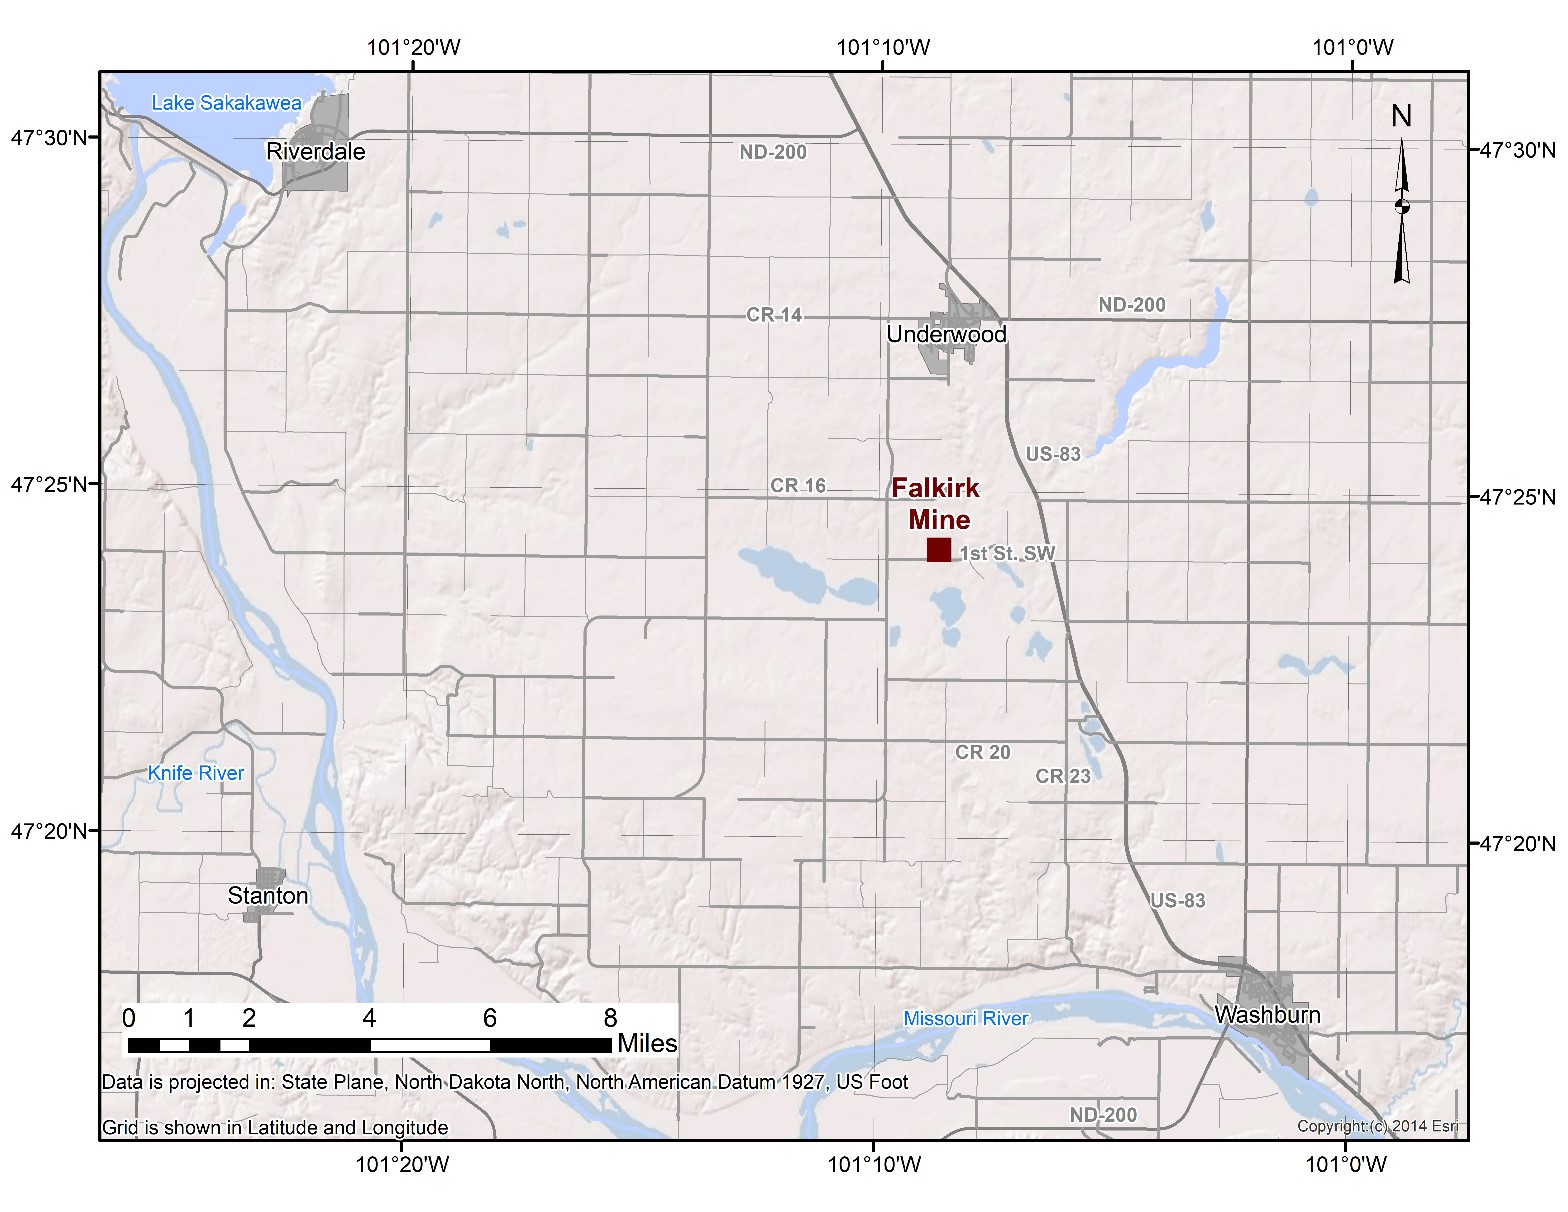
The Falkirk Mining Company ("Falkirk") operates the Falkirk Mine in North Dakota. Falkirk is the sole supplier of lignite coal to the Coal Creek Station power plant. On May 2, 2022, Great River Energy ("GRE") completed the sale of Coal Creek Station and the adjacent high-voltage direct current transmission line to Rainbow Energy Center, LLC (“Rainbow Energy”) and its affiliates. The Coal Sales Agreement (“CSA”) between Falkirk and Rainbow Energy became effective upon the closing of the transaction. Falkirk continues to supply all coal requirements of Coal Creek Station and is paid a management fee per ton of coal delivered. To support the transfer to new ownership, Falkirk agreed to a reduction in the current per ton management fee from the effective date of the CSA through May 31, 2024. After May 31, 2024, the per ton management fee increases to a higher base in line with 2021 fee levels, and thereafter adjusts annually according to an index which tracks broad measures of U.S. inflation. Rainbow Energy is responsible for funding all mine operating costs, including mine reclamation, and directly or indirectly providing all of the capital required to operate the mine. The initial production period is expected to run through May 1, 2032, but the CSA may be extended or terminated early under certain circumstances.
The Company recognized a gain of $30.9 million during 2022 as GRE paid the Company cash, transferred ownership of an office building, and conveyed membership units in Midwest AgEnergy Group, LLC (“MAG”), a North Dakota-based ethanol business as agreed to under the termination and release of claims agreement between Falkirk and GRE.
Prior to receiving the membership units from GRE, the Company held a $5.0 million investment in MAG. On December 1, 2022, HLCP Ethanol Holdco, LLC (“HLCP”) completed its acquisition of MAG. Upon closing of the transaction, NACCO transferred its ownership interest in MAG to HLCP and received a cash payment of $18.6 million during 2022.
The Company received additional payments totaling $3.6 million during 2023 in connection with a post-closing purchase price adjustment and the release of amounts held in escrow.
During 2023, the Board of Directors of the Company approved the termination of the Combined Defined Benefit Plan for NACCO and its subsidiaries (the “Combined Plan”) and Combined Plan participants were offered lump-sum distributions as part of the termination process. As a result of the lump-sum distributions, the Company recognized a non-cash, pension settlement charge of $1.8 million. See Note 14 to the Consolidated Financial Statements in this Form 10-K for further information on the Combined Plan.
In December 2023, the Company entered into a power purchase agreement with the Tennessee Valley Authority (“TVA”) for the energy generated from a proposed 67.5 MW solar photovoltaic electric generation facility to be developed on reclaimed land at the Company’s Red Hills Mine. The development of this project is subject to the favorable completion of an environmental impact study under the National Environmental Policy Act (“NEPA”) and approval of an interconnection agreement with TVA. In addition, the Company will enter into an engineering, procurement and construction agreement related to development of the project. The estimated commercial operation date for this generation facility is 2027.
Operations
Coal Mining Segment
The Coal Mining segment, operating as North American Coal, LLC, operates surface coal mines under long-term contracts with power generation companies pursuant to a service-based business model. Coal is surface mined in North Dakota and Mississippi. Each mine is fully integrated with its customer's operations.
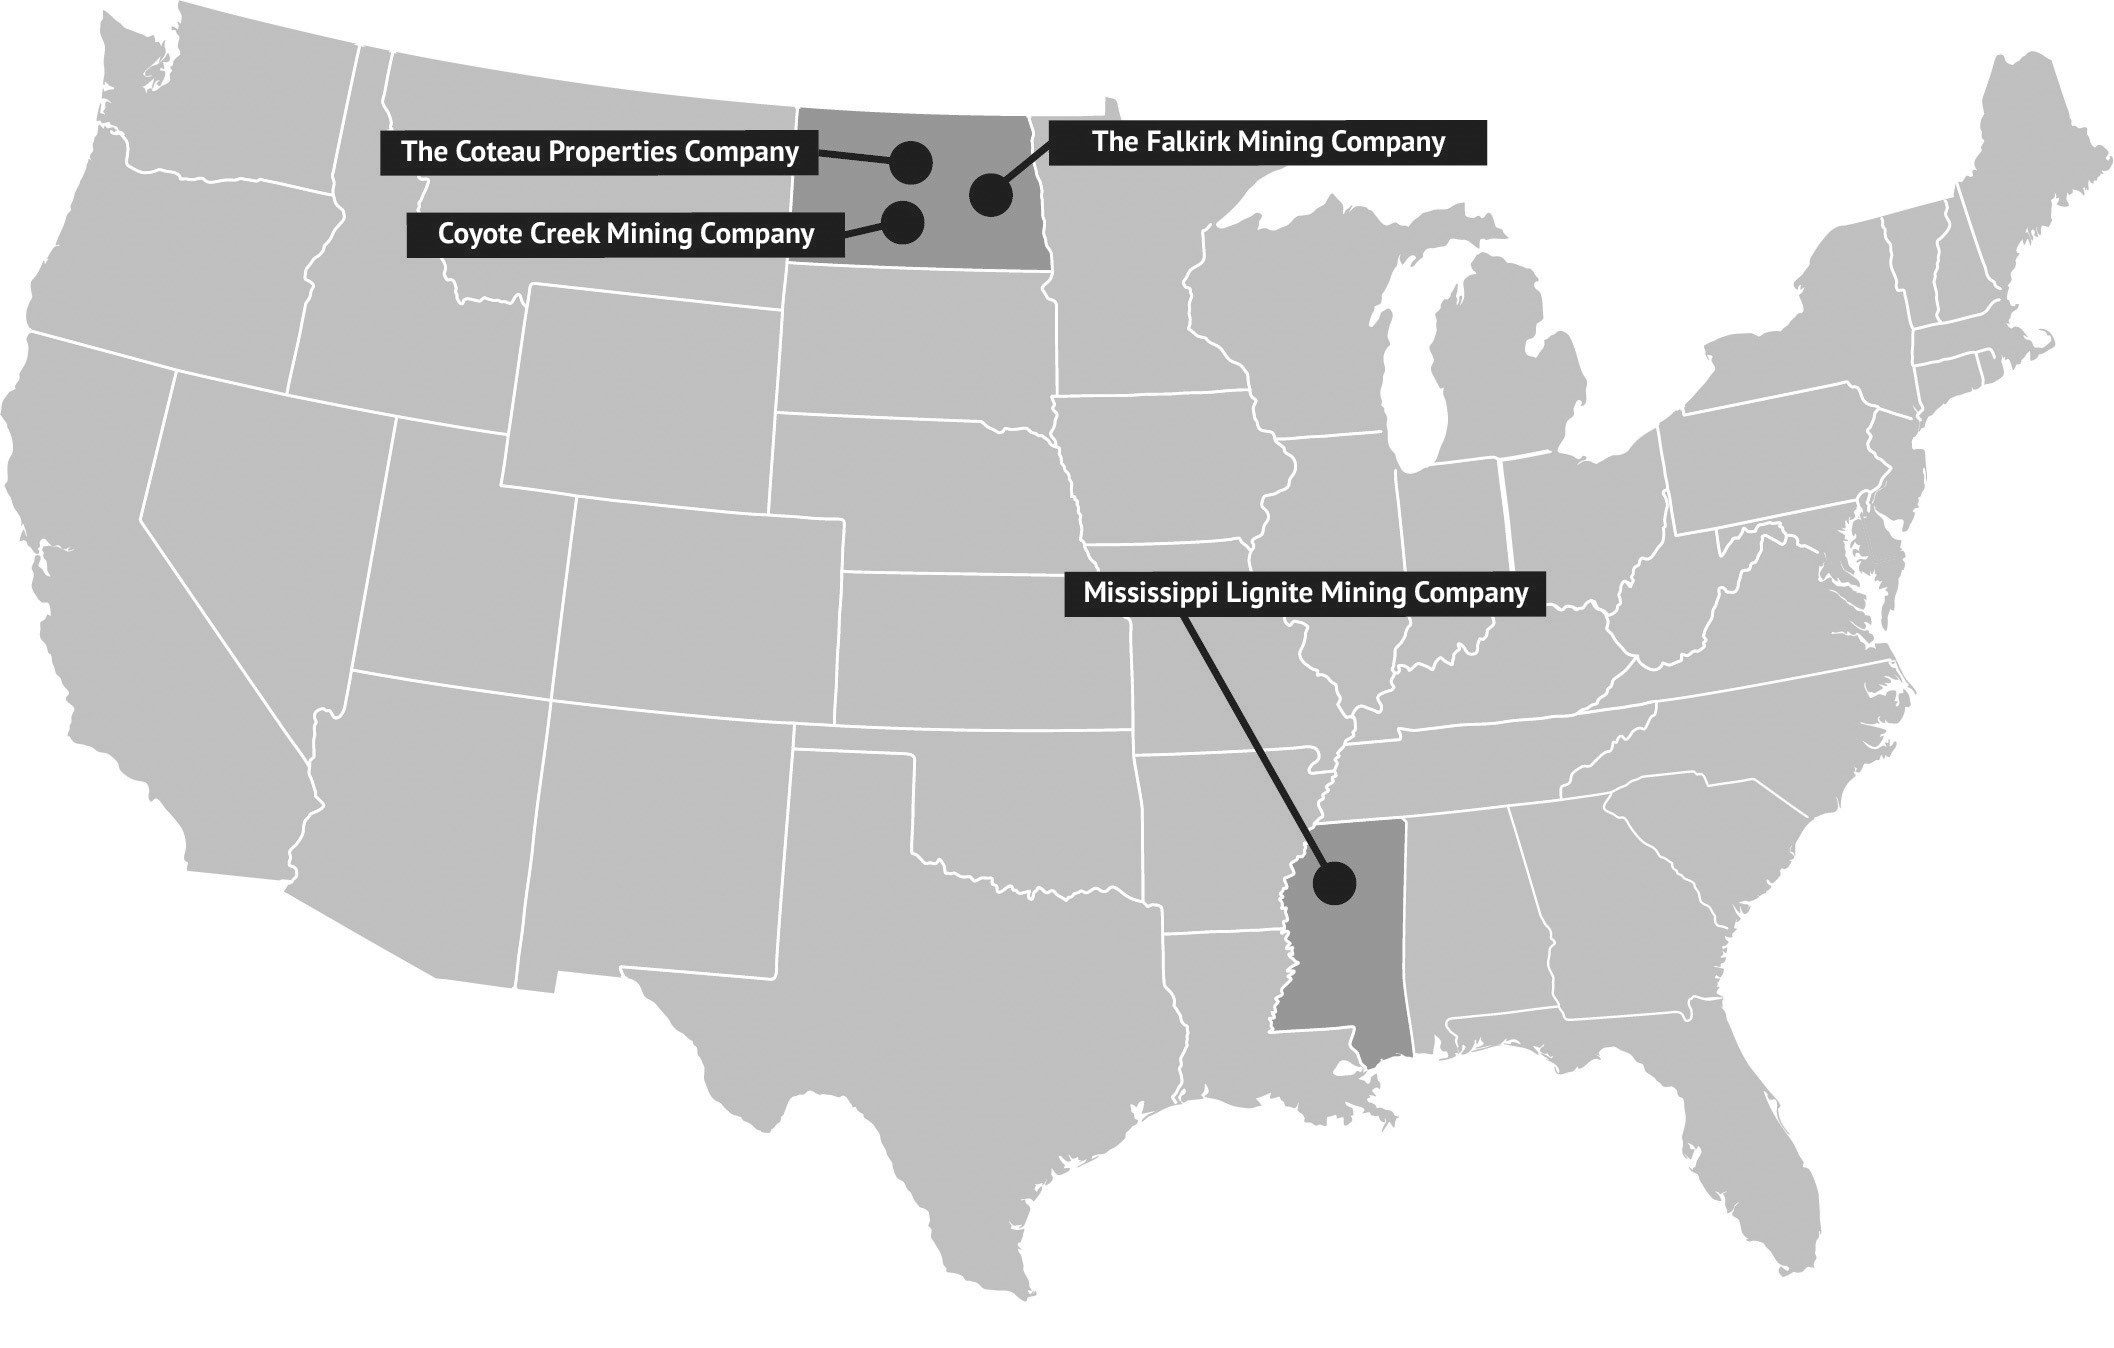
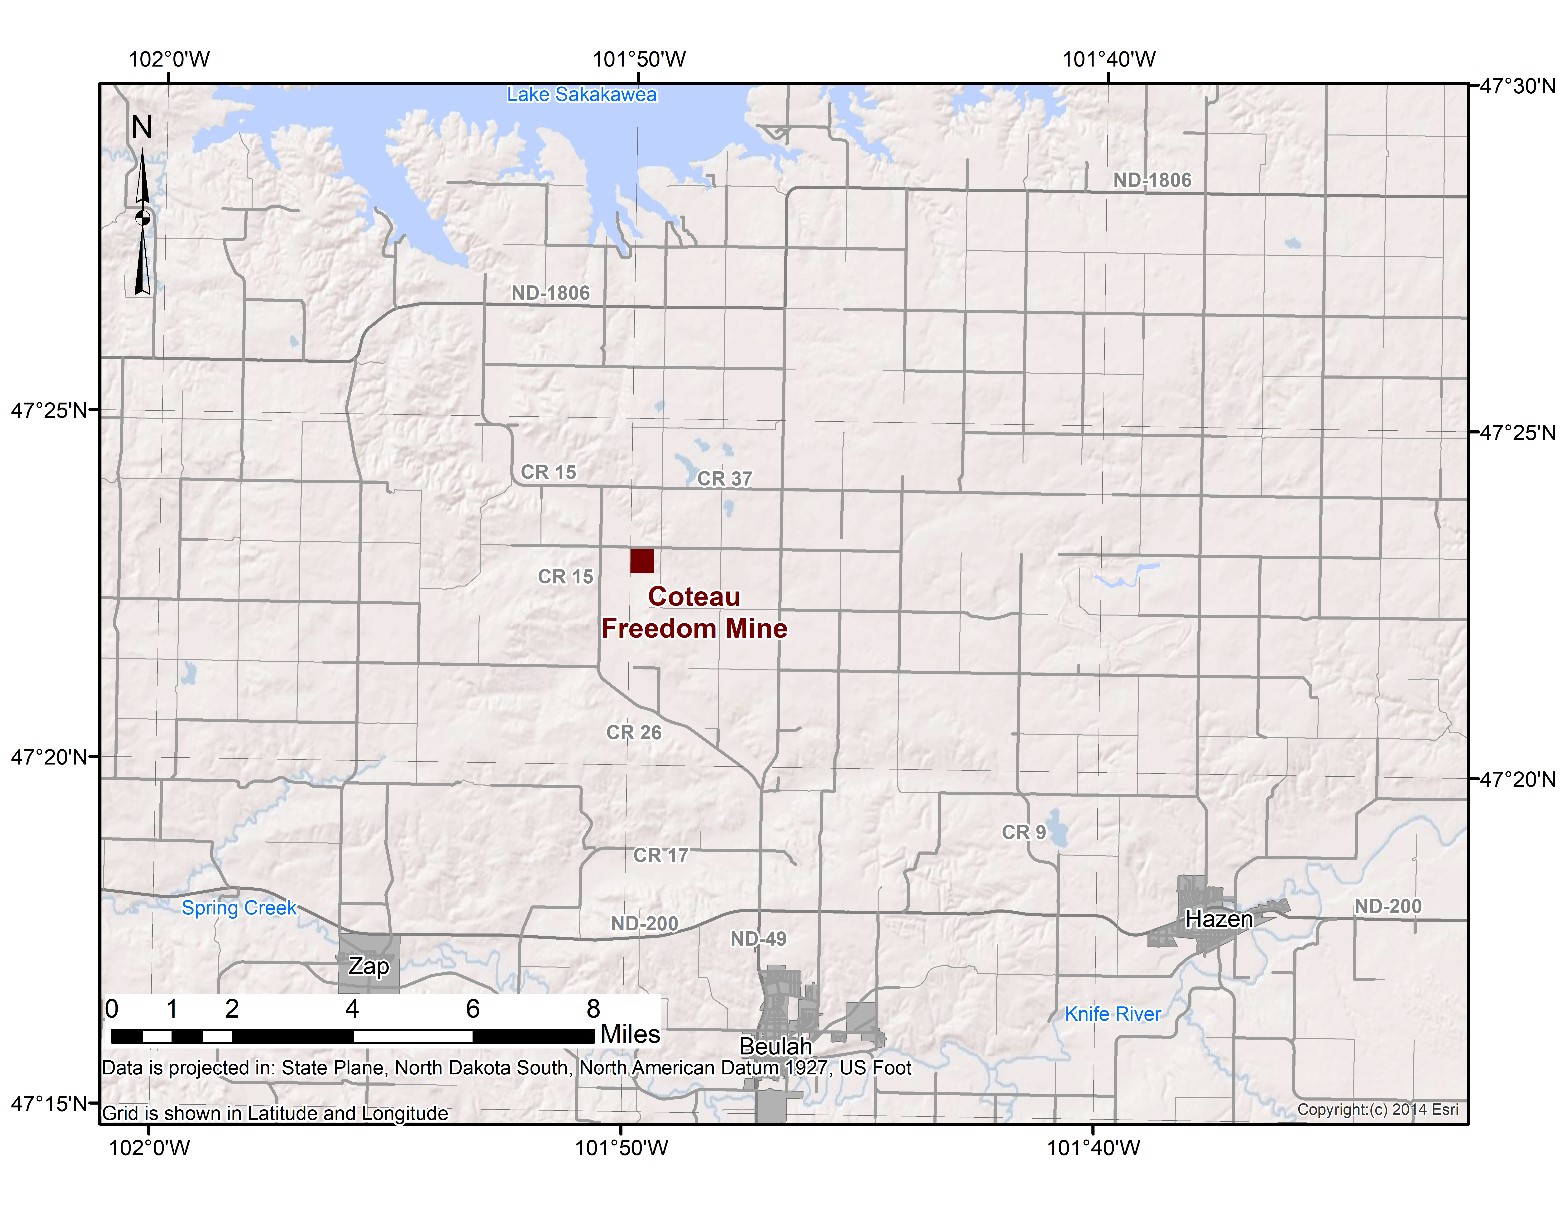
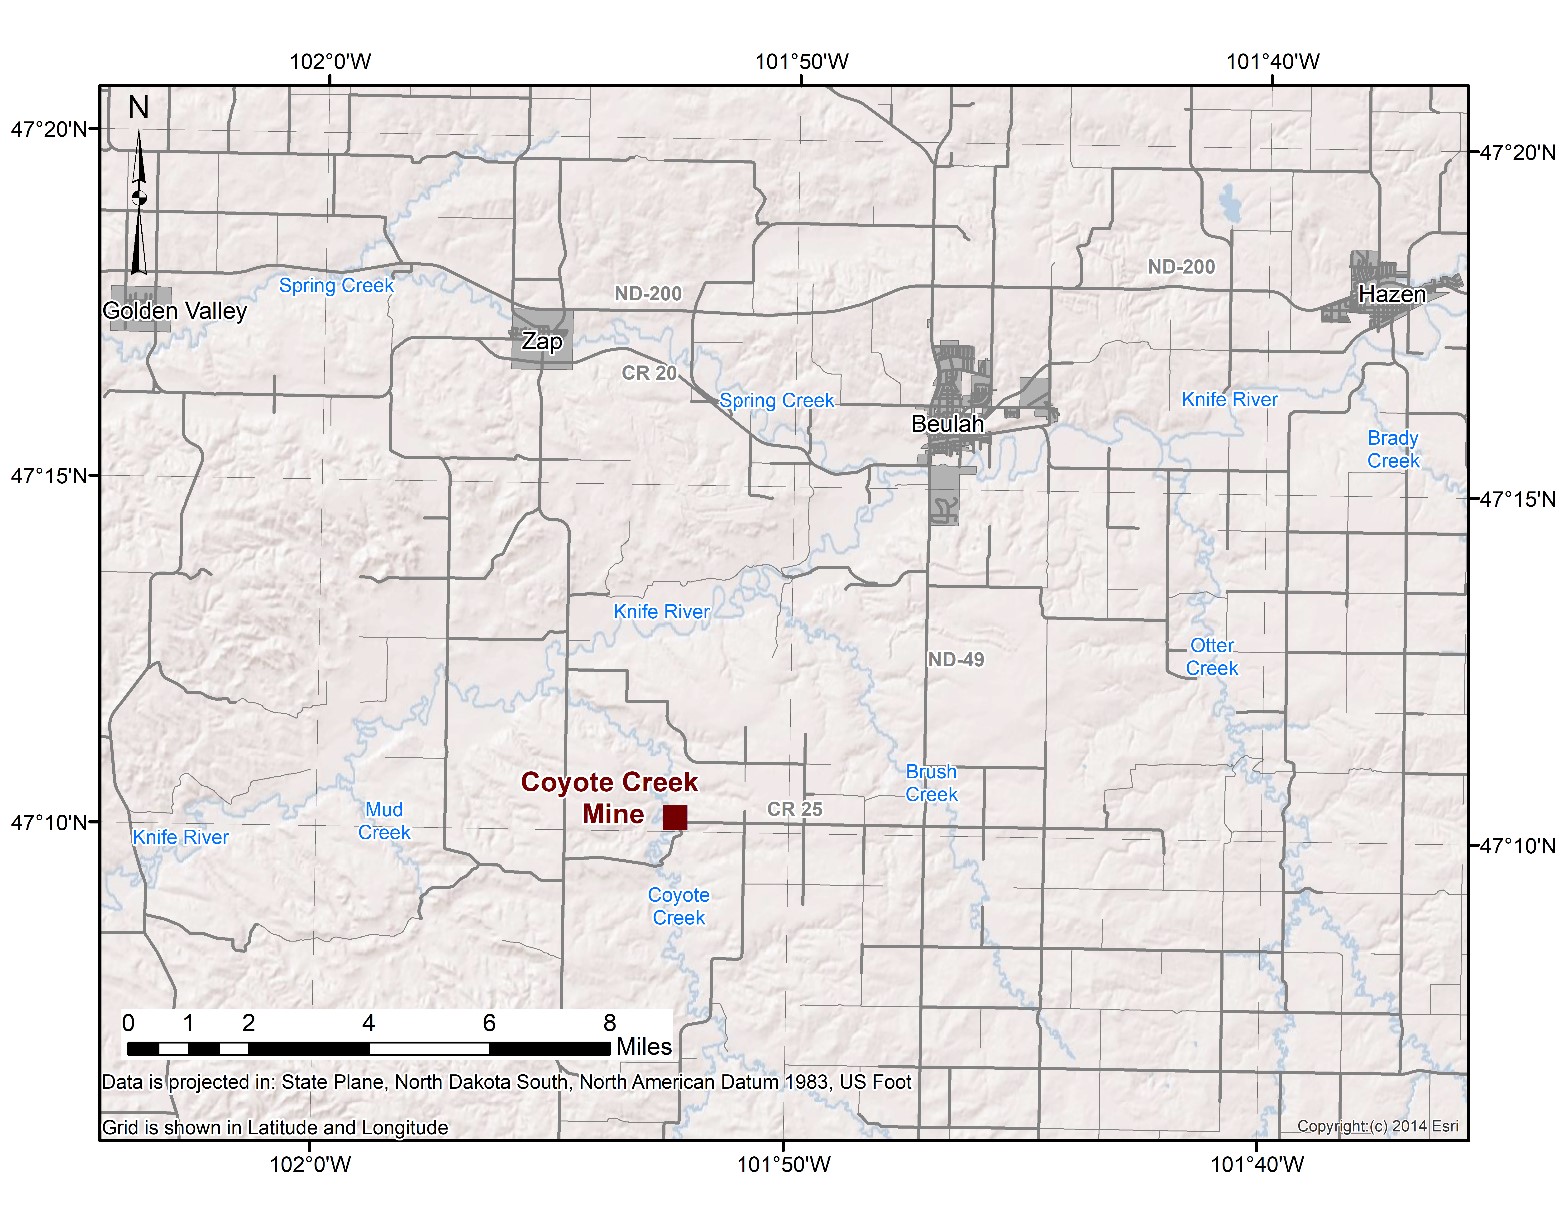
As of December 31, 2023, the Coal Mining segment's operating coal mines were: The Coteau Properties Company (“Coteau”), Coyote Creek Mining Company, LLC (“Coyote Creek”), Falkirk and MLMC. Each of these mines supply lignite coal for power generation and delivers its coal production to an adjacent power plant or synfuels plant under a long-term supply contract. MLMC’s coal supply contract contains a take or pay provision but contains a force majeure provision that allows for the temporary suspension of the take or pay provision during the duration of certain specified events beyond the control of either party; all other coal supply contracts are requirements contracts. Certain coal supply contracts can be terminated early, which would result in a reduction to future earnings.
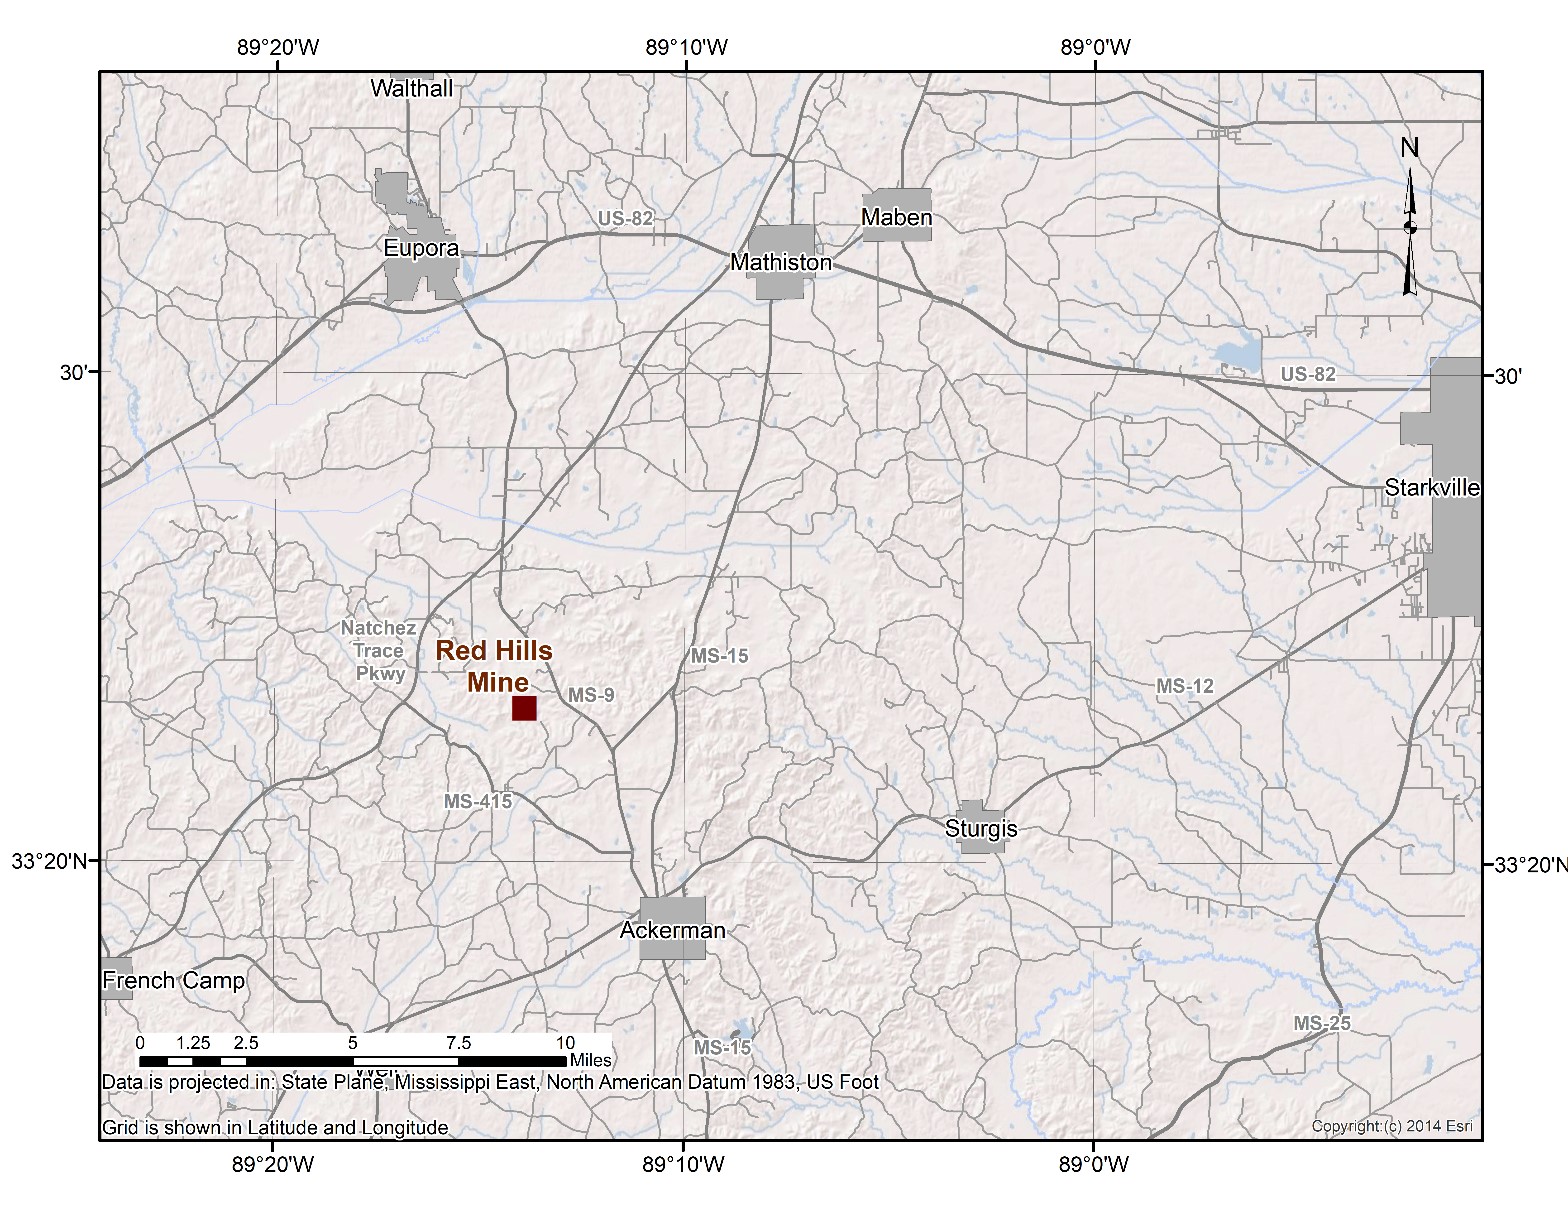
The MLMC contract is the only operating coal contract in which the Company is responsible for all operating costs, capital requirements and final mine reclamation; therefore, MLMC is consolidated within NACCO’s financial statements. MLMC sells coal to its customer's Red Hills Power Plant at a contractually agreed-upon price which adjusts monthly, primarily based on changes in the level of established indices which reflect general U.S. inflation rates. Profitability at MLMC is affected by customer demand for coal and changes in the indices that determine sales price and actual costs incurred. As diesel fuel is heavily weighted among the indices used to determine the coal sales price, fluctuations in diesel fuel prices can result in significant fluctuations in earnings at MLMC. The Red Hills Power Plant supplies electricity to TVA under a long-term power purchase agreement. MLMC’s contract with its customer runs through April 1, 2032. TVA’s power portfolio includes coal, nuclear, hydroelectric, natural gas and renewables. The decision regarding which power plants to dispatch is determined by TVA. Reduction in dispatch of the Red Hills Power Plant will result in reduced earnings at MLMC. During 2023, MLMC completed mining in its original mine area and began mining in a new mine area. The move to the new mine area resulted in increased costs during 2023. MLMC does not anticipate opening additional mine areas through the remaining contract term unless doing so would result in improved economic returns.
On December 18, 2023, MLMC received a force majeure event notice from its customer related to an issue that began on December 15, 2023 and impacted one of two boilers at the Red Hills Power Plant. The notice did not provide a timeline for resolution of the issue. As of March 6, 2024, the impacted boiler is still not operational. The prolonged mechanical issue is expected to result in a reduction in customer demand and will have a significant impact on the Company's results of operations during 2024. The Company determined the anticipated reduction in customer demand caused by this issue was an indicator of potential impairment. The Company reviewed MLMC's long-lived assets for impairment as of December 31, 2023 and determined the carrying amount of its long-lived assets were not recoverable. As a result, the Company recorded a non-cash, long-lived asset impairment charge of $65.9 million in 2023. See Note 9 to the Consolidated Financial Statements in this Form 10-K for further information on the impairment analysis.
At Coteau, Coyote Creek and Falkirk, the Company is paid a management fee per ton of coal or heating unit (MMBtu) delivered. Each contract specifies the indices and mechanics by which fees change over time, generally in line with broad
measures of U.S. inflation. The customers are responsible for funding all mine operating costs, including final mine reclamation, and directly or indirectly providing all of the capital required to build and operate the mine. This contract structure eliminates exposure to spot coal market price fluctuations while providing income and cash flow with minimal capital investment. Other than at Coyote Creek, debt financing provided by or supported by the customers is without recourse to the Company. See Note 16 to the Consolidated Financial Statements in this Form 10-K for further discussion of Coyote Creek's guarantees.
Coteau, Coyote Creek, Falkirk and Sabine each meet the definition of a variable interest entity ("VIE"). In each case, NACCO
is not the primary beneficiary of the VIE as it does not exercise financial control; therefore, NACCO does not consolidate the
results of these operations within its financial statements. Instead, these contracts are accounted for as equity method
investments. The income before income taxes associated with these VIEs is reported as Earnings of unconsolidated operations
on the Consolidated Statements of Operations and the Company’s investment is reported on the line Investments in unconsolidated subsidiaries in the Consolidated Balance Sheets. The mines that meet the definition of a VIE are referred to collectively as the “Unconsolidated Subsidiaries.” For tax purposes, the Unconsolidated Subsidiaries are included within the NACCO consolidated U.S. tax return; therefore, the Income tax provision line on the Consolidated Statements of Operations includes income taxes related to these entities. See Note 16 to the Consolidated Financial Statements in this Form 10-K for further information on the Unconsolidated Subsidiaries.
The Company performs contemporaneous reclamation activities at each mine in the normal course of operations. Under all of the Unconsolidated Subsidiaries’ contracts, the customer has the obligation to fund final mine reclamation activities. Under certain contracts, the Unconsolidated Subsidiary holds the mine permit and is therefore responsible for final mine reclamation activities. To the extent the Unconsolidated Subsidiary performs such final reclamation, it is compensated for providing those services in addition to receiving reimbursement from customers for costs incurred.
See “Item 2. Properties" on page 31 in this Form 10-K for discussion of the Company's mineral resources and mineral reserves.
NAMining Segment
The NAMining segment provides value-added contract mining and other services for producers of industrial minerals. The segment is a platform for the Company’s growth and diversification of mining activities outside of the thermal coal industry. NAMining provides contract mining services for independently owned mines and quarries, creating value for its customers by performing the mining aspects of its customers’ operations. This allows customers to focus on their areas of expertise: materials handling and processing, product sales and distribution. As of December 31, 2023, NAMining operates in Florida, Texas, Arkansas, Virginia and Nebraska. In addition, Sawtooth Mining, LLC ("Sawtooth") provides mining design, consulting and will be the exclusive contract miner for the Thacker Pass lithium project in northern Nevada.
Certain of the entities within the NAMining segment are VIEs and are accounted for under the equity method as Unconsolidated Subsidiaries. See Note 16 to the Consolidated Financial Statements in this Form 10-K for further information on the Unconsolidated Subsidiaries.
Minerals Management Segment
The Minerals Management segment derives income primarily by leasing its royalty and mineral interests to third-party exploration and production companies, and, to a lesser extent, other mining companies, granting them the rights to explore, develop, mine, produce, market and sell gas, oil, and coal in exchange for royalty payments based on the lessees' sales of those minerals.
The Minerals Management segment owns royalty interests, mineral interests, non-participating royalty interests and overriding royalty interests.
•Royalty Interest. Royalty interests generally result when the owner of a mineral interest leases the underlying minerals to an exploration and production company pursuant to an oil and gas lease. Typically, the resulting royalty interest is a cost-free percentage of production revenues for minerals extracted from the acreage. A holder of royalty interests is generally not responsible for capital expenditures or lease operating expenses, but royalty interests may be calculated net of post-production expenses, and typically has no environmental liability. Royalty interests leased to producers expire upon the expiration of the oil and gas lease and revert to the mineral owner.
•Mineral Interest. Mineral interests are perpetual rights of the owner to explore, develop, exploit, mine and/or produce any or all of the minerals lying below the surface of the property. The holder of a mineral interest has the right to lease the minerals to an exploration and production company. Upon the execution of an oil and gas lease, the lessee (the exploration and production company) becomes the working interest owner and the lessor (the mineral interest owner) has a royalty interest.
•Non-Participating Royalty Interest (“NPRIs”). NPRI is an interest in oil and gas production which is created from the mineral estate. The NPRI is expense-free, bearing no operational costs of production. The term “non-participating” indicates that the interest owner does not share in the bonus, rentals from a lease, nor the right to participate in the execution of oil and gas leases. The NPRI owner does; however, typically receive royalty payments.
•Overriding Royalty Interest (“ORRIs”). ORRIs are created by carving out the right to receive royalties from a working interest. Like royalty interests, ORRIs do not confer an obligation to make capital expenditures or pay for lease operating expenses and have limited environmental liability; however, ORRIs may be calculated net of post-production expenses, depending on how the ORRI is structured. ORRIs that are carved out of working interests are linked to the same underlying oil and gas lease that created the working interest, and therefore, such ORRIs are typically subject to expiration upon the expiration or termination of the oil and gas lease.
The Company may own more than one type of mineral and royalty interest in the same tract of land. For example, where the Company owns an ORRI in a lease on the same tract of land in which it owns a mineral interest, the ORRI in that tract will relate to the same gross acres as the mineral interest in that tract.
The Minerals Management segment will benefit from the continued development of its mineral properties without the need for investment of additional capital once mineral and royalty interests have been acquired. The Minerals Management segment does not currently have any material investments under which it would be required to bear the cost of exploration, production or development.
Total consideration for the 2023 and 2022 acquisitions of mineral and royalty interests was $36.7 million and $11.9 million, respectively. The 2023 acquisition includes 43.4 thousand gross acres and 2.5 thousand net royalty acres. The 2022 acquisitions included 13.6 thousand gross acres and 880 net royalty acres. Total mineral and royalty interests include approximately 184.7 thousand gross acres and 63.3 thousand net royalty acres at December 31, 2023. Net royalty acres are calculated based on the Company’s ownership and royalty rate, normalized to a standard 1/8th royalty lease, and assumes a 1/4th royalty rate for unleased acres.
The Company's acquisition criteria for building a blended portfolio of mineral and royalty interests includes (i) new wells anticipated to come online within one to two years of investment, (ii) areas with forecasted future development within five years after acquisition and (iii) existing producing wells further along the decline curve that will generate stable cash flow. In addition, acquisitions should extend the geographic footprint to diversify across multiple basins with a preliminary focus on the more oil-rich Permian basin and a secondary focus on other diversifying basins to increase regional exposure. While the current focus is on the acquisition of mineral and royalty interests, the Company would also consider investments in ORRIs, NPRIs or non-operating working interests under certain circumstances. The current acquisition strategy does not contemplate any near-term working interest investments in which the Company would act as the operator.
The Company also manages legacy royalty and mineral interests located in Ohio (Utica and Marcellus shale natural gas), Louisiana (Haynesville shale and Cotton Valley formation natural gas), Texas (Cotton Valley and Austin Chalk formation natural gas), Mississippi (coal), Pennsylvania (coal, coalbed methane and Marcellus shale natural gas), Alabama (coal, coalbed methane and natural gas) and North Dakota (coal, oil and natural gas). The majority of the Company’s legacy reserves were acquired as part of its historical coal mining operations.
See “Item 2. Properties" on page 31 in this Form 10-K for discussion of the Company's proved reserves.
Customers
The principal customers of the Coal Mining segment are electric utilities and an independent power provider.
The principal customers of the NAMining segment are limestone producers and to a lesser extent, sand and gravel producers. In addition, NAMining will serve as exclusive contract miner for the Thacker Pass lithium project in northern Nevada.
The Minerals Management segment generates income primarily from royalty-based lease payments from oil, gas and to a lesser extent, coal producers. The pricing of oil, gas and coal sales is primarily determined by supply and demand in the marketplace and can fluctuate considerably. As a mineral owner, the Company has limited access to timely information, involvement, and operational control over the volumes of oil, gas and coal produced and sold and the terms and conditions on which such volumes are marketed and sold.
In 2023 and 2022, two customers individually accounted for more than 10% of consolidated revenues. The following represents the revenue attributable to each of these entities as a percentage of consolidated revenues for those years:
|
|
|
|
|
|
|
|
|
|
|
|
|
|
|
|
|
|
|
|
|
Percentage of Consolidated Revenues |
|
Segment |
|
2023 |
|
2022 |
|
|
|
Coal Mining customer |
|
40 |
% |
|
39 |
% |
|
|
|
NAMining customer |
|
22 |
% |
|
17 |
% |
|
|
|
|
|
|
|
|
|
|
The loss of either of these customers could have a material adverse effect on the results of operations attributable to the applicable segment and on the Company's consolidated results of operations.
Competition
Coteau, Coyote Creek, Falkirk and MLMC each have only one customer for which they extract and deliver coal. The Company's coal mines are directly adjacent to the customer’s property, with economical delivery methods that include conveyor belt delivery systems linked to the customer’s facilities or short-haul rail systems. All of the mines in the Coal Mining segment are the most economical suppliers to each of their respective customers as a result of transportation advantages over competitors. In addition, the customers' facilities were specifically designed to use the coal being mined.
The coal industry competes with other sources of energy, particularly oil, gas, hydro-electric power and nuclear power. In addition, it competes with subsidized sources of energy, primarily wind and solar. Among the factors that affect competition are the price and availability of oil and natural gas, environmental and related political considerations, the time and expenditures required to develop new energy sources, the cost of transportation, the cost of compliance with governmental regulations, the impact of federal and state energy policies, the impact of subsidies on pricing of renewable energy and the Company's customers' dispatch decisions, which may also take into account carbon dioxide emissions. The ability of the Coal Mining segment to maintain comparable levels of coal production at existing facilities and develop its reserves will depend upon the interaction of these factors.
Coal-fired electricity generating units are chosen to run primarily based on operating costs, of which fuel costs account for the largest share. Natural gas-fired power plants have the most potential to displace coal-fired electric baseload power generation in the near term. Federal and state mandates for increased use of electricity derived from renewable energy sources could also negatively affect demand for coal. Such mandates, combined with other incentives to use renewable energy sources, such as tax credits, make alternative fuel sources more competitive with coal. Fluctuations in natural gas prices and the availability of renewable energy sources, particularly wind, can contribute to changes in power plant dispatch and customer demand for coal. Over the longer term, the Company continues to believe that customer demand will remain pressured by regulations mandating or incentivizing the purchase of power from subsidized renewable energy sources, particularly wind and solar. See “Item 1. Business — Government Regulation" on page 8 in this Form 10-K for further discussion. Environmental, social and governance considerations can also have an impact on power plant dispatch and demand for coal.
Based on industry information, the Company believes it was one of the ten largest coal producers in the U.S. in 2023 based on total coal tons produced.
NAMining faces competition from producers of aggregates, lithium or other minerals that choose to self-perform mining operations and from other mining companies.
In the Minerals Management segment, the oil and gas industry is intensely competitive; the Company primarily competes with companies and investors for the acquisition of oil and gas properties, some of which have greater resources and may be able to pay more for productive oil and natural gas properties or to define, evaluate, bid for and purchase a greater number of properties than the Company’s financial resources permit. Additionally, many of the Minerals Management segment's competitors are, or are affiliated with, operators that engage in the exploration and production of their oil and gas properties, which allows them to acquire larger assets that include operated properties. Larger or more integrated competitors may be able to absorb the burden of existing, and any changes to, federal, state and local laws and regulations more easily than the Company can, which would adversely affect its competitive position. The integrated competitors may also have a better understanding of when minerals they acquire will be developed, as they are often the developer. The Minerals Management segment’s ability to acquire additional properties in the future will be dependent upon its ability to evaluate and select suitable properties and to consummate transactions in a highly competitive environment. Further, oil and natural gas compete with other forms of energy available to customers, primarily based on price.
Changes in the availability or price of oil and natural gas or other forms of energy, as well as business conditions, conservation, legislation, regulations, and the ability to convert to alternate fuels and other forms of energy may affect the demand for oil and natural gas.
Seasonality
The Company has experienced limited variability in its results due to the effect of seasonality; however, variations in coal demand can occur as a result of the timing and duration of planned or unplanned outages at customers' facilities. Variations in coal demand can also occur as a result of changes in market prices of competing fuels such as natural gas, wind and solar power and demand for electricity, which can fluctuate based on changes in weather patterns.
The NAMining segment extracts a significant amount of the annual limestone produced in Florida. The Florida construction industry can be affected by the cyclicality of the economy, seasonal weather conditions and pandemics, all of which can result in variations in demand for aggregates.
In the Minerals Management segment, oil and natural gas wells have high initial production rates and follow a natural decline before settling into relatively stable, long-term production. Decline rates can vary due to factors like well depth, well length, geology, formation pressure, and facility design. In addition to the natural production decline curve, royalty income can fluctuate favorably or unfavorably in response to a number of factors outside of the Company's control, including the number of wells being operated by third parties, fluctuations in commodity prices (primarily oil and natural gas), fluctuations in production rates associated with operator decisions, regulatory risks, the Company's lessees' willingness and ability to incur well-development and other operating costs, and changes in the availability and continuing development of infrastructure.
Weather conditions affect the demand for, and prices of, natural gas and can also delay drilling activities. Demand for natural gas is typically higher during the winter, resulting in higher natural gas prices during the first and fourth quarters. Certain natural gas users utilize natural gas storage facilities and purchase some of their anticipated winter requirements during the summer, which can lessen seasonal demand fluctuations. Seasonal weather conditions can limit drilling and producing activities and other oil and natural gas operations. Due to these seasonal fluctuations, Minerals Management results of operations for individual quarterly periods may not be indicative of the results that may be realize on an annual basis.
Human Capital
As of December 31, 2023, the Company and its subsidiaries had approximately 1,700 employees, including approximately 1,100 employees at the Company’s unconsolidated mining operations, none of which are represented by a collective bargaining agreement. NACCO believes it has good relations with its employees.
Market-Based Compensation: NACCO believes its employees are critical to its success and invests in its employees by offering a market-based competitive total rewards package that includes a combination of salaries and wages and a benefits package that promotes employee well-being across all aspects of their lives. The Company offers a 100% 401(k) matching contribution up to 5% of compensation and a generous profit-sharing contribution for all of our full-time and part-time employees. The Company provides employee wages that are competitive and consistent with employee positions, skill levels, experience, knowledge and geographic location. Benefits offered to employees include:
•Medical, dental and vision benefits for employees, spouses and dependents;
•Flexible spending accounts for both healthcare and dependent care;
•Health savings accounts and health reimbursement accounts, both of which receive company contributions;
•Paid vacation and holidays;
•Parental leave;
•Short-term and long-term disability benefits;
•Wellness incentives for employees;
•Life and AD&D insurance benefits;
•Charitable donation matches; and
•Employee assistance program.
Employee Development: The Company recognizes that its culture and success is strengthened when employees are respected, motivated and engaged. The Company works to match employees with assignments that capitalize on the skills, talents and potential of each employee, and provides opportunities for professional growth. The Company believes in hiring, engaging, developing and promoting people who are fully able to meet the demands of each position, regardless of race, color, religion, gender, sexual orientation, gender identity, national origin, age, veteran status or disability.
Safety: Employee safety in the workplace is one of the Company’s core values. The Company is committed to strict compliance with applicable laws and regulations regarding workplace safety and provides on-going safety training, education and communication. The National Mining Association ranks NACCO as an industry leader in safety, and the Company's incident rate is consistently below the national average for comparable mines, based on Mine Safety and Health Administration data. The Company has earned more than 100 safety awards at the state and national levels. NACCO strives to have zero safety incidents or injuries. The Company's operations have onsite safety personnel who train employees in safe work practices, review safety-related incidents and recommend improvements when appropriate. Hazards in the workplace are actively identified and management tracks incidents so remedial actions can be taken to improve workplace safety. The Company believes communication related to “near misses,” safety incidents and protocols is essential to continuously developing and maintaining best-practices related to safety and enables identification and correction of operational practices that might impair employee safety or health.
Company Ethics: The Company has processes in place for compliance with its Code of Corporate Conduct, Insider Trading Policy and Anti-Corruption Policy. All of the Company's Directors and employees annually complete certifications with respect to compliance with the Company's Code of Corporate Conduct. In addition, all employees of the Company are required to complete annual Code of Corporate Conduct training. The Code of Corporate Conduct, Insider Trading Policy and Anti-Corruption Policy require employees to comply with applicable laws and regulations, maintain high ethical standards and report situations of actual or potential noncompliance. The Company also maintains an ethics related hotline, managed by a third party, through which individuals can anonymously raise concerns or ask questions about business behavior.
Community Engagement: The Company supports its local communities and is committed to helping them remain safe, healthy and resilient. The Company's past activities include corporate donations, volunteerism and education. Community engagement is encouraged and supported through the Company's matching gift program. The Company will match employee contributions up to $5,000 per employee if program criteria are met.
Please visit nacco.com/stewardship/ for the full text of certain NACCO stewardship policies.
Available Information
The Company makes its annual reports on Form 10-K, quarterly reports on Form 10-Q, current reports on Form 8-K, and any amendments to those reports available through its website, www.nacco.com, as soon as reasonably practicable after such material is electronically filed with, or furnished to, the Securities and Exchange Commission (“SEC”). The content of the Company's website is not incorporated by reference into this Form 10-K or in any other report or document filed with the SEC, and any reference to the Company's website is intended to be an inactive textual reference only. The SEC maintains an internet site at http://www.sec.gov that contains reports, proxy and information statements, and other information regarding the Company and other issuers that file electronically with the SEC.
Under Rule 12b-2 of the Exchange Act, the Company qualifies as a “smaller reporting company” because its public float as of the last business day of the Company’s most recently completed second quarter was less than $250 million. For as long as the Company remains a “smaller reporting company,” it may take advantage of certain exemptions from the SEC’s reporting requirements that are otherwise applicable to public companies that are not smaller reporting companies.
Government Regulation
The Company's operations are subject to various federal, state and local laws and regulations on matters such as employee health and safety, and certain environmental laws and regulations relating to, among other matters, the reclamation and restoration of coal mining properties, air pollution, water pollution, the disposal of wastes and effects on groundwater. In addition, the electric power generation industry is subject to extensive regulation regarding the environmental impact of its power generation activities that could affect demand for coal from the Company's Coal Mining segment.
Numerous governmental permits and approvals are required for coal mining operations. The Company's subsidiaries hold or will hold the necessary permits at all of its lignite coal mining operations. At the coal mining operations where the Company's subsidiaries hold the permits, the Company is required to prepare and present to federal, state or local governmental authorities data pertaining to the effect or impact that any proposed exploration for or production of coal may have upon the environment and public and employee health and safety.
Some laws, as discussed below, place many requirements on the Company's operations and its customers' operations. Federal and state regulations require regular monitoring of the Company's operations to ensure compliance.
Many aspects of the production, pricing and marketing of oil and natural gas are regulated by federal and state agencies. Legislation affecting the oil and natural gas industry is under constant review for amendment or expansion, which frequently increases the regulatory burden on affected members of the industry and could affect the results of the Company’s Minerals Management segment.
Mine Health and Safety Laws
The Federal Mine Safety and Health Act of 1977 imposes safety and health standards on all mining operations. Regulations are comprehensive and affect numerous aspects of mining operations, including training of mine personnel, mining procedures, blasting, the equipment used in mining operations and other matters. The Federal Mine Safety and Health Administration enforces compliance with these federal laws and regulations.
Environmental Laws
The Company's coal mining operations are subject to various federal environmental laws, as amended, including:
•the Surface Mining Control and Reclamation Act of 1977 (“SMCRA”);
•the Clean Air Act, including amendments to that act in 1990 (“CAA”);
•the Clean Water Act of 1972 (“CWA”);
•the Resource Conservation and Recovery Act ("RCRA");
•the National Environmental Policy Act of 1970 (“NEPA”); and
•the Comprehensive Environmental Response, Compensation and Liability Act ("CERCLA").
In addition to these federal environmental laws, various states have enacted environmental laws that provide for higher levels of environmental compliance than similar federal laws. These state environmental laws require reporting, permitting and/or approval of many aspects of coal mining operations. Both federal and state inspectors regularly visit mines to enforce compliance. The Company has ongoing training, compliance and permitting programs to ensure compliance with such environmental laws. Changes in environmental laws and regulations occur frequently, and any changes that result in more stringent and costly pollution control or waste handling, storage, transport, disposal or cleanup requirements could materially adversely affect the Coal Mining segment.
Surface Mining Control and Reclamation Act
SMCRA establishes mining, environmental protection and reclamation standards for all aspects of surface coal mining operations. Where state regulatory agencies have adopted federal mining programs under SMCRA, the state becomes the primary regulatory authority.
Coal mine operators must obtain SMCRA permits and permit renewals for coal mining operations from the applicable regulatory agency. These SMCRA permit provisions include requirements for coal prospecting, mine plan development, topsoil removal, storage and replacement, selective handling of overburden materials, mine pit backfilling and grading, protection of the hydrologic balance, surface drainage control, mine drainage and mine discharge control and treatment, and revegetation. Although mining permits have stated expiration dates, SMCRA provides for a right of successive renewal. The cost of obtaining surface mining permits can vary widely depending on the quantity and type of information that must be provided to obtain the permits.
The Abandoned Mine Land Fund, which is provided for by SMCRA, imposes a fee on certain coal mining operations. The proceeds are intended to be used principally to reclaim mine lands closed prior to 1977. In addition, the Abandoned Mine Land Fund also makes transfers annually to the United Mine Workers of America Combined Benefit Fund (the “Fund”), which provides health care benefits to retired coal miners who are beneficiaries of the Fund. The 2021 Infrastructure Investment and Jobs Act reauthorized the Abandoned Mine Land fee at a reduced rate. The fee for lignite coal was reduced from $0.08 per ton to $0.064 per ton and for other surface-mined coal from $0.28 per ton to $0.224 per ton. These fees have been reauthorized until the end of fiscal year 2035.
SMCRA establishes operational, reclamation and closure standards for surface coal mines. The Company accrues for the costs of current mine disturbance and final mine closure, including the cost of treating mine water discharges, at mines where the Company's subsidiaries hold the mining permit. While these obligations are largely unfunded, they can require securitization through bonding, with the exception of the final mine closure costs for the Coyote Creek Mine, which are being funded throughout the production stage.
SMCRA stipulates compliance with many other major environmental programs, including the CAA and CWA. The U.S. Army Corps of Engineers regulates activities affecting navigable waters, and the U.S. Bureau of Alcohol, Tobacco and Firearms regulates the use of explosives for blasting. In addition, the U.S. Environmental Protection Agency (the “EPA”), the U.S. Army Corps of Engineers and the Office of Surface Mining Reclamation and Enforcement ("OSMRE") have engaged in a series of rulemakings and other administrative actions under the CWA and other statutes that are directed at reducing the impact of coal mining operations on water bodies.
The Company does not believe there is any significant risk to the Company's subsidiaries' ability to maintain its existing mining permits or its ability to acquire future mining permits for its mines.
Greenhouse Gas (“GHG”) Emissions
In July 2019, the EPA finalized a rule that repealed the Clean Power Plan ("CPP") that had been finalized in 2015 and established new regulations addressing GHG emissions from existing coal-fueled electric generation units, referred to as the Affordable Clean Energy (“ACE”) rule. The ACE rule developed emission guidelines that states must use when developing plans to regulate GHG emissions from existing coal-fueled electric generating units (“EGUs”). In response to challenges brought by environmental groups and certain states, the U.S. Court of Appeals for the District of Columbia Circuit (the “D.C. Circuit Court”) vacated the ACE rule, including its repeal of the CPP, in January 2021 and remanded the rule to the EPA for further action. On June 30, 2022, the Supreme Court of the United States (“SCOTUS”) issued an opinion reversing the D.C. Circuit Court's decision, and finding that the EPA exceeded its statutory authority when it adopted the CPP.
On May 11, 2023, the EPA published a draft rule imposing limits on GHG emissions from existing coal and new natural-gas electric generating units, which could compel such facilities to install additional pollution controls or shut down ("CPP2"). The proposed CPP2 includes guidelines for carbon dioxide ("CO2") emissions from existing EGUs with a proposed compliance
date of January 1, 2030. For coal-fired steam EGUs that plan to operate past January 1, 2040, the EPA is proposing a best
system of emissions reduction ("BSER") of carbon capture and sequestration/storage ("CCS") with 90 percent capture of CO2
at the stack. For coal-fired steam EGUs that will permanently cease operations after December 31, 2031, but before January 1,
2040, the EPA is proposing a BSER of 40 percent natural gas co-firing on a heat input basis. Coal-fired steam EGUs that will permanently cease operations between December 31, 2031 and January 1, 2035, will be subject to an annual capacity factor
limit, and for units that will permanently cease operations before January 1, 2032, the EPA is proposing a BSER of routine
methods of operation and maintenance that maintain current emission rates. Each of the EGUs supplied by the Company would
be subject to these proposed requirements.
Additionally, the proposed CPP2 contains other actions, including revised new source performance standards for GHG
emissions from new and reconstructed fossil fuel-fired steam EGUs that undertake a large modification. These new rules may
raise the cost of fossil fuel generated energy, making coal-fired power plants less competitive, and/or result in early closure
which could have an adverse impact on demand for coal and ultimately result in the early closure of the mines servicing these
plants, including closure of the Company's coal mines. Any such closure of the Company's mines could have a material adverse
effect on the Company’s business, financial condition and results of operations.
Clean Air Act
The process of burning coal can cause many compounds and impurities in the coal to be released into the air, including sulfur dioxide, nitrogen oxides ("NOx"), mercury, particulates and other matter. The CAA and the corresponding state laws that extensively regulate the emissions of materials into the air affect coal mining operations both directly and indirectly. Direct impacts on coal mining operations occur through CAA permitting requirements and/or emission control requirements relating to air contaminants, especially particulate matter. Indirect impacts on coal mining operations occur through regulation of the air emissions of sulfur dioxide, nitrogen oxides, mercury, particulate matter and other compounds emitted by coal-fired power plants. The EPA has promulgated or proposed regulations that impose tighter emission restrictions in a number of areas, some of which are currently subject to litigation. The general effect of tighter restrictions is to reduce demand for coal. Ongoing reduction in coal’s share of the capacity for power generation could have a material adverse effect on the Company’s business, financial condition and results of operations.
The CAA requires the EPA to review national ambient air quality standards (“NAAQS”) every five years to determine whether revisions to current standards are appropriate. In addition, states are required to submit to the EPA revisions to their state implementation plans ("SIPs") that demonstrate the manner in which the states will attain NAAQS every time a NAAQS is issued or revised by the EPA. The EPA has adopted NAAQS for several pollutants, which continue to be reviewed periodically for revisions. When the EPA adopts new, more stringent NAAQS for a pollutant, some states have to change their existing SIPs. If a state fails to revise its SIP and obtain EPA approval, the EPA may adopt regulations to affect the revision. Coal mining operations and coal-fired power plants that emit particulate matter or other specified material are, therefore, affected by changes in the SIPs. Through this process over the last few years, the EPA has reduced the NAAQS for particulate matter, ozone and nitrogen oxides. The Company's coal mining operations and power generation customers may be directly affected when the revisions to the SIPs are made and incorporate new NAAQS for sulfur dioxide, nitrogen oxides, ozone and particulate matter. In March 2019, the EPA published a final rule that retains the current primary (health-based) NAAQS for sulfur oxides ("SOx") without revision. The current primary standard is set at a level of 75 parts per billion, as the 99th percentile of daily maximum 1-hour sulfur dioxide concentrations, averaged over 3 years. On January 6, 2023, the EPA proposed to lower the level of the particulate matter. If enacted as proposed, this rule would require fossil fuel generating units to install additional emission reducing technologies, which will ultimately increase the cost of fossil fuel generated energy or cause potential EGU retirements.
In 2011, the EPA finalized the Cross-State Air Pollution Rule ("CSAPR") to address interstate transport of pollutants. While the CSAPR affects states in the eastern half of the U.S. and Texas, it does not affect EGUs in North Dakota. This rule imposes
additional emission restrictions on coal-fired power plants to attain ozone and fine particulate NAAQS. The EPA began
implementation of the rule in 2015, when Phase I emission reductions in sulfur dioxide and nitrogen dioxide became effective.
In 2019, certain states submitted SIPs to the EPA in response to the 2015 ozone standard reduction. On February 13, 2023, the EPA rejected the SIPs. The EPA’s action to deny the SIPs was challenged in various courts, including the 5th Circuit Court of Appeals (the “Fifth Circuit”). The Fifth Circuit issued a stay of the SIP rejection in Texas, Louisiana, and Mississippi which prevents the federal implementation plan ("FIP") from going into effect pending the outcome of the litigation challenges.
On June 5, 2023, the EPA published the FIP in the Federal Register. The FIP decreases, over time, the ozone-season NOx allowances allocated to generators in the states not affected by the judicial stay beginning in 2024 by assuming that participants in this cap-and-trade program had or would optimize existing NOx controls and later install additional NOx controls.
On July 31, 2023, the EPA promulgated an interim rule (“Interim FIP”) that addresses the various judicial orders where the SIP rejection has been stayed. The Interim FIP requires these states to return to the previously approved NOx trading program and emission caps. The Interim FIP maintains the state emissions budgets, unit level allowance allocation provisions, and banked allowance holdings reflecting the status quo for the power plants in these states under the Group 2 trading program.
In December 2023, the SCOTUS agreed to hear a challenge to the FIP. The case was heard in February 2024 and will be decided later in the year. Should the FIP be fully implemented in states where a stay has been issued, the rule could influence the closure of some coal-fired EGUs that have not installed selective catalytic reduction technologies, potentially including the EGU supplied by MLMC. The Company cannot predict the outcome of the legal challenges to the: (i) various state challenges; (ii) the FIP promulgated on June 5, 2023; and (iii) the interim final rule promulgated on July 31, 2023 that seeks to address the judicial orders. If the original FIP withstands legal challenge, it would increase the cost of operating the customer facility serviced by MLMC.
Under the CAA, the EPA also adopts national emission standards for hazardous air pollutants. In December 2011, the EPA
adopted a final rule called the Mercury and Air Toxics Standard (“MATS”), which applies to new and existing coal-fired
EGUs. This rule requires mercury emission reductions in mercury-containing particulate matter.
On March 6, 2023, the EPA concluded that it is appropriate and necessary to regulate mercury-containing particulate matter. In April 2023, the EPA drafted proposed revisions to MATS. These revisions would remove the mercury emission limit for lignite-fired EGUs and require particulate emission reductions for all coal-fired EGUs. If enacted as proposed, this rule could influence the closure of additional coal-fired EGUs, potentially including all of the EGUs supplied by the Company.
The EPA promulgated a regional haze program designed to protect and to improve visibility at and around Class I Areas, which are generally National Parks, National Wilderness Areas and International Parks. This program may restrict the construction of new coal-fired power plants, the operation of which may impair visibility at and around the Class I Areas. Additionally, the program requires certain existing coal-fired power plants to install additional control measures designed to limit haze-causing emissions, such as sulfur dioxide, nitrogen oxide and particulate matter. States were required to submit Regional Haze SIPs to the EPA in 2007; however, many states did not meet that deadline. In 2016, the EPA finalized revisions to the Regional Haze Rule which addresses requirements for the second planning period.
State implementation of the EPA’s Regional Haze Rule could require Coyote Creek’s customers to incur significant new costs at the Coyote Station power plant, which could result in the premature closure of the power plant and the Coyote Creek mine. The North Dakota Department of Environmental Quality (“NDDEQ”) finalized its state implementation plan and submitted it to the EPA for approval in August 2022. The NDDEQ determined that visibility progress was being made and did not require significant emissions controls at Coyote Station power plant. Notwithstanding NDDEQ’s determination, the EPA may require additional costly emission controls and it may not be economically feasible for Coyote Creek's customers to invest in such equipment, which could result in early retirement of Coyote Station and the Coyote Creek mine.
Under the CAA, new and modified sources of air pollution must meet certain new source standards (the “NSR program”). Under the NSR program, before constructing a new stationary emission source or a modification of an existing major source, the source owner or operator must determine whether the new source will emit or the modification will increase air emissions above certain thresholds. Both emissions increases and decreases from a major modification at an existing source are to be considered during Step 1 of the two-step NSR applicability test which is designed to determine if there is a “significant emission increase”.
Uncertainty around the NSR program rules could adversely impact demand for coal. Any additional new controls may have an adverse impact on the demand for coal, which may have a material adverse effect on the Company’s business, financial condition or results of operations.
The Company's power generation customers must incur substantial costs to control emissions to meet all of the CAA
requirements, including the requirements under MATS and the EPA's regional haze program. These costs raise the price of
coal-generated electricity, making coal-fired power less competitive with other sources of electricity, thereby reducing demand
for coal. If the Company's customers cannot offset the cost to control certain regulated pollutant emissions by lowering costs or
if the Company's customers elect to close coal-fired units, the Company’s business, financial condition and results of operations
could be materially adversely affected.
Global climate change continues to attract considerable attention in the United States. The U.S. Congress has considered climate change legislation aimed at reducing GHG emissions, particularly from coal combustion by power plants. Enactment of laws and passage of regulations regarding GHG emissions by the U.S. or States, or other actions to limit carbon dioxide emissions, such as opposition by environmental groups to expansion or modification of coal-fired power plants, could result in electric generators switching from coal to other fuel sources.
The U.S. Congress continues to consider a variety of proposals to reduce GHG emissions from the combustion of coal and other fuels. These proposals include emission taxes, emission reductions, including carbon tax and “cap-and-trade” programs, and mandates or incentives to generate electricity by using renewable energy sources, such as wind or solar power. Some states have established programs to reduce GHG emissions. Further, governmental agencies have been providing grants or other financial incentives to entities developing or selling alternative energy sources with lower levels of GHG emissions, which may lead to more competition from those entities.
The U.S. has not implemented the 1992 Framework Convention on Global Climate Change (“Kyoto Protocol”), which became effective for many countries on February 16, 2005. The Kyoto Protocol was intended to limit or reduce emissions of GHGs. The U.S. has not ratified the emission targets of the Kyoto Protocol or any other GHG agreement. Though the U.S. has not accepted these international GHG limiting treaties, numerous lawsuits and regulatory actions have been undertaken by states and environmental groups to try to force controls on the emission of carbon dioxide; or to prevent the construction of new coal-fired power plants.
As a successor to the Kyoto Protocol, in 2015, international negotiators finalized the Paris Agreement under the United Nations Framework Convention on Climate Change (“Paris Agreement”). Unlike the Kyoto Protocol, the Paris Agreement has no binding GHG reduction mandates on signatories. Participating countries only submit a description of their intended GHG reductions, and provide periodic progress updates, with no penalties for not meeting their self-imposed targets. The Paris Agreement also includes language stating that developed countries will provide financial assistance to help developing countries meet their GHG targets and adapt to climate change, but there are no mandated contributions. The United States is a party to the Paris Agreement. The renegotiation and implementation of the Paris Agreement, or other international agreements, the regulations promulgated to date by the EPA with respect to GHG emissions or the adoption of new legislation or regulations to control GHG emissions, could have a material adverse effect on the Company’s business, financial condition and results of operations.
Significant public opposition has also been raised with respect to the proposed construction of certain new coal-fired EGUs due to the potential for increased air emissions. Such opposition, as well as any corporate or investor policies against coal-fired EGUs or requiring disclosures related to global climate change, could also reduce the demand for the Company's coal or marketability of NACCO stock. Further, policies limiting available financing for the development of new coal-fueled EGUs or coal mines or the retrofitting of existing EGUs could adversely impact the global demand for coal in the future. The potential impact on the Company of future laws, regulations or other policies or circumstances will depend upon the degree to which any such laws, regulations or other policies or circumstances force electricity generators to diminish their reliance on coal as a fuel source. In view of the significant uncertainty surrounding each of these factors, it is not possible for the Company to predict reasonably the impact that any such laws, regulations or other policies may have on the Company's business, financial condition and results of operations. However, such impacts could have a material adverse effect on the Company's business, financial condition and results of operations.
The Company believes it has obtained all necessary permits under the CAA at all of its coal mining operations where it is responsible for permitting and is in compliance with such permits.
Clean Water Act
CWA affects coal mining operations by establishing in-stream water quality standards and treatment standards for wastewater
discharge, including from coal mines. These federal and state requirements could require more costly water treatment and could
materially adversely affect the Company’s business, financial condition and results of operations.
The Company believes it has obtained all permits required under the CWA and corresponding state laws and is in compliance
with such permits. In many instances, mining operations require securing CWA authorization or a permit from the U.S. Army
Corps of Engineers for operations in waters of the United States ("WOTUS.") The SCOTUS heard the Sackett vs. EPA case in October 2022, which considered whether certain wetlands constitute WOTUS. Prior to the SCOTUS issuing a decision, in January 2023, the EPA published a new rule that redefines WOTUS using an expansive significant nexus test. The new definition expanded the scope of federal jurisdiction over land and water features which could cause some of the Company's operations to incur additional costs to mitigate streams and wetlands. The new WOTUS definition was ultimately stayed in 24 states, including Louisiana, Mississippi and North Dakota. On May 25, 2023, the SCOTUS issued its Sackett vs. EPA ruling that defines WOTUS as “a relatively permanent body of water connected to traditional interstate navigable waters” with a “continuous surface connection with that water, making it difficult to determine where the ‘water’ ends and the ‘wetland’ begins.” The SCOTUS decision rejected the “significant nexus” test used by the EPA in its 2023 WOTUS rule.
As a result of the Sackett decision, the EPA and the Army Corps of Engineers authored a revised definition of WOTUS and promulgated a final rule that removed references to “significant nexus”. The new rule does not go into effect in states
where a stay had been issued for the previous rule, including North Dakota, Texas, Louisiana, and Mississippi. In these states,
the legal challenge to the rule will resume. In the meantime, securing CWA permits may be more challenging since the agencies
in the states where a stay has been issued have less guidance to rely on to determine whether certain features are considered
WOTUS.
Bellaire is treating mine water drainage from coal refuse piles associated with former underground coal mines in Ohio and Pennsylvania and is treating mine water from a former underground coal mine in Pennsylvania. Bellaire anticipates that it will need to continue these activities indefinitely. Bellaire was notified by the Pennsylvania Department of Environmental Protection during 2004 that in order to obtain renewal of a permit, Bellaire would be required to establish a mine water treatment trust. See Note 7 and Note 9 to the Consolidated Financial Statements in this Form 10-K for further information on Bellaire.
Resource Conservation and Recovery Act
RCRA affects coal mining operations by establishing requirements for the treatment, storage and disposal of wastes, including
hazardous wastes. Coal mine wastes, such as overburden and coal cleaning wastes, currently are exempted from hazardous
waste management. In 2020, the EPA finalized changes to the coal combustion residual ("CCR") rule that classified all clay-lined surface impoundments that receive CCR as unlined. The EPA also established alternative deadlines to cease receipt of waste to include new site-specific alternatives due to lack of disposal capacity with a deadline to initiate closure and a new site-specific alternative due to permanent cessation of coal-fired boilers with deadlines to complete closure. These rules may raise the cost for CCR disposal at coal-fired power plants, making them less competitive, and/or result in early closure which could have an adverse impact on demand for coal and ultimately result in the early closure of the mines servicing these plants, including closure of the Company's mines. Any such closure of the Company's mines could have a material adverse effect on the Company’s business, financial condition and results of operations.
In compliance with these regulations, the owner of the Coal Creek Station power plant, Falkirk’s customer, submitted a CCR Part B application to the EPA in 2020 asserting a unit complied with the CCR rules. In the first quarter of 2023, the EPA proposed to deny the owner’s application. The owner and other parties have submitted additional information and comments supporting the owner’s position. If the EPA ultimately denies the owner’s application, a new liner may need to be installed or new waste management processes and/or units may need to be constructed. Accordingly, it is possible that a denial by the EPA could require a temporary unit shut down. Any temporary unit shut down could result in a temporary suspension of operations at Coal Creek Station. To minimize any impact to operations, Coal Creek Station is moving forward with plans to dry CCR materials produced by the plant, reducing the need to utilize the lined area in question. Falkirk is the sole supplier of lignite coal to Coal Creek Station. Any suspension of operations at Coal Creek Station would eliminate the need for lignite coal during the
suspension period. Any such suspension of operations at Coal Creek Station or any of the power plants supplied by the
Company's mines could have a material adverse effect on the Company’s business, financial condition and results of operations.
In May 2023, the EPA published proposed regulations that would impose federal regulatory requirements for previously
exempt inactive CCR surface impoundments at inactive facilities (legacy CCR surface impoundments). If finalized as proposed,
it could increase the regulatory cost of compliance for the Company's customers thereby increasing the cost of power which
could materially adversely affect the Company’s business, financial condition and results of operations.
The EPA rule exempts CCRs beneficially used at mine sites and reserves any regulation thereof to OSMRE. OSMRE suspended all rulemaking actions on CCRs, but could re-initiate them in the future. The outcome of these rulemakings, and any subsequent actions by the EPA and OSMRE, could impact those Company operations that beneficially use CCRs. If the Company were unable to beneficially use CCRs, its revenues for handling CCRs from its customers may decrease and its costs may increase due to the purchase of alternative materials for beneficial uses.
National Environmental Policy Act
NEPA requires federal agencies to review the environmental impacts of their decisions and issue either an environmental
assessment or an environmental impact statement. There are certain actions associated with surface coal mining that may trigger
these types of assessments by federal agencies. When a NEPA action is required, the Company provides the required
information to the appropriate federal agency to enable it to complete the required study. Historically, this process has been
lengthy and may take several years to complete. In January 2023, the White House Council on Environmental Quality ("CEQ")
issued interim guidance that instructs federal agencies to quantify GHG emissions and use the social cost of greenhouse gases to calculate a monetary metric associated with the proposed actions’ climate effects. The NEPA and interim guidance could adversely affect the Company’s ability to secure necessary permits.
On April 21, 2023, President Biden signed a new executive order focused on incorporating environmental justice considerations
into federal decision-making. The executive order created a new White House Office of Environmental Justice, and directed all federal agencies to make environmental justice a central part of each agency’s mission by publishing an environmental justice
strategic plan for the agency. Additionally, the order requires agencies conducting NEPA reviews to assess direct, indirect and
cumulative impacts on environmental justice communities in their analyses, to consider best available science and information
on disparate health impacts related to exposure to environmental hazards and provide opportunities for meaningful engagement
with environmental justice communities during the environmental review process. It largely remains to be seen how federal agencies will undertake to comply with these new requirements addressing environmental justice considerations, but the development and application of the new requirements may result in permit uncertainty and delays for activities that require federal approvals.
On June 3, 2023, President Biden signed the Fiscal Responsibility Act of 2023 into law, which included certain provisions
collectively known as the Builder Act. The Builder Act includes amendments to NEPA which codify past regulatory reforms,
including narrowing what qualifies as a “major federal action,” limiting the scope of NEPA review to “reasonably foreseeable
environmental effects,” narrowing consideration of cumulative effects, directing agencies to only consider technically and
economically feasible reasonable alternatives and providing page limits and timelines for environmental impact statements and
environmental assessments. It remains to be seen how the changes enacted by Congress will impact site level NEPA analysis.
Regulation of the Oil and Natural Gas Industry
The oil and natural gas industry is extensively regulated by numerous federal, state and local authorities. Legislation affecting the oil and natural gas industry is under constant review for amendment or expansion, frequently increasing the regulatory burden. Also, numerous departments and agencies, both federal and state, are authorized by statute to issue rules and regulations that are binding on the oil and natural gas industry and its individual members, some of which carry substantial penalties for failure to comply. Although the regulatory burden on the oil and natural gas industry increases the cost of doing business, these burdens generally do not affect the Company any differently or to any greater or lesser extent than they affect other companies in the industry with similar assets.
The availability, terms and cost of transportation significantly affect sales of oil and natural gas. The interstate transportation of oil and natural gas and the sale or resale of natural gas is subject to federal regulation, including regulation of the terms, conditions and rates for interstate transportation, storage and various other matters, primarily by the Federal Energy Regulatory Commission (“FERC”). Federal and state regulations govern the price and terms for access to oil and natural gas pipeline transportation. FERC’s regulations for interstate oil and natural gas transmission in some circumstances may also affect the intrastate transportation of oil and natural gas.
Although oil and natural gas prices are currently unregulated, Congress historically has been active in the area of oil and natural gas regulation. The Company cannot predict whether new legislation to regulate oil and natural gas might be proposed, what proposals, if any, might be enacted by Congress or the various state legislatures, and what effect, if any, the proposals might have on the Minerals Management segment. Sales of crude oil, condensate and natural gas liquids ("NGLs") are not currently regulated and are made at market prices.
Environmental Matters
Oil and natural gas exploration, development and production operations are subject to stringent laws and regulations governing the discharge of materials into the environment or otherwise relating to protection of the environment or occupational health and safety. These laws and regulations have the potential to impact production on the Company’s mineral interests, which could materially adversely affect the Minerals Management segment. Numerous federal, state and local governmental agencies, such as the EPA, issue regulations that often require difficult and costly compliance measures that carry substantial administrative, civil and criminal penalties and may result in injunctive obligations for non-compliance. These laws and regulations may require the acquisition of a permit before drilling commences, restrict the types, quantities and concentrations of various substances that can be released into the environment in connection with drilling and production activities, limit or prohibit construction or drilling activities on certain lands lying within wilderness, wetlands, ecologically sensitive and other protected areas, require action to prevent or remediate pollution from current or former operations, such as plugging abandoned wells or closing earthen pits, result in the suspension or revocation of necessary permits, licenses and authorizations, require that additional pollution controls be installed and impose substantial liabilities for pollution resulting from operations. The strict, joint and several liability nature of such laws and regulations could impose liability upon the operators on the Company’s mineral interests, regardless of fault. Moreover, it is not uncommon for neighboring landowners and other third parties to file claims for personal injury and property damage allegedly caused by the release of hazardous substances, hydrocarbons or other waste products into the environment.
In December 2023, EPA finalized a rule that will require oil and gas producers to reduce methane and other air pollutants from existing sources. Oil and gas companies will be required to phase out routine flaring of natural gas and install methane leak detection equipment. Changes in environmental laws and regulations occur frequently, and any changes that result in more stringent and costly pollution control or waste handling, storage, transport, disposal or cleanup requirements could materially adversely affect the Minerals Management segment.
Drilling and Production
The operations of the Company’s third-party lessees are subject to various types of regulation at the federal, state and local level. These types of regulation include requiring permits for the drilling of wells, drilling bonds and generating reports concerning operations. The states, and some counties and municipalities, in which the Company has mineral interests also regulate one or more of the following:
•the location of wells;
•the method of drilling and casing wells;
•the timing of construction or drilling activities, including seasonal wildlife closures;
•the rates of production;
•the surface use and restoration of properties upon which wells are drilled;
•the plugging and abandoning of wells; and
•notice to, and consultation with, surface owners and other third parties.
State laws regulate the size and shape of drilling and spacing units or proration units governing the pooling of oil and natural gas properties. Some states allow forced pooling or integration of tracts to facilitate exploration while other states rely on voluntary pooling of lands and leases. In some instances, forced pooling or unitization may be implemented by third parties and may reduce the Company’s interest in the unitized properties. In addition, state conservation laws establish maximum rates of production from oil and natural gas wells, generally prohibit the venting or flaring of natural gas and impose requirements regarding the ratability of production. These laws and regulations may limit the amount of oil and natural gas that the lessees of the Company’s mineral interests can produce from existing wells or limit the number of wells or the locations at which operators can drill. Moreover, each state generally imposes a production or severance tax with respect to the production and sale of oil, natural gas and NGLs within its jurisdiction. States do not regulate wellhead prices or engage in other similar direct regulation, but the effect of any future regulations could have a material effect on the Minerals Management segment. The effect of such future regulations may be to limit the amounts of oil and natural gas that may be produced from the Company’s mineral interests, negatively affect the economics of production from these wells or limit the number of locations operators can drill.
Federal, state and local regulations provide detailed requirements for the abandonment of wells, closure or decommissioning of production facilities and pipelines and for site restoration in areas where the operators of the acreage underlying the Company's mineral and royalty interests operate. The U.S. Army Corps of Engineers and many other state and local authorities also have regulations for plugging and abandonment, decommissioning and site restoration. Although the U.S. Army Corps of Engineers does not require bonds or other financial assurances, some state agencies and municipalities do have such requirements.
Regulation of Hydraulic Fracturing
Hydraulic fracturing is an important common practice that is used to stimulate production of hydrocarbons, particularly natural gas, from tight formations, including shales. The process involves the injection of water, sand and chemicals under pressure into formations to fracture the surrounding rock and stimulate production. The CWA regulates the underground injection of substances through the Underground Injection Control (“UIC”) program. Hydraulic fracturing generally is exempt from regulation under the UIC program, and the hydraulic fracturing process is typically regulated by state oil and gas commissions. However, in recent years efforts have been made to regulate hydraulic fracturing at the federal level. The Biden administration has also signaled the intent to stop hydraulic fracturing on federal land.
Several states, including Texas, have adopted, or are considering adopting, regulations that could restrict or prohibit hydraulic fracturing in certain circumstances and/or require the disclosure of the composition of hydraulic fracturing fluids. The Texas Legislature previously adopted legislation requiring oil and gas operators to publicly disclose the chemicals used in the hydraulic fracturing process, effective as of September 1, 2011. The Texas Railroad Commission subsequently adopted rules and regulations implementing this legislation that apply to all wells for which the Railroad Commission issues an initial drilling permit. This law requires that the well operator disclose the list of chemical ingredients subject to the requirements of the Occupational Safety and Health Act for disclosure on an internet website and also file the list of chemicals with the Texas Railroad Commission with the well completion report. The total volume of water used to hydraulically fracture a well must also be disclosed to the public and filed with the Texas Railroad Commission. Further, in May 2013, the Texas Railroad Commission issued a “well integrity rule,” which updates the requirements for drilling, putting pipe down, and cementing wells. The rule also includes new testing and reporting requirements, such as: (i) the requirement to submit cementing reports after well completion or after cessation of drilling, whichever is later; and (ii) the imposition of additional testing on wells less than 1,000 feet below usable groundwater. The well integrity rule took effect in January 2014. Local governments also may seek to adopt ordinances within their jurisdictions regulating the time, place and manner of drilling activities in general or hydraulic fracturing activities in particular or prohibit the performance of well drilling in general or hydraulic fracturing in particular.
There has been increasing public controversy regarding hydraulic fracturing with regard to the use of fracturing fluids, impacts on drinking water supplies, use of water and the potential for impacts to surface water, groundwater and the environment generally. A number of lawsuits and enforcement actions have been initiated across the country implicating hydraulic fracturing practices. If new laws or regulations that significantly restrict hydraulic fracturing are adopted, such laws could make it more difficult or costly to perform fracturing to stimulate production from tight formations as well as make it easier for third parties opposing the hydraulic fracturing process to initiate legal proceedings based on allegations that specific chemicals used in the fracturing process could adversely affect groundwater. In addition, if hydraulic fracturing is further regulated at the federal or state level, fracturing activities could become subject to additional permitting and financial assurance requirements, more stringent construction specifications, increased monitoring, reporting and recordkeeping obligations, plugging and abandonment requirements and also to attendant permitting delays and potential increases in costs. Such legislative or regulatory changes could cause operators of the operation on the acreage underlying the Company’s mineral interests to incur substantial compliance costs, and compliance or the consequences of any failure to comply by operators could have a material adverse effect on the Minerals Management segment.
In addition, hydraulic fracturing operations require the use of a significant amount of water, and the inability of the operators of the acreage underlying the Company’s mineral interests to locate sufficient amounts of water or dispose of or recycle water used in their drilling and production operations could adversely impact their operations. Moreover, new environmental initiatives and regulations could include restrictions on the ability to conduct certain operations such as hydraulic fracturing or disposal of waste, including, but not limited to, produced water, drilling fluids and other wastes associated with the development or production of natural gas.
In some instances, the operation of underground injection wells has been alleged to cause earthquakes. Such issues have sometimes led to orders prohibiting continued injection or the suspension of drilling in certain wells identified as possible sources of seismic activity. Such concerns also have resulted in stricter regulatory requirements in some jurisdictions relating to the location and operation of underground injection wells. Future orders or regulations addressing concerns about seismic activity from well injection could affect operations on the acreage underlying the Company’s mineral interests.
Endangered Species Act
The Endangered Species Act (“ESA”) and analogous state laws restrict activities that may affect endangered or threatened species or their habitats. Pursuant to a settlement with environmental groups, the U.S. Fish and Wildlife Service (“USFWS”) was required to determine whether over 250 species required listing as threatened or endangered under the ESA. USFWS has not yet completed its review, but the potential remains for new species to be listed under the ESA. Some of the Company’s properties or mineral interests may be located in areas that are or may be designated as habitats for endangered or threatened species, and previously unprotected species may later be designated as threatened or endangered in areas where the Company holds interests.
For example, recently, there have been renewed calls to review protections currently in place for the Dunes Sagebrush Lizard, whose habitat includes portions of the Permian Basin, and to reconsider listing the species under the ESA. Likewise, there have been calls to review protections in place for the Greater Sage Grouse, which can be found across a large swath of the northwestern United States in oil and gas producing states. The listing of either of these species, or any others, in areas where the Company holds mineral interests could cause lessees to incur increased costs arising from species protection measures, delay the completion of exploration and production activities, and/or result in limitations on operating activities that could have an adverse impact the Minerals Management segment.
Natural Gas Sales and Transportation
Historically, federal legislation and regulatory controls have affected the price and marketing of natural gas. FERC has jurisdiction over the transportation and sale for resale of natural gas in interstate commerce by natural gas companies under the Natural Gas Act of 1938 (“NGA”) and the Natural Gas Policy Act of 1978. Since 1978, various federal laws have been enacted which have resulted in the complete removal of all price and non-price controls for sales of domestic natural gas sold in “first sales.” Under the Energy Policy Act of 2005, FERC has substantial enforcement authority to prohibit the manipulation of natural gas markets and enforce its rules and orders, including the ability to assess substantial civil penalties.
FERC also regulates interstate natural gas transportation rates and service conditions and establishes the terms under which operators may use interstate natural gas pipeline capacity, which affects the marketing of natural gas that operators produce, as well as the revenues operators receive for sales of natural gas and release of natural gas pipeline capacity. Commencing in 1985, FERC promulgated a series of orders, regulations and rule makings that significantly fostered competition in the business of transporting and marketing gas. Today, interstate pipeline companies are required to provide nondiscriminatory transportation services to producers, marketers and other shippers, regardless of whether such shippers are affiliated with an interstate pipeline company. FERC’s initiatives have led to the development of a competitive, open access market for natural gas purchases and sales that permits all purchasers of natural gas to buy gas directly from third-party sellers other than pipelines. However, the natural gas industry historically has been very heavily regulated; therefore, the Company cannot guarantee that the less stringent regulatory approach currently pursued by FERC and Congress will continue indefinitely into the future nor can the Company determine what effect, if any, future regulatory changes might have on natural gas-related activities.
Under FERC’s current regulatory regime, transmission services must be provided on an open-access, nondiscriminatory basis at cost-based rates or at market-based rates if the transportation market at issue is sufficiently competitive. Gathering service, which occurs upstream of jurisdictional transmission services, is regulated by the states onshore and in-state waters. Section 1(b) of the NGA exempts natural gas gathering facilities from regulation by FERC as a natural gas company under the NGA. Although its policy is still in flux, FERC has in the past reclassified certain jurisdictional transmission facilities as non-jurisdictional gathering facilities, which has the tendency to increase operators’ costs of transporting gas to point-of-sale locations.
Oil Sales and Transportation
Sales of crude oil, condensate and natural gas liquids are not currently regulated and are made at negotiated prices. Nevertheless, Congress could reenact price controls in the future.
Crude oil sales are affected by the availability, terms and cost of transportation. The transportation of oil in common carrier pipelines is also subject to rate regulation. FERC regulates interstate oil pipeline transportation rates under the Interstate Commerce Act and intrastate oil pipeline transportation rates are subject to regulation by state regulatory commissions. The basis for intrastate oil pipeline regulation, and the degree of regulatory oversight and scrutiny given to intrastate oil pipeline rates, varies from state to state. Insofar as effective interstate and intrastate rates are equally applicable to all comparable shippers, the Company believes that the regulation of oil transportation rates will not affect its operations in any materially different way than such regulation will affect the operations of competitors.
Further, interstate and intrastate common carrier oil pipelines must provide service on a non-discriminatory basis. Under this open access standard, common carriers must offer service to all shippers requesting service on the same terms and under the same rates. When oil pipelines operate at full capacity, access is governed by portioning provisions set forth in the pipelines’ published tariffs. Accordingly, the Company believes that access to oil pipeline transportation services generally will be available to its operators to the same extent as to the Company or its competitors.
State Regulation
States regulate the drilling for, and the production, gathering and sale of, oil and natural gas, including imposing severance taxes and requirements for obtaining drilling permits. For example, Texas currently imposes a 4.6% severance tax on the market value of oil production and a 7.5% severance tax on the market value of natural gas production.
States also regulate the method of developing new fields, the spacing and operation of wells and the prevention of waste of oil and natural gas resources. States may regulate rates of production and may establish maximum daily production allowable from oil and natural gas wells based on market demand or resource conservation, or both. States do not regulate wellhead prices or engage in other similar direct economic regulation, but the Company cannot be certain that they will not do so in the future. The effect of these regulations may be to limit the amount of oil and natural gas that may be produced from wells drilled by third-party lessee's and to limit the number of wells or locations the Company's third-party lessee operators can drill.
The petroleum industry is also subject to compliance with various other federal, state and local regulations and laws. Some of those laws relate to resource conservation and equal employment opportunity. The Company does not believe that compliance with these laws will have a material adverse effect on its results of operations or financial condition.
Comprehensive Environmental Response, Compensation and Liability Act
CERCLA and similar state laws create liabilities for the investigation and remediation of releases of hazardous substances into the environment and for damages to natural resources. The Company must also comply with reporting requirements under the Emergency Planning and Community Right-to-Know Act and the Toxic Substances Control Act.
From time to time, the Company has been the subject of administrative proceedings, litigation and investigations relating to environmental matters.
The extent of the liability and the cost of complying with environmental laws cannot be predicted with certainty due to many factors, including the lack of specific information available with respect to many sites, the potential for new or changed laws and regulations, the development of new remediation technologies and the uncertainty regarding the timing of work with respect to particular sites. As a result, the Company may incur material liabilities or costs related to environmental matters in the future, and such environmental liabilities or costs could materially and adversely affect the Company’s results of operations and financial condition. In addition, there can be no assurance that changes in laws or regulations would not affect the manner in which the Company is required to conduct its operations.
Other Regulations
The Taxpayer Certainty and Disaster Tax Relief Act of 2020 extended the production tax credit (“PTC”) under Section 45 of the Internal Revenue Code and the investment tax credit (“ITC”) under Section 48 of the Code. The PTC for wind was extended at the current phase-out level (60% of the otherwise allowable credits) for facilities where construction began in 2021.
On August 16, 2022, President Biden signed into law the Inflation Reduction Act of 2022 (the “Inflation Reduction Act”). The Inflation Reduction Act contains hundreds of billions of dollars in incentives for the development of renewable energy sources, clean hydrogen, clean fuels, electric vehicles and supporting infrastructure and carbon capture and sequestration, among other provisions. These incentives could further accelerate the transition of the U.S. economy away from the use of fossil fuels and impact demand for fossil fuels. The ultimate impact on fossil fuel demand and the Company is uncertain and may change as implementation of the Inflation Reduction Act moves forward. The subsidization of alternative energy sources may have a material adverse effect on the Company’s business, financial condition or results of operations.
INFORMATION ABOUT OUR EXECUTIVE OFFICERS
The following tables set forth as of March 1, 2024 the name, age, current position and principal occupation and employment during the past five years of the Company’s executive officers. There exists no arrangement or understanding between any executive officer and any other person pursuant to which such executive officer was selected.
EXECUTIVE OFFICERS OF THE COMPANY
|
|
|
|
|
|
|
|
|
|
|
|
|
|
|
|
| Name |
|
Age |
|
Current Position |
|
| J.C. Butler, Jr. |
|
63 |
|
President and Chief Executive Officer of NACCO and President and Chief Executive Officer of NACCO Natural Resources Corporation ("NNRC") (from prior to 2018) |
|
|
|
|
|
|
|
|
|
|
|
|
|
|
|
|
|
|
|
| Elizabeth I. Loveman |
|
54 |
|
|
Senior Vice President and Controller and Principal Financial Officer (from prior to 2018) |
|
|
|
|
|
|
|
| John D. Neumann |
|
48 |
|
|
Senior Vice President, General Counsel and Secretary of NACCO, Senior Vice President, General Counsel and Secretary of NNRC (from prior to 2018) |
|
|
|
|
|
|
|
|
|
|
|
|
|
|
|
|
|
|
|
|
|
|
|
|
|
|
|
|
|
|
|
| Thomas A. Maxwell |
|
46 |
|
|
Senior Vice President - Financial Planning and Analysis and Treasurer (from prior to 2018)
|
|
PRINCIPAL OFFICERS OF THE COMPANY’S SUBSIDIARIES
|
|
|
|
|
|
|
|
|
|
|
|
|
|
|
|
| Name |
|
Age |
|
Current Position |
|
| J.C. Butler, Jr. |
|
63 |
|
President and Chief Executive Officer of NACCO and President and Chief Executive Officer of NNRC (from prior to 2018) |
|
|
|
|
|
|
|
|
|
|
|
|
|
|
|
|
|
|
|
|
|
|
|
|
|
|
|
|
|
|
|
| Carroll L. Dewing |
|
67 |
|
Senior Vice President and Chief Operating Officer of NNRC (from prior to 2018) |
|
|
|
|
|
|
|
|
|
|
|
|
|
|
|
|
|
|
|
| John D. Neumann |
|
48 |
|
|
Senior Vice President, General Counsel and Secretary of NACCO, Senior Vice President, General Counsel and Secretary of NNRC (from prior to 2018) |
|
|
|
|
|
|
|
|
J. Patrick Sullivan, Jr.
|
|
65 |
|
|
Senior Vice President and Chief Financial Officer of NNRC (from prior to 2018) |
|
Item 1A. RISK FACTORS
The Company operates in a rapidly changing environment that involves a number of risks. The following discussion highlights some of these risks and others are discussed elsewhere in this report. These and other risks could materially and adversely affect the Company’s business, financial condition, operating results or cash flows. The following risk factors are not an exhaustive list of the risks associated with the Company’s business. New factors may emerge or changes to these risks could occur that could materially affect the Company’s business.
Risks related to the Coal Mining segment
Termination of or default under long-term mining contracts could adversely affect the Company's business, financial condition, results of operation and cash flows.
Substantially all of the Coal Mining segment's profits are derived from long-term mining contracts. Although the Company has long-term contracts, numerous regulatory authorities, along with well-funded political and environmental activist groups, are devoting substantial resources to anti-coal activities to minimize or eliminate the use of coal as a source of electricity generation. Any customer's premature facility closure could have a material adverse effect on the Company’s business, financial condition and results of operations.
The coal mining industry is subject to ongoing complex governmental regulations and legislation that could adversely impact the Company’s long-term mining contracts and the Company’s results of operations, liquidity, financial condition and cash flow.
The United States Environmental Protection Agency (the “EPA”) has a comprehensive regulatory program to manage the disposal of coal combustion residuals (“CCR”) from coal-fired power plants as non-hazardous material under the Resource Conservation and Recovery Act (“RCRA”). Individual states administer some or all of the RCRA provisions. The North Dakota Department of Environmental Quality approved Falkirk’s customer's plan for an alternate disposal liner to store coal ash at the Coal Creek Station power plant. In the first quarter of 2023, the EPA proposed to deny the application. If denied, a new liner or new waste management unit(s) may need to be installed, which could result in the temporary suspension of operations at Coal Creek Station.
To minimize any impact to operations, Coal Creek Station is moving forward with plans to dry CCR materials produced by the plant, reducing the need to utilize the lined area in question. Falkirk is the sole supplier of lignite coal to Coal Creek Station. Any suspension of operations at Coal Creek Station would eliminate the need for lignite coal during the suspension period. Any such suspension of operations at Coal Creek Station or any of the power plants supplied by the Company's mines could have a material adverse effect on the Company’s business, financial condition and results of operations.
The EPA also has a comprehensive regulatory program to manage airborne emissions from coal-fired power plants. During 2023, the EPA proposed updated rules related to mercury and greenhouse gas emissions from coal-fired power plants. The first update was to the Mercury Air Toxics Standard, or MATS. In this update, the EPA proposed to eliminate a mercury emission standard for lignite-fired power plants that currently permits higher mercury emissions by lignite plants than other coal plants. In the event this rule is adopted as proposed, and not successfully legally challenged, it could result in the closure of many lignite-fired power plants, potentially including all of those supplied by the Company. The second update was the EPA’s proposed new rule for greenhouse gas emissions from coal-fired power plants. In this proposed new rule, the EPA requires that power plant owners that intend to operate the plants beyond 2031 utilize controls, including reduced levels of power generation, co-firing coal and natural gas and installing carbon capture and sequestration to reduce greenhouse gas emissions. Each of these controls may impact the plant owners’ profitability and could result in the closure of coal-fired power plants, potentially including all of those supplied by the Company. The closure of any of the power plants supplied by the Company could have a material adverse effect on the Company’s business, financial condition and results of operation.
The coal mining industry and the electric generation industry are subject to extensive regulation by federal, state and local authorities on matters concerning the health and safety of employees, land use, stream and wetland protection, permit and licensing requirements, air and water quality standards, plant and wildlife protection, reclamation and restoration of mining properties after mining, the discharge of GHGs and other materials into the environment, surface subsidence from underground mining and the effects that mining has on groundwater quality and availability. Legislation mandating certain benefits for current and retired coal miners also affects the industry. Mining operations require numerous governmental and regulatory permits and approvals. The Company is required to prepare and present to federal, state or local authorities data pertaining to the impact the production and combustion of coal may have upon the environment. The public, including non-governmental organizations, opposition groups and individuals, have statutory rights to comment upon and submit objections to requested permits and approvals and to legally challenge certain permits subsequent to their issuance. Compliance with these requirements is costly and time-consuming and may delay commencement or continuation of development or production. New legislation and/or regulations and orders may materially adversely affect the Company's mining operations or its cost structure, or its customers. All of these factors could significantly reduce the Company's profitability.
See “Item 1. Business — Government Regulation" on page 8 in this Form 10-K for discussion of regulations that could materially adversely affect the Coal Mining segment.
The loss of, or significant reduction in, purchases by NACCO's coal customers could adversely affect the Company's business, financial condition, results of operation and cash flows.
Earnings from the Coal Mining segment's customers may fluctuate from time to time based on numerous factors, including market conditions and the realignment of customers' power generation portfolios that reduce the electric power generated from coal, which may be outside of the Company's control. Future environmental regulation of GHG emissions, CCRs and/or new federal and state mandates for increased use of electricity derived from renewable energy sources could accelerate the use by utilities of fuels other than coal. Such mandates, combined with other incentives to use renewable energy sources, such as tax credits, could accelerate the realignment of customers' power generation portfolios to reduce the electric power generated from coal.
If any of the Coal Mining segment's customers experience declining demand due to market, economic, regulatory or competitive conditions, it could have an adverse effect on the Company's profitability, cash flows and financial position. In addition, if any customers were to significantly reduce or eliminate their purchases of coal from us or if the Company is unable to renew expiring long-term sales agreements with existing customers or enter into new supply agreements, the Company's business, financial condition, results of operations and cash flows could be adversely affected. See “Item 1. Business — Business Developments" on page 2 in this Form 10-K for further discussion.
MLMC is subject to risks associated with its capital investment, operating and equipment costs, growing use of alternative generation that competes with coal-fired generation, changes in customer demand and inflationary adjustments.
The profitability of MLMC is subject to the risk of loss of investment in this operation, increases in the cost of mining, changes in customer demand, growing competition from alternative power generation that competes with coal-fired generation and the emergence of adverse mining conditions. At MLMC, the costs of mining operations are not reimbursed by MLMC's customer. As such, increased costs at MLMC or decreased revenues could materially reduce the Company's profitability.
Similar to the Company's unconsolidated mines, all production costs at MLMC are capitalized into inventory and recognized in cost of sales as tons are delivered. In periods of limited or no deliveries, MLMC may be required to reduce its inventory carrying value using the lower of cost and net realizable value approach, which could adversely affect MLMC’s results of operations.
Profitability at MLMC is affected by customer demand for coal and changes in the indices that determine sales price and actual costs incurred. MLMC sells lignite at contractually agreed upon prices which are subject to changes in the level of established indices over time. Diesel fuel is heavily weighted among the indices used to determine the coal sales price. The diesel fuel-related component of the coal sales price is based on average price changes over time whereas the impact on actual costs from changes in diesel fuel prices is more immediate; therefore, fluctuations in diesel fuel prices can result in significant fluctuations in earnings at MLMC.
Any reduction in customer demand at MLMC, including, but not limited to, reduced mechanical availability of the customer’s power plant, dispatch of power generated by other energy sources ahead of coal, fluctuations in demand due to unanticipated weather conditions, regulations or comparable policies which may promote planned and unplanned outages at the Red Hills Power Plant, economic conditions, including an economic slowdown and a corresponding decline in the use of electricity, governmental regulations and inflationary adjustments could have a material adverse effect on MLMC's financial condition, results of operations and cash flows.
The Coal Mining segment's Unconsolidated Subsidiaries are subject to risks created by changes in customer demand and inflationary adjustments.
The contracts with the Unconsolidated Subsidiaries' customers are primarily based on a "management fee" approach, whereby compensation includes reimbursement of all operating costs, plus a fee based on the amount of coal delivered. The fees earned adjust over time in line with various indices which reflect general U.S. inflation rates. During the production stage, the Unconsolidated Subsidiaries' customers pay the Company its agreed upon fee only for the coal delivered to them for consumption or use. As a result, reduced coal usage by customers for any reason, including, but not limited to, fluctuations in demand due to unanticipated weather conditions, scheduled and unscheduled outages at the Coal Mining segment's customers' facilities, unplanned equipment failures including U.S. power grid reliability issues, economic conditions or governmental regulations or comparable policies which may promote dispatch of power generated by renewable energy sources, such as wind or solar, and the realignment of customers' power generation portfolios that reduce the electric power generated from coal could have a material adverse effect on the Company's results of operations. Because of the contractual price formulas for the management fees at these Unconsolidated Subsidiaries, the profitability of these operations is also subject to fluctuations in inflationary adjustments (or lack thereof) that can impact the agreed upon management fees. These factors could materially reduce the Company's profitability.
Changes in coal consumption patterns of U.S. electric power generators could adversely affect the Company's profitability.
The amount of coal consumed by the electric power generation industry is affected by general economic conditions; overall demand for electricity; availability of transmission; competition from alternative fuel sources for power generation, such as natural gas, nuclear, hydroelectric, wind and solar power, and the location, availability, quality and price of those alternative fuel sources; environmental and other governmental regulations, including those impacting coal-fired power plants; and energy conservation efforts and related governmental policies.
Changes in the utility industry that affect NACCO's customers could also adversely affect the Company. The increased availability of renewable energy sources has contributed to a reduction in demand for coal-fired electric power generation. Competition from natural gas-fired plants that are relatively more efficient, less expensive to construct and less difficult to permit than coal-fired plants has the most potential to continue to displace a significant amount of coal-fired electric power generation in the near term. Federal and state mandates for increased use of electricity derived from renewable energy sources have also adversely affected demand for coal-fired electric power generation.
Such mandates make alternative fuel sources more competitive with coal-fired electric power generation.
Changes in federal and state mandates that would include an acceleration in the use of electricity derived from renewable energy sources could result in a decrease in coal consumption by the electric power generation industry and the Company’s customers.
Any of these risks could result in a decrease in coal consumption by the Company’s customers and could have a material adverse effect on the Company’s business, financial condition and results of operations.
The Company is subject to burdensome federal and state mining regulations and the assumptions underlying the Company's reclamation and mine closure obligations could be materially inaccurate.
Federal and state statutes require the Company to restore mine property in accordance with specified standards and an approved reclamation plan, and require that the Company obtain and periodically renew permits for mining operations. Regulations require the Company to incur the cost of reclaiming current mine disturbance at operations where the Company holds the mining permit. Estimates of the Company's total reclamation and mine closing liabilities are based upon permit requirements and the Company's engineering expertise related to these requirements. While management regularly reviews the estimated reclamation liabilities and believes that appropriate accruals have been recorded for all expected reclamation and other costs associated with closed mines, the estimate can change significantly if actual costs vary from assumptions or if governmental regulations change significantly. Such changes could have a material adverse effect on the Company’s business and could significantly reduce its profitability.
The Coal Mining segment's customers' operations require significant capital expenditures.
Maintaining and installing environmental controls on power plants requires significant capital expenditures. Any delay or reduction in making capital expenditures to maintain or upgrade coal-fired power plants by the Coal Segment's customers, principally electric utilities, could result in an increase in outage days and a corresponding decrease in coal consumption. A decrease in coal consumption could have a material adverse effect on the Coal Mining segment's financial condition, results of operations and cash flows.
Mining operations are vulnerable to weather and other conditions that are beyond the Company's control.
Many conditions beyond the Company's control can decrease the delivery, and therefore the use, of coal to the Company's customers. These conditions include weather, pandemics, adverse mining conditions, unexpected maintenance problems and shortages of replacement parts, any of which could significantly reduce the Company's profitability.
The Company faces numerous uncertainties in estimating economically recoverable reserves and resources, and inaccuracies in estimates could result in lower than expected revenues, higher than expected costs and decreased profitability.
Information concerning the Company's mining operations in "Item 2 - Properties" on page 31 has been prepared in accordance with the requirements of subpart 1300 of Regulation S-K. A mineral is economically recoverable when the price at which it can be sold exceeds the costs and expenses of mining, processing and selling the mineral. Forecasts of NACCO's future performance are based on, among other things, estimates of mineral reserves and resources. Mineral reserve and resource estimates of the remaining tons of coal at MLMC are based on many factors, including engineering, economic and geological data assembled and analyzed by internal staff, which includes various engineers and geologists, the area and volume covered by mining rights, assumptions regarding extraction rates and duration of mining operations, and the quality of in-place reserves and resources. The reserve and resource estimates as to both quantity and quality are updated from time to time to reflect, among other matters, production of minerals, new mining or other data received.
There are numerous uncertainties inherent in estimating quantities and qualities of minerals and costs to mine recoverable reserves and resources, including many factors beyond the Company's control. While the Company believes that its mineral reserve and resource estimates are developed using well-established practices and with appropriate controls, mineral reserve and mineral resource estimation is an imprecise and subjective process. Estimates of mineral reserves and resources depend upon a number of variable factors and assumptions, any one of which may, if incorrect, result in an estimate that varies considerably from actual results. These factors and assumptions include:
•Geologic and mining conditions, including the Company's ability to access certain mineral deposits as a result of the nature of the geologic formations of coal deposits or other factors, which may not be fully identified by available exploration data and may differ from past experience;
•Demand for the Company's minerals;
•Contractual arrangements, operating costs and capital expenditures;
•Development and reclamation costs;
•Mining technology and processing improvements;
•The effects of regulation by governmental agencies;
•The ability to obtain, maintain and renew all required permits;
•Employee health and safety; and
•NACCO's ability to convert all or any part of mineral resources to economically extractable mineral reserves.
As a result, actual tonnage recovered, estimated revenues, expenditures and cash flows with respect to reserves and resources may vary materially from estimates. Thus, these estimates may not accurately reflect the Company’s actual reserves and resources. Any material inaccuracy in estimates related to the Company's reserves or resources could result in lower than expected revenues, higher than expected costs or decreased profitability and changes in future cash flow, which could materially and adversely affect the Company business, results of operations, financial position and cash flows. Additionally, reserve and resource estimates may be adversely affected in the future by interpretations of, or changes to, the SEC’s property disclosure requirements for mining companies.
A defect in title or the loss of a leasehold interest in certain property could limit the Company's ability to mine coal reserves or result in significant unanticipated costs.
The Company conducts a significant part of its coal mining operations on leased properties. A title defect or the loss of a lease could adversely affect the ability to mine the associated coal reserves. The Company may not verify title to leased properties or associated coal reserves until the Company has committed to developing those properties or coal reserves. The Company may not commit to develop property or coal reserves until the Company has obtained necessary permits and completed exploration. As such, the title to property that the Company intends to lease or mine may contain defects prohibiting the ability to conduct mining operations. Similarly, leasehold interests may be subject to superior property rights of third parties. In order to conduct mining operations on properties where these defects exist, the Company may incur unanticipated costs. In addition, some leases require the Company to produce a minimum quantity of coal and/or pay minimum production royalties. The Company's inability to satisfy those requirements may cause the leasehold interest to terminate.
Risks related to the NAMining segment
The Company has experienced growth in its NAMining business in recent periods and it may not be able to sustain growth or manage future growth effectively.
The Company has expanded its overall NAMining business, operations and headcount in recent periods. NAMining’s operating expenses may continue to increase as the Company scales the NAMining business. As NACCO continues to grow the NAMining business, the Company must effectively integrate, develop and motivate new employees, as well as existing employees who are promoted or moved into new roles, while maintaining the effectiveness of its business execution. In part, NAMining’s success depends on its ability to integrate new customers in an efficient and effective manner. The Company anticipates that it will continue to incur costs and capital expenditures associated with future growth prior to realizing the full measure of anticipated long-term benefits, and the return on these investments may be lower, may develop more slowly than expected or may never be realized. If the Company is unable to manage this growth and the associated expenses effectively, the Company may not be able to take advantage of market opportunities or remain competitive. The Company may also fail to execute on its business plan or respond to competitive pressures, any of which could adversely affect the NAMining business, operating results and financial condition.
NAMining faces competition from aggregates producers that choose to self-perform mining operations and from other mining companies.
NAMining faces competition from existing and prospective customers that are capable of performing, or engaging other companies to perform the services NAMining provides. NAMining cannot be certain that its existing customers will continue to outsource these services to NAMining in the future, which could adversely affect the NAMining business, operating results and financial condition.
The Company is subject to risks involved in the development of new mining projects.
From time to time, the Company seeks to develop new mining projects, including the Thacker Pass project. The risks associated with such projects can be substantial. New mining projects can take up to several years to complete, are complex and require significant capital expenditures. These projects are subject to significant risks, including delays or reductions in making capital expenditures by NAMining's customers, extreme weather events, unexpected increases in the cost of required materials, and disputes with third party providers of materials, equipment or services, and a completed project may not yield the anticipated operational or financial benefit, any of which could have a material adverse effect on the Company’s business, financial condition and results of operations.
NAMining operations are currently geographically concentrated and therefore subject to regional economic risk, regulatory conditions, natural disasters, severe weather events or other circumstances affecting Florida.
As of December 31, 2023, over 75% of the quarries NAMining operates are located in Florida. A prolonged economic downturn or adverse change in regulatory conditions in the Florida mining or construction industry could result in a significant reduction in demand for NAMining’s services. The occurrence of one or more natural disasters, severe weather events, terrorist attacks, or disruptive political events in Florida could adversely affect the NAMining business.
Risks related to the Minerals Management segment
The Company has no control over the timing of the development and operation of its natural gas, oil and coal reserves extracted by third parties.
The Company owns mineral and royalty interests in the continental United States. The Company does not develop oil and gas reserves and is not a natural gas and oil producer. The Company primarily derives income from royalty-based leases under which lessees make payments to the Company based on their sale of natural gas, oil and coal. Future royalty-based income is dependent on the number of oil and gas wells being developed and operated on the Company’s mineral acreage. The decision to pursue development and operation of oil and gas wells is made by third-party operators, not by the Company, and depends on a number of factors outside of the Company's control, including fluctuations in commodity prices (primarily natural gas), regulatory risk, the Company's lessees' willingness and ability to incur well-development and other operating costs, the rate of production of the reserves and changes in the availability and continuing development of infrastructure. Lower commodity prices may reduce the amount of oil and natural gas that third-party operators can produce economically. In the event that new federal or state restrictions related to the hydraulic fracturing process are adopted in areas where the Company owns mineral and royalty interests, the Company’s lessees may incur additional costs or permitting requirements to comply with such requirements that may be significant and could result in added restrictions, delays or curtailments in the pursuit of exploration, development, or production activities. In addition, if a lessee were to experience financial difficulty, the lessee might not be able to pay its royalty payments or continue operations. A failure on the part of the lessee to make royalty payments may give the Company the right to terminate the lease, repossess the property and enforce payment obligations under the lease. If the Company repossessed any of its properties, it would seek a replacement lessee. However, the Company may not be able to find a replacement lessee and, if it did, the Company might not be able to enter into a new lease on favorable terms within a reasonable period of time. In addition, if the Company is able to enter into a new lease with a new lessee, the replacement lessee may not achieve the same levels of production or sales prices as the lessee it replaced. Any of these risks could materially reduce the Company’s expected royalty income and the Company’s profitability.
Minerals are a depleting asset. Unless the Company replaces existing mineral and royalty interests with new mineral and royalty interests and third-party lessees develop those mineral and royalty interests, the Company’s reserves and royalty income will decline.
Producing oil and natural gas reservoirs are generally characterized by declining production rates that vary depending upon reservoir characteristics and other factors. Unless the Company’s third-party lessees conduct successful ongoing well development activities or the Company continually acquires mineral and royalty interests, production and income related to the Company’s mineral and royalty interests will decline as those reserves are depleted. The future cash flow and results of operations of the Minerals Management segment are highly dependent on third-party operators’ success in developing the Company’s current and future mineral and royalty interests. These operators may not have access to the capital needed to develop the Company's mineral interests. The Company may not be able to acquire or find sufficient additional mineral and royalty interests to replace third-party operators' current and future production. Further, the decline curve the Company uses to project future royalty income is subject to numerous assumptions and limitations. Natural gas wells have high initial production rates and follow a natural decline before settling into relatively stable, long-term production. Decline rates can vary due to factors like well depth, well length, formation pressure, and facility design.
Any of these risks could materially reduce the Company’s expected royalty income and the Company’s profitability.
Substantially all of the Minerals Management segment’s revenues are derived from royalty payments that are based on the price at which oil and natural gas produced from the acreage underlying the Company’s interests are sold. Prices of oil and natural gas are volatile due to factors beyond the Company’s control. A substantial or extended decline in commodity prices may adversely affect the Minerals Management segment’s financial condition or results of operations.
The Minerals Management segment’s revenues and operating results depend significantly upon the prevailing prices for oil and natural gas. Historically, oil and natural gas prices have been volatile and are subject to fluctuations in response to changes in supply and demand, market uncertainty and a variety of additional factors that are beyond the Company's control; market expectations about future prices of oil and natural gas; the level of global oil and natural gas exploration and production; the cost of exploring for, developing, producing and delivering oil and natural gas; the price and quantity of foreign imports and U.S. exports of oil and natural gas; the level of U.S. domestic production; political and economic conditions in oil producing regions; the ability of members of the Organization of Petroleum Exporting Countries to agree to and maintain oil price and production controls; trading in oil and natural gas derivative contracts; the level of consumer product demand; weather conditions and natural disasters; technological advances affecting energy consumption, energy storage and energy supply; domestic and foreign governmental regulations and taxes; the continued threat of terrorism and the impact of military and other action, including the ongoing conflict between Israel and Hamas, the conflict between Russia and Ukraine and associated oil and natural gas import bans as well as U.S. military operations in the Middle East and economic sanctions such as those imposed by the U.S. on oil and gas exports from Iran; the proximity, cost, availability and capacity of oil and natural gas pipelines and other transportation facilities; the price and availability of alternative fuels; and overall domestic and global economic conditions. A substantial or extended decline in commodity prices may adversely affect the Minerals Management segment’s financial condition or results of operations.
The marketability of oil and natural gas production is dependent upon transportation, pipelines and refining facilities and continued operation of the U.S. power grid. Any limitation in the availability of these items could interfere with our third-party lessee’s ability to market oil and natural gas production and may adversely affect the Minerals Management segment’s financial condition or results of operations.
The marketability of our third-party lessee’s production depends in part on the availability, proximity, and capacity of pipelines, tanker trucks, and other transportation methods, and processing and refining facilities owned by third parties as well as continued reliable operation of the U.S power grid. Any significant disruption in the U.S. power grid, gathering system or transportation, processing, or refining-facility capacity could reduce our third-party lessee’s ability to market oil production and may adversely affect the Minerals Management segment’s financial condition or results of operations.
Risks related to corporate structure
The amount and frequency of dividend payments made on NACCO's common stock could change.
The Board of Directors has the power to determine the amount and frequency of the payment of dividends. Decisions regarding whether or not to pay dividends and the amount of any dividends are based on earnings, capital and future expense requirements, financial conditions and other factors the Board of Directors may consider. Accordingly, holders of NACCO's common stock should not rely on past payments of dividends in a particular amount as an indication of the amount of dividends that will be paid in the future.
The price of NACCO's securities may be volatile.
The price of the Company's common stock may fluctuate due to a variety of market and industry factors that may materially reduce the market price of NACCO's common stock regardless of operating performance, including, among others: (i) actual or anticipated fluctuations in the Company's quarterly and annual results and those of other public companies in the industry; (ii) industry cycles and trends; (iii) changes in government regulation; (iv) potential or actual military conflicts or acts of terrorism; (v) announcements concerning NACCO, its customers or its competitors; (vi) lack of trading liquidity as a result of low trading volumes could make it difficult for investors to sell shares; and (vii) the general state of the securities market. In addition, the stock market in general has experienced significant volatility that often has been unrelated to the operating performance of companies whose shares are traded. These market fluctuations could adversely affect the trading price of the Company's common stock, regardless of NACCO's actual operating performance. As a result of all of these factors, investors in the Company's common stock may not be able to resell their stock at or above the price they paid or at all. Further, NACCO could be the subject of securities class action litigation due to any such stock price volatility, which could divert management’s attention and have a material adverse effect on the Company's operating results.
NACCO's certificate of incorporation and by-laws include provisions that may discourage a takeover attempt.
Provisions contained in the Company's certificate of incorporation and by-laws and Delaware law could make it more difficult for a third-party to acquire the Company, even if doing so might be beneficial to NACCO's stockholders. Provisions of the Company's by-laws and certificate of incorporation impose various procedural and other requirements that could make it more difficult for stockholders to affect certain corporate actions. These provisions could limit the price that certain investors might be willing to pay in the future for shares of NACCO's common stock and may have the effect of delaying or preventing a change in control.
The Company’s stock repurchase program could affect the price of NACCO’s common stock and increase volatility and may not enhance long-term shareholder value.
The Company’s Board of Directors has authorized a stock repurchase program. The timing and amount of any repurchases under the stock repurchase program are determined at the discretion of the Company's management based on a number of factors, including the availability of capital, other capital allocation alternatives, market conditions for the Company's Class A common stock and other legal and contractual restrictions. The stock repurchase program does not require the Company to acquire any specific number of shares and may be modified, suspended, extended or terminated without prior notice and may be executed through open market purchases, privately negotiated transactions or otherwise.
Repurchases under the stock repurchase program could affect the price of the Company's Class A common stock. The existence of a stock repurchase program could cause the price of the Company's Class A common stock to be higher than it would be in the absence of such a program and could potentially reduce the market liquidity for the Company’s Class A common stock. There can be no assurance that any stock repurchases will enhance shareholder value because the market price of the Company’s Class A common stock may decline below the levels at which the Company repurchased the shares. Although the stock repurchase program is intended to enhance long-term shareholder value, there is no assurance that it will do so and short-term price fluctuations in the Class A common stock could reduce the program’s effectiveness. Furthermore, the stock repurchase program does not obligate the Company to repurchase any dollar amount or number of shares of the Company's Class A common stock, and it may be suspended or discontinued at any time and any suspension or discontinuation could cause the market price of the Company's Class A common stock to decline.
NACCO is a smaller reporting company and cannot be certain if the reduced disclosure requirements applicable to smaller reporting companies will make the Company's common stock less attractive to investors.
The Company is currently a “smaller reporting company” as defined in the Securities Exchange Act of 1934, and thus allowed to provide simplified executive compensation disclosures and other decreased disclosure in SEC filings. The reduced disclosures may make it more difficult to compare the Company's performance with other public companies.
NACCO cannot predict whether investors will find the Company's common stock less attractive because of these exemptions. If some investors find NACCO's common stock less attractive as a result, there may be a less active trading market for the Company's common stock and the stock price may be more volatile.
Certain members of the Company's extended founding family own a substantial amount of its Class A and Class B common stock and, if they were to act in concert, could control the outcome of director elections and other stockholder votes on significant corporate actions.
The Company has two classes of common stock: Class A common stock and Class B common stock. Holders of Class A common stock are entitled to cast one vote per share and, as of December 31, 2023, accounted for approximately 27 percent of the voting power of the Company. Holders of Class B common stock are entitled to cast ten votes per share and, as of December 31, 2023, accounted for the remaining voting power of the Company. As of December 31, 2023, certain members of the Company's extended founding family held approximately 34 percent of the Company's outstanding Class A common stock and approximately 99 percent of the Company's outstanding Class B common stock. On the basis of this common stock ownership, certain members of the Company's extended founding family could have exercised approximately 81 percent of the Company's total voting power. Although there is no voting agreement among such extended family members, in writing or otherwise, if they were to act in concert, they could control the outcome of director elections and other stockholder votes on significant corporate actions, such as certain amendments to the Company's certificate of incorporation and sales of the Company or substantially all of its assets. Because certain members of the Company's extended founding family could prevent other stockholders from exercising significant influence over significant corporate actions, the Company may be a less attractive takeover target, which could adversely affect the market price of its common stock.
General Risk Factors
The Company’s effective income tax rate could be volatile and materially change as a result of changes in tax laws, mix of earnings and other factors.
The Company is subject to income taxes in the United States and the effective income tax rate is impacted by certain U.S. federal income tax benefits currently available to coal mining and oil and gas exploration and development companies. Future results of operations could be affected by changes in the Company’s effective income tax rate as a result of an increase in the statutory tax rate or the reduction or elimination of percentage depletion as well as changes in the mix of earnings between entities that benefit from percentage depletion and those that do not.
Current and future capital and credit market conditions could adversely affect the Company’s ability to obtain bank financing on reasonable terms. Certain financial institutions have acted to limit available financing for companies in the fossil fuel industry, including coal mining, which could result in increases in costs of borrowing or in the Company’s ability to maintain financing at current levels.
The Company may be unable to obtain financing on reasonable terms. Historically, the Company has addressed its liquidity needs (including funds required to pay dividends and fund working capital and planned capital expenditures) with operating cash flow and borrowings under credit facilities. The Company’s wholly-owned subsidiary has a revolving line of credit of up to $150.0 million that expires in November 2025. The Company’s ability to access the capital markets and the costs and terms of available financing depends on many factors, including perceived credit risks of companies with coal and/or oil and gas exposure as a result of current market sentiment for fossil fuels. Certain financial institutions have taken actions to limit available financing to entities that produce or use fossil fuels. The volatility in the energy industry and additional perceived credit risks of companies with coal and/or oil and gas exposure has resulted in traditional bank lenders seeking to reduce or eliminate their lending exposure to these companies. An inability to obtain bank financing, or refinance with terms that are as favorable as the existing terms of such indebtedness, could have a material adverse effect on the Company's operating results and financial condition.
Failure to obtain financial assurance to secure reclamation and other long-term obligations, including surety bonds and letters of credit on acceptable terms, could affect NACCO's ability to mine.
Federal and state laws require the Company to provide financial assurance or financial security to secure performance or payment of certain long-term obligations, such as mine closure or reclamation costs, federal and state workers’ compensation and black lung benefit costs, leases, transmission interconnection construction costs, power purchase agreement delivery obligations and other obligations. Future federal and state laws and regulations, regional transmission organizations and power purchase agreement customers may require higher amounts of financial security, including as a result of changes to certain factors used to calculate the bonding or security amounts. Bond issuers may demand higher fees or additional collateral, including cash or letters of credit or other terms less favorable upon renewals. As the Company is required by state and federal law to have bonds or other acceptable security in place before mining can commence or for certain projects to move forward, the failure to maintain surety bonds, letters of credit or other guarantees or security arrangements would materially and adversely affect NACCO's ability to mine. That failure could result from a variety of factors, including lack of availability, higher expense or unfavorable market terms, the exercise by third-party surety bond issuers of their right to refuse to renew the surety and restrictions on availability of collateral for current and future third-party surety bond issuers under the terms of the Company's financing arrangements. In addition, as a result of increasing credit pressures on the coal industry, it is possible that surety bond providers could demand other forms of collateral as a condition to providing or maintaining surety bonds. Any such demands, could have a material adverse impact on the Company’s liquidity and financial position. If the Company is unable to meet collateral requirements and cannot otherwise obtain or retain required surety bonds, it may be unable to satisfy legal requirements necessary to conduct mining operations. Difficulty in acquiring surety bonds, or additional collateral requirements, would increase the Company’s costs and likely require greater use of alternative sources of funding for this purpose, which would reduce the Company’s liquidity.
Insurance coverage is increasingly expensive, contains more stringent terms and may be difficult to obtain in the future. A number of global insurance companies have taken steps to limit coverage for companies in the fossil fuel industry, including coal mining, which could result in significant increases in costs of insurance or in the Company’s ability to maintain insurance coverage at current levels.
The Company holds a number of insurance policies, including director and officers’ liability and property and casualty insurance coverages. Because the Company is involved in coal mining, costs of insurance may increase substantially or insurance carriers may limit or decide not to insure the Company in the future. In addition, if the Company makes significant insurance claims under the Company’s insurance policies, such claims may have a material adverse effect on its ability to obtain future insurance coverage at commercially reasonable rates. Limited, or an inability to obtain, insurance coverage, significant increases in the premiums or deductibles of insurance, or losses in excess of its liability insurance coverage limits, could have a material adverse effect on the Company's operating results and financial condition.
Increasing emphasis and changing expectations with respect to environmental, social and governance matters may impose additional costs on the Company or expose the Company to new or additional risks.
Expectations relating to environmental, social and governance (“ESG”) matters have been rapidly evolving and increasing. Government organizations, including the SEC, are enhancing or advancing legal, regulatory and disclosure requirements specific to ESG matters. The heightened focus on ESG issues requires the continuous monitoring of various and evolving laws, regulations, standards and expectations and the associated reporting requirements. Investor advocacy groups, certain institutional investors, investment funds and other influential investors are also increasingly focused on ESG practices. The Company could face pressures from investors, who are increasingly focused on climate change, to prioritize sustainable energy practices, reduce the Company’s carbon footprint and promote sustainability. Investors may request the Company implement ESG procedures or standards as a condition to maintain their investment or to make further investments. Lenders and insurers may also limit lending to and insuring of companies that do not meet certain ESG measures endorsed by them. Additionally, the Company may face reputational challenges in the event its ESG practices are inconsistent with the third-party views of acceptable ESG practices. Companies which do not adapt to or comply with regulatory, investor or stakeholder expectations and standards, which are evolving, or which are perceived to have not responded appropriately, may suffer from reputational damage and the business, financial condition, and/or stock price of such a company could be materially and adversely affected.
The Company may be subject to litigation seeking to hold energy companies accountable for the effects of climate change.
Increasing attention to climate change risk has also resulted in a recent trend of governmental investigations and private litigation by local and state governmental agencies as well as private plaintiffs in an effort to hold energy companies accountable for the effects of climate change. Other public nuisance lawsuits have been brought in the past against power, coal, oil and gas companies alleging that their operations are contributing to climate change. The plaintiffs in these suits sought various remedies, including punitive and compensatory damages and injunctive relief. While the U.S. Supreme Court held that any federal common law had been displaced by the CAA and thus dismissed the public nuisance claims against the defendants in those cases, tort-type liabilities remain a possibility and a source of concern. We could incur substantial legal costs associated with defending such lawsuits in the future. Government entities in certain states have brought similar claims seeking to hold a wide variety of companies that produce fossil fuels liable for the alleged impacts of the GHG emissions attributable to those fuels or for other grounds related to climate change, such as improper disclosure of climate change risks. Those lawsuits allege damages as a result of climate change and the plaintiffs are seeking unspecified damages and abatement under various tort theories. We have not been made a party to these suits, but it is possible that we could be included in similar future lawsuits initiated by state and local governments as well as private claimants.
The Company’s business could suffer if NACCO’s information technology systems are disrupted, cease to operate effectively or if the Company experiences a security breach, a cyber incident or cyber attack.
Like many other companies, the Company is the target of malicious cyber attack attempts in the normal course of business. Cybersecurity incidents involving businesses and other institutions are on the rise. Cyber threats are rapidly evolving and those threats and the means for obtaining access to information in digital and other storage media are becoming increasingly sophisticated. Cyber threats and cyber attackers can be sponsored by nation states or sophisticated criminal organizations or be the work of independent hackers.
As cyber threats evolve and become more difficult to detect and successfully defend against, one or more cyber attacks might defeat the Company's or a third-party service provider's security measures in the future. Employee error or other irregularities may also result in a failure of security measures and a breach of information systems. Moreover, hardware, software or applications the Company may use have inherent defects of design, manufacture or operations or could be inadvertently or intentionally implemented or used in a manner that could compromise information security.
A security breach and loss of information may not be discovered for a significant period of time after it occurs. Any compromise of data security could result in a violation of applicable privacy and other laws or standards, the loss of valuable business data, or a disruption of the Company's business. A security breach involving the misappropriation, loss or other unauthorized disclosure of sensitive or confidential information could give rise to unwanted media attention, materially damage customer relationships and the Company's reputation, and result in fines, fees, or liabilities, which may not be covered by insurance policies.
The Company relies on information technology systems to operate its business and to record and process transactions; respond to customer inquiries; purchase supplies; provide services; deliver inventory on a timely basis; and maintain cost-efficient operations. Despite the Company's efforts, the Company’s information technology systems may be vulnerable, from time to time, to damage or interruption from user error, computer viruses, power outages, third-party intrusions and other technical malfunctions.
Through the Company’s business operations, the Company collects and stores confidential information from its customers and vendors and personal information and other confidential information from its employees. Although the Company has taken steps designed to safeguard such information, there can be no assurance that such information will be protected against unauthorized access, use or disclosure. Unauthorized parties may penetrate the Company’s or its vendors’ network security and, if successful, misappropriate such information. Additionally, methods to obtain unauthorized access to confidential information change frequently and may be difficult to detect, which can impact the Company’s ability to respond appropriately.
The Company could be subject to liability for failure to comply with privacy and information security laws, for failing to protect personal information or for failing to respond appropriately. Loss, unauthorized access to, or misuse of confidential or personal information could disrupt the Company’s operations, damage the Company’s reputation, and expose the Company to claims from customers, financial institutions, regulators, employees and other persons, any of which could have an adverse effect on the Company’s business, financial condition and results of operations.
Security breaches, cyber incidents or cyber attacks could include, among other things, computer viruses, malicious or destructive code, ransomware, social engineering attacks (including phishing and impersonation), hacking, denial of service attacks and other attacks. Cybersecurity threats to, and incidents involving, vendors and other third-parties who support the Company's activities could impact the business. The Company is continuously installing new and upgrading existing information technology systems. The Company uses employee awareness training around phishing, malware, and other cyber risks. The Company believes these incidents are likely to continue and is unable to predict the direct or indirect impact of future attacks or breaches to business operations.
The Company’s operations could be disrupted by natural or human causes beyond its control.
The Company’s operations are subject to disruption from natural or human causes beyond its control, including physical risks from hurricanes, severe storms, floods and other forms of severe weather, accidents, fires, earthquakes, terrorist acts and epidemic or pandemic diseases such as the coronavirus, any of which could result in suspension of operations or harm to people or the environment. While all of the Company’s operations are located in the United States, the Company participates in a global supply chain, and if governments regulate or restrict the flow of labor or products or impede the travel of Company personnel, the Company’s ability to conduct normal business operations could be impacted which could adversely affect the Company’s results of operations and liquidity.
Item 1B. UNRESOLVED STAFF COMMENTS
None.
Item 1C. CYBERSECURITY
The Company maintains a cybersecurity program that is aligned with its business and has established policies and processes for assessing, identifying, and managing material risk from cybersecurity threats, which have been integrated into its overall risk management processes and governance structure.
The Company has implemented and invested in, and will continue to implement and invest in, controls, technologies, and resources (both internal and external) that are designed to identify, protect against, detect, respond to and mitigate cybersecurity risks, in alignment with frameworks established by the National Institute of Standards and Technology. These include, but are not limited to, internal reporting mechanisms, monitoring and detection tools, threat intelligence, and general and role-based training. The Company also maintains third party management processes to identify and manage the cybersecurity risks associated with third party service providers.
The Company periodically evaluates its cybersecurity program internally and by engaging with consultants to conduct reviews and assessments of the program. Such reviews and assessments may include penetration testing, maturity assessments as well as table-top and other exercises with subsequent remediation of key findings. Additionally, the Company has a Cybersecurity Task Force in place that is comprised of individuals across various departments within the organization including information systems, legal, finance, human resources and internal audit which meets regularly to further advance the Company’s cybersecurity strategy.
The Board of Directors (the “Board”) oversees NACCO's risk management. The full Board regularly reviews information provided by management to oversee risk identification, risk management and risk mitigation strategies. The Audit Review Committee assists the Board with cybersecurity risk oversight. The Audit Review Committee is responsible for regularly reviewing and discussing with management risk exposure relating to cybersecurity, which includes reviewing the state of the Company's cybersecurity program and emerging cybersecurity developments and threats, as well as the steps management has taken to monitor and mitigate such exposure. In 2023, the Board and the Audit Review Committee received periodic updates throughout the year on cybersecurity matters and these updates are part of their standing agendas.
The Company’s Chief Information Security Officer ("CISO") leads the Company’s cybersecurity program and is responsible for the management of its cybersecurity risks. The CISO has extensive cybersecurity knowledge and skills gained from over 30 years of technical and business experience, including as General Manager & President of MLMC, Vice President of Mississippi Operations and Vice President of Innovation & Technology. The CISO holds a bachelor’s degree in engineering, an executive MBA, and certifications in cybersecurity from Harvard. Additionally, the CISO is currently enrolled in an Executive course through Northwestern’s Kellogg School of Management focused on artificial intelligence (“AI”). The CISO reports directly to the President and Chief Executive Officer. The CISO manages a team of internal and external resources that have expertise and experience in cybersecurity. The CISO is informed of cybersecurity incidents by the cybersecurity team, which is generally responsible for monitoring the prevention, detection, mitigation, and remediation of cybersecurity incidents. The Company has an established process governing its assessment, response and internal and external notifications upon the occurrence of a cybersecurity incident, including evaluation of the potential impacts of cybersecurity incidents to determine materiality. Depending on the nature and severity of an incident, this process provides for escalation procedures upon discovery of material cybersecurity risks, including notification to the Company’s executive management and/or Board.
As of the date of this filing, the Company’s business strategy, results of operations, and financial condition have not been materially impacted as a result of any previously identified cybersecurity incidents; however, we cannot provide assurance that they will not be materially impacted in the future by such risks or any future material incidents. For additional information regarding the Company’s cybersecurity risks, please refer to "Item 1A - “Risk Factors” on page 19.
Item 2. PROPERTIES
Coal Mining Segment - Operations
NACCO-owned Properties
1.0 INTRODUCTION
Information concerning the Company’s mining properties in this Form 10-K have been prepared in accordance with the requirements of subpart 1300 of Regulation S-K. As used in this Report on Form 10-K, the terms “mineral resource,” “measured mineral resource,” “indicated mineral resource,” “inferred mineral resource,” “mineral reserve,” “proven mineral reserve” and “probable mineral reserve” are defined and used in accordance with subpart 1300 of Regulation S-K. Under subpart 1300 of Regulation S-K, mineral resources may not be classified as “mineral reserves” unless the determination has been made by a qualified person that the mineral resources can be the basis of an economically viable project. Readers are specifically cautioned not to assume that any part or all of the mineral deposits (including any mineral resources) in these categories will ever be converted into mineral reserves, as defined by the subpart 1300 of Regulation S-K.
Readers are cautioned that, except for that portion of mineral resources classified as mineral reserves, mineral resources do not have demonstrated economic value. Inferred mineral resources are estimates based on limited geological evidence and sampling and have too high of a degree of uncertainty as to their existence to apply relevant technical and economic factors likely to influence the prospects of economic extraction in a manner useful for evaluation of economic viability. Estimates of inferred mineral resources may not be converted to a mineral reserve. It cannot be assumed that all or any part of an inferred mineral resource will ever be upgraded to a higher category. A significant amount of exploration must be completed in order to determine whether an inferred mineral resource may be upgraded to a higher category. Therefore, readers are cautioned not to assume that all or any part of an inferred mineral resource exists, that it can be the basis of an economically viable project, or that it will ever be upgraded to a higher category. Likewise, readers are cautioned not to assume that all or any part of measured or indicated mineral resources will ever be converted to mineral reserves. See "Item 1A - “Risk Factors” on page 19.
The information that follows is derived, for the most part, from, and in some instances is an extract from, the technical report summary (“TRS”) prepared in compliance with the Item 601(b)(96) and subpart 1300 of Regulation S-K. The TRS was prepared by employees of the Company. Portions of the following information are based on assumptions, qualifications and procedures that are not fully described herein. Reference should be made to the full text of the TRS, incorporated herein by reference and made a part of this Report on Form 10-K. The information regarding MLMC was reviewed by employees of the Company that are qualified persons as defined by subpart 1300 of Regulation S-K.
Coteau, Falkirk, Coyote Creek and MLMC, each wholly-owned subsidiaries of NACCO, operate surface coal mines under long-term contracts with power generation companies pursuant to a service-based business model.
Locations of the properties subject to SEC Section 1300 reporting are shown in Figure 1.1 Surface Coal Mines Operational During 2023 Subject to SEC Section 1300 Reporting.
Figure 1.1 Surface Coal Mines Operational During 2023 Subject to SEC Section 1300 Reporting
A summary of coal production at the Mines subject to SEC Section 1300 Reporting for the past three years has been tabulated and is presented on Table 1.1 Production Summary.
|
|
|
|
|
|
|
|
|
|
|
|
|
Tons (in millions) |
|
2021 |
2022 |
2023 |
The Coteau Properties Company |
12.5 |
13.4 |
11.4 |
The Falkirk Mining Company |
7.9 |
7.6 |
6.6 |
Coyote Creek Mining Company |
2.0 |
1.8 |
2.2 |
Mississippi Lignite Mining Company |
3.0 |
3.2 |
2.7 |
Totals |
25.4 |
26.0 |
22.9 |
Table 1.1 Production Summary
2.0 MINING PROPERTIES SUBJECT TO SUBPART 1300 OF REGULATION S-K REPORTING
2.1 Red Hills Mine — Mississippi Lignite Mining Company
MLMC is the owner and operator of the Red Hills Mine. The Red Hills Mine is a lignite surface mine in production. Prior to MLMC, there were no previous mining operations on the Red Hills Mine property.
The MLMC contract is the only operating coal contract in which the Company is responsible for all operating costs, capital requirements and final mine reclamation; therefore, MLMC is consolidated within NACCO’s financial statements. MLMC sells coal to its customer at a contractually agreed-upon price which adjusts monthly, primarily based on changes in the level of established indices which reflect general U.S. inflation rates. Profitability at MLMC is affected by customer demand for coal and changes in the indices that determine sales price and actual costs incurred.
A summary of coal production at MLMC for the past three years has been tabulated and is presented on Table 2.1 Production Summary.
|
|
|
|
|
|
|
|
|
|
|
|
|
Tons (in millions) |
|
2021 |
2022 |
2023 |
Mississippi Lignite Mining Company |
3.0 |
3.2 |
2.7 |
Table 2.1 Production Summary
The Red Hills Mine generally produces between 2 million and 3 million tons of lignite coal annually. The Red Hills Mine started delivering coal in 2000. All production from the mine is delivered to its customer's Red Hills Power Plant. On December 18, 2023, MLMC received a force majeure event notice from its customer related to an issue that began on December 15, 2023 and impacted one of two boilers at the Red Hills Power Plant. The notice did not provide a timeline for resolution of the issue. As of March 6, 2024, the impacted boiler is still not operational. The prolonged mechanical issue is expected to result in a reduction in customer demand and will have a significant impact on the Company's results of operations during 2024.
The Red Hills Mine, operated by MLMC, is located approximately 120 miles northeast of Jackson, Mississippi (Figure 2.1). The entrance to the mine is by means of a paved road located approximately one mile west of Highway 9. MLMC owns in fee approximately 8,026 acres of surface interest and 5,015 acres of coal interests. MLMC holds leases granting the right to mine approximately 5,490 acres of coal interests and the right to utilize approximately 4,956 acres of surface interests. MLMC holds subleases under which it has the right to mine approximately 1,663 acres of coal interest. The majority of the leases held by MLMC were originally acquired during the mid-1970s to the early 1980s with terms extending 50 years, many of which can be further extended by the continuation of mining operations. The lignite deposits of the Gulf Coast are found primarily in a narrow band of strata that outcrops/subcrops along the margin of the Mississippi Embayment. The potentially exploitable tertiary lignites in Mississippi are found in the Wilcox Group. The outcropping Wilcox is composed predominately of non-marine sediments deposited on a broad flat plain.
The towns of Ackerman, Eupora, Starkville, Louisville, Kosciusko, and numerous smaller communities are within a 40-mile radius of the Red Hills Mine and provide a vast employment base. Furthermore, Mississippi State University (MSU) is located approximately 30 miles east of the mine in Starkville. MLMC has a history of partnership with MSU as well as the local community colleges for science, technology, engineering, and mathematics (STEM) research and skilled trades training.
The Red Hills Mine sources power for mine office facilities and operations from 4-County Electric Power Association, and water for the mine office facilities from the Choctaw Water Association. Fuel for equipment is supplied by Dickerson Petroleum located in Kosciusko. The Red Hills Mine has, or is currently constructing, all supporting infrastructure for mining operations.
Local access to the Red Hills Mine is by way of Highway 9 between Ackerman, Mississippi and Eupora, Mississippi which connects to Pensacola Road that leads to the Red Hills Mine paved access road. Pensacola Road connects with Highway 9 approximately 5 miles north of Ackerman, MS. The mine road is approximately 1 mile west from Highway 9 along Pensacola Road.
Travel to the Red Hills Mine by air is possible using the Jackson-Medgar Wiley Evers International Airport in Jackson, Mississippi, approximately 104 miles south of the mine, and then using ground transportation, traveling via Highway 25, Highway 15, and Highway 9. Alternatively, the Golden Triangle Regional Airport is a smaller airport approximately 50 miles from the Red Hills Mine by means of Highway 82 west, Highway 15 south, and Highway 9 north.
The Red Hills Mine is in close proximity to river ports of the Tennessee-Tombigbee Waterway and the Mississippi River. The Lowndes County Port is approximately 60 miles east of the mine. The Port of Greenville is approximately 135 miles west of the mine, and the Port of Vicksburg, approximately 150 miles southwest of the mine. All ports are connected by major state and federal highways.
In addition to transportation via roadways, air and waterways, the Kansas City Southern (KCS) railroad has a depot located approximately 5 miles south of the mine in Ackerman, and is accessible by Highway 9 and Highway 15. MLMC currently has all permits in place for the Red Hills Mine to operate and adhere to a mine plan projected through April 1, 2032. No mineral processing occurs at the Red Hills Mine.
The geology encountered at the Red Hills Mine is stratigraphic in nature with depositional sequences of sands, silts, clays, and lignite. The vertical repetition of geologic strata facilitated a straightforward setting to establish and study the baseline geological, geochemical, geotechnical, and geohydrological conditions at the Red Hills Mine.
Development of the Red Hills Mine began in 1997, with full commercial deliveries commencing in 2002. The mining operation is comprised of four major equipment fleets. Primary removal of burden is achieved with one 82-cubic yard electric-powered dragline, four large track-type push dozers, and a truck and shovel fleet utilizing a 41-cubic yard electric rope shovel. Lignite is mined using a surface miner or a hydraulic backhoe to load a fleet of end dump haul trucks, and is directly shipped to the RHPP or the lignite stockpile. The overall average quality of the mined lignite seams meets the required power plant quality specifications. Therefore, no mineral processing is performed by MLMC.
The mine office facilities and original equipment fleets at the Red Hills Mine were constructed, acquired, or purchased new during the development stage of the mine. The facilities and equipment are maintained to allow for safe and efficient operation. The equipment is well maintained, in good physical condition and is either updated or replaced periodically with newer models or upgrades available to keep up with modern technology. As equipment wears out, MLMC evaluates what replacement option will be the most cost-efficient, including the evaluation of both new and used equipment.
The total cost of the property and equipment, net of applicable accumulated amortization, depreciation and impairment as of December 31, 2023 is $52.8 million.
The Red Hills Mine currently has no significant encumbrances to the property. No mining permit violations have been issued at the Red Hills Mine in the past ten years. One notice of violation ("NOV") was issued in April 2020 for a water quality exceedance that was determined to not be the fault of Red Hills Mine and no further action was required. A second NOV was issued in June 2022 for a water sampling violation. Both NOVs were not related to the mining permit. Permitting requirements are discussed in Section 17.0 of the TRS.
Figure 2.1 – Red Hills Mine Location
Mineral Resources and Reserves have been summarized from the December 31, 2022 TRS for MLMC and have been modified from mining depletion. The Mineral Resources and Mineral Reserves as of December 31, 2023 are included as Table 2.2 and Table 2.3. Coal qualities are reported on an as-received moisture basis. Based on the December 31, 2022 TRS, prices in Table 2.2 are based on economic cut-off grades of $29.66 per ton at MLMC and prices in Table 2.3 are based on economic cut-off grades of $36.06 per ton at MLMC.
Material assumptions and criteria used in the determination of Mineral Resource and Mineral Reserves reported herein are provided within the filed TRS for the Mississippi Lignite Mining Company – Red Hills Mine dated December 31, 2022.
Section 11.0 of the TRS describes the key assumptions, parameters, and methods used for the estimation of Mineral Resources. Assumptions include a maximum cumulative stripping ratio of 18:1 based on an assumed lignite sales price of $29.66 per ton. A further description of the verified drilling data used to model the lignite deposit for estimation of Mineral Resources is provided in Section 7.2 Drilling Exploration, 8.0 Sample Preparation, Analyses, and Security, and Section 9.0 Data Verification.
Section 12.0 of the TRS describes the key assumptions, parameters, and methods used for the estimation of Mineral Reserves, and include the following:
•Maximum stripping ratio: 14:1;
•Mining production rates on a cubic yard and per ton basis remain relatively consistent with historical performance;
•Mining costs on a unit basis remain relatively consistent with historical performance;
•Minimum minable lignite thickness: 1.0 feet;
•Minimum parting thickness before seams are composited: 6.0 inches;
•Maximum depth of mining: approximately 320 feet;
•Lignite density defined by seam from coal core drilling data and modified by dilution parameters and approximately 80 lb/ft³; and
•Recovery rates by seam ranging from 67% to 100%.
Modifying factors including dilution parameters and technical information related to the mining process are described in detail under Section 13.0 Mining Methods. Economic factors to support the Mineral Reserve estimates are described in Section 18.0 Capital and Operating Costs and 19.0 Economic Analyses.
The Mineral Resources as of December 31, 2023 presented in Table 2.2 below have been estimated by applying a series of geologic and physical limits as well as high-level mining and economic constraints. The mining and economic constraints were limited to a level sufficient to support reasonable prospect for future economic extraction of the estimated Mineral Resources. The categorized Mineral Resources reported herein are exclusive of Mineral Reserves.
|
|
|
|
|
|
|
|
|
|
|
|
|
|
|
|
|
|
|
|
|
Lignite Coal |
Resource Classification |
Tonnage
(Kiloton "Kt")
|
Grades/Qualities |
Calorific Value (Btu/lb) |
Moisture (%wt) |
Ash (%wt) |
Sulfur (%wt) |
Mississippi Lignite Mining Company |
Measured |
4,300 |
5,210 |
44.6 |
12.8 |
0.6 |
Mississippi Lignite Mining Company |
Indicated |
500 |
5,300 |
43.6 |
12.7 |
0.7 |
Mississippi Lignite Mining Company |
Measured + Indicated |
4,800 |
5,220 |
44.5 |
12.8 |
0.6 |
Mississippi Lignite Mining Company |
Inferred |
1,600 |
5,370 |
46.0 |
9.9 |
0.5 |
Note:
–Mineral Resources that are not Mineral Reserves do not have demonstrated economic viability and there is no certainty that all or any part of such Mineral Resources will be converted into Mineral Reserves.
–Mineral Resources are in-situ and exclusive of 22.5 million tons (Mt) of Mineral Reserves.
–Mineral Resources are reported using an economic cutoff of $29.66 per ton.
–Resources are presented with a minimum 1 foot seam thickness, a maximum as received moisture basis ash content of 30%, and a minimum calorific value of 4000 BTUs on an as received moisture basis cutoff.
–Resources are estimated using Vulcan Software.
–Tonnages and qualities have been rounded to an accuracy level deemed appropriate by the QP. Summation errors due to rounding may exist.
Table 2.2 Mineral Resources Summary as of December 31, 2023
The Mineral Reserves as of December 31, 2023 presented in Table 2.3 below were determined to be the economically mineable portion of the measured and indicated Mineral Resources after the consideration of modifying factors related to the mining process. Inferred Mineral Resources were not considered for Mineral Reserves.
|
|
|
|
|
|
|
|
|
|
|
|
|
|
|
|
|
|
|
|
|
| Lignite Coal |
Reserve Classification |
Tonnage
(Kt) |
Grades/Qualities |
| Calorific Value (Btu/lb) |
Moisture (%wt) |
Ash (%wt) |
Sulfur (%wt) |
| Mississippi Lignite Mining Company |
Proven |
15,100 |
5,102 |
43.4 |
14.8 |
0.6 |
| Mississippi Lignite Mining Company |
Probable |
7,400 |
5,120 |
42.5 |
15.2 |
0.7 |
| Mississippi Lignite Mining Company |
Total |
22,500 |
5,107 |
43.1 |
14.9 |
0.6 |
Note:
–Mineral Reserves have been demonstrated to be economic based on a positive cash flow
–Mineral Reserves are stated on a Run of Mine basis
–An economic cutoff in the Life of Mine plan averaged $36.06 per ton and was used to demonstrate coal reserves
–Recovery varies by coal seam and ranges from 67% to 100%
–Mineral Reserves use an economic cut-off of a maximum cumulative stripping ratio of 14:1. There are some instances where the stripping ratio for a single year could exceed 14:1, but the average for the entire area evaluated is less than 14:1.
–Historical coal recovery rates at Red Hills Mine have been applied to generate the Mineral Reserve tonnages.
–Mineral Reserves are estimated using Vulcan Software.
–Tonnages and qualities have been rounded to an accuracy level deemed appropriate by the Qualified person ("QP"). Summation errors due to rounding may exist.
Table 2.3 Mineral Reserves Summary as of December 31, 2023
Table 2.4 describes the difference between the Mineral Reserves and Mineral Resources reported as of December 31, 2022 and December 31, 2023.
|
|
|
|
|
|
|
|
|
|
|
|
| Resource Classification |
December 31, 2022 Tonnage (Kt) |
December 31, 2023 Tonnage (Kt) |
Percent Change |
| Measured |
4,300 |
4,300 |
—% |
| Indicated |
500 |
500 |
—% |
| Measured + Indicated |
4,800 |
4,800 |
—% |
| Inferred |
1,600 |
1,600 |
—% |
|
|
|
|
| Reserve Classification |
December 31, 2022 Tonnage (Kt) |
December 31, 2023 Tonnage (Kt) |
Percent Change |
| Proven |
18,000 |
15,100 |
(16)% |
| Probable |
7,400 |
7,400 |
—% |
| Proven + Probable |
25,400 |
22,500 |
(11)% |
Table 2.4. Net difference of reported Mineral Resources and Mineral Reserves from previous reporting period to current reporting period.
The Mineral Resources and Mineral Reserves as of December 31, 2023 reflect modifications from mining extraction of Mineral Reserves. No updates to Mineral Resources were made for 2023. Mineral Reserves have been exhausted in Mine Area 1 and mining extraction is occurring in Mine Area 3. Additionally, MLMC delivered 2.9 million tons during 2023.
2.2 Material Properties with no Mineral Resources or Mineral Reserves
The lignite coal tonnages at Coteau, Falkirk and Coyote Creek have not been classified as “measured resources”, “indicated resources”, or “inferred resources” as defined in Items 1300 through 1305 of Regulation S-K, and as a result, do not have any “proven” or “probable” reserves under such definition and are therefore classified as an “Exploration Stage Property” pursuant to Items 1300 through 1305 of Regulation S-K. Coteau, Falkirk and Coyote Creek will continue to be classified as exploration stage properties until such time as proven or probable mineral reserves have been established in accordance with subpart 1300 of Regulation S-K, even though they continue to deliver lignite to their respective customers.
At Coteau, Coyote Creek and Falkirk, the Company is paid a management fee per ton of coal or heating unit (MMBtu) delivered. Each contract specifies the indices and mechanics by which fees change over time, generally in line with broad measures of U.S. inflation. The customers are responsible for funding all mine operating cost, including final mine reclamation, and directly or indirectly providing all of the capital required to build and operate the mine. This contract structure eliminates the Company's exposure to spot coal market price fluctuations.
Coteau, Coyote Creek and Falkirk each have only one customer for which they extract and deliver coal. These customers operate coal-fired electric generation power plants adjacent to each mine location (and in the case of Coteau, a synthetic natural gas and chemical/fertilizer production facility).
The sales price under the Coteau, Coyote Creek and Falkirk contracts are not market driven. Unlike traditional sales made based on market factors, under the provisions of the long-term mining agreements, the coal sales price at Coteau, Coyote Creek and Falkirk includes (i) all costs incurred to extract, process and deliver coal (i.e. the cost of production) and (ii) the agreed-upon profit per ton of coal or MMBtu unit delivered to the customer. Cost of production includes all the costs actually incurred in the operation of the mine including mining, processing and delivery of coal. Costs included within revenue include all production, transportation and maintenance costs including, without limitation, the following types of costs:
◦Labor, which include wages and all related payroll taxes, benefits and fringes, including welfare plans; group insurance, vacations and other comparable benefits of employees
◦Materials and supplies,
◦Tools,
◦Machinery and equipment not capitalized or leased,
◦Costs of acquiring interests in coal reserves and surface lands,
◦Rental of machinery and equipment,
◦Power costs,
◦Reasonable and necessary services by third parties
◦Insurance including worker’s compensation
◦Certain taxes, and
◦Cost of reclamation
The contractually-determined coal sales price includes reimbursement of all costs incurred and the agreed-upon profit. The agreed-upon profit adjusts based on changes in the level of established indices (e.g., CPI-U and/or PPI indices). The cost-plus nature of the contracts provide assurance that all costs incurred, including contemporaneous and final reclamation, will be reimbursed by the respective customer and negates any risk of loss which allows the mines to remain cash flow positive through the end of the contract terms. The coal sales price as well as profitability at Coteau, Falkirk and Coyote Creek are not subject to any change based on market factors. Profitability at these mines is affected by two factors: demand for coal (because this impacts units of agreed profit that are charged) and changes in the indices that determine coal sales price (because this adjusts the agreed-upon per unit profit). Under any scenario, Coteau, Coyote Creek and Falkirk will be cash flow positive as a result of the terms of the mining agreements.
Extraction of Coteau, Coyote Creek and Falkirk’s lignite tonnages is only economically viable as a result of the long-term mining agreements in place with each mine’s respective customer. The development of the Coteau, Coyote Creek and Falkirk mines was conducted in tandem with the development of the respective mine mouth power plants each serve. The power plants were designed to operate exclusively on the coal provided by the adjacent mines. No other market exists for the lignite at Coteau, Coyote Creek and Falkirk as the cost of transportation makes sales to any entity other than the current mine-mouth operator unprofitable.
Coteau, Coyote Creek and Falkirk meet the definition of a variable interest entity (“VIE”). In each case, NACCO is not the primary beneficiary of the VIE as it does not exercise financial control; therefore, NACCO does not consolidate the results of these operations within its financial statements. Instead, these contracts are accounted for as equity method investments. The income before income taxes associated with these VIEs is reported as Earnings of unconsolidated operations on the Consolidated Statements of Operations, and the Company’s investment is reported on the line Investments in unconsolidated subsidiaries in the Consolidated Balance Sheets.
Coteau
The Freedom Mine, operated by Coteau, generally produces between 12.5 million and 13.5 million tons of lignite coal annually. The mine started delivering coal in 1983. All production from the mine is delivered to Dakota Coal Company, a wholly owned subsidiary of Basin Electric. Dakota Coal Company then sells the coal to the Synfuels Plant, Antelope Valley Station and Leland Olds Station, all of which are operated by affiliates of Basin Electric. The Synfuels Plant is a coal gasification plant that manufactures synthetic natural gas and produces fertilizers, solvents, phenol, carbon dioxide, and other chemical products for sale. Although the term of the existing lignite sales agreement terminates in 2027, the term may be extended for two additional periods of five years, or until 2037, at the option of Coteau.
The Freedom Mine is located approximately 90 miles northwest of Bismarck, North Dakota (Figure 2.2). The main entrance to the Freedom Mine is accessed by means of a paved road and is located on County Road 15. Coteau holds 368 leases granting the right to extract approximately 33,676 acres of coal interests and the right to utilize approximately 23,451 acres of surface interests. In addition, Coteau owns in fee 33,888 acres of surface interests and 4,107 acres of coal interests. Substantially all of the leases held by Coteau were acquired in the early 1970s and have been replaced with new leases or have lease terms for a period sufficient to meet Coteau’s contractual production requirements.
Figure 2.2 – Freedom Mine Location
The towns of Beulah, Hazen, and Stanton along with other smaller communities are within a 40-mile radius of the Freedom Mine and provide a vast supply of the employment base. Employees also come from the cities of Bismarck, Minot, and Dickinson, all of which are less than 100 miles away from the mine.
The Freedom Mine sources power for mine office facilities and operations from Roughrider Electric Cooperative, and water for the mine office facilities from the Southwest Water Authority. Fuel for equipment is supplied by multiple local vendors. The Freedom Mine has, or is currently constructing, all supporting infrastructure for mining operations.
The main entrance to the Freedom Mine is accessed by traveling north of Beulah on Highway 49 for one mile, then north on County Road 21 for two miles, then west on County Road 26 for three miles, and then north on County Road 15 for two miles as shown on Figure 2.2. Location of the Freedom Mine.
Travel to the Freedom Mine by air is possible by means of the Bismarck Municipal Airport, Bismarck, ND, which is approximately 90 miles southeast of the mine. From the airport, the mine is accessed by means of ground transportation by traveling west approximately 50 miles via Interstate 94, taking exit 110 and traveling north approximately 28 miles on ND Highway 49 to Beulah, ND, and so on as explained in the previous paragraph.
Travel to the Freedom Mine by rail is possible using the Amtrak Network, which runs through northern North Dakota mostly along the US Highway 2 corridor, and passes through the larger cities of Williston, Minot, Grand Forks, and Fargo, and smaller cities of Stanley, Rugby, and Devils Lake. From these locations, the mine can be accessed via ground transportation on Interstate 29 or Interstate 94 and various highways. The main highways are US Highway 2, US Highway 83, US Highway 85, US Highway 200, and US Highway 281.
North Dakota’s freight rail service is largely provided by Burlington Northern Santa Fe Railway and Canadian Pacific Railway.
The coal tonnages are located in Mercer County, North Dakota, starting approximately two miles north of Beulah, North Dakota. The formations of sedimentary origin were deposited in the Williston Basin, the dominant structural feature of western North Dakota. The center of the basin is located near the city of Williston, North Dakota, approximately 100 miles northwest of the Freedom Mine. The economically mineable coal occurs in the Sentinel Butte Formation, and is overlain by the Coleharbor Formation. The Coleharbor Formation unconformably overlies the Sentinel Butte Formation. It includes all of the unconsolidated sediments resulting from deposition during glacial and interglacial periods. Lithologic types include gravel, sand, silt, clay and till. The modified glacial channels are in-filled with gravels, sands, silts and clays overlain by till. The coarser gravel and sand beds are generally limited to near the bottom of the channel fill. The general stratigraphic sequence in the upland portions of the reserve area consists of till, silty sands and clayey silts.
Fill-in drilling programs are routinely conducted by Coteau for the purpose of refining guidance related to ongoing operations. It is common practice at the Freedom Mine to tighten the drilling density within the three to four-year block ahead of active operations to an average drill hole spacing of 660-feet. However, additional exploration may also be scheduled in areas farther out to increase confidence in future mine plan projections.
Coteau utilizes standard surface mining techniques to extract coal from the proposed permit area. Mining operations will typically occur in a sequence of seven events: suitable plant growth material removal, overburden removal, coal removal, overburden replacement, final grading, suitable plant growth material replacement, and revegetation.
The mine office facilities and original equipment fleets at the Freedom Mine were constructed, acquired, or purchased new during the development stage of the mine. The facilities and equipment are maintained to allow for safe and efficient operation. The equipment is well maintained, in good physical condition and is either updated or replaced periodically with newer models or upgrades available to keep up with modern technology. As equipment wears out, Coteau evaluates what replacement option will be the most cost-efficient, including the evaluation of both new and used equipment.
The total cost of the property, plant and equipment, net of applicable accumulated amortization, depreciation and impairment as of December 31, 2023 is $116.2 million.
The Freedom Mine currently has no significant encumbrances to the property. No NOVs have been issued at the Freedom Mine in the past three years. Coteau currently has all permits in place for the Freedom Mine to operate through 2031. Permit expansions required to extend the life of the mine through 2045 will be acquired as needed. No mineral processing occurs at the Freedom Mine.
Falkirk Mine
The Falkirk Mine generally produces between 7 million and 8 million tons of lignite coal annually. The mine started delivering coal in 1978 primarily for the Coal Creek Station, an electric power generating station. Coal Creek Station was owned by GRE until May 1, 2022 when it was purchased by Rainbow Energy. The initial production period is expected to run through May 1, 2032, but the coal sales agreement may be extended or terminated early under certain circumstances. In 2014, Falkirk began delivering coal to Spiritwood Station, another electric power generating station owned by GRE.
The Falkirk Mine, operated by Falkirk, is located approximately 50 miles north of Bismarck, North Dakota on a paved access road off U.S. Highway 83 (Figure 2.3). Falkirk holds 338 leases granting the right to extract approximately 43,648 acres of coal interests and the right to utilize approximately 23,844 acres of surface interests. In addition, Falkirk owns in fee 40,826 acres of surface interests and 1,788 acres of coal interests. Substantially all of the leases held by Falkirk were acquired in the early 1970s with initial terms that have been further extended by the continuation of mining operations.
The towns of Underwood and Washburn are located within ten miles of the mine, with other small communities also nearby. Numerous employees also reside in Bismarck and Mandan, a distance of about 50 miles.
The Falkirk Mine receives both its power and water from Coal Creek Station. However, Falkirk’s East shift change building receives water from McLean-Sheridan Rural Water. Fuel for equipment is supplied by multiple local vendors including: Farstad Oil, Missouri Valley Petroleum, and Enerbase Cooperative Resources.
The main entrance to the Falkirk Mine is accessed by traveling north from Bismarck on State Highway 83 for approximately 50 miles, then going west on the access road, 1st Street SW located four miles south of Underwood. The mine office is located two miles to the west.
Travel to the Falkirk Mine by air is possible using the Bismarck Airport in Bismarck, ND, approximately 55 miles south of the mine, and then using ground transportation, traveling via US Highway 83.
The main railway systems near the Falkirk Mine are Canadian Pacific, BNSF, and Dakota Missouri Valley & Western (DMVW). DMVW crosses through the Falkirk Mine Reserve.
The coal tonnages are located in McLean County, North Dakota, from approximately nine miles northwest of the town of Washburn, North Dakota to four miles north of the town of Underwood, North Dakota. Structurally, the area is located on an intercratonic basin containing a thick sequence of sedimentary rocks. The economically mineable coal occurs in the Sentinel Butte Formation and the Bullion Creek Formation and are unconformably overlain by the Coleharbor Formation. The Sentinel Butte Formation conformably overlies the Bullion Creek Formation. The general stratigraphic sequence in the upland portions of the reserve area (Sentinel Butte Formation) consists of till, silty sands and clayey silts, main hagel lignite bed, silty clay, lower lignite of the hagel lignite interval and silty clays. Beneath the Tavis Creek, there is a repeating sequence of silty to sand clays with generally thin lignite beds.
Operationally, overburden and interburden removal are accomplished using scrapers, dozers, front end loaders, truck shovel fleets, and draglines. Lignite is mined with front end loaders or hydraulic backhoes, and loaded into haul trucks to transport to the stockpile or directly to the customer via truck dumps and conveyors.
Fill-in drilling programs are routinely conducted by Falkirk for the purpose of refining guidance related to ongoing operations. It is common practice at the Falkirk Mine to tighten the drilling density within the three to four-year block ahead of active operations to an average drill hole spacing of 1320-feet. However, additional exploration may also be scheduled in areas farther out to increase confidence in future mine plan projections.
The mine office facilities and original equipment fleets at the Falkirk Mine were constructed, acquired, or purchased new during the development stage of the mine. The facilities and equipment are maintained to allow for safe and efficient operation. The equipment is well maintained, in good physical condition and is either updated or replaced periodically with newer models or upgrades available to keep up with modern technology. As equipment wears out, Falkirk evaluates what replacement option will be the most cost-efficient, including the evaluation of both new and used equipment.
The total cost of the property, plant and equipment, net of applicable accumulated amortization, depreciation and impairment as of December 31, 2023 is $58.4 million.
The Falkirk Mine currently has no significant encumbrances to the property. No Notice of Violations (NOVs) have been issued at the Falkirk Mine in the past three years. There are no outstanding permits related to the LOM plan awaiting regulatory approval. The Falkirk Mining Company currently has all permits in place to operate and adhere to the current mine plan. No mineral processing occurs at the Falkirk Mine.
Figure 2.3 – Falkirk Mine Location
Coyote Creek
The Coyote Creek Mine generally produces between 1.5 million and 2.0 million tons of lignite annually. The mine began delivering coal in 2016 to the Coyote Station owned by Otter Tail Power Company, Northern Municipal Power Agency, Montana-Dakota Utilities Company and Northwestern Corporation. The term of the existing lignite sales agreement terminates in 2040.
The Coyote Creek Mine is located approximately 70 miles northwest of Bismarck, North Dakota (Figure 2.4). The main entrance to the Coyote Creek Mine is accessed by means of a four-mile paved road extending west off of State Highway 49. Coyote Creek holds a sublease to 86 leases granting the right to mine approximately 8,129 acres of coal interests and the right to utilize approximately 15,168 acres of surface interests. In addition, Coyote Creek Mine owns in fee 160 acres of surface interests and has four easements to conduct coal mining operations on approximately 352 acres.
Figure 2.4 – Coyote Creek Mine Location
The towns of Beulah, Hazen, and Stanton along with other smaller communities are within a 40-mile radius of the Coyote Creek Mine and provide a vast supply and employment base. A vast supply and employment base also come from some of the major cities of Bismarck, Minot, and Dickinson, all of which are less than 100 miles away from the mine.
The Coyote Creek Mine sources power for mine office facilities and operations from Roughrider Electric Cooperative and Montana-Dakota Utilities Co., and water for the mine office facilities from the Southwest Water Authority. Fuel for equipment is supplied by multiple local vendors. The Coyote Creek Mine has all supporting infrastructure for mining operations.
The main entrance to the mine will be accessed by traveling south of Beulah on Highway 49 for five miles, then west on County Road 25 for four miles. The general location of the Coyote Creek Mine is shown in Figure 1.0 Location of Coyote Creek Mine.
Travel to the Coyote Creek Mine by air is possible using the Bismarck Municipal Airport, Bismarck, ND, approximately 75 miles southeast of the mine. From the airport, the mine is accessed using ground transportation by traveling west approximately 50 miles via Interstate 94, taking exit 110 and traveling north approximately 21 miles on ND Highway 49 to County Road 25, then west for four miles on County Road 25.
Travel to the Coyote Creek Mine by rail is possible using the Amtrak Network, which runs through northern North Dakota mostly along the US Highway 2 corridor, and passes through the larger cities of Williston, Minot, Grand Forks, and Fargo, and smaller cities of Stanley, Rugby, and Devils Lake. From these locations, the mine can be accessed via ground transportation on Interstate 29 or Interstate 94 and various highways. The main highways are US Highway 2, US Highway 83, US Highway 85, US Highway 200, and US Highway 281.
North Dakota’s freight rail service is largely provided by Burlington Northern Santa Fe Railway and Canadian Pacific Railway.
The coal tonnages are located in Mercer County, North Dakota, starting approximately six miles southwest of Beulah, North Dakota. The formations of sedimentary origin were deposited in the Williston Basin, the dominant structural feature of western North Dakota. The center of the basin is located near the city of Williston, North Dakota, approximately 110 miles northwest of the Coyote Creek Mine. The economically mineable coal occurs in the Sentinel Butte Formation, and is overlain by the Coleharbor Formation. The Coleharbor Formation unconformably overlies the Sentinel Butte Formation. It includes all of the unconsolidated sediments resulting from deposition during glacial and interglacial periods. Lithologic types include gravel, sand silt, clay and till. The modified glacial channels are in-filled with gravels, sands, silts and clays overlain by till. The coarser gravel and sand beds are generally limited to near the bottom of the channel fill. The general stratigraphic sequence in the upland portions of the reserve area consists of till, silty sands and clayey silts.
Fill-in drilling programs are routinely conducted by Coyote Creek for the purpose of refining guidance related to ongoing operations. It is common practice at the Coyote Creek Mine to tighten the drilling density within the three to four-year block ahead of active operations to an average drill hole spacing of 660-feet. However, additional exploration may also be scheduled in areas farther out to increase confidence in future mine plan projections.
Operationally, overburden removal is accomplished using scrapers, dozers, front end loaders, excavators, truck fleets, and a dragline. Lignite is mined with front end loaders, and loaded into haul trucks to transport to the coal stockpile.
The mine office facilities and original equipment fleets at the Coyote Creek Mine were constructed, acquired, or purchased during the development stage of the mine. The facilities and equipment are maintained to allow for safe and efficient operation. The equipment is well maintained, in good physical condition and is either updated or replaced periodically with newer models or upgrades available to keep up with modern technology. As equipment wears out, Coyote Creek evaluates what replacement option will be the most cost-efficient, including the evaluation of both new and used equipment.
The total cost of the property, plant and equipment, net of applicable accumulated amortization, depreciation and impairment as of December 31, 2023 is $114.6 million.
The Coyote Creek Mine currently has no significant encumbrances to the property. No NOVs have been issued at the Coyote Creek Mine in the past three years. There are no outstanding permits related to the LOM plan awaiting regulatory approval. Coyote currently has all permits in place for the Coyote Creek Mine to operate and adhere to a mine plan projected through 2040. No mineral processing occurs at the Coyote Creek Mine.
3.0 Internal Control Disclosure Over Mineral Resources and Reserves
The modeling and analysis of the Company’s resources and reserves has been developed by Company mine personnel and reviewed by several levels of internal management, including the QPs. The development of such resources and reserves estimates, including related assumptions, was a collaborative effort between the QPs and Company staff. This section summarizes the internal control considerations for the Company’s development of estimations, including assumptions, used in resource and reserve analysis and modeling.
When determining resources and reserves, as well as the differences between resources and reserves, management developed specific criteria, each of which must be met to qualify as a resource or reserve, respectively. These criteria, such as demonstration of economic viability, points of reference and grade, are specific and attainable. The QPs and Company management agree on the reasonableness of the criteria for the purposes of estimating resources and reserves. Calculations using these criteria are reviewed and validated by the QPs.
Estimations and assumptions were developed independently for each significant mineral location. All estimates require a combination of historical data and key assumptions and parameters. When possible, resources and data from generally accepted industry sources were used to develop these estimations. Review teams were created by utilizing subject matter experts from across all of NACCO to review the cost assumptions and estimations used as the basis of the classification of mineral resources and reserves.
Geological modeling and mine planning efforts serve as a base assumption for resource estimates at MLMC. These outputs have been prepared and reviewed by Company personnel. Mine planning decisions are determined and agreed upon by Company management. Management adjusts forward-looking models by reference to historic mining results, including by reviewing actual versus predicted levels of production from the mineral deposit, and if necessary, re-evaluating mining methodologies if production outcomes were not realized as predicted. Ongoing mining of the mineral deposit, coupled with product quality validation pursuant to Company and customer expectations, provides further empirical evidence as to the homogeneity, continuity and characteristics of the deposit. Geologic modeling assumptions are evaluated to historic mining results and are adjusted if necessary to better reflect actual mining results.
Ongoing quality validation of production also provides a means to monitor for any potential changes in quality. Also, ongoing monitoring of ground conditions within the mine, surveying for evidence of subsidence and other visible signs of deterioration that may signal the need to re-evaluate rock mechanics and structure of the mine ultimately inform extraction ratios and mine design, which underpin mineral reserve estimates.
Management also assesses risks inherent in mineral resource and reserve estimates, such as the accuracy of geophysical data that is used to support mine planning, changes in QPs, identifying hazards and informing operations of the presence of mineable deposits. Also, management is aware of risks associated with potential gaps in assessing the completeness of mineral extraction licenses, entitlements or rights, or changes in laws or regulations that could directly impact the ability to assess mineral resources and reserves or impact production levels. Risks inherent in overestimated reserves can impact financial performance when revealed, such as changes in amortizations that are based on life of mine estimates.
4.0 Customer-owned Properties
South Hallsville No. 1 Mine — The Sabine Mining Company
The Sabine Mining Company (“Sabine”) operated the Sabine Mine in Texas. All production from Sabine was delivered to Southwestern Electric Power Company's (“SWEPCO”) Henry W. Pirkey Plant (the “Pirkey Plant”). SWEPCO is an American Electric Power (“AEP”) company. As a result of the early retirement of the Pirkey Plant, Sabine ceased deliveries in the first quarter of 2023 and final reclamation began on April 1, 2023. Funding for mine reclamation is the responsibility of SWEPCO, and Sabine receives compensation for providing mine reclamation services. During the third quarter of 2023, Sabine and SWEPCO entered into an agreement under which Sabine will provide mine reclamation services through September 30, 2026. On October 1, 2026, SWEPCO will take over and complete the remaining mine reclamation services by acquiring all of the capital stock of Sabine.
5.0 Facilities and Equipment
The facilities and equipment for each of the coal mines are maintained to allow for safe and efficient operation. The equipment is well maintained, in good physical condition and is either updated or replaced periodically with newer models or upgrades available to keep up with modern technology. As equipment wears out, the mines evaluate what replacement option will be the most cost-efficient, including the evaluation of both new and used equipment, and proceed with that replacement. The mining method and total cost of the property, plant and equipment, net of applicable accumulated amortization, depreciation and impairment as of December 31, 2023 is set forth in the chart below:
|
|
|
|
|
|
|
|
|
|
|
|
|
|
|
| Location |
|
Mining Method |
|
Total Historical Cost of Mine
Property, Plant and Equipment
(excluding Coal Land, Real Estate
and Construction in Progress), Net of
Applicable Accumulated
Amortization, Depreciation and Impairment |
|
|
|
|
|
| Unconsolidated Mining Operations |
|
|
|
(in millions) |
| Freedom Mine — The Coteau Properties Company |
|
Dragline operation with 3 draglines |
|
$ |
116.2 |
|
| Falkirk Mine — The Falkirk Mining Company |
|
Dragline operation with 4 draglines |
|
$ |
58.4 |
|
|
|
|
|
|
| Coyote Creek Mine — Coyote Creek Mining Company, LLC |
|
Dragline operation with 1 dragline |
|
$ |
114.6 |
|
| Consolidated Mining Operations |
|
|
|
|
| Red Hills Mine — Mississippi Lignite Mining Company |
|
Dragline operation with 1 dragline |
|
$ |
52.8 |
|
|
|
|
|
|
NAMining Segment - Operations
NAMining provides contract mining services for independently owned mines and quarries, primarily operating and maintaining draglines at limestone quarries and utilizing other mining equipment at sand and gravel quarries. At December 31, 2023, NAMining operated 30 draglines and other equipment at 23 quarries. Of the 30 draglines, 7 are owned by the Company and 23 are owned by customers. At December 31, 2023, NAMining had $75.8 million in property, plant and equipment, net of applicable accumulated amortization, depreciation and impairment.
The mining process at the limestone mines involves excavating limestone from a water-filled quarry utilizing draglines. The excavated limestone is transported and processed by the customer. The following mines were operational during 2023:
|
|
|
|
|
|
|
|
|
|
|
|
|
|
|
|
|
|
| Location Name |
Aggregate |
Location |
State |
Customer |
Year NACCO Started Operations |
| White Rock — North |
Limestone |
Miami |
FL |
WRQ |
1995 |
| Krome |
Limestone |
Miami |
FL |
Cemex |
2003 |
| Alico |
Limestone |
Ft. Myers |
FL |
Cemex |
2004 |
| FEC |
Limestone |
Miami |
FL |
Cemex |
2005 |
| SCL |
Limestone |
Miami |
FL |
Cemex |
2006 |
| Central State Aggregates |
Limestone |
Zephyrhills |
FL |
McDonald Group |
2016 |
| Mid Coast Aggregates |
Limestone |
Sumter County |
FL |
McDonald Group |
2016 |
| West Florida Aggregates |
Limestone |
Hernando County |
FL |
McDonald Group |
2016 |
| St. Catherine |
Limestone |
Sumter County |
FL |
Cemex |
2016 |
| Center Hill |
Limestone |
Sumter County |
FL |
Cemex |
2016 |
| Inglis |
Limestone |
Crystal River |
FL |
Cemex |
2016 |
| Titan Corkscrew |
Limestone |
Ft. Myers |
FL |
Titan America |
2017 |
| Palm Beach Aggregates |
Limestone |
Loxahatchee |
FL |
Palm Beach Aggregates |
2017 |
| Perry |
Limestone |
Lamont |
FL |
Martin Marietta |
2018 |
| SDI Aggregates |
Limestone |
Florida City |
FL |
Blue Water Industries |
2018 |
| Queenfield |
Sand and gravel |
King William County |
VA |
King William Sand and Gravel Company, Inc. |
2018 |
| Newberry |
Limestone |
Alachua County |
FL |
Argos USA, LLC |
2019 |
| Seven Diamonds |
Limestone |
Pasco County |
FL |
Seven Diamonds, LLC |
2021 |
Johnson County (a) |
Sand and gravel |
Johnson County |
IN |
Martin Marietta |
2021 |
| Little River |
Sand and gravel |
Ashdown |
AR |
Lehigh Hanson |
2021 |
| Rosser |
Sand and gravel |
Ennis |
TX |
Lehigh Hanson |
2021 |
| Brooksville Cement Plant |
Limestone |
Brooksville |
FL |
Cemex |
2021 |
| Ash Grove |
Limestone |
Louisville |
NE |
Ash Grove |
2022 |
(a) The Johnson County quarry was idled during 2023. NAMining mined de minimis amounts at this location during the 2023 and 2022 periods.
NAMining's customers control all of the limestone and sand reserves within their respective mines. NAMining has no title, claim, lease or option to acquire any of the reserves at any of the mines where it provides services.
Access to the White Rock mine is by means of a paved road from 122nd Avenue.
Access to the Krome mine is by means of a paved road from Krome Avenue.
Access to the Alico mine is by means of a paved road from Alico Road.
Access to the FEC mine is by means of a paved road from NW 118th Avenue.
Access to the SCL mine is by means of a paved road from NW 137th Avenue.
Access to the Central State Aggregates mine is by means of a paved road from Yonkers Boulevard.
Access to the Mid Coast Aggregates mine is by means of a paved road from State Road 50.
Access to the West Florida Aggregates mine is by means of a paved road from Cortez Boulevard.
Access to the St. Catherine mine is by means of a paved road from County Road 673.
Access to the Center Hill mine is by means of a paved road from West Kings Highway.
Access to the Inglis mine is by means of a paved road from Highway 19 South.
Access to the Titan Corkscrew mine is by means of a paved road from Corkscrew Road.
Access to the Palm Beach Aggregates mine is by means of a paved road from State Road 80.
Access to the Perry mine is by means of paved road from Nutall Rise Road.
Access to the SDI Aggregates mine is by means of paved road from SW 167th AVE.
Access to the Queenfield Mine is by means of paved road from Dabney's Mill Road (SR 604).
Access to the Newberry mine is by means of paved road from NW County Road 235 (CR 235).
Access to the Seven Diamonds mine is by means of a paved road from US-41 S/Broad St.
Access to the Little River mine is by means of an unpaved road from Little River 60.
Access to the Rosser mine is by means of a paved road from TX-34 S.
Access to Brooksville Cement plant is by means of a paved road from Cement Plant Road.
Access to Ash Grove Louisville Quarry is by means of a paved road from HWY 50.
Minerals Management - Operations
As an owner of royalty and mineral interests, the Company’s access to information concerning activity and operations of its royalty and mineral interests is limited. The Company does not have information that would be available to a company with oil and natural gas operations because detailed information is not generally available to owners of royalty and mineral interests. Consequently, the exact number of wells producing from or drilling on the Company’s mineral interests at a given point in time is not determinable. The following table sets forth the Company’s estimate of the number of gross and net productive wells:
|
|
|
|
|
|
|
|
|
|
|
|
|
|
|
|
|
|
|
|
|
|
|
|
|
December 31, 2023 |
|
December 31, 2022 |
|
Gross |
|
Net |
|
Gross |
|
Net |
| Oil |
1,646 |
|
6.6 |
|
1,049 |
|
3.3 |
| Natural Gas |
246 |
|
13.5 |
|
251 |
|
10.1 |
| Total |
1,892 |
|
20.1 |
|
1,300 |
|
13.4 |
Gross wells are the total wells in which an interest is owned.
Net wells are calculated based on the Company's net royalty interest, factoring in both ownership percentage of gross wells and royalty rate.
The majority of the Company’s producing mineral and royalty interest acreage now, or in the future, can be pooled with third-party acreage to form pooled units. Pooling proportionately reduces the Company’s royalty interest in wells drilled in a pooled unit, and it proportionately increases the number of wells in which the Company has such reduced royalty interest.
The following table includes the Company's estimate of acreage for oil and gas mineral interests, NPRIs, and ORRIs:
|
|
|
|
|
|
|
|
|
|
|
|
|
|
|
|
|
|
|
|
|
|
|
|
|
December 31, 2023 |
|
December 31, 2022 |
|
Gross Acres |
|
Net Royalty Acres |
|
Gross Acres |
|
Net Royalty Acres |
Appalachia |
34,661 |
|
36,199 |
|
34,661 |
|
36,199 |
Gulf Coast |
27,932 |
|
20,105 |
|
27,932 |
|
20,105 |
Permian |
120,636 |
|
4,556 |
|
77,278 |
|
2,050 |
Rockies |
326 |
|
72 |
|
326 |
|
72 |
Williston |
1,194 |
|
2,388 |
|
1,194 |
|
2,388 |
Total |
184,749 |
|
63,320 |
|
141,391 |
|
60,814 |
The Company may own more than one type of interest in the same tract of land, but the overlap is not significant. Net royalty acres are calculated based on the Company’s ownership and royalty rate, normalized to a standard 1/8th royalty lease, and assumes a 1/4th royalty rate for unleased acres.
The following table includes the Company's estimate of developed and undeveloped acreage based on the gross acres in a basin or region and includes mineral interests, NPRIs, and ORRIs:
|
|
|
|
|
|
|
|
|
|
|
|
|
|
|
|
|
|
|
|
|
|
|
|
|
|
|
|
|
|
|
|
|
|
|
|
|
|
|
|
|
December 31, 2023 |
|
December 31, 2022 |
|
|
Developed Acreage |
|
Undeveloped Acreage |
|
Gross Acreage |
|
Developed Acreage |
|
Undeveloped Acreage |
|
Gross Acreage |
| Appalachia |
|
32,156 |
|
2,505 |
|
34,661 |
|
32,027 |
|
2,634 |
|
34,661 |
| Gulf Coast |
|
22,191 |
|
5,741 |
|
27,932 |
|
22,191 |
|
5,741 |
|
27,932 |
| Permian |
|
117,220 |
|
3,416 |
|
120,636 |
|
73,862 |
|
3,416 |
|
77,278 |
| Rockies |
|
326 |
|
— |
|
|
326 |
|
326 |
|
— |
|
|
326 |
| Williston |
|
— |
|
|
1,194 |
|
1,194 |
|
— |
|
|
1,194 |
|
1,194 |
| Total |
|
171,893 |
|
|
12,856 |
|
184,749 |
|
128,406 |
|
12,985 |
|
141,391 |
Undeveloped acres are either unleased and open or are leased acres on which wells have not been drilled or completed to a point that would permit the production of commercial quantities of oil or natural gas, regardless of whether such acreage contains proved reserves.
Production and Price History
The following table sets forth the estimated oil and natural gas production data related to the Company’s mineral and royalty interests as well as certain price and cost information for the years ended December 31:
|
|
|
|
|
|
|
|
|
|
|
|
|
|
|
|
|
2023 (4) |
|
2022 (4) |
| Production data: |
|
|
|
|
Oil (bbl) (1) |
|
98,553 |
|
|
46,571 |
|
NGL (bbl) (1) |
|
56,768 |
|
|
61,511 |
|
Residue gas (Mcf) (2) |
|
7,601,521 |
|
|
7,329,985 |
|
Total BOE (3) |
|
1,422,241 |
|
|
1,329,747 |
|
| Average realized prices: |
|
|
|
|
Oil (bbl) (1) |
|
$ |
72.19 |
|
|
$ |
94.31 |
|
NGL (bbl) (1) |
|
$ |
23.33 |
|
|
$ |
36.81 |
|
Residue gas (Mcf) (2) |
|
$ |
2.37 |
|
|
$ |
5.87 |
|
| Average unit cost |
|
|
|
|
BOE (3) |
|
$ |
3.32 |
|
|
$ |
4.26 |
|
(1) Bbl. One stock tank barrel, or 42 U.S. gallons liquid volume.
(2) Mcf. One thousand cubic feet of natural gas at the contractual pressure and temperature bases.
(3) BOE. Barrel of Oil Equivalent, a conversion factor of 6 MCF of gas was used for 1 equivalent bbl of oil.
(4) As an owner of mineral and royalty interests, the Company’s access to information concerning activity and operations of its royalty and mineral interests is limited. As a result, the Company estimated the last two months of 2023 and 2022 production and pricing data using projections based on decline rates of wells and prior expense information.
Evaluation and Review of Reserves
The reserve estimates as of December 31, 2023 were prepared by Haas Petroleum Engineering Services, Inc. ("Haas Engineering"). Haas Engineering has provided reservoir engineering services, consulting and ongoing support for major and independent petroleum companies, public utilities, financial institutions, investors, and government agencies since 1980. Haas Engineering does not own an interest in NACCO or any of the Company's properties, nor is it employed on a contingent basis. A copy of Haas Engineering's estimated proved reserve report as of December 31, 2023 is incorporated by reference herein to Exhibit 99.1 to this Form 10-K.
The properties evaluated for proved reserves are located in Alabama, Louisiana, New Mexico, Ohio, Pennsylvania, Texas and Wyoming and represent all of the Company’s oil and gas reserves. A reserves audit is not the same as a financial audit. Reserve engineering is a subjective process of estimating volumes of economically recoverable oil and natural gas that cannot be measured in an exact manner. The accuracy of any reserve estimate is a function of the quality of available data and of engineering and geological interpretation. As a result, the estimates of different engineers often vary. In addition, the results of drilling, testing, and production may justify revisions of such estimates. Accordingly, reserve estimates often differ from the quantities of oil and natural gas that are ultimately recovered. Estimates of economically recoverable oil and natural gas and of future net revenues are based on several variables and assumptions, all of which may vary from actual results, including geologic interpretation, prices, and future production rates and costs.
The reserves estimates have been prepared using standard engineering practices generally accepted by the petroleum industry. Decline curve analysis was used to estimate the remaining reserves of pressure depletion reservoirs with enough historical production data to establish decline trends. Reservoirs under non-pressure depletion drive mechanisms and non-producing reserves were estimated by volumetric analysis, research of analogous reservoirs, or a combination of both. Reserves have been estimated using deterministic and probabilistic methods. The appropriate methodology was used, as deemed necessary, to estimate reserves in conformance with SEC regulations. The maximum remaining reserves life assigned to wells included in this report is 50 years.
Total net proved reserves are defined as those natural gas and hydrocarbon liquid reserves to the Company's interests after deducting all royalties, overriding royalties, and reversionary interests owned by outside parties that become effective upon payout of specified monetary balances. All reserves estimates have been prepared using standard engineering practices generally accepted by the petroleum industry and conform to guidelines developed and adopted by the SEC.
Technologies Used in Reserve Estimation
The SEC’s reserves rules allow the use of techniques that have been proved effective by actual production from projects in the same reservoir or an analogous reservoir or by other evidence using reliable technology that establishes reasonable certainty. The term “reasonable certainty” implies a high degree of confidence that the quantities of oil, natural gas and/or NGLs actually recovered will equal or exceed the estimate. To achieve reasonable certainty, the Company employed technologies that have been demonstrated to yield results with consistency and repeatability. The technologies and economic data used in the estimation of the Company’s proved reserves include, but are not limited to, well logs, geologic maps, seismic data, well test data, production data, historical price and cost information and property ownership interests. The accuracy of the estimates of the Company’s reserves is a function of:
•the quality and quantity of available data and the engineering and geological interpretation of that data;
•estimates regarding the amount and timing of future operating costs, development costs and workovers, all of which may vary considerably from actual results;
•future prices of oil, natural gas and NGLs, which may vary considerably from those estimated; and
•the judgment of the persons preparing the estimates.
The following table presents the Company's estimated net proved oil and natural gas reserves based on the reserve report prepared by Haas Engineering, the Company’s independent petroleum engineering firm. All of the Company’s reserves are located in the United States.
|
|
|
|
|
|
|
|
|
|
|
|
|
|
|
|
|
|
|
|
|
|
|
|
|
|
|
|
|
|
|
|
|
|
|
|
|
|
|
|
|
Net reserves as of December 31, 2023 |
|
Net reserves as of December 31, 2022 |
|
|
Oil (bbl) (1) |
|
NGL (bbl) (1) |
|
Residue gas (Mcf) (2) |
|
Oil (bbl) (1) |
|
NGL (bbl) (1) |
|
Residue gas (Mcf) (2) |
| Proved developed |
|
656,370 |
|
|
380,650 |
|
|
23,596,110 |
|
|
305,710 |
|
|
408,280 |
|
|
25,907,890 |
|
| Proved undeveloped |
|
9,020 |
|
|
3,720 |
|
|
26,420 |
|
|
32,570 |
|
|
11,030 |
|
|
1,784,670 |
|
| Total |
|
665,390 |
|
|
384,370 |
|
|
23,622,530 |
|
|
338,280 |
|
|
419,310 |
|
|
27,692,560 |
|
|
|
|
|
|
|
|
|
|
|
|
|
|
(1) Bbl. One stock tank barrel, or 42 U.S. gallons liquid volume.
(2) Mcf. One thousand cubic feet of natural gas at the contractual pressure and temperature bases.
As an owner of mineral and royalty interests and not working interests, the Company is not required to make capital expenditures and did not make capital expenditures to convert proved undeveloped reserves from undeveloped to developed.
Internal Control Disclosure
The Company's internal staff works closely with Haas Engineering to ensure the integrity, accuracy and timeliness of the data used to calculate proved reserves relating to NACCO's assets. Internal technical team members met with independent reserve engineers periodically during the period covered by the reserves report to discuss the assumptions and methods used in the proved reserve estimation process.
The preparation of the Company's proved reserve estimates is completed in accordance with internal control procedures. These procedures, which are intended to ensure reliability of reserve estimations, include the following:
•Review and verification of historical production data, which data is based on actual production as reported by third-party producers who lease the Company’s royalty and mineral interests;
•Preparation of reserve estimates by Haas Engineering under the direct supervision of internal staff;
•Verification of property ownership by the Company's land department; and
•No employee’s compensation is tied to the amount of reserves booked.
The Minerals Management Segment’s Vice President of Engineering and Finance is the technical person primarily responsible for overseeing the preparation of the internal reserve estimates and for coordinating with Haas Engineering in the preparation of the third-party reserve report. The Vice President of Engineering and Finance has over 15 years of industry experience with positions of increasing responsibility and reports directly to the President of Catapult Mineral Partners, the Company’s business unit focused on managing and expanding the Company’s portfolio of oil and gas mineral and royalty interests.
Estimated Proved Reserves
The following table summarizes changes in proved reserves during the year ended December 31, 2023:
|
|
|
|
|
|
|
|
|
|
|
|
|
|
|
|
|
|
|
|
|
|
|
|
Estimated Proved Reserves |
|
|
Oil (bbl) (1) |
|
NGL (bbl) (1) |
|
Residue gas (Mcf) (2) |
|
| December 31, 2022 |
|
338,280 |
|
|
419,310 |
|
|
27,692,560 |
|
|
| Purchases |
|
259,178 |
|
|
43,934 |
|
|
609,184 |
|
|
| Extensions and discoveries |
|
170,330 |
|
|
77,527 |
|
|
2,340,715 |
|
|
Revisions of previous estimates (3) |
|
37,483 |
|
|
(73,375) |
|
|
1,027,779 |
|
|
| Production |
|
(98,553) |
|
|
(56,768) |
|
|
(7,601,521) |
|
|
| Other |
|
(41,328) |
|
|
(26,258) |
|
|
(446,187) |
|
|
| December 31, 2023 |
|
665,390 |
|
|
384,370 |
|
|
23,622,530 |
|
|
Estimated Proved Undeveloped Reserves ("PUDs")
The following table summarizes changes in PUDs during the year ended December 31, 2023:
|
|
|
|
|
|
|
|
|
|
|
|
|
|
|
|
|
|
|
|
|
|
|
|
Estimated Proved Undeveloped Reserves |
|
|
Oil (bbl) (1) |
|
NGL (bbl) (1) |
|
Residue gas (Mcf) (2) |
|
| December 31, 2022 |
|
32,570 |
|
|
11,030 |
|
|
1,784,670 |
|
|
|
|
|
|
|
|
|
|
| Purchases |
|
2,300 |
|
|
950 |
|
|
8,237 |
|
|
| Extensions and discoveries |
|
5,786 |
|
|
2,021 |
|
|
14,814 |
|
|
Conversions |
|
(29,757) |
|
|
(9,172) |
|
|
(1,770,232) |
|
|
Revisions of previous estimates (3) |
|
(1,879) |
|
|
(1,109) |
|
|
(11,069) |
|
|
|
|
|
|
|
|
|
|
| December 31, 2023 |
|
9,020 |
|
|
3,720 |
|
|
26,420 |
|
|
(1) Bbl. One stock tank barrel, or 42 U.S. gallons liquid volume.
(2) Mcf. One thousand cubic feet of natural gas at the contractual pressure and temperature bases.
(3) Revisions of previous estimates include technical revisions due to changes in commodity prices, historical and projected performance and other factors.
As an owner of mineral and royalty interests, the Company generally does not have evidence or approval of operators’ development plans. As a result, proved undeveloped reserve estimates are limited to those relatively few locations for which drilling permits have been publicly filed. As of December 31, 2023, PUD reserves consists of 45 wells in various stages of drilling or completions. As of December 31, 2023, less than 1% of the Company's total proved reserves were classified as PUDs.
Headquarter locations
NACCO leases office space in Mayfield Heights, Ohio, a suburb of Cleveland, Ohio, which serves as its corporate headquarters.
Coal Mining and Minerals Management lease corporate headquarters office space in Plano, Texas.
NAMining leases office and warehouse space in Medley, Florida.
Item 3. LEGAL PROCEEDINGS
Neither the Company nor any of its subsidiaries is a party to any material legal proceeding other than ordinary routine litigation incidental to its respective business.
Item 4. MINE SAFETY DISCLOSURES
Information concerning mine safety violations or other regulatory matters required by Section 1503(a) of The Dodd-Frank Wall Street Reform and Consumer Protection Act and Item 104 of Regulation S-K is included in Exhibit 95 filed with this Form 10-K.
PART II
Item 5. MARKET FOR REGISTRANT’S COMMON EQUITY, RELATED STOCKHOLDER MATTERS AND ISSUER PURCHASES OF EQUITY SECURITIES
NACCO's Class A common stock is traded on the New York Stock Exchange under the ticker symbol “NC.” Because of transfer restrictions, no trading market has developed, or is expected to develop, for the Company's Class B common stock. The Class B common stock is convertible into Class A common stock on a one-for-one basis.
At December 31, 2023, there were 660 Class A common stockholders of record and 113 Class B common stockholders of record.
Purchases of Equity Securities by the Issuer and Affiliated Purchasers
|
|
|
|
|
|
|
|
|
|
|
|
|
|
|
|
|
|
|
|
|
|
|
|
Issuer Purchases of Equity Securities (1) |
| Period |
(a)
Total Number of Shares Purchased |
|
(b)
Average Price Paid per Share |
|
(c)
Total Number of Shares Purchased as Part of the Publicly Announced Program |
|
(d)
Maximum Number of Shares (or Approximate Dollar Value) that May Yet Be Purchased Under the Program (1)
|
| October 1 to 31, 2023 |
13,398 |
|
|
$ |
34.33 |
|
|
13,398 |
|
|
$ |
18,716,958 |
|
| November 1 to 30, 2023 |
15,090 |
|
|
$ |
34.46 |
|
|
15,090 |
|
|
$ |
18,196,957 |
|
| December 1 to 31, 2023 |
37,717 |
|
|
$ |
34.47 |
|
|
37,717 |
|
|
$ |
16,896,852 |
|
Total |
66,205 |
|
|
$ |
34.44 |
|
|
66,205 |
|
|
$ |
16,896,852 |
|
(1) On November 7, 2023, the Company's Board of Directors approved a stock purchase program providing for the purchase of up to $20.0 million of the Company’s outstanding Class A common stock through December 31, 2025. See Note 12 to the Consolidated Financial Statements in this Form 10-K for a discussion of the Company's stock repurchase programs.
Item 6. [RESERVED]
Item 7. MANAGEMENT'S DISCUSSION AND ANALYSIS OF FINANCIAL CONDITION AND RESULTS OF OPERATIONS
NACCO INDUSTRIES, INC. AND SUBSIDIARIES
(Tabular Amounts in Thousands, Except Per Share and Percentage Data)
OVERVIEW
Management's Discussion and Analysis of Financial Condition and Results of Operations contains forward-looking statements within the meaning of the Private Securities Litigation Reform Act of 1995. These statements are based upon management's current expectations and are subject to various uncertainties and changes in circumstances. Important factors that could cause actual results to differ materially from those described in these forward-looking statements are set forth below under the heading “Forward-Looking Statements."
Management's Discussion and Analysis of Financial Condition and Results of Operations include NACCO Industries, Inc.® (“NACCO” or the “Company”). NACCO brings natural resources to life by delivering aggregates, minerals, reliable fuels and environmental solutions through its robust portfolio of NACCO Natural Resources® businesses. The Company operates under three business segments: Coal Mining, North American Mining® ("NAMining") and Minerals Management. The Coal Mining segment operates surface coal mines for power generation companies. The NAMining segment is a trusted mining partner for producers of aggregates, activated carbon, lithium and other industrial minerals. The Minerals Management segment, which includes the Catapult Mineral Partners (“Catapult”) business, acquires and promotes the development of mineral interests. Mitigation Resources of North America® (“Mitigation Resources”) provides stream and wetland mitigation solutions.
The Company has items not directly attributable to a reportable segment that are not included in the reported financial results of the operating segment. These items primarily include administrative costs related to public company reporting requirements, including management and board compensation, and the financial results of Bellaire Corporation ("Bellaire"), Mitigation Resources and other developing businesses. Bellaire manages the Company’s long-term liabilities related to former Eastern U.S. underground mining activities.
All financial statement line items below operating loss/profit (other income, including interest expense and interest income, the benefit/provision for income taxes and net loss/income) are presented and discussed within this Form 10-K on a consolidated basis.
See “Item 1. Business" beginning on page 1 in this Form 10-K for further discussion of NACCO's subsidiaries. Additional information relating to financial and operating data on a segment basis (including unallocated items) is set forth in Note 15 to the Consolidated Financial Statements contained in this Form 10-K.
CRITICAL ACCOUNTING POLICIES AND ESTIMATES
The Company's discussion and analysis of its financial condition and results of operations are based upon the Company's consolidated financial statements, which have been prepared in accordance with U.S. generally accepted accounting principles. The preparation of these financial statements requires the Company to make estimates and judgments that affect the reported amounts of assets, liabilities, revenues and expenses, and related disclosure of contingent assets and liabilities (if any). On an ongoing basis, the Company evaluates its estimates based on historical experience, actuarial valuations and various other assumptions that are believed to be reasonable under the circumstances, the results of which form the basis for making judgments about the carrying values of assets and liabilities that are not readily apparent from other sources. Actual results may differ from those estimates.
The Company believes the following critical accounting policies affect its more significant judgments and estimates used in the preparation of its consolidated financial statements.
Revenue recognition: Revenues are recognized when control of the promised goods or services is transferred to the Company’s customers, in an amount that reflects the consideration the Company expects to be entitled to in exchange for those goods or services. The Company accounts for revenue in accordance with Accounting Standards Codification ("ASC") Topic 606, "Revenue from Contracts with Customers." See Note 3 to the Consolidated Financial Statements in this Form 10-K for further discussion of the Company's revenue recognition.
Long-lived assets: The Company periodically evaluates long-lived assets for impairment when changes in circumstances or the occurrence of certain events indicate the carrying amount of an asset or asset group may not be recoverable. Upon identification of indicators of impairment, the Company evaluates the carrying value of the asset by comparing the estimated future undiscounted cash flows generated from the use of the asset or asset group and its eventual disposition with the asset's net carrying value. If the carrying value of an asset is considered impaired, an impairment charge is recorded for the amount that the carrying value of the long-lived asset or asset group exceeds its fair value.
Item 7. MANAGEMENT'S DISCUSSION AND ANALYSIS OF FINANCIAL CONDITION AND RESULTS OF OPERATIONS
NACCO INDUSTRIES, INC. AND SUBSIDIARIES
(Tabular Amounts in Thousands, Except Per Share and Percentage Data)
Fair value is estimated as the price that would be received to sell an asset or paid to transfer a liability in an orderly transaction between market participants at the measurement date.
Identifying and assessing whether impairment indicators exist, or if events or changes in circumstances have occurred, including assumptions about future power plant dispatch levels, changes in future sales price, operating costs and other factors that impact anticipated revenue and customer demand, requires significant judgment. A reduction in customer demand at MLMC, including reductions related to reduced mechanical availability of the customer’s power plant, could adversely affect the Company's operating results. The costs of mining operations are not reimbursed by MLMC's customer. As such, increased costs at MLMC could materially reduce the Company's profitability. The Company determined that indicators of impairment existed at MLMC during the fourth quarter of 2023 and, as a result, MLMC's long-lived assets were reviewed for impairment. The Company assessed the recoverability of the MLMC asset group and determined that the assets were not fully recoverable when compared to the remaining future undiscounted cash flows from these assets. As a result, the Company estimated the fair value of the asset group which resulted in a non-cash, long-lived asset impairment charge of $65.9 million in 2023.
See Note 9 to the Consolidated Financial Statements in this Form 10-K for further discussion of the Company's impairment analysis.
Income taxes: The Company files income tax returns in the U.S. federal jurisdiction, and in various state and foreign jurisdictions. Tax law requires certain items to be included in the tax return at different times than the items are reflected in the financial statements. Some of these differences are permanent, such as expenses that are not deductible for tax purposes, and some differences are temporary, reversing over time, such as depreciation expense. These temporary differences create deferred tax assets and liabilities using currently enacted tax rates. The objective of accounting for income taxes is to recognize the amount of taxes payable or refundable for the current year, and deferred tax liabilities and assets for the future tax consequences of events that have been recognized in the financial statements or tax returns. The effect of a change in tax rates on deferred tax assets and liabilities is recognized in the provision for income taxes in the period that includes the enactment date. Management is required to estimate the timing of the recognition of deferred tax assets and liabilities, make assumptions about the future deductibility of deferred tax assets and assess deferred tax liabilities based on enacted laws and tax rates for the appropriate tax jurisdictions to determine the amount of such deferred tax assets and liabilities. Changes in the calculated deferred tax assets and liabilities may occur in certain circumstances, including statutory income tax rate changes, statutory tax law changes, or changes in the structure or tax status.
The Company's tax assets, liabilities, and tax expense are supported by historical earnings and losses and the Company's best estimates and assumptions of future earnings. The Company assesses whether a valuation allowance should be established against its deferred tax assets based on consideration of all available evidence, both positive and negative, using a more likely than not standard. This assessment considers, among other matters, scheduled reversals of deferred tax liabilities, projected future taxable income, tax-planning strategies, and results of recent operations. The assumptions about future taxable income require significant judgment and are consistent with the plans and estimates the Company is using to manage the underlying businesses. When the Company determines, based on all available evidence, that it is more likely than not that deferred tax assets will not be realized, a valuation allowance is established.
Since significant judgment is required to assess the future tax consequences of events that have been recognized in the Company's financial statements or tax returns, the ultimate resolution of these events could result in adjustments to the Company's financial statements and such adjustments could be material. The Company believes the current assumptions, judgments and other considerations used to estimate the current year accrued and deferred tax positions are appropriate. If the actual outcome of future tax consequences differs from these estimates and assumptions, due to changes or future events, the resulting change to the provision for income taxes could have a material impact on the Company's results of operations and financial position. Since 2021, the Company has participated in a voluntary program with the IRS called Compliance Assurance Process (“CAP”). The objective of CAP is to contemporaneously work with the IRS to achieve federal tax compliance and resolve all or most issues prior to the filing of the tax return.
See Note 13 to the Consolidated Financial Statements in this Form 10-K for further discussion of the Company's income taxes.
Item 7. MANAGEMENT'S DISCUSSION AND ANALYSIS OF FINANCIAL CONDITION AND RESULTS OF OPERATIONS
NACCO INDUSTRIES, INC. AND SUBSIDIARIES
(Tabular Amounts in Thousands, Except Per Share and Percentage Data)
CONSOLIDATED FINANCIAL SUMMARY
The results of operations for NACCO were as follows for the years ended December 31:
|
|
|
|
|
|
|
|
|
|
|
|
| |
2023 |
|
2022 |
| Revenues: |
|
|
|
| Coal Mining |
$ |
85,415 |
|
|
$ |
95,204 |
|
| NAMining |
90,532 |
|
|
85,664 |
|
| Minerals Management |
32,985 |
|
|
60,242 |
|
| Unallocated Items |
8,459 |
|
|
2,952 |
|
| Eliminations |
(2,597) |
|
|
(2,343) |
|
| Total revenue |
$ |
214,794 |
|
|
$ |
241,719 |
|
Operating (loss) profit: |
|
|
|
| Coal Mining |
$ |
(71,342) |
|
|
$ |
38,309 |
|
| NAMining |
3,348 |
|
|
2,202 |
|
| Minerals Management |
19,418 |
|
|
52,214 |
|
| Unallocated Items |
(21,461) |
|
|
(23,233) |
|
| Eliminations |
(100) |
|
|
494 |
|
| Total operating profit |
$ |
(70,137) |
|
|
$ |
69,986 |
|
| Interest expense |
2,460 |
|
|
2,034 |
|
| Interest income |
(6,081) |
|
|
(1,449) |
|
| Closed mine obligations |
3,585 |
|
|
1,179 |
|
(Gain) loss on equity securities |
(1,958) |
|
|
283 |
|
|
|
|
|
| Other contract termination settlements |
— |
|
|
(16,882) |
|
| Other, net |
(3,985) |
|
|
(2,902) |
|
| Other income, net |
(5,979) |
|
|
(17,737) |
|
(Loss) income before income tax (benefit) provision |
(64,158) |
|
|
87,723 |
|
Income tax (benefit) provision |
(24,571) |
|
|
13,565 |
|
Net (loss) income |
$ |
(39,587) |
|
|
$ |
74,158 |
|
|
|
|
|
| Effective income tax rate |
38.3 |
% |
|
15.5 |
% |
The components of the change in revenues and operating profit are discussed below in "Segment Results."
Other income, net
During 2023, the Board of Directors of the Company approved the termination of the Combined Defined Benefit Plan for NACCO and its subsidiaries (the “Combined Plan”) and Combined Plan participants were offered lump-sum distributions as part of the termination process. As a result of the lump-sum distributions, the Company recognized a non-cash, pension settlement charge of $1.8 million on the line "Other, net" within the accompanying Consolidated Statements of Operations. The $1.8 million charge represents a pro rata portion of the unrecognized net loss recorded in Accumulated other comprehensive loss. See Note 14 to the Consolidated Financial Statements in this Form 10-K for further information on the Combined Plan.
During 2022, GRE transferred ownership of an office building with an estimated fair value of $4.1 million and conveyed membership units in Midwest AgEnergy Group, LLC (“MAG”), a North Dakota-based ethanol business, with an estimated fair value of $12.8 million, as agreed to under the termination and release of claims agreement between Falkirk and GRE. As a result, the Company recognized $16.9 million on the "Other contract termination settlements" line within the accompanying Consolidated Statements of Operations.
Item 7. MANAGEMENT'S DISCUSSION AND ANALYSIS OF FINANCIAL CONDITION AND RESULTS OF OPERATIONS
NACCO INDUSTRIES, INC. AND SUBSIDIARIES
(Tabular Amounts in Thousands, Except Per Share and Percentage Data)
Prior to receiving the membership units from GRE, the Company held a $5.0 million investment in MAG. Subsequent to the receipt of the additional membership units, the Company began to account for the investment under the equity method of accounting. During the third quarter of 2022, the Company recorded $2.2 million, which represented its share of MAG's earnings on the "Other, net" line within the accompanying Consolidated Statements of Operations.
On December 1, 2022, HLCP Ethanol Holdco, LLC (“HLCP”) completed its acquisition of MAG. Upon closing of the transaction, NACCO transferred its ownership interest in MAG to HLCP and received a cash payment of $18.6 million and recognized a $1.3 million loss during the fourth quarter of 2022 on the line "Other, net" within the accompanying Consolidated Statements of Operations.
The Company received additional cash payments totaling $3.6 million during 2023 in connection with MAG's post-closing purchase price adjustment and the release of amounts held in escrow. The Company recognized the $3.6 million gain on the line "Other, net" within the accompanying Consolidated Statements of Operations.
Interest income increased $4.6 million primarily due to higher interest rates and a higher average invested cash balance during 2023 compared with 2022.
(Gain) loss on equity securities represents changes in the market price of invested assets reported at fair value. The change during 2023 compared with 2022 was due to fluctuations in the market prices of the exchange-traded equity securities. See Note 9 to the Consolidated Financial Statements in this Form 10-K for further discussion of the Company's invested assets reported at fair value.
Income Taxes
Income tax benefit of $24.6 million for the year ended December 31, 2023 includes $4.0 million of discrete tax benefits, primarily the reversal of uncertain tax positions and the impact of U.S. federal provision to return adjustments. Excluding the $4.0 million of discrete tax benefits, the effective income tax rate in 2023 was 32.0%.
Income tax expense of $13.6 million for the year ended December 31, 2022 included $1.5 million of discrete tax benefits, primarily from the reversal of uncertain tax positions as a result of the conclusion of the IRS examination of the Company’s 2013, 2014, 2015 and 2016 federal income tax returns. Excluding the $1.5 million of discrete tax benefits, the effective income tax rate in 2022 was 17.1%.
The change in the effective income tax rate for 2023 compared to 2022, excluding the impact of the long-lived asset impairment charge and discrete items, is primarily due to a decrease in earnings at entities that qualify for percentage depletion. The benefit from percentage depletion is not directly related to the amount of pre-tax income recorded in a period.
See Note 13 to the Consolidated Financial Statements in this Form 10-K for further discussion of the Company's income taxes.
Item 7. MANAGEMENT'S DISCUSSION AND ANALYSIS OF FINANCIAL CONDITION AND RESULTS OF OPERATIONS
NACCO INDUSTRIES, INC. AND SUBSIDIARIES
(Tabular Amounts in Thousands, Except Per Share and Percentage Data)
LIQUIDITY AND CAPITAL RESOURCES
Cash Flows
The following tables detail the change in cash flow for the years ended December 31:
|
|
|
|
|
|
|
|
|
|
|
|
|
|
|
|
|
|
| |
2023 |
|
2022 |
|
Change |
| Operating activities: |
|
|
|
|
|
Net (loss) income |
$ |
(39,587) |
|
|
$ |
74,158 |
|
|
$ |
(113,745) |
|
| Depreciation, depletion and amortization |
29,387 |
|
|
26,816 |
|
|
2,571 |
|
| Deferred income taxes |
(21,114) |
|
|
(8,471) |
|
|
(12,643) |
|
| Stock-based compensation |
5,157 |
|
|
7,541 |
|
|
(2,384) |
|
| Loss (gain) on sale of assets |
221 |
|
|
(2,463) |
|
|
2,684 |
|
| Inventory impairment charge |
7,514 |
|
|
— |
|
|
7,514 |
|
| Other contract termination settlements |
— |
|
|
(15,552) |
|
|
15,552 |
|
| Long-lived asset impairment charge |
65,887 |
|
|
3,939 |
|
|
61,948 |
|
| Other |
1,473 |
|
|
(345) |
|
|
1,818 |
|
| Working capital changes |
5,552 |
|
|
(17,888) |
|
|
23,440 |
|
| Net cash provided by operating activities |
54,490 |
|
|
67,735 |
|
|
(13,245) |
|
|
|
|
|
|
|
| Investing activities: |
|
|
|
|
|
| Expenditures for property, plant and equipment and acquisition of mineral interests |
(82,122) |
|
|
(54,447) |
|
|
(27,675) |
|
| Proceeds from the sale of assets |
561 |
|
|
2,837 |
|
|
(2,276) |
|
| Proceeds from the sale of private company equity units |
3,574 |
|
|
18,628 |
|
|
(15,054) |
|
| Equity method investment |
(3,464) |
|
|
— |
|
|
(3,464) |
|
| Other |
(146) |
|
|
(170) |
|
|
24 |
|
| Net cash used for investing activities |
(81,597) |
|
|
(33,152) |
|
|
(48,445) |
|
|
|
|
|
|
|
| Cash flow before financing activities |
$ |
(27,107) |
|
|
$ |
34,583 |
|
|
$ |
(61,690) |
|
The $13.2 million change in net cash provided by operating activities during 2023 compared with 2022 was primarily due to a decrease in cash provided by net income adjusted for non-cash items, partially offset by a favorable change in cash provided by working capital. The Company’s non-cash items primarily include Long-lived asset impairment charge, Other contract termination settlements, Inventory impairment charge, Deferred income taxes, Depreciation, depletion and amortization, Stock-based compensation, and Loss (gain) on sale of assets.
The favorable change in working capital was mainly the result of a decrease in Trade accounts receivable during 2023 compared with a significant increase during 2022. In addition, a significant reduction in the Federal income tax receivable during 2023 compared with an increase during 2022 also contributed to the favorable change in working capital.
|
|
|
|
|
|
|
|
|
|
|
|
|
|
|
|
|
|
| |
2023 |
|
2022 |
|
Change |
| Financing activities: |
|
|
|
|
|
Net additions (reductions) to long-term debt and revolving credit agreements |
$ |
11,023 |
|
|
$ |
(3,828) |
|
|
$ |
14,851 |
|
| Cash dividends paid |
(6,452) |
|
|
(6,012) |
|
|
(440) |
|
Purchase of treasury shares |
(3,103) |
|
|
— |
|
|
(3,103) |
|
Net cash provided by (used for) financing activities |
$ |
1,468 |
|
|
$ |
(9,840) |
|
|
$ |
11,308 |
|
Item 7. MANAGEMENT'S DISCUSSION AND ANALYSIS OF FINANCIAL CONDITION AND RESULTS OF OPERATIONS
NACCO INDUSTRIES, INC. AND SUBSIDIARIES
(Tabular Amounts in Thousands, Except Per Share and Percentage Data)
The change in net cash provided by (used for) financing activities was primarily due to debt borrowing during 2023 compared with debt repayments during 2022, partially offset by share repurchases during 2023. On November 7, 2023, the Company's Board of Directors approved a stock purchase program providing for the purchase of up to $20.0 million of the Company’s outstanding Class A common stock through December 31, 2025. See Note 12 to the Consolidated Financial Statements in this Form 10-K for a discussion of the Company's stock repurchase programs.
Financing Activities
Financing arrangements are obtained and maintained at the subsidiary level. The Company has a secured revolving line of credit of up to $150.0 million (the “Facility”) that expires in November 2025. Borrowings outstanding under the Facility were $10.0 million at December 31, 2023. At December 31, 2023, the excess availability under the Facility was $105.1 million, which reflects a reduction for outstanding letters of credit of $34.9 million.
NACCO has not guaranteed any borrowings of its subsidiaries. Dividends (to the extent permitted by the Facility) and management fees paid by NACCO subsidiaries are the primary sources of cash for NACCO and enable the Company to pay dividends to stockholders.
The Facility has performance-based pricing, which sets interest rates based upon achieving various levels of debt to EBITDA ratios, as defined in the Facility. Borrowings bear interest at a floating rate plus a margin based on the level of debt to EBITDA ratio achieved. The applicable margins, effective December 31, 2023, for base rate and Secured Overnight Financing Rate loans were 1.23% and 2.23%, respectively. The Facility has a commitment fee which is based upon achieving various levels of debt to EBITDA ratios. The commitment fee was 0.34% on the unused commitment at December 31, 2023. During the year ended December 31, 2023, the average borrowing under the Facility was $6.2 million. The weighted-average annual interest rate, including the floating rate margin, was 6.06% and 2.54% at December 31, 2023 and December 31, 2022, respectively.
The Facility contains restrictive covenants, which require, among other things, maintaining a maximum net debt to EBITDA ratio of 2.75 to 1.00 and an interest coverage ratio of not less than 4.00 to 1.00. The Facility provides the ability to make loans, dividends and advances to NACCO, with some restrictions based on maintaining a maximum debt to EBITDA ratio of 1.50 to 1.00, or if greater than 1.50 to 1.00, a Fixed Charge Coverage Ratio of 1.10 to 1.00, in conjunction with maintaining unused availability thresholds of borrowing capacity, as defined in the Facility, of $15.0 million. At December 31, 2023, the Company was in compliance with all financial covenants in the Facility.
The obligations under the Facility are guaranteed by certain direct and indirect, existing and future domestic subsidiaries, and is secured by certain assets and the guarantors, subject to customary exceptions and limitations.
The Company believes funds available from cash on hand, the Facility and operating cash flows will provide sufficient liquidity to meet its operating needs and commitments arising during the next twelve months and until the expiration of the Facility in November 2025.
See Note 8 and Note 10 to the Consolidated Financial Statements in this Form 10-K for further information on the Company's other financing arrangements and leases, respectively.
Expenditures for property, plant and equipment and mineral interests
Following is a table which summarizes actual and planned expenditures (in millions):
|
|
|
|
|
|
|
|
|
|
|
|
|
|
|
|
|
|
|
Planned |
|
Actual |
|
Actual |
| |
2024 |
|
2023 |
|
2022 |
| NACCO |
$ |
69.0 |
|
|
$ |
82.1 |
|
|
$ |
54.4 |
|
Planned expenditures for 2024 are expected to be approximately $32 million in the NAMining segment, $20 million in the Minerals Management segment, $13 million in the Coal Mining segment and $4 million in Unallocated Items.
Item 7. MANAGEMENT'S DISCUSSION AND ANALYSIS OF FINANCIAL CONDITION AND RESULTS OF OPERATIONS
NACCO INDUSTRIES, INC. AND SUBSIDIARIES
(Tabular Amounts in Thousands, Except Per Share and Percentage Data)
Expenditures are expected to be funded from internally generated funds and/or bank borrowings.
Capital Structure
NACCO's consolidated capital structure is presented below:
|
|
|
|
|
|
|
|
|
|
|
|
|
|
|
|
|
|
| |
December 31 |
|
|
| |
2023 |
|
2022 |
|
Change |
| Cash and cash equivalents |
$ |
85,109 |
|
|
$ |
110,748 |
|
|
$ |
(25,639) |
|
Other net tangible assets |
349,934 |
|
|
329,045 |
|
|
20,889 |
|
| Intangible assets, net |
6,006 |
|
|
28,055 |
|
|
(22,049) |
|
| Net assets |
441,049 |
|
|
467,848 |
|
|
(26,799) |
|
| Total debt |
(35,956) |
|
|
(19,668) |
|
|
(16,288) |
|
| Closed mine obligations |
(22,753) |
|
|
(21,214) |
|
|
(1,539) |
|
| Total equity |
$ |
382,340 |
|
|
$ |
426,966 |
|
|
$ |
(44,626) |
|
| Debt to total capitalization |
9 |
% |
|
4 |
% |
|
5 |
% |
The $20.9 million increase in other net tangible assets was primarily due to a favorable change in Deferred income taxes.
During the fourth quarter of 2023, intangible assets, net, decreased by $22.0 million, primarily because the Company recorded a non-cash, long-lived asset impairment charge. See Note 9 to the Consolidated Financial Statements in this Form 10-K for further discussion of the Company's impairment analysis.
Contractual Obligations, Contingent Liabilities and Commitments
Pension and postretirement funding can vary significantly each year due to plan amendments, changes in the market value of plan assets, legislation and the Company’s decisions to contribute above the minimum regulatory funding requirements. The Company does not expect to contribute to its pension plan in 2024 and any settlements will be paid out of pension plan assets. NACCO maintains one supplemental retirement plan that pays monthly benefits to participants directly out of corporate funds and expects to pay benefits of approximately $0.4 million per year from 2024 through 2033. Benefit payments beyond that time cannot currently be estimated. NACCO also expects to make payments related to its other postretirement plans of approximately $0.2 million per year from 2024 through 2033. Benefit payments beyond that time cannot currently be estimated.
NACCO has asset retirement obligations. See Note 7 to the Consolidated Financial Statements in this Form 10-K for further discussion of the Company's asset retirement obligations.
NACCO has unrecognized tax benefits, including interest and penalties. See Note 13 to the Consolidated Financial Statements in this Form 10-K for further discussion of the Company's income taxes.
The Company is a party to certain guarantees related to Coyote Creek. The Company believes that the likelihood of future performance under the guarantees is remote, and no amounts related to these guarantees have been recorded. See Note 16 to the Consolidated Financial Statements in this Form 10-K for further discussion of the Company's guarantees.
The Company utilizes letters of credit to support commitments made in the ordinary course of business. As of December 31, 2023 and 2022, outstanding letters of credit totaled $34.9 million and $33.7 million, respectively.
ENVIRONMENTAL MATTERS
The Company is affected by the regulations of numerous agencies, particularly the Federal Office of Surface Mining, the U.S. Environmental Protection Agency, the U.S. Army Corps of Engineers and associated state regulatory authorities. In addition, the Company closely monitors proposed legislation and regulation concerning SMCRA, CAA, ACE, CWA, RCRA, CERCLA and other regulatory actions.
Item 7. MANAGEMENT'S DISCUSSION AND ANALYSIS OF FINANCIAL CONDITION AND RESULTS OF OPERATIONS
NACCO INDUSTRIES, INC. AND SUBSIDIARIES
(Tabular Amounts in Thousands, Except Per Share and Percentage Data)
Compliance with these increasingly stringent regulations could result in higher expenditures for both capital improvements and operating costs. The Company’s policies stress environmental responsibility and compliance with these regulations. See Item 1 in Part I of this Form 10-K for further discussion of these matters.
Certain states have enacted, and others are considering enacting, mandatory clean energy standards requiring utilities to meet certain thresholds of renewable energy sources and/or carbon-free energy supply. The current presidential administration has made climate change a focus, including consideration for legislation on clean energy standards and GHG emission, and the Company expects that to continue. The Company believes the move to require utilities to generate a greater portion of energy from renewable energy sources could create imbalances in the existing electric grid if fossil-fuel power plants are retired faster than renewable energy sources are developed resulting in electrical grid disruptions and outages. The Company will continue to monitor the progress of these initiatives and assess the potential impacts they may have on its financial condition, results of operations and disclosures.
SEGMENT RESULTS
COAL MINING SEGMENT
FINANCIAL REVIEW
See “Item 2. Properties" on page 31 in this Form 10-K for discussion of the Company's mineral resources and mineral reserves.
Tons of coal delivered by the Coal Mining segment were as follows for the years ended December 31:
|
|
|
|
|
|
|
|
|
|
|
|
| |
2023 |
|
2022 |
|
|
|
|
|
|
|
|
|
|
|
|
|
|
|
|
|
|
|
|
|
|
|
|
|
|
|
|
| Unconsolidated mines |
20,741 |
|
|
25,236 |
|
|
|
|
|
| Consolidated mines |
2,931 |
|
|
3,215 |
|
| Total tons delivered |
23,672 |
|
|
28,451 |
|
The results of operations for the Coal Mining segment were as follows for the years ended December 31:
|
|
|
|
|
|
|
|
|
|
|
|
| |
2023 |
|
2022 |
| Revenues |
$ |
85,415 |
|
|
$ |
95,204 |
|
| Cost of sales |
108,760 |
|
|
89,670 |
|
Gross (loss) profit |
(23,345) |
|
|
5,534 |
|
Earnings of unconsolidated operations(a) |
44,633 |
|
|
52,535 |
|
| Contract termination settlement |
— |
|
|
14,000 |
|
| Selling, general and administrative expenses and asset impairment charges |
89,971 |
|
|
30,049 |
|
| Amortization of intangible assets |
2,998 |
|
|
3,719 |
|
| Gain on sale of assets |
(339) |
|
|
(8) |
|
Operating (loss) profit |
$ |
(71,342) |
|
|
$ |
38,309 |
|
(a) See Note 16 to the Consolidated Financial Statements in this Form 10-K for a discussion of the Company's unconsolidated subsidiaries, including summarized financial information.
2023 Compared with 2022
Revenues decreased 10.3% in 2023 compared with 2022 primarily due to a reduction in customer requirements at MLMC.
Item 7. MANAGEMENT'S DISCUSSION AND ANALYSIS OF FINANCIAL CONDITION AND RESULTS OF OPERATIONS
NACCO INDUSTRIES, INC. AND SUBSIDIARIES
(Tabular Amounts in Thousands, Except Per Share and Percentage Data)
The following table identifies the components of change in operating profit for 2023 compared with 2022:
|
|
|
|
|
|
| |
Operating (Loss) Profit |
| 2022 |
$ |
38,309 |
|
| Increase (decrease) from: |
|
| Long-lived asset impairment charge |
(60,832) |
|
| Gross profit, excluding inventory impairment charges |
(21,365) |
|
| Contract termination settlement in 2022 |
(14,000) |
|
| Earnings of unconsolidated operations |
(7,902) |
|
| Inventory impairment charges |
(7,514) |
|
| Selling, general and administrative expenses |
910 |
|
| Amortization of intangibles |
721 |
|
| Net change on sale of assets |
331 |
|
| 2023 |
$ |
(71,342) |
|
Operating (loss) profit changed unfavorably by $109.7 million in 2023 compared with 2022. The change in operating profit was primarily due to:
•A long-lived asset impairment charge;
•A decrease in gross profit;
•The non-recurrence of $14.0 million recognized in 2022 related to the contract termination settlement with GRE; and
•A decrease in the earnings of unconsolidated operations.
On December 18, 2023, MLMC received a force majeure event notice from its customer related to an issue that began on December 15, 2023 and impacted one of two boilers at the Red Hills Power Plant. The notice did not provide a timeline for resolution of the issue. The Company determined the anticipated reduction in customer demand caused by this issue was an indicator of potential impairment. The Company recorded a non-cash, long-lived asset impairment charge of $65.9 million in 2023. The $65.9 million relates exclusively to MLMC; however, $60.8 million and $5.1 million were recorded on the Coal Mining segment and the Minerals Management segment, respectively, as certain MLMC land assets were recorded within the Minerals Management segment. See Note 9 to the Consolidated Financial Statements in this Form 10-K for further information on the long-lived asset impairment charge.
The decrease in gross profit was primarily due to an increase in the cost per ton delivered at MLMC. The increase in cost per
ton delivered at MLMC is due to costs associated with establishing operations in a new mine area and a reduction in the number of tons severed. The reduction in severed tons was due to adverse mining conditions during 2023, as well as operational inefficiencies related to final mining activities at the existing mine area. Fewer tons severed caused a decrease in tons held in inventory since more tons were delivered than produced during 2023. This resulted in an increase in the cost per ton sold and $7.5 million of inventory impairment charges to write down coal inventory to its net realizable value.
The decrease in the earnings of unconsolidated operations was primarily due to a reduction in customer requirements at Coteau and Falkirk. A reduction in the per ton management fee at Falkirk, effective May 2022 through May 2024, to support the transition of the Coal Creek Station Power Plant to Rainbow Energy also contributed to the 2023 decrease in earnings.
NORTH AMERICAN MINING ("NAMining") SEGMENT
FINANCIAL REVIEW
Aggregate tons delivered by the NAMining segment were as follows for the years ended December 31:
|
|
|
|
|
|
|
|
|
|
|
|
| |
2023 |
|
2022 |
|
|
|
|
|
|
|
|
| Total tons delivered |
56,655 |
|
|
54,223 |
|
Item 7. MANAGEMENT'S DISCUSSION AND ANALYSIS OF FINANCIAL CONDITION AND RESULTS OF OPERATIONS
NACCO INDUSTRIES, INC. AND SUBSIDIARIES
(Tabular Amounts in Thousands, Except Per Share and Percentage Data)
The results of operations for the NAMining segment were as follows for the years ended December 31:
|
|
|
|
|
|
|
|
|
|
|
|
| |
2023 |
|
2022 |
| Total revenues |
$ |
90,532 |
|
|
$ |
85,664 |
|
| Reimbursable costs |
56,611 |
|
|
52,935 |
|
| Revenues excluding reimbursable costs |
$ |
33,921 |
|
|
$ |
32,729 |
|
|
|
|
|
| Revenues |
$ |
90,532 |
|
|
$ |
85,664 |
|
| Cost of sales |
83,719 |
|
|
79,842 |
|
| Gross profit |
6,813 |
|
|
5,822 |
|
Earnings of unconsolidated operations(a) |
5,361 |
|
|
4,715 |
|
| Selling, general and administrative expenses |
8,308 |
|
|
8,260 |
|
| Loss on sale of assets |
518 |
|
|
75 |
|
| Operating profit |
$ |
3,348 |
|
|
$ |
2,202 |
|
(a) See Note 16 to the Consolidated Financial Statements in this Form 10-K for a discussion of the Company's unconsolidated subsidiaries, including summarized financial information.
2023 Compared with 2022
Total revenues increased 5.7% in 2023 compared with 2022 primarily due to:
•An increase in reimbursable costs at Sawtooth, which have an offsetting amount in cost of sales and have no impact on operating profit;
•An increase in customer requirements and tons delivered at the consolidated quarries; and
•Higher dragline part sales.
These improvements were partially offset by a reduction in mine reclamation revenue at Caddo Creek.
The following table identifies the components of change in operating profit for 2023 compared with 2022.
|
|
|
|
|
|
| |
Operating Profit |
| 2022 |
$ |
2,202 |
|
| Increase (decrease) from: |
|
| Voluntary retirement program charge |
769 |
|
| Earnings of unconsolidated operations |
646 |
|
| Gross profit |
459 |
|
| Net change on sale of assets |
(443) |
|
| Selling, general and administrative expenses |
(285) |
|
| 2023 |
$ |
3,348 |
|
Operating profit increased $1.1 million in 2023 compared with 2022 primarily due to the absence of a voluntary retirement program charge, as well as increases in the earnings of unconsolidated operations and gross profit.
During 2022, the Company implemented a voluntary retirement program for employees who met certain age and service requirements to reduce overall headcount. As a result of this program, operating profit in 2022 included a charge of $0.8 million related to one-time termination benefits.
The increases in the earnings of the unconsolidated operations and gross profit were primarily due to higher earnings at the limestone quarries. An increase in dragline part sales and higher earnings at Sawtooth also contributed to the increase in gross profit. These improvements were largely offset by the absence of earnings associated with Caddo Creek reclamation activities.
Item 7. MANAGEMENT'S DISCUSSION AND ANALYSIS OF FINANCIAL CONDITION AND RESULTS OF OPERATIONS
NACCO INDUSTRIES, INC. AND SUBSIDIARIES
(Tabular Amounts in Thousands, Except Per Share and Percentage Data)
MINERALS MANAGEMENT SEGMENT
FINANCIAL REVIEW
The results of operations for the Minerals Management segment were as follows for the years ended December 31:
|
|
|
|
|
|
|
|
|
|
|
|
| |
2023 |
|
2022 |
| Revenues |
$ |
32,985 |
|
|
$ |
60,242 |
|
| Cost of sales |
3,969 |
|
|
3,935 |
|
| Gross profit |
29,016 |
|
|
56,307 |
|
| Selling, general and administrative expenses and asset impairment charges |
9,556 |
|
|
6,623 |
|
Loss (gain) on sale of assets |
42 |
|
|
(2,530) |
|
| Operating profit |
$ |
19,418 |
|
|
$ |
52,214 |
|
During 2023, the oil and natural gas industry experienced a decline in commodity prices compared with 2022. Oil and natural gas prices have been historically volatile and may continue to be volatile in the future. The table below demonstrates such volatility with the average price as reported by the United States Energy Information Administration for the twelve months ended December 31:
|
|
|
|
|
|
|
|
|
|
|
|
|
|
|
|
|
|
| |
|
2023 |
|
2022 |
| West Texas Intermediate Average Crude Oil Price |
|
$ |
77.64 |
|
|
$ |
94.79 |
|
| Henry Hub Average Natural Gas Price |
|
$ |
2.54 |
|
|
$ |
6.42 |
|
Revenues and operating profit decreased in 2023 compared with 2022 primarily due to substantially lower natural gas and oil prices, as well as lower settlement income. The 2023 and 2022 periods included settlement income of $1.4 million and $2.1 million, respectively. Settlement income relates to the Company’s ownership interest in certain mineral rights.
The Minerals Management segment recorded a non-cash, long-lived asset impairment charge of $5.1 million during 2023 as certain MLMC land assets were recorded within the Minerals Management segment. See Note 9 to the Consolidated Financial Statements in this Form 10-K for further information on the impairment analysis.
The Company regularly performs reviews of potential future development projects and identified certain legacy coal assets
where future development is unlikely. The long-lived assets, which included land, prepaid royalties and capitalized leasehold
costs, were written off in 2022 and resulted in non-cash asset impairment charges of $3.9 million.
In addition, operating profit in 2023 decreased due to a $2.4 million gain on the sale of land related to legacy operations recognized during 2022.
An increase in selling, general and administrative expenses, mainly due to higher employee-related costs, also contributed to the decrease in operating profit.
Item 7. MANAGEMENT'S DISCUSSION AND ANALYSIS OF FINANCIAL CONDITION AND RESULTS OF OPERATIONS
NACCO INDUSTRIES, INC. AND SUBSIDIARIES
(Tabular Amounts in Thousands, Except Per Share and Percentage Data)
UNALLOCATED ITEMS AND ELIMINATIONS
FINANCIAL REVIEW
Unallocated Items and Eliminations were as follows for the years ended December 31:
|
|
|
|
|
|
|
|
|
|
|
|
| |
2023 |
|
2022 |
| Operating loss |
$ |
(21,561) |
|
|
$ |
(22,739) |
|
2023 Compared with 2022
The operating loss decreased during 2023 compared with 2022 primarily due to higher earnings at Mitigation Resources and lower employee-related costs. These favorable items were partially offset by increased spending on growth initiatives.
NACCO Industries, Inc. Outlook
Coal Mining Outlook
In 2024, the Company expects coal deliveries to increase modestly from 2023 levels. Higher deliveries at Coteau and Falkirk are expected to be partly offset by the unfavorable effects of the force majeure event at MLMC and the power plant retirement that led to the March 31, 2023 cessation of coal deliveries from the Company's Sabine Mine.
Strong operating profit compared with a significant 2023 loss and substantially higher Segment Adjusted EBITDA are expected in 2024. These anticipated increases are primarily the result of an improvement in results at MLMC and higher earnings at Falkirk and Coteau.
MLMC expects to incur a loss in 2024, albeit significantly less than in 2023, as a result of the lower tons expected to be delivered in 2024. While total production costs at MLMC are anticipated to decline substantially from 2023 levels, they are expected to remain above historical levels throughout 2024 until deliveries return to normal and a pit extension in the new mine area is completed. Lower depreciation and amortization expense as a result of the lower depreciable value of MLMC's assets after the impairment is expected to contribute to the improved results. An extended delay in repairs to the Red Hills Power Plant could significantly affect the Company's 2024 outlook.
An increase in 2024 earnings at the unconsolidated coal mining operations is driven primarily by an expectation for increased customer requirements at Coteau and Falkirk, as well as a higher per ton management fee at Falkirk beginning in June 2024 when temporary price concessions end.
Operating profit is expected to be higher in the second half of 2024 compared with the first half due to anticipated improvements at MLMC, increased demand at the unconsolidated coal mining operations and the end of the Falkirk price concessions in June 2024.
Capital expenditures are expected to be approximately $12.5 million in 2024.
The Company's contract structure at each of its coal mining operations eliminates exposure to spot coal market price fluctuations. However, fluctuations in natural gas prices, weather and the availability of renewable power generation, particularly wind, can contribute to changes in power plant dispatch and customer demand for coal. Changes to customer power plant dispatch would affect the Company’s 2024 outlook, as well as outlook over the longer term.
NAMining Outlook
In October 2023, NAMining executed a 15-year contract to mine phosphate at a quarry in central Florida. Production is expected to commence in the first half of 2024 once relocation of a dragline is complete. The business also amended and extended existing limestone contracts with two customers that contain mutually advantageous contract terms and expanded the scope of work with another customer. As a result of the impact of these new and modified contracts, as well as improvements at existing operations, NAMining expects consecutive quarterly growth in operating profit and Segment Adjusted EBITDA in 2024, leading to significantly improved full-year results over 2023.
Item 7. MANAGEMENT'S DISCUSSION AND ANALYSIS OF FINANCIAL CONDITION AND RESULTS OF OPERATIONS
NACCO INDUSTRIES, INC. AND SUBSIDIARIES
(Tabular Amounts in Thousands, Except Per Share and Percentage Data)
Sawtooth has an exclusive agreement to provide mining design, consulting and, once mining commences, will be the exclusive contract miner for the Thacker Pass lithium project in northern Nevada. Thacker Pass is owned by Lithium Americas Corp. (TSX: LAC) (NYSE: LAC). Lithium Americas controls the lithium reserves at Thacker Pass. In March 2023, Lithium Americas commenced construction at Thacker Pass. With construction underway, Sawtooth began acquiring mining equipment totaling $23.3 million in 2023. These capital expenditures will be reimbursed by Lithium Americas over a five-year period, Sawtooth will recognize the associated revenue over the estimated useful life of the asset. In addition, during the construction period, Sawtooth will be reimbursed for all costs of construction and will recognize a contractually agreed upon construction fee. The Company expects to continue to recognize moderate income prior to the commencement of Phase 1 lithium production.
In 2024, capital expenditures are expected to be approximately $32 million, primarily for the acquisition of dragline parts and other equipment to support existing contracts as well as the new and modified contracts previously discussed.
Minerals Management Outlook
The Minerals Management segment derives income primarily from royalty-based leases under which lessees make payments to the Company based on their sale of natural gas, oil, natural gas liquids and coal, extracted primarily by third parties. Changing prices of natural gas and oil could have a significant impact on Minerals Management’s operating profit.
In December 2023, Minerals Management completed an approximately $37 million acquisition of mineral interests within the Midland Basin, the eastern sub-basin of the oil-rich Permian Basin. The acquisition includes 43.4 thousand gross acres and 2.5 thousand net royalty acres. This acquisition offers an attractive investment profile and aligns with the Company's strategy to establish a diversified portfolio of mineral and royalty interests. Management believes this acquisition will be accretive to 2024 earnings and provides opportunities for longer-term growth.
In 2024, operating profit and Segment Adjusted EBITDA are expected to decrease moderately compared with the prior year, excluding the 2023 impairment charge stemming from issues at the power plant served by MLMC. The forecasted reduction in profitability is primarily driven by current market expectations for natural gas and oil prices and modest expectations for development of additional new wells by third-party lessees. Lower operating expenses are expected to partially offset the anticipated profit decline.
The Company's forecast is based on current market assumptions for natural gas and oil market prices, as well as development and production assumptions on currently owned reserves. Commodity prices are inherently volatile. Changes may be abrupt in response to factors such as OPEC and/or government actions, geopolitical developments, economic conditions and regulatory changes, as well as supply and demand dynamics. Any change in natural gas and oil prices from current expectations will result in adjustments to the Company's outlook. The Company is closely monitoring the Russia/Ukraine and Israel/Hamas conflicts and their potential impact on OPEC countries and international oil and gas production and demand. Current merger and acquisition activity within the oil and gas exploration and production industry is also a focus as the Company works to understand its potential impact on development plans by third-party lessees.
As an owner of royalty and mineral interests, the Company’s access to information concerning activity and operations with respect to its interests is limited. The Company's expectations are based on the best information currently available and could vary positively or negatively as a result of adjustments made by operators, additional leasing and development and/or changes to commodity prices. Development of additional wells on existing interests in excess of current expectations, or acquisitions of additional interests, could be accretive to future results.
In 2024, Minerals Management is targeting additional investments of up to $20 million. Future investments are expected to be accretive, but each investment's contribution to near-term earnings is dependent on the details of that investment, including the size and type of interests acquired and the stage and timing of mineral development.
Mitigation Resources
Mitigation Resources continues to build on the substantial foundation it has established over the past several years. Mitigation Resources currently has nine mitigation banks and four permittee-responsible mitigation projects located in Tennessee, Mississippi, Alabama and Texas. In addition, Mitigation Resources is providing ecological restoration services for abandoned surface mines, as well as pursuing additional environmental restoration projects. It was named a designated provider of abandoned mine land restoration by the State of Texas.
Item 7. MANAGEMENT'S DISCUSSION AND ANALYSIS OF FINANCIAL CONDITION AND RESULTS OF OPERATIONS
NACCO INDUSTRIES, INC. AND SUBSIDIARIES
(Tabular Amounts in Thousands, Except Per Share and Percentage Data)
Mitigation Resources anticipates expanding its business in 2024, with a focus on generating a modest operating profit by 2025 and achieving sustainable profitability in future years.
Consolidated Outlook
Overall, the Company expects to generate net income in 2024 compared with the substantial 2023 consolidated net loss. Adjusted EBITDA is also expected to increase significantly over 2023. These improvements are primarily due to anticipated increased profitability at the Coal Mining segment from improved results at MLMC, Falkirk and Coteau. Growth at NAMining is also expected to contribute to the higher 2024 results. Additional contracts for NAMining or Mitigation Resources, or the acquisition of additional mineral interests at Minerals Management could be accretive to the current forecast.
Consolidated capital expenditures are expected to total approximately $69 million in 2024. In 2024, cash flow before financing activities is expected to be a moderate use of cash.
Long-Term Growth and Diversification Outlook
Management continues to view the long-term business outlook for NACCO positively. The Company is pursuing growth and diversification by strategically leveraging its core mining and natural resources management skills to build a strong portfolio of affiliated businesses. Management continues to be optimistic about the long-term outlook. In the Minerals Management segment, as well as in the Company's Mitigation Resources business, opportunities for growth remain strong. Acquisitions of additional mineral interests, an improvement in the outlook for the Company's largest Coal Mining segment customers, and securing contracts for Mitigation Resources and new NAMining projects should be accretive to the Company's outlook.
The Minerals Management segment continues to pursue acquisitions of mineral and royalty interests in the United States. Catapult, the Company’s business unit focused on managing and expanding the Company’s portfolio of oil and gas mineral and royalty interests, has developed a strong network to source and secure new acquisitions. The goal is to construct a high-quality diversified portfolio of oil and gas mineral and royalty interests in the United States that delivers near-term cash flow yields and long-term projected growth. The Company believes this business will provide unlevered after-tax returns on invested capital in the mid-teens as this business model matures. This business model has the potential to deliver higher average operating margins over the life of a reserve than traditional oil and gas companies that bear the cost of exploration, production and/or development as these costs are borne entirely by third-party exploration and development companies that lease the minerals.
NAMining is focused on evaluating new business opportunities and driving profitable growth in line with refined strategic objectives. After a pause on business development in early 2023, NAMining has better identified how to enhance operational excellence, where to focus and scale, and how to drive profitable growth. New contracts and contract extensions are central to the business' organic growth strategy, and NAMining intends to be a substantial contributor to operating profit over time.
Mitigation Resources continues to expand its business, which creates and sells stream and wetland mitigation credits, provides services to those engaged in permittee-responsible mitigation and provides other environmental restoration services. This business offers an opportunity for growth and diversification in an industry where the Company has substantial knowledge and expertise and a strong reputation. Mitigation Resources is making strong progress toward its goal of becoming a top ten provider of stream and wetland mitigation services in the southeastern United States. The Company believes that Mitigation Resources can provide solid rates of return on capital employed as this business matures.
The Company also continues to pursue activities which can strengthen the resiliency of its existing coal mining operations. The Company remains focused on managing coal production costs and maximizing efficiencies and operating capacity at mine locations to help customers with management fee contracts be more competitive. These activities benefit both customers and the Company's Coal Mining segment, as fuel cost is a significant driver for power plant dispatch. Increased power plant dispatch results in increased demand for coal by the Coal Mining segment's customers. Fluctuating natural gas prices, weather and availability of renewable energy sources, such as wind and solar, could affect the amount of electricity dispatched from coal-fired power plants. While the Company realizes the coal mining industry faces political and regulatory challenges and demand for coal is projected to decline over the longer-term, the Company believes coal should be an essential part of the energy mix in the United States for the foreseeable future.
Item 7. MANAGEMENT'S DISCUSSION AND ANALYSIS OF FINANCIAL CONDITION AND RESULTS OF OPERATIONS
NACCO INDUSTRIES, INC. AND SUBSIDIARIES
(Tabular Amounts in Thousands, Except Per Share and Percentage Data)
The Company continues to look for ways to create additional value by utilizing its core mining competencies which include reclamation and permitting. The Company is working to utilize these skills through development of utility-scale solar projects on reclaimed mining properties. Reclaimed mining properties offer large tracts of land that could be well-suited for solar and other energy-related projects. These projects could be developed by the Company itself or through joint ventures that include partners with expertise in energy development projects. In 2023, NACCO formed ReGen Resources to pursue such projects, including the development of a solar farm on reclaimed land at MLMC.
The Company is committed to maintaining a conservative capital structure as it continues to grow and diversify, while avoiding unnecessary risk. Strategic diversification will generate cash that can be re-invested to strengthen and expand the businesses. The Company also continues to maintain the highest levels of customer service and operational excellence with an unwavering focus on safety and environmental stewardship.
RECENTLY ISSUED ACCOUNTING STANDARDS
See Note 2 to the Consolidated Financial Statements in this Form 10-K for a description of recently issued accounting standards, if any, including actual and expected dates of adoption and effects to the Company's Consolidated Financial Statements.
FORWARD-LOOKING STATEMENTS
The statements contained in “Management’s Discussion and Analysis of Financial Condition and Results of Operations” and elsewhere throughout this Annual Report on Form 10-K that are not historical facts are “forward-looking statements” within the meaning of Section 27A of the Securities Act of 1933 and Section 21E of the Securities Exchange Act of 1934. These forward-looking statements are made subject to certain risks and uncertainties, which could cause actual results to differ materially from those presented. Readers are cautioned not to place undue reliance on these forward-looking statements, which speak only as of the date hereof. The Company undertakes no obligation to publicly revise these forward-looking statements to reflect events or circumstances that arise after the date hereof. Among the factors that could cause plans, actions and results to differ materially from current expectations are, without limitation: (1) changes to or termination of customer or other third-party contracts, or a customer or other third party default under a contract, (2) any customer's premature facility closure or extended project development delay, (3) regulatory actions, including the United States EPA's 2023 proposed rules relating to mercury and greenhouse gas emissions for coal-fired power plants, changes in mining permit requirements or delays in obtaining mining permits that could affect deliveries to customers, (4) a significant reduction in purchases by the Company's customers, including as a result of changes in coal consumption patterns of U.S. electric power generators, or changes in the power industry that would affect demand for the Company's coal and other mineral reserves, (5) changes in the prices of hydrocarbons, particularly diesel fuel, natural gas, natural gas liquids and oil, (6) failure or delays by the Company's lessees in achieving expected production of natural gas and other hydrocarbons; the availability and cost of transportation and processing services in the areas where the Company's oil and gas reserves are located; federal and state legislative and regulatory initiatives relating to hydraulic fracturing and U.S. export of natural gas; and the ability of lessees to obtain capital or financing needed for well-development operations and leasing and development of oil and gas reserves on federal lands, (7) failure to obtain adequate insurance coverages at reasonable rates, (8) supply chain disruptions, including price increases and shortages of parts and materials, (9) changes in tax laws or regulatory requirements, including the elimination of, or reduction in, the percentage depletion tax deduction, changes in mining or power plant emission regulations and health, safety or environmental legislation, (10) the ability of the Company to access credit in the current economic environment, or obtain financing at reasonable rates, or at all, and to maintain surety bonds for mine reclamation as a result of current market sentiment for fossil fuels, (11) impairment charges, (12) changes in costs related to geological and geotechnical conditions, repairs and maintenance, new equipment and replacement parts, fuel or other similar items, (13) weather conditions, extended power plant outages, liquidity events or other events that would change the level of customers' coal or aggregates requirements, (14) weather or equipment problems that could affect deliveries to customers, (15) changes in the costs to reclaim mining areas, (16) costs to pursue and develop new mining, mitigation, oil and gas and solar development opportunities and other value-added service opportunities, (17) delays or reductions in coal or aggregates deliveries, (18) the ability to successfully evaluate investments and achieve intended financial results in new business and growth initiatives, (19) disruptions from natural or human causes, including severe weather, accidents, fires, earthquakes and terrorist acts, any of which could result in suspension of operations or harm to people or the environment, and (20) the ability to attract, retain, and replace workforce and administrative employees.
Item 7A. QUANTITATIVE AND QUALITATIVE DISCLOSURES ABOUT MARKET RISK
As a “smaller reporting company” as defined by Rule 12b-2 of the Securities Exchange Act of 1934, the Company is not required to provide this information.
Item 8. FINANCIAL STATEMENTS AND SUPPLEMENTARY DATA
The information required by this Item 8 is set forth in the Financial Statements and Supplementary Data contained in Part IV of this Form 10-K and is hereby incorporated herein by reference to such information.
Item 9. CHANGES IN AND DISAGREEMENTS WITH ACCOUNTANTS ON ACCOUNTING AND FINANCIAL DISCLOSURE
There were no disagreements with accountants on accounting and financial disclosure for the two-year period ended December 31, 2023 that require disclosure pursuant to this Item 9.
Item 9A. CONTROLS AND PROCEDURES
Evaluation of disclosure controls and procedures: An evaluation was carried out under the supervision and with the participation of the Company's management, including the principal executive officer and the principal financial officer, of the effectiveness of the Company's disclosure controls and procedures as of the end of the period covered by this report. Based on that evaluation, these officers have concluded that the Company's disclosure controls and procedures are effective.
Management's report on internal control over financial reporting: Management is responsible for establishing and maintaining adequate internal control over financial reporting. Under the supervision and with the participation of management, including the principal executive officer and principal financial officer, the Company conducted an evaluation of the effectiveness of internal control over financial reporting based on the framework in Internal Control — Integrated Framework issued by the Committee of Sponsoring Organizations of the Treadway Commission (2013 framework). Based on this evaluation under the framework, management concluded that the Company's internal control over financial reporting was effective as of December 31, 2023. The Company's effectiveness of internal control over financial reporting as of December 31, 2023 has been audited by Ernst & Young LLP, an independent registered public accounting firm, as stated in its report, which is included in Item 15 of this Form 10-K and incorporated herein by reference.
Changes in internal control: There have been no changes in the Company's internal control over financial reporting, that occurred during the fourth quarter of 2023, that have materially affected, or are reasonably likely to materially affect, the Company's internal control over financial reporting.
Item 9B. OTHER INFORMATION
None.
Item 9C. DISCLOSURE REGARDING FOREIGN JURISDICTIONS THAT PREVENT INSPECTIONS
None.
PART III
Item 10. DIRECTORS, EXECUTIVE OFFICERS AND CORPORATE GOVERNANCE
Information with respect to Directors of the Company will be set forth in the 2024 Proxy Statement under the subheadings “Part III — Proposals To Be Voted On At The 2024 Annual Meeting — Proposal 1 — Election of Directors,” which information is incorporated herein by reference.
Information with respect to the audit review committee and the audit review committee financial expert will be set forth in the 2024 Proxy Statement under the subheading “Part I — Corporate Governance Information — Directors' Meetings and Committees,” which information is incorporated herein by reference.
Information with respect to compliance with Section 16(a) of the Securities Exchange Act of 1934 by the Company's Directors, executive officers and holders of more than ten percent of the Company's equity securities will be set forth in the 2024 Proxy Statement under the subheading “Part IV — Other Important Information,” which information is incorporated herein by reference.
The Company has adopted a code of business conduct and ethics applicable to all Company personnel, including the principal executive officer, principal financial officer, principal accounting officer or controller, or other persons performing similar functions. The code of business conduct and ethics, entitled the “Code of Corporate Conduct,” is posted on the Company's website at www.nacco.com under “Corporate Governance.” If the Company makes any amendments to or grants any waivers from the code of business conduct and ethics which are required to be disclosed pursuant to the Securities and Exchange Act of 1934, the Company will make such disclosure on the NACCO website.
Item 11. EXECUTIVE COMPENSATION
Information with respect to executive compensation will be set forth in the 2024 Proxy Statement under the headings “Part II — Executive Compensation Information” and “Part III — Proposals To Be Voted On At The 2024 Annual Meeting — Proposal 1 — Election of Directors,” which information is incorporated herein by reference.
Item 12. SECURITY OWNERSHIP OF CERTAIN BENEFICIAL OWNERS AND MANAGEMENT AND RELATED STOCKHOLDER MATTERS
Information with respect to security ownership of certain beneficial owners and management will be set forth in the 2024 Proxy Statement under the subheading “Part IV — Other Important Information — Beneficial Ownership of Class A Common and Class B Common,” which information is incorporated herein by reference.
Information with respect to compensation plans (including individual compensation arrangements) under which equity securities are authorized for issuance will be set forth in the 2024 Proxy Statement under the subheading “Part IV — Other Important Information — Equity Compensation Plan Information," which information is incorporated herein by reference.
Item 13. CERTAIN RELATIONSHIPS AND RELATED TRANSACTIONS, AND DIRECTOR INDEPENDENCE
Information with respect to certain relationships and related transactions will be set forth in the 2024 Proxy Statement under the subheadings “Part I — Corporate Governance Information — Review and Approval of Related-Person Transactions,” which information is incorporated herein by reference.
Item 14. PRINCIPAL ACCOUNTANT FEES AND SERVICES
Information with respect to principal accountant fees and services will be set forth in the 2024 Proxy Statement under the heading “Part III — Proposals To Be Voted On At The 2024 Annual Meeting — Proposal 4 — Ratification of the Appointment of Company's Independent Registered Public Accounting Firm,” which information is incorporated herein by reference.
PART IV
Item 15. EXHIBITS AND FINANCIAL STATEMENT SCHEDULES
(a) (1) and (2) The response to Item 15(a)(1) and (2) is set forth beginning at page F-1 of this Form 10-K.
(b) Financial Statement Schedules — The response to Item 15(c) is set forth beginning at page F-43 of this Form 10-K.
(c) Exhibits required by Item 601 of Regulation S-K
|
|
|
|
|
|
|
|
|
| Exhibit Number |
|
Exhibit Description |
(3) Articles of Incorporation and By-laws. |
| 3.1(i) |
|
Restated Certificate of Incorporation of the Company is incorporated herein by reference to Exhibit 3(i) to the Company’s Annual Report on Form 10-K for the fiscal year ended December 31, 1992, Commission File Number 1-9172. |
| 3.1(ii) |
|
|
|
|
|
|
|
|
|
|
|
|
|
|
(4) Instruments defining the rights of security holders, including indentures. |
| 4.1 |
|
The Company by this filing agrees, upon request, to file with the Securities and Exchange Commission the instruments defining the rights of holders of long-term debt of the Company and its subsidiaries where the total amount of securities authorized thereunder does not exceed 10% of the total assets of the Company and its subsidiaries on a consolidated basis. |
| 4.2 |
|
Amended and Restated Stockholders' Agreement, dated as of September 29, 2017, among NACCO Industries, Inc., the other signatories thereto and NACCO Industries, Inc., as depository, is incorporated by reference to Exhibit 10.4 to the Company's Current Report on Form 8-K, filed by the Company on October 5, 2017, Commission File Number 1-9172. |
| 4.3 |
|
Amendment to Amended and Restated Stockholders' Agreement, dated as of February 14, 2019, among NACCO Industries, Inc., the other signatories thereto and NACCO Industries, Inc., as depository, is incorporated by reference to Exhibit 4.5 to the Company's Annual Report on Form 10-K for the fiscal year ended December 31, 2018, Commission File Number 1-9172. |
| 4.4 |
|
Second Amendment to Amended and Restated Stockholders' Agreement, dated as of February 12, 2021, by and among the Depository, NACCO Industries, Inc., the new Participating Stockholders identified on the signature pages thereto and the Participating Stockholders under the Amended and Restated Stockholders' Agreement, dated as of September 29, 2017, as amended, is incorporated by reference to Exhibit 99.60 of the Company's General statement of acquisition of beneficial ownership on Form SC 13D, filed on February 12, 2021, Commission File Number 1-9172. |
| 4.5 |
|
Third Amendment to Amended and Restated Stockholders' Agreement, dated as of February 11, 2022, by and among the Depository, NACCO Industries, Inc., the new Participating Stockholders identified on the signature pages thereto and the Participating Stockholders under the Amended and Restated Stockholders' Agreement, dated as of September 29, 2017, as amended, is incorporated by reference to Exhibit 99.62 of the Company's General statement of acquisition of beneficial ownership on Form SC 13D, filed on February 11, 2022, Commission File Number 1-9172. |
| 4.6 |
|
Fourth Amendment to Amended and Restated Stockholders' Agreement, dated as of February 10, 2023, by and among the Depository, NACCO Industries, Inc., the new Participating Stockholders identified on the signature pages thereto and the Participating Stockholders under the Amended and Restated Stockholders' Agreement, dated as of September 29, 2017, as amended, is incorporated by reference to Exhibit 99.67 of the Company's General statement of acquisition of beneficial ownership on Form SC 13D, filed on February 10, 2023, Commission File Number 1-9172. |
| 4.7 |
|
Fifth Amendment to Amended and Restated Stockholders' Agreement, dated as of February 9, 2024, by and among the Depository, NACCO Industries, Inc., the new Participating Stockholders identified on the signature pages thereto and the Participating Stockholders under the Amended and Restated Stockholders' Agreement, dated as of September 29, 2017, as amended, is incorporated by reference to Exhibit 99.69 of the Company's General statement of acquisition of beneficial ownership on Form SC 13D, filed on February 12, 2024, Commission File Number 1-9172. |
| 4.8 |
|
|
|
|
|
|
|
|
|
|
|
| Exhibit Number |
|
Exhibit Description |
(10) Material contracts |
| 10.1* |
|
|
| 10.2* |
|
|
| 10.3* |
|
|
| 10.4* |
|
|
| 10.5* |
|
|
| 10.6* |
|
|
| 10.7* |
|
|
| 10.8* |
|
|
| 10.9* |
|
|
| 10.10 |
|
Consulting Agreement, dated as of September 29, 2017, between NACCO Industries, Inc. and Alfred M. Rankin, Jr., is incorporated by reference to Exhibit 10.5 of NACCO Industries, Inc.'s Current Report on Form 8-K, filed on October 5, 2017, Commission File Number 1-9172. |
| 10.11 |
|
Amendment to Consulting Agreement, dated as of December 15, 2020, between NACCO Industries, Inc. and Alfred M. Rankin, Jr., is incorporated by reference to Exhibit 10.1 of NACCO Industries, Inc.'s Current Report on Form 8-K, filed on December 15, 2020, Commission File Number 1-9172. |
| 10.12 |
|
Amendment to Consulting Agreement, dated as of December 21, 2021, between NACCO Industries, Inc. and Alfred M. Rankin, Jr., is incorporated by reference to Exhibit 10.1 of NACCO Industries, Inc.'s Current Report on Form 8-K, filed on December 22, 2021, Commission File Number 1-9172. |
| 10.13 |
|
Amendment to Consulting Agreement, dated as of December 19, 2023, between NACCO Industries, Inc. and Alfred M. Rankin, Jr., is incorporated by reference to Exhibit 10.1 of NACCO Industries, Inc.'s Current Report on Form 8-K, filed on December 19, 2023, Commission File Number 1-9172.
|
| 10.14* |
|
|
| 10.15* |
|
|
| 10.16* |
|
|
| 10.17* |
|
|
| 10.18* |
|
|
|
|
|
|
|
|
|
|
|
| Exhibit Number |
|
Exhibit Description |
| 10.19 |
|
|
| 10.20 |
|
|
| 10.21 |
|
|
| 10.22 |
|
|
| 10.23 |
|
|
| 10.24 |
|
|
| 10.25 |
|
|
| 10.26 |
|
|
| 10.27 |
|
|
| 10.28 |
|
|
| 10.29 |
|
|
| 10.3 |
|
|
| 10.31 |
|
|
10.32
*** |
|
|
| 10.33 |
|
|
| 10.34 |
|
|
|
|
|
|
|
|
|
|
|
| Exhibit Number |
|
Exhibit Description |
10.35
*** |
|
|
10.36
*** |
|
Mortgage, Assignment of Leases, Rents and As-Extracted Collateral, Security Agreement, Financing Statement and Fixture Filing, by and between The Falkirk Mining Company and Rainbow Energy Center, LLC, dated June 30, 2021, is incorporated herein by reference to Exhibit 10.3 to the Company's Quarterly Report on Form 10-Q, filed by the Company on August 4, 2021, Commission File Number 1-9172. |
| 10.37 |
|
|
| 10.38 |
|
Option Agreement, by and between The Falkirk Mining Company, Rainbow Energy Center, LLC and the State of North Dakota, Doing Business as The Bank of North Dakota, dated June 30, 2021, is incorporated herein by reference to Exhibit 10.5 to the Company's Quarterly Report on Form 10-Q, filed by the Company on August 4, 2021, Commission File Number 1-9172. |
| 10.39 |
|
|
| 10.40 |
|
First Amendment to Lignite Sales Agreement, dated as of January 30, 2014, between Coyote Creek Mining Company, L.L.C. and Otter Tail Power Company, Northern Municipal Power Agency, Montana-Dakota Utilities Co., a division of MDU Resources Group, Inc. and NorthWestern Corporation is incorporated herein by reference to Exhibit 10.1 to the Company’s Quarterly Report on Form 8-K, filed by the Company on January 30, 2014, Commission File Number 1-9172. |
| 10.41 |
|
Second Amendment to Lignite Sales Agreement, dated as of March 16, 2015, between Coyote Creek Mining Company, L.L.C. and Otter Tail Power Company, Northern Municipal Power Agency, Montana-Dakota Utilities Co., a division of MDU Resources Group, Inc., and NorthWestern Corporation is incorporated herein by reference to Exhibit 10.1 to the Company’s Quarterly Report on Form 10-Q, filed by the Company on May 5, 2015, Commission File Number 1-9172. |
| 10.42* |
|
|
| 10.43* |
|
|
| 10.44* |
|
|
| 10.45* |
|
|
| 10.46 |
|
Agreement, dated as of March 16, 2015, among The North American Coal Corporation, Otter Tail Power Company, Northern Municipal Power Agency, Montana-Dakota Utilities Co., a division of MDU Resources Group, Inc. and Northwestern Corporation is incorporated herein by reference to Exhibit 10.2 to the Company's Quarterly Report on Form 10-Q, filed by the Company on May 5, 2015, Commission File Number 1-9172. |
| 10.47 |
|
|
| 10.48 |
|
|
| 10.49 |
|
|
| 10.50 |
|
|
|
|
|
|
|
|
|
|
|
| Exhibit Number |
|
Exhibit Description |
(23) Consents of experts and counsel.
|
|
|
|
|
|
|
|
|
| 23.1** |
|
|
| 23.2** |
|
|
| 23.3** |
|
|
| 23.4** |
|
|
(24) Powers of Attorney.
|
|
|
|
|
|
|
|
|
| 24.1** |
|
|
| 24.2** |
|
|
| 24.3** |
|
|
| 24.4** |
|
|
| 24.5** |
|
|
| 24.6** |
|
|
| 24.7** |
|
|
| 24.8** |
|
|
| 24.9** |
|
|
| 24.10** |
|
|
| 24.11** |
|
|
| 24.12** |
|
|
|
|
|
|
|
|
|
|
|
| Exhibit Number |
|
Exhibit Description |
| (31) Rule 13a-14(a)/15d-14(a) Certifications. |
31(i)(1)
** |
|
|
31(i)(2)
** |
|
|
| (32)**** |
|
|
| (95)** |
|
|
| 96.1 |
|
|
| (97.1)** |
|
|
| (99.1**) |
|
|
| (99.2**) |
|
|
|
|
|
| 101.INS |
|
Inline XBRL Instance Document |
| 101.SCH |
|
Inline XBRL Taxonomy Extension Schema Document |
| 101.CAL |
|
Inline XBRL Taxonomy Extension Calculation Linkbase Document |
| 101.DEF |
|
Inline XBRL Taxonomy Extension Definition Linkbase Document |
| 101.LAB |
|
Inline XBRL Taxonomy Extension Label Linkbase Document |
| 101.PRE |
|
Inline XBRL Taxonomy Extension Presentation Linkbase Document |
| 104 |
|
Cover Page Interactive Data File (formatted as Inline XBRL and contained in Exhibit 101) |
|
|
|
|
|
|
|
|
|
| * |
|
Management contract or compensation plan or arrangement required to be filed as an exhibit pursuant to Item15(b) of this Annual Report on Form 10-K. |
|
|
|
| ** |
|
Filed herewith. |
|
|
|
| *** |
|
Certain confidential information contained in this agreement has been omitted because it (i) is not material and (ii) would be competitively harmful if publicly disclosed. |
|
|
|
| **** |
|
Furnished herewith. |
|
|
|
| + |
|
Portions of Exhibit have been omitted and filed separately with the Securities and Exchange Commission in reliance on Rule 24b-2 and an Order from the Commission granting the Company's request for confidential treatment dated March 27, 2013. Portions for which confidential treatment has been granted have been marked with three asterisks [***] and a footnote indicating "Confidential treatment requested". |
|
|
|
| ++ |
|
Portions of Exhibit have been omitted and filed separately with the Securities and Exchange Commission in reliance on Rule 24b-2 and an Order from the Commission granting the Company's request for confidential treatment dated April 2, 2013. Portions for which confidential treatment has been granted have been marked with three asterisks [***] and a footnote indicating "Confidential treatment requested". |
Item 16. Form 10-K Summary
None.
SIGNATURES
Pursuant to the requirements of Section 13 or 15(d) of the Securities Exchange Act of 1934, the registrant has duly caused this report to be signed on its behalf by the undersigned, thereunto duly authorized.
|
|
|
|
|
|
|
|
|
|
|
|
|
|
|
| |
NACCO Industries, Inc.
|
|
| |
By: |
/s/ Elizabeth I. Loveman |
|
| |
|
Elizabeth I. Loveman |
|
| |
|
Senior Vice President and Controller
(principal financial and accounting officer) |
|
|
|
|
|
March 6, 2024
Pursuant to the requirements of the Securities Exchange Act of 1934, this report has been signed below by the following persons on behalf of the registrant and in the capacities and on the dates indicated.
|
|
|
|
|
|
|
|
|
|
|
|
| /s/ J.C. Butler, Jr. |
|
President and Chief Executive Officer (principal executive officer) |
March 6, 2024 |
| J.C. Butler, Jr. |
|
|
|
|
|
|
|
| /s/ Elizabeth I. Loveman |
|
Senior Vice President and Controller
(principal financial and accounting officer) |
March 6, 2024 |
| Elizabeth I. Loveman |
|
|
|
|
|
|
| *John S. Dalrymple |
|
Director |
March 6, 2024 |
| John S. Dalrymple |
|
|
|
|
|
|
|
| * John P. Jumper |
|
Director |
March 6, 2024 |
| John P. Jumper |
|
|
|
| |
|
|
|
| * Dennis W. LaBarre |
|
Director |
March 6, 2024 |
| Dennis W. LaBarre |
|
|
|
|
|
|
|
* W. Paul McDonald |
|
Director |
March 6, 2024 |
W. Paul McDonald |
|
|
|
|
|
|
|
| * Michael S. Miller |
|
Director |
March 6, 2024 |
| Michael S. Miller |
|
|
|
|
|
|
|
| * Alfred M. Rankin, Jr. |
|
Director |
March 6, 2024 |
| Alfred M. Rankin, Jr. |
|
|
|
|
|
|
|
| * Matthew M. Rankin |
|
Director |
March 6, 2024 |
| Matthew M. Rankin |
|
|
|
|
|
|
|
| * Roger F. Rankin |
|
Director |
March 6, 2024 |
| Roger F. Rankin |
|
|
|
|
|
|
|
| *Lori J. Robinson |
|
Director |
March 6, 2024 |
| Lori J. Robinson |
|
|
|
|
|
|
|
| * Valerie Gentile Sachs |
|
Director |
March 6, 2024 |
| Valerie Gentile Sachs |
|
|
|
|
|
|
|
| *Robert S. Shapard |
|
Director |
March 6, 2024 |
| Robert S. Shapard |
|
|
|
|
|
|
|
| * Britton T. Taplin |
|
Director |
March 6, 2024 |
| Britton T. Taplin |
|
|
|
* Elizabeth I. Loveman, by signing her name hereto, does hereby sign this Form 10-K on behalf of each of the above named and designated directors of the Company pursuant to a Power of Attorney executed by such persons and filed with the Securities and Exchange Commission.
|
|
|
|
|
|
|
|
|
| /s/ Elizabeth I. Loveman |
|
March 6, 2024 |
| Elizabeth I. Loveman, Attorney-in-Fact |
|
|
ANNUAL REPORT ON FORM 10-K
ITEM 8, ITEM 15(a)(1) AND (2), AND ITEM 15(c)
FINANCIAL STATEMENTS AND SUPPLEMENTARY DATA
LIST OF FINANCIAL STATEMENTS AND FINANCIAL STATEMENT SCHEDULES
FINANCIAL STATEMENTS
FINANCIAL STATEMENT SCHEDULES
YEAR ENDED DECEMBER 31, 2023
NACCO INDUSTRIES, INC.
CLEVELAND, OHIO
FORM 10-K
ITEM 15(a)(1) AND (2)
NACCO INDUSTRIES, INC. AND SUBSIDIARIES
LIST OF FINANCIAL STATEMENTS AND FINANCIAL STATEMENT SCHEDULES
The following consolidated financial statements of NACCO Industries, Inc. and Subsidiaries and the reports of the Company's independent registered public accounting firm (PCAOB ID:42) are incorporated by reference in Item 8:
The following consolidated financial statement schedules of NACCO Industries, Inc. and Subsidiaries are included in Item 15(c):
All other schedules for which provision is made in the applicable accounting regulation of the SEC are not required under the related instructions or are inapplicable, and therefore have been omitted.
Report of Independent Registered Public Accounting Firm
To the Stockholders and the Board of Directors of NACCO Industries, Inc.
Opinion on the Financial Statements
We have audited the accompanying consolidated balance sheets of NACCO Industries, Inc. and Subsidiaries (the Company) as of December 31, 2023 and 2022, the related consolidated statements of operations, comprehensive (loss) income, equity and cash flows for each of the two years in the period ended December 31,2023, and the related notes and financial statement schedule listed in the Index at Item 15(b) (collectively referred to as the “consolidated financial statements”). In our opinion, the consolidated financial statements present fairly, in all material respects, the financial position of the Company at December 31, 2023 and 2022, and the results of its operations and its cash flows for each of the two years in the period ended December 31, 2023, in conformity with U.S. generally accepted accounting principles.
We also have audited, in accordance with the standards of the Public Company Accounting Oversight Board (United States) (PCAOB), the Company's internal control over financial reporting as of December 31, 2023, based on criteria established in Internal Control-Integrated Framework issued by the Committee of Sponsoring Organizations of the Treadway Commission (2013 framework) and our report dated March 6, 2024 expressed an unqualified opinion thereon.
Basis for Opinion
These financial statements are the responsibility of the Company's management. Our responsibility is to express an opinion on the Company’s financial statements based on our audits. We are a public accounting firm registered with the PCAOB and are required to be independent with respect to the Company in accordance with the U.S. federal securities laws and the applicable rules and regulations of the Securities and Exchange Commission and the PCAOB.
We conducted our audits in accordance with the standards of the PCAOB. Those standards require that we plan and perform the audit to obtain reasonable assurance about whether the financial statements are free of material misstatement, whether due to error or fraud. Our audits included performing procedures to assess the risks of material misstatement of the financial statements, whether due to error or fraud, and performing procedures that respond to those risks. Such procedures included examining, on a test basis, evidence regarding the amounts and disclosures in the financial statements. Our audits also included evaluating the accounting principles used and significant estimates made by management, as well as evaluating the overall presentation of the financial statements. We believe that our audits provide a reasonable basis for our opinion.
Critical Audit Matters
The critical audit matters communicated below are matters arising from the current period audit of the financial statements that were communicated or required to be communicated to the audit review committee and that: (1) relate to accounts or disclosures that are material to the financial statements and (2) involved our especially challenging, subjective or complex judgments. The communication of critical audit matters does not alter in any way our opinion on the consolidated financial statements, taken as a whole, and we are not, by communicating the critical audit matters below, providing separate opinions on the critical audit matters or on the accounts or disclosures to which they relate.
Unconsolidated subsidiaries – accounting for variable interest entities
|
|
|
|
|
|
| Description of the Matter |
As discussed in Note 1 and 16 to the consolidated financial statements, certain of the operating coal mines and entities within the NAMining segment, collectively referred to as the “Unconsolidated Subsidiaries,” are variable interest entities (VIEs) and are accounted for under the equity method. In each case, NACCO is not the primary beneficiary of the VIE as it does not exercise financial control. Although NACCO owns 100% of the equity and manages the daily operations of the Unconsolidated Subsidiaries, the Company has determined that the equity capital provided by NACCO is not sufficient to adequately finance the ongoing activities or absorb any expected losses without additional support from the customers. The customers have a controlling financial interest and have the power to direct activities that most significantly affect the economic performance of the entities. As a result, the Company is not the primary beneficiary and therefore does not consolidate these entities’ financial position or results of operations. The Company regularly evaluates if there are reconsideration events which could change the Company's conclusion as to whether these entities meet the definition of a VIE and the determination of the primary beneficiary.
The income before income taxes associated with these VIEs is reported as Earnings of unconsolidated operations on the Consolidated Statements of Operations, and the Company’s investment is reported on the line Investments in unconsolidated subsidiaries in the Consolidated Balance Sheets.
Evaluating the Company’s judgments in determining whether an entity is a VIE and the primary beneficiary of the VIE at formation and reconsideration events requires a high degree of complex auditor judgment. The Company also monitors for reconsideration events relating to the Unconsolidated Subsidiaries, which necessitates on-going critical judgments over whether any such events have arisen that require a re-evaluation of prior accounting judgments. |
How We Addressed the Matter in Our Audit |
We obtained an understanding, evaluated and tested the design and operating effectiveness of the controls surrounding the Company’s application of the variable interest model and the processes to continually assess the implications of significant transactions and events that could trigger a VIE reconsideration event.
For those entities where the Company has determined it is not the primary beneficiary, we evaluated the Company’s accounting for and disclosure of the Unconsolidated Subsidiaries under the equity method in accordance with the generally accepted accounting principles. To test the identification of reconsideration events, we obtained and inspected amendments to the agreements with customers, if any, and evaluated evidence from other parts of the audit to determine if a reconsideration event arose that necessitated a re-evaluation of previous accounting judgments. These procedures included, among others, reading board minutes, inquiring of management about transactions or events that could require a reconsideration of previous consolidation conclusions and obtaining direct confirmation of the total annual support provided in accordance with the contractual arrangements from the customers. |
MLMC Long-Lived Asset Impairment
|
|
|
|
|
|
| Description of the Matter |
As discussed in Notes 2 and 9 of the consolidated financial statements, the Company evaluates if there are indicators of impairment for long-lived assets in accordance with ASC 360, Property, Plant, and Equipment. The Company’s first step is to determine whether indicators of impairment exist in its long-lived assets at the lowest level at which individual cash flows can be identified. If indicators of impairment are identified, the Company evaluates if the projected undiscounted cash flows to be generated by those assets are less than their carrying amounts. When this is the case, the Company compares the estimated fair value to the carrying value of the asset group. If fair value is less than carrying value, an impairment loss is recorded for the difference. The Company determined that indicators of impairment existed at MLMC during the fourth quarter of 2023 and, as a result, MLMC's long-lived assets were reviewed for impairment. The Company assessed the recoverability of the MLMC asset group and determined that the assets were not fully recoverable. The Company estimated the fair value of the asset group. The impairment charge was allocated to the long-lived assets of the asset group on a pro rata basis using the relative carrying amount of those assets. For the year ended December 31, 2023, the Company recorded a long-lived asset impairment of $65.9 million.
Auditing the Company’s MLMC long-lived asset impairment was complex and involved a high degree of subjectivity due to the significant estimation required by management to determine the fair value of the long-lived asset group. The Company measured the fair value of the asset group using observable and unobservable inputs.
|
How We Addressed the Matter in Our Audit |
We obtained an understanding, evaluated the design, and tested the operating effectiveness of controls over the Company’s process over the determination of the fair values of the MLMC asset group and measurement of the impairment charge. These controls include, among others, management’s review of the selection of the valuation model, the determination and review of the fair value estimates, and management’s testing of the completeness and accuracy of the underlying data utilized to estimate the fair value of the asset group.
Our audit procedures included, among others, procedures to evaluate the selection of the valuation methodology used by management to determine the fair value of the asset group and to corroborate the fair value measurement of the long-lived assets using our specialists. Further, we evaluated the Company’s disclosures related to the impairment of long-lived assets.
|
/s/ Ernst & Young LLP
We have served as the Company’s auditor since 2002.
Cleveland, Ohio
March 6, 2024
Report of Independent Registered Public Accounting Firm
To the Stockholders and the Board of Directors of NACCO Industries, Inc.
Opinion on Internal Control Over Financial Reporting
We have audited NACCO Industries, Inc. and Subsidiaries’ internal control over financial reporting as of December 31, 2023, based on criteria established in Internal Control—Integrated Framework issued by the Committee of Sponsoring Organizations of the Treadway Commission (2013 framework) (the COSO criteria). In our opinion, NACCO Industries, Inc. and Subsidiaries (the Company) maintained, in all material respects, effective internal control over financial reporting as of December 31, 2023, based on the COSO criteria.
We also have audited, in accordance with the standards of the Public Company Accounting Oversight Board (United States) (PCAOB), the 2023 consolidated financial statements of the Company and our report dated March 6, 2024 expressed an unqualified opinion thereon.
Basis for Opinion
The Company’s management is responsible for maintaining effective internal control over financial reporting and for its assessment of the effectiveness of internal control over financial reporting included in the accompanying Management’s report on internal control over financial reporting. Our responsibility is to express an opinion on the Company’s internal control over financial reporting based on our audit. We are a public accounting firm registered with the PCAOB and are required to be independent with respect to the Company in accordance with the U.S. federal securities laws and the applicable rules and regulations of the Securities and Exchange Commission and the PCAOB.
We conducted our audit in accordance with the standards of the PCAOB. Those standards require that we plan and perform the audit to obtain reasonable assurance about whether effective internal control over financial reporting was maintained in all material respects.
Our audit included obtaining an understanding of internal control over financial reporting, assessing the risk that a material weakness exists, testing and evaluating the design and operating effectiveness of internal control based on the assessed risk, and performing such other procedures as we considered necessary in the circumstances. We believe that our audit provides a reasonable basis for our opinion.
Definition and Limitations of Internal Control Over Financial Reporting
A company’s internal control over financial reporting is a process designed to provide reasonable assurance regarding the reliability of financial reporting and the preparation of financial statements for external purposes in accordance with generally accepted accounting principles. A company’s internal control over financial reporting includes those policies and procedures that (1) pertain to the maintenance of records that, in reasonable detail, accurately and fairly reflect the transactions and dispositions of the assets of the company; (2) provide reasonable assurance that transactions are recorded as necessary to permit preparation of financial statements in accordance with generally accepted accounting principles, and that receipts and expenditures of the company are being made only in accordance with authorizations of management and directors of the company; and (3) provide reasonable assurance regarding prevention or timely detection of unauthorized acquisition, use, or disposition of the company’s assets that could have a material effect on the financial statements.
Because of its inherent limitations, internal control over financial reporting may not prevent or detect misstatements. Also, projections of any evaluation of effectiveness to future periods are subject to the risk that controls may become inadequate because of changes in conditions, or that the degree of compliance with the policies or procedures may deteriorate.
/s/ Ernst & Young LLP
Cleveland, Ohio
March 6, 2024
NACCO INDUSTRIES, INC. AND SUBSIDIARIES
CONSOLIDATED STATEMENTS OF OPERATIONS
|
|
|
|
|
|
|
|
|
|
|
|
| |
Year Ended December 31 |
| |
2023 |
|
2022 |
| |
(In thousands, except per share data) |
| Revenues |
$ |
214,794 |
|
|
$ |
241,719 |
|
| Cost of sales |
200,203 |
|
|
173,877 |
|
| Gross profit |
14,591 |
|
|
67,842 |
|
| Earnings of unconsolidated operations |
49,994 |
|
|
57,250 |
|
| Contract termination settlement |
— |
|
|
14,000 |
|
| Operating expenses |
|
|
|
| Selling, general and administrative expenses |
65,616 |
|
|
63,911 |
|
| Amortization of intangible assets |
2,998 |
|
|
3,719 |
|
| Loss (gain) on sale of assets |
221 |
|
|
(2,463) |
|
| Long-lived asset impairment charge |
65,887 |
|
|
3,939 |
|
| |
134,722 |
|
|
69,106 |
|
| Operating (loss) profit |
(70,137) |
|
|
69,986 |
|
| Other (income) expense |
|
|
|
| Interest expense |
2,460 |
|
|
2,034 |
|
| Interest income |
(6,081) |
|
|
(1,449) |
|
| Closed mine obligations |
3,585 |
|
|
1,179 |
|
| (Gain) loss on equity securities |
(1,958) |
|
|
283 |
|
|
|
|
|
| Other contract termination settlements |
— |
|
|
(16,882) |
|
| Other, net |
(3,985) |
|
|
(2,902) |
|
| |
(5,979) |
|
|
(17,737) |
|
| (Loss) income before income tax (benefit) provision |
(64,158) |
|
|
87,723 |
|
| Income tax (benefit) provision |
(24,571) |
|
|
13,565 |
|
| Net (loss) income |
$ |
(39,587) |
|
|
$ |
74,158 |
|
|
|
|
|
| (Loss) earnings per share: |
|
|
|
| Basic (loss) earnings per share |
$ |
(5.29) |
|
|
$ |
10.14 |
|
| Diluted (loss) earnings per share |
$ |
(5.29) |
|
|
$ |
10.06 |
|
|
|
|
|
| Basic weighted average shares outstanding |
7,478 |
|
|
7,312 |
|
| Diluted weighted average shares outstanding |
7,478 |
|
|
7,373 |
|
See notes to the Consolidated Financial Statements.
NACCO INDUSTRIES, INC. AND SUBSIDIARIES
CONSOLIDATED STATEMENTS OF COMPREHENSIVE (LOSS) INCOME
|
|
|
|
|
|
|
|
|
|
|
|
| |
Year Ended December 31 |
| |
2023 |
|
2022 |
| |
(In thousands) |
| Net (loss) income |
$ |
(39,587) |
|
|
$ |
74,158 |
|
| Other comprehensive (loss) income |
|
|
|
|
Current period pension and postretirement plan adjustment, net of $615 and $363 tax
benefit in 2023 and 2022, respectively
|
(2,118) |
|
|
(1,310) |
|
Pension settlement, net of $417 tax benefit in 2023 |
1,398 |
|
|
— |
|
|
Reclassification of pension and postretirement adjustments into earnings, net of $24
and $140 tax benefit in 2023 and 2022, respectively
|
79 |
|
|
473 |
|
| Total other comprehensive loss |
(641) |
|
|
(837) |
|
| Comprehensive (loss) income |
$ |
(40,228) |
|
|
$ |
73,321 |
|
See notes to the Consolidated Financial Statements.
NACCO INDUSTRIES, INC. AND SUBSIDIARIES
CONSOLIDATED BALANCE SHEETS
|
|
|
|
|
|
|
|
|
|
|
|
| |
December 31 |
| |
2023 |
|
2022 |
| |
(In thousands, except share data) |
| ASSETS |
|
|
|
| Current assets |
|
|
|
| Cash and cash equivalents |
$ |
85,109 |
|
|
$ |
110,748 |
|
| Trade accounts receivable |
37,429 |
|
|
37,940 |
|
Accounts receivable from affiliates
|
7,860 |
|
|
6,638 |
|
| Inventories |
77,000 |
|
|
71,488 |
|
| Assets held for sale |
6,466 |
|
|
285 |
|
| Federal income tax receivable |
845 |
|
|
15,687 |
|
| Prepaid insurance |
1,790 |
|
|
1,999 |
|
| Other current assets |
15,499 |
|
|
15,622 |
|
| Total current assets |
231,998 |
|
|
260,407 |
|
| Property, plant and equipment, net |
223,902 |
|
|
217,952 |
|
| Intangibles, net |
6,006 |
|
|
28,055 |
|
| Deferred income taxes |
15,081 |
|
|
— |
|
| Investments in unconsolidated subsidiaries |
12,371 |
|
|
14,927 |
|
|
|
|
|
| Operating lease right-of-use assets |
8,667 |
|
|
6,419 |
|
| Other non-current assets |
41,683 |
|
|
40,312 |
|
| Total assets |
$ |
539,708 |
|
|
$ |
568,072 |
|
| LIABILITIES AND EQUITY |
|
|
|
| Current liabilities |
|
|
|
| Accounts payable |
$ |
16,702 |
|
|
$ |
11,952 |
|
Accounts payable to affiliates
|
904 |
|
|
1,362 |
|
| Revolving credit agreements |
10,000 |
|
|
— |
|
| Current maturities of long-term debt |
3,953 |
|
|
3,649 |
|
Asset retirement obligations
|
13,114 |
|
|
1,746 |
|
| Accrued payroll |
17,317 |
|
|
18,105 |
|
|
|
|
|
| Deferred revenue |
878 |
|
|
833 |
|
| Other current liabilities |
7,118 |
|
|
6,623 |
|
| Total current liabilities |
69,986 |
|
|
44,270 |
|
| Long-term debt |
22,003 |
|
|
16,019 |
|
| Operating lease liabilities |
8,782 |
|
|
7,528 |
|
| Asset retirement obligations |
39,499 |
|
|
44,256 |
|
| Pension and other postretirement obligations |
5,183 |
|
|
5,082 |
|
| Deferred income taxes |
— |
|
|
6,122 |
|
| Liability for uncertain tax positions |
5,795 |
|
|
9,329 |
|
| Other long-term liabilities |
6,120 |
|
|
8,500 |
|
| Total liabilities |
157,368 |
|
|
141,106 |
|
| Stockholders’ equity |
|
|
|
| Common stock: |
|
|
|
Class A, par value $1 per share, 5,882,845 shares outstanding (2022 - 5,782,944 shares outstanding) |
5,883 |
|
|
5,783 |
|
Class B, par value $1 per share, convertible into Class A on a one-for-one basis, 1,565,819 shares outstanding (2022 - 1,566,129 shares outstanding) |
1,566 |
|
|
1,566 |
|
| Capital in excess of par value |
28,672 |
|
|
23,706 |
|
| Retained earnings |
355,873 |
|
|
404,924 |
|
| Accumulated other comprehensive loss |
(9,654) |
|
|
(9,013) |
|
| Total stockholders’ equity |
382,340 |
|
|
426,966 |
|
| Total liabilities and equity |
$ |
539,708 |
|
|
$ |
568,072 |
|
See notes to the Consolidated Financial Statements.
NACCO INDUSTRIES, INC. AND SUBSIDIARIES
CONSOLIDATED STATEMENTS OF CASH FLOWS
|
|
|
|
|
|
|
|
|
|
|
|
| |
Year Ended December 31 |
| |
2023 |
|
2022 |
| |
(In thousands) |
| Operating Activities |
|
|
|
| Net (loss) income |
$ |
(39,587) |
|
|
$ |
74,158 |
|
|
|
|
|
| Adjustments to reconcile net income to net cash provided by operating activities: |
|
|
|
| Depreciation, depletion and amortization |
29,387 |
|
|
26,816 |
|
| Amortization of deferred financing fees |
505 |
|
|
446 |
|
| Deferred income taxes |
(21,114) |
|
|
(8,471) |
|
| Stock-based compensation |
5,157 |
|
|
7,541 |
|
| Loss (gain) on sale of assets |
221 |
|
|
(2,463) |
|
| Inventory impairment charge |
7,514 |
|
|
— |
|
| Other contract termination settlements |
— |
|
|
(15,552) |
|
| Long-lived asset impairment charge |
65,887 |
|
|
3,939 |
|
| Other |
968 |
|
|
(791) |
|
| Working capital changes: |
|
|
|
Affiliates receivable/payable
|
(55) |
|
|
— |
|
| Accounts receivable |
2,519 |
|
|
(13,224) |
|
| Inventories |
(12,971) |
|
|
(6,834) |
|
| Other current assets |
(1,849) |
|
|
1,308 |
|
| Accounts payable |
3,148 |
|
|
252 |
|
| Income taxes receivable/payable |
14,996 |
|
|
(416) |
|
| Other current liabilities |
(236) |
|
|
1,026 |
|
| Net cash provided by operating activities |
54,490 |
|
|
67,735 |
|
|
|
|
|
| Investing Activities |
|
|
|
| Expenditures for property, plant and equipment |
(45,408) |
|
|
(42,523) |
|
| Acquisition of mineral interests |
(36,714) |
|
|
(11,924) |
|
| Proceeds from the sale of assets |
561 |
|
|
2,837 |
|
| Equity method investment |
(3,464) |
|
|
— |
|
| Proceeds from the sale of private company equity units |
3,574 |
|
|
18,628 |
|
| Other |
(146) |
|
|
(170) |
|
| Net cash used for investing activities |
(81,597) |
|
|
(33,152) |
|
|
|
|
|
| Financing Activities |
|
|
|
| Net additions (reductions) to revolving credit agreement |
10,000 |
|
|
(4,000) |
|
| Additions to long-term debt |
5,232 |
|
|
3,091 |
|
| Reductions to long-term debt |
(4,209) |
|
|
(2,919) |
|
| Cash dividends paid |
(6,452) |
|
|
(6,012) |
|
| Purchase of treasury shares |
(3,103) |
|
|
— |
|
|
|
|
|
| Net cash provided by (used for) financing activities |
1,468 |
|
|
(9,840) |
|
|
|
|
|
| Cash and Cash Equivalents |
|
|
|
| Total (decrease) increase for the year |
(25,639) |
|
|
24,743 |
|
| Balance at the beginning of the year |
110,748 |
|
|
86,005 |
|
| Balance at the end of the year |
$ |
85,109 |
|
|
$ |
110,748 |
|
See notes to the Consolidated Financial Statements.
NACCO INDUSTRIES, INC. AND SUBSIDIARIES
CONSOLIDATED STATEMENTS OF EQUITY
|
|
|
|
|
|
|
|
|
|
|
|
|
|
|
|
|
|
|
|
|
| |
Class A Common Stock |
Class B Common Stock |
Capital in Excess of Par Value |
Retained Earnings |
Accumulated Other Comprehensive (Loss) Income |
Total Stockholders' Equity |
|
(In thousands, except per share data) |
| Balance, January 1, 2022 |
$ |
5,616 |
|
$ |
1,567 |
|
$ |
16,331 |
|
$ |
336,778 |
|
$ |
(8,176) |
|
$ |
352,116 |
|
| Stock-based compensation |
166 |
|
— |
|
7,375 |
|
— |
|
— |
|
7,541 |
|
| Conversion of Class B to Class A shares |
1 |
|
(1) |
|
— |
|
— |
|
— |
|
— |
|
|
|
|
|
|
|
|
| Net income |
— |
|
— |
|
— |
|
74,158 |
|
— |
|
74,158 |
|
Cash dividends on Class A and Class B common stock: $0.8200 per share |
— |
|
— |
|
— |
|
(6,012) |
|
— |
|
(6,012) |
|
| Current period other comprehensive income, net of tax |
— |
|
— |
|
— |
|
— |
|
(1,310) |
|
(1,310) |
|
| Reclassification adjustment to net income, net of tax |
— |
|
— |
|
— |
|
— |
|
473 |
|
473 |
|
| Balance, December 31, 2022 |
$ |
5,783 |
|
$ |
1,566 |
|
$ |
23,706 |
|
$ |
404,924 |
|
$ |
(9,013) |
|
$ |
426,966 |
|
| Stock-based compensation |
191 |
|
— |
|
4,966 |
|
— |
|
— |
|
5,157 |
|
| Purchase of treasury shares |
(91) |
|
— |
|
— |
|
(3,012) |
|
— |
|
(3,103) |
|
|
|
|
|
|
|
|
| Net income |
— |
|
— |
|
— |
|
(39,587) |
|
— |
|
(39,587) |
|
Cash dividends on Class A and Class B common stock: $0.8600 per share |
— |
|
— |
|
— |
|
(6,452) |
|
— |
|
(6,452) |
|
| Current period other comprehensive income, net of tax |
— |
|
— |
|
— |
|
— |
|
(2,118) |
|
(2,118) |
|
| Pension settlement, net of tax |
— |
|
— |
|
— |
|
— |
|
1,398 |
|
1,398 |
|
| Reclassification adjustment to net income, net of tax |
— |
|
— |
|
— |
|
— |
|
79 |
|
79 |
|
| Balance, December 31, 2023 |
$ |
5,883 |
|
$ |
1,566 |
|
$ |
28,672 |
|
$ |
355,873 |
|
$ |
(9,654) |
|
$ |
382,340 |
|
See notes to the Consolidated Financial Statements.
NOTES TO CONSOLIDATED FINANCIAL STATEMENTS
NACCO INDUSTRIES, INC. AND SUBSIDIARIES
(Tabular Amounts in Thousands, Except Per Share, Percentage Data and Oil and Gas Disclosures)
NOTE 1—Principles of Consolidation and Nature of Operations
The Consolidated Financial Statements include the accounts of NACCO Industries, Inc.® (“NACCO”) and its wholly owned subsidiaries (collectively, the “Company”). NACCO brings natural resources to life by delivering aggregates, minerals, reliable fuels and environmental solutions through its robust portfolio of NACCO Natural Resources® businesses. The Company operates under three business segments: Coal Mining, North American Mining® ("NAMining") and Minerals Management. The Coal Mining segment operates surface coal mines for power generation companies. The NAMining segment is a trusted mining partner for producers of aggregates, activated carbon, lithium and other industrial minerals. The Minerals Management segment, which includes the Catapult Mineral Partners (“Catapult”) business, acquires and promotes the development of mineral interests. Mitigation Resources of North America® (“Mitigation Resources”) provides stream and wetland mitigation solutions.
The Company has items not directly attributable to a reportable segment that are not included in the reported financial results of the operating segment. These items primarily include administrative costs related to public company reporting requirements, including management and board compensation, and the financial results of Bellaire Corporation ("Bellaire"), Mitigation Resources and other developing businesses. Bellaire manages the Company’s long-term liabilities related to former Eastern U.S. underground mining activities. Intercompany accounts and transactions are eliminated in consolidation. See Note 15 to the Consolidated Financial Statements for further discussion of segment reporting.
The Company’s operating segments are further described below:
Coal Mining Segment
The Coal Mining segment, operating as North American Coal, LLC ("NACoal"), operates surface coal mines under long-term contracts with power generation companies pursuant to a service-based business model. Coal is surface mined in North Dakota and Mississippi. Each mine is fully integrated with its customer's operations.
As of December 31, 2023, the Coal Mining segment's operating coal mines were: The Coteau Properties Company (“Coteau”), Coyote Creek Mining Company, LLC (“Coyote Creek”), The Falkirk Mining Company ("Falkirk") and Mississippi Lignite Mining Company ("MLMC"). Each of these mines supply lignite coal for power generation and delivers its coal production to an adjacent power plant or synfuels plant under a long-term supply contract. MLMC’s coal supply contract contains a take or pay provision but contains a force majeure provision that allows for the temporary suspension of the take or pay provision during the duration of certain specified events beyond the control of either party; all other coal supply contracts are requirements contracts. Certain coal supply contracts can be terminated early, which would result in a reduction to future earnings.
The MLMC contract is the only operating coal contract in which the Company is responsible for all operating costs, capital requirements and final mine reclamation; therefore, MLMC is consolidated within NACCO’s financial statements. MLMC sells coal to its customer's Red Hills Power Plant at a contractually agreed-upon price which adjusts monthly, primarily based on changes in the level of established indices which reflect general U.S. inflation rates. Profitability at MLMC is affected by customer demand for coal and changes in the indices that determine sales price and actual costs incurred. As diesel fuel is heavily weighted among the indices used to determine the coal sales price, fluctuations in diesel fuel prices can result in significant fluctuations in earnings at MLMC. The Red Hills Power Plant supplies electricity to the Tennessee Valley Authority (“TVA”) under a long-term power purchase agreement. MLMC’s contract with its customer runs through April 1, 2032. TVA’s power portfolio includes coal, nuclear, hydroelectric, natural gas and renewables. The decision regarding which power plants to dispatch is determined by TVA. Reduction in dispatch of the Red Hills Power Plant will result in reduced earnings at MLMC. During 2023, MLMC completed mining in its original mine area and began mining in a new mine area. The move to the new mine area resulted in increased costs during 2023. MLMC does not anticipate opening additional mine areas through the remaining contract term unless doing so would result in improved economic returns.
On December 18, 2023, MLMC received a force majeure event notice from its customer related to an issue that began on December 15, 2023 and impacted one of two boilers at the Red Hills Power Plant. The notice did not provide a timeline for resolution of the issue. As of March 6, 2024, the impacted boiler is still not operational. The prolonged mechanical issue is expected to result in a reduction in customer demand and will have a significant impact on the Company's results of operations during 2024. The Company determined the anticipated reduction in customer demand caused by this issue was an indicator of potential impairment.
NOTES TO CONSOLIDATED FINANCIAL STATEMENTS
NACCO INDUSTRIES, INC. AND SUBSIDIARIES
(Tabular Amounts in Thousands, Except Per Share, Percentage Data and Oil and Gas Disclosures)
The Company reviewed MLMC's long-lived assets for impairment as of December 31, 2023 and determined the carrying amount of its long-lived assets were not recoverable. As a result, the Company recorded a non-cash, long-lived asset impairment charge of $65.9 million in 2023. See Note 9 to the Consolidated Financial Statements in this Form 10-K for further information on the impairment analysis.
The Sabine Mining Company (“Sabine”) operates the Sabine Mine in Texas. All production from Sabine was delivered to
Southwestern Electric Power Company's (“SWEPCO”) Henry W. Pirkey Plant (the “Pirkey Plant”). SWEPCO is an American
Electric Power (“AEP”) company. As a result of the early retirement of the Pirkey Plant, Sabine ceased deliveries and final reclamation began on April 1, 2023. Funding for mine reclamation is the responsibility of SWEPCO, and Sabine receives compensation for providing mine reclamation services. Sabine will provide mine reclamation services through September 30, 2026. On October 1, 2026, SWEPCO will acquire all of the capital stock of Sabine and complete the remaining mine reclamation.
At Coteau, Coyote Creek and Falkirk, the Company is paid a management fee per ton of coal or heating unit (MMBtu) delivered. Each contract specifies the indices and mechanics by which fees change over time, generally in line with broad
measures of U.S. inflation. The customers are responsible for funding all mine operating costs, including final mine
reclamation, and directly or indirectly providing all of the capital required to build and operate the mine. This contract structure eliminates exposure to spot coal market price fluctuations while providing income and cash flow with minimal capital investment. Other than at Coyote Creek, debt financing provided by or supported by the customers is without recourse to the Company. See Note 16 to the Consolidated Financial Statements in this Form 10-K for further discussion of Coyote Creek's guarantees.
Coteau, Coyote Creek, Falkirk and Sabine each meet the definition of a variable interest entity ("VIE"). In each case, NACCO
is not the primary beneficiary of the VIE as it does not exercise financial control; therefore, NACCO does not consolidate the
results of these operations within its financial statements. Instead, these contracts are accounted for as equity method
investments. The Company regularly evaluates if there are reconsideration events which could change the Company's conclusion as to whether these entities meet the definition of a VIE and the determination of the primary beneficiary. The income before income taxes associated with these VIEs is reported as Earnings of unconsolidated operations on the Consolidated Statements of Operations and the Company’s investment is reported on the line Investments in unconsolidated subsidiaries in the Consolidated Balance Sheets. The mines that meet the definition of a VIE are referred to collectively as the “Unconsolidated Subsidiaries.” For tax purposes, the Unconsolidated Subsidiaries are included within the NACCO consolidated U.S. tax return; therefore, the Income tax (benefit) provision line on the Consolidated Statements of Operations includes income taxes related to these entities. See Note 16 to the Consolidated Financial Statements in this Form 10-K for further information on the Unconsolidated Subsidiaries.
The Company performs contemporaneous reclamation activities at each mine in the normal course of operations. Under all of the Unconsolidated Subsidiaries’ contracts, the customer has the obligation to fund final mine reclamation activities. Under certain contracts, the Unconsolidated Subsidiary holds the mine permit and is therefore responsible for final mine reclamation activities. To the extent the Unconsolidated Subsidiary performs such final reclamation, it is compensated for providing those services in addition to receiving reimbursement from customers for costs incurred.
NAMining Segment
The NAMining segment provides value-added contract mining and other services for producers of industrial minerals. The segment is a platform for the Company’s growth and diversification of mining activities outside of the thermal coal industry. NAMining provides contract mining services for independently owned mines and quarries, creating value for its customers by performing the mining aspects of its customers’ operations. This allows customers to focus on their areas of expertise: materials handling and processing, product sales and distribution. As of December 31, 2023, NAMining operates in Florida, Texas, Arkansas, Virginia and Nebraska. In addition, Sawtooth Mining, LLC ("Sawtooth") provides mining design, consulting and will be the exclusive contract miner for the Thacker Pass lithium project in northern Nevada.
During December 2023, NAMining executed a 15-year contract to mine phosphate at a quarry in central Florida. Production is expected to commence in the first half of 2024 once relocation and commissioning of a dragline is complete. NAMining also amended and extended existing limestone contracts with two customers and expanded the scope of work with another customer.
NOTES TO CONSOLIDATED FINANCIAL STATEMENTS
NACCO INDUSTRIES, INC. AND SUBSIDIARIES
(Tabular Amounts in Thousands, Except Per Share, Percentage Data and Oil and Gas Disclosures)
Certain of the entities within the NAMining segment are VIEs and are accounted for under the equity method as Unconsolidated Subsidiaries. See Note 16 to the Consolidated Financial Statements in this Form 10-K for further information on the Unconsolidated Subsidiaries.
Minerals Management Segment
The Minerals Management segment derives income primarily by leasing its royalty and mineral interests to third-party exploration and production companies, and, to a lesser extent, other mining companies, granting them the rights to explore, develop, mine, produce, market and sell gas, oil, and coal in exchange for royalty payments based on the lessees' sales of those minerals.
The Minerals Management segment owns royalty interests, mineral interests, non-participating royalty interests and overriding royalty interests.
•Royalty Interest. Royalty interests generally result when the owner of a mineral interest leases the underlying minerals to an exploration and production company pursuant to an oil and gas lease. Typically, the resulting royalty interest is a cost-free percentage of production revenues for minerals extracted from the acreage. A holder of royalty interests is generally not responsible for capital expenditures or lease operating expenses, but royalty interests may be calculated net of post-production expenses, and typically has no environmental liability. Royalty interests leased to producers expire upon the expiration of the oil and gas lease and revert to the mineral owner.
•Mineral Interest. Mineral interests are perpetual rights of the owner to explore, develop, exploit, mine and/or produce any or all of the minerals lying below the surface of the property. The holder of a mineral interest has the right to lease the minerals to an exploration and production company. Upon the execution of an oil and gas lease, the lessee (the exploration and production company) becomes the working interest owner and the lessor (the mineral interest owner) has a royalty interest.
•Non-Participating Royalty Interest (“NPRIs”). NPRI is an interest in oil and gas production which is created from the mineral estate. The NPRI is expense-free, bearing no operational costs of production. The term “non-participating” indicates that the interest owner does not share in the bonus, rentals from a lease, nor the right to participate in the execution of oil and gas leases. The NPRI owner does; however, typically receive royalty payments.
•Overriding Royalty Interest (“ORRIs”). ORRIs are created by carving out the right to receive royalties from a working interest. Like royalty interests, ORRIs do not confer an obligation to make capital expenditures or pay for lease operating expenses and have limited environmental liability; however, ORRIs may be calculated net of post-production expenses, depending on how the ORRI is structured. ORRIs that are carved out of working interests are linked to the same underlying oil and gas lease that created the working interest, and therefore, such ORRIs are typically subject to expiration upon the expiration or termination of the oil and gas lease.
The Company may own more than one type of mineral and royalty interest in the same tract of land. For example, where the Company owns an ORRI in a lease on the same tract of land in which it owns a mineral interest, the ORRI in that tract will relate to the same gross acres as the mineral interest in that tract.
The Minerals Management segment will benefit from the continued development of its mineral properties without the need for investment of additional capital once mineral and royalty interests have been acquired. The Minerals Management segment does not currently have any material investments under which it would be required to bear the cost of exploration, production or development.
During 2023, Minerals Management completed an acquisition of $36.7 million of mineral and royalty interests in the Texas portion of the Permian Basin. During 2022, Minerals Management acquired $11.4 million of mineral and royalty interests in the Texas portion of the Permian Basin and the Wyoming portion of the Powder River Basin as well as a small acquisition of mineral interests in the New Mexico portion of the Permian Basin.
NOTES TO CONSOLIDATED FINANCIAL STATEMENTS
NACCO INDUSTRIES, INC. AND SUBSIDIARIES
(Tabular Amounts in Thousands, Except Per Share, Percentage Data and Oil and Gas Disclosures)
Total consideration for the 2023 and 2022 acquisitions of mineral and royalty interests was $36.7 million and $11.9 million, respectively. The 2023 acquisition includes 43.4 thousand gross acres and 2.5 thousand net royalty acres. The 2022 acquisitions included 13.6 thousand gross acres and 880 net royalty acres. Total mineral and royalty interests include approximately 184.7 thousand gross acres and 63.3 thousand net royalty acres at December 31, 2023. Net royalty acres are calculated based on the Company’s ownership and royalty rate, normalized to a standard 1/8th royalty lease, and assumes a 1/4th royalty rate for unleased acres. See Note 18 for further discussion of Minerals Management.
The Company's acquisition criteria for building a blended portfolio of mineral and royalty interests includes (i) new wells anticipated to come online within one to two years of investment, (ii) areas with forecasted future development within five years after acquisition and (iii) existing producing wells further along the decline curve that will generate stable cash flow. In addition, acquisitions should extend the geographic footprint to diversify across multiple basins with a preliminary focus on the more oil-rich Permian basin and a secondary focus on other diversifying basins to increase regional exposure. While the current focus is on the acquisition of mineral and royalty interests, the Company would also consider investments in ORRIs, NPRIs or non-operating working interests under certain circumstances. The current acquisition strategy does not contemplate any near-term working interest investments in which the Company would act as the operator.
The Company also manages legacy royalty and mineral interests located in Ohio (Utica and Marcellus shale natural gas), Louisiana (Haynesville shale and Cotton Valley formation natural gas), Texas (Cotton Valley and Austin Chalk formation natural gas), Mississippi (coal), Pennsylvania (coal, coalbed methane and Marcellus shale natural gas), Alabama (coal, coalbed methane and natural gas) and North Dakota (coal, oil and natural gas). The majority of the Company’s legacy reserves were acquired as part of its historical coal mining operations.
Other items: During 2023, the Board of Directors of the Company approved the termination of the Combined Defined Benefit Plan for NACCO and its subsidiaries (the “Combined Plan”) and Combined Plan participants were offered lump-sum distributions as part of the termination process. As a result of the lump-sum distributions, the Company recognized a non-cash, pension settlement charge of $1.8 million on the line "Other, net" within the accompanying Consolidated Statements of Operations. The $1.8 million charge represents a pro rata portion of the unrecognized net loss recorded in Accumulated other comprehensive loss. See Note 14 to the Consolidated Financial Statements in this Form 10-K for further information on the Combined Plan.
On May 2, 2022, Great River Energy ("GRE") completed the sale of Coal Creek Station and the adjacent high-voltage direct current transmission line to Rainbow Energy Center, LLC (“Rainbow Energy”) and its affiliates. The Coal Sales Agreement (“CSA”) between Falkirk and Rainbow Energy became effective upon the closing of the transaction. Falkirk continues to supply all coal requirements of Coal Creek Station and is paid a management fee per ton of coal delivered. To support the transfer to new ownership, Falkirk agreed to a reduction in the current per ton management fee from the effective date of the CSA through May 31, 2024. After May 31, 2024, the per ton management fee increases to a higher base in line with 2021 fee levels, and thereafter adjusts annually according to an index which tracks broad measures of U.S. inflation. Rainbow Energy is responsible for funding all mine operating costs, including mine reclamation, and directly or indirectly providing all of the capital required to operate the mine. The initial production period is expected to run through May 1, 2032, but the CSA may be extended or terminated early under certain circumstances.
The Company recognized a gain of $30.9 million within the accompanying Consolidated Statements of Operations during 2022 as GRE paid $14.0 million in cash, as well as transferred ownership of an office building with an estimated fair value of $4.1 million, and conveyed membership units in Midwest AgEnergy Group, LLC (“MAG”), a North Dakota-based ethanol business, with an estimated fair value of $12.8 million, as agreed to under the termination and release of claims agreement between Falkirk and GRE. The office building is included in assets held for sale at December 31, 2023.
Prior to receiving the membership units from GRE, the Company held a $5.0 million investment in MAG carried at cost, less impairment. Subsequent to the receipt of the additional membership units, the Company began to account for the investment under the equity method of accounting. During 2022, the Company recorded $2.2 million, which represented its share of MAG's earnings on the "Other, net" line within the accompanying Consolidated Statements of Operations.
On December 1, 2022, HLCP Ethanol Holdco, LLC (“HLCP”) completed its acquisition of MAG. Upon closing of the transaction, NACCO transferred its ownership interest in MAG to HLCP and received a cash payment of $18.6 million and recognized a $1.3 million loss in 2022 on the line "Other, net" within the accompanying Consolidated Statements of Operations.
NOTES TO CONSOLIDATED FINANCIAL STATEMENTS
NACCO INDUSTRIES, INC. AND SUBSIDIARIES
(Tabular Amounts in Thousands, Except Per Share, Percentage Data and Oil and Gas Disclosures)
The Company received additional payments totaling $3.6 million during 2023 in connection with a post-closing purchase price adjustment and the release of amounts held in escrow recorded on the "Other, net" line within the accompanying Consolidated Statements of Operations.
NOTE 2—Significant Accounting Policies
Use of Estimates: The preparation of financial statements in conformity with U.S. generally accepted accounting principles requires management to make estimates and judgments. These estimates and judgments affect the reported amounts of assets and liabilities and the disclosure of contingent assets and liabilities (if any) at the date of the financial statements and the reported amounts of revenues and expenses during the reporting period. Actual results could differ from those estimates.
Cash and Cash Equivalents: Cash and cash equivalents include cash in banks and highly liquid investments with original maturities of three months or less.
Property, Plant and Equipment, Net: Property, plant and equipment are initially recorded at cost. Depreciation, depletion and amortization are provided in amounts sufficient to amortize the cost of the assets, including assets recorded under finance leases, over their estimated useful lives using the straight-line method or the units-of-production method. Buildings and building improvements are depreciated over the life of the mine, which is generally 30 years. Estimated lives for machinery and equipment range from three to 15 years. The units-of-production method is used to amortize certain assets based on estimated recoverable tonnages. Repairs and maintenance costs are expensed when incurred, unless such costs extend the estimated useful life of the asset, in which case such costs are capitalized and depreciated. Asset retirement costs associated with asset retirement obligations are capitalized with the carrying amount of the related long-lived asset and depreciated over the asset's estimated useful life.
Royalty Interests in Oil and Natural Gas Properties: The Company follows the successful efforts method of accounting for its royalty and mineral interests. Under this method, costs to acquire mineral and royalty interests in oil and natural gas properties are capitalized when incurred. Acquisitions of royalty interests of oil and natural gas properties are considered asset acquisitions and are recorded at cost. As an owner of mineral and royalty interests and not working interests, the Company is not required to make capital expenditures and did not make capital expenditures to convert proved undeveloped reserves from undeveloped to developed.
Acquisition costs of proved royalty and mineral interests are amortized using the units of production method over the life of the property, which is estimated using proved reserves. For purposes of amortization, interests in oil and natural gas properties are grouped in a reasonable aggregation of properties with common geological structural features or stratigraphic condition.
The Company reviews and evaluates its royalty interests in oil and natural gas properties for impairment when events or changes in circumstances indicate that the related carrying amounts may not be recoverable. Proved oil and gas properties are reviewed for impairment when events and circumstances indicate a potential decline in the fair value of such properties below the carrying value, such as a downward revision of the reserve estimates or lower commodity prices. When such events or changes in circumstances occur, the Company estimates the undiscounted future cash flows expected in connection with the properties and compares such future cash flows to the carrying amounts of the properties to determine if the carrying amounts are recoverable. If the carrying value of the properties is determined to not be recoverable based on the undiscounted cash flows, an impairment charge is recognized by comparing the carrying value to the estimated fair value of the properties.
See Note 18 for further discussion of the Company's royalty and mineral interests.
Long-Lived Assets: The Company periodically evaluates long-lived assets for impairment when changes in circumstances or the occurrence of certain events indicate the carrying amount of an asset or asset group may not be recoverable. Upon identification of indicators of impairment, the Company evaluates the carrying value of the asset by comparing the estimated future undiscounted cash flows generated from the use of the asset or asset group and its eventual disposition with the asset's net carrying value. If the carrying value of an asset is considered impaired, an impairment charge is recorded for the amount that the carrying value of the long-lived asset or asset group exceeds its fair value. Fair value is estimated as the price that would be received to sell an asset or paid to transfer a liability in an orderly transaction between market participants at the measurement date.
Identifying and assessing whether impairment indicators exist, or if events or changes in circumstances have occurred, including assumptions about future power plant dispatch levels, changes in future sales price, operating costs and other factors that impact anticipated revenue and customer demand, requires significant judgment. A reduction in customer demand at MLMC, including reductions related to reduced mechanical availability of the customer’s power plant, could adversely affect the Company's operating results.
NOTES TO CONSOLIDATED FINANCIAL STATEMENTS
NACCO INDUSTRIES, INC. AND SUBSIDIARIES
(Tabular Amounts in Thousands, Except Per Share, Percentage Data and Oil and Gas Disclosures)
The costs of mining operations are not reimbursed by MLMC's customer. As such, increased costs at MLMC could materially reduce the Company's profitability. The Company determined that indicators of impairment existed at MLMC during the fourth quarter of 2023 and, as a result, MLMC's long-lived assets were reviewed for impairment. The Company assessed the recoverability of the MLMC asset group and determined that the assets were not fully recoverable when compared to the remaining future undiscounted cash flows from these assets. As a result, the Company estimated the fair value of the asset group which resulted in a non-cash, long-lived asset impairment charge of $65.9 million in 2023.
See Note 9 for further discussion of the Company's impairment analysis.
Self-insurance Liabilities: The Company is generally self-insured for medical claims, certain workers’ compensation claims and certain closed mine liabilities. An estimated provision for claims reported and for claims incurred but not yet reported under the self-insurance programs is recorded and revised periodically based on industry trends, historical experience and management judgment. In addition, industry trends are considered within management's judgment for valuing claims. Changes in assumptions for such matters as legal judgments and settlements, inflation rates, medical costs and actual experience could cause estimates to change in the near term.
Revenue Recognition: See Note 3 to the Consolidated Financial Statements for discussion of revenue recognition.
Stock Compensation: The Company maintains long-term incentive programs that allow for the grant of shares of Class A common stock, subject to restrictions, as a means of retaining and rewarding selected employees for long-term performance and to increase ownership in the Company. Shares awarded under the plans are fully vested and entitle the stockholder to all rights of common stock ownership except that shares may not be assigned, pledged or otherwise transferred during the restriction period. In general, for shares awarded for years ended December 31, 2023 and December 31, 2022, the restriction period ends at the earliest of (i) three years after the participant's retirement date, (ii) three, five or ten years from the award date, or (iii) the participant's death or permanent disability. Pursuant to the plans, the Company issued 120,649 and 165,574 shares related to the years ended December 31, 2023 and 2022, respectively. After the issuance of these shares, there were 779,351 shares of Class A common stock available for issuance under these plans. Compensation expense related to these share awards was $4.1 million ($3.3 million net of tax) and $6.4 million ($5.0 million net of tax) for the years ended December 31, 2023 and 2022, respectively. Compensation expense represents fair value based on the market price of the shares of Class A common stock at the grant date.
The Company also has a stock compensation plan for non-employee directors of the Company under which a portion of the annual retainer for each non-employee director is paid in restricted shares of Class A common stock. For the year ended December 31, 2023 and 2022, $110,000 ($150,000 for the Chairman) of the non-employee director's annual retainer of $175,000 ($250,000 for the Chairman) was paid in restricted shares of Class A common stock. Shares awarded under the plan are fully vested and entitle the stockholder to all rights of common stock ownership except that shares may not be assigned, pledged, hypothecated or otherwise transferred during the restriction period. In general, the restriction period ends at the earliest of (i) ten years from the award date, (ii) the date of the director's death or permanent disability, (iii) five years (or earlier with the approval of the Board of Directors) after the director's date of retirement from the Board of Directors, (iv) the date the director has both retired from the Board of Directors and has reached age 70, or (v) at such other time as determined by the Board of Directors in its sole and absolute discretion. Pursuant to this plan, the Company issued 35,965 and 30,034 shares related to the years ended December 31, 2023 and 2022, respectively. In addition to the mandatory retainer fee received in restricted stock, directors may elect to receive shares of Class A common stock in lieu of cash for up to 100% of the balance of their annual retainer, committee retainer and any committee chairman's fees. These voluntary shares are not subject to any restrictions. Total shares issued under voluntary elections were 1,603 in 2023 and 480 in 2022. After the issuance of these shares, there were 98,479 shares of Class A common stock available for issuance under this plan. Compensation expense related to these awards was $1.3 million ($1.1 million net of tax) and $1.3 million ($1.0 million net of tax) for the years ended December 31, 2023 and 2022, respectively. Compensation expense represents fair value based on the market price of the shares of Class A common stock at the grant date.
Financial Instruments: Financial instruments held by the Company include cash and cash equivalents, accounts receivable, equity securities, accounts payable, revolving credit agreements and long-term debt.
Fair Value Measurements: The Company accounts for the fair value measurement of its financial assets and liabilities in accordance with U.S. generally accepted accounting principles, which defines fair value as the price that would be received to sell an asset or paid to transfer a liability in an orderly transaction between market participants at the measurement date.
A fair value hierarchy requires an entity to maximize the use of observable inputs, where available, and minimize the use of unobservable inputs when measuring fair value.
NOTES TO CONSOLIDATED FINANCIAL STATEMENTS
NACCO INDUSTRIES, INC. AND SUBSIDIARIES
(Tabular Amounts in Thousands, Except Per Share, Percentage Data and Oil and Gas Disclosures)
Described below are the three levels of inputs that may be used to measure fair value:
Level 1 - Quoted prices in active markets that are accessible at the measurement date for identical assets or liabilities.
Level 2 - Observable prices that are based on inputs not quoted on active markets, but corroborated by market data.
Level 3 - Unobservable inputs are used when little or no market data is available.
The hierarchy is based upon the transparency of inputs to the valuation of an asset or liability as of the measurement date. The classification of fair value measurements within the hierarchy is based upon the lowest level of input that is significant to the measurement. See Note 9 for further discussion of fair value measurements.
NOTE 3—Revenue Recognition
Nature of Performance Obligations
At contract inception, the Company assesses the goods and services promised in its contracts with customers and identifies a performance obligation for each promised good or service that is distinct. To identify the performance obligations, the Company considers all of the goods or services promised in the contract regardless of whether they are explicitly stated or are implied by customary business practices.
Each mine or mine area has a contract with its respective customer that represents a contract under ASC 606. For its consolidated entities, the Company’s performance obligations vary by contract and consist of the following:
At MLMC, each MMBtu delivered during the production period is considered a separate performance obligation. Revenue is recognized at the point in time that control of each MMBtu of lignite transfers to the customer. Fluctuations in revenue from period to period generally result from changes in customer demand.
At NAMining, the management service to oversee the operation of the equipment and delivery of aggregates or other minerals is the performance obligation accounted for as a series. Performance momentarily creates an asset that the customer simultaneously receives and consumes; therefore, control is transferred to the customer over time. Consistent with the conclusion that the customer simultaneously receives and consumes the benefits provided, an input-based measure of progress is appropriate. As each month of service is completed, revenue is recognized for the amount of actual costs incurred, plus the management fee or fixed fee and the general and administrative fee (as applicable). Fluctuations in revenue from period to period result from changes in customer demand primarily due to increases and decreases in activity levels on individual contracts and variances in reimbursable costs. Revenue from part sales is recognized upon transfer of control of the parts to the customer.
The Minerals Management segment enters into contracts which grant the right to explore, develop, produce and sell minerals controlled by the Company. These arrangements result in the transfer of mineral rights for a period of time; however, no rights to the actual land are granted other than access for purposes of exploration, development, production and sales. The mineral rights revert back to the Company at the expiration of the contract.
Under these contracts, granting exclusive right, title, and interest in and to minerals, if any, is the performance obligation. The performance obligation under these contracts represents a series of distinct goods or services whereby each day of access that is provided is distinct. The transaction price consists of a variable sales-based royalty and, in certain arrangements, a fixed component in the form of an up-front lease bonus payment. As the amount of consideration the Company will ultimately be entitled to is entirely susceptible to factors outside its control, the entire amount of variable consideration is constrained at contract inception. The Company believes that the pricing provisions of royalty contracts are customary in the industry. Up-front lease bonus payments represent the fixed portion of the transaction price and are recognized over the primary term of the contract, which is generally three to five years.
Mitigation Resources generates and sells stream and wetland mitigation credits (known as mitigation banking) and provides services to those engaged in permittee-responsible stream and wetland mitigation. Each mitigation credit sale is considered a separate performance obligation. Revenue is recognized at the point in time that control of each mitigation credit transfers to the customer. Fluctuations in revenue from period to period generally result from changes in customer demand. Under the permittee-responsible stream and wetland mitigation model, the contracts are generally structured as a management fee agreement under which Mitigation Resources is reimbursed for all costs incurred in performing the required mitigation plus an agreed profit percentage or a fixed fee. The mitigation services provided is the performance obligation and is accounted for as a series. Performance momentarily creates an asset that the customer simultaneously receives and consumes; therefore, control is transferred to the customer as work is completed.
NOTES TO CONSOLIDATED FINANCIAL STATEMENTS
NACCO INDUSTRIES, INC. AND SUBSIDIARIES
(Tabular Amounts in Thousands, Except Per Share, Percentage Data and Oil and Gas Disclosures)
Consistent with the conclusion that the customer simultaneously receives and consumes the benefits provided, an input-based measure of progress is appropriate. As each month of service is completed, revenue is recognized for the amount of actual costs incurred, plus the management fee or fixed fee. Fluctuations in revenue from period to period result from changes in customer demand primarily due to increases and decreases in activity levels of individual contracts and variances in reimbursable costs.
Significant Judgments
The Company’s contracts with its customers contain different types of variable consideration including, but not limited to, management fees that adjust based on volumes or MMBtu delivered, however, the terms of these variable payments relate specifically to the Company's efforts to satisfy one or more, but not all of, the performance obligations (or to a specific outcome from satisfying the performance obligations) in the contract. Therefore, the Company allocates each variable payment (and subsequent changes to that payment) entirely to the specific performance obligation to which it relates. Management fees, as well as general and administrative fees, are also adjusted based on changes in specified indices (e.g., CPI) to compensate for general inflation changes. Index adjustments, if applicable, are effective prospectively.
Cost Reimbursement
Certain contracts include reimbursement from customers of actual costs incurred for the purchase of supplies, equipment and services in accordance with contractual terms. Such reimbursable revenue is variable and subject to uncertainty, as the amounts received and timing thereof is highly dependent on factors outside of the Company’s control. Accordingly, reimbursable revenue is fully constrained and not recognized until the uncertainty is resolved, which typically occurs when the related costs are incurred on behalf of a customer. The Company is considered a principal in such transactions and records the associated revenue at the gross amount billed to the customer with the related costs recorded as an expense within cost of sales. At the Thacker Pass lithium project, in addition to management fee income, the customer will reimburse Sawtooth for up to $50 million of capital expenditures. The amount is variable until the equipment is acquired. At the time the equipment is acquired, the variability is resolved as the compensation is fixed. Sawtooth will recognize revenue over the estimated useful life of the asset on a straight-line basis as the performance obligation is satisfied over time. Sawtooth acquired $23.3 million of equipment for this project during 2023. In addition, Sawtooth recognized $4.9 million in revenue for reimbursable costs during the year ended December 31, 2023. In accordance with the Thacker Pass agreement, the customer received a $3.5 million advance from Sawtooth, which is included in the long-term contract asset. The customer will pay a $4.7 million success fee to Sawtooth upon achieving commercial mining milestones or repay the advance if such commercial mining milestones are not met.
Prior Period Performance Obligations
The Company records royalty income in the month production is delivered to the purchaser. As a mineral owner, the Company has limited visibility into when new wells start producing and production statements may not be received for 30 to 90 days or more after the date production is delivered. As a result, the Company is required to estimate the amount of production delivered to the purchaser of the product and the price that will be received for the sale of the product. The expected sales volumes and prices for these properties are estimated and recorded in "Trade accounts receivable" in the accompanying Consolidated Balance Sheets. The difference between the Company’s estimates and the actual amounts received is recorded in the month that payment is received from the third-party lessee. During 2023, royalty income recognized in the reporting period related to performance obligations satisfied in prior reporting periods was $1.4 million. During 2022, royalty income of $2.1 million was recognized for a settlement related to the Company's ownership interest in certain mineral rights.
Disaggregation of Revenue
In accordance with ASC 606-10-50, the Company disaggregates revenue from contracts with customers into major goods and service lines and timing of transfer of goods and services. The Company determined that disaggregating revenue into these categories achieves the disclosure objective of depicting how the nature, amount, timing, and uncertainty of revenue and cash flows are affected by economic factors. The Company’s business consists of the Coal Mining, NAMining and Minerals Management segments as well as Unallocated Items. See Note 15 to the Consolidated Financial Statements for further discussion of segment reporting.
NOTES TO CONSOLIDATED FINANCIAL STATEMENTS
NACCO INDUSTRIES, INC. AND SUBSIDIARIES
(Tabular Amounts in Thousands, Except Per Share, Percentage Data and Oil and Gas Disclosures)
The following table disaggregates revenue by major sources for the years ended December 31:
|
|
|
|
|
|
|
|
|
|
|
|
| Major Goods/Service Lines |
2023 |
|
2022 |
| Coal Mining |
$ |
85,415 |
|
|
$ |
95,204 |
|
| NAMining |
90,532 |
|
|
85,664 |
|
| Minerals Management |
32,985 |
|
|
60,242 |
|
Unallocated Items |
8,459 |
|
|
2,952 |
|
| Eliminations |
(2,597) |
|
|
(2,343) |
|
| Total revenues |
$ |
214,794 |
|
|
$ |
241,719 |
|
|
|
|
|
| Timing of Revenue Recognition |
|
|
|
| Goods transferred at a point in time |
$ |
83,273 |
|
|
$ |
92,842 |
|
| Services transferred over time |
131,521 |
|
|
148,877 |
|
| Total revenues |
$ |
214,794 |
|
|
$ |
241,719 |
|
Contract Balances
The opening and closing balances of the Company’s current and long-term contract assets and liabilities and receivables are as follows:
|
|
|
|
|
|
|
|
|
|
|
|
|
|
|
|
|
|
|
|
|
|
|
|
|
|
|
|
|
|
|
Contract balances |
|
Trade accounts receivable |
|
Contract asset
(current) |
|
Contract asset
(long-term) |
|
Contract liability (current) |
|
Contract liability (long-term) |
| Balance at January 1, 2023 |
$ |
37,940 |
|
|
$ |
409 |
|
|
$ |
5,985 |
|
|
$ |
833 |
|
|
$ |
1,709 |
|
| Balance at December 31, 2023 |
37,429 |
|
|
— |
|
|
3,712 |
|
|
878 |
|
|
1,470 |
|
| Increase (decrease) |
$ |
(511) |
|
|
$ |
(409) |
|
|
$ |
(2,273) |
|
|
$ |
45 |
|
|
$ |
(239) |
|
As described above, the Company enters into royalty contracts that grant exclusive right, title, and interest in and to minerals.
The transaction price consists of a variable sales-based royalty and, in certain arrangements, a fixed component in the form of
an up-front lease bonus payment. The timing of the payment of the fixed portion of the transaction price is upfront, however,
the performance obligation is satisfied over the primary term of the contract, which is generally three to five years. Therefore, at the time any such up-front payment is received, a contract liability is recorded which represents deferred revenue. The amount of royalty revenue recognized in the years ended December 31, 2023 and December 31, 2022 that was included in the opening contract liability was $0.8 million and $1.0 million, respectively. This revenue consists of up-front lease bonus payments received under royalty contracts that are recognized over the primary term of the royalty contracts, which are generally three to five years.
The Company expects to recognize $0.9 million in 2024, $1.3 million in 2025, $0.1 million in 2026, and less than $0.1 million in 2027 related to the contract liability remaining at December 31, 2023. The difference between the opening and closing balances of the Company’s contract balances results from the timing difference between the Company’s performance and the customer’s payment.
The Company has no contract assets recognized from the costs to obtain or fulfill a contract with a customer.
NOTES TO CONSOLIDATED FINANCIAL STATEMENTS
NACCO INDUSTRIES, INC. AND SUBSIDIARIES
(Tabular Amounts in Thousands, Except Per Share, Percentage Data and Oil and Gas Disclosures)
NOTE 4—Inventories
Inventories are summarized as follows:
|
|
|
|
|
|
|
|
|
|
|
|
| |
December 31 |
| |
2023 |
|
2022 |
| Coal |
$ |
23,784 |
|
|
$ |
27,927 |
|
| Mining supplies |
53,216 |
|
|
43,561 |
|
| Total inventories |
$ |
77,000 |
|
|
$ |
71,488 |
|
The weighted average method is used for inventory valuation. During 2023, the Company recorded a $7.5 million inventory impairment charge in the line “Cost of sales” in the accompanying Consolidated Statements of Operations as mining costs exceeded net realizable value at MLMC.
NOTE 5—Property, Plant and Equipment, Net
Property, plant and equipment, net includes the following:
|
|
|
|
|
|
|
|
|
|
|
|
| |
December 31 |
| |
2023 |
|
2022 |
| Coal lands and real estate |
$ |
58,353 |
|
|
$ |
60,277 |
|
| Mineral interests |
68,150 |
|
|
31,436 |
|
| Plant and equipment |
325,655 |
|
|
290,511 |
|
| Property, plant and equipment, at cost |
452,158 |
|
|
382,224 |
|
Less allowances for depreciation, depletion, amortization and impairment |
228,256 |
|
|
164,272 |
|
| |
$ |
223,902 |
|
|
$ |
217,952 |
|
Total depreciation, depletion and amortization expense on property, plant and equipment was $26.4 million and $23.1 million during 2023 and 2022, respectively.
During the fourth quarter of 2023, the Company recorded a non-cash, long-lived asset impairment charge of $65.9 million. See Note 9 for further discussion of the impairment charge.
NOTE 6—Intangible Assets
The Company has a coal supply agreement intangible asset which is subject to amortization based on units of production over the term of the lignite sales agreement which expires in 2032. The gross and net balances are set forth in the following table:
|
|
|
|
|
|
|
|
|
|
|
|
|
|
|
|
|
|
| |
Gross Carrying
Amount |
|
Accumulated
Amortization and Impairment |
|
Net
Balance |
| Balance at December 31, 2023 |
|
|
|
|
|
| Coal supply agreement |
$ |
84,200 |
|
|
$ |
(78,194) |
|
|
$ |
6,006 |
|
|
|
|
|
|
|
| Balance at December 31, 2022 |
|
|
|
|
|
| Coal supply agreement |
$ |
84,200 |
|
|
$ |
(56,145) |
|
|
$ |
28,055 |
|
|
|
|
|
|
|
Amortization expense for intangible assets was $3.0 million and $3.7 million in 2023 and 2022, respectively.
During the fourth quarter of 2023,the Company recorded a non-cash, long-lived asset impairment charge of $65.9 million. See Note 9 for further discussion of the impairment charge.
NOTE 7—Asset Retirement Obligations
The Company’s obligations associated with the retirement of long-lived assets are recognized at fair value at the time the legal obligations are incurred.
NOTES TO CONSOLIDATED FINANCIAL STATEMENTS
NACCO INDUSTRIES, INC. AND SUBSIDIARIES
(Tabular Amounts in Thousands, Except Per Share, Percentage Data and Oil and Gas Disclosures)
Upon initial recognition of a liability, a corresponding amount is capitalized as part of the carrying
value of the related long-lived asset and is depreciated either by the straight-line method or the units-of-production method. The
liability is accreted each period until the liability is settled, at which time the liability is removed. If the liability is settled for an amount other than the recorded amount, a gain or loss is recognized.
The Company's asset retirement obligations are principally for costs to close its surface mines and reclaim the land it has disturbed as a result of its normal mining activities as well as for costs to dismantle certain mining equipment at the end of the life of the mine. Management’s estimate involves a high degree of subjectivity. In particular, the obligation’s fair value is determined using a discounted cash flow technique and is based upon mining permit requirements and various assumptions including credit adjusted risk-free-rates, estimates of disturbed acreage, life of the mine, estimated reclamation costs, the application of various environmental laws and regulations and assumptions regarding equipment productivity. The Company reviews its asset retirement obligations at each mine site at least annually and makes necessary adjustments for permit changes and for revisions of estimates of the timing and extent of reclamation activities and cost estimates.
The accretion of the liability is being recognized over the estimated life of each individual asset retirement obligation and is recorded in the line Cost of sales in the accompanying Consolidated Statements of Operations. The associated asset is recorded in Property, Plant and Equipment, net in the accompanying Consolidated Balance Sheets. The depreciation of the asset is recorded in the line Cost of sales in the accompanying Consolidated Statements of Operations.
A reconciliation of the Company's beginning and ending aggregate carrying amount of the asset retirement obligations are as follows:
|
|
|
|
|
|
|
|
|
|
|
|
|
|
|
|
|
|
|
|
|
|
|
| |
|
Coal Mining |
|
|
|
Unallocated Items |
|
NACCO
Consolidated |
| Balance at January 1, 2022 |
|
$ |
26,898 |
|
|
|
|
$ |
17,053 |
|
|
$ |
43,951 |
|
|
|
|
|
|
|
|
|
|
| Liabilities settled during the period |
|
(223) |
|
|
|
|
(956) |
|
|
(1,179) |
|
| Accretion expense |
|
2,190 |
|
|
|
|
1,332 |
|
|
3,522 |
|
| Revision of estimated cash flows |
|
(405) |
|
|
|
|
113 |
|
|
(292) |
|
| Balance at December 31, 2022 |
|
$ |
28,460 |
|
|
|
|
$ |
17,542 |
|
|
$ |
46,002 |
|
| Liabilities incurred during the period |
|
1,920 |
|
|
|
|
— |
|
|
1,920 |
|
| Liabilities settled during the period |
|
(852) |
|
|
|
|
(1,048) |
|
|
(1,900) |
|
| Accretion expense |
|
2,170 |
|
|
|
|
1,358 |
|
|
3,528 |
|
| Revision of estimated cash flows |
|
1,346 |
|
|
|
|
1,717 |
|
|
3,063 |
|
| Balance at December 31, 2023 |
|
$ |
33,044 |
|
|
|
|
$ |
19,569 |
|
|
$ |
52,613 |
|
During 2023, the Company’s wholly-owned subsidiary, Caddo Creek Resources Company (“Caddo Creek”), acquired 100% of the membership interests in the Marshall Mine. Prior to the acquisition, Caddo Creek was performing mine reclamation under a fixed price contract with a customer. The Company received $2.2 million of cash, assumed the asset retirement obligation estimated to be approximately $1.9 million and recognized a gain of approximately $0.3 million in the line "Other, net” in the accompanying Consolidated Statements of Operations. The asset retirement obligation’s fair value was determined using a discounted cash flow technique and is based upon permit requirements and various estimates and assumptions that would be used by market participants, including estimates of disturbed acreage, reclamation costs and assumptions regarding equipment productivity.
Bellaire's legacy liabilities include obligations for water treatment and other environmental remediation that arose as part of the normal course of closing these underground mining operations. Since Bellaire's properties are no longer active operations, no associated asset has been capitalized. Bellaire’s asset retirement obligation is included in the table above in the Unallocated Items column.
Prior to 2022, Bellaire established a $5.0 million Mine Water Treatment Trust to provide a financial assurance mechanism in order to assure the long-term treatment of post-mining discharges. The fair value of Bellaire's Mine Water Treatment assets, which are recognized as a component of Other non-current assets on the Consolidated Balance Sheets, are $11.2 million and $9.9 million at December 31, 2023 and December 31, 2022, respectively, and are legally restricted for purposes of settling the Bellaire asset retirement obligation. See Note 9 for further discussion of the Mine Water Treatment Trust.
NOTES TO CONSOLIDATED FINANCIAL STATEMENTS
NACCO INDUSTRIES, INC. AND SUBSIDIARIES
(Tabular Amounts in Thousands, Except Per Share, Percentage Data and Oil and Gas Disclosures)
NOTE 8—Current and Long-Term Financing
Financing arrangements are obtained and maintained at the subsidiary level. NACCO has not guaranteed any borrowings of its subsidiaries.
The following table summarizes the Company's available and outstanding borrowings:
|
|
|
|
|
|
|
|
|
|
|
|
| |
December 31 |
| |
2023 |
|
2022 |
| Total outstanding borrowings: |
|
|
|
| Revolving credit agreement |
$ |
10,000 |
|
|
$ |
— |
|
| Other debt |
25,956 |
|
|
19,668 |
|
| Total debt outstanding |
$ |
35,956 |
|
|
$ |
19,668 |
|
|
|
|
|
Current portion of borrowings outstanding
|
$ |
13,953 |
|
|
$ |
3,649 |
|
| Long-term portion of borrowings outstanding |
22,003 |
|
|
16,019 |
|
| |
$ |
35,956 |
|
|
$ |
19,668 |
|
|
|
|
|
| Total available borrowings, net of limitations, under revolving credit agreement |
$ |
115,120 |
|
|
$ |
116,285 |
|
|
|
|
|
| Unused revolving credit agreement |
$ |
105,120 |
|
|
$ |
116,285 |
|
|
|
|
|
| Weighted average stated interest rate on total borrowings |
6.6 |
% |
|
3.9 |
% |
Annual maturities of total debt, excluding leases, are as follows:
|
|
|
|
|
|
| 2024 |
13,925 |
|
| 2025 |
3,149 |
|
| 2026 |
7,591 |
|
| 2027 |
1,987 |
|
| 2028 |
1,720 |
|
| Thereafter |
7,472 |
|
| |
$ |
35,844 |
|
Interest paid on total debt was $2.4 million and $2.0 million during 2023 and 2022, respectively.
The Company has a secured revolving line of credit of up to $150.0 million (the “Facility”) that expires in November 2025. Borrowings outstanding under the Facility were $10.0 million at December 31, 2023. At December 31, 2023, the excess availability under the Facility was $105.1 million, which reflects a reduction for outstanding letters of credit of $34.9 million.
The Facility has performance-based pricing, which sets interest rates based upon achieving various levels of debt to EBITDA ratios, as defined in the Facility. Borrowings bear interest at a floating rate plus a margin based on the level of debt to EBITDA ratio achieved. The applicable margins, effective December 31, 2023, for base rate and Secured Overnight Financing Rate loans were 1.23% and 2.23%, respectively. The Facility has a commitment fee which is based upon achieving various levels of debt to EBITDA ratios. The commitment fee was 0.34% on the unused commitment at December 31, 2023. During the year ended December 31, 2023, the average borrowing under the Facility was $6.2 million. The weighted-average annual interest rate, including the floating rate margin, was 6.06% and 2.54% at December 31, 2023 and December 31, 2022, respectively.
The Facility contains restrictive covenants, which require, among other things, maintaining maximum net debt to EBITDA ratio of 2.75 to 1.00 and an interest coverage ratio of not less than 4.00 to 1.00. The Facility provides subsidiaries the ability to make loans, dividends and advances to NACCO, with some restrictions based on maintaining a maximum debt to EBITDA ratio of 1.50 to 1.00, or if greater than 1.50 to 1.00, a Fixed Charge Coverage Ratio of 1.10 to 1.00, in conjunction with maintaining unused availability thresholds of borrowing capacity, as defined in the Facility, of $15.0 million. At December 31, 2023, the Company was in compliance with all financial covenants in the Facility.
NOTES TO CONSOLIDATED FINANCIAL STATEMENTS
NACCO INDUSTRIES, INC. AND SUBSIDIARIES
(Tabular Amounts in Thousands, Except Per Share, Percentage Data and Oil and Gas Disclosures)
The obligations under the Facility are guaranteed by certain direct and indirect, existing and future domestic subsidiaries, and is secured by certain assets and the guarantors, subject to customary exceptions and limitations.
The Company has a demand note payable to Coteau, one of the unconsolidated subsidiaries, which bears interest based on the applicable quarterly federal short-term interest rate as announced from time to time by the IRS. At December 31, 2023 and 2022, the balance of the note was $7.0 million and $5.7 million and the interest rate was 5.12% and 3.36%, respectively.
The Company has eleven notes payable that are secured by sixteen specified units of equipment, bear interest at a weighted average rate of 5.42%, and expire at various dates through 2029. One note includes a principal payment of $4.4 million at the end of the term on December 15, 2026. At December 31, 2023 and 2022, the outstanding balances of the notes were $18.8 million and $13.2 million, respectively.
NOTE 9—Fair Value Disclosure
Recurring Fair Value Measurements: The following table presents the Company's assets accounted for at fair value on a recurring basis:
|
|
|
|
|
|
|
|
|
|
|
|
|
|
|
|
|
|
|
|
|
|
|
|
|
|
|
|
|
|
|
Fair Value Measurements at Reporting Date Using |
|
|
|
|
Quoted Prices in |
|
|
|
Significant |
|
|
|
|
Active Markets for |
|
Significant Other |
|
Unobservable |
|
|
|
|
Identical Assets |
|
Observable Inputs |
|
Inputs |
| Description |
|
December 31, 2023 |
|
(Level 1) |
|
(Level 2) |
|
(Level 3) |
| Assets: |
|
|
|
|
|
|
|
|
| Equity securities |
|
$ |
17,208 |
|
|
$ |
17,208 |
|
|
$ |
— |
|
|
$ |
— |
|
|
|
|
|
|
|
|
|
|
|
|
$ |
17,208 |
|
|
$ |
17,208 |
|
|
$ |
— |
|
|
$ |
— |
|
|
|
|
|
|
|
|
|
|
|
|
|
|
|
|
|
|
|
|
|
|
|
|
|
|
|
|
|
|
|
|
|
|
|
|
|
|
|
|
|
|
|
|
|
|
|
|
|
|
|
|
|
|
|
|
|
|
|
Fair Value Measurements at Reporting Date Using |
|
|
|
|
Quoted Prices in |
|
|
|
Significant |
|
|
|
|
Active Markets for |
|
Significant Other |
|
Unobservable |
|
|
|
|
Identical Assets |
|
Observable Inputs |
|
Inputs |
| Description |
|
December 31, 2022 |
|
(Level 1) |
|
(Level 2) |
|
(Level 3) |
| Assets: |
|
|
|
|
|
|
|
|
| Equity securities |
|
$ |
15,534 |
|
|
$ |
15,534 |
|
|
$ |
— |
|
|
$ |
— |
|
|
|
|
|
|
|
|
|
|
|
|
$ |
15,534 |
|
|
$ |
15,534 |
|
|
$ |
— |
|
|
$ |
— |
|
Bellaire's Mine Water Treatment Trust invests in available for sale securities that are reported at fair value based upon quoted market prices in active markets for identical assets; therefore, they are classified as Level 1 within the fair value hierarchy. The Mine Water Treatment Trust realized a gain of $1.6 million and a loss of $2.2 million in the years ended December 31, 2023 and 2022, respectively. See Note 7 for further discussion of Bellaire's Mine Water Treatment Trust.
Prior to 2022, the Company invested $2.0 million in equity securities of a public company with a diversified portfolio of royalty producing mineral interests. The investment is reported at fair value based upon quoted market prices in active markets for identical assets; therefore, it is classified as Level 1 within the fair value hierarchy. The Company recognized a gain of $0.4 million and $1.9 million in the years ended December 31, 2023 and 2022, respectively, related to the investment in these equity securities. The change in fair value of equity securities is reported on the line (Gain) loss on equity securities in the Other (income) expense section of the Consolidated Statements of Operations.
There were no transfers into or out of Levels 1, 2 or 3 during the year ended December 31, 2023.
Nonrecurring Fair Value Measurements: On December 18, 2023, MLMC received a force majeure event notice from its customer related to an issue that began on December 15, 2023 and impacted one of the two boilers at the Red Hills Power Plant. The notice did not provide a timeline for resolution of the issue. As of March 6, 2024, the impacted boiler is still not operational.
NOTES TO CONSOLIDATED FINANCIAL STATEMENTS
NACCO INDUSTRIES, INC. AND SUBSIDIARIES
(Tabular Amounts in Thousands, Except Per Share, Percentage Data and Oil and Gas Disclosures)
The prolonged mechanical issue is expected to result in a reduction in customer demand and will have a significant impact on the Company's results of operations during 2024. The Company determined the anticipated reduction in customer demand caused by this issue was an indicator that potential impairment existed as of December 31, 2023 and, as a result, reviewed MLMC's long-lived assets for impairment.
The Company assessed the recoverability of the MLMC asset group and determined that the assets were not fully recoverable when compared to the remaining future undiscounted cash flows from the asset group. As a result, the Company estimated the fair value of the asset group which resulted in a non-cash, long-lived asset impairment charge of $65.9 million. The asset impairment charge was recorded as Long-lived asset impairment charge in the Consolidated Statement of Operations for the year ended December 31, 2023. The $65.9 million relates exclusively to MLMC; however, $60.8 million and $5.1 million were recorded on the Coal Mining segment and the Minerals Management segment, respectively, as certain MLMC land assets were recorded within the Minerals Management segment. The impairment charge was allocated to the long-lived assets of the asset group on a pro rata basis using the relative carrying amount of those assets in relation to their fair value. The analysis for the land and real estate and other property, plant and equipment was calculated using market data for similar assets, which are classified as Level 2 inputs. The analysis of certain other long-term assets was calculated using unobservable inputs with little or no market data, which are classified as Level 3 inputs.
The Company regularly performs reviews of potential future development projects and in 2022 identified certain legacy assets where future development is unlikely. As a result, the Company estimated the fair value of the assets using unobservable inputs, which are classified as Level 3 inputs. The long-lived assets, which included land, prepaid royalties and capitalized leasehold costs, were written off to zero during 2022 and resulted in non-cash asset impairment charges of $3.9 million in the Minerals Management segment. The impairment charge is reported on the line Long-lived asset impairment charge in the Consolidated Statements of Operations.
Other Fair Value Measurement Disclosures: The carrying amounts of cash and cash equivalents, accounts receivable and accounts payable approximate fair value due to the short-term maturities of these instruments. The fair values of revolving credit agreements and long-term debt, excluding finance leases, were determined using current rates offered for similar obligations taking into account subsidiary credit risk, which is Level 2 as defined in the fair value hierarchy. The fair value and the book value of revolving credit agreements and long-term debt, excluding finance leases, was $35.3 million and $35.8 million, respectively, at December 31, 2023 and $18.1 million and $18.9 million, respectively, at December 31, 2022.
Financial instruments that potentially subject the Company to concentration of credit risk consist principally of accounts receivable. Under its mining contracts, the Company recognizes revenue and a related receivable as coal or other aggregates are delivered or predevelopment services are provided. These mining contracts provide for monthly settlements. The Company's significant credit concentration is uncollateralized; however, historically minimal credit losses have been incurred. To further reduce credit risk associated with accounts receivable, the Company performs periodic credit evaluations of its customers, but does not generally require advance payments or collateral.
NOTE 10—Leases
The Company recognizes right-of-use assets (“ROU assets”) and lease liabilities for operating leases of real estate, mining and other equipment that expire at various dates through 2033. The majority of the Company's leases are operating leases. NACCO does not recognize leases with a term of 12 months or less on the balance sheet. Instead, the Company recognizes the related lease expense on a straight-line basis over the lease term. The Company accounts for lease and non-lease components as a single lease component. The Company's lease agreements do not contain lease payments that depend on an index or a rate, as such, minimum lease payments do not include variable lease payments.
NOTES TO CONSOLIDATED FINANCIAL STATEMENTS
NACCO INDUSTRIES, INC. AND SUBSIDIARIES
(Tabular Amounts in Thousands, Except Per Share, Percentage Data and Oil and Gas Disclosures)
Leased assets and liabilities include the following at December 31:
|
|
|
|
|
|
|
|
|
|
|
|
|
|
|
| Description |
Location |
2023 |
2022 |
|
|
|
| Assets |
|
|
|
|
|
|
| Operating |
Operating lease right-of-use assets |
$ |
8,667 |
|
$ |
6,419 |
|
|
|
|
| Finance |
Property, plant and equipment, net (a)
|
107 |
|
843 |
|
|
|
|
|
|
|
|
|
|
|
|
|
|
|
|
|
|
| Liabilities |
|
|
|
|
|
|
| Current |
|
|
|
|
|
|
| Operating |
Other current liabilities |
$ |
1,485 |
|
$ |
1,039 |
|
|
|
|
| Finance |
Current maturities of long-term debt |
28 |
|
776 |
|
|
|
|
| Non-current |
|
|
|
|
|
|
| Operating |
Operating lease liabilities |
$ |
8,782 |
|
$ |
7,528 |
|
|
|
|
| Finance |
Long-term debt |
84 |
|
19 |
|
|
|
|
(a) Finance leased assets are recorded net of accumulated amortization of less than $0.1 million and $0.2 million as of December 31, 2023 and December 31, 2022, respectively.
The components of lease expense for the years ended December 31 are as follows:
|
|
|
|
|
|
|
|
|
|
|
|
| Description |
Location |
2023 |
2022 |
| Lease expense |
|
|
|
| Operating lease cost |
Selling, general and administrative expenses |
$ |
1,712 |
|
$ |
1,881 |
|
| Finance lease cost: |
|
|
|
| Amortization of leased assets |
Cost of sales |
61 |
|
128 |
|
| Interest on lease liabilities |
Interest expense
|
7 |
|
13 |
|
| Variable lease expense |
Selling, general and administrative expenses |
572 |
|
534 |
|
| Short-term lease expense |
Selling, general and administrative expenses |
3,214 |
|
3,434 |
|
| Total lease expense |
|
$ |
5,566 |
|
$ |
5,990 |
|
Future minimum finance and operating lease payments were as follows at December 31, 2023:
|
|
|
|
|
|
|
|
|
|
|
|
|
|
|
|
|
|
| |
Finance Leases |
|
Operating Leases |
|
Total |
| 2024 |
$ |
36 |
|
|
$ |
2,238 |
|
|
$ |
2,274 |
|
| 2025 |
33 |
|
|
2,014 |
|
|
2,047 |
|
| 2026 |
33 |
|
|
2,003 |
|
|
2,036 |
|
| 2027 |
21 |
|
|
1,593 |
|
|
1,614 |
|
| 2028 |
9 |
|
|
1,607 |
|
|
1,616 |
|
| Subsequent to 2028 |
— |
|
|
3,935 |
|
|
3,935 |
|
| Total minimum lease payments |
132 |
|
|
13,390 |
|
|
$ |
13,522 |
|
| Amounts representing interest |
20 |
|
|
3,123 |
|
|
|
| Present value of net minimum lease payments |
$ |
112 |
|
|
$ |
10,267 |
|
|
|
NOTES TO CONSOLIDATED FINANCIAL STATEMENTS
NACCO INDUSTRIES, INC. AND SUBSIDIARIES
(Tabular Amounts in Thousands, Except Per Share, Percentage Data and Oil and Gas Disclosures)
As most of the Company's leases do not provide an implicit rate, the Company determines the incremental borrowing rate based on the information available at the lease commencement date in determining the present value of lease payments. The Company considers its credit rating and the current economic environment in determining this collateralized rate. The assumptions used in accounting for ASC 842 for the years ended December 31 are as follows:
|
|
|
|
|
|
|
|
|
|
2023 |
2022 |
| Weighted average remaining lease term (years) |
|
|
| Operating |
6.81 |
7.66 |
| Finance |
3.97 |
1.41 |
|
|
|
| Weighted average discount rate |
|
|
| Operating |
8.13 |
% |
7.13 |
% |
| Finance |
8.69 |
% |
3.11 |
% |
The following table details cash paid for amounts included in the measurement of lease liabilities for the years ended December 31:
|
|
|
|
|
|
|
|
|
|
2023 |
2022 |
| Operating cash flows from operating leases |
$ |
1,823 |
|
$ |
2,097 |
|
| Operating cash flows from finance leases |
7 |
|
13 |
|
| Financing cash flows from finance leases |
786 |
|
183 |
|
NOTE 11—Contingencies
Various legal and regulatory proceedings and claims have been or may be asserted against NACCO and certain subsidiaries relating to the conduct of their businesses. These proceedings and claims are incidental to the ordinary course of business of the Company. Management believes that it has meritorious defenses and will vigorously defend the Company in these actions. Any costs that management estimates will be paid as a result of these claims are accrued when the liability is considered probable and the amount can be reasonably estimated. If a range of amounts can be reasonably estimated and no amount within the range is a better estimate than any other amount, then the minimum of the range is accrued. The Company does not accrue liabilities when the likelihood that the liability has been incurred is probable but the amount cannot be reasonably estimated or when the liability is believed to be only reasonably possible or remote. For contingencies where an unfavorable outcome is probable or reasonably possible and which are material, the Company discloses the nature of the contingency and, in some circumstances, an estimate of the possible loss.
These matters are subject to inherent uncertainties, and unfavorable rulings could occur. If an unfavorable ruling were to occur, there exists the possibility of an adverse impact on the Company’s financial position, results of operations and cash flows of the period in which the ruling occurs, or in future periods.
NOTE 12—Stockholders' Equity and Earnings Per Share
NACCO Industries, Inc. Class A common stock is traded on the New York Stock Exchange under the ticker symbol “NC.” Because of transfer restrictions on Class B common stock, no trading market has developed, or is expected to develop, for the Company's Class B common stock. The Class B common stock is convertible into Class A common stock on a one-for-one basis at any time at the request of the holder. The Company's Class A common stock and Class B common stock have the same cash dividend rights per share. As the liquidation and dividend rights are identical, any distribution of earnings would be allocated to Class A and Class B stockholders on a proportionate basis, and accordingly the net income per share for each class of common stock is identical. The Class A common stock has one vote per share and the Class B common stock has ten votes per share. The total number of authorized shares of Class A common stock and Class B common stock at December 31, 2023 was 25,000,000 shares and 6,756,176 shares, respectively. Treasury shares of Class A common stock totaling 2,335,178 and 2,434,769 at December 31, 2023 and 2022, respectively, have been deducted from shares outstanding.
Stock Repurchase Program: On November 7, 2023, the Company's Board of Directors approved a stock purchase program ("2023 Stock Repurchase Program") providing for the purchase of up to $20.0 million of the Company’s outstanding Class A common stock through December 31, 2025.
NOTES TO CONSOLIDATED FINANCIAL STATEMENTS
NACCO INDUSTRIES, INC. AND SUBSIDIARIES
(Tabular Amounts in Thousands, Except Per Share, Percentage Data and Oil and Gas Disclosures)
NACCO's previous repurchase program ("2021 Stock Repurchase Program") would have expired on December 31, 2023 but was terminated and replaced by the 2023 Stock Repurchase Program. During 2023, the Company repurchased 47,095 shares of Class A Common Stock under the 2021 Stock Repurchase Program for an aggregate purchase price of $1.6 million and 43,872 shares of Class A Common Stock under the 2023 Stock Repurchase Program for an aggregate purchase price of $1.5 million. There were no stock repurchases in 2022.
The timing and amount of any repurchases under the 2023 Stock Repurchase Program are determined at the discretion of the Company's management based on a number of factors, including the availability of capital, other capital allocation alternatives, market conditions for the Company's Class A common stock and other legal and contractual restrictions. The 2023 Stock Repurchase Program does not require the Company to acquire any specific number of shares and may be modified, suspended, extended or terminated by the Company without prior notice and may be executed through open market purchases, privately negotiated transactions or otherwise. All or part of the repurchases under the 2023 Stock Repurchase Program may be implemented under a Rule 10b5-1 trading plan, which would allow repurchases under pre-set terms at times when the Company might otherwise be restricted from doing so under applicable securities laws.
Stock Compensation: See Note 2 for a discussion of the Company's restricted stock awards.
Earnings per Share: The weighted average number of shares of Class A common stock and Class B common stock outstanding used to calculate basic and diluted earnings per share were as follows:
|
|
|
|
|
|
|
|
|
|
|
|
| |
2023 |
|
2022 |
| Basic weighted average shares outstanding |
7,478 |
|
|
7,312 |
|
| Dilutive effect of restricted stock awards |
N/A |
|
61 |
|
| Diluted weighted average shares outstanding |
7,478 |
|
|
7,373 |
|
|
|
|
|
| Basic (loss) earnings per share |
$ |
(5.29) |
|
|
$ |
10.14 |
|
| Diluted (loss) earnings per share |
$ |
(5.29) |
|
|
$ |
10.06 |
|
NOTES TO CONSOLIDATED FINANCIAL STATEMENTS
NACCO INDUSTRIES, INC. AND SUBSIDIARIES
(Tabular Amounts in Thousands, Except Per Share, Percentage Data and Oil and Gas Disclosures)
NOTE 13—Income Taxes
The Company provides for income taxes and the related accounts under the asset and liability method. Deferred tax assets and liabilities are determined based on the difference between the financial statement and tax bases of assets and liabilities using enacted tax rates expected to be in effect during the year in which the basis differences reverse. Valuation allowances are established when management determines it is more likely than not that some portion, or all, of the deferred tax assets will not be realized.
The components of (Loss) income before income tax (benefit) provision and the Income tax (benefit) provision for the years ended December 31 are as follows:
|
|
|
|
|
|
|
|
|
|
|
|
| |
2023 |
|
2022 |
| (Loss) income before income tax (benefit) provision |
|
|
|
| Domestic |
$ |
(64,077) |
|
|
$ |
87,975 |
|
| Foreign |
(81) |
|
|
(252) |
|
|
$ |
(64,158) |
|
|
$ |
87,723 |
|
| Income tax (benefit) provision |
|
|
|
| Current income tax (benefit) provision: |
|
|
|
| Federal |
$ |
(3,405) |
|
|
$ |
20,761 |
|
| State |
290 |
|
|
1,328 |
|
| Foreign |
(342) |
|
|
(53) |
|
| Total current |
(3,457) |
|
|
22,036 |
|
| Deferred income tax (benefit) provision: |
|
|
|
| Federal |
(16,467) |
|
|
(8,887) |
|
| State |
(4,647) |
|
|
416 |
|
|
|
|
|
| Total deferred |
(21,114) |
|
|
(8,471) |
|
| |
$ |
(24,571) |
|
|
$ |
13,565 |
|
The Company made income tax payments of $1.4 million and $23.4 million during 2023 and 2022, respectively. During the same periods, income tax refunds totaled $14.9 million and $0.1 million, respectively.
NOTES TO CONSOLIDATED FINANCIAL STATEMENTS
NACCO INDUSTRIES, INC. AND SUBSIDIARIES
(Tabular Amounts in Thousands, Except Per Share, Percentage Data and Oil and Gas Disclosures)
The provision for income taxes differs from the amount computed by applying the statutory federal income tax rate to income before the provision for income taxes. A reconciliation of the federal statutory and effective income tax rate for the years ended December 31 is as follows:
|
|
|
|
|
|
|
|
|
|
|
|
| |
2023 |
|
2022 |
| (Loss) income before income tax (benefit) provision |
$ |
(64,158) |
|
|
$ |
87,723 |
|
| Statutory taxes at 21.0% |
$ |
(13,473) |
|
|
$ |
18,422 |
|
| State and local income taxes |
(4,392) |
|
|
1,629 |
|
| Non-deductible expenses |
1,071 |
|
|
745 |
|
| Percentage depletion |
(3,455) |
|
|
(4,866) |
|
| R&D and other federal credits |
(109) |
|
|
(300) |
|
| Settlements and uncertain tax positions |
(3,512) |
|
|
(787) |
|
|
|
|
|
| Other, net |
(701) |
|
|
(1,278) |
|
| Income tax (benefit) provision |
$ |
(24,571) |
|
|
$ |
13,565 |
|
| Effective income tax rate |
38.3 |
% |
|
15.5 |
% |
The Company recorded an income tax benefit of $24.6 million for the year ended December 31, 2023 on loss before income tax of $64.2 million, or 38.3%, compared to income tax expense of $13.6 million on income before income tax of $87.7 million, or 15.5%, for the year ended December 31, 2022.
The year ended December 31, 2023 included $4.0 million of discrete tax benefits, primarily from the reversal of uncertain tax provisions and the impact of U.S. federal provision to return adjustments. Excluding the $4.0 million of discrete tax benefit, the effective income tax rate in 2023 was 32.0%. The income tax provision for the year ended December 31, 2022 includes $1.5 million of discrete tax benefits, primarily from the reversal of uncertain tax positions as a result of the conclusion of the IRS examination of the Company’s 2013, 2014, 2015 and 2016 federal income tax returns. Excluding the $1.5 million of discrete tax benefits, the effective income tax rate in 2022 was 17.1%.
The change in the effective income tax rate for 2023 compared to 2022, excluding the impact of the long-lived asset impairment charge and discrete items, is primarily due to a decrease in earnings at entities that qualify for percentage depletion. The benefit from percentage depletion is not directly related to the amount of pre-tax income recorded in a period.
NOTES TO CONSOLIDATED FINANCIAL STATEMENTS
NACCO INDUSTRIES, INC. AND SUBSIDIARIES
(Tabular Amounts in Thousands, Except Per Share, Percentage Data and Oil and Gas Disclosures)
A detailed summary of the total deferred tax assets and liabilities in the Company's Consolidated Balance Sheets resulting from differences between the carrying amounts of assets and liabilities for financial reporting purposes and the amounts used for income tax purposes is as follows:
|
|
|
|
|
|
|
|
|
|
|
|
| |
December 31 |
| |
2023 |
|
2022 |
| Deferred tax assets |
|
|
|
| Lease liabilities |
$ |
22,265 |
|
|
$ |
21,880 |
|
| Tax carryforwards |
14,816 |
|
|
12,398 |
|
| Inventories |
4,880 |
|
|
5,571 |
|
| Accrued liabilities |
9,226 |
|
|
8,176 |
|
| Employee benefits |
3,319 |
|
|
3,086 |
|
| Land valuation adjustment |
6,378 |
|
|
6,261 |
|
| Partnership investment - development costs |
12,565 |
|
|
— |
|
| Other |
9,680 |
|
|
6,850 |
|
| Total deferred tax assets |
83,129 |
|
|
64,222 |
|
| Less: Valuation allowance |
11,783 |
|
|
11,809 |
|
| |
71,346 |
|
|
52,413 |
|
| Deferred tax liabilities |
|
|
|
| Lease right-of-use assets |
22,611 |
|
|
21,880 |
|
| Depreciation and depletion |
23,607 |
|
|
19,665 |
|
| Partnership investment - development costs |
— |
|
|
6,069 |
|
| Accrued pension benefits |
10,047 |
|
|
10,921 |
|
| Total deferred tax liabilities |
56,265 |
|
|
58,535 |
|
| Net deferred asset (liability) |
$ |
15,081 |
|
|
$ |
(6,122) |
|
The following table summarizes the tax carryforwards and associated carryforward periods and related valuation allowances where the Company has determined that realization is uncertain:
|
|
|
|
|
|
|
|
|
|
|
|
|
|
|
|
|
|
| |
December 31, 2023 |
| |
Net deferred tax
asset |
|
Valuation
allowance |
|
Carryforwards
expire during: |
| State net operating loss |
$ |
16,526 |
|
|
$ |
14,757 |
|
|
2024 - 2043 |
|
|
|
|
|
|
|
|
|
|
|
|
|
|
|
|
|
|
| |
December 31, 2022 |
| |
Net deferred tax
asset |
|
Valuation
allowance |
|
Carryforwards
expire during: |
| State net operating loss |
$ |
15,347 |
|
|
$ |
14,422 |
|
|
2023-2042 |
|
|
|
|
|
|
|
|
|
|
|
|
The Company has a valuation allowance for certain state and foreign deferred tax assets. Based upon the review of historical earnings and the relevant expiration of carryforwards, including utilization limitations in the various state taxing jurisdictions, the Company believes the valuation allowances are appropriate and does not expect to release valuation allowances within the next twelve months that would have a significant effect on the Company's financial position or results of operations.
Since 2021, the Company has participated in a voluntary program with the IRS called Compliance Assurance Process (“CAP”). The objective of CAP is to contemporaneously work with the IRS to achieve federal tax compliance and resolve all or most issues prior to the filing of the tax return. In general, the Company operates in taxing jurisdictions that provide a statute of limitations period ranging from three to five years for the taxing authorities to review the applicable tax filings. The tax returns of the Company and certain of its subsidiaries are under routine examination by various taxing authorities. The Company has not been informed of any material assessment for which an accrual has not been previously provided and the Company would vigorously contest any material assessment.
NOTES TO CONSOLIDATED FINANCIAL STATEMENTS
NACCO INDUSTRIES, INC. AND SUBSIDIARIES
(Tabular Amounts in Thousands, Except Per Share, Percentage Data and Oil and Gas Disclosures)
Management believes any potential adjustment would not materially affect the Company's financial condition or results of operations.
The following is a reconciliation of the Company's total gross unrecognized tax benefits, defined as the aggregate tax effect of differences between tax return positions and the benefits recognized in the financial statements for the years ended December 31, 2023 and 2022. Approximately $2.8 million and $5.5 million of the gross unrecognized tax benefits as of December 31, 2023 and 2022, respectively, relate to permanent items that, if recognized, would impact the effective income tax rate. This amount differs from the gross unrecognized tax benefits presented in the table below due to (1) the deferred tax asset which would be available if the position were not sustained upon audit and (2) the decrease in U.S. federal income taxes which would occur upon the recognition of the state tax benefits included herein.
|
|
|
|
|
|
|
|
|
|
|
|
|
|
| |
2023 |
|
2022 |
|
|
| Balance at January 1 |
$ |
9,626 |
|
|
$ |
10,554 |
|
|
|
|
|
|
|
|
|
| Decreases based on settlements with tax authorities |
— |
|
|
(928) |
|
|
|
| Decreases based on lapse of applicable statute of limitations |
(3,478) |
|
|
— |
|
|
|
| Balance at December 31 |
$ |
6,148 |
|
|
$ |
9,626 |
|
|
|
The Company records interest and penalties on uncertain tax positions as a component of the income tax provision. The Company recognized net benefit of less than $0.1 million and net expense of less than $0.1 million in interest and penalties related to uncertain tax positions during 2023 and 2022, respectively. The total amount of interest and penalties accrued was $0.2 million and $0.3 million as of December 31, 2023 and 2022, respectively.
The Company expects the amount of unrecognized tax benefits will change within the next 12 months; however, the change in unrecognized tax benefits, which is reasonably possible within the next 12 months, is not expected to have a significant effect on the Company's financial position, results of operations or cash flows.
NOTE 14—Retirement Benefit Plans
Defined Benefit Plans: The Company maintains defined benefit pension plans that provide benefits based on years of service and average compensation during certain periods. Prior to 2022, the Company amended Combined Plan to freeze pension benefits for all employees. The Company also amended the Supplemental Retirement Benefit Plan (the “SERP”) to freeze all pension benefits. All eligible employees of the Company, including employees whose pension benefits are frozen, receive retirement benefits under defined contribution retirement plans.
During 2023, the Board of Directors of the Company approved the termination of the Combined Plan and participants were offered lump-sum distributions as part of the termination process. As a result of the lump-sum distributions, the Company recognized a non-cash, pension settlement charge of $1.8 million on the "Other, net" line within the accompanying Consolidated Statements of Operations. The $1.8 million charge represents a pro rata portion of the unrecognized net loss recorded in Accumulated other comprehensive loss.
The assumptions used in accounting for the defined benefit plans were as follows for the years ended December 31:
|
|
|
|
|
|
|
|
|
|
|
|
|
|
| |
2023 |
|
2022 |
|
|
| Weighted average discount rates for pension benefit obligation |
5.02% - 5.04% |
|
5.36% - 5.40% |
|
|
| Weighted average discount rates for net periodic benefit cost |
5.36% - 5.40% |
|
2.53% - 2.77% |
|
|
|
|
|
|
|
|
| Expected long-term rate of return on assets for net periodic benefit cost |
7.00 |
% |
|
7.00 |
% |
|
|
NOTES TO CONSOLIDATED FINANCIAL STATEMENTS
NACCO INDUSTRIES, INC. AND SUBSIDIARIES
(Tabular Amounts in Thousands, Except Per Share, Percentage Data and Oil and Gas Disclosures)
Set forth below is detail of the net periodic pension expense (income) for the defined benefit plans for the years ended December 31:
|
|
|
|
|
|
|
|
|
|
|
|
|
|
| |
2023 |
|
2022 |
|
|
| Interest cost |
$ |
1,639 |
|
|
$ |
1,105 |
|
|
|
| Expected return on plan assets |
(2,751) |
|
|
(2,707) |
|
|
|
| Amortization of actuarial loss |
51 |
|
|
543 |
|
|
|
| Amortization of prior service cost |
58 |
|
|
58 |
|
|
|
| Settlements |
1,815 |
|
|
— |
|
|
|
|
|
|
|
|
|
| Net periodic pension expense (income) |
$ |
812 |
|
|
$ |
(1,001) |
|
|
|
Set forth below is detail of other changes in plan assets and benefit obligations recognized in other comprehensive loss for the years ended December 31:
|
|
|
|
|
|
|
|
|
|
|
|
|
|
| |
2023 |
|
2022 |
|
|
| Current year actuarial (gain) loss |
$ |
2,560 |
|
|
$ |
1,717 |
|
|
|
| Amortization of actuarial loss |
(51) |
|
|
(543) |
|
|
|
| Amortization of prior service cost |
(58) |
|
|
(58) |
|
|
|
| Settlements |
(1,815) |
|
|
— |
|
|
|
| Total recognized in other comprehensive loss |
$ |
636 |
|
|
$ |
1,116 |
|
|
|
NOTES TO CONSOLIDATED FINANCIAL STATEMENTS
NACCO INDUSTRIES, INC. AND SUBSIDIARIES
(Tabular Amounts in Thousands, Except Per Share, Percentage Data and Oil and Gas Disclosures)
The following table sets forth the changes in the benefit obligation and the plan assets during the year and the funded status of the defined benefit plans at December 31:
|
|
|
|
|
|
|
|
|
|
|
|
| |
2023 |
2022 |
| Change in benefit obligation |
|
|
|
| Projected benefit obligation at beginning of year |
$ |
31,722 |
|
|
$ |
41,663 |
|
| Interest cost |
1,639 |
|
|
1,105 |
|
| Actuarial loss (gain) |
2,261 |
|
|
(8,396) |
|
| Benefits paid |
(2,614) |
|
|
(2,650) |
|
|
|
|
|
|
|
|
|
|
|
|
|
| Settlements |
(4,651) |
|
|
— |
|
| Projected benefit obligation at end of year |
$ |
28,357 |
|
|
$ |
31,722 |
|
| Accumulated benefit obligation at end of year |
$ |
28,357 |
|
|
$ |
31,722 |
|
| Change in plan assets |
|
|
|
| Fair value of plan assets at beginning of year |
$ |
34,485 |
|
|
$ |
44,009 |
|
| Actual return on plan assets |
2,452 |
|
|
(7,405) |
|
| Employer contributions |
456 |
|
|
531 |
|
| Benefits paid |
(2,614) |
|
|
(2,650) |
|
|
|
|
|
|
|
|
|
| Settlements |
(4,651) |
|
|
— |
|
| Fair value of plan assets at end of year |
$ |
30,128 |
|
|
$ |
34,485 |
|
| Funded status at end of year |
$ |
1,771 |
|
|
$ |
2,763 |
|
| Amounts recognized in the balance sheets consist of: |
|
|
|
| Non-current assets |
$ |
6,068 |
|
|
$ |
6,991 |
|
| Current liabilities |
(510) |
|
|
(491) |
|
| Non-current liabilities |
(3,787) |
|
|
(3,737) |
|
| |
$ |
1,771 |
|
|
$ |
2,763 |
|
| Components of accumulated other comprehensive loss consist of: |
|
|
|
| Actuarial loss |
$ |
11,379 |
|
|
$ |
10,682 |
|
| Prior service cost |
586 |
|
|
645 |
|
| Deferred taxes |
(2,724) |
|
|
(2,490) |
|
|
|
|
|
| |
$ |
9,241 |
|
|
$ |
8,837 |
|
The Company recognizes as a component of benefit (income) cost, as of the measurement date, any unrecognized actuarial net gains or losses that exceed 10% of the larger of the projected benefit obligations or the plan assets, defined as the "corridor." Amounts outside the corridor are amortized over the average expected remaining service of active participants expected to benefit under the retiree medical plans or over the average expected remaining lifetime of inactive participants for the pension plans. The (gain) loss amounts recognized in AOCI are not expected to be fully recognized until the plan is terminated or as settlements occur, which would trigger accelerated recognition. Prior service costs resulting from plan changes are also in AOCI.
The Company's policy is to make contributions to fund its pension plans within the range allowed by applicable regulations.
The Company maintains one supplemental defined benefit plan that pays monthly benefits to participants directly out of corporate funds. All other pension benefit payments are made from assets of the pension plans.
NOTES TO CONSOLIDATED FINANCIAL STATEMENTS
NACCO INDUSTRIES, INC. AND SUBSIDIARIES
(Tabular Amounts in Thousands, Except Per Share, Percentage Data and Oil and Gas Disclosures)
Future pension benefit payments expected to be paid from assets of the pension plans are:
|
|
|
|
|
|
| 2024 |
$ |
2,739 |
|
| 2025 |
2,636 |
|
| 2026 |
2,588 |
|
| 2027 |
2,533 |
|
| 2028 |
2,473 |
|
| 2029 - 2033 |
11,129 |
|
| |
$ |
24,098 |
|
The expected long-term rate of return on defined benefit plan assets reflects management's expectations of long-term rates of return on funds invested to provide for benefits included in the projected benefit obligations. In establishing the expected long-term rate of return assumption for plan assets, the Company considers the historical rates of return over a period of time that is consistent with the long-term nature of the underlying obligations of these plans as well as a forward-looking rate of return. The historical and forward-looking rates of return for each of the asset classes used to determine the Company's estimated rate of return assumption were based upon the rates of return earned or expected to be earned by investments in the equivalent benchmark market indices for each of the asset classes.
Expected returns for pension plans are based on a calculated market-related value for pension plan assets. Under this methodology, asset gains and losses resulting from actual returns that differ from the Company's expected returns are recognized in the market-related value of assets ratably over three years.
The pension plans maintain investment policies that, among other things, establish a portfolio asset allocation methodology with percentage allocation bands for individual asset classes. The investment policies provide that investments are reallocated between asset classes as balances exceed or fall below the appropriate allocation bands.
The following is the actual allocation percentage and target allocation percentage for the pension plan assets at December 31:
|
|
|
|
|
|
|
|
|
|
|
|
|
|
|
|
|
|
| |
2023 Actual
Allocation |
|
2022 Actual
Allocation |
|
Target Allocation
Range |
| Fixed income securities |
99.1 |
% |
|
34.1 |
% |
|
90.0% - 100.0% |
| Cash equivalents |
0.3 |
% |
|
— |
% |
|
—% - 5.0% |
| Money market funds |
0.6 |
% |
|
0.5 |
% |
|
0.0% - 10.0% |
| U.S. equity securities |
— |
% |
|
44.9 |
% |
|
0.0% - 0.0% |
| Non-U.S. equity securities |
— |
% |
|
20.5 |
% |
|
0.0% - 0.0% |
The 2023 asset allocation reflects the move into fixed income securities to mitigate volatility prior to the termination of the Combined Plan.
The defined benefit pension plans do not have any direct ownership of NACCO common stock.
The fair value of each major category of the Company's pension plan assets are valued using quoted market prices in active markets for identical assets, or Level 1 in the fair value hierarchy. Following are the values as of December 31:
|
|
|
|
|
|
|
|
|
|
|
|
|
Level 1 |
| |
2023 |
|
2022 |
| Fixed income securities |
$ |
29,866 |
|
|
$ |
11,753 |
|
| Cash equivalents |
81 |
|
|
— |
|
| Money market funds |
181 |
|
|
178 |
|
| U.S. equity securities |
— |
|
|
15,499 |
|
| Non-U.S. equity securities |
— |
|
|
7,055 |
|
| Total |
$ |
30,128 |
|
|
$ |
34,485 |
|
NOTES TO CONSOLIDATED FINANCIAL STATEMENTS
NACCO INDUSTRIES, INC. AND SUBSIDIARIES
(Tabular Amounts in Thousands, Except Per Share, Percentage Data and Oil and Gas Disclosures)
Postretirement Health Care: The Company also maintains health care plans which provide benefits to grandfathered eligible retired employees. All health care plans of the Company have a cap on the Company's share of the costs. The health care plans have network provided benefits which result in cost savings for the Company. These plans have no assets. Under the Company's current policy, plan benefits are funded at the time they are due to participants.
The assumptions used in accounting for the postretirement health care plans are set forth below for the years ended December 31:
|
|
|
|
|
|
|
|
|
|
|
|
|
|
| |
2023 |
|
2022 |
|
|
| Weighted average discount rates for benefit obligation |
4.98 |
% |
|
5.29 |
% |
|
|
| Weighted average discount rates for net periodic benefit cost |
5.29 |
% |
|
2.12 |
% |
|
|
| Health care cost trend rate assumed for next year |
6.25% - 6.50% |
|
6.25 |
% |
|
|
| Rate to which the cost trend rate is assumed to decline (ultimate trend rate) |
4.75% |
|
4.50% - 4.75% |
|
|
| Year that the rate reaches the ultimate trend rate |
2029 - 2033 |
|
2029 |
|
|
Set forth below is detail of the net periodic benefit expense for the postretirement health care plans for the years ended December 31:
|
|
|
|
|
|
|
|
|
|
|
|
|
|
| |
2023 |
|
2022 |
|
|
| Service cost |
$ |
7 |
|
|
$ |
12 |
|
|
|
| Interest cost |
77 |
|
|
38 |
|
|
|
| Amortization of actuarial loss |
44 |
|
|
64 |
|
|
|
| Amortization of prior service credit |
(50) |
|
|
(52) |
|
|
|
|
|
|
|
|
|
| Net periodic benefit expense |
$ |
78 |
|
|
$ |
62 |
|
|
|
Set forth below is detail of other changes in plan assets and benefit obligations recognized in other comprehensive loss (income) for the years ended December 31:
|
|
|
|
|
|
|
|
|
|
|
|
|
|
| |
2023 |
|
2022 |
|
|
| Current year actuarial loss (gain) |
$ |
173 |
|
|
$ |
(44) |
|
|
|
| Amortization of actuarial loss |
(44) |
|
|
(64) |
|
|
|
|
|
|
|
|
|
| Amortization of prior service credit |
50 |
|
|
52 |
|
|
|
|
|
|
|
|
|
|
|
|
|
|
|
| Total recognized in other comprehensive loss (income) |
$ |
179 |
|
|
$ |
(56) |
|
|
|
NOTES TO CONSOLIDATED FINANCIAL STATEMENTS
NACCO INDUSTRIES, INC. AND SUBSIDIARIES
(Tabular Amounts in Thousands, Except Per Share, Percentage Data and Oil and Gas Disclosures)
The following sets forth the changes in benefit obligations during the year and the funded status of the postretirement health care at December 31:
|
|
|
|
|
|
|
|
|
|
|
|
| |
2023 |
|
2022 |
| Change in benefit obligation |
|
|
|
| Benefit obligation at beginning of year |
$ |
1,551 |
|
|
$ |
1,877 |
|
| Service cost |
7 |
|
|
12 |
|
| Interest cost |
77 |
|
|
38 |
|
|
|
|
|
| Actuarial loss (gain) |
173 |
|
|
(44) |
|
| Benefits paid |
(229) |
|
|
(332) |
|
| Benefit obligation at end of year |
$ |
1,579 |
|
|
$ |
1,551 |
|
| Funded status at end of year |
$ |
(1,579) |
|
|
$ |
(1,551) |
|
| Amounts recognized in the balance sheets consist of: |
|
|
|
| Current liabilities |
$ |
(183) |
|
|
$ |
(206) |
|
| Noncurrent liabilities |
(1,396) |
|
|
(1,345) |
|
| |
$ |
(1,579) |
|
|
$ |
(1,551) |
|
| Components of accumulated other comprehensive loss consist of: |
|
|
|
| Actuarial loss |
$ |
542 |
|
|
$ |
412 |
|
| Prior service credit |
(6) |
|
|
(56) |
|
| Deferred taxes |
(123) |
|
|
(180) |
|
| |
$ |
413 |
|
|
$ |
176 |
|
Future postretirement health care benefit payments expected to be paid are:
|
|
|
|
|
|
| 2024 |
188 |
|
| 2025 |
182 |
|
| 2026 |
191 |
|
| 2027 |
194 |
|
| 2028 |
185 |
|
| 2029 - 2033 |
660 |
|
| |
$ |
1,600 |
|
Defined Contribution Plans: NACCO and its subsidiaries maintain a defined contribution (401(k)) plan for substantially all employees and provide employer matching contributions based on plan provisions. The plan also provides for a minimum employer contribution. Total costs, including Company contributions, for these plans were $3.6 million and $3.3 million in 2023 and 2022, respectively.
NOTE 15—Business Segments
The Company’s operating segments are: (i) Coal Mining, (ii) NAMining and (iii) Minerals Management. The Company determines its reportable segments by first identifying its operating segments, and then by assessing whether any components of these segments constitute a business for which discrete financial information is available and where segment management regularly reviews the operating results of that component. The Company’s Chief Operating Decision Maker utilizes operating profit to evaluate segment performance and allocate resources.
All financial statement line items below operating profit (other income including interest expense and interest income, the provision for income taxes and net income) are presented and discussed within this Form 10-K on a consolidated basis.
NOTES TO CONSOLIDATED FINANCIAL STATEMENTS
NACCO INDUSTRIES, INC. AND SUBSIDIARIES
(Tabular Amounts in Thousands, Except Per Share, Percentage Data and Oil and Gas Disclosures)
See Note 1 for additional discussion of the Company's reportable segments. All current operations reside in the U.S. The accounting policies of the reportable segments are described in Note 2 and Note 18.
In 2023 and 2022, two customers individually accounted for more than 10% of consolidated revenue. The following represents the revenue attributable to each of these entities as a percentage of consolidated revenue for those years:
|
|
|
|
|
|
|
|
|
|
|
|
|
|
|
|
|
|
|
Percentage of Consolidated Revenue |
|
Segment |
|
2023 |
|
2022 |
|
Coal Mining customer |
|
40 |
% |
|
39 |
% |
|
NAMining customer |
|
22 |
% |
|
17 |
% |
|
|
|
|
|
|
The following tables present revenue, operating profit, depreciation expense and capital expenditures for the years ended December 31:
|
|
|
|
|
|
|
|
|
|
|
|
|
|
| |
2023 |
|
2022 |
|
|
| Revenues |
|
|
|
|
|
| Coal Mining |
$ |
85,415 |
|
|
$ |
95,204 |
|
|
|
| NAMining |
90,532 |
|
|
85,664 |
|
|
|
| Minerals Management |
32,985 |
|
|
60,242 |
|
|
|
| Unallocated Items |
8,459 |
|
|
2,952 |
|
|
|
| Eliminations |
(2,597) |
|
|
(2,343) |
|
|
|
| Total |
$ |
214,794 |
|
|
$ |
241,719 |
|
|
|
|
|
|
|
|
|
| Operating (loss) profit |
|
|
|
|
|
| Coal Mining |
$ |
(71,342) |
|
|
$ |
38,309 |
|
|
|
| NAMining |
3,348 |
|
|
2,202 |
|
|
|
| Minerals Management |
19,418 |
|
|
52,214 |
|
|
|
| Unallocated Items |
(21,461) |
|
|
(23,233) |
|
|
|
| Eliminations |
(100) |
|
|
494 |
|
|
|
| Total |
$ |
(70,137) |
|
|
$ |
69,986 |
|
|
|
|
|
|
|
|
|
|
|
|
|
|
|
|
|
|
|
|
|
|
|
| Expenditures for property, plant and equipment and acquisition of mineral interests |
|
|
|
|
|
| Coal Mining |
$ |
6,609 |
|
|
$ |
14,853 |
|
|
|
| NAMining |
36,073 |
|
|
13,203 |
|
|
|
| Minerals Management |
38,881 |
|
|
13,388 |
|
|
|
| Unallocated Items |
559 |
|
|
13,003 |
|
|
|
| Total |
$ |
82,122 |
|
|
$ |
54,447 |
|
|
|
|
|
|
|
|
|
| Depreciation, depletion and amortization |
|
|
|
|
|
| Coal Mining |
$ |
17,569 |
|
|
$ |
17,074 |
|
|
|
| NAMining |
8,172 |
|
|
6,457 |
|
|
|
| Minerals Management |
3,067 |
|
|
3,026 |
|
|
|
| Unallocated Items |
579 |
|
|
259 |
|
|
|
| Total |
$ |
29,387 |
|
|
$ |
26,816 |
|
|
|
Asset information by segment is not discretely maintained for internal reporting or used in evaluating performance.
NOTES TO CONSOLIDATED FINANCIAL STATEMENTS
NACCO INDUSTRIES, INC. AND SUBSIDIARIES
(Tabular Amounts in Thousands, Except Per Share, Percentage Data and Oil and Gas Disclosures)
NOTE 16—Unconsolidated Subsidiaries
Each of the Company's wholly owned Unconsolidated Subsidiaries, within the Coal Mining and NAMining segments, meet the definition of a VIE. The Unconsolidated Subsidiaries are capitalized primarily with debt financing provided by or supported by their respective customers, and generally without recourse to NACCO and NACoal. Although NACoal owns 100% of the equity and manages the daily operations of the Unconsolidated Subsidiaries, the Company has determined that the equity capital provided by NACoal is not sufficient to adequately finance the ongoing activities or absorb any expected losses without additional support from the customers. The customers have a controlling financial interest and have the power to direct the activities that most significantly affect the economic performance of the entities. As a result, the Company is not the primary beneficiary and therefore does not consolidate these entities' financial positions or results of operations. See Note 1 for a discussion of these entities.
The Investment in the unconsolidated subsidiaries and related tax positions totaled $12.4 million and $14.9 million at December 31, 2023 and 2022, respectively. The Company's risk of loss relating to these entities is limited to its invested capital, which was $5.0 million and $7.1 million at December 31, 2023 and 2022, respectively.
NACoal is a party to certain guarantees related to Coyote Creek. Under certain circumstances of default or termination of Coyote Creek’s Lignite Sales Agreement (“LSA”), NACoal would be obligated for payment of a "make-whole" amount to Coyote Creek’s third-party lenders. The “make-whole” amount is based on the excess, if any, of the discounted value of the remaining scheduled debt payments over the principal amount. In addition, in the event Coyote Creek’s LSA is terminated on or after January 1, 2024 by Coyote Creek’s customers, NACoal is obligated to purchase Coyote Creek’s dragline and rolling stock for the then net book value of those assets. To date, no payments have been required from NACoal since the inception of these guarantees. The Company believes that the likelihood NACoal would be required to perform under the guarantees is remote, and no amounts related to these guarantees have been recorded.
Summarized financial information for the unconsolidated subsidiaries is as follows:
|
|
|
|
|
|
|
|
|
|
|
|
| |
2023 |
|
2022 |
| Statement of Operations |
|
|
|
| Revenue |
$ |
610,734 |
|
|
$ |
664,824 |
|
| Gross profit |
$ |
63,646 |
|
|
$ |
47,748 |
|
| Income before income taxes |
$ |
49,994 |
|
|
$ |
57,250 |
|
| Net income |
$ |
43,714 |
|
|
$ |
48,467 |
|
| Balance Sheet |
|
|
|
| Current assets |
$ |
124,387 |
|
|
$ |
214,098 |
|
| Non-current assets |
$ |
814,226 |
|
|
$ |
805,833 |
|
| Current liabilities |
$ |
161,606 |
|
|
$ |
116,701 |
|
| Non-current liabilities |
$ |
772,003 |
|
|
$ |
896,134 |
|
Revenue includes all mine operating costs that are reimbursed by the customers of the Unconsolidated Subsidiaries as well as the compensation per ton of coal, heating unit (MMBtu) or ton of limestone delivered. Reimbursed costs have offsetting expenses and have no impact on income before income taxes. Income before income taxes represents the Earnings of the unconsolidated operations.
The Company received dividends of $45.8 million and $49.0 million from the Unconsolidated Subsidiaries in 2023 and 2022, respectively.
NOTE 17—Related Party Transactions
One of the Company's directors is a retired Jones Day partner. Legal services rendered by Jones Day approximated $0.8 million and $1.0 million for the years ended December 31, 2023 and 2022.
NOTES TO CONSOLIDATED FINANCIAL STATEMENTS
NACCO INDUSTRIES, INC. AND SUBSIDIARIES
(Tabular Amounts in Thousands, Except Per Share, Percentage Data and Oil and Gas Disclosures)
Alfred M. Rankin, Jr. serves as the Chairman of the Board of Directors of NACCO and supports the President and Chief Executive Officer of NACCO upon request under the terms of a consulting agreement. Fees for consulting services rendered by Mr. Rankin approximated $0.3 million for both of the years ended December 31, 2023 and 2022.
Hyster-Yale Materials Handling, Inc. ("Hyster-Yale") is a former subsidiary of the Company that was spun-off to stockholders in 2012. Mr. Rankin is Executive Chairman of Hyster-Yale. In the ordinary course of business, the Company leases or buys Hyster-Yale lift trucks. The terms may not be comparable to terms that would be obtained in a transaction between unaffiliated parties.
NOTE 18—Supplemental Oil and Gas Disclosures (Unaudited)
The Minerals Management segment derives income primarily by leasing its royalty and mineral interests to third-party exploration and production companies, and, to a lesser extent, other mining companies, granting them the rights to explore, develop, mine, produce, market and sell gas, oil and coal in exchange for royalty payments based on the lessees' sales of those minerals. As an owner of royalty and mineral interests, the Company’s access to information concerning activity and operations of its royalty and mineral interests is limited. The Company does not have information that would be available to a company with working interests in oil and natural gas operations because detailed information is not generally available to owners of royalty and mineral interests. See Note 1, Note 2 and Note 15 for additional discussion of the Minerals Management segment.
Capitalized Oil and Natural Gas Costs
Aggregate capitalized costs related to oil and gas royalty and mineral interests with applicable accumulated depreciation, depletion and amortization at December 31 are as follows:
|
|
|
|
|
|
|
|
|
|
|
|
|
|
|
2023 |
|
2022 |
|
|
| Proved developed |
$ |
16,179 |
|
|
$ |
7,302 |
|
|
|
| Proved undeveloped |
51,971 |
|
|
24,134 |
|
|
|
| Proved reserves |
68,150 |
|
|
31,436 |
|
|
|
| Less: accumulated depreciation, depletion and amortization |
3,309 |
|
|
1,936 |
|
|
|
| Net royalty interests in oil and natural gas properties |
$ |
64,841 |
|
|
$ |
29,500 |
|
|
|
Oil and Natural Gas Reserves
Total net proved reserves are defined as those natural gas and hydrocarbon liquid reserves to Company interests after deducting all royalties, overriding royalties, and reversionary interests owned by outside parties that become effective upon payout of specified monetary balances. Decline curve analysis was used to estimate the remaining reserves of pressure depletion reservoirs with enough historical production data to establish decline trends. Reservoirs under non-pressure depletion drive mechanisms and non-producing reserves were estimated by volumetric analysis, research of analogous reservoirs, or a combination of both. Reserves have been estimated using deterministic and probabilistic methods. All reserves estimates have been prepared using standard engineering practices generally accepted by the petroleum industry and conform to guidelines developed and adopted by the SEC.
The following table presents the Company's estimated net proved oil and natural gas reserves as of December 31 based on the reserve report prepared by Haas Engineering, the Company’s independent petroleum engineering firm. All of the Company’s reserves are located in the United States.
|
|
|
|
|
|
|
|
|
|
|
|
|
|
|
|
|
|
|
|
|
|
|
Net reserves as of December 31, 2023 |
|
|
Oil (bbl) (1) |
|
NGL (bbl) (1) |
|
Residue gas (Mcf) (2) |
| Proved developed |
|
656,370 |
|
|
380,650 |
|
|
23,596,110 |
|
| Proved undeveloped |
|
9,020 |
|
|
3,720 |
|
|
26,420 |
|
| Total |
|
665,390 |
|
|
384,370 |
|
|
23,622,530 |
|
|
|
|
|
|
|
|
NOTES TO CONSOLIDATED FINANCIAL STATEMENTS
NACCO INDUSTRIES, INC. AND SUBSIDIARIES
(Tabular Amounts in Thousands, Except Per Share, Percentage Data and Oil and Gas Disclosures)
|
|
|
|
|
|
|
|
|
|
|
|
|
|
|
|
|
|
|
|
|
|
|
Net reserves as of December 31, 2022 |
|
|
Oil (bbl) (1) |
|
NGL (bbl) (1) |
|
Residue gas (Mcf) (2) |
| Proved developed |
|
305,710 |
|
|
408,280 |
|
|
25,907,890 |
|
| Proved undeveloped |
|
32,570 |
|
|
11,030 |
|
|
1,784,670 |
|
| Total |
|
338,280 |
|
|
419,310 |
|
|
27,692,560 |
|
|
|
|
|
|
|
|
(1) Bbl. One stock tank barrel, or 42 U.S. gallons liquid volume.
(2) Mcf. One thousand cubic feet of natural gas at the contractual pressure and temperature bases.
Estimated Proved Reserves
The following table summarizes changes in proved reserves during the year ended December 31, 2023:
|
|
|
|
|
|
|
|
|
|
|
|
|
|
|
|
|
|
|
|
|
|
|
|
Estimated Proved Reserves |
|
|
Oil (bbl) (1) |
|
NGL (bbl) (1) |
|
Residue gas (Mcf) (2) |
|
| December 31, 2022 |
|
338,280 |
|
|
419,310 |
|
|
27,692,560 |
|
|
| Purchases |
|
259,178 |
|
|
43,934 |
|
|
609,184 |
|
|
| Extensions and discoveries |
|
170,330 |
|
|
77,527 |
|
|
2,340,715 |
|
|
Revisions of previous estimates (3) |
|
37,483 |
|
|
(73,375) |
|
|
1,027,779 |
|
|
| Production |
|
(98,553) |
|
|
(56,768) |
|
|
(7,601,521) |
|
|
| Other |
|
(41,328) |
|
|
(26,258) |
|
|
(446,187) |
|
|
| December 31, 2023 |
|
665,390 |
|
|
384,370 |
|
|
23,622,530 |
|
|
Estimated Proved Undeveloped Reserves ("PUDs")
The following table summarizes changes in PUDs during the year ended December 31, 2023:
|
|
|
|
|
|
|
|
|
|
|
|
|
|
|
|
|
|
|
|
|
|
|
|
Estimated Proved Undeveloped Reserves |
|
|
Oil (bbl) (1) |
|
NGL (bbl) (1) |
|
Residue gas (Mcf) (2) |
|
| December 31, 2022 |
|
32,570 |
|
|
11,030 |
|
|
1,784,670 |
|
|
|
|
|
|
|
|
|
|
| Purchases |
|
2,300 |
|
|
950 |
|
|
8,237 |
|
|
| Extensions and discoveries |
|
5,786 |
|
|
2,021 |
|
|
14,814 |
|
|
Conversions |
|
(29,757) |
|
|
(9,172) |
|
|
(1,770,232) |
|
|
Revisions of previous estimates (3) |
|
(1,879) |
|
|
(1,109) |
|
|
(11,069) |
|
|
|
|
|
|
|
|
|
|
| December 31, 2023 |
|
9,020 |
|
|
3,720 |
|
|
26,420 |
|
|
(1) Bbl. One stock tank barrel, or 42 U.S. gallons liquid volume.
(2) Mcf. One thousand cubic feet of natural gas at the contractual pressure and temperature bases.
(3) Revisions of previous estimates include technical revisions due to changes in commodity prices, historical and projected performance and other factors.
As an owner of mineral and royalty interests, the Company generally does not have evidence of approval of operators’ development plans. As a result, proved undeveloped reserve estimates are limited to those relatively few locations for which drilling permits have been publicly filed. As of December 31, 2023, PUD reserves consists of 45 wells in various stages of drilling or completions. As of December 31, 2023, less than 1% of the Company's total proved reserves were classified as PUDs.
NOTES TO CONSOLIDATED FINANCIAL STATEMENTS
NACCO INDUSTRIES, INC. AND SUBSIDIARIES
(Tabular Amounts in Thousands, Except Per Share, Percentage Data and Oil and Gas Disclosures)
Standardized Measure of Discounted Future Net Cash Flows
Future cash inflows represent expected revenues from production of period-end quantities of proved reserves based on the 12-month unweighted average of first-day-of-the-month commodity prices for the periods presented. Future cash inflows are computed by applying applicable prices relating to proved reserves to the year-end quantities of those reserves. Future production and costs are derived based on current costs assuming continuation of existing economic conditions. Federal income tax expenses are deducted from future production revenues in the calculation of the standardized measure using the statutory tax rate. The Company is subject to certain state-based taxes; however, these amounts are not material. The projections should not be viewed as realistic estimates of future cash flows, nor should the “standardized measure” be interpreted as representing current value to the Company. Material revisions to estimates of proved reserves may occur in the future; development and production of the reserves may not occur in the periods assumed; actual prices realized are expected to vary significantly from those used; and actual costs may vary.
The following table provides the future net cash flows relating to proved oil and gas reserves based on the standardized measure of discounted cash flows as of December 31, 2023:
|
|
|
|
|
|
|
|
|
|
|
|
|
|
|
|
|
|
|
|
|
|
|
Gross Amounts |
|
Statutory tax rate |
|
Net Amounts |
Future cash inflows(3) |
|
$ |
122,286 |
|
|
|
|
|
| Future production costs |
|
27,487 |
|
|
|
|
|
| Future net cash flows before income tax expense |
|
94,799 |
|
|
21 |
% |
|
74,891 |
|
| 10% discount to reflect timing of cash flows |
|
(33,521) |
|
|
21 |
% |
|
(26,481) |
|
| Standardized measure of discounted cash flows |
|
$ |
61,278 |
|
|
21 |
% |
|
$ |
48,410 |
|
|
|
|
|
|
|
|
The following table provides the future net cash flows relating to proved oil and gas reserves based on the standardized measure of discounted cash flows as of December 31, 2022:
|
|
|
|
|
|
|
|
|
|
|
|
|
|
|
|
|
|
|
|
|
|
|
Gross Amounts |
|
Statutory tax rate |
|
Net Amounts |
Future cash inflows(3) |
|
$ |
218,982 |
|
|
|
|
|
| Future production costs |
|
39,841 |
|
|
|
|
|
| Future net cash flows before income tax expense |
|
179,141 |
|
|
21 |
% |
|
141,521 |
|
| 10% discount to reflect timing of cash flows |
|
(62,615) |
|
|
21 |
% |
|
(49,465) |
|
| Standardized measure of discounted cash flows |
|
$ |
116,526 |
|
|
21 |
% |
|
$ |
92,056 |
|
|
|
|
|
|
|
|
The following summarizes the principal sources of change in the standardized measure of discounted future net cash flows during 2023:
|
|
|
|
|
|
|
|
|
|
|
|
|
|
|
|
|
|
|
|
Gross amounts |
|
|
|
|
2023 |
|
2022 |
|
|
|
| January 1 |
|
$ |
116,526 |
|
|
$ |
36,839 |
|
|
|
|
|
|
|
|
|
|
|
|
| Purchases |
|
11,312 |
|
|
6,236 |
|
|
|
|
| Extensions and discoveries |
|
11,419 |
|
|
54,795 |
|
|
|
|
Revisions of previous estimates (3)(4) |
|
(61,206) |
|
|
18,695 |
|
|
|
|
| Conversions |
|
(16,773) |
|
|
(39) |
|
|
|
|
| December 31 |
|
$ |
61,278 |
|
|
$ |
116,526 |
|
|
|
|
(3) Requirements for oil and gas reserve estimation and disclosure require that reserve estimates and future cash flows be based on the average market prices for sales of oil and gas on the first calendar day of each month during the year. The benchmark price for WTI crude oil sold at Cushing, OK during 2023 and 2022 was $78.22 and $93.67 per bbl, respectively. The benchmark price for natural gas delivered at Henry Hub during 2023 and 2022 was $2.64 and $6.36 per MMBTU, respectively. Actual future prices and costs are likely to be substantially different from historical prices and costs utilized in the computation of reported amounts. Any analysis or evaluation of the reported amounts should give specific recognition to the computational methods utilized and the limitations inherent therein.
(4) Revisions of previous estimates include technical revisions due to changes in commodity prices, historical and projected performance and other factors.
SCHEDULE II—VALUATION AND QUALIFYING ACCOUNTS
NACCO INDUSTRIES, INC. AND SUBSIDIARIES
YEAR ENDED DECEMBER 31, 2023 AND 2022
|
|
|
|
|
|
|
|
|
|
|
|
|
|
|
|
|
|
|
|
|
|
|
|
|
|
|
|
|
|
|
|
|
|
|
|
|
|
|
| |
|
|
|
Additions |
|
|
|
|
|
|
| Description |
|
Balance at Beginning of Period |
|
Charged to
Costs and
Expenses |
|
Charged to
Other Accounts
— Describe |
|
Deductions
— Describe |
|
Balance at
End of
Period (A) |
| (In thousands) |
| 2023 |
|
|
|
|
|
|
|
|
|
|
|
|
| Reserves deducted from asset accounts: |
|
|
|
|
|
|
|
|
|
|
|
|
| Deferred tax valuation allowances |
|
$ |
11,809 |
|
|
$ |
(26) |
|
|
$ |
— |
|
|
$ |
— |
|
|
|
|
$ |
11,783 |
|
| 2022 |
|
|
|
|
|
|
|
|
|
|
|
|
| Reserves deducted from asset accounts: |
|
|
|
|
|
|
|
|
|
|
|
|
| Deferred tax valuation allowances |
|
$ |
11,695 |
|
|
$ |
114 |
|
|
$ |
— |
|
|
$ |
— |
|
|
|
|
$ |
11,809 |
|
(A)Balances which are not required to be presented and those which are immaterial have been omitted.
EX-21
2
exhibit21202310-k.htm
EX-21
Document
Exhibit 21
SUBSIDIARIES OF NACCO INDUSTRIES, INC.
The following is a list of active subsidiaries as of the date of the filing with the Securities and Exchange Commission of the Annual Report on Form 10‑K to which this is an Exhibit. Except as noted, all of these subsidiaries are wholly owned, directly or indirectly.
|
|
|
|
|
|
| Name |
Incorporation |
| Bellaire Corporation |
Ohio |
| C&H Mining Company, Inc. |
Alabama |
| Caddo Creek Redevelopment, LLC |
Delaware |
| Caddo Creek Resources Company, LLC |
Nevada |
| Catapult Mineral Partners, LLC |
Nevada |
| Centennial Natural Resources, LLC |
Nevada |
| Coyote Creek Mining Company, L.L.C. |
Nevada |
| Crossbow Energy Partners, LLC |
Nevada |
| Demery Resources Company, L.L.C. |
Nevada |
| The Coteau Properties Company |
Ohio |
| The Falkirk Mining Company |
Ohio |
| GRENAC, LLC |
Delaware (50%) |
| Liberty Fuels Company, L.L.C. |
Nevada |
| Marshall Mine LLC |
Delaware |
| Mississippi Lignite Mining Company |
Texas |
| Mitigation Resources of North America, LLC |
Nevada |
| Mitigate Alabama, LLC |
Nevada |
| Mitigate Tennessee, LLC |
Nevada |
| Mitigate Texas, LLC |
Nevada |
| MitRes Services, LLC |
Nevada |
| NACCO Energy Properties, LLC |
Nevada |
| NACCO Natural Resources Corporation |
Delaware |
| NACCO Properties, LLC |
Nevada |
| NAM - AGL, LLC |
Nevada |
| NAM - CMX, LLC |
Nevada |
| NAM - Corkscrew, LLC |
Nevada |
| NAM - CSA, LLC |
Nevada |
| NAM - IND, LLC |
Nevada |
| NAM - Little River, LLC |
Nevada |
| NAM - MCA, LLC |
Nevada |
| NAM - MDL, LLC |
Nevada |
| NAM - Newberry, LLC |
Nevada |
| NAM - PBA, LLC |
Nevada |
| NAM - Perry, LLC |
Nevada |
| NAM - QueenField, LLC |
Nevada |
| NAM - Rosser, LLC |
Nevada |
| NAM - SDI, LLC |
Nevada |
| NAM - WFA, LLC |
Nevada |
| NAM - WRQ, LLC |
Nevada |
| NAM - 7D, LLC |
Nevada |
| NoDak Energy Investments Corporation |
Nevada |
| North American Coal Corporation India Private Limited |
India |
| North American Coal, LLC |
Nevada |
| North American Mining, LLC |
Nevada |
| North American Coal Royalty Company |
Delaware |
| Otter Creek Mining Company, LLC |
Nevada |
| Powhatan Development LLC |
Delaware (50%) |
| Red Hills Property Company, L.L.C. |
Mississippi |
| ReGen Resources, LLC |
Delaware |
| RRP I, LLC |
Delaware |
| The Sabine Mining Company |
Nevada |
| Sawtooth Mining, LLC |
Nevada |
| Texas Mitigate Solutions, LLC |
Delaware (20%) |
| Trident Technology Services Group, LLC |
Nevada |
| Trifecta Red Hills I, LLC |
Delaware |
| Trifecta Renewable Solutions, LLC |
Delaware |
|
|
|
|
|
|
| Name |
Incorporation |
| TRU Global Energy Services, LLC |
Delaware |
| TRU Energy Services, LLC |
Nevada |
| Reed Minerals, Inc. |
Alabama |
| Yockanookany Mitigation Resources, LLC |
Nevada |
EX-23.1
3
exhibit231202310-k.htm
EX-23.1
Document
Exhibit 23.1
Consent of Independent Registered Public Accounting Firm
We consent to the incorporation by reference in the following Registration Statements:
(1)Registration Statement (Form S-8 No. 333-277013) pertaining to the Amended and Restated Executive Long-Term Incentive Compensation Plan,
(2)Registration Statement (Form S-8 No. 333-256443) pertaining to the Amended and Restated Executive Long-Term Incentive Compensation Plan,
(3)Registration Statement (Form S-8 No. 333-256445) pertaining to the Amended and Restated Non-Employee Directors’ Equity Compensation Plan
(4)Registration Statement (Form S-8 No. 333-231316) pertaining to the Amended and Restated Executive Long-Term Incentive Compensation Plan,
(5)Registration Statement (Form S-8 No. 333-231315) pertaining to the Amended and Restated Non-Employee Directors’ Equity Compensation Plan,
(6)Registration Statement (Form S-8 No. 333-139268) pertaining to the NACCO Industries, Inc. Executive Long-Term Incentive Compensation Plan,
(7)Registration Statement (Form S-8 No. 333-166944) pertaining to the NACCO Industries, Inc. Executive Long-Term Incentive Compensation Plan,
(8)Registration Statement (Form S-8 No. 333-183242) pertaining to the NACCO Industries, Inc. Supplemental Executive Long-Term Incentive Compensation Plan,
(9)Registration Statement (Form S-8 No. 333-217862) pertaining to the NACCO Industries, Inc. Executive Long-Term Incentive Compensation Plan (Amended and Restated Effective March 1, 2017), and
(10)Registration Statement (Form S-8 No. 333-217900) pertaining to NACCO Industries, Inc. Non-Employee Directors’ Equity Compensation Plan (Amended and Restated Effective May 9, 2017);
of our reports dated March 6, 2024, with respect to the consolidated financial statements and schedules of NACCO Industries, Inc. and Subsidiaries and the effectiveness of internal control over financial reporting of NACCO Industries, Inc. and Subsidiaries included in this Annual Report (Form 10-K) of NACCO Industries, Inc. for the year ended December 31, 2023.
|
|
|
|
|
|
|
|
|
|
|
|
|
|
|
/s/ Ernst & Young LLP |
| Cleveland, Ohio |
|
|
|
| March 6, 2024 |
|
|
|
EX-23.2
4
exhibit232202310-k.htm
EX-23.2
Document
Exhibit 23.2
Consent of Jefferson King
I consent to the incorporation by reference in the following Registration Statements:
(1)Registration Statement (Form S-8 No. 333-277013) pertaining to the Amended and Restated Executive Long-Term Incentive Compensation Plan,
(2)Registration Statement (Form S-8 No. 333-256443) pertaining to the Amended and Restated Executive Long-Term Incentive Compensation Plan,
(3)Registration Statement (Form S-8 No. 333-256445) pertaining to the Amended and Restated Non-Employee Directors’ Equity Compensation Plan
(4)Registration Statement (Form S-8 No. 333-231316) pertaining to the Amended and Restated Executive Long-Term Incentive Compensation Plan,
(5)Registration Statement (Form S-8 No. 333-231315) pertaining to the Amended and Restated Non-Employee Directors’ Equity Compensation Plan,
(6)Registration Statement (Form S-8 No. 333-139268) pertaining to the NACCO Industries, Inc. Executive Long-Term Incentive Compensation Plan,
(7)Registration Statement (Form S-8 No. 333-166944) pertaining to the NACCO Industries, Inc. Executive Long-Term Incentive Compensation Plan,
(8)Registration Statement (Form S-8 No. 333-183242) pertaining to the NACCO Industries, Inc. Supplemental Executive Long-Term Incentive Compensation Plan,
(9)Registration Statement (Form S-8 No. 333-217862) pertaining to the NACCO Industries, Inc. Executive Long-Term Incentive Compensation Plan (Amended and Restated Effective March 1, 2017), and
(10)Registration Statement (Form S-8 No. 333-217900) pertaining to NACCO Industries, Inc. Non-Employee Directors’ Equity Compensation Plan (Amended and Restated Effective May 9, 2017);
of the references to my name, the use of the SEC S-K 1300 Technical Report Summary, Mississippi Lignite Mining Company – Red Hills Mine, Ackerman, Mississippi (the “Technical Report”) and the information derived from the Technical Report, including any quotation from or summarization of the Technical Report, which are included in the Annual Report on Form 10-K.
|
|
|
|
|
|
|
|
|
|
|
|
|
|
|
/s/ Jefferson King |
| March 6, 2024 |
|
|
|
EX-23.3
5
exhibit233202310-k.htm
EX-23.3
Document
Exhibit 23.3
Consent of Benson Chow
I consent to the incorporation by reference in the following Registration Statements:
(1)Registration Statement (Form S-8 No. 333-277013) pertaining to the Amended and Restated Executive Long-Term Incentive Compensation Plan,
(2)Registration Statement (Form S-8 No. 333-256443) pertaining to the Amended and Restated Executive Long-Term Incentive Compensation Plan,
(3)Registration Statement (Form S-8 No. 333-256445) pertaining to the Amended and Restated Non-Employee Directors’ Equity Compensation Plan
(4)Registration Statement (Form S-8 No. 333-231316) pertaining to the Amended and Restated Executive Long-Term Incentive Compensation Plan,
(5)Registration Statement (Form S-8 No. 333-231315) pertaining to the Amended and Restated Non-Employee Directors’ Equity Compensation Plan,
(6)Registration Statement (Form S-8 No. 333-139268) pertaining to the NACCO Industries, Inc. Executive Long-Term Incentive Compensation Plan,
(7)Registration Statement (Form S-8 No. 333-166944) pertaining to the NACCO Industries, Inc. Executive Long-Term Incentive Compensation Plan,
(8)Registration Statement (Form S-8 No. 333-183242) pertaining to the NACCO Industries, Inc. Supplemental Executive Long-Term Incentive Compensation Plan,
(9)Registration Statement (Form S-8 No. 333-217862) pertaining to the NACCO Industries, Inc. Executive Long-Term Incentive Compensation Plan (Amended and Restated Effective March 1, 2017), and
(10)Registration Statement (Form S-8 No. 333-217900) pertaining to NACCO Industries, Inc. Non-Employee Directors’ Equity Compensation Plan (Amended and Restated Effective May 9, 2017);
of the references to my name, the use of the SEC S-K 1300 Technical Report Summary, Mississippi Lignite Mining Company – Red Hills Mine, Ackerman, Mississippi (the “Technical Report”) and the information derived from the Technical Report, including any quotation from or summarization of the Technical Report, which are included in the Annual Report on Form 10-K.
|
|
|
|
|
|
|
|
|
|
|
|
|
|
|
/s/ Benson Chow |
| March 6, 2024 |
|
|
|
EX-23.4
6
exhibit234202310-k.htm
EX-23.4
Document
Exhibit 23.4
Consent of Haas Petroleum Engineering Services, Inc
We consent to the incorporation by reference in the following Registration Statements:
(1)Registration Statement (Form S-8 No. 333-277013) pertaining to the Amended and Restated Executive Long-Term Incentive Compensation Plan,
(2)Registration Statement (Form S-8 No. 333-256443) pertaining to the Amended and Restated Executive Long-Term Incentive Compensation Plan,
(3)Registration Statement (Form S-8 No. 333-256445) pertaining to the Amended and Restated Non-Employee Directors’ Equity Compensation Plan
(4)Registration Statement (Form S-8 No. 333-231316) pertaining to the Amended and Restated Executive Long-Term Incentive Compensation Plan,
(5)Registration Statement (Form S-8 No. 333-231315) pertaining to the Amended and Restated Non-Employee Directors’ Equity Compensation Plan,
(6)Registration Statement (Form S-8 No. 333-139268) pertaining to the NACCO Industries, Inc. Executive Long-Term Incentive Compensation Plan,
(7)Registration Statement (Form S-8 No. 333-166944) pertaining to the NACCO Industries, Inc. Executive Long-Term Incentive Compensation Plan,
(8)Registration Statement (Form S-8 No. 333-183242) pertaining to the NACCO Industries, Inc. Supplemental Executive Long-Term Incentive Compensation Plan,
(9)Registration Statement (Form S-8 No. 333-217862) pertaining to the NACCO Industries, Inc. Executive Long-Term Incentive Compensation Plan (Amended and Restated Effective March 1, 2017), and
(10)Registration Statement (Form S-8 No. 333-217900) pertaining to NACCO Industries, Inc. Non-Employee Directors’ Equity Compensation Plan (Amended and Restated Effective May 9, 2017);
of the references to our name, the use of the Reserve Report of Catapult Mineral Partners (“Reserve Report”) and the information derived from the Reserve Report, including any quotation from or summarization of the Reserve Report, which are included in the Annual Report on Form 10-K.
|
|
|
|
|
|
|
|
|
|
|
|
|
|
|
/s/ Haas Petroleum Engineering Services, Inc |
| March 6, 2024 |
|
|
|
EX-24.1
7
exhibit241202310-k.htm
EX-24.1
Document
Exhibit 24.1
POWER OF ATTORNEY
KNOW ALL MEN BY THESE PRESENTS, that the undersigned director of NACCO Industries, Inc. hereby appoints Elizabeth I. Loveman as the true and lawful attorney or attorney-in-fact, with full power of substitution and revocation, for the undersigned and in the name, place and stead of the undersigned, to sign on behalf of the undersigned as director of NACCO Industries, Inc., a Delaware corporation, an Annual Report pursuant to Section 13 of the Securities Exchange Act of 1934 on Form 10-K for the fiscal year ended December 31, 2023 and to sign any and all amendments to such Annual Report, and to file the same, with all exhibits thereto, and other documents in connection therewith, with the Securities and Exchange Commission, granting to said attorney or attorney-in-fact full power and authority to do so and perform each and every act and thing requisite and necessary to be done in and about the premises, as fully to all intents and purposes as the undersigned might or could do in person, hereby ratifying and confirming all that said attorney or attorney-in-fact substitute or substitutes may lawfully do or cause to be done by virtue hereof.
|
|
|
|
|
|
|
|
|
|
|
|
| /s/ John S. Dalrymple |
|
February 21, 2024 |
|
| John S. Dalrymple |
|
Date |
|
EX-24.2
8
exhibit242202310-k.htm
EX-24.2
Document
Exhibit 24.2
POWER OF ATTORNEY
KNOW ALL MEN BY THESE PRESENTS, that the undersigned director of NACCO Industries, Inc. hereby appoints Elizabeth I. Loveman as the true and lawful attorney or attorney-in-fact, with full power of substitution and revocation, for the undersigned and in the name, place and stead of the undersigned, to sign on behalf of the undersigned as director of NACCO Industries, Inc., a Delaware corporation, an Annual Report pursuant to Section 13 of the Securities Exchange Act of 1934 on Form 10-K for the fiscal year ended December 31, 2023 and to sign any and all amendments to such Annual Report, and to file the same, with all exhibits thereto, and other documents in connection therewith, with the Securities and Exchange Commission, granting to said attorney or attorney-in-fact full power and authority to do so and perform each and every act and thing requisite and necessary to be done in and about the premises, as fully to all intents and purposes as the undersigned might or could do in person, hereby ratifying and confirming all that said attorney or attorney-in-fact substitute or substitutes may lawfully do or cause to be done by virtue hereof.
|
|
|
|
|
|
|
|
|
|
|
|
| /s/ John P. Jumper |
|
February 21, 2024 |
|
| John P. Jumper |
|
Date |
|
EX-24.3
9
exhibit243202310-k.htm
EX-24.3
Document
Exhibit 24.3
POWER OF ATTORNEY
KNOW ALL MEN BY THESE PRESENTS, that the undersigned director of NACCO Industries, Inc. hereby appoints Elizabeth I. Loveman as the true and lawful attorney or attorney-in-fact, with full power of substitution and revocation, for the undersigned and in the name, place and stead of the undersigned, to sign on behalf of the undersigned as director of NACCO Industries, Inc., a Delaware corporation, an Annual Report pursuant to Section 13 of the Securities Exchange Act of 1934 on Form 10-K for the fiscal year ended December 31, 2023 and to sign any and all amendments to such Annual Report, and to file the same, with all exhibits thereto, and other documents in connection therewith, with the Securities and Exchange Commission, granting to said attorney or attorney-in-fact full power and authority to do so and perform each and every act and thing requisite and necessary to be done in and about the premises, as fully to all intents and purposes as the undersigned might or could do in person, hereby ratifying and confirming all that said attorney or attorney-in-fact substitute or substitutes may lawfully do or cause to be done by virtue hereof.
|
|
|
|
|
|
|
|
|
|
|
|
| /s/ Dennis W. LaBarre |
|
February 21, 2024 |
|
| Dennis W. LaBarre |
|
Date |
|
EX-24.4
10
exhibit244202310-k.htm
EX-24.4
Document
Exhibit 24.4
POWER OF ATTORNEY
KNOW ALL MEN BY THESE PRESENTS, that the undersigned director of NACCO Industries, Inc. hereby appoints Elizabeth I. Loveman as the true and lawful attorney or attorney-in-fact, with full power of substitution and revocation, for the undersigned and in the name, place and stead of the undersigned, to sign on behalf of the undersigned as director of NACCO Industries, Inc., a Delaware corporation, an Annual Report pursuant to Section 13 of the Securities Exchange Act of 1934 on Form 10-K for the fiscal year ended December 31, 2023 and to sign any and all amendments to such Annual Report, and to file the same, with all exhibits thereto, and other documents in connection therewith, with the Securities and Exchange Commission, granting to said attorney or attorney-in-fact full power and authority to do so and perform each and every act and thing requisite and necessary to be done in and about the premises, as fully to all intents and purposes as the undersigned might or could do in person, hereby ratifying and confirming all that said attorney or attorney-in-fact substitute or substitutes may lawfully do or cause to be done by virtue hereof.
|
|
|
|
|
|
|
|
|
|
|
|
| /s/ W. Paul McDonald |
|
February 21, 2024 |
|
| W. Paul McDonald |
|
Date |
|
EX-24.5
11
exhibit245202310-k.htm
EX-24.5
Document
Exhibit 24.5
POWER OF ATTORNEY
KNOW ALL MEN BY THESE PRESENTS, that the undersigned director of NACCO Industries, Inc. hereby appoints Elizabeth I. Loveman as the true and lawful attorney or attorney-in-fact, with full power of substitution and revocation, for the undersigned and in the name, place and stead of the undersigned, to sign on behalf of the undersigned as director of NACCO Industries, Inc., a Delaware corporation, an Annual Report pursuant to Section 13 of the Securities Exchange Act of 1934 on Form 10-K for the fiscal year ended December 31, 2023 and to sign any and all amendments to such Annual Report, and to file the same, with all exhibits thereto, and other documents in connection therewith, with the Securities and Exchange Commission, granting to said attorney or attorney-in-fact full power and authority to do so and perform each and every act and thing requisite and necessary to be done in and about the premises, as fully to all intents and purposes as the undersigned might or could do in person, hereby ratifying and confirming all that said attorney or attorney-in-fact substitute or substitutes may lawfully do or cause to be done by virtue hereof.
|
|
|
|
|
|
|
|
|
|
|
|
| /s/ Michael S. Miller |
|
February 21, 2024 |
|
| Michael S. Miller |
|
Date |
|
EX-24.6
12
exhibit246202310-k.htm
EX-24.6
Document
Exhibit 24.6
POWER OF ATTORNEY
KNOW ALL MEN BY THESE PRESENTS, that the undersigned director of NACCO Industries, Inc. hereby appoints Elizabeth I. Loveman as the true and lawful attorney or attorney-in-fact, with full power of substitution and revocation, for the undersigned and in the name, place and stead of the undersigned, to sign on behalf of the undersigned as director of NACCO Industries, Inc., a Delaware corporation, an Annual Report pursuant to Section 13 of the Securities Exchange Act of 1934 on Form 10-K for the fiscal year ended December 31, 2023 and to sign any and all amendments to such Annual Report, and to file the same, with all exhibits thereto, and other documents in connection therewith, with the Securities and Exchange Commission, granting to said attorney or attorney-in-fact full power and authority to do so and perform each and every act and thing requisite and necessary to be done in and about the premises, as fully to all intents and purposes as the undersigned might or could do in person, hereby ratifying and confirming all that said attorney or attorney-in-fact substitute or substitutes may lawfully do or cause to be done by virtue hereof.
|
|
|
|
|
|
|
|
|
|
|
|
| /s/ Alfred M. Rankin, Jr. |
|
February 21, 2024 |
|
| Alfred M. Rankin, Jr. |
|
Date |
|
EX-24.7
13
exhibit247202310-k.htm
EX-24.7
Document
Exhibit 24.7
POWER OF ATTORNEY
KNOW ALL MEN BY THESE PRESENTS, that the undersigned director of NACCO Industries, Inc. hereby appoints Elizabeth I. Loveman as the true and lawful attorney or attorney-in-fact, with full power of substitution and revocation, for the undersigned and in the name, place and stead of the undersigned, to sign on behalf of the undersigned as director of NACCO Industries, Inc., a Delaware corporation, an Annual Report pursuant to Section 13 of the Securities Exchange Act of 1934 on Form 10-K for the fiscal year ended December 31, 2023 and to sign any and all amendments to such Annual Report, and to file the same, with all exhibits thereto, and other documents in connection therewith, with the Securities and Exchange Commission, granting to said attorney or attorney-in-fact full power and authority to do so and perform each and every act and thing requisite and necessary to be done in and about the premises, as fully to all intents and purposes as the undersigned might or could do in person, hereby ratifying and confirming all that said attorney or attorney-in-fact substitute or substitutes may lawfully do or cause to be done by virtue hereof.
|
|
|
|
|
|
|
|
|
|
|
|
| /s/ Matthew M. Rankin |
|
February 21, 2024 |
|
| Matthew M. Rankin |
|
Date |
|
EX-24.8
14
exhibit248202310-k.htm
EX-24.8
Document
Exhibit 24.8
POWER OF ATTORNEY
KNOW ALL MEN BY THESE PRESENTS, that the undersigned director of NACCO Industries, Inc. hereby appoints Elizabeth I. Loveman as the true and lawful attorney or attorney-in-fact, with full power of substitution and revocation, for the undersigned and in the name, place and stead of the undersigned, to sign on behalf of the undersigned as director of NACCO Industries, Inc., a Delaware corporation, an Annual Report pursuant to Section 13 of the Securities Exchange Act of 1934 on Form 10-K for the fiscal year ended December 31, 2023 and to sign any and all amendments to such Annual Report, and to file the same, with all exhibits thereto, and other documents in connection therewith, with the Securities and Exchange Commission, granting to said attorney or attorney-in-fact full power and authority to do so and perform each and every act and thing requisite and necessary to be done in and about the premises, as fully to all intents and purposes as the undersigned might or could do in person, hereby ratifying and confirming all that said attorney or attorney-in-fact substitute or substitutes may lawfully do or cause to be done by virtue hereof.
|
|
|
|
|
|
|
|
|
|
|
|
| /s/ Roger F. Rankin |
|
February 21, 2024 |
|
| Roger F. Rankin |
|
Date |
|
EX-24.9
15
exhibit249202310-k.htm
EX-24.9
Document
Exhibit 24.9
POWER OF ATTORNEY
KNOW ALL MEN BY THESE PRESENTS, that the undersigned director of NACCO Industries, Inc. hereby appoints Elizabeth I. Loveman as the true and lawful attorney or attorney-in-fact, with full power of substitution and revocation, for the undersigned and in the name, place and stead of the undersigned, to sign on behalf of the undersigned as director of NACCO Industries, Inc., a Delaware corporation, an Annual Report pursuant to Section 13 of the Securities Exchange Act of 1934 on Form 10-K for the fiscal year ended December 31, 2023 and to sign any and all amendments to such Annual Report, and to file the same, with all exhibits thereto, and other documents in connection therewith, with the Securities and Exchange Commission, granting to said attorney or attorney-in-fact full power and authority to do so and perform each and every act and thing requisite and necessary to be done in and about the premises, as fully to all intents and purposes as the undersigned might or could do in person, hereby ratifying and confirming all that said attorney or attorney-in-fact substitute or substitutes may lawfully do or cause to be done by virtue hereof.
|
|
|
|
|
|
|
|
|
|
|
|
| /s/ Lori J. Robinson |
|
February 21, 2024 |
|
| Lori J. Robinson |
|
Date |
|
EX-24.10
16
exhibit2410202310-k.htm
EX-24.10
Document
Exhibit 24.10
POWER OF ATTORNEY
KNOW ALL MEN BY THESE PRESENTS, that the undersigned director of NACCO Industries, Inc. hereby appoints Elizabeth I. Loveman as the true and lawful attorney or attorney-in-fact, with full power of substitution and revocation, for the undersigned and in the name, place and stead of the undersigned, to sign on behalf of the undersigned as director of NACCO Industries, Inc., a Delaware corporation, an Annual Report pursuant to Section 13 of the Securities Exchange Act of 1934 on Form 10-K for the fiscal year ended December 31, 2023 and to sign any and all amendments to such Annual Report, and to file the same, with all exhibits thereto, and other documents in connection therewith, with the Securities and Exchange Commission, granting to said attorney or attorney-in-fact full power and authority to do so and perform each and every act and thing requisite and necessary to be done in and about the premises, as fully to all intents and purposes as the undersigned might or could do in person, hereby ratifying and confirming all that said attorney or attorney-in-fact substitute or substitutes may lawfully do or cause to be done by virtue hereof.
|
|
|
|
|
|
|
|
|
|
|
|
| /s/ Valerie Gentile Sachs |
|
February 21, 2024 |
|
| Valerie Gentile Sachs |
|
Date |
|
EX-24.11
17
exhibit2411202310-k.htm
EX-24.11
Document
Exhibit 24.11
POWER OF ATTORNEY
KNOW ALL MEN BY THESE PRESENTS, that the undersigned director of NACCO Industries, Inc. hereby appoints Elizabeth I. Loveman as the true and lawful attorney or attorney-in-fact, with full power of substitution and revocation, for the undersigned and in the name, place and stead of the undersigned, to sign on behalf of the undersigned as director of NACCO Industries, Inc., a Delaware corporation, an Annual Report pursuant to Section 13 of the Securities Exchange Act of 1934 on Form 10-K for the fiscal year ended December 31, 2023 and to sign any and all amendments to such Annual Report, and to file the same, with all exhibits thereto, and other documents in connection therewith, with the Securities and Exchange Commission, granting to said attorney or attorney-in-fact full power and authority to do so and perform each and every act and thing requisite and necessary to be done in and about the premises, as fully to all intents and purposes as the undersigned might or could do in person, hereby ratifying and confirming all that said attorney or attorney-in-fact substitute or substitutes may lawfully do or cause to be done by virtue hereof.
|
|
|
|
|
|
|
|
|
|
|
|
| /s/ Robert S. Shapard |
|
February 21, 2024 |
|
| Robert S. Shapard |
|
Date |
|
EX-24.12
18
exhibit2412202310-k.htm
EX-24.12
Document
Exhibit 24.12
POWER OF ATTORNEY
KNOW ALL MEN BY THESE PRESENTS, that the undersigned director of NACCO Industries, Inc. hereby appoints Elizabeth I. Loveman as the true and lawful attorney or attorney-in-fact, with full power of substitution and revocation, for the undersigned and in the name, place and stead of the undersigned, to sign on behalf of the undersigned as director of NACCO Industries, Inc., a Delaware corporation, an Annual Report pursuant to Section 13 of the Securities Exchange Act of 1934 on Form 10-K for the fiscal year ended December 31, 2023 and to sign any and all amendments to such Annual Report, and to file the same, with all exhibits thereto, and other documents in connection therewith, with the Securities and Exchange Commission, granting to said attorney or attorney-in-fact full power and authority to do so and perform each and every act and thing requisite and necessary to be done in and about the premises, as fully to all intents and purposes as the undersigned might or could do in person, hereby ratifying and confirming all that said attorney or attorney-in-fact substitute or substitutes may lawfully do or cause to be done by virtue hereof.
|
|
|
|
|
|
|
|
|
|
|
|
| /s/ Britton T. Taplin |
|
February 21, 2024 |
|
| Britton T. Taplin |
|
Date |
|
EX-31.1
19
exhibit311202310-k.htm
EX-31.1
Document
Exhibit 31(i)(1)
Certifications
I, J.C. Butler, Jr., certify that:
1.I have reviewed this annual report on Form 10-K of NACCO Industries, Inc.;
2.Based on my knowledge, this report does not contain any untrue statement of a material fact or omit to state a material fact necessary to make the statements made, in light of the circumstances under which such statements were made, not misleading with respect to the period covered by this report;
3.Based on my knowledge, the financial statements, and other financial information included in this report, fairly present in all material respects the financial condition, results of operations and cash flows of the registrant as of, and for, the periods presented in this report;
4.The registrant’s other certifying officer(s) and I are responsible for establishing and maintaining disclosure controls and procedures (as defined in Exchange Act Rules 13a-15(e) and 15d-15(e)) and internal control over financial reporting (as defined in Exchange Act Rules 13a-15(f) and 15d-15(f)) for the registrant and have:
a)Designed such disclosure controls and procedures, or caused such disclosure controls and procedures to be designed under our supervision, to ensure that material information relating to the registrant, including its consolidated subsidiaries, is made known to us by others within those entities, particularly during the period in which this report is being prepared;
b)Designed such internal control over financial reporting, or caused such internal control over financial reporting to be designed under our supervision, to provide reasonable assurance regarding the reliability of financial reporting and the preparation of financial statements for external purposes in accordance with generally accepted accounting principles;
c)Evaluated the effectiveness of the registrant’s disclosure controls and procedures and presented in this report our conclusions about the effectiveness of the disclosure controls and procedures, as of the end of the period covered by this report based on such evaluation; and
d)Disclosed in this report any change in the registrant’s internal control over financial reporting that occurred during the registrant’s most recent fiscal quarter (the registrant’s fourth fiscal quarter in the case of an annual report) that has materially affected, or is reasonably likely to materially affect, the registrant’s internal control over financial reporting; and
5.The registrant’s other certifying officer(s) and I have disclosed, based on our most recent evaluation of internal control over financial reporting, to the registrant’s auditors and the audit committee of the registrant’s board of directors (or persons performing the equivalent functions):
a)All significant deficiencies and material weaknesses in the design or operation of internal control over financial reporting which are reasonably likely to adversely affect the registrant’s ability to record, process, summarize and report financial information; and
b)Any fraud, whether or not material, that involves management or other employees who have a significant role in the registrant’s internal control over financial reporting.
|
|
|
|
|
|
|
|
|
|
|
|
|
|
|
| Date: |
March 6, 2024 |
|
/s/ J.C. Butler, Jr. |
|
|
|
|
J.C. Butler, Jr. |
|
|
|
|
President and Chief Executive Officer
(principal executive officer) |
|
EX-31.2
20
exhibit312202310-k.htm
EX-31.2
Document
Exhibit 31(i)(2)
Certifications
I, Elizabeth I. Loveman, certify that:
1.I have reviewed this annual report on Form 10-K of NACCO Industries, Inc.;
2.Based on my knowledge, this report does not contain any untrue statement of a material fact or omit to state a material fact necessary to make the statements made, in light of the circumstances under which such statements were made, not misleading with respect to the period covered by this report;
3.Based on my knowledge, the financial statements, and other financial information included in this report, fairly present in all material respects the financial condition, results of operations and cash flows of the registrant as of, and for, the periods presented in this report;
4.The registrant’s other certifying officer(s) and I are responsible for establishing and maintaining disclosure controls and procedures (as defined in Exchange Act Rules 13a-15(e) and 15d-15(e)) and internal control over financial reporting (as defined in Exchange Act Rules 13a-15(f) and 15d-15(f)) for the registrant and have:
a)Designed such disclosure controls and procedures, or caused such disclosure controls and procedures to be designed under our supervision, to ensure that material information relating to the registrant, including its consolidated subsidiaries, is made known to us by others within those entities, particularly during the period in which this report is being prepared;
b)Designed such internal control over financial reporting, or caused such internal control over financial reporting to be designed under our supervision, to provide reasonable assurance regarding the reliability of financial reporting and the preparation of financial statements for external purposes in accordance with generally accepted accounting principles;
c)Evaluated the effectiveness of the registrant’s disclosure controls and procedures and presented in this report our conclusions about the effectiveness of the disclosure controls and procedures, as of the end of the period covered by this report based on such evaluation; and
d)Disclosed in this report any change in the registrant’s internal control over financial reporting that occurred during the registrant’s most recent fiscal quarter (the registrant’s fourth fiscal quarter in the case of an annual report) that has materially affected, or is reasonably likely to materially affect, the registrant’s internal control over financial reporting; and
5.The registrant’s other certifying officer(s) and I have disclosed, based on our most recent evaluation of internal control over financial reporting, to the registrant’s auditors and the audit committee of the registrant’s board of directors (or persons performing the equivalent functions):
a)All significant deficiencies and material weaknesses in the design or operation of internal control over financial reporting which are reasonably likely to adversely affect the registrant’s ability to record, process, summarize and report financial information; and
b)Any fraud, whether or not material, that involves management or other employees who have a significant role in the registrant’s internal control over financial reporting.
|
|
|
|
|
|
|
|
|
|
|
|
|
|
|
| Date: |
March 6, 2024 |
|
/s/ Elizabeth I. Loveman |
|
|
|
|
Elizabeth I. Loveman |
|
|
|
|
Vice President and Controller
(principal financial officer) |
|
EX-32
21
exhibit32202310-k.htm
EX-32
Document
Exhibit 32
CERTIFICATION PURSUANT TO 18 U.S.C. SECTION 1350, AS ADOPTED PURSUANT TO SECTION 906 OF THE SARBANES-OXLEY ACT OF 2002
In connection with the Annual Report of NACCO Industries, Inc. (the “Company”) on Form 10-K for the year ended December 31, 2023, as filed with the Securities and Exchange Commission on the date hereof (the “Report”), each of the undersigned officers of the Company certifies, pursuant to 18 U.S.C. § 1350, as adopted pursuant to § 906 of the Sarbanes-Oxley Act of 2002, that, to such officer's knowledge:
(1)The Report fully complies with the requirements of Section 13(a) or 15(d) of the Securities Exchange Act of 1934; and
(2)The information contained in the Report fairly presents, in all material respects, the financial condition and results of operations of the Company as of the dates and for the periods expressed in the Report.
|
|
|
|
|
|
|
|
|
|
|
|
|
|
|
| Date: |
March 6, 2024 |
|
/s/ J.C. Butler, Jr. |
|
|
|
|
J.C. Butler, Jr. |
|
|
|
|
President and Chief Executive Officer
(principal executive officer) |
|
|
|
|
|
|
|
|
|
|
|
|
|
|
|
|
| Date: |
March 6, 2024 |
|
/s/ Elizabeth I. Loveman |
|
|
|
|
Elizabeth I. Loveman |
|
|
|
|
Vice President and Controller
(principal financial officer) |
|
EX-95
22
exhibit95202310-k.htm
EX-95
Document
Exhibit 95
MINE SAFETY DISCLOSURES
NACCO Industries, Inc. (the “Company”) believes that The North American Coal Corporation and its affiliated mining companies (collectively, “NACoal”) is an industry leader in safety. NACoal has health and safety programs in place that include extensive employee training, accident prevention, workplace inspection, emergency response, accident investigation, regulatory compliance and program auditing. The objectives for NACoal's programs are to eliminate workplace incidents, comply with all mining-related regulations and provide support for both regulators and the industry to improve mine safety.
Under the Dodd-Frank Wall Street Reform and Consumer Protection Act, each operator of a coal or other mine is required to include certain mine safety results in its periodic reports filed with the Securities and Exchange Commission. The operation of NACoal's mines is subject to regulation by the Federal Mine Safety and Health Administration ("MSHA") under the Federal Mine Safety and Health Act of 1977 (the "Mine Act"). MSHA inspects NACoal's mines on a regular basis and issues various citations and orders when it believes a violation has occurred under the Mine Act. The Company has presented information below regarding certain mining safety and health matters for NACoal's mining operations for the year ended December 31, 2023. In evaluating this information, consideration should be given to factors such as: (i) the number of citations and orders will vary depending on the size of the mine, (ii) the number of citations issued will vary from inspector to inspector and from mine to mine, and (iii) citations and orders can be contested and appealed, and in that process, are often reduced in severity and amount, and are sometimes vacated.
During the year ended December 31, 2023, neither the Company's current mining operations nor it's closed mines: (i) were assessed any Mine Act section 104(b) orders for alleged failure to totally abate the subject matter of a Mine Act section 104(a) citation within the period specified in the citation; (ii) were assessed any Mine Act section 110(b)(2) penalties for failure to correct the subject matter of a Mine Act section 104(a) citation within the specified time period, which failure was deemed flagrant (i.e., reckless or repeated failure to make reasonable efforts to eliminate a known violation that substantially and proximately caused, or reasonably could have been expected to cause, death or serious bodily injury); (iii) received any Mine Act section 107(a) imminent danger orders to immediately remove miners; or (iv) received any MSHA written notices under Mine Act section 104(e) of a pattern of violation of mandatory health or safety standards or of the potential to have such a pattern. In addition, there were no mining-related fatalities at the Company's operations or it's closed mines during the year ended December 31, 2023.
The following table sets forth the total number of specific citations and orders, the total dollar value of the proposed civil penalty assessments that were issued by MSHA, the total number of legal actions initiated and resolved before the Federal Mine Safety and Health Review Commission ("FMSHRC") during the year ended December 31, 2023, and the total number of legal actions pending before the FMSHRC at December 31, 2023, pursuant to the Mine Act, by individual mine at NACoal:
|
|
|
|
|
|
|
|
|
|
|
|
|
|
|
|
|
|
|
|
|
|
|
|
|
|
|
|
|
|
|
|
|
|
|
|
|
|
|
Name of Mine or Quarry (1) |
|
Mine Act Section 104 Significant & Substantial Citations (2)(3) |
|
Mine Act Section 104(d) Citations |
|
Total Dollar Value of Proposed MSHA Assessment |
|
Number of Legal Actions Initiated before the FMSHRC for the year ended at December 31, 2023 |
|
Number of Legal Actions Resolved before the FMSHRC for the year ended at December 31, 2023 |
|
Number of Legal Actions Pending before the FMSHRC at December 31, 2023 (4) |
| Coteau (Freedom Mine) |
|
1 |
|
|
— |
|
|
$ |
1,769 |
|
|
— |
|
|
— |
|
|
— |
|
| Falkirk (Falkirk Mine) |
|
— |
|
|
— |
|
|
143 |
|
|
— |
|
|
— |
|
|
— |
|
| Sabine (South Hallsville No. 1 Mine) |
|
— |
|
|
— |
|
|
453 |
|
|
— |
|
|
— |
|
|
— |
|
| Demery (Five Forks Mine) |
|
— |
|
|
— |
|
|
572 |
|
|
— |
|
|
— |
|
|
— |
|
| Caddo Creek (Marshall Mine) |
|
— |
|
|
— |
|
|
— |
|
|
— |
|
|
— |
|
|
— |
|
| Coyote Creek (Coyote Creek Mine) |
|
1 |
|
|
— |
|
|
2,099 |
|
|
— |
|
|
— |
|
|
1 |
|
| MLMC (Red Hills Mine) |
|
— |
|
|
— |
|
|
— |
|
|
— |
|
|
— |
|
|
— |
|
| North American Mining Operations: |
|
— |
|
|
— |
|
|
— |
|
|
— |
|
|
— |
|
|
— |
|
| Alico Quarry |
|
— |
|
|
— |
|
|
— |
|
|
— |
|
|
— |
|
|
— |
|
| Center Hill Quarry |
|
— |
|
|
— |
|
|
— |
|
|
— |
|
|
— |
|
|
— |
|
| FEC Quarry |
|
1 |
|
|
— |
|
|
2,682 |
|
|
— |
|
|
— |
|
|
— |
|
| Inglis Quarry |
|
— |
|
|
— |
|
|
— |
|
|
— |
|
|
— |
|
|
— |
|
| Krome Quarry |
|
— |
|
|
— |
|
|
— |
|
|
— |
|
|
— |
|
|
— |
|
| SCL Quarry |
|
— |
|
|
— |
|
|
— |
|
|
— |
|
|
— |
|
|
— |
|
| St. Catherine Quarry |
|
— |
|
|
— |
|
|
— |
|
|
— |
|
|
— |
|
|
— |
|
| Seven Diamonds Quarry |
|
— |
|
|
— |
|
|
— |
|
|
— |
|
|
— |
|
|
— |
|
| Central State Aggregates Quarry |
|
— |
|
|
— |
|
|
— |
|
|
— |
|
|
— |
|
|
— |
|
| Johnson County Quarry |
|
— |
|
|
— |
|
|
428 |
|
|
— |
|
|
— |
|
|
— |
|
| Little River Quarry |
|
1 |
|
|
— |
|
|
428 |
|
|
— |
|
|
— |
|
|
— |
|
| Mid Coast Aggregates Quarry |
|
— |
|
|
— |
|
|
— |
|
|
— |
|
|
— |
|
|
— |
|
| Newberry Quarry |
|
— |
|
|
— |
|
|
— |
|
|
— |
|
|
— |
|
|
— |
|
| County Line Quarry |
|
— |
|
|
— |
|
|
— |
|
|
— |
|
|
— |
|
|
— |
|
| Palm Beach Aggregates Quarry |
|
1 |
|
|
— |
|
|
2,440 |
|
|
— |
|
|
— |
|
|
— |
|
| Perry Quarry |
|
— |
|
|
— |
|
|
— |
|
|
— |
|
|
— |
|
|
— |
|
| Queenfield Mine |
|
— |
|
|
— |
|
|
|
|
— |
|
|
— |
|
|
— |
|
| Rosser Quarry |
|
— |
|
|
— |
|
|
1,152 |
|
|
— |
|
|
— |
|
|
— |
|
| SDI Aggregates Quarry |
|
— |
|
|
— |
|
|
— |
|
|
— |
|
|
— |
|
|
— |
|
| West Florida Aggregates Quarry |
|
1 |
|
|
— |
|
|
1,063 |
|
|
1 |
|
|
— |
|
|
1 |
|
| Titan Corkscrew Quarry |
|
— |
|
|
— |
|
|
232 |
|
|
— |
|
|
— |
|
|
— |
|
| White Rock Quarry - North |
|
— |
|
|
— |
|
|
642 |
|
|
1 |
|
|
— |
|
|
1 |
|
| Ash Grove |
|
— |
|
|
— |
|
|
— |
|
|
— |
|
|
— |
|
|
— |
|
| Total |
|
6 |
|
|
— |
|
|
$ |
14,103 |
|
|
2 |
|
|
— |
|
|
3 |
|
(1) Bellaire's, Centennial's, Liberty's and Camino Real's closed mines are not included in the table above and did not receive any of the indicated citations.
(2) Mine Act section 104(a) significant and substantial citations are for alleged violations of a mining safety standard or regulation where there exists a reasonable likelihood that the hazard contributed to or will result in an injury or illness of a reasonably serious nature.
(3) The citation at Coteau was originally classified by MSHA as significant and substantial but has been reduced to non-significant and substantial during 2023.
(4) The pending legal actions are contests of citations received and contests of proposed penalties.
EX-97.1
23
exhibit971202310-k.htm
EX-97.1
Document
POLICY ON RECOUPMENT OF INCENTIVE COMPENSATION
Introduction
The Board of Directors (the “Board”) of NACCO Industries, Inc. (the “Company”) has adopted this Policy on Recoupment of Incentive Compensation (this “Policy”), which shall apply in certain circumstances in the event of a restatement of financial results by the Company. This Policy shall be interpreted to comply with the requirements of U.S. Securities and Exchange Commission rules and New York Stock Exchange (“NYSE”) listing standards implementing Section 954 of the Dodd-Frank Wall Street Reform and Consumer Protection Act of 2010 (the “Dodd-Frank Act”) and, to the extent this Policy is in any manner deemed inconsistent with such rules, this Policy shall be treated as retroactively amended to be compliant with such rules.
Definitions
17 C.F.R. §240.10D-1(d) defines the terms “Executive Officer,” “Financial Reporting Measure,” “Incentive-Based Compensation,” and “Received.” As used herein, these terms shall have the same meaning as in that regulation.
Administration
This Policy shall be administered by the Compensation and Human Capital Committee of the Board (the “Committee”). Any determinations made by the Committee shall be final and binding on all affected individuals. The Committee is authorized to interpret and construe this Policy and to make all determinations necessary, appropriate or advisable for the administration of this Policy, in all cases consistent with the Dodd-Frank Act. The Board may amend this Policy from time to time in its discretion.
Covered Executive Officers
This Policy applies to any current or former Executive Officer of the Company or a subsidiary of the Company who is a current or former Section 16 officer of the Company within the meaning of Rule 16a-1(f) under the Exchange Act. This Policy shall be binding and enforceable against all Executive Officers and their beneficiaries, executors, administrators, and other legal representatives.
Recoupment Upon Financial Restatement
If the Company is required to prepare an accounting restatement due to the material noncompliance of the Company with any financial reporting requirement under the securities laws, including any required accounting restatement to correct an error in previously issued financial statements that is material to the previously issued financial statements, or that would result in a material misstatement if corrected in the current period or if left uncorrected in the current period (a “Financial Restatement”), the Committee shall cause the Company to recoup from each Executive Officer, as promptly as reasonably possible, any erroneously awarded Incentive-Based Compensation.
No-Fault Recovery
Recoupment under this Policy shall be required regardless of whether the Executive Officer or any other person was at fault or responsible for accounting errors that contributed to the need for the Financial Restatement.
Compensation Subject to Recovery; Enforcement
This Policy applies to all compensation granted, earned or vested based wholly or in part upon the attainment of any Financial Reporting Measure, including but not limited to performance-based cash, stock, options or other equity-based awards paid or granted to the Executive Officer. Compensation that is granted, vests or is earned based solely upon the occurrence of non-financial events, such as base salary or a bonus awarded solely at the discretion of the Board or Committee and not based on the attainment of any financial measure, is not subject to this Policy.
In the event of a Financial Restatement, the amount to be recovered will be the excess of (i) the Incentive-Based Compensation Received by the Executive Officer during the Recovery Period (as defined below) based on the erroneous data and calculated without regard to any taxes paid or withheld, over (ii) the Incentive-Based Compensation that would have been Received by the Executive Officer had it been calculated based on the restated financial information, as determined by the Committee. For purposes of this Policy, “Recovery Period” means the three completed fiscal years immediately preceding the date on which the Company is required to prepare the Financial Restatement, as determined in accordance with 17 C.F.R.
§240.10D-1(b)(1)(ii), or any transition period that results from a change in the Company’s fiscal year (as set forth in Section 303A.14(c)(1)(i)(D) of the NYSE Listed Company Manual).
For Incentive-Based Compensation based on stock price or total shareholder return, where the amount of erroneously awarded compensation is not subject to mathematical recalculation directly from the information in the Financial Restatement, the Committee shall determine the amount to be recovered, document such determination and provide such documentation to the NYSE in accordance with 17 C.F.R. §240.10D-1(b)(1)(iii).
The Company may use any legal or equitable remedies that are available to the Company to recoup any erroneously awarded Incentive-Based Compensation, including but not limited to by collecting from the Executive Officer cash payments or shares of Company common stock or by forfeiting any amounts that the Company owes to the Executive Officer. Executive Officers shall be solely responsible for any tax consequences to them that result from the recoupment or recovery of any amount pursuant to this Policy, and the Company shall have no obligation to administer the Policy in a manner that avoids or minimizes any such tax consequences.
No Indemnification
The Company shall not indemnify any Executive Officer or pay or reimburse the premium for any insurance policy to cover any losses incurred by such Executive Officer under this Policy or any claims relating to the Company’s enforcement of rights under this Policy.
Exceptions
The compensation recouped under this Policy shall not include Incentive-Based Compensation Received by an Executive Officer (i) prior to beginning service as an Executive Officer or (ii) if he or she did not serve as an Executive Officer at any time during the performance period for that Incentive-Based Compensation. The Committee may determine not to seek recovery from an Executive Officer in whole or part to the extent it determines in its sole discretion that such recovery would be impracticable because (A) the direct expense paid to a third party to assist in enforcing recovery would exceed the recoverable amount (after making a reasonable attempt to recover the erroneously awarded Incentive-Based Compensation and providing corresponding documentation of such attempt to the NYSE), (B) recovery would violate the home country law that was adopted prior to November 28, 2022, as determined by an opinion of home country counsel that is acceptable to the NYSE, or (C) recovery would likely cause the failure of certain tax-qualified retirement plans to meet certain tax-qualification requirements, as described in 17 C.F.R. §240.10D-1(b)(1)(iv).
Other Remedies Not Precluded
The exercise by the Committee of any rights pursuant to this Policy shall be without prejudice to any other rights or remedies that the Company, the Board or the Committee may have with respect to any Executive Officer subject to this Policy, whether arising under applicable law (including pursuant to Section 304 of the Sarbanes-Oxley Act of 2002), regulation or pursuant to the terms of any other policy of the Company, employment agreement, equity award, cash incentive award or other agreement applicable to an Executive Officer. Notwithstanding the foregoing, there shall be no duplication of recovery of the same Incentive-Based Compensation under this Policy and any other such rights or remedies.
Acknowledgment
To the extent required by the Committee, each Executive Officer shall be required to sign and return to the Company the acknowledgement form attached hereto as Exhibit A pursuant to which such Executive Officer will agree to be bound by the terms of, and comply with, this Policy. For the avoidance of doubt, each Executive Officer shall be fully bound by, and must comply with, the Policy, whether or not such Executive Officer has executed and returned such acknowledgment form to the Company.
Effective Date and Applicability
This Policy has been adopted by the Board on November 7, 2023, and shall apply to any Incentive-Based Compensation that is Received by an Executive Officer on or after October 2, 2023.
EXHIBIT A
NACCO INDUSTRIES, INC.
POLICY ON RECOUPMENT OF INCENTIVE COMPENSATION
ACKNOWLEDGEMENT FORM
Capitalized terms used but not otherwise defined in this Acknowledgement Form (this “Acknowledgement Form”) shall have the meanings ascribed to such terms in the Policy.
By signing this Acknowledgement Form, the undersigned acknowledges, confirms and agrees that the undersigned: (i) has received and reviewed a copy of the Policy; (ii) is and will continue to be subject to the Policy and that the Policy will apply both during and after the undersigned’s employment with the Company; and (iii) will abide by the terms of the Policy, including, without limitation, by reasonably promptly returning any recoverable compensation to the Company as required by the Policy, as determined by the Committee in its sole discretion.
Sign: _____________________________
Name: [Employee]
Date: _____________________________
EX-99.1
24
exhibit991-202310xk.htm
EX-99.1
Document
Exhibit 99.1
APPRAISAL OF CERTAIN
OIL AND NATURAL GAS INTERESTS
OWNED BY
CATAPULT MINERAL PARTNERS, LLC
A NACCO INDUSTRIES, INC. COMPANY
LOCATED IN
VARIOUS COUNTIES IN ALABAMA, LOUISIANA, NEW MEXICO,
OHIO, PENNSYLVANIA, TEXAS, AND WYOMING
AS OF
JANUARY 1, 2024
PREPARED FOR
CATAPULT MINERAL PARTNERS
Haas Petroleum Engineering Services, Inc.
F-0002950
/s/ Fraklin W. Stagg, P.E.
Franklin W. Stagg, P.E.
February 20, 2024
750 N. St. Paul Street
Suite 1750
Dallas, Texas 75201
Phone (214) 754-7090
February 20, 2024
Mr. Brian Larson
Catapult Mineral Partners, LLC
A NACCO Company
5340 Legacy Drive, Suite 300
Plano, TX 75024
Mr. Larson:
As requested, Haas Petroleum Engineering Services, Inc. (hereinafter referred to as “Haas Engineering”) has prepared an estimate of certain hydrocarbon Proved Reserves owned by Catapult Mineral Partners, LLC. (hereinafter referred to as “Catapult”), a wholly owned subsidiary of NACCO Industries, Inc. (“NACCO”). The properties evaluated in this report are primarily located in Alabama, Louisiana, New Mexico, Ohio, Pennsylvania, Texas, and Wyoming.
Haas Engineering has completed this report in accordance with the definitions of set forth in Rule 4-10(a) of Regulation S-X of the U.S. Securities and Exchange Commission (“SEC”). With the exception of the exclusion of future income taxes, this evaluation conforms to the FASB Accounting Standards Codification Topic 932, Extractive Industries - Oil and Gas. This report was prepared for Catapult’s inclusion as an exhibit in their filing with the SEC, and it is our understanding that it contains 100 percent of their Proved Reserves. It is Haas Engineering’s opinion that the assumptions, data, methods, and procedures used in the preparation of this report are suitable for use in SEC filings.
Production data was generally available through September 30, 2023. As of January 1, 2024, Catapult’s net Reserves, future net income (“FNI”), and net present worth discounted at 10 percent per annum (“NPV”) have been estimated to be as follows:
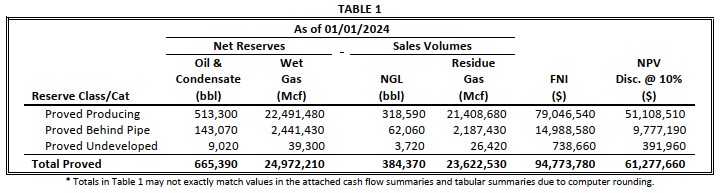
FNI is after deducting estimated operating and future development costs, severance, and ad valorem taxes, but before Federal income taxes. Total net Proved Reserves are defined as those natural gas and hydrocarbon liquid Reserves to Catapult interests after deducting all royalties, overriding royalties, and reversionary interests owned by outside parties that become effective upon payout of specified monetary balances. All Reserves estimates have been prepared using standard engineering practices generally accepted by the petroleum industry and conform to guidelines developed and adopted by the SEC. All hydrocarbon liquid Reserves are expressed in United States barrels (“bbl”) of 42 gallons. Natural gas Reserves are expressed in thousand standard cubic feet (“Mcf”) at the contractual pressure and temperature bases and include shrinkage adjustment related to field and plant losses.
RESERVES ESTIMATE CLASSIFICATION
The estimates contained in this report have been prepared using standard engineering methods and practices generally accepted by the petroleum industry. The appropriate depth and thoroughness were used to estimate Reserves in conformance with SEC regulations. For more information regarding Reserves classification definitions see Appendix A. A complete discussion of the Reserves classification definitions can be found on the United States Securities and Exchange Commission website (www.sec.gov).
The maximum remaining Reserves life assigned to wells included in this report is 50 years. This report does not include any gas sales imbalances. All volumes are related to commercial production.
The SEC requires a development plan be in place for these assets. As Catapult is a mineral and royalty company, there is some uncertainty in the timing of future completions and development. Haas Engineering has used professional judgment in forecasting such timing. For the purposes of this report, completed, non-producing and drilled, and uncompleted wells have been classified as Proved Behind Pipe, and locations with an active permit have been classified as Proved Undeveloped. All Proved Undeveloped locations are developed within 5 years.
METHODOLOGY AND DISCUSSION
The Reserves estimates contained in this report have been prepared using standard engineering practices generally accepted by the petroleum industry. Decline curve analysis was used to estimate the remaining Reserves of pressure depletion reservoirs with enough historical production data to establish decline trends. Reservoirs under non-pressure depletion drive mechanisms and non-producing Reserves were estimated by volumetric analysis, research of analogous reservoirs, or a combination of both. Reserves in this report have been estimated using deterministic and probabilistic methods. The appropriate methodology was used, as deemed necessary, to estimate Reserves in conformance with SEC regulations.
COMMODITY PRICES
Pursuant to SEC guidelines, the cash flow projections in this report utilize the unweighted 12-month arithmetic average of the first-day-of month benchmark prices for January 2023 through December 2023. The benchmark price for natural gas is the NYMEX Natural Gas Henry Hub settlement price for each respective month and the benchmark price for hydrocarbon liquids is the price received for West Texas Intermediate (“WTI”) crude oil at the Cushing, OK sales point.
The benchmark price for WTI crude oil sold at Cushing, OK during this time period is $78.22 per bbl. For crude oil, the benchmark price is held constant throughout the life of the wells and is adjusted for crude quality, marketing fees, BS&W, purchaser bonuses, and basis differentials, resulting in a weighted average received price of $77.73 per bbl. For natural gas liquids (“NGL”), the WTI crude oil price was held constant throughout the life of the wells and is adjusted for BTU content and basis differentials, resulting in a weighted average net price of $23.56 per bbl.
The benchmark price for natural gas delivered at Henry Hub during this time period is $2.64 per MMBTU. The Henry Hub price was held constant throughout the life of the wells and is adjusted for BTU content and basis differentials, resulting in a weighted average received price of $2.60 per Mcf.
Fees associated with gathering, marketing, processing, and transportation were applied as expenses in this report.
Catapult Mineral Partners, LLC | February 20, 2024| Page 2 of 5
Summary level revenue accounting data for the period of October 1, 2022 through September 30, 2023 was generally used in this evaluation.
OPERATING EXPENSES & CAPITAL COSTS
As Catapult is a mineral and royalty company, it is not burdened by operating expenses and capital costs. Therefore, Asset Retirement Obligations (“ARO”) have not been included in this evaluation. The lease operating costs used in this evaluation have been included to truncate the commercial life of the property and were estimated based on knowledge of analogous wells producing under similar conditions. The lease operating expenses in this report represent field level operating costs.
Operating expenses and capital costs were not escalated in this evaluation.
DISCLAIMERS
The Proved Reserves presented in this report are estimates only and should not be construed as being exact quantities. They may or may not be actually recovered; and, if recovered, the revenues therefrom and the actual costs related thereto could be more or less than the estimated amounts. Because of governmental policies and uncertainties of supply and demand, the product prices and the costs incurred in recovering these Reserves may vary from the price and cost assumptions in this report. Because these estimates are based on existing governmental regulations, changes could affect the ability to recover these Reserves. In any case, quantities of Reserves may increase or decrease as a result of future operations.
It should be understood that the financial information supplied by Catapult for 2023 has not yet been audited and has been accepted as represented.
Reserves estimates for individual properties included in this report are only valid when considered within the context of the overall report and should not be considered independently. The future net income and net present value estimates contained in this report do not represent an estimate of fair market value.
All information pertaining to the operating expenses, prices, and the interests of Catapult in the properties appraised has been accepted as represented. It was not considered necessary to make a field examination of the appraised properties. Data used in performing this appraisal were obtained from Catapult, public sources, and our own files. Supporting work papers pertinent to the appraisal are retained in our files and are available to you or designated parties at your convenience.
It was beyond the scope of this Haas Engineering report to evaluate the potential environmental liability costs from the operation and abandonment of these properties. In addition, no evaluation was made to determine the degree of operator compliance with current environmental rules, regulations, and reporting requirements. Therefore, no estimate of the potential economic liability, if any, from environmental concerns is included in the forecasts presented herein.
Nothing contained in this report is intended to create or confer, or shall be construed as having created or conferred, any rights in any third party, and all claims, rights, remedies, and obligations of Haas Engineering or Catapult, as the case may be, in connection with this report shall accrue or apply solely to Haas Engineering or Catapult. For all purposes of this paragraph, the term “third party” means any party other than Catapult or Haas Engineering, including without limitation Catapult’s owners, prospective investors, lenders or prospective lenders, partners or prospective partners, and vendors or other service providers. Without the express written consent of Haas Engineering, only Catapult is entitled to rely on this report and any information, conclusions, and/or opinions contained herein.
Catapult Mineral Partners, LLC | February 20, 2024| Page 3 of 5
Haas Engineering is independent with respect to Catapult as provided in the Standards Pertaining to the
Estimating and Auditing of Oil and Gas Reserves Information promulgated by the SPE.
The technical persons primarily responsible for conducting this Report meets the requirements regarding qualifications, independence, objectivity, and confidentiality, as defined by the SPE Standards.
Franklin Stagg, a Licensed Professional Engineer in the State of Texas, has been practicing consulting petroleum engineering at Haas Engineering since 2016 and has over 8 years of industry experience.
GENERAL INFORMATION
Attached are summary tables of economic analysis of predicted future performance. Other tables identify the properties appraised with summary Reserves and the economic factors applicable to each. A list of tables is included.
We appreciate this opportunity to have been of service and hope that this report will fulfill your requirements.
[Remainder of page intentionally left blank. Signature page follows.]
Catapult Mineral Partners, LLC | February 20, 2024| Page 4 of 5
Respectfully submitted,
Haas Petroleum Engineering Services, Inc. F-0002950
/s/ Franklin W. Stagg, P.E.
Franklin W. Stagg, P.E.
February 20, 2024
Catapult Mineral Partners, LLC | February 20, 2024| Page 5 of 5
Appendix
Appendix A
Definitions of Oil and Gas Reserves ‐ Securities and Exchange Commission
The list of definitions below were compiled by HPESI. They represent selected definitions from the Securities and Exchange Commission’s Rule 4‐10 document. This document was amended on January 14, 2009, and the definitions below reflect the changes resulting from the amendment. Comprehensive versions of Rule 4‐10 and the amendments to Rule 4‐10 can be obtained online at
http://www.gpoaccess.gov/ .
(a) Definitions. The following definitions apply to the terms listed below as they are used in this section:
(1) Developed oil and gas reserves. Developed oil and gas reserves are reserves of any category that can
be expected to be recovered:
(i) Through existing wells with existing equipment and operating methods or in which the cost
of the required equipment is relatively minor compared to the cost of a new well; and
(ii) Through installed extraction equipment and infrastructure operational at the time of the
reserves estimate if the extraction is by means not involving a well.
(2) Possible reserves. Possible reserves are those additional reserves that are less certain to be
recovered than probable reserves.
(i) When deterministic methods are used, the total quantities ultimately recovered from a
project have a low probability of exceeding proved plus probable plus possible reserves.
When probabilistic methods are used, there should be at least a 10% probability that the
total quantities ultimately recovered will equal or exceed the proved plus probable plus
possible reserves estimates.
(ii) Possible reserves may be assigned to areas of a reservoir adjacent to probable reserves
where data control and interpretations of available data are progressively less certain.
Frequently, this will be in areas where geoscience and engineering data are unable to
define clearly the area and vertical limits of commercial production from the reservoir by a
defined project.
(iii) Possible reserves also include incremental quantities associated with a greater percentage
recovery of the hydrocarbons in place than the recovery quantities assumed for probable
reserves.
(iv) The proved plus probable and proved plus probable plus possible reserves estimates must
be based on reasonable alternative technical and commercial interpretations within the
reservoir or subject project that are clearly documented, including comparisons to results
in successful similar projects.
(v) Possible reserves may be assigned where geoscience and engineering data identify directly
adjacent portions of a reservoir within the same accumulation that may be separated from
proved areas by faults with displacement less than formation thickness or other geological
discontinuities and that have not been penetrated by a wellbore, and the registrant
believes that such adjacent portions are in communication with the known (proved)
reservoir. Possible reserves may be assigned to areas that are structurally higher or lower
than the proved area if these areas are in communication with the proved reservoir.
(vi) Pursuant to paragraph (a)(22)(iii) of this section, where direct observation has defined a
highest known oil (HKO) elevation and the potential exists for an associated gas cap,
proved oil reserves should be assigned in the structurally higher portions of the reservoir
above the HKO only if the higher contact can be established with reasonable certainty
through reliable technology. Portions of the reservoir that do not meet this reasonable
certainty criterion may be assigned as probable and possible oil or gas based on reservoir
fluid properties and pressure gradient interpretations.
(3) Probable reserves. Probable reserves are those additional reserves that are less certain to be
recovered than proved reserves but which, together with proved reserves, are as likely as not to be
recovered.
(i) When deterministic methods are used, it is as likely as not that actual remaining quantities
recovered will exceed the sum of estimated proved plus probable reserves. When
probabilistic methods are used, there should be at least a 50% probability that the actual
quantities recovered will equal or exceed the proved plus probable reserves estimates.
(ii) Probable reserves may be assigned to areas of a reservoir adjacent to proved reserves
where data control or interpretations of available data are less certain, even if the
interpreted reservoir continuity of structure or productivity does not meet the reasonable
certainty criterion. Probable reserves may be assigned to areas that are structurally higher (iii) Probable reserves estimates also include potential incremental quantities associated with a
than the proved area if these areas are in communication with the proved reservoir.
Appendix A
Definitions of Oil and Gas Reserves ‐ Securities and Exchange Commission
greater percentage recovery of the hydrocarbons in place than assumed for proved
reserves.
(iv) See also guidelines in paragraphs (a)(17)(iv) and (a)(17)(vi) of this section.
(4) Proved oil and gas reserves. Proved oil and gas reserves are those quantities of oil and gas, which, by
analysis of geoscience and engineering data, can be estimated with reasonable certainty to be
economically producible—from a given date forward, from known reservoirs, and under existing
economic conditions, operating methods, and government regulations—prior to the time at which
contracts providing the right to operate expire, unless evidence indicates that renewal is reasonably
certain, regardless of whether deterministic or probabilistic methods are used for the estimation.
The project to extract the hydrocarbons must have commenced or the operator must be reasonably
certain that it will commence the project within a reasonable time.
(i) The area of the reservoir considered as proved includes:
(A) The area identified by drilling and limited by fluid contacts, if any, and
(B) Adjacent undrilled portions of the reservoir that can, with reasonable certainty, be
judged to be continuous with it and to contain economically producible oil or gas on
the basis of available geoscience and engineering data.
(ii) In the absence of data on fluid contacts, proved quantities in a reservoir are limited by the
lowest known hydrocarbons (LKH) as seen in a well penetration unless geoscience,
engineering, or performance data and reliable technology establishes a lower contact with
reasonable certainty.
(iii) Where direct observation from well penetrations has defined a highest known oil(HKO)
elevation and the potential exists for an associated gas cap, proved oil reserves may be
assigned in the structurally higher portions of the reservoir only if geoscience, engineering,
or performance data and reliable technology establish the higher contact with reasonable
certainty.
(iv) Reserves which can be produced economically through application of improved recovery
techniques (including, but not limited to, fluid injection) are included in the proved
classification when:
(A) Successful testing by a pilot project in an area of the reservoir with properties no
more favorable than in the reservoir as a whole, the operation of an installed
program in the reservoir or an analogous reservoir, or other evidence using
reliable technology establishes the reasonable certainty of the engineering
analysis on which the project or program was based; and
(B) The project has been approved for development by all necessary parties and
entities, including governmental entities.
(v) Existing economic conditions include prices and costs at which economic producibility from
a reservoir is to be determined. The price shall be the average price during the 12‐month
period prior to the ending date of the period covered by the report, determined as an
unweighted arithmetic average of the first‐day‐of‐the‐month price for each month within
such period, unless prices are defined by contractual arrangements, excluding escalations
based upon future conditions.
(5) Reasonable certainty. If deterministic methods are used, reasonable certainty means a high degree
of confidence that the quantities will be recovered. If probabilistic methods are used, there should
be at least a 90% probability that the quantities actually recovered will equal or exceed the estimate.
A high degree of confidence exists if the quantity is much more likely to be achieved than not, and, as
changes due to increased availability of geoscience (geological, geophysical, and geochemical),
engineering, and economic data are made to estimated ultimate recovery (EUR) with time,
reasonably certain EUR is much more likely to increase or remain constant than to decrease.
(6) Reliable technology. Reliable technology is a grouping of one or more technologies (including
computational methods) that has been field tested and has been demonstrated to provide
reasonably certain results with consistency and repeatability in the formation being evaluated or in
an analogous formation.
Appendix A
Definitions of Oil and Gas Reserves ‐ Securities and Exchange Commission
(7) Reserves. Reserves are estimated remaining quantities of oil and gas and related substances
anticipated to be economically producible, as of a given date, by application of development projects
to known accumulations. In addition, there must exist, or there must be a reasonable expectation
that there will exist, the legal right to produce or a revenue interest in the production, installed
means of delivering oil and gas or related substances to market, and all permits and financing
required to implement the project.
Note to paragraph (a)(26): Reserves should not be assigned to adjacent reservoirs isolated by major,
potentially sealing, faults until those reservoirs are penetrated and evaluated as economically
producible. Reserves should not be assigned to areas that are clearly separated from a known
accumulation by a non‐productive reservoir ( i.e. , absence of reservoir, structurally low reservoir, or
negative test results). Such areas may contain prospective resources ( i.e. , potentially recoverable
resources from undiscovered accumulations).
(8) Undeveloped oil and gas reserves. Undeveloped oil and gas reserves are reserves of any category
that are expected to be recovered from new wells on undrilled acreage, or from existing wells where
a relatively major expenditure is required for recompletion.
(i) Reserves on undrilled acreage shall be limited to those directly offsetting development
spacing areas that are reasonably certain of production when drilled, unless evidence using
reliable technology exists that establishes reasonable certainty of economic producibility at
greater distances.
(ii) Undrilled locations can be classified as having undeveloped reserves only if a development
plan has been adopted indicating that they are scheduled to be drilled within five years,
unless the specific circumstances, justify a longer time.
(iii) Under no circumstances shall estimates for undeveloped reserves be attributable to any
acreage for which an application of fluid injection or other improved recovery technique is
contemplated, unless such techniques have been proved effective by actual projects in the
same reservoir or an analogous reservoir, as defined in paragraph (a)(2) of this section, or
by other evidence using reliable technology establishing reasonable certainty.
EX-99.2
25
exhibit992-202310xk.htm
EX-99.2
exhibit992-202310xk

LIST OF ECONOMIC TABLES Table No. Summary Economic Analysis Cash Flow Grand Total .......................................................................................................................... 2 Proved Developed Producing .............................................................................................. 3 Proved Developed Behind Pipe ........................................................................................... 4 Proved Undeveloped ........................................................................................................... 5 Tabular Summary of Economic Analysis All Reserves Categories ...................................................................................................... 6 Gross Ultimate Reserves, Cumulative Production and Basic Economic Data All Reserves Categories ....................................................................................................... 7

Cash Flow Summaries

Total Year Oil ------ Mbbl Residue Gas ------ MMcf ------ NGL ------- Mbbl ------- Oil ------- Mbbl ------- Gas ----- MMcf----- ------ Net Reserves Volume -------------- Estimated 8/8 Prod. ------- NGL - $/bbl - Oil - $/bbl - Production and Economic Projection As of: 1/1/2024 Wells Res. Gas - $/Mcf - ---------- Plant Net Sales Volume Wet Gas ------ MMcf TABLE 2 44,050.15 104.75 6,071.30 307,608.80 52.83 23.59 2.62 77.782024 1,702 6,272.86 35,305.75 98.61 3,889.07 236,451.80 51.52 22.76 2.61 77.562025 1,761 4,078.57 29,887.83 73.44 2,533.37 185,219.09 37.94 23.38 2.61 77.622026 1,773 2,666.99 23,461.71 49.49 1,831.27 154,087.05 30.29 23.51 2.61 77.722027 1,783 1,934.62 17,640.39 37.93 1,419.47 129,772.12 25.15 23.58 2.61 77.742028 1,778 1,503.87 13,775.25 30.77 1,136.91 106,690.54 21.27 23.61 2.61 77.762029 1,769 1,207.46 11,474.63 26.01 938.07 90,874.45 18.36 23.64 2.60 77.762030 1,753 998.57 9,852.59 22.50 793.77 79,041.39 16.06 23.66 2.60 77.772031 1,743 846.50 8,649.93 19.86 674.57 69,772.99 14.20 23.67 2.60 77.772032 1,731 721.16 7,664.05 17.65 571.50 61,900.13 12.56 23.69 2.60 77.782033 1,710 612.74 6,884.55 15.89 493.53 55,547.03 11.06 23.71 2.59 77.782034 1,691 530.10 6,234.25 14.41 433.47 50,256.84 9.98 23.73 2.59 77.792035 1,672 466.46 5,699.33 13.19 375.89 45,674.16 8.88 23.76 2.59 77.792036 1,653 405.48 5,204.83 12.06 316.81 41,310.08 7.96 23.78 2.58 77.792037 1,627 343.48 4,781.21 11.08 268.30 37,725.34 7.24 23.80 2.58 77.802038 1,600 292.61 49,543.09After 383,468.72 117.75 1,875.24 59.07 Total 595,323.62 4,602,366.14Ult. 280,109.55 2,035,400.52 665.39 384.37 23,622.54 Cum. Sub-T 23.56 2.60 77.73 24.13 2.54 77.81 230,566.45 1,651,931.80 547.64 325.30 21,747.30 77.71 23.46 2.61 0.00% Lease Shrinkage and 5.40% Plant Shrinkage 2,566,965.62 315,214.08 24,972.21 2,090.73 22,881.48 Gas ------ M$ ------ Oil ------ M$ ------ Other ------ M$ ------ Year ----------------------------------- Company Future Gross Revenue ---------------------------------- NGL ------ M$ ------ Total ------ M$ ------ Prod Tax ------ M$ ------ Adv Tax ------ M$ ------ after Sev & Adv ------- M$ -------- ------- Prod & Adv Taxes ----- Revenue 8,147.69 1,246.39 15,921.90 0.00 25,315.97 1,161.78 733.01 23,421.182024 7,648.15 1,172.46 10,149.08 0.00 18,969.69 815.62 625.46 17,528.612025 5,700.16 887.09 6,605.51 0.00 13,192.76 556.58 455.02 12,181.162026 3,846.30 712.12 4,773.93 0.00 9,332.35 385.40 338.69 8,608.262027 2,948.51 592.94 3,699.63 0.00 7,241.09 294.81 271.14 6,675.132028 2,392.21 502.20 2,962.16 0.00 5,856.57 236.44 223.50 5,396.632029 2,022.46 433.97 2,442.81 0.00 4,899.25 197.06 188.94 4,513.252030 1,749.92 379.87 2,066.13 0.00 4,195.92 168.27 163.08 3,864.572031 1,544.30 336.25 1,754.10 0.00 3,634.65 146.23 141.21 3,347.212032 1,372.81 297.44 1,484.22 0.00 3,154.47 127.84 121.83 2,904.802033 1,236.01 262.22 1,280.22 0.00 2,778.45 112.88 106.98 2,558.582034 1,121.11 236.67 1,123.52 0.00 2,481.29 101.02 95.46 2,284.802035 1,025.83 211.05 972.89 0.00 2,209.76 90.85 83.90 2,035.012036 938.39 189.21 818.12 0.00 1,945.72 81.57 72.18 1,791.982037 862.19 172.29 690.96 0.00 1,725.45 73.76 62.52 1,589.162038 9,162.14 4,765.59After Total 51,718.17 9,057.50 61,510.78 0.00 0.00 1,425.34 Sub-T 122,286.45 15,353.07 5,228.38 678.27 4,200.37 517.45 112,857.70 14,157.35 42,556.03 7,632.16 56,745.19 0.00 106,933.38 4,550.11 3,682.92 98,700.35 Cumulative ------- M$ ------- Annual ------ M$ ------ Disc. Cum. Annual @ 10.00% ------- M$ ------- -------------------- Future Net Income Before Income Taxes ------------------------------------------------------- Deductions Trans. Costs ------ M$ ------ Net Investments ------ M$ ------ Lease Net Costs ------ M$ ------ Net Profits ------ M$ ------ Undiscounted Discounted Ann @ 10.00% -------M$ ------- Year 2024 0.33 8.35 3,490.06 0.00 19,922.44 19,037.90 19,037.90 19,922.44 2025 0.50 0.00 2,629.72 0.00 14,898.39 12,954.53 31,992.43 34,820.83 2026 0.50 0.00 1,920.75 0.00 10,259.91 8,115.53 40,107.96 45,080.75 2027 0.50 0.00 1,496.93 0.00 7,110.83 5,107.12 45,215.08 52,191.57 2028 0.50 0.00 1,219.64 0.00 5,454.98 3,559.78 48,774.86 57,646.56 2029 0.50 0.00 1,011.84 0.00 4,384.29 2,599.99 51,374.85 62,030.85 2030 0.50 0.00 855.87 0.00 3,656.87 1,971.12 53,345.98 65,687.72 2031 0.50 0.00 737.86 0.00 3,126.20 1,531.78 54,877.75 68,813.92 2032 0.50 0.00 634.90 0.00 2,711.81 1,207.81 56,085.56 71,525.73 2033 0.50 0.00 541.77 0.00 2,362.52 956.40 57,041.96 73,888.26 2034 0.50 0.00 468.69 0.00 2,089.39 768.91 57,810.87 75,977.65 2035 0.50 0.00 415.02 0.00 1,869.28 625.39 58,436.26 77,846.93 2036 0.50 0.00 358.53 0.00 1,675.98 509.70 58,945.96 79,522.91 2037 0.50 0.00 301.20 0.00 1,490.27 412.03 59,358.00 81,013.18 2038 0.50 0.00 255.35 0.00 1,333.31 335.11 59,693.11 82,346.49 1,584.55 0.00 12,427.29 13.83 6.45 18,061.73 1,723.61 8.35 94,773.79 61,277.66 94,773.79 Sub-T After Total 0.00 7.38 8.35 16,338.12 0.00 82,346.49 59,693.11 59,693.11 61,277.66 0.00 12,427.29 1,584.55 82,346.49 Present Worth Profile (M$) PW 5.00% : PW 8.00% : PW 10.00% : PW 12.00% : PW 15.00% : PW 20.00% : 73,098.58 65,320.03 61,277.66 57,872.55 53,642.39 48,196.63

Proved Producing Rsv Class & Category Year Oil ------ Mbbl Residue Gas ------ MMcf ------ NGL ------- Mbbl ------- Oil ------- Mbbl ------- Gas ----- MMcf----- ------ Net Reserves Volume -------------- Estimated 8/8 Prod. ------- NGL - $/bbl - Oil - $/bbl - Production and Economic Projection As of: 1/1/2024 Wells Res. Gas - $/Mcf - ---------- Plant Net Sales Volume Wet Gas ------ MMcf TABLE 3 39,804.88 92.34 5,893.75 291,901.80 48.48 23.97 2.63 77.962024 1,647 6,077.88 24,817.65 58.33 3,400.31 193,101.98 36.82 23.92 2.62 77.922025 1,648 3,529.10 18,877.32 44.23 2,258.45 146,352.89 29.91 23.91 2.62 77.882026 1,635 2,358.72 14,724.49 34.82 1,654.77 117,811.83 24.83 23.89 2.62 77.872027 1,628 1,735.95 12,084.08 28.77 1,290.16 96,648.71 21.07 23.88 2.62 77.862028 1,623 1,358.05 10,175.87 24.32 1,036.24 81,344.32 18.09 23.87 2.62 77.852029 1,614 1,094.02 8,787.70 21.07 855.78 70,121.08 15.77 23.87 2.61 77.842030 1,598 905.87 7,713.31 18.54 724.39 61,453.56 13.87 23.87 2.61 77.842031 1,588 768.37 6,873.52 16.55 614.58 54,482.82 12.31 23.87 2.61 77.832032 1,576 653.61 6,156.39 14.85 519.01 48,455.31 10.90 23.88 2.61 77.832033 1,555 553.66 5,575.10 13.46 446.83 43,534.79 9.59 23.90 2.60 77.832034 1,536 477.55 5,079.15 12.28 391.47 39,412.33 8.66 23.91 2.60 77.832035 1,517 419.20 4,665.03 11.28 337.67 35,778.54 7.68 23.95 2.60 77.832036 1,498 362.49 4,274.40 10.35 281.96 32,272.10 6.87 23.98 2.59 77.832037 1,472 304.28 3,934.95 9.53 236.22 29,406.04 6.24 24.00 2.59 77.842038 1,445 256.54 40,846.65After 283,411.41 102.57 1,467.08 47.51 Total 529,604.56 4,192,455.13Ult. 214,390.49 1,625,489.51 513.30 318.59 21,408.68 Cum. Sub-T 23.99 2.61 77.87 24.45 2.55 77.84 173,543.83 1,342,078.10 410.73 271.09 19,941.61 77.88 23.91 2.62 0.00% Lease Shrinkage and 4.81% Plant Shrinkage 2,566,965.62 315,214.08 22,491.48 1,636.22 20,855.27 Gas ------ M$ ------ Oil ------ M$ ------ Other ------ M$ ------ Year ----------------------------------- Company Future Gross Revenue ---------------------------------- NGL ------ M$ ------ Total ------ M$ ------ Prod Tax ------ M$ ------ Adv Tax ------ M$ ------ after Sev & Adv ------- M$ -------- ------- Prod & Adv Taxes ----- Revenue 7,198.80 1,161.73 15,471.22 0.00 23,831.75 1,104.20 679.11 22,048.442024 4,545.40 880.78 8,919.27 0.00 14,345.46 626.57 467.28 13,251.602025 3,444.16 715.01 5,917.00 0.00 10,076.17 422.14 356.65 9,297.392026 2,711.64 593.21 4,333.00 0.00 7,637.85 312.53 283.19 7,042.132027 2,239.87 502.95 3,376.82 0.00 6,119.64 246.74 233.45 5,639.452028 1,893.08 431.87 2,710.71 0.00 5,035.67 201.40 195.41 4,638.862029 1,640.28 376.26 2,237.27 0.00 4,253.81 169.59 166.59 3,917.642030 1,442.80 331.07 1,892.85 0.00 3,666.71 145.80 144.59 3,376.322031 1,288.53 293.97 1,604.29 0.00 3,186.79 127.25 125.45 2,934.102032 1,155.76 260.40 1,353.16 0.00 2,769.32 111.54 108.20 2,549.582033 1,047.79 229.24 1,163.67 0.00 2,440.69 98.61 94.97 2,247.112034 955.46 206.99 1,018.70 0.00 2,181.16 88.36 84.74 2,008.052035 877.91 184.05 877.52 0.00 1,939.48 79.46 74.21 1,785.812036 805.71 164.60 731.16 0.00 1,701.47 71.29 63.39 1,566.792037 741.88 149.64 610.93 0.00 1,502.45 64.39 54.47 1,383.592038 7,983.78 3,746.28After Total 39,972.85 7,643.12 55,963.87 0.00 0.00 1,161.35 Sub-T 103,579.84 12,891.41 4,448.27 578.40 3,554.73 423.03 95,576.84 11,889.98 31,989.07 6,481.77 52,217.59 0.00 90,688.43 3,869.87 3,131.70 83,686.86 Cumulative ------- M$ ------- Annual ------ M$ ------ Disc. Cum. Annual @ 10.00% ------- M$ ------- -------------------- Future Net Income Before Income Taxes ------------------------------------------------------- Deductions Trans. Costs ------ M$ ------ Net Investments ------ M$ ------ Lease Net Costs ------ M$ ------ Net Profits ------ M$ ------ Undiscounted Discounted Ann @ 10.00% -------M$ ------- Year 2024 0.00 0.00 3,360.50 0.00 18,687.94 17,899.87 17,899.87 18,687.94 2025 0.00 0.00 2,311.21 0.00 10,940.39 9,517.13 27,416.99 29,628.33 2026 0.00 0.00 1,740.83 0.00 7,556.56 5,971.33 33,388.33 37,184.89 2027 0.00 0.00 1,376.21 0.00 5,665.92 4,067.88 37,456.21 42,850.81 2028 0.00 0.00 1,129.41 0.00 4,510.04 2,942.50 40,398.71 47,360.85 2029 0.00 0.00 940.86 0.00 3,698.00 2,192.77 42,591.48 51,058.85 2030 0.00 0.00 797.44 0.00 3,120.20 1,681.72 44,273.20 54,179.04 2031 0.00 0.00 688.35 0.00 2,687.97 1,316.99 45,590.19 56,867.01 2032 0.00 0.00 591.94 0.00 2,342.16 1,043.15 46,633.34 59,209.17 2033 0.00 0.00 504.08 0.00 2,045.49 828.04 47,461.38 61,254.66 2034 0.00 0.00 435.10 0.00 1,812.00 666.82 48,128.20 63,066.67 2035 0.00 0.00 384.77 0.00 1,623.28 543.09 48,671.29 64,689.94 2036 0.00 0.00 330.98 0.00 1,454.83 442.44 49,113.73 66,144.77 2037 0.00 0.00 276.06 0.00 1,290.73 356.87 49,470.60 67,435.50 2038 0.00 0.00 232.20 0.00 1,151.39 289.39 49,760.00 68,586.89 1,348.51 0.00 10,459.65 0.07 0.04 16,530.23 1,430.29 0.00 79,046.54 51,108.51 79,046.54 Sub-T After Total 0.00 0.03 0.00 15,099.94 0.00 68,586.89 49,760.00 49,760.00 51,108.51 0.00 10,459.65 1,348.51 68,586.89 Present Worth Profile (M$) PW 5.00% : PW 8.00% : PW 10.00% : PW 12.00% : PW 15.00% : PW 20.00% : 60,932.86 54,459.63 51,108.51 48,294.84 44,813.46 40,358.72

Proved Behind Pipe Rsv Class & Category Year Oil ------ Mbbl Residue Gas ------ MMcf ------ NGL ------- Mbbl ------- Oil ------- Mbbl ------- Gas ----- MMcf----- ------ Net Reserves Volume -------------- Estimated 8/8 Prod. ------- NGL - $/bbl - Oil - $/bbl - Production and Economic Projection As of: 1/1/2024 Wells Res. Gas - $/Mcf - ---------- Plant Net Sales Volume Wet Gas ------ MMcf TABLE 4 4,245.28 12.41 177.55 15,706.99 4.36 19.42 2.54 76.482024 51 194.98 10,488.10 40.28 488.75 43,349.82 14.70 19.84 2.52 77.032025 109 549.47 8,623.48 27.49 272.99 35,310.38 7.81 21.35 2.51 77.212026 110 305.65 4,188.06 12.71 173.25 24,922.65 5.02 21.72 2.52 77.262027 110 193.97 2,759.72 8.09 126.40 19,337.20 3.68 21.95 2.52 77.302028 110 141.48 2,029.37 5.80 98.56 15,696.54 2.88 22.10 2.52 77.342029 110 110.29 1,595.85 4.47 80.62 13,207.54 2.36 22.21 2.52 77.362030 110 90.20 1,307.72 3.60 68.00 11,376.25 1.99 22.30 2.51 77.392031 110 76.07 1,105.88 3.01 58.82 9,998.66 1.72 22.36 2.51 77.412032 110 65.78 950.35 2.55 51.47 8,861.44 1.50 22.42 2.51 77.422033 110 57.56 832.86 2.22 45.80 7,964.43 1.34 22.46 2.51 77.442034 110 51.20 739.65 1.95 41.19 7,223.52 1.20 22.50 2.51 77.452035 110 46.05 665.74 1.74 37.49 6,614.26 1.09 22.53 2.51 77.472036 110 41.90 601.32 1.56 34.19 6,056.10 1.00 22.56 2.51 77.482037 110 38.21 548.62 1.42 31.48 5,586.65 0.92 22.58 2.51 77.492038 110 35.16 5,590.80After 67,476.89 13.76 400.86 10.49 Total 46,272.81 298,689.33Ult. 46,272.81 298,689.33 143.07 62.06 2,187.43 Cum. Sub-T 21.44 2.52 77.18 22.88 2.51 77.59 40,682.01 231,212.44 129.30 51.56 1,786.57 77.14 21.15 2.52 0.00% Lease Shrinkage and 10.40% Plant Shrinkage 0.00 0.00 2,441.43 443.47 1,997.96 Gas ------ M$ ------ Oil ------ M$ ------ Other ------ M$ ------ Year ----------------------------------- Company Future Gross Revenue ---------------------------------- NGL ------ M$ ------ Total ------ M$ ------ Prod Tax ------ M$ ------ Adv Tax ------ M$ ------ after Sev & Adv ------- M$ -------- ------- Prod & Adv Taxes ----- Revenue 948.89 84.65 450.68 0.00 1,484.22 57.58 53.89 1,372.752024 3,102.74 291.68 1,229.81 0.00 4,624.23 189.04 158.18 4,277.012025 2,122.45 166.72 685.44 0.00 2,974.61 127.65 94.99 2,751.972026 982.02 109.06 435.79 0.00 1,526.86 64.71 51.51 1,410.642027 625.66 80.80 318.03 0.00 1,024.49 43.19 35.40 945.902028 448.60 63.60 247.94 0.00 760.15 31.94 26.66 701.552029 345.86 52.35 202.76 0.00 600.97 25.18 21.30 554.492030 278.90 44.35 170.98 0.00 494.23 20.66 17.66 455.912031 232.72 38.47 147.84 0.00 419.03 17.48 15.08 386.472032 197.72 33.74 129.34 0.00 360.80 15.03 13.05 332.722033 171.57 30.06 115.04 0.00 316.67 13.17 11.51 291.992034 151.06 27.06 103.46 0.00 281.57 11.69 10.28 259.602035 134.92 24.64 94.13 0.00 253.69 10.52 9.30 233.872036 121.03 22.46 85.84 0.00 229.33 9.50 8.43 211.402037 109.75 20.67 79.01 0.00 209.43 8.66 7.72 193.042038 1,067.99 1,007.07After Total 11,041.89 1,330.42 5,503.16 0.00 0.00 240.11 Sub-T 17,875.46 2,315.18 738.09 92.07 625.92 90.95 16,511.46 2,132.16 9,973.89 1,090.30 4,496.09 0.00 15,560.28 646.01 534.97 14,379.30 Cumulative ------- M$ ------- Annual ------ M$ ------ Disc. Cum. Annual @ 10.00% ------- M$ ------- -------------------- Future Net Income Before Income Taxes ------------------------------------------------------- Deductions Trans. Costs ------ M$ ------ Net Investments ------ M$ ------ Lease Net Costs ------ M$ ------ Net Profits ------ M$ ------ Undiscounted Discounted Ann @ 10.00% -------M$ ------- Year 2024 0.33 8.35 129.56 0.00 1,234.50 1,138.03 1,138.03 1,234.50 2025 0.50 0.00 318.51 0.00 3,958.00 3,437.40 4,575.43 5,192.50 2026 0.50 0.00 176.61 0.00 2,574.85 2,044.28 6,619.71 7,767.35 2027 0.50 0.00 116.50 0.00 1,293.64 930.52 7,550.23 9,060.99 2028 0.50 0.00 86.86 0.00 858.53 560.72 8,110.96 9,919.53 2029 0.50 0.00 68.61 0.00 632.44 375.25 8,486.21 10,551.97 2030 0.50 0.00 56.59 0.00 497.40 268.21 8,754.42 11,049.37 2031 0.50 0.00 48.00 0.00 407.41 199.67 8,954.10 11,456.77 2032 0.50 0.00 41.68 0.00 344.29 153.36 9,107.46 11,801.06 2033 0.50 0.00 36.58 0.00 295.64 119.69 9,227.15 12,096.70 2034 0.50 0.00 32.61 0.00 258.88 95.28 9,322.43 12,355.58 2035 0.50 0.00 29.38 0.00 229.72 76.86 9,399.29 12,585.30 2036 0.50 0.00 26.76 0.00 206.61 62.83 9,462.12 12,791.91 2037 0.50 0.00 24.43 0.00 186.47 51.55 9,513.66 12,978.38 2038 0.50 0.00 22.50 0.00 170.04 42.73 9,556.40 13,148.42 220.80 0.00 1,840.17 13.75 6.41 1,500.77 285.59 8.35 14,988.58 9,777.19 14,988.58 Sub-T After Total 0.00 7.35 8.35 1,215.18 0.00 13,148.42 9,556.40 9,556.40 9,777.19 0.00 1,840.17 220.80 13,148.42 Present Worth Profile (M$) PW 5.00% : PW 8.00% : PW 10.00% : PW 12.00% : PW 15.00% : PW 20.00% : 11,652.08 10,426.87 9,777.19 9,220.73 8,515.25 7,579.53

Proved Undeveloped Rsv Class & Category Year Oil ------ Mbbl Residue Gas ------ MMcf ------ NGL ------- Mbbl ------- Oil ------- Mbbl ------- Gas ----- MMcf----- ------ Net Reserves Volume -------------- Estimated 8/8 Prod. ------- NGL - $/bbl - Oil - $/bbl - Production and Economic Projection As of: 1/1/2024 Wells Res. Gas - $/Mcf - ---------- Plant Net Sales Volume Wet Gas ------ MMcf TABLE 5 0.00 0.00 0.00 0.00 0.00 0.00 0.00 0.002024 4 0.00 0.00 0.00 0.00 0.00 0.00 0.00 0.00 0.002025 4 0.00 2,387.03 1.72 1.93 3,555.82 0.22 24.03 1.59 77.642026 28 2.63 4,549.16 1.96 3.25 11,352.57 0.43 22.71 1.58 78.012027 45 4.70 2,796.59 1.06 2.90 13,786.21 0.40 22.80 1.65 78.062028 45 4.34 1,570.01 0.65 2.11 9,649.67 0.30 22.59 1.66 78.062029 45 3.15 1,091.08 0.47 1.67 7,545.82 0.24 22.48 1.67 78.072030 45 2.50 831.57 0.36 1.38 6,211.57 0.20 22.42 1.68 78.092031 45 2.07 670.54 0.30 1.18 5,291.51 0.17 22.38 1.68 78.102032 45 1.77 557.31 0.25 1.02 4,583.38 0.15 22.35 1.68 78.112033 45 1.53 476.59 0.21 0.90 4,047.81 0.13 22.33 1.69 78.112034 45 1.35 415.45 0.19 0.80 3,620.99 0.12 22.32 1.69 78.122035 45 1.21 368.56 0.17 0.73 3,281.36 0.11 22.31 1.69 78.132036 45 1.10 329.10 0.15 0.66 2,981.89 0.10 22.30 1.69 78.142037 45 1.00 297.63 0.14 0.60 2,732.65 0.09 22.30 1.70 78.142038 45 0.91 3,105.64After 32,580.41 1.41 7.30 1.07 Total 19,446.26 111,221.68Ult. 19,446.26 111,221.68 9.02 3.72 26.42 Cum. Sub-T 22.56 1.66 78.00 22.34 1.68 78.18 16,340.62 78,641.27 7.61 2.65 19.12 77.97 22.66 1.65 0.00% Lease Shrinkage and 32.77% Plant Shrinkage 0.00 0.00 39.30 11.04 28.26 Gas ------ M$ ------ Oil ------ M$ ------ Other ------ M$ ------ Year ----------------------------------- Company Future Gross Revenue ---------------------------------- NGL ------ M$ ------ Total ------ M$ ------ Prod Tax ------ M$ ------ Adv Tax ------ M$ ------ after Sev & Adv ------- M$ -------- ------- Prod & Adv Taxes ----- Revenue 0.00 0.00 0.00 0.00 0.00 0.00 0.00 0.002024 0.00 0.00 0.00 0.00 0.00 0.00 0.00 0.002025 133.55 5.36 3.07 0.00 141.98 6.79 3.38 131.812026 152.65 9.85 5.14 0.00 167.64 8.16 3.99 155.492027 82.99 9.19 4.78 0.00 96.96 4.88 2.30 89.782028 50.52 6.73 3.50 0.00 60.75 3.10 1.44 56.212029 36.32 5.36 2.78 0.00 44.46 2.29 1.05 41.122030 28.22 4.45 2.31 0.00 34.98 1.81 0.83 32.342031 23.05 3.80 1.98 0.00 28.83 1.50 0.68 26.652032 19.33 3.30 1.71 0.00 24.35 1.27 0.58 22.502033 16.64 2.92 1.52 0.00 21.08 1.10 0.50 19.482034 14.59 2.61 1.36 0.00 18.56 0.97 0.44 17.152035 13.00 2.37 1.23 0.00 16.60 0.87 0.39 15.332036 11.65 2.15 1.12 0.00 14.92 0.78 0.35 13.782037 10.57 1.98 1.02 0.00 13.57 0.71 0.32 12.532038 110.36 12.23After Total 703.44 83.96 43.75 0.00 0.00 23.88 Sub-T 831.15 146.48 42.03 7.80 19.73 3.47 769.40 135.21 593.08 60.08 31.52 0.00 684.67 34.23 16.26 634.19 Cumulative ------- M$ ------- Annual ------ M$ ------ Disc. Cum. Annual @ 10.00% ------- M$ ------- -------------------- Future Net Income Before Income Taxes ------------------------------------------------------- Deductions Trans. Costs ------ M$ ------ Net Investments ------ M$ ------ Lease Net Costs ------ M$ ------ Net Profits ------ M$ ------ Undiscounted Discounted Ann @ 10.00% -------M$ ------- Year 2024 0.00 0.00 0.00 0.00 0.00 0.00 0.00 0.00 2025 0.00 0.00 0.00 0.00 0.00 0.00 0.00 0.00 2026 0.00 0.00 3.31 0.00 128.50 99.92 99.92 128.50 2027 0.00 0.00 4.22 0.00 151.27 108.72 208.64 279.77 2028 0.00 0.00 3.37 0.00 86.41 56.55 265.19 366.18 2029 0.00 0.00 2.37 0.00 53.85 31.98 297.16 420.03 2030 0.00 0.00 1.84 0.00 39.28 21.19 318.35 459.31 2031 0.00 0.00 1.51 0.00 30.83 15.11 333.47 490.14 2032 0.00 0.00 1.28 0.00 25.37 11.30 344.77 515.50 2033 0.00 0.00 1.11 0.00 21.40 8.66 353.43 536.90 2034 0.00 0.00 0.97 0.00 18.51 6.81 360.24 555.41 2035 0.00 0.00 0.87 0.00 16.28 5.45 365.69 571.69 2036 0.00 0.00 0.79 0.00 14.55 4.42 370.11 586.23 2037 0.00 0.00 0.71 0.00 13.07 3.61 373.73 599.31 2038 0.00 0.00 0.65 0.00 11.88 2.99 376.71 611.18 15.24 0.00 127.48 0.00 0.00 30.73 7.73 0.00 738.66 391.96 738.66 Sub-T After Total 0.00 0.00 0.00 23.00 0.00 611.18 376.71 376.71 391.96 0.00 127.48 15.24 611.18 Present Worth Profile (M$) PW 5.00% : PW 8.00% : PW 10.00% : PW 12.00% : PW 15.00% : PW 20.00% : 513.65 433.53 391.96 356.99 313.68 258.38

Tabular Summaries

Economic One-Liners Lease Name Life (years) Oil (Mbbl) Residue Gas (MMcf) Residue Gas (M$) Other (M$) Expense & Tax (M$) Invest. (M$) Non-Disc. (M$) Cash FlowNet Sales Volumes Net Revenue As of Date: 1/1/2024 Reserve Category Oil (M$) Disc. 10% (M$) NGL (M$) NGL (Mbbl) TABLE 6 Proved Producing Rsv Class & Category 39.65 23.13 0.72 0.49 0.00 38.83 1.71 3.48 0.00P-DP 43.5444 MAGNUM 9-4 H 1LS - H 1LS 2.59 0.08 18.84 11.53 1.02 0.19 0.00 14.86 2.41 2.08 0.00P-DP 31.8644 MAGNUM 9-4 H 1WA - H 1WA 3.65 0.11 16.21 9.61 1.23 0.14 0.00 10.91 2.91 2.01 0.00P-DP 29.7444 MAGNUM 9-4 H 1WB - H 1WB 4.40 0.13 45.81 24.92 1.08 0.55 0.00 43.55 2.56 4.18 0.00P-DP 47.2344 MAGNUM 9-4 H 2LS 3.88 0.12 29.88 17.15 0.87 0.35 0.00 27.53 2.06 2.83 0.00P-DP 39.9944 MAGNUM 9-4 H 2WA - H 2WA 3.12 0.09 19.33 12.39 0.70 0.22 0.00 17.07 1.66 1.92 0.00P-DP 30.5144 MAGNUM 9-4 H 2WB - H 2WB 2.51 0.08 25.69 15.00 0.89 0.29 0.00 22.90 2.11 2.52 0.00P-DP 37.4744 MAGNUM 9-4 H 3WA - H 3WA 3.19 0.10 1.52 0.87 0.14 0.02 0.00 1.16 0.20 0.30 0.00P-DP 32.91ABIGAIL 218-219 UNIT 1H - 1H 0.47 0.02 0.95 0.55 0.01 0.01 0.00 0.98 0.02 0.09 0.00P-DP 29.98ACKERLY BROWN 9 1 - 1 0.04 0.00 0.00 0.00 0.00 0.00 0.00 0.00 0.00 0.00 0.00P-DP 0.00ADAMCHIK 4 - 4 0.00 0.00 0.00 0.00 0.00 0.00 0.00 0.00 0.00 0.00 0.00P-DP 0.00ADAMCHIK 5 - 5 0.00 0.00 0.00 0.00 0.00 0.00 0.00 0.00 0.00 0.00 0.00P-DP 0.00ADAMCHIK 7 - 7 0.00 0.00 32.79 17.84 2.21 0.29 0.00 21.79 5.14 2.89 0.00P-DP 50.00ADAMEK UNIT 2H - 2H 8.76 0.47 2.93 1.72 0.15 0.04 0.00 2.72 0.16 0.27 0.00P-DP 26.72ADAMS EAST H 23-26 4208H - 4208H 0.32 0.02 6.92 3.80 0.29 0.09 0.00 6.61 0.30 0.62 0.00P-DP 39.24ADAMS EAST H 23-26 4408H - 4408H 0.62 0.03 15.49 8.00 1.01 0.18 0.00 13.73 1.07 1.51 0.00P-DP 50.00ADAMS WEST A 23-26 4301H - 4301H 2.19 0.12 0.81 0.59 0.03 0.01 0.00 0.78 0.03 0.07 0.00P-DP 11.02ADAMS WEST B 23-26 4202H - 4202H 0.06 0.00 2.84 1.68 0.15 0.03 0.00 2.61 0.16 0.27 0.00P-DP 25.91ADAMS WEST B 23-26 4402H - 4402H 0.33 0.02 4.15 2.24 0.63 0.03 0.00 2.62 0.68 0.53 0.00P-DP 33.57ADAMS WEST D 23-26 4304H - 4304H 1.38 0.08 1.49 1.01 0.16 0.01 0.00 1.14 0.17 0.17 0.00P-DP 16.14ADAMS WEST E 23-26 4205H - 4205H 0.35 0.02 3.45 2.10 0.27 0.04 0.00 2.92 0.29 0.35 0.00P-DP 27.20ADAMS WEST E 23-26 4405H - 4405H 0.59 0.03 5.25 3.01 0.75 0.05 0.00 3.47 0.80 0.65 0.00P-DP 34.23ADAMS WEST G 23-26 4307H - 4307H 1.63 0.09 8.79 4.44 0.38 0.11 0.00 8.28 0.58 1.18 0.00P-DP 38.05ADMIRAL 4-48 47 1H - 1H 1.11 0.04 18.83 12.32 0.01 0.26 0.00 20.26 0.02 1.49 0.00P-DP 14.34AGGIE THE BULLDOG 39-46 A 1LS - 1LS 0.04 0.00 105.55 66.88 1.95 1.37 0.00 106.22 3.05 10.35 0.00P-DP 30.24AGGIE THE BULLDOG 39-46 A 1MS - 1MS 6.63 0.28 33.42 21.11 0.07 0.46 0.00 35.77 0.11 2.70 0.00P-DP 18.74AGGIE THE BULLDOG 39-46 A 1WA - 1WA 0.23 0.01 38.70 23.16 0.03 0.54 0.00 41.61 0.05 3.07 0.00P-DP 20.97AGGIE THE BULLDOG 39-46 A 1WB - 1WB 0.11 0.00 12.14 7.85 0.18 0.16 0.00 12.40 0.28 1.14 0.00P-DP 12.29AGGIE THE BULLDOG 39-46 B 2DN - 2DN 0.60 0.03 0.00 0.00 0.00 0.00 0.00 0.00 0.00 0.00 0.00P-DP 0.00AGGIE THE BULLDOG 39-46 B 2WA - 2WA 0.00 0.00 44.94 29.74 3.50 0.45 0.00 34.80 5.48 7.25 0.00P-DP 19.75AGGIE THE BULLDOG 39-46 C 3LS - 3LS 11.91 0.51 21.05 14.42 0.35 0.27 0.00 21.32 0.55 2.03 0.00P-DP 13.95AGGIE THE BULLDOG 39-46 C 3WB - 3WB 1.20 0.05 34.65 22.62 0.97 0.43 0.00 33.58 1.52 3.75 0.00P-DP 18.30AGGIE THE BULLDOG 39-46 C 4WA - 4WA 3.30 0.14 32.68 19.74 0.03 0.45 0.00 35.14 0.04 2.60 0.00P-DP 19.46AGGIE THE BULLDOG 39-46 D 5LS - 5LS 0.09 0.00 7.46 5.81 0.03 0.10 0.00 7.94 0.04 0.61 0.00P-DP 7.06AGGIE THE BULLDOG 39-46 D 5WB - 5WB 0.09 0.00

Economic One-Liners Lease Name Life (years) Oil (Mbbl) Residue Gas (MMcf) Residue Gas (M$) Other (M$) Expense & Tax (M$) Invest. (M$) Non-Disc. (M$) Cash FlowNet Sales Volumes Net Revenue As of Date: 1/1/2024 Reserve Category Oil (M$) Disc. 10% (M$) NGL (M$) NGL (Mbbl) TABLE 6 65.92 42.44 2.36 0.80 0.00 61.89 3.69 7.68 0.00P-DP 25.45AGGIE THE BULLDOG 39-46 D 6JD - 6JD 8.02 0.34 17.95 11.68 0.05 0.25 0.00 19.18 0.07 1.46 0.00P-DP 14.19AGGIE THE BULLDOG 39-46 D 6WA - 6WA 0.16 0.01 39.75 24.67 0.05 0.55 0.00 42.68 0.08 3.17 0.00P-DP 20.42AGGIE THE BULLDOG 39-46 E 6DN - 6DN 0.16 0.01 54.92 32.96 0.07 0.76 0.00 58.94 0.12 4.39 0.00P-DP 23.82AGGIE THE BULLDOG 39-46 E 7LS - 7LS 0.25 0.01 142.97 88.22 2.23 1.87 0.00 145.47 3.50 13.60 0.00P-DP 33.93AGGIE THE BULLDOG 39-46 E 7MS - 7MS 7.60 0.32 58.18 37.45 0.04 0.81 0.00 62.58 0.07 4.61 0.00P-DP 22.46AGGIE THE BULLDOG 39-46 E 7WA - 7WA 0.15 0.01 38.20 22.69 0.19 0.52 0.00 40.45 0.30 3.20 0.00P-DP 20.98AGGIE THE BULLDOG 39-46 E 7WB - 7WB 0.65 0.03 0.00 0.00 0.00 0.00 0.00 0.00 0.00 0.00 0.00P-DP 0.00ALEX TAMSULA 2 - 2 0.00 0.00 0.00 0.00 0.00 0.00 0.00 0.00 0.00 0.00 0.00P-DP 0.00ALEX TAMSULA 3 - 3 0.00 0.00 0.00 0.00 0.00 0.00 0.00 0.00 0.00 0.00 0.00P-DP 0.00ALEX TAMSULA 4 - 4 0.00 0.00 0.93 0.69 0.00 0.01 0.00 1.00 0.00 0.07 0.00P-DP 8.37ALICO 1 0.00 0.00 0.00 0.00 0.00 0.00 0.00 0.00 0.00 0.00 0.00P-DP 0.00ALICO A 1 - 1 0.00 0.00 49.45 28.01 8.20 0.34 0.00 26.45 12.53 13.53 0.00P-DP 32.19ALLMAN 24 1H - 1H 24.01 0.96 3.69 2.34 0.09 0.04 0.00 3.48 0.22 0.34 0.00P-DP 24.54ALLRED UNIT B 08-05 5AH - 5AH 0.33 0.01 1.66 1.11 0.15 0.01 0.00 1.00 0.35 0.22 0.00P-DP 15.64ALLRED UNIT B 08-05 5BH - 5BH 0.52 0.02 5.65 3.28 0.34 0.05 0.00 4.27 0.80 0.65 0.00P-DP 31.38ALLRED UNIT B 08-05 5MH - 5MH 1.22 0.04 5.19 3.06 0.21 0.06 0.00 4.47 0.49 0.53 0.00P-DP 30.16ALLRED UNIT B 08-05 5SH - 5SH 0.75 0.02 8.01 4.63 0.29 0.09 0.00 7.06 0.70 0.80 0.00P-DP 35.06ALLRED UNIT B 08-05 6AH - 6AH 1.05 0.03 4.47 2.75 0.22 0.05 0.00 3.66 0.51 0.48 0.00P-DP 26.87ALLRED UNIT B 08-05 6MH - 6MH 0.78 0.02 6.05 3.47 0.59 0.04 0.00 3.37 1.40 0.83 0.00P-DP 32.80ALLRED UNIT B 08-05 6SH - 6SH 2.12 0.06 5.89 3.45 0.31 0.06 0.00 4.71 0.72 0.64 0.00P-DP 31.59ALLRED UNIT B 08-05 7AH - 7AH 1.10 0.03 4.21 2.49 0.36 0.03 0.00 2.62 0.85 0.55 0.00P-DP 27.95ALLRED UNIT B 08-05 7BH - 7BH 1.28 0.04 9.71 5.21 0.05 0.13 0.00 10.16 0.13 0.77 0.00P-DP 38.57ALLRED UNIT B 08-05 8AH - 8AH 0.20 0.01 2.74 1.74 0.04 0.03 0.00 2.76 0.09 0.23 0.00P-DP 22.03ALLRED UNIT B 08-05 8SH - 8SH 0.13 0.00 0.64 0.47 0.30 0.00 0.00 0.00 0.71 0.08 0.00P-DP 11.23ALPHA 210488 1A - 1A 0.00 0.00 0.78 0.54 0.37 0.00 0.00 0.00 0.88 0.09 0.00P-DP 14.16ALPHA 210488 2B - 2B 0.00 0.00 1.48 0.89 0.70 0.00 0.00 0.00 1.66 0.18 0.00P-DP 22.08ALPHA 210488 3C - 3C 0.00 0.00 1.83 1.21 0.01 0.03 0.00 2.08 0.04 0.29 0.00P-DP 21.75AMAZON 3304-02H - 3304-02H 0.00 0.00 3.84 2.26 0.03 0.06 0.00 4.32 0.15 0.64 0.00P-DP 32.04AMAZON 3304-03H - 3304-03H 0.01 0.00 2.68 1.60 0.31 0.03 0.00 2.17 1.54 1.14 0.00P-DP 28.70AMAZON 3304-04H - 3304-4H 0.11 0.00 3.78 2.21 0.54 0.04 0.00 2.77 2.65 1.83 0.00P-DP 33.47AMAZON 3304-05H - 3304-05H 0.18 0.01 4.67 2.89 3.27 0.00 0.00 0.00 8.73 4.06 0.00P-DP 26.74AMBER NE WEL JF 3H - 3H 0.00 0.00 6.20 3.85 4.35 0.00 0.00 0.00 11.61 5.40 0.00P-DP 25.92AMBER NW WEL JF 1H - 1H 0.00 0.00 35.47 16.91 1.00 0.44 0.00 34.37 1.56 3.84 0.00P-DP 41.45ANN COLE TRUST 1 - 1 3.39 0.14 16.85 8.37 0.00 0.23 0.00 18.14 0.00 1.28 0.00P-DP 24.30ANNABEL 1 - 1 0.00 0.00

Economic One-Liners Lease Name Life (years) Oil (Mbbl) Residue Gas (MMcf) Residue Gas (M$) Other (M$) Expense & Tax (M$) Invest. (M$) Non-Disc. (M$) Cash FlowNet Sales Volumes Net Revenue As of Date: 1/1/2024 Reserve Category Oil (M$) Disc. 10% (M$) NGL (M$) NGL (Mbbl) TABLE 6 71.48 56.19 50.15 0.00 0.00 0.00 133.76 62.27 0.00P-DP 10.02ARCHIE E WYN JF 6H - 6H 0.00 0.00 53.48 43.64 37.52 0.00 0.00 0.00 100.07 46.59 0.00P-DP 8.01ARCHIE E WYN JF 8H - 8H 0.00 0.00 2.01 1.14 0.05 0.02 0.00 1.90 0.12 0.18 0.00P-DP 27.88ARLINGTON 33-40 C UNIT 4H - 4H 0.18 0.01 3.31 1.73 0.12 0.04 0.00 2.95 0.28 0.33 0.00P-DP 36.17ARLINGTON 33-40 D UNIT 5H - 5H 0.42 0.01 29.98 20.39 0.77 0.36 0.00 28.17 1.82 2.77 0.00P-DP 17.17ARON 41-32 #1AH - 1AH 2.76 0.08 33.51 20.56 2.12 0.31 0.00 24.80 5.01 3.89 0.00P-DP 20.98ARON 41-32 #2SH - 2SH 7.59 0.23 58.56 35.06 2.33 0.64 0.00 50.62 5.52 5.94 0.00P-DP 26.26ARON 41-32 #3AH - 3AH 8.36 0.25 14.81 10.64 0.20 0.19 0.00 14.87 0.47 1.26 0.00P-DP 11.68ARON 41-32 #3SH - 3SH 0.72 0.02 361.47 215.55 253.61 0.00 0.00 0.00 676.37 314.90 0.00P-DP 29.06ATHENA N SMF JF 3H - 3H 0.00 0.00 543.38 320.25 381.24 0.00 0.00 0.00 1,016.76 473.38 0.00P-DP 29.57ATHENA NE SMF JF 5H - 5H 0.00 0.00 770.67 454.36 540.71 0.00 0.00 0.00 1,442.07 671.39 0.00P-DP 33.00ATHENA NE SMF JF 7H - 7H 0.00 0.00 428.54 249.29 300.66 0.00 0.00 0.00 801.87 373.33 0.00P-DP 34.34ATHENA NW SMF JF 1H - 1H 0.00 0.00 48.54 28.96 24.40 0.00 0.00 0.00 66.29 17.75 0.00P-DP 27.41AUSTIN 5H - 5H 0.00 0.00 46.27 27.61 23.25 0.00 0.00 0.00 63.18 16.91 0.00P-DP 27.09AUSTIN 6H - 6H 0.00 0.00 50.02 30.92 25.14 0.00 0.00 0.00 68.30 18.29 0.00P-DP 26.22AUSTIN 7H - 7H 0.00 0.00 64.64 36.48 32.49 0.00 0.00 0.00 88.28 23.63 0.00P-DP 31.38AUSTIN 8H - 8H 0.00 0.00 5.06 2.90 0.34 0.05 0.00 4.28 0.91 1.17 0.00P-DP 30.88B AND B 1H - 1H 1.05 0.04 8.61 4.69 0.66 0.09 0.00 6.93 1.79 2.19 0.00P-DP 38.13B AND B 2H - 2H 2.07 0.07 4.68 2.82 0.47 0.04 0.00 3.37 1.26 1.41 0.00P-DP 29.60B AND B 6H - 6H 1.46 0.05 5.06 2.88 0.27 0.06 0.00 4.53 0.73 1.04 0.00P-DP 31.86B AND B STATE 4H - 4H 0.84 0.03 9.04 5.14 0.86 0.08 0.00 6.67 2.32 2.63 0.00P-DP 38.06B AND B STATE A 5H - 5H 2.68 0.09 8.27 4.52 1.47 0.04 0.00 3.51 3.97 3.81 0.00P-DP 41.95B AND B STATE B 7H - 7H 4.59 0.15 35.96 23.32 1.50 0.42 0.00 32.91 2.35 4.42 0.00P-DP 48.37BADFISH 31-43 A 1JM - 1JM 5.11 0.22 0.74 0.59 0.02 0.01 0.00 0.70 0.04 0.08 0.00P-DP 8.26BADFISH 31-43 A 4LS - 4LS 0.08 0.00 22.28 13.67 1.48 0.24 0.00 18.25 2.32 3.32 0.00P-DP 44.77BADFISH 31-43 B 9LS - 9LS 5.04 0.21 9.54 5.88 0.27 0.12 0.00 9.22 0.43 1.04 0.00P-DP 34.91BADFISH 31-43 E 5WA - 5WA 0.93 0.04 8.25 5.52 0.41 0.09 0.00 7.30 0.64 1.08 0.00P-DP 31.23BADFISH 31-43 E 7WB - 7WB 1.40 0.06 7.12 4.55 0.09 0.09 0.00 7.35 0.13 0.65 0.00P-DP 31.13BADFISH 31-43 F 6WA - 6WA 0.29 0.01 15.94 9.80 1.00 0.17 0.00 13.29 1.56 2.31 0.00P-DP 40.72BADFISH 31-43 F 8WB - 8WB 3.40 0.14 8.97 5.78 0.36 0.11 0.00 8.26 0.56 1.09 0.00P-DP 33.36BADFISH 31-43 J 10WA - 10WA 1.23 0.05 16.49 10.43 0.86 0.19 0.00 14.42 1.35 2.21 0.00P-DP 40.47BADFISH 31-43 J 11WB - 11WB 2.93 0.12 11.14 7.43 0.29 0.14 0.00 10.87 0.46 1.19 0.00P-DP 34.36BADFISH 31-43 L 12MS - 12MS 1.00 0.04 0.07 0.06 0.00 0.00 0.00 0.06 0.01 0.01 0.00P-DP 1.29BADFISH 31-43 M 13JM - 13JM 0.01 0.00 27.40 17.43 0.67 0.35 0.00 26.93 1.05 2.86 0.00P-DP 46.10BADFISH 31-43 M 3LS - 3LS 2.29 0.10 0.36 0.20 0.01 0.00 0.00 0.37 0.01 0.04 0.00P-DP 22.86BARNES, D. E. ESTATE 2 - 2 0.02 0.00

Economic One-Liners Lease Name Life (years) Oil (Mbbl) Residue Gas (MMcf) Residue Gas (M$) Other (M$) Expense & Tax (M$) Invest. (M$) Non-Disc. (M$) Cash FlowNet Sales Volumes Net Revenue As of Date: 1/1/2024 Reserve Category Oil (M$) Disc. 10% (M$) NGL (M$) NGL (Mbbl) TABLE 6 1.51 0.91 0.05 0.02 0.00 1.47 0.07 0.20 0.00P-DP 21.62BARNES, D. E. ESTATE 3H - 3H 0.17 0.01 5.04 2.80 0.04 0.07 0.00 5.37 0.05 0.51 0.00P-DP 34.95BARNES, D. E. ESTATE 4H - 4H 0.13 0.01 12.09 6.95 0.06 0.16 0.00 12.69 0.14 0.96 0.00P-DP 50.00BARR 10-8 B UNIT A 5H 0.22 0.01 12.04 7.21 0.09 0.16 0.00 12.48 0.21 0.97 0.00P-DP 49.91BARR 10-8 B UNIT L 5H 0.32 0.01 0.00 0.00 0.00 0.00 0.00 0.00 0.00 0.00 0.00P-DP 33.68BARSTOW -18- 1 - 1 0.00 0.00 0.00 0.00 0.00 0.00 0.00 0.00 0.00 0.00 0.00P-DP 13.07BARSTOW -18- 2 - 2 0.00 0.00 0.00 0.00 0.00 0.00 0.00 0.00 0.00 0.00 0.00P-DP 20.94BARSTOW -18- 3 - 3 0.00 0.00 0.00 0.00 0.00 0.00 0.00 0.00 0.00 0.00 0.00P-DP 14.33BARSTOW -18- 4 - 4 0.00 0.00 0.01 0.01 0.00 0.00 0.00 0.01 0.00 0.00 0.00P-DP 29.93BARSTOW -18- 5 - 5 0.00 0.00 0.00 0.00 0.00 0.00 0.00 0.00 0.00 0.00 0.00P-DP 22.44BARSTOW -23- 1 - 1 0.00 0.00 0.00 0.00 0.00 0.00 0.00 0.00 0.00 0.00 0.00P-DP 25.14BARSTOW -23- 2 - 2 0.00 0.00 0.02 0.01 0.00 0.00 0.00 0.02 0.00 0.00 0.00P-DP 45.66BARSTOW -23- 3 - 3 0.00 0.00 0.01 0.01 0.00 0.00 0.00 0.01 0.00 0.00 0.00P-DP 32.21BARSTOW -23- 4 - 4 0.00 0.00 0.00 0.00 0.00 0.00 0.00 0.00 0.00 0.00 0.00P-DP 25.39BARSTOW -23- 6 - 6 0.00 0.00 0.00 0.00 0.00 0.00 0.00 0.00 0.00 0.00 0.00P-DP 28.37BARSTOW -23- 6A - 6A 0.00 0.00 0.00 0.00 0.00 0.00 0.00 0.00 0.00 0.00 0.00P-DP 25.91BARSTOW -23- 7 - 7 0.00 0.00 0.00 0.00 0.00 0.00 0.00 0.00 0.00 0.00 0.00P-DP 24.16BARSTOW -23- 8 - 8 0.00 0.00 0.00 0.00 0.00 0.00 0.00 0.00 0.00 0.00 0.00P-DP 26.54BARSTOW -23- 9 - 9 0.00 0.00 0.02 0.01 0.00 0.00 0.00 0.02 0.00 0.00 0.00P-DP 35.21BARSTOW 155 1 - 1 0.00 0.00 0.06 0.04 0.00 0.00 0.00 0.06 0.00 0.01 0.00P-DP 46.28BARSTOW 155 2 - 2 0.00 0.00 0.00 0.00 0.00 0.00 0.00 0.00 0.00 0.00 0.00P-DP 16.78BARSTOW 27 1 - 1 0.00 0.00 0.00 0.00 0.00 0.00 0.00 0.00 0.00 0.00 0.00P-DP 26.81BARSTOW 27 2 - 2 0.00 0.00 0.01 0.01 0.00 0.00 0.00 0.01 0.00 0.00 0.00P-DP 31.50BARSTOW 27 3 - 3 0.00 0.00 0.00 0.00 0.00 0.00 0.00 0.00 0.00 0.00 0.00P-DP 21.50BARSTOW 27 4 - 4 0.00 0.00 0.00 0.00 0.00 0.00 0.00 0.00 0.00 0.00 0.00P-DP 16.21BARSTOW 27 5 - 5 0.00 0.00 0.01 0.01 0.00 0.00 0.00 0.01 0.00 0.00 0.00P-DP 42.24BARSTOW 27 6 - 6 0.00 0.00 0.00 0.00 0.00 0.00 0.00 0.00 0.00 0.00 0.00P-DP 14.99BARSTOW 27 7 - 7 0.00 0.00 0.03 0.02 0.00 0.00 0.00 0.03 0.00 0.00 0.00P-DP 41.80BARSTOW 27 8 - 8 0.00 0.00 0.01 0.01 0.00 0.00 0.00 0.01 0.00 0.00 0.00P-DP 8.34BARSTOW 33 UA 1BS - 1BS 0.00 0.00 0.06 0.03 0.00 0.00 0.00 0.05 0.00 0.01 0.00P-DP 24.59BARSTOW 33 UB 2BS - 2BS 0.01 0.00 0.02 0.01 0.00 0.00 0.00 0.02 0.00 0.00 0.00P-DP 30.53BARSTOW 33-34 1H - 1H 0.00 0.00 0.00 0.00 0.00 0.00 0.00 0.00 0.00 0.00 0.00P-DP 4.60BARSTOW 33-35 1H - 1H 0.00 0.00 0.01 0.01 0.00 0.00 0.00 0.01 0.00 0.00 0.00P-DP 27.10BARSTOW 33-35 2H - 2H 0.00 0.00 0.02 0.01 0.00 0.00 0.00 0.02 0.00 0.00 0.00P-DP 35.93BARSTOW 33-35 3H - 3H 0.00 0.00 0.01 0.00 0.00 0.00 0.00 0.01 0.00 0.00 0.00P-DP 46.53BARSTOW A 3652H - 3652H 0.00 0.00

Economic One-Liners Lease Name Life (years) Oil (Mbbl) Residue Gas (MMcf) Residue Gas (M$) Other (M$) Expense & Tax (M$) Invest. (M$) Non-Disc. (M$) Cash FlowNet Sales Volumes Net Revenue As of Date: 1/1/2024 Reserve Category Oil (M$) Disc. 10% (M$) NGL (M$) NGL (Mbbl) TABLE 6 581.09 352.35 407.69 0.00 0.00 0.00 1,087.31 506.22 0.00P-DP 25.64BATES S CRC JF 5H - 5H 0.00 0.00 0.01 0.01 0.00 0.00 0.00 0.01 0.00 0.00 0.00P-DP 1.92BAYES 16 1 - 1 0.00 0.00 0.02 0.02 0.00 0.00 0.00 0.02 0.00 0.00 0.00P-DP 4.79BAYES 16 2 - 2 0.00 0.00 0.43 0.22 0.04 0.00 0.00 0.31 0.06 0.07 0.00P-DP 31.86BAYES 16A 1 - 1 0.13 0.01 0.69 0.40 0.02 0.01 0.00 0.67 0.03 0.08 0.00P-DP 27.16BAYES 4 1 - 1 0.07 0.00 0.76 0.44 0.01 0.01 0.00 0.79 0.01 0.07 0.00P-DP 29.48BAYES 4 2 - 2 0.03 0.00 0.62 0.31 0.00 0.01 0.00 0.65 0.01 0.05 0.00P-DP 35.66BAYES 4 3 - 3 0.01 0.00 0.14 0.09 0.01 0.00 0.00 0.11 0.01 0.02 0.00P-DP 16.29BAYES 4A 2 - 2 0.03 0.00 0.06 0.05 0.00 0.00 0.00 0.07 0.00 0.01 0.00P-DP 9.67BAYES 4A 3 - 3 0.00 0.00 0.43 0.23 0.01 0.01 0.00 0.42 0.02 0.05 0.00P-DP 30.04BAYES 4A 4 - 4 0.04 0.00 0.00 0.00 0.00 0.00 0.00 0.00 0.00 0.00 0.00P-DP 0.00BELL 1A - 1A 0.00 0.00 45.86 27.93 0.28 0.61 0.00 47.84 0.67 3.68 0.00P-DP 32.38BIG EL 45-04 1AH - 1AH 1.02 0.03 39.41 23.60 2.21 0.39 0.00 30.68 5.22 4.40 0.00P-DP 31.26BIG EL 45-04 1SH - 1SH 7.91 0.24 84.35 51.62 2.67 0.97 0.00 76.60 6.31 8.11 0.00P-DP 42.63BIG EL 45-04 B 2MS - 2MS 9.56 0.29 55.04 33.70 1.04 0.68 0.00 53.72 2.45 4.85 0.00P-DP 37.47BIG EL 45-04 C 3SA - 3SA 3.72 0.11 74.51 44.41 1.59 0.91 0.00 71.75 3.75 6.68 0.00P-DP 42.54BIG EL 45-04 C 3SS - 3SS 5.68 0.17 62.89 40.52 1.63 0.75 0.00 59.03 3.85 5.82 0.00P-DP 36.80BIG EL 45-04 D 4MS - 4MS 5.83 0.18 57.09 33.08 3.10 0.57 0.00 44.94 7.34 6.31 0.00P-DP 39.72BIG EL 45-04 D 4SA - 4SA 11.11 0.34 79.84 48.63 3.60 0.85 0.00 66.77 8.52 8.36 0.00P-DP 42.50BIG EL 45-04 D 4SS - 4SS 12.90 0.39 5.06 2.87 0.03 0.07 0.00 5.33 0.05 0.43 0.00P-DP 33.12BIG JAY 10-15 A 1JD - 1JD 0.11 0.00 4.44 2.53 0.08 0.06 0.00 4.47 0.13 0.44 0.00P-DP 31.64BIG JAY 10-15 A 1LS - 1LS 0.28 0.01 3.10 2.03 0.10 0.04 0.00 2.96 0.16 0.35 0.00P-DP 24.54BIG JAY 10-15 A 1MS - 1MS 0.34 0.01 7.97 4.42 0.81 0.07 0.00 5.42 1.27 1.49 0.00P-DP 38.37BIG JAY 10-15 A 1WA - 1WA 2.76 0.12 3.81 2.38 0.33 0.04 0.00 2.83 0.51 0.65 0.00P-DP 27.68BIG JAY 10-15 B 2DN - 2DN 1.11 0.05 3.33 2.14 0.34 0.03 0.00 2.27 0.53 0.62 0.00P-DP 25.65BIG JAY 10-15 B 2LS - 2LS 1.15 0.05 3.71 2.28 0.48 0.03 0.00 2.14 0.75 0.80 0.00P-DP 27.92BIG JAY 10-15 B 2WB - 2WB 1.62 0.07 3.87 2.43 0.28 0.04 0.00 3.10 0.43 0.60 0.00P-DP 27.70BIG JAY 10-15 B 3JC - 3JC 0.94 0.04 3.97 2.34 0.57 0.03 0.00 2.05 0.90 0.92 0.00P-DP 29.78BIG JAY 10-15 C 4LS - 4LS 1.95 0.08 3.54 2.13 0.54 0.02 0.00 1.73 0.84 0.85 0.00P-DP 28.20BIG JAY 10-15 C 4WA - 4WA 1.83 0.08 1.38 0.90 0.18 0.01 0.00 0.78 0.28 0.30 0.00P-DP 18.08BIG JAY 10-15 D 5JC - 5JC 0.61 0.03 2.81 1.80 0.28 0.02 0.00 1.94 0.44 0.52 0.00P-DP 24.08BIG JAY 10-15 D 6DN - 6DN 0.95 0.04 3.34 1.95 0.33 0.03 0.00 2.32 0.51 0.61 0.00P-DP 28.27BIG JAY 10-15 D 6LS - 6LS 1.12 0.05 3.46 2.03 0.49 0.02 0.00 1.82 0.76 0.79 0.00P-DP 28.51BIG JAY 10-15 D 6WB - 6WB 1.66 0.07 4.03 2.30 0.37 0.04 0.00 2.88 0.59 0.71 0.00P-DP 30.60BIG JAY 10-15 E 7JD - 7JD 1.27 0.05 4.59 2.61 0.43 0.04 0.00 3.26 0.68 0.82 0.00P-DP 32.03BIG JAY 10-15 E 7LS - 7LS 1.48 0.06

Economic One-Liners Lease Name Life (years) Oil (Mbbl) Residue Gas (MMcf) Residue Gas (M$) Other (M$) Expense & Tax (M$) Invest. (M$) Non-Disc. (M$) Cash FlowNet Sales Volumes Net Revenue As of Date: 1/1/2024 Reserve Category Oil (M$) Disc. 10% (M$) NGL (M$) NGL (Mbbl) TABLE 6 0.97 0.69 0.18 0.00 0.00 0.35 0.28 0.27 0.00P-DP 13.28BIG JAY 10-15 E 7MS - 7MS 0.61 0.03 3.01 1.86 0.35 0.02 0.00 1.90 0.54 0.60 0.00P-DP 25.92BIG JAY 10-15 E 7WA - 7WA 1.18 0.05 4.07 2.48 0.25 0.04 0.00 3.40 0.40 0.59 0.00P-DP 29.18BIG JAY 10-15 F 4MS - 4MS 0.86 0.04 8.21 4.73 0.25 0.10 0.00 7.50 0.59 0.78 0.00P-DP 35.21BIGHORN 33E 2HJ - 2HJ 0.90 0.03 12.26 7.02 0.46 0.14 0.00 10.73 1.10 1.23 0.00P-DP 40.76BIGHORN 33G 3HJ - 3HJ 1.66 0.05 3.15 2.13 0.05 0.04 0.00 3.11 0.12 0.27 0.00P-DP 17.25BIGHORN HORIZONTAL UNIT 1HJ - 1HJ 0.18 0.01 0.46 0.23 0.00 0.01 0.00 0.49 0.01 0.05 0.00P-DP 30.98BILLINGSLEY 12 1 - 1 0.00 0.00 0.52 0.21 0.00 0.01 0.00 0.55 0.00 0.05 0.00P-DP 36.61BIZZELL -B- 1 - 1 0.01 0.00 0.44 0.22 0.00 0.01 0.00 0.45 0.01 0.04 0.00P-DP 26.92BIZZELL -B- 2 - 2 0.02 0.00 7.47 4.00 0.27 0.08 0.00 6.54 0.63 1.04 0.00P-DP 23.07BIZZELL 1 - 1 1.33 0.06 14.04 9.37 0.00 0.19 0.00 15.24 0.01 1.22 0.00P-DP 22.46BIZZELL-IRVIN 15L UNIT 116H - 116H 0.02 0.00 28.77 16.45 1.74 0.27 0.00 21.25 4.02 4.96 0.00P-DP 34.97BIZZELL-IRVIN 15L UNIT 13H - 13H 8.46 0.39 22.34 12.81 1.14 0.22 0.00 17.72 2.63 3.55 0.00P-DP 31.93BIZZELL-IRVIN 15L UNIT 18H - 18H 5.54 0.25 18.65 10.99 0.52 0.22 0.00 17.27 1.20 2.36 0.00P-DP 28.97BIZZELL-IRVIN 15U UNIT 113H - 113H 2.53 0.12 37.02 20.76 1.02 0.43 0.00 34.33 2.37 4.66 0.00P-DP 37.50BIZZELL-IRVIN 15U UNIT 114H - 114H 4.98 0.23 23.09 13.97 0.46 0.28 0.00 22.45 1.06 2.65 0.00P-DP 29.92BIZZELL-IRVIN 15U UNIT 115H - 115H 2.23 0.10 22.84 13.22 0.66 0.27 0.00 21.03 1.52 2.92 0.00P-DP 30.92BIZZELL-IRVIN 15U UNIT 117H - 117H 3.20 0.15 34.25 19.58 0.81 0.41 0.00 32.54 1.88 4.12 0.00P-DP 36.05BIZZELL-IRVIN 15U UNIT 118H - 118H 3.95 0.18 24.70 14.36 0.54 0.30 0.00 23.73 1.25 2.91 0.00P-DP 31.62BIZZELL-IRVIN 15U UNIT 14H - 14H 2.63 0.12 27.63 15.63 0.86 0.32 0.00 25.05 2.00 3.62 0.00P-DP 34.14BIZZELL-IRVIN 15U UNIT 15H - 15H 4.21 0.19 28.65 17.05 0.80 0.34 0.00 26.53 1.85 3.62 0.00P-DP 33.11BIZZELL-IRVIN 15U UNIT 16H - 16H 3.88 0.18 44.59 25.25 0.22 0.60 0.00 47.21 0.50 4.17 0.00P-DP 38.62BIZZELL-IRVIN 15U UNIT 17H - 17H 1.05 0.05 0.00 0.00 0.00 0.00 0.00 0.00 0.00 0.00 0.00P-DP 0.00BLACK STONE 34-216 1H - 1H 0.00 0.00 0.00 0.00 0.00 0.00 0.00 0.00 0.00 0.00 0.00P-DP 0.00BLACK STONE 34-216 2H - 2H 0.00 0.00 0.05 0.05 0.00 0.00 0.00 0.05 0.00 0.00 0.00P-DP 0.50BLACK, S.E. 42 1 - 1 0.00 0.00 0.64 0.51 0.01 0.01 0.00 0.61 0.04 0.06 0.00P-DP 6.78BLACK, S.E. 42 9 - 9 0.06 0.00 5.38 3.45 0.18 0.07 0.00 5.21 0.49 0.89 0.00P-DP 48.88BOBCAT 55-1-16-21 E 12H 0.57 0.02 6.06 3.89 0.20 0.07 0.00 5.87 0.55 1.00 0.00P-DP 50.00BOBCAT 55-1-16-21 F 13H 0.64 0.02 5.17 3.32 0.15 0.06 0.00 5.09 0.41 0.81 0.00P-DP 48.26BOBCAT 55-1-16-21 G 14H 0.47 0.02 5.49 3.52 0.15 0.07 0.00 5.44 0.41 0.83 0.00P-DP 48.96BOBCAT 55-1-16-21 H 15H 0.47 0.02 3.58 2.31 0.20 0.04 0.00 3.17 0.53 0.75 0.00P-DP 44.43BOBCAT 55-1-16-21 I 21H 0.62 0.02 3.55 2.29 0.16 0.04 0.00 3.29 0.43 0.66 0.00P-DP 44.14BOBCAT 55-1-16-21 J 22H 0.49 0.02 2.43 1.22 0.12 0.03 0.00 2.23 0.31 0.47 0.00P-DP 43.95BOBCAT 55-1-28 UNIT 1H - 1H 0.36 0.01 23.96 11.56 0.50 0.30 0.00 22.71 1.16 1.90 0.00P-DP 44.63BOENING UNIT 1H - 1H 1.98 0.11 25.02 12.79 2.02 0.19 0.00 14.57 4.71 2.27 0.00P-DP 50.00BOENING UNIT 2H - 2H 8.01 0.43

Economic One-Liners Lease Name Life (years) Oil (Mbbl) Residue Gas (MMcf) Residue Gas (M$) Other (M$) Expense & Tax (M$) Invest. (M$) Non-Disc. (M$) Cash FlowNet Sales Volumes Net Revenue As of Date: 1/1/2024 Reserve Category Oil (M$) Disc. 10% (M$) NGL (M$) NGL (Mbbl) TABLE 6 86.26 48.47 4.50 0.86 0.00 65.33 10.46 7.36 0.00P-DP 31.73BOENING UNIT 3H - 3H 17.82 0.95 48.18 27.65 2.15 0.51 0.00 38.68 5.01 4.04 0.00P-DP 50.00BOENING UNIT 4H - 4H 8.53 0.45 52.67 30.93 2.25 0.57 0.00 42.90 5.24 4.40 0.00P-DP 27.63BOENING UNIT 6L - 6L 8.93 0.48 93.70 57.31 3.48 1.05 0.00 79.56 8.09 7.72 0.00P-DP 33.10BOENING UNIT 6U - 6U 13.77 0.73 3.24 1.92 0.04 0.05 0.00 3.60 0.20 0.58 0.00P-DP 21.27BOLT 15-33H - 15-33H 0.01 0.00 24.82 16.93 1.02 0.33 0.00 25.53 5.04 6.09 0.00P-DP 16.42BOLT 406-0904H - 406-0904H 0.35 0.01 27.99 18.01 0.82 0.38 0.00 29.75 4.07 6.10 0.00P-DP 18.65BOLT 407-0904H - 407-0904H 0.28 0.01 0.00 0.00 0.00 0.00 0.00 0.00 0.00 0.00 0.00P-DP 0.00BONACCI 1 - 1 0.00 0.00 0.00 0.00 0.00 0.00 0.00 0.00 0.00 0.00 0.00P-DP 0.00BONACCI 2 - 2 0.00 0.00 1.27 0.78 0.01 0.02 0.00 1.35 0.01 0.12 0.00P-DP 21.75BOREAS 79 1H - 1H 0.02 0.00 49.41 40.36 34.66 0.00 0.00 0.00 92.45 43.04 0.00P-DP 8.67BORUM E SMF JF 4H - 4H 0.00 0.00 62.56 46.24 43.89 0.00 0.00 0.00 117.05 54.50 0.00P-DP 13.31BORUM E SMF JF 6H - 6H 0.00 0.00 3.87 2.89 2.71 0.00 0.00 0.00 7.24 3.37 0.00P-DP 12.99BORUM W SMF JF 2H - 2H 0.00 0.00 0.71 0.42 0.03 0.01 0.00 0.61 0.07 0.07 0.00P-DP 26.91BOW TIE 41-44 1AH - 1AH 0.10 0.00 0.39 0.26 0.00 0.01 0.00 0.42 0.00 0.03 0.00P-DP 17.53BOW TIE 41-44 1BH - 1BH 0.01 0.00 0.36 0.23 0.00 0.00 0.00 0.36 0.01 0.03 0.00P-DP 17.65BOW TIE 41-44 2AH - 2AH 0.02 0.00 0.38 0.25 0.01 0.00 0.00 0.35 0.03 0.04 0.00P-DP 18.13BOW TIE 41-44 2SH - 2SH 0.04 0.00 0.77 0.46 0.02 0.01 0.00 0.71 0.05 0.07 0.00P-DP 27.65BOW TIE 41-44 3AH - 3AH 0.08 0.00 0.56 0.35 0.02 0.01 0.00 0.50 0.04 0.05 0.00P-DP 22.93BOW TIE 41-44 3SH - 3SH 0.06 0.00 5.23 3.12 0.12 0.06 0.00 4.98 0.29 0.47 0.00P-DP 42.92BOX 42-55 UNIT 3LS - 3LS 0.43 0.01 4.13 2.71 0.07 0.05 0.00 4.05 0.17 0.36 0.00P-DP 35.61BOX 42-55 UNIT 4WA - 4WA 0.26 0.01 0.40 0.24 0.01 0.00 0.00 0.37 0.02 0.05 0.00P-DP 24.24BOX NAIL 2LM - 2LM 0.05 0.00 0.45 0.27 0.02 0.01 0.00 0.42 0.02 0.05 0.00P-DP 25.52BOX NAIL 3LL - 3LL 0.05 0.00 0.51 0.29 0.02 0.01 0.00 0.45 0.04 0.06 0.00P-DP 28.28BOX NAIL E 1LM - 1LM 0.08 0.00 3.53 2.27 0.08 0.04 0.00 3.38 0.19 0.32 0.00P-DP 32.28BOX UNIT 42-55 1AH - 1AH 0.29 0.01 3.19 1.98 0.06 0.04 0.00 3.14 0.13 0.28 0.00P-DP 35.54BOX UNIT 42-55 1SH 0.20 0.01 3.68 2.23 0.07 0.05 0.00 3.60 0.16 0.32 0.00P-DP 38.06BOX UNIT 42-55 2AH - 2AH 0.24 0.01 3.60 2.17 0.03 0.05 0.00 3.70 0.08 0.29 0.00P-DP 37.81BOX UNIT 42-55 2SH - 2SH 0.12 0.00 0.00 0.00 0.00 0.00 0.00 0.00 0.00 0.00 0.00P-DP 0.00BOYD, FANNIE 4 - 4 0.00 0.00 0.00 0.00 0.00 0.00 0.00 0.00 0.00 0.00 0.00P-DP 0.00BOYD, FANNIE 5 - 5 0.00 0.00 0.00 0.00 0.00 0.00 0.00 0.00 0.00 0.00 0.00P-DP 0.00BOYD, FANNIE 8 - 8 0.00 0.00 5.98 4.21 0.45 0.06 0.00 4.93 0.63 1.08 0.00P-DP 17.88BRACERO 226-34 UNIT 1H - 1H 1.50 0.06 7.30 3.85 0.50 0.08 0.00 6.21 0.69 1.25 0.00P-DP 26.02BRAMBLETT 34-216 1H - 1H 1.66 0.07 1.55 0.88 0.01 0.02 0.00 1.60 0.03 0.15 0.00P-DP 40.15BRAUN B S1 2008LH - 2008LH 0.07 0.00 0.97 0.59 0.02 0.01 0.00 0.95 0.04 0.11 0.00P-DP 32.95BRAUN B S10 2014JH - 2014JH 0.09 0.00

Economic One-Liners Lease Name Life (years) Oil (Mbbl) Residue Gas (MMcf) Residue Gas (M$) Other (M$) Expense & Tax (M$) Invest. (M$) Non-Disc. (M$) Cash FlowNet Sales Volumes Net Revenue As of Date: 1/1/2024 Reserve Category Oil (M$) Disc. 10% (M$) NGL (M$) NGL (Mbbl) TABLE 6 2.59 1.64 0.05 0.03 0.00 2.54 0.11 0.29 0.00P-DP 32.28BRAUN B S11 2004LH - 2004LH 0.23 0.01 5.67 3.39 0.15 0.07 0.00 5.28 0.35 0.71 0.00P-DP 42.26BRAUN B S12 2004MH - 2004MH 0.74 0.03 4.36 2.63 0.06 0.06 0.00 4.40 0.13 0.46 0.00P-DP 38.68BRAUN B S13 2003LH - 2003LH 0.28 0.01 4.98 3.04 0.09 0.06 0.00 4.91 0.20 0.56 0.00P-DP 39.73BRAUN B S14 2003MH - 2003MH 0.42 0.02 1.18 0.80 0.01 0.02 0.00 1.22 0.03 0.12 0.00P-DP 31.98BRAUN B S2 2008MH - 2008MH 0.06 0.00 0.84 0.55 0.01 0.01 0.00 0.85 0.03 0.09 0.00P-DP 31.84BRAUN B S3 2007LH - 2007LH 0.06 0.00 0.89 0.54 0.01 0.01 0.00 0.90 0.03 0.09 0.00P-DP 34.54BRAUN B S4 2007MH - 2007MH 0.06 0.00 1.53 0.87 0.02 0.02 0.00 1.57 0.04 0.15 0.00P-DP 41.99BRAUN B S5 2016JH - 2016JH 0.07 0.00 1.15 0.65 0.03 0.01 0.00 1.07 0.07 0.15 0.00P-DP 40.00BRAUN B S6 2006LH - 2006LH 0.16 0.01 1.13 0.73 0.02 0.01 0.00 1.11 0.05 0.13 0.00P-DP 34.34BRAUN B S7 2006MH - 2006MH 0.10 0.00 0.80 0.47 0.03 0.01 0.00 0.70 0.07 0.11 0.00P-DP 35.13BRAUN B S8 2005LH - 2005LH 0.14 0.01 2.65 1.62 0.07 0.03 0.00 2.50 0.15 0.32 0.00P-DP 38.65BRAUN B S9 2005MH - 2005MH 0.32 0.01 7.60 4.24 0.08 0.10 0.00 7.82 0.18 0.77 0.00P-DP 47.18BRAUN B W1 2001MH - 2001MH 0.38 0.02 4.82 2.74 0.06 0.06 0.00 4.91 0.13 0.50 0.00P-DP 41.74BRAUN B W3 2001LH - 2001LH 0.28 0.01 6.25 2.79 0.11 0.08 0.00 6.19 0.24 0.69 0.00P-DP 43.17BRAUN C W10 2106LH - 2106LH 0.51 0.02 1.77 0.95 0.12 0.02 0.00 1.25 0.27 0.32 0.00P-DP 41.73BRAUN C W11 2106BH - 2106BH 0.57 0.03 6.91 3.66 0.07 0.09 0.00 7.09 0.17 0.70 0.00P-DP 41.73BRAUN C W5 2108LH - 2108LH 0.35 0.02 1.50 0.78 0.10 0.01 0.00 1.08 0.22 0.27 0.00P-DP 37.00BRAUN C W6 2108BH - 2108BH 0.47 0.02 2.02 1.04 0.03 0.03 0.00 2.03 0.07 0.22 0.00P-DP 37.00BRAUN C W7 2107MH - 2107MH 0.14 0.01 2.74 1.54 0.04 0.03 0.00 2.74 0.10 0.30 0.00P-DP 37.00BRAUN C W8 2107LH - 2107LH 0.20 0.01 1.35 0.79 0.04 0.02 0.00 1.25 0.09 0.17 0.00P-DP 37.25BRAUN C W9 2106MH - 2106MH 0.18 0.01 12.73 7.01 0.46 0.14 0.00 11.28 1.08 1.26 0.00P-DP 34.60BROKEN ARROW 55-54-1-12 H 3LS - H 3LS 1.63 0.05 14.56 7.53 0.49 0.17 0.00 13.08 1.15 1.42 0.00P-DP 37.72BROKEN ARROW 55-54-1-12 H 4W - H 4W 1.75 0.05 10.51 5.96 0.90 0.11 0.00 8.33 1.24 2.01 0.00P-DP 43.30BROOKE 184-185 UNIT 132H - 132H 2.96 0.12 16.58 8.87 1.25 0.18 0.00 13.73 1.72 2.97 0.00P-DP 50.00BROOKE 184-185 UNIT 221H - 221H 4.11 0.17 11.60 6.45 1.08 0.11 0.00 8.88 1.49 2.32 0.00P-DP 45.17BROOKE 184-185 UNIT 232H - 232H 3.55 0.15 7.54 4.33 0.68 0.08 0.00 5.84 0.94 1.49 0.00P-DP 38.29BROOKE 184-185 UNIT 233H - 233H 2.25 0.09 10.75 5.30 1.07 0.10 0.00 7.99 1.47 2.23 0.00P-DP 42.51BROOKE 184-185 UNIT 2H - 2H 3.51 0.14 14.44 7.75 1.59 0.13 0.00 10.18 2.20 3.18 0.00P-DP 49.25BROOKE 184-185 UNIT 331H - 331H 5.25 0.22 21.13 10.24 0.44 0.27 0.00 21.05 0.70 2.13 0.00P-DP 36.89BROOKS 1 - 1 1.51 0.06 0.30 0.21 0.00 0.00 0.00 0.33 0.00 0.03 0.00P-DP 9.46BROWN, A. D. 2 - 2 0.00 0.00 143.99 76.27 5.39 1.60 0.00 126.30 12.75 14.38 0.00P-DP 33.20BRUT 40-33 #1AH - 1AH 19.31 0.59 3.27 1.49 0.00 0.04 0.00 3.52 0.00 0.25 0.00P-DP 47.50BUCHANAN 3111 2 - 2 0.00 0.00 1.95 1.01 0.08 0.02 0.00 1.83 0.22 0.36 0.00P-DP 41.79BUCKEYE 55-1-28 UNIT 1H - 1H 0.26 0.01 368.63 242.06 250.58 0.00 0.00 0.00 688.35 803.98 0.00P-DP 18.37BUELL 10-11-5 10H - 10H 484.25 20.64

Economic One-Liners Lease Name Life (years) Oil (Mbbl) Residue Gas (MMcf) Residue Gas (M$) Other (M$) Expense & Tax (M$) Invest. (M$) Non-Disc. (M$) Cash FlowNet Sales Volumes Net Revenue As of Date: 1/1/2024 Reserve Category Oil (M$) Disc. 10% (M$) NGL (M$) NGL (Mbbl) TABLE 6 24.88 18.07 16.21 0.02 0.00 1.20 44.53 52.18 0.00P-DP 9.79BUELL 10-11-5 1H - 1H 31.33 1.34 432.61 248.62 293.89 0.00 0.00 0.31 807.32 942.97 0.00P-DP 25.17BUELL 10-11-5 206H - 206H 567.94 24.20 494.86 289.55 335.68 0.02 0.00 1.23 922.11 1,077.17 0.00P-DP 23.85BUELL 10-11-5 210H - 210H 648.70 27.64 15.49 12.40 10.13 0.01 0.00 0.69 27.82 32.59 0.00P-DP 6.48BUELL 10-11-5 2H - 2H 19.57 0.83 23.03 16.88 15.41 0.01 0.00 0.42 42.33 49.50 0.00P-DP 9.35BUELL 10-11-5 3H - 3H 29.78 1.27 35.74 24.36 23.25 0.03 0.00 1.78 63.88 74.86 0.00P-DP 12.60BUELL 10-11-5 4H - 4H 44.94 1.92 153.50 101.76 104.34 0.00 0.00 0.00 286.63 334.78 0.00P-DP 17.13BUELL 10-11-5 6H - 6H 201.65 8.59 0.01 0.01 0.00 0.00 0.00 0.00 0.00 0.00 0.00P-DP 5.48BURKHOLDER A UNIT 1 - 1 0.01 0.00 27.21 11.53 0.16 0.37 0.00 28.73 0.25 2.30 0.00P-DP 47.33BUTCHEE 21 1 - 1 0.54 0.02 9.38 4.46 0.13 0.12 0.00 9.61 0.20 0.87 0.00P-DP 31.20BUTCHEE 21 2 - 2 0.44 0.02 35.34 15.11 0.14 0.48 0.00 37.56 0.22 2.92 0.00P-DP 50.00BUTCHEE 21 3 - 3 0.48 0.02 9.00 4.51 0.04 0.12 0.00 9.53 0.07 0.75 0.00P-DP 29.68BUTCHEE 21 4 - 4 0.15 0.01 2.29 1.56 0.03 0.03 0.00 2.35 0.05 0.21 0.00P-DP 11.92BUTCHEE 21 5 - 5 0.11 0.00 24.27 10.72 0.55 0.31 0.00 24.01 0.87 2.50 0.00P-DP 44.96BUTCHEE 21 6 - 6 1.89 0.08 15.45 6.95 0.28 0.20 0.00 15.59 0.43 1.51 0.00P-DP 38.45BUTCHEE 21 7 - 7 0.94 0.04 28.70 12.37 0.23 0.39 0.00 30.05 0.36 2.50 0.00P-DP 47.81BUTCHEE 21 8 - 8 0.79 0.03 8.12 4.96 0.16 0.11 0.00 8.29 0.24 0.87 0.00P-DP 26.78BUZZARD NORTH 6972 A 1H - A 1H 0.47 0.02 14.86 8.61 1.10 0.16 0.00 12.49 1.68 2.51 0.00P-DP 34.85BUZZARD NORTH 6972 B 2H - B 2H 3.21 0.13 15.18 8.78 0.71 0.18 0.00 14.13 1.08 2.10 0.00P-DP 35.00BUZZARD NORTH 6972 S 3H - S 3H 2.07 0.08 24.12 13.51 1.36 0.28 0.00 21.67 2.07 3.60 0.00P-DP 38.88BUZZARD SOUTH 6972 A 3H - A 3H 3.98 0.16 21.20 12.15 1.20 0.25 0.00 19.02 1.84 3.17 0.00P-DP 37.82BUZZARD SOUTH 6972 A 4H - A 4H 3.52 0.14 13.19 7.94 0.57 0.16 0.00 12.41 0.88 1.78 0.00P-DP 30.42BUZZARD SOUTH 6972 B 1H - B 1H 1.68 0.07 1.77 0.89 0.04 0.02 0.00 1.81 0.05 0.21 0.00P-DP 31.93BYRD 34-170 UNIT 3H - 3H 0.12 0.00 0.03 0.03 0.01 0.00 0.00 0.01 0.01 0.01 0.00P-DP 1.92BYRD 34-170 UNIT 4H - 4H 0.03 0.00 16.60 9.27 1.30 0.18 0.00 13.56 1.79 3.04 0.00P-DP 38.34CALIFORNIA CHROME UNIT 2H - 2H 4.29 0.18 16.76 8.63 1.33 0.18 0.00 13.63 1.83 3.08 0.00P-DP 40.21CALIFORNIA CHROME UNIT 5003HR - 5003HR 4.38 0.18 86.27 54.18 2.54 0.98 0.00 76.73 7.55 9.32 0.00P-DP 38.72CALVERLEY-LANE 30G 7H - 7H 11.31 0.60 58.14 38.21 1.64 0.66 0.00 52.16 4.88 6.20 0.00P-DP 32.90CALVERLEY-LANE 30H 8H - 8H 7.31 0.39 111.35 68.89 1.96 1.37 0.00 107.36 5.82 10.56 0.00P-DP 41.91CALVERLEY-LANE 30I 9H - 9H 8.72 0.46 74.70 45.16 3.56 0.74 0.00 57.92 10.55 9.57 0.00P-DP 38.25CALVERLEY-LANE 30J 10H - 10H 15.81 0.84 81.98 50.61 2.11 0.95 0.00 74.88 6.25 8.51 0.00P-DP 38.73CALVERLEY-LANE 30K 11H - 11H 9.37 0.50 67.41 41.75 2.44 0.73 0.00 57.11 7.24 7.78 0.00P-DP 36.54CALVERLEY-LANE 30L 12H - 12H 10.85 0.58 1.39 0.81 0.23 0.00 0.00 0.18 0.54 0.45 0.00P-DP 26.17CARALYNE 24 1 - 1 1.13 0.05 26.71 16.51 0.55 0.37 0.00 28.24 1.95 3.91 0.00P-DP 16.67CASSIDY UNIT 26-23 1H - 1H 0.43 0.02 135.78 69.25 1.52 1.89 0.00 145.18 5.38 15.95 0.00P-DP 38.18CASSIDY UNIT 26-23 5AH - 5AH 1.18 0.04

Economic One-Liners Lease Name Life (years) Oil (Mbbl) Residue Gas (MMcf) Residue Gas (M$) Other (M$) Expense & Tax (M$) Invest. (M$) Non-Disc. (M$) Cash FlowNet Sales Volumes Net Revenue As of Date: 1/1/2024 Reserve Category Oil (M$) Disc. 10% (M$) NGL (M$) NGL (Mbbl) TABLE 6 6.35 3.26 0.00 0.09 0.00 6.83 0.00 0.48 0.00P-DP 27.82CATES 24 1 - 1 0.00 0.00 395.77 269.34 277.67 0.00 0.00 0.00 740.56 344.78 0.00P-DP 19.59CENA WYN JF 2H - 2H 0.00 0.00 149.32 120.83 104.77 0.00 0.00 0.00 279.41 130.09 0.00P-DP 8.84CENA WYN JF 4H - 4H 0.00 0.00 56.18 30.57 1.57 0.72 0.00 55.85 2.16 6.98 0.00P-DP 38.64CHALUPA 34-153 UNIT 1H - 1H 5.16 0.21 91.42 50.57 1.54 1.22 0.00 94.40 2.13 10.19 0.00P-DP 43.39CHALUPA 34-153 UNIT 2H - 2H 5.08 0.21 0.17 0.14 0.07 0.00 0.00 0.01 0.33 0.18 0.00P-DP 5.49CHAMBERS FED W-39138 1-25 - 1-25 0.02 0.00 19.09 11.89 0.38 0.23 0.00 18.51 0.91 1.70 0.00P-DP 33.88CHAPARRAL UNIT A1 15SH - 15SH 1.37 0.04 16.81 10.98 0.29 0.21 0.00 16.57 0.68 1.46 0.00P-DP 31.10CHAPARRAL UNIT A1 21H - 21H 1.03 0.03 18.95 11.27 0.40 0.23 0.00 18.28 0.94 1.70 0.00P-DP 37.37CHAPARRAL UNIT A1 8AH - 8AH 1.42 0.04 16.39 9.78 0.64 0.22 0.00 16.95 2.25 3.31 0.00P-DP 34.46CHAPARRAL UNIT A2 7AH - 7AH 0.49 0.02 10.47 7.01 0.28 0.14 0.00 11.00 0.97 1.72 0.00P-DP 26.27CHAPARRAL UNIT A3 14SH - 14SH 0.21 0.01 11.49 7.01 0.52 0.15 0.00 11.79 1.83 2.54 0.00P-DP 30.12CHAPARRAL UNIT A3 20H - 20H 0.40 0.02 17.87 10.33 0.50 0.24 0.00 18.73 1.76 3.01 0.00P-DP 36.01CHAPARRAL UNIT A4 6AH - 6AH 0.39 0.01 13.59 8.32 0.34 0.17 0.00 13.26 0.51 2.09 0.00P-DP 31.80CHAPARRAL UNIT A5 13SH - 13SH 1.91 0.07 4.61 2.98 0.01 0.06 0.00 4.97 0.02 0.45 0.00P-DP 20.69CHAPARRAL UNIT A5 19H - 19H 0.07 0.00 24.09 15.13 0.56 0.30 0.00 23.70 0.84 3.60 0.00P-DP 37.14CHAPARRAL UNIT A5 5AH - 5AH 3.15 0.11 14.47 8.78 6.87 0.00 0.00 0.00 16.19 1.72 0.00P-DP 26.98CHARLIE 210468 7A - 7A 0.00 0.00 10.50 6.70 4.98 0.00 0.00 0.00 11.74 1.25 0.00P-DP 22.78CHARLIE 210468 8B - 8B 0.00 0.00 144.53 89.04 68.60 0.00 0.00 0.00 161.68 17.15 0.00P-DP 27.04CHARLIE 210469 10B - 10B 0.00 0.00 141.05 86.92 66.94 0.00 0.00 0.00 157.78 16.73 0.00P-DP 26.80CHARLIE 210469 9A - 9A 0.00 0.00 110.27 65.78 52.33 0.00 0.00 0.00 123.35 13.08 0.00P-DP 18.77CHARLIE 210472 4A - 4A 0.00 0.00 103.69 66.25 49.21 0.00 0.00 0.00 115.99 12.30 0.00P-DP 16.75CHARLIE 210472 5B - 5B 0.00 0.00 68.83 47.52 32.67 0.00 0.00 0.00 77.00 8.17 0.00P-DP 12.46CHARLIE 210472 6C - 6C 0.00 0.00 5.45 2.84 0.05 0.08 0.00 6.07 0.11 0.79 0.00P-DP 29.70CHAROLAIS 28 21 B2NC STATE COM 001H - 001H 0.07 0.00 4.32 2.67 0.05 0.06 0.00 4.78 0.10 0.63 0.00P-DP 24.29CHAROLAIS 28 21 W1MD STATE COM 001H - 001H 0.06 0.00 346.63 213.11 4.64 4.88 0.00 381.92 9.45 50.76 0.00P-DP 36.96CHAROLAIS 33 21 B1GB STATE COM 001H - 001H 6.01 0.15 281.62 172.56 3.39 3.98 0.00 311.39 6.90 41.07 0.00P-DP 39.22CHAROLAIS 33 21 B1HA STATE COM 001H - 001H 4.39 0.11 4.93 2.99 0.05 0.06 0.00 5.03 0.12 0.41 0.00P-DP 33.80CHEVRON 3-38 2AH - 2AH 0.18 0.01 8.78 5.20 0.05 0.12 0.00 9.19 0.12 0.70 0.00P-DP 42.42CHEVRON 3-38 2SH - 2SH 0.18 0.01 8.88 4.63 0.63 0.08 0.00 6.22 1.49 1.07 0.00P-DP 45.90CHEVRON 3-38 WOLFCAMP UNIT 1H - 1H 2.25 0.07 3.19 2.82 0.26 0.04 0.00 2.68 0.27 0.33 0.00P-DP 2.95CHILDRESS 140 1 - 1 0.56 0.03 1.48 1.31 0.07 0.02 0.00 1.37 0.08 0.12 0.00P-DP 2.75CHILDRESS 140 2 - 2 0.15 0.01 1.43 1.32 0.02 0.02 0.00 1.47 0.03 0.11 0.00P-DP 1.86CHILDRESS 140 5 - 5 0.05 0.00 2.24 1.14 0.09 0.03 0.00 2.11 0.24 0.40 0.00P-DP 38.57CHINOOK 55-1-7 UNIT 1H - 1H 0.28 0.01 0.69 0.37 0.03 0.01 0.00 0.64 0.04 0.06 0.00P-DP 23.32CHRIESMAN 2 - 2 0.07 0.00

Economic One-Liners Lease Name Life (years) Oil (Mbbl) Residue Gas (MMcf) Residue Gas (M$) Other (M$) Expense & Tax (M$) Invest. (M$) Non-Disc. (M$) Cash FlowNet Sales Volumes Net Revenue As of Date: 1/1/2024 Reserve Category Oil (M$) Disc. 10% (M$) NGL (M$) NGL (Mbbl) TABLE 6 0.06 0.06 0.00 0.00 0.00 0.06 0.00 0.01 0.00P-DP 3.62CHRIESMAN 3 - 3 0.01 0.00 0.56 0.39 0.04 0.01 0.00 0.39 0.08 0.05 0.00P-DP 10.88CHUMCHAL UNIT 1H - 1H 0.14 0.01 6.29 4.25 0.19 0.07 0.00 5.63 0.43 0.51 0.00P-DP 12.80CHUMCHAL UNIT 4H - 4H 0.74 0.04 57.20 32.18 2.07 0.64 0.00 48.90 4.81 4.70 0.00P-DP 36.38CHUMCHAL UNIT 6L - 6L 8.20 0.44 58.12 32.80 1.97 0.66 0.00 50.46 4.59 4.75 0.00P-DP 50.00CHUMCHAL UNIT 7L - 7L 7.82 0.42 4.31 2.46 0.08 0.06 0.00 4.43 0.11 0.49 0.00P-DP 42.47CHURRO 34-157/158 UNIT 1H - 1H 0.26 0.01 139.91 82.13 4.31 1.62 0.00 127.62 10.21 13.39 0.00P-DP 41.01CLARICE STARLING SUNDOWN B 4521LS - 4521LS 15.46 0.47 96.37 55.84 3.60 1.07 0.00 84.56 8.52 9.62 0.00P-DP 41.27CLARICE STARLING SUNDOWN D 4542WA - 4542WA 12.90 0.39 0.00 0.00 0.00 0.00 0.00 0.00 0.00 0.00 0.00P-DP 0.00CLAWSON 3 - 3 0.00 0.00 4.14 2.46 0.04 0.06 0.00 4.44 0.14 0.46 0.00P-DP 33.53CLEMENTS ALLOCATION A 26-35 4HA - 4HA 0.03 0.00 8.74 4.06 0.05 0.12 0.00 9.23 0.08 0.74 0.00P-DP 35.87COFFIELD -A- 1 - 1 0.17 0.01 4.09 2.18 0.03 0.06 0.00 4.30 0.05 0.35 0.00P-DP 24.64COFFIELD 1 - 1 0.10 0.00 0.33 0.22 0.00 0.00 0.00 0.35 0.00 0.03 0.00P-DP 18.25COLE 36-37 A UNIT A 2H - A 2H 0.00 0.00 79.56 39.01 2.77 0.90 0.00 68.64 6.45 6.52 0.00P-DP 50.00COLLE UNIT 1H - 1H 10.99 0.59 243.24 171.92 170.66 0.00 0.00 0.00 455.15 211.91 0.00P-DP 13.35COLLINS WYN JF 2H - 2H 0.00 0.00 270.46 188.29 189.76 0.00 0.00 0.00 506.08 235.62 0.00P-DP 14.31COLLINS WYN JF 4H - 4H 0.00 0.00 232.90 172.78 163.40 0.00 0.00 0.00 435.80 202.90 0.00P-DP 11.76COLLINS WYN JF 6H - 6H 0.00 0.00 0.02 0.01 0.00 0.00 0.00 0.01 0.00 0.00 0.00P-DP 5.40COLUMBINE 34-167 3H - 3H 0.00 0.00 0.23 0.11 0.01 0.00 0.00 0.23 0.01 0.03 0.00P-DP 29.79COLUMBINE 34-167 4H - 4H 0.02 0.00 0.00 0.00 0.00 0.00 0.00 0.00 0.00 0.00 0.00P-DP 0.00CONNER 15 1 - 1 0.00 0.00 146.49 67.07 3.98 1.73 0.00 136.50 9.41 13.68 0.00P-DP 46.67CONNER 15 1504N - 1504N 14.25 0.43 0.00 0.00 0.00 0.00 0.00 0.00 0.00 0.00 0.00P-DP 0.00CONNER 15 2 - 2 0.00 0.00 90.16 40.61 5.33 0.87 0.00 68.70 12.61 10.23 0.00P-DP 40.23CONNER 15 3 - 3 19.09 0.58 335.66 193.79 10.51 3.87 0.00 305.32 24.89 32.22 0.00P-DP 45.00CONNER 15-10 (ALLOC-A) 1NA - 1NA 37.68 1.15 110.76 70.94 3.74 1.26 0.00 99.28 8.86 10.81 0.00P-DP 27.53CONNER 15-10 (ALLOC-B) 2NB - 2NB 13.42 0.41 148.42 92.27 5.58 1.65 0.00 130.04 13.21 14.84 0.00P-DP 31.90CONNER 15-10 (ALLOC-B) 2NS - 2NS 20.01 0.61 214.93 119.07 2.85 2.74 0.00 216.15 6.75 18.18 0.00P-DP 40.22CONNER 15-10 (ALLOC-C) 3NA - 3NA 10.22 0.31 373.57 209.59 7.49 4.59 0.00 362.21 17.73 33.20 0.00P-DP 47.47CONNER 15-10 (ALLOC-D) 4NB - 4NB 26.84 0.82 58.16 35.75 7.30 0.30 0.00 23.76 17.28 9.04 0.00P-DP 22.35CONNER 15-10 (ALLOC-D) 4NS - 4NS 26.16 0.80 195.07 111.66 5.85 2.27 0.00 178.80 13.85 18.56 0.00P-DP 44.81CONNER 15-3 (ALLOC-E) 5NA - 5NA 20.98 0.64 173.74 98.11 5.01 2.03 0.00 160.35 11.85 16.40 0.00P-DP 43.98CONNER 15-3 (ALLOC-F) 6NB - 6NB 17.94 0.55 69.89 40.81 2.10 0.81 0.00 64.05 4.97 6.65 0.00P-DP 34.01CONNER 15-3 (ALLOC-F) 6NS - 6NS 7.52 0.23 293.77 150.13 7.18 3.53 0.00 277.99 16.99 26.92 0.00P-DP 50.00CONNER 15-3 (ALLOC-G) 7NA - 7NA 25.72 0.78 187.04 107.14 4.75 2.23 0.00 176.02 11.25 17.26 0.00P-DP 44.08CONNER 15-3 (ALLOC-H) 8NB - 8NB 17.03 0.52 126.61 73.74 3.42 1.50 0.00 118.08 8.09 11.81 0.00P-DP 37.10CONNER 15-3 (ALLOC-H) 8NS - 8NS 12.25 0.37

Economic One-Liners Lease Name Life (years) Oil (Mbbl) Residue Gas (MMcf) Residue Gas (M$) Other (M$) Expense & Tax (M$) Invest. (M$) Non-Disc. (M$) Cash FlowNet Sales Volumes Net Revenue As of Date: 1/1/2024 Reserve Category Oil (M$) Disc. 10% (M$) NGL (M$) NGL (Mbbl) TABLE 6 0.11 0.06 0.01 0.00 0.00 0.10 0.01 0.02 0.00P-DP 34.90CONSTANTAN 34-174 (N) 1H - 1H 0.02 0.00 18.44 8.73 0.05 0.25 0.00 19.70 0.08 1.50 0.00P-DP 39.82COOK 21 1 - 1 0.17 0.01 8.53 3.90 0.10 0.11 0.00 8.81 0.15 0.77 0.00P-DP 30.78COOK 21 2 - 2 0.33 0.01 12.80 5.66 0.13 0.17 0.00 13.28 0.21 1.15 0.00P-DP 36.25COOK 21 3 - 3 0.46 0.02 13.76 6.09 0.19 0.18 0.00 14.09 0.30 1.28 0.00P-DP 37.16COOK 21 4 - 4 0.65 0.03 5.65 2.79 0.04 0.08 0.00 5.92 0.07 0.49 0.00P-DP 25.04COOK 21 5 - 5 0.15 0.01 9.32 4.30 0.13 0.12 0.00 9.56 0.20 0.87 0.00P-DP 31.63COOK 21 6 - 6 0.43 0.02 12.60 5.58 0.17 0.17 0.00 12.93 0.26 1.17 0.00P-DP 36.01COOK 21 7 - 7 0.57 0.02 5.75 2.81 0.04 0.08 0.00 6.02 0.07 0.50 0.00P-DP 25.36COOK 21 8 - 8 0.15 0.01 14.00 7.41 1.16 0.14 0.00 11.22 1.60 2.63 0.00P-DP 37.80CORNELL 226-34 1H - 1H 3.82 0.16 0.10 0.07 0.00 0.00 0.00 0.11 0.00 0.01 0.00P-DP 8.84COWDEN F 2402 - 2402 0.00 0.00 0.83 0.53 0.01 0.01 0.00 0.84 0.02 0.09 0.00P-DP 23.56COWDEN F 2403 - 2403 0.05 0.00 0.83 0.50 0.01 0.01 0.00 0.85 0.02 0.09 0.00P-DP 21.41COWDEN F 2404 - 2404 0.05 0.00 0.60 0.35 0.00 0.01 0.00 0.62 0.01 0.06 0.00P-DP 22.77COWDEN F 2405 - 2405 0.02 0.00 0.60 0.45 0.01 0.01 0.00 0.62 0.01 0.07 0.00P-DP 10.92CRAZY CAMEL 1 - 1 0.03 0.00 3.08 1.89 0.03 0.04 0.00 3.26 0.04 0.32 0.00P-DP 28.97CRAZY CAMEL 2 - 2 0.10 0.00 0.00 0.00 0.00 0.00 0.00 0.00 0.00 0.00 0.00P-DP 0.00CRAZY CAMEL 5 - 5 0.00 0.00 0.56 0.41 0.00 0.01 0.00 0.60 0.01 0.06 0.00P-DP 11.21CRAZY CAMEL 6 - 6 0.01 0.00 1.04 0.69 0.02 0.01 0.00 1.07 0.03 0.12 0.00P-DP 17.38CRAZY CAMEL 7 - 7 0.06 0.00 31.60 19.21 0.11 0.42 0.00 33.43 0.26 2.48 0.00P-DP 20.42CRAZY CAT 41-32 #1SH - 1SH 0.39 0.01 60.81 36.20 2.10 0.69 0.00 54.27 4.97 5.96 0.00P-DP 26.69CRAZY CAT 41-32 #2AH - 2AH 7.53 0.23 50.59 29.92 2.92 0.49 0.00 38.91 6.91 5.70 0.00P-DP 25.38CRAZY CAT 41-32 #3SH - 3SH 10.46 0.32 26.92 17.04 0.18 0.36 0.00 28.02 0.42 2.16 0.00P-DP 18.30CRAZY CAT 41-32 #4AH - 4AH 0.64 0.02 318.10 189.71 223.18 0.00 0.00 0.00 595.22 277.12 0.00P-DP 18.33CROSS CREEK A 5H-20 - 5H-20 0.00 0.00 7.07 3.62 0.15 0.09 0.00 7.19 0.21 0.82 0.00P-DP 38.71CROSS V RANCH 34-170 UNIT 1H - 1H 0.49 0.02 16.16 9.78 7.67 0.00 0.00 0.00 18.08 1.92 0.00P-DP 27.46CROWIE E RCH BL 3H - 3H 0.00 0.00 14.88 8.60 7.06 0.00 0.00 0.00 16.65 1.77 0.00P-DP 27.86CROWIE RCH BL 1H - 1H 0.00 0.00 4.61 2.64 0.05 0.07 0.00 5.11 0.10 0.67 0.00P-DP 18.27CUATRO HIJOS FEE 003H - 003H 0.07 0.00 3.07 2.51 0.04 0.04 0.00 3.40 0.07 0.45 0.00P-DP 4.80CUATRO HIJOS FEE 004H - 004H 0.05 0.00 0.10 0.09 0.00 0.00 0.00 0.11 0.00 0.01 0.00P-DP 0.80CUATRO HIJOS FEE 008H - 008H 0.00 0.00 0.15 0.14 0.07 0.00 0.00 0.00 0.17 0.02 0.00P-DP 1.13CV RB SU58;SJ MONDELLO ETAL 18 001 - 1 0.00 0.00 0.00 0.00 0.00 0.00 0.00 0.00 0.00 0.00 0.00P-DP 0.00CV RB SUV;SHELBY INTERESTS 31 001 - 1 0.00 0.00 27.75 17.51 19.14 0.00 0.00 0.00 48.18 20.42 0.00P-DP 14.99CV RB SUW;LESHE 36 001 - 1 0.00 0.00 4.44 3.65 3.06 0.00 0.00 0.00 7.71 3.27 0.00P-DP 4.58CV RB SUW;NAC 36 001-ALT - 001-ALT 0.00 0.00 0.00 0.00 0.00 0.00 0.00 0.00 0.00 0.00 0.00P-DP 0.00DANIEL D & EDNA MILLER 1 - 1 0.00 0.00

Economic One-Liners Lease Name Life (years) Oil (Mbbl) Residue Gas (MMcf) Residue Gas (M$) Other (M$) Expense & Tax (M$) Invest. (M$) Non-Disc. (M$) Cash FlowNet Sales Volumes Net Revenue As of Date: 1/1/2024 Reserve Category Oil (M$) Disc. 10% (M$) NGL (M$) NGL (Mbbl) TABLE 6 3.18 1.68 0.16 0.04 0.00 2.91 0.22 0.48 0.00P-DP 41.71DANIELLE 183 UNIT 1H - 1H 0.53 0.02 3.21 1.66 0.23 0.03 0.00 2.70 0.32 0.56 0.00P-DP 42.21DANIELLE 183 UNIT 2H - 2H 0.76 0.03 5.40 2.74 0.18 0.07 0.00 5.11 0.28 0.62 0.00P-DP 32.02DARWIN 22 1 - 1 0.62 0.03 3.80 2.08 0.00 0.05 0.00 4.10 0.00 0.30 0.00P-DP 27.26DARWIN 22 2 - 2 0.00 0.00 6.07 2.10 0.01 0.08 0.00 6.58 0.02 0.58 0.00P-DP 50.00DAVID 1 - 1 0.06 0.00 0.00 0.00 0.00 0.00 0.00 0.00 0.00 0.00 0.00P-DP 0.00DAVID L BONACCI 0031 - 31 0.00 0.00 76.41 26.30 2.42 0.88 0.00 69.36 5.73 7.35 0.00P-DP 50.00DAVIS 1 - 1 8.67 0.26 3.97 2.35 0.43 0.04 0.00 2.81 0.60 0.87 0.00P-DP 33.00DAVIS 201-200-199 UNIT 1H - 1H 1.43 0.06 4.48 2.44 0.22 0.05 0.00 3.67 0.51 0.48 0.00P-DP 42.09DAVIS 36-5 (ALLOC-E) 5SA - 5SA 0.78 0.02 9.62 4.96 0.31 0.11 0.00 8.69 0.74 0.93 0.00P-DP 50.00DAVIS 36-5 (ALLOC-F) 6SB - 6SB 1.12 0.03 5.81 3.05 0.45 0.05 0.00 3.87 1.06 0.73 0.00P-DP 43.26DAVIS 36-5 (ALLOC-F) 6SS - 6SS 1.61 0.05 5.56 3.16 0.15 0.07 0.00 5.21 0.35 0.52 0.00P-DP 41.25DAVIS 36-5 (ALLOC-G) 7SA - 7SA 0.52 0.02 7.87 4.31 0.20 0.09 0.00 7.42 0.47 0.72 0.00P-DP 45.66DAVIS 36-5 (ALLOC-H) 8SB - 8SB 0.71 0.02 3.46 1.99 0.10 0.04 0.00 3.20 0.23 0.33 0.00P-DP 34.80DAVIS 36-5 (ALLOC-H) 8SS - 8SS 0.35 0.01 0.00 0.00 0.00 0.00 0.00 0.00 0.00 0.00 0.00P-DP 0.00DEMANGONE 1 - 1 0.00 0.00 338.40 246.96 237.42 0.00 0.00 0.00 633.20 294.80 0.00P-DP 13.12DICKSON CRC JF 1H - 1H 0.00 0.00 216.81 166.12 152.12 0.00 0.00 0.00 405.70 188.88 0.00P-DP 9.91DICKSON CRC JF 3H - 3H 0.00 0.00 0.08 0.05 0.04 0.00 0.00 0.00 0.09 0.01 0.00P-DP 22.98DILLES BOTTOM 210744 3B - 3B 0.00 0.00 66.91 41.92 5.29 0.66 0.00 51.49 8.28 10.87 0.00P-DP 36.25DIRE WOLF UNIT 1 0402BH - 0402BH 18.01 0.77 50.05 33.33 3.72 0.51 0.00 39.42 5.83 7.89 0.00P-DP 30.58DIRE WOLF UNIT 1 0404BH - 0404BH 12.68 0.54 3.14 2.45 0.84 0.00 0.00 0.09 1.32 1.14 0.00P-DP 7.77DIRE WOLF UNIT 1 0411AH - 0411AH 2.87 0.12 2.52 2.02 0.67 0.00 0.00 0.09 1.05 0.91 0.00P-DP 6.58DIRE WOLF UNIT 1 0413AH - 0413AH 2.29 0.10 121.33 69.01 0.16 1.68 0.00 130.22 0.26 9.70 0.00P-DP 44.70DIRE WOLF UNIT 1 0414AH - 0414AH 0.56 0.02 3.85 2.71 1.03 0.00 0.00 0.10 1.62 1.40 0.00P-DP 10.54DIRE WOLF UNIT 1 0422SH - 0422SH 3.52 0.15 48.68 32.04 1.41 0.61 0.00 47.00 2.21 5.32 0.00P-DP 31.10DIRE WOLF UNIT 1 0424SH - 0424SH 4.80 0.20 26.62 16.92 0.32 0.35 0.00 27.46 0.50 2.43 0.00P-DP 25.99DIRE WOLF UNIT 1 0433SH - 0433SH 1.09 0.05 36.18 24.88 0.27 0.49 0.00 37.97 0.42 3.13 0.00P-DP 26.54DIRE WOLF UNIT 1 0471JH - 0471JH 0.92 0.04 72.62 43.73 0.17 1.00 0.00 77.67 0.26 5.88 0.00P-DP 37.72DIRE WOLF UNIT 1 0474JH - 0474JH 0.57 0.02 66.21 38.08 3.25 0.76 0.00 58.71 5.09 8.65 0.00P-DP 48.48DIRE WOLF UNIT 2 0406BH - 0406BH 11.06 0.47 66.67 38.50 2.64 0.79 0.00 61.56 4.14 8.05 0.00P-DP 48.47DIRE WOLF UNIT 2 0407BH - 0407BH 9.01 0.38 43.90 25.76 1.78 0.52 0.00 40.40 2.78 5.33 0.00P-DP 43.32DIRE WOLF UNIT 2 0415AH - 0415AH 6.05 0.26 41.07 24.15 0.71 0.53 0.00 41.51 1.12 3.98 0.00P-DP 42.52DIRE WOLF UNIT 2 0416AH - 0416AH 2.43 0.10 34.45 20.35 0.89 0.43 0.00 33.69 1.39 3.65 0.00P-DP 40.43DIRE WOLF UNIT 2 0417AH - 0417AH 3.02 0.13 19.04 11.26 1.07 0.21 0.00 16.36 1.67 2.63 0.00P-DP 33.98DIRE WOLF UNIT 2 0426SH - 0426SH 3.64 0.16 13.90 8.42 1.19 0.13 0.00 10.34 1.86 2.36 0.00P-DP 30.23DIRE WOLF UNIT 2 0427SH - 0427SH 4.05 0.17

Economic One-Liners Lease Name Life (years) Oil (Mbbl) Residue Gas (MMcf) Residue Gas (M$) Other (M$) Expense & Tax (M$) Invest. (M$) Non-Disc. (M$) Cash FlowNet Sales Volumes Net Revenue As of Date: 1/1/2024 Reserve Category Oil (M$) Disc. 10% (M$) NGL (M$) NGL (Mbbl) TABLE 6 11.54 7.37 0.61 0.13 0.00 10.06 0.96 1.56 0.00P-DP 27.13DIRE WOLF UNIT 2 0428SH - 0428SH 2.08 0.09 0.88 0.74 0.00 0.01 0.00 0.95 0.00 0.07 0.00P-DP 5.54DIRE WOLF UNIT 2 0435SH - 0435SH 0.00 0.00 4.05 2.74 0.20 0.05 0.00 3.58 0.31 0.53 0.00P-DP 16.95DIRE WOLF UNIT 2 0437SH - 0437SH 0.68 0.03 0.39 0.27 0.07 0.00 0.00 0.17 0.11 0.12 0.00P-DP 12.24DONALDSON 4-54 1H - 1H 0.22 0.01 1.68 0.92 0.26 0.01 0.00 0.97 0.39 0.44 0.00P-DP 28.70DONALDSON 4-54 U 34H - U 34H 0.75 0.03 76.27 44.52 53.51 0.00 0.00 0.00 142.72 66.45 0.00P-DP 28.42DOYEN NE WEL JF 3H - 3H 0.00 0.00 3.14 1.74 2.20 0.00 0.00 0.00 5.87 2.73 0.00P-DP 34.38DOYEN NW WEL JF 1H - 1H 0.00 0.00 0.00 0.00 0.00 0.00 0.00 0.00 0.00 0.00 0.00P-DP 0.00DRAINAGE 34-136 1H - 1H 0.00 0.00 0.88 0.57 0.03 0.01 0.00 0.87 0.04 0.11 0.00P-DP 14.99DRAINAGE 34-136 2H - 2H 0.08 0.00 2.21 1.39 0.01 0.03 0.00 2.36 0.02 0.22 0.00P-DP 22.16DRAINAGE 34-136 3H - 3H 0.05 0.00 3.30 1.99 0.02 0.05 0.00 3.52 0.03 0.33 0.00P-DP 27.10DRAINAGE 34-136 4H - 4H 0.08 0.00 3.44 2.22 0.06 0.05 0.00 3.54 0.08 0.39 0.00P-DP 35.42DRAINAGE A3 6LA - 6LA 0.20 0.01 86.43 54.19 2.31 1.00 0.00 78.38 6.85 9.07 0.00P-DP 41.32DRIVER-LANE 30A 1H - 1H 10.27 0.55 56.09 34.72 1.38 0.66 0.00 51.63 4.08 5.75 0.00P-DP 36.82DRIVER-LANE 30B 2H - 2H 6.12 0.33 83.70 51.38 2.31 0.96 0.00 75.46 6.84 8.86 0.00P-DP 41.45DRIVER-LANE 30C 3H - 3H 10.25 0.55 55.13 34.20 1.27 0.65 0.00 51.30 3.76 5.55 0.00P-DP 36.53DRIVER-LANE 30D 4H - 4H 5.63 0.30 88.95 55.01 2.78 0.99 0.00 78.14 8.24 9.78 0.00P-DP 41.84DRIVER-LANE 30E 5H - 5H 12.35 0.66 63.32 38.79 1.34 0.76 0.00 59.66 3.97 6.25 0.00P-DP 38.57DRIVER-LANE 30F 6H - 6H 5.94 0.32 4.90 2.91 0.00 0.07 0.00 5.28 0.00 0.38 0.00P-DP 16.84DYER 33 A - 33 A 0.00 0.00 21.25 11.22 1.24 0.23 0.00 18.07 1.94 2.99 0.00P-DP 30.95DYER 3301 - 3301 4.22 0.18 15.60 8.21 1.53 0.14 0.00 10.84 2.40 2.85 0.00P-DP 28.33DYER 3303 - 3303 5.21 0.22 5.25 3.12 0.89 0.03 0.00 2.16 1.40 1.36 0.00P-DP 16.85DYER 33B - 33B 3.05 0.13 20.21 11.35 1.10 0.23 0.00 17.48 1.73 2.76 0.00P-DP 28.81DYER 33D - 33D 3.76 0.16 5.27 3.55 0.40 0.05 0.00 4.13 0.62 0.84 0.00P-DP 12.05DYER 33F - 33F 1.36 0.06 5.94 3.50 0.77 0.04 0.00 3.41 1.20 1.28 0.00P-DP 17.87DYER 33H - 33H 2.61 0.11 37.71 12.98 0.99 0.45 0.00 35.34 2.33 3.50 0.00P-DP 50.00EASON UNIT 1 - 1 3.53 0.11 0.04 0.02 0.00 0.00 0.00 0.04 0.00 0.00 0.00P-DP 11.10EAST ACKERLY DEAN UNIT 99 - 99 0.00 0.00 0.93 0.66 0.00 0.01 0.00 1.00 0.00 0.07 0.00P-DP 9.89EASTER 5 1 - 1 0.00 0.00 2.68 1.59 0.04 0.04 0.00 2.77 0.06 0.30 0.00P-DP 28.24EILAND 1806A-33 1H - 1H 0.15 0.01 3.93 2.16 0.04 0.05 0.00 4.14 0.06 0.41 0.00P-DP 34.59EILAND 1806B-33 1H - 1H 0.14 0.01 2.27 1.50 0.05 0.03 0.00 2.30 0.07 0.27 0.00P-DP 24.70EILAND 1806B-33 62H - 62H 0.17 0.01 2.33 1.35 0.05 0.03 0.00 2.38 0.07 0.27 0.00P-DP 28.50EILAND 1806C-33 1H - 1H 0.16 0.01 1.69 1.07 0.02 0.02 0.00 1.79 0.02 0.18 0.00P-DP 23.09EILAND 1806C-33 81H - 81H 0.06 0.00 2.45 1.60 0.02 0.03 0.00 2.60 0.03 0.25 0.00P-DP 25.34EILAND 1806C-33 82H - 82H 0.07 0.00 3.55 2.11 0.03 0.05 0.00 3.76 0.05 0.36 0.00P-DP 31.85EILAND 1806C-33 83H - 83H 0.11 0.00

Economic One-Liners Lease Name Life (years) Oil (Mbbl) Residue Gas (MMcf) Residue Gas (M$) Other (M$) Expense & Tax (M$) Invest. (M$) Non-Disc. (M$) Cash FlowNet Sales Volumes Net Revenue As of Date: 1/1/2024 Reserve Category Oil (M$) Disc. 10% (M$) NGL (M$) NGL (Mbbl) TABLE 6 7.43 4.68 0.13 0.10 0.00 7.64 0.19 0.84 0.00P-DP 27.65EILAND 6047A-34 41H - 41H 0.44 0.02 2.91 1.65 0.02 0.04 0.00 3.02 0.07 0.27 0.00P-DP 31.78EL KABONG UNIT 48-17-8 301H - 301H 0.10 0.00 4.41 2.43 0.07 0.06 0.00 4.40 0.19 0.46 0.00P-DP 36.79EL KABONG UNIT 48-17-8 302H - 302H 0.28 0.01 13.59 7.57 1.41 0.10 0.00 7.44 3.71 2.99 0.00P-DP 49.30EL KABONG UNIT 48-17-8 303H - 303H 5.43 0.23 2.66 1.50 0.04 0.03 0.00 2.70 0.09 0.26 0.00P-DP 30.91EL KABONG UNIT 48-17-8 701H - 701H 0.14 0.01 5.44 2.86 0.18 0.06 0.00 4.93 0.49 0.69 0.00P-DP 40.05EL KABONG UNIT 48-17-8 702H - 702H 0.71 0.03 4.02 2.24 0.03 0.05 0.00 4.18 0.09 0.37 0.00P-DP 35.52EL KABONG UNIT 48-17-8 703H - 703H 0.13 0.01 3.18 1.82 0.01 0.04 0.00 3.41 0.01 0.27 0.00P-DP 32.38EL KABONG UNIT 48-17-8 704H - 704H 0.02 0.00 2.74 1.72 0.00 0.04 0.00 2.94 0.01 0.23 0.00P-DP 28.92EL KABONG UNIT 48-17-8 705H - 705H 0.02 0.00 0.19 0.15 0.03 0.00 0.00 0.04 0.08 0.06 0.00P-DP 6.60EL KABONG UNIT 48-17-8 801H - 801H 0.12 0.01 11.91 6.15 0.88 0.13 0.00 10.00 1.35 2.02 0.00P-DP 42.80ELKHEAD 4144 A 2H - A 2H 2.58 0.10 8.15 4.28 0.65 0.09 0.00 6.68 1.00 1.44 0.00P-DP 38.32ELKHEAD 4144 A 5H - A 5H 1.91 0.08 9.03 5.04 0.70 0.10 0.00 7.47 1.07 1.57 0.00P-DP 38.15ELKHEAD 4144 A 7H - A 7H 2.05 0.08 6.86 3.74 0.29 0.08 0.00 6.50 0.44 0.91 0.00P-DP 36.10ELKHEAD 4144 B 1H - B 1H 0.84 0.03 5.05 2.78 0.44 0.05 0.00 4.01 0.68 0.93 0.00P-DP 32.38ELKHEAD 4144 B 6H - B 6H 1.30 0.05 5.20 3.11 0.47 0.05 0.00 4.09 0.72 0.98 0.00P-DP 30.54ELKHEAD 4144 B 8H - B 8H 1.38 0.06 6.22 3.45 0.44 0.07 0.00 5.30 0.67 1.03 0.00P-DP 34.38ELKHEAD 4144 C 4H - C 4H 1.28 0.05 6.00 3.32 0.29 0.07 0.00 5.56 0.44 0.84 0.00P-DP 33.99ELKHEAD 4144 S 3H - S 3H 0.84 0.03 3.28 1.79 1.96 0.00 0.00 0.00 5.33 2.05 0.00P-DP 21.50ELY GAS UNIT NO. 2 1 - 1 0.00 0.00 3.16 1.74 0.33 0.03 0.00 2.28 0.46 0.68 0.00P-DP 41.57EMMA 218-219 UNIT 1H - 1H 1.09 0.05 2.46 1.24 0.00 0.03 0.00 2.65 0.00 0.19 0.00P-DP 32.67EPLEY, J. C. 9 - 9 0.00 0.00 64.09 30.49 44.96 0.00 0.00 0.00 119.92 55.83 0.00P-DP 37.04EXTREME 210716 3A - 210716 3A 0.00 0.00 21.43 14.76 15.04 0.00 0.00 0.00 40.10 18.67 0.00P-DP 20.32EXTREME 210716 4B - 210716 4B 0.00 0.00 25.58 14.83 0.13 0.35 0.00 26.81 0.27 1.95 0.00P-DP 19.59FAIREY UNIT 1H - 1H 0.45 0.07 61.67 32.54 1.24 0.79 0.00 61.64 1.95 6.17 0.00P-DP 46.37FEARLESS 136-137 A 8WB - 8WB 4.24 0.18 2.44 0.78 0.70 0.01 0.00 0.75 3.47 2.02 0.00P-DP 50.00FED W-18346 2-11 - 2-11 0.24 0.01 0.00 0.00 0.00 0.00 0.00 0.00 0.00 0.00 0.00P-DP 0.00FED W-18346 3-33 - 3-33 0.00 0.00 0.00 0.00 0.00 0.00 0.00 0.00 0.00 0.00 0.00P-DP 0.00FEDERAL W-7037 30-11 - 30-11 0.00 0.00 0.00 0.00 0.00 0.00 0.00 0.00 0.00 0.00 0.00P-DP 0.00FERGUSON 6 - 6 0.00 0.00 45.87 22.42 2.08 0.48 0.00 36.61 4.85 3.85 0.00P-DP 50.00FIELDS UNIT 1H - 1H 8.26 0.44 27.20 13.32 1.31 0.28 0.00 21.26 3.05 2.30 0.00P-DP 45.86FIELDS UNIT 2H - 2H 5.19 0.28 12.57 7.62 0.52 0.14 0.00 10.36 1.21 1.05 0.00P-DP 33.12FIELDS UNIT 3H - 3H 2.06 0.11 31.48 17.50 2.22 0.27 0.00 20.34 5.16 2.80 0.00P-DP 48.78FIELDS UNIT 4H - 4H 8.78 0.47 31.95 17.44 0.92 0.37 0.00 29.49 2.18 3.02 0.00P-DP 50.00FIRE EYES 47-38 1NA - 1NA 3.30 0.10 20.71 11.92 0.55 0.25 0.00 19.37 1.30 1.92 0.00P-DP 45.46FIRE EYES 47-38 1NS - 1NS 1.96 0.06

Economic One-Liners Lease Name Life (years) Oil (Mbbl) Residue Gas (MMcf) Residue Gas (M$) Other (M$) Expense & Tax (M$) Invest. (M$) Non-Disc. (M$) Cash FlowNet Sales Volumes Net Revenue As of Date: 1/1/2024 Reserve Category Oil (M$) Disc. 10% (M$) NGL (M$) NGL (Mbbl) TABLE 6 22.40 12.83 0.65 0.26 0.00 20.62 1.55 2.12 0.00P-DP 46.74FIRE EYES 47-38 3NA - 3NA 2.34 0.07 11.71 6.90 0.38 0.13 0.00 10.57 0.90 1.13 0.00P-DP 36.84FIRE EYES 47-38 3NS - 3NS 1.37 0.04 19.10 8.55 0.05 0.26 0.00 20.29 0.12 1.49 0.00P-DP 50.00FIRE EYES 47-38 4AH - 4AH 0.18 0.01 10.33 6.31 0.33 0.12 0.00 9.37 0.78 0.99 0.00P-DP 34.06FIRE EYES 47-38 4NS - 4NS 1.18 0.04 8.37 4.65 0.29 0.10 0.00 8.12 0.40 1.11 0.00P-DP 36.65FIRE FROG 57-32 A 1WA - 1WA 0.96 0.04 16.06 8.58 0.51 0.22 0.00 17.37 0.70 2.04 0.00P-DP 43.39FIRE FROG 57-32 B 2BS - 2BS 0.04 0.00 9.53 5.14 0.40 0.13 0.00 10.27 0.55 1.32 0.00P-DP 38.16FIRE FROG 57-32 C 3WA - 3WA 0.03 0.00 17.54 9.15 0.69 0.24 0.00 18.92 0.95 2.38 0.00P-DP 44.15FIRE FROG 57-32 D 4BS - 4BS 0.05 0.00 0.04 0.02 0.00 0.00 0.00 0.03 0.00 0.01 0.00P-DP 17.15FIREBIRD 52 1 - 1 0.01 0.00 3.61 2.14 0.07 0.04 0.00 3.51 0.16 0.32 0.00P-DP 36.33FIRESTORM 54-1-12-13-24 AL1 H 1LS - H 1LS 0.25 0.01 4.11 2.45 0.08 0.05 0.00 3.99 0.20 0.37 0.00P-DP 37.99FIRESTORM 54-1-12-13-24 AL2 H 1WA - H 1WA 0.30 0.01 4.84 2.82 0.15 0.06 0.00 4.40 0.36 0.46 0.00P-DP 40.89FIRESTORM 54-1-12-13-24 AL3 H 2WB - H 2WB 0.54 0.02 5.20 3.04 0.09 0.06 0.00 5.11 0.21 0.45 0.00P-DP 41.69FIRESTORM 54-1-12-13-24 AL5 H 2LS - H 2LS 0.32 0.01 3.33 2.05 0.08 0.04 0.00 3.18 0.18 0.30 0.00P-DP 34.25FIRESTORM 54-1-12-13-24 AL5 H 2WA - H 2WA 0.27 0.01 5.29 3.15 0.14 0.06 0.00 4.95 0.33 0.49 0.00P-DP 41.49FIRESTORM 54-1-12-13-24 AL6 H 3WB - H 3WB 0.50 0.02 65.03 38.87 1.39 0.83 0.00 64.71 2.18 6.58 0.00P-DP 37.03FISHERMAN-BRISTOW 23A 1H - 1H 4.73 0.20 55.10 32.04 0.95 0.72 0.00 55.70 1.49 5.34 0.00P-DP 35.51FISHERMAN-BRISTOW 23B 2H - 2H 3.25 0.14 76.30 43.74 1.55 0.98 0.00 76.21 2.43 7.64 0.00P-DP 39.60FISHERMAN-BRISTOW 23C 3H - 3H 5.29 0.23 101.14 57.61 2.61 1.27 0.00 98.87 4.09 10.72 0.00P-DP 42.54FISHERMAN-BRISTOW 23D 4H - 4H 8.90 0.38 52.44 28.69 0.93 0.65 0.00 51.48 2.21 4.59 0.00P-DP 46.17FLAMING STAR 02-11 1SA - 1SA 3.34 0.10 36.72 20.83 0.58 0.46 0.00 36.42 1.38 3.17 0.00P-DP 40.18FLAMING STAR 02-11 1SS - 1SS 2.09 0.06 50.12 27.95 0.45 0.65 0.00 51.55 1.06 4.10 0.00P-DP 45.01FLAMING STAR 02-11 2SS - 2SS 1.61 0.05 58.50 31.82 1.07 0.73 0.00 57.24 2.54 5.14 0.00P-DP 47.93FLAMING STAR 02-11 3SA - 3SA 3.85 0.12 21.81 10.54 1.49 0.20 0.00 15.56 3.52 2.60 0.00P-DP 36.89FLAMING STAR 0211 4AH - 4AH 5.34 0.16 12.32 6.34 0.88 0.11 0.00 8.57 2.08 1.49 0.00P-DP 28.73FLAMING STAR 0211 4SH - 4SH 3.15 0.10 25.96 13.93 4.61 0.17 0.00 12.89 7.03 7.44 0.00P-DP 27.56FLEMING 13 10H - 10H 13.48 0.54 2.91 1.88 0.19 0.03 0.00 2.12 0.45 0.34 0.00P-DP 19.80FORT KNOX 11-2 H 1LS - H 1LS 0.67 0.02 6.57 3.89 0.13 0.08 0.00 6.36 0.32 0.59 0.00P-DP 30.76FORT KNOX 11-2 H 1WA - H 1WA 0.48 0.01 5.47 3.24 0.28 0.06 0.00 4.41 0.66 0.59 0.00P-DP 28.68FORT KNOX 11-2 H 1WB - H 1WB 1.00 0.03 5.47 3.33 0.38 0.05 0.00 3.88 0.89 0.66 0.00P-DP 27.82FORT KNOX 11-2 H 2WA - H 2WA 1.35 0.04 5.11 3.06 0.40 0.04 0.00 3.38 0.94 0.64 0.00P-DP 27.48FORT KNOX 11-2 H 2WB - H 2WB 1.43 0.04 2.10 1.47 0.16 0.02 0.00 1.42 0.38 0.26 0.00P-DP 14.98FORT KNOX 11-2 R 2LS - R 2LS 0.57 0.02 11.88 6.77 0.55 0.13 0.00 9.87 1.30 1.25 0.00P-DP 39.62FORT KNOX 11-2-58EX H 3WA - H 3WA 1.96 0.06 6.27 3.77 0.37 0.06 0.00 4.76 0.88 0.71 0.00P-DP 29.86FORT KNOX 11-2-58X H 3WB - H 3WB 1.34 0.04 1.08 0.89 0.01 0.01 0.00 1.11 0.03 0.11 0.00P-DP 4.63FRED HALL UNIT 1 - 1 0.05 0.00

Economic One-Liners Lease Name Life (years) Oil (Mbbl) Residue Gas (MMcf) Residue Gas (M$) Other (M$) Expense & Tax (M$) Invest. (M$) Non-Disc. (M$) Cash FlowNet Sales Volumes Net Revenue As of Date: 1/1/2024 Reserve Category Oil (M$) Disc. 10% (M$) NGL (M$) NGL (Mbbl) TABLE 6 2.34 1.39 0.03 0.03 0.00 2.35 0.08 0.25 0.00P-DP 23.99FRED HALL UNIT 2 - 2 0.16 0.01 3.66 2.01 0.03 0.05 0.00 3.80 0.07 0.36 0.00P-DP 29.97FRED HALL UNIT 3 - 3 0.16 0.01 16.71 7.29 0.41 0.20 0.00 15.81 0.97 1.53 0.00P-DP 39.20FRYAR 18 2 - 2 1.47 0.04 16.06 7.83 0.00 0.22 0.00 17.32 0.00 1.26 0.00P-DP 37.43FULLER 1 - 1 0.00 0.00 0.03 0.01 0.00 0.00 0.00 0.02 0.00 0.00 0.00P-DP 42.69FUNKY BOSS B 8251H - 8251H 0.00 0.00 0.03 0.01 0.00 0.00 0.00 0.03 0.00 0.00 0.00P-DP 45.20FUNKY BOSS C 8270H - 8270H 0.00 0.00 11.69 6.87 0.26 0.15 0.00 11.86 0.35 1.37 0.00P-DP 33.33GADDIE 1-31 UNIT 1H - 1H 0.85 0.03 3.72 2.13 0.06 0.05 0.00 3.84 0.08 0.41 0.00P-DP 23.69GADDIE 1-31 UNIT 2H - 2H 0.20 0.01 1.65 1.06 0.00 0.02 0.00 1.80 0.00 0.15 0.00P-DP 15.41GADDIE 1-31 UNIT 3H - 3H 0.00 0.00 0.00 0.00 0.00 0.00 0.00 0.00 0.00 0.00 0.00P-DP 0.00GASTON 1 - 1 0.00 0.00 0.00 0.00 0.00 0.00 0.00 0.00 0.00 0.00 0.00P-DP 0.00GASTON 4 - 4 0.00 0.00 2.68 2.25 0.54 0.01 0.00 1.11 0.83 0.84 0.00P-DP 5.72GEORGE T STAGG 5-2 UNIT 1H - 1H 1.59 0.06 11.69 6.10 0.19 0.15 0.00 11.87 0.29 1.12 0.00P-DP 46.56GEORGIA 39 1 - 1 0.64 0.03 4.23 2.23 0.11 0.05 0.00 3.86 0.26 0.34 0.00P-DP 50.00GERDES UNIT 1H - 1H 0.44 0.02 40.54 19.16 2.77 0.35 0.00 26.72 6.44 3.58 0.00P-DP 50.00GERDES UNIT 2H - 2H 10.96 0.58 12.46 6.11 1.09 0.09 0.00 6.74 2.54 1.15 0.00P-DP 38.11GERDES UNIT 3H - 3H 4.33 0.23 29.70 16.05 1.14 0.33 0.00 25.00 2.65 2.45 0.00P-DP 24.52GERDES UNIT 4H - 4H 4.51 0.24 70.94 42.19 2.33 0.82 0.00 62.08 5.42 5.79 0.00P-DP 24.57GERDES UNIT 5H - 5H 9.23 0.49 81.66 46.20 2.74 0.94 0.00 71.12 6.36 6.67 0.00P-DP 27.61GERDES UNIT 6H - 6H 10.84 0.58 110.07 60.02 4.29 1.22 0.00 92.21 9.98 9.11 0.00P-DP 50.00GERDES-LANGHOFF 1L - 1L 16.99 0.91 123.90 66.47 4.79 1.37 0.00 104.05 11.13 10.25 0.00P-DP 50.00GERDES-RATHKAMP 1L - 1L 18.96 1.01 33.97 18.95 0.03 0.48 0.00 36.37 0.06 2.56 0.00P-DP 28.70GILLESPIE UNIT 1H - 1H 0.10 0.02 0.03 0.03 0.01 0.00 0.00 0.00 0.01 0.01 0.00P-DP 3.02GILLIHAN 3 - 3 0.02 0.00 17.82 8.34 0.52 0.21 0.00 16.44 1.22 1.68 0.00P-DP 46.92GINGER 22-27 1AH - 1AH 1.85 0.06 6.89 3.81 0.07 0.09 0.00 7.04 0.17 0.57 0.00P-DP 30.49GINGER 22-27 1MS - 1MS 0.25 0.01 18.74 9.19 0.77 0.20 0.00 16.07 1.82 1.92 0.00P-DP 46.63GINGER 22-27 2AH - 2AH 2.76 0.08 18.24 8.98 0.70 0.20 0.00 15.89 1.66 1.83 0.00P-DP 46.14GINGER 22-27 2SH - 2SH 2.52 0.08 3.68 1.89 0.07 0.05 0.00 3.54 0.19 0.35 0.00P-DP 26.27GIST '4' 1 - 1 0.29 0.02 6.99 3.11 0.00 0.10 0.00 7.51 0.00 0.53 0.00P-DP 36.42GIST '4' 4 - 4 0.00 0.00 0.27 0.11 0.00 0.00 0.00 0.28 0.00 0.02 0.00P-DP 50.00GLASS -Y- 1 - 1 0.00 0.00 147.37 104.83 103.39 0.00 0.00 0.00 275.75 128.38 0.00P-DP 12.22GORDON SE CRC JF 4H - 4H 0.00 0.00 172.40 120.12 120.96 0.00 0.00 0.00 322.59 150.19 0.00P-DP 13.49GORDON SE CRC JF 6H - 6H 0.00 0.00 157.04 112.48 110.18 0.00 0.00 0.00 293.84 136.81 0.00P-DP 11.70GORDON SW CRC JF 2H - 2H 0.00 0.00 0.00 0.00 0.00 0.00 0.00 0.00 0.00 0.00 0.00P-DP 0.00GRAFF 1 - 1 0.00 0.00 10.41 6.09 0.32 0.12 0.00 9.51 0.75 0.99 0.00P-DP 32.14GRANT 18A 4HL - 4HL 1.14 0.03

Economic One-Liners Lease Name Life (years) Oil (Mbbl) Residue Gas (MMcf) Residue Gas (M$) Other (M$) Expense & Tax (M$) Invest. (M$) Non-Disc. (M$) Cash FlowNet Sales Volumes Net Revenue As of Date: 1/1/2024 Reserve Category Oil (M$) Disc. 10% (M$) NGL (M$) NGL (Mbbl) TABLE 6 12.35 7.12 0.47 0.14 0.00 10.82 1.10 1.24 0.00P-DP 34.35GRANT 18B 5HJ - 5HJ 1.67 0.05 15.17 8.61 0.63 0.16 0.00 12.99 1.48 1.55 0.00P-DP 36.84GRANT 18B 6HK - 6HK 2.25 0.07 6.14 3.94 0.68 0.06 0.00 4.62 0.73 0.69 0.00P-DP 27.94GREER SIKES 42-41 E 251 - 251 1.48 0.08 13.20 7.35 2.12 0.11 0.00 8.04 2.26 1.71 0.00P-DP 42.90GREER SIKES 42-41 F 261 - 261 4.61 0.26 13.55 7.73 1.23 0.14 0.00 10.99 1.32 1.44 0.00P-DP 42.58GREER SIKES 42-41 F 262 - 262 2.69 0.15 13.64 7.79 1.22 0.15 0.00 11.13 1.30 1.44 0.00P-DP 42.40GREER SIKES 42-41 G 271 - 271 2.65 0.15 7.06 3.93 1.38 0.05 0.00 3.59 1.47 1.00 0.00P-DP 34.63GREER SIKES 42-41 G 272 - 272 3.00 0.17 3.90 2.64 0.43 0.04 0.00 2.94 0.46 0.44 0.00P-DP 21.08GREER SIKES 42-41 H 281 - 281 0.94 0.05 29.27 17.14 0.43 0.37 0.00 29.21 1.02 2.50 0.00P-DP 45.07GRIFFIN RANCH UNIT 23-31 1AH - 1AH 1.54 0.05 28.75 15.95 0.62 0.35 0.00 27.65 1.47 2.58 0.00P-DP 46.92GRIFFIN RANCH UNIT 23-31 1SH - 1SH 2.22 0.07 13.64 8.17 0.41 0.16 0.00 12.51 0.96 1.30 0.00P-DP 34.36GRIFFIN RANCH UNIT 23-31 2AH - 2AH 1.46 0.04 13.89 8.20 0.88 0.13 0.00 10.26 2.09 1.62 0.00P-DP 35.10GRIFFIN RANCH UNIT 23-31 2SH - 2SH 3.16 0.10 24.27 13.92 0.64 0.29 0.00 22.71 1.52 2.26 0.00P-DP 43.50GRIFFIN RANCH UNIT 23-31 3AH - 3AH 2.30 0.07 18.19 10.28 1.53 0.15 0.00 11.45 3.62 2.35 0.00P-DP 39.91GRIFFIN RANCH UNIT 23-31 3SH - 3SH 5.48 0.17 112.09 83.44 78.64 0.00 0.00 0.00 209.74 97.65 0.00P-DP 12.91GRISWOLD S WYN JF 4H - 4H 0.00 0.00 31.74 23.01 22.27 0.00 0.00 0.00 59.39 27.65 0.00P-DP 14.34GRISWOLD SW WYN JF 2H - 2H 0.00 0.00 109.08 88.90 76.53 0.00 0.00 0.00 204.10 95.03 0.00P-DP 7.65GRISWOLD WYN JF 6H - 6H 0.00 0.00 181.13 134.11 127.08 0.00 0.00 0.00 338.93 157.80 0.00P-DP 12.05GRISWOLD WYN JF 8H - 8H 0.00 0.00 3.34 2.00 0.17 0.04 0.00 3.05 0.26 0.48 0.00P-DP 23.51GRIZZLY BEAR 7780 2U A 2H - A 2H 0.50 0.02 2.24 1.33 0.24 0.02 0.00 1.63 0.37 0.47 0.00P-DP 20.68GRIZZLY BEAR 7780 3U A 3H - A 3H 0.71 0.03 6.45 3.58 0.54 0.07 0.00 5.21 0.83 1.16 0.00P-DP 32.36GRIZZLY BEAR 7780 4U A 4H - A 4H 1.58 0.06 1.74 1.13 0.14 0.02 0.00 1.43 0.21 0.31 0.00P-DP 16.98GRIZZLY BEAR 7780 5U A 5H - A 5H 0.40 0.02 5.67 3.14 0.33 0.07 0.00 5.06 0.51 0.86 0.00P-DP 30.61GRIZZLY BEAR 7780 6U A 6H - A 6H 0.97 0.04 0.00 0.00 0.00 0.00 0.00 0.00 0.00 0.00 0.00P-DP 0.00GRIZZLY SOUTH 7673 A 1H - A 1H 0.00 0.00 27.10 15.19 0.74 0.35 0.00 26.95 1.13 3.15 0.00P-DP 34.23GRIZZLY SOUTH 7673 A 3H - A 3H 2.17 0.09 23.36 13.72 1.07 0.28 0.00 21.81 1.63 3.20 0.00P-DP 31.67GRIZZLY SOUTH 7673 A 5H - A 5H 3.12 0.12 39.74 22.69 1.52 0.49 0.00 38.07 2.33 5.12 0.00P-DP 37.94GRIZZLY SOUTH 7673 A 8H - A 8H 4.46 0.18 14.70 8.84 0.17 0.20 0.00 15.39 0.26 1.45 0.00P-DP 26.50GRIZZLY SOUTH 7673 B 2H - B 2H 0.50 0.02 9.10 6.07 0.49 0.11 0.00 8.24 0.75 1.33 0.00P-DP 19.69GRIZZLY SOUTH 7673 B 4H - B 4H 1.44 0.06 25.26 15.00 1.39 0.30 0.00 22.80 2.13 3.73 0.00P-DP 32.06GRIZZLY SOUTH 7673 B 6H - B 6H 4.07 0.16 7.05 4.00 0.52 0.08 0.00 5.92 0.79 1.19 0.00P-DP 28.03GRIZZLY WEST 77 1H - 1H 1.52 0.06 3.33 2.04 0.06 0.04 0.00 3.40 0.10 0.36 0.00P-DP 19.48GRIZZLY WEST 77 A 3H - A 3H 0.19 0.01 3.38 2.00 0.13 0.04 0.00 3.24 0.20 0.43 0.00P-DP 20.30GRIZZLY WEST 77 C 2H - C 2H 0.38 0.02 34.97 21.16 0.53 0.44 0.00 34.81 1.26 3.00 0.00P-DP 49.47GUARDIAN UNIT 12-22 4AH 1.90 0.06 43.39 25.70 0.81 0.54 0.00 42.40 1.91 3.82 0.00P-DP 50.00GUARDIAN UNIT 12-22 4SH 2.89 0.09

Economic One-Liners Lease Name Life (years) Oil (Mbbl) Residue Gas (MMcf) Residue Gas (M$) Other (M$) Expense & Tax (M$) Invest. (M$) Non-Disc. (M$) Cash FlowNet Sales Volumes Net Revenue As of Date: 1/1/2024 Reserve Category Oil (M$) Disc. 10% (M$) NGL (M$) NGL (Mbbl) TABLE 6 27.30 14.99 0.69 0.33 0.00 25.71 1.64 2.52 0.00P-DP 48.30GUARDIAN UNIT 21-24 5AH - 5AH 2.48 0.08 37.12 19.75 0.76 0.46 0.00 35.92 1.79 3.31 0.00P-DP 50.00GUARDIAN UNIT 21-24 5SH - 5SH 2.71 0.08 5.92 3.87 0.11 0.07 0.00 5.81 0.25 0.52 0.00P-DP 23.56GUARDIAN UNIT 21-24 6AH - 6AH 0.38 0.01 5.26 3.20 0.09 0.07 0.00 5.17 0.22 0.46 0.00P-DP 34.97GUARDIAN UNIT 21-24 6SH - 6SH 0.33 0.01 0.26 0.20 0.02 0.00 0.00 0.18 0.04 0.03 0.00P-DP 5.89GUITAR 11 1 - 1 0.06 0.00 0.00 0.00 0.00 0.00 0.00 0.00 0.00 0.00 0.00P-DP 0.00GUITAR 11 2 - 2 0.00 0.00 0.36 0.29 0.02 0.00 0.00 0.29 0.04 0.04 0.00P-DP 5.75GUITAR 13 1 - 1 0.07 0.00 0.96 0.59 0.02 0.01 0.00 0.92 0.05 0.09 0.00P-DP 44.96GUNNER C 3LS 0.08 0.00 1.02 0.63 0.01 0.01 0.00 1.02 0.03 0.09 0.00P-DP 45.28GUNNER C 4A 0.05 0.00 0.64 0.40 0.01 0.01 0.00 0.62 0.03 0.06 0.00P-DP 38.32GUNNER D 5MS 0.04 0.00 0.85 0.53 0.01 0.01 0.00 0.85 0.03 0.07 0.00P-DP 42.65GUNNER D 6LS 0.04 0.00 4.52 2.72 0.06 0.06 0.00 4.55 0.14 0.38 0.00P-DP 34.93GUNSLINGER UNIT L 4H - L 4H 0.21 0.01 39.51 23.58 1.13 0.49 0.00 38.19 1.77 4.30 0.00P-DP 39.83GUNSMOKE 1-40 A 1JM - 1JM 3.85 0.16 29.42 16.28 1.07 0.35 0.00 27.53 1.68 3.45 0.00P-DP 38.58GUNSMOKE 1-40 B 2LS - 2LS 3.66 0.16 39.63 22.16 1.56 0.47 0.00 36.64 2.44 4.77 0.00P-DP 42.19GUNSMOKE 1-40 C 3WA - 3WA 5.31 0.23 26.11 15.50 0.92 0.32 0.00 24.57 1.44 3.03 0.00P-DP 36.16GUNSMOKE 1-40 D 4WA - 4WB 3.13 0.13 26.51 16.43 0.60 0.34 0.00 26.26 0.93 2.71 0.00P-DP 34.25GUNSMOKE 40-1 E 5JM - R009LS 2.03 0.09 27.04 15.39 0.56 0.35 0.00 26.98 0.88 2.72 0.00P-DP 36.62GUNSMOKE 40-1 F 6LS - 6LS 1.90 0.08 43.10 24.55 1.90 0.50 0.00 39.06 2.97 5.40 0.00P-DP 42.42GUNSMOKE 40-1 G 7WA - 7WA 6.47 0.28 24.38 13.96 0.82 0.30 0.00 23.08 1.29 2.79 0.00P-DP 35.52GUNSMOKE 40-1 H 8WB - 8WB 2.81 0.12 32.66 19.21 0.50 0.43 0.00 33.28 0.78 3.09 0.00P-DP 37.56GUNSMOKE 40-1 I 9LS - 9LS 1.69 0.07 32.49 20.74 2.12 0.34 0.00 26.76 3.32 4.80 0.00P-DP 36.06GUNSMOKE 40-1 J 10WA - 10WA 7.22 0.31 21.96 12.49 0.97 0.26 0.00 19.91 1.51 2.75 0.00P-DP 34.77GUNSMOKE 40-1 K 11WB - 11WB 3.29 0.14 1.89 1.12 0.03 0.02 0.00 1.88 0.07 0.21 0.00P-DP 21.85GUY COWDEN UNIT 2 2505BH - 2505BH 0.15 0.01 4.30 2.49 0.42 0.03 0.00 2.23 0.98 0.97 0.00P-DP 27.50GUY COWDEN UNIT 2 2506BH - 2506BH 2.06 0.09 1.49 0.86 0.06 0.02 0.00 1.28 0.14 0.21 0.00P-DP 20.46GUY COWDEN UNIT 2 2507BH - 2507BH 0.29 0.01 8.99 4.94 0.65 0.08 0.00 6.00 1.51 1.71 0.00P-DP 38.64GUY COWDEN UNIT 2 2508BH - 2508BH 3.18 0.15 0.55 0.40 0.01 0.01 0.00 0.53 0.03 0.06 0.00P-DP 9.76GUY COWDEN UNIT 2 2515AH - 2515AH 0.05 0.00 3.05 1.78 0.10 0.03 0.00 2.73 0.23 0.41 0.00P-DP 26.18GUY COWDEN UNIT 2 2516AH - 2516AH 0.49 0.02 2.10 1.30 0.09 0.02 0.00 1.79 0.20 0.30 0.00P-DP 21.77GUY COWDEN UNIT 2 2517AH - 2517AH 0.42 0.02 13.88 7.48 0.13 0.18 0.00 14.34 0.30 1.39 0.00P-DP 43.89GUY COWDEN UNIT 2 2518AH - 2518AH 0.63 0.03 15.48 11.96 10.68 0.00 0.00 0.00 26.87 11.39 0.00P-DP 9.61HA RA SU77;LEE 25-36 HC 001-ALT - 001-ALT 0.00 0.00 8.30 6.09 4.15 0.00 0.00 0.00 10.98 2.68 0.00P-DP 23.44HA RA SU98;ONEAL 8&17-14-16 HC 001-ALT - 001-ALT 0.00 0.00 11.90 8.38 5.95 0.00 0.00 0.00 15.75 3.85 0.00P-DP 28.73HA RA SU98;ONEAL 8&17-14-16 HC 002-ALT - 002-ALT 0.00 0.00 2.13 1.71 1.06 0.00 0.00 0.00 2.81 0.69 0.00P-DP 8.22HA RA SU98;PACE 8-14-16 H 001 - 1 0.00 0.00

Economic One-Liners Lease Name Life (years) Oil (Mbbl) Residue Gas (MMcf) Residue Gas (M$) Other (M$) Expense & Tax (M$) Invest. (M$) Non-Disc. (M$) Cash FlowNet Sales Volumes Net Revenue As of Date: 1/1/2024 Reserve Category Oil (M$) Disc. 10% (M$) NGL (M$) NGL (Mbbl) TABLE 6 644.51 449.06 276.61 0.00 0.00 0.00 729.43 84.92 0.00P-DP 21.59HA RA SUA;GOLSON 36-25 HC 001-ALT - 001-ALT 0.00 0.00 643.28 422.37 276.09 0.00 0.00 0.00 728.04 84.76 0.00P-DP 23.57HA RA SUA;GOLSON 36-25 HC 002-ALT - 002-ALT 0.00 0.00 95.68 75.27 41.06 0.00 0.00 0.00 108.28 12.61 0.00P-DP 9.43HA RA SUA;WIGGINS 36-25 HC 001 - 1 0.00 0.00 35.89 27.77 15.40 0.00 0.00 0.00 40.62 4.73 0.00P-DP 12.86HA RA SUB;LAWSON 31-30 HC 001-ALT - 001-ALT 0.00 0.00 22.99 18.56 9.87 0.00 0.00 0.00 26.02 3.03 0.00P-DP 10.73HA RA SUB;LAWSON 31-30-19 HC 002-ALT - 002-ALT 0.00 0.00 42.05 32.43 18.05 0.00 0.00 0.00 47.59 5.54 0.00P-DP 14.92HA RA SUB;LAWSON 31-30-19 HC 003-ALT - 003-ALT 0.00 0.00 3.22 2.49 1.38 0.00 0.00 0.00 3.64 0.42 0.00P-DP 10.38HA RA SUL;L & L INV 18-19 HC 001-ALT - 001-ALT 0.00 0.00 7.11 5.02 3.05 0.00 0.00 0.00 8.05 0.94 0.00P-DP 16.40HA RA SUL;L & L INV 18-19 HC 002-ALT - 002-ALT 0.00 0.00 57.44 41.48 24.65 0.00 0.00 0.00 65.01 7.57 0.00P-DP 20.36HA RA SUL;SCHION 18-19 HC 001-ALT - 001-ALT 0.00 0.00 786.49 622.15 337.55 0.00 0.00 0.00 890.12 103.63 0.00P-DP 14.81HA RA SUS;MJR FAMLLC21-28-33HC 001-ALT - 001-ALT 0.00 0.00 2,266.75 1,574.71 972.85 0.00 0.00 0.00 2,565.42 298.67 0.00P-DP 30.89HA RA SUS;MJR FAMLLC21-28-33HC 002-ALT - 002-ALT 0.00 0.00 717.99 520.26 308.15 0.00 0.00 0.00 812.60 94.60 0.00P-DP 17.87HA RA SUS;POOLE-DRAKE 21 H 001 - 1 0.00 0.00 0.03 0.03 0.01 0.00 0.00 0.00 0.04 0.01 0.00P-DP 1.08HA RA SUSS;JORDAN 16-21 HC 001-ALT - 001-ALT 0.00 0.00 0.22 0.18 0.09 0.00 0.00 0.00 0.26 0.04 0.00P-DP 4.44HA RA SUTT;BSMC LA 21 HZ 001 - 1 0.00 0.00 0.00 0.00 0.00 0.00 0.00 0.00 0.00 0.00 0.00P-DP 0.00HA RA SUZ;GLOVER 20 001 - 1 0.00 0.00 20.97 12.84 9.00 0.00 0.00 0.00 23.73 2.76 0.00P-DP 17.54HA RA SUZ;GLOVER 20 002-ALT - 002-ALT 0.00 0.00 19.17 11.77 8.23 0.00 0.00 0.00 21.69 2.53 0.00P-DP 16.95HA RA SUZ;GLOVER 20 003-ALT - 003-ALT 0.00 0.00 0.00 0.00 0.00 0.00 0.00 0.00 0.00 0.00 0.00P-DP 0.00HA RA SUZ;JUNCACEAE 20 001-ALT - 001-ALT 0.00 0.00 6.52 4.98 2.80 0.00 0.00 0.00 7.38 0.86 0.00P-DP 7.67HA RA SUZ;JUNCACEAE 20 002-ALT - 002-ALT 0.00 0.00 3.96 3.27 1.70 0.00 0.00 0.00 4.48 0.52 0.00P-DP 5.10HA RA SUZ;JUNCACEAE 20 003-ALT - 003-ALT 0.00 0.00 677.81 472.73 290.90 0.00 0.00 0.00 767.11 89.31 0.00P-DP 23.32HA RB SU69;NAC ROYALTY 33 H 001 - 1 0.00 0.00 1,383.19 1,161.63 593.65 0.00 0.00 0.00 1,565.44 182.25 0.00P-DP 19.63HA RB SU77;NAC ROYALTY 27-41HC 002-ALT - 002-ALT 0.00 0.00 0.00 0.00 0.00 0.00 0.00 0.00 0.00 0.00 0.00P-DP 0.00HA RB SU77;WAHL 27 H 001 - 1 0.00 0.00 150.27 117.36 64.49 0.00 0.00 0.00 170.07 19.80 0.00P-DP 13.07HA RB SU90;BYU PIERRE29-12-10H 001-ALT - 001-ALT 0.00 0.00 119.13 96.44 51.13 0.00 0.00 0.00 134.83 15.70 0.00P-DP 10.69HA RB SU90;BYU PIERRE29-12-10H 002-ALT - 002-ALT 0.00 0.00 56.21 42.17 24.13 0.00 0.00 0.00 63.62 7.41 0.00P-DP 10.20HA RB SU90;NRG 29-12-10 H 001 - 1 0.00 0.00 87.05 66.69 37.36 0.00 0.00 0.00 98.52 11.47 0.00P-DP 10.83HA RB SU90;NRG 29-12-10 H 002-ALT - 002-ALT 0.00 0.00 526.85 380.65 226.11 0.00 0.00 0.00 596.26 69.42 0.00P-DP 25.00HA RB SU90;NRG 29-12-10 H 003-ALT - 003-ALT 0.00 0.00 136.06 113.24 58.40 0.00 0.00 0.00 153.99 17.93 0.00P-DP 9.80HA RB SU90;NRG 29-12-10 H 004-ALT - 004-ALT 0.00 0.00 0.00 0.00 0.00 0.00 0.00 0.00 0.00 0.00 0.00P-DP 0.00HA RB SU92;NAC ROYALTY 34 H 001 - 1 0.00 0.00 5,290.90 4,444.88 2,270.77 0.00 0.00 0.00 5,988.03 697.13 0.00P-DP 19.61HA RB SU92;NAC ROYALTY 34 H 002-ALT - 002-ALT 0.00 0.00 3,801.36 3,199.10 1,631.49 0.00 0.00 0.00 4,302.23 500.87 0.00P-DP 17.32HA RB SU92;NAC ROYALTY 34 H 003-ALT - 003-ALT 0.00 0.00 22.15 17.44 8.69 0.00 0.00 0.00 25.94 3.80 0.00P-DP 27.85HA RB SUZZ;BIER 15&10-11-10 HC - 001-ALT 0.00 0.00 0.90 0.47 0.00 0.01 0.00 0.96 0.00 0.07 0.00P-DP 26.14HALL 18 1 - 1 0.00 0.00 0.09 0.06 0.00 0.00 0.00 0.09 0.00 0.01 0.00P-DP 6.68HALL 18 2 - 2 0.00 0.00

Economic One-Liners Lease Name Life (years) Oil (Mbbl) Residue Gas (MMcf) Residue Gas (M$) Other (M$) Expense & Tax (M$) Invest. (M$) Non-Disc. (M$) Cash FlowNet Sales Volumes Net Revenue As of Date: 1/1/2024 Reserve Category Oil (M$) Disc. 10% (M$) NGL (M$) NGL (Mbbl) TABLE 6 0.02 0.02 0.00 0.00 0.00 0.02 0.00 0.00 0.00P-DP 1.88HALL 18 3 - 3 0.00 0.00 0.00 0.00 0.00 0.00 0.00 0.00 0.00 0.00 0.00P-DP 0.00HALL 18 4 - 4 0.00 0.00 9.13 4.86 0.05 0.12 0.00 9.64 0.08 0.77 0.00P-DP 25.28HALL TRUST 38 1 - 1 0.18 0.01 1.79 1.32 0.01 0.02 0.00 1.89 0.02 0.15 0.00P-DP 13.92HALL TRUST 38 2 - 2 0.04 0.00 3.90 2.39 0.06 0.05 0.00 3.90 0.14 0.42 0.00P-DP 18.63HALL-PORTER 621-596 A 112 - 112 0.29 0.01 6.59 3.76 0.09 0.08 0.00 6.63 0.21 0.70 0.00P-DP 24.26HALL-PORTER 621-596 A 211 - 211 0.45 0.02 5.87 3.43 0.11 0.07 0.00 5.76 0.25 0.66 0.00P-DP 22.74HALL-PORTER 621-596 B 122 - 122 0.53 0.02 5.73 3.45 0.08 0.07 0.00 5.76 0.19 0.61 0.00P-DP 21.82HALL-PORTER 621-596 B 221 - 221 0.40 0.02 5.91 3.58 0.09 0.07 0.00 5.90 0.21 0.64 0.00P-DP 21.92HALL-PORTER 621-596 B 224 - 224 0.44 0.02 6.34 3.63 0.09 0.08 0.00 6.37 0.21 0.68 0.00P-DP 23.77HALL-PORTER 621-596 C 132 - 132 0.43 0.02 1.54 1.13 0.04 0.02 0.00 1.45 0.09 0.19 0.00P-DP 12.46HALL-PORTER 621-596 C 231R - 231R 0.19 0.01 3.51 2.38 0.08 0.04 0.00 3.34 0.19 0.42 0.00P-DP 15.52HALL-PORTER 621-596 C 233 - 233 0.40 0.02 22.49 14.46 0.95 0.24 0.00 18.96 2.20 3.30 0.00P-DP 39.20HALL-PORTER 621-596 D 142 - 142 4.63 0.21 3.80 2.23 0.05 0.05 0.00 3.84 0.12 0.40 0.00P-DP 23.64HALL-PORTER 621-596 D 241 - 241 0.25 0.01 0.00 0.00 0.00 0.00 0.00 0.00 0.00 0.00 0.00P-DP 0.00HARGROVE, BETTY 1 - 1 0.00 0.00 1.64 0.79 0.00 0.02 0.00 1.75 0.01 0.13 0.00P-DP 46.16HARPER-BAYES 16 1 - 1 0.02 0.00 1.19 0.64 0.05 0.01 0.00 1.12 0.13 0.22 0.00P-DP 39.67HAWKS 55-1-28 UNIT 1H - 1H 0.15 0.01 2.95 1.98 1.40 0.00 0.00 0.00 3.30 0.35 0.00P-DP 25.59HENDERSHOT 210471 1A - 1A 0.00 0.00 3.31 2.09 1.57 0.00 0.00 0.00 3.71 0.39 0.00P-DP 28.89HENDERSHOT 210471 2B - 2B 0.00 0.00 96.69 52.45 1.07 1.37 0.00 107.19 2.17 14.06 0.00P-DP 39.16HEREFORD 29 20 W1NC STATE COM 001H - 001H 1.38 0.03 13.62 7.76 0.99 0.18 0.00 13.52 3.50 4.16 0.00P-DP 32.59HIGGINBOTHAM UNIT A 30-18 2AH - 2AH 0.77 0.03 8.23 4.55 0.09 0.11 0.00 8.80 0.33 0.97 0.00P-DP 28.10HIGGINBOTHAM UNIT A 30-18 3AH - 3AH 0.07 0.00 7.06 4.16 0.07 0.10 0.00 7.56 0.26 0.82 0.00P-DP 25.28HIGGINBOTHAM UNIT A 30-18 4AH - 4AH 0.06 0.00 16.40 8.58 0.12 0.23 0.00 17.60 0.44 1.74 0.00P-DP 34.42HIGGINBOTHAM UNIT B 30-19 1H - 1H 0.10 0.00 5.87 3.34 0.69 0.07 0.00 5.50 2.44 2.60 0.00P-DP 23.33HIGGINBOTHAM UNIT B 30-19 7AH - 7AH 0.54 0.02 8.67 5.24 0.54 0.11 0.00 8.71 1.91 2.37 0.00P-DP 26.46HIGGINBOTHAM UNIT C 30-18 5AH - 5AH 0.42 0.02 9.72 5.45 0.46 0.13 0.00 9.96 1.62 2.21 0.00P-DP 29.59HIGGINBOTHAM UNIT C 30-18 6AH - 6AH 0.36 0.01 75.65 47.94 50.89 0.01 0.00 0.92 139.78 163.39 0.00P-DP 22.97HOCHSTETLER 7-11-5 5H - 5H 98.34 4.19 0.33 0.24 0.01 0.00 0.00 0.28 0.03 0.03 0.00P-DP 7.24HOERMANN UNIT 1H - 1H 0.05 0.00 13.86 8.17 0.41 0.16 0.00 12.41 0.95 1.12 0.00P-DP 37.42HOERMANN UNIT 2H - 2H 1.62 0.09 87.72 45.55 2.69 1.03 0.00 77.90 6.27 7.12 0.00P-DP 50.00HOERMANN UNIT 3H - 3H 10.67 0.57 65.85 32.25 1.62 0.80 0.00 60.90 3.78 5.27 0.00P-DP 36.13HOERMANN UNIT 4H - 4H 6.44 0.34 44.17 28.11 1.33 0.52 0.00 39.39 3.09 3.58 0.00P-DP 43.53HOERMANN-KOLM 1H - 1H 5.27 0.28 36.13 23.89 1.37 0.40 0.00 30.47 3.20 2.98 0.00P-DP 32.30HOERMANN-KOLM 201H - 201H 5.45 0.29 111.74 79.35 2.37 1.39 0.00 105.72 5.50 8.86 0.00P-DP 40.72HOERMANN-LANGHOFF B 1H - 1H 9.37 0.50

Economic One-Liners Lease Name Life (years) Oil (Mbbl) Residue Gas (MMcf) Residue Gas (M$) Other (M$) Expense & Tax (M$) Invest. (M$) Non-Disc. (M$) Cash FlowNet Sales Volumes Net Revenue As of Date: 1/1/2024 Reserve Category Oil (M$) Disc. 10% (M$) NGL (M$) NGL (Mbbl) TABLE 6 110.52 72.86 1.00 1.49 0.00 112.77 2.32 8.51 0.00P-DP 39.57HOERMANN-LANGHOFF B 201H - 201H 3.95 0.21 42.74 31.29 1.36 0.50 0.00 37.68 3.16 3.48 0.00P-DP 26.23HOERMANN-LANGHOFF B A 2H - 2H 5.38 0.29 0.46 0.19 0.01 0.01 0.00 0.45 0.02 0.05 0.00P-DP 43.95HOFFERKAMP 1 - 1 0.04 0.00 2.02 1.08 0.20 0.02 0.00 1.50 0.28 0.42 0.00P-DP 37.30HORNSILVER 1H - 1H 0.66 0.03 30.45 16.42 0.25 0.40 0.00 31.63 0.59 3.00 0.00P-DP 35.28HOUSE 47 1 - 1 1.23 0.06 8.46 3.48 0.00 0.12 0.00 9.09 0.00 0.64 0.00P-DP 50.00HUBBARD 18-B 2 - 2 0.00 0.00 3.09 2.12 0.05 0.04 0.00 3.01 0.15 0.29 0.00P-DP 22.95HULING 'A' 18-7 ESL (ALLOC) 1HA - 1HA 0.22 0.01 0.45 0.32 0.01 0.01 0.00 0.41 0.03 0.05 0.00P-DP 10.21HULING 'D' 18-7 ESL (ALLOC) 4HS - 4HS 0.05 0.00 5.92 3.82 0.15 0.07 0.00 5.42 0.44 0.61 0.00P-DP 31.23HULING 7-19 B 221 - 221 0.67 0.04 3.88 2.62 0.02 0.05 0.00 4.05 0.05 0.31 0.00P-DP 25.75HULING 7-19 D 241 - 241 0.08 0.00 11.58 5.99 0.56 0.12 0.00 9.47 1.33 1.24 0.00P-DP 32.82HYDEN 47-35 1H - 1H 2.01 0.06 11.12 6.96 0.14 0.14 0.00 11.24 0.32 0.93 0.00P-DP 27.57HYDEN UNIT 47-35 1SH - 1SH 0.49 0.01 30.16 17.67 0.25 0.39 0.00 31.11 0.60 2.46 0.00P-DP 42.40HYDEN UNIT 47-35 2AH - 2AH 0.91 0.03 23.55 13.78 0.23 0.31 0.00 24.12 0.55 1.94 0.00P-DP 38.99HYDEN UNIT 47-35 2SH - 2SH 0.83 0.03 41.73 24.18 0.25 0.55 0.00 43.58 0.59 3.34 0.00P-DP 47.42HYDEN UNIT 47-35 3AH - 3AH 0.90 0.03 9.66 5.32 0.34 0.12 0.00 9.08 0.54 1.12 0.00P-DP 34.05HYDRA 45-4 UNIT 1 112 - 112 1.17 0.05 8.25 4.55 0.27 0.10 0.00 7.82 0.43 0.94 0.00P-DP 32.34HYDRA 45-4 UNIT 1 122 - 122 0.93 0.04 14.13 7.56 0.43 0.17 0.00 13.56 0.67 1.57 0.00P-DP 39.40HYDRA 45-4 UNIT 1 124 - 124 1.46 0.06 14.60 7.79 0.52 0.18 0.00 13.70 0.82 1.70 0.00P-DP 39.94HYDRA 45-4 UNIT 1 132 - 132 1.79 0.08 8.47 4.67 0.32 0.10 0.00 7.87 0.51 1.01 0.00P-DP 32.64HYDRA 45-4 UNIT 1 142 - 142 1.11 0.05 10.89 5.93 0.38 0.13 0.00 10.26 0.60 1.26 0.00P-DP 35.49HYDRA 45-4 UNIT 1 211 - 211 1.29 0.06 18.49 9.88 0.20 0.25 0.00 19.16 0.31 1.66 0.00P-DP 41.97HYDRA 45-4 UNIT 1 221 - 221 0.68 0.03 12.41 6.67 0.42 0.15 0.00 11.74 0.66 1.42 0.00P-DP 37.91HYDRA 45-4 UNIT 1 223 - 223 1.43 0.06 8.31 4.59 0.28 0.10 0.00 7.88 0.44 0.95 0.00P-DP 32.44HYDRA 45-4 UNIT 1 231 - 231 0.95 0.04 15.35 8.17 0.61 0.18 0.00 14.19 0.95 1.85 0.00P-DP 40.69HYDRA 45-4 UNIT 1 241 - 241 2.06 0.09 13.16 8.34 0.51 0.16 0.00 12.20 0.80 1.58 0.00P-DP 34.18HYDRA 45-4 UNIT 2 151 - 151 1.74 0.07 9.62 5.96 0.73 0.10 0.00 7.52 1.15 1.53 0.00P-DP 31.51HYDRA 45-4 UNIT 2 161 - 161 2.49 0.11 16.98 10.61 0.77 0.20 0.00 15.31 1.20 2.15 0.00P-DP 37.30HYDRA 45-4 UNIT 2 164 - 164 2.62 0.11 7.74 4.85 0.58 0.08 0.00 6.10 0.90 1.22 0.00P-DP 29.04HYDRA 45-4 UNIT 2 171 - 171 1.96 0.08 18.78 11.76 0.64 0.23 0.00 17.76 1.00 2.15 0.00P-DP 38.35HYDRA 45-4 UNIT 2 173 - 173 2.17 0.09 8.70 5.40 0.71 0.09 0.00 6.60 1.11 1.44 0.00P-DP 30.45HYDRA 45-4 UNIT 2 181 - 181 2.42 0.10 19.81 11.90 0.63 0.24 0.00 18.90 0.98 2.22 0.00P-DP 40.07HYDRA 45-4 UNIT 2 262 - 262 2.14 0.09 5.75 3.66 0.75 0.04 0.00 3.28 1.17 1.25 0.00P-DP 25.80HYDRA 45-4 UNIT 2 263 - 263 2.55 0.11 15.34 9.58 0.75 0.18 0.00 13.61 1.18 2.00 0.00P-DP 36.21HYDRA 45-4 UNIT 2 272 - 272 2.56 0.11 8.38 5.04 0.96 0.07 0.00 5.27 1.51 1.68 0.00P-DP 30.82HYDRA 45-4 UNIT 2 274 - 274 3.29 0.14

Economic One-Liners Lease Name Life (years) Oil (Mbbl) Residue Gas (MMcf) Residue Gas (M$) Other (M$) Expense & Tax (M$) Invest. (M$) Non-Disc. (M$) Cash FlowNet Sales Volumes Net Revenue As of Date: 1/1/2024 Reserve Category Oil (M$) Disc. 10% (M$) NGL (M$) NGL (Mbbl) TABLE 6 16.22 10.20 0.62 0.19 0.00 15.06 0.98 1.94 0.00P-DP 36.63HYDRA 45-4 UNIT 2 282 - 282 2.12 0.09 0.00 0.00 0.00 0.00 0.00 0.00 0.00 0.00 0.00P-DP 31.76JACKSON A 34-166-175 5201H - 5201H 0.00 0.00 4.78 3.72 0.18 0.05 0.00 4.05 0.42 0.39 0.00P-DP 6.84JANAK UNIT 1H - 1H 0.71 0.04 28.63 15.93 0.65 0.35 0.00 26.83 1.51 2.28 0.00P-DP 28.13JANAK UNIT 3H - 3H 2.57 0.14 46.55 26.56 2.32 0.47 0.00 35.92 5.39 3.95 0.00P-DP 19.73JANAK UNIT 4H - 4H 9.18 0.49 36.12 18.72 1.80 0.37 0.00 27.86 4.19 3.06 0.00P-DP 50.00JANAK UNIT 5H - 5H 7.14 0.38 33.02 19.91 1.57 0.34 0.00 25.95 3.65 2.79 0.00P-DP 34.40JANAK UNIT 7L - 7L 6.21 0.33 47.56 27.47 1.85 0.53 0.00 39.86 4.30 3.93 0.00P-DP 47.53JANAK-LOOS 6L - 6L 7.33 0.39 4.07 2.61 0.05 0.06 0.00 4.35 0.17 0.49 0.00P-DP 30.55JH SELMAN ALLOCATION A 26-35 1HA - 1HA 0.04 0.00 1.55 1.13 0.02 0.02 0.00 1.66 0.05 0.18 0.00P-DP 16.85JH SELMAN ALLOCATION B 26-35 5LS - 5LS 0.01 0.00 1.77 1.10 0.02 0.02 0.00 1.81 0.04 0.16 0.00P-DP 14.81JIM TOM 1 - 1 0.08 0.00 0.06 0.04 0.01 0.00 0.00 0.04 0.01 0.01 0.00P-DP 14.80JMW NAIL 10 1 - 1 0.02 0.00 0.06 0.04 0.00 0.00 0.00 0.05 0.01 0.01 0.00P-DP 13.72JMW NAIL 10 2 - 2 0.02 0.00 0.12 0.08 0.01 0.00 0.00 0.10 0.01 0.02 0.00P-DP 19.83JMW NAIL 10A 3 - 3 0.03 0.00 0.25 0.13 0.01 0.00 0.00 0.23 0.02 0.03 0.00P-DP 30.49JMW NAIL 10A 4 - 4 0.04 0.00 0.00 0.00 0.00 0.00 0.00 0.00 0.00 0.00 0.00P-DP 0.00JOHN F FERGUSON 1 - 1 0.00 0.00 0.00 0.00 0.00 0.00 0.00 0.00 0.00 0.00 0.00P-DP 0.00JOHN F FERGUSON 2 - 2 0.00 0.00 0.00 0.00 0.00 0.00 0.00 0.00 0.00 0.00 0.00P-DP 0.00JOHN F. FERGUSON 3 - 3 0.00 0.00 0.00 0.00 0.00 0.00 0.00 0.00 0.00 0.00 0.00P-DP 0.00JOHN F. FERGUSON 4 - 4 0.00 0.00 9.67 5.43 0.78 0.12 0.00 9.50 2.73 3.17 0.00P-DP 26.70JOTUNN UNIT A 25-24 3AH - 3AH 0.60 0.02 18.46 10.35 0.67 0.25 0.00 19.17 2.35 3.57 0.00P-DP 32.96JOTUNN UNIT A 25-24 4AH - 4AH 0.52 0.02 10.35 6.19 0.68 0.13 0.00 10.36 2.38 2.92 0.00P-DP 25.65JOTUNN UNIT A 25-24 5AH - 5AH 0.53 0.02 17.40 9.52 0.97 0.23 0.00 17.63 3.44 4.42 0.00P-DP 35.20JOTUNN UNIT B 25-13 6AH - 6AH 0.76 0.03 13.06 7.29 1.07 0.17 0.00 12.81 3.77 4.35 0.00P-DP 31.87JOTUNN UNIT B 25-13 7AH - 7AH 0.83 0.03 0.00 0.00 0.00 0.00 0.00 0.00 0.00 0.00 0.00P-DP 0.00JOYCE 1 - 1 0.00 0.00 0.45 0.28 0.00 0.01 0.00 0.48 0.00 0.03 0.00P-DP 23.08JUDY '16' 1 - 1 0.00 0.00 0.32 0.30 0.17 0.00 0.00 0.00 0.41 0.09 0.00P-DP 1.83JUR RA SUG;OLYMPIA MIN 30 H 001 - 1 0.00 0.00 12.55 6.89 0.58 0.13 0.00 9.97 1.34 1.06 0.00P-DP 29.41KAISER UNIT 1H - 1H 2.29 0.12 27.17 13.34 1.65 0.25 0.00 19.17 3.83 2.36 0.00P-DP 46.22KAISER UNIT 4H - 4H 6.53 0.35 38.47 18.41 1.71 0.41 0.00 30.94 3.98 3.22 0.00P-DP 50.00KAISER UNIT 5H - 5H 6.78 0.36 18.42 7.19 1.02 0.23 0.00 18.18 5.04 5.14 0.00P-DP 43.83KEELINE 2-13 - 2-13 0.35 0.01 0.34 0.18 0.00 0.00 0.00 0.36 0.00 0.03 0.00P-DP 29.07KEMPER 16 1 - 1 0.00 0.00 0.11 0.07 0.00 0.00 0.00 0.12 0.00 0.01 0.00P-DP 14.71KEMPER 16 2 - 2 0.00 0.00 0.04 0.03 0.00 0.00 0.00 0.02 0.01 0.01 0.00P-DP 6.22KEMPER 16A 1 - 1 0.02 0.00 0.28 0.19 0.03 0.00 0.00 0.19 0.04 0.05 0.00P-DP 12.93KEMPER 16A 3 - 3 0.10 0.00

Economic One-Liners Lease Name Life (years) Oil (Mbbl) Residue Gas (MMcf) Residue Gas (M$) Other (M$) Expense & Tax (M$) Invest. (M$) Non-Disc. (M$) Cash FlowNet Sales Volumes Net Revenue As of Date: 1/1/2024 Reserve Category Oil (M$) Disc. 10% (M$) NGL (M$) NGL (Mbbl) TABLE 6 7.98 4.19 0.69 0.08 0.00 6.38 1.05 1.46 0.00P-DP 38.93KENOSHA 4441 1H - 1H 2.01 0.08 7.63 4.10 0.66 0.08 0.00 6.09 1.01 1.40 0.00P-DP 39.28KENOSHA 4441 B 2H - B 2H 1.93 0.08 8.14 5.32 0.54 0.09 0.00 7.03 0.83 1.31 0.00P-DP 33.37KENOSHA-KEYHOLE 4341 1U A 1H - A 1H 1.59 0.06 7.69 5.08 0.75 0.08 0.00 5.85 1.15 1.51 0.00P-DP 33.44KENOSHA-KEYHOLE 4341 2U B 2H - B 2H 2.20 0.09 91.50 51.42 1.98 1.17 0.00 90.95 3.10 9.29 0.00P-DP 40.93KENTEX-HARRISON 35A 1H - 1H 6.74 0.29 91.92 50.96 2.65 1.14 0.00 88.75 4.16 10.04 0.00P-DP 41.03KENTEX-HARRISON 35B 2H - 2H 9.05 0.39 95.55 51.48 1.13 1.27 0.00 98.62 1.78 8.71 0.00P-DP 42.75KENTEX-HARRISON 35C 3H - 3H 3.86 0.16 49.88 28.74 1.32 0.63 0.00 48.63 2.07 5.32 0.00P-DP 33.59KENTEX-HARRISON 35D 4H - 4H 4.51 0.19 5.80 2.95 0.13 0.08 0.00 5.87 0.20 0.64 0.00P-DP 36.93KEYHOLE 43 1H - 1H 0.38 0.02 14.93 8.58 0.29 0.18 0.00 14.50 0.70 1.32 0.00P-DP 34.38KINGSLEY 10HK - 10HK 1.05 0.03 17.28 9.89 0.37 0.21 0.00 16.62 0.88 1.55 0.00P-DP 32.52KINGSLEY 1HJ - 1HJ 1.33 0.04 19.22 11.34 0.40 0.24 0.00 18.56 0.95 1.72 0.00P-DP 32.87KINGSLEY 2HF - 2HF 1.43 0.04 14.83 8.89 0.47 0.17 0.00 13.43 1.12 1.43 0.00P-DP 30.32KINGSLEY 3HK - 3HK 1.70 0.05 46.04 27.98 1.00 0.56 0.00 44.21 2.38 4.14 0.00P-DP 30.86KINGSLEY 4HJ - 4HJ 3.60 0.11 54.32 29.76 1.21 0.66 0.00 52.01 2.87 4.90 0.00P-DP 35.75KINGSLEY 5HK - 5HK 4.34 0.13 46.87 27.48 0.97 0.57 0.00 45.29 2.29 4.19 0.00P-DP 32.34KINGSLEY 6HF - 6HF 3.47 0.11 14.62 8.35 0.31 0.18 0.00 14.09 0.73 1.31 0.00P-DP 34.18KINGSLEY 7HJ - 7HJ 1.11 0.03 13.53 7.42 0.45 0.15 0.00 12.19 1.06 1.31 0.00P-DP 34.05KINGSLEY 8HK - 8HK 1.60 0.05 10.25 6.03 0.18 0.13 0.00 10.05 0.44 0.90 0.00P-DP 29.81KINGSLEY 9HJ - 9HJ 0.66 0.02 7.06 3.78 0.13 0.09 0.00 7.23 0.20 0.75 0.00P-DP 34.09KODIAK 7677 1U B 1H - B 1H 0.38 0.02 4.10 2.52 0.23 0.05 0.00 3.67 0.36 0.61 0.00P-DP 25.98KODIAK 7677 2U B 2H - B 2H 0.68 0.03 9.71 5.46 0.28 0.13 0.00 9.62 0.42 1.14 0.00P-DP 36.63KODIAK 7677 3U A 3H - A 3H 0.81 0.03 6.17 3.76 0.39 0.07 0.00 5.39 0.60 0.97 0.00P-DP 29.93KODIAK 7677 4U A 4H - A 4H 1.15 0.05 0.00 0.00 0.00 0.00 0.00 0.00 0.00 0.00 0.00P-DP 0.00KOOS 1 - 1 0.00 0.00 0.00 0.00 0.00 0.00 0.00 0.00 0.00 0.00 0.00P-DP 0.00KOOS 2 - 2 0.00 0.00 8.98 4.94 0.81 0.07 0.00 5.33 1.93 1.20 0.00P-DP 37.04KRAKEN 10-3 E1 251 - 251 2.92 0.09 15.62 9.10 0.77 0.16 0.00 12.70 1.83 1.68 0.00P-DP 34.06KRAKEN 10-3 UNIT 2 153 - 153 2.77 0.08 19.42 10.89 0.93 0.20 0.00 15.94 2.21 2.07 0.00P-DP 37.34KRAKEN 10-3 UNIT 2 162 - 162 3.34 0.10 19.09 10.68 0.91 0.20 0.00 15.69 2.16 2.03 0.00P-DP 37.20KRAKEN 10-3 UNIT 2 171 - 171 3.27 0.10 18.14 10.09 0.86 0.21 0.00 16.21 1.34 2.34 0.00P-DP 36.77KRAKEN 10-3 UNIT 2 181 - 181 2.92 0.12 10.74 6.32 0.90 0.10 0.00 8.05 1.42 1.80 0.00P-DP 29.91KRAKEN 10-3 UNIT 2 183 - 183 3.08 0.13 8.30 4.92 0.25 0.10 0.00 7.58 0.60 0.79 0.00P-DP 28.41KRAKEN 10-3 UNIT 2 252 - 252 0.91 0.03 13.64 7.90 0.82 0.13 0.00 10.31 1.95 1.56 0.00P-DP 32.80KRAKEN 10-3 UNIT 2 261 - 261 2.95 0.09 19.91 10.89 1.29 0.18 0.00 14.58 3.05 2.33 0.00P-DP 38.12KRAKEN 10-3 UNIT 2 272 - 272 4.62 0.14 6.60 3.96 0.52 0.07 0.00 5.09 0.81 1.07 0.00P-DP 25.01KRAKEN 10-3 UNIT 2 273 - 273 1.77 0.08

Economic One-Liners Lease Name Life (years) Oil (Mbbl) Residue Gas (MMcf) Residue Gas (M$) Other (M$) Expense & Tax (M$) Invest. (M$) Non-Disc. (M$) Cash FlowNet Sales Volumes Net Revenue As of Date: 1/1/2024 Reserve Category Oil (M$) Disc. 10% (M$) NGL (M$) NGL (Mbbl) TABLE 6 20.38 11.47 0.88 0.24 0.00 18.53 1.38 2.54 0.00P-DP 37.79KRAKEN 10-3 UNIT 2 282 - 282 3.01 0.13 213.39 143.80 2.09 2.86 0.00 221.98 3.27 18.97 0.00P-DP 42.34KRONOS 61-7 E1 151 - 151 7.11 0.30 164.82 109.20 5.69 2.00 0.00 155.49 8.92 18.99 0.00P-DP 44.79KRONOS 61-7 UNIT 2 153 - 153 19.40 0.83 14.11 9.86 0.34 0.18 0.00 13.88 0.54 1.47 0.00P-DP 15.26KRONOS 61-7 UNIT 2 154 - 154 1.17 0.05 209.41 138.19 7.59 2.53 0.00 196.15 11.90 24.51 0.00P-DP 48.49KRONOS 61-7 UNIT 2 161 - 161 25.87 1.10 169.22 114.45 5.61 2.07 0.00 160.56 8.79 19.25 0.00P-DP 44.38KRONOS 61-7 UNIT 2 163 - 163 19.12 0.81 16.46 12.83 0.70 0.19 0.00 15.02 1.10 2.04 0.00P-DP 12.74KRONOS 61-7 UNIT 2 171 - 171 2.39 0.10 181.36 119.40 7.17 2.16 0.00 167.57 11.23 21.86 0.00P-DP 46.46KRONOS 61-7 UNIT 2 173 - 173 24.42 1.04 198.35 130.66 7.11 2.40 0.00 186.12 11.14 23.13 0.00P-DP 47.75KRONOS 61-7 UNIT 2 181 - 181 24.22 1.03 45.78 29.58 0.73 0.60 0.00 46.50 1.15 4.37 0.00P-DP 26.59KRONOS 61-7 UNIT 2 182 - 182 2.50 0.11 136.83 90.19 9.60 1.42 0.00 110.04 15.04 20.95 0.00P-DP 37.50KRONOS 61-7 UNIT 2 255 - 255 32.70 1.39 154.13 100.51 11.77 1.55 0.00 120.18 18.45 24.62 0.00P-DP 44.56KRONOS 61-7 UNIT 2 262 - 262 40.12 1.71 378.24 228.63 5.73 4.97 0.00 385.51 8.98 35.79 0.00P-DP 50.00KRONOS 61-7 UNIT 2 272 - 272 19.53 0.83 108.75 69.50 10.64 0.97 0.00 75.68 16.67 19.85 0.00P-DP 40.30KRONOS 61-7 UNIT 2 274 - 274 36.26 1.55 344.27 208.07 5.29 4.52 0.00 350.60 8.30 32.65 0.00P-DP 50.00KRONOS 61-7 UNIT 2 283 - 283 18.04 0.77 279.71 158.34 132.75 0.00 0.00 0.00 312.89 33.19 0.00P-DP 26.75KRUPA 210483 3A - 3A 0.00 0.00 117.19 64.74 55.62 0.00 0.00 0.00 131.09 13.90 0.00P-DP 30.23KRUPA 211259 2A - 2A 0.00 0.00 41.72 23.41 0.08 0.59 0.00 44.43 0.17 3.15 0.00P-DP 20.93KUBENKA UNIT 1H - 1H 0.28 0.04 0.00 0.00 0.00 0.00 0.00 0.00 0.00 0.00 0.00P-DP 0.00L E STARTZELL 2 - 2 0.00 0.00 2.86 1.68 0.06 0.04 0.00 2.79 0.13 0.25 0.00P-DP 43.47LAITALA UNIT B 21-24 5AH - 5AH 0.20 0.01 3.70 2.23 0.06 0.05 0.00 3.67 0.14 0.32 0.00P-DP 47.64LAITALA UNIT B 21-24 5SH - 5SH 0.21 0.01 0.73 0.44 0.13 0.00 0.00 0.11 0.30 0.14 0.00P-DP 26.25LAITALA UNIT B 21-24 6AH - 6AH 0.46 0.01 0.11 0.09 0.00 0.00 0.00 0.12 0.00 0.01 0.00P-DP 6.35LAITALA UNIT B 21-24 6SH - 6SH 0.00 0.00 12.28 6.24 2.11 0.00 0.00 0.32 4.92 1.33 0.00P-DP 50.00LANGHOFF UNIT A 1H - 1H 8.38 0.45 2.75 1.95 0.11 0.03 0.00 2.31 0.25 0.23 0.00P-DP 12.98LANGHOFF UNIT A 2H - 2H 0.42 0.02 3.54 2.08 0.35 0.02 0.00 1.67 0.82 0.33 0.00P-DP 32.71LANGHOFF UNIT A 3H - 3H 1.39 0.07 2.42 1.50 0.26 0.01 0.00 1.00 0.61 0.23 0.00P-DP 26.80LANGHOFF UNIT A 4H - 4H 1.04 0.06 49.00 28.12 2.80 0.47 0.00 35.63 6.51 4.23 0.00P-DP 50.00LANGHOFF UNIT A 8L - 8L 11.09 0.59 37.84 20.98 2.02 0.37 0.00 28.38 4.70 3.24 0.00P-DP 49.72LANGHOFF UNIT A 9L - 9L 8.00 0.43 3.58 2.09 0.22 0.03 0.00 2.51 0.51 0.31 0.00P-DP 50.00LANGHOFF UNIT B 701 - 701 0.87 0.05 4.48 2.36 0.10 0.06 0.00 4.55 0.15 0.49 0.00P-DP 40.29LAURA WILDER 72-69 UNIT A 3H - 3H 0.28 0.01 1.46 0.79 0.04 0.02 0.00 1.45 0.07 0.17 0.00P-DP 31.73LAURA WILDER 72-69 UNIT B 4HL - 4HL 0.13 0.01 98.92 54.70 2.14 1.38 0.00 107.36 10.57 19.74 0.00P-DP 33.51LEAVITT FED 1-9-4PH - 1-9-4PH 0.73 0.03 78.66 39.20 7.16 0.89 0.00 69.47 35.33 28.58 0.00P-DP 37.01LEAVITT FED 1-9-4TH - 1-9-4TH 2.44 0.10 165.63 81.74 4.46 2.27 0.00 177.22 22.00 35.11 0.00P-DP 41.56LEAVITT FED 2-9-4PH - 2-9-4PH 1.52 0.06

Economic One-Liners Lease Name Life (years) Oil (Mbbl) Residue Gas (MMcf) Residue Gas (M$) Other (M$) Expense & Tax (M$) Invest. (M$) Non-Disc. (M$) Cash FlowNet Sales Volumes Net Revenue As of Date: 1/1/2024 Reserve Category Oil (M$) Disc. 10% (M$) NGL (M$) NGL (Mbbl) TABLE 6 12.95 7.74 0.26 0.17 0.00 13.24 0.35 1.49 0.00P-DP 18.87LEE 34-154 1H - 1H 0.85 0.03 194.78 114.65 2.31 2.50 0.00 197.32 5.48 16.31 0.00P-DP 39.57LEECH 32-41 UNIT A 1LS - 1LS 8.29 0.25 8.20 5.48 0.03 0.11 0.00 8.68 0.06 0.64 0.00P-DP 20.02LEECH EAST 5SA - 5SA 0.10 0.00 3.75 2.87 0.04 0.05 0.00 3.79 0.11 0.31 0.00P-DP 10.59LEECH EAST 7SB - 7SB 0.16 0.00 19.82 11.68 0.60 0.23 0.00 18.16 1.41 1.89 0.00P-DP 33.31LEECH EAST 8SA - 8SA 2.14 0.07 331.70 179.64 3.92 4.26 0.00 336.11 9.29 27.76 0.00P-DP 50.00LEECH WEST 2SB - 2SB 14.06 0.43 372.57 203.86 2.39 4.92 0.00 388.25 5.66 29.91 0.00P-DP 50.00LEECH WEST 3SA - 3SA 8.57 0.26 306.51 169.23 2.14 4.04 0.00 318.52 5.06 24.72 0.00P-DP 48.45LEECH WEST 4SB - 4SB 7.66 0.23 3.77 1.77 0.05 0.05 0.00 3.93 0.07 0.41 0.00P-DP 50.00LEEDE UNIT 7 1H - 1H 0.17 0.01 2.24 1.19 0.06 0.03 0.00 2.25 0.08 0.27 0.00P-DP 23.73LEEDE UNIT 7 2H - 2H 0.19 0.01 12.32 6.63 1.11 0.16 0.00 11.95 3.92 4.42 0.00P-DP 33.11LEVIATHAN UNIT A 29-17 4AH - 4AH 0.86 0.03 14.24 7.88 0.16 0.20 0.00 15.23 0.56 1.67 0.00P-DP 33.52LEVIATHAN UNIT A 29-17 5AH - 5AH 0.12 0.00 13.27 7.04 0.78 0.17 0.00 13.40 2.75 3.49 0.00P-DP 34.04LEVIATHAN UNIT A 29-17 6AH - 6AH 0.61 0.02 7.36 4.36 1.22 0.08 0.00 6.44 4.32 4.35 0.00P-DP 22.50LEVIATHAN UNIT B 29-20 7AH - 7AH 0.95 0.04 2.67 1.84 0.23 0.03 0.00 2.61 0.80 0.91 0.00P-DP 12.28LEVIATHAN UNIT B 29-20 8SH - 8SH 0.18 0.01 4.11 2.68 0.34 0.05 0.00 4.02 1.22 1.40 0.00P-DP 15.94LEVIATHAN UNIT B 29-20 9AH(8AH) - 9AH 0.27 0.01 1.45 1.06 0.23 0.02 0.00 1.29 0.30 0.65 0.00P-DP 11.41LION #1H - 1H 0.51 0.01 2.23 1.55 0.51 0.02 0.00 1.79 0.67 1.37 0.00P-DP 23.62LION #3H - 3H 1.15 0.03 0.32 0.22 0.01 0.00 0.00 0.31 0.01 0.03 0.00P-DP 13.41LISA MARIE 34-27 4AH - 4AH 0.02 0.00 3.02 1.39 0.21 0.03 0.00 2.65 0.22 0.30 0.00P-DP 40.23LONE WOLF 12 1HB - 1HB 0.45 0.02 0.74 0.54 0.00 0.01 0.00 0.80 0.00 0.06 0.00P-DP 9.39LONG 18 1 - 1 0.00 0.00 0.00 0.00 0.00 0.00 0.00 0.00 0.00 0.00 0.00P-DP 0.00LONG UNIT 1 - 1 0.00 0.00 5.63 4.10 0.22 0.06 0.00 4.69 0.52 0.47 0.00P-DP 11.03LOOS UNIT 10H - 10H 0.89 0.05 80.44 44.81 3.50 0.86 0.00 65.17 8.14 6.73 0.00P-DP 50.00LOOS UNIT 11L - 11L 13.86 0.74 70.14 37.77 3.50 0.71 0.00 54.08 8.14 5.95 0.00P-DP 50.00LOOS UNIT 12L - 12L 13.87 0.74 2.44 1.76 0.25 0.01 0.00 1.11 0.58 0.23 0.00P-DP 10.03LOOS UNIT 1H - 1H 0.98 0.05 0.06 0.03 0.01 0.00 0.00 0.00 0.02 0.01 0.00P-DP 19.59LOOS UNIT 2H - 2H 0.04 0.00 2.43 1.18 0.43 0.00 0.00 0.00 1.00 0.27 0.00P-DP 37.67LOOS UNIT 3H - 3H 1.70 0.09 6.13 3.37 0.27 0.07 0.00 4.94 0.63 0.51 0.00P-DP 27.33LOOS UNIT 8H - 8H 1.07 0.06 69.55 38.06 2.03 0.82 0.00 62.39 4.73 5.62 0.00P-DP 49.97LOOS UNIT 9H - 9H 8.05 0.43 2.12 1.31 0.12 0.02 0.00 1.90 0.19 0.32 0.00P-DP 35.62LOST KEYS 4345 1U B 1H - B 1H 0.36 0.01 4.07 2.38 0.25 0.05 0.00 3.60 0.38 0.63 0.00P-DP 44.32LOST KEYS 4345 2U A 2H - A 2H 0.72 0.03 2.89 1.95 0.27 0.03 0.00 2.23 0.42 0.55 0.00P-DP 34.46LOST KEYS 4345 3U A 3H - A 3H 0.80 0.03 1.36 0.82 0.12 0.01 0.00 1.07 0.19 0.25 0.00P-DP 38.58LOST KEYS 4345 4U A 4H - A 4H 0.36 0.01 1.00 0.61 0.13 0.01 0.00 0.67 0.19 0.23 0.00P-DP 35.67LOST KEYS 4345 5U B 5H - B 5H 0.37 0.01

Economic One-Liners Lease Name Life (years) Oil (Mbbl) Residue Gas (MMcf) Residue Gas (M$) Other (M$) Expense & Tax (M$) Invest. (M$) Non-Disc. (M$) Cash FlowNet Sales Volumes Net Revenue As of Date: 1/1/2024 Reserve Category Oil (M$) Disc. 10% (M$) NGL (M$) NGL (Mbbl) TABLE 6 0.79 0.48 0.05 0.01 0.00 0.68 0.08 0.13 0.00P-DP 37.74LOST KEYS 4345 6U A 6H - A 6H 0.16 0.01 0.40 0.26 0.02 0.00 0.00 0.37 0.03 0.06 0.00P-DP 15.81LOST SADDLE 45 1H - 1H 0.06 0.00 4.25 2.32 0.09 0.05 0.00 4.11 0.20 0.49 0.00P-DP 38.91LRT UNIT 2 ALLOCATION 2318AH - 2318AH 0.42 0.02 0.00 0.00 0.00 0.00 0.00 0.00 0.00 0.00 0.00P-DP 0.00LUKCIK 4 - 4 0.00 0.00 0.00 0.00 0.00 0.00 0.00 0.00 0.00 0.00 0.00P-DP 0.00LUKCIK 5 - 5 0.00 0.00 14.62 9.88 0.16 0.19 0.00 14.87 0.39 1.22 0.00P-DP 30.51LULO 2531LP 4H - 4H 0.59 0.02 29.96 19.82 0.89 0.35 0.00 27.52 2.10 2.84 0.00P-DP 38.54LULO 2543DP 6H - 6H 3.18 0.10 42.57 27.35 0.36 0.56 0.00 43.89 0.86 3.47 0.00P-DP 43.55LULO 2551AP 5H - 5H 1.30 0.04 22.11 14.37 0.40 0.27 0.00 21.66 0.95 1.94 0.00P-DP 35.93LULO 2553AP 9H - 9H 1.44 0.04 15.21 10.12 0.08 0.20 0.00 15.96 0.18 1.21 0.00P-DP 31.30LULO 3641DP 2H - 2H 0.28 0.01 0.13 0.08 0.00 0.00 0.00 0.12 0.01 0.02 0.00P-DP 28.13MABEE 22A 1H - 1H 0.01 0.00 0.03 0.02 0.00 0.00 0.00 0.03 0.00 0.00 0.00P-DP 22.60MABEE DDA J8 3HK - 1701MH 0.00 0.00 0.07 0.04 0.00 0.00 0.00 0.07 0.00 0.01 0.00P-DP 30.76MABEE-ELKIN W16B 2H - 2H 0.01 0.00 0.61 0.35 0.02 0.01 0.00 0.56 0.04 0.08 0.00P-DP 33.30MABEE-STIMSON 22B 2H - 2H 0.09 0.00 60.27 36.22 1.83 0.70 0.00 54.91 4.25 7.84 0.00P-DP 29.68MABEE-TREDAWAY W16A 1H - 1H 8.95 0.41 3.03 1.69 0.28 0.03 0.00 2.31 0.39 0.61 0.00P-DP 35.60MARY GRACE 201-202 UNIT 1H - 1H 0.93 0.04 3.20 1.77 0.24 0.03 0.00 2.66 0.33 0.57 0.00P-DP 36.50MARY GRACE 201-202 UNIT 3H - 3H 0.78 0.03 4.83 2.78 0.10 0.06 0.00 4.82 0.16 0.49 0.00P-DP 37.65MARYRUTH-ANDERSON 47C 103H - 103H 0.34 0.01 4.81 2.64 0.09 0.06 0.00 4.85 0.14 0.47 0.00P-DP 39.02MARYRUTH-ANDERSON 47D 104H - 104H 0.30 0.01 4.03 2.33 0.09 0.05 0.00 3.98 0.15 0.42 0.00P-DP 35.74MARYRUTH-ANDERSON 47E 105H - 105H 0.32 0.01 5.61 3.09 0.05 0.08 0.00 5.84 0.08 0.50 0.00P-DP 40.51MARYRUTH-ANDERSON 47F 106H - 106H 0.18 0.01 81.77 54.61 50.58 0.13 0.00 8.57 138.94 163.48 0.00P-DP 13.66MATTIE 18-11-5 6H - 6H 97.75 4.17 60.28 41.89 38.71 0.06 0.00 3.88 106.33 124.73 0.00P-DP 11.54MATTIE 18-11-5 7H - 7H 74.80 3.19 90.11 58.28 57.73 0.09 0.00 6.03 158.59 186.07 0.00P-DP 15.12MATTIE 18-11-5 8H - 8H 111.56 4.75 1.57 0.88 0.01 0.02 0.00 1.67 0.01 0.14 0.00P-DP 19.57MCCALL, JACK O. ET AL 2 - 2 0.02 0.00 1.21 0.77 0.03 0.02 0.00 1.22 0.04 0.13 0.00P-DP 14.87MCCALL, JACK O. ET AL 3 - 3 0.08 0.00 1.13 0.72 0.01 0.02 0.00 1.20 0.01 0.11 0.00P-DP 14.70MCCALL, JACK O. ET AL 4 - 4 0.03 0.00 3.87 2.07 0.05 0.05 0.00 3.98 0.08 0.36 0.00P-DP 26.49MCCLANE 2 - 2 0.17 0.01 6.06 3.37 0.03 0.08 0.00 6.42 0.05 0.51 0.00P-DP 26.63MCCLANE 3 - 3 0.10 0.00 0.00 0.00 0.00 0.00 0.00 0.00 0.00 0.00 0.00P-DP 0.00MCINTIRE 1 - 1 0.00 0.00 0.12 0.08 0.01 0.00 0.00 0.09 0.01 0.01 0.00P-DP 10.43MEADOR, J. J. 3 - 3 0.02 0.00 8.95 5.31 0.73 0.11 0.00 8.78 2.57 2.97 0.00P-DP 22.59MEDUSA UNIT A 28-21 1AH - 1AH 0.57 0.02 11.28 6.46 1.17 0.14 0.00 10.75 4.14 4.52 0.00P-DP 25.44MEDUSA UNIT A 28-21 2AH - 2AH 0.91 0.03 8.69 5.42 0.58 0.11 0.00 8.70 2.03 2.48 0.00P-DP 21.16MEDUSA UNIT B 28-21 7AH - 7AH 0.45 0.02 12.21 7.38 0.90 0.16 0.00 12.10 3.18 3.77 0.00P-DP 24.86MEDUSA UNIT B 28-21 8AH - 8AH 0.70 0.03

Economic One-Liners Lease Name Life (years) Oil (Mbbl) Residue Gas (MMcf) Residue Gas (M$) Other (M$) Expense & Tax (M$) Invest. (M$) Non-Disc. (M$) Cash FlowNet Sales Volumes Net Revenue As of Date: 1/1/2024 Reserve Category Oil (M$) Disc. 10% (M$) NGL (M$) NGL (Mbbl) TABLE 6 16.80 9.26 0.30 0.23 0.00 17.83 1.06 2.32 0.00P-DP 35.39MEDUSA UNIT C 28-09 3AH - 3AH 0.23 0.01 8.99 5.21 0.39 0.12 0.00 9.26 1.36 1.93 0.00P-DP 28.03MEDUSA UNIT C 28-09 6AH - 6AH 0.30 0.01 0.00 0.00 0.00 0.00 0.00 0.00 0.00 0.00 0.00P-DP 0.00MEHAFFEY - BURNEM 1 - 1 0.00 0.00 0.07 0.05 0.00 0.00 0.00 0.07 0.00 0.01 0.00P-DP 10.33MELISSA A 1 - 1 0.00 0.00 1.01 0.63 0.01 0.01 0.00 1.01 0.03 0.09 0.00P-DP 41.79MEMPHIS FLASH 39-27 1LS 0.05 0.00 1.03 0.64 0.02 0.01 0.00 1.03 0.04 0.09 0.00P-DP 42.31MEMPHIS FLASH 39-27 2A 0.05 0.00 0.24 0.14 0.00 0.00 0.00 0.24 0.01 0.02 0.00P-DP 24.17MEMPHIS FLASH 39-27 4AH - 4AH 0.01 0.00 2.11 1.22 0.10 0.02 0.00 1.75 0.23 0.22 0.00P-DP 20.90MIDDLETON 21 1 - 1 0.35 0.01 7.80 4.12 0.45 0.09 0.00 7.09 0.48 0.74 0.00P-DP 44.99MIKE SCOTT 19-30-H 4315H - 4315H 0.97 0.05 4.56 2.46 0.27 0.05 0.00 4.11 0.29 0.44 0.00P-DP 37.05MIKE SCOTT 19-30-H 4415H - 4415H 0.59 0.03 12.97 10.54 0.00 0.18 0.00 13.96 0.00 0.99 0.00P-DP 4.90MILLER 4 2 - 2 0.00 0.00 7.57 6.60 0.00 0.10 0.00 8.15 0.00 0.58 0.00P-DP 3.11MILLER 4 3 - 3 0.00 0.00 33.47 19.59 1.35 0.40 0.00 30.81 2.12 4.07 0.00P-DP 28.30MIMS 32H 3306BH - 3306BH 4.61 0.20 21.53 12.97 0.96 0.25 0.00 19.48 1.50 2.71 0.00P-DP 22.93MIMS 32H 3307BH - 3307BH 3.26 0.14 30.61 18.24 1.06 0.37 0.00 28.89 1.66 3.53 0.00P-DP 27.06MIMS 32H 3315AH - 3315AH 3.60 0.15 20.18 12.52 1.18 0.22 0.00 17.15 1.85 2.84 0.00P-DP 22.43MIMS 32H 3317AH - 3317AH 4.03 0.17 15.60 10.08 0.62 0.19 0.00 14.40 0.97 1.89 0.00P-DP 19.43MIMS 32H 3318AH - 3318AH 2.12 0.09 9.46 6.59 0.39 0.11 0.00 8.67 0.61 1.16 0.00P-DP 14.09MIMS 32H 3326SH - 3326SH 1.34 0.06 12.49 8.24 0.50 0.15 0.00 11.52 0.78 1.51 0.00P-DP 17.35MIMS 32H 3327SH - 3327SH 1.70 0.07 15.56 10.10 0.39 0.20 0.00 15.26 0.61 1.63 0.00P-DP 19.31MIMS 32H 3345SH - 3345SH 1.32 0.06 16.48 9.12 0.64 0.20 0.00 15.25 1.01 1.98 0.00P-DP 22.93MIMS 32H 3347SH - 3347SH 2.19 0.09 12.89 7.56 0.50 0.15 0.00 11.95 0.78 1.54 0.00P-DP 20.04MIMS 32H 3348SH - 3348SH 1.70 0.07 55.57 41.01 38.98 0.00 0.00 0.00 103.97 48.41 0.00P-DP 12.50MINGO S CRC JF 4H - 4H 0.00 0.00 161.70 107.70 113.45 0.00 0.00 0.00 302.57 140.87 0.00P-DP 17.97MINGO SE CRC JF 6H - 6H 0.00 0.00 23.02 17.14 16.15 0.00 0.00 0.00 43.07 20.05 0.00P-DP 11.84MINGO SW CRC JF 2H - 2H 0.00 0.00 78.57 58.65 55.13 0.00 0.00 0.00 147.03 68.45 0.00P-DP 10.82MINGO W CRC JF 8H - 8H 0.00 0.00 8.27 5.40 0.02 0.11 0.00 8.80 0.04 0.64 0.00P-DP 33.44MITCHELL 47-31 A UNIT A 2H - A 2H 0.07 0.00 11.71 7.20 0.02 0.16 0.00 12.52 0.04 0.90 0.00P-DP 39.99MITCHELL 47-31 A UNIT L 2H - L 2H 0.06 0.00 6.20 4.09 0.02 0.08 0.00 6.57 0.05 0.49 0.00P-DP 28.70MITCHELL 47-31 B UNIT A 7H - A 7H 0.08 0.00 16.89 8.83 0.00 0.23 0.00 18.17 0.00 1.29 0.00P-DP 48.23MITCHELL 47-31 B UNIT L 6H - L 6H 0.00 0.00 13.18 8.91 0.25 0.17 0.00 12.82 0.53 1.04 0.00P-DP 11.39MOLNOSKEY UNIT 1H - 1H 0.87 0.14 63.21 36.93 0.00 0.90 0.00 67.96 0.00 4.75 0.00P-DP 31.60MOLNOSKEY UNIT 2H - 2H 0.00 0.00 0.00 0.00 0.00 0.00 0.00 0.00 0.00 0.00 0.00P-DP 0.00MONROE 34-158 UNIT 1H - 1H 0.00 0.00 0.15 0.12 0.00 0.00 0.00 0.15 0.00 0.02 0.00P-DP 4.74MONROE 34-158 UNIT 2H - 2H 0.01 0.00 1.52 0.91 0.02 0.02 0.00 1.59 0.03 0.16 0.00P-DP 24.11MONROE 34-158 UNIT 3H - 3H 0.07 0.00

Economic One-Liners Lease Name Life (years) Oil (Mbbl) Residue Gas (MMcf) Residue Gas (M$) Other (M$) Expense & Tax (M$) Invest. (M$) Non-Disc. (M$) Cash FlowNet Sales Volumes Net Revenue As of Date: 1/1/2024 Reserve Category Oil (M$) Disc. 10% (M$) NGL (M$) NGL (Mbbl) TABLE 6 0.71 0.40 0.00 0.01 0.00 0.76 0.00 0.07 0.00P-DP 18.70MONROE 34-158 UNIT 4H - 4H 0.01 0.00 1.04 0.55 0.04 0.01 0.00 0.92 0.09 0.10 0.00P-DP 34.93MORGAN-NEAL 39-26 2LS - 2LS 0.14 0.00 1.51 0.77 0.06 0.02 0.00 1.31 0.14 0.15 0.00P-DP 40.77MORGAN-NEAL 39-26 3WA - 3WA 0.21 0.01 0.76 0.44 0.04 0.01 0.00 0.63 0.08 0.08 0.00P-DP 29.97MORGAN-NEAL UNIT NO.2 39-26 1LS - 1LS 0.13 0.00 0.77 0.39 0.02 0.01 0.00 0.71 0.06 0.07 0.00P-DP 32.90MORGAN-NEAL UNIT NO.2 39-26 1WA - 1WA 0.08 0.00 0.62 0.33 0.04 0.01 0.00 0.47 0.08 0.07 0.00P-DP 28.96MORGAN-NEAL UNIT NO.2 39-26 2WA - 2WA 0.13 0.00 4.26 2.23 0.05 0.05 0.00 4.29 0.13 0.36 0.00P-DP 34.05MORTAL STORM 12-13-24 H 1W - H 1W 0.20 0.01 29.91 15.43 0.66 0.41 0.00 31.57 2.32 4.50 0.00P-DP 35.06MOTHMAN UNIT A 45-04 2AH - 2AH 0.51 0.02 6.63 3.32 0.08 0.09 0.00 6.71 0.19 0.56 0.00P-DP 40.51MR HOBBS 11-14 H 1W - H 1W 0.28 0.01 2.11 1.39 0.03 0.03 0.00 2.12 0.06 0.18 0.00P-DP 22.58MR HOBBS 11-14-23 H 1LS - H 1LS 0.10 0.00 5.02 2.65 0.14 0.06 0.00 4.67 0.33 0.47 0.00P-DP 41.00MR HOBBS 11-14-23A H 2W - H 2W 0.50 0.02 59.67 33.63 2.71 0.63 0.00 49.80 6.42 6.26 0.00P-DP 46.48MR. PHILLIPS 11-02 A 1NA - 1NA 9.72 0.30 56.36 32.63 1.33 0.68 0.00 53.58 3.15 5.14 0.00P-DP 45.11MR. PHILLIPS 11-02 A 1NS - 1NS 4.77 0.15 32.15 17.26 0.92 0.38 0.00 29.71 2.18 3.03 0.00P-DP 38.95MR. PHILLIPS 11-02 B 2AH - 2AH 3.29 0.10 30.51 16.42 0.67 0.37 0.00 29.30 1.58 2.75 0.00P-DP 38.05MR. PHILLIPS 11-02 B 2SH - 2SH 2.39 0.07 23.62 14.71 0.70 0.27 0.00 21.68 1.67 2.24 0.00P-DP 31.59MR. PHILLIPS 11-02 D 4SA - 4SA 2.52 0.08 5.72 3.87 0.11 0.07 0.00 5.54 0.27 0.51 0.00P-DP 15.38MR. PHILLIPS 11-2 1SH - 1SH 0.41 0.01 2.54 1.61 0.13 0.04 0.00 2.73 0.17 0.37 0.00P-DP 26.96MUD HEN 57-31 A 1WA - 1WA 0.01 0.00 8.55 5.02 0.32 0.12 0.00 9.23 0.45 1.15 0.00P-DP 36.76MUD HEN 57-31 B 2BS - 2BS 0.03 0.00 5.21 2.90 0.28 0.07 0.00 5.59 0.39 0.79 0.00P-DP 35.00MUD HEN 57-31 C 3WA - 3WA 0.02 0.00 10.42 5.87 0.36 0.15 0.00 11.25 0.50 1.36 0.00P-DP 40.43MUD HEN 57-31 D 4BS - 4BS 0.03 0.00 17.03 8.31 0.35 0.21 0.00 16.47 0.83 1.52 0.00P-DP 42.05MUSGROVE MILLER 0904 2HM - 2HM 1.25 0.04 0.00 0.00 0.00 0.00 0.00 0.00 0.00 0.00 0.00P-DP 0.00MUSSER 1 - 1 0.00 0.00 0.00 0.00 0.00 0.00 0.00 0.00 0.00 0.00 0.00P-DP 0.00N A C R C 1-15 ACRES 1 - 1 0.00 0.00 0.00 0.00 0.00 0.00 0.00 0.00 0.00 0.00 0.00P-DP 0.00N A C R C 5-132 - 5-132 0.00 0.00 149.11 115.45 104.62 0.00 0.00 0.00 279.02 129.90 0.00P-DP 8.51NAC 3H-20 - 3H-20 0.00 0.00 261.92 172.65 183.76 0.00 0.00 0.00 490.10 228.18 0.00P-DP 14.45NAC 4H-20 - 4H-20 0.00 0.00 190.24 149.39 133.47 0.00 0.00 0.00 355.96 165.73 0.00P-DP 8.72NAC B WYN JF 1H - 1H 0.00 0.00 101.61 85.73 71.29 0.00 0.00 0.00 190.14 88.52 0.00P-DP 5.49NAC B WYN JF 3H - 3H 0.00 0.00 194.74 151.20 136.63 0.00 0.00 0.00 364.39 169.65 0.00P-DP 9.08NAC B WYN JF 5H - 5H 0.00 0.00 24.03 21.36 16.86 0.00 0.00 0.00 44.96 20.93 0.00P-DP 2.79NAC GAS UNIT B 3H-3 - 3H-3 0.00 0.00 1,385.05 1,163.53 594.44 0.00 0.00 0.00 1,567.55 182.49 0.00P-DP 19.62NAC ROYALTY 27-41 HC 001 - 1 0.00 0.00 0.30 0.10 0.01 0.00 0.00 0.30 0.01 0.03 0.00P-DP 50.00NAIL -A- 1 - 1 0.02 0.00 0.05 0.03 0.00 0.00 0.00 0.05 0.00 0.01 0.00P-DP 20.05NAIL -C- 1 - 1 0.01 0.00 0.10 0.05 0.00 0.00 0.00 0.10 0.00 0.01 0.00P-DP 26.46NAIL -E- 1 - 1 0.01 0.00

Economic One-Liners Lease Name Life (years) Oil (Mbbl) Residue Gas (MMcf) Residue Gas (M$) Other (M$) Expense & Tax (M$) Invest. (M$) Non-Disc. (M$) Cash FlowNet Sales Volumes Net Revenue As of Date: 1/1/2024 Reserve Category Oil (M$) Disc. 10% (M$) NGL (M$) NGL (Mbbl) TABLE 6 0.07 0.04 0.00 0.00 0.00 0.07 0.00 0.01 0.00P-DP 16.42NAIL -E- 2 - 2 0.00 0.00 0.07 0.04 0.00 0.00 0.00 0.07 0.00 0.01 0.00P-DP 17.95NAIL -E- 3 - 3 0.01 0.00 0.17 0.05 0.00 0.00 0.00 0.17 0.00 0.02 0.00P-DP 50.00NAIL -K- 1 - 1 0.01 0.00 0.04 0.03 0.00 0.00 0.00 0.04 0.00 0.00 0.00P-DP 12.08NAIL -P- 1 - 1 0.00 0.00 0.08 0.03 0.00 0.00 0.00 0.07 0.00 0.01 0.00P-DP 34.75NAIL J 1 - 1 0.01 0.00 0.17 0.09 0.00 0.00 0.00 0.18 0.00 0.02 0.00P-DP 26.86NAIL O 1 - 1 0.01 0.00 0.18 0.11 0.01 0.00 0.00 0.18 0.01 0.02 0.00P-DP 25.61NAIL RANCH 10 1 - 1 0.02 0.00 0.17 0.10 0.00 0.00 0.00 0.16 0.01 0.02 0.00P-DP 24.60NAIL RANCH 10 2 - 2 0.02 0.00 0.15 0.09 0.00 0.00 0.00 0.16 0.00 0.01 0.00P-DP 22.26NAIL RANCH 10 3 - 3 0.00 0.00 0.17 0.10 0.01 0.00 0.00 0.15 0.01 0.02 0.00P-DP 22.34NAIL RANCH 10 4 - 4 0.02 0.00 7.39 4.78 0.05 0.10 0.00 7.70 0.09 0.56 0.00P-DP 13.96NANCY 1H - 1H 0.16 0.02 4.96 2.89 1.57 0.04 0.00 3.42 2.05 4.06 0.00P-DP 30.65NE AXIS #2H - 2H 3.54 0.10 0.32 0.17 0.01 0.00 0.00 0.31 0.01 0.03 0.00P-DP 32.51NE NAIL 10 1 - 1 0.03 0.00 0.43 0.23 0.02 0.00 0.00 0.39 0.03 0.05 0.00P-DP 35.51NE NAIL 10 2 - 2 0.06 0.00 0.14 0.09 0.01 0.00 0.00 0.12 0.01 0.02 0.00P-DP 21.13NE NAIL 10 3 - 3 0.02 0.00 0.10 0.06 0.00 0.00 0.00 0.09 0.01 0.01 0.00P-DP 19.39NE NAIL 10 4 - 4 0.02 0.00 0.09 0.05 0.00 0.00 0.00 0.08 0.01 0.01 0.00P-DP 19.67NE NAIL 10 5 - 5 0.02 0.00 649.85 297.07 2.14 9.11 0.00 701.26 7.56 60.63 0.00P-DP 50.00NESSIE UNIT A 34-46 1AH - 1AH 1.67 0.06 400.42 198.73 6.18 5.53 0.00 426.00 21.81 52.20 0.00P-DP 45.80NESSIE UNIT A 34-46 2AH - 2AH 4.80 0.18 225.30 107.03 2.26 3.13 0.00 241.23 7.96 25.64 0.00P-DP 38.96NESSIE UNIT A 34-46 3AH - 3AH 1.75 0.07 364.90 188.36 42.69 4.44 0.00 341.84 150.58 160.69 0.00P-DP 43.89NESSIE UNIT A 34-46 3SH - 3SH 33.17 1.25 532.76 262.26 20.26 7.17 0.00 551.75 71.45 106.18 0.00P-DP 50.00NESSIE UNIT B 34-46 7AH - 7AH 15.74 0.59 150.82 77.65 22.02 1.76 0.00 135.82 77.66 79.76 0.00P-DP 32.04NESSIE UNIT B 34-46 8AH - 8AH 17.11 0.64 18.43 9.46 0.75 0.20 0.00 15.85 1.77 1.88 0.00P-DP 38.59NEWTON 43A 1HE - 1HE 2.68 0.08 13.26 6.99 0.54 0.14 0.00 11.40 1.28 1.35 0.00P-DP 35.02NEWTON 43A 2HK - 2HK 1.93 0.06 1.99 1.27 0.16 0.02 0.00 1.32 0.37 0.25 0.00P-DP 20.76NEWTON 43B 3HJ - 3HJ 0.56 0.02 5.31 3.08 0.08 0.07 0.00 5.30 0.18 0.45 0.00P-DP 23.89NEWTON 43BK 4HE - 4HE 0.28 0.01 8.37 5.05 0.10 0.11 0.00 8.50 0.23 0.70 0.00P-DP 26.73NEWTON 43BK 5HK - 5HK 0.34 0.01 309.41 197.80 10.35 3.52 0.00 277.92 24.51 30.12 0.00P-DP 23.27NEWTON 43C 6HJ - 6HJ 37.10 1.13 12.73 9.47 8.39 0.01 0.00 0.45 23.06 27.00 0.00P-DP 8.23NM HARRISON 16-11-5 10H - 10H 16.22 0.69 13.96 10.31 8.31 0.03 0.00 2.02 22.83 26.95 0.00P-DP 8.62NM HARRISON 16-11-5 6H - 6H 16.06 0.68 12.37 9.49 8.15 0.01 0.00 0.45 22.38 26.20 0.00P-DP 7.58NM HARRISON 16-11-5 8H - 8H 15.75 0.67 70.12 58.00 49.19 0.00 0.00 0.00 131.20 61.08 0.00P-DP 5.83NOLAN NE CRC JF 3H - 3H 0.00 0.00 554.25 353.33 388.86 0.00 0.00 0.00 1,037.09 482.84 0.00P-DP 22.10NOLAN NW CRC JF 1H - 1H 0.00 0.00 242.20 171.99 169.93 0.00 0.00 0.00 453.21 211.00 0.00P-DP 13.05NOLAN S CRC JF 2H - 2H 0.00 0.00

Economic One-Liners Lease Name Life (years) Oil (Mbbl) Residue Gas (MMcf) Residue Gas (M$) Other (M$) Expense & Tax (M$) Invest. (M$) Non-Disc. (M$) Cash FlowNet Sales Volumes Net Revenue As of Date: 1/1/2024 Reserve Category Oil (M$) Disc. 10% (M$) NGL (M$) NGL (Mbbl) TABLE 6 258.52 181.46 181.38 0.00 0.00 0.00 483.74 225.22 0.00P-DP 13.69NOLAN S CRC JF 4H - 4H 0.00 0.00 276.55 194.62 194.03 0.00 0.00 0.00 517.47 240.92 0.00P-DP 13.95NOLAN S CRC JF 6H - 6H 0.00 0.00 21.12 12.81 1.46 0.22 0.00 17.07 2.28 3.21 0.00P-DP 23.42NORRIS UNIT 32-H 3301BH - 3301BH 4.97 0.21 23.99 14.89 1.74 0.25 0.00 19.06 2.73 3.74 0.00P-DP 23.92NORRIS UNIT 32-H 3303BH - 3303BH 5.94 0.25 19.64 12.46 0.25 0.26 0.00 20.18 0.40 1.81 0.00P-DP 21.69NORRIS UNIT 32-H 3304BH - 3304BH 0.87 0.04 18.99 11.54 1.86 0.17 0.00 13.20 2.92 3.47 0.00P-DP 22.47NORRIS UNIT 32-H 3312AH - 3312AH 6.35 0.27 25.35 15.56 2.71 0.22 0.00 16.73 4.25 4.88 0.00P-DP 24.65NORRIS UNIT 32-H 3313AH - 3313AH 9.24 0.39 40.12 22.84 2.81 0.42 0.00 32.28 4.40 6.14 0.00P-DP 30.76NORRIS UNIT 32-H 3322SH - 3322SH 9.57 0.41 95.10 52.87 7.74 0.93 0.00 72.30 12.13 15.69 0.00P-DP 40.44NORRIS UNIT 32-H 3323SH - 3323SH 26.37 1.12 49.67 28.21 4.14 0.48 0.00 37.36 6.49 8.31 0.00P-DP 33.00NORRIS UNIT 32-H 3361DH - 3361DH 14.12 0.60 45.02 25.88 3.84 0.43 0.00 33.52 6.02 7.62 0.00P-DP 31.67NORRIS UNIT 32-H 3363DH - 3363DH 13.10 0.56 35.71 20.77 1.71 0.41 0.00 31.83 2.68 4.62 0.00P-DP 29.16NORRIS UNIT 32-H 3364DH - 3364DH 5.82 0.25 22.21 13.88 1.57 0.23 0.00 17.80 2.47 3.42 0.00P-DP 23.09NORRIS UNIT 32-H 3371JH - 3371JH 5.36 0.23 21.24 13.33 1.60 0.21 0.00 16.63 2.51 3.37 0.00P-DP 22.60NORRIS UNIT 32-H 3373JH - 3373JH 5.47 0.23 26.24 15.56 1.72 0.28 0.00 21.58 2.69 3.89 0.00P-DP 25.83NORRIS UNIT 32-H 3374JH - 3374JH 5.86 0.25 17.96 11.45 1.19 0.19 0.00 14.70 1.87 2.68 0.00P-DP 20.84NORRIS-MIMS ALLOCATION 3315AH - 3315AH 4.07 0.17 16.10 10.79 2.06 0.12 0.00 9.31 3.23 3.45 0.00P-DP 18.77NORRIS-MIMS ALLOCATION 3325SH - 3325SH 7.02 0.30 0.00 0.00 0.00 0.00 0.00 0.00 0.00 0.00 0.00P-DP 0.00NORTH AMERICAN COAL CORP 1 - 1 0.00 0.00 20.42 11.97 12.23 0.00 0.00 0.00 33.22 12.81 0.00P-DP 18.51NORTH AMERICAN COAL GAS UNIT 1 - 1 0.00 0.00 86.36 61.86 57.40 0.03 0.00 2.23 157.68 184.48 0.00P-DP 9.85NORTH AMERICAN COAL ROYALTY CO BUELL 8H - 8H 110.93 4.73 0.41 0.19 0.01 0.01 0.00 0.41 0.01 0.03 0.00P-DP 27.03NUNN 1 0.02 0.00 0.42 0.20 0.01 0.01 0.00 0.42 0.01 0.04 0.00P-DP 27.47NUNN 2 - 2 0.03 0.00 12.12 5.72 2.13 0.09 0.00 6.85 2.27 1.63 0.00P-DP 41.23NUNN 5-44 1HB - 1HB 4.63 0.26 10.72 5.26 1.53 0.09 0.00 7.10 1.63 1.33 0.00P-DP 38.81NUNN 5-44 4303H - 4303H 3.32 0.18 7.52 3.69 0.98 0.07 0.00 5.24 1.05 0.90 0.00P-DP 34.16NUNN 5-44 4403H - 4403H 2.13 0.12 10.76 4.75 1.26 0.10 0.00 7.90 1.35 1.24 0.00P-DP 41.06NUNN 5-44 4803H - 4803H 2.75 0.15 0.52 0.24 0.02 0.01 0.00 0.52 0.02 0.04 0.00P-DP 30.41NUNN A 2 - 2 0.03 0.00 1.61 0.64 0.00 0.02 0.00 1.73 0.00 0.12 0.00P-DP 40.77NUNN A 3 - 3 0.00 0.00 0.00 0.00 0.00 0.00 0.00 0.00 0.00 0.00 0.00P-DP 0.00NUNN B 3 - 3 0.00 0.00 0.00 0.00 0.00 0.00 0.00 0.00 0.00 0.00 0.00P-DP 0.00NUNN, ELIZABETH C -C- 1 - 1 0.00 0.00 0.00 0.00 0.00 0.00 0.00 0.00 0.00 0.00 0.00P-DP 0.00NUNN, ELIZABETH C -C- 2 - 2 0.00 0.00 0.00 0.00 0.00 0.00 0.00 0.00 0.00 0.00 0.00P-DP 0.00NUNN, ELIZABETH C -C- 3 - 3 0.00 0.00 0.00 0.00 0.00 0.00 0.00 0.00 0.00 0.00 0.00P-DP 0.00NUNN, ELIZABETH C -C- 4 - 4 0.00 0.00 0.00 0.00 0.00 0.00 0.00 0.00 0.00 0.00 0.00P-DP 0.00NUNN, J F B 3 - 3 0.00 0.00 6.72 3.74 0.05 0.09 0.00 7.03 0.11 0.65 0.00P-DP 22.12O'NEAL -D- 1 - 1 0.23 0.01

Economic One-Liners Lease Name Life (years) Oil (Mbbl) Residue Gas (MMcf) Residue Gas (M$) Other (M$) Expense & Tax (M$) Invest. (M$) Non-Disc. (M$) Cash FlowNet Sales Volumes Net Revenue As of Date: 1/1/2024 Reserve Category Oil (M$) Disc. 10% (M$) NGL (M$) NGL (Mbbl) TABLE 6 9.95 5.21 0.16 0.13 0.00 9.92 0.36 1.08 0.00P-DP 24.88O'NEAL 1 - 1 0.76 0.03 7.55 3.64 0.15 0.10 0.00 7.53 0.23 1.07 0.00P-DP 38.32OAK VALLEY 2 1 - 1 0.86 0.03 0.02 0.01 0.00 0.00 0.00 0.01 0.00 0.00 0.00P-DP 1.03OLDHAM 38-27 B UNIT A 7H - A 7H 0.00 0.00 0.00 0.00 0.00 0.00 0.00 0.00 0.00 0.00 0.00P-DP 0.00OLDHAM 38-27 B UNIT A 8H - A 8H 0.00 0.00 5.35 2.72 0.02 0.07 0.00 5.66 0.04 0.42 0.00P-DP 50.00OLDHAM 38-27 B UNIT L 7H - L 7H 0.06 0.00 0.06 0.05 0.01 0.00 0.00 0.01 0.03 0.01 0.00P-DP 4.63OLDHAM 38-27 B UNIT L 8H - L 8H 0.04 0.00 3.09 1.46 0.12 0.03 0.00 2.68 0.28 0.31 0.00P-DP 47.43OLDHAM TRUST EAST 3871WA - 3871WA 0.43 0.01 3.58 1.83 0.06 0.04 0.00 3.53 0.14 0.31 0.00P-DP 47.59OLDHAM TRUST EAST 3875LS - 3875LS 0.22 0.01 3.67 1.80 0.09 0.04 0.00 3.49 0.20 0.33 0.00P-DP 48.93OLDHAM TRUST EAST 3876WA - 3876WA 0.31 0.01 2.99 1.86 0.03 0.04 0.00 3.04 0.08 0.25 0.00P-DP 33.33OLDHAM TRUST WEST 1SH - 1SH 0.12 0.00 3.99 2.44 0.10 0.05 0.00 3.77 0.23 0.37 0.00P-DP 38.28OLDHAM TRUST WEST 2AH - 2AH 0.35 0.01 3.29 2.11 0.07 0.04 0.00 3.19 0.16 0.29 0.00P-DP 32.31OLDHAM TRUST WEST 4051WA 0.24 0.01 2.79 1.53 0.08 0.03 0.00 2.60 0.18 0.26 0.00P-DP 35.38OLDHAM TRUST WEST 4058LS - 4058LS 0.27 0.01 2.79 1.70 0.09 0.03 0.00 2.51 0.22 0.27 0.00P-DP 35.23OLDHAM TRUST WEST UNIT 25-56 2SH - 2SH 0.33 0.01 5.68 3.27 0.12 0.07 0.00 5.47 0.28 0.51 0.00P-DP 46.75OLDHAM TRUST WEST UNIT 25-56 3AH - 3AH 0.43 0.01 3.90 2.35 0.10 0.05 0.00 3.66 0.24 0.36 0.00P-DP 40.14OLDHAM TRUST WEST UNIT 25-56 3SH 0.36 0.01 21.52 12.82 0.71 0.24 0.00 19.30 1.64 2.87 0.00P-DP 28.96OLDHAM-GRAHAM 35A 1H - 1H 3.45 0.16 19.33 11.62 0.79 0.21 0.00 16.46 1.83 2.80 0.00P-DP 28.92OLDHAM-GRAHAM 35B 2H - 2H 3.84 0.18 27.46 15.81 1.02 0.30 0.00 23.94 2.37 3.84 0.00P-DP 32.16OLDHAM-GRAHAM 35C 3H - 3H 4.99 0.23 23.16 13.32 1.07 0.24 0.00 18.97 2.49 3.54 0.00P-DP 31.65OLDHAM-GRAHAM 35D 4H - 4H 5.24 0.24 28.08 16.82 1.10 0.31 0.00 24.16 2.55 4.00 0.00P-DP 31.35OLDHAM-GRAHAM 35E 5H - 5H 5.37 0.25 31.25 17.29 0.78 0.37 0.00 29.45 1.81 3.82 0.00P-DP 35.73OLDHAM-GRAHAM 35F 6H - 6H 3.81 0.17 38.32 23.73 0.76 0.49 0.00 38.37 1.19 3.81 0.00P-DP 37.78ORSON-BILLY 139A 1H - 1H 2.58 0.11 67.44 42.65 1.00 0.89 0.00 68.82 1.57 6.36 0.00P-DP 44.54ORSON-BILLY 139B 2H - 2H 3.41 0.15 71.58 45.91 1.21 0.93 0.00 72.48 1.89 6.90 0.00P-DP 44.91ORSON-BILLY 139C 3H - 3H 4.11 0.18 44.76 27.26 0.67 0.59 0.00 45.63 1.06 4.23 0.00P-DP 40.44ORSON-BILLY 139D 4H - 4H 2.30 0.10 37.36 22.97 0.54 0.49 0.00 38.18 0.85 3.51 0.00P-DP 37.66ORSON-BILLY 139E 5H - 5H 1.84 0.08 96.78 58.36 2.20 1.23 0.00 95.78 3.44 9.94 0.00P-DP 50.00ORSON-BILLY 139F 6H - 6H 7.49 0.32 50.51 30.33 1.38 0.63 0.00 49.09 2.16 5.43 0.00P-DP 42.57ORSON-BILLY 139G 7H - 7H 4.70 0.20 197.26 99.18 4.26 2.71 0.00 208.35 15.03 29.43 0.00P-DP 42.24ORTHRUS UNIT A 34-22 1AH - 1AH 3.31 0.12 186.68 95.17 4.73 2.55 0.00 196.31 16.67 29.96 0.00P-DP 41.13ORTHRUS UNIT A 34-22 2AH - 2AH 3.67 0.14 150.45 84.06 7.53 1.99 0.00 153.54 26.57 35.52 0.00P-DP 36.08ORTHRUS UNIT A 34-22 3AH - 3AH 5.85 0.22 72.20 41.63 5.47 0.93 0.00 71.36 19.31 22.72 0.00P-DP 26.26ORTHRUS UNIT B 34-22 7AH - 7AH 4.25 0.16 166.67 86.10 3.09 2.29 0.00 176.67 10.90 23.31 0.00P-DP 39.26ORTHRUS UNIT B 34-22 8AH - 8AH 2.40 0.09 7.78 3.74 0.15 0.10 0.00 7.79 0.23 1.09 0.00P-DP 39.15OV UNIT 1 - 1 0.85 0.03

Economic One-Liners Lease Name Life (years) Oil (Mbbl) Residue Gas (MMcf) Residue Gas (M$) Other (M$) Expense & Tax (M$) Invest. (M$) Non-Disc. (M$) Cash FlowNet Sales Volumes Net Revenue As of Date: 1/1/2024 Reserve Category Oil (M$) Disc. 10% (M$) NGL (M$) NGL (Mbbl) TABLE 6 8.68 4.35 0.24 0.11 0.00 8.35 0.36 1.39 0.00P-DP 32.08OVMLC 1 - 1 1.36 0.05 7.27 3.54 0.04 0.10 0.00 7.77 0.06 0.76 0.00P-DP 37.34OVMLC 2 - 2 0.21 0.01 0.00 0.00 0.00 0.00 0.00 0.00 0.00 0.00 0.00P-DP 0.00P LAMANTIA 1 - 1 0.00 0.00 0.00 0.00 0.00 0.00 0.00 0.00 0.00 0.00 0.00P-DP 0.00P LONG 1 - 1 0.00 0.00 0.00 0.00 0.00 0.00 0.00 0.00 0.00 0.00 0.00P-DP 0.00P LONG 4 - 4 0.00 0.00 29.94 17.19 2.33 0.32 0.00 24.53 3.20 5.45 0.00P-DP 40.28PALMER 52 UNIT 222H - 222H 7.65 0.32 19.48 11.50 2.16 0.18 0.00 13.68 2.98 4.30 0.00P-DP 36.79PALMER 52 UNIT 332H - 332H 7.12 0.29 8.18 6.51 2.74 0.00 0.00 0.00 9.09 0.91 0.00P-DP 5.35PALOS 01-12-241 0.00 0.00 18.15 10.95 6.08 0.00 0.00 0.00 20.16 2.02 0.00P-DP 15.07PALOS 02-10-239 0.00 0.00 56.95 33.66 19.08 0.00 0.00 0.00 63.28 6.33 0.00P-DP 17.63PALOS 02-16-240 0.00 0.00 43.47 24.83 14.56 0.00 0.00 0.00 48.30 4.83 0.00P-DP 17.11PALOS 03-06-245 0.00 0.00 36.10 22.46 12.09 0.00 0.00 0.00 40.11 4.01 0.00P-DP 14.13PALOS 03-10-232 0.00 0.00 18.33 13.53 6.14 0.00 0.00 0.00 20.37 2.04 0.00P-DP 8.18PALOS 03-14-233 0.00 0.00 33.43 22.44 11.20 0.00 0.00 0.00 37.15 3.71 0.00P-DP 12.08PALOS 03-16-231 0.00 0.00 35.23 23.48 0.52 0.49 0.00 37.51 1.84 4.52 0.00P-DP 16.59PAMOLA UNIT A 35-23 1AH - 1AH 0.40 0.02 19.12 13.92 1.64 0.24 0.00 18.65 5.80 6.61 0.00P-DP 10.81PAMOLA UNIT A 35-23 2AH - 2AH 1.28 0.05 141.33 85.14 5.68 1.90 0.00 145.99 20.02 29.08 0.00P-DP 33.27PAMOLA UNIT A 35-23 3AH - 3AH 4.41 0.17 194.15 105.92 7.26 2.61 0.00 201.22 25.59 38.31 0.00P-DP 40.52PAMOLA UNIT A 35-23 4AH - 4AH 5.64 0.21 33.29 20.08 0.43 0.44 0.00 34.24 0.67 3.07 0.00P-DP 34.67PAPER RINGS 136-137 A 1WB - 1WB 1.45 0.06 2.63 1.36 0.00 0.04 0.00 2.86 0.00 0.23 0.00P-DP 31.71PARKS 1 - 1 0.00 0.00 1.41 0.61 0.00 0.02 0.00 1.53 0.00 0.12 0.00P-DP 43.03PARKS 6 2 - 2 0.00 0.00 7.02 3.74 0.33 0.07 0.00 5.70 0.77 1.08 0.00P-DP 31.90PARKS FIELD UNIT 2 1450BH - 1450BH 1.63 0.07 6.79 3.86 0.33 0.07 0.00 5.49 0.76 1.05 0.00P-DP 30.11PARKS FIELD UNIT 2 1450LH - 1450LH 1.59 0.07 10.09 5.38 0.23 0.12 0.00 9.65 0.53 1.20 0.00P-DP 35.62PARKS FIELD UNIT 2 1451LH - 1451LH 1.12 0.05 2.64 1.59 0.07 0.03 0.00 2.47 0.16 0.33 0.00P-DP 20.58PARKS FIELD UNIT 2 1454H - 1454H 0.34 0.02 14.01 7.44 0.28 0.17 0.00 13.59 0.65 1.62 0.00P-DP 39.22PARKS FIELD UNIT 2 1454LH - 1454LH 1.38 0.06 5.19 2.92 0.14 0.06 0.00 4.83 0.33 0.65 0.00P-DP 27.90PARKS FIELD UNIT 2 1455LH - 1455LH 0.69 0.03 18.90 10.50 1.39 0.16 0.00 12.54 3.21 3.61 0.00P-DP 41.52PARKS FIELD UNIT 2 1458CH - 1458CH 6.76 0.31 21.51 11.44 1.68 0.17 0.00 13.70 3.89 4.25 0.00P-DP 43.97PARKS FIELD UNIT 2 1458LH - 1458LH 8.18 0.37 4.74 2.65 0.32 0.04 0.00 3.30 0.74 0.87 0.00P-DP 27.07PARKS FIELD UNIT 2 1863BH - 1863BH 1.56 0.07 5.74 3.24 0.29 0.06 0.00 4.58 0.66 0.90 0.00P-DP 28.65PARKS FIELD UNIT 2 1863LH - 1863LH 1.40 0.06 5.67 3.07 0.10 0.07 0.00 5.56 0.24 0.64 0.00P-DP 29.48PARKS FIELD UNIT 2 1904BH - 1904BH 0.51 0.02 3.63 2.03 0.14 0.04 0.00 3.15 0.32 0.51 0.00P-DP 24.94PARKS FIELD UNIT 2 1921H - 1921H 0.67 0.03 11.99 6.81 0.79 0.11 0.00 8.48 1.83 2.16 0.00P-DP 36.02PARKS FIELD UNIT 2 2001BH - 2001BH 3.84 0.18 6.00 3.56 0.19 0.07 0.00 5.45 0.43 0.78 0.00P-DP 27.95PARKS FIELD UNIT 2 2308BH - 2308BH 0.90 0.04

Economic One-Liners Lease Name Life (years) Oil (Mbbl) Residue Gas (MMcf) Residue Gas (M$) Other (M$) Expense & Tax (M$) Invest. (M$) Non-Disc. (M$) Cash FlowNet Sales Volumes Net Revenue As of Date: 1/1/2024 Reserve Category Oil (M$) Disc. 10% (M$) NGL (M$) NGL (Mbbl) TABLE 6 20.90 10.53 0.64 0.24 0.00 19.03 1.48 2.72 0.00P-DP 44.75PARKS FIELD UNIT 2 2308LH - 2308LH 3.11 0.14 16.26 8.79 0.55 0.18 0.00 14.52 1.27 2.19 0.00P-DP 40.49PARKS FIELD UNIT 2 2308MH - 2308MH 2.66 0.12 1.74 1.09 0.16 0.01 0.00 0.96 0.37 0.38 0.00P-DP 16.05PARKS FIELD UNIT 2 2329LH - 2329LH 0.79 0.04 0.77 0.62 0.11 0.00 0.00 0.19 0.26 0.23 0.00P-DP 5.58PARKS FIELD UNIT 2 2336BH - 2336BH 0.55 0.03 0.00 0.00 0.00 0.00 0.00 0.00 0.00 0.00 0.00P-DP 0.00PARKS FIELD UNIT 2 2346CH - 2346CH 0.00 0.00 8.41 4.37 0.08 0.11 0.00 8.69 0.18 0.84 0.00P-DP 34.22PARKS FIELD UNIT 2 2348H - 2348H 0.37 0.02 3.78 2.55 0.26 0.03 0.00 2.58 0.61 0.70 0.00P-DP 12.94PARKS FIELD UNIT 2 2630H - 2630H 1.29 0.06 10.14 5.48 0.28 0.12 0.00 9.39 0.65 1.28 0.00P-DP 35.38PARKS FIELD UNIT 2 2709H - 2709H 1.37 0.06 1.36 0.75 0.13 0.01 0.00 0.74 0.30 0.30 0.00P-DP 18.24PARKS FIELD UNIT NO. 2 1320H - 1320H 0.62 0.03 2.52 1.32 0.36 0.01 0.00 0.64 0.85 0.74 0.00P-DP 23.37PARKS FIELD UNIT NO. 2 1421H - 1421H 1.78 0.08 3.07 1.45 0.44 0.01 0.00 0.79 1.02 0.89 0.00P-DP 28.25PARKS FIELD UNIT NO. 2 1422H - 1422H 2.15 0.10 0.09 0.08 0.01 0.00 0.00 0.05 0.02 0.02 0.00P-DP 2.01PARKS FIELD UNIT NO. 2 1423H - 1423H 0.04 0.00 0.29 0.23 0.04 0.00 0.00 0.10 0.09 0.08 0.00P-DP 6.00PARKS FIELD UNIT NO. 2 1829H - 1829H 0.19 0.01 0.07 0.07 0.01 0.00 0.00 0.00 0.03 0.03 0.00P-DP 1.74PARKS FIELD UNIT NO. 2 1831H - 1831H 0.07 0.00 1.32 0.79 0.15 0.01 0.00 0.56 0.35 0.33 0.00P-DP 15.89PARKS FIELD UNIT NO. 2 2324H - 2324H 0.73 0.03 0.00 0.00 0.00 0.00 0.00 0.00 0.00 0.00 0.00P-DP 0.00PARKS FIELD UNIT NO. 2 2401 - 2401 0.00 0.00 0.00 0.00 0.00 0.00 0.00 0.00 0.00 0.00 0.00P-DP 0.00PARKS FIELD UNIT NO. 2 2417H - 2417H 0.00 0.00 2.13 1.43 0.04 0.03 0.00 2.05 0.10 0.25 0.00P-DP 24.84PARKS, ROY 306BH - 306BH 0.22 0.01 6.69 3.84 0.05 0.09 0.00 6.98 0.11 0.65 0.00P-DP 41.51PARKS, ROY 306LH - 306LH 0.24 0.01 2.23 1.40 0.03 0.03 0.00 2.24 0.08 0.24 0.00P-DP 27.73PARKS, ROY 307BH - 307BH 0.16 0.01 0.24 0.17 0.04 0.00 0.00 0.00 0.10 0.08 0.00P-DP 9.19PARKS, ROY 307LH - 307LH 0.22 0.01 2.50 1.53 0.03 0.03 0.00 2.52 0.08 0.27 0.00P-DP 29.62PARKS, ROY 308BH - 308BH 0.17 0.01 0.13 0.11 0.02 0.00 0.00 0.00 0.06 0.05 0.00P-DP 5.35PARKS, ROY 308LH - 308LH 0.12 0.01 7.38 4.44 0.04 0.10 0.00 7.81 0.08 0.69 0.00P-DP 41.40PARKS, ROY 308MH - 308MH 0.18 0.01 0.60 0.41 0.02 0.01 0.00 0.51 0.06 0.09 0.00P-DP 15.22PARKS, ROY 316CH - 316CH 0.12 0.01 3.05 1.93 0.04 0.04 0.00 3.10 0.09 0.32 0.00P-DP 30.54PARKS, ROY 316LH - 316LH 0.18 0.01 0.41 0.29 0.07 0.00 0.00 0.03 0.17 0.14 0.00P-DP 12.13PARKS, ROY 99H - 99H 0.35 0.02 34.95 22.05 0.36 0.45 0.00 35.91 0.83 3.54 0.00P-DP 34.28PARKS-COYOTE 1506 A 15HJ - 15HJ 1.75 0.08 35.71 22.96 0.67 0.44 0.00 34.97 1.54 4.04 0.00P-DP 34.74PARKS-COYOTE 1506 A 1HM - 1HM 3.24 0.15 54.91 34.12 0.70 0.70 0.00 55.62 1.63 5.76 0.00P-DP 39.78PARKS-COYOTE 1506 A 8HS - 8HS 3.43 0.16 15.19 10.28 0.26 0.19 0.00 14.99 0.61 1.69 0.00P-DP 24.60PARKS-COYOTE 1506 B 2HM - 2HM 1.28 0.06 40.76 26.12 0.53 0.52 0.00 41.23 1.23 4.29 0.00P-DP 34.71PARKS-COYOTE 1506 B 9HS - 9HS 2.59 0.12 49.80 29.87 0.69 0.63 0.00 50.12 1.61 5.31 0.00P-DP 39.61PARKS-COYOTE 1506 C 10HS - 10HS 3.38 0.15 46.25 27.87 0.62 0.59 0.00 46.68 1.44 4.89 0.00P-DP 38.68PARKS-COYOTE 1506 C 16HJ - 16HJ 3.03 0.14 26.76 16.35 0.80 0.31 0.00 24.48 1.85 3.46 0.00P-DP 33.15PARKS-COYOTE 1506 C 3HM - 3HM 3.89 0.18

Economic One-Liners Lease Name Life (years) Oil (Mbbl) Residue Gas (MMcf) Residue Gas (M$) Other (M$) Expense & Tax (M$) Invest. (M$) Non-Disc. (M$) Cash FlowNet Sales Volumes Net Revenue As of Date: 1/1/2024 Reserve Category Oil (M$) Disc. 10% (M$) NGL (M$) NGL (Mbbl) TABLE 6 29.07 19.04 0.53 0.36 0.00 28.52 1.23 3.28 0.00P-DP 30.99PARKS-COYOTE 1506 D 11HS - 11HS 2.60 0.12 21.68 14.33 0.34 0.27 0.00 21.59 0.79 2.36 0.00P-DP 27.65PARKS-COYOTE 1506 D 17HS - 17HS 1.66 0.08 68.71 41.76 1.30 0.85 0.00 67.15 3.02 7.81 0.00P-DP 43.59PARKS-COYOTE 1506 D 4HM - 4HM 6.35 0.29 65.40 38.38 0.90 0.83 0.00 65.86 2.09 6.96 0.00P-DP 43.50PARKS-COYOTE 1506 E 12HS - 12HS 4.40 0.20 48.61 30.66 0.64 0.62 0.00 49.16 1.47 5.12 0.00P-DP 37.62PARKS-COYOTE 1506 E 18HJ - 18HJ 3.10 0.14 32.91 19.96 0.80 0.39 0.00 31.15 1.85 3.99 0.00P-DP 35.52PARKS-COYOTE 1506 E 5HM - 5HM 3.90 0.18 40.46 25.12 0.53 0.52 0.00 40.90 1.23 4.26 0.00P-DP 36.63PARKS-COYOTE 1506 F 13HS - 13HS 2.59 0.12 17.77 12.36 0.18 0.23 0.00 18.28 0.41 1.80 0.00P-DP 25.18PARKS-COYOTE 1506 F 6HM - 6HM 0.87 0.04 68.12 41.98 0.42 0.91 0.00 71.59 0.98 6.51 0.00P-DP 42.47PARKS-COYOTE 1506 G 14HS - 14HS 2.07 0.09 14.88 9.62 0.18 0.19 0.00 15.10 0.43 1.55 0.00P-DP 25.43PARKS-COYOTE 1506 G 19HS - 19HS 0.90 0.04 44.02 27.91 0.47 0.57 0.00 45.11 1.09 4.49 0.00P-DP 37.41PARKS-COYOTE 1506 G 7HM - 7HM 2.30 0.11 3.20 2.41 0.68 0.01 0.00 0.80 1.06 0.97 0.00P-DP 9.80PATRICIA-NORRIS ALLOCATION 3311AH - 3311AH 2.31 0.10 8.99 6.21 1.21 0.06 0.00 4.95 1.90 2.00 0.00P-DP 13.69PATRICIA-NORRIS ALLOCATION 3321SH - 3321SH 4.14 0.18 0.00 0.00 0.00 0.00 0.00 0.00 0.00 0.00 0.00P-DP 0.00PATTERSON 3 - 3 0.00 0.00 6.51 3.70 0.21 0.08 0.00 6.20 0.33 0.74 0.00P-DP 38.44PERCY 39 1R - 1R 0.72 0.03 0.00 0.00 0.00 0.00 0.00 0.00 0.00 0.00 0.00P-DP 0.00PHILLIPS 1 - 1 0.00 0.00 0.00 0.00 0.00 0.00 0.00 0.00 0.00 0.00 0.00P-DP 0.00PHILLIPS 2 - 2 0.00 0.00 0.00 0.00 0.00 0.00 0.00 0.00 0.00 0.00 0.00P-DP 0.00PHILLIPS 3 - 3 0.00 0.00 2.68 1.51 0.00 0.04 0.00 2.88 0.00 0.20 0.00P-DP 26.02PHILLIPS 7 1 - 1 0.00 0.00 0.80 0.59 0.01 0.01 0.00 0.84 0.01 0.07 0.00P-DP 9.59PHILLIPS-GUTHRIE 1 - 1 0.03 0.00 0.44 0.41 0.02 0.01 0.00 0.39 0.03 0.06 0.00P-DP 2.76PHILLIPS-GUTHRIE 2 - 2 0.07 0.00 132.01 79.22 5.21 1.77 0.00 136.48 18.38 26.89 0.00P-DP 24.75PHOENIX UNIT 35-38 8AH - 8AH 4.05 0.15 266.29 145.29 1.13 3.73 0.00 287.04 3.97 25.60 0.00P-DP 38.04PIXIE UNIT A 35-47 1AH - 1AH 0.88 0.03 74.37 48.42 6.13 0.95 0.00 72.88 21.63 24.91 0.00P-DP 18.52PIXIE UNIT A 35-47 2AH - 2AH 4.77 0.18 559.77 265.72 14.80 7.64 0.00 587.84 52.19 91.76 0.00P-DP 50.00PIXIE UNIT B 35-47 5AH - 5AH 11.50 0.43 150.86 91.72 105.84 0.00 0.00 0.00 282.28 131.42 0.00P-DP 39.63POINTER N CRC JF 7H - 7H 0.00 0.00 168.30 101.48 118.08 0.00 0.00 0.00 314.91 146.61 0.00P-DP 41.41POINTER N CRC JF 9H - 9H 0.00 0.00 10.35 6.35 7.26 0.00 0.00 0.00 19.36 9.01 0.00P-DP 36.97POINTER W CRC JF 5H - 5H 0.00 0.00 60.04 35.31 1.27 0.73 0.00 57.86 3.01 5.38 0.00P-DP 50.00POLTERGEIST GUARDIAN A 12-02 2SH 4.55 0.14 63.22 36.93 1.19 0.78 0.00 61.69 2.83 5.57 0.00P-DP 50.00POLTERGEIST GUARDIAN B 12-02 2AH 4.28 0.13 63.22 36.93 1.19 0.78 0.00 61.69 2.83 5.57 0.00P-DP 50.00POLTERGEIST GUARDIAN C 12-02 3SH 4.28 0.13 19.43 9.94 0.71 0.22 0.00 16.54 1.66 1.60 0.00P-DP 38.83POTH UNIT 1H - 1H 2.83 0.15 3.23 1.62 0.02 0.04 0.00 3.41 0.03 0.27 0.00P-DP 30.98POWELL 43 1 - 1 0.06 0.00 12.47 7.38 0.20 0.16 0.00 12.65 0.32 1.19 0.00P-DP 27.36POWELL A 2 - 2 0.69 0.03 0.04 0.04 0.00 0.00 0.00 0.03 0.00 0.01 0.00P-DP 1.42POWELL A 3 - 3 0.01 0.00

Economic One-Liners Lease Name Life (years) Oil (Mbbl) Residue Gas (MMcf) Residue Gas (M$) Other (M$) Expense & Tax (M$) Invest. (M$) Non-Disc. (M$) Cash FlowNet Sales Volumes Net Revenue As of Date: 1/1/2024 Reserve Category Oil (M$) Disc. 10% (M$) NGL (M$) NGL (Mbbl) TABLE 6 6.27 3.55 0.21 0.08 0.00 5.95 0.33 0.71 0.00P-DP 34.96POWELL B 1 - 1 0.71 0.03 6.53 3.22 0.22 0.08 0.00 6.17 0.35 0.75 0.00P-DP 38.11POWELL C 1 - 1 0.76 0.03 5.90 3.16 0.61 0.06 0.00 4.31 0.84 1.25 0.00P-DP 38.71PRIMA 1H - 1H 2.01 0.08 145.55 60.05 2.55 1.81 0.00 143.08 6.04 12.71 0.00P-DP 50.00PRIMERO 42 1 - 1 9.14 0.28 5.64 3.47 0.00 0.08 0.00 6.07 0.00 0.43 0.00P-DP 14.14PRIMERO 42 A 2 - 2 0.00 0.00 66.93 27.88 0.53 0.88 0.00 69.21 1.25 5.44 0.00P-DP 47.14PRIMERO 42 B3 3 - 3 1.90 0.06 11.98 6.10 0.00 0.16 0.00 12.89 0.00 0.91 0.00P-DP 22.84PRIMERO 42 C 5 - 5 0.00 0.00 4.43 3.10 0.00 0.06 0.00 4.77 0.00 0.34 0.00P-DP 9.65PRIMERO 42 D 6 - 6 0.00 0.00 7.53 4.44 0.16 0.09 0.00 7.25 0.38 0.68 0.00P-DP 46.44PRISCILLA 23-14 1LS - 1LS 0.58 0.02 3.85 2.67 0.08 0.05 0.00 3.74 0.18 0.34 0.00P-DP 30.15PRISCILLA 23-14 2MS - 2MS 0.28 0.01 9.91 5.84 0.15 0.13 0.00 9.89 0.35 0.85 0.00P-DP 50.00PRISCILLA 23-14 3A - 3A 0.52 0.02 2.46 1.32 0.06 0.03 0.00 2.33 0.14 0.23 0.00P-DP 33.65PRISCILLA 23-14 4AH - 4AH 0.21 0.01 9.54 5.60 0.12 0.12 0.00 9.65 0.28 0.80 0.00P-DP 50.00PRISCILLA 23-14 4LS - 4LS 0.42 0.01 2.55 1.39 0.05 0.03 0.00 2.46 0.13 0.23 0.00P-DP 33.54PRISCILLA 23-14 4SH - 4SH 0.19 0.01 0.77 0.54 0.16 0.00 0.00 0.00 0.37 0.16 0.00P-DP 15.20PRISCILLA 23-14 5A 0.56 0.02 10.19 5.96 0.21 0.12 0.00 9.85 0.50 0.91 0.00P-DP 50.00PRISCILLA 23-14 6LS - 6LS 0.75 0.02 1.03 0.77 0.01 0.01 0.00 1.08 0.01 0.08 0.00P-DP 15.44PRISCILLA 23-14 7MS - 7MS 0.02 0.00 30.56 15.91 0.94 0.39 0.00 30.10 1.30 3.93 0.00P-DP 50.00PRONGHORN C 34-166-165 WB 3H - 3H 3.10 0.13 4.58 2.38 0.34 0.05 0.00 3.81 0.47 0.82 0.00P-DP 34.85PRONTO 1H - 1H 1.12 0.05 0.10 0.06 0.00 0.00 0.00 0.10 0.00 0.01 0.00P-DP 17.91PRUETT 20 2 - 2 0.01 0.00 0.09 0.05 0.00 0.00 0.00 0.09 0.00 0.01 0.00P-DP 16.58PRUETT 20 4H - 4H 0.00 0.00 0.06 0.04 0.00 0.00 0.00 0.06 0.00 0.01 0.00P-DP 14.31PRUETT 20 5H - 5H 0.01 0.00 0.31 0.16 0.01 0.00 0.00 0.32 0.01 0.04 0.00P-DP 30.28PRUETT 20 6H - 6H 0.02 0.00 0.12 0.06 0.00 0.00 0.00 0.12 0.00 0.01 0.00P-DP 19.94PRUETT 23 1H - 1H 0.01 0.00 0.14 0.08 0.00 0.00 0.00 0.15 0.00 0.01 0.00P-DP 16.68PRUETT 23 2H - 2H 0.00 0.00 0.42 0.22 0.01 0.01 0.00 0.44 0.01 0.05 0.00P-DP 27.72PRUETT 23A 1H - 1H 0.02 0.00 0.43 0.23 0.01 0.01 0.00 0.45 0.01 0.05 0.00P-DP 27.70PRUETT 23A 2H - 2H 0.02 0.00 500.12 346.43 350.89 0.00 0.00 0.00 935.81 435.69 0.00P-DP 17.52PUGGLE E WYN JF 4H - 4H 0.00 0.00 491.14 330.83 344.59 0.00 0.00 0.00 919.02 427.87 0.00P-DP 18.85PUGGLE E WYN JF 6H - 6H 0.00 0.00 10.83 10.38 7.60 0.00 0.00 0.00 20.26 9.43 0.00P-DP 1.08PUGGLE W WYN JF 2H - 2H 0.00 0.00 51.77 31.21 1.93 0.64 0.00 49.74 2.66 7.00 0.00P-DP 34.55QUESO 34-153 UNIT 1H - 1H 6.36 0.26 73.21 39.96 1.69 0.96 0.00 74.03 2.32 8.68 0.00P-DP 40.99QUESO 34-153 UNIT 2H - 2H 5.55 0.23 3.04 1.58 0.15 0.04 0.00 2.78 0.40 0.59 0.00P-DP 40.76QUICK SILVER 55-1-7 UNIT 1H 1.5 - 1H 0.46 0.02 0.01 0.01 0.00 0.00 0.00 0.01 0.00 0.00 0.00P-DP 2.02QUITO, S. W. (DELAWARE) UNIT 201 - 201 0.00 0.00 0.00 0.00 0.00 0.00 0.00 0.00 0.00 0.00 0.00P-DP 0.00QUITO, S. W. (DELAWARE) UNIT 801 - 801 0.00 0.00

Economic One-Liners Lease Name Life (years) Oil (Mbbl) Residue Gas (MMcf) Residue Gas (M$) Other (M$) Expense & Tax (M$) Invest. (M$) Non-Disc. (M$) Cash FlowNet Sales Volumes Net Revenue As of Date: 1/1/2024 Reserve Category Oil (M$) Disc. 10% (M$) NGL (M$) NGL (Mbbl) TABLE 6 7.05 5.60 0.16 0.09 0.00 6.99 0.25 0.72 0.00P-DP 8.47RAGLAND 2 6 - 6 0.54 0.02 73.09 41.71 1.65 0.93 0.00 72.38 2.58 7.49 0.00P-DP 35.75RAGLAND-ANDERSON 47A 1H - 1H 5.62 0.24 79.54 44.14 2.27 0.99 0.00 76.89 3.56 8.66 0.00P-DP 37.19RAGLAND-ANDERSON 47B 2H - 2H 7.75 0.33 61.46 35.93 2.43 0.73 0.00 56.79 3.80 7.41 0.00P-DP 33.17RAGLAND-ANDERSON 47C 3H - 3H 8.27 0.35 1.37 0.75 0.05 0.02 0.00 1.30 0.14 0.24 0.00P-DP 39.59RAINIER 55-1-28 UNIT 1H - 1H 0.16 0.01 0.18 0.14 0.00 0.00 0.00 0.19 0.00 0.02 0.00P-DP 6.67RAKSHASA UNIT B 01-48 8BH 0.00 0.00 4.71 2.77 0.03 0.07 0.00 5.27 0.07 0.68 0.00P-DP 30.05RAMBO E2 08 17 STATE COM 001H - 001H 0.04 0.00 5.10 3.01 0.05 0.07 0.00 5.67 0.10 0.74 0.00P-DP 30.88RAMBO E2 08 17 STATE COM 002H - 002H 0.07 0.00 6.50 3.65 0.23 0.07 0.00 5.59 0.53 0.53 0.00P-DP 27.13RATHKAMP UNIT 1H - 1H 0.91 0.05 7.81 4.52 0.44 0.08 0.00 5.74 1.01 0.67 0.00P-DP 37.34RATHKAMP UNIT 3H - 3H 1.73 0.09 11.86 5.80 1.05 0.08 0.00 6.35 2.44 1.09 0.00P-DP 50.00RATHKAMP UNIT 4H - 4H 4.16 0.22 1.54 0.96 0.00 0.02 0.00 1.68 0.00 0.15 0.00P-DP 22.19REED 24 UNIT 2H - 2H 0.00 0.00 0.92 0.56 0.01 0.01 0.00 0.95 0.04 0.12 0.00P-DP 19.14REED 24 UNIT 4H - 4H 0.05 0.00 2.83 1.71 0.10 0.03 0.00 2.72 0.28 0.48 0.00P-DP 28.59REED 24 UNIT 5H - 5H 0.32 0.01 3.21 1.89 0.10 0.04 0.00 3.13 0.28 0.52 0.00P-DP 30.54REED 24 UNIT 7H - 7H 0.32 0.01 2.29 1.35 0.01 0.03 0.00 2.48 0.02 0.24 0.00P-DP 27.30REED 24 UNIT 8H - 8H 0.02 0.00 78.16 57.54 37.10 0.00 0.00 0.00 87.44 9.27 0.00P-DP 28.58REITZ UNIT 3H - 3H 0.00 0.00 14.87 10.88 7.06 0.00 0.00 0.00 16.63 1.76 0.00P-DP 14.40REITZ UNIT 5H - 5H 0.00 0.00 4.98 2.81 0.06 0.07 0.00 5.23 0.08 0.53 0.00P-DP 36.87RENDEZVOUS NORTH POOLED UNIT 1LA - 1LA 0.19 0.01 4.76 2.41 0.09 0.06 0.00 4.87 0.13 0.55 0.00P-DP 39.02RENDEZVOUS NORTH POOLED UNIT 9UA - 9UA 0.31 0.01 4.42 2.62 2.19 0.00 0.00 0.00 4.81 0.39 0.00P-DP 27.99RICHARD E LEHMAN SWITZ9BHSU - SWITZ9BHSU 0.00 0.00 2.95 1.79 1.46 0.00 0.00 0.00 3.21 0.26 0.00P-DP 23.98RICHARD E LEHMAN SWITZ9DHSU - SWITZ9DHSU 0.00 0.00 0.00 0.00 0.00 0.00 0.00 0.00 0.00 0.00 0.00P-DP 0.00RICHMOND 39 1H - 1H 0.00 0.00 0.15 0.12 0.00 0.00 0.00 0.15 0.00 0.02 0.00P-DP 7.89RICHMOND 39 2H - 2H 0.01 0.00 0.00 0.00 0.00 0.00 0.00 0.00 0.00 0.00 0.00P-DP 0.00RICHMOND 39 3H - 3H 0.00 0.00 0.57 0.33 0.04 0.01 0.00 0.50 0.06 0.09 0.00P-DP 33.35RICHMOND W STATE 4239 A-A 70H - 70H 0.11 0.00 0.58 0.33 0.04 0.01 0.00 0.49 0.07 0.10 0.00P-DP 34.44RICHMOND W STATE 4239 A-B 71H - 71H 0.13 0.01 0.29 0.17 0.02 0.00 0.00 0.24 0.04 0.05 0.00P-DP 26.55RICHMOND W STATE 4239 A-C 72H - 72H 0.07 0.00 0.39 0.22 0.03 0.00 0.00 0.33 0.04 0.07 0.00P-DP 30.43RICHMOND W STATE 4239 A-D 73H - 73H 0.08 0.00 2.17 1.25 0.11 0.03 0.00 2.00 0.16 0.30 0.00P-DP 50.00RICHMOND W. STATE 4239 A5 6H - 6H 0.31 0.01 2.17 1.26 0.11 0.03 0.00 2.01 0.16 0.31 0.00P-DP 50.00RICHMOND W. STATE 4239 A6 11UA - 11UA 0.31 0.01 0.13 0.07 0.01 0.00 0.00 0.11 0.01 0.02 0.00P-DP 50.00RICHMOND W. STATE 4239 A7 7LA - 7LA 0.02 0.00 0.74 0.45 0.00 0.01 0.00 0.80 0.00 0.06 0.00P-DP 15.03RINGNECK DOVE 3 - 3 0.00 0.00 139.31 76.23 4.00 1.63 0.00 128.65 9.47 13.15 0.00P-DP 32.02RISING SUN 40-33 #1AH - 1AH 14.34 0.44 178.12 114.19 4.16 2.15 0.00 169.58 9.84 16.20 0.00P-DP 48.79RISING SUN B 1LS - 1LS 14.90 0.45

Economic One-Liners Lease Name Life (years) Oil (Mbbl) Residue Gas (MMcf) Residue Gas (M$) Other (M$) Expense & Tax (M$) Invest. (M$) Non-Disc. (M$) Cash FlowNet Sales Volumes Net Revenue As of Date: 1/1/2024 Reserve Category Oil (M$) Disc. 10% (M$) NGL (M$) NGL (Mbbl) TABLE 6 62.29 41.48 1.83 0.73 0.00 57.29 4.33 5.90 0.00P-DP 37.34RISING SUN C 2A - 2A 6.56 0.20 178.18 114.23 4.16 2.15 0.00 169.64 9.84 16.21 0.00P-DP 48.79RISING SUN C 3LS - 3LS 14.90 0.45 62.29 41.48 1.83 0.73 0.00 57.29 4.33 5.90 0.00P-DP 37.34RISING SUN D 4A - 4A 6.56 0.20 2.50 1.61 0.07 0.03 0.00 2.30 0.17 0.24 0.00P-DP 44.17RISING SUN D 4A 0.26 0.01 18.11 9.89 0.68 0.25 0.00 19.54 0.94 2.42 0.00P-DP 43.20RIVER CAT 57-33 A 1WA - 1WA 0.05 0.00 12.68 7.71 0.66 0.18 0.00 13.62 0.91 1.90 0.00P-DP 36.10RIVER CAT 57-33 B 2BS - 2BS 0.05 0.00 24.37 15.43 0.83 0.34 0.00 26.32 1.15 3.16 0.00P-DP 34.38RIVER CAT 57-33 C 3TS - 3TS 0.07 0.00 1.73 0.97 0.07 0.02 0.00 1.66 0.09 0.24 0.00P-DP 21.49ROADRUNNER 1 - 1 0.22 0.01 2.54 1.34 0.06 0.03 0.00 2.56 0.08 0.30 0.00P-DP 25.78ROADRUNNER 2 - 2 0.20 0.01 5.52 2.88 0.09 0.07 0.00 5.73 0.12 0.61 0.00P-DP 30.58ROCA UNIT 7 1H - 1H 0.28 0.01 2.60 1.46 0.05 0.03 0.00 2.66 0.07 0.30 0.00P-DP 22.44ROCA UNIT 7 2H - 2H 0.17 0.01 593.64 275.13 5.23 8.27 0.00 636.50 18.44 65.36 0.00P-DP 50.00ROUGAROU UNIT 36-48 5AH - 5AH 4.06 0.15 86.52 65.17 60.71 0.00 0.00 0.00 161.90 75.38 0.00P-DP 11.09ROXY CRC JF 1H - 1H 0.00 0.00 21.18 16.33 14.86 0.00 0.00 0.00 39.62 18.45 0.00P-DP 10.29ROXY N CRC JF 3H - 3H 0.00 0.00 6.22 4.93 4.36 0.00 0.00 0.00 11.64 5.42 0.00P-DP 8.99ROXY NE CRC JF 5H - 5H 0.00 0.00 7.33 3.74 0.23 0.09 0.00 7.19 0.61 1.16 0.00P-DP 37.95RUSTLER A UNIT #3H - 3H 0.70 0.02 15.26 7.53 0.00 0.21 0.00 16.70 0.01 1.47 0.00P-DP 46.28RUSTLER A UNIT #4H - 4H 0.02 0.00 8.02 4.38 0.14 0.10 0.00 8.25 0.39 1.06 0.00P-DP 37.56RUSTLER B UNIT #1H - 1H 0.45 0.02 10.02 5.48 0.13 0.13 0.00 10.50 0.34 1.22 0.00P-DP 39.86RUSTLER B UNIT #3H - 3H 0.39 0.01 6.43 3.76 0.31 0.07 0.00 5.89 0.83 1.24 0.00P-DP 33.61RUSTLER C UNIT #1H - 1H 0.96 0.03 6.47 3.79 0.00 0.09 0.00 7.08 0.00 0.62 0.00P-DP 33.08RUSTLER C UNIT #2H - 2H 0.00 0.00 0.43 0.34 0.01 0.01 0.00 0.45 0.01 0.05 0.00P-DP 7.29RUSTLER D UNIT #1H - 1H 0.02 0.00 3.30 1.93 0.21 0.04 0.00 2.83 0.57 0.75 0.00P-DP 27.13RUSTLER D UNIT #2H - 2H 0.66 0.02 3.03 1.86 0.01 0.04 0.00 3.30 0.02 0.31 0.00P-DP 24.89RUSTLER D UNIT #4H - 4H 0.02 0.00 2.88 1.77 0.01 0.04 0.00 3.13 0.02 0.29 0.00P-DP 24.35RUSTLER D UNIT #5H - 5H 0.02 0.00 8.11 3.94 0.20 0.10 0.00 7.97 0.31 0.85 0.00P-DP 43.89SABINE 39 1 - 1 0.67 0.03 0.60 0.37 0.04 0.01 0.00 0.49 0.06 0.09 0.00P-DP 15.57SABINE 39 2 - 2 0.14 0.01 142.57 101.31 96.92 0.00 0.00 0.00 266.23 310.95 0.00P-DP 12.39SADIE 33-10-4 1H - 1H 187.29 7.98 231.84 147.05 157.60 0.00 0.00 0.00 432.93 505.65 0.00P-DP 18.23SADIE 33-10-4 201H - 201H 304.56 12.98 31.71 20.91 21.56 0.00 0.00 0.00 59.22 69.16 0.00P-DP 17.23SADIE 33-10-4 205H - 205H 41.66 1.78 103.24 67.49 70.18 0.00 0.00 0.00 192.79 225.17 0.00P-DP 16.81SADIE 33-10-4 3H - 3H 135.62 5.78 102.33 63.60 69.56 0.00 0.00 0.00 191.08 223.18 0.00P-DP 18.81SADIE 33-10-4 5H - 5H 134.42 5.73 1.27 0.72 0.00 0.02 0.00 1.36 0.00 0.10 0.00P-DP 19.40SAND DOLLAR UNIT 1 - 1 0.00 0.00 21.62 12.40 2.09 0.21 0.00 16.52 3.19 4.22 0.00P-DP 23.47SANTANA 29 2H - 2H 6.12 0.24 253.90 123.88 2.94 3.52 0.00 271.35 10.38 30.12 0.00P-DP 46.60SASQUATCH UNIT 36-24 1AH - 1AH 2.29 0.09

Economic One-Liners Lease Name Life (years) Oil (Mbbl) Residue Gas (MMcf) Residue Gas (M$) Other (M$) Expense & Tax (M$) Invest. (M$) Non-Disc. (M$) Cash FlowNet Sales Volumes Net Revenue As of Date: 1/1/2024 Reserve Category Oil (M$) Disc. 10% (M$) NGL (M$) NGL (Mbbl) TABLE 6 157.53 84.07 5.71 2.12 0.00 163.49 20.14 30.54 0.00P-DP 37.95SASQUATCH UNIT 36-24 2AH - 2AH 4.44 0.17 153.00 82.02 5.46 2.06 0.00 158.89 19.27 29.41 0.00P-DP 37.45SASQUATCH UNIT 36-24 3AH - 3AH 4.24 0.16 0.54 0.32 0.05 0.01 0.00 0.44 0.05 0.06 0.00P-DP 19.64SAU 25 1B - 1B 0.11 0.01 0.16 0.12 0.01 0.00 0.00 0.13 0.01 0.02 0.00P-DP 7.76SAU 25 1C - 1C 0.03 0.00 0.22 0.16 0.01 0.00 0.00 0.21 0.01 0.02 0.00P-DP 9.68SAU 25-2 2C - 2C 0.02 0.00 0.54 0.31 0.02 0.01 0.00 0.53 0.02 0.05 0.00P-DP 20.01SAU MARINER 25-2A 2A - 2A 0.04 0.00 5.81 3.37 0.07 0.07 0.00 5.89 0.16 0.48 0.00P-DP 32.62SCATTER 1510 1AH - 1AH 0.24 0.01 6.15 3.56 0.25 0.07 0.00 5.27 0.60 0.63 0.00P-DP 33.40SCATTER 1510 2AH - 2AH 0.91 0.03 8.71 4.87 0.27 0.10 0.00 7.95 0.63 0.83 0.00P-DP 38.87SCATTER 1510 2SH - 2SH 0.96 0.03 15.94 9.35 0.53 0.18 0.00 14.31 1.27 1.55 0.00P-DP 45.86SCATTER GINGER 15-27 (ALLOC-D) 4SA - 4SA 1.92 0.06 17.43 10.11 0.69 0.19 0.00 15.07 1.64 1.77 0.00P-DP 47.49SCATTER GINGER 15-27 (ALLOC-D) 4SS - 4SS 2.48 0.08 599.90 356.41 19.50 6.87 0.00 541.89 46.16 58.04 0.00P-DP 42.90SCATTER TISH 10-46 (ALLOC-D) 4NA - 4NA 69.89 2.13 480.02 287.80 13.96 5.61 0.00 442.33 33.05 45.41 0.00P-DP 40.16SCATTER TISH 10-46 (ALLOC-D) 4NS - 4NS 50.04 1.52 5.49 3.24 1.08 0.03 0.00 2.37 1.65 1.69 0.00P-DP 24.88SHADRACH 68 UNIT 134H - 134H 3.16 0.13 16.27 9.48 1.16 0.18 0.00 13.81 1.77 2.71 0.00P-DP 35.44SHADRACH 68 UNIT 1H - 1H 3.40 0.14 16.88 9.74 1.35 0.18 0.00 13.84 2.06 2.97 0.00P-DP 36.27SHADRACH 68 UNIT 223H - 223H 3.95 0.16 16.35 9.49 0.69 0.20 0.00 15.45 1.05 2.18 0.00P-DP 35.65SHADRACH 68 UNIT 2H - 2H 2.02 0.08 12.48 7.58 0.86 0.14 0.00 10.71 1.31 2.04 0.00P-DP 32.03SHADRACH 68 UNIT 324H - 324H 2.50 0.10 15.98 9.63 0.80 0.19 0.00 14.70 1.22 2.27 0.00P-DP 34.32SHADRACH 68 UNIT 332H - 332H 2.34 0.09 5.84 3.32 0.71 0.05 0.00 3.99 1.08 1.30 0.00P-DP 34.54SHADRACH MOSES CANTALOUPE 221H - 221H 2.08 0.08 0.14 0.09 0.07 0.00 0.00 0.00 0.15 0.02 0.00P-DP 29.09SHANNON 210470 3C - 3C 0.00 0.00 0.16 0.10 0.08 0.00 0.00 0.00 0.18 0.02 0.00P-DP 31.03SHANNON 210470 4B - 4B 0.00 0.00 119.89 78.45 56.90 0.00 0.00 0.00 134.11 14.22 0.00P-DP 25.14SHANNON 211271 1B - 1B 0.00 0.00 152.05 96.67 72.17 0.00 0.00 0.00 170.09 18.04 0.00P-DP 28.21SHANNON 211271 2A - 2A 0.00 0.00 2.52 1.51 0.00 0.03 0.00 2.70 0.00 0.19 0.00P-DP 27.81SHENANDOAH 11-2-58 H 1W - H 1W 0.01 0.00 2.88 1.79 0.09 0.03 0.00 2.60 0.22 0.28 0.00P-DP 28.32SHENANDOAH 11-2-58 H 2WA - H 2WA 0.34 0.01 0.34 0.21 0.00 0.00 0.00 0.36 0.00 0.03 0.00P-DP 14.51SHERROD UNIT 3903 - 3903 0.00 0.00 0.00 0.00 0.00 0.00 0.00 0.00 0.00 0.00 0.00P-DP 0.00SHERROD UNIT 3906 - 3906 0.00 0.00 0.00 0.00 0.00 0.00 0.00 0.00 0.00 0.00 0.00P-DP 0.00SHERROD UNIT 3907 - 3907 0.00 0.00 0.14 0.11 0.00 0.00 0.00 0.15 0.00 0.01 0.00P-DP 7.58SHERROD UNIT 903 - 903 0.00 0.00 27.18 14.88 0.30 0.35 0.00 27.82 0.69 2.78 0.00P-DP 34.40SHIRLEY -B- 3815R - 3815R 1.45 0.07 14.81 8.17 0.10 0.20 0.00 15.49 0.24 1.43 0.00P-DP 28.24SHIRLEY 3806 - 3806 0.51 0.02 6.88 3.75 0.07 0.09 0.00 7.07 0.16 0.70 0.00P-DP 21.81SHIRLEY 3807 - 3807 0.35 0.02 11.63 5.99 0.14 0.15 0.00 11.82 0.33 1.21 0.00P-DP 27.40SHIRLEY 3808 - 3808 0.69 0.03 0.01 0.01 0.00 0.00 0.00 0.01 0.00 0.00 0.00P-DP 36.42SHOSHONE A 34-166-165 5201H - 5201H 0.00 0.00

Economic One-Liners Lease Name Life (years) Oil (Mbbl) Residue Gas (MMcf) Residue Gas (M$) Other (M$) Expense & Tax (M$) Invest. (M$) Non-Disc. (M$) Cash FlowNet Sales Volumes Net Revenue As of Date: 1/1/2024 Reserve Category Oil (M$) Disc. 10% (M$) NGL (M$) NGL (Mbbl) TABLE 6 0.04 0.03 0.00 0.00 0.00 0.04 0.01 0.02 0.00P-DP 13.37SHOSHONE B 34-166-165 TB 2H - 2H 0.01 0.00 0.48 0.29 0.01 0.01 0.00 0.52 0.02 0.10 0.00P-DP 39.56SHOSHONE C 34-166-165 WA 3H - 3H 0.04 0.00 0.04 0.02 0.00 0.00 0.00 0.04 0.00 0.00 0.00P-DP 41.12SHOSHONE E 34-166-165 WB 5H - 5H 0.00 0.00 124.30 91.68 59.00 0.00 0.00 0.00 139.05 14.75 0.00P-DP 14.08SIDWELL SE WHL BL 10H - 10H 0.00 0.00 194.33 124.26 92.23 0.00 0.00 0.00 217.39 23.06 0.00P-DP 22.37SIDWELL SE WHL BL 8H - 8H 0.00 0.00 67.97 34.02 32.26 0.00 0.00 0.00 76.03 8.06 0.00P-DP 37.36SIDWELL SW WHL BL 2H - 2H 0.00 0.00 10.63 7.47 5.04 0.00 0.00 0.00 11.89 1.26 0.00P-DP 11.70SIDWELL SW WHL BL 4H - 4H 0.00 0.00 50.43 31.49 0.89 0.66 0.00 50.91 1.39 4.90 0.00P-DP 40.66SILVERADO 40-1 A 1JM - 1JM 3.03 0.13 32.60 21.62 0.42 0.43 0.00 33.52 0.66 3.01 0.00P-DP 24.59SILVERADO 40-1 B 2LS - 2LS 1.43 0.06 21.89 13.42 0.49 0.28 0.00 21.69 0.77 2.24 0.00P-DP 32.59SILVERADO 40-1 C 3WA - 3WA 1.68 0.07 32.34 19.50 0.74 0.41 0.00 31.98 1.16 3.33 0.00P-DP 37.30SILVERADO 40-1 E 5JM - 5JM 2.53 0.11 18.22 11.59 0.53 0.23 0.00 17.56 0.84 2.00 0.00P-DP 29.23SILVERADO 40-1 F 6LS - 6LS 1.82 0.08 18.53 11.64 0.88 0.21 0.00 16.56 1.37 2.39 0.00P-DP 30.35SILVERADO 40-1 G 7LS - 7LS 2.99 0.13 45.04 26.49 1.64 0.54 0.00 42.17 2.57 5.28 0.00P-DP 42.00SILVERADO 40-1 H 8WA - 8WA 5.58 0.24 24.52 15.57 0.81 0.30 0.00 23.26 1.28 2.79 0.00P-DP 32.40SILVERADO 40-1 I 9WB - 9WB 2.78 0.12 28.61 16.89 2.96 0.25 0.00 19.30 4.63 5.39 0.00P-DP 37.62SILVERADO 40-1 J 10WB - 10WB 10.07 0.43 38.05 23.14 1.71 0.44 0.00 34.35 2.68 4.81 0.00P-DP 39.18SILVERADO 40-1 K 11WA - 11WA 5.83 0.25 215.58 128.23 1.26 2.86 0.00 225.29 2.99 17.23 0.00P-DP 40.24SIMPSON SMITH 0844 A 1W - 1WH 4.53 0.14 70.01 44.42 1.55 0.85 0.00 67.12 3.66 6.31 0.00P-DP 46.00SIMPSON SMITH A 08-44 1SH - 1SH 5.55 0.17 173.63 112.21 4.45 2.07 0.00 163.18 10.53 16.04 0.00P-DP 40.79SIMPSON SMITH B 08-44 2AH - 2AH 15.95 0.49 74.24 48.39 1.57 0.91 0.00 71.56 3.71 6.65 0.00P-DP 39.99SIMPSON SMITH C 08-44 2SH - 2SH 5.62 0.17 261.57 162.46 5.63 3.19 0.00 251.55 13.33 23.49 0.00P-DP 47.61SIMPSON SMITH D 08-44 3AH - 3AH 20.18 0.61 75.48 49.18 1.65 0.92 0.00 72.46 3.90 6.79 0.00P-DP 40.17SIMPSON SMITH E 08-44 3SH - 3SH 5.91 0.18 625.48 289.71 16.99 8.52 0.00 656.28 59.91 103.91 0.00P-DP 50.00SIREN UNIT 36-48 1AH - 1AH 13.20 0.50 0.12 0.09 0.00 0.00 0.00 0.12 0.01 0.01 0.00P-DP 8.47SIXTEEN PENNY NAIL 310 1LL - 1LL 0.01 0.00 0.04 0.03 0.00 0.00 0.00 0.04 0.00 0.00 0.00P-DP 3.74SIXTEEN PENNY NAIL 310 2LM - 2LM 0.00 0.00 2.81 1.59 0.13 0.03 0.00 2.53 0.20 0.36 0.00P-DP 39.00SIXTEEN PENNY NAIL 310 8JM - 8JM 0.44 0.02 0.51 0.31 0.01 0.01 0.00 0.53 0.01 0.05 0.00P-DP 21.16SIXTEEN PENNY NAIL 310A 3LL - 3LL 0.02 0.00 0.89 0.51 0.07 0.01 0.00 0.67 0.12 0.15 0.00P-DP 26.95SIXTEEN PENNY NAIL 310A 9JM - 9JM 0.25 0.01 0.99 0.57 0.00 0.01 0.00 1.06 0.00 0.08 0.00P-DP 28.17SIXTEEN PENNY NAIL 310B 10JM - 10JM 0.01 0.00 0.11 0.09 0.02 0.00 0.00 0.03 0.04 0.03 0.00P-DP 7.78SIXTEEN PENNY NAIL 310B 4LM - 4LM 0.08 0.00 0.13 0.10 0.02 0.00 0.00 0.05 0.04 0.03 0.00P-DP 6.60SIXTEEN PENNY NAIL 310B 5LL - 5LL 0.08 0.00 1.61 0.95 0.07 0.02 0.00 1.48 0.10 0.20 0.00P-DP 32.19SIXTEEN PENNY NAIL 310C 11JM - 11JM 0.22 0.01 0.36 0.23 0.03 0.00 0.00 0.28 0.04 0.06 0.00P-DP 16.92SIXTEEN PENNY NAIL 310C 6LM - 6LM 0.09 0.00 0.17 0.12 0.01 0.00 0.00 0.14 0.02 0.03 0.00P-DP 10.67SIXTEEN PENNY NAIL 310C 7LL - 7LL 0.04 0.00

Economic One-Liners Lease Name Life (years) Oil (Mbbl) Residue Gas (MMcf) Residue Gas (M$) Other (M$) Expense & Tax (M$) Invest. (M$) Non-Disc. (M$) Cash FlowNet Sales Volumes Net Revenue As of Date: 1/1/2024 Reserve Category Oil (M$) Disc. 10% (M$) NGL (M$) NGL (Mbbl) TABLE 6 0.26 0.19 0.12 0.00 0.00 0.00 0.29 0.03 0.00P-DP 12.62SMASHOSAURUS 3 - 3 0.00 0.00 31.73 23.21 15.06 0.00 0.00 0.00 35.50 3.77 0.00P-DP 12.95SMASHOSAURUS 5 - 5 0.00 0.00 0.05 0.05 0.01 0.00 0.00 0.02 0.01 0.01 0.00P-DP 0.80SMITH 4 1 - 1 0.02 0.00 11.75 5.71 0.30 0.15 0.00 11.51 0.47 1.24 0.00P-DP 38.73SON 136 1 - 1 1.02 0.04 13.63 6.45 0.41 0.17 0.00 13.09 0.64 1.51 0.00P-DP 41.19SON 136 2 - 2 1.40 0.06 0.00 0.00 0.00 0.00 0.00 0.00 0.00 0.00 0.00P-DP 0.00SOUTH HILIGHT UNIT 1-41 - 1-41 0.00 0.00 0.00 0.00 0.00 0.00 0.00 0.00 0.00 0.00 0.00P-DP 0.00SOUTH HILIGHT UNIT 13-39 - 13-39 0.00 0.00 9.25 5.44 0.85 0.09 0.00 7.12 1.17 1.83 0.00P-DP 27.94SPIRE 226-34 UNIT 1H - 1H 2.79 0.12 0.29 0.17 0.14 0.00 0.00 0.00 0.32 0.03 0.00P-DP 15.34SPITFIRE 1H - 1H 0.00 0.00 0.29 0.20 0.14 0.00 0.00 0.00 0.32 0.03 0.00P-DP 11.94SPITFIRE 3H - 3H 0.00 0.00 687.18 446.44 482.13 0.00 0.00 0.00 1,285.84 598.66 0.00P-DP 26.75SPORT E WYN JF 3H - 3H 0.00 0.00 887.65 551.76 622.78 0.00 0.00 0.00 1,660.94 773.29 0.00P-DP 28.72SPORT W WYN JF 1H - 1H 0.00 0.00 2.36 1.24 0.12 0.03 0.00 2.17 0.16 0.35 0.00P-DP 38.26SRO 551 ALLOC B 101H - 101H 0.38 0.02 1.32 0.69 0.12 0.01 0.00 1.00 0.17 0.26 0.00P-DP 33.30SRO 551 ALLOC. A 100H - 100H 0.41 0.02 6.39 5.13 0.19 0.08 0.00 6.31 0.26 0.81 0.00P-DP 16.88STATE EILAND 3-33 11H - 11H 0.63 0.03 2.66 1.82 0.06 0.03 0.00 2.71 0.08 0.31 0.00P-DP 20.25STATE EILAND 6047B-34 51H - 51H 0.18 0.01 6.36 3.58 0.40 0.07 0.00 5.57 0.61 1.00 0.00P-DP 22.08STATE MUDDY WATERS 30 2H - 2H 1.18 0.05 75.56 45.30 4.24 0.88 0.00 67.93 6.47 11.25 0.00P-DP 48.30STATE MUDDY WATERS UNIT 711H - 711H 12.40 0.50 63.70 38.53 4.87 0.69 0.00 52.96 7.44 10.96 0.00P-DP 46.47STATE MUDDY WATERS UNIT 731H - 731H 14.26 0.57 81.72 48.38 11.08 0.67 0.00 51.93 16.91 19.54 0.00P-DP 50.00STATE MUDDY WATERS UNIT 732H - 732H 32.42 1.30 78.14 46.28 10.16 0.66 0.00 51.09 15.51 18.20 0.00P-DP 50.00STATE MUDDY WATERS UNIT 733H - 733H 29.73 1.19 23.44 14.02 4.72 0.13 0.00 9.79 7.20 7.35 0.00P-DP 36.66STATE MUDDY WATERS UNIT 751H - 751H 13.80 0.55 1.03 0.57 0.07 0.01 0.00 0.89 0.09 0.17 0.00P-DP 24.45STELLA STATE 34-208 WRD UNIT 1H - 1H 0.22 0.01 2.17 1.07 0.12 0.03 0.00 1.95 0.16 0.34 0.00P-DP 33.48STELLA STATE 34-208 WRD UNIT 2H - 2H 0.39 0.02 0.90 0.47 0.08 0.01 0.00 0.71 0.11 0.17 0.00P-DP 45.22STICKLINE 1H - 1H 0.26 0.01 0.07 0.04 0.00 0.00 0.00 0.07 0.00 0.01 0.00P-DP 17.67STIMSON BURLEY -B- 1 - 1 0.00 0.00 0.10 0.04 0.00 0.00 0.00 0.10 0.00 0.01 0.00P-DP 26.38STIMSON BURLEY -B- 2 - 2 0.00 0.00 0.07 0.04 0.00 0.00 0.00 0.07 0.00 0.01 0.00P-DP 16.12STIMSON BURLEY -B- 4 - 4 0.00 0.00 0.14 0.09 0.00 0.00 0.00 0.14 0.01 0.02 0.00P-DP 18.12STIMSON BURLEY -D- 1 - 1 0.02 0.00 0.03 0.02 0.00 0.00 0.00 0.03 0.00 0.00 0.00P-DP 7.67STIMSON BURLEY -E- 3DW - 3DW 0.00 0.00 0.11 0.06 0.00 0.00 0.00 0.11 0.00 0.01 0.00P-DP 20.50STIMSON BURLEY -M- 1 - 1 0.01 0.00 0.05 0.03 0.00 0.00 0.00 0.05 0.00 0.01 0.00P-DP 19.51STIMSON-BURLEY -C- 1 - 1 0.00 0.00 0.21 0.09 0.00 0.00 0.00 0.22 0.01 0.02 0.00P-DP 39.47STIMSON-BURLEY -C- 3 - 3 0.01 0.00 0.14 0.07 0.00 0.00 0.00 0.14 0.00 0.01 0.00P-DP 23.98STIMSON-BURLEY 18 1 - 1 0.00 0.00 0.01 0.01 0.00 0.00 0.00 0.01 0.00 0.00 0.00P-DP 3.19STIMSON-BURLEY 4 - 4 0.00 0.00

Economic One-Liners Lease Name Life (years) Oil (Mbbl) Residue Gas (MMcf) Residue Gas (M$) Other (M$) Expense & Tax (M$) Invest. (M$) Non-Disc. (M$) Cash FlowNet Sales Volumes Net Revenue As of Date: 1/1/2024 Reserve Category Oil (M$) Disc. 10% (M$) NGL (M$) NGL (Mbbl) TABLE 6 0.00 0.00 0.00 0.00 0.00 0.00 0.00 0.00 0.00P-DP 0.00STIMSON-BURLEY 6 - 6 0.00 0.00 0.18 0.09 0.00 0.00 0.00 0.19 0.01 0.02 0.00P-DP 27.86STINSON-BURLEY K 1 - 1 0.01 0.00 42.77 25.21 0.54 0.54 0.00 42.58 1.60 3.82 0.00P-DP 34.18STONE-GIST W45A 1H - 1H 2.40 0.13 35.39 21.37 0.41 0.45 0.00 35.48 1.21 3.12 0.00P-DP 31.43STONE-GIST W45B 2H - 2H 1.82 0.10 31.25 19.83 0.39 0.40 0.00 31.12 1.17 2.79 0.00P-DP 29.51STONE-GIST W45C 3H - 3H 1.75 0.09 17.40 9.61 0.27 0.22 0.00 17.00 0.81 1.61 0.00P-DP 26.95STONE-GIST W45I 9H - 9H 1.21 0.06 19.52 12.76 0.22 0.25 0.00 19.63 0.64 1.71 0.00P-DP 23.84STONE-GIST W45J 10H - 10H 0.96 0.05 67.93 39.49 2.50 0.92 0.00 70.46 8.83 13.29 0.00P-DP 27.44SUCCUBUS UNIT B 25-24 8AH - 8AH 1.94 0.07 18.91 10.06 0.60 0.24 0.00 18.53 0.91 2.29 0.00P-DP 30.54SUGARLOAF 74 1H - 1H 1.75 0.07 33.28 14.89 1.66 0.40 0.00 30.61 2.54 4.72 0.00P-DP 42.03SUGARLOAF 7475 10U C 10H - C 10H 4.86 0.19 25.98 13.49 1.64 0.30 0.00 22.76 2.50 4.08 0.00P-DP 36.38SUGARLOAF 7475 1U B 1H - B 1H 4.80 0.19 9.76 5.85 0.41 0.12 0.00 9.21 0.63 1.30 0.00P-DP 25.12SUGARLOAF 7475 2U B 2H - B 2H 1.21 0.05 25.15 14.88 1.08 0.31 0.00 23.71 1.65 3.37 0.00P-DP 34.11SUGARLOAF 7475 3U A 3H - A 3H 3.16 0.13 33.80 15.12 1.69 0.40 0.00 31.08 2.58 4.80 0.00P-DP 42.03SUGARLOAF 7475 4U A 4H - A 4H 4.94 0.20 67.22 44.18 2.83 0.83 0.00 63.55 4.33 8.95 0.00P-DP 44.72SUGARLOAF 7475 5U B 5H - B 5H 8.29 0.33 67.60 38.28 2.85 0.83 0.00 63.91 4.35 9.00 0.00P-DP 46.26SUGARLOAF 7475 6U A 6H - A 6H 8.34 0.33 67.08 37.86 2.83 0.82 0.00 63.41 4.32 8.93 0.00P-DP 46.26SUGARLOAF 7475 7U A 7H - A 7H 8.27 0.33 66.07 37.18 2.78 0.81 0.00 62.46 4.25 8.79 0.00P-DP 46.31SUGARLOAF 7475 8U A 8H - A 8H 8.15 0.33 67.93 38.10 2.86 0.83 0.00 64.22 4.37 9.04 0.00P-DP 46.38SUGARLOAF 7475 9U B 9H - B 9H 8.38 0.33 87.49 52.14 14.88 0.67 0.00 50.84 15.88 11.64 0.00P-DP 27.89SUGG A 141-140 (ALLOC-A) 1SM - 1SM 32.41 1.80 55.58 33.17 12.89 0.29 0.00 22.30 13.76 8.56 0.00P-DP 23.32SUGG A 141-140 (ALLOC-B) 2SU - 2SU 28.08 1.56 87.91 49.59 16.17 0.63 0.00 47.54 17.26 12.11 0.00P-DP 28.92SUGG A 141-140 (ALLOC-C) 3SM - 3SM 35.22 1.96 69.34 38.16 15.83 0.38 0.00 28.58 16.89 10.59 0.00P-DP 27.43SUGG A 141-140 (ALLOC-D) 4SU - 4SU 34.46 1.92 78.45 44.73 19.56 0.36 0.00 27.53 20.87 12.55 0.00P-DP 24.87SUGG A 141-140 (ALLOC-E) 5RM - 5RM 42.60 2.37 15.63 10.92 4.69 0.04 0.00 3.20 5.00 2.77 0.00P-DP 11.89SUGG A 141-140 (ALLOC-F) 6SM - 6SM 10.20 0.57 24.96 15.64 6.74 0.10 0.00 7.27 7.19 4.17 0.00P-DP 17.10SUGG A 141-140 (ALLOC-F) 6SU - 6SU 14.67 0.82 62.75 35.05 18.78 0.17 0.00 12.92 20.04 11.10 0.00P-DP 26.28SUGG A 141-140 (ALLOC-G) 7SM - 7SM 40.90 2.27 67.29 36.26 20.67 0.16 0.00 12.31 22.05 12.09 0.00P-DP 27.53SUGG A 141-140 (ALLOC-G) 7SU - 7SU 45.01 2.50 95.58 50.12 30.68 0.18 0.00 13.65 32.74 17.62 0.00P-DP 31.58SUGG A 141-140 (ALLOC-H) 8SM - 8SM 66.82 3.71 29.41 19.29 7.14 0.14 0.00 10.87 7.62 4.64 0.00P-DP 16.50SUGG A 141-140 (ALLOC-H) 8SU - 8SU 15.56 0.86 61.52 36.71 2.41 0.68 0.00 53.41 5.69 6.21 0.00P-DP 27.55SUNDOWN 4524LS - 4524LS 8.62 0.26 246.90 139.67 7.32 2.88 0.00 226.80 17.32 23.44 0.00P-DP 42.97SUNDOWN 4541WA - 4541WA 26.22 0.80 95.86 53.90 5.72 0.92 0.00 72.72 13.55 10.92 0.00P-DP 34.59SUNDOWN 4566WB - 4566WB 20.51 0.62 20.36 11.66 0.24 0.27 0.00 20.62 0.50 1.58 0.00P-DP 22.35SUSTR UNIT 1H - 1H 0.82 0.13 0.00 0.00 0.00 0.00 0.00 0.00 0.00 0.00 0.00P-DP 0.00TAMSULA 5 - 5 0.00 0.00

Economic One-Liners Lease Name Life (years) Oil (Mbbl) Residue Gas (MMcf) Residue Gas (M$) Other (M$) Expense & Tax (M$) Invest. (M$) Non-Disc. (M$) Cash FlowNet Sales Volumes Net Revenue As of Date: 1/1/2024 Reserve Category Oil (M$) Disc. 10% (M$) NGL (M$) NGL (Mbbl) TABLE 6 196.41 158.55 137.80 0.00 0.00 0.00 367.53 171.11 0.00P-DP 8.28TANNER WYN JF 2H - 2H 0.00 0.00 389.19 288.50 273.06 0.00 0.00 0.00 728.25 339.05 0.00P-DP 13.47TANNER WYN JF 4H - 4H 0.00 0.00 25.61 17.82 0.07 0.36 0.00 27.17 0.14 1.94 0.00P-DP 13.69TARGAC UNIT 1H - 1H 0.24 0.04 0.06 0.05 0.00 0.00 0.00 0.06 0.00 0.01 0.00P-DP 10.63TCB 3934 1AH - 1AH 0.00 0.00 0.72 0.35 0.00 0.01 0.00 0.75 0.01 0.06 0.00P-DP 43.56TCB 3934 4AH - 4AH 0.01 0.00 0.18 0.11 0.00 0.00 0.00 0.18 0.00 0.01 0.00P-DP 20.74TCB 3934 4SH - 4SH 0.01 0.00 5.04 2.91 0.10 0.06 0.00 4.91 0.23 0.45 0.00P-DP 50.00TCB A 1LS 0.35 0.01 5.38 3.16 0.08 0.07 0.00 5.34 0.20 0.46 0.00P-DP 50.00TCB B 2A 0.30 0.01 0.64 0.45 0.04 0.01 0.00 0.55 0.06 0.09 0.00P-DP 8.53TCM 3 - 3 0.12 0.01 18.21 7.74 0.48 0.23 0.00 17.78 0.75 1.94 0.00P-DP 48.87TCM 48L - 48L 1.62 0.07 1.63 0.97 0.02 0.02 0.00 1.70 0.03 0.18 0.00P-DP 20.09TEEWINOT NORTH UNIT 4LA - 4LA 0.08 0.00 5.74 3.13 0.04 0.08 0.00 6.10 0.06 0.58 0.00P-DP 33.35TEEWINOT SOUTH UNIT 5LA - 5LA 0.15 0.01 0.00 0.00 0.00 0.00 0.00 0.00 0.00 0.00 0.00P-DP 0.00TESTA 5 - 5 0.00 0.00 3.87 2.35 0.00 0.05 0.00 4.14 0.01 0.30 0.00P-DP 15.25THE KING 45-04 1AH - 1AH 0.02 0.00 55.63 34.77 1.61 0.65 0.00 51.31 3.81 5.26 0.00P-DP 43.12THE KING 45-04 1MS - 1MS 5.76 0.18 4.53 2.75 0.20 0.05 0.00 3.80 0.48 0.47 0.00P-DP 16.22THE KING 45-04 1SH - 1SH 0.73 0.02 52.79 32.06 1.91 0.59 0.00 46.68 4.51 5.23 0.00P-DP 43.32THE KING 45-04 C 3SA - 3SA 6.83 0.21 46.50 30.15 1.89 0.51 0.00 39.99 4.47 4.74 0.00P-DP 38.46THE KING 45-04 C 3SS - 3SS 6.77 0.21 42.95 26.08 1.80 0.46 0.00 36.62 4.27 4.41 0.00P-DP 40.62THE KING 45-04 D 4MS - 4MS 6.47 0.20 48.17 29.68 0.31 0.64 0.00 50.21 0.72 3.87 0.00P-DP 41.92THE KING 45-04 D 4SA - 4SA 1.10 0.03 46.74 26.96 2.57 0.46 0.00 36.62 6.09 5.19 0.00P-DP 44.02THE KING 45-04 D 4SS - 4SS 9.22 0.28 4.61 3.41 3.23 0.00 0.00 0.00 8.62 4.01 0.00P-DP 13.66THOMPSON E SMF JF 5H - 5H 0.00 0.00 17.68 14.10 12.41 0.00 0.00 0.00 33.09 15.40 0.00P-DP 9.66THOMPSON W SMF JF 1H - 1H 0.00 0.00 23.63 17.65 16.58 0.00 0.00 0.00 44.21 20.58 0.00P-DP 13.23THOMPSON W SMF JF 3H - 3H 0.00 0.00 0.06 0.04 0.00 0.00 0.00 0.06 0.00 0.01 0.00P-DP 13.59THORPE 1-74 LOV 1H - 1H 0.00 0.00 0.01 0.01 0.00 0.00 0.00 0.01 0.00 0.00 0.00P-DP 2.61THORPE 1-74 LOV 2H - 2H 0.00 0.00 0.79 0.40 0.02 0.01 0.00 0.80 0.05 0.11 0.00P-DP 33.17THORPE 1-74 LOV 3H - 3H 0.06 0.00 0.31 0.21 0.01 0.00 0.00 0.32 0.01 0.04 0.00P-DP 14.03THORPE 1-74 LOV 4H - 4H 0.02 0.00 15.65 11.27 0.26 0.22 0.00 16.62 0.92 2.10 0.00P-DP 16.76THUNDERBIRD UNIT 07-10 1AH - 1AH 0.20 0.01 14.36 8.72 1.43 0.14 0.00 10.82 2.19 2.85 0.00P-DP 28.57THURMOND 132 ALLOC C 11H - 11H 4.20 0.17 13.29 7.45 1.11 0.14 0.00 10.75 1.69 2.39 0.00P-DP 30.14THURMOND A137 ALLOC. A 10H - 10H 3.25 0.13 8.68 5.47 4.12 0.00 0.00 0.00 9.71 1.03 0.00P-DP 17.80TIGER 210187 2A - 2A 0.00 0.00 8.47 5.66 4.02 0.00 0.00 0.00 9.48 1.01 0.00P-DP 15.99TIGER 210187 3C - 3C 0.00 0.00 5.61 4.06 2.66 0.00 0.00 0.00 6.28 0.67 0.00P-DP 11.60TIGER 210187 5B - 5B 0.00 0.00 0.02 0.01 0.01 0.00 0.00 0.00 0.02 0.00 0.00P-DP 14.43TIGER 210475 4C - 4C 0.00 0.00

Economic One-Liners Lease Name Life (years) Oil (Mbbl) Residue Gas (MMcf) Residue Gas (M$) Other (M$) Expense & Tax (M$) Invest. (M$) Non-Disc. (M$) Cash FlowNet Sales Volumes Net Revenue As of Date: 1/1/2024 Reserve Category Oil (M$) Disc. 10% (M$) NGL (M$) NGL (Mbbl) TABLE 6 9.13 6.11 4.33 0.00 0.00 0.00 10.21 1.08 0.00P-DP 16.48TIGER 210476 1A - 1A 0.00 0.00 7.62 4.09 0.42 0.10 0.00 7.72 0.55 1.61 0.00P-DP 37.53TIGIWON 2627-C23 E 1H - 1H 0.96 0.03 10.32 5.76 0.47 0.13 0.00 10.57 0.61 1.93 0.00P-DP 40.34TIGIWON 2627-C23 E 433H - 433H 1.06 0.03 1.26 0.79 0.03 0.02 0.00 1.20 0.07 0.15 0.00P-DP 30.36TIMMERMAN J1 2208MH - 2208MH 0.15 0.01 2.49 1.49 0.05 0.03 0.00 2.42 0.11 0.29 0.00P-DP 37.27TIMMERMAN J10 2206LH - 2206LH 0.24 0.01 1.61 0.96 0.06 0.02 0.00 1.41 0.14 0.22 0.00P-DP 33.00TIMMERMAN J11 2206BH - 2206BH 0.29 0.01 1.77 1.00 0.04 0.02 0.00 1.68 0.10 0.21 0.00P-DP 36.08TIMMERMAN J2 2208LH - 2208LH 0.20 0.01 1.19 0.70 0.06 0.01 0.00 0.92 0.15 0.20 0.00P-DP 31.07TIMMERMAN J3 2208BH - 2208BH 0.32 0.01 2.66 1.49 0.05 0.03 0.00 2.59 0.12 0.31 0.00P-DP 39.70TIMMERMAN J4 2207MH - 2207MH 0.26 0.01 1.48 0.87 0.06 0.02 0.00 1.28 0.13 0.21 0.00P-DP 32.18TIMMERMAN J5 2207LH - 2207LH 0.27 0.01 1.49 0.88 0.12 0.01 0.00 0.93 0.28 0.30 0.00P-DP 32.22TIMMERMAN J6 2207BH - 2207BH 0.59 0.03 1.48 0.88 0.05 0.02 0.00 1.35 0.10 0.19 0.00P-DP 31.92TIMMERMAN J7 2217LH - 2217LH 0.22 0.01 0.08 0.06 0.00 0.00 0.00 0.08 0.00 0.01 0.00P-DP 5.79TIMMERMAN J8 2207CH - 2207CH 0.00 0.00 3.33 1.91 0.07 0.04 0.00 3.23 0.15 0.38 0.00P-DP 41.67TIMMERMAN J9 2206MH - 2206MH 0.33 0.01 7.06 3.59 0.51 0.08 0.00 5.96 0.78 1.18 0.00P-DP 42.16TIN STAR A L 33H - L 33H 1.50 0.06 2.41 1.34 0.20 0.03 0.00 1.95 0.31 0.43 0.00P-DP 30.87TIN STAR B L 42H - L 42H 0.59 0.02 5.17 2.94 0.37 0.06 0.00 4.39 0.56 0.86 0.00P-DP 36.38TIN STAR D U 46H - U 46H 1.08 0.04 0.00 0.00 0.00 0.00 0.00 0.00 0.00 0.00 0.00P-DP 13.94TIPI CHAPMAN 34-163 1H - 1H 0.00 0.00 0.01 0.00 0.00 0.00 0.00 0.01 0.00 0.00 0.00P-DP 20.88TIPI CHAPMAN 34-163 2H - 2H 0.00 0.00 0.00 0.00 0.00 0.00 0.00 0.00 0.00 0.00 0.00P-DP 11.27TIPI CHAPMAN 34-163 3H - 3H 0.00 0.00 0.01 0.01 0.00 0.00 0.00 0.01 0.00 0.00 0.00P-DP 17.54TIPI CHAPMAN 34-163 4H - 4H 0.00 0.00 142.60 80.48 1.66 1.83 0.00 144.65 3.93 11.92 0.00P-DP 25.51TISH 46-03 #1AH - 1AH 5.95 0.18 231.62 144.79 7.84 2.63 0.00 207.54 18.57 22.61 0.00P-DP 28.13TISH 46-03 1Ss - 1SS 28.11 0.86 457.73 286.30 13.84 5.31 0.00 419.00 32.76 43.63 0.00P-DP 35.00TISH 46-03 3Sa - 3SA 49.60 1.51 570.67 339.12 10.13 7.11 0.00 560.31 23.97 49.89 0.00P-DP 38.75TISH 46-03 3Ss - 3SS 36.29 1.10 4.17 2.52 0.01 0.06 0.00 4.45 0.02 0.34 0.00P-DP 24.21TITO'S 31-42 1LS - 1LS 0.04 0.00 4.04 2.46 0.01 0.06 0.00 4.33 0.01 0.32 0.00P-DP 23.71TITO'S 31-42 1WA - 1WA 0.02 0.00 3.50 2.19 0.01 0.05 0.00 3.75 0.01 0.28 0.00P-DP 21.82TITO'S 31-42 1WB - 1WB 0.02 0.00 9.11 5.22 0.07 0.12 0.00 9.55 0.11 0.79 0.00P-DP 31.90TITO'S 31-42 2LS - 2LS 0.24 0.01 3.33 2.19 0.36 0.03 0.00 2.18 0.57 0.64 0.00P-DP 17.99TITO'S 31-42 2WA - 2WA 1.23 0.05 3.01 1.93 0.06 0.04 0.00 2.99 0.10 0.30 0.00P-DP 19.30TITO'S 31-42 2WB - 2WB 0.22 0.01 2.31 1.56 0.02 0.03 0.00 2.40 0.04 0.21 0.00P-DP 16.18TITO'S 31-42 3WA - 3WA 0.08 0.00 100.07 60.21 3.07 1.16 0.00 91.36 7.27 9.57 0.00P-DP 30.68TOMCAT 4448WA - 4448WA 11.01 0.34 15.12 7.68 1.08 0.17 0.00 12.84 1.65 2.51 0.00P-DP 42.47TOWNSEN 24265 ALLOC. A 10H - 10H 3.15 0.13 1.05 0.63 0.00 0.01 0.00 1.14 0.00 0.10 0.00P-DP 22.52TRAUBE 1-11 WRD 1H - 1H 0.01 0.00

Economic One-Liners Lease Name Life (years) Oil (Mbbl) Residue Gas (MMcf) Residue Gas (M$) Other (M$) Expense & Tax (M$) Invest. (M$) Non-Disc. (M$) Cash FlowNet Sales Volumes Net Revenue As of Date: 1/1/2024 Reserve Category Oil (M$) Disc. 10% (M$) NGL (M$) NGL (Mbbl) TABLE 6 1.27 0.71 0.03 0.02 0.00 1.27 0.04 0.15 0.00P-DP 25.99TRAUBE 1-11 WRD 2H - 2H 0.10 0.00 6.37 3.83 0.35 0.06 0.00 4.97 0.84 0.71 0.00P-DP 26.31TREE FROG 47 EAST A 1LS - 1LS 1.27 0.04 9.44 5.53 0.35 0.11 0.00 8.28 0.83 0.94 0.00P-DP 30.43TREE FROG 47 EAST A 1WA - 1WA 1.26 0.04 9.01 5.28 0.29 0.10 0.00 8.13 0.70 0.87 0.00P-DP 30.26TREE FROG 47 EAST C 3LS - 3LS 1.05 0.03 11.95 6.52 0.97 0.10 0.00 7.69 2.30 1.52 0.00P-DP 34.75TREE FROG 47 EAST C 3WA - 3WA 3.48 0.11 9.17 5.29 0.55 0.09 0.00 6.93 1.31 1.05 0.00P-DP 30.78TREE FROG 47 EAST C 3WB - 3WB 1.98 0.06 8.42 5.09 0.24 0.10 0.00 7.77 0.57 0.79 0.00P-DP 28.39TREE FROG 47 WEST UNIT 5LS - 5LS 0.87 0.03 15.60 8.95 0.71 0.17 0.00 13.01 1.68 1.64 0.00P-DP 35.98TREE FROG 47 WEST UNIT 5WA - 5WA 2.54 0.08 11.63 6.74 0.52 0.12 0.00 9.73 1.24 1.22 0.00P-DP 32.69TREE FROG 47 WEST UNIT 5WB - 5WB 1.88 0.06 10.83 6.53 0.36 0.12 0.00 9.74 0.85 1.05 0.00P-DP 30.96TREE FROG 47 WEST UNIT 7LS - 7LS 1.29 0.04 14.17 8.43 0.75 0.14 0.00 11.27 1.77 1.55 0.00P-DP 34.08TREE FROG 47 WEST UNIT 7WA - 7WA 2.68 0.08 15.43 7.35 0.57 0.17 0.00 13.57 1.35 1.54 0.00P-DP 50.00TRENTINO 1 - 1 2.05 0.06 6.35 2.67 0.05 0.08 0.00 6.57 0.12 0.52 0.00P-DP 48.88TRENTINO 2 - 2 0.18 0.01 1.64 0.85 0.06 0.02 0.00 1.42 0.15 0.17 0.00P-DP 23.62TRENTINO 36 3 - 3 0.23 0.01 5.01 3.12 0.14 0.06 0.00 4.65 0.33 0.47 0.00P-DP 25.59TRENTINO 36-37 (ALLOC-C) 3SA - 3SA 0.51 0.02 20.80 11.65 1.20 0.20 0.00 16.01 2.84 2.34 0.00P-DP 39.75TRENTINO 36-37 (ALLOC-C) 3SB - 3SB 4.29 0.13 3.99 2.56 0.09 0.05 0.00 3.80 0.22 0.36 0.00P-DP 21.33TRENTINO 36-37 (ALLOC-C) 3SS - 3SS 0.33 0.01 15.08 8.71 0.45 0.18 0.00 13.86 1.05 1.43 0.00P-DP 33.78TRENTINO 36-37 (ALLOC-D) 4SB - 4SB 1.60 0.05 10.96 5.56 0.99 0.08 0.00 6.52 2.35 1.46 0.00P-DP 33.57TRENTINO 36-37 (ALLOC-D) 4SS - 4SS 3.56 0.11 5.55 3.68 0.38 0.05 0.00 3.93 0.91 0.67 0.00P-DP 18.76TRENTINO 36-37 (ALLOC-DA) 4SA - 4SA 1.38 0.04 1.83 1.22 0.10 0.02 0.00 1.67 0.15 0.26 0.00P-DP 14.14TRIANGLE 75 2H - 2H 0.28 0.01 0.67 0.38 0.06 0.01 0.00 0.53 0.08 0.13 0.00P-DP 26.35TRIDACNA 34-208 WRD UNIT 1H - 1H 0.19 0.01 0.63 0.37 0.06 0.01 0.00 0.48 0.08 0.13 0.00P-DP 25.39TRIDACNA 34-208 WRD UNIT 2H - 2H 0.20 0.01 0.71 0.42 0.04 0.01 0.00 0.63 0.05 0.11 0.00P-DP 25.83TRIDACNA 34-208 WRD UNIT 3H - 3H 0.13 0.01 0.18 0.12 0.01 0.00 0.00 0.15 0.02 0.03 0.00P-DP 13.40TROTT 34-183 1H - 1H 0.04 0.00 1.56 0.78 0.02 0.02 0.00 1.64 0.03 0.17 0.00P-DP 43.10UNFORGIVEN 34 113-114 D 604H - 604H 0.06 0.00 0.93 0.60 0.02 0.01 0.00 0.99 0.06 0.13 0.00P-DP 19.59UNICORN UNIT A 04-37 1AH - 1AH 0.01 0.00 0.59 0.39 0.02 0.01 0.00 0.62 0.08 0.12 0.00P-DP 16.93UNICORN UNIT B 37-04 7AH - 7AH 0.02 0.00 0.86 0.54 0.01 0.01 0.00 0.93 0.02 0.09 0.00P-DP 21.11UNICORN UNIT B 37-04 8MH - 8MH 0.00 0.00 28.28 18.89 0.00 0.39 0.00 30.43 0.01 2.16 0.00P-DP 21.32URSULA 0848WA - 0848WA 0.01 0.00 20.69 15.24 0.73 0.23 0.00 18.41 1.72 2.03 0.00P-DP 15.62URSULA 1546WA - 1546WA 2.60 0.08 13.63 8.93 0.30 0.17 0.00 13.08 0.70 1.23 0.00P-DP 25.58URSULA BIG DADDY B 1527LS - 1527LS 1.07 0.03 14.11 8.79 0.27 0.17 0.00 13.74 0.64 1.25 0.00P-DP 27.53URSULA BIG DADDY B 1547WA - 1547WA 0.98 0.03 30.07 18.40 0.99 0.34 0.00 27.10 2.34 2.92 0.00P-DP 34.14URSULA BIG DADDY C 1528LS - 1528LS 3.54 0.11 103.87 62.69 2.20 1.27 0.00 100.08 5.21 9.31 0.00P-DP 32.78URSULA TOMCAT A 4446WA - 4446WA 7.89 0.24

Economic One-Liners Lease Name Life (years) Oil (Mbbl) Residue Gas (MMcf) Residue Gas (M$) Other (M$) Expense & Tax (M$) Invest. (M$) Non-Disc. (M$) Cash FlowNet Sales Volumes Net Revenue As of Date: 1/1/2024 Reserve Category Oil (M$) Disc. 10% (M$) NGL (M$) NGL (Mbbl) TABLE 6 86.23 51.19 1.59 1.07 0.00 84.35 3.76 7.58 0.00P-DP 31.23URSULA TOMCAT B 4421LS - 4421LS 5.69 0.17 93.36 54.06 4.73 0.96 0.00 75.32 11.19 10.10 0.00P-DP 33.88URSULA TOMCAT C 4447WA - 4447WA 16.95 0.52 6.05 3.78 0.03 0.08 0.00 6.35 0.07 0.48 0.00P-DP 40.32VALENCIA 10-8 A UNIT A 3H - A 3H 0.11 0.00 3.72 2.44 0.02 0.05 0.00 3.91 0.04 0.29 0.00P-DP 32.11VALENCIA 10-8 A UNIT L 3H - L 3H 0.06 0.00 17.59 12.39 8.35 0.00 0.00 0.00 19.68 2.09 0.00P-DP 12.61VALERIE 210473 1A - 1A 0.00 0.00 17.44 12.39 8.28 0.00 0.00 0.00 19.51 2.07 0.00P-DP 12.33VALERIE 210473 2B - 2B 0.00 0.00 26.20 16.65 12.43 0.00 0.00 0.00 29.30 3.11 0.00P-DP 17.86VALERIE 210473 4C - 4C 0.00 0.00 254.12 152.47 120.61 0.00 0.00 0.00 284.27 30.15 0.00P-DP 42.51VANNELLE SW WHL BL 2H - 2H 0.00 0.00 0.46 0.36 0.02 0.01 0.00 0.44 0.02 0.06 0.00P-DP 8.04VICKERS '34-127' 1H - 1H 0.06 0.00 0.84 0.57 0.01 0.01 0.00 0.88 0.01 0.09 0.00P-DP 13.11VICKERS '34-127' 2H - 2H 0.03 0.00 2.31 1.31 0.19 0.02 0.00 1.88 0.29 0.41 0.00P-DP 36.37VINTAGE A U 06H - U 06H 0.55 0.02 2.77 1.61 0.27 0.03 0.00 2.10 0.42 0.55 0.00P-DP 36.41VINTAGE B T 13H - T 13H 0.80 0.03 12.23 7.01 0.95 0.13 0.00 10.10 1.46 2.13 0.00P-DP 50.00VINTAGE C C 03H - C 03H 2.79 0.11 1.11 0.63 0.12 0.01 0.00 0.81 0.18 0.23 0.00P-DP 50.00VINTAGE D T 26H - T 26H 0.35 0.01 14.01 8.09 0.82 0.16 0.00 12.49 1.25 2.13 0.00P-DP 50.00VINTAGE E C 04H - C 04H 2.40 0.10 1.92 0.99 0.14 0.02 0.00 1.61 0.22 0.33 0.00P-DP 39.86VINTAGE UNIT A U 19H - U 19H 0.42 0.02 72.39 42.39 0.87 0.93 0.00 73.28 2.06 6.07 0.00P-DP 33.91VIPER FOSTER B 4545WA - 4545WA 3.12 0.09 101.66 57.12 3.24 1.17 0.00 92.16 7.67 9.80 0.00P-DP 39.39VIPER FOSTER C 4525LS - 4525LS 11.62 0.35 91.65 53.59 2.51 1.08 0.00 85.31 5.93 8.57 0.00P-DP 36.92VIPER FOSTER D 4546WA - 4546WA 8.98 0.27 91.76 51.53 0.52 1.22 0.00 96.00 1.22 7.32 0.00P-DP 47.92WALKER 32-48 B UNIT A 5H - A 5H 1.85 0.06 59.94 34.28 0.63 0.78 0.00 61.19 1.48 4.96 0.00P-DP 41.28WALKER 32-48 B UNIT L 6H - L 6H 2.24 0.07 132.55 72.17 0.11 1.80 0.00 142.09 0.25 10.17 0.00P-DP 43.00WALKER 48-32 A UNIT A 1H - A 1H 0.38 0.01 0.53 0.51 0.00 0.01 0.00 0.56 0.00 0.04 0.00P-DP 1.02WALKER 48-32 A UNIT L 1H - L 1H 0.00 0.00 24.76 13.99 0.21 0.32 0.00 25.53 0.49 2.02 0.00P-DP 50.00WALKER DRRC EAST 30-56 6SH - 6SH 0.75 0.02 4.04 2.44 0.23 0.04 0.00 3.15 0.53 0.45 0.00P-DP 26.85WALKER DRRC EAST 30-56 7AH - 7AH 0.81 0.02 3.17 2.11 0.20 0.03 0.00 2.33 0.48 0.37 0.00P-DP 20.88WALKER DRRC EAST 30-56 7SH - 7SH 0.73 0.02 16.23 9.58 1.00 0.15 0.00 12.16 2.36 1.87 0.00P-DP 36.94WALKER-DRRC 30-56 WEST UNIT 5LS - 5LS 3.58 0.11 4.50 2.96 0.36 0.04 0.00 2.91 0.86 0.57 0.00P-DP 19.53WALKER-DRRC 30-56 WEST UNIT 5WA - 5WA 1.31 0.04 16.53 11.22 0.23 0.21 0.00 16.54 0.55 1.41 0.00P-DP 30.18WALKER-DRRC WEST 30-56 6AH - 6AH 0.84 0.03 0.23 0.12 0.00 0.00 0.00 0.25 0.00 0.02 0.00P-DP 28.91WALLACE, T. L. 1 - 1 0.00 0.00 0.10 0.08 0.00 0.00 0.00 0.11 0.00 0.01 0.00P-DP 8.13WALLACE, T. L. 3 - 3 0.00 0.00 24.32 13.56 0.30 0.31 0.00 24.58 0.71 2.04 0.00P-DP 36.73WARD 18CC 1804D - 1804D 1.07 0.03 6.73 4.30 0.08 0.09 0.00 6.83 0.19 0.56 0.00P-DP 21.03WARD 18D 1803D - 1803D 0.28 0.01 5.84 3.05 0.60 0.06 0.00 4.53 0.64 0.64 0.00P-DP 40.91WASHINGTON EAST I 23-14 4409H - 4409H 1.31 0.07 6.93 3.53 0.14 0.09 0.00 7.05 0.15 0.57 0.00P-DP 41.85WASHINGTON WEST A 23-14 4201H - 4201H 0.30 0.02

Economic One-Liners Lease Name Life (years) Oil (Mbbl) Residue Gas (MMcf) Residue Gas (M$) Other (M$) Expense & Tax (M$) Invest. (M$) Non-Disc. (M$) Cash FlowNet Sales Volumes Net Revenue As of Date: 1/1/2024 Reserve Category Oil (M$) Disc. 10% (M$) NGL (M$) NGL (Mbbl) TABLE 6 6.09 3.15 0.39 0.07 0.00 5.41 0.42 0.59 0.00P-DP 39.25WASHINGTON WEST A 23-14 4401H - 4401H 0.85 0.05 9.14 4.51 1.58 0.07 0.00 5.24 1.69 1.23 0.00P-DP 46.48WASHINGTON WEST B 23-14 4302H - 4302H 3.44 0.19 2.18 1.36 0.43 0.01 0.00 1.10 0.46 0.31 0.00P-DP 21.59WASHINGTON WEST B 23-14 4602H - 4602H 0.94 0.05 2.58 1.49 0.59 0.01 0.00 1.07 0.63 0.39 0.00P-DP 27.58WASHINGTON WEST D 23-14 4404H - 4404H 1.28 0.07 3.81 2.14 0.67 0.03 0.00 2.15 0.71 0.51 0.00P-DP 33.53WASHINGTON WEST E 23-14 4305H - 4305H 1.46 0.08 1.79 1.13 0.26 0.02 0.00 1.16 0.28 0.22 0.00P-DP 20.77WASHINGTON WEST F 23-14 4406H - 4406H 0.57 0.03 8.42 4.43 1.31 0.07 0.00 5.26 1.39 1.08 0.00P-DP 45.43WASHINGTON WEST G 23-14 4307H - 4307H 2.84 0.16 38.05 19.98 0.61 0.50 0.00 38.64 0.96 3.64 0.00P-DP 30.25WATKINS 7 1 - 1 2.09 0.09 11.70 5.86 0.17 0.15 0.00 11.97 0.26 1.09 0.00P-DP 47.37WELCH 39 1 - 1 0.56 0.02 0.62 0.38 0.01 0.01 0.00 0.63 0.02 0.06 0.00P-DP 15.55WELCH 39 2 - 2 0.04 0.00 1.34 0.73 0.07 0.02 0.00 1.19 0.10 0.17 0.00P-DP 23.30WELCH 39 3 - 3 0.22 0.01 3.20 1.75 0.08 0.04 0.00 3.12 0.13 0.34 0.00P-DP 31.60WELCH 39 4 - 4 0.29 0.01 56.24 31.68 1.35 0.71 0.00 55.36 2.12 5.85 0.00P-DP 50.00WELCH-COX E39A 301H - 301H 4.61 0.20 107.91 59.18 1.98 1.40 0.00 108.62 3.11 10.58 0.00P-DP 50.00WELCH-COX E39B 302H - 302H 6.76 0.29 56.24 31.68 1.35 0.71 0.00 55.36 2.12 5.85 0.00P-DP 50.00WELCH-COX E39C 303H - 303H 4.61 0.20 66.92 36.33 0.87 0.89 0.00 68.78 1.36 6.17 0.00P-DP 50.00WELCH-COX E39D 304H - 304H 2.95 0.13 56.24 31.68 1.35 0.71 0.00 55.36 2.12 5.85 0.00P-DP 50.00WELCH-COX E39S 319H - 319H 4.61 0.20 43.80 24.19 0.90 0.56 0.00 43.71 1.41 4.40 0.00P-DP 50.00WELCH-COX E39T 320H - 320H 3.08 0.13 107.91 59.18 1.98 1.40 0.00 108.62 3.11 10.58 0.00P-DP 50.00WELCH-COX E39U 321H - 321H 6.76 0.29 24.75 15.40 1.08 0.29 0.00 22.47 1.69 3.09 0.00P-DP 37.91WELCH-COX E39V 322H - 322H 3.68 0.16 73.73 42.24 0.94 0.98 0.00 75.86 1.47 6.78 0.00P-DP 50.00WELCH-COX E39W 323H - 323H 3.19 0.14 26.52 16.98 1.23 0.31 0.00 23.81 1.92 3.39 0.00P-DP 38.25WELCH-COX W39F 206H - 206H 4.18 0.18 43.21 25.41 0.94 0.55 0.00 42.91 1.48 4.40 0.00P-DP 46.16WELCH-COX W39G 207H - 207H 3.22 0.14 27.61 17.34 1.29 0.32 0.00 24.75 2.01 3.53 0.00P-DP 39.00WELCH-COX W39H 208H - 208H 4.38 0.19 28.11 17.44 0.64 0.36 0.00 27.83 1.00 2.88 0.00P-DP 39.87WELCH-COX W39I 209H - 209H 2.16 0.09 27.75 16.84 0.69 0.35 0.00 27.23 1.08 2.91 0.00P-DP 40.44WELCH-COX W39J 210H - 210H 2.35 0.10 25.14 16.38 0.62 0.32 0.00 24.69 0.97 2.63 0.00P-DP 37.29WELCH-COX W39K 211H - 211H 2.11 0.09 23.02 14.09 0.83 0.28 0.00 21.56 1.31 2.69 0.00P-DP 38.02WELCH-COX W39L 212H - 212H 2.84 0.12 27.67 17.97 0.89 0.34 0.00 26.37 1.39 3.12 0.00P-DP 38.34WELCH-COX W39M 213H - 213H 3.03 0.13 20.60 12.90 0.71 0.25 0.00 19.44 1.11 2.37 0.00P-DP 36.47WELCH-COX W39N 214H - 214H 2.42 0.10 24.81 15.87 0.75 0.31 0.00 23.81 1.18 2.75 0.00P-DP 37.68WELCH-COX W39O 215H - 215H 2.57 0.11 27.79 17.98 1.00 0.34 0.00 26.06 1.57 3.25 0.00P-DP 38.50WELCH-COX W39P 216H - 216H 3.41 0.15 1.64 1.09 0.02 0.02 0.00 1.75 0.08 0.20 0.00P-DP 31.79WEREWOLF UNIT A 12-05 1AH - 1AH 0.02 0.00 2.70 1.60 0.02 0.04 0.00 2.89 0.09 0.30 0.00P-DP 41.54WEREWOLF UNIT A 12-05 2AH - 2AH 0.02 0.00 3.42 1.99 0.05 0.05 0.00 3.64 0.17 0.44 0.00P-DP 46.25WEREWOLF UNIT B 12-05 4AH - 4AH 0.04 0.00

Economic One-Liners Lease Name Life (years) Oil (Mbbl) Residue Gas (MMcf) Residue Gas (M$) Other (M$) Expense & Tax (M$) Invest. (M$) Non-Disc. (M$) Cash FlowNet Sales Volumes Net Revenue As of Date: 1/1/2024 Reserve Category Oil (M$) Disc. 10% (M$) NGL (M$) NGL (Mbbl) TABLE 6 3.18 1.85 0.05 0.04 0.00 3.39 0.16 0.40 0.00P-DP 45.13WEREWOLF UNIT B 12-05 5AH - 5AH 0.03 0.00 3.17 1.85 0.05 0.04 0.00 3.38 0.16 0.40 0.00P-DP 45.13WEREWOLF UNIT B 12-05 6AH - 6AH 0.04 0.00 1.33 0.83 0.01 0.02 0.00 1.42 0.01 0.13 0.00P-DP 23.29WHIRLAWAY 99 1HA - 1HA 0.03 0.00 0.22 0.12 0.00 0.00 0.00 0.23 0.00 0.02 0.00P-DP 45.42WHISKEY RIVER 9596A-34 11H - 11H 0.01 0.00 0.07 0.04 0.00 0.00 0.00 0.07 0.00 0.01 0.00P-DP 32.51WHISKEY RIVER 9596A-34 12H - 12H 0.01 0.00 0.12 0.05 0.00 0.00 0.00 0.12 0.00 0.01 0.00P-DP 49.63WHISKEY RIVER 9596A-34 13H - 13H 0.01 0.00 0.05 0.03 0.00 0.00 0.00 0.05 0.00 0.00 0.00P-DP 31.37WHISKEY RIVER 9596B-34 1H - 1H 0.00 0.00 0.09 0.05 0.00 0.00 0.00 0.09 0.00 0.01 0.00P-DP 37.26WHISKEY RIVER 9596B-34 31H - 31H 0.00 0.00 0.11 0.06 0.00 0.00 0.00 0.11 0.00 0.01 0.00P-DP 37.83WHISKEY RIVER 9596B-34 32H - 32H 0.01 0.00 0.15 0.07 0.00 0.00 0.00 0.16 0.00 0.02 0.00P-DP 44.93WHISKEY RIVER 9596C-34 1H - 1H 0.01 0.00 0.09 0.05 0.00 0.00 0.00 0.09 0.00 0.01 0.00P-DP 36.68WHISKEY RIVER 9596D-34 81H - 81H 0.01 0.00 0.41 0.19 0.00 0.01 0.00 0.44 0.00 0.04 0.00P-DP 28.53WHITE 19 - 19 0.00 0.00 0.67 0.42 0.02 0.01 0.00 0.62 0.05 0.06 0.00P-DP 21.36WHITMIRE 36-37 (ALLOC-F) 6SA - 6SA 0.07 0.00 0.70 0.43 0.04 0.01 0.00 0.56 0.08 0.08 0.00P-DP 22.74WHITMIRE 36-37 (ALLOC-F) 6SB - 6SB 0.13 0.00 1.15 0.67 0.08 0.01 0.00 0.84 0.18 0.14 0.00P-DP 28.97WHITMIRE 36-37 (ALLOC-G) 7SA - 7SA 0.27 0.01 7.61 4.15 0.35 0.08 0.00 6.33 0.83 0.80 0.00P-DP 33.44WHITMIRE 36-37 (ALLOC-G) 7SB - 7SB 1.25 0.04 8.71 4.82 0.22 0.10 0.00 8.18 0.53 0.81 0.00P-DP 34.78WHITMIRE 36-37 (ALLOC-H) 8SA - 8SA 0.81 0.02 5.85 3.57 0.09 0.07 0.00 5.83 0.21 0.50 0.00P-DP 26.83WHITMIRE 36-37 (ALLOC-H) 8SB - 8SB 0.31 0.01 6.89 3.46 0.18 0.09 0.00 6.72 0.28 0.73 0.00P-DP 36.58WILEY 4 1 - 1 0.62 0.03 25.87 14.71 2.04 0.28 0.00 21.32 3.11 4.52 0.00P-DP 28.10WILLETT POT STILL 5-2C UNIT 1H - 1H 5.96 0.24 3.25 1.80 0.27 0.03 0.00 2.45 0.42 0.54 0.00P-DP 31.24WILLIE THE WILDCAT 3-15 A 1JC - 1JC 0.92 0.04 4.31 2.37 0.21 0.05 0.00 3.82 0.33 0.56 0.00P-DP 34.14WILLIE THE WILDCAT 3-15 A 1LS - 1LS 0.72 0.03 10.70 5.62 0.92 0.10 0.00 7.92 1.45 1.82 0.00P-DP 44.94WILLIE THE WILDCAT 3-15 A 1WA - 1WA 3.15 0.13 2.25 1.53 0.16 0.02 0.00 1.79 0.26 0.35 0.00P-DP 21.79WILLIE THE WILDCAT 3-15 B 2DN - 2DN 0.56 0.02 4.14 2.34 0.23 0.05 0.00 3.58 0.36 0.57 0.00P-DP 33.07WILLIE THE WILDCAT 3-15 B 2LS - 2LS 0.77 0.03 2.84 1.69 0.45 0.02 0.00 1.31 0.70 0.70 0.00P-DP 28.07WILLIE THE WILDCAT 3-15 B 2WB - 2WB 1.53 0.07 2.27 1.45 0.16 0.02 0.00 1.82 0.25 0.35 0.00P-DP 24.11WILLIE THE WILDCAT 3-15 B 3JD - 3JD 0.55 0.02 2.22 1.41 0.26 0.02 0.00 1.39 0.40 0.45 0.00P-DP 23.89WILLIE THE WILDCAT 3-15 C 4LS - 4LS 0.87 0.04 5.63 3.23 0.76 0.04 0.00 3.08 1.20 1.25 0.00P-DP 35.80WILLIE THE WILDCAT 3-15 C 4WA - 4WA 2.60 0.11 2.33 1.38 0.11 0.03 0.00 2.08 0.17 0.30 0.00P-DP 26.50WILLIE THE WILDCAT 3-15 D 5JD - 5JD 0.38 0.02 6.41 3.57 0.58 0.06 0.00 4.65 0.91 1.12 0.00P-DP 38.05WILLIE THE WILDCAT 3-15 D 6DN - 6DN 1.98 0.08 4.12 2.41 0.24 0.05 0.00 3.51 0.37 0.58 0.00P-DP 30.08WILLIE THE WILDCAT 3-15 D 6LS - 6LS 0.81 0.03 5.49 3.12 0.71 0.04 0.00 3.14 1.11 1.19 0.00P-DP 35.72WILLIE THE WILDCAT 3-15 D 6WB - 6WB 2.42 0.10 4.49 2.77 0.02 0.06 0.00 4.76 0.03 0.37 0.00P-DP 31.42WILLIE THE WILDCAT 3-15 E 7JC - 7JC 0.07 0.00 9.82 5.41 0.28 0.12 0.00 9.51 0.43 1.06 0.00P-DP 42.88WILLIE THE WILDCAT 3-15 E 7LS - 7LS 0.94 0.04

Economic One-Liners Lease Name Life (years) Oil (Mbbl) Residue Gas (MMcf) Residue Gas (M$) Other (M$) Expense & Tax (M$) Invest. (M$) Non-Disc. (M$) Cash FlowNet Sales Volumes Net Revenue As of Date: 1/1/2024 Reserve Category Oil (M$) Disc. 10% (M$) NGL (M$) NGL (Mbbl) TABLE 6 4.05 2.30 0.68 0.02 0.00 1.71 1.06 1.04 0.00P-DP 28.66WILLIE THE WILDCAT 3-15 E 7WA - 7WA 2.31 0.10 9.07 5.01 0.76 0.09 0.00 7.24 1.04 1.71 0.00P-DP 49.02WILSON 184-185 UNIT 131H - 131H 2.49 0.10 5.54 3.17 0.44 0.06 0.00 4.51 0.60 1.02 0.00P-DP 41.02WILSON 184-185 UNIT 132H - 132H 1.44 0.06 5.37 3.08 0.30 0.06 0.00 4.81 0.42 0.84 0.00P-DP 40.53WILSON 184-185 UNIT 232H - 232H 0.99 0.04 4.75 2.40 0.46 0.05 0.00 3.59 0.63 0.97 0.00P-DP 42.97WILSON 184-185 UNIT 2H - 2H 1.50 0.06 11.28 6.06 1.29 0.10 0.00 7.80 1.77 2.53 0.00P-DP 50.00WILSON 184-185 UNIT 332H - 332H 4.23 0.17 1.71 0.99 0.10 0.02 0.00 1.51 0.16 0.26 0.00P-DP 29.68WINDY MOUNTAIN 7879 1U B 1H - B 1H 0.30 0.01 1.92 1.11 0.11 0.02 0.00 1.73 0.16 0.29 0.00P-DP 30.79WINDY MOUNTAIN 7879 2U B 2H - B 2H 0.31 0.01 1.79 1.01 0.03 0.02 0.00 1.75 0.08 0.16 0.00P-DP 17.42WINTERS BB 2 - 2 0.11 0.00 3.21 1.68 0.00 0.04 0.00 3.45 0.00 0.24 0.00P-DP 22.65WINTERS FERN D 2 - 2 0.00 0.00 36.02 18.68 0.54 0.45 0.00 35.88 1.28 3.09 0.00P-DP 48.88WORTHY 13-12 (ALLOC-A) 1NA - 1NA 1.95 0.06 18.51 9.91 0.23 0.24 0.00 18.72 0.53 1.55 0.00P-DP 38.69WORTHY 13-12 (ALLOC-A) 1NS - 1NS 0.81 0.02 29.04 15.44 1.09 0.32 0.00 25.45 2.58 2.90 0.00P-DP 44.93WORTHY 13-12 (ALLOC-B) 2NB - 2NB 3.91 0.12 38.21 20.69 1.18 0.44 0.00 34.82 2.80 3.66 0.00P-DP 48.42WORTHY 13-12 (ALLOC-C) 3NA - 3NA 4.24 0.13 28.66 15.45 1.09 0.32 0.00 25.05 2.58 2.87 0.00P-DP 44.35WORTHY 13-12 (ALLOC-D) 4NB - 4NB 3.91 0.12 18.59 10.27 0.61 0.21 0.00 16.77 1.44 1.80 0.00P-DP 37.72WORTHY 13-12 (ALLOC-D) 4NS - 4NS 2.18 0.07 108.76 64.50 2.87 1.48 0.00 114.22 10.13 17.82 0.00P-DP 42.64WRAITH UNIT A 12-16 1AH - 1AH 2.23 0.08 98.50 58.96 2.43 1.35 0.00 103.66 8.58 15.63 0.00P-DP 41.43WRAITH UNIT A 12-16 2AH - 2AH 1.89 0.07 144.81 85.51 2.59 2.00 0.00 153.61 9.14 19.97 0.00P-DP 47.37WRAITH UNIT A 12-16 3AH - 3AH 2.01 0.08 105.64 70.31 1.95 1.45 0.00 111.99 6.89 14.76 0.00P-DP 38.28WRAITH UNIT B 12-16-4AH - 4AH 1.52 0.06 8.93 4.71 0.30 0.11 0.00 8.66 0.80 1.47 0.00P-DP 39.82WRANGLER A UNIT #1H - 1H 0.93 0.03 10.08 5.53 0.02 0.14 0.00 10.95 0.06 1.01 0.00P-DP 39.59WRANGLER A UNIT #2H - 2H 0.07 0.00 3.51 2.23 0.07 0.05 0.00 3.56 0.20 0.49 0.00P-DP 25.27WRANGLER B UNIT #1H - 1H 0.23 0.01 7.41 4.52 0.13 0.10 0.00 7.64 0.34 0.97 0.00P-DP 34.16WRANGLER B UNIT #2H - 2H 0.40 0.01 9.47 5.06 0.22 0.12 0.00 9.56 0.58 1.35 0.00P-DP 40.03WRANGLER C UNIT #1H - 1H 0.68 0.02 10.59 5.83 0.18 0.14 0.00 10.91 0.49 1.39 0.00P-DP 40.38WRANGLER C UNIT #2H - 2H 0.57 0.02 6.34 3.53 0.14 0.08 0.00 6.43 0.37 0.89 0.00P-DP 34.64WRANGLER D UNIT #1H - 1H 0.42 0.01 10.95 6.05 0.24 0.14 0.00 11.10 0.65 1.54 0.00P-DP 40.83WRANGLER D UNIT #2H - 2H 0.75 0.03 0.29 0.20 0.01 0.00 0.00 0.29 0.01 0.03 0.00P-DP 13.23WRIGHT 1-22 E WRD UNIT 2H - 2H 0.02 0.00 0.79 0.46 0.01 0.01 0.00 0.82 0.02 0.09 0.00P-DP 25.01WRIGHT 1-22 W WRD UNIT 2H - 2H 0.05 0.00 0.13 0.09 0.00 0.00 0.00 0.13 0.00 0.02 0.00P-DP 14.59WRIGHT 1-22E WRD 1H - 1H 0.01 0.00 0.00 0.00 0.00 0.00 0.00 0.00 0.00 0.00 0.00P-DP 0.00WRIGHT 1-22W WRD 1H - 1H 0.00 0.00 1.49 0.67 0.08 0.01 0.00 1.16 0.20 0.17 0.00P-DP 37.41WYNN 29 1 - 1 0.30 0.01 0.12 0.10 0.00 0.00 0.00 0.11 0.01 0.01 0.00P-DP 5.83WYNN FARMS 28 1 - 1 0.01 0.00 8.74 5.02 0.56 0.09 0.00 6.66 1.76 1.28 0.00P-DP 35.16XBC-CAROLINE 3B 302H - 302H 1.60 0.09

Economic One-Liners Lease Name Life (years) Oil (Mbbl) Residue Gas (MMcf) Residue Gas (M$) Other (M$) Expense & Tax (M$) Invest. (M$) Non-Disc. (M$) Cash FlowNet Sales Volumes Net Revenue As of Date: 1/1/2024 Reserve Category Oil (M$) Disc. 10% (M$) NGL (M$) NGL (Mbbl) TABLE 6 9.79 5.44 0.61 0.10 0.00 7.54 1.92 1.41 0.00P-DP 37.17XBC-CAROLINE 3C 303H - 303H 1.74 0.10 7.72 4.46 0.47 0.08 0.00 5.98 1.49 1.10 0.00P-DP 33.59XBC-CAROLINE 3K 311H - 311H 1.35 0.08 8.93 5.19 0.62 0.08 0.00 6.55 1.96 1.36 0.00P-DP 34.79XBC-CAROLINE 3L 312H - 312H 1.78 0.10 12.05 6.56 0.72 0.12 0.00 9.41 2.28 1.71 0.00P-DP 39.56XBC-CAROLINE 3M 313H - 313H 2.07 0.12 13.76 7.58 0.46 0.16 0.00 12.53 1.46 1.55 0.00P-DP 40.63XBC-UNRUH 3A 16H - 16H 1.32 0.08 10.33 5.88 0.58 0.11 0.00 8.24 1.84 1.42 0.00P-DP 36.44XBC-UNRUH 3B 17H - 17H 1.67 0.10 0.03 0.02 0.01 0.00 0.00 0.00 0.03 0.00 0.00P-DP 20.68YANKEE 210475 5A - 5A 0.00 0.00 2.34 1.38 0.00 0.03 0.00 2.55 0.01 0.23 0.00P-DP 33.88YELLOW ROSE A UNIT 1H - 1H 0.01 0.00 2.22 1.38 0.00 0.03 0.00 2.42 0.01 0.22 0.00P-DP 31.94YELLOW ROSE A UNIT 2H - 2H 0.01 0.00 1.99 1.10 0.15 0.02 0.00 1.62 0.40 0.50 0.00P-DP 33.47YELLOW ROSE A UNIT 3H - 3H 0.47 0.02 7.02 3.65 0.01 0.10 0.00 7.64 0.04 0.70 0.00P-DP 48.84YELLOW ROSE B UNIT 1H - 1H 0.04 0.00 2.37 1.40 0.00 0.03 0.00 2.59 0.01 0.23 0.00P-DP 33.79YELLOW ROSE B UNIT 2H - 2H 0.01 0.00 6.46 3.51 0.30 0.08 0.00 5.96 0.81 1.23 0.00P-DP 46.84YELLOW ROSE B UNIT 3H - 3H 0.93 0.03 147.39 91.17 7.55 1.67 0.00 129.43 11.83 19.60 0.00P-DP 46.46YORK-LAW 139A 101H - 101H 25.72 1.10 176.60 107.41 4.01 2.25 0.00 174.80 6.28 18.12 0.00P-DP 50.00YORK-LAW 139B 102H - 102H 13.65 0.58 198.59 124.39 2.56 2.63 0.00 204.16 4.02 18.32 0.00P-DP 50.00YORK-LAW 139C 103H - 103H 8.74 0.37 228.55 143.64 4.08 2.97 0.00 230.55 6.39 22.28 0.00P-DP 50.00YORK-LAW 139D 104H - 104H 13.89 0.59 140.08 83.14 3.43 1.77 0.00 137.67 5.37 14.64 0.00P-DP 47.49YORK-LAW 139E 105H - 105H 11.68 0.50 126.37 76.87 5.09 1.50 0.00 116.36 7.98 15.34 0.00P-DP 45.26YORK-LAW 139F 106H - 106H 17.36 0.74 109.61 73.12 1.19 1.46 0.00 113.56 1.86 9.87 0.00P-DP 39.43YORK-LAW 139G 107H - 107H 4.05 0.17 125.47 78.68 4.03 1.54 0.00 119.55 6.32 14.14 0.00P-DP 44.20YORK-LAW 139H 108H - 108H 13.74 0.59 513.30 51,108.51 79,046.54 0.00 24,533.30 0.00 55,963.87 39,972.85 21,408.68Total 50.00 7,643.12 318.59 Proved Behind Pipe Rsv Class & Category 11.75 8.27 0.46 0.14 0.00 10.88 0.72 1.41 0.00P-BP 41.30ELIAS 16-9 G 173 - 173 1.56 0.07 7.60 5.36 0.25 0.09 0.00 7.24 0.38 0.86 0.00P-BP 40.36ELIAS 16-9 UNIT 1 111 - 111 0.84 0.04 7.58 5.33 0.24 0.09 0.00 7.21 0.38 0.85 0.00P-BP 40.33ELIAS 16-9 UNIT 1 122 - 122 0.83 0.04 7.55 5.31 0.24 0.09 0.00 7.19 0.38 0.85 0.00P-BP 40.31ELIAS 16-9 UNIT 1 124 - 124 0.83 0.04 7.58 5.32 0.24 0.09 0.00 7.21 0.38 0.85 0.00P-BP 40.36ELIAS 16-9 UNIT 1 221 - 221 0.83 0.04 7.54 5.28 0.24 0.09 0.00 7.18 0.38 0.85 0.00P-BP 40.31ELIAS 16-9 UNIT 1 223 - 223 0.83 0.04 4.50 3.17 0.16 0.05 0.00 4.22 0.26 0.53 0.00P-BP 37.44ELIAS 16-9 UNIT 2 172 - 172 0.56 0.02 5.87 4.10 0.19 0.07 0.00 5.59 0.30 0.66 0.00P-BP 41.11ELIAS 16-9 UNIT 2 271 - 271 0.65 0.03 5.93 4.14 0.19 0.07 0.00 5.65 0.30 0.67 0.00P-BP 40.86ELIAS 16-9 UNIT 2 281 - 281 0.65 0.03 4.57 3.20 0.15 0.06 0.00 4.36 0.23 0.52 0.00P-BP 37.95ELIAS 16-9 UNIT 2 282 - 282 0.50 0.02 58.91 41.94 1.67 0.91 0.00 70.42 2.30 15.12 4.19P-BP 27.25FRYING PAN A 22202 175-176 01H 5.50 0.23 63.56 44.65 1.58 0.98 0.00 76.02 2.18 15.69 4.16P-BP 28.34FRYING PAN B 22202 175-176 02H 5.21 0.21

Economic One-Liners Lease Name Life (years) Oil (Mbbl) Residue Gas (MMcf) Residue Gas (M$) Other (M$) Expense & Tax (M$) Invest. (M$) Non-Disc. (M$) Cash FlowNet Sales Volumes Net Revenue As of Date: 1/1/2024 Reserve Category Oil (M$) Disc. 10% (M$) NGL (M$) NGL (Mbbl) TABLE 6 56.93 39.94 2.05 0.69 0.00 53.40 3.20 6.64 0.00P-BP 34.94GRANTHAM WEST 50-48 UNIT 1LS 6.97 0.30 45.20 31.88 1.61 0.55 0.00 42.45 2.52 5.26 0.00P-BP 32.06GRANTHAM WEST 50-48 UNIT 1MS 5.48 0.23 78.62 54.44 2.53 0.96 0.00 74.90 3.96 8.86 0.00P-BP 38.96GRANTHAM WEST 50-48 UNIT 1WA 8.62 0.37 64.35 44.68 2.06 0.79 0.00 61.35 3.22 7.24 0.00P-BP 36.45GRANTHAM WEST 50-48 UNIT 1WB 7.01 0.30 56.91 39.67 2.04 0.69 0.00 53.38 3.20 6.64 0.00P-BP 35.00GRANTHAM WEST 50-48 UNIT 2LS 6.97 0.30 47.53 33.26 1.70 0.57 0.00 44.63 2.66 5.53 0.00P-BP 32.75GRANTHAM WEST 50-48 UNIT 2MS 5.78 0.25 55.99 38.93 2.01 0.68 0.00 52.52 3.15 6.53 0.00P-BP 34.83GRANTHAM WEST 50-48 UNIT 3LS 6.85 0.29 48.18 33.59 1.72 0.58 0.00 45.23 2.69 5.61 0.00P-BP 32.96GRANTHAM WEST 50-48 UNIT 3MS 5.86 0.25 81.48 55.85 2.62 1.00 0.00 77.62 4.11 9.19 0.00P-BP 39.51GRANTHAM WEST 50-48 UNIT 3WA 8.94 0.38 59.72 41.16 1.90 0.73 0.00 56.96 2.99 6.71 0.00P-BP 35.61GRANTHAM WEST 50-48 UNIT 3WB 6.49 0.28 80.56 54.91 3.12 0.96 0.00 74.66 4.90 9.65 0.00P-BP 39.89GRANTHAM WEST 50-48 UNIT 4WA 10.65 0.45 315.07 190.81 149.54 0.00 0.00 0.00 352.46 37.38 0.00P-BP 36.12HENDERSHOT 210501 6A-M - 6A-M 0.00 0.00 214.13 127.47 101.63 0.00 0.00 0.00 239.53 25.41 0.00P-BP 40.89HENDERSHOT 211824 5A-M - 5A-M 0.00 0.00 16.52 11.07 0.96 0.20 0.00 14.97 1.02 1.57 0.00P-BP 40.31HONEY B 20-29 4202H 2.09 0.12 18.85 11.61 1.56 0.21 0.00 15.74 1.66 1.95 0.00P-BP 45.87HONEY B 20-29 4402H 3.39 0.19 18.80 11.56 1.55 0.21 0.00 15.70 1.66 1.94 0.00P-BP 45.85HONEY E 20-29 4305H 3.38 0.19 18.87 11.59 1.56 0.21 0.00 15.76 1.66 1.95 0.00P-BP 45.92HONEY G 20-29 4207H 3.39 0.19 16.47 10.96 0.96 0.20 0.00 14.93 1.02 1.56 0.00P-BP 40.34HONEY G 20-29 4407H 2.08 0.12 37.00 24.60 2.15 0.44 0.00 33.54 2.29 3.51 0.00P-BP 40.24KILLER BEE M 8-5 4213H - 4213H 4.68 0.26 37.05 24.59 2.15 0.44 0.00 33.59 2.29 3.52 0.00P-BP 40.28KILLER BEE N 8-5 4314H - 4314H 4.68 0.26 4.90 3.27 0.14 0.06 0.00 4.55 0.33 0.46 0.00P-BP 41.25LAITALA UNIT B 21-24 4AH 0.49 0.01 3.67 2.46 0.11 0.04 0.00 3.34 0.27 0.35 0.00P-BP 37.71LAITALA UNIT B 21-24 4SH 0.41 0.01 56.20 35.36 1.94 0.68 0.00 53.03 3.04 6.47 0.00P-BP 41.28LAMAR 13-1-A 03LS - 03LS 6.60 0.28 75.70 46.45 1.72 0.96 0.00 74.89 2.70 7.78 0.00P-BP 45.57LAMAR 13-1-B 03WA - 03WA 5.88 0.25 54.91 35.05 2.49 0.64 0.00 49.48 3.90 6.96 0.00P-BP 40.41LAMAR 13-1-C 08WB - 08WB 8.49 0.36 56.22 35.20 1.94 0.68 0.00 53.06 3.04 6.48 0.00P-BP 41.34LAMAR 13-1-H 22JM - 22JM 6.61 0.28 54.85 34.90 2.49 0.64 0.00 49.42 3.90 6.95 0.00P-BP 40.43LAMAR 13-1-H G 18WB - 18WB 8.48 0.36 150.69 98.16 4.99 1.84 0.00 143.00 7.82 17.14 0.00P-BP 42.85LAMAR 13-1-I 22WA - 22WA 17.00 0.72 1,331.17 1,030.43 48.51 14.96 0.00 1,135.52 112.89 109.51 0.00P-BP 28.01LGM A 1H - 1H 192.27 10.24 1,366.49 1,055.61 49.81 15.36 0.00 1,165.59 115.91 112.42 0.00P-BP 28.36LGM B 2H - 2H 197.41 10.52 1,097.78 850.42 39.95 12.34 0.00 936.80 92.96 90.30 0.00P-BP 25.62LGM C 201H - 201H 158.32 8.43 49.64 31.62 1.52 0.57 0.00 45.34 3.60 4.74 0.00P-BP 43.66LULO 2533LP 8H - 8H 5.45 0.17 16.84 10.90 11.81 0.00 0.00 0.00 31.50 14.67 0.00P-BP 47.89NOELLE SW CRC JF 4H - 4H 0.00 0.00 523.26 339.65 367.12 0.00 0.00 0.00 979.11 455.85 0.00P-BP 47.61NOELLE SW CRC JF 6H - 6H 0.00 0.00 674.61 438.40 473.31 0.00 0.00 0.00 1,262.32 587.70 0.00P-BP 48.43NOELLE W CRC JF 2H - 2H 0.00 0.00

Economic One-Liners Lease Name Life (years) Oil (Mbbl) Residue Gas (MMcf) Residue Gas (M$) Other (M$) Expense & Tax (M$) Invest. (M$) Non-Disc. (M$) Cash FlowNet Sales Volumes Net Revenue As of Date: 1/1/2024 Reserve Category Oil (M$) Disc. 10% (M$) NGL (M$) NGL (Mbbl) TABLE 6 9.77 6.36 0.27 0.11 0.00 9.07 0.65 0.92 0.00P-BP 40.72OLDHAM TRUST WEST 4AH 0.98 0.03 7.37 4.82 0.23 0.09 0.00 6.71 0.54 0.71 0.00P-BP 37.27OLDHAM TRUST WEST 4SH 0.82 0.03 9.78 6.34 0.27 0.12 0.00 9.07 0.65 0.92 0.00P-BP 40.76OLDHAM TRUST WEST 5AH 0.98 0.03 5.83 3.83 0.18 0.07 0.00 5.32 0.43 0.56 0.00P-BP 34.32OLDHAM TRUST WEST 5MH 0.65 0.02 7.32 4.77 0.23 0.08 0.00 6.67 0.54 0.70 0.00P-BP 37.24OLDHAM TRUST WEST 5SH 0.82 0.02 9.69 6.26 0.27 0.11 0.00 8.99 0.64 0.91 0.00P-BP 40.69OLDHAM TRUST WEST 6AH 0.97 0.03 299.87 174.80 10.74 3.34 0.00 263.93 24.87 41.27 0.00P-BP 49.30ONEAL-ANNIE 15H 8H - 8H 52.35 2.39 304.83 177.37 10.92 3.40 0.00 268.27 25.30 41.96 0.00P-BP 49.54ONEAL-ANNIE 15H 9H - 9H 53.23 2.43 303.76 176.48 10.88 3.39 0.00 267.32 25.20 41.81 0.00P-BP 49.51ONEAL-ANNIE 15J 10H - 10H 53.04 2.42 291.37 169.12 10.42 3.25 0.00 256.48 24.15 40.09 0.00P-BP 48.96ONEAL-ANNIE 15M 13H - 13H 50.83 2.32 280.62 162.73 10.03 3.13 0.00 247.07 23.24 38.60 0.00P-BP 48.47ONEAL-ANNIE 15P 16H - 16H 48.91 2.23 281.05 162.68 10.05 3.14 0.00 247.45 23.28 38.66 0.00P-BP 48.50ONEAL-ANNIE 15P 17H - 17H 48.99 2.24 6.64 4.08 0.14 0.09 0.00 6.75 0.20 0.78 0.00P-BP 39.35RENDEZVOUS NORTH POOLED UNIT 10UA - 10UA 0.47 0.02 0.00 0.00 0.00 0.00 0.00 0.00 0.00 0.00 0.00P-BP 1.20RENDEZVOUS NORTH POOLED UNIT 28SB - 28SB 0.00 0.00 26.25 16.40 0.77 0.33 0.00 25.31 1.20 2.88 0.00P-BP 43.34RIO GRANDE 12-24-A 32LS - 32LS 2.61 0.11 27.58 17.27 0.91 0.34 0.00 26.16 1.43 3.14 0.00P-BP 44.13RIO GRANDE 12-24-B 32WA - 32WA 3.12 0.13 27.17 16.30 1.06 0.32 0.00 25.16 1.66 3.26 0.00P-BP 48.28RIO GRANDE 12-24-C 36WB - 36WB 3.61 0.15 26.40 16.41 0.77 0.33 0.00 25.45 1.21 2.89 0.00P-BP 43.46RIO GRANDE 12-24-D 42LS - 42LS 2.63 0.11 27.61 17.22 0.92 0.34 0.00 26.20 1.44 3.14 0.00P-BP 44.20RIO GRANDE 12-24-E 42WA - 42WA 3.12 0.13 27.56 16.45 1.08 0.33 0.00 25.51 1.69 3.31 0.00P-BP 48.51RIO GRANDE 12-24-F 48WB - 48WB 3.67 0.16 27.93 17.35 0.93 0.34 0.00 26.49 1.45 3.18 0.00P-BP 44.38RIO GRANDE 12-24-G 52WA - 52WA 3.16 0.13 26.42 16.33 0.77 0.33 0.00 25.48 1.21 2.90 0.00P-BP 43.54RIO GRANDE 12-24-H 52LS - 52LS 2.63 0.11 99.65 62.66 2.78 1.17 0.00 92.43 6.59 9.35 0.00P-BP 40.74ROI TAN A 1A 9.98 0.30 99.77 62.62 2.79 1.17 0.00 92.55 6.60 9.37 0.00P-BP 40.78ROI TAN B 2LS 9.99 0.30 74.52 47.08 2.32 0.86 0.00 67.85 5.50 7.15 0.00P-BP 37.21ROI TAN B 3B 8.32 0.25 99.34 62.16 2.78 1.17 0.00 92.15 6.57 9.32 0.00P-BP 40.76ROI TAN D 4A 9.95 0.30 104.58 65.28 2.93 1.23 0.00 96.99 6.93 9.82 0.00P-BP 41.43ROI TAN D 5LS 10.49 0.32 107.68 67.06 3.01 1.27 0.00 99.85 7.14 10.11 0.00P-BP 41.82ROI TAN E 6A 10.80 0.33 109.21 67.59 3.67 1.24 0.00 98.02 8.68 10.64 0.00P-BP 42.64ROI TAN F 7A 13.15 0.40 108.90 67.60 3.05 1.28 0.00 100.98 7.22 10.23 0.00P-BP 42.00ROI TAN F 8LS 10.93 0.33 1,340.37 719.22 636.15 0.00 0.00 0.00 1,499.40 159.03 0.00P-BP 50.00ROSS NW WHL BL 1H - 1H 0.00 0.00 359.39 228.05 15.30 4.81 0.00 370.15 53.98 76.63 0.00P-BP 38.51ROUGAROU UNIT 36-48 6AH - 6AH 11.89 0.45 0.86 0.51 0.02 0.01 0.00 0.87 0.03 0.10 0.00P-BP 40.22SCOTT, F.H. -33- 4 - 4 0.06 0.00 409.70 259.89 19.95 5.44 0.00 418.83 70.36 94.99 0.00P-BP 40.04SPHINX UNIT 13-01 5AH - 5AH 15.50 0.58 9.51 5.41 0.37 0.10 0.00 8.18 0.87 1.36 0.00P-BP 46.54STIMSON-NAIL E17T 120H - 120H 1.83 0.08

Economic One-Liners Lease Name Life (years) Oil (Mbbl) Residue Gas (MMcf) Residue Gas (M$) Other (M$) Expense & Tax (M$) Invest. (M$) Non-Disc. (M$) Cash FlowNet Sales Volumes Net Revenue As of Date: 1/1/2024 Reserve Category Oil (M$) Disc. 10% (M$) NGL (M$) NGL (Mbbl) TABLE 6 3.40 1.93 0.13 0.04 0.00 2.92 0.31 0.48 0.00P-BP 45.49STIMSON-NAIL W17K 11H - 11H 0.65 0.03 3.40 1.93 0.13 0.04 0.00 2.92 0.31 0.48 0.00P-BP 45.51STIMSON-NAIL W17L 12H - 12H 0.65 0.03 3.40 1.92 0.13 0.04 0.00 2.92 0.31 0.48 0.00P-BP 45.52STIMSON-NAIL W17M 13H - 13H 0.65 0.03 3.40 1.92 0.13 0.04 0.00 2.92 0.31 0.48 0.00P-BP 45.54STIMSON-NAIL W17N 14H - 14H 0.65 0.03 3.40 1.92 0.13 0.04 0.00 2.92 0.31 0.48 0.00P-BP 45.56STIMSON-NAIL W17O 15H - 15H 0.65 0.03 3.40 1.92 0.13 0.04 0.00 2.92 0.31 0.48 0.00P-BP 45.57STIMSON-NAIL W17P 16H - 16H 0.65 0.03 3.40 1.91 0.13 0.04 0.00 2.92 0.31 0.48 0.00P-BP 45.59STIMSON-NAIL W17Q 17H - 17H 0.65 0.03 3.52 1.98 0.14 0.04 0.00 3.03 0.32 0.50 0.00P-BP 46.44STIMSON-NAIL W17R 18H - 18H 0.68 0.03 3.40 1.91 0.13 0.04 0.00 2.92 0.31 0.48 0.00P-BP 45.62STIMSON-NAIL W17S 19H - 19H 0.65 0.03 3.40 1.90 0.13 0.04 0.00 2.92 0.31 0.48 0.00P-BP 45.64STIMSON-NAIL W17T 20H - 20H 0.65 0.03 337.89 209.96 14.36 4.52 0.00 348.04 50.65 71.96 0.00P-BP 37.99SUCCUBUS UNIT B 25-24 5AH - 5AH 11.16 0.42 621.01 381.63 26.84 8.30 0.00 639.11 94.67 133.61 0.00P-BP 45.45SUCCUBUS-ROUGAROU 24-37 7AH - 7AH 20.85 0.78 58.60 35.81 2.12 0.71 0.00 54.91 3.32 6.85 0.00P-BP 38.67TOMCAT 23-24 A 1LS - 1LS 7.22 0.31 58.53 35.71 2.12 0.71 0.00 54.85 3.32 6.84 0.00P-BP 38.67TOMCAT 23-24 B 2LS - 2LS 7.21 0.31 78.45 47.25 3.06 0.94 0.00 72.65 4.79 9.41 0.00P-BP 43.30TOMCAT 23-24 C 1DN - 1DN 10.42 0.44 78.65 47.29 3.07 0.94 0.00 72.84 4.80 9.43 0.00P-BP 43.35TOMCAT 23-24 D 2DN - 2DN 10.44 0.45 80.06 48.16 2.59 0.98 0.00 76.21 4.06 9.04 0.00P-BP 43.46TOMCAT 23-24 E 1AB - 1AB 8.83 0.38 78.81 47.34 2.55 0.97 0.00 75.02 4.00 8.90 0.00P-BP 43.28TOMCAT 23-24 F 2WA - 2WA 8.69 0.37 79.45 47.64 2.57 0.97 0.00 75.62 4.03 8.97 0.00P-BP 43.40TOMCAT 23-24 G 3WA - 3WA 8.76 0.37 11.74 7.01 0.33 0.14 0.00 10.89 0.78 1.10 0.00P-BP 41.68VALENCIA 10-8 A UNIT A 2H - A 2H 1.18 0.04 11.77 7.02 0.33 0.14 0.00 10.91 0.78 1.10 0.00P-BP 41.73VALENCIA 10-8 A UNIT L 2H - L 2H 1.18 0.04 232.59 141.20 9.98 3.11 0.00 239.46 35.21 49.83 0.00P-BP 42.17WENDIGO UNIT A 10-15 1AH - 1AH 7.76 0.29 193.28 117.51 8.25 2.59 0.00 199.04 29.11 41.28 0.00P-BP 39.93WENDIGO UNIT A 10-15 1MH - 1MH 6.41 0.24 233.25 141.15 10.01 3.12 0.00 240.13 35.31 49.97 0.00P-BP 42.25WENDIGO UNIT A 10-15 2AH - 2AH 7.78 0.29 233.88 141.27 10.04 3.13 0.00 240.78 35.41 50.11 0.00P-BP 42.29WENDIGO UNIT A 10-15 3AH - 3AH 7.80 0.29 7.38 4.44 0.32 0.10 0.00 7.59 1.12 1.58 0.00P-BP 44.27WEREWOLF UNIT A 12-05 3AH 0.25 0.01 249.11 149.86 10.71 3.33 0.00 256.44 37.78 53.43 0.00P-BP 43.10WRAITH UNIT B 12-16 5AH - 5AH 8.32 0.31 244.93 147.15 10.53 3.27 0.00 252.14 37.13 52.52 0.00P-BP 42.91WRAITH UNIT B 12-16 6AH - 6AH 8.18 0.31 28.71 15.53 0.46 0.38 0.00 29.71 1.25 3.70 0.00P-BP 50.00WRANGLER D UNIT 751H - 751H 1.45 0.05 143.07 9,777.19 14,988.58 8.35 2,878.53 0.00 5,503.16 11,041.89 2,187.43Total 50.00 1,330.42 62.06 Proved Undeveloped Rsv Class & Category 9.35 5.70 0.39 0.13 0.00 9.64 1.39 1.98 0.00P-UD 34.48CLEMENTS ALLOCATION B 26-35 2HA 0.31 0.01 9.28 5.64 0.39 0.12 0.00 9.57 1.38 1.96 0.00P-UD 34.43CLEMENTS ALLOCATION C 26-35 3HA 0.30 0.01 6.83 4.20 0.32 0.09 0.00 7.00 1.13 1.55 0.00P-UD 30.66CLEMENTS ALLOCATION D 26-35 7LS 0.25 0.01 55.83 31.11 1.22 0.73 0.00 56.69 1.67 6.54 0.00P-UD 45.40DIRE WOLF 30 3BS B 2H - 2H 4.00 0.16

Economic One-Liners Lease Name Life (years) Oil (Mbbl) Residue Gas (MMcf) Residue Gas (M$) Other (M$) Expense & Tax (M$) Invest. (M$) Non-Disc. (M$) Cash FlowNet Sales Volumes Net Revenue As of Date: 1/1/2024 Reserve Category Oil (M$) Disc. 10% (M$) NGL (M$) NGL (Mbbl) TABLE 6 55.68 30.91 1.21 0.73 0.00 56.55 1.67 6.52 0.00P-UD 45.41DIRE WOLF 50 WA B 2H - 2H 3.99 0.16 55.93 30.92 1.22 0.73 0.00 56.80 1.68 6.55 0.00P-UD 45.51DIRE WOLF 70 WC B 2H - 2H 4.01 0.17 7.56 4.38 0.24 0.09 0.00 7.20 0.38 0.85 0.00P-UD 42.36ELIAS 16-9 UNIT 1 132 - 132 0.83 0.04 5.63 3.28 0.20 0.07 0.00 5.28 0.32 0.66 0.00P-UD 38.77ELIAS 16-9 UNIT 1 141 - 141 0.69 0.03 5.65 3.27 0.20 0.07 0.00 5.30 0.32 0.66 0.00P-UD 38.85ELIAS 16-9 UNIT 1 231 - 231 0.70 0.03 5.63 3.25 0.20 0.07 0.00 5.28 0.32 0.66 0.00P-UD 38.85ELIAS 16-9 UNIT 1 242 - 242 0.69 0.03 4.28 2.46 0.15 0.05 0.00 4.01 0.24 0.50 0.00P-UD 38.95ELIAS 16-9 UNIT 2 151 - 151 0.53 0.02 4.29 2.45 0.15 0.05 0.00 4.02 0.24 0.50 0.00P-UD 39.01ELIAS 16-9 UNIT 2 161 - 161 0.53 0.02 4.29 2.45 0.16 0.05 0.00 4.02 0.24 0.50 0.00P-UD 39.07ELIAS 16-9 UNIT 2 163 - 163 0.53 0.02 4.28 2.43 0.15 0.05 0.00 4.02 0.24 0.50 0.00P-UD 39.08ELIAS 16-9 UNIT 2 252 - 252 0.53 0.02 4.29 2.43 0.15 0.05 0.00 4.02 0.24 0.50 0.00P-UD 39.14ELIAS 16-9 UNIT 2 262 - 262 0.53 0.02 76.24 42.71 2.45 0.94 0.00 72.64 3.84 8.59 0.00P-UD 40.80GRANTHAM WEST 50-48 UNIT 2WA 8.35 0.36 103.72 52.95 1.97 1.36 0.00 109.68 2.58 13.00 0.00P-UD 50.00HIP LION F 107H - 107H 4.45 0.12 37.14 20.35 2.16 0.44 0.00 33.67 2.30 3.53 0.00P-UD 42.32KILLER BEE I 8-5 4209H - 4209H 4.69 0.26 37.05 20.23 2.15 0.44 0.00 33.59 2.29 3.52 0.00P-UD 42.34KILLER BEE J 8-5 4310H - 4310H 4.68 0.26 37.00 20.12 2.15 0.44 0.00 33.54 2.29 3.51 0.00P-UD 42.35KILLER BEE K 8-5 4411H - 4411H 4.68 0.26 10.40 5.13 0.37 0.12 0.00 9.15 0.86 1.43 0.00P-UD 50.00PARKS, ROY 301LH - 301LH 1.81 0.08 11.80 5.80 0.44 0.13 0.00 10.31 1.01 1.64 0.00P-UD 50.00PARKS, ROY 301MH - 301MH 2.12 0.10 9.89 4.85 0.35 0.11 0.00 8.71 0.82 1.36 0.00P-UD 50.00PARKS, ROY 302LH - 302LH 1.72 0.08 9.23 4.71 0.23 0.11 0.00 8.71 0.53 1.13 0.00P-UD 46.89PARKS, ROY 302MH - 302MH 1.12 0.05 9.23 4.69 0.23 0.11 0.00 8.71 0.53 1.13 0.00P-UD 46.94PARKS, ROY 303BH - 303BH 1.12 0.05 9.88 4.79 0.35 0.11 0.00 8.70 0.82 1.36 0.00P-UD 50.00PARKS, ROY 303LH - 303LH 1.72 0.08 7.36 3.72 0.18 0.09 0.00 6.95 0.42 0.90 0.00P-UD 44.08PARKS, ROY 303MH - 303MH 0.89 0.04 11.18 5.37 0.41 0.12 0.00 9.77 0.96 1.56 0.00P-UD 50.00PARKS, ROY 311JH - 311JH 2.01 0.09 6.79 3.45 0.15 0.09 0.00 6.90 0.20 0.79 0.00P-UD 42.24RENDEZVOUS NORTH POOLED UNIT 2LA - 2LA 0.48 0.02 0.88 0.45 0.02 0.01 0.00 0.90 0.03 0.10 0.00P-UD 42.29SCOTT, F.H. -33- 5 - 5 0.06 0.00 0.04 0.02 0.00 0.00 0.00 0.04 0.00 0.01 0.00P-UD 46.76SHOSHONE D 34-166-165 TB 4H - 4H 0.01 0.00 9.50 4.57 0.37 0.10 0.00 8.17 0.87 1.36 0.00P-UD 48.69STIMSON-NAIL E17K 111H - 111H 1.83 0.08 9.52 4.56 0.37 0.10 0.00 8.18 0.87 1.36 0.00P-UD 48.75STIMSON-NAIL E17L 112H - 112H 1.83 0.08 9.52 4.55 0.37 0.10 0.00 8.18 0.87 1.36 0.00P-UD 48.79STIMSON-NAIL E17M 113H - 113H 1.83 0.08 9.49 4.51 0.37 0.10 0.00 8.16 0.87 1.35 0.00P-UD 48.80STIMSON-NAIL E17N 114H - 114H 1.82 0.08 9.49 4.49 0.37 0.10 0.00 8.16 0.87 1.35 0.00P-UD 48.84STIMSON-NAIL E17O 115H - 115H 1.82 0.08 9.49 4.48 0.37 0.10 0.00 8.16 0.87 1.35 0.00P-UD 48.88STIMSON-NAIL E17P 116H - 116H 1.82 0.08 9.49 4.46 0.37 0.10 0.00 8.16 0.87 1.35 0.00P-UD 48.92STIMSON-NAIL E17Q 117H - 117H 1.82 0.08 9.49 4.44 0.37 0.10 0.00 8.16 0.87 1.35 0.00P-UD 48.96STIMSON-NAIL E17R 118H - 118H 1.82 0.08

Economic One-Liners Lease Name Life (years) Oil (Mbbl) Residue Gas (MMcf) Residue Gas (M$) Other (M$) Expense & Tax (M$) Invest. (M$) Non-Disc. (M$) Cash FlowNet Sales Volumes Net Revenue As of Date: 1/1/2024 Reserve Category Oil (M$) Disc. 10% (M$) NGL (M$) NGL (Mbbl) TABLE 6 9.52 4.44 0.37 0.10 0.00 8.18 0.87 1.36 0.00P-UD 49.05STIMSON-NAIL E17S 119H - 119H 1.83 0.08 3.16 1.59 0.10 0.04 0.00 2.87 0.24 0.30 0.00P-UD 43.41TCB B 3LS 0.36 0.01 8.86 4.48 0.28 0.10 0.00 8.06 0.65 0.85 0.00P-UD 40.06VALENCIA 10-8 A UNIT L 1H - L 1H 0.99 0.03 8.17 3.75 0.90 0.08 0.00 5.90 1.37 1.71 0.00P-UD 50.00WINDY MOUNTAIN 7978 7U A 7H - A 7H 2.62 0.10 8.13 3.72 0.89 0.08 0.00 5.87 1.36 1.71 0.00P-UD 50.00WINDY MOUNTAIN 7978 8U A 8H - A 8H 2.61 0.10 8.16 3.72 0.89 0.08 0.00 5.89 1.37 1.71 0.00P-UD 50.00WINDY MOUNTAIN 7978 9U A 9H - A 9H 2.62 0.10 9.02 391.96 738.66 0.00 92.49 0.00 43.75 703.44 26.42Total 50.00 83.96 3.72 Grand Total 665.39 61,277.66 94,773.79 8.35 27,504.32 0.00 61,510.78 51,718.17 23,622.54Total 50.00 9,057.50 384.37

Gross Ultimates, Interests, & Prices

LEASE NAME GAS PRC INITIAL GROSS ULTIMATE Mbbl GROSS ULTIMATE MMcf CUM GAS MMcf CUM OIL Mbbl EXPENSE INITIAL DECIMAL INTEREST FINAL DECIMAL REVENUE INITIAL DECIMAL INTEREST FINAL DECIMAL OIL PRC INITIAL $/bbl RES CAT AS OF DATE FIXED COST $/MO As of : 01/01/2024 GROSS ULTIMATE RESERVES, CUMULATIVE PRODUCTION AND BASIC ECONOMIC DATA TABLE 7 Proved Producing Rsv Class & Category 44 MAGNUM 9-4 H 1LS P-DP 0.0000000 0.0019394 0.0019394 0.0000000 834.71 522.66 2.37 78.86 268.74 270.62 0 44 MAGNUM 9-4 H 1WA P-DP 0.0000000 0.0019394 0.0019394 0.0000000 1,057.59 247.97 2.37 78.86 150.81 262.47 0 44 MAGNUM 9-4 H 1WB P-DP 0.0000000 0.0019394 0.0019394 0.0000000 1,184.23 173.91 2.37 78.86 102.55 224.47 0 44 MAGNUM 9-4 H 2LS P-DP 0.0000000 0.0019394 0.0019394 0.0000000 1,095.31 453.15 2.37 78.86 168.40 249.97 0 44 MAGNUM 9-4 H 2WA P-DP 0.0000000 0.0019394 0.0019394 0.0000000 919.09 338.57 2.37 78.86 158.57 239.25 0 44 MAGNUM 9-4 H 2WB P-DP 0.0000000 0.0019394 0.0019394 0.0000000 815.11 225.52 2.37 78.86 113.88 267.18 0 44 MAGNUM 9-4 H 3WA P-DP 0.0000000 0.0019394 0.0019394 0.0000000 875.48 250.47 2.37 78.86 100.71 179.05 0 ABIGAIL 218-219 UNIT 1H P-DP 0.0000000 0.0001208 0.0001208 0.0000000 4,409.57 329.15 1.38 77.44 204.61 2,728.24 0 ACKERLY BROWN 9 1 P-DP 0.0000000 0.0006510 0.0006510 0.0000000 171.89 136.92 1.57 77.63 117.56 147.30 0 ADAMCHIK 4 P-DP 0.0000000 0.1250000 0.1250000 0.0000000 164.98 0.00 1.77 77.22 0.00 164.98 0 ADAMCHIK 5 P-DP 0.0000000 0.1250000 0.1250000 0.0000000 99.47 0.00 1.77 77.22 0.00 99.47 0 ADAMCHIK 7 P-DP 0.0000000 0.1250000 0.1250000 0.0000000 136.71 0.00 1.77 77.22 0.00 136.71 0 ADAMEK UNIT 2H P-DP 0.0000000 0.0105379 0.0105379 0.0000000 1,804.92 123.65 2.33 75.89 96.40 1,416.66 0 ADAMS EAST H 23-26 4208H P-DP 0.0000000 0.0004806 0.0004806 0.0000000 701.92 180.29 1.07 75.95 105.79 297.45 0 ADAMS EAST H 23-26 4408H P-DP 0.0000000 0.0004788 0.0004788 0.0000000 1,517.67 414.59 1.07 75.95 232.74 734.38 0 ADAMS WEST A 23-26 4301H P-DP 0.0000000 0.0004708 0.0004708 0.0000000 4,036.76 797.97 1.07 75.95 413.94 1,225.08 0 ADAMS WEST B 23-26 4202H P-DP 0.0000000 0.0004732 0.0004732 0.0000000 300.21 103.41 1.07 75.95 81.68 218.96 0 ADAMS WEST B 23-26 4402H P-DP 0.0000000 0.0005079 0.0005079 0.0000000 937.64 248.71 1.07 75.95 181.03 542.40 0 ADAMS WEST D 23-26 4304H P-DP 0.0000000 0.0004799 0.0004799 0.0000000 2,879.48 240.48 1.07 75.95 168.55 1,143.76 0 ADAMS WEST E 23-26 4205H P-DP 0.0000000 0.0004785 0.0004785 0.0000000 989.82 122.08 1.07 75.95 90.82 548.41 0 ADAMS WEST E 23-26 4405H P-DP 0.0000000 0.0004785 0.0004785 0.0000000 1,359.42 279.02 1.07 75.95 198.70 615.76 0 ADAMS WEST G 23-26 4307H P-DP 0.0000000 0.0004795 0.0004795 0.0000000 3,598.43 338.80 1.07 75.95 243.51 1,539.27 0 ADMIRAL 4-48 47 1H P-DP 0.0000000 0.0005432 0.0005432 0.0000000 3,813.66 663.37 1.53 76.96 465.19 2,740.89 0 AGGIE THE BULLDOG 39-46 A 1LS P-DP 0.0000000 0.0102086 0.0102086 0.0000000 134.56 190.62 1.57 77.63 165.05 133.13 0 AGGIE THE BULLDOG 39-46 A 1MS P-DP 0.0000000 0.0102200 0.0102200 0.0000000 349.71 199.50 1.57 77.63 65.61 89.00 0 AGGIE THE BULLDOG 39-46 A 1WA P-DP 0.0000000 0.0101899 0.0101899 0.0000000 559.57 447.97 1.57 77.63 402.75 550.40 0 AGGIE THE BULLDOG 39-46 A 1WB P-DP 0.0000000 0.0102037 0.0102037 0.0000000 412.59 344.07 1.57 77.63 291.54 408.34 0 AGGIE THE BULLDOG 39-46 B 2DN P-DP 0.0000000 0.0101988 0.0101988 0.0000000 745.79 334.60 1.57 77.63 318.93 722.15 0 AGGIE THE BULLDOG 39-46 B 2WA P-DP 0.0000000 0.0102027 0.0102027 0.0000000 454.66 193.08 1.57 77.63 193.08 454.66 0 AGGIE THE BULLDOG 39-46 C 3LS P-DP 0.0000000 0.0101997 0.0101997 0.0000000 1,568.50 287.58 1.57 77.63 243.62 1,099.04 0 AGGIE THE BULLDOG 39-46 C 3WB P-DP 0.0000000 0.0101958 0.0101958 0.0000000 211.55 178.37 1.57 77.63 151.43 164.16 0 AGGIE THE BULLDOG 39-46 C 4WA P-DP 0.0000000 0.0102037 0.0102037 0.0000000 482.45 370.23 1.57 77.63 327.83 352.42 0 AGGIE THE BULLDOG 39-46 D 5LS P-DP 0.0000000 0.0101968 0.0101968 0.0000000 305.76 278.07 1.57 77.63 233.67 302.04 0

LEASE NAME GAS PRC INITIAL GROSS ULTIMATE Mbbl GROSS ULTIMATE MMcf CUM GAS MMcf CUM OIL Mbbl EXPENSE INITIAL DECIMAL INTEREST FINAL DECIMAL REVENUE INITIAL DECIMAL INTEREST FINAL DECIMAL OIL PRC INITIAL $/bbl RES CAT AS OF DATE FIXED COST $/MO As of : 01/01/2024 GROSS ULTIMATE RESERVES, CUMULATIVE PRODUCTION AND BASIC ECONOMIC DATA TABLE 7 AGGIE THE BULLDOG 39-46 D 5WB P-DP 0.0000000 0.0101988 0.0101988 0.0000000 574.28 195.43 1.57 77.63 185.40 570.79 0 AGGIE THE BULLDOG 39-46 D 6JD P-DP 0.0000000 0.0102200 0.0102200 0.0000000 365.59 116.09 1.57 77.63 38.08 49.93 0 AGGIE THE BULLDOG 39-46 D 6WA P-DP 0.0000000 0.0102056 0.0102056 0.0000000 657.83 287.64 1.57 77.63 263.43 651.64 0 AGGIE THE BULLDOG 39-46 E 6DN P-DP 0.0000000 0.0102056 0.0102056 0.0000000 291.74 361.17 1.57 77.63 307.30 285.27 0 AGGIE THE BULLDOG 39-46 E 7LS P-DP 0.0000000 0.0102076 0.0102076 0.0000000 373.95 316.59 1.57 77.63 242.21 363.98 0 AGGIE THE BULLDOG 39-46 E 7MS P-DP 0.0000000 0.0102300 0.0102300 0.0000000 360.70 257.09 1.57 77.63 73.91 62.03 0 AGGIE THE BULLDOG 39-46 E 7WA P-DP 0.0000000 0.0102096 0.0102096 0.0000000 215.51 566.89 1.57 77.63 487.94 209.62 0 AGGIE THE BULLDOG 39-46 E 7WB P-DP 0.0000000 0.0102076 0.0102076 0.0000000 1,103.41 373.42 1.57 77.63 322.38 1,077.72 0 ALEX TAMSULA 2 P-DP 0.0000000 0.1100000 0.1100000 0.0000000 75.58 0.00 1.77 77.22 0.00 75.58 0 ALEX TAMSULA 3 P-DP 0.0000000 0.1003470 0.1003470 0.0000000 65.99 0.14 1.77 77.22 0.14 65.99 0 ALEX TAMSULA 4 P-DP 0.0000000 0.1100000 0.1100000 0.0000000 30.29 0.00 1.77 77.22 0.00 30.29 0 ALICO 1 P-DP 0.0000000 0.0077294 0.0077294 0.0000000 336.59 72.85 1.57 77.63 71.18 336.59 0 ALICO A 1 P-DP 0.0000000 0.2625000 0.2625000 0.0000000 186.79 38.61 1.57 77.63 38.61 186.79 0 ALLMAN 24 1H P-DP 0.0000000 0.0043022 0.0043022 0.0000000 8,205.27 315.85 1.53 76.96 235.97 5,271.89 0 ALLRED UNIT B 08-05 5AH P-DP 0.0000000 0.0005800 0.0005800 0.0000000 1,101.86 687.32 2.37 78.86 611.33 860.46 0 ALLRED UNIT B 08-05 5BH P-DP 0.0000000 0.0005800 0.0005800 0.0000000 1,045.08 226.90 2.37 78.86 204.93 663.17 0 ALLRED UNIT B 08-05 5MH P-DP 0.0000000 0.0005800 0.0005800 0.0000000 1,341.02 250.82 2.37 78.86 157.37 453.35 0 ALLRED UNIT B 08-05 5SH P-DP 0.0000000 0.0005800 0.0005800 0.0000000 929.72 252.56 2.37 78.86 154.76 384.25 0 ALLRED UNIT B 08-05 6AH P-DP 0.0000000 0.0005800 0.0005800 0.0000000 1,287.07 403.88 2.37 78.86 249.62 519.80 0 ALLRED UNIT B 08-05 6MH P-DP 0.0000000 0.0005800 0.0005800 0.0000000 898.87 239.31 2.37 78.86 159.39 330.67 0 ALLRED UNIT B 08-05 6SH P-DP 0.0000000 0.0005800 0.0005800 0.0000000 2,192.44 209.38 2.37 78.86 135.64 649.18 0 ALLRED UNIT B 08-05 7AH P-DP 0.0000000 0.0005800 0.0005800 0.0000000 1,340.36 273.30 2.37 78.86 170.27 541.82 0 ALLRED UNIT B 08-05 7BH P-DP 0.0000000 0.0005800 0.0005800 0.0000000 1,567.26 155.63 2.37 78.86 98.32 631.70 0 ALLRED UNIT B 08-05 8AH P-DP 0.0000000 0.0005800 0.0005800 0.0000000 598.12 821.17 2.37 78.86 598.99 455.89 0 ALLRED UNIT B 08-05 8SH P-DP 0.0000000 0.0005800 0.0005800 0.0000000 597.43 478.39 2.37 78.86 418.12 502.13 0 ALPHA 210488 1A P-DP 0.0000000 0.0003237 0.0003237 0.0000000 6,720.79 0.00 2.36 78.22 0.00 5,765.86 0 ALPHA 210488 2B P-DP 0.0000000 0.0003237 0.0003237 0.0000000 7,851.00 0.00 2.36 78.22 0.00 6,680.39 0 ALPHA 210488 3C P-DP 0.0000000 0.0003237 0.0003237 0.0000000 10,251.09 0.00 2.36 78.22 0.00 8,035.45 0 AMAZON 3304-02H P-DP 0.0000000 0.0003115 0.0003115 0.0000000 163.77 315.94 4.94 77.99 230.33 127.86 0 AMAZON 3304-03H P-DP 0.0000000 0.0003115 0.0003115 0.0000000 366.79 581.77 4.94 77.99 404.09 225.81 0 AMAZON 3304-04H P-DP 0.0000000 0.0003115 0.0003115 0.0000000 4,135.98 302.99 4.94 77.99 213.81 2,721.33 0 AMAZON 3304-05H P-DP 0.0000000 0.0003115 0.0003115 0.0000000 4,943.05 389.95 4.94 77.99 275.90 2,511.83 0 AMBER NE WEL JF 3H P-DP 0.0000000 0.0007121 0.0007121 0.0000000 13,823.42 0.00 2.67 78.22 0.00 9,226.27 0 AMBER NW WEL JF 1H P-DP 0.0000000 0.0010075 0.0010075 0.0000000 14,154.75 0.00 2.67 78.22 0.00 9,835.15 0

LEASE NAME GAS PRC INITIAL GROSS ULTIMATE Mbbl GROSS ULTIMATE MMcf CUM GAS MMcf CUM OIL Mbbl EXPENSE INITIAL DECIMAL INTEREST FINAL DECIMAL REVENUE INITIAL DECIMAL INTEREST FINAL DECIMAL OIL PRC INITIAL $/bbl RES CAT AS OF DATE FIXED COST $/MO As of : 01/01/2024 GROSS ULTIMATE RESERVES, CUMULATIVE PRODUCTION AND BASIC ECONOMIC DATA TABLE 7 ANN COLE TRUST 1 P-DP 0.0000000 0.0131250 0.0131250 0.0000000 271.54 182.02 1.57 77.63 148.29 167.68 0 ANNABEL 1 P-DP 0.0000000 0.0367941 0.0367941 0.0000000 0.00 11.99 2.37 78.86 5.74 0.00 0 ARCHIE E WYN JF 6H P-DP 0.0000000 0.0312851 0.0312851 0.0000000 9,084.30 0.00 2.67 78.22 0.00 7,481.21 0 ARCHIE E WYN JF 8H P-DP 0.0000000 0.0312851 0.0312851 0.0000000 7,325.45 0.00 2.67 78.22 0.00 6,126.16 0 ARLINGTON 33-40 C UNIT 4H P-DP 0.0000000 0.0003297 0.0003297 0.0000000 587.99 182.16 2.37 78.86 108.92 362.59 0 ARLINGTON 33-40 D UNIT 5H P-DP 0.0000000 0.0003297 0.0003297 0.0000000 993.90 288.79 2.37 78.86 175.51 459.65 0 ARON 41-32 #1AH P-DP 0.0000000 0.0083770 0.0083770 0.0000000 302.87 283.66 2.37 78.86 241.03 163.52 0 ARON 41-32 #2SH P-DP 0.0000000 0.0083770 0.0083770 0.0000000 673.10 155.98 2.37 78.86 118.43 290.10 0 ARON 41-32 #3AH P-DP 0.0000000 0.0083770 0.0083770 0.0000000 886.63 319.59 2.37 78.86 242.97 464.60 0 ARON 41-32 #3SH P-DP 0.0000000 0.0083770 0.0083770 0.0000000 90.37 138.19 2.37 78.86 115.68 54.20 0 ATHENA N SMF JF 3H P-DP 0.0000000 0.0392073 0.0392073 0.0000000 16,241.31 0.00 2.67 78.22 0.00 9,772.99 0 ATHENA NE SMF JF 5H P-DP 0.0000000 0.0574113 0.0574113 0.0000000 15,756.38 0.00 2.67 78.22 0.00 9,115.89 0 ATHENA NE SMF JF 7H P-DP 0.0000000 0.0574113 0.0574113 0.0000000 17,911.96 0.00 2.67 78.22 0.00 8,493.84 0 ATHENA NW SMF JF 1H P-DP 0.0000000 0.0289381 0.0289381 0.0000000 19,512.40 0.00 2.67 78.22 0.00 9,122.55 0 AUSTIN 5H P-DP 0.0000000 0.0060725 0.0060725 0.0000000 7,874.16 0.00 2.72 78.22 0.00 3,815.75 0 AUSTIN 6H P-DP 0.0000000 0.0060725 0.0060725 0.0000000 7,821.29 0.00 2.72 78.22 0.00 3,953.11 0 AUSTIN 7H P-DP 0.0000000 0.0060725 0.0060725 0.0000000 8,314.43 0.00 2.72 78.22 0.00 4,132.74 0 AUSTIN 8H P-DP 0.0000000 0.0060725 0.0060725 0.0000000 9,383.75 0.00 2.72 78.22 0.00 3,979.32 0 B AND B 1H P-DP 0.0000000 0.0005308 0.0005308 0.0000000 2,613.20 297.09 2.70 78.79 194.68 1,592.40 0 B AND B 2H P-DP 0.0000000 0.0005308 0.0005308 0.0000000 4,354.08 416.53 2.70 78.79 250.85 2,334.89 0 B AND B 6H P-DP 0.0000000 0.0005308 0.0005308 0.0000000 1,932.00 118.65 2.70 78.79 38.05 511.24 0 B AND B STATE 4H P-DP 0.0000000 0.0004530 0.0004530 0.0000000 1,987.02 266.49 2.70 78.79 139.56 1,029.53 0 B AND B STATE A 5H P-DP 0.0000000 0.0004530 0.0004530 0.0000000 5,031.42 390.63 2.70 78.79 203.88 1,963.51 0 B AND B STATE B 7H P-DP 0.0000000 0.0004530 0.0004530 0.0000000 6,945.70 149.53 2.70 78.79 51.06 1,703.41 0 BADFISH 31-43 A 1JM P-DP 0.0000000 0.0005398 0.0005398 0.0000000 4,382.84 1,131.01 1.57 77.63 345.59 574.84 0 BADFISH 31-43 A 4LS P-DP 0.0000000 0.0005393 0.0005393 0.0000000 143.49 56.33 1.57 77.63 39.58 82.19 0 BADFISH 31-43 B 9LS P-DP 0.0000000 0.0005346 0.0005346 0.0000000 4,165.80 669.99 1.57 77.63 230.33 373.60 0 BADFISH 31-43 E 5WA P-DP 0.0000000 0.0005548 0.0005548 0.0000000 869.86 422.88 1.57 77.63 208.80 192.52 0 BADFISH 31-43 E 7WB P-DP 0.0000000 0.0005389 0.0005389 0.0000000 1,589.79 429.19 1.57 77.63 254.76 547.65 0 BADFISH 31-43 F 6WA P-DP 0.0000000 0.0005368 0.0005368 0.0000000 445.16 349.65 1.57 77.63 173.28 228.02 0 BADFISH 31-43 F 8WB P-DP 0.0000000 0.0005472 0.0005472 0.0000000 3,158.94 574.91 1.57 77.63 261.97 664.38 0 BADFISH 31-43 J 10WA P-DP 0.0000000 0.0005348 0.0005348 0.0000000 1,210.63 366.89 1.57 77.63 167.87 287.53 0 BADFISH 31-43 J 11WB P-DP 0.0000000 0.0005362 0.0005362 0.0000000 2,848.86 636.39 1.57 77.63 290.03 649.83 0 BADFISH 31-43 L 12MS P-DP 0.0000000 0.0005392 0.0005392 0.0000000 860.43 377.29 1.57 77.63 117.51 117.03 0

LEASE NAME GAS PRC INITIAL GROSS ULTIMATE Mbbl GROSS ULTIMATE MMcf CUM GAS MMcf CUM OIL Mbbl EXPENSE INITIAL DECIMAL INTEREST FINAL DECIMAL REVENUE INITIAL DECIMAL INTEREST FINAL DECIMAL OIL PRC INITIAL $/bbl RES CAT AS OF DATE FIXED COST $/MO As of : 01/01/2024 GROSS ULTIMATE RESERVES, CUMULATIVE PRODUCTION AND BASIC ECONOMIC DATA TABLE 7 BADFISH 31-43 M 13JM P-DP 0.0000000 0.0005605 0.0005605 0.0000000 25.33 23.57 1.57 77.63 22.24 16.19 0 BADFISH 31-43 M 3LS P-DP 0.0000000 0.0005358 0.0005358 0.0000000 2,228.06 1,083.79 1.57 77.63 436.32 513.00 0 BARNES, D. E. ESTATE 2 P-DP 0.0000000 0.0000900 0.0000900 0.0000000 221.85 271.44 1.38 77.44 218.93 116.01 0 BARNES, D. E. ESTATE 3H P-DP 0.0000000 0.0003553 0.0003553 0.0000000 606.62 269.83 1.38 77.44 216.49 399.37 0 BARNES, D. E. ESTATE 4H P-DP 0.0000000 0.0003553 0.0003553 0.0000000 420.23 498.72 1.38 77.44 303.51 265.52 0 BARR 10-8 B UNIT A 5H P-DP 0.0000000 0.0003616 0.0003616 0.0000000 301.96 548.94 2.37 78.86 103.80 47.79 0 BARR 10-8 B UNIT L 5H P-DP 0.0000000 0.0003616 0.0003616 0.0000000 412.93 564.37 2.37 78.86 126.58 41.62 0 BARSTOW -18- 1 P-DP 0.0000000 0.0000036 0.0000036 0.0000000 1,051.73 190.40 1.38 77.44 177.26 959.12 0 BARSTOW -18- 2 P-DP 0.0000000 0.0000036 0.0000036 0.0000000 235.24 122.39 1.38 77.44 119.16 188.71 0 BARSTOW -18- 3 P-DP 0.0000000 0.0000036 0.0000036 0.0000000 242.55 74.15 1.38 77.44 65.97 137.30 0 BARSTOW -18- 4 P-DP 0.0000000 0.0000036 0.0000036 0.0000000 463.88 83.81 1.38 77.44 80.21 413.53 0 BARSTOW -18- 5 P-DP 0.0000000 0.0000036 0.0000036 0.0000000 579.45 195.24 1.38 77.44 165.21 484.47 0 BARSTOW -23- 1 P-DP 0.0000000 0.0000039 0.0000039 0.0000000 370.22 105.83 1.38 77.44 95.50 315.93 0 BARSTOW -23- 2 P-DP 0.0000000 0.0000039 0.0000039 0.0000000 343.49 86.94 1.38 77.44 75.15 251.79 0 BARSTOW -23- 3 P-DP 0.0000000 0.0000039 0.0000039 0.0000000 551.19 238.20 1.38 77.44 173.71 268.23 0 BARSTOW -23- 4 P-DP 0.0000000 0.0000039 0.0000039 0.0000000 869.42 190.44 1.38 77.44 161.37 679.24 0 BARSTOW -23- 6 P-DP 0.0000000 0.0000039 0.0000039 0.0000000 425.54 64.32 1.38 77.44 52.08 351.69 0 BARSTOW -23- 6A P-DP 0.0000000 0.0000039 0.0000039 0.0000000 192.71 70.13 1.38 77.44 58.23 71.74 0 BARSTOW -23- 7 P-DP 0.0000000 0.0000039 0.0000039 0.0000000 551.10 126.41 1.38 77.44 113.44 473.85 0 BARSTOW -23- 8 P-DP 0.0000000 0.0000039 0.0000039 0.0000000 210.00 101.84 1.38 77.44 90.65 125.85 0 BARSTOW -23- 9 P-DP 0.0000000 0.0000039 0.0000039 0.0000000 1,125.72 102.86 1.38 77.44 92.31 920.53 0 BARSTOW 155 1 P-DP 0.0000000 0.0000075 0.0000075 0.0000000 69.51 73.37 1.38 77.44 41.58 41.12 0 BARSTOW 155 2 P-DP 0.0000000 0.0000075 0.0000075 0.0000000 239.04 177.17 1.38 77.44 76.85 91.58 0 BARSTOW 27 1 P-DP 0.0000000 0.0000050 0.0000050 0.0000000 292.30 190.14 1.38 77.44 187.19 204.64 0 BARSTOW 27 2 P-DP 0.0000000 0.0000050 0.0000050 0.0000000 155.17 76.53 1.38 77.44 66.78 95.75 0 BARSTOW 27 3 P-DP 0.0000000 0.0000050 0.0000050 0.0000000 148.31 199.04 1.38 77.44 169.22 78.05 0 BARSTOW 27 4 P-DP 0.0000000 0.0000050 0.0000050 0.0000000 565.80 124.08 1.38 77.44 120.82 356.09 0 BARSTOW 27 5 P-DP 0.0000000 0.0000050 0.0000050 0.0000000 522.78 72.89 1.38 77.44 70.20 438.61 0 BARSTOW 27 6 P-DP 0.0000000 0.0000050 0.0000050 0.0000000 494.08 120.67 1.38 77.44 84.69 390.61 0 BARSTOW 27 7 P-DP 0.0000000 0.0000050 0.0000050 0.0000000 455.68 84.54 1.38 77.44 81.98 383.46 0 BARSTOW 27 8 P-DP 0.0000000 0.0000050 0.0000050 0.0000000 244.01 159.39 1.38 77.44 74.96 99.86 0 BARSTOW 33 UA 1BS P-DP 0.0000000 0.0000114 0.0000114 0.0000000 1,122.57 162.79 1.38 77.44 155.12 996.22 0 BARSTOW 33 UB 2BS P-DP 0.0000000 0.0000114 0.0000114 0.0000000 1,096.88 370.07 1.38 77.44 309.11 768.28 0 BARSTOW 33-34 1H P-DP 0.0000000 0.0000025 0.0000025 0.0000000 2,236.09 734.65 1.38 77.44 609.06 1,879.63 0

LEASE NAME GAS PRC INITIAL GROSS ULTIMATE Mbbl GROSS ULTIMATE MMcf CUM GAS MMcf CUM OIL Mbbl EXPENSE INITIAL DECIMAL INTEREST FINAL DECIMAL REVENUE INITIAL DECIMAL INTEREST FINAL DECIMAL OIL PRC INITIAL $/bbl RES CAT AS OF DATE FIXED COST $/MO As of : 01/01/2024 GROSS ULTIMATE RESERVES, CUMULATIVE PRODUCTION AND BASIC ECONOMIC DATA TABLE 7 BARSTOW 33-35 1H P-DP 0.0000000 0.0000018 0.0000018 0.0000000 597.05 297.21 1.38 77.44 292.34 587.21 0 BARSTOW 33-35 2H P-DP 0.0000000 0.0000018 0.0000018 0.0000000 741.44 344.09 1.38 77.44 267.02 542.80 0 BARSTOW 33-35 3H P-DP 0.0000000 0.0000018 0.0000018 0.0000000 3,077.98 694.16 1.38 77.44 526.84 2,271.13 0 BARSTOW A 3652H P-DP 0.0000000 0.0000003 0.0000003 0.0000000 5,844.59 1,154.76 1.38 77.44 745.11 3,721.56 0 BATES S CRC JF 5H P-DP 0.0000000 0.0802990 0.0802990 0.0000000 18,563.04 0.00 2.67 78.22 0.00 13,485.89 0 BAYES 16 1 P-DP 0.0000000 0.0003348 0.0003348 0.0000000 230.42 39.32 1.57 77.63 39.07 230.27 0 BAYES 16 2 P-DP 0.0000000 0.0003348 0.0003348 0.0000000 107.55 42.75 1.57 77.63 41.83 107.49 0 BAYES 16A 1 P-DP 0.0000000 0.0003720 0.0003720 0.0000000 583.92 76.69 1.57 77.63 65.93 442.90 0 BAYES 4 1 P-DP 0.0000000 0.0003700 0.0003700 0.0000000 500.76 105.60 1.57 77.63 82.21 428.14 0 BAYES 4 2 P-DP 0.0000000 0.0003348 0.0003348 0.0000000 201.46 125.96 1.57 77.63 95.56 168.86 0 BAYES 4 3 P-DP 0.0000000 0.0003348 0.0003348 0.0000000 305.42 106.05 1.57 77.63 80.94 288.16 0 BAYES 4A 2 P-DP 0.0000000 0.0003599 0.0003599 0.0000000 158.36 32.39 1.57 77.63 28.32 124.86 0 BAYES 4A 3 P-DP 0.0000000 0.0003599 0.0003599 0.0000000 49.74 23.07 1.57 77.63 20.64 47.87 0 BAYES 4A 4 P-DP 0.0000000 0.0003599 0.0003599 0.0000000 476.44 54.64 1.57 77.63 39.64 429.71 0 BELL 1A P-DP 0.0000000 0.1100000 0.1100000 0.0000000 67.82 0.00 1.77 77.22 0.00 67.82 0 BIG EL 45-04 1AH P-DP 0.0000000 0.0032541 0.0032541 0.0000000 286.50 522.80 2.37 78.86 336.37 153.98 0 BIG EL 45-04 1SH P-DP 0.0000000 0.0032541 0.0032541 0.0000000 1,661.65 391.12 2.37 78.86 271.58 633.91 0 BIG EL 45-04 B 2MS P-DP 0.0000000 0.0037311 0.0037311 0.0000000 1,280.74 385.52 2.37 78.86 125.19 197.82 0 BIG EL 45-04 C 3SA P-DP 0.0000000 0.0037405 0.0037405 0.0000000 606.70 333.69 2.37 78.86 151.58 186.70 0 BIG EL 45-04 C 3SS P-DP 0.0000000 0.0037407 0.0037407 0.0000000 851.31 420.47 2.37 78.86 177.24 208.98 0 BIG EL 45-04 D 4MS P-DP 0.0000000 0.0037163 0.0037163 0.0000000 896.35 365.76 2.37 78.86 164.36 232.72 0 BIG EL 45-04 D 4SA P-DP 0.0000000 0.0037242 0.0037242 0.0000000 1,479.98 261.69 2.37 78.86 108.66 218.58 0 BIG EL 45-04 D 4SS P-DP 0.0000000 0.0037311 0.0037311 0.0000000 1,727.30 410.83 2.37 78.86 183.89 265.28 0 BIG JAY 10-15 A 1JD P-DP 0.0000000 0.0004640 0.0004640 0.0000000 204.75 404.86 1.57 77.63 256.96 105.63 0 BIG JAY 10-15 A 1LS P-DP 0.0000000 0.0004639 0.0004639 0.0000000 460.86 364.42 1.57 77.63 240.28 220.46 0 BIG JAY 10-15 A 1MS P-DP 0.0000000 0.0004640 0.0004640 0.0000000 639.10 278.58 1.57 77.63 196.44 345.94 0 BIG JAY 10-15 A 1WA P-DP 0.0000000 0.0004640 0.0004640 0.0000000 4,270.86 429.76 1.57 77.63 279.31 1,876.99 0 BIG JAY 10-15 B 2DN P-DP 0.0000000 0.0004638 0.0004638 0.0000000 1,782.32 270.36 1.57 77.63 191.81 817.07 0 BIG JAY 10-15 B 2LS P-DP 0.0000000 0.0004639 0.0004639 0.0000000 1,950.02 237.67 1.57 77.63 174.66 953.27 0 BIG JAY 10-15 B 2WB P-DP 0.0000000 0.0004642 0.0004642 0.0000000 2,309.11 220.10 1.57 77.63 160.77 904.51 0 BIG JAY 10-15 B 3JC P-DP 0.0000000 0.0004642 0.0004642 0.0000000 1,471.91 282.90 1.57 77.63 196.88 658.30 0 BIG JAY 10-15 C 4LS P-DP 0.0000000 0.0004637 0.0004637 0.0000000 2,570.43 250.70 1.57 77.63 193.81 880.11 0 BIG JAY 10-15 C 4WA P-DP 0.0000000 0.0004640 0.0004640 0.0000000 2,788.83 237.03 1.57 77.63 189.10 1,206.46 0 BIG JAY 10-15 D 5JC P-DP 0.0000000 0.0004641 0.0004641 0.0000000 1,022.58 103.07 1.57 77.63 81.41 492.36 0

LEASE NAME GAS PRC INITIAL GROSS ULTIMATE Mbbl GROSS ULTIMATE MMcf CUM GAS MMcf CUM OIL Mbbl EXPENSE INITIAL DECIMAL INTEREST FINAL DECIMAL REVENUE INITIAL DECIMAL INTEREST FINAL DECIMAL OIL PRC INITIAL $/bbl RES CAT AS OF DATE FIXED COST $/MO As of : 01/01/2024 GROSS ULTIMATE RESERVES, CUMULATIVE PRODUCTION AND BASIC ECONOMIC DATA TABLE 7 BIG JAY 10-15 D 6DN P-DP 0.0000000 0.0004642 0.0004642 0.0000000 1,679.14 266.45 1.57 77.63 212.75 856.66 0 BIG JAY 10-15 D 6LS P-DP 0.0000000 0.0004642 0.0004642 0.0000000 1,770.68 287.74 1.57 77.63 223.38 803.47 0 BIG JAY 10-15 D 6WB P-DP 0.0000000 0.0004643 0.0004643 0.0000000 2,762.12 207.43 1.57 77.63 156.89 1,323.44 0 BIG JAY 10-15 E 7JD P-DP 0.0000000 0.0004663 0.0004663 0.0000000 1,800.19 295.76 1.57 77.63 216.14 702.80 0 BIG JAY 10-15 E 7LS P-DP 0.0000000 0.0004643 0.0004643 0.0000000 2,149.63 354.21 1.57 77.63 263.86 870.85 0 BIG JAY 10-15 E 7MS P-DP 0.0000000 0.0004641 0.0004641 0.0000000 1,085.26 77.05 1.57 77.63 67.46 553.75 0 BIG JAY 10-15 E 7WA P-DP 0.0000000 0.0004640 0.0004640 0.0000000 2,094.05 292.69 1.57 77.63 240.03 1,074.60 0 BIG JAY 10-15 F 4MS P-DP 0.0000000 0.0004647 0.0004647 0.0000000 1,303.88 253.57 1.57 77.63 159.35 559.27 0 BIGHORN 33E 2HJ P-DP 0.0000000 0.0007140 0.0007140 0.0000000 872.92 356.26 2.37 78.86 223.06 340.72 0 BIGHORN 33G 3HJ P-DP 0.0000000 0.0007144 0.0007144 0.0000000 1,478.21 453.82 2.37 78.86 263.33 495.40 0 BIGHORN HORIZONTAL UNIT 1HJ P-DP 0.0000000 0.0010364 0.0010364 0.0000000 148.96 120.26 2.37 78.86 82.17 73.65 0 BILLINGSLEY 12 1 P-DP 0.0000000 0.0003906 0.0003906 0.0000000 39.13 43.78 3.53 76.99 27.47 29.83 0 BIZZELL -B- 1 P-DP 0.0000000 0.0006609 0.0006609 0.0000000 108.68 112.63 2.32 78.93 102.08 103.27 0 BIZZELL -B- 2 P-DP 0.0000000 0.0006609 0.0006609 0.0000000 355.81 111.91 2.32 78.93 103.33 342.11 0 BIZZELL 1 P-DP 0.0000000 0.0138640 0.0138640 0.0000000 318.10 80.26 2.32 78.93 74.28 280.96 0 BIZZELL-IRVIN 15L UNIT 116H P-DP 0.0000000 0.0021906 0.0021906 0.0000000 88.61 322.03 2.32 78.93 233.90 85.24 0 BIZZELL-IRVIN 15L UNIT 13H P-DP 0.0000000 0.0021906 0.0021906 0.0000000 2,678.06 325.86 2.32 78.93 202.98 1,183.21 0 BIZZELL-IRVIN 15L UNIT 18H P-DP 0.0000000 0.0021906 0.0021906 0.0000000 1,561.71 258.84 2.32 78.93 156.35 582.57 0 BIZZELL-IRVIN 15U UNIT 113H P-DP 0.0000000 0.0021906 0.0021906 0.0000000 835.12 258.58 2.32 78.93 158.70 387.88 0 BIZZELL-IRVIN 15U UNIT 114H P-DP 0.0000000 0.0021906 0.0021906 0.0000000 1,430.55 449.61 2.32 78.93 251.04 550.31 0 BIZZELL-IRVIN 15U UNIT 115H P-DP 0.0000000 0.0021906 0.0021906 0.0000000 725.02 346.57 2.32 78.93 216.73 331.42 0 BIZZELL-IRVIN 15U UNIT 117H P-DP 0.0000000 0.0021906 0.0021906 0.0000000 979.32 304.44 2.32 78.93 182.81 413.31 0 BIZZELL-IRVIN 15U UNIT 118H P-DP 0.0000000 0.0021906 0.0021906 0.0000000 1,256.09 454.36 2.32 78.93 266.19 557.67 0 BIZZELL-IRVIN 15U UNIT 14H P-DP 0.0000000 0.0021906 0.0021906 0.0000000 845.92 338.68 2.32 78.93 201.47 381.24 0 BIZZELL-IRVIN 15U UNIT 15H P-DP 0.0000000 0.0021906 0.0021906 0.0000000 1,173.31 345.08 2.32 78.93 200.23 430.25 0 BIZZELL-IRVIN 15U UNIT 16H P-DP 0.0000000 0.0021906 0.0021906 0.0000000 1,247.51 396.04 2.32 78.93 242.58 561.56 0 BIZZELL-IRVIN 15U UNIT 17H P-DP 0.0000000 0.0021906 0.0021906 0.0000000 341.52 702.98 2.32 78.93 429.94 156.09 0 BLACK STONE 34-216 1H P-DP 0.0000000 0.0009146 0.0009146 0.0000000 290.43 45.39 1.38 77.44 45.39 290.43 0 BLACK STONE 34-216 2H P-DP 0.0000000 0.0009146 0.0009146 0.0000000 131.48 23.08 1.38 77.44 23.08 131.48 0 BLACK, S.E. 42 1 P-DP 0.0000000 0.0117187 0.0117187 0.0000000 393.65 104.93 2.97 78.55 104.87 393.65 0 BLACK, S.E. 42 9 P-DP 0.0000000 0.0058594 0.0058594 0.0000000 6.93 3.28 2.97 78.55 1.97 1.33 0 BOBCAT 55-1-16-21 E 12H P-DP 0.0000000 0.0000895 0.0000895 0.0000000 3,805.62 871.00 2.70 78.79 132.32 514.47 0 BOBCAT 55-1-16-21 F 13H P-DP 0.0000000 0.0000895 0.0000895 0.0000000 4,256.40 980.15 2.70 78.79 147.52 577.78 0 BOBCAT 55-1-16-21 G 14H P-DP 0.0000000 0.0000895 0.0000895 0.0000000 3,250.21 857.00 2.70 78.79 135.51 512.74 0

LEASE NAME GAS PRC INITIAL GROSS ULTIMATE Mbbl GROSS ULTIMATE MMcf CUM GAS MMcf CUM OIL Mbbl EXPENSE INITIAL DECIMAL INTEREST FINAL DECIMAL REVENUE INITIAL DECIMAL INTEREST FINAL DECIMAL OIL PRC INITIAL $/bbl RES CAT AS OF DATE FIXED COST $/MO As of : 01/01/2024 GROSS ULTIMATE RESERVES, CUMULATIVE PRODUCTION AND BASIC ECONOMIC DATA TABLE 7 BOBCAT 55-1-16-21 H 15H P-DP 0.0000000 0.0000895 0.0000895 0.0000000 3,186.64 903.24 2.70 78.79 131.70 463.53 0 BOBCAT 55-1-16-21 I 21H P-DP 0.0000000 0.0000895 0.0000895 0.0000000 4,202.85 531.31 2.70 78.79 81.54 629.26 0 BOBCAT 55-1-16-21 J 22H P-DP 0.0000000 0.0000895 0.0000895 0.0000000 3,343.98 548.35 2.70 78.79 81.29 493.89 0 BOBCAT 55-1-28 UNIT 1H P-DP 0.0000000 0.0000895 0.0000895 0.0000000 4,746.86 823.15 2.70 78.79 506.83 2,657.28 0 BOENING UNIT 1H P-DP 0.0000000 0.0106684 0.0106684 0.0000000 1,171.56 182.57 2.33 75.89 154.51 1,084.90 0 BOENING UNIT 2H P-DP 0.0000000 0.0106684 0.0106684 0.0000000 1,785.70 167.23 2.33 75.89 149.23 1,434.68 0 BOENING UNIT 3H P-DP 0.0000000 0.0106684 0.0106684 0.0000000 2,466.81 286.88 2.33 75.89 206.19 1,686.26 0 BOENING UNIT 4H P-DP 0.0000000 0.0106684 0.0106684 0.0000000 1,900.18 240.35 2.33 75.89 192.58 1,526.37 0 BOENING UNIT 6L P-DP 0.0000000 0.0106684 0.0106684 0.0000000 1,595.23 205.65 2.33 75.89 152.66 1,204.17 0 BOENING UNIT 6U P-DP 0.0000000 0.0106684 0.0106684 0.0000000 1,660.83 258.33 2.33 75.89 160.07 1,057.54 0 BOLT 15-33H P-DP 0.0000000 0.0006198 0.0006198 0.0000000 200.86 267.51 4.94 77.99 193.05 108.10 0 BOLT 406-0904H P-DP 0.0000000 0.0080596 0.0080596 0.0000000 635.55 381.50 4.94 77.99 340.88 457.32 0 BOLT 407-0904H P-DP 0.0000000 0.0080600 0.0080600 0.0000000 641.54 522.36 4.94 77.99 475.04 497.47 0 BONACCI 1 P-DP 0.0000000 0.1250000 0.1250000 0.0000000 91.44 0.00 1.77 77.22 0.00 91.44 0 BONACCI 2 P-DP 0.0000000 0.1250000 0.1250000 0.0000000 77.04 0.00 1.77 77.22 0.00 77.04 0 BOREAS 79 1H P-DP 0.0000000 0.0002688 0.0002688 0.0000000 684.55 332.45 1.53 76.96 267.13 639.04 0 BORUM E SMF JF 4H P-DP 0.0000000 0.0211292 0.0211292 0.0000000 11,857.48 0.00 2.67 78.22 0.00 10,216.88 0 BORUM E SMF JF 6H P-DP 0.0000000 0.0211292 0.0211292 0.0000000 12,644.34 0.00 2.67 78.22 0.00 10,567.16 0 BORUM W SMF JF 2H P-DP 0.0000000 0.0013045 0.0013045 0.0000000 11,394.74 0.00 2.67 78.22 0.00 9,313.48 0 BOW TIE 41-44 1AH P-DP 0.0000000 0.0001204 0.0001204 0.0000000 805.48 266.56 2.37 78.86 202.15 445.00 0 BOW TIE 41-44 1BH P-DP 0.0000000 0.0001204 0.0001204 0.0000000 58.70 199.36 2.37 78.86 155.43 41.01 0 BOW TIE 41-44 2AH P-DP 0.0000000 0.0001204 0.0001204 0.0000000 134.28 140.18 2.37 78.86 102.73 71.47 0 BOW TIE 41-44 2SH P-DP 0.0000000 0.0001204 0.0001204 0.0000000 364.05 140.12 2.37 78.86 103.67 208.01 0 BOW TIE 41-44 3AH P-DP 0.0000000 0.0001204 0.0001204 0.0000000 548.66 271.39 2.37 78.86 196.68 262.86 0 BOW TIE 41-44 3SH P-DP 0.0000000 0.0001204 0.0001204 0.0000000 519.41 197.15 2.37 78.86 144.21 293.77 0 BOX 42-55 UNIT 3LS P-DP 0.0000000 0.0002461 0.0002461 0.0000000 1,065.13 683.23 2.37 78.86 426.53 319.02 0 BOX 42-55 UNIT 4WA P-DP 0.0000000 0.0002461 0.0002461 0.0000000 788.09 341.41 2.37 78.86 132.48 336.34 0 BOX NAIL 2LM P-DP 0.0000000 0.0000713 0.0000713 0.0000000 732.87 322.25 1.57 77.63 255.53 449.33 0 BOX NAIL 3LL P-DP 0.0000000 0.0000709 0.0000709 0.0000000 822.75 369.55 1.57 77.63 292.95 517.89 0 BOX NAIL E 1LM P-DP 0.0000000 0.0000706 0.0000706 0.0000000 992.99 330.33 1.57 77.63 247.34 547.07 0 BOX UNIT 42-55 1AH P-DP 0.0000000 0.0002461 0.0002461 0.0000000 613.71 284.42 2.37 78.86 110.35 120.50 0 BOX UNIT 42-55 1SH P-DP 0.0000000 0.0002461 0.0002461 0.0000000 447.22 243.74 2.37 78.86 82.04 100.24 0 BOX UNIT 42-55 2AH P-DP 0.0000000 0.0002461 0.0002461 0.0000000 532.13 276.04 2.37 78.86 90.25 117.60 0 BOX UNIT 42-55 2SH P-DP 0.0000000 0.0002461 0.0002461 0.0000000 254.05 263.74 2.37 78.86 73.17 52.62 0

LEASE NAME GAS PRC INITIAL GROSS ULTIMATE Mbbl GROSS ULTIMATE MMcf CUM GAS MMcf CUM OIL Mbbl EXPENSE INITIAL DECIMAL INTEREST FINAL DECIMAL REVENUE INITIAL DECIMAL INTEREST FINAL DECIMAL OIL PRC INITIAL $/bbl RES CAT AS OF DATE FIXED COST $/MO As of : 01/01/2024 GROSS ULTIMATE RESERVES, CUMULATIVE PRODUCTION AND BASIC ECONOMIC DATA TABLE 7 BOYD, FANNIE 4 P-DP 0.0000000 0.0083859 0.0083859 0.0000000 172.35 26.93 2.97 78.55 26.93 172.35 0 BOYD, FANNIE 5 P-DP 0.0000000 0.0083859 0.0083859 0.0000000 30.20 249.96 2.97 78.55 249.96 30.20 0 BOYD, FANNIE 8 P-DP 0.0000000 0.0083859 0.0083859 0.0000000 26.62 7.46 2.97 78.55 7.46 26.62 0 BRACERO 226-34 UNIT 1H P-DP 0.0000000 0.0011740 0.0011740 0.0000000 1,910.12 181.11 1.38 77.44 126.85 1,357.05 0 BRAMBLETT 34-216 1H P-DP 0.0000000 0.0014654 0.0014654 0.0000000 1,289.06 181.10 1.38 77.44 126.36 798.66 0 BRAUN B S1 2008LH P-DP 0.0000000 0.0000673 0.0000673 0.0000000 685.45 586.08 2.32 78.93 285.72 279.13 0 BRAUN B S10 2014JH P-DP 0.0000000 0.0000725 0.0000725 0.0000000 831.25 387.06 2.32 78.93 220.83 355.21 0 BRAUN B S11 2004LH P-DP 0.0000000 0.0001760 0.0001760 0.0000000 759.02 365.40 2.32 78.93 182.30 256.30 0 BRAUN B S12 2004MH P-DP 0.0000000 0.0001940 0.0001940 0.0000000 1,932.95 654.87 2.32 78.93 309.95 449.07 0 BRAUN B S13 2003LH P-DP 0.0000000 0.0001884 0.0001884 0.0000000 865.28 551.96 2.32 78.93 255.81 289.90 0 BRAUN B S14 2003MH P-DP 0.0000000 0.0001943 0.0001943 0.0000000 1,221.51 634.36 2.32 78.93 314.37 377.50 0 BRAUN B S2 2008MH P-DP 0.0000000 0.0000663 0.0000663 0.0000000 527.73 412.22 2.32 78.93 179.54 187.46 0 BRAUN B S3 2007LH P-DP 0.0000000 0.0000534 0.0000534 0.0000000 748.35 458.01 2.32 78.93 257.45 320.79 0 BRAUN B S4 2007MH P-DP 0.0000000 0.0000571 0.0000571 0.0000000 666.96 415.03 2.32 78.93 215.75 281.06 0 BRAUN B S5 2016JH P-DP 0.0000000 0.0000564 0.0000564 0.0000000 865.59 676.32 2.32 78.93 322.90 358.32 0 BRAUN B S6 2006LH P-DP 0.0000000 0.0000558 0.0000558 0.0000000 1,399.02 469.53 2.32 78.93 227.23 317.95 0 BRAUN B S7 2006MH P-DP 0.0000000 0.0000588 0.0000588 0.0000000 976.84 497.80 2.32 78.93 259.03 324.80 0 BRAUN B S8 2005LH P-DP 0.0000000 0.0000547 0.0000547 0.0000000 1,318.69 348.38 2.32 78.93 186.81 304.30 0 BRAUN B S9 2005MH P-DP 0.0000000 0.0001159 0.0001159 0.0000000 1,480.91 567.34 2.32 78.93 293.68 410.93 0 BRAUN B W1 2001MH P-DP 0.0000000 0.0001966 0.0001966 0.0000000 1,313.05 1,082.68 2.32 78.93 578.82 571.46 0 BRAUN B W3 2001LH P-DP 0.0000000 0.0001955 0.0001955 0.0000000 1,082.10 803.37 2.32 78.93 485.44 533.52 0 BRAUN C W10 2106LH P-DP 0.0000000 0.0001074 0.0001074 0.0000000 2,518.25 1,200.41 2.32 78.93 470.52 663.28 0 BRAUN C W11 2106BH P-DP 0.0000000 0.0001104 0.0001104 0.0000000 3,293.67 378.52 2.32 78.93 235.46 1,278.89 0 BRAUN C W5 2108LH P-DP 0.0000000 0.0002839 0.0002839 0.0000000 970.55 694.08 2.32 78.93 377.73 491.78 0 BRAUN C W6 2108BH P-DP 0.0000000 0.0001131 0.0001131 0.0000000 2,424.21 358.99 2.32 78.93 238.26 822.73 0 BRAUN C W7 2107MH P-DP 0.0000000 0.0000925 0.0000925 0.0000000 1,045.09 625.30 2.32 78.93 347.86 455.41 0 BRAUN C W8 2107LH P-DP 0.0000000 0.0000985 0.0000985 0.0000000 1,429.22 804.19 2.32 78.93 451.65 631.64 0 BRAUN C W9 2106MH P-DP 0.0000000 0.0000879 0.0000879 0.0000000 1,366.83 530.03 2.32 78.93 350.07 559.02 0 BROKEN ARROW 55-54-1-12 H 3LS P-DP 0.0000000 0.0013178 0.0013178 0.0000000 858.33 248.05 2.37 78.86 139.49 334.29 0 BROKEN ARROW 55-54-1-12 H 4W P-DP 0.0000000 0.0013178 0.0013178 0.0000000 1,150.25 371.93 2.37 78.86 246.06 589.90 0 BROOKE 184-185 UNIT 132H P-DP 0.0000000 0.0005642 0.0005642 0.0000000 3,554.42 300.76 1.38 77.44 110.11 1,280.00 0 BROOKE 184-185 UNIT 221H P-DP 0.0000000 0.0005642 0.0005642 0.0000000 4,462.82 453.46 1.38 77.44 139.32 1,304.32 0 BROOKE 184-185 UNIT 232H P-DP 0.0000000 0.0005642 0.0005642 0.0000000 3,735.93 302.49 1.38 77.44 99.20 1,004.18 0 BROOKE 184-185 UNIT 233H P-DP 0.0000000 0.0005642 0.0005642 0.0000000 2,570.14 215.27 1.38 77.44 81.63 841.01 0

LEASE NAME GAS PRC INITIAL GROSS ULTIMATE Mbbl GROSS ULTIMATE MMcf CUM GAS MMcf CUM OIL Mbbl EXPENSE INITIAL DECIMAL INTEREST FINAL DECIMAL REVENUE INITIAL DECIMAL INTEREST FINAL DECIMAL OIL PRC INITIAL $/bbl RES CAT AS OF DATE FIXED COST $/MO As of : 01/01/2024 GROSS ULTIMATE RESERVES, CUMULATIVE PRODUCTION AND BASIC ECONOMIC DATA TABLE 7 BROOKE 184-185 UNIT 2H P-DP 0.0000000 0.0005642 0.0005642 0.0000000 7,108.88 569.13 1.38 77.44 386.17 4,406.26 0 BROOKE 184-185 UNIT 331H P-DP 0.0000000 0.0005642 0.0005642 0.0000000 4,905.34 326.09 1.38 77.44 93.20 867.12 0 BROOKS 1 P-DP 0.0000000 0.0112500 0.0112500 0.0000000 176.54 95.05 1.57 77.63 70.95 122.41 0 BROWN, A. D. 2 P-DP 0.0000000 0.0026042 0.0026042 0.0000000 70.46 98.53 1.49 79.19 96.94 70.46 0 BRUT 40-33 #1AH P-DP 0.0000000 0.0140910 0.0140910 0.0000000 855.29 339.73 2.37 78.86 226.06 276.07 0 BUCHANAN 3111 2 P-DP 0.0000000 0.0012597 0.0012597 0.0000000 139.85 72.28 2.37 78.86 36.88 138.24 0 BUCKEYE 55-1-28 UNIT 1H P-DP 0.0000000 0.0000895 0.0000895 0.0000000 4,017.41 711.65 2.70 78.79 452.43 2,522.96 0 BUELL 10-11-5 10H P-DP 0.0000000 0.0940794 0.0940794 0.0000000 16,156.87 16.00 2.75 68.45 16.00 13,023.30 0 BUELL 10-11-5 1H P-DP 0.0000000 0.0209883 0.0209883 0.0000000 5,912.35 47.59 2.75 68.45 46.75 5,003.60 0 BUELL 10-11-5 206H P-DP 0.0000000 0.0749937 0.0749937 0.0000000 18,092.79 45.57 2.75 68.45 45.51 13,482.33 0 BUELL 10-11-5 210H P-DP 0.0000000 0.0940794 0.0940794 0.0000000 17,039.90 13.44 2.75 68.45 13.25 12,842.21 0 BUELL 10-11-5 2H P-DP 0.0000000 0.0209883 0.0209883 0.0000000 5,665.10 38.27 2.75 68.45 37.79 5,097.37 0 BUELL 10-11-5 3H P-DP 0.0000000 0.0209883 0.0209883 0.0000000 6,101.40 42.91 2.75 68.45 42.61 5,237.72 0 BUELL 10-11-5 4H P-DP 0.0000000 0.0209883 0.0209883 0.0000000 7,574.54 47.85 2.75 68.45 46.61 6,271.07 0 BUELL 10-11-5 6H P-DP 0.0000000 0.0452066 0.0452066 0.0000000 14,859.24 24.58 2.75 68.45 24.58 12,143.75 0 BURKHOLDER A UNIT 1 P-DP 0.0000000 0.0001481 0.0001481 0.0000000 65,776.72 0.01 1.38 77.44 0.01 65,752.02 0 BUTCHEE 21 1 P-DP 0.0000000 0.0116666 0.0116666 0.0000000 69.56 122.10 1.57 77.63 90.38 51.06 0 BUTCHEE 21 2 P-DP 0.0000000 0.0116666 0.0116666 0.0000000 51.42 43.53 1.57 77.63 32.91 36.22 0 BUTCHEE 21 3 P-DP 0.0000000 0.0116666 0.0116666 0.0000000 58.54 143.49 1.57 77.63 102.01 41.93 0 BUTCHEE 21 4 P-DP 0.0000000 0.0116666 0.0116666 0.0000000 20.50 41.79 1.57 77.63 31.27 15.30 0 BUTCHEE 21 5 P-DP 0.0000000 0.0116666 0.0116666 0.0000000 27.09 25.80 1.57 77.63 23.21 23.46 0 BUTCHEE 21 6 P-DP 0.0000000 0.0116666 0.0116666 0.0000000 178.42 93.04 1.57 77.63 66.53 113.27 0 BUTCHEE 21 7 P-DP 0.0000000 0.0116666 0.0116666 0.0000000 86.59 51.46 1.57 77.63 34.25 54.25 0 BUTCHEE 21 8 P-DP 0.0000000 0.0116666 0.0116666 0.0000000 73.79 125.15 1.57 77.63 91.97 46.55 0 BUZZARD NORTH 6972 A 1H P-DP 0.0000000 0.0009749 0.0009749 0.0000000 2,675.50 939.37 1.53 76.96 828.94 2,423.06 0 BUZZARD NORTH 6972 B 2H P-DP 0.0000000 0.0009749 0.0009749 0.0000000 2,998.04 392.60 1.53 76.96 226.17 1,265.95 0 BUZZARD NORTH 6972 S 3H P-DP 0.0000000 0.0009749 0.0009749 0.0000000 2,226.66 403.75 1.53 76.96 215.43 1,110.44 0 BUZZARD SOUTH 6972 A 3H P-DP 0.0000000 0.0011548 0.0011548 0.0000000 3,304.08 541.61 1.53 76.96 297.81 1,493.75 0 BUZZARD SOUTH 6972 A 4H P-DP 0.0000000 0.0011548 0.0011548 0.0000000 2,991.87 454.30 1.53 76.96 240.26 1,390.42 0 BUZZARD SOUTH 6972 B 1H P-DP 0.0000000 0.0011548 0.0011548 0.0000000 2,605.74 723.84 1.53 76.96 584.24 1,840.04 0 BYRD 34-170 UNIT 3H P-DP 0.0000000 0.0002005 0.0002005 0.0000000 1,146.09 437.32 1.38 77.44 321.02 884.08 0 BYRD 34-170 UNIT 4H P-DP 0.0000000 0.0002005 0.0002005 0.0000000 331.72 176.43 1.38 77.44 176.02 277.57 0 CALIFORNIA CHROME UNIT 2H P-DP 0.0000000 0.0008218 0.0008218 0.0000000 7,455.24 669.20 1.38 77.44 456.21 5,191.56 0 CALIFORNIA CHROME UNIT 5003HR P-DP 0.0000000 0.0008218 0.0008218 0.0000000 6,814.54 624.24 1.38 77.44 410.12 4,500.51 0

LEASE NAME GAS PRC INITIAL GROSS ULTIMATE Mbbl GROSS ULTIMATE MMcf CUM GAS MMcf CUM OIL Mbbl EXPENSE INITIAL DECIMAL INTEREST FINAL DECIMAL REVENUE INITIAL DECIMAL INTEREST FINAL DECIMAL OIL PRC INITIAL $/bbl RES CAT AS OF DATE FIXED COST $/MO As of : 01/01/2024 GROSS ULTIMATE RESERVES, CUMULATIVE PRODUCTION AND BASIC ECONOMIC DATA TABLE 7 CALVERLEY-LANE 30G 7H P-DP 0.0000000 0.0033490 0.0033490 0.0000000 2,362.92 484.42 2.97 78.55 192.73 364.68 0 CALVERLEY-LANE 30H 8H P-DP 0.0000000 0.0033504 0.0033504 0.0000000 1,643.08 313.21 2.97 78.55 115.02 352.47 0 CALVERLEY-LANE 30I 9H P-DP 0.0000000 0.0033517 0.0033517 0.0000000 1,953.77 621.28 2.97 78.55 213.50 413.51 0 CALVERLEY-LANE 30J 10H P-DP 0.0000000 0.0033044 0.0033044 0.0000000 3,232.51 352.89 2.97 78.55 129.75 401.16 0 CALVERLEY-LANE 30K 11H P-DP 0.0000000 0.0033050 0.0033050 0.0000000 1,968.57 441.94 2.97 78.55 153.52 291.09 0 CALVERLEY-LANE 30L 12H P-DP 0.0000000 0.0032912 0.0032912 0.0000000 2,364.88 347.24 2.97 78.55 126.35 413.52 0 CARALYNE 24 1 P-DP 0.0000000 0.0011719 0.0011719 0.0000000 1,316.21 15.12 2.32 78.93 13.15 944.43 0 CASSIDY UNIT 26-23 1H P-DP 0.0000000 0.0121835 0.0121835 0.0000000 189.70 171.15 3.53 76.99 141.04 138.77 0 CASSIDY UNIT 26-23 5AH P-DP 0.0000000 0.0121835 0.0121835 0.0000000 342.19 405.41 3.53 76.99 250.64 201.63 0 CATES 24 1 P-DP 0.0000000 0.0043750 0.0043750 0.0000000 69.05 61.48 2.37 78.86 41.68 68.78 0 CENA WYN JF 2H P-DP 0.0000000 0.0717877 0.0717877 0.0000000 16,566.58 0.00 2.67 78.22 0.00 12,698.60 0 CENA WYN JF 4H P-DP 0.0000000 0.0717877 0.0717877 0.0000000 10,807.81 0.00 2.67 78.22 0.00 9,348.42 0 CHALUPA 34-153 UNIT 1H P-DP 0.0000000 0.0030208 0.0030208 0.0000000 1,802.40 680.08 1.38 77.44 441.35 1,060.73 0 CHALUPA 34-153 UNIT 2H P-DP 0.0000000 0.0030208 0.0030208 0.0000000 2,023.64 1,252.87 1.38 77.44 849.32 1,293.35 0 CHAMBERS FED W-39138 1-25 P-DP 0.0000000 0.0033962 0.0033962 0.0000000 1,889.30 19.49 4.94 77.99 19.47 1,861.96 0 CHAPARRAL UNIT A1 15SH P-DP 0.0000000 0.0011199 0.0011199 0.0000000 936.83 506.74 2.37 78.86 297.15 418.20 0 CHAPARRAL UNIT A1 21H P-DP 0.0000000 0.0010455 0.0010455 0.0000000 776.01 506.95 2.37 78.86 306.00 360.65 0 CHAPARRAL UNIT A1 8AH P-DP 0.0000000 0.0010427 0.0010427 0.0000000 1,039.62 642.95 2.37 78.86 420.64 462.09 0 CHAPARRAL UNIT A2 7AH P-DP 0.0000000 0.0010526 0.0010526 0.0000000 1,049.05 409.47 3.53 76.99 200.27 368.96 0 CHAPARRAL UNIT A3 14SH P-DP 0.0000000 0.0010601 0.0010601 0.0000000 479.26 219.81 3.53 76.99 85.09 186.31 0 CHAPARRAL UNIT A3 20H P-DP 0.0000000 0.0010691 0.0010691 0.0000000 784.96 274.55 3.53 76.99 131.27 238.42 0 CHAPARRAL UNIT A4 6AH P-DP 0.0000000 0.0010590 0.0010590 0.0000000 810.31 431.01 3.53 76.99 201.28 280.14 0 CHAPARRAL UNIT A5 13SH P-DP 0.0000000 0.0010590 0.0010590 0.0000000 743.78 262.65 1.49 79.19 104.52 186.04 0 CHAPARRAL UNIT A5 19H P-DP 0.0000000 0.0010543 0.0010543 0.0000000 123.96 215.41 1.49 79.19 155.85 103.27 0 CHAPARRAL UNIT A5 5AH P-DP 0.0000000 0.0010532 0.0010532 0.0000000 1,149.05 426.20 1.49 79.19 142.00 224.16 0 CHARLIE 210468 7A P-DP 0.0000000 0.0018185 0.0018185 0.0000000 14,670.50 0.00 2.36 78.22 0.00 10,815.70 0 CHARLIE 210468 8B P-DP 0.0000000 0.0018185 0.0018185 0.0000000 12,929.81 0.00 2.36 78.22 0.00 10,134.57 0 CHARLIE 210469 10B P-DP 0.0000000 0.0172842 0.0172842 0.0000000 17,202.77 0.00 2.36 78.22 0.00 13,153.02 0 CHARLIE 210469 9A P-DP 0.0000000 0.0172842 0.0172842 0.0000000 17,123.19 0.00 2.36 78.22 0.00 13,171.18 0 CHARLIE 210472 4A P-DP 0.0000000 0.0386492 0.0386492 0.0000000 9,582.43 0.00 2.36 78.22 0.00 8,200.72 0 CHARLIE 210472 5B P-DP 0.0000000 0.0386492 0.0386492 0.0000000 10,389.45 0.00 2.36 78.22 0.00 9,090.14 0 CHARLIE 210472 6C P-DP 0.0000000 0.0386492 0.0386492 0.0000000 9,508.80 0.00 2.36 78.22 0.00 8,646.30 0 CHAROLAIS 28 21 B2NC STATE COM 001H P-DP 0.0000000 0.0007251 0.0007251 0.0000000 304.58 355.99 2.04 78.21 249.04 223.32 0 CHAROLAIS 28 21 W1MD STATE COM 001H P-DP 0.0000000 0.0007251 0.0007251 0.0000000 117.33 150.71 2.04 78.21 66.36 44.36 0

LEASE NAME GAS PRC INITIAL GROSS ULTIMATE Mbbl GROSS ULTIMATE MMcf CUM GAS MMcf CUM OIL Mbbl EXPENSE INITIAL DECIMAL INTEREST FINAL DECIMAL REVENUE INITIAL DECIMAL INTEREST FINAL DECIMAL OIL PRC INITIAL $/bbl RES CAT AS OF DATE FIXED COST $/MO As of : 01/01/2024 GROSS ULTIMATE RESERVES, CUMULATIVE PRODUCTION AND BASIC ECONOMIC DATA TABLE 7 CHAROLAIS 33 21 B1GB STATE COM 001H P-DP 0.0000000 0.0174023 0.0174023 0.0000000 365.42 360.43 2.04 78.21 79.82 72.44 0 CHAROLAIS 33 21 B1HA STATE COM 001H P-DP 0.0000000 0.0116016 0.0116016 0.0000000 406.97 441.21 2.04 78.21 98.02 85.92 0 CHEVRON 3-38 2AH P-DP 0.0000000 0.0004375 0.0004375 0.0000000 303.81 356.39 2.37 78.86 210.52 128.32 0 CHEVRON 3-38 2SH P-DP 0.0000000 0.0004375 0.0004375 0.0000000 253.20 496.69 2.37 78.86 230.30 81.55 0 CHEVRON 3-38 WOLFCAMP UNIT 1H P-DP 0.0000000 0.0004375 0.0004375 0.0000000 2,977.68 465.85 2.37 78.86 285.49 803.97 0 CHILDRESS 140 1 P-DP 0.0000000 0.0500000 0.0500000 0.0000000 180.24 15.93 1.07 75.95 15.22 173.46 0 CHILDRESS 140 2 P-DP 0.0000000 0.0500000 0.0500000 0.0000000 72.79 16.87 1.07 75.95 16.51 70.92 0 CHILDRESS 140 5 P-DP 0.0000000 0.0500000 0.0500000 0.0000000 90.14 20.47 1.07 75.95 20.09 89.51 0 CHINOOK 55-1-7 UNIT 1H P-DP 0.0000000 0.0001410 0.0001410 0.0000000 3,020.29 521.99 2.70 78.79 332.21 1,982.24 0 CHRIESMAN 2 P-DP 0.0000000 0.0014585 0.0014585 0.0000000 711.00 87.67 1.07 75.95 81.91 680.24 0 CHRIESMAN 3 P-DP 0.0000000 0.0014585 0.0014585 0.0000000 248.60 16.67 1.07 75.95 16.17 244.49 0 CHUMCHAL UNIT 1H P-DP 0.0000000 0.0101899 0.0101899 0.0000000 731.72 116.36 2.33 75.89 115.86 725.34 0 CHUMCHAL UNIT 4H P-DP 0.0000000 0.0101899 0.0101899 0.0000000 850.69 123.43 2.33 75.89 116.14 816.90 0 CHUMCHAL UNIT 6L P-DP 0.0000000 0.0101899 0.0101899 0.0000000 1,656.98 241.40 2.33 75.89 178.17 1,281.18 0 CHUMCHAL UNIT 7L P-DP 0.0000000 0.0101899 0.0101899 0.0000000 1,771.99 255.43 2.33 75.89 190.18 1,413.30 0 CHURRO 34-157/158 UNIT 1H P-DP 0.0000000 0.0001395 0.0001395 0.0000000 2,088.37 1,176.81 1.38 77.44 766.98 1,271.11 0 CLARICE STARLING SUNDOWN B 4521LS P-DP 0.0000000 0.0053340 0.0053340 0.0000000 1,887.64 670.45 2.37 78.86 367.04 662.37 0 CLARICE STARLING SUNDOWN D 4542WA P-DP 0.0000000 0.0038697 0.0038697 0.0000000 2,183.14 745.52 2.37 78.86 468.42 773.61 0 CLAWSON 3 P-DP 0.0000000 0.1250000 0.1250000 0.0000000 159.42 0.00 1.77 77.22 0.00 159.42 0 CLEMENTS ALLOCATION A 26-35 4HA P-DP 0.0000000 0.0004050 0.0004050 0.0000000 135.08 187.47 3.53 76.99 45.21 26.17 0 COFFIELD -A- 1 P-DP 0.0000000 0.0077294 0.0077294 0.0000000 353.39 121.61 1.57 77.63 106.23 344.57 0 COFFIELD 1 P-DP 0.0000000 0.0077294 0.0077294 0.0000000 534.99 149.13 1.57 77.63 141.97 529.60 0 COLE 36-37 A UNIT A 2H P-DP 0.0000000 0.0001085 0.0001085 0.0000000 37.61 141.66 2.37 78.86 100.31 30.52 0 COLLE UNIT 1H P-DP 0.0000000 0.0199165 0.0199165 0.0000000 1,626.72 208.58 2.33 75.89 163.17 1,368.85 0 COLLINS WYN JF 2H P-DP 0.0000000 0.1005277 0.1005277 0.0000000 9,248.69 0.00 2.67 78.22 0.00 7,551.06 0 COLLINS WYN JF 4H P-DP 0.0000000 0.1005277 0.1005277 0.0000000 9,866.95 0.00 2.67 78.22 0.00 7,979.34 0 COLLINS WYN JF 6H P-DP 0.0000000 0.1005277 0.1005277 0.0000000 10,095.24 0.00 2.67 78.22 0.00 8,469.78 0 COLUMBINE 34-167 3H P-DP 0.0000000 0.0000337 0.0000337 0.0000000 367.36 80.38 1.38 77.44 74.65 335.93 0 COLUMBINE 34-167 4H P-DP 0.0000000 0.0000337 0.0000337 0.0000000 956.32 411.52 1.38 77.44 322.83 733.82 0 CONNER 15 1 P-DP 0.0000000 0.0595000 0.0595000 0.0000000 75.16 19.15 2.37 78.86 19.15 75.16 0 CONNER 15 1504N P-DP 0.0000000 0.0595000 0.0595000 0.0000000 323.62 76.34 2.37 78.86 47.25 222.34 0 CONNER 15 2 P-DP 0.0000000 0.0595000 0.0595000 0.0000000 24.20 11.30 2.37 78.86 11.30 24.20 0 CONNER 15 3 P-DP 0.0000000 0.0595000 0.0595000 0.0000000 316.64 37.08 2.37 78.86 22.44 181.03 0 CONNER 15-10 (ALLOC-A) 1NA P-DP 0.0000000 0.0143416 0.0143416 0.0000000 1,467.77 510.04 2.37 78.86 240.08 357.05 0

LEASE NAME GAS PRC INITIAL GROSS ULTIMATE Mbbl GROSS ULTIMATE MMcf CUM GAS MMcf CUM OIL Mbbl EXPENSE INITIAL DECIMAL INTEREST FINAL DECIMAL REVENUE INITIAL DECIMAL INTEREST FINAL DECIMAL OIL PRC INITIAL $/bbl RES CAT AS OF DATE FIXED COST $/MO As of : 01/01/2024 GROSS ULTIMATE RESERVES, CUMULATIVE PRODUCTION AND BASIC ECONOMIC DATA TABLE 7 CONNER 15-10 (ALLOC-B) 2NB P-DP 0.0000000 0.0143255 0.0143255 0.0000000 622.02 236.41 2.37 78.86 148.53 225.96 0 CONNER 15-10 (ALLOC-B) 2NS P-DP 0.0000000 0.0144592 0.0144592 0.0000000 840.59 288.64 2.37 78.86 174.60 255.58 0 CONNER 15-10 (ALLOC-C) 3NA P-DP 0.0000000 0.0146685 0.0146685 0.0000000 638.52 463.70 2.37 78.86 276.84 344.00 0 CONNER 15-10 (ALLOC-D) 4NB P-DP 0.0000000 0.0146290 0.0146290 0.0000000 1,145.69 662.64 2.37 78.86 348.66 370.04 0 CONNER 15-10 (ALLOC-D) 4NS P-DP 0.0000000 0.0139881 0.0139881 0.0000000 1,121.81 112.75 2.37 78.86 91.21 331.28 0 CONNER 15-3 (ALLOC-E) 5NA P-DP 0.0000000 0.0088155 0.0088155 0.0000000 1,448.68 566.96 2.37 78.86 309.76 442.76 0 CONNER 15-3 (ALLOC-F) 6NB P-DP 0.0000000 0.0085537 0.0085537 0.0000000 1,271.54 533.27 2.37 78.86 295.54 384.63 0 CONNER 15-3 (ALLOC-F) 6NS P-DP 0.0000000 0.0066847 0.0066847 0.0000000 677.57 275.47 2.37 78.86 153.96 201.91 0 CONNER 15-3 (ALLOC-G) 7NA P-DP 0.0000000 0.0094297 0.0094297 0.0000000 1,516.52 642.75 2.37 78.86 268.92 363.45 0 CONNER 15-3 (ALLOC-H) 8NB P-DP 0.0000000 0.0088774 0.0088774 0.0000000 1,290.15 589.55 2.37 78.86 338.12 479.18 0 CONNER 15-3 (ALLOC-H) 8NS P-DP 0.0000000 0.0095942 0.0095942 0.0000000 866.38 343.20 2.37 78.86 187.13 326.78 0 CONSTANTAN 34-174 (N) 1H P-DP 0.0000000 0.0000090 0.0000090 0.0000000 4,483.25 671.10 1.38 77.44 529.81 3,372.99 0 COOK 21 1 P-DP 0.0000000 0.0116666 0.0116666 0.0000000 36.11 79.08 1.57 77.63 57.33 30.37 0 COOK 21 2 P-DP 0.0000000 0.0116666 0.0116666 0.0000000 45.61 44.60 1.57 77.63 34.86 34.10 0 COOK 21 3 P-DP 0.0000000 0.0116666 0.0116666 0.0000000 51.84 66.43 1.57 77.63 51.76 36.13 0 COOK 21 4 P-DP 0.0000000 0.0116666 0.0116666 0.0000000 70.86 69.54 1.57 77.63 53.99 48.47 0 COOK 21 5 P-DP 0.0000000 0.0116666 0.0116666 0.0000000 50.10 31.60 1.57 77.63 25.06 45.04 0 COOK 21 6 P-DP 0.0000000 0.0116666 0.0116666 0.0000000 65.37 49.76 1.57 77.63 39.20 50.59 0 COOK 21 7 P-DP 0.0000000 0.0116666 0.0116666 0.0000000 82.97 57.20 1.57 77.63 42.91 63.36 0 COOK 21 8 P-DP 0.0000000 0.0116666 0.0116666 0.0000000 47.60 27.23 1.57 77.63 20.58 42.32 0 CORNELL 226-34 1H P-DP 0.0000000 0.0008204 0.0008204 0.0000000 4,578.91 401.16 1.38 77.44 224.53 2,558.51 0 COWDEN F 2402 P-DP 0.0000000 0.0009375 0.0009375 0.0000000 28.89 19.72 2.32 78.93 18.28 27.62 0 COWDEN F 2403 P-DP 0.0000000 0.0009375 0.0009375 0.0000000 49.92 30.52 2.32 78.93 19.13 29.38 0 COWDEN F 2404 P-DP 0.0000000 0.0009375 0.0009375 0.0000000 104.34 50.93 2.32 78.93 39.47 83.79 0 COWDEN F 2405 P-DP 0.0000000 0.0009375 0.0009375 0.0000000 97.63 40.52 2.32 78.93 32.16 87.66 0 CRAZY CAMEL 1 P-DP 0.0000000 0.0021149 0.0021149 0.0000000 33.19 22.97 1.38 77.44 19.17 26.59 0 CRAZY CAMEL 2 P-DP 0.0000000 0.0021149 0.0021149 0.0000000 66.09 75.94 1.38 77.44 56.01 46.43 0 CRAZY CAMEL 5 P-DP 0.0000000 0.0021149 0.0021149 0.0000000 23.66 2.29 1.38 77.44 2.29 23.66 0 CRAZY CAMEL 6 P-DP 0.0000000 0.0021149 0.0021149 0.0000000 7.25 11.70 1.38 77.44 8.05 4.44 0 CRAZY CAMEL 7 P-DP 0.0000000 0.0021149 0.0021149 0.0000000 41.71 17.88 1.38 77.44 11.36 29.28 0 CRAZY CAT 41-32 #1SH P-DP 0.0000000 0.0083917 0.0083917 0.0000000 65.37 205.25 2.37 78.86 154.73 45.67 0 CRAZY CAT 41-32 #2AH P-DP 0.0000000 0.0083917 0.0083917 0.0000000 815.97 384.96 2.37 78.86 302.95 436.73 0 CRAZY CAT 41-32 #3SH P-DP 0.0000000 0.0083917 0.0083917 0.0000000 1,089.28 236.68 2.37 78.86 177.88 562.20 0 CRAZY CAT 41-32 #4AH P-DP 0.0000000 0.0083917 0.0083917 0.0000000 117.81 199.13 2.37 78.86 156.79 85.60 0

LEASE NAME GAS PRC INITIAL GROSS ULTIMATE Mbbl GROSS ULTIMATE MMcf CUM GAS MMcf CUM OIL Mbbl EXPENSE INITIAL DECIMAL INTEREST FINAL DECIMAL REVENUE INITIAL DECIMAL INTEREST FINAL DECIMAL OIL PRC INITIAL $/bbl RES CAT AS OF DATE FIXED COST $/MO As of : 01/01/2024 GROSS ULTIMATE RESERVES, CUMULATIVE PRODUCTION AND BASIC ECONOMIC DATA TABLE 7 CROSS CREEK A 5H-20 P-DP 0.0000000 0.1190618 0.1190618 0.0000000 9,211.38 0.00 2.67 78.22 0.00 7,336.89 0 CROSS V RANCH 34-170 UNIT 1H P-DP 0.0000000 0.0004007 0.0004007 0.0000000 1,295.10 601.15 1.38 77.44 369.30 762.68 0 CROWIE E RCH BL 3H P-DP 0.0000000 0.0018968 0.0018968 0.0000000 16,073.74 0.00 2.36 78.22 0.00 11,946.75 0 CROWIE RCH BL 1H P-DP 0.0000000 0.0018968 0.0018968 0.0000000 10,561.57 0.00 2.36 78.22 0.00 6,762.37 0 CUATRO HIJOS FEE 003H P-DP 0.0000000 0.0019336 0.0019336 0.0000000 112.95 146.69 2.04 78.21 112.93 83.80 0 CUATRO HIJOS FEE 004H P-DP 0.0000000 0.0019336 0.0019336 0.0000000 94.62 130.49 2.04 78.21 108.01 74.54 0 CUATRO HIJOS FEE 008H P-DP 0.0000000 0.0019336 0.0019336 0.0000000 143.01 139.32 2.04 78.21 138.61 142.21 0 CV RB SU58;SJ MONDELLO ETAL 18 001 P-DP 0.0000000 0.0156250 0.0156250 0.0000000 378.94 0.00 2.64 69.05 0.00 374.74 0 CV RB SUV;SHELBY INTERESTS 31 001 P-DP 0.0000000 0.0192857 0.0192857 0.0000000 481.17 1.33 2.52 69.04 1.33 481.17 0 CV RB SUW;LESHE 36 001 P-DP 0.0000000 0.0986163 0.0986163 0.0000000 1,301.19 0.28 2.52 69.04 0.28 1,105.13 0 CV RB SUW;NAC 36 001-ALT P-DP 0.0000000 0.0986163 0.0986163 0.0000000 590.75 0.33 2.52 69.04 0.33 559.39 0 DANIEL D & EDNA MILLER 1 P-DP 0.0000000 0.1250000 0.1250000 0.0000000 93.45 0.00 1.77 77.22 0.00 93.45 0 DANIELLE 183 UNIT 1H P-DP 0.0000000 0.0001309 0.0001309 0.0000000 4,626.94 682.89 1.38 77.44 395.42 2,879.41 0 DANIELLE 183 UNIT 2H P-DP 0.0000000 0.0001309 0.0001309 0.0000000 5,978.82 674.95 1.38 77.44 409.03 3,459.69 0 DARWIN 22 1 P-DP 0.0000000 0.0041071 0.0041071 0.0000000 137.39 50.15 1.57 77.63 34.11 76.76 0 DARWIN 22 2 P-DP 0.0000000 0.0041071 0.0041071 0.0000000 28.34 51.56 1.57 77.63 38.70 28.34 0 DAVID 1 P-DP 0.0000000 0.0031250 0.0031250 0.0000000 56.19 107.71 1.49 79.19 81.12 50.57 0 DAVID L BONACCI 0031 P-DP 0.0000000 0.1250000 0.1250000 0.0000000 41.22 0.00 1.77 77.22 0.00 41.22 0 DAVIS 1 P-DP 0.0000000 0.0297465 0.0297465 0.0000000 363.17 135.63 2.37 78.86 106.06 239.96 0 DAVIS 201-200-199 UNIT 1H P-DP 0.0000000 0.0002820 0.0002820 0.0000000 6,564.57 400.71 1.38 77.44 272.18 4,364.96 0 DAVIS 36-5 (ALLOC-E) 5SA P-DP 0.0000000 0.0002727 0.0002727 0.0000000 1,666.37 426.76 2.37 78.86 255.98 461.05 0 DAVIS 36-5 (ALLOC-F) 6SB P-DP 0.0000000 0.0003280 0.0003280 0.0000000 1,968.81 650.71 2.37 78.86 314.51 526.65 0 DAVIS 36-5 (ALLOC-F) 6SS P-DP 0.0000000 0.0003367 0.0003367 0.0000000 2,433.41 313.24 2.37 78.86 167.66 416.15 0 DAVIS 36-5 (ALLOC-G) 7SA P-DP 0.0000000 0.0003269 0.0003269 0.0000000 1,010.79 460.73 2.37 78.86 258.77 333.22 0 DAVIS 36-5 (ALLOC-H) 8SB P-DP 0.0000000 0.0003745 0.0003745 0.0000000 1,268.97 535.16 2.37 78.86 283.81 469.50 0 DAVIS 36-5 (ALLOC-H) 8SS P-DP 0.0000000 0.0003294 0.0003294 0.0000000 666.26 296.95 2.37 78.86 173.60 217.31 0 DEMANGONE 1 P-DP 0.0000000 0.1250000 0.1250000 0.0000000 161.99 0.00 1.77 77.22 0.00 161.99 0 DICKSON CRC JF 1H P-DP 0.0000000 0.1203236 0.1203236 0.0000000 13,778.72 0.00 2.67 78.22 0.00 11,805.53 0 DICKSON CRC JF 3H P-DP 0.0000000 0.1203236 0.1203236 0.0000000 11,843.59 0.00 2.67 78.22 0.00 10,579.36 0 DILLES BOTTOM 210744 3B P-DP 0.0000000 0.0000137 0.0000137 0.0000000 15,501.99 0.00 2.36 78.22 0.00 12,711.14 0 DIRE WOLF UNIT 1 0402BH P-DP 0.0000000 0.0034180 0.0034180 0.0000000 2,419.59 345.84 1.57 77.63 151.78 301.35 0 DIRE WOLF UNIT 1 0404BH P-DP 0.0000000 0.0034180 0.0034180 0.0000000 2,361.55 417.69 1.57 77.63 269.12 870.02 0 DIRE WOLF UNIT 1 0411AH P-DP 0.0000000 0.0034180 0.0034180 0.0000000 479.21 13.88 1.57 77.63 13.53 141.45 0 DIRE WOLF UNIT 1 0413AH P-DP 0.0000000 0.0034180 0.0034180 0.0000000 387.51 12.07 1.57 77.63 11.73 118.61 0

LEASE NAME GAS PRC INITIAL GROSS ULTIMATE Mbbl GROSS ULTIMATE MMcf CUM GAS MMcf CUM OIL Mbbl EXPENSE INITIAL DECIMAL INTEREST FINAL DECIMAL REVENUE INITIAL DECIMAL INTEREST FINAL DECIMAL OIL PRC INITIAL $/bbl RES CAT AS OF DATE FIXED COST $/MO As of : 01/01/2024 GROSS ULTIMATE RESERVES, CUMULATIVE PRODUCTION AND BASIC ECONOMIC DATA TABLE 7 DIRE WOLF UNIT 1 0414AH P-DP 0.0000000 0.0034180 0.0034180 0.0000000 98.73 745.81 1.57 77.63 255.06 33.27 0 DIRE WOLF UNIT 1 0422SH P-DP 0.0000000 0.0034180 0.0034180 0.0000000 500.54 11.75 1.57 77.63 11.36 86.19 0 DIRE WOLF UNIT 1 0424SH P-DP 0.0000000 0.0034180 0.0034180 0.0000000 805.82 344.78 1.57 77.63 167.66 241.38 0 DIRE WOLF UNIT 1 0433SH P-DP 0.0000000 0.0034180 0.0034180 0.0000000 173.86 176.80 1.57 77.63 73.31 45.50 0 DIRE WOLF UNIT 1 0471JH P-DP 0.0000000 0.0034180 0.0034180 0.0000000 148.58 263.27 1.57 77.63 120.19 40.55 0 DIRE WOLF UNIT 1 0474JH P-DP 0.0000000 0.0034180 0.0034180 0.0000000 138.87 495.78 1.57 77.63 203.08 72.40 0 DIRE WOLF UNIT 2 0406BH P-DP 0.0000000 0.0013021 0.0013021 0.0000000 4,356.90 959.87 1.57 77.63 379.03 942.20 0 DIRE WOLF UNIT 2 0407BH P-DP 0.0000000 0.0013021 0.0013021 0.0000000 3,713.40 1,010.79 1.57 77.63 401.74 930.95 0 DIRE WOLF UNIT 2 0415AH P-DP 0.0000000 0.0013021 0.0013021 0.0000000 2,472.06 712.69 1.57 77.63 312.99 604.10 0 DIRE WOLF UNIT 2 0416AH P-DP 0.0000000 0.0013021 0.0013021 0.0000000 1,096.47 681.63 1.57 77.63 271.00 346.16 0 DIRE WOLF UNIT 2 0417AH P-DP 0.0000000 0.0013021 0.0013021 0.0000000 1,367.91 574.98 1.57 77.63 241.72 435.85 0 DIRE WOLF UNIT 2 0426SH P-DP 0.0000000 0.0013021 0.0013021 0.0000000 1,428.28 269.30 1.57 77.63 107.44 304.92 0 DIRE WOLF UNIT 2 0427SH P-DP 0.0000000 0.0013021 0.0013021 0.0000000 1,591.33 223.78 1.57 77.63 121.49 339.52 0 DIRE WOLF UNIT 2 0428SH P-DP 0.0000000 0.0013021 0.0013021 0.0000000 1,007.21 239.88 1.57 77.63 140.37 364.26 0 DIRE WOLF UNIT 2 0435SH P-DP 0.0000000 0.0013021 0.0013021 0.0000000 1.71 22.16 1.57 77.63 12.81 0.86 0 DIRE WOLF UNIT 2 0437SH P-DP 0.0000000 0.0013021 0.0013021 0.0000000 286.89 68.17 1.57 77.63 32.72 75.46 0 DONALDSON 4-54 1H P-DP 0.0000000 0.0002250 0.0002250 0.0000000 3,200.68 87.97 1.53 76.96 77.88 2,689.04 0 DONALDSON 4-54 U 34H P-DP 0.0000000 0.0002250 0.0002250 0.0000000 3,889.67 159.21 1.53 76.96 103.00 2,129.05 0 DOYEN NE WEL JF 3H P-DP 0.0000000 0.0093247 0.0093247 0.0000000 15,966.00 0.00 2.67 78.22 0.00 10,227.13 0 DOYEN NW WEL JF 1H P-DP 0.0000000 0.0002367 0.0002367 0.0000000 22,338.61 0.00 2.67 78.22 0.00 13,036.31 0 DRAINAGE 34-136 1H P-DP 0.0000000 0.0003759 0.0003759 0.0000000 328.51 156.74 1.38 77.44 156.74 328.51 0 DRAINAGE 34-136 2H P-DP 0.0000000 0.0003759 0.0003759 0.0000000 529.43 231.53 1.38 77.44 201.61 432.84 0 DRAINAGE 34-136 3H P-DP 0.0000000 0.0003759 0.0003759 0.0000000 560.33 573.39 1.38 77.44 492.41 505.36 0 DRAINAGE 34-136 4H P-DP 0.0000000 0.0003759 0.0003759 0.0000000 667.83 604.54 1.38 77.44 483.74 574.77 0 DRAINAGE A3 6LA P-DP 0.0000000 0.0001540 0.0001540 0.0000000 986.92 584.96 1.38 77.44 288.19 422.95 0 DRIVER-LANE 30A 1H P-DP 0.0000000 0.0026684 0.0026684 0.0000000 2,683.70 584.80 2.97 78.55 210.85 406.33 0 DRIVER-LANE 30B 2H P-DP 0.0000000 0.0026676 0.0026676 0.0000000 1,674.88 370.51 2.97 78.55 124.10 317.51 0 DRIVER-LANE 30C 3H P-DP 0.0000000 0.0026770 0.0026770 0.0000000 2,623.33 540.47 2.97 78.55 181.60 357.08 0 DRIVER-LANE 30D 4H P-DP 0.0000000 0.0026793 0.0026793 0.0000000 1,563.60 369.38 2.97 78.55 125.64 320.08 0 DRIVER-LANE 30E 5H P-DP 0.0000000 0.0027086 0.0027086 0.0000000 3,104.10 580.67 2.97 78.55 213.42 405.59 0 DRIVER-LANE 30F 6H P-DP 0.0000000 0.0026261 0.0026261 0.0000000 1,624.81 412.22 2.97 78.55 122.99 285.50 0 DYER 33 A P-DP 0.0000000 0.0183333 0.0183333 0.0000000 112.92 25.14 1.57 77.63 21.43 112.92 0 DYER 3301 P-DP 0.0000000 0.0183333 0.0183333 0.0000000 232.76 89.31 1.57 77.63 76.62 140.21 0 DYER 3303 P-DP 0.0000000 0.0183333 0.0183333 0.0000000 270.11 53.77 1.57 77.63 46.15 155.79 0

LEASE NAME GAS PRC INITIAL GROSS ULTIMATE Mbbl GROSS ULTIMATE MMcf CUM GAS MMcf CUM OIL Mbbl EXPENSE INITIAL DECIMAL INTEREST FINAL DECIMAL REVENUE INITIAL DECIMAL INTEREST FINAL DECIMAL OIL PRC INITIAL $/bbl RES CAT AS OF DATE FIXED COST $/MO As of : 01/01/2024 GROSS ULTIMATE RESERVES, CUMULATIVE PRODUCTION AND BASIC ECONOMIC DATA TABLE 7 DYER 33B P-DP 0.0000000 0.0183333 0.0183333 0.0000000 170.86 13.58 1.57 77.63 12.06 103.99 0 DYER 33D P-DP 0.0000000 0.0183333 0.0183333 0.0000000 230.07 98.49 1.57 77.63 86.21 147.55 0 DYER 33F P-DP 0.0000000 0.0183333 0.0183333 0.0000000 114.82 23.70 1.57 77.63 20.80 85.09 0 DYER 33H P-DP 0.0000000 0.0183333 0.0183333 0.0000000 136.30 16.40 1.57 77.63 14.00 79.05 0 EASON UNIT 1 P-DP 0.0000000 0.0121247 0.0121247 0.0000000 758.80 393.52 2.37 78.86 356.56 635.59 0 EAST ACKERLY DEAN UNIT 99 P-DP 0.0000000 0.0000223 0.0000223 0.0000000 159.41 129.33 1.49 79.19 107.88 145.26 0 EASTER 5 1 P-DP 0.0000000 0.0063802 0.0063802 0.0000000 3.46 9.92 2.37 78.86 7.93 3.46 0 EILAND 1806A-33 1H P-DP 0.0000000 0.0003115 0.0003115 0.0000000 883.88 472.57 1.38 77.44 357.81 679.01 0 EILAND 1806B-33 1H P-DP 0.0000000 0.0002850 0.0002850 0.0000000 811.40 677.15 1.38 77.44 489.42 602.74 0 EILAND 1806B-33 62H P-DP 0.0000000 0.0002850 0.0002850 0.0000000 1,079.55 546.32 1.38 77.44 442.15 820.75 0 EILAND 1806C-33 1H P-DP 0.0000000 0.0002850 0.0002850 0.0000000 939.80 489.97 1.38 77.44 382.30 703.07 0 EILAND 1806C-33 81H P-DP 0.0000000 0.0002849 0.0002849 0.0000000 360.60 319.11 1.38 77.44 238.03 274.91 0 EILAND 1806C-33 82H P-DP 0.0000000 0.0002849 0.0002849 0.0000000 513.89 549.80 1.38 77.44 431.76 412.62 0 EILAND 1806C-33 83H P-DP 0.0000000 0.0002850 0.0002850 0.0000000 565.92 488.22 1.38 77.44 317.83 401.68 0 EILAND 6047A-34 41H P-DP 0.0000000 0.0007587 0.0007587 0.0000000 952.09 564.14 1.38 77.44 434.15 698.34 0 EL KABONG UNIT 48-17-8 301H P-DP 0.0000000 0.0002629 0.0002629 0.0000000 471.86 449.73 2.63 78.14 302.74 340.57 0 EL KABONG UNIT 48-17-8 302H P-DP 0.0000000 0.0002629 0.0002629 0.0000000 778.21 663.59 2.63 78.14 449.22 398.39 0 EL KABONG UNIT 48-17-8 303H P-DP 0.0000000 0.0002629 0.0002629 0.0000000 7,459.43 411.22 2.63 78.14 49.04 0.01 0 EL KABONG UNIT 48-17-8 701H P-DP 0.0000000 0.0002629 0.0002629 0.0000000 394.56 412.37 2.63 78.14 280.96 208.62 0 EL KABONG UNIT 48-17-8 702H P-DP 0.0000000 0.0002629 0.0002629 0.0000000 1,688.18 560.13 2.63 78.14 319.94 711.30 0 EL KABONG UNIT 48-17-8 703H P-DP 0.0000000 0.0002629 0.0002629 0.0000000 413.31 577.16 2.63 78.14 373.79 232.77 0 EL KABONG UNIT 48-17-8 704H P-DP 0.0000000 0.0002629 0.0002629 0.0000000 294.61 510.43 2.63 78.14 344.22 266.13 0 EL KABONG UNIT 48-17-8 705H P-DP 0.0000000 0.0002629 0.0002629 0.0000000 149.98 286.07 2.63 78.14 143.18 125.07 0 EL KABONG UNIT 48-17-8 801H P-DP 0.0000000 0.0002629 0.0002629 0.0000000 626.84 122.69 2.63 78.14 120.53 457.19 0 ELKHEAD 4144 A 2H P-DP 0.0000000 0.0004602 0.0004602 0.0000000 7,294.68 955.49 1.53 76.96 673.27 4,345.88 0 ELKHEAD 4144 A 5H P-DP 0.0000000 0.0004602 0.0004602 0.0000000 4,553.15 506.44 1.53 76.96 317.97 2,366.47 0 ELKHEAD 4144 A 7H P-DP 0.0000000 0.0004602 0.0004602 0.0000000 5,548.45 620.04 1.53 76.96 409.08 3,202.45 0 ELKHEAD 4144 B 1H P-DP 0.0000000 0.0004602 0.0004602 0.0000000 3,111.55 768.45 1.53 76.96 585.00 2,153.05 0 ELKHEAD 4144 B 6H P-DP 0.0000000 0.0004602 0.0004602 0.0000000 3,267.12 334.72 1.53 76.96 221.58 1,785.78 0 ELKHEAD 4144 B 8H P-DP 0.0000000 0.0004602 0.0004602 0.0000000 3,897.25 407.18 1.53 76.96 291.85 2,322.68 0 ELKHEAD 4144 C 4H P-DP 0.0000000 0.0004602 0.0004602 0.0000000 3,307.12 412.79 1.53 76.96 263.08 1,849.33 0 ELKHEAD 4144 S 3H P-DP 0.0000000 0.0004602 0.0004602 0.0000000 2,786.91 470.27 1.53 76.96 313.19 1,827.60 0 ELY GAS UNIT NO. 2 1 P-DP 0.0000000 0.0079574 0.0079574 0.0000000 1,537.27 0.00 2.72 78.22 0.00 1,285.71 0 EMMA 218-219 UNIT 1H P-DP 0.0000000 0.0001208 0.0001208 0.0000000 9,024.62 565.15 1.38 77.44 320.94 5,095.42 0

LEASE NAME GAS PRC INITIAL GROSS ULTIMATE Mbbl GROSS ULTIMATE MMcf CUM GAS MMcf CUM OIL Mbbl EXPENSE INITIAL DECIMAL INTEREST FINAL DECIMAL REVENUE INITIAL DECIMAL INTEREST FINAL DECIMAL OIL PRC INITIAL $/bbl RES CAT AS OF DATE FIXED COST $/MO As of : 01/01/2024 GROSS ULTIMATE RESERVES, CUMULATIVE PRODUCTION AND BASIC ECONOMIC DATA TABLE 7 EPLEY, J. C. 9 P-DP 0.0000000 0.0010986 0.0010986 0.0000000 104.09 78.95 1.57 77.63 47.83 103.00 0 EXTREME 210716 3A P-DP 0.0000000 0.0008186 0.0008186 0.0000000 67,585.73 0.04 2.67 78.22 0.02 12,656.60 0 EXTREME 210716 4B P-DP 0.0000000 0.0008186 0.0008186 0.0000000 30,241.40 0.05 2.67 78.22 0.03 11,873.39 0 FAIREY UNIT 1H P-DP 0.0000000 0.0187018 0.0187018 0.0000000 441.75 135.60 2.08 75.57 116.63 383.89 0 FEARLESS 136-137 A 8WB P-DP 0.0000000 0.0028672 0.0028672 0.0000000 1,143.83 564.85 1.57 77.63 287.91 549.00 0 FED W-18346 2-11 P-DP 0.0000000 0.0017058 0.0017058 0.0000000 3,270.13 38.22 4.94 77.99 32.58 2,689.00 0 FED W-18346 3-33 P-DP 0.0000000 0.0033965 0.0000000 0.0000000 1,064.88 40.12 4.94 77.99 40.12 1,064.88 0 FEDERAL W-7037 30-11 P-DP 0.0000000 0.0124851 0.0124851 0.0000000 1,468.70 19.29 2.60 78.22 19.29 1,468.70 0 FERGUSON 6 P-DP 0.0000000 0.0054340 0.0054340 0.0000000 27.85 0.00 1.77 77.22 0.00 27.85 0 FIELDS UNIT 1H P-DP 0.0000000 0.0217246 0.0217246 0.0000000 1,230.97 129.83 2.33 75.89 107.62 1,053.32 0 FIELDS UNIT 2H P-DP 0.0000000 0.0217246 0.0217246 0.0000000 1,021.70 85.24 2.33 75.89 72.34 910.08 0 FIELDS UNIT 3H P-DP 0.0000000 0.0217246 0.0217246 0.0000000 813.41 93.36 2.33 75.89 87.08 769.16 0 FIELDS UNIT 4H P-DP 0.0000000 0.0217246 0.0217246 0.0000000 958.64 97.44 2.33 75.89 85.11 769.75 0 FIRE EYES 47-38 1NA P-DP 0.0000000 0.0008855 0.0008855 0.0000000 1,933.02 726.80 2.37 78.86 304.50 357.99 0 FIRE EYES 47-38 1NS P-DP 0.0000000 0.0008855 0.0008855 0.0000000 1,170.39 493.10 2.37 78.86 215.69 233.41 0 FIRE EYES 47-38 3NA P-DP 0.0000000 0.0008855 0.0008855 0.0000000 1,409.81 525.30 2.37 78.86 229.97 290.49 0 FIRE EYES 47-38 3NS P-DP 0.0000000 0.0008855 0.0008855 0.0000000 817.68 275.54 2.37 78.86 124.20 163.92 0 FIRE EYES 47-38 4AH P-DP 0.0000000 0.0008855 0.0008855 0.0000000 260.07 606.27 2.37 78.86 315.65 174.83 0 FIRE EYES 47-38 4NS P-DP 0.0000000 0.0008855 0.0008855 0.0000000 758.23 254.53 2.37 78.86 120.34 195.98 0 FIRE FROG 57-32 A 1WA P-DP 0.0000000 0.0005029 0.0005029 0.0000000 1,740.25 493.23 1.38 77.44 284.63 914.90 0 FIRE FROG 57-32 B 2BS P-DP 0.0000000 0.0005662 0.0005662 0.0000000 2,778.57 887.46 1.38 77.44 491.41 1,489.19 0 FIRE FROG 57-32 C 3WA P-DP 0.0000000 0.0005288 0.0005288 0.0000000 2,068.55 565.67 1.38 77.44 314.91 980.33 0 FIRE FROG 57-32 D 4BS P-DP 0.0000000 0.0006019 0.0006019 0.0000000 3,191.75 872.01 1.38 77.44 466.20 1,548.57 0 FIREBIRD 52 1 P-DP 0.0000000 0.0001179 0.0001179 0.0000000 275.47 21.65 1.38 77.44 18.40 237.62 0 FIRESTORM 54-1-12-13-24 AL1 H 1LS P-DP 0.0000000 0.0002863 0.0002863 0.0000000 451.63 221.13 2.37 78.86 65.59 83.07 0 FIRESTORM 54-1-12-13-24 AL2 H 1WA P-DP 0.0000000 0.0002863 0.0002863 0.0000000 524.20 265.84 2.37 78.86 89.19 87.77 0 FIRESTORM 54-1-12-13-24 AL3 H 2WB P-DP 0.0000000 0.0002863 0.0002863 0.0000000 914.81 315.12 2.37 78.86 120.15 114.77 0 FIRESTORM 54-1-12-13-24 AL5 H 2LS P-DP 0.0000000 0.0002863 0.0002863 0.0000000 567.40 326.93 2.37 78.86 100.51 90.82 0 FIRESTORM 54-1-12-13-24 AL5 H 2WA P-DP 0.0000000 0.0002863 0.0002863 0.0000000 505.53 253.58 2.37 78.86 112.83 106.44 0 FIRESTORM 54-1-12-13-24 AL6 H 3WB P-DP 0.0000000 0.0002863 0.0002863 0.0000000 875.74 346.54 2.37 78.86 127.45 137.19 0 FISHERMAN-BRISTOW 23A 1H P-DP 0.0000000 0.0037045 0.0037045 0.0000000 979.35 585.69 1.57 77.63 360.69 465.97 0 FISHERMAN-BRISTOW 23B 2H P-DP 0.0000000 0.0037783 0.0037783 0.0000000 752.86 522.75 1.57 77.63 332.84 407.45 0 FISHERMAN-BRISTOW 23C 3H P-DP 0.0000000 0.0037009 0.0037009 0.0000000 1,040.15 669.73 1.57 77.63 404.46 465.15 0 FISHERMAN-BRISTOW 23D 4H P-DP 0.0000000 0.0037701 0.0037701 0.0000000 1,509.60 791.91 1.57 77.63 454.08 560.95 0

LEASE NAME GAS PRC INITIAL GROSS ULTIMATE Mbbl GROSS ULTIMATE MMcf CUM GAS MMcf CUM OIL Mbbl EXPENSE INITIAL DECIMAL INTEREST FINAL DECIMAL REVENUE INITIAL DECIMAL INTEREST FINAL DECIMAL OIL PRC INITIAL $/bbl RES CAT AS OF DATE FIXED COST $/MO As of : 01/01/2024 GROSS ULTIMATE RESERVES, CUMULATIVE PRODUCTION AND BASIC ECONOMIC DATA TABLE 7 FLAMING STAR 02-11 1SA P-DP 0.0000000 0.0024056 0.0024056 0.0000000 826.43 418.24 2.37 78.86 146.86 239.31 0 FLAMING STAR 02-11 1SS P-DP 0.0000000 0.0024056 0.0024056 0.0000000 504.68 305.52 2.37 78.86 113.55 137.09 0 FLAMING STAR 02-11 2SS P-DP 0.0000000 0.0024056 0.0024056 0.0000000 490.24 455.88 2.37 78.86 184.14 207.71 0 FLAMING STAR 02-11 3SA P-DP 0.0000000 0.0024056 0.0024056 0.0000000 871.68 473.89 2.37 78.86 172.13 194.82 0 FLAMING STAR 0211 4AH P-DP 0.0000000 0.0024042 0.0024042 0.0000000 1,443.97 472.12 2.37 78.86 390.06 505.72 0 FLAMING STAR 0211 4SH P-DP 0.0000000 0.0024042 0.0024042 0.0000000 877.12 272.63 2.37 78.86 227.40 322.32 0 FLEMING 13 10H P-DP 0.0000000 0.0040391 0.0040391 0.0000000 4,196.38 116.08 1.53 76.96 74.60 2,442.25 0 FORT KNOX 11-2 H 1LS P-DP 0.0000000 0.0007924 0.0007924 0.0000000 577.02 104.06 2.37 78.86 70.05 216.93 0 FORT KNOX 11-2 H 1WA P-DP 0.0000000 0.0007924 0.0007924 0.0000000 509.40 260.63 2.37 78.86 158.85 253.09 0 FORT KNOX 11-2 H 1WB P-DP 0.0000000 0.0007924 0.0007924 0.0000000 800.85 191.95 2.37 78.86 121.42 267.08 0 FORT KNOX 11-2 H 2WA P-DP 0.0000000 0.0007924 0.0007924 0.0000000 1,091.98 195.64 2.37 78.86 133.53 369.93 0 FORT KNOX 11-2 H 2WB P-DP 0.0000000 0.0007924 0.0007924 0.0000000 1,178.04 165.65 2.37 78.86 111.61 415.31 0 FORT KNOX 11-2 R 2LS P-DP 0.0000000 0.0007924 0.0007924 0.0000000 510.50 83.15 2.37 78.86 60.44 207.55 0 FORT KNOX 11-2-58EX H 3WA P-DP 0.0000000 0.0007595 0.0007595 0.0000000 1,477.15 345.14 2.37 78.86 180.37 383.96 0 FORT KNOX 11-2-58X H 3WB P-DP 0.0000000 0.0007567 0.0007567 0.0000000 1,129.60 224.89 2.37 78.86 145.11 382.71 0 FRED HALL UNIT 1 P-DP 0.0000000 0.0029612 0.0029612 0.0000000 653.38 81.98 2.32 78.93 77.24 646.37 0 FRED HALL UNIT 2 P-DP 0.0000000 0.0029612 0.0029612 0.0000000 136.03 67.07 2.32 78.93 57.00 114.82 0 FRED HALL UNIT 3 P-DP 0.0000000 0.0029612 0.0029612 0.0000000 131.57 67.66 2.32 78.93 51.42 111.27 0 FRYAR 18 2 P-DP 0.0000000 0.0123960 0.0123960 0.0000000 120.57 37.42 2.37 78.86 21.25 70.56 0 FULLER 1 P-DP 0.0000000 0.0077294 0.0077294 0.0000000 327.78 114.45 1.57 77.63 85.59 327.78 0 FUNKY BOSS B 8251H P-DP 0.0000000 0.0000010 0.0000010 0.0000000 5,706.82 1,195.95 1.38 77.44 868.76 3,844.39 0 FUNKY BOSS C 8270H P-DP 0.0000000 0.0000010 0.0000010 0.0000000 4,550.35 767.83 1.38 77.44 420.26 2,594.69 0 GADDIE 1-31 UNIT 1H P-DP 0.0000000 0.0007690 0.0007690 0.0000000 1,548.61 689.25 1.38 77.44 490.10 1,069.78 0 GADDIE 1-31 UNIT 2H P-DP 0.0000000 0.0007690 0.0007690 0.0000000 614.01 292.30 1.38 77.44 227.74 499.45 0 GADDIE 1-31 UNIT 3H P-DP 0.0000000 0.0007690 0.0007690 0.0000000 39.36 241.99 1.38 77.44 211.76 39.30 0 GASTON 1 P-DP 0.0000000 0.1250000 0.1250000 0.0000000 70.51 0.00 1.77 77.22 0.00 70.51 0 GASTON 4 P-DP 0.0000000 0.1250000 0.1250000 0.0000000 120.12 0.00 1.77 77.22 0.00 120.12 0 GEORGE T STAGG 5-2 UNIT 1H P-DP 0.0000000 0.0034293 0.0034293 0.0000000 2,209.87 73.02 1.53 76.96 68.81 1,966.81 0 GEORGIA 39 1 P-DP 0.0000000 0.0023438 0.0023438 0.0000000 349.02 150.56 1.57 77.63 85.32 239.01 0 GERDES UNIT 1H P-DP 0.0000000 0.0176399 0.0176399 0.0000000 1,132.55 169.52 2.33 75.89 166.63 1,120.77 0 GERDES UNIT 2H P-DP 0.0000000 0.0176399 0.0176399 0.0000000 1,157.77 153.23 2.33 75.89 133.26 867.43 0 GERDES UNIT 3H P-DP 0.0000000 0.0176399 0.0176399 0.0000000 1,031.72 149.47 2.33 75.89 144.44 917.10 0 GERDES UNIT 4H P-DP 0.0000000 0.0176399 0.0176399 0.0000000 1,344.57 178.72 2.33 75.89 160.04 1,225.20 0 GERDES UNIT 5H P-DP 0.0000000 0.0176399 0.0176399 0.0000000 1,333.99 199.39 2.33 75.89 153.01 1,089.61 0

LEASE NAME GAS PRC INITIAL GROSS ULTIMATE Mbbl GROSS ULTIMATE MMcf CUM GAS MMcf CUM OIL Mbbl EXPENSE INITIAL DECIMAL INTEREST FINAL DECIMAL REVENUE INITIAL DECIMAL INTEREST FINAL DECIMAL OIL PRC INITIAL $/bbl RES CAT AS OF DATE FIXED COST $/MO As of : 01/01/2024 GROSS ULTIMATE RESERVES, CUMULATIVE PRODUCTION AND BASIC ECONOMIC DATA TABLE 7 GERDES UNIT 6H P-DP 0.0000000 0.0176399 0.0176399 0.0000000 1,392.58 209.61 2.33 75.89 156.48 1,105.46 0 GERDES-LANGHOFF 1L P-DP 0.0000000 0.0140589 0.0140589 0.0000000 2,172.03 334.61 2.33 75.89 248.19 1,607.31 0 GERDES-RATHKAMP 1L P-DP 0.0000000 0.0124533 0.0124533 0.0000000 2,342.32 358.83 2.33 75.89 248.73 1,630.76 0 GILLESPIE UNIT 1H P-DP 0.0000000 0.0262016 0.0262016 0.0000000 452.49 160.73 2.08 75.57 142.36 443.20 0 GILLIHAN 3 P-DP 0.0000000 0.0011141 0.0011141 0.0000000 667.57 15.56 2.37 78.86 15.56 659.13 0 GINGER 22-27 1AH P-DP 0.0000000 0.0009891 0.0009891 0.0000000 1,385.42 633.51 2.37 78.86 422.73 596.21 0 GINGER 22-27 1MS P-DP 0.0000000 0.0009891 0.0009891 0.0000000 176.22 300.11 2.37 78.86 209.83 69.26 0 GINGER 22-27 2AH P-DP 0.0000000 0.0009891 0.0009891 0.0000000 2,050.06 555.23 2.37 78.86 349.17 869.35 0 GINGER 22-27 2SH P-DP 0.0000000 0.0009891 0.0009891 0.0000000 1,835.34 579.04 2.37 78.86 375.31 759.41 0 GIST '4' 1 P-DP 0.0000000 0.0062500 0.0062500 0.0000000 86.57 26.07 2.97 78.55 18.85 59.14 0 GIST '4' 4 P-DP 0.0000000 0.0062500 0.0062500 0.0000000 82.42 40.70 2.97 78.55 25.40 82.42 0 GLASS -Y- 1 P-DP 0.0000000 0.0000860 0.0000860 0.0000000 197.89 132.64 1.57 77.63 90.35 178.50 0 GORDON SE CRC JF 4H P-DP 0.0000000 0.0752589 0.0752589 0.0000000 10,424.07 0.00 2.67 78.22 0.00 9,050.25 0 GORDON SE CRC JF 6H P-DP 0.0000000 0.0752589 0.0752589 0.0000000 10,228.63 0.00 2.67 78.22 0.00 8,621.43 0 GORDON SW CRC JF 2H P-DP 0.0000000 0.0871079 0.0871079 0.0000000 9,164.02 0.00 2.67 78.22 0.00 7,899.19 0 GRAFF 1 P-DP 0.0000000 0.1250000 0.1250000 0.0000000 127.95 0.00 1.77 77.22 0.00 127.95 0 GRANT 18A 4HL P-DP 0.0000000 0.0009554 0.0009554 0.0000000 1,207.82 429.24 2.37 78.86 302.99 704.45 0 GRANT 18B 5HJ P-DP 0.0000000 0.0009509 0.0009509 0.0000000 1,336.72 495.66 2.37 78.86 351.42 594.57 0 GRANT 18B 6HK P-DP 0.0000000 0.0009551 0.0009551 0.0000000 1,770.59 518.55 2.37 78.86 346.09 776.61 0 GREER SIKES 42-41 E 251 P-DP 0.0000000 0.0007224 0.0007224 0.0000000 1,801.26 178.48 1.07 75.95 94.31 559.86 0 GREER SIKES 42-41 F 261 P-DP 0.0000000 0.0007217 0.0007217 0.0000000 5,104.18 245.19 1.07 75.95 98.58 1,242.03 0 GREER SIKES 42-41 F 262 P-DP 0.0000000 0.0007224 0.0007224 0.0000000 2,915.54 363.26 1.07 75.95 163.02 669.12 0 GREER SIKES 42-41 G 271 P-DP 0.0000000 0.0007350 0.0007350 0.0000000 2,855.97 389.77 1.07 75.95 190.42 678.42 0 GREER SIKES 42-41 G 272 P-DP 0.0000000 0.0007347 0.0007347 0.0000000 3,218.95 135.82 1.07 75.95 71.53 751.34 0 GREER SIKES 42-41 H 281 P-DP 0.0000000 0.0007301 0.0007301 0.0000000 1,234.36 126.94 1.07 75.95 73.98 456.13 0 GRIFFIN RANCH UNIT 23-31 1AH P-DP 0.0000000 0.0011956 0.0011956 0.0000000 698.67 702.95 2.37 78.86 393.15 152.87 0 GRIFFIN RANCH UNIT 23-31 1SH P-DP 0.0000000 0.0011956 0.0011956 0.0000000 1,140.10 610.27 2.37 78.86 316.97 355.70 0 GRIFFIN RANCH UNIT 23-31 2AH P-DP 0.0000000 0.0011956 0.0011956 0.0000000 816.63 390.49 2.37 78.86 257.79 300.30 0 GRIFFIN RANCH UNIT 23-31 2SH P-DP 0.0000000 0.0011956 0.0011956 0.0000000 1,573.36 376.44 2.37 78.86 267.62 456.26 0 GRIFFIN RANCH UNIT 23-31 3AH P-DP 0.0000000 0.0011956 0.0011956 0.0000000 1,272.57 588.64 2.37 78.86 347.77 459.82 0 GRIFFIN RANCH UNIT 23-31 3SH P-DP 0.0000000 0.0011956 0.0011956 0.0000000 2,747.97 262.20 2.37 78.86 140.77 811.92 0 GRISWOLD S WYN JF 4H P-DP 0.0000000 0.0365400 0.0365400 0.0000000 13,611.30 0.00 2.67 78.22 0.00 11,459.03 0 GRISWOLD SW WYN JF 2H P-DP 0.0000000 0.0092237 0.0092237 0.0000000 14,275.40 0.00 2.67 78.22 0.00 11,861.29 0 GRISWOLD WYN JF 6H P-DP 0.0000000 0.0740675 0.0740675 0.0000000 9,048.36 0.00 2.67 78.22 0.00 8,015.12 0

LEASE NAME GAS PRC INITIAL GROSS ULTIMATE Mbbl GROSS ULTIMATE MMcf CUM GAS MMcf CUM OIL Mbbl EXPENSE INITIAL DECIMAL INTEREST FINAL DECIMAL REVENUE INITIAL DECIMAL INTEREST FINAL DECIMAL OIL PRC INITIAL $/bbl RES CAT AS OF DATE FIXED COST $/MO As of : 01/01/2024 GROSS ULTIMATE RESERVES, CUMULATIVE PRODUCTION AND BASIC ECONOMIC DATA TABLE 7 GRISWOLD WYN JF 8H P-DP 0.0000000 0.0740675 0.0740675 0.0000000 9,990.38 0.00 2.67 78.22 0.00 8,274.60 0 GRIZZLY BEAR 7780 2U A 2H P-DP 0.0000000 0.0006487 0.0006487 0.0000000 1,419.05 356.23 1.53 76.96 295.07 1,011.41 0 GRIZZLY BEAR 7780 3U A 3H P-DP 0.0000000 0.0006490 0.0006490 0.0000000 1,685.03 224.28 1.53 76.96 191.63 1,110.25 0 GRIZZLY BEAR 7780 4U A 4H P-DP 0.0000000 0.0006540 0.0006540 0.0000000 2,546.00 413.41 1.53 76.96 309.88 1,274.74 0 GRIZZLY BEAR 7780 5U A 5H P-DP 0.0000000 0.0006460 0.0006460 0.0000000 1,226.58 206.33 1.53 76.96 177.49 897.27 0 GRIZZLY BEAR 7780 6U A 6H P-DP 0.0000000 0.0006488 0.0006488 0.0000000 2,113.93 477.68 1.53 76.96 376.40 1,326.78 0 GRIZZLY SOUTH 7673 A 1H P-DP 0.0000000 0.0019953 0.0019953 0.0000000 1,268.78 471.46 1.53 76.96 471.46 1,268.78 0 GRIZZLY SOUTH 7673 A 3H P-DP 0.0000000 0.0019953 0.0019953 0.0000000 1,060.66 373.18 1.53 76.96 197.70 489.06 0 GRIZZLY SOUTH 7673 A 5H P-DP 0.0000000 0.0019953 0.0019953 0.0000000 1,658.87 398.04 1.53 76.96 256.03 836.13 0 GRIZZLY SOUTH 7673 A 8H P-DP 0.0000000 0.0019953 0.0019953 0.0000000 2,356.39 605.72 1.53 76.96 357.81 1,180.75 0 GRIZZLY SOUTH 7673 B 2H P-DP 0.0000000 0.0019953 0.0019953 0.0000000 1,670.32 726.79 1.53 76.96 626.56 1,539.65 0 GRIZZLY SOUTH 7673 B 4H P-DP 0.0000000 0.0019953 0.0019953 0.0000000 1,041.52 164.95 1.53 76.96 111.31 661.73 0 GRIZZLY SOUTH 7673 B 6H P-DP 0.0000000 0.0019953 0.0019953 0.0000000 2,128.37 355.48 1.53 76.96 207.02 1,054.92 0 GRIZZLY WEST 77 1H P-DP 0.0000000 0.0010076 0.0010076 0.0000000 1,799.48 376.86 1.53 76.96 300.49 1,004.58 0 GRIZZLY WEST 77 A 3H P-DP 0.0000000 0.0010076 0.0010076 0.0000000 839.22 204.86 1.53 76.96 161.00 740.95 0 GRIZZLY WEST 77 C 2H P-DP 0.0000000 0.0010076 0.0010076 0.0000000 897.46 161.47 1.53 76.96 119.72 701.17 0 GUARDIAN UNIT 12-22 4AH P-DP 0.0000000 0.0010763 0.0010763 0.0000000 790.90 469.23 2.37 78.86 59.07 44.46 0 GUARDIAN UNIT 12-22 4SH P-DP 0.0000000 0.0010763 0.0010763 0.0000000 1,150.23 517.27 2.37 78.86 17.67 13.10 0 GUARDIAN UNIT 21-24 5AH P-DP 0.0000000 0.0010763 0.0010763 0.0000000 1,222.90 533.13 2.37 78.86 230.23 249.99 0 GUARDIAN UNIT 21-24 5SH P-DP 0.0000000 0.0010763 0.0010763 0.0000000 1,312.69 612.22 2.37 78.86 188.98 248.03 0 GUARDIAN UNIT 21-24 6AH P-DP 0.0000000 0.0010763 0.0010763 0.0000000 351.53 272.83 2.37 78.86 204.36 203.64 0 GUARDIAN UNIT 21-24 6SH P-DP 0.0000000 0.0004382 0.0004382 0.0000000 519.49 288.86 2.37 78.86 139.37 197.40 0 GUITAR 11 1 P-DP 0.0000000 0.0041667 0.0041667 0.0000000 88.26 44.40 2.37 78.86 43.84 81.98 0 GUITAR 11 2 P-DP 0.0000000 0.0031250 0.0031250 0.0000000 73.57 40.23 2.37 78.86 40.23 73.57 0 GUITAR 13 1 P-DP 0.0000000 0.0041111 0.0041111 0.0000000 158.12 62.63 2.37 78.86 61.75 151.38 0 GUNNER C 3LS P-DP 0.0000000 0.0000389 0.0000389 0.0000000 903.95 336.74 2.37 78.86 36.75 34.14 0 GUNNER C 4A P-DP 0.0000000 0.0000389 0.0000389 0.0000000 593.30 408.52 2.37 78.86 75.39 44.42 0 GUNNER D 5MS P-DP 0.0000000 0.0000389 0.0000389 0.0000000 464.54 222.23 2.37 78.86 18.53 16.41 0 GUNNER D 6LS P-DP 0.0000000 0.0000389 0.0000389 0.0000000 522.99 324.73 2.37 78.86 48.33 35.67 0 GUNSLINGER UNIT L 4H P-DP 0.0000000 0.0002894 0.0002894 0.0000000 621.89 573.93 2.37 78.86 374.63 308.64 0 GUNSMOKE 1-40 A 1JM P-DP 0.0000000 0.0016151 0.0016151 0.0000000 1,444.93 590.54 1.57 77.63 285.93 486.80 0 GUNSMOKE 1-40 B 2LS P-DP 0.0000000 0.0016244 0.0016244 0.0000000 1,278.01 470.93 1.57 77.63 252.64 373.09 0 GUNSMOKE 1-40 C 3WA P-DP 0.0000000 0.0016160 0.0016160 0.0000000 1,860.35 647.75 1.57 77.63 355.65 538.27 0 GUNSMOKE 1-40 D 4WA P-DP 0.0000000 0.0016110 0.0016110 0.0000000 1,460.08 569.33 1.57 77.63 372.87 678.84 0

LEASE NAME GAS PRC INITIAL GROSS ULTIMATE Mbbl GROSS ULTIMATE MMcf CUM GAS MMcf CUM OIL Mbbl EXPENSE INITIAL DECIMAL INTEREST FINAL DECIMAL REVENUE INITIAL DECIMAL INTEREST FINAL DECIMAL OIL PRC INITIAL $/bbl RES CAT AS OF DATE FIXED COST $/MO As of : 01/01/2024 GROSS ULTIMATE RESERVES, CUMULATIVE PRODUCTION AND BASIC ECONOMIC DATA TABLE 7 GUNSMOKE 40-1 E 5JM P-DP 0.0000000 0.0016151 0.0016151 0.0000000 875.37 482.89 1.57 77.63 273.46 369.77 0 GUNSMOKE 40-1 F 6LS P-DP 0.0000000 0.0016356 0.0016356 0.0000000 824.25 427.37 1.57 77.63 214.91 356.10 0 GUNSMOKE 40-1 G 7WA P-DP 0.0000000 0.0016350 0.0016350 0.0000000 2,340.56 677.09 1.57 77.63 369.36 750.37 0 GUNSMOKE 40-1 H 8WB P-DP 0.0000000 0.0016357 0.0016357 0.0000000 1,298.10 393.08 1.57 77.63 211.34 608.37 0 GUNSMOKE 40-1 I 9LS P-DP 0.0000000 0.0016283 0.0016283 0.0000000 651.55 536.88 1.57 77.63 273.63 233.74 0 GUNSMOKE 40-1 J 10WA P-DP 0.0000000 0.0016353 0.0016353 0.0000000 2,695.02 658.36 1.57 77.63 447.60 920.48 0 GUNSMOKE 40-1 K 11WB P-DP 0.0000000 0.0016350 0.0016350 0.0000000 1,354.63 368.24 1.57 77.63 211.39 545.76 0 GUY COWDEN UNIT 2 2505BH P-DP 0.0000000 0.0005088 0.0005088 0.0000000 694.94 224.08 2.32 78.93 177.25 581.41 0 GUY COWDEN UNIT 2 2506BH P-DP 0.0000000 0.0005088 0.0005088 0.0000000 3,927.87 336.11 2.32 78.93 280.57 2,361.73 0 GUY COWDEN UNIT 2 2507BH P-DP 0.0000000 0.0005088 0.0005088 0.0000000 1,025.58 118.94 2.32 78.93 87.09 806.60 0 GUY COWDEN UNIT 2 2508BH P-DP 0.0000000 0.0005088 0.0005088 0.0000000 6,883.79 624.61 2.32 78.93 475.08 4,464.39 0 GUY COWDEN UNIT 2 2515AH P-DP 0.0000000 0.0005088 0.0005088 0.0000000 507.80 154.82 2.32 78.93 141.50 467.53 0 GUY COWDEN UNIT 2 2516AH P-DP 0.0000000 0.0005088 0.0005088 0.0000000 1,978.21 297.73 2.32 78.93 229.72 1,606.64 0 GUY COWDEN UNIT 2 2517AH P-DP 0.0000000 0.0005088 0.0005088 0.0000000 1,671.44 200.01 2.32 78.93 155.41 1,353.18 0 GUY COWDEN UNIT 2 2518AH P-DP 0.0000000 0.0005088 0.0005088 0.0000000 1,485.56 1,146.53 2.32 78.93 789.54 1,007.24 0 HA RA SU77;LEE 25-36 HC 001-ALT P-DP 0.0000000 0.0092009 0.0092009 0.0000000 6,396.30 0.00 2.52 69.04 0.00 5,224.31 0 HA RA SU98;ONEAL 8&17-14-16 HC 001-ALT P-DP 0.0000000 0.0007335 0.0007335 0.0000000 15,437.14 0.00 2.65 78.22 0.00 9,725.05 0 HA RA SU98;ONEAL 8&17-14-16 HC 002-ALT P-DP 0.0000000 0.0007318 0.0007318 0.0000000 15,124.54 0.00 2.65 78.22 0.00 6,909.25 0 HA RA SU98;PACE 8-14-16 H 001 P-DP 0.0000000 0.0014598 0.0014598 0.0000000 5,328.47 0.00 2.65 78.22 0.00 4,592.70 0 HA RA SUA;GOLSON 36-25 HC 001-ALT P-DP 0.0000000 0.0889716 0.0889716 0.0000000 7,656.42 0.00 2.64 69.05 0.00 4,516.00 0 HA RA SUA;GOLSON 36-25 HC 002-ALT P-DP 0.0000000 0.0891294 0.0891294 0.0000000 6,812.41 0.00 2.64 69.05 0.00 3,683.51 0 HA RA SUA;WIGGINS 36-25 HC 001 P-DP 0.0000000 0.0493230 0.0493230 0.0000000 11,421.86 0.00 2.64 69.05 0.00 10,580.90 0 HA RA SUB;LAWSON 31-30 HC 001-ALT P-DP 0.0000000 0.0099298 0.0099298 0.0000000 14,393.72 0.00 2.64 69.05 0.00 12,826.78 0 HA RA SUB;LAWSON 31-30-19 HC 002-ALT P-DP 0.0000000 0.0073240 0.0073240 0.0000000 16,840.93 0.00 2.64 69.05 0.00 15,480.18 0 HA RA SUB;LAWSON 31-30-19 HC 003-ALT P-DP 0.0000000 0.0073300 0.0073300 0.0000000 19,185.99 0.00 2.64 69.05 0.00 16,699.08 0 HA RA SUL;L & L INV 18-19 HC 001-ALT P-DP 0.0000000 0.0012590 0.0012590 0.0000000 10,696.20 0.00 2.64 69.05 0.00 9,589.02 0 HA RA SUL;L & L INV 18-19 HC 002-ALT P-DP 0.0000000 0.0013872 0.0013872 0.0000000 13,155.72 0.00 2.64 69.05 0.00 10,933.24 0 HA RA SUL;SCHION 18-19 HC 001-ALT P-DP 0.0000000 0.0078136 0.0078136 0.0000000 14,025.38 0.00 2.64 69.05 0.00 10,838.23 0 HA RA SUS;MJR FAMLLC21-28-33HC 001-ALT P-DP 0.0000000 0.1163630 0.1163630 0.0000000 9,073.39 0.00 2.64 69.05 0.00 6,143.26 0 HA RA SUS;MJR FAMLLC21-28-33HC 002-ALT P-DP 0.0000000 0.1077978 0.1077978 0.0000000 20,515.83 0.00 2.64 69.05 0.00 11,399.86 0 HA RA SUS;POOLE-DRAKE 21 H 001 P-DP 0.0000000 0.1177174 0.1177174 0.0000000 11,118.77 0.00 2.64 69.05 0.00 8,474.60 0 HA RA SUSS;JORDAN 16-21 HC 001-ALT P-DP 0.0000000 0.0004531 0.0004531 0.0000000 9,081.43 0.00 2.99 78.22 0.00 9,052.54 0 HA RA SUTT;BSMC LA 21 HZ 001 P-DP 0.0000000 0.0006879 0.0006879 0.0000000 3,977.27 0.00 2.99 78.22 0.00 3,849.80 0 HA RA SUZ;GLOVER 20 001 P-DP 0.0000000 0.0078075 0.0078075 0.0000000 11,201.05 0.00 2.64 69.05 0.00 11,201.05 0

LEASE NAME GAS PRC INITIAL GROSS ULTIMATE Mbbl GROSS ULTIMATE MMcf CUM GAS MMcf CUM OIL Mbbl EXPENSE INITIAL DECIMAL INTEREST FINAL DECIMAL REVENUE INITIAL DECIMAL INTEREST FINAL DECIMAL OIL PRC INITIAL $/bbl RES CAT AS OF DATE FIXED COST $/MO As of : 01/01/2024 GROSS ULTIMATE RESERVES, CUMULATIVE PRODUCTION AND BASIC ECONOMIC DATA TABLE 7 HA RA SUZ;GLOVER 20 002-ALT P-DP 0.0000000 0.0078075 0.0078075 0.0000000 9,175.79 0.00 2.64 69.05 0.00 8,011.50 0 HA RA SUZ;GLOVER 20 003-ALT P-DP 0.0000000 0.0078075 0.0078075 0.0000000 10,157.40 0.00 2.64 69.05 0.00 9,093.23 0 HA RA SUZ;JUNCACEAE 20 001-ALT P-DP 0.0000000 0.0078075 0.0078075 0.0000000 7,685.92 0.00 2.64 69.05 0.00 7,685.92 0 HA RA SUZ;JUNCACEAE 20 002-ALT P-DP 0.0000000 0.0078075 0.0078075 0.0000000 7,031.39 0.00 2.64 69.05 0.00 6,669.27 0 HA RA SUZ;JUNCACEAE 20 003-ALT P-DP 0.0000000 0.0078075 0.0078075 0.0000000 11,879.41 0.00 2.64 69.05 0.00 11,659.51 0 HA RB SU69;NAC ROYALTY 33 H 001 P-DP 0.0000000 0.0792500 0.0792500 0.0000000 9,966.61 0.00 2.64 69.05 0.00 6,258.82 0 HA RB SU77;NAC ROYALTY 27-41HC 002-ALT P-DP 0.0000000 0.0412007 0.0412007 0.0000000 17,609.67 0.00 2.64 69.05 0.00 3,055.50 0 HA RB SU77;WAHL 27 H 001 P-DP 0.0000000 0.0428300 0.0428300 0.0000000 4,723.24 0.00 2.64 69.05 0.00 4,723.24 0 HA RB SU90;BYU PIERRE29-12-10H 001-ALT P-DP 0.0000000 0.0375773 0.0375773 0.0000000 10,866.86 0.00 2.64 69.05 0.00 9,133.20 0 HA RB SU90;BYU PIERRE29-12-10H 002-ALT P-DP 0.0000000 0.0375773 0.0375773 0.0000000 6,987.91 0.00 2.64 69.05 0.00 5,613.51 0 HA RB SU90;NRG 29-12-10 H 001 P-DP 0.0000000 0.0375773 0.0375773 0.0000000 9,295.42 0.00 2.64 69.05 0.00 8,646.91 0 HA RB SU90;NRG 29-12-10 H 002-ALT P-DP 0.0000000 0.0375773 0.0375773 0.0000000 15,991.30 0.00 2.64 69.05 0.00 14,987.03 0 HA RB SU90;NRG 29-12-10 H 003-ALT P-DP 0.0000000 0.0375773 0.0375773 0.0000000 13,296.58 0.00 2.64 69.05 0.00 7,218.49 0 HA RB SU90;NRG 29-12-10 H 004-ALT P-DP 0.0000000 0.0375773 0.0375773 0.0000000 8,746.27 0.00 2.64 69.05 0.00 7,176.57 0 HA RB SU92;NAC ROYALTY 34 H 001 P-DP 0.0000000 0.1572809 0.1572809 0.0000000 1,241.29 0.00 2.64 69.05 0.00 1,241.29 0 HA RB SU92;NAC ROYALTY 34 H 002-ALT P-DP 0.0000000 0.1572810 0.1572810 0.0000000 17,005.51 0.00 2.64 69.05 0.00 2,422.00 0 HA RB SU92;NAC ROYALTY 34 H 003-ALT P-DP 0.0000000 0.1572810 0.1572810 0.0000000 12,486.57 0.00 2.64 69.05 0.00 2,008.72 0 HA RB SUZZ;BIER 15&10-11-10 HC P-DP 0.0000000 0.0007500 0.0007500 0.0000000 25,096.04 0.00 2.99 78.22 0.00 13,398.86 0 HALL 18 1 P-DP 0.0000000 0.0011905 0.0011905 0.0000000 167.81 40.86 2.37 78.86 30.61 167.66 0 HALL 18 2 P-DP 0.0000000 0.0011905 0.0011905 0.0000000 31.62 16.98 2.37 78.86 16.00 31.60 0 HALL 18 3 P-DP 0.0000000 0.0011905 0.0011905 0.0000000 39.81 10.77 2.37 78.86 10.56 39.75 0 HALL 18 4 P-DP 0.0000000 0.0011905 0.0011905 0.0000000 6.41 5.00 2.37 78.86 5.00 6.41 0 HALL TRUST 38 1 P-DP 0.0000000 0.0039063 0.0039063 0.0000000 292.26 188.34 1.57 77.63 156.55 273.97 0 HALL TRUST 38 2 P-DP 0.0000000 0.0039063 0.0039063 0.0000000 255.92 105.15 1.57 77.63 98.91 252.07 0 HALL-PORTER 621-596 A 112 P-DP 0.0000000 0.0014830 0.0014830 0.0000000 176.93 83.56 2.32 78.93 50.24 101.83 0 HALL-PORTER 621-596 A 211 P-DP 0.0000000 0.0014830 0.0014830 0.0000000 297.40 134.49 2.32 78.93 77.84 180.36 0 HALL-PORTER 621-596 B 122 P-DP 0.0000000 0.0014830 0.0014830 0.0000000 292.94 123.27 2.32 78.93 74.09 155.28 0 HALL-PORTER 621-596 B 221 P-DP 0.0000000 0.0014830 0.0014830 0.0000000 275.19 126.64 2.32 78.93 77.47 170.12 0 HALL-PORTER 621-596 B 224 P-DP 0.0000000 0.0014830 0.0014830 0.0000000 302.92 134.53 2.32 78.93 84.15 188.38 0 HALL-PORTER 621-596 C 132 P-DP 0.0000000 0.0014830 0.0014830 0.0000000 262.80 127.19 2.32 78.93 72.74 150.09 0 HALL-PORTER 621-596 C 231R P-DP 0.0000000 0.0007406 0.0007406 0.0000000 292.31 110.72 2.32 78.93 85.99 192.69 0 HALL-PORTER 621-596 C 233 P-DP 0.0000000 0.0014830 0.0014830 0.0000000 271.43 104.47 2.32 78.93 75.94 167.04 0 HALL-PORTER 621-596 D 142 P-DP 0.0000000 0.0008464 0.0008464 0.0000000 5,246.74 823.80 2.32 78.93 540.07 3,128.13 0

LEASE NAME GAS PRC INITIAL GROSS ULTIMATE Mbbl GROSS ULTIMATE MMcf CUM GAS MMcf CUM OIL Mbbl EXPENSE INITIAL DECIMAL INTEREST FINAL DECIMAL REVENUE INITIAL DECIMAL INTEREST FINAL DECIMAL OIL PRC INITIAL $/bbl RES CAT AS OF DATE FIXED COST $/MO As of : 01/01/2024 GROSS ULTIMATE RESERVES, CUMULATIVE PRODUCTION AND BASIC ECONOMIC DATA TABLE 7 HALL-PORTER 621-596 D 241 P-DP 0.0000000 0.0008464 0.0008464 0.0000000 304.90 141.16 2.32 78.93 83.76 189.44 0 HARGROVE, BETTY 1 P-DP 0.0000000 0.0159713 0.0159713 0.0000000 1,792.26 0.00 1.53 76.96 0.00 1,792.26 0 HARPER-BAYES 16 1 P-DP 0.0000000 0.0003720 0.0003720 0.0000000 169.75 151.18 1.57 77.63 90.56 151.81 0 HAWKS 55-1-28 UNIT 1H P-DP 0.0000000 0.0000624 0.0000624 0.0000000 3,739.29 751.96 2.70 78.79 524.01 2,464.26 0 HENDERSHOT 210471 1A P-DP 0.0000000 0.0003040 0.0003040 0.0000000 15,800.06 0.00 2.36 78.22 0.00 11,099.77 0 HENDERSHOT 210471 2B P-DP 0.0000000 0.0003040 0.0003040 0.0000000 16,476.96 0.00 2.36 78.22 0.00 11,200.79 0 HEREFORD 29 20 W1NC STATE COM 001H P-DP 0.0000000 0.0049500 0.0049500 0.0000000 438.26 567.58 2.04 78.21 290.69 201.50 0 HIGGINBOTHAM UNIT A 30-18 2AH P-DP 0.0000000 0.0011513 0.0011513 0.0000000 2,054.21 525.01 3.53 76.99 372.53 1,085.62 0 HIGGINBOTHAM UNIT A 30-18 3AH P-DP 0.0000000 0.0011513 0.0011513 0.0000000 146.63 326.22 3.53 76.99 226.95 54.52 0 HIGGINBOTHAM UNIT A 30-18 4AH P-DP 0.0000000 0.0011513 0.0011513 0.0000000 216.05 424.50 3.53 76.99 339.26 142.87 0 HIGGINBOTHAM UNIT B 30-19 1H P-DP 0.0000000 0.0013528 0.0013528 0.0000000 232.83 531.44 3.53 76.99 362.42 129.46 0 HIGGINBOTHAM UNIT B 30-19 7AH P-DP 0.0000000 0.0013528 0.0013528 0.0000000 1,077.01 214.83 3.53 76.99 162.05 503.16 0 HIGGINBOTHAM UNIT C 30-18 5AH P-DP 0.0000000 0.0011504 0.0011504 0.0000000 819.79 296.17 3.53 76.99 197.81 290.97 0 HIGGINBOTHAM UNIT C 30-18 6AH P-DP 0.0000000 0.0011504 0.0011504 0.0000000 730.36 306.44 3.53 76.99 194.01 281.56 0 HOCHSTETLER 7-11-5 5H P-DP 0.0000000 0.0147059 0.0147059 0.0000000 11,885.70 53.97 2.75 68.45 53.06 7,814.81 0 HOERMANN UNIT 1H P-DP 0.0000000 0.0100962 0.0100962 0.0000000 849.22 150.83 2.33 75.89 150.46 847.07 0 HOERMANN UNIT 2H P-DP 0.0000000 0.0100962 0.0100962 0.0000000 1,200.60 194.78 2.33 75.89 178.58 1,125.68 0 HOERMANN UNIT 3H P-DP 0.0000000 0.0100962 0.0100962 0.0000000 2,401.16 369.17 2.33 75.89 267.50 1,907.24 0 HOERMANN UNIT 4H P-DP 0.0000000 0.0100962 0.0100962 0.0000000 1,739.15 315.42 2.33 75.89 235.93 1,441.31 0 HOERMANN-KOLM 1H P-DP 0.0000000 0.0017240 0.0017240 0.0000000 2,036.41 487.71 2.33 75.89 186.63 608.72 0 HOERMANN-KOLM 201H P-DP 0.0000000 0.0029044 0.0029044 0.0000000 1,210.14 203.04 2.33 75.89 64.81 333.44 0 HOERMANN-LANGHOFF B 1H P-DP 0.0000000 0.0038966 0.0038966 0.0000000 1,479.55 459.01 2.33 75.89 101.49 355.38 0 HOERMANN-LANGHOFF B 201H P-DP 0.0000000 0.0053335 0.0053335 0.0000000 402.79 329.93 2.33 75.89 51.33 57.03 0 HOERMANN-LANGHOFF B A 2H P-DP 0.0000000 0.0040907 0.0040907 0.0000000 753.82 160.84 2.33 75.89 39.45 139.57 0 HOFFERKAMP 1 P-DP 0.0000000 0.0002581 0.0002581 0.0000000 329.45 119.63 2.32 78.93 97.48 263.92 0 HORNSILVER 1H P-DP 0.0000000 0.0001203 0.0001203 0.0000000 6,155.95 449.97 1.38 77.44 288.63 3,784.73 0 HOUSE 47 1 P-DP 0.0000000 0.0156250 0.0156250 0.0000000 270.05 168.08 2.32 78.93 142.43 239.54 0 HUBBARD 18-B 2 P-DP 0.0000000 0.0023148 0.0023148 0.0000000 166.91 85.22 2.97 78.55 35.22 166.91 0 HULING 'A' 18-7 ESL (ALLOC) 1HA P-DP 0.0000000 0.0004419 0.0004419 0.0000000 1,008.04 255.42 2.97 78.55 168.66 714.83 0 HULING 'D' 18-7 ESL (ALLOC) 4HS P-DP 0.0000000 0.0004425 0.0004425 0.0000000 332.63 116.70 2.97 78.55 104.79 270.11 0 HULING 7-19 B 221 P-DP 0.0000000 0.0004340 0.0004340 0.0000000 1,005.15 227.50 2.97 78.55 68.38 96.84 0 HULING 7-19 D 241 P-DP 0.0000000 0.0004340 0.0004340 0.0000000 166.84 181.50 2.97 78.55 62.59 57.74 0 HYDEN 47-35 1H P-DP 0.0000000 0.0015803 0.0015803 0.0000000 910.79 440.19 2.37 78.86 364.16 372.00 0 HYDEN UNIT 47-35 1SH P-DP 0.0000000 0.0015803 0.0015803 0.0000000 188.06 166.23 2.37 78.86 76.04 56.49 0

LEASE NAME GAS PRC INITIAL GROSS ULTIMATE Mbbl GROSS ULTIMATE MMcf CUM GAS MMcf CUM OIL Mbbl EXPENSE INITIAL DECIMAL INTEREST FINAL DECIMAL REVENUE INITIAL DECIMAL INTEREST FINAL DECIMAL OIL PRC INITIAL $/bbl RES CAT AS OF DATE FIXED COST $/MO As of : 01/01/2024 GROSS ULTIMATE RESERVES, CUMULATIVE PRODUCTION AND BASIC ECONOMIC DATA TABLE 7 HYDEN UNIT 47-35 2AH P-DP 0.0000000 0.0015803 0.0015803 0.0000000 370.69 447.11 2.37 78.86 197.50 127.38 0 HYDEN UNIT 47-35 2SH P-DP 0.0000000 0.0015803 0.0015803 0.0000000 328.14 331.75 2.37 78.86 138.22 106.61 0 HYDEN UNIT 47-35 3AH P-DP 0.0000000 0.0015803 0.0015803 0.0000000 395.57 634.99 2.37 78.86 285.24 155.96 0 HYDRA 45-4 UNIT 1 112 P-DP 0.0000000 0.0007586 0.0007586 0.0000000 1,059.73 359.70 1.57 77.63 205.47 440.60 0 HYDRA 45-4 UNIT 1 122 P-DP 0.0000000 0.0007586 0.0007586 0.0000000 855.45 301.45 1.57 77.63 168.58 362.05 0 HYDRA 45-4 UNIT 1 124 P-DP 0.0000000 0.0007586 0.0007586 0.0000000 1,329.57 502.34 1.57 77.63 272.09 554.29 0 HYDRA 45-4 UNIT 1 132 P-DP 0.0000000 0.0007586 0.0007586 0.0000000 1,638.04 541.06 1.57 77.63 308.48 692.04 0 HYDRA 45-4 UNIT 1 142 P-DP 0.0000000 0.0007586 0.0007586 0.0000000 1,012.65 310.46 1.57 77.63 176.82 426.88 0 HYDRA 45-4 UNIT 1 211 P-DP 0.0000000 0.0007586 0.0007586 0.0000000 1,180.95 406.14 1.57 77.63 232.00 495.05 0 HYDRA 45-4 UNIT 1 221 P-DP 0.0000000 0.0007586 0.0007586 0.0000000 557.08 741.37 1.57 77.63 416.08 195.64 0 HYDRA 45-4 UNIT 1 223 P-DP 0.0000000 0.0007586 0.0007586 0.0000000 1,311.85 461.59 1.57 77.63 262.29 551.46 0 HYDRA 45-4 UNIT 1 231 P-DP 0.0000000 0.0007586 0.0007586 0.0000000 847.33 317.57 1.57 77.63 183.78 344.94 0 HYDRA 45-4 UNIT 1 241 P-DP 0.0000000 0.0007586 0.0007586 0.0000000 1,792.83 571.71 1.57 77.63 330.74 699.53 0 HYDRA 45-4 UNIT 2 151 P-DP 0.0000000 0.0007566 0.0007566 0.0000000 1,182.74 372.31 1.57 77.63 164.60 260.00 0 HYDRA 45-4 UNIT 2 161 P-DP 0.0000000 0.0007566 0.0007566 0.0000000 1,497.05 230.78 1.57 77.63 102.77 173.56 0 HYDRA 45-4 UNIT 2 164 P-DP 0.0000000 0.0007566 0.0007566 0.0000000 1,680.43 464.23 1.57 77.63 203.63 289.06 0 HYDRA 45-4 UNIT 2 171 P-DP 0.0000000 0.0007566 0.0007566 0.0000000 1,182.60 189.00 1.57 77.63 85.17 140.01 0 HYDRA 45-4 UNIT 2 173 P-DP 0.0000000 0.0007566 0.0007566 0.0000000 1,383.49 544.36 1.57 77.63 241.93 228.28 0 HYDRA 45-4 UNIT 2 181 P-DP 0.0000000 0.0007566 0.0007566 0.0000000 1,453.40 203.25 1.57 77.63 90.82 168.43 0 HYDRA 45-4 UNIT 2 262 P-DP 0.0000000 0.0007566 0.0007566 0.0000000 1,411.52 526.18 1.57 77.63 204.32 273.70 0 HYDRA 45-4 UNIT 2 263 P-DP 0.0000000 0.0007566 0.0007566 0.0000000 1,601.38 92.74 1.57 77.63 36.83 248.23 0 HYDRA 45-4 UNIT 2 272 P-DP 0.0000000 0.0007566 0.0007566 0.0000000 1,612.77 415.16 1.57 77.63 183.48 253.70 0 HYDRA 45-4 UNIT 2 274 P-DP 0.0000000 0.0007566 0.0007566 0.0000000 2,033.29 146.85 1.57 77.63 57.18 287.67 0 HYDRA 45-4 UNIT 2 282 P-DP 0.0000000 0.0007566 0.0007566 0.0000000 1,405.36 454.68 1.57 77.63 198.27 277.67 0 JACKSON A 34-166-175 5201H P-DP 0.0000000 0.0000000 0.0000000 0.0000000 878.01 470.99 1.38 77.44 339.89 716.09 0 JANAK UNIT 1H P-DP 0.0000000 0.0251620 0.0251620 0.0000000 649.38 97.46 2.33 75.89 95.34 636.21 0 JANAK UNIT 3H P-DP 0.0000000 0.0251620 0.0251620 0.0000000 1,001.29 104.31 2.33 75.89 90.25 953.62 0 JANAK UNIT 4H P-DP 0.0000000 0.0251620 0.0251620 0.0000000 1,411.06 144.93 2.33 75.89 126.11 1,240.52 0 JANAK UNIT 5H P-DP 0.0000000 0.0251620 0.0251620 0.0000000 1,223.85 120.65 2.33 75.89 106.06 1,091.34 0 JANAK UNIT 7L P-DP 0.0000000 0.0251620 0.0251620 0.0000000 629.93 66.95 2.33 75.89 53.36 514.62 0 JANAK-LOOS 6L P-DP 0.0000000 0.0180519 0.0180519 0.0000000 1,069.58 120.81 2.33 75.89 91.72 879.86 0 JH SELMAN ALLOCATION A 26-35 1HA P-DP 0.0000000 0.0004050 0.0004050 0.0000000 178.07 212.39 3.53 76.99 72.96 40.71 0 JH SELMAN ALLOCATION B 26-35 5LS P-DP 0.0000000 0.0004050 0.0004050 0.0000000 66.34 83.19 3.53 76.99 29.85 23.33 0 JIM TOM 1 P-DP 0.0000000 0.0077294 0.0077294 0.0000000 372.84 90.81 1.57 77.63 87.79 368.54 0

LEASE NAME GAS PRC INITIAL GROSS ULTIMATE Mbbl GROSS ULTIMATE MMcf CUM GAS MMcf CUM OIL Mbbl EXPENSE INITIAL DECIMAL INTEREST FINAL DECIMAL REVENUE INITIAL DECIMAL INTEREST FINAL DECIMAL OIL PRC INITIAL $/bbl RES CAT AS OF DATE FIXED COST $/MO As of : 01/01/2024 GROSS ULTIMATE RESERVES, CUMULATIVE PRODUCTION AND BASIC ECONOMIC DATA TABLE 7 JMW NAIL 10 1 P-DP 0.0000000 0.0002151 0.0002151 0.0000000 163.76 66.02 1.57 77.63 63.57 131.18 0 JMW NAIL 10 2 P-DP 0.0000000 0.0002151 0.0002151 0.0000000 145.91 37.61 1.57 77.63 34.87 116.53 0 JMW NAIL 10A 3 P-DP 0.0000000 0.0002151 0.0002151 0.0000000 162.84 43.11 1.57 77.63 37.04 114.13 0 JMW NAIL 10A 4 P-DP 0.0000000 0.0002151 0.0002151 0.0000000 181.56 59.26 1.57 77.63 45.61 115.31 0 JOHN F FERGUSON 1 P-DP 0.0000000 0.1100000 0.1100000 0.0000000 217.42 0.00 1.77 77.22 0.00 217.42 0 JOHN F FERGUSON 2 P-DP 0.0000000 0.1100000 0.1100000 0.0000000 291.49 0.00 1.77 77.22 0.00 291.49 0 JOHN F. FERGUSON 3 P-DP 0.0000000 0.0736450 0.0736450 0.0000000 268.06 0.00 1.77 77.22 0.00 268.06 0 JOHN F. FERGUSON 4 P-DP 0.0000000 0.0054340 0.0054340 0.0000000 313.74 0.00 1.77 77.22 0.00 313.74 0 JOTUNN UNIT A 25-24 3AH P-DP 0.0000000 0.0015623 0.0015623 0.0000000 934.99 276.22 3.53 76.99 197.24 377.58 0 JOTUNN UNIT A 25-24 4AH P-DP 0.0000000 0.0015623 0.0015623 0.0000000 757.34 461.51 3.53 76.99 302.17 278.05 0 JOTUNN UNIT A 25-24 5AH P-DP 0.0000000 0.0015623 0.0015623 0.0000000 940.16 339.60 3.53 76.99 253.45 453.97 0 JOTUNN UNIT B 25-13 6AH P-DP 0.0000000 0.0012787 0.0012787 0.0000000 1,232.68 508.21 3.53 76.99 329.14 376.11 0 JOTUNN UNIT B 25-13 7AH P-DP 0.0000000 0.0012787 0.0012787 0.0000000 1,371.92 382.24 3.53 76.99 252.09 433.90 0 JOYCE 1 P-DP 0.0000000 0.1100000 0.1100000 0.0000000 328.77 0.00 1.77 77.22 0.00 328.77 0 JUDY '16' 1 P-DP 0.0000000 0.0003348 0.0003348 0.0000000 174.57 72.39 1.57 77.63 53.89 174.57 0 JUR RA SUG;OLYMPIA MIN 30 H 001 P-DP 0.0000000 0.0026730 0.0026730 0.0000000 7,272.59 0.00 2.44 78.22 0.00 7,208.75 0 KAISER UNIT 1H P-DP 0.0000000 0.0189370 0.0189370 0.0000000 1,090.15 95.62 2.33 75.89 88.68 1,033.70 0 KAISER UNIT 4H P-DP 0.0000000 0.0189370 0.0189370 0.0000000 1,240.20 112.96 2.33 75.89 99.63 1,079.12 0 KAISER UNIT 5H P-DP 0.0000000 0.0189370 0.0189370 0.0000000 1,471.91 129.78 2.33 75.89 108.25 1,304.73 0 KEELINE 2-13 P-DP 0.0000000 0.0139482 0.0139482 0.0000000 1,299.23 142.91 4.94 77.99 126.20 1,196.22 0 KEMPER 16 1 P-DP 0.0000000 0.0003348 0.0003348 0.0000000 116.36 62.49 1.57 77.63 48.46 115.70 0 KEMPER 16 2 P-DP 0.0000000 0.0003348 0.0003348 0.0000000 138.14 43.13 1.57 77.63 38.65 137.52 0 KEMPER 16A 1 P-DP 0.0000000 0.0003348 0.0003348 0.0000000 435.30 33.07 1.57 77.63 32.29 415.81 0 KEMPER 16A 3 P-DP 0.0000000 0.0003348 0.0003348 0.0000000 561.04 44.87 1.57 77.63 37.73 444.08 0 KENOSHA 4441 1H P-DP 0.0000000 0.0004248 0.0004248 0.0000000 7,855.44 830.27 1.53 76.96 635.05 5,373.72 0 KENOSHA 4441 B 2H P-DP 0.0000000 0.0004248 0.0004248 0.0000000 5,303.77 625.61 1.53 76.96 439.34 2,914.16 0 KENOSHA-KEYHOLE 4341 1U A 1H P-DP 0.0000000 0.0004206 0.0004206 0.0000000 3,761.34 485.88 1.53 76.96 268.85 1,772.54 0 KENOSHA-KEYHOLE 4341 2U B 2H P-DP 0.0000000 0.0004206 0.0004206 0.0000000 5,012.33 424.12 1.53 76.96 243.26 2,264.94 0 KENTEX-HARRISON 35A 1H P-DP 0.0000000 0.0041020 0.0041020 0.0000000 1,108.72 733.49 1.57 77.63 447.89 447.90 0 KENTEX-HARRISON 35B 2H P-DP 0.0000000 0.0041890 0.0041890 0.0000000 1,404.32 583.63 1.57 77.63 310.71 536.19 0 KENTEX-HARRISON 35C 3H P-DP 0.0000000 0.0040994 0.0040994 0.0000000 787.72 708.03 1.57 77.63 398.13 409.19 0 KENTEX-HARRISON 35D 4H P-DP 0.0000000 0.0041869 0.0041869 0.0000000 888.02 385.07 1.57 77.63 235.46 455.26 0 KEYHOLE 43 1H P-DP 0.0000000 0.0004034 0.0004034 0.0000000 1,980.10 660.11 1.53 76.96 471.05 1,489.87 0 KINGSLEY 10HK P-DP 0.0000000 0.0010712 0.0010712 0.0000000 865.55 473.72 2.37 78.86 302.08 449.65 0

LEASE NAME GAS PRC INITIAL GROSS ULTIMATE Mbbl GROSS ULTIMATE MMcf CUM GAS MMcf CUM OIL Mbbl EXPENSE INITIAL DECIMAL INTEREST FINAL DECIMAL REVENUE INITIAL DECIMAL INTEREST FINAL DECIMAL OIL PRC INITIAL $/bbl RES CAT AS OF DATE FIXED COST $/MO As of : 01/01/2024 GROSS ULTIMATE RESERVES, CUMULATIVE PRODUCTION AND BASIC ECONOMIC DATA TABLE 7 KINGSLEY 1HJ P-DP 0.0000000 0.0014351 0.0014351 0.0000000 775.99 373.91 2.37 78.86 227.01 385.27 0 KINGSLEY 2HF P-DP 0.0000000 0.0014266 0.0014266 0.0000000 816.61 408.55 2.37 78.86 243.54 392.48 0 KINGSLEY 3HK P-DP 0.0000000 0.0014262 0.0014262 0.0000000 931.73 353.21 2.37 78.86 233.76 428.13 0 KINGSLEY 4HJ P-DP 0.0000000 0.0038606 0.0038606 0.0000000 879.73 426.54 2.37 78.86 281.33 485.43 0 KINGSLEY 5HK P-DP 0.0000000 0.0038423 0.0038423 0.0000000 880.76 414.08 2.37 78.86 242.42 403.23 0 KINGSLEY 6HF P-DP 0.0000000 0.0038583 0.0038583 0.0000000 713.93 354.14 2.37 78.86 205.28 333.29 0 KINGSLEY 7HJ P-DP 0.0000000 0.0010875 0.0010875 0.0000000 886.79 441.84 2.37 78.86 277.58 454.55 0 KINGSLEY 8HK P-DP 0.0000000 0.0010708 0.0010708 0.0000000 1,134.58 392.70 2.37 78.86 248.34 502.70 0 KINGSLEY 9HJ P-DP 0.0000000 0.0010795 0.0010795 0.0000000 569.75 343.51 2.37 78.86 225.41 311.81 0 KODIAK 7677 1U B 1H P-DP 0.0000000 0.0005786 0.0005786 0.0000000 1,018.56 282.88 1.53 76.96 120.59 672.59 0 KODIAK 7677 2U B 2H P-DP 0.0000000 0.0005779 0.0005779 0.0000000 1,154.89 168.45 1.53 76.96 85.91 533.80 0 KODIAK 7677 3U A 3H P-DP 0.0000000 0.0005765 0.0005765 0.0000000 1,261.24 392.27 1.53 76.96 175.36 525.22 0 KODIAK 7677 4U A 4H P-DP 0.0000000 0.0005743 0.0005743 0.0000000 1,791.94 243.82 1.53 76.96 121.84 743.39 0 KOOS 1 P-DP 0.0000000 0.1250000 0.1250000 0.0000000 54.40 0.00 1.77 77.22 0.00 54.40 0 KOOS 2 P-DP 0.0000000 0.1250000 0.1250000 0.0000000 173.27 0.00 1.77 77.22 0.00 173.27 0 KRAKEN 10-3 E1 251 P-DP 0.0000000 0.0005532 0.0005532 0.0000000 3,116.55 505.63 2.37 78.86 383.41 884.38 0 KRAKEN 10-3 UNIT 2 153 P-DP 0.0000000 0.0010769 0.0010769 0.0000000 1,772.60 433.54 2.37 78.86 284.02 686.03 0 KRAKEN 10-3 UNIT 2 162 P-DP 0.0000000 0.0010769 0.0010769 0.0000000 2,094.26 517.47 2.37 78.86 329.77 782.15 0 KRAKEN 10-3 UNIT 2 171 P-DP 0.0000000 0.0010769 0.0010769 0.0000000 2,030.62 486.23 2.37 78.86 301.48 747.40 0 KRAKEN 10-3 UNIT 2 181 P-DP 0.0000000 0.0010769 0.0010769 0.0000000 1,850.60 497.10 1.57 77.63 303.20 759.23 0 KRAKEN 10-3 UNIT 2 183 P-DP 0.0000000 0.0010769 0.0010769 0.0000000 1,680.11 294.86 1.57 77.63 198.51 531.38 0 KRAKEN 10-3 UNIT 2 252 P-DP 0.0000000 0.0010769 0.0010769 0.0000000 614.88 326.87 2.37 78.86 237.59 256.29 0 KRAKEN 10-3 UNIT 2 261 P-DP 0.0000000 0.0010769 0.0010769 0.0000000 1,751.39 369.31 2.37 78.86 247.90 595.12 0 KRAKEN 10-3 UNIT 2 272 P-DP 0.0000000 0.0010769 0.0010769 0.0000000 2,558.59 471.26 2.37 78.86 299.64 746.04 0 KRAKEN 10-3 UNIT 2 273 P-DP 0.0000000 0.0010769 0.0010769 0.0000000 943.54 197.85 1.57 77.63 137.02 281.99 0 KRAKEN 10-3 UNIT 2 282 P-DP 0.0000000 0.0010769 0.0010769 0.0000000 2,028.02 584.55 1.57 77.63 362.94 904.00 0 KRONOS 61-7 E1 151 P-DP 0.0000000 0.0055435 0.0055435 0.0000000 595.62 681.35 1.57 77.63 165.52 79.80 0 KRONOS 61-7 UNIT 2 153 P-DP 0.0000000 0.0060700 0.0060700 0.0000000 1,383.40 459.33 1.57 77.63 129.35 98.60 0 KRONOS 61-7 UNIT 2 154 P-DP 0.0000000 0.0060700 0.0060700 0.0000000 83.37 35.19 1.57 77.63 5.74 5.93 0 KRONOS 61-7 UNIT 2 161 P-DP 0.0000000 0.0060700 0.0060700 0.0000000 1,842.08 574.35 1.57 77.63 158.08 128.50 0 KRONOS 61-7 UNIT 2 163 P-DP 0.0000000 0.0060700 0.0060700 0.0000000 1,339.36 447.18 1.57 77.63 106.43 73.11 0 KRONOS 61-7 UNIT 2 171 P-DP 0.0000000 0.0060700 0.0060700 0.0000000 174.33 46.80 1.57 77.63 14.93 16.29 0 KRONOS 61-7 UNIT 2 173 P-DP 0.0000000 0.0060700 0.0060700 0.0000000 1,740.47 495.73 1.57 77.63 140.11 123.19 0 KRONOS 61-7 UNIT 2 181 P-DP 0.0000000 0.0060700 0.0060700 0.0000000 1,724.28 546.77 1.57 77.63 151.79 120.34 0

LEASE NAME GAS PRC INITIAL GROSS ULTIMATE Mbbl GROSS ULTIMATE MMcf CUM GAS MMcf CUM OIL Mbbl EXPENSE INITIAL DECIMAL INTEREST FINAL DECIMAL REVENUE INITIAL DECIMAL INTEREST FINAL DECIMAL OIL PRC INITIAL $/bbl RES CAT AS OF DATE FIXED COST $/MO As of : 01/01/2024 GROSS ULTIMATE RESERVES, CUMULATIVE PRODUCTION AND BASIC ECONOMIC DATA TABLE 7 KRONOS 61-7 UNIT 2 182 P-DP 0.0000000 0.0060700 0.0060700 0.0000000 179.89 117.60 1.57 77.63 18.93 14.11 0 KRONOS 61-7 UNIT 2 255 P-DP 0.0000000 0.0060700 0.0060700 0.0000000 2,361.62 319.78 1.57 77.63 86.25 195.78 0 KRONOS 61-7 UNIT 2 262 P-DP 0.0000000 0.0060700 0.0060700 0.0000000 2,807.08 335.79 1.57 77.63 80.74 149.85 0 KRONOS 61-7 UNIT 2 272 P-DP 0.0000000 0.0060700 0.0060700 0.0000000 1,391.05 960.76 1.57 77.63 142.63 97.42 0 KRONOS 61-7 UNIT 2 274 P-DP 0.0000000 0.0060700 0.0060700 0.0000000 2,585.17 222.97 1.57 77.63 62.37 183.89 0 KRONOS 61-7 UNIT 2 283 P-DP 0.0000000 0.0060700 0.0060700 0.0000000 1,285.08 874.07 1.57 77.63 130.04 90.44 0 KRUPA 210483 3A P-DP 0.0000000 0.0425468 0.0425468 0.0000000 14,546.91 0.00 2.36 78.22 0.00 11,363.14 0 KRUPA 211259 2A P-DP 0.0000000 0.0130602 0.0130602 0.0000000 17,555.49 0.00 2.36 78.22 0.00 13,210.01 0 KUBENKA UNIT 1H P-DP 0.0000000 0.0279630 0.0279630 0.0000000 242.70 117.21 2.08 75.57 96.19 218.38 0 L E STARTZELL 2 P-DP 0.0000000 0.0301781 0.0301781 0.0000000 110.26 0.00 1.77 77.22 0.00 110.26 0 LAITALA UNIT B 21-24 5AH P-DP 0.0000000 0.0001271 0.0001271 0.0000000 839.78 492.86 2.37 78.86 214.72 183.67 0 LAITALA UNIT B 21-24 5SH P-DP 0.0000000 0.0001271 0.0001271 0.0000000 875.12 701.66 2.37 78.86 335.79 175.59 0 LAITALA UNIT B 21-24 6AH P-DP 0.0000000 0.0001271 0.0001271 0.0000000 1,931.38 131.97 2.37 78.86 121.21 413.32 0 LAITALA UNIT B 21-24 6SH P-DP 0.0000000 0.0001271 0.0001271 0.0000000 73.79 122.64 2.37 78.86 111.04 65.55 0 LANGHOFF UNIT A 1H P-DP 0.0000000 0.0103536 0.0103536 0.0000000 2,369.63 212.62 2.33 75.89 212.22 1,991.47 0 LANGHOFF UNIT A 2H P-DP 0.0000000 0.0103536 0.0103536 0.0000000 999.67 129.96 2.33 75.89 127.03 980.67 0 LANGHOFF UNIT A 3H P-DP 0.0000000 0.0103536 0.0103536 0.0000000 736.42 63.99 2.33 75.89 61.86 673.71 0 LANGHOFF UNIT A 4H P-DP 0.0000000 0.0103536 0.0103536 0.0000000 1,184.03 118.45 2.33 75.89 117.18 1,136.89 0 LANGHOFF UNIT A 8L P-DP 0.0000000 0.0103536 0.0103536 0.0000000 1,697.40 146.99 2.33 75.89 101.65 1,196.93 0 LANGHOFF UNIT A 9L P-DP 0.0000000 0.0103536 0.0103536 0.0000000 1,099.68 101.83 2.33 75.89 65.71 738.50 0 LANGHOFF UNIT B 701 P-DP 0.0000000 0.0006823 0.0006823 0.0000000 3,322.89 357.65 2.33 75.89 309.22 2,725.43 0 LAURA WILDER 72-69 UNIT A 3H P-DP 0.0000000 0.0002102 0.0002102 0.0000000 3,387.43 1,030.92 1.53 76.96 749.93 2,689.53 0 LAURA WILDER 72-69 UNIT B 4HL P-DP 0.0000000 0.0001452 0.0001452 0.0000000 1,605.84 526.70 1.53 76.96 397.37 1,145.12 0 LEAVITT FED 1-9-4PH P-DP 0.0000000 0.0080596 0.0080596 0.0000000 765.64 560.83 4.94 77.99 390.04 391.36 0 LEAVITT FED 1-9-4TH P-DP 0.0000000 0.0080596 0.0080596 0.0000000 3,000.97 349.75 4.94 77.99 239.22 1,750.56 0 LEAVITT FED 2-9-4PH P-DP 0.0000000 0.0080596 0.0080596 0.0000000 1,340.60 659.45 4.94 77.99 377.51 561.89 0 LEE 34-154 1H P-DP 0.0000000 0.0045313 0.0045313 0.0000000 297.23 174.16 1.38 77.44 136.44 216.09 0 LEECH 32-41 UNIT A 1LS P-DP 0.0000000 0.0115766 0.0115766 0.0000000 445.71 451.98 2.37 78.86 235.85 142.80 0 LEECH EAST 5SA P-DP 0.0000000 0.0020199 0.0020199 0.0000000 50.59 127.97 2.37 78.86 73.47 30.05 0 LEECH EAST 7SB P-DP 0.0000000 0.0020199 0.0020199 0.0000000 75.28 62.49 2.37 78.86 38.67 41.80 0 LEECH EAST 8SA P-DP 0.0000000 0.0020199 0.0020199 0.0000000 597.09 235.52 2.37 78.86 121.50 150.06 0 LEECH WEST 2SB P-DP 0.0000000 0.0115766 0.0115766 0.0000000 652.94 561.03 2.37 78.86 192.86 139.33 0 LEECH WEST 3SA P-DP 0.0000000 0.0115766 0.0115766 0.0000000 459.36 685.15 2.37 78.86 259.87 146.28 0 LEECH WEST 4SB P-DP 0.0000000 0.0115766 0.0115766 0.0000000 405.48 536.71 2.37 78.86 187.81 125.88 0

LEASE NAME GAS PRC INITIAL GROSS ULTIMATE Mbbl GROSS ULTIMATE MMcf CUM GAS MMcf CUM OIL Mbbl EXPENSE INITIAL DECIMAL INTEREST FINAL DECIMAL REVENUE INITIAL DECIMAL INTEREST FINAL DECIMAL OIL PRC INITIAL $/bbl RES CAT AS OF DATE FIXED COST $/MO As of : 01/01/2024 GROSS ULTIMATE RESERVES, CUMULATIVE PRODUCTION AND BASIC ECONOMIC DATA TABLE 7 LEEDE UNIT 7 1H P-DP 0.0000000 0.0005495 0.0005495 0.0000000 673.33 466.28 1.38 77.44 374.02 536.33 0 LEEDE UNIT 7 2H P-DP 0.0000000 0.0005495 0.0005495 0.0000000 551.53 264.80 1.38 77.44 212.00 402.64 0 LEVIATHAN UNIT A 29-17 4AH P-DP 0.0000000 0.0011533 0.0011533 0.0000000 1,672.46 339.60 3.53 76.99 205.00 590.01 0 LEVIATHAN UNIT A 29-17 5AH P-DP 0.0000000 0.0011533 0.0011533 0.0000000 243.33 469.65 3.53 76.99 298.12 88.38 0 LEVIATHAN UNIT A 29-17 6AH P-DP 0.0000000 0.0011533 0.0011533 0.0000000 1,170.25 425.01 3.53 76.99 274.13 410.03 0 LEVIATHAN UNIT B 29-20 7AH P-DP 0.0000000 0.0017399 0.0017399 0.0000000 1,433.69 287.56 3.53 76.99 239.49 643.45 0 LEVIATHAN UNIT B 29-20 8SH P-DP 0.0000000 0.0017399 0.0017399 0.0000000 299.72 139.29 3.53 76.99 119.81 153.68 0 LEVIATHAN UNIT B 29-20 9AH(8AH) P-DP 0.0000000 0.0017399 0.0017399 0.0000000 459.67 240.95 3.53 76.99 210.92 236.87 0 LION #1H P-DP 0.0000000 0.0003660 0.0003660 0.0000000 3,781.86 262.43 1.31 80.44 218.67 2,955.56 0 LION #3H P-DP 0.0000000 0.0003660 0.0003660 0.0000000 4,825.05 402.32 1.31 80.44 341.64 2,971.45 0 LISA MARIE 34-27 4AH P-DP 0.0000000 0.0001740 0.0001740 0.0000000 191.33 226.22 2.37 78.86 203.55 144.70 0 LONE WOLF 12 1HB P-DP 0.0000000 0.0002730 0.0002730 0.0000000 1,832.65 364.33 1.07 75.95 236.70 842.13 0 LONG 18 1 P-DP 0.0000000 0.0032222 0.0032222 0.0000000 35.80 27.75 2.37 78.86 24.62 35.80 0 LONG UNIT 1 P-DP 0.0000000 0.0662439 0.0662439 0.0000000 62.80 0.00 1.77 77.22 0.00 62.80 0 LOOS UNIT 10H P-DP 0.0000000 0.0124811 0.0124811 0.0000000 571.33 94.35 2.33 75.89 89.40 538.07 0 LOOS UNIT 11L P-DP 0.0000000 0.0124811 0.0124811 0.0000000 1,986.15 260.04 2.33 75.89 191.24 1,467.07 0 LOOS UNIT 12L P-DP 0.0000000 0.0124811 0.0124811 0.0000000 1,823.81 192.23 2.33 75.89 135.14 1,304.56 0 LOOS UNIT 1H P-DP 0.0000000 0.0124811 0.0124811 0.0000000 932.24 151.62 2.33 75.89 150.45 895.45 0 LOOS UNIT 2H P-DP 0.0000000 0.0124811 0.0124811 0.0000000 722.54 97.48 2.33 75.89 97.48 720.98 0 LOOS UNIT 3H P-DP 0.0000000 0.0124811 0.0124811 0.0000000 583.96 70.78 2.33 75.89 70.78 520.34 0 LOOS UNIT 8H P-DP 0.0000000 0.0124811 0.0124811 0.0000000 578.96 75.82 2.33 75.89 70.60 538.75 0 LOOS UNIT 9H P-DP 0.0000000 0.0124811 0.0124811 0.0000000 1,370.98 241.47 2.33 75.89 175.60 1,069.54 0 LOST KEYS 4345 1U B 1H P-DP 0.0000000 0.0001277 0.0001277 0.0000000 2,472.10 307.43 1.53 76.96 114.16 996.40 0 LOST KEYS 4345 2U A 2H P-DP 0.0000000 0.0001308 0.0001308 0.0000000 3,741.97 496.49 1.53 76.96 139.13 836.94 0 LOST KEYS 4345 3U A 3H P-DP 0.0000000 0.0001376 0.0001376 0.0000000 3,727.81 322.73 1.53 76.96 111.94 688.26 0 LOST KEYS 4345 4U A 4H P-DP 0.0000000 0.0000695 0.0000695 0.0000000 3,844.50 321.95 1.53 76.96 121.79 1,139.33 0 LOST KEYS 4345 5U B 5H P-DP 0.0000000 0.0000685 0.0000685 0.0000000 3,992.38 212.87 1.53 76.96 86.41 1,136.64 0 LOST KEYS 4345 6U A 6H P-DP 0.0000000 0.0000414 0.0000414 0.0000000 2,923.27 326.79 1.53 76.96 114.60 944.18 0 LOST SADDLE 45 1H P-DP 0.0000000 0.0001628 0.0001628 0.0000000 1,813.72 206.32 1.53 76.96 177.16 1,624.54 0 LRT UNIT 2 ALLOCATION 2318AH P-DP 0.0000000 0.0002397 0.0002397 0.0000000 1,971.24 650.15 2.32 78.93 432.93 1,285.47 0 LUKCIK 4 P-DP 0.0000000 0.1250000 0.1250000 0.0000000 76.20 0.00 1.77 77.22 0.00 76.20 0 LUKCIK 5 P-DP 0.0000000 0.1250000 0.1250000 0.0000000 89.85 0.00 1.77 77.22 0.00 89.85 0 LULO 2531LP 4H P-DP 0.0000000 0.0010156 0.0010156 0.0000000 297.76 272.77 2.37 78.86 87.10 54.13 0 LULO 2543DP 6H P-DP 0.0000000 0.0010156 0.0010156 0.0000000 1,524.92 603.51 2.37 78.86 259.86 200.51 0

LEASE NAME GAS PRC INITIAL GROSS ULTIMATE Mbbl GROSS ULTIMATE MMcf CUM GAS MMcf CUM OIL Mbbl EXPENSE INITIAL DECIMAL INTEREST FINAL DECIMAL REVENUE INITIAL DECIMAL INTEREST FINAL DECIMAL OIL PRC INITIAL $/bbl RES CAT AS OF DATE FIXED COST $/MO As of : 01/01/2024 GROSS ULTIMATE RESERVES, CUMULATIVE PRODUCTION AND BASIC ECONOMIC DATA TABLE 7 LULO 2551AP 5H P-DP 0.0000000 0.0010156 0.0010156 0.0000000 705.11 830.74 2.37 78.86 282.79 165.40 0 LULO 2553AP 9H P-DP 0.0000000 0.0010156 0.0010156 0.0000000 770.05 466.90 2.37 78.86 196.51 170.96 0 LULO 3641DP 2H P-DP 0.0000000 0.0010156 0.0010156 0.0000000 197.40 361.73 2.37 78.86 162.51 82.01 0 MABEE 22A 1H P-DP 0.0000000 0.0000159 0.0000159 0.0000000 790.04 301.40 2.32 78.93 205.18 449.02 0 MABEE DDA J8 3HK P-DP 0.0000000 0.0000068 0.0000068 0.0000000 388.25 147.77 2.37 78.86 93.05 260.80 0 MABEE-ELKIN W16B 2H P-DP 0.0000000 0.0000068 0.0000068 0.0000000 1,032.57 348.04 2.32 78.93 225.76 575.35 0 MABEE-STIMSON 22B 2H P-DP 0.0000000 0.0000537 0.0000537 0.0000000 1,289.44 373.74 2.32 78.93 241.03 659.12 0 MABEE-TREDAWAY W16A 1H P-DP 0.0000000 0.0066308 0.0066308 0.0000000 1,180.72 350.66 2.32 78.93 245.76 658.60 0 MARY GRACE 201-202 UNIT 1H P-DP 0.0000000 0.0001950 0.0001950 0.0000000 5,004.95 458.70 1.38 77.44 305.57 2,932.16 0 MARY GRACE 201-202 UNIT 3H P-DP 0.0000000 0.0001950 0.0001950 0.0000000 4,771.55 473.79 1.38 77.44 297.37 3,038.99 0 MARYRUTH-ANDERSON 47C 103H P-DP 0.0000000 0.0002698 0.0002698 0.0000000 1,125.52 806.53 1.57 77.63 576.49 618.16 0 MARYRUTH-ANDERSON 47D 104H P-DP 0.0000000 0.0002697 0.0002697 0.0000000 989.80 709.25 1.57 77.63 477.51 547.72 0 MARYRUTH-ANDERSON 47E 105H P-DP 0.0000000 0.0002696 0.0002696 0.0000000 1,004.66 627.98 1.57 77.63 437.69 528.92 0 MARYRUTH-ANDERSON 47F 106H P-DP 0.0000000 0.0002695 0.0002695 0.0000000 703.70 839.22 1.57 77.63 559.92 430.12 0 MATTIE 18-11-5 6H P-DP 0.0000000 0.0413913 0.0413913 0.0000000 6,649.00 36.77 2.75 68.45 33.75 5,211.35 0 MATTIE 18-11-5 7H P-DP 0.0000000 0.0413913 0.0413913 0.0000000 5,740.42 36.44 2.75 68.45 35.07 4,640.24 0 MATTIE 18-11-5 8H P-DP 0.0000000 0.0413913 0.0413913 0.0000000 7,238.91 38.72 2.75 68.45 36.59 5,598.03 0 MCCALL, JACK O. ET AL 2 P-DP 0.0000000 0.0039063 0.0039063 0.0000000 120.33 91.06 1.53 76.96 85.50 117.09 0 MCCALL, JACK O. ET AL 3 P-DP 0.0000000 0.0039063 0.0039063 0.0000000 822.79 114.44 1.53 76.96 110.38 812.52 0 MCCALL, JACK O. ET AL 4 P-DP 0.0000000 0.0039063 0.0039063 0.0000000 117.90 93.21 1.53 76.96 89.22 114.10 0 MCCLANE 2 P-DP 0.0000000 0.0039063 0.0039063 0.0000000 116.04 60.91 1.57 77.63 47.77 98.61 0 MCCLANE 3 P-DP 0.0000000 0.0039063 0.0039063 0.0000000 53.52 84.50 1.57 77.63 63.32 43.18 0 MCINTIRE 1 P-DP 0.0000000 0.1250000 0.1250000 0.0000000 179.19 0.00 1.77 77.22 0.00 179.19 0 MEADOR, J. J. 3 P-DP 0.0000000 0.0003120 0.0003120 0.0000000 225.68 88.01 2.37 78.86 84.17 196.34 0 MEDUSA UNIT A 28-21 1AH P-DP 0.0000000 0.0020274 0.0020274 0.0000000 705.41 260.35 3.53 76.99 204.10 301.17 0 MEDUSA UNIT A 28-21 2AH P-DP 0.0000000 0.0020274 0.0020274 0.0000000 1,090.46 273.87 3.53 76.99 205.01 439.51 0 MEDUSA UNIT B 28-21 7AH P-DP 0.0000000 0.0020251 0.0020251 0.0000000 597.37 268.76 3.53 76.99 212.97 278.05 0 MEDUSA UNIT B 28-21 8AH P-DP 0.0000000 0.0020251 0.0020251 0.0000000 956.44 329.54 3.53 76.99 251.96 455.55 0 MEDUSA UNIT C 28-09 3AH P-DP 0.0000000 0.0011542 0.0011542 0.0000000 517.60 548.65 3.53 76.99 348.05 223.90 0 MEDUSA UNIT C 28-09 6AH P-DP 0.0000000 0.0011542 0.0011542 0.0000000 762.16 296.57 3.53 76.99 192.37 386.10 0 MEHAFFEY - BURNEM 1 P-DP 0.0000000 0.0625000 0.0625000 0.0000000 192.26 0.96 2.04 78.22 0.96 192.26 0 MELISSA A 1 P-DP 0.0000000 0.0003638 0.0003638 0.0000000 364.22 27.11 1.38 77.44 24.54 362.48 0 MEMPHIS FLASH 39-27 1LS P-DP 0.0000000 0.0000483 0.0000483 0.0000000 461.07 293.78 2.37 78.86 29.29 17.43 0 MEMPHIS FLASH 39-27 2A P-DP 0.0000000 0.0000483 0.0000483 0.0000000 489.27 301.10 2.37 78.86 29.93 17.86 0

LEASE NAME GAS PRC INITIAL GROSS ULTIMATE Mbbl GROSS ULTIMATE MMcf CUM GAS MMcf CUM OIL Mbbl EXPENSE INITIAL DECIMAL INTEREST FINAL DECIMAL REVENUE INITIAL DECIMAL INTEREST FINAL DECIMAL OIL PRC INITIAL $/bbl RES CAT AS OF DATE FIXED COST $/MO As of : 01/01/2024 GROSS ULTIMATE RESERVES, CUMULATIVE PRODUCTION AND BASIC ECONOMIC DATA TABLE 7 MEMPHIS FLASH 39-27 4AH P-DP 0.0000000 0.0000483 0.0000483 0.0000000 271.34 331.27 2.37 78.86 268.10 190.66 0 MIDDLETON 21 1 P-DP 0.0000000 0.0041667 0.0041667 0.0000000 191.54 24.63 2.37 78.86 19.30 156.07 0 MIKE SCOTT 19-30-H 4315H P-DP 0.0000000 0.0003889 0.0003889 0.0000000 3,276.32 719.55 1.07 75.95 479.43 1,765.53 0 MIKE SCOTT 19-30-H 4415H P-DP 0.0000000 0.0003875 0.0003875 0.0000000 2,065.37 418.78 1.07 75.95 279.02 1,144.22 0 MILLER 4 2 P-DP 0.0000000 0.2625000 0.2625000 0.0000000 142.24 36.06 2.37 78.86 35.38 142.24 0 MILLER 4 3 P-DP 0.0000000 0.2625000 0.2625000 0.0000000 18.39 5.36 2.37 78.86 4.97 18.39 0 MIMS 32H 3306BH P-DP 0.0000000 0.0045833 0.0045833 0.0000000 1,195.44 520.81 1.57 77.63 434.23 791.17 0 MIMS 32H 3307BH P-DP 0.0000000 0.0045833 0.0045833 0.0000000 961.05 315.87 1.57 77.63 261.13 675.35 0 MIMS 32H 3315AH P-DP 0.0000000 0.0045833 0.0045833 0.0000000 1,349.34 577.07 1.57 77.63 495.88 1,033.55 0 MIMS 32H 3317AH P-DP 0.0000000 0.0045833 0.0045833 0.0000000 1,442.83 388.27 1.57 77.63 340.09 1,089.46 0 MIMS 32H 3318AH P-DP 0.0000000 0.0045833 0.0045833 0.0000000 695.44 343.52 1.57 77.63 303.05 509.73 0 MIMS 32H 3326SH P-DP 0.0000000 0.0045833 0.0045833 0.0000000 506.34 230.38 1.57 77.63 206.01 389.15 0 MIMS 32H 3327SH P-DP 0.0000000 0.0045833 0.0045833 0.0000000 531.50 280.58 1.57 77.63 248.21 382.22 0 MIMS 32H 3345SH P-DP 0.0000000 0.0045833 0.0045833 0.0000000 397.40 396.38 1.57 77.63 353.48 281.31 0 MIMS 32H 3347SH P-DP 0.0000000 0.0045833 0.0045833 0.0000000 810.68 173.81 1.57 77.63 130.95 618.21 0 MIMS 32H 3348SH P-DP 0.0000000 0.0045833 0.0045833 0.0000000 831.85 164.75 1.57 77.63 131.16 682.68 0 MINGO S CRC JF 4H P-DP 0.0000000 0.0209787 0.0209787 0.0000000 14,178.07 0.00 2.67 78.22 0.00 12,319.77 0 MINGO SE CRC JF 6H P-DP 0.0000000 0.0409383 0.0409383 0.0000000 15,548.94 0.00 2.67 78.22 0.00 12,777.70 0 MINGO SW CRC JF 2H P-DP 0.0000000 0.0095069 0.0095069 0.0000000 13,223.16 0.00 2.67 78.22 0.00 11,524.62 0 MINGO W CRC JF 8H P-DP 0.0000000 0.0412216 0.0412216 0.0000000 9,554.85 0.00 2.67 78.22 0.00 8,217.49 0 MITCHELL 47-31 A UNIT A 2H P-DP 0.0000000 0.0006587 0.0006587 0.0000000 57.98 268.11 2.37 78.86 98.69 14.60 0 MITCHELL 47-31 A UNIT L 2H P-DP 0.0000000 0.0006587 0.0006587 0.0000000 47.16 322.66 2.37 78.86 81.67 11.78 0 MITCHELL 47-31 B UNIT A 7H P-DP 0.0000000 0.0007028 0.0007028 0.0000000 88.18 225.81 2.37 78.86 107.36 42.93 0 MITCHELL 47-31 B UNIT L 6H P-DP 0.0000000 0.0007028 0.0007028 0.0000000 23.48 567.08 2.37 78.86 239.16 21.09 0 MOLNOSKEY UNIT 1H P-DP 0.0000000 0.0230365 0.0230365 0.0000000 761.02 183.33 2.08 75.57 175.97 669.26 0 MOLNOSKEY UNIT 2H P-DP 0.0000000 0.0230365 0.0230365 0.0000000 129.06 142.59 2.08 75.57 103.55 128.95 0 MONROE 34-158 UNIT 1H P-DP 0.0000000 0.0002791 0.0002791 0.0000000 452.41 378.25 1.38 77.44 378.25 452.41 0 MONROE 34-158 UNIT 2H P-DP 0.0000000 0.0002791 0.0002791 0.0000000 681.68 475.20 1.38 77.44 468.09 672.99 0 MONROE 34-158 UNIT 3H P-DP 0.0000000 0.0002791 0.0002791 0.0000000 786.22 507.73 1.38 77.44 434.00 682.55 0 MONROE 34-158 UNIT 4H P-DP 0.0000000 0.0002791 0.0002791 0.0000000 191.42 207.13 1.38 77.44 172.04 174.48 0 MORGAN-NEAL 39-26 2LS P-DP 0.0000000 0.0001127 0.0001127 0.0000000 942.07 306.87 2.37 78.86 203.82 427.53 0 MORGAN-NEAL 39-26 3WA P-DP 0.0000000 0.0001127 0.0001127 0.0000000 1,401.40 488.48 2.37 78.86 340.54 611.81 0 MORGAN-NEAL UNIT NO.2 39-26 1LS P-DP 0.0000000 0.0001057 0.0001057 0.0000000 1,192.84 335.85 2.37 78.86 259.72 689.11 0 MORGAN-NEAL UNIT NO.2 39-26 1WA P-DP 0.0000000 0.0001057 0.0001057 0.0000000 622.28 322.25 2.37 78.86 237.53 286.46 0

LEASE NAME GAS PRC INITIAL GROSS ULTIMATE Mbbl GROSS ULTIMATE MMcf CUM GAS MMcf CUM OIL Mbbl EXPENSE INITIAL DECIMAL INTEREST FINAL DECIMAL REVENUE INITIAL DECIMAL INTEREST FINAL DECIMAL OIL PRC INITIAL $/bbl RES CAT AS OF DATE FIXED COST $/MO As of : 01/01/2024 GROSS ULTIMATE RESERVES, CUMULATIVE PRODUCTION AND BASIC ECONOMIC DATA TABLE 7 MORGAN-NEAL UNIT NO.2 39-26 2WA P-DP 0.0000000 0.0001057 0.0001057 0.0000000 942.11 257.42 2.37 78.86 200.77 429.62 0 MORTAL STORM 12-13-24 H 1W P-DP 0.0000000 0.0005100 0.0005100 0.0000000 506.52 325.51 2.37 78.86 218.77 343.50 0 MOTHMAN UNIT A 45-04 2AH P-DP 0.0000000 0.0033425 0.0033425 0.0000000 465.62 358.69 3.53 76.99 235.99 244.51 0 MR HOBBS 11-14 H 1W P-DP 0.0000000 0.0005177 0.0005177 0.0000000 536.67 334.05 2.37 78.86 169.58 304.84 0 MR HOBBS 11-14-23 H 1LS P-DP 0.0000000 0.0003969 0.0003969 0.0000000 252.53 216.32 2.37 78.86 148.49 147.84 0 MR HOBBS 11-14-23A H 2W P-DP 0.0000000 0.0003483 0.0003483 0.0000000 914.25 358.79 2.37 78.86 188.80 310.44 0 MR. PHILLIPS 11-02 A 1NA P-DP 0.0000000 0.0024948 0.0024948 0.0000000 1,939.38 429.70 2.37 78.86 176.59 292.62 0 MR. PHILLIPS 11-02 A 1NS P-DP 0.0000000 0.0024392 0.0024392 0.0000000 1,065.74 492.29 2.37 78.86 213.75 238.73 0 MR. PHILLIPS 11-02 B 2AH P-DP 0.0000000 0.0024059 0.0024059 0.0000000 1,029.08 405.87 2.37 78.86 249.25 450.16 0 MR. PHILLIPS 11-02 B 2SH P-DP 0.0000000 0.0024199 0.0024199 0.0000000 786.61 377.64 2.37 78.86 224.12 369.59 0 MR. PHILLIPS 11-02 D 4SA P-DP 0.0000000 0.0024318 0.0024318 0.0000000 643.53 200.37 2.37 78.86 87.33 205.17 0 MR. PHILLIPS 11-2 1SH P-DP 0.0000000 0.0024143 0.0024143 0.0000000 591.64 500.46 2.37 78.86 471.35 519.67 0 MUD HEN 57-31 A 1WA P-DP 0.0000000 0.0002888 0.0002888 0.0000000 1,428.76 372.65 1.38 77.44 250.65 809.07 0 MUD HEN 57-31 B 2BS P-DP 0.0000000 0.0004518 0.0004518 0.0000000 2,362.74 691.65 1.38 77.44 427.92 1,337.77 0 MUD HEN 57-31 C 3WA P-DP 0.0000000 0.0003635 0.0003635 0.0000000 1,920.89 450.02 1.38 77.44 251.29 817.23 0 MUD HEN 57-31 D 4BS P-DP 0.0000000 0.0004281 0.0004281 0.0000000 2,478.47 735.48 1.38 77.44 396.00 1,278.21 0 MUSGROVE MILLER 0904 2HM P-DP 0.0000000 0.0012625 0.0012625 0.0000000 770.89 443.58 2.37 78.86 278.14 350.77 0 MUSSER 1 P-DP 0.0000000 0.1250000 0.1250000 0.0000000 39.72 0.00 1.77 77.22 0.00 39.72 0 N A C R C 1-15 ACRES 1 P-DP 0.0000000 0.1250000 0.1250000 0.0000000 34.17 0.00 1.77 77.22 0.00 34.17 0 N A C R C 5-132 P-DP 0.0000000 0.1250000 0.1250000 0.0000000 75.86 0.00 1.77 77.22 0.00 75.86 0 NAC 3H-20 P-DP 0.0000000 0.1190618 0.1190618 0.0000000 6,650.68 0.00 2.67 78.22 0.00 5,771.99 0 NAC 4H-20 P-DP 0.0000000 0.1190618 0.1190618 0.0000000 6,917.37 0.00 2.67 78.22 0.00 5,373.94 0 NAC B WYN JF 1H P-DP 0.0000000 0.1250000 0.1250000 0.0000000 7,054.10 0.00 2.67 78.22 0.00 5,986.34 0 NAC B WYN JF 3H P-DP 0.0000000 0.1250000 0.1250000 0.0000000 4,838.85 0.00 2.67 78.22 0.00 4,268.51 0 NAC B WYN JF 5H P-DP 0.0000000 0.1250000 0.1250000 0.0000000 7,880.57 0.00 2.67 78.22 0.00 6,787.53 0 NAC GAS UNIT B 3H-3 P-DP 0.0000000 0.1157926 0.1157926 0.0000000 5,557.95 0.07 2.67 78.22 0.07 5,412.37 0 NAC ROYALTY 27-41 HC 001 P-DP 0.0000000 0.0412007 0.0412007 0.0000000 17,629.24 0.00 2.64 69.05 0.00 3,055.50 0 NAIL -A- 1 P-DP 0.0000000 0.0002151 0.0002151 0.0000000 259.20 77.40 1.57 77.63 59.60 212.90 0 NAIL -C- 1 P-DP 0.0000000 0.0000860 0.0000860 0.0000000 364.69 119.11 1.57 77.63 112.36 339.90 0 NAIL -E- 1 P-DP 0.0000000 0.0002151 0.0002151 0.0000000 173.64 109.20 1.57 77.63 103.01 162.73 0 NAIL -E- 2 P-DP 0.0000000 0.0002151 0.0002151 0.0000000 170.22 108.14 1.57 77.63 104.20 162.87 0 NAIL -E- 3 P-DP 0.0000000 0.0002151 0.0002151 0.0000000 188.20 83.40 1.57 77.63 79.34 176.39 0 NAIL -K- 1 P-DP 0.0000000 0.0001075 0.0001075 0.0000000 172.45 84.85 1.57 77.63 63.90 147.97 0 NAIL -P- 1 P-DP 0.0000000 0.0001344 0.0001344 0.0000000 173.71 69.41 1.57 77.63 65.84 164.13 0

LEASE NAME GAS PRC INITIAL GROSS ULTIMATE Mbbl GROSS ULTIMATE MMcf CUM GAS MMcf CUM OIL Mbbl EXPENSE INITIAL DECIMAL INTEREST FINAL DECIMAL REVENUE INITIAL DECIMAL INTEREST FINAL DECIMAL OIL PRC INITIAL $/bbl RES CAT AS OF DATE FIXED COST $/MO As of : 01/01/2024 GROSS ULTIMATE RESERVES, CUMULATIVE PRODUCTION AND BASIC ECONOMIC DATA TABLE 7 NAIL J 1 P-DP 0.0000000 0.0000860 0.0000860 0.0000000 213.92 93.19 1.57 77.63 82.16 176.27 0 NAIL O 1 P-DP 0.0000000 0.0002151 0.0002151 0.0000000 176.51 100.63 1.57 77.63 89.93 162.47 0 NAIL RANCH 10 1 P-DP 0.0000000 0.0002151 0.0002151 0.0000000 163.97 60.68 1.57 77.63 50.20 124.86 0 NAIL RANCH 10 2 P-DP 0.0000000 0.0002151 0.0002151 0.0000000 122.54 64.73 1.57 77.63 54.97 93.94 0 NAIL RANCH 10 3 P-DP 0.0000000 0.0002151 0.0002151 0.0000000 83.72 67.48 1.57 77.63 58.12 77.18 0 NAIL RANCH 10 4 P-DP 0.0000000 0.0002151 0.0002151 0.0000000 215.16 81.01 1.57 77.63 71.80 175.62 0 NANCY 1H P-DP 0.0000000 0.0044356 0.0044356 0.0000000 855.47 140.60 2.08 75.57 117.61 770.44 0 NE AXIS #2H P-DP 0.0000000 0.0007720 0.0007720 0.0000000 6,192.42 204.97 1.31 80.44 149.90 3,479.27 0 NE NAIL 10 1 P-DP 0.0000000 0.0002151 0.0002151 0.0000000 147.15 72.70 1.57 77.63 54.38 89.87 0 NE NAIL 10 2 P-DP 0.0000000 0.0002151 0.0002151 0.0000000 341.76 86.38 1.57 77.63 63.19 224.80 0 NE NAIL 10 3 P-DP 0.0000000 0.0002151 0.0002151 0.0000000 208.59 100.98 1.57 77.63 93.65 165.72 0 NE NAIL 10 4 P-DP 0.0000000 0.0002151 0.0002151 0.0000000 94.38 15.85 1.57 77.63 10.70 65.33 0 NE NAIL 10 5 P-DP 0.0000000 0.0002151 0.0002151 0.0000000 97.28 20.52 1.57 77.63 15.55 68.78 0 NESSIE UNIT A 34-46 1AH P-DP 0.0000000 0.0216944 0.0216944 0.0000000 356.37 874.33 3.53 76.99 454.48 245.36 0 NESSIE UNIT A 34-46 2AH P-DP 0.0000000 0.0216944 0.0216944 0.0000000 891.62 729.93 3.53 76.99 474.88 571.33 0 NESSIE UNIT A 34-46 3AH P-DP 0.0000000 0.0216944 0.0216944 0.0000000 386.25 396.49 3.53 76.99 252.06 269.34 0 NESSIE UNIT A 34-46 3SH P-DP 0.0000000 0.0216944 0.0216944 0.0000000 2,818.92 376.69 3.53 76.99 172.02 607.72 0 NESSIE UNIT B 34-46 7AH P-DP 0.0000000 0.0216940 0.0216940 0.0000000 1,724.83 857.80 3.53 76.99 527.45 675.64 0 NESSIE UNIT B 34-46 8AH P-DP 0.0000000 0.0216940 0.0216940 0.0000000 1,705.51 344.94 3.53 76.99 263.62 565.08 0 NEWTON 43A 1HE P-DP 0.0000000 0.0011938 0.0011938 0.0000000 1,492.76 364.70 2.37 78.86 196.40 541.96 0 NEWTON 43A 2HK P-DP 0.0000000 0.0011912 0.0011912 0.0000000 1,159.08 277.54 2.37 78.86 156.14 473.88 0 NEWTON 43B 3HJ P-DP 0.0000000 0.0004990 0.0004990 0.0000000 958.98 231.32 2.37 78.86 197.90 484.93 0 NEWTON 43BK 4HE P-DP 0.0000000 0.0010780 0.0010780 0.0000000 637.92 159.28 2.37 78.86 96.92 528.17 0 NEWTON 43BK 5HK P-DP 0.0000000 0.0010802 0.0010802 0.0000000 583.02 442.13 2.37 78.86 342.37 449.31 0 NEWTON 43C 6HJ P-DP 0.0000000 0.0555556 0.0555556 0.0000000 682.76 392.23 2.37 78.86 328.79 400.41 0 NM HARRISON 16-11-5 10H P-DP 0.0000000 0.0154884 0.0154884 0.0000000 5,201.46 19.69 2.75 68.45 19.27 4,563.81 0 NM HARRISON 16-11-5 6H P-DP 0.0000000 0.0155018 0.0155018 0.0000000 6,190.24 57.25 2.75 68.45 55.35 5,559.47 0 NM HARRISON 16-11-5 8H P-DP 0.0000000 0.0154886 0.0154886 0.0000000 6,878.13 45.46 2.75 68.45 45.04 6,259.27 0 NOLAN NE CRC JF 3H P-DP 0.0000000 0.0915912 0.0915912 0.0000000 8,751.63 0.00 2.67 78.22 0.00 8,214.51 0 NOLAN NW CRC JF 1H P-DP 0.0000000 0.0972461 0.0972461 0.0000000 22,259.22 0.00 2.67 78.22 0.00 18,260.49 0 NOLAN S CRC JF 2H P-DP 0.0000000 0.1036506 0.1036506 0.0000000 11,494.63 0.00 2.67 78.22 0.00 9,855.17 0 NOLAN S CRC JF 4H P-DP 0.0000000 0.1036506 0.1036506 0.0000000 10,020.09 0.00 2.67 78.22 0.00 8,270.19 0 NOLAN S CRC JF 6H P-DP 0.0000000 0.1036506 0.1036506 0.0000000 11,040.65 0.00 2.67 78.22 0.00 9,168.73 0 NORRIS UNIT 32-H 3301BH P-DP 0.0000000 0.0045833 0.0045833 0.0000000 767.47 127.81 1.57 77.63 79.83 331.70 0

LEASE NAME GAS PRC INITIAL GROSS ULTIMATE Mbbl GROSS ULTIMATE MMcf CUM GAS MMcf CUM OIL Mbbl EXPENSE INITIAL DECIMAL INTEREST FINAL DECIMAL REVENUE INITIAL DECIMAL INTEREST FINAL DECIMAL OIL PRC INITIAL $/bbl RES CAT AS OF DATE FIXED COST $/MO As of : 01/01/2024 GROSS ULTIMATE RESERVES, CUMULATIVE PRODUCTION AND BASIC ECONOMIC DATA TABLE 7 NORRIS UNIT 32-H 3303BH P-DP 0.0000000 0.0045833 0.0045833 0.0000000 922.06 167.97 1.57 77.63 114.41 401.27 0 NORRIS UNIT 32-H 3304BH P-DP 0.0000000 0.0045833 0.0045833 0.0000000 146.19 173.29 1.57 77.63 116.56 69.99 0 NORRIS UNIT 32-H 3312AH P-DP 0.0000000 0.0045833 0.0045833 0.0000000 909.84 108.58 1.57 77.63 71.48 353.20 0 NORRIS UNIT 32-H 3313AH P-DP 0.0000000 0.0045833 0.0045833 0.0000000 1,421.32 147.07 1.57 77.63 100.05 610.43 0 NORRIS UNIT 32-H 3322SH P-DP 0.0000000 0.0045833 0.0045833 0.0000000 1,373.19 246.12 1.57 77.63 155.40 533.55 0 NORRIS UNIT 32-H 3323SH P-DP 0.0000000 0.0045833 0.0045833 0.0000000 3,866.59 543.41 1.57 77.63 340.21 1,553.71 0 NORRIS UNIT 32-H 3361DH P-DP 0.0000000 0.0045833 0.0045833 0.0000000 1,981.17 280.82 1.57 77.63 175.81 742.45 0 NORRIS UNIT 32-H 3363DH P-DP 0.0000000 0.0045833 0.0045833 0.0000000 1,867.45 259.60 1.57 77.63 165.39 718.60 0 NORRIS UNIT 32-H 3364DH P-DP 0.0000000 0.0045833 0.0045833 0.0000000 919.00 253.60 1.57 77.63 164.15 408.31 0 NORRIS UNIT 32-H 3371JH P-DP 0.0000000 0.0045833 0.0045833 0.0000000 821.22 163.16 1.57 77.63 113.14 350.99 0 NORRIS UNIT 32-H 3373JH P-DP 0.0000000 0.0045833 0.0045833 0.0000000 847.74 155.93 1.57 77.63 109.20 368.19 0 NORRIS UNIT 32-H 3374JH P-DP 0.0000000 0.0045833 0.0045833 0.0000000 854.18 170.98 1.57 77.63 110.34 340.31 0 NORRIS-MIMS ALLOCATION 3315AH P-DP 0.0000000 0.0045833 0.0045833 0.0000000 714.70 157.24 1.57 77.63 115.93 358.02 0 NORRIS-MIMS ALLOCATION 3325SH P-DP 0.0000000 0.0045833 0.0045833 0.0000000 1,390.98 167.16 1.57 77.63 141.00 775.29 0 NORTH AMERICAN COAL CORP 1 P-DP 0.0000000 0.7500000 0.7500000 0.0000000 141.57 0.00 1.77 77.22 0.00 141.57 0 NORTH AMERICAN COAL GAS UNIT 1 P-DP 0.0000000 0.0544738 0.0544738 0.0000000 1,259.58 0.05 2.72 78.22 0.05 1,030.52 0 NORTH AMERICAN COAL ROYALTY CO BUELL 8H P-DP 0.0000000 0.0788856 0.0788856 0.0000000 9,822.27 33.08 2.75 68.45 32.67 8,966.20 0 NUNN 1 P-DP 0.0000000 0.0007291 0.0007291 0.0000000 191.65 62.49 1.07 75.95 55.01 176.69 0 NUNN 2 P-DP 0.0000000 0.0007291 0.0007291 0.0000000 200.39 61.33 1.07 75.95 53.80 177.82 0 NUNN 5-44 1HB P-DP 0.0000000 0.0009835 0.0009835 0.0000000 4,869.28 434.05 1.07 75.95 342.34 2,024.29 0 NUNN 5-44 4303H P-DP 0.0000000 0.0009853 0.0009853 0.0000000 3,774.01 385.66 1.07 75.95 290.82 1,735.96 0 NUNN 5-44 4403H P-DP 0.0000000 0.0009839 0.0009839 0.0000000 2,060.08 229.34 1.07 75.95 159.17 749.31 0 NUNN 5-44 4803H P-DP 0.0000000 0.0009825 0.0009825 0.0000000 2,668.24 232.37 1.07 75.95 126.43 977.59 0 NUNN A 2 P-DP 0.0000000 0.0007291 0.0007291 0.0000000 253.21 54.94 1.07 75.95 45.57 225.12 0 NUNN A 3 P-DP 0.0000000 0.0014585 0.0014585 0.0000000 463.45 68.65 1.07 75.95 53.00 463.45 0 NUNN B 3 P-DP 0.0000000 0.0014585 0.0014585 0.0000000 652.38 40.14 1.07 75.95 40.14 652.38 0 NUNN, ELIZABETH C -C- 1 P-DP 0.0000000 0.0014676 0.0014676 0.0000000 584.92 98.03 1.07 75.95 98.03 584.92 0 NUNN, ELIZABETH C -C- 2 P-DP 0.0000000 0.0014585 0.0014585 0.0000000 574.75 90.91 1.07 75.95 90.91 574.75 0 NUNN, ELIZABETH C -C- 3 P-DP 0.0000000 0.0014585 0.0014585 0.0000000 580.95 94.88 1.07 75.95 94.88 580.95 0 NUNN, ELIZABETH C -C- 4 P-DP 0.0000000 0.0014585 0.0014585 0.0000000 573.99 90.88 1.07 75.95 90.88 573.99 0 NUNN, J F B 3 P-DP 0.0000000 0.0014585 0.0014585 0.0000000 309.06 44.10 1.07 75.95 44.10 309.06 0 O'NEAL -D- 1 P-DP 0.0000000 0.0117184 0.0117184 0.0000000 245.80 93.46 2.32 78.93 85.86 238.13 0 O'NEAL 1 P-DP 0.0000000 0.0156250 0.0156250 0.0000000 237.19 90.73 2.32 78.93 82.69 218.44 0

LEASE NAME GAS PRC INITIAL GROSS ULTIMATE Mbbl GROSS ULTIMATE MMcf CUM GAS MMcf CUM OIL Mbbl EXPENSE INITIAL DECIMAL INTEREST FINAL DECIMAL REVENUE INITIAL DECIMAL INTEREST FINAL DECIMAL OIL PRC INITIAL $/bbl RES CAT AS OF DATE FIXED COST $/MO As of : 01/01/2024 GROSS ULTIMATE RESERVES, CUMULATIVE PRODUCTION AND BASIC ECONOMIC DATA TABLE 7 OAK VALLEY 2 1 P-DP 0.0000000 0.0035807 0.0035807 0.0000000 162.12 83.38 1.49 79.19 56.84 87.61 0 OLDHAM 38-27 B UNIT A 7H P-DP 0.0000000 0.0001624 0.0001624 0.0000000 184.74 65.11 2.37 78.86 64.18 176.48 0 OLDHAM 38-27 B UNIT A 8H P-DP 0.0000000 0.0001624 0.0001624 0.0000000 111.48 13.49 2.37 78.86 13.49 111.48 0 OLDHAM 38-27 B UNIT L 7H P-DP 0.0000000 0.0001624 0.0001624 0.0000000 612.32 1,146.98 2.37 78.86 705.08 447.76 0 OLDHAM 38-27 B UNIT L 8H P-DP 0.0000000 0.0001624 0.0001624 0.0000000 420.42 39.57 2.37 78.86 38.88 313.55 0 OLDHAM TRUST EAST 3871WA P-DP 0.0000000 0.0001624 0.0001624 0.0000000 2,049.16 766.73 2.37 78.86 557.17 926.27 0 OLDHAM TRUST EAST 3875LS P-DP 0.0000000 0.0001624 0.0001624 0.0000000 910.70 707.40 2.37 78.86 431.97 343.48 0 OLDHAM TRUST EAST 3876WA P-DP 0.0000000 0.0001624 0.0001624 0.0000000 1,127.80 633.73 2.37 78.86 361.26 325.60 0 OLDHAM TRUST WEST 1SH P-DP 0.0000000 0.0002590 0.0002590 0.0000000 364.00 295.06 2.37 78.86 146.46 162.06 0 OLDHAM TRUST WEST 2AH P-DP 0.0000000 0.0002489 0.0002489 0.0000000 839.16 367.66 2.37 78.86 175.60 240.10 0 OLDHAM TRUST WEST 4051WA P-DP 0.0000000 0.0002699 0.0002699 0.0000000 1,140.37 690.53 2.37 78.86 540.60 772.07 0 OLDHAM TRUST WEST 4058LS P-DP 0.0000000 0.0002695 0.0002695 0.0000000 745.47 446.02 2.37 78.86 323.62 322.12 0 OLDHAM TRUST WEST UNIT 25-56 2SH P-DP 0.0000000 0.0002279 0.0002279 0.0000000 831.82 326.16 2.37 78.86 186.56 215.87 0 OLDHAM TRUST WEST UNIT 25-56 3AH P-DP 0.0000000 0.0002279 0.0002279 0.0000000 995.64 523.06 2.37 78.86 218.48 197.67 0 OLDHAM TRUST WEST UNIT 25-56 3SH P-DP 0.0000000 0.0002279 0.0002279 0.0000000 902.02 418.96 2.37 78.86 215.30 224.85 0 OLDHAM-GRAHAM 35A 1H P-DP 0.0000000 0.0026452 0.0026452 0.0000000 841.51 237.53 2.32 78.93 145.11 336.14 0 OLDHAM-GRAHAM 35B 2H P-DP 0.0000000 0.0023377 0.0023377 0.0000000 1,127.55 242.03 2.32 78.93 152.83 491.55 0 OLDHAM-GRAHAM 35C 3H P-DP 0.0000000 0.0026494 0.0026494 0.0000000 1,176.28 296.93 2.32 78.93 182.45 447.46 0 OLDHAM-GRAHAM 35D 4H P-DP 0.0000000 0.0023569 0.0023569 0.0000000 1,326.69 254.96 2.32 78.93 152.99 466.22 0 OLDHAM-GRAHAM 35E 5H P-DP 0.0000000 0.0026473 0.0026473 0.0000000 1,111.56 284.96 2.32 78.93 169.31 326.82 0 OLDHAM-GRAHAM 35F 6H P-DP 0.0000000 0.0023368 0.0023368 0.0000000 999.16 348.94 2.32 78.93 189.26 368.52 0 ORSON-BILLY 139A 1H P-DP 0.0000000 0.0024903 0.0024903 0.0000000 575.20 321.33 1.57 77.63 122.87 159.12 0 ORSON-BILLY 139B 2H P-DP 0.0000000 0.0024903 0.0024903 0.0000000 672.65 526.71 1.57 77.63 170.71 122.46 0 ORSON-BILLY 139C 3H P-DP 0.0000000 0.0024903 0.0024903 0.0000000 821.23 546.26 1.57 77.63 171.34 157.01 0 ORSON-BILLY 139D 4H P-DP 0.0000000 0.0024903 0.0024903 0.0000000 513.67 364.88 1.57 77.63 128.83 142.78 0 ORSON-BILLY 139E 5H P-DP 0.0000000 0.0024903 0.0024903 0.0000000 455.93 313.71 1.57 77.63 116.23 158.17 0 ORSON-BILLY 139F 6H P-DP 0.0000000 0.0024903 0.0024903 0.0000000 1,498.91 706.75 1.57 77.63 211.30 289.56 0 ORSON-BILLY 139G 7H P-DP 0.0000000 0.0024903 0.0024903 0.0000000 976.12 400.75 1.57 77.63 146.84 218.05 0 ORTHRUS UNIT A 34-22 1AH P-DP 0.0000000 0.0134561 0.0134561 0.0000000 774.35 469.91 3.53 76.99 268.80 418.49 0 ORTHRUS UNIT A 34-22 2AH P-DP 0.0000000 0.0134561 0.0134561 0.0000000 697.80 478.19 3.53 76.99 288.70 303.14 0 ORTHRUS UNIT A 34-22 3AH P-DP 0.0000000 0.0134561 0.0134561 0.0000000 834.46 283.80 3.53 76.99 135.59 205.35 0 ORTHRUS UNIT B 34-22 7AH P-DP 0.0000000 0.0134491 0.0134491 0.0000000 905.62 274.87 3.53 76.99 205.95 448.26 0 ORTHRUS UNIT B 34-22 8AH P-DP 0.0000000 0.0134491 0.0134491 0.0000000 546.77 477.58 3.53 76.99 306.96 288.52 0 OV UNIT 1 P-DP 0.0000000 0.0034314 0.0034314 0.0000000 172.37 85.46 1.49 79.19 56.78 96.10 0

LEASE NAME GAS PRC INITIAL GROSS ULTIMATE Mbbl GROSS ULTIMATE MMcf CUM GAS MMcf CUM OIL Mbbl EXPENSE INITIAL DECIMAL INTEREST FINAL DECIMAL REVENUE INITIAL DECIMAL INTEREST FINAL DECIMAL OIL PRC INITIAL $/bbl RES CAT AS OF DATE FIXED COST $/MO As of : 01/01/2024 GROSS ULTIMATE RESERVES, CUMULATIVE PRODUCTION AND BASIC ECONOMIC DATA TABLE 7 OVMLC 1 P-DP 0.0000000 0.0035807 0.0035807 0.0000000 316.51 103.38 1.49 79.19 73.93 198.88 0 OVMLC 2 P-DP 0.0000000 0.0035807 0.0035807 0.0000000 42.09 87.76 1.49 79.19 60.37 23.79 0 P LAMANTIA 1 P-DP 0.0000000 0.1250000 0.1250000 0.0000000 99.54 0.00 1.77 77.22 0.00 99.54 0 P LONG 1 P-DP 0.0000000 0.1250000 0.1250000 0.0000000 133.93 0.00 1.77 77.22 0.00 133.93 0 P LONG 4 P-DP 0.0000000 0.1250000 0.1250000 0.0000000 124.88 0.00 1.77 77.22 0.00 124.88 0 PALMER 52 UNIT 222H P-DP 0.0000000 0.0012230 0.0012230 0.0000000 4,221.73 431.68 1.38 77.44 172.64 1,505.34 0 PALMER 52 UNIT 332H P-DP 0.0000000 0.0012230 0.0012230 0.0000000 4,374.25 271.24 1.38 77.44 126.79 1,848.10 0 PALOS 01-12-241 P-DP 0.0000000 0.1591250 0.1591250 0.0000000 225.56 0.00 3.32 78.22 0.00 207.61 0 PALOS 02-10-239 P-DP 0.0000000 0.0800417 0.0800417 0.0000000 349.70 0.00 3.32 78.22 0.00 270.59 0 PALOS 02-16-240 P-DP 0.0000000 0.1587292 0.1587292 0.0000000 429.86 0.00 3.32 78.22 0.00 304.67 0 PALOS 03-06-245 P-DP 0.0000000 0.1666667 0.1666667 0.0000000 333.90 0.00 3.32 78.22 0.00 242.90 0 PALOS 03-10-232 P-DP 0.0000000 0.1666667 0.1666667 0.0000000 400.95 0.00 3.32 78.22 0.00 325.37 0 PALOS 03-14-233 P-DP 0.0000000 0.1666667 0.1666667 0.0000000 366.77 0.00 3.32 78.22 0.00 328.39 0 PALOS 03-16-231 P-DP 0.0000000 0.1666667 0.1666667 0.0000000 563.04 0.00 3.32 78.22 0.00 493.05 0 PAMOLA UNIT A 35-23 1AH P-DP 0.0000000 0.0127848 0.0127848 0.0000000 187.08 256.26 3.53 76.99 218.15 141.28 0 PAMOLA UNIT A 35-23 2AH P-DP 0.0000000 0.0127848 0.0127848 0.0000000 332.81 147.17 3.53 76.99 128.22 188.26 0 PAMOLA UNIT A 35-23 3AH P-DP 0.0000000 0.0127848 0.0127848 0.0000000 727.84 329.81 3.53 76.99 181.50 229.09 0 PAMOLA UNIT A 35-23 4AH P-DP 0.0000000 0.0127848 0.0127848 0.0000000 895.66 361.70 3.53 76.99 157.27 258.00 0 PAPER RINGS 136-137 A 1WB P-DP 0.0000000 0.0026943 0.0026943 0.0000000 597.53 418.41 1.57 77.63 254.70 381.06 0 PARKS 1 P-DP 0.0000000 0.0020090 0.0020090 0.0000000 121.63 108.92 2.32 78.93 90.87 121.63 0 PARKS 6 2 P-DP 0.0000000 0.0008036 0.0008036 0.0000000 37.10 55.95 2.32 78.93 31.82 37.10 0 PARKS FIELD UNIT 2 1450BH P-DP 0.0000000 0.0008036 0.0008036 0.0000000 1,644.69 366.11 2.32 78.93 276.17 861.62 0 PARKS FIELD UNIT 2 1450LH P-DP 0.0000000 0.0008036 0.0008036 0.0000000 1,895.40 487.42 2.32 78.93 400.88 1,127.41 0 PARKS FIELD UNIT 2 1451LH P-DP 0.0000000 0.0008036 0.0008036 0.0000000 1,195.26 703.65 2.32 78.93 551.58 658.29 0 PARKS FIELD UNIT 2 1454H P-DP 0.0000000 0.0008036 0.0008036 0.0000000 492.47 306.13 2.32 78.93 267.18 329.14 0 PARKS FIELD UNIT 2 1454LH P-DP 0.0000000 0.0008036 0.0008036 0.0000000 1,389.96 969.52 2.32 78.93 755.24 726.99 0 PARKS FIELD UNIT 2 1455LH P-DP 0.0000000 0.0008036 0.0008036 0.0000000 670.88 431.43 2.32 78.93 355.25 340.98 0 PARKS FIELD UNIT 2 1458CH P-DP 0.0000000 0.0008036 0.0008036 0.0000000 6,476.03 883.97 2.32 78.93 686.26 3,220.01 0 PARKS FIELD UNIT 2 1458LH P-DP 0.0000000 0.0008036 0.0008036 0.0000000 7,177.25 871.58 2.32 78.93 655.56 3,240.13 0 PARKS FIELD UNIT 2 1863BH P-DP 0.0000000 0.0008036 0.0008036 0.0000000 2,453.52 389.15 2.32 78.93 337.08 1,701.03 0 PARKS FIELD UNIT 2 1863LH P-DP 0.0000000 0.0008036 0.0008036 0.0000000 2,108.41 597.79 2.32 78.93 525.55 1,436.57 0 PARKS FIELD UNIT 2 1904BH P-DP 0.0000000 0.0008036 0.0008036 0.0000000 558.83 387.67 2.32 78.93 300.01 312.36 0 PARKS FIELD UNIT 2 1921H P-DP 0.0000000 0.0008036 0.0008036 0.0000000 2,804.56 383.46 2.32 78.93 333.81 2,481.17 0 PARKS FIELD UNIT 2 2001BH P-DP 0.0000000 0.0008036 0.0008036 0.0000000 2,923.27 365.10 2.32 78.93 231.49 1,072.40 0

LEASE NAME GAS PRC INITIAL GROSS ULTIMATE Mbbl GROSS ULTIMATE MMcf CUM GAS MMcf CUM OIL Mbbl EXPENSE INITIAL DECIMAL INTEREST FINAL DECIMAL REVENUE INITIAL DECIMAL INTEREST FINAL DECIMAL OIL PRC INITIAL $/bbl RES CAT AS OF DATE FIXED COST $/MO As of : 01/01/2024 GROSS ULTIMATE RESERVES, CUMULATIVE PRODUCTION AND BASIC ECONOMIC DATA TABLE 7 PARKS FIELD UNIT 2 2308BH P-DP 0.0000000 0.0008036 0.0008036 0.0000000 1,323.04 411.34 2.32 78.93 325.38 887.45 0 PARKS FIELD UNIT 2 2308LH P-DP 0.0000000 0.0008036 0.0008036 0.0000000 2,582.82 901.91 2.32 78.93 601.90 1,085.75 0 PARKS FIELD UNIT 2 2308MH P-DP 0.0000000 0.0008036 0.0008036 0.0000000 2,316.64 835.43 2.32 78.93 606.48 1,034.37 0 PARKS FIELD UNIT 2 2329LH P-DP 0.0000000 0.0008036 0.0008036 0.0000000 984.47 229.07 2.32 78.93 213.91 605.61 0 PARKS FIELD UNIT 2 2336BH P-DP 0.0000000 0.0008036 0.0008036 0.0000000 1,065.05 52.62 2.32 78.93 49.64 801.19 0 PARKS FIELD UNIT 2 2346CH P-DP 0.0000000 0.0008036 0.0008036 0.0000000 178.70 17.33 2.32 78.93 17.33 178.70 0 PARKS FIELD UNIT 2 2348H P-DP 0.0000000 0.0008036 0.0008036 0.0000000 552.53 647.84 2.32 78.93 510.76 372.87 0 PARKS FIELD UNIT 2 2630H P-DP 0.0000000 0.0008036 0.0008036 0.0000000 1,963.48 110.78 2.32 78.93 70.04 1,342.16 0 PARKS FIELD UNIT 2 2709H P-DP 0.0000000 0.0008036 0.0008036 0.0000000 1,826.77 1,183.15 2.32 78.93 1,035.07 1,166.57 0 PARKS FIELD UNIT NO. 2 1320H P-DP 0.0000000 0.0008036 0.0008036 0.0000000 1,697.85 40.56 2.32 78.93 28.91 1,398.68 0 PARKS FIELD UNIT NO. 2 1421H P-DP 0.0000000 0.0008036 0.0008036 0.0000000 9,172.79 186.89 2.32 78.93 176.88 8,315.95 0 PARKS FIELD UNIT NO. 2 1422H P-DP 0.0000000 0.0008036 0.0008036 0.0000000 8,369.31 153.72 2.32 78.93 141.31 7,333.51 0 PARKS FIELD UNIT NO. 2 1423H P-DP 0.0000000 0.0008036 0.0008036 0.0000000 1,559.45 45.25 2.32 78.93 44.49 1,540.84 0 PARKS FIELD UNIT NO. 2 1829H P-DP 0.0000000 0.0008036 0.0008036 0.0000000 3,299.47 54.17 2.32 78.93 52.63 3,209.03 0 PARKS FIELD UNIT NO. 2 1831H P-DP 0.0000000 0.0008036 0.0008036 0.0000000 9,893.25 221.11 2.32 78.93 221.11 9,860.26 0 PARKS FIELD UNIT NO. 2 2324H P-DP 0.0000000 0.0008036 0.0008036 0.0000000 3,846.63 113.76 2.32 78.93 104.94 3,492.88 0 PARKS FIELD UNIT NO. 2 2401 P-DP 0.0000000 0.0008036 0.0008036 0.0000000 2,604.08 57.40 2.32 78.93 57.40 2,604.08 0 PARKS FIELD UNIT NO. 2 2417H P-DP 0.0000000 0.0008036 0.0008036 0.0000000 2,375.35 53.61 2.32 78.93 53.61 2,375.35 0 PARKS, ROY 306BH P-DP 0.0000000 0.0002678 0.0002678 0.0000000 1,145.81 496.15 2.32 78.93 399.05 829.33 0 PARKS, ROY 306LH P-DP 0.0000000 0.0002678 0.0002678 0.0000000 741.77 859.65 2.32 78.93 529.33 396.39 0 PARKS, ROY 307BH P-DP 0.0000000 0.0002678 0.0002678 0.0000000 894.95 460.77 2.32 78.93 354.89 665.24 0 PARKS, ROY 307LH P-DP 0.0000000 0.0002678 0.0002678 0.0000000 954.55 36.25 2.32 78.93 36.25 640.77 0 PARKS, ROY 308BH P-DP 0.0000000 0.0002678 0.0002678 0.0000000 599.39 459.45 2.32 78.93 340.46 357.83 0 PARKS, ROY 308LH P-DP 0.0000000 0.0002678 0.0002678 0.0000000 733.07 6.40 2.32 78.93 6.39 560.06 0 PARKS, ROY 308MH P-DP 0.0000000 0.0002678 0.0002678 0.0000000 740.45 1,055.43 2.32 78.93 686.07 483.08 0 PARKS, ROY 316CH P-DP 0.0000000 0.0002678 0.0002678 0.0000000 485.42 183.98 2.32 78.93 159.81 309.33 0 PARKS, ROY 316LH P-DP 0.0000000 0.0002678 0.0002678 0.0000000 650.59 483.11 2.32 78.93 336.51 391.64 0 PARKS, ROY 99H P-DP 0.0000000 0.0002678 0.0002678 0.0000000 1,601.26 198.09 2.32 78.93 196.59 1,090.87 0 PARKS-COYOTE 1506 A 15HJ P-DP 0.0000000 0.0020089 0.0020089 0.0000000 543.64 461.25 2.32 78.93 234.78 205.62 0 PARKS-COYOTE 1506 A 1HM P-DP 0.0000000 0.0020089 0.0020089 0.0000000 1,434.08 619.61 2.32 78.93 399.05 809.46 0 PARKS-COYOTE 1506 A 8HS P-DP 0.0000000 0.0020089 0.0020089 0.0000000 1,022.77 701.13 2.32 78.93 350.38 363.00 0 PARKS-COYOTE 1506 B 2HM P-DP 0.0000000 0.0020089 0.0020089 0.0000000 944.87 348.93 2.32 78.93 254.38 697.87 0 PARKS-COYOTE 1506 B 9HS P-DP 0.0000000 0.0020089 0.0020089 0.0000000 738.21 441.71 2.32 78.93 181.69 240.12 0 PARKS-COYOTE 1506 C 10HS P-DP 0.0000000 0.0020089 0.0020089 0.0000000 959.28 574.15 2.32 78.93 258.09 307.70 0

LEASE NAME GAS PRC INITIAL GROSS ULTIMATE Mbbl GROSS ULTIMATE MMcf CUM GAS MMcf CUM OIL Mbbl EXPENSE INITIAL DECIMAL INTEREST FINAL DECIMAL REVENUE INITIAL DECIMAL INTEREST FINAL DECIMAL OIL PRC INITIAL $/bbl RES CAT AS OF DATE FIXED COST $/MO As of : 01/01/2024 GROSS ULTIMATE RESERVES, CUMULATIVE PRODUCTION AND BASIC ECONOMIC DATA TABLE 7 PARKS-COYOTE 1506 C 16HJ P-DP 0.0000000 0.0020089 0.0020089 0.0000000 842.61 543.33 2.32 78.93 248.96 259.78 0 PARKS-COYOTE 1506 C 3HM P-DP 0.0000000 0.0020089 0.0020089 0.0000000 1,594.76 458.38 2.32 78.93 303.98 845.65 0 PARKS-COYOTE 1506 D 11HS P-DP 0.0000000 0.0020089 0.0020089 0.0000000 748.42 351.38 2.32 78.93 171.53 248.47 0 PARKS-COYOTE 1506 D 17HS P-DP 0.0000000 0.0020089 0.0020089 0.0000000 503.22 268.28 2.32 78.93 132.11 183.41 0 PARKS-COYOTE 1506 D 4HM P-DP 0.0000000 0.0020089 0.0020089 0.0000000 2,241.13 918.97 2.32 78.93 495.47 1,017.22 0 PARKS-COYOTE 1506 E 12HS P-DP 0.0000000 0.0020089 0.0020089 0.0000000 1,135.18 674.29 2.32 78.93 258.92 286.86 0 PARKS-COYOTE 1506 E 18HJ P-DP 0.0000000 0.0020089 0.0020089 0.0000000 847.01 529.48 2.32 78.93 219.44 249.65 0 PARKS-COYOTE 1506 E 5HM P-DP 0.0000000 0.0020089 0.0020089 0.0000000 1,453.31 547.34 2.32 78.93 350.87 702.42 0 PARKS-COYOTE 1506 F 13HS P-DP 0.0000000 0.0020089 0.0020089 0.0000000 772.34 464.30 2.32 78.93 206.35 273.62 0 PARKS-COYOTE 1506 F 6HM P-DP 0.0000000 0.0020089 0.0020089 0.0000000 711.01 463.80 2.32 78.93 348.50 542.99 0 PARKS-COYOTE 1506 G 14HS P-DP 0.0000000 0.0020089 0.0020089 0.0000000 662.63 817.36 2.32 78.93 365.87 264.86 0 PARKS-COYOTE 1506 G 19HS P-DP 0.0000000 0.0020089 0.0020089 0.0000000 275.75 213.57 2.32 78.93 118.31 103.08 0 PARKS-COYOTE 1506 G 7HM P-DP 0.0000000 0.0020089 0.0020089 0.0000000 1,088.40 760.56 2.32 78.93 476.05 645.31 0 PATRICIA-NORRIS ALLOCATION 3311AH P-DP 0.0000000 0.0022917 0.0022917 0.0000000 861.75 110.10 1.57 77.63 105.60 456.30 0 PATRICIA-NORRIS ALLOCATION 3321SH P-DP 0.0000000 0.0022917 0.0022917 0.0000000 1,354.78 182.42 1.57 77.63 154.61 628.90 0 PATTERSON 3 P-DP 0.0000000 0.1100000 0.1100000 0.0000000 118.52 0.00 1.77 77.22 0.00 118.52 0 PERCY 39 1R P-DP 0.0000000 0.0023438 0.0023438 0.0000000 295.79 82.92 1.57 77.63 48.85 172.35 0 PHILLIPS 1 P-DP 0.0000000 0.1250000 0.1250000 0.0000000 117.12 0.00 1.77 77.22 0.00 117.12 0 PHILLIPS 2 P-DP 0.0000000 0.1250000 0.1250000 0.0000000 114.83 0.00 1.77 77.22 0.00 114.83 0 PHILLIPS 3 P-DP 0.0000000 0.1250000 0.1250000 0.0000000 102.76 0.00 1.77 77.22 0.00 102.76 0 PHILLIPS 7 1 P-DP 0.0000000 0.0031014 0.0031014 0.0000000 45.08 48.10 2.37 78.86 36.32 45.08 0 PHILLIPS-GUTHRIE 1 P-DP 0.0000000 0.0039063 0.0039063 0.0000000 66.90 97.02 1.57 77.63 94.26 64.21 0 PHILLIPS-GUTHRIE 2 P-DP 0.0000000 0.0039063 0.0039063 0.0000000 214.48 78.21 1.57 77.63 76.91 206.93 0 PHOENIX UNIT 35-38 8AH P-DP 0.0000000 0.0215673 0.0215673 0.0000000 549.77 338.62 3.53 76.99 256.43 278.27 0 PIXIE UNIT A 35-47 1AH P-DP 0.0000000 0.0210728 0.0210728 0.0000000 283.04 615.71 3.53 76.99 438.78 222.98 0 PIXIE UNIT A 35-47 2AH P-DP 0.0000000 0.0210728 0.0210728 0.0000000 959.51 209.17 3.53 76.99 164.25 632.50 0 PIXIE UNIT B 35-47 5AH P-DP 0.0000000 0.0210728 0.0210728 0.0000000 1,330.21 838.55 3.53 76.99 476.23 541.20 0 POINTER N CRC JF 7H P-DP 0.0000000 0.0089250 0.0089250 0.0000000 16,793.10 0.00 2.67 78.22 0.00 4,933.89 0 POINTER N CRC JF 9H P-DP 0.0000000 0.0089250 0.0089250 0.0000000 18,587.76 0.00 2.67 78.22 0.00 5,357.88 0 POINTER W CRC JF 5H P-DP 0.0000000 0.0007275 0.0007275 0.0000000 14,707.47 0.00 2.67 78.22 0.00 4,729.48 0 POLTERGEIST GUARDIAN A 12-02 2SH P-DP 0.0000000 0.0010763 0.0010763 0.0000000 1,865.39 754.96 2.37 78.86 73.24 77.59 0 POLTERGEIST GUARDIAN B 12-02 2AH P-DP 0.0000000 0.0010763 0.0010763 0.0000000 1,758.35 809.09 2.37 78.86 82.28 77.17 0 POLTERGEIST GUARDIAN C 12-02 3SH P-DP 0.0000000 0.0010763 0.0010763 0.0000000 1,758.35 809.09 2.37 78.86 82.28 77.17 0 POTH UNIT 1H P-DP 0.0000000 0.0073981 0.0073981 0.0000000 1,648.33 167.98 2.33 75.89 138.53 1,469.65 0

LEASE NAME GAS PRC INITIAL GROSS ULTIMATE Mbbl GROSS ULTIMATE MMcf CUM GAS MMcf CUM OIL Mbbl EXPENSE INITIAL DECIMAL INTEREST FINAL DECIMAL REVENUE INITIAL DECIMAL INTEREST FINAL DECIMAL OIL PRC INITIAL $/bbl RES CAT AS OF DATE FIXED COST $/MO As of : 01/01/2024 GROSS ULTIMATE RESERVES, CUMULATIVE PRODUCTION AND BASIC ECONOMIC DATA TABLE 7 POWELL 43 1 P-DP 0.0000000 0.0027778 0.0027778 0.0000000 108.48 75.80 1.57 77.63 59.98 99.78 0 POWELL A 2 P-DP 0.0000000 0.0031250 0.0031250 0.0000000 372.02 184.75 1.57 77.63 132.59 283.16 0 POWELL A 3 P-DP 0.0000000 0.0031250 0.0031250 0.0000000 50.35 12.23 1.57 77.63 12.09 49.05 0 POWELL B 1 P-DP 0.0000000 0.0031250 0.0031250 0.0000000 239.73 95.19 1.57 77.63 70.67 148.25 0 POWELL C 1 P-DP 0.0000000 0.0031250 0.0031250 0.0000000 269.71 101.39 1.57 77.63 75.95 172.49 0 PRIMA 1H P-DP 0.0000000 0.0003637 0.0003637 0.0000000 5,323.64 373.52 1.38 77.44 220.54 2,930.12 0 PRIMERO 42 1 P-DP 0.0000000 0.0295841 0.0295841 0.0000000 338.42 181.42 2.37 78.86 120.09 207.74 0 PRIMERO 42 A 2 P-DP 0.0000000 0.0295841 0.0295841 0.0000000 0.18 12.93 2.37 78.86 10.33 0.18 0 PRIMERO 42 B3 3 P-DP 0.0000000 0.0295841 0.0295841 0.0000000 68.44 85.08 2.37 78.86 55.42 41.32 0 PRIMERO 42 C 5 P-DP 0.0000000 0.0295841 0.0295841 0.0000000 20.59 32.13 2.37 78.86 26.60 20.59 0 PRIMERO 42 D 6 P-DP 0.0000000 0.0369803 0.0369803 0.0000000 1.64 7.85 2.37 78.86 6.21 1.64 0 PRISCILLA 23-14 1LS P-DP 0.0000000 0.0002951 0.0002951 0.0000000 969.38 427.14 2.37 78.86 115.51 145.23 0 PRISCILLA 23-14 2MS P-DP 0.0000000 0.0002951 0.0002951 0.0000000 518.35 247.42 2.37 78.86 86.89 123.23 0 PRISCILLA 23-14 3A P-DP 0.0000000 0.0002951 0.0002951 0.0000000 929.84 593.73 2.37 78.86 168.57 181.24 0 PRISCILLA 23-14 4AH P-DP 0.0000000 0.0002951 0.0002951 0.0000000 840.07 500.18 2.37 78.86 399.88 532.12 0 PRISCILLA 23-14 4LS P-DP 0.0000000 0.0002951 0.0002951 0.0000000 749.76 562.78 2.37 78.86 148.04 150.55 0 PRISCILLA 23-14 4SH P-DP 0.0000000 0.0002951 0.0002951 0.0000000 694.69 559.21 2.37 78.86 453.69 417.72 0 PRISCILLA 23-14 5A P-DP 0.0000000 0.0002951 0.0002951 0.0000000 1,019.23 0.00 2.37 78.86 0.00 221.58 0 PRISCILLA 23-14 6LS P-DP 0.0000000 0.0002951 0.0002951 0.0000000 1,339.93 569.80 2.37 78.86 146.41 261.82 0 PRISCILLA 23-14 7MS P-DP 0.0000000 0.0002951 0.0002951 0.0000000 44.70 74.46 2.37 78.86 28.13 15.57 0 PRONGHORN C 34-166-165 WB 3H P-DP 0.0000110 0.0010950 0.0010950 0.0000110 1,457.93 468.74 1.38 77.44 113.82 229.99 3,500 PRONTO 1H P-DP 0.0000000 0.0003630 0.0003630 0.0000000 2,985.07 281.82 1.38 77.44 146.33 1,647.08 0 PRUETT 20 2 P-DP 0.0000000 0.0000412 0.0000412 0.0000000 400.80 213.27 1.38 77.44 182.10 313.43 0 PRUETT 20 4H P-DP 0.0000000 0.0000412 0.0000412 0.0000000 169.21 199.63 1.38 77.44 171.60 132.99 0 PRUETT 20 5H P-DP 0.0000000 0.0000412 0.0000412 0.0000000 217.98 81.77 1.38 77.44 62.15 149.89 0 PRUETT 20 6H P-DP 0.0000000 0.0000412 0.0000412 0.0000000 742.57 358.30 1.38 77.44 258.36 499.52 0 PRUETT 23 1H P-DP 0.0000000 0.0000687 0.0000687 0.0000000 16,834.43 89.00 1.38 77.44 66.90 16,769.91 0 PRUETT 23 2H P-DP 0.0000000 0.0000687 0.0000687 0.0000000 108.82 143.65 1.38 77.44 114.85 95.95 0 PRUETT 23A 1H P-DP 0.0000000 0.0000687 0.0000687 0.0000000 514.86 327.39 1.38 77.44 245.27 391.99 0 PRUETT 23A 2H P-DP 0.0000000 0.0000687 0.0000687 0.0000000 327.83 217.15 1.38 77.44 132.52 201.40 0 PUGGLE E WYN JF 4H P-DP 0.0000000 0.1107177 0.1107177 0.0000000 13,173.49 0.00 2.67 78.22 0.00 10,004.29 0 PUGGLE E WYN JF 6H P-DP 0.0000000 0.1107177 0.1107177 0.0000000 12,923.83 0.00 2.67 78.22 0.00 9,811.52 0 PUGGLE W WYN JF 2H P-DP 0.0000000 0.1033932 0.1033932 0.0000000 8,797.79 0.00 2.67 78.22 0.00 8,724.31 0 QUESO 34-153 UNIT 1H P-DP 0.0000000 0.0030208 0.0030208 0.0000000 2,908.53 757.77 1.38 77.44 545.14 1,993.97 0

LEASE NAME GAS PRC INITIAL GROSS ULTIMATE Mbbl GROSS ULTIMATE MMcf CUM GAS MMcf CUM OIL Mbbl EXPENSE INITIAL DECIMAL INTEREST FINAL DECIMAL REVENUE INITIAL DECIMAL INTEREST FINAL DECIMAL OIL PRC INITIAL $/bbl RES CAT AS OF DATE FIXED COST $/MO As of : 01/01/2024 GROSS ULTIMATE RESERVES, CUMULATIVE PRODUCTION AND BASIC ECONOMIC DATA TABLE 7 QUESO 34-153 UNIT 2H P-DP 0.0000000 0.0030208 0.0030208 0.0000000 2,545.90 912.94 1.38 77.44 596.50 1,748.56 0 QUICK SILVER 55-1-7 UNIT 1H 1.5 P-DP 0.0000000 0.0001410 0.0001410 0.0000000 4,162.83 675.33 2.70 78.79 425.04 2,487.36 0 QUITO, S. W. (DELAWARE) UNIT 201 P-DP 0.0000000 0.0003638 0.0003638 0.0000000 232.00 300.20 1.38 77.44 299.94 231.08 0 QUITO, S. W. (DELAWARE) UNIT 801 P-DP 0.0000000 0.0003638 0.0003638 0.0000000 18.47 0.37 1.38 77.44 0.37 18.47 0 RAGLAND 2 6 P-DP 0.0000000 0.0062500 0.0062500 0.0000000 505.35 187.35 1.57 77.63 172.94 470.81 0 RAGLAND-ANDERSON 47A 1H P-DP 0.0000000 0.0050365 0.0050365 0.0000000 858.95 517.35 1.57 77.63 332.23 410.56 0 RAGLAND-ANDERSON 47B 2H P-DP 0.0000000 0.0050319 0.0050319 0.0000000 1,091.61 533.79 1.57 77.63 336.95 472.81 0 RAGLAND-ANDERSON 47C 3H P-DP 0.0000000 0.0050327 0.0050327 0.0000000 1,118.18 439.21 1.57 77.63 293.85 457.47 0 RAINIER 55-1-28 UNIT 1H P-DP 0.0000000 0.0000624 0.0000624 0.0000000 3,835.80 804.41 2.70 78.79 539.42 2,472.24 0 RAKSHASA UNIT B 01-48 8BH P-DP 0.0000000 0.0002408 0.0002408 0.0000000 57.74 61.21 3.53 76.99 51.03 52.40 0 RAMBO E2 08 17 STATE COM 001H P-DP 0.0000000 0.0004834 0.0004834 0.0000000 136.98 263.99 2.04 78.21 124.57 59.61 0 RAMBO E2 08 17 STATE COM 002H P-DP 0.0000000 0.0004834 0.0004834 0.0000000 220.53 297.96 2.04 78.21 148.00 104.27 0 RATHKAMP UNIT 1H P-DP 0.0000000 0.0097130 0.0097130 0.0000000 1,193.73 172.13 2.33 75.89 164.54 1,150.03 0 RATHKAMP UNIT 3H P-DP 0.0000000 0.0097130 0.0097130 0.0000000 1,368.77 132.64 2.33 75.89 124.85 1,285.70 0 RATHKAMP UNIT 4H P-DP 0.0000000 0.0097130 0.0097130 0.0000000 1,066.77 87.21 2.33 75.89 78.60 866.66 0 REED 24 UNIT 2H P-DP 0.0000000 0.0002962 0.0002962 0.0000000 709.06 567.29 2.70 78.79 495.25 706.22 0 REED 24 UNIT 4H P-DP 0.0000000 0.0002962 0.0002962 0.0000000 376.39 229.37 2.70 78.79 188.52 295.11 0 REED 24 UNIT 5H P-DP 0.0000000 0.0002962 0.0002962 0.0000000 1,876.17 637.47 2.70 78.79 521.13 1,318.99 0 REED 24 UNIT 7H P-DP 0.0000000 0.0002962 0.0002962 0.0000000 2,064.65 686.19 2.70 78.79 551.94 1,508.97 0 REED 24 UNIT 8H P-DP 0.0000000 0.0002962 0.0002962 0.0000000 645.17 574.45 2.70 78.79 468.05 603.14 0 REITZ UNIT 3H P-DP 0.0000000 0.0040315 0.0040315 0.0000000 12,593.64 0.00 2.36 78.22 0.00 3,391.99 0 REITZ UNIT 5H P-DP 0.0000000 0.0040300 0.0040300 0.0000000 12,080.76 0.00 2.36 78.22 0.00 10,294.01 0 RENDEZVOUS NORTH POOLED UNIT 1LA P-DP 0.0000000 0.0002748 0.0002748 0.0000000 774.21 978.56 1.38 77.44 732.62 471.49 0 RENDEZVOUS NORTH POOLED UNIT 9UA P-DP 0.0000000 0.0002748 0.0002748 0.0000000 1,229.74 684.17 1.38 77.44 455.28 741.60 0 RICHARD E LEHMAN SWITZ9BHSU P-DP 0.0000000 0.0005064 0.0005064 0.0000000 16,641.50 0.00 2.20 78.22 0.00 12,277.27 0 RICHARD E LEHMAN SWITZ9DHSU P-DP 0.0000000 0.0005064 0.0005064 0.0000000 15,908.80 0.00 2.20 78.22 0.00 12,997.12 0 RICHMOND 39 1H P-DP 0.0000000 0.0001197 0.0001197 0.0000000 675.19 81.40 1.53 76.96 81.40 675.19 0 RICHMOND 39 2H P-DP 0.0000000 0.0001197 0.0001197 0.0000000 1,882.02 434.00 1.53 76.96 417.76 1,849.04 0 RICHMOND 39 3H P-DP 0.0000000 0.0001197 0.0001197 0.0000000 1,460.43 297.80 1.53 76.96 297.80 1,460.43 0 RICHMOND W STATE 4239 A-A 70H P-DP 0.0000000 0.0000418 0.0000418 0.0000000 2,784.02 367.41 1.53 76.96 212.07 1,450.44 0 RICHMOND W STATE 4239 A-B 71H P-DP 0.0000000 0.0000415 0.0000415 0.0000000 3,252.19 375.21 1.53 76.96 221.32 1,656.12 0 RICHMOND W STATE 4239 A-C 72H P-DP 0.0000000 0.0000415 0.0000415 0.0000000 1,805.99 180.77 1.53 76.96 107.10 930.59 0 RICHMOND W STATE 4239 A-D 73H P-DP 0.0000000 0.0000415 0.0000415 0.0000000 2,192.44 227.71 1.53 76.96 123.59 1,124.11 0 RICHMOND W. STATE 4239 A5 6H P-DP 0.0000000 0.0000410 0.0000410 0.0000000 4,435.44 707.64 1.53 76.96 72.90 465.51 0

LEASE NAME GAS PRC INITIAL GROSS ULTIMATE Mbbl GROSS ULTIMATE MMcf CUM GAS MMcf CUM OIL Mbbl EXPENSE INITIAL DECIMAL INTEREST FINAL DECIMAL REVENUE INITIAL DECIMAL INTEREST FINAL DECIMAL OIL PRC INITIAL $/bbl RES CAT AS OF DATE FIXED COST $/MO As of : 01/01/2024 GROSS ULTIMATE RESERVES, CUMULATIVE PRODUCTION AND BASIC ECONOMIC DATA TABLE 7 RICHMOND W. STATE 4239 A6 11UA P-DP 0.0000000 0.0000410 0.0000410 0.0000000 4,444.86 721.82 1.53 76.96 85.94 468.10 0 RICHMOND W. STATE 4239 A7 7LA P-DP 0.0000000 0.0000037 0.0000037 0.0000000 3,840.73 445.27 1.53 76.96 52.52 326.32 0 RINGNECK DOVE 3 P-DP 0.0000000 0.0031014 0.0031014 0.0000000 7.85 20.33 2.37 78.86 17.06 7.85 0 RISING SUN 40-33 #1AH P-DP 0.0000000 0.0140130 0.0140130 0.0000000 713.94 390.70 2.37 78.86 274.28 281.34 0 RISING SUN B 1LS P-DP 0.0000000 0.0046913 0.0046913 0.0000000 1,410.49 526.72 2.37 78.86 68.33 68.02 0 RISING SUN C 2A P-DP 0.0000000 0.0022756 0.0022756 0.0000000 1,283.55 369.05 2.37 78.86 49.78 64.19 0 RISING SUN C 3LS P-DP 0.0000000 0.0046929 0.0046929 0.0000000 1,410.49 526.72 2.37 78.86 68.33 68.02 0 RISING SUN D 4A P-DP 0.0000000 0.0022756 0.0022756 0.0000000 1,283.55 369.05 2.37 78.86 49.78 64.19 0 RISING SUN D 4A P-DP 0.0000000 0.0000882 0.0000882 0.0000000 1,320.44 381.14 2.37 78.86 49.78 64.19 0 RIVER CAT 57-33 A 1WA P-DP 0.0000000 0.0006221 0.0006221 0.0000000 2,723.82 771.60 1.38 77.44 366.00 1,152.10 0 RIVER CAT 57-33 B 2BS P-DP 0.0000000 0.0007022 0.0007022 0.0000000 1,656.34 383.43 1.38 77.44 132.92 312.53 0 RIVER CAT 57-33 C 3TS P-DP 0.0000000 0.0014008 0.0014008 0.0000000 1,135.95 371.04 1.38 77.44 128.40 286.75 0 ROADRUNNER 1 P-DP 0.0000000 0.0035091 0.0035091 0.0000000 106.16 29.71 1.38 77.44 23.62 79.18 0 ROADRUNNER 2 P-DP 0.0000000 0.0035091 0.0035091 0.0000000 970.05 43.24 1.38 77.44 33.84 945.35 0 ROCA UNIT 7 1H P-DP 0.0000000 0.0006594 0.0006594 0.0000000 819.96 529.15 1.38 77.44 416.96 635.60 0 ROCA UNIT 7 2H P-DP 0.0000000 0.0006594 0.0006594 0.0000000 518.29 280.71 1.38 77.44 228.61 404.66 0 ROUGAROU UNIT 36-48 5AH P-DP 0.0000000 0.0225446 0.0225446 0.0000000 495.06 781.90 3.53 76.99 415.19 234.54 0 ROXY CRC JF 1H P-DP 0.0000000 0.0396138 0.0396138 0.0000000 8,927.23 0.00 2.67 78.22 0.00 7,394.80 0 ROXY N CRC JF 3H P-DP 0.0000000 0.0099981 0.0099981 0.0000000 10,212.24 0.00 2.67 78.22 0.00 8,726.28 0 ROXY NE CRC JF 5H P-DP 0.0000000 0.0034336 0.0034336 0.0000000 10,134.65 0.00 2.67 78.22 0.00 8,863.73 0 RUSTLER A UNIT #3H P-DP 0.0000000 0.0004679 0.0004679 0.0000000 2,366.87 558.93 2.70 78.79 363.97 1,589.24 0 RUSTLER A UNIT #4H P-DP 0.0000000 0.0004679 0.0004679 0.0000000 382.31 1,229.63 2.70 78.79 776.69 365.62 0 RUSTLER B UNIT #1H P-DP 0.0000000 0.0004679 0.0004679 0.0000000 1,675.87 872.09 2.70 78.79 648.28 1,179.60 0 RUSTLER B UNIT #3H P-DP 0.0000000 0.0004690 0.0004690 0.0000000 1,427.48 948.03 2.70 78.79 663.79 993.62 0 RUSTLER C UNIT #1H P-DP 0.0000000 0.0004690 0.0004690 0.0000000 2,526.16 693.22 2.70 78.79 533.88 1,471.49 0 RUSTLER C UNIT #2H P-DP 0.0000000 0.0004690 0.0004690 0.0000000 198.24 524.73 2.70 78.79 333.06 196.95 0 RUSTLER D UNIT #1H P-DP 0.0000000 0.0004679 0.0004679 0.0000000 225.09 177.58 2.70 78.79 165.37 207.37 0 RUSTLER D UNIT #2H P-DP 0.0000000 0.0004679 0.0004679 0.0000000 1,951.83 318.40 2.70 78.79 241.71 1,226.72 0 RUSTLER D UNIT #4H P-DP 0.0000000 0.0004690 0.0004690 0.0000000 360.23 442.07 2.70 78.79 352.86 334.45 0 RUSTLER D UNIT #5H P-DP 0.0000000 0.0004679 0.0004679 0.0000000 313.37 405.56 2.70 78.79 320.54 294.05 0 SABINE 39 1 P-DP 0.0000000 0.0023438 0.0023438 0.0000000 533.70 137.45 1.57 77.63 93.64 418.47 0 SABINE 39 2 P-DP 0.0000000 0.0023438 0.0023438 0.0000000 147.10 13.37 1.57 77.63 10.65 123.61 0 SADIE 33-10-4 1H P-DP 0.0000000 0.0704641 0.0704641 0.0000000 10,870.12 1.06 2.75 68.45 1.06 9,251.99 0 SADIE 33-10-4 201H P-DP 0.0000000 0.0704641 0.0704641 0.0000000 11,802.54 2.35 2.75 68.45 2.35 9,171.23 0

LEASE NAME GAS PRC INITIAL GROSS ULTIMATE Mbbl GROSS ULTIMATE MMcf CUM GAS MMcf CUM OIL Mbbl EXPENSE INITIAL DECIMAL INTEREST FINAL DECIMAL REVENUE INITIAL DECIMAL INTEREST FINAL DECIMAL OIL PRC INITIAL $/bbl RES CAT AS OF DATE FIXED COST $/MO As of : 01/01/2024 GROSS ULTIMATE RESERVES, CUMULATIVE PRODUCTION AND BASIC ECONOMIC DATA TABLE 7 SADIE 33-10-4 205H P-DP 0.0000000 0.0082758 0.0082758 0.0000000 15,100.65 0.67 2.75 68.45 0.67 12,036.19 0 SADIE 33-10-4 3H P-DP 0.0000000 0.0306224 0.0306224 0.0000000 13,930.65 4.35 2.75 68.45 4.35 11,234.39 0 SADIE 33-10-4 5H P-DP 0.0000000 0.0309096 0.0309096 0.0000000 13,145.26 1.73 2.75 68.45 1.73 10,497.70 0 SAND DOLLAR UNIT 1 P-DP 0.0000000 0.0032222 0.0032222 0.0000000 38.16 35.70 2.37 78.86 30.34 38.16 0 SANTANA 29 2H P-DP 0.0000000 0.0035482 0.0035482 0.0000000 4,917.56 239.77 1.53 76.96 179.26 4,010.88 0 SASQUATCH UNIT 36-24 1AH P-DP 0.0000000 0.0133914 0.0133914 0.0000000 689.05 586.97 3.53 76.99 323.78 442.12 0 SASQUATCH UNIT 36-24 2AH P-DP 0.0000000 0.0133914 0.0133914 0.0000000 651.76 305.24 3.53 76.99 146.66 172.66 0 SASQUATCH UNIT 36-24 3AH P-DP 0.0000000 0.0133914 0.0133914 0.0000000 634.05 299.17 3.53 76.99 145.06 175.65 0 SAU 25 1B P-DP 0.0000000 0.0014585 0.0014585 0.0000000 310.93 45.77 1.07 75.95 41.81 265.16 0 SAU 25 1C P-DP 0.0000000 0.0014585 0.0014585 0.0000000 213.78 26.80 1.07 75.95 25.59 202.42 0 SAU 25-2 2C P-DP 0.0000000 0.0014585 0.0014585 0.0000000 167.26 29.78 1.07 75.95 27.90 159.06 0 SAU MARINER 25-2A 2A P-DP 0.0000000 0.0014585 0.0014585 0.0000000 200.12 59.41 1.07 75.95 54.59 185.15 0 SCATTER 1510 1AH P-DP 0.0000000 0.0006307 0.0006307 0.0000000 389.31 496.57 2.37 78.86 378.07 229.25 0 SCATTER 1510 2AH P-DP 0.0000000 0.0006307 0.0006307 0.0000000 1,332.54 414.02 2.37 78.86 308.05 722.40 0 SCATTER 1510 2SH P-DP 0.0000000 0.0006307 0.0006307 0.0000000 1,364.52 577.82 2.37 78.86 417.94 722.96 0 SCATTER GINGER 15-27 (ALLOC-D) 4SA P-DP 0.0000000 0.0006577 0.0006577 0.0000000 1,458.31 454.47 2.37 78.86 178.48 225.78 0 SCATTER GINGER 15-27 (ALLOC-D) 4SS P-DP 0.0000000 0.0006577 0.0006577 0.0000000 1,853.86 469.77 2.37 78.86 179.15 258.32 0 SCATTER TISH 10-46 (ALLOC-D) 4NA P-DP 0.0000000 0.0180473 0.0180473 0.0000000 1,933.54 614.39 2.37 78.86 233.64 296.36 0 SCATTER TISH 10-46 (ALLOC-D) 4NS P-DP 0.0000000 0.0180698 0.0180698 0.0000000 1,394.60 507.32 2.37 78.86 196.91 223.76 0 SHADRACH 68 UNIT 134H P-DP 0.0000000 0.0009551 0.0009551 0.0000000 3,680.05 280.07 1.53 76.96 247.76 1,942.10 0 SHADRACH 68 UNIT 1H P-DP 0.0000000 0.0009551 0.0009551 0.0000000 4,990.97 708.78 1.53 76.96 520.96 3,119.85 0 SHADRACH 68 UNIT 223H P-DP 0.0000000 0.0009551 0.0009551 0.0000000 4,171.16 518.83 1.53 76.96 330.49 1,998.41 0 SHADRACH 68 UNIT 2H P-DP 0.0000000 0.0009551 0.0009551 0.0000000 4,212.74 630.40 1.53 76.96 420.17 3,101.78 0 SHADRACH 68 UNIT 324H P-DP 0.0000000 0.0009551 0.0009551 0.0000000 4,958.59 738.36 1.53 76.96 592.66 3,581.06 0 SHADRACH 68 UNIT 332H P-DP 0.0000000 0.0009551 0.0009551 0.0000000 2,965.82 513.89 1.53 76.96 313.93 1,680.42 0 SHADRACH MOSES CANTALOUPE 221H P-DP 0.0000000 0.0004688 0.0004688 0.0000000 4,097.89 401.59 1.53 76.96 291.11 1,766.98 0 SHANNON 210470 3C P-DP 0.0000000 0.0000125 0.0000125 0.0000000 17,064.56 0.01 2.36 78.22 0.01 11,716.08 0 SHANNON 210470 4B P-DP 0.0000000 0.0000125 0.0000125 0.0000000 19,393.27 0.02 2.36 78.22 0.02 13,018.95 0 SHANNON 211271 1B P-DP 0.0000000 0.0147315 0.0147315 0.0000000 14,799.36 0.01 2.36 78.22 0.01 10,858.14 0 SHANNON 211271 2A P-DP 0.0000000 0.0147315 0.0147315 0.0000000 16,618.51 0.01 2.36 78.22 0.01 11,619.79 0 SHENANDOAH 11-2-58 H 1W P-DP 0.0000000 0.0003766 0.0003766 0.0000000 189.96 304.77 2.37 78.86 213.94 182.49 0 SHENANDOAH 11-2-58 H 2WA P-DP 0.0000000 0.0003766 0.0003766 0.0000000 749.52 253.86 2.37 78.86 166.17 371.42 0 SHERROD UNIT 3903 P-DP 0.0000000 0.0014585 0.0014585 0.0000000 17.28 32.91 1.07 75.95 29.65 16.75 0 SHERROD UNIT 3906 P-DP 0.0000000 0.0014585 0.0014585 0.0000000 93.73 5.72 1.07 75.95 5.72 93.73 0

LEASE NAME GAS PRC INITIAL GROSS ULTIMATE Mbbl GROSS ULTIMATE MMcf CUM GAS MMcf CUM OIL Mbbl EXPENSE INITIAL DECIMAL INTEREST FINAL DECIMAL REVENUE INITIAL DECIMAL INTEREST FINAL DECIMAL OIL PRC INITIAL $/bbl RES CAT AS OF DATE FIXED COST $/MO As of : 01/01/2024 GROSS ULTIMATE RESERVES, CUMULATIVE PRODUCTION AND BASIC ECONOMIC DATA TABLE 7 SHERROD UNIT 3907 P-DP 0.0000000 0.2625000 0.2625000 0.0000000 203.04 3.64 1.07 75.95 3.64 203.04 0 SHERROD UNIT 903 P-DP 0.0000000 0.0014585 0.0014585 0.0000000 29.15 30.87 1.07 75.95 29.50 28.88 0 SHIRLEY -B- 3815R P-DP 0.0000000 0.0140625 0.0140625 0.0000000 115.74 92.27 2.32 78.93 67.21 75.89 0 SHIRLEY 3806 P-DP 0.0000000 0.0140625 0.0140625 0.0000000 87.83 77.44 2.32 78.93 63.49 73.80 0 SHIRLEY 3807 P-DP 0.0000000 0.0140625 0.0140625 0.0000000 51.78 27.34 2.32 78.93 20.98 42.26 0 SHIRLEY 3808 P-DP 0.0000000 0.0140625 0.0140625 0.0000000 77.14 48.96 2.32 78.93 38.31 58.22 0 SHOSHONE A 34-166-165 5201H P-DP 0.0000000 0.0000010 0.0000010 0.0000000 2,040.63 626.73 1.38 77.44 457.75 1,450.47 0 SHOSHONE B 34-166-165 TB 2H P-DP 0.0000227 0.0000227 0.0000227 0.0000227 360.17 67.74 1.38 77.44 44.66 112.79 3,500 SHOSHONE C 34-166-165 WA 3H P-DP 0.0000222 0.0000222 0.0000222 0.0000222 1,032.25 435.43 1.38 77.44 134.16 251.62 3,500 SHOSHONE E 34-166-165 WB 5H P-DP 0.0000000 0.0000010 0.0000010 0.0000000 980.02 532.47 1.38 77.44 42.61 82.24 0 SIDWELL SE WHL BL 10H P-DP 0.0000000 0.0340845 0.0340845 0.0000000 7,735.05 0.00 2.36 78.22 0.00 5,968.86 0 SIDWELL SE WHL BL 8H P-DP 0.0000000 0.0340845 0.0340845 0.0000000 9,107.09 0.00 2.36 78.22 0.00 6,345.88 0 SIDWELL SW WHL BL 2H P-DP 0.0000000 0.0068418 0.0068418 0.0000000 9,459.18 0.00 2.36 78.22 0.00 4,648.05 0 SIDWELL SW WHL BL 4H P-DP 0.0000000 0.0068418 0.0068418 0.0000000 10,409.81 0.00 2.36 78.22 0.00 9,657.68 0 SILVERADO 40-1 A 1JM P-DP 0.0000000 0.0016332 0.0016332 0.0000000 1,201.28 757.16 1.57 77.63 355.64 455.28 0 SILVERADO 40-1 B 2LS P-DP 0.0000000 0.0016337 0.0016337 0.0000000 681.13 565.04 1.57 77.63 300.71 329.23 0 SILVERADO 40-1 C 3WA P-DP 0.0000000 0.0016343 0.0016343 0.0000000 637.99 380.97 1.57 77.63 210.02 225.39 0 SILVERADO 40-1 E 5JM P-DP 0.0000000 0.0016275 0.0016275 0.0000000 1,067.36 572.36 1.57 77.63 319.23 443.22 0 SILVERADO 40-1 F 6LS P-DP 0.0000000 0.0016344 0.0016344 0.0000000 808.20 376.39 1.57 77.63 237.97 360.11 0 SILVERADO 40-1 G 7LS P-DP 0.0000000 0.0016340 0.0016340 0.0000000 1,177.85 371.28 1.57 77.63 240.74 442.80 0 SILVERADO 40-1 H 8WA P-DP 0.0000000 0.0016344 0.0016344 0.0000000 2,080.06 772.32 1.57 77.63 439.95 707.77 0 SILVERADO 40-1 I 9WB P-DP 0.0000000 0.0016332 0.0016332 0.0000000 1,220.72 412.06 1.57 77.63 228.63 537.19 0 SILVERADO 40-1 J 10WB P-DP 0.0000000 0.0016296 0.0016296 0.0000000 3,497.30 357.47 1.57 77.63 204.89 1,013.02 0 SILVERADO 40-1 K 11WA P-DP 0.0000000 0.0016331 0.0016331 0.0000000 2,332.49 718.27 1.57 77.63 447.34 896.98 0 SIMPSON SMITH 0844 A 1W P-DP 0.0000000 0.0078080 0.0078080 0.0000000 658.68 911.95 2.37 78.86 546.06 413.49 0 SIMPSON SMITH A 08-44 1SH P-DP 0.0000000 0.0022674 0.0022674 0.0000000 1,142.46 487.38 2.37 78.86 112.02 108.41 0 SIMPSON SMITH B 08-44 2AH P-DP 0.0000000 0.0051129 0.0051129 0.0000000 1,430.77 542.12 2.37 78.86 137.39 111.88 0 SIMPSON SMITH C 08-44 2SH P-DP 0.0000000 0.0022560 0.0022560 0.0000000 1,164.28 538.80 2.37 78.86 136.59 111.33 0 SIMPSON SMITH D 08-44 3AH P-DP 0.0000000 0.0080199 0.0080199 0.0000000 1,174.40 526.24 2.37 78.86 128.50 110.49 0 SIMPSON SMITH E 08-44 3SH P-DP 0.0000000 0.0022564 0.0022564 0.0000000 1,232.86 550.44 2.37 78.86 143.23 125.59 0 SIREN UNIT 36-48 1AH P-DP 0.0000000 0.0216832 0.0216832 0.0000000 1,477.05 860.64 3.53 76.99 467.51 596.88 0 SIXTEEN PENNY NAIL 310 1LL P-DP 0.0000000 0.0001428 0.0001428 0.0000000 527.46 252.98 1.57 77.63 242.26 491.02 0 SIXTEEN PENNY NAIL 310 2LM P-DP 0.0000000 0.0001434 0.0001434 0.0000000 212.08 141.50 1.57 77.63 137.95 203.29 0 SIXTEEN PENNY NAIL 310 8JM P-DP 0.0000000 0.0001447 0.0001447 0.0000000 2,071.26 491.05 1.57 77.63 265.60 856.58 0

LEASE NAME GAS PRC INITIAL GROSS ULTIMATE Mbbl GROSS ULTIMATE MMcf CUM GAS MMcf CUM OIL Mbbl EXPENSE INITIAL DECIMAL INTEREST FINAL DECIMAL REVENUE INITIAL DECIMAL INTEREST FINAL DECIMAL OIL PRC INITIAL $/bbl RES CAT AS OF DATE FIXED COST $/MO As of : 01/01/2024 GROSS ULTIMATE RESERVES, CUMULATIVE PRODUCTION AND BASIC ECONOMIC DATA TABLE 7 SIXTEEN PENNY NAIL 310A 3LL P-DP 0.0000000 0.0001435 0.0001435 0.0000000 404.28 216.60 1.57 77.63 169.08 342.88 0 SIXTEEN PENNY NAIL 310A 9JM P-DP 0.0000000 0.0001444 0.0001444 0.0000000 1,265.34 152.87 1.57 77.63 93.42 561.36 0 SIXTEEN PENNY NAIL 310B 10JM P-DP 0.0000000 0.0001447 0.0001447 0.0000000 61.65 220.92 1.57 77.63 126.50 42.06 0 SIXTEEN PENNY NAIL 310B 4LM P-DP 0.0000000 0.0001433 0.0001433 0.0000000 879.19 134.09 1.57 77.63 131.07 663.89 0 SIXTEEN PENNY NAIL 310B 5LL P-DP 0.0000000 0.0001434 0.0001434 0.0000000 910.97 205.78 1.57 77.63 201.22 694.55 0 SIXTEEN PENNY NAIL 310C 11JM P-DP 0.0000000 0.0001449 0.0001449 0.0000000 1,063.26 311.44 1.57 77.63 179.97 447.52 0 SIXTEEN PENNY NAIL 310C 6LM P-DP 0.0000000 0.0001435 0.0001435 0.0000000 983.08 277.06 1.57 77.63 252.27 722.01 0 SIXTEEN PENNY NAIL 310C 7LL P-DP 0.0000000 0.0001427 0.0001427 0.0000000 481.91 165.00 1.57 77.63 152.67 370.13 0 SMASHOSAURUS 3 P-DP 0.0000000 0.0000761 0.0000761 0.0000000 19,957.46 0.00 2.36 78.22 0.00 18,324.93 0 SMASHOSAURUS 5 P-DP 0.0000000 0.0115187 0.0115187 0.0000000 17,092.11 0.00 2.36 78.22 0.00 15,757.91 0 SMITH 4 1 P-DP 0.0000000 0.0071768 0.0071768 0.0000000 40.70 23.13 2.37 78.86 23.09 39.48 0 SON 136 1 P-DP 0.0000000 0.0077291 0.0077291 0.0000000 140.31 50.83 1.57 77.63 31.65 87.36 0 SON 136 2 P-DP 0.0000000 0.0077291 0.0077291 0.0000000 149.87 49.92 1.57 77.63 28.11 76.98 0 SOUTH HILIGHT UNIT 1-41 P-DP 0.0000000 0.0049998 0.0049998 0.0000000 303.12 8.46 4.94 77.99 8.46 303.12 0 SOUTH HILIGHT UNIT 13-39 P-DP 0.0000000 0.0100006 0.0100006 0.0000000 1,352.01 42.89 4.94 77.99 42.89 1,352.01 0 SPIRE 226-34 UNIT 1H P-DP 0.0000000 0.0011695 0.0011695 0.0000000 3,750.62 259.61 1.38 77.44 180.97 2,715.24 0 SPITFIRE 1H P-DP 0.0000000 0.0001648 0.0001648 0.0000000 11,017.66 0.00 2.36 78.22 0.00 10,173.81 0 SPITFIRE 3H P-DP 0.0000000 0.0001648 0.0001648 0.0000000 8,394.54 0.00 2.36 78.22 0.00 7,546.60 0 SPORT E WYN JF 3H P-DP 0.0000000 0.0750150 0.0750150 0.0000000 13,882.56 0.00 2.67 78.22 0.00 7,455.46 0 SPORT W WYN JF 1H P-DP 0.0000000 0.0906968 0.0906968 0.0000000 15,163.71 0.00 2.67 78.22 0.00 8,297.14 0 SRO 551 ALLOC B 101H P-DP 0.0000000 0.0001342 0.0001342 0.0000000 3,331.63 449.28 1.38 77.44 240.82 2,098.57 0 SRO 551 ALLOC. A 100H P-DP 0.0000000 0.0001342 0.0001342 0.0000000 3,284.74 312.03 1.38 77.44 215.47 1,969.38 0 STATE EILAND 3-33 11H P-DP 0.0000000 0.0005021 0.0005021 0.0000000 1,542.94 568.75 1.38 77.44 406.47 999.48 0 STATE EILAND 6047B-34 51H P-DP 0.0000000 0.0004966 0.0004966 0.0000000 991.17 485.72 1.38 77.44 415.25 831.98 0 STATE MUDDY WATERS 30 2H P-DP 0.0000000 0.0016884 0.0016884 0.0000000 2,983.17 234.43 1.53 76.96 191.60 2,616.45 0 STATE MUDDY WATERS UNIT 711H P-DP 0.0000000 0.0016884 0.0016884 0.0000000 4,250.21 596.04 1.53 76.96 73.23 388.92 0 STATE MUDDY WATERS UNIT 731H P-DP 0.0000000 0.0016884 0.0016884 0.0000000 5,164.50 490.17 1.53 76.96 82.59 723.37 0 STATE MUDDY WATERS UNIT 732H P-DP 0.0000000 0.0016884 0.0016884 0.0000000 11,313.48 482.90 1.53 76.96 83.29 1,220.11 0 STATE MUDDY WATERS UNIT 733H P-DP 0.0000000 0.0016884 0.0016884 0.0000000 10,330.26 474.45 1.53 76.96 81.28 1,072.93 0 STATE MUDDY WATERS UNIT 751H P-DP 0.0000000 0.0016884 0.0016884 0.0000000 4,833.97 91.65 1.53 76.96 16.29 536.86 0 STELLA STATE 34-208 WRD UNIT 1H P-DP 0.0000000 0.0002116 0.0002116 0.0000000 1,861.47 230.28 1.38 77.44 175.76 1,412.89 0 STELLA STATE 34-208 WRD UNIT 2H P-DP 0.0000000 0.0002116 0.0002116 0.0000000 2,180.10 298.35 1.38 77.44 179.49 1,375.07 0 STICKLINE 1H P-DP 0.0000000 0.0000282 0.0000282 0.0000000 8,237.14 672.62 1.38 77.44 348.89 4,219.83 0 STIMSON BURLEY -B- 1 P-DP 0.0000000 0.0002151 0.0002151 0.0000000 252.50 97.65 2.32 78.93 93.43 247.23 0

LEASE NAME GAS PRC INITIAL GROSS ULTIMATE Mbbl GROSS ULTIMATE MMcf CUM GAS MMcf CUM OIL Mbbl EXPENSE INITIAL DECIMAL INTEREST FINAL DECIMAL REVENUE INITIAL DECIMAL INTEREST FINAL DECIMAL OIL PRC INITIAL $/bbl RES CAT AS OF DATE FIXED COST $/MO As of : 01/01/2024 GROSS ULTIMATE RESERVES, CUMULATIVE PRODUCTION AND BASIC ECONOMIC DATA TABLE 7 STIMSON BURLEY -B- 2 P-DP 0.0000000 0.0002151 0.0002151 0.0000000 258.74 99.67 2.32 78.93 93.85 250.10 0 STIMSON BURLEY -B- 4 P-DP 0.0000000 0.0002151 0.0002151 0.0000000 261.62 82.67 2.32 78.93 78.52 255.70 0 STIMSON BURLEY -D- 1 P-DP 0.0000000 0.0002151 0.0002151 0.0000000 173.61 187.04 1.57 77.63 178.84 144.08 0 STIMSON BURLEY -E- 3DW P-DP 0.0000000 0.0002151 0.0002151 0.0000000 7.36 4.54 1.57 77.63 2.92 3.40 0 STIMSON BURLEY -M- 1 P-DP 0.0000000 0.0002151 0.0002151 0.0000000 218.15 76.05 2.32 78.93 69.36 204.94 0 STIMSON-BURLEY -C- 1 P-DP 0.0000000 0.0001344 0.0001344 0.0000000 231.61 140.10 1.57 77.63 134.84 222.74 0 STIMSON-BURLEY -C- 3 P-DP 0.0000000 0.0001344 0.0001344 0.0000000 219.35 131.18 1.57 77.63 110.54 181.63 0 STIMSON-BURLEY 18 1 P-DP 0.0000000 0.0002151 0.0002151 0.0000000 123.07 180.18 2.32 78.93 171.77 114.80 0 STIMSON-BURLEY 4 P-DP 0.0000000 0.0002151 0.0002151 0.0000000 303.86 59.37 1.57 77.63 59.03 300.16 0 STIMSON-BURLEY 6 P-DP 0.0000000 0.0002151 0.0002151 0.0000000 67.95 38.85 1.57 77.63 38.85 67.95 0 STINSON-BURLEY K 1 P-DP 0.0000000 0.0002151 0.0002151 0.0000000 263.42 85.52 2.32 78.93 74.56 242.56 0 STONE-GIST W45A 1H P-DP 0.0000000 0.0031123 0.0031123 0.0000000 808.95 521.61 2.97 78.55 347.42 353.00 0 STONE-GIST W45B 2H P-DP 0.0000000 0.0031557 0.0031557 0.0000000 745.19 468.02 2.97 78.55 324.90 404.10 0 STONE-GIST W45C 3H P-DP 0.0000000 0.0031135 0.0031135 0.0000000 822.37 515.35 2.97 78.55 388.11 489.35 0 STONE-GIST W45I 9H P-DP 0.0000000 0.0031129 0.0031129 0.0000000 469.91 261.43 2.97 78.55 191.92 240.42 0 STONE-GIST W45J 10H P-DP 0.0000000 0.0031508 0.0031508 0.0000000 538.28 339.00 2.97 78.55 259.69 358.02 0 SUCCUBUS UNIT B 25-24 8AH P-DP 0.0000000 0.0106872 0.0106872 0.0000000 450.89 287.30 3.53 76.99 201.67 187.82 0 SUGARLOAF 74 1H P-DP 0.0000000 0.0021897 0.0021897 0.0000000 2,072.52 513.93 1.53 76.96 403.96 1,652.58 0 SUGARLOAF 7475 10U C 10H P-DP 0.0000000 0.0015205 0.0015205 0.0000000 1,680.30 261.57 1.53 76.96 0.00 0.00 0 SUGARLOAF 7475 1U B 1H P-DP 0.0000000 0.0017861 0.0017861 0.0000000 2,607.59 398.27 1.53 76.96 232.72 1,195.81 0 SUGARLOAF 7475 2U B 2H P-DP 0.0000000 0.0015462 0.0015462 0.0000000 1,632.23 323.66 1.53 76.96 246.23 1,219.45 0 SUGARLOAF 7475 3U A 3H P-DP 0.0000000 0.0016105 0.0016105 0.0000000 3,172.20 809.36 1.53 76.96 618.02 2,141.19 0 SUGARLOAF 7475 4U A 4H P-DP 0.0000000 0.0015441 0.0015441 0.0000000 1,680.30 261.57 1.53 76.96 0.00 0.00 0 SUGARLOAF 7475 5U B 5H P-DP 0.0000000 0.0015341 0.0015341 0.0000000 2,841.03 538.27 1.53 76.96 0.00 0.00 0 SUGARLOAF 7475 6U A 6H P-DP 0.0000000 0.0015450 0.0015450 0.0000000 2,836.73 537.47 1.53 76.96 0.00 0.00 0 SUGARLOAF 7475 7U A 7H P-DP 0.0000000 0.0015372 0.0015372 0.0000000 2,828.95 536.02 1.53 76.96 0.00 0.00 0 SUGARLOAF 7475 8U A 8H P-DP 0.0000000 0.0015122 0.0015122 0.0000000 2,832.70 536.72 1.53 76.96 0.00 0.00 0 SUGARLOAF 7475 9U B 9H P-DP 0.0000000 0.0015498 0.0015498 0.0000000 2,841.81 538.42 1.53 76.96 0.00 0.00 0 SUGG A 141-140 (ALLOC-A) 1SM P-DP 0.0000000 0.0121102 0.0121102 0.0000000 3,648.00 265.78 1.07 75.95 210.50 2,030.93 0 SUGG A 141-140 (ALLOC-B) 2SU P-DP 0.0000000 0.0128238 0.0128238 0.0000000 2,803.81 157.04 1.07 75.95 134.14 1,480.85 0 SUGG A 141-140 (ALLOC-C) 3SM P-DP 0.0000000 0.0124861 0.0124861 0.0000000 3,592.12 227.04 1.07 75.95 176.91 1,887.72 0 SUGG A 141-140 (ALLOC-D) 4SU P-DP 0.0000000 0.0122146 0.0122146 0.0000000 2,988.14 171.03 1.07 75.95 140.22 1,283.39 0 SUGG A 141-140 (ALLOC-E) 5RM P-DP 0.0000000 0.0121537 0.0121537 0.0000000 4,300.32 179.19 1.07 75.95 149.36 2,182.71 0 SUGG A 141-140 (ALLOC-F) 6SM P-DP 0.0000000 0.0121297 0.0121297 0.0000000 2,133.87 71.58 1.07 75.95 68.10 1,625.63 0

LEASE NAME GAS PRC INITIAL GROSS ULTIMATE Mbbl GROSS ULTIMATE MMcf CUM GAS MMcf CUM OIL Mbbl EXPENSE INITIAL DECIMAL INTEREST FINAL DECIMAL REVENUE INITIAL DECIMAL INTEREST FINAL DECIMAL OIL PRC INITIAL $/bbl RES CAT AS OF DATE FIXED COST $/MO As of : 01/01/2024 GROSS ULTIMATE RESERVES, CUMULATIVE PRODUCTION AND BASIC ECONOMIC DATA TABLE 7 SUGG A 141-140 (ALLOC-F) 6SU P-DP 0.0000000 0.0122156 0.0122156 0.0000000 2,002.83 122.47 1.07 75.95 114.64 1,277.16 0 SUGG A 141-140 (ALLOC-G) 7SM P-DP 0.0000000 0.0122500 0.0122500 0.0000000 4,122.35 115.50 1.07 75.95 101.62 2,105.26 0 SUGG A 141-140 (ALLOC-G) 7SU P-DP 0.0000000 0.0123396 0.0123396 0.0000000 4,154.46 119.93 1.07 75.95 106.79 1,950.83 0 SUGG A 141-140 (ALLOC-H) 8SM P-DP 0.0000000 0.0121654 0.0121654 0.0000000 5,890.83 127.17 1.07 75.95 112.40 2,572.54 0 SUGG A 141-140 (ALLOC-H) 8SU P-DP 0.0000000 0.0123361 0.0123361 0.0000000 2,409.18 125.92 1.07 75.95 114.32 1,647.28 0 SUNDOWN 4524LS P-DP 0.0000000 0.0078088 0.0078088 0.0000000 918.26 400.83 2.37 78.86 314.09 451.48 0 SUNDOWN 4541WA P-DP 0.0000000 0.0078088 0.0078088 0.0000000 1,990.10 963.18 2.37 78.86 594.88 570.32 0 SUNDOWN 4566WB P-DP 0.0000000 0.0078088 0.0078088 0.0000000 1,768.36 589.19 2.37 78.86 471.10 657.70 0 SUSTR UNIT 1H P-DP 0.0000000 0.0107181 0.0107181 0.0000000 780.87 201.59 2.08 75.57 176.13 595.20 0 TAMSULA 5 P-DP 0.0000000 0.1100000 0.1100000 0.0000000 28.27 0.00 1.77 77.22 0.00 28.27 0 TANNER WYN JF 2H P-DP 0.0000000 0.1162524 0.1162524 0.0000000 12,301.30 0.00 2.67 78.22 0.00 11,115.90 0 TANNER WYN JF 4H P-DP 0.0000000 0.1162524 0.1162524 0.0000000 15,104.33 0.00 2.67 78.22 0.00 12,755.50 0 TARGAC UNIT 1H P-DP 0.0000000 0.0235042 0.0235042 0.0000000 484.68 175.55 2.08 75.57 160.25 460.28 0 TCB 3934 1AH P-DP 0.0000000 0.0000483 0.0000483 0.0000000 171.59 163.00 2.37 78.86 146.49 142.04 0 TCB 3934 4AH P-DP 0.0000000 0.0000483 0.0000483 0.0000000 356.31 545.79 2.37 78.86 348.67 227.24 0 TCB 3934 4SH P-DP 0.0000000 0.0000483 0.0000483 0.0000000 220.75 231.72 2.37 78.86 184.09 165.56 0 TCB A 1LS P-DP 0.0000000 0.0000882 0.0000882 0.0000000 1,758.66 809.19 2.37 78.86 103.01 100.19 0 TCB B 2A P-DP 0.0000000 0.0000882 0.0000882 0.0000000 1,560.04 894.59 2.37 78.86 126.46 116.68 0 TCM 3 P-DP 0.0000000 0.0070000 0.0070000 0.0000000 51.86 41.36 1.57 77.63 40.35 44.98 0 TCM 48L P-DP 0.0000000 0.0070000 0.0070000 0.0000000 395.84 92.26 1.57 77.63 59.54 302.67 0 TEEWINOT NORTH UNIT 4LA P-DP 0.0000000 0.0004880 0.0004880 0.0000000 472.00 381.26 1.38 77.44 336.37 404.89 0 TEEWINOT SOUTH UNIT 5LA P-DP 0.0000000 0.0004880 0.0004880 0.0000000 771.43 708.64 1.38 77.44 547.10 640.15 0 TESTA 5 P-DP 0.0000000 0.1100000 0.1100000 0.0000000 93.54 0.00 1.77 77.22 0.00 93.54 0 THE KING 45-04 1AH P-DP 0.0000000 0.0022422 0.0022422 0.0000000 415.39 319.12 2.37 78.86 295.70 412.31 0 THE KING 45-04 1MS P-DP 0.0000000 0.0022636 0.0022636 0.0000000 1,262.41 431.48 2.37 78.86 144.04 185.92 0 THE KING 45-04 1SH P-DP 0.0000000 0.0022422 0.0022422 0.0000000 354.68 287.89 2.37 78.86 266.38 217.83 0 THE KING 45-04 C 3SA P-DP 0.0000000 0.0022656 0.0022656 0.0000000 1,500.10 409.53 2.37 78.86 148.25 226.07 0 THE KING 45-04 C 3SS P-DP 0.0000000 0.0022627 0.0022627 0.0000000 1,491.94 384.59 2.37 78.86 160.46 226.91 0 THE KING 45-04 D 4MS P-DP 0.0000000 0.0022725 0.0022725 0.0000000 1,447.98 351.00 2.37 78.86 146.67 244.68 0 THE KING 45-04 D 4SA P-DP 0.0000000 0.0022641 0.0022641 0.0000000 334.02 447.16 2.37 78.86 165.93 129.17 0 THE KING 45-04 D 4SS P-DP 0.0000000 0.0022715 0.0022715 0.0000000 1,959.05 350.32 2.37 78.86 145.88 243.36 0 THOMPSON E SMF JF 5H P-DP 0.0000000 0.0014512 0.0014512 0.0000000 12,129.71 0.00 2.67 78.22 0.00 9,902.17 0 THOMPSON W SMF JF 1H P-DP 0.0000000 0.0075886 0.0075886 0.0000000 12,118.13 0.00 2.67 78.22 0.00 10,483.30 0 THOMPSON W SMF JF 3H P-DP 0.0000000 0.0075886 0.0075886 0.0000000 12,479.39 0.00 2.67 78.22 0.00 10,295.13 0

LEASE NAME GAS PRC INITIAL GROSS ULTIMATE Mbbl GROSS ULTIMATE MMcf CUM GAS MMcf CUM OIL Mbbl EXPENSE INITIAL DECIMAL INTEREST FINAL DECIMAL REVENUE INITIAL DECIMAL INTEREST FINAL DECIMAL OIL PRC INITIAL $/bbl RES CAT AS OF DATE FIXED COST $/MO As of : 01/01/2024 GROSS ULTIMATE RESERVES, CUMULATIVE PRODUCTION AND BASIC ECONOMIC DATA TABLE 7 THORPE 1-74 LOV 1H P-DP 0.0000000 0.0000398 0.0000398 0.0000000 349.12 172.36 2.70 78.79 153.49 310.83 0 THORPE 1-74 LOV 2H P-DP 0.0000000 0.0000797 0.0000797 0.0000000 378.18 50.61 2.70 78.79 48.44 370.67 0 THORPE 1-74 LOV 3H P-DP 0.0000000 0.0000797 0.0000797 0.0000000 1,121.95 461.60 2.70 78.79 334.22 754.60 0 THORPE 1-74 LOV 4H P-DP 0.0000000 0.0001593 0.0001593 0.0000000 418.59 272.09 2.70 78.79 246.56 363.86 0 THUNDERBIRD UNIT 07-10 1AH P-DP 0.0000000 0.0037447 0.0037447 0.0000000 413.92 409.84 3.53 76.99 352.19 335.50 0 THURMOND 132 ALLOC C 11H P-DP 0.0000000 0.0015190 0.0015190 0.0000000 3,260.28 271.49 1.53 76.96 178.92 1,807.32 0 THURMOND A137 ALLOC. A 10H P-DP 0.0000000 0.0014494 0.0014494 0.0000000 2,961.37 364.97 1.53 76.96 268.63 1,784.04 0 TIGER 210187 2A P-DP 0.0000000 0.0028920 0.0028920 0.0000000 10,481.60 0.00 2.36 78.22 0.00 9,028.06 0 TIGER 210187 3C P-DP 0.0000000 0.0028920 0.0028920 0.0000000 9,910.74 0.00 2.36 78.22 0.00 8,491.79 0 TIGER 210187 5B P-DP 0.0000000 0.0028920 0.0028920 0.0000000 8,155.38 0.00 2.36 78.22 0.00 7,215.25 0 TIGER 210475 4C P-DP 0.0000000 0.0000077 0.0000077 0.0000000 8,783.92 0.00 2.36 78.22 0.00 7,635.80 0 TIGER 210476 1A P-DP 0.0000000 0.0028516 0.0028516 0.0000000 10,548.15 0.00 2.36 78.22 0.00 8,997.73 0 TIGIWON 2627-C23 E 1H P-DP 0.0000000 0.0004920 0.0004920 0.0000000 3,420.94 571.45 1.31 80.44 376.40 2,271.46 0 TIGIWON 2627-C23 E 433H P-DP 0.0000000 0.0004920 0.0004920 0.0000000 3,349.77 755.01 1.31 80.44 487.85 2,078.73 0 TIMMERMAN J1 2208MH P-DP 0.0000000 0.0001200 0.0001200 0.0000000 1,032.31 494.11 2.32 78.93 367.82 563.66 0 TIMMERMAN J10 2206LH P-DP 0.0000000 0.0001300 0.0001300 0.0000000 1,471.17 728.92 2.32 78.93 492.85 761.56 0 TIMMERMAN J11 2206BH P-DP 0.0000000 0.0001300 0.0001300 0.0000000 2,158.82 485.79 2.32 78.93 348.68 1,307.68 0 TIMMERMAN J2 2208LH P-DP 0.0000000 0.0001200 0.0001200 0.0000000 1,281.72 548.54 2.32 78.93 371.09 620.94 0 TIMMERMAN J3 2208BH P-DP 0.0000000 0.0001200 0.0001200 0.0000000 2,140.80 390.17 2.32 78.93 292.57 1,124.96 0 TIMMERMAN J4 2207MH P-DP 0.0000000 0.0001300 0.0001300 0.0000000 1,646.76 687.03 2.32 78.93 434.76 887.66 0 TIMMERMAN J5 2207LH P-DP 0.0000000 0.0001300 0.0001300 0.0000000 1,584.55 482.56 2.32 78.93 357.87 769.70 0 TIMMERMAN J6 2207BH P-DP 0.0000000 0.0001300 0.0001300 0.0000000 3,056.13 367.39 2.32 78.93 276.87 1,307.12 0 TIMMERMAN J7 2217LH P-DP 0.0000000 0.0001300 0.0001300 0.0000000 1,368.63 463.72 2.32 78.93 332.59 711.62 0 TIMMERMAN J8 2207CH P-DP 0.0000000 0.0001300 0.0001300 0.0000000 783.78 159.41 2.32 78.93 151.32 783.67 0 TIMMERMAN J9 2206MH P-DP 0.0000000 0.0001300 0.0001300 0.0000000 1,869.61 917.83 2.32 78.93 602.84 899.87 0 TIN STAR A L 33H P-DP 0.0000000 0.0002979 0.0002979 0.0000000 6,122.29 731.11 1.53 76.96 471.00 3,472.47 0 TIN STAR B L 42H P-DP 0.0000000 0.0002462 0.0002462 0.0000000 3,657.76 400.50 1.53 76.96 297.77 2,405.75 0 TIN STAR D U 46H P-DP 0.0000000 0.0002933 0.0002933 0.0000000 5,895.72 602.25 1.53 76.96 407.92 3,967.81 0 TIPI CHAPMAN 34-163 1H P-DP 0.0000000 0.0000016 0.0000016 0.0000000 519.58 283.36 1.38 77.44 245.58 438.40 0 TIPI CHAPMAN 34-163 2H P-DP 0.0000000 0.0000016 0.0000016 0.0000000 383.90 350.97 1.38 77.44 287.34 312.52 0 TIPI CHAPMAN 34-163 3H P-DP 0.0000000 0.0000016 0.0000016 0.0000000 729.45 167.60 1.38 77.44 144.89 615.75 0 TIPI CHAPMAN 34-163 4H P-DP 0.0000000 0.0000016 0.0000016 0.0000000 1,215.59 532.98 1.38 77.44 461.19 1,079.91 0 TISH 46-03 #1AH P-DP 0.0000000 0.0251410 0.0251410 0.0000000 444.51 470.34 2.37 78.86 397.38 344.50 0 TISH 46-03 1Ss P-DP 0.0000000 0.0251406 0.0251406 0.0000000 641.47 206.73 2.37 78.86 102.05 168.70 0

LEASE NAME GAS PRC INITIAL GROSS ULTIMATE Mbbl GROSS ULTIMATE MMcf CUM GAS MMcf CUM OIL Mbbl EXPENSE INITIAL DECIMAL INTEREST FINAL DECIMAL REVENUE INITIAL DECIMAL INTEREST FINAL DECIMAL OIL PRC INITIAL $/bbl RES CAT AS OF DATE FIXED COST $/MO As of : 01/01/2024 GROSS ULTIMATE RESERVES, CUMULATIVE PRODUCTION AND BASIC ECONOMIC DATA TABLE 7 TISH 46-03 3Sa P-DP 0.0000000 0.0251406 0.0251406 0.0000000 1,106.99 396.98 2.37 78.86 185.63 272.97 0 TISH 46-03 3Ss P-DP 0.0000000 0.0251406 0.0251406 0.0000000 813.83 470.13 2.37 78.86 187.51 203.59 0 TITO'S 31-42 1LS P-DP 0.0000000 0.0008172 0.0008172 0.0000000 180.74 398.22 1.57 77.63 328.02 162.92 0 TITO'S 31-42 1WA P-DP 0.0000000 0.0008171 0.0008171 0.0000000 187.84 410.87 1.57 77.63 342.57 176.72 0 TITO'S 31-42 1WB P-DP 0.0000000 0.0008172 0.0008172 0.0000000 146.67 334.10 1.57 77.63 275.00 136.53 0 TITO'S 31-42 2LS P-DP 0.0000000 0.0009102 0.0009102 0.0000000 389.82 480.25 1.57 77.63 345.11 282.67 0 TITO'S 31-42 2WA P-DP 0.0000000 0.0008172 0.0008172 0.0000000 1,816.71 219.95 1.57 77.63 185.60 1,212.03 0 TITO'S 31-42 2WB P-DP 0.0000000 0.0009101 0.0009101 0.0000000 486.19 212.73 1.57 77.63 170.36 388.94 0 TITO'S 31-42 3WA P-DP 0.0000000 0.0009099 0.0009099 0.0000000 152.87 279.97 1.57 77.63 246.00 115.83 0 TOMCAT 4448WA P-DP 0.0000000 0.0090222 0.0090222 0.0000000 901.11 489.97 2.37 78.86 361.56 385.17 0 TOWNSEN 24265 ALLOC. A 10H P-DP 0.0000000 0.0007196 0.0007196 0.0000000 6,550.51 703.68 1.53 76.96 471.91 4,246.14 0 TRAUBE 1-11 WRD 1H P-DP 0.0000000 0.0002124 0.0002124 0.0000000 704.47 597.91 1.38 77.44 528.61 683.16 0 TRAUBE 1-11 WRD 2H P-DP 0.0000000 0.0002124 0.0002124 0.0000000 806.54 355.53 1.38 77.44 278.21 592.97 0 TREE FROG 47 EAST A 1LS P-DP 0.0000000 0.0010000 0.0010000 0.0000000 1,170.48 398.07 2.37 78.86 335.06 632.76 0 TREE FROG 47 EAST A 1WA P-DP 0.0000000 0.0010054 0.0010054 0.0000000 1,185.37 628.12 2.37 78.86 523.65 653.97 0 TREE FROG 47 EAST C 3LS P-DP 0.0000000 0.0009949 0.0009949 0.0000000 1,095.61 392.26 2.37 78.86 288.60 648.34 0 TREE FROG 47 EAST C 3WA P-DP 0.0000000 0.0009948 0.0009948 0.0000000 2,550.24 412.02 2.37 78.86 313.97 1,071.87 0 TREE FROG 47 EAST C 3WB P-DP 0.0000000 0.0009963 0.0009963 0.0000000 1,495.26 321.97 2.37 78.86 233.77 655.21 0 TREE FROG 47 WEST UNIT 5LS P-DP 0.0000000 0.0010396 0.0010396 0.0000000 828.40 477.58 2.37 78.86 382.78 476.26 0 TREE FROG 47 WEST UNIT 5WA P-DP 0.0000000 0.0010396 0.0010396 0.0000000 1,847.93 624.60 2.37 78.86 465.88 814.28 0 TREE FROG 47 WEST UNIT 5WB P-DP 0.0000000 0.0010396 0.0010396 0.0000000 1,333.99 438.14 2.37 78.86 319.48 569.04 0 TREE FROG 47 WEST UNIT 7LS P-DP 0.0000000 0.0010396 0.0010396 0.0000000 940.94 276.41 2.37 78.86 157.56 417.27 0 TREE FROG 47 WEST UNIT 7WA P-DP 0.0000000 0.0010396 0.0010396 0.0000000 1,871.21 331.36 2.37 78.86 193.84 782.30 0 TRENTINO 1 P-DP 0.0000000 0.0024766 0.0024766 0.0000000 728.10 228.98 2.37 78.86 159.51 378.04 0 TRENTINO 2 P-DP 0.0000000 0.0024766 0.0024766 0.0000000 65.90 66.44 2.37 78.86 32.82 34.62 0 TRENTINO 36 3 P-DP 0.0000000 0.0036085 0.0036085 0.0000000 137.56 17.97 2.37 78.86 12.98 110.44 0 TRENTINO 36-37 (ALLOC-C) 3SA P-DP 0.0000000 0.0008449 0.0008449 0.0000000 543.96 285.50 2.37 78.86 215.75 291.13 0 TRENTINO 36-37 (ALLOC-C) 3SB P-DP 0.0000000 0.0014088 0.0014088 0.0000000 2,165.84 463.58 2.37 78.86 319.49 876.98 0 TRENTINO 36-37 (ALLOC-C) 3SS P-DP 0.0000000 0.0008820 0.0008820 0.0000000 321.56 168.46 2.37 78.86 113.84 162.66 0 TRENTINO 36-37 (ALLOC-D) 4SB P-DP 0.0000000 0.0015008 0.0015008 0.0000000 813.21 315.57 2.37 78.86 198.51 363.29 0 TRENTINO 36-37 (ALLOC-D) 4SS P-DP 0.0000000 0.0014557 0.0014557 0.0000000 1,389.64 149.60 2.37 78.86 92.80 356.35 0 TRENTINO 36-37 (ALLOC-DA) 4SA P-DP 0.0000000 0.0014634 0.0014634 0.0000000 823.15 163.02 2.37 78.86 128.99 425.11 0 TRIANGLE 75 2H P-DP 0.0000000 0.0008994 0.0008994 0.0000000 1,070.75 196.81 1.53 76.96 172.74 907.93 0 TRIDACNA 34-208 WRD UNIT 1H P-DP 0.0000000 0.0001060 0.0001060 0.0000000 2,562.38 321.56 1.38 77.44 256.81 1,788.74 0

LEASE NAME GAS PRC INITIAL GROSS ULTIMATE Mbbl GROSS ULTIMATE MMcf CUM GAS MMcf CUM OIL Mbbl EXPENSE INITIAL DECIMAL INTEREST FINAL DECIMAL REVENUE INITIAL DECIMAL INTEREST FINAL DECIMAL OIL PRC INITIAL $/bbl RES CAT AS OF DATE FIXED COST $/MO As of : 01/01/2024 GROSS ULTIMATE RESERVES, CUMULATIVE PRODUCTION AND BASIC ECONOMIC DATA TABLE 7 TRIDACNA 34-208 WRD UNIT 2H P-DP 0.0000000 0.0001060 0.0001060 0.0000000 2,510.17 305.46 1.38 77.44 246.94 1,705.04 0 TRIDACNA 34-208 WRD UNIT 3H P-DP 0.0000000 0.0001060 0.0001060 0.0000000 2,382.70 351.96 1.38 77.44 274.75 1,858.12 0 TROTT 34-183 1H P-DP 0.0000000 0.0000983 0.0000983 0.0000000 1,192.20 155.76 1.38 77.44 135.45 1,013.84 0 UNFORGIVEN 34 113-114 D 604H P-DP 0.0000000 0.0000637 0.0000637 0.0000000 937.05 645.02 1.38 77.44 312.53 503.29 0 UNICORN UNIT A 04-37 1AH P-DP 0.0000000 0.0002289 0.0002289 0.0000000 230.48 219.66 3.53 76.99 163.68 149.25 0 UNICORN UNIT B 37-04 7AH P-DP 0.0000000 0.0002265 0.0002265 0.0000000 202.74 148.67 3.53 76.99 113.38 94.00 0 UNICORN UNIT B 37-04 8MH P-DP 0.0000000 0.0002265 0.0002265 0.0000000 48.28 124.89 3.53 76.99 71.76 21.83 0 URSULA 0848WA P-DP 0.0000000 0.0047990 0.0047990 0.0000000 130.29 423.84 2.37 78.86 343.45 129.47 0 URSULA 1546WA P-DP 0.0000000 0.0047990 0.0047990 0.0000000 840.45 278.95 2.37 78.86 230.32 611.39 0 URSULA BIG DADDY B 1527LS P-DP 0.0000000 0.0015214 0.0015214 0.0000000 753.53 401.29 2.37 78.86 292.24 457.14 0 URSULA BIG DADDY B 1547WA P-DP 0.0000000 0.0015867 0.0015867 0.0000000 646.26 378.63 2.37 78.86 268.84 386.30 0 URSULA BIG DADDY C 1528LS P-DP 0.0000000 0.0018029 0.0018029 0.0000000 1,474.49 551.58 2.37 78.86 360.97 643.57 0 URSULA TOMCAT A 4446WA P-DP 0.0000000 0.0076145 0.0076145 0.0000000 1,022.72 655.96 2.37 78.86 489.29 584.59 0 URSULA TOMCAT B 4421LS P-DP 0.0000000 0.0076145 0.0076145 0.0000000 761.36 514.80 2.37 78.86 374.34 445.17 0 URSULA TOMCAT C 4447WA P-DP 0.0000000 0.0076145 0.0076145 0.0000000 1,438.20 564.71 2.37 78.86 439.27 497.18 0 VALENCIA 10-8 A UNIT A 3H P-DP 0.0000000 0.0003220 0.0003220 0.0000000 175.27 334.19 2.37 78.86 84.26 29.40 0 VALENCIA 10-8 A UNIT L 3H P-DP 0.0000000 0.0003220 0.0003220 0.0000000 94.74 224.52 2.37 78.86 70.40 19.78 0 VALERIE 210473 1A P-DP 0.0000000 0.0083562 0.0083562 0.0000000 10,470.56 0.00 2.36 78.22 0.00 9,450.99 0 VALERIE 210473 2B P-DP 0.0000000 0.0083562 0.0083562 0.0000000 10,896.33 0.00 2.36 78.22 0.00 9,885.64 0 VALERIE 210473 4C P-DP 0.0000000 0.0083562 0.0083562 0.0000000 12,529.34 0.00 2.36 78.22 0.00 11,011.09 0 VANNELLE SW WHL BL 2H P-DP 0.0000000 0.0121791 0.0121791 0.0000000 20,937.40 0.00 2.36 78.22 0.00 10,832.43 0 VICKERS '34-127' 1H P-DP 0.0000000 0.0004386 0.0004386 0.0000000 457.53 206.04 1.38 77.44 193.03 399.48 0 VICKERS '34-127' 2H P-DP 0.0000000 0.0004386 0.0004386 0.0000000 202.42 160.85 1.38 77.44 134.89 168.38 0 VINTAGE A U 06H P-DP 0.0000000 0.0001526 0.0001526 0.0000000 3,295.50 347.55 1.53 76.96 187.20 1,393.61 0 VINTAGE B T 13H P-DP 0.0000000 0.0001720 0.0001720 0.0000000 5,424.98 367.70 1.53 76.96 208.97 2,976.78 0 VINTAGE C C 03H P-DP 0.0000000 0.0002547 0.0002547 0.0000000 6,379.51 609.00 1.53 76.96 93.59 614.47 0 VINTAGE D T 26H P-DP 0.0000000 0.0000688 0.0000688 0.0000000 5,602.01 359.06 1.53 76.96 205.71 2,952.04 0 VINTAGE E C 04H P-DP 0.0000000 0.0002769 0.0002769 0.0000000 5,119.28 690.95 1.53 76.96 105.06 563.27 0 VINTAGE UNIT A U 19H P-DP 0.0000000 0.0001526 0.0001526 0.0000000 2,517.79 288.02 1.53 76.96 151.35 1,058.30 0 VIPER FOSTER B 4545WA P-DP 0.0000000 0.0050519 0.0050519 0.0000000 620.15 576.23 2.37 78.86 392.30 359.15 0 VIPER FOSTER C 4525LS P-DP 0.0000000 0.0050419 0.0050419 0.0000000 1,503.50 638.93 2.37 78.86 407.13 529.20 0 VIPER FOSTER D 4546WA P-DP 0.0000000 0.0050447 0.0050447 0.0000000 1,423.80 656.60 2.37 78.86 442.17 670.90 0 WALKER 32-48 B UNIT A 5H P-DP 0.0000000 0.0034776 0.0034776 0.0000000 306.07 647.90 2.37 78.86 297.83 80.91 0 WALKER 32-48 B UNIT L 6H P-DP 0.0000000 0.0034776 0.0034776 0.0000000 373.10 431.68 2.37 78.86 208.57 100.68 0

LEASE NAME GAS PRC INITIAL GROSS ULTIMATE Mbbl GROSS ULTIMATE MMcf CUM GAS MMcf CUM OIL Mbbl EXPENSE INITIAL DECIMAL INTEREST FINAL DECIMAL REVENUE INITIAL DECIMAL INTEREST FINAL DECIMAL OIL PRC INITIAL $/bbl RES CAT AS OF DATE FIXED COST $/MO As of : 01/01/2024 GROSS ULTIMATE RESERVES, CUMULATIVE PRODUCTION AND BASIC ECONOMIC DATA TABLE 7 WALKER 48-32 A UNIT A 1H P-DP 0.0000000 0.0075079 0.0075079 0.0000000 77.01 515.72 2.37 78.86 275.74 55.40 0 WALKER 48-32 A UNIT L 1H P-DP 0.0000000 0.0075079 0.0075079 0.0000000 2.31 3.06 2.37 78.86 2.11 2.05 0 WALKER DRRC EAST 30-56 6SH P-DP 0.0000000 0.0006489 0.0006489 0.0000000 731.86 889.14 2.37 78.86 390.20 243.83 0 WALKER DRRC EAST 30-56 7AH P-DP 0.0000000 0.0006489 0.0006489 0.0000000 747.43 191.87 2.37 78.86 130.32 221.95 0 WALKER DRRC EAST 30-56 7SH P-DP 0.0000000 0.0006489 0.0006489 0.0000000 708.08 188.54 2.37 78.86 142.98 233.70 0 WALKER-DRRC 30-56 WEST UNIT 5LS P-DP 0.0000000 0.0012121 0.0012121 0.0000000 1,779.64 560.56 2.37 78.86 433.37 531.84 0 WALKER-DRRC 30-56 WEST UNIT 5WA P-DP 0.0000000 0.0012121 0.0012121 0.0000000 801.12 220.82 2.37 78.86 190.38 345.53 0 WALKER-DRRC WEST 30-56 6AH P-DP 0.0000000 0.0012121 0.0012121 0.0000000 490.33 384.83 2.37 78.86 211.78 197.25 0 WALLACE, T. L. 1 P-DP 0.0000000 0.0002339 0.0002339 0.0000000 149.40 477.59 1.49 79.19 464.17 149.40 0 WALLACE, T. L. 3 P-DP 0.0000000 0.0002339 0.0002339 0.0000000 39.39 112.96 1.49 79.19 106.85 39.39 0 WARD 18CC 1804D P-DP 0.0000000 0.0015893 0.0015893 0.0000000 766.41 555.03 2.37 78.86 358.93 480.59 0 WARD 18D 1803D P-DP 0.0000000 0.0015893 0.0015893 0.0000000 488.53 441.29 2.37 78.86 386.80 413.66 0 WASHINGTON EAST I 23-14 4409H P-DP 0.0000000 0.0004162 0.0004162 0.0000000 2,587.37 320.19 1.07 75.95 176.73 688.88 0 WASHINGTON WEST A 23-14 4201H P-DP 0.0000000 0.0004806 0.0004806 0.0000000 658.16 466.12 1.07 75.95 272.92 279.11 0 WASHINGTON WEST A 23-14 4401H P-DP 0.0000000 0.0004809 0.0004809 0.0000000 1,820.01 357.22 1.07 75.95 209.17 749.20 0 WASHINGTON WEST B 23-14 4302H P-DP 0.0000000 0.0004809 0.0004809 0.0000000 6,031.11 546.16 1.07 75.95 402.76 1,703.45 0 WASHINGTON WEST B 23-14 4602H P-DP 0.0000000 0.0005226 0.0005226 0.0000000 2,122.48 138.16 1.07 75.95 110.55 1,037.87 0 WASHINGTON WEST D 23-14 4404H P-DP 0.0000000 0.0004267 0.0004267 0.0000000 2,682.93 129.80 1.07 75.95 96.83 867.48 0 WASHINGTON WEST E 23-14 4305H P-DP 0.0000000 0.0004120 0.0004120 0.0000000 3,448.95 207.71 1.07 75.95 138.91 1,314.74 0 WASHINGTON WEST F 23-14 4406H P-DP 0.0000000 0.0004295 0.0004295 0.0000000 1,365.79 124.93 1.07 75.95 89.27 558.69 0 WASHINGTON WEST G 23-14 4307H P-DP 0.0000000 0.0004221 0.0004221 0.0000000 5,466.50 394.62 1.07 75.95 230.56 1,397.84 0 WATKINS 7 1 P-DP 0.0000000 0.0333333 0.0333333 0.0000000 132.23 79.97 1.57 77.63 65.04 107.02 0 WELCH 39 1 P-DP 0.0000000 0.0023438 0.0023438 0.0000000 433.32 248.75 1.57 77.63 182.97 336.43 0 WELCH 39 2 P-DP 0.0000000 0.0023438 0.0023438 0.0000000 46.59 21.53 1.57 77.63 18.09 39.97 0 WELCH 39 3 P-DP 0.0000000 0.0023438 0.0023438 0.0000000 221.85 35.89 1.57 77.63 29.35 183.82 0 WELCH 39 4 P-DP 0.0000000 0.0023438 0.0023438 0.0000000 329.32 66.61 1.57 77.63 49.47 279.87 0 WELCH-COX E39A 301H P-DP 0.0000000 0.0011719 0.0011719 0.0000000 1,674.97 684.76 1.57 77.63 76.20 93.24 0 WELCH-COX E39B 302H P-DP 0.0000000 0.0011719 0.0011719 0.0000000 2,319.02 1,193.95 1.57 77.63 0.00 0.00 0 WELCH-COX E39C 303H P-DP 0.0000000 0.0011719 0.0011719 0.0000000 1,674.97 684.76 1.57 77.63 76.20 93.24 0 WELCH-COX E39D 304H P-DP 0.0000000 0.0011719 0.0011719 0.0000000 1,094.89 834.24 1.57 77.63 78.19 82.32 0 WELCH-COX E39S 319H P-DP 0.0000000 0.0011719 0.0011719 0.0000000 1,674.97 684.76 1.57 77.63 76.20 93.24 0 WELCH-COX E39T 320H P-DP 0.0000000 0.0011719 0.0011719 0.0000000 1,115.54 534.46 1.57 77.63 53.96 60.44 0 WELCH-COX E39U 321H P-DP 0.0000000 0.0011719 0.0011719 0.0000000 2,319.02 1,193.95 1.57 77.63 0.00 0.00 0 WELCH-COX E39V 322H P-DP 0.0000000 0.0011719 0.0011719 0.0000000 1,513.04 378.77 1.57 77.63 131.72 252.03 0

LEASE NAME GAS PRC INITIAL GROSS ULTIMATE Mbbl GROSS ULTIMATE MMcf CUM GAS MMcf CUM OIL Mbbl EXPENSE INITIAL DECIMAL INTEREST FINAL DECIMAL REVENUE INITIAL DECIMAL INTEREST FINAL DECIMAL OIL PRC INITIAL $/bbl RES CAT AS OF DATE FIXED COST $/MO As of : 01/01/2024 GROSS ULTIMATE RESERVES, CUMULATIVE PRODUCTION AND BASIC ECONOMIC DATA TABLE 7 WELCH-COX E39W 323H P-DP 0.0000000 0.0011719 0.0011719 0.0000000 1,094.30 833.84 1.57 77.63 0.00 0.00 0 WELCH-COX W39F 206H P-DP 0.0000000 0.0011311 0.0011311 0.0000000 1,849.16 445.83 1.57 77.63 174.68 364.86 0 WELCH-COX W39G 207H P-DP 0.0000000 0.0011411 0.0011411 0.0000000 1,488.18 778.97 1.57 77.63 294.62 354.30 0 WELCH-COX W39H 208H P-DP 0.0000000 0.0011529 0.0011529 0.0000000 1,915.55 439.82 1.57 77.63 163.27 388.09 0 WELCH-COX W39I 209H P-DP 0.0000000 0.0011411 0.0011411 0.0000000 1,051.91 551.33 1.57 77.63 237.16 289.26 0 WELCH-COX W39J 210H P-DP 0.0000000 0.0011404 0.0011404 0.0000000 1,162.13 499.73 1.57 77.63 192.13 334.06 0 WELCH-COX W39K 211H P-DP 0.0000000 0.0011160 0.0011160 0.0000000 977.03 453.61 1.57 77.63 168.63 216.92 0 WELCH-COX W39L 212H P-DP 0.0000000 0.0011408 0.0011408 0.0000000 1,217.18 407.70 1.57 77.63 164.23 214.67 0 WELCH-COX W39M 213H P-DP 0.0000000 0.0011271 0.0011271 0.0000000 1,364.11 497.48 1.57 77.63 196.09 284.71 0 WELCH-COX W39N 214H P-DP 0.0000000 0.0011165 0.0011165 0.0000000 1,108.41 397.03 1.57 77.63 172.70 237.86 0 WELCH-COX W39O 215H P-DP 0.0000000 0.0011165 0.0011165 0.0000000 1,111.93 414.23 1.57 77.63 139.52 187.38 0 WELCH-COX W39P 216H P-DP 0.0000000 0.0011297 0.0011297 0.0000000 1,442.64 481.85 1.57 77.63 184.66 229.74 0 WEREWOLF UNIT A 12-05 1AH P-DP 0.0000000 0.0001425 0.0001425 0.0000000 271.20 331.05 3.53 76.99 171.30 102.77 0 WEREWOLF UNIT A 12-05 2AH P-DP 0.0000000 0.0001425 0.0001425 0.0000000 293.72 459.14 3.53 76.99 195.47 101.57 0 WEREWOLF UNIT B 12-05 4AH P-DP 0.0000000 0.0001428 0.0001428 0.0000000 420.70 389.53 3.53 76.99 58.54 30.59 0 WEREWOLF UNIT B 12-05 5AH P-DP 0.0000000 0.0001428 0.0001428 0.0000000 382.13 362.20 3.53 76.99 54.14 27.75 0 WEREWOLF UNIT B 12-05 6AH P-DP 0.0000000 0.0001428 0.0001428 0.0000000 386.52 362.89 3.53 76.99 55.41 28.46 0 WHIRLAWAY 99 1HA P-DP 0.0000000 0.0002250 0.0002250 0.0000000 259.63 357.98 1.38 77.44 276.48 202.83 0 WHISKEY RIVER 9596A-34 11H P-DP 0.0000000 0.0000059 0.0000059 0.0000000 1,382.58 1,279.42 1.38 77.44 782.11 821.71 0 WHISKEY RIVER 9596A-34 12H P-DP 0.0000000 0.0000055 0.0000055 0.0000000 1,382.55 410.65 1.38 77.44 254.51 602.29 0 WHISKEY RIVER 9596A-34 13H P-DP 0.0000000 0.0000056 0.0000056 0.0000000 957.14 625.42 1.38 77.44 348.61 349.52 0 WHISKEY RIVER 9596B-34 1H P-DP 0.0000000 0.0000056 0.0000056 0.0000000 372.98 416.88 1.38 77.44 292.41 300.04 0 WHISKEY RIVER 9596B-34 31H P-DP 0.0000000 0.0000056 0.0000056 0.0000000 849.71 496.47 1.38 77.44 287.70 464.28 0 WHISKEY RIVER 9596B-34 32H P-DP 0.0000000 0.0000056 0.0000056 0.0000000 1,509.36 610.51 1.38 77.44 353.43 873.32 0 WHISKEY RIVER 9596C-34 1H P-DP 0.0000000 0.0000056 0.0000056 0.0000000 947.50 723.16 1.38 77.44 360.67 426.31 0 WHISKEY RIVER 9596D-34 81H P-DP 0.0000000 0.0000056 0.0000056 0.0000000 969.08 630.56 1.38 77.44 424.95 581.17 0 WHITE 19 P-DP 0.0000000 0.0006510 0.0006510 0.0000000 121.78 56.91 1.49 79.19 48.35 119.68 0 WHITMIRE 36-37 (ALLOC-F) 6SA P-DP 0.0000000 0.0001673 0.0001673 0.0000000 424.09 173.70 2.37 78.86 126.69 248.32 0 WHITMIRE 36-37 (ALLOC-F) 6SB P-DP 0.0000000 0.0001673 0.0001673 0.0000000 631.81 146.34 2.37 78.86 103.60 306.74 0 WHITMIRE 36-37 (ALLOC-G) 7SA P-DP 0.0000000 0.0001673 0.0001673 0.0000000 1,047.31 201.65 2.37 78.86 137.78 367.00 0 WHITMIRE 36-37 (ALLOC-G) 7SB P-DP 0.0000000 0.0008810 0.0008810 0.0000000 929.15 257.47 2.37 78.86 166.37 328.43 0 WHITMIRE 36-37 (ALLOC-H) 8SA P-DP 0.0000000 0.0008803 0.0008803 0.0000000 882.75 309.27 2.37 78.86 191.39 495.68 0 WHITMIRE 36-37 (ALLOC-H) 8SB P-DP 0.0000000 0.0008792 0.0008792 0.0000000 405.20 270.24 2.37 78.86 186.18 254.48 0 WILEY 4 1 P-DP 0.0000000 0.0050223 0.0050223 0.0000000 416.81 139.33 1.57 77.63 122.11 367.30 0

LEASE NAME GAS PRC INITIAL GROSS ULTIMATE Mbbl GROSS ULTIMATE MMcf CUM GAS MMcf CUM OIL Mbbl EXPENSE INITIAL DECIMAL INTEREST FINAL DECIMAL REVENUE INITIAL DECIMAL INTEREST FINAL DECIMAL OIL PRC INITIAL $/bbl RES CAT AS OF DATE FIXED COST $/MO As of : 01/01/2024 GROSS ULTIMATE RESERVES, CUMULATIVE PRODUCTION AND BASIC ECONOMIC DATA TABLE 7 WILLETT POT STILL 5-2C UNIT 1H P-DP 0.0000000 0.0033416 0.0033416 0.0000000 2,940.84 299.26 1.53 76.96 216.38 2,003.12 0 WILLIE THE WILDCAT 3-15 A 1JC P-DP 0.0000000 0.0003773 0.0003773 0.0000000 1,555.34 234.84 1.57 77.63 151.27 572.20 0 WILLIE THE WILDCAT 3-15 A 1LS P-DP 0.0000000 0.0003803 0.0003803 0.0000000 1,458.25 360.23 1.57 77.63 230.80 700.20 0 WILLIE THE WILDCAT 3-15 A 1WA P-DP 0.0000000 0.0003828 0.0003828 0.0000000 4,821.44 724.72 1.57 77.63 458.05 1,516.55 0 WILLIE THE WILDCAT 3-15 B 2DN P-DP 0.0000000 0.0003835 0.0003835 0.0000000 1,435.94 372.99 1.57 77.63 312.80 853.09 0 WILLIE THE WILDCAT 3-15 B 2LS P-DP 0.0000000 0.0003835 0.0003835 0.0000000 1,518.23 379.75 1.57 77.63 259.63 707.74 0 WILLIE THE WILDCAT 3-15 B 2WB P-DP 0.0000000 0.0003837 0.0003837 0.0000000 3,034.49 211.34 1.57 77.63 167.49 1,433.97 0 WILLIE THE WILDCAT 3-15 B 3JD P-DP 0.0000000 0.0003837 0.0003837 0.0000000 1,264.73 293.24 1.57 77.63 232.17 687.62 0 WILLIE THE WILDCAT 3-15 C 4LS P-DP 0.0000000 0.0003843 0.0003843 0.0000000 1,528.27 255.25 1.57 77.63 208.58 618.75 0 WILLIE THE WILDCAT 3-15 C 4WA P-DP 0.0000000 0.0003819 0.0003819 0.0000000 4,057.31 348.50 1.57 77.63 244.55 1,318.50 0 WILLIE THE WILDCAT 3-15 D 5JD P-DP 0.0000000 0.0003814 0.0003814 0.0000000 787.96 225.84 1.57 77.63 155.64 389.54 0 WILLIE THE WILDCAT 3-15 D 6DN P-DP 0.0000000 0.0003824 0.0003824 0.0000000 3,692.81 530.93 1.57 77.63 374.36 1,615.31 0 WILLIE THE WILDCAT 3-15 D 6LS P-DP 0.0000000 0.0003846 0.0003846 0.0000000 1,514.95 417.83 1.57 77.63 300.22 664.57 0 WILLIE THE WILDCAT 3-15 D 6WB P-DP 0.0000000 0.0003845 0.0003845 0.0000000 4,102.30 329.59 1.57 77.63 224.26 1,573.99 0 WILLIE THE WILDCAT 3-15 E 7JC P-DP 0.0000000 0.0003752 0.0003752 0.0000000 139.88 368.38 1.57 77.63 204.95 64.63 0 WILLIE THE WILDCAT 3-15 E 7LS P-DP 0.0000000 0.0003860 0.0003860 0.0000000 1,644.42 754.43 1.57 77.63 437.21 663.14 0 WILLIE THE WILDCAT 3-15 E 7WA P-DP 0.0000000 0.0003857 0.0003857 0.0000000 3,949.52 310.86 1.57 77.63 253.62 1,542.79 0 WILSON 184-185 UNIT 131H P-DP 0.0000000 0.0003420 0.0003420 0.0000000 4,543.38 410.52 1.38 77.44 137.15 1,376.88 0 WILSON 184-185 UNIT 132H P-DP 0.0000000 0.0003420 0.0003420 0.0000000 2,958.72 283.20 1.38 77.44 112.97 1,128.75 0 WILSON 184-185 UNIT 232H P-DP 0.0000000 0.0003420 0.0003420 0.0000000 2,054.49 279.49 1.38 77.44 98.03 795.21 0 WILSON 184-185 UNIT 2H P-DP 0.0000000 0.0001883 0.0001883 0.0000000 8,379.77 675.22 1.38 77.44 428.77 4,923.95 0 WILSON 184-185 UNIT 332H P-DP 0.0000000 0.0003420 0.0003420 0.0000000 6,516.87 422.28 1.38 77.44 127.66 1,148.04 0 WINDY MOUNTAIN 7879 1U B 1H P-DP 0.0000000 0.0001809 0.0001809 0.0000000 3,124.24 377.22 1.53 76.96 268.40 2,248.65 0 WINDY MOUNTAIN 7879 2U B 2H P-DP 0.0000000 0.0001797 0.0001797 0.0000000 3,081.23 444.03 1.53 76.96 319.26 2,161.62 0 WINTERS BB 2 P-DP 0.0000000 0.0069769 0.0069769 0.0000000 311.75 203.38 2.37 78.86 200.19 304.82 0 WINTERS FERN D 2 P-DP 0.0000000 0.0069769 0.0069769 0.0000000 398.46 330.05 2.37 78.86 323.77 398.46 0 WORTHY 13-12 (ALLOC-A) 1NA P-DP 0.0000000 0.0015040 0.0015040 0.0000000 896.92 576.04 2.37 78.86 273.53 350.06 0 WORTHY 13-12 (ALLOC-A) 1NS P-DP 0.0000000 0.0015040 0.0015040 0.0000000 378.27 289.01 2.37 78.86 131.15 151.26 0 WORTHY 13-12 (ALLOC-B) 2NB P-DP 0.0000000 0.0015040 0.0015040 0.0000000 1,446.02 424.98 2.37 78.86 210.40 346.18 0 WORTHY 13-12 (ALLOC-C) 3NA P-DP 0.0000000 0.0015040 0.0015040 0.0000000 1,588.38 537.51 2.37 78.86 243.90 395.38 0 WORTHY 13-12 (ALLOC-D) 4NB P-DP 0.0000000 0.0015040 0.0015040 0.0000000 1,593.23 447.92 2.37 78.86 236.74 495.23 0 WORTHY 13-12 (ALLOC-D) 4NS P-DP 0.0000000 0.0015040 0.0015040 0.0000000 915.47 297.07 2.37 78.86 155.67 301.96 0 WRAITH UNIT A 12-16 1AH P-DP 0.0000000 0.0053000 0.0053000 0.0000000 840.85 524.50 3.53 76.99 244.58 232.08 0 WRAITH UNIT A 12-16 2AH P-DP 0.0000000 0.0053000 0.0053000 0.0000000 672.87 511.74 3.53 76.99 257.71 156.95 0

LEASE NAME GAS PRC INITIAL GROSS ULTIMATE Mbbl GROSS ULTIMATE MMcf CUM GAS MMcf CUM OIL Mbbl EXPENSE INITIAL DECIMAL INTEREST FINAL DECIMAL REVENUE INITIAL DECIMAL INTEREST FINAL DECIMAL OIL PRC INITIAL $/bbl RES CAT AS OF DATE FIXED COST $/MO As of : 01/01/2024 GROSS ULTIMATE RESERVES, CUMULATIVE PRODUCTION AND BASIC ECONOMIC DATA TABLE 7 WRAITH UNIT A 12-16 3AH P-DP 0.0000000 0.0053000 0.0053000 0.0000000 683.00 597.09 3.53 76.99 220.64 133.37 0 WRAITH UNIT B 12-16-4AH P-DP 0.0000000 0.0052966 0.0052966 0.0000000 563.82 511.73 3.53 76.99 237.10 149.24 0 WRANGLER A UNIT #1H P-DP 0.0000000 0.0004688 0.0004688 0.0000000 2,392.51 689.47 2.70 78.79 454.90 1,365.88 0 WRANGLER A UNIT #2H P-DP 0.0000000 0.0004688 0.0004688 0.0000000 658.46 910.43 2.70 78.79 613.89 578.98 0 WRANGLER B UNIT #1H P-DP 0.0000000 0.0004688 0.0004688 0.0000000 1,126.03 509.72 2.70 78.79 413.24 871.49 0 WRANGLER B UNIT #2H P-DP 0.0000000 0.0004688 0.0004688 0.0000000 1,457.72 772.19 2.70 78.79 565.36 1,018.10 0 WRANGLER C UNIT #1H P-DP 0.0000000 0.0004687 0.0004687 0.0000000 1,615.82 744.92 2.70 78.79 485.93 869.52 0 WRANGLER C UNIT #2H P-DP 0.0000000 0.0004687 0.0004687 0.0000000 1,820.20 931.60 2.70 78.79 636.06 1,193.45 0 WRANGLER D UNIT #1H P-DP 0.0000000 0.0004688 0.0004688 0.0000000 1,555.39 701.26 2.70 78.79 527.11 1,086.39 0 WRANGLER D UNIT #2H P-DP 0.0000000 0.0004688 0.0004688 0.0000000 2,599.68 1,092.78 2.70 78.79 792.36 1,774.10 0 WRIGHT 1-22 E WRD UNIT 2H P-DP 0.0000000 0.0001410 0.0001410 0.0000000 303.71 168.16 1.38 77.44 141.46 245.26 0 WRIGHT 1-22 W WRD UNIT 2H P-DP 0.0000000 0.0001410 0.0001410 0.0000000 398.17 226.17 1.38 77.44 151.28 256.97 0 WRIGHT 1-22E WRD 1H P-DP 0.0000000 0.0000705 0.0000705 0.0000000 390.17 218.20 1.38 77.44 193.57 329.97 0 WRIGHT 1-22W WRD 1H P-DP 0.0000000 0.0000705 0.0000705 0.0000000 206.98 157.24 2.70 78.79 157.24 206.98 0 WYNN 29 1 P-DP 0.0000000 0.0012306 0.0012306 0.0000000 204.20 33.30 2.37 78.86 21.33 101.55 0 WYNN FARMS 28 1 P-DP 0.0000000 0.0013419 0.0013419 0.0000000 58.44 16.26 2.37 78.86 15.22 54.57 0 XBC-CAROLINE 3B 302H P-DP 0.0000000 0.0006273 0.0006273 0.0000000 2,318.26 533.01 3.15 77.99 396.91 1,064.12 0 XBC-CAROLINE 3C 303H P-DP 0.0000000 0.0006275 0.0006275 0.0000000 2,426.56 507.60 3.15 77.99 353.55 1,058.18 0 XBC-CAROLINE 3K 311H P-DP 0.0000000 0.0006350 0.0006350 0.0000000 2,131.76 468.21 3.15 77.99 347.45 1,082.40 0 XBC-CAROLINE 3L 312H P-DP 0.0000000 0.0006470 0.0006470 0.0000000 2,439.49 474.13 3.15 77.99 344.29 1,083.55 0 XBC-CAROLINE 3M 313H P-DP 0.0000000 0.0006438 0.0006438 0.0000000 2,594.35 549.66 3.15 77.99 362.27 1,010.55 0 XBC-UNRUH 3A 16H P-DP 0.0000000 0.0006519 0.0006519 0.0000000 2,048.25 696.49 3.15 77.99 450.10 1,048.54 0 XBC-UNRUH 3B 17H P-DP 0.0000000 0.0006606 0.0006606 0.0000000 2,503.21 559.49 3.15 77.99 399.57 1,256.80 0 YANKEE 210475 5A P-DP 0.0000000 0.0000077 0.0000077 0.0000000 10,475.88 0.00 2.36 78.22 0.00 8,761.25 0 YELLOW ROSE A UNIT 1H P-DP 0.0000000 0.0001586 0.0001586 0.0000000 535.18 740.60 2.70 78.79 536.34 500.38 0 YELLOW ROSE A UNIT 2H P-DP 0.0000000 0.0001586 0.0001586 0.0000000 595.66 740.38 2.70 78.79 547.00 551.15 0 YELLOW ROSE A UNIT 3H P-DP 0.0000000 0.0001586 0.0001586 0.0000000 3,324.53 517.63 2.70 78.79 388.24 1,798.98 0 YELLOW ROSE B UNIT 1H P-DP 0.0000000 0.0001586 0.0001586 0.0000000 627.54 1,149.31 2.70 78.79 537.74 483.40 0 YELLOW ROSE B UNIT 2H P-DP 0.0000000 0.0001586 0.0001586 0.0000000 261.97 518.60 2.70 78.79 311.28 239.28 0 YELLOW ROSE B UNIT 3H P-DP 0.0000000 0.0001586 0.0001586 0.0000000 5,397.45 1,001.68 2.70 78.79 524.90 2,360.30 0 YORK-LAW 139A 101H P-DP 0.0000000 0.0050411 0.0050411 0.0000000 2,419.88 534.17 1.57 77.63 203.42 368.36 0 YORK-LAW 139B 102H P-DP 0.0000000 0.0050411 0.0050411 0.0000000 1,375.65 688.39 1.57 77.63 241.72 287.03 0 YORK-LAW 139C 103H P-DP 0.0000000 0.0050411 0.0050411 0.0000000 861.65 737.47 1.57 77.63 215.78 165.02 0 YORK-LAW 139D 104H P-DP 0.0000000 0.0050411 0.0050411 0.0000000 1,407.56 852.68 1.57 77.63 263.55 300.07 0

LEASE NAME GAS PRC INITIAL GROSS ULTIMATE Mbbl GROSS ULTIMATE MMcf CUM GAS MMcf CUM OIL Mbbl EXPENSE INITIAL DECIMAL INTEREST FINAL DECIMAL REVENUE INITIAL DECIMAL INTEREST FINAL DECIMAL OIL PRC INITIAL $/bbl RES CAT AS OF DATE FIXED COST $/MO As of : 01/01/2024 GROSS ULTIMATE RESERVES, CUMULATIVE PRODUCTION AND BASIC ECONOMIC DATA TABLE 7 YORK-LAW 139E 105H P-DP 0.0000000 0.0050397 0.0050397 0.0000000 1,191.71 551.94 1.57 77.63 200.05 259.63 0 YORK-LAW 139F 106H P-DP 0.0000000 0.0050397 0.0050397 0.0000000 1,661.39 490.72 1.57 77.63 193.28 276.69 0 YORK-LAW 139G 107H P-DP 0.0000000 0.0050397 0.0050397 0.0000000 448.60 459.48 1.57 77.63 169.20 125.21 0 YORK-LAW 139H 108H P-DP 0.0000000 0.0050397 0.0050397 0.0000000 1,359.92 510.51 1.57 77.63 204.93 263.72 0 529,604.56 4,192,455.13 315,214.08 2,566,965.62 Proved Behind Pipe Rsv Class & Category ELIAS 16-9 G 173 P-BP 0.0000000 0.0003438 0.0003438 0.0000000 1,822.89 407.73 1.57 77.63 0.00 0.00 0 ELIAS 16-9 UNIT 1 111 P-BP 0.0000000 0.0002219 0.0002219 0.0000000 1,515.52 420.29 1.57 77.63 0.00 0.00 0 ELIAS 16-9 UNIT 1 122 P-BP 0.0000000 0.0002219 0.0002219 0.0000000 1,510.02 418.81 1.57 77.63 0.00 0.00 0 ELIAS 16-9 UNIT 1 124 P-BP 0.0000000 0.0002219 0.0002219 0.0000000 1,505.35 417.56 1.57 77.63 0.00 0.00 0 ELIAS 16-9 UNIT 1 221 P-BP 0.0000000 0.0002219 0.0002219 0.0000000 1,510.02 418.81 1.57 77.63 0.00 0.00 0 ELIAS 16-9 UNIT 1 223 P-BP 0.0000000 0.0002219 0.0002219 0.0000000 1,501.69 416.57 1.57 77.63 0.00 0.00 0 ELIAS 16-9 UNIT 2 172 P-BP 0.0000000 0.0001679 0.0001679 0.0000000 1,329.04 323.73 1.57 77.63 0.00 0.00 0 ELIAS 16-9 UNIT 2 271 P-BP 0.0000000 0.0001679 0.0001679 0.0000000 1,548.58 428.82 1.57 77.63 0.00 0.00 0 ELIAS 16-9 UNIT 2 281 P-BP 0.0000000 0.0001679 0.0001679 0.0000000 1,563.70 433.28 1.57 77.63 0.00 0.00 0 ELIAS 16-9 UNIT 2 282 P-BP 0.0000000 0.0001679 0.0001679 0.0000000 1,197.45 334.20 1.57 77.63 0.00 0.00 0 FRYING PAN A 22202 175-176 01H P-BP 0.0020940 0.0020940 0.0020940 0.0020940 1,139.52 434.26 1.38 77.44 0.00 0.00 10,000 FRYING PAN B 22202 175-176 02H P-BP 0.0020810 0.0020810 0.0020810 0.0020810 1,087.40 471.73 1.38 77.44 0.00 0.00 10,000 GRANTHAM WEST 50-48 UNIT 1LS P-BP 0.0000000 0.0023006 0.0023006 0.0000000 1,217.82 299.02 1.57 77.63 0.00 0.00 0 GRANTHAM WEST 50-48 UNIT 1MS P-BP 0.0000000 0.0023006 0.0023006 0.0000000 958.08 237.70 1.57 77.63 0.00 0.00 0 GRANTHAM WEST 50-48 UNIT 1WA P-BP 0.0000000 0.0023006 0.0023006 0.0000000 1,506.33 419.41 1.57 77.63 0.00 0.00 0 GRANTHAM WEST 50-48 UNIT 1WB P-BP 0.0000000 0.0023006 0.0023006 0.0000000 1,225.24 343.51 1.57 77.63 0.00 0.00 0 GRANTHAM WEST 50-48 UNIT 2LS P-BP 0.0000000 0.0023006 0.0023006 0.0000000 1,217.26 298.88 1.57 77.63 0.00 0.00 0 GRANTHAM WEST 50-48 UNIT 2MS P-BP 0.0000000 0.0023006 0.0023006 0.0000000 1,009.64 249.89 1.57 77.63 0.00 0.00 0 GRANTHAM WEST 50-48 UNIT 3LS P-BP 0.0000000 0.0023006 0.0023006 0.0000000 1,197.01 294.10 1.57 77.63 0.00 0.00 0 GRANTHAM WEST 50-48 UNIT 3MS P-BP 0.0000000 0.0023006 0.0023006 0.0000000 1,024.00 253.27 1.57 77.63 0.00 0.00 0 GRANTHAM WEST 50-48 UNIT 3WA P-BP 0.0000000 0.0023006 0.0023006 0.0000000 1,562.67 434.60 1.57 77.63 0.00 0.00 0 GRANTHAM WEST 50-48 UNIT 3WB P-BP 0.0000000 0.0023006 0.0023006 0.0000000 1,134.31 318.92 1.57 77.63 0.00 0.00 0 GRANTHAM WEST 50-48 UNIT 4WA P-BP 0.0000000 0.0023006 0.0023006 0.0000000 1,860.69 418.07 1.57 77.63 0.00 0.00 0 HENDERSHOT 210501 6A-M P-BP 0.0000000 0.0231184 0.0231184 0.0000000 6,600.29 0.00 2.36 78.22 0.00 0.00 0 HENDERSHOT 211824 5A-M P-BP 0.0000000 0.0111977 0.0111977 0.0000000 9,260.91 0.00 2.36 78.22 0.00 0.00 0 HONEY B 20-29 4202H P-BP 0.0000000 0.0004848 0.0004848 0.0000000 2,602.44 406.71 1.07 75.95 0.00 0.00 0 HONEY B 20-29 4402H P-BP 0.0000000 0.0004848 0.0004848 0.0000000 4,223.77 427.61 1.07 75.95 0.00 0.00 0 HONEY E 20-29 4305H P-BP 0.0000000 0.0004848 0.0004848 0.0000000 4,212.81 426.54 1.07 75.95 0.00 0.00 0

LEASE NAME GAS PRC INITIAL GROSS ULTIMATE Mbbl GROSS ULTIMATE MMcf CUM GAS MMcf CUM OIL Mbbl EXPENSE INITIAL DECIMAL INTEREST FINAL DECIMAL REVENUE INITIAL DECIMAL INTEREST FINAL DECIMAL OIL PRC INITIAL $/bbl RES CAT AS OF DATE FIXED COST $/MO As of : 01/01/2024 GROSS ULTIMATE RESERVES, CUMULATIVE PRODUCTION AND BASIC ECONOMIC DATA TABLE 7 HONEY G 20-29 4207H P-BP 0.0000000 0.0004848 0.0004848 0.0000000 4,229.46 428.17 1.07 75.95 0.00 0.00 0 HONEY G 20-29 4407H P-BP 0.0000000 0.0004848 0.0004848 0.0000000 2,594.23 405.48 1.07 75.95 0.00 0.00 0 KILLER BEE M 8-5 4213H P-BP 0.0000000 0.0010983 0.0010983 0.0000000 2,571.89 402.10 1.07 75.95 0.00 0.00 0 KILLER BEE N 8-5 4314H P-BP 0.0000000 0.0010983 0.0010983 0.0000000 2,575.43 402.64 1.07 75.95 0.00 0.00 0 LAITALA UNIT B 21-24 4AH P-BP 0.0000000 0.0001271 0.0001271 0.0000000 1,637.95 453.87 2.37 78.86 0.00 0.00 0 LAITALA UNIT B 21-24 4SH P-BP 0.0000000 0.0001271 0.0001271 0.0000000 1,367.62 333.32 2.37 78.86 0.00 0.00 0 LAMAR 13-1-A 03LS P-BP 0.0000000 0.0015625 0.0015625 0.0000000 1,698.70 437.19 1.57 77.63 0.00 0.00 0 LAMAR 13-1-B 03WA P-BP 0.0000000 0.0015625 0.0015625 0.0000000 1,511.76 617.44 1.57 77.63 0.00 0.00 0 LAMAR 13-1-C 08WB P-BP 0.0000000 0.0015625 0.0015625 0.0000000 2,184.51 407.92 1.57 77.63 0.00 0.00 0 LAMAR 13-1-H 22JM P-BP 0.0000000 0.0015625 0.0015625 0.0000000 1,699.57 437.41 1.57 77.63 0.00 0.00 0 LAMAR 13-1-H G 18WB P-BP 0.0000000 0.0015625 0.0015625 0.0000000 2,181.82 407.43 1.57 77.63 0.00 0.00 0 LAMAR 13-1-I 22WA P-BP 0.0000000 0.0041667 0.0041667 0.0000000 1,640.57 442.09 1.57 77.63 0.00 0.00 0 LGM A 1H P-BP 0.0000000 0.0385547 0.0385547 0.0000000 2,330.25 388.09 2.33 75.89 0.00 0.00 0 LGM B 2H P-BP 0.0000000 0.0385547 0.0385547 0.0000000 2,392.55 398.37 2.33 75.89 0.00 0.00 0 LGM C 201H P-BP 0.0000000 0.0385547 0.0385547 0.0000000 1,918.80 320.17 2.33 75.89 0.00 0.00 0 LULO 2533LP 8H P-BP 0.0000000 0.0010156 0.0010156 0.0000000 2,268.99 566.07 2.37 78.86 0.00 0.00 0 NOELLE SW CRC JF 4H P-BP 0.0000000 0.0007500 0.0007500 0.0000000 15,748.81 0.00 2.67 78.22 0.00 0.00 0 NOELLE SW CRC JF 6H P-BP 0.0000000 0.0235878 0.0235878 0.0000000 15,564.09 0.00 2.67 78.22 0.00 0.00 0 NOELLE W CRC JF 2H P-BP 0.0000000 0.0286759 0.0286759 0.0000000 16,505.53 0.00 2.67 78.22 0.00 0.00 0 OLDHAM TRUST WEST 4AH P-BP 0.0000000 0.0002695 0.0002695 0.0000000 1,536.55 426.57 2.37 78.86 0.00 0.00 0 OLDHAM TRUST WEST 4SH P-BP 0.0000000 0.0002695 0.0002695 0.0000000 1,292.31 315.61 2.37 78.86 0.00 0.00 0 OLDHAM TRUST WEST 5AH P-BP 0.0000000 0.0002695 0.0002695 0.0000000 1,537.50 426.83 2.37 78.86 0.00 0.00 0 OLDHAM TRUST WEST 5MH P-BP 0.0000000 0.0002695 0.0002695 0.0000000 1,014.51 250.19 2.37 78.86 0.00 0.00 0 OLDHAM TRUST WEST 5SH P-BP 0.0000000 0.0002695 0.0002695 0.0000000 1,284.31 313.73 2.37 78.86 0.00 0.00 0 OLDHAM TRUST WEST 6AH P-BP 0.0000000 0.0002695 0.0002695 0.0000000 1,523.49 423.05 2.37 78.86 0.00 0.00 0 ONEAL-ANNIE 15H 8H P-BP 0.0000000 0.0076914 0.0076914 0.0000000 2,633.57 434.74 2.32 78.93 0.00 0.00 0 ONEAL-ANNIE 15H 9H P-BP 0.0000000 0.0076914 0.0076914 0.0000000 2,678.13 441.90 2.32 78.93 0.00 0.00 0 ONEAL-ANNIE 15J 10H P-BP 0.0000000 0.0076914 0.0076914 0.0000000 2,668.46 440.34 2.32 78.93 0.00 0.00 0 ONEAL-ANNIE 15M 13H P-BP 0.0000000 0.0076914 0.0076914 0.0000000 2,557.20 422.48 2.32 78.93 0.00 0.00 0 ONEAL-ANNIE 15P 16H P-BP 0.0000000 0.0076914 0.0076914 0.0000000 2,460.76 406.98 2.32 78.93 0.00 0.00 0 ONEAL-ANNIE 15P 17H P-BP 0.0000000 0.0076914 0.0076914 0.0000000 2,464.57 407.60 2.32 78.93 0.00 0.00 0 RENDEZVOUS NORTH POOLED UNIT 10UA P-BP 0.0000000 0.0002250 0.0002250 0.0000000 911.78 387.28 1.38 77.44 0.00 0.00 0 RENDEZVOUS NORTH POOLED UNIT 28SB P-BP 0.0000000 0.0000705 0.0000705 0.0000000 0.00 0.00 1.38 77.44 0.00 0.00 0 RIO GRANDE 12-24-A 32LS P-BP 0.0000000 0.0006079 0.0006079 0.0000000 1,727.75 536.35 1.57 77.63 0.00 0.00 0

LEASE NAME GAS PRC INITIAL GROSS ULTIMATE Mbbl GROSS ULTIMATE MMcf CUM GAS MMcf CUM OIL Mbbl EXPENSE INITIAL DECIMAL INTEREST FINAL DECIMAL REVENUE INITIAL DECIMAL INTEREST FINAL DECIMAL OIL PRC INITIAL $/bbl RES CAT AS OF DATE FIXED COST $/MO As of : 01/01/2024 GROSS ULTIMATE RESERVES, CUMULATIVE PRODUCTION AND BASIC ECONOMIC DATA TABLE 7 RIO GRANDE 12-24-B 32WA P-BP 0.0000000 0.0006079 0.0006079 0.0000000 2,061.57 554.43 1.57 77.63 0.00 0.00 0 RIO GRANDE 12-24-C 36WB P-BP 0.0000000 0.0005040 0.0005040 0.0000000 2,882.27 643.07 1.57 77.63 0.00 0.00 0 RIO GRANDE 12-24-D 42LS P-BP 0.0000000 0.0006079 0.0006079 0.0000000 1,737.69 539.36 1.57 77.63 0.00 0.00 0 RIO GRANDE 12-24-E 42WA P-BP 0.0000000 0.0006079 0.0006079 0.0000000 2,064.29 555.14 1.57 77.63 0.00 0.00 0 RIO GRANDE 12-24-F 48WB P-BP 0.0000000 0.0005040 0.0005040 0.0000000 2,923.50 652.07 1.57 77.63 0.00 0.00 0 RIO GRANDE 12-24-G 52WA P-BP 0.0000000 0.0006079 0.0006079 0.0000000 2,088.36 561.42 1.57 77.63 0.00 0.00 0 RIO GRANDE 12-24-H 52LS P-BP 0.0000000 0.0006079 0.0006079 0.0000000 1,739.55 539.92 1.57 77.63 0.00 0.00 0 ROI TAN A 1A P-BP 0.0000000 0.0028207 0.0028207 0.0000000 1,495.60 415.54 2.37 78.86 0.00 0.00 0 ROI TAN B 2LS P-BP 0.0000000 0.0028207 0.0028207 0.0000000 1,497.55 416.07 2.37 78.86 0.00 0.00 0 ROI TAN B 3B P-BP 0.0000000 0.0028207 0.0028207 0.0000000 1,247.32 305.03 2.37 78.86 0.00 0.00 0 ROI TAN D 4A P-BP 0.0000000 0.0028207 0.0028207 0.0000000 1,490.92 414.28 2.37 78.86 0.00 0.00 0 ROI TAN D 5LS P-BP 0.0000000 0.0028207 0.0028207 0.0000000 1,571.68 436.04 2.37 78.86 0.00 0.00 0 ROI TAN E 6A P-BP 0.0000000 0.0028207 0.0028207 0.0000000 1,619.38 448.87 2.37 78.86 0.00 0.00 0 ROI TAN F 7A P-BP 0.0000000 0.0028207 0.0028207 0.0000000 1,970.47 440.66 2.37 78.86 0.00 0.00 0 ROI TAN F 8LS P-BP 0.0000000 0.0028207 0.0028207 0.0000000 1,638.28 453.96 2.37 78.86 0.00 0.00 0 ROSS NW WHL BL 1H P-BP 0.0000000 0.0244948 0.0244948 0.0000000 26,500.75 0.00 2.36 78.22 0.00 0.00 0 ROUGAROU UNIT 36-48 6AH P-BP 0.0000000 0.0106872 0.0106872 0.0000000 1,609.02 449.86 3.53 76.99 0.00 0.00 0 SCOTT, F.H. -33- 4 P-BP 0.0000000 0.0000290 0.0000290 0.0000000 913.44 387.65 1.38 77.44 0.00 0.00 0 SPHINX UNIT 13-01 5AH P-BP 0.0000000 0.0106872 0.0106872 0.0000000 2,097.37 509.02 3.53 76.99 0.00 0.00 0 STIMSON-NAIL E17T 120H P-BP 0.0000000 0.0001924 0.0001924 0.0000000 3,674.12 538.51 2.32 78.93 0.00 0.00 0 STIMSON-NAIL W17K 11H P-BP 0.0000000 0.0000752 0.0000752 0.0000000 3,354.06 492.04 2.32 78.93 0.00 0.00 0 STIMSON-NAIL W17L 12H P-BP 0.0000000 0.0000752 0.0000752 0.0000000 3,354.06 492.04 2.32 78.93 0.00 0.00 0 STIMSON-NAIL W17M 13H P-BP 0.0000000 0.0000752 0.0000752 0.0000000 3,354.06 492.04 2.32 78.93 0.00 0.00 0 STIMSON-NAIL W17N 14H P-BP 0.0000000 0.0000752 0.0000752 0.0000000 3,354.06 492.04 2.32 78.93 0.00 0.00 0 STIMSON-NAIL W17O 15H P-BP 0.0000000 0.0000752 0.0000752 0.0000000 3,354.06 492.04 2.32 78.93 0.00 0.00 0 STIMSON-NAIL W17P 16H P-BP 0.0000000 0.0000752 0.0000752 0.0000000 3,354.06 492.04 2.32 78.93 0.00 0.00 0 STIMSON-NAIL W17Q 17H P-BP 0.0000000 0.0000752 0.0000752 0.0000000 3,354.06 492.04 2.32 78.93 0.00 0.00 0 STIMSON-NAIL W17R 18H P-BP 0.0000000 0.0000752 0.0000752 0.0000000 3,477.56 509.80 2.32 78.93 0.00 0.00 0 STIMSON-NAIL W17S 19H P-BP 0.0000000 0.0000752 0.0000752 0.0000000 3,354.06 492.04 2.32 78.93 0.00 0.00 0 STIMSON-NAIL W17T 20H P-BP 0.0000000 0.0000752 0.0000752 0.0000000 3,354.06 492.04 2.32 78.93 0.00 0.00 0 SUCCUBUS UNIT B 25-24 5AH P-BP 0.0000000 0.0106872 0.0106872 0.0000000 1,509.77 422.99 3.53 76.99 0.00 0.00 0 SUCCUBUS-ROUGAROU 24-37 7AH P-BP 0.0000000 0.0106872 0.0106872 0.0000000 2,821.82 776.74 3.53 76.99 0.00 0.00 0 TOMCAT 23-24 A 1LS P-BP 0.0000000 0.0022321 0.0022321 0.0000000 1,300.01 316.90 1.57 77.63 0.00 0.00 0 TOMCAT 23-24 B 2LS P-BP 0.0000000 0.0022321 0.0022321 0.0000000 1,298.36 316.52 1.57 77.63 0.00 0.00 0

LEASE NAME GAS PRC INITIAL GROSS ULTIMATE Mbbl GROSS ULTIMATE MMcf CUM GAS MMcf CUM OIL Mbbl EXPENSE INITIAL DECIMAL INTEREST FINAL DECIMAL REVENUE INITIAL DECIMAL INTEREST FINAL DECIMAL OIL PRC INITIAL $/bbl RES CAT AS OF DATE FIXED COST $/MO As of : 01/01/2024 GROSS ULTIMATE RESERVES, CUMULATIVE PRODUCTION AND BASIC ECONOMIC DATA TABLE 7 TOMCAT 23-24 C 1DN P-BP 0.0000000 0.0022321 0.0022321 0.0000000 1,876.21 419.29 1.57 77.63 0.00 0.00 0 TOMCAT 23-24 D 2DN P-BP 0.0000000 0.0022321 0.0022321 0.0000000 1,881.13 420.34 1.57 77.63 0.00 0.00 0 TOMCAT 23-24 E 1AB P-BP 0.0000000 0.0022321 0.0022321 0.0000000 1,591.07 439.81 1.57 77.63 0.00 0.00 0 TOMCAT 23-24 F 2WA P-BP 0.0000000 0.0022321 0.0022321 0.0000000 1,565.42 432.91 1.57 77.63 0.00 0.00 0 TOMCAT 23-24 G 3WA P-BP 0.0000000 0.0022321 0.0022321 0.0000000 1,578.50 436.42 1.57 77.63 0.00 0.00 0 VALENCIA 10-8 A UNIT A 2H P-BP 0.0000000 0.0003220 0.0003220 0.0000000 1,544.77 428.78 2.37 78.86 0.00 0.00 0 VALENCIA 10-8 A UNIT L 2H P-BP 0.0000000 0.0003220 0.0003220 0.0000000 1,548.62 429.83 2.37 78.86 0.00 0.00 0 WENDIGO UNIT A 10-15 1AH P-BP 0.0000000 0.0053000 0.0053000 0.0000000 2,116.43 586.83 3.53 76.99 0.00 0.00 0 WENDIGO UNIT A 10-15 1MH P-BP 0.0000000 0.0052966 0.0052966 0.0000000 1,750.57 488.11 3.53 76.99 0.00 0.00 0 WENDIGO UNIT A 10-15 2AH P-BP 0.0000000 0.0052966 0.0052966 0.0000000 2,123.96 588.87 3.53 76.99 0.00 0.00 0 WENDIGO UNIT A 10-15 3AH P-BP 0.0000000 0.0053000 0.0053000 0.0000000 2,128.47 590.08 3.53 76.99 0.00 0.00 0 WEREWOLF UNIT A 12-05 3AH P-BP 0.0000000 0.0001425 0.0001425 0.0000000 2,507.78 692.26 3.53 76.99 0.00 0.00 0 WRAITH UNIT B 12-16 5AH P-BP 0.0000000 0.0052966 0.0052966 0.0000000 2,272.37 628.86 3.53 76.99 0.00 0.00 0 WRAITH UNIT B 12-16 6AH P-BP 0.0000000 0.0052966 0.0052966 0.0000000 2,233.23 618.31 3.53 76.99 0.00 0.00 0 WRANGLER D UNIT 751H P-BP 0.0000000 0.0004688 0.0004688 0.0000000 1,595.75 804.47 2.70 78.79 0.00 0.00 0 46,272.81 298,689.33 0.00 0.00 Proved Undeveloped Rsv Class & Category CLEMENTS ALLOCATION B 26-35 2HA P-UD 0.0000000 0.0004050 0.0004050 0.0000000 1,090.22 309.21 3.53 76.99 0.00 0.00 0 CLEMENTS ALLOCATION C 26-35 3HA P-UD 0.0000000 0.0004050 0.0004050 0.0000000 1,081.91 306.95 3.53 76.99 0.00 0.00 0 CLEMENTS ALLOCATION D 26-35 7LS P-UD 0.0000000 0.0004050 0.0004050 0.0000000 892.75 224.42 3.53 76.99 0.00 0.00 0 DIRE WOLF 30 3BS B 2H P-UD 0.0000000 0.0013021 0.0013021 0.0000000 1,333.82 562.25 1.38 77.44 0.00 0.00 0 DIRE WOLF 50 WA B 2H P-UD 0.0000000 0.0013021 0.0013021 0.0000000 1,330.24 560.77 1.38 77.44 0.00 0.00 0 DIRE WOLF 70 WC B 2H P-UD 0.0000000 0.0013021 0.0013021 0.0000000 1,336.35 563.31 1.38 77.44 0.00 0.00 0 ELIAS 16-9 UNIT 1 132 P-UD 0.0000000 0.0002219 0.0002219 0.0000000 1,506.97 418.00 1.57 77.63 0.00 0.00 0 ELIAS 16-9 UNIT 1 141 P-UD 0.0000000 0.0002219 0.0002219 0.0000000 1,256.10 306.58 1.57 77.63 0.00 0.00 0 ELIAS 16-9 UNIT 1 231 P-UD 0.0000000 0.0002219 0.0002219 0.0000000 1,259.52 307.39 1.57 77.63 0.00 0.00 0 ELIAS 16-9 UNIT 1 242 P-UD 0.0000000 0.0002219 0.0002219 0.0000000 1,255.25 306.39 1.57 77.63 0.00 0.00 0 ELIAS 16-9 UNIT 2 151 P-UD 0.0000000 0.0001679 0.0001679 0.0000000 1,261.56 307.87 1.57 77.63 0.00 0.00 0 ELIAS 16-9 UNIT 2 161 P-UD 0.0000000 0.0001679 0.0001679 0.0000000 1,262.92 308.19 1.57 77.63 0.00 0.00 0 ELIAS 16-9 UNIT 2 163 P-UD 0.0000000 0.0001679 0.0001679 0.0000000 1,265.07 308.69 1.57 77.63 0.00 0.00 0 ELIAS 16-9 UNIT 2 252 P-UD 0.0000000 0.0001679 0.0001679 0.0000000 1,262.23 308.03 1.57 77.63 0.00 0.00 0 ELIAS 16-9 UNIT 2 262 P-UD 0.0000000 0.0001679 0.0001679 0.0000000 1,263.88 308.40 1.57 77.63 0.00 0.00 0 GRANTHAM WEST 50-48 UNIT 2WA P-UD 0.0000000 0.0023006 0.0023006 0.0000000 1,459.33 406.73 1.57 77.63 0.00 0.00 0 HIP LION F 107H P-UD 0.0000000 0.0014648 0.0014648 0.0000000 1,797.09 930.84 1.31 80.44 0.00 0.00 0

LEASE NAME GAS PRC INITIAL GROSS ULTIMATE Mbbl GROSS ULTIMATE MMcf CUM GAS MMcf CUM OIL Mbbl EXPENSE INITIAL DECIMAL INTEREST FINAL DECIMAL REVENUE INITIAL DECIMAL INTEREST FINAL DECIMAL OIL PRC INITIAL $/bbl RES CAT AS OF DATE FIXED COST $/MO As of : 01/01/2024 GROSS ULTIMATE RESERVES, CUMULATIVE PRODUCTION AND BASIC ECONOMIC DATA TABLE 7 KILLER BEE I 8-5 4209H P-UD 0.0000000 0.0010983 0.0010983 0.0000000 2,582.25 403.67 1.07 75.95 0.00 0.00 0 KILLER BEE J 8-5 4310H P-UD 0.0000000 0.0010983 0.0010983 0.0000000 2,576.00 402.73 1.07 75.95 0.00 0.00 0 KILLER BEE K 8-5 4411H P-UD 0.0000000 0.0010983 0.0010983 0.0000000 2,571.89 402.10 1.07 75.95 0.00 0.00 0 PARKS, ROY 301LH P-UD 0.0000000 0.0002678 0.0002678 0.0000000 2,617.90 433.11 2.32 78.93 0.00 0.00 0 PARKS, ROY 301MH P-UD 0.0000000 0.0002678 0.0002678 0.0000000 3,068.78 487.69 2.32 78.93 0.00 0.00 0 PARKS, ROY 302LH P-UD 0.0000000 0.0002678 0.0002678 0.0000000 2,489.86 412.00 2.32 78.93 0.00 0.00 0 PARKS, ROY 302MH P-UD 0.0000000 0.0002678 0.0002678 0.0000000 1,622.50 411.89 2.32 78.93 0.00 0.00 0 PARKS, ROY 303BH P-UD 0.0000000 0.0002678 0.0002678 0.0000000 1,622.50 411.89 2.32 78.93 0.00 0.00 0 PARKS, ROY 303LH P-UD 0.0000000 0.0002678 0.0002678 0.0000000 2,487.58 411.74 2.32 78.93 0.00 0.00 0 PARKS, ROY 303MH P-UD 0.0000000 0.0002678 0.0002678 0.0000000 1,285.52 328.62 2.32 78.93 0.00 0.00 0 PARKS, ROY 311JH P-UD 0.0000000 0.0002678 0.0002678 0.0000000 2,907.12 462.23 2.32 78.93 0.00 0.00 0 RENDEZVOUS NORTH POOLED UNIT 2LA P-UD 0.0000000 0.0002250 0.0002250 0.0000000 933.87 396.07 1.38 77.44 0.00 0.00 0 SCOTT, F.H. -33- 5 P-UD 0.0000000 0.0000290 0.0000290 0.0000000 942.47 399.71 1.38 77.44 0.00 0.00 0 SHOSHONE D 34-166-165 TB 4H P-UD 0.0000000 0.0000010 0.0000010 0.0000000 2,594.32 492.16 1.38 77.44 0.00 0.00 0 STIMSON-NAIL E17K 111H P-UD 0.0000000 0.0001924 0.0001924 0.0000000 3,670.51 537.81 2.32 78.93 0.00 0.00 0 STIMSON-NAIL E17L 112H P-UD 0.0000000 0.0001924 0.0001924 0.0000000 3,676.10 538.62 2.32 78.93 0.00 0.00 0 STIMSON-NAIL E17M 113H P-UD 0.0000000 0.0001924 0.0001924 0.0000000 3,677.16 538.78 2.32 78.93 0.00 0.00 0 STIMSON-NAIL E17N 114H P-UD 0.0000000 0.0001924 0.0001924 0.0000000 3,665.26 537.05 2.32 78.93 0.00 0.00 0 STIMSON-NAIL E17O 115H P-UD 0.0000000 0.0001924 0.0001924 0.0000000 3,665.26 537.05 2.32 78.93 0.00 0.00 0 STIMSON-NAIL E17P 116H P-UD 0.0000000 0.0001924 0.0001924 0.0000000 3,665.26 537.05 2.32 78.93 0.00 0.00 0 STIMSON-NAIL E17Q 117H P-UD 0.0000000 0.0001924 0.0001924 0.0000000 3,665.26 537.05 2.32 78.93 0.00 0.00 0 STIMSON-NAIL E17R 118H P-UD 0.0000000 0.0001924 0.0001924 0.0000000 3,665.26 537.05 2.32 78.93 0.00 0.00 0 STIMSON-NAIL E17S 119H P-UD 0.0000000 0.0001924 0.0001924 0.0000000 3,677.51 538.82 2.32 78.93 0.00 0.00 0 TCB B 3LS P-UD 0.0000000 0.0000882 0.0000882 0.0000000 1,705.71 412.68 2.37 78.86 0.00 0.00 0 VALENCIA 10-8 A UNIT L 1H P-UD 0.0000000 0.0003220 0.0003220 0.0000000 1,300.66 317.57 2.37 78.86 0.00 0.00 0 WINDY MOUNTAIN 7978 7U A 7H P-UD 0.0000000 0.0001797 0.0001797 0.0000000 7,671.60 426.50 1.53 76.96 0.00 0.00 0 WINDY MOUNTAIN 7978 8U A 8H P-UD 0.0000000 0.0001797 0.0001797 0.0000000 7,635.18 424.50 1.53 76.96 0.00 0.00 0 WINDY MOUNTAIN 7978 9U A 9H P-UD 0.0000000 0.0001797 0.0001797 0.0000000 7,663.24 426.09 1.53 76.96 0.00 0.00 0 19,446.26 111,221.68 0.00 0.00 Grand Total 595,323.62 4,602,366.14 315,214.08 2,566,965.62