| Delaware | 0-14112 | 43-1128385 | ||||||
(State or other jurisdiction of incorporation) |
(Commission File Number) | (IRS Employer Identification No.) |
||||||
| Title of each class | Ticker symbol(s) | Name of each exchange on which registered | ||||||
| Common Stock, $0.01 par value | JKHY | Nasdaq Global Select Market | ||||||
JACK HENRY & ASSOCIATES, INC. |
|||||||||||
| (Registrant) | |||||||||||
| Date: | August 20, 2024 | /s/ Mimi L. Carsley | |||||||||
| Mimi L. Carsley | |||||||||||
| Chief Financial Officer and Treasurer | |||||||||||

 |
|||||
| Press Release | |||||
Mimi L. Carsley | Chief Financial Officer | mcarsley@jackhenry.com | |||||
| Current | ||||||||
| GAAP | Low | High | ||||||
| Revenue | $2,369 | $2,391 | ||||||
| Operating margin | 23.0% | 23.2% | ||||||
| EPS | $5.78 | $5.87 | ||||||
Non-GAAP3 |
||||||||
| Adjusted revenue | $2,353 | $2,375 | ||||||
| Adjusted operating margin | 22.7% | 22.8% | ||||||
Fourth Qtr Revenue |
Fourth Qtr Operating Income |
FY2024 Net Income |
||||||||||||||||||||||||
|
|
|
||||||||||||||||||||||||
| GAAP | Non-GAAP1 |
GAAP | Non-GAAP1 |
GAAP | Non-GAAP1 |
|||||||||||||||||||||
| increased | increased | increased | increased | increased | increased | |||||||||||||||||||||
| 4.7% | 6.4% | 1.2% | 5.3% | 4.1% | 13.3% | |||||||||||||||||||||
FY2024 Revenue |
FY2024 Operating Income |
FY2024 EBITDA |
||||||||||||||||||||||||
|
|
|
||||||||||||||||||||||||
| GAAP | Non-GAAP1 |
GAAP | Non-GAAP1 |
Non-GAAP4 |
||||||||||||||||||||||
| increased | increased | increased | increased | increased | ||||||||||||||||||||||
| 6.6% | 7.4% | 1.8% | 10.3% | 8.3% | ||||||||||||||||||||||
 |
1 |
|||||||
According to Greg Adelson, President and CEO, “We are very pleased to report overall strong financial performance results for the fourth quarter and full 2024 fiscal year. We produced record revenue and operating income in fiscal year 2024 along with our highest-ever sales bookings in both the fourth quarter and fiscal year. Technology spending remains robust with significant demand for our innovative solutions. Even with record sales bookings, we continued to replenish and keep our sales pipeline near its all-time high. We are well positioned for future growth as we continue to invest in innovation, execute on our strategy, and deliver for our clients and shareholders.” | |||||||||||||||||
| Revenue | |||||||||||||||||||||||||||||||||||
| (Unaudited, In Thousands) | Three Months Ended June 30, |
% Change | Year Ended June 30, |
% Change | |||||||||||||||||||||||||||||||
| 2024 | 2023 | 2024 | 2023 | ||||||||||||||||||||||||||||||||
| Revenue | |||||||||||||||||||||||||||||||||||
| Services and Support | $ | 316,739 | $ | 311,931 | 1.5 | % | $ | 1,275,954 | $ | 1,214,701 | 5.0 | % | |||||||||||||||||||||||
| Percentage of Total Revenue | 56.6 | % | 58.3 | % | 57.6 | % | 58.5 | % | |||||||||||||||||||||||||||
| Processing | 243,173 | 222,703 | 9.2 | % | 939,589 | 863,001 | 8.9 | % | |||||||||||||||||||||||||||
| Percentage of Total Revenue | 43.4 | % | 41.7 | % | 42.4 | % | 41.5 | % | |||||||||||||||||||||||||||
| REVENUE | $ | 559,912 | $ | 534,634 | 4.7 | % | $ | 2,215,543 | $ | 2,077,702 | 6.6 | % | |||||||||||||||||||||||
|
2 |
|||||||
Operating Expenses and Operating Income |
||||||||||||||||||||||||||||||||||||||
| (Unaudited, In Thousands) | Three Months Ended June 30, |
% Change | Year Ended June 30, |
% Change | ||||||||||||||||||||||||||||||||||
| 2024 | 2023 | 2024 | 2023 | |||||||||||||||||||||||||||||||||||
| Cost of Revenue | $ | 327,272 | $ | 308,868 | 6.0 | % | $ | 1,299,477 | $ | 1,219,062 | 6.6 | % | ||||||||||||||||||||||||||
Percentage of Total Revenue5 |
58.5 | % | 57.8 | % | 58.7 | % | 58.7 | % | ||||||||||||||||||||||||||||||
| Research and Development | 39,892 | 38,498 | 3.6 | % | 148,256 | 142,678 | 3.9 | % | ||||||||||||||||||||||||||||||
Percentage of Total Revenue5 |
7.1 | % | 7.2 | % | 6.7 | % | 6.9 | % | ||||||||||||||||||||||||||||||
| Selling, General, and Administrative | 67,122 | 63,069 | 6.4 | % | 278,419 | 235,274 | 18.3 | % | ||||||||||||||||||||||||||||||
Percentage of Total Revenue5 |
12.0 | % | 11.8 | % | 12.6 | % | 11.3 | % | ||||||||||||||||||||||||||||||
| OPERATING EXPENSES | 434,286 | 410,435 | 5.8 | % | 1,726,152 | 1,597,014 | 8.1 | % | ||||||||||||||||||||||||||||||
| OPERATING INCOME | $ | 125,626 | $ | 124,199 | 1.2 | % | $ | 489,391 | $ | 480,688 | 1.8 | % | ||||||||||||||||||||||||||
Operating Margin5 |
22.4 | % | 23.2 | % | 22.1 | % | 23.1 | % | ||||||||||||||||||||||||||||||
| (Unaudited, In Thousands, Except Per Share Data) |
Three Months Ended June 30, |
% Change | Year Ended June 30, |
% Change | |||||||||||||||||||||||||||||||
| 2024 | 2023 | 2024 | 2023 | ||||||||||||||||||||||||||||||||
| Income Before Income Taxes | $ | 130,384 | $ | 123,950 | 5.2 | % | $ | 498,019 | $ | 474,574 | 4.9 | % | |||||||||||||||||||||||
| Provision for Income Taxes | 29,311 | 26,177 | 12.0 | % | 116,203 | 107,928 | 7.7 | % | |||||||||||||||||||||||||||
| NET INCOME | $ | 101,073 | $ | 97,773 | 3.4 | % | $ | 381,816 | $ | 366,646 | 4.1 | % | |||||||||||||||||||||||
| Diluted earnings per share | $ | 1.38 | $ | 1.34 | 3.3 | % | $ | 5.23 | $ | 5.02 | 4.2 | % | |||||||||||||||||||||||
According to Mimi Carsley, CFO and Treasurer, “For both the fourth quarter and the fiscal year, our private cloud and processing services continued to drive robust revenue growth. These key areas of revenue had strong, organic revenue growth of 9%, while overall revenue grew over 7% on a non-GAAP basis and non-GAAP operating income grew over 10%.” | |||||||||||||||||
|
3 |
|||||||
| (Unaudited, In Thousands) | Three Months Ended June 30, | % Change | Year Ended June 30, | % Change | |||||||||||||||||||||||||||||||
| 2024 | 2023 | 2024 | 2023 | ||||||||||||||||||||||||||||||||
GAAP Revenue** |
$ | 559,912 | $ | 534,634 | 4.7 | % | $ | 2,215,543 | $ | 2,077,702 | 6.6 | % | |||||||||||||||||||||||
| Adjustments: | |||||||||||||||||||||||||||||||||||
| Deconversion revenue | (6,693) | (14,733) | (16,554) | (31,775) | |||||||||||||||||||||||||||||||
| Revenue from acquisition | — | — | (1,945) | — | |||||||||||||||||||||||||||||||
NON-GAAP ADJUSTED REVENUE** |
$ | 553,219 | $ | 519,901 | 6.4 | % | $ | 2,197,044 | $ | 2,045,927 | 7.4 | % | |||||||||||||||||||||||
| GAAP Operating Income | $ | 125,626 | $ | 124,199 | 1.2 | % | $ | 489,391 | $ | 480,688 | 1.8 | % | |||||||||||||||||||||||
| Adjustments: | |||||||||||||||||||||||||||||||||||
| Operating income from deconversions | (5,594) | (13,054) | (13,146) | (27,513) | |||||||||||||||||||||||||||||||
VEDIP program expense* |
— | — | 16,443 | — | |||||||||||||||||||||||||||||||
Operating loss from acquisition |
— | — | 2,237 | — | |||||||||||||||||||||||||||||||
(Gain)/loss on sale of assets, net |
— | 2,816 | — | (4,567) | |||||||||||||||||||||||||||||||
| NON-GAAP ADJUSTED OPERATING INCOME | $ | 120,032 | $ | 113,961 | 5.3 | % | $ | 494,925 | $ | 448,608 | 10.3 | % | |||||||||||||||||||||||
Non-GAAP Adjusted Operating Margin*** |
21.7 | % | 21.9 | % | 22.5 | % | 21.9 | % | |||||||||||||||||||||||||||
| GAAP Net Income | $ | 101,073 | $ | 97,773 | 3.4 | % | $ | 381,816 | $ | 366,646 | 4.1 | % | |||||||||||||||||||||||
|
4 |
|||||||
| (Unaudited, In Thousands) | Three Months Ended June 30, | % Change | Year Ended June 30, | % Change | |||||||||||||||||||||||||||||||
| 2024 | 2023 | 2024 | 2023 | ||||||||||||||||||||||||||||||||
| GAAP Net Income | $ | 101,073 | $ | 97,773 | 3.4 | % | $ | 381,816 | $ | 366,646 | 4.1 | % | |||||||||||||||||||||||
| Adjustments: | |||||||||||||||||||||||||||||||||||
| Net income from deconversions | (5,594) | (13,054) | (13,146) | (27,513) | |||||||||||||||||||||||||||||||
VEDIP program expense* |
— | — | 16,443 | — | |||||||||||||||||||||||||||||||
| Net loss from acquisition | — | — | 4,656 | — | |||||||||||||||||||||||||||||||
(Gain)/loss on sale of assets, net |
— | 2,816 | — | (4,567) | |||||||||||||||||||||||||||||||
Tax impact of adjustments** |
1,343 | 2,456 | (1,909) | 7,699 | |||||||||||||||||||||||||||||||
| NON-GAAP ADJUSTED NET INCOME | $ | 96,822 | $ | 89,991 | 7.6 | % | $ | 387,860 | $ | 342,265 | 13.3 | % | |||||||||||||||||||||||
| Three Months Ended June 30, 2024 | |||||||||||||||||||||||||||||
| (Unaudited, In Thousands) | Core | Payments | Complementary | Corporate and Other | Total | ||||||||||||||||||||||||
| GAAP REVENUE | $ | 172,040 | $ | 212,593 | $ | 155,149 | $ | 20,130 | $ | 559,912 | |||||||||||||||||||
| Non-GAAP adjustments* | (2,407) | (2,367) | (1,777) | (142) | (6,693) | ||||||||||||||||||||||||
| NON-GAAP ADJUSTED REVENUE | 169,633 | 210,226 | 153,372 | 19,988 | 553,219 | ||||||||||||||||||||||||
| GAAP COST OF REVENUE | 69,900 | 111,787 | 64,295 | 81,290 | 327,272 | ||||||||||||||||||||||||
| Non-GAAP adjustments* | (415) | (66) | (188) | — | (669) | ||||||||||||||||||||||||
| NON-GAAP ADJUSTED COST OF REVENUE | 69,485 | 111,721 | 64,107 | 81,290 | 326,603 | ||||||||||||||||||||||||
| GAAP SEGMENT INCOME | $ | 102,140 | $ | 100,806 | $ | 90,854 | $ | (61,160) | |||||||||||||||||||||
| Segment Income Margin** | 59.4 | % | 47.4 | % | 58.6 | % | (303.8) | % | |||||||||||||||||||||
| NON-GAAP ADJUSTED SEGMENT INCOME | $ | 100,148 | $ | 98,505 | $ | 89,265 | $ | (61,302) | |||||||||||||||||||||
Non-GAAP Adjusted Segment Income Margin** |
59.0 | % | 46.9 | % | 58.2 | % | (306.7) | % | |||||||||||||||||||||
| Research and Development | 39,892 | ||||||||||||||||||||||||||||
| Selling, General, and Administrative | 67,122 | ||||||||||||||||||||||||||||
| Non-GAAP adjustments unassigned to a segment*** | (430) | ||||||||||||||||||||||||||||
| NON-GAAP TOTAL ADJUSTED OPERATING EXPENSES | 433,187 | ||||||||||||||||||||||||||||
| NON-GAAP ADJUSTED OPERATING INCOME | $ | 120,032 | |||||||||||||||||||||||||||
|
5 |
|||||||
| Three Months Ended June 30, 2023 | |||||||||||||||||||||||||||||
| (Unaudited, In Thousands) | Core | Payments | Complementary | Corporate and Other | Total | ||||||||||||||||||||||||
| GAAP REVENUE | $ | 167,085 | $ | 197,466 | $ | 151,059 | $ | 19,024 | $ | 534,634 | |||||||||||||||||||
| Non-GAAP adjustments* | (4,676) | (3,510) | (6,330) | (217) | (14,733) | ||||||||||||||||||||||||
| NON-GAAP ADJUSTED REVENUE | 162,409 | 193,956 | 144,729 | 18,807 | 519,901 | ||||||||||||||||||||||||
| GAAP COST OF REVENUE | 69,554 | 106,699 | 59,673 | 72,942 | 308,868 | ||||||||||||||||||||||||
| Non-GAAP adjustments* | (256) | (82) | (269) | (3) | (610) | ||||||||||||||||||||||||
| NON-GAAP ADJUSTED COST OF REVENUE | 69,298 | 106,617 | 59,404 | 72,939 | 308,258 | ||||||||||||||||||||||||
| GAAP SEGMENT INCOME | $ | 97,531 | $ | 90,767 | $ | 91,386 | $ | (53,918) | |||||||||||||||||||||
| Segment Income Margin | 58.4 | % | 46.0 | % | 60.5 | % | (283.4) | % | |||||||||||||||||||||
| NON-GAAP ADJUSTED SEGMENT INCOME | $ | 93,111 | $ | 87,339 | $ | 85,325 | $ | (54,132) | |||||||||||||||||||||
| Non-GAAP Adjusted Segment Income Margin | 57.3 | % | 45.0 | % | 59.0 | % | (287.8) | % | |||||||||||||||||||||
| Research and Development | 38,498 | ||||||||||||||||||||||||||||
| Selling, General, and Administrative | 63,069 | ||||||||||||||||||||||||||||
| Non-GAAP adjustments unassigned to a segment** | (3,885) | ||||||||||||||||||||||||||||
| NON-GAAP TOTAL ADJUSTED OPERATING EXPENSES | 405,940 | ||||||||||||||||||||||||||||
| NON-GAAP ADJUSTED OPERATING INCOME | $ | 113,961 | |||||||||||||||||||||||||||
| Year Ended June 30, 2024 | |||||||||||||||||||||||||||||
| (Unaudited, In Thousands) | Core | Payments | Complementary | Corporate and Other | Total | ||||||||||||||||||||||||
| GAAP REVENUE | $ | 690,738 | $ | 817,708 | $ | 618,211 | $ | 88,886 | $ | 2,215,543 | |||||||||||||||||||
| Non-GAAP adjustments* | (7,292) | (7,781) | (3,217) | (209) | (18,499) | ||||||||||||||||||||||||
| NON-GAAP ADJUSTED REVENUE | 683,446 | 809,927 | 614,994 | 88,677 | 2,197,044 | ||||||||||||||||||||||||
| GAAP COST OF REVENUE | 287,349 | 442,084 | 256,007 | 314,037 | 1,299,477 | ||||||||||||||||||||||||
| Non-GAAP adjustments* | (1,065) | (3,573) | (903) | (24) | (5,565) | ||||||||||||||||||||||||
| NON-GAAP ADJUSTED COST OF REVENUE | 286,284 | 438,511 | 255,104 | 314,013 | 1,293,912 | ||||||||||||||||||||||||
| GAAP SEGMENT INCOME | $ | 403,389 | $ | 375,624 | $ | 362,204 | $ | (225,151) | |||||||||||||||||||||
| Segment Income Margin | 58.4 | % | 45.9 | % | 58.6 | % | (253.3) | % | |||||||||||||||||||||
| NON-GAAP ADJUSTED SEGMENT INCOME | $ | 397,162 | $ | 371,416 | $ | 359,890 | $ | (225,336) | |||||||||||||||||||||
| Non-GAAP Adjusted Segment Income Margin | 58.1 | % | 45.9 | % | 58.5 | % | (254.1) | % | |||||||||||||||||||||
| Research and Development | 148,256 | ||||||||||||||||||||||||||||
| Selling, General, and Administrative | 278,419 | ||||||||||||||||||||||||||||
| Non-GAAP adjustments unassigned to a segment** | (18,468) | ||||||||||||||||||||||||||||
| NON-GAAP TOTAL ADJUSTED OPERATING EXPENSES | 1,702,119 | ||||||||||||||||||||||||||||
| NON-GAAP ADJUSTED OPERATING INCOME | $ | 494,925 | |||||||||||||||||||||||||||
|
6 |
|||||||
| Year Ended June 30, 2023 | |||||||||||||||||||||||||||||
| (Unaudited, In Thousands) | Core | Payments | Complementary | Corporate and Other | Total | ||||||||||||||||||||||||
| GAAP REVENUE | $ | 649,045 | $ | 767,309 | $ | 583,586 | $ | 77,762 | $ | 2,077,702 | |||||||||||||||||||
| Non-GAAP adjustments* | (10,924) | (7,924) | (12,649) | (278) | (31,775) | ||||||||||||||||||||||||
| NON-GAAP ADJUSTED REVENUE | 638,121 | 759,385 | 570,937 | 77,484 | 2,045,927 | ||||||||||||||||||||||||
| GAAP COST OF REVENUE | 276,818 | 420,880 | 237,758 | 283,606 | 1,219,062 | ||||||||||||||||||||||||
| Non-GAAP adjustments* | (913) | (303) | (807) | (23) | (2,046) | ||||||||||||||||||||||||
| NON-GAAP ADJUSTED COST OF REVENUE | 275,905 | 420,577 | 236,951 | 283,583 | 1,217,016 | ||||||||||||||||||||||||
| GAAP SEGMENT INCOME | $ | 372,227 | $ | 346,429 | $ | 345,828 | $ | (205,844) | |||||||||||||||||||||
| Segment Income Margin | 57.3 | % | 45.1 | % | 59.3 | % | (264.7) | % | |||||||||||||||||||||
| NON-GAAP ADJUSTED SEGMENT INCOME | $ | 362,216 | $ | 338,808 | $ | 333,986 | $ | (206,099) | |||||||||||||||||||||
| Non-GAAP Adjusted Segment Income Margin | 56.8 | % | 44.6 | % | 58.5 | % | (266.0) | % | |||||||||||||||||||||
| Research and Development | 142,678 | ||||||||||||||||||||||||||||
| Selling, General, and Administrative | 235,274 | ||||||||||||||||||||||||||||
| Non-GAAP adjustments unassigned to a segment** | 2,351 | ||||||||||||||||||||||||||||
| NON-GAAP TOTAL ADJUSTED OPERATING EXPENSES | 1,597,319 | ||||||||||||||||||||||||||||
| NON-GAAP ADJUSTED OPERATING INCOME | $ | 448,608 | |||||||||||||||||||||||||||
|
7 |
|||||||
| GAAP to Non-GAAP GUIDANCE (In Millions, except per share data) | Annual FY25 |
Adjusted for FY25 Comparison |
Reported |
Acquisition Activity** |
|||||||||||||||||||||||||||||||
| Low | High | FY24 |
FY24 |
FY24 |
|||||||||||||||||||||||||||||||
| GAAP REVENUE | $ | 2,369 | $ | 2,391 | $ | 2,216 | $ | 2,216 | $ | — | |||||||||||||||||||||||||
| Growth | 6.9 | % | 7.9 | % | |||||||||||||||||||||||||||||||
Deconversions* |
$ | 16 | $ | 16 | $ | 17 | $ | 17 | $ | — | |||||||||||||||||||||||||
Acquisition** |
$ | 2 | $ | (2) | |||||||||||||||||||||||||||||||
NON-GAAP ADJUSTED REVENUE*** |
$ | 2,353 | $ | 2,375 | $ | 2,199 | $ | 2,197 | $ | 2 | |||||||||||||||||||||||||
| Non-GAAP Adjusted Growth | 7.0 | % | 8.0 | % | |||||||||||||||||||||||||||||||
| GAAP OPERATING EXPENSES | $ | 1,823 | $ | 1,836 | $ | 1,726 | $ | 1,726 | $ | — | |||||||||||||||||||||||||
| Growth | 5.6 | % | 6.4 | % | |||||||||||||||||||||||||||||||
Deconversion costs* |
$ | 3 | $ | 3 | $ | 3 | $ | 3 | $ | — | |||||||||||||||||||||||||
Acquisition costs** |
— | — | $ | — | $ | 4 | $ | (4) | |||||||||||||||||||||||||||
| VEDIP Program**** | — | — | $ | 16 | $ | 16 | $ | — | |||||||||||||||||||||||||||
NON-GAAP ADJUSTED OPERATING EXPENSES*** |
$ | 1,820 | $ | 1,833 | $ | 1,706 | $ | 1,702 | $ | 4 | |||||||||||||||||||||||||
| Non-GAAP Adjusted Growth | 6.7 | % | 7.4 | % | |||||||||||||||||||||||||||||||
| GAAP OPERATING INCOME | $ | 546 | $ | 555 | $ | 489 | $ | 489 | $ | — | |||||||||||||||||||||||||
| Growth | 11.6 | % | 13.3 | % | |||||||||||||||||||||||||||||||
| GAAP OPERATING MARGIN | 23.0 | % | 23.2 | % | 22.1 | % | 22.1 | % | |||||||||||||||||||||||||||
NON-GAAP ADJUSTED OPERATING INCOME*** |
$ | 533 | $ | 542 | $ | 493 | $ | 495 | $ | (2) | |||||||||||||||||||||||||
| Non-GAAP Adjusted Growth | 8.2 | % | 9.9 | % | |||||||||||||||||||||||||||||||
| NON-GAAP ADJUSTED OPERATING MARGIN | 22.7 | % | 22.8 | % | 22.4 | % | 22.5 | % | |||||||||||||||||||||||||||
GAAP EPS***** |
$ | 5.78 | $ | 5.87 | $ | 5.23 | $ | 5.23 | $ | — | |||||||||||||||||||||||||
| Growth | 10.6 | % | 12.3 | % | |||||||||||||||||||||||||||||||
Non-GAAP EPS***** |
$ | 5.65 | $ | 5.74 | $ | 5.26 | $ | 5.31 | $ | (0.05) | |||||||||||||||||||||||||
| Growth | 7.3 | % | 9.0 | % | |||||||||||||||||||||||||||||||
|
8 |
|||||||
| (Unaudited, In Thousands) | Year Ended June 30, | ||||||||||
| 2024 | 2023 | ||||||||||
| Net income | $ | 381,816 | $ | 366,646 | |||||||
| Depreciation | 46,342 | 48,720 | |||||||||
| Amortization | 153,562 | 142,006 | |||||||||
| Change in deferred income taxes | (909) | (48,199) | |||||||||
| Other non-cash expenses | 32,714 | 24,094 | |||||||||
| Change in receivables | 28,219 | (12,067) | |||||||||
| Change in deferred revenue | (10,797) | (10,547) | |||||||||
Change in other assets and liabilities* |
(62,906) | (129,094) | |||||||||
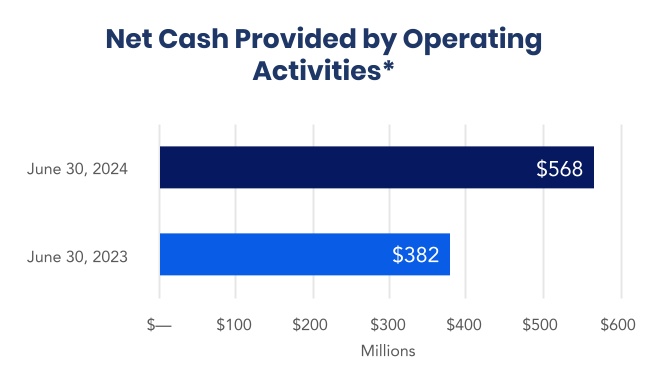
| NET CASH FROM OPERATING ACTIVITIES | $ | 568,041 | $ | 381,559 | |||||||
|
9 |
|||||||
| (Unaudited, In Thousands) | Year Ended June 30, | ||||||||||
| 2024 | 2023 | ||||||||||
| Payment for acquisitions, net of cash acquired* | $ | — | $ | (229,628) | |||||||
| Capital expenditures | (58,118) | (39,179) | |||||||||
| Proceeds from dispositions | 904 | 27,939 | |||||||||
| Purchased software | (7,130) | (1,685) | |||||||||
| Computer software developed | (167,175) | (166,120) | |||||||||
| Purchase of investments | (8,646) | (1,000) | |||||||||
| NET CASH FROM INVESTING ACTIVITIES | $ | (240,165) | $ | (409,673) | |||||||
| (Unaudited, In Thousands) | Year Ended June 30, | ||||||||||
| 2024 | 2023 | ||||||||||
| Borrowings on credit facilities* | $ | 475,000 | $ | 810,000 | |||||||
| Repayments on credit facilities and financing leases | (600,000) | (650,060) | |||||||||
| Purchase of treasury stock | (28,055) | (25,000) | |||||||||
| Dividends paid | (155,877) | (147,237) | |||||||||
| Net cash from issuance of stock and tax related to stock-based compensation | 7,097 | 3,867 | |||||||||
| NET CASH FROM FINANCING ACTIVITIES | $ | (301,835) | $ | (8,430) | |||||||
|
10 |
|||||||
|
11 |
|||||||
About Jack Henry & Associates, Inc.® |
 |
Quarterly Conference Call | ||||||||||||
Jack HenryTM (Nasdaq: JKHY) is a well-rounded financial technology company that strengthens connections between financial institutions and the people and businesses they serve. We are an S&P 500 company that prioritizes openness, collaboration, and user centricity — offering banks and credit unions a vibrant ecosystem of internally developed modern capabilities as well as the ability to integrate with leading fintechs. For more than 48 years, Jack Henry has provided technology solutions to enable clients to innovate faster, strategically differentiate, and successfully compete while serving the evolving needs of their accountholders. We empower approximately 7,500 clients with people-inspired innovation, personal service, and insight-driven solutions that help reduce the barriers to financial health. Additional information is available at www.jackhenry.com. |
The Company will hold a conference call on August 21, 2024, at 7:45 a.m. Central Time, and investors are invited to listen at www.jackhenry.com. A webcast replay will be available approximately one hour after the event at ir.jackhenry.com/corporate-events-and-presentations and will remain available for one year. |
|||||||||||||
Statements made in this news release that are not historical facts are "forward-looking statements" within the meaning of the Private Securities Litigation Reform Act of 1995, Section 27A of the Securities Act of 1933 and Section 21E of the Securities Exchange Act of 1934. Because forward-looking statements relate to the future, they are subject to inherent risks and uncertainties that could cause actual results to differ materially from those expressed or implied by such statements. Such risks and uncertainties include, but are not limited to, those discussed in the Company's Securities and Exchange Commission filings, including the Company's most recent reports on Form 10-K and Form 10-Q, particularly under the heading Risk Factors. Any forward-looking statement made in this news release speaks only as of the date of the news release, and the Company expressly disclaims any obligation to publicly update or revise any forward-looking statement, whether because of new information, future events or otherwise. |
 |
MEDIA CONTACT | ||||||||||||
| Mark Folk | ||||||||||||||
| Corporate Communications | ||||||||||||||
| Jack Henry & Associates, Inc. | ||||||||||||||
| 704-890-5323 | ||||||||||||||
| MFolk@jackhenry.com | ||||||||||||||
| ANALYST CONTACT | ||||||||||||||
| Vance Sherard, CFA | ||||||||||||||
| Investor Relations | ||||||||||||||
| Jack Henry & Associates, Inc. | ||||||||||||||
| 417-235-6652 | ||||||||||||||
| VSherard@jackhenry.com | ||||||||||||||
|
12 |
|||||||
| Condensed Consolidated Statements of Income (Unaudited) | |||||||||||||||||||||||||||||||||||
| (In Thousands, except per share data) | Three Months Ended June 30, | % Change | Year Ended June 30, | % Change | |||||||||||||||||||||||||||||||
| 2024 | 2023 | 2024 | 2023 | ||||||||||||||||||||||||||||||||
| REVENUE | $ | 559,912 | $ | 534,634 | 4.7 | % | $ | 2,215,543 | $ | 2,077,702 | 6.6 | % | |||||||||||||||||||||||
| Cost of Revenue | 327,272 | 308,868 | 6.0 | % | 1,299,477 | 1,219,062 | 6.6 | % | |||||||||||||||||||||||||||
| Research and Development | 39,892 | 38,498 | 3.6 | % | 148,256 | 142,678 | 3.9 | % | |||||||||||||||||||||||||||
| Selling, General, and Administrative | 67,122 | 63,069 | 6.4 | % | 278,419 | 235,274 | 18.3 | % | |||||||||||||||||||||||||||
| EXPENSES | 434,286 | 410,435 | 5.8 | % | 1,726,152 | 1,597,014 | 8.1 | % | |||||||||||||||||||||||||||
| OPERATING INCOME | 125,626 | 124,199 | 1.2 | % | 489,391 | 480,688 | 1.8 | % | |||||||||||||||||||||||||||
| Interest income | 8,647 | 5,176 | 67.1 | % | 25,012 | 8,959 | 179.2 | % | |||||||||||||||||||||||||||
| Interest expense | (3,889) | (5,425) | (28.3) | % | (16,384) | (15,073) | 8.7 | % | |||||||||||||||||||||||||||
| Interest Income (Expense), net | 4,758 | (249) | (2,010.8) | % | 8,628 | (6,114) | (241.1) | % | |||||||||||||||||||||||||||
| INCOME BEFORE INCOME TAXES | 130,384 | 123,950 | 5.2 | % | 498,019 | 474,574 | 4.9 | % | |||||||||||||||||||||||||||
| Provision for Income Taxes | 29,311 | 26,177 | 12.0 | % | 116,203 | 107,928 | 7.7 | % | |||||||||||||||||||||||||||
| NET INCOME | $ | 101,073 | $ | 97,773 | 3.4 | % | $ | 381,816 | $ | 366,646 | 4.1 | % | |||||||||||||||||||||||
| Diluted net income per share | $ | 1.38 | $ | 1.34 | $ | 5.23 | $ | 5.02 | |||||||||||||||||||||||||||
| Diluted weighted average shares outstanding | 73,069 | 73,027 | 73,025 | 73,096 | |||||||||||||||||||||||||||||||
| Consolidated Balance Sheet Highlights (Unaudited) | |||||||||||||||||||||||||||||||||||
| (In Thousands) | June 30, | % Change | |||||||||||||||||||||||||||||||||
| 2024 | 2023 | ||||||||||||||||||||||||||||||||||
| Cash and cash equivalents | $ | 38,284 | $ | 12,243 | 212.7 | % | |||||||||||||||||||||||||||||
| Receivables | 333,033 | 361,252 | (7.8) | % | |||||||||||||||||||||||||||||||
| Total assets | 2,924,481 | 2,773,826 | 5.4 | % | |||||||||||||||||||||||||||||||
| Accounts payable and accrued expenses | $ | 226,084 | $ | 191,785 | 17.9 | % | |||||||||||||||||||||||||||||
| Current and long-term debt | 150,000 | 275,000 | (45.5) | % | |||||||||||||||||||||||||||||||
| Deferred revenue | 388,932 | 399,729 | (2.7) | % | |||||||||||||||||||||||||||||||
| Stockholders' equity | 1,842,364 | 1,608,510 | 14.5 | % | |||||||||||||||||||||||||||||||
|
13 |
|||||||
| Calculation of Non-GAAP Earnings Before Income Taxes, Depreciation and Amortization (Non-GAAP EBITDA) | |||||||||||||||||||||||||||||||||||
| Three Months Ended June 30, | % Change | Year Ended June 30, | % Change | ||||||||||||||||||||||||||||||||
| (in thousands) | 2024 | 2023 | 2024 | 2023 | |||||||||||||||||||||||||||||||
| Net income | $ | 101,073 | $ | 97,773 | $ | 381,816 | $ | 366,646 | |||||||||||||||||||||||||||
| Net interest | (4,758) | 249 | (8,628) | 6,114 | |||||||||||||||||||||||||||||||
| Taxes | 29,310 | 26,177 | 116,203 | 107,928 | |||||||||||||||||||||||||||||||
| Depreciation and amortization | 50,690 | 48,377 | 199,904 | 190,726 | |||||||||||||||||||||||||||||||
| Less: Net income before interest expense, taxes, depreciation and amortization attributable to eliminated one-time adjustments* | (5,594) | (10,238) | 3,412 | (32,081) | |||||||||||||||||||||||||||||||
| NON-GAAP EBITDA | $ | 170,721 | $ | 162,338 | 5.2 | % | $ | 692,707 | $ | 639,333 | 8.3 | % | |||||||||||||||||||||||
*The fiscal fourth quarter 2024 adjustments for net income before interest expense, taxes, depreciation and amortization were for deconversions. The fiscal year 2024 adjustments were for deconversions, the VEDIP program expense, and the acquisition, and were $(13,146), $16,443, and $115, respectively. The fiscal fourth quarter 2023 adjustments for net income before interest expense, taxes, depreciation and amortization were for deconversions of $(13,054) and gain on sale of assets, net, of $2,816. The fiscal year 2023 adjustments were for deconversions and a gain on sale of assets, net, and were $(27,514) and $(4,567), respectively. | |||||||||||||||||||||||||||||||||||
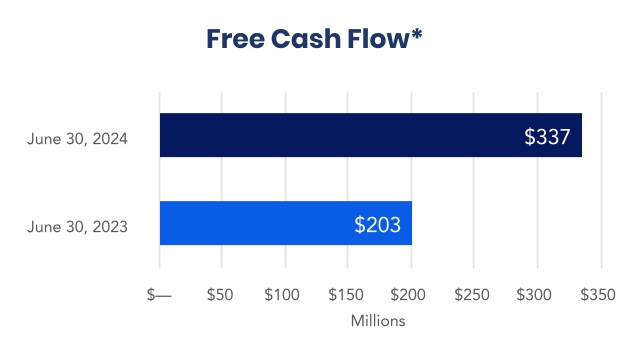
| Calculation of Free Cash Flow (Non-GAAP) | Year Ended June 30, | ||||||||||||||||||||||||||||||||||
| (in thousands) | 2024 | 2023 | |||||||||||||||||||||||||||||||||
| Net cash from operating activities | $ | 568,041 | $ | 381,559 | |||||||||||||||||||||||||||||||
| Capitalized expenditures | (58,118) | (39,179) | |||||||||||||||||||||||||||||||||
| Internal use software | (7,130) | (1,685) | |||||||||||||||||||||||||||||||||
| Proceeds from sale of assets | 904 | 27,939 | |||||||||||||||||||||||||||||||||
| Capitalized software | (167,175) | (166,120) | |||||||||||||||||||||||||||||||||
| FREE CASH FLOW | $ | 336,522 | $ | 202,514 | |||||||||||||||||||||||||||||||
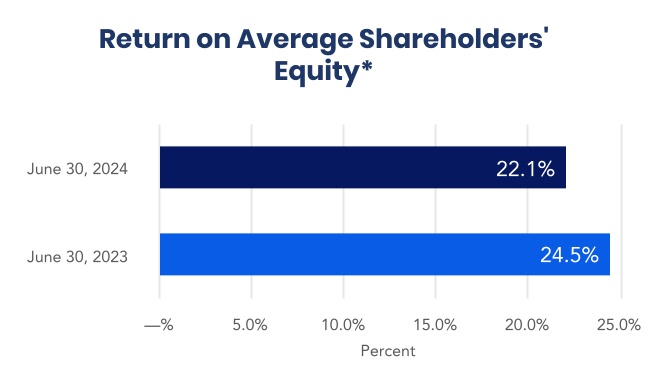
| Calculation of the Return on Average Shareholders’ Equity | June 30, | ||||||||||||||||||||||||||||||||||
| (in thousands) | 2024 | 2023 | |||||||||||||||||||||||||||||||||
| Net income (trailing four quarters) | $ | 381,816 | $ | 366,646 | |||||||||||||||||||||||||||||||
| Average stockholder's equity (period beginning and ending balances) | 1,725,437 | 1,495,066 | |||||||||||||||||||||||||||||||||
| RETURN ON AVERAGE SHAREHOLDERS’ EQUITY | 22.1% | 24.5% | |||||||||||||||||||||||||||||||||
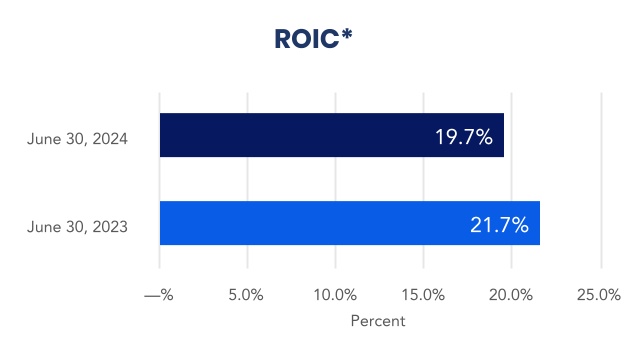
| Calculation of Return on Invested Capital (ROIC) (Non-GAAP) | June 30, | ||||||||||||||||||||||||||||||||||
| (in thousands) | 2024 | 2023 | |||||||||||||||||||||||||||||||||
| Net income (trailing four quarters) | $ | 381,816 | $ | 366,646 | |||||||||||||||||||||||||||||||
| Average stockholder's equity (period beginning and ending balances) | 1,725,437 | 1,495,066 | |||||||||||||||||||||||||||||||||
| Average current maturities of long-term debt (period beginning and ending balances) | 45,000 | 34 | |||||||||||||||||||||||||||||||||
| Average long-term debt (period beginning and ending balances) | 167,500 | 195,000 | |||||||||||||||||||||||||||||||||
| Average invested capital | $ | 1,937,937 | $ | 1,690,100 | |||||||||||||||||||||||||||||||
| ROIC | 19.7% | 21.7% | |||||||||||||||||||||||||||||||||
|
14 |
|||||||
| GAAP to Non-GAAP EPS Reconciliation Table | |||||||||||||||||||||||
| Actual Non-GAAP EPS | Pretax | Net of Tax | FY24 Reported | Pretax | Net of Tax | FY24 Adjusted for FY25 comparison | |||||||||||||||||
| GAAP EPS | $5.23 | $5.23 | |||||||||||||||||||||
| Excluded Activity, net of Tax: | |||||||||||||||||||||||
| Deconversion | $0.18 | $0.14 | $0.18 | $0.14 | |||||||||||||||||||
| VEDIP* | $(0.23) | $(0.17) | $(0.23) | $(0.17) | |||||||||||||||||||
Acquisition** |
$(0.06) | $(0.05) | n/a | n/a | |||||||||||||||||||
| Non-GAAP EPS | $5.31 | $5.26 | |||||||||||||||||||||
| FY25 Guidance | |||||||||||||||||||||||
| GAAP EPS | $5.78-$5.87 | ||||||||||||||||||||||
| Excluded Activity, net of Tax: | |||||||||||||||||||||||
Deconversion*** |
$0.13 | ||||||||||||||||||||||
| Non-GAAP EPS | $5.65-$5.74 | ||||||||||||||||||||||
|
15 |
|||||||