| Delaware | 0-14112 | 43-1128385 | ||||||
(State or other jurisdiction of incorporation) |
(Commission File Number) | (IRS Employer Identification No.) |
||||||
| Title of each class | Ticker symbol(s) | Name of each exchange on which registered | ||||||
| Common Stock, $0.01 par value | JKHY | Nasdaq Global Select Market | ||||||
JACK HENRY & ASSOCIATES, INC. |
|||||||||||
| (Registrant) | |||||||||||
| Date: | November 8, 2022 | /s/ Mimi L. Carsley | |||||||||
| Mimi L. Carsley | |||||||||||
| Chief Financial Officer and Treasurer | |||||||||||

 |
|||||
| Press Release | |||||
Mimi L. Carsley | Chief Financial Officer | mcarsley@jackhenry.com | |||||
| First Quarter Revenue | First Quarter Operating Income | First Quarter Net Income / EBITDA |
||||||||||||||||||
|
|
|
||||||||||||||||||
| GAAP | Non-GAAP1 |
GAAP | Non-GAAP1 |
GAAP | Non-GAAP4 |
|||||||||||||||
increased |
increased | increased |
increased | increased |
increased |
|||||||||||||||
8% |
8% |
5% |
2% |
4% |
2% |
|||||||||||||||
According to David Foss, Board Chair and CEO, “We are very pleased to report another quarter of record revenue and an overall strong performance for the first quarter of our new fiscal year. Our sales teams continue to see strong demand for Jack Henry technology solutions, and we’re seeing significant interest in our new initiatives including our technology modernization strategy, Financial Crimes Defender platform, Banno Business solution, and Payrailz. Today, as a well-rounded financial technology company, we continue to invest in a modern technology infrastructure that is cloud-native, digitally centric, open and scalable in order to deliver the speed and agility that our clients require." | |||||||||||||||||
 |
1 |
|||||||
| Revenue (Unaudited) | |||||||||||||||||
| (In Thousands) | Three Months Ended September 30, |
% Change | |||||||||||||||
| 2022 | 2021 | ||||||||||||||||
| Revenue | |||||||||||||||||
| Services and Support | $ | 320,149 | $ | 297,494 | 8 | % | |||||||||||
| Percentage of Total Revenue | 60 | % | 61 | % | |||||||||||||
| Processing | 209,053 | 190,562 | 10 | % | |||||||||||||
| Percentage of Total Revenue | 40 | % | 39 | % | |||||||||||||
| REVENUE | $ | 529,202 | $ | 488,056 | 8 | % | |||||||||||
| (Unaudited, In Thousands) | Three Months Ended September 30, |
% Change | |||||||||||||||
| 2022 | 2021 | ||||||||||||||||
| Cost of Revenue | $ | 298,261 | $ | 276,636 | 8 | % | |||||||||||
| Percentage of Total Revenue | 56 | % | 57 | % | |||||||||||||
| Research and Development | 32,993 | 26,754 | 23 | % | |||||||||||||
| Percentage of Total Revenue | 6 | % | 5 | % | |||||||||||||
| Selling, General, and Administrative | 57,225 | 51,071 | 12 | % | |||||||||||||
| Percentage of Total Revenue | 11 | % | 10 | % | |||||||||||||
| OPERATING EXPENSES | 388,479 | 354,461 | 10 | % | |||||||||||||
| OPERATING INCOME | $ | 140,723 | $ | 133,595 | 5 | % | |||||||||||
Operating Margin5 |
27 | % | 27 | % | |||||||||||||
|
2 |
|||||||
| (Unaudited, In Thousands, Except Per Share Data) |
Three Months Ended September 30, |
% Change | |||||||||||||||
| 2022 | 2021 | ||||||||||||||||
| Income Before Income Taxes | $ | 139,299 | $ | 133,354 | 4 | % | |||||||||||
| Provision for Income Taxes | 32,750 | 31,240 | 5 | % | |||||||||||||
| NET INCOME | $ | 106,549 | $ | 102,114 | 4 | % | |||||||||||
| Diluted earnings per share | $ | 1.46 | $ | 1.38 | 6 | % | |||||||||||
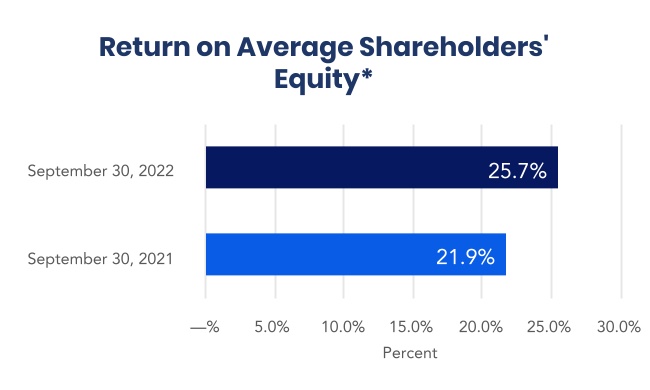
According to Mimi Carsley, CFO and Treasurer, “For the first quarter of the fiscal year, private and public cloud, card processing, transaction and digital, remittance, software usage and implementation services drove revenue growth. We reported strong 8% GAAP and non-GAAP revenue growth compared to the prior year quarter. As anticipated, operating margins were down on a GAAP basis, despite a gain on sale of assets and slightly higher deconversion fees, which were offset by higher operating expenses. Non-GAAP operating margin also decreased compared to the prior year. This quarter we hosted our first live customer conference since 2019, which combined two conferences, including one that had been held in our second quarter in previous years. We continue to be pleased to report our Return on Average Shareholders’ Equity and Return on Invested Capital (ROIC) for the trailing twelve months of 25.7% and 23.2%, respectively, which improved nicely from 21.9% and 21.5%, respectively, from the first quarter a year ago. The team at Jack Henry continues to perform very well ensuring the continued success of our customers.” | |||||||||||||||||
| (Unaudited, In Thousands) | Three Months Ended September 30, | % Change | |||||||||||||||
| 2022 | 2021 | ||||||||||||||||
| Revenue (GAAP) | $ | 529,202 | $ | 488,056 | 8 | % | |||||||||||
| Adjustments: | |||||||||||||||||
| Deconversion fee revenue | (4,518) | (3,724) | |||||||||||||||
| Revenue from acquisitions | (738) | — | |||||||||||||||
| NON-GAAP ADJUSTED REVENUE | $ | 523,946 | $ | 484,332 | 8 | % | |||||||||||
| Operating Income (GAAP) | $ | 140,723 | $ | 133,595 | 5 | % | |||||||||||
| Adjustments: | |||||||||||||||||
| Operating income from deconversion fees | (3,865) | (3,184) | |||||||||||||||
| Operating income from acquisitions | 1,797 | — | |||||||||||||||
| Gain on disposal of assets, net | (6,176) | — | |||||||||||||||
| NON-GAAP ADJUSTED OPERATING INCOME | $ | 132,479 | $ | 130,411 | 2 | % | |||||||||||
|
3 |
|||||||
| (Unaudited, In Thousands) | Three Months Ended September 30, 2022 | ||||||||||||||||||||||||||||
| Core | Payments | Complementary | Corporate and Other | Total | |||||||||||||||||||||||||
| REVENUE | $ | 175,124 | $ | 186,540 | $ | 148,350 | $ | 19,188 | $ | 529,202 | |||||||||||||||||||
| Non-GAAP adjustments* | (1,818) | (2,173) | (1,235) | (30) | (5,256) | ||||||||||||||||||||||||
| NON-GAAP ADJUSTED REVENUE | 173,306 | 184,367 | 147,115 | 19,158 | 523,946 | ||||||||||||||||||||||||
| COST OF REVENUE | 72,240 | 101,155 | 58,437 | 66,429 | 298,261 | ||||||||||||||||||||||||
| Non-GAAP adjustments** | (140) | (1,603) | (199) | (7) | (1,949) | ||||||||||||||||||||||||
| NON-GAAP ADJUSTED COST OF REVENUE | 72,100 | 99,552 | 58,238 | 66,422 | 296,312 | ||||||||||||||||||||||||
| NON-GAAP ADJUSTED SEGMENT INCOME | $ | 101,206 | $ | 84,815 | $ | 88,877 | $ | (47,264) | |||||||||||||||||||||
| Research and Development | 32,993 | ||||||||||||||||||||||||||||
| Selling, General, and Administrative | 57,225 | ||||||||||||||||||||||||||||
| Non-GAAP adjustments unassigned to a segment | 4,937 | ||||||||||||||||||||||||||||
| NON-GAAP TOTAL ADJUSTED OPERATING EXPENSES | 391,467 | ||||||||||||||||||||||||||||
| NON-GAAP ADJUSTED OPERATING INCOME | $ | 132,479 | |||||||||||||||||||||||||||
| (Unaudited, In Thousands) | Three Months Ended September 30, 2021 | ||||||||||||||||||||||||||||
| Core | Payments | Complementary | Corporate and Other | Total | |||||||||||||||||||||||||
| REVENUE (GAAP) | $ | 165,285 | $ | 172,591 | $ | 137,778 | $ | 12,402 | $ | 488,056 | |||||||||||||||||||
| Non-GAAP adjustments* | (2,168) | (448) | (1,097) | (11) | (3,724) | ||||||||||||||||||||||||
| NON-GAAP ADJUSTED REVENUE | 163,117 | 172,143 | 136,681 | 12,391 | 484,332 | ||||||||||||||||||||||||
| COST OF REVENUE | 66,902 | 94,582 | 54,417 | 60,735 | 276,636 | ||||||||||||||||||||||||
| Non-GAAP adjustments | (138) | (45) | (153) | (2) | (338) | ||||||||||||||||||||||||
| NON-GAAP ADJUSTED COST OF REVENUE | 66,764 | 94,537 | 54,264 | 60,733 | 276,298 | ||||||||||||||||||||||||
| NON-GAAP ADJUSTED SEGMENT INCOME | $ | 96,353 | $ | 77,606 | $ | 82,417 | $ | (48,342) | |||||||||||||||||||||
| Research and Development | 26,754 | ||||||||||||||||||||||||||||
| Selling, General, and Administrative | 51,071 | ||||||||||||||||||||||||||||
| Non-GAAP adjustments unassigned to a segment | (202) | ||||||||||||||||||||||||||||
| NON-GAAP TOTAL ADJUSTED OPERATING EXPENSES | 353,921 | ||||||||||||||||||||||||||||
| NON-GAAP ADJUSTED OPERATING INCOME | $ | 130,411 | |||||||||||||||||||||||||||
|
4 |
|||||||
| GAAP to Non-GAAP GUIDANCE (In Millions, except per share data) | Annual FY23 | ||||||||||||||||
| Low | High | ||||||||||||||||
| REVENUE (GAAP) | $ | 2,092 | $ | 2,099 | |||||||||||||
| Growth | 7.7 | % | 8.0 | % | |||||||||||||
| Deconversion fee | $ | 35 | $ | 35 | |||||||||||||
| Acquisition | 12 | 12 | |||||||||||||||
| NON-GAAP ADJUSTED REVENUE | $ | 2,045 | $ | 2,052 | |||||||||||||
Non-GAAP Adjusted Growth |
8.2 | % | 8.6 | % | |||||||||||||
| OPERATING EXPENSES (GAAP) | $ | 1,607 | $ | 1,611 | |||||||||||||
| Growth | 9.5 | % | 9.7 | % | |||||||||||||
| Deconversion costs | $ | 5 | $ | 5 | |||||||||||||
| Acquisition costs | 23 | 23 | |||||||||||||||
| Gain on disposal of assets, net | (6) | (6) | |||||||||||||||
| NON-GAAP ADJUSTED OPERATING EXPENSES | $ | 1,585 | $ | 1,589 | |||||||||||||
Non-GAAP Adjusted Growth |
8.5 | % | 8.7 | % | |||||||||||||
| OPERATING INCOME (GAAP) | $ | 485 | $ | 488 | |||||||||||||
| Growth | 2.1 | % | 2.9 | % | |||||||||||||
| OPERATING INCOME MARGIN (GAAP) | 23.2 | % | 23.3 | % | |||||||||||||
| NON-GAAP ADJUSTED OPERATING INCOME | $ | 460 | $ | 463 | |||||||||||||
Non-GAAP Adjusted Growth |
7.5 | % | 8.3 | % | |||||||||||||
| NON-GAAP ADJUSTED OPERATING INCOME MARGIN | 22.5 | % | 22.6 | % | |||||||||||||
| EPS (GAAP) | $ | 4.90 | $ | 4.94 | |||||||||||||
| Growth | (0.8) | % | (0.1) | % | |||||||||||||
|
5 |
|||||||

| (Unaudited, In Thousands) | Three Months Ended September 30, | ||||||||||
| 2022 | 2021 | ||||||||||
| Net income | $ | 106,549 | $ | 102,114 | |||||||
| Depreciation | 12,416 | 13,157 | |||||||||
| Amortization | 33,194 | 31,016 | |||||||||
| Change in deferred income taxes | (12,345) | 6,088 | |||||||||
| Other non-cash expenses | 874 | 6,237 | |||||||||
| Change in receivables | 101,509 | 53,404 | |||||||||
| Change in deferred revenue | (65,130) | (60,662) | |||||||||
| Change in other assets and liabilities | (40,236) | (44,805) | |||||||||
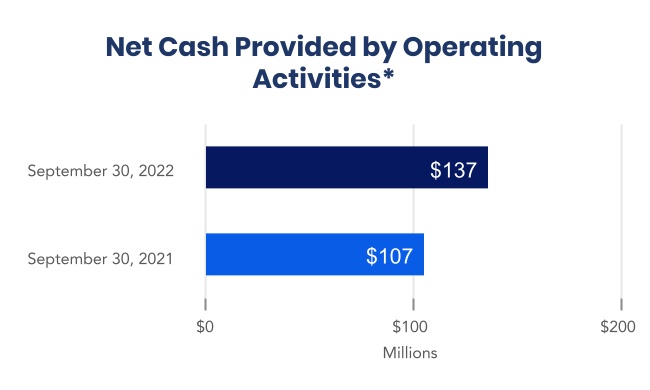
| NET CASH PROVIDED BY OPERATING ACTIVITIES | $ | 136,831 | $ | 106,549 | |||||||
|
6 |
|||||||
| (Unaudited, In Thousands) | Three Months Ended September 30, | ||||||||||
| 2022 | 2021 | ||||||||||
| Payment for acquisitions, net of cash acquired* | $ | (228,986) | $ | — | |||||||
| Capital expenditures | (7,737) | (9,273) | |||||||||
| Proceeds from dispositions | 26,252 | 14 | |||||||||
| Purchased software | (408) | (1,221) | |||||||||
| Computer software developed | (38,715) | (35,971) | |||||||||
| NET CASH FROM INVESTING ACTIVITIES | $ | (249,594) | $ | (46,451) | |||||||
| (Unaudited, In Thousands) | Three Months Ended September 30, | ||||||||||
| 2022 | 2021 | ||||||||||
| Borrowings on credit facilities* | $ | 280,000 | $ | — | |||||||
| Repayments on credit facilities and financing leases | (150,022) | (35,027) | |||||||||
| Dividends paid | (35,709) | (34,036) | |||||||||
| Net cash from issuance of stock and tax related to stock-based compensation | 1,677 | 2,224 | |||||||||
| NET CASH FROM FINANCING ACTIVITIES | $ | 95,946 | $ | (66,839) | |||||||
|
7 |
|||||||
About Jack Henry & Associates, Inc.® |
 |
Quarterly Conference Call | ||||||||||||
Jack Henry (Nasdaq: JKHY) is a well-rounded financial technology company that strengthens connections between financial institutions and the people and businesses they serve. We are an S&P 500 company that prioritizes openness, collaboration, and user centricity — offering banks and credit unions a vibrant ecosystem of internally developed modern capabilities as well as the ability to integrate with leading fintechs. For more than 45 years, Jack Henry has provided technology solutions to enable clients to innovate faster, strategically differentiate, and successfully compete while serving the evolving needs of their accountholders. We empower approximately 8,000 clients with people-inspired innovation, personal service, and insight-driven solutions that help reduce the barriers to financial health. Additional information is available at www.jackhenry.com. |
The Company will hold a conference call on November 9, 2022; at 7:45 a.m. Central Time and investors are invited to listen at www.jackhenry.com. A webcast replay will be available approximately one hour after the event at ir.jackhenry.com/events-and-presentations and will remain available for one year. |
|||||||||||||
Statements made in this news release that are not historical facts are "forward-looking statements" within the meaning of the Private Securities Litigation Reform Act of 1995, Section 27A of the Securities Act of 1933 and Section 21E of the Securities Exchange Act of 1934. Because forward-looking statements relate to the future, they are subject to inherent risks and uncertainties that could cause actual results to differ materially from those expressed or implied by such statements. Such risks and uncertainties include, but are not limited to, those discussed in the Company's Securities and Exchange Commission filings, including the Company's most recent reports on Form 10-K and Form 10-Q, particularly under the heading Risk Factors. Any forward-looking statement made in this news release speaks only as of the date of the news release, and the Company expressly disclaims any obligation to publicly update or revise any forward-looking statement, whether because of new information, future events or otherwise. |
 |
MEDIA CONTACT | ||||||||||||
| Mark Folk | ||||||||||||||
| Corporate Communications | ||||||||||||||
| Jack Henry & Associates, Inc. | ||||||||||||||
| 704-890-5323 | ||||||||||||||
| MFolk@jackhenry.com | ||||||||||||||
| ANALYST CONTACT | ||||||||||||||
| Vance Sherard, CFA | ||||||||||||||
| Investor Relations | ||||||||||||||
| Jack Henry & Associates, Inc. | ||||||||||||||
| 417-235-6652 | ||||||||||||||
| VSherard@jackhenry.com | ||||||||||||||
|
8 |
|||||||
| Condensed Consolidated Statements of Income (Unaudited) | |||||||||||||||||
| (In Thousands, except per share data) | Three Months Ended September 30, | % Change | |||||||||||||||
| 2022 | 2021 | ||||||||||||||||
| REVENUE | $ | 529,202 | $ | 488,056 | 8 | % | |||||||||||
| Cost of Revenue | 298,261 | 276,636 | 8 | % | |||||||||||||
| Research and Development | 32,993 | 26,754 | 23 | % | |||||||||||||
| Selling, General, and Administrative | 57,225 | 51,071 | 12 | % | |||||||||||||
| EXPENSES | 388,479 | 354,461 | 10 | % | |||||||||||||
| OPERATING INCOME | 140,723 | 133,595 | 5 | % | |||||||||||||
| Interest income | 152 | 7 | 2,071 | % | |||||||||||||
| Interest expense | (1,576) | (248) | 535 | % | |||||||||||||
| Interest Income (Expense) | (1,424) | (241) | 491 | % | |||||||||||||
| INCOME BEFORE INCOME TAXES | 139,299 | 133,354 | 4 | % | |||||||||||||
| Provision for Income Taxes | 32,750 | 31,240 | 5 | % | |||||||||||||
| NET INCOME | $ | 106,549 | $ | 102,114 | 4 | % | |||||||||||
| Diluted net income per share | $ | 1.46 | $ | 1.38 | |||||||||||||
| Diluted weighted average shares outstanding | 73,138 | 74,142 | |||||||||||||||
| Consolidated Balance Sheet Highlights (Unaudited) | |||||||||||||||||
| (In Thousands) | September 30, | % Change | |||||||||||||||
| 2022 | 2021 | ||||||||||||||||
| Cash and cash equivalents | $ | 31,970 | $ | 44,251 | (28) | % | |||||||||||
| Receivables | 247,541 | 253,160 | (2) | % | |||||||||||||
| Total assets | 2,578,460 | 2,280,911 | 13 | % | |||||||||||||
| Accounts payable and accrued expenses | $ | 195,518 | $ | 161,088 | 21 | % | |||||||||||
| Current and long-term debt | 245,041 | 65,166 | 276 | % | |||||||||||||
| Deferred revenue | 345,146 | 334,939 | 3 | % | |||||||||||||
| Stockholders' equity | 1,461,138 | 1,395,665 | 5 | % | |||||||||||||
|
9 |
|||||||
| Calculation of Non-GAAP Earnings Before Income Taxes, Depreciation and Amortization (Non-GAAP EBITDA) | |||||||||||||||||
| Three Months Ended September 30, | % Change | ||||||||||||||||
| (in thousands) | 2022 | 2021 | |||||||||||||||
| Net income | $ | 106,549 | $ | 102,114 | |||||||||||||
| Interest expense | 1,576 | 248 | |||||||||||||||
| Taxes | 32,750 | 31,240 | |||||||||||||||
| Depreciation and amortization | 45,610 | 44,173 | |||||||||||||||
| Less: Net income before interest expense, taxes, depreciation and amortization attributable to eliminated one-time deconversions, acquisitions, and gain on disposal of assets, net.* | (8,847) | (3,184) | |||||||||||||||
| NON-GAAP EBITDA | $ | 177,638 | $ | 174,591 | 2 | % | |||||||||||
| *The first quarter adjustments for net income before interest expense, taxes, depreciation and amortization for deconversions, acquisitions, and gain on disposal of assets, net, were $3,865, ($1,194), and $6,176, respectively, and the prior year first quarter adjustment was for deconversions only. | |||||||||||||||||
| Calculation of Free Cash Flow (Non-GAAP) | |||||||||||||||||
| Three Months Ended September 30, | |||||||||||||||||
| (in thousands) | 2022 | 2021 | |||||||||||||||
| Net cash from operating activities | $ | 136,832 | $ | 106,549 | |||||||||||||
| Capitalized expenditures | (7,737) | (9,273) | |||||||||||||||
| Internal use software | (408) | (1,221) | |||||||||||||||
| Proceeds from sale of assets | 26,252 | 14 | |||||||||||||||
| Capitalized software | (38,715) | (35,971) | |||||||||||||||
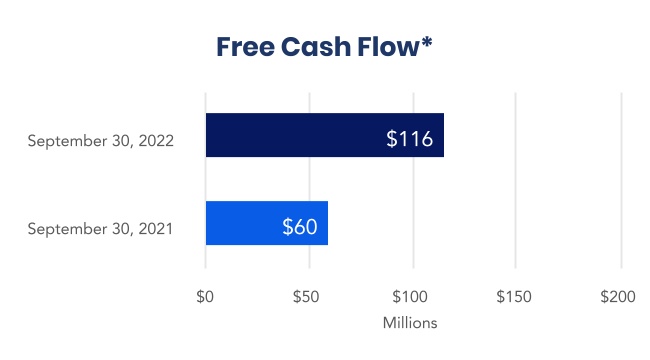
| FREE CASH FLOW | $ | 116,224 | $ | 60,098 | |||||||||||||
| Calculation of the Return on Average Shareholders’ Equity | |||||||||||||||||
| September 30, | |||||||||||||||||
| ( in thousands) | 2022 | 2021 | |||||||||||||||
| Net income (trailing four quarters) | $ | 367,352 | $ | 322,366 | |||||||||||||
| Average stockholder's equity (period ending balances) | 1,428,401 | 1,469,708 | |||||||||||||||
| RETURN ON AVERAGE SHAREHOLDERS’ EQUITY | 25.7% | 21.9% | |||||||||||||||
| Calculation of Return on Invested Capital (ROIC) (Non-GAAP) | |||||||||||||||||
| September 30, | |||||||||||||||||
| (in thousands) | 2022 | 2021 | |||||||||||||||
| Net income (trailing four quarters) | $ | 367,352 | $ | 322,366 | |||||||||||||
| Average stockholder's equity (period ending balances) | 1,428,401 | 1,469,708 | |||||||||||||||
| Average current maturities of long-term debt (period ending balances) | 76 | 118 | |||||||||||||||
| Average long-term debt (period ending balances) | 155,028 | 32,613 | |||||||||||||||
| Average invested capital | $ | 1,583,505 | $ | 1,502,439 | |||||||||||||
| ROIC | 23.2% | 21.5% | |||||||||||||||
|
10 |
|||||||