| Delaware | 1-8974 | 22-2640650 | ||||||
| (State or other jurisdiction of incorporation) |
(Commission File Number) | (I.R.S. Employer Identification Number) |
||||||
| ☐ | Written communications pursuant to Rule 425 under the Securities Act (17 CFR 230.425) | ||||
| ☐ | Soliciting material pursuant to Rule 14a-12 under the Exchange Act (17 CFR 240.14a-12) | ||||
| ☐ | Pre-commencement communications pursuant to Rule 14d-2(b) under the Exchange Act (17 CFR 240.14d-2(b)) | ||||
| ☐ | Pre-commencement communications pursuant to Rule 13e-4(c) under the Exchange Act (17 CFR 240.13e-4(c)) | ||||
| Title of each class | Trading Symbol(s) | Name of each exchange on which registered | ||||||||||||
| Common Stock, par value $1 per share | HON | The Nasdaq Stock Market LLC | ||||||||||||
| 3.500% Senior Notes due 2027 | HON 27 | The Nasdaq Stock Market LLC | ||||||||||||
| 2.250% Senior Notes due 2028 | HON 28A | The Nasdaq Stock Market LLC | ||||||||||||
| 3.375% Senior Notes due 2030 | HON 30 | The Nasdaq Stock Market LLC | ||||||||||||
| 0.750% Senior Notes due 2032 | HON 32 | The Nasdaq Stock Market LLC | ||||||||||||
| 3.750% Senior Notes due 2032 | HON 32A | The Nasdaq Stock Market LLC | ||||||||||||
| 4.125% Senior Notes due 2034 | HON 34 | The Nasdaq Stock Market LLC | ||||||||||||
| 3.750% Senior Notes due 2036 | HON 36 | The Nasdaq Stock Market LLC | ||||||||||||
Exhibit # |
Description |
|||||||
| 99.1 | ||||||||
| 104 | Cover Page Interactive Data File (the cover page XBRL tags are embedded within the Inline XBRL document). |
|||||||
| Date: | December 22, 2025 | HONEYWELL INTERNATIONAL INC. | |||||||||||||||
By: /s/ Su Ping Lu |
|||||||||||||||||
| Su Ping Lu | |||||||||||||||||
| Senior Vice President, General Counsel and Corporate Secretary | |||||||||||||||||
| Three Months Ended | ||||||||||||||||||||||||||
| March 31, 2025 | June 30, 2025 | Sept 30, 2025 | March 31, 2024 | June 30, 2024 | Sept 30, 2024 | Dec 31, 2024 | ||||||||||||||||||||
| Net sales | ||||||||||||||||||||||||||
| Aerospace Technologies | $ | 4,172 | $ | 4,307 | $ | 4,511 | $ | 3,669 | $ | 3,891 | $ | 3,912 | $ | 3,986 | ||||||||||||
| Building Automation | 1,692 | 1,826 | 1,878 | 1,426 | 1,571 | 1,745 | 1,798 | |||||||||||||||||||
| Process Automation and Technology | 1,445 | 1,613 | 1,598 | 1,352 | 1,408 | 1,478 | 1,681 | |||||||||||||||||||
| Industrial Automation | 1,597 | 1,574 | 1,447 | 1,703 | 1,697 | 1,677 | 1,699 | |||||||||||||||||||
| Corporate and All Other | 19 | 2 | 3 | 7 | 5 | 7 | 5 | |||||||||||||||||||
| Total Net sales from continuing operations | $ | 8,925 | $ | 9,322 | $ | 9,437 | $ | 8,157 | $ | 8,572 | $ | 8,819 | $ | 9,169 | ||||||||||||
Total Net sales from discontinued operations1 |
$ | 897 | $ | 1,030 | $ | 971 | $ | 948 | $ | 1,005 | $ | 909 | $ | 919 | ||||||||||||
| Segment profit | ||||||||||||||||||||||||||
| Aerospace Technologies | $ | 1,099 | $ | 1,098 | $ | 1,178 | $ | 1,035 | $ | 1,060 | $ | 1,082 | $ | 811 | ||||||||||||
| Building Automation | 440 | 479 | 502 | 350 | 397 | 452 | 482 | |||||||||||||||||||
| Process Automation and Technology | 313 | 386 | 389 | 289 | 346 | 381 | 448 | |||||||||||||||||||
| Industrial Automation | 230 | 256 | 215 | 285 | 270 | 286 | 272 | |||||||||||||||||||
Corporate and All Other2 |
(80) | (140) | (157) | (100) | (171) | (162) | (146) | |||||||||||||||||||
| Total segment profit from continuing operations | $ | 2,002 | $ | 2,079 | $ | 2,127 | $ | 1,859 | $ | 1,902 | $ | 2,039 | $ | 1,867 | ||||||||||||
Total segment profit from discontinued operations1 |
$ | 256 | $ | 287 | $ | 280 | $ | 235 | $ | 297 | $ | 257 | $ | 243 | ||||||||||||
| Three Months Ended | ||||||||||||||||||||||||||
| March 31, 2025 | June 30, 2025 | Sept 30, 2025 | March 31, 2024 | June 30, 2024 | Sept 30, 2024 | Dec 31, 2024 | ||||||||||||||||||||
| Aerospace Technologies | ||||||||||||||||||||||||||
| Commercial Aviation Original Equipment | $ | 627 | $ | 586 | $ | 632 | $ | 674 | $ | 668 | $ | 617 | $ | 264 | ||||||||||||
| Commercial Aviation Aftermarket | 1,899 | 1,916 | 2,085 | 1,659 | 1,798 | 1,758 | 1,929 | |||||||||||||||||||
| Defense and Space | 1,646 | 1,805 | 1,794 | 1,336 | 1,425 | 1,537 | 1,793 | |||||||||||||||||||
| Total Net Aerospace Technologies sales | 4,172 | 4,307 | 4,511 | 3,669 | 3,891 | 3,912 | 3,986 | |||||||||||||||||||
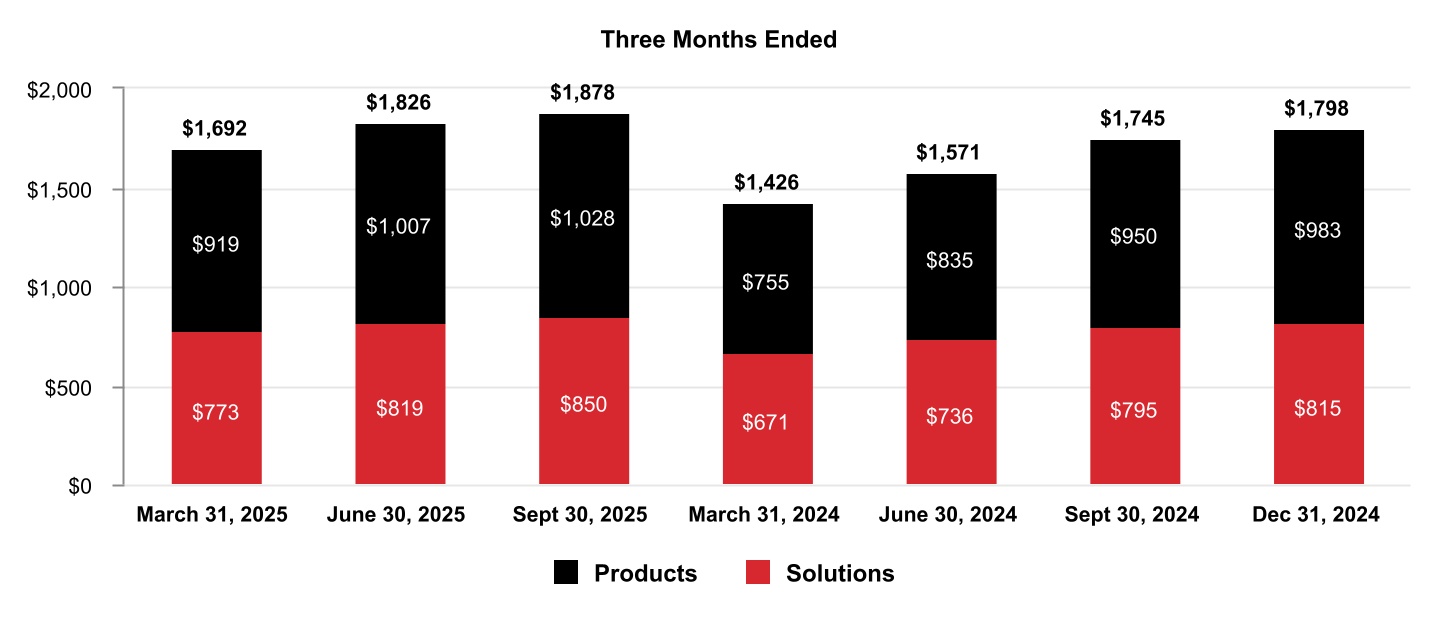
| Building Automation | ||||||||||||||||||||||||||
| Products | 919 | 1,007 | 1,028 | 755 | 835 | 950 | 983 | |||||||||||||||||||
| Solutions | 773 | 819 | 850 | 671 | 736 | 795 | 815 | |||||||||||||||||||
| Total Net Building Automation sales | 1,692 | 1,826 | 1,878 | 1,426 | 1,571 | 1,745 | 1,798 | |||||||||||||||||||
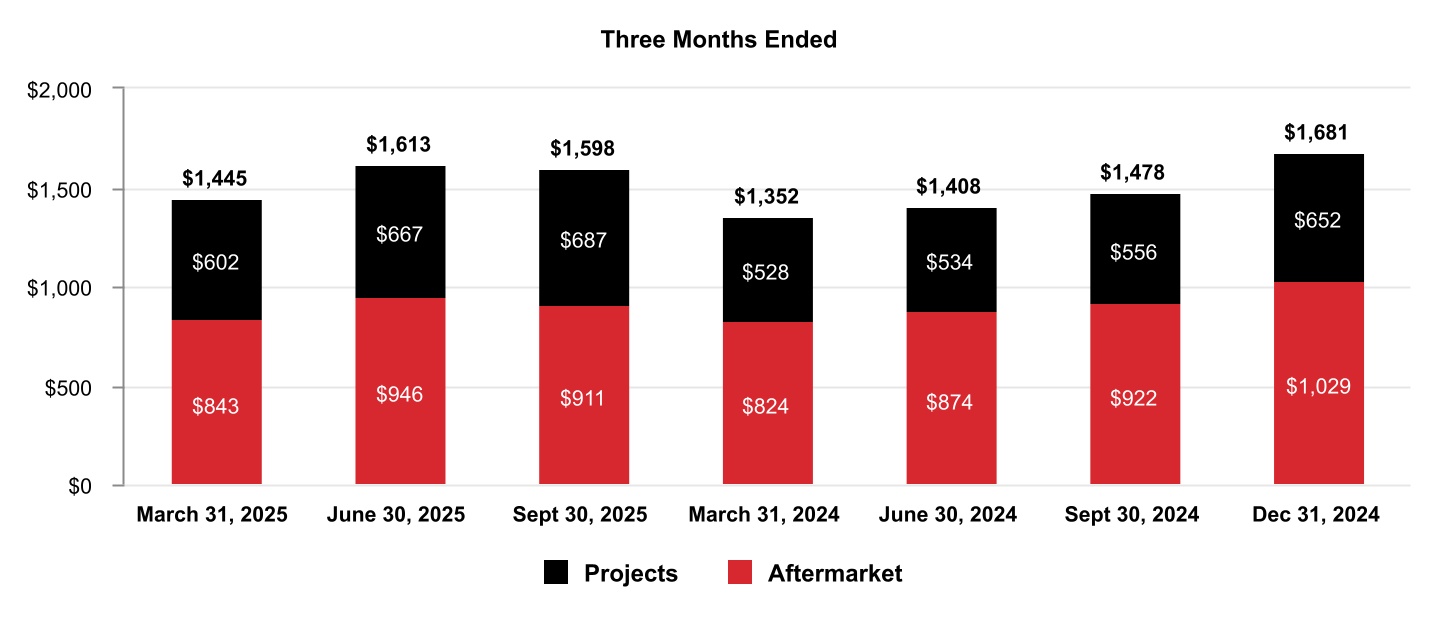
| Process Automation and Technology | ||||||||||||||||||||||||||
| Projects | 602 | 667 | 687 | 528 | 534 | 556 | 652 | |||||||||||||||||||
| Aftermarket | 843 | 946 | 911 | 824 | 874 | 922 | 1,029 | |||||||||||||||||||
| Total Net Process Automation and Technology sales | 1,445 | 1,613 | 1,598 | 1,352 | 1,408 | 1,478 | 1,681 | |||||||||||||||||||
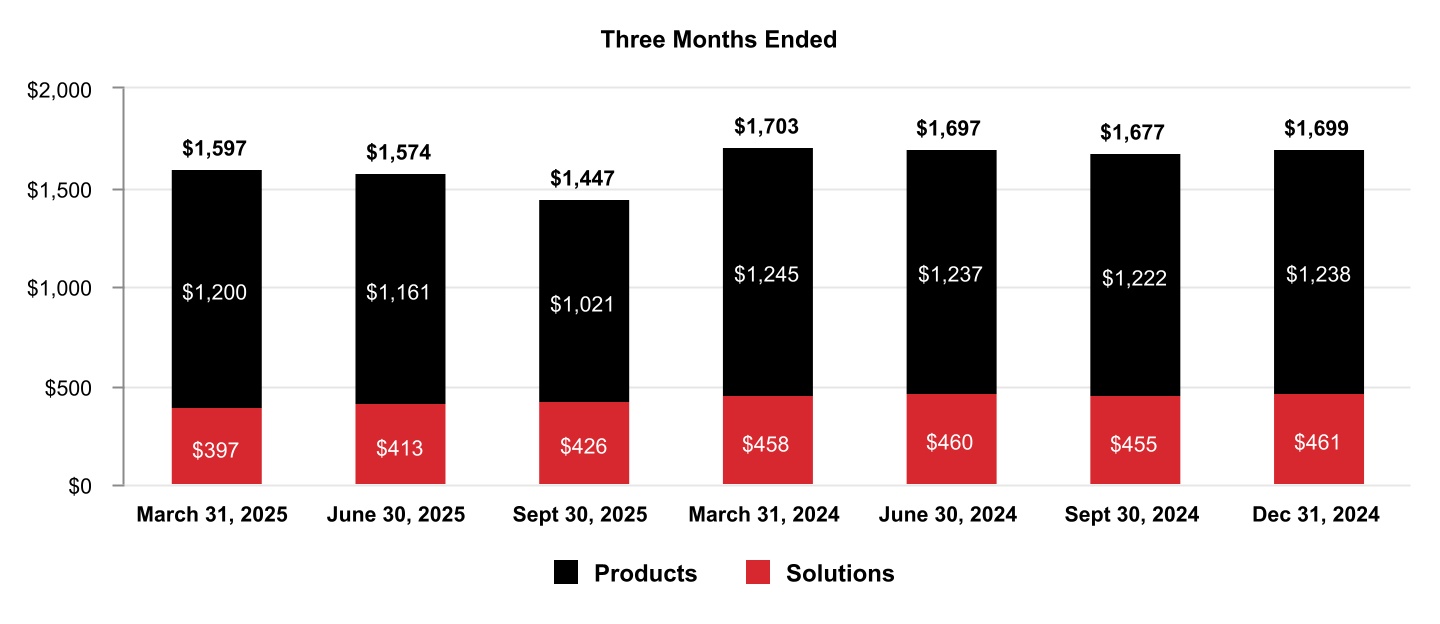
| Industrial Automation | ||||||||||||||||||||||||||
| Products | 1,200 | 1,161 | 1,021 | 1,245 | 1,237 | 1,222 | 1,238 | |||||||||||||||||||
| Solutions | 397 | 413 | 426 | 458 | 460 | 455 | 461 | |||||||||||||||||||
| Total Net Industrial Automation sales | 1,597 | 1,574 | 1,447 | 1,703 | 1,697 | 1,677 | 1,699 | |||||||||||||||||||
| Corporate and All Other | 19 | 2 | 3 | 7 | 5 | 7 | 5 | |||||||||||||||||||
| Total Net sales from continuing operations | $ | 8,925 | $ | 9,322 | $ | 9,437 | $ | 8,157 | $ | 8,572 | $ | 8,819 | $ | 9,169 | ||||||||||||
Total Net sales from discontinued operations1 |
$ | 897 | $ | 1,030 | $ | 971 | $ | 948 | $ | 1,005 | $ | 909 | $ | 919 | ||||||||||||
| 1 | Effective October 30, 2025, Honeywell completed the spin-off of its Advanced Materials (AM) business into an independent, publicly traded company, Solstice Advanced Materials. The AM business had historically been part of the Energy and Sustainability Systems reportable segment. In connection with the spin-off, the AM business is reported as discontinued operations in all periods presented. | |||||||
| 2 | Corporate expenses historically allocated to AM and not eligible to be part of discontinued operations are included in Corporate and All Other. | |||||||
| Years Ended Dec 31, | |||||||||||
| 2024 | 2023 | ||||||||||
| Net sales | |||||||||||
| Aerospace Technologies | $ | 15,458 | $ | 13,624 | |||||||
| Building Automation | 6,540 | 6,031 | |||||||||
| Process Automation and Technology | 5,919 | 5,683 | |||||||||
| Industrial Automation | 6,776 | 7,659 | |||||||||
| Corporate and All Other | 24 | 12 | |||||||||
| Total Net sales from continuing operations | $ | 34,717 | $ | 33,009 | |||||||
Total Net sales from discontinued operations1 |
$ | 3,781 | $ | 3,653 | |||||||
| Segment profit | |||||||||||
| Aerospace Technologies | $ | 3,988 | $ | 3,760 | |||||||
| Building Automation | 1,681 | 1,529 | |||||||||
| Process Automation and Technology | 1,464 | 1,390 | |||||||||
| Industrial Automation | 1,113 | 1,388 | |||||||||
Corporate and All Other2 |
(579) | (504) | |||||||||
| Total segment profit from continuing operations | $ | 7,667 | $ | 7,563 | |||||||
Total segment profit from discontinued operations1 |
$ | 1,032 | $ | 1,035 | |||||||
| Years Ended Dec 31, | |||||||||||
| 2024 | 2023 | ||||||||||
| Aerospace Technologies | |||||||||||
| Commercial Aviation Original Equipment | $ | 2,223 | $ | 2,397 | |||||||
| Commercial Aviation Aftermarket | 7,144 | 6,241 | |||||||||
| Defense and Space | 6,091 | 4,986 | |||||||||
| Total Net Aerospace Technologies sales | 15,458 | 13,624 | |||||||||
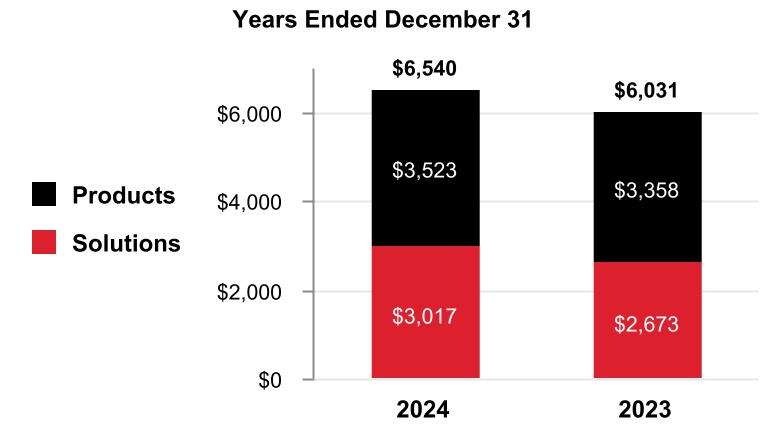
| Building Automation | |||||||||||
| Products | 3,523 | 3,358 | |||||||||
| Solutions | 3,017 | 2,673 | |||||||||
| Total Net Building Automation sales | 6,540 | 6,031 | |||||||||
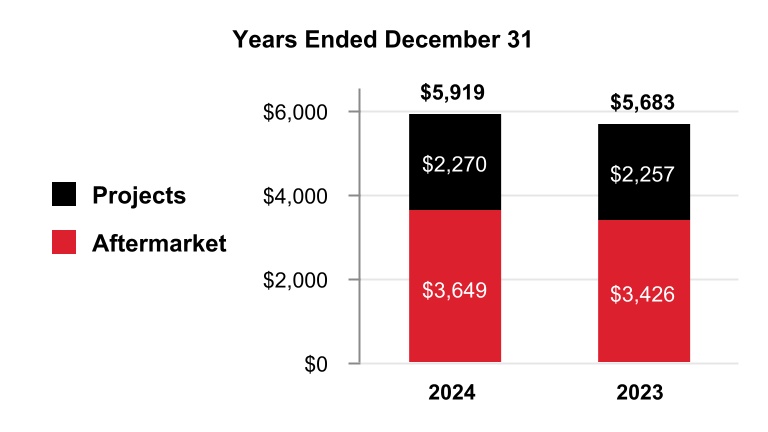
| Process Automation & Technology | |||||||||||
| Projects | 2,270 | 2,257 | |||||||||
| Aftermarket | 3,649 | 3,426 | |||||||||
| Total Net Process Automation and Technology sales | 5,919 | 5,683 | |||||||||
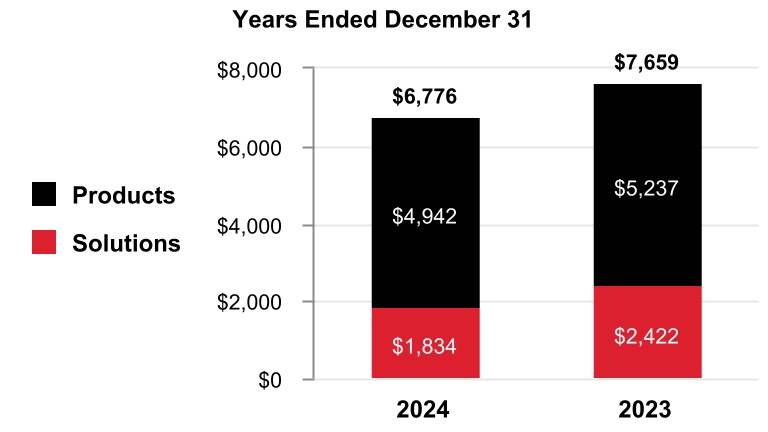
| Industrial Automation | |||||||||||
| Products | 4,942 | 5,237 | |||||||||
| Solutions | 1,834 | 2,422 | |||||||||
| Total Net Industrial Automation sales | 6,776 | 7,659 | |||||||||
| Corporate and All Other | 24 | 12 | |||||||||
| Total Net sales from continuing operations | $ | 34,717 | $ | 33,009 | |||||||
Total Net sales from discontinued operations1 |
$ | 3,781 | $ | 3,653 | |||||||
| 1 | Effective October 30, 2025, Honeywell completed the spin-off of its AM business into an independent, publicly traded company, Solstice Advanced Materials. The AM business had historically been part of the Energy and Sustainability Systems reportable segment. In connection with the spin-off, the AM business is reported as discontinued operations in all periods presented. | |||||||
| 2 | Corporate expenses historically allocated to AM and not eligible to be part of discontinued operations are included in Corporate and All Other. |
|||||||
| Three Months Ended | |||||||||||||||||||||||||||||||||||||||||
| March 31, 2025 | June 30, 2025 | Sept 30, 2025 |
March 31, 2024 | June 30, 2024 | Sept 30, 2024 |
Dec 31, 2024 |
|||||||||||||||||||||||||||||||||||
| Net sales | $ | 1,692 | $ | 1,826 | $ | 1,878 | $ | 1,426 | $ | 1,571 | $ | 1,745 | $ | 1,798 | |||||||||||||||||||||||||||
| Cost of products and services sold | 868 | 944 | 990 | 764 | 844 | 926 | 948 | ||||||||||||||||||||||||||||||||||
| Selling, general and administrative and other expenses | 384 | 403 | 386 | 312 | 330 | 367 | 368 | ||||||||||||||||||||||||||||||||||
| Segment profit | $ | 440 | $ | 479 | $ | 502 | $ | 350 | $ | 397 | $ | 452 | $ | 482 | |||||||||||||||||||||||||||
| 2024 | 2023 | ||||||||||
| Net sales | $ | 6,540 | $ | 6,031 | |||||||
| Cost of products and services sold | 3,482 | 3,240 | |||||||||
| Selling, general and administrative and other expenses | 1,377 | 1,262 | |||||||||
| Segment profit | $ | 1,681 | $ | 1,529 | |||||||
| Three Months Ended | |||||||||||||||||||||||||||||||||||||||||
| March 31, 2025 | June 30, 2025 | Sept 30, 2025 |
March 31, 2024 | June 30, 2024 | Sept 30, 2024 |
Dec 31, 2024 |
|||||||||||||||||||||||||||||||||||
| Net sales | $ | 1,445 | $ | 1,613 | $ | 1,598 | $ | 1,352 | $ | 1,408 | $ | 1,478 | $ | 1,681 | |||||||||||||||||||||||||||
| Cost of products and services sold | 809 | 896 | 896 | 753 | 736 | $ | 792 | $ | 924 | ||||||||||||||||||||||||||||||||
| Selling, general and administrative and other expenses | 323 | 331 | 313 | 310 | 326 | 305 | 309 | ||||||||||||||||||||||||||||||||||
| Segment profit | $ | 313 | $ | 386 | $ | 389 | $ | 289 | $ | 346 | $ | 381 | $ | 448 | |||||||||||||||||||||||||||
| 2024 | 2023 | ||||||||||
| Net sales | $ | 5,919 | $ | 5,683 | |||||||
| Cost of products and services sold | 3,205 | $ | 3,220 | ||||||||
| Selling, general and administrative and other expenses | 1,250 | 1,073 | |||||||||
| Segment profit | $ | 1,464 | $ | 1,390 | |||||||
| Three Months Ended | |||||||||||||||||||||||||||||||||||||||||
| March 31, 2025 | June 30, 2025 | Sept 30, 2025 |
March 31, 2024 | June 30, 2024 | Sept 30, 2024 |
Dec 31, 2024 |
|||||||||||||||||||||||||||||||||||
| Net sales | $ | 1,597 | $ | 1,574 | $ | 1,447 | $ | 1,703 | $ | 1,697 | $ | 1,677 | $ | 1,699 | |||||||||||||||||||||||||||
| Cost of products and services sold | 989 | 958 | 911 | 1,046 | 1,075 | 1,051 | 1,067 | ||||||||||||||||||||||||||||||||||
| Selling, general and administrative and other expenses | 378 | 360 | 321 | 372 | 352 | 340 | 360 | ||||||||||||||||||||||||||||||||||
| Segment profit | $ | 230 | $ | 256 | $ | 215 | $ | 285 | $ | 270 | $ | 286 | $ | 272 | |||||||||||||||||||||||||||
| 2024 | 2023 | ||||||||||
| Net sales | $ | 6,776 | $ | 7,659 | |||||||
| Cost of products and services sold | 4,239 | 4,758 | |||||||||
| Selling, general and administrative and other expenses | 1,424 | 1,513 | |||||||||
| Segment profit | $ | 1,113 | $ | 1,388 | |||||||
| Three Months Ended | Year Ended | ||||||||||||||||||||||
| March 31, 2025 |
June 30, 2025 |
September 30, 2025 | December 31, 2024 | ||||||||||||||||||||
| Honeywell | |||||||||||||||||||||||
| Reported sales % change | 9% | 9% | 7% | 5% | |||||||||||||||||||
| Less: Foreign currency translation | (1)% | —% | —% | (1)% | |||||||||||||||||||
| Less: Acquisitions, divestitures and other, net | 5% | 4% | 1% | 3% | |||||||||||||||||||
| Organic sales % change | 5% | 5% | 6% | 3% | |||||||||||||||||||
| Aerospace Technologies | |||||||||||||||||||||||
| Reported sales % change | 14% | 11% | 15% | 13% | |||||||||||||||||||
| Less: Foreign currency translation | —% | —% | —% | —% | |||||||||||||||||||
| Less: Acquisitions, divestitures and other, net | 5% | 5% | 3% | 2% | |||||||||||||||||||
| Organic sales % change | 9% | 6% | 12% | 11% | |||||||||||||||||||
| Building Automation | |||||||||||||||||||||||
| Reported sales % change | 19% | 16% | 8% | 8% | |||||||||||||||||||
| Less: Foreign currency translation | (2)% | —% | 1% | (1)% | |||||||||||||||||||
| Less: Acquisitions, divestitures and other, net | 13% | 8% | —% | 7% | |||||||||||||||||||
| Organic sales % change | 8% | 8% | 7% | 2% | |||||||||||||||||||
| Process Automation and Technology | |||||||||||||||||||||||
| Reported sales % change | 7% | 15% | 8% | 4% | |||||||||||||||||||
| Less: Foreign currency translation | (2)% | 1% | —% | (1)% | |||||||||||||||||||
| Less: Acquisitions, divestitures and other, net | 6% | 8% | 14% | 2% | |||||||||||||||||||
| Organic sales % change | 3% | 6% | (6)% | 3% | |||||||||||||||||||
| Industrial Automation | |||||||||||||||||||||||
| Reported sales % change | (6)% | (7)% | (14)% | (12)% | |||||||||||||||||||
| Less: Foreign currency translation | (1)% | 1% | 1% | (1)% | |||||||||||||||||||
| Less: Acquisitions, divestitures and other, net | —% | (8)% | (16)% | —% | |||||||||||||||||||
| Organic sales % change | (5)% | —% | 1% | (11)% | |||||||||||||||||||
| Three Months Ended March 31, | |||||||||||||||||
| 2025 | 2024 | ||||||||||||||||
| Continuing Operations | Discontinued Operations1 |
Continuing Operations | Discontinued Operations1 |
||||||||||||||
| Operating income | $ | 1,721 | $ | 249 | $ | 1,626 | $ | 234 | |||||||||
Stock compensation expense2 |
59 | 2 | 52 | 1 | |||||||||||||
Repositioning, Other3,4 |
59 | 3 | 94 | (2) | |||||||||||||
Pension and other postretirement service costs5 |
13 | 1 | 15 | 1 | |||||||||||||
Amortization of acquisition-related intangibles6 |
135 | 1 | 69 | 1 | |||||||||||||
Acquisition-related costs7 |
— | — | 3 | — | |||||||||||||
| Impairment of assets held for sale | 15 | — | — | — | |||||||||||||
| Segment profit | $ | 2,002 | $ | 256 | $ | 1,859 | $ | 235 | |||||||||
| 1 | Effective October 30, 2025, Honeywell completed the spin-off of its AM business into an independent, publicly traded company, Solstice Advanced Materials. The AM business had historically been part of the Energy and Sustainability Systems reportable segment. In connection with the spin-off, the AM business is reported as discontinued operations in all periods presented. | |||||||
| 2 | Included in Selling, general and administrative expenses. | |||||||
| 3 | Includes repositioning, asbestos, environmental expenses, equity income adjustment, and other charges. | |||||||
| 4 | Included in Cost of products and services sold and Selling, general and administrative expenses. | |||||||
| 5 | Included in Cost of products and services sold, Research and development expenses, and Selling, general and administrative expenses. | |||||||
| 6 | Included in Cost of products and services sold. | |||||||
| 7 | Included in Other (income) expense. Includes acquisition-related fair value adjustments to inventory and third-party transaction and integration costs. | |||||||
| Three Months Ended June 30, | |||||||||||||||||
| 2025 | 2024 | ||||||||||||||||
| Continuing Operations | Discontinued Operations1 |
Continuing Operations | Discontinued Operations1 |
||||||||||||||
| Operating income | $ | 1,843 | $ | 271 | $ | 1,692 | $ | 286 | |||||||||
Stock compensation expense2 |
55 | 2 | 54 | 1 | |||||||||||||
Repositioning, Other3,4 |
42 | 12 | 50 | 8 | |||||||||||||
Pension and other postretirement service costs5 |
14 | 1 | 15 | 1 | |||||||||||||
Amortization of acquisition-related intangibles6 |
132 | 1 | 84 | 1 | |||||||||||||
Acquisition-related costs7 |
(7) | — | 7 | — | |||||||||||||
| Segment profit | $ | 2,079 | $ | 287 | $ | 1,902 | $ | 297 | |||||||||
| 1 | Effective October 30, 2025, Honeywell completed the spin-off of its AM business into an independent, publicly traded company, Solstice Advanced Materials. The AM business had historically been part of the Energy and Sustainability Systems reportable segment. In connection with the spin-off, the AM business is reported as discontinued operations in all periods presented. | |||||||
| 2 | Included in Selling, general and administrative expenses. | |||||||
| 3 | Includes repositioning, asbestos, environmental expenses, equity income adjustment, and other charges. | |||||||
| 4 | Included in Cost of products and services sold and Selling, general and administrative expenses. | |||||||
| 5 | Included in Cost of products and services sold, Research and development expenses, and Selling, general and administrative expenses. | |||||||
| 6 | Included in Cost of products and services sold. | |||||||
| 7 | Included in Other (income) expense. Includes acquisition-related fair value adjustments to inventory and third-party transaction and integration costs. | |||||||
| Three Months Ended September 30, | |||||||||||||||||
| 2025 | 2024 | ||||||||||||||||
| Continuing Operations | Discontinued Operations1 |
Continuing Operations | Discontinued Operations1 |
||||||||||||||
| Operating income | $ | 1,484 | $ | 270 | $ | 1,610 | $ | 248 | |||||||||
Stock compensation expense2 |
32 | 4 | 44 | 1 | |||||||||||||
Repositioning, Other3,4 |
444 | 4 | 63 | 6 | |||||||||||||
Pension and other postretirement service costs5 |
18 | 1 | 15 | 1 | |||||||||||||
Amortization of acquisition-related intangibles6 |
140 | 1 | 119 | 1 | |||||||||||||
Acquisition-related costs7 |
9 | — | 15 | — | |||||||||||||
Indefinite-lived intangible asset impairment2 |
— | — | 48 | — | |||||||||||||
| Impairment of assets held for sale | — | — | 125 | — | |||||||||||||
| Segment profit | $ | 2,127 | $ | 280 | $ | 2,039 | $ | 257 | |||||||||
| 1 | Effective October 30, 2025, Honeywell completed the spin-off of its AM business into an independent, publicly traded company, Solstice Advanced Materials. The AM business had historically been part of the Energy and Sustainability Systems reportable segment. In connection with the spin-off, the AM business is reported as discontinued operations in all periods presented. | |||||||
| 2 | Included in Selling, general and administrative expenses. | |||||||
| 3 | Includes repositioning, asbestos, environmental expenses, equity income adjustment, and other charges. |
|||||||
| 4 | Included in Cost of products and services sold and Selling, general and administrative expenses. | |||||||
| 5 | Included in Cost of products and services sold, Research and development expenses, and Selling, general and administrative expenses. | |||||||
| 6 | Included in Cost of products and services sold. | |||||||
| 7 | Included in Other (income) expense. Includes acquisition-related fair value adjustments to inventory and third-party transaction and integration costs. | |||||||
| Three Months Ended December 31, | ||||||||
| 2024 | ||||||||
| Continuing Operations | Discontinued Operations1 |
|||||||
| Operating income | $ | 1,521 | $ | 224 | ||||
Stock compensation expense2 |
39 | 2 | ||||||
Repositioning, Other3,4 |
58 | 15 | ||||||
Pension and other postretirement service costs5 |
16 | 1 | ||||||
Amortization of acquisition-related intangibles6 |
139 | 1 | ||||||
| Impairment of assets held for sale | 94 | — | ||||||
| Segment profit | $ | 1,867 | $ | 243 | ||||
| 1 | Effective October 30, 2025, Honeywell completed the spin-off of its AM business into an independent, publicly traded company, Solstice Advanced Materials. The AM business had historically been part of the Energy and Sustainability Systems reportable segment. In connection with the spin-off, the AM business is reported as discontinued operations in all periods presented. | |||||||
| 2 | Included in Selling, general and administrative expenses. | |||||||
| 3 | Includes repositioning, asbestos, environmental expenses, equity income adjustment, and other charges. |
|||||||
| 4 | Included in Cost of products and services sold and Selling, general and administrative expenses. | |||||||
| 5 | Included in Cost of products and services sold, Research and development expenses, and Selling, general and administrative expenses. | |||||||
| 6 | Included in Cost of products and services sold. | |||||||
| Years Ended December 31, | |||||||||||||||||
| 2024 | 2023 | ||||||||||||||||
| Continuing Operations | Discontinued Operations1 |
Continuing Operations | Discontinued Operations1 |
||||||||||||||
| Operating income | $ | 6,449 | $ | 992 | $ | 6,110 | $ | 974 | |||||||||
Stock compensation expense2 |
189 | 5 | 197 | 5 | |||||||||||||
Repositioning, Other3,4 |
265 | 27 | 900 | 52 | |||||||||||||
Pension and other postretirement service costs5 |
61 | 4 | 64 | 2 | |||||||||||||
Amortization of acquisition-related intangibles6 |
411 | 4 | 290 | 2 | |||||||||||||
Acquisition-related costs7 |
25 | — | 2 | — | |||||||||||||
Indefinite-lived intangible asset impairment2 |
48 | — | — | — | |||||||||||||
| Impairment of assets held for sale | 219 | — | — | — | |||||||||||||
| Segment profit | $ | 7,667 | $ | 1,032 | $ | 7,563 | $ | 1,035 | |||||||||
| 1 | Effective October 30, 2025, Honeywell completed the spin-off of its AM business into an independent, publicly traded company, Solstice Advanced Materials. The AM business had historically been part of the Energy and Sustainability Systems reportable segment. In connection with the spin-off, the AM business is reported as discontinued operations in all periods presented. | |||||||
| 2 | Included in Selling, general and administrative expenses. | |||||||
| 3 | Includes repositioning, asbestos, environmental expenses, equity income adjustment, and other charges. | |||||||
| 4 | Included in Cost of products and services sold and Selling, general and administrative expenses. | |||||||
| 5 | Included in Cost of products and services sold, Research and development expenses, and Selling, general and administrative expenses. | |||||||
| 6 | Included in Cost of products and services sold. | |||||||
| 7 | Included in Other (income) expense. Includes acquisition-related fair value adjustments to inventory and third-party transaction and integration costs. | |||||||