| CIRRUS LOGIC, INC. | ||||||||
| (Exact name of Registrant as specified in its charter) | ||||||||
| Delaware | 000-17795 | 77-0024818 | ||||||||||||
| (State or Other Jurisdiction of Incorporation or Organization) |
(Commission File Number) | (IRS Employer Identification No.) |
||||||||||||
| 800 W. 6th Street | Austin, | TX | 78701 | |||||||||||
| (Address of Principal Executive Offices) | (Zip Code) | |||||||||||||
Registrant’s telephone number, including area code: |
(512) |
851-4000 |
||||||||||||
| Title of each class | Trading Symbol | Name of each exchange on which registered | ||||||||||||
| Common stock, $0.001 par value | CRUS | The NASDAQ Stock Market LLC | ||||||||||||
| CIRRUS LOGIC, INC. | |||||||||||||||||
| Date: | August 3, 2023 | By: | /s/ Venk Nathamuni | ||||||||||||||
| Name: | Venk Nathamuni | ||||||||||||||||
| Title: | Chief Financial Officer | ||||||||||||||||

| CONSOLIDATED CONDENSED STATEMENT OF OPERATIONS | |||||||||||||||||
| (in thousands, except per share data; unaudited) | |||||||||||||||||
| Three Months Ended | |||||||||||||||||
| Jun. 24, | Mar. 25, | Jun. 25, | |||||||||||||||
| 2023 | 2023 | 2022 | |||||||||||||||
| Q1'24 | Q4'23 | Q1'23 | |||||||||||||||
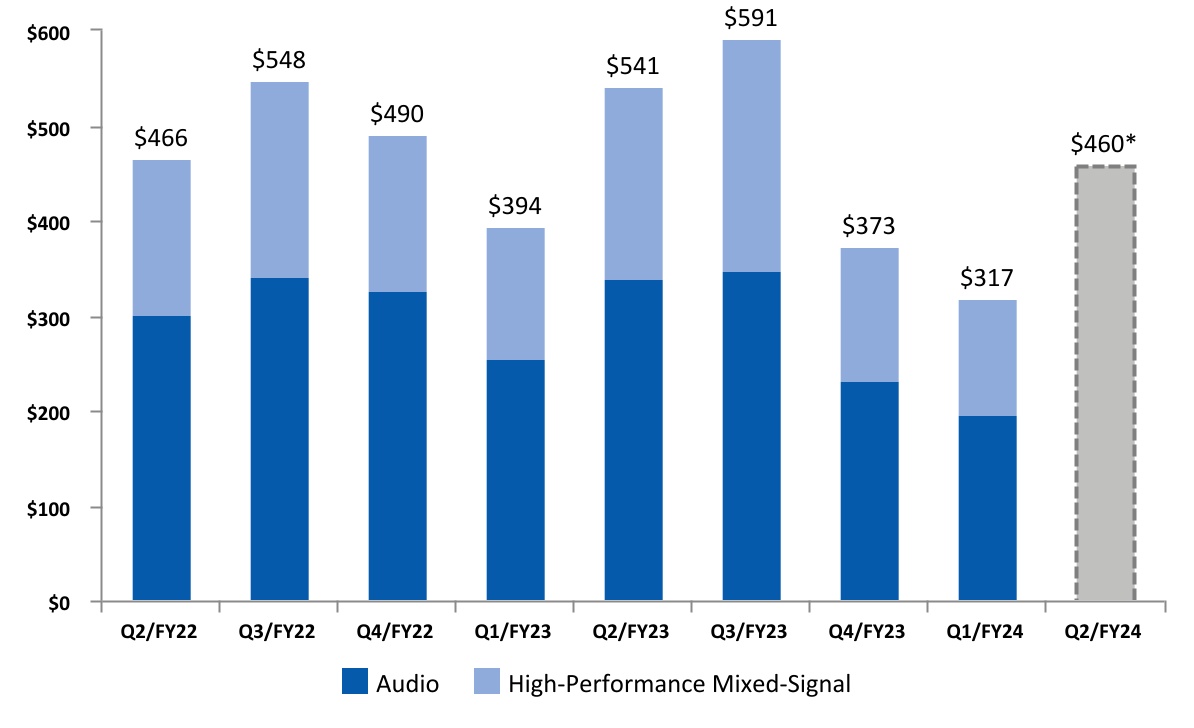
| Audio | $ | 195,806 | $ | 232,402 | $ | 254,496 | |||||||||||
| High-Performance Mixed-Signal | 121,210 | 140,420 | 139,143 | ||||||||||||||
| Net sales | 317,016 | 372,822 | 393,639 | ||||||||||||||
| Cost of sales | 157,629 | 186,468 | 191,005 | ||||||||||||||
| Gross profit | 159,387 | 186,354 | 202,634 | ||||||||||||||
| Gross margin | 50.3 | % | 50.0 | % | 51.5 | % | |||||||||||
| Research and development | 106,215 | 115,162 | 109,716 | ||||||||||||||
| Selling, general and administrative | 35,379 | 37,642 | 38,642 | ||||||||||||||
| Lease impairments and restructuring | — | 10,632 | — | ||||||||||||||
| Intangibles impairment | — | 85,760 | — | ||||||||||||||
| Total operating expenses | 141,594 | 249,196 | 148,358 | ||||||||||||||
| Income (loss) from operations | 17,793 | (62,842) | 54,276 | ||||||||||||||
| Interest income (expense) | 4,600 | 4,720 | 305 | ||||||||||||||
| Other income (expense) | 377 | (464) | 506 | ||||||||||||||
| Income (loss) before income taxes | 22,770 | (58,586) | 55,087 | ||||||||||||||
| Provision for income taxes | 7,170 | (4,917) | 15,380 | ||||||||||||||
| Net income (loss) | $ | 15,600 | $ | (53,669) | $ | 39,707 | |||||||||||
| Basic earnings (loss) per share | $ | 0.28 | $ | (0.97) | $ | 0.71 | |||||||||||
| Diluted earnings (loss) per share: | $ | 0.28 | $ | (0.97) | $ | 0.69 | |||||||||||
| Weighted average number of shares: | |||||||||||||||||
| Basic | 54,862 | 55,219 | 56,277 | ||||||||||||||
| Diluted | 56,631 | 55,219 | 57,804 | ||||||||||||||
| Prepared in accordance with Generally Accepted Accounting Principles | |||||||||||||||||
| RECONCILIATION BETWEEN GAAP AND NON-GAAP FINANCIAL INFORMATION | |||||||||||||||||
| (in thousands, except per share data; unaudited) | |||||||||||||||||
| (not prepared in accordance with GAAP) | |||||||||||||||||
| Non-GAAP financial information is not meant as a substitute for GAAP results, but is included because management believes such information is useful to our investors for informational and comparative purposes. In addition, certain non-GAAP financial information is used internally by management to evaluate and manage the company. As a note, the non-GAAP financial information used by Cirrus Logic may differ from that used by other companies. These non-GAAP measures should be considered in addition to, and not as a substitute for, the results prepared in accordance with GAAP. | |||||||||||||||||
| Three Months Ended | |||||||||||||||||
| Jun. 24, | Mar. 25, | Jun. 25, | |||||||||||||||
| 2023 | 2023 | 2022 | |||||||||||||||
| Net Income (Loss) Reconciliation | Q1'24 | Q4'23 | Q1'23 | ||||||||||||||
| GAAP Net Income (Loss) | $ | 15,600 | $ | (53,669) | $ | 39,707 | |||||||||||
| Amortization of acquisition intangibles | 2,170 | 7,657 | 7,835 | ||||||||||||||
| Stock-based compensation expense | 22,715 | 22,533 | 18,138 | ||||||||||||||
| Lease impairments and restructuring | — | 10,632 | — | ||||||||||||||
| Intangibles impairment | — | 85,760 | — | ||||||||||||||
| Acquisition-related costs | 3,166 | 3,166 | 3,164 | ||||||||||||||
| Adjustment to income taxes | (5,628) | (23,461) | (4,300) | ||||||||||||||
| Non-GAAP Net Income | $ | 38,023 | $ | 52,618 | $ | 64,544 | |||||||||||
| Earnings (Loss) Per Share Reconciliation | |||||||||||||||||
| GAAP Diluted earnings (loss) per share | $ | 0.28 | $ | (0.97) | $ | 0.69 | |||||||||||
| Effect of Amortization of acquisition intangibles | 0.04 | 0.14 | 0.14 | ||||||||||||||
| Effect of Stock-based compensation expense | 0.40 | 0.40 | 0.31 | ||||||||||||||
| Effect of Lease impairments and restructuring | — | 0.19 | — | ||||||||||||||
| Effect of Intangibles impairment | — | 1.51 | — | ||||||||||||||
| Effect of Acquisition-related costs | 0.05 | 0.06 | 0.05 | ||||||||||||||
| Effect of Adjustment to income taxes | (0.10) | (0.41) | (0.07) | ||||||||||||||
| Non-GAAP Diluted earnings per share | $ | 0.67 | $ | 0.92 | $ | 1.12 | |||||||||||
| Diluted Shares Reconciliation | |||||||||||||||||
| GAAP Diluted shares | 56,631 | 55,219 | 57,804 | ||||||||||||||
| Effect of weighted dilutive shares | — | 1,821 | — | ||||||||||||||
| Non-GAAP Diluted shares | 56,631 | 57,040 | 57,804 | ||||||||||||||
| Operating Income (Loss) Reconciliation | |||||||||||||||||
| GAAP Operating Income (Loss) | $ | 17,793 | $ | (62,842) | $ | 54,276 | |||||||||||
| GAAP Operating Profit (Loss) | 5.6 | % | (16.9) | % | 13.8 | % | |||||||||||
| Amortization of acquisition intangibles | 2,170 | 7,657 | 7,835 | ||||||||||||||
| Stock-based compensation expense - COGS | 285 | 372 | 277 | ||||||||||||||
| Stock-based compensation expense - R&D | 15,952 | 15,782 | 12,592 | ||||||||||||||
| Stock-based compensation expense - SG&A | 6,478 | 6,379 | 5,269 | ||||||||||||||
| Lease impairments and restructuring | — | 10,632 | — | ||||||||||||||
| Intangibles impairment | — | 85,760 | — | ||||||||||||||
| Acquisition-related costs | 3,166 | 3,166 | 3,164 | ||||||||||||||
| Non-GAAP Operating Income | $ | 45,844 | $ | 66,906 | $ | 83,413 | |||||||||||
| Non-GAAP Operating Profit | 14.5 | % | 17.9 | % | 21.2 | % | |||||||||||
| Operating Expense Reconciliation | |||||||||||||||||
| GAAP Operating Expenses | $ | 141,594 | $ | 249,196 | $ | 148,358 | |||||||||||
| Amortization of acquisition intangibles | (2,170) | (7,657) | (7,835) | ||||||||||||||
| Stock-based compensation expense - R&D | (15,952) | (15,782) | (12,592) | ||||||||||||||
| Stock-based compensation expense - SG&A | (6,478) | (6,379) | (5,269) | ||||||||||||||
| Lease impairments and restructuring | — | (10,632) | — | ||||||||||||||
| Intangibles impairment | — | (85,760) | — | ||||||||||||||
| Acquisition-related costs | (3,166) | (3,166) | (3,164) | ||||||||||||||
| Non-GAAP Operating Expenses | $ | 113,828 | $ | 119,820 | $ | 119,498 | |||||||||||
| Gross Margin/Profit Reconciliation | |||||||||||||||||
| GAAP Gross Profit | $ | 159,387 | $ | 186,354 | $ | 202,634 | |||||||||||
| GAAP Gross Margin | 50.3 | % | 50.0 | % | 51.5 | % | |||||||||||
| Stock-based compensation expense - COGS | 285 | 372 | 277 | ||||||||||||||
| Non-GAAP Gross Profit | $ | 159,672 | $ | 186,726 | $ | 202,911 | |||||||||||
| Non-GAAP Gross Margin | 50.4 | % | 50.1 | % | 51.5 | % | |||||||||||
| RECONCILIATION BETWEEN GAAP AND NON-GAAP FINANCIAL INFORMATION | |||||||||||||||||
| (in thousands, except per share data; unaudited) | |||||||||||||||||
| (not prepared in accordance with GAAP) | |||||||||||||||||
| Three Months Ended | |||||||||||||||||
| Jun. 24, | Mar. 25, | Jun. 25, | |||||||||||||||
| 2023 | 2023 | 2022 | |||||||||||||||
| Effective Tax Rate Reconciliation | Q1'24 | Q4'23 | Q1'23 | ||||||||||||||
| GAAP Tax Expense (Benefit) | $ | 7,170 | $ | (4,917) | $ | 15,380 | |||||||||||
| GAAP Effective Tax Rate | 31.5 | % | 8.4 | % | 27.9 | % | |||||||||||
| Adjustments to income taxes | 5,628 | 23,461 | 4,300 | ||||||||||||||
| Non-GAAP Tax Expense | $ | 12,798 | $ | 18,544 | $ | 19,680 | |||||||||||
| Non-GAAP Effective Tax Rate | 25.2 | % | 26.1 | % | 23.4 | % | |||||||||||
| Tax Impact to EPS Reconciliation | |||||||||||||||||
| GAAP Tax Expense (Benefit) | $ | 0.13 | $ | (0.09) | $ | 0.27 | |||||||||||
| Adjustments to income taxes | 0.10 | 0.41 | 0.07 | ||||||||||||||
| Non-GAAP Tax Expense | $ | 0.23 | $ | 0.32 | $ | 0.34 | |||||||||||
| CONSOLIDATED CONDENSED BALANCE SHEET | ||||||||||||||||||||
| (in thousands; unaudited) | ||||||||||||||||||||
| Jun. 24, | Mar. 25, | Jun. 25, | ||||||||||||||||||
| 2023 | 2023 | 2022 | ||||||||||||||||||
| ASSETS | ||||||||||||||||||||
| Current assets | ||||||||||||||||||||
| Cash and cash equivalents | $ | 352,346 | $ | 445,784 | $ | 379,335 | ||||||||||||||
| Marketable securities | 35,765 | 34,978 | 18,397 | |||||||||||||||||
| Accounts receivable, net | 186,033 | 150,473 | 206,272 | |||||||||||||||||
| Inventories | 300,956 | 233,450 | 174,370 | |||||||||||||||||
| Prepaid wafers | 84,739 | 60,638 | — | |||||||||||||||||
| Other current assets | 88,829 | 92,533 | 82,634 | |||||||||||||||||
| Total current Assets | 1,048,668 | 1,017,856 | 861,008 | |||||||||||||||||
| Long-term marketable securities | 38,029 | 36,509 | 55,965 | |||||||||||||||||
| Right-of-use lease assets | 125,538 | 128,145 | 168,680 | |||||||||||||||||
| Property and equipment, net | 167,238 | 162,972 | 157,165 | |||||||||||||||||
| Intangibles, net | 36,447 | 38,876 | 149,984 | |||||||||||||||||
| Goodwill | 435,936 | 435,936 | 435,936 | |||||||||||||||||
| Deferred tax asset | 44,991 | 35,580 | 16,928 | |||||||||||||||||
| Long-term prepaid wafers | 110,262 | 134,363 | 195,000 | |||||||||||||||||
| Other assets | 49,483 | 73,729 | 65,236 | |||||||||||||||||
| Total assets | $ | 2,056,592 | $ | 2,063,966 | $ | 2,105,902 | ||||||||||||||
| LIABILITIES AND STOCKHOLDERS' EQUITY | ||||||||||||||||||||
| Current liabilities | ||||||||||||||||||||
| Accounts payable | $ | 75,941 | $ | 81,462 | $ | 121,451 | ||||||||||||||
| Accrued salaries and benefits | 36,465 | 50,606 | 41,026 | |||||||||||||||||
| Lease liability | 19,903 | 18,442 | 13,988 | |||||||||||||||||
| Acquisition-related liabilities | 24,527 | 21,361 | 30,964 | |||||||||||||||||
| Other accrued liabilities | 46,018 | 44,469 | 45,167 | |||||||||||||||||
| Total current liabilities | 202,854 | 216,340 | 252,596 | |||||||||||||||||
| Non-current lease liability | 125,071 | 122,631 | 159,344 | |||||||||||||||||
| Non-current income taxes | 59,587 | 59,013 | 73,735 | |||||||||||||||||
| Long-term acquisition-related liabilities | — | — | 11,856 | |||||||||||||||||
| Other long-term liabilities | 12,286 | 7,700 | 9,184 | |||||||||||||||||
| Total long-term liabilities | 196,944 | 189,344 | 254,119 | |||||||||||||||||
| Stockholders' equity: | ||||||||||||||||||||
| Capital stock | 1,693,420 | 1,670,141 | 1,596,684 | |||||||||||||||||
| Accumulated earnings (deficit) | (33,621) | (9,320) | 5,894 | |||||||||||||||||
| Accumulated other comprehensive loss | (3,005) | (2,539) | (3,391) | |||||||||||||||||
| Total stockholders' equity | 1,656,794 | 1,658,282 | 1,599,187 | |||||||||||||||||
| Total liabilities and stockholders' equity | $ | 2,056,592 | $ | 2,063,966 | $ | 2,105,902 | ||||||||||||||
| Prepared in accordance with Generally Accepted Accounting Principles | ||||||||||||||||||||
| CONSOLIDATED CONDENSED STATEMENT OF CASH FLOWS | ||||||||||||||
| (in thousands; unaudited) | ||||||||||||||
| Three Months Ended | ||||||||||||||
| Jun. 24, | Jun. 25, | |||||||||||||
| 2023 | 2022 | |||||||||||||
| Q1'24 | Q1'23 | |||||||||||||
| Cash flows from operating activities: | ||||||||||||||
| Net income | $ | 15,600 | $ | 39,707 | ||||||||||
| Adjustments to reconcile net income to net cash provided by (used in) operating activities: | ||||||||||||||
| Depreciation and amortization | 11,941 | 16,515 | ||||||||||||
| Stock-based compensation expense | 22,715 | 18,138 | ||||||||||||
| Deferred income taxes | (9,411) | (5,860) | ||||||||||||
| Loss on retirement or write-off of long-lived assets | 6 | 292 | ||||||||||||
| Other non-cash charges | 1,334 | 99 | ||||||||||||
| Net change in operating assets and liabilities: | ||||||||||||||
| Accounts receivable, net | (35,560) | 33,992 | ||||||||||||
| Inventories | (67,506) | (35,934) | ||||||||||||
| Other assets | 8,101 | 549 | ||||||||||||
| Accounts payable and other accrued liabilities | (10,278) | (20,327) | ||||||||||||
| Income taxes payable | 20,079 | 24,030 | ||||||||||||
| Acquisition-related liabilities | 3,166 | 3,164 | ||||||||||||
| Net cash provided by (used in) operating activities | (39,813) | 74,365 | ||||||||||||
| Cash flows from investing activities: | ||||||||||||||
| Maturities and sales of available-for-sale marketable securities | 11,048 | 4,694 | ||||||||||||
| Purchases of available-for-sale marketable securities | (13,372) | (5,186) | ||||||||||||
| Purchases of property, equipment and software | (12,310) | (6,776) | ||||||||||||
| Investments in technology | — | (448) | ||||||||||||
| Net cash used in investing activities | (14,634) | (7,716) | ||||||||||||
| Cash flows from financing activities: | ||||||||||||||
| Issuance of common stock, net of shares withheld for taxes | 560 | 120 | ||||||||||||
| Repurchase of stock to satisfy employee tax withholding obligations | (1,047) | (866) | ||||||||||||
| Repurchase and retirement of common stock | (38,504) | (56,382) | ||||||||||||
| Net cash used in financing activities | (38,991) | (57,128) | ||||||||||||
| Net increase (decrease) in cash and cash equivalents | (93,438) | 9,521 | ||||||||||||
| Cash and cash equivalents at beginning of period | 445,784 | 369,814 | ||||||||||||
| Cash and cash equivalents at end of period | $ | 352,346 | $ | 379,335 | ||||||||||
| Prepared in accordance with Generally Accepted Accounting Principles | ||||||||||||||
| RECONCILIATION BETWEEN GAAP AND NON-GAAP FINANCIAL INFORMATION | ||||||||||||||||||||||||||||||||
| (in thousands; unaudited) | ||||||||||||||||||||||||||||||||
| Free cash flow, a non-GAAP financial measure, is GAAP cash flow from operations (or cash provided by operating activities) less capital expenditures. Capital expenditures include purchases of property, equipment and software as well as investments in technology, as presented within our GAAP Consolidated Condensed Statement of Cash Flows. Free cash flow margin represents free cash flow divided by revenue. | ||||||||||||||||||||||||||||||||
| Twelve Months Ended | Three Months Ended | |||||||||||||||||||||||||||||||
| Jun. 24, | Jun. 24, | Mar. 25, | Dec. 24, | Sep. 24, | ||||||||||||||||||||||||||||
| 2023 | 2023 | 2023 | 2022 | 2022 | ||||||||||||||||||||||||||||
| Q1'24 | Q1'24 | Q4'23 | Q3'23 | Q2'23 | ||||||||||||||||||||||||||||
| Net cash provided by (used in) operating activities (GAAP) | $ | 225,390 | $ | (39,813) | $ | 48,266 | $ | 180,948 | $ | 35,989 | ||||||||||||||||||||||
| Capital expenditures | (41,800) | (12,310) | (11,635) | (7,608) | (10,247) | |||||||||||||||||||||||||||
| Free Cash Flow (Non-GAAP) | $ | 183,590 | $ | (52,123) | $ | 36,631 | $ | 173,340 | $ | 25,742 | ||||||||||||||||||||||
| Cash Flow from Operations as a Percentage of Revenue (GAAP) | 12 | % | (13) | % | 13 | % | 31 | % | 7 | % | ||||||||||||||||||||||
| Capital Expenditures as a Percentage of Revenue (GAAP) | 2 | % | 4 | % | 3 | % | 1 | % | 2 | % | ||||||||||||||||||||||
| Free Cash Flow Margin (Non-GAAP) | 10 | % | (16) | % | 10 | % | 29 | % | 5 | % | ||||||||||||||||||||||

| Q1 FY24 Letter to Shareholders | 2 |
||||
| Q1 FY24 | GAAP | Adj. | Non-GAAP* | ||||||||
| Revenue | $317.0 | $317.0 | |||||||||
| Gross Profit | $159.4 | $0.3 | $159.7 | ||||||||
| Gross Margin | 50.3% | 50.4% | |||||||||
| Operating Expense | $141.6 | ($27.8) | $113.8 | ||||||||
| Operating Income | $17.8 | $28.0 | $45.8 | ||||||||
| Operating Profit | 5.6% | 14.5% | |||||||||
| Interest Income | $4.6 | $4.6 | |||||||||
| Other Income | $0.4 | $0.4 | |||||||||
| Income Tax Expense | $7.2 | $5.6 | $12.8 | ||||||||
| Net Income | $15.6 | $22.4 | $38.0 | ||||||||
| Diluted EPS | $0.28 | $0.39 | $0.67 | ||||||||
| Q1 FY24 Letter to Shareholders | 3 |
||||
| FY19 | FY23 | Future | ||||||
| Q1 FY24 Letter to Shareholders | 4 |
||||
| Q1 FY24 Letter to Shareholders | 5 |
||||
| Q1 FY24 Letter to Shareholders | 6 |
||||
| Q1 FY24 Letter to Shareholders | 7 |
||||
| Q1 FY24 Letter to Shareholders | 8 |
||||
 |
John Forsyth
President &
Chief Executive Officer
|
 |
Venk Nathamuni
Chief Financial Officer
|
||||||||
| Q1 FY24 Letter to Shareholders | 9 |
||||
| Q1 FY24 Letter to Shareholders | 10 |
||||
| Q1 FY24 Letter to Shareholders | 11 |
||||
| Three Months Ended | |||||||||||||||||
| Jun. 24, 2023 |
Mar. 25, 2023 |
Jun. 25, 2022 |
|||||||||||||||
| Q1'24 | Q4'23 | Q1'23 | |||||||||||||||
| Audio | $ | 195,806 | $ | 232,402 | $ | 254,496 | |||||||||||
| High-Performance Mixed-Signal | 121,210 | 140,420 | 139,143 | ||||||||||||||
| Net sales | 317,016 | 372,822 | 393,639 | ||||||||||||||
| Cost of sales | 157,629 | 186,468 | 191,005 | ||||||||||||||
| Gross profit | 159,387 | 186,354 | 202,634 | ||||||||||||||
| Gross margin | 50.3 | % | 50.0 | % | 51.5 | % | |||||||||||
| Research and development | 106,215 | 115,162 | 109,716 | ||||||||||||||
| Selling, general and administrative | 35,379 | 37,642 | 38,642 | ||||||||||||||
| Lease impairments and restructuring | — | 10,632 | — | ||||||||||||||
| Intangibles impairment | — | 85,760 | — | ||||||||||||||
| Total operating expenses | 141,594 | 249,196 | 148,358 | ||||||||||||||
| Income (loss) from operations | 17,793 | (62,842) | 54,276 | ||||||||||||||
| Interest income (expense) | 4,600 | 4,720 | 305 | ||||||||||||||
| Other income (expense) | 377 | (464) | 506 | ||||||||||||||
| Income (loss) before income taxes | 22,770 | (58,586) | 55,087 | ||||||||||||||
| Provision for income taxes | 7,170 | (4,917) | 15,380 | ||||||||||||||
| Net income (loss) | $ | 15,600 | $ | (53,669) | $ | 39,707 | |||||||||||
| Basic earnings (loss) per share | $ | 0.28 | $ | (0.97) | $ | 0.71 | |||||||||||
| Diluted earnings (loss) per share: | $ | 0.28 | $ | (0.97) | $ | 0.69 | |||||||||||
| Weighted average number of shares: | |||||||||||||||||
| Basic | 54,862 | 55,219 | 56,277 | ||||||||||||||
| Diluted | 56,631 | 55,219 | 57,804 | ||||||||||||||
| Q1 FY24 Letter to Shareholders | 12 |
||||
| Three Months Ended | |||||||||||||||||
| Jun. 24, 2023 |
Mar. 25, 2023 |
Jun. 25, 2022 |
|||||||||||||||
| Net Income (Loss) Reconciliation | Q1'24 | Q4'23 | Q1'23 | ||||||||||||||
| GAAP Net Income (Loss) | $ | 15,600 | $ | (53,669) | $ | 39,707 | |||||||||||
| Amortization of acquisition intangibles | 2,170 | 7,657 | 7,835 | ||||||||||||||
| Stock-based compensation expense | 22,715 | 22,533 | 18,138 | ||||||||||||||
| Lease impairments and restructuring | — | 10,632 | — | ||||||||||||||
| Intangibles impairment | — | 85,760 | — | ||||||||||||||
| Acquisition-related costs | 3,166 | 3,166 | 3,164 | ||||||||||||||
| Adjustment to income taxes | (5,628) | (23,461) | (4,300) | ||||||||||||||
| Non-GAAP Net Income | $ | 38,023 | $ | 52,618 | $ | 64,544 | |||||||||||
| Earnings (Loss) Per Share Reconciliation | |||||||||||||||||
| GAAP Diluted earnings (loss) per share | $ | 0.28 | $ | (0.97) | $ | 0.69 | |||||||||||
| Effect of Amortization of acquisition intangibles | 0.04 | 0.14 | 0.14 | ||||||||||||||
| Effect of Stock-based compensation expense | 0.40 | 0.40 | 0.31 | ||||||||||||||
| Effect of Lease impairments and restructuring | — | 0.19 | — | ||||||||||||||
| Effect of Intangibles impairment | — | 1.51 | — | ||||||||||||||
| Effect of Acquisition-related costs | 0.05 | 0.06 | 0.05 | ||||||||||||||
| Effect of Adjustment to income taxes | (0.10) | (0.41) | (0.07) | ||||||||||||||
| Non-GAAP Diluted earnings per share | $ | 0.67 | $ | 0.92 | $ | 1.12 | |||||||||||
| Diluted Shares Reconciliation | |||||||||||||||||
| GAAP Diluted shares | 56,631 | 55,219 | 57,804 | ||||||||||||||
| Effect of weighted dilutive shares | — | 1,821 | — | ||||||||||||||
| Non-GAAP Diluted shares | 56,631 | 57,040 | 57,804 | ||||||||||||||
| Operating Income (Loss) Reconciliation | |||||||||||||||||
| GAAP Operating Income (Loss) | $ | 17,793 | $ | (62,842) | $ | 54,276 | |||||||||||
| GAAP Operating Profit (Loss) | 5.6 | % | (16.9) | % | 13.8 | % | |||||||||||
| Amortization of acquisition intangibles | 2,170 | 7,657 | 7,835 | ||||||||||||||
| Stock-based compensation expense - COGS | 285 | 372 | 277 | ||||||||||||||
| Stock-based compensation expense - R&D | 15,952 | 15,782 | 12,592 | ||||||||||||||
| Stock-based compensation expense - SG&A | 6,478 | 6,379 | 5,269 | ||||||||||||||
| Lease impairments and restructuring | — | 10,632 | — | ||||||||||||||
| Intangibles impairment | — | 85,760 | — | ||||||||||||||
| Acquisition-related costs | 3,166 | 3,166 | 3,164 | ||||||||||||||
| Non-GAAP Operating Income | $ | 45,844 | $ | 66,906 | $ | 83,413 | |||||||||||
| Non-GAAP Operating Profit | 14.5 | % | 17.9 | % | 21.2 | % | |||||||||||
| Operating Expense Reconciliation | |||||||||||||||||
| GAAP Operating Expenses | $ | 141,594 | $ | 249,196 | $ | 148,358 | |||||||||||
| Amortization of acquisition intangibles | (2,170) | (7,657) | (7,835) | ||||||||||||||
| Stock-based compensation expense - R&D | (15,952) | (15,782) | (12,592) | ||||||||||||||
| Stock-based compensation expense - SG&A | (6,478) | (6,379) | (5,269) | ||||||||||||||
| Lease impairments and restructuring | — | (10,632) | — | ||||||||||||||
| Intangibles impairment | — | (85,760) | — | ||||||||||||||
| Acquisition-related costs | (3,166) | (3,166) | (3,164) | ||||||||||||||
| Non-GAAP Operating Expenses | $ | 113,828 | $ | 119,820 | $ | 119,498 | |||||||||||
| Gross Margin/Profit Reconciliation | |||||||||||||||||
| GAAP Gross Profit | $ | 159,387 | $ | 186,354 | $ | 202,634 | |||||||||||
| GAAP Gross Margin | 50.3 | % | 50.0 | % | 51.5 | % | |||||||||||
| Stock-based compensation expense - COGS | 285 | 372 | 277 | ||||||||||||||
| Non-GAAP Gross Profit | $ | 159,672 | $ | 186,726 | $ | 202,911 | |||||||||||
| Non-GAAP Gross Margin | 50.4 | % | 50.1 | % | 51.5 | % | |||||||||||
| Q1 FY24 Letter to Shareholders | 13 |
||||
| RECONCILIATION BETWEEN GAAP AND NON-GAAP FINANCIAL INFORMATION CONTINUED | |||||||||||||||||
| (in thousands, except per share data; unaudited) | |||||||||||||||||
| (not prepared in accordance with GAAP) | |||||||||||||||||
| Three Months Ended | |||||||||||||||||
| Jun. 24, 2023 |
Mar. 25, 2023 |
Jun. 25, 2022 |
|||||||||||||||
| Effective Tax Rate Reconciliation | Q1'24 | Q4'23 | Q1'23 | ||||||||||||||
| GAAP Tax Expense (Benefit) | $ | 7,170 | $ | (4,917) | $ | 15,380 | |||||||||||
| GAAP Effective Tax Rate | 31.5 | % | 8.4 | % | 27.9 | % | |||||||||||
| Adjustments to income taxes | 5,628 | 23,461 | 4,300 | ||||||||||||||
| Non-GAAP Tax Expense | $ | 12,798 | $ | 18,544 | $ | 19,680 | |||||||||||
| Non-GAAP Effective Tax Rate | 25.2 | % | 26.1 | % | 23.4 | % | |||||||||||
| Tax Impact to EPS Reconciliation | |||||||||||||||||
| GAAP Tax Expense (Benefit) | $ | 0.13 | $ | (0.09) | $ | 0.27 | |||||||||||
| Adjustments to income taxes | 0.10 | 0.41 | 0.07 | ||||||||||||||
| Non-GAAP Tax Expense | $ | 0.23 | $ | 0.32 | $ | 0.34 | |||||||||||
| Q1 FY24 Letter to Shareholders | 14 |
||||
| Jun. 24, 2023 |
Mar. 25, 2023 |
Jun. 25, 2022 |
|||||||||||||||
| ASSETS | |||||||||||||||||
| Current assets | |||||||||||||||||
| Cash and cash equivalents | $ | 352,346 | $ | 445,784 | $ | 379,335 | |||||||||||
| Marketable securities | 35,765 | 34,978 | 18,397 | ||||||||||||||
| Accounts receivable, net | 186,033 | 150,473 | 206,272 | ||||||||||||||
| Inventories | 300,956 | 233,450 | 174,370 | ||||||||||||||
| Prepaid wafers | 84,739 | 60,638 | — | ||||||||||||||
| Other current assets | 88,829 | 92,533 | 82,634 | ||||||||||||||
| Total current Assets | 1,048,668 | 1,017,856 | 861,008 | ||||||||||||||
| Long-term marketable securities | 38,029 | 36,509 | 55,965 | ||||||||||||||
| Right-of-use lease assets | 125,538 | 128,145 | 168,680 | ||||||||||||||
| Property and equipment, net | 167,238 | 162,972 | 157,165 | ||||||||||||||
| Intangibles, net | 36,447 | 38,876 | 149,984 | ||||||||||||||
| Goodwill | 435,936 | 435,936 | 435,936 | ||||||||||||||
| Deferred tax asset | 44,991 | 35,580 | 16,928 | ||||||||||||||
| Long-term prepaid wafers | 110,262 | 134,363 | 195,000 | ||||||||||||||
| Other assets | 49,483 | 73,729 | 65,236 | ||||||||||||||
| Total assets | $ | 2,056,592 | $ | 2,063,966 | $ | 2,105,902 | |||||||||||
| LIABILITIES AND STOCKHOLDERS' EQUITY | |||||||||||||||||
| Current liabilities | |||||||||||||||||
| Accounts payable | $ | 75,941 | $ | 81,462 | $ | 121,451 | |||||||||||
| Accrued salaries and benefits | 36,465 | 50,606 | 41,026 | ||||||||||||||
| Lease liability | 19,903 | 18,442 | 13,988 | ||||||||||||||
| Acquisition-related liabilities | 24,527 | 21,361 | 30,964 | ||||||||||||||
| Other accrued liabilities | 46,018 | 44,469 | 45,167 | ||||||||||||||
| Total current liabilities | 202,854 | 216,340 | 252,596 | ||||||||||||||
| Non-current lease liability | 125,071 | 122,631 | 159,344 | ||||||||||||||
| Non-current income taxes | 59,587 | 59,013 | 73,735 | ||||||||||||||
| Long-term acquisition-related liabilities | — | — | 11,856 | ||||||||||||||
| Other long-term liabilities | 12,286 | 7,700 | 9,184 | ||||||||||||||
| Total long-term liabilities | 196,944 | 189,344 | 254,119 | ||||||||||||||
| Stockholders' equity: | |||||||||||||||||
| Capital stock | 1,693,420 | 1,670,141 | 1,596,684 | ||||||||||||||
| Accumulated earnings (deficit) | (33,621) | (9,320) | 5,894 | ||||||||||||||
| Accumulated other comprehensive loss | (3,005) | (2,539) | (3,391) | ||||||||||||||
| Total stockholders' equity | 1,656,794 | 1,658,282 | 1,599,187 | ||||||||||||||
| Total liabilities and stockholders' equity | $ | 2,056,592 | $ | 2,063,966 | $ | 2,105,902 | |||||||||||
| Q1 FY24 Letter to Shareholders | 15 |
||||
| Three Months Ended | |||||||||||
| Jun. 24, | Jun. 25, | ||||||||||
| 2023 | 2022 | ||||||||||
| Q1'24 | Q1'23 | ||||||||||
| Cash flows from operating activities: | |||||||||||
| Net income | $ | 15,600 | $ | 39,707 | |||||||
| Adjustments to reconcile net income to net cash provided by (used in) operating activities: | |||||||||||
| Depreciation and amortization | 11,941 | 16,515 | |||||||||
| Stock-based compensation expense | 22,715 | 18,138 | |||||||||
| Deferred income taxes | (9,411) | (5,860) | |||||||||
| Loss on retirement or write-off of long-lived assets | 6 | 292 | |||||||||
| Other non-cash charges | 1,334 | 99 | |||||||||
| Net change in operating assets and liabilities: | |||||||||||
| Accounts receivable, net | (35,560) | 33,992 | |||||||||
| Inventories | (67,506) | (35,934) | |||||||||
| Other assets | 8,101 | 549 | |||||||||
| Accounts payable and other accrued liabilities | (10,278) | (20,327) | |||||||||
| Income taxes payable | 20,079 | 24,030 | |||||||||
| Acquisition-related liabilities | 3,166 | 3,164 | |||||||||
| Net cash provided by (used in) operating activities | (39,813) | 74,365 | |||||||||
| Cash flows from investing activities: | |||||||||||
| Maturities and sales of available-for-sale marketable securities | 11,048 | 4,694 | |||||||||
| Purchases of available-for-sale marketable securities | (13,372) | (5,186) | |||||||||
| Purchases of property, equipment and software | (12,310) | (6,776) | |||||||||
| Investments in technology | — | (448) | |||||||||
| Net cash used in investing activities | (14,634) | (7,716) | |||||||||
| Cash flows from financing activities: | |||||||||||
| Issuance of common stock, net of shares withheld for taxes | 560 | 120 | |||||||||
| Repurchase of stock to satisfy employee tax withholding obligations | (1,047) | (866) | |||||||||
| Repurchase and retirement of common stock | (38,504) | (56,382) | |||||||||
| Net cash used in financing activities | (38,991) | (57,128) | |||||||||
| Net increase (decrease) in cash and cash equivalents | (93,438) | 9,521 | |||||||||
| Cash and cash equivalents at beginning of period | 445,784 | 369,814 | |||||||||
| Cash and cash equivalents at end of period | $ | 352,346 | $ | 379,335 | |||||||
| Q1 FY24 Letter to Shareholders | 16 |
||||
| Twelve Months Ended | Three Months Ended | ||||||||||||||||||||||||||||
| Jun. 24, | Jun. 24, | Mar. 25, | Dec. 24, | Sep. 24, | |||||||||||||||||||||||||
| 2023 | 2023 | 2023 | 2022 | 2022 | |||||||||||||||||||||||||
| Q1'24 | Q1'24 | Q4'23 | Q3'23 | Q2'23 | |||||||||||||||||||||||||
| Net cash provided by (used in) operating activities (GAAP) | $ | 225,390 | $ | (39,813) | $ | 48,266 | $ | 180,948 | $ | 35,989 | |||||||||||||||||||
| Capital expenditures | (41,800) | (12,310) | (11,635) | (7,608) | (10,247) | ||||||||||||||||||||||||
| Free Cash Flow (Non-GAAP) | $ | 183,590 | $ | (52,123) | $ | 36,631 | $ | 173,340 | $ | 25,742 | |||||||||||||||||||
| Cash Flow from Operations as a Percentage of Revenue (GAAP) | 12 | % | (13) | % | 13 | % | 31 | % | 7 | % | |||||||||||||||||||
| Capital Expenditures as a Percentage of Revenue (GAAP) | 2 | % | 4 | % | 3 | % | 1 | % | 2 | % | |||||||||||||||||||
| Free Cash Flow Margin (Non-GAAP) | 10 | % | (16) | % | 10 | % | 29 | % | 5 | % | |||||||||||||||||||
| Q1 FY24 Letter to Shareholders | 17 |
||||