Document
Management’s Discussion and Analysis
FOR THE THREE MONTHS ENDED MARCH 31, 2023
|
|
|
|
|
|
|
Management Discussion and Analysis |
For the three months ended March 31, 2023 and 2022
(tabular amounts are in millions of U.S. dollars and thousands of shares, options,
and warrants except per share amounts and per ounce amounts, unless otherwise noted) |
|
|
|
|
|
|
| TABLE OF CONTENTS |
|
|
|
|
|
|
|
|
|
|
|
|
|
|
|
|
|
|
|
|
|
|
|
|
|
|
|
|
|
|
|
|
|
|
|
Disclosure Controls and Procedures and Technical Information |
|
|
|
|
|
|
|
|
|
|
|
|
|
PAN AMERICAN SILVER CORP. |
1 |
|
|
|
|
|
|
|
Management Discussion and Analysis |
For the three months ended March 31, 2023 and 2022
(tabular amounts are in millions of U.S. dollars and thousands of shares, options,
and warrants except per share amounts and per ounce amounts, unless otherwise noted) |
MANAGEMENT’S DISCUSSION AND ANALYSIS OF FINANCIAL CONDITION
AND RESULTS OF OPERATIONS
May 10, 2023
This Management’s Discussion and Analysis (“MD&A”) is intended to help the reader understand the significant factors that influence the performance of Pan American Silver Corp. and its subsidiaries (collectively “Pan American”, “we”, “us”, “our” or the “Company”) and such factors that may affect its future performance. This MD&A should be read in conjunction with the Company’s audited consolidated financial statements for the year ended December 31, 2022 (the “2022 Annual Financial Statements”), and the related notes contained therein, and the unaudited condensed interim consolidated financial statements for the three months ended March 31, 2023 (the “Q1 2023 Financial Statements”), and the related notes contained therein. All amounts in this MD&A, the 2022 Annual Financial Statements, and the Q1 2023 Financial Statements are expressed in United States dollars (“USD”) unless identified otherwise. The Company reports its financial position, financial performance and cash flows in accordance with International Financial Reporting Standards (“IFRS”), as issued by the International Accounting Standards Board (“IASB”). Pan American’s accounting policies are set out in Note 3 of the 2022 Annual Financial Statements.
This MD&A refers to various non-Generally Accepted Accounting Principles (“non-GAAP”) measures, such as “all-in sustaining costs per ounce sold”, “cash costs per ounce sold”, “adjusted earnings” and “basic adjusted earnings per share”, “total debt”, “capital”, and “working capital”, which are used by the Company to manage and evaluate operating performance at each of the Company’s mines and are widely reported in the mining industry as benchmarks for performance, do not have standardized meanings under IFRS, and the methodology by which these measures are calculated may differ from similar measures reported by other companies. To facilitate a better understanding of these non-GAAP measures as calculated by the Company, additional information has been provided in this MD&A. Please refer to the section of this MD&A entitled “Alternative Performance (Non-GAAP) Measures” for a detailed description of “all-in sustaining costs per ounce sold”, “cash costs per ounce sold”, “adjusted earnings” and “basic adjusted earnings per share”, “total debt”, “capital”, and “working capital” as well as details of the Company’s by-product credits and a reconciliation, where appropriate, of these measures to the Q1 2023 Financial Statements.
Any reference to “cash costs” in this MD&A should be understood to mean cash costs per ounce of silver or gold sold, net of by-product credits. Any reference to “AISC” in this MD&A should be understood to mean all-in sustaining costs per silver or gold ounce sold, net of by-product credits.
Except for historical information contained in this MD&A, the following disclosures are forward-looking statements within the meaning of the U.S. Private Securities Litigation Reform Act of 1995 and forward-looking information within the meaning of applicable Canadian provincial securities laws, or are future oriented financial information and as such, are based on an assumed set of economic conditions and courses of action. Please refer to the cautionary note regarding forward-looking statements and information at the back of this MD&A, the “Risks Related to Pan American’s Business” contained in the Company’s most recent Annual Information Form on file with the Canadian provincial securities regulatory authorities and Form 40-F on file with the U.S. Securities and Exchange Commission (the “SEC”), and the “Risks of the Business” in Yamana Gold Inc.'s most recent Annual Information Form on file with the Canadian provincial securities regulatory authorities and Form 40-F on file with the SEC. Additional information about Pan American and its business activities, including its Annual Information Form, is available on SEDAR at www.sedar.com.
|
|
|
|
|
|
|
|
|
|
PAN AMERICAN SILVER CORP. |
2 |
|
|
|
|
|
|
|
Management Discussion and Analysis |
For the three months ended March 31, 2023 and 2022
(tabular amounts are in millions of U.S. dollars and thousands of shares, options,
and warrants except per share amounts and per ounce amounts, unless otherwise noted) |
CORE BUSINESS AND STRATEGY
Pan American engages in silver and gold mining and related activities, including exploration, mine development, extraction, processing, refining and reclamation. The Company owns and operates silver and gold mines located in Canada, Mexico, Peru, Bolivia, Argentina, Chile and Brazil. We also own the Escobal mine in Guatemala that is currently not operating. In addition, the Company is exploring for new silver deposits and opportunities throughout the Americas. The Company is listed on the Toronto Stock Exchange (Symbol: PAAS) and on the New York Stock Exchange (Symbol: PAAS).
Pan American’s vision is to be the world’s premier silver mining company, with a reputation for excellence in discovery, engineering, innovation and sustainable development. To achieve this vision, we base our business on the following strategy:
•Generate sustainable profits and superior returns on investments through the safe, efficient and environmentally sound development and operation of our assets.
•Constantly replace and grow our mineral reserves and mineral resources through targeted near-mine exploration and global business development.
•Foster positive long-term relationships with our employees, shareholders, communities and local governments through open and honest communication and ethical and sustainable business practices.
•Continually search for opportunities to upgrade and improve the quality of our assets, both internally and through acquisition.
•Encourage our employees to be innovative, responsive and entrepreneurial throughout our entire organization.
To execute this strategy, Pan American has assembled a sector-leading team of mining professionals with a depth of knowledge and experience in all aspects of our business, which enables the Company to confidently advance early stage projects through construction and into operation.
|
|
|
|
|
|
|
|
|
|
PAN AMERICAN SILVER CORP. |
3 |
|
|
|
|
|
|
|
Management Discussion and Analysis |
For the three months ended March 31, 2023 and 2022
(tabular amounts are in millions of U.S. dollars and thousands of shares, options,
and warrants except per share amounts and per ounce amounts, unless otherwise noted) |
Acquisition of Yamana Gold Inc. ("Yamana")
On March 31, 2023, the Company completed the previously announced transaction whereby Pan American acquired all of the issued and outstanding shares of Yamana (the "Acquisition"), following the sale by Yamana of its Canadian assets to Agnico Eagle Mines Limited, including the Canadian Malartic mine. Yamana was a mid-tier publicly traded precious metals mining company with ownership interests in a diverse portfolio of mines and projects including the following principal mines: Jacobina in Brazil; El Peñon and Minera Florida in Chile; and Cerro Moro in Argentina (together the "Acquired Operations"), as well as the Minera Agua Rica Alumbrera project ("MARA Project") in Argentina.
Given the timing of the Acquisition close, the Acquisition had limited impact on the Q1 2023 results. All production and operating results (including Cash Costs and AISC amounts) reported in this MD&A reflect only the original Pan American assets. As such, the 2023 operating outlook includes the results from the Acquired Operations only from March 31, 2023 onwards. Further details of the Acquisition are provided in the "Yamana Acquisition" section of this MD&A.
Operations
Silver production of 3.89 million ounces
Consolidated silver production for the three months ended March 31, 2023 ("Q1 2023") was 3.89 million ounces compared with 4.62 million ounces in the three months ended March 31, 2022 ("Q1 2022"). While production increased at all the Silver Segment mines quarter-over-quarter, most notably at San Vicente, the placement of Morococha and Manantial Espejo on care and maintenance resulted in an overall decline in consolidated silver production, as expected. Morococha was placed on care and maintenance in February 2022 and Manantial Espejo completed mining activities at the end of 2022 with limited processing activities completed in January 2023.
Gold production of 122.7 thousand ounces
Consolidated gold production for Q1 2023 was 122.7 thousand ounces compared with 131.0 thousand ounces in Q1 2022 . This quarter-over-quarter variance was due to lower stacked tonnes and the timing of leach sequencing at Dolores, as well as expected lower production from Manantial Espejo being placed on care and maintenance.
Base metal production
Zinc, lead and copper ("base metal") production in Q1 2023 was 10.6 thousand tonnes, 5.3 thousand tonnes, and 1.2 thousand tonnes, respectively. Zinc and lead production increased relative to Q1 2022 due to higher production at La Colorada, Huaron and San Vicente, which more than offset the loss in production resulting from Morococha being placed on care and maintenance. Lower copper production was attributable to mine sequencing at Huaron moving from copper ore zones to lead ore zones, as well as the cessation of mining activities at Morococha.
Financial
Revenue and net income
Revenue in Q1 2023 of $390.3 million was 11% lower than in Q1 2022 as a result of the anticipated reduction in production resulting in a $35.1 million decrease in quantities of metal sold, $12.6 million in lower precious metals prices, and $3.8 million increase in negative settlement adjustments on open concentrate shipments, partially offset by $1.9 million in lower treatment and refining charges due to Morococha being on care and maintenance since February 2022.
|
|
|
|
|
|
|
|
|
|
PAN AMERICAN SILVER CORP. |
4 |
|
|
|
|
|
|
|
Management Discussion and Analysis |
For the three months ended March 31, 2023 and 2022
(tabular amounts are in millions of U.S. dollars and thousands of shares, options,
and warrants except per share amounts and per ounce amounts, unless otherwise noted) |
The decreased revenue from quantities of metal sold largely reflects lower silver and gold produced, primarily due to Morococha being placed in care and maintenance in February 2022, Manantial Espejo having limited processing activities in January 2023 following completion of mining activities at the end of 2022, and lower production at Dolores due to lower throughput and the timing of leach sequencing.
Net earnings of $16.5 million, or $0.08 basic earnings per share, was recorded for Q1 2023, compared with net earnings of $76.8 million, or $0.36 basic earnings per share in Q1 2022. The quarter-over-quarter change is largely related to the prior period benefiting from a $44.6 million one-time gain due to the re-designation of the Company's investment in Maverix Metals Inc. ("Maverix") from an "Investment in Associate" to a "long-term financial asset", while the current period reflects $18.9 million of transaction and integration costs related to the Acquisition. These factors more than offset the $10.4 million increase in mine operating earnings in Q1 2023 over Q1 2022.
See the "Overview of Q1 2023 Financial Results" section of this MD&A for further information.
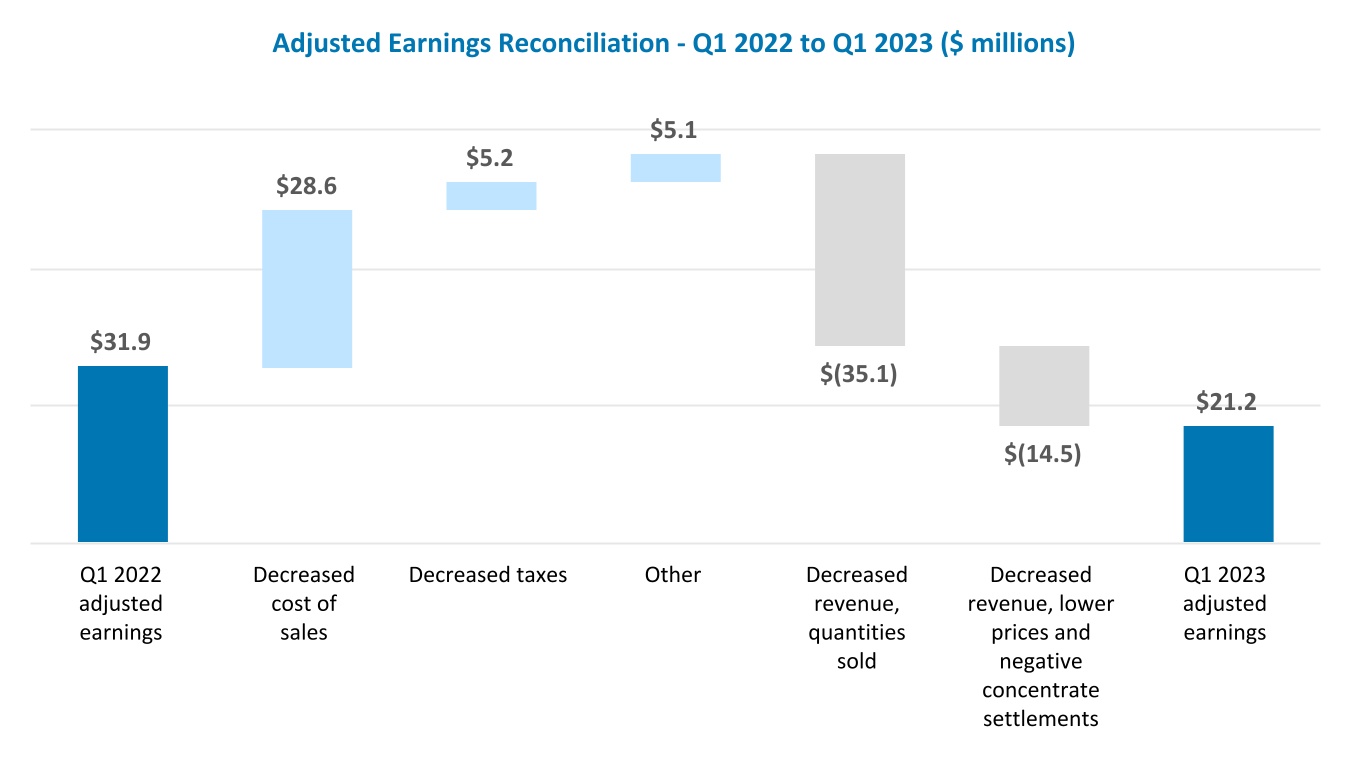
Adjusted earnings(1) was $21.2 million, or $0.10 adjusted earnings per share, in Q1 2023, compared to adjusted earnings of $31.9 million, or $0.15 basic adjusted earnings per share in Q1 2022.
Cash Flow, liquidity and working capital position
Cash flow from operations: The Company generated $51.3 million in Q1 2023, compared to $68.8 million generated in Q1 2022. In addition to inflationary pressures across the asset portfolio, which offset the lower production costs from Morococha and Manantial Espejo, the decrease was primarily driven by:
i.$49.6 million from decreased revenue, as described above;
ii.$18.9 million incurred in transaction costs related to the Acquisition; and,
iii.$12.3 million from increased care and maintenance costs, largely attributable to Morococha.
These factors were partially offset by:
i.$27.6 million reduction in income taxes paid; and,
ii.$22.8 million positive variance from changes in working capital accounts, largely from trade and other receivable draw-downs net of accounts payable draw-downs.
As at March 31, 2023, the Company had working capital of $826.6 million, inclusive of cash and short-term investments of $513.1 million, and $425.0 million available under its $750.0 million revolving Sustainability-Linked Credit Facility ("SL-Credit Facility"). Total debt of $1,187.0 million is related to, the SL-Credit Facility, construction loans and leases and two senior notes Pan American assumed through the Acquisition: $500 million due in 2031 with a coupon of 2.63% and $283 million due in 2027 with a coupon of 4.625%.
Cash Costs(1)
During Q1 2023, inflationary pressures moderated relative to that experienced during 2022; however, when comparing costs relative to Q1 2022, all operations were negatively impacted by inflationary pressures, mainly reflecting increased prices for diesel and certain consumables, including cyanide, explosives, and steel products (such as grinding media). We are also experiencing indirect cost increases in other supplies and services due to the inflationary impact of diesel and consumable prices on third-party suppliers.
Silver Segment Cash Costs per ounce in Q1 2023 of $12.19 were $1.96 higher than the $10.23 in Q1 2022. The increase in quarter-over-quarter Cash Costs is driven primarily by:
i.a $2.26 per ounce increase at La Colorada, largely from inflationary pressures and lower silver grades;
ii.a $0.95 per ounce increase at Huaron, largely from inflationary pressures and lower by-product credits; and,
iii.a $0.65 per ounce increase from the cessation of mining activities at Morococha, which benefited Cash Costs in Q1 2022.
|
|
|
|
|
|
|
|
|
|
PAN AMERICAN SILVER CORP. |
5 |
|
|
|
|
|
|
|
Management Discussion and Analysis |
For the three months ended March 31, 2023 and 2022
(tabular amounts are in millions of U.S. dollars and thousands of shares, options,
and warrants except per share amounts and per ounce amounts, unless otherwise noted) |
These increases were partially offset by a $1.86 per ounce decrease to Silver Segment Cash Costs due to: higher silver and zinc grades and timing of shipments at San Vicente; and higher gold grades at Manantial Espejo.
Gold Segment Cash Costs per ounce in Q1 2023 were $1,120, $51 higher than in Q1 2022, largely reflecting increases at La Arena and Timmins, which was driven by lower gold grades at La Arena and inflationary pressures at both operations.
All-In Sustaining Costs (“AISC”)(1)
Silver Segment AISC for Q1 2023 of $14.13 per ounce were $0.72 higher than Q1 2022. The increase primarily reflects the previously described factors increasing Cash Costs, partially offset by lower sustaining capital, largely from San Vicente and Manantial Espejo.
Gold Segment AISC for Q1 2023 of $1,196 per ounce were $307 lower than Q1 2022. The decrease largely reflects lower sustaining capital at Dolores and La Arena, and a $34.0 million quarter-over-quarter positive variance in cost-decreasing Net Realizable Value ("NRV") adjustments at Dolores, which led to a $259 per ounce decrease in Gold Segment AISC, which more than offset the factors increasing quarter-over-quarter Cash Costs.
(1) Adjusted earnings, Cash Costs, and AISC are non-GAAP measures, please refer to the “Alternative Performance (Non-GAAP) Measures” section of this MD&A for a detailed reconciliation of these measures to the Q1 2023 Financial Statements.
On March 31, 2023, the Company completed the acquisition of 100% of the issued and outstanding shares of Yamana for consideration of 153.8 million Pan American common shares which were valued at $2.8 billion based on the closing price of the shares on March 30, 2023.
As a result of the Acquisition, the Company received $259.5 million in cash and cash equivalents from Yamana. After this share issuance, Pan American shareholders owned approximately 58%, while former Yamana shareholders owned approximately 42%, of the shares of the combined company. The Company began consolidating the operating results, cash flows and net assets of Yamana from March 31, 2023 onwards.
The Company sought to increase production of silver and gold, expand its mineral reserves, mine life and growth opportunities through the acquisition of Yamana's diverse portfolio of mines and projects including the following principal mines: Jacobina in Brazil; El Peñon and Minera Florida in Chile; Cerro Moro in Argentina; and the MARA Project in Argentina.
As at March 31, 2023, the allocation of the Acquisition purchase price has not been finalized. The Company is continuing its review estimates of mineral properties, plant and equipment, leases, deferred taxes, closure provisions, litigation provisions, non-controlling interests and goodwill but will finalize the allocation of the Acquisition purchase price no later than twelve months after the Acquisition date.
The Company recorded $157.3 million of Acquisition-related costs during the year ended December 31, 2022 and an additional $18.9 million which were expensed during the three months ended March 31, 2023 and were presented as transaction and integration costs.
Total consideration:
|
|
|
|
|
|
|
|
|
Nature of consideration |
Shares
(in millions)
|
Consideration |
Pan American Shares (1) |
153.8 |
|
$ |
2,823.0 |
|
(1)The Pan American Share consideration value is based on an assumed value of $18.36 per share (based on the closing price of the common shares of Pan American on NASDAQ on March 30, 2023).
|
|
|
|
|
|
|
|
|
|
PAN AMERICAN SILVER CORP. |
6 |
|
|
|
|
|
|
|
Management Discussion and Analysis |
For the three months ended March 31, 2023 and 2022
(tabular amounts are in millions of U.S. dollars and thousands of shares, options,
and warrants except per share amounts and per ounce amounts, unless otherwise noted) |
Allocation of the Acquisition purchase price:
|
|
|
|
|
|
Assets acquired |
|
| Cash and cash equivalents |
$ |
259.5 |
|
| Investments |
59.5 |
|
Accounts receivable |
20.4 |
|
| Income tax receivables |
19.4 |
|
Value added tax receivables |
54.0 |
|
Inventories |
242.0 |
|
| Mineral properties, plant and equipment |
5,273.2 |
|
| Other assets |
59.4 |
|
Liabilities assumed |
|
Accounts payable |
(215.2) |
|
Income tax payables |
(34.8) |
|
Provision for closure and decommissioning liabilities |
(238.7) |
|
Litigation provisions |
(34.6) |
|
Lease obligations |
(65.9) |
|
Debt |
(943.1) |
|
Other long-term liabilities |
(59.7) |
|
Deferred taxes |
(1,083.2) |
|
Net assets acquired |
$ |
3,312.2 |
|
Non-controlling interests |
(489.2) |
|
Net assets attributable to Pan American |
$ |
2,823.0 |
|
|
|
|
|
ENVIRONMENTAL, SOCIAL, AND GOVERNANCE (ESG)
Pan American is committed to conducting its business in a responsible and sustainable manner. Our ESG values include: caring for the environment in which we operate; contributing to the long-term development of our host communities; ensuring safe and secure workplaces for our employees; contributing to the welfare of our employees, local communities and governments; and, operating transparently.
Pan American expects to release its 2022 sustainability report (the "Sustainability Report") later in Q2 2023, which will be available on our website at www.panamericansilver.com. The Sustainability Report articulates our vision of sustainability, shares our management approach to sustainable development in the context of our business, discloses environmental, workplace and social performance, including challenges and opportunities, and demonstrates our progress toward our sustainability goals and initiatives. The Sustainability Report is prepared in accordance to the Global Reporting Initiative (GRI) Standards and is aligned with the Sustainability Accounting Standards Board (SASB) Standard. It also contains information in consideration of the Task Force on Climate Related Financial Disclosures (TCFD) reporting framework, which is included in the Climate, Energy, and Greenhouse Gas Emissions section of the Sustainability Report.
In the upcoming 2022 Sustainability Report release, we will focus on the assets that the Company owned in 2022. In the 2023 Pan American Silver sustainability report, we will include information on all former Yamana assets following the Acquisition.
|
|
|
|
|
|
|
|
|
|
PAN AMERICAN SILVER CORP. |
7 |
|
|
|
|
|
|
|
Management Discussion and Analysis |
For the three months ended March 31, 2023 and 2022
(tabular amounts are in millions of U.S. dollars and thousands of shares, options,
and warrants except per share amounts and per ounce amounts, unless otherwise noted) |
Silver and Gold Production
The following table provides silver and gold production at each of Pan American’s operations for the three month periods ended March 31, 2023 and 2022. Each operation’s production variances are further discussed in the “Individual Mine Performance” section of this MD&A.
|
|
|
|
|
|
|
|
|
|
|
|
|
|
|
|
|
|
|
| |
Silver Production
(ounces ‘000s) |
Gold Production
(ounces ‘000s) |
| |
Three months ended
March 31, |
|
Three months ended
March 31, |
|
| |
2023 |
2022 |
|
|
2023 |
2022 |
|
|
| La Colorada |
1,432 |
|
1,419 |
|
|
|
0.7 |
|
0.6 |
|
|
|
| Huaron |
922 |
|
899 |
|
|
|
0.3 |
|
0.2 |
|
|
|
Morococha(1) |
— |
|
324 |
|
|
|
— |
|
0.1 |
|
|
|
San Vicente(2) |
725 |
|
476 |
|
|
|
— |
|
— |
|
|
|
Manantial Espejo(3) |
191 |
|
903 |
|
|
|
1.7 |
|
6.1 |
|
|
|
| Dolores |
544 |
|
518 |
|
|
|
26.5 |
|
34.6 |
|
|
|
Shahuindo |
66 |
|
66 |
|
|
|
38.8 |
|
34.3 |
|
|
|
La Arena |
9 |
|
11 |
|
|
|
20.1 |
|
23.3 |
|
|
|
Timmins |
4 |
|
4 |
|
|
|
34.5 |
|
31.8 |
|
|
|
Total |
3,891 |
|
4,619 |
|
|
|
122.7 |
|
131.0 |
|
|
|
Total Payable Production(4) |
3,632 |
|
4,312 |
|
|
|
122.1 |
|
130.5 |
|
|
|
(1)Morococha data represents Pan American's 92.3% interest in the mine's production. Morococha was placed on care and maintenance in February 2022.
(2)San Vicente data represents Pan American's 95.0% interest in the mine's production.
(3)Mining activities have been completed at Manantial Espejo at the end of 2022, with residual processing completed in January 2023.
(4)Payable production reflects sellable metal after deducting commercial contract metal payable deductions.
Base Metal Production
The following table provides the Company’s base metal production and payable base metal production for the three months ended March 31, 2023 and 2022:
|
|
|
|
|
|
|
|
|
|
|
| |
Base Metal Production |
Three months ended
March 31, |
|
| 2023 |
2022 |
|
|
| Zinc – kt |
10.6 |
|
10.2 |
|
|
|
| Lead – kt |
5.3 |
|
4.7 |
|
|
|
| Copper – kt |
1.2 |
|
1.8 |
|
|
|
|
|
|
|
|
|
|
|
|
|
|
| |
Base Metal Payable Production |
Three months ended
March 31, |
|
| 2023 |
2022 |
|
|
| Zinc – kt |
8.8 |
|
8.5 |
|
|
|
| Lead – kt |
4.9 |
|
4.4 |
|
|
|
| Copper – kt |
0.9 |
|
1.6 |
|
|
|
|
|
|
|
|
|
|
|
|
|
PAN AMERICAN SILVER CORP. |
8 |
|
|
|
|
|
|
|
Management Discussion and Analysis |
For the three months ended March 31, 2023 and 2022
(tabular amounts are in millions of U.S. dollars and thousands of shares, options,
and warrants except per share amounts and per ounce amounts, unless otherwise noted) |
Cash Costs and AISC
The quantification of both Cash Costs and AISC measures is described in detail, and where appropriate reconciled to the Q1 2023 Financial Statements, in the "Alternative (Non-GAAP) Performance Measures" section of this MD&A.
The following table reflects the Cash Costs and AISC net of by-product credits at each of Pan American’s operations for the three months ended March 31, 2023, as compared to the same periods in 2022:
|
|
|
|
|
|
|
|
|
|
|
|
|
|
|
|
|
|
|
|
Cash Costs(1)
($ per ounce)
|
AISC(1)
($ per ounce)
|
Three months ended
March 31, |
|
Three months ended
March 31, |
|
| 2023 |
2022 |
|
|
2023 |
2022 |
|
|
| La Colorada |
15.58 |
|
9.73 |
|
|
|
17.94 |
|
12.19 |
|
|
|
| Huaron |
5.62 |
|
(1.16) |
|
|
|
8.74 |
|
3.49 |
|
|
|
| Morococha |
N/A |
5.68 |
|
|
|
N/A |
7.08 |
|
|
|
| San Vicente |
10.86 |
|
19.39 |
|
|
|
11.58 |
|
23.94 |
|
|
|
| Manantial Espejo |
13.64 |
|
15.42 |
|
|
|
14.35 |
|
18.38 |
|
|
|
Silver Segment Consolidated(2) |
12.19 |
|
10.23 |
|
|
|
14.13 |
|
13.41 |
|
|
|
| Silver Segment Consolidated (Excl. NRV Adjustments) |
12.19 |
|
10.23 |
|
|
|
14.11 |
|
13.08 |
|
|
|
Dolores(3) |
968 |
|
976 |
|
|
|
390 |
|
1,682 |
|
|
|
| Shahuindo |
926 |
|
915 |
|
|
|
1,242 |
|
1,152 |
|
|
|
| La Arena |
1,124 |
|
963 |
|
|
|
1,237 |
|
1,424 |
|
|
|
Timmins |
1,462 |
|
1,414 |
|
|
|
1,725 |
|
1,695 |
|
|
|
Gold Segment Consolidated(2) |
1,120 |
|
1,069 |
|
|
|
1,196 |
|
1,502 |
|
|
|
| Gold Segment Consolidated (Excl. NRV Adjustments) |
1,120 |
|
1,069 |
|
|
|
1,361 |
|
1,409 |
|
|
|
(1)Cash Costs and AISC are non-GAAP measures. Please refer to the “Alternative Performance (Non-GAAP) Measures” section of this MD&A for a detailed description of these measures and where appropriate a reconciliation of the measure to the Q1 2023 Financial Statements.
(2)Silver Segment Cash Costs and AISC are calculated net of credits for realized revenues from all metals other than silver ("silver segment by-product credits"), and are calculated per ounce of silver sold. Gold segment Cash Costs and AISC are calculated net of credits for realized silver revenues ("gold segment by-product credits"), and are calculated per ounce of gold sold.
(3)AISC for Dolores, excluding NRV Adjustments, was $1,164 per ounce for Q1 2023, (Q1 2022: $1,361 per ounce). NRV adjustments included in AISC decreased costs by $775 per ounce for Q1 2023, (Q1 2022: increased by $321 per ounce).
|
|
|
|
|
|
|
|
|
|
PAN AMERICAN SILVER CORP. |
9 |
|
|
|
|
|
|
|
Management Discussion and Analysis |
For the three months ended March 31, 2023 and 2022
(tabular amounts are in millions of U.S. dollars and thousands of shares, options,
and warrants except per share amounts and per ounce amounts, unless otherwise noted) |
Individual Mine Performance
An analysis of performance at each operation in Q1 2023 compared with Q1 2022 follows. The project capital amounts invested in Q1 2023 are further discussed in the "Project Development Update" section of this MD&A.
La Colorada Operation
|
|
|
|
|
|
|
|
|
|
|
| |
Three months ended
March 31, |
|
| |
2023 |
2022 |
|
|
| Ore tonnes mined – kt |
171.3 |
|
138.3 |
|
|
|
| Tonnes milled – kt |
179.9 |
|
138.4 |
|
|
|
| Average silver grade – grams per tonne |
269 |
|
350 |
|
|
|
| Average zinc grade - % |
1.66 |
|
1.83 |
|
|
|
| Average lead grade - % |
0.92 |
|
1.03 |
|
|
|
| Production: |
|
|
|
|
| Silver – koz |
1,432 |
|
1,419 |
|
|
|
| Gold – koz |
0.73 |
|
0.61 |
|
|
|
| Zinc – kt |
2.49 |
|
2.15 |
|
|
|
| Lead – kt |
1.46 |
|
1.19 |
|
|
|
| Copper - kt |
0.12 |
|
— |
|
|
|
| Payable Production |
|
|
|
|
| Silver – koz |
1,350 |
|
1,351 |
|
|
|
| Gold – koz |
0.57 |
|
0.52 |
|
|
|
| Zinc – kt |
2.12 |
|
1.83 |
|
|
|
| Lead – kt |
1.35 |
|
1.11 |
|
|
|
| Copper - kt |
0.06 |
|
— |
|
|
|
Cash Costs - $ per silver ounce(1) |
15.58 |
|
9.73 |
|
|
|
Sustaining capital - $ millions(2) |
3.7 |
|
3.9 |
|
|
|
AISC - $ per silver ounce(1) |
17.94 |
|
12.19 |
|
|
|
| Payable silver sold - koz |
1,629 |
|
1,620 |
|
|
|
(1)Cash Costs and AISC are non-GAAP measures. Please refer to the “Alternative Performance (Non-GAAP) Measures” section of this MD&A for a detailed reconciliation of these measures to cost of sales.
(2)Sustaining capital expenditures exclude $9.2 million of investing activity cash outflows for Q1 2023, (Q1 2022: $8.6 million) related to investment capital incurred on the La Colorada projects, as disclosed in the “Project Development Update” section of this MD&A.
Q1 2023 vs. Q1 2022
Production:
•Silver: 1% increase, reflecting higher throughput, partially offset by lower silver grades. While overall ventilation conditions in the mine have improved, new ventilation challenges were encountered in the high-grade, deep eastern Candelaria zone of the mine during Q1 2023, whereas the ventilation conditions allowed for higher mining rates in this deep eastern zone in Q1 2022.
•By-products: 23% and 16% increase in lead and zinc production, respectively, as a result of higher throughput rates.
Cash Costs: increased by $5.85 per ounce, primarily driven by lower silver grades increasing costs per ounce, as well as inflationary pressures relative to Q1 2022.
Sustaining Capital: comparable quarter-over-quarter, with a reduction in investments in sustaining ventilation infrastructure being offset by higher tailings storage facility expansions and mine deepening projects. The balance of capital expenditures in both periods related to near-mine exploration and mine equipment replacements and refurbishments in both periods.
AISC: increased quarter-over-quarter, as a result of the same factors that affected Cash Costs.
|
|
|
|
|
|
|
|
|
|
PAN AMERICAN SILVER CORP. |
10 |
|
|
|
|
|
|
|
Management Discussion and Analysis |
For the three months ended March 31, 2023 and 2022
(tabular amounts are in millions of U.S. dollars and thousands of shares, options,
and warrants except per share amounts and per ounce amounts, unless otherwise noted) |
Huaron Operation
|
|
|
|
|
|
|
|
|
|
|
| |
Three months ended
March 31, |
|
| |
2023 |
2022 |
|
|
| Ore tonnes mined – kt |
238.3 |
|
237.8 |
|
|
|
| Tonnes milled – kt |
237.6 |
|
234.9 |
|
|
|
| Average silver grade – grams per tonne |
144 |
|
143 |
|
|
|
| Average zinc grade - % |
2.76 |
|
2.22 |
|
|
|
| Average lead grade - % |
1.81 |
|
1.40 |
|
|
|
| Average copper grade - % |
— |
|
0.70 |
|
|
|
| Production: |
|
|
|
|
| Silver – koz |
922 |
|
899 |
|
|
|
| Gold – koz |
0.27 |
|
0.24 |
|
|
|
| Zinc – kt |
5.16 |
|
4.05 |
|
|
|
| Lead – kt |
3.65 |
|
2.58 |
|
|
|
| Copper – kt |
0.91 |
|
1.22 |
|
|
|
| Payable Production: |
|
|
|
|
| Silver – koz |
810 |
|
740 |
|
|
|
| Gold – koz |
0.03 |
|
0.05 |
|
|
|
| Zinc – kt |
4.27 |
|
3.34 |
|
|
|
| Lead – kt |
3.44 |
|
2.43 |
|
|
|
| Copper – kt |
0.81 |
|
1.10 |
|
|
|
Cash Costs - $ per silver ounce(1) |
5.62 |
|
(1.16) |
|
|
|
| Sustaining capital - $ millions |
2.3 |
|
3.1 |
|
|
|
AISC-$ per silver ounce(1) |
8.74 |
|
3.49 |
|
|
|
| Payable silver sold – koz |
831 |
|
720 |
|
|
|
(1)Cash Costs and AISC are non-GAAP measures. Please refer to the “Alternative Performance (Non-GAAP) Measures” section of this MD&A for a detailed reconciliation of these measures to cost of sales.
(2)Sustaining capital expenditures exclude $1.1 million investing activity cash outflows for Q1 2023, (Q1 2022: $nil million) related to investment capital incurred on the Huaron Projects, as disclosed in the “Project Development Update” section of this MD&A.
Q1 2023 vs. Q1 2022
Production:
•Silver: 3% higher, from a combination of higher throughput, grades and recoveries.
•By-products: lead and zinc production were 41% and 28% higher, respectively, while copper was 25% lower, all due to mine sequencing.
Cash Costs: increased $6.77 per ounce, primarily due to lower by-product credits per ounce from lower base metal prices and lower copper production, as well as the impact from inflationary pressures relative to Q1 2022.
Sustaining Capital: was lower than Q1 2022 due to decreased spending on mine equipment replacements and refurbishments, and on tailings facility expansions. The balance of Q1 2023 capital spending related to equipment and facility leases, and mine ventilation infrastructure.
AISC: increased $5.24 as a result of the same factors that affected Cash Costs, partially offset by lower sustaining capital per ounce.
|
|
|
|
|
|
|
|
|
|
PAN AMERICAN SILVER CORP. |
11 |
|
|
|
|
|
|
|
Management Discussion and Analysis |
For the three months ended March 31, 2023 and 2022
(tabular amounts are in millions of U.S. dollars and thousands of shares, options,
and warrants except per share amounts and per ounce amounts, unless otherwise noted) |
Dolores Operation
|
|
|
|
|
|
|
|
|
|
|
| |
Three months ended
March 31, |
|
| |
2023 |
2022 |
|
|
| Ore tonnes mined – kt |
2,598.7 |
|
1,532.6 |
|
|
|
| Waste tonnes mined – kt |
4,109.3 |
|
6,317.1 |
|
|
|
| Tonnes placed – kt |
1,821.7 |
|
2,002.2 |
|
|
|
| Average silver grade – grams per tonne |
18 |
|
14 |
|
|
|
| Average gold grade – grams per tonne |
0.61 |
|
0.63 |
|
|
|
| Production: |
|
|
|
|
| Silver – koz |
544 |
|
518 |
|
|
|
| Gold – koz |
26.5 |
|
34.6 |
|
|
|
| Payable Production: |
|
|
|
|
| Silver – koz |
543 |
|
517 |
|
|
|
| Gold – koz |
26.4 |
|
34.5 |
|
|
|
Cash Costs - $ per gold ounce(1) |
968 |
|
976 |
|
|
|
Sustaining capital - $ millions |
3.3 |
|
14.4 |
|
|
|
AISC - $ per gold ounce(1)(2) |
390 |
|
1,682 |
|
|
|
| Payable gold sold - koz |
27.0 |
|
40.8 |
|
|
|
(1)Cash Costs and AISC are non-GAAP measures. Please refer to the “Alternative Performance (Non-GAAP) Measures” section of this MD&A for a detailed reconciliation of these measures to cost of sales.
(2)AISC excluding NRV Adjustments is $1,164 per ounce for Q1 2023, (Q1 2022: $1,361). NRV adjustments included in AISC decreased costs by $775 for Q1 2023, (Q1 2022: $321 increase).
Q1 2023 vs. Q1 2022
Production:
•Silver: 5% higher, primarily from mine sequencing into higher silver grade ores, partially offset by a lower ratio of silver ounces produced to ounces stacked from leach sequencing and lower tonnes stacked due to a temporary 7-day operation suspension while negotiating local service contracts to adjust for the anticipated depletion of reserves in late 2024.
•Gold: 23% lower, primarily from a lower ratio of gold ounces recovered to ounces stacked from leach sequencing and the lower tonnes stacked.
Cash Costs: decreased $8 per ounce, primarily due to higher silver by-product credits per ounce and lower costs from the cessation of underground mining activities, which were partially offset by inflationary pressures relative to Q1 2022.
Sustaining Capital: was lower than Q1 2022, largely due to a reduction in expenditures on capitalized deferred stripping. The balance of Q1 2023 capital spending related to heap leach pad expansions, and mine equipment replacements and refurbishments in Q1 2023.
AISC: decreased $1,292 per ounce, primarily due to the impact of NRV inventory adjustments, in addition to lower sustaining capital. The NRV inventory adjustments decreased costs by $34.0 million, or $1,095 per ounce, in Q1 2023 relative to Q1 2022.
|
|
|
|
|
|
|
|
|
|
PAN AMERICAN SILVER CORP. |
12 |
|
|
|
|
|
|
|
Management Discussion and Analysis |
For the three months ended March 31, 2023 and 2022
(tabular amounts are in millions of U.S. dollars and thousands of shares, options,
and warrants except per share amounts and per ounce amounts, unless otherwise noted) |
Shahuindo Operation
|
|
|
|
|
|
|
|
|
|
|
| |
Three months ended
March 31, |
|
| |
2023 |
2022 |
|
|
| Ore tonnes mined – kt |
2,782.8 |
|
3,211.5 |
|
|
|
| Waste tonnes mined – kt |
3,559.7 |
|
4,314.2 |
|
|
|
| Tonnes placed – kt |
2,789.6 |
|
3,327.2 |
|
|
|
| Average silver grade – grams per tonne |
7 |
|
6 |
|
|
|
| Average gold grade – grams per tonne |
0.52 |
|
0.41 |
|
|
|
| Production: |
|
|
|
|
| Silver – koz |
66 |
|
66 |
|
|
|
| Gold – koz |
38.8 |
|
34.3 |
|
|
|
| Payable Production: |
|
|
|
|
| Silver – koz |
66 |
|
65 |
|
|
|
| Gold – koz |
38.8 |
|
34.2 |
|
|
|
Cash Costs - $ per gold ounce(1) |
926 |
|
915 |
|
|
|
Sustaining capital - $ millions(2) |
12.5 |
|
7.4 |
|
|
|
AISC - $ per gold ounce(1) |
1,242 |
|
1,152 |
|
|
|
| Payable gold sold - koz |
42.3 |
|
33.8 |
|
|
|
(1)Cash Costs and AISC are non-GAAP measures. Please refer to the “Alternative Performance (Non-GAAP) Measures” section of this MD&A for a detailed reconciliation of these measures to cost of sales.
(2)Sustaining capital expenditures exclude $0.2 million of investing activity cash outflows for Q1 2023, (Q1 2022: $0.2 million) related to lease payments for the crushing and agglomeration plant, and is included in Other Projects, as disclosed in the “Project Development Update” section of this MD&A.
Q1 2023 vs. Q1 2022
Production:
•Gold: 13% higher, primarily due to mine sequencing into higher gold grades and a higher ratio of ounces recovered to ounces stacked from leach sequencing, which offset the decrease in tonnes stacked.
Cash Costs: were $11 per ounce higher, primarily due to lower by-product credits per ounce of gold sold and higher operating costs from inflationary pressures relative to Q1 2022, which were partially offset by higher gold grades.
Sustaining Capital: increased relative to Q1 2022 expenditures, primarily driven by construction of a mine water treatment plant, waste dump preparation and increased expenditures for heap leach pad expansions, partially offset by lower expenditures for mine equipment replacements and refurbishments.
AISC: were $90 per ounce higher, largely due to the increased sustaining capital per ounce.
|
|
|
|
|
|
|
|
|
|
PAN AMERICAN SILVER CORP. |
13 |
|
|
|
|
|
|
|
Management Discussion and Analysis |
For the three months ended March 31, 2023 and 2022
(tabular amounts are in millions of U.S. dollars and thousands of shares, options,
and warrants except per share amounts and per ounce amounts, unless otherwise noted) |
La Arena Operation
|
|
|
|
|
|
|
|
|
|
|
| |
Three months ended
March 31, |
|
| |
2023 |
2022 |
|
|
| Ore tonnes mined – kt |
2,624.8 |
|
2,035.1 |
|
|
|
| Waste tonnes mined – kt |
4,955.7 |
|
6,869.7 |
|
|
|
| Tonnes placed – kt |
2,531.0 |
|
2,035.1 |
|
|
|
| Average silver grade – grams per tonne |
0.79 |
|
0.54 |
|
|
|
| Average gold grade – grams per tonne |
0.29 |
|
0.33 |
|
|
|
| Production: |
|
|
|
|
| Silver – koz |
9 |
|
11 |
|
|
|
| Gold – koz |
20.1 |
|
23.3 |
|
|
|
| Payable Production: |
|
|
|
|
| Silver – koz |
9 |
|
11 |
|
|
|
| Gold – koz |
20.1 |
|
23.3 |
|
|
|
Cash Costs - $ per gold ounce(1) |
1,124 |
|
963 |
|
|
|
| Sustaining capital - $ millions |
0.8 |
|
13.0 |
|
|
|
AISC - $ per gold ounce(1) |
1,237 |
|
1,424 |
|
|
|
| Payable gold sold - koz |
21.7 |
|
29.7 |
|
|
|
(1)Cash Costs and AISC are non-GAAP measures. Please refer to the “Alternative Performance (Non-GAAP) Measures” section of this MD&A for a detailed reconciliation of these measures to cost of sales.
Q1 2023 vs. Q1 2022
Production:
•Gold: 14% lower as a result of a reduction in the ratio of ounces recovered to ounces stacked due to the timing of leach sequencing and a reduction in gold grades due to mine sequencing, which more than offset the increase in tonnes stacked.
Cash Costs: increased by $161 per ounce, primarily reflecting higher operating costs per ounce due to lower gold grades and the impact from inflationary pressures relative to Q1 2022, which more than offset a lower ratio of waste-to-ore tonnes mined.
Sustaining Capital: lower than Q1 2022, largely as a result of lower expenditures for capitalized deferred stripping and a build-up in accounts payables, which reduced cash spent in Q1 2023. The balance of Q1 2023 capital spending was comprised of waste storage facility preparation, near-mine exploration, and payments for leased mine equipment.
AISC: decreased by $188 per ounce, largely from lower sustaining capital per ounce, which was partially offset by the increase driven from the factors affecting quarter-over-quarter Cash Costs.
|
|
|
|
|
|
|
|
|
|
PAN AMERICAN SILVER CORP. |
14 |
|
|
|
|
|
|
|
Management Discussion and Analysis |
For the three months ended March 31, 2023 and 2022
(tabular amounts are in millions of U.S. dollars and thousands of shares, options,
and warrants except per share amounts and per ounce amounts, unless otherwise noted) |
Timmins Operation
|
|
|
|
|
|
|
|
|
|
|
| |
Three months ended
March 31, |
|
| |
2023 |
2022 |
|
|
| Ore tonnes mined – kt |
391.7 |
|
415.6 |
|
|
|
| Tonnes milled – kt |
419.0 |
|
409.4 |
|
|
|
| Average silver grade – grams per tonne |
— |
|
— |
|
|
|
| Average gold grade – grams per tonne |
2.59 |
|
2.51 |
|
|
|
| Production: |
|
|
|
|
| Silver – koz |
4 |
|
4 |
|
|
|
| Gold – koz |
34.5 |
|
31.8 |
|
|
|
| Payable Production: |
|
|
|
|
| Silver – koz |
4 |
|
4 |
|
|
|
| Gold – koz |
34.5 |
|
31.8 |
|
|
|
Cash Costs - $ per gold ounce(1) |
1,462 |
|
1,414 |
|
|
|
Sustaining capital - $ millions(2) |
9.3 |
|
9.9 |
|
|
|
AISC - $ per gold ounce(1) |
1,725 |
|
1,695 |
|
|
|
| Payable gold sold - koz |
35.8 |
|
35.4 |
|
|
|
(1)Cash Costs and AISC are non-GAAP measures. Please refer to the “Alternative Performance (Non-GAAP) Measures” section of this MD&A for a detailed reconciliation of these measures to cost of sales.
(2)Sustaining capital expenditures exclude $nil million of investing activity cash outflows for Q1 2023, (Q1 2022: $0.4 million) related to investment capital incurred on the Timmins projects, as disclosed in the “Project Development Update” section of this MD&A.
Q1 2023 vs. Q1 2022
Production:
•Gold: 8% higher, primarily due to higher grades from mine sequencing and higher throughput.
Cash Costs: increased $48 per ounce, primarily as a result of the impact of inflationary pressures relative to Q1 2022.
Sustaining Capital: lower than Q1 2022, reflecting lower expenditures on mine equipment replacements and refurbishments, partially offset by higher expenditures on tailings storage facility expansions and near-mine exploration.
AISC: the $29 per ounce increase reflects the same factors that affected Cash Costs, partially offset by lower sustaining capital per ounce.
|
|
|
|
|
|
|
|
|
|
PAN AMERICAN SILVER CORP. |
15 |
|
|
|
|
|
|
|
Management Discussion and Analysis |
For the three months ended March 31, 2023 and 2022
(tabular amounts are in millions of U.S. dollars and thousands of shares, options,
and warrants except per share amounts and per ounce amounts, unless otherwise noted) |
Other Operations(1)
|
|
|
|
|
|
|
|
|
|
|
|
|
|
|
|
|
|
|
|
|
| |
Three months ended
March 31, 2023 |
Three months ended
March 31, 2022 |
| |
Morococha |
San Vicente |
Manantial Espejo |
Morococha |
San Vicente |
Manantial Espejo |
|
|
|
|
|
|
|
| Tonnes milled – kt |
— |
|
94.0 |
|
10.0 |
|
100.5 |
|
75.1 |
|
134.7 |
|
| Average silver grade – grams per tonne |
— |
|
260 |
|
205 |
|
112 |
|
222 |
|
234 |
|
| Average gold grade – grams per tonne |
|
|
2.13 |
|
|
|
1.55 |
|
| Average zinc grade - % |
— |
|
3.62 |
|
|
3.12 |
|
2.16 |
|
|
| Average lead grade - % |
— |
|
0.25 |
|
|
0.96 |
|
0.28 |
|
|
| Average copper grade - % |
— |
|
0.18 |
|
|
0.60 |
|
0.21 |
|
|
| Production: |
|
|
|
|
|
|
| Silver – koz |
— |
|
725 |
|
191 |
|
324 |
|
476 |
|
903 |
|
| Gold – koz |
— |
|
0.03 |
|
1.73 |
|
0.15 |
|
0.02 |
|
6.07 |
|
| Zinc – kt |
— |
|
2.90 |
|
|
2.67 |
|
1.34 |
|
|
| Lead – kt |
— |
|
0.19 |
|
|
0.73 |
|
0.19 |
|
|
| Copper – kt |
— |
|
0.13 |
|
|
0.47 |
|
0.12 |
|
|
|
|
|
|
|
|
|
|
|
|
|
|
|
|
|
|
|
|
|
|
|
|
|
|
|
|
|
|
|
|
|
|
|
|
|
|
|
|
|
|
|
|
Cash Costs - $ per silver ounce(2) |
N/A |
10.86 |
|
13.64 |
|
5.68 |
|
19.39 |
|
15.42 |
|
|
|
|
|
|
|
|
|
|
|
|
|
|
|
AISC - $ per silver ounce(2) |
N/A |
11.58 |
|
14.35 |
|
7.08 |
|
23.94 |
|
18.38 |
|
|
|
|
|
|
|
|
(1)Production figures reflect Pan American’s 92.3% share of Morococha and 95% share of San Vicente, unless otherwise noted. Morococha was placed on care and maintenance in February 2022 and Manantial Espejo was placed in care and maintenance at the end of 2022.
(2)Cash Costs and AISC are non-GAAP measures. Please refer to the “Alternative Performance (Non-GAAP) Measures” section of this MD&A for a detailed reconciliation of these measures to cost of sales.
Q1 2023 vs. Q1 2022
Morococha: the mine was placed on care and maintenance in February 2022 to complete the previously agreed closure of the Amistad processing plant while the Company evaluates strategic alternatives for the future of the mine.
San Vicente: higher throughput and silver and zinc grades, timing of zinc concentrate shipments, as well as reduced sustaining capital expenditures resulted in better cost performance in Q1 2023 relative to Q1 2022.
Manantial Espejo: production reflects the mine being placed on care and maintenance at the end of 2022, and some residual processing in January after which the mill was also placed on care and maintenance.
|
|
|
|
|
|
|
|
|
|
PAN AMERICAN SILVER CORP. |
16 |
|
|
|
|
|
|
|
Management Discussion and Analysis |
For the three months ended March 31, 2023 and 2022
(tabular amounts are in millions of U.S. dollars and thousands of shares, options,
and warrants except per share amounts and per ounce amounts, unless otherwise noted) |
2023 OPERATING OUTLOOK INCLUDING 9 MONTHS OF YAMANA ASSETS
The following operating outlook provides 2023 production, AISC and project capital estimates for Pan American's original operations ("Original Assets") on a full 12 month basis and the Acquired Operations based on ownership for the last nine months of 2023.
Pan American reports mines under either a Silver Segment or a Gold Segment with costs calculated on a by-product basis (by-product metal sales a credit to costs to produce the primary metal for that segment). Yamana previously reported production and costs in gold equivalent ounces ("GEO"), which is not directly comparable to the way in which Pan American reports its production and costs.
The operating outlook also incorporates the application of Pan American's accounting and reporting policies to the Acquired Operations, of which the most significant changes relate to re-allocating large portions of previously capitalized mine development to operating expenses, and re-categorizing certain capital expenditures (including exploration and tailings facility expansions) from project capital to sustaining capital. This re-categorization will result in higher AISC. Specifically, for the Acquired Operations in 2023, Pan American is providing project capital guidance for Jacobina only, where it will be invested to complete certain growth-related projects that were already underway prior to the closing of the Acquisition and to initiate a comprehensive mine optimization study. For the remaining Acquired Operations, all capital expenditures are being classified as sustaining capital for the remainder of 2023.
The following estimates contain forward-looking information about expected future events and financial and operating performance of Pan American. Readers should refer to the risks and assumptions set out in the "Cautionary Note Regarding Forward-Looking Statements and Information" that accompany the MD&A for period ending March 31, 2023. Pan American may revise forecasts during the year to reflect actual results to date and those anticipated for the remainder of the year.
|
|
|
|
|
|
|
|
|
|
PAN AMERICAN SILVER CORP. |
17 |
|
|
|
|
|
|
|
Management Discussion and Analysis |
For the three months ended March 31, 2023 and 2022
(tabular amounts are in millions of U.S. dollars and thousands of shares, options,
and warrants except per share amounts and per ounce amounts, unless otherwise noted) |
2023 Production and Cost Forecast, Including 9-months of Production from Acquired Operations:
|
|
|
|
|
|
|
|
|
|
|
|
|
|
|
|
Silver Production
(million ounces) |
Gold Production
(thousand ounces) |
Cash Costs
($ per ounce)(1)
|
AISC
($ per ounce)(1)
|
| Silver Segment: |
|
|
|
|
| La Colorada (Mexico) |
5.5 - 5.9 |
3 |
14.00 - 15.50 |
17.00 - 18.50 |
Cerro Moro (Argentina)(2) |
3.6 - 3.9 |
77 - 85 |
5.50 - 8.80 |
11.00 - 14.50 |
| Huaron (Peru) |
3.6 - 3.8 |
— |
5.80 - 7.30 |
11.50 - 13.00 |
San Vicente (Bolivia)(3) |
2.5 - 2.6 |
— |
14.10 - 15.90 |
16.00 - 17.50 |
Manantial Espejo (Argentina)(4) |
0.2 |
2 |
11.80 - 12.90 |
13.70 - 14.80 |
| Total |
15.4 - 16.4 |
82 - 90 |
10.00 - 12.00 |
14.00 - 16.00 |
| Gold Segment: |
|
|
|
|
Jacobina (Brazil)(2) |
— |
144 - 164 |
750 - 810 |
1,020 - 1,110 |
El Peñon (Chile)(2) |
2.9 - 3.5 |
122 - 142 |
600 - 770 |
785 - 985 |
| Timmins (Canada) |
— |
130 - 141 |
1,340 - 1,480 |
1,650 - 1,800 |
| Shahuindo (Peru) |
0.3 |
134 - 146 |
780 - 920 |
1,300 - 1,470 |
| La Arena (Peru) |
— |
98 - 106 |
1,200 - 1,270 |
1,600 - 1,690 |
Minera Florida (Chile)(2) |
0.2 - 0.3 |
62 - 74 |
1,340 - 1,430 |
1,700 - 1,850 |
| Dolores (Mexico) |
2.2 - 2.5 |
98 - 107 |
1,110 - 1,240 |
1,230 - 1,360 |
| Total |
5.6 - 6.6 |
788 - 880 |
975 - 1,100 |
1,275 - 1,425 |
12-months Pan American Original Assets Production(5) |
14.3 - 15.3 |
465 - 505 |
n/a |
n/a |
9-months Acquired Operations Production(6) |
6.7 - 7.7 |
405 - 465 |
n/a |
n/a |
| Total Production |
21.0 - 23.0 |
870 - 970 |
n/a |
n/a |
(1)Cash Costs and AISC are non-GAAP measures. Please refer to the “Alternative Performance (Non-GAAP) Measures” section of this MD&A for further information on this measure. The AISC forecast assumes metal prices of $22.00/oz for silver, $1,850/oz for gold, $3,000/tonne ($1.36/lb) for zinc, $2,100/tonne ($0.95/lb) for lead, and $8,000/tonne ($3.63/lb) for copper; and average annual exchange rates relative to 1 USD of 18.75 for the Mexican peso ("MXN"), 3.75 for the Peruvian sol ("PEN"), 270.00 for the Argentine peso ("ARS"), 7.00 for the Bolivian boliviano ("BOB"), $1.33 for the Canadian dollar ("CAD"), $800.00 for the Chilean peso ("CLP") and $5.00 for the Brazilian real ("BRL").
(2)2023 production and AISC forecasts for Cerro Moro, Jacobina, El Peñon and Minera Florida reflects ownership for the nine- month period from March 31 to December 31, 2023.
(3)San Vicente data represents Pan American’s 95.0% interest in the mine's production.
(4)Mining activities have been completed at Manantial Espejo at the end of 2022, with residual processing completed in January 2023.
(5)Includes La Colorada, Huaron, San Vicente, Manantial Espejo, Timmins, Shahuindo, La Arena and Dolores mines.
(6)Reflects ownership of the Cerro Moro, Jacobina, El Peñon and Minera Florida mines for the nine-month period from March 31 to December 31, 2023.
2023 Consolidated Base Metal Production Forecasts:
|
|
|
|
|
|
|
|
|
|
|
|
|
Zinc
(kt) |
Lead
(kt) |
Copper
(kt) |
| Consolidated Production |
41 - 45 |
18 - 21 |
5 |
Consolidated silver production is estimated to total 21.0 to 23.0 million ounces, with Pan American's Original Assets contributing 14.3 to 15.3 million ounces of silver over the 12-month period and the Acquired Operations expected to contribute 6.7 to 7.7 million ounces of silver for the nine-month period of 2023. The 3.2 to 4.2 million ounce decrease in Pan American's Original Assets relative to 2022 silver production of 18.5 million ounces largely reflects the completion of mining activities at Manantial Espejo at the end of 2022.
|
|
|
|
|
|
|
|
|
|
PAN AMERICAN SILVER CORP. |
18 |
|
|
|
|
|
|
|
Management Discussion and Analysis |
For the three months ended March 31, 2023 and 2022
(tabular amounts are in millions of U.S. dollars and thousands of shares, options,
and warrants except per share amounts and per ounce amounts, unless otherwise noted) |
Consolidated gold production is estimated to total 870 to 970 thousand ounces, with Pan American's Original Assets contributing 465 to 505 thousand ounces over the 12-month period and the Acquired Operations expected to contribute 405 to 465 thousand ounces. The 47.5 to 87.5 thousand ounce decrease in Pan American's Original Assets production relative to 2022 gold production of 552.5 thousand ounces is largely related to mine sequencing at Dolores and Shahuindo and the completion of mining activities at Manantial Espejo.
Silver Segment AISC is anticipated to be between $14.00 and $16.00 in 2023, which is a $0.56 to $2.56 per ounce decrease relative to 2022 AISC excluding NRV inventory adjustments of $16.56 per ounce. The decrease is largely related to the addition of nine-months of the Cerro Moro mine, which is a low-cost mine, partly due to the significant gold by-product credits.
Gold Segment AISC is anticipated to be between $1,275 and $1,425 in 2023, which is a $29 to $184 per ounce decrease relative to 2022 AISC excluding NRV inventory adjustments of $1,459 per ounce. The decrease is largely related to the addition of nine-months of production from Jacobina and El Peñon, which are low cost mines.
2023 Capital Expenditure and Reclamation Expenditures Forecast
The following table details the forecast capital expenditures in 2023:
|
|
|
|
|
|
|
2023 Forecast Capital
Investment
($ millions) |
| Sustaining Capital |
|
| La Colorada (Mexico) |
15.0 - 16.0 |
| Cerro Moro (Argentina) |
20.0 - 21.0 |
| Huaron (Peru) |
17.0 - 18.0 |
San Vicente (Bolivia)(1) |
3.5 - 4.5 |
| Jacobina (Brazil) |
42.0 - 44.0 |
| El Peñon (Chile) |
25.5 - 26.5 |
| Timmins (Canada) |
41.0 - 43.0 |
| Shahuindo (Peru) |
72.0 - 74.0 |
| La Arena (Peru) |
38.0 - 40.0 |
| Minera Florida (Chile) |
24.0 - 25.0 |
| Dolores (Mexico) |
7.0 - 8.0 |
| Sustaining Capital Sub-total |
305.0 - 320.0 |
| Project Capital |
|
| La Colorada projects (Mexico) |
36.0 - 38.0 |
| Huaron projects (Peru) |
22.0 - 25.0 |
| Timmins projects (Canada) |
11.0 - 13.0 |
| Jacobina projects (Brazil) |
26.0 - 29.0 |
| Project Capital Sub-total |
95.0 - 105.0 |
| Total Capital Expenditures |
400.0 - 425.0 |
| Reclamation Expenditures |
18.0 - 20.0 |
In 2023, Pan American plans to invest an estimated $95 to $105 million of project capital as follows:
•At Jacobina, $26 to $29 million of project capital will be invested during the nine-months of 2023 to stabilize the operation with the expansion underway, which involves upgrading plant facility infrastructure to sustain a gold recovery of about 96%.
|
|
|
|
|
|
|
|
|
|
PAN AMERICAN SILVER CORP. |
19 |
|
|
|
|
|
|
|
Management Discussion and Analysis |
For the three months ended March 31, 2023 and 2022
(tabular amounts are in millions of U.S. dollars and thousands of shares, options,
and warrants except per share amounts and per ounce amounts, unless otherwise noted) |
•At La Colorada, $36 to $38 million of project capital will be invested in: continued exploration and in-fill drilling on the La Colorada Skarn project; advancing engineering work towards a preliminary economic assessment ("PEA") for the Skarn project, which is expected to be released in the second half of 2023; and advancing construction of the concrete-lined ventilation shaft, which is expected to benefit both the long-term development of the La Colorada Skarn project, as well as the current vein-system operation. We expect to complete the concrete-lined ventilation shaft by the end of 2023 and install and commission the high-capacity fans in mid-2024. Pan American assumes mining ore below reserve grades until this additional infrastructure for the ventilation system is operating. The estimate for La Colorada Skarn project capital has increased from the one provided on April 27, 2023, due to finalization of the estimated budget for completing the PEA studies and advancing the exploration drilling.
•At Huaron, $22 to $25 million of project capital will be invested in advancing the construction of a tailings filtration plant and a dry-stack tailings storage facility to replace the conventional tailings storage facility currently in operation. The project is expected to be completed in 2024 and operational thereafter.
•At Timmins, $12 to $13 million of project capital will be invested in the construction of a paste fill plant at Bell Creek, which will improve backfill quality and availability for more effective ground support systems and to increase resource recovery and throughput.
2023 General and Administrative, Care and Maintenance, and Exploration Expense Outlook:
2023 General and Administrative budget is estimated to total between $75.0 to $80.0 million and reflects increased personnel following the Acquisition, increased regulatory and insurance costs, and a normalized year of stock based compensation which was lower than targeted in 2022 due to share price performance.
2023 Care and Maintenance costs are estimated to total $98.0 to $109.0 million, which reflects expenditures for Escobal, MARA Project, Manantial Espejo and Morococha. The year over year increase is largely attributed to expenditures of $60.0 to $65.0 million is related to care and maintenance activities at the MARA project on a 100% ownership interest.
2023 Exploration Expense is estimated to total $14.0 to $16.0 million for regional greenfield expenditures. The expenditures relating to near-mine exploration are included in the sustaining and project capital amounts guided above.
2023 Quarterly Operating Outlook:
Below is Management's breakdown for our 2023 Operating Outlook by quarter ("2023 Quarterly Expectations").
|
|
|
|
|
|
|
|
|
|
|
|
|
|
|
|
|
|
2023 Quarterly Expectations |
|
Q2 |
Q3 |
Q4 |
FY 2023 |
| Silver Production (million ounces) |
|
5.40 - 6.00 |
5.70 - 6.40 |
6.00 - 6.70 |
21.00 - 23.00 |
| Gold Production (thousand ounces) |
|
225.0 - 255.0 |
248.0 - 283.0 |
274.0 - 309.0 |
870.0 - 970.0 |
Silver Segment Cash Costs (1) |
|
11.00 - 13.10 |
8.50 - 10.60 |
9.20 - 11.30 |
10.00 - 12.00 |
Silver Segment AISC (1) |
|
16.10 - 18.20 |
11.70 - 13.80 |
12.10 - 14.20 |
14.00 - 16.00 |
Gold Segment Cash Costs (1) |
|
1,070 - 1,200 |
975 - 1,110 |
860 - 975 |
975 - 1,100 |
Gold Segment AISC (1) |
|
1,430 - 1,580 |
1,290 - 1,440 |
1,070 - 1,200 |
1,275 - 1,425 |
(1)Cash Costs and AISC are non-GAAP measures. Please refer to the “Alternative Performance (Non-GAAP) Measures” section of this MD&A for further information on this measure. The AISC forecast assumes metal prices of $22.00/oz for silver, $1,850/oz for gold, $3,000/tonne ($1.36/lb) for zinc, $2,100/tonne ($0.95/lb) for lead, and $8,000/tonne ($3.63/lb) for copper; and average annual exchange rates relative to 1 USD of 18.75 for the Mexican peso ("MXN"), 3.75 for the Peruvian sol ("PEN"), 270.00 for the Argentine peso ("ARS"), 7.00 for the Bolivian boliviano ("BOB"), $1.33 for the Canadian dollar ("CAD"), $800.00 for the Chilean peso ("CLP") and $5.00 for the Brazilian real ("BRL").
|
|
|
|
|
|
|
|
|
|
PAN AMERICAN SILVER CORP. |
20 |
|
|
|
|
|
|
|
Management Discussion and Analysis |
For the three months ended March 31, 2023 and 2022
(tabular amounts are in millions of U.S. dollars and thousands of shares, options,
and warrants except per share amounts and per ounce amounts, unless otherwise noted) |
PROJECT DEVELOPMENT UPDATE
The following table reflects the amounts spent on each of Pan American’s major projects in Q1 2023 compared with Q1 2022.
|
|
|
|
|
|
|
|
|
|
|
Project Development Capital |
Three months ended
March 31, |
|
| (millions of USD) |
| |
2023 |
2022 |
|
|
La Colorada projects |
$9.2 |
$8.6 |
|
|
| Huaron projects |
1.1 |
|
— |
|
|
|
Other projects |
0.2 |
|
0.2 |
|
|
|
| Total |
$ |
10.5 |
|
$ |
8.7 |
|
|
|
During Q1 2023, the Company invested $10.5 million, largely on exploration and advancing the La Colorada Skarn project, including construction of the new concrete-lined ventilation shaft, as well as investments relating to the construction of the new dry-stack tailings storage facility at Huaron.
OVERVIEW OF Q1 2023 FINANCIAL RESULTS
Selected Annual and Quarterly Information
The following tables set out selected quarterly results for the past nine quarters as well as selected annual results for the past two years. The dominant factors affecting results in the quarters and years presented below are the volatility of realized metal prices and the timing of sales, which vary with the timing of shipments and impairment charges.
|
|
|
|
|
|
|
|
|
|
| 2023 |
|
|
|
|
Quarter Ended |
| (In millions of USD, other than per share amounts) |
|
|
|
|
Mar 31 |
| Revenue |
|
|
|
|
$ |
390.3 |
|
| Mine operating earnings |
|
|
|
|
$ |
77.2 |
|
| Earnings for the period attributable to equity holders |
|
|
|
|
$ |
16.4 |
|
| Basic earnings per share |
|
|
|
|
$ |
0.08 |
|
| Diluted earnings per share |
|
|
|
|
$ |
0.08 |
|
| Cash flow from operating activities |
|
|
|
|
$ |
51.3 |
|
| Cash dividends paid per share |
|
|
|
|
$ |
0.10 |
|
| Other financial information |
|
|
|
|
|
| Total assets |
|
|
|
|
$ |
9,112.7 |
|
Total long-term financial liabilities(1) |
|
|
|
|
$ |
1,761.1 |
|
| Total attributable shareholders’ equity |
|
|
|
|
$ |
4,997.4 |
|
(1)Total long-term financial liabilities are comprised of non-current liabilities excluding deferred tax liabilities, and deferred revenue.
|
|
|
|
|
|
|
|
|
|
PAN AMERICAN SILVER CORP. |
21 |
|
|
|
|
|
|
|
Management Discussion and Analysis |
For the three months ended March 31, 2023 and 2022
(tabular amounts are in millions of U.S. dollars and thousands of shares, options,
and warrants except per share amounts and per ounce amounts, unless otherwise noted) |
|
|
|
|
|
|
|
|
|
|
|
|
|
|
|
|
|
|
|
|
|
|
| 2022 |
Quarter Ended |
Year
Ended |
|
|
|
|
| (In millions of USD, other than per share amounts) |
Mar 31 |
Jun 30 |
Sep 30 |
Dec 31 |
Dec 31 |
|
|
|
|
| Revenue |
$ |
439.9 |
|
$ |
340.5 |
|
$ |
338.9 |
|
$ |
375.5 |
|
$ |
1,494.8 |
|
|
|
|
|
| Mine operating earnings (loss) |
$ |
66.8 |
|
$ |
(31.7) |
|
$ |
(21.8) |
|
$ |
35.0 |
|
$ |
48.3 |
|
|
|
|
|
| Earnings (loss) for the period attributable to equity holders |
$ |
76.5 |
|
$ |
(174.0) |
|
$ |
(71.5) |
|
$ |
(172.8) |
|
$ |
(341.8) |
|
|
|
|
|
| Basic (loss) earnings per share |
$ |
0.36 |
|
$ |
(0.83) |
|
$ |
(0.34) |
|
$ |
(0.81) |
|
$ |
(1.62) |
|
|
|
|
|
| Diluted (loss) earnings per share |
$ |
0.36 |
|
$ |
(0.83) |
|
$ |
(0.34) |
|
$ |
(0.81) |
|
$ |
(1.62) |
|
|
|
|
|
Cash flow from operating activities(1) |
$ |
68.8 |
|
$ |
20.8 |
|
$ |
54.4 |
|
$ |
(112.1) |
|
$ |
31.9 |
|
|
|
|
|
| Cash dividends paid per share |
$ |
0.12 |
|
$ |
0.12 |
|
$ |
0.11 |
|
$ |
0.10 |
|
$ |
0.45 |
|
|
|
|
|
| Other financial information |
|
|
|
|
|
|
|
|
|
| Total assets |
|
|
|
|
$ |
3,248.5 |
|
|
|
|
|
Total long-term financial liabilities(2) |
|
|
|
|
$ |
511.8 |
|
|
|
|
|
| Total attributable shareholders’ equity |
|
|
|
|
$ |
2,195.5 |
|
|
|
|
|
(1)Cash flow from operating activities includes $157.3 million of transaction and integration costs related to the Acquisition.
(2)Total long-term financial liabilities are comprised of non-current liabilities excluding deferred tax liabilities and deferred revenue.
|
|
|
|
|
|
|
|
|
|
|
|
|
|
|
|
|
|
| 2021 |
Quarter Ended |
Year
Ended |
| (In millions of USD, other than per share amounts) |
Mar 31 |
Jun 30 |
Sep 30 |
Dec 31 |
Dec 31 |
| Revenue |
$ |
368.1 |
|
$ |
382.1 |
|
$ |
460.3 |
|
$ |
422.2 |
|
$ |
1,632.7 |
|
| Mine operating earnings |
$ |
90.0 |
|
$ |
103.0 |
|
$ |
98.9 |
|
$ |
76.0 |
|
$ |
367.9 |
|
| (Loss) earnings for the period attributable to equity holders |
$ |
(7.8) |
$ |
70.9 |
$ |
20.3 |
$ |
14.0 |
$ |
97.4 |
|
| Basic (loss) earnings per share |
$ |
(0.04) |
|
$ |
0.34 |
|
$ |
0.10 |
|
$ |
0.06 |
|
$ |
0.46 |
|
| Diluted (loss) earnings per share |
$ |
(0.04) |
|
$ |
0.34 |
|
$ |
0.10 |
|
$ |
0.06 |
|
$ |
0.46 |
|
| Cash flow from operating activities |
$ |
29.9 |
|
$ |
87.1 |
|
$ |
157.0 |
|
$ |
118.1 |
|
$ |
392.1 |
|
| Cash dividends paid per share |
$ |
0.07 |
|
$ |
0.07 |
|
$ |
0.10 |
|
$ |
0.10 |
|
$ |
0.34 |
|
| Other financial information |
|
|
|
|
|
| Total assets |
|
|
|
|
$ |
3,518.6 |
|
Total long-term financial liabilities(1) |
|
|
|
|
$ |
297.6 |
|
| Total attributable shareholders’ equity |
|
|
|
|
$ |
2,631.6 |
|
(1)Total long-term financial liabilities are comprised of non-current liabilities excluding deferred tax liabilities and deferred revenue.
|
|
|
|
|
|
|
|
|
|
PAN AMERICAN SILVER CORP. |
22 |
|
|
|
|
|
|
|
Management Discussion and Analysis |
For the three months ended March 31, 2023 and 2022
(tabular amounts are in millions of U.S. dollars and thousands of shares, options,
and warrants except per share amounts and per ounce amounts, unless otherwise noted) |
Income Statement: Q1 2023 vs. Q1 2022
Net earnings of $16.5 million was recorded in Q1 2023 compared to net earnings of $76.8 million in Q1 2022, which corresponds to basic earnings per share of $0.08 and $0.36, respectively.
The following table highlights the differences between the Q1 2022 and Q1 2023 net earnings:
|
|
|
|
|
|
|
|
|
|
|
|
|
|
|
| Net earnings, three months ended March 31, 2022 |
|
|
$ |
76.8 |
|
Note |
| Revenue: |
|
|
|
|
| Decreased realized metal prices |
|
$ |
(12.6) |
|
|
|
| Lower quantities of metal sold |
|
(35.1) |
|
|
|
| Decreased direct selling costs |
|
1.9 |
|
|
|
| Increased negative settlement adjustments |
|
(3.8) |
|
|
|
| Total decrease in revenue |
|
|
$ |
(49.6) |
|
(1) |
| Cost of sales: |
|
|
|
|
| Decreased production costs |
$ |
12.7 |
|
|
|
|
| Decreased production costs, NRV |
35.3 |
|
|
|
|
| Decreased royalty charges |
0.6 |
|
|
|
|
| Decreased production costs and decreased royalty charges |
|
48.6 |
|
|
(2) |
| Decreased depreciation and amortization |
|
11.4 |
|
|
(3) |
| Total decrease in cost of sales |
|
|
$ |
60.0 |
|
|
| Decreased investment loss |
|
|
4.1 |
|
|
| Decreased foreign exchange loss |
|
|
3.8 |
|
|
| Decreased income tax expense |
|
|
2.7 |
|
|
| Other |
|
|
(0.7) |
|
|
| Decreased gains and income from associates |
|
|
(45.4) |
|
(4) |
| Increased Transaction and integration costs |
|
|
(18.9) |
|
(5) |
| Increased care and maintenance costs |
|
|
(12.3) |
|
(6) |
|
|
|
|
|
|
|
|
|
|
|
|
|
|
|
|
|
|
|
|
|
|
|
|
|
| Increased interest and finance expense |
|
|
(4.0) |
|
|
|
|
|
|
|
|
|
|
|
|
| Net earnings, three months ended March 31, 2023 |
|
|
$ |
16.5 |
|
|
1)Revenue for Q1 2023 was $49.6 million lower than in Q1 2022 from decreased quantities of metal sold and lower metal prices for all metals except gold. The quarter-over-quarter decrease in metal quantities sold reflects decreases in gold, silver and copper sales, which decreased 10%, 9%, and 49%, respectively (see table below). This was partially offset by increased zinc sales of 36%.
The lower quantities sold resulted from lower production due to Morococha being placed on care and maintenance in February 2022 and limited production from Manantial Espejo in Q1 2023 due to the completion of mining activities at the end of 2022, as well as lower gold production at Dolores, as described in the "Operating Performance" section of this MD&A. Zinc sales increased this quarter due to normalized shipments following delays in Q4 2022, which largely offset a lower draw-down of silver and gold inventories in this quarter relative to the previous quarter.
The lower metal prices were related to a decrease in realized silver, zinc and copper prices of 5%, 18% and 9%, respectively. Additionally, there was a revenue decrease of $3.8 million due to increased negative concentrate settlement price adjustments on open shipments. This was partially offset by a $1.9 million decrease in net selling costs, primarily from Morococha being placed on care and maintenance in February 2022.
|
|
|
|
|
|
|
|
|
|
PAN AMERICAN SILVER CORP. |
23 |
|
|
|
|
|
|
|
Management Discussion and Analysis |
For the three months ended March 31, 2023 and 2022
(tabular amounts are in millions of U.S. dollars and thousands of shares, options,
and warrants except per share amounts and per ounce amounts, unless otherwise noted) |
The following table reflects the metal prices realized by the Company and the quantities of metal sold during each quarter:
|
|
|
|
|
|
|
|
|
|
|
|
|
|
|
| |
Realized Metal Prices (1) |
Quantities of Metal Sold (2) |
| |
Three months ended
March 31, |
Three months ended
March 31, |
| |
2023 |
2022 |
2023 |
2022 |
Silver |
$ |
22.75 |
|
$ |
24.03 |
|
4,446 |
|
4,890 |
|
Gold |
$ |
1,895 |
|
$ |
1,880 |
|
133 |
|
148 |
|
Zinc |
$ |
3,133 |
|
$ |
3,792 |
|
11 |
|
8 |
|
Lead |
$ |
2,160 |
|
$ |
2,341 |
|
5 |
|
5 |
|
Copper |
$ |
8,903 |
|
$ |
9,767 |
|
1 |
|
2 |
|
(1)Metal price stated as dollars per ounce for silver and gold, and dollars per tonne for zinc, lead and copper, inclusive of final settlement adjustments on concentrate sales.
(2)Metal quantities stated as koz for silver and gold and kt for zinc, lead and copper.
2)Production and royalty costs in Q1 2023 were $48.6 million lower than in Q1 2022, largely as a result of a $48.0 million, or 17%, decrease in production costs. All operations were affected by inflationary pressures, as noted in the "Operating Performance" section of this MD&A. The largest factors that decreased quarter-over-quarter production costs, which included this inflationary impact, are described below:
i.$35.3 million from NRV inventory adjustments, which decreased costs by $20.9 million in Q1 2023 compared to an increase of $14.4 million in Q1 2022. The change in NRV inventory adjustments largely reflects lower heap inventory write-downs at Dolores from the wind-down of open pit mining, which is expected to be completed in 2024, and higher precious metal prices;
ii.$21.6 million decrease from production costs at Mororocha and Manantial Espejo. Morococha entered care and maintenance in February 2022 while Manantial Espejo had limited production in Q1 2023 as the operation winded down following completion of mining activties in December 2022 ; and,
iii.$9.0 million decrease at the Gold Segment mines (exclusive of NRV inventory adjustments), largely reflecting decreases in volumes sold at Dolores and Timmins offset by increased sales at Shahuindo and inflationary pressures; offset by
iv.$18.0 million increase in Silver Segment costs (exclusive of Manantial Espejo, Morococha, and NRV inventory adjustments), largely from inflationary pressures, as well as lower silver grades at La Colorada resulting in higher costs per ounce, despite consistent volumes of silver ounces sold in both periods, as well as higher sales volumes at Huaron.
3)Depreciation and amortization ("D&A") expense was $11.4 million lower than in Q1 2022. The decrease was largely the result of Morococha and Manantial Espejo being on care and maintenance. Additionally, there was a decrease in Dolores depreciation due to volumes sold. Depreciation at La Arena also decreased due to decreased production. This was partially offset by higher sales volumes at Shahuindo, which is predominantly recorded on a units-of-production basis.
4)Decreased gains and income from associates largely due to the one-time gain in 2022 of $44.6 million resulting from the re-designation of the Company's investment in Maverix from an "Investment in Associate" accounted for using the "equity method" (the Company's ownership proportion of Maverix's estimated earnings was recorded in income) to a "long-term financial asset" recorded at fair value beginning on March 31, 2022. The 2022 gains were attributable to the Company accounting for Maverix using the equity method.
5)Transaction and integration costs of $18.9 million in Q1 2023 were incurred pursuant to the Acquisition in which the Company acquired 100% of the issued and outstanding shares of Yamana on March 31, 2023. The Acquisition is discussed in further detail in the "Acquisition of Yamana" part of the "Q1 2023 Highlights" section of this MD&A. No such costs were incurred in Q1 2022.
|
|
|
|
|
|
|
|
|
|
PAN AMERICAN SILVER CORP. |
24 |
|
|
|
|
|
|
|
Management Discussion and Analysis |
For the three months ended March 31, 2023 and 2022
(tabular amounts are in millions of U.S. dollars and thousands of shares, options,
and warrants except per share amounts and per ounce amounts, unless otherwise noted) |
6)Care and maintenance expenses increased in Q1 2023 by $12.3 million compared to Q1 2022, primarily due to Morococha and Manantial Espejo being placed on care and maintenance.
Statement of Cash Flows: Q1 2023 vs. Q1 2022
Cash flow from operations of $51.3 million in Q1 2023 was $17.5 million less than the $68.8 million generated in Q1 2022. The decrease was primarily driven by a $49.6 million decrease in revenue, as described above, $18.9 million incurred in transaction costs related to the Acquisition, offset partially by a $27.6 million reduction in income taxes paid and a $22.8 million positive variance from changes in working capital accounts, largely from trade and other receivable draw-downs net of accounts payable draw-downs.
Changes in working capital, other than cash, drove a $8.0 million source of cash in Q1 2023 compared with a $14.8 million use of cash in Q1 2022. The $22.8 million quarter-over-quarter increase resulted largely from $49.0 million from decreased trade receivable balances and $10.0 million in inventory draw-downs, partially offset by $33.8 million negative variance from a decrease in accounts payable and provisions. The decrease in trade receivables was primarily related to collections from clients at La Arena and La Colorada, while the decrease in accounts payables was largely related to severances paid at Manantial Espejo and payments on previously accrued bonuses, as well as the settlement of accrued transaction costs related to the Acquisition.
Investing activities generated $327.9 million in Q1 2023, primarily related to the $259.5 million cash acquired from the Acquisition and $105.3 million generated in the disposition of the Company's investment in Maverix, which was partially offset by $38.5 million spent on mineral properties, plant and equipment ("MPP&E") at the Company’s mines and projects, inclusive of $10.5 million in project development capital, as previously described in the “Operating Performance” and "Project Development Update" sections of this MD&A.
In Q1 2022, investing activities used $51.1 million, primarily from the $61.5 million spent on mineral properties, plant and equipment, inclusive of $8.7 million of project development capital, which offset $7.7 million in proceeds from the consideration received on the sale of non-core exploration properties and $2.0 million in proceeds from derivative settlements comprised of commodity and foreign exchange hedging contracts.
Financing activities in Q1 2023 used $73.7 million compared to $29.2 million used in Q1 2022. In Q1 2023, the Company repaid the $205.0 million outstanding balance on the Yamana revolving credit facility as part of the closing of the Acquisition, paid $21.1 million in dividends, and spent $3.7 million on lease repayments. These were in part funded by the $165.0 million in net draw-downs on the SL-Credit Facility. In Q1 2022, the Company paid $25.3 million in dividends, spent $3.4 million in lease payments, and spent $0.8 million in Peruvian loan repayments.
Adjusted Earnings: Q1 2023 vs Q1 2022
Adjusted earnings is a non-GAAP measure. Please refer to the “Alternative Performance (Non-GAAP) Measures” section of this MD&A for a detailed description of “adjusted earnings”, and a reconciliation of these measures to the Q1 2023 Financial Statements.
Adjusted Earnings was $21.2 million or $0.10 basic adjusted earnings per share, in Q1 2023, compared to adjusted earnings of $31.9 million, or $0.15 basic adjusted earnings per share in Q1 2022. A reconciliation of adjusted earnings or loss for the three months ended March 31, 2023 and 2022, to the net earnings or loss for each period is included in the “Alternative Performance (Non-GAAP) Measures” section of this MD&A.
|
|
|
|
|
|
|
|
|
|
PAN AMERICAN SILVER CORP. |
25 |
|
|
|
|
|
|
|
Management Discussion and Analysis |
For the three months ended March 31, 2023 and 2022
(tabular amounts are in millions of U.S. dollars and thousands of shares, options,
and warrants except per share amounts and per ounce amounts, unless otherwise noted) |
The following chart illustrates the key factors leading to the change in adjusted earnings from Q1 2022 to Q1 2023:
LIQUIDITY AND CAPITAL POSITION
|
|
|
|
|
|
|
|
|
|
|
|
|
|
| Liquidity and Capital Measures (in million of USD) |
March 31, 2023 |
|
December 31, 2022 |
|
YTD 2023
Change |
| Cash and cash equivalents ("Cash") |
$ |
411.3 |
|
|
$ |
107.0 |
|
|
$ |
304.3 |
|
| Short-term Investments |
$ |
101.8 |
|
|
$ |
35.3 |
|
|
$ |
66.5 |
|
| Cash and Short-term investments |
$ |
513.1 |
|
|
$ |
142.3 |
|
|
$ |
370.8 |
|
| Working Capital |
$ |
826.6 |
|
|
$ |
423.6 |
|
|
$ |
403.0 |
|
| SL-Credit Facility committed amount |
$ |
750.0 |
|
|
$ |
500.0 |
|
|
$ |
250.0 |
|
| Credit Facility amounts drawn |
$ |
325.0 |
|
|
$ |
160.0 |
|
|
$ |
165.0 |
|
| Shareholders' equity |
$ |
4,997.4 |
|
|
$ |
2,195.5 |
|
|
$ |
2,801.9 |
|
Total debt (1) |
$ |
1,187.0 |
|
|
$ |
226.8 |
|
|
$ |
960.2 |
|
Capital (1) |
$ |
5,671.3 |
|
|
$ |
2,280.0 |
|
|
$ |
3,391.3 |
|
(1)Total debt is a non-GAAP measure calculated as the total of amounts drawn on the SL-Credit Facility, finance lease liabilities and loans payable. Capital is a non-GAAP measure and consists of shareholders’ equity and debt net of cash and cash equivalents and short term investments. Please refer to the “Alternative Performance (Non-GAAP) Measures” section of this MD&A for a detailed description of the calculations.
Liquidity and Capital Resources
The Company's cash and short term investments increased by $370.8 million during Q1 2023, largely as a result of cash and short term investments acquired as part of the Acquisition, as described in the "Acquisition of Yamana" section of this MD&A. In Q1 2023, the Company had operating cash flow of $51.3 million, which was more than sufficient to cover investments in MPP&E additions and dividend payments.
Pan American’s investment objectives for its cash balances are to preserve capital, to provide liquidity and to maximize returns. The Company’s strategy to achieve these objectives is to invest excess cash balances in a portfolio of primarily fixed income instruments with specified credit rating targets established by the Board of
|
|
|
|
|
|
|
|
|
|
PAN AMERICAN SILVER CORP. |
26 |
|
|
|
|
|
|
|
Management Discussion and Analysis |
For the three months ended March 31, 2023 and 2022
(tabular amounts are in millions of U.S. dollars and thousands of shares, options,
and warrants except per share amounts and per ounce amounts, unless otherwise noted) |
Directors, and by diversifying the currencies in which it maintains its cash balances. The Company does not own any asset-backed commercial paper or other similar, known, at-risk investments in its investment portfolio.
Working capital of $826.6 million at March 31, 2023 was $403.0 million higher than working capital of $423.6 million at December 31, 2022; largely as a result of the working capital acquired as part of the Acquisition.
The Company amended and upsized its SL-Credit Facility. The SL-Credit Facility was increased from its previous $500.0 million to $750.0 million. As of March 31, 2023, the Company was in compliance with all financial covenants under the $750 million revolving SL-Credit Facility, which had $425 million undrawn. The borrowing costs under the Company's SL-Credit Facility are based on the Company's leverage ratio subject to pricing adjustments based on the Company's sustainability performance ratings and scores at either (i) Secured Overnight Financing Rate ("SOFR") plus 1.825% to 2.80% or; (ii) The Bank of Montreal's Base Rate on U.S. dollar denominated commercial loans plus 0.825% to 1.80%. Undrawn amounts under the SL-Credit Facility are subject to a stand-by fee of 0.41% to 0.63% per annum, dependent on the Company's leverage ratio and subject to pricing adjustments based on sustainability performance ratings and scores. Upon maintaining investment grade rating for a period of 60 days from the closing of the upsized facility on March 31, the Company's cost of borrowing will be based on the credit ratings from Moody's and S&P Global's subject to pricing adjustments based on the Company's sustainability performance ratings and scores at either: (i) SOFR plus 1.15% to 2.30% or; (ii) The Bank of Montreal's Base Rate on U.S. dollar denominated commercial loans plus 0.15% to 1.30%. Under the ratings based pricing, undrawn amounts under the SL-Credit Facility are subject to a stand-by fee of 0.23% to 0.46% per annum, dependent on the Company's credit rating and subject to pricing adjustments based on sustainability performance ratings and scores. The Company's SL-Credit Facility matures on August 8, 2025.
In conjunction with the Acquisition, the Company made a net draw of $165.0 million in Q1 2023 under the SL-Credit Facility, under SOFR based interest rates to repay, in full, and cancel Yamana's revolving credit facility, under which $205.0 million had been drawn.
As part of the Acquisition, the Company acquired the following senior notes: a $283 million senior note with a 4.625% coupon and maturing in December 2027; and, a $500 million senior note with a 2.63% coupon and maturing in August 2031 (collectively "Senior Notes"). The Senior Notes are unsecured with interest payable semi-annually. Each series of Senior Notes is redeemable, in whole or in part, at the Company's option, at any time prior to maturity, subject to make-whole provisions. The Senior Notes are accreted to the face value over their respective terms and were recorded at fair value upon acquisition using an effective interest rate of 5.52%.
The net cash generated from the sales of metal production provides our primary source of cash flows, and we do not currently expect to experience payment delinquencies from our metal sales counterparties.
The Company’s financial position at March 31, 2023, and the operating cash flows that are expected over the next 12 months, lead Management to believe that the Company’s liquid assets and available credit from the revolving SL-Credit Facility are sufficient to satisfy our 2023 working capital requirements, fund currently planned capital expenditures, and to discharge liabilities as they come due. The Company remains well positioned to take advantage of strategic opportunities as they become available. Liquidity risks are discussed further in the “Risks and Uncertainties” section of this MD&A.
In the normal course of business, the Company enters into contracts that give rise to commitments for future minimum payments, details of which are described in Note 8(f)(ii) of the 2022 Annual Financial Statements, and in the "Liquidity and Capital Position" section of the Company's annual 2022 Management Discussion and Analysis (the "2022 Annual MD&A"). Since December 31, 2022, there have been no significant changes to these contractual obligations and commitments.
The impact of inflation on the Company’s financial position, operational performance, or cash flows over the next 12 months cannot be determined with any degree of certainty due to a number of uncertainties.
|
|
|
|
|
|
|
|
|
|
PAN AMERICAN SILVER CORP. |
27 |
|
|
|
|
|
|
|
Management Discussion and Analysis |
For the three months ended March 31, 2023 and 2022
(tabular amounts are in millions of U.S. dollars and thousands of shares, options,
and warrants except per share amounts and per ounce amounts, unless otherwise noted) |
Outstanding Share Amounts
As at March 31, 2023, the Company had approximately 0.4 million stock options outstanding (each exercisable for one common share of the Company), with exercise prices in the range of CAD $17.53 to CAD $39.48 and a weighted average life of 5.1 years. Approximately 0.2 million of the stock options were vested and exercisable at March 31, 2023, with an average weighted exercise price of CAD $21.64 per share.
The following table sets out the common shares and options outstanding as at the date of this MD&A:
|
|
|
|
|
|
| |
Outstanding as at May 10, 2023 |
| Common shares |
364,439 |
|
| Options |
377 |
|
| Total |
364,816 |
|
As part of the acquisition of Tahoe Resources Inc. ("Tahoe") on February 22, 2019, the Company issued 313.9 million Contingent Value Rights ("CVRs"), with a term of 10 years, which are convertible into 15.6 million common shares upon the first commercial shipment of concentrate following the restart of operations at the Escobal mine. As of March 31, 2023, there were 313.9 million CVRs outstanding which were convertible into 15.6 million common shares.
CLOSURE AND DECOMMISSIONING PROVISION
The estimated future closure and decommissioning costs are based principally on the requirements of relevant authorities and the Company’s environmental policies. The provision is measured using Management’s assumptions and estimates for future cash outflows. The Company accrues these costs, which are determined by discounting costs using rates specific to the underlying obligation. Upon recognition of a liability for the closure and decommissioning costs, the Company capitalizes these costs to the related mine and amortizes such amounts over the life of each mine on a unit-of-production basis except in the case of exploration projects for which the offset to the liability is expensed. The accretion of the discount due to the passage of time is recognized as an increase in the liability and a finance expense.
The total inflated and undiscounted amount of estimated cash flows required to settle the Company’s estimated future closure and decommissioning costs as of March 31, 2023 was $1,123.5 million (December 31, 2022 - $679.8 million) using inflation rates of between 1% and 6% (December 31, 2022 - between 2% and 6%). The inflated and discounted provision on the statement of financial position as at March 31, 2023 was $541.5 million (December 31, 2022 - $296.2 million), using discount rates between 3% and 13% (December 31, 2022 - between 3% and 11%). Spending with respect to decommissioning obligations at Alamo Dorado and Manantial Espejo began in 2016, while the remainder of the obligations are expected to be substantially paid through 2075, or later if the mine lives are extended. Revisions made to the reclamation obligations in Q1 2023 were primarily a result of new provisions relating to the Acquired Operations, as well as updates to assumed inflation and discount rates, increased site disturbance from the ordinary course of operations at the mines, reclamation activities, and revisions to the estimates based on periodic reviews of closure plans and related costs, actual expenditures incurred, and closure activities completed. These obligations will be funded from operating cash flows, reclamation deposits, and cash on hand.
The accretion of the discount charged in Q1 2023 as finance expense was $5.9 million (Q1 2022 - $3.7 million). Reclamation expenditures incurred during Q1 2023 were $0.9 million (Q1 2022 - $1.0 million).
RELATED PARTY TRANSACTIONS
The Company’s related parties include its subsidiaries, associates over which it exercises significant influence, and key management personnel. Transactions with the Company's subsidiaries have been eliminated on consolidation. There were no other related party transactions for the three months ended March 31, 2023 and 2022.
|
|
|
|
|
|
|
|
|
|
PAN AMERICAN SILVER CORP. |
28 |
|
|
|
|
|
|
|
Management Discussion and Analysis |
For the three months ended March 31, 2023 and 2022
(tabular amounts are in millions of U.S. dollars and thousands of shares, options,
and warrants except per share amounts and per ounce amounts, unless otherwise noted) |
ALTERNATIVE PERFORMANCE (NON-GAAP) MEASURES
Per Ounce Measures
Cash Costs and AISC are non-GAAP financial measures that do not have any standardized meaning prescribed by IFRS and are therefore unlikely to be comparable to similar measures presented by other companies.
Pan American produces by-product metals incidentally to our silver and gold mining activities. We have adopted the practice of calculating a performance measure with the net cost of producing an ounce of silver and gold, our primary payable metals, after deducting revenues gained from incidental by-product production. This performance measurement has been commonly used in the mining industry for many years and was developed as a relatively simple way of comparing the net production costs of the primary metal for a specific period against the prevailing market price of that metal.
Silver segment Cash Costs and AISC are calculated net of credits for realized revenues from all metals other than silver ("silver segment by-product credits"), and are calculated per ounce of silver sold. Gold segment Cash Costs and AISC are calculated net of credits for realized silver revenues ("gold segment by-product credits"), and are calculated per ounce of gold sold.
Cash costs per ounce metrics, net of by-product credits, is used extensively in our internal decision making processes. We believe the metric is also useful to investors because it facilitates comparison, on a mine-by-mine basis, notwithstanding the unique mix of incidental by-product production at each mine, of our operations’ relative performance on a period-by-period basis, and against the operations of our peers in the silver industry. Cash costs per ounce is conceptually understood and widely reported in the mining industry.
We believe that AISC, also calculated net of by-products, is a comprehensive measure of the full cost of operating our consolidated business, given it includes the cost of replacing silver and gold ounces through exploration, the cost of ongoing capital investments (sustaining capital), as well as other items that affect the Company’s consolidated cash flow.
To facilitate a better understanding of these measure as calculated by the Company, the following table provides the detailed reconciliation of these measure to the applicable cost items, as reported in the consolidated financial statements for the respective periods.
|
|
|
|
|
|
|
|
|
|
PAN AMERICAN SILVER CORP. |
29 |
|
|
|
|
|
|
|
Management Discussion and Analysis |
For the three months ended March 31, 2023 and 2022
(tabular amounts are in millions of U.S. dollars and thousands of shares, options,
and warrants except per share amounts and per ounce amounts, unless otherwise noted) |
|
|
|
|
|
|
|
|
|
|
|
|
|
|
|
| |
Silver Segment |
Gold Segment |
| (In millions of USD, except as noted) |
Three months ended
March 31, 2023 |
Three months ended
March 31, 2022 |
Three months ended
March 31, 2023 |
Three months ended
March 31, 2022 |
Production costs(1) |
$ |
92.7 |
|
$ |
97.6 |
|
$ |
131.2 |
|
$ |
174.4 |
|
|
|
|
|
|
| NRV inventory adjustments |
(0.1) |
|
(1.4) |
|
20.9 |
|
(13.1) |
|
| On-site direct operating costs |
92.6 |
|
96.2 |
|
152.1 |
|
161.3 |
|
| Royalties |
5.1 |
|
4.7 |
|
4.1 |
|
5.1 |
|
Smelting, refining and direct selling charges(2) |
14.4 |
|
16.3 |
|
0.1 |
|
— |
|
Cash cost of sales before by-product credits |
112.1 |
|
117.2 |
|
156.3 |
|
166.4 |
|
Silver segment by-product credits(2) |
(65.8) |
|
(74.3) |
|
— |
|
— |
|
Gold segment by-product credits(2) |
— |
|
— |
|
(14.3) |
|
(17.0) |
|
Cash Costs |
$ |
46.4 |
|
$ |
42.9 |
|
$ |
142.0 |
|
$ |
149.4 |
|
|
|
|
|
|
| NRV inventory adjustments |
0.1 |
|
1.4 |
|
(20.9) |
|
13.1 |
|
Sustaining capital |
6.6 |
|
11.3 |
|
25.8 |
|
44.6 |
|
Exploration and project development(3) |
— |
|
— |
|
— |
|
— |
|
Reclamation cost accretion(4) |
0.7 |
|
0.7 |
|
4.7 |
|
2.8 |
|
All-in sustaining costs |
$ |
53.8 |
|
$ |
56.3 |
|
$ |
151.6 |
|
$ |
210.0 |
|
|
|
|
|
|
| Silver segment silver ounces sold (Moz) |
3.8 |
|
4.2 |
|
— |
|
— |
|
| Gold segment gold ounces sold (koz) |
— |
|
— |
|
126.8 |
|
139.8 |
|
Cash costs per ounce sold |
$ |
12.19 |
|
$ |
10.23 |
|
$ |
1,120 |
|
$ |
1,069 |
|
| AISC per ounce sold |
$ |
14.13 |
|
$ |
13.41 |
|
$ |
1,196 |
|
$ |
1,502 |
|
| AISC per ounce sold (excluding NRV inventory adjustments) |
$ |
14.11 |
|
$ |
13.08 |
|
$ |
1,361 |
|
$ |
1,409 |
|
(1)Silver Segment production costs exclude amounts relating to mine operation severance payments and other accruals at Manantial Espejo, which increased Production Costs by $5.3 million for Q1 2023 (Q1 2022: $6.9 million from severances at Mororocha). Gold Segment production costs exclude amounts relating to mine operations severance payments and other accruals at Dolores related to the restructuring of the operation workforce, which increased production costs by $1.5 million in Q1 2023.
(2)Included in the revenue line of the consolidated income statements. By-product credits are reflective of realized metal prices for the applicable periods.
(3)Exploration and project development expenditures exclude $1.0 million for Q1 2023, (Q1 2022: $2.8 million) of exploration expenditures related to non-operating properties.
(4)Reclamation cost accretion excludes $0.5 million for Q1 2023, (Q1 2022: $0.2 million) of accretion related to non-operating properties.
|
|
|
|
|
|
|
|
|
|
PAN AMERICAN SILVER CORP. |
30 |
|
|
|
|
|
|
|
Management Discussion and Analysis |
For the three months ended March 31, 2023 and 2022
(tabular amounts are in millions of U.S. dollars and thousands of shares, options,
and warrants except per share amounts and per ounce amounts, unless otherwise noted) |
Sustaining capital is included in AISC, while capital related to growth projects or acquisitions (referred to by the Company as project or investment capital) is not. Inclusion of only sustaining capital in the AISC measure reflects the capital costs associated with current ounces sold as opposed to project capital, which is expected to increase future production. The project capital excluded in the reconciliation below is further described in the "Project Development Update" section of this MD&A.
|
|
|
|
|
|
|
|
|
|
|
Reconciliation of payments for mineral properties,
plant and equipment and sustaining capital |
Three months ended
March 31, |
|
| (in millions of USD) |
2023 |
2022 |
|
|
Payments for mineral properties, plant and equipment(1) |
$ |
38.5 |
|
$ |
61.5 |
|
|
|
| Add/(Subtract) |
|
|
|
|
Lease Payments(1) |
3.7 |
|
3.4 |
|
|
|
Repayment of loans(2) |
1.7 |
|
0.9 |
|
|
|
| Investment (non-sustaining) capital |
(11.5) |
|
(9.8) |
|
|
|
Sustaining Capital |
$ |
32.5 |
|
$ |
56.0 |
|
|
|
(1)As presented on the consolidated statements of cash flows.
(2)As presented on the consolidated statements of cash flows. Related to repayments of construction loans for leach pad expansions in Peru.
|
|
|
|
|
|
|
|
|
|
PAN AMERICAN SILVER CORP. |
31 |
|
|
|
|
|
|
|
Management Discussion and Analysis |
For the three months ended March 31, 2023 and 2022
(tabular amounts are in millions of U.S. dollars and thousands of shares, options,
and warrants except per share amounts and per ounce amounts, unless otherwise noted) |
Silver Segment Cash Costs and AISC by mine:
|
|
|
|
|
|
|
|
|
|
|
|
|
|
|
|
|
|
|
|
|
| SILVER SEGMENT |
Three months ended March 31, 2023 |
| (In millions of USD, except as noted) |
La Colorada |
Huaron |
Morococha |
San
Vicente |
Manantial
Espejo |
Consolidated
Silver Segment |
| Production Costs |
$ |
33.5 |
|
$ |
24.7 |
|
$ |
— |
|
$ |
16.6 |
|
$ |
18.0 |
|
$ |
92.7 |
|
| NRV inventory adjustments |
— |
|
— |
|
— |
|
— |
|
(0.1) |
|
(0.1) |
|
| On-site direct operating costs |
33.5 |
|
24.7 |
|
— |
|
16.6 |
|
17.9 |
|
92.6 |
|
| Royalties |
0.1 |
|
— |
|
— |
|
4.7 |
|
0.3 |
|
5.1 |
|
| Smelting, refining & direct selling costs |
3.2 |
|
5.9 |
|
— |
|
3.7 |
|
1.5 |
|
14.4 |
|
Cash Costs before by-product credits |
36.8 |
|
30.6 |
|
— |
|
25.0 |
|
19.7 |
|
112.1 |
|
| Silver segment by-product credits |
(11.4) |
|
(25.9) |
|
— |
|
(17.1) |
|
(11.3) |
|
(65.8) |
|
| Cash Costs |
$ |
25.4 |
|
$ |
4.7 |
|
$ |
— |
|
$ |
7.9 |
|
$ |
8.4 |
|
$ |
46.4 |
|
|
|
|
|
|
|
|
| NRV inventory adjustments |
— |
|
— |
|
— |
|
— |
|
0.1 |
|
0.1 |
|
| Sustaining capital |
3.7 |
|
2.3 |
|
— |
|
0.4 |
|
0.2 |
|
6.6 |
|
| Exploration and project development |
— |
|
— |
|
— |
|
— |
|
— |
|
— |
|
| Reclamation cost accretion |
0.2 |
|
0.3 |
|
— |
|
0.1 |
|
0.2 |
|
0.7 |
|
All-in sustaining costs |
$ |
29.2 |
|
$ |
7.3 |
|
$ |
— |
|
$ |
8.4 |
|
$ |
8.9 |
|
$ |
53.8 |
|
|
|
|
|
|
|
|
| Silver segment silver ounces sold (Moz) |
1.63 |
|
0.83 |
|
— |
|
0.73 |
|
0.62 |
|
3.81 |
|
|
|
|
|
|
|
|
| Cash cost per ounce sold |
$ |
15.58 |
|
$ |
5.62 |
|
N/A |
$ |
10.86 |
|
$ |
13.64 |
|
$ |
12.19 |
|
| AISC per ounce sold |
$ |
17.94 |
|
$ |
8.74 |
|
N/A |
$ |
11.58 |
|
$ |
14.35 |
|
$ |
14.13 |
|
| AISC per ounce sold (excluding NRV inventory adjustments) |
$ |
17.94 |
|
$ |
8.74 |
|
N/A |
$ |
11.58 |
|
$ |
14.23 |
|
$ |
14.11 |
|
|
|
|
|
|
|
|
|
|
|
|
|
|
|
|
|
|
|
|
|
|
| SILVER SEGMENT |
Three months ended March 31, 2022 |
| (In millions of USD, except as noted) |
La Colorada |
Huaron |
Morococha |
San
Vicente |
Manantial
Espejo |
Consolidated
Silver Segment |
| Production Costs |
$ |
24.2 |
|
$ |
22.9 |
|
$ |
15.3 |
|
$ |
9.7 |
|
$ |
25.6 |
|
$ |
97.6 |
|
| NRV inventory adjustments |
— |
|
— |
|
— |
|
— |
|
(1.4) |
|
(1.4) |
|
| On-site direct operating costs |
24.2 |
|
22.9 |
|
15.3 |
|
9.7 |
|
24.2 |
|
96.2 |
|
| Royalties |
0.3 |
|
— |
|
— |
|
3.2 |
|
1.2 |
|
4.7 |
|
| Smelting, refining & direct selling costs |
3.5 |
|
5.9 |
|
3.6 |
|
1.3 |
|
2.0 |
|
16.3 |
|
Cash Costs before by-product credits |
27.9 |
|
28.8 |
|
18.9 |
|
14.1 |
|
27.4 |
|
117.2 |
|
| Silver segment by-product credits |
(12.1) |
|
(29.7) |
|
(17.0) |
|
(1.4) |
|
(14.1) |
|
(74.3) |
|
Cash Costs |
$ |
15.8 |
|
$ |
(0.8) |
|
$ |
1.9 |
|
$ |
12.7 |
|
$ |
13.4 |
|
$ |
42.9 |
|
|
|
|
|
|
|
|
| NRV inventory adjustments |
— |
|
— |
|
— |
|
— |
|
1.4 |
|
1.4 |
|
| Sustaining capital |
3.9 |
|
3.1 |
|
0.3 |
|
2.9 |
|
1.1 |
|
11.3 |
|
| Exploration and project development |
— |
|
— |
|
— |
|
— |
|
— |
|
— |
|
| Reclamation cost accretion |
0.1 |
|
0.2 |
|
0.1 |
|
0.1 |
|
0.1 |
|
0.7 |
|
All-in sustaining costs |
$ |
19.8 |
|
$ |
2.5 |
|
$ |
2.4 |
|
$ |
15.7 |
|
$ |
15.9 |
|
$ |
56.3 |
|
|
|
|
|
|
|
|
| Silver segment silver ounces sold (Moz) |
1.62 |
|
0.72 |
|
0.33 |
|
0.66 |
|
0.87 |
|
4.20 |
|
|
|
|
|
|
|
|
Cash cost per ounce sold |
$ |
9.73 |
|
$ |
(1.16) |
|
$ |
5.68 |
|
$ |
19.39 |
|
$ |
15.42 |
|
$ |
10.23 |
|
| AISC per ounce sold |
$ |
12.19 |
|
$ |
3.49 |
|
$ |
7.08 |
|
$ |
23.94 |
|
$ |
18.38 |
|
$ |
13.41 |
|
| AISC per ounce sold (excluding NRV inventory adjustments) |
$ |
12.19 |
|
$ |
3.49 |
|
$ |
7.08 |
|
$ |
23.94 |
|
$ |
16.81 |
|
$ |
13.08 |
|
|
|
|
|
|
|
|
|
|
|
PAN AMERICAN SILVER CORP. |
32 |
|
|
|
|
|
|
|
Management Discussion and Analysis |
For the three months ended March 31, 2023 and 2022
(tabular amounts are in millions of U.S. dollars and thousands of shares, options,
and warrants except per share amounts and per ounce amounts, unless otherwise noted) |
Gold Segment Cash Costs and AISC by mine:
|
|
|
|
|
|
|
|
|
|
|
|
|
|
|
|
|
|
| GOLD SEGMENT |
Three months ended March 31, 2023 |
| (In millions of USD, except as noted) |
Dolores |
Shahuindo |
La Arena |
Timmins |
Consolidated Gold Segment |
| Production Costs |
$ |
15.3 |
|
$ |
40.9 |
|
$ |
24.7 |
|
$ |
50.3 |
|
$ |
131.2 |
|
| Purchase Price Allocation Inventory Fair Value Adjustment |
— |
|
— |
|
— |
|
— |
|
— |
|
| NRV inventory adjustments |
20.9 |
|
— |
|
— |
|
— |
|
20.9 |
|
| On-site direct operating costs |
36.2 |
|
40.9 |
|
24.7 |
|
50.3 |
|
152.1 |
|
| Royalties |
2.2 |
|
— |
|
— |
|
1.9 |
|
4.1 |
|
| Smelting, refining & direct selling costs |
— |
|
— |
|
— |
|
— |
|
0.1 |
|
Cash Costs before by-product credits |
38.4 |
|
40.9 |
|
24.7 |
|
52.3 |
|
156.3 |
|
| Gold segment by-product credits |
(12.2) |
|
(1.7) |
|
(0.3) |
|
(0.1) |
|
(14.3) |
|
| Cash Costs of Sales |
$ |
26.1 |
|
$ |
39.2 |
|
$ |
24.4 |
|
$ |
52.3 |
|
$ |
142.0 |
|
|
|
|
|
|
|
| NRV inventory adjustments |
(20.9) |
|
— |
|
— |
|
— |
|
(20.9) |
|
| Sustaining capital |
3.3 |
|
12.5 |
|
0.8 |
|
9.3 |
|
25.8 |
|
| Exploration and project development |
— |
|
— |
|
— |
|
— |
|
— |
|
| Reclamation cost accretion |
2.0 |
|
0.9 |
|
1.6 |
|
0.1 |
|
4.7 |
|
All-in sustaining costs |
$ |
10.5 |
|
$ |
52.6 |
|
$ |
26.8 |
|
$ |
61.7 |
|
$ |
151.6 |
|
|
|
|
|
|
|
| Gold segment gold ounces sold (koz) |
27.0 |
|
42.3 |
|
21.7 |
|
35.8 |
|
126.8 |
|
|
|
|
|
|
|
| Cash cost per ounce sold |
$ |
968 |
|
$ |
926 |
|
$ |
1,124 |
|
$ |
1,462 |
|
$ |
1,120 |
|
| AISC per ounce sold |
$ |
390 |
|
$ |
1,242 |
|
$ |
1,237 |
|
$ |
1,725 |
|
$ |
1,196 |
|
| AISC per ounce sold (excluding NRV inventory adjustments) |
$ |
1,164 |
|
$ |
1,242 |
|
$ |
1,237 |
|
$ |
1,725 |
|
$ |
1,361 |
|
|
|
|
|
|
|
|
|
|
|
|
|
|
|
|
|
|
|
|
|
|
|
|
|
| GOLD SEGMENT |
Three months ended March 31, 2022 |
| (In millions of USD, except as noted) |
Dolores |
Shahuindo |
La Arena |
Timmins |
Consolidated Gold Segment |
| Production Costs |
$ |
64.3 |
|
$ |
33.0 |
|
$ |
28.8 |
|
$ |
48.2 |
|
$ |
174.4 |
|
| Purchase Price Allocation Inventory Fair Value Adjustment |
— |
|
— |
|
— |
|
— |
|
— |
|
| NRV inventory adjustments |
(13.1) |
|
— |
|
— |
|
— |
|
(13.1) |
|
| On-site direct operating costs |
51.2 |
|
33.0 |
|
28.8 |
|
48.2 |
|
161.3 |
|
| Royalties |
3.2 |
|
— |
|
— |
|
1.9 |
|
5.1 |
|
| Smelting, refining & direct selling costs |
— |
|
— |
|
— |
|
— |
|
— |
|
Cash Costs before by-product credits |
54.4 |
|
33.0 |
|
28.8 |
|
50.1 |
|
166.4 |
|
| Gold segment by-product credits |
(14.6) |
|
(2.1) |
|
(0.2) |
|
(0.1) |
|
(17.0) |
|
| Cash Costs of Sales |
$ |
39.9 |
|
$ |
30.9 |
|
$ |
28.6 |
|
$ |
50.0 |
|
$ |
149.4 |
|
|
|
|
|
|
|
| NRV inventory adjustments |
13.1 |
|
— |
|
— |
|
— |
|
13.1 |
|
| Sustaining capital |
14.4 |
|
7.4 |
|
13.0 |
|
9.9 |
|
44.6 |
|
| Exploration and project development |
— |
|
— |
|
— |
|
— |
|
— |
|
| Reclamation cost accretion |
1.4 |
|
0.6 |
|
0.7 |
|
— |
|
2.8 |
|
All-in sustaining costs |
$ |
68.7 |
|
$ |
39.0 |
|
$ |
42.3 |
|
$ |
60.0 |
|
$ |
210.0 |
|
|
|
|
|
|
|
| Gold segment gold ounces sold (koz) |
40.8 |
|
33.8 |
|
29.7 |
|
35.4 |
|
139.8 |
|
|
|
|
|
|
|
| Cash cost per ounce sold |
$ |
976 |
|
$ |
915 |
|
$ |
963 |
|
$ |
1,414 |
|
$ |
1,069 |
|
| AISC per ounce sold |
$ |
1,682 |
|
$ |
1,152 |
|
$ |
1,424 |
|
$ |
1,695 |
|
$ |
1,502 |
|
| AISC per ounce sold (excluding NRV inventory adjustments) |
$ |
1,361 |
|
$ |
1,152 |
|
$ |
1,424 |
|
$ |
1,695 |
|
$ |
1,409 |
|
|
|
|
|
|
|
|
|
|
|
PAN AMERICAN SILVER CORP. |
33 |
|
|
|
|
|
|
|
Management Discussion and Analysis |
For the three months ended March 31, 2023 and 2022
(tabular amounts are in millions of U.S. dollars and thousands of shares, options,
and warrants except per share amounts and per ounce amounts, unless otherwise noted) |
Adjusted Earnings
Adjusted earnings and basic adjusted earnings per share are non-GAAP measures that the Company considers to better reflect normalized earnings because it eliminates items that in Management's judgment are subject to volatility as a result of factors that are unrelated to operations in the period, and/or relate to items that will settle in future periods. Certain items that become applicable in a period may be adjusted for, with the Company retroactively presenting comparable periods with an adjustment for such items and conversely, items no longer applicable may be removed from the calculation. The Company adjusts certain items in the periods that they occurred, but does not reverse or otherwise unwind the effect of such items in future periods. Neither adjusted earnings nor basic adjusted earnings per share have any standardized meaning prescribed by GAAP and are therefore unlikely to be comparable to similar measures presented by other companies.
The following table shows a reconciliation of adjusted earnings for the three months ended March 31, 2023 and 2022, to the net earnings for each period.
|
|
|
|
|
|
|
|
|
|
|
|
Three months ended
March 31, |
|
| (In millions of USD, except as noted) |
2023 |
2022 |
|
|
| Net earnings for the period |
$ |
16.5 |
|
$ |
76.8 |
|
|
|
| Adjust for: |
|
|
|
|
|
|
|
|
|
|
|
|
|
|
| Unrealized foreign exchange (gains) losses |
(0.7) |
|
2.3 |
|
|
|
| Net realizable value heap inventory (recovery) expense |
(3.9) |
|
14.7 |
|
|
|
| Derivative unrealized gains |
(1.8) |
|
(2.4) |
|
|
|
| Loss (gains and income) from associates |
0.4 |
|
(45.0) |
|
|
|
| Severance provisions |
12.7 |
|
6.9 |
|
|
|
| Mineral property, plant and equipment (gains) losses on sale |
(0.2) |
|
0.2 |
|
|
|
|
|
|
|
|
| Transaction and integration costs |
18.9 |
|
— |
|
|
|
| Investment income |
(6.9) |
|
(2.8) |
|
|
|
| Closure and decommissioning liability |
2.6 |
|
— |
|
|
|
|
|
|
|
|
| Effect of taxes on adjusting items |
(0.4) |
|
(7.3) |
|
|
|
| Effect of foreign exchange on taxes |
(16.0) |
|
(11.5) |
|
|
|
| Total adjustments |
$ |
4.7 |
|
$ |
(44.9) |
|
|
|
| Adjusted earnings for the period |
$ |
21.2 |
|
$ |
31.9 |
|
|
|
| Weighted average shares for the period |
210.7 |
|
210.5 |
|
|
|
| Adjusted earnings per share for the period |
$ |
0.10 |
|
$ |
0.15 |
|
|
|
Total Debt
Total debt is a non-GAAP measure calculated as the total current and non-current portions of: long-term debt (including amounts drawn on the SL-Credit Facility), lease liabilities, and loans payable. Total debt does not have any standardized meaning prescribed by GAAP and is therefore unlikely to be comparable to similar measures presented by other companies. The Company and certain investors use this information to evaluate the financial debt leverage of the Company.
Capital
Capital is a non-GAAP measure and is calculated as total equity plus total debt less cash and cash equivalents and short term investments. Capital does not have any standardized meaning prescribed by GAAP and is therefore unlikely to be comparable to similar measures presented by other companies. The Company and certain investors use this information to evaluate the enterprise value of the Company.
|
|
|
|
|
|
|
|
|
|
PAN AMERICAN SILVER CORP. |
34 |
|
|
|
|
|
|
|
Management Discussion and Analysis |
For the three months ended March 31, 2023 and 2022
(tabular amounts are in millions of U.S. dollars and thousands of shares, options,
and warrants except per share amounts and per ounce amounts, unless otherwise noted) |
Working Capital
Working capital is a non-GAAP measure calculated as current assets less current liabilities. Working capital does not have any standardized meaning prescribed by GAAP and is therefore unlikely to be comparable to similar measures presented by other companies. The Company and certain investors use this information to evaluate whether the Company is able to meet its current obligations using its current assets.
The Company is exposed to many risks in conducting its business, including but not limited to: metal price risk as the Company derives its revenue from the sale of silver, gold, zinc, lead, and copper; trading and credit risk in the normal course of dealing with other companies; foreign exchange risk as the Company reports its financial statements in USD whereas the Company operates in jurisdictions that utilize other currencies; risks relating to cyber security; the inherent risk of uncertainties in estimating mineral reserves and mineral resources; political, economic and social risks related to conducting business in jurisdictions such as Canada, Peru, Mexico, Argentina, Bolivia, Chile, Brazil and Guatemala; environmental risks; risks related to its relations with employees and local communities where we operate; risks related to the Acquisition and the related integration of the Acquired Mines, offices, employees, IT systems, logistics, procurement and sales processes; and risks relating to the spread of COVID-19, which has to date resulted in profound health and economic impacts globally and which presents future risks and uncertainties that are largely unknown at this time. Certain of these risks, and additional risks and uncertainties, are described below, and are more fully described in Pan American’s Annual Information Form dated February 22, 2023 (available on SEDAR at www.sedar.com) and Form 40-F filed with the SEC, and in the Financial Instruments section of the 2022 Annual Financial Statements. Readers are encouraged to refer to these documents for a more detailed description of some of the risks and uncertainties inherent to Pan American’s business.
Financial Risk Exposure
The Company is exposed to financial risks, including metal price risk, credit risk, interest rate risk, foreign currency exchange rate risk, and liquidity risk. The Company's exposures and management of each of those risks is described in the 2022 Annual Financial Statements under Note 8 "Financial Instruments", along with the financial statement classification, the significant assumptions made in determining the fair value, and amounts of income, expenses, gains and losses associated with financial instruments. Fair value estimates are made at a specific point in time, based on relevant market information and information about the financial instrument. These estimates are subjective in nature and involve uncertainties and matters of significant judgment and, therefore, cannot be determined with precision. Changes in assumptions could significantly affect the estimates. There were no significant changes to those risks or to the Company's management of exposure to those risks during the three months ended March 31, 2023.
The following provides a description of the risks related to financial instruments and how management manages these risks:
Price Risk
A decrease in the market price of commodities such as silver, gold and other metals and increase in the price of consumables could affect our profitability, along with the commercial viability of our mines and production from some of our mining properties. From time to time, Pan American mitigates the price risk associated with its base metal production by committing some of its future production under forward sales or option contracts. However, decisions relating to hedging may have material adverse effects on our financial performance, financial position, and results of operations. The Board of Directors continually assesses Pan American’s strategy towards our base metal exposure.
|
|
|
|
|
|
|
|
|
|
PAN AMERICAN SILVER CORP. |
35 |
|
|
|
|
|
|
|
Management Discussion and Analysis |
For the three months ended March 31, 2023 and 2022
(tabular amounts are in millions of U.S. dollars and thousands of shares, options,
and warrants except per share amounts and per ounce amounts, unless otherwise noted) |
As at March 31, 2022, the Company had outstanding collars made up of put and call contracts for its exposure to zinc (2,700 tonnes); as well as an outstanding forward contract for its exposure to zinc (2,700 tonnes) with settlement dates between April 2022 and December 2022. The Company recorded losses of $1.1 million in Q1 2022. There were no comparable zinc positions during Q1 2023. During 2020, the Company entered into diesel swap contracts designed to fix or limit the Company’s exposure to higher fuel prices. The Company recorded gains of $2.8 million in Q1 2022. There were no comparable diesel positions during Q1 2023.
The Company recorded the following derivative gains and losses on commodities for the three months ended March 31, 2023:
|
|
|
|
|
|
|
|
|
|
|
|
Three months ended
March 31, |
|
|
2023 |
2022 |
|
|
| Zinc losses |
$ |
— |
|
$ |
(1.1) |
|
|
|
|
|
|
|
|
| Diesel gains |
— |
|
2.8 |
|
|
|
|
|
|
|
|
|
|
|
|
|
| Other |
0.6 |
|
(0.1) |
|
|
|
|
$ |
0.6 |
|
$ |
1.6 |
|
|
|
Trading Activities and Credit Risk
The zinc, lead, copper, and silver concentrates produced by us are sold through long-term supply arrangements to metal traders or integrated mining and smelting companies. The terms of the concentrate contracts may require us to deliver concentrate that has a value greater than the payment received at the time of delivery, thereby introducing us to credit risk of the buyers of our concentrates. Should any of these counterparties not honour our contractual arrangements, or should any of them become insolvent, we may incur losses for products already shipped and be forced to sell our concentrates in the spot market or we may not have a market for our concentrates and therefore our future operating results may be materially adversely impacted.
As at March 31, 2023, we had receivable balances associated with buyers of our concentrates of $29.3 million (December 31, 2022 - $28.7 million). The vast majority of our concentrate is sold to a limited number of concentrate buyers.
Doré production is refined under long-term agreements with fixed refining terms at eleven separate refineries worldwide. The Company generally retains the title to the precious metals throughout the process of refining and therefore is exposed to the risk that the refineries will not be able to perform in accordance with the refining contract and that the Company may not be able to fully recover precious metals in such circumstances. As at March 31, 2023, we had approximately $54.2 million (December 31, 2022 - $37.0 million) contained in precious metal inventory at refineries. The Company maintains insurance coverage against the loss of precious metals at the Company’s mine sites, and in-transit to refineries. Risk is transferred to the refineries at various stages from mine site to refinery.
Refined silver and gold is sold in the spot market to various bullion traders and banks. Credit risk may arise from these activities if we are not paid for metal at the time it is delivered, as required by spot sale contracts.
The Company maintains trading facilities with several banks and bullion dealers for the purposes of transacting the Company’s metal sales. None of these facilities are subject to margin arrangements. The Company’s trading activities can expose the Company to the credit risk of its counterparties to the extent that the trading positions have a positive mark-to-market value.
Supplier advances for products and services yet to be provided are a common practice in some jurisdictions in which we operate. These advances represent a credit risk to us to the extent that suppliers do not deliver products or perform services as expected. As at March 31, 2023, we had made $11.6 million of supplier advances (December 31, 2022 - $8.9 million), which are reflected in "Trade and other receivables" on the consolidated statements of financial position.
Management constantly monitors and assesses the credit risk resulting from its refining arrangements, concentrate sales and commodity contracts with its refiners, supplier advances, trading counterparties and
|
|
|
|
|
|
|
|
|
|
PAN AMERICAN SILVER CORP. |
36 |
|
|
|
|
|
|
|
Management Discussion and Analysis |
For the three months ended March 31, 2023 and 2022
(tabular amounts are in millions of U.S. dollars and thousands of shares, options,
and warrants except per share amounts and per ounce amounts, unless otherwise noted) |
customers. Furthermore, management carefully considers credit risk when allocating prospective sales and refining business to counterparties. In making allocation decisions, management attempts to avoid unacceptable concentration of credit risk to any single counterparty.
From time to time, we may invest in equity securities of other companies. Just as investing in Pan American is inherent with risks such as those set out in this MD&A, by investing in other companies we will be exposed to the risks associated with owning equity securities and those risks inherent in the investee companies.
Foreign currency exchange rate risk
We report our financial statements in USD; however we operate in jurisdictions that utilize other currencies. As a consequence, the financial results of our operations, as reported in USD, are subject to changes in the value of the USD relative to local currencies. Since our sales are denominated in USD and a portion of our operating costs and capital spending are in local currencies, we are negatively impacted by strengthening local currencies relative to the USD and positively impacted by the inverse. From time to time, we mitigate part of this currency exposure by accumulating local currencies, entering into contracts designed to fix or limit our exposure to changes in the value of local currencies relative to the USD, or assuming liability positions to offset financial assets subject to currency risk.
Pan American held cash and short-term investments of $106.0 million in CAD, $10.7 million in ARS, $6.9 million in MXN, $5.9 million in BOB, $4.1 million in PEN, $2.2 million in BRL, $1.6 million in CLP and $0.5 million in Guatemalan quetzales, as at March 31, 2023.
At March 31, 2023, Pan American had the following outstanding positions on foreign currency exposure of purchases:
|
|
|
|
|
|
|
|
|
|
|
|
|
|
|
|
|
|
|
|
|
|
|
|
USD Notional |
Weighted Average USD Forward Rate |
Weighted Average USD Put Rate |
Weighted Average USD Call Rate |
Expiry Dates |
|
|
|
|
| Mexican peso collars |
$ |
13.5 |
|
|
$ |
21.00 |
|
$ |
24.35 |
|
April 2023 to December 2023 |
|
|
|
|
|
| Peruvian sol forwards |
$ |
34.2 |
|
$ |
4.02 |
|
|
|
April 2023 to December 2023 |
|
|
|
|
|
| Canadian dollar collars |
$ |
63.0 |
|
|
$ |
1.30 |
|
$ |
1.34 |
|
April 2023 to December 2023 |
|
|
|
|
|
Canadian dollar forwards(1) |
$ |
45.0 |
|
$ |
1.35 |
|
|
|
April 2023 to December 2023 |
|
|
|
|
|
| Chilean peso collars |
$ |
77.0 |
|
|
$ |
825.00 |
|
$ |
890.00 |
|
April 2023 to December 2024 |
|
|
|
|
|
| Chilean peso forwards |
$ |
78.3 |
|
$ |
855.00 |
|
|
|
April 2023 to December 2024 |
|
|
|
|
|
| Brazilian real collars |
$ |
72.0 |
|
|
$ |
5.25 |
|
$ |
5.93 |
|
April 2023 to December 2024 |
|
|
|
|
|
| Brazilian real forwards |
$ |
82.7 |
|
$ |
5.55 |
|
|
|
April 2023 to December 2024 |
|
|
|
|
|
(1)$9.0 million of CAD purchases at a rate of $1.39 while the USDCAD spot rate trades within a range of $1.31 and $1.39. If the USDCAD spot rate trades at or outside the barrier strikes, this results in a reset rate of $1.36. Following the reset, at monthly expiration, if the USDCAD spot rate is below $1.36, the position is exercised at $1.36 at the original notional. However, if the USDCAD spot rate is above $1.36, the position is exercised at a 33% increased notional. As of March 31, 2023, there had been no breach of barrier strikes and the applicable rate for purchases was $1.39.
Subsequent to March 31, 2023, Pan American terminated positions on $101.5 million in foreign currency exposure of CLP purchases and $116.6 million in foreign currency exposure of BRL purchases, including all 2024 positions. In April, Pan American received net proceeds of $5.4 million on the termination of the positions.
Subsequent to the termination, Pan American had outstanding positions on $53.7 million in foreign currency exposure of CLP purchases. The CLP collar positions ($27.3 million of CLP purchases) had weighted average USD put and call exchange rates of $825 and 895, respectively, expiring between April 2023 and December 2023. The CLP forward contracts ($26.5 million of CLP purchases) had a weighted average USD fixed exchange rate of $850, expiring between April 2023 and December 2023.
Subsequent to the termination, Pan American had outstanding positions on $38.1 million in foreign currency exposure of BRL purchases. The BRL collar positions ($17.1 million of BRL purchases) had weighted average USD
|
|
|
|
|
|
|
|
|
|
PAN AMERICAN SILVER CORP. |
37 |
|
|
|
|
|
|
|
Management Discussion and Analysis |
For the three months ended March 31, 2023 and 2022
(tabular amounts are in millions of U.S. dollars and thousands of shares, options,
and warrants except per share amounts and per ounce amounts, unless otherwise noted) |
put and call exchange rates of $5.25 and 5.90, respectively, expiring between April 2023 and December 2023. The BRL forward contracts ($21.0 million of BRL purchases) had a weighted average USD fixed exchange rate of $5.58, expiring between April 2023 and December 2023.
The Company recorded the following derivative gains and losses on currencies for the three months ended March 31, 2023:
|
|
|
|
|
|
|
|
|
|
|
|
Three months ended
March 31, |
|
|
2023 |
2022 |
|
|
| Mexican peso gains |
$ |
1.4 |
|
$ |
0.5 |
|
|
|
| Peruvian sol gains |
0.8 |
|
2.1 |
|
|
|
| Canadian dollar gains |
0.5 |
|
0.2 |
|
|
|
|
$ |
2.7 |
|
$ |
2.8 |
|
|
|
Foreign Operations and Political Risk
The Company holds mining and exploration properties in Peru, Mexico, Argentina, Bolivia, Brazil, Chile, Canada and Guatemala, exposing it to the socioeconomic conditions, as well as the laws governing the mining industry in those countries. Inherent risks with conducting foreign operations include, but are not limited to: high rates of inflation; military repression; war or civil war; social and labour unrest; organized crime; hostage taking; terrorism; violent crime; extreme fluctuations in currency exchange rates; expropriation and nationalization; renegotiation or nullification of existing concessions, licenses, permits and contracts; illegal mining; changes in taxation policies including carbon taxes; restrictions on foreign exchange and repatriation; and changing political norms, currency controls and governmental regulations that favour or require the Company to award contracts in, employ citizens of, or purchase supplies from, a particular jurisdiction.
Changes, if any, in mining or investment policies or shifts in political attitude in any of the jurisdictions in which the Company operates may adversely affect the Company’s operations or profitability. Operations may be affected in varying degrees by government regulations with respect to, but not limited to, restrictions on production, price controls, export controls, currency remittance, importation of parts and supplies, income, carbon and other taxes, expropriation or restrictions on the ownership of property, foreign investment, maintenance of claims, environmental legislation, land use, land claims of local people, water use and mine safety. For example, Argentina has in the past and continues to have many highly restrictive policies with respect to foreign investment, currency controls, taxation, import and export controls, and restrictions on the ownership and use of lands, including bans on mining and the use of cyanide in certain provinces and restrictions on the amount of lands that foreign entities, directly or indirectly, can have an ownership interest in. In some cases, this may result in the loss of properties or rights that are valuable or that might otherwise be beneficial or needed in connection with our operations.
On December 30, 2020, the Argentine government issued Decree 1060/2020 that establishes a 4.5% rate on silver and gold concentrate. Cerro Moro, owned by Estelar Resources, is entitled to tax stability pursuant to Argentina’s Mining Investments Law No. 24,196. Such tax stability entitles Estelar Resources to recover taxes in excess of their overall tax burden at the time of the filing of the feasibility study in 2012 for Cerro Moro. On June 16, 2021, the Argentine government enacted legislation that increased the corporate tax rate from 25% to 35% and maintains the dividend withholding tax rate at 7% retroactive to January 1, 2021.
In July 2022, a tax reform bill was being discussed in Chile, however, on March 8, 2023, the Chamber of Deputies rejected the bill. The government will wait a year before re-introducing new legislation. In addition, there is currently a bill in Chilean Congress which seeks to impose a new mining royalty of 3% of ad valorem value on copper and make changes to the existing royal tax.
In December 2022, the Brazilian government introduced new transfer pricing rules that would see Brazil adopt the Organisation for Economic Co-operation and Development (“OECD”) arm length’s principal for cross-border
|
|
|
|
|
|
|
|
|
|
PAN AMERICAN SILVER CORP. |
38 |
|
|
|
|
|
|
|
Management Discussion and Analysis |
For the three months ended March 31, 2023 and 2022
(tabular amounts are in millions of U.S. dollars and thousands of shares, options,
and warrants except per share amounts and per ounce amounts, unless otherwise noted) |
transactions. These rules would align Brazil with OECD countries and pave the way for Brazil to join the OECD. The rules would come into effect in 2024, with early adoption allowed in 2023.
On May 8, 2023, the Mexican government completed a decree reforming various provisions of the mining law (the "Decree"), which was published in the Official Gazette and became law on May 9, 2023. The Decree makes significant changes to the current mining laws, including but not limited to: reducing mining license concession terms; restricting the granting of mining concessions requiring public auctions; imposing conditions on water use and availability; imposing regulations on mining concession transfers; imposing additional grounds for cancellation of mining concessions and further limitations on mining in protected areas; granting preferential rights to mining strategic minerals to state owned enterprises; imposing additional requirements for financial instruments to be provided to guarantee preventive, mitigation, and compensation measures resulting from the social impact assessment, as well as potential damages that may occur during mining activities; and potentially requiring Indigenous Peoples’ (ILO 169) consultation. These changes to the mining law are expected to have impacts on our current and future exploration activities and operations in Mexico, the extent of which is yet to be determined but which could be material.
Credit Rating
There can be no assurance that the credit ratings and outlook assigned to the Company's debt securities or to the Company will remain in effect for any given period of time or that any such rating or outlook will not be revised downward or withdrawn entirely by a rating agency. Real or anticipated changes in credit ratings or outlook assigned to the Company’s debt securities will generally affect the market price of its debt securities. In addition, real or anticipated changes in its credit ratings may also affect the cost at which the Company can access the capital markets. If such ratings decline and its cost of accessing capital markets increases, the Company may not be able to fund proposed capital expenditures and other operations in the future.
Liquidity Risk
Liquidity risk is the risk that we will not be able to meet our financial obligations as they come due. The volatility of the metals markets can impact our ability to forecast cash flow from operations.
We must maintain sufficient liquidity to meet our short-term business requirements, taking into account our anticipated cash flows from operations, our holdings of cash and cash equivalents, and committed loan facilities.
We manage our liquidity risk by continuously monitoring forecasted and actual cash flows. We have in place a rigorous reporting, planning and budgeting process to help determine the funds required to support our normal operating requirements on an ongoing basis and our expansion plans. We continually evaluate and review capital and operating expenditures in order to identify, decrease, and limit all non-essential expenditures.
We are required to use a portion of our cash flow to service principal and interest on debt, which will limit the cash flow available for other business opportunities. We also maintain and enter into intercompany credit arrangements with our subsidiaries in the normal course. Our ability to make scheduled principal payments, pay interest on or refinance our indebtedness depends on our future performance, which is subject to economic, financial, competitive and other factors beyond our control. Unexpected delays in production, the suspension of our mining licenses, or other operational problems could impact our ability to service the debt and make necessary capital expenditures when the debt becomes due. If we are unable to generate such cash flow to timely repay any debt outstanding, we may be required to adopt one or more alternatives, such as selling assets, restructuring debt or obtaining additional equity capital on terms that may be onerous or highly dilutive. Our ability to refinance our indebtedness will depend on the capital markets and our financial condition at such time. We may not be able to engage in any of these activities or engage in these activities on desirable terms, which could result in a default on our debt obligations.
While we have paid dividends to our shareholders for many years, the payment of dividends is impacted by our cash flows and liquidity situation. The payment of any future dividends is at the discretion of our Board of Directors after taking into account many factors, including availability of and sources of cash, future anticipated funding needs, our debt position, general and regional economic conditions, and expectations with respect to
|
|
|
|
|
|
|
|
|
|
PAN AMERICAN SILVER CORP. |
39 |
|
|
|
|
|
|
|
Management Discussion and Analysis |
For the three months ended March 31, 2023 and 2022
(tabular amounts are in millions of U.S. dollars and thousands of shares, options,
and warrants except per share amounts and per ounce amounts, unless otherwise noted) |
operational matters such as anticipated metals production and metals prices. There can be no assurance that dividends will continue to be paid in the future or on the same terms as are currently paid by Pan American.
Claims and Legal Proceedings
Pan American is subject to various claims and legal proceedings covering a wide range of matters that arise in the ordinary course of business activities. The nature, assessment and management of such claims are described in this section, and in Note 31 to the Company's 2022 Annual Financial Statements. There were no significant changes to those risks or to the Company's management of exposure to those risks during the three months ended March 31, 2023. As a consequence of the Acquisition, the Company also assumed various claims and legal proceedings described in Yamana’s Annual Information Form dated March 29, 2023 (available on SEDAR at www.sedar.com). These claims and legal proceedings include numerous individual labour and tax claims in Argentina and Brazil. While these claims are not considered material individually and may be settled for amounts much less than the original amounts claimed, the aggregate amounts claimed against us, if successful, could be material.
In Peru, there are many claims from current or ex-employees, or employees of former or current owners of our operations such as the Quiruvilca-related claims in Peru, which could in the aggregate, be of significant value, and include alleged improper dismissals, workplace illnesses, such as silicosis, and claims for additional profit-sharing and bonuses in prior years. In some cases, we may also be subject to collective settlement obligations with our employees and contractors relating to closures of our operations, and such obligations may be significant.
We may also become subject to class action lawsuits. For example, in mid-2017, Tahoe, which was acquired by us in late February 2019, and certain of its former directors and officers became the subject of three purported class action lawsuits filed in the United States that center primarily around alleged misrepresentations. These U.S. class action lawsuits were later consolidated into one class action suit that is ongoing in Nevada. In October 2018, Tahoe learned that a similar proposed class action lawsuit had been filed against Tahoe and its former chief executive officer in the Superior Court of Ontario. These lawsuits seek significant damages. We have disputed the allegations made in these suits, however, and while a successful resolution of these lawsuits is anticipated, the outcomes are not determinable at this time.
In early May 2021, PAS Guatemala and the Guatemala Ministry of Energy and Mines were served with legal proceedings that were originated in the Constitutional Court of Guatemala by a small group of residents and landowners, or alleged residents and landowners, from the La Cuchilla community near the Escobal mine claiming that prior mining activities damaged their lands. Currently, operations at Escobal are suspended pending the completion of the government-led ILO 169 consultation process. Nevertheless, the action seeks injunctive relief to prevent future mining activities at Escobal. The claim against the Guatemala Ministry of Energy and Mines has subsequently been denied and the claims against PAS Guatemala is pending determination by the Constitutional Court. While we believe that the claims against PAS Guatemala are procedurally and substantively flawed and without merit, the outcome of this proceeding cannot be determined at this time.
As reported in our Annual Information Form dated February 22, 2023, certain individuals have asserted community rights and land ownership over a portion of the La Colorada mine’s surface lands in the Agrarian Courts of Mexico. They also initiated a process before the Secretariat of Agrarian, Territorial and Urban Development (“SEDATU”) in Zacatecas to declare such lands as national property. In 2019, we filed a legal challenge (amparo) against this SEDATU process and obtained an injunction to protect our ownership of these surface rights pending the outcome of the challenge and a further review by SEDATU. Our challenge was dismissed on October 25, 2021, primarily on the basis that no final declaration of national lands had yet been made by SEDATU that would affect our property rights. Our appeal was also dismissed on the same basis. In March 2023, the Agrarian Court dismissed the claims of these certain individuals declaring that they had not established community rights or land ownership over any of La Colorada's surface lands. Certain of these individuals have appealed against this decision. We will also continue to oppose the ongoing SEDATU process. While we believe that we hold proper title to the surface lands in question, if we are unable to maintain, or maintain access to, those surface rights, there could be material adverse impacts on the La Colorada mine’s future mining operations.
|
|
|
|
|
|
|
|
|
|
PAN AMERICAN SILVER CORP. |
40 |
|
|
|
|
|
|
|
Management Discussion and Analysis |
For the three months ended March 31, 2023 and 2022
(tabular amounts are in millions of U.S. dollars and thousands of shares, options,
and warrants except per share amounts and per ounce amounts, unless otherwise noted) |
We may also be subject to proceedings in our commercial relationships. While we would, where available and appropriate to do so, defend against any such allegations, if we are unsuccessful in our defense of these claims, we may be subject to significant losses.
Each of these matters is subject to various uncertainties and it is possible that some of these matters may be resolved unfavourably against us. We establish provisions for matters that are probable and can be reasonably estimated. We also carry liability insurance coverage, however, such insurance does not cover all risks to which we might be exposed and in other cases, may only partially cover losses incurred by us. In addition, we may be involved in disputes with other parties in the future that may result in litigation, which could have a material adverse effect on our financial or operating position, cash flow and results of operations.
COVID-19 and Other Pandemics
The spread of COVID-19 impacted our operations, our employees and our contractors, not only as it related to significant health concerns, but also in terms of governmental restrictions on, and in some cases suspensions of, our operations, limitations on the movement of people and supplies, inflation and cost escalation availability of food and other goods, and personal well-being, among others. Our suppliers and service providers were also similarly impacted.
While COVID-19 had significant, direct impacts on our operations, our business, our workforce, and our production, the extent to which COVID-19, or other pathogens that might emerge, will impact our operations in the future is highly uncertain and cannot be predicted with confidence.
Moreover, the continued presence of, or spread, of COVID-19 or other pathogens globally may have material adverse effects on the economies and financial markets of many countries, resulting in an economic downturn that could have significant impacts on commodity prices, demand for metals, investor confidence, and general financial market liquidity, all of which may adversely affect our business and the market price of our common shares, as well as impacting our suppliers and commercial partners. In addition, such a pandemic could also impact our ability to raise capital, and cause continued interest rate volatility that could make obtaining financing or refinancing our debt obligations more challenging or more expensive (if such financing is available at all). Inflationary pressures relating to COVID-19 global financial support measures and current supply chain challenges continue to have both direct and indirect impacts and could worsen with additional outbreaks or the spread of global pathogens.
Climate Change
There is significant evidence of the effects of climate change on our planet and an intensifying focus on addressing these issues. The Company recognizes that climate change is a global challenge that may have both favorable and adverse effects on our business in a range of possible ways. Mining and processing operations are energy intensive and result in a carbon footprint either directly or through the purchase of fossil-fuel based electricity. As such, the Company is impacted by current and emerging policy and regulation relating to greenhouse gas emission levels, energy efficiency, and reporting of climate change related risks. While some of the costs associated with reducing emissions may be offset by increased energy efficiency, technological innovation, or the increased demand for our metals as part of technological innovations, the current regulatory trend may result in additional transition costs at some of our operations. Governments are introducing climate change legislation and treaties at the international, national, and local levels, and regulations relating to emission levels and energy efficiency are evolving and becoming more rigorous. Current laws and regulatory requirements are not consistent across the jurisdictions in which we operate, and regulatory uncertainty is likely to result in additional complexity and cost in our compliance efforts. Public perception of mining is, in some respects, negative and there is increasing pressure to curtail mining in many jurisdictions as a result, in part, of perceived adverse effects of mining on the environment.
Concerns around climate change may also affect the market price of our shares as institutional investors and others may divest interests in industries that are thought to have more environmental impacts. While we are committed to operating responsibly and reducing the negative effects of our operations on the environment, our
|
|
|
|
|
|
|
|
|
|
PAN AMERICAN SILVER CORP. |
41 |
|
|
|
|
|
|
|
Management Discussion and Analysis |
For the three months ended March 31, 2023 and 2022
(tabular amounts are in millions of U.S. dollars and thousands of shares, options,
and warrants except per share amounts and per ounce amounts, unless otherwise noted) |
ability to reduce emissions, energy and water usage by increasing efficiency and by adopting new innovation is constrained by technological advancement, operational factors and economics. Adoption of new technologies, the use of renewable energy, and infrastructure and operational changes necessary to reduce water usage may also increase our costs significantly. Concerns over climate change, and our ability to respond to regulatory requirements and societal expectations, may have significant impacts on our operations and on our reputation, and may even result in reduced demand for our products.
The physical risks of climate change could also adversely impact our operations. These risks include, among other things, extreme weather events, resource shortages, changes in rainfall and in storm patterns and intensities, water shortages, changing sea levels and extreme temperatures. Climate-related events such as mudslides, floods, droughts and fires can have significant impacts, directly and indirectly, on our operations and could result in damage to our facilities, disruptions in accessing our sites with labour and essential materials or in shipping products from our mines, risks to the safety and security of our personnel and to communities, shortages of required supplies such as fuel and chemicals, inability to source enough water to supply our operations, and the temporary or permanent cessation of one or more of our operations. There is no assurance that we will be able to successfully anticipate, respond to, or manage the risks associated with physical climate change events and impacts, and this may result in material adverse consequences to our business and to our financial results.
MATERIAL ACCOUNTING POLICIES, STANDARDS AND JUDGEMENTS
Changes in accounting policies
The accounting policies applied in the preparation of these unaudited condensed interim consolidated financial statements are consistent with those applied and disclosed in the 2022 Annual Financial Statements with the exception of the mandatory adoption of certain amendments noted below:
Amendment to IAS 12 - Deferred Tax related to Assets and Liabilities arising from a Single Transaction
The amendments to IAS 12 clarify that the initial recognition exemption does not apply to transactions in which equal amounts of deductible and taxable temporary differences arise on initial recognition.
The implementation of this amendment did not have a material impact on the Company.
Amendments to IAS 1 and IFRS Practice Statement 2 – Disclosure of Accounting policies
The amendments require that an entity discloses its material accounting policies, instead of its significant accounting policies. Further amendments explain how an entity can identify a material accounting policy. Examples of when an accounting policy is likely to be material are added. To support the amendment, the IASB has also developed guidance and examples to explain and demonstrate the application of the ‘four-step materiality process’ described in IFRS Practice Statement 2. This amendment did not have a significant impact to the Company’s condensed interim consolidated financial statements.
Future changes in accounting standards
Certain new accounting standards and interpretations have been published that are not mandatory for the current period and have not been early adopted. Management is still evaluating and does not expect any such pronouncements to have a material impact on the Company’s consolidated financial statements upon adoption.
Significant judgements
In preparing financial statements in accordance with IFRS, Management is required to make estimates and assumptions that affect the amounts reported in the consolidated financial statements. These critical accounting estimates represent Management's estimates and judgments that are uncertain and any changes in these could materially impact the Company’s financial statements. Management continuously reviews its estimates, judgments, and assumptions using the most current information available.
|
|
|
|
|
|
|
|
|
|
PAN AMERICAN SILVER CORP. |
42 |
|
|
|
|
|
|
|
Management Discussion and Analysis |
For the three months ended March 31, 2023 and 2022
(tabular amounts are in millions of U.S. dollars and thousands of shares, options,
and warrants except per share amounts and per ounce amounts, unless otherwise noted) |
Readers should also refer to Note 3 of the 2022 Annual Financial Statements, for the Company’s summary of significant accounting policies and the following critical judgments and estimates in applying accounting policies:
Yamana Acquisition Business Combination
Management has concluded that Yamana constitutes a business and, therefore, the acquisition is accounted for in accordance with IFRS 3 - Business Combinations. Acquisitions of businesses are accounted for using the acquisition method. The consideration transferred in a business combination is measured at fair value.
Yamana Acquisition Fair Value Estimates
Business combinations require time to identify and measure the following as of the acquisition date: 1. The identifiable assets acquired and liabilities assumed; 2. The consideration transferred in exchange for an interest in the acquiree; and 3. The resulting goodwill.
The Company reports provisional amounts if the business combination accounting is incomplete at the end of the reporting period in which the combination occurs. During the measurement period, provisional amounts will be adjusted retrospectively to reflect new information obtained about facts and circumstances that existed as of the acquisition date and, if known, would have affected the measurement of the amounts recognized as of that date.
The Company may also recognize additional assets or liabilities if new information is obtained about facts and circumstances that existed as of the acquisition date and, if known, would have resulted in the recognition of those assets and liabilities as of that date. The measurement period ends as soon as the Company receives the information it was seeking about facts and circumstances that existed as of the acquisition date or learns that more information is not obtainable and shall not exceed one year from the acquisition date.
As at March 31, 2023, the purchase consideration for the acquisition of Yamana has been allocated on a preliminary basis based on management’s best estimates at the time these interim consolidated financial statements were prepared. The Company is continuing its review of estimates of mineral properties, plant and equipment, leases, deferred taxes, closure provisions, litigation provisions, non-controlling interests and goodwill. Changes to these provisional values, if any, are retrospectively adjusted when the final measurements are determined if related to conditions existing at the date of acquisition.
Yamana Acquisition Functional Currency
The Company has determined that Yamana and its subsidiaries' functional currencies are USD, as as this is the principal currency of the economic environments in which they operate. Transaction amounts denominated in foreign currencies (currencies other than USD) are translated into USD at exchange rates prevailing at the transaction dates. Carrying values of foreign currency monetary assets and liabilities are re-translated at each statement of financial position date to reflect the U.S. exchange rate prevailing at that date.
In April 2023, the Company disposed of $47.3 million of equity holdings classified as short-term investments.
DISCLOSURE AND INTERNAL CONTROL PROCEDURES
Pan American’s Management considers the meaning of internal control to be the processes established by Management to provide reasonable assurance about the achievement of the Company’s objectives regarding operations, reporting and compliance. Internal control is designed to address identified risks that threaten any of these objectives.
Disclosure controls and procedures (“DC&P”)
Our Chief Executive Officer (“CEO”) and Chief Financial Officer (“CFO”) are responsible for establishing and maintaining adequate DC&P. Under the supervision and with the participation of our CEO and CFO, we evaluated the effectiveness of the design and operation of our DC&P in accordance with requirements of National
|
|
|
|
|
|
|
|
|
|
PAN AMERICAN SILVER CORP. |
43 |
|
|
|
|
|
|
|
Management Discussion and Analysis |
For the three months ended March 31, 2023 and 2022
(tabular amounts are in millions of U.S. dollars and thousands of shares, options,
and warrants except per share amounts and per ounce amounts, unless otherwise noted) |
Instrument 52-109 of the Canadian Securities Commission (“NI 52-109”) and the Sarbanes Oxley Act of 2002 (as adopted by the Securities and Exchange Commission ("SEC")).
As of December 31, 2022, based on the evaluation, our CEO and CFO concluded that our DC&P were effective to ensure that information required to be disclosed by us in reports we file or submit is recorded, processed, summarized and reported within the time periods specified in securities legislation and is accumulated and communicated to our management, including our CEO and CFO.
Internal control over financial reporting (“ICFR”)
Our CEO and CFO are responsible for establishing and maintaining adequate ICFR. Under the supervision and with the participation of our CEO and CFO, we evaluated the effectiveness of our ICFR as of December 31, 2022 based upon the Internal Control - Integrated Framework (2013) issued by the Committee of Sponsoring Organizations of the Treadway Commission. Based on the evaluation, our CEO and CFO concluded that our ICFR was effective as of December 31, 2022. Management reviewed the results of Management’s evaluation with the Audit Committee of the Board.
The effectiveness of the Company’s ICFR as of December 31, 2022 has been audited by Deloitte LLP, Independent Registered Public Accounting Firm as stated in their report immediately preceding the Company’s 2022 Annual Financial Statements.
Changes in ICFR
There has been no change in the Company’s ICFR during the three months ended March 31, 2023 that has materially affected, or is reasonably likely to materially affect, its ICFR.
Inherent limitations of controls and procedures
All internal control systems, no matter how well designed, have inherent limitations. As a result, even systems determined to be effective may not prevent or detect misstatements on a timely basis, as systems can provide only reasonable assurance that the objectives of the control system are met. In addition, projections of any evaluation of the effectiveness of ICFR to future periods are subject to the risk that controls may become inadequate because of changes in conditions, or that the degree of compliance with the policies or procedures may change.
Scientific and technical information contained in this MD&A has been reviewed and approved by Martin Wafforn, P.Eng., Senior Vice President Technical Services and Processing Optimization, and Christopher Emerson, FAusIMM, Vice President Business Development and Geology, each of whom are Qualified Persons, as the term is defined in NI 43-101.
For more detailed information regarding the Company’s material mineral properties and technical information related thereto, including a complete list of current technical reports applicable to such properties, please refer to the Company’s Annual Information Form dated February 22, 2023, filed at www.sedar.com or the Company’s most recent Form 40-F filed with the SEC.
Cautionary Note Regarding Forward-Looking Statements and Information
Certain of the statements and information in this MD&A constitute “forward-looking statements” within the meaning of the United States Private Securities Litigation Reform Act of 1995 and “forward-looking information” within the meaning of applicable Canadian provincial securities laws relating to the Company and its operations. All statements, other than statements of historical fact, are forward-looking statements. When used in this MD&A, the words, “will”, “believes”, “expects”, “intents”, “plans”, “forecast”, “objective”, “guidance”, “outlook”, “potential”, “anticipated”, “budget”, and other similar words and expressions, identify forward-looking statements or information. These forward-looking statements or information relate to, among other things: future financial or operational performance; future anticipated prices for gold, silver and other metals and assumed foreign exchange
|
|
|
|
|
|
|
|
|
|
PAN AMERICAN SILVER CORP. |
44 |
|
|
|
|
|
|
|
Management Discussion and Analysis |
For the three months ended March 31, 2023 and 2022
(tabular amounts are in millions of U.S. dollars and thousands of shares, options,
and warrants except per share amounts and per ounce amounts, unless otherwise noted) |
rates; the impacts of inflation on Pan American and its operations; whether Pan American is able to maintain a strong financial condition and have sufficient capital, or have access to capital through the SL-Credit Facility or otherwise, to sustain our business and operations; the timing and outcome with respect to Pan American's environmental, social and governance activities, and Pan American's corporate social responsibility activities and our reporting in respect thereof, including but not limited to, the timing for release of the Sustainability Report; the duration and effect of the suspensions of operations of the Escobal mine, as well as the nature of and continuation of the constitutional court-mandated ILO 169 consultation process in Guatemala, and the timing and, if applicable, completion thereof; certain legal proceedings that were originated in the Constitutional Court of Guatemala relating to the Escobal mine; the SEDATU process with respect to a portion of the La Colorada mine’s surface lands; the timing and success of site infrastructure upgrades at the La Colorada mine; the ability of Pan American to successfully complete any capital projects including at Jacobina, La Colorada, Huaron and Timmins, the expected economic or operational results derived from those projects, and the impacts of any such projects on Pan American; the future results of our exploration activities, including with respect to the skarn exploration program at La Colorada; anticipated mineral reserves and mineral resources; the costs associated with the Company's decommissioning obligations; the Company’s plans and expectations for its properties and operations; and expectations with respect to the future anticipated impact of COVID-19 on our operations.
These forward-looking statements and information reflect the Company’s current views with respect to future events and are necessarily based upon a number of assumptions and estimates that, while considered reasonable by the Company, are inherently subject to significant operational, business, economic, competitive, political, regulatory, and social uncertainties and contingencies. These assumptions, some of which are described in the “Risks and Uncertainties” section of this MD&A, include: our ability to implement environmental, social and governance activities; tonnage of ore to be mined and processed; ore grades and recoveries; prices for silver, gold and base metals remaining as estimated; currency exchange rates remaining as estimated; capital, decommissioning and reclamation estimates; our mineral reserve and mineral resource estimates and the assumptions upon which they are based; prices for energy inputs, labour, materials, supplies and services (including transportation); no labour-related disruptions at any of our operations; no unplanned delays or interruptions in scheduled production; protection of our interests against claims and legal proceedings; all necessary permits, licenses and regulatory approvals for our operations are received in a timely manner and can be maintained; the world-wide economic and social impact of COVID-19 is managed and the duration and extent of the coronavirus pandemic is minimized or not long-term; the management of COVID-19 in each jurisdiction; and our ability to comply with environmental, health and safety laws, particularly given the potential for modifications and expansion of such laws. The foregoing list of assumptions is not exhaustive.
The Company cautions the reader that forward-looking statements and information involve known and unknown risks, uncertainties and other factors that may cause actual results and developments to differ materially from those expressed or implied by such forward-looking statements or information contained in this MD&A and the Company has made assumptions and estimates based on or related to many of these factors. Such factors include, without limitation: fluctuations in silver, gold, and base metal prices; fluctuations in prices for energy inputs; fluctuations in currency markets (such as the PEN, MXN, ARS, BOL, CLP, BRL, GTQ and CAD versus the USD); risks related to the technological and operational nature of the Company’s business; changes in national and local government, legislation, taxation, controls or regulations and political, legal or economic developments in Canada, the United States, Mexico, Peru, Argentina, Bolivia, Chile, Brazil, Guatemala or other countries where the Company may carry on business, some of which might prevent or cause the suspension or discontinuation of mining activities, including the risk of expropriation related to certain of our operations, particularly in Argentina and Bolivia and risks related to the constitutional court-mandated ILO 169 consultation process in Guatemala; risks and hazards associated with the business of mineral exploration, development and mining (including environmental hazards, industrial accidents, unusual or unexpected geological or structural formations, pressures, cave-ins and flooding); risks relating to the credit worthiness or financial condition of suppliers, refiners and other parties with whom the Company does business; inadequate insurance, or inability to obtain insurance, to cover these risks and hazards; employee relations; relationships with and claims by the local communities and indigenous populations; availability and increasing costs associated with mining inputs and labour; the Company’s ability to secure our
|
|
|
|
|
|
|
|
|
|
PAN AMERICAN SILVER CORP. |
45 |
|
|
|
|
|
|
|
Management Discussion and Analysis |
For the three months ended March 31, 2023 and 2022
(tabular amounts are in millions of U.S. dollars and thousands of shares, options,
and warrants except per share amounts and per ounce amounts, unless otherwise noted) |
mine sites or maintain access to our mine sites due to criminal activity, violence, or civil and labour unrest; the speculative nature of mineral exploration and development, including the risk of obtaining or retaining necessary licenses and permits; challenges to, or difficulty in maintaining, the Company’s title to properties and continued ownership thereof; diminishing quantities or grades of mineral reserves as properties are mined; global financial conditions; the Company’s ability to complete and successfully integrate acquisitions, including in connection with the Acquisition, and to mitigate other business combination risks; the actual results of current exploration activities, conclusions of economic evaluations, and changes in project parameters to deal with unanticipated economic or other factors; increased competition in the mining industry for properties, equipment, qualified personnel, and their costs; having sufficient cash to pay obligations as they come due; the duration and effects of the coronavirus and COVID-19 variants, and any other epidemics or pandemics on our operations and workforce, and their effects on global economies and society; those factors identified under the caption “Risks Related to Pan American’s Business” in the Company’s most recent Form 40-F and Annual Information Form filed with the United States Securities and Exchange Commission and Canadian provincial securities regulatory authorities, respectively, and those factors identified under the caption “Risks of the Business” in Yamana's most recent Form 40-F and Annual Information Form filed with the United States Securities and Exchange Commission and Canadian provincial securities regulatory authorities, respectively. Although the Company has attempted to identify important factors that could cause actual results to differ materially, there may be other factors that cause results not to be as anticipated, estimated, described, or intended. Investors are cautioned against attributing undue certainty or reliance on forward-looking statements or information. Forward-looking statements and information are designed to help readers understand Management's current views of our near- and longer-term prospects and may not be appropriate for other purposes. The Company does not intend, and does not assume any obligation, to update or revise forward-looking statements or information to reflect changes in assumptions or in circumstances or any other events affecting such statements or information, other than as required by applicable law.
Cautionary Note to U.S. Investors Concerning Estimates of Mineral Reserves and Mineral Resources
Unless otherwise indicated, all reserve and resource estimates included in this MD&A have been prepared in accordance with Canadian National Instrument 43-101 - Standards of Disclosure for Mineral Projects (“NI 43-101”) and the Canadian Institute of Mining, Metallurgy and Petroleum (the “CIM”) — CIM Definition Standards on Mineral Resources and Mineral Reserves, adopted by the CIM Council, as amended (the “CIM Standards”). NI 43-101 is a rule developed by the Canadian Securities Administrators that establishes standards for all public disclosure an issuer makes of scientific and technical information concerning mineral projects. Canadian standards, including NI 43-101, differ significantly from the requirements of the United States Securities and Exchange Commission (the “SEC”), and reserve and resource information included herein may not be comparable to similar information disclosed by U.S. companies. In particular, and without limiting the generality of the foregoing, this MD&A use the terms “measured resources,” “indicated resources” and “inferred resources” as defined in accordance with NI 43-101 and the CIM Standards.
Further to recent amendments, mineral property disclosure requirements in the United States (the “U.S. Rules”) are governed by subpart 1300 of Regulation S-K of the U.S. Securities Act of 1933, as amended (the “U.S. Securities Act”) which differ from the CIM Standards. As a foreign private issuer that is eligible to file reports with the SEC pursuant to the multi-jurisdictional disclosure system (the “MJDS”), the Company is not required to provide disclosure on its mineral properties under the U.S. Rules and will continue to provide disclosure under NI 43-101 and the CIM Standards. If the Company ceases to be a foreign private issuer or loses its eligibility to file its annual report on Form 40-F pursuant to the MJDS, then the Company will be subject to the U.S. Rules, which differ from the requirements of NI 43-101 and the CIM Standards.
|
|
|
|
|
|
|
|
|
|
PAN AMERICAN SILVER CORP. |
46 |
|
|
|
|
|
|
|
Management Discussion and Analysis |
For the three months ended March 31, 2023 and 2022
(tabular amounts are in millions of U.S. dollars and thousands of shares, options,
and warrants except per share amounts and per ounce amounts, unless otherwise noted) |
Pursuant to the new U.S. Rules, the SEC recognizes estimates of “measured mineral resources”, “indicated mineral resources” and “inferred mineral resources.” In addition, the definitions of “proven mineral reserves” and “probable mineral reserves” under the U.S. Rules are now “substantially similar” to the corresponding standards under NI 43-101. Mineralization described using these terms has a greater amount of uncertainty as to its existence and feasibility than mineralization that has been characterized as reserves. Accordingly, U.S. investors are cautioned not to assume that any measured mineral resources, indicated mineral resources, or inferred mineral resources that the Company reports are or will be economically or legally mineable. Further, “inferred mineral resources” have a greater amount of uncertainty as to their existence and as to whether they can be mined legally or economically. Under Canadian securities laws, estimates of “inferred mineral resources” may not form the basis of feasibility or pre-feasibility studies, except in rare cases. While the above terms under the U.S. Rules are “substantially similar” to the standards under NI 43-101 and CIM Standards, there are differences in the definitions under the U.S. Rules and CIM Standards. Accordingly, there is no assurance any mineral reserves or mineral resources that the Company may report as “proven mineral reserves”, “probable mineral reserves”, “measured mineral resources”, “indicated mineral resources” and “inferred mineral resources” under NI 43-101 would be the same had the Company prepared the reserve or resource estimates under the standards adopted under the U.S. Rules.
|
|
|
|
|
|
|
|
|
|
PAN AMERICAN SILVER CORP. |
47 |