| 1-8957 | 91-1292054 | |||||||
| (Commission File Number) | (IRS Employer Identification No.) | |||||||
| 19300 International Boulevard | Seattle | Washington | 98188 | |||||||||||
| (Address of Principal Executive Offices) | (Zip Code) | |||||||||||||
| Title of each class | Ticker Symbol | Name of each exchange on which registered | ||||||
| Common stock, $0.01 par value | ALK | New York Stock Exchange | ||||||
| Updated Q4 Expectation | Previous Q4 2024 Expectation | |||||||||||||
| Capacity (ASMs) % change versus 2023 | Up ~1.5% | Up 1.5% to 2.5% | ||||||||||||
| CASMex % change versus 2023 | Up low double digits | Up high single digits | ||||||||||||
| RASM % change versus 2023 | Up mid-to-high single digits | Up mid single digits | ||||||||||||
| Economic fuel cost per gallon | $2.55 to $2.65 | $2.55 to $2.65 | ||||||||||||
| Non-operating expense | ~$45 million | ~$50 million | ||||||||||||
| Adjusted earnings per share | $0.40 to $0.50 | $0.20 to $0.40 | ||||||||||||
| Press Release | ||||||||
| Investor Day Presentation | ||||||||
| Unaudited pro forma condensed combined financial information of the Company for the quarter-to-date periods ending March 31, 2024 and June 30, 2024. | ||||||||
| 104 | Cover Page Interactive Data File - embedded within the Inline XBRL Document | |||||||

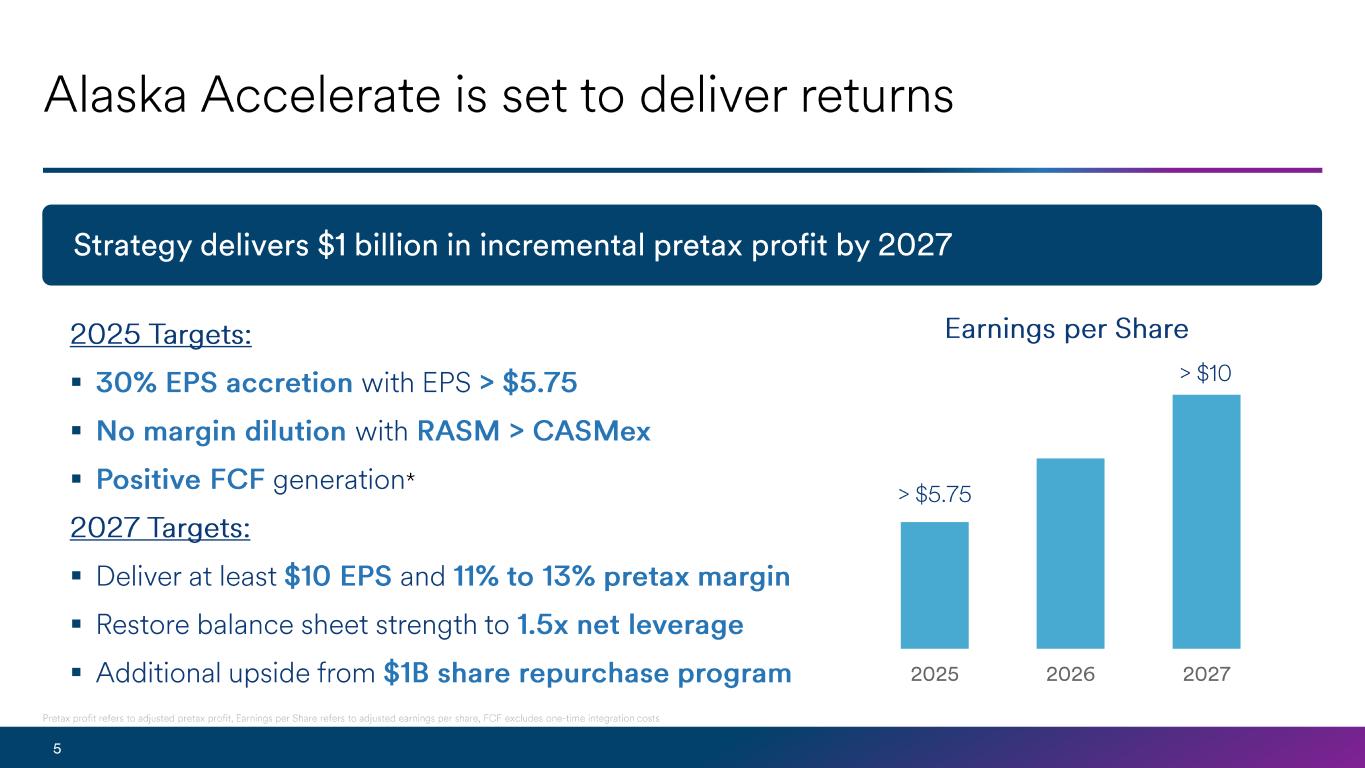
| 2025 Metric | Expectation | ||||
| Capacity | Up 2% to 3% | ||||
| Earnings Per Share | At least $5.75 | ||||
| Capital Expenditures | $1.4 to $1.5 billion | ||||
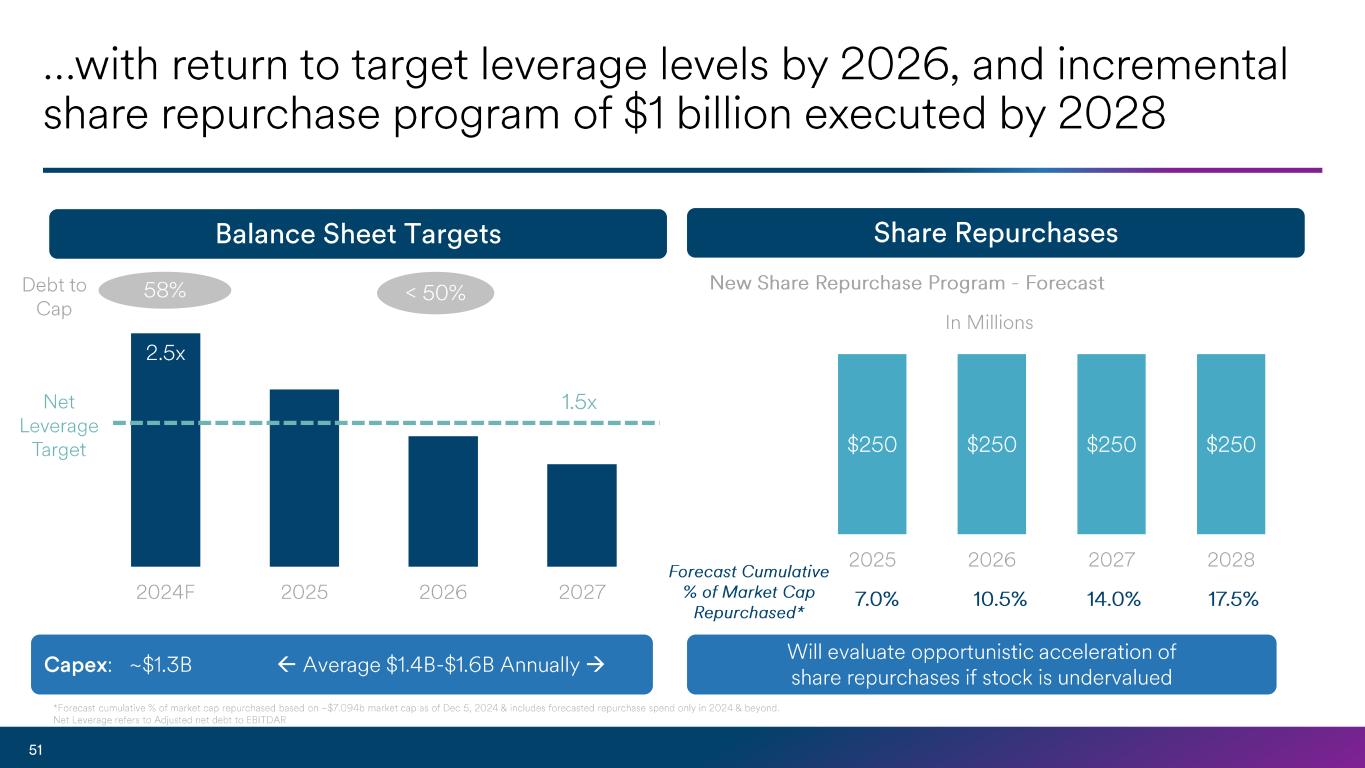
| Share Repurchases | ~ $250 million | ||||




As Reported |
Pro Forma |
||||||||||||||||||||||||||||
| (in millions, except statistical data) | Alaska |
Hawaiian |
Reclassification and Policy Adjustments | Other | Condensed Combined Pro Forma |
||||||||||||||||||||||||
| Operating Revenue | |||||||||||||||||||||||||||||
| Passenger revenue | $ | 2,004 | $ | 583 | $ | 2 | $ | — | $ | 2,589 | |||||||||||||||||||
| Mileage Plan other revenue | 164 | — | (29) | — | 135 | ||||||||||||||||||||||||
| Cargo and other revenue | 64 | 62 | 26 | — | 152 | ||||||||||||||||||||||||
| Total Operating Revenue | 2,232 | 645 | (1) | — | 2,876 | ||||||||||||||||||||||||
| Wages and benefits | 804 | 262 | (5) | — | (a) | 1,061 | |||||||||||||||||||||||
| Variable incentive pay | 44 | — | 5 | — | 49 | ||||||||||||||||||||||||
| Aircraft fuel, including hedging gains and losses | 565 | 189 | 5 | — | 759 | ||||||||||||||||||||||||
| Aircraft maintenance | 122 | 71 | 5 | — | 198 | ||||||||||||||||||||||||
| Aircraft rent | 47 | 30 | (6) | (7) | 64 | ||||||||||||||||||||||||
| Landing fees and other rentals | 165 | 43 | 4 | — | 212 | ||||||||||||||||||||||||
| Contracted services | 97 | — | 32 | — | 129 | ||||||||||||||||||||||||
| Selling expenses | 77 | 28 | 2 | — | 107 | ||||||||||||||||||||||||
| Depreciation and amortization | 126 | 33 | 2 | 17 | 178 | ||||||||||||||||||||||||
| Food and beverage service | 58 | — | 22 | — | 80 | ||||||||||||||||||||||||
| Third-party regional carrier expense | 54 | — | — | — | 54 | ||||||||||||||||||||||||
| Other | 205 | 46 | 19 | — | 270 | ||||||||||||||||||||||||
| Special items - operating | 34 | 8 | — | — | 42 | ||||||||||||||||||||||||
| Aircraft and passenger servicing | — | 45 | (45) | — | — | ||||||||||||||||||||||||
| Purchased services | — | 38 | (38) | — | — | ||||||||||||||||||||||||
| Total Operating Expenses | 2,398 | 793 | 2 | 10 | 3,203 | ||||||||||||||||||||||||
| Operating Income / (Loss) | (166) | (148) | (3) | (10) | (327) | ||||||||||||||||||||||||
| Non-operating Income (Expense) | (12) | (4) | 1 | (3) | (b) | (18) | |||||||||||||||||||||||
| Income (Loss) Before Income Tax | (178) | (152) | (2) | (13) | (345) | ||||||||||||||||||||||||
| Income tax expense / (benefit) | (46) | (15) | — | (3) | (c) | (64) | |||||||||||||||||||||||
| Net Income (Loss) | (132) | (137) | (2) | (10) | (281) | ||||||||||||||||||||||||
| RPMs (000,000) "traffic" | 12,524 | 4,073 | 16,597 | ||||||||||||||||||||||||||
| ASMs (000,000) "capacity" | 15,378 | 5,051 | 20,429 | ||||||||||||||||||||||||||
| Load Factor | 81.4 | % | 80.6 | % | 81.2 | % | |||||||||||||||||||||||
| RASM | 14.51 | ¢ | 12.78 | ¢ | 14.08 | ¢ | |||||||||||||||||||||||
| As Reported | Pro Forma | ||||||||||||||||||||||||||||
| (in millions, except statistical data) | Alaska |
Hawaiian |
Reclassification and Policy Adjustments | Other | Condensed Combined Pro Forma |
||||||||||||||||||||||||
| CASMex Reconciliation | |||||||||||||||||||||||||||||
| Non-fuel operating expense | $ | 1,833 | $ | 604 | $ | (3) | $ | 10 | $ | 2,444 | |||||||||||||||||||
| Less the following components: | |||||||||||||||||||||||||||||
| Freighter costs | 15 | — | — | — | 15 | ||||||||||||||||||||||||
| Special items - operating | 34 | 8 | — | — | 42 | ||||||||||||||||||||||||
| Total non-fuel operating expenses, excluding freighter costs and special items | $ | 1,784 | $ | 596 | $ | (3) | $ | 10 | $ | 2,387 | |||||||||||||||||||
| CASMex | 11.60 | ¢ | 11.79 | ¢ | 11.68 | ¢ | |||||||||||||||||||||||
Adjusted Pretax Income |
|||||||||||||||||||||||||||||
| Income before income tax | $ | (178) | $ | (152) | $ | (2) | $ | (13) | $ | (345) | |||||||||||||||||||
| Adjusted for: | |||||||||||||||||||||||||||||
| Mark-to-market fuel hedge adjustment | (13) | (2) | — | — | (15) | ||||||||||||||||||||||||
| Special items - operating | 34 | 8 | — | — | 42 | ||||||||||||||||||||||||
| Special items - net non-operating | — | (14) | — | — | (14) | ||||||||||||||||||||||||
| Adjusted income before income tax | $ | (157) | $ | (160) | $ | (2) | $ | (13) | $ | (332) | |||||||||||||||||||
| Pretax margin | (8.0) | % | (23.6) | % | (12.0) | % | |||||||||||||||||||||||
| Adjusted pretax margin | (7.0) | % | (24.8) | % | (11.4) | % | |||||||||||||||||||||||
Adjusted Net Income |
|||||||||||||||||||||||||||||
| Net Income (Loss) | $ | (132) | $ | (137) | $ | (2) | $ | (10) | $ | (281) | |||||||||||||||||||
| Adjusted for: | |||||||||||||||||||||||||||||
| Mark-to-market fuel hedge adjustments | (13) | (2) | — | — | (15) | ||||||||||||||||||||||||
| Special items - operating | 34 | 8 | — | — | 42 | ||||||||||||||||||||||||
| Special items - net non-operating | — | (14) | — | — | (14) | ||||||||||||||||||||||||
| Income tax effect of reconciling items above | (5) | 1 | — | — | (4) | ||||||||||||||||||||||||
| Adjusted Net Income (Loss) | $ | (116) | $ | (144) | $ | (2) | $ | (10) | $ | (272) | |||||||||||||||||||
| As Reported | Pro Forma | ||||||||||||||||||||||||||||
| (in millions, except statistical data) | Alaska | Hawaiian | Reclassification and Policy Adjustments | Other | Condensed Combined Pro Forma |
||||||||||||||||||||||||
| Operating Revenue | |||||||||||||||||||||||||||||
| Passenger revenue | $ | 2,651 | $ | 666 | $ | 3 | $ | — | $ | 3,320 | |||||||||||||||||||
| Mileage Plan other revenue | 174 | — | (29) | — | 145 | ||||||||||||||||||||||||
| Cargo and other revenue | 72 | 66 | 27 | — | 165 | ||||||||||||||||||||||||
| Total Operating Revenue | 2,897 | 732 | 1 | — | 3,630 | ||||||||||||||||||||||||
| Wages and benefits | 782 | 265 | (5) | — | (a) | 1,042 | |||||||||||||||||||||||
| Variable incentive pay | 49 | — | 5 | — | 54 | ||||||||||||||||||||||||
| Aircraft fuel, including hedging gains and losses | 615 | 179 | 7 | — | 801 | ||||||||||||||||||||||||
| Aircraft maintenance | 129 | 70 | 5 | — | 204 | ||||||||||||||||||||||||
| Aircraft rent | 46 | 30 | (6) | (7) | 63 | ||||||||||||||||||||||||
| Landing fees and other rentals | 173 | 45 | 4 | — | 222 | ||||||||||||||||||||||||
| Contracted services | 106 | — | 33 | — | 139 | ||||||||||||||||||||||||
| Selling expenses | 84 | 29 | 2 | — | 115 | ||||||||||||||||||||||||
| Depreciation and amortization | 128 | 35 | 2 | 17 | 182 | ||||||||||||||||||||||||
| Food and beverage service | 67 | — | 23 | — | 90 | ||||||||||||||||||||||||
| Third-party regional carrier expense | 64 | — | — | — | 64 | ||||||||||||||||||||||||
| Other | 186 | 41 | 19 | — | 246 | ||||||||||||||||||||||||
| Special items - operating | 146 | 6 | — | — | 152 | ||||||||||||||||||||||||
| Aircraft and passenger servicing | — | 48 | (48) | — | — | ||||||||||||||||||||||||
| Purchased services | — | 39 | (39) | — | — | ||||||||||||||||||||||||
| Total Operating Expenses | 2,575 | 787 | 2 | 10 | 3,374 | ||||||||||||||||||||||||
| Operating Income / (Loss) | 322 | (55) | (1) | (10) | 256 | ||||||||||||||||||||||||
| Non-operating Income (Expense) | (6) | (12) | 2 | (3) | (b) | (19) | |||||||||||||||||||||||
| Income (Loss) Before Income Tax | 316 | (67) | 1 | (13) | 237 | ||||||||||||||||||||||||
| Income tax expense / (benefit) | 96 | — | — | (3) | (c) | 93 | |||||||||||||||||||||||
| Net Income (Loss) | 220 | (67) | 1 | (10) | 144 | ||||||||||||||||||||||||
| RPMs (000,000) "traffic" | 15,309 | 4,519 | 19,828 | ||||||||||||||||||||||||||
| ASMs (000,000) "capacity" | 18,196 | 5,230 | 23,426 | ||||||||||||||||||||||||||
| Load Factor | 84.1 | % | 86.4 | % | 84.6 | % | |||||||||||||||||||||||
| RASM | 15.92 | ¢ | 13.99 | ¢ | 15.50 | ¢ | |||||||||||||||||||||||
| As Reported | Pro Forma | ||||||||||||||||||||||||||||
| (in millions, except statistical data) | Alaska | Hawaiian | Reclassification and Policy Adjustments | Other | Condensed Combined Pro Forma |
||||||||||||||||||||||||
| CASMex Reconciliation | |||||||||||||||||||||||||||||
| Non-fuel operating expense | $ | 1,960 | $ | 608 | $ | (5) | $ | 10 | $ | 2,573 | |||||||||||||||||||
| Less the following components: | |||||||||||||||||||||||||||||
| Freighter costs | 13 | — | — | — | 15 | ||||||||||||||||||||||||
| Special items - operating | 146 | 6 | — | — | 152 | ||||||||||||||||||||||||
| Total non-fuel operating expenses, excluding freighter costs and special items | $ | 1,801 | $ | 602 | $ | (5) | $ | 10 | $ | 2,406 | |||||||||||||||||||
| CASMex | 9.89 | ¢ | 11.50 | ¢ | 10.27 | ¢ | |||||||||||||||||||||||
| Adjusted Pretax Income | |||||||||||||||||||||||||||||
| Income before income tax | $ | 316 | $ | (67) | $ | 1 | $ | (13) | $ | 237 | |||||||||||||||||||
| Adjusted for: | |||||||||||||||||||||||||||||
| Mark-to-market fuel hedge adjustment | (5) | — | — | — | (5) | ||||||||||||||||||||||||
| Special items - operating | 146 | 6 | — | — | 152 | ||||||||||||||||||||||||
| Special items - net non-operating | — | (10) | — | — | (10) | ||||||||||||||||||||||||
| Adjusted income before income tax | $ | 457 | $ | (71) | $ | 1 | $ | (13) | $ | 374 | |||||||||||||||||||
| Pretax margin | 10.9 | % | (9.2) | % | 6.5 | % | |||||||||||||||||||||||
| Adjusted pretax margin | 15.8 | % | (9.7) | % | 10.4 | % | |||||||||||||||||||||||
| Adjusted Net Income | |||||||||||||||||||||||||||||
| Net Income (Loss) | $ | 220 | $ | (67) | $ | 1 | $ | (10) | $ | 144 | |||||||||||||||||||
| Adjusted for: | |||||||||||||||||||||||||||||
| Mark-to-market fuel hedge adjustments | (5) | — | — | — | (5) | ||||||||||||||||||||||||
| Special items - operating | 146 | 6 | — | — | 152 | ||||||||||||||||||||||||
| Special items - net non-operating | — | (10) | — | — | (10) | ||||||||||||||||||||||||
| Income tax effect of reconciling items above | (34) | — | — | — | (34) | ||||||||||||||||||||||||
| Adjusted Net Income (Loss) | $ | 327 | $ | (71) | $ | 1 | $ | (10) | $ | 247 | |||||||||||||||||||