株探米国株
エドガーで原本を確認する
0000764622falseAZ00000072868-KAugust 4, 2026falseAZfalsefalsefalsefalsefalse00007646222026-08-042026-08-040000764622pnw:ArizonaPublicServiceCompanyMember2026-08-042026-08-04

UNITED STATES
SECURITIES AND EXCHANGE COMMISSION
WASHINGTON, D.C. 20549 
 
FORM 8-K 
 
CURRENT REPORT
Pursuant to Section 13 or 15(d) of the
Securities Exchange Act of 1934
Date of report (Date of earliest event reported):
August 4, 2026
Commission File
Number
Exact name of registrant as specified in its
charter; State or other jurisdiction of incorporation or organization; Address of principal executive offices, including zip code; and
Registrant's telephone number, including area code
IRS Employer
Identification No.
1-8962 PINNACLE WEST CAPITAL CORPORATION 86-0512431
(an Arizona corporation)
400 North Fifth Street, P.O. Box 53999
Phoenix Arizona 85072-3999
(602) 250-1000
1-4473 ARIZONA PUBLIC SERVICE COMPANY 86-0011170
(an Arizona corporation)
400 North Fifth Street, P.O. Box 53999
Phoenix Arizona 85072-3999
(602) 250-1000
Not Applicable
(Former name or former address, if changed since last report.)

Check the appropriate box below if the Form 8-K filing is intended to simultaneously satisfy the filing obligation of the registrant under any of the following provisions:
Written communications pursuant to Rule 425 under the Securities Act (17 CFR 230.425)
Soliciting material pursuant to Rule 14a-12 under the Exchange Act (17 CFR 240.14a-12)
Pre-commencement communications pursuant to Rule 14d-2(b) under the Exchange Act (17 CFR 240.14d-2(b))
Pre-commencement communications pursuant to Rule 13e-4(c) under the Exchange Act (17 CFR 240.13e-4(c))

Securities registered pursuant to Section 12(b) of the Act:
Title of each class
Trading Symbol(s)
Name of each exchange on which registered
Common Stock, no par value
PNW
New York Stock Exchange

Indicate by check mark whether the registrant is an emerging growth company as defined in Rule 405 of the Securities Act of 1933 (17 CFR §230.405) or Rule 12b-2 of the Securities Exchange Act of 1934 (17 CFR §240.12b-2).
Emerging growth company

If an emerging growth company, indicate by check mark if the registrant has elected not to use the extended transition period for complying with any new or revised financial accounting standards provided pursuant to Section 13(a) of the Exchange Act. ¨

This combined Form 8-K is separately filed or furnished by Pinnacle West Capital Corporation and Arizona Public Service Company. Each registrant is filing or furnishing on its own behalf all of the information contained in this Form 8-K that relates to such registrant and, where required, its subsidiaries. Except as stated in the preceding sentence, neither registrant is filing or furnishing any information that does not relate to such registrant, and therefore makes no representation as to any such information.


Item 2.02. Results of Operations and Financial Condition.

    The following information is furnished pursuant to Item 2.02.

    On August 4, 2026, Pinnacle West Capital Corporation (“Pinnacle West”) issued a press release regarding its financial results for the fiscal quarter ended June 30, 2026. A copy of the press release is attached hereto as Exhibit 99.1.

Item 7.01. Regulation FD Disclosure.

    The following information is furnished pursuant to Item 7.01.

    Pinnacle West is providing a copy of the slide presentation made in connection with the quarterly earnings conference call on August 4, 2026. This information contains Pinnacle West operating results for the fiscal quarter ended June 30, 2026 and earnings outlook for 2026. The slide presentation is attached hereto as Exhibit 99.2 and is concurrently being posted to Pinnacle West’s website at www.pinnaclewest.com.

Item 9.01.    Financial Statements and Exhibits.

    (d)    Exhibits
Exhibit No. Registrant(s) Description
99.1 Pinnacle West
Arizona Public Service Company
99.2 Pinnacle West
Arizona Public Service Company
104.0 Pinnacle West
Arizona Public Service Company
104 Cover Page Interactive Data File (embedded within the Inline XBRL document)


SIGNATURES

    Pursuant to the requirements of the Securities Exchange Act of 1934, each registrant has duly caused this report to be signed on its behalf by the undersigned hereunto duly authorized.

PINNACLE WEST CAPITAL CORPORATION
(Registrant)
Dated: August 4, 2026 By: /s/ Andrew Cooper
Andrew Cooper
Senior Vice President and
Chief Financial Officer
ARIZONA PUBLIC SERVICE COMPANY
(Registrant)
Dated: August 4, 2026 By: /s/ Andrew Cooper
Andrew Cooper
Senior Vice President and
Chief Financial Officer


EX-99.1 2 a8-kpnw063026exhibit991.htm EX-99.1 Document
Exhibit 99.1
a2q2020earningsfinal0_imaga.jpg
FOR IMMEDIATE RELEASE August 4, 2026
Media Contact:
Analyst Contact:
Alan Bunnell (602) 250-3376
Amanda Ho (602) 250-3334
Website: pinnaclewest.com

PINNACLE WEST REPORTS LOWER 2026 SECOND-QUARTER FINANCIAL RESULTS COMPARED TO A YEAR AGO

Lower second-quarter financial results align with company expectations as operating performance, reliability remain strong

Robust customer growth and increased energy demand driven by early summer heat

Customer support and financial assistance resources enhanced for peak summer season

PHOENIX – Pinnacle West Capital Corp. (NYSE: PNW) today reported consolidated net income attributable to common shareholders of $178.6 million, or $1.43 per diluted share of common stock, for the quarter ended June 30, 2026. This result compares with consolidated net income of $192.6 million, or $1.58 per diluted share, for the same period in 2025.

The 2026 quarterly results reflect a decrease of about $14 million, primarily as a result of higher interest charges; higher depreciation and amortization; and lower transmission service revenues. These negative factors were partially offset by the favorable impacts of the effects of weather; customer growth and usage; decreased operations and maintenance expenses; and lower taxes.

“Summer arrived early this year, with temperatures reaching 105° F back in March. As a result, our customers turned on their air conditioners sooner than usual and continued using them heavily even after temperatures returned to levels similar to last year,” said Pinnacle West Chairman, President and Chief Executive Officer Ted Geisler, citing a 7% increase in residential cooling degree days in the 2026 second quarter versus the same period a year ago. “This usage drove higher energy demand and sustained load growth and contributed to financial results within our expectations.”

Operationally, Geisler said Arizona Public Service Co. (APS) employees delivered strong performance throughout the second quarter, maintaining reliable service during extreme summer heat and increased energy demand. During the period, APS achieved robust residential customer growth of 2.1% and weather-normalized sales growth of 5.6%. Overall, customer growth was 2.1%, while total sales increased 9.6%.

Supporting Customers Through the Summer
While APS remains focused on delivering safe, reliable power throughout the summer, the company is also expanding existing programs and resources to help customers manage higher seasonal energy bills.
As Arizona enters the peak summer season, APS has expanded its customer support through enhanced Care Center resources, customer education, targeted communications and community outreach. These efforts help connect customers with information, tools and assistance designed to support them during the peak summer season. Customer resources include webinars, educational materials, bill-management options and personalized support from customer advisors.

Bringing APS’s customer-first commitment to life, Geisler highlighted a recent example of APS employees going above and beyond to support some of the company’s most vulnerable customers:


Ahead of a planned outage in Prescott Valley, Ariz., employees responded to concerns from a local elderly and disabled housing community about outage communications. By collaborating across Customer Experience, Public Affairs and Transmission & Distribution teams, this particular outage was delayed to provide additional customer support and education.

“When residents shared concerns about how a planned outage could affect their community, our employees took the time to listen and respond,” said Geisler. “By providing personalized outreach, answering questions, verifying customer information, sharing preparedness resources and connecting residents with APS assistance programs, we were able to better support customers and strengthen trust within the community. The experience also helped us identify opportunities to improve future outreach and communication with customers who may need additional support.”

Enhancing the APS Safety Net Program
APS also enhanced its Safety Net program that expands support for customers and their designated emergency contacts. The updated program provides earlier notifications about past-due bills, potential disconnection notices and outages. This added awareness can help customers avoid service interruptions and connect with available support sooner. APS also expanded enrollment opportunities through customer service interactions and digital channels, making participation more accessible.

Additionally, APS offers financial assistance programs, including discounts of up to 25% or 60% for eligible vulnerable customers; emergency utility bill assistance offering up to $1,000 annually; and APS CARE (Crisis Assistance Relief Effort), a Salvation Army-administered service providing up to $500 annually in emergency energy bill assistance. To ensure customers in need are connected to these programs, the company partners with more than one hundred community action agencies across its service territory to train representatives who serve our shared customers.

Customers are encouraged to visit aps.com/save for a full list of assistance programs or call (602) 371-7171 or (800) 253-9405 for support, available 24/7 in English and Spanish. APS’s call center answers 75% of customer calls within 30 seconds, and the company’s mobile app enables customers to quickly and easily find the information they need when they need it.

Strengthening Reliability for Customers
Supporting customers extends beyond assistance programs and outage preparedness, added Geisler. APS also is investing in the infrastructure and resources needed to provide the reliable energy service customers count on at the lowest cost possible.

Toward that end, APS recently announced plans to convert two retired coal-fired units at the Cholla Power Plant near Joseph City to natural gas, bringing about 380 MW of reliable, dispatchable energy back online by 2029 – enough to power about 61,000 Arizona homes. By repurposing existing infrastructure and transmission facilities, Geisler said the project will help meet Arizona’s growing energy demand in a cost-effective way while supporting grid reliability, complementing renewable energy resources, and creating jobs and economic benefits for Navajo County. The project remains subject to regulatory approvals and is expected to begin construction in 2028.

Financial Outlook
For 2026, the Company continues to estimate its consolidated earnings will be within a range of $4.55 to $4.75 per diluted share on a weather-normalized basis. Key factors and assumptions underlying this outlook can be found in the second-quarter 2026 earnings presentation slides at pinnaclewest.com/investors.

Conference Call and Webcast
Pinnacle West invites interested parties to listen to the live webcast of management’s conference call to discuss the company’s financial results and recent developments, and to provide an update on the company’s longer-term financial outlook, at noon ET (9 a.m. Arizona time) today, Tuesday August 4. The webcast can be accessed at pinnaclewest.com/presentations and will be available for replay on the website for 30 days. To access the live conference call by telephone, dial (888) 506-0062 or (973) 528-0011 for international callers and enter participant access code 293662. A replay of the call also will be available at pinnaclewest.com/presentations or by telephone until 11:59 p.m. ET, Tuesday, Aug. 11,


2026, by calling (877) 481-4010 in the U.S. and Canada or (919) 882-2331 internationally and entering replay passcode 54218.

General Information
Pinnacle West Capital Corp., an energy holding company based in Phoenix, has consolidated assets of about $32.6 billion, about 6,200 megawatts of generating capacity and approximately 6,600 employees in Arizona and New Mexico. Through its principal subsidiary, Arizona Public Service, the company provides retail electricity service to about 1.5 million Arizona homes and businesses. For more information about Pinnacle West, visit the company’s website at pinnaclewest.com.

Dollar amounts in this news release are after income taxes. Earnings per share amounts are based on average diluted common shares outstanding. For more information on Pinnacle West’s operating statistics and earnings, please visit
pinnaclewest.com/investors.

FORWARD-LOOKING STATEMENTS

This press release contains forward-looking statements based on current expectations. These forward-looking statements are often identified by words such as "estimate," "predict," "may," "believe," "plan," "expect," "require," "intend," "assume," "project," "anticipate," "goal," "seek," "strategy," "likely," "should," "will," "could," and similar words. Because actual results may differ materially from expectations, we caution readers not to place undue reliance on these statements. A number of factors could cause future results to differ materially from historical results, or from outcomes currently expected or sought by Pinnacle West or APS. These factors include, but are not limited to:

our ability to achieve timely and adequate rate recovery of our costs through our regulated rates and adjustor recovery mechanisms, including returns on and of debt and equity capital investment;
the impacts of federal, state, and local laws, judicial decisions, statutes, regulations, and FERC, NRC, EPA, ACC, and other agency requirements, including as they are changed by legislative and regulatory action as well as executive orders, such as those relating to tax, environment, energy, nuclear plants, and deregulation of the retail electric market;
our operation of Palo Verde is subject to substantial regulatory oversight and potentially significant liabilities and capital expenditures;
we are subject to numerous environmental laws and changes to existing laws, or new laws, may increase our costs and impact our business;
the potential effects of climate change on our electric system, including as a result of weather extremes, such as prolonged drought and high temperature variations in the area where APS conducts its business, as well as the impacts of policy and regulatory changes introduced to address climate change;
co-owners of our jointly owned generation and transmission facilities may have unaligned goals;
the willingness or ability of counterparties, participants, and landowners to meet contractual or other obligations or extend the rights for continued generation and transmission operations;
deregulation of the electric industry and other factors, such as large customers developing large, utility scale generation to serve their energy needs, may result in increased competition;
variations in demand for electricity, including those due to weather, seasonality (including large increases in ambient temperatures), the general economy or social conditions, customer and sales growth (or decline), data center growth (or lack thereof), including to support the AI industry, the effects of energy conservation measures and DG, and technological advancements;
wildfires, including those arising as a result of climate change, extreme weather events, or the expansion of the wildland urban interface;
generation, transmission, and distribution facilities and system operating costs, conditions, performance, and outages;
our ability and efforts to meet current and anticipated future needs for generation and transmission and distribution facilities in our region at reliable levels, including factors affecting our ability to acquire and develop new resources to serve this load as well as difficulties in accurately forecasting load growth, particularly from high load energy users;


availability of fuel and water supplies as well as the volatility and costs of fuel and purchased power;
the direct or indirect effect on our facilities or business from cybersecurity threats or intrusions, data security breaches, terrorist attack, physical attack, severe storms, or other catastrophic events, such as fires, explosions, pandemic health events, or similar occurrences;
risks inherent in the operation of nuclear facilities, including spent fuel disposal uncertainty;
the development of new technologies and the impact they have on the retail and wholesale electricity market and the impacts of our adoption or failure to adopt such technologies;
the availability and retention of qualified personnel and the need to negotiate collective bargaining agreements with union employees;
the cost of debt, including increased cost as a result of rising interest rates, and equity capital and our ability to access capital markets when required as well as the impacts a credit rating downgrade would have on us;
the investment performance of the assets of our nuclear decommissioning trust, captive insurance cell, coal mine reclamation escrow, pension, and other postretirement benefit plans, and the resulting impact on future funding requirements;
Pinnacle West’s cash flow depends on the performance of APS and its ability to make dividends and distributions;
potential shortfalls in insurance coverage;
Pinnacle West’s ability to meet its debt service obligation could be adversely affected because its debt securities are structurally subordinated to the debt securities and obligations of its subsidiaries;
the liquidity of wholesale power markets and the use of derivative contracts in our business;
policy changes in Arizona or other states through ballot initiatives or referenda may increase our cost or operations or affect our business plans;
general economic conditions, such as tariffs, inflation, and other supply chain constraints, as well as uncertainties associated with the current and future economic environment and conditions in Arizona; and
disruptions in financial markets could adversely affect our cost of and access to credit and capital markets.

These and other factors are discussed in the most recent Pinnacle West/APS Form 10-K and 10-Q along with other public filings with the Securities and Exchange Commission, which readers should review carefully before placing any reliance on our financial statements or disclosures. Neither Pinnacle West nor APS assumes any obligation to update these statements, even if our internal estimates change, except as required by law.

# # #


PINNACLE WEST CAPITAL CORPORATION
CONDENSED CONSOLIDATED STATEMENTS OF INCOME
(unaudited)
(dollars and shares in thousands, except per share amounts)

Three Months Ended
Six Months Ended
June 30, June 30,
2026 2025 2026 2025
Operating Revenues $ 1,455,749  $ 1,358,751  $ 2,605,346  $ 2,391,031 
Operating Expenses
Fuel and purchased power 558,498  477,008  995,227  857,079 
Operations and maintenance 283,387  286,605  560,087  586,714 
Depreciation and amortization 243,226  228,893  483,084  463,833 
Taxes other than income taxes 61,684  57,651  123,656  117,005 
Other expense 3,282  1,042  6,446  1,626 
Total 1,150,077  1,051,199  2,168,500  2,026,257 
Operating Income
305,672  307,552  436,846  364,774 
Other Income (Deductions)
Allowance for equity funds used during construction 17,052  14,767  31,834  28,016 
Pension and other postretirement non-service credits, net 5,018  3,692  9,000  6,650 
Other income 13,096  12,104  18,077  29,565 
Other expense (6,570) (4,259) (9,310) (6,829)
Total 28,596  26,304  49,601  57,402 
Interest Expense
Interest charges 133,601  113,527  259,360  218,470 
Allowance for borrowed funds used during construction (11,402) (11,559) (21,265) (21,661)
Total 122,199  101,968  238,095  196,809 
Income Before Income Taxes
212,069  231,888  248,352  225,367 
Income taxes
31,302  35,018  32,471  28,835 
Net Income
180,767  196,870  215,881  196,532 
Less: Net income attributable to noncontrolling interests
2,193  4,306  4,387  8,612 
Net Income Attributable To Common Shareholders
$ 178,574  $ 192,564  $ 211,494  $ 187,920 
Weighted-Average Common Shares Outstanding - Basic 121,306  119,517  121,333  119,555 
Weighted-Average Common Shares Outstanding - Diluted 124,494  121,865  124,136  121,813 
Earnings Per Weighted-Average Common Share Outstanding
Net income attributable to common shareholders - basic
$ 1.47  $ 1.61  $ 1.74  $ 1.57 
Net income attributable to common shareholders - diluted
$ 1.43  $ 1.58  $ 1.70  $ 1.54 

EX-99.2 3 q2_2026xearningsxfinal.htm EX-99.2 q2_2026xearningsxfinal
Powering Arizona’s Future Second-Quarter Financial Results August 4, 2026


2 This presentation contains forward-looking statements based on current expectations, including statements regarding our earnings guidance and financial outlook and goals. These forward-looking statements are often identified by words such as “estimate,” “predict,” “may,” “believe,” “plan,” “expect,” “require,” “intend,” “assume,” “project,” "anticipate," "goal," "seek," "strategy," "likely," "should," "will," "could," and similar words. Because actual results may differ materially from expectations, we caution you not to place undue reliance on these statements. A number of factors could cause future results to differ materially from historical results, or from outcomes currently expected or sought by Pinnacle West or APS. These factors include, but are not limited to: our ability to achieve timely and adequate rate recovery of our costs through our regulated rates and adjustor recovery mechanisms, including returns on and of debt and equity capital investment; the impacts of federal, state, and local laws, judicial decisions, statutes, regulations, and FERC, NRC, EPA, ACC, and other agency requirements, including as they are changed by legislative and regulatory action as well as executive orders, such as those relating to tax, environment, energy, nuclear plants, and deregulation of the retail electric market; our operation of Palo Verde is subject to substantial regulatory oversight and potentially significant liabilities and capital expenditures; we are subject to numerous environmental laws and changes to existing laws, or new laws, may increase our costs and impact our business; the potential effects of climate change on our electric system, including as a result of weather extremes, such as prolonged drought and high temperature variations in the area where APS conducts its business, as well as the impacts of policy and regulatory changes introduced to address climate change; co-owners of our jointly owned generation and transmission facilities may have unaligned goals; the willingness or ability of counterparties, participants, and landowners to meet contractual or other obligations or extend the rights for continued generation and transmission operations; deregulation of the electric industry and other factors, such as large customers developing large, utility scale generation to serve their energy needs, may result in increased competition; variations in demand for electricity, including those due to weather, seasonality (including large increases in ambient temperatures), the general economy or social conditions, customer and sales growth (or decline), data center growth (or lack thereof), including to support the AI industry, the effects of energy conservation measures and DG, and technological advancements; wildfires, including those arising as a result of climate change, extreme weather events, or the expansion of the wildland urban interface; generation, transmission, and distribution facilities and system operating costs, conditions, performance, and outages; our ability and efforts to meet current and anticipated future needs for generation and transmission and distribution facilities in our region at reliable levels, including factors affecting our ability to acquire and develop new resources to serve this load as well as difficulties in accurately forecasting load growth, particularly from high load energy users; availability of fuel and water supplies as well as the volatility and costs of fuel and purchased power; the direct or indirect effect on our facilities or business from cybersecurity threats or intrusions, data security breaches, terrorist attack, physical attack, severe storms, or other catastrophic events, such as fires, explosions, pandemic health events, or similar occurrences; risks inherent in the operation of nuclear facilities, including spent fuel disposal uncertainty; the development of new technologies and the impact they have on the retail and wholesale electricity market and the impacts of our adoption or failure to adopt such technologies; the availability and retention of qualified personnel and the need to negotiate collective bargaining agreements with union employees; the cost of debt, including increased cost as a result of rising interest rates, and equity capital and our ability to access capital markets when required as well as the impacts a credit rating downgrade would have on us; the investment performance of the assets of our nuclear decommissioning trust, captive insurance cell, coal mine reclamation escrow, pension, and other postretirement benefit plans, and the resulting impact on future funding requirements; Pinnacle West’s cash flow depends on the performance of APS and its ability to make dividends and distributions; potential shortfalls in insurance coverage; Pinnacle West’s ability to meet its debt service obligation could be adversely affected because its debt securities are structurally subordinated to the debt securities and obligations of its subsidiaries; the liquidity of wholesale power markets and the use of derivative contracts in our business; policy changes in Arizona or other states through ballot initiatives or referenda may increase our cost or operations or affect our business plans; general economic conditions, such as tariffs, inflation, and other supply chain constraints, as well as uncertainties associated with the current and future economic environment and conditions in Arizona; and disruptions in financial markets could adversely affect our cost of and access to credit and capital markets. These and other factors are discussed in the most recent Pinnacle West/APS Form 10-K and Form 10-Q along with other public filings with the Securities and Exchange Commission, which you should review carefully before placing any reliance on our financial statements, disclosures or earnings outlook. Neither Pinnacle West nor APS assumes any obligation to update these statements, even if our internal estimates change, except as required by law. In this presentation, references to net income and earnings per share (EPS) refer to amounts attributable to common shareholders. Forward Looking Statements


$0.10 $0.02 ($0.09) ($0.02) ($0.11) $0.01 ($0.05) ($0.01) $1.58 $1.43 Q2 2026 vs Q2 2025 Operating Revenue less Fuel and Purchased Power Weather $ 0.12 Sales / Usage $ 0.11 LFCR / Other $ 0.04 Transmission $ (0.07) RES / DSM $ (0.10)Q2 2025 Q2 2026 1 Includes costs and offsetting operating revenues associated with renewable energy and demand side management programs, see slide 25 for more information. 2 Reflects year-over-year impacts of purchase agreement and termination of two of the three Palo Verde VIE lease agreements, primarily offset by changes in D&A and O&M expense. See Note 12 in the 2025 Form 10K for more information. Operating Revenue less Fuel and Purchased Power1 O&M1 D&A Pension & OPEB non- service credits, net Interest, net AFUDC All other 3 Second-Quarter results All Other Net Income attributable to non-controlling interest2 $ 0.03 Change in Outstanding Shares $ (0.03) Other, net & rounding $ (0.05) Other taxes Income taxes


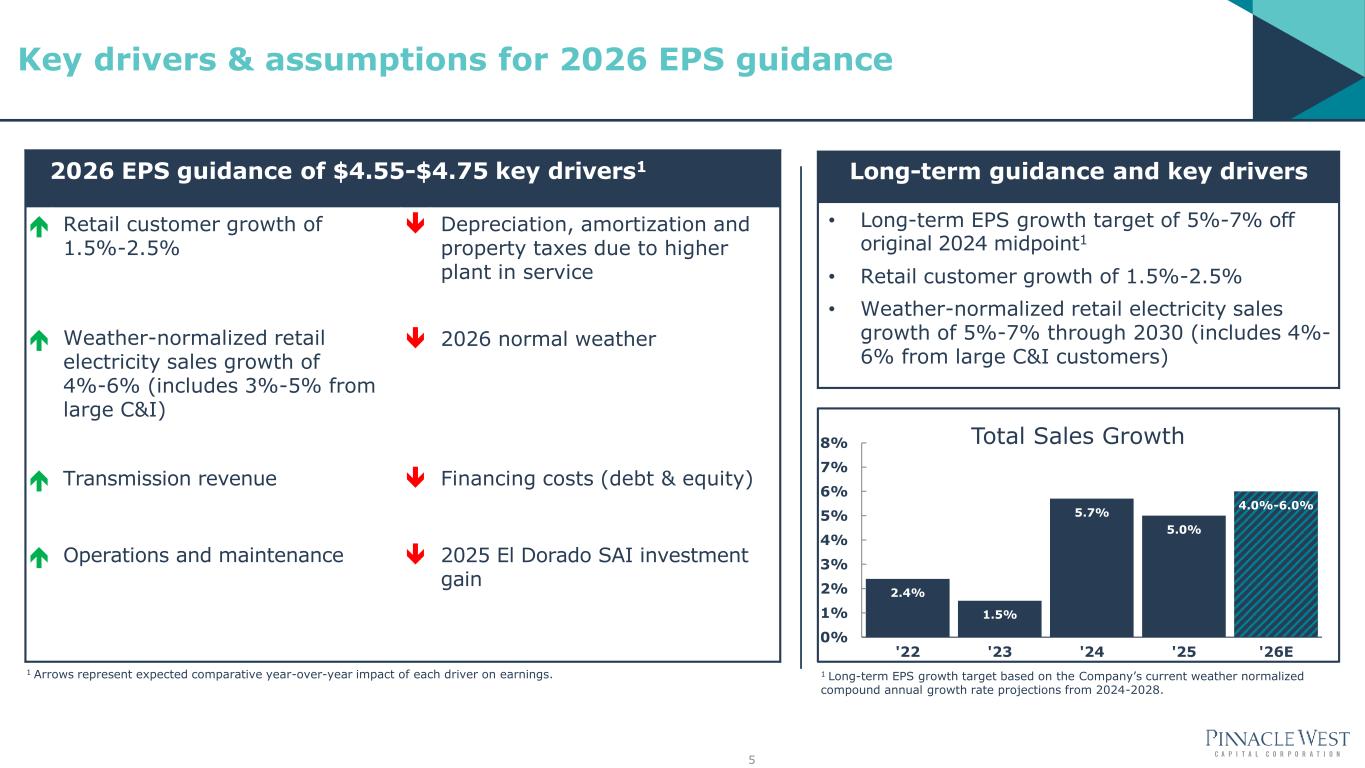
Key Factors and Assumptions (as of August 4, 2026) 2026 Adjusted gross margin (operating revenues, net of fuel and purchased power expenses, x/RES,DSM)1 $3.31 – $3.37 billion • Retail customer growth of 1.5%-2.5% • Weather-normalized retail electricity sales growth of 4.0%-6.0% • Includes 3.0%-5.0% contribution to sales growth of new large manufacturing facilities and several large data centers • Assumes normal weather Adjusted operating and maintenance expense (O&M x/RES,DSM)1 $1.02 – $1.04 billion Other operating expenses (depreciation and amortization, and taxes other than income taxes) $1.22 – $1.24 billion Other income (pension and other post-retirement non-service credits, other income and other expense) $0 – $5 million Interest expense, net of allowance for borrowed and equity funds used during construction (Total AFUDC ~$128 million) $415 – $435 million Net income attributable to noncontrolling interests $8 million Effective tax rate 11.5% – 12.5% Average diluted common shares outstanding 123.8 million EPS Guidance $4.55 – $4.75 1 Excludes costs and offsetting operating revenues associated with renewable energy and demand side management programs. For reconciliation, see slide 25. 4 2026 EPS guidance


2026 EPS guidance of $4.55-$4.75 key drivers1  Retail customer growth of 1.5%-2.5%  Depreciation, amortization and property taxes due to higher plant in service  Weather-normalized retail electricity sales growth of 4%-6% (includes 3%-5% from large C&I)  2026 normal weather  Transmission revenue  Financing costs (debt & equity)  Operations and maintenance  2025 El Dorado SAI investment gain Long-term guidance and key drivers • Long-term EPS growth target of 5%-7% off original 2024 midpoint1 • Retail customer growth of 1.5%-2.5% • Weather-normalized retail electricity sales growth of 5%-7% through 2030 (includes 4%- 6% from large C&I customers) 2.4% 1.5% 5.7% 5.0% 4.0%-6.0% 0% 1% 2% 3% 4% 5% 6% 7% 8% '22 '23 '24 '25 '26E Total Sales Growth 5 1 Arrows represent expected comparative year-over-year impact of each driver on earnings. Key drivers & assumptions for 2026 EPS guidance 1 Long-term EPS growth target based on the Company’s current weather normalized compound annual growth rate projections from 2024-2028.


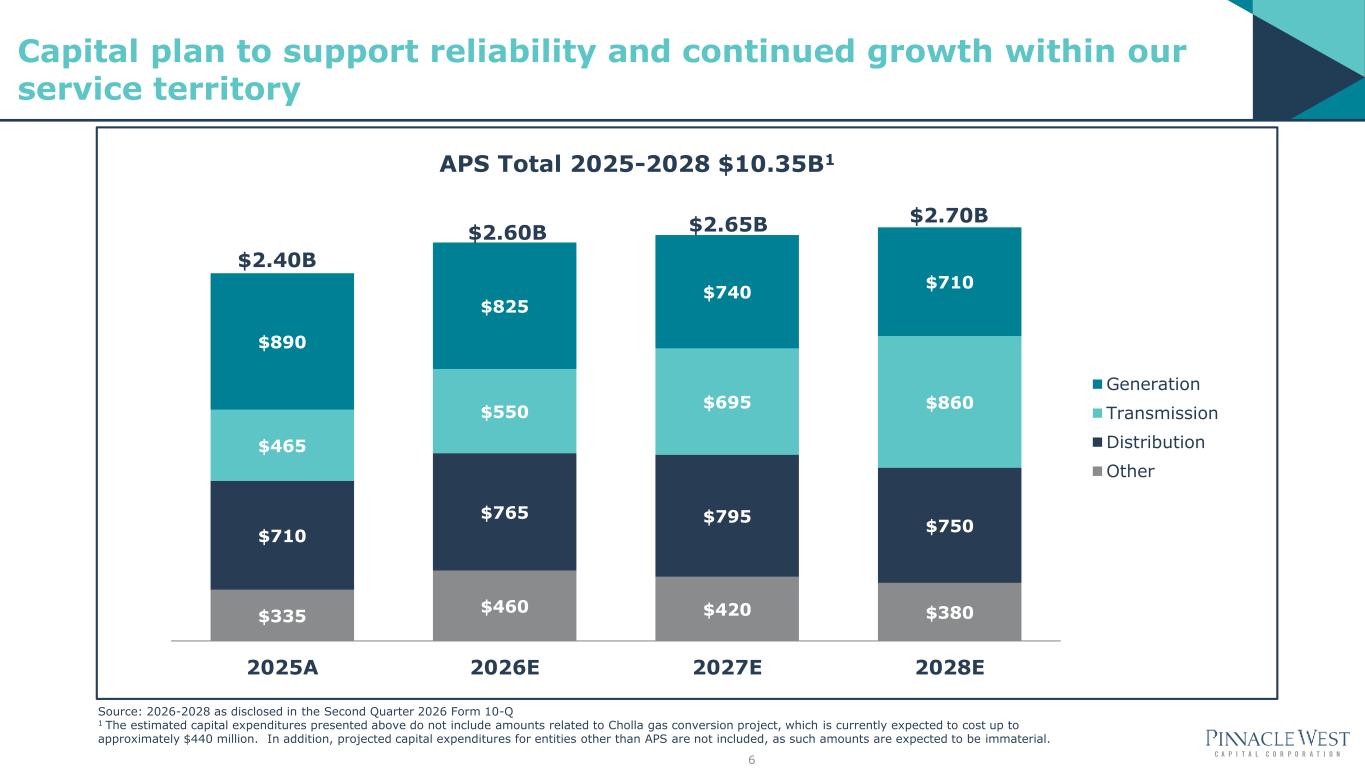
$335 $460 $420 $380 $710 $765 $795 $750 $465 $550 $695 $860 $890 $825 $740 $710 2025A 2026E 2027E 2028E APS Total 2025-2028 $10.35B1 Generation Transmission Distribution Other $2.40B $2.60B $2.65B $2.70B Source: 2026-2028 as disclosed in the Second Quarter 2026 Form 10-Q 1 The estimated capital expenditures presented above do not include amounts related to Cholla gas conversion project, which is currently expected to cost up to approximately $440 million. In addition, projected capital expenditures for entities other than APS are not included, as such amounts are expected to be immaterial. 6 Capital plan to support reliability and continued growth within our service territory


Current Approved Rate Base and Test Year Detail End-of-Year Rate Base and Growth Guidance1 ACC FERC Rate Effective Date 03/08/2024 06/01/2026 Test Year Ended 6/30/20221 12/31/2025 Equity Layer 51.93% 51.99% Allowed ROE 9.55% 10.75% Rate Base $10.36B2 $2.81B $12.23 $13.33 $15.7 $2.52 $2.82 $4.0 2024 2025 2026 2027 2028 ACC FERC 7 Rate base $ in billions, rounded Projected 1 Guidance excludes CWIP amounts of $1.6B in 2024 and $2.7B-$3.2B in 2028. 2 Derived from APS annual update of formula transmission service rates. 3 Represents unadjusted ACC jurisdictional rate base consistent with regulatory filings. 1 Adjusted to include post-test year plant in service through 06/30/2023. 2 Rate Base excludes $215M approved through Joint Resolution in Case No. E-01345A-19-0236. Increased rate base growth within our service territory


8 Operations & Maintenance Guidance • Core O&M remains flat with rapidly growing customer base • Lean culture and declining O&M per MWh goal • Reduction of year-over-year O&M including planned outages We are focused on cost control and customer affordability $955 $978 $970-$980 $141 $143 $80-$90 $70 $64 $45-$55 2024A 2025A 2026E O&M Guidance (millions) Planned Outages RES/DSM Core O&M Numbers may not foot due to rounding.


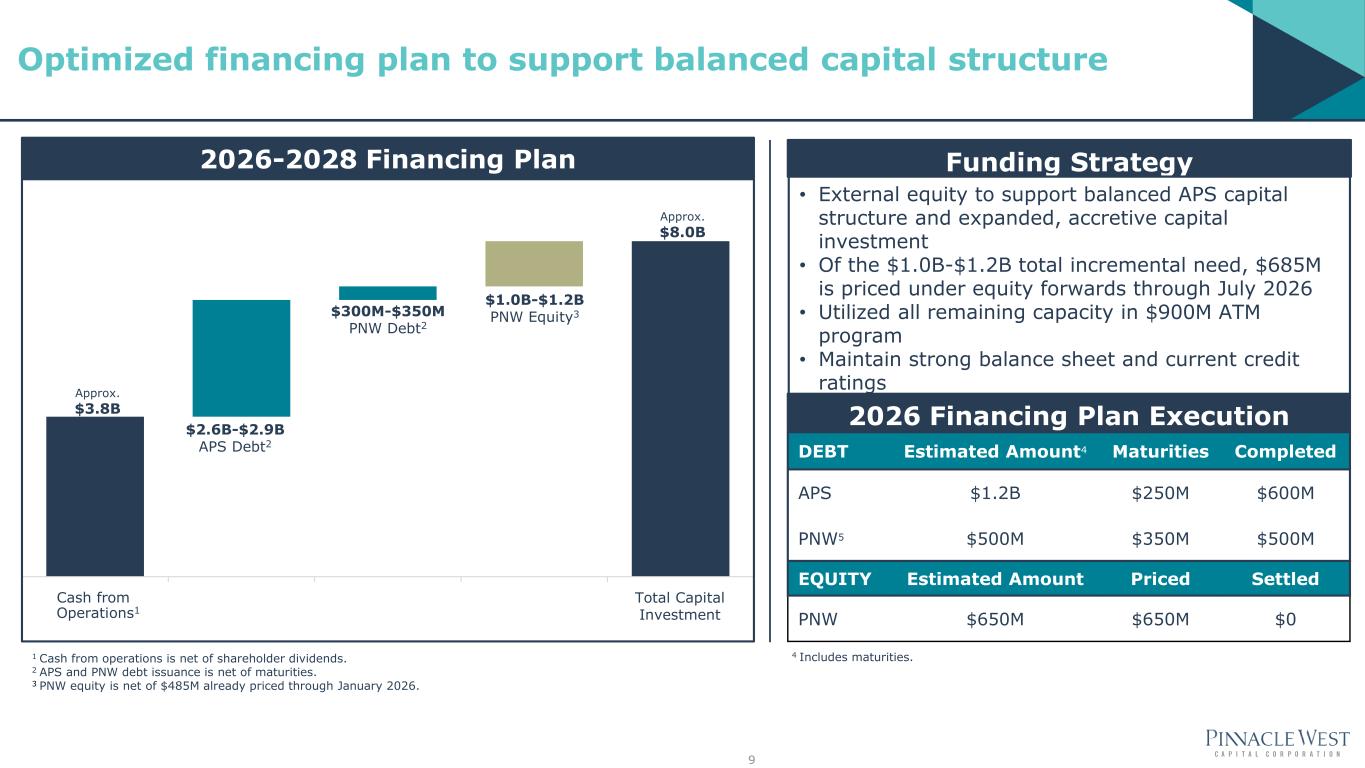
Approx. $3.8B Cash from Operations1 Total Capital Investment $2.6B-$2.9B APS Debt2 $300M-$350M PNW Debt2 1 Cash from operations is net of shareholder dividends. 2 APS and PNW debt issuance is net of maturities. 3 PNW equity is net of $485M already priced through January 2026. 2026 Financing Plan Execution 2026-2028 Financing Plan Approx. $8.0B $1.0B-$1.2B PNW Equity3 9 Optimized financing plan to support balanced capital structure 4 Includes maturities. DEBT Estimated Amount4 Maturities Completed APS $1.2B $250M $600M PNW5 $500M $350M $500M EQUITY Estimated Amount Priced Settled PNW $650M $650M $0 Funding Strategy • External equity to support balanced APS capital structure and expanded, accretive capital investment • Of the $1.0B-$1.2B total incremental need, $685M is priced under equity forwards through July 2026 • Utilized all remaining capacity in $900M ATM program • Maintain strong balance sheet and current credit ratings


Corporate Ratings1 Senior Unsecured Ratings Short-Term Ratings Outlook APS Moody’s Baa1 Baa1 P-2 Stable S&P BBB+ BBB+ A-2 Stable Fitch BBB+ A- F2 Stable Pinnacle West Moody’s Baa2 Baa2 P-2 Stable S&P BBB+ BBB A-2 Stable Fitch BBB BBB F3 Stable 10 1 Ratings as of July 31, 2026. Outlooks were reaffirmed by all agencies in April 2026. We are focused on maintaining healthy credit ratings to support affordable growth Credit Objectives • Maintain current investment-grade ratings at both PNW and APS • Target PNW FFO/Debt range of 14%-16% over the long-term o Midpoint represents >100bps cushion above Moody’s threshold • Target HoldCo debt to total Company debt % in the mid-teens • Maintain APS capital structure at >50% equity


$0 $200 $400 $600 $800 $1,000 $1,200 2026 2028 2030 2032 2034 2036 2038 2040 2042 2044 2046 2048 2050 2052 2054 APS Fixed APS Floating PNW Fixed($millions) As of June 30, 2026 11 Debt maturity profile shows well managed and stable financing plan


Appendix


13 2025 APS Rate Case – Updated Positions Overview of rate request ($ in millions) key components Rate Base Growth $206 12 months Post-test Year Plant $162 Fair Value Increment $89 WACC (7.63%) $129 Other (Base fuel, depreciation study, etc.) $107 Total Revenue Requirement $692 Adjustor Transfers $(83) Net Revenue Increase $609 Customer Net Revenue Impact on Day 1 14.69% Additional details • APS has requested rates become effective in the second half of 2026 • Docket number: E-01345A-25-0105 • Additional details, including filing, can be found at http://www.pinnaclewest.com/investors Numbers may not foot due to rounding.


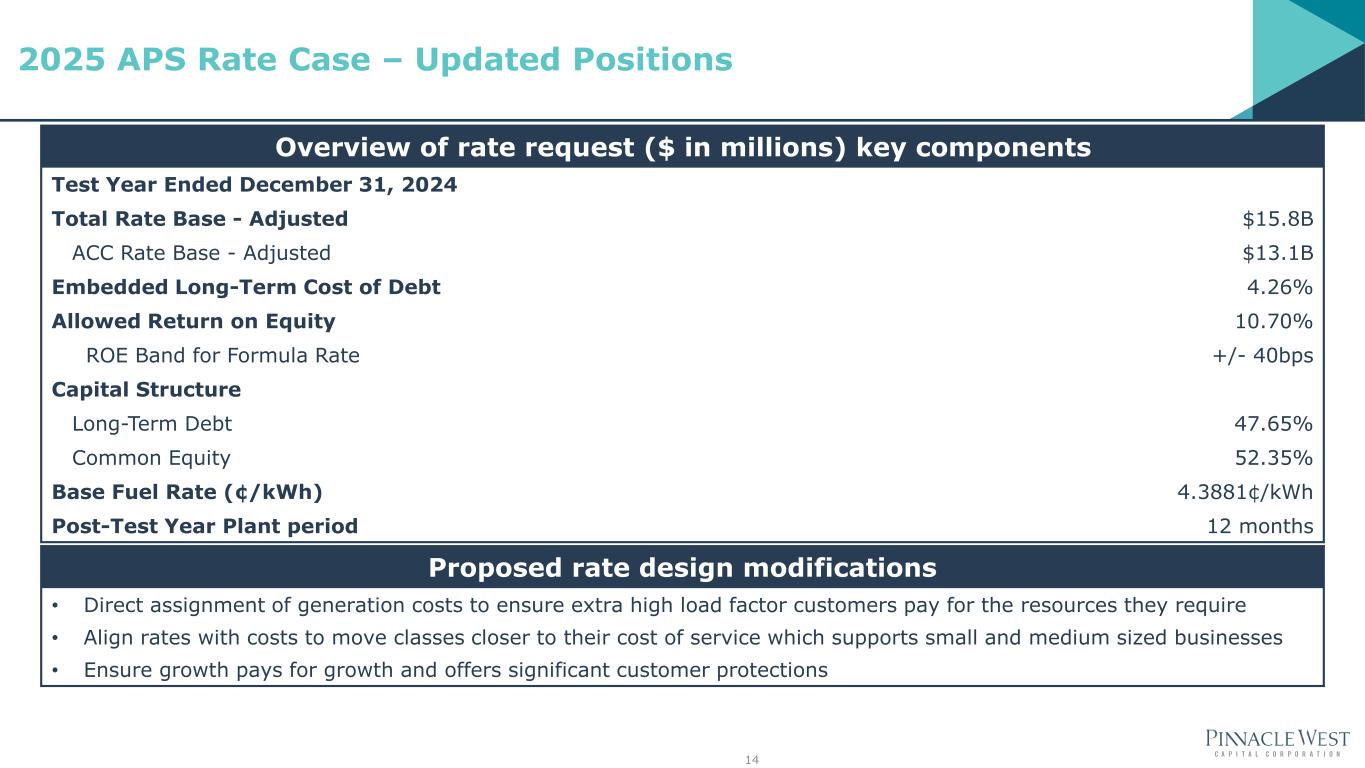
14 2025 APS Rate Case – Updated Positions Overview of rate request ($ in millions) key components Test Year Ended December 31, 2024 Total Rate Base - Adjusted $15.8B ACC Rate Base - Adjusted $13.1B Embedded Long-Term Cost of Debt 4.26% Allowed Return on Equity 10.70% ROE Band for Formula Rate +/- 40bps Capital Structure Long-Term Debt 47.65% Common Equity 52.35% Base Fuel Rate (¢/kWh) 4.3881¢/kWh Post-Test Year Plant period 12 months Proposed rate design modifications • Direct assignment of generation costs to ensure extra high load factor customers pay for the resources they require • Align rates with costs to move classes closer to their cost of service which supports small and medium sized businesses • Ensure growth pays for growth and offers significant customer protections


15 2025 APS Rate Case – Updated Positions Formula Rate Adjustment Mechanism (FRAM) proposal • Historic test year, with authorized ROE and capital structure approved in most recent rate case • Inclusion of 6 months post-test year plant • Removal of System Reliability Benefit and the Tax Expense Adjustor Mechanism if FRAM is approved • No rate adjustment if actual ROE falls within +/- 40 bps of authorized ROE • Revenue surplus/deficiency allocated based on ACC jurisdictional cost of service results FRAM proposed schedule ACC filing of Annual Update May 1 Last day for data requests for informal information exchange and to submit informal challenge(s). June 30 Informal challenge(s) resolution deadline July 30 Adjusted annual update posted August 25 Last day for data requests and to submit formal challenge(s) September 4 Last day for Staff challenges and responses to formal challenge(s) September 28 Staff Report (if no hearing) October 31 Commission Decision (if necessary) Before December 1 Rate Effective Date First billing cycle in December


16 2025 APS Rate Case - Testimony Summaries 1. Eliminate if FRAM approved 2. If the FRAM is adopted, the Commission should consider an ROE at the lower end of Staff's recommended range (9.55% - 9.80%) 3. Eliminate if FRAM approved and maintains 120-day schedule 4. Staff is currently evaluating the potential use of the TEAM mechanism to pass on the Nuclear PTC benefits to customers. APS Direct Testimony ACC Direct Testimony APS Rebuttal Testimony ACC Surrebuttal Testimony APS Rejoinder Testimony Return on Equity 10.70% 9.55% - 9.80%2 10.70% 9.55% - 9.80%2 10.70% Fair Value Increment 1.00% 0.20% 0.90% 0.20% 0.90% Capital Tracking Mechanism & Existing Adjustors Eliminate LFCR1 Eliminate SRB, LFCR & TEAM Eliminate SRB, LFCR & TEAM if FRAM Approved3 Eliminate SRB, LFCR, & TEAM4 if FRAM Approved Eliminate SRB, LFCR & TEAM if FRAM Approved3 Maintain SRB, TCA, PSA, DSMAC, REAC and TEAM Phase out DSMAC & REAC Optionally Eliminated Maintain TCA, PSA, DSMAC, and REAC Maintain TCA, PSA, DSMAC, and REAC Maintain TCA, PSA, DSMAC, and REAC Maintain PSA & TCA Formula Rate Adjustment Mechanism (FRAM) TY Eligible 12/31/2026 TY Eligible 12/31/2027 TY Eligible 12/31/2026 TY Eligible 12/31/2026 TY Eligible 12/31/2026 10.70% ROE 9.55% ROE 10.70% ROE 9.55% ROE 10.70% ROE +/- 20pbs Deadband +/- 50pbs Deadband +/- 40pbs Deadband +/- 50pbs Deadband +/- 40pbs Deadband Projected Plant 12 Months Post Test-Year Plant 6 Months Post Test-Year Plant 6 Months Post Test-Year Plant 6 Months Post Test-Year Plant 6 Months Additional items 100% D&O 50% D&O 50% D&O 50% D&O 50% D&O 100% Incentive Comp 50% Incentive Comp 50% Incentive Comp 50% Incentive Comp 50% Incentive Comp 100% BOD Expense 50% BOD Expense 50% BOD Expense 50% BOD Expense 50% BOD Expense Total Revenue Requirement Increase $662.44M $525.19M $694.23M $506.46M $691.61M Bill Impact 13.99% 10.68% 14.75% 10.22% 14.69%


2.4% 2.2% 2.1% 2.3% 2.5% 1.5%-2.5% 0% 1% 2% 3% 2021 2022 2023 2024 2025 2026E Residential Customer Growth1 APS Residential Growth Natn'l Avg.-Residential 17 • Phoenix housing is affordable compared to major cities in the region • Maricopa County ranked top county for economic development in 2025 by Site Selection Magazine • Ranked #1 in the nation for semiconductor manufacturing by Business Facilities Magazine – TSMC has committed $265B • Phoenix is ranked #1 out of 15 top growth markets for manufacturing by Newmark Group, a global real estate firm • Arizona State University ranked #1 in Innovation for 11th straight year by U.S. News and World Report • Phoenix ranks #1 in Western industrial markets by sales and industrial development (3rd nationally) by Commercial Café Report Arizona economy continues to be robust and attractive 1 National average from 2025 Itron Annual Energy Survey Report. Arizona continues to be an attractive service territory with strong customer growth - 10,000 20,000 30,000 40,000 2013 2017 2021 2025 New APS Customer Meter Sets


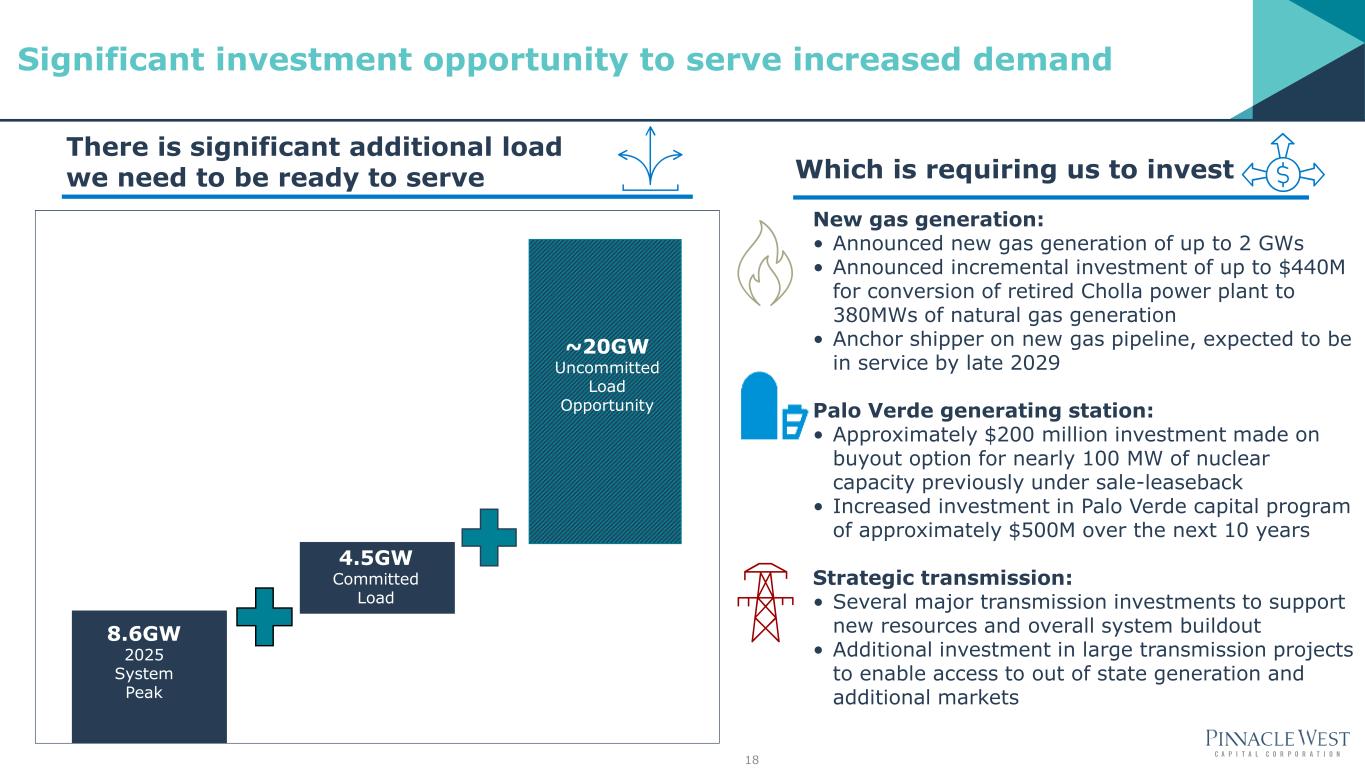
18 Significant investment opportunity to serve increased demand Which is requiring us to invest There is significant additional load we need to be ready to serve New gas generation: • Announced new gas generation of up to 2 GWs • Announced incremental investment of up to $440M for conversion of retired Cholla power plant to 380MWs of natural gas generation • Anchor shipper on new gas pipeline, expected to be in service by late 2029 Palo Verde generating station: • Approximately $200 million investment made on buyout option for nearly 100 MW of nuclear capacity previously under sale-leaseback • Increased investment in Palo Verde capital program of approximately $500M over the next 10 years Strategic transmission: • Several major transmission investments to support new resources and overall system buildout • Additional investment in large transmission projects to enable access to out of state generation and additional markets 8.6GW 2025 System Peak 4.5GW Committed Load ~20GW Uncommitted Load Opportunity


5.9% 5.5% 5.9% 5.5% 4.0%* 5.2% 5.4% 6.8% 7.4%* 9.6% 0% 1% 2% 3% 4% 5% 6% 7% 8% 9% 10% Q1 2024Q2 2024Q3 2024Q4 2024Q1 2025Q2 2025Q3 2025Q4 2025Q1 2026Q2 2026 Weather-Normalized Retail Sales Growth 19 Strong track record of consistently robust sales growth * Excludes $11M reduction to unbilled revenues in January 2025 • 10 consecutive quarters of growth within or exceeding the original long-term guidance range of 4%-6% • Strong C&I sales growth as extra high load factor customers continue to ramp • 2026 YTD C&I growth of 13.6% • 2026 sales growth guidance of 4%-6% • Long term sales growth increased to 5%-7% and extended through 2030 Continued trend of robust sales growth


20 Transmission expansion could drive significant capital investment $6 billion + of investmentCumulative Transmission CapEx 2026 2028 2035 Source: APS 2026-2035 Ten Year Transmission System Plan • Investments in Extra High Voltage (EHV) transmission to support reliability, resiliency, and integration of new resources – Over 600 miles of 345kV and above and over 300 miles of 230kV lines in planning period • Investments in large transmission projects to enable access to out of state generation and additional markets • Constructive and timely recovery through annual FERC Formula rate with wheeling revenue benefiting retail customers $0.6B $2.1B Major Transmission Projects in Development Project Miles/kV Est. in-service Helios to Milligan ~23 mi/230kV 2027 Pinnacle Peak to Ocotillo ~50 mi/230kV 2030 Cotton Transmission Corridor: Panda to Freedom Lines #2 & #1 Jojoba to Rudd ~80 mi/230kV ~29 mi/500kV 2030/2031 2031 Proposed Transmission for New Gas TBD 2030 Transmission Investment Strategy • Investments in Extra High Voltage (EHV) transmission to support reliability, resiliency, and integration of new resources – Over 600 miles of 345kV and above and over 300 miles of 230kV lines in planni g period • Investments in large transmission projects to enable access to out f state gen ration nd additional markets • Constructive and timely recovery through annual FERC Formula rate with wheeling revenue ben fiti g retail customers


Source: Arizona Commerce Authority 21 Arizona’s commercial and industrial growth is diverse


$18 $16 $19 $19 $17 $9 $15 $18 $24 $14 $6 $7 $0 $5 $10 $15 $20 $25 $30 $35 $40 $45 $50 Q1 Q2 Q3 Q4 Q1 Q2 Q3 Q4 Renewable Energy Demand Side Management 2025 $143 Million 2026 $40 Million 1 Renewable Energy and Demand Side Management expenses are substantially offset by adjustment mechanisms. Numbers may not foot due to rounding. ($ in millions pretax) 22 Renewable Energy & Demand Side Management expenses1


$17 $28 Q1 Q2 Q3 Q4 Variances vs. Normal All periods recalculated to current 10-year rolling average (2015 – 2024). Numbers may not foot due to rounding. ($ in millions pretax) 2026 Total Weather Impact: $45 Million 23 2026 gross margin effects of weather


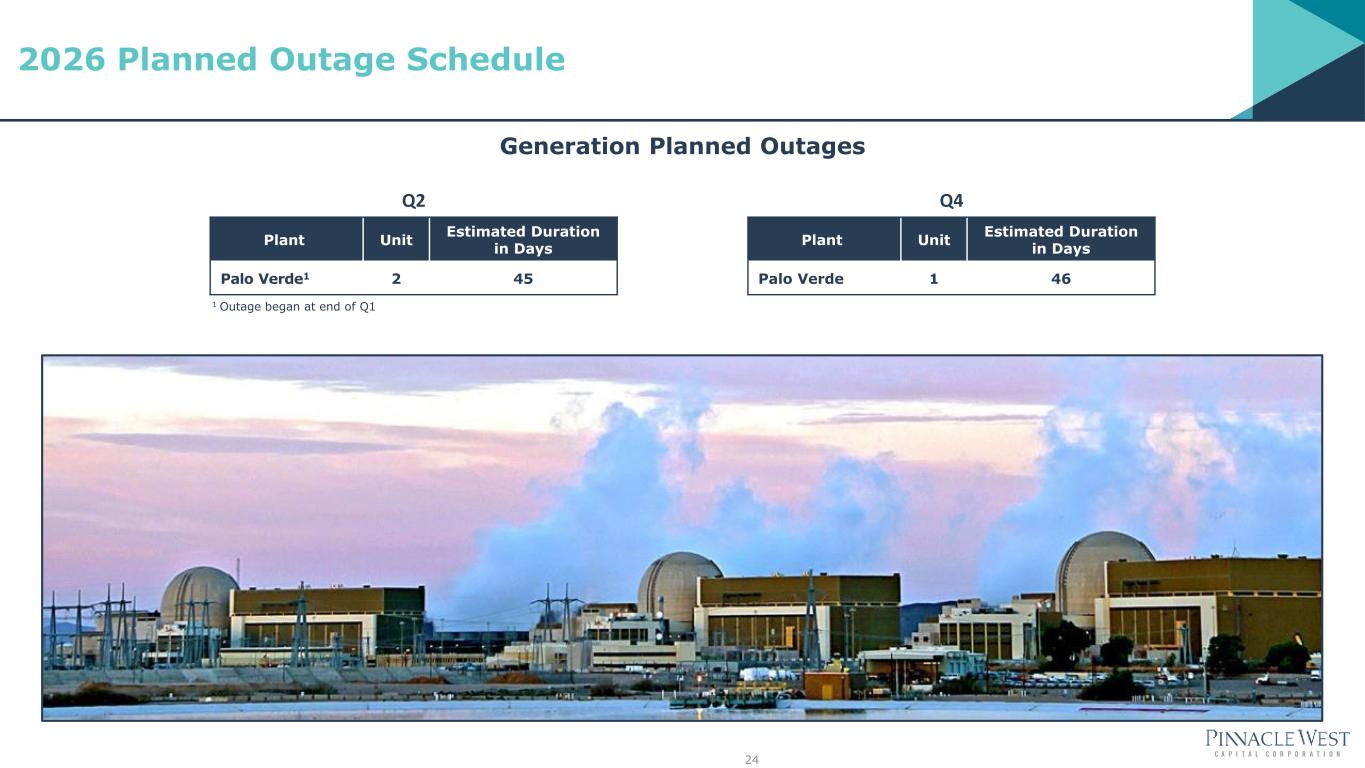
Generation Planned Outages 24 2026 Planned Outage Schedule Q2 Plant Unit Estimated Duration in Days Palo Verde1 2 45 Q4 Plant Unit Estimated Duration in Days Palo Verde 1 46 1 Outage began at end of Q1


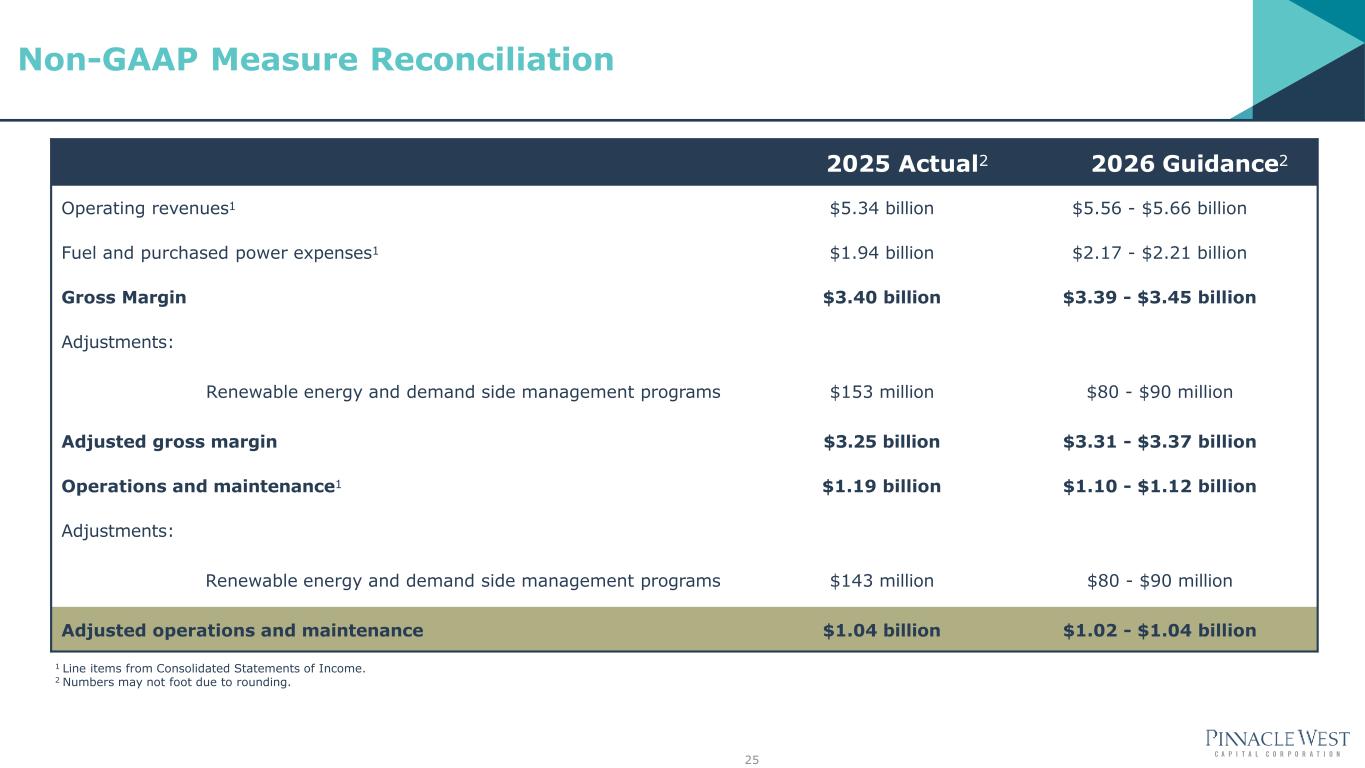
2025 Actual2 2026 Guidance2 Operating revenues1 $5.34 billion $5.56 - $5.66 billion Fuel and purchased power expenses1 $1.94 billion $2.17 - $2.21 billion Gross Margin $3.40 billion $3.39 - $3.45 billion Adjustments: Renewable energy and demand side management programs $153 million $80 - $90 million Adjusted gross margin $3.25 billion $3.31 - $3.37 billion Operations and maintenance1 $1.19 billion $1.10 - $1.12 billion Adjustments: Renewable energy and demand side management programs $143 million $80 - $90 million Adjusted operations and maintenance $1.04 billion $1.02 - $1.04 billion 25 1 Line items from Consolidated Statements of Income. 2 Numbers may not foot due to rounding. Non-GAAP Measure Reconciliation


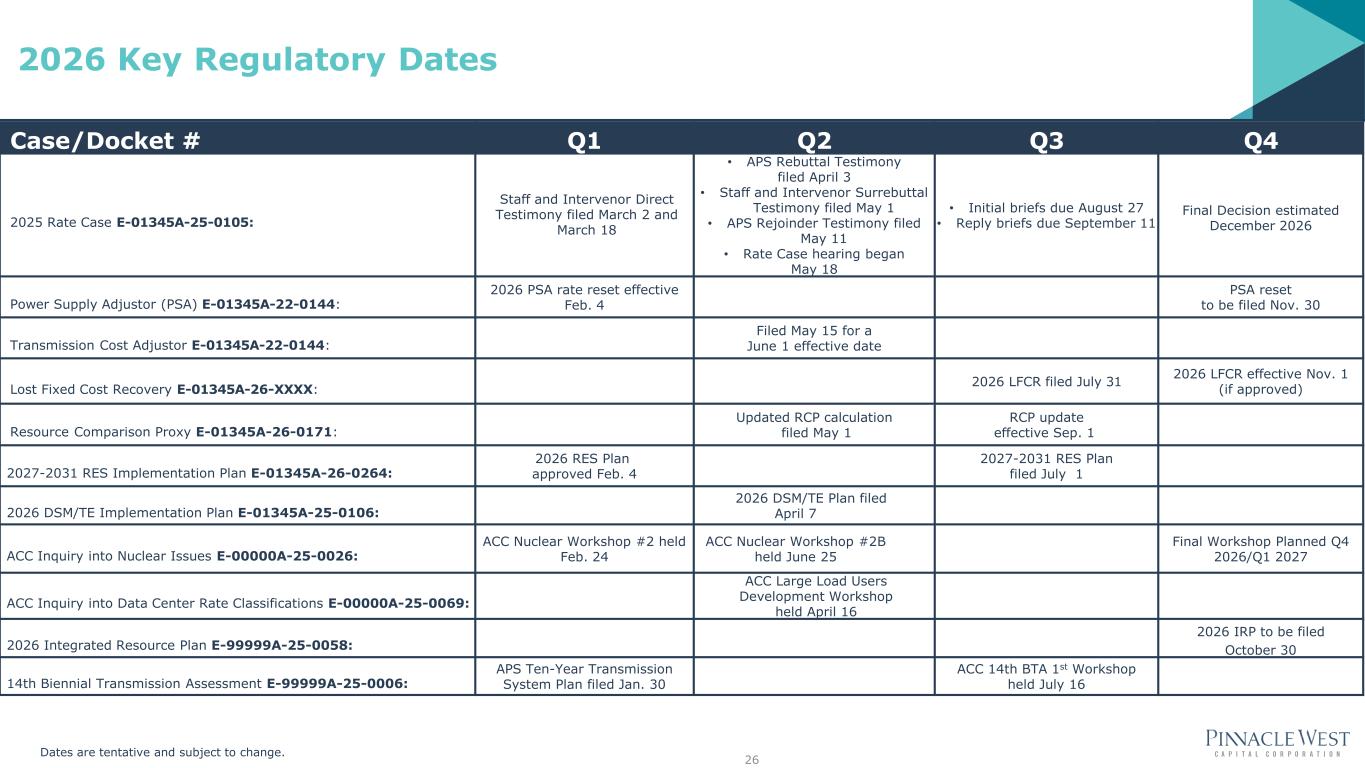
Case/Docket # Q1 Q2 Q3 Q4 2025 Rate Case E-01345A-25-0105: Staff and Intervenor Direct Testimony filed March 2 and March 18 • APS Rebuttal Testimony filed April 3 • Staff and Intervenor Surrebuttal Testimony filed May 1 • APS Rejoinder Testimony filed May 11 • Rate Case hearing began May 18 • Initial briefs due August 27 • Reply briefs due September 11 Final Decision estimated December 2026 Power Supply Adjustor (PSA) E-01345A-22-0144: 2026 PSA rate reset effective Feb. 4 PSA reset to be filed Nov. 30 Transmission Cost Adjustor E-01345A-22-0144: Filed May 15 for a June 1 effective date Lost Fixed Cost Recovery E-01345A-26-XXXX: 2026 LFCR filed July 31 2026 LFCR effective Nov. 1 (if approved) Resource Comparison Proxy E-01345A-26-0171: Updated RCP calculation filed May 1 RCP update effective Sep. 1 2027-2031 RES Implementation Plan E-01345A-26-0264: 2026 RES Plan approved Feb. 4 2027-2031 RES Plan filed July 1 2026 DSM/TE Implementation Plan E-01345A-25-0106: 2026 DSM/TE Plan filed April 7 ACC Inquiry into Nuclear Issues E-00000A-25-0026: ACC Nuclear Workshop #2 held Feb. 24 ACC Nuclear Workshop #2B held June 25 Final Workshop Planned Q4 2026/Q1 2027 ACC Inquiry into Data Center Rate Classifications E-00000A-25-0069: ACC Large Load Users Development Workshop held April 16 2026 Integrated Resource Plan E-99999A-25-0058: 2026 IRP to be filed October 30 14th Biennial Transmission Assessment E-99999A-25-0006: APS Ten-Year Transmission System Plan filed Jan. 30 ACC 14th BTA 1st Workshop held July 16 26 2026 Key Regulatory Dates Dates are tentative and subject to change.


27 Wildfire Mitigation Vegetation Management Asset Inspection Monitoring and Awareness Operational Mitigations • Comprehensive right- of-way clearance on maintained cycles • Defensible space around poles (DSAP) • Hazard tree program • Enhanced line patrols • Technology deployments • Drone use • Infra-red scans • Non-reclosing strategy • Public outreach program • Red Flag Alert protocols • Enhanced Powerline Safety Settings (EPSS) • Public Safety Power Shutoff (PSPS) • Dedicated team of meteorologists • Advanced fire modeling software • Cameras and weather stations • Federal & state agency partnerships Grid Hardening Investments • Ongoing distribution system upgrades • Mesh pole wrapping • Expulsion limiting fuses • Steel poles (if truck accessible) Internal: 21-person fire mitigation department engages across entire APS organization to plan and implement initiatives External: Member of 10 fire mitigation industry associations Comprehensive Wildfire Mitigation Plan (CWMP) approved by AZ DFFM as required by AZ Revised Statutes Our current practices are comprehensive and multi-faceted:


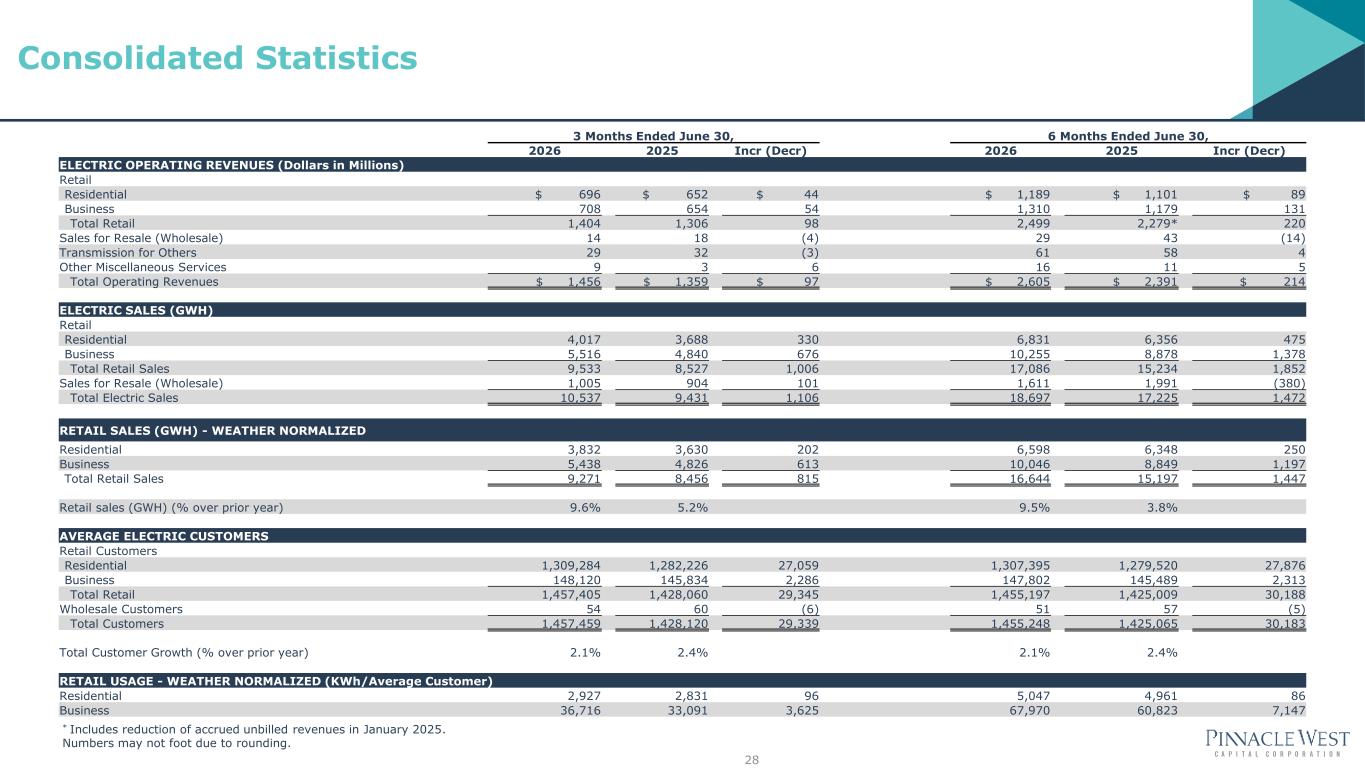
28 Consolidated Statistics * Includes reduction of accrued unbilled revenues in January 2025. Numbers may not foot due to rounding. 3 Months Ended June 30, 6 Months Ended June 30, 2026 2025 Incr (Decr) 2026 2025 Incr (Decr) ELECTRIC OPERATING REVENUES (Dollars in Millions) Retail Residential $ 696 $ 652 $ 44 $ 1,189 $ 1,101 $ 89 Business 708 654 54 1,310 1,179 131 Total Retail 1,404 1,306 98 2,499 2,279* 220 Sales for Resale (Wholesale) 14 18 (4) 29 43 (14) Transmission for Others 29 32 (3) 61 58 4 Other Miscellaneous Services 9 3 6 16 11 5 Total Operating Revenues $ 1,456 $ 1,359 $ 97 $ 2,605 $ 2,391 $ 214 ELECTRIC SALES (GWH) Retail Residential 4,017 3,688 330 6,831 6,356 475 Business 5,516 4,840 676 10,255 8,878 1,378 Total Retail Sales 9,533 8,527 1,006 17,086 15,234 1,852 Sales for Resale (Wholesale) 1,005 904 101 1,611 1,991 (380) Total Electric Sales 10,537 9,431 1,106 18,697 17,225 1,472 RETAIL SALES (GWH) - WEATHER NORMALIZED Residential 3,832 3,630 202 6,598 6,348 250 Business 5,438 4,826 613 10,046 8,849 1,197 Total Retail Sales 9,271 8,456 815 16,644 15,197 1,447 Retail sales (GWH) (% over prior year) 9.6% 5.2% 9.5% 3.8% AVERAGE ELECTRIC CUSTOMERS Retail Customers Residential 1,309,284 1,282,226 27,059 1,307,395 1,279,520 27,876 Business 148,120 145,834 2,286 147,802 145,489 2,313 Total Retail 1,457,405 1,428,060 29,345 1,455,197 1,425,009 30,188 Wholesale Customers 54 60 (6) 51 57 (5) Total Customers 1,457,459 1,428,120 29,339 1,455,248 1,425,065 30,183 Total Customer Growth (% over prior year) 2.1% 2.4% 2.1% 2.4% RETAIL USAGE - WEATHER NORMALIZED (KWh/Average Customer) Residential 2,927 2,831 96 5,047 4,961 86 Business 36,716 33,091 3,625 67,970 60,823 7,147


29 Consolidated Statistics Numbers may not foot due to rounding. Due to hot weather starting in March, we are reporting CDDs through March for 2025, 2026, and the Normal *Includes net battery activity (charges less discharges). 3 Months Ended June 30, 6 Months Ended June 30, 2026 2025 Incr (Decr) 2026 2025 Incr (Decr) ENERGY SOURCES (GWH) Generation Production Nuclear 2,164 2,139 25 4,558 4,647 (89) Coal 1,357 1,448 (91) 2,818 2,549 268 Gas 2,162 2,208 (45) 4,179 4,429 (250) Oil 0 0 (0) 0 0 (0) Renewables 278 295 * (17) 473 475 * (2) Total Generation Production 5,962 6,091 (129) 12,028 12,101 (73) Purchased Power Conventional 1,845 1,550 295 2,636 2,262 373 Resales 216 248 (32) 224 288 (64) Renewables 2,864 1,922 941 4,502 3,414 1,088 Total Purchased Power 4,925 3,720 1,204 7,362 5,965 1,397 Total Energy Sources 10,887 9,811 1,076 19,390 18,066 1,324 POWER PLANT PERFORMANCE Capacity Factors - Owned Nuclear 86% 86% 0% 92% 93% (2)% Coal 64% 50% 14% 67% 43% 23% Gas and Oil 26% 28% (1)% 26% 28% (2)% Solar 34% 33% 1% 29% 26% 3% System Average 44% 43% 1% 44% 42% 2% 3 Months Ended June 30, 6 Months Ended June 30, 2026 2025 Incr (Decr) 2026 2025 Incr (Decr) WEATHER INDICATORS - RESIDENTIAL Actual Cooling Degree-Days 619 578 41 691 584 107 Heating Degree-Days - 10 (10) 163 389 (226) Average Humidity 17% 17% 1% 17% 17% 1% 10-Year Averages (2015 - 2024) Cooling Degree-Days 534 534 - 535 535 - Heating Degree-Days 5 5 474 474 - Average Humidity 18% 18% - 18% 18% -