UNITED STATES
SECURITIES AND EXCHANGE COMMISSION
Washington, D.C. 20549
____________________________________________________________________________
FORM 10-K
(Mark One)
|
|
x |
ANNUAL REPORT PURSUANT TO SECTION 13 OR 15(d) OF THE SECURITIES EXCHANGE ACT OF 1934 |
For the fiscal year ended February 1, 2025
OR
|
|
¨ |
TRANSITION REPORT PURSUANT TO SECTION 13 OR 15(d) OF THE SECURITIES EXCHANGE ACT OF 1934 |
For the transition period from to
Commission file number 1-9595
______________________________________________________________

BEST BUY CO., INC.
(Exact name of registrant as specified in its charter)
|
|
|
Minnesota |
|
41-0907483 |
|
(State or other jurisdiction of incorporation or organization) |
|
(I.R.S. Employer Identification No.) |
|
7601 Penn Avenue South Richfield, Minnesota |
|
55423 (Zip Code) |
(Address of principal executive offices) |
|
|
(612) 291-1000
(Registrant’s telephone number, including area code)
Securities registered pursuant to Section 12(b) of the Act:
|
|
|
|
|
|
Title of each class |
Trading Symbol |
Name of exchange on which registered |
Common Stock, $0.10 par value per share |
BBY |
New York Stock Exchange |
Securities registered pursuant to Section 12(g) of the Act: None.
Indicate by check mark if the registrant is a well-known seasoned issuer, as defined in Rule 405 of the Securities Act. Yes No
Indicate by check mark if the registrant is not required to file reports pursuant to Section 13 or Section 15(d) of the Act. Yes No
Indicate by check mark whether the registrant (1) has filed all reports required to be filed by Section 13 or 15(d) of the Securities Exchange Act of 1934 during the preceding 12 months (or for such shorter period that the registrant was required to file such reports), and (2) has been subject to such filing requirements for the past 90 days. Yes No
Indicate by check mark whether the registrant has submitted electronically every Interactive Data File required to be submitted pursuant to Rule 405 of Regulation S-T (§ 232.405 of this chapter) during the preceding 12 months (or for such shorter period that the registrant was required to submit such files). Yes No
Indicate by check mark whether the registrant is a large accelerated filer, an accelerated filer, a non-accelerated filer, a smaller reporting company, or an emerging growth company. See the definitions of “large accelerated filer,” “accelerated filer,” “smaller reporting company,” and “emerging growth company” in Rule 12b-2 of the Exchange Act.
|
|
|
|
Large Accelerated Filer |
Accelerated Filer |
Non-accelerated Filer |
|
|
|
|
|
Smaller Reporting Company |
Emerging Growth Company |
||
If an emerging growth company, indicate by check mark if the registrant has elected not to use the extended transition period for complying with any new or revised financial accounting standards provided pursuant to Section 13(a) of the Exchange Act.
Indicate by check mark whether the registrant has filed a report on and attestation to its management’s assessment of the effectiveness of its internal control over financial reporting under Section 404(b) of the Sarbanes-Oxley Act (15 U.S.C. 7262(b)) by the registered public accounting firm that prepared or issued its audit report.
If securities are registered pursuant to Section 12(b) of the Act, indicate by check mark whether the financial statements of the registrant included in the filing reflect the correction of an error to previously issued financial statements.
Indicate by check mark whether any of those error corrections are restatements that required a recovery analysis of incentive-based compensation received by any of the registrant’s executive officers during the relevant recovery period pursuant to §240.10D-1(b).
Indicate by check mark whether the registrant is a shell company (as defined in Rule 12b-2 of the Act). Yes No
The aggregate market value of the voting and non-voting common equity held by non-affiliates of the registrant as of August 2, 2024 (the last business day of the registrant’s most recently completed second fiscal quarter) was approximately $15.8 billion, computed by reference to the price of $82.36 per share, the price at which the common equity was last sold on August 2, 2024, as reported on the New York Stock Exchange-Composite Index. (For purposes of this calculation, all of the registrant’s directors and executive officers are deemed affiliates of the registrant.)
As of March 17, 2025, the registrant had 211,369,657 shares of its common stock, $0.10 par value per share, issued and outstanding.
DOCUMENTS INCORPORATED BY REFERENCE
Portions of the registrant's Definitive Proxy Statement relating to its 2025 Regular Meeting of Shareholders ("Proxy Statement") are incorporated by reference into Part III. The Proxy Statement will be filed with the U.S. Securities and Exchange Commission within 120 days after the end of the fiscal year to which this report relates.
CAUTIONARY STATEMENT PURSUANT TO THE
PRIVATE SECURITIES LITIGATION REFORM ACT OF 1995
Section 27A of the Securities Act of 1933, as amended (“Securities Act”), and Section 21E of the Securities Exchange Act of 1934, as amended (“Exchange Act”), provide a “safe harbor” for forward-looking statements to encourage companies to provide prospective information about their companies. With the exception of historical information, the matters discussed in this Annual Report on Form 10-K are forward-looking statements and may be identified by the use of words such as “anticipate,” “appear,” “approximate,” “assume,” “believe,” “continue,” “could,” “estimate,” “expect,” “foresee,” “guidance,” “intend,” “may,” “might,” “outlook,” “plan,” “possible,” “project” “seek,” “should,” “would,” and other words and terms of similar meaning or the negatives thereof. Such statements reflect our current view with respect to future events and are subject to certain risks, uncertainties and assumptions. A variety of factors could cause our future results to differ materially from the anticipated results expressed in such forward-looking statements. Readers should review Item 1A, Risk Factors, of this Annual Report on Form 10-K for a description of important factors that could cause our future results to differ materially from those contemplated by the forward-looking statements made in this Annual Report on Form 10-K. Our forward-looking statements speak only as of the date of this report or as of the date they are made, and we undertake no obligation to update our forward-looking statements.
BEST BUY FISCAL 2025 FORM 10-K
TABLE OF CONTENTS
PART I
Item 1. Business.
Unless the context otherwise requires, the terms “we,” “us,” “our” and the “company” in this Annual Report on Form 10-K refer to Best Buy Co., Inc. and, as applicable, its consolidated subsidiaries. Any references to our website addresses do not constitute incorporation by reference of the information contained on the websites.
Description of Business
We were incorporated in the state of Minnesota in 1966. We are driven by our purpose to enrich lives through technology and our vision to personalize and humanize technology solutions for every stage of life. We accomplish this by leveraging our unique combination of tech expertise and a human touch to meet our customers’ everyday needs, whether they come to us online, visit our stores or invite us into their homes. We have operations in the U.S. and Canada.
Segments and Geographic Areas
We have two reportable segments: Domestic and International. The Domestic segment is comprised of our operations in all states, districts and territories of the U.S. and our Best Buy Health business, and includes the brand names Best Buy, Best Buy Ads, Best Buy Business, Best Buy Essentials, Best Buy Health, Current Health, Geek Squad, Imagine That, Insignia, Lively, My Best Buy, My Best Buy Memberships, Pacific Kitchen and Home, TechLiquidators and Yardbird; and the domain names bestbuy.com, currenthealth.com, lively.com, techliquidators.com and yardbird.com. Our International segment is comprised of all operations in Canada under the brand names Best Buy, Best Buy Express, Best Buy Mobile, Geek Squad and TechLiquidators and the domain names bestbuy.ca and techliquidators.ca.
Operations
Our Domestic and International segments are managed by leadership teams responsible for all areas of the business. Both segments operate an omnichannel platform that allows customers to come to us online, visit our stores or invite us into their homes.
Development of merchandise and service offerings, pricing and promotions, procurement and supply chain, online and mobile application operations, marketing and advertising and labor deployment across all channels are centrally managed. In addition, support capabilities (for example, human resources, finance, information technology and real estate management) operate primarily from our corporate headquarters. We also have field operations that support retail, services and in-home teams primarily from our corporate headquarters and regional locations. Our retail stores have procedures for inventory management, asset protection, transaction processing, customer relations, store administration, product sales and services, staff training and merchandise display that are largely standardized. All stores generally operate under standard procedures with a degree of flexibility for store management to address certain local market characteristics. While day-to-day operations of our stores are led by store management, more strategic decisions regarding, for example, store locations, format, category assortment and fulfillment strategy, are led by our corporate teams with input from market or regional leadership.
Our Best Buy Health business has a dedicated leadership team that manages the day-to-day affairs of all aspects of its business, while receiving support from certain Best Buy enterprise capabilities.
Merchandise and Services
Our Domestic and International segments have offerings in six revenue categories. The key components of each revenue category are as follows:
Computing and Mobile Phones - computing (including desktops, notebooks and peripherals), mobile phones (including related mobile network carrier commissions), networking, tablets (including e-readers) and wearables (including smartwatches);
Consumer Electronics - digital imaging, health and fitness products, home theater (including home theater accessories, soundbars and televisions), portable audio (including headphones and portable speakers) and smart home;
Appliances - large appliances (including dishwashers, laundry, ovens and refrigerators) and small appliances (including blenders, coffee makers, vacuums and personal care);
Entertainment - drones, gaming (including hardware, peripherals and software), movies, toys, virtual reality and other software;
Services - delivery, health-related services, installation, memberships, repair, set-up, technical support and warranty-related services; and
Other - other product offerings, including baby, food and beverage and outdoor living.
Distribution
Customers within our Domestic segment who purchase product online have the choice to have product delivered, or pick up product from a Best Buy store (including curbside pick-up for many products at most stores) or an alternative pick-up location. Our ship-from-store capability allows us to offer additional fast and convenient delivery options for customers. Most merchandise is shipped directly from manufacturers to our distribution centers. Distribution is similar for our International segment.
Suppliers and Inventory
Our Domestic and International segments purchase merchandise from a variety of suppliers. In fiscal 2025, our 20 largest suppliers accounted for approximately 80% of the merchandise we purchased, with five suppliers – Apple, Samsung, HP, Sony and LG – representing approximately 55% of total merchandise purchased. We generally do not have long-term written contracts with our vendors that would require them to continue supplying us with merchandise or that secure any of the key terms of our arrangements.
We carefully monitor and manage our inventory levels in an effort to match quantities on hand with consumer demand as closely as possible. Key elements to our inventory management process include the following: continuous monitoring of consumer demand and product life cycles, continuous monitoring and adjustment of inventory receipt levels and pricing, agreements with vendors relating to reimbursement for the cost of markdowns or sales incentives, and agreements with vendors relating to return privileges for certain products.
We also have a global sourcing operation to design, develop, test and contract-manufacture our exclusive brands products.
Store Development
We had 1,117 stores at the end of fiscal 2025 throughout our Domestic and International segments. Our stores are a vital component of our omnichannel strategy, and we believe they are an important competitive advantage. We also have vendor store-within-a-store concepts to allow closer vendor partnerships and a higher quality customer experience. We continuously look for opportunities to optimize our store space, renegotiate leases and selectively open or close locations to support our operations.
Intellectual Property
We own or have the right to use valuable intellectual property such as trademarks, service marks and trade names, including, but not limited to, Best Buy, Best Buy Ads, Best Buy Essentials, Best Buy Express, Best Buy Health, Best Buy Marketplace, Current Health, Geek Squad, Imagine That, Insignia, Jitterbug, Lively, Magnolia, My Best Buy, My Best Buy Memberships, Pacific Kitchen and Home, Pacific Sales, Rocketfish, TechLiquidators, Yardbird and our Yellow Tag logo.
We have secured domestic and international trademark and service mark registrations for many of our brands. We have also secured patents for many of our inventions. We believe our intellectual property has significant value and is an important factor in the marketing of our company, our stores, our products and our websites.
Seasonality
Our business, like that of many retailers, is seasonal. A large proportion of our revenue and earnings is generated in the fiscal fourth quarter, which includes the majority of the holiday shopping season.
Working Capital
We fund our business operations through a combination of available cash and cash equivalents and cash flows generated from operations. In addition, our revolving credit facility is available for additional working capital needs, for general corporate purposes, investments and growth opportunities. Our working capital needs typically increase in the months leading up to the holiday shopping season as we purchase inventory in advance of expected sales.
Competition
Our competitors are primarily multi-channel retailers, e-commerce businesses, technology service providers, traditional store-based retailers, vendors and mobile network carriers who offer their products and services directly to customers. We believe our ability to help customers online, in our stores and in their homes, and to connect technology product and solutions with customer needs, provide us key competitive advantages. Some of our competitors have lower cost operating structures and seek to compete for sales primarily on price. We carefully monitor pricing offered by other retailers and service providers, as maintaining price competitiveness is one of our ongoing priorities. In addition, we have price-matching policies that allow customers to request that we match a price offered by certain retail stores and online operators. In order to allow this, we are focused on maintaining efficient operations and leveraging the economies of scale available to us through our global vendor partnerships. We believe our dedicated and knowledgeable people; our integrated online, retail and in-home assets; our broad and curated product assortment; our strong vendor partnerships; our service and support offerings designed to solve customer needs; our unique ability to showcase technology in distinct store formats; and our supply chain are important ways in which we maintain our competitive advantage.
Corporate Responsibility & Sustainability (“CR&S”)
As we pursue our purpose to enrich lives through technology, we are committed to creating shared long-term value and positively impacting the world, the environment and the communities in which we operate through interactions with our stakeholders, including our customers, employees, vendor partners, community partners and shareholders.
The Nominating, Corporate Governance and Public Policy Committee of our Board of Directors (“Board”) advises and oversees management regarding the effectiveness and risks of our CR&S strategy, programs and initiatives, including environmental goals and progress, corporate responsibility programs, initiatives and public policy positions and advocacy.
Environmental
We aspire to drive forward the circular economy, a system that aims to reduce waste and preserve resources. We focus on our highest-impact areas, including our operations, the energy we procure and the products we sell. These efforts contribute to mitigating climate risks, reducing potential risks to our business and generating long-term cost savings.
In our operations, we strive to reduce the use of natural resources. We believe the following focus areas help to reduce the use of natural resources and our impact on the environment while improving our efficiency and profitability:
We aim to reduce our carbon emissions by minimizing energy usage, advocating for a cleaner grid and sourcing renewable energy.
We monitor our water consumption across our business to identify and manage programs that lessen our dependence on water.
To reduce waste and maximize resource efficiency, we continue our efforts to build a more sustainable supply chain by focusing on certifying our supply chain locations as TRUE zero waste.
Our focus on sustainable products centers on helping our customers reduce their impact on the environment through the products we sell. We do this by providing a variety of energy-efficient products for our customers.
We also support the circular economy by keeping consumer products in use for as long as possible through our repair and trade-in services. We put materials back into the manufacturing process when products reach the end of their lives through our electronics and appliance recycling program. In fiscal 2025, we continued to evolve our industry-leading e-waste recycling program and found additional ways to incentivize recycling.
Human Rights and Responsible Sourcing
We are committed to respecting human rights through our alignment with the United Nations Guiding Principles on Business and Human Rights.
Further, across all the products and services we procure, we seek to mitigate risk and enhance our partnership with suppliers and create value for all stakeholders through our Responsible Sourcing Program. We are active members of the Responsible Business Alliance, as are many of the major brands we sell, which allows us to partner across initiatives and increase our impact. Collectively, we embrace a common Supplier Code of Conduct and audit methodology that creates business value by improving working conditions and environmental practices throughout the supply chain.
Social Impact
We are committed to helping teens build brighter futures and increasing access to technology for the tech-reliant careers of the future. We believe our employee volunteer programs, like Geek Squad Academy, help to spark excitement and interest in technology for young learners while engaging our employees’ unique technical expertise.
Best Buy also serves as a fiscal sponsor of the Best Buy Foundation™, whose signature Best Buy Teen Tech Center® program consists of a network of youth-centered community hubs where teens can engage with the latest technology, learn career skills, and interact with safe and supportive mentors. As of February 1, 2025, the Best Buy Foundation™ supported a network of 68 Best Buy Teen Tech Center® locations across the U.S. and Canada.
Human Capital Management
We believe in the power of our people. Our culture is built on the belief that engaged and committed employees – supported by opportunities to learn, grow, innovate and explore – can lead to extraordinary outcomes. At the end of fiscal 2025, we employed approximately 85,000 employees in the U.S. and Canada.
Inclusion and Belonging
We believe in an inclusive work environment with a culture of belonging where everyone feels valued, can thrive and has equal opportunities at all levels in the organization. At the core of this environment are our company values, which were founded decades ago and focus, in part, on what it means to unleash the power of our people, as individuals, so everyone can learn, grow and be the best version of themselves. We believe that creating this environment is the right thing to do and has been key to our long-term business success.
Our Executive Leadership Team and Compensation and Human Resources Committee of our Board supports the development of a culture of belonging and engagement through oversight of our human resources policies and programs. The Nominating, Corporate Governance and Public Policy Committee of our Board recommends criteria for the selection of individuals to be considered as candidates for election to the Board.
Training and Development
We continue to invest in our employees and build a culture focused on developing our talent. Prioritizing foundational and leadership skill development helps to meet employees where they are at, which creates a more adaptable and resilient workforce and enhances our competitive advantage. Additionally, we believe by investing in employee training and development we can create a better employee environment and increase productivity, retention and innovation that ultimately improves our overall company performance and brings value to stakeholders. With the continued goal of creating learning opportunities that are tailored to the unique work of each role and a focus on solving the most important problems in our business, we expanded our variety of training experiences in fiscal 2025. This included new learning campaigns, leadership programs and expanded side-by-side trainings to support employee growth alongside their peers and leaders in condensed training formats.
Examples of enhancements in fiscal 2025 include:
We evolved our leadership development offerings to grow and transform Best Buy for its future. These offerings included unique programs such as an enterprise-wide manager development program, a skill development program for our senior store leaders and several emerging talent programs including an officer readiness program.
We expanded our learning campaigns, reaching thousands of employees for new products to include a closer partnership with our vendors, more exposure for our employees and in-depth training in artificial intelligence to help customers with the products they use.
We enhanced our portfolio of risk, compliance and safety microlearning courses to enable employees to continuously develop safe, secure and ethical behaviors to protect the company.
Employee Benefits
Our benefits aim to support employees’ overall well-being: physical, mental, financial and work-life. We believe our ability to deliver on our purpose of enriching our customers’ lives depends on ensuring our employees are living happy and healthy lives — both while at work and outside of work. In fiscal 2025, we introduced the following benefits to our employees:
A well-being sabbatical for employees with five or more years of service that provides them an opportunity to take four weeks off (once every three years) to focus on their well-being.
Additional paid time off each year in recognition of tenure for full-time employees with 20 or more years of service, plus additional tiers for part-time employees at three and six years.
Five floating holidays and two fixed company holidays (Thanksgiving and Christmas Day) in place of seven fixed holidays for U.S. employees, to give flexibility for employees to celebrate what is meaningful to them.
Additionally, in fiscal 2025, we continued our focus on:
Caregiver support, including:
oAccess to Joshin, a support system for employees and their loved ones with a focus on disabilities and neurodivergence;
oPersonalized help in a time of great need through Wellthy, a program that helps with emergency housing, healthcare, substance abuse, complex eldercare issues and other moments of crisis;
oPay continuation (paid leave) and caregiver pay so employees can care for themselves and their loved ones;
oParental leave for U.S. employees that provides eligible birth parents 100% pay for 10 weeks and eligible non-birth parents 100% pay for four weeks;
Up to $2,500 in financial assistance to employees experiencing personal hardship through the HOPE Fund – Helping Our People in Emergencies – in partnership with the Richard M. Schulze Family Foundation;
Mental health support, including our commitment to raise awareness by equipping employees with training to notice issues in themselves or others, and then find help; and
Tuition assistance, including the expansion of our partnership schools that give eligible employees the opportunity to earn a degree with no out-of-pocket costs.
The Compensation and Human Resources Committee of our Board oversees risks related to our human capital management through its regular review of our practices, policies and programs, which includes overall employee wellness and engagement in these areas, employee benefit plan compliance, leadership succession planning and wage, retention and hiring programs.
For more information on CR&S matters, as well as human capital management, please see Best Buy’s Fiscal 2025 Corporate Responsibility and Sustainability Report expected to be published later this year, at https://corporate.bestbuy.com/reports-and-resources. This website and the report are not part of this Annual Report on Form 10-K and are not incorporated by reference herein.
Available Information
We are subject to the reporting requirements of the Exchange Act and its rules and regulations. The Exchange Act requires us to file reports, proxy statements and other information with the U.S. Securities and Exchange Commission (“SEC”). We make available, free of charge on our website, our Annual Reports on Form 10-K, Quarterly Reports on Form 10-Q, Current Reports on Form 8-K, proxy statements and amendments to these reports filed or furnished pursuant to Section 13(a) or 15(d) of the Exchange Act, as soon as reasonably practicable after we electronically file these documents with, or furnish them to, the SEC. These documents are posted on our website at https://investors.bestbuy.com. The SEC also maintains a website that contains reports, proxy and information statements, and other information regarding issuers, including us, that file electronically with the SEC at https://sec.gov.
We also make available, free of charge on our website, our Amended and Restated Articles of Incorporation, Amended and Restated By-laws, the Corporate Governance Principles of our Board and our Code of Business Ethics adopted by our Board, as well as the charters of all of our Board's committees: Audit Committee; Compensation and Human Resources Committee; Finance and Investment Policy Committee; and Nominating, Corporate Governance and Public Policy Committee. These documents are posted on our website at https://investors.bestbuy.com.
Copies of any of the above-referenced documents will also be made available, free of charge, upon written request to Best Buy Co., Inc. Investor Relations Department at 7601 Penn Avenue South, Richfield, MN 55423-3645.
Website and Social Media Disclosure
We disclose information to the public concerning Best Buy, Best Buy’s products, content and services and other items through our websites in order to achieve broad, non-exclusionary distribution of information to the public. Some of the information distributed through this channel may be considered material information. Investors and others are encouraged to review the information we make public in the locations below.* This list may be updated from time to time.
For information concerning Best Buy and its products, content and services, please visit: https://bestbuy.com.
For information provided to the investment community, including news releases, events and presentations, and filings with the SEC, please visit: https://investors.bestbuy.com.
For the latest information from Best Buy, including press releases, please visit: https://corporate.bestbuy.com/archive/.
* These corporate websites, and the contents thereof, are not incorporated by reference into this Annual Report on Form 10-K nor deemed filed with the SEC.
Item 1A. Risk Factors.
Described below are certain risks we believe apply to our business and the industry in which we operate. The risks are categorized using the following headings: external, strategic, operational, regulatory and legal, and financial and market. Each of the following risk factors should be carefully considered in conjunction with other information provided in this Annual Report on Form 10-K and in our other public disclosures. The risks described below highlight potential events, trends or other circumstances that could adversely affect our business, financial condition, results of operations, cash flows, liquidity or access to sources of financing and, consequently, the market value of our common stock and debt instruments. These risks could cause our future results to differ materially from historical results and from guidance we may provide regarding our expectations of future financial performance. The risks described below are not an exhaustive list of all the risks we face. There may be others that we have not identified or that we have deemed to be immaterial. All forward-looking statements made by us or on our behalf are qualified by the risks described below.
External Risks
Macroeconomic pressures may adversely affect consumer spending and our financial results.
To varying degrees, our products and services are sensitive to changes in macroeconomic conditions. Consumer demand for the products and services that we offer could be affected by a number of factors, including: real GDP growth, inflation, recession, consumer confidence, employment levels, cost of living, tax rates, availability of consumer financing, interest rates, housing market conditions, foreign currency exchange rates, the price of oil, gas and other commodities, and other macroeconomic trends. Additionally, the impact of these factors could be compounded with respect to discretionary purchases of consumer electronics.
These macroeconomic conditions impact consumer behavior and spending in various ways, including:
whether or not they make a purchase;
how frequently they upgrade or replace their devices;
their choice of brand, model or price-point; and
their appetite for complementary services (for example, My Best Buy Plus™ or My Best Buy Total™ membership).
Any decrease in consumer demand due to macroeconomic conditions may negatively impact our financial results.
We are subject to specific pressures that may increase our product prices, including high consumer demand, inflation, tariffs and supply chain disruptions. Additionally, price increases in the products we purchase for resale may require us to adjust our sales prices. Our ability to increase prices to offset these pressures might be limited, requiring us to absorb these increases within our margins. Increases in the cost of living may also put pressure on our ability to offer competitive compensation and other employer-provided benefits and may adversely affect our financial results. Any economic factors or circumstances resulting in higher transportation, labor, insurance costs, healthcare costs or commodity prices can increase our cost of sales and operating, selling, general and administrative expenses and otherwise materially adversely affect our financial results.
Geopolitical pressures may adversely impact our supply chain, the cost of our products or revenues and financial results.
Geopolitical tensions, both domestic and international, including issues related to trade routes, political instability and divisiveness, the potential implementation of more restrictive trade policies, higher tariffs or the renegotiation of existing trade agreements could have a material adverse impact on our business.
While we directly import approximately 2% to 3% of our overall assortment, our complex supply chain is heavily reliant on vendor imports from China and Mexico, which we currently estimate make up approximately 55% and 20%, respectively, of the products we purchase. Moreover, the consumer electronics we sell and our underlying technological infrastructure are dependent on rare earth elements, predominantly processed in China. Recently passed or proposed tariffs involving these countries could have an adverse impact on our operations. Any further changes in, or uncertainty surrounding, trade policies with these countries, including tariffs on products and parts imported by us or our vendors, as well as any international retaliatory actions, could increase costs, disrupt our supply chain and/or impact the availability of underlying technology critical to our operations. Additionally, changes in, or uncertainty surrounding, policies or efforts that may affect the flow of trade, especially those impacting critical international trade routes, such as the Panama Canal and the Suez Canal, could potentially cause disruption to the global supply chain and may adversely affect our operations and financial results.
Ongoing or emerging conflicts, including those in Ukraine, the Middle East and the South China Sea, may continue to impact fuel prices, inflation, the global supply chain, cybersecurity and other macroeconomic conditions, which may further adversely affect global economic growth, consumer confidence and demand for our products and services. For example, attacks on cargo ships in the Red Sea, catalyzed by tensions in the Middle East, continue to disrupt global trade flows and shipping capacity. Additionally, any further deterioration of relations between Taiwan and China, the resulting actions taken, the response of the international community and other factors affecting trade with China or political or economic conditions in Taiwan could disrupt the manufacturing and distribution of products or hardware components in the region, such as semiconductors and television panels sourced from Taiwan or the broader array of products sourced from China.
These trade restrictions and any associated political uncertainty surrounding international trade measures and international relations may affect market stability and consumer confidence. One or more of these factors could have a material adverse effect on our supply chain, the cost of our products or our revenues and financial results.
Catastrophic events, including the effects of climate change, could adversely affect our operating results.
The risk and actual occurrence of various catastrophic events could have a material adverse effect on our financial performance. Events that affect our properties, supply chain, partners, workforce or customers may consist of, or be caused by, for example:
natural disasters or extreme weather events (such as storms, blizzards, extreme temperatures, earthquakes, hurricanes, floods, fires and droughts), including those related to, or exacerbated by, climate change;
diseases or pandemics;
power loss, telecommunications failures, or software and hardware malfunctions; and
terrorism (including related cyber threats), civil unrest, violent acts or other conflicts.
The number and severity of certain catastrophic events is increasing in many of our markets. Such events can adversely affect our workforce and prevent employees and customers from reaching our stores and properties. Catastrophic events can also disrupt portions of our supply chain, distribution network and third-party services, and may impact our ability to procure goods or services required for operating our business. Such events can also affect our information technology systems, resulting in disruption to various aspects of our operations, including our ability to transact with customers and fulfill orders. The adverse effects of any such catastrophic event would be exacerbated if experienced at the same time as another unexpected and adverse event, such as a pandemic.
Three of our largest states by total sales (California, Texas and Florida) are particularly vulnerable to natural disasters and extreme weather conditions. Natural disasters and climate-related events in these states, and other areas where our sales and operations are concentrated, could result in significant physical damage to, or closure of, our facilities and may require upgrades to our facilities and infrastructure.
Additionally, heightened violence and crime in or around our stores, customer homes or businesses where we are performing services may further jeopardize the safety and security of our workforce and customers as well as the general operation of our stores. Further, social unrest/tension, and any related potential for violence, may impact our workforce, customers, properties and the communities where we operate. If our customers, employees and shareholders do not perceive our response to be appropriate or adequate, we could suffer damage to our reputation and brand, which could adversely affect our business.
As a consequence of these catastrophic events, we may experience interruptions to our operations or losses of property, equipment and/or inventory, which could adversely affect our revenue and profitability.
Many of the products we sell are highly susceptible to technological advancement, product life-cycle fluctuations and changes in consumer preferences.
We operate in a highly and increasingly dynamic industry sector fueled by constant technological innovation and disruption, including most recently by the proliferation of artificial intelligence (“AI”) technologies. These factors manifest in a variety of ways: the emergence of new products and categories, the rapid maturation of categories, cannibalization of categories, changing price points, and product replacement and upgrade cycles.
This rapid pace of change can be hard to predict and manage. If we fail to interpret, predict and react to these changes in a timely and effective manner, the consequences may include, but are not limited to:
failure to offer, or inability to secure an adequate supply of, the products and services that our customers want;
excess inventory, which may require heavy discounting or liquidation;
delays in adapting our merchandising, marketing or supply chain capabilities to accommodate changes in product trends; and
damage to our brand and reputation.
Vendors may also fail to adequately invest in new technology, design, production or distribution facilities and may reduce their customer incentives, advertising and promotional activities or change their pricing policies.
These and other similar factors could have a material adverse impact on our revenue and profitability.
Strategic Risks
We face strong competition from multi-channel retailers, e-commerce businesses, technology service providers, traditional store-based retailers, vendors and mobile network carriers, which directly affects our revenue and profitability.
While we constantly strive to offer consumers the best value, the retail sector is highly competitive. Price is of great importance to most customers, and price transparency and comparability continues to increase. Digital technology enables consumers to compare prices on a real-time basis, putting additional pressure on us to maintain competitive prices. We compete against many local, regional, national and international retailers (both online and brick and mortar), as well as against some of our vendors and mobile network carriers that market their products directly to consumers. Competition is becoming increasingly diverse, including in the advertising revenue space and with the proliferation of marketplace platforms offering products at increasingly lower prices. Diverse competition may also arise from new entrants into the markets we serve, including unexpected players who could more aggressively leverage technologies such as AI and platform integrations.
The retail sector continues to experience increased sales initiated online and using mobile applications, as well as online sales for both in-store or curbside pick-up. Online and multi-channel retailers continue to focus on delivery services, with customers increasingly seeking faster, guaranteed delivery times and low-cost or free shipping. Our ability to offer competitive delivery times and delivery costs depends on many factors and our failure to successfully manage these factors and offer competitive delivery options could negatively impact the demand for our products and our profit margins. Because our business strategy is based on offering superior levels of customer service and a full range of services to complement the products we offer, our cost structure might be higher than some of our competitors, and this, in conjunction with price transparency, could put pressure on our margins.
Further, as our competitors develop and expand their strategic use of AI, our operations and profitability could be adversely impacted if we fail to execute or maintain our own focused AI strategy enabling technology advancement and innovation. As these and related competitive factors evolve, we may experience material adverse pressure on our revenue and profitability.
If we fail to attract, retain and engage qualified employees, our operations and profitability may be negatively impacted. In addition, changes in market compensation rates could adversely affect our profitability.
Our performance is highly dependent on attracting, retaining and engaging appropriately qualified employees in our stores, service centers, distribution centers, field and corporate offices. Our strategy of offering high-quality services and assistance for our customers requires a highly trained and engaged workforce, which is reliant on the creation and maintenance of a positive culture that is attractive to all qualified employees and beneficial relationships between employees and the enterprise. The turnover rate in the retail sector is relatively high, and there is an ongoing need to recruit and train new employees. Factors that affect our ability to maintain sufficient numbers of qualified employees include, for example, employee engagement, our reputation, our ability to train and develop our employees, our ability to connect with and promote available talent pools, our development and maintenance of employer-desired policies and practices, unemployment rates, competition from other employers, availability of qualified personnel and our ability to offer appropriate compensation and benefit packages. Our policies and practices may be affected by, or require changes in response to, legal and regulatory restrictions on policies related to inclusion and belonging, employee engagement and climate change, which may further impact our ability to retain and engage qualified employees. Failure to recruit or retain qualified employees may impair our efficiency and effectiveness and our ability to pursue growth opportunities. In addition, significant turnover of our executive team or other employees in key positions with specific knowledge relating to our operations and industry may negatively impact our operations and financial results.
We operate in a competitive labor market and there is a risk that market increases in compensation and employer-provided benefits could have a material adverse effect on our profitability. We may also be subject to continued market pressure to increase employee hourly wage rates and increased cost pressure on employer-provided benefits. Our need to implement corresponding adjustments within our labor model and compensation and benefit packages could have a material adverse impact on the profitability of our business. Additionally, increasingly prevalent legal and regulatory restrictions on the terms or enforceability of non-competition, employee non-solicitation, confidentiality and similar restrictive covenant clauses could make it more difficult to retain qualified personnel.
The execution of our strategy relating to certain products and services (including health technology, services and logistics) brings business, financial and regulatory risks.
In the health sector, we offer a range of products and services, including, for example, Personal Emergency Response (PERS) and Remote Patient Monitoring (RPM) technology and services. As we refine existing offerings and introduce new offerings, we must navigate a complex, dynamic regulatory and technological environment, which may subject us to additional operational, financial and reputational risks. Our customers may not like our new value propositions, and we may be subject to claims if customers of these offerings experience service disruptions, failures or other issues.
Our health sector offerings and the customers we serve bring us into scope for many significant regulatory requirements, including those enforced by the U.S. Food and Drug Administration (FDA), the Centers for Medicaid and Medicaid Services (CMS), State Medicaid Agencies and the Federal Communications Commission (FCC). Additionally, the collection, storage, use and disclosure of personal information subjects us to privacy and security requirements, such as the Health Insurance Portability and Accountability Act (HIPAA), the United Kingdom’s General Data Protection Regulation (GDPR, as retained in United Kingdom law) and numerous state data privacy laws.
The risk accompanied with operating in the health sector may lead to a range of consequences, including, but not limited to, customer complaints, individual consumer claims or class actions, product recalls, temporary bans on products, stoppages at production facilities, orders to stop providing services, remediation costs, corrective action plans, fines, penalties, regulatory enforcement actions, potential loss of business and impairment of our ability to continue participation in government healthcare programs. These and other related issues could have a material adverse impact on our financial results and reputation.
Our focus on services exposes us to certain risks that could have a material adverse impact on our revenue, profitability and reputation.
We offer a full range of services that complement our product offerings, including consultation, delivery, design, installation, memberships, protection plans, repair, set-up, technical support and health, safety and caregiving monitoring and support. The strategy and execution of our service offerings are subject to incremental risks. These risks could include, for example:
sustained increase in consumer desire to purchase product offerings online and through mobile applications, impacting our ability to sell ancillary services;
inability to sustain and operate a technology infrastructure sufficient to support our services growth;
ongoing pressure on margins from our Best Buy membership offerings, and the risk that increased volumes will not fully compensate for lower margins;
increased labor expenses and inability to accurately forecast staffing levels to meet customer needs and demands;
pressure on traditional labor models to meet the evolving landscape of offerings and customer needs;
responsibility for third parties that fail to meet our standards or fail to comply with applicable labor and independent contractor regulations;
increased reputational risk of bad actors posing as Geek Squad and/or customer care;
increased risk of errors or omissions in the fulfillment of services;
unpredictable extended warranty failure rates and related expenses;
employees in transit using company vehicles to visit customer locations and employees being present in customer homes, which may increase our scope of liability;
the potential for increased scope of liability relating to services offerings provided by third parties on our behalf;
employees having access to customer devices, including the information held on those devices, which increases our risk given the responsibility for the security of those devices and the privacy of the data they hold while in our possession;
the risk that in-home services could be more adversely impacted by inclement weather, health and safety concerns and catastrophic events; and
increased risk of non-compliance with new laws and regulations applicable to these services.
Our reliance on key vendors and mobile network carriers subjects us to various risks and uncertainties which could affect our revenue and profitability.
We source the products we sell from a wide variety of domestic and international vendors. In fiscal 2025, our 20 largest suppliers accounted for approximately 80% of the merchandise we purchased, with five suppliers – Apple, Samsung, HP, Sony and LG - representing approximately 55% of total merchandise purchased. We generally do not have long-term written contracts with our vendors that would require them to continue supplying us with merchandise. Our profitability depends on securing acceptable terms with our vendors for, among other things, the price of merchandise we purchase from them, funding for various forms of promotional programs, payment terms, allocations of merchandise, development of compelling assortments of products, operation of vendor-focused shopping experiences within our stores and terms covering returns and factory warranties. While we believe we offer capabilities that these vendors value and depend upon to varying degrees, our vendors may be able to leverage their competitive advantages — for example, their own stores or online channels, their financial strength, the strength of their brands with customers or their relationships with other retailers — to our detriment. In addition, vendors may decide to limit or cease allowing us to offer certain categories, focus their marketing efforts on alternative channels or make unfavorable changes to our financial or other terms. Further, our flexibility to modify selling prices is limited due to digital technology that enables consumers to compare prices on a real-time basis.
We are also dependent on a small number of mobile carriers to allow us to offer mobile devices with carrier connections. The competitive strategies utilized by mobile network carriers can have a material impact on our business, especially with ongoing consolidation in the mobile industry. For example, if carriers change the structure of contracts, upgrade terms, qualification requirements, monthly fee plans, cancellation fees or service levels, the volume of upgrades and new contracts we sign with customers may be reduced, adversely affecting our revenue and profitability. In addition, our carriers may also serve customers through their own stores, websites, mobile applications and call centers or through other competing retail channels.
Demand for the products and services we sell could decline if we fail to maintain positive brand perception and recognition.
We operate a portfolio of brands with a commitment to customer service and innovation. We believe that recognition and the reputation of our company and our brands are key to our success. Operational factors, such as failure to deliver high quality services, noncompetitive pricing, failure to meet delivery promises or business interruptions, could damage our reputation. External factors, such as negative public remarks or accusations, or our failure to meet enhanced, and sometimes conflicting, expectations on corporate response to sensitive topics, could also be damaging, including those related to inclusion and belonging, employee engagement and climate change. Third parties may commit fraud (including AI-driven fraud) while using our brand without our permission, possibly harming brand perception or reputation. The ubiquity of social media means that customer feedback and other information, which may include fictitious information, about our company are shared with a broad audience in a manner that is easily accessible and rapidly disseminated. Damage to the perception or reputation of our brands could result in, among other things, declines in revenues and customer loyalty, decreases in gift card and service plan sales, lower employee retention and productivity and vendor relationship issues, all of which could materially adversely affect our revenue and profitability.
Failure to effectively manage and execute strategic ventures or partnerships could have a negative impact on our business.
We may pursue new strategic ventures, including business relationships, acquisitions, and expanding or adding revenue streams, including our retail media network, known as Best Buy Ads, and our marketplace platforms, where third-party sellers can sell their own products on Best Buy’s platform (“Marketplace”) (collectively “Strategic Ventures”). Assessing the viability of Strategic Ventures is typically subject to uncertainty, and the success of such Strategic Ventures can be adversely affected by many factors, including, for example:
failure to identify or appropriately evaluate the risks of Strategic Ventures in our diligence assessments;
state or local regulations that may limit our ability to execute certain aspects of our Strategic Ventures;
failure to integrate aspects of Strategic Ventures into our existing business, such as new product or service offerings or information technology systems;
failure to accurately predict customer demand, or generate forecasted revenue or profitability;
failure to maintain appropriate internal controls over financial reporting;
uncertainty of accurately forecasting financial performance, including the impact of unforeseen changes in the business environment of Strategic Ventures, including, for example, the continuity of government funding for certain in-home care programs;
failure to generate expected synergies, such as cost reductions and other benefits; and
adverse impacts on relationships with employees, vendors and other key partners of our existing business or Strategic Ventures.
If our new or emerging Strategic Ventures are unsuccessful, our liquidity and profitability could be materially adversely affected, and we may be required to recognize material impairments to goodwill and other assets acquired. For example, we recorded a pre-tax, non-cash goodwill impairment charge of $475 million related to our Best Buy Health reporting unit, as described further in the Notes to Consolidated Financial Statements included in Item 8, Financial Statements and Supplementary Data and Item 7, Management’s Discussion and Analysis of Financial Condition and Results of Operations, in fiscal 2025. Strategic Ventures may also divert our financial resources and management’s attention from other important areas of our business.
Failure to effectively manage our real estate portfolio and market segmentation strategy may negatively impact our operating results.
Effective management of our real estate portfolio is critical to our omnichannel strategy. Failure to identify and secure suitable locations for our stores and other facilities, failure to negotiate appropriate terms related to our real estate portfolio, or failure to react appropriately should any unforeseen changes arise, could impair our ability to compete successfully and our profitability. Any of the following factors could impact our long-term real estate strategy:
our ability to adjust store operating models to adapt to these changing patterns;
the location and appropriate number of stores, supply chain and other facilities in our portfolio;
the products and services we offer at each store;
the local competitive positioning, trade area demographics and economic factors for each of our stores; and
the primary term lease commitment and long-term lease option coverage for each store.
Operational Risks
Interruptions and other factors affecting our supply chain may adversely affect our business.
Our supply chain assets are a critical part of our operations, particularly considering industry trends and initiatives, such as ship-from-store and the emphasis on fast delivery when purchasing online. We depend on our vendors’ abilities to deliver products to us at the right location, at the right time and in the right quantities. We also depend on third parties for the operation of certain aspects of our supply chain network. These risks are compounded for small parcel home deliveries, as we are dependent on a relatively small number of carriers with the scope and capacity required by our business. The continuing growth of online purchases for delivery increases our exposure to these risks. The factors that can adversely affect our operations or cause interruptions to our delivery capabilities include, but are not limited to:
operational failures from growing demand on existing technological infrastructure;
risk to our employees, customers and inventory arising from burglaries or robberies in transit, at our stores or other facilities;
failure of third parties to meet our standards or commitments; and
consolidation or business failures in the transportation and distribution sectors.
Additionally, global supply chain impacts, similar to previous disruptions in the Red Sea and Panama Canal, could lead to increases in transportation costs or hinder third parties’ abilities to meet our demand for product volumes and timing, including:
unionization, labor strikes, slow-downs, competitive job markets and labor shortages impacting ports or any other aspect of our supply chain;
geopolitical affairs, including tariffs;
natural disasters and climate events; and
diseases, pandemics, outbreaks and other health-related concerns.
It is important that we maintain optimal levels of inventory in each store and distribution center and respond rapidly to shifting demands. Any disruption to our supply chain network, including for any of the reasons above, could damage our revenue and profitability. If we fail to manage these risks effectively, we could experience a material adverse impact on our reputation, revenue and profitability.
We utilize third-party vendors for certain aspects of our operations, and any material disruption in our relationships or their services may have an adverse impact on our business.
We engage key third-party business partners to support various functions of our business, including delivery and installation, customer warranty, information technology, web hosting and cloud-based services, customer loyalty programs, promotional financing and customer loyalty credit cards, gift cards, technical support, transportation, insurance programs and human resource operations. Any material disruption in our relationships with key third-party business partners or any disruption in the services or systems provided or managed by third parties could impact our revenues and cost structure and hinder our operations, particularly if a disruption occurs during peak revenue periods.
We are subject to risks related to the products we sell, including those products sold on our Marketplace platforms and products under our exclusive brand labels (Best Buy Essentials, Dynex, Insignia, Modal, Platinum, Rocketfish, Yardbird and Lively brands) that could affect our operating results.
If the products we sell fail to meet, or are alleged to fail to meet, applicable safety standards or our customers’ expectations regarding safety and quality, we could be exposed to increased legal risk and damage to our reputation. Failure to take appropriate actions in relation to product-related issues (for example, product recalls) could lead to violations of laws and regulations and leave us susceptible to government enforcement actions or private litigation. Recalls of products, particularly when combined with lack of available alternatives or difficulty in sourcing sufficient volumes of replacement products, could also have a material adverse impact on our revenue and profitability.
Our ability to find qualified vendors who can supply products that meet our internal standards of quality and safety in a timely and efficient manner can be difficult, especially with respect to goods sourced from outside the U.S. Risks such as political or economic instability, cross-border trade restrictions or tariffs, merchandise quality issues, product safety concerns, work stoppages, human rights violations, port delays, foreign currency exchange rate fluctuations, transportation capacity and costs, inflation, civil unrest, natural disasters, outbreaks of pandemics and other factors relating to foreign trade are beyond our control. These and other related issues could have a material adverse impact on our financial results.
We have greater exposure to product-related risks in our exclusive brand category, including:
exposure and responsibility to consumers for warranty replacements and repairs as well as product liability claims (including bodily injury or death), some of which may require us to take significant actions, such as product recalls;
inventory obsolescence as we do not generally have return-to-vendor rights;
disruptions in manufacturing or logistics due to inconsistent and unanticipated order patterns;
our inability to develop long-term relationships with key manufacturers;
claims by technology or other intellectual property owners if we inadvertently infringe upon their patents or other intellectual property rights or if we fail to pay royalties owed on our exclusive brand products;
inability to obtain or adequately protect patents and other intellectual property rights on our exclusive brand products or manufacturing processes; and
failure to maintain consistent quality, availability and competitive pricing, which could have a material adverse impact on the demand for exclusive brand products and the profits we are able to generate from them.
Most of our exclusive brand products are manufactured by contract manufacturers in China, Mexico and Southeast Asia. This arrangement exposes us to the following additional potential risks:
inability to seek recourse from manufacturers may be limited in foreign jurisdictions;
inability to conform in a timely manner to new rules or interpretations of developing and often-changing labor and environmental laws for the manufacturing of products in foreign countries; and
inability to source alternatives quickly enough to avoid interruptions in product supply due to disruptions, such as trade disputes or excessive tariffs.
Our expanding third-party Marketplace, including our existing Canadian platform and our soon-to-launch U.S. platform, could present additional risks. Should the products sold on our Marketplace fail to meet quality, safety or regulatory standards, it could erode customer trust and damage our reputation. Moreover, unsettled laws regarding retailer responsibility for product liability and intellectual property claims related to third-party products sold on marketplace platforms compound our marketplace risk.
We rely heavily on our information technology systems for key business processes. Any failure or interruption in these systems could have a material adverse impact on our business.
The effective and efficient operation of our business is dependent on our information technology systems and those of our information technology vendors. We rely heavily on these information technology systems to manage all key aspects of our business, including demand forecasting, purchasing, supply chain management, point-of-sale processing, services fulfillment (including, for example, our Urgent Response service provided by Best Buy Health), staff planning and deployment, financial management, reporting and forecasting and safeguarding critical and sensitive information.
Our information technology systems and those of our partners are subject to damage or interruption from power outages, computer and telecommunications failures, computer viruses, worms, other malicious computer programs, denial-of-service attacks, security breaches (through cyber-attacks and other malicious actions, including ransomware and phishing attacks), catastrophic events (such as fires, tornadoes, earthquakes and hurricanes) and configuration or usage errors by our employees. While we have adopted, and continue to enhance, business continuity and disaster recovery plans and strategies, there is no guarantee that such plans and strategies will be effective, which could interrupt the functionality of our information technology systems or those of third parties. The failure or interruption of these information systems, data centers, cloud platforms or their backup systems could significantly disrupt our business and cause higher costs and lost revenues and could threaten our ability to remain in operation.
As we continue to expand our use of software as a service (SaaS) providers, we may face additional risks that may compromise our security or disrupt our business capabilities, including ensuring the proper configuration and dependencies on our service providers’ cybersecurity practices.
Further, as our online interactions and sales have increased and have become critical to our growth, and as many employees now use hybrid or full-time remote-working arrangements, the risk of any interruption of our information technology system capabilities is heightened, as well as the risk that customer demand exceeds the capacity of our online operations. Any such interruption or capacity constraint could result in a deterioration of our ability to process online sales, provide customer service or perform other necessary business functions.
We face a heightened risk of cybersecurity attacks or data security incidents, which could have a material adverse impact on our business.
We utilize complex information technology platforms to operate our websites and mobile applications. If we fail to secure these systems against attacks, or fail to effectively configure, upgrade and maintain our hardware, software, network, and system infrastructure and improve the efficiency and resiliency of our systems, it could cause system interruptions and delays. Disruptions to these services, such as those caused by unforeseen traffic levels, malicious attacks by foreign governments, criminals or other non-state actors, other technical difficulties or events outside of our control, such as natural disasters, power or telecommunications failures or loss of critical data, could prevent us from accepting and fulfilling customer orders for products or services, which could have an adverse impact on our revenue, incur material costs and could adversely affect our reputation. If a cybersecurity event is related to data that is regulated, such as under HIPAA, GDPR or California Consumer Privacy Act, in addition to the direct business risks noted, we could be subject to additional regulatory investigations, penalties and fines.
The integration of AI into our operations increases cybersecurity and privacy risks (including unauthorized or misuse of AI tools) and could lead to potential unauthorized access, misuse, acquisition, release, disclosure, alteration or destruction of company and customer data or other confidential or proprietary information and challenge the stability of our platforms. Further, threat actors may leverage AI to engage in automated, targeted and coordinated attacks of our systems.
Failure to prevent or effectively respond to a breach of the privacy or security of our customer, employee, vendor or company information could expose us to substantial costs and reputational damage, as well as litigation and enforcement actions.
Our business involves the collection, use and storage of personal information, including payment card information and protected health information, as well as confidential information regarding our employees, customers, vendors and other company information. We also share personal and confidential information with suppliers and other third parties and we use third-party technology and systems that process and transmit information for a variety of activities. We have been the target of attempted cyber-attacks and other security threats, and we may be subject to breaches of our information technology systems. While we engage in significant data-protection efforts, criminal activity, such as cyberattacks, lapses in our controls, impersonation of individuals with proper access controls, or the intentional or negligent actions of employees, business associates or third parties, may undermine our privacy and security measures. As a result, unauthorized parties may obtain access to our data systems and misappropriate company, employee, third-party or customer information, or authorized parties may use or share personal information in an inappropriate manner or otherwise seek to extract financial gain based on access to, or possession of, company, employee, customer or vendor information. Furthermore, because the methods used to obtain unauthorized access change frequently and may not be immediately detected, and, given the potentially disruptive nature of emerging technologies (including AI), we may be unable to anticipate such attacks or promptly and effectively respond to them. Any compromise of our customer information or other confidential information could have a material adverse impact on our reputation and/or our relationships with our customers and partners, which may in turn, have a negative impact on our revenue and may expose us to material costs, penalties and claims.
Sensitive customer data may also be present on customer-owned devices entrusted to us for service and repair. Vulnerable code on products sold or serviced, including our exclusive brands, may also result in a compromise of customer privacy or security. If our efforts to protect against such compromises and ensure appropriate handling of customer data on devices we manufacture, sell and service are not effective, this may result in potential liability and damage to our customer relationships.
Increasing costs associated with information security and privacy, such as increased investment in technology and qualified staff, costs of compliance, costs resulting from fraud or criminal activity and costs of cyber and privacy insurance, could cause our business and results of operations to suffer materially. Additionally, newly applicable and potential new or significantly revised state, provincial and federal laws and regulations in the jurisdictions in which we do business are expanding our obligations to protect and honor the privacy and security of customer data, requiring additional resources and creating incremental risk arising from a potential breach or compliance failure. In addition, any compromise of our data security may materially increase the costs we incur to protect against such breaches and could subject us to additional legal risk.
Regulatory, Compliance and Legal Risks
We are subject to statutory, regulatory and legal developments that could have a material adverse impact on our business.
The laws and regulations with which we must comply expose us to complex compliance and litigation risks that could have a material adverse effect on our operations. Some of the most significant compliance and litigation risks we face include, but are not limited to:
the difficulty of complying with sometimes conflicting statutes and regulations in local, national and international jurisdictions;
the potential for incremental costs related to compliance with new or existing environmental legislation or international agreements affecting energy transition, greenhouse gas emissions, electronics recycling and water or product materials;
the challenges of ensuring compliance with applicable product laws and regulations, including laws and regulations related to product safety, product transport and product disposal, as well as laws and regulations related to the products sold by us or by our third-party Marketplace sellers and the products we contract to manufacture;
the impact of evolving regulations governing data privacy and security, including limitations on the collection, use or sharing of information, consumer rights to access, delete or limit/opt-out of the use of information, and litigation arising from new private rights of action; the impact of other new or changing statutes and regulations related to, but not limited to, finance, healthcare, corporate governance matters, escheatment, pricing, anti-money laundering, content, distribution, copyright, mobile communications, AI deployment or usage, electronic device certification or payment services, or other future legislation that could affect how we operate and execute our strategies or alter our expense structure;
the challenges of ensuring compliance with applicable labor and employment laws, including: laws governing the organization of unions and related rules that affect the nature of labor relations, which are frequently modified by the National Labor Relations Board; laws that impact the relationship between the company and independent contractors and the classification of employees and independent contractors; laws regarding diversity, equity and inclusion, inclusion and belonging, discrimination and related issues; and laws that impact minimum wage, sick time, paid leave, non-compete covenants and scheduling requirements;
the impact of litigation, including class-action lawsuits involving consumers, shareholders and labor and employment matters;
the possibility of a federal ban on arbitration clauses in consumer or employee contracts, which could increase costs of dispute resolution;
the impact of potential changes in U.S., state or other countries’ tax laws and regulations or evolving interpretations of existing laws; and
the impact of changes in the federal government on laws, regulations and policies; and the potential for an increasing patchwork of state regulations.
Regulatory activity affecting the retail sector has increased in recent years, raising the risk of fines and additional operating costs associated with compliance. Additionally, defending against lawsuits and other proceedings may involve significant expense and divert management’s attention and resources from other matters.
Our business is subject to evolving corporate governance and public disclosure regulations and expectations, including with respect to cybersecurity and corporate responsibility and sustainability matters.
We are subject to changing rules and regulations promulgated by several governmental and self-regulatory organizations, including the SEC, the New York Stock Exchange, the Financial Accounting Standards Board and various states. These rules and regulations continue to evolve, demanding increased attention and vigilance for compliance. In addition, regulators, customers, investors, employees and other stakeholders are increasingly focusing on cybersecurity and CR&S matters and related disclosures. At the same time, regulators have increasingly expressed or pursued opposing views with respect to environmental, social and governance initiatives. These opposing views may also be adopted by our customers, investors, employees and other stakeholders. As a result of these changing rules, regulations and stakeholder expectations, there has been, and will likely continue to be, an increase in general and administrative expenses and an increase in management time and attention spent complying with or meeting such regulations and expectations. We may also communicate certain initiatives and goals regarding environmental matters, diversity, responsible sourcing, social investments and other related matters in our SEC filings or in other public disclosures. These initiatives and goals within the scope of CR&S could be difficult and expensive to implement, the technologies needed to implement them may not be cost-effective and may not advance at a sufficient pace and we could be criticized for the accuracy, adequacy or completeness of the disclosures. Further, statements about our initiatives and goals and progress toward those goals, may be based on measurement standards that are still developing, internal controls and processes that continue to evolve and assumptions that are subject to change in the future. In addition, we could be criticized or face legal action, including suits brought by shareholders, for the scope or nature of such initiatives or goals, or for any revisions to these goals. Any issues with our CR&S-related reporting, processes or goals, such as incomplete or inaccurate information, failure to achieve timely progress with respect to our goals, or misalignment with our stakeholders’ expectations, could negatively impact our reputation, business, financial performance or growth.
Our international activities are subject to many of the same risks as described above, as well as to risks associated with the legislative, judicial, regulatory, political, economic and cultural factors specific to the countries or regions in which we operate.
We have, or expect to have during fiscal 2026, wholly-owned legal entities registered in various foreign countries, including Bermuda, Canada, China, Hong Kong, India, Luxembourg, the Republic of Mauritius, the United Kingdom and Vietnam. Additionally, most of our exclusive brand products are manufactured by contract manufacturers based in China, Mexico and Southeast Asia. During fiscal 2025, our International segment generated approximately 8% of our consolidated revenue. In general, the risk factors identified above also have relevance to our international operations. Our international operations expose us to additional risks, such as risks related to:
political conditions and geopolitical events, including war and terrorism;
economic conditions, including monetary and fiscal policies and tax rules, as well as foreign exchange rate risk;
rules governing international trade and potential changes to trade policies or trade agreements and ownership of foreign entities;
government-imposed travel restrictions or warnings and differing responses of governmental authorities to pandemics and other global events;
cultural differences that we may be unable to anticipate or respond to appropriately;
different rules or practices regarding employee relations, including the existence of works councils or unions;
difficulties in enforcing intellectual property rights; and
difficulties encountered in exerting appropriate management oversight to operations in remote locations.
These factors could significantly disrupt our international operations and have a material adverse effect on our revenue and profitability and could lead us to incur material impairments and other exit costs.
Financial and Market Risks
Failure to meet any financial performance guidance or other forward-looking statements we may provide to the public could result in a decline in our stock price.
We may provide public guidance on our expected financial results or other forward-looking information for future periods. When we provide guidance, we believe that this guidance provides investors and analysts with a better understanding of management’s expectations for the future and is useful to our existing and potential shareholders, but such guidance is comprised of forward-looking statements subject to the risks and uncertainties described in this report and in our other public filings and public statements. Our actual results may not be in line with guidance we have provided. We may not be able to accurately forecast our growth rate and profitability. We base our expense levels and investment plans on sales estimates. A significant portion of our expenses and investments are fixed, and we may not be able to adjust our spending quickly enough if our sales are less than expected. Our revenue growth may not be predictable or sustainable, and our percentage growth rates may decrease. Our revenue and profitability depend on the continued growth of demand for the products and services offered by us, and our business is affected by general economic and business conditions worldwide. If our financial results for a particular period do not meet any guidance we provide or the expectations of market participants, or if we reduce any guidance for future periods, the market price of our common stock may decline.
Failure to effectively manage our costs could have a material adverse effect on our profitability.
As discussed above, our revenues are susceptible to volatility from various sources, which can lead to periods of flat or declining revenues. However, some of our operating costs are fixed and/or are subject to multi-year contracts. Some elements of our costs may be higher than our competitors’ because of, for example, our extended retail footprint and structure, our hourly pay structure, our differentiated service offerings or our levels of customer service. Accordingly, our ongoing drive to reduce costs and increase efficiency represents a strategic imperative. Failure to successfully manage our costs could have a material adverse impact on our profitability and curtail our ability to fund our growth or other critical initiatives.
We are highly dependent on the cash flows and net earnings we generate during our fiscal fourth quarter, which includes the majority of the holiday shopping season.
A large proportion of our revenue and earnings is generated in the fiscal fourth quarter, which includes the majority of the holiday shopping season. In addition, the holiday shopping season also incorporates many other unpredictable factors, such as the level of competitive promotional activity, new product release activity and customer buying patterns, which makes it difficult to forecast and react to these factors quickly. Unexpected events or developments, such as pandemics, natural or man-made disasters, changes in consumer demand, economic factors, product sourcing issues, cyber-attacks, failure or interruption of management information systems, or disruptions in services or systems provided or managed by third-party vendors could significantly disrupt our operations, especially during the fiscal fourth quarter. As a result of these factors, our fiscal fourth quarter and annual results could be adversely affected.
Economic, regulatory and other developments could adversely affect our ability to offer attractive promotional financing to our customers and adversely affect the profits we generate from these programs.
In partnership with third parties, we offer promotional financing as well as credit cards issued by third-party banks that manage and directly extend credit to our customers. Customers choosing promotional financing can receive extended payment terms and low- or no-interest financing on qualifying purchases. We believe our financing programs generate incremental revenue from customers who prefer the financing terms to other available forms of payment or otherwise need access to financing in order to make purchases. Approximately 25% of our fiscal 2025 Domestic segment revenue was transacted using one of the company’s branded cards. In addition, we earn profit-share income and share in any losses from some of our banking partners based on the performance of the programs. Profit-sharing revenue from our credit card arrangement approximated 1.1% of Domestic segment revenue in fiscal 2025. The income or loss we earn in this regard is subject to numerous factors, including the volume and value of transactions, the terms of promotional financing offers, bad debt rates, credit card delinquency rates, interest rates, the regulatory and competitive environment and expenses of operating the program. Adverse changes to any of these factors could impair our ability to offer these programs to customers and reduce customer purchases and our ability to earn income from sharing in the profits of the programs.
Constraints in the capital markets or our vendor credit terms may have a material adverse impact on our liquidity.
We need sufficient sources of liquidity to fund our working capital requirements, service our outstanding indebtedness and finance business opportunities. Without sufficient liquidity, we could be forced to curtail our operations, or we may not be able to pursue business opportunities. The principal sources of our liquidity are funds generated from operating activities, available cash and cash equivalents, short-term investments, credit facilities, other debt arrangements and trade payables. Our liquidity could be materially adversely impacted if our vendors reduce payment terms and/or impose tighter credit limits. If our sources of liquidity do not satisfy our requirements, we may need to seek additional financing. We typically hold material balances of cash, cash equivalents and/or short-term investments and are therefore reliant on banks and other financial institutions to safeguard and allow ready access to these assets. Our future liquidity will depend on a variety of factors, such as economic and market conditions, the regulatory environment and financial stability of banks and other financial institutions, the availability of credit, our credit ratings and our reputation with potential lenders. These factors could have a material adverse effect on our costs of borrowing and our ability to pursue business opportunities and threaten our ability to meet our obligations as they become due.
Changes in our credit ratings may limit our access to capital and materially increase our borrowing costs.
Any future downgrades to our credit ratings and outlook could negatively impact the perception of our credit risk and thus our access to capital markets, borrowing costs, vendor terms and lease terms. Our credit ratings are based upon information furnished by us or obtained by a rating agency from its own sources and are subject to revision, suspension or withdrawal by one or more rating agencies at any time. Rating agencies may change the ratings assigned to us due to developments that are beyond our control, including the introduction of new rating practices and methodologies.
Item 1B. Unresolved Staff Comments.
Not applicable.
Item 1C. Cybersecurity.
We rely heavily on information technology systems to operate and manage all key aspects of our business. We also process substantial volumes of confidential business information and sensitive consumer and employee personal information, which if impacted by cyber threats, could result in financial and reputational harms and regulatory sanction. We have developed and implemented, and update on an ongoing basis, a risk-based information security program designed to identify, assess and manage material risks from cybersecurity threats.
Cybersecurity Risk Management and Strategy
Our information security program comprises administrative, technical and physical safeguards designed, under a risk-based approach, to reasonably mitigate cybersecurity risks to the confidentiality, integrity or availability of our information systems and information. These include safeguards designed to oversee service-provider relationships in a manner consistent with the risks presented by the engagement and use of the service provider.
The program deploys multiple layers of controls designed to identify, protect against, detect, respond to and recover from information security and cybersecurity incidents and our Cyber Security Incident Response Team, which is part of our Enterprise Information Protection (“EIP”) organization, plays a core role in detecting, mitigating and remediating cybersecurity incidents. Based on the nature and severity of the incident, our response is to be guided by documented incident response plans. These plans outline steps to be followed, functional areas to be engaged, internal escalations to be pursued (which may include, as appropriate, senior management, executive management and the Board) and stakeholders to be notified.
Third parties also play a role in our cybersecurity. We engage third parties for advice and support in the design and implementation of certain program elements and leverage third-party tools to help identify and mitigate cybersecurity risks. Certain specific, defined components of our technology environment are assessed by third-party auditors with a view to align with industry standards such as, for example, the Payment Card Industry Data Security Standards.
We also periodically retain outside expertise to conduct a maturity assessment of our program against industry standards and participants. Our program is informed by industry standards such as, for example, the National Institute of Standards and Technology’s Cybersecurity Framework (“NIST CSF”), but this does not imply that we meet all technical standards, specifications or requirements under the NIST CSF, NIST CSF 2.0 or other sources.
We have combatted cybersecurity threats in the normal course of business, but prior cybersecurity incidents have not materially affected, and do not appear likely to materially affect, our operations, business strategy, results of operations or financial condition. However, our Enterprise Risk Management program has recognized that we face ongoing risks from cybersecurity threats that, if not successfully prevented or mitigated, could materially affect us, including our operations, business strategy, results of operations or financial condition. For additional information on such risks, see Item 1A, Risk Factors, of this Annual Report on Form 10-K.
Cybersecurity Governance
Our Board, with oversight by the Audit Committee, oversees management’s processes for identifying and mitigating cybersecurity risks. Executive management including our Chief Information Security Officer (“CISO”), who reports to our General Counsel & Chief Risk Officer, update the Audit Committee on our cybersecurity posture no less frequently than quarterly and periodically update the full Board.
Our EIP organization, led by our CISO, is responsible for the design and implementation of our information security program. Our current CISO has been with the Company for more than nine years—serving as our CISO for nearly eight years—and has extensive cybersecurity experience through leadership and consulting roles. His current leadership team has over 100 years of combined cybersecurity experience. These and other EIP team members work closely with stakeholders across the company to implement the program’s policies, standards and processes. They also help ensure awareness that securing customer information and honoring our privacy promises are core employee obligations, as highlighted in our Code of Ethics and reinforced through our Valuable Information Protection training program.
Item 2. Properties.
Domestic Stores
The location and total square footage of our Domestic segment stores at the end of fiscal 2025 were as follows:
|
|
|
|
|
|
|
|
|
|
U.S. Stores(1) |
|
|
U.S. Stores(1) |
||||
Alabama |
|
11 |
|
|
Nebraska |
|
4 |
|
Alaska |
|
2 |
|
|
Nevada |
|
9 |
|
Arizona |
|
21 |
|
|
New Hampshire |
|
6 |
|
Arkansas |
|
7 |
|
|
New Jersey |
|
25 |
|
California |
|
130 |
|
|
New Mexico |
|
5 |
|
Colorado |
|
21 |
|
|
New York |
|
44 |
|
Connecticut |
|
9 |
|
|
North Carolina |
|
32 |
|
Delaware |
|
3 |
|
|
North Dakota |
|
4 |
|
District of Columbia |
|
1 |
|
|
Ohio |
|
33 |
|
Florida |
|
62 |
|
|
Oklahoma |
|
12 |
|
Georgia |
|
28 |
|
|
Oregon |
|
11 |
|
Hawaii |
|
2 |
|
|
Pennsylvania |
|
33 |
|
Idaho |
|
5 |
|
|
Puerto Rico |
|
2 |
|
Illinois |
|
40 |
|
|
Rhode Island |
|
1 |
|
Indiana |
|
22 |
|
|
South Carolina |
|
13 |
|
Iowa |
|
10 |
|
|
South Dakota |
|
2 |
|
Kansas |
|
8 |
|
|
Tennessee |
|
13 |
|
Kentucky |
|
9 |
|
|
Texas |
|
100 |
|
Louisiana |
|
15 |
|
|
Utah |
|
10 |
|
Maine |
|
3 |
|
|
Vermont |
|
1 |
|
Maryland |
|
19 |
|
|
Virginia |
|
29 |
|
Massachusetts |
|
21 |
|
|
Washington |
|
20 |
|
Michigan |
|
28 |
|
|
West Virginia |
|
5 |
|
Minnesota |
|
18 |
|
|
Wisconsin |
|
22 |
|
Mississippi |
|
7 |
|
|
Wyoming |
|
1 |
|
Missouri |
|
14 |
|
|
Total Domestic store count |
|
957 |
|
Montana |
|
4 |
|
|
Square footage (in thousands) |
|
36,539 |
|
(1)Includes 20 Pacific Sales stores, 25 Best Buy Outlet Centers and 21 Yardbird stand-alone stores.
International Stores
The location and total square footage of our International segment stores at the end of fiscal 2025 were as follows:
|
|
|
|
|
Canada Stores(1) |
||
Alberta |
|
25 |
|
British Columbia |
|
27 |
|
Manitoba |
|
4 |
|
New Brunswick |
|
3 |
|
Newfoundland |
|
1 |
|
Nova Scotia |
|
3 |
|
Ontario |
|
69 |
|
Prince Edward Island |
|
1 |
|
Quebec |
|
23 |
|
Saskatchewan |
|
4 |
|
Total International store count |
|
160 |
|
Square footage (in thousands) |
|
3,603 |
|
(1)
(1)Includes 31 Best Buy Mobile stand-alone stores.
Ownership Status
The ownership status of our stores by segment at the end of fiscal 2025 was as follows:
|
|
|
|
|
|
|
|
|
|
|
|
|
Leased Locations |
|
Owned Locations |
|
Owned Buildings and Leased Land |
||||||
Domestic |
|
901 |
|
|
|
24 |
|
|
|
32 |
|
International |
|
153 |
|
|
|
3 |
|
|
|
4 |
|
Distribution
The ownership status and total square footage of space utilized for distribution by segment at the end of fiscal 2025 were as follows:
|
|
|
|
|
|
|
|
|
|
|
|
|
|
|
|
|
Square Footage (in thousands) |
||||||
|
|
|
|
|
Leased Locations |
|
Owned Locations |
||||
Domestic |
|
|
|
|
|
15,637 |
|
|
|
3,168 |
|
International |
|
|
|
|
|
1,418 |
|
|
|
- |
|
Other Properties
We own our corporate headquarters buildings located in Richfield, Minnesota. We also lease additional office space to support and carry out our business operations.
Item 3. Legal Proceedings.
For additional information regarding our legal proceedings, see Note 12, Contingencies and Commitments, of the Notes to Consolidated Financial Statements, included in Item 8, Financial Statements and Supplementary Data, of this Annual Report on Form 10-K.
Item 4. Mine Safety Disclosures.
Not applicable.
Information about our Executive Officers
(As of March 19, 2025)
|
|
|
|
|
|
|
|
|
Name |
|
Age |
|
Position with the Company |
|
Years with the Company |
||
Corie S. Barry |
|
49 |
|
Chief Executive Officer |
|
|
25 |
|
Matt Bilunas |
|
52 |
|
Senior Executive Vice President, Chief Financial Officer & Enterprise Strategy |
|
|
19 |
|
Jason Bonfig |
|
48 |
|
Senior Executive Vice President, Customer Offering, Fulfilment & Best Buy Canada |
|
|
26 |
|
Damien Harmon |
|
46 |
|
Senior Executive Vice President, Channel & Customer Experiences & Enterprise Services |
|
|
6 |
|
Todd G. Hartman |
|
58 |
|
Executive Vice President, General Counsel, Chief Risk Officer & Secretary |
|
|
19 |
|
Kamy Scarlett |
|
61 |
|
Senior Executive Vice President, Corporate Affairs & Human Resources |
|
|
11 |
|
Mathew R. Watson |
|
54 |
|
Senior Vice President, Controller and Chief Accounting Officer |
|
|
19 |
|
Corie S. Barry is our Chief Executive Officer (“CEO”). She also serves on the company’s board of directors. Prior to becoming CEO in June 2019, she was the company’s chief financial officer & chief strategic transformation officer, overseeing strategic transformation and growth, digital and technology, global finance, investor relations, enterprise risk and compliance, integration management and Best Buy Health. In that role, she also played a critical role in developing and executing the Company’s Building the New Blue growth strategy and related transformation. Ms. Barry joined Best Buy in 1999 and has held a variety of financial and operational roles across the organization, both in the field and at corporate. She became the chief financial officer in 2016 and prior to that served as the company’s chief strategic growth officer and the interim leader of Best Buy’s services organization from 2015 until 2016. She also served as senior vice president of domestic finance from 2013 to 2015; vice president, chief financial officer and business development of our home business group from 2012 to 2013; and vice president, finance of the home customer solutions group from 2010 to 2012. Prior to Best Buy, Ms. Barry worked at Deloitte & Touche LLP. Additionally, she has served on the board of directors for Domino’s Pizza Inc. since July 2018 and serves on the board of trustees for the College of St. Benedict. She is also a member of the Business Roundtable, serves on the executive committees for the Business Council and the Minnesota Business Partnership, and serves as the Chairwoman of the Retail Industry Leaders Association.
Matt Bilunas is our Senior Executive Vice President, Chief Financial Officer (“CFO”) & Enterprise Strategy. In this role, he is responsible for overseeing all aspects of global finance, inclusive of audit, procurement and financial services, as well as enterprise strategy and real estate. Since joining Best Buy in 2006, Mr. Bilunas has served in a variety of financial leadership roles, both in the field and at corporate. He started as a territory finance director in Los Angeles and has worked in the company’s domestic and international businesses. Prior to becoming CFO in 2019, he was senior vice president of enterprise and merchandise finance from 2017 to 2019; vice president, finance for category, e-commerce and marketing from 2015 to 2017; and vice president, category finance from 2014 to 2015. He also has held finance roles in retail, e-commerce and marketing. Before Best Buy, he worked at Carlson Inc., NRG Energy Inc., Bandag Inc. and KPMG. Mr. Bilunas serves on the board of Genesco, Inc.
Jason Bonfig is our Senior Executive Vice President of Customer Offering, Fulfillment and Best Buy Canada. In this role, he oversees all elements of merchandising, ecommerce, supply chain and marketing, including Best Buy’s retail media network, Best Buy Ads. He also oversees the Best Buy Canada business and leads the company’s Exclusive Brands private-label team. Mr. Bonfig has served in merchant roles for the Company for over 20 years, working in and leading some of the most complex product categories. Prior to his current role, Mr. Bonfig served in the positions of chief category officer – computing, mobile, gaming, exclusive brands, printing, wearables and accessories from 2018 to 2019; and senior vice president – computing, mobile, tablets, wearables, printing and accessories from 2014 to 2018. Mr. Bonfig has also held merchant-related roles since joining the company in 1999.
Damien Harmon is our Senior Executive Vice President of Channel & Customer Experiences & Enterprise Services. His areas of responsibility include Best Buy’s retail stores and operations, in-home services and sales, virtual experiences, customer care and customer strategy. In his role, Mr. Harmon leads Geek Squad. Mr. Harmon previously served as executive vice president of omnichannel from 2021 to 2023. Prior to that, Mr. Harmon served as president, operations from 2020 to 2021 and senior vice president of workforce design from 2019 to 2020. Mr. Harmon first joined Best Buy as a store general manager in 2005 and held various leadership positions in store operations. Before rejoining Best Buy in 2019, Mr. Harmon spent four years at Bridgestone Americas Inc., where he served as president of GCR Tires from 2017 to 2018 and chief operating officer at Bridgestone Tires from 2016 to 2017. Mr. Harmon serves on the board of Driven Brands and on the board of the Petco Love Foundation.
Todd G. Hartman was appointed General Counsel in 2019 and has also served as Chief Risk Officer since 2017. In this role, he is responsible for the company’s legal activities and its global risk and compliance program. He also serves as corporate secretary. Mr. Hartman joined Best Buy in 2006. He most recently served as chief risk and compliance officer, overseeing enterprise data security, customer data privacy, enterprise risk management, global security, business continuity/disaster recovery, internal investigations, crisis response management and compliance and ethics from 2017 to 2019. He continues to lead the risk functions in his current role. Mr. Hartman previously was Best Buy’s deputy general counsel from 2011 to 2017. Before that, he served as the company’s chief compliance officer and vice president of strategic alliances. Prior to joining Best Buy, Mr. Hartman was a partner at Minneapolis law firm Robins Kaplan. A Minnesota native, he worked for several years as a telecommunications and technology attorney in Washington, D.C., before returning to Minneapolis. Mr. Hartman sits on the advisory board of Markaaz, Inc. He serves as chair of the Best Buy Foundation and is on the board of the Retail Litigation Center and Equal Justice Works. He is an adjunct faculty member at the University of Minnesota Law School.
Kamy Scarlett is our Senior Executive Vice President of Corporate Affairs & Human Resources. In this role, she oversees talent development and the health and well-being of our employees worldwide, communications and public affairs. She was appointed executive vice president, human resources in 2017. She also assumed responsibility for communications and public affairs in 2023. She previously had responsibility for Best Buy Canada from 2021 to 2024, with oversight and responsibility for Canadian business performance. She served as our president of U.S. retail stores from 2019 until 2020 and was responsible for the execution and operation of all domestic Best Buy store locations. Ms. Scarlett joined Best Buy in 2014 as senior vice president of retail and chief human resources officer for Best Buy Canada, serving in that role until 2017. She has served in a variety of retail, operations, marketing and human resources leadership roles since beginning her career in retail more than 30 years ago. Prior to joining Best Buy, Ms. Scarlett was the chief operating officer from 2012 to 2014 at Grafton-Fraser Inc., a leading Canadian retailer of men’s apparel. She also previously held leadership roles at Loblaw Cos., Hudson’s Bay Co. and Dylex Inc. Ms. Scarlett has served on the board of Dollar General Corporation since August 2024 and previously served on the board of Floor & Décor.
Mathew R. Watson was appointed our Senior Vice President, Controller and Chief Accounting Officer in 2017. He previously served as our vice president, controller and chief accounting officer from 2015 until his current role. Mr. Watson is responsible for our controllership, financial operations and external reporting functions. Mr. Watson served in the role of vice president, finance - controller from 2014 to 2015. Prior to that role, he was vice president - finance, domestic controller from 2013 to 2014. Mr. Watson was also senior director, external reporting and corporate accounting from 2010 to 2013 and director, external reporting and corporate accounting beginning in 2007. Prior to joining us in 2005, Mr. Watson worked at KPMG from 1995 to 2005. He serves on the boards of directors of Achieve Twin Cities and the Best Buy Foundation.
PART II
Item 5. Market for Registrant's Common Equity, Related Stockholder Matters and Issuer Purchases of Equity Securities.
Market Information and Dividends
Our common stock is traded on the New York Stock Exchange (“NYSE”) under the ticker symbol BBY. In fiscal 2004, our Board of Directors (“Board”) initiated the payment of a regular quarterly cash dividend with respect to shares of our common stock. A quarterly cash dividend has been paid in each subsequent quarter. On March 4, 2025, we announced the Board’s approval of a 1% increase in the regularly quarterly cash dividend to $0.95 per share. Future dividend payments will depend on our earnings, capital requirements, financial condition and other factors considered relevant by our Board.
Holders
As of March 17, 2025, there were 1,866 holders of record of our common stock.
Purchases of Equity Securities by the Issuer and Affiliated Purchasers
On February 28, 2022, our Board approved a $5.0 billion share repurchase authorization. There is no expiration date governing the period over which we can repurchase shares under this authorization. During fiscal 2025, we repurchased and retired 5.8 million shares at a cost of $500 million. For additional information, see “Share Repurchases and Dividends” in Item 7, Management’s Discussion and Analysis of Financial Condition and Results of Operations, and Note 8, Shareholders’ Equity, of the Notes to Consolidated Financial Statements, included in Item 8, Financial Statements and Supplementary Data, of this Annual Report on Form 10-K.
Information regarding our repurchases of common stock during the fourth quarter of fiscal 2025 was as follows:
|
|
|
|
|
|
|
|
|
|
|
|
|
|
Period |
Total Number |
|
Average Price |
|
Total Number of Shares |
|
Approximate Dollar Value |
||||||
Nov. 3, 2024 through Nov. 30, 2024 |
- |
|
|
$ |
- |
|
|
- |
|
|
$ |
3,499,000,000 |
|
Dec. 1, 2024 through Jan. 4, 2025 |
1,059,305 |
|
|
$ |
86.92 |
|
|
1,059,305 |
|
|
$ |
3,407,000,000 |
|
Jan. 5, 2025 through Feb. 1, 2025 |
1,457,336 |
|
|
$ |
84.35 |
|
|
1,457,336 |
|
|
$ |
3,284,000,000 |
|
Total fiscal 2025 fourth quarter |
2,516,641 |
|
|
$ |
85.43 |
|
|
2,516,641 |
|
|
$ |
3,284,000,000 |
|
Best Buy Stock Comparative Performance Graph
The information contained in this Best Buy Stock Comparative Performance Graph section shall not be deemed to be “soliciting material” or “filed” or incorporated by reference in future filings with the SEC, or subject to the liabilities of Section 18 of the Exchange Act, except to the extent that we specifically incorporate it by reference into a document filed under the Securities Act or the Exchange Act.
The graph below compares the cumulative total shareholder return on our common stock for the last five fiscal years with the cumulative total return on the Standard & Poor's (“S&P”) 500 Index (“S&P 500”), of which we are a component, and the S&P 500 Consumer Discretionary Distribution & Retail Index (formerly the S&P 500 Retailing Group Industry Index), of which we are also a component. The S&P 500 Consumer Discretionary Distribution & Retail Index is a capitalization-weighted index of domestic equities traded on the NYSE and NASDAQ and includes high-capitalization stocks representing the retail sector of the S&P 500.
The graph assumes an investment of $100 at the close of trading on January 31, 2020, the last trading day of fiscal 2020, in our common stock, the S&P 500 Index and the S&P 500 Consumer Discretionary Distribution & Retail Index.
COMPARISON OF 5 YEAR CUMULATIVE TOTAL RETURN*
Among Best Buy Co., Inc., the S&P 500 Index
and the S&P 500 Consumer Discretionary Distribution & Retail Index
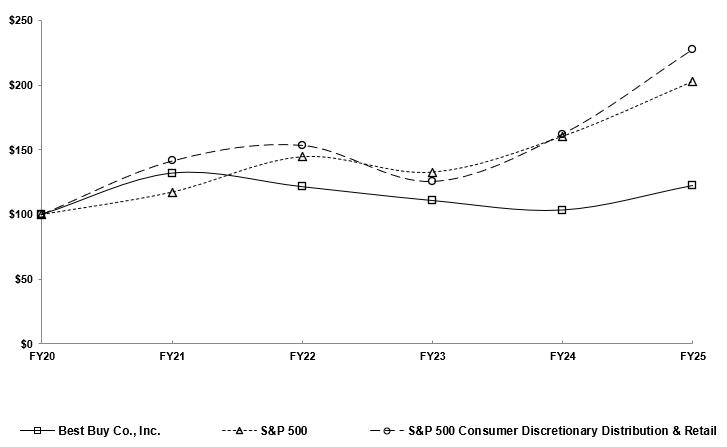
|
|
|
|
|
|
|
|
|
|
|
|
|
|
|
|
|
|
|
|
|
|
|
|
Fiscal Years Ended |
February 1, 2020 |
|
January 30, 2021 |
|
January 29, 2022 |
|
January 28, 2023 |
|
February 3, 2024 |
|
February 1, 2025 |
||||||||||||
Best Buy Co., Inc. |
$ |
100.00 |
|
|
$ |
132.06 |
|
|
$ |
121.58 |
|
|
$ |
110.85 |
|
|
$ |
103.47 |
|
|
$ |
122.43 |
|
S&P 500 |
$ |
100.00 |
|
|
$ |
117.25 |
|
|
$ |
144.56 |
|
|
$ |
132.68 |
|
|
$ |
160.30 |
|
|
$ |
202.59 |
|
S&P 500 Consumer Discretionary Distribution & Retail |
$ |
100.00 |
|
|
$ |
141.39 |
|
|
$ |
153.61 |
|
|
$ |
125.62 |
|
|
$ |
162.21 |
|
|
$ |
227.91 |
|
*Cumulative total return assumes dividend reinvestment.
Source: Research Data Group, Inc.
Item 6. [Reserved].
Item 7. Management's Discussion and Analysis of Financial Condition and Results of Operations.
Management's Discussion and Analysis of Financial Condition and Results of Operations (“MD&A”) is intended to provide a reader of our financial statements with a narrative from the perspective of our management on our financial condition, results of operations, liquidity and certain other factors that may affect our future results. Unless otherwise noted, transactions and other factors significantly impacting our financial condition, results of operations and liquidity are discussed in order of magnitude. Our MD&A should be read in conjunction with the Consolidated Financial Statements and related Notes included in Item 8, Financial Statements and Supplementary Data, of this Annual Report on Form 10-K. Refer to Item 7, Management’s Discussion and Analysis of Financial Condition and Results of Operations, in our Form 10-K for the fiscal year ended February 3, 2024, for discussion of the results of operations for the year ended February 3, 2024, compared to the year ended January 28, 2023, which is incorporated by reference herein.
Overview
We are driven by our purpose to enrich lives through technology and our vision to personalize and humanize technology solutions for every stage of life. We accomplish this by leveraging our combination of tech expertise and a human touch to meet our customers’ everyday needs, whether they come to us online, visit our stores or invite us into their homes. We have operations in the U.S. and Canada.
We have two reportable segments: Domestic and International. The Domestic segment is comprised of our operations in all states, districts and territories of the U.S. and our Best Buy Health business, and includes the brand names Best Buy, Best Buy Ads, Best Buy Business, Best Buy Essentials, Best Buy Health, Current Health, Geek Squad, Imagine That, Insignia, Lively, My Best Buy, My Best Buy Memberships, Pacific Kitchen and Home, TechLiquidators and Yardbird; and the domain names bestbuy.com, currenthealth.com, lively.com, techliquidators.com and yardbird.com. Our International segment is comprised of all operations in Canada under the brand names Best Buy, Best Buy Express, Best Buy Mobile, Geek Squad and TechLiquidators and the domain names bestbuy.ca and techliquidators.ca.
Our fiscal year ends on the Saturday nearest the end of January. Fiscal 2025, fiscal 2024 and fiscal 2023 ended on February 1, 2025, February 3, 2024, and January 28, 2023, respectively. Fiscal 2025 and fiscal 2023 each included 52 weeks. Fiscal 2024 included 53 weeks with the 53rd week occurring in the fiscal fourth quarter. Unless otherwise noted, references to years within the MD&A section of this report relate to fiscal years, not calendar years. Our business, like that of many retailers, is seasonal. A large proportion of our revenue and earnings is generated in the fiscal fourth quarter, which includes the majority of the holiday shopping season.
Comparable Sales
Throughout this MD&A, we refer to comparable sales. Comparable sales is a metric used by management to evaluate the performance of our existing stores, websites and call centers by measuring the change in net sales for a particular period over the comparable prior period of equivalent length. Comparable sales includes revenue from stores, websites and call centers operating for at least 14 full months. Revenue from online sales is included in comparable sales and represents sales initiated on a website or app, regardless of whether customers choose to have product delivered, or pick up product in store, curbside or at an alternative pick-up location. Revenue from acquisitions is included in comparable sales beginning with the first full quarter following the first anniversary of the date of the acquisition. Comparable sales also includes credit card revenue, gift card breakage, commercial sales and sales of merchandise to wholesalers and dealers, as applicable. Revenue from stores closed more than 14 days, including but not limited to relocated, remodeled, expanded and downsized stores, or stores impacted by natural disasters, is excluded from comparable sales until at least 14 full months after reopening. Comparable sales excludes the impact of certain periodic warranty-related profit-share revenue, the effect of fluctuations in foreign currency exchange rates (applicable to our International segment only) and the impact of the 53rd week (applicable in 53-week fiscal years only). Comparable sales is based on our fiscal calendar and is not adjusted to align calendar weeks. All periods presented apply this methodology consistently.
Consistent with our comparable sales policy, revenue from Best Buy Express locations rebranded as a result of our previously announced collaboration with Bell Canada is excluded from our comparable sales calculation until locations have been operating for at least 14 full months.
We believe comparable sales is a meaningful supplemental metric for investors to evaluate revenue performance resulting from growth in existing stores, websites and call centers versus the portion resulting from opening new stores or closing existing stores. The method of calculating comparable sales varies across the retail industry. As a result, our method of calculating comparable sales may not be the same as other retailers’ methods.
Non-GAAP Financial Measures
Beginning in the fourth quarter of fiscal 2025, we renamed our non-GAAP financial measures to adjusted financial measures; for example, consolidated non-GAAP operating income has been renamed to consolidated adjusted operating income. The methodology for calculating these measures remains unchanged, and therefore any previously reported non-GAAP financial measures that are renamed to corresponding adjusted financial measures remain unchanged.
This MD&A includes financial information prepared in accordance with accounting principles generally accepted in the U.S. (“GAAP”), as well as certain non-GAAP financial measures, such as consolidated adjusted operating income, consolidated adjusted operating income rate, consolidated adjusted effective tax rate and consolidated adjusted diluted earnings per share (“EPS”). We believe that non-GAAP financial measures, when reviewed in conjunction with GAAP financial measures, provide additional useful information for evaluating current period performance and assessing future performance. For these reasons, internal management reporting, including budgets, forecasts and financial targets used for short-term incentives are based on non-GAAP financial measures. Generally, our non-GAAP financial measures include adjustments for items such as restructuring charges, goodwill and acquired intangible asset impairments, price-fixing settlements, gains and losses on sales of subsidiaries and certain investments, amortization of definite-lived intangible assets associated with acquisitions, certain acquisition-related costs and the tax effect of all such items. In addition, certain other items may be excluded from non-GAAP financial measures when we believe doing so provides greater clarity to management and our investors. We provide reconciliations of the most comparable financial measures presented in accordance with GAAP to presented non-GAAP financial measures that enable investors to understand the adjustments made in arriving at the non-GAAP financial measures and to evaluate performance using the same metrics as management. These non-GAAP financial measures should be considered in addition to, and not superior to or as a substitute for, GAAP financial measures. We strongly encourage investors and shareholders to review our financial statements and publicly filed reports in their entirety and not to rely on any single financial measure. Non-GAAP financial measures may be calculated differently from similarly titled measures used by other companies, thereby limiting their usefulness for comparative purposes.
In our discussions of the operating results of our consolidated business and our International segment, we sometimes refer to the impact of changes in foreign currency exchange rates or the impact of foreign currency exchange rate fluctuations, which are references to the differences between the foreign currency exchange rates we use to convert the International segment’s operating results from local currencies into U.S. dollars for reporting purposes. We also may use the term “constant currency,” which represents results adjusted to exclude foreign currency impacts. We calculate those impacts as the difference between the current period results translated using the current period currency exchange rates and using the comparable prior period currency exchange rates. We believe the disclosure of revenue changes in constant currency provides useful supplementary information to investors in light of significant fluctuations in currency rates.
Refer to the Non-GAAP Financial Measures section below for detailed reconciliations of items impacting consolidated adjusted operating income, consolidated adjusted effective tax rate and consolidated adjusted diluted EPS in the presented periods.
Business Strategy Update
Our strategy for fiscal 2026 involves three key priorities:
Omni-channel enhancements
Starting with our digital experiences, we intend to improve our search and discover capability to make it easier for our customers to find what they want and need. We will leverage artificial intelligence (“AI”) to launch an innovative new search experience across our websites and apps. We will also leverage AI to enhance personalization, which we believe will drive both customer engagement and sales conversion.
In our physical stores, we expect to prioritize merchandising and store health and appearance updates over large-scale remodels, building on the insights we have gained from testing and changes implemented within our stores in recent years. From a store labor perspective, we will focus on enhancements and optimization, building on the significant operating model changes we have made in recent years that were designed to provide the experience our customers expect in the most efficient way possible.
Investment in new growth initiatives
We are targeting a mid-fiscal 2026 launch for our new Best Buy Marketplace (“Marketplace”) within our Domestic segment, which we believe will complement our existing product assortment with access to a broader range of products offered by Marketplace sellers. We believe this will unlock potential new commission and advertising revenue, without requiring our investment in inventory.
We have recently elevated our focus on Best Buy Ads, our retail media network, and we see fiscal 2026 as a pivotal year. In recent years, Best Buy Ads has primarily served our merchandise vendors. In fiscal 2026, we will continue this evolution and also expect Best Buy Ads to expand into other areas of opportunity. In order to support this growth, we plan to invest in technology capabilities, our Best Buy Ads team and other new third-party partnerships.
Operational efficiency
Our third strategic priority for fiscal 2026 is to continue our longstanding commitment to operational efficiency by identifying cost reductions and other savings to help fund investment capacity for new and existing initiatives and offset financial pressures facing our business.
Tariffs
We enter fiscal 2026 facing significant uncertainty regarding the scope, timing and magnitude of tariffs we may experience for the products we sell and the consequent financial impact on our business. In conjunction with our vendors, we will seek to mitigate the impact of tariffs on our business and our customers. For more information regarding the potential impacts of tariffs on our business, refer to Item 1A, Risk Factors, of this Annual Report on Form 10-K.
Results of Operations
Consolidated Results
In fiscal 2025, we continued to manage our profitability through strong execution despite revenue declines. As we entered the year, we were operating in an uneven environment and expected there would be industry pressure. Our strategy was to focus on sharpening our customer experiences and industry positioning while optimizing our operating income rate.
Selected consolidated financial data was as follows ($ in millions, except per share amounts):
(1)
|
|
|
|
|
|
|
|
|
|
|
|
|
2025 |
|
2024 |
|
2023 |
||||||
Revenue |
$ |
41,528 |
|
|
$ |
43,452 |
|
|
$ |
46,298 |
|
Revenue % change |
|
(4.4) |
% |
|
|
(6.1) |
% |
|
|
(10.6) |
% |
Comparable sales % change |
|
(2.3) |
% |
|
|
(6.8) |
% |
|
|
(9.9) |
% |
Gross profit |
$ |
9,385 |
|
|
$ |
9,603 |
|
|
$ |
9,912 |
|
Gross profit as a % of revenue(1) |
|
22.6 |
% |
|
|
22.1 |
% |
|
|
21.4 |
% |
SG&A |
$ |
7,651 |
|
|
$ |
7,876 |
|
|
$ |
7,970 |
|
SG&A as a % of revenue(1) |
|
18.4 |
% |
|
|
18.1 |
% |
|
|
17.2 |
% |
Restructuring charges |
$ |
(3) |
|
|
$ |
153 |
|
|
$ |
147 |
|
Goodwill impairment |
$ |
475 |
|
|
$ |
- |
|
|
$ |
- |
|
Operating income |
$ |
1,262 |
|
|
$ |
1,574 |
|
|
$ |
1,795 |
|
Operating income as a % of revenue |
|
3.0 |
% |
|
|
3.6 |
% |
|
|
3.9 |
% |
Net earnings |
$ |
927 |
|
|
$ |
1,241 |
|
|
$ |
1,419 |
|
Diluted EPS |
$ |
4.28 |
|
|
$ |
5.68 |
|
|
$ |
6.29 |
|
(1)Because retailers vary in how they record costs of operating their supply chain between cost of sales and SG&A, our gross profit rate and SG&A rate may not be comparable to other retailers' corresponding rates. For additional information regarding costs classified in cost of sales and SG&A, refer to Note 1, Summary of Significant Accounting Policies, of the Notes to Consolidated Financial Statements, included in Item 8, Financial Statements and Supplementary Data, of this Annual Report on Form 10-K.
In fiscal 2025, we generated $41.5 billion in revenue, compared to $43.5 billion in fiscal 2024 that included approximately $735 million in revenue from the 53rd week. Our comparable sales declined 2.3% in fiscal 2025, as we continued to operate in a challenged consumer electronics industry and experienced softer consumer demand. While our comparable sales declined in fiscal 2025 in categories such as appliances, home theater and gaming, we grew comparable sales in our computing, tablet and services categories.
Restructuring charges in fiscal 2025 were primarily comprised of adjustments to employee termination benefits related to previously planned organizational changes and higher-than-expected employee retention associated with an enterprise-wide initiative that commenced in the fourth quarter of fiscal 2024. Refer to Note 2, Restructuring, of the Notes to Consolidated Financial Statements, included in Item 8, Financial Statements and Supplementary Data, of this Annual Report on Form 10-K for additional information.
The goodwill impairment in fiscal 2025 was related to our Best Buy Health reporting unit. The impairment primarily arose from downward revisions of our revenue growth rates and margin rates compared to projections used in prior years. Refer to Note 3, Goodwill and Intangible Assets, of the Notes to Consolidated Financial Statements, included in Item 8, Financial Statements and Supplementary Data, of this Annual Report on Form 10-K for additional information.
Operating income rate decreased in fiscal 2025, primarily due to the goodwill impairment and unfavorable SG&A rate, partially offset by favorability in the gross profit rate and lower restructuring charges.
Diluted EPS decreased in fiscal 2025, primarily due to lower operating income.
Revenue, gross profit rate, SG&A and operating income rate changes in fiscal 2025 were primarily driven by our Domestic segment. For further discussion of our Domestic and International segments, see Segment Performance Summary, below.
Store Summary
Stores open by segment were as follows:
|
|
|
|
|
|
|
|
|
|
|
|
|
|
|
|
|
|
|
|
|
|
|
|
|
February 1, 2025 |
|
February 3, 2024 |
|
January 28, 2023 |
||||||
Best Buy |
|
891 |
|
|
|
901 |
|
|
|
925 |
|
Best Buy Outlet Centers |
|
25 |
|
|
|
22 |
|
|
|
19 |
|
Pacific Sales |
|
20 |
|
|
|
20 |
|
|
|
20 |
|
Yardbird |
|
21 |
|
|
|
22 |
|
|
|
14 |
|
Total Domestic stores |
|
957 |
|
|
|
965 |
|
|
|
978 |
|
Canada Best Buy stores |
|
129 |
|
|
|
128 |
|
|
|
127 |
|
Canada Best Buy Mobile stand-alone stores |
|
31 |
|
|
|
32 |
|
|
|
33 |
|
Total International stores |
|
160 |
|
|
|
160 |
|
|
|
160 |
|
Total stores |
|
1,117 |
|
|
|
1,125 |
|
|
|
1,138 |
|
We continuously monitor store performance as part of a market-driven, omnichannel strategy. As we approach the expiration of leases, we evaluate various options for each location, including whether a store should remain open. In fiscal 2026, we currently expect to reduce our Domestic segment Best Buy store count by approximately 5 to 10 stores.
In fiscal 2024, we announced our collaboration with Bell Canada to rebrand 167 of its stores to Best Buy Express. These stores, previously part of The Source, a wholly owned subsidiary of Bell Canada, are leased by Bell Canada and therefore excluded from our store count. Under the arrangement, we provide the curated consumer electronics assortment and Geek Squad services, as well as supply chain, marketing and e-commerce support. Bell Canada is the exclusive telecommunications services provider and is also responsible for the store operations. By the end of fiscal 2025, all of the 167 stores have been rebranded.
Income Tax Expense
Income tax expense decreased to $372 million in fiscal 2025 compared to $381 million in fiscal 2024, primarily due to the impact of decreased pre-tax earnings, partially offset by the impact of certain expenses that are not tax deductible. Our effective tax rate increased to 28.7% in fiscal 2025 compared to 23.5% in fiscal 2024, primarily due to the impacts of certain expenses that are not tax deductible and lower pre-tax earnings, partially offset by increased tax benefits from green energy incentives.
Segment Performance Summary
Domestic Segment
Selected financial data for the Domestic segment was as follows ($ in millions):
|
|
|
|
|
|
|
|
|
|
|
|
|
2025 |
|
2024 |
|
2023 |
||||||
Revenue |
$ |
38,238 |
|
|
$ |
40,097 |
|
|
$ |
42,794 |
|
Revenue % change |
|
(4.6) |
% |
|
|
(6.3) |
% |
|
|
(10.5) |
% |
Comparable sales % change(1) |
|
(2.5) |
% |
|
|
(7.1) |
% |
|
|
(10.3) |
% |
Gross profit |
$ |
8,647 |
|
|
$ |
8,850 |
|
|
$ |
9,106 |
|
Gross profit as a % of revenue |
|
22.6 |
% |
|
|
22.1 |
% |
|
|
21.3 |
% |
Adjusted SG&A(2) |
$ |
7,000 |
|
|
$ |
7,175 |
|
|
$ |
7,246 |
|
Adjusted SG&A as a % of revenue(3) |
|
18.3 |
% |
|
|
17.9 |
% |
|
|
16.9 |
% |
Adjusted operating income(2) |
$ |
1,647 |
|
|
$ |
1,675 |
|
|
$ |
1,860 |
|
Adjusted operating income as a % of revenue(4) |
|
4.3 |
% |
|
|
4.2 |
% |
|
|
4.3 |
% |
Selected Online Revenue Data |
|
|
|
|
|
|
|
|
|
|
|
Total online revenue |
$ |
12,994 |
|
|
$ |
13,102 |
|
|
$ |
14,212 |
|
Online revenue as a % of total segment revenue |
|
34.0 |
% |
|
|
32.7 |
% |
|
|
33.2 |
% |
Comparable online sales % change(1) |
|
(0.8) |
% |
|
|
(7.8) |
% |
|
|
(13.5) |
% |
(1)Comparable online sales are included in the comparable sales calculation.
(2)Represents Domestic segment Adjusted SG&A and Domestic segment Adjusted operating income as reported in accordance with the adoption of Accounting Standards Update (“ASU”) 2023-07, Segment Reporting (Topic 280): Improvements to Reportable Segment Disclosures. See Note 1, Summary of Significant Accounting Policies, and Note13, Segment and Geographic Information, of the Notes to Consolidated Financial Statements, included in Item 8, Financial Statements and Supplementary Data, of this Annual Report on Form 10-K for additional information.
(3)Adjusted SG&A as a % of revenue is calculated as Domestic segment Adjusted SG&A divided by Domestic segment Revenue.
(4)Adjusted operating income as a % of revenue is calculated as Domestic segment Adjusted operating income divided by Domestic segment Revenue.
Domestic segment revenue decreased in fiscal 2025, primarily driven by comparable sales declines in appliances and home theater and by the extra week of revenue totaling approximately $675 million in fiscal 2024. These decreases were partially offset by comparable sales growth in computing. Online revenue of $13.0 billion decreased 0.8% on a comparable basis in fiscal 2025.
Domestic segment revenue mix percentages and comparable sales percentage changes by revenue category were as follows:
|
|
|
|
|
|
|
|
|
|
|
|
|
Revenue Mix Summary |
|
Comparable Sales Summary |
||||||||
|
2025 |
|
2024 |
|
2025 |
|
2024 |
||||
Computing and Mobile Phones |
45 |
% |
|
42 |
% |
|
3.4 |
% |
|
(7.8) |
% |
Consumer Electronics |
29 |
% |
|
30 |
% |
|
(5.2) |
% |
|
(8.6) |
% |
Appliances |
12 |
% |
|
14 |
% |
|
(14.8) |
% |
|
(15.1) |
% |
Entertainment |
7 |
% |
|
7 |
% |
|
(11.9) |
% |
|
9.7 |
% |
Services |
6 |
% |
|
6 |
% |
|
8.4 |
% |
|
8.7 |
% |
Other |
1 |
% |
|
1 |
% |
|
15.9 |
% |
|
6.1 |
% |
Total |
100 |
% |
|
100 |
% |
|
(2.5) |
% |
|
(7.1) |
% |
Notable comparable sales changes by revenue category were as follows:
• Computing and Mobile Phones: The 3.4% comparable sales growth was driven primarily by computing and tablets.
• Consumer Electronics: The 5.2% comparable sales decline was driven primarily by home theater.
• Appliances: The 14.8% comparable sales decline was driven primarily by large appliances.
• Entertainment: The 11.9% comparable sales decline was driven primarily by gaming.
• Services: The 8.4% comparable sales growth was driven primarily by growth in our delivery and installation services, as well as our membership programs.
Domestic segment gross profit rate increased in fiscal 2025, primarily due to improved financial performance from our services category, including our membership offerings, partially offset by lower product margin rates and lower profit-sharing revenue from our private label and co-branded credit card arrangement.
Domestic segment adjusted SG&A decreased in fiscal 2025, primarily due to lower employee compensation expense, which was primarily store payroll, the impact of the 53rd week in fiscal 2024 and reduced vehicle rental costs. These decreases were partially offset by higher advertising and technology expense.
Domestic segment adjusted operating income rate increased in fiscal 2025, primarily due to a favorable gross profit rate, partially offset by higher advertising and technology spend on lower sales, resulting in an unfavorable SG&A rate.
International Segment
Selected financial data for the International segment was as follows ($ in millions):
|
|
|
|
|
|
|
|
|
|
|
|
|
2025 |
|
2024 |
|
2023 |
||||||
Revenue |
$ |
3,290 |
|
|
$ |
3,355 |
|
|
$ |
3,504 |
|
Revenue % change |
|
(1.9) |
% |
|
|
(4.3) |
% |
|
|
(10.9) |
% |
Comparable sales % change |
|
(0.5) |
% |
|
|
(3.2) |
% |
|
|
(5.4) |
% |
Gross profit |
$ |
738 |
|
|
$ |
753 |
|
|
$ |
806 |
|
Gross profit as a % of revenue |
|
22.4 |
% |
|
|
22.4 |
% |
|
|
23.0 |
% |
Adjusted SG&A(1) |
$ |
630 |
|
|
$ |
640 |
|
|
$ |
638 |
|
Adjusted SG&A as a % of revenue(2) |
|
19.1 |
% |
|
|
19.1 |
% |
|
|
18.2 |
% |
Adjusted operating income(1) |
$ |
108 |
|
|
$ |
113 |
|
|
$ |
168 |
|
Adjusted operating income as a % of revenue(3) |
|
3.3 |
% |
|
|
3.4 |
% |
|
|
4.8 |
% |
(1)Represents International segment Adjusted SG&A and International segment Adjusted operating income as reported in accordance with the adoption of ASU 2023-07. See Note 1, Summary of Significant Accounting Policies, and Note 13, Segment and Geographic Information, of the Notes to Consolidated Financial Statements, included in Item 8, Financial Statements and Supplementary Data, of this Annual Report on Form 10-K for additional information.
(2)Adjusted SG&A as a % of revenue is calculated as International segment Adjusted SG&A divided by International segment Revenue.
(3)Adjusted operating income as a % of revenue is calculated as International segment Adjusted operating income divided by International segment Revenue.
International segment revenue decreased in fiscal 2025, primarily driven by the negative impact of foreign exchange rates and by the extra week of revenue totaling approximately $60 million in fiscal 2024. These decreases were partially offset by increased revenue from Best Buy Express locations.
International segment revenue mix percentages and comparable sales percentage changes by revenue category were as follows:
|
|
|
|
|
|
|
|
|
|
|
|
|
|
|
|
|
Revenue Mix Summary |
|
Comparable Sales Summary |
||||||||||||
|
2025 |
|
2024 |
|
2025 |
|
2024 |
||||||||
Computing and Mobile Phones |
|
48 |
% |
|
|
46 |
% |
|
|
3.4 |
% |
|
|
(0.9) |
% |
Consumer Electronics |
|
28 |
% |
|
|
29 |
% |
|
|
(3.3) |
% |
|
|
(9.3) |
% |
Appliances |
|
10 |
% |
|
|
10 |
% |
|
|
(0.9) |
% |
|
|
(4.5) |
% |
Entertainment |
|
8 |
% |
|
|
9 |
% |
|
|
(13.3) |
% |
|
|
13.2 |
% |
Services |
|
5 |
% |
|
|
5 |
% |
|
|
5.3 |
% |
|
|
1.0 |
% |
Other |
|
1 |
% |
|
|
1 |
% |
|
|
(11.0) |
% |
|
|
(33.8) |
% |
Total |
|
100 |
% |
|
|
100 |
% |
|
|
(0.5) |
% |
|
|
(3.2) |
% |
Notable comparable sales changes by revenue category were as follows:
• Computing and Mobile Phones: The 3.4% comparable sales growth was driven primarily by mobile phones.
• Consumer Electronics: The 3.3% comparable sales decline was driven primarily by home theater and smart home.
• Appliances: The 0.9% comparable sales decline was driven primarily by large appliances.
• Entertainment: The 13.3% comparable sales decline was driven primarily by gaming.
• Services: The 5.3% comparable sales growth was driven primarily by growth in our warranty services and membership programs.
International segment gross profit rate in fiscal 2025 remained unchanged from fiscal 2024.
International segment adjusted SG&A decreased in fiscal 2025, primarily due to the favorable impact of foreign exchange rates and the impact of the 53rd week in fiscal 2024, partially offset by expenses associated with new Best Buy Express locations.
International segment adjusted operating income rate in fiscal 2025 remained relatively unchanged from fiscal 2024.
Non-GAAP Financial Measures
Reconciliations of consolidated operating income, effective tax rate and diluted EPS (GAAP financial measures) to consolidated adjusted operating income, adjusted effective tax rate and adjusted diluted EPS (non-GAAP financial measures), respectively, were as follows ($ in millions, except per share amounts):
|
|
|
|
|
|
|
|
|
|
|
|
|
2025 |
|
2024 |
|
2023 |
||||||
Operating income |
$ |
1,262 |
|
|
$ |
1,574 |
|
|
$ |
1,795 |
|
% of revenue |
|
3.0 |
% |
|
|
3.6 |
% |
|
|
3.9 |
% |
Intangible asset amortization(1) |
|
21 |
|
|
|
61 |
|
|
|
86 |
|
Restructuring charges(2) |
|
(3) |
|
|
|
153 |
|
|
|
147 |
|
Goodwill impairment(3) |
|
475 |
|
|
|
- |
|
|
|
- |
|
Adjusted operating income |
$ |
1,755 |
|
|
$ |
1,788 |
|
|
$ |
2,028 |
|
% of revenue |
|
4.2 |
% |
|
|
4.1 |
% |
|
|
4.4 |
% |
|
|
|
|
|
|
|
|
|
|
|
|
Effective tax rate |
|
28.7 |
% |
|
|
23.5 |
% |
|
|
20.7 |
% |
Intangible asset amortization(1) |
|
(0.6) |
% |
|
|
0.1 |
% |
|
|
0.1 |
% |
Restructuring charges(2) |
|
0.1 |
% |
|
|
0.2 |
% |
|
|
0.2 |
% |
Goodwill impairment(3) |
|
(4.9) |
% |
|
|
- |
% |
|
|
- |
% |
Adjusted effective tax rate |
|
23.3 |
% |
|
|
23.8 |
% |
|
|
21.0 |
% |
|
|
|
|
|
|
|
|
|
|
|
|
Diluted EPS |
$ |
4.28 |
|
|
$ |
5.68 |
|
|
$ |
6.29 |
|
Intangible asset amortization(1) |
|
0.10 |
|
|
|
0.28 |
|
|
|
0.38 |
|
Restructuring charges(2) |
|
(0.01) |
|
|
|
0.70 |
|
|
|
0.65 |
|
Goodwill impairment(3) |
|
2.19 |
|
|
|
- |
|
|
|
- |
|
Gain on sale of subsidiary, net(4) |
|
- |
|
|
|
(0.10) |
|
|
|
- |
|
Loss on investments |
|
0.03 |
|
|
|
0.05 |
|
|
|
- |
|
Income tax impact of non-GAAP adjustments(5) |
|
(0.22) |
|
|
|
(0.24) |
|
|
|
(0.24) |
|
Adjusted diluted EPS |
$ |
6.37 |
|
|
$ |
6.37 |
|
|
$ |
7.08 |
|
For additional information regarding the nature of charges discussed below, refer to Note 1, Summary of Significant Accounting Policies; Note 2, Restructuring; Note 3, Goodwill and Intangible Assets; and Note 10, Income Taxes, of the Notes to Consolidated Financial Statements, included in Item 8, Financial Statements and Supplementary Data, of this Annual Report on Form 10-K.
(1)Represents the non-cash amortization of definite-lived intangible assets associated with acquisitions, including customer relationships, tradenames and developed technology assets.
(2)Represents charges related to employee termination benefits and subsequent adjustments to previously planned organizational changes and higher-than-expected employee retention associated with enterprise-wide restructuring initiatives.
(3)Represents the non-cash goodwill impairment charge related to our Best Buy Health reporting unit.
(4)Represents the gain on sale of a Mexico subsidiary subsequent to our exit from operations in Mexico.
(5)The non-GAAP adjustments primarily relate to the U.S. As such, the income tax on a portion of the U.S. non-GAAP adjustments is calculated using the statutory tax rate of 24.5%. There is no income tax for a portion of the U.S. non-GAAP adjustments, as there is no tax benefit on the expenses in the calculation of GAAP income tax expense.
Adjusted operating income rate increased in fiscal 2025, primarily due to a favorable gross profit rate in our Domestic segment, partially offset by an unfavorable SG&A rate in our Domestic segment.
Adjusted effective tax rate decreased in fiscal 2025, primarily due to increased tax benefits from green energy incentives.
Adjusted diluted EPS in fiscal 2025 remained unchanged from fiscal 2024, as the decrease in adjusted earnings was offset by lower diluted weighted-average common shares outstanding.
Liquidity and Capital Resources
We closely manage our liquidity and capital resources. Our liquidity requirements depend on key variables, including the level of investment required to support our business strategies, the performance of our business, capital expenditures, dividends, credit facilities, short-term borrowing arrangements and working capital management. We modify our approach to managing these variables as changes in our operating environment arise. For example, capital expenditures and share repurchases are a component of our cash flow and capital management strategy, which, to a large extent, we can adjust in response to economic and other changes in our business environment.
Cash and cash equivalents were as follows ($ in millions):
|
|
|
|
|
|
|
|
|
February 1, 2025 |
|
February 3, 2024 |
||||
Cash and cash equivalents |
$ |
1,578 |
|
|
$ |
1,447 |
|
The increase in cash and cash equivalents in fiscal 2025 was primarily due to positive cash flows from operations, primarily driven by earnings. These increases were partially offset by dividend payments, capital expenditures and share repurchases.
Our cash deposits held at financial institutions may exceed the amount of insurance provided on such deposits. Generally, these deposits may be redeemed upon demand and are maintained with financial institutions with reputable credit. We limit exposure relating to financial instruments by diversifying the financial instruments among various counterparties, which consist primarily of major financial institutions.
Cash Flows
Cash flows were as follows ($ in millions):
|
|
|
|
|
|
|
|
|
|
|
|
|
2025 |
|
2024 |
|
2023 |
||||||
Total cash provided by (used in): |
|
|
|
|
|
|
|
|
|
|
|
Operating activities |
$ |
2,098 |
|
|
$ |
1,470 |
|
|
$ |
1,824 |
|
Investing activities |
|
(704) |
|
|
|
(781) |
|
|
|
(962) |
|
Financing activities |
|
(1,309) |
|
|
|
(1,144) |
|
|
|
(1,806) |
|
Effect of exchange rate changes on cash |
|
(10) |
|
|
|
(5) |
|
|
|
(8) |
|
Increase (decrease) in cash, cash equivalents and restricted cash |
$ |
75 |
|
|
$ |
(460) |
|
|
$ |
(952) |
|
Operating Activities
Cash provided by operating activities increased in fiscal 2025, primarily driven by the timing and volume of inventory purchases and payments, partially offset by the timing of vendor funding receivables.
Investing Activities
Cash used in investing activities decreased in fiscal 2025, primarily driven by lower capital spending.
Financing Activities
Cash used in financing activities increased in fiscal 2025, primarily driven by higher share repurchases.
Sources of Liquidity
Funds generated by operating activities, available cash and cash equivalents, our credit facilities, other debt arrangements and trade payables are our most significant sources of liquidity. We believe our sources of liquidity will be sufficient to fund operations and anticipated capital expenditures, share repurchases, dividends and strategic initiatives, including business combinations. However, in the event our liquidity is insufficient, we may be required to limit our spending. There can be no assurance that we will continue to generate cash flows at or above current levels or that we will be able to maintain our ability to borrow under our existing credit facilities or obtain additional financing, if necessary, on favorable terms.
We have a $1.25 billion five-year senior unsecured revolving credit facility agreement (the “Five-Year Facility Agreement”) with a syndicate of banks that expires in April 2028. There were no borrowings outstanding under the Five-Year Facility Agreement as of February 1, 2025, or February 3, 2024.
The Five-Year Facility Agreement contains a covenant that requires the company to maintain a maximum quarterly cash flow leverage ratio. The Five-Year Facility Agreement contains customary default provisions, including, but not limited to, failure to pay interest or principal when due and failure to comply with covenants. As of February 1, 2025, we were in compliance with all covenants. If an event of default were to occur with respect to any of our other debt, it would likely constitute an event of default under the Five-Year Facility Agreement as well.
Our credit ratings and outlook as of March 17, 2025, remained unchanged from those disclosed in our Annual Report on Form 10-K for the fiscal year ended February 3, 2024, and are summarized below.
|
|
|
|
|
|
|
|
|
|
|
|
Rating Agency |
Rating |
|
Outlook |
Standard & Poor's |
BBB+ |
|
Stable |
Moody's |
A3 |
|
Stable |
Credit rating agencies review their ratings periodically, and, therefore, the credit rating assigned to us by each agency may be subject to revision at any time. Factors that can affect our credit ratings include, but are not limited to, changes in our operating performance; the economic environment, regulatory and political environment; conditions in the retail and consumer electronics industries; our competitive standing within the industries we operate; our financial position; and changes in our business strategy. If changes in our credit ratings were to occur, they could impact, among other things, interest costs for certain of our credit facilities, our future borrowing costs, access to capital markets, vendor financing terms and future new-store leasing costs.
Restricted Cash
Our liquidity is also affected by restricted cash balances that are primarily restricted to cover product protection plans provided under our membership offerings and self-insurance liabilities. Restricted cash, which is included in Other current assets on our Consolidated Balance Sheets, was $290 million and $346 million as of February 1, 2025, and February 3, 2024, respectively. The decrease in restricted cash was primarily due to releases of product protection reserves based on claims and purchasing behaviors of customers participating in our membership offerings.
Capital Expenditures
Capital expenditures were as follows ($ in millions):
|
|
|
|
|
|
|
|
|
|
|
|
|
2025 |
|
2024 |
|
2023 |
||||||
E-commerce and information technology |
$ |
438 |
|
|
$ |
496 |
|
|
$ |
540 |
|
Store-related projects(1) |
|
230 |
|
|
|
278 |
|
|
|
355 |
|
Supply chain |
|
38 |
|
|
|
21 |
|
|
|
35 |
|
Total capital expenditures |
$ |
706 |
|
|
$ |
795 |
|
|
$ |
930 |
|
(1)Store-related projects are primarily comprised of store remodels and various merchandising projects.
We currently expect capital expenditures in fiscal 2026 of $700 million to $750 million.
Debt and Capital
As of February 1, 2025, we had $500 million of principal amount of notes due October 1, 2028 (“2028 Notes”) and $650 million of principal amount of notes due October 1, 2030 (“2030 Notes”). Refer to Note 7, Debt, in the Notes to Consolidated Financial Statements, included in Item 8, Financial Statements and Supplementary Data, of this Annual Report on Form 10-K for further information about our outstanding debt.
Share Repurchases and Dividends
We repurchase our common stock and pay dividends pursuant to programs approved by our Board of Directors (“Board”). The payment of cash dividends is also subject to customary legal and contractual restrictions. Our long-term capital allocation strategy is to first fund operations and investments in growth and then return excess cash over time to shareholders through dividends and share repurchases while maintaining investment-grade credit metrics. Our share repurchase plans are evaluated on an ongoing basis, considering factors such as our financial condition and cash flows, our economic outlook, the impact of tax laws, our liquidity needs, and the health and stability of global credit markets. The timing and amount of future repurchases may vary depending on such factors.
On February 28, 2022, our Board approved a $5.0 billion share repurchase program. There is no expiration date governing the period over which we can repurchase shares under this authorization.
Share repurchase and dividend activity were as follows ($ and shares in millions, except per share amounts):
|
|
|
|
|
|
|
|
|
|
|
|
|
2025 |
|
2024 |
|
2023 |
||||||
Total cost of shares repurchased |
$ |
500 |
|
|
$ |
340 |
|
|
$ |
1,001 |
|
Average price per share |
$ |
86.42 |
|
|
$ |
72.52 |
|
|
$ |
84.78 |
|
Total number of shares repurchased |
|
5.8 |
|
|
|
4.7 |
|
|
|
11.8 |
|
Regular quarterly cash dividends per share |
$ |
3.76 |
|
|
$ |
3.68 |
|
|
$ |
3.52 |
|
Cash dividends declared and paid |
$ |
807 |
|
|
$ |
801 |
|
|
$ |
789 |
|
The total cost of shares repurchased increased in fiscal 2025 from increases in the volume of repurchases and the average price per share.
Cash dividends declared and paid increased in fiscal 2025, primarily due to an increase in the regular quarterly cash dividend per share, partially offset by fewer shares outstanding. On March 4, 2025, we announced the Board’s approval of a 1% increase in the regular quarterly cash dividend to $0.95 per share.
Off-Balance-Sheet Arrangements and Contractual Obligations
We do not have outstanding off-balance-sheet arrangements. Contractual obligations as of February 1, 2025, were as follows ($ in millions):
|
|
|
|
|
|
|
|
|
|
|
|
|
|
|
|
|
|
|
|
|
|
|
|
|
Payments Due by Period |
||||||||||||||
Contractual Obligations |
Total |
|
Less Than |
|
1-3 Years |
|
3-5 Years |
|
More Than |
||||||||||
Purchase obligations(1) |
$ |
2,957 |
|
|
$ |
2,411 |
|
|
$ |
343 |
|
|
$ |
135 |
|
|
$ |
68 |
|
Operating lease obligations(2) |
|
3,263 |
|
|
|
723 |
|
|
|
1,277 |
|
|
|
741 |
|
|
|
522 |
|
Long-term debt obligations(3) |
|
1,150 |
|
|
|
- |
|
|
|
- |
|
|
|
500 |
|
|
|
650 |
|
Interest payments(4) |
|
174 |
|
|
|
42 |
|
|
|
80 |
|
|
|
44 |
|
|
|
8 |
|
Finance lease obligations |
|
29 |
|
|
|
13 |
|
|
|
11 |
|
|
|
2 |
|
|
|
3 |
|
Total |
$ |
7,573 |
|
|
$ |
3,189 |
|
|
$ |
1,711 |
|
|
$ |
1,422 |
|
|
$ |
1,251 |
|
For additional information regarding the nature of contractual obligations discussed below, refer to Note 5, Derivative Instruments; Note 6, Leases; Note 7, Debt; and Note 12, Contingencies and Commitments, of the Notes to Consolidated Financial Statements, included in Item 8, Financial Statements and Supplementary Data, of this Annual Report on Form 10-K.
(1)Purchase obligations primarily include agreements to purchase goods or services that are enforceable, are legally binding and specify all significant terms, including fixed or minimum quantities to be purchased; fixed, minimum or variable price provisions; and the approximate timing of the transaction. Purchase obligations do not include agreements that are cancelable without penalty. Additionally, although they do not contain legally binding purchase commitments, we include open purchase orders in the table above. Substantially all open purchase orders are fulfilled within 30 days.
(2)Operating lease obligations exclude payments to landlords covering real estate taxes and common area maintenance. These charges, if included, would increase total operating lease obligations by $0.7 billion as of February 1, 2025. Operating lease obligations also exclude $19 million of legally binding fixed costs for leases signed but not yet commenced.
(3)Long-term debt obligations represent principal amounts only and exclude interest rate swap valuation adjustments.
(4)Interest payments related to our 2028 Notes and 2030 Notes include the variable interest rate payments included in our interest rate swaps.
Additionally, we have $1.25 billion in undrawn capacity on our Five-Year Facility Agreement as of February 1, 2025, which, if drawn upon, would be included in either short-term or long-term debt on our Consolidated Balance Sheets.
Critical Accounting Estimates
The preparation of our financial statements requires us to make assumptions and estimates about future events and apply judgments that affect the reported amounts of assets, liabilities, revenue, expenses and the related disclosures. We base our assumptions, estimates and judgments on historical experience, current trends and other factors believed to be relevant at the time our consolidated financial statements are prepared. Because future events and their effects cannot be determined with certainty, actual results could differ from our assumptions and estimates, and such differences could be material.
Our significant accounting policies are discussed in Note 1, Summary of Significant Accounting Policies, of the Notes to Consolidated Financial Statements, included in Item 8, Financial Statements and Supplementary Data, of this Annual Report on Form 10-K. We have not made any material changes to our accounting policies or methodologies during the past three fiscal years. We believe that the following accounting estimates are the most critical to aid in fully understanding and evaluating our reported financial results. These estimates require our most difficult, subjective or complex judgments and generally incorporate significant uncertainty.
Vendor Allowances
Description
We receive funds from our merchandise vendors through a variety of programs and arrangements, primarily in the form of purchases-based or sales-based volumes and for product advertising and placement. We recognize vendor allowances based on purchases and sales as a reduction of cost of sales when the associated inventory is sold. Vendor allowances for advertising and placement are recognized as a reduction of cost of sales ratably over the corresponding performance period. Funds that are determined to be a reimbursement of specific, incremental and identifiable costs incurred to sell a vendor's products are recorded as an offset to the related expense within SG&A when incurred.
Judgments and uncertainties involved in the estimate
Due to the quantity and diverse nature of our vendor agreements, estimates are made to determine the amount of funding to be recognized in earnings or deferred as an offset to inventory. These estimates require a detailed analysis of complex factors, including proper classification of the type of funding received and the methodology to estimate the portion of purchases-based funding that should be recognized in cost of sales in each period, which considers factors such as inventory-turn by product category and actual sell-through of inventory.
Effect if actual results differ from assumptions
A 10% change in our vendor funding deferral as of February 1, 2025, would have affected net earnings by approximately $45 million in fiscal 2025. The level of vendor funding deferral has remained relatively stable over the last three fiscal years.
Goodwill
Description
Goodwill is evaluated for impairment annually in the fiscal fourth quarter or whenever events or circumstances indicate the carrying value may not be recoverable. The impairment test involves a comparison of the fair value of each reporting unit with its carrying value. Fair value reflects our estimate of the price a potential market participant would be willing to pay for the reporting unit in an arms-length transaction.
We have goodwill in two reporting units – Best Buy Domestic (comprising our core U.S. Best Buy business) and Best Buy Health – with carrying values of $492 million and $416 million, respectively, as of February 1, 2025.
Judgments and uncertainties involved in the estimate
Determining the fair value of a reporting unit requires complex analysis and judgment. We use a combination of discounted cash flow (“DCF”) analysis and market data, such as revenue multiples and quoted market prices, for observable comparable companies. DCF analysis requires detailed forecasts of cash flow drivers, such as revenue growth rates, margin rates and capital investments, and estimates of weighted-average cost of capital rates. These estimates incorporate many uncertain factors, such as the effectiveness of our strategy, changes in customer behavior, technological changes, competitor actions, regulatory changes and macroeconomic trends.
Effects if actual results differ from assumptions
For our Best Buy Domestic reporting unit, fair value is primarily derived from market data and exceeded carrying value by a substantial margin in fiscal 2025, fiscal 2024 and fiscal 2023. Barring a fundamental, material deterioration of macroeconomic factors, we believe the risk of future goodwill impairment within our Best Buy Domestic reporting unit is remote.
In fiscal 2025, we recorded a goodwill impairment of $475 million for the Best Buy Health reporting unit. The impairment was identified during the fourth quarter as a result of our annual impairment review. This coincides with our annual review of performance against financial and strategic goals, and the annual update of our budget and long-range financial projections. Fair value for the Best Buy Health reporting unit is estimated primarily based on DCF analysis. The impairment primarily arose from downward revisions of our revenue growth rates and margin rates compared to projections used in prior years, as the market has not scaled as we originally forecasted.
Our Best Buy Health reporting unit is subject to a greater level of uncertainty compared to our Best Buy Domestic reporting unit, since it operates in a more uncertain environment. Factors that drive this uncertainty include macro-economic conditions, the regulatory environment, government funding programs, competitor actions, technology changes and other trends in the health and care sectors. Changes in any of these factors could lead to further lowering our expectations, which could result in further goodwill impairment.
Inventory Markdown
Description
We value our inventory at the lower of cost or net realizable value through the establishment of inventory markdown adjustments. Markdown adjustments reflect the excess of cost over the net recovery we expect to realize from the ultimate sale or other disposal of inventory and establish a new cost basis. No adjustment is recorded for inventory that we expect to return to our vendors for full credit.
Judgments and uncertainties involved in the estimate
Markdown adjustments involve uncertainty because the calculations require management to make assumptions and to apply judgment about the expected revenue and incremental costs we will generate for selling current inventory. Such estimates include the evaluation of historical recovery rates, as well as factors such as product type and condition, forecasted consumer demand, product lifecycles, promotional environment, regulatory actions, vendor return rights and the expected sales channel of ultimate disposition. We also apply judgment in the assumptions about other components of net realizable value, such as vendor allowances and selling costs.
Effect if actual results differ from assumptions
A 10% change in our markdown adjustment as of February 1, 2025, would have affected net earnings by approximately $11 million in fiscal 2025. The level of markdown adjustments has remained relatively stable over the last three fiscal years.
Tax Contingencies
Description
Our income tax returns are routinely examined by domestic and foreign tax authorities. Taxing authorities audit our tax filing positions, including the timing and amount of income and deductions and the allocation of income among various tax jurisdictions. At any one time, multiple tax years are subject to audit by the various taxing authorities. In evaluating the exposures associated with our various tax filing positions, we may record a liability for such exposures. A number of years may elapse before a particular matter, for which we have established a liability, is audited and fully resolved or clarified. We adjust our liability for unrecognized tax benefits and income tax provisions in the period in which an uncertain tax position is effectively settled, the statute of limitations expires for the relevant taxing authority to examine the tax position or when more information becomes available. Our effective income tax rate is also affected by changes in tax law, the tax jurisdiction of new stores or business ventures, the level of earnings and the results of tax audits.
Judgments and uncertainties involved in the estimate
Our liability for unrecognized tax benefits contains uncertainties because management is required to make assumptions and apply judgment to estimate the exposures associated with our various tax filing positions. Such assumptions can include complex and uncertain external factors, such as changes in tax law, interpretations of tax law and the timing of such changes, and uncertain internal factors such as taxable earnings by jurisdiction, the magnitude and timing of certain transactions and capital spending.
Effect if actual results differ from assumptions
To the extent we prevail in matters for which a liability has been established or are required to pay amounts in excess of our established liability, our effective income tax rate in a given financial statement period could be materially affected. An unfavorable tax settlement generally would require use of our cash and may result in an increase in our effective income tax rate in the period of resolution. A favorable tax settlement may reduce our effective income tax rate in the period of resolution.
Service Revenue
Description
We sell membership plans that include access to benefits such as technical support, price discounts on certain products and services and product protection plans. We allocate the transaction price to all performance obligations identified in the contract based on their relative fair value. For performance obligations provided over the term of the contract, we typically recognize revenue on a usage basis, an input method of measuring progress over the related contract term. This method involves the estimation of expected usage patterns, primarily derived from historical information.
Judgments and uncertainties involved in the estimate
Estimates involve complex calculations and judgment, for example, in estimating the relative standalone selling price for bundled performance obligations; the appropriate recognition methodology for each performance obligation; and, for those based on usage, the expected pattern of consumption across a large portfolio of customers. When insufficient reliable and relevant history is available to estimate usage, we generally recognize revenue ratably over the life of the contract until such history has accumulated.
Effect if actual results differ from assumptions
A 10% change in the amount of services membership deferred revenue as of February 1, 2025, would have affected net earnings by approximately $43 million in fiscal 2025. The level of services membership deferred revenue has remained relatively stable over the last three fiscal years.
New Accounting Pronouncements
For a description of applicable new accounting pronouncements, including our assessment of the impact on our financial statements, see Note 1, Summary of Significant Accounting Policies, of the Notes to Consolidated Financial Statements, included in Item 8, Financial Statements and Supplementary Data, of this Annual Report on Form 10-K.
Item 7A. Quantitative and Qualitative Disclosures About Market Risk.
In addition to the risks inherent in our operations, we are exposed to certain market risks.
Interest Rate Risk
We are exposed to changes in short-term market interest rates and these changes in rates will impact our net interest expense. Our cash, cash equivalents and restricted cash generate interest income that will vary based on changes in short-term interest rates. In addition, we have swapped a portion of our fixed-rate debt to floating rate such that the interest expense on this debt will vary with short-term interest rates. Refer to Note 5, Derivative Instruments, and Note 7, Debt, of the Notes to Consolidated Financial Statements, included in Item 8, Financial Statements and Supplementary Data, of this Annual Report on Form 10-K for further information regarding our interest rate swaps.
As of February 1, 2025, we had $1.9 billion of cash, cash equivalents and restricted cash and $0.5 billion of debt that has been swapped to floating rate, and therefore the net asset balance exposed to interest rate changes was $1.4 billion. As of February 1, 2025, a 50-basis point increase in short-term interest rates would have led to an estimated $7 million increase in net interest income, and conversely a 50-basis point decrease in short-term interest rates would have led to an estimated $7 million decrease in net interest income.
Foreign Currency Exchange Rate Risk
We have market risk arising from changes in foreign currency exchange rates related to operations in our International segment. On a limited basis, we utilize foreign currency forward contracts to manage foreign currency exposure to certain forecasted inventory purchases, recognized receivable and payable balances and our investment in our Canadian operations. Our primary objective in holding derivatives is to reduce the volatility of net earnings and cash flows, as well as net asset value associated with changes in foreign currency exchange rates. Our foreign currency risk management strategy includes both hedging instruments and derivatives that are not designated as hedging instruments. Refer to Note 1, Summary of Significant Accounting Policies, and Note 5, Derivative Instruments, of the Notes to Consolidated Financial Statements, included in Item 8, Financial Statements and Supplementary Data, of this Annual Report on Form 10-K for further information regarding these instruments.
During fiscal 2025, foreign currency exchange rate fluctuations were primarily driven by the strength of the U.S. dollar against the Canadian dollar compared to the prior-year period. We estimate that the foreign currency exchange rate fluctuations had an unfavorable impact on our revenue of approximately $85 million. The estimated impact of foreign exchange rate fluctuations on our net earnings in fiscal 2025 was not significant.
Item 8. Financial Statements and Supplementary Data.
Management's Report on the Consolidated Financial Statements
Our management is responsible for the preparation, integrity and objectivity of the accompanying consolidated financial statements and the related financial information. The consolidated financial statements have been prepared in conformity with GAAP and necessarily include certain amounts that are based on estimates and informed judgments. Our management also prepared the related financial information included in this Annual Report on Form 10-K and is responsible for its accuracy and consistency with the consolidated financial statements.
The accompanying consolidated financial statements have been audited by Deloitte & Touche LLP, an independent registered public accounting firm, which conducted its audits in accordance with the standards of the Public Company Accounting Oversight Board (United States). The independent registered public accounting firm's responsibility is to express an opinion as to whether such consolidated financial statements present fairly, in all material respects, our financial position, results of operations and cash flows in accordance with GAAP.
Management's Report on Internal Control Over Financial Reporting
Our management is responsible for establishing and maintaining adequate internal control over financial reporting (as defined in Rule 13a-15(f) under the Exchange Act). Our internal control over financial reporting is designed under the supervision of our principal executive officer and principal financial officer, and effected by our Board, management and other personnel, to provide reasonable assurance regarding the reliability of financial reporting and the preparation of financial statements for external purposes in accordance with GAAP, and includes those policies and procedures that:
(1)pertain to the maintenance of records that in reasonable detail accurately and fairly reflect our transactions and the dispositions of our assets;
(2)provide reasonable assurance that our transactions are recorded as necessary to permit preparation of financial statements in accordance with GAAP and that our receipts and expenditures are being made only in accordance with authorizations of our management and Board; and
(3)provide reasonable assurance regarding prevention or timely detection of unauthorized acquisition, use or disposition of our assets that could have a material effect on our financial statements.
Because of its inherent limitations, internal control over financial reporting may not prevent or detect misstatements. Therefore, even those systems determined to be effective can provide only reasonable assurance with respect to financial statement preparation and presentation.
Under the supervision and with the participation of our management, including our principal executive officer and principal financial officer, we assessed the effectiveness of our internal control over financial reporting as of February 1, 2025, using the criteria set forth by the Committee of Sponsoring Organizations of the Treadway Commission (COSO) in Internal Control — Integrated Framework (2013). Based on our assessment, we have concluded that our internal control over financial reporting was effective as of February 1, 2025. During our assessment, we did not identify any material weaknesses in our internal control over financial reporting. Deloitte & Touche LLP, the independent registered public accounting firm that audited our consolidated financial statements for the year ended February 1, 2025, included in Item 8, Financial Statements and Supplementary Data, of this Annual Report on Form 10-K, has issued an unqualified attestation report on our internal control over financial reporting as of February 1, 2025.
REPORT OF INDEPENDENT REGISTERED PUBLIC ACCOUNTING FIRM
To the shareholders and the Board of Directors of
Best Buy Co., Inc.
Richfield, Minnesota.
Opinion on the Financial Statements
We have audited the accompanying consolidated balance sheets of Best Buy Co., Inc. and subsidiaries (the "Company") as of February 1, 2025, and February 3, 2024, the related consolidated statements of earnings, comprehensive income, cash flows and changes in shareholders’ equity for each of the three years in the period ended February 1, 2025, and the related notes (collectively referred to as the "financial statements"). In our opinion, the financial statements present fairly, in all material respects, the financial position of the Company as of February 1, 2025, and February 3, 2024, and the results of its operations and its cash flows for each of the three fiscal years in the period ended February 1, 2025, in conformity with accounting principles generally accepted in the United States of America.
We have also audited, in accordance with the standards of the Public Company Accounting Oversight Board (United States) (PCAOB), the Company's internal control over financial reporting as of February 1, 2025, based on criteria established in Internal Control — Integrated Framework (2013) issued by the Committee of Sponsoring Organizations of the Treadway Commission and our report dated March 19, 2025, expressed an unqualified opinion on the Company's internal control over financial reporting.
Basis for Opinion
These financial statements are the responsibility of the Company's management. Our responsibility is to express an opinion on the Company's financial statements based on our audits. We are a public accounting firm registered with the PCAOB and are required to be independent with respect to the Company in accordance with the U.S. federal securities laws and the applicable rules and regulations of the Securities and Exchange Commission and the PCAOB.
We conducted our audits in accordance with the standards of the PCAOB. Those standards require that we plan and perform the audit to obtain reasonable assurance about whether the financial statements are free of material misstatement, whether due to error or fraud. Our audits included performing procedures to assess the risks of material misstatement of the financial statements, whether due to error or fraud, and performing procedures that respond to those risks. Such procedures included examining, on a test basis, evidence regarding the amounts and disclosures in the financial statements. Our audits also included evaluating the accounting principles used and significant estimates made by management, as well as evaluating the overall presentation of the financial statements. We believe that our audits provide a reasonable basis for our opinion.
Critical Audit Matters
The critical audit matters communicated below are matters arising from the current-period audit of the financial statements that were communicated or required to be communicated to the audit committee and that (1) relate to accounts or disclosures that are material to the financial statements and (2) involved our especially challenging, subjective, or complex judgments. The communication of critical audit matters does not alter in any way our opinion on the financial statements, taken as a whole, and we are not, by communicating the critical audit matters below, providing separate opinions on the critical audit matters or on the accounts or disclosures to which they relate.
Vendor Allowances – Domestic Reporting Segment — Refer to Note 1 to the financial statements
Critical Audit Matter Description
The Company receives vendor allowances from certain merchandise vendors through a variety of programs intended to offset the invoice cost of inventory and for promoting and selling merchandise inventory. Allowances based on purchases are initially deferred and recorded as a reduction of merchandise inventory and are recognized as a reduction to cost of sales when the associated inventory is sold. Allowances based on sales volumes are based on merchandise sold and are calculated using an agreed upon amount for each unit sold and recognized as a reduction to cost of sales when the associated inventory is sold. Other promotional allowances not specifically related to volume of purchases or sales, such as advertising and placement, are recognized as a reduction to cost of sales ratably over the corresponding performance period.
Given the significance of vendor allowances recorded by the Domestic Reporting Segment to the financial statements and the volume and diversity of individual vendor agreements, auditing these vendor allowances was complex and subjective due to the extent of effort required to evaluate whether these vendor allowances were recorded in accordance with the terms of the vendor agreements and that these allowances deferred as an offset to inventory were complete and accurate.
How the Critical Audit Matter Was Addressed in the Audit
Our audit procedures related to evaluating whether these vendor allowances were recorded in accordance with the terms of the vendor agreements and the completeness and accuracy of deferred vendor allowances included the following, among others:
We tested the effectiveness of controls over the recording of these vendor allowances, including management's controls over the establishment of vendor arrangements, the calculation of vendor allowances earned, and the determination of the deferred vendor allowances recorded as a reduction to inventory.
We selected a sample of these vendor allowances recorded as a reduction of cost of sales and (1) recalculated the amount recognized using the terms of the vendor agreement; (2) evaluated, based on the terms of the agreement, if the amount should be deferred and recorded as a reduction of merchandise inventory; and (3) tested the settlement of the arrangement.
We tested the amount of these deferred vendor allowances recorded as a reduction to inventory by developing an expectation for the amount and comparing our expectation to the amount recorded by management.
Goodwill – Best Buy Health Reporting Unit — Refer to Note 1 and Note 3 to the financial statements
Critical Audit Matter Description
The Company’s evaluation of goodwill for impairment involves the comparison of the fair value of each reporting unit to its carrying value. The goodwill balance was $908 million as of February 1, 2025, of which $416 million was related to the Best Buy Health reporting unit. The Company primarily uses a discounted cash flow analysis to estimate the fair value of the Best Buy Health reporting unit. The discounted cash flow analysis requires management to make subjective estimates and assumptions related to forecasts of cash flows, such as revenue growth rates and margin rates, and estimates of the weighted average cost of capital rate. Changes in these assumptions could have a significant impact on either the fair value, the amount of any goodwill impairment charge, or both. The Company recorded a goodwill impairment of $475 million related to the Best Buy Health reporting unit in the year ended February 1, 2025.
Given the significant judgments made by management to estimate the fair value of the Best Buy Health reporting unit, performing audit procedures to evaluate the reasonableness of management’s estimates and assumptions related to the forecasts of cash flows, such as revenue growth rates and margin rates, and estimates of the weighted average cost of capital rate, required a high degree of auditor judgment and an increased extent of effort, including the need to involve our fair value specialists.
How the Critical Audit Matter Was Addressed in the Audit
Our audit procedures related to the forecasts of cash flows, such as revenue growth rates and margin rates, and estimates of the weighted average cost of capital rate used by management to estimate the fair value of the Best Buy Health reporting unit included the following, among others:
We tested the effectiveness of controls over management’s goodwill impairment evaluation, including those over the determination of the fair value of the Best Buy Health reporting unit, such as controls related to management’s forecasts of future revenue and margin rates, and estimates of the weighted average cost of capital rate.
We evaluated management’s ability to accurately forecast future revenues and margin rates by comparing actual results to management’s historical forecasts.
We evaluated the reasonableness of management’s revenue forecasts and margin rates by comparing the forecasts to: (1) the Company’s historical revenue growth rates; (2) internal communications to management and the board of directors; (3) underlying source documents, when available, such as customer contracts; (4) forecasted information included in industry reports, applicable market data, and certain peer companies; and (5) underlying analyses detailing business strategies and growth plans.
We inquired of operating and sales management teams to determine whether the judgments and assumptions used in the future revenue projections were consistent with the strategy and long-range plans for the Best Buy Health reporting unit.
With the assistance of our fair value specialists, we evaluated the reasonableness of the weighted average cost of capital rate by: (1) testing the mathematical accuracy of the calculations; and (2) developing a range based upon our independent estimate and comparing the rate selected by management to that range.
/s/ Deloitte & Touche LLP
Minneapolis, Minnesota
March 19, 2025
We have served as the Company's auditor since 2005.
REPORT OF INDEPENDENT REGISTERED PUBLIC ACCOUNTING FIRM
To the shareholders and the Board of Directors of
Best Buy Co., Inc.
Richfield, Minnesota.
Opinion on Internal Control over Financial Reporting
We have audited the internal control over financial reporting of Best Buy Co., Inc. and subsidiaries (the “Company”) as of February 1, 2025, based on criteria established in Internal Control — Integrated Framework (2013) issued by the Committee of Sponsoring Organizations of the Treadway Commission (COSO). In our opinion, the Company maintained, in all material respects, effective internal control over financial reporting as of February 1, 2025, based on criteria established in Internal Control — Integrated Framework (2013) issued by COSO.
We have also audited, in accordance with the standards of the Public Company Accounting Oversight Board (United States) (PCAOB), the consolidated financial statements as of and for the year ended February 1, 2025, of the Company and our report dated March 19, 2025, expressed an unqualified opinion on those financial statements.
Basis for Opinion
The Company’s management is responsible for maintaining effective internal control over financial reporting and for its assessment of the effectiveness of internal control over financial reporting, included in the accompanying Management's Report on Internal Control Over Financial Reporting. Our responsibility is to express an opinion on the Company’s internal control over financial reporting based on our audit. We are a public accounting firm registered with the PCAOB and are required to be independent with respect to the Company in accordance with the U.S. federal securities laws and the applicable rules and regulations of the Securities and Exchange Commission and the PCAOB.
We conducted our audit in accordance with the standards of the PCAOB. Those standards require that we plan and perform the audit to obtain reasonable assurance about whether effective internal control over financial reporting was maintained in all material respects. Our audit included obtaining an understanding of internal control over financial reporting, assessing the risk that a material weakness exists, testing and evaluating the design and operating effectiveness of internal control based on the assessed risk, and performing such other procedures as we considered necessary in the circumstances. We believe that our audit provides a reasonable basis for our opinion.
Definition and Limitations of Internal Control over Financial Reporting
A company’s internal control over financial reporting is a process designed to provide reasonable assurance regarding the reliability of financial reporting and the preparation of financial statements for external purposes in accordance with generally accepted accounting principles. A company’s internal control over financial reporting includes those policies and procedures that (1) pertain to the maintenance of records that, in reasonable detail, accurately and fairly reflect the transactions and dispositions of the assets of the company; (2) provide reasonable assurance that transactions are recorded as necessary to permit preparation of financial statements in accordance with generally accepted accounting principles, and that receipts and expenditures of the company are being made only in accordance with authorizations of management and directors of the company; and (3) provide reasonable assurance regarding prevention or timely detection of unauthorized acquisition, use, or disposition of the company’s assets that could have a material effect on the financial statements.
Because of its inherent limitations, internal control over financial reporting may not prevent or detect misstatements. Also, projections of any evaluation of effectiveness to future periods are subject to the risk that controls may become inadequate because of changes in conditions, or that the degree of compliance with the policies or procedures may deteriorate.
/s/ Deloitte & Touche LLP
Minneapolis, Minnesota
March 19, 2025
Consolidated Balance Sheets
$ in millions, except per share amounts
|
|
|
|
|
|
|
|
|
February 1, 2025 |
|
February 3, 2024 |
||||
Assets |
|
|
|
|
|
|
|
Current assets |
|
|
|
|
|
|
|
Cash and cash equivalents |
$ |
1,578 |
|
|
$ |
1,447 |
|
Receivables, net |
|
1,044 |
|
|
|
939 |
|
Merchandise inventories |
|
5,085 |
|
|
|
4,958 |
|
Other current assets |
|
517 |
|
|
|
553 |
|
Total current assets |
|
8,224 |
|
|
|
7,897 |
|
Property and equipment |
|
|
|
|
|
|
|
Land and buildings |
|
722 |
|
|
|
702 |
|
Leasehold improvements |
|
2,370 |
|
|
|
2,275 |
|
Fixtures and equipment |
|
3,872 |
|
|
|
4,002 |
|
Property under finance leases |
|
88 |
|
|
|
97 |
|
Gross property and equipment |
|
7,052 |
|
|
|
7,076 |
|
Less accumulated depreciation |
|
4,930 |
|
|
|
4,816 |
|
Net property and equipment |
|
2,122 |
|
|
|
2,260 |
|
Operating lease assets |
|
2,833 |
|
|
|
2,758 |
|
Goodwill |
|
908 |
|
|
|
1,383 |
|
Other assets |
|
695 |
|
|
|
669 |
|
Total assets |
$ |
14,782 |
|
|
$ |
14,967 |
|
|
|
|
|
|
|
|
|
Liabilities and equity |
|
|
|
|
|
|
|
Current liabilities |
|
|
|
|
|
|
|
Accounts payable |
$ |
4,980 |
|
|
$ |
4,637 |
|
Unredeemed gift card liabilities |
|
253 |
|
|
|
253 |
|
Deferred revenue |
|
951 |
|
|
|
1,000 |
|
Accrued compensation and related expenses |
|
464 |
|
|
|
486 |
|
Accrued liabilities |
|
741 |
|
|
|
902 |
|
Current portion of operating lease liabilities |
|
617 |
|
|
|
618 |
|
Current portion of long-term debt |
|
10 |
|
|
|
13 |
|
Total current liabilities |
|
8,016 |
|
|
|
7,909 |
|
Long-term operating lease liabilities |
|
2,282 |
|
|
|
2,199 |
|
Long-term debt |
|
1,144 |
|
|
|
1,152 |
|
Long-term liabilities |
|
532 |
|
|
|
654 |
|
Contingencies and commitments (Note 12) |
|
|
|
|
|
|
|
Equity |
|
|
|
|
|
|
|
Best Buy Co., Inc. Shareholders' Equity |
|
|
|
|
|
|
|
Preferred stock, $1.00 par value: Authorized - 400,000 shares; Issued and outstanding - none |
|
- |
|
|
|
- |
|
Common stock, $0.10 par value: Authorized - 1.0 billion shares; Issued and outstanding - 211.4 million and 215.4 million shares, respectively |
|
22 |
|
|
|
22 |
|
Additional paid-in capital |
|
- |
|
|
|
31 |
|
Retained earnings |
|
2,486 |
|
|
|
2,683 |
|
Accumulated other comprehensive income |
|
300 |
|
|
|
317 |
|
Total equity |
|
2,808 |
|
|
|
3,053 |
|
Total liabilities and equity |
$ |
14,782 |
|
|
$ |
14,967 |
|
See Notes to Consolidated Financial Statements.
Consolidated Statements of Earnings
$ and shares in millions, except per share amounts
|
|
|
|
|
|
|
|
|
|
|
|
Fiscal Years Ended |
February 1, 2025 |
|
February 3, 2024 |
|
January 28, 2023 |
||||||
Revenue |
$ |
41,528 |
|
|
$ |
43,452 |
|
|
$ |
46,298 |
|
Cost of sales |
|
32,143 |
|
|
|
33,849 |
|
|
|
36,386 |
|
Gross profit |
|
9,385 |
|
|
|
9,603 |
|
|
|
9,912 |
|
Selling, general and administrative expenses |
|
7,651 |
|
|
|
7,876 |
|
|
|
7,970 |
|
Restructuring charges |
|
(3) |
|
|
|
153 |
|
|
|
147 |
|
Goodwill impairment |
|
475 |
|
|
|
- |
|
|
|
- |
|
Operating income |
|
1,262 |
|
|
|
1,574 |
|
|
|
1,795 |
|
Other income (expense): |
|
|
|
|
|
|
|
|
|
|
|
Gain on sale of subsidiary, net |
|
- |
|
|
|
21 |
|
|
|
- |
|
Investment income and other |
|
84 |
|
|
|
78 |
|
|
|
28 |
|
Interest expense |
|
(51) |
|
|
|
(52) |
|
|
|
(35) |
|
Earnings before income tax expense and equity in income of affiliates |
|
1,295 |
|
|
|
1,621 |
|
|
|
1,788 |
|
Income tax expense |
|
372 |
|
|
|
381 |
|
|
|
370 |
|
Equity in income of affiliates |
|
4 |
|
|
|
1 |
|
|
|
1 |
|
Net earnings |
$ |
927 |
|
|
$ |
1,241 |
|
|
$ |
1,419 |
|
|
|
|
|
|
|
|
|
|
|
|
|
Basic earnings per share |
$ |
4.31 |
|
|
$ |
5.70 |
|
|
$ |
6.31 |
|
Diluted earnings per share |
$ |
4.28 |
|
|
$ |
5.68 |
|
|
$ |
6.29 |
|
|
|
|
|
|
|
|
|
|
|
|
|
Weighted-average common shares outstanding: |
|
|
|
|
|
|
|
|
|
|
|
Basic |
|
215.2 |
|
|
|
217.7 |
|
|
|
224.8 |
|
Diluted |
|
216.6 |
|
|
|
218.5 |
|
|
|
225.7 |
|
See Notes to Consolidated Financial Statements.
Consolidated Statements of Comprehensive Income
$ in millions
|
|
|
|
|
|
|
|
|
|
|
|
Fiscal Years Ended |
February 1, 2025 |
|
February 3, 2024 |
|
January 28, 2023 |
||||||
Net earnings |
$ |
927 |
|
|
$ |
1,241 |
|
|
$ |
1,419 |
|
Foreign currency translation adjustments, net of tax |
|
(17) |
|
|
|
(5) |
|
|
|
(7) |
|
Comprehensive income |
$ |
910 |
|
|
$ |
1,236 |
|
|
$ |
1,412 |
|
See Notes to Consolidated Financial Statements.
Consolidated Statements of Cash Flows
$ in millions
|
|
|
|
|
|
|
|
|
|
|
|
Fiscal Years Ended |
February 1, 2025 |
|
February 3, 2024 |
|
January 28, 2023 |
||||||
Operating activities |
|
|
|
|
|
|
|
|
|
|
|
Net earnings |
$ |
927 |
|
|
$ |
1,241 |
|
|
$ |
1,419 |
|
Adjustments to reconcile net earnings to total cash provided by operating activities: |
|
|
|
|
|
|
|
|
|||
Depreciation and amortization |
|
866 |
|
|
|
923 |
|
|
|
918 |
|
Restructuring charges |
|
(3) |
|
|
|
153 |
|
|
|
147 |
|
Goodwill impairment |
|
475 |
|
|
|
- |
|
|
|
- |
|
Stock-based compensation |
|
139 |
|
|
|
145 |
|
|
|
138 |
|
Deferred income taxes |
|
(59) |
|
|
|
(214) |
|
|
|
51 |
|
Gain on sale of subsidiary, net |
|
- |
|
|
|
(21) |
|
|
|
- |
|
Other, net |
|
12 |
|
|
|
26 |
|
|
|
12 |
|
Changes in operating assets and liabilities: |
|
|
|
|
|
|
|
|
|
||
Receivables |
|
(111) |
|
|
|
204 |
|
|
|
(103) |
|
Merchandise inventories |
|
(155) |
|
|
|
178 |
|
|
|
809 |
|
Other assets |
|
11 |
|
|
|
(18) |
|
|
|
(21) |
|
Accounts payable |
|
358 |
|
|
|
(1,025) |
|
|
|
(1,099) |
|
Income taxes |
|
(212) |
|
|
|
52 |
|
|
|
36 |
|
Other liabilities |
|
(150) |
|
|
|
(174) |
|
|
|
(483) |
|
Total cash provided by operating activities |
|
2,098 |
|
|
|
1,470 |
|
|
|
1,824 |
|
|
|
|
|
|
|
|
|
|
|
|
|
Investing activities |
|
|
|
|
|
|
|
|
|
|
|
Additions to property and equipment |
|
(706) |
|
|
|
(795) |
|
|
|
(930) |
|
Purchases of investments |
|
(26) |
|
|
|
(9) |
|
|
|
(46) |
|
Net proceeds from sale of subsidiary |
|
- |
|
|
|
14 |
|
|
|
- |
|
Sales of investments |
|
20 |
|
|
|
7 |
|
|
|
7 |
|
Other, net |
|
8 |
|
|
|
2 |
|
|
|
7 |
|
Total cash used in investing activities |
|
(704) |
|
|
|
(781) |
|
|
|
(962) |
|
|
|
|
|
|
|
|
|
|
|
|
|
Financing activities |
|
|
|
|
|
|
|
|
|
|
|
Repurchase of common stock |
|
(500) |
|
|
|
(340) |
|
|
|
(1,014) |
|
Issuance of common stock |
|
17 |
|
|
|
19 |
|
|
|
16 |
|
Dividends paid |
|
(807) |
|
|
|
(801) |
|
|
|
(789) |
|
Repayments of debt |
|
(17) |
|
|
|
(19) |
|
|
|
(19) |
|
Other, net |
|
(2) |
|
|
|
(3) |
|
|
|
- |
|
Total cash used in financing activities |
|
(1,309) |
|
|
|
(1,144) |
|
|
|
(1,806) |
|
|
|
|
|
|
|
|
|
|
|
|
|
Effect of exchange rate changes on cash |
|
(10) |
|
|
|
(5) |
|
|
|
(8) |
|
Increase (decrease) in cash, cash equivalents and restricted cash |
|
75 |
|
|
|
(460) |
|
|
|
(952) |
|
Cash, cash equivalents and restricted cash at beginning of period |
|
1,793 |
|
|
|
2,253 |
|
|
|
3,205 |
|
Cash, cash equivalents and restricted cash at end of period |
$ |
1,868 |
|
|
$ |
1,793 |
|
|
$ |
2,253 |
|
|
|
|
|
|
|
|
|
|
|
|
|
Supplemental cash flow information |
|
|
|
|
|
|
|
|
|
|
|
Income taxes paid (includes payments for purchased tax credits of $267 million, $103 million and $2 million, respectively) |
$ |
643 |
|
|
$ |
543 |
|
|
$ |
283 |
|
Interest paid |
$ |
46 |
|
|
$ |
51 |
|
|
$ |
31 |
|
See Notes to Consolidated Financial Statements.
Consolidated Statements of Changes in Shareholders' Equity
$ and shares in millions, except per share amounts
|
|
|
|
|
|
|
|
|
|
|
|
|
|
|
|
|
|
|
|
|
|
|
|
|
Common |
|
Common |
|
Additional |
|
Retained |
|
Accumulated |
|
Total |
||||||||||||
Balances as of January 29, 2022 |
|
227.4 |
|
|
$ |
23 |
|
|
$ |
- |
|
|
$ |
2,668 |
|
|
$ |
329 |
|
|
$ |
3,020 |
|
Net earnings |
|
- |
|
|
|
- |
|
|
|
- |
|
|
|
1,419 |
|
|
|
- |
|
|
|
1,419 |
|
Other comprehensive loss: |
|
|
|
|
|
|
|
|
|
|
|
|
|
|
|
|
|
|
|
|
|
|
|
Foreign currency translation adjustments, net of tax |
- |
|
|
|
- |
|
|
|
- |
|
|
|
- |
|
|
|
(7) |
|
|
|
(7) |
|
|
Stock-based compensation |
|
- |
|
|
|
- |
|
|
|
138 |
|
|
|
- |
|
|
|
- |
|
|
|
138 |
|
Issuance of common stock |
|
2.5 |
|
|
|
- |
|
|
|
16 |
|
|
|
- |
|
|
|
- |
|
|
|
16 |
|
Common stock dividends, $3.52 per share |
|
- |
|
|
|
- |
|
|
|
14 |
|
|
|
(804) |
|
|
|
- |
|
|
|
(790) |
|
Repurchase of common stock |
|
(11.8) |
|
|
|
(1) |
|
|
|
(147) |
|
|
|
(853) |
|
|
|
- |
|
|
|
(1,001) |
|
Balances as of January 28, 2023 |
|
218.1 |
|
|
|
22 |
|
|
|
21 |
|
|
|
2,430 |
|
|
|
322 |
|
|
|
2,795 |
|
Net earnings |
|
- |
|
|
|
- |
|
|
|
- |
|
|
|
1,241 |
|
|
|
- |
|
|
|
1,241 |
|
Other comprehensive loss: |
|
|
|
|
|
|
|
|
|
|
|
|
|
|
|
|
|
|
|
|
|
|
|
Foreign currency translation adjustments, net of tax |
- |
|
|
|
- |
|
|
|
- |
|
|
|
- |
|
|
|
(5) |
|
|
|
(5) |
|
|
Stock-based compensation |
|
- |
|
|
|
- |
|
|
|
145 |
|
|
|
- |
|
|
|
- |
|
|
|
145 |
|
Issuance of common stock |
|
2.0 |
|
|
|
- |
|
|
|
19 |
|
|
|
- |
|
|
|
- |
|
|
|
19 |
|
Common stock dividends, $3.68 per share |
|
- |
|
|
|
- |
|
|
|
14 |
|
|
|
(816) |
|
|
|
- |
|
|
|
(802) |
|
Repurchase of common stock |
|
(4.7) |
|
|
|
- |
|
|
|
(168) |
|
|
|
(172) |
|
|
|
- |
|
|
|
(340) |
|
Balances as of February 3, 2024 |
|
215.4 |
|
|
|
22 |
|
|
|
31 |
|
|
|
2,683 |
|
|
|
317 |
|
|
|
3,053 |
|
Net earnings |
|
- |
|
|
|
- |
|
|
|
- |
|
|
|
927 |
|
|
|
- |
|
|
|
927 |
|
Other comprehensive loss: |
|
|
|
|
|
|
|
|
|
|
|
|
|
|
|
|
|
|
|
|
|
|
|
Foreign currency translation adjustments, net of tax |
- |
|
|
|
- |
|
|
|
- |
|
|
|
- |
|
|
|
(17) |
|
|
|
(17) |
|
|
Stock-based compensation |
|
- |
|
|
|
- |
|
|
|
139 |
|
|
|
- |
|
|
|
- |
|
|
|
139 |
|
Issuance of common stock |
|
1.8 |
|
|
|
- |
|
|
|
17 |
|
|
|
- |
|
|
|
- |
|
|
|
17 |
|
Common stock dividends, $3.76 per share |
|
- |
|
|
|
- |
|
|
|
17 |
|
|
|
(824) |
|
|
|
- |
|
|
|
(807) |
|
Repurchase of common stock |
|
(5.8) |
|
|
|
- |
|
|
|
(204) |
|
|
|
(300) |
|
|
|
- |
|
|
|
(504) |
|
Balances as of February 1, 2025 |
|
211.4 |
|
|
$ |
22 |
|
|
$ |
- |
|
|
$ |
2,486 |
|
|
$ |
300 |
|
|
$ |
2,808 |
|
See Notes to Consolidated Financial Statements.
Notes to Consolidated Financial Statements
1. Summary of Significant Accounting Policies
Unless the context otherwise requires, the terms “Best Buy,” “we,” “us”, “our” and the “company” in these Notes to Consolidated Financial Statements refer to Best Buy Co., Inc. and, as applicable, its consolidated subsidiaries.
Description of Business
We are driven by our purpose to enrich lives through technology and our vision to personalize and humanize technology solutions for every stage of life. We accomplish this by leveraging our combination of tech expertise and a human touch to meet our customers’ everyday needs, whether they come to us online, visit our stores or invite us into their homes. We have operations in the U.S. and Canada.
We have two reportable segments: Domestic and International. The Domestic segment is comprised of our operations in all states, districts and territories of the U.S. and our Best Buy Health business, and includes the brand names Best Buy, Best Buy Ads, Best Buy Business, Best Buy Essentials, Best Buy Health, Current Health, Geek Squad, Imagine That, Insignia, Lively, My Best Buy, My Best Buy Memberships, Pacific Kitchen and Home, TechLiquidators and Yardbird; and the domain names bestbuy.com, currenthealth.com, lively.com, techliquidators.com and yardbird.com. Our International segment is comprised of all operations in Canada under the brand names Best Buy, Best Buy Express, Best Buy Mobile, Geek Squad and TechLiquidators and the domain names bestbuy.ca and techliquidators.ca. Our Domestic and International segments generate revenue from the sale of products and services within six revenue categories: computing and mobile phones, consumer electronics, appliances, entertainment, services and other.
In fiscal 2024, we completed the sale of a Mexico subsidiary subsequent to our exit from operations in Mexico and recognized a $21 million gain within Gain on sale of subsidiary, net on our Consolidated Statements of Earnings.
Basis of Presentation
The consolidated financial statements include the accounts of Best Buy Co., Inc. and its consolidated subsidiaries. All intercompany balances and transactions are eliminated upon consolidation.
Use of Estimates in the Preparation of Financial Statements
The preparation of financial statements in conformity with accounting principles generally accepted in the U.S. ("GAAP") requires us to make estimates and assumptions. These estimates and assumptions affect the reported amounts in the consolidated financial statements, as well as the disclosure of contingent liabilities. Future results could be materially affected if actual results were to differ from these estimates and assumptions.
Fiscal Year
Our fiscal year ends on the Saturday nearest the end of January. Fiscal 2025, fiscal 2024 and fiscal 2023 ended on February 1, 2025, February 3, 2024, and January 28, 2023, respectively. Fiscal 2025 and fiscal 2023 each included 52 weeks. Fiscal 2024 included 53 weeks with the 53rd week occurring in the fiscal fourth quarter. Unless otherwise noted, references to years in these notes to consolidated financial statements relate to fiscal years, not calendar years.
Adopted Accounting Pronouncements
In the fourth quarter of fiscal 2025, we adopted Accounting Standards Update (“ASU”) 2023-07, Segment Reporting (Topic 280): Improvements to Reportable Segment Disclosures, issued by the Financial Accounting Standards Board (“FASB”). ASU 2023-07 enhances reportable segment disclosure requirements primarily through expanded disclosures around significant segment expenses. The amendments were applied retrospectively to all prior periods presented in these financial statements. See Note 13, Segment and Geographic Information, for the applicable new disclosures.
Unadopted Accounting Pronouncements
In December 2023, the FASB issued ASU 2023-09, Income Taxes (Topic 740): Improvements to Income Tax Disclosures, which requires disclosure of specific categories meeting a quantitative threshold within the income tax rate reconciliation, as well as disaggregation of income taxes paid by jurisdiction. This ASU, which can be applied either prospectively or retrospectively, is effective for annual periods beginning after December 15, 2024, with early adoption permitted. We are currently evaluating the impact of the ASU and expect to include updated income tax disclosures in our fiscal 2026 Form 10-K.
In November 2024, the FASB issued ASU 2024-03, Income Statement—Reporting Comprehensive Income—Expense Disaggregation Disclosures (Subtopic 220-40): Disaggregation of Income Statement Expenses, which requires disclosure of specific expense categories in the notes to financial statements. The amendments are effective for fiscal years beginning after December 15, 2026, and for interim periods within fiscal years beginning after December 15, 2027. We are currently evaluating the impact of the ASU and expect to include updated expense disclosures in our fiscal 2028 Form 10-K.
Segment Information
Our business is organized into two reportable segments: Domestic (which is comprised of all states, districts and territories of the U.S. and our Best Buy Health business) and International (which is comprised of all operations in Canada). Our Chief Operating Decision Maker (“CODM”) is our Chief Executive Officer. Our segments are primarily based on geographical area and reflect the way in which internally reported financial information is regularly reviewed by the CODM, who has ultimate responsibility for enterprise decisions, including determining resource allocation for, and monitoring the performance of, the consolidated enterprise, the Domestic segment and the International segment.
Cash, Cash Equivalents and Restricted Cash
Cash, cash equivalents and restricted cash reported on our Consolidated Balance Sheets are reconciled to the total shown on our Consolidated Statements of Cash Flows as follows ($ in millions):
|
|
|
|
|
|
|
|
|
|
|
|
|
February 1, 2025 |
|
February 3, 2024 |
|
January 28, 2023 |
||||||
Cash and cash equivalents |
$ |
1,578 |
|
|
$ |
1,447 |
|
|
$ |
1,874 |
|
Restricted cash included in Other current assets |
|
290 |
|
|
|
346 |
|
|
|
379 |
|
Total cash, cash equivalents and restricted cash |
$ |
1,868 |
|
|
$ |
1,793 |
|
|
$ |
2,253 |
|
Cash equivalents consist primarily of highly liquid investments with original maturities of three months or less.
Amounts included in restricted cash are primarily restricted to cover product protection plans provided under our membership offerings and self-insurance liabilities.
Receivables
Receivables consist primarily of amounts due from banks for vendors for various vendor funding programs, customer credit card and debit card transactions, and mobile phone network operators for device sales and commissions. Receivables are stated at their carrying values, net of a reserve for expected credit losses, which is primarily based on historical collection trends. Our allowances for uncollectible receivables were $26 million and $32 million as of February 1, 2025, and February 3, 2024, respectively. We had $48 million and $43 million of write-offs in fiscal 2025 and fiscal 2024, respectively.
Merchandise Inventories
Merchandise inventories are recorded at the lower of cost or net realizable value. The weighted-average method is used to determine the cost of inventory which includes costs of in-bound freight to move inventory into our distribution centers. Also included as a reduction to the cost of inventory are certain vendor allowances. Costs associated with storing and transporting merchandise inventories to our retail stores are expensed as incurred and included within Cost of sales on our Consolidated Statements of Earnings.
Our inventory valuation also reflects markdown adjustments for the excess of cost over the net recovery we expect to realize from the ultimate sale or other disposal of inventory and establish a new cost basis. No adjustment is recorded for inventory that we expect to return to our vendors for full credit. Subsequent changes in facts or circumstances do not result in the reversal of previously recorded markdown adjustments or an increase in the newly established cost basis.
Our inventory valuation reflects adjustments for physical inventory losses (resulting from, for example, theft). Physical inventory is maintained through a combination of full location counts and more regular cycle counts.
Property and Equipment
Property and equipment is initially recorded at cost. We depreciate property and equipment to its residual value using the straight-line method over the estimated useful lives of the assets. Leasehold improvements are depreciated over the shorter of their estimated useful lives or the period from the date the assets are placed in service to the end of the lease term, which includes optional renewal periods if they are reasonably certain. Accelerated depreciation methods are generally used for income tax purposes.
When property is retired or otherwise disposed of, the cost and accumulated depreciation are removed from our Consolidated Balance Sheets and any resulting gain or loss is reflected on our Consolidated Statements of Earnings.
Repairs and maintenance costs are expensed as incurred. Major renewals or replacements that substantially extend the useful life of an asset are capitalized at cost and depreciated over its remaining useful life.
Estimated useful lives by major asset category are as follows (in years):
|
|
Asset Category |
Useful Life |
Buildings |
5-35 |
Leasehold improvements |
5-10 |
Fixtures and equipment |
2-15 |
Capitalized software is included in Fixtures and equipment on our Consolidated Balance Sheets. Costs associated with the acquisition or development of software for internal use are capitalized at cost and amortized over the expected useful life of the software, generally from two years to five years. A subsequent addition, modification or upgrade to internal-use software is capitalized to the extent that it enhances the software's functionality. Software maintenance and training costs are expensed as incurred. The costs of developing software for sale to customers are expensed as incurred until technological feasibility is established, which generally leads to expensing substantially all costs.
Costs associated with implementing cloud-computing arrangements that are service contracts are capitalized using methodology similar to internal-use software, but are included in Other assets on our Consolidated Balance Sheets.
Impairment of Long-Lived Assets
Long-lived assets are evaluated for impairment whenever events or changes in circumstances indicate that the carrying value may not be recoverable. When evaluating long-lived assets with impairment indicators for potential impairment, we first compare the carrying value of the asset to its estimated undiscounted future cash flows. If the sum of the estimated undiscounted future cash flows is less than the carrying value of the asset, we calculate an impairment loss. The impairment loss calculation compares the carrying value of the asset to its estimated fair value, which is typically based on estimated discounted future cash flows. We recognize an impairment loss if the amount of the asset’s carrying value exceeds the asset’s estimated fair value.
We evaluate locations for triggering events on a quarterly basis. For store locations, our primary indicator that asset carrying values may not be recoverable is negative store operating income for the most recent 12-month period. We also monitor other factors when evaluating store locations for impairment, including significant changes in the manner of use or expected life of the assets, or significant changes in our business strategies.
When reviewing long-lived assets for impairment, we group long-lived assets with other assets and liabilities at the lowest level for which identifiable cash flows are largely independent of the cash flows of other assets and liabilities. For example, long-lived assets deployed at store locations are reviewed for impairment at either the individual store level or at the local market level. Such reviews involve comparing the net carrying value of all assets to the net cash flow projections for each store or market. In addition, we conduct separate impairment reviews at other levels as appropriate, for example, to evaluate the potential impairment of assets shared by several areas of operations, such as information technology systems.
Leases
The majority of our lease obligations are real estate operating leases used in our retail and distribution operations. Our finance leases are primarily equipment-related. For any lease with an initial term in excess of 12 months, the related lease assets and liabilities are recognized on our Consolidated Balance Sheets as either operating or finance leases at the inception of an agreement where it is determined that a lease exists. We have lease agreements that contain both lease and non-lease components. We have elected to account for these lease agreements with both lease and non-lease components as a single component for all classes of assets. Leases with an initial term of 12 months or less are not recorded on our Consolidated Balance Sheets; we recognize lease expense for these leases on a straight-line basis over the lease term.
Operating lease assets represent the right to use an underlying asset for the lease term and operating lease liabilities represent the obligation to make lease payments arising from the lease. These assets and liabilities are recognized based on the present value of future payments over the lease term at the commencement date. We estimate the incremental borrowing rate for each lease based on an evaluation of our credit ratings and the prevailing market rates for collateralized debt in a similar economic environment with similar payment terms and maturity dates commensurate with the terms of the lease. Our operating leases also typically require payment of real estate taxes, common area maintenance and insurance. These components comprise the majority of our variable lease cost and are excluded from the present value of our lease obligations. In instances where they are fixed, they are included due to our election to combine lease and non-lease components. Operating lease assets also include prepaid lease payments and initial direct costs and are reduced by lease incentives. We generally do not include options to extend or terminate a lease unless it is reasonably certain that the option will be exercised. Fixed payments may contain predetermined fixed rent escalations. We recognize the related rent expense on a straight-line basis from the commencement date to the end of the lease term.
Refer to Note 6, Leases, for additional information.
Goodwill and Intangible Assets
Goodwill
Goodwill is the excess of the purchase price over the fair value of identifiable net assets acquired in business combinations. We test goodwill for impairment annually in the fiscal fourth quarter or whenever events or circumstances indicate the carrying value may not be recoverable. We monitor the existence of potential impairment indicators throughout the fiscal year. We test for goodwill impairment at the reporting unit level. Reporting units are determined by identifying operating segments (or components thereof) that constitute businesses for which discrete financial information is available and is regularly reviewed by segment management. We have goodwill in two reporting units – Best Buy Domestic and Best Buy Health – with carrying values of $492 million and $416 million, respectively, as of February 1, 2025, and carrying values of $492 million and $891 million, respectively, as of February 3, 2024. In fiscal 2025, we recorded a goodwill impairment related to our Best Buy Health reporting unit.
Our impairment testing involves a comparison of the fair value of each reporting unit with its carrying value, including goodwill. Fair value reflects our estimate of the price a potential market participant would be willing to pay for the reporting unit in an arms-length transaction. We use a combination of discounted cash flow (“DCF”) analysis and market data, such as revenue multiples and quoted market prices, for observable comparable companies. DCF analysis requires detailed forecasts of cash flow drivers, such as revenue growth rates, margin rates and capital investments, and estimates of weighted-average cost of capital rates. If the fair value of a reporting unit exceeds its carrying value, we conclude that no goodwill impairment has occurred. If the carrying value of a reporting unit exceeds its fair value, we recognize an impairment loss in an amount equal to the excess, not to exceed the total amount of goodwill allocated to that reporting unit.
Intangible Assets
Our valuation of identifiable intangible assets acquired is based on information and assumptions available to us at the time of acquisition, using income and market approaches to determine fair value, as appropriate.
We amortize definite-lived intangible assets associated with acquisitions over the estimated useful lives of the assets. We review these assets for impairment whenever events or circumstances indicate that the carrying value may not be recoverable. We monitor the existence of potential impairment indicators throughout the fiscal year and recognize an impairment loss for any portion of the carrying value that is not recoverable. The goodwill impairment recorded in the fourth quarter of fiscal 2025 related to our Best Buy Health reporting unit was a triggering event to evaluate Best Buy Health intangible assets for impairment. No intangible asset impairments were identified.
We do not amortize indefinite-lived intangible assets, but test for impairment annually in the fiscal fourth quarter or whenever events or circumstances indicate that the carrying value may not be recoverable. We utilize the relief from royalty method to determine the fair value of our indefinite-lived intangible asset. If the carrying value exceeds its fair value, we recognize an impairment loss in an amount equal to the excess.
Refer to Note 3, Goodwill and Intangible Assets, for additional information.
Derivatives
Net Investment Hedges
We use foreign currency forward contracts to hedge against the effect of Canadian dollar exchange rate fluctuations on a portion of our net investment in our Canadian operations. The contracts have terms of up to 12 months. For a net investment hedge, we recognize changes in the fair value of the derivative as a component of foreign currency translation within other comprehensive income to offset a portion of the change in translated value of the net investment being hedged, until the investment is sold or liquidated. We limit recognition in net earnings of amounts previously recorded in other comprehensive income to circumstances such as complete or substantially complete liquidation of the net investment in the hedged foreign operation. We report the gains and losses, if any, related to the amount excluded from the assessment of hedge effectiveness on our Consolidated Statements of Earnings. Net cash flows related to our net investment hedges are presented within Investing activities on our Consolidated Statements of Cash Flows.
Fair Value Hedges
We utilize “receive fixed-rate, pay variable-rate” interest rate swaps to mitigate the effect of interest rate risk on our $500 million principal amount of notes due October 1, 2028 (“2028 Notes”). Our interest rate swap contracts are considered perfect hedges because the critical terms and notional amounts match those of our fixed-rate debt being hedged and are, therefore, accounted for as fair value hedges using the shortcut method. Under the shortcut method, we recognize the change in the fair value of the derivatives with an offsetting change to the carrying value of the debt. Accordingly, there is no net impact on our Consolidated Statements of Earnings from the fair value of the derivatives. Net cash flows related to our fair value hedges are presented within Operating activities on our Consolidated Statements of Cash Flows.
Derivatives Not Designated as Hedging Instruments
We use foreign currency forward contracts to manage the impact of fluctuations in foreign currency exchange rates relative to recognized receivable and payable balances denominated in non-functional currencies. The contracts generally have terms of up to 12 months. These derivative instruments are not designated in hedging relationships and, therefore, we record gains and losses on these contracts directly to our Consolidated Statements of Earnings. Net cash flows related to our derivatives not designated as hedging instruments are presented within Operating activities on our Consolidated Statements of Cash Flows.
Refer to Note 5, Derivative Instruments, for additional information.
Fair Value
Fair value is the price that would be received to sell an asset or paid to transfer a liability (an exit price) in the principal or most advantageous market for the asset or liability in an orderly transaction between market participants on the measurement date. To measure fair value, we use a three-tier valuation hierarchy based upon observable and non-observable inputs:
Level 1 — Unadjusted quoted prices that are available in active markets for identical assets or liabilities at the measurement date.
Level 2 — Significant other observable inputs available at the measurement date, other than quoted prices included in Level 1, either directly or indirectly, including:
• Quoted prices for similar assets or liabilities in active markets;
• Quoted prices for identical or similar assets or liabilities in non-active markets;
• Inputs other than quoted prices that are observable for the asset or liability; and
• Inputs that are derived principally from or corroborated by other observable market data.
Level 3 — Significant unobservable inputs that cannot be corroborated by observable market data and reflect the use of significant management judgment. These values are generally determined using pricing models for which the assumptions utilize management’s estimates of market participant assumptions.
The fair value hierarchy requires the use of observable market data when available. In instances where the inputs used to measure fair value fall into different levels of the fair value hierarchy, the fair value measurement has been determined based on the lowest level input that is significant to the fair value measurement in its entirety. Our assessment of the significance of a particular item to the fair value measurement in its entirety requires judgment, including the consideration of inputs specific to the asset or liability.
Fair value measurements are based on significant unobservable inputs (Level 3). Fixed asset fair values are primarily derived using a DCF analysis to estimate the present value of net cash flows that the asset or asset group was expected to generate. The key inputs to the DCF analysis generally include our forecasts of net cash generated from investment operations, as well as an appropriate discount rate.
Assets and liabilities that are measured at fair value on a nonrecurring basis relate primarily to our tangible fixed assets, goodwill and intangible assets, which are remeasured when the derived fair value is below carrying value on our Consolidated Balance Sheets. For these assets, we do not periodically adjust carrying value to fair value, except in the event of impairment. When we determine that impairment has occurred, the carrying value of the asset is reduced to fair value and the difference is typically recorded within Selling, general and administrative expenses (“SG&A”) or Restructuring charges on our Consolidated Statements of Earnings for non-restructuring and restructuring charges, respectively. In fiscal 2025, we recorded a goodwill impairment related to our Best Buy Health reporting unit within Goodwill impairment on our Consolidated Statements of Earnings.
Refer to Note 3, Goodwill and Intangible Assets, and Note 4, Fair Value Measurements, for additional information.
Insurance
We are self-insured for certain losses related to workers’ compensation, medical, general liability and auto claims; however, we obtain third-party excess insurance coverage to limit our exposure to certain claims. Some of these self-insured losses are managed through a wholly-owned insurance captive. Liabilities associated with these losses include estimates of both claims filed and losses incurred but not yet reported. We utilize valuations provided by qualified, independent third-party actuaries as well as internal resources with insurance and risk expertise. Our net self-insured liabilities included on our Consolidated Balance Sheets were as follows ($ in millions):
|
|
|
|
|
|
|
|
|
February 1, 2025 |
|
February 3, 2024 |
||||
Accrued compensation and related expenses |
$ |
23 |
|
|
$ |
41 |
|
Accrued liabilities |
|
65 |
|
|
|
70 |
|
Long-term liabilities |
|
69 |
|
|
|
57 |
|
Total |
$ |
157 |
|
|
$ |
168 |
|
Income Taxes
We account for income taxes using the asset and liability method. Under this method, deferred tax assets and liabilities are recognized for the estimated future tax consequences attributable to differences between the financial statement carrying amounts of existing assets and liabilities and their respective tax bases and operating loss and tax credit carry-forwards. We record a valuation allowance to reduce the carrying amounts of deferred tax assets if it is more likely than not that such assets will not be realized.
In determining our provision for income taxes, we use an annual effective income tax rate based on annual income, permanent differences between book and tax income and statutory income tax rates. The effective income tax rate also reflects our assessment of the ultimate outcome of tax audits. We adjust our annual effective income tax rate as additional information on outcomes or events becomes available. Discrete events, such as audit settlements or changes in tax laws, are recognized in the period in which they occur.
Our income tax returns are routinely examined by domestic and foreign tax authorities. At any one time, multiple tax years are subject to audit by the various taxing authorities. In evaluating the exposures associated with our various tax filing positions, we may record a liability for such exposures. A number of years may elapse before a particular matter, for which we have established a liability, is audited and fully resolved or clarified. We adjust our liability for unrecognized tax benefits and income tax provisions in the period in which an uncertain tax position is effectively settled, the statute of limitations expires for the relevant taxing authority to examine the tax position or when more information becomes available. We include our liability for unrecognized tax benefits, including accrued penalties and interest, in Long-term liabilities on our Consolidated Balance Sheets and in Income tax expense on our Consolidated Statements of Earnings.
Refer to Note 10, Income Taxes, for additional information.
Supply Chain Financing
We have a supply chain financing program with an independent financial institution, whereby some of our suppliers have the opportunity to receive accounts payable settlements early, at a discount, facilitated by the financial institution. Under this program, the financial institution agrees to terms with our suppliers, including amounts that are eligible for early payment, the timing of such payments and the discounts. The financial institution then pays the supplier based on the payment terms agreed to. Suppliers’ participation in this program is at their own option. The financial institution can vary discounts offered at their own discretion. Our rights and obligations to our suppliers – which are typically formalized in standardized agreements – are not affected by the existence of the program.
Our liability associated with the funded participation in the program, which is primarily included in Accounts payable on our Consolidated Balance Sheets, was as follows ($ in millions):
|
|
|
|
|
2025 |
||
Supply chain financing liability at beginning of period |
$ |
426 |
|
Invoices confirmed during the year |
|
4,048 |
|
Confirmed invoices paid during the year |
|
(4,076) |
|
Supply chain financing liability at end of period |
$ |
398 |
|
Accrued Liabilities
The major components of accrued liabilities are sales tax liabilities, advertising accruals, insurance liabilities, sales return reserves and customer deposits.
Long-Term Liabilities
The major components of long-term liabilities are deferred revenue from our private label and co-branded credit card arrangement and unrecognized tax benefits.
Foreign Currency
Foreign currency denominated assets and liabilities are translated into U.S. dollars using the exchange rates in effect at our Consolidated Balance Sheet dates. Results of operations and cash flows are translated using the average exchange rates throughout the periods. The effect of exchange rate fluctuations on the translation of assets and liabilities is included as a component of shareholders' equity in Accumulated other comprehensive income on our Consolidated Balance Sheets. Gains and losses from foreign currency transactions, which are included in SG&A on our Consolidated Statements of Earnings, have not been significant in any period presented.
Revenue Recognition
We generate substantially all of our revenue from contracts with customers from the sale of products and services, both as a principal and as an agent. Revenue is recognized when control of the promised goods or services is transferred to our customers, in an amount that reflects the consideration that we expect to receive in exchange for those goods or services. Our revenue excludes sales and usage-based taxes collected and is reported net of sales refunds, which includes an estimate of future returns and contract cancellations based on historical refund rates, with a corresponding reduction to cost of sales. We defer the revenue associated with any unsatisfied performance obligation until the obligation is satisfied, typically when control of a product is transferred to the customer or a service is completed.
Product Revenue
Product revenue is recognized when the customer takes physical control, either in our stores or at their home. Any fees charged to customers for delivery are recognized when delivery has been completed. We use delivery information to determine when to recognize revenue for delivered products and any related delivery fee revenue.
In most cases, we are the principal to product contracts as we have control of the physical products prior to transfer to the customer. Accordingly, revenue is recognized on a gross basis.
For certain sales, primarily activation-based software licenses and third-party stored-value cards, we are the sales agent providing access to the content and recognize commission revenue net of amounts due to third parties who fulfill the performance obligation. For these transactions, commission revenue is typically recorded once customers have taken possession of licenses or cards and can access their benefits.
Warranty obligations associated with the sale of our exclusive brands products are assurance-type warranties that are a guarantee of the product’s intended functionality and, therefore, do not represent a distinct performance obligation within the context of the contract.
Services - When we are the principal
We recognize revenue for services, such as delivery, installation, set-up, software troubleshooting, product repair and data services once the service is completed, as this is when the customer has the ability to direct the use of and obtain the benefits of the service or serviced product. Payment terms are typically at the point of sale, but may also occur upon completion of the service. Our service contracts are primarily with retail customers, merchandise vendors (for factory warranty repairs) and extended warranty underwriters.
For technical support membership contracts (for example, our My Best Buy Plus™ or My Best Buy Total™ memberships), we are responsible for providing support services to customers. These contracts have terms ranging from one month to one year and typically contain several performance obligations. Payment for the membership contracts is typically due at the start of the contract period. We have determined that our contracts do not include a significant financing component. For performance obligations provided over the term of the contract, we typically recognize revenue on a usage basis, an input method of measuring progress over the related contract term. This method involves the estimation of expected usage patterns, primarily derived from historical information, as this depicts when customers use the services and, accordingly, when delivery of the performance obligation occurs. There is judgment in, for example, estimating the relative standalone selling price for bundled performance obligations; the appropriate recognition methodology for each performance obligation; and, for those based on usage, the expected pattern of consumption across a large portfolio of customers. When insufficient reliable and relevant history is available to estimate usage, we generally recognize revenue ratably over the life of the contract until such history has accumulated.
Services - When we are the agent
On behalf of third-party underwriters, we sell various hardware protection plans to customers that provide extended warranty coverage on their device purchases. Such plans have terms ranging from one month to five years. Payment is due at the point of sale. Third-party underwriters assume the risk associated with the coverage and are primarily responsible for fulfillment. We record the net commissions (the amount charged to the customer less the premiums remitted to the underwriter) as revenue once the corresponding product revenue is recognized. In addition, in some cases we are eligible to receive profit-sharing payments, a form of variable consideration, which are dependent upon the financial performance of the underwriter’s protection plan portfolio. We do not share in any losses of the portfolio. We record any profit share as revenue once the uncertainty associated with the portfolio period, which is calendar-year based, is no longer constrained using the expected value method. This typically occurs during our fiscal fourth quarter, with payment of the profit share occurring in the subsequent fiscal year. Net commissions and profit-sharing revenue earned from the sale of extended warranties represented 0.9%, 0.8% and 0.9% of revenue in fiscal 2025, fiscal 2024 and fiscal 2023, respectively.
We earn commissions from mobile network carriers to sell service contracts on their platforms. Revenue is recognized upon sale of the contract and activation of the customer on the provider’s platform. The time between when we activate the service with the customer and when we receive payment from the content provider is generally 30 to 60 days, which is after control has passed. Activation commissions are subject to repayment to the carrier primarily in the event of customer cancellation for specified time periods after the sale. Commission revenue from mobile network carriers is reported net of expected cancellations, which we estimate based on historical cancellation rates.
Credit Card Revenue
We offer promotional financing and credit cards issued by third-party banks that manage and directly extend credit to our customers. Approximately 25% of Domestic segment revenue in fiscal 2025, fiscal 2024 and fiscal 2023 was transacted using one of our branded cards. We provide a license to our brand and marketing services, and we facilitate credit applications in our stores and online. The banks are the sole owners of the accounts receivable generated under the program and, accordingly, we do not hold any customer receivables related to these programs and act as an agent in the financing transactions with customers. We are eligible to receive a profit share from certain of our banking partners based on the annual performance of their corresponding portfolio. We receive profit-share payments quarterly based on forecasts of full-year performance shortly after the end of each program quarter. This is a form of variable consideration. We record such profit share as revenue over time using the most likely amount method, which reflects the amount earned each quarter when it is determined that the likelihood of a significant revenue reversal is not probable, which is typically quarterly. Profit-sharing revenue from our credit card arrangement approximated 1.1%, 1.4% and 1.4% of Domestic segment revenue in fiscal 2025, fiscal 2024 and fiscal 2023, respectively.
Best Buy Gift Cards
We sell Best Buy gift cards to our customers in our retail stores, online and through select third parties. Our gift cards do not expire. We recognize revenue from gift cards when the card is redeemed by the customer. We also recognize revenue for the portion of gift card values that is not expected to be redeemed (“breakage”). We estimate breakage based on historical patterns and other factors, such as laws and regulations applicable to each jurisdiction. We recognize breakage revenue using a method that is consistent with customer redemption patterns. Typically, over 90% of gift card redemptions (and therefore recognition of over 90% of gift card breakage revenue) occur within one year of issuance. There is judgment in assessing the level at which we group gift cards for analysis of breakage rates, redemption patterns and the ultimate value of gift cards which we do not expect to be redeemed.
Sales Incentives
We frequently offer sales incentives that entitle our customers to receive a gift card at the time of purchase or an instant savings coupon that can be redeemed towards a future purchase. For sales incentives issued to customers that are only earned in conjunction with the purchase of products or services, the sales incentives represent an option that is a material right and, accordingly, is a performance obligation in the contract. The revenue allocated to these sales incentives is deferred as a contract liability and is based on the cards that are projected to be redeemed. We recognize revenue for this performance obligation when it is redeemed by the customer or when it is not expected to be redeemed. There is judgment in determining the level at which we group incentives based on similar redemption patterns, future redemption patterns and the ultimate number of incentives that we do not expect to be redeemed.
We also issue coupons that are not earned in conjunction with a purchase of a product or service, typically as part of targeted marketing activities. This is not a performance obligation, but is recognized as a reduction of the transaction price when redeemed by the customer.
Customer Loyalty Programs
We have customer loyalty programs which allow members to earn points when using our private label and co-branded credit cards. Points earned enable members to receive a certificate that may be redeemed on future purchases. Certificate expirations are typically two months from the date of issuance. Our loyalty programs represent customer options that provide a material right and, accordingly, are performance obligations for each applicable contract. The relative standalone selling price of points earned by our loyalty program members is deferred and included in Deferred revenue on our Consolidated Balance Sheets based on the percentage of points that are projected to be redeemed. We recognize revenue for this performance obligation over time when a certificate is redeemed by the customer. There is inherent judgment in estimating the value of our customer loyalty programs as they are susceptible to factors outside of our influence, particularly customer redemption activity. However, we have significant experience in estimating the amount and timing of redemptions of certificates, based primarily on historical data.
Refer to Note 9, Revenue, and Note 13, Segment and Geographic Information, for additional information.
Cost of Sales and Selling, General and Administrative Expenses
Types of costs classified in each major expense category are as follows:
|
Cost of Sales |
Cost of products sold, including: |
Cash discounts on payments to merchandise vendors |
Costs associated with operating our distribution network, including payroll and benefit costs, occupancy costs and depreciation |
Customer shipping and handling expenses |
Freight expenses associated with moving merchandise inventories from our distribution centers to our retail stores |
Freight expenses associated with moving merchandise inventories from our vendors to our distribution centers |
Markdowns |
Physical inventory losses |
Vendor allowances that are not a reimbursement of specific, incremental and identifiable costs |
Cost of services provided, including: |
Cost of replacement parts and related freight expenses |
Payroll and benefit costs for services employees associated with providing the service |
|
Selling, General and Administrative Expenses |
Advertising costs |
Charitable contributions |
Depreciation and amortization related to retail, services and corporate assets |
Long-lived asset impairment charges |
Occupancy and maintenance costs of retail, services and corporate facilities |
Other administrative costs, such as supplies, travel and lodging |
Outside and outsourced service fees |
Payroll and benefit costs for retail and corporate employees, including termination benefits incurred as part of normal operations |
Tender costs, including bank charges and costs associated with credit and debit card interchange fees |
Vendor allowances that are a reimbursement of specific, incremental and identifiable costs |
Vendor Allowances
We receive funds from our merchandise vendors through a variety of programs and arrangements, primarily in the form of purchases-based or sales-based volumes and for product advertising and placement. We recognize vendor allowances based on purchases and sales as a reduction of cost of sales when the associated inventory is sold. Vendor allowances for advertising and placement are recognized as a reduction of cost of sales ratably over the corresponding performance period. Funds that are determined to be a reimbursement of specific, incremental and identifiable costs incurred to sell vendors’ products are recorded as an offset to the related expense within SG&A on our Consolidated Statements of Earnings when incurred.
Advertising Costs
Advertising costs, which are included in SG&A on our Consolidated Statements of Earnings, primarily consist of digital advertisements. Digital advertising costs are generally expensed as incurred, which is typically when customers either view or click through a digital ad. Other advertising costs are expensed the first time the advertisement runs, or as broadcast costs are incurred. Advertising costs were $846 million, $794 million and $864 million in fiscal 2025, fiscal 2024 and fiscal 2023, respectively.
Stock-Based Compensation
We recognize stock-based compensation expense for the fair value of our stock-based compensation awards, which is determined based on the closing market price of our stock at the date of grant for time-based share awards and Monte-Carlo simulation for market-based share awards. Compensation expense is recognized on a straight-line basis over the period in which services are required. Forfeitures are expensed as incurred or upon termination. Refer to Note 8, Shareholders’ Equity, for additional information.
Earnings per Share
We compute our basic earnings per share based on the weighted-average number of common shares outstanding, and our diluted earnings per share based on the weighted-average number of common shares outstanding adjusted by the number of additional shares that would have been outstanding had the potentially dilutive common shares been issued as calculated using the treasury stock method. Potentially dilutive securities include stock options and non-vested share awards. Non-vested market-based share awards and non-vested performance-based share awards, to the extent they exist, are included in the average diluted shares outstanding each period if established market or performance criteria have been met at the end of the respective periods. Refer to Note 8, Shareholders’ Equity, for additional information.
Comprehensive Income (Loss)
Comprehensive income (loss) is computed as net earnings plus or minus certain other items that are recorded directly to shareholders’ equity.
2. Restructuring
Restructuring charges were as follows ($ in millions):
|
|
|
|
|
|
|
|
|
|
|
|
|
|
|
|
|
|
|
|
|
|
|
2025 |
|
2024 |
|
2023 |
||||||
Fiscal 2024 Restructuring Initiative |
|
|
|
|
|
$ |
3 |
|
|
$ |
171 |
|
|
$ |
- |
|
Fiscal 2023 Resource Optimization Initiative |
|
|
|
|
|
|
(6) |
|
|
|
(18) |
|
|
|
145 |
|
Mexico Exit and Strategic Realignment |
|
|
|
|
|
|
- |
|
|
|
- |
|
|
|
2 |
|
Total |
|
|
|
|
|
$ |
(3) |
|
|
$ |
153 |
|
|
$ |
147 |
|
Fiscal 2024 Restructuring Initiative
During the fourth quarter of fiscal 2024, we commenced an enterprise-wide restructuring initiative intended to accomplish the following: (1) align field labor resources with where customers want to shop to optimize the customer experience; (2) redirect corporate resources for better alignment with our strategy; and (3) right-size resources to better align with our revenue outlook for fiscal 2025. We do not expect to incur material future restructuring charges related to this initiative.
All charges incurred related to this initiative were comprised of employee termination benefits from continuing operations and were presented within Restructuring charges on our Consolidated Statements of Earnings as follows ($ in millions):
|
|
|
|
|
|
|
|
|
|
|
|
|
|
|
|
|
|
|
|
|
|
|
2025 |
|
2024 |
|
Cumulative Amount as of |
||||||
Domestic |
|
|
|
|
|
$ |
3 |
|
|
$ |
163 |
|
|
$ |
166 |
|
International |
|
|
|
|
|
|
- |
|
|
|
8 |
|
|
|
8 |
|
Total |
|
|
|
|
|
$ |
3 |
|
|
$ |
171 |
|
|
$ |
174 |
|
Restructuring accrual activity related to this initiative was as follows ($ in millions):
|
|
|
|
|
|
|
|
|
|
|
|
|
|
|
|
|
|
|
|
|
|
|
Domestic |
|
International |
|
Total |
||||||
Balances as of January 28, 2023 |
|
|
|
|
|
$ |
- |
|
|
$ |
- |
|
|
$ |
- |
|
Charges |
|
|
|
|
|
|
163 |
|
|
|
8 |
|
|
|
171 |
|
Balances as of February 3, 2024 |
|
|
|
|
|
|
163 |
|
|
|
8 |
|
|
|
171 |
|
Charges |
|
|
|
|
|
|
18 |
|
|
|
2 |
|
|
|
20 |
|
Cash payments |
|
|
|
|
|
|
(86) |
|
|
|
(3) |
|
|
|
(89) |
|
Adjustments(1) |
|
|
|
|
|
|
(15) |
|
|
|
(2) |
|
|
|
(17) |
|
Balances as of February 1, 2025 |
|
|
|
|
|
$ |
80 |
|
|
$ |
5 |
|
|
$ |
85 |
|
(1)Represents adjustments to previously planned organizational changes and higher-than-expected employee retention.
Fiscal 2023 Resource Optimization Initiative
During the second quarter of fiscal 2023, we commenced an enterprise-wide initiative to better align our spending with critical strategies and operations, as well as to optimize our cost structure. We do not expect to incur material future restructuring charges related to this initiative.
All charges incurred related to this initiative were comprised of employee termination benefits from continuing operations and were presented within Restructuring charges on our Consolidated Statements of Earnings as follows ($ in millions):
|
|
|
|
|
|
|
|
|
|
|
|
|
|
|
|
|
|
|
2025 |
|
2024 |
|
2023 |
|
Cumulative Amount as of |
||||||||
Domestic |
|
$ |
(6) |
|
|
$ |
(16) |
|
|
$ |
140 |
|
|
$ |
118 |
|
International |
|
|
- |
|
|
|
(2) |
|
|
|
5 |
|
|
|
3 |
|
Total |
|
$ |
(6) |
|
|
$ |
(18) |
|
|
$ |
145 |
|
|
$ |
121 |
|
Restructuring accrual activity related to this initiative was as follows ($ in millions):
|
|
|
|
|
|
|
|
|
|
|
|
|
|
|
|
|
|
|
|
|
|
|
Domestic |
|
International |
|
Total |
||||||
Balances as of January 28, 2023 |
|
|
|
|
|
|
102 |
|
|
|
5 |
|
|
|
107 |
|
Cash payments |
|
|
|
|
|
|
(70) |
|
|
|
(3) |
|
|
|
(73) |
|
Adjustments(1) |
|
|
|
|
|
|
(16) |
|
|
|
(2) |
|
|
|
(18) |
|
Balances as of February 3, 2024 |
|
|
|
|
|
$ |
16 |
|
|
$ |
- |
|
|
$ |
16 |
|
(1)Represents adjustments primarily related to higher-than-expected employee retention from previously planned organizational changes.
No material restructuring accrual activity occurred in fiscal 2025 related to this initiative, and no material liability remains as of February 1, 2025.
3. Goodwill and Intangible Assets
Goodwill
Goodwill balances by segment were as follows ($ in millions):
|
|
|
|
|
|
|
|
|
|
|
|
|
|
|
|
|
February 1, 2025 |
|
February 3, 2024 |
||||||||||||
|
Gross Carrying Amount |
|
Cumulative Impairment |
|
Gross Carrying Amount |
|
Cumulative Impairment |
||||||||
Domestic |
$ |
1,450 |
|
|
$ |
(542) |
|
|
$ |
1,450 |
|
|
$ |
(67) |
|
International |
|
608 |
|
|
|
(608) |
|
|
|
608 |
|
|
|
(608) |
|
Total |
$ |
2,058 |
|
|
$ |
(1,150) |
|
|
$ |
2,058 |
|
|
$ |
(675) |
|
In fiscal 2025, we recorded a goodwill impairment of $475 million within the Domestic segment for the Best Buy Health reporting unit. The impairment was identified during the fourth quarter as a result of our annual impairment review. This coincides with our annual review of performance against financial and strategic goals, and the annual update of our budget and long-range financial projections. Fair value for the Best Buy Health reporting unit is estimated primarily based on DCF analysis. The impairment primarily arose from downward revisions of our revenue growth rates and margin rates compared to projections used in prior years, as the market has not scaled as we originally forecasted.
Indefinite-Lived Intangible Assets
In the second quarter of fiscal 2025, we reclassified our Yardbird tradename from a definite-lived intangible asset to an indefinite-lived intangible asset to better reflect our expectations of the long-term use of the tradename. The carrying value of the tradename was $16 million as of February 1, 2025, and was recorded within Other assets on our Consolidated Balance Sheets.
Definite-Lived Intangible Assets
We have definite-lived intangible assets which are recorded within Other assets on our Consolidated Balance Sheets as follows ($ in millions):
|
|
|
|
|
|
|
|
|
|
|
|
|
|
|
|
|
|
|
|
|
February 1, 2025 |
|
February 3, 2024 |
|
Weighted-Average |
||||||||||||||
|
Gross Carrying Amount |
|
Accumulated Amortization |
|
Gross Carrying Amount |
|
Accumulated Amortization |
|
Useful Life Remaining as of February 1, 2025 (in years) |
||||||||||
Customer relationships |
$ |
360 |
|
|
$ |
285 |
|
|
$ |
360 |
|
|
$ |
276 |
|
|
|
7.6 |
|
Tradenames |
|
92 |
|
|
|
79 |
|
|
|
108 |
|
|
|
69 |
|
|
|
1.7 |
|
Developed technology |
|
64 |
|
|
|
61 |
|
|
|
64 |
|
|
|
59 |
|
|
|
2.8 |
|
Total |
$ |
516 |
|
|
$ |
425 |
|
|
$ |
532 |
|
|
$ |
404 |
|
|
|
6.6 |
|
Amortization expense was as follows ($ in millions):
|
|
|
|
|
|
|
|
|
|
|
|
|
|
|
Statement of Earnings Location |
2025 |
|
2024 |
|
2023 |
|||||||
Amortization expense |
SG&A |
|
$ |
21 |
|
|
$ |
61 |
|
|
$ |
86 |
|
Amortization expense expected to be recognized in future periods is as follows ($ in millions):
|
|
|
|
|
|
|
|
|
|
|
|
|
|
|
|
Fiscal Year |
|
|
|
|
|
|
|
|
|
|
|
|
|
Amount |
|
Fiscal 2026 |
|
|
|
|
|
|
|
|
|
|
|
|
$ |
20 |
|
Fiscal 2027 |
|
|
|
|
|
|
|
|
|
|
|
|
|
18 |
|
Fiscal 2028 |
|
|
|
|
|
|
|
|
|
|
|
|
|
12 |
|
Fiscal 2029 |
|
|
|
|
|
|
|
|
|
|
|
|
|
10 |
|
Fiscal 2030 |
|
|
|
|
|
|
|
|
|
|
|
|
|
8 |
|
Thereafter |
|
|
|
|
|
|
|
|
|
|
|
|
|
23 |
|
|
|
|
|
|
|
|
|
|
|
|
|
|
|
|
|
4. Fair Value Measurements
Fair value measurements are reported in one of three levels based on the lowest level of significant input used: Level 1 (unadjusted quoted prices in active markets); Level 2 (observable market inputs, other than quoted prices included in Level 1); and Level 3 (unobservable inputs that cannot be corroborated by observable market data).
Recurring Fair Value Measurements
Financial assets and liabilities accounted for at fair value were as follows ($ in millions):
|
|
|
|
|
|
|
|
|
|
|
|
|
|
|
|
|
Fair Value |
|
Fair Value at |
||||||
Assets |
|
Balance Sheet Location(1) |
|
Hierarchy |
|
February 1, 2025 |
|
February 3, 2024 |
||||
Money market funds(2) |
|
Cash and cash equivalents |
|
Level 1 |
|
$ |
439 |
|
|
$ |
330 |
|
Time deposits(3) |
|
Cash and cash equivalents |
|
Level 2 |
|
|
150 |
|
|
|
60 |
|
Money market funds(2) |
|
Other current assets |
|
Level 1 |
|
|
140 |
|
|
|
182 |
|
Time deposits(3) |
|
Other current assets |
|
Level 2 |
|
|
50 |
|
|
|
50 |
|
Marketable securities that fund deferred compensation(4) |
|
Other assets |
|
Level 1 |
|
|
39 |
|
|
|
48 |
|
Liabilities |
|
|
|
|
|
|
|
|
|
|
|
|
Interest rate swap derivative instruments(5) |
|
Long-term liabilities |
|
Level 2 |
|
|
14 |
|
|
|
11 |
|
(1)Balance sheet location is determined by the length to maturity at date of purchase and whether the assets are restricted for particular use.
(2)Valued at quoted market prices in active markets at period end.
(3)Valued at face value plus accrued interest at period end, which approximates fair value.
(4)Valued using the performance of mutual funds that trade with sufficient frequency and volume to obtain pricing information on an ongoing basis.
(5)Valued using readily observable market inputs. These instruments are custom, over-the-counter contracts with various bank counterparties that are not traded on an active market. See Note 5, Derivative Instruments, for additional information.
Nonrecurring Fair Value Measurements
In fiscal 2025, we recorded a goodwill impairment related to our Best Buy Health reporting unit. Refer to Note 3, Goodwill and Intangible Assets, for additional information.
Fair Value of Financial Instruments
The fair values of cash, certain restricted cash, receivables, accounts payable and other payables approximated their carrying values because of the short-term nature of these instruments. If these instruments were measured at fair value in the financial statements, they would be classified as Level 1 in the fair value hierarchy. Fair values for other investments held at cost are not readily available, but we estimate that the carrying values for these investments approximate their fair values.
Long-term debt is presented at carrying value on our Consolidated Balance Sheets. If our long-term debt were recorded at fair value, it would be classified as Level 2 in the fair value hierarchy. Long-term debt balances were as follows ($ in millions):
|
|
|
|
|
|
|
|
|
|
|
|
|
|
|
|
|
February 1, 2025 |
|
February 3, 2024 |
||||||||||||
|
Fair Value |
|
Carrying Value |
|
Fair Value |
|
Carrying Value |
||||||||
Long-term debt(1) |
$ |
1,031 |
|
|
$ |
1,136 |
|
|
$ |
1,022 |
|
|
$ |
1,139 |
|
(1)Excludes debt discounts, issuance costs and finance lease obligations.
5. Derivative Instruments
We manage our economic and transaction exposure to certain risks by using foreign currency forward contracts to hedge against the effect of Canadian dollar exchange rate fluctuations on a portion of our net investment in our Canadian operations and by using interest rate swaps to mitigate the effect of interest rate risk on our 2028 Notes. In addition, we use foreign currency forward contracts not designated as hedging instruments to manage the impact of fluctuations in foreign currency exchange rates relative to recognized receivable and payable balances denominated in non-functional currencies.
Our derivative instruments designated as net investment hedges and fair value hedges are recorded on our Consolidated Balance Sheets at fair value. See Note 4, Fair Value Measurements, for gross fair values of our outstanding derivative instruments and corresponding fair value classifications.
Notional amounts of our derivative instruments were as follows ($ in millions):
|
|
|
|
|
|
|
|
|
|
|
|
|
|
|
|
Contract Type |
February 1, 2025 |
|
February 3, 2024 |
||||
Derivatives designated as net investment hedges |
$ |
119 |
|
|
$ |
100 |
|
Derivatives designated as fair value hedges (interest rate swaps) |
|
500 |
|
|
|
500 |
|
No hedging designation (foreign exchange contracts) |
|
42 |
|
|
|
66 |
|
Total |
$ |
661 |
|
|
$ |
666 |
|
Effects of our fair value hedges on our Consolidated Statements of Earnings were as follows ($ in millions):
|
|
|
|
|
|
|
|
|
|
|
|
|
|
|
|
|
|
|
|
|
|
|
|
|
|
|
|
Gain (Loss) Recognized |
||||||||||
Contract Type |
Statement of Earnings Location |
2025 |
|
2024 |
|
2023 |
||||||
Interest rate swaps |
Interest expense |
$ |
(3) |
|
|
$ |
(4) |
|
|
$ |
(57) |
|
Adjustments to carrying value of long-term debt |
Interest expense |
|
3 |
|
|
|
4 |
|
|
|
57 |
|
Total |
|
$ |
- |
|
|
$ |
- |
|
|
$ |
- |
|
6. Leases
Supplemental balance sheet information related to our leases was as follows ($ in millions):
|
|
|
|
|
|
|
|
|
|
|
Balance Sheet Location |
|
February 1, 2025 |
|
February 3, 2024 |
||||
Assets |
|
|
|
|
|
|
|
|
|
Operating leases |
Operating lease assets |
|
$ |
2,833 |
|
|
$ |
2,758 |
|
Finance leases |
Property under finance leases, net(1) |
|
|
34 |
|
|
|
43 |
|
Total lease assets |
|
|
$ |
2,867 |
|
|
$ |
2,801 |
|
Liabilities |
|
|
|
|
|
|
|
|
|
Current: |
|
|
|
|
|
|
|
|
|
Operating leases |
Current portion of operating lease liabilities |
|
$ |
617 |
|
|
$ |
618 |
|
Finance leases |
Current portion of long-term debt |
|
|
10 |
|
|
|
13 |
|
Non-current: |
|
|
|
|
|
|
|
|
|
Operating leases |
Long-term operating lease liabilities |
|
|
2,282 |
|
|
|
2,199 |
|
Finance leases |
Long-term debt |
|
|
15 |
|
|
|
21 |
|
Total lease liabilities |
|
|
$ |
2,924 |
|
|
$ |
2,851 |
|
(1)Finance leases were recorded net of accumulated depreciation of $54 million and $54 million as of February 1, 2025 and February 3, 2024, respectively.
Costs and cash flow impacts associated with our finance leases were immaterial in the periods presented. Components of our total operating lease cost were as follows ($ in millions):
|
|
|
|
|
|
|
|
|
|
|
|
|
|
|
Statement of Earnings Location |
|
2025 |
|
2024 |
|
2023 |
||||||
Operating lease cost(1) |
Cost of sales and SG&A(2) |
|
$ |
784 |
|
|
$ |
777 |
|
|
$ |
780 |
|
Variable lease cost |
Cost of sales and SG&A(2) |
|
|
236 |
|
|
|
239 |
|
|
|
233 |
|
Sublease income |
SG&A |
|
|
(13) |
|
|
|
(11) |
|
|
|
(12) |
|
Total operating lease cost |
|
|
$ |
1,007 |
|
|
$ |
1,005 |
|
|
$ |
1,001 |
|
(1)Includes short-term leases, which are immaterial.
(2)Supply chain-related amounts are included in Cost of sales.
Other information related to our operating leases was as follows ($ in millions):
|
|
|
|
|
|
|
|
|
|
|
|
|
2025 |
|
2024 |
||||
Cash paid for amounts included in the measurement of lease liabilities: |
|
|
|
|
|
|
|
|
|
Operating cash flows |
|
$ |
781 |
|
|
$ |
772 |
|
|
Lease assets obtained in exchange for new lease liabilities |
|
$ |
771 |
|
|
$ |
717 |
|
|
Weighted average remaining lease term (in years) |
|
|
5.4 |
|
|
|
5.2 |
|
|
Weighted average discount rate |
|
|
4.1 |
% |
|
|
3.6 |
% |
|
Future lease payments under our non-cancellable operating leases as of February 1, 2025, were as follows ($ in millions):
|
|
|
|
|
|
|
|
|
|
|
|
|
Operating Leases(1) |
||
Fiscal 2026 |
|
|
|
|
$ |
723 |
|
Fiscal 2027 |
|
|
|
|
|
703 |
|
Fiscal 2028 |
|
|
|
|
|
574 |
|
Fiscal 2029 |
|
|
|
|
|
429 |
|
Fiscal 2030 |
|
|
|
|
|
312 |
|
Thereafter |
|
|
|
|
|
522 |
|
Total future undiscounted lease payments |
|
|
|
|
|
3,263 |
|
Less imputed interest |
|
|
|
|
|
364 |
|
Total reported lease liability |
|
|
|
|
$ |
2,899 |
|
(1)Lease payments exclude $19 million of legally binding fixed costs for leases signed but not yet commenced.
7. Debt
Short-Term Debt
U.S. Revolving Credit Facility
On April 12, 2023, we entered into a $1.25 billion five-year senior unsecured revolving credit facility agreement (the “Five-Year Facility Agreement”) with a syndicate of banks. The Five-Year Facility Agreement permits borrowings of up to $1.25 billion and expires in April 2028. There were no borrowings outstanding under the Five-Year Facility Agreement as of February 1, 2025, or February 3, 2024.
The interest rate under the Five-Year Facility Agreement is variable and, absent certain events of default, is determined at our option as: (i) the sum of (a) the greatest of (1) JPMorgan Chase Bank, N.A.’s prime rate, (2) the greater of the federal funds effective rate and the overnight bank funding rate plus, in each case, 0.5%, and (3) Adjusted Term Secured Overnight Financing Rate (the “Adjusted Term SOFR” as defined in the Five-Year Facility Agreement) for an interest period of one month plus 1%, and (b) a variable margin rate (the “ABR Margin”); or (ii) Adjusted Term SOFR for the applicable interest period plus a variable margin rate (the “Term SOFR Margin”). In addition, a facility fee is assessed on the commitment amount. The ABR Margin, Term SOFR Margin and the facility fee are based upon our current senior unsecured debt rating. Under the Five-Year Facility Agreement, the ABR Margin ranges from 0.00% to 0.100%, the Term SOFR Margin ranges from 0.680% to 1.100%, and the facility fee ranges from 0.070% to 0.150%.
The Five-Year Facility Agreement is guaranteed by certain of our subsidiaries and contains customary affirmative and negative covenants. Among other things, these covenants restrict our and certain of our subsidiaries’ abilities to incur liens on certain assets, make material changes in corporate structure or materially alter the nature of our business, dispose of material assets, engage in mergers, consolidations and certain other fundamental changes, or engage in certain transactions with affiliates.
The Five-Year Facility Agreement also contains a covenant that requires the registrant to maintain a maximum quarterly cash flow leverage ratio. The Five-Year Facility Agreement contains customary default provisions, including, but not limited to, failure to pay interest or principal when due and failure to comply with covenants.
Long-Term Debt
Long-term debt consisted of the following ($ in millions):
|
|
|
|
|
|
|
|
|
February 1, 2025 |
|
February 3, 2024 |
||||
2028 Notes |
$ |
500 |
|
|
$ |
500 |
|
2030 Notes |
|
650 |
|
|
|
650 |
|
Interest rate swap valuation adjustments |
|
(14) |
|
|
|
(11) |
|
Subtotal |
|
1,136 |
|
|
|
1,139 |
|
Debt discounts and issuance costs |
|
(7) |
|
|
|
(8) |
|
Finance lease obligations |
|
25 |
|
|
|
34 |
|
Total long-term debt |
|
1,154 |
|
|
|
1,165 |
|
Less current portion |
|
10 |
|
|
|
13 |
|
Total long-term debt, less current portion |
$ |
1,144 |
|
|
$ |
1,152 |
|
2028 Notes
In September 2018, we issued $500 million of principal amount of notes due October 1, 2028 (the “2028 Notes”). The 2028 Notes bear interest at a fixed rate of 4.45% per year, payable semi-annually on April 1 and October 1 of each year, beginning on April 1, 2019. Net proceeds from the issuance were $495 million after underwriting and issuance discounts totaling $5 million.
We may redeem some or all of the 2028 Notes at any time at a redemption price equal to the greater of (i) 100% of the principal amount, and (ii) the sum of the present values of each remaining scheduled payment of principal and interest discounted to the redemption date on a semiannual basis, plus accrued and unpaid interest on the principal amount to the redemption date as described in the indenture (including the supplemental indenture) relating to the 2028 Notes. Furthermore, if a change of control triggering event occurs, we will be required to offer to purchase the remaining unredeemed 2028 Notes at a price equal to 101% of their principal amount, plus accrued and unpaid interest to the purchase date. The 2028 Notes are unsecured and unsubordinated obligations and rank equally with all of our other unsecured and unsubordinated debt.
The 2028 Notes contain covenants that, among other things, limit our ability to incur debt secured by liens or to enter into sale and lease-back transactions.
2030 Notes
In October 2020, we issued $650 million of principal amount of notes due October 1, 2030, (the “2030 Notes”) that bear interest at a fixed rate of 1.95% per year, payable semi-annually on April 1 and October 1 of each year, beginning on April 1, 2021. Net proceeds from the issuance were $642 million after underwriting and issuance discounts totaling $8 million.
We may redeem some or all of the 2030 Notes at any time at a redemption price equal to the greater of (i) 100% of the principal amount, and (ii) the sum of the present values of each remaining scheduled payment of principal and interest discounted to the redemption date on a semiannual basis, plus accrued and unpaid interest on the principal amount to the redemption date as described in the indenture (including the supplemental indenture) relating to the 2030 Notes. Furthermore, if a change of control triggering event occurs, we will be required to offer to purchase the remaining unredeemed 2030 Notes at a price equal to 101% of their principal amount, plus accrued and unpaid interest to the purchase date.
The 2030 Notes are unsecured and unsubordinated obligations and rank equally with all of our other unsecured and unsubordinated debt. The 2030 Notes contain covenants that, among other things, limit our ability to incur debt secured by liens or to enter into sale and lease-back transactions.
Fair Value and Future Maturities
See Note 4, Fair Value Measurements, for the fair value of long-term debt. Other than the 2028 Notes, we do not have any future maturities of long-term debt within the next five fiscal years.
8. Shareholders’ Equity
Stock Compensation Plans
The Best Buy Co., Inc. 2020 Omnibus Incentive Plan (the “2020 Plan”) approved by shareholders in June 2020 authorizes us to issue up to 18.6 million shares plus the remaining unused shares available for issuance under the Best Buy Co., Inc. Amended and Restated 2014 Omnibus Incentive Plan (the “2014 Plan”). In addition, shares subject to any outstanding awards under our prior stock incentive plans that are forfeited, cancelled or reacquired by the company are available for reissuance under the 2020 Plan. The 2014 Plan was terminated as to the grant of any additional awards, but prior awards remain outstanding and continue to vest in accordance with the original terms of such plan.
The 2020 Plan authorizes us to grant or issue non-qualified stock options, incentive stock options, stock appreciation rights, restricted stock, restricted stock units and other equity awards. We have not granted incentive stock options. Under the terms of the 2020 Plan, awards may be granted to our employees, officers, advisers, consultants and directors. Awards issued under the 2020 Plan vest as determined by the Compensation and Human Resources Committee of our Board of Directors (“Board”) at the time of grant. Dividend equivalents accrue on restricted stock and restricted stock units during the vesting period, are forfeitable prior to the vesting date and are settled in shares of our common stock at the vesting or distribution date. As of February 1, 2025, a total of 9.5 million shares were available for future grants under the 2020 Plan.
Stock-based compensation expense was as follows ($ in millions):
|
|
|
|
|
|
|
|
|
|
|
|
|
2025 |
|
2024 |
|
2023 |
||||||
Share awards: |
|
|
|
|
|
|
|
|
|
|
|
Time-based |
$ |
122 |
|
|
$ |
126 |
|
|
$ |
121 |
|
Market-based |
|
17 |
|
|
|
19 |
|
|
|
14 |
|
Stock options |
|
- |
|
|
|
- |
|
|
|
3 |
|
Stock-based compensation expense |
|
139 |
|
|
|
145 |
|
|
|
138 |
|
Income tax benefits |
|
25 |
|
|
|
27 |
|
|
|
27 |
|
Stock-based compensation expense, net of tax |
$ |
114 |
|
|
$ |
118 |
|
|
$ |
111 |
|
Time-Based Share Awards
Time-based share awards vest solely upon continued employment, generally 33% on each of the three annual anniversary dates following the grant date. Time-based share awards to directors vest one year from the date of grant. Information on our time-based share awards was as follows (shares in thousands):
|
|
|
|
|
|
|
Time-Based Share Awards |
Shares |
|
Weighted-Average Fair Value per Share |
|||
Outstanding as of February 3, 2024 |
3,266 |
|
|
$ |
85.71 |
|
Granted |
1,987 |
|
|
$ |
79.01 |
|
Vested and distributed |
(1,419) |
|
|
$ |
93.01 |
|
Forfeited |
(356) |
|
|
$ |
82.14 |
|
Outstanding as of February 1, 2025 |
3,478 |
|
|
$ |
79.43 |
|
Information regarding the vesting and distribution of time-based share awards was as follows ($ in millions):
|
|
|
|
|
|
|
|
|
|
|
|
Time-Based Share Awards |
2025 |
|
2024 |
|
2023 |
||||||
Fair value of awards vested and distributed |
$ |
113 |
|
|
$ |
114 |
|
|
$ |
159 |
|
Tax benefits realized for tax deductions related to vesting |
$ |
23 |
|
|
$ |
24 |
|
|
$ |
33 |
|
As of February 1, 2025, there was $133 million of unrecognized compensation expense related to non-vested time-based share awards that we expect to recognize over a weighted-average period of 1.8 years.
Market-Based Share Awards
Market-based share awards vest at the end of a three-year incentive period based upon our total shareholder return ("TSR") compared to the TSR of companies that comprise Standard & Poor's 500 Index. The number of shares of common stock that could be distributed at the end of the three-year TSR-incentive period may range from 0% to 150% of each share granted (“target”). Shares are granted at 100% of target. Information on our market-based share awards was as follows (shares in thousands):
|
|
|
|
|
|
|
Market-Based Share Awards |
Shares |
|
Weighted-Average Fair Value per Share |
|||
Outstanding as of February 3, 2024 |
579 |
|
|
$ |
106.38 |
|
Granted |
285 |
|
|
$ |
84.25 |
|
Adjustment for performance achievement |
(131) |
|
|
$ |
132.21 |
|
Forfeited |
(41) |
|
|
$ |
103.66 |
|
Outstanding as of February 1, 2025 |
692 |
|
|
$ |
92.95 |
|
Distributions of market-based share awards in fiscal 2025 and fiscal 2024 were not significant. Information regarding the vesting and distribution of market-based share awards in fiscal 2023 was as follows ($ in millions):
|
|
|
|
Market-Based Share Awards |
|
2023 |
|
Fair value of awards vested and distributed |
$ |
18 |
|
Tax benefits realized for tax deductions related to vesting |
$ |
2 |
|
As of February 1, 2025, there was $21 million of unrecognized compensation expense related to non-vested market-based share awards that we expect to recognize over a weighted-average period of 1.7 years.
Earnings per Share
Reconciliations of the numerators and denominators of basic and diluted earnings per share were as follows ($ and shares in millions, except per share amounts):
|
|
|
|
|
|
|
|
|
|
|
|
|
2025 |
|
2024 |
|
2023 |
||||||
Numerator |
|
|
|
|
|
|
|
|
|
|
|
Net earnings |
$ |
927 |
|
|
$ |
1,241 |
|
|
$ |
1,419 |
|
Denominator |
|
|
|
|
|
|
|
|
|
|
|
Weighted-average common shares outstanding |
|
215.2 |
|
|
|
217.7 |
|
|
|
224.8 |
|
Dilutive effect of stock compensation plan awards |
|
1.4 |
|
|
|
0.8 |
|
|
|
0.9 |
|
Weighted-average common shares outstanding, assuming dilution |
|
216.6 |
|
|
|
218.5 |
|
|
|
225.7 |
|
|
|
|
|
|
|
|
|
|
|
|
|
Potential shares which were anti-dilutive and excluded from weighted-average share computations |
|
- |
|
|
|
- |
|
|
|
0.7 |
|
|
|
|
|
|
|
|
|
|
|
|
|
Basic earnings per share |
$ |
4.31 |
|
|
$ |
5.70 |
|
|
$ |
6.31 |
|
Diluted earnings per share |
$ |
4.28 |
|
|
$ |
5.68 |
|
|
$ |
6.29 |
|
Repurchase of Common Stock
On February 28, 2022, our Board approved a $5.0 billion share repurchase program. The program had $3.3 billion remaining available for repurchases as of February 1, 2025. There is no expiration date governing the period over which we can repurchase shares under this authorization.
Information regarding the shares we repurchased and retired was as follows ($ and shares in millions, except per share amounts):
|
|
|
|
|
|
|
|
|
|
|
|
|
2025 |
|
2024 |
|
2023 |
||||||
Total cost of shares repurchased |
$ |
500 |
|
|
$ |
340 |
|
|
$ |
1,001 |
|
Average price per share |
$ |
86.42 |
|
|
$ |
72.52 |
|
|
$ |
84.78 |
|
Number of shares repurchased and retired |
|
5.8 |
|
|
|
4.7 |
|
|
|
11.8 |
|
9. Revenue
We generate substantially all of our revenue from contracts with customers from the sale of products and services. Contract balances primarily relate to unfulfilled membership benefits and services not yet completed, product merchandise not yet delivered to customers, unredeemed gift cards and deferred revenue from our private label and co-branded credit card arrangement. Contract balances were as follows ($ in millions):
|
|
|
|
|
|
|
|
|
February 1, 2025 |
|
February 3, 2024 |
||||
Receivables(1) |
$ |
504 |
|
|
$ |
512 |
|
Short-term contract liabilities included in: |
|
|
|
|
|
|
|
Unredeemed gift cards |
|
253 |
|
|
|
253 |
|
Deferred revenue |
|
951 |
|
|
|
1,000 |
|
Accrued liabilities |
|
50 |
|
|
|
53 |
|
Long-term contract liabilities included in: |
|
|
|
|
|
|
|
Long-term liabilities |
|
229 |
|
|
|
245 |
|
(1)Receivables are recorded net of allowances for expected credit losses of $20 million and $23 million as of February 1, 2025, and February 3, 2024, respectively.
During fiscal 2025 and fiscal 2024, $1.1 billion and $1.3 billion of revenue was recognized, respectively, that was included in the contract liabilities at the beginning of the respective periods.
Estimated revenue from our contract liability balances expected to be recognized in future periods if the performance of the contract is expected to have an initial duration of more than one year is as follows ($ in millions):
|
|
|
|
|
|
|
|
Fiscal Year |
|
|
|
|
|
Amount |
|
Fiscal 2026 |
|
|
|
|
$ |
32 |
|
Fiscal 2027 |
|
|
|
|
|
33 |
|
Fiscal 2028 |
|
|
|
|
|
29 |
|
Fiscal 2029 |
|
|
|
|
|
26 |
|
Fiscal 2030 |
|
|
|
|
|
26 |
|
Thereafter |
|
|
|
|
|
115 |
|
See Note 13, Segment and Geographic Information, for information on our revenue by segment and category.
10. Income Taxes
Reconciliations of the federal statutory income tax rate to income tax expense were as follows ($ in millions):
|
|
|
|
|
|
|
|
|
|
|
|
|
2025 |
|
2024 |
|
2023 |
||||||
Federal income tax at the statutory rate |
$ |
272 |
|
|
$ |
340 |
|
|
$ |
376 |
|
State income taxes, net of federal benefit |
|
52 |
|
|
|
57 |
|
|
|
63 |
|
Change in unrecognized tax benefits |
|
(5) |
|
|
|
(6) |
|
|
|
(45) |
|
Expense (benefit) from foreign operations |
|
3 |
|
|
|
(5) |
|
|
|
(2) |
|
Tax credits |
|
(23) |
|
|
|
(13) |
|
|
|
(8) |
|
Goodwill impairments (non-deductible) |
|
63 |
|
|
|
- |
|
|
|
- |
|
Other |
|
10 |
|
|
|
8 |
|
|
|
(14) |
|
Income tax expense |
$ |
372 |
|
|
$ |
381 |
|
|
$ |
370 |
|
Effective income tax rate |
|
28.7 |
% |
|
|
23.5 |
% |
|
|
20.7 |
% |
Earnings before income tax expense and equity in income of affiliates by jurisdiction were as follows ($ in millions):
|
|
|
|
|
|
|
|
|
|
|
|
|
2025 |
|
2024 |
|
2023 |
||||||
United States |
$ |
1,095 |
|
|
$ |
1,389 |
|
|
$ |
1,533 |
|
Foreign |
|
200 |
|
|
|
232 |
|
|
|
255 |
|
Earnings before income tax expense and equity in income of affiliates |
$ |
1,295 |
|
|
$ |
1,621 |
|
|
$ |
1,788 |
|
Income tax expense (benefit) was comprised of the following ($ in millions):
|
|
|
|
|
|
|
|
|
|
|
|
|
2025 |
|
2024 |
|
2023 |
||||||
Current: |
|
|
|
|
|
|
|
|
|
|
|
Federal |
$ |
341 |
|
|
$ |
452 |
|
|
$ |
213 |
|
State |
|
67 |
|
|
|
104 |
|
|
|
64 |
|
Foreign |
|
23 |
|
|
|
39 |
|
|
|
42 |
|
|
|
431 |
|
|
|
595 |
|
|
|
319 |
|
Deferred: |
|
|
|
|
|
|
|
|
|
|
|
Federal |
|
(55) |
|
|
|
(177) |
|
|
|
33 |
|
State |
|
(7) |
|
|
|
(37) |
|
|
|
19 |
|
Foreign |
|
3 |
|
|
|
- |
|
|
|
(1) |
|
|
|
(59) |
|
|
|
(214) |
|
|
|
51 |
|
Income tax expense |
$ |
372 |
|
|
$ |
381 |
|
|
$ |
370 |
|
Deferred taxes are the result of differences between the bases of assets and liabilities for financial reporting and income tax purposes. Deferred tax assets and liabilities were comprised of the following ($ in millions):
|
|
|
|
|
|
|
|
|
February 1, 2025 |
|
February 3, 2024 |
||||
Deferred revenue |
$ |
125 |
|
|
$ |
127 |
|
Compensation and benefits |
|
75 |
|
|
|
91 |
|
Stock-based compensation |
|
29 |
|
|
|
32 |
|
Other accrued expenses |
|
46 |
|
|
|
45 |
|
Operating lease liabilities |
|
758 |
|
|
|
730 |
|
Loss and credit carryforwards |
|
163 |
|
|
|
173 |
|
Property and equipment |
|
57 |
|
|
|
- |
|
Other |
|
48 |
|
|
|
42 |
|
Total deferred tax assets |
|
1,301 |
|
|
|
1,240 |
|
Valuation allowance |
|
(172) |
|
|
|
(175) |
|
Total deferred tax assets after valuation allowance |
|
1,129 |
|
|
|
1,065 |
|
|
|
|
|
|
|
|
|
Inventory |
|
(92) |
|
|
|
(45) |
|
Property and equipment |
|
- |
|
|
|
(49) |
|
Operating lease assets |
|
(734) |
|
|
|
(701) |
|
Goodwill and intangible assets |
|
(61) |
|
|
|
(81) |
|
Other |
|
(19) |
|
|
|
(22) |
|
Total deferred tax liabilities |
|
(906) |
|
|
|
(898) |
|
Net deferred tax assets |
$ |
223 |
|
|
$ |
167 |
|
Net deferred tax assets were included in Other assets on our Consolidated Balance Sheets as of February 1, 2025, and February 3, 2024.
As of February 1, 2025, we had deferred tax assets for net operating loss carryforwards from international operations of $112 million, of which $30 million will expire in various years through 2042 and the remaining amounts have no expiration; acquired U.S. federal net operating loss carryforwards of $3 million, of which $1 million will expire in various years between 2026 and 2029 and the remaining amounts have no expiration; U.S. federal foreign tax credit carryforwards of $29 million, which will expire between 2026 and 2035; state credit carryforwards of $1 million, which will expire between 2026 and 2029; state net operating loss carryforwards of $9 million, which will expire between 2026 and 2045; international credit carryforwards of $2 million, which have no expiration; and international capital loss carryforwards of $7 million, which have no expiration.
As of February 1, 2025, a valuation allowance of $172 million had been established, of which $29 million is against U.S. federal foreign tax credit carryforwards; $13 million is against international, federal and state capital loss carryforwards; $119 million is against international and state net operating loss carryforwards; $2 million is against international and state credit carryforwards; and $9 million is against other foreign deferred tax assets. The decrease in fiscal 2025 was primarily due to tax rate changes and releases relating to certain international net operating loss carryforwards, and expirations relating to U.S. federal foreign tax credit and state credit carryforwards. These decreases were partially offset by the set-up of additional valuation allowances against certain foreign deferred tax assets and state and international net operating loss carryforwards.
Reconciliations of changes in unrecognized tax benefits were as follows ($ in millions):
|
|
|
|
|
|
|
|
|
|
|
|
|
2025 |
|
2024 |
|
2023 |
||||||
Balances at beginning of period |
$ |
140 |
|
|
$ |
163 |
|
|
$ |
235 |
|
Gross increases related to prior period tax positions |
|
13 |
|
|
|
10 |
|
|
|
28 |
|
Gross decreases related to prior period tax positions(1) |
|
(10) |
|
|
|
(11) |
|
|
|
(75) |
|
Gross increases related to current period tax positions |
|
20 |
|
|
|
20 |
|
|
|
21 |
|
Settlements with taxing authorities |
|
1 |
|
|
|
(3) |
|
|
|
- |
|
Lapse of statute of limitations |
|
(19) |
|
|
|
(39) |
|
|
|
(46) |
|
Balances at end of period |
$ |
145 |
|
|
$ |
140 |
|
|
$ |
163 |
|
(1)Represents multi-jurisdiction, multi-year resolutions of certain discrete tax matters.
Unrecognized tax benefits of $116 million, $121 million and $141 million as of February 1, 2025, February 3, 2024, and January 28, 2023, respectively, would favorably impact our effective income tax rate if recognized.
We recognize interest and penalties (not included in the unrecognized tax benefits above), as well as interest received from favorable tax settlements, as components of income tax expense. Interest expense of $1 million, interest expense of $3 million and interest income of $6 million was recognized in fiscal 2025, fiscal 2024 and fiscal 2023, respectively. As of February 1, 2025, February 3, 2024, and January 28, 2023, we had accrued interest of $45 million, $43 million and $42 million, respectively.
We file a consolidated U.S. federal income tax return, as well as income tax returns in various states and foreign jurisdictions. With few exceptions, we are no longer subject to U.S. federal, state and local, or non-U.S. income tax examinations by taxing authorities for years before fiscal 2016.
Changes in state, federal and foreign tax laws may increase or decrease our tax contingencies. The timing of the resolution of income tax examinations and controversies is highly uncertain, and the amounts ultimately paid, if any, upon resolution of the issues raised by the taxing authorities may differ from the amounts accrued. It is reasonably possible that within the next twelve months we will receive additional assessments by various taxing authorities or reach resolutions of income tax examinations or controversies in one or more jurisdictions. These assessments, resolutions or law changes could result in changes to our gross unrecognized tax benefits. The actual amount of any changes could vary significantly depending on the ultimate timing and nature of any assessments, resolutions or law changes. An estimate of the amount or range of such changes cannot be made at this time.
11. Benefit Plans
We sponsor retirement savings plans for employees meeting certain eligibility requirements. Participants may choose from various investment options, including a fund comprised of our company stock. Participants can contribute up to 50% of their eligible compensation annually as defined by the plan document, subject to Internal Revenue Service limitations. After one year of service, we will match 100% of the participant’s eligible contributions that do not exceed 3% of compensation, plus 50% of eligible contributions that exceed 3% but do not exceed 5% of compensation. Employer contributions vest immediately. Total employer contributions were $71 million, $76 million and $77 million in fiscal 2025, fiscal 2024 and fiscal 2023, respectively.
We offer a non-qualified, unfunded deferred compensation plan for highly-compensated employees and members of our Board. Amounts contributed and deferred under the plan are invested in options offered under the plan and elected by the participants. The liability for compensation deferred under the plan was $20 million and $24 million as of February 1, 2025, and February 3, 2024, respectively, and is included in Long-term liabilities on our Consolidated Balance Sheets. See Note 4, Fair Value Measurements, for the fair value of assets held for deferred compensation.
12. Contingencies and Commitments
We are involved in a number of legal proceedings. Where appropriate, we have made accruals with respect to these matters, which are reflected on our Consolidated Financial Statements. However, there are cases where liability is not probable or the amount cannot be reasonably estimated and, therefore, accruals have not been made. We provide disclosure of matters where we believe it is reasonably possible the impact may be material to our Consolidated Financial Statements.
We had outstanding letters of credit totaling $71 million as of February 1, 2025.
13. Segment and Geographic Information
Segment and category revenue information was as follows ($ in millions):
|
|
|
|
|
|
|
|
|
|
|
|
|
2025 |
|
2024 |
|
2023 |
||||||
Domestic: |
|
|
|
|
|
|
|
|
|
|
|
Computing and Mobile Phones |
$ |
17,103 |
|
|
$ |
16,930 |
|
|
$ |
18,191 |
|
Consumer Electronics |
|
11,148 |
|
|
|
12,014 |
|
|
|
13,040 |
|
Appliances |
|
4,589 |
|
|
|
5,469 |
|
|
|
6,381 |
|
Entertainment |
|
2,641 |
|
|
|
3,063 |
|
|
|
2,786 |
|
Services |
|
2,456 |
|
|
|
2,357 |
|
|
|
2,149 |
|
Other |
|
301 |
|
|
|
264 |
|
|
|
247 |
|
Total Domestic revenue |
$ |
38,238 |
|
|
$ |
40,097 |
|
|
$ |
42,794 |
|
International: |
|
|
|
|
|
|
|
|
|
|
|
Computing and Mobile Phones |
$ |
1,578 |
|
|
$ |
1,552 |
|
|
$ |
1,575 |
|
Consumer Electronics |
|
917 |
|
|
|
955 |
|
|
|
1,054 |
|
Appliances |
|
321 |
|
|
|
335 |
|
|
|
355 |
|
Entertainment |
|
267 |
|
|
|
300 |
|
|
|
267 |
|
Services |
|
175 |
|
|
|
173 |
|
|
|
183 |
|
Other |
|
32 |
|
|
|
40 |
|
|
|
70 |
|
Total International revenue |
|
3,290 |
|
|
|
3,355 |
|
|
|
3,504 |
|
Total revenue |
$ |
41,528 |
|
|
$ |
43,452 |
|
|
$ |
46,298 |
|
Our CODM regularly reviews a range of financial and non-financial information to evaluate the performance of, and determine resource allocation for, the consolidated enterprise, the Domestic segment and the International segment. Adjusted operating income is the primary financial performance measure used by our CODM, which includes revenue and significant expenses – cost of sales and adjusted SG&A. Our CODM reviews adjusted operating income and its components via the annual budget and the ongoing monitoring of variances to budget, forecasts and prior periods.
Adjusted operating income by segment and the reconciliation to consolidated earnings before income tax expense and equity in income of affiliates were as follows ($ in millions):
|
|
|
|
|
|
|
|
|
|
|
|
|
2025 |
||||||||||
|
Domestic (1) |
|
International |
|
Total |
||||||
Revenue |
$ |
38,238 |
|
|
$ |
3,290 |
|
|
$ |
41,528 |
|
Cost of sales |
|
29,591 |
|
|
|
2,552 |
|
|
|
32,143 |
|
Adjusted SG&A (2) |
|
7,000 |
|
|
|
630 |
|
|
|
7,630 |
|
Adjusted operating income |
$ |
1,647 |
|
|
$ |
108 |
|
|
$ |
1,755 |
|
Restructuring charges |
|
|
|
|
|
|
|
|
|
(3) |
|
Goodwill impairment |
|
|
|
|
|
|
|
|
|
475 |
|
Intangible asset amortization |
|
|
|
|
|
|
|
|
|
21 |
|
Operating income |
|
|
|
|
|
|
|
|
|
1,262 |
|
Other income (expense): |
|
|
|
|
|
|
|
|
|
|
|
Investment income and other |
|
|
|
|
|
|
|
|
|
84 |
|
Interest expense |
|
|
|
|
|
|
|
|
|
(51) |
|
Earnings before income tax expense and equity in income of affiliates |
|
|
|
|
|
|
|
|
$ |
1,295 |
|
(1)Domestic segment adjusted operating income includes certain operations that are based in foreign tax jurisdictions and primarily relate to sourcing products into the U.S.
(2)Adjusted SG&A excludes amortization of definite-lived intangible assets associated with acquisitions.
|
|
|
|
|
|
|
|
|
|
|
|
|
2024 |
||||||||||
|
Domestic (1) |
|
International |
|
Total |
||||||
Revenue |
$ |
40,097 |
|
|
$ |
3,355 |
|
|
$ |
43,452 |
|
Cost of sales |
|
31,247 |
|
|
|
2,602 |
|
|
|
33,849 |
|
Adjusted SG&A (2) |
|
7,175 |
|
|
|
640 |
|
|
|
7,815 |
|
Adjusted operating income |
$ |
1,675 |
|
|
$ |
113 |
|
|
$ |
1,788 |
|
Restructuring charges |
|
|
|
|
|
|
|
|
|
153 |
|
Intangible asset amortization |
|
|
|
|
|
|
|
|
|
61 |
|
Operating income |
|
|
|
|
|
|
|
|
|
1,574 |
|
Other income (expense): |
|
|
|
|
|
|
|
|
|
|
|
Gain on sale of subsidiary, net |
|
|
|
|
|
|
|
|
|
21 |
|
Investment income and other |
|
|
|
|
|
|
|
|
|
78 |
|
Interest expense |
|
|
|
|
|
|
|
|
|
(52) |
|
Earnings before income tax expense and equity in income of affiliates |
|
|
|
|
|
|
|
|
$ |
1,621 |
|
(1)Domestic segment adjusted operating income includes certain operations that are based in foreign tax jurisdictions and primarily relate to sourcing products into the U.S.
(2)Adjusted SG&A excludes amortization of definite-lived intangible assets associated with acquisitions.
|
|
|
|
|
|
|
|
|
|
|
|
|
2023 |
||||||||||
|
Domestic (1) |
|
International |
|
Total |
||||||
Revenue |
$ |
42,794 |
|
|
$ |
3,504 |
|
|
$ |
46,298 |
|
Cost of sales |
|
33,688 |
|
|
|
2,698 |
|
|
|
36,386 |
|
Adjusted SG&A (2) |
|
7,246 |
|
|
|
638 |
|
|
|
7,884 |
|
Adjusted operating income |
$ |
1,860 |
|
|
$ |
168 |
|
|
$ |
2,028 |
|
Restructuring charges |
|
|
|
|
|
|
|
|
|
147 |
|
Intangible asset amortization |
|
|
|
|
|
|
|
|
|
86 |
|
Operating income |
|
|
|
|
|
|
|
|
|
1,795 |
|
Other income (expense): |
|
|
|
|
|
|
|
|
|
|
|
Investment income and other |
|
|
|
|
|
|
|
|
|
28 |
|
Interest expense |
|
|
|
|
|
|
|
|
|
(35) |
|
Earnings before income tax expense and equity in income of affiliates |
|
|
|
|
|
|
|
|
$ |
1,788 |
|
(1)Domestic segment adjusted operating income includes certain operations that are based in foreign tax jurisdictions and primarily relate to sourcing products into the U.S.
(2)Adjusted SG&A excludes amortization of definite-lived intangible assets associated with acquisitions.
Asset information by segment was as follows ($ in millions):
|
|
|
|
|
|
|
|
|
|
|
|
|
2025 |
|
2024 |
|
2023 |
||||||
Assets |
|
|
|
|
|
|
|
|
|
|
|
Domestic |
$ |
13,567 |
|
|
$ |
13,660 |
|
|
$ |
14,549 |
|
International |
|
1,215 |
|
|
|
1,307 |
|
|
|
1,254 |
|
Total assets |
$ |
14,782 |
|
|
$ |
14,967 |
|
|
$ |
15,803 |
|
Capital expenditures |
|
|
|
|
|
|
|
|
|
|
|
Domestic |
$ |
640 |
|
|
$ |
760 |
|
|
$ |
891 |
|
International |
|
66 |
|
|
|
35 |
|
|
|
39 |
|
Total capital expenditures |
$ |
706 |
|
|
$ |
795 |
|
|
$ |
930 |
|
Depreciation and amortization |
|
|
|
|
|
|
|
|
|
|
|
Domestic |
$ |
825 |
|
|
$ |
880 |
|
|
$ |
873 |
|
International |
|
41 |
|
|
|
43 |
|
|
|
45 |
|
Total depreciation and amortization |
$ |
866 |
|
|
$ |
923 |
|
|
$ |
918 |
|
Geographic information was as follows ($ in millions):
|
|
|
|
|
|
|
|
|
|
|
|
|
2025 |
|
2024 |
|
2023 |
||||||
Revenue from external customers |
|
|
|
|
|
|
|
|
|
|
|
U.S. |
$ |
38,238 |
|
|
$ |
40,097 |
|
|
$ |
42,794 |
|
Canada |
|
3,290 |
|
|
|
3,355 |
|
|
|
3,504 |
|
Total revenue from external customers |
$ |
41,528 |
|
|
$ |
43,452 |
|
|
$ |
46,298 |
|
Property and equipment, net |
|
|
|
|
|
|
|
|
|
|
|
U.S. |
$ |
2,002 |
|
|
$ |
2,157 |
|
|
$ |
2,243 |
|
Canada |
|
120 |
|
|
|
102 |
|
|
|
107 |
|
Other |
|
- |
|
|
|
1 |
|
|
|
2 |
|
Total property and equipment, net |
$ |
2,122 |
|
|
$ |
2,260 |
|
|
$ |
2,352 |
|
Item 9. Changes in and Disagreements With Accountants on Accounting and Financial Disclosure.
None.
Item 9A. Controls and Procedures.
Disclosure Controls and Procedures
We maintain disclosure controls and procedures that are designed to ensure that information required to be disclosed by us in the reports we file or submit under the Exchange Act is recorded, processed, summarized and reported within the time periods specified in the U.S. Securities and Exchange Commission’s (“SEC”) rules and forms, and that such information is accumulated and communicated to our management, including our Chief Executive Officer (principal executive officer) and Chief Financial Officer (principal financial officer), to allow timely decisions regarding required disclosure. We have established a Disclosure Committee, consisting of certain members of management, to assist in this evaluation. Our Disclosure Committee meets on a quarterly basis and more often if necessary.
Our management, including our Chief Executive Officer and Chief Financial Officer, evaluated the effectiveness of our disclosure controls and procedures (as defined in Rules 13a-15(e) and 15d-15(e) promulgated under the Exchange Act), as of February 1, 2025. Based on that evaluation, our Chief Executive Officer and Chief Financial Officer concluded that, as of February 1, 2025, our disclosure controls and procedures were effective.
Management's Report on Internal Control Over Financial Reporting
Management’s report on our internal control over financial reporting is included in Item 8, Financial Statements and Supplementary Data, of this Annual Report on Form 10-K.
Attestation Report of the Independent Registered Public Accounting Firm
The attestation report of Deloitte & Touche LLP, our independent registered public accounting firm, on the effectiveness of our internal control over financial reporting is included in Item 8, Financial Statements and Supplementary Data, of this Annual Report on Form 10-K.
Changes in Internal Control Over Financial Reporting
There were no changes in internal control over financial reporting during the fiscal fourth quarter ended February 1, 2025, that have materially affected, or are reasonably likely to materially affect, our internal control over financial reporting.
Item 9B. Other Information.
Rule 10b5-1 Plan Elections
Set forth below are developments regarding trading plan arrangements among our directors and officers (as defined in Rule 16a-1(f) of the Securities Exchange Act of 1934, as amended (the “Exchange Act”)) for the quarter ended February 1, 2025.
After the completion of his prior trading plan on December 11, 2024, Matthew Bilunas, the company’s Senior Executive Vice President of Enterprise Strategy and Chief Financial Officer, entered into a new trading plan intended to satisfy the affirmative defense conditions of Rule 10b5-1(c) under the Exchange Act. The new trading plan was entered into on December 19, 2024, and provides for the potential sale of up to 51,000 shares of our common stock through April 25, 2025.
Other Information
There was no information required to be disclosed in a Current Report on Form 8-K during the fourth quarter of the fiscal year covered by this Annual Report on Form 10-K that was not reported.
Item 9C. Disclosure Regarding Foreign Jurisdictions that Prevent Inspections.
Not applicable.
PART III
Item 10. Directors, Executive Officers and Corporate Governance.
The information required by this Item is incorporated by reference to the applicable information in the company’s Proxy Statement for the 2025 Regular Meeting of Shareholders (the “2025 Proxy Statement”), which is expected to be filed with the SEC on or before May 2, 2025.
Code of Ethics
We adopted a Code of Ethics that applies to our directors and all of our employees, including our principal executive officer, our principal financial officer and our principal accounting officer. Our Code of Ethics is available on our website at https://investors.bestbuy.com. A copy of our Code of Ethics may also be obtained, free of charge, upon written request to Best Buy Co., Inc. Investor Relations Department at 7601 Penn Avenue South, Richfield, MN 55423-3645.
We intend to satisfy the disclosure requirement under Item 5.05 of Form 8-K regarding an amendment to, or a waiver from, a provision of our Code of Ethics that applies to our principal executive officer, principal financial officer or principal accounting officer by posting such information within two business days of any such amendment or waiver on our website at https://investors.bestbuy.com.
Item 11. Executive Compensation.
The information required by this Item is incorporated by reference to the applicable information in the 2025 Proxy Statement.
Item 12. Security Ownership of Certain Beneficial Owners and Management and Related Stockholder Matters.
The information required by this Item is incorporated by reference to the applicable information in the 2025 Proxy Statement.
Item 13. Certain Relationships and Related Transactions, and Director Independence.
The information required by this Item is incorporated by reference to the applicable information in the 2025 Proxy Statement.
Item 14. Principal Accountant Fees and Services.
The information required by this Item related to our principal accountant, Deloitte & Touche LLP (PCAOB ID No. 34) is incorporated by reference to the applicable information in the 2025 Proxy Statement.
PART IV
Item 15. Exhibit and Financial Statement Schedules.
(a) The following documents are filed as part of this report:
1. Financial Statements:
All financial statements as set forth under Item 8 of this report.
2. Supplementary Financial Statement Schedules:
Certain schedules have been omitted because the required information is not present or is not present in amounts sufficient to require submission of the schedule, or because the information required is included in the Consolidated Financial Statements, including the notes thereto.
* Management contracts or compensatory plans or arrangements required to be filed as exhibits pursuant to Item 15(b) of Form 10-K. Pursuant to Item 601(b)(4)(iii) of Regulation S-K under the Securities Act of 1933, as amended, the registrant has not filed as exhibits to this Annual Report on Form 10-K certain instruments with respect to long-term debt under which the amount of securities authorized does not exceed 10% of the total assets of the registrant.
The registrant hereby agrees to furnish copies of all such instruments to the SEC upon request.
The agreements and other documents filed as exhibits to this report are not intended to provide factual information or other disclosure other than with respect to the terms of the agreements or other documents themselves, and you should not rely on them for that purpose. In particular, any representations and warranties made by us in these agreements or other documents were made solely within the specific context of the relevant agreement or document and may not describe the actual state of affairs as of the date they were made or at any other time.
Item 16. Form 10-K Summary.
None.
SIGNATURES
Pursuant to the requirements of Section 13 or 15(d) of the Securities Exchange Act of 1934, the registrant has duly caused this report to be signed on its behalf by the undersigned, thereunto duly authorized.
|
|
|
|
|
Best Buy Co., Inc. |
|
|
(Registrant) |
|
|
|
|
|
By: |
/s/ Corie Barry |
|
|
Corie Barry |
|
|
Chief Executive Officer |
Pursuant to the requirements of the Securities Exchange Act of 1934, this report has been signed below by the following persons on behalf of the registrant and in the capacities and on the dates indicated.
|
|
|
|
|
|
|
|
|
|
| ||||
|
|
|
|
|
Signature |
|
Title |
|
Date |
|
|
|
|
|
/s/ Corie Barry |
|
Chief Executive Officer |
|
March 19, 2025 |
Corie Barry |
|
(principal executive officer) |
|
|
|
|
|
|
|
/s/ Matthew Bilunas |
|
Senior Executive Vice President, Chief Financial Officer & Enterprise Strategy |
|
March 19, 2025 |
Matthew Bilunas |
|
(principal financial officer) |
|
|
|
|
|
|
|
/s/ Mathew R. Watson |
|
Senior Vice President, Controller and Chief Accounting Officer |
|
March 19, 2025 |
Mathew R. Watson |
|
(principal accounting officer) |
|
|
|
|
|
|
|
/s/ David W. Kenny |
|
Chairman |
|
March 19, 2025 |
David W. Kenny |
|
|
|
|
|
|
|
|
|
/s/ Lisa M. Caputo |
|
Director |
|
March 19, 2025 |
Lisa M. Caputo |
|
|
|
|
|
|
|
|
|
/s/ David C. Kimbell |
|
Director |
|
March 19, 2025 |
David C. Kimbell |
|
|
|
|
|
|
|
|
|
/s/ Mario J. Marte |
|
Director |
|
March 19, 2025 |
Mario J. Marte |
|
|
|
|
|
|
|
|
|
/s/ Karen A. McLoughlin |
|
Director |
|
March 19, 2025 |
Karen A. McLoughlin |
|
|
|
|
|
|
|
|
|
/s/ Claudia F. Munce |
|
Director |
|
March 19, 2025 |
Claudia F. Munce |
|
|
|
|
|
|
|
|
|
/s/ Richelle P. Parham |
|
Director |
|
March 19, 2025 |
Richelle P. Parham |
|
|
|
|
|
|
|
|
|
/s/ Steven E. Rendle |
|
Director |
|
March 19, 2025 |
Steven E. Rendle |
|
|
|
|
|
|
|
|
|
/s/ Sima D. Sistani |
|
Director |
|
March 19, 2025 |
Sima D. Sistani |
|
|
|
|
|
|
|
|
|
/s/ Melinda D. Whittington |
|
Director |
|
March 19, 2025 |
Melinda D. Whittington |
|
|
|
|
|
|
|
|
|
|
|
|
|
|
|
Exhibit 4.6
Description of the Registrant’s Securities
Registered Pursuant to Section 12 of the
Securities Exchange Act of 1934, as Amended
Our Common Stock, $.10 par value per share, is the only class of securities of Best Buy Co., Inc., a Minnesota corporation (the “Company”), registered pursuant to Section 12 of the Securities Exchange Act of 1934, as amended. The common stock is listed on the New York Stock Exchange under the symbol “BBY.”
The following description of the Company’s common stock is a summary and does not purport to be complete. It is subject to, and qualified in its entirety by, reference to the Company’s Amended and Restated Articles of Incorporation (the “Articles”) and Amended and Restated By-Laws (the “Bylaws”), each of which are incorporated by reference as exhibits to our Annual Reports on Form 10-K of which this Exhibit is a part, and the Minnesota Business Corporation Act (the “MBCA”). We encourage you to read the Articles, the Bylaws and the applicable provisions of the MBCA for additional information.
Authorized Shares of Capital Stock
We are authorized to issue 1,000,000,000 shares of common stock, par value $.10 per share. The outstanding shares of common stock are fully paid and nonassessable.
The transfer agent and registrar for our common stock is Broadridge Corporate Issuer Solutions, Inc.
We are also authorized to issue up to 400,000 shares of preferred stock, par value $1.00 per share. Our Articles provide that shares of preferred stock may be issued from time to time, in one or more series, with such designations, relative rights, preferences, limitations, dividend rights, redemption prices, liquidation prices, conversion rights, sinking or purchase fund rights or other privileges as our board of directors may establish, fix or determine. There are no issued and outstanding shares of preferred stock.
Voting Rights
Each share of common stock is entitled to one vote on all matters submitted to a vote of shareholders, including the election of directors. Cumulative voting of shares in the election of directors is prohibited. Subject to the rights, if any, of any holders of preferred stock, (i) except with respect to the election of directors, the shareholders shall take action at a meeting of shareholders by the affirmative vote of a majority of the voting power of the shares present and entitled to vote, except where a larger proportion is required by law, and (ii) each director shall be elected at a meeting of shareholders by the vote of a majority of the votes cast with respect to the director.
Dividend Rights
The holders of common stock may receive cash dividends if declared by the Board of Directors out of funds legally available for that purpose, subject to the rights of any holders of preferred shares and any other restrictions that may be applicable to the Company.
Rights upon Liquidation
Each share of common stock is entitled to participate pro rata in distributions upon liquidation, subject to the rights of holders of preferred shares.
Other Rights and Preferences
Holders of common stock have no preemptive or similar equity preservation rights. There are no redemption or sinking fund provisions applicable to the common stock. The rights, powers, preferences and privileges of holders of our common stock will be subject to those of the holders of any shares of our preferred stock that we may authorize and issue in the future. For example, issuance of preferred stock could result in a class of securities outstanding that will have preferences with respect to dividends and in liquidation over the common stock and could (upon conversion or otherwise) enjoy all of the rights appurtenant to common stock.
Anti-Takeover Effects of Our Articles and Bylaws and Certain Provisions of Minnesota Law
The following provisions of the Articles, Bylaws and the MBCA may be deemed to have an anti-takeover effect.
Requirements for Advance Notification of Director Nominations and Shareholder Proposals
The Bylaws establish advance notice procedures with respect to shareholder proposals and the nomination of candidates for election as directors and the proposal of any business not intended to be included in the Company’s proxy statement, other than nominations made by or at the direction of the board of directors or a committee of the board of directors. In order for any matter to be “properly brought” before a meeting, a shareholder must comply with advance notice requirements and provide us with certain information. Generally, to be timely, a shareholder’s notice must be received at our principal executive offices not less than 120 days nor more than 150 days prior to the anniversary of the immediately preceding annual meeting of shareholders. The Bylaws also specify requirements as to the form and content of a shareholder’s notice.
In addition to the director nomination provisions described above, the Bylaws contain a “proxy access” provision that provides that any shareholder or group of up to twenty shareholders who qualify as an eligible shareholder under the proxy access provisions of our Bylaws may nominate and include in our proxy materials director candidates constituting up to 20% of our board of directors or two directors, whichever is greater. In order for a shareholder or group of shareholders to be eligible under the proxy access provisions of our Bylaws to nominate a director, such shareholder or group of shareholders must, among other criteria, be eligible to vote at the Company’s annual meeting, have owned or together with other group shareholders owned 3% or more of the voting power of our issued and outstanding common stock continuously for at least three years and represent that such shares were acquired in the ordinary course of business and not with the intent to change or influence control of the Company and that each such person does not have such intent. In order to use the proxy access provisions of our Bylaws, shareholders and their nominees must satisfy all the eligibility and notice requirements specified in our Bylaws. A shareholder proposing to nominate a person for election to our board of directors through the proxy access provision must generally provide us with a notice requesting the inclusion of the director nominee in our proxy materials and other required information not less than 120 days nor more than 150 days prior to the first anniversary of the date on which our definitive proxy statement was released to shareholders in connection with the prior year’s annual meeting. The complete proxy access provision for director nominations are set forth in the Bylaws.
Additional Authorized Shares of Capital Stock. The additional shares of authorized common stock and preferred shares available for issuance under the Articles could be issued at such times, under such circumstances and with such terms and conditions as to impede a change in control.
Special Meetings of Shareholders; Shareholder Action by Unanimous Written Consent. Section 302A.433 of the MBCA and the Bylaws provide that special meetings of the Company’s shareholders may be called by the Company’s chief executive officer, chief financial officer, two or more directors, the chairman of the board of directors, or shareholders holding 10% or more of the voting shares of the Company, except that a special meeting called by shareholders for the purpose of considering any action to directly or indirectly facilitate or effect a business combination, including any action to change or otherwise affect the composition of the Company’s Board of Directors for that purpose, must be called by 25% or more of the voting shares of the Company. Section 302A.441 of the MBCA and the Bylaws also provide that action may be taken by shareholders without a meeting only by unanimous written consent.
Control Share Provision. Section 302A.671 of the MBCA applies, with certain exceptions, to any acquisition of the Company’s voting stock (from a person other than the Company and other than in connection with certain mergers and exchanges to which the Company is a party) resulting in the acquiring person owning 20% or more of the Company’s voting stock then outstanding. Section 302A.671 requires approval of any such acquisitions by both (i) the affirmative vote of the holders of a majority of the shares entitled to vote, including shares held by the acquiring person, and (ii) the affirmative vote of the holders of a majority of the shares entitled to vote, excluding all interested shares. In general, shares acquired in the absence of such approval are denied voting rights and are redeemable at their then fair market value by the Company within 30 days after the acquiring person has failed to give a timely information statement to the Company or the date the shareholders voted not to grant voting rights to the acquiring person’s shares.
Business Combination Provision. Section 302A.673 of the MBCA and the Articles generally prohibit the Company or any of its subsidiaries from entering into any merger, share exchange, sale of material assets or similar transaction with a beneficial owner of 10% or more of the voting power of the Company’s shares entitled to vote within four years following the date the person became a 10% shareholder, unless either the transaction or the person’s acquisition of shares is approved prior to the person becoming a 10% shareholder by a committee of disinterested members of the Board of Directors.
Takeover Offer; Fair Price. Under Section 302A.675 of the MBCA, an offeror may not acquire shares of a publicly held corporation within two years following the last purchase of shares pursuant to a takeover offer with respect to that class, including acquisitions made by purchase, exchange, merger, consolidation, partial or complete liquidation, redemption, reverse stock split, recapitalization, reorganization, or any other similar transaction, unless (i) the acquisition is approved by a committee of the board’s disinterested directors before the purchase of any shares by the offeror pursuant to the earlier takeover offer, or (ii) shareholders are afforded, at the time of the proposed acquisition, a reasonable opportunity to dispose of the shares to the offeror upon substantially equivalent terms as those provided in the earlier takeover offer.
Anti-Greenmail Provisions. Under Section 302A.553 of the MBCA and the Articles, we are prohibited from buying shares at an above-market price from a shareholder of 5% or more of the Company’s outstanding shares entitled to vote who has held the shares for less than two years unless (i) the purchase is approved by a majority of the voting power of the shares present and entitled to vote at a meeting of shareholders, except where a larger proportion is required by law, or (ii) all other holders of shares of the same class or series are given the opportunity to sell the same percentage of their shares on substantially as favorable terms.
Exhibit 19.1
BEST BUY CO., INC.
Securities Trading Policy
Summary:
This Policy outlines the Company’s (i) rules and guidelines for trading in Company Securities and securities of other companies while aware of Material Nonpublic Information regarding that company and (ii) for the handling of Material Nonpublic Information.
Policy Details:
Purpose:
This Policy helps ensure that Best Buy and its employees comply with federal, state and foreign securities laws and maintain the highest principles of business ethics. Unlawful “Insider Trading” occurs when a person aware of Material Nonpublic Information obtained through their employment or other involvement with a company purchases, sells or otherwise trades that company’s securities or provides that information to others outside the company. Insider Trading laws are designed to protect the investing public by ensuring that all investors have access to the same information when making investment decisions. Such laws also help facilitate stable and fair securities markets.
A. Responsibilities
Policy Owner
The Legal Department is responsible for administration of this Policy. All determinations and interpretations by the General Counsel shall be final.
Employees
|
· |
Employees are responsible for complying with this Policy. Employees are also responsible for ensuring compliance by their Family Members, as well as any entities under their control. |
|
· |
In all cases, each person subject to this Policy is responsible for determining whether they are aware of Material Nonpublic Information prior to trading in Company Securities. Any guidance provided by the Best Buy Legal Department, or another employee of Best Buy, does not constitute legal advice or insulate an individual from liability. |
Employees Subject to the Extended Closed Trading Period
Certain employees (e.g., Officers, directors and above in Finance, the Legal Department, Associate Vice Presidents and other persons designated by the General Counsel) and members of the Company’s board of directors, and their Family Members, are subject to, and need to be aware of, heightened trading restrictions during Extended Closed Trading Periods given their likelihood to be aware of Material Nonpublic Information, as set forth in further detail in Section F—“Reference/Definitions—Closed Trading Period” below.
B. Requirements (See Section F – “Reference/Definitions” for definitions of certain capitalized terms)
|
1. |
Certain Prohibited Actions – No person subject to this Policy may, directly or indirectly: |
|
(a) |
Trade in Company Securities when aware of Material Nonpublic Information regarding Best Buy (including post-departure from Best Buy) or trade during a Closed Trading Period to which the person is subject. Before trading, ask yourself the following questions: |
|
· |
Question 1: Am I aware of Material Nonpublic Information? If yes, do not trade. If no, move to Question 2. |
|
· |
Question 2: Am I currently subject to a Closed Trading Period? If yes, do not trade. If no, then you may trade in Company Securities, provided such trading otherwise complies with the terms of this Policy, including pre-clearance of the transaction as set forth in Section B — “4. Pre-clearance.” |
|
(b) |
Trade in securities of any other company if you are aware of Material Nonpublic Information regarding that company (such as suppliers, competitors and merger or acquisition candidates). |
|
(c) |
Provide Material Nonpublic Information to anyone else within the Company with jobs that do not require them to have that information, or to anyone outside of the Company, including family, friends, business associates, investors and consulting firms, unless such disclosure is made in compliance with the Company’s Confidentiality Policy. |
|
(d) |
Recommend that other people trade or provide an opinion on the value of Company Securities to another person likely to trade based on Material Nonpublic Information of Best Buy or any other company (i.e., “Tipping”). |
|
· |
Note that Best Buy’s business relationships with smaller companies may have a material impact on the value of such companies’ securities even if those relationships are not material to Best Buy. |
|
(e) |
Trade within one full trading day after the public release of previously Material Nonpublic Information such as Company earnings results. |
|
(f) |
Sell Company Securities short (that is, selling securities you do not yet own). |
|
(g) |
Trade Derivatives relating to Company Securities (other than exercises of stock options for Best Buy stock granted to you by the Company). |
|
(h) |
Hedge Company Securities (that is, make an investment in another security in order to reduce the risk of a loss or gain on any Company Security), whether via forward contracts, equity swaps, collars, exchange funds or otherwise. |
|
2. |
Notice to Other Employees. If you are aware of another Best Buy employee who is aware of Material Nonpublic Information (e.g., consolidated financial performance of Best Buy or material transactions), you must advise them that they have Material Nonpublic Information and are subject to extended Closed Trading Periods. |
|
3. |
Pledging. If you are an Executive Officer or a member of the Board of Directors, you are also prohibited from holding Company Securities in a margin account or pledging Company Securities as collateral for a loan. |
|
4. |
Pre-Clearance. All Senior Vice Presidents and above, and members of the Board of Directors, are required to obtain pre-clearance from the Legal Department prior to engaging in any transaction involving Company Securities. This requirement includes transactions made by Family Members of such individuals, as well as entities controlled by them. Pre-clearance requests should be directed to preclearance@bestbuy.com, and must include the number of shares you wish to trade and affirm that you are not aware of Material Nonpublic Information. Pre-clearance approvals, when appropriate, are typically granted for up to three days during open trading windows, provided that notwithstanding the receipt of pre-clearance, you may not trade in Company Securities if you subsequently become aware of Material Nonpublic Information prior to effecting the transaction. Affected individuals who wish to trade over a longer period of time should consider a 10b5-1 Plan, as described below. Please note: Pre-clearance approval does not relieve you of your legal obligations or responsibilities under this Policy, and pre-clearance approval does not constitute legal advice. |
|
5. |
Disclosure Compliance with Regulation FD. Regulation FD (which stands for “Fair Disclosure”) prohibits selective disclosure of Material Nonpublic Information to the investment community. Material Nonpublic Information may not be disclosed externally through any forum, including social media, until it has been approved by Investor Relations, Public Relations, External Reporting, and Legal. |
|
(a) |
Upon approval, external disclosures of Material Nonpublic Information must be broadly disseminated to the public by authorized individuals so that all investors have prompt and fair access to information that may affect the price of the Company’s Securities. These authorized individuals include certain senior officers and members of the Public Relations and Investor Relations teams who regularly communicate with investors and who are speaking on the Company’s behalf. Individuals specifically authorized and working with the Public Relations and Investor Relations teams may also be authorized to speak about such information on behalf of the Company. |
|
(b) |
The only exceptions to this Policy are as follows: 1) Communications made to a person who owes the Company a duty of trust or confidence, such as a retained accountant or attorney; 2) Communications made to any person who, as part of their relationship with the Company, expressly agrees to maintain the information in confidence; and 3) Disclosures pursuant to a legal duty or a valid order of law enforcement. |
|
(c) |
Please see the Confidentiality Policy for more information regarding disclosure of Company information. |
|
6. |
Policy Effective Time. Note that if an employee leaves the Company or is terminated during a Closed Trading Period, the trading restrictions in this policy continue in effect for the employee until the end of the Closed Trading Period. |
|
7. |
Managed Accounts. If you have a managed account (where another person has been given discretion or authority to trade without your prior approval), you must advise your broker or investment advisor not to trade in Company Securities at any time. |
|
8. |
Legal Penalties. In addition to the provisions set forth in Section E — “Violations,” herein, violations of Insider Trading laws can result in one or more of the following penalties: |
|
(a) |
Criminal charges resulting in up to 20 years in prison and fines of up to $5 million. |
|
(b) |
Civil charges by the U.S. Securities and Exchange Commission resulting in fines of up to 3 times the profit you gained or the loss you avoided by your trades and can include interest and other damages, including prohibition from doing certain types of work with public companies. |
|
(c) |
Civil charges by shareholders or former shareholders who traded about the same time as you who did not have access to Material Nonpublic Information. |
2
|
(d) |
Criminal and/or civil charges brought by foreign governments. |
|
(e) |
Anyone guilty of aiding another person in connection with Insider Trading may be subject to the same civil and criminal penalties as the person who violated the laws. |
|
9. |
Company Transactions. The Company will not transact in its own stock (repurchases, etc.) when aware of Material Nonpublic Information. |
C. Exceptions.
Disclosure of Material Nonpublic Information or Securities transactions that may be necessary or justifiable for independent reasons (such as the need to raise money for an emergency expenditure), or small transactions are not exempted from this Policy. The following types of transactions are exceptions to this Policy:
|
1. |
Vesting of Restricted Stock / Restricted Stock Unit Awards. This policy does not apply to the vesting of restricted stock or restricted stock units granted to you by Best Buy or the withholding of shares by the Company (or its administrator) upon vesting to satisfy tax withholding requirements. However, any subsequent discretionary sale of any such stock is subject to the requirements stated in this policy. |
|
2. |
Certain Stock Option Exercises. This Policy does not apply to the exercise of an employee stock option in cash or via a net exercise (i.e., paying the exercise price by forfeiting a number of shares otherwise issuable upon exercise equal to the option strike price) so long as you do not sell the shares issued upon the exercise of the option. Any subsequent sale of such share is subject to the requirements herein. This Policy does not apply to the withholding of shares by the Company (or its administrator) to satisfy tax withholding requirements. This Policy does apply, however, to any sale of stock as part of a broker-assisted cashless exercise of an option, or any other market sale for the purpose of generating the cash needed to pay the exercise price of an option. |
|
3. |
401(k) Plan & Employee Stock Purchase Plan. This Policy does not apply to purchases of Company Securities in the Best Buy 401(k) Plan or Employee Stock Purchase Plan (“ESPP”) resulting from your periodic contribution of money to the 401(k) Plan or ESPP pursuant to your payroll deduction election. This Policy does apply, however, to the following transactions: |
|
(a) |
You may not elect to start or stop participating or increase or decrease your level of participation in the 401(k) Plan Best Buy stock fund or ESPP while aware of Material Nonpublic Information or subject to a Closed Trading Period. |
|
(b) |
You may not elect to make an intra-plan transfer of an existing account balance into or out of the 401(k) Best Buy stock fund if the election will result in liquidation of some or all of your Best Buy stock fund while aware of Material Nonpublic Information or subject to a Closed Trading Period. You also may not pre-pay a 401(k) Plan loan if the pre-payment will result in allocation of loan proceeds to the Company stock fund while aware of Material Nonpublic Information or subject to a Closed Trading Period. |
|
(c) |
Section 16 Persons, please note that any sale/transfer of Company Securities within Best Buy's 401(k) plan or ESPP or deferred compensation plan must occur within the third to twelfth business day following any quarterly or year-end earnings release to be an exempt transaction for short swing profit matching rules (see Best Buy's Rule 144/Section 16 Notice and Guide). |
|
4. |
Dividend Reinvestment Plan. This Policy does not apply to purchases of Company Securities under the Company’s dividend reinvestment plan resulting from dividends paid on Company Securities. This Policy does apply, however, to voluntary purchases of Company Securities resulting from additional contributions you choose to make to the dividend reinvestment plan, and to your election to participate in the plan or increase your level of participation in the plan. This Policy also applies to the sale of any Company Securities purchased pursuant to the plan. |
|
5. |
Bona Fide Gifts. This Policy does not apply to bona fide gifts of Company Securities, unless the person making the gift is aware of Material Nonpublic Information or has reason to believe the recipient intends to sell the Company Securities while the employee is aware of Material Nonpublic Information or subject to a Closed Trading Period, or the person making the gift is subject to pre-clearance trading restrictions as outlined above. Individuals subject to the Company’s pre-clearance policy must obtain pre-clearance prior to making a gift. |
|
6. |
10b5-1 Plans. This Policy does not apply to trades made pursuant to a binding contract, binding instruction, or written plan that satisfies the requirements and limitations of Rule 10b5‐1(c) (17 C.F.R. 240.10b5‐1(c)) (“Rule 10b5-1”), as amended from time to time, promulgated under the Securities Exchange Act of 1934, as amended (the “Exchange Act”) Plans may not be entered into, modified or terminated during a Closed Trading Period, or while aware of Material Nonpublic Information. Additionally, Rule 10b5-1 plans may not be adopted if the individual adopting the plan has an existing contract, instruction or plan that would qualify for the affirmative defense under Rule 10b5-1, subject to the exceptions set forth therein. |
In addition, all Rule 10b5-1 plans must be approved in writing in advance by the Legal Department (email preclearance@bestbuy.com to obtain approval), and a copy of all such trading contracts, instructions, and plans must be sent to the Legal Department.
3
The Company reserves the right to withhold pre-clearance of the adoption, amendment or termination of any such trading plan that the Company determines is not consistent with the rules regarding such plans. Notwithstanding any pre-clearance of a Rule 10b5-1 or other trading plan, the Company assumes no liability for the consequences of any transaction made pursuant to such plan. Transactions effected pursuant to a pre-cleared Rule 10b5-1 or other trading plan will not require further pre-clearance at the time of the transaction if the plan specifies the dates, prices and amounts of the contemplated trades, or establishes a formula for determining the dates, prices and amounts.
The rules regarding Rule 10b5-1 plans are complex and you must fully comply with them. You should consult with your legal and/or financial advisor before entering into any Rule 10b5-1 plan.
If you are a Section 16 Person, Rule 10b5-1 and other trading plans require special care, as the Company may be required to disclose the adoption, amendment or termination of a such plans by such persons in its periodic reports filed with the U.S. Securities and Exchange Commission (the “SEC”). Accordingly, it is imperative that Section 16 Persons coordinate with the Legal Department prior to adopting or modifying such plans. Moreover, because such plans may specify conditions that trigger a purchase or sale, you may not even be aware that a transaction has taken place and you may not be able to comply with the SEC’s requirement that you report your transaction to the SEC within two business days after its execution. Therefore, for Section 16 Persons, a transaction executed according to a trading plan is not permitted unless the trading plan requires your broker to notify the Company before the close of business on the day of the execution of the transaction.
D. Rule 144/Section 16
Each member of the Company’s Board of Directors and certain Officers (as determined by the Board) are subject to additional responsibilities and restrictions under the federal securities laws. Among other things, these individuals are subject to certain restrictions with respect to trading in Company Securities and are required to file reports of their transactions with the Securities and Exchange Commission and the New York Stock Exchange.
For more information, a copy of the Rule 144/Section 16 Notice and Guide can be obtained from the Legal Department.
E. Violations
Violation of this Policy could result in disciplinary action in the workplace up to and including termination of your employment. Also, failure to adhere to these restrictions will expose you and Best Buy to the risk of civil and criminal liability under securities laws as described in the "Legal Penalties" section above.
F. Reference/Definitions
|
1. |
Closed Trading Period - a scheduled period of time prior to and immediately following the release by the Company of Material Nonpublic Information in which trading in Company Securities by subject employees is prohibited, which includes Extended Closed Trading Periods and Special Closed Trading Periods as set forth in further detail below. |
|
(a) |
An “Extended Closed Trading Period” exists each fiscal quarter from two weeks prior to the end of the fiscal quarter until one full trading day after release of quarterly earnings results (with the exception that the Extended Closed Trading Period for year-end results typically begins around the end of December). Best Buy generally releases quarterly earnings and year‐end results in the month following each quarter and year‐end. The fiscal quarters end at the end of April, July, October, and January. Best Buy's fiscal year ends on the Saturday nearest the end of January. Specific Closed Trading period dates are posted on Best Buy Connect. |
|
· |
Extended Closed Trading Periods are typically communicated out to applicable employees via email. The Extended Closed Trading Period applies to members of the Board of Directors, Officers, directors and above in Finance, members of the Legal Department, Territory General Managers, Associate Vice Presidents, any other individuals who may be aware of Material Nonpublic Information during that time and other persons as designated by the General Counsel, along with the Family Members of each of the foregoing individuals. |
|
· |
A mandatory Closed Trading Period applies to all Company employees, regardless of position, for one full trading day following the release of quarterly and year-end earnings results and other Material Nonpublic Information. |
|
(b) |
“Special Closed Trading Periods” may be imposed by the Legal Department from time to time depending upon Best Buy events or expected announcements, such as transformative transactions or senior management changes. |
|
2. |
Company Security or Company Securities - these terms are defined broadly to include stock (common and preferred), stock options, warrants, bonds, notes, debentures, convertible instruments, put or call options (i.e., exchange-traded options), other Derivatives or other similar instruments. |
|
3. |
Derivative - a security that derives its value from one or more underlying securities. A common example is an option bought on the open market to buy or sell a certain number of shares at a certain price during a specific time period (often called a “put” or “call” option). |
4
|
4. |
Executive Officer – an “executive officer” as defined by Rule 3b-7 of the Exchange Act. This refers to the Company’s president, any vice president in charge of a principal business unit, division or function (such as sales, administration or finance), any other officer who performs a policy making function or any other person who performs similar policy making functions for the Company, as determined by the Company’s Board of Directors. |
|
5. |
Family Members – family members who reside with you, anyone else who lives in your household and any family members who do not live in your household but whose transactions in Company Securities are directed by you or are subject to your influence or control. |
|
6. |
Insider – all employees, consultants, contractors and members of the Board of Directors of a company and its subsidiaries, and members of their immediate families and households, who are aware of Material Nonpublic Information. |
|
7. |
Material – Information – refers to information that is reasonably likely to be considered important to an investor in determining whether to buy, sell, or hold securities of a company. Any information that could impact a company’s stock price, whether positive or negative, should be considered material. Whether information is material depends on the facts of each event, but information frequently regarded as material, whether positive or negative, includes: |
|
· |
Actual and projected financial results including quarterly and annual earnings or losses; |
|
· |
Earnings guidance, including changes to previously announced earnings guidance, or the decision to suspend earnings guidance, or changes in quarterly dividend practices; |
|
· |
Significant pending or proposed mergers, acquisitions, joint ventures, or other business combinations; |
|
· |
Divestitures of subsidiaries, divisions, or other business units; |
|
· |
Significant write-offs; |
|
· |
Company restructuring, layoffs, furloughs, bankruptcy or receivership; |
|
· |
Major new products, services or processes; |
|
· |
Gain or loss of a significant customer or supplier; |
|
· |
Significant changes in senior management; |
|
· |
Significant changes in compensation policy; |
|
· |
Entering into, or loss of, certain strategic relationships; |
|
· |
Impending bankruptcy or financial liquidity problems; |
|
· |
A significant disruption in the Company’s operations or loss, potential loss, breach or un-authorized access to its property or assets, including its facilities, data and information technology infrastructure and cybersecurity and privacy incidents or events; |
|
· |
New equity or debt offerings, or other changes in capitalization including stock splits or the acquisition of, refinancing or repayment of significant debt or defaults on debt; |
|
· |
Bank borrowing or other financial transactions outside of the ordinary course of business; |
|
· |
Changes in, or disagreements with, auditors or notifications that the Company may no longer rely on such firm’s report; |
|
· |
Litigation exposure due to actual or threatened significant litigation; and |
|
· |
Expansion plans, including international expansion. |
You may not trade in Company Securities if you are aware of Material Nonpublic Information. Information that something is likely to happen or even just that it may happen can be material. Courts often resolve close cases in favor of finding the information material. Therefore, Insiders should err on the side of caution. Insiders should keep in mind that the rules and regulations of the SEC provide that the mere fact that a person is aware of the information is a bar to trading. It is no excuse that such person’s reasons for trading were unrelated to the information.
|
8. |
Nonpublic Information – for the purpose of this policy, all Company information is “Nonpublic Information” until three criteria have been satisfied: |
First, the information must have been widely disseminated by the Company. Generally, Insiders should assume that information has NOT been widely disseminated unless it has been disclosed by the Company in (i) a press release distributed through a widely disseminated news or wire service; (ii) a publicly available filing made with the SEC; or (iii) through a pre-announced, broadly accessible conference call or webcast.
Second, the information disseminated must be some form of “official” announcement or disclosure, which, in the case of information about the Company, must be made by the Company. In other words, the fact that rumors, speculation, or statements attributed to unidentified sources are public is insufficient to be considered widely disseminated even when the rumors, speculation, or statements are accurate.
Third, after the information has been disseminated, a period of time must pass sufficient for the information to be absorbed by the general public. As a general rule, information should not be considered fully absorbed until after at least one full trading day has elapsed on the NYSE after the information has been publicly disclosed in a manner described above.
|
9. |
Officer means the Company’s Chief Executive Officer, president (if any), Chief Financial Officer, Chief Accounting Officer, any vice president of the Company in charge of a principal business unit, division or function, any other officer who performs a policy-making function or any other person who performs similar policy making functions for the Company. |
5
|
10. |
Section 16 Persons – members of the Company’s Board of Directors and the Company’s Officers. |
|
11. |
Tipping – communicating Material Nonpublic Information to other persons, recommending that anyone trade on the basis of Material Nonpublic Information, or expressing an opinion on the basis of Material Nonpublic Information as to trading in a company’s securities. |
|
12. |
Trading or Trade – any purchase, sale or other transaction to acquire, transfer or dispose of securities, including derivative exercises, gifts or other contributions, pledges, exercises of stock options granted under the Company’s stock plans, sales of stock acquired upon the exercise of options and trades made under an employee benefit plan such as a 401(k) plan. |
6
Exhibit 21.1
BEST BUY CO., INC.
SUBSIDIARIES OF THE REGISTRANT AT February 1, 2025 *
|
|
|||||
|
|
State or Other Jurisdiction of Incorporation or Organization |
||||
|
BBC Investment Co. |
Nevada |
||||
|
BBC Property Co. |
Minnesota |
||||
|
|
Best Buy Stores, L.P. (1) |
Virginia |
|||
|
|
BBY Services, Inc. |
Delaware |
|||
|
|
BestBuy.com, LLC |
Virginia |
|||
|
|
Best Buy Puerto Rico Holdings, LLC |
Delaware |
|||
|
|
Best Buy Stores Puerto Rico, LLC |
Puerto Rico |
|||
|
|
Best Buy Texas.com, LLC |
Virginia |
|||
|
|
Best Buy Warehousing Logistics, LLC |
Delaware |
|||
|
|
Nichols Distribution, LLC |
Minnesota |
|||
|
|
Magnolia Hi-Fi, LLC (2) |
Washington |
|||
|
|
Pacific Sales Kitchen and Bath Centers, LLC |
California |
|||
|
|
ProTheo III, LLC |
Delaware |
|||
|
|
Two Peaks, LLC (3) |
Delaware |
|||
|
|
USB RETC Fund 2019-7, LLC |
Delaware |
|||
|
|
Lily Solar Lessee, LLC # |
Delaware |
|||
|
|
USB RETC Fund 2021-8, LLC |
Delaware |
|||
|
|
Albedo Lessee 2, LLC # |
Delaware |
|||
|
|
USB RETC Fund 2020-12, LLC |
Delaware |
|||
|
|
Little Bear Master Tenant, LLC # |
Delaware |
|||
|
|
USB RETC Fund 2020-19, LLC |
Delaware |
|||
|
|
Prospero II Master Tenant, LLC# |
Delaware |
|||
|
BBY Holdings International, Inc. |
Minnesota |
||||
|
BBY Insurance Company |
Vermont |
||||
|
Best Buy China Holdings, Ltd. |
Mauritius |
||||
|
Best Buy Enterprise Services, Inc. |
Minnesota |
||||
|
|
BBY Canada Finance, LLC |
Delaware |
|||
|
|
BBY Solutions, Inc. |
Minnesota |
|||
|
|
BBY Technology Services, LLC |
Delaware |
|||
|
|
Best Buy Canada Ltd. / Magasins Best Buy LTEE (4) |
Canada+ |
|||
|
|
Best Buy China Ltd. |
Bermuda |
|||
|
|
Best Buy Purchasing LLC (5) |
Minnesota |
|||
|
|
Partsearch Technologies, Inc. |
Delaware |
|||
|
|
ProTheo, Inc. |
Delaware |
|||
|
|
ProTheo IV, LLC |
Delaware |
|||
|
|
Best Buy Distributions Limited |
United Kingdom |
|||
|
|
ProTheo V, LLC |
Delaware |
|||
|
Best Buy Finance, Inc. |
Minnesota |
||||
|
|
BBY (Mauritius I) Ltd. |
Mauritius |
|||
|
|
BBY (Mauritius II) Ltd. |
Mauritius |
|||
|
|
Best Buy China % |
China |
|||
|
|
BBY (Mauritius III) Ltd. |
Mauritius |
|||
|
|
Best Buy (AsiaPacific) Limited |
China |
|||
|
|
Best Buy International Finance, S.à.r.l. |
Luxembourg |
|||
|
|
Best Buy Enterprises, S. de R.L. de C.V. |
Mexico, Federal District |
|||
|
|
Best Buy Imports, S. de R.L. de C.V. |
Mexico, Federal District |
|||
|
|
ExB Hong Kong Limited |
Hong Kong |
|||
|
|
BBY Vietnam Company Limited |
Vietnam |
|||
|
Best Buy Health Holdings, LLC |
Delaware |
||||
|
|
Current Health, Inc. |
Delaware |
|||
|
|
Current Health Limited |
United Kingdom |
|||
|
|
GC Buyer, Inc. |
Delaware |
|||
|
|
Best Buy Health, Inc.(6) |
Delaware |
|||
|
|
GTL, Incorporated(7) |
New York |
|||
|
Best Buy Product Protection, Inc. |
South Dakota |
||||
|
CP Gal Richfield, LLC |
Delaware |
||||
* Indirect subsidiaries are indicated by indentation.
+ Federally chartered
% China Business Trust
# Indicates a subsidiary entity that is not wholly owned by us. In each instance, our ownership interest is greater than 90%.
Also doing business as:
(1) Best Buy Express; Best Buy Outlet; Best Buy Health; Geek Squad; Magnolia Home Theater; Pacific Kitchen and Home; Pacific Kitchen and Home Bath Centers; Pacific Sales; Pacific Sales Kitchen and Bath Centers; Pacific Sales Kitchen and Home; TechLiquidators
(2) Magnolia Design Center
(3) Yardbird; Yardbird Furniture
(4) Geek Squad
(5) Pacific Kitchen and Bath Centers; Pacific Sales Kitchen and Home
(6) Critical Signal Technologies; Lively; Lively North America
(7) CST Your Link to Life; Link to Life
Exhibit 23.1
CONSENT OF INDEPENDENT REGISTERED PUBLIC ACCOUNTING FIRM
We consent to the incorporation by reference in Registration Statement Nos. 333-39531, 333-39533, 333-49371, 333-61897, 333-80967, 333-46228, 333-56146, 333-108033, 333-119472, 333-137483, 333-144957, 333-153801, 333-160247, 333-175609, 333-185587, 333-192412, 333-196841, 333-218875 and 333-239583 on Form S-8 and Registration Statement Nos. 333-172662, 333-227404 and 333-274741 on Form S-3 of our reports dated March 19, 2025, relating to the financial statements of Best Buy Co., Inc. and the effectiveness of Best Buy Co., Inc.’s internal control over financial reporting, appearing in this Annual Report on Form 10-K for the year ended February 1, 2025.
/s/ Deloitte and Touche LLP
Minneapolis, Minnesota
March 19, 2025
Exhibit 31.1
CERTIFICATION PURSUANT TO
RULES 13a-14(a) AND 15d-14(a) UNDER THE SECURITIES
EXCHANGE ACT OF 1934, AS ADOPTED PURSUANT TO
SECTION 302 OF THE SARBANES-OXLEY ACT OF 2002
I, Corie Barry, certify that:
|
1. |
I have reviewed this Annual Report on Form 10-K of Best Buy Co., Inc.; |
|
2. |
Based on my knowledge, this report does not contain any untrue statement of a material fact or omit to state a material fact necessary to make the statements made, in light of the circumstances under which such statements were made, not misleading with respect to the period covered by this report; |
|
3. |
Based on my knowledge, the financial statements, and other financial information included in this report, fairly present in all material respects the financial condition, results of operations and cash flows of the registrant as of, and for, the periods presented in this report; |
|
4. |
The registrant’s other certifying officer and I are responsible for establishing and maintaining disclosure controls and procedures (as defined in Exchange Act Rules 13a-15(e) and 15d-15(e)) and internal control over financial reporting (as defined in Exchange Act Rules 13a-15(f) and 15d-15(f)) for the registrant and have: |
|
a) |
Designed such disclosure controls and procedures, or caused such disclosure controls and procedures to be designed under our supervision, to ensure that material information relating to the registrant, including its consolidated subsidiaries, is made known to us by others within those entities, particularly during the period in which this report is being prepared; |
|
b) |
Designed such internal control over financial reporting, or caused such internal control over financial reporting to be designed under our supervision, to provide reasonable assurance regarding the reliability of financial reporting and the preparation of financial statements for external purposes in accordance with generally accepted accounting principles; |
|
c) |
Evaluated the effectiveness of the registrant’s disclosure controls and procedures and presented in this report our conclusions about the effectiveness of the disclosure controls and procedures, as of the end of the period covered by this report based on such evaluation; and |
|
d) |
Disclosed in this report any change in the registrant’s internal control over financial reporting that occurred during the registrant’s most recent fiscal quarter that has materially affected, or is reasonably likely to materially affect, the registrant’s internal control over financial reporting; and |
|
5. |
The registrant’s other certifying officer and I have disclosed, based on our most recent evaluation of internal control over financial reporting, to the registrant’s auditors and the audit committee of the registrant’s board of directors (or persons performing equivalent functions): |
|
a) |
All significant deficiencies and material weaknesses in the design or operation of internal control over financial reporting which are reasonably likely to adversely affect the registrant’s ability to record, process, summarize and report financial information; and |
|
b) |
Any fraud, whether or not material, that involves management or other employees who have a significant role in the registrant’s internal control over financial reporting. |
|
Date: March 19, 2025 |
/s/ Corie Barry |
|
|
Corie Barry |
|
|
Chief Executive Officer |
Exhibit 31.2
CERTIFICATION PURSUANT TO
RULES 13a-14(a) AND 15d-14(a) UNDER THE SECURITIES
EXCHANGE ACT OF 1934, AS ADOPTED PURSUANT TO
SECTION 302 OF THE SARBANES-OXLEY ACT OF 2002
I, Matthew Bilunas, certify that:
|
1. |
I have reviewed this Annual Report on Form 10-K of Best Buy Co., Inc.; |
|
2. |
Based on my knowledge, this report does not contain any untrue statement of a material fact or omit to state a material fact necessary to make the statements made, in light of the circumstances under which such statements were made, not misleading with respect to the period covered by this report; |
|
3. |
Based on my knowledge, the financial statements, and other financial information included in this report, fairly present in all material respects the financial condition, results of operations and cash flows of the registrant as of, and for, the periods presented in this report; |
|
4. |
The registrant’s other certifying officer and I are responsible for establishing and maintaining disclosure controls and procedures (as defined in Exchange Act Rules 13a-15(e) and 15d-15(e)) and internal control over financial reporting (as defined in Exchange Act Rules 13a-15(f) and 15d-15(f)) for the registrant and have: |
|
a) |
Designed such disclosure controls and procedures, or caused such disclosure controls and procedures to be designed under our supervision, to ensure that material information relating to the registrant, including its consolidated subsidiaries, is made known to us by others within those entities, particularly during the period in which this report is being prepared; |
|
b) |
Designed such internal control over financial reporting, or caused such internal control over financial reporting to be designed under our supervision, to provide reasonable assurance regarding the reliability of financial reporting and the preparation of financial statements for external purposes in accordance with generally accepted accounting principles; |
|
c) |
Evaluated the effectiveness of the registrant’s disclosure controls and procedures and presented in this report our conclusions about the effectiveness of the disclosure controls and procedures, as of the end of the period covered by this report based on such evaluation; and |
|
d) |
Disclosed in this report any change in the registrant’s internal control over financial reporting that occurred during the registrant’s most recent fiscal quarter that has materially affected, or is reasonably likely to materially affect, the registrant’s internal control over financial reporting; and |
|
5. |
The registrant’s other certifying officer and I have disclosed, based on our most recent evaluation of internal control over financial reporting, to the registrant’s auditors and the audit committee of the registrant’s board of directors (or persons performing equivalent functions): |
|
a) |
All significant deficiencies and material weaknesses in the design or operation of internal control over financial reporting which are reasonably likely to adversely affect the registrant’s ability to record, process, summarize and report financial information; and |
|
b) |
Any fraud, whether or not material, that involves management or other employees who have a significant role in the registrant’s internal control over financial reporting. |
|
|
|
|
Date: March 19, 2025 |
/s/ Matthew Bilunas |
|
|
Matthew Bilunas |
|
|
Senior Executive Vice President, Chief Financial Officer & Enterprise Strategy |
Exhibit 32.1
CERTIFICATION PURSUANT TO
18 U.S.C. SECTION 1350,
AS ADOPTED PURSUANT TO
SECTION 906 OF THE SARBANES-OXLEY ACT OF 2002
Pursuant to 18 U.S.C. §1350 (adopted pursuant to §906 of the Sarbanes-Oxley Act of 2002), I, the undersigned Chief Executive Officer of Best Buy Co., Inc. (the “Company”), hereby certify that the Annual Report on Form 10-K of the Company for the fiscal year ended February 1, 2025 (the “Report”), fully complies with the requirements of section 13(a) or 15(d) of the Securities Exchange Act of 1934, as amended, and that information contained in the Report fairly presents, in all material respects, the financial condition and results of operations of the Company.
A signed original of this written statement required by Section 906 has been provided to the Company and will be retained by the Company and furnished to the Securities and Exchange Commission or its staff upon request.
|
|
||
|
|
|
|
|
Date: |
March 19, 2025 |
/s/ Corie Barry |
|
|
|
Corie Barry |
|
|
|
Chief Executive Officer |
Exhibit 32.2
CERTIFICATION PURSUANT TO
18 U.S.C. SECTION 1350,
AS ADOPTED PURSUANT TO
SECTION 906 OF THE SARBANES-OXLEY ACT OF 2002
Pursuant to 18 U.S.C. §1350 (adopted pursuant to §906 of the Sarbanes-Oxley Act of 2002), I, the undersigned Chief Financial Officer of Best Buy Co., Inc. (the “Company”), hereby certify that the Annual Report on Form 10-K of the Company for the fiscal year ended February 1, 2025 (the “Report”), fully complies with the requirements of section 13(a) or 15(d) of the Securities Exchange Act of 1934, as amended, and that information contained in the Report fairly presents, in all material respects, the financial condition and results of operations of the Company.
A signed original of this written statement required by Section 906 has been provided to the Company and will be retained by the Company and furnished to the Securities and Exchange Commission or its staff upon request.
|
|
||
|
|
|
|
|
Date: |
March 19, 2025 |
/s/ Matthew Bilunas |
|
|
|
Matthew Bilunas |
|
|
|
Senior Executive Vice President, Chief Financial Officer & Enterprise Strategy |