| Delaware | 1-8606 | 23-2259884 | |||||||||
| (State or other jurisdiction of incorporation) |
(Commission File Number) | (I.R.S. Employer Identification No.) | |||||||||
| 1095 Avenue of the Americas | 10036 | ||||||||||
| New York, | New York | ||||||||||
| (Address of principal executive offices) | (Zip Code) | ||||||||||
| Title of Each Class | Trading Symbol(s) | Name of Each Exchange on Which Registered | ||||||||||||
| Common Stock, par value $0.10 | VZ | New York Stock Exchange | ||||||||||||
| Common Stock, par value $0.10 | VZ | The Nasdaq Global Select Market | ||||||||||||
| 0.875% Notes due 2025 | VZ 25 | New York Stock Exchange | ||||||||||||
| 3.25% Notes due 2026 | VZ 26 | New York Stock Exchange | ||||||||||||
| 1.375% Notes due 2026 | VZ 26B | New York Stock Exchange | ||||||||||||
| 0.875% Notes due 2027 | VZ 27E | New York Stock Exchange | ||||||||||||
| 1.375% Notes due 2028 | VZ 28 | New York Stock Exchange | ||||||||||||
| 1.125% Notes due 2028 | VZ 28A | New York Stock Exchange | ||||||||||||
| 2.350% Fixed Rate Notes due 2028 | VZ 28C | New York Stock Exchange | ||||||||||||
| 1.875% Notes due 2029 | VZ 29B | New York Stock Exchange | ||||||||||||
| 0.375% Notes due 2029 | VZ 29D | New York Stock Exchange | ||||||||||||
| 1.250% Notes due 2030 | VZ 30 | New York Stock Exchange | ||||||||||||
| 1.875% Notes due 2030 | VZ 30A | New York Stock Exchange | ||||||||||||
| 4.250% Notes due 2030 | VZ 30D | New York Stock Exchange | ||||||||||||
| 2.625% Notes due 2031 | VZ 31 | New York Stock Exchange | ||||||||||||
| 2.500% Notes due 2031 | VZ 31A | New York Stock Exchange | ||||||||||||
| 3.000% Fixed Rate Notes due 2031 | VZ 31D | New York Stock Exchange | ||||||||||||
| 0.875% Notes due 2032 | VZ 32 | New York Stock Exchange | ||||||||||||
| 0.750% Notes due 2032 | VZ 32A | New York Stock Exchange | ||||||||||||
| 3.500% Notes due 2032 | VZ 32B | New York Stock Exchange | ||||||||||||
| 1.300% Notes due 2033 | VZ 33B | New York Stock Exchange | ||||||||||||
| 4.75% Notes due 2034 | VZ 34 | New York Stock Exchange | ||||||||||||
| 4.750% Notes due 2034 | VZ 34C | New York Stock Exchange | ||||||||||||
| 3.125% Notes due 2035 | VZ 35 | New York Stock Exchange | ||||||||||||
| 1.125% Notes due 2035 | VZ 35A | New York Stock Exchange | ||||||||||||
| 3.375% Notes due 2036 | VZ 36A | New York Stock Exchange | ||||||||||||
| 3.750% Notes due 2036 | VZ 36B | New York Stock Exchange | ||||||||||||
| 2.875% Notes due 2038 | VZ 38B | New York Stock Exchange | ||||||||||||
| 1.875% Notes due 2038 | VZ 38C | New York Stock Exchange | ||||||||||||
| 1.500% Notes due 2039 | VZ 39C | New York Stock Exchange | ||||||||||||
| 3.50% Fixed Rate Notes due 2039 | VZ 39D | New York Stock Exchange | ||||||||||||
| 1.850% Notes due 2040 | VZ 40 | New York Stock Exchange | ||||||||||||
| 3.850% Fixed Rate Notes due 2041 | VZ 41C | New York Stock Exchange | ||||||||||||
| (d) Exhibits. | ||||||||
| Exhibit Number |
Description | |||||||
Press release and financial tables, dated October 22, 2024, issued by Verizon Communications Inc. |
||||||||
Commentary discussing financial and operating results of Verizon Communications Inc. for the third quarter of 2024. |
||||||||
| 104 | Cover Page Interactive Data File (formatted as inline XBRL). | |||||||
| Verizon Communications Inc. | ||||||||||||||||||||
| (Registrant) | ||||||||||||||||||||
| Date: | October 22, 2024 | /s/ Mary-Lee Stillwell | ||||||||||||||||||
| Mary-Lee Stillwell | ||||||||||||||||||||
| Senior Vice President and Controller | ||||||||||||||||||||
FOR IMMEDIATE RELEASE |
Media contacts: |
||||
| October 22, 2024 | Katie Magnotta | ||||
| 201-602-9235 | |||||
| katie.magnotta@verizon.com | |||||
| Eric Wilkens | |||||
| 201-572-9317 | |||||
| eric.wilkens@verizon.com | |||||
(dollars in millions, except per share amounts) | ||||||||||||||||||||||||||||||||||||||
| Unaudited | 3 Mos. Ended 9/30/24 | 3 Mos. Ended 9/30/23 | % Change |
9 Mos. Ended 9/30/24 | 9 Mos. Ended 9/30/23 | % Change |
||||||||||||||||||||||||||||||||
| Operating Revenues | ||||||||||||||||||||||||||||||||||||||
| Service revenues and other | $ | 27,987 | $ | 27,523 | 1.7 | $ | 83,405 | $ | 81,994 | 1.7 | ||||||||||||||||||||||||||||
| Wireless equipment revenues | 5,343 | 5,813 | (8.1) | 15,702 | 16,850 | (6.8) | ||||||||||||||||||||||||||||||||
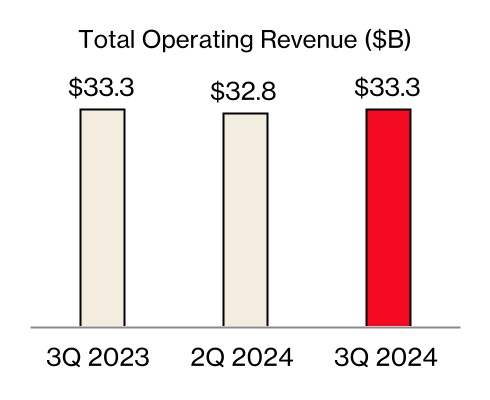
| Total Operating Revenues | 33,330 | 33,336 | — | 99,107 | 98,844 | 0.3 | ||||||||||||||||||||||||||||||||
| Operating Expenses | ||||||||||||||||||||||||||||||||||||||
| Cost of services | 7,193 | 7,084 | 1.5 | 21,064 | 21,148 | (0.4) | ||||||||||||||||||||||||||||||||
| Cost of wireless equipment | 6,047 | 6,353 | (4.8) | 17,519 | 18,557 | (5.6) | ||||||||||||||||||||||||||||||||
| Selling, general and administrative expense | 9,706 | 7,995 | 21.4 | 25,873 | 23,754 | 8.9 | ||||||||||||||||||||||||||||||||
| Depreciation and amortization expense | 4,458 | 4,431 | 0.6 | 13,386 | 13,108 | 2.1 | ||||||||||||||||||||||||||||||||
| Total Operating Expenses | 27,404 | 25,863 | 6.0 | 77,842 | 76,567 | 1.7 | ||||||||||||||||||||||||||||||||
| Operating Income | 5,926 | 7,473 | (20.7) | 21,265 | 22,277 | (4.5) | ||||||||||||||||||||||||||||||||
| Equity in losses of unconsolidated businesses | (24) | (18) | 33.3 | (47) | (42) | 11.9 | ||||||||||||||||||||||||||||||||
| Other income, net | 72 | 170 | (57.6) | 198 | 494 | (59.9) | ||||||||||||||||||||||||||||||||
| Interest expense | (1,672) | (1,433) | 16.7 | (5,005) | (3,925) | 27.5 | ||||||||||||||||||||||||||||||||
| Income Before Provision For Income Taxes | 4,302 | 6,192 | (30.5) | 16,411 | 18,804 | (12.7) | ||||||||||||||||||||||||||||||||
| Provision for income taxes | (891) | (1,308) | (31.9) | (3,576) | (4,136) | (13.5) | ||||||||||||||||||||||||||||||||
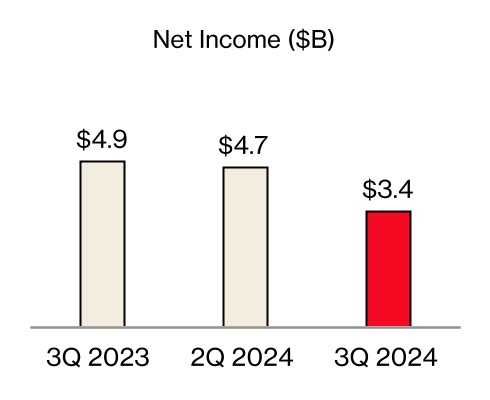
| Net Income | $ | 3,411 | $ | 4,884 | (30.2) | $ | 12,835 | $ | 14,668 | (12.5) | ||||||||||||||||||||||||||||
| Net income attributable to noncontrolling interests | $ | 105 | $ | 122 | (13.9) | $ | 334 | $ | 349 | (4.3) | ||||||||||||||||||||||||||||
| Net income attributable to Verizon | 3,306 | 4,762 | (30.6) | 12,501 | 14,319 | (12.7) | ||||||||||||||||||||||||||||||||
| Net Income | $ | 3,411 | $ | 4,884 | (30.2) | $ | 12,835 | $ | 14,668 | (12.5) | ||||||||||||||||||||||||||||
| Basic Earnings Per Common Share | ||||||||||||||||||||||||||||||||||||||
| Net income attributable to Verizon | $ | 0.78 | $ | 1.13 | (31.0) | $ | 2.96 | $ | 3.40 | (12.9) | ||||||||||||||||||||||||||||
| Weighted-average shares outstanding (in millions) | 4,220 | 4,213 | 4,217 | 4,209 | ||||||||||||||||||||||||||||||||||
Diluted Earnings Per Common Share(1) |
||||||||||||||||||||||||||||||||||||||
| Net income attributable to Verizon | $ | 0.78 | $ | 1.13 | (31.0) | $ | 2.96 | $ | 3.40 | (12.9) | ||||||||||||||||||||||||||||
| Weighted-average shares outstanding (in millions) | 4,225 | 4,216 | 4,221 | 4,214 | ||||||||||||||||||||||||||||||||||
| (dollars in millions) | ||||||||||||||||||||
| Unaudited | 9/30/24 | 12/31/23 | $ Change | |||||||||||||||||
| Assets | ||||||||||||||||||||
| Current assets | ||||||||||||||||||||
| Cash and cash equivalents | $ | 4,987 | $ | 2,065 | $ | 2,922 | ||||||||||||||
| Accounts receivable | 27,040 | 26,102 | 938 | |||||||||||||||||
| Less Allowance for credit losses | 1,086 | 1,017 | 69 | |||||||||||||||||
| Accounts receivable, net | 25,954 | 25,085 | 869 | |||||||||||||||||
| Inventories | 2,523 | 2,057 | 466 | |||||||||||||||||
| Prepaid expenses and other | 7,177 | 7,607 | (430) | |||||||||||||||||
| Total current assets | 40,641 | 36,814 | 3,827 | |||||||||||||||||
| Property, plant and equipment | 327,555 | 320,108 | 7,447 | |||||||||||||||||
| Less Accumulated depreciation | 220,027 | 211,798 | 8,229 | |||||||||||||||||
| Property, plant and equipment, net | 107,528 | 108,310 | (782) | |||||||||||||||||
| Investments in unconsolidated businesses | 867 | 953 | (86) | |||||||||||||||||
| Wireless licenses | 156,481 | 155,667 | 814 | |||||||||||||||||
| Goodwill | 22,844 | 22,843 | 1 | |||||||||||||||||
| Other intangible assets, net | 10,674 | 11,057 | (383) | |||||||||||||||||
| Operating lease right-of-use assets | 23,613 | 24,726 | (1,113) | |||||||||||||||||
| Other assets | 18,516 | 19,885 | (1,369) | |||||||||||||||||
| Total assets | $ | 381,164 | $ | 380,255 | $ | 909 | ||||||||||||||
| Liabilities and Equity | ||||||||||||||||||||
| Current liabilities | ||||||||||||||||||||
| Debt maturing within one year | $ | 21,763 | $ | 12,973 | $ | 8,790 | ||||||||||||||
| Accounts payable and accrued liabilities | 22,222 | 23,453 | (1,231) | |||||||||||||||||
| Current operating lease liabilities | 4,312 | 4,266 | 46 | |||||||||||||||||
| Other current liabilities | 13,519 | 12,531 | 988 | |||||||||||||||||
| Total current liabilities | 61,816 | 53,223 | 8,593 | |||||||||||||||||
| Long-term debt | 128,878 | 137,701 | (8,823) | |||||||||||||||||
| Employee benefit obligations | 12,744 | 13,189 | (445) | |||||||||||||||||
| Deferred income taxes | 45,865 | 45,781 | 84 | |||||||||||||||||
| Non-current operating lease liabilities | 19,247 | 20,002 | (755) | |||||||||||||||||
| Other liabilities | 14,946 | 16,560 | (1,614) | |||||||||||||||||
| Total long-term liabilities | 221,680 | 233,233 | (11,553) | |||||||||||||||||
| Equity | ||||||||||||||||||||
| Common stock | 429 | 429 | — | |||||||||||||||||
| Additional paid in capital | 13,479 | 13,631 | (152) | |||||||||||||||||
| Retained earnings | 86,958 | 82,915 | 4,043 | |||||||||||||||||
| Accumulated other comprehensive loss | (1,665) | (1,380) | (285) | |||||||||||||||||
| Common stock in treasury, at cost | (3,585) | (3,821) | 236 | |||||||||||||||||
| Deferred compensation – employee stock ownership plans and other | 710 | 656 | 54 | |||||||||||||||||
| Noncontrolling interests | 1,342 | 1,369 | (27) | |||||||||||||||||
| Total equity | 97,668 | 93,799 | 3,869 | |||||||||||||||||
| Total liabilities and equity | $ | 381,164 | $ | 380,255 | $ | 909 | ||||||||||||||
| (dollars in millions, except per share amounts) | ||||||||||||||
| Unaudited | 9/30/24 | 12/31/23 | ||||||||||||
| Total debt | $ | 150,641 | $ | 150,674 | ||||||||||
| Unsecured debt | $ | 126,369 | $ | 128,491 | ||||||||||
Net unsecured debt(1) |
$ | 121,382 | $ | 126,426 | ||||||||||
| Unsecured debt / Consolidated Net Income (LTM) | 12.3 | x | 10.6 | x | ||||||||||
Net unsecured debt / Consolidated Adjusted EBITDA(1)(2) |
2.5 | x | 2.6 | x | ||||||||||
| Common shares outstanding end of period (in millions) | 4,210 | 4,204 | ||||||||||||
Total employees (‘000)(3) |
101.2 | 105.4 | ||||||||||||
| Quarterly cash dividends declared per common share | $ | 0.6775 | $ | 0.6650 | ||||||||||
| (dollars in millions) | ||||||||||||||||||||
| Unaudited | 9 Mos. Ended 9/30/24 | 9 Mos. Ended 9/30/23 | $ Change | |||||||||||||||||
| Cash Flows from Operating Activities | ||||||||||||||||||||
| Net Income | $ | 12,835 | $ | 14,668 | $ | (1,833) | ||||||||||||||
| Adjustments to reconcile net income to net cash provided by operating activities: | ||||||||||||||||||||
| Depreciation and amortization expense | 13,386 | 13,108 | 278 | |||||||||||||||||
| Employee retirement benefits | 469 | 161 | 308 | |||||||||||||||||
| Deferred income taxes | 247 | 822 | (575) | |||||||||||||||||
| Provision for expected credit losses | 1,623 | 1,596 | 27 | |||||||||||||||||
| Equity in losses of unconsolidated businesses, inclusive of dividends received | 62 | 69 | (7) | |||||||||||||||||
Changes in current assets and liabilities, net of effects from acquisition/disposition of businesses |
(2,609) | 972 | (3,581) | |||||||||||||||||
| Other, net | 467 | (2,598) | 3,065 | |||||||||||||||||
| Net cash provided by operating activities | 26,480 | 28,798 | (2,318) | |||||||||||||||||
| Cash Flows from Investing Activities | ||||||||||||||||||||
| Capital expenditures (including capitalized software) | (12,019) | (14,164) | 2,145 | |||||||||||||||||
| Acquisitions of wireless licenses | (768) | (1,859) | 1,091 | |||||||||||||||||
| Collateral receipts (payments) related to derivative contracts, net | (332) | 162 | (494) | |||||||||||||||||
| Other, net | 6 | 253 | (247) | |||||||||||||||||
| Net cash used in investing activities | (13,113) | (15,608) | 2,495 | |||||||||||||||||
| Cash Flows from Financing Activities | ||||||||||||||||||||
| Proceeds from long-term borrowings | 3,142 | 1,999 | 1,143 | |||||||||||||||||
| Proceeds from asset-backed long-term borrowings | 8,229 | 4,656 | 3,573 | |||||||||||||||||
| Net proceeds from short-term commercial paper | — | 333 | (333) | |||||||||||||||||
| Repayments of long-term borrowings and finance lease obligations | (6,623) | (5,568) | (1,055) | |||||||||||||||||
| Repayments of asset-backed long-term borrowings | (6,158) | (3,729) | (2,429) | |||||||||||||||||
| Dividends paid | (8,399) | (8,231) | (168) | |||||||||||||||||
| Other, net | (1,668) | (1,101) | (567) | |||||||||||||||||
| Net cash used in financing activities | (11,477) | (11,641) | 164 | |||||||||||||||||
| Increase in cash, cash equivalents and restricted cash | 1,890 | 1,549 | 341 | |||||||||||||||||
| Cash, cash equivalents and restricted cash, beginning of period | 3,497 | 4,111 | (614) | |||||||||||||||||
| Cash, cash equivalents and restricted cash, end of period | $ | 5,387 | $ | 5,660 | $ | (273) | ||||||||||||||
| (dollars in millions) | ||||||||||||||||||||||||||||||||||||||
| Unaudited | 3 Mos. Ended 9/30/24 | 3 Mos. Ended 9/30/23 | % Change |
9 Mos. Ended 9/30/24 | 9 Mos. Ended 9/30/23 | % Change |
||||||||||||||||||||||||||||||||
| Operating Revenues | ||||||||||||||||||||||||||||||||||||||
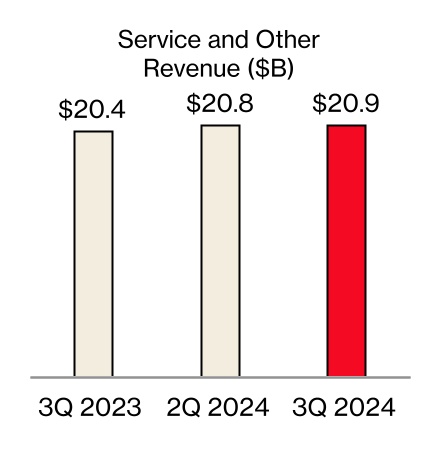
| Service | $ | 19,260 | $ | 18,850 | 2.2 | $ | 57,466 | $ | 55,947 | 2.7 | ||||||||||||||||||||||||||||
| Wireless equipment | 4,478 | 4,902 | (8.6) | 13,111 | 14,210 | (7.7) | ||||||||||||||||||||||||||||||||
| Other | 1,622 | 1,505 | 7.8 | 4,767 | 4,515 | 5.6 | ||||||||||||||||||||||||||||||||
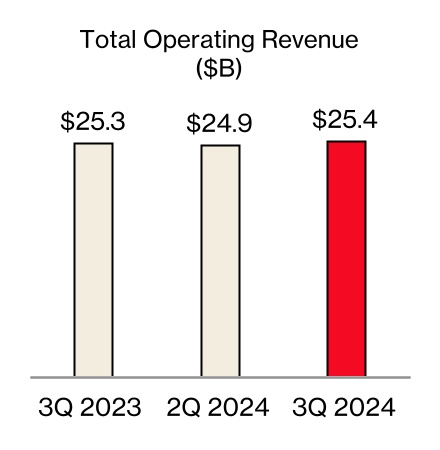
| Total Operating Revenues | 25,360 | 25,257 | 0.4 | 75,344 | 74,672 | 0.9 | ||||||||||||||||||||||||||||||||
| Operating Expenses | ||||||||||||||||||||||||||||||||||||||
| Cost of services | 4,567 | 4,419 | 3.3 | 13,554 | 13,218 | 2.5 | ||||||||||||||||||||||||||||||||
| Cost of wireless equipment | 4,850 | 5,133 | (5.5) | 14,032 | 14,950 | (6.1) | ||||||||||||||||||||||||||||||||
| Selling, general and administrative expense | 4,928 | 4,886 | 0.9 | 15,064 | 14,795 | 1.8 | ||||||||||||||||||||||||||||||||
| Depreciation and amortization expense | 3,411 | 3,272 | 4.2 | 10,114 | 9,733 | 3.9 | ||||||||||||||||||||||||||||||||
| Total Operating Expenses | 17,756 | 17,710 | 0.3 | 52,764 | 52,696 | 0.1 | ||||||||||||||||||||||||||||||||
| Operating Income | $ | 7,604 | $ | 7,547 | 0.8 | $ | 22,580 | $ | 21,976 | 2.7 | ||||||||||||||||||||||||||||
| Operating Income Margin | 30.0 | % | 29.9 | % | 30.0 | % | 29.4 | % | ||||||||||||||||||||||||||||||
Segment EBITDA(1) |
$ | 11,015 | $ | 10,819 | 1.8 | $ | 32,694 | $ | 31,709 | 3.1 | ||||||||||||||||||||||||||||
Segment EBITDA Margin(1) |
43.4 | % | 42.8 | % | 43.4 | % | 42.5 | % | ||||||||||||||||||||||||||||||
| Unaudited | 9/30/24 | 9/30/23 | % Change | |||||||||||||||||||||||||||||||||||
| Connections (‘000): | ||||||||||||||||||||||||||||||||||||||
| Wireless retail postpaid | 94,005 | 92,704 | 1.4 | |||||||||||||||||||||||||||||||||||
| Wireless retail prepaid | 20,206 | 21,420 | (5.7) | |||||||||||||||||||||||||||||||||||
| Total wireless retail | 114,211 | 114,124 | 0.1 | |||||||||||||||||||||||||||||||||||
Wireless retail prepaid excl. SafeLink |
18,780 | 19,123 | (1.8) | |||||||||||||||||||||||||||||||||||
| Wireless retail postpaid phone | 74,624 | 74,407 | 0.3 | |||||||||||||||||||||||||||||||||||
| Fios video | 2,744 | 3,013 | (8.9) | |||||||||||||||||||||||||||||||||||
| Fios internet | 7,088 | 6,923 | 2.4 | |||||||||||||||||||||||||||||||||||
| Fixed wireless access (FWA) broadband | 2,498 | 1,641 | 52.2 | |||||||||||||||||||||||||||||||||||
| Wireline broadband | 7,264 | 7,151 | 1.6 | |||||||||||||||||||||||||||||||||||
| Total broadband | 9,762 | 8,792 | 11.0 | |||||||||||||||||||||||||||||||||||
| Unaudited | 3 Mos. Ended 9/30/24 | 3 Mos. Ended 9/30/23 | % Change |
9 Mos. Ended 9/30/24 | 9 Mos. Ended 9/30/23 | % Change |
||||||||||||||||||||||||||||||||
| Gross Additions (‘000): | ||||||||||||||||||||||||||||||||||||||
| Wireless retail postpaid | 3,088 | 3,152 | (2.0) | 8,972 | 9,290 | (3.4) | ||||||||||||||||||||||||||||||||
| Wireless retail postpaid phone | 1,952 | 1,843 | 5.9 | 5,420 | 5,037 | 7.6 | ||||||||||||||||||||||||||||||||
Net Additions Detail (‘000): |
||||||||||||||||||||||||||||||||||||||
| Wireless retail postpaid | 68 | 251 | (72.9) | 215 | 876 | (75.5) | ||||||||||||||||||||||||||||||||
| Wireless retail prepaid | (69) | (207) | 66.7 | (909) | (862) | (5.5) | ||||||||||||||||||||||||||||||||
| Total wireless retail | (1) | 44 | * | (694) | 14 | * | ||||||||||||||||||||||||||||||||
Wireless retail prepaid excl. SafeLink |
80 | (221) | * | (63) | (815) | 92.3 | ||||||||||||||||||||||||||||||||
| Wireless retail postpaid phone | 81 | (51) | * | (85) | (450) | 81.1 | ||||||||||||||||||||||||||||||||
| Fios video | (74) | (78) | 5.1 | (207) | (221) | 6.3 | ||||||||||||||||||||||||||||||||
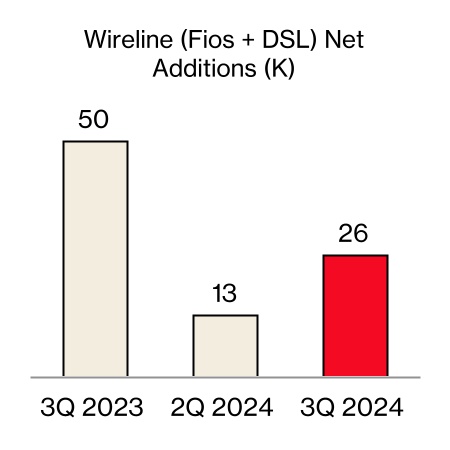
| Fios internet | 39 | 69 | (43.5) | 112 | 183 | (38.8) | ||||||||||||||||||||||||||||||||
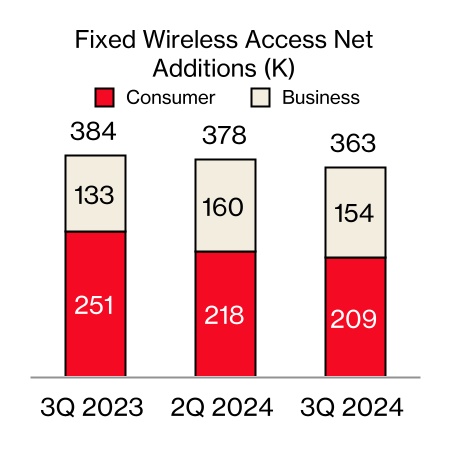
| FWA broadband | 209 | 251 | (16.7) | 630 | 758 | (16.9) | ||||||||||||||||||||||||||||||||
| Wireline broadband | 26 | 53 | (50.9) | 75 | 135 | (44.4) | ||||||||||||||||||||||||||||||||
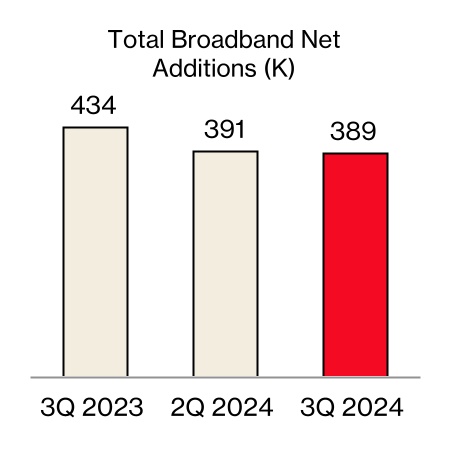
| Total broadband | 235 | 304 | (22.7) | 705 | 893 | (21.1) | ||||||||||||||||||||||||||||||||
| Churn Rate: | ||||||||||||||||||||||||||||||||||||||
| Wireless retail postpaid | 1.07 | % | 1.04 | % | 1.04 | % | 1.01 | % | ||||||||||||||||||||||||||||||
| Wireless retail postpaid phone | 0.84 | % | 0.85 | % | 0.82 | % | 0.82 | % | ||||||||||||||||||||||||||||||
| Wireless retail prepaid | 4.08 | % | 4.39 | % | 4.28 | % | 4.31 | % | ||||||||||||||||||||||||||||||
Wireless retail prepaid excl. SafeLink |
3.72 | % | 3.85 | % | 3.64 | % | 3.76 | % | ||||||||||||||||||||||||||||||
| Wireless retail | 1.61 | % | 1.68 | % | 1.62 | % | 1.65 | % | ||||||||||||||||||||||||||||||
| Revenue Statistics (in millions): | ||||||||||||||||||||||||||||||||||||||
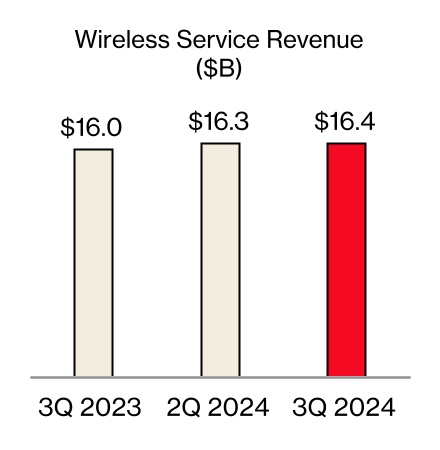
| Wireless service revenue | $ | 16,377 | $ | 15,963 | 2.6 | $ | 48,853 | $ | 47,324 | 3.2 | ||||||||||||||||||||||||||||
| Fios revenue | $ | 2,916 | $ | 2,897 | 0.7 | $ | 8,708 | $ | 8,672 | 0.4 | ||||||||||||||||||||||||||||
| Unaudited | 3 Mos. Ended 9/30/24 | 3 Mos. Ended 9/30/23 | % Change |
9 Mos. Ended 9/30/24 | 9 Mos. Ended 9/30/23 | % Change |
||||||||||||||||||||||||||||||||
| Other Wireless Statistics: | ||||||||||||||||||||||||||||||||||||||
Wireless retail postpaid ARPA(1) |
$ | 139.06 | $ | 133.47 | 4.2 | $ | 137.75 | $ | 131.79 | 4.5 | ||||||||||||||||||||||||||||
Wireless retail postpaid upgrade rate |
3.2 | % | 3.6 | % | ||||||||||||||||||||||||||||||||||
Wireless retail postpaid accounts (‘000)(2) |
32,719 | 32,938 | (0.7) | |||||||||||||||||||||||||||||||||||
Wireless retail postpaid connections per account(2) |
2.87 | 2.81 | 2.1 | |||||||||||||||||||||||||||||||||||
Wireless retail prepaid ARPU(3) |
$ | 30.70 | $ | 31.87 | (3.7) | $ | 30.93 | $ | 31.32 | (1.2) | ||||||||||||||||||||||||||||
Wireless retail prepaid ARPU(3) excl. SafeLink |
$ | 32.41 | $ | 33.13 | (2.2) | $ | 32.38 | $ | 32.72 | (1.0) | ||||||||||||||||||||||||||||
| (dollars in millions) | ||||||||||||||||||||||||||||||||||||||
| Unaudited | 3 Mos. Ended 9/30/24 | 3 Mos. Ended 9/30/23 | % Change |
9 Mos. Ended 9/30/24 | 9 Mos. Ended 9/30/23 | % Change |
||||||||||||||||||||||||||||||||
| Operating Revenues | ||||||||||||||||||||||||||||||||||||||
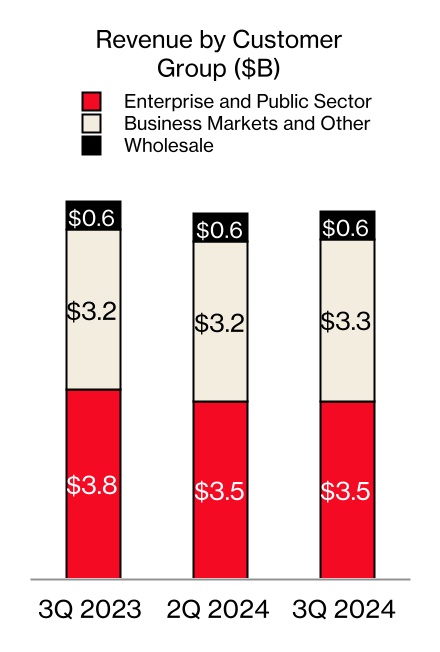
| Enterprise and Public Sector | $ | 3,538 | $ | 3,787 | (6.6) | $ | 10,670 | $ | 11,358 | (6.1) | ||||||||||||||||||||||||||||
| Business Markets and Other | 3,263 | 3,184 | 2.5 | 9,661 | 9,397 | 2.8 | ||||||||||||||||||||||||||||||||
| Wholesale | 550 | 556 | (1.1) | 1,696 | 1,749 | (3.0) | ||||||||||||||||||||||||||||||||
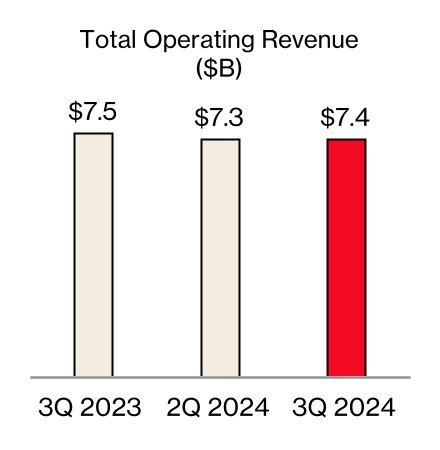
| Total Operating Revenues | 7,351 | 7,527 | (2.3) | 22,027 | 22,504 | (2.1) | ||||||||||||||||||||||||||||||||
| Operating Expenses | ||||||||||||||||||||||||||||||||||||||
| Cost of services | 2,440 | 2,536 | (3.8) | 7,327 | 7,661 | (4.4) | ||||||||||||||||||||||||||||||||
| Cost of wireless equipment | 1,197 | 1,220 | (1.9) | 3,487 | 3,606 | (3.3) | ||||||||||||||||||||||||||||||||
| Selling, general and administrative expense | 2,109 | 2,105 | 0.2 | 6,503 | 6,290 | 3.4 | ||||||||||||||||||||||||||||||||
| Depreciation and amortization expense | 1,040 | 1,127 | (7.7) | 3,246 | 3,324 | (2.3) | ||||||||||||||||||||||||||||||||
| Total Operating Expenses | 6,786 | 6,988 | (2.9) | 20,563 | 20,881 | (1.5) | ||||||||||||||||||||||||||||||||
| Operating Income | $ | 565 | $ | 539 | 4.8 | $ | 1,464 | $ | 1,623 | (9.8) | ||||||||||||||||||||||||||||
| Operating Income Margin | 7.7 | % | 7.2 | % | 6.6 | % | 7.2 | % | ||||||||||||||||||||||||||||||
Segment EBITDA(1) |
$ | 1,605 | $ | 1,666 | (3.7) | $ | 4,710 | $ | 4,947 | (4.8) | ||||||||||||||||||||||||||||
Segment EBITDA Margin(1) |
21.8 | % | 22.1 | % | 21.4 | % | 22.0 | % | ||||||||||||||||||||||||||||||
| Unaudited | 9/30/24 | 9/30/23 | % Change |
|||||||||||||||||||||||||||||||||||
| Connections (‘000): | ||||||||||||||||||||||||||||||||||||||
| Wireless retail postpaid | 30,532 | 29,455 | 3.7 | |||||||||||||||||||||||||||||||||||
| Wireless retail postpaid phone | 18,649 | 18,019 | 3.5 | |||||||||||||||||||||||||||||||||||
| Fios video | 56 | 63 | (11.1) | |||||||||||||||||||||||||||||||||||
| Fios internet | 397 | 383 | 3.7 | |||||||||||||||||||||||||||||||||||
| FWA broadband | 1,698 | 1,038 | 63.6 | |||||||||||||||||||||||||||||||||||
| Wireline broadband | 459 | 461 | (0.4) | |||||||||||||||||||||||||||||||||||
| Total broadband | 2,157 | 1,499 | 43.9 | |||||||||||||||||||||||||||||||||||
| Unaudited | 3 Mos. Ended 9/30/24 | 3 Mos. Ended 9/30/23 | % Change |
9 Mos. Ended 9/30/24 | 9 Mos. Ended 9/30/23 | % Change |
||||||||||||||||||||||||||||||||
| Gross Additions (‘000): | ||||||||||||||||||||||||||||||||||||||
| Wireless retail postpaid | 1,601 | 1,618 | (1.1) | 4,711 | 4,815 | (2.2) | ||||||||||||||||||||||||||||||||
| Wireless retail postpaid phone | 784 | 761 | 3.0 | 2,249 | 2,251 | (0.1) | ||||||||||||||||||||||||||||||||
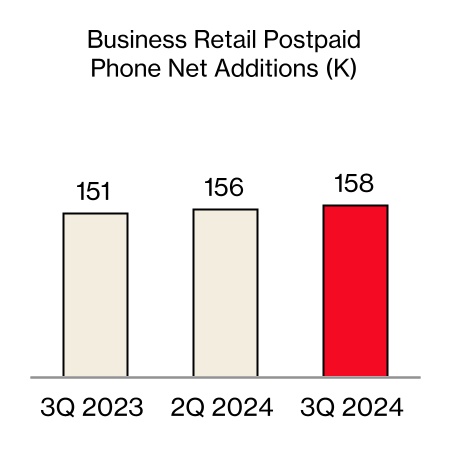
| Net Additions Detail (‘000): | ||||||||||||||||||||||||||||||||||||||
| Wireless retail postpaid | 281 | 330 | (14.8) | 727 | 950 | (23.5) | ||||||||||||||||||||||||||||||||
| Wireless retail postpaid phone | 158 | 151 | 4.6 | 404 | 431 | (6.3) | ||||||||||||||||||||||||||||||||
| Fios video | (2) | (1) | * | (5) | (4) | (25.0) | ||||||||||||||||||||||||||||||||
| Fios internet | 4 | 3 | 33.3 | 12 | 10 | 20.0 | ||||||||||||||||||||||||||||||||
| FWA broadband | 154 | 133 | 15.8 | 465 | 403 | 15.4 | ||||||||||||||||||||||||||||||||
| Wireline broadband | — | (3) | * | (1) | (7) | 85.7 | ||||||||||||||||||||||||||||||||
| Total broadband | 154 | 130 | 18.5 | 464 | 396 | 17.2 | ||||||||||||||||||||||||||||||||
| Churn Rate: | ||||||||||||||||||||||||||||||||||||||
| Wireless retail postpaid | 1.45 | % | 1.47 | % | 1.47 | % | 1.48 | % | ||||||||||||||||||||||||||||||
| Wireless retail postpaid phone | 1.12 | % | 1.14 | % | 1.12 | % | 1.13 | % | ||||||||||||||||||||||||||||||
| Revenue Statistics (in millions): | ||||||||||||||||||||||||||||||||||||||
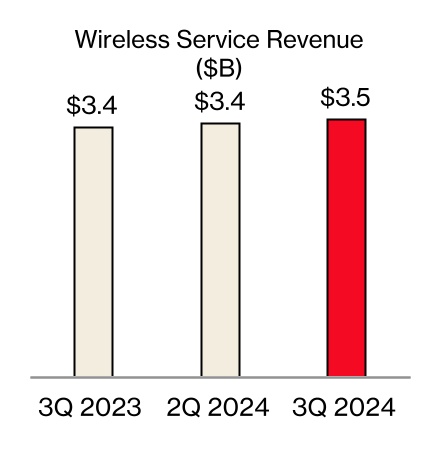
| Wireless service revenue | $ | 3,466 | $ | 3,367 | 2.9 | $ | 10,276 | $ | 10,008 | 2.7 | ||||||||||||||||||||||||||||
| Fios revenue | $ | 314 | $ | 308 | 1.9 | $ | 938 | $ | 923 | 1.6 | ||||||||||||||||||||||||||||
| Other Operating Statistics: | ||||||||||||||||||||||||||||||||||||||
| Wireless retail postpaid upgrade rate | 2.5 | % | 2.9 | % | ||||||||||||||||||||||||||||||||||
| Unaudited | 9/30/24 | 9/30/23 | % Change | |||||||||||||||||||||||||||||||||||
| Connections (‘000) | ||||||||||||||||||||||||||||||||||||||
| Retail postpaid | 124,537 | 122,159 | 1.9 | |||||||||||||||||||||||||||||||||||
Retail prepaid |
20,206 | 21,420 | (5.7) | |||||||||||||||||||||||||||||||||||
| Total retail | 144,743 | 143,579 | 0.8 | |||||||||||||||||||||||||||||||||||
Retail prepaid excl. SafeLink |
18,780 | 19,123 | (1.8) | |||||||||||||||||||||||||||||||||||
| Retail postpaid phone | 93,273 | 92,426 | 0.9 | |||||||||||||||||||||||||||||||||||
| Unaudited | 3 Mos. Ended 9/30/24 | 3 Mos. Ended 9/30/23 | % Change |
9 Mos. Ended 9/30/24 | 9 Mos. Ended 9/30/23 | % Change |
||||||||||||||||||||||||||||||||
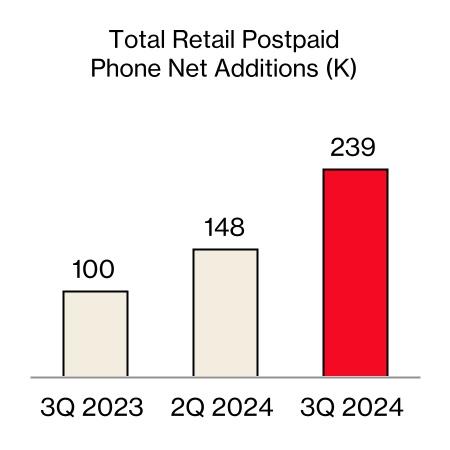
| Net Additions Detail (‘000) | ||||||||||||||||||||||||||||||||||||||
| Retail postpaid phone | 239 | 100 | * | 319 | (19) | * | ||||||||||||||||||||||||||||||||
| Retail postpaid | 349 | 581 | (39.9) | 942 | 1,826 | (48.4) | ||||||||||||||||||||||||||||||||
| Retail prepaid | (69) | (207) | 66.7 | (909) | (862) | (5.5) | ||||||||||||||||||||||||||||||||
| Total retail | 280 | 374 | (25.1) | 33 | 964 | (96.6) | ||||||||||||||||||||||||||||||||
| Retail prepaid excl. SafeLink | 80 | (221) | * | (63) | (815) | 92.3 | ||||||||||||||||||||||||||||||||
| Account Statistics | ||||||||||||||||||||||||||||||||||||||
Retail postpaid accounts (‘000)(1) |
34,746 | 34,855 | (0.3) | |||||||||||||||||||||||||||||||||||
Retail postpaid connections per account(1) |
3.58 | 3.50 | 2.3 | |||||||||||||||||||||||||||||||||||
Retail postpaid ARPA(2) |
$ | 162.05 | $ | 156.13 | 3.8 | $ | 160.50 | $ | 154.30 | 4.0 | ||||||||||||||||||||||||||||
Retail prepaid ARPU(3) |
$ | 30.70 | $ | 31.87 | (3.7) | $ | 30.93 | $ | 31.32 | (1.2) | ||||||||||||||||||||||||||||
Retail prepaid ARPU(3) excl. SafeLink |
$ | 32.41 | $ | 33.13 | (2.2) | $ | 32.38 | $ | 32.72 | (1.0) | ||||||||||||||||||||||||||||
| Churn Detail | ||||||||||||||||||||||||||||||||||||||
| Retail postpaid phone | 0.89 | % | 0.90 | % | 0.88 | % | 0.88 | % | ||||||||||||||||||||||||||||||
| Retail postpaid | 1.16 | % | 1.15 | % | 1.14 | % | 1.12 | % | ||||||||||||||||||||||||||||||
| Retail prepaid | 4.08 | % | 4.39 | % | 4.28 | % | 4.31 | % | ||||||||||||||||||||||||||||||
Retail prepaid excl. SafeLink |
3.72 | % | 3.85 | % | 3.64 | % | 3.76 | % | ||||||||||||||||||||||||||||||
| Retail | 1.57 | % | 1.63 | % | 1.59 | % | 1.61 | % | ||||||||||||||||||||||||||||||
| Retail Postpaid Connection Statistics | ||||||||||||||||||||||||||||||||||||||
| Upgrade rate | 3.0 | % | 3.4 | % | ||||||||||||||||||||||||||||||||||
Revenue Statistics (in millions)(4) |
||||||||||||||||||||||||||||||||||||||
| FWA revenue | $ | 562 | $ | 347 | 62.0 | $ | 1,528 | $ | 899 | 70.0 | ||||||||||||||||||||||||||||
| Wireless service | $ | 19,843 | $ | 19,330 | 2.7 | $ | 59,129 | $ | 57,332 | 3.1 | ||||||||||||||||||||||||||||
| Wireless equipment | 5,343 | 5,813 | (8.1) | 15,702 | 16,850 | (6.8) | ||||||||||||||||||||||||||||||||
| Wireless other | 1,662 | 1,507 | 10.3 | 4,847 | 4,508 | 7.5 | ||||||||||||||||||||||||||||||||
| Total Wireless | $ | 26,848 | $ | 26,650 | 0.7 | $ | 79,678 | $ | 78,690 | 1.3 | ||||||||||||||||||||||||||||
Consolidated EBITDA and Consolidated Adjusted EBITDA |
|||||||||||||||||||||||||||||||||||||||||
| (dollars in millions) | |||||||||||||||||||||||||||||||||||||||||
| Unaudited | 3 Mos. Ended 9/30/24 | 3 Mos. Ended 6/30/24 | 3 Mos. Ended 3/31/24 | 3 Mos. Ended 12/31/23 | 3 Mos. Ended 9/30/23 | 3 Mos. Ended 6/30/23 | 3 Mos. Ended 3/31/23 | ||||||||||||||||||||||||||||||||||
| Consolidated Net Income (Loss) | $ | 3,411 | $ | 4,702 | $ | 4,722 | $ | (2,573) | $ | 4,884 | $ | 4,766 | $ | 5,018 | |||||||||||||||||||||||||||
| Add: | |||||||||||||||||||||||||||||||||||||||||
| Provision for income taxes | 891 | 1,332 | 1,353 | 756 | 1,308 | 1,346 | 1,482 | ||||||||||||||||||||||||||||||||||
| Interest expense | 1,672 | 1,698 | 1,635 | 1,599 | 1,433 | 1,285 | 1,207 | ||||||||||||||||||||||||||||||||||
Depreciation and amortization expense(1) |
4,458 | 4,483 | 4,445 | 4,516 | 4,431 | 4,359 | 4,318 | ||||||||||||||||||||||||||||||||||
| Consolidated EBITDA | $ | 10,432 | $ | 12,215 | $ | 12,155 | $ | 4,298 | $ | 12,056 | $ | 11,756 | $ | 12,025 | |||||||||||||||||||||||||||
| Add/(subtract): | |||||||||||||||||||||||||||||||||||||||||
Other (income) expense, net(2) |
$ | (72) | $ | 72 | $ | (198) | $ | 807 | $ | (170) | $ | (210) | $ | (114) | |||||||||||||||||||||||||||
| Equity in (earnings) losses of unconsolidated businesses | 24 | 14 | 9 | 11 | 18 | 33 | (9) | ||||||||||||||||||||||||||||||||||
| Severance charges | 1,733 | — | — | 296 | — | 237 | — | ||||||||||||||||||||||||||||||||||
| Asset and business rationalization | 374 | — | — | 325 | — | 155 | — | ||||||||||||||||||||||||||||||||||
| Legacy legal matter | — | — | 106 | — | — | — | — | ||||||||||||||||||||||||||||||||||
| Verizon Business Group goodwill impairment | — | — | — | 5,841 | — | — | — | ||||||||||||||||||||||||||||||||||
| Legal settlement | — | — | — | 100 | — | — | — | ||||||||||||||||||||||||||||||||||
| Business transformation costs | — | — | — | — | 176 | — | — | ||||||||||||||||||||||||||||||||||
| Non-strategic business shutdown | — | — | — | — | 158 | — | — | ||||||||||||||||||||||||||||||||||
| 2,059 | 86 | (83) | 7,380 | 182 | 215 | (123) | |||||||||||||||||||||||||||||||||||
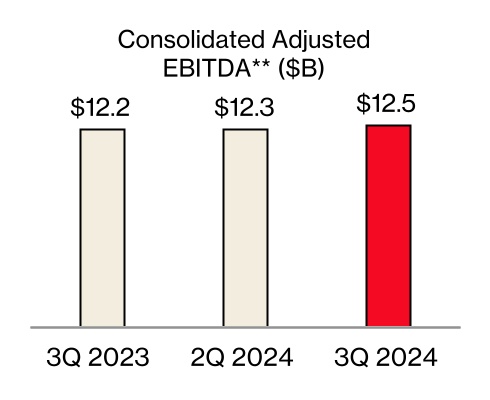
| Consolidated Adjusted EBITDA | $ | 12,491 | $ | 12,301 | $ | 12,072 | $ | 11,678 | $ | 12,238 | $ | 11,971 | $ | 11,902 | |||||||||||||||||||||||||||
| Footnotes: | |||||||||||||||||||||||||||||||||||||||||
(1) Includes Amortization of acquisition-related intangible assets and a portion of the Non-strategic business shutdown, where applicable. |
|||||||||||||||||||||||||||||||||||||||||
(2) Includes Pension and benefits remeasurement adjustments, where applicable. |
|||||||||||||||||||||||||||||||||||||||||
| Consolidated EBITDA and Consolidated Adjusted EBITDA (LTM) | |||||||||||||||||
(dollars in millions) |
|||||||||||||||||
| Unaudited | 12 Mos. Ended 9/30/24 | 12 Mos. Ended 6/30/24 | 12 Mos. Ended 12/31/23 | ||||||||||||||
| Consolidated Net Income | $ | 10,262 | $ | 11,735 | $ | 12,095 | |||||||||||
| Add: | |||||||||||||||||
| Provision for income taxes | 4,332 | 4,749 | 4,892 | ||||||||||||||
| Interest expense | 6,604 | 6,365 | 5,524 | ||||||||||||||
Depreciation and amortization expense(1) |
17,902 | 17,875 | 17,624 | ||||||||||||||
| Consolidated EBITDA | $ | 39,100 | $ | 40,724 | $ | 40,135 | |||||||||||
| Add/(subtract): | |||||||||||||||||
Other expense, net(2) |
$ | 609 | $ | 511 | $ | 313 | |||||||||||
Equity in losses of unconsolidated businesses |
58 | 52 | 53 | ||||||||||||||
| Severance charges | 2,029 | 296 | 533 | ||||||||||||||
| Asset and business rationalization | 699 | 325 | 480 | ||||||||||||||
| Legacy legal matter | 106 | 106 | — | ||||||||||||||
| Verizon Business Group goodwill impairment | 5,841 | 5,841 | 5,841 | ||||||||||||||
| Legal settlement | 100 | 100 | 100 | ||||||||||||||
| Business transformation costs | — | 176 | 176 | ||||||||||||||
| Non-strategic business shutdown | — | 158 | 158 | ||||||||||||||
| 9,442 | 7,565 | 7,654 | |||||||||||||||
| Consolidated Adjusted EBITDA | $ | 48,542 | $ | 48,289 | $ | 47,789 | |||||||||||
| Footnotes: | |||||||||||||||||
| (1) Includes Amortization of acquisition-related intangible assets and a portion of the Non-strategic business shutdown, where applicable. | |||||||||||||||||
(2) Includes Pension and benefits remeasurement adjustments, where applicable. |
|||||||||||||||||
| Net Unsecured Debt and Net Unsecured Debt to Consolidated Adjusted EBITDA Ratio | ||||||||||||||||||||||||||
| (dollars in millions) | ||||||||||||||||||||||||||
| Unaudited | 9/30/24 | 6/30/24 | 12/31/23 | 9/30/23 | ||||||||||||||||||||||
| Debt maturing within one year | $ | 21,763 | $ | 23,255 | $ | 12,973 | $ | 12,950 | ||||||||||||||||||
| Long-term debt | 128,878 | 126,022 | 137,701 | 134,441 | ||||||||||||||||||||||
| Total Debt | 150,641 | 149,277 | 150,674 | 147,391 | ||||||||||||||||||||||
| Less Secured debt | 24,272 | 24,015 | 22,183 | 20,951 | ||||||||||||||||||||||
| Unsecured Debt | 126,369 | 125,262 | 128,491 | 126,440 | ||||||||||||||||||||||
| Less Cash and cash equivalents | 4,987 | 2,432 | 2,065 | 4,210 | ||||||||||||||||||||||
Net Unsecured Debt |
$ | 121,382 | $ | 122,830 | $ | 126,426 | $ | 122,230 | ||||||||||||||||||
| Consolidated Net Income (LTM) | $ | 10,262 | $ | 12,095 | ||||||||||||||||||||||
| Unsecured Debt to Consolidated Net Income Ratio | 12.3 | x | 10.6 | x | ||||||||||||||||||||||
| Consolidated Adjusted EBITDA (LTM) | $ | 48,542 | $ | 47,789 | ||||||||||||||||||||||
| Net Unsecured Debt to Consolidated Adjusted EBITDA Ratio | 2.5 | x | 2.6 | x | ||||||||||||||||||||||
| Adjusted Earnings per Common Share (Adjusted EPS) | ||||||||||||||||||||||||||||||||
(dollars in millions, except per share amounts) | ||||||||||||||||||||||||||||||||
| Unaudited | 3 Mos. Ended 9/30/24 | 3 Mos. Ended 9/30/23 | ||||||||||||||||||||||||||||||
| Pre-tax | Tax | After-Tax | Pre-tax | Tax | After-Tax | |||||||||||||||||||||||||||
| EPS | $ | 0.78 | $ | 1.13 | ||||||||||||||||||||||||||||
| Amortization of acquisition-related intangible assets | $ | 186 | $ | (46) | $ | 140 | 0.03 | $ | 224 | $ | (56) | $ | 168 | 0.04 | ||||||||||||||||||
| Severance charges | 1,733 | (429) | 1,304 | 0.31 | — | — | — | — | ||||||||||||||||||||||||
| Asset and business rationalization | 374 | (90) | 284 | 0.07 | — | — | — | — | ||||||||||||||||||||||||
| Business transformation costs | — | — | — | — | — | 176 | (45) | 131 | 0.03 | |||||||||||||||||||||||
| Non-strategic business shutdown | — | — | — | — | 179 | (83) | 96 | 0.02 | ||||||||||||||||||||||||
| $ | 2,293 | $ | (565) | $ | 1,728 | $ | 0.41 | $ | 579 | $ | (184) | $ | 395 | $ | 0.09 | |||||||||||||||||
| Adjusted EPS | $ | 1.19 | $ | 1.22 | ||||||||||||||||||||||||||||
Footnote: |
||||||||||||||||||||||||||||||||
Adjusted EPS may not add due to rounding. |
||||||||||||||||||||||||||||||||
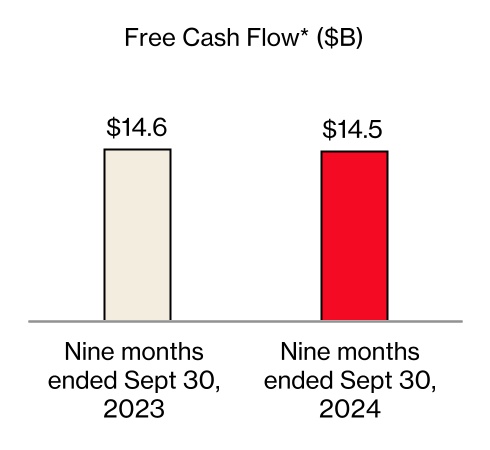
| Free Cash Flow | ||||||||||||||
| (dollars in millions) | ||||||||||||||
| Unaudited | 9 Mos. Ended 9/30/24 | 9 Mos. Ended 9/30/23 | ||||||||||||
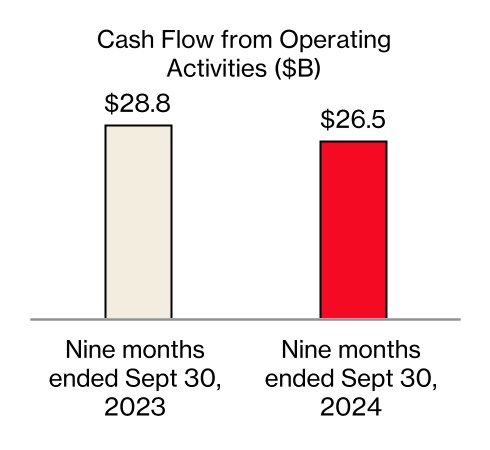
| Net Cash Provided by Operating Activities | $ | 26,480 | $ | 28,798 | ||||||||||
| Capital expenditures (including capitalized software) | (12,019) | (14,164) | ||||||||||||
| Free Cash Flow | $ | 14,461 | $ | 14,634 | ||||||||||
| Segment EBITDA and Segment EBITDA Margin | ||||||||||||||||||||||||||
| Consumer | ||||||||||||||||||||||||||
| (dollars in millions) | ||||||||||||||||||||||||||
| Unaudited | 3 Mos. Ended 9/30/24 | 3 Mos. Ended 9/30/23 | 9 Mos. Ended 9/30/24 | 9 Mos. Ended 9/30/23 | ||||||||||||||||||||||
| Operating Income | $ | 7,604 | $ | 7,547 | $ | 22,580 | $ | 21,976 | ||||||||||||||||||
| Add Depreciation and amortization expense | 3,411 | 3,272 | 10,114 | 9,733 | ||||||||||||||||||||||
| Segment EBITDA | $ | 11,015 | $ | 10,819 | $ | 32,694 | $ | 31,709 | ||||||||||||||||||
| Year over year change % | 1.8 | % | 3.1 | % | ||||||||||||||||||||||
| Total operating revenues | $ | 25,360 | $ | 25,257 | $ | 75,344 | $ | 74,672 | ||||||||||||||||||
| Operating Income Margin | 30.0 | % | 29.9 | % | 30.0 | % | 29.4 | % | ||||||||||||||||||
| Segment EBITDA Margin | 43.4 | % | 42.8 | % | 43.4 | % | 42.5 | % | ||||||||||||||||||
| Business | ||||||||||||||||||||||||||
| (dollars in millions) | ||||||||||||||||||||||||||
| Unaudited | 3 Mos. Ended 9/30/24 | 3 Mos. Ended 9/30/23 | 9 Mos. Ended 9/30/24 | 9 Mos. Ended 9/30/23 | ||||||||||||||||||||||
| Operating Income | $ | 565 | $ | 539 | $ | 1,464 | $ | 1,623 | ||||||||||||||||||
| Add Depreciation and amortization expense | 1,040 | 1,127 | 3,246 | 3,324 | ||||||||||||||||||||||
| Segment EBITDA | $ | 1,605 | $ | 1,666 | $ | 4,710 | $ | 4,947 | ||||||||||||||||||
| Year over year change % | (3.7) | % | (4.8) | % | ||||||||||||||||||||||
| Total operating revenues | $ | 7,351 | $ | 7,527 | $ | 22,027 | $ | 22,504 | ||||||||||||||||||
| Operating Income Margin | 7.7 | % | 7.2 | % | 6.6 | % | 7.2 | % | ||||||||||||||||||
| Segment EBITDA Margin | 21.8 | % | 22.1 | % | 21.4 | % | 22.0 | % | ||||||||||||||||||


| (dollars in millions) | |||||||||||||||||||||||||||||||||||||||||||||||
| Unaudited | 3 Mos. Ended 9/30/24 | 3 Mos. Ended 6/30/24 | 3 Mos. Ended 3/31/24 | 3 Mos. Ended 12/31/23 | 3 Mos. Ended 9/30/23 | 3 Mos. Ended 6/30/23 | 3 Mos. Ended 3/31/23 | 3 Mos. Ended 12/31/22 | |||||||||||||||||||||||||||||||||||||||
| Consolidated Net Income (Loss) | $ | 3,411 | $ | 4,702 | $ | 4,722 | $ | (2,573) | $ | 4,884 | $ | 4,766 | $ | 5,018 | $ | 6,698 | |||||||||||||||||||||||||||||||
| Add: | |||||||||||||||||||||||||||||||||||||||||||||||
| Provision for income taxes | 891 | 1,332 | 1,353 | 756 | 1,308 | 1,346 | 1,482 | 2,113 | |||||||||||||||||||||||||||||||||||||||
| Interest expense | 1,672 | 1,698 | 1,635 | 1,599 | 1,433 | 1,285 | 1,207 | 1,105 | |||||||||||||||||||||||||||||||||||||||
Depreciation and amortization expense(1) |
4,458 | 4,483 | 4,445 | 4,516 | 4,431 | 4,359 | 4,318 | 4,218 | |||||||||||||||||||||||||||||||||||||||
| Consolidated EBITDA | $ | 10,432 | $ | 12,215 | $ | 12,155 | $ | 4,298 | $ | 12,056 | $ | 11,756 | $ | 12,025 | $ | 14,134 | |||||||||||||||||||||||||||||||
| Add/(subtract): | |||||||||||||||||||||||||||||||||||||||||||||||
Other (income) expense, net(2) |
$ | (72) | $ | 72 | $ | (198) | $ | 807 | $ | (170) | $ | (210) | $ | (114) | $ | (2,687) | |||||||||||||||||||||||||||||||
| Equity in (earnings) losses of unconsolidated businesses | 24 | 14 | 9 | 11 | 18 | 33 | (9) | (4) | |||||||||||||||||||||||||||||||||||||||
| Severance charges | 1,733 | — | — | 296 | — | 237 | — | 304 | |||||||||||||||||||||||||||||||||||||||
| Asset and business rationalization | 374 | — | — | 325 | — | 155 | — | — | |||||||||||||||||||||||||||||||||||||||
| Legacy legal matter | — | — | 106 | — | — | — | — | — | |||||||||||||||||||||||||||||||||||||||
| Verizon Business Group goodwill impairment | — | — | — | 5,841 | — | — | — | — | |||||||||||||||||||||||||||||||||||||||
| Legal settlement | — | — | — | 100 | — | — | — | — | |||||||||||||||||||||||||||||||||||||||
| Business transformation costs | — | — | — | — | 176 | — | — | — | |||||||||||||||||||||||||||||||||||||||
| Non-strategic business shutdown | — | — | — | — | 158 | — | — | — | |||||||||||||||||||||||||||||||||||||||
| 2,059 | 86 | (83) | 7,380 | 182 | 215 | (123) | (2,387) | ||||||||||||||||||||||||||||||||||||||||
| Consolidated Adjusted EBITDA | $ | 12,491 | $ | 12,301 | $ | 12,072 | $ | 11,678 | $ | 12,238 | $ | 11,971 | $ | 11,902 | $ | 11,747 | |||||||||||||||||||||||||||||||
| (dollars in millions) | |||||||||||||||||
| 12 Mos. Ended | 12 Mos. Ended | 12 Mos. Ended | |||||||||||||||
| Unaudited | 9/30/24 | 6/30/24 | 9/30/23 | ||||||||||||||
| Consolidated Net Income | $ | 10,262 | $ | 11,735 | $ | 21,366 | |||||||||||
| Add: | |||||||||||||||||
| Provision for income taxes | 4,332 | 4,749 | 6,249 | ||||||||||||||
| Interest expense | 6,604 | 6,365 | 5,030 | ||||||||||||||
Depreciation and amortization expense(1) |
17,902 | 17,875 | 17,326 | ||||||||||||||
| Consolidated EBITDA | $ | 39,100 | $ | 40,724 | $ | 49,971 | |||||||||||
| Add/(subtract): | |||||||||||||||||
Other (income) expense, net(2) |
$ | 609 | $ | 511 | $ | (3,181) | |||||||||||
| Equity in losses of unconsolidated businesses | 58 | 52 | 38 | ||||||||||||||
| Severance charges | 2,029 | 296 | 541 | ||||||||||||||
| Asset and business rationalization | 699 | 325 | 155 | ||||||||||||||
| Legacy legal matter | 106 | 106 | — | ||||||||||||||
| Verizon Business Group goodwill impairment | 5,841 | 5,841 | — | ||||||||||||||
| Legal settlement | 100 | 100 | — | ||||||||||||||
| Business transformation costs | — | 176 | 176 | ||||||||||||||
| Non-strategic business shutdown | — | 158 | 158 | ||||||||||||||
| 9,442 | 7,565 | (2,113) | |||||||||||||||
| Consolidated Adjusted EBITDA | $ | 48,542 | $ | 48,289 | $ | 47,858 | |||||||||||
| (dollars in millions) | ||||||||||||||||||||
| Unaudited | 9/30/24 | 6/30/24 | 9/30/23 | |||||||||||||||||
| Debt maturing within one year | $ | 21,763 | $ | 23,255 | $ | 12,950 | ||||||||||||||
| Long-term debt | 128,878 | 126,022 | 134,441 | |||||||||||||||||
| Total Debt | 150,641 | 149,277 | 147,391 | |||||||||||||||||
| Less Secured debt | 24,272 | 24,015 | 20,951 | |||||||||||||||||
| Unsecured Debt | 126,369 | 125,262 | 126,440 | |||||||||||||||||
| Less Cash and cash equivalents | 4,987 | 2,432 | 4,210 | |||||||||||||||||
Net Unsecured Debt |
$ | 121,382 | $ | 122,830 | $ | 122,230 | ||||||||||||||
| Consolidated Net Income (LTM) | $ | 10,262 | $ | 11,735 | $ | 21,366 | ||||||||||||||
| Consolidated Adjusted EBITDA (LTM) | $ | 48,542 | $ | 48,289 | $ | 47,858 | ||||||||||||||
| Unsecured Debt to Consolidated Net Income Ratio | 12.3 | x | 10.7 | x | 5.9 | x | ||||||||||||||
| Net Unsecured Debt to Consolidated Adjusted EBITDA Ratio | 2.5 | x | 2.5 | x | 2.6 | x | ||||||||||||||
| Net Unsecured Debt - Quarter over quarter change | $ | (1,448) | ||||||||||||||||||
| Net Unsecured Debt - Year over year change | $ | (848) | ||||||||||||||||||
Net Unsecured Debt to Consolidated Adjusted EBITDA Ratio - Quarter over quarter change |
— | x | ||||||||||||||||||
| Net Unsecured Debt to Consolidated Adjusted EBITDA Ratio - Year over year change | (0.1) | x | ||||||||||||||||||
(dollars in millions, except per share amounts) | ||||||||||||||||||||||||||||||||
| Unaudited | 3 Mos. Ended 9/30/24 | 3 Mos. Ended 9/30/23 | ||||||||||||||||||||||||||||||
| Pre-tax | Tax | After-Tax | Pre-tax | Tax | After-Tax | |||||||||||||||||||||||||||
| EPS | $ | 0.78 | $ | 1.13 | ||||||||||||||||||||||||||||
| Amortization of acquisition-related intangible assets | $ | 186 | $ | (46) | $ | 140 | 0.03 | $ | 224 | $ | (56) | $ | 168 | 0.04 | ||||||||||||||||||
| Severance charges | 1,733 | (429) | 1,304 | 0.31 | — | — | — | — | ||||||||||||||||||||||||
| Asset and business rationalization | 374 | (90) | 284 | 0.07 | — | — | — | — | ||||||||||||||||||||||||
| Business transformation costs | — | — | — | — | 176 | (45) | 131 | 0.03 | ||||||||||||||||||||||||
| Non-strategic business shutdown | — | — | — | — | 179 | (83) | 96 | 0.02 | ||||||||||||||||||||||||
| $ | 2,293 | $ | (565) | $ | 1,728 | $ | 0.41 | $ | 579 | $ | (184) | $ | 395 | $ | 0.09 | |||||||||||||||||
| Adjusted EPS | $ | 1.19 | $ | 1.22 | ||||||||||||||||||||||||||||
| Free Cash Flow | ||||||||||||||
| (dollars in millions) | ||||||||||||||
| Unaudited | 9 Mos. Ended 9/30/24 | 9 Mos. Ended 9/30/23 | ||||||||||||
| Net Cash Provided by Operating Activities | $ | 26,480 | $ | 28,798 | ||||||||||
| Capital expenditures (including capitalized software) | (12,019) | (14,164) | ||||||||||||
| Free Cash Flow | $ | 14,461 | $ | 14,634 | ||||||||||
| Consolidated Operating Expenses Excluding Depreciation and Amortization and Special Items | ||||||||||||||
| (dollars in millions) | ||||||||||||||
| Unaudited | 3 Mos. Ended 9/30/24 | 3 Mos. Ended 9/30/23 | ||||||||||||
| Consolidated Operating Expenses | $ | 27,404 | $ | 25,863 | ||||||||||
Depreciation and amortization expense(1) |
4,458 | 4,431 | ||||||||||||
| Severance charges | 1,733 | — | ||||||||||||
| Asset and business rationalization | 374 | — | ||||||||||||
| Business transformation costs | — | 176 | ||||||||||||
| Non-strategic business shutdown | — | 158 | ||||||||||||
| Consolidated Operating Expenses Excluding Depreciation and Amortization and Special Items | $ | 20,839 | $ | 21,098 | ||||||||||
| Year over year change % | (1.2) | % | ||||||||||||
| (dollars in millions) | ||||||||||||||
| Unaudited | 3 Mos. Ended 9/30/24 | 3 Mos. Ended 9/30/23 | ||||||||||||
| Operating Income | $ | 7,604 | $ | 7,547 | ||||||||||
| Add Depreciation and amortization expense | 3,411 | 3,272 | ||||||||||||
| Segment EBITDA | $ | 11,015 | $ | 10,819 | ||||||||||
| Year over year change % | 1.8 | % | ||||||||||||
| Total operating revenues | $ | 25,360 | $ | 25,257 | ||||||||||
| Operating Income Margin | 30.0 | % | 29.9 | % | ||||||||||
| Segment EBITDA Margin | 43.4 | % | 42.8 | % | ||||||||||
| (dollars in millions) | ||||||||||||||
| Unaudited | 3 Mos. Ended 9/30/24 | 3 Mos. Ended 9/30/23 | ||||||||||||
| Operating Income | $ | 565 | $ | 539 | ||||||||||
| Add Depreciation and amortization expense | 1,040 | 1,127 | ||||||||||||
| Segment EBITDA | $ | 1,605 | $ | 1,666 | ||||||||||
| Year over year change % | (3.7) | % | ||||||||||||
| Total operating revenues | $ | 7,351 | $ | 7,527 | ||||||||||
| Operating Income Margin | 7.7 | % | 7.2 | % | ||||||||||
| Segment EBITDA Margin | 21.8 | % | 22.1 | % | ||||||||||