| Delaware | 1-8606 | 23-2259884 | |||||||||
| (State or other jurisdiction of incorporation) |
(Commission File Number) | (I.R.S. Employer Identification No.) | |||||||||
| 1095 Avenue of the Americas | 10036 | ||||||||||
| New York, | New York | ||||||||||
| (Address of principal executive offices) | (Zip Code) | ||||||||||
| Title of Each Class | Trading Symbol(s) | Name of Each Exchange on Which Registered | ||||||||||||
| Common Stock, par value $0.10 | VZ | New York Stock Exchange | ||||||||||||
| Common Stock, par value $0.10 | VZ | The Nasdaq Global Select Market | ||||||||||||
| 0.875% Notes due 2025 | VZ 25 | New York Stock Exchange | ||||||||||||
| 3.25% Notes due 2026 | VZ 26 | New York Stock Exchange | ||||||||||||
| 1.375% Notes due 2026 | VZ 26B | New York Stock Exchange | ||||||||||||
| 0.875% Notes due 2027 | VZ 27E | New York Stock Exchange | ||||||||||||
| 1.375% Notes due 2028 | VZ 28 | New York Stock Exchange | ||||||||||||
| 1.125% Notes due 2028 | VZ 28A | New York Stock Exchange | ||||||||||||
| 2.350% Fixed Rate Notes due 2028 | VZ 28C | New York Stock Exchange | ||||||||||||
| 1.875% Notes due 2029 | VZ 29B | New York Stock Exchange | ||||||||||||
| 0.375% Notes due 2029 | VZ 29D | New York Stock Exchange | ||||||||||||
| 1.250% Notes due 2030 | VZ 30 | New York Stock Exchange | ||||||||||||
| 1.875% Notes due 2030 | VZ 30A | New York Stock Exchange | ||||||||||||
| 4.250% Notes due 2030 | VZ 30D | New York Stock Exchange | ||||||||||||
| 2.625% Notes due 2031 | VZ 31 | New York Stock Exchange | ||||||||||||
| 2.500% Notes due 2031 | VZ 31A | New York Stock Exchange | ||||||||||||
| 3.000% Fixed Rate Notes due 2031 | VZ 31D | New York Stock Exchange | ||||||||||||
| 0.875% Notes due 2032 | VZ 32 | New York Stock Exchange | ||||||||||||
| 0.750% Notes due 2032 | VZ 32A | New York Stock Exchange | ||||||||||||
| 3.500% Notes due 2032 | VZ 32B | New York Stock Exchange | ||||||||||||
| 1.300% Notes due 2033 | VZ 33B | New York Stock Exchange | ||||||||||||
| 4.75% Notes due 2034 | VZ 34 | New York Stock Exchange | ||||||||||||
| 4.750% Notes due 2034 | VZ 34C | New York Stock Exchange | ||||||||||||
| 3.125% Notes due 2035 | VZ 35 | New York Stock Exchange | ||||||||||||
| 1.125% Notes due 2035 | VZ 35A | New York Stock Exchange | ||||||||||||
| 3.375% Notes due 2036 | VZ 36A | New York Stock Exchange | ||||||||||||
| 3.750% Notes due 2036 | VZ 36B | New York Stock Exchange | ||||||||||||
| 2.875% Notes due 2038 | VZ 38B | New York Stock Exchange | ||||||||||||
| 1.875% Notes due 2038 | VZ 38C | New York Stock Exchange | ||||||||||||
| 1.500% Notes due 2039 | VZ 39C | New York Stock Exchange | ||||||||||||
| 3.50% Fixed Rate Notes due 2039 | VZ 39D | New York Stock Exchange | ||||||||||||
| 1.850% Notes due 2040 | VZ 40 | New York Stock Exchange | ||||||||||||
| 3.850% Fixed Rate Notes due 2041 | VZ 41C | New York Stock Exchange | ||||||||||||
| (d) Exhibits. | ||||||||
| Exhibit Number |
Description | |||||||
Press release and financial tables, dated July 22, 2024, issued by Verizon Communications Inc. |
||||||||
Commentary discussing financial and operating results of Verizon Communications Inc. for the second quarter of 2024. |
||||||||
| 104 | Cover Page Interactive Data File (formatted as inline XBRL). | |||||||
| Verizon Communications Inc. | ||||||||||||||||||||
| (Registrant) | ||||||||||||||||||||
| Date: | July 22, 2024 | /s/ Mary-Lee Stillwell | ||||||||||||||||||
| Mary-Lee Stillwell | ||||||||||||||||||||
| Senior Vice President and Controller | ||||||||||||||||||||

FOR IMMEDIATE RELEASE |
Media contacts: |
||||
| July 22, 2024 | Katie Magnotta | ||||
| 201-602-9235 | |||||
| katie.magnotta@verizon.com | |||||
| Eric Wilkens | |||||
| 201-572-9317 | |||||
| eric.wilkens@verizon.com | |||||
(dollars in millions, except per share amounts) | ||||||||||||||||||||||||||||||||||||||
| Unaudited | 3 Mos. Ended 6/30/24 | 3 Mos. Ended 6/30/23 | % Change |
6 Mos. Ended 6/30/24 | 6 Mos. Ended 6/30/23 | % Change |
||||||||||||||||||||||||||||||||
| Operating Revenues | ||||||||||||||||||||||||||||||||||||||
| Service revenues and other | $ | 27,798 | $ | 27,319 | 1.8 | $ | 55,418 | $ | 54,471 | 1.7 | ||||||||||||||||||||||||||||
| Wireless equipment revenues | 4,998 | 5,277 | (5.3) | 10,359 | 11,037 | (6.1) | ||||||||||||||||||||||||||||||||
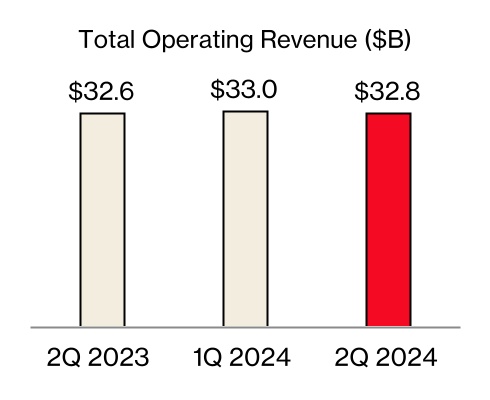
| Total Operating Revenues | 32,796 | 32,596 | 0.6 | 65,777 | 65,508 | 0.4 | ||||||||||||||||||||||||||||||||
| Operating Expenses | ||||||||||||||||||||||||||||||||||||||
| Cost of services | 6,904 | 6,986 | (1.2) | 13,871 | 14,064 | (1.4) | ||||||||||||||||||||||||||||||||
| Cost of wireless equipment | 5,567 | 5,778 | (3.7) | 11,472 | 12,204 | (6.0) | ||||||||||||||||||||||||||||||||
| Selling, general and administrative expense | 8,024 | 8,253 | (2.8) | 16,167 | 15,759 | 2.6 | ||||||||||||||||||||||||||||||||
| Depreciation and amortization expense | 4,483 | 4,359 | 2.8 | 8,928 | 8,677 | 2.9 | ||||||||||||||||||||||||||||||||
| Total Operating Expenses | 24,978 | 25,376 | (1.6) | 50,438 | 50,704 | (0.5) | ||||||||||||||||||||||||||||||||
| Operating Income | 7,818 | 7,220 | 8.3 | 15,339 | 14,804 | 3.6 | ||||||||||||||||||||||||||||||||
| Equity in losses of unconsolidated businesses | (14) | (33) | (57.6) | (23) | (24) | (4.2) | ||||||||||||||||||||||||||||||||
| Other income (expense), net | (72) | 210 | * | 126 | 324 | (61.1) | ||||||||||||||||||||||||||||||||
| Interest expense | (1,698) | (1,285) | 32.1 | (3,333) | (2,492) | 33.7 | ||||||||||||||||||||||||||||||||
| Income Before Provision For Income Taxes | 6,034 | 6,112 | (1.3) | 12,109 | 12,612 | (4.0) | ||||||||||||||||||||||||||||||||
| Provision for income taxes | (1,332) | (1,346) | (1.0) | (2,685) | (2,828) | (5.1) | ||||||||||||||||||||||||||||||||
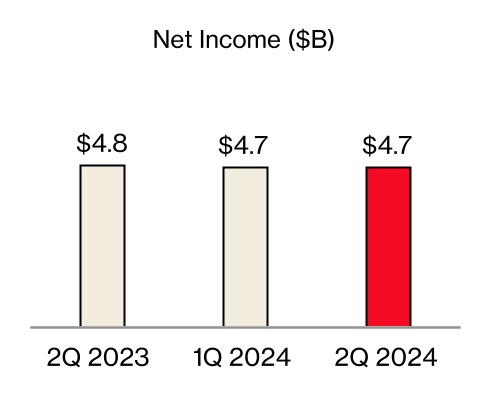
| Net Income | $ | 4,702 | $ | 4,766 | (1.3) | $ | 9,424 | $ | 9,784 | (3.7) | ||||||||||||||||||||||||||||
| Net income attributable to noncontrolling interests | $ | 109 | $ | 118 | (7.6) | $ | 229 | $ | 227 | 0.9 | ||||||||||||||||||||||||||||
| Net income attributable to Verizon | 4,593 | 4,648 | (1.2) | 9,195 | 9,557 | (3.8) | ||||||||||||||||||||||||||||||||
| Net Income | $ | 4,702 | $ | 4,766 | (1.3) | $ | 9,424 | $ | 9,784 | (3.7) | ||||||||||||||||||||||||||||
| Basic Earnings Per Common Share | ||||||||||||||||||||||||||||||||||||||
| Net income attributable to Verizon | $ | 1.09 | $ | 1.10 | (0.9) | $ | 2.18 | $ | 2.27 | (4.0) | ||||||||||||||||||||||||||||
| Weighted-average shares outstanding (in millions) | 4,215 | 4,208 | 4,215 | 4,207 | ||||||||||||||||||||||||||||||||||
Diluted Earnings Per Common Share(1) |
||||||||||||||||||||||||||||||||||||||
| Net income attributable to Verizon | $ | 1.09 | $ | 1.10 | (0.9) | $ | 2.18 | $ | 2.27 | (4.0) | ||||||||||||||||||||||||||||
| Weighted-average shares outstanding (in millions) | 4,221 | 4,213 | 4,220 | 4,212 | ||||||||||||||||||||||||||||||||||
| (dollars in millions) | ||||||||||||||||||||
| Unaudited | 6/30/24 | 12/31/23 | $ Change | |||||||||||||||||
| Assets | ||||||||||||||||||||
| Current assets | ||||||||||||||||||||
| Cash and cash equivalents | $ | 2,432 | $ | 2,065 | $ | 367 | ||||||||||||||
| Accounts receivable | 26,702 | 26,102 | 600 | |||||||||||||||||
| Less Allowance for credit losses | 1,095 | 1,017 | 78 | |||||||||||||||||
| Accounts receivable, net | 25,607 | 25,085 | 522 | |||||||||||||||||
| Inventories | 1,841 | 2,057 | (216) | |||||||||||||||||
| Prepaid expenses and other | 8,176 | 7,607 | 569 | |||||||||||||||||
| Total current assets | 38,056 | 36,814 | 1,242 | |||||||||||||||||
| Property, plant and equipment | 324,978 | 320,108 | 4,870 | |||||||||||||||||
| Less Accumulated depreciation | 217,088 | 211,798 | 5,290 | |||||||||||||||||
| Property, plant and equipment, net | 107,890 | 108,310 | (420) | |||||||||||||||||
| Investments in unconsolidated businesses | 908 | 953 | (45) | |||||||||||||||||
| Wireless licenses | 156,291 | 155,667 | 624 | |||||||||||||||||
| Goodwill | 22,842 | 22,843 | (1) | |||||||||||||||||
| Other intangible assets, net | 10,680 | 11,057 | (377) | |||||||||||||||||
| Operating lease right-of-use assets | 24,064 | 24,726 | (662) | |||||||||||||||||
| Other assets | 18,415 | 19,885 | (1,470) | |||||||||||||||||
| Total assets | $ | 379,146 | $ | 380,255 | $ | (1,109) | ||||||||||||||
| Liabilities and Equity | ||||||||||||||||||||
| Current liabilities | ||||||||||||||||||||
| Debt maturing within one year | $ | 23,255 | $ | 12,973 | $ | 10,282 | ||||||||||||||
| Accounts payable and accrued liabilities | 19,727 | 23,453 | (3,726) | |||||||||||||||||
| Current operating lease liabilities | 4,247 | 4,266 | (19) | |||||||||||||||||
| Other current liabilities | 13,577 | 12,531 | 1,046 | |||||||||||||||||
| Total current liabilities | 60,806 | 53,223 | 7,583 | |||||||||||||||||
| Long-term debt | 126,022 | 137,701 | (11,679) | |||||||||||||||||
| Employee benefit obligations | 12,812 | 13,189 | (377) | |||||||||||||||||
| Deferred income taxes | 46,082 | 45,781 | 301 | |||||||||||||||||
| Non-current operating lease liabilities | 19,456 | 20,002 | (546) | |||||||||||||||||
| Other liabilities | 16,429 | 16,560 | (131) | |||||||||||||||||
| Total long-term liabilities | 220,801 | 233,233 | (12,432) | |||||||||||||||||
| Equity | ||||||||||||||||||||
| Common stock | 429 | 429 | — | |||||||||||||||||
| Additional paid in capital | 13,539 | 13,631 | (92) | |||||||||||||||||
| Retained earnings | 86,504 | 82,915 | 3,589 | |||||||||||||||||
| Accumulated other comprehensive loss | (1,287) | (1,380) | 93 | |||||||||||||||||
| Common stock in treasury, at cost | (3,590) | (3,821) | 231 | |||||||||||||||||
| Deferred compensation – employee stock ownership plans and other | 577 | 656 | (79) | |||||||||||||||||
| Noncontrolling interests | 1,367 | 1,369 | (2) | |||||||||||||||||
| Total equity | 97,539 | 93,799 | 3,740 | |||||||||||||||||
| Total liabilities and equity | $ | 379,146 | $ | 380,255 | $ | (1,109) | ||||||||||||||
| (dollars in millions, except per share amounts) | ||||||||||||||
| Unaudited | 6/30/24 | 12/31/23 | ||||||||||||
| Total debt | $ | 149,277 | $ | 150,674 | ||||||||||
| Unsecured debt | $ | 125,262 | $ | 128,491 | ||||||||||
Net unsecured debt(1) |
$ | 122,830 | $ | 126,426 | ||||||||||
| Unsecured debt / Consolidated Net Income (LTM) | 10.7 | x | 10.6 | x | ||||||||||
Net unsecured debt / Consolidated Adjusted EBITDA(1)(2) |
2.5 | x | 2.6 | x | ||||||||||
| Common shares outstanding end of period (in millions) | 4,210 | 4,204 | ||||||||||||
Total employees (‘000)(3) |
103.9 | 105.4 | ||||||||||||
| Quarterly cash dividends declared per common share | $ | 0.6650 | $ | 0.6650 | ||||||||||
| (dollars in millions) | ||||||||||||||||||||
| Unaudited | 6 Mos. Ended 6/30/24 | 6 Mos. Ended 6/30/23 | $ Change | |||||||||||||||||
| Cash Flows from Operating Activities | ||||||||||||||||||||
| Net Income | $ | 9,424 | $ | 9,784 | $ | (360) | ||||||||||||||
| Adjustments to reconcile net income to net cash provided by operating activities: | ||||||||||||||||||||
| Depreciation and amortization expense | 8,928 | 8,677 | 251 | |||||||||||||||||
| Employee retirement benefits | 354 | 108 | 246 | |||||||||||||||||
| Deferred income taxes | 282 | 633 | (351) | |||||||||||||||||
| Provision for expected credit losses | 1,119 | 1,061 | 58 | |||||||||||||||||
| Equity in losses of unconsolidated businesses, inclusive of dividends received | 33 | 49 | (16) | |||||||||||||||||
Changes in current assets and liabilities, net of effects from acquisition/disposition of businesses |
(3,572) | (620) | (2,952) | |||||||||||||||||
| Other, net | 1 | (1,672) | 1,673 | |||||||||||||||||
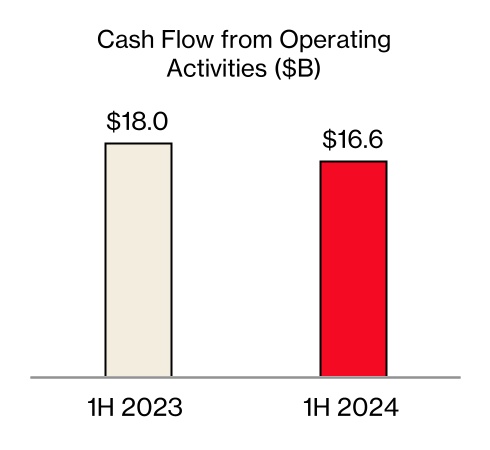
| Net cash provided by operating activities | 16,569 | 18,020 | (1,451) | |||||||||||||||||
| Cash Flows from Investing Activities | ||||||||||||||||||||
| Capital expenditures (including capitalized software) | (8,071) | (10,070) | 1,999 | |||||||||||||||||
| Acquisitions of wireless licenses | (613) | (1,085) | 472 | |||||||||||||||||
| Collateral receipts (payments) related to derivative contracts, net | (424) | 824 | (1,248) | |||||||||||||||||
| Other, net | (2) | 131 | (133) | |||||||||||||||||
| Net cash used in investing activities | (9,110) | (10,200) | 1,090 | |||||||||||||||||
| Cash Flows from Financing Activities | ||||||||||||||||||||
| Proceeds from long-term borrowings | 3,122 | 1,503 | 1,619 | |||||||||||||||||
| Proceeds from asset-backed long-term borrowings | 5,828 | 3,705 | 2,123 | |||||||||||||||||
| Net proceeds from (repayments of) short-term commercial paper | 603 | (167) | 770 | |||||||||||||||||
| Repayments of long-term borrowings and finance lease obligations | (5,719) | (2,600) | (3,119) | |||||||||||||||||
| Repayments of asset-backed long-term borrowings | (4,008) | (2,383) | (1,625) | |||||||||||||||||
| Dividends paid | (5,598) | (5,487) | (111) | |||||||||||||||||
| Other, net | (1,290) | (157) | (1,133) | |||||||||||||||||
| Net cash used in financing activities | (7,062) | (5,586) | (1,476) | |||||||||||||||||
| Increase in cash, cash equivalents and restricted cash | 397 | 2,234 | (1,837) | |||||||||||||||||
| Cash, cash equivalents and restricted cash, beginning of period | 3,497 | 4,111 | (614) | |||||||||||||||||
| Cash, cash equivalents and restricted cash, end of period | $ | 3,894 | $ | 6,345 | $ | (2,451) | ||||||||||||||
| (dollars in millions) | ||||||||||||||||||||||||||||||||||||||
| Unaudited | 3 Mos. Ended 6/30/24 | 3 Mos. Ended 6/30/23 | % Change |
6 Mos. Ended 6/30/24 | 6 Mos. Ended 6/30/23 | % Change |
||||||||||||||||||||||||||||||||
| Operating Revenues | ||||||||||||||||||||||||||||||||||||||
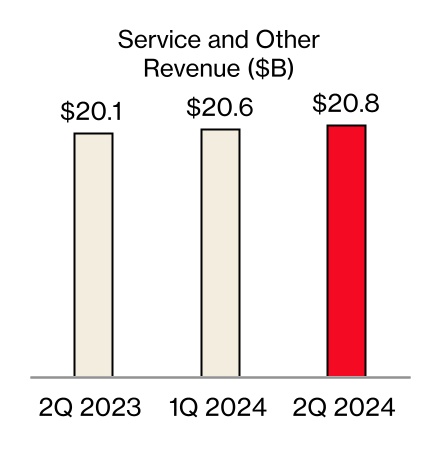
| Service | $ | 19,208 | $ | 18,641 | 3.0 | $ | 38,206 | $ | 37,097 | 3.0 | ||||||||||||||||||||||||||||
| Wireless equipment | 4,143 | 4,430 | (6.5) | 8,633 | 9,308 | (7.3) | ||||||||||||||||||||||||||||||||
| Other | 1,576 | 1,487 | 6.0 | 3,145 | 3,010 | 4.5 | ||||||||||||||||||||||||||||||||
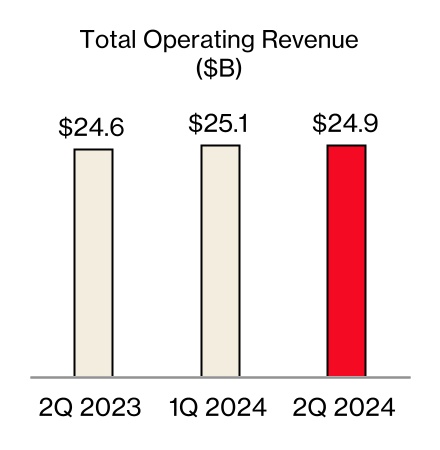
| Total Operating Revenues | 24,927 | 24,558 | 1.5 | 49,984 | 49,415 | 1.2 | ||||||||||||||||||||||||||||||||
| Operating Expenses | ||||||||||||||||||||||||||||||||||||||
| Cost of services | 4,450 | 4,367 | 1.9 | 8,987 | 8,799 | 2.1 | ||||||||||||||||||||||||||||||||
| Cost of wireless equipment | 4,432 | 4,626 | (4.2) | 9,182 | 9,817 | (6.5) | ||||||||||||||||||||||||||||||||
| Selling, general and administrative expense | 5,047 | 4,988 | 1.2 | 10,136 | 9,909 | 2.3 | ||||||||||||||||||||||||||||||||
| Depreciation and amortization expense | 3,394 | 3,247 | 4.5 | 6,703 | 6,461 | 3.7 | ||||||||||||||||||||||||||||||||
| Total Operating Expenses | 17,323 | 17,228 | 0.6 | 35,008 | 34,986 | 0.1 | ||||||||||||||||||||||||||||||||
| Operating Income | $ | 7,604 | $ | 7,330 | 3.7 | $ | 14,976 | $ | 14,429 | 3.8 | ||||||||||||||||||||||||||||
| Operating Income Margin | 30.5 | % | 29.8 | % | 30.0 | % | 29.2 | % | ||||||||||||||||||||||||||||||
Segment EBITDA(1) |
$ | 10,998 | $ | 10,577 | 4.0 | $ | 21,679 | $ | 20,890 | 3.8 | ||||||||||||||||||||||||||||
Segment EBITDA Margin(1) |
44.1 | % | 43.1 | % | 43.4 | % | 42.3 | % | ||||||||||||||||||||||||||||||
| Unaudited | 6/30/24 | 6/30/23 | % Change | |||||||||||||||||||||||||||||||||||
| Connections (‘000): | ||||||||||||||||||||||||||||||||||||||
| Wireless retail postpaid | 93,960 | 92,474 | 1.6 | |||||||||||||||||||||||||||||||||||
| Wireless retail prepaid | 20,276 | 21,646 | (6.3) | |||||||||||||||||||||||||||||||||||
| Total wireless retail | 114,236 | 114,120 | 0.1 | |||||||||||||||||||||||||||||||||||
Wireless retail prepaid excl. SafeLink |
18,702 | 19,362 | (3.4) | |||||||||||||||||||||||||||||||||||
| Wireless retail postpaid phone | 74,551 | 74,465 | 0.1 | |||||||||||||||||||||||||||||||||||
| Fios video | 2,818 | 3,091 | (8.8) | |||||||||||||||||||||||||||||||||||
| Fios internet | 7,049 | 6,854 | 2.8 | |||||||||||||||||||||||||||||||||||
| Fixed wireless access (FWA) broadband | 2,292 | 1,390 | 64.9 | |||||||||||||||||||||||||||||||||||
| Wireline broadband | 7,238 | 7,098 | 2.0 | |||||||||||||||||||||||||||||||||||
| Total broadband | 9,530 | 8,488 | 12.3 | |||||||||||||||||||||||||||||||||||
| Unaudited | 3 Mos. Ended 6/30/24 | 3 Mos. Ended 6/30/23 | % Change |
6 Mos. Ended 6/30/24 | 6 Mos. Ended 6/30/23 | % Change |
||||||||||||||||||||||||||||||||
| Gross Additions (‘000): | ||||||||||||||||||||||||||||||||||||||
| Wireless retail postpaid | 2,901 | 2,928 | (0.9) | 5,884 | 6,138 | (4.1) | ||||||||||||||||||||||||||||||||
| Wireless retail postpaid phone | 1,758 | 1,570 | 12.0 | 3,468 | 3,194 | 8.6 | ||||||||||||||||||||||||||||||||
Net Additions Detail (‘000): |
||||||||||||||||||||||||||||||||||||||
| Wireless retail postpaid | 72 | 304 | (76.3) | 147 | 625 | (76.5) | ||||||||||||||||||||||||||||||||
| Wireless retail prepaid | (624) | (304) | * | (840) | (655) | (28.2) | ||||||||||||||||||||||||||||||||
| Total wireless retail | (552) | — | * | (693) | (30) | * | ||||||||||||||||||||||||||||||||
Wireless retail prepaid excl. SafeLink |
(12) | (317) | 96.2 | (143) | (594) | 75.9 | ||||||||||||||||||||||||||||||||
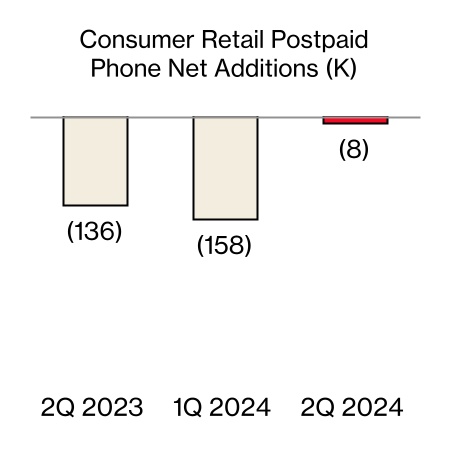
| Wireless retail postpaid phone | (8) | (136) | 94.1 | (166) | (399) | 58.4 | ||||||||||||||||||||||||||||||||
| Fios video | (65) | (69) | 5.8 | (133) | (143) | 7.0 | ||||||||||||||||||||||||||||||||
| Fios internet | 24 | 51 | (52.9) | 73 | 114 | (36.0) | ||||||||||||||||||||||||||||||||
| FWA broadband | 218 | 251 | (13.1) | 421 | 507 | (17.0) | ||||||||||||||||||||||||||||||||
| Wireline broadband | 13 | 36 | (63.9) | 49 | 82 | (40.2) | ||||||||||||||||||||||||||||||||
| Total broadband | 231 | 287 | (19.5) | 470 | 589 | (20.2) | ||||||||||||||||||||||||||||||||
| Churn Rate: | ||||||||||||||||||||||||||||||||||||||
| Wireless retail postpaid | 1.00 | % | 0.95 | % | 1.02 | % | 1.00 | % | ||||||||||||||||||||||||||||||
| Wireless retail postpaid phone | 0.79 | % | 0.76 | % | 0.81 | % | 0.80 | % | ||||||||||||||||||||||||||||||
| Wireless retail prepaid | 4.49 | % | 4.24 | % | 4.37 | % | 4.28 | % | ||||||||||||||||||||||||||||||
Wireless retail prepaid excl. SafeLink |
3.59 | % | 3.71 | % | 3.60 | % | 3.72 | % | ||||||||||||||||||||||||||||||
| Wireless retail | 1.63 | % | 1.58 | % | 1.63 | % | 1.63 | % | ||||||||||||||||||||||||||||||
| Revenue Statistics (in millions): | ||||||||||||||||||||||||||||||||||||||
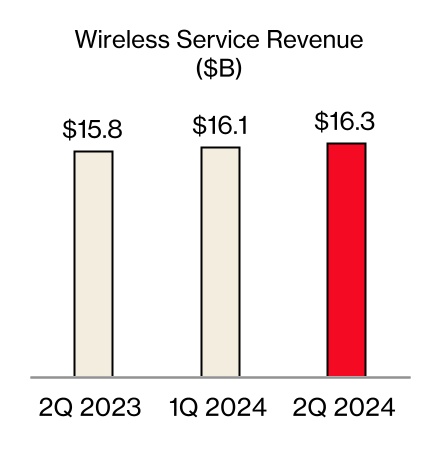
| Wireless service revenue | $ | 16,342 | $ | 15,762 | 3.7 | $ | 32,476 | $ | 31,361 | 3.6 | ||||||||||||||||||||||||||||
| Fios revenue | $ | 2,896 | $ | 2,886 | 0.3 | $ | 5,792 | $ | 5,775 | 0.3 | ||||||||||||||||||||||||||||
| Unaudited | 3 Mos. Ended 6/30/24 | 3 Mos. Ended 6/30/23 | % Change |
6 Mos. Ended 6/30/24 | 6 Mos. Ended 6/30/23 | % Change |
||||||||||||||||||||||||||||||||
| Other Wireless Statistics: | ||||||||||||||||||||||||||||||||||||||
Wireless retail postpaid ARPA(1) |
$ | 138.44 | $ | 131.83 | 5.0 | $ | 137.09 | $ | 130.95 | 4.7 | ||||||||||||||||||||||||||||
Wireless retail postpaid upgrade rate |
2.9 | % | 3.5 | % | ||||||||||||||||||||||||||||||||||
Wireless retail postpaid accounts (‘000)(2) |
32,769 | 32,976 | (0.6) | |||||||||||||||||||||||||||||||||||
Wireless retail postpaid connections per account(2) |
2.87 | 2.80 | 2.5 | |||||||||||||||||||||||||||||||||||
Wireless retail prepaid ARPU(3) |
$ | 30.90 | $ | 31.42 | (1.7) | $ | 31.04 | $ | 31.06 | (0.1) | ||||||||||||||||||||||||||||
Wireless retail prepaid ARPU(3) excl. SafeLink |
$ | 32.48 | $ | 32.90 | (1.3) | $ | 32.37 | $ | 32.52 | (0.5) | ||||||||||||||||||||||||||||
| (dollars in millions) | ||||||||||||||||||||||||||||||||||||||
| Unaudited | 3 Mos. Ended 6/30/24 | 3 Mos. Ended 6/30/23 | % Change |
6 Mos. Ended 6/30/24 | 6 Mos. Ended 6/30/23 | % Change |
||||||||||||||||||||||||||||||||
| Operating Revenues | ||||||||||||||||||||||||||||||||||||||
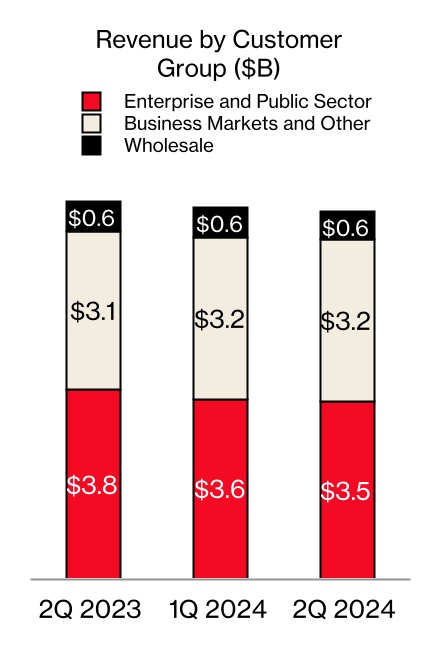
| Enterprise and Public Sector | $ | 3,545 | $ | 3,784 | (6.3) | $ | 7,132 | $ | 7,571 | (5.8) | ||||||||||||||||||||||||||||
| Business Markets and Other | 3,203 | 3,109 | 3.0 | 6,398 | 6,213 | 3.0 | ||||||||||||||||||||||||||||||||
| Wholesale | 552 | 590 | (6.4) | 1,146 | 1,193 | (3.9) | ||||||||||||||||||||||||||||||||
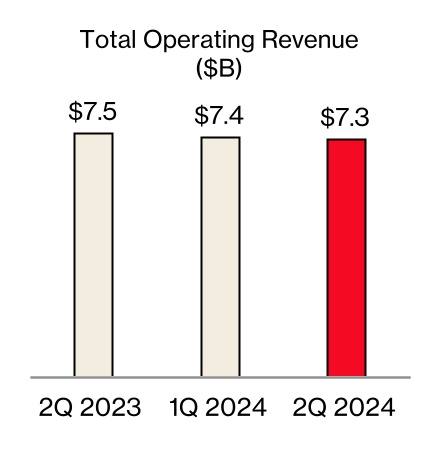
| Total Operating Revenues | 7,300 | 7,483 | (2.4) | 14,676 | 14,977 | (2.0) | ||||||||||||||||||||||||||||||||
| Operating Expenses | ||||||||||||||||||||||||||||||||||||||
| Cost of services | 2,455 | 2,543 | (3.5) | 4,887 | 5,125 | (4.6) | ||||||||||||||||||||||||||||||||
| Cost of wireless equipment | 1,135 | 1,152 | (1.5) | 2,290 | 2,386 | (4.0) | ||||||||||||||||||||||||||||||||
| Selling, general and administrative expense | 2,132 | 2,152 | (0.9) | 4,394 | 4,185 | 5.0 | ||||||||||||||||||||||||||||||||
| Depreciation and amortization expense | 1,078 | 1,103 | (2.3) | 2,206 | 2,197 | 0.4 | ||||||||||||||||||||||||||||||||
| Total Operating Expenses | 6,800 | 6,950 | (2.2) | 13,777 | 13,893 | (0.8) | ||||||||||||||||||||||||||||||||
| Operating Income | $ | 500 | $ | 533 | (6.2) | $ | 899 | $ | 1,084 | (17.1) | ||||||||||||||||||||||||||||
| Operating Income Margin | 6.8 | % | 7.1 | % | 6.1 | % | 7.2 | % | ||||||||||||||||||||||||||||||
Segment EBITDA(1) |
$ | 1,578 | $ | 1,636 | (3.5) | $ | 3,105 | $ | 3,281 | (5.4) | ||||||||||||||||||||||||||||
Segment EBITDA Margin(1) |
21.6 | % | 21.9 | % | 21.2 | % | 21.9 | % | ||||||||||||||||||||||||||||||
| Unaudited | 6/30/24 | 6/30/23 | % Change |
|||||||||||||||||||||||||||||||||||
| Connections (‘000): | ||||||||||||||||||||||||||||||||||||||
| Wireless retail postpaid | 30,230 | 29,105 | 3.9 | |||||||||||||||||||||||||||||||||||
| Wireless retail postpaid phone | 18,480 | 17,856 | 3.5 | |||||||||||||||||||||||||||||||||||
| Fios video | 58 | 64 | (9.4) | |||||||||||||||||||||||||||||||||||
| Fios internet | 393 | 380 | 3.4 | |||||||||||||||||||||||||||||||||||
| FWA broadband | 1,523 | 870 | 75.1 | |||||||||||||||||||||||||||||||||||
| Wireline broadband | 458 | 464 | (1.3) | |||||||||||||||||||||||||||||||||||
| Total broadband | 1,981 | 1,334 | 48.5 | |||||||||||||||||||||||||||||||||||
| Unaudited | 3 Mos. Ended 6/30/24 | 3 Mos. Ended 6/30/23 | % Change |
6 Mos. Ended 6/30/24 | 6 Mos. Ended 6/30/23 | % Change |
||||||||||||||||||||||||||||||||
| Gross Additions (‘000): | ||||||||||||||||||||||||||||||||||||||
| Wireless retail postpaid | 1,579 | 1,590 | (0.7) | 3,110 | 3,197 | (2.7) | ||||||||||||||||||||||||||||||||
| Wireless retail postpaid phone | 760 | 733 | 3.7 | 1,465 | 1,490 | (1.7) | ||||||||||||||||||||||||||||||||
| Net Additions Detail (‘000): | ||||||||||||||||||||||||||||||||||||||
| Wireless retail postpaid | 268 | 308 | (13.0) | 446 | 620 | (28.1) | ||||||||||||||||||||||||||||||||
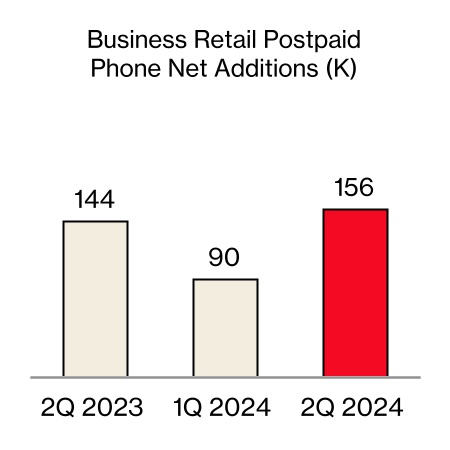
| Wireless retail postpaid phone | 156 | 144 | 8.3 | 246 | 280 | (12.1) | ||||||||||||||||||||||||||||||||
| Fios video | (1) | (1) | — | (3) | (3) | — | ||||||||||||||||||||||||||||||||
| Fios internet | 4 | 3 | 33.3 | 8 | 7 | 14.3 | ||||||||||||||||||||||||||||||||
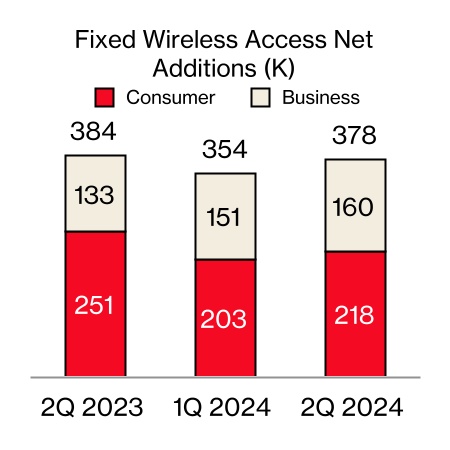
| FWA broadband | 160 | 133 | 20.3 | 311 | 270 | 15.2 | ||||||||||||||||||||||||||||||||
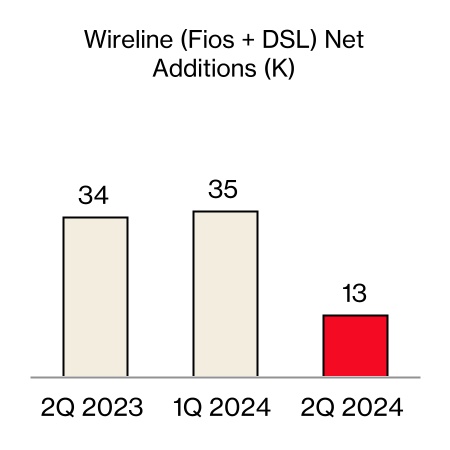
| Wireline broadband | — | (2) | * | (1) | (4) | 75.0 | ||||||||||||||||||||||||||||||||
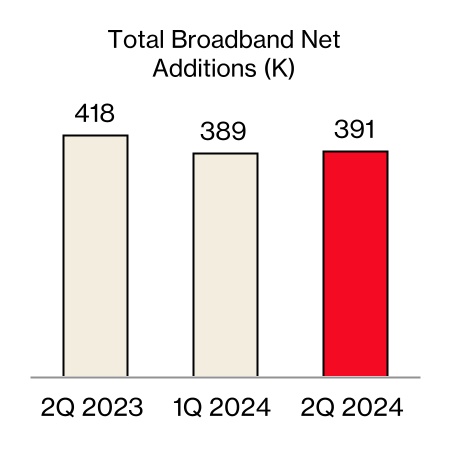
| Total broadband | 160 | 131 | 22.1 | 310 | 266 | 16.5 | ||||||||||||||||||||||||||||||||
| Churn Rate: | ||||||||||||||||||||||||||||||||||||||
| Wireless retail postpaid | 1.45 | % | 1.48 | % | 1.48 | % | 1.49 | % | ||||||||||||||||||||||||||||||
| Wireless retail postpaid phone | 1.10 | % | 1.10 | % | 1.11 | % | 1.13 | % | ||||||||||||||||||||||||||||||
| Revenue Statistics (in millions): | ||||||||||||||||||||||||||||||||||||||
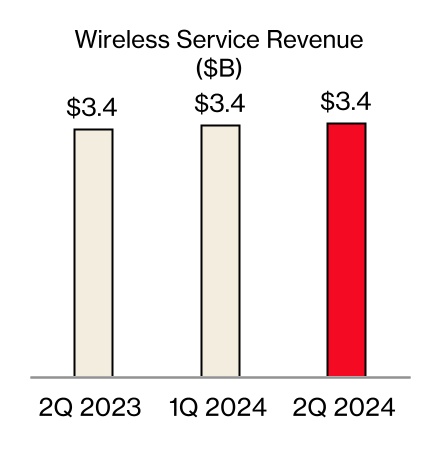
| Wireless service revenue | $ | 3,431 | $ | 3,351 | 2.4 | $ | 6,810 | $ | 6,641 | 2.5 | ||||||||||||||||||||||||||||
| Fios revenue | $ | 313 | $ | 308 | 1.6 | $ | 624 | $ | 615 | 1.5 | ||||||||||||||||||||||||||||
| Other Operating Statistics: | ||||||||||||||||||||||||||||||||||||||
| Wireless retail postpaid upgrade rate | 2.4 | % | 2.7 | % | ||||||||||||||||||||||||||||||||||
| Unaudited | 6/30/24 | 6/30/23 | % Change | |||||||||||||||||||||||||||||||||||
| Connections (‘000) | ||||||||||||||||||||||||||||||||||||||
| Retail postpaid | 124,190 | 121,579 | 2.1 | |||||||||||||||||||||||||||||||||||
Retail prepaid |
20,276 | 21,646 | (6.3) | |||||||||||||||||||||||||||||||||||
| Total retail | 144,466 | 143,225 | 0.9 | |||||||||||||||||||||||||||||||||||
Retail prepaid excl. SafeLink |
18,702 | 19,362 | (3.4) | |||||||||||||||||||||||||||||||||||
| Retail postpaid phone | 93,031 | 92,321 | 0.8 | |||||||||||||||||||||||||||||||||||
| Unaudited | 3 Mos. Ended 6/30/24 | 3 Mos. Ended 6/30/23 | % Change |
6 Mos. Ended 6/30/24 | 6 Mos. Ended 6/30/23 | % Change |
||||||||||||||||||||||||||||||||
| Net Additions Detail (‘000) | ||||||||||||||||||||||||||||||||||||||
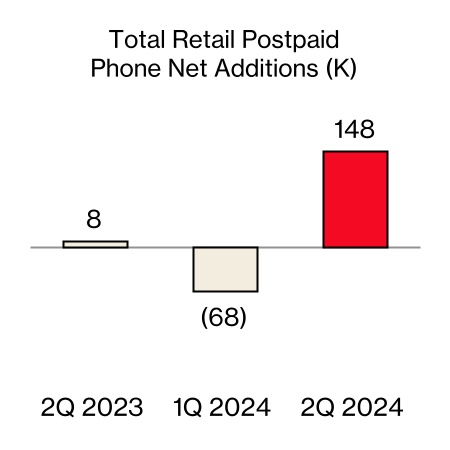
| Retail postpaid phone | 148 | 8 | * | 80 | (119) | * | ||||||||||||||||||||||||||||||||
| Retail postpaid | 340 | 612 | (44.4) | 593 | 1,245 | (52.4) | ||||||||||||||||||||||||||||||||
| Retail prepaid | (624) | (304) | * | (840) | (655) | (28.2) | ||||||||||||||||||||||||||||||||
| Total retail | (284) | 308 | * | (247) | 590 | * | ||||||||||||||||||||||||||||||||
| Retail prepaid excl. SafeLink | (12) | (317) | 96.2 | (143) | (594) | 75.9 | ||||||||||||||||||||||||||||||||
| Account Statistics | ||||||||||||||||||||||||||||||||||||||
Retail postpaid accounts (‘000)(1) |
34,766 | 34,855 | (0.3) | |||||||||||||||||||||||||||||||||||
Retail postpaid connections per account(1) |
3.57 | 3.49 | 2.3 | |||||||||||||||||||||||||||||||||||
Retail postpaid ARPA(2) |
$ | 161.20 | $ | 154.51 | 4.3 | $ | 159.72 | $ | 153.39 | 4.1 | ||||||||||||||||||||||||||||
Retail prepaid ARPU(3) |
$ | 30.90 | $ | 31.42 | (1.7) | $ | 31.04 | $ | 31.06 | (0.1) | ||||||||||||||||||||||||||||
Retail prepaid ARPU(3) excl. SafeLink |
$ | 32.48 | $ | 32.90 | (1.3) | $ | 32.37 | $ | 32.52 | (0.5) | ||||||||||||||||||||||||||||
| Churn Detail | ||||||||||||||||||||||||||||||||||||||
| Retail postpaid phone | 0.85 | % | 0.83 | % | 0.87 | % | 0.87 | % | ||||||||||||||||||||||||||||||
| Retail postpaid | 1.11 | % | 1.07 | % | 1.13 | % | 1.11 | % | ||||||||||||||||||||||||||||||
| Retail prepaid | 4.49 | % | 4.24 | % | 4.37 | % | 4.28 | % | ||||||||||||||||||||||||||||||
Retail prepaid excl. SafeLink |
3.59 | % | 3.71 | % | 3.60 | % | 3.72 | % | ||||||||||||||||||||||||||||||
| Retail | 1.59 | % | 1.56 | % | 1.60 | % | 1.60 | % | ||||||||||||||||||||||||||||||
| Retail Postpaid Connection Statistics | ||||||||||||||||||||||||||||||||||||||
| Upgrade rate | 2.8 | % | 3.3 | % | ||||||||||||||||||||||||||||||||||
Revenue Statistics (in millions)(4) |
||||||||||||||||||||||||||||||||||||||
| FWA revenue | $ | 514 | $ | 297 | 73.1 | $ | 966 | $ | 552 | 75.0 | ||||||||||||||||||||||||||||
| Wireless service | $ | 19,773 | $ | 19,113 | 3.5 | $ | 39,286 | $ | 38,002 | 3.4 | ||||||||||||||||||||||||||||
| Wireless equipment | 4,998 | 5,277 | (5.3) | 10,359 | 11,037 | (6.1) | ||||||||||||||||||||||||||||||||
| Wireless other | 1,600 | 1,486 | 7.7 | 3,185 | 3,001 | 6.1 | ||||||||||||||||||||||||||||||||
| Total Wireless | $ | 26,371 | $ | 25,876 | 1.9 | $ | 52,830 | $ | 52,040 | 1.5 | ||||||||||||||||||||||||||||
Consolidated EBITDA and Consolidated Adjusted EBITDA |
||||||||||||||||||||||||||||||||||||||
| (dollars in millions) | ||||||||||||||||||||||||||||||||||||||
| Unaudited | 3 Mos. Ended 6/30/24 | 3 Mos. Ended 3/31/24 | 3 Mos. Ended 12/31/23 | 3 Mos. Ended 9/30/23 | 3 Mos. Ended 6/30/23 | 3 Mos. Ended 3/31/23 | ||||||||||||||||||||||||||||||||
| Consolidated Net Income (Loss) | $ | 4,702 | $ | 4,722 | $ | (2,573) | $ | 4,884 | $ | 4,766 | $ | 5,018 | ||||||||||||||||||||||||||
| Add: | ||||||||||||||||||||||||||||||||||||||
| Provision for income taxes | 1,332 | 1,353 | 756 | 1,308 | 1,346 | 1,482 | ||||||||||||||||||||||||||||||||
| Interest expense | 1,698 | 1,635 | 1,599 | 1,433 | 1,285 | 1,207 | ||||||||||||||||||||||||||||||||
Depreciation and amortization expense(1) |
4,483 | 4,445 | 4,516 | 4,431 | 4,359 | 4,318 | ||||||||||||||||||||||||||||||||
| Consolidated EBITDA | $ | 12,215 | $ | 12,155 | $ | 4,298 | $ | 12,056 | $ | 11,756 | $ | 12,025 | ||||||||||||||||||||||||||
| Add/(subtract): | ||||||||||||||||||||||||||||||||||||||
Other (income) expense, net(2) |
$ | 72 | $ | (198) | $ | 807 | $ | (170) | $ | (210) | $ | (114) | ||||||||||||||||||||||||||
| Equity in (earnings) losses of unconsolidated businesses | 14 | 9 | 11 | 18 | 33 | (9) | ||||||||||||||||||||||||||||||||
| Severance charges | — | — | 296 | — | 237 | — | ||||||||||||||||||||||||||||||||
| Legacy legal matter | — | 106 | — | — | — | — | ||||||||||||||||||||||||||||||||
| Verizon Business Group goodwill impairment | — | — | 5,841 | — | — | — | ||||||||||||||||||||||||||||||||
| Asset rationalization | — | — | 325 | — | 155 | — | ||||||||||||||||||||||||||||||||
| Legal settlement | — | — | 100 | — | — | — | ||||||||||||||||||||||||||||||||
| Business transformation costs | — | — | — | 176 | — | — | ||||||||||||||||||||||||||||||||
| Non-strategic business shutdown | — | — | — | 158 | — | — | ||||||||||||||||||||||||||||||||
| 86 | (83) | 7,380 | 182 | 215 | (123) | |||||||||||||||||||||||||||||||||
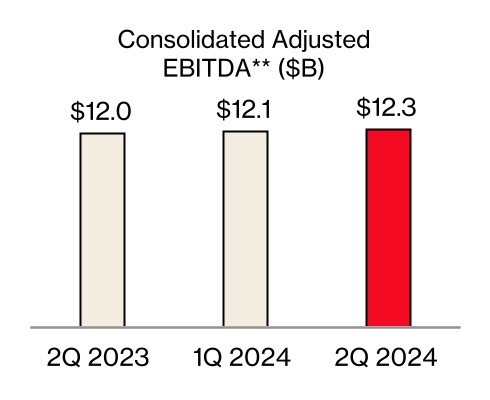
| Consolidated Adjusted EBITDA | $ | 12,301 | $ | 12,072 | $ | 11,678 | $ | 12,238 | $ | 11,971 | $ | 11,902 | ||||||||||||||||||||||||||
| Footnotes: | ||||||||||||||||||||||||||||||||||||||
(1) Includes Amortization of acquisition-related intangible assets and a portion of the Non-strategic business shutdown, where applicable. |
||||||||||||||||||||||||||||||||||||||
(2) Includes Pension and benefits remeasurement adjustments, where applicable. |
||||||||||||||||||||||||||||||||||||||
| Consolidated EBITDA and Consolidated Adjusted EBITDA (LTM) | ||||||||||||||
(dollars in millions) |
||||||||||||||
| Unaudited | 12 Mos. Ended 6/30/24 | 12 Mos. Ended 12/31/23 | ||||||||||||
| Consolidated Net Income | $ | 11,735 | $ | 12,095 | ||||||||||
| Add: | ||||||||||||||
| Provision for income taxes | 4,749 | 4,892 | ||||||||||||
| Interest expense | 6,365 | 5,524 | ||||||||||||
Depreciation and amortization expense(1) |
17,875 | 17,624 | ||||||||||||
| Consolidated EBITDA | $ | 40,724 | $ | 40,135 | ||||||||||
| Add/(subtract): | ||||||||||||||
Other expense, net(2) |
$ | 511 | $ | 313 | ||||||||||
Equity in losses of unconsolidated businesses |
52 | 53 | ||||||||||||
| Severance charges | 296 | 533 | ||||||||||||
| Legacy legal matter | 106 | — | ||||||||||||
| Verizon Business Group goodwill impairment | 5,841 | 5,841 | ||||||||||||
| Asset rationalization | 325 | 480 | ||||||||||||
| Legal settlement | 100 | 100 | ||||||||||||
| Business transformation costs | 176 | 176 | ||||||||||||
| Non-strategic business shutdown | 158 | 158 | ||||||||||||
| 7,565 | 7,654 | |||||||||||||
| Consolidated Adjusted EBITDA | $ | 48,289 | $ | 47,789 | ||||||||||
| Footnotes: | ||||||||||||||
| (1) Includes Amortization of acquisition-related intangible assets and a portion of the Non-strategic business shutdown, where applicable. | ||||||||||||||
(2) Includes Pension and benefits remeasurement adjustments, where applicable. |
||||||||||||||
| Net Unsecured Debt and Net Unsecured Debt to Consolidated Adjusted EBITDA Ratio | ||||||||||||||||||||||||||
| (dollars in millions) | ||||||||||||||||||||||||||
| Unaudited | 6/30/24 | 3/31/24 | 12/31/23 | 6/30/23 | ||||||||||||||||||||||
| Debt maturing within one year | $ | 23,255 | $ | 15,594 | $ | 12,973 | $ | 14,827 | ||||||||||||||||||
| Long-term debt | 126,022 | 136,104 | 137,701 | 137,871 | ||||||||||||||||||||||
| Total Debt | 149,277 | 151,698 | 150,674 | 152,698 | ||||||||||||||||||||||
| Less Secured debt | 24,015 | 23,290 | 22,183 | 21,342 | ||||||||||||||||||||||
| Unsecured Debt | 125,262 | 128,408 | 128,491 | 131,356 | ||||||||||||||||||||||
| Less Cash and cash equivalents | 2,432 | 2,365 | 2,065 | 4,803 | ||||||||||||||||||||||
Net Unsecured Debt |
$ | 122,830 | $ | 126,043 | $ | 126,426 | $ | 126,553 | ||||||||||||||||||
| Consolidated Net Income (LTM) | $ | 11,735 | $ | 12,095 | ||||||||||||||||||||||
| Unsecured Debt to Consolidated Net Income Ratio | 10.7 | x | 10.6 | x | ||||||||||||||||||||||
| Consolidated Adjusted EBITDA (LTM) | $ | 48,289 | $ | 47,789 | ||||||||||||||||||||||
| Net Unsecured Debt to Consolidated Adjusted EBITDA Ratio | 2.5 | x | 2.6 | x | ||||||||||||||||||||||
| Adjusted Earnings per Common Share (Adjusted EPS) | ||||||||||||||||||||||||||||||||
(dollars in millions, except per share amounts) | ||||||||||||||||||||||||||||||||
| Unaudited | 3 Mos. Ended 6/30/24 | 3 Mos. Ended 6/30/23 | ||||||||||||||||||||||||||||||
| Pre-tax | Tax | After-Tax | Pre-tax | Tax | After-Tax | |||||||||||||||||||||||||||
| EPS | $ | 1.09 | $ | 1.10 | ||||||||||||||||||||||||||||
| Amortization of acquisition-related intangible assets | $ | 219 | $ | (55) | $ | 164 | 0.04 | $ | 206 | $ | (53) | $ | 153 | 0.04 | ||||||||||||||||||
| Severance, pension and benefits charges | 136 | (34) | 102 | 0.02 | 237 | (59) | 178 | 0.04 | ||||||||||||||||||||||||
| Asset rationalization | — | — | — | — | 155 | (33) | 122 | 0.03 | ||||||||||||||||||||||||
| $ | 355 | $ | (89) | $ | 266 | $ | 0.06 | $ | 598 | $ | (145) | $ | 453 | $ | 0.11 | |||||||||||||||||
| Adjusted EPS | $ | 1.15 | $ | 1.21 | ||||||||||||||||||||||||||||
Footnote: |
||||||||||||||||||||||||||||||||
Adjusted EPS may not add due to rounding. |
||||||||||||||||||||||||||||||||
| Free Cash Flow | ||||||||||||||
| (dollars in millions) | ||||||||||||||
| Unaudited | 6 Mos. Ended 6/30/24 | 6 Mos. Ended 6/30/23 | ||||||||||||
| Net Cash Provided by Operating Activities | $ | 16,569 | $ | 18,020 | ||||||||||
| Capital expenditures (including capitalized software) | (8,071) | (10,070) | ||||||||||||
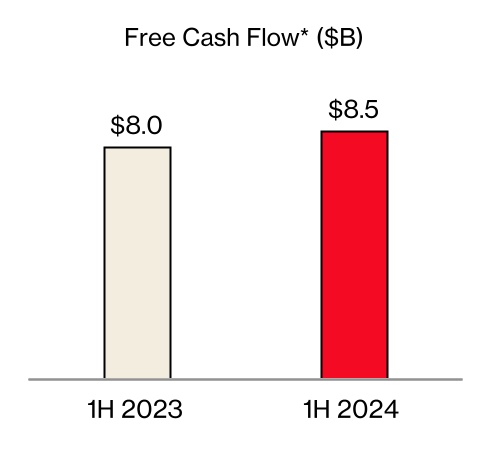
| Free Cash Flow | $ | 8,498 | $ | 7,950 | ||||||||||
| Segment EBITDA and Segment EBITDA Margin | ||||||||||||||||||||||||||
| Consumer | ||||||||||||||||||||||||||
| (dollars in millions) | ||||||||||||||||||||||||||
| Unaudited | 3 Mos. Ended 6/30/24 | 3 Mos. Ended 6/30/23 | 6 Mos. Ended 6/30/24 | 6 Mos. Ended 6/30/23 | ||||||||||||||||||||||
| Operating Income | $ | 7,604 | $ | 7,330 | $ | 14,976 | $ | 14,429 | ||||||||||||||||||
| Add Depreciation and amortization expense | 3,394 | 3,247 | 6,703 | 6,461 | ||||||||||||||||||||||
| Segment EBITDA | $ | 10,998 | $ | 10,577 | $ | 21,679 | $ | 20,890 | ||||||||||||||||||
| Year over year change % | 4.0 | % | 3.8 | % | ||||||||||||||||||||||
| Total operating revenues | $ | 24,927 | $ | 24,558 | $ | 49,984 | $ | 49,415 | ||||||||||||||||||
| Operating Income Margin | 30.5 | % | 29.8 | % | 30.0 | % | 29.2 | % | ||||||||||||||||||
| Segment EBITDA Margin | 44.1 | % | 43.1 | % | 43.4 | % | 42.3 | % | ||||||||||||||||||
| Business | ||||||||||||||||||||||||||
| (dollars in millions) | ||||||||||||||||||||||||||
| Unaudited | 3 Mos. Ended 6/30/24 | 3 Mos. Ended 6/30/23 | 6 Mos. Ended 6/30/24 | 6 Mos. Ended 6/30/23 | ||||||||||||||||||||||
| Operating Income | $ | 500 | $ | 533 | $ | 899 | $ | 1,084 | ||||||||||||||||||
| Add Depreciation and amortization expense | 1,078 | 1,103 | 2,206 | 2,197 | ||||||||||||||||||||||
| Segment EBITDA | $ | 1,578 | $ | 1,636 | $ | 3,105 | $ | 3,281 | ||||||||||||||||||
| Year over year change % | (3.5) | % | (5.4) | % | ||||||||||||||||||||||
| Total operating revenues | $ | 7,300 | $ | 7,483 | $ | 14,676 | $ | 14,977 | ||||||||||||||||||
| Operating Income Margin | 6.8 | % | 7.1 | % | 6.1 | % | 7.2 | % | ||||||||||||||||||
| Segment EBITDA Margin | 21.6 | % | 21.9 | % | 21.2 | % | 21.9 | % | ||||||||||||||||||


| (dollars in millions) | |||||||||||||||||||||||||||||||||||||||||||||||
| Unaudited | 3 Mos. Ended 6/30/24 | 3 Mos. Ended 3/31/24 | 3 Mos. Ended 12/31/23 | 3 Mos. Ended 9/30/23 | 3 Mos. Ended 6/30/23 | 3 Mos. Ended 3/31/23 | 3 Mos. Ended 12/31/22 | 3 Mos. Ended 9/30/22 | |||||||||||||||||||||||||||||||||||||||
| Consolidated Net Income (Loss) | $ | 4,702 | $ | 4,722 | $ | (2,573) | $ | 4,884 | $ | 4,766 | $ | 5,018 | $ | 6,698 | $ | 5,024 | |||||||||||||||||||||||||||||||
| Add: | |||||||||||||||||||||||||||||||||||||||||||||||
| Provision for income taxes | 1,332 | 1,353 | 756 | 1,308 | 1,346 | 1,482 | 2,113 | 1,496 | |||||||||||||||||||||||||||||||||||||||
| Interest expense | 1,698 | 1,635 | 1,599 | 1,433 | 1,285 | 1,207 | 1,105 | 937 | |||||||||||||||||||||||||||||||||||||||
Depreciation and amortization expense(1) |
4,483 | 4,445 | 4,516 | 4,431 | 4,359 | 4,318 | 4,218 | 4,324 | |||||||||||||||||||||||||||||||||||||||
| Consolidated EBITDA | $ | 12,215 | $ | 12,155 | $ | 4,298 | $ | 12,056 | $ | 11,756 | $ | 12,025 | $ | 14,134 | $ | 11,781 | |||||||||||||||||||||||||||||||
| Add/(subtract): | |||||||||||||||||||||||||||||||||||||||||||||||
Other (income) expense, net(2) |
$ | 72 | $ | (198) | $ | 807 | $ | (170) | $ | (210) | $ | (114) | $ | (2,687) | $ | 439 | |||||||||||||||||||||||||||||||
| Equity in (earnings) losses of unconsolidated businesses | 14 | 9 | 11 | 18 | 33 | (9) | (4) | (2) | |||||||||||||||||||||||||||||||||||||||
| Severance charges | — | — | 296 | — | 237 | — | 304 | — | |||||||||||||||||||||||||||||||||||||||
| Legacy legal matter | — | 106 | — | — | — | — | — | — | |||||||||||||||||||||||||||||||||||||||
| Verizon Business Group goodwill impairment | — | — | 5,841 | — | — | — | — | — | |||||||||||||||||||||||||||||||||||||||
| Asset rationalization | — | — | 325 | — | 155 | — | — | — | |||||||||||||||||||||||||||||||||||||||
| Legal settlement | — | — | 100 | — | — | — | — | — | |||||||||||||||||||||||||||||||||||||||
| Business transformation costs | — | — | — | 176 | — | — | — | — | |||||||||||||||||||||||||||||||||||||||
| Non-strategic business shutdown | — | — | — | 158 | — | — | — | — | |||||||||||||||||||||||||||||||||||||||
| 86 | (83) | 7,380 | 182 | 215 | (123) | (2,387) | 437 | ||||||||||||||||||||||||||||||||||||||||
| Consolidated Adjusted EBITDA | $ | 12,301 | $ | 12,072 | $ | 11,678 | $ | 12,238 | $ | 11,971 | $ | 11,902 | $ | 11,747 | $ | 12,218 | |||||||||||||||||||||||||||||||
| (dollars in millions) | |||||||||||||||||
| 12 Mos. Ended | 12 Mos. Ended | 12 Mos. Ended | |||||||||||||||
| Unaudited | 6/30/24 | 3/31/24 | 6/30/23 | ||||||||||||||
| Consolidated Net Income | $ | 11,735 | $ | 11,799 | $ | 21,506 | |||||||||||
| Add: | |||||||||||||||||
| Provision for income taxes | 4,749 | 4,763 | 6,437 | ||||||||||||||
| Interest expense | 6,365 | 5,952 | 4,534 | ||||||||||||||
Depreciation and amortization expense(1) |
17,875 | 17,751 | 17,219 | ||||||||||||||
| Consolidated EBITDA | $ | 40,724 | $ | 40,265 | $ | 49,696 | |||||||||||
| Add/(subtract): | |||||||||||||||||
Other (income) expense, net(2) |
$ | 511 | $ | 229 | $ | (2,572) | |||||||||||
| Equity in losses of unconsolidated businesses | 52 | 71 | 18 | ||||||||||||||
| Severance charges | 296 | 533 | 541 | ||||||||||||||
| Legacy legal matter | 106 | 106 | — | ||||||||||||||
| Verizon Business Group goodwill impairment | 5,841 | 5,841 | — | ||||||||||||||
| Asset rationalization | 325 | 480 | 155 | ||||||||||||||
| Legal settlement | 100 | 100 | — | ||||||||||||||
| Business transformation costs | 176 | 176 | — | ||||||||||||||
| Non-strategic business shutdown | 158 | 158 | — | ||||||||||||||
| 7,565 | 7,694 | (1,858) | |||||||||||||||
| Consolidated Adjusted EBITDA | $ | 48,289 | $ | 47,959 | $ | 47,838 | |||||||||||
| (dollars in millions) | ||||||||||||||||||||
| Unaudited | 6/30/24 | 3/31/24 | 6/30/23 | |||||||||||||||||
| Debt maturing within one year | $ | 23,255 | $ | 15,594 | $ | 14,827 | ||||||||||||||
| Long-term debt | 126,022 | 136,104 | 137,871 | |||||||||||||||||
| Total Debt | 149,277 | 151,698 | 152,698 | |||||||||||||||||
| Less Secured debt | 24,015 | 23,290 | 21,342 | |||||||||||||||||
| Unsecured Debt | 125,262 | 128,408 | 131,356 | |||||||||||||||||
| Less Cash and cash equivalents | 2,432 | 2,365 | 4,803 | |||||||||||||||||
Net Unsecured Debt |
$ | 122,830 | $ | 126,043 | $ | 126,553 | ||||||||||||||
| Consolidated Net Income (LTM) | $ | 11,735 | $ | 11,799 | $ | 21,506 | ||||||||||||||
| Consolidated Adjusted EBITDA (LTM) | $ | 48,289 | $ | 47,959 | $ | 47,838 | ||||||||||||||
| Unsecured Debt to Consolidated Net Income Ratio | 10.7 | x | 10.9 | x | 6.1 | x | ||||||||||||||
| Net Unsecured Debt to Consolidated Adjusted EBITDA Ratio | 2.5 | x | 2.6 | x | 2.6 | x | ||||||||||||||
| Net Unsecured Debt - Quarter over quarter change | $ | (3,213) | ||||||||||||||||||
| Net Unsecured Debt - Year over year change | $ | (3,723) | ||||||||||||||||||
Net Unsecured Debt to Consolidated Adjusted EBITDA Ratio - Quarter over quarter change |
(0.1) | x | ||||||||||||||||||
| Net Unsecured Debt to Consolidated Adjusted EBITDA Ratio - Year over year change | (0.1) | x | ||||||||||||||||||
(dollars in millions, except per share amounts) | ||||||||||||||||||||||||||||||||
| Unaudited | 3 Mos. Ended 6/30/24 | 3 Mos. Ended 6/30/23 | ||||||||||||||||||||||||||||||
| Pre-tax | Tax | After-Tax | Pre-tax | Tax | After-Tax | |||||||||||||||||||||||||||
| EPS | $ | 1.09 | $ | 1.10 | ||||||||||||||||||||||||||||
| Amortization of acquisition-related intangible assets | $ | 219 | $ | (55) | $ | 164 | 0.04 | $ | 206 | $ | (53) | $ | 153 | 0.04 | ||||||||||||||||||
| Severance, pension and benefits charges | 136 | (34) | 102 | 0.02 | 237 | (59) | 178 | 0.04 | ||||||||||||||||||||||||
| Asset rationalization | — | — | — | — | 155 | (33) | 122 | 0.03 | ||||||||||||||||||||||||
| $ | 355 | $ | (89) | $ | 266 | $ | 0.06 | $ | 598 | $ | (145) | $ | 453 | $ | 0.11 | |||||||||||||||||
| Adjusted EPS | $ | 1.15 | $ | 1.21 | ||||||||||||||||||||||||||||
| Free Cash Flow | ||||||||||||||
| (dollars in millions) | ||||||||||||||
| Unaudited | 6 Mos. Ended 6/30/24 | 6 Mos. Ended 6/30/23 | ||||||||||||
| Net Cash Provided by Operating Activities | $ | 16,569 | $ | 18,020 | ||||||||||
| Capital expenditures (including capitalized software) | (8,071) | (10,070) | ||||||||||||
| Free Cash Flow | $ | 8,498 | $ | 7,950 | ||||||||||
| Consolidated Operating Expenses Excluding Depreciation and Amortization and Special Items | ||||||||||||||
| (dollars in millions) | ||||||||||||||
| Unaudited | 3 Mos. Ended 6/30/24 | 3 Mos. Ended 6/30/23 | ||||||||||||
| Consolidated Operating Expenses | $ | 24,978 | $ | 25,376 | ||||||||||
Depreciation and amortization expense(1) |
4,483 | 4,359 | ||||||||||||
| Severance charges | — | 237 | ||||||||||||
| Asset rationalization | — | 155 | ||||||||||||
| Consolidated Operating Expenses Excluding Depreciation and Amortization and Special Items | $ | 20,495 | $ | 20,625 | ||||||||||
| Year over year change % | (0.6) | % | ||||||||||||
| (dollars in millions) | ||||||||||||||
| Unaudited | 3 Mos. Ended 6/30/24 | 3 Mos. Ended 6/30/23 | ||||||||||||
| Operating Income | $ | 7,604 | $ | 7,330 | ||||||||||
| Add Depreciation and amortization expense | 3,394 | 3,247 | ||||||||||||
| Segment EBITDA | $ | 10,998 | $ | 10,577 | ||||||||||
| Year over year change % | 4.0 | % | ||||||||||||
| Total operating revenues | $ | 24,927 | $ | 24,558 | ||||||||||
| Operating Income Margin | 30.5 | % | 29.8 | % | ||||||||||
| Segment EBITDA Margin | 44.1 | % | 43.1 | % | ||||||||||
| (dollars in millions) | ||||||||||||||
| Unaudited | 3 Mos. Ended 6/30/24 | 3 Mos. Ended 6/30/23 | ||||||||||||
| Operating Income | $ | 500 | $ | 533 | ||||||||||
| Add Depreciation and amortization expense | 1,078 | 1,103 | ||||||||||||
| Segment EBITDA | $ | 1,578 | $ | 1,636 | ||||||||||
| Year over year change % | (3.5) | % | ||||||||||||
| Total operating revenues | $ | 7,300 | $ | 7,483 | ||||||||||
| Operating Income Margin | 6.8 | % | 7.1 | % | ||||||||||
| Segment EBITDA Margin | 21.6 | % | 21.9 | % | ||||||||||