| Delaware | 1-8606 | 23-2259884 | |||||||||
| (State or other jurisdiction of incorporation) |
(Commission File Number) | (I.R.S. Employer Identification No.) | |||||||||
| 1095 Avenue of the Americas | 10036 | ||||||||||
| New York, | New York | ||||||||||
| (Address of principal executive offices) | (Zip Code) | ||||||||||
| Title of Each Class | Trading Symbol(s) | Name of Each Exchange on Which Registered | ||||||||||||
| Common Stock, par value $0.10 | VZ | New York Stock Exchange | ||||||||||||
| Common Stock, par value $0.10 | VZ | The Nasdaq Global Select Market | ||||||||||||
| 1.625% Notes due 2024 | VZ 24B | New York Stock Exchange | ||||||||||||
| 4.073% Notes due 2024 | VZ 24C | New York Stock Exchange | ||||||||||||
| 0.875% Notes due 2025 | VZ 25 | New York Stock Exchange | ||||||||||||
| 3.25% Notes due 2026 | VZ 26 | New York Stock Exchange | ||||||||||||
| 1.375% Notes due 2026 | VZ 26B | New York Stock Exchange | ||||||||||||
| 0.875% Notes due 2027 | VZ 27E | New York Stock Exchange | ||||||||||||
| 1.375% Notes due 2028 | VZ 28 | New York Stock Exchange | ||||||||||||
| 1.125% Notes due 2028 | VZ 28A | New York Stock Exchange | ||||||||||||
| 2.350% Fixed Rate Notes due 2028 | VZ 28C | New York Stock Exchange | ||||||||||||
| 1.875% Notes due 2029 | VZ 29B | New York Stock Exchange | ||||||||||||
| 0.375% Notes due 2029 | VZ 29D | New York Stock Exchange | ||||||||||||
| 1.250% Notes due 2030 | VZ 30 | New York Stock Exchange | ||||||||||||
| 1.875% Notes due 2030 | VZ 30A | New York Stock Exchange | ||||||||||||
| 4.250% Notes due 2030 | VZ 30D | New York Stock Exchange | ||||||||||||
| 2.625% Notes due 2031 | VZ 31 | New York Stock Exchange | ||||||||||||
| 2.500% Notes due 2031 | VZ 31A | New York Stock Exchange | ||||||||||||
| 3.000% Fixed Rate Notes due 2031 | VZ 31D | New York Stock Exchange | ||||||||||||
| 0.875% Notes due 2032 | VZ 32 | New York Stock Exchange | ||||||||||||
| 0.750% Notes due 2032 | VZ 32A | New York Stock Exchange | ||||||||||||
| 1.300% Notes due 2033 | VZ 33B | New York Stock Exchange | ||||||||||||
| 4.75% Notes due 2034 | VZ 34 | New York Stock Exchange | ||||||||||||
| 4.750% Notes due 2034 | VZ 34C | New York Stock Exchange | ||||||||||||
| 3.125% Notes due 2035 | VZ 35 | New York Stock Exchange | ||||||||||||
| 1.125% Notes due 2035 | VZ 35A | New York Stock Exchange | ||||||||||||
| 3.375% Notes due 2036 | VZ 36A | New York Stock Exchange | ||||||||||||
| 2.875% Notes due 2038 | VZ 38B | New York Stock Exchange | ||||||||||||
| 1.875% Notes due 2038 | VZ 38C | New York Stock Exchange | ||||||||||||
| 1.500% Notes due 2039 | VZ 39C | New York Stock Exchange | ||||||||||||
| 3.50% Fixed Rate Notes due 2039 | VZ 39D | New York Stock Exchange | ||||||||||||
| 1.850% Notes due 2040 | VZ 40 | New York Stock Exchange | ||||||||||||
| 3.850% Fixed Rate Notes due 2041 | VZ 41C | New York Stock Exchange | ||||||||||||
| (d) Exhibits. | ||||||||
| Exhibit Number |
Description | |||||||
Press release and financial tables, dated January 23, 2024, issued by Verizon Communications Inc. |
||||||||
Commentary discussing financial and operating results of Verizon Communications Inc. for the fourth quarter and full year of 2023. |
||||||||
| 104 | Cover Page Interactive Data File (formatted as inline XBRL). | |||||||
| Verizon Communications Inc. | ||||||||||||||||||||
| (Registrant) | ||||||||||||||||||||
| Date: | January 23, 2024 | /s/ Mary-Lee Stillwell | ||||||||||||||||||
| Mary-Lee Stillwell | ||||||||||||||||||||
| Senior Vice President and Controller | ||||||||||||||||||||

FOR IMMEDIATE RELEASE |
Media contacts: |
||||
| January 23, 2024 | Katie Magnotta | ||||
| 201-602-9235 | |||||
| katie.magnotta@verizon.com | |||||
| Eric Wilkens | |||||
| 201-572-9317 | |||||
| eric.wilkens@verizon.com | |||||
(dollars in millions, except per share amounts) | ||||||||||||||||||||||||||||||||||||||
| Unaudited | 3 Mos. Ended 12/31/23 | 3 Mos. Ended 12/31/22 | % Change |
12 Mos. Ended 12/31/23 | 12 Mos. Ended 12/31/22 | % Change |
||||||||||||||||||||||||||||||||
| Operating Revenues | ||||||||||||||||||||||||||||||||||||||
| Service revenues and other | $ | 27,658 | $ | 27,626 | 0.1 | $ | 109,652 | $ | 109,625 | — | ||||||||||||||||||||||||||||
| Wireless equipment revenues | 7,472 | 7,625 | (2.0) | 24,322 | 27,210 | (10.6) | ||||||||||||||||||||||||||||||||
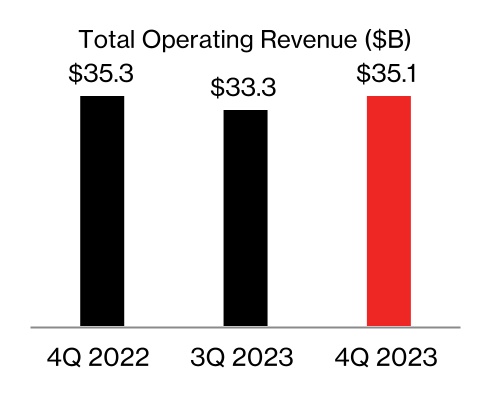
| Total Operating Revenues | 35,130 | 35,251 | (0.3) | 133,974 | 136,835 | (2.1) | ||||||||||||||||||||||||||||||||
| Operating Expenses | ||||||||||||||||||||||||||||||||||||||
| Cost of services | 6,952 | 7,185 | (3.2) | 28,100 | 28,637 | (1.9) | ||||||||||||||||||||||||||||||||
| Cost of wireless equipment | 8,230 | 8,577 | (4.0) | 26,787 | 30,496 | (12.2) | ||||||||||||||||||||||||||||||||
| Selling, general and administrative expense | 8,991 | 8,046 | 11.7 | 32,745 | 30,136 | 8.7 | ||||||||||||||||||||||||||||||||
| Depreciation and amortization expense | 4,516 | 4,218 | 7.1 | 17,624 | 17,099 | 3.1 | ||||||||||||||||||||||||||||||||
| Verizon Business Group goodwill impairment | 5,841 | — | * | 5,841 | — | * | ||||||||||||||||||||||||||||||||
| Total Operating Expenses | 34,530 | 28,026 | 23.2 | 111,097 | 106,368 | 4.4 | ||||||||||||||||||||||||||||||||
| Operating Income | 600 | 7,225 | (91.7) | 22,877 | 30,467 | (24.9) | ||||||||||||||||||||||||||||||||
| Equity in earnings (losses) of unconsolidated businesses | (11) | 4 | * | (53) | 44 | * | ||||||||||||||||||||||||||||||||
| Other income (expense), net | (807) | 2,687 | * | (313) | 1,373 | * | ||||||||||||||||||||||||||||||||
| Interest expense | (1,599) | (1,105) | 44.7 | (5,524) | (3,613) | 52.9 | ||||||||||||||||||||||||||||||||
| Income (Loss) Before Provision For Income Taxes | (1,817) | 8,811 | * | 16,987 | 28,271 | (39.9) | ||||||||||||||||||||||||||||||||
| Provision for income taxes | (756) | (2,113) | (64.2) | (4,892) | (6,523) | (25.0) | ||||||||||||||||||||||||||||||||
| Net Income (Loss) | $ | (2,573) | $ | 6,698 | * | $ | 12,095 | $ | 21,748 | (44.4) | ||||||||||||||||||||||||||||
| Net income attributable to noncontrolling interests | $ | 132 | $ | 121 | 9.1 | $ | 481 | $ | 492 | (2.2) | ||||||||||||||||||||||||||||
| Net income (loss) attributable to Verizon | (2,705) | 6,577 | * | 11,614 | 21,256 | (45.4) | ||||||||||||||||||||||||||||||||
| Net Income (Loss) | $ | (2,573) | $ | 6,698 | * | $ | 12,095 | $ | 21,748 | (44.4) | ||||||||||||||||||||||||||||
| Basic Earnings Per Common Share | ||||||||||||||||||||||||||||||||||||||
| Net income (loss) attributable to Verizon | $ | (0.64) | $ | 1.56 | * | $ | 2.76 | $ | 5.06 | (45.5) | ||||||||||||||||||||||||||||
| Weighted-average shares outstanding (in millions) | 4,214 | 4,204 | 4,211 | 4,202 | ||||||||||||||||||||||||||||||||||
Diluted Earnings Per Common Share (1) |
||||||||||||||||||||||||||||||||||||||
| Net income (loss) attributable to Verizon | $ | (0.64) | $ | 1.56 | * | $ | 2.75 | $ | 5.06 | (45.7) | ||||||||||||||||||||||||||||
| Weighted-average shares outstanding (in millions) | 4,214 | 4,207 | 4,215 | 4,204 | ||||||||||||||||||||||||||||||||||
| (dollars in millions) | ||||||||||||||||||||
| Unaudited | 12/31/23 | 12/31/22 | $ Change | |||||||||||||||||
| Assets | ||||||||||||||||||||
| Current assets | ||||||||||||||||||||
| Cash and cash equivalents | $ | 2,065 | $ | 2,605 | $ | (540) | ||||||||||||||
| Accounts receivable | 26,102 | 25,332 | 770 | |||||||||||||||||
| Less Allowance for credit losses | 1,017 | 826 | 191 | |||||||||||||||||
| Accounts receivable, net | 25,085 | 24,506 | 579 | |||||||||||||||||
| Inventories | 2,057 | 2,388 | (331) | |||||||||||||||||
| Prepaid expenses and other | 7,607 | 8,358 | (751) | |||||||||||||||||
| Total current assets | 36,814 | 37,857 | (1,043) | |||||||||||||||||
| Property, plant and equipment | 320,108 | 307,689 | 12,419 | |||||||||||||||||
| Less Accumulated depreciation | 211,798 | 200,255 | 11,543 | |||||||||||||||||
| Property, plant and equipment, net | 108,310 | 107,434 | 876 | |||||||||||||||||
| Investments in unconsolidated businesses | 953 | 1,071 | (118) | |||||||||||||||||
| Wireless licenses | 155,667 | 149,796 | 5,871 | |||||||||||||||||
| Goodwill | 22,843 | 28,671 | (5,828) | |||||||||||||||||
| Other intangible assets, net | 11,057 | 11,461 | (404) | |||||||||||||||||
| Operating lease right-of-use assets | 24,726 | 26,130 | (1,404) | |||||||||||||||||
| Other assets | 19,885 | 17,260 | 2,625 | |||||||||||||||||
| Total assets | $ | 380,255 | $ | 379,680 | $ | 575 | ||||||||||||||
| Liabilities and Equity | ||||||||||||||||||||
| Current liabilities | ||||||||||||||||||||
| Debt maturing within one year | $ | 12,973 | $ | 9,963 | $ | 3,010 | ||||||||||||||
| Accounts payable and accrued liabilities | 23,453 | 23,977 | (524) | |||||||||||||||||
| Current operating lease liabilities | 4,266 | 4,134 | 132 | |||||||||||||||||
| Other current liabilities | 12,531 | 12,097 | 434 | |||||||||||||||||
| Total current liabilities | 53,223 | 50,171 | 3,052 | |||||||||||||||||
| Long-term debt | 137,701 | 140,676 | (2,975) | |||||||||||||||||
| Employee benefit obligations | 13,189 | 12,974 | 215 | |||||||||||||||||
| Deferred income taxes | 45,781 | 43,441 | 2,340 | |||||||||||||||||
| Non-current operating lease liabilities | 20,002 | 21,558 | (1,556) | |||||||||||||||||
| Other liabilities | 16,560 | 18,397 | (1,837) | |||||||||||||||||
| Total long-term liabilities | 233,233 | 237,046 | (3,813) | |||||||||||||||||
| Equity | ||||||||||||||||||||
| Common stock | 429 | 429 | — | |||||||||||||||||
| Additional paid in capital | 13,631 | 13,420 | 211 | |||||||||||||||||
| Retained earnings | 82,915 | 82,380 | 535 | |||||||||||||||||
| Accumulated other comprehensive loss | (1,380) | (1,865) | 485 | |||||||||||||||||
| Common stock in treasury, at cost | (3,821) | (4,013) | 192 | |||||||||||||||||
| Deferred compensation – employee stock ownership plans and other | 656 | 793 | (137) | |||||||||||||||||
| Noncontrolling interests | 1,369 | 1,319 | 50 | |||||||||||||||||
| Total equity | 93,799 | 92,463 | 1,336 | |||||||||||||||||
| Total liabilities and equity | $ | 380,255 | $ | 379,680 | $ | 575 | ||||||||||||||
| (dollars in millions, except per share amounts) | ||||||||||||||
| Unaudited | 12/31/23 | 12/31/22 | ||||||||||||
| Total debt | $ | 150,674 | $ | 150,639 | ||||||||||
| Unsecured debt | $ | 128,491 | $ | 130,631 | ||||||||||
Net unsecured debt(1) |
$ | 126,426 | $ | 128,026 | ||||||||||
| Unsecured debt / Consolidated Net Income (LTM) | 10.6 | x | 6.0 | x | ||||||||||
Net unsecured debt / Consolidated Adjusted EBITDA(1)(2) |
2.6 | x | 2.7 | x | ||||||||||
| Common shares outstanding end of period (in millions) | 4,204 | 4,200 | ||||||||||||
| Total employees (‘000) | 105.4 | 117.1 | ||||||||||||
| Quarterly cash dividends declared per common share | $ | 0.6650 | $ | 0.6525 | ||||||||||
| (dollars in millions) | ||||||||||||||||||||
| Unaudited | 12 Mos. Ended 12/31/23 | 12 Mos. Ended 12/31/22 | $ Change | |||||||||||||||||
| Cash Flows from Operating Activities | ||||||||||||||||||||
| Net Income | $ | 12,095 | $ | 21,748 | $ | (9,653) | ||||||||||||||
| Adjustments to reconcile net income to net cash provided by operating activities: | ||||||||||||||||||||
| Depreciation and amortization expense | 17,624 | 17,099 | 525 | |||||||||||||||||
| Employee retirement benefits | 1,206 | (2,046) | 3,252 | |||||||||||||||||
| Deferred income taxes | 2,388 | 2,973 | (585) | |||||||||||||||||
| Provision for expected credit losses | 2,214 | 1,611 | 603 | |||||||||||||||||
| Equity in losses (earnings) of unconsolidated businesses, net of dividends received | 84 | (10) | 94 | |||||||||||||||||
| Verizon Business Group goodwill impairment | 5,841 | — | 5,841 | |||||||||||||||||
Changes in current assets and liabilities, net of effects from acquisition/disposition of businesses |
(267) | (456) | 189 | |||||||||||||||||
| Other, net | (3,710) | (3,778) | 68 | |||||||||||||||||
| Net cash provided by operating activities | 37,475 | 37,141 | 334 | |||||||||||||||||
| Cash Flows from Investing Activities | ||||||||||||||||||||
| Capital expenditures (including capitalized software) | (18,767) | (23,087) | 4,320 | |||||||||||||||||
| Cash received (paid) related to acquisitions of businesses, net of cash acquired | (30) | 248 | (278) | |||||||||||||||||
| Acquisitions of wireless licenses | (5,796) | (3,653) | (2,143) | |||||||||||||||||
| Collateral receipts (payments) related to derivative contracts, net | 880 | (2,265) | 3,145 | |||||||||||||||||
| Proceeds from disposition of business | — | 33 | (33) | |||||||||||||||||
| Other, net | 281 | 62 | 219 | |||||||||||||||||
| Net cash used in investing activities | (23,432) | (28,662) | 5,230 | |||||||||||||||||
| Cash Flows from Financing Activities | ||||||||||||||||||||
| Proceeds from long-term borrowings | 2,018 | 7,074 | (5,056) | |||||||||||||||||
| Proceeds from asset-backed long-term borrowings | 6,594 | 10,732 | (4,138) | |||||||||||||||||
| Net proceeds from (repayments of) short-term commercial paper | (150) | 106 | (256) | |||||||||||||||||
| Repayments of long-term borrowings and finance lease obligations | (6,181) | (8,616) | 2,435 | |||||||||||||||||
| Repayments of asset-backed long-term borrowings | (4,443) | (4,948) | 505 | |||||||||||||||||
| Dividends paid | (11,025) | (10,805) | (220) | |||||||||||||||||
| Other, net | (1,470) | (2,072) | 602 | |||||||||||||||||
| Net cash used in financing activities | (14,657) | (8,529) | (6,128) | |||||||||||||||||
| Decrease in cash, cash equivalents and restricted cash | (614) | (50) | (564) | |||||||||||||||||
| Cash, cash equivalents and restricted cash, beginning of period | 4,111 | 4,161 | (50) | |||||||||||||||||
| Cash, cash equivalents and restricted cash, end of period | $ | 3,497 | $ | 4,111 | $ | (614) | ||||||||||||||
| (dollars in millions) | ||||||||||||||||||||||||||||||||||||||
| Unaudited | 3 Mos. Ended 12/31/23 | 3 Mos. Ended 12/31/22 | % Change |
12 Mos. Ended 12/31/23 | 12 Mos. Ended 12/31/22 | % Change |
||||||||||||||||||||||||||||||||
| Operating Revenues | ||||||||||||||||||||||||||||||||||||||
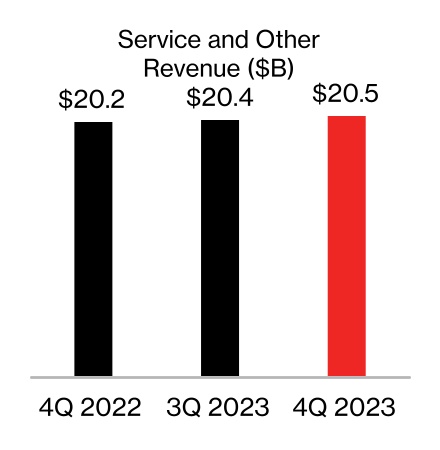
| Service | $ | 18,927 | $ | 18,443 | 2.6 | $ | 74,874 | $ | 73,139 | 2.4 | ||||||||||||||||||||||||||||
| Wireless equipment | 6,435 | 6,528 | (1.4) | 20,645 | 23,168 | (10.9) | ||||||||||||||||||||||||||||||||
| Other | 1,592 | 1,799 | (11.5) | 6,107 | 7,199 | (15.2) | ||||||||||||||||||||||||||||||||
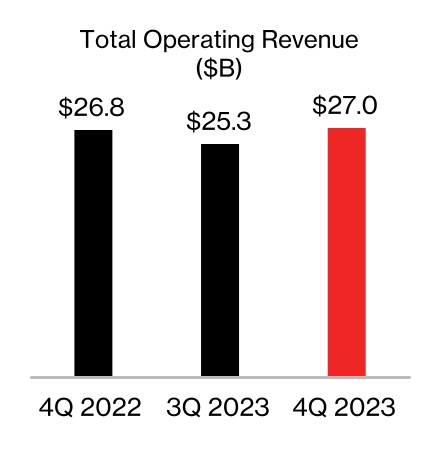
| Total Operating Revenues | 26,954 | 26,770 | 0.7 | 101,626 | 103,506 | (1.8) | ||||||||||||||||||||||||||||||||
| Operating Expenses | ||||||||||||||||||||||||||||||||||||||
| Cost of services | 4,362 | 4,450 | (2.0) | 17,580 | 17,746 | (0.9) | ||||||||||||||||||||||||||||||||
| Cost of wireless equipment | 6,877 | 7,137 | (3.6) | 21,827 | 25,134 | (13.2) | ||||||||||||||||||||||||||||||||
| Selling, general and administrative expense | 5,336 | 5,044 | 5.8 | 20,131 | 19,064 | 5.6 | ||||||||||||||||||||||||||||||||
| Depreciation and amortization expense | 3,344 | 3,111 | 7.5 | 13,077 | 12,716 | 2.8 | ||||||||||||||||||||||||||||||||
| Total Operating Expenses | 19,919 | 19,742 | 0.9 | 72,615 | 74,660 | (2.7) | ||||||||||||||||||||||||||||||||
| Operating Income | $ | 7,035 | $ | 7,028 | 0.1 | $ | 29,011 | $ | 28,846 | 0.6 | ||||||||||||||||||||||||||||
| Operating Income Margin | 26.1 | % | 26.3 | % | 28.5 | % | 27.9 | % | ||||||||||||||||||||||||||||||
Segment EBITDA(1) |
$ | 10,379 | $ | 10,139 | 2.4 | $ | 42,088 | $ | 41,562 | 1.3 | ||||||||||||||||||||||||||||
Segment EBITDA Margin(1) |
38.5 | % | 37.9 | % | 41.4 | % | 40.2 | % | ||||||||||||||||||||||||||||||
| Unaudited | 12/31/23 | 12/31/22 | % Change | |||||||||||||||||||||||||||||||||||
| Connections (‘000): | ||||||||||||||||||||||||||||||||||||||
| Wireless retail postpaid | 93,850 | 91,856 | 2.2 | |||||||||||||||||||||||||||||||||||
| Wireless retail prepaid | 21,122 | 22,664 | (6.8) | |||||||||||||||||||||||||||||||||||
| Total wireless retail | 114,972 | 114,520 | 0.4 | |||||||||||||||||||||||||||||||||||
| Wireless retail postpaid phones | 74,720 | 74,857 | (0.2) | |||||||||||||||||||||||||||||||||||
| Fios video | 2,951 | 3,234 | (8.8) | |||||||||||||||||||||||||||||||||||
| Fios internet | 6,976 | 6,740 | 3.5 | |||||||||||||||||||||||||||||||||||
| Fixed wireless access (FWA) broadband | 1,866 | 884 | * | |||||||||||||||||||||||||||||||||||
| Wireline broadband | 7,190 | 7,016 | 2.5 | |||||||||||||||||||||||||||||||||||
| Total broadband | 9,056 | 7,900 | 14.6 | |||||||||||||||||||||||||||||||||||
| Unaudited | 3 Mos. Ended 12/31/23 | 3 Mos. Ended 12/31/22 | % Change |
12 Mos. Ended 12/31/23 | 12 Mos. Ended 12/31/22 | % Change |
||||||||||||||||||||||||||||||||
| Gross Additions (‘000): | ||||||||||||||||||||||||||||||||||||||
| Wireless retail postpaid | 4,185 | 3,889 | 7.6 | 13,475 | 12,037 | 11.9 | ||||||||||||||||||||||||||||||||
Net Additions Detail (‘000): |
||||||||||||||||||||||||||||||||||||||
| Wireless retail postpaid | 1,168 | 979 | 19.3 | 2,044 | 965 | * | ||||||||||||||||||||||||||||||||
| Wireless retail prepaid | (289) | (175) | (65.1) | (1,151) | (445) | * | ||||||||||||||||||||||||||||||||
| Total wireless retail | 879 | 804 | 9.3 | 893 | 520 | 71.7 | ||||||||||||||||||||||||||||||||
| Wireless retail postpaid phones | 318 | 41 | * | (132) | (655) | 79.8 | ||||||||||||||||||||||||||||||||
| Fios video | (62) | (80) | 22.5 | (283) | (339) | 16.5 | ||||||||||||||||||||||||||||||||
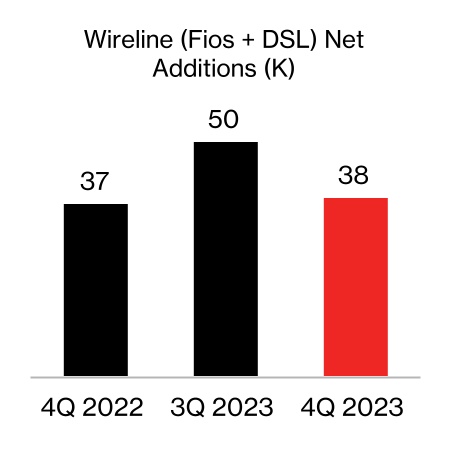
| Fios internet | 53 | 56 | (5.4) | 236 | 199 | 18.6 | ||||||||||||||||||||||||||||||||
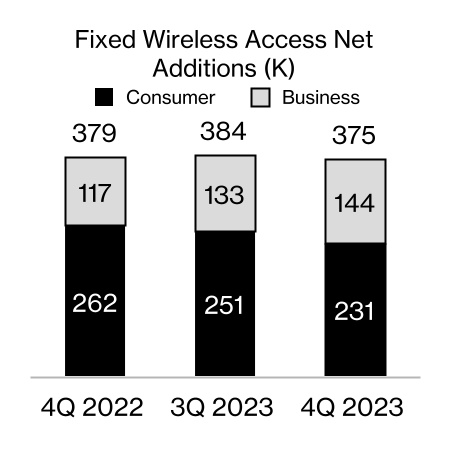
| FWA broadband | 231 | 262 | (11.8) | 989 | 776 | 27.4 | ||||||||||||||||||||||||||||||||
| Wireline broadband | 39 | 40 | (2.5) | 174 | 128 | 35.9 | ||||||||||||||||||||||||||||||||
| Total broadband | 270 | 302 | (10.6) | 1,163 | 904 | 28.7 | ||||||||||||||||||||||||||||||||
| Churn Rate: | ||||||||||||||||||||||||||||||||||||||
| Wireless retail postpaid | 1.08 | % | 1.06 | % | 1.03 | % | 1.01 | % | ||||||||||||||||||||||||||||||
| Wireless retail postpaid phones | 0.88 | % | 0.86 | % | 0.83 | % | 0.81 | % | ||||||||||||||||||||||||||||||
| Wireless retail prepaid | 4.55 | % | 4.90 | % | 4.37 | % | 4.09 | % | ||||||||||||||||||||||||||||||
| Wireless retail | 1.73 | % | 1.83 | % | 1.67 | % | 1.63 | % | ||||||||||||||||||||||||||||||
| Revenue Statistics (in millions): | ||||||||||||||||||||||||||||||||||||||
| Wireless service revenue | $ | 16,034 | $ | 15,539 | 3.2 | $ | 63,358 | $ | 61,509 | 3.0 | ||||||||||||||||||||||||||||
| Fios revenues | $ | 2,942 | $ | 2,914 | 1.0 | $ | 11,614 | $ | 11,622 | (0.1) | ||||||||||||||||||||||||||||
| Unaudited | 3 Mos. Ended 12/31/23 | 3 Mos. Ended 12/31/22 | % Change |
12 Mos. Ended 12/31/23 | 12 Mos. Ended 12/31/22 | % Change |
||||||||||||||||||||||||||||||||
| Other Wireless Statistics: | ||||||||||||||||||||||||||||||||||||||
Wireless retail postpaid ARPA (1) |
$ | 134.10 | $ | 128.02 | 4.7 | $ | 132.36 | $ | 125.97 | 5.1 | ||||||||||||||||||||||||||||
Wireless retail postpaid upgrade rate |
4.4 | % | 5.6 | % | ||||||||||||||||||||||||||||||||||
Wireless retail postpaid accounts (‘000) (2) |
32,990 | 33,183 | (0.6) | |||||||||||||||||||||||||||||||||||
Wireless retail postpaid connections per account (2) |
2.84 | 2.77 | 2.5 | |||||||||||||||||||||||||||||||||||
Wireless retail prepaid ARPU (3) |
$ | 31.87 | $ | 31.53 | 1.1 | $ | 31.46 | $ | 31.21 | 0.8 | ||||||||||||||||||||||||||||
| (dollars in millions) | ||||||||||||||||||||||||||||||||||||||
| Unaudited | 3 Mos. Ended 12/31/23 | 3 Mos. Ended 12/31/22 | % Change |
12 Mos. Ended 12/31/23 | 12 Mos. Ended 12/31/22 | % Change |
||||||||||||||||||||||||||||||||
| Operating Revenues | ||||||||||||||||||||||||||||||||||||||
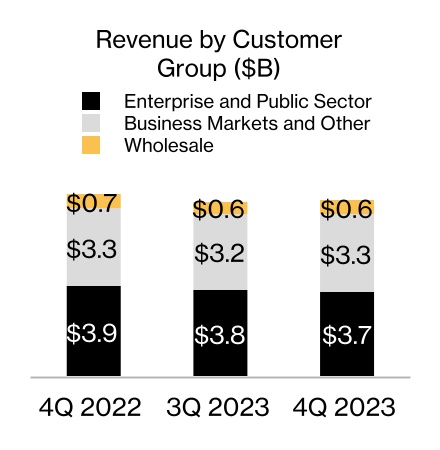
| Enterprise and Public Sector | $ | 3,718 | $ | 3,908 | (4.9) | $ | 15,076 | $ | 15,693 | (3.9) | ||||||||||||||||||||||||||||
| Business Markets and Other | 3,318 | 3,330 | (0.4) | 12,715 | 12,772 | (0.4) | ||||||||||||||||||||||||||||||||
| Wholesale | 582 | 662 | (12.1) | 2,331 | 2,607 | (10.6) | ||||||||||||||||||||||||||||||||
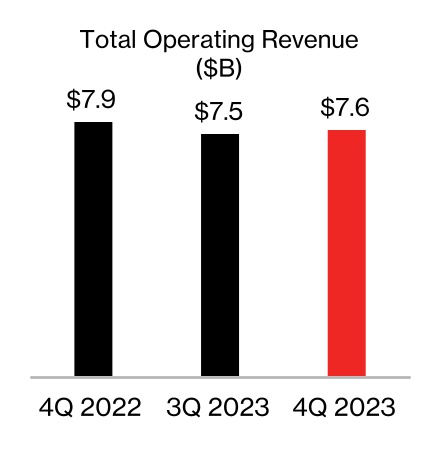
| Total Operating Revenues | 7,618 | 7,900 | (3.6) | 30,122 | 31,072 | (3.1) | ||||||||||||||||||||||||||||||||
| Operating Expenses | ||||||||||||||||||||||||||||||||||||||
| Cost of services | 2,519 | 2,665 | (5.5) | 10,180 | 10,483 | (2.9) | ||||||||||||||||||||||||||||||||
| Cost of wireless equipment | 1,353 | 1,440 | (6.0) | 4,959 | 5,362 | (7.5) | ||||||||||||||||||||||||||||||||
| Selling, general and administrative expense | 2,139 | 2,112 | 1.3 | 8,429 | 8,284 | 1.8 | ||||||||||||||||||||||||||||||||
| Depreciation and amortization expense | 1,164 | 1,098 | 6.0 | 4,488 | 4,312 | 4.1 | ||||||||||||||||||||||||||||||||
| Total Operating Expenses | 7,175 | 7,315 | (1.9) | 28,056 | 28,441 | (1.4) | ||||||||||||||||||||||||||||||||
| Operating Income | $ | 443 | $ | 585 | (24.3) | $ | 2,066 | $ | 2,631 | (21.5) | ||||||||||||||||||||||||||||
| Operating Income Margin | 5.8 | % | 7.4 | % | 6.9 | % | 8.5 | % | ||||||||||||||||||||||||||||||
Segment EBITDA(1) |
$ | 1,607 | $ | 1,683 | (4.5) | $ | 6,554 | $ | 6,943 | (5.6) | ||||||||||||||||||||||||||||
Segment EBITDA Margin(1) |
21.1 | % | 21.3 | % | 21.8 | % | 22.3 | % | ||||||||||||||||||||||||||||||
| Unaudited | 12/31/23 | 12/31/22 | % Change |
|||||||||||||||||||||||||||||||||||
| Connections (‘000): | ||||||||||||||||||||||||||||||||||||||
| Wireless retail postpaid | 29,779 | 28,733 | 3.6 | |||||||||||||||||||||||||||||||||||
| Wireless retail postpaid phones | 18,170 | 17,782 | 2.2 | |||||||||||||||||||||||||||||||||||
| Fios video | 61 | 67 | (9.0) | |||||||||||||||||||||||||||||||||||
| Fios internet | 385 | 373 | 3.2 | |||||||||||||||||||||||||||||||||||
| FWA broadband | 1,201 | 568 | * | |||||||||||||||||||||||||||||||||||
| Wireline broadband | 460 | 468 | (1.7) | |||||||||||||||||||||||||||||||||||
| Total broadband | 1,661 | 1,036 | 60.3 | |||||||||||||||||||||||||||||||||||
| Unaudited | 3 Mos. Ended 12/31/23 | 3 Mos. Ended 12/31/22 | % Change |
12 Mos. Ended 12/31/23 | 12 Mos. Ended 12/31/22 | % Change |
||||||||||||||||||||||||||||||||
| Gross Additions (‘000): | ||||||||||||||||||||||||||||||||||||||
| Wireless retail postpaid | 1,605 | 1,644 | (2.4) | 6,420 | 6,294 | 2.0 | ||||||||||||||||||||||||||||||||
| Net Additions Detail (‘000): | ||||||||||||||||||||||||||||||||||||||
| Wireless retail postpaid | 292 | 455 | (35.8) | 1,242 | 1,640 | (24.3) | ||||||||||||||||||||||||||||||||
| Wireless retail postpaid phones | 131 | 176 | (25.6) | 562 | 856 | (34.3) | ||||||||||||||||||||||||||||||||
| Fios video | (2) | (2) | — | (6) | (4) | (50.0) | ||||||||||||||||||||||||||||||||
| Fios internet | 2 | 3 | (33.3) | 12 | 17 | (29.4) | ||||||||||||||||||||||||||||||||
| FWA broadband | 144 | 117 | 23.1 | 547 | 395 | 38.5 | ||||||||||||||||||||||||||||||||
| Wireline broadband | (1) | (3) | 66.7 | (8) | (9) | 11.1 | ||||||||||||||||||||||||||||||||
| Total broadband | 143 | 114 | 25.4 | 539 | 386 | 39.6 | ||||||||||||||||||||||||||||||||
| Churn Rate: | ||||||||||||||||||||||||||||||||||||||
| Wireless retail postpaid | 1.48 | % | 1.38 | % | 1.48 | % | 1.38 | % | ||||||||||||||||||||||||||||||
| Wireless retail postpaid phones | 1.12 | % | 1.06 | % | 1.13 | % | 1.07 | % | ||||||||||||||||||||||||||||||
| Revenue Statistics (in millions): | ||||||||||||||||||||||||||||||||||||||
| Wireless service revenue | $ | 3,364 | $ | 3,265 | 3.0 | $ | 13,372 | $ | 12,845 | 4.1 | ||||||||||||||||||||||||||||
| Fios revenues | $ | 312 | $ | 304 | 2.6 | $ | 1,235 | $ | 1,201 | 2.8 | ||||||||||||||||||||||||||||
| Other Operating Statistics: | ||||||||||||||||||||||||||||||||||||||
| Wireless retail postpaid upgrade rate | 3.1 | % | 3.6 | % | ||||||||||||||||||||||||||||||||||
| Unaudited | 12/31/23 | 12/31/22 | % Change | |||||||||||||||||||||||||||||||||||
| Connections (‘000) | ||||||||||||||||||||||||||||||||||||||
| Retail postpaid | 123,629 | 120,589 | 2.5 | |||||||||||||||||||||||||||||||||||
Retail prepaid |
21,122 | 22,664 | (6.8) | |||||||||||||||||||||||||||||||||||
| Total retail | 144,751 | 143,253 | 1.0 | |||||||||||||||||||||||||||||||||||
| Retail postpaid phones | 92,890 | 92,639 | 0.3 | |||||||||||||||||||||||||||||||||||
| Unaudited | 3 Mos. Ended 12/31/23 | 3 Mos. Ended 12/31/22 | % Change |
12 Mos. Ended 12/31/23 | 12 Mos. Ended 12/31/22 | % Change |
||||||||||||||||||||||||||||||||
| Net Additions Detail (‘000) | ||||||||||||||||||||||||||||||||||||||
| Retail postpaid phones | 449 | 217 | * | 430 | 201 | * | ||||||||||||||||||||||||||||||||
| Retail postpaid | 1,460 | 1,434 | 1.8 | 3,286 | 2,605 | 26.1 | ||||||||||||||||||||||||||||||||
| Retail prepaid | (289) | (175) | (65.1) | (1,151) | (445) | * | ||||||||||||||||||||||||||||||||
| Total retail | 1,171 | 1,259 | (7.0) | 2,135 | 2,160 | (1.2) | ||||||||||||||||||||||||||||||||
| Account Statistics | ||||||||||||||||||||||||||||||||||||||
Retail postpaid accounts (‘000) (1) |
34,958 | 35,002 | (0.1) | |||||||||||||||||||||||||||||||||||
Retail postpaid connections per account (1) |
3.54 | 3.45 | 2.6 | |||||||||||||||||||||||||||||||||||
Retail postpaid ARPA (2) |
$ | 156.48 | $ | 149.95 | 4.4 | $ | 154.84 | $ | 147.53 | 5.0 | ||||||||||||||||||||||||||||
Retail prepaid ARPU (3) |
$ | 31.87 | $ | 31.53 | 1.1 | $ | 31.46 | $ | 31.21 | 0.8 | ||||||||||||||||||||||||||||
| Churn Detail | ||||||||||||||||||||||||||||||||||||||
| Retail postpaid phone | 0.93 | % | 0.89 | % | 0.89 | % | 0.86 | % | ||||||||||||||||||||||||||||||
| Retail postpaid | 1.18 | % | 1.14 | % | 1.14 | % | 1.10 | % | ||||||||||||||||||||||||||||||
| Retail prepaid | 4.55 | % | 4.90 | % | 4.37 | % | 4.09 | % | ||||||||||||||||||||||||||||||
| Retail | 1.67 | % | 1.74 | % | 1.63 | % | 1.58 | % | ||||||||||||||||||||||||||||||
| Retail Postpaid Connection Statistics | ||||||||||||||||||||||||||||||||||||||
| Upgrade rate | 4.1 | % | 5.1 | % | ||||||||||||||||||||||||||||||||||
Revenue Statistics (in millions) (4) |
||||||||||||||||||||||||||||||||||||||
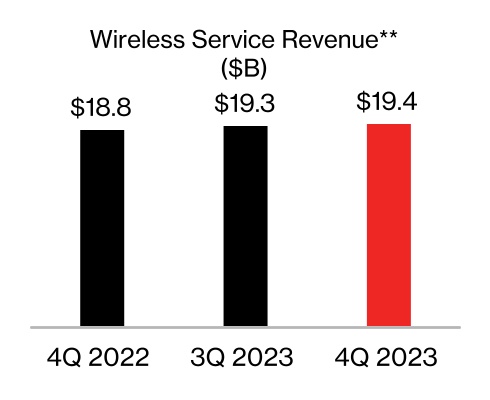
| Wireless service | $ | 19,398 | $ | 18,804 | 3.2 | $ | 76,730 | $ | 74,354 | 3.2 | ||||||||||||||||||||||||||||
| Wireless equipment | 7,472 | 7,625 | (2.0) | 24,322 | 27,210 | (10.6) | ||||||||||||||||||||||||||||||||
| Wireless other | 1,575 | 1,851 | (14.9) | 6,083 | 7,391 | (17.7) | ||||||||||||||||||||||||||||||||
| Total Wireless | $ | 28,445 | $ | 28,280 | 0.6 | $ | 107,135 | $ | 108,955 | (1.7) | ||||||||||||||||||||||||||||
Consolidated EBITDA and Consolidated Adjusted EBITDA |
|||||||||||||||||||||||||||||||||||||||||||||||
| (dollars in millions) | |||||||||||||||||||||||||||||||||||||||||||||||
| Unaudited | 3 Mos. Ended 12/31/23 | 3 Mos. Ended 9/30/23 | 3 Mos. Ended 6/30/23 | 3 Mos. Ended 3/31/23 | 3 Mos. Ended 12/31/22 | 3 Mos. Ended 9/30/22 | 3 Mos. Ended 6/30/22 | 3 Mos. Ended 3/31/22 | |||||||||||||||||||||||||||||||||||||||
| Consolidated Net Income (Loss) | $ | (2,573) | $ | 4,884 | $ | 4,766 | $ | 5,018 | $ | 6,698 | $ | 5,024 | $ | 5,315 | $ | 4,711 | |||||||||||||||||||||||||||||||
| Add: | |||||||||||||||||||||||||||||||||||||||||||||||
| Provision for income taxes | 756 | 1,308 | 1,346 | 1,482 | 2,113 | 1,496 | 1,542 | 1,372 | |||||||||||||||||||||||||||||||||||||||
| Interest expense | 1,599 | 1,433 | 1,285 | 1,207 | 1,105 | 937 | 785 | 786 | |||||||||||||||||||||||||||||||||||||||
Depreciation and amortization expense (1) |
4,516 | 4,431 | 4,359 | 4,318 | 4,218 | 4,324 | 4,321 | 4,236 | |||||||||||||||||||||||||||||||||||||||
| Consolidated EBITDA | $ | 4,298 | $ | 12,056 | $ | 11,756 | $ | 12,025 | $ | 14,134 | $ | 11,781 | $ | 11,963 | $ | 11,105 | |||||||||||||||||||||||||||||||
| Add/(subtract): | |||||||||||||||||||||||||||||||||||||||||||||||
Other (income) expense, net (2) |
$ | 807 | $ | (170) | $ | (210) | $ | (114) | $ | (2,687) | $ | 439 | $ | (49) | $ | 924 | |||||||||||||||||||||||||||||||
| Equity in losses (earnings) of unconsolidated businesses | 11 | 18 | 33 | (9) | (4) | (2) | (41) | 3 | |||||||||||||||||||||||||||||||||||||||
| Severance charges | 296 | — | 237 | — | 304 | — | — | — | |||||||||||||||||||||||||||||||||||||||
| Verizon Business Group goodwill impairment | 5,841 | — | — | — | — | — | — | — | |||||||||||||||||||||||||||||||||||||||
| Asset rationalization | 325 | — | 155 | — | — | — | — | — | |||||||||||||||||||||||||||||||||||||||
| Legal settlement | 100 | — | — | — | — | — | — | — | |||||||||||||||||||||||||||||||||||||||
| Business transformation costs | — | 176 | — | — | — | — | — | — | |||||||||||||||||||||||||||||||||||||||
| Non-strategic business shutdown | — | 158 | — | — | — | — | — | — | |||||||||||||||||||||||||||||||||||||||
| 7,380 | 182 | 215 | (123) | (2,387) | 437 | (90) | 927 | ||||||||||||||||||||||||||||||||||||||||
| Consolidated Adjusted EBITDA | $ | 11,678 | $ | 12,238 | $ | 11,971 | $ | 11,902 | $ | 11,747 | $ | 12,218 | $ | 11,873 | $ | 12,032 | |||||||||||||||||||||||||||||||
| Consolidated Adjusted EBITDA - Year over year change % | (0.6) | % | |||||||||||||||||||||||||||||||||||||||||||||
| Footnotes: | |||||||||||||||||||||||||||||||||||||||||||||||
(1) Includes Amortization of acquisition-related intangible assets and a portion of the Non-strategic business shutdown, where applicable. |
|||||||||||||||||||||||||||||||||||||||||||||||
(2) Includes Pension and benefits remeasurement adjustments and Early debt redemption costs, where applicable. |
|||||||||||||||||||||||||||||||||||||||||||||||
| Consolidated EBITDA and Consolidated Adjusted EBITDA (LTM) | ||||||||||||||||||||
| Unaudited | 12 Mos. Ended 12/31/23 | 12 Mos. Ended 9/30/23 | 12 Mos. Ended 12/31/22 | |||||||||||||||||
| Consolidated Net Income | $ | 12,095 | $ | 21,366 | $ | 21,748 | ||||||||||||||
| Add: | ||||||||||||||||||||
| Provision for income taxes | 4,892 | 6,249 | 6,523 | |||||||||||||||||
| Interest expense | 5,524 | 5,030 | 3,613 | |||||||||||||||||
Depreciation and amortization expense (1) |
17,624 | 17,326 | 17,099 | |||||||||||||||||
| Consolidated EBITDA | $ | 40,135 | $ | 49,971 | $ | 48,983 | ||||||||||||||
| Add/(subtract): | ||||||||||||||||||||
Other (income) expense, net (2) |
$ | 313 | $ | (3,181) | $ | (1,373) | ||||||||||||||
| Equity in losses (earnings) of unconsolidated businesses | 53 | 38 | (44) | |||||||||||||||||
| Severance charges | 533 | 541 | 304 | |||||||||||||||||
| Verizon Business Group goodwill impairment | 5,841 | — | — | |||||||||||||||||
| Asset rationalization | 480 | 155 | — | |||||||||||||||||
| Legal settlement | 100 | — | — | |||||||||||||||||
| Business transformation costs | 176 | 176 | — | |||||||||||||||||
| Non-strategic business shutdown | 158 | 158 | — | |||||||||||||||||
| 7,654 | (2,113) | (1,113) | ||||||||||||||||||
| Consolidated Adjusted EBITDA | $ | 47,789 | $ | 47,858 | $ | 47,870 | ||||||||||||||
| Footnotes: | ||||||||||||||||||||
| (1) Includes Amortization of acquisition-related intangible assets and a portion of the Non-strategic business shutdown, where applicable. | ||||||||||||||||||||
(2) Includes Pension and benefits remeasurement adjustments and Early debt redemption costs, where applicable. |
||||||||||||||||||||
| Net Unsecured Debt and Net Unsecured Debt to Consolidated Adjusted EBITDA Ratio | ||||||||||||||||||||
| (dollars in millions) | ||||||||||||||||||||
| Unaudited | 12/31/23 | 9/30/23 | 12/31/22 | |||||||||||||||||
| Debt maturing within one year | $ | 12,973 | $ | 12,950 | $ | 9,963 | ||||||||||||||
| Long-term debt | 137,701 | 134,441 | 140,676 | |||||||||||||||||
| Total Debt | 150,674 | 147,391 | 150,639 | |||||||||||||||||
| Less Secured debt | 22,183 | 20,951 | 20,008 | |||||||||||||||||
| Unsecured Debt | 128,491 | 126,440 | 130,631 | |||||||||||||||||
| Less Cash and cash equivalents | 2,065 | 4,210 | 2,605 | |||||||||||||||||
Net Unsecured Debt |
$ | 126,426 | $ | 122,230 | $ | 128,026 | ||||||||||||||
| Consolidated Net Income (LTM) | $ | 12,095 | $ | 21,748 | ||||||||||||||||
| Unsecured Debt to Consolidated Net Income Ratio | 10.6 | x | 6.0 | x | ||||||||||||||||
| Consolidated Adjusted EBITDA (LTM) | $ | 47,789 | $ | 47,870 | ||||||||||||||||
| Net Unsecured Debt to Consolidated Adjusted EBITDA Ratio | 2.6 | x | 2.7 | x | ||||||||||||||||
| Net Unsecured Debt - Quarter over quarter change | $ | 4,196 | ||||||||||||||||||
| Net Unsecured Debt - Year over year change | $ | (1,600) | ||||||||||||||||||
| Adjusted Earnings per Common Share (Adjusted EPS) | ||||||||||||||||||||||||||||||||
(dollars in millions, except per share amounts) | ||||||||||||||||||||||||||||||||
| Unaudited | 3 Mos. Ended 12/31/23 | 3 Mos. Ended 12/31/22 | ||||||||||||||||||||||||||||||
| Pre-tax | Tax | After-Tax | Pre-tax | Tax | After-Tax | |||||||||||||||||||||||||||
| EPS | $ | (0.64) | $ | 1.56 | ||||||||||||||||||||||||||||
| Amortization of acquisition-related intangible assets | $ | 227 | $ | (57) | $ | 170 | 0.04 | $ | 115 | $ | (34) | $ | 81 | 0.02 | ||||||||||||||||||
| Severance, pension and benefits charges (credits) | 1,288 | (319) | 969 | 0.23 | (2,214) | 552 | (1,662) | (0.40) | ||||||||||||||||||||||||
| Verizon Business Group goodwill impairment | 5,841 | (52) | 5,789 | 1.37 | — | — | — | — | ||||||||||||||||||||||||
| Asset rationalization | 325 | (80) | 245 | 0.06 | — | — | — | — | ||||||||||||||||||||||||
| Legal settlement | 100 | (25) | 75 | 0.02 | — | — | — | — | ||||||||||||||||||||||||
| $ | 7,781 | $ | (533) | $ | 7,248 | $ | 1.72 | $ | (2,099) | $ | 518 | $ | (1,581) | $ | (0.38) | |||||||||||||||||
| Adjusted EPS | $ | 1.08 | $ | 1.19 | ||||||||||||||||||||||||||||
| Footnotes: | ||||||||||||||||||||||||||||||||
|
Adjusted EPS may not add due to rounding. |
||||||||||||||||||||||||||||||||
(dollars in millions, except per share amounts) | ||||||||||||||||||||||||||||||||
| Unaudited | 12 Mos. Ended 12/31/23 | 12 Mos. Ended 12/31/22 | ||||||||||||||||||||||||||||||
| Pre-tax | Tax | After-Tax | Pre-tax | Tax | After-Tax | |||||||||||||||||||||||||||
| EPS | $ | 2.75 | $ | 5.06 | ||||||||||||||||||||||||||||
| Amortization of acquisition-related intangible assets | $ | 865 | $ | (219) | $ | 646 | 0.15 | $ | 826 | $ | (214) | $ | 612 | 0.15 | ||||||||||||||||||
| Severance, pension and benefits charges (credits) | 1,525 | (378) | 1,147 | 0.27 | (1,371) | 339 | (1,032) | (0.25) | ||||||||||||||||||||||||
| Verizon Business Group goodwill impairment | 5,841 | (52) | 5,789 | 1.37 | — | — | — | — | ||||||||||||||||||||||||
| Asset rationalization | 480 | (113) | 367 | 0.09 | — | — | — | — | ||||||||||||||||||||||||
| Legal settlement | 100 | (25) | 75 | 0.02 | — | — | — | — | ||||||||||||||||||||||||
| Business transformation costs | 176 | (45) | 131 | 0.03 | — | — | — | — | ||||||||||||||||||||||||
| Non-strategic business shutdown | 179 | (83) | 96 | 0.02 | — | — | — | — | ||||||||||||||||||||||||
| Early debt redemption costs | — | — | — | — | 1,241 | (316) | 925 | 0.22 | ||||||||||||||||||||||||
| $ | 9,166 | $ | (915) | $ | 8,251 | $ | 1.96 | $ | 696 | $ | (191) | $ | 505 | $ | 0.12 | |||||||||||||||||
| Adjusted EPS | $ | 4.71 | $ | 5.18 | ||||||||||||||||||||||||||||
| Footnotes: | ||||||||||||||||||||||||||||||||
| Adjusted EPS may not add due to rounding. | ||||||||||||||||||||||||||||||||
| Free Cash Flow | ||||||||||||||
| (dollars in millions) | ||||||||||||||
| Unaudited | 12 Mos. Ended 12/31/23 | 12 Mos. Ended 12/31/22 | ||||||||||||
| Net Cash Provided by Operating Activities | $ | 37,475 | $ | 37,141 | ||||||||||
| Capital expenditures (including capitalized software) | (18,767) | (23,087) | ||||||||||||
| Free Cash Flow | $ | 18,708 | $ | 14,054 | ||||||||||
| Segment EBITDA and Segment EBITDA Margin | ||||||||||||||||||||||||||
| Consumer | ||||||||||||||||||||||||||
| (dollars in millions) | ||||||||||||||||||||||||||
| Unaudited | 3 Mos. Ended 12/31/23 | 3 Mos. Ended 12/31/22 | 12 Mos. Ended 12/31/23 | 12 Mos. Ended 12/31/22 | ||||||||||||||||||||||
| Operating Income | $ | 7,035 | $ | 7,028 | $ | 29,011 | $ | 28,846 | ||||||||||||||||||
| Add Depreciation and amortization expense | 3,344 | 3,111 | 13,077 | 12,716 | ||||||||||||||||||||||
| Segment EBITDA | $ | 10,379 | $ | 10,139 | $ | 42,088 | $ | 41,562 | ||||||||||||||||||
| Year over year change % | 2.4 | % | 1.3 | % | ||||||||||||||||||||||
| Total operating revenues | $ | 26,954 | $ | 26,770 | $ | 101,626 | $ | 103,506 | ||||||||||||||||||
| Operating Income Margin | 26.1 | % | 26.3 | % | 28.5 | % | 27.9 | % | ||||||||||||||||||
| Segment EBITDA Margin | 38.5 | % | 37.9 | % | 41.4 | % | 40.2 | % | ||||||||||||||||||
| Business | ||||||||||||||||||||||||||
| (dollars in millions) | ||||||||||||||||||||||||||
| Unaudited | 3 Mos. Ended 12/31/23 | 3 Mos. Ended 12/31/22 | 12 Mos. Ended 12/31/23 | 12 Mos. Ended 12/31/22 | ||||||||||||||||||||||
| Operating Income | $ | 443 | $ | 585 | $ | 2,066 | $ | 2,631 | ||||||||||||||||||
| Add Depreciation and amortization expense | 1,164 | 1,098 | 4,488 | 4,312 | ||||||||||||||||||||||
| Segment EBITDA | $ | 1,607 | $ | 1,683 | $ | 6,554 | $ | 6,943 | ||||||||||||||||||
| Year over year change % | (4.5) | % | (5.6) | % | ||||||||||||||||||||||
| Total operating revenues | $ | 7,618 | $ | 7,900 | $ | 30,122 | $ | 31,072 | ||||||||||||||||||
| Operating Income Margin | 5.8 | % | 7.4 | % | 6.9 | % | 8.5 | % | ||||||||||||||||||
| Segment EBITDA Margin | 21.1 | % | 21.3 | % | 21.8 | % | 22.3 | % | ||||||||||||||||||


| (dollars in millions) | ||||||||||||||||||||||||||||||||||||||||||||||||||
| Unaudited | 3 Mos. Ended 12/31/23 | 3 Mos. Ended 9/30/23 | 3 Mos. Ended 6/30/23 | 3 Mos. Ended 3/31/23 | 3 Mos. Ended 12/31/22 | 3 Mos. Ended 9/30/22 | 3 Mos. Ended 6/30/22 | 3 Mos. Ended 3/31/22 | ||||||||||||||||||||||||||||||||||||||||||
| Consolidated Net Income (Loss) | $ | (2,573) | $ | 4,884 | $ | 4,766 | $ | 5,018 | $ | 6,698 | $ | 5,024 | $ | 5,315 | $ | 4,711 | ||||||||||||||||||||||||||||||||||
| Add: | ||||||||||||||||||||||||||||||||||||||||||||||||||
| Provision for income taxes | 756 | 1,308 | 1,346 | 1,482 | 2,113 | 1,496 | 1,542 | 1,372 | ||||||||||||||||||||||||||||||||||||||||||
| Interest expense | 1,599 | 1,433 | 1,285 | 1,207 | 1,105 | 937 | 785 | 786 | ||||||||||||||||||||||||||||||||||||||||||
Depreciation and amortization expense (1) |
4,516 | 4,431 | 4,359 | 4,318 | 4,218 | 4,324 | 4,321 | 4,236 | ||||||||||||||||||||||||||||||||||||||||||
| Consolidated EBITDA | $ | 4,298 | $ | 12,056 | $ | 11,756 | $ | 12,025 | $ | 14,134 | $ | 11,781 | $ | 11,963 | $ | 11,105 | ||||||||||||||||||||||||||||||||||
| Add/(subtract): | ||||||||||||||||||||||||||||||||||||||||||||||||||
Other (income) expense, net (2) |
$ | 807 | $ | (170) | $ | (210) | $ | (114) | $ | (2,687) | $ | 439 | $ | (49) | $ | 924 | ||||||||||||||||||||||||||||||||||
| Equity in losses (earnings) of unconsolidated businesses | 11 | 18 | 33 | (9) | (4) | (2) | (41) | 3 | ||||||||||||||||||||||||||||||||||||||||||
| Severance charges | 296 | — | 237 | — | 304 | — | — | — | ||||||||||||||||||||||||||||||||||||||||||
| Verizon Business Group goodwill impairment | 5,841 | — | — | — | — | — | — | — | ||||||||||||||||||||||||||||||||||||||||||
| Asset rationalization | 325 | — | 155 | — | — | — | — | — | ||||||||||||||||||||||||||||||||||||||||||
| Legal settlement | 100 | — | — | — | — | — | — | — | ||||||||||||||||||||||||||||||||||||||||||
| Business transformation costs | — | 176 | — | — | — | — | — | — | ||||||||||||||||||||||||||||||||||||||||||
| Non-strategic business shutdown | — | 158 | — | — | — | — | — | — | ||||||||||||||||||||||||||||||||||||||||||
| 7,380 | 182 | 215 | (123) | (2,387) | 437 | (90) | 927 | |||||||||||||||||||||||||||||||||||||||||||
| Consolidated Adjusted EBITDA | $ | 11,678 | $ | 12,238 | $ | 11,971 | $ | 11,902 | $ | 11,747 | $ | 12,218 | $ | 11,873 | $ | 12,032 | ||||||||||||||||||||||||||||||||||
| Consolidated Adjusted EBITDA - Year over year change % | (0.6) | % | ||||||||||||||||||||||||||||||||||||||||||||||||
| Unaudited | 12 Mos. Ended 12/31/23 | 12 Mos. Ended 9/30/23 | 12 Mos. Ended 12/31/22 | |||||||||||||||||
| Consolidated Net Income | $ | 12,095 | $ | 21,366 | $ | 21,748 | ||||||||||||||
| Add: | ||||||||||||||||||||
| Provision for income taxes | 4,892 | 6,249 | 6,523 | |||||||||||||||||
| Interest expense | 5,524 | 5,030 | 3,613 | |||||||||||||||||
Depreciation and amortization expense (1) |
17,624 | 17,326 | 17,099 | |||||||||||||||||
| Consolidated EBITDA | $ | 40,135 | $ | 49,971 | $ | 48,983 | ||||||||||||||
| Add/(subtract): | ||||||||||||||||||||
Other (income) expense, net (2) |
$ | 313 | $ | (3,181) | $ | (1,373) | ||||||||||||||
| Equity in losses (earnings) of unconsolidated businesses | 53 | 38 | (44) | |||||||||||||||||
| Severance charges | 533 | 541 | 304 | |||||||||||||||||
| Verizon Business Group goodwill impairment | 5,841 | — | — | |||||||||||||||||
| Asset rationalization | 480 | 155 | — | |||||||||||||||||
| Legal settlement | 100 | — | — | |||||||||||||||||
| Business transformation costs | 176 | 176 | — | |||||||||||||||||
| Non-strategic business shutdown | 158 | 158 | — | |||||||||||||||||
| 7,654 | (2,113) | (1,113) | ||||||||||||||||||
| Consolidated Adjusted EBITDA | $ | 47,789 | $ | 47,858 | $ | 47,870 | ||||||||||||||
| (dollars in millions) | ||||||||||||||||||||
| Unaudited | 12/31/23 | 9/30/23 | 12/31/22 | |||||||||||||||||
| Debt maturing within one year | $ | 12,973 | $ | 12,950 | $ | 9,963 | ||||||||||||||
| Long-term debt | 137,701 | 134,441 | 140,676 | |||||||||||||||||
| Total Debt | 150,674 | 147,391 | 150,639 | |||||||||||||||||
| Less Secured debt | 22,183 | 20,951 | 20,008 | |||||||||||||||||
| Unsecured Debt | 128,491 | 126,440 | 130,631 | |||||||||||||||||
| Less Cash and cash equivalents | 2,065 | 4,210 | 2,605 | |||||||||||||||||
Net Unsecured Debt |
$ | 126,426 | $ | 122,230 | $ | 128,026 | ||||||||||||||
| Consolidated Net Income (LTM) | $ | 12,095 | $ | 21,366 | $ | 21,748 | ||||||||||||||
| Consolidated Adjusted EBITDA (LTM) | $ | 47,789 | $ | 47,858 | $ | 47,870 | ||||||||||||||
| Unsecured Debt to Consolidated Net Income Ratio | 10.6 | x | 5.9 | x | 6.0 | x | ||||||||||||||
| Net Unsecured Debt to Consolidated Adjusted EBITDA Ratio | 2.6 | x | 2.6 | x | 2.7 | x | ||||||||||||||
| Net Unsecured Debt - Quarter over quarter change | $ | 4,196 | ||||||||||||||||||
| Net Unsecured Debt - Year over year change | $ | (1,600) | ||||||||||||||||||
Net Unsecured Debt to Consolidated Adjusted EBITDA Ratio - Quarter over quarter change |
— | x | ||||||||||||||||||
| Net Unsecured Debt to Consolidated Adjusted EBITDA Ratio - Year over year change | (0.1) | x | ||||||||||||||||||
(dollars in millions, except per share amounts) | ||||||||||||||||||||||||||||||||
| Unaudited | 3 Mos. Ended 12/31/23 | 3 Mos. Ended 12/31/22 | ||||||||||||||||||||||||||||||
| Pre-tax | Tax | After-Tax | Pre-tax | Tax | After-Tax | |||||||||||||||||||||||||||
| EPS | $ | (0.64) | $ | 1.56 | ||||||||||||||||||||||||||||
| Amortization of acquisition-related intangible assets | $ | 227 | $ | (57) | $ | 170 | 0.04 | $ | 115 | $ | (34) | $ | 81 | 0.02 | ||||||||||||||||||
| Severance, pension and benefits charges (credits) | 1,288 | (319) | 969 | 0.23 | (2,214) | 552 | (1,662) | (0.40) | ||||||||||||||||||||||||
| Verizon Business Group goodwill impairment | 5,841 | (52) | 5,789 | 1.37 | — | — | — | — | ||||||||||||||||||||||||
| Asset rationalization | 325 | (80) | 245 | 0.06 | — | — | — | — | ||||||||||||||||||||||||
| Legal settlement | 100 | (25) | 75 | 0.02 | — | — | — | — | ||||||||||||||||||||||||
| $ | 7,781 | $ | (533) | $ | 7,248 | $ | 1.72 | $ | (2,099) | $ | 518 | $ | (1,581) | $ | (0.38) | |||||||||||||||||
| Adjusted EPS | $ | 1.08 | $ | 1.19 | ||||||||||||||||||||||||||||
(dollars in millions, except per share amounts) | ||||||||||||||||||||||||||||||||
| Unaudited | 12 Mos. Ended 12/31/23 | 12 Mos. Ended 12/31/22 | ||||||||||||||||||||||||||||||
| Pre-tax | Tax | After-Tax | Pre-tax | Tax | After-Tax | |||||||||||||||||||||||||||
| EPS | $ | 2.75 | $ | 5.06 | ||||||||||||||||||||||||||||
| Amortization of acquisition-related intangible assets | $ | 865 | $ | (219) | $ | 646 | 0.15 | $ | 826 | $ | (214) | $ | 612 | 0.15 | ||||||||||||||||||
| Severance, pension and benefits charges (credits) | 1,525 | (378) | 1,147 | 0.27 | (1,371) | 339 | (1,032) | (0.25) | ||||||||||||||||||||||||
| Verizon Business Group goodwill impairment | 5,841 | (52) | 5,789 | 1.37 | — | — | — | — | ||||||||||||||||||||||||
| Asset rationalization | 480 | (113) | 367 | 0.09 | — | — | — | — | ||||||||||||||||||||||||
| Legal settlement | 100 | (25) | 75 | 0.02 | — | — | — | — | ||||||||||||||||||||||||
| Business transformation costs | 176 | (45) | 131 | 0.03 | — | — | — | — | ||||||||||||||||||||||||
| Non-strategic business shutdown | 179 | (83) | 96 | 0.02 | — | — | — | — | ||||||||||||||||||||||||
| Early debt redemption costs | — | — | — | — | 1,241 | (316) | 925 | 0.22 | ||||||||||||||||||||||||
| $ | 9,166 | $ | (915) | $ | 8,251 | $ | 1.96 | $ | 696 | $ | (191) | $ | 505 | $ | 0.12 | |||||||||||||||||
| Adjusted EPS | $ | 4.71 | $ | 5.18 | ||||||||||||||||||||||||||||
| Footnotes: | ||||||||||||||||||||||||||||||||
| Adjusted EPS may not add due to rounding. | ||||||||||||||||||||||||||||||||
| Free Cash Flow | ||||||||||||||
| (dollars in millions) | ||||||||||||||
| Unaudited | 12 Mos. Ended 12/31/23 | 12 Mos. Ended 12/31/22 | ||||||||||||
| Net Cash Provided by Operating Activities | $ | 37,475 | $ | 37,141 | ||||||||||
| Capital expenditures (including capitalized software) | (18,767) | (23,087) | ||||||||||||
| Free Cash Flow | $ | 18,708 | $ | 14,054 | ||||||||||
| Consolidated Operating Expenses Excluding Depreciation and Amortization and Special Items | ||||||||||||||
| (dollars in millions) | ||||||||||||||
| Unaudited | 3 Mos. Ended 12/31/23 | 3 Mos. Ended 12/31/22 | ||||||||||||
| Consolidated Operating Expenses | $ | 34,530 | $ | 28,026 | ||||||||||
Depreciation and amortization expense(1) |
4,516 | 4,218 | ||||||||||||
| Severance charges | 296 | 304 | ||||||||||||
| Verizon Business Group goodwill impairment | 5,841 | — | ||||||||||||
| Asset rationalization | 325 | — | ||||||||||||
| Legal settlement | 100 | — | ||||||||||||
| Consolidated Operating Expenses Excluding Depreciation and Amortization and Special Items | $ | 23,452 | $ | 23,504 | ||||||||||
| Year over year change % | (0.2) | % | ||||||||||||
| (dollars in millions) | ||||||||||||||
| Unaudited | 3 Mos. Ended 12/31/23 | 3 Mos. Ended 12/31/22 | ||||||||||||
| Operating Income | $ | 7,035 | $ | 7,028 | ||||||||||
| Add Depreciation and amortization expense | 3,344 | 3,111 | ||||||||||||
| Segment EBITDA | $ | 10,379 | $ | 10,139 | ||||||||||
| Year over year change % | 2.4 | % | ||||||||||||
| Total operating revenues | $ | 26,954 | $ | 26,770 | ||||||||||
| Operating Income Margin | 26.1 | % | 26.3 | % | ||||||||||
| Segment EBITDA Margin | 38.5 | % | 37.9 | % | ||||||||||
| (dollars in millions) | ||||||||||||||
| Unaudited | 3 Mos. Ended 12/31/23 | 3 Mos. Ended 12/31/22 | ||||||||||||
| Operating Income | $ | 443 | $ | 585 | ||||||||||
| Add Depreciation and amortization expense | 1,164 | 1,098 | ||||||||||||
| Segment EBITDA | $ | 1,607 | $ | 1,683 | ||||||||||
| Year over year change % | (4.5) | % | ||||||||||||
| Total operating revenues | $ | 7,618 | $ | 7,900 | ||||||||||
| Operating Income Margin | 5.8 | % | 7.4 | % | ||||||||||
| Segment EBITDA Margin | 21.1 | % | 21.3 | % | ||||||||||