| Delaware | 1-8606 | 23-2259884 | |||||||||
| (State or other jurisdiction of incorporation) |
(Commission File Number) | (I.R.S. Employer Identification No.) | |||||||||
| 1095 Avenue of the Americas | 10036 | ||||||||||
| New York, | New York | ||||||||||
| (Address of principal executive offices) | (Zip Code) | ||||||||||
| Title of Each Class | Trading Symbol(s) | Name of Each Exchange on Which Registered | ||||||||||||
| Common Stock, par value $0.10 | VZ | New York Stock Exchange | ||||||||||||
| Common Stock, par value $0.10 | VZ | The Nasdaq Global Select Market | ||||||||||||
| 1.625% Notes due 2024 | VZ 24B | New York Stock Exchange | ||||||||||||
| 4.073% Notes due 2024 | VZ 24C | New York Stock Exchange | ||||||||||||
| 0.875% Notes due 2025 | VZ 25 | New York Stock Exchange | ||||||||||||
| 3.25% Notes due 2026 | VZ 26 | New York Stock Exchange | ||||||||||||
| 1.375% Notes due 2026 | VZ 26B | New York Stock Exchange | ||||||||||||
| 0.875% Notes due 2027 | VZ 27E | New York Stock Exchange | ||||||||||||
| 1.375% Notes due 2028 | VZ 28 | New York Stock Exchange | ||||||||||||
| 1.125% Notes due 2028 | VZ 28A | New York Stock Exchange | ||||||||||||
| 2.350% Fixed Rate Notes due 2028 | VZ 28C | New York Stock Exchange | ||||||||||||
| 1.875% Notes due 2029 | VZ 29B | New York Stock Exchange | ||||||||||||
| 0.375% Notes due 2029 | VZ 29D | New York Stock Exchange | ||||||||||||
| 1.250% Notes due 2030 | VZ 30 | New York Stock Exchange | ||||||||||||
| 1.875% Notes due 2030 | VZ 30A | New York Stock Exchange | ||||||||||||
| 4.250% Notes due 2030 | VZ 30D | New York Stock Exchange | ||||||||||||
| 2.625% Notes due 2031 | VZ 31 | New York Stock Exchange | ||||||||||||
| 2.500% Notes due 2031 | VZ 31A | New York Stock Exchange | ||||||||||||
| 3.000% Fixed Rate Notes due 2031 | VZ 31D | New York Stock Exchange | ||||||||||||
| 0.875% Notes due 2032 | VZ 32 | New York Stock Exchange | ||||||||||||
| 0.750% Notes due 2032 | VZ 32A | New York Stock Exchange | ||||||||||||
| 1.300% Notes due 2033 | VZ 33B | New York Stock Exchange | ||||||||||||
| 4.75% Notes due 2034 | VZ 34 | New York Stock Exchange | ||||||||||||
| 4.750% Notes due 2034 | VZ 34C | New York Stock Exchange | ||||||||||||
| 3.125% Notes due 2035 | VZ 35 | New York Stock Exchange | ||||||||||||
| 1.125% Notes due 2035 | VZ 35A | New York Stock Exchange | ||||||||||||
| 3.375% Notes due 2036 | VZ 36A | New York Stock Exchange | ||||||||||||
| 2.875% Notes due 2038 | VZ 38B | New York Stock Exchange | ||||||||||||
| 1.875% Notes due 2038 | VZ 38C | New York Stock Exchange | ||||||||||||
| 1.500% Notes due 2039 | VZ 39C | New York Stock Exchange | ||||||||||||
| 3.50% Fixed Rate Notes due 2039 | VZ 39D | New York Stock Exchange | ||||||||||||
| 1.850% Notes due 2040 | VZ 40 | New York Stock Exchange | ||||||||||||
| 3.850% Fixed Rate Notes due 2041 | VZ 41C | New York Stock Exchange | ||||||||||||
| (d) Exhibits. | ||||||||
| Exhibit Number |
Description | |||||||
Press release and financial tables, dated July 25, 2023, issued by Verizon Communications Inc. |
||||||||
Commentary discussing financial and operating results of Verizon Communications Inc. for the second quarter of 2023. |
||||||||
| 104 | Cover Page Interactive Data File (formatted as inline XBRL). | |||||||
| Verizon Communications Inc. | ||||||||||||||||||||
| (Registrant) | ||||||||||||||||||||
| Date: | July 25, 2023 | /s/ Mary-Lee Stillwell | ||||||||||||||||||
| Mary-Lee Stillwell | ||||||||||||||||||||
| Senior Vice President and Controller | ||||||||||||||||||||

FOR IMMEDIATE RELEASE |
Media contacts: |
||||
| July 25, 2023 | Donna Lyden | ||||
| 908-872-0278 | |||||
| donna.lyden@verizon.com | |||||
| Eric Wilkens | |||||
| 201-572-9317 | |||||
| eric.wilkens@verizon.com | |||||
(dollars in millions, except per share amounts) | ||||||||||||||||||||||||||||||||||||||
| Unaudited | 3 Mos. Ended 6/30/23 | 3 Mos. Ended 6/30/22 | % Change |
6 Mos. Ended 6/30/23 | 6 Mos. Ended 6/30/22 | % Change |
||||||||||||||||||||||||||||||||
| Operating Revenues | ||||||||||||||||||||||||||||||||||||||
| Service revenues and other | $ | 27,319 | $ | 27,115 | 0.8 | $ | 54,471 | $ | 54,333 | 0.3 | ||||||||||||||||||||||||||||
| Wireless equipment revenues | 5,277 | 6,674 | (20.9) | 11,037 | 13,010 | (15.2) | ||||||||||||||||||||||||||||||||
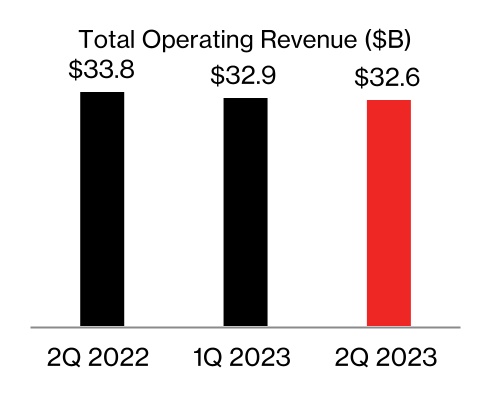
| Total Operating Revenues | 32,596 | 33,789 | (3.5) | 65,508 | 67,343 | (2.7) | ||||||||||||||||||||||||||||||||
| Operating Expenses | ||||||||||||||||||||||||||||||||||||||
| Cost of services | 6,986 | 6,932 | 0.8 | 14,064 | 14,159 | (0.7) | ||||||||||||||||||||||||||||||||
| Cost of wireless equipment | 5,778 | 7,488 | (22.8) | 12,204 | 14,611 | (16.5) | ||||||||||||||||||||||||||||||||
| Selling, general and administrative expense | 8,253 | 7,496 | 10.1 | 15,759 | 14,668 | 7.4 | ||||||||||||||||||||||||||||||||
| Depreciation and amortization expense | 4,359 | 4,321 | 0.9 | 8,677 | 8,557 | 1.4 | ||||||||||||||||||||||||||||||||
| Total Operating Expenses | 25,376 | 26,237 | (3.3) | 50,704 | 51,995 | (2.5) | ||||||||||||||||||||||||||||||||
| Operating Income | 7,220 | 7,552 | (4.4) | 14,804 | 15,348 | (3.5) | ||||||||||||||||||||||||||||||||
| Equity in earnings (losses) of unconsolidated businesses | (33) | 41 | * | (24) | 38 | * | ||||||||||||||||||||||||||||||||
| Other income (expense), net | 210 | 49 | * | 324 | (875) | * | ||||||||||||||||||||||||||||||||
| Interest expense | (1,285) | (785) | 63.7 | (2,492) | (1,571) | 58.6 | ||||||||||||||||||||||||||||||||
| Income Before Provision For Income Taxes | 6,112 | 6,857 | (10.9) | 12,612 | 12,940 | (2.5) | ||||||||||||||||||||||||||||||||
| Provision for income taxes | (1,346) | (1,542) | (12.7) | (2,828) | (2,914) | (3.0) | ||||||||||||||||||||||||||||||||
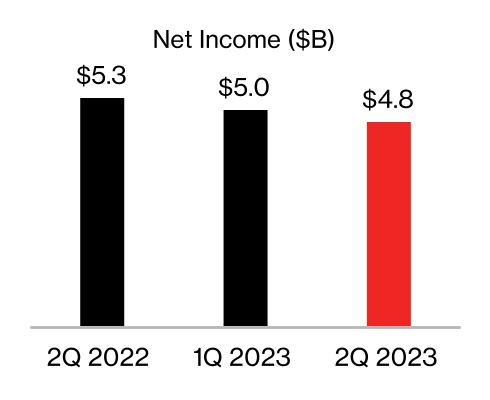
| Net Income | $ | 4,766 | $ | 5,315 | (10.3) | $ | 9,784 | $ | 10,026 | (2.4) | ||||||||||||||||||||||||||||
| Net income attributable to noncontrolling interests | $ | 118 | $ | 116 | 1.7 | $ | 227 | $ | 247 | (8.1) | ||||||||||||||||||||||||||||
| Net income attributable to Verizon | 4,648 | 5,199 | (10.6) | 9,557 | 9,779 | (2.3) | ||||||||||||||||||||||||||||||||
| Net Income | $ | 4,766 | $ | 5,315 | (10.3) | $ | 9,784 | $ | 10,026 | (2.4) | ||||||||||||||||||||||||||||
| Basic Earnings Per Common Share | ||||||||||||||||||||||||||||||||||||||
| Net income attributable to Verizon | $ | 1.10 | $ | 1.24 | (11.3) | $ | 2.27 | $ | 2.33 | (2.6) | ||||||||||||||||||||||||||||
| Weighted-average shares outstanding (in millions) | 4,208 | 4,201 | 4,207 | 4,201 | ||||||||||||||||||||||||||||||||||
Diluted Earnings Per Common Share (1) |
||||||||||||||||||||||||||||||||||||||
| Net income attributable to Verizon | $ | 1.10 | $ | 1.24 | (11.3) | $ | 2.27 | $ | 2.33 | (2.6) | ||||||||||||||||||||||||||||
| Weighted-average shares outstanding (in millions) | 4,213 | 4,202 | 4,212 | 4,202 | ||||||||||||||||||||||||||||||||||
| (dollars in millions) | ||||||||||||||||||||
| Unaudited | 6/30/23 | 12/31/22 | $ Change | |||||||||||||||||
| Assets | ||||||||||||||||||||
| Current assets | ||||||||||||||||||||
| Cash and cash equivalents | $ | 4,803 | $ | 2,605 | $ | 2,198 | ||||||||||||||
| Accounts receivable | 24,108 | 25,332 | (1,224) | |||||||||||||||||
| Less Allowance for credit losses | 922 | 826 | 96 | |||||||||||||||||
| Accounts receivable, net | 23,186 | 24,506 | (1,320) | |||||||||||||||||
| Inventories | 1,896 | 2,388 | (492) | |||||||||||||||||
| Prepaid expenses and other | 7,503 | 8,358 | (855) | |||||||||||||||||
| Total current assets | 37,388 | 37,857 | (469) | |||||||||||||||||
| Property, plant and equipment | 313,424 | 307,689 | 5,735 | |||||||||||||||||
| Less Accumulated depreciation | 206,154 | 200,255 | 5,899 | |||||||||||||||||
| Property, plant and equipment, net | 107,270 | 107,434 | (164) | |||||||||||||||||
| Investments in unconsolidated businesses | 1,015 | 1,071 | (56) | |||||||||||||||||
| Wireless licenses | 151,337 | 149,796 | 1,541 | |||||||||||||||||
| Goodwill | 28,647 | 28,671 | (24) | |||||||||||||||||
| Other intangible assets, net | 11,097 | 11,461 | (364) | |||||||||||||||||
| Operating lease right-of-use assets | 25,345 | 26,130 | (785) | |||||||||||||||||
| Other assets | 17,856 | 17,260 | 596 | |||||||||||||||||
| Total assets | $ | 379,955 | $ | 379,680 | $ | 275 | ||||||||||||||
| Liabilities and Equity | ||||||||||||||||||||
| Current liabilities | ||||||||||||||||||||
| Debt maturing within one year | $ | 14,827 | $ | 9,963 | $ | 4,864 | ||||||||||||||
| Accounts payable and accrued liabilities | 20,067 | 23,977 | (3,910) | |||||||||||||||||
| Current operating lease liabilities | 4,211 | 4,134 | 77 | |||||||||||||||||
| Other current liabilities | 12,299 | 12,097 | 202 | |||||||||||||||||
| Total current liabilities | 51,404 | 50,171 | 1,233 | |||||||||||||||||
| Long-term debt | 137,871 | 140,676 | (2,805) | |||||||||||||||||
| Employee benefit obligations | 12,357 | 12,974 | (617) | |||||||||||||||||
| Deferred income taxes | 44,055 | 43,441 | 614 | |||||||||||||||||
| Non-current operating lease liabilities | 20,745 | 21,558 | (813) | |||||||||||||||||
| Other liabilities | 17,021 | 18,397 | (1,376) | |||||||||||||||||
| Total long-term liabilities | 232,049 | 237,046 | (4,997) | |||||||||||||||||
| Equity | ||||||||||||||||||||
| Common stock | 429 | 429 | — | |||||||||||||||||
| Additional paid in capital | 13,523 | 13,420 | 103 | |||||||||||||||||
| Retained earnings | 86,448 | 82,380 | 4,068 | |||||||||||||||||
| Accumulated other comprehensive loss | (1,921) | (1,865) | (56) | |||||||||||||||||
| Common stock in treasury, at cost | (3,830) | (4,013) | 183 | |||||||||||||||||
| Deferred compensation – employee stock ownership plans and other | 544 | 793 | (249) | |||||||||||||||||
| Noncontrolling interests | 1,309 | 1,319 | (10) | |||||||||||||||||
| Total equity | 96,502 | 92,463 | 4,039 | |||||||||||||||||
| Total liabilities and equity | $ | 379,955 | $ | 379,680 | $ | 275 | ||||||||||||||
| (dollars in millions, except per share amounts) | ||||||||||||||
| Unaudited | 6/30/23 | 12/31/22 | ||||||||||||
| Total debt | $ | 152,698 | $ | 150,639 | ||||||||||
| Unsecured debt | $ | 131,356 | $ | 130,631 | ||||||||||
Net unsecured debt(1) |
$ | 126,553 | $ | 128,026 | ||||||||||
| Unsecured debt / Consolidated Net Income (LTM) | 6.1 | x | 6.0 | x | ||||||||||
Net unsecured debt / Consolidated Adjusted EBITDA(1)(2) |
2.6x | 2.7 | x | |||||||||||
| Common shares outstanding end of period (in millions) | 4,204 | 4,200 | ||||||||||||
| Total employees (‘000) | 114.2 | 117.1 | ||||||||||||
| Quarterly cash dividends declared per common share | $ | 0.6525 | $ | 0.6525 | ||||||||||
| (dollars in millions) | ||||||||||||||||||||
| Unaudited | 6 Mos. Ended 6/30/23 | 6 Mos. Ended 6/30/22 | $ Change | |||||||||||||||||
| Cash Flows from Operating Activities | ||||||||||||||||||||
| Net Income | $ | 9,784 | $ | 10,026 | $ | (242) | ||||||||||||||
| Adjustments to reconcile net income to net cash provided by operating activities: | ||||||||||||||||||||
| Depreciation and amortization expense | 8,677 | 8,557 | 120 | |||||||||||||||||
| Employee retirement benefits | 108 | (121) | 229 | |||||||||||||||||
| Deferred income taxes | 633 | 1,514 | (881) | |||||||||||||||||
| Provision for expected credit losses | 1,061 | 665 | 396 | |||||||||||||||||
| Equity in losses (earnings) of unconsolidated businesses, net of dividends received | 49 | (18) | 67 | |||||||||||||||||
Changes in current assets and liabilities, net of effects from acquisition/disposition of businesses |
(620) | (1,959) | 1,339 | |||||||||||||||||
| Other, net | (1,672) | (999) | (673) | |||||||||||||||||
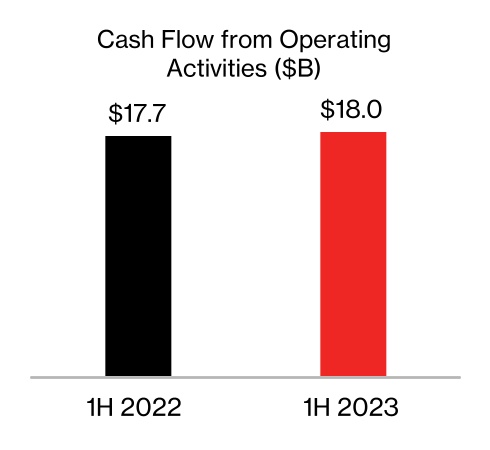
| Net cash provided by operating activities | 18,020 | 17,665 | 355 | |||||||||||||||||
| Cash Flows from Investing Activities | ||||||||||||||||||||
| Capital expenditures (including capitalized software) | (10,070) | (10,491) | 421 | |||||||||||||||||
| Cash received related to acquisitions of businesses, net | — | 247 | (247) | |||||||||||||||||
| Acquisitions of wireless licenses | (1,085) | (2,275) | 1,190 | |||||||||||||||||
| Collateral receipts (payments) related to derivative contracts, net | 824 | (2,075) | 2,899 | |||||||||||||||||
| Other, net | 131 | (62) | 193 | |||||||||||||||||
| Net cash used in investing activities | (10,200) | (14,656) | 4,456 | |||||||||||||||||
| Cash Flows from Financing Activities | ||||||||||||||||||||
| Proceeds from long-term borrowings | 1,503 | 3,617 | (2,114) | |||||||||||||||||
| Proceeds from asset-backed long-term borrowings | 3,705 | 5,053 | (1,348) | |||||||||||||||||
| Net proceeds from (repayments of) short-term commercial paper | (167) | 2,560 | (2,727) | |||||||||||||||||
| Repayments of long-term borrowings and finance lease obligations | (2,600) | (7,405) | 4,805 | |||||||||||||||||
| Repayments of asset-backed long-term borrowings | (2,383) | (2,695) | 312 | |||||||||||||||||
| Dividends paid | (5,487) | (5,378) | (109) | |||||||||||||||||
| Other, net | (157) | 411 | (568) | |||||||||||||||||
| Net cash used in financing activities | (5,586) | (3,837) | (1,749) | |||||||||||||||||
| Increase (decrease) in cash, cash equivalents and restricted cash | 2,234 | (828) | 3,062 | |||||||||||||||||
| Cash, cash equivalents and restricted cash, beginning of period | 4,111 | 4,161 | (50) | |||||||||||||||||
| Cash, cash equivalents and restricted cash, end of period | $ | 6,345 | $ | 3,333 | $ | 3,012 | ||||||||||||||
| (dollars in millions) | ||||||||||||||||||||||||||||||||||||||
| Unaudited | 3 Mos. Ended 6/30/23 | 3 Mos. Ended 6/30/22 | % Change |
6 Mos. Ended 6/30/23 | 6 Mos. Ended 6/30/22 | % Change |
||||||||||||||||||||||||||||||||
| Operating Revenues | ||||||||||||||||||||||||||||||||||||||
| Service | $ | 18,641 | $ | 18,149 | 2.7 | $ | 37,097 | $ | 36,275 | 2.3 | ||||||||||||||||||||||||||||
| Wireless equipment | 4,430 | 5,708 | (22.4) | 9,308 | 11,082 | (16.0) | ||||||||||||||||||||||||||||||||
| Other | 1,487 | 1,747 | (14.9) | 3,010 | 3,539 | (14.9) | ||||||||||||||||||||||||||||||||
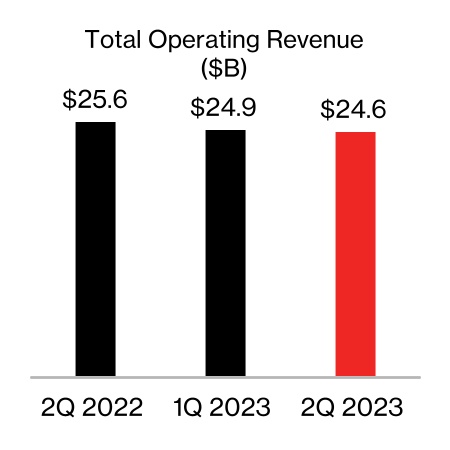
| Total Operating Revenues | 24,558 | 25,604 | (4.1) | 49,415 | 50,896 | (2.9) | ||||||||||||||||||||||||||||||||
| Operating Expenses | ||||||||||||||||||||||||||||||||||||||
| Cost of services | 4,367 | 4,284 | 1.9 | 8,799 | 8,730 | 0.8 | ||||||||||||||||||||||||||||||||
| Cost of wireless equipment | 4,626 | 6,221 | (25.6) | 9,817 | 12,034 | (18.4) | ||||||||||||||||||||||||||||||||
| Selling, general and administrative expense | 4,988 | 4,738 | 5.3 | 9,909 | 9,290 | 6.7 | ||||||||||||||||||||||||||||||||
| Depreciation and amortization expense | 3,247 | 3,211 | 1.1 | 6,461 | 6,373 | 1.4 | ||||||||||||||||||||||||||||||||
| Total Operating Expenses | 17,228 | 18,454 | (6.6) | 34,986 | 36,427 | (4.0) | ||||||||||||||||||||||||||||||||
| Operating Income | $ | 7,330 | $ | 7,150 | 2.5 | $ | 14,429 | $ | 14,469 | (0.3) | ||||||||||||||||||||||||||||
| Operating Income Margin | 29.8 | % | 27.9 | % | 29.2 | % | 28.4 | % | ||||||||||||||||||||||||||||||
Segment EBITDA(1) |
$ | 10,577 | $ | 10,361 | 2.1 | $ | 20,890 | $ | 20,842 | 0.2 | ||||||||||||||||||||||||||||
Segment EBITDA Margin(1) |
43.1 | % | 40.5 | % | 42.3 | % | 41.0 | % | ||||||||||||||||||||||||||||||
| Unaudited | 6/30/23 | 6/30/22 | % Change | |||||||||||||||||||||||||||||||||||
| Connections (‘000): | ||||||||||||||||||||||||||||||||||||||
| Wireless retail postpaid | 92,474 | 91,475 | 1.1 | |||||||||||||||||||||||||||||||||||
| Wireless retail prepaid | 21,646 | 23,138 | (6.4) | |||||||||||||||||||||||||||||||||||
| Total wireless retail | 114,120 | 114,613 | (0.4) | |||||||||||||||||||||||||||||||||||
| Wireless retail postpaid phones | 74,465 | 75,197 | (1.0) | |||||||||||||||||||||||||||||||||||
| Fios video | 3,091 | 3,409 | (9.3) | |||||||||||||||||||||||||||||||||||
| Fios internet | 6,854 | 6,626 | 3.4 | |||||||||||||||||||||||||||||||||||
| Fixed wireless access (FWA) broadband | 1,390 | 384 | * | |||||||||||||||||||||||||||||||||||
| Wireline broadband | 7,098 | 6,938 | 2.3 | |||||||||||||||||||||||||||||||||||
| Total broadband | 8,488 | 7,322 | 15.9 | |||||||||||||||||||||||||||||||||||
| Unaudited | 3 Mos. Ended 6/30/23 | 3 Mos. Ended 6/30/22 | % Change |
6 Mos. Ended 6/30/23 | 6 Mos. Ended 6/30/22 | % Change |
||||||||||||||||||||||||||||||||
| Gross Additions (‘000): | ||||||||||||||||||||||||||||||||||||||
| Wireless retail postpaid | 2,928 | 2,622 | 11.7 | 6,138 | 5,103 | 20.3 | ||||||||||||||||||||||||||||||||
Net Additions Detail (‘000): |
||||||||||||||||||||||||||||||||||||||
| Wireless retail postpaid | 304 | 84 | * | 625 | (42) | * | ||||||||||||||||||||||||||||||||
| Wireless retail prepaid | (304) | (229) | (32.8) | (655) | (309) | * | ||||||||||||||||||||||||||||||||
| Total wireless retail | — | (145) | * | (30) | (351) | 91.5 | ||||||||||||||||||||||||||||||||
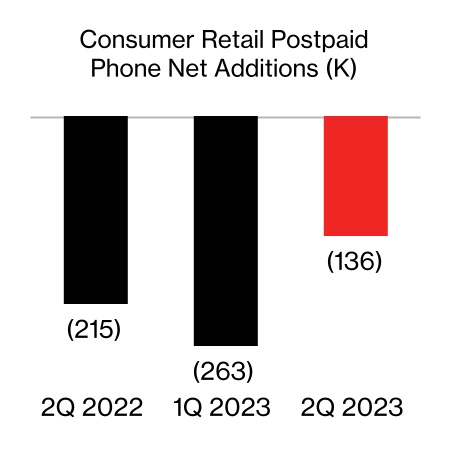
| Wireless retail postpaid phones | (136) | (215) | 36.7 | (399) | (507) | 21.3 | ||||||||||||||||||||||||||||||||
| Fios video | (69) | (86) | 19.8 | (143) | (164) | 12.8 | ||||||||||||||||||||||||||||||||
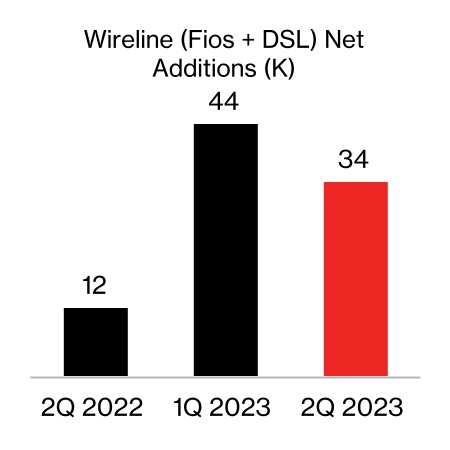
| Fios internet | 51 | 30 | 70.0 | 114 | 85 | 34.1 | ||||||||||||||||||||||||||||||||
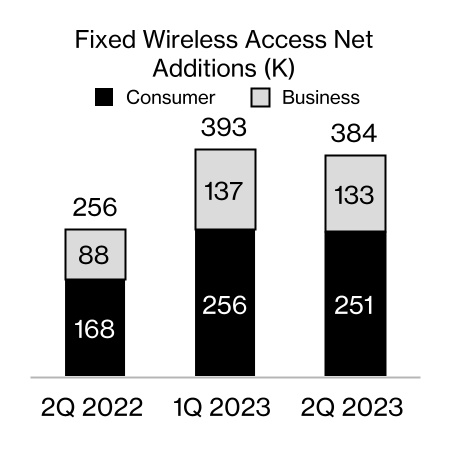
| FWA broadband | 251 | 168 | 49.4 | 507 | 280 | 81.1 | ||||||||||||||||||||||||||||||||
| Wireline broadband | 36 | 13 | * | 82 | 50 | 64.0 | ||||||||||||||||||||||||||||||||
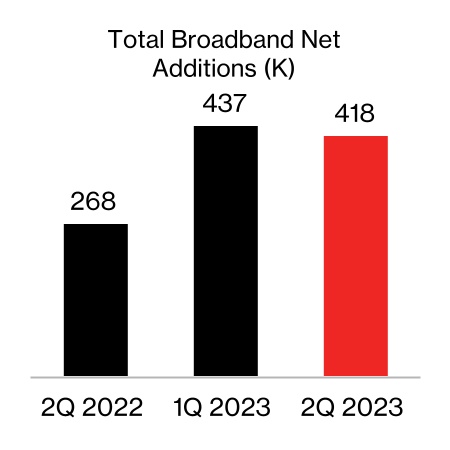
| Total broadband | 287 | 181 | 58.6 | 589 | 330 | 78.5 | ||||||||||||||||||||||||||||||||
| Churn Rate: | ||||||||||||||||||||||||||||||||||||||
| Wireless retail postpaid | 0.95 | % | 0.93 | % | 1.00 | % | 0.94 | % | ||||||||||||||||||||||||||||||
| Wireless retail postpaid phones | 0.76 | % | 0.75 | % | 0.80 | % | 0.76 | % | ||||||||||||||||||||||||||||||
| Wireless retail prepaid | 4.24 | % | 3.90 | % | 4.28 | % | 3.79 | % | ||||||||||||||||||||||||||||||
| Wireless retail | 1.58 | % | 1.53 | % | 1.63 | % | 1.52 | % | ||||||||||||||||||||||||||||||
| Revenue Statistics (in millions): | ||||||||||||||||||||||||||||||||||||||
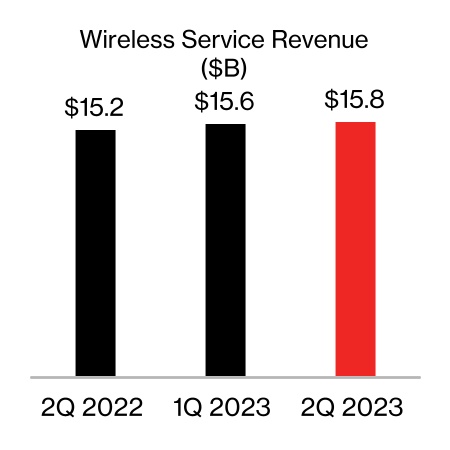
| Wireless service revenue | $ | 15,762 | $ | 15,236 | 3.5 | $ | 31,361 | $ | 30,453 | 3.0 | ||||||||||||||||||||||||||||
| Fios revenues | $ | 2,886 | $ | 2,895 | (0.3) | $ | 5,775 | $ | 5,806 | (0.5) | ||||||||||||||||||||||||||||
| Unaudited | 3 Mos. Ended 6/30/23 | 3 Mos. Ended 6/30/22 | % Change |
6 Mos. Ended 6/30/23 | 6 Mos. Ended 6/30/22 | % Change |
||||||||||||||||||||||||||||||||
| Other Wireless Statistics: | ||||||||||||||||||||||||||||||||||||||
Wireless retail postpaid ARPA (1) |
$ | 131.83 | $ | 124.16 | 6.2 | $ | 130.95 | $ | 124.06 | 5.6 | ||||||||||||||||||||||||||||
Wireless retail postpaid upgrade rate |
3.5 | % | 5.6 | % | ||||||||||||||||||||||||||||||||||
Wireless retail postpaid accounts (‘000) (2) |
32,976 | 33,386 | (1.2) | |||||||||||||||||||||||||||||||||||
Wireless retail postpaid connections per account (2) |
2.80 | 2.74 | 2.2 | |||||||||||||||||||||||||||||||||||
Wireless retail prepaid ARPU (3) |
$ | 31.42 | $ | 31.26 | 0.5 | $ | 31.06 | $ | 31.07 | — | ||||||||||||||||||||||||||||
| (dollars in millions) | ||||||||||||||||||||||||||||||||||||||
| Unaudited | 3 Mos. Ended 6/30/23 | 3 Mos. Ended 6/30/22 | % Change |
6 Mos. Ended 6/30/23 | 6 Mos. Ended 6/30/22 | % Change |
||||||||||||||||||||||||||||||||
| Operating Revenues | ||||||||||||||||||||||||||||||||||||||
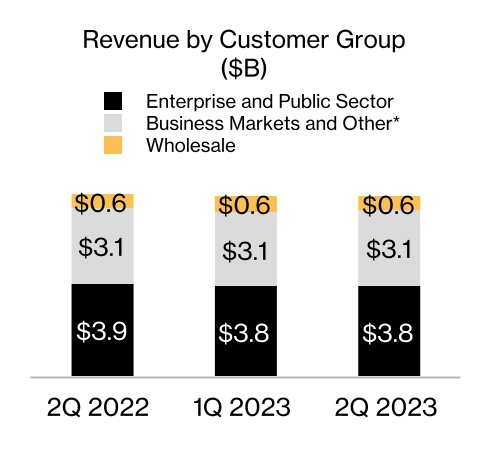
| Enterprise and Public Sector | $ | 3,784 | $ | 3,867 | (2.1) | $ | 7,571 | $ | 7,845 | (3.5) | ||||||||||||||||||||||||||||
Business Markets and Other(1) |
3,109 | 3,130 | (0.7) | 6,213 | 6,206 | 0.1 | ||||||||||||||||||||||||||||||||
| Wholesale | 590 | 629 | (6.2) | 1,193 | 1,284 | (7.1) | ||||||||||||||||||||||||||||||||
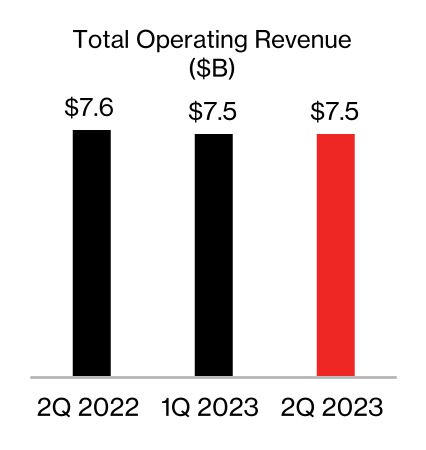
| Total Operating Revenues | 7,483 | 7,626 | (1.9) | 14,977 | 15,335 | (2.3) | ||||||||||||||||||||||||||||||||
| Operating Expenses | ||||||||||||||||||||||||||||||||||||||
| Cost of services | 2,543 | 2,559 | (0.6) | 5,125 | 5,165 | (0.8) | ||||||||||||||||||||||||||||||||
| Cost of wireless equipment | 1,152 | 1,268 | (9.1) | 2,386 | 2,578 | (7.4) | ||||||||||||||||||||||||||||||||
| Selling, general and administrative expense | 2,152 | 2,050 | 5.0 | 4,185 | 4,109 | 1.8 | ||||||||||||||||||||||||||||||||
| Depreciation and amortization expense | 1,103 | 1,074 | 2.7 | 2,197 | 2,135 | 2.9 | ||||||||||||||||||||||||||||||||
| Total Operating Expenses | 6,950 | 6,951 | — | 13,893 | 13,987 | (0.7) | ||||||||||||||||||||||||||||||||
| Operating Income | $ | 533 | $ | 675 | (21.0) | $ | 1,084 | $ | 1,348 | (19.6) | ||||||||||||||||||||||||||||
| Operating Income Margin | 7.1 | % | 8.9 | % | 7.2 | % | 8.8 | % | ||||||||||||||||||||||||||||||
Segment EBITDA(2) |
$ | 1,636 | $ | 1,749 | (6.5) | $ | 3,281 | $ | 3,483 | (5.8) | ||||||||||||||||||||||||||||
Segment EBITDA Margin(2) |
21.9 | % | 22.9 | % | 21.9 | % | 22.7 | % | ||||||||||||||||||||||||||||||
| Unaudited | 6/30/23 | 6/30/22 | % Change |
|||||||||||||||||||||||||||||||||||
| Connections (‘000): | ||||||||||||||||||||||||||||||||||||||
| Wireless retail postpaid | 29,105 | 28,208 | 3.2 | |||||||||||||||||||||||||||||||||||
| Wireless retail postpaid phones | 17,856 | 17,586 | 1.5 | |||||||||||||||||||||||||||||||||||
| Fios video | 64 | 70 | (8.6) | |||||||||||||||||||||||||||||||||||
| Fios internet | 380 | 367 | 3.5 | |||||||||||||||||||||||||||||||||||
| FWA broadband | 870 | 316 | * | |||||||||||||||||||||||||||||||||||
| Wireline broadband | 464 | 474 | (2.1) | |||||||||||||||||||||||||||||||||||
| Total broadband | 1,334 | 790 | 68.9 | |||||||||||||||||||||||||||||||||||
| Unaudited | 3 Mos. Ended 6/30/23 | 3 Mos. Ended 6/30/22 | % Change |
6 Mos. Ended 6/30/23 | 6 Mos. Ended 6/30/22 | % Change |
||||||||||||||||||||||||||||||||
| Gross Additions (‘000): | ||||||||||||||||||||||||||||||||||||||
| Wireless retail postpaid | 1,590 | 1,582 | 0.5 | 3,197 | 3,084 | 3.7 | ||||||||||||||||||||||||||||||||
| Net Additions Detail (‘000): | ||||||||||||||||||||||||||||||||||||||
| Wireless retail postpaid | 308 | 430 | (28.4) | 620 | 825 | (24.8) | ||||||||||||||||||||||||||||||||
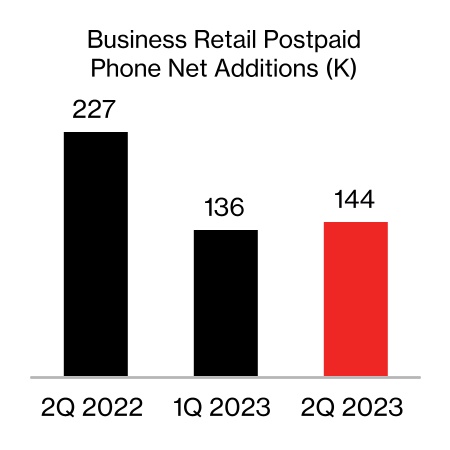
| Wireless retail postpaid phones | 144 | 227 | (36.6) | 280 | 483 | (42.0) | ||||||||||||||||||||||||||||||||
| Fios video | (1) | (1) | — | (3) | (1) | * | ||||||||||||||||||||||||||||||||
| Fios internet | 3 | 6 | (50.0) | 7 | 11 | (36.4) | ||||||||||||||||||||||||||||||||
| FWA broadband | 133 | 88 | 51.1 | 270 | 170 | 58.8 | ||||||||||||||||||||||||||||||||
| Wireline broadband | (2) | (1) | * | (4) | (3) | (33.3) | ||||||||||||||||||||||||||||||||
| Total broadband | 131 | 87 | 50.6 | 266 | 167 | 59.3 | ||||||||||||||||||||||||||||||||
| Churn Rate: | ||||||||||||||||||||||||||||||||||||||
| Wireless retail postpaid | 1.48 | % | 1.37 | % | 1.49 | % | 1.35 | % | ||||||||||||||||||||||||||||||
| Wireless retail postpaid phones | 1.10 | % | 1.07 | % | 1.13 | % | 1.07 | % | ||||||||||||||||||||||||||||||
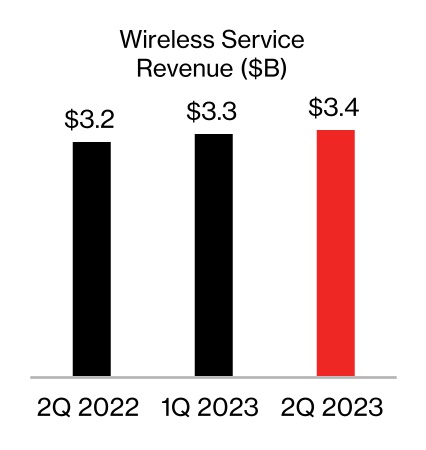
| Revenue Statistics (in millions): | ||||||||||||||||||||||||||||||||||||||
| Wireless service revenue | $ | 3,351 | $ | 3,182 | 5.3 | $ | 6,641 | $ | 6,307 | 5.3 | ||||||||||||||||||||||||||||
| Fios revenues | $ | 308 | $ | 298 | 3.4 | $ | 615 | $ | 593 | 3.7 | ||||||||||||||||||||||||||||
| Other Operating Statistics: | ||||||||||||||||||||||||||||||||||||||
| Wireless retail postpaid upgrade rate | 2.7 | % | 3.1 | % | ||||||||||||||||||||||||||||||||||
| Unaudited | 6/30/23 | 6/30/22 | % Change | |||||||||||||||||||||||||||||||||||
| Connections (‘000) | ||||||||||||||||||||||||||||||||||||||
| Retail postpaid | 121,579 | 119,683 | 1.6 | |||||||||||||||||||||||||||||||||||
Retail prepaid |
21,646 | 23,138 | (6.4) | |||||||||||||||||||||||||||||||||||
| Total retail | 143,225 | 142,821 | 0.3 | |||||||||||||||||||||||||||||||||||
| Retail postpaid phones | 92,321 | 92,783 | (0.5) | |||||||||||||||||||||||||||||||||||
| Unaudited | 3 Mos. Ended 6/30/23 | 3 Mos. Ended 6/30/22 | % Change |
6 Mos. Ended 6/30/23 | 6 Mos. Ended 6/30/22 | % Change |
||||||||||||||||||||||||||||||||
| Net Additions Detail (‘000) | ||||||||||||||||||||||||||||||||||||||
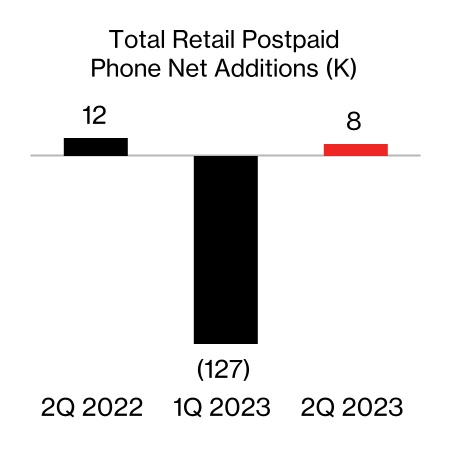
| Retail postpaid phones | 8 | 12 | (33.3) | (119) | (24) | * | ||||||||||||||||||||||||||||||||
| Retail postpaid | 612 | 514 | 19.1 | 1,245 | 783 | 59.0 | ||||||||||||||||||||||||||||||||
| Retail prepaid | (304) | (229) | (32.8) | (655) | (309) | * | ||||||||||||||||||||||||||||||||
| Total retail | 308 | 285 | 8.1 | 590 | 474 | 24.5 | ||||||||||||||||||||||||||||||||
| Account Statistics | ||||||||||||||||||||||||||||||||||||||
Retail postpaid accounts (‘000) (1) |
34,855 | 35,132 | (0.8) | |||||||||||||||||||||||||||||||||||
Retail postpaid connections per account (1) |
3.49 | 3.41 | 2.3 | |||||||||||||||||||||||||||||||||||
Retail postpaid ARPA (2) |
$ | 154.51 | $ | 145.50 | 6.2 | $ | 153.39 | $ | 145.18 | 5.7 | ||||||||||||||||||||||||||||
Retail prepaid ARPU (3) |
$ | 31.42 | $ | 31.26 | 0.5 | $ | 31.06 | $ | 31.07 | — | ||||||||||||||||||||||||||||
| Churn Detail | ||||||||||||||||||||||||||||||||||||||
| Retail postpaid phone | 0.83 | % | 0.81 | % | 0.87 | % | 0.82 | % | ||||||||||||||||||||||||||||||
| Retail postpaid | 1.07 | % | 1.03 | % | 1.11 | % | 1.03 | % | ||||||||||||||||||||||||||||||
| Retail prepaid | 4.24 | % | 3.90 | % | 4.28 | % | 3.79 | % | ||||||||||||||||||||||||||||||
| Retail | 1.56 | % | 1.50 | % | 1.60 | % | 1.49 | % | ||||||||||||||||||||||||||||||
| Retail Postpaid Connection Statistics | ||||||||||||||||||||||||||||||||||||||
| Upgrade rate | 3.3 | % | 5.0 | % | ||||||||||||||||||||||||||||||||||
Revenue Statistics (in millions) (4) |
||||||||||||||||||||||||||||||||||||||
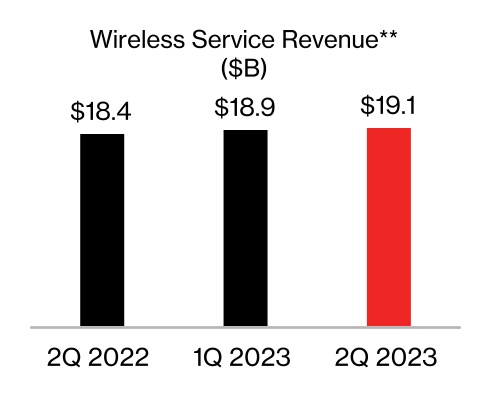
| Wireless service | $ | 19,113 | $ | 18,418 | 3.8 | $ | 38,002 | $ | 36,760 | 3.4 | ||||||||||||||||||||||||||||
| Wireless equipment | 5,277 | 6,674 | (20.9) | 11,037 | 13,010 | (15.2) | ||||||||||||||||||||||||||||||||
| Wireless other | 1,486 | 1,800 | (17.4) | 3,001 | 3,618 | (17.1) | ||||||||||||||||||||||||||||||||
| Total Wireless | $ | 25,876 | $ | 26,892 | (3.8) | $ | 52,040 | $ | 53,388 | (2.5) | ||||||||||||||||||||||||||||
| (dollars in millions) | ||||||||||||||||||||||||||||||||||||||
| Unaudited | 3 Mos. Ended 6/30/23 | 3 Mos. Ended 3/31/23 | 3 Mos. Ended 12/31/22 | 3 Mos. Ended 9/30/22 | 3 Mos. Ended 6/30/22 | 3 Mos. Ended 3/31/22 | ||||||||||||||||||||||||||||||||
| Consolidated Net Income | $ | 4,766 | $ | 5,018 | $ | 6,698 | $ | 5,024 | $ | 5,315 | $ | 4,711 | ||||||||||||||||||||||||||
| Add: | ||||||||||||||||||||||||||||||||||||||
| Provision for income taxes | 1,346 | 1,482 | 2,113 | 1,496 | 1,542 | 1,372 | ||||||||||||||||||||||||||||||||
| Interest expense | 1,285 | 1,207 | 1,105 | 937 | 785 | 786 | ||||||||||||||||||||||||||||||||
Depreciation and amortization expense (1) |
4,359 | 4,318 | 4,218 | 4,324 | 4,321 | 4,236 | ||||||||||||||||||||||||||||||||
| Consolidated EBITDA | $ | 11,756 | $ | 12,025 | $ | 14,134 | $ | 11,781 | $ | 11,963 | $ | 11,105 | ||||||||||||||||||||||||||
| Add/(subtract): | ||||||||||||||||||||||||||||||||||||||
Other (income) expense, net (2) |
$ | (210) | $ | (114) | $ | (2,687) | $ | 439 | $ | (49) | $ | 924 | ||||||||||||||||||||||||||
| Equity in losses (earnings) of unconsolidated businesses | 33 | (9) | (4) | (2) | (41) | 3 | ||||||||||||||||||||||||||||||||
| Severance charges | 237 | — | 304 | — | — | — | ||||||||||||||||||||||||||||||||
| Asset rationalization | 155 | — | — | — | — | — | ||||||||||||||||||||||||||||||||
| 215 | (123) | (2,387) | 437 | (90) | 927 | |||||||||||||||||||||||||||||||||
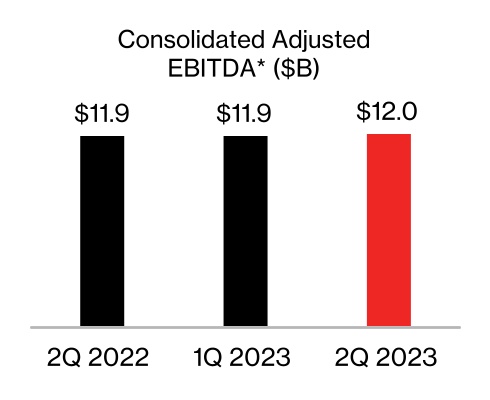
| Consolidated Adjusted EBITDA | $ | 11,971 | $ | 11,902 | $ | 11,747 | $ | 12,218 | $ | 11,873 | $ | 12,032 | ||||||||||||||||||||||||||
| Consolidated Adjusted EBITDA - Year over year change % | 0.8 | % | ||||||||||||||||||||||||||||||||||||
| Unaudited | 12 Mos. Ended 6/30/23 | 12 Mos. Ended 3/31/23 | 12 Mos. Ended 12/31/22 | |||||||||||||||||
| Consolidated Net Income | $ | 21,506 | $ | 22,055 | $ | 21,748 | ||||||||||||||
| Add: | ||||||||||||||||||||
| Provision for income taxes | 6,437 | 6,633 | 6,523 | |||||||||||||||||
| Interest expense | 4,534 | 4,034 | 3,613 | |||||||||||||||||
Depreciation and amortization expense (1) |
17,219 | 17,181 | 17,099 | |||||||||||||||||
| Consolidated EBITDA | $ | 49,696 | $ | 49,903 | $ | 48,983 | ||||||||||||||
| Add/(subtract): | ||||||||||||||||||||
Other (income) expense, net (2) |
$ | (2,572) | $ | (2,411) | $ | (1,373) | ||||||||||||||
| Equity in losses (earnings) of unconsolidated businesses | 18 | (56) | (44) | |||||||||||||||||
| Severance charges | 541 | 304 | 304 | |||||||||||||||||
| Asset rationalization | 155 | — | — | |||||||||||||||||
| (1,858) | (2,163) | (1,113) | ||||||||||||||||||
| Consolidated Adjusted EBITDA | $ | 47,838 | $ | 47,740 | $ | 47,870 | ||||||||||||||
| (dollars in millions) | ||||||||||||||||||||
| Unaudited | 6/30/23 | 3/31/23 | 12/31/22 | |||||||||||||||||
| Debt maturing within one year | $ | 14,827 | $ | 12,081 | $ | 9,963 | ||||||||||||||
| Long-term debt | 137,871 | 140,772 | 140,676 | |||||||||||||||||
| Total Debt | 152,698 | 152,853 | 150,639 | |||||||||||||||||
| Less Secured debt | 21,342 | 20,835 | 20,008 | |||||||||||||||||
| Unsecured Debt | 131,356 | 132,018 | 130,631 | |||||||||||||||||
| Less Cash and cash equivalents | 4,803 | 2,234 | 2,605 | |||||||||||||||||
Net Unsecured Debt |
$ | 126,553 | $ | 129,784 | $ | 128,026 | ||||||||||||||
| Consolidated Net Income (LTM) | $ | 21,506 | $ | 21,748 | ||||||||||||||||
| Unsecured Debt to Consolidated Net Income Ratio | 6.1 | x | 6.0 | x | ||||||||||||||||
| Consolidated Adjusted EBITDA (LTM) | $ | 47,838 | $ | 47,870 | ||||||||||||||||
| Net Unsecured Debt to Consolidated Adjusted EBITDA Ratio | 2.6x | 2.7 | x | |||||||||||||||||
| Net Unsecured Debt - Quarter over quarter change | $ | (3,231) | ||||||||||||||||||
(dollars in millions, except per share amounts) | ||||||||||||||||||||||||||||||||
| Unaudited | 3 Mos. Ended 6/30/23 | 3 Mos. Ended 6/30/22 | ||||||||||||||||||||||||||||||
| Pre-tax | Tax | After-Tax | Pre-tax | Tax | After-Tax | |||||||||||||||||||||||||||
| EPS | $ | 1.10 | $ | 1.24 | ||||||||||||||||||||||||||||
| Amortization of acquisition-related intangible assets | $ | 206 | $ | (53) | $ | 153 | 0.04 | $ | 237 | $ | (62) | $ | 175 | 0.04 | ||||||||||||||||||
| Severance, pension and benefits charges | 237 | (59) | 178 | 0.04 | 198 | (51) | 147 | 0.03 | ||||||||||||||||||||||||
| Asset rationalization | 155 | (33) | 122 | 0.03 | — | — | — | — | ||||||||||||||||||||||||
| $ | 598 | $ | (145) | $ | 453 | $ | 0.11 | $ | 435 | $ | (113) | $ | 322 | $ | 0.08 | |||||||||||||||||
| Adjusted EPS | $ | 1.21 | $ | 1.31 | ||||||||||||||||||||||||||||
| Free Cash Flow | ||||||||||||||
| (dollars in millions) | ||||||||||||||
| Unaudited | 6 Mos. Ended 6/30/23 | 6 Mos. Ended 6/30/22 | ||||||||||||
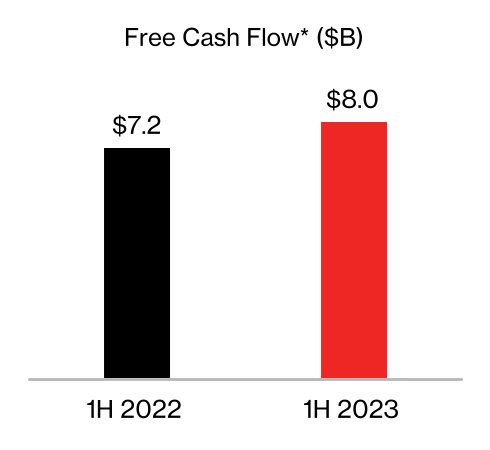
| Net Cash Provided by Operating Activities | $ | 18,020 | $ | 17,665 | ||||||||||
| Capital expenditures (including capitalized software) | (10,070) | (10,491) | ||||||||||||
| Free Cash Flow | $ | 7,950 | $ | 7,174 | ||||||||||
| (dollars in millions) | ||||||||||||||||||||||||||
| Unaudited | 3 Mos. Ended 6/30/23 | 3 Mos. Ended 6/30/22 | 6 Mos. Ended 6/30/23 | 6 Mos. Ended 6/30/22 | ||||||||||||||||||||||
| Operating Income | $ | 7,330 | $ | 7,150 | $ | 14,429 | $ | 14,469 | ||||||||||||||||||
| Add Depreciation and amortization expense | 3,247 | 3,211 | 6,461 | 6,373 | ||||||||||||||||||||||
| Segment EBITDA | $ | 10,577 | $ | 10,361 | $ | 20,890 | $ | 20,842 | ||||||||||||||||||
| Year over year change % | 2.1 | % | 0.2 | % | ||||||||||||||||||||||
| Total operating revenues | $ | 24,558 | $ | 25,604 | $ | 49,415 | $ | 50,896 | ||||||||||||||||||
| Operating Income Margin | 29.8 | % | 27.9 | % | 29.2 | % | 28.4 | % | ||||||||||||||||||
| Segment EBITDA Margin | 43.1 | % | 40.5 | % | 42.3 | % | 41.0 | % | ||||||||||||||||||
| (dollars in millions) | ||||||||||||||||||||||||||
| Unaudited | 3 Mos. Ended 6/30/23 | 3 Mos. Ended 6/30/22 | 6 Mos. Ended 6/30/23 | 6 Mos. Ended 6/30/22 | ||||||||||||||||||||||
| Operating Income | $ | 533 | $ | 675 | $ | 1,084 | $ | 1,348 | ||||||||||||||||||
| Add Depreciation and amortization expense | 1,103 | 1,074 | 2,197 | 2,135 | ||||||||||||||||||||||
| Segment EBITDA | $ | 1,636 | $ | 1,749 | $ | 3,281 | $ | 3,483 | ||||||||||||||||||
| Year over year change % | (6.5) | % | (5.8) | % | ||||||||||||||||||||||
| Total operating revenues | $ | 7,483 | $ | 7,626 | $ | 14,977 | $ | 15,335 | ||||||||||||||||||
| Operating Income Margin | 7.1 | % | 8.9 | % | 7.2 | % | 8.8 | % | ||||||||||||||||||
| Segment EBITDA Margin | 21.9 | % | 22.9 | % | 21.9 | % | 22.7 | % | ||||||||||||||||||


| (dollars in millions) | ||||||||||||||||||||||||||||||||||||||||||||||||||
| Unaudited | 3 Mos. Ended 6/30/23 | 3 Mos. Ended 3/31/23 | 3 Mos. Ended 12/31/22 | 3 Mos. Ended 9/30/22 | 3 Mos. Ended 6/30/22 | 3 Mos. Ended 3/31/22 | 3 Mos. Ended 12/31/21 | 3 Mos. Ended 9/30/21 | ||||||||||||||||||||||||||||||||||||||||||
| Consolidated Net Income | $ | 4,766 | $ | 5,018 | $ | 6,698 | $ | 5,024 | $ | 5,315 | $ | 4,711 | $ | 4,737 | $ | 6,554 | ||||||||||||||||||||||||||||||||||
| Add: | ||||||||||||||||||||||||||||||||||||||||||||||||||
| Provision for income taxes | 1,346 | 1,482 | 2,113 | 1,496 | 1,542 | 1,372 | 1,407 | 1,820 | ||||||||||||||||||||||||||||||||||||||||||
| Interest expense | 1,285 | 1,207 | 1,105 | 937 | 785 | 786 | 739 | 801 | ||||||||||||||||||||||||||||||||||||||||||
Depreciation and amortization expense (1) |
4,359 | 4,318 | 4,218 | 4,324 | 4,321 | 4,236 | 4,051 | 3,961 | ||||||||||||||||||||||||||||||||||||||||||
| Consolidated EBITDA | $ | 11,756 | $ | 12,025 | $ | 14,134 | $ | 11,781 | $ | 11,963 | $ | 11,105 | $ | 10,934 | $ | 13,136 | ||||||||||||||||||||||||||||||||||
| Add/(subtract): | ||||||||||||||||||||||||||||||||||||||||||||||||||
Other (income) expense, net (2) |
$ | (210) | $ | (114) | $ | (2,687) | $ | 439 | $ | (49) | $ | 924 | $ | 860 | $ | (269) | ||||||||||||||||||||||||||||||||||
Equity in losses (earnings) of unconsolidated businesses (3) |
33 | (9) | (4) | (2) | (41) | 3 | (135) | (1) | ||||||||||||||||||||||||||||||||||||||||||
| Severance charges | 237 | — | 304 | — | — | — | 106 | 103 | ||||||||||||||||||||||||||||||||||||||||||
| Asset rationalization | 155 | — | — | — | — | — | — | — | ||||||||||||||||||||||||||||||||||||||||||
| Net gain from disposition of business | — | — | — | — | — | — | — | (706) | ||||||||||||||||||||||||||||||||||||||||||
| 215 | (123) | (2,387) | 437 | (90) | 927 | 831 | (873) | |||||||||||||||||||||||||||||||||||||||||||
| Consolidated Adjusted EBITDA | $ | 11,971 | $ | 11,902 | $ | 11,747 | $ | 12,218 | $ | 11,873 | $ | 12,032 | $ | 11,765 | $ | 12,263 | ||||||||||||||||||||||||||||||||||
| Consolidated Adjusted EBITDA - Year over year change % | 0.8 | % | ||||||||||||||||||||||||||||||||||||||||||||||||
| Unaudited | 12 Mos. Ended 6/30/23 | 12 Mos. Ended 3/31/23 | 12 Mos. Ended 6/30/22 | |||||||||||||||||
| Consolidated Net Income | $ | 21,506 | $ | 22,055 | $ | 21,317 | ||||||||||||||
| Add: | ||||||||||||||||||||
| Provision for income taxes | 6,437 | 6,633 | 6,141 | |||||||||||||||||
| Interest expense | 4,534 | 4,034 | 3,111 | |||||||||||||||||
Depreciation and amortization expense (1) |
17,219 | 17,181 | 16,569 | |||||||||||||||||
| Consolidated EBITDA | $ | 49,696 | $ | 49,903 | $ | 47,138 | ||||||||||||||
| Add/(subtract): | ||||||||||||||||||||
Other (income) expense, net (2) |
$ | (2,572) | $ | (2,411) | $ | 1,466 | ||||||||||||||
Equity in losses (earnings) of unconsolidated businesses (3) |
18 | (56) | (174) | |||||||||||||||||
| Severance charges | 541 | 304 | 209 | |||||||||||||||||
| Asset rationalization | 155 | — | — | |||||||||||||||||
| Net gain from disposition of business | — | (706) | ||||||||||||||||||
| (1,858) | (2,163) | 795 | ||||||||||||||||||
| Consolidated Adjusted EBITDA | $ | 47,838 | $ | 47,740 | $ | 47,933 | ||||||||||||||
| (dollars in millions) | ||||||||||||||||||||
| Unaudited | 6/30/23 | 3/31/23 | 6/30/22 | |||||||||||||||||
| Debt maturing within one year | $ | 14,827 | $ | 12,081 | $ | 12,873 | ||||||||||||||
| Long-term debt | 137,871 | 140,772 | 136,184 | |||||||||||||||||
| Total Debt | 152,698 | 152,853 | 149,057 | |||||||||||||||||
| Less Secured debt | 21,342 | 20,835 | 16,572 | |||||||||||||||||
| Unsecured Debt | 131,356 | 132,018 | 132,485 | |||||||||||||||||
| Less Cash and cash equivalents | 4,803 | 2,234 | 1,857 | |||||||||||||||||
Net Unsecured Debt |
$ | 126,553 | $ | 129,784 | $ | 130,628 | ||||||||||||||
| Consolidated Net Income (LTM) | $ | 21,506 | $ | 22,055 | $ | 21,317 | ||||||||||||||
| Unsecured Debt to Consolidated Net Income Ratio | 6.1 | x | 6.0 | x | 6.2 | x | ||||||||||||||
| Consolidated Adjusted EBITDA (LTM) | $ | 47,838 | $ | 47,740 | $ | 47,933 | ||||||||||||||
| Net Unsecured Debt to Consolidated Adjusted EBITDA Ratio | 2.6 | x | 2.7 | x | 2.7 | x | ||||||||||||||
| Net Unsecured Debt - Quarter over quarter change | $ | (3,231) | ||||||||||||||||||
| Net Unsecured Debt - Year over year change | $ | (4,075) | ||||||||||||||||||
| Net Unsecured Debt to Consolidated Adjusted EBITDA Ratio - Quarter over quarter change | (0.1) | x | ||||||||||||||||||
| Net Unsecured Debt to Consolidated Adjusted EBITDA Ratio - Year over year change | (0.1) | x | ||||||||||||||||||
(dollars in millions, except per share amounts) | ||||||||||||||||||||||||||||||||
| Unaudited | 3 Mos. Ended 6/30/23 | 3 Mos. Ended 6/30/22 | ||||||||||||||||||||||||||||||
| Pre-tax | Tax | After-Tax | Pre-tax | Tax | After-Tax | |||||||||||||||||||||||||||
| EPS | $ | 1.10 | $ | 1.24 | ||||||||||||||||||||||||||||
| Amortization of acquisition-related intangible assets | $ | 206 | $ | (53) | $ | 153 | 0.04 | $ | 237 | $ | (62) | $ | 175 | 0.04 | ||||||||||||||||||
| Severance, pension and benefits charges | 237 | (59) | 178 | 0.04 | 198 | (51) | 147 | 0.03 | ||||||||||||||||||||||||
| Asset rationalization | 155 | (33) | 122 | 0.03 | — | — | — | — | ||||||||||||||||||||||||
| $ | 598 | $ | (145) | $ | 453 | $ | 0.11 | $ | 435 | $ | (113) | $ | 322 | $ | 0.08 | |||||||||||||||||
| Adjusted EPS | $ | 1.21 | $ | 1.31 | ||||||||||||||||||||||||||||
| Year over year change % | (7.6) | % | ||||||||||||||||||||||||||||||
| Free Cash Flow | ||||||||||||||
| (dollars in millions) | ||||||||||||||
| Unaudited | 6 Mos. Ended 6/30/23 | 6 Mos. Ended 6/30/22 | ||||||||||||
| Net Cash Provided by Operating Activities | $ | 18,020 | $ | 17,665 | ||||||||||
| Capital expenditures (including capitalized software) | (10,070) | (10,491) | ||||||||||||
| Free Cash Flow | $ | 7,950 | $ | 7,174 | ||||||||||
| Consolidated Operating Expenses Excluding Depreciation and Amortization and Special Items | ||||||||||||||
| (dollars in millions) | ||||||||||||||
| Unaudited | 3 Mos. Ended 6/30/23 | 3 Mos. Ended 6/30/22 | ||||||||||||
| Consolidated Operating Expenses | $ | 25,376 | $ | 26,237 | ||||||||||
Depreciation and amortization expense (1) |
4,359 | 4,321 | ||||||||||||
| Severance charges | 237 | — | ||||||||||||
| Asset rationalization | 155 | — | ||||||||||||
| Consolidated Operating Expenses Excluding Depreciation and Amortization and Special Items | $ | 20,625 | $ | 21,916 | ||||||||||
| Year over year change % | (5.9) | % | ||||||||||||
| (dollars in millions) | ||||||||||||||
| Unaudited | 3 Mos. Ended 6/30/23 | 3 Mos. Ended 6/30/22 | ||||||||||||
| Operating Income | $ | 7,330 | $ | 7,150 | ||||||||||
| Add Depreciation and amortization expense | 3,247 | 3,211 | ||||||||||||
| Segment EBITDA | $ | 10,577 | $ | 10,361 | ||||||||||
| Year over year change % | 2.1 | % | ||||||||||||
| Total operating revenues | $ | 24,558 | $ | 25,604 | ||||||||||
| Operating Income Margin | 29.8 | % | 27.9 | % | ||||||||||
| Segment EBITDA Margin | 43.1 | % | 40.5 | % | ||||||||||
| (dollars in millions) | ||||||||||||||
| Unaudited | 3 Mos. Ended 6/30/23 | 3 Mos. Ended 6/30/22 | ||||||||||||
| Operating Income | $ | 533 | $ | 675 | ||||||||||
| Add Depreciation and amortization expense | 1,103 | 1,074 | ||||||||||||
| Segment EBITDA | $ | 1,636 | $ | 1,749 | ||||||||||
| Year over year change % | (6.5) | % | ||||||||||||
| Total operating revenues | $ | 7,483 | $ | 7,626 | ||||||||||
| Operating Income Margin | 7.1 | % | 8.9 | % | ||||||||||
| Segment EBITDA Margin | 21.9 | % | 22.9 | % | ||||||||||