UNITED STATES
SECURITIES AND EXCHANGE COMMISSION
Washington, D.C. 20549
FORM 8-K
CURRENT REPORT
Pursuant to Section 13 or 15(d) of
The Securities Exchange Act of 1934
Date of Report: April 23, 2024
FRANKLIN FINANCIAL SERVICES CORPORATION(Exact name of registrant as specified in its new charter)
|
|
|
|
|
|
Pennsylvania |
001-38884 |
25-1440803 |
|
|
(State or other jurisdiction of incorporation) |
(Commission File Number) |
(IRS Employer Identification No.) |
|
|
|
|
|
|
1500 Nitterhouse Drive, Chambersburg, PA |
17201 |
|
|
(Address of principal executive office) |
(Zip Code) |
|
|
|
|
|
|
Registrant's telephone number, including area code |
(717) 264-6116 |
|
|
|
|
|
N/A
(Former name or former address, if changes since last report)
Check the appropriate box below if the Form 8-K is intended to simultaneously satisfy the filing obligation of the registrant under any of the following provisions:
¨ Written communications pursuant to Rule 425 under the Securities Act (17 CFR 230.425)
¨ Soliciting material pursuant to Rule 14a –12 under the Exchange Act (17 CFR 240.14a –12)
¨ Pre-commencement communications pursuant to Rule 14d – 2(b) under the Exchange Act (17 CFR 240.14d-2(b))
¨ Pre-commencement communications pursuant to Rule 13e – 4(c) under the Exchange Act (17 CFR 240.13e-4(c))
Securities registered pursuant to Section 12(b) of the Act:
|
|
|
|
|
|
Title of class |
Symbol |
Name of exchange on which registered |
Common stock |
FRAF |
Nasdaq Capital Market |
Indicate by check mark whether the registrant is an emerging growth company as defined in Rule 405 of the Securities Act of 1933 (§230.405 of this chapter) or Rule 12b-2 of the Securities Exchange Act of 1934 (§240.12b-2 of this chapter).
Emerging growth company ¨
If an emerging growth company, indicate by check mark if the registrant has elected not to use the extended transition period for complying with any new or revised financial accounting standards provided pursuant to Section 13(a) of the Exchange Act. ¨
Item 7.01 Regulations FD Disclosure
Franklin Financial Services Corporation (the “Corporation”) held its annual meeting of shareholders on April 23, 2024. The shareholder presentation is attached hereto as Exhibits 99.1 and is incorporated herein by reference.
The information in this Form 8-K provided under Item 7.01, including all exhibits attached hereto, is being furnished and shall not be deemed to be “filed” for purposes of Section 18 of the Securities Exchange Act of 1934 (the “Exchange Act”), or otherwise subject to the liability of such section, nor shall it be deemed incorporated by reference in any filing of the Corporation under the Securities Act of 1933 or the Exchange Act, regardless of any general incorporation language in such filing, unless expressly incorporated by specific reference in such filing.
Item 9.01 Financial Statements and Exhibits
(c) Exhibits. The following exhibits are filed herewith:
Number Description
99.1 Investor Presentation, dated April 23, 2024 of Franklin Financial Services
104 The cover page from this Current Report on Form 8-K, formatted in Inline XBRL
SIGNATURES
Pursuant to the requirements of the Securities Exchange Act of 1934, the registrant has duly caused this report to be signed on its behalf by the undersigned hereunto duly authorized.
FRANKLIN FINANCIAL SERVICES CORPORATION
By: /s/ Timothy G. Henry
Timothy G. Henry
President and Chief Executive Officer Call to OrderG.
Dated: April 23, 2024
Exhibit 99.1
Annual MeetingApril 23, 2024

Warren Elliott

InvocationPam Johns
Minutes of Last MeetingG.
Warren Elliott Forward Looking Statements In order to help you to better understand the business of the Company – where we have been and where we want to go – my remarks today (and those of other Company officers who will speak or respond to questions) will include forward looking statements relating to anticipated financial performance, future operating results, business prospects, new products, and similar matters. These statements represent our best judgment, based upon present circumstances and the information now available to us, of what we think may occur in the future – and, of course, it is possible that actual results may differ materially from those we envision today. For a more complete discussion on the subject of forward looking statements, including a list of some of the risk factors that might adversely affect operating results, I refer you to the section entitled “Forward Looking Statements” which appears in our annual report on Form 10-K as filed with the Securities and Exchange Commission (SEC).

IntroductionG. Warren Elliott
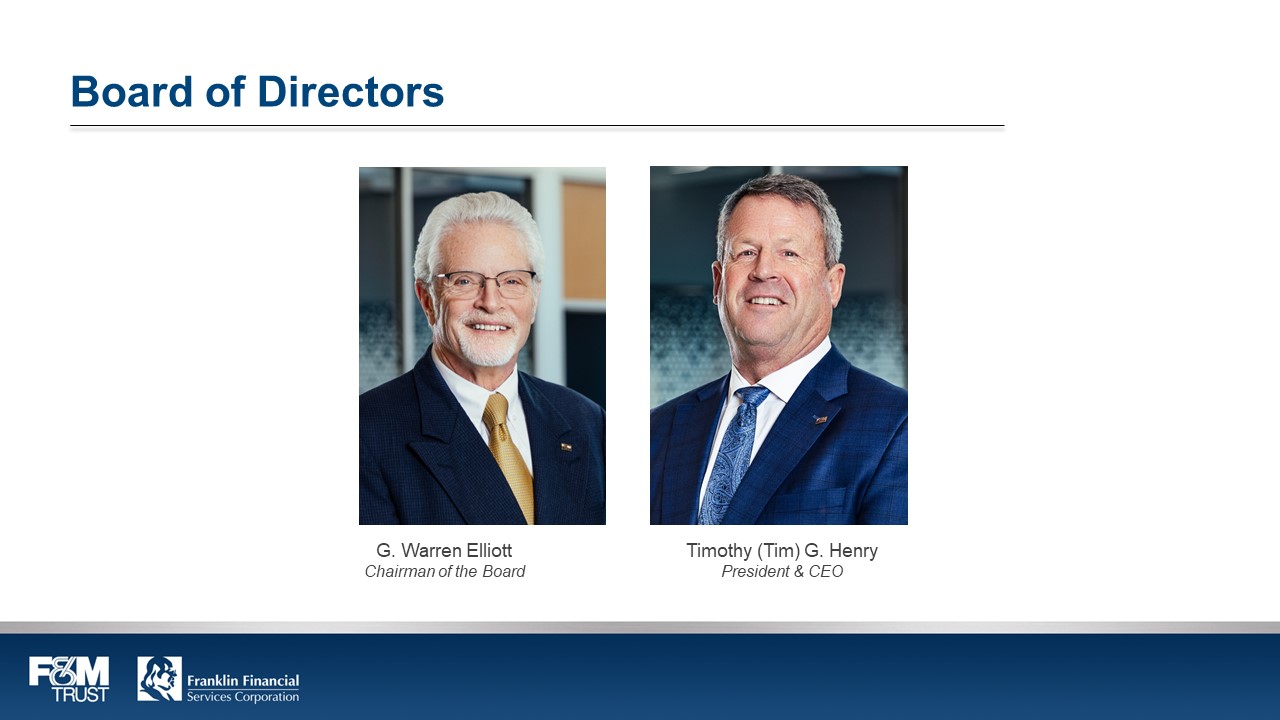
Board of DirectorsG. Warren Elliott Chairman of the BoardTimothy (Tim) G. Henry President & CEO Board of DirectorsMartin R. BrownKevin W. CraigGregory A. Duffey
Board of DirectorsDaniel J. FisherAllan E. Jennings, Jr. Stanley J. Kerlin Board of DirectorsDonald H. MoweryKimberly M. RzompGregory I. Snook
Nick BybelPartner, Bybel Rutledge LLPZoe ClaytonAssistant Corporate Secretary – Judge of ElectionsIan KandrayCPA, Crowe LLP

Chairman’s RemarksG. Warren Elliott
G. Warren ElliottChairman of the Board Election of DirectorsG.
Warren Elliott

Kevin W. CraigDaniel J. FisherDonald H. Mowery Ratification of AuditorsG.
Say-On-Pay VoteG. Warren Elliott
Warren Elliott

Polls OpenG. Warren Elliott
Financial OverviewMark R.
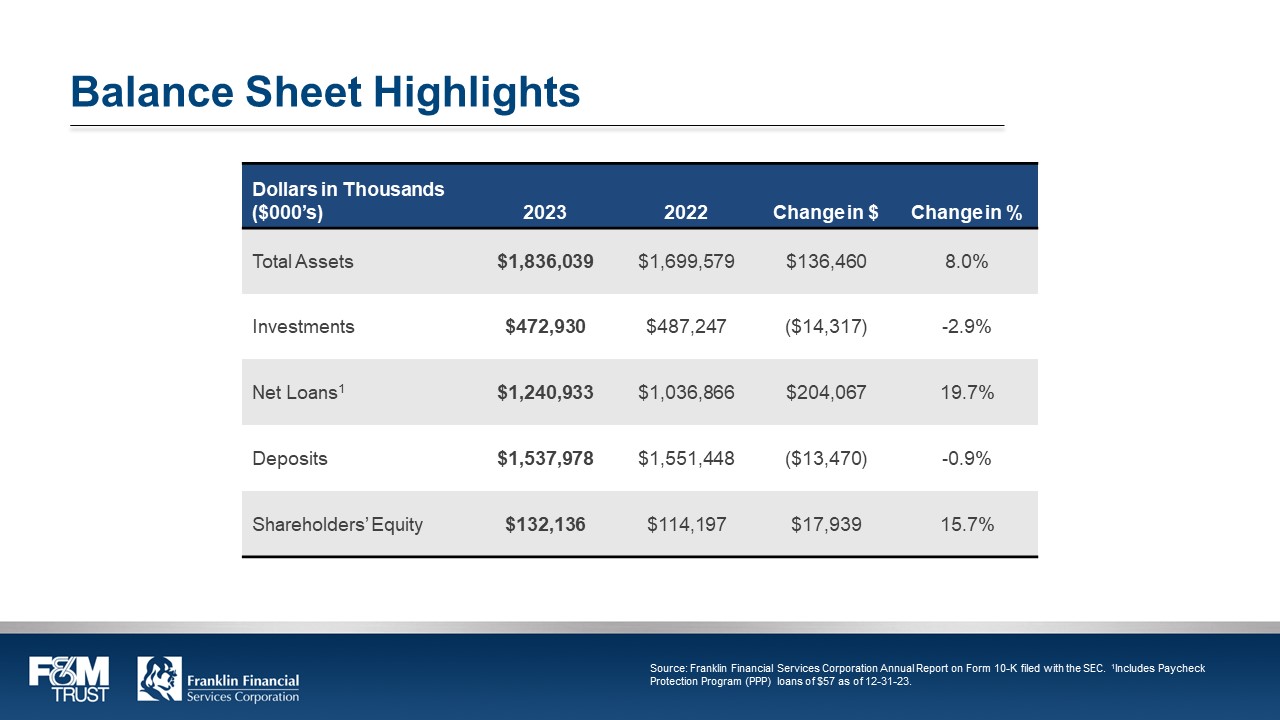
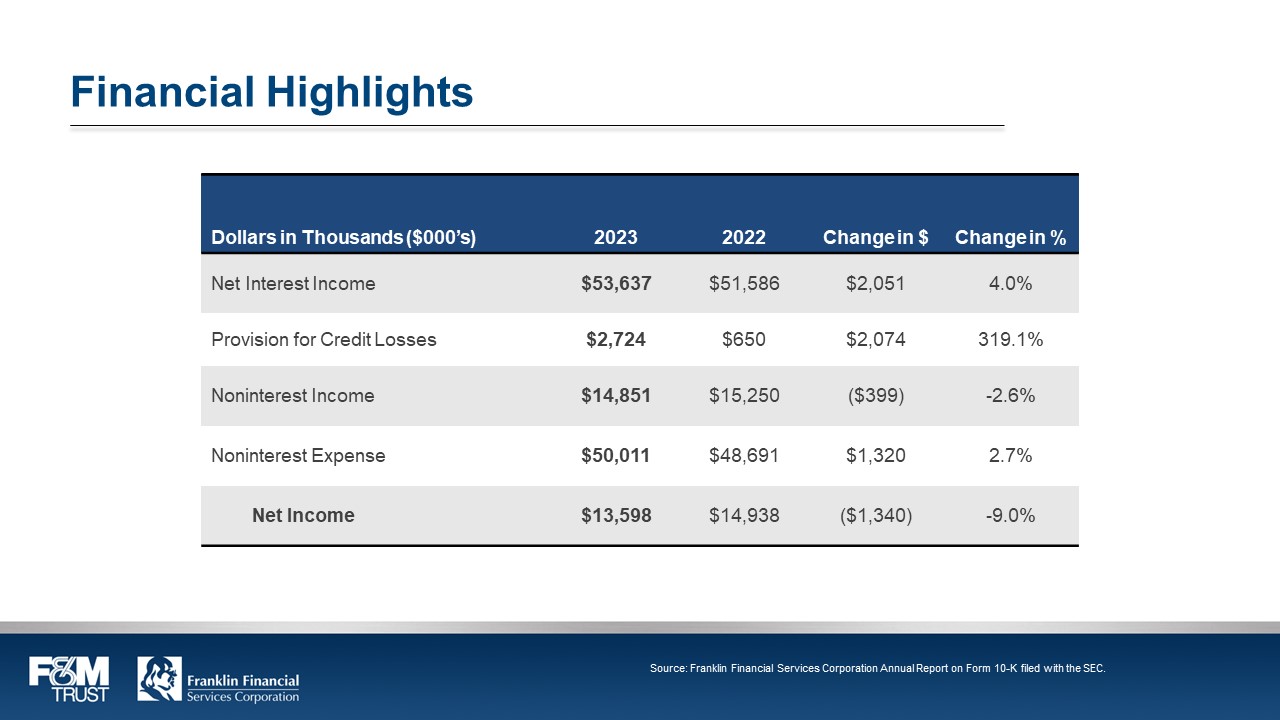
Hollar, Chief Financial Officer Balance Sheet HighlightsDollars in Thousands ($000’s) Total AssetsInvestmentsNet Loans1DepositsShareholders’ Equity2023$1,836,039$472,930$1,240,933$1,537,978$132,1362022$1,699,579$487,247$1,036,866$1,551,448$114,197Change in $$136,460($14,317) $204,067($13,470) $17,939Change in %8.0%-2.9%19.7%-0.9%15.7% Financial HighlightsNet Interest IncomeProvision for Credit LossesNoninterest IncomeNoninterest Expense Net Income2023$53,637$2,724$14,851$50,011$13,5982022$51,586$650$15,250$48,691$14,938Change in $$2,051$2,074($399) $1,320($1,340) Change in %4.0%319.1%-2.6%2.7%-9.0%
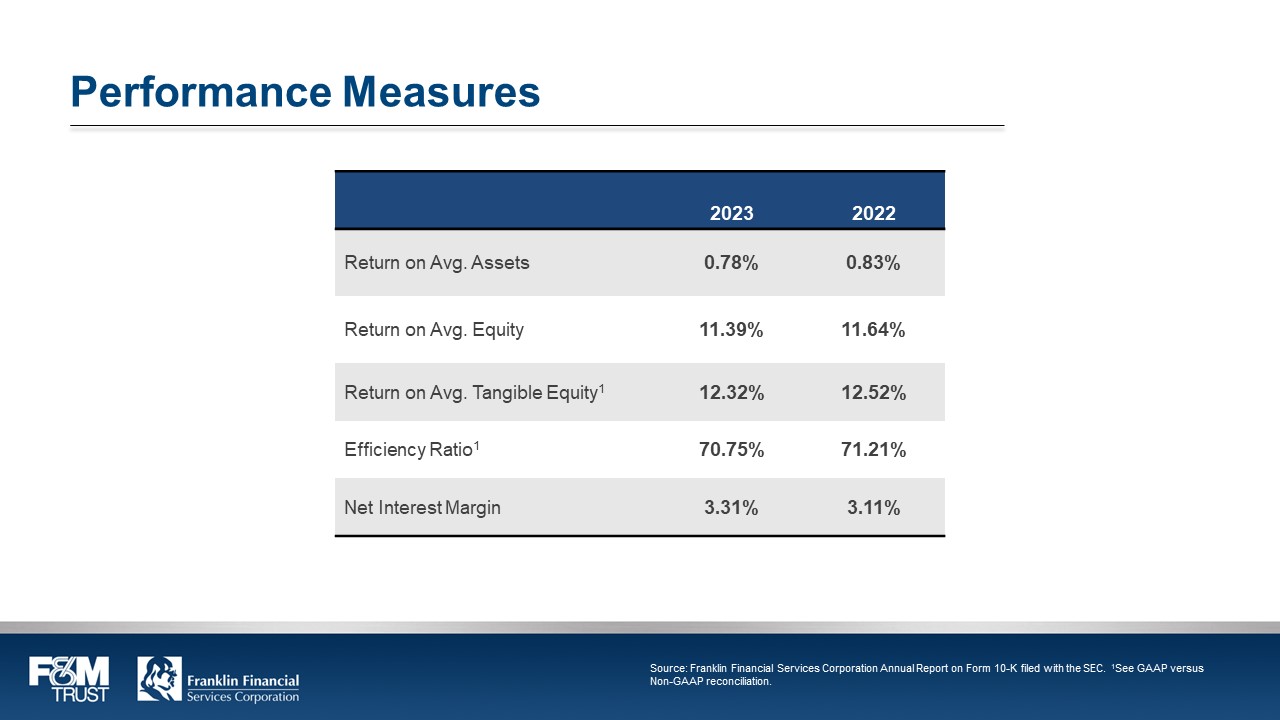
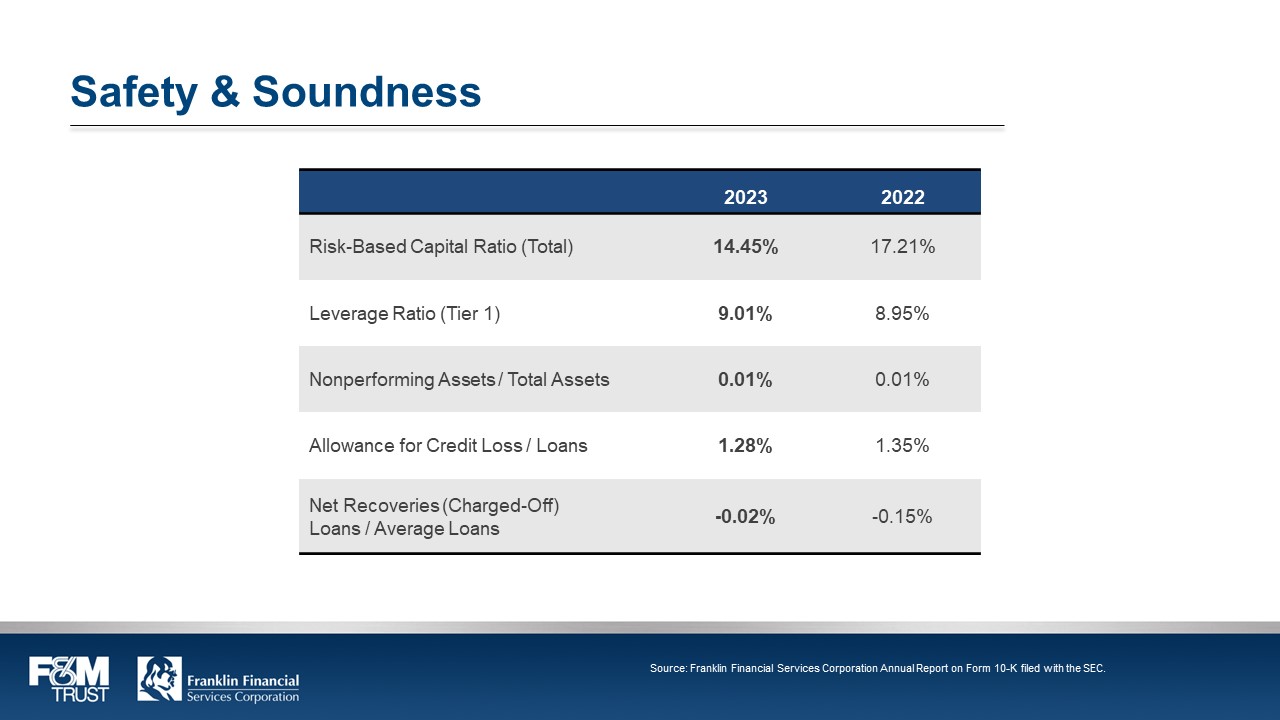
Performance MeasuresReturn on Avg. Assets20230.78%Return on Avg. Equity11.39%Return on Avg. Tangible Equity112.32%Efficiency Ratio170.75%Net Interest Margin3.31%20220.83%11.64%12.52%71.21%3.11% Safety & Soundness Risk-Based Capital Ratio (Total) 20232022Leverage Ratio (Tier 1) 14.45%17.21%9.01%8.95%Nonperforming Assets / Total Assets0.01%0.01%Allowance for Credit Loss / Loans1.28%1.35%Net Recoveries (Charged-Off) Loans / Average Loans-0.02%-0.15%
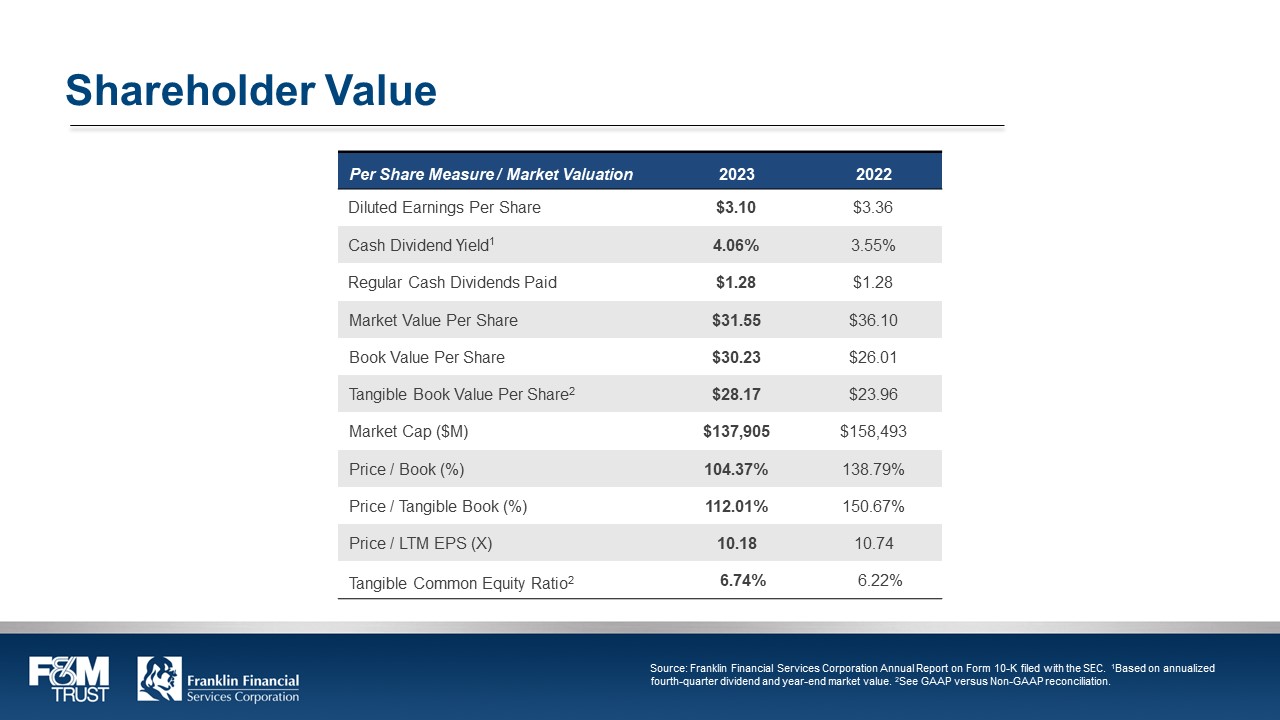
Shareholder ValuePer Share Measure / Market Valuation20232022 Diluted Earnings Per Share$3.10$3.36 Cash Dividend Yield14.06%3.55% Regular Cash Dividends Paid$1.28$1.28Market Value Per Share$31.55$36.10Book Value Per Share$30.23$26.01Tangible Book Value Per Share2$28.17$23.96Market Cap ($M) $137,905$158,493Price / Book (%104.37%)138.79%Price / Tangible Book (%)112.01%150.67%Price / LTM EPS (X) 10.1810.74Tangible Common Equity Ratio2 6.74% 6.22% President & CEO’s RemarksTimothy (Tim) G. Henry
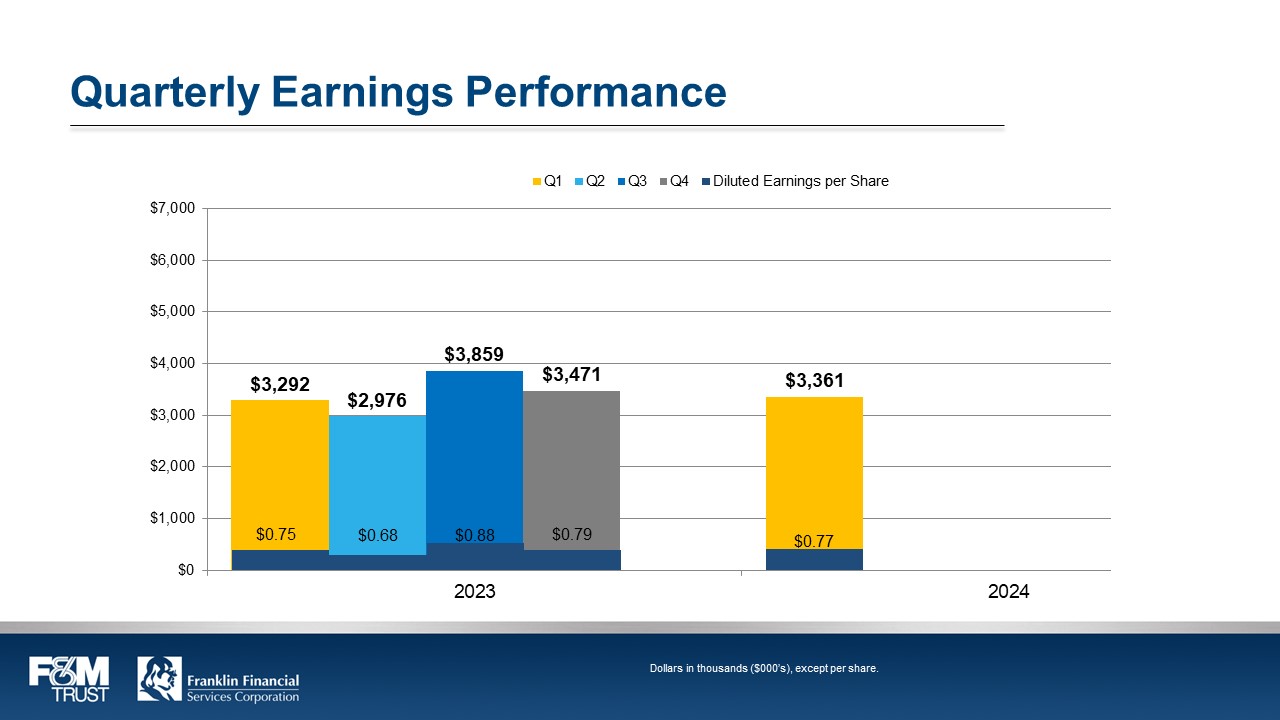
Quarterly Earnings PerformanceQ1Q2Q3Q4$7,000,$6,000,$5,000$4,000$3,000$2,000$1,000$0$3,292$0.75$2,976$0.68$3,859$0.88$3,859$0.88$3,471,$0.79$3,471$0.79$3,361$0.7720232024


Timothy (Tim) G. HenryPresident & CEO Report by Judge of ElectionZoe R. Clayton

QuestionsTimothy (Tim) G. Henry

Polls ClosedG. Warren Elliott
AnnouncementG. Warren Elliott
Thank YouG. Warren Elliott
Meeting Adjourned
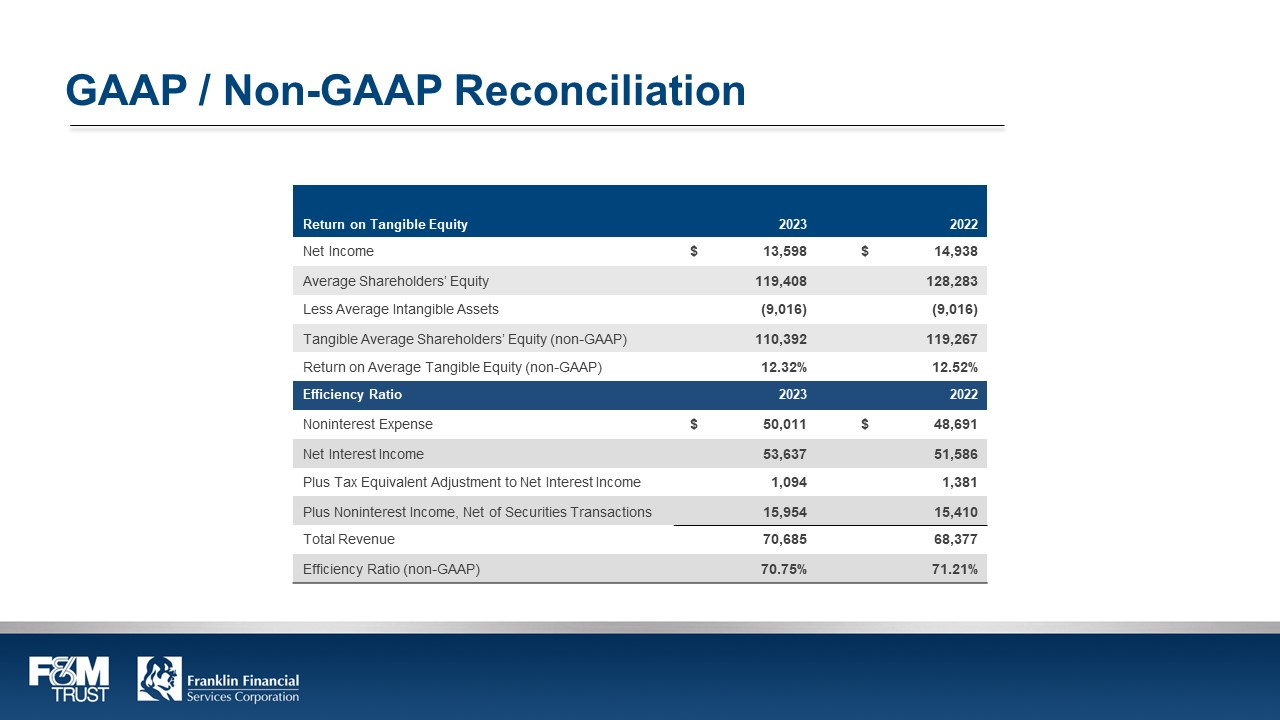
GAAP / Non-GAAP Reconciliation 20232022 Return on Tangible EquityNet Income$ 13,598$ 14,938Average Shareholders’ Equity119,408128,283Less Average Intangible Assets(9,016) (9,016) Tangible Average Shareholders’ Equity (non-GAAP) 110,392119,267Return on Average Tangible Equity (non-GAAP) 12.32%12.52%Efficiency RatioNoninterest Expense$ 50,011$ 48,691Net Interest Income53,63751,586Plus Tax Equivalent Adjustment to Net Interest Income1,0941,381Plus Noninterest Income, Net of Securities Transactions15,95415,410Total Revenue70,68568,377Efficiency Ratio (non-GAAP) 70.75%71.21%
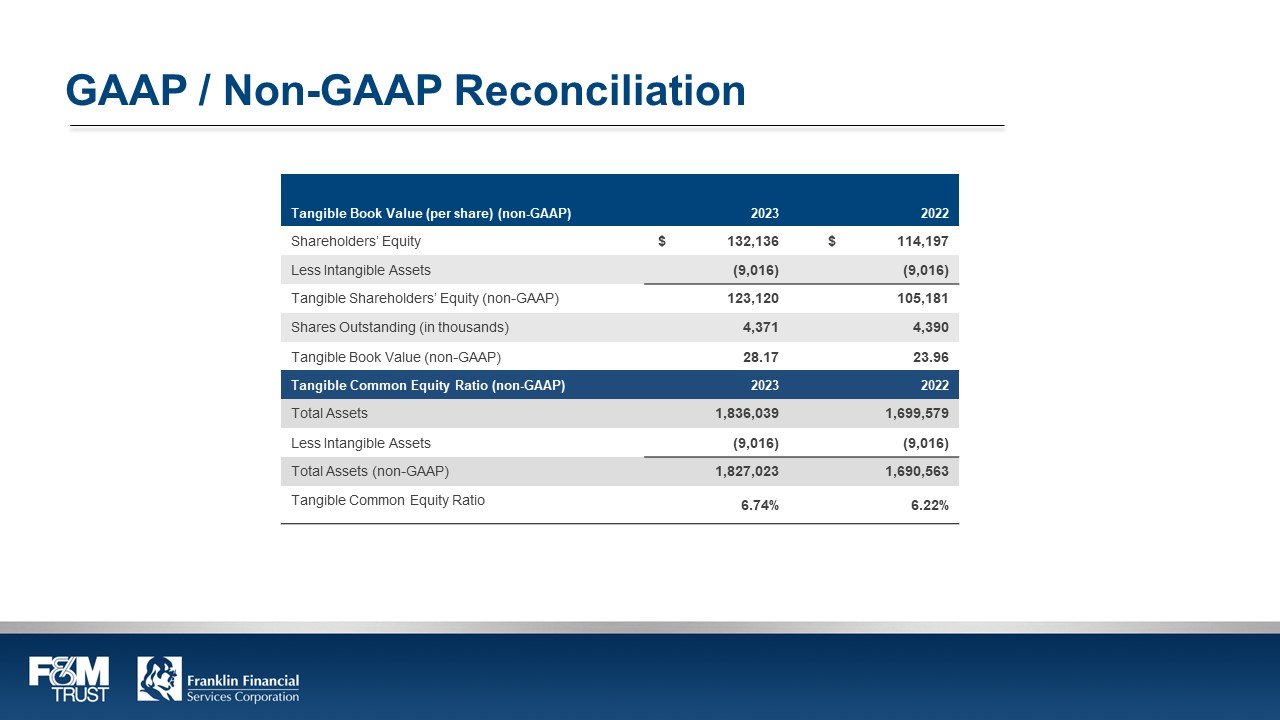
GAAP / Non-GAAP ReconciliationTangible Book Value (per share) (non-GAAP) 20232022Shareholders’ Equity132,136114,197Less Intangible Assets(9,016) (9,016) Tangible Shareholders’ Equity (non-GAAP) 123,120105,181Shares Outstanding (in thousands) 4,3714,390Tangible Book Value (non-GAAP) 28.1723.96Tangible Common Equity Ratio (non-GAAP) Total Assets1,836,0391,699,579Less Intangible Assets(9,016) (9,016) Total Assets (non-GAAP) 1,827,0231,690,563Tangible Common Equity Ratio6.74%6.22%