UNITED STATES
SECURITIES AND EXCHANGE COMMISSION
Washington, D.C. 20549
FORM 8-K
CURRENT REPORT
Pursuant to Section 13 or 15(d) of
The Securities Exchange Act of 1934
Date of Report: March 27, 2024
FRANKLIN FINANCIAL SERVICES CORPORATION(Exact name of registrant as specified in its new charter)
|
|
|
|
|
|
Pennsylvania |
001-38884 |
25-1440803 |
|
|
(State or other jurisdiction of incorporation) |
(Commission File Number) |
(IRS Employer Identification No.) |
|
|
|
|
|
|
1500 Nitterhouse Drive, Chambersburg, PA |
17201 |
|
|
(Address of principal executive office) |
(Zip Code) |
|
|
|
|
|
|
Registrant's telephone number, including area code |
(717) 264-6116 |
|
|
|
|
|
N/A
(Former name or former address, if changes since last report)
Check the appropriate box below if the Form 8-K is intended to simultaneously satisfy the filing obligation of the registrant under any of the following provisions:
¨ Written communications pursuant to Rule 425 under the Securities Act (17 CFR 230.425)
¨ Soliciting material pursuant to Rule 14a –12 under the Exchange Act (17 CFR 240.14a –12)
¨ Pre-commencement communications pursuant to Rule 14d – 2(b) under the Exchange Act (17 CFR 240.14d-2(b))
¨ Pre-commencement communications pursuant to Rule 13e – 4(c) under the Exchange Act (17 CFR 240.13e-4(c))
Securities registered pursuant to Section 12(b) of the Act:
|
|
|
|
|
|
Title of class |
Symbol |
Name of exchange on which registered |
Common stock |
FRAF |
Nasdaq Capital Market |
Indicate by check mark whether the registrant is an emerging growth company as defined in Rule 405 of the Securities Act of 1933 (§230.405 of this chapter) or Rule 12b-2 of the Securities Exchange Act of 1934 (§240.12b-2 of this chapter).
Emerging growth company ¨
If an emerging growth company, indicate by check mark if the registrant has elected not to use the extended transition period for complying with any new or revised financial accounting standards provided pursuant to Section 13(a) of the Exchange Act. ¨
Item 7.01 Regulations FD Disclosure
Franklin Financial Services Corporation (“the Corporation”) is furnishing this presentation which will be presented in whole or in part, from time to time, by executives of the Corporation in one or more meetings with investors and analysts. The presentation is attached as Exhibit 99.1 and is incorporated by reference. It is also available on the Corporation’s website at www.franklinfin.com.
The information in this Form 8-K provided under Item 7.01, including all exhibits attached hereto, is being furnished and shall not be deemed to be “filed” for purposes of Section 18 of the Securities Exchange Act of 1934 (the “Exchange Act”), or otherwise subject to the liability of such section, nor shall it be deemed incorporated by reference in any filing of the Corporation under the Securities Act of 1933 or the Exchange Act, regardless of any general incorporation language in such filing, unless expressly incorporated by specific reference in such.
Item 9.01 Financial Statements and Exhibits
(c) Exhibits. The following exhibits are filed herewith:
Number Description
99.1 Investor Presentation, dated March 27, 2024 of Franklin Financial Services
104 The cover page from this Current Report on Form 8-K, formatted in Inline XBRL
SIGNATURES
Pursuant to the requirements of the Securities Exchange Act of 1934, the registrant has duly caused this report to be signed on its behalf by the undersigned hereunto duly authorized.
FRANKLIN FINANCIAL SERVICES CORPORATION
By: /s/ Timothy G. Henry
Timothy G. Henry
President and Chief Executive Officer
Dated: March 27, 2024
Exhibit 99.1
Investor Presentation Fourth Quarter 2023 Highlights F&M TRUST Frankling Financial Services Corporation Forward Looking Statements Certain statements appearing herein which are not historical in nature are forward-looking statements within the meaning of the Private Securities Litigation Reform Act of 1995. Such forward-looking statements refer to a future period or periods, reflecting management’s current views as to likely future developments, and use words “may,” “will,” “expect,” “believe,” “estimate,” “anticipate,” or similar terms. Because forward-looking statements involve certain risks, uncertainties and other factors over which Franklin Financial Services Corporation has no direct control, actual results could differ materially from those contemplated in such statements. These factors include (but are not limited to) the following: general economic conditions particularly with regard to the negative impact of severe, wide-ranging and continuing disruptions caused by the spread of the coronavirus COVID-19 pandemic and responses thereto, changes in interest rates, changes in the Corporation’s cost of funds, changes in government monetary policy, changes in government regulation and taxation of financial institutions, changes in the rate of inflation, changes in technology, the intensification of competition within the Corporation’s market area, and other similar factors. We caution readers not to place undue reliance on these forward-looking statements. They only reflect management’s analysis as of this date. The Corporation does not revise or update these forward-looking statements to reflect events or changed circumstances. Please carefully review the risk factors described in other documents the Corporation files from time to time with the SEC, including the Annual Reports on Form 10-K, Quarterly Reports on Form 10-Q, and any Current Reports on Form 8-K. F&M TRUST Franklin Financial Services Corporation 2 CEO Comments 2023 was a challenging year for financial institutions across the country, but we operated profitably, paid a solid dividend to our shareholders, and made investments that will support the future growth and continued success of Franklin Financial Services Corporation.
Some key changes during the year included the development of a data analytics team that will help improve decision-making and workflows, improving efficiencies that should be reflected in future earnings. Through a series of opportunistic hires, we expanded our trade area into southeastern Pennsylvania and northeast Maryland, which provides the opportunity for profitable growth, particularly in commercial lending and wealth management. We are in the process of updating and improving our retail infrastructure, which includes facility realignment and updated product sets, to continue to support and grow the strong retail deposit base that provides us with low-cost core deposits. Because credit quality remains very good, with no signs of significant deterioration, we have been able to focus on the future and take the necessary charges to adjust our investment portfolio and pay off a non-productive lease. While the combined cost of these moves to the bank in 2023 was $1.6 million, pre-tax, the adjustments will lead to improved performance by the company in future years. Certainly, there are challenges ahead. Continuing to build new relationships, grow deposits, manage costs and liquidity, and remain vigilant for signs of credit quality issues will be important to the company in 2024. The successes of 2023, including solid loan growth, geographic expansion of markets, and investments in people and systems, while maintaining profitability and providing consistent dividends to our shareholders, help propel us forward as a strong financial services company. Your support continues to be greatly appreciated. Sincerely, F&M TRUST Franklin Financial Services Corporation 3 Mission, Vision & Core Values Mission Statement Delivering the right financial solutions from people you know and trust.
Vision We are committed to remaining independent by growing our bank to meet the increasing needs of our employees, customers, communities, and shareholders. We strive to be a financial services leader in the markets we serve. Core Values The employees, officers and directors are committed to the core values of integrity, teamwork, excellence, accountability, and concern for our customers and the communities we serve.
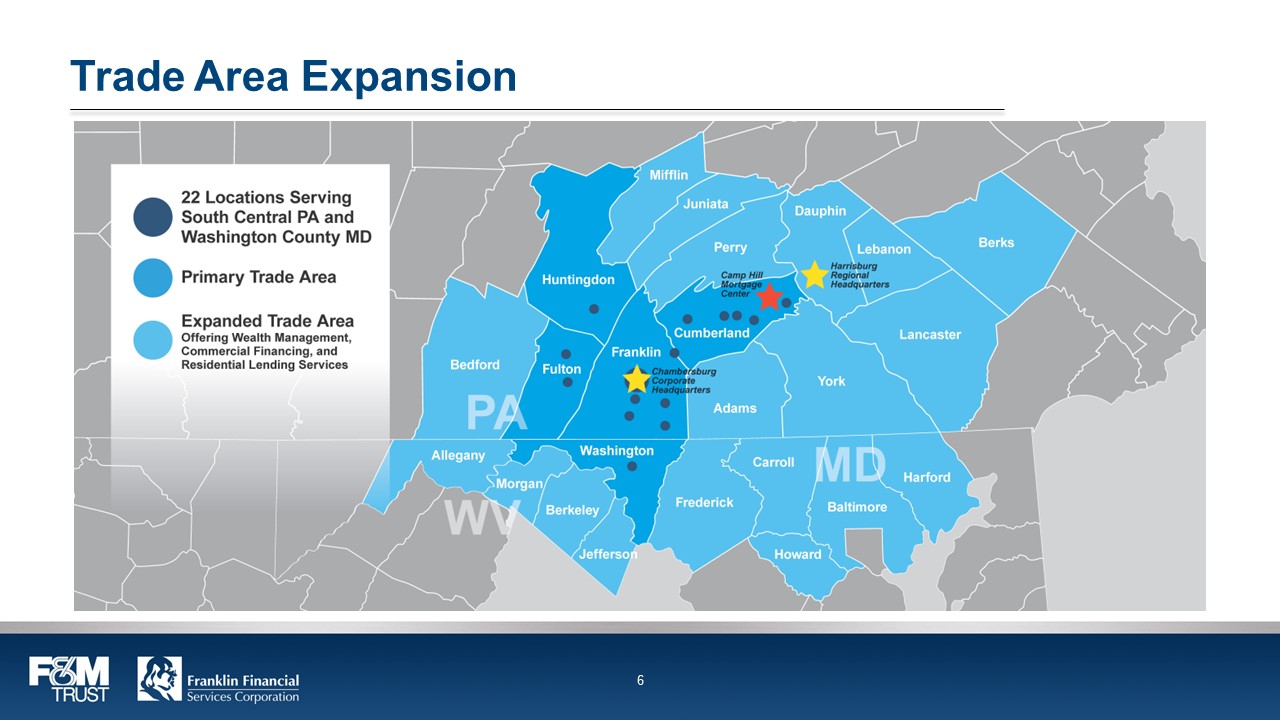
F&M TRUST Franklin Financial Services Corporation 4 Overview of Franklin Financial Franklin Financial, which was formed in 1983, is a holding company headquartered in Franklin County, PA Franklin Financial’s wholly-owned subsidiary, F&M Trust, was founded in Chambersburg, PA in 1906 Total assets of the Company were $1.84 billion as of December 31, 2023 As of December 31, 2023, Franklin Financial reported $1.23 billion in brokerage and trust assets under management Franklin Financial stock is trading on the Nasdaq Stock Market (NASDAQ: FRAF) F&M TRUST Franklin Financial Services Corporation 5 Trade Area Expansion 22 Locations Serving South Central PA and Washington County MD Primary Trade Area Expanded Trade are Offering Wealth Management, Commercial Financing, and Residential Lending Services F&M TRUST Franklin Financial Services Corporation 6
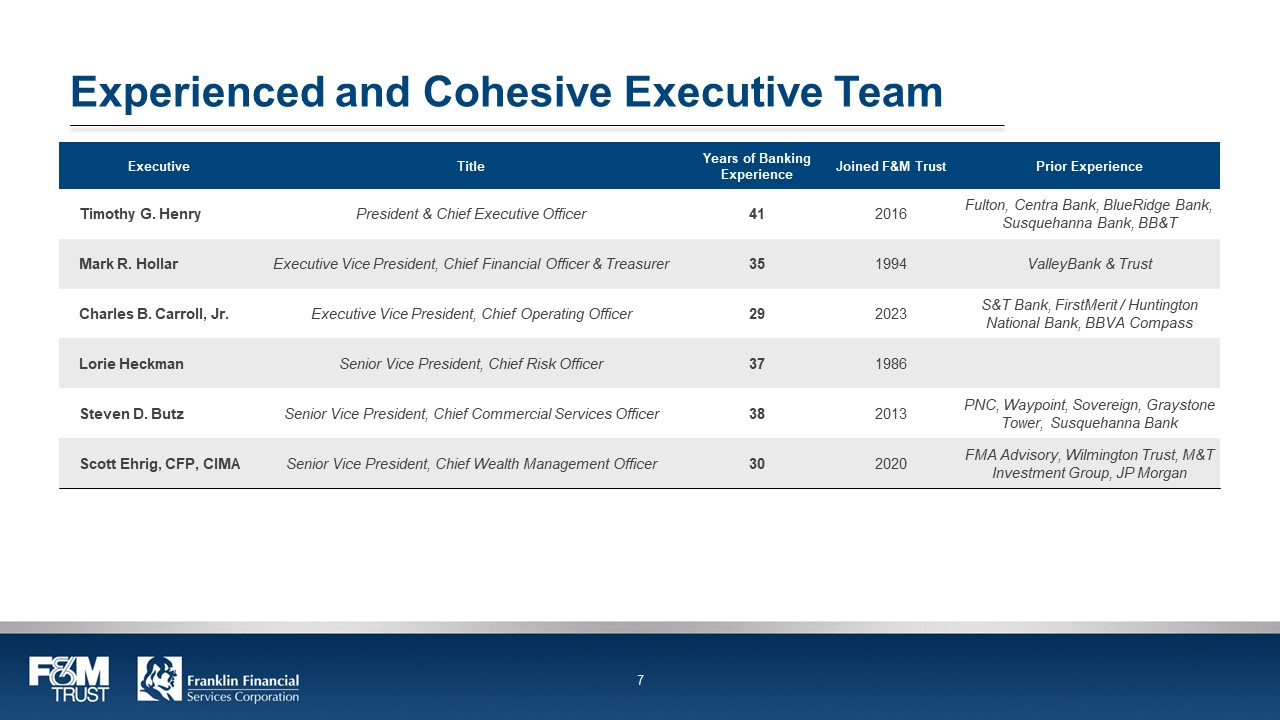
Experienced and Cohesive Executive Team Executive Title Years of Banking Experience Joined F&M Trust Prior Experience Timothy G. Henry President & Chief Executive Officer 41 2016 Fulton, Centra Bank, BlueRidge Bank, Susquehanna Bank, BB&T Mark R. Hollar Executive Vice President, Chief Financial Officer & Treasurer 35 1994 ValleyBank & Trust Charles B. Carroll, Jr. Executive Vice President, Chief Operating Officer 29 2023 S&T Bank, FirstMerit / Huntington National Bank, BBVA Compass Lorie Heckman Senior Vice President, Chief Risk Officer 37 1986 Steven D.
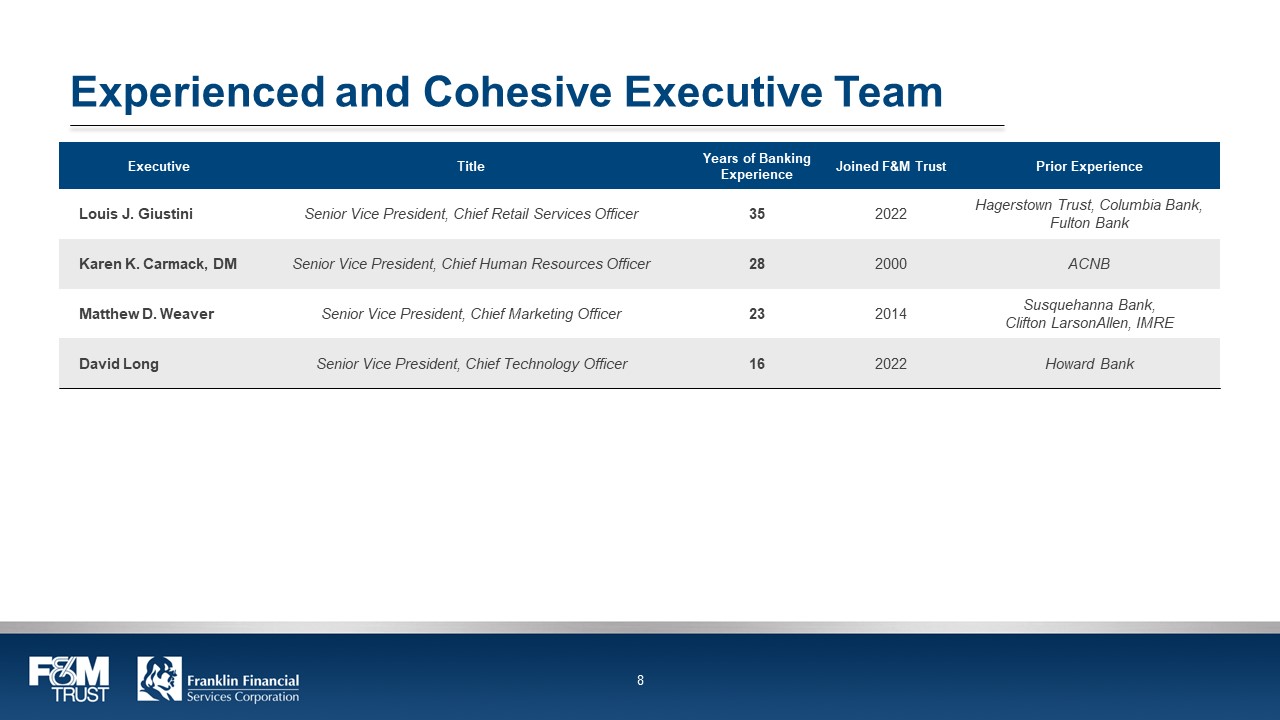
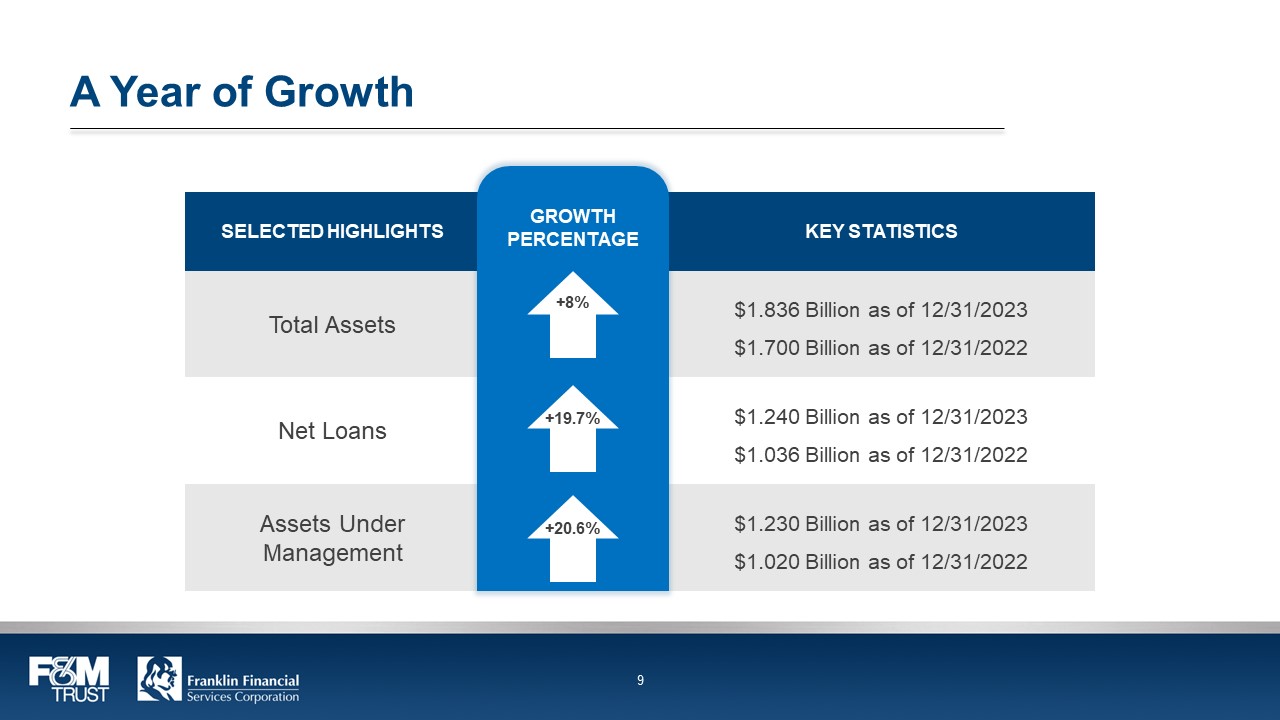
Butz Senior Vice President, Chief Commercial Services Officer 38 2013 PNC, Waypoint, Sovereign, Graystone Tower, Susquehanna Bank Scott Ehrig, CFP, CIMA Senior Vice President, Chief Wealth Management Officer 30 2020 FMA Advisory, Wilmington Trust, M&T Investment Group, JP Morgan F&M TRUST Franklin Financial Services Corporation 7 Experienced and Cohesive Executive Team Executive Title Years of Banking Experience Joined F&M Trust Prior Experience Louis J. Giustini Senior Vice President, Chief Retail Services Officer 35 2022 Hagerstown Trust, Columbia Bank, Fulton Bank Karen K. Carmack, DM Senior Vice President, Chief Human Resources Officer 28 2000 ACNB Matthew D. Weaver Senior Vice President, Chief Marketing Officer 23 2014 Susquehanna Bank, Clifton LarsonAllen, IMRE David Long Senior Vice President, Chief Technology Officer 16 2022 Howard Bank F&M TRUST Franklin Financial Services Corporation 8 A Year of Growth SELECTED HIGHLIGHTS Growth Percentage KEY STATISTICS Total Assets +8% $1.836 Billion as of 12/31/2023 $1.700 Billion as of 12/31/2022 Net Loans +19.7% $1.240 Billion as of 12/31/2023 $1.036 Billion as of 12/31/2022 Assets Under Management +20.6% $1.230 Billion as of 12/31/2023 $1.020 Billion as of 12/31/2022 F&M TRUST Franklin Financial Services Corporation 9
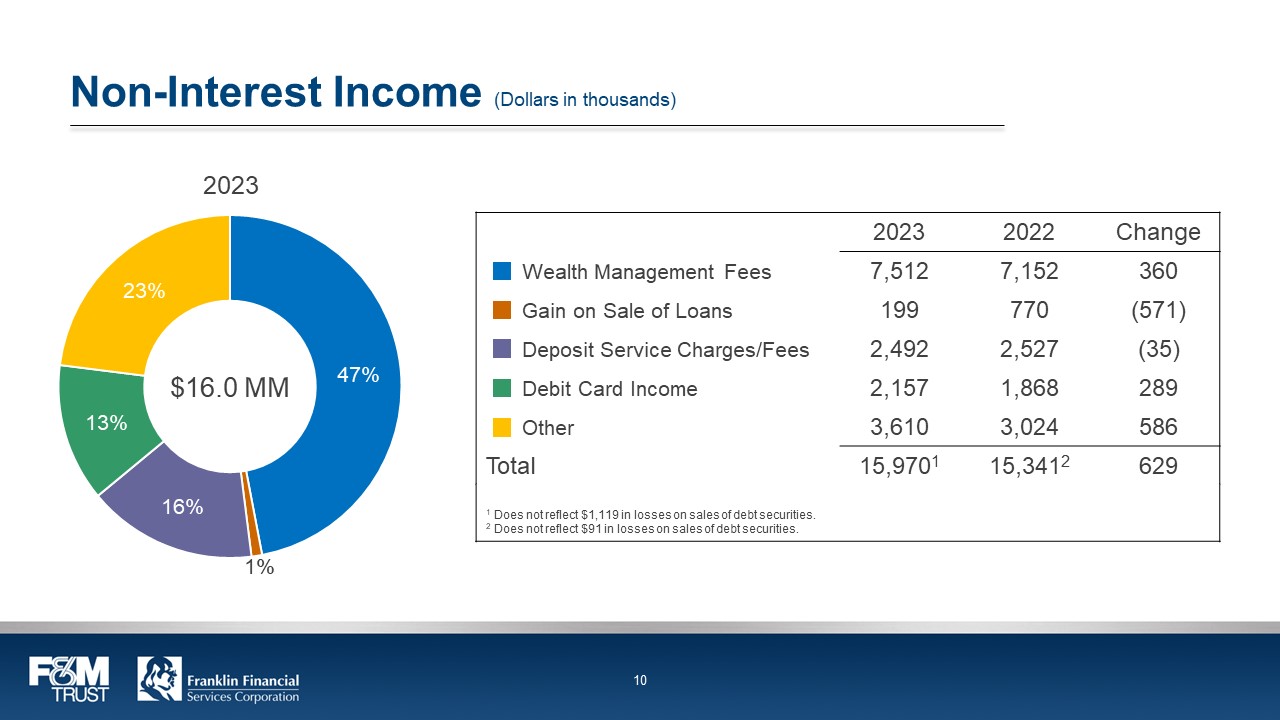
Non-Interest Income (Dollars in thousands) 2023 23% 47% 1% 16% 13% $16.0 MM 2023 2022 Change Wealth Management Fees 7,512 7,152 360 Gain on Sale of Loans 199 770 (571) Deposit Service Charges/Fees 2,492 2,527 (35) Debit Card Income 2,157 1,868 289 Other 3,610 3,024 586 Total 15,9701 15,3412 629 1 Does not reflect $1,119 in losses on sales of debt securities 2.
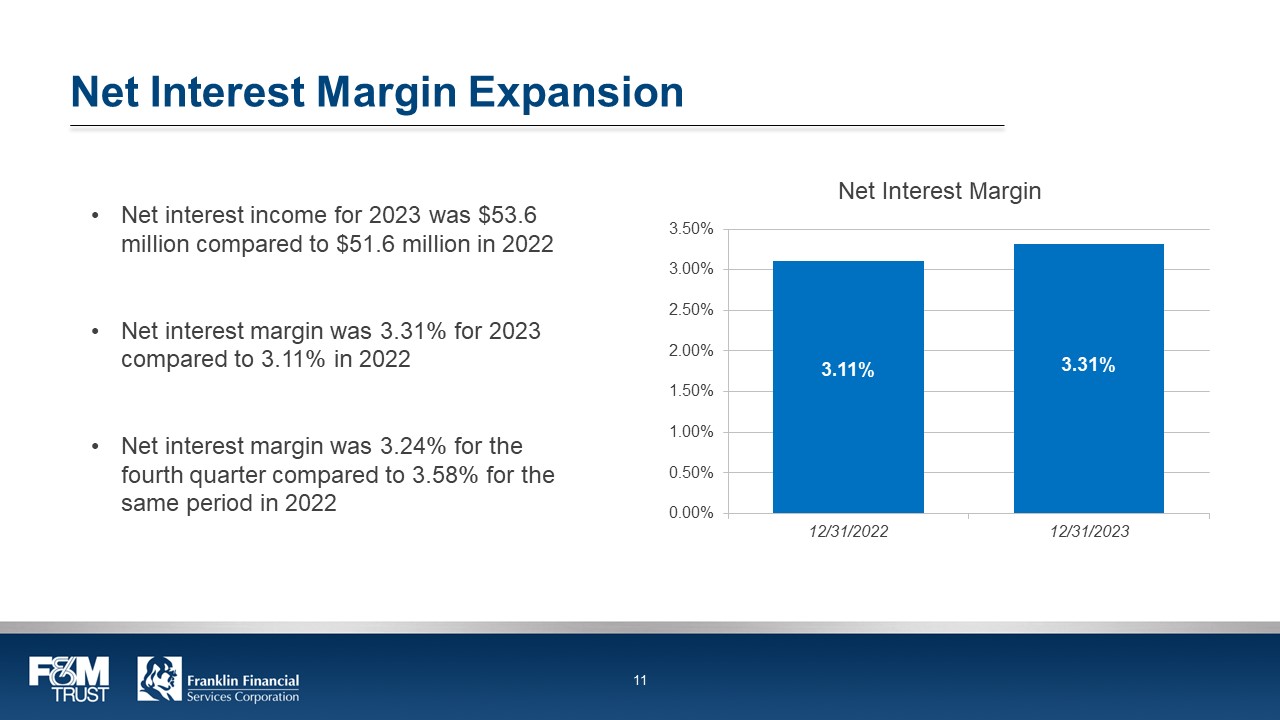
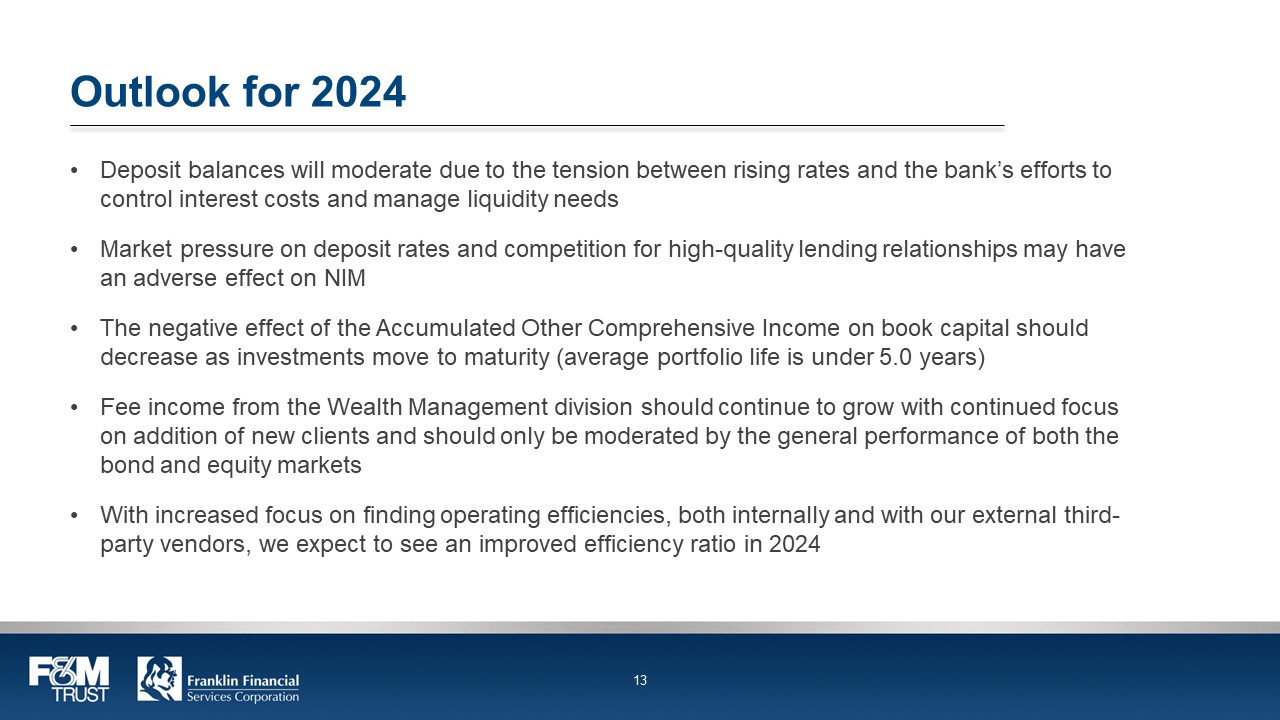
Does not reflect $91 in losses on sales of debt securities F&M TRUST Franklin Financial Services Corporation 10 Net Interest Margin Expansion Net interest income for 2023 was $53.6 million compared to $51.6 million in 2022 Net interest margin was 3.31% for 2023 compared to 3.11% in 2022 Net interest margin was 3.24% for the fourth quarter compared to 3.58% for the same period in 2022 Net Interest Margin 3.50% 3.00% 2.50% 2.00% 1.50% 1.00% 0.50% 0.00% 3.11% 3.31% 12/31/2022 12/31/2023 F&M TRUST Franklin Financial Services Corporation 11 Outlook for 2024 The Company will continue building for the future by leveraging our investments in human capital as well as our physical, technological, and sales infrastructure including: Further integration of Salesforce into sales, operations, and marketing Expanding our presence in the Pennsylvania and Maryland markets Expanding the use of digitization in both customer interface and operational workflows to improve efficiencies and decrease costs across the company The focus on cross-selling between Commercial, Retail, and Wealth Managment Services lines of business, to the benefit of the bank’s customers, continues with improvement due to the adoption and use of Salesforce throughout the bank and senior management’s focus on the opportunities available to the company Commercial loan growth will continue due to the integration of new commercial relationship managers, improved underwriting processes, and growth into new regional markets for the bank F&M TRUST Franklin Financial Services Corporation 12 Outlook for 2024 Deposit balances will moderate due to the tension between rising rates and the bank’s efforts to control interest costs and manage liquidity needs Market pressure on deposit rates and competition for high-quality lending relationships may have an adverse effect on NIM The negative effect of the Accumulated Other Comprehensive Income on book capital should decrease as investments move to maturity (average portfolio life is under 5.0 years) Fee income from the Wealth Management division should continue to grow with continued focus on addition of new clients and should only be moderated by the general performance of both the bond and equity markets With increased focus on finding operating efficiencies, both internally and with our external third-party vendors, we expect to see an improved efficiency ratio in 2024 F&M TRUST Franklin Financial Services Corporation 13
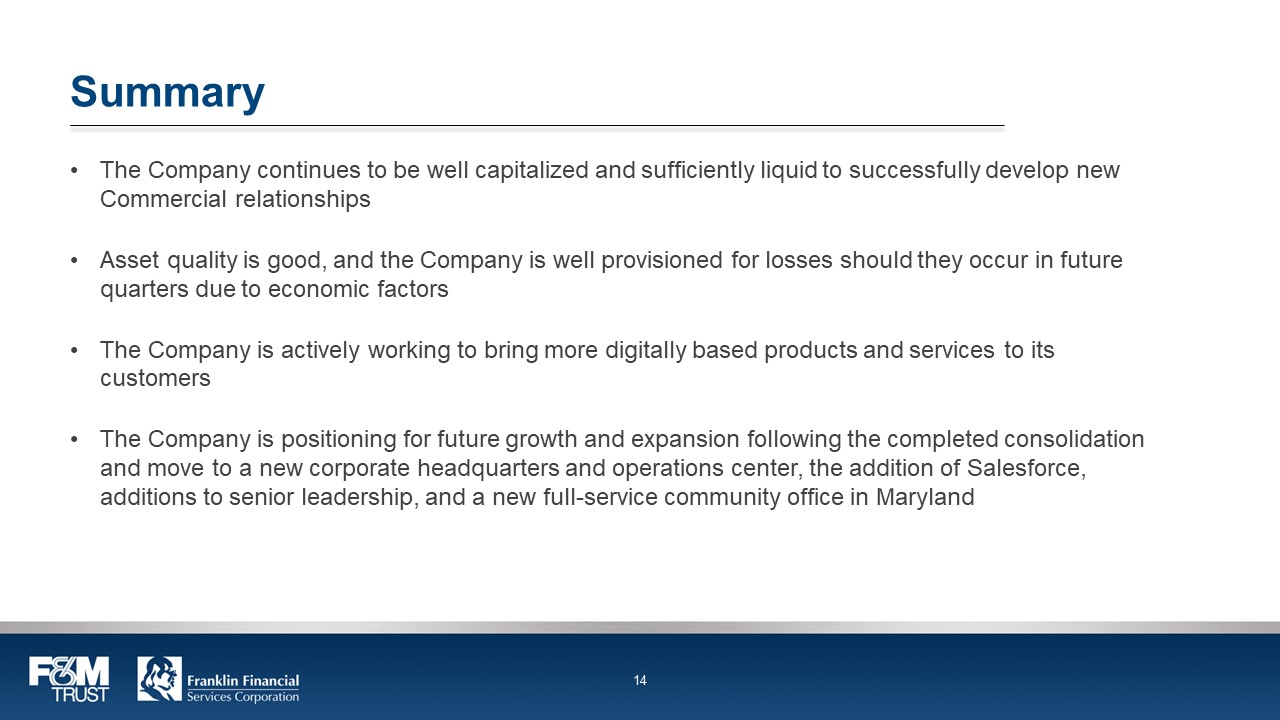
Summary The Company continues to be well capitalized and sufficiently liquid to successfully develop new Commercial relationships Asset quality is good, and the Company is well provisioned for losses should they occur in future quarters due to economic factors The Company is actively working to bring more digitally based products and services to its customers The Company is positioning for future growth and expansion following the completed consolidation and move to a new corporate headquarters and operations center, the addition of Salesforce, additions to senior leadership, and a new full-service community office in Maryland F&M TRUST Franklin Financial Services Corporation 14 Financial Updates Fourth Quarter Ended December 31, 2023 F&M TRUST Franklin Financial Services Corporation 15
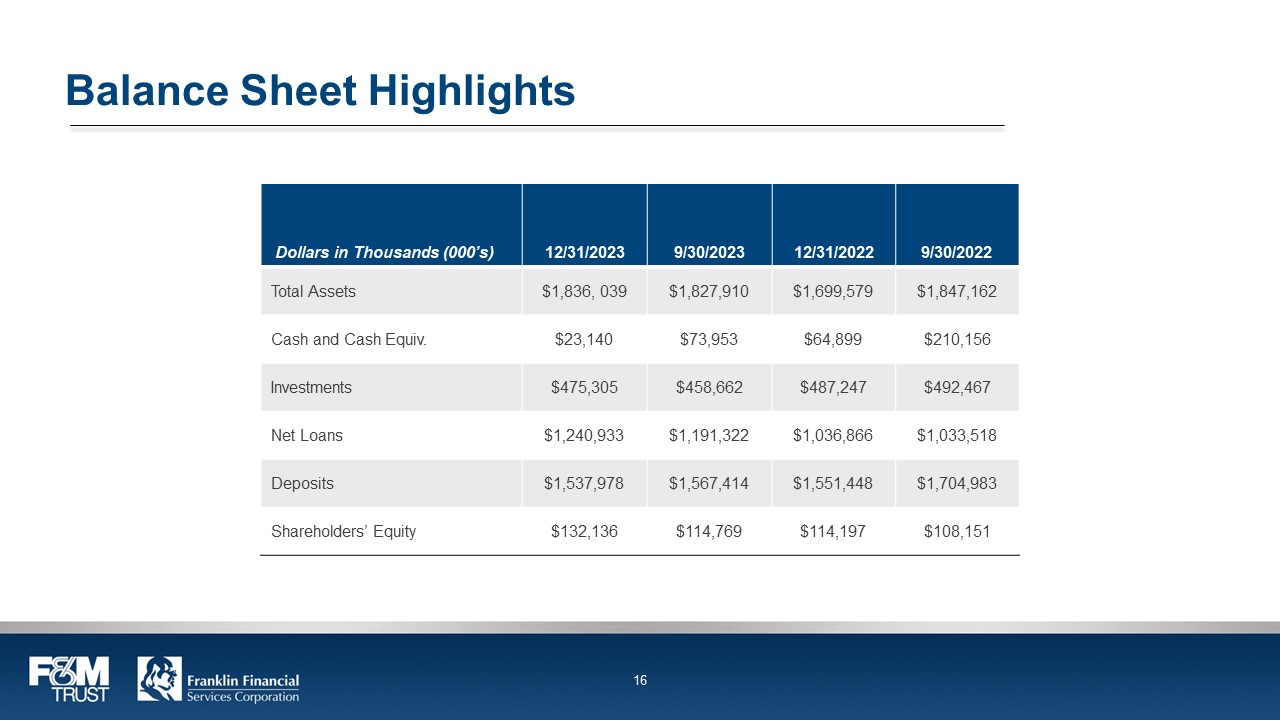
Balance Sheet Highlights Dollars in Thousands (000’s) 12/31/2023 9/30/2023 12/31/2022 9/30/2022 Total Assets $1,836, 039 $1,827,910 $1,699,579 $1,847,162 Cash and Cash Equiv.
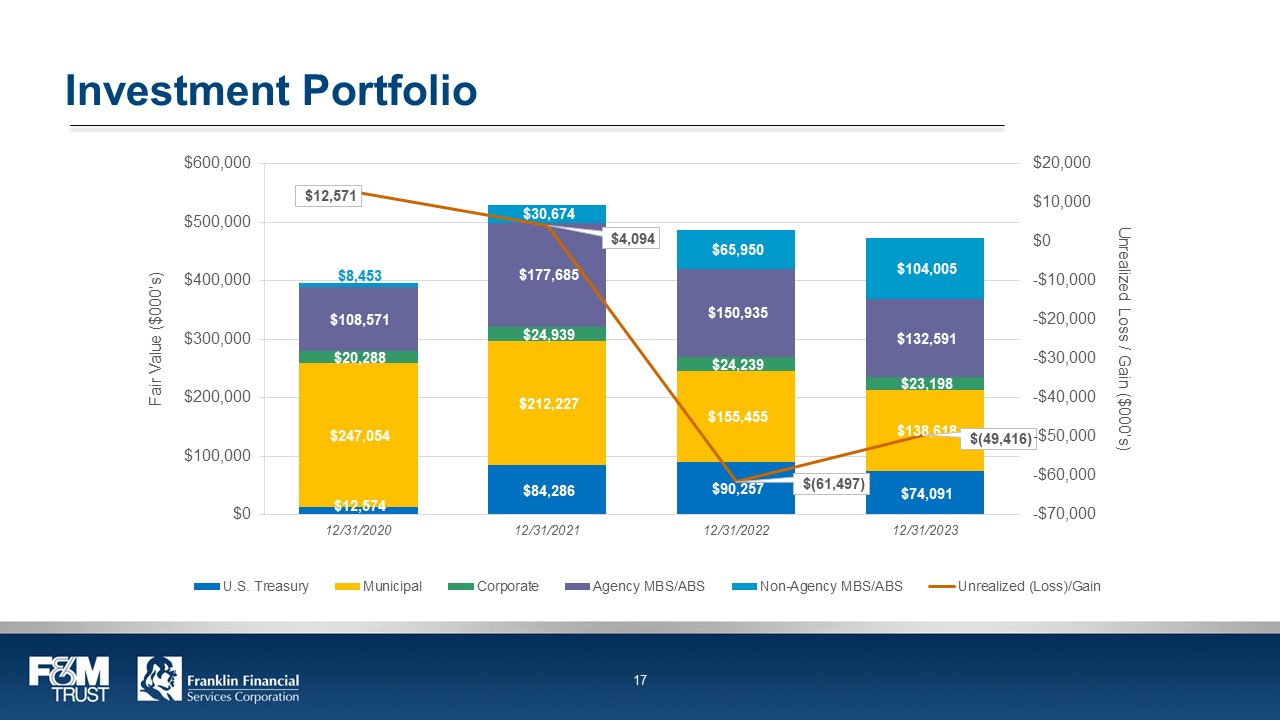
$23,140 $73,953 $64,899 $210,156 Investments $475,305 $458,662 $487,247 $492,467 Net Loans $1,240,933 $1,191,322 $1,036,866 $1,033,518 Deposits $1,537,978 $1,567,414 $1,551,448 $1,704,983 Shareholders’ Equity $132,136 $114,769 $114,197 $108,151 F&M TRUST Franklin Financial Services Corporation 16 Investment Portfolio $20,000 $10,000 $0 $12,571 $4,094 ($61,497) ($49,416) -$10,000 $600,000 $8,453 $30,674 $65,950 $104,005 -$20,000 $500,000 $108,571 $117,685 $150,935 $132,591 -$30,000 $400,000 $20,288 $24,934 $24,239 $23,198 -$40,000 $300,000 $247,054 $212,227 $155,455 $138,618 -$50,000 $200,000 $1,257 $84,286 $90,257 $74,091 -$60,000 $100,000 $44,196 $44,561 $44,926 $45,291 -$70,000 12/31/2020 12/31/2021 12/31/2022 12/31/2023 U.S.
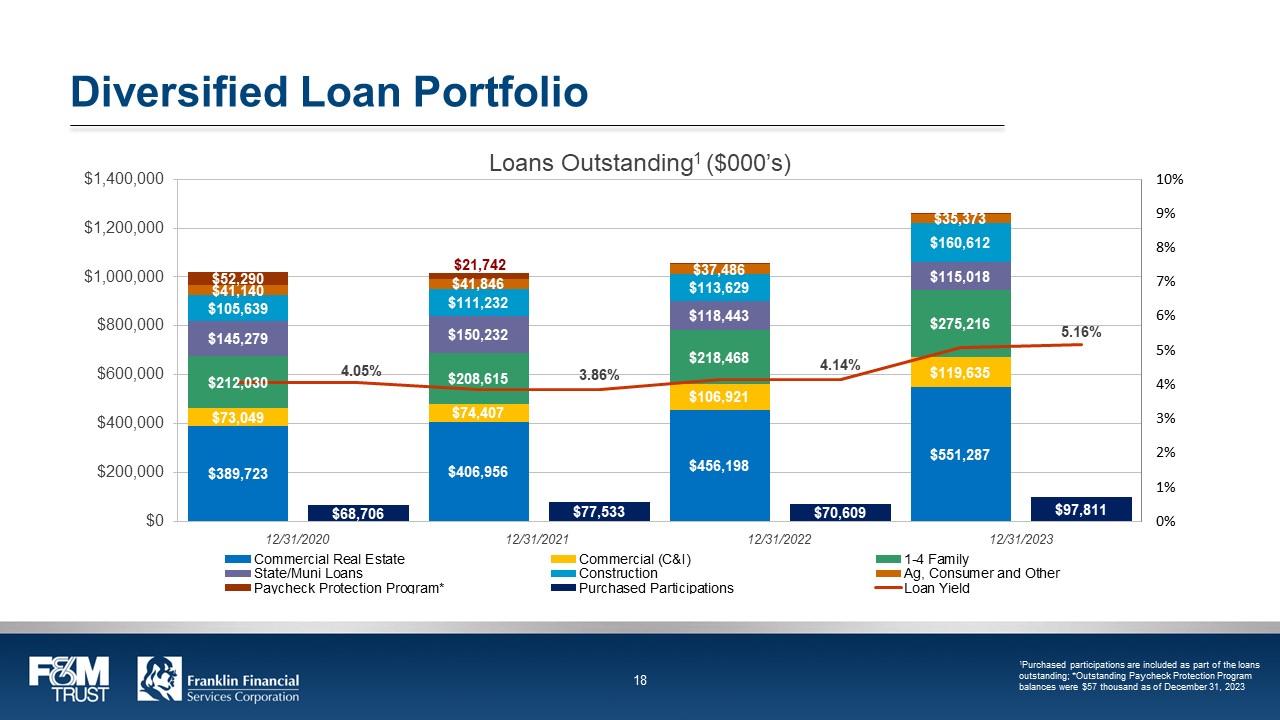
Treasury Municipal Corporate Agency MBS/ABS Non-Agency MBS/ABS Unrealized (Loss)/Gain F&M TRUST Franklin Financial Services Corporation 17 Diversified Loan Portfolio Loans Outstanding1 ($000’s) 10% 9% 8% $1,400,000 $52,290 $21,742 $37,486 $35,373 7% $1,200,000 $41,140 $41,846 $113,629 $160,612 6% $1,000,000 $105,639 $111,232 $118,443 $115,018 5% $800,000 $145,279 $150,232 $218,468 $275,216 4% $600,000 $212,030 $208,615 $106,921 $119,635 3% $400,000 $73,049 4.05% $74,407 3.86% $456,198 4.14% $551,287 5.16% 2% $200,000 $389,723 $68,706 $406,956 $77,533 $70,609 $97,811 1% 12/31/2020 12/31/2021 12/31/2022 12/31/2023 0% Commercial Real Estate State/Minus Loans Paycheck Protection Program* Commercial (C&I) Construction Purchased Participations 1-4 Family Ag.
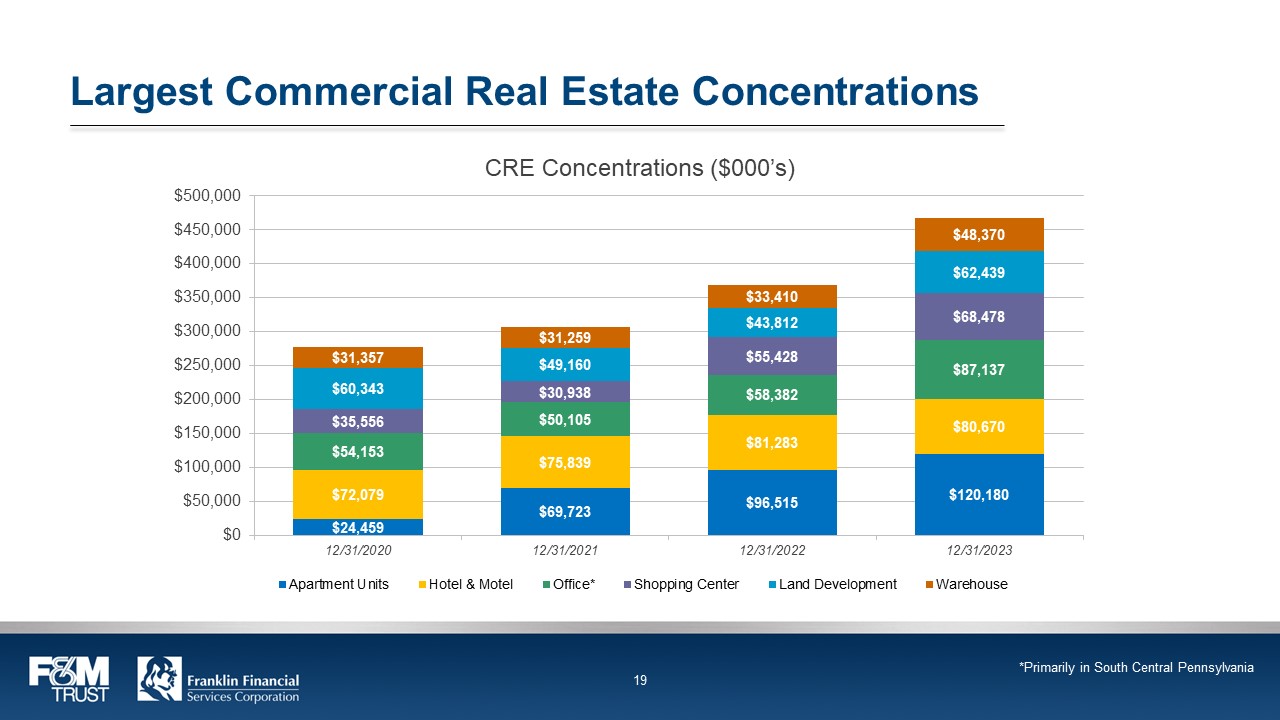
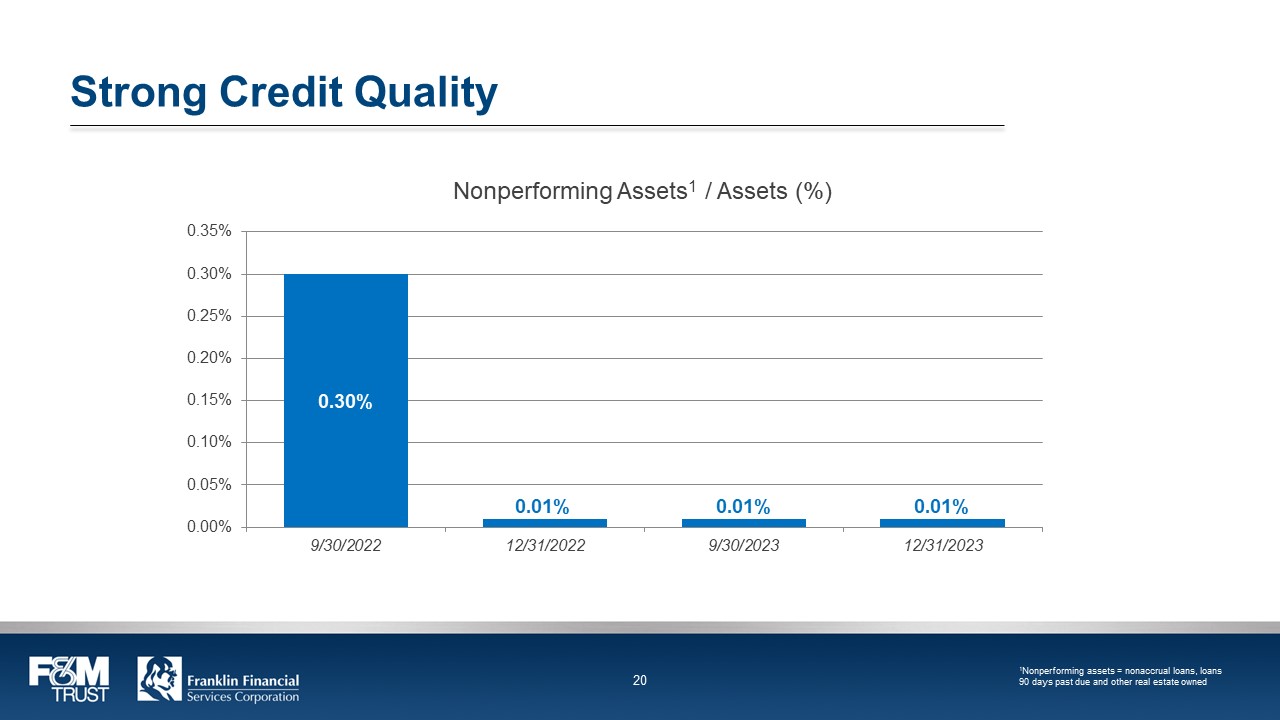
Consumer and Other Loan Yield F&M TRUST Franklin Financial Services Corporation 18 Largest Commercial Real Estate Concentrations CRE Concentrations ($000’s) $500,000 $450,000 $400,000 $350,000 $300,000 $250,000 $31,357 $31,259 $33,410 $48,370 $200,000 $60,343 $49,160 $43,812 $62,439 $150,000 $35,556 $30,938 $55,428 $68,478 $100,000 $54,153 $50,105 $58,382 $87,137 $50,000 $72,079 $75,839 $81,283 $80,670 $0 $24,459 $69,723 $96,515 $120,180 12/31/2020 12/31/2021 12/31/2022 12/31/2023 Apartment Units Hotel & Motel Office* Shopping Centre Land Development Warehouse *Primarily in South Central Pennsylvania F&M TRUST Franklin Financial Services Corporation 19 Strong Credit Quality Nonperforming Assets1 / Assets (%) 0.35% 0.30% 0.25% 0.20% 0.15% 0.10% 0.05% 0.00% 0.30% 0.01% 0.01% 0.01% 9/30/2022 12/31/2022 9/30/2023 12/31/2023 1Nonperforming assets = nonaccrual loans, loans 90 days past due and other real estate owned F&M TRUST Franklin Financial Services Corporation 20
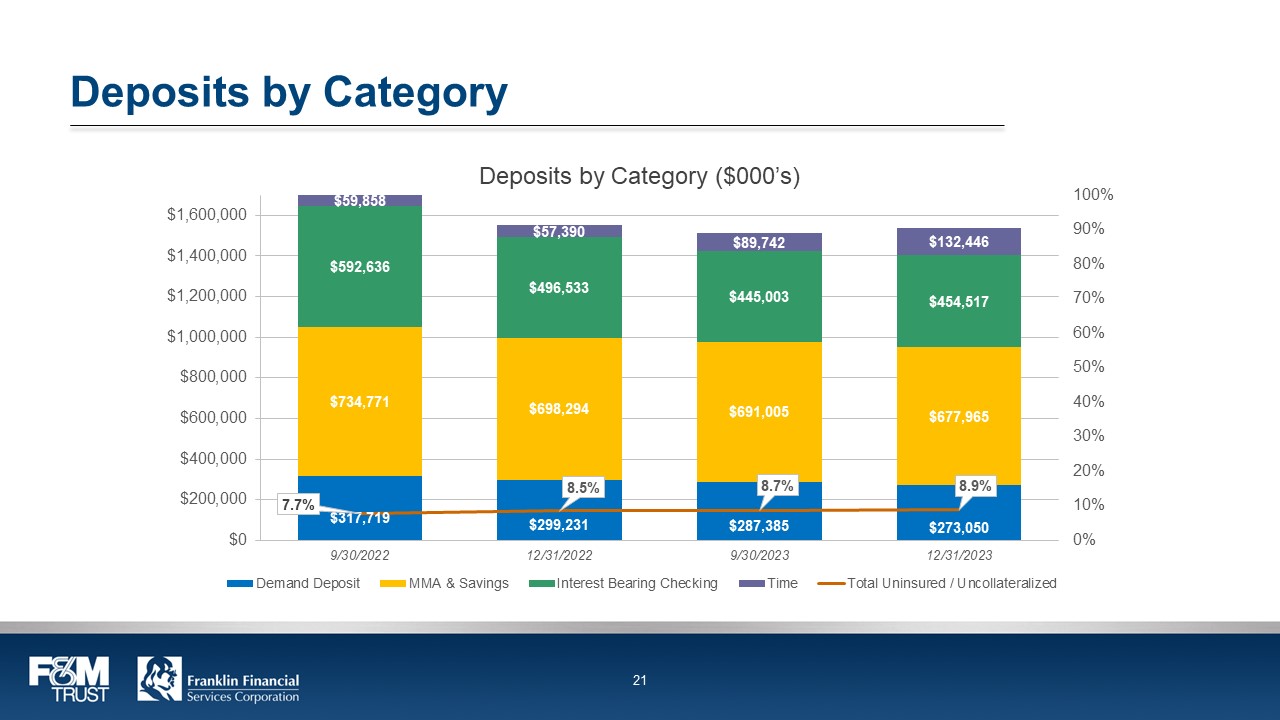
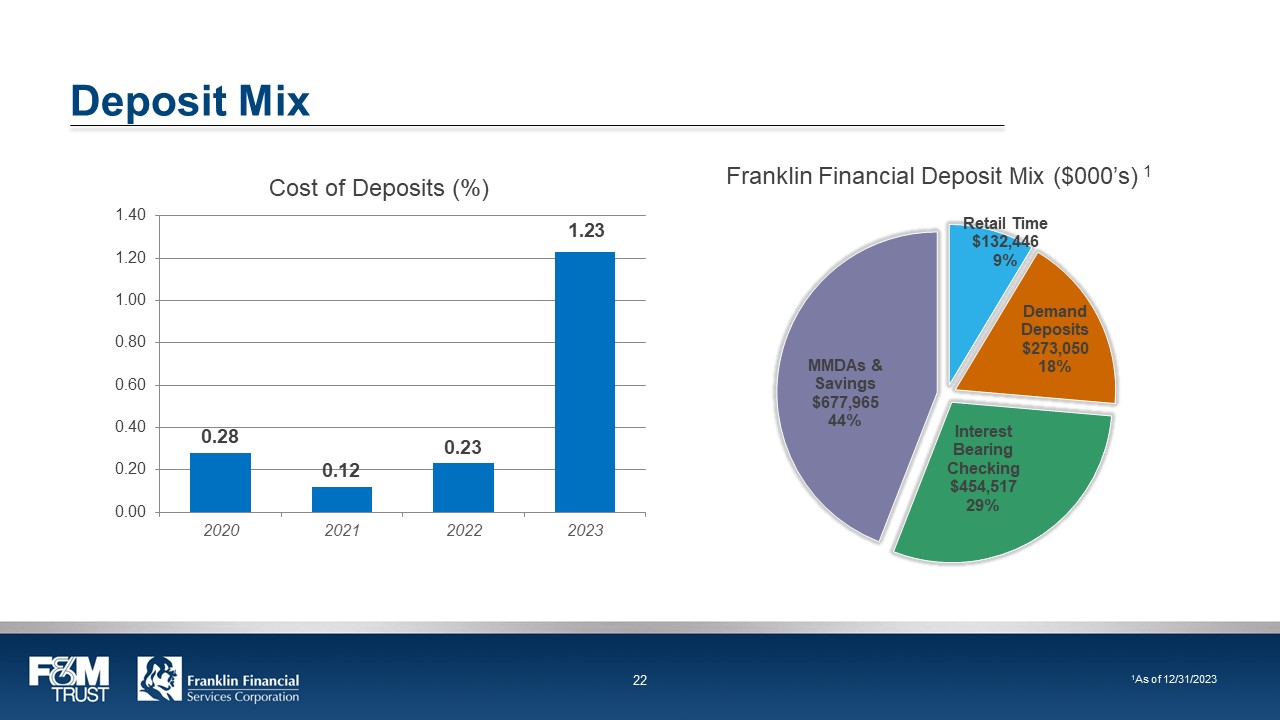
Deposits by Category Deposits by Category ($000’s) $1,600,000 $1,400,000 $1,200,000 $1,000,000 $59,858 $57,390 $89,742 $132,446 $800,000 $592,636 $496,553 $445,003 $454,517 $600,000 $734,771 $698,294 $691,005 $677,965 $400,000 7.7% 8.5% 8.7% 8.9% $200,000 $317,719 $299,231 $287,385 $273,050 9/30/2022 12/31/2022 9/30/2023 12/31/2023 Demand Deposit MMA & Savings Interest Bearing Checking Time Total Uninsured/Collateralized F&M TRUST Franklin Financial Services Corporation 21 Deposit Mix Cost of Deposits (%) 1.40 1.20 1.00 0.80 0.60 0.40 0.20 0.00 0.28 0.12 0.23 1.23 2020 2021 2022 2023 Franklin Financial Deposit Mix ($000’s) 1 Retail Time $132,446 9% Demand Deposits $273,050 18% Interest Bearing Checking $454,517 29% MMDAs & Savings $677,965 44% 1As of 12/31/2023 F&M TRUST Franklin Financial Services Corporation 22
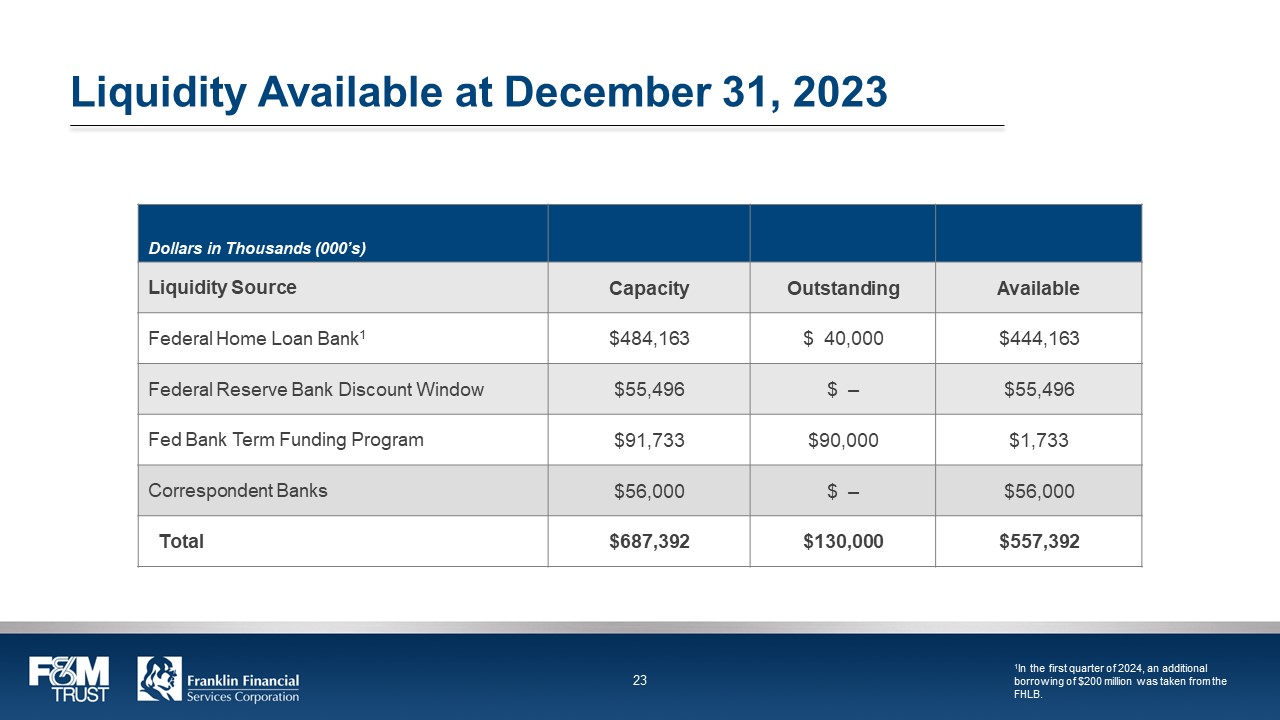
Liquidity Available at December 31, 2023 Dollars in Thousands (000’s) Liquidity Source Capacity Outstanding Available Federal Home Loan Bank1 $484,163 $ 40,000 $444,163 Federal Reserve Bank Discount Window $55,496 $ – $55,496 Fed Bank Term Funding Program $91,733 $90,000 $1,733 Correspondent Banks $56,000 $ – $56,000 Total $687,392 $130,000 $557,392 1In the first quarter of 2024, an additional borrowing of $200 million was taken from the FHLB.
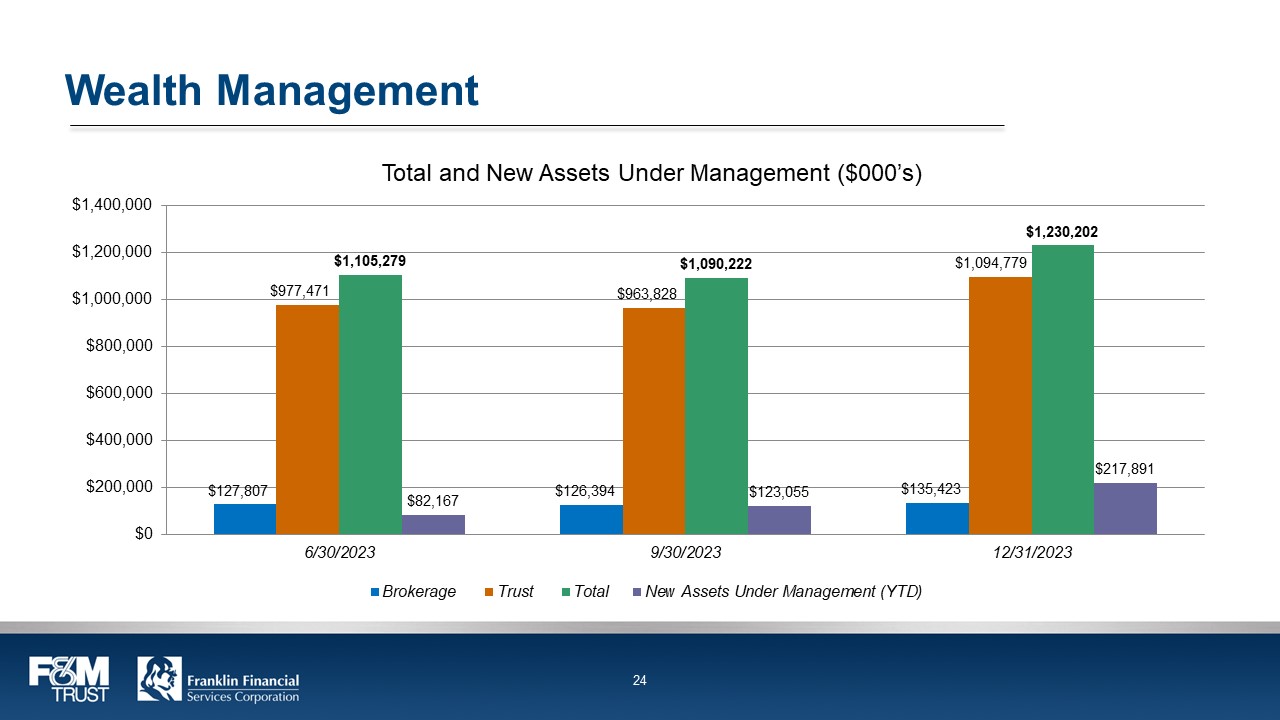
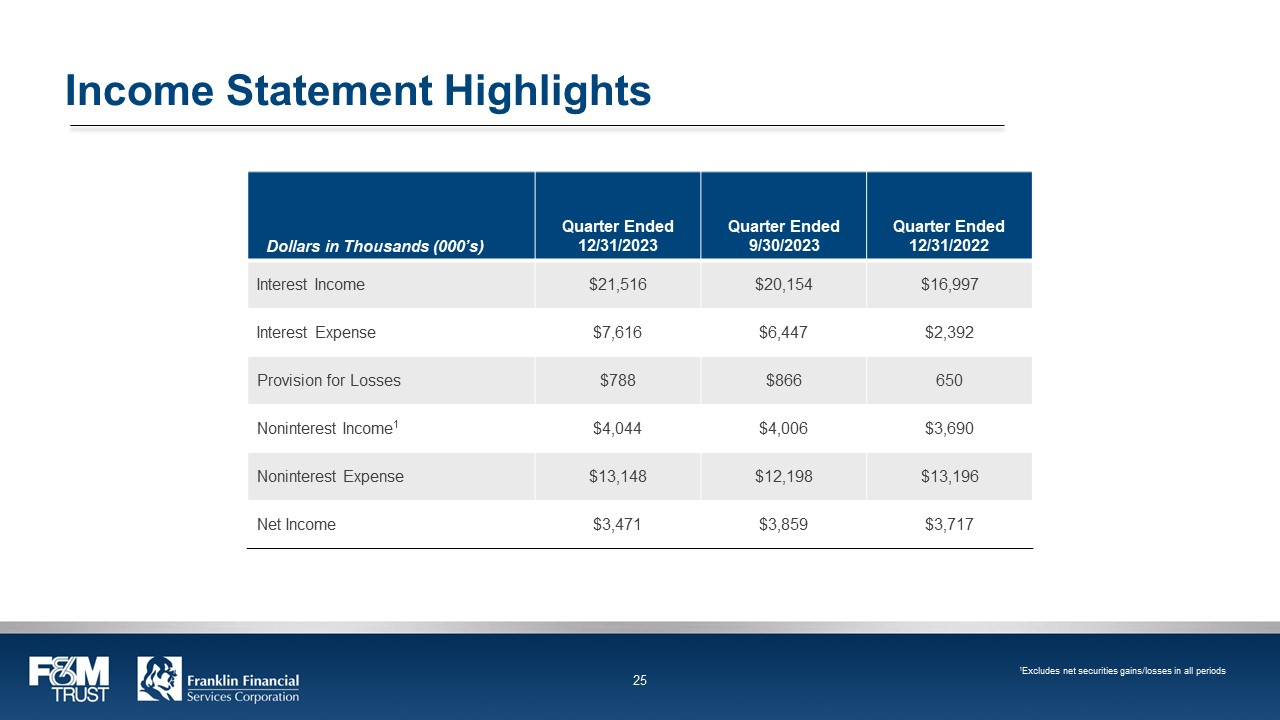
F&M TRUST Franklin Financial Services Corporation 23 Wealth Management Total and New Assets Under Management ($000’s) $1,400,000 $1,200,000 $1,000,000 $800,000 $600,000 $400,000 $200,000 $127,807 $997,471 $1,105,279 $82,167 $126,394 $963,828 $1,090,222 $123,055 $135,423 $1,094,779 $1,230,202 $217,891 6/30/2023 9/30/2023 12/31/2023 Brokerage Trust Total New Assets Under Management (YTD) F&M TRUST Franklin Financial Services Corporation 24 Income Statement Highlights Dollars in Thousands (000’s) Quarter Ended 12/31/2023 Quarter Ended 9/30/2023 Quarter Ended 12/31/2022 Interest Income $21,516 $20,154 $16,997 Interest Expense $7,616 $6,447 $2,392 Provision for Losses $788 $866 650 Noninterest Income1 $4,044 $4,006 $3,690 Noninterest Expense $13,148 $12,198 $13,196 Net Income $3,471 $3,859 $3,717 1Excludes net securities gains/losses in all periods F&M TRUST Franklin Financial Services Corporation 25
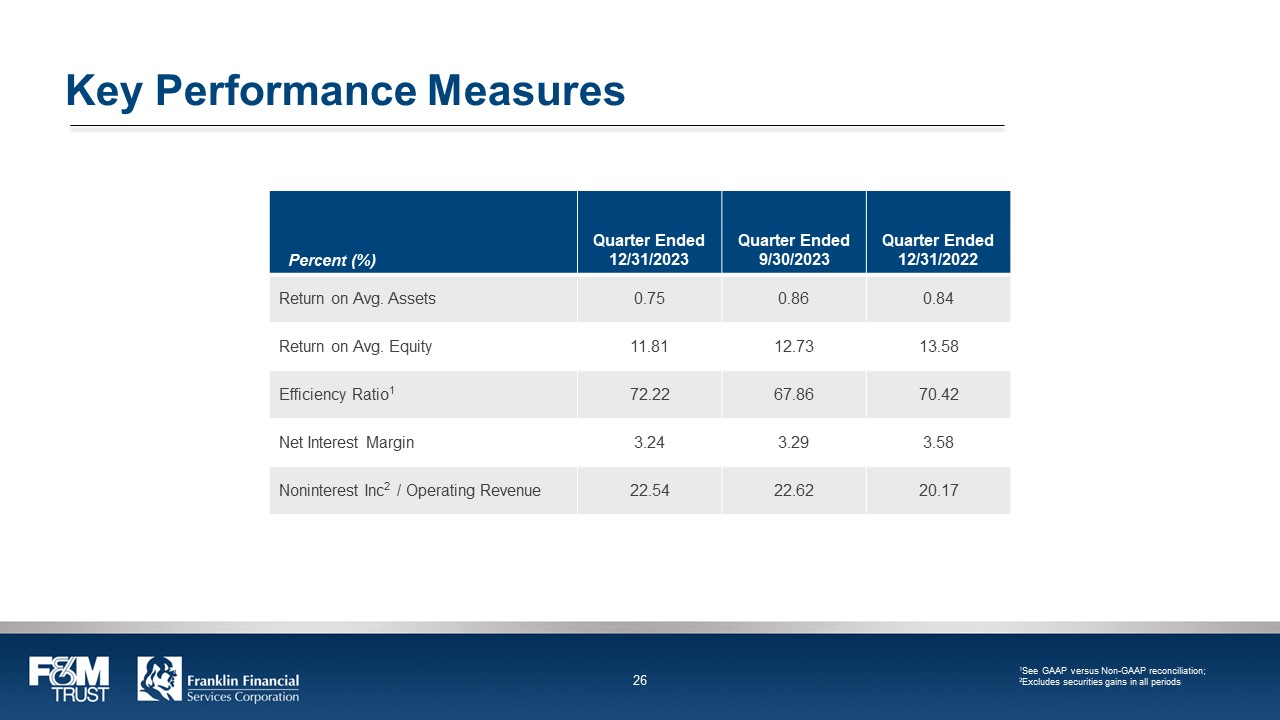
Key Performance Measures Percent (%) Quarter Ended 12/31/2023 Quarter Ended 9/30/2023 Quarter Ended 12/31/2022 Return on Avg. Assets 0.75 0.86 0.84 Return on Avg. Equity 11.81 12.73 13.58 Efficiency Ratio1 72.22 67.86 70.42 Net Interest Margin 3.24 3.29 3.58 Noninterest Inc2 / Operating Revenue 22.54 22.62 20.17 1See GAAP versus Non-GAAP reconciliation; 2Excludes securities gains in all periods F&M TRUST Franklin Financial Services Corporation 26 Balance Sheet Strength Percent (%) Quarter Ended 12/31/2023 Quarter Ended 9/30/2023 Quarter Ended 12/31/2022 Risk-Based Capital Ratio (Total) 14.45 15.16 17.21 Leverage Ratio (Tier 1) 9.01 9.10 8.95 Common Equity Ratio (Tier 1) 11.82 12.43 14.22 Tangible Common Equity Ratio1 6.74 5.81 6.22 Tangible Common Equity Ratio, excl.
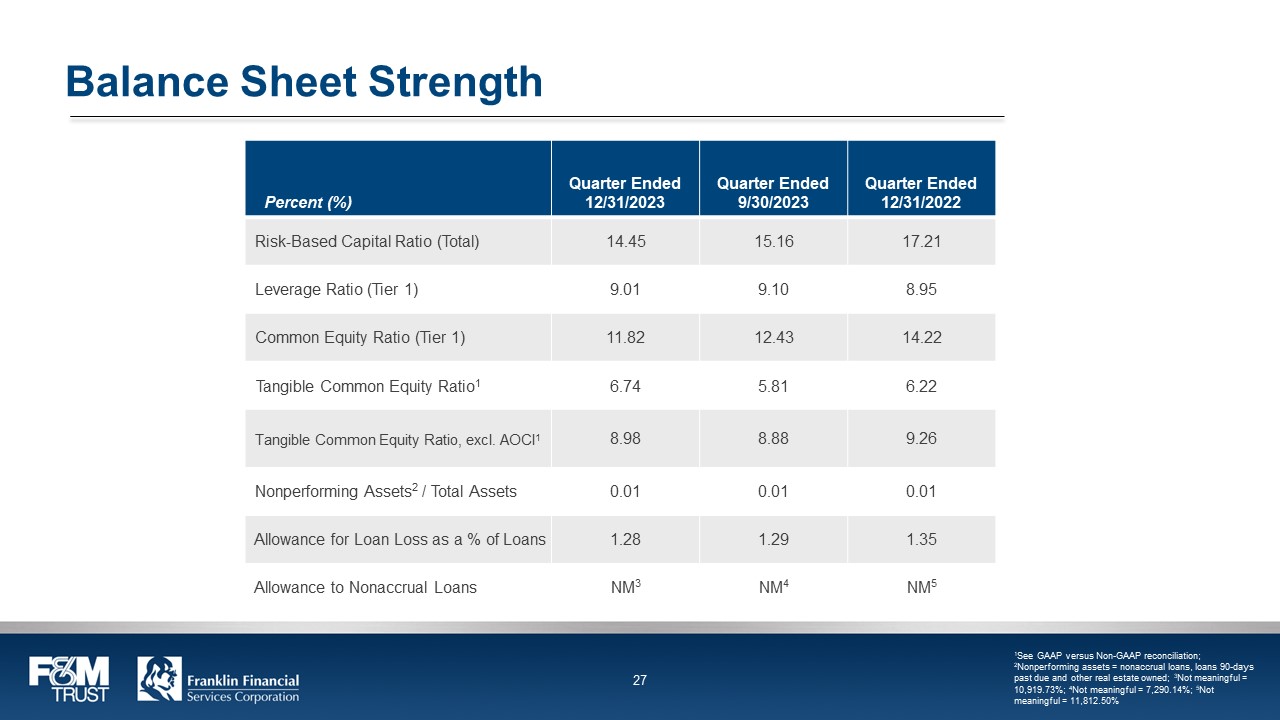
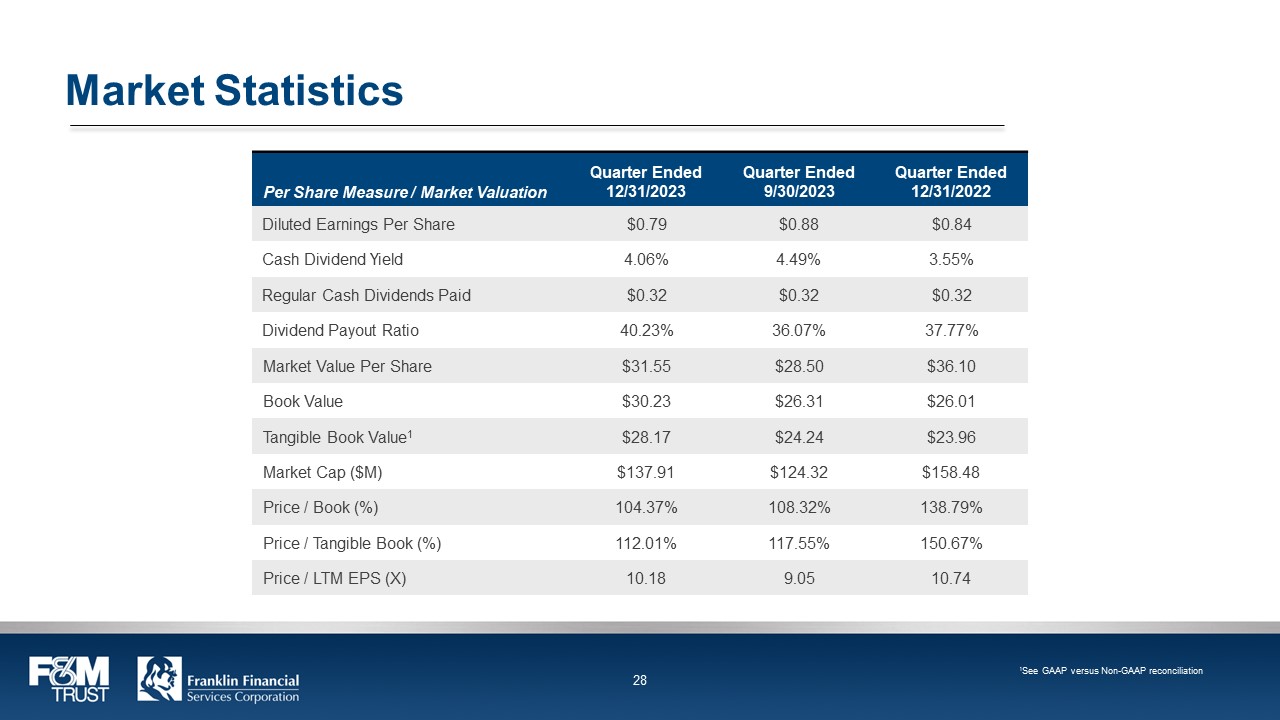
AOCI1 8.98 8.88 9.26 Nonperforming Assets2 / Total Assets 0.01 0.01 0.01 Allowance for Loan Loss as a % of Loans 1.28 1.29 1.35 Allowance to Nonaccrual Loans NM3 NM4 NM5 1See GAAP versus Non-GAAP reconciliation; 2Nonperforming assets = nonaccrual loans, loans 90-days past due and other real estate owned; 3Not meaningful = 10,919.73%; 4Not meaningful = 7,290.14%; 5Not meaningful = 11,812.50% F&M TRUST Franklin Financial Services Corporation 27 Market Statistics Per Share Measure / Market Valuation Quarter Ended 12/31/2023 Quarter Ended 9/30/2023 Quarter Ended 12/31/2022 Diluted Earnings Per Share $0.79 $0.88 $0.84 Cash Dividend Yield 4.06% 4.49% 3.55% Regular Cash Dividends Paid $0.32 $0.32 $0.32 Dividend Payout Ratio 40.23% 36.07% 37.77% Market Value Per Share $31.55 $28.50 $36.10 Book Value $30.23 $26.31 $26.01 Tangible Book Value1 $28.17 $24.24 $23.96 Market Cap ($M) $137.91 $124.32 $158.48 Price / Book (%) 104.37% 108.32% 138.79% Price / Tangible Book (%) 112.01% 117.55% 150.67% Price / LTM EPS (X) 10.18 9.05 10.74 1See GAAP versus Non-GAAP reconciliation F&M TRUST Franklin Financial Services Corporation 28 Stock Symbol: FRAF (Nasdaq) www.franklinfin.com www.fmtrust.bank F&M TRUST Franklin Financial Services Corporation 29

Appendix F&M TRUST Franklin Financial Services Corporation 30
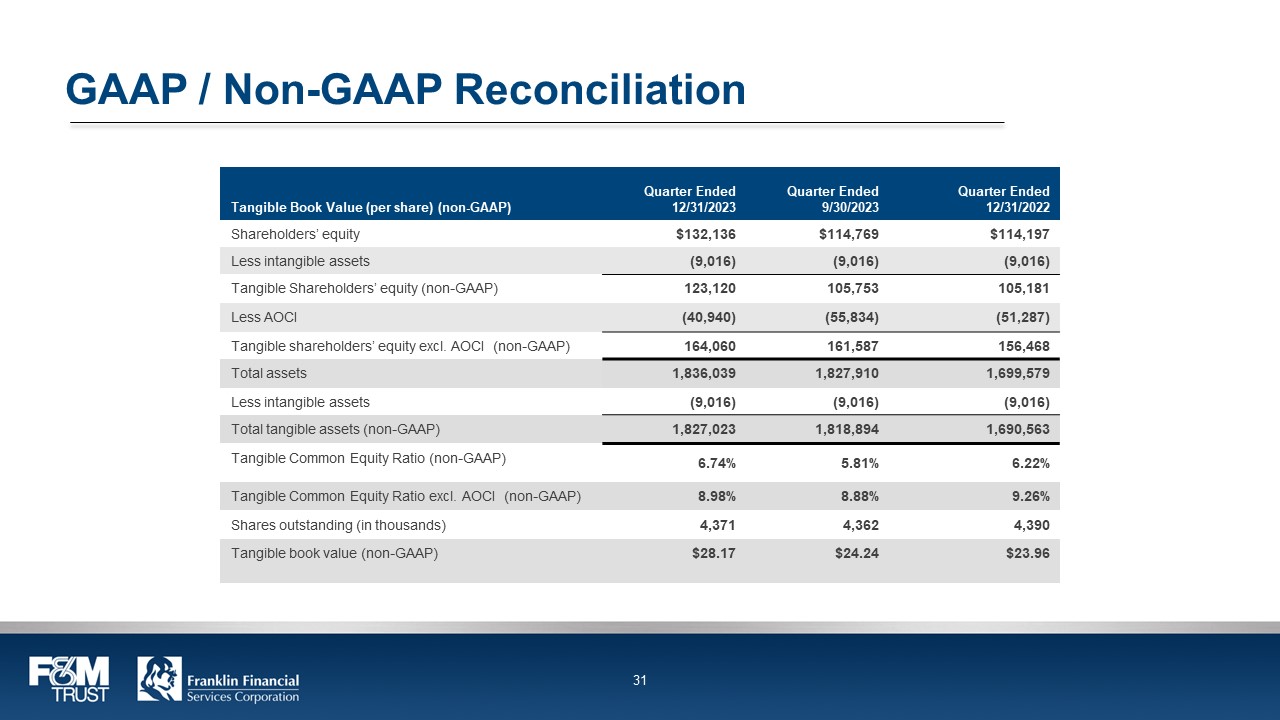
GAAP / Non-GAAP Reconciliation Tangible Book Value (per share) (non-GAAP) Quarter Ended 12/31/2023 Quarter Ended 9/30/2023 Quarter Ended 12/31/2022 Shareholders’ equity $132,136 $114,769 $114,197 Less intangible assets (9,016) (9,016) (9,016) Tangible Shareholders’ equity (non-GAAP) 123,120 105,753 105,181 Less AOCI (40,940) (55,834) (51,287) Tangible shareholders’ equity excl. AOCI (non-GAAP) 164,060 161,587 156,468 Total assets 1,836,039 1,827,910 1,699,579 Less intangible assets (9,016) (9,016) (9,016) Total tangible assets (non-GAAP) 1,827,023 1,818,894 1,690,563 Tangible Common Equity Ratio (non-GAAP) 6.74% 5.81% 6.22% Tangible Common Equity Ratio excl.
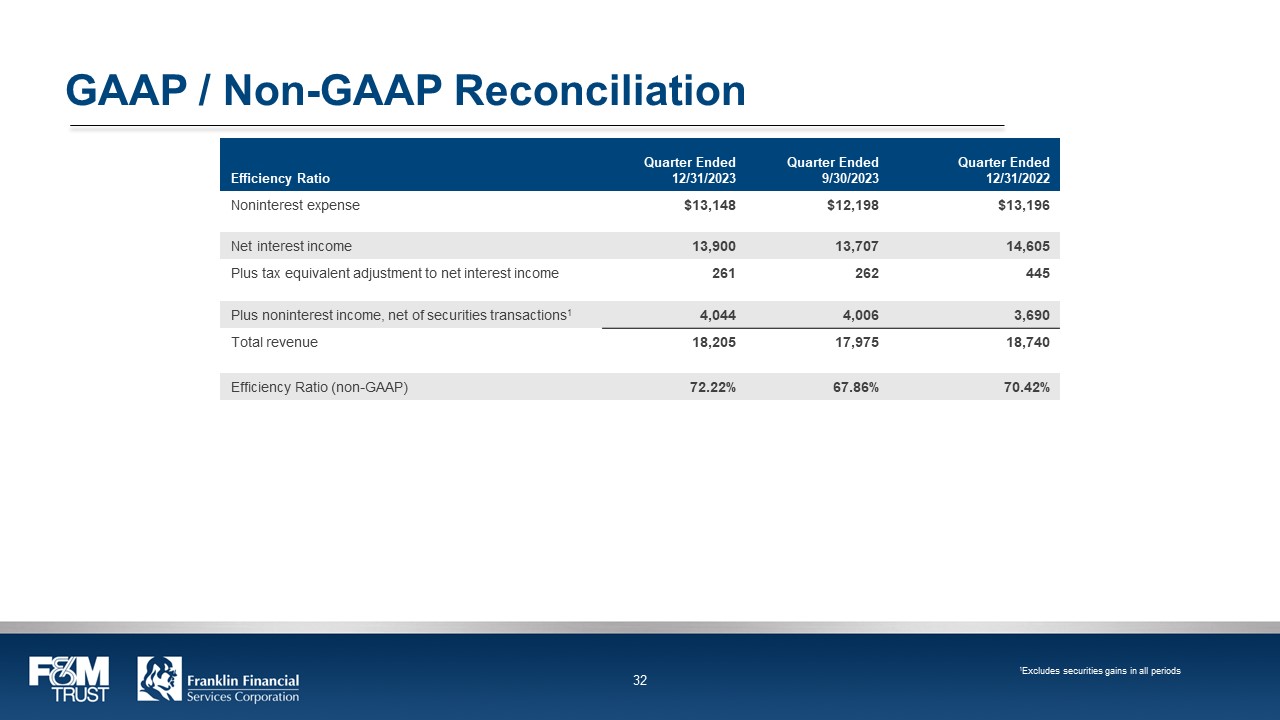
AOCI (non-GAAP) 8.98% 8.88% 9.26% Shares outstanding (in thousands) 4,371 4,362 4,390 Tangible book value (non-GAAP) $28.17 $24.24 $23.96 F&M TRUST Franklin Financial Services Corporation 31 GAAP / Non-GAAP Reconciliation Efficiency Ratio Quarter Ended 12/31/2023 Quarter Ended 9/30/2023 Quarter Ended 12/31/2022 Noninterest expense $13,148 $12,198 $13,196 Net interest income 13,900 13,707 14,605 Plus tax equivalent adjustment to net interest income 261 262 445 Plus noninterest income, net of securities transactions1 4,044 4,006 3,690 Total revenue 18,205 17,975 18,740 Efficiency Ratio (non-GAAP) 72.22% 67.86% 70.42% 1Excludes securities gains in all periods F&M TRUST Franklin Financial Services Corporation 32