UNITED STATES
SECURITIES AND EXCHANGE COMMISSION
Washington, D.C. 20549
FORM 8-K
CURRENT REPORT
Pursuant to Section 13 or 15(d) of
The Securities Exchange Act of 1934
Date of Report: November 17, 2023
FRANKLIN FINANCIAL SERVICES CORPORATION(Exact name of registrant as specified in its new charter)
|
|
|
|
|
|
Pennsylvania |
001-38884 |
25-1440803 |
|
|
(State or other jurisdiction of incorporation) |
(Commission File Number) |
(IRS Employer Identification No.) |
|
|
|
|
|
|
1500 Nitterhouse Drive, Chambersburg, PA |
17201 |
|
|
(Address of principal executive office) |
(Zip Code) |
|
|
|
|
|
|
Registrant's telephone number, including area code |
(717) 264-6116 |
|
|
|
|
|
N/A
(Former name or former address, if changes since last report)
Check the appropriate box below if the Form 8-K is intended to simultaneously satisfy the filing obligation of the registrant under any of the following provisions:
¨ Written communications pursuant to Rule 425 under the Securities Act (17 CFR 230.425)
¨ Soliciting material pursuant to Rule 14a –12 under the Exchange Act (17 CFR 240.14a –12)
¨ Pre-commencement communications pursuant to Rule 14d – 2(b) under the Exchange Act (17 CFR 240.14d-2(b))
¨ Pre-commencement communications pursuant to Rule 13e – 4(c) under the Exchange Act (17 CFR 240.13e-4(c))
Securities registered pursuant to Section 12(b) of the Act:
|
|
|
|
|
|
Title of class |
Symbol |
Name of exchange on which registered |
Common stock |
FRAF |
Nasdaq Capital Market |
Indicate by check mark whether the registrant is an emerging growth company as defined in Rule 405 of the Securities Act of 1933 (§230.405 of this chapter) or Rule 12b-2 of the Securities Exchange Act of 1934 (§240.12b-2 of this chapter).
Emerging growth company ¨
If an emerging growth company, indicate by check mark if the registrant has elected not to use the extended transition period for complying with any new or revised financial accounting standards provided pursuant to Section 13(a) of the Exchange Act. ¨
Item 7.01 Regulations FD Disclosure
Franklin Financial Services Corporation (“the Corporation”) is furnishing this presentation which will be presented in whole or in part, from time to time, by executives of the Corporation in one or more meetings with investors and analysts. The presentation is attached as Exhibit 99.1 and is incorporated by reference. It is also available on the Corporation’s website at www.franklinfin.com.
The information in this Form 8-K provided under Item 7.01, including all exhibits attached hereto, is being furnished and shall not be deemed to be “filed” for purposes of Section 18 of the Securities Exchange Act of 1934 (the “Exchange Act”), or otherwise subject to the liability of such section, nor shall it be deemed incorporated by reference in any filing of the Corporation under the Securities Act of 1933 or the Exchange Act, regardless of any general incorporation language in such filing, unless expressly incorporated by specific reference in such.
Item 9.01 Financial Statements and Exhibits
(c) Exhibits. The following exhibits are filed herewith:
Number Description
99.1 Investor Presentation, dated November 17, 2023 of Franklin Financial Services
104 The cover page from this Current Report on Form 8-K, formatted in Inline XBRL
SIGNATURES
Pursuant to the requirements of the Securities Exchange Act of 1934, the registrant has duly caused this report to be signed on its behalf by the undersigned hereunto duly authorized.
FRANKLIN FINANCIAL SERVICES CORPORATION
By: /s/ Timothy G. Henry
Timothy G. Henry
President and Chief Executive Officer
Dated: November 17, 2023
Exhibit 99.1
Investor Presentation Third Quarter 2023 Highlights F&M TRUST Franklin Financial Services Corporation Forward Looking Statements Certain statements appearing herein which are not historical in nature are forward-looking statements within the meaning of the Private Securities Litigation Reform Act of 1995.
Such forward-looking statements refer to a future period or periods, reflecting management’s current views as to likely future developments, and use words such as “may,” “will,” “expect,” “believe,” “estimate,” “anticipate,” or similar terms. Because forward-looking statements involve certain risks, uncertainties and other factors over which the Corporation has no direct control, actual results could differ materially from those contemplated in such statements. These factors include (but are not limited to) the following: general economic conditions, changes in the rates of inflation and the effects of inflation, changes in interest rates, ongoing disruption in the financial services industry caused by the recent failure and continuing uncertainty of various banks, changes in the Corporation’s cost of funds, changes in government monetary policy, changes in government regulation and taxation of financial institutions, changes in technology, the intensification of competition within the Corporation’s market area, and other similar factors. We caution readers not to place undue reliance on these forward-looking statements. They only reflect management’s analysis as of this date. The Corporation does not revise or update these forward-looking statements to reflect events or changed circumstances. F&M TRUST Franklin Financial Services Corporation 2 CEO Comments By many measures, 2023 has been a very challenging year for the banking industry.
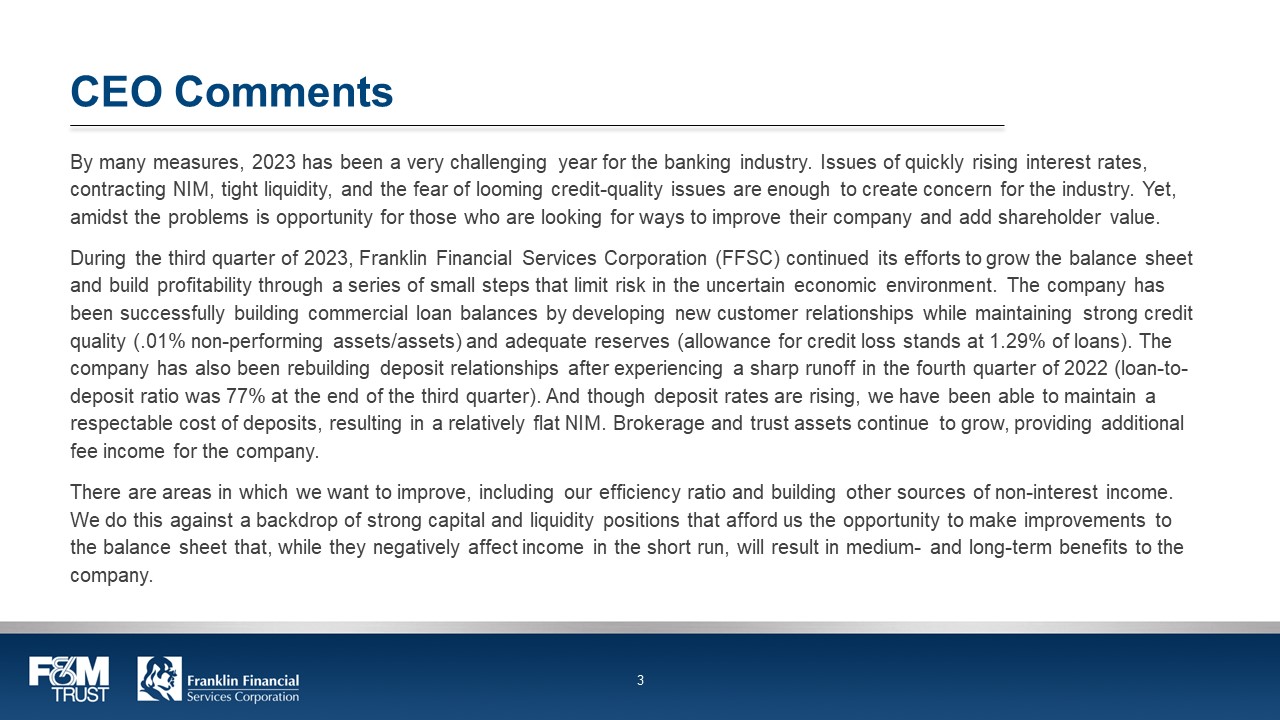
Issues of quickly rising interest rates, contracting NIM, tight liquidity, and the fear of looming credit-quality issues are enough to create concern for the industry. Yet, amidst the problems is opportunity for those who are looking for ways to improve their company and add shareholder value. During the third quarter of 2023, Franklin Financial Services Corporation (FFSC) continued its efforts to grow the balance sheet and build profitability through a series of small steps that limit risk in the uncertain economic environment. The company has been successfully building commercial loan balances by developing new customer relationships while maintaining strong credit quality (.01% non-performing assets/assets) and adequate reserves (allowance for credit loss stands at 1.29% of loans). The company has also been rebuilding deposit relationships after experiencing a sharp runoff in the fourth quarter of 2022 (loan-to-deposit ratio was 77% at the end of the third quarter). And though deposit rates are rising, we have been able to maintain a respectable cost of deposits, resulting in a relatively flat NIM. Brokerage and trust assets continue to grow, providing additional fee income for the company. There are areas in which we want to improve, including our efficiency ratio and building other sources of non-interest income. We do this against a backdrop of strong capital and liquidity positions that afford us the opportunity to make improvements to the balance sheet that, while they negatively affect income in the short run, will result in medium- and long-term benefits to the company. F&M TRUST Franklin Financial Services Corporation 3 CEO Comments As we discussed at the end of the second quarter, FFSC is focused on the future.
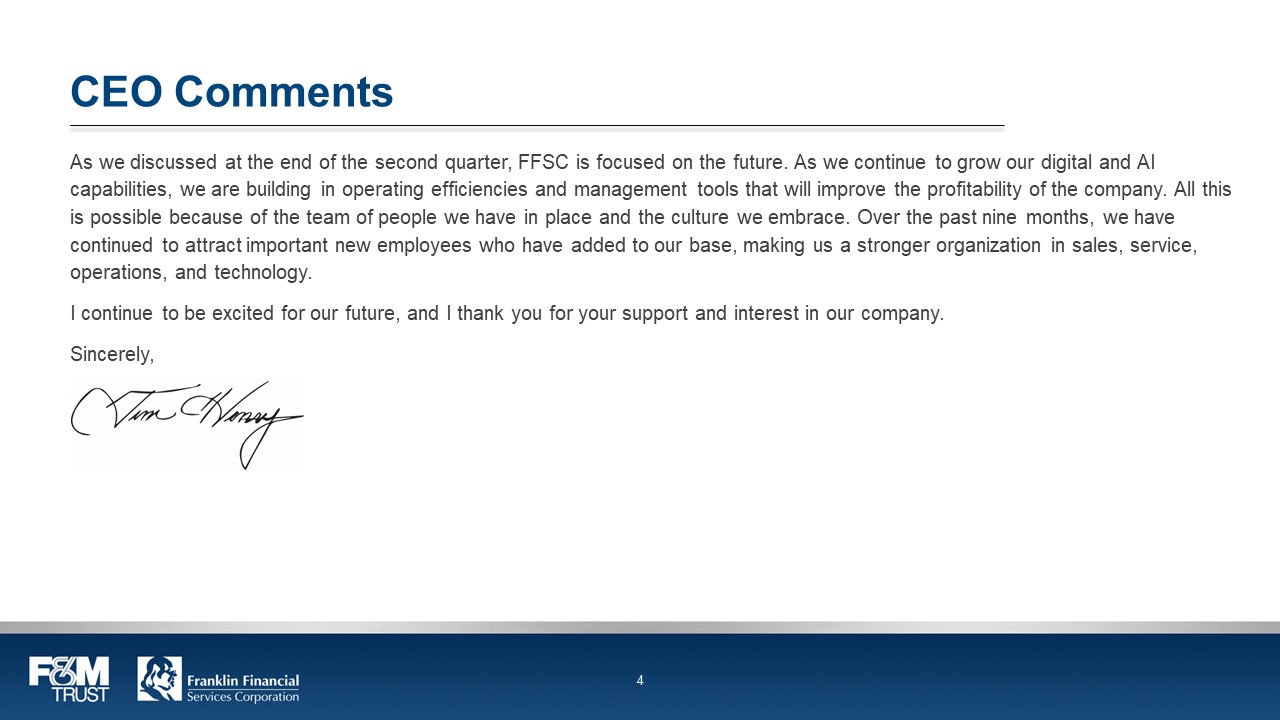
As we continue to grow our digital and AI capabilities, we are building in operating efficiencies and management tools that will improve the profitability of the company. All this is possible because of the team of people we have in place and the culture we embrace. Over the past nine months, we have continued to attract important new employees who have added to our base, making us a stronger organization in sales, service, operations, and technology. I continue to be excited for our future, and I thank you for your support and interest in our company. Sincerely, F&M TRUST Franklin Financial Services Corporation 4 Mission, Vision & Core Values Mission Statement Delivering the right financial solutions from people you know and trust.
Vision We are committed to remaining independent by growing our bank to meet the increasing needs of our employees, customers, communities, and shareholders. We strive to be a financial services leader in the markets we serve. Core Values The employees, officers, and directors are committed to the core values of integrity, teamwork, excellence, accountability, and concern for our customers and the communities we serve.
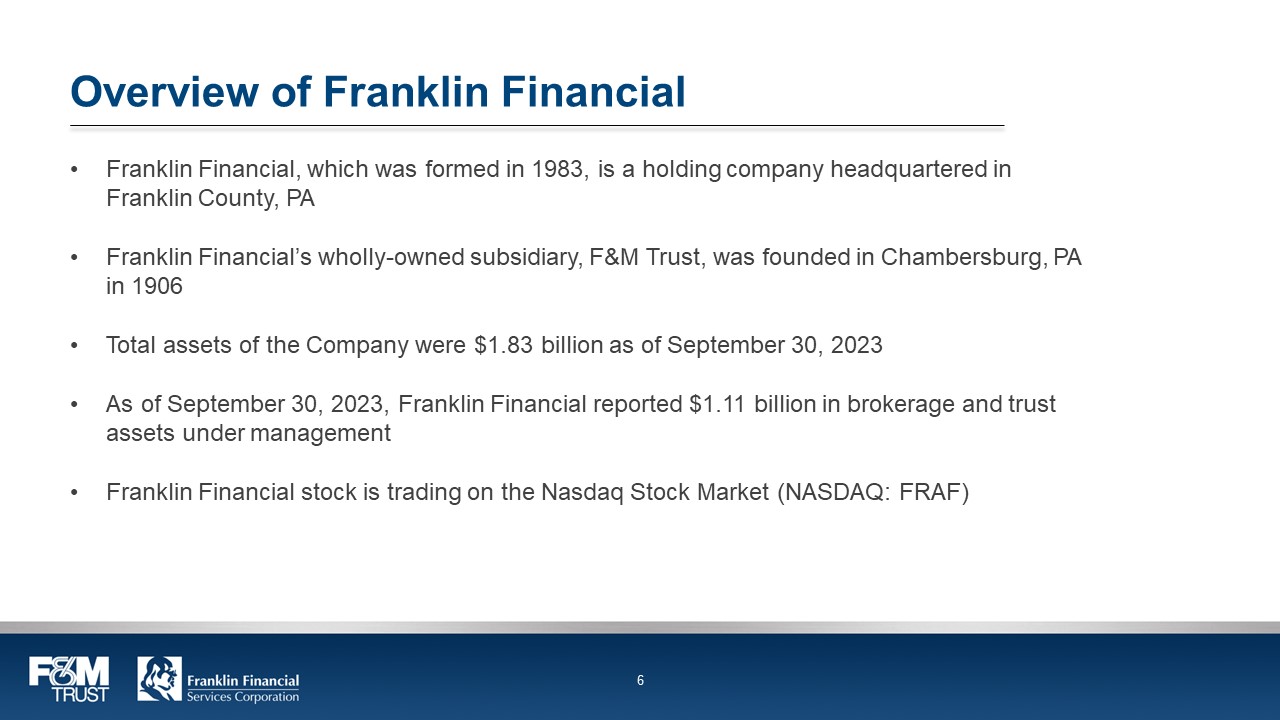
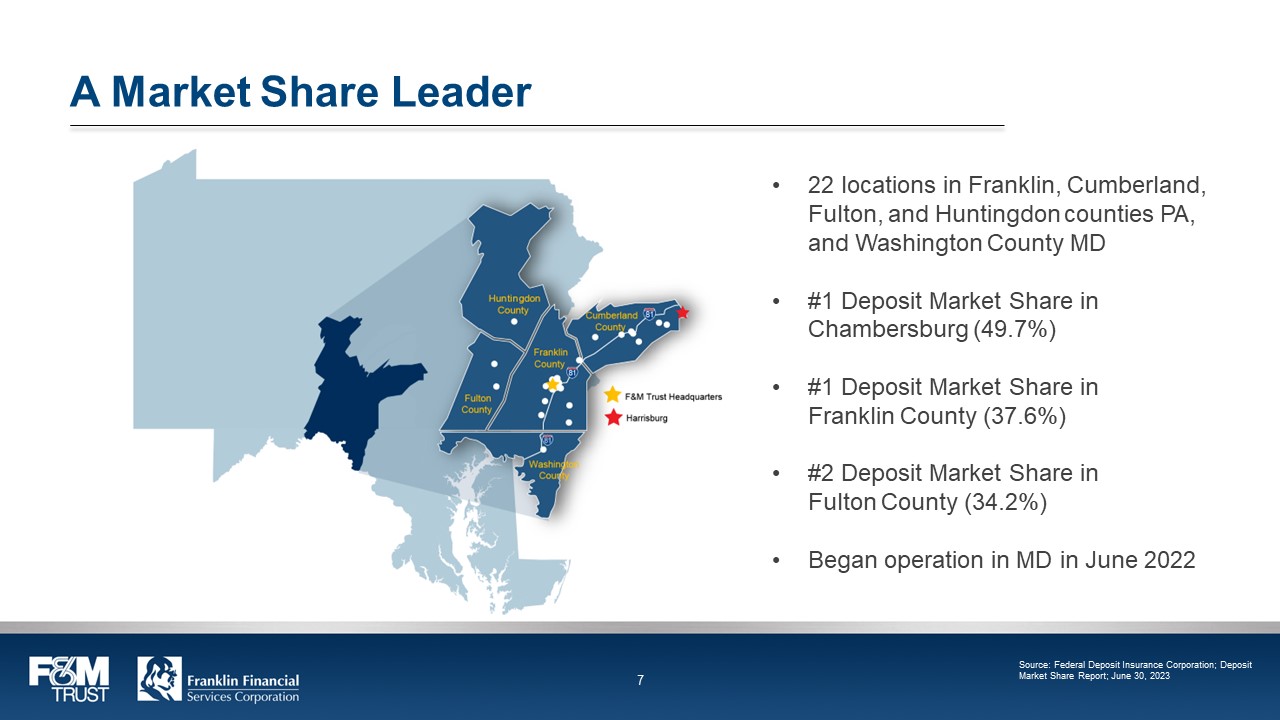
F&M TRUST Franklin Financial Services Corporation 5 Overview of Franklin Financial Franklin Financial, which was formed in 1983, is a holding company headquartered in Franklin County, PA Franklin Financial’s wholly-owned subsidiary, F&M Trust, was founded in Chambersburg, PA in 1906 Total assets of the Company were $1.83 billion as of September 30, 2023 As of September 30, 2023, Franklin Financial reported $1.11 billion in brokerage and trust assets under management Franklin Financial stock is trading on the Nasdaq Stock Market (NASDAQ: FRAF) F&M TRUST Franklin Financial Services Corporation 6 A Market Share Leader 22 locations in Franklin, Cumberland, Fulton, and Huntingdon counties PA, and Washington County MD #1 Deposit Market Share in Chambersburg (49.7%) #1 Deposit Market Share in Franklin County (37.6%) #2 Deposit Market Share in Fulton County (34.2%) Began operation in MD in June 2022 Source: Federal Deposit Insurance Corporation; Deposit Market Share Report; June 30, 2023 F&M TRUST Franklin Financial Services Corporation 7
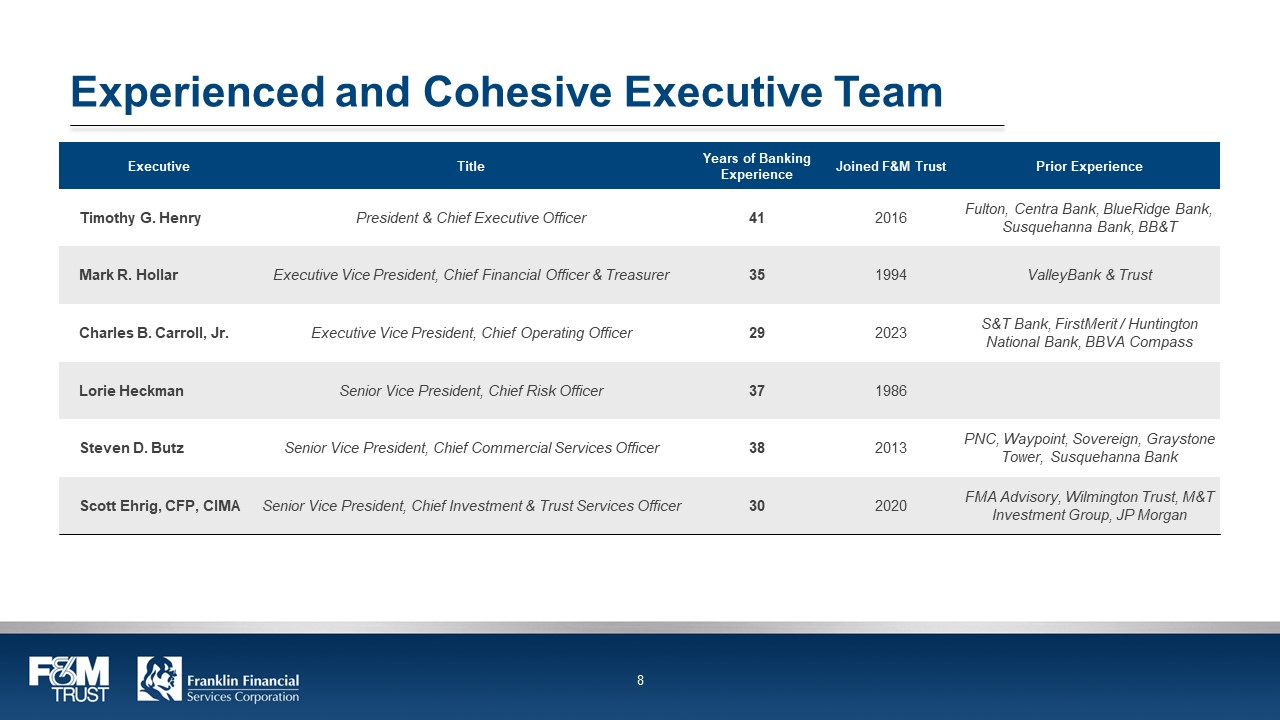
Experienced and Cohesive Executive Team Executive Title Years of Banking Experience Joined F&M Trust Prior Experience Timothy G. Henry President & Chief Executive Officer 41 2016 Fulton, Centra Bank, BlueRidge Bank, Susquehanna Bank, BB&T Mark R. Hollar Executive Vice President, Chief Financial Officer & Treasurer 35 1994 ValleyBank & Trust Charles B. Carroll, Jr. Executive Vice President, Chief Operating Officer 29 2023 S&T Bank, FirstMerit / Huntington National Bank, BBVA Compass Lorie Heckman Senior Vice President, Chief Risk Officer 37 1986 Steven D.
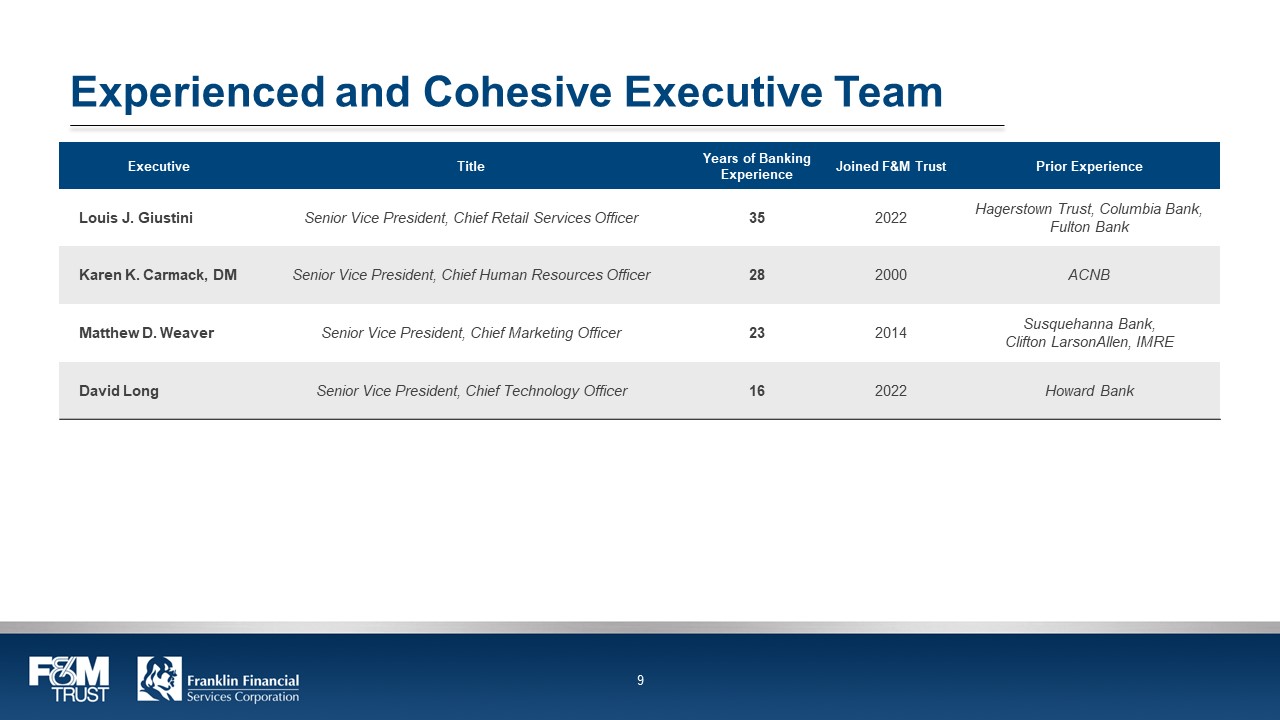
Butz Senior Vice President, Chief Commercial Services Officer 38 2013 PNC, Waypoint, Sovereign, Graystone Tower, Susquehanna Bank Scott Ehrig, CFP, CIMA Senior Vice President, Chief Investment & Trust Services Officer 30 2020 FMA Advisory, Wilmington Trust, M&T Investment Group, JP Morgan F&M TRUST Franklin Financial Services Corporation 8 Experienced and Cohesive Executive Team Executive Title Years of Banking Experience Joined F&M Trust Prior Experience Louis J. Giustini Senior Vice President, Chief Retail Services Officer 35 2022 Hagerstown Trust, Columbia Bank, Fulton Bank Karen K. Carmack, DM Senior Vice President, Chief Human Resources Officer 28 2000 ACNB Matthew D.
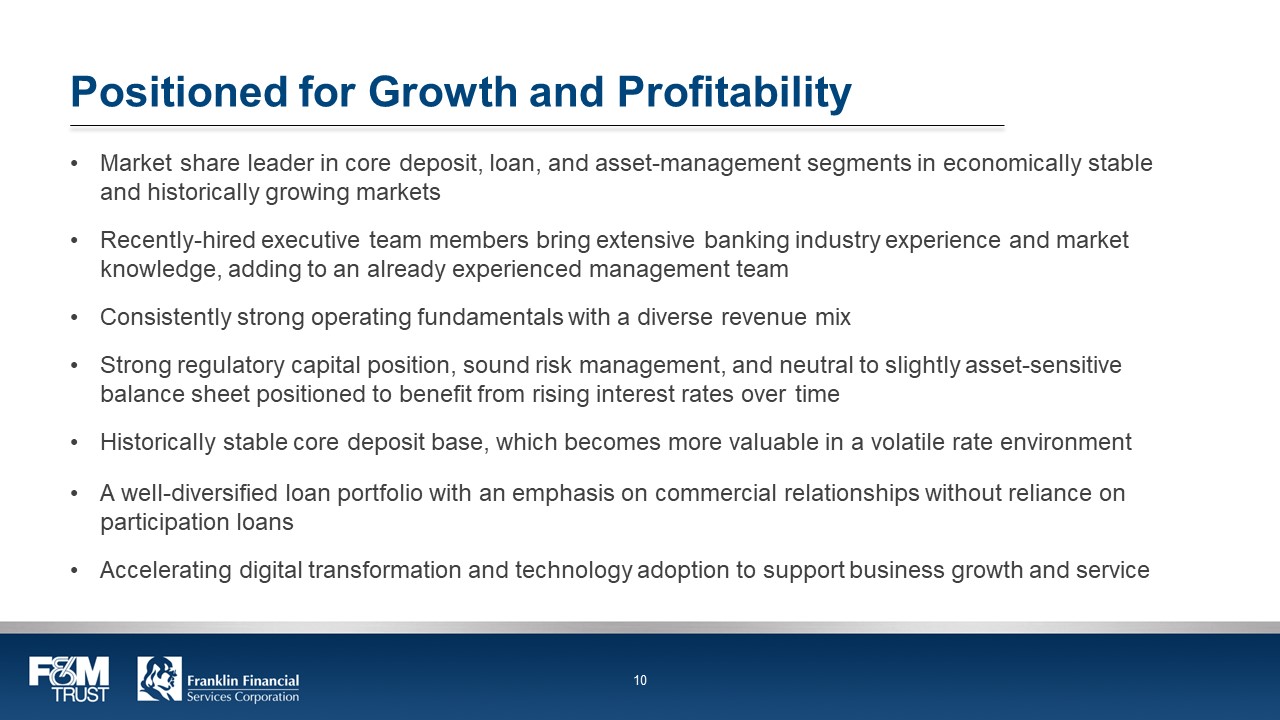
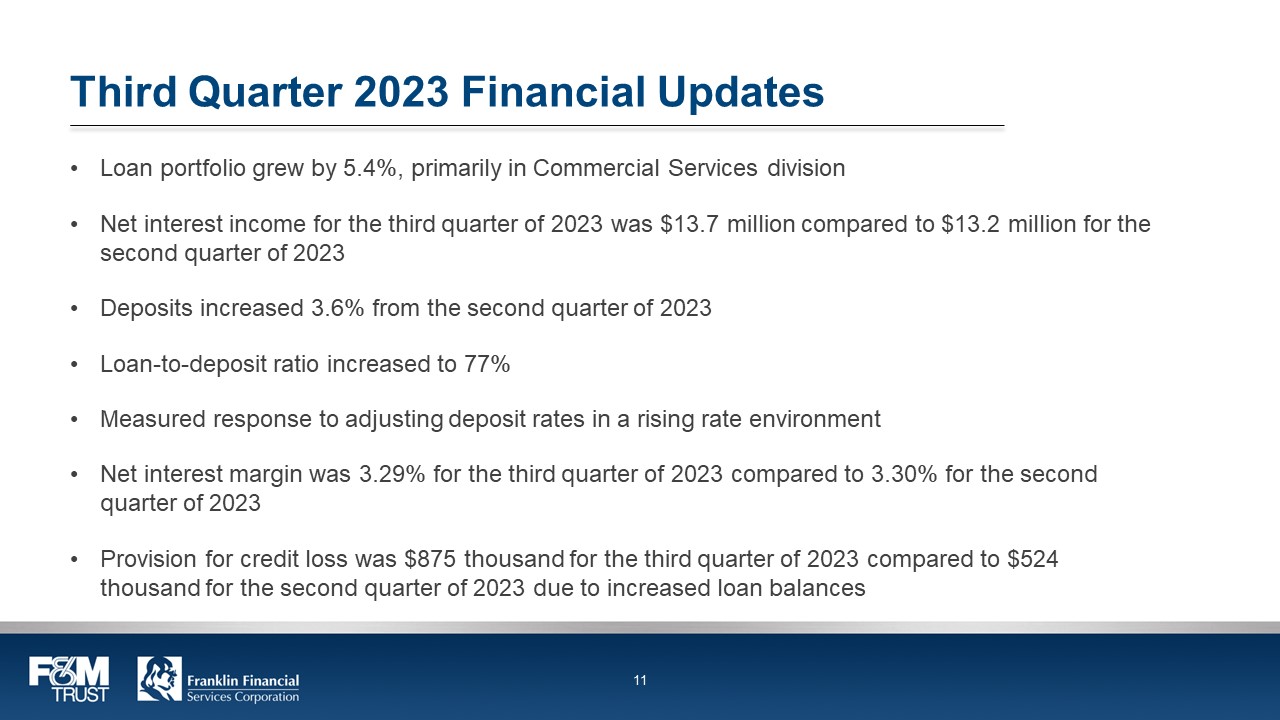
Weaver Senior Vice President, Chief Marketing Officer 23 2014 Susquehanna Bank, Clifton LarsonAllen, IMRE David Long Senior Vice President, Chief Technology Officer 16 2022 Howard Bank F&M TRUST Franklin Financial Services Corporation 9 Positioned for Growth and Profitability Market share leader in core deposit, loan, and asset-management segments in economically stable and historically growing markets Recently-hired executive team members bring extensive banking industry experience and market knowledge, adding to an already experienced management team Consistently strong operating fundamentals with a diverse revenue mix Strong regulatory capital position, sound risk management, and neutral to slightly asset-sensitive balance sheet positioned to benefit from rising interest rates over time Historically stable core deposit base, which becomes more valuable in a volatile rate environment A well-diversified loan portfolio with an emphasis on commercial relationships without reliance on participation loans Accelerating digital transformation and technology adoption to support business growth and service F&M TRUST Franklin Financial Services Corporation 10 Third Quarter 2023 Financial Updates Loan portfolio grew by 5.4%, primarily in Commercial Services division Net interest income for the third quarter of 2023 was $13.7 million compared to $13.2 million for the second quarter of 2023 Deposits increased 3.6% from the second quarter of 2023 Loan-to-deposit ratio increased to 77% Measured response to adjusting deposit rates in a rising rate environment Net interest margin was 3.29% for the third quarter of 2023 compared to 3.30% for the second quarter of 2023 Provision for credit loss was $875 thousand for the third quarter of 2023 compared to $524 thousand for the second quarter of 2023 due to increased loan balances F&M TRUST Franklin Financial Services Corporation 11
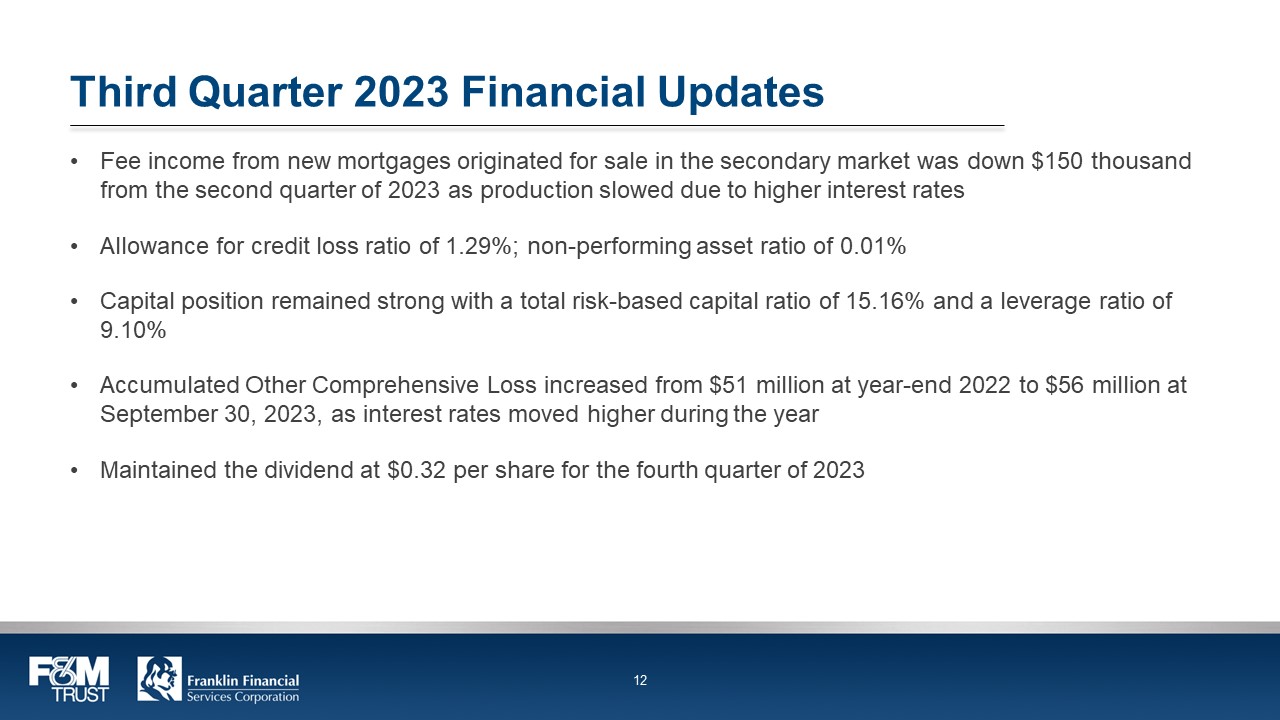
Third Quarter 2023 Financial Updates Fee income from new mortgages originated for sale in the secondary market was down $150 thousand from the second quarter of 2023 as production slowed due to higher interest rates Allowance for credit loss ratio of 1.29%; non-performing asset ratio of 0.01% Capital position remained strong with a total risk-based capital ratio of 15.16% and a leverage ratio of 9.10% Accumulated Other Comprehensive Loss increased from $51 million at year-end 2022 to $56 million at September 30, 2023, as interest rates moved higher during the year Maintained the dividend at $0.32 per share for the fourth quarter of 2023 F&M TRUST Franklin Financial Services Corporation 12 Data-Driven Performance To support the bank’s growth, a Data & Performance Analytics department that includes Manager, Salesforce Administrator, Salesforce Developer, and Business Performance Analyst was created Performance reporting and data analytics will support key business decisions, improve productivity, and uncover optimization opportunities across the bank’s business lines Continued development and increased usage of Salesforce customer relationship management platform will help sales leaders make informed decisions and create more revenue for the bank Sound data collection will provide valuable customer information, allowing for the cross-selling of products and the potential to increase customer wallet share Use of new AI-driven bots completes about 8 hours of manual work weekly for Deposit Operations, and returned time has been reallocated to compliance tasks Early 2024 rollout of Salesforce to Data and Deposit Operations will improve efficiencies across the bank F&M TRUST Franklin Financial Services Corporation 13 Outlook for the Remainder of 2023 The Company will continue building for the future by leveraging our investments in our physical, technological, and sales infrastructure including: Further integration of Salesforce into sales, operations, and marketing Expanding our presence in the Pennsylvania and Maryland markets Expanding the use of digitization in both customer interface and operational workflows to improve efficiencies and decrease costs across the company The focus on cross-selling between Commercial, Retail, and Investment & Trust Services lines of business, to the benefit of the bank’s customers, continues with improvement due to the adoption and use of Salesforce throughout the bank and senior management’s focus on the opportunities available to the company Commercial loan growth will continue due to the integration of new commercial relationship managers, improved underwriting processes, and growth into new regional markets for the bank F&M TRUST Franklin Financial Services Corporation 14
Outlook for the Remainder of 2023 Deposit balances will moderate due to the tension between rising rates and the bank’s efforts to control interest costs and manage liquidity needs Market pressure on deposit rates and competition for high-quality lending relationships may have an adverse effect on NIM The negative effect of the Accumulated Other Comprehensive Income on book capital should decrease as investments move to maturity (average portfolio life is under 5.5 years) Fee income from the Investment & Trust Services division should continue to grow with the addition of new clients / assets and should only be moderated by the general performance of both the bond and equity markets With increased focus on finding operating efficiencies, both internally and with our external third-party vendors, we expect to see an improved efficiency ratio in 2024 F&M TRUST Franklin Financial Services Corporation 15 Summary The Company continues to be well capitalized and positioned to successfully develop new Commercial and Investment & Trust relationships The bank is positioned to fund future growth Asset quality is good, and the Company is well provisioned for losses should they occur in future quarters due to economic factors The Company is actively working to bring more digitally based products and services to its customers The Company is positioning for future growth and expansion following the completed consolidation and move to a new corporate headquarters and operations center, the addition of Salesforce, the additions to senior leadership, and a new full-service community office in Maryland F&M TRUST Franklin Financial Services Corporation 16
Financial Updates Third Quarter Ended September 30, 2023 F&M TRUST Franklin Financial Services Corporation 17 Balance Sheet Highlights Dollars in Thousands (000’s) 9/30/2023 6/30/2023 12/31/2022 9/30/2022 Total Assets $1,827,910 $1,736,165 $1,699,579 $1,847,162 Cash and Cash Equiv.
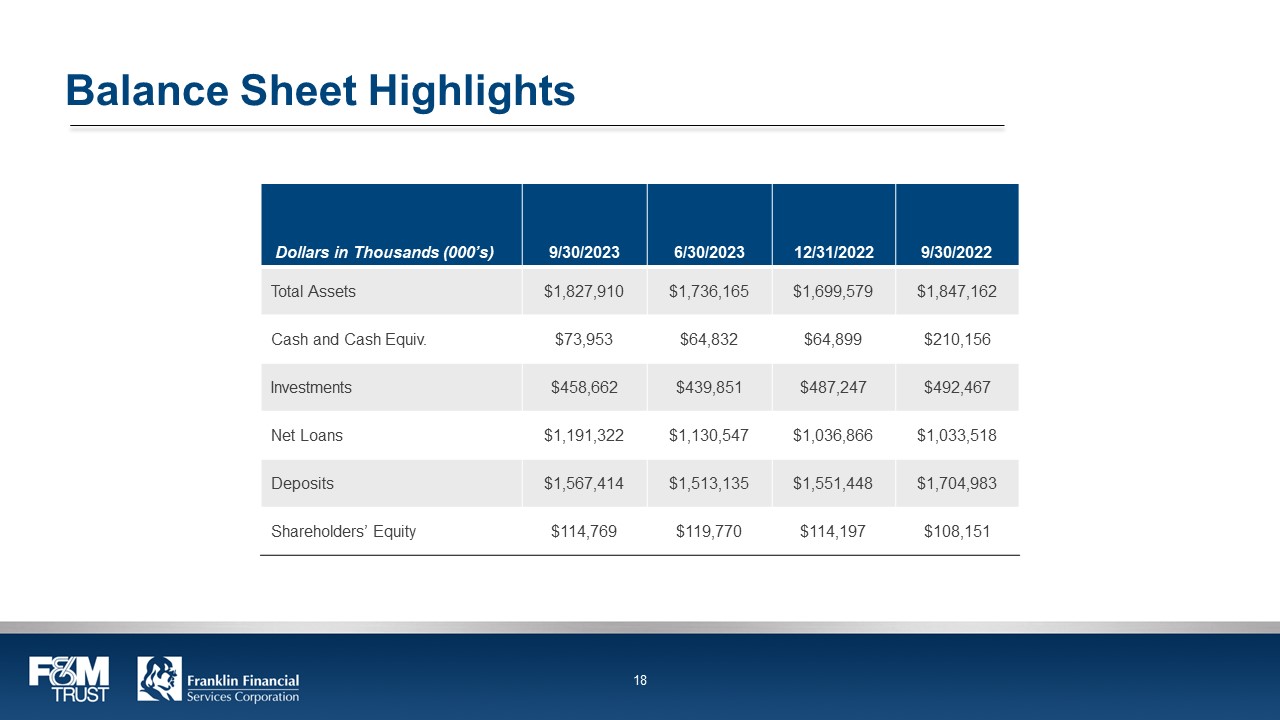
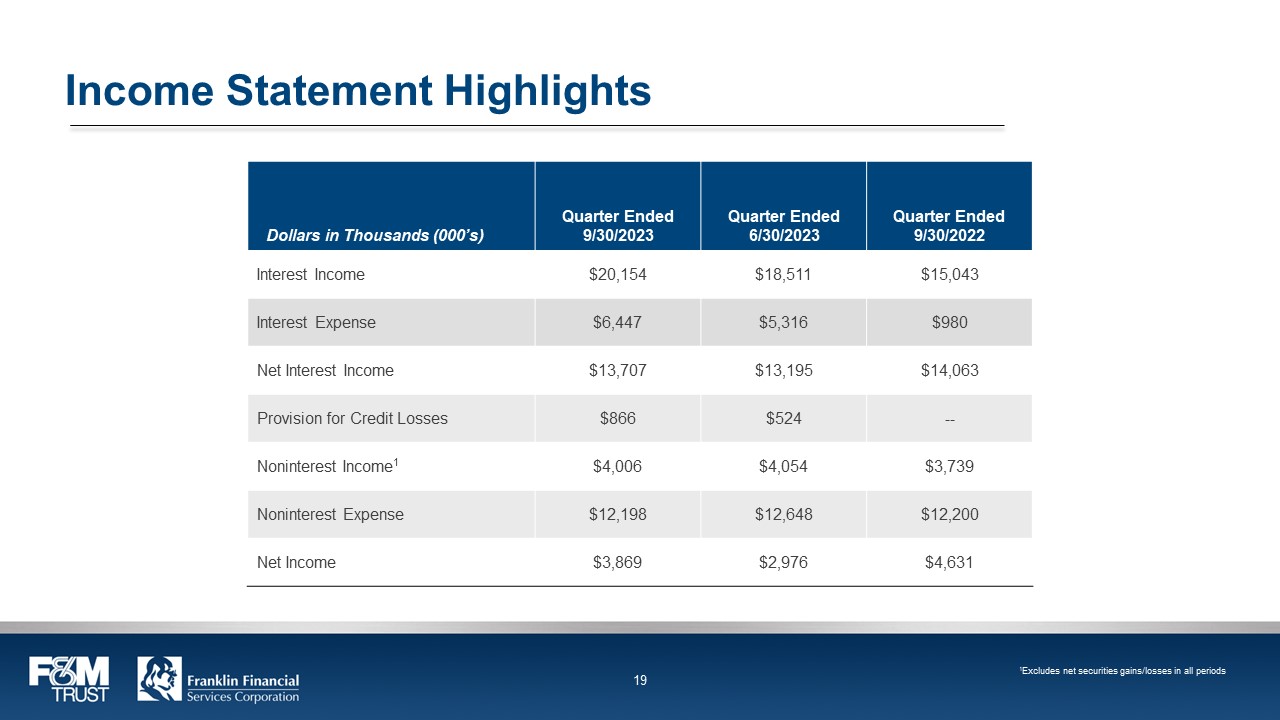
$73,953 $64,832 $64,899 $210,156 Investments $458,662 $439,851 $487,247 $492,467 Net Loans $1,191,322 $1,130,547 $1,036,866 $1,033,518 Deposits $1,567,414 $1,513,135 $1,551,448 $1,704,983 Shareholders’ Equity $114,769 $119,770 $114,197 $108,151 F&M TRUST Franklin Financial Services Corporation 18 Income Statement Highlights Dollars in Thousands (000’s) Quarter Ended 9/30/2023 Quarter Ended 6/30/2023 Quarter Ended 9/30/2022 Interest Income $20,154 $18,511 $15,043 Interest Expense $6,447 $5,316 $980 Net Interest Income $13,707 $13,195 $14,063 Provision for Credit Losses $866 $524 -- Noninterest Income1 $4,006 $4,054 $3,739 Noninterest Expense $12,198 $12,648 $12,200 Net Income $3,869 $2,976 $4,631 F&M TRUST Franklin Financial Services Corporation 19
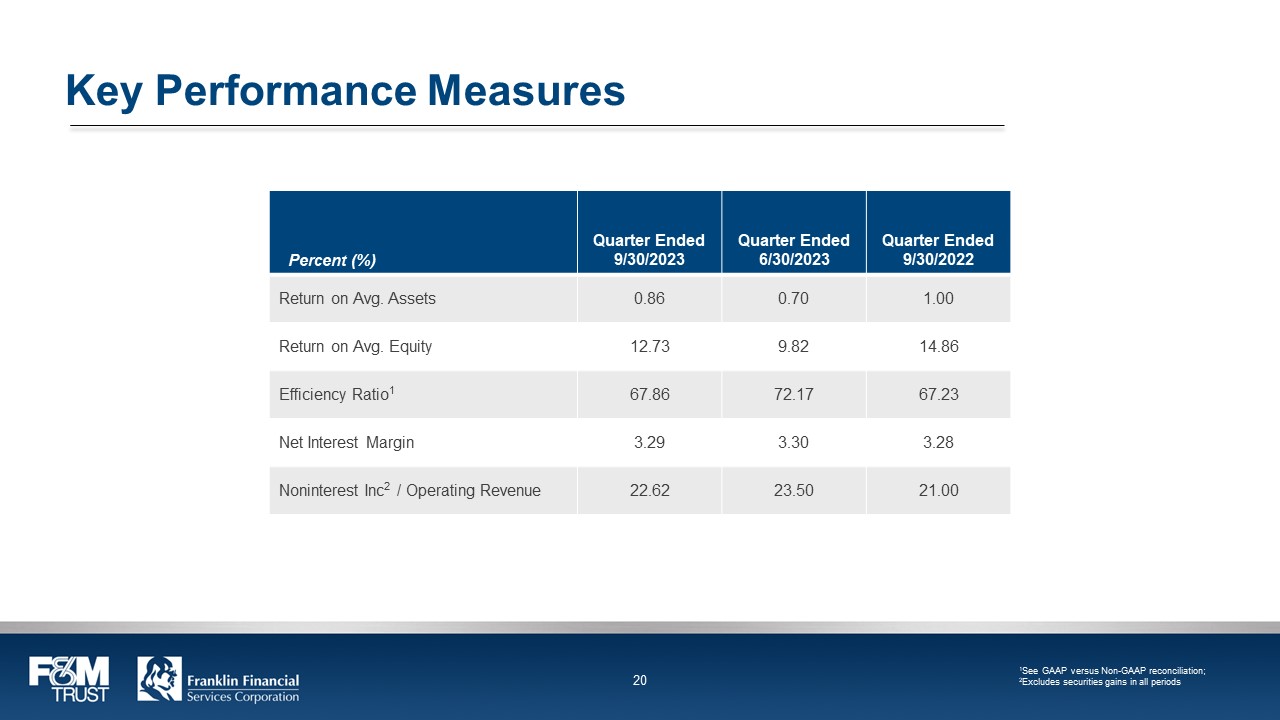
Key Performance Measures Percent (%) Quarter Ended 9/30/2023 Quarter Ended 6/30/2023 Quarter Ended 9/30/2022 Return on Avg. Assets 0.86 0.70 1.00 Return on Avg.
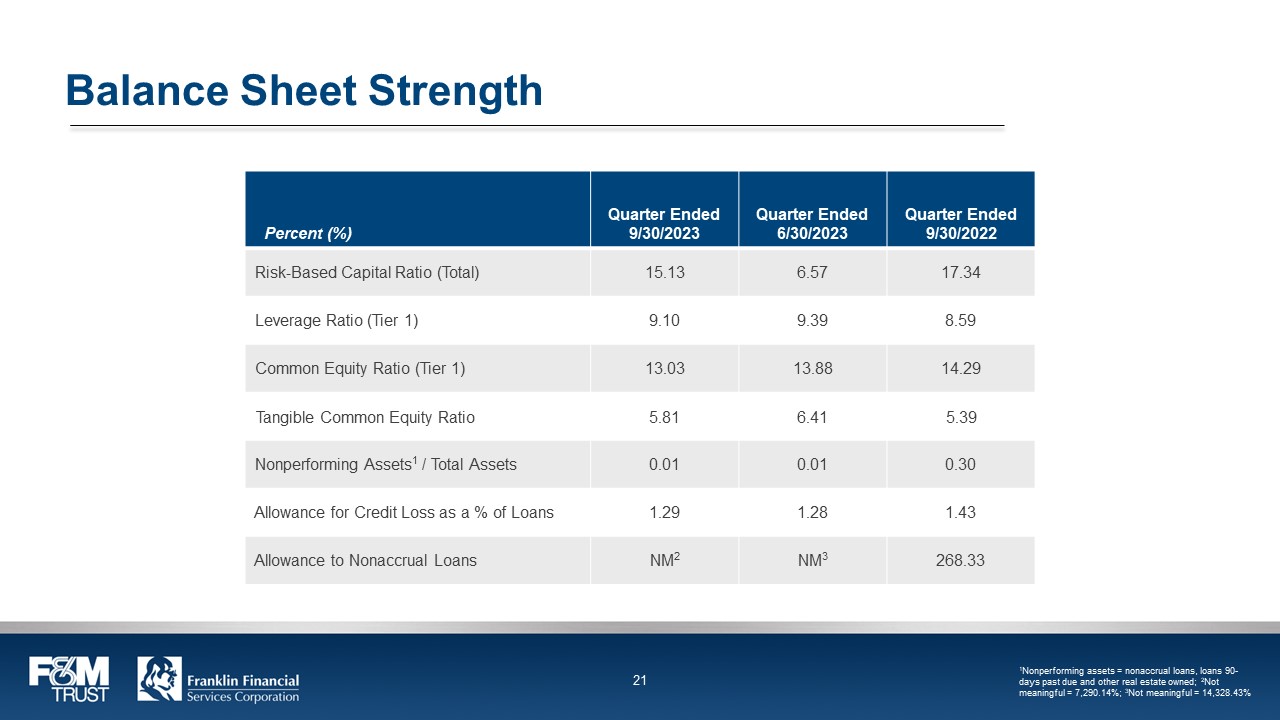
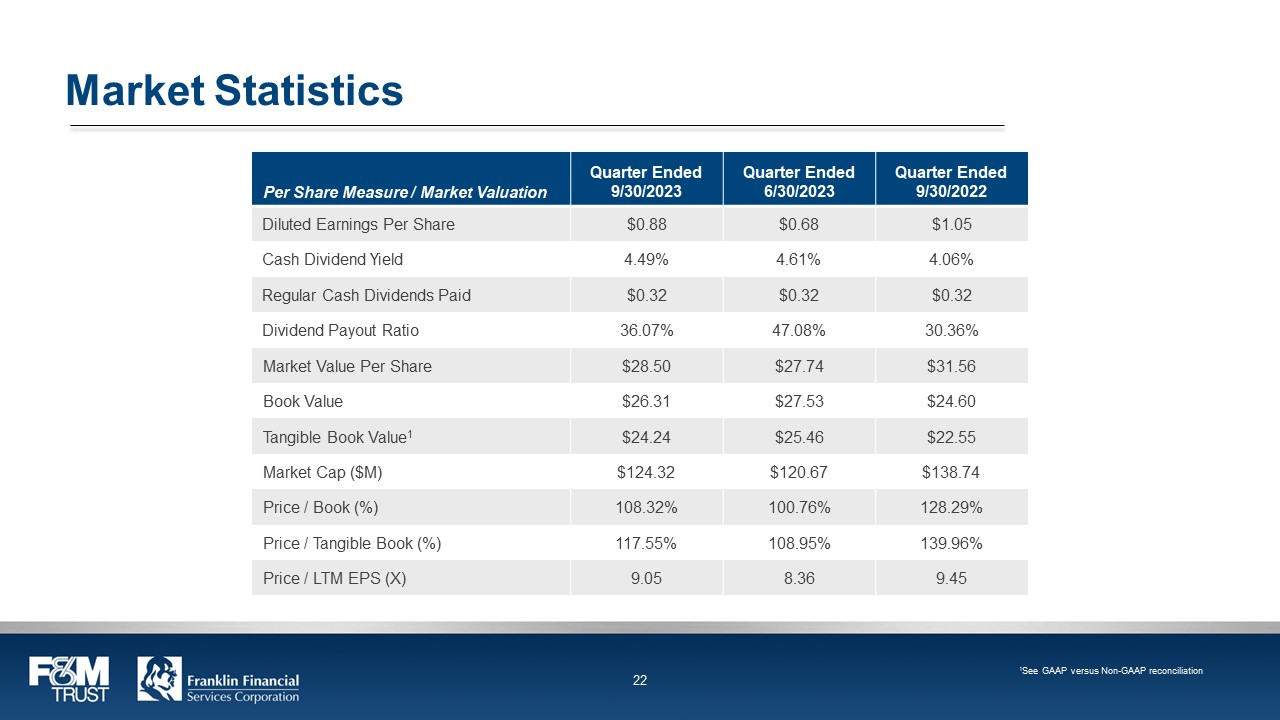
Equity 12.73 9.82 14.86 Efficiency Ratio1 67.86 72.17 67.23 Net Interest Margin 3.29 3.30 3.28 Noninterest Inc2 / Operating Revenue 22.62 23.50 21.00 1See GAAP versus Non-GAAP reconciliation; 2Excludes securities gains in all periods F&M TRUST Franklin Financial Services Corporation 20 Balance Sheet Strength Percent (%) Quarter Ended 9/30/2023 Quarter Ended 6/30/2023 Quarter Ended 9/30/2022 Risk-Based Capital Ratio (Total) 15.13 6.57 17.34 Leverage Ratio (Tier 1) 9.10 9.39 8.59 Common Equity Ratio (Tier 1) 13.03 13.88 14.29 Tangible Common Equity Ratio 5.81 6.41 5.39 Nonperforming Assets1 / Total Assets 0.01 0.01 0.30 Allowance for Credit Loss as a % of Loans 1.29 1.28 1.43 Allowance to Nonaccrual Loans NM2 NM3 268.33 1Nonperforming assets = nonaccrual loans, loans 90-days past due and other real estate owned; 2Not meaningful = 7,290.14%; 3Not meaningful = 14,328.43% F&M TRUST Franklin Financial Services Corporation 21 Market Statistics Per Share Measure / Market Valuation Quarter Ended 9/30/2023 Quarter Ended 6/30/2023 Quarter Ended 9/30/2022 Diluted Earnings Per Share $0.88 $0.68 $1.05 Cash Dividend Yield 4.49% 4.61% 4.06% Regular Cash Dividends Paid $0.32 $0.32 $0.32 Dividend Payout Ratio 36.07% 47.08% 30.36% Market Value Per Share $28.50 $27.74 $31.56 Book Value $26.31 $27.53 $24.60 Tangible Book Value1 $24.24 $25.46 $22.55 Market Cap ($M) $124.32 $120.67 $138.74 Price / Book (%) 108.32% 100.76% 128.29% Price / Tangible Book (%) 117.55% 108.95% 139.96% Price / LTM EPS (X) 9.05 8.36 9.45 1See GAAP versus Non-GAAP reconciliation F&M TRUST Franklin Financial Services Corporation 22
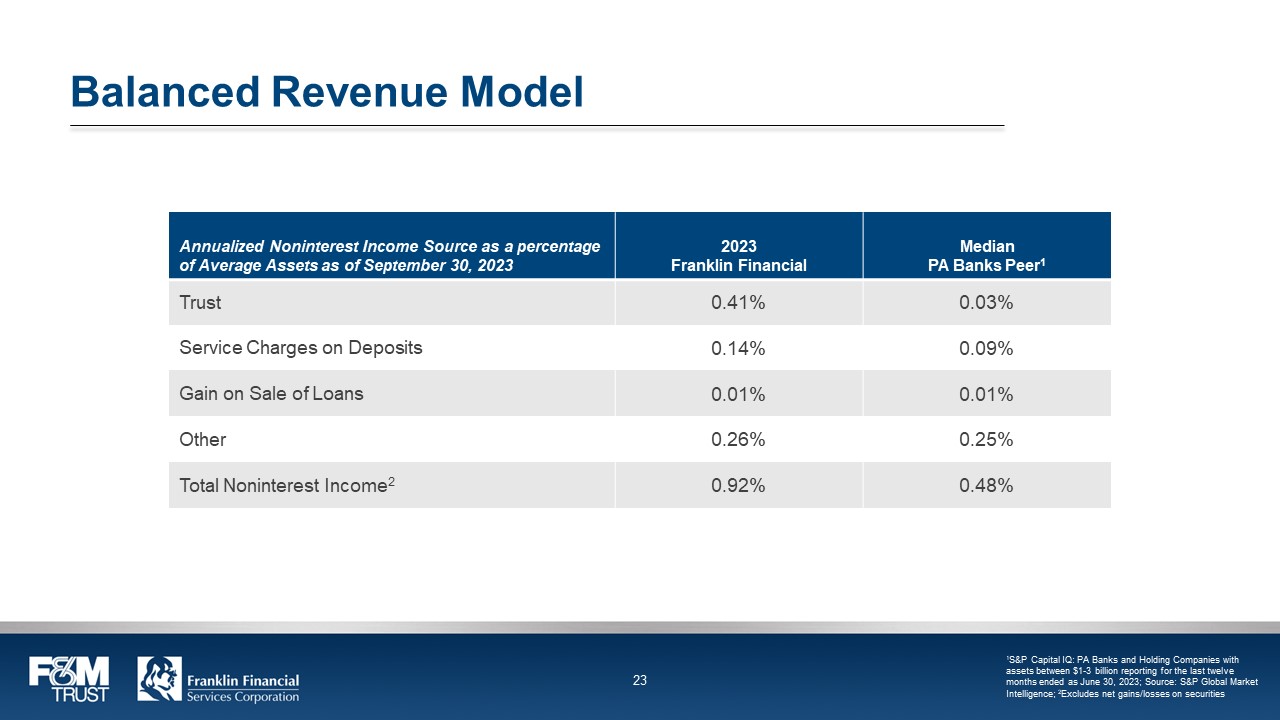
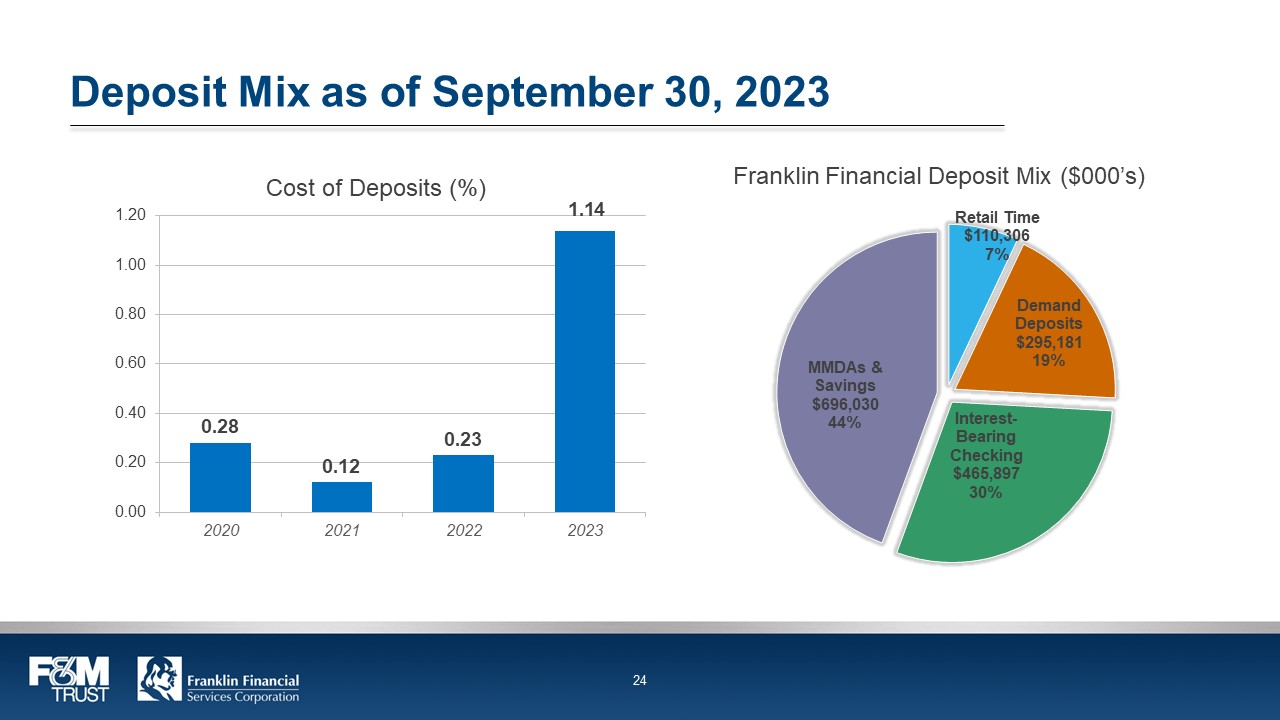
Balanced Revenue Model Annualized Noninterest Income Source as a percentage of Average Assets as of September 30, 2023 2023 Franklin Financial Median PA Banks Peer1 Trust 0.41% 0.03% Service Charges on Deposits 0.14% 0.09% Gain on Sale of Loans 0.01% 0.01% Other 0.26% 0.25% Total Noninterest Income2 0.92% 0.48% 1S&P Capital IQ: PA Banks and Holding Companies with assets between $1-3 billion reporting for the last twelve months ended as June 30, 2023; Source: S&P Global Market Intelligence; 2Excludes net gains/losses on securities F&M TRUST Franklin Financial Services Corporation 23 Deposit Mix as of September 30, 2023 Cost of Deposits (%) 0.28 0.12 0.23 1.14 Franklin Financial Deposit Mix ($000’s) Retail Time $110,306 7% Demand Deposits $295,181 19% Interest- Bearing Checking $465,897 30% MMDAs & Savings $696,030 44% F&M TRUST Franklin Financial Services Corporation 24
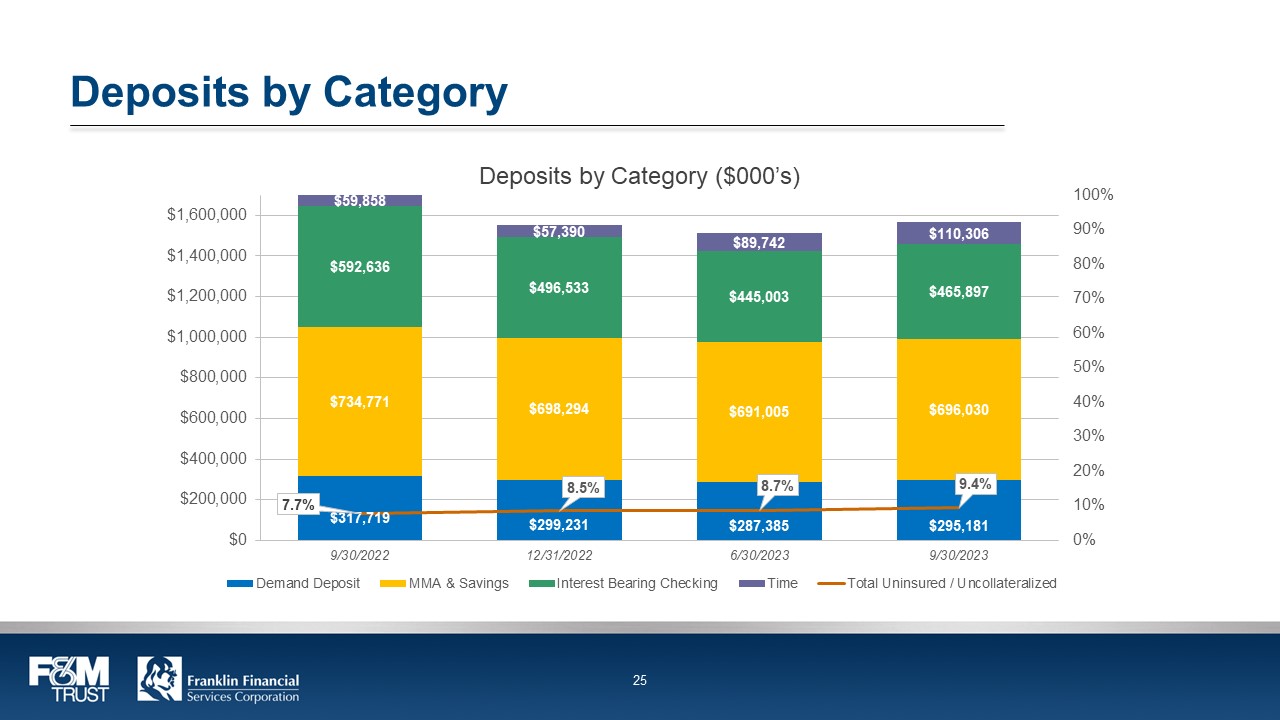
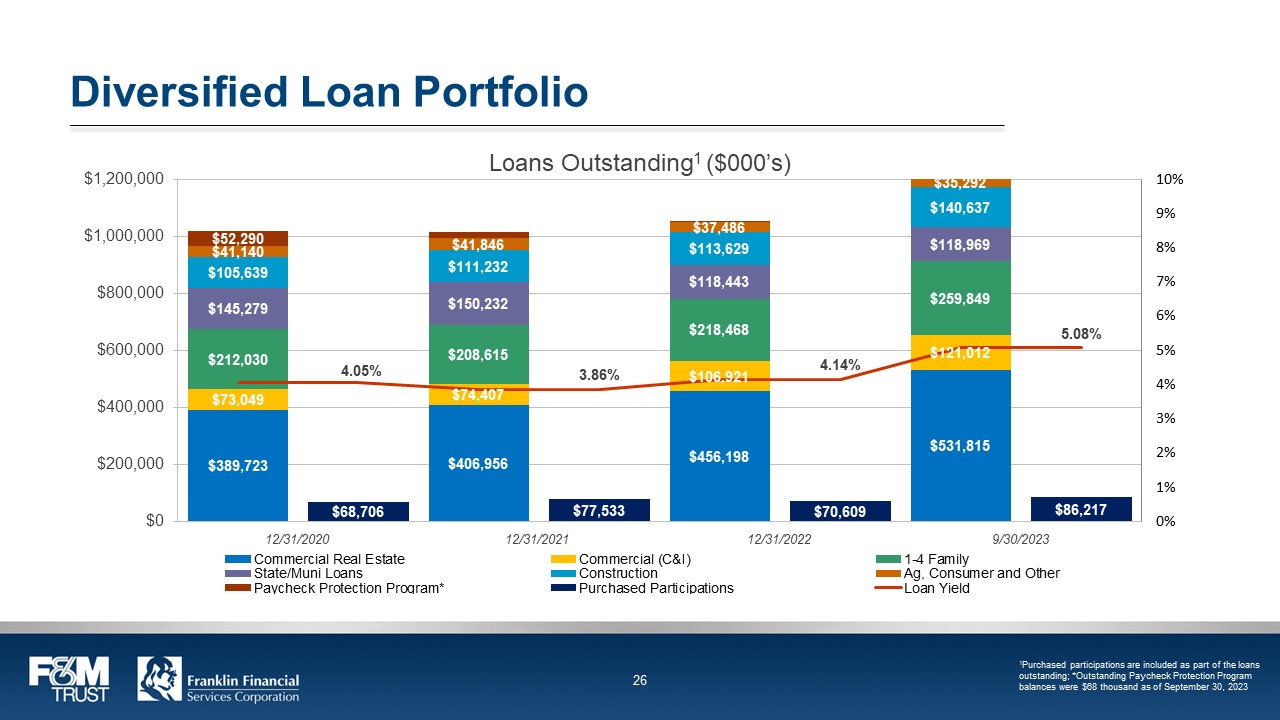
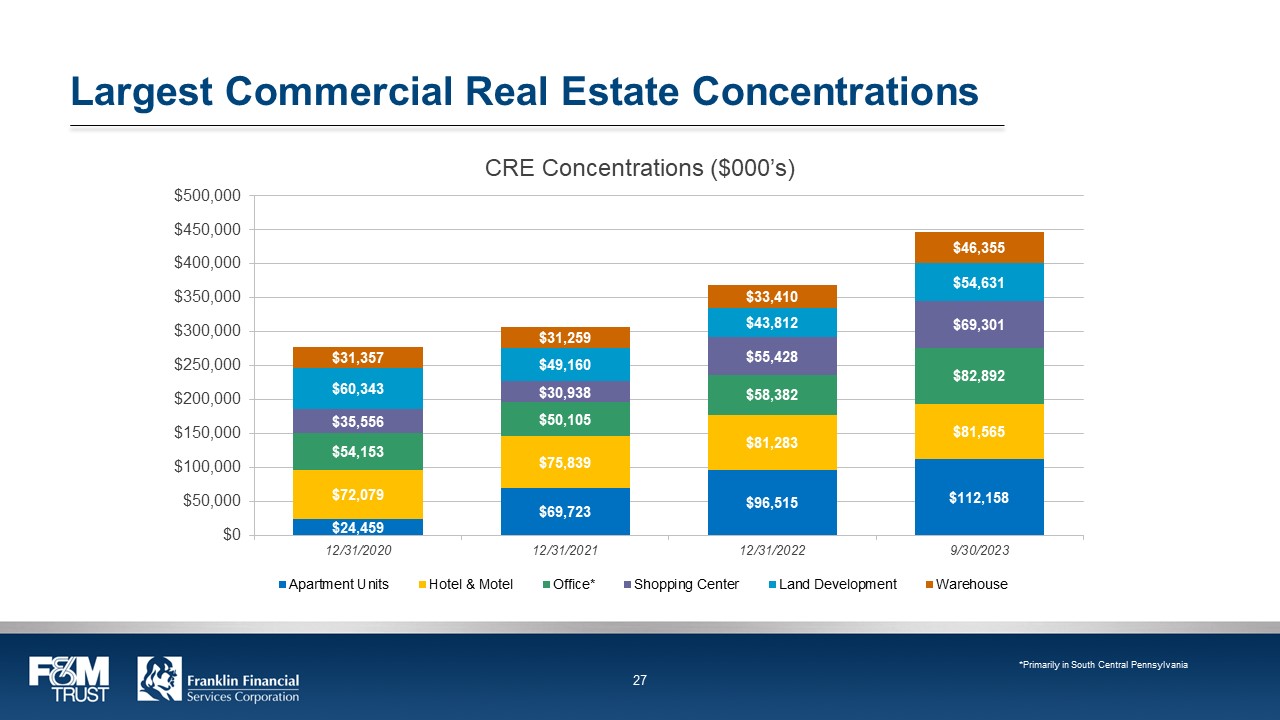
Deposits by Category Deposits by Category ($000’s) $59,858 $57,390 $89,742 $110,306 $592,636 $496,533 $445,003 $465,897 $734,771 $698,294 $691,005 $696,030 7.7% 8.5% 8.7% 9.4% $317,719 $299,231 $287,385 $295,181 Demand Deposit MMA & Savings Interest Bearing Checking Time Total Uninsured / Uncollateralized F&M TRUST Franklin Financial Services Corporation 25 Diversified Loan Portfolio Loans Outstanding1 ($000’s) $52,290 $41,140 $41,846 $37,486 $35,292 $105,639 $111,232 $113,629 $140,637 $145,279 $150,232 $118,443 $118,969 $212,030 $208,615 $218,468 $259,849 $73,049 4.05% $74,407 3.86% $106,921 4.14% $121,012 5.08% $389,723 68706 $406,956 77533 $456,198 70609 $531,815 $86,217 Commercial Real Estate Commercial (C&I) 1-4 Family State/Muni Loans Construction Ag, Consumer and Other Paycheck Protection Program* Purchased Participations Loan Yield 1Purchased participations are included as part of the loans outstanding; *Outstanding Paycheck Protection Program balances were $68 thousand as of September 30, 2023 F&M TRUST Franklin Financial Services Corporation 26 Largest Commercial Real Estate Concentrations CRE Concentrations ($000’s) $31,357 $31,259 $33,410 $46,355 $60,343 $49,160 $43,812 $54,631 $35,556 $30,938 $55,428 $69,301 $54,153 $50,105 $58,382 $82,892 $72,079 $112,158 $75,839 $81,283 $81,565 $24,459 $69,723 $96,515 $72,079 $112,158 Apartment Units Hotel & Motel Office* Shopping Center Land Development Warehouse F&M TRUST Franklin Financial Services Corporation 27
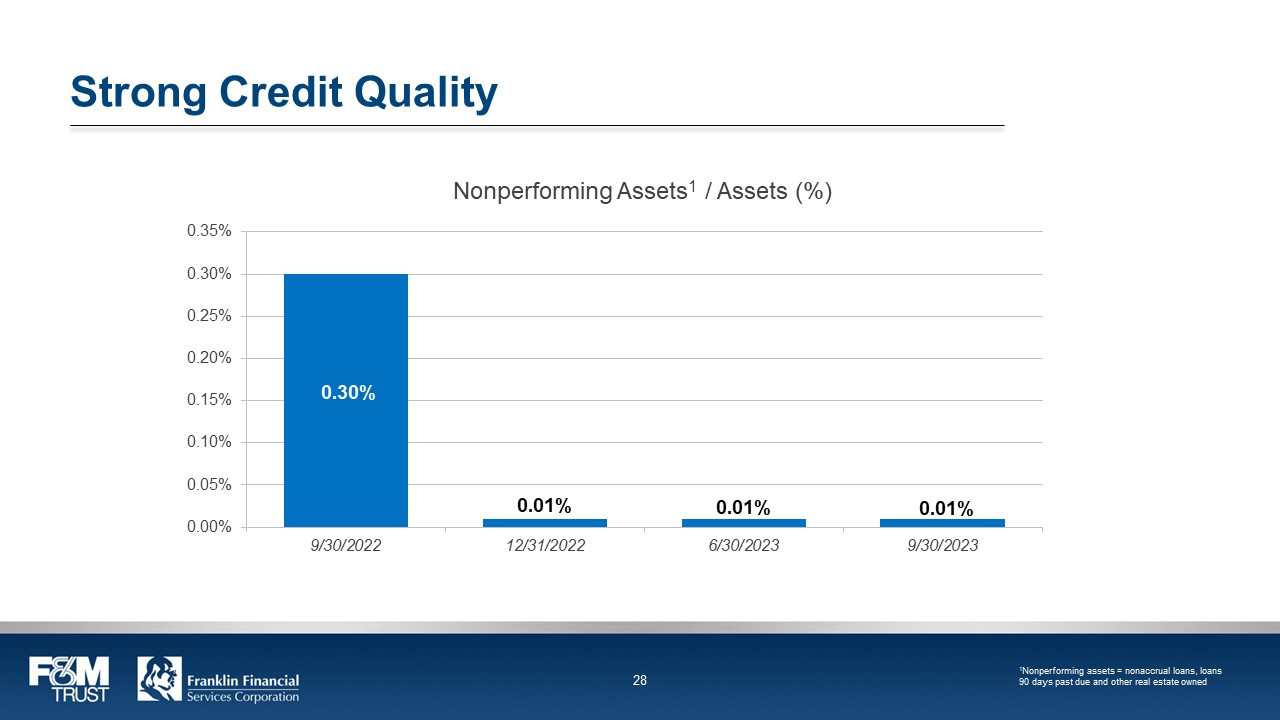
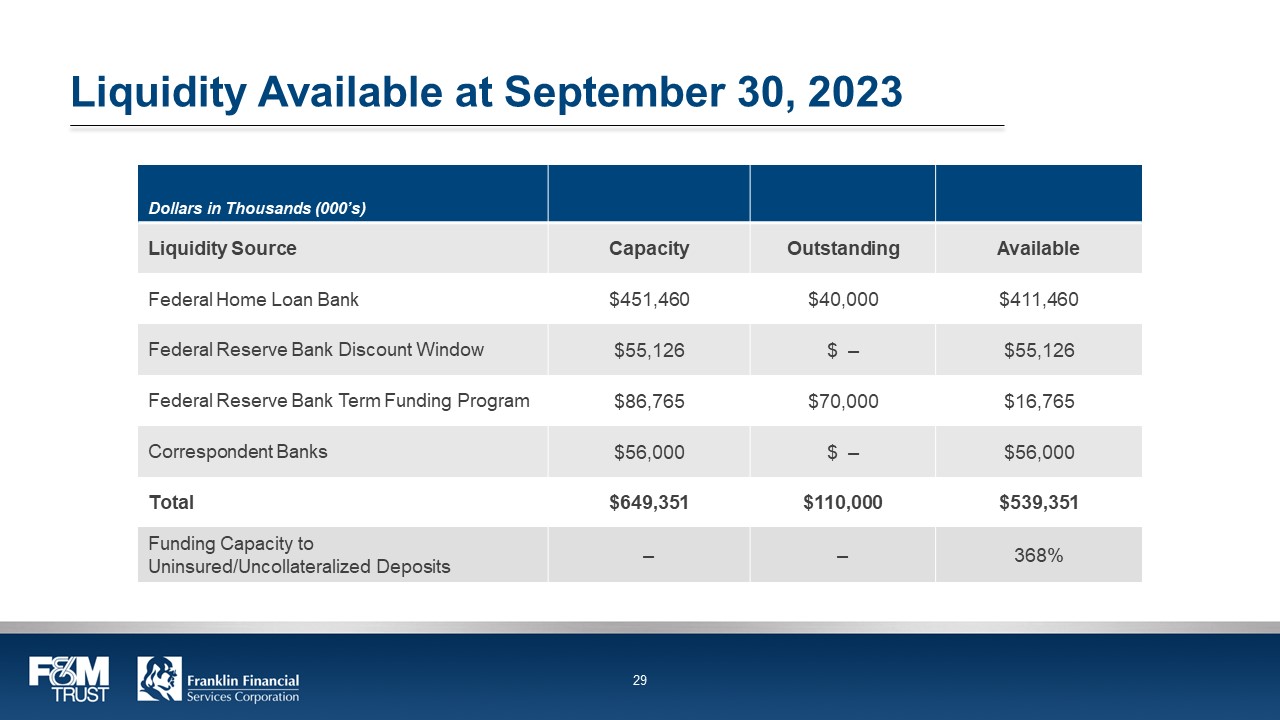
Strong Credit Quality Nonperforming Assets1 / Assets (%) 0.30% 0.01% 0.01% 0.00% 0.05% 0.10% 0.15% 0.20% 0.25% 0.30% 0.35% 9/30/2022 12/31/2022 6/30/2023 9/30/2023 0.01%1Nonperforming assets = nonaccrual loans, loans 90 days past due and other real estate owned F&M TRUST Franklin Financial Services Corporation 28 Liquidity Available at September 30, 2023 Dollars in Thousands (000’s) Liquidity Source Capacity Outstanding Available Federal Home Loan Bank $451,460 $40,000 $411,460 Federal Reserve Bank Discount Window $55,126 $ – $55,126 Federal Reserve Bank Term Funding Program $86,765 $70,000 $16,765 Correspondent Banks $56,000 $ – $56,000 Total $649,351 $110,000 $539,351 Funding Capacity to Uninsured/Uncollateralized Deposits – – 368% F&M TRUST Franklin Financial Services Corporation 29
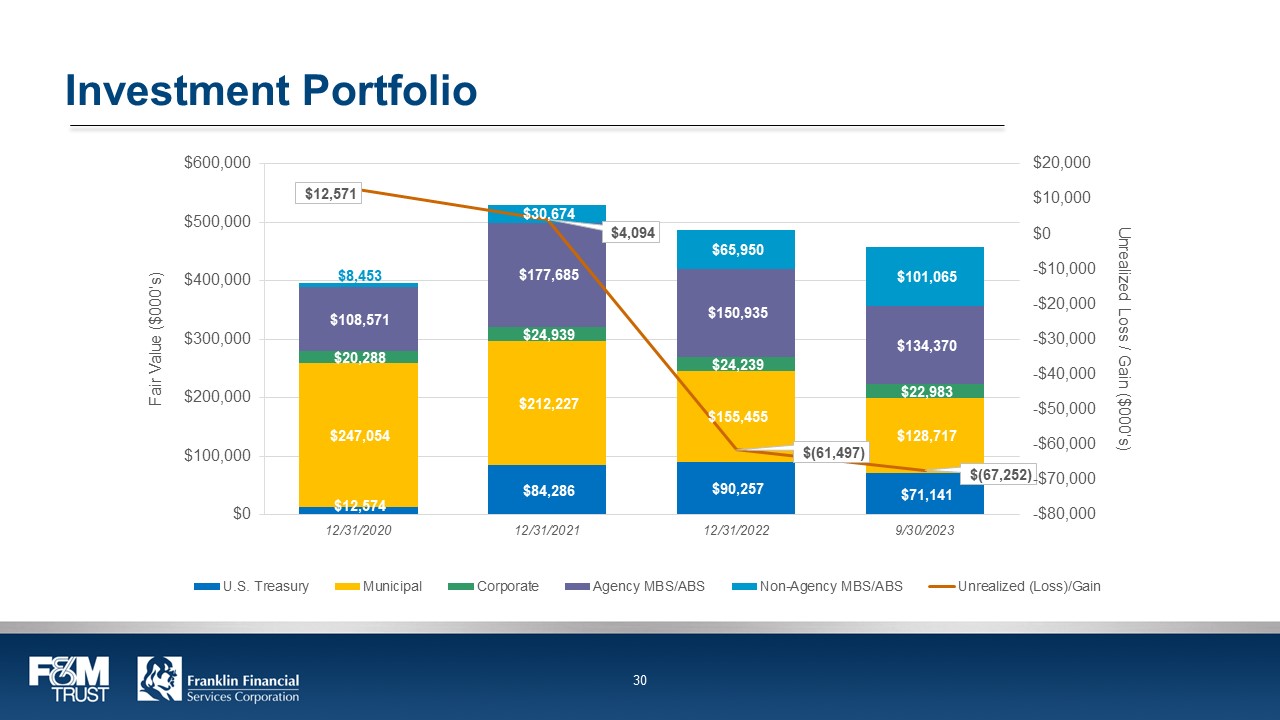
Investment Portfolio 29 $12,574 $84,286 $90,257 $71,141 $247,054 $212,227 $155,455 $128,717 $20,288 $24,939 $24,239 $22,983 $108,571 $177,685 $150,935 $134,370 $8,453 $30,674 $65,950 $101,065 $12,571 $4,094 $(61,497) $(67,252) -$80,000 -$70,000 -$60,000 -$50,000 -$40,000 -$30,000 -$20,000 -$10,000 $0 $10,000 $20,000 $0 $100,000 $200,000 $300,000 $400,000 $500,000 U.S.
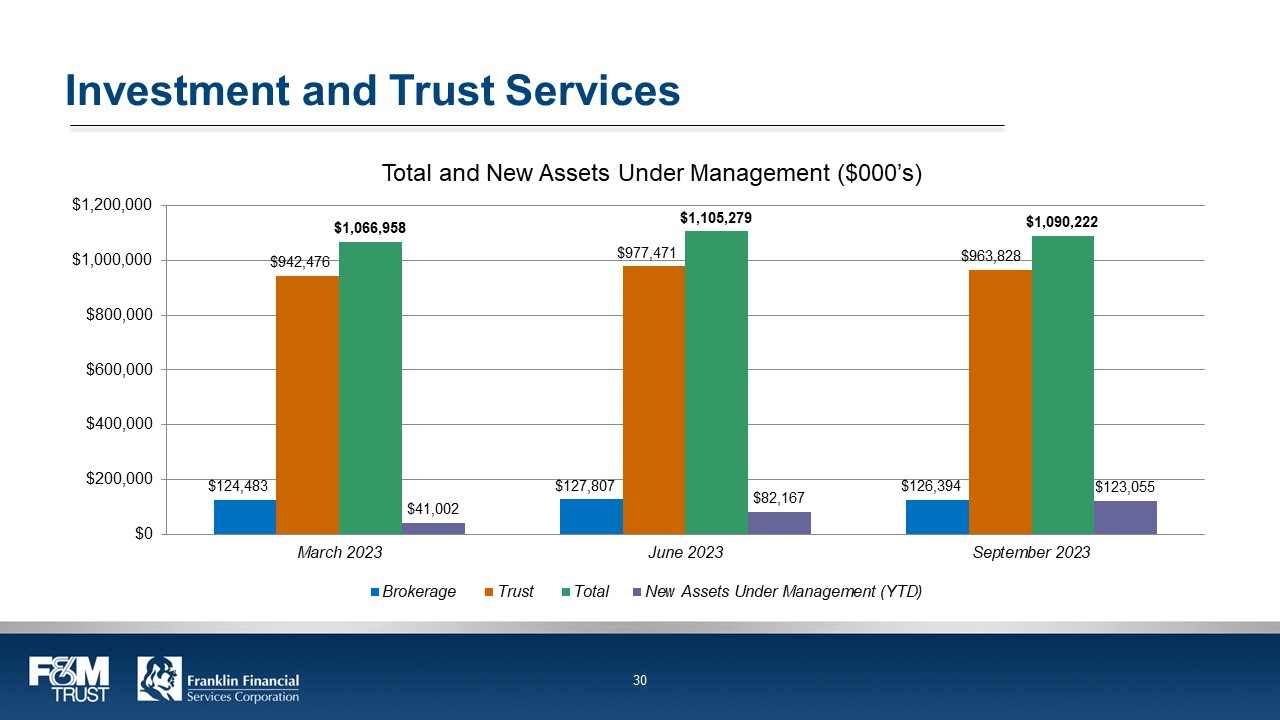
Treasury Municipal Corporate Agency MBS/ABS Non-Agency MBS/ABS Unrealized (Loss)/Gain F&M TRUST Franklin Financial Services Corporation 30 Investment and Trust Services Total and New Assets Under Management ($000’s) $1,200,00 30 $124,483 $127,807 $126,394 $942,476 $977,471 $963,828 $1,066,958 $1,105,279 $1,090,222 $41,002 $82,167 $123,055 $0 $200,000 $400,000 $600,000 $800,000 $1,000,000 Brokerage Trust Total New Assets Under Management (YTD) F&M TRUST Franklin Financial Services Corporation 31 Stock Symbol: FRAF (Nasdaq) www.franklinfin.com www.fmtrust.bank F&M TRUST Franklin Financial Services Corporation 32

Appendix F&M TRUST Franklin Financial Services Corporation 33
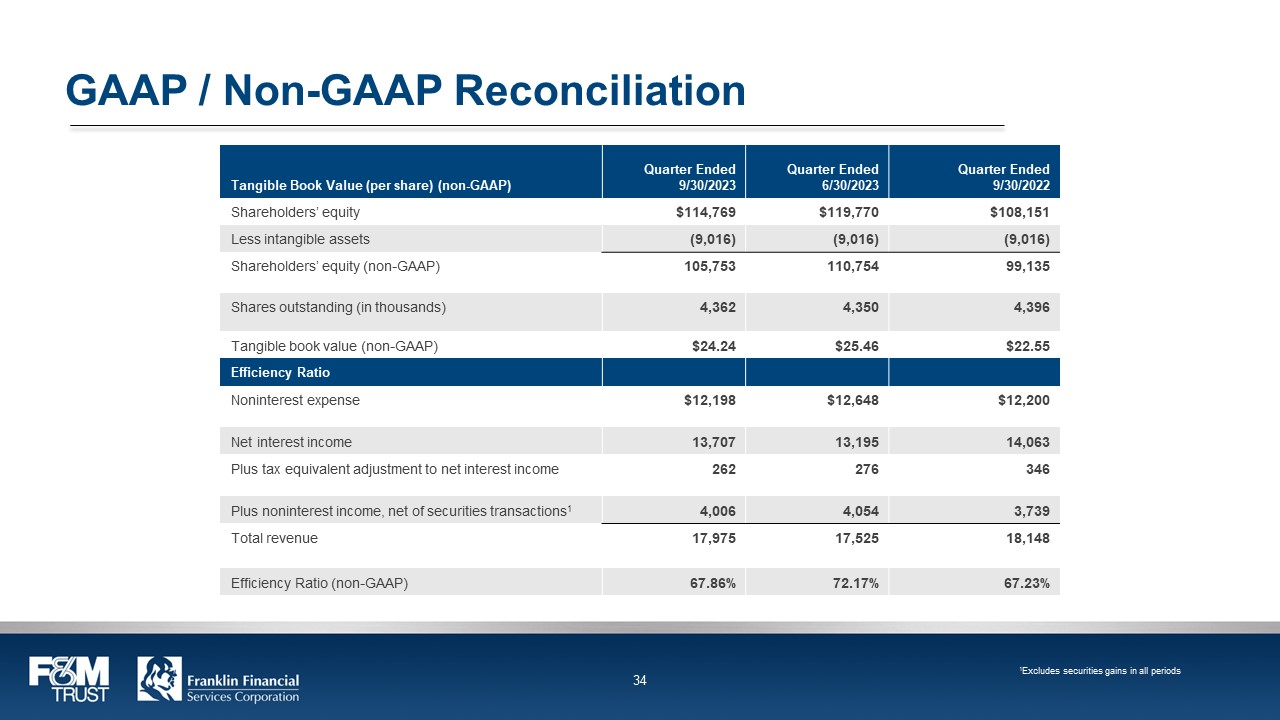
GAAP / Non-GAAP Reconciliation Tangible Book Value (per share) (non-GAAP) Quarter Ended 9/30/2023 Quarter Ended 6/30/2023 Quarter Ended 9/30/2022 Shareholders’ equity $114,769 $119,770 $108,151 Less intangible assets (9,016) (9,016) (9,016) Shareholders’ equity (non-GAAP) 105,753 110,754 99,135 Shares outstanding (in thousands) 4,362 4,350 4,396 Tangible book value (non-GAAP) $24.24 $25.46 $22.55 Efficiency Ratio Noninterest expense $12,198 $12,648 $12,200 Net interest income 13,707 13,195 14,063 Plus tax equivalent adjustment to net interest income 262 276 346 Plus noninterest income, net of securities transactions1 4,006 4,054 3,739 Total revenue 17,975 17,525 18,148 Efficiency Ratio (non-GAAP) 67.86% 72.17% 67.23% 1Excludes securities gains in all periods F&M TRUST Franklin Financial Services Corporation 34