Document
Management's discussion and analysis
Table of contents
Management’s discussion and analysis
In this management’s discussion and analysis (MD&A), we, us, our, BCE and the company mean, as the context may require, either BCE Inc. or, collectively, BCE Inc., Bell Canada, their subsidiaries, joint arrangements and associates. Bell means, as the context may require, either Bell Canada or, collectively, Bell Canada, its subsidiaries, joint arrangements and associates.
All amounts in this MD&A are in millions of Canadian dollars, except where noted. Please refer to section 8, Non-GAAP financial measures, other financial measures and key performance indicators (KPIs) for a list of defined non-GAAP financial measures, other financial measures and KPIs.
Please refer to BCE’s unaudited consolidated financial statements for the third quarter of 2025 (Q3 2025 Financial Statements) when reading this MD&A. We also encourage you to read BCE’s MD&A for the year ended December 31, 2024 dated March 6, 2025 (BCE 2024 Annual MD&A) as updated in BCE's MD&A for the first quarter of 2025 dated May 7, 2025 (BCE 2025 First Quarter MD&A), BCE's MD&A for the second quarter of 2025 dated August 6, 2025 (BCE 2025 Second Quarter MD&A) and BCE’s news release dated August 7, 2025, which contains an update to our 2025 financial guidance targets originally provided on February 6, 2025 to incorporate the impact of the acquisition of Northwest Fiber Holdco, LLC (doing business as Ziply Fiber (Ziply Fiber)) (BCE 2025 Second Quarter News Release). In preparing this MD&A, we have taken into account information available to us up to November 5, 2025, the date of this MD&A, unless otherwise stated.
You will find additional information relating to BCE, including BCE’s annual information form for the year ended December 31, 2024 dated March 6, 2025 (BCE 2024 AIF) and recent financial reports, including the BCE 2024 Annual MD&A, the BCE 2025 First Quarter MD&A, the BCE 2025 Second Quarter MD&A and the BCE 2025 Second Quarter News Release on BCE’s website at BCE.ca, on SEDAR+ at sedarplus.ca and on EDGAR at sec.gov.
Documents and other information contained in BCE’s website including, without limitation, the BCE 2025 Third Quarter News Release, or in any other site referred to in BCE’s website or in this MD&A are not part of this MD&A and are not incorporated by reference herein unless explicitly stated.
This MD&A comments on our business operations, performance, financial position and other matters for the three months (Q3) and nine months (YTD) ended September 30, 2025 and 2024.
Caution regarding forward-looking statements
This MD&A and, in particular, but without limitation, section 1.2, Key corporate and business developments, section 3.1, Bell CTS, the section and sub-sections entitled Assumptions and section 4.7, Liquidity, contain forward-looking statements. These forward-looking statements include, without limitation, statements relating to: BCE’s three-year strategic plan to deliver sustainable free cash flow growth and long-term shareholder value; potential future purchases by BCE of its preferred shares pursuant to a normal course issuer bid (NCIB); the proposed disposition of Northwestel Inc. (Northwestel); Bell Canada’s plan to deploy low Earth orbit direct-to-cell services in 2026 and the benefits expected to result therefrom; the sources of liquidity we expect to use to meet our 2025 cash requirements; BCE's annualized common share dividend; BCE's common share dividend payout policy target; and BCE’s business outlook, objectives, plans and strategic priorities, and other statements that do not refer to historical facts. A statement we make is forward-looking when it uses what we know and expect today to make a statement about the future. Forward-looking statements are typically identified by the words assumption, goal, guidance, objective, outlook, project, strategy, target, commitment and other similar expressions or future or conditional verbs such as aim, anticipate, believe, could, expect, intend, may, plan, seek, should, strive and will. All such forward-looking statements are made pursuant to the safe harbour provisions of applicable Canadian securities laws and of the United States (U.S.) Private Securities Litigation Reform Act of 1995.
Unless otherwise indicated by us, forward-looking statements in this MD&A describe our expectations as at November 5, 2025 and, accordingly, are subject to change after that date. Except as may be required by applicable securities laws, we do not undertake any obligation to update or revise any forward-looking statements, whether as a result of new information, future events or otherwise.
Forward-looking statements, by their very nature, are subject to inherent risks and uncertainties and are based on several assumptions, both general and specific, which give rise to the possibility that actual results or events could differ materially from our expectations expressed in, or implied by, such forward-looking statements and that our business outlook, objectives, plans and strategic priorities may not be achieved. These statements are not guarantees of future performance or events, and we caution you against relying on any of these forward-looking statements. Forward-looking statements are presented in this MD&A for the purpose of assisting investors and others in understanding our objectives, strategic priorities and business outlook as well as our anticipated operating environment. Readers are cautioned, however, that such information may not be appropriate for other purposes.
We have made certain economic, market, operational and other assumptions in preparing the forward-looking statements contained in this MD&A and, in particular, but without limitation, the forward-looking statements contained in the previously mentioned sections of this MD&A. These assumptions include, without limitation, the assumptions described in the section and sub-sections of this MD&A entitled Assumptions, which section and sub-sections are incorporated by reference in this
4 BCE Inc. 2025 THIRD QUARTER SHAREHOLDER REPORT
cautionary statement. Subject to various factors, we believe that our assumptions were reasonable at November 5, 2025. If our assumptions turn out to be inaccurate, our actual results could be materially different from what we expect.
Important risk factors that could cause actual results or events to differ materially from those expressed in, or implied by, the previously-mentioned forward-looking statements and other forward-looking statements contained in this MD&A, include, but are not limited to: the negative effect of adverse economic conditions, including from trade tariffs and other protective government measures, including the imposition of U.S. tariffs on imports from Canada and retaliatory tariffs by the Canadian government on goods coming from the U.S., recessions, inflation, reductions in immigration levels, high housing support costs relative to income, and financial and capital market volatility, and the resulting negative impact on customer spending and the demand for our products and services, higher costs and supply chain disruptions; the negative effect of adverse conditions associated with geopolitical events; the intensity of competitive activity and the failure to effectively respond to evolving competitive dynamics; the level of technological substitution and the presence of alternative service providers contributing to disruptions and disintermediation in each of our business segments; changing customer behaviour and the expansion of cloud-based, over-the-top (OTT) and other alternative solutions; advertising market pressures from economic conditions, fragmentation and non-traditional/global digital services; rising content costs and challenges in our ability to acquire or develop key content; high Canadian Internet and smartphone penetration; regulatory initiatives, proceedings and decisions, government consultations and government positions that negatively affect us and influence our business including, without limitation, concerning mandatory access to networks, spectrum auctions, the imposition of consumer-related codes of conduct, approval of acquisitions, broadcast and spectrum licensing, foreign ownership requirements, privacy and cybersecurity obligations and control of copyright piracy; the inability to implement enhanced compliance frameworks and to comply with legal and regulatory obligations; unfavourable resolution of legal proceedings; the failure to evolve and transform our networks, systems and operations using next-generation technologies while lowering our cost structure, including the failure to meet customer expectations of product and service experience; the inability to drive a positive customer experience; the inability to protect our physical and non-physical assets from events such as information security attacks, unauthorized access or entry, fire and natural disasters; the failure to implement an effective security and data governance framework; the risk that we may need to incur significant capital expenditures to provide additional capacity and reduce network congestion; service interruptions or outages due to network failures or slowdowns; events affecting the functionality of, and our ability to protect, test, maintain, replace and upgrade, our networks, information technology (IT) systems, equipment and other facilities; the failure by other telecommunications carriers on which we rely to provide services to complete planned and sufficient testing, maintenance, replacement or upgrade of their networks, equipment and other facilities, which could disrupt our operations including through network or other infrastructure failures; the complexity of our operations and IT systems and the failure to implement, maintain or manage highly effective processes and IT systems; in-orbit and other operational risks to which the satellites used to provide our satellite television (TV) services are subject; the failure to attract, develop and retain a talented team capable of furthering our strategic imperatives and operational transformation; the potential deterioration in employee morale and engagement resulting from staff reductions, cost reductions or reorganizations and the de-prioritization of transformation initiatives due to staff reductions, cost reductions or reorganizations; the failure to adequately manage health and safety concerns; labour disruptions and shortages; the inability to access adequate sources of capital and generate sufficient cash flows from operating activities to meet our cash requirements, fund capital expenditures and provide for planned growth; uncertainty as to whether our dividend payout policy will be maintained or achieved, or that the dividend on common shares will be maintained or dividends on any of BCE’s outstanding shares will be declared by BCE’s board of directors (the Board); the failure to reduce costs and adequately assess investment priorities, as well as unexpected increases in costs; the inability to manage various credit, liquidity and market risks; the failure to evolve practices to effectively monitor and control fraudulent activities; new or higher taxes due to new tax laws or changes thereto or in the interpretation thereof, and the inability to predict the outcome of government audits; the impact on our financial statements and estimates from a number of factors; pension obligation volatility and increased contributions to post-employment benefit plans; the expected timing and completion of the proposed disposition of Northwestel are subject to closing conditions, termination rights and other risks and uncertainties, including, without limitation, the purchaser securing financing, which may affect its completion, terms or timing and, as such, there can be no assurance that the proposed disposition will occur, or that it will occur on the terms and conditions, or at the time, currently contemplated, or that the potential benefits expected to result from the proposed disposition will be realized; there can be no assurance that the potential benefits expected to result from the formation of Network FiberCo will be realized; reputational risks and the inability to meaningfully integrate environmental, social and governance (ESG) considerations into our business strategy, operations and governance; the adverse impact of various internal and external factors on our ability to achieve our ESG targets including, without limitation, those related to greenhouse gas (GHG) reduction and supplier engagement; the failure to take appropriate actions to adapt to current and emerging environmental impacts, including climate change; the failure to develop and implement sufficient corporate governance practices; the inability to adequately manage social issues; health risks, including pandemics, epidemics and other health concerns, such as radio frequency emissions from wireless communications devices and equipment; our dependence on third-party suppliers, outsourcers and consultants to provide an uninterrupted supply of the products and services we need; the failure of our vendor selection, governance and oversight processes, including our management of supplier risk in the areas of security, data governance and responsible procurement; the quality of our products and services and the extent to which they may be subject to defects or fail to comply with applicable government regulations and standards; the failure to successfully expand Ziply Fiber’s fibre network and optimize its existing copper network; the inability of Ziply Fiber’s current and future initiatives or programs to generate the level of returns, or to occur on the timeline, we anticipate; the intensity of competitive activity in Ziply Fiber’s services market in the U.S., and the failure to effectively respond to fragmented and rapidly evolving competitive dynamics; the failure to successfully integrate Ziply Fiber as a subsidiary of BCE, and to generate the anticipated benefits from the acquisition of Ziply Fiber; the failure to accurately anticipate fluctuations in the exchange rate between the Canadian dollar and U.S. dollar and our inability to successfully implement currency hedging strategies; Ziply Fiber is subject to significant regulation in the U.S. which may reduce the amount of subsidies or revenues it receives, increase its compliance burdens or constrain its ability to compete; the failure to comply with the non-U.S. ownership rules and our regulatory obligations imposed by the Federal Communications Commission (FCC); changes to tax legislation in the U.S., Canada, or other relevant jurisdictions, or to its interpretation or enforcement, may affect Ziply Fiber’s income tax position, as well as our effective tax rate and the after-tax returns we derive from Ziply Fiber’s U.S. operations.
We caution that the foregoing list of risk factors is not exhaustive and other factors could also materially adversely affect us. Please see section 9, Business risks of the BCE 2024 Annual MD&A for a more complete description of the above-mentioned and other risks, which section, and the other sections of the BCE 2024 Annual MD&A referred to therein, are incorporated by reference in this cautionary statement. Please also see section 6, Regulatory environment in the BCE 2025 First Quarter MD&A, in the BCE 2025 Second Quarter MD&A and in this MD&A for an update to the regulatory initiatives and proceedings described in the BCE 2024 Annual MD&A, which sections 6 are incorporated by reference in this cautionary statement. Please also see section 7, Business risks in the BCE 2025 Second Quarter MD&A for a description of the risk factors relating to Ziply Fiber, which section 7 is incorporated by reference in this cautionary statement. Any of those risks could cause actual results or events to differ materially from our expectations expressed in, or implied by, the forward-looking statements set out in this MD&A. Except for the updates set out in section 6, Regulatory environment in the BCE 2025 First Quarter MD&A, in the BCE 2025 Second Quarter MD&A and in this MD&A, as well as in section 7, Business risks in the BCE 2025 Second Quarter MD&A, the risks described in the BCE 2024 Annual MD&A remain substantially unchanged.
Additional risks and uncertainties not currently known to us or that we currently deem to be immaterial may also have a material adverse effect on our business, financial condition, liquidity, financial results or reputation. We regularly consider potential acquisitions, dispositions, mergers, business combinations, investments, monetizations, joint ventures and other transactions, some of which may be significant. Except as otherwise indicated by us, forward-looking statements do not reflect the potential impact of any such transactions or of special items that may be announced or that may occur after November 5, 2025. The financial impact of these transactions and special items can be complex and depends on facts particular to each of them. We therefore cannot describe the expected impact in a meaningful way, or in the same way we present known risks affecting our business.
6 BCE Inc. 2025 THIRD QUARTER SHAREHOLDER REPORT
1 Overview
BCE Q3 2025 selected quarterly information
|
|
|
|
|
|
|
|
|
|
|
|
|
|
|
|
|
|
|
| Operating revenues |
Net earnings (loss) |
Adjusted EBITDA(1) |
|
| $6,049 |
$4,555 |
$2,762 |
|
| million |
million |
million |
|
+1.3% vs. Q3 2024 |
vs. ($1,191) million in Q3 2024 |
+1.5% vs. Q3 2024 |
|
|
|
|
|
|
|
|
|
|
|
|
|
|
|
| Net earnings (loss) attributable to common shareholders |
Adjusted net earnings(1) |
Cash flows from operating activities |
Free cash flow(1) |
|
| $4,502 |
$733 |
$1,914 |
$1,003 |
|
| million |
million |
million |
million |
|
vs. ($1,237) million in Q3 2024 |
+6.5% vs. Q3 2024 |
+3.9% vs. Q3 2024 |
+20.6% vs. Q3 2024 |
|
|
|
|
|
|
|
|
|
|
|
|
|
Total mobile phones(2)(5)(6) |
Bell CTS retail high-speed Internet(3)(4)(6) |
Bell CTS retail Internet protocol television (IPTV)(3)(4)(7) |
Bell CTS retail residential network access services (NAS) lines(3)(4) |
| +0.4% |
+9.7% |
(2.0%) |
(5.9%) |
|
10.4 million subscribers
at September 30, 2025
|
4.9 million subscribers
at September 30, 2025
|
2.1 million subscribers
at September 30, 2025
|
1.8 million subscribers
at September 30, 2025
|
(1)Adjusted EBITDA is a total of segments measure, and adjusted net earnings and free cash flow are non-GAAP financial measures. See section 8.3, Total of segments measures and section 8.1, Non-GAAP financial measures in this MD&A for more information on these measures.
(2)In Q3 2025, Bell Communication and Technology Services (Bell CTS) Canada reduced its postpaid mobile phone and connected device subscriber bases by 51,541 and 7,867, respectively, following a review of a public sector customer account to eliminate subscribers with no usage.
(3)In Q3 2025, as a result of the acquisition of Ziply Fiber on August 1, 2025, Bell CTS U.S. retail high-speed Internet, retail IPTV and retail residential NAS lines subscriber bases increased by 442,225, 6,089 and 84,440 subscribers, respectively.
(4)In Q1 2025, we reduced our retail high-speed Internet, retail IPTV and retail residential NAS lines subscriber bases by 80,666, 441 and 14,150 subscribers, respectively, in Bell CTS Canada, as at March 31, 2025, as we stopped selling new plans for these services under the Distributel, Acanac, Oricom and B2B2C brands. Additionally, at the beginning of Q1 2025, we reduced our retail high-speed Internet subscriber base by 2,783 subscribers in Bell CTS Canada to adjust for prior year customer deactivations following a review of customer accounts.
(5)In Q4 2024, we removed 124,216 Bell prepaid mobile phone subscribers from our prepaid mobile phone subscriber base in Bell CTS Canada as at December 31, 2024, as we stopped selling new plans for this service as of that date.
(6)In Q3 2024, we removed 77,971 Virgin Plus prepaid mobile phone subscribers from our prepaid mobile phone subscriber base in Bell CTS Canada as at September 30, 2024, as we stopped selling new plans for this service as of that date. Additionally, as a result of a recent Canadian Radio-television and Telecommunications Commission (CRTC) decision on wholesale high-speed Internet access services, we are no longer able to resell cable Internet services to new customers in our wireline footprint as of September 12, 2024, and consequently, in Bell CTS Canada, we removed all of the existing 106,259 cable subscribers in our wireline footprint from our retail high-speed Internet subscriber base as of that date.
(7)In Q2 2024, we increased our retail IPTV subscriber base by 40,997 in Bell CTS Canada to align the deactivation policy for our Fibe TV streaming services to our traditional Fibe TV service.
BCE income statements - selected information
|
|
|
|
|
|
|
|
|
|
|
|
|
|
|
|
|
|
|
|
|
|
|
|
|
|
|
| |
Q3 2025 |
Q3 2024 |
$ change |
% change |
YTD 2025 |
YTD 2024 |
$ change |
% change |
| Operating revenues |
|
|
|
|
|
|
|
|
| Service |
5,329 |
5,286 |
43 |
|
0.8 |
% |
15,768 |
15,786 |
(18) |
|
(0.1 |
%) |
| Product |
720 |
685 |
35 |
|
5.1 |
% |
2,296 |
2,201 |
95 |
|
4.3 |
% |
| Total operating revenues |
6,049 |
5,971 |
78 |
|
1.3 |
% |
18,064 |
17,987 |
77 |
|
0.4 |
% |
| Operating costs |
(3,287) |
(3,249) |
(38) |
|
(1.2 |
%) |
(10,070) |
(10,003) |
(67) |
|
(0.7 |
%) |
| Adjusted EBITDA |
2,762 |
2,722 |
40 |
|
1.5 |
% |
7,994 |
7,984 |
10 |
|
0.1 |
% |
Adjusted EBITDA margin(1) |
45.7 |
% |
45.6 |
% |
|
0.1 pts |
44.3 |
% |
44.4 |
% |
|
(0.1) pts |
|
|
|
|
|
|
|
|
|
|
|
|
|
|
|
|
|
|
|
|
|
|
|
|
|
|
|
|
|
|
|
|
|
|
|
|
|
|
|
|
|
|
|
|
|
|
|
|
|
|
|
|
|
|
|
|
|
|
|
|
|
|
|
|
|
|
|
|
|
|
|
|
|
|
|
|
|
|
|
|
|
|
|
|
|
|
|
|
|
|
|
|
|
|
|
|
|
|
|
|
|
|
|
|
|
|
|
|
|
|
|
|
|
|
|
|
|
|
|
|
|
|
|
|
|
|
|
|
|
|
|
|
|
|
|
|
|
|
|
|
|
|
|
|
| Net earnings (loss) attributable to: |
|
|
|
|
|
|
|
|
| Common shareholders |
4,502 |
(1,237) |
5,739 |
|
n.m. |
5,711 |
(298) |
6,009 |
|
n.m. |
| Preferred shareholders |
38 |
45 |
(7) |
|
(15.6 |
%) |
119 |
138 |
(19) |
|
(13.8 |
%) |
| Non-controlling interest (NCI) |
15 |
1 |
14 |
|
n.m. |
52 |
30 |
22 |
|
73.3 |
% |
| Net earnings (loss) |
4,555 |
(1,191) |
5,746 |
|
n.m. |
5,882 |
(130) |
6,012 |
|
n.m. |
| Adjusted net earnings |
733 |
688 |
45 |
|
6.5 |
% |
1,958 |
2,054 |
(96) |
|
(4.7 |
%) |
|
|
|
|
|
|
|
|
|
|
|
|
|
|
|
|
|
|
| Net earnings (loss) per common share (EPS) |
4.84 |
(1.36) |
6.20 |
|
n.m. |
6.15 |
(0.33) |
6.48 |
|
n.m. |
Adjusted EPS(2) |
0.79 |
0.75 |
0.04 |
|
5.3 |
% |
2.11 |
2.25 |
(0.14) |
|
(6.2 |
%) |
n.m.: not meaningful
(1)Adjusted EBITDA margin is defined as adjusted EBITDA divided by operating revenues. Refer to section 8.6, KPIs in this MD&A for more information on this measure.
(2)Adjusted EPS is a non-GAAP ratio. Refer to section 8.2, Non-GAAP ratios in this MD&A for more information on this measure.
BCE statements of cash flows – selected information
|
|
|
|
|
|
|
|
|
|
|
|
|
|
|
|
|
|
|
|
|
|
|
|
|
|
|
| |
Q3 2025 |
Q3 2024 |
$ change |
% change |
YTD 2025 |
YTD 2024 |
$ change |
% change |
| Cash flows from operating activities |
1,914 |
|
1,842 |
|
72 |
|
3.9 |
% |
5,432 |
|
5,111 |
|
321 |
|
6.3 |
% |
| Capital expenditures |
(891) |
|
(954) |
|
63 |
|
6.6 |
% |
(2,383) |
|
(2,934) |
|
551 |
|
18.8 |
% |
| Free cash flow |
1,003 |
|
832 |
|
171 |
|
20.6 |
% |
2,953 |
|
2,014 |
|
939 |
|
46.6 |
% |
Q3 2025 financial highlights
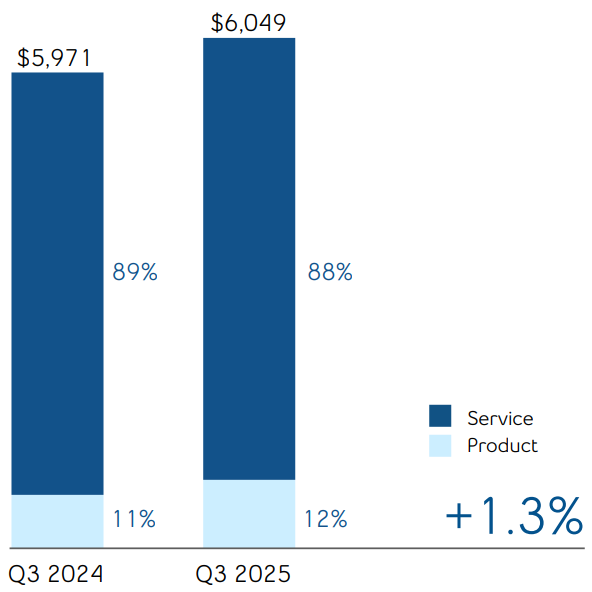
BCE operating revenues grew by 1.3% in Q3 2025, compared to the same period last year, driven by higher service and product revenues of 0.8% and 5.1%, respectively. The increase in service revenues was driven by our new segment, Bell CTS U.S., due to the contribution from the acquisition of Ziply Fiber on August 1, 2025, higher wireless and retail Internet average subscriber bases coupled with the flow-through of rate increases, greater Bell Media direct-to-consumer (DTC) streaming subscriber revenues, and higher revenues from our artificial intelligence (AI)-powered solutions business. This growth was moderated by ongoing erosion in legacy voice and data revenues, greater acquisition, retention and bundle discounts on wireline residential services, lower TV revenues, continued decreased demand for traditional advertising, ongoing but abating wireless competitive pricing pressures and lower Bell Media subscriber revenues due to the benefit in Q3 2024 from retroactive adjustments related to contracts with Canadian TV distributors. The increase in product revenues was mainly driven by higher wireless device sales, moderated by lower consumer electronics sales from The Source (Bell) Electronics Inc. (The Source) due to permanent store closures and conversions of locations to Best Buy Express as part of our distribution partnership with Best Buy Canada.
Net earnings of $4,555 million and net earnings attributable to common shareholders of $4,502 million in the third quarter of 2025 increased by $5,746 million and $5,739 million, respectively, compared to the same period last year, mainly due to higher gains on investments resulting from the sale of our minority stake in Maple Leaf Sports and Entertainment Ltd. (MLSE) and lower impairment of assets, primarily in our Bell Media segment, partly offset by higher income taxes.
BCE adjusted EBITDA increased by 1.5% in Q3 2025, compared to the same period last year, driven by the contribution from our Bell CTS U.S. segment due to the acquisition of Ziply Fiber, partly offset by declines in our Bell CTS Canada and Bell Media segments. The year-over-year growth in adjusted EBITDA was driven by higher operating revenues, partly offset by greater operating expenses mainly resulting from the acquisition of Ziply Fiber, moderated by cost reduction initiatives driven by workforce reductions, cost containment, as well as technology and automation-enabled operating efficiencies across the organization. This drove an adjusted EBITDA margin of 45.7% in Q3 2025, which was essentially stable year over year, up 0.1 pts over Q3 2024.
BCE’s EPS of $4.84 in Q3 2025 increased by $6.20 compared to the same period last year.
8 BCE Inc. 2025 THIRD QUARTER SHAREHOLDER REPORT
In the third quarter of 2025, adjusted net earnings, which excludes the impact of severance, acquisition and other costs, net mark-to-market gains (losses) on derivatives used to economically hedge equity settled share-based compensation plans, net equity gains (losses) on investments in associates and joint ventures, net gains (losses) on investments, early debt redemption gains (costs) and impairment of assets, net of tax and NCI, was $733 million, or $0.79 per common share, compared to $688 million, or $0.75 per common share, for the same period last year.
Cash flows from operating activities in the third quarter of 2025 increased by $72 million, compared to the same period last year, mainly due to higher cash from working capital and lower severance and other costs paid, partly offset by higher interest paid and higher income taxes paid.
Free cash flow in the third quarter of 2025 increased by $171 million compared to the same period last year, mainly due to higher cash flows from operating activities, excluding cash from acquisition and other costs paid, and lower capital expenditures and lower cash dividends paid on preferred shares.
1.2 Key corporate and business developments
This section contains forward-looking statements, including relating to BCE’s three-year strategic plan to deliver sustainable free cash flow growth and long-term shareholder value; BCE's strategic priorities; potential future purchases by BCE of its preferred shares pursuant to an NCIB; and the proposed disposition of Northwestel. Refer to the section Caution regarding forward-looking statements at the beginning of this MD&A.
Strategic plan to drive sustainable growth and long-term shareholder value
On October 14, 2025, ahead of its Investor Day, BCE unveiled its three-year strategic plan to deliver sustainable free cash flow growth and long-term shareholder value, supported by a disciplined capital allocation strategy tailored to a reshaped operating environment. The plan is anchored by four strategic priorities: put the customer first, deliver the best fibre and wireless networks, lead in enterprise with AI-powered solutions, and build a digital media and content powerhouse.
Refreshed brand platform
On October 14, 2025, Bell introduced its refreshed brand platform, “Connection is everything”, alongside a modernized visual identity. The initiative emphasizes a more human, relevant and connected future. The platform underscores Bell's fundamental role in facilitating essential human connections, reaffirming its dedication to helping individuals and businesses forge meaningful relationships with each other, their communities and the wider world.
Extension of partnership with Canadian Olympic Committee
On October 2, 2025, Bell announced the renewal of its long-standing partnership with the Canadian Olympic Committee, extending through the 2032 Olympic Games. This renewal continues Bell’s nearly 30-year commitment to supporting Canadian athletes through the Bell Athletes Connect program, including free phones and mobile plans to Team Canada. With this renewal, Bell remains the Official Telecommunications Partner of Team Canada for the 2026, 2028, 2030 and 2032 Olympic Games.
Public debt offering
On August 14, 2025, Bell Canada completed a public offering in Canada of $2.0 billion aggregate principal amount of medium-term note (MTN) debentures in four series pursuant to its MTN program.
The $400 million Series M-64 MTN debentures will mature on August 14, 2029 carry an annual interest rate of 3.65%. The $500 million Series M-65 MTN debentures will mature on March 14, 2033 and carry an annual interest rate of 4.30%. The $600 million Series M-66 MTN debentures will mature on March 14, 2036 and carry an annual interest rate of 4.70%. The $500 million Series M-67 MTN debentures will mature on August 14, 2055 and carry an annual interest rate of 5.25%. The MTN debentures are fully and unconditionally guaranteed by BCE. The net proceeds of the offering were used to redeem, prior to maturity, outstanding debt securities issued by Ziply Fiber and for general corporate purposes.
Early redemption of Ziply Fiber debt
On August 28, 2025, Bell Canada completed the redemption, prior to maturity, of all of Ziply Fiber’s outstanding debt securities having an aggregate principal amount of $1,961 million in U.S. dollars ($2,701 million in Canadian dollars). Ziply Fiber's outstanding debt securities consisted of $1,594 million in U.S. dollars ($2,192 million in Canadian dollars) principal amount of Secured Fiber Network Revenue Term Notes (Term Notes), which were redeemed on August 28, 2025, and $367 million in U.S. dollars ($509 million in Canadian dollars) in Secured Fiber Network Revenue Funding Notes (Funding Notes), which were redeemed on August 20, 2025. The redemption of Ziply Fiber’s debt was partially funded by Bell’s $2.0 billion offering of MTN debentures which was completed on August 14, 2025.
Renewal of NCIB for BCE First Preferred Shares
On November 5, 2025, the Board authorized the company to renew its NCIB to purchase for cancellation up to 10% of the public float of each series of BCE’s outstanding First Preferred Shares (Preferred Shares) that are listed on the Toronto Stock Exchange (TSX). The NCIB will extend from November 11, 2025 to November 10, 2026, or an earlier date should BCE complete its purchases under the NCIB. Under the NCIB, BCE is authorized to repurchase up to 711,590 Series R Preferred Shares, 188,207 Series S Preferred Shares, 506,243 Series T Preferred Shares, 540,688 Series Y Preferred Shares, 239,924 Series Z Preferred Shares, 1,031,507 Series AA Preferred Shares, 607,333 Series AB Preferred Shares, 620,567 Series AC Preferred Shares, 1,100,123 Series AD Preferred Shares, 323,372 Series AE Preferred Shares, 1,057,613 Series AF Preferred Shares, 813,483 Series AG Preferred Shares, 420,261 Series AH Preferred Shares, 875,404 Series AI Preferred Shares, 378,276 Series AJ Preferred Shares, 1,939,114 Series AK Preferred Shares, 165,538 Series AL Preferred Shares, 898,765 Series AM Preferred Shares, 95,442 Series AN Preferred Shares and 774,390 Series AQ Preferred Shares, representing approximately 10% of the public float in respect of each series of Preferred Shares. The actual number of Preferred Shares to be repurchased under the NCIB and the timing of such repurchases will be at BCE’s discretion and shall be subject to the limitations set out by the TSX. BCE is making this NCIB because it believes that, from time to time, the Preferred Shares may trade in price ranges that do not fully reflect their value. BCE believes that, in such circumstances, the repurchase of its Preferred Shares represents an appropriate use of its available funds. Since the beginning of BCE’s previous NCIB for Preferred Shares on November 11, 2024 until October 31, 2025, BCE repurchased and cancelled 9,770,589 Preferred Shares with a stated capital of $243 million for a total of cost of $176 million. A copy of BCE’s Notice of Intention to Make a Normal Course Issuer Bid through the facilities of the TSX may be obtained, without charge, by contacting BCE’s Investor Relations department at investor.relations@bce.ca or by phone at 1-800-339-6353.
Disposition of Northwestel
In June 2024, Bell Canada entered into an agreement for the disposition of Northwestel to Sixty North Unity, a consortium of Indigenous communities from the Yukon, the Northwest Territories and Nunavut, for up to $1 billion, subject to adjustments. We previously expected this transaction to close in 2025 but that is no longer our expectation and we continue to work with Sixty North Unity to close the transaction in 2026. The transaction remains subject to certain closing conditions, including securing financing by Sixty North Unity and, as such, there can be no assurance that the transaction will ultimately be consummated. The results of Northwestel are included in our Bell CTS Canada segment.
Home security and monitored alarm assets
In Q2 2025, BCE entered into an agreement to sell substantially all of its home security and monitored alarm assets to a.p.i. ALARM Inc. Subsequent to quarter end, on October 1, 2025, BCE completed the previously announced sale of substantially all of its home security and monitored alarm assets to a.p.i. ALARM Inc. for $170 million.
Appointment to BCE's and Bell Canada's boards of directors; Gordon Nixon to retire as Chair, Board to nominate Louis Vachon
On November 5, 2025, Steve Weed was appointed to the BCE and Bell Canada boards of directors. Mr. Weed is the former Executive Chairman of Ziply Fiber and is Chief Executive Officer of WaveDivision Capital, a broadband investment firm which has invested in over a dozen broadband companies with the goal of bringing better broadband to more homes and businesses across the U.S. and Canada. Mr. Weed was also the founder and Chief Executive Officer of Wave Broadband, which he led from 2002 through its sale in 2018. Mr. Weed serves as an advisory board member of Consolidated Communications and as a board member of Greenlight Networks.
As previously announced, Gordon Nixon, who will reach the end of his 12-year term in 2026, will step down as Chair and will not seek re-election as a director at the BCE Annual General Shareholder Meeting on May 7, 2026. Mr. Nixon joined the Board in 2014 and served as Chair for 10 years. As part of the Board's renewal and succession plan, the Board plans to nominate BCE director Louis Vachon C.M., O.Q., as Chair of the Board, contingent upon his re-election as a director by BCE shareholders on May 7, 2026. Mr. Vachon joined the Board in 2022 and is a member of the Management Resources and Compensation Committee and Risk and Pension Fund Committee.
10 BCE Inc. 2025 THIRD QUARTER SHAREHOLDER REPORT
As at the date of this MD&A, our forward-looking statements set out in the BCE 2024 Annual MD&A, as updated or supplemented in the BCE 2025 First Quarter MD&A, in the BCE 2025 Second Quarter MD&A and in this MD&A, are based on certain assumptions including, without limitation, the following assumptions, as well as the various assumptions referred to under the sub-sections entitled Assumptions set out in section 3, Business segment analysis of this MD&A.
Assumptions about the Canadian economy
Considerable uncertainty remains around U.S. tariffs and how changes to global trade relationships will affect economic growth and consumer prices in Canada. In particular, we have assumed:
•Slowing economic growth, given the Bank of Canada’s most recent estimated growth in Canadian gross domestic product of 1.2% in 2025, representing a decrease from the earlier estimate of 1.8%
•Low population growth driven by government policies designed to reduce the inflow of newcomers
•Modest growth in consumer spending supported by lower interest rates
•Slowing business investment, particularly by businesses in sectors most reliant on U.S. markets
•Easing consumer price index (CPI) inflation
•Ongoing labour market softness
•Interest rates expected to remain at or near current levels
•Canadian dollar expected to remain near current levels. Further movements may be impacted by the degree of strength of the U.S. dollar, interest rates and changes in commodity prices.
Assumptions about the U.S. economy
•Slowdown in consumer spending, offset by business investment
•Ongoing uncertainty surrounding trade policy
•Stable CPI inflation
•Near-term resolution to the U.S. government shutdown
Canadian market assumptions
•A higher level of wireline and wireless competition in consumer, business and wholesale markets
•Higher, but slowing, wireless industry penetration
•A shrinking data and voice connectivity market as business customers migrate to lower-priced telecommunications solutions or alternative OTT competitors
•The Canadian traditional TV and radio advertising markets are expected to be impacted by audience declines as the advertising market growth continues to shift towards digital
•Declines in broadcasting distribution undertaking (BDU) subscribers driven by increasing competition from the continued rollout of subscription video on demand (SVOD) streaming services together with further scaling of OTT aggregators
U.S. market assumptions
•A higher level of wireline pricing competition in consumer, business and wholesale markets
•Increased demand for colocation and data centre connectivity services
•A shrinking traditional voice services market as customers migrate to wireless or voice over Internet protocol (VoIP) offerings
Assumptions underlying expected continuing contribution holiday in 2025 in the majority of our pension plans
•At the relevant time, our defined benefit (DB) pension plans will remain in funded positions with going concern surpluses and maintain solvency ratios that exceed the minimum legal requirements for a contribution holiday to be taken for applicable DB and defined contribution (DC) components
•No significant declines in our DB pension plans’ financial position due to declines in investment returns or interest rates
•No material experience losses from other events such as through litigation or changes in laws, regulations or actuarial standards
2 Consolidated financial analysis
On August 1, 2025, BCE acquired Ziply Fiber, the leading fibre Internet provider in the Pacific Northwest of the U.S. providing wireline, Internet and TV services to residential, business and wholesale customers in this region. The results from the acquired Ziply Fiber operations are included in a new segment, Bell CTS U.S., from the date of acquisition.
Our results are subsequently reported in three segments: Bell CTS Canada, Bell CTS U.S. and Bell Media. Our segments reflect how we manage our business and how we classify our operations for planning and measuring performance.
This section provides detailed information and analysis about BCE’s performance in Q3 and YTD 2025 compared with Q3 and YTD 2024. It focuses on BCE’s consolidated operating results and provides financial information for our Bell CTS Canada, Bell CTS U.S. and Bell Media business segments. For further discussion and analysis of our business segments, refer to section 3, Business segment analysis.
2.1 BCE consolidated income statements
|
|
|
|
|
|
|
|
|
|
|
|
|
|
|
|
|
|
|
|
|
|
|
|
|
|
|
| |
Q3 2025 |
Q3 2024 |
$ change |
% change |
YTD 2025 |
YTD 2024 |
$ change |
% change |
| Operating revenues |
|
|
|
|
|
|
|
|
| Service |
5,329 |
5,286 |
43 |
|
0.8 |
% |
15,768 |
15,786 |
(18) |
|
(0.1 |
%) |
| Product |
720 |
685 |
35 |
|
5.1 |
% |
2,296 |
2,201 |
95 |
|
4.3 |
% |
| Total operating revenues |
6,049 |
5,971 |
78 |
|
1.3 |
% |
18,064 |
17,987 |
77 |
|
0.4 |
% |
| Operating costs |
(3,287) |
(3,249) |
(38) |
|
(1.2 |
%) |
(10,070) |
(10,003) |
(67) |
|
(0.7 |
%) |
| Adjusted EBITDA |
2,762 |
2,722 |
40 |
|
1.5 |
% |
7,994 |
7,984 |
10 |
|
0.1 |
% |
| Adjusted EBITDA margin |
45.7 |
% |
45.6 |
% |
|
0.1 pts |
44.3 |
% |
44.4 |
% |
|
(0.1) pts |
| Severance, acquisition and other costs |
(82) |
(49) |
(33) |
|
(67.3 |
%) |
(370) |
(300) |
(70) |
|
(23.3 |
%) |
| Depreciation |
(969) |
(934) |
(35) |
|
(3.7 |
%) |
(2,859) |
(2,825) |
(34) |
|
(1.2 |
%) |
| Amortization |
(340) |
(325) |
(15) |
|
(4.6 |
%) |
(1,009) |
(966) |
(43) |
|
(4.5 |
%) |
| Finance costs |
|
|
|
|
|
|
|
|
| Interest expense |
(457) |
(440) |
(17) |
|
(3.9 |
%) |
(1,322) |
(1,282) |
(40) |
|
(3.1 |
%) |
| Net return on post-employment benefit plans |
26 |
16 |
10 |
|
62.5 |
% |
77 |
49 |
28 |
|
57.1 |
% |
| Impairment of assets |
(970) |
(2,113) |
1,143 |
|
54.1 |
% |
(987) |
(2,186) |
1,199 |
|
54.8 |
% |
| Gains on investments |
5,175 |
66 |
5,109 |
|
n.m. |
5,165 |
58 |
5,107 |
|
n.m. |
| Other (expense) income |
(95) |
(129) |
34 |
|
26.4 |
% |
185 |
(260) |
445 |
|
n.m. |
| Income taxes |
(495) |
(5) |
(490) |
|
n.m. |
(992) |
(402) |
(590) |
|
n.m. |
|
|
|
|
|
|
|
|
|
|
|
|
|
|
|
|
|
|
| Net earnings (loss) |
4,555 |
(1,191) |
5,746 |
|
n.m. |
5,882 |
(130) |
6,012 |
|
n.m. |
|
|
|
|
|
|
|
|
|
|
|
|
|
|
|
|
|
|
|
|
|
|
|
|
|
|
|
|
|
|
|
|
|
|
|
|
|
|
|
|
|
|
|
|
|
| Net earnings (loss) attributable to: |
|
|
|
|
|
|
|
|
| Common shareholders |
4,502 |
(1,237) |
5,739 |
|
n.m. |
5,711 |
(298) |
6,009 |
|
n.m. |
| Preferred shareholders |
38 |
45 |
(7) |
|
(15.6 |
%) |
119 |
138 |
(19) |
|
(13.8 |
%) |
| NCI |
15 |
1 |
14 |
|
n.m. |
52 |
30 |
22 |
|
73.3 |
% |
| Net earnings (loss) |
4,555 |
(1,191) |
5,746 |
|
n.m. |
5,882 |
(130) |
6,012 |
|
n.m. |
| Adjusted net earnings |
733 |
688 |
45 |
|
6.5 |
% |
1,958 |
2,054 |
(96) |
|
(4.7 |
%) |
|
|
|
|
|
|
|
|
|
|
|
|
|
|
|
|
|
|
|
|
|
|
|
|
|
|
|
| EPS |
4.84 |
(1.36) |
6.20 |
|
n.m. |
6.15 |
(0.33) |
6.48 |
|
n.m. |
| Adjusted EPS |
0.79 |
0.75 |
0.04 |
|
5.3 |
% |
2.11 |
2.25 |
(0.14) |
|
(6.2 |
%) |
n.m.: not meaningful
12 BCE Inc. 2025 THIRD QUARTER SHAREHOLDER REPORT
2.2 Customer connections
Total BCE net activations
|
|
|
|
|
|
|
|
|
|
|
|
|
|
|
|
|
|
|
|
|
| |
Q3 2025 |
Q3 2024 |
% change |
YTD 2025 |
YTD 2024 |
% change |
| Mobile phone net subscriber activations |
68,018 |
|
102,196 |
|
(33.4 |
%) |
161,901 |
|
258,447 |
|
(37.4 |
%) |
| Postpaid |
11,511 |
|
33,111 |
|
(65.2 |
%) |
46,460 |
|
156,858 |
|
(70.4 |
%) |
| Prepaid |
56,507 |
|
69,085 |
|
(18.2 |
%) |
115,441 |
|
101,589 |
|
13.6 |
% |
| Mobile connected device net subscriber activations |
83,505 |
|
56,216 |
|
48.5 |
% |
216,991 |
|
210,539 |
|
3.1 |
% |
| Bell CTS retail high-speed Internet net subscriber activations |
26,111 |
|
42,415 |
|
(38.4 |
%) |
40,625 |
|
97,334 |
|
(58.3 |
%) |
|
|
|
|
|
|
|
| Bell CTS - Canada |
21,426 |
|
42,415 |
|
(49.5 |
%) |
35,940 |
|
97,334 |
|
(63.1 |
%) |
| Bell CTS - U.S. |
4,685 |
|
— |
|
n.m. |
4,685 |
|
— |
|
n.m. |
| Bell CTS retail IPTV net subscriber (losses) activations |
(16,218) |
|
9,197 |
|
n.m. |
(48,040) |
|
22,058 |
|
n.m. |
|
|
|
|
|
|
|
|
|
|
|
|
|
|
| Bell CTS - Canada |
(16,161) |
|
9,197 |
|
n.m. |
(47,983) |
|
22,058 |
|
n.m. |
| Bell CTS - U.S. |
(57) |
|
— |
|
n.m. |
(57) |
|
— |
|
n.m. |
| Bell CTS retail residential NAS lines net losses |
(45,990) |
|
(47,674) |
|
3.5 |
% |
(138,120) |
|
(144,835) |
|
4.6 |
% |
| Bell CTS - Canada |
(42,866) |
|
(47,674) |
|
10.1 |
% |
(134,996) |
|
(144,835) |
|
6.8 |
% |
| Bell CTS - U.S. |
(3,124) |
|
— |
|
n.m. |
(3,124) |
|
— |
|
n.m. |
|
|
|
|
|
|
|
| Total services net activations |
115,426 |
|
162,350 |
|
(28.9 |
%) |
233,357 |
|
443,543 |
|
(47.4 |
%) |
n.m.: not meaningful
Total BCE customer connections
|
|
|
|
|
|
|
|
|
|
|
|
|
|
|
| |
Q3 2025 |
Q3 2024 |
% change |
|
|
|
Mobile phone subscribers(1)(4)(5) |
10,398,934 |
|
10,361,720 |
|
0.4 |
% |
|
|
|
Postpaid(1) |
9,525,355 |
|
9,473,886 |
|
0.5 |
% |
|
|
|
Prepaid(4)(5) |
873,579 |
|
887,834 |
|
(1.6 |
%) |
|
|
|
Mobile connected device subscribers(1) |
3,252,554 |
|
2,943,087 |
|
10.5 |
% |
|
|
|
Bell CTS retail high-speed Internet subscribers(2)(3)(5) |
4,890,297 |
|
4,456,709 |
|
9.7 |
% |
|
|
|
|
|
|
|
|
|
|
Bell CTS - Canada(3)(5) |
4,443,387 |
|
4,456,709 |
|
(0.3 |
%) |
|
|
|
Bell CTS - U.S.(2) |
446,910 |
|
— |
|
n.m. |
|
|
|
Bell CTS retail IPTV subscribers(2)(3)(6) |
2,090,561 |
|
2,133,397 |
|
(2.0 |
%) |
|
|
|
|
|
|
|
|
|
|
|
|
|
|
|
|
|
Bell CTS - Canada(3)(6) |
2,084,529 |
|
2,133,397 |
|
(2.3 |
%) |
|
|
|
Bell CTS - U.S.(2) |
6,032 |
|
— |
|
n.m. |
|
|
|
Bell CTS retail residential NAS lines(2)(3) |
1,766,361 |
|
1,876,782 |
|
(5.9 |
%) |
|
|
|
Bell CTS - Canada(3) |
1,685,045 |
|
1,876,782 |
|
(10.2 |
%) |
|
|
|
Bell CTS - U.S.(2) |
81,316 |
|
— |
|
n.m. |
|
|
|
|
|
|
|
|
|
|
| Total services subscribers |
22,398,707 |
|
21,771,695 |
|
2.9 |
% |
|
|
|
n.m.: not meaningful
(1)In Q3 2025, Bell CTS Canada reduced its postpaid mobile phone and connected device subscriber bases by 51,541 and 7,867, respectively, following a review of a public sector customer account to eliminate subscribers with no usage.
(2)In Q3 2025, as a result of the acquisition of Ziply Fiber on August 1, 2025, Bell CTS U.S. retail high-speed Internet, retail IPTV and retail residential NAS lines subscriber bases increased by 442,225, 6,089 and 84,440 subscribers, respectively.
(3)In Q1 2025, we reduced our retail high-speed Internet, retail IPTV and retail residential NAS lines subscriber bases by 80,666, 441 and 14,150 subscribers, respectively, in Bell CTS Canada as at March 31, 2025, as we stopped selling new plans for these services under the Distributel, Acanac, Oricom and B2B2C brands. Additionally, at the beginning of Q1 2025, we reduced our retail high-speed Internet subscriber base by 2,783 subscribers in Bell CTS Canada to adjust for prior year customer deactivations following a review of customer accounts.
(4)In Q4 2024, we removed 124,216 Bell prepaid mobile phone subscribers from our prepaid mobile phone subscriber base in Bell CTS Canada as at December 31, 2024, as we stopped selling new plans for this service as of that date.
(5)In Q3 2024, we removed 77,971 Virgin Plus prepaid mobile phone subscribers from our prepaid mobile phone subscriber base in Bell CTS Canada as at September 30, 2024, as we stopped selling new plans for this service as of that date. Additionally, as a result of a recent CRTC decision on wholesale high-speed Internet access services, we are no longer able to resell cable Internet services to new customers in our wireline footprint as of September 12, 2024, and consequently, in Bell CTS Canada, we removed all of the existing 106,259 cable subscribers in our wireline footprint from our retail high-speed Internet subscriber base as of that date.
(6)In Q2 2024, we increased our retail IPTV subscriber base by 40,997 in Bell CTS Canada to align the deactivation policy for our Fibe TV streaming services to our traditional Fibe TV service.
BCE total services net subscriber activations were 115,426 in Q3 2025, down 28.9% compared to Q3 2024. The total services net subscriber activations in Q3 2025 consisted of:
•68,018 mobile phone and 83,505 mobile connected device net subscriber activations
•26,111 Bell CTS retail high-speed Internet net subscriber activations, composed of:
•Bell CTS Canada net subscriber activations of 21,426
•Bell CTS U.S. net subscriber activations of 4,685
•16,218 Bell CTS retail IPTV net subscriber losses, composed of:
•Bell CTS Canada net subscriber losses of 16,161
•Bell CTS U.S. net subscriber losses of 57
•45,990 Bell CTS retail residential NAS lines net losses, composed of:
•Bell CTS Canada net losses of 42,866
•Bell CTS U.S. net losses of 3,124
In the first nine months of the year, BCE added 233,357 total services net subscriber activations, down 47.4% compared to the same period in 2024. The total services net subscriber activations in the first nine months of 2025 consisted of:
•161,901 mobile phone and 216,991 mobile connected device net subscriber activations
•40,625 Bell CTS retail high-speed Internet net subscriber activations, composed of:
•Bell CTS Canada net subscriber activations of 35,940
•Bell CTS U.S. net subscriber activations of 4,685
•48,040 Bell CTS retail IPTV net subscriber losses, composed of:
•Bell CTS Canada net subscriber losses of 47,983
•Bell CTS U.S. net subscriber losses of 57
•138,120 Bell CTS retail residential NAS lines net losses, composed of:
•Bell CTS Canada net losses of 134,996
•Bell CTS U.S. net losses of 3,124
At September 30, 2025, BCE's customer connections totalled 22,398,707, up 2.9% year over year, and consisted of:
•10,398,934 mobile phone subscribers, up 0.4% year over year, and 3,252,554 mobile connected device subscribers, up 10.5% year over year
•4,890,297 Bell CTS retail high-speed Internet subscribers, up 9.7% year over year, composed of:
•Bell CTS Canada subscribers of 4,443,387, down 0.3% year over year
•Bell CTS U.S. subscribers of 446,910, compared to nil last year, as a result of the acquisition of Ziply Fiber on August 1, 2025
•2,090,561 Bell CTS retail IPTV subscribers, down 2.0% year over year, composed of:
•Bell CTS Canada subscribers of 2,084,529, down 2.3% year over year
•Bell CTS U.S. subscribers of 6,032, compared to nil last year, as a result of the acquisition of Ziply Fiber
•1,766,361 Bell CTS retail residential NAS lines, down 5.9% year over year, composed of:
•Bell CTS Canada lines of 1,685,045, down 10.2% year over year
•Bell CTS U.S. lines of 81,316, compared to nil in last year, as a result of the acquisition of Ziply Fiber
14 BCE Inc. 2025 THIRD QUARTER SHAREHOLDER REPORT
2.3 Operating revenues
|
|
|
|
|
|
|
|
|
| BCE |
|
BCE |
| Revenues |
|
Revenues |
| (in $ millions) |
|
(in $ millions) |
|
|
|
|
|
|
|
|
|
|
|
|
|
|
|
|
|
|
|
|
|
|
|
|
|
|
|
|
|
|
| |
Q3 2025 |
Q3 2024 |
$ change |
% change |
YTD 2025 |
YTD 2024 |
$ change |
% change |
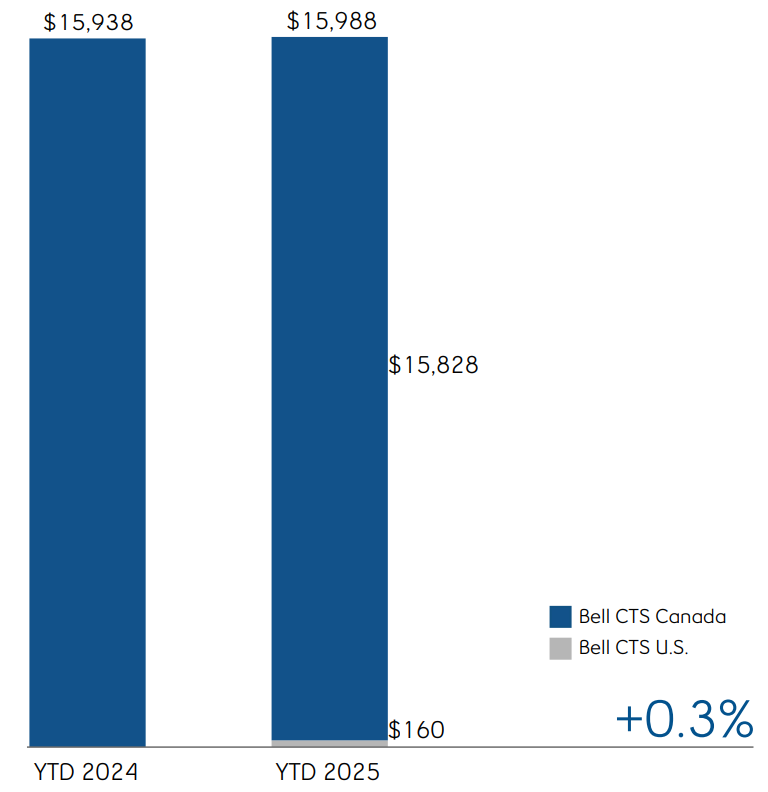
| Bell CTS |
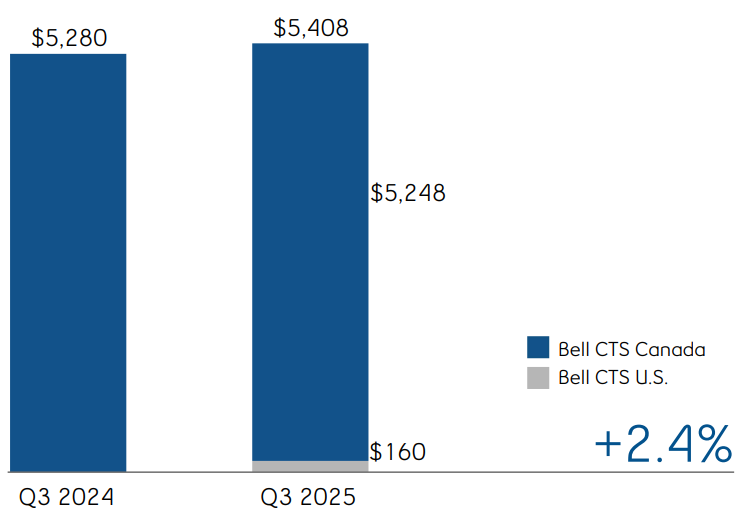
5,408 |
|
5,280 |
|
128 |
|
2.4 |
% |
15,988 |
|
15,938 |
|
50 |
|
0.3 |
% |
| Bell CTS - Canada |
5,248 |
|
5,280 |
|
(32) |
|
(0.6 |
%) |
15,828 |
|
15,938 |
|
(110) |
|
(0.7 |
%) |
| Bell CTS - U.S. |
160 |
|
— |
|
160 |
|
n.m. |
160 |
|
— |
|
160 |
|
n.m. |
|
|
|
|
|
|
|
|
|
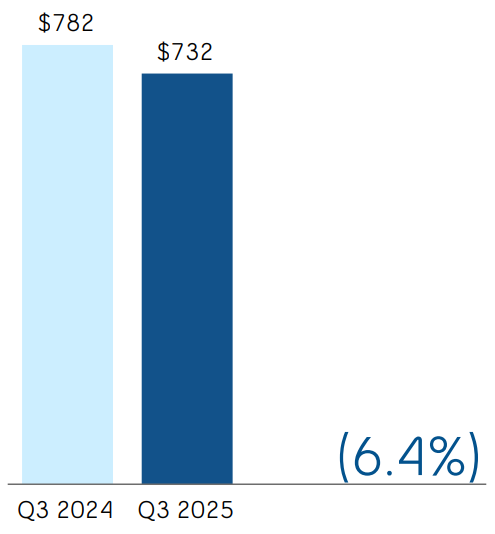
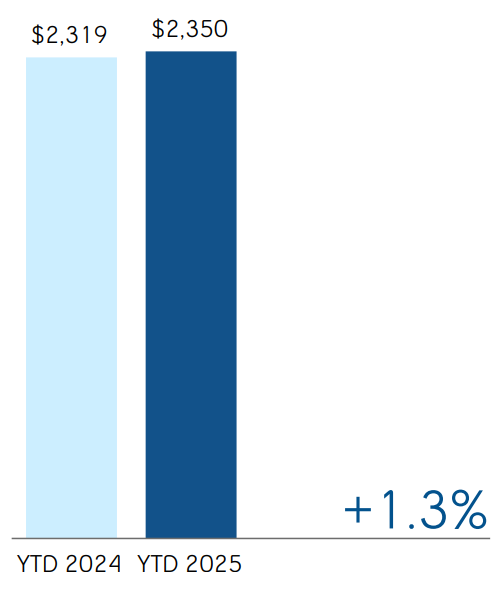
| Bell Media |
732 |
|
782 |
|
(50) |
|
(6.4 |
%) |
2,350 |
|
2,319 |
|
31 |
|
1.3 |
% |
| Inter-segment eliminations |
(91) |
|
(91) |
|
— |
|
— |
|
(274) |
|
(270) |
|
(4) |
|
(1.5 |
%) |
| Total BCE operating revenues |
6,049 |
|
5,971 |
|
78 |
|
1.3 |
% |
18,064 |
|
17,987 |
|
77 |
|
0.4 |
% |
n.m.: not meaningful
BCE
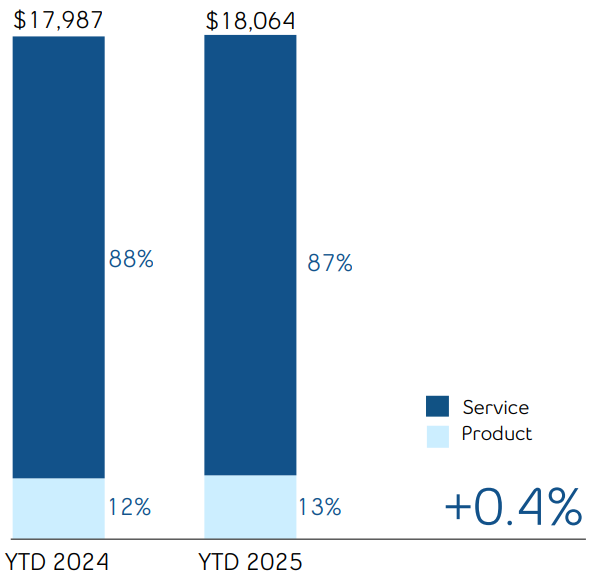
BCE operating revenues increased by 1.3% in Q3 2025, compared to the same period last year, driven by both higher service and product revenues. During the first nine months of 2025, BCE operating revenues grew by 0.4% year over year, from higher product revenues, moderated by lower service revenues. Service revenues of $5,329 million in Q3 2025 increased by 0.8% compared to Q3 2024, while service revenues of $15,768 million year to date, declined by 0.1% year over year. Product revenues of $720 million in Q3 2025 and $2,296 million year to date, increased by 5.1% and 4.3%, respectively, over the same periods in 2024.
The year-over-year growth in Q3 2025 operating revenues was driven by an increase from Bell CTS of 2.4% as a result of the contribution from our Bell CTS U.S. segment, due to the acquisition of Ziply Fiber on August 1, 2025, moderated by a decline in our Bell CTS Canada segment of 0.6%, as well as reflecting a decline in our Bell Media segment of 6.4%. Year-to-date revenues grew by 0.4% year over year, due to an increase in Bell CTS of 0.3% from the contribution of Bell CTS U.S, moderated by a decrease in Bell CTS Canada of 0.7%, along with an increase in Bell Media of 1.3%.
2.4 Operating costs
|
|
|
|
|
|
| BCE |
BCE |
| Operating cost profile |
Operating cost profile |
| Q3 2024 |
Q3 2025 |
|
|
| BCE |
BCE |
| Operating cost profile |
Operating cost profile |
| YTD 2024 |
YTD 2025 |
|
|
|
|
|
|
|
|
|
|
|
|
|
|
|
|
|
|
|
|
|
|
|
|
|
|
|
|
|
| |
Q3 2025 |
Q3 2024 |
$ change |
% change |
YTD 2025 |
YTD 2024 |
$ change |
% change |
| Bell CTS |
(2,883) |
|
(2,812) |
|
(71) |
|
(2.5 |
%) |
(8,625) |
|
(8,543) |
|
(82) |
|
(1.0 |
%) |
| Bell CTS - Canada |
(2,794) |
|
(2,812) |
|
18 |
|
0.6 |
% |
(8,536) |
|
(8,543) |
|
7 |
|
0.1 |
% |
| Bell CTS - U.S. |
(89) |
|
— |
|
(89) |
|
n.m. |
(89) |
|
— |
|
(89) |
|
n.m. |
|
|
|
|
|
|
|
|
|
| Bell Media |
(495) |
|
(528) |
|
33 |
|
6.3 |
% |
(1,719) |
|
(1,730) |
|
11 |
|
0.6 |
% |
| Inter-segment eliminations |
91 |
|
91 |
|
— |
|
— |
|
274 |
|
270 |
|
4 |
|
1.5 |
% |
| Total BCE operating costs |
(3,287) |
|
(3,249) |
|
(38) |
|
(1.2 |
%) |
(10,070) |
|
(10,003) |
|
(67) |
|
(0.7 |
%) |
n.m.: not meaningful
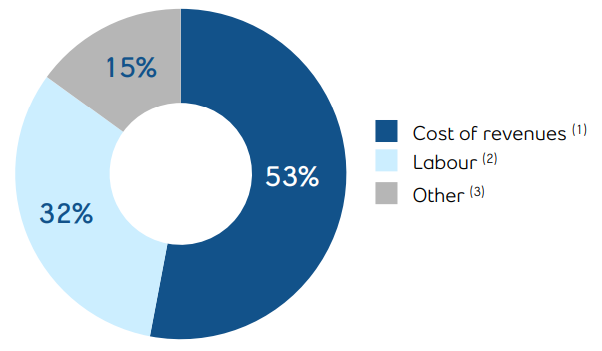
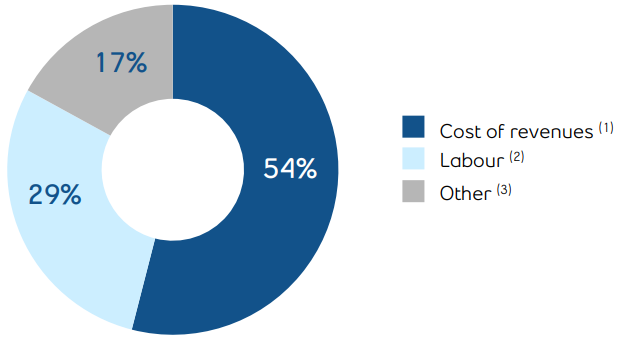
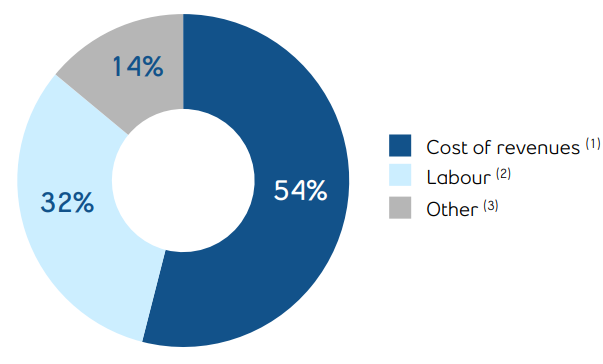
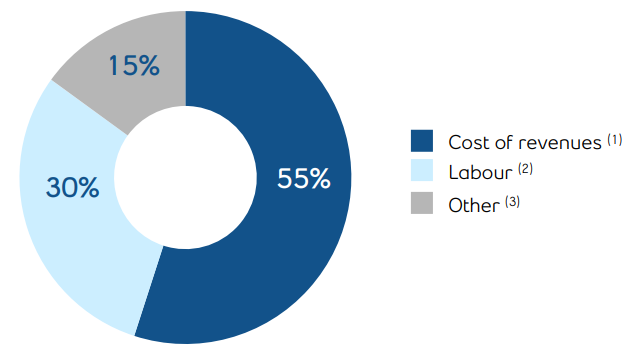
(1)Cost of revenues includes costs of wireless devices and other equipment sold, network and content costs, and payments to other carriers.
(2)Labour costs (net of capitalized costs) include wages, salaries and related taxes and benefits, post-employment benefit plans service cost, and other labour costs, including contractor and outsourcing costs.
(3)Other operating costs include marketing, advertising and sales commission costs, bad debt expense, taxes other than income taxes, IT costs, professional service fees and rent.
BCE
BCE operating costs increased by 1.2% in Q3 2025, and by 0.7% in the first nine months of the year, compared to the same periods in 2024, driven by higher expenses in Bell CTS of 2.5% and 1.0%, respectively, due to increased costs from Bell CTS U.S. of $89 million in both the quarter and year to date reflecting the operating costs of Ziply Fiber as a result of the acquisition on August 1, 2025, partly offset by reductions in Bell CTS Canada of 0.6% in Q3 2025 and 0.1% year to date, as well as reflecting lower costs in Bell Media of 6.3% and 0.6%, respectively.
16 BCE Inc. 2025 THIRD QUARTER SHAREHOLDER REPORT
2.5 Net earnings (loss)
|
|
|
|
|
|
|
|
|
| BCE |
|
BCE |
| Net earnings (loss) |
|
Net earnings (loss) |
| (in $ millions) |
|
(in $ millions) |
|
|
|
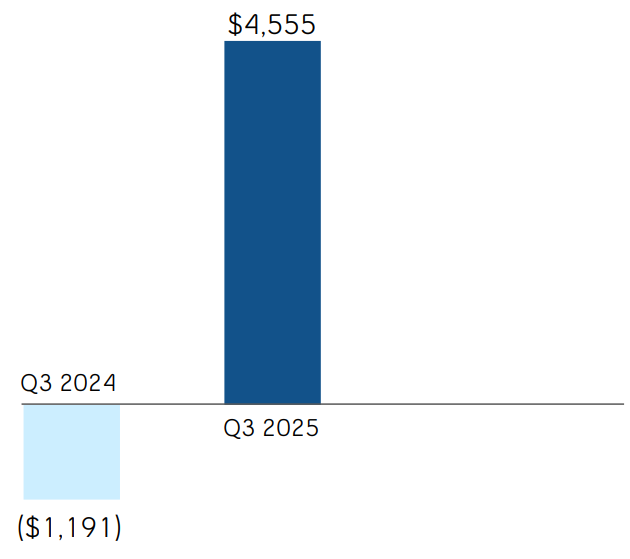
Net earnings in the third quarter of 2025 increased by $5,746 million, compared to the same period last year, mainly due to higher gains on investments resulting from the sale of our minority stake in MLSE and lower impairment of assets primarily in our Bell Media segment, partly offset by higher income taxes.
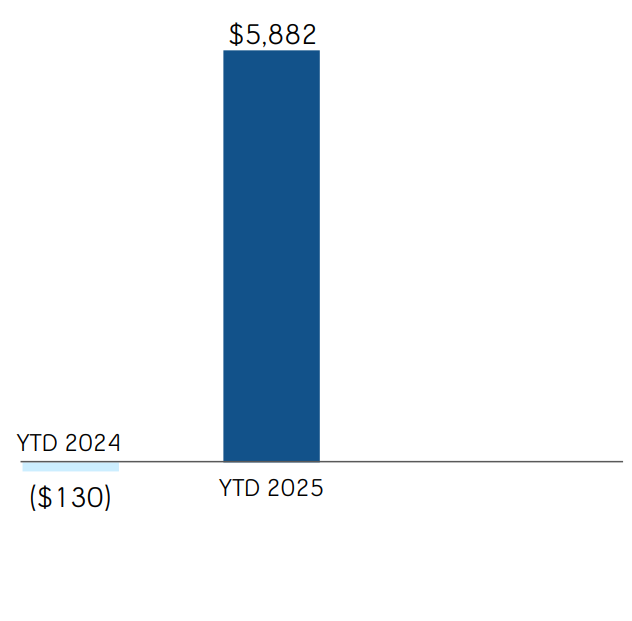
Net earnings on a year-to-date basis in 2025 increased by $6,012 million, compared to the same period last year, mainly due to higher gains on investments resulting from the sale of our minority stake in MLSE, lower impairment of assets primarily in our Bell Media segment as well as higher other income from early debt redemption gains, partly offset by higher income taxes.
|
|
|
|
|
|
|
|
|
| BCE |
|
BCE |
| Adjusted EBITDA |
|
Adjusted EBITDA |
| (in $ millions) |
|
(in $ millions) |
|
|
|
|
|
|
|
|
|
|
|
|
|
|
|
|
|
|
|
|
|
|
|
|
|
|
|
|
|
|
| |
Q3 2025 |
Q3 2024 |
$ change |
% change |
YTD 2025 |
YTD 2024 |
$ change |
% change |
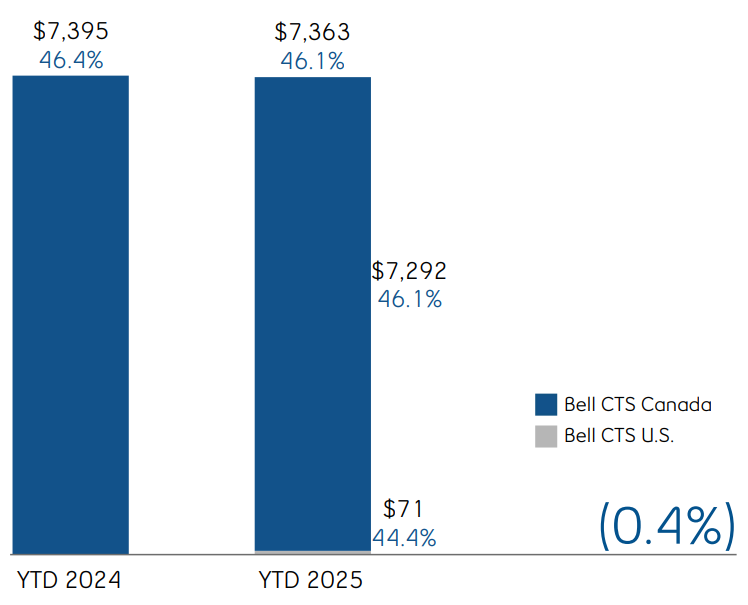
Bell CTS(1) |
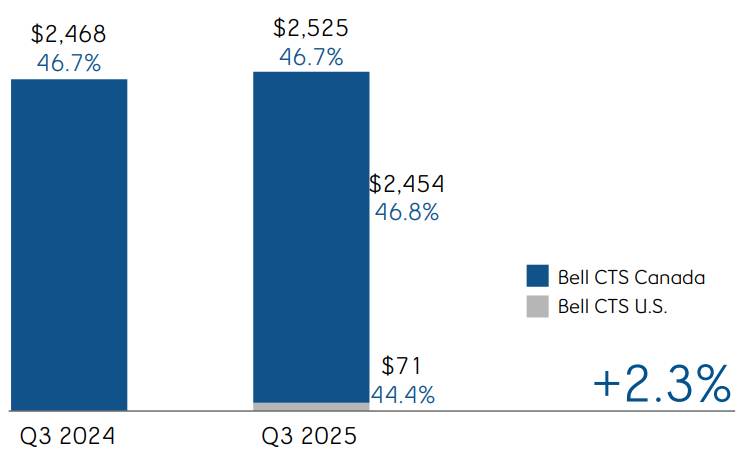
2,525 |
|
2,468 |
|
57 |
|
2.3 |
% |
7,363 |
|
7,395 |
|
(32) |
|
(0.4 |
%) |
| Adjusted EBITDA margin |
46.7 |
% |
46.7 |
% |
|
— |
|
46.1 |
% |
46.4 |
% |
|
(0.3) pts |
| Bell CTS - Canada |
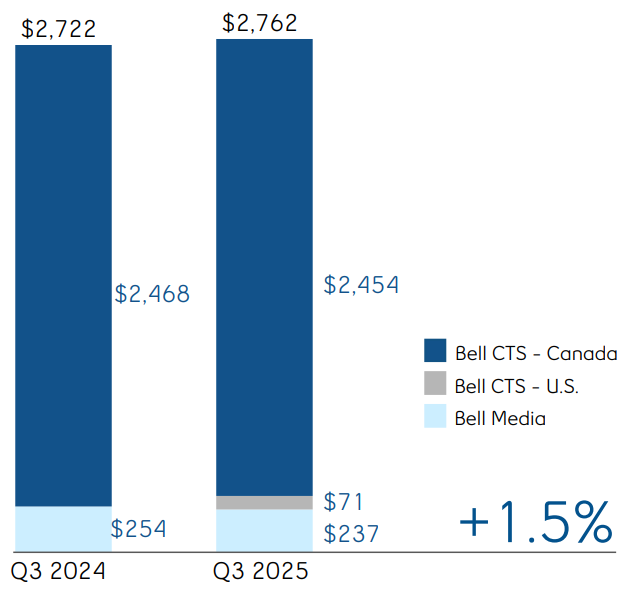
2,454 |
|
2,468 |
|
(14) |
|
(0.6 |
%) |
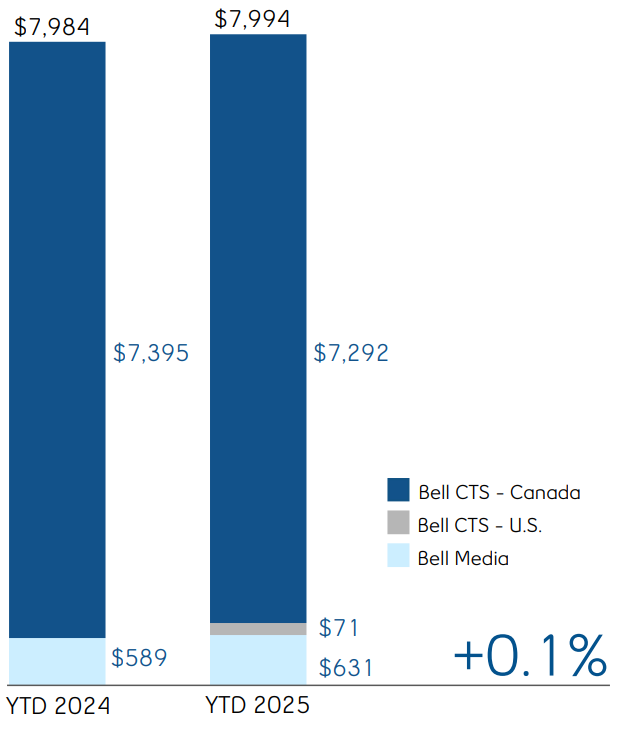
7,292 |
|
7,395 |
|
(103) |
|
(1.4 |
%) |
| Adjusted EBITDA margin |
46.8 |
% |
46.7 |
% |
|
0.1 pts |
46.1 |
% |
46.4 |
% |
|
(0.3) pts |
| Bell CTS - U.S. |
71 |
|
— |
|
71 |
|
n.m. |
71 |
|
— |
|
71 |
|
n.m. |
| Adjusted EBITDA margin |
44.4 |
% |
— |
|
|
44.4 pts |
44.4 |
% |
— |
|
|
44.4 pts |
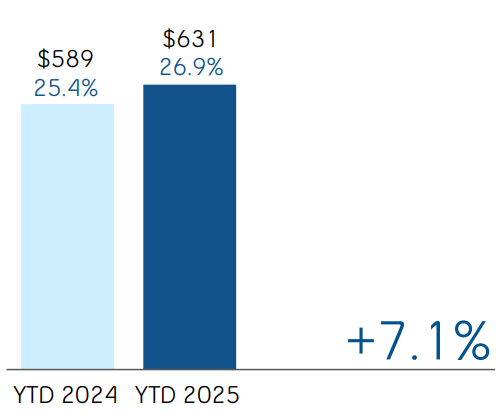
| Bell Media |
237 |
|
254 |
|
(17) |
|
(6.7 |
%) |
631 |
|
589 |
|
42 |
|
7.1 |
% |
| Adjusted EBITDA margin |
32.4 |
% |
32.5 |
% |
|
(0.1) pts |
26.9 |
% |
25.4 |
% |
|
1.5 pts |
| Total BCE adjusted EBITDA |
2,762 |
|
2,722 |
|
40 |
|
1.5 |
% |
7,994 |
|
7,984 |
|
10 |
|
0.1 |
% |
| Adjusted EBITDA margin |
45.7 |
% |
45.6 |
% |
|
0.1 pts |
44.3 |
% |
44.4 |
% |
|
(0.1) pts |
n.m.: not meaningful
(1)Bell CTS adjusted EBITDA is a total of segments measure. See section 8.3, Total of segments measures in this MD&A for more information on this measure.
BCE
BCE adjusted EBITDA increased by 1.5% in Q3 2025, compared to the same period last year, driven by an increase in Bell CTS of 2.3% due to the contribution from our Bell CTS U.S. segment of $71 million resulting from the acquisition of Ziply Fiber on August 1, 2025, partly offset by a decline in our Bell CTS Canada segment of 0.6%, along with a decline in our Bell Media segment of 6.7%. During the first nine months of the year, BCE adjusted EBITDA grew by 0.1% year over year, from an increase in Bell Media of 7.1%, partly offset by a decline in Bell CTS of 0.4% from a decrease in Bell CTS Canada of 1.4%, partly offset by the contribution from Bell CTS U.S. of $71 million. This drove an adjusted EBITDA margin of 45.7% in Q3 2025 and 44.3% year to date, which was essentially stable year over year, up 0.1 pts in Q3 2025 and down 0.1 pts year to date.
18 BCE Inc. 2025 THIRD QUARTER SHAREHOLDER REPORT Severance, acquisition and other costs of $82 million in the third quarter of 2025 and $370 million on a year-to-date basis included:
2.7 Severance, acquisition and other costs
2025
•Severance costs of $5 million in Q3 2025 and $250 million on a year-to-date basis related to involuntary and voluntary employee terminations
•Acquisition and other costs of $77 million in Q3 2025 and $120 million on a year-to-date basis
2024
Severance, acquisition and other costs of $49 million in the third quarter of 2024 and $300 million on a year-to-date basis included:
•Severance costs of $16 million in Q3 2024 and $246 million on a year-to-date basis related to involuntary and voluntary employee terminations
•Acquisition and other costs of $33 million in Q3 2024 and $54 million on a year-to-date basis
2.8 Depreciation and amortization
Depreciation
Depreciation in the third quarter and on a year-to-date basis in 2025 increased by $35 million and $34 million, respectively, compared to the same periods in 2024, mainly due to a higher asset base as a result of the acquisition of Ziply Fiber on August 1, 2025.
Amortization
Amortization in the third quarter and on a year-to-date basis in 2025 increased by $15 million and $43 million, respectively, compared to the same periods in 2024, mainly due to a higher asset base.
Interest expense
Interest expense in the third quarter of 2025 increased by $17 million compared to the same period last year, mainly due to higher average cost of debt and higher debt balances as a result of the acquisition of Ziply Fiber on August 1, 2025.
Interest expense in the first nine months of 2025 increased by $40 million compared to the same period last year, mainly due to higher debt balances as a result of the acquisition of Ziply Fiber on August 1, 2025 and higher average cost of debt.
Net return on post-employment benefit plans
Net return on our post-employment benefit plans is based on market conditions that existed at the beginning of the year as well as the net post-employment benefit plan asset (liability). On January 1, 2025, the discount rate was 4.7% compared to 4.6% on January 1, 2024.
In the third quarter and on a year-to-date basis in 2025, net return on post-employment benefit plans increased by $10 million and $28 million, respectively, compared to the same periods last year, as a result of a higher discount rate in 2025 and a higher net asset position.
The impacts of changes in market conditions during the year are recognized in Other comprehensive income (OCI).
2.10 Impairment of assets
2025
During the third quarter of 2025, we identified indicators of impairment for our Bell Media TV services, radio markets and out-of-home (OOH) advertising business, due to a decline in legacy advertising demand and spending in the linear advertising market as we transition to digital. Accordingly, impairment testing was required for certain groups of cash-generating units (CGUs) as well as for goodwill for the Bell Media group of CGUs.
We recognized $976 million of impairment charges for English and French TV services, radio markets and our OOH advertising business within our Bell Media segment. These charges included $554 million allocated to indefinite-life intangible assets for broadcast licences, spectrum and other licences and brands, $250 million allocated to program and feature film rights, $111 million allocated to property, plant and equipment for network, infrastructure and equipment and assets under construction, $39 million allocated to software, $18 million allocated to prepaid expenses and inventory, and $4 million allocated to finite-life intangible assets mainly for trademarks.
There was no impairment of Bell Media goodwill.
2024
During the third quarter of 2024, we identified indicators of impairment for our Bell Media TV services and radio markets, due to a further decline in advertising demand and spending in the linear advertising market. Accordingly, impairment testing was required for certain groups of CGUs as well as for goodwill for the Bell Media group of CGUs.
We recognized $958 million of impairment charges for English and French TV services and radio markets within our Bell Media segment. These charges included $627 million allocated to indefinite-life intangible assets for broadcast licences and brands, $144 million allocated to program and feature film rights, $85 million allocated to property, plant and equipment for network and infrastructure and equipment, $85 million allocated to software, $10 million allocated to finite-life intangible assets mainly for trademarks, and $7 million allocated to prepaid expenses.
We recorded $1,132 million of impairment charges for goodwill.
Additionally, for the three and nine months ended September 30, 2024, impairment charges of $23 million and $96 million, respectively, relate mainly to right-of-use assets for certain office spaces we ceased using as part of our real estate optimization strategy as a result of our hybrid work policy.
2.11 Gains on investments
2025
In the third quarter and on a year-to-date basis in 2025, gains on investments of $5,175 million and $5,165 million, respectively, included a $5.2 billion gain on sale of our minority stake in MLSE on July 1, 2025.
2024
In the third quarter and on a year-to-date basis in 2024, gains on investments of $66 million and $58 million, respectively, included a gain related to an obligation to repurchase at fair value the minority interest in one of our subsidiaries.
2.12 Other (expense) income
2025
Other expense of $95 million in the third quarter of 2025 included early debt redemption costs due to the redemption by Bell Canada of the outstanding principal amounts of Ziply Fiber's Term Notes and Funding Notes.
Other income of $185 million on a year-to-date basis in 2025 included early debt redemption gains due to the repurchase by Bell Canada, as a result of its cash tender offers, of a portion of its Series M-39, M-45, M-51 and M-55 MTN debentures, and a portion of its Series US-2, US-4, US-5, US-6, and US-7 Notes, and interest income, partly offset by early debt redemption costs due to the redemption by Bell Canada of the outstanding principal amounts of Ziply Fiber's Term Notes and Funding Notes, and foreign exchange losses on derivatives used to economically hedge anticipated purchases and the acquisition of Ziply Fiber in foreign currencies.
2024
Other expense of $129 million in the third quarter of 2024 included losses on our equity investments in associates and joint ventures, which included a loss on BCE's share of an obligation to repurchase at fair value the minority interest in MLSE, partly offset by net mark-to-market gains on derivatives used to economically hedge equity settled share-based compensation plans.
Other expense of $260 million on a year-to-date basis in 2024 included losses on our equity investments in associates and joint ventures, which included a loss on BCE's share of an obligation to repurchase at fair value the minority interest in MLSE, net mark-to-market losses on derivatives used to economically hedge equity settled share-based compensation plans and losses on retirements and disposals of property, plant and equipment and intangible assets, partly offset by interest income.
20 BCE Inc. 2025 THIRD QUARTER SHAREHOLDER REPORT
The following table reconciles the amount of reported income taxes in the consolidated income statements (income statements) with income taxes calculated at a statutory income tax rate of 26.8% for the three and nine month periods ended September 30, 2025 and 2024.
|
|
|
|
|
|
|
|
|
|
|
|
|
|
|
|
Three months |
Nine months |
| For the period ended September 30 |
2025 |
2024 |
2025 |
2024 |
| Net earnings (loss) |
4,555 |
(1,191) |
5,882 |
(130) |
| Add back income taxes |
495 |
5 |
992 |
402 |
| Earnings (loss) before income taxes |
5,050 |
(1,186) |
6,874 |
272 |
| Applicable statutory tax rate |
26.8 |
% |
26.8 |
% |
26.8 |
% |
26.8 |
% |
| Income taxes computed at applicable statutory rates |
(1,353) |
318 |
(1,842) |
(73) |
| Non-taxable portion of gains on investments |
840 |
19 |
839 |
18 |
| Uncertain tax positions |
19 |
4 |
22 |
4 |
|
|
|
|
|
| Impairment of goodwill |
— |
(303) |
— |
(303) |
| Change in estimate relating to prior periods |
(1) |
1 |
(1) |
1 |
| Non-taxable portion of equity losses |
— |
(47) |
(2) |
(67) |
| Previously unrecognized tax benefits |
— |
— |
— |
3 |
| Other |
— |
3 |
(8) |
15 |
| Total income taxes |
(495) |
(5) |
(992) |
(402) |
| Average effective tax rate |
9.8 |
% |
(0.4 |
%) |
14.4 |
% |
147.8 |
% |
Income taxes in the third quarter and on a year-to-date basis in 2025 increased by $490 million and $590 million, respectively, compared to the same periods in 2024, mainly due to higher taxable income in 2025 as a result of the gain on sale of $5.2 billion that was recorded on the disposition of our minority stake in MLSE.
2.14 Net earnings (loss) attributable to common shareholders and EPS
Net earnings attributable to common shareholders in the third quarter of 2025 of $4,502 million, increased by $5,739 million, compared to the same period last year, mainly due to higher gains on investments resulting from the sale of our minority stake in MLSE and lower impairment of assets primarily in our Bell Media segment, partly offset by higher income taxes.
Net earnings attributable to common shareholders on a year-to-date basis in 2025 of $5,711 million, increased by $6,009 million, compared to the same period last year, mainly due to higher gains on investments resulting from the sale of our minority stake in MLSE, lower impairment of assets primarily in our Bell Media segment as well as higher other income from early debt redemption gains, partly offset by higher income taxes.
BCE’s EPS of $4.84 in Q3 2025 increased by $6.20 compared to the same period last year. BCE's EPS of $6.15 on a year-to-date basis in 2025 increased by $6.48 compared to the same period last year.
In the third quarter of 2025, adjusted net earnings, which excludes the impact of severance, acquisition and other costs, net mark-to-market gains (losses) on derivatives used to economically hedge equity settled share-based compensation plans, net equity gains (losses) on investments in associates and joint ventures, net gains (losses) on investments, early debt redemption gains (costs) and impairment of assets, net of tax and NCI, was $733 million, or $0.79 per common share, compared to $688 million, or $0.75 per common share, for the same period last year. Adjusted net earnings in the first nine months of 2025 was $1,958 million, or $2.11 per common share, compared to $2,054 million, or $2.25 per common share, for the first nine months of 2024.
3 Business segment analysis
3.1 Bell CTS
This section contains forward-looking statements, including relating to Bell Canada’s plan to deploy low Earth orbit direct-to-cell services in 2026 and the benefits expected to result therefrom. Refer to the section Caution regarding forward-looking statements at the beginning of this MD&A.
Key business developments
Launch of Bell Cyber
On September 9, 2025, Bell Canada launched Bell Cyber, a new brand consolidating its cybersecurity capabilities. Bell Cyber includes the launch of a new autonomous Security Operations Centre (SOC) that leverages AI and automation to detect and contain threats in under five minutes, shifting the cybersecurity model from reactive to proactive defence. Bell Cyber’s Security-as-a-Service (SECaaS) platform is hosted on a sovereign Canadian cloud, to seek to ensure compliance with national privacy and data residency regulations. Bell Cyber partners with global technology leaders such as Palo Alto Networks, Cisco, Microsoft, and Fortinet to deliver scalable, tailored cybersecurity solutions for Canadian enterprises.
Partnership with BUZZ HPC to deliver sovereign AI infrastructure
On August 3, 2025, Bell and BUZZ High Performance Computing (BUZZ HPC) signed a preferred partnership to deliver one of Canada’s largest sovereign AI ecosystem through Bell AI Fabric. The collaboration integrates BUZZ HPC’s NVIDIA GPU clusters with Bell’s fibre network, data centres, and partner ecosystems, including Cohere. The initial 5 megawatts deployment in Manitoba will expand to other Bell AI Fabric data centres. The infrastructure will seek to ensure compliance with Canadian data residency and cybersecurity regulations with Canadian-owned facilities.
Rollout of Cohere's North platform to Bell team members
On October 9, 2025, Bell announced an important advancement in its strategic partnership with Cohere, providing the first group of Bell team members with access to Cohere's secure agentic AI platform North. The North platform will be introduced to all Bell management team members early in 2026, enabling them to build AI agents and leverage automation to optimize day-to-day work and drive stronger operational outcomes across the business.
Bell and AST SpaceMobile complete Canada’s first successful space-based direct-to-cell VoLTE voice call, broadband data and video streaming
On October 2, 2025, Bell and AST SpaceMobile (AST) announced the successful completion of a space-based direct-to-cell fourth generation voice over LTE (VoLTE) call, video call, video streaming via the Bell Fibe TV app, broadband data, short-message service (SMS) messaging, and emergency alerts, to a standard, unmodified smartphone over a Canadian wireless network. Conducted in New Brunswick, the test utilized AST’s BlueBird satellites and Bell’s sovereign gateway infrastructure. This milestone supports Bell’s plan to deploy low Earth orbit direct-to-cell services in 2026, extending coverage to remote and underserved regions across Canada.
Launch of Bell Streaming bundles
On August 18, 2025, Bell introduced Bell Streaming, a new bundled offering that combines Crave, Netflix, and Disney+ into a single subscription with simplified billing and up to 25% savings. Available to Bell Internet, TV, home phone, and Mobility customers in Ontario and Québec, the bundles offer cost efficiency and convenience of a single bill. Customers can link existing accounts and maintain access to personalized streaming profiles and viewing histories.
Partnership with Perplexity to bring advanced AI search tools to customers
On August 11, 2025, Bell announced an exclusive partnership with Perplexity, a leading AI-powered answer engine, becoming the company's exclusive telecommunications partner in Canada. Through this agreement, eligible Bell Mobility and Internet customers will receive 12 months of complimentary access to Perplexity Pro, a premium AI research and productivity platform valued at nearly $300. Perplexity Pro includes access to top-tier AI models such as GPT-5, Claude 4.0, and Gemini 2.5 Pro, along with features like unlimited file uploads, image generation, and advanced summarization tools.
Launch of Giga Hub 2.0 with Wi-Fi 7 technology
On September 4, 2025, Bell launched Giga Hub 2.0, introducing Wi-Fi 7 technology to Canadian homes. Available across major areas of Ontario and select regions in Québec, the new modem delivers up to four times faster speeds than Wi-Fi 6E, lower latency, and support for double the number of connected devices. Giga Hub 2.0 features a high-resolution OLED display, a design using 80% recycled plastics, and multiple high-speed Ethernet ports.
22 BCE Inc. 2025 THIRD QUARTER SHAREHOLDER REPORT
Financial performance analysis
Q3 2025 performance highlights
|
|
|
|
|
|
|
|
|
|
|
|
|
|
|
|
|
|
|
|
|
|
|
|
| Bell CTS |
Bell CTS |
| Revenues |
Adjusted EBITDA |
| (in $ millions) |
(in $ millions) |
|
|
|
|
(% adjusted EBITDA margin) |
|
|
|
|
|
|
|
|
|
|
|
|
|
|
| Bell CTS |
Bell CTS |
| Revenues |
Adjusted EBITDA |
| (in $ millions) |
(in $ millions) |
|
|
|
|
(% adjusted EBITDA margin) |
|
|
|
|
|
|
|
|
|
|
|
|
|
|
|
|
|
|
|
|
|
|
|
|
|
Total mobile phone subscriber growth(1)(4)(5) |
Mobile phone postpaid net subscriber activations in Q3 2025 |
Mobile phone prepaid net subscriber activations in
Q3 2025
|
Mobile phone postpaid churn in Q3 2025(7) |
Mobile phone blended average revenue per user (ARPU)(1)(4)(5)(8)
per month
|
|
|
| +0.4% |
11,511 |
56,507 |
1.13% |
(0.4%) |
|
Q3 2025 vs. Q3 2024 |
Decreased (65.2%) vs. Q3 2024 |
Decreased (18.2%) vs. Q3 2024 |
Decreased 0.15 pts vs. Q3 2024 |
Q3 2025: $58.04
Q3 2024: $58.26
|
|
|
| Retail high-speed Internet subscriber growth (decline) |
Retail IPTV subscriber decline |
Retail residential NAS lines decline |
|
| Q3 2025 vs. Q3 2024 |
Q3 2025 vs. Q3 2024 |
Q3 2025 vs. Q3 2024 |
|
Bell CTS(2)(3)(5) |
+9.7% |
Bell CTS(2)(3)(6) |
(2.0%) |
Bell CTS(2)(3) |
(5.9%) |
|
Bell CTS - Canada(3)(5) |
(0.3%) |
Bell CTS - Canada(3)(6) |
(2.3%) |
Bell CTS - Canada(3) |
(10.2%) |
|
Bell CTS - U.S.(2) |
n.m. |
Bell CTS - U.S.(2) |
n.m. |
Bell CTS - U.S.(2) |
n.m. |
|
|
|
|
|
|
|
|
Retail high-speed Internet net subscriber activations in Q3 2025 |
Retail IPTV net subscriber (losses) activations in Q3 2025 |
Retail residential NAS lines net losses in Q3 2025 |
|
|
|
|
|
| Bell CTS |
26,111 |
Bell CTS |
(16,218) |
Bell CTS |
(45,990) |
|
Decreased (38.4%) vs. Q3 2024 |
vs. net activations of 9,197 in Q3 2024 |
Decreased 3.5% vs. Q3 2024 |
|
| Bell CTS - Canada |
21,426 |
Bell CTS - Canada |
(16,161) |
Bell CTS - Canada |
(42,866) |
|
Decreased (49.5%) vs. Q3 2024 |
vs. net activations of 9,197 in Q3 2024 |
Decreased 10.1% vs. Q3 2024 |
|
| Bell CTS - U.S. |
4,685 |
Bell CTS - U.S. |
(57) |
Bell CTS - U.S. |
(3,124) |
|
nil in Q3 2024 |
nil in Q3 2024 |
nil in Q3 2024 |
|
n.m.: not meaningful
(1)In Q3 2025, Bell CTS Canada reduced its postpaid mobile phone and connected device subscriber bases by 51,541 and 7,867, respectively, following a review of a public sector customer account to eliminate subscribers with no usage.
(2)In Q3 2025, as a result of the acquisition of Ziply Fiber on August 1, 2025, Bell CTS U.S. retail high-speed Internet, retail IPTV and retail residential NAS lines subscriber bases increased by 442,225, 6,089 and 84,440 subscribers, respectively.
(3)In Q1 2025, we reduced our retail high-speed Internet, retail IPTV and retail residential NAS lines subscriber bases by 80,666, 441 and 14,150 subscribers, respectively, in Bell CTS Canada as at March 31, 2025, as we stopped selling new plans for these services under the Distributel, Acanac, Oricom and B2B2C brands. Additionally, at the beginning of Q1 2025, we reduced our retail high-speed Internet subscriber base by 2,783 subscribers in Bell CTS Canada to adjust for prior year customer deactivations following a review of customer accounts.
(4)In Q4 2024, we removed 124,216 Bell prepaid mobile phone subscribers from our prepaid mobile phone subscriber base in Bell CTS Canada as at December 31, 2024, as we stopped selling new plans for this service as of that date.
(5)In Q3 2024, we removed 77,971 Virgin Plus prepaid mobile phone subscribers from our prepaid mobile phone subscriber base in Bell CTS Canada as at September 30, 2024, as we stopped selling new plans for this service as of that date. Additionally, as a result of a recent CRTC decision on wholesale high-speed Internet access services, we are no longer able to resell cable Internet services to new customers in our wireline footprint as of September 12, 2024, and consequently, in Bell CTS Canada, we removed all of the existing 106,259 cable subscribers in our wireline footprint from our retail high-speed Internet subscriber base as of that date.
(6)In Q2 2024, we increased our retail IPTV subscriber base by 40,997 in Bell CTS Canada to align the deactivation policy for our Fibe TV streaming services to our traditional Fibe TV service.
(7)Mobile phone churn is defined as the rate at which existing mobile phone subscribers cancel their services. Refer to section 8.6, KPIs in this MD&A for more information on this measure.
(8)Mobile phone blended ARPU is defined as Bell CTS Canada wireless external services revenues divided by the average mobile phone subscriber base for the specified period, expressed as a dollar unit per month. Refer to section 8.6, KPIs in this MD&A for more information on this measure.
24 BCE Inc. 2025 THIRD QUARTER SHAREHOLDER REPORT
Revenues
Bell CTS
|
|
|
|
|
|
|
|
|
|
|
|
|
|
|
|
|
|
|
|
|
|
|
|
|
|
|
| |
Q3 2025 |
Q3 2024 |
$ change |
% change |
YTD 2025 |
YTD 2024 |
$ change |
% change |
| Wireless |
1,804 |
|
1,811 |
|
(7) |
|
(0.4 |
%) |
5,346 |
|
5,373 |
|
(27) |
|
(0.5 |
%) |
| Wireline data |
2,165 |
|
2,038 |
|
127 |
|
6.2 |
% |
6,204 |
|
6,084 |
|
120 |
|
2.0 |
% |
| Wireline voice |
632 |
|
663 |
|
(31) |
|
(4.7 |
%) |
1,885 |
|
2,023 |
|
(138) |
|
(6.8 |
%) |
| Other wireline services |
80 |
|
76 |
|
4 |
|
5.3 |
% |
236 |
|
236 |
|
— |
|
— |
|
| External service revenues |
4,681 |
|
4,588 |
|
93 |
|
2.0 |
% |
13,671 |
|
13,716 |
|
(45) |
|
(0.3 |
%) |
| Inter-segment service revenues |
7 |
|
7 |
|
— |
|
— |
|
21 |
|
21 |
|
— |
|
— |
|
| Operating service revenues |
4,688 |
|
4,595 |
|
93 |
|
2.0 |
% |
13,692 |
|
13,737 |
|
(45) |
|
(0.3 |
%) |
| Wireless |
610 |
|
569 |
|
41 |
|
7.2 |
% |
1,828 |
|
1,821 |
|
7 |
|
0.4 |
% |
| Wireline |
110 |
|
116 |
|
(6) |
|
(5.2 |
%) |
468 |
|
380 |
|
88 |
|
23.2 |
% |
|
|
|
|
|
|
|
|
|
|
|
|
|
|
|
|
|
|
|
|
|
|
|
|
|
|
|
| External/operating product revenues |
720 |
|
685 |
|
35 |
|
5.1 |
% |
2,296 |
|
2,201 |
|
95 |
|
4.3 |
% |
| Total external revenues |
5,401 |
|
5,273 |
|
128 |
|
2.4 |
% |
15,967 |
|
15,917 |
|
50 |
|
0.3 |
% |
| Total operating revenues |
5,408 |
|
5,280 |
|
128 |
|
2.4 |
% |
15,988 |
|
15,938 |
|
50 |
|
0.3 |
% |
Bell CTS operating revenues increased by 2.4% in Q3 2025 and by 0.3% in the first nine months of the year, compared to the same periods in 2024, due to the contribution from Bell CTS U.S. of $160 million in both the quarter and year to date, as a result of the acquisition of Ziply Fiber on August 1, 2025, partly offset by a year-over-year decline in Bell CTS Canada of 0.6% in Q3 2025 and 0.7% in the first nine months of the year. The year-over-year revenue growth in Q3 2025 was driven by both higher service and product revenues, while the growth in the first nine months of the year was attributable to higher product revenues, moderated by lower service revenues.
Bell CTS Canada
|
|
|
|
|
|
|
|
|
|
|
|
|
|
|
|
|
|
|
|
|
|
|
|
|
|
|
| |
Q3 2025 |
Q3 2024 |
$ change |
% change |
YTD 2025 |
YTD 2024 |
$ change |
% change |
| Wireless |
1,804 |
|
1,811 |
|
(7) |
|
(0.4 |
%) |
5,346 |
|
5,373 |
|
(27) |
|
(0.5 |
%) |
| Wireline data |
2,036 |
|
2,038 |
|
(2) |
|
(0.1 |
%) |
6,075 |
|
6,084 |
|
(9) |
|
(0.1 |
%) |
| Wireline voice |
603 |
|
663 |
|
(60) |
|
(9.0 |
%) |
1,856 |
|
2,023 |
|
(167) |
|
(8.3 |
%) |
| Other wireline services |
78 |
|
76 |
|
2 |
|
2.6 |
% |
234 |
|
236 |
|
(2) |
|
(0.8 |
%) |
| External service revenues |
4,521 |
|
4,588 |
|
(67) |
|
(1.5 |
%) |
13,511 |
|
13,716 |
|
(205) |
|
(1.5 |
%) |
| Inter-segment service revenues |
7 |
|
7 |
|
— |
|
— |
|
21 |
|
21 |
|
— |
|
— |
|
| Operating service revenues |
4,528 |
|
4,595 |
|
(67) |
|
(1.5 |
%) |
13,532 |
|
13,737 |
|
(205) |
|
(1.5 |
%) |
| Wireless |
610 |
|
569 |
|
41 |
|
7.2 |
% |
1,828 |
|
1,821 |
|
7 |
|
0.4 |
% |
| Wireline |
110 |
|
116 |
|
(6) |
|
(5.2 |
%) |
468 |
|
380 |
|
88 |
|
23.2 |
% |
|
|
|
|
|
|
|
|
|
|
|
|
|
|
|
|
|
|
|
|
|
|
|
|
|
|
|
| External/operating product revenues |
720 |
|
685 |
|
35 |
|
5.1 |
% |
2,296 |
|
2,201 |
|
95 |
|
4.3 |
% |
| Total external revenues |
5,241 |
|
5,273 |
|
(32) |
|
(0.6 |
%) |
15,807 |
|
15,917 |
|
(110) |
|
(0.7 |
%) |
| Total operating revenues |
5,248 |
|
5,280 |
|
(32) |
|
(0.6 |
%) |
15,828 |
|
15,938 |
|
(110) |
|
(0.7 |
%) |
Bell CTS Canada operating revenues decreased by 0.6% in Q3 2025, and by 0.7% in the first nine months of the year, compared to the same periods last year, from lower service revenues, mitigated in part by higher product revenues. The service revenues decline in both the quarter and year to date was driven by continued erosion in wireline voice revenues and a modest decline in wireless and wireline data revenues.
Bell CTS Canada operating service revenues declined by 1.5% in both Q3 2025 and in the first nine months of the year, compared to the same periods in 2024.
•Wireless revenues decreased by 0.4% in Q3 2025 and by 0.5% in the first nine months of the year, compared to the same periods last year, driven by:
•Ongoing but abating competitive pricing pressures in the quarter on-rate plans and greater discounting
•Reduced data overages driven by increased customer adoption of monthly plans with higher data thresholds, including unlimited plans
•Lower roaming revenues mainly from reduced travel to the U.S.
These factors were partly offset by:
•Continued growth in our mobile phone and connected device average subscriber bases coupled with the flow-through of rate increases Additionally, year-to-date wireless service revenues were favourably impacted by revenues from the 2025 G7 Leader's Summit.
•Wireline data revenues were essentially stable year over year, declining by 0.1% in both Q3 2025 and year to date, compared to the same periods last year, mainly driven by:
•Greater acquisition, retention and bundle discounts on residential services
•Erosion of our TV subscriber bases
These factors were partly offset by:
•Higher retail Internet average subscriber base, along with the flow-through of residential rate increases
•Greater revenues from our AI-powered solutions business driven by growth in Ateko, our Systems Integrator and Managed Services practice and Bell Cyber, our cyber security business, including the impact of small 2024 and 2025 acquisitions
•Wireline voice revenues decreased by 9.0% in Q3 2025 and by 8.3% in the first nine months of the year, compared to the same periods in 2024, primarily due to:
•Higher retail residential NAS lines erosion, combined with business voice declines, driven by technological substitution to wireless and Internet-based services unfavourably impacting local & access and long distance revenues
•Increased acquisition, retention and bundle discounts on residential services
These factors were partly offset by:
•Flow-through of residential rate increases
Bell CTS Canada operating product revenues increased by 5.1% in Q3 2025 and by 4.3% in the first nine months of the year, compared to the same periods last year.
•Wireless operating product revenues increased by 7.2% in Q3 2025 and by 0.4% in the first nine months of the year, compared to the same periods last year, due to higher wireless device sales to consumers mainly from greater upgrade volumes and contracted activations, moderated by reduced consumer electronics sales due to permanent store closures of The Source. In the first nine months of the year, the operating product revenues were also unfavourably impacted by lower device sales in Q1 2025 to the government sector, as well as, mix shift to lower value handsets and greater discounting.
•Wireline operating product revenues declined in the quarter by 5.2%, compared to Q3 2024, attributable to reduced equipment sales to large business customers, partly offset by greater land mobile radio systems sales to the government sector. During the first nine months of the year, product revenues grew by 23.2%, compared to the same period last year, driven by Bell AI Fabric, our full-stack AI Managed Service Provider, from the delivery of our first AI facility in Kamloops, British Columbia (B.C.) in Q2 2025.
Bell CTS U.S.
|
|
|
|
|
|
|
|
|
|
|
|
|
|
|
|
|
|
|
|
|
|
|
|
|
|
|
| |
Q3 2025 |
Q3 2024 |
$ change |
% change |
YTD 2025 |
YTD 2024 |
$ change |
% change |
|
|
|
|
|
|
|
|
|
| Wireline data |
129 |
|
— |
|
129 |
|
n.m. |
129 |
|
— |
|
129 |
|
n.m. |
| Wireline voice |
29 |
|
— |
|
29 |
|
n.m. |
29 |
|
— |
|
29 |
|
n.m. |
| Other wireline services |
2 |
|
— |
|
2 |
|
n.m. |
2 |
|
— |
|
2 |
|
n.m. |
|
|
|
|
|
|
|
|
|
|
|
|
|
|
|
|
|
|
| External/operating service revenues |
160 |
|
— |
|
160 |
|
n.m. |
160 |
|
— |
|
160 |
|
n.m. |
|
|
|
|
|
|
|
|
|
|
|
|
|
|
|
|
|
|
|
|
|
|
|
|
|
|
|
|
|
|
|
|
|
|
|
|
|
|
|
|
|
|
|
|
|
|
|
|
|
|
|
|
|
|
|
|
|
|
|
|
|
|
|
| Total external/operating revenues |
160 |
|
— |
|
160 |
|
n.m. |
160 |
|
— |
|
160 |
|
n.m. |
n.m.: not meaningful
Bell CTS U.S. operating revenues were $160 million in Q3 2025 and year to date, compared with nil in the same periods last year, due to the acquisition of Ziply Fiber on August 1, 2025. The operating revenues were comprised of service revenues, mainly from wireline data and voice revenues.
•Wireline data revenues totalled $129 million in Q3 2025 and year to date, compared to nil, in the same periods last year and mainly consisted of:
•Internet revenues generated from residential, business and wholesale broadband Internet services primarily delivered over Ziply Fiber's fibre network which benefited in the quarter from the continued expansion of the fibre-to-the-premise (FTTP) footprint, along with a successful move and back-to-school period
•Internet protocol (IP) broadband revenues derived from the sale of commercial ethernet, dedicated Internet/non-switched access, and other data transport networking options. In Q3 2025, this also included non-recurring construction revenue relating to a fibre build.
•Modest TV revenues from the sale of IPTV service
•Wireline voice revenues were $29 million in Q3 2025 and year to date, compared with nil, in the same periods last year. These revenues included traditional local and long-distance wireline services, VoIP services, and a number of unified messaging services. Voice revenues were unfavourably impacted by ongoing losses due to technological substitution to wireless and Internet-based services.
26 BCE Inc. 2025 THIRD QUARTER SHAREHOLDER REPORT
Operating costs and adjusted EBITDA
|
|
|
|
|
|
|
|
|
|
|
|
|
|
|
|
|
|
|
|
|
|
|
|
|
|
|
| |
Q3 2025 |
Q3 2024 |
$ change |
% change |
YTD 2025 |
YTD 2024 |
$ change |
% change |
| Bell CTS operating costs |
(2,883) |
(2,812) |
(71) |
|
(2.5 |
%) |
(8,625) |
(8,543) |
(82) |
|
(1.0 |
%) |
| Bell CTS - Canada |
(2,794) |
(2,812) |
18 |
|
0.6 |
% |
(8,536) |
(8,543) |
7 |
|
0.1 |
% |
| Bell CTS - U.S. |
(89) |
— |
(89) |
|
n.m. |
(89) |
— |
(89) |
|
n.m. |
|
|
|
|
|
|
|
|
|
| Bell CTS adjusted EBITDA |
2,525 |
2,468 |
57 |
|
2.3 |
% |
7,363 |
7,395 |
(32) |
|
(0.4 |
%) |
| Margin |
46.7 |
% |
46.7 |
% |
|
— |
46.1 |
% |
46.4 |
% |
|
(0.3) pts |
| Bell CTS - Canada |
2,454 |
2,468 |
(14) |
|
(0.6 |
%) |
7,292 |
7,395 |
(103) |
|
(1.4 |
%) |
| Margin |
46.8 |
% |
46.7 |
% |
|
0.1 pts |
46.1 |
% |
46.4 |
% |
|
(0.3) pts |
| Bell CTS - U.S. |
71 |
— |
71 |
|
n.m. |
71 |
— |
71 |
|
n.m. |
| Margin |
44.4 |
% |
— |
|
44.4 pts |
44.4 |
% |
— |
|
44.4 pts |
|
|
|
|
|
|
|
|
|
|
|
|
|
|
|
|
|
|
|
|
|
|
|
|
|
|
|
n.m.: not meaningful
Bell CTS operating costs increased by 2.5% in Q3 2025 and by 1.0% in the first nine months of the year, compared to the same periods last year, due to greater costs from Bell CTS U.S. of $89 million in the quarter and year to date, reflecting the operating expenses of Ziply Fiber as a result of the acquisition on August 1, 2025, partly offset by lower costs in Bell CTS Canada of 0.6% in Q3 2025 and 0.1% in the first nine months of the year, compared to the same periods last year.
Bell CTS Canada operating costs decreased by 0.6% in Q3 2025 and by 0.1% in the first nine months of the year, compared to the same periods last year, due to:
•Cost reduction initiatives attributable to workforce reductions, savings from our customer service centres driven by improved call placement and reduced call volumes, permanent closures of The Source stores, as well as various other cost containment initiatives across the organization including, technology and automation-enabled operating efficiencies
•Reduced TV programming costs relating to the lower revenues
These factors were partly offset by:
•Increased cost of goods sold, bad debt and commission expense, as well as higher payments to other carriers, reflecting growth in related revenues
•Higher operating expenses from small acquisitions made in 2024 and 2025
In the first nine months of the year, costs were also unfavourably impacted by expenses related to the revenues from the delivery of our first AI facility in Kamloops, B.C and from the 2025 G7 Leader's Summit.
Bell CTS U.S. operating costs were $89 million in Q3 2025 and year to date, compared with nil in the same periods last year, reflecting the operating costs of Ziply Fiber due to the acquisition on August 1, 2025. The costs predominantly consisted of labour costs, network-related expenses, payments to other carriers, regulatory costs and various administrative and marketing costs. The expenses reflect operating efficiencies, primarily from simplification of systems and processes, as well as lower call volumes despite the expanding customer base.
Bell CTS adjusted EBITDA increased by 2.3% in Q3 2025, compared to Q3 2024, due to the contribution from Bell CTS U.S. of $71 million in the quarter, as a result of the acquisition of Ziply Fiber on August 1, 2025, partly offset by a decline in Bell CTS Canada of 0.6%. During the first nine months of the year, Bell CTS adjusted EBITDA declined by 0.4% year over year driven by a decrease in Bell CTS Canada of 1.4%, partly offset by the contribution from Bell CTS U.S. of $71 million. Bell CTS adjusted EBITDA margin of 46.7% in Q3 2025 was stable compared to Q3 2024, while in the first nine months of the year, adjusted EBITDA margin of 46.1% declined by 0.3 pts, due to reduced service revenues flow-through and a higher proportion of lower margin product sales in our total revenue base, partly offset by cost reduction initiatives and operating efficiencies. Bell CTS U.S. adjusted EBITDA margin in Q3 2025 and year to date was 44.4%.
Bell CTS Canada adjusted EBITDA decreased by 0.6% in Q3 2025, and by 1.4% year to date, compared to the same periods in 2024, due to lower operating revenues, mitigated in part by reduced operating costs. Adjusted EBITDA margin of 46.8% in Q3 2025 remained essentially stable compared to 46.7% in Q3 2024, while in the first nine months of the year, adjusted EBITDA margin of 46.1% decreased by 0.3 pts, year over year, due to lower service revenues flow-through, along with a higher proportion of lower margin product sales in our total revenue base, partly offset by cost reduction initiatives and operating efficiencies.
Bell CTS U.S. adjusted EBITDA was $71 million in Q3 2025 and year to date, compared to nil in the same periods last year, due to the acquisition of Ziply Fiber on August 1, 2025. This corresponded to an adjusted EBITDA margin of 44.4% for the quarter and year to date.
Bell CTS operating metrics
Wireless
|
|
|
|
|
|
|
|
|
|
|
|
|
|
|
|
|
|
|
|
|
|
|
|
|
|
|
| |
Q3 2025 |
Q3 2024 |
Change |
% change |
YTD 2025 |
YTD 2024 |
Change |
% change |
| Mobile phones |
|
|
|
|
|
|
|
|
|
Blended ARPU(1)(2)(3)
($/month)
|
58.04 |
58.26 |
(0.22) |
(0.4 |
%) |
57.58 |
58.15 |
(0.57) |
(1.0 |
%) |
|
|
|
|
|
|
|
|
|
| Gross subscriber activations |
514,661 |
588,263 |
(73,602) |
(12.5 |
%) |
1,493,843 |
1,671,036 |
(177,193) |
(10.6 |
%) |
| Postpaid |
315,607 |
374,116 |
(58,509) |
(15.6 |
%) |
967,295 |
1,130,203 |
(162,908) |
(14.4 |
%) |
| Prepaid |
199,054 |
214,147 |
(15,093) |
(7.0 |
%) |
526,548 |
540,833 |
(14,285) |
(2.6 |
%) |
| Net subscriber activations |
68,018 |
102,196 |
(34,178) |
(33.4 |
%) |
161,901 |
258,447 |
(96,546) |
(37.4 |
%) |
| Postpaid |
11,511 |
33,111 |
(21,600) |
(65.2 |
%) |
46,460 |
156,858 |
(110,398) |
(70.4 |
%) |
| Prepaid |
56,507 |
69,085 |
(12,578) |
(18.2 |
%) |
115,441 |
101,589 |
13,852 |
13.6 |
% |
| Blended churn % (average per month) |
1.45 |
% |
1.58 |
% |
|
0.13 pts |
1.45 |
% |
1.55 |
% |
|
0.10 pts |
| Postpaid |
1.13 |
% |
1.28 |
% |
|
0.15 pts |
1.13 |
% |
1.23 |
% |
|
0.10 pts |
| Prepaid |
5.10 |
% |
4.66 |
% |
|
(0.44) pts |
5.30 |
% |
4.99 |
% |
|
(0.31) pts |
Subscribers(1)(2)(3) |
10,398,934 |
10,361,720 |
37,214 |
0.4 |
% |
10,398,934 |
10,361,720 |
37,214 |
0.4 |
% |
Postpaid(1) |
9,525,355 |
9,473,886 |
51,469 |
0.5 |
% |
9,525,355 |
9,473,886 |
51,469 |
0.5 |
% |
Prepaid(2)(3) |
873,579 |
887,834 |
(14,255) |
(1.6 |
%) |
873,579 |
887,834 |
(14,255) |
(1.6 |
%) |
| Mobile connected devices |
|
|
|
|
|
|
|
|
| Net subscriber activations |
83,505 |
56,216 |
27,289 |
48.5 |
% |
216,991 |
210,539 |
6,452 |
3.1 |
% |
Subscribers(1) |
3,252,554 |
2,943,087 |
309,467 |
10.5 |
% |
3,252,554 |
2,943,087 |
309,467 |
10.5 |
% |
(1)In Q3 2025, Bell CTS Canada reduced its postpaid mobile phone and connected device subscriber bases by 51,541 and 7,867, respectively, following a review of a public sector customer account to eliminate subscribers with no usage.
(2)In Q4 2024, we removed 124,216 Bell prepaid mobile phone subscribers from our prepaid mobile phone subscriber base in Bell CTS Canada as at December 31, 2024, as we stopped selling new plans for this service as of that date.
(3)In Q3 2024, we removed 77,971 Virgin Plus prepaid mobile phone subscribers from our prepaid mobile phone subscriber base in Bell CTS Canada as at September 30, 2024, as we stopped selling new plans for this service as of that date.
Mobile phone blended ARPU of $58.04 in Q3 2025 and $57.58 in the first nine months of the year, decreased by 0.4% and 1.0%, respectively, compared to the same periods last year, however reflecting year-over-year sequential improvement. The decline in Q3 2025 and year to date, compared to the same periods last year, was driven by:
•Ongoing but abating competitive pricing pressures in the quarter, on-rate plans and greater discounting
•Lower data overages due to greater customer adoption of monthly plans with higher data thresholds, including unlimited plans
•Decrease in roaming revenues mainly due to reduced travel to the U.S.
These factors were partly offset by:
•Flow-through of rate increases
•The favourable impact from 2024 adjustments to our mobile phone prepaid subscriber base and Q3 2025 adjustment to our mobile phone postpaid subscriber base to remove 202,187 and 51,541 subscribers, respectively
In the first nine months of the year, mobile phone blended ARPU was also favourably impacted by revenues related to the 2025 G7 Leader's Summit.
Mobile phone gross subscriber activations declined by 12.5% in Q3 2025 and by 10.6% in the first nine months of the year, compared to the same periods last year, due to both lower postpaid and prepaid gross subscriber activations.
•Mobile phone postpaid gross subscriber activations decreased by 15.6% in the quarter and by 14.4% in the first nine months of the year, compared to the same periods in 2024, driven by lower market activity, slowing population growth mainly attributable to government immigration policies, and fewer lower-valued bring-your-own-device activations, partly offset by greater contracted activations, mainly on the Bell brand, reflecting our continued focus on higher-value subscriber activations
•Mobile phone prepaid gross subscriber activations declined by 7.0% in Q3 2025 and by 2.6% in the first nine months of the year, compared to the same periods last year, due to slowing population growth, mainly from lower immigration, partly offset by effective Lucky Mobile promotional offers
28 BCE Inc. 2025 THIRD QUARTER SHAREHOLDER REPORT Mobile phone net subscriber activations decreased by 33.4% in Q3 2025, compared to the same period in 2024, due to lower postpaid and prepaid net subscriber activations. In the first nine months of the year, mobile phone net subscriber activations decreased by 37.4% due to lower postpaid net subscriber activations, partly offset by higher prepaid net subscriber activations.
•Mobile phone postpaid net subscriber activations decreased by 65.2% in the quarter and by 70.4% year to date, compared to the same periods last year, due to lower gross subscriber activations and fewer migrations from prepaid subscribers, partly offset by reduced subscriber deactivations
•Mobile phone prepaid net subscriber activations decreased by 18.2% in Q3 2025, compared to Q3 2024, due to lower gross activations and greater deactivations, partly offset by fewer migrations to postpaid subscribers. In the first nine months of the year, prepaid net subscriber activations increased by 13.6%, compared to last year, due to fewer migrations to postpaid subscribers and lower subscriber deactivations, partly offset by reduced gross activations.
Mobile phone blended churn of 1.45% in both Q3 2025 and year to date, decreased by 0.13 pts and 0.10 pts, respectively, compared to the same periods in the prior year.
•Mobile phone postpaid churn of 1.13% in both the quarter and year to date, decreased by 0.15 pts and 0.10 pts, respectively, compared to the same periods last year, due to the benefit from our greater investment in customer retention and improvements to our customer service
•Mobile phone prepaid churn of 5.10% in Q3 2025 and 5.30% in the first nine months of the year, increased by 0.44 pts and 0.31 pts, respectively, compared to the same periods in 2024, due to greater market activity, as well as the impact of the 2024 adjustments to our mobile phone prepaid subscriber base to remove 202,187 subscribers
Mobile phone subscribers at September 30, 2025 totalled 10,398,934, an increase of 0.4%, from 10,361,720 subscribers reported at the end of Q3 2024. This consisted of 9,525,355 postpaid subscribers, an increase of 0.5% from 9,473,886 subscribers reported at the end of Q3 2024, and 873,579 prepaid subscribers, a decrease of 1.6% from 887,834 subscribers reported at the end of Q3 2024. In Q3 2025, we reduced our postpaid mobile phone subscriber base by 51,541, following a review of a public sector customer account to eliminate subscribers with no usage.
Mobile connected device net subscriber activations increased by 48.5% in Q3 2025 and by 3.1% year to date, compared to the same periods last year, mainly due to lower data devices net losses and greater Connected Car net activations, partly offset by lower business Internet of Things (IoT) net activations.
Mobile connected device subscribers at September 30, 2025 totalled 3,252,554 up 10.5% from 2,943,087 subscribers reported at the end of Q3 2024. In Q3 2025, we reduced our connected device subscriber base by 7,867, following a review of a public sector customer account to eliminate subscribers with no usage.
Wireline data
Retail high-speed Internet
|
|
|
|
|
|
|
|
|
|
|
|
|
|
|
|
|
|
|
|
|
|
|
|
|
|
|
| |
Q3 2025 |
Q3 2024 |
Change |
% change |
YTD 2025 |
YTD 2024 |
Change |
% change |
| Bell CTS retail high-speed Internet net subscriber activations |
26,111 |
|
42,415 |
|
(16,304) |
|
(38.4 |
%) |
40,625 |
|
97,334 |
|
(56,709) |
|
(58.3 |
%) |
|
|
|
|
|
|
|
|
|
| Bell CTS - Canada |
21,426 |
|
42,415 |
|
(20,989) |
|
(49.5 |
%) |
35,940 |
|
97,334 |
|
(61,394) |
|
(63.1 |
%) |
| Bell CTS - U.S. |
4,685 |
|
— |
|
4,685 |
|
n.m. |
4,685 |
|
— |
|
4,685 |
|
n.m. |
Bell CTS retail high-speed Internet subscribers(1)(2)(3) |
4,890,297 |
|
4,456,709 |
|
433,588 |
|
9.7 |
% |
4,890,297 |
|
4,456,709 |
|
433,588 |
|
9.7 |
% |
Bell CTS - Canada(2)(3) |
4,443,387 |
|
4,456,709 |
|
(13,322) |
|
(0.3 |
%) |
4,443,387 |
|
4,456,709 |
|
(13,322) |
|
(0.3 |
%) |
Bell CTS - U.S.(1) |
446,910 |
|
— |
|
446,910 |
|
n.m. |
446,910 |
|
— |
|
446,910 |
|
n.m. |
|
|
|
|
|
|
|
|
|
n.m.: not meaningful
(1)In Q3 2025, as a result of the acquisition of Ziply Fiber on August 1, 2025, Bell CTS U.S. retail high-speed Internet subscriber base increased by 442,225 subscribers.
(2)In Q1 2025, we reduced our retail high-speed Internet subscriber base by 80,666 subscribers in Bell CTS Canada, as at March 31, 2025, as we stopped selling new plans for this service under the Distributel, Acanac, Oricom and B2B2C brands. Additionally, at the beginning of Q1 2025, we reduced our retail high-speed Internet subscriber base by 2,783 subscribers in Bell CTS Canada to adjust for prior year customer deactivations following a review of customer accounts.
(3)As a result of a recent CRTC decision on wholesale high-speed Internet access services, we are no longer able to resell cable Internet services to new customers in our wireline footprint as of September 12, 2024, and consequently, in Bell CTS Canada, we removed all of the existing 106,259 cable subscribers in our wireline footprint from our retail high-speed Internet subscriber base as of that date.
Bell CTS retail high-speed Internet net subscriber activations decreased by 38.4% in Q3 2025 and by 58.3% in the first nine months of the year, compared to the same periods last year, attributable to a decline in Bell CTS Canada, partly offset by the contribution from Bell CTS U.S.
Bell CTS Canada retail high-speed Internet net subscriber activations decreased by 49.5% in Q3 2025 and by 63.1% in the first nine months of the year, compared to the same periods last year, driven by fewer activations attributable to continued aggressive promotional offers by competitors, reduced new fibre footprint expansion, as well as slowing market growth, driven by lower immigration and slowing housing starts, mitigated in part by fewer customer deactivations, due to our focus on customer retention.
Bell CTS U.S. retail high-speed Internet net subscriber activations were 4,685 in the quarter and year to date, compared to nil last year, as a result of the acquisition of Ziply Fiber on August 1, 2025. Net activations benefited from the continued expansion of the fibre footprint, coupled with strong fibre penetration, more than offsetting non-fibre disconnects. Additionally, retail high-speed net activations were favourably impacted by a successful move and back-to-school period.
Bell CTS retail high-speed Internet subscribers totalled 4,890,297 at September 30, 2025, up 9.7% from 4,456,709 subscribers reported at the end of Q3 2024, due to the contribution from Bell CTS U.S. as a result of the acquisition of Ziply Fiber on August 1, 2025, moderated by a decline in Bell CTS Canada. In Q3 2025, as a result of the acquisition of Ziply Fiber on August 1, 2025, Bell CTS U.S. retail high-speed Internet subscriber base increased by 442,225 subscribers.
Bell CTS Canada retail high-speed Internet subscribers totalled 4,443,387 at September 30, 2025, down 0.3% from 4,456,709 subscribers reported at the end of Q3 2024.
Bell CTS U.S. retail high-speed Internet subscribers totalled 446,910 at September 30, 2025. In Q3 2025, as a result of the acquisition of Ziply Fiber on August 1, 2025, our retail high-speed Internet subscriber base increased by 442,225 subscribers.
Retail IPTV
|
|
|
|
|
|
|
|
|
|
|
|
|
|
|
|
|
|
|
|
|
|
|
|
|
|
|
| |
Q3 2025 |
Q3 2024 |
Change |
% change |
YTD 2025 |
YTD 2024 |
Change |
% change |
| Bell CTS retail IPTV net subscriber (losses) activations |
(16,218) |
|
9,197 |
|
(25,415) |
|
n.m. |
(48,040) |
|
22,058 |
|
(70,098) |
|
n.m. |
|
|
|
|
|
|
|
|
|
|
|
|
|
|
|
|
|
|
| Bell CTS - Canada |
(16,161) |
|
9,197 |
|
(25,358) |
|
n.m. |
(47,983) |
|
22,058 |
|
(70,041) |
|
n.m. |
| Bell CTS - U.S. |
(57) |
|
— |
|
(57) |
|
n.m. |
(57) |
|
— |
|
(57) |
|
n.m. |
Bell CTS retail IPTV subscribers(1)(2)(3) |
2,090,561 |
|
2,133,397 |
|
(42,836) |
|
(2.0 |
%) |
2,090,561 |
|
2,133,397 |
|
(42,836) |
|
(2.0 |
%) |
Bell CTS - Canada(2)(3) |
2,084,529 |
|
2,133,397 |
|
(48,868) |
|
(2.3 |
%) |
2,084,529 |
|
2,133,397 |
|
(48,868) |
|
(2.3 |
%) |
Bell CTS - U.S.(1) |
6,032 |
|
— |
|
6,032 |
|
n.m. |
6,032 |
|
— |
|
6,032 |
|
n.m. |
|
|
|
|
|
|
|
|
|
|
|
|
|
|
|
|
|
|
n.m.: not meaningful
(1)In Q3 2025, as a result of the acquisition of Ziply Fiber on August 1, 2025, Bell CTS U.S. retail IPTV subscriber base increased by 6,089 subscribers.
(2)In Q1 2025, we reduced our retail IPTV subscriber base by 441 subscribers in Bell CTS Canada, as at March 31, 2025, as we stopped selling new plans for this service under the Distributel, Acanac, Oricom and B2B2C brands.
(3)In Q2 2024, we increased our retail IPTV subscriber base by 40,997 in Bell CTS Canada to align the deactivation policy for our Fibe TV streaming services to our traditional Fibe TV service.
Bell CTS retail IPTV net subscriber losses of 16,218 in Q3 2025 and 48,040 year to date, deteriorated by 25,415 and 70,098, respectively, compared to net activations of 9,197 in Q3 2024 and 22,058 in the first nine months of 2024, driven by a deterioration in Bell CTS Canada and modest losses in Bell CTS U.S.
Bell CTS Canada retail IPTV net subscriber losses of 16,161 in Q3 2025 and 47,983 year to date, deteriorated by 25,358 in Q3 2025 and by 70,041 in the first nine months of the year, compared to the net subscriber activations of 9,197 and 22,058, respectively, in the same periods in 2024, driven by reduced pull-through on lower Internet activations, fewer activations from our Fibe TV streaming services due to our focus on growing higher-valued subscribers, increased competitive intensity and greater substitution with OTT services.
Bell CTS U.S. retail IPTV net subscriber losses were 57 in Q3 2025 and year to date, compared to nil last year, as a result of the acquisition of Ziply Fiber on August 1, 2025, reflecting greater deactivations as traditional IPTV services are challenged by customer adoption of OTT services.
Bell CTS retail IPTV subscribers at September 30, 2025 totalled 2,090,561, down 2.0% from 2,133,397 subscribers reported at the end of Q3 2024, due to a decline in Bell CTS Canada, partly offset by the contribution from Bell CTS U.S. attributable to the acquisition of Ziply Fiber on August 1, 2025, resulting in an increase to our retail IPTV subscriber base of 6,089 subscribers.
Bell CTS Canada retail IPTV subscribers at September 30, 2025 totalled 2,084,529, down 2.3% from 2,133,397 subscribers reported at the end of Q3 2024.
Bell CTS U.S. retail IPTV subscribers at September 30 2025 totalled 6,032. In Q3 2025, as a result of the acquisition of Ziply Fiber on August 1, 2025, our retail IPTV subscriber base increased by 6,089 subscribers.
30 BCE Inc. 2025 THIRD QUARTER SHAREHOLDER REPORT
Wireline voice
|
|
|
|
|
|
|
|
|
|
|
|
|
|
|
|
|
|
|
|
|
|
|
|
|
|
|
| |
Q3 2025 |
Q3 2024 |
Change |
% change |
YTD 2025 |
YTD 2024 |
Change |
% change |
| Bell CTS retail residential NAS lines net losses |
(45,990) |
|
(47,674) |
|
1,684 |
|
3.5 |
% |
(138,120) |
|
(144,835) |
|
6,715 |
|
4.6 |
% |
| Bell CTS - Canada |
(42,866) |
|
(47,674) |
|
4,808 |
|
10.1 |
% |
(134,996) |
|
(144,835) |
|
9,839 |
|
6.8 |
% |
| Bell CTS - U.S. |
(3,124) |
|
— |
|
(3,124) |
|
n.m. |
(3,124) |
|
— |
|
(3,124) |
|
n.m. |
|
|
|
|
|
|
|
|
|
Bell CTS retail residential NAS lines(1)(2) |
1,766,361 |
|
1,876,782 |
|
(110,421) |
|
(5.9 |
%) |
1,766,361 |
|
1,876,782 |
|
(110,421) |
|
(5.9 |
%) |
Bell CTS - Canada(2) |
1,685,045 |
|
1,876,782 |
|
(191,737) |
|
(10.2 |
%) |
1,685,045 |
|
1,876,782 |
|
(191,737) |
|
(10.2 |
%) |
Bell CTS - U.S.(1) |
81,316 |
|
— |
|
81,316 |
|
n.m. |
81,316 |
|
— |
|
81,316 |
|
n.m. |
|
|
|
|
|
|
|
|
|
n.m.: not meaningful
(1)In Q3 2025, as a result of the acquisition of Ziply Fiber on August 1, 2025, Bell CTS U.S. retail residential NAS lines increased by 84,440 subscribers.
(2)In Q1 2025, we reduced our retail residential NAS lines by 14,150 subscribers in Bell CTS Canada, as at March 31, 2025, as we stopped selling new plans for this service under the Distributel, Acanac, Oricom and B2B2C brands.
Bell CTS retail residential NAS lines net losses decreased by 3.5% in Q3 2025 and by 4.6% in the first nine months of the year, compared to the same periods last year, from lower net losses in Bell CTS Canada, partly offset by net losses in Bell CTS U.S.
Bell CTS Canada retail residential NAS lines net losses decreased by 10.1% in Q3 2025 and by 6.8% in the first nine months of the year, compared to the same periods last year, attributable to fewer customer deactivations, partly offset by lower gross activations resulting from ongoing substitution to wireless and Internet-based technologies, coupled with less pull-through on lower Internet activations.
Bell CTS U.S. retail residential NAS lines net losses were 3,124 in Q3 2025 and year to date, compared with nil in the same periods last year, due to the acquisition of Ziply Fiber on August 1, 2025. The net losses are impacted by ongoing substitution to wireless and Internet-based technologies.
Bell CTS retail residential NAS lines of 1,766,361 at September 30, 2025, declined by 5.9% from 1,876,782 lines reported at the end of Q3 2024 due to a decline in Bell CTS Canada, partly offset by the contribution from Bell CTS U.S. due to the acquisition of Ziply Fiber on August 1, 2025, resulting in an increase of 84,440 to our retail residential NAS lines.
Bell CTS Canada retail residential NAS lines of 1,685,045 at September 30, 2025, declined by 10.2% from 1,876,782 lines reported at the end of Q3 2024.
Bell CTS U.S. retail residential NAS lines were 81,316 at September 30, 2025. In Q3 2025, as a result of the acquisition of Ziply Fiber on August 1, 2025, our retail residential NAS lines increased by 84,440.
Assumptions
As at the date of this MD&A, our forward-looking statements set out in the BCE 2024 Annual MD&A, as updated or supplemented in the BCE 2025 First Quarter MD&A, in the BCE 2025 Second Quarter MD&A and in this MD&A, are based on certain assumptions including, without limitation, the following assumptions, the assumptions referred to in the Bell Media business segment discussion set out in section 3.2, Bell Media, of this MD&A, as well as the economic, market and other assumptions referred to in section 1.3, Assumptions of this MD&A.
Assumptions applicable to Bell CTS Canada
•Stable or slight decrease in our market share of national operators’ wireless mobile phone net additions as we manage increased competitive intensity and promotional activity across all regions and market segments
•Ongoing expansion and deployment of fifth generation (5G) and 5G+ wireless networks, offering competitive coverage and quality
•Continued diversification of our distribution strategy with a focus on expanding DTC and online transactions
•Slightly declining mobile phone blended ARPU due to competitive pricing pressure
•Continuing business customer adoption of advanced 5G, 5G+ and IoT solutions
•Continued scaling of technology services from recent acquisitions made in the enterprise market through leveraging our sales channels with the acquired businesses’ technical expertise
•Improving wireless handset device availability in addition to stable device pricing and margins
•Moderating deployment of direct fibre to incremental homes and businesses within our wireline footprint
•Continued growth in retail Internet subscribers
•Increasing wireless and Internet-based technological substitution
•Continued focus on the consumer household and bundled service offers for mobility, Internet and content services
•Continued large business customer migration to IP-based systems
•Ongoing competitive repricing pressures in our business and wholesale markets
•Traditional high-margin product categories challenged by large global cloud and OTT providers of business voice and data solutions expanding into Canada with on-demand services, which, in many cases, are also sold as a service by Bell Business Markets (BBM) to ensure continuity of customer relationships and adjacent revenue growth opportunities
•Increasing customer adoption of OTT services resulting in downsizing of TV packages and fewer consumers purchasing BDU subscriptions services
•Realization of cost savings related to operating efficiencies enabled by our direct fibre footprint, changes in consumer behaviour and product innovation, digital and AI adoption, product and service enhancements, expanding self-serve capabilities, new call centre and digital investments, other improvements to the customer service experience, management workforce reductions including attrition and retirements, and lower contracted rates from our suppliers
•No adverse material financial, operational or competitive consequences of changes in or implementation of regulations affecting our communication and technology services business
Assumptions applicable to Bell CTS U.S.
•Continued growth in retail Internet customers with continued deployment of direct fibre to incremental homes and businesses within our footprint
•Increasing retail Internet ARPU through continued migration of customers to higher speed tiers and rate increases
•Ongoing competitive repricing pressures in our business and wholesale markets
•Realization of cost savings related to operational efficiencies enabled by our direct fibre footprint, digital and AI adoption, expanding self service capabilities, and other improvements to the customer service experience
32 BCE Inc. 2025 THIRD QUARTER SHAREHOLDER REPORT
Key business developments
Launch of Disney+, Crave, and TSN streaming bundles
On August 27, 2025, Bell Media and Disney Entertainment launched new streaming bundles for the Canadian market, combining Disney+, Crave, and/or TSN. The bundles offer subscribers access to premium entertainment and sports content with packages starting at $15.75 per month for the Basic Bundle.
Crave Standard With Ads tier launch on Prime Video in Canada
On October 1, 2025, Crave Standard With Ads tier became available on Prime Video for $11.99/month. This introduction of additional Crave plans on Prime Video offers advertisers new opportunities to reach Crave’s audiences.
Long-term broadcast and streaming rights extension with Montreal Canadiens
On October 10, 2025, TSN and RDS announced a long-term agreement with the Montreal Canadiens to continue regional broadcast and streaming coverage of Montreal Canadiens games. The deal includes 50 games on TSN and 45 on RDS, available to subscribers in the team’s designated broadcast region which includes Québec and parts of Atlantic Canada.
Long-term broadcast and streaming rights extension with Winnipeg Jets
On October 30, 2025, TSN and True North Sports + Entertainment announced a long-term rights extension for Winnipeg Jets regional broadcasts and streaming, ensuring Canada’s Sports Leader is home to Jets games for years to come. Games will continue to be available to viewers located in the team’s designated broadcast region.
Extension of Bell Media and iHeartMedia partnership
On September 12, 2025, Bell Media and iHeartMedia announced a long-term extension of their exclusive partnership, continuing their collaboration on iHeartRadio Canada. The renewed agreement grants Bell Media representation of iHeartRadio’s podcast portfolio in Canada, creating opportunities for Bell Media advertisers to reach Canadian audio listeners.
Bell Media and Environics Analytics launch Outcomes Measurement
On October 22, 2025, Bell Media, in partnership with Environics Analytics (EA), announced the launch of its new Outcomes Measurement solution for TV campaigns. This measurement product will give advertisers a clear, comprehensive, and privacy-first way to connect ad exposure to real-world outcomes including sales, leads, spend, and more.
Bell Media and Tubi announce strategic ad sales and distribution partnership
On October 23, 2025, Bell Media and Tubi, Fox Corporation’s ad-supported streaming service, announced a long-term strategic partnership across ad sales and content distribution, including Canadian titles from Bell Media's market-leading on-demand catalogue and free, ad-supported streaming television (FAST) channel lineup. The partnership also includes plans to co-develop original content for distribution on Tubi globally, across Bell Media platforms in Canada, and through Sphere Abacus, Bell Media’s international content distribution company.
Financial performance analysis
Q3 2025 performance highlights
|
|
|
|
|
|
| Bell Media |
Bell Media |
| Revenues |
Adjusted EBITDA |
| (in $ millions) |
(in $ millions) |
|
(% adjusted EBITDA margin) |
|
|
| Bell Media |
Bell Media |
| Revenues |
Adjusted EBITDA |
| (in $ millions) |
(in $ millions) |
|
(% adjusted EBITDA margin) |
|
|
Bell Media results
Revenues
|
|
|
|
|
|
|
|
|
|
|
|
|
|
|
|
|
|
|
|
|
|
|
|
|
|
|
|
Q3 2025 |
Q3 2024 |
$ change |
% change |
YTD 2025 |
YTD 2024 |
$ change |
% change |
| External revenues |
648 |
|
698 |
|
(50) |
|
(7.2 |
%) |
2,097 |
|
2,070 |
|
27 |
|
1.3 |
% |
| Inter-segment revenues |
84 |
|
84 |
|
— |
|
— |
|
253 |
|
249 |
|
4 |
|
1.6 |
% |
| Bell Media operating revenues |
732 |
|
782 |
|
(50) |
|
(6.4 |
%) |
2,350 |
|
2,319 |
|
31 |
|
1.3 |
% |
34 BCE Inc. 2025 THIRD QUARTER SHAREHOLDER REPORT Bell Media operating revenues decreased by 6.4% in Q3 2025, compared to the same period last year, driven by lower advertising and subscriber revenues, partly offset by higher other revenues. In the first nine months of the year, operating revenues increased by 1.3% year over year, due to higher subscriber and other revenues, partly offset by lower advertising revenues. Operating revenues included growth from digital revenues(1) of 0.8% in Q3 2025 and 7.0% year to date, compared to the same periods last year.
•Advertising revenues decreased by 11.5% in Q3 2025 and by 3.5% year to date, compared to the same periods last year, due to continued lower demand for traditional advertising, primarily impacting conventional and entertainment specialty channels, and reduced year-over-year audio advertising revenues attributable to the previously announced divestitures of 45 radio stations along with lower demand by advertisers, partly offset by greater digital video advertising revenues from growth in Connected TV and ad-supported subscription tiers on Crave, and higher digital OOH revenues. In the first nine months of the year, the decline in advertising revenues was also moderated by higher OOH revenues from the acquisition of OUTEDGE Media Canada (OUTEDGE) in June 2024.
•Subscriber revenues decreased by 5.2% in Q3 2025, compared to the same period in 2024, due to the benefit in Q3 2024 from retroactive adjustments related to contracts with Canadian TV distributors, and continued erosion in BDU subscribers, partly offset by higher DTC streaming revenues, primarily from greater Crave and sports streaming subscribers. Conversely in the first nine months of the year, subscriber revenues increased by 3.1% year over year, as the growth in DTC streaming revenues exceeded the pressures noted above.
•Other revenues increased in Q3 2025 and year to date, compared to the same periods last year, due to the acquisition of Sphere Abacus, a content distributor, in May 2025. In the first nine months of the year, the growth in other revenues was also favourably impacted by the higher revenues from the Formula 1 (F1) Canadian Grand Prix 2025.
Operating costs and adjusted EBITDA
|
|
|
|
|
|
|
|
|
|
|
|
|
|
|
|
|
|
|
|
|
|
|
|
|
|
|
|
Q3 2025 |
Q3 2024 |
$ change |
% change |
YTD 2025 |
YTD 2024 |
$ change |
% change |
| Operating costs |
(495) |
(528) |
33 |
|
6.3% |
(1,719) |
(1,730) |
11 |
|
0.6% |
| Adjusted EBITDA |
237 |
254 |
(17) |
|
(6.7%) |
631 |
589 |
42 |
|
7.1% |
| Adjusted EBITDA margin |
32.4 |
% |
32.5 |
% |
|
(0.1) |
pts |
26.9 |
% |
25.4 |
% |
|
1.5 |
pts |
Bell Media operating costs decreased by 6.3% in Q3 2025 and by 0.6% in the first nine months of the year, compared to the same periods last year, due to:
•Lower content costs
•Cost reduction initiatives from workforce reductions and other operating efficiencies
•Lower expenses related to the radio station divestitures
These factors were partly offset by:
•Greater costs relating to the acquisition of Sphere Abacus
In the first nine months of the year, the year-over-year operating costs were also unfavourably impacted by higher costs related to the OUTEDGE acquisition and greater costs associated with the revenue growth from the F1 Canadian Grand Prix 2025.
Bell Media adjusted EBITDA declined by 6.7% in Q3 2025, compared to the same period last year, driven by lower operating revenues, partly offset by reduced operating costs. Conversely, in the first nine months of the year, adjusted EBITDA grew by 7.1% year over year, due to higher operating revenues and lower operating costs.
(1)Digital revenues are comprised of subscription revenue from DTC services and video on demand services and advertising revenue from digital platforms including websites, mobile apps, Connected TV apps and OOH digital assets/platforms, as well as advertising procured through Bell digital buying platforms.
Assumptions
As at the date of this MD&A, our forward-looking statements set out in the BCE 2024 Annual MD&A, as updated or supplemented in the BCE 2025 First Quarter MD&A, in the BCE 2025 Second Quarter MD&A and in this MD&A, are based on certain assumptions including, without limitation, the following assumptions, the assumptions referred to in the Bell CTS business segment discussion set out in section 3.1, Bell CTS, of this MD&A, as well as the economic, market and other assumptions referred to in section 1.3, Assumptions, of this MD&A.
•Overall digital revenue expected to reflect scaling of Connected TV, DTC advertising and subscriber growth, as well as digital growth in our OOH business contributing towards the advancement of our digital-first media strategy
•Leveraging of first-party data to improve targeting, advertisement delivery including personalized viewing experience and attribution
•Strategically managing escalating content acquisition and production costs to secure high-quality, differentiated programming across all screens and platforms
•Continued scaling of Crave, TSN, TSN+ and RDS through expanded distribution, optimized content offering and user experience improvements
•Continued support in original French content with a focus on digital platforms such as Crave, Noovo.ca and iHeartRadio Canada, to better serve our French-language customers through a personalized digital experience
•No adverse material financial, operational or competitive consequences of changes in or implementation of regulations affecting our media business
36 BCE Inc. 2025 THIRD QUARTER SHAREHOLDER REPORT
4 Financial and capital management
This section tells you how we manage our cash and capital resources to carry out our strategy and deliver financial results. It provides an analysis of our financial condition, cash flows and liquidity on a consolidated basis.
|
|
|
|
|
|
|
|
|
|
|
|
|
|
|
|
September 30, 2025 |
December 31, 2024 |
$ change |
% change |
| Long-term debt |
35,155 |
|
32,835 |
|
2,320 |
|
7.1 |
% |
less: 50% of junior subordinated debt(1) |
(2,177) |
|
— |
|
(2,177) |
|
n.m. |
| Debt due within one year |
5,820 |
|
7,669 |
|
(1,849) |
|
(24.1 |
%) |
50% of preferred shares(2) |
1,669 |
|
1,767 |
|
(98) |
|
(5.5 |
%) |
| Cash |
(460) |
|
(1,572) |
|
1,112 |
|
70.7 |
% |
| Cash equivalents |
(5) |
|
— |
|
(5) |
|
n.m. |
| Short-term investments |
— |
|
(400) |
|
400 |
|
100.0 |
% |
Net debt(3) |
40,002 |
|
40,299 |
|
(297) |
|
(0.7 |
%) |
n.m.: not meaningful
(1)50% of junior subordinated debt at September 30, 2025 is excluded as it has been afforded equity treatment by certain credit rating agencies.
(2)50% of outstanding preferred shares of $3,338 million and $3,533 million at September 30, 2025 and December 31, 2024, respectively, are classified as debt consistent with the treatment by certain credit rating agencies.
(3)Net debt is a non-GAAP financial measure. See section 8.1, Non-GAAP financial measures in this MD&A for more information on this measure.
The decrease of $1,849 million in debt due within one year and the increase of $2,320 million in long-term debt were due to:
•the issuance by Bell Canada of Series A Fixed-to-Fixed Rate Junior Subordinated Notes (Series A Notes), with a total principal amount of $1,000 million in U.S. dollars ($1,416 million in Canadian dollars)
•the issuance by Bell Canada of Series B Fixed-to-Fixed Rate Junior Subordinated Notes (Series B Notes), with a total principal amount of $1,250 million in U.S. dollars ($1,771 million in Canadian dollars)
•the issuance by Bell Canada of Series C Fixed-to-Fixed Rate Junior Subordinated Notes (Series C Notes), with a total principal amount of $1,250 million
•the issuance by Bell Canada of Series M-64 MTN debentures, with a total principal amount of $400 million
•the issuance by Bell Canada of Series M-65 MTN debentures, with a total principal amount of $500 million
•the issuance by Bell Canada of Series M-66 MTN debentures, with a total principal amount of $600 million
•the issuance by Bell Canada of Series M-67 MTN debentures, with a total principal amount of $500 million
•an increase in outstanding loans of $376 million in U.S. dollars ($521 million in Canadian dollars) under the Bell Canada unsecured committed term loan agreement
•an increase of $1,942 million in U.S. dollars ($2,679 million in Canadian dollars) upon the acquisition of Ziply Fiber comprised of Term Notes with an outstanding principal amount of $1,594 million in U.S. dollars ($2,199 million in Canadian dollars), Funding Notes with an outstanding principal amount of $367 million in U.S. dollars ($506 million in Canadian dollars) and lease liabilities and other debt of $16 million in U.S. dollars ($23 million in Canadian dollars), partly offset by unamortized debt costs of $35 million in U.S. dollars ($49 million in Canadian dollars)
•an increase in outstanding loans of $500 million in U.S. dollars ($697 million in Canadian dollars) under a new unsecured term loan agreement
Partly offset by:
•the repayment at maturity of Series M-47 MTN debentures, with a total principal amount of $1,500 million
•the repayment at maturity of Series M-49 MTN debentures, with a total principal amount of $600 million
•the repurchase by Bell Canada, pursuant to tender offers, for an aggregate cash purchase price of $633 million in U.S. dollars ($903 million in Canadian dollars) of:
•a principal amount of $174 million in U.S. dollars ($249 million in Canadian dollars) of its Series US-2 Notes, that had an outstanding principal amount of $600 million in U.S. dollars ($856 million in Canadian dollars)
•a principal amount of $79 million in U.S. dollars ($112 million in Canadian dollars) of its Series US-4 Notes, that had an outstanding principal amount of $500 million in U.S. dollars ($713 million in Canadian dollars)
•a principal amount of $183 million in U.S. dollars ($261 million in Canadian dollars) of its Series US-5 Notes, that had an outstanding principal amount of $600 million in U.S. dollars ($856 million in Canadian dollars)
•a principal amount of $191 million in U.S. dollars ($273 million in Canadian dollars) of its Series US-6 Notes, that had an outstanding principal amount of $650 million in U.S. dollars ($927 million in Canadian dollars)
•a principal amount of $217 million in U.S. dollars ($310 million in Canadian dollars) of its Series US-7 Notes, that had an outstanding principal amount of $750 million in U.S. dollars ($1,070 million in Canadian dollars)
•the repurchase by Bell Canada, pursuant to tender offers, for an aggregate cash purchase price of $1,498 million of:
•a principal amount of $105 million of its Series M-39 MTN debentures, that had an outstanding principal amount of $500 million
•a principal amount of $100 million of its Series M-45 MTN debentures, that had an outstanding principal amount of $500 million
•a principal amount of $1,166 million of its Series M-51 MTN debentures, that had an original outstanding principal amount of $1,250 million
•a principal amount of $460 million of its Series M-55 MTN debentures, that had an outstanding principal amount of $550 million
•a decrease in debt of $636 million due to an early debt redemption gain as a result of the tender offers described above
•the repurchase by Bell Canada, in the open market, for a cash purchase price of $6 million, of a principal amount of $7 million of its Series M-55 MTN debentures, that had an outstanding principal amount of $90 million, following the tender offers described above
•the repayment of the outstanding loan of $600 million in U.S. dollars ($814 million in Canadian dollars) under the Bell Mobility Inc. (Bell Mobility) trade loan agreement
•the redemption, prior to maturity, of the outstanding principal amount of $1,594 million in U.S. dollars ($2,192 million in Canadian dollars) of Ziply Fiber's Term Notes
•the redemption, prior to maturity, of the outstanding principal amount of $367 million in U.S. dollars ($509 million in Canadian dollars) of Ziply Fiber's Funding Notes
•a decrease in notes payable (net of issuances) of $628 million
•a net decrease of $577 million mainly due to lower lease liabilities and other debt and foreign exchange fluctuations on U.S. debt for which we have entered into hedges. Refer to section 4.5, Financial risk management, of this MD&A for more details.
The decrease in cash of $1,112 million, the decrease in short-term investments of $400 million and the increase in cash equivalents of $5 million were mainly due to:
•$8,167 million repayment of long-term debt, excluding principal payment of lease liabilities
•$4,880 million of business acquisitions, mainly from the acquisition of Ziply Fiber
•$2,383 million of capital expenditures
•$1,618 million of dividends paid on BCE common shares
•$879 million principal payment of lease liabilities
•$628 million decrease in notes payable (net of issuances)
•$188 million paid for other financing activities which includes early debt redemption costs at Ziply Fiber
•$157 million paid for other investing activities which includes a pre-acquisition loan to Ziply Fiber
•$143 million paid for the repurchase of BCE preferred shares
•$129 million paid for the purchase on the open market of BCE common shares for the settlement of share-based payments
•$105 million of dividends paid on BCE preferred shares
Partly offset by:
•$7,653 million of issuance of long-term debt
•$5,432 million of cash flows from operating activities
•$4,686 million of decrease in investments due to the sale of our minority stake in MLSE
4.2 Outstanding share data
|
|
|
|
|
|
| Common shares outstanding |
Number of shares |
| Outstanding, January 1, 2025 |
912,283,103 |
|
| Shares issued under deferred share plan |
715 |
|
| Shares issued under BCE's Shareholder Dividend Reinvestment and Stock Purchase Plan (DRP) |
20,241,999 |
|
|
|
|
|
Outstanding, September 30, 2025 |
932,525,817 |
|
On May 7, 2025, the Board determined that common shares distributed under BCE's DRP will no longer be issued from treasury at a 2% discount to the average market price and will rather be purchased by BCE's agent, TSX Trust Company, on the secondary market with cash provided by BCE. The modifications became effective commencing with the dividend payable on July 15, 2025 to eligible holders of common shares as of the June 16, 2025 record date, and subsequently until further notice.
|
|
|
|
|
|
|
|
|
| Stock options outstanding |
Number of options |
Weighted average
exercise price ($) |
| Outstanding, January 1, 2025 |
6,545,819 |
|
61 |
|
|
|
|
|
|
|
| Forfeited or expired |
(1,042,645) |
|
57 |
|
|
|
|
| Outstanding and exercisable, September 30, 2025 |
5,503,174 |
|
62 |
|
|
|
|
38 BCE Inc. 2025 THIRD QUARTER SHAREHOLDER REPORT
|
|
|
|
|
|
|
|
|
|
|
|
|
|
|
|
|
|
|
|
|
|
|
|
|
|
|
|
Q3 2025 |
Q3 2024 |
$ change |
% change |
YTD 2025 |
YTD 2024 |
$ change |
% change |
| Cash flows from operating activities |
1,914 |
|
1,842 |
|
72 |
|
3.9 |
% |
5,432 |
|
5,111 |
|
321 |
|
6.3 |
% |
| Capital expenditures |
(891) |
|
(954) |
|
63 |
|
6.6 |
% |
(2,383) |
|
(2,934) |
|
551 |
|
18.8 |
% |
| Cash dividends paid on preferred shares |
(28) |
|
(43) |
|
15 |
|
34.9 |
% |
(105) |
|
(134) |
|
29 |
|
21.6 |
% |
| Cash dividends paid by subsidiaries to NCI |
(25) |
|
(14) |
|
(11) |
|
(78.6 |
%) |
(38) |
|
(56) |
|
18 |
|
32.1 |
% |
| Acquisition and other costs paid |
33 |
|
1 |
|
32 |
|
n.m. |
47 |
|
27 |
|
20 |
|
74.1 |
% |
|
|
|
|
|
|
|
|
|
|
|
|
|
|
|
|
|
|
| Free cash flow |
1,003 |
|
832 |
|
171 |
|
20.6 |
% |
2,953 |
|
2,014 |
|
939 |
|
46.6 |
% |
| Principal payment of lease liabilities |
(297) |
|
(305) |
|
8 |
|
2.6 |
% |
(879) |
|
(872) |
|
(7) |
|
(0.8 |
%) |
Free cash flow after payment of lease liabilities(1) |
706 |
|
527 |
|
179 |
|
34.0 |
% |
2,074 |
|
1,142 |
|
932 |
|
81.6 |
% |
|
|
|
|
|
|
|
|
|
| Business acquisitions |
(4,857) |
|
(73) |
|
(4,784) |
|
n.m. |
(4,880) |
|
(590) |
|
(4,290) |
|
n.m. |
| Business dispositions |
— |
|
— |
|
— |
|
— |
|
38 |
|
— |
|
38 |
|
n.m. |
| Decrease in investments |
4,686 |
|
10 |
|
4,676 |
|
n.m. |
4,686 |
|
10 |
|
4,676 |
|
n.m. |
| Acquisition and other costs paid |
(33) |
|
(1) |
|
(32) |
|
n.m. |
(47) |
|
(27) |
|
(20) |
|
(74.1 |
%) |
| Decrease in short-term investments |
— |
|
— |
|
— |
|
— |
|
400 |
|
250 |
|
150 |
|
60.0 |
% |
| Spectrum licences |
(3) |
|
(13) |
|
10 |
|
76.9 |
% |
(3) |
|
(531) |
|
528 |
|
99.4 |
% |
|
|
|
|
|
|
|
|
|
|
|
|
|
|
|
|
|
|
|
|
|
|
|
|
|
|
|
| Other investing activities |
(145) |
|
(18) |
|
(127) |
|
n.m. |
(157) |
|
(39) |
|
(118) |
|
n.m. |
|
|
|
|
|
|
|
|
|
| Increase (decrease) in notes payable |
98 |
|
763 |
|
(665) |
|
(87.2 |
%) |
(628) |
|
2,146 |
|
(2,774) |
|
n.m. |
|
|
|
|
|
|
|
|
|
| Issue of long-term debt |
2,898 |
|
10 |
|
2,888 |
|
n.m. |
7,653 |
|
3,818 |
|
3,835 |
|
n.m. |
| Repayment of long-term debt, excluding principal payment of lease liabilities |
(2,768) |
|
(38) |
|
(2,730) |
|
n.m. |
(8,167) |
|
(2,109) |
|
(6,058) |
|
n.m. |
|
|
|
|
|
|
|
|
|
|
|
|
|
|
|
|
|
|
|
|
|
|
|
|
|
|
|
|
|
|
|
|
|
|
|
|
| Purchase of shares for settlement of share-based payments |
(33) |
|
(42) |
|
9 |
|
21.4 |
% |
(129) |
|
(186) |
|
57 |
|
30.6 |
% |
| Repurchase of preferred shares |
(67) |
|
— |
|
(67) |
|
n.m. |
(143) |
|
(76) |
|
(67) |
|
(88.2 |
%) |
| Cash dividends paid on common shares |
(408) |
|
(910) |
|
502 |
|
55.2 |
% |
(1,618) |
|
(2,703) |
|
1,085 |
|
40.1 |
% |
|
|
|
|
|
|
|
|
|
|
|
|
|
|
|
|
|
|
|
|
|
|
|
|
|
|
|
|
|
|
|
|
|
|
|
|
|
|
|
|
|
|
|
|
|
| Other financing activities |
(121) |
|
(3) |
|
(118) |
|
n.m. |
(188) |
|
(17) |
|
(171) |
|
n.m. |
| Effect of currency exchange rate changes on cash and cash equivalents |
2 |
|
— |
|
2 |
|
n.m. |
2 |
|
— |
|
2 |
|
n.m. |
|
|
|
|
|
|
|
|
|
| Net (decrease) increase in cash |
(47) |
|
462 |
|
(509) |
|
n.m. |
(1,112) |
|
1,313 |
|
(2,425) |
|
n.m. |
| Net increase (decrease) in cash equivalents |
2 |
|
(250) |
|
252 |
|
n.m. |
5 |
|
(225) |
|
230 |
|
n.m. |
n.m.: not meaningful
(1)Free cash flow after payment of lease liabilities is a non-GAAP financial measure. Refer to section 8.1, Non-GAAP financial measures in this MD&A for more information on this measure.
Cash flows from operating activities and free cash flow
Cash flows from operating activities in the third quarter of 2025 increased by $72 million, compared to the same period last year, mainly due to higher cash from working capital and lower severance and other costs paid, partly offset by higher interest paid and higher income taxes paid.
Cash flows from operating activities in the first nine months of 2025 increased by $321 million, compared to the same period last year, mainly due to lower income taxes paid and higher cash from working capital, partly offset by higher interest paid and higher severance and other costs paid.
Free cash flow in the third quarter of 2025 increased by $171 million compared to the same period last year, mainly due to higher cash flows from operating activities, excluding cash from acquisition and other costs paid, and lower capital expenditures and lower cash dividends paid on preferred shares.
Free cash flow in the first nine months of 2025 increased by $939 million compared to the same period last year, mainly due to lower capital expenditures and higher cash flows from operating activities, excluding cash from acquisition and other costs paid.
Capital expenditures
|
|
|
|
|
|
|
|
|
|
|
|
|
|
|
|
|
|
|
|
|
|
|
|
|
|
|
|
Q3 2025 |
Q3 2024 |
$ change |
% change |
YTD 2025 |
YTD 2024 |
$ change |
% change |
| Bell CTS |
860 |
919 |
59 |
|
6.4 |
% |
2,291 |
2,839 |
548 |
|
19.3 |
% |
Capital intensity(1) |
15.9 |
% |
17.4 |
% |
|
1.5 |
pts |
14.3 |
% |
17.8 |
% |
|
3.5 |
pts |
| Bell CTS - Canada |
732 |
919 |
187 |
|
20.3 |
% |
2,163 |
2,839 |
676 |
|
23.8 |
% |
| Capital intensity |
13.9 |
% |
17.4 |
% |
|
3.5 |
pts |
13.7 |
% |
17.8 |
% |
|
4.1 |
pts |
| Bell CTS - U.S. |
128 |
— |
(128) |
|
n.m. |
128 |
— |
(128) |
|
n.m. |
| Capital intensity |
80.0 |
% |
— |
|
(80.0) |
pts |
80.0 |
% |
— |
|
(80.0) |
pts |
| Bell Media |
31 |
35 |
4 |
|
11.4 |
% |
92 |
95 |
3 |
|
3.2 |
% |
| Capital intensity |
4.2 |
% |
4.5 |
% |
|
0.3 |
pts |
3.9 |
% |
4.1 |
% |
|
0.2 |
pts |
| BCE |
891 |
954 |
63 |
|
6.6 |
% |
2,383 |
2,934 |
551 |
|
18.8 |
% |
| Capital intensity |
14.7 |
% |
16.0 |
% |
|
1.3 |
pts |
13.2 |
% |
16.3 |
% |
|
3.1 |
pts |
n.m.: not meaningful
(1)Capital intensity is defined as capital expenditures divided by operating revenues. Refer to section 8.6, KPIs in this MD&A for more information on this measure.
BCE capital expenditures of $891 million in Q3 2025 and $2,383 million in the first nine months of the year, declined by 6.6% and 18.8%, respectively, over the same periods last year. This corresponded to a capital intensity ratio of 14.7% in Q3 2025 and 13.2% year to date, down 1.3 pts and 3.1 pts, respectively. The year-over-year declines in capital expenditures were mainly attributable to decreased investment at Bell CTS of $59 million in Q3 2025 and $548 million in the first nine months of the year, driven by reduced spending in Bell CTS Canada, partly offset by greater spending in Bell CTS U.S. following the acquisition of Ziply Fiber on August 1, 2025. The decline in the quarter and year to date reflected the following:
•Lower year-over-year capital spending in Bell CTS Canada of $187 million in Q3 2025 and $676 million year to date, aligned with the planned reduction in capital spending, primarily from slower FTTP footprint expansion, partly as a result of regulatory decisions that discourage network investment
•Increased spending in Bell CTS U.S. of $128 million in both the quarter and year to date, as a result of the acquisition of Ziply Fiber. Capital investments were focused on the continued expansion of the FTTP network.
Business acquisitions
On August 1, 2025, Bell Canada completed the acquisition of Ziply Fiber, the leading fibre Internet provider in the Pacific Northwest of the U.S., for cash consideration of $3.64 billion in U.S. dollars ($5.01 billion in Canadian dollars) which was $3.52 billion in U.S. dollars net of cash acquired ($4.84 billion in Canadian dollars net of cash acquired).
On July 2, 2024, Bell Canada acquired Stratejm Inc. for cash consideration of $78 million ($73 million net of cash acquired) and additional cash consideration contingent on the achievement of certain performance objectives. This contingent consideration is expected to be settled by 2027 and the maximum amount payable is $20 million.
On June 7, 2024, Bell Media completed the acquisition of OUTFRONT Media Inc.’s Canadian OOH media business, OUTEDGE, for cash consideration of $429 million ($418 million net of cash acquired). Pursuant to a consent agreement negotiated with the Competition Bureau, in April 2025, Bell Media disposed of 669 advertising displays in Québec and Ontario for proceeds of $14 million.
Decrease in investments
On July 1, 2025, BCE completed the previously announced disposition of its minority stake in MLSE. We recorded gross proceeds of $4.7 billion.
Spectrum licences
On November 30, 2023, Bell Mobility secured the right to acquire 939 licences of 3800 Megahertz (MHz) spectrum across Canada for $518 million. On January 17, 2024, Bell made a first payment of $104 million to Innovation, Science and Economic Development Canada. The remaining balance of $414 million was paid on May 29, 2024, at which time Bell acquired the 3800 MHz spectrum licences.
40 BCE Inc. 2025 THIRD QUARTER SHAREHOLDER REPORT In the third quarter of 2025, we repaid debt, net of issuances. This included:
Debt instruments
2025
•$3,065 million repayment of long-term debt comprised of:
•the redemption, prior to maturity, of the outstanding principal amount of $1,594 million in U.S. dollars ($2,192 million in Canadian dollars) of Ziply Fiber's Term Notes
•the redemption, prior to maturity, of the outstanding principal amount of $367 million in U.S. dollars ($509 million in Canadian dollars) of Ziply Fiber's Funding Notes
•the repurchase by Bell Canada, in the open market, for a cash purchase price of $6 million, of a principal amount of $7 million of its Series M-55 MTN debentures, that had an outstanding principal amount of $90 million
•principal payment of lease liabilities of $297 million
•net payments of other debt of $61 million
Partly offset by:
•$2,898 million issuance of long-term debt comprised of:
•the issuance by Bell Canada of Series M-64 MTN debentures, with a total principal amount of $400 million
•the issuance by Bell Canada of Series M-65 MTN debentures, with a total principal amount of $500 million
•the issuance by Bell Canada of Series M-66 MTN debentures, with a total principal amount of $600 million
•the issuance by Bell Canada of Series M-67 MTN debentures, with a total principal amount of $500 million
•an increase in outstanding loans of $148 million in U.S. dollars ($206 million in Canadian dollars) under the Bell Canada unsecured committed term loan agreement
•an increase in outstanding loans of $500 million in U.S. dollars ($697 million in Canadian dollars) under a new unsecured term loan agreement
•partly offset by $5 million of discounts on our debt issuances
•$98 million issuance (net of repayments) of notes payable
In the first nine months of 2025, we repaid debt, net of issuances. This included:
•$9,046 million repayment of long-term debt comprised of:
•the repayment at maturity of Series M-47 MTN debentures with a total principal amount of $1,500 million
•the repayment at maturity of Series M-49 MTN debentures with a total principal amount of $600 million
•the repurchase by Bell Canada, pursuant to tender offers, for an aggregate cash purchase price of $633 million in U.S. dollars ($903 million in Canadian dollars), of an aggregate principal amount of $844 million in U.S. dollars ($1,205 million in Canadian dollars), representing part of the outstanding principal amount of five of its series of U.S. notes. Refer to section 4.1, Net debt, of this MD&A for more details.
•the repurchase by Bell Canada, pursuant to tender offers, for an aggregate cash purchase price of $1,498 million, of an aggregate principal amount of $1,831 million representing part of the outstanding principal amount of four of its series of MTN debentures. Refer to section 4.1, Net Debt, of this MD&A for more details.
•the repurchase by Bell Canada, in the open market, for a cash purchase price of $6 million, of a principal amount of $7 million of its Series M-55 MTN debentures, that had an outstanding principal amount of $90 million, following the tender offers described above
•the repayment of the outstanding loan of $600 million in U.S. dollars ($814 million in Canadian dollars) under the Bell Mobility trade loan agreement
•the redemption, prior to maturity, of the outstanding principal amount of $1,594 million in U.S. dollars ($2,192 million in Canadian dollars) of Ziply Fiber's Term Notes
•the redemption, prior to maturity, of the outstanding principal amount of $367 million in U.S. dollars ($509 million in Canadian dollars) of Ziply Fiber's Funding Notes
•principal payment of lease liabilities of $879 million
•net payments of other debt of $145 million
•$628 million repayment (net of issuances) of notes payable
Partly offset by:
•$7,653 million issuance of long-term debt comprised of:
•the issuance of Series A Notes with a total principal amount of $1,000 million U.S. dollars ($1,416 million in Canadian dollars)
•the issuance of Series B Notes with a total principal amount of $1,250 million U.S. dollars ($1,771 million in Canadian dollars)
•the issuance of Series C Notes with a total principal amount of $1,250 million
•the issuance by Bell Canada of Series M-64 MTN debentures, with a total principal amount of $400 million
•the issuance by Bell Canada of Series M-65 MTN debentures, with a total principal amount of $500 million
•the issuance by Bell Canada of Series M-66 MTN debentures, with a total principal amount of $600 million
•the issuance by Bell Canada of Series M-67 MTN debentures, with a total principal amount of $500 million
•an increase in outstanding loans of $376 million in U.S. dollars ($521 million in Canadian dollars) under the Bell Canada unsecured committed term loan agreement
•an increase in outstanding loans of $500 million in U.S. dollars ($697 million in Canadian dollars) under a new unsecured term loan agreement
•the issuance of $3 million of other debt
•partly offset by $5 million of discounts on our debt issuances
2024
In the third quarter of 2024, we issued debt, net of repayments. This included:
•$763 million issuance (net of repayments) of notes payable
•$10 million issuance of long-term debt
Partly offset by:
•$343 million repayment of long-term debt comprised of:
•principal payment of lease liabilities of $305 million
•net payments of other debt of $38 million
In the first nine months of 2024, we issued debt, net of repayments. This included:
•$3,818 million issuance of long-term debt comprised of:
•the issuance of Series US-9 Notes with a total principal amount of $700 million in U.S. dollars ($942 million in Canadian dollars)
•the issuance of Series US-10 Notes with a total principal amount of $750 million in U.S. dollars ($1,009 million in Canadian dollars)
•the issuance of Series M-61 MTN debentures with a total principal amount of $400 million
•the issuance of Series M-63 MTN debentures with a total principal amount of $1,100 million
•the increase of $324 million in outstanding loans under the Bell Mobility uncommitted trade loan agreement
•the issuance of other debt of $50 million, partly offset by $7 million of discounts on our debt issuances
•$2,146 million issuance (net of repayments) of notes payable
Partly offset by:
•$2,981 million repayment of long-term debt comprised of:
•the repayment of Series M-44 MTN debentures with a total principal amount of $1,000 million
•the repayment of Series US-3 Notes with a total principal amount of $600 million in U.S. dollars ($748 million in Canadian dollars)
•the repayment of Series 10 Notes with a total principal amount of $225 million
•principal payment of lease liabilities of $872 million
•net payments of other debt of $136 million
Repurchase of preferred shares
2025
For the three and nine months ended September 30, 2025, BCE repurchased and canceled 3,482,011 and 7,844,542 First Preferred Shares under its NCIB for a total cost of $67 million and $143 million, respectively.
Subsequent to quarter end, BCE repurchased and canceled 1,078,447 First Preferred Shares under its NCIB for a total cost of $21 million.
2024
For the nine months ended September 30, 2024, BCE repurchased and canceled 4,301,488 First Preferred Shares under its NCIB for a total cost of $76 million.
Cash dividends paid on common shares
In the third quarter of 2025, cash dividends paid on common shares decreased by $502 million compared to Q3 2024, due to a lower dividend paid in Q3 2025 of $0.4375 per common share compared to $0.9975 per common share in Q3 2024.
In the first nine months of 2025, cash dividends paid on common shares decreased by $1,085 million compared to 2024, as 20,241,999 common shares were issued from treasury under the DRP, for $633 million, and due to a lower dividend paid in the first nine months of 2025 of $2.4325 per common share compared to $2.9625 per common share for the same period last year.
42 BCE Inc. 2025 THIRD QUARTER SHAREHOLDER REPORT
4.4 Post-employment benefit plans
For the three months ended September 30, 2025, we recorded an increase in our post-employment benefit plans and a gain, before taxes, in OCI of $302 million, due to a higher-than-expected return on plan assets, partly offset by an increase in the effect of the asset limit. The discount rate of 4.8% at September 30, 2025 did not change compared to June 30, 2025.
For the nine months ended September 30, 2025, we recorded an increase in our post-employment benefit plans and a gain, before taxes, in OCI of $509 million, due to a higher-than-expected return on plan assets and an increase in the discount rate of 4.8% at September 30, 2025, compared to 4.7% at December 31, 2024, partly offset by an increase in the effect of the asset limit.
For the three months ended September 30, 2024, we recorded an increase in our post-employment benefit plans and a gain, before taxes, in OCI of $125 million, due to a higher-than-expected return on plan assets, partly offset by a decrease in the discount rate to 4.7% at September 30, 2024, compared to 5.0% at June 30, 2024 and an increase in the effect of the asset limit.
For the nine months ended September 30, 2024, we recorded an increase in our post-employment benefit plans and a gain, before taxes, in OCI of $706 million, due to a higher-than-expected return on plan assets, and an increase in the discount rate to 4.7% at September 30, 2024, compared to 4.6% at December 31, 2023, partly offset by an increase in the effect of the asset limit.
4.5 Financial risk management
Fair value
The following table provides the fair value details of certain financial instruments measured at amortized cost in the consolidated statements of financial position (statements of financial position).
|
|
|
|
|
|
|
|
|
|
|
|
|
|
|
|
|
|
|
|
|
| |
|
|
September 30, 2025 |
December 31, 2024 |
|
|
|
|
|
|
|
|
Classification |
Fair value methodology |
Carrying value |
Fair value |
Carrying value |
Fair value (1) |
|
|
|
|
|
|
|
|
|
|
|
|
|
|
|
|
|
|
|
|
|
Debt securities
and other debt |
Debt due within one year and long-term debt |
Quoted market price of debt |
33,469 |
|
33,710 |
|
31,247 |
|
30,022 |
|
(1)We have reclassified amounts from the previous period to make them consistent with the presentation of the current period.
The following table provides the fair value details of financial instruments measured at fair value in the statements of financial position.
|
|
|
|
|
|
|
|
|
|
|
|
|
|
|
|
|
|
|
Classification |
Fair value |
| Carrying value of asset (liability) |
Quoted prices in active markets for identical assets (level 1) |
Observable market data (level 2)(1) |
Non-observable market inputs (level 3)(2) |
| September 30, 2025 |
|
|
|
|
|
Publicly-traded and privately-held investments(3) |
Other non-current assets |
928 |
|
73 |
|
— |
|
855 |
|
| Derivative financial instruments |
Other current assets, trade payables and other liabilities, other non-current assets and liabilities |
(580) |
|
— |
|
(580) |
|
— |
|
|
|
|
|
|
|
| Other |
Other non-current assets |
244 |
|
— |
|
244 |
|
— |
|
| December 31, 2024 |
|
|
|
|
|
Publicly-traded and privately-held investments(3) |
Other non-current assets |
877 |
|
35 |
|
— |
|
842 |
|
| Derivative financial instruments |
Other current assets, trade payables and other liabilities, other non-current assets and liabilities |
(368) |
|
— |
|
(368) |
|
— |
|
|
|
|
|
|
|
| Other |
Other non-current assets |
225 |
|
— |
|
225 |
|
— |
|
(1)Observable market data such as equity prices, interest rates, swap rate curves and foreign currency exchange rates.
(2)Non-observable market inputs such as discounted cash flows and revenue and earnings multiples. For certain privately-held investments, changes in our valuation assumptions may result in a significant change in the fair value of our level 3 financial instruments.
(3)Unrealized gains and losses are recorded in OCI in the consolidated statements of comprehensive income and are reclassified from Accumulated OCI to the Deficit in the statements of financial position when realized.
Market risk
Currency exposures
In 2025, we entered into and subsequently settled deal contingent foreign exchange forward contracts with a notional amount of $905 million in U.S. dollars ($1,241 million in Canadian dollars) and foreign exchange forward contracts with a notional amount of $1,019 million in U.S. dollars ($1,402 million in Canadian dollars) to hedge the U.S. currency exposure related to the Ziply Fiber acquisition cost. In 2025, we also designated U.S. dollar cash deposits of $3,545 million ($4,908 million in Canadian dollars) to hedge the U.S. currency exposure related to the Ziply Fiber acquisition cost. A net gain of $7 million from settlement of the foreign exchange forwards and cash deposits is reflected in the Ziply Fiber acquisition cost.
In 2025, we designated an unsecured term loan of $500 million in U.S. dollars ($697 million in Canadian dollars) to partially hedge the U.S. currency exposure related to our net investment in Ziply Fiber.
In 2025, we entered into amortizing cross currency interest rate swaps with a notional amount of $376 million in U.S. dollars ($521 million in Canadian dollars), to hedge the U.S. currency exposure on other debt maturing in 2029. The fair value of the amortizing cross currency interest rate swaps at September 30, 2025 was a net asset of $1 million recognized in Other current assets and Other non-current liabilities in the statements of financial position.
In 2025, we terminated cross currency interest rate swaps expiring in 2025 and 2026 with a notional amount of $600 million in U.S. dollars ($814 million in Canadian dollars) used to hedge the U.S. currency exposure of loans maturing in 2025 and 2026 under our Bell Mobility trade loan agreement. The fair value of the cross currency interest rate swaps at the date of termination was $4 million.
In 2025, following the repurchase of a portion of certain debt prior to maturity, we proportionately terminated the corresponding cross currency interest rate swaps used to hedge the U.S. currency exposure of this debt. Specifically, we terminated cross currency interest rate swaps with a notional amount of $174 million in U.S. dollars ($235 million in Canadian dollars) relating to our Series US-2 Notes, $79 million in U.S. dollars ($100 million in Canadian dollars) relating to our Series US-4 Notes, $183 million in U.S. dollars ($230 million in Canadian dollars) relating to our Series US-5 Notes, $191 million in U.S. dollars ($241 million in Canadian dollars) relating to our Series US-6 Notes and $217 million in U.S. dollars ($276 million in Canadian dollars) relating to our Series US-7 Notes. The fair value of the cross currency interest rate swaps at the date of termination was a net liability of $110 million, reflected in the initial fair value of the cross currency interest rate swaps relating to our Series A Notes and Series B Notes described below.
44 BCE Inc. 2025 THIRD QUARTER SHAREHOLDER REPORT
In 2025, we entered into foreign exchange swaps with a notional amount of $1,000 million in U.S. dollars ($1,398 million in Canadian dollars), maturing in 2025, to hedge the U.S. currency exposure of our Series A Notes maturing in 2055. Also in 2025, we terminated a portion of these foreign exchange swaps with a notional amount $871 million in U.S. dollars ($1,218 million in Canadian dollars). The fair value of the foreign exchange swaps at the dates of termination was a net liability of $12 million, which is reflected in the initial fair value of the cross currency interest rate swaps relating to our Series A Notes described below. The fair value of the remaining foreign exchange swaps with a notional amount of $129 million in U.S. dollars ($180 million in Canadian dollars) at September 30, 2025 was a net liability of $1 million recognized in Other current assets and Trade payables and other liabilities in the statements of financial position.
In 2025, we entered into foreign exchange swaps with a notional amount of $1,250 million in U.S. dollars ($1,769 million in Canadian dollars) to hedge the U.S. currency exposure of our Series B Notes maturing in 2055. The foreign exchange swaps matured in 2025. The fair value of the foreign exchange swaps at maturity was $13 million. Subsequently, we entered into foreign exchange swaps with a notional amount of $828 million in U.S. dollars ($1,167 million in Canadian dollars), maturing in 2025, to hedge the U.S. currency exposure of our Series B Notes. In 2025, we terminated a portion of these foreign exchange swaps with a notional amount of $456 million in U.S. dollars ($643 million in Canadian dollars). The fair value of the foreign exchange swaps at the date of termination was a liability of $24 million, of which $14 million is reflected in the initial fair value of the cross currency interest rate swaps relating to our Series B Notes described below. The fair value of the remaining foreign exchange swaps with a notional amount of $372 million in U.S. dollars ($524 million in Canadian dollars) at September 30, 2025 was a net liability of $7 million recognized in Other current assets and Trade payables and other liabilities in the statements of financial position.
In 2025, we entered into cross currency interest rate swaps with a notional amount of $871 million in U.S. dollars ($1,286 million in Canadian dollars), maturing in 2030, to hedge the U.S. currency exposure of our Series A Notes maturing in 2055. The fair value of the cross currency interest rate swaps at September 30, 2025 was a net liability of $63 million recognized in Other current assets, Other non-current assets, Trade payables and other liabilities and Other non-current liabilities in the statements of financial position. This fair value reflects an initial net liability of $55 million on termination of the cross currency swaps and an initial liability of $12 million on termination of the foreign exchange swaps, both noted above, and an initial asset of $5 million on termination of the interest rate swaps noted below.
In 2025, we entered into cross currency interest rate swaps with a notional amount of $878 million in U.S. dollars ($1,288 million in Canadian dollars), maturing in 2035 to hedge the U.S. currency exposure of our Series B Notes maturing in 2055. The fair value of the cross currency interest rate swaps at September 30, 2025 was a net liability of $56 million recognized in Other current assets, Other non-current assets, Trade payables and other liabilities and Other non-current liabilities in the statements of financial position. This fair value reflects an initial net liability of $55 million on termination of the cross currency swaps noted above and an initial liability of $14 million related to the terminated foreign exchange swaps also noted above.
The following table provides details on our outstanding foreign currency forward contracts and options at September 30, 2025.
|
|
|
|
|
|
|
|
|
|
|
|
|
|
|
|
|
|
|
|
|
| Type of hedge |
Buy
currency |
Amount to receive |
Sell
currency |
Amount
to pay |
Maturity |
Hedged item |
Cash flow (1) |
USD |
1,163 |
|
CAD |
1,604 |
|
2025 |
Loans |
| Cash flow |
USD |
1,100 |
|
CAD |
1,515 |
|
2025 |
Commercial paper |
| Cash flow |
USD |
208 |
|
CAD |
271 |
|
2025 |
Anticipated purchases |
| Cash flow |
PHP |
802 |
|
CAD |
19 |
|
2025 |
|
Anticipated purchases |
| Cash flow |
USD |
641 |
|
CAD |
852 |
|
2026 |
|
Anticipated purchases |
| Cash flow |
PHP |
3,299 |
|
CAD |
79 |
|
2026 |
|
Anticipated purchases |
| Cash flow |
USD |
320 |
|
CAD |
427 |
|
2027 |
|
Anticipated purchases |
| Economic - put options |
USD |
96 |
|
CAD |
126 |
|
2025 |
|
Anticipated purchases |
Economic - options (2) |
USD |
350 |
|
CAD |
477 |
|
2025 |
|
Anticipated purchases |
| Economic - swaps |
CAD |
341 |
|
USD |
250 |
|
2026 |
Anticipated purchases |
| Economic - swaps |
USD |
125 |
|
CAD |
170 |
|
2026 |
Anticipated purchases |
| Economic - call options |
USD |
120 |
|
CAD |
158 |
|
2026 |
Anticipated purchases |
Economic - options (2) |
USD |
200 |
|
CAD |
273 |
|
2026 |
Anticipated purchases |
| Economic - call options |
CAD |
348 |
|
USD |
240 |
|
2026 |
Anticipated purchases |
| Economic - put options |
USD |
150 |
|
CAD |
197 |
|
2026 |
Anticipated purchases |
| Economic - call options |
USD |
150 |
|
CAD |
197 |
|
2027 |
Anticipated purchases |
| Economic - put options |
USD |
120 |
|
CAD |
158 |
|
2027 |
Anticipated purchases |
| Economic - call options |
CAD |
360 |
|
USD |
240 |
|
2028 |
Anticipated purchases |
|
|
|
|
|
|
|
|
|
|
|
|
|
|
|
|
|
|
|
|
|
|
|
|
|
|
|
|
|
|
|
|
|
|
|
|
|
|
|
|
|
|
|
|
|
|
|
|
|
|
|
|
|
|
|
|
|
|
|
|
|
|
|
|
|
|
|
|
|
|
|
|
|
|
|
|
|
|
|
|
|
|
|
|
|
|
|
|
|
|
|
|
|
|
|
|
|
|
(1)Forward contracts to hedge loans secured by receivables under our securitization program.
(2)Foreign currency options with a leverage provision and a profit cap limitation.
A 10% depreciation (appreciation) in the value of the Canadian dollar relative to the U.S. dollar would result in a loss of $21 million (loss of $36 million) recognized in net earnings at September 30, 2025 and a gain of $163 million (loss of $146 million) recognized in OCI at September 30, 2025, with all other variables held constant.
Interest rate exposures
In 2025, we entered into interest rate swaps with a notional amount of $300 million, maturing in 2033, to hedge the fair value of our Series M-65 MTN debentures maturing in 2033. The fair value of the interest rate swaps at September 30, 2025 was an asset of $4 million recognized in Other current assets and Other non-current assets in the statements of financial position.
In 2025, we entered into an interest rate swap with a notional amount of $300 million, maturing in 2036, to hedge the fair value of our Series M-66 MTN debentures maturing in 2036. The fair value of the interest rate swap at September 30, 2025 was an asset of $4 million recognized in Other current assets and Other non-current assets in the statements of financial position.
In 2025, we sold interest rate swaptions with a notional amount of $690 million, expiring in 2025 and maturing in 2030 and 2035, to hedge economically the fair value of our Series A Notes and Series B Notes maturing in 2055 for $3 million. Also in 2025, interest rate swaptions with a notional amount of $345 million expired unexercised and an interest rate swaption with a notional amount of $172 million was settled at its fair value of nil. The fair value of the remaining interest rate swaption with a notional amount of $173 million at September 30, 2025 was a liability of $1 million recognized in Trade payables and other liabilities in the statements of financial position.
In 2025, we entered into bond forwards with a notional amount of $300 million, maturing in 2025, to hedge economically the cost to repurchase a portion of our Series M-55 MTN debentures maturing in 2051. The fair value of the bond forwards at the date of maturity was a loss of $3 million.
In 2025, we entered into interest rate swaps with a notional amount of $372 million in U.S. dollars ($531 million in Canadian dollars), maturing in 2030, to hedge the fair value of our Series A Notes maturing in 2055. We terminated a portion of these interest rate swaps with a notional amount of $243 million in U.S. dollars ($344 million in Canadian dollars). The fair value of the interest rate swaps at the date of termination was an asset of $5 million, which is reflected in the initial fair value of the cross currency interest rate swaps relating to our Series A Notes described above. The fair value of the remaining interest rate swaps with a notional amount of $129 million in U.S. dollars ($183 million in Canadian dollars) at September 30, 2025 was an asset of $3 million recognized in Other non-current assets in the statements of financial position.
In 2025, we entered into interest rate swaps with a notional amount of $372 million in U.S. dollars ($531 million in Canadian dollars), maturing in 2035, to hedge the fair value of our Series B Notes maturing in 2055. The fair value of the interest rate swaps at September 30, 2025 was an asset of $9 million recognized in Other current assets and Other non-current assets in the statements of financial position.
In 2025, we terminated interest rate floors expiring in 2029 with a notional amount of $350 million used to hedge economically the interest cost of our Series M-62 MTN debentures maturing in 2029. In 2025, we also terminated interest rate swaps expiring in 2029 with a notional amount of $105 million used to hedge the fair value of our Series M-62 MTN debentures. The fair value of the interest rate floors and interest rate swaps at the date of termination was nil.
In 2025, we entered into forward starting interest rate swaps, effective from 2025, with a notional amount of $423 million, maturing in 2055, to hedge the interest rate exposure on future debt issuances. The fair value of the forward starting interest rate swaps upon issuance of our M-67 MTN debentures was an asset of $25 million.
In 2025, we entered into and subsequently terminated forward starting cross currency basis rate swaps with a notional amount of $350 million in U.S. dollars ($500 million in Canadian dollars) to hedge economically the basis rate on the termination of the cross currency interest rate swaps noted above. The fair value of the forward starting cross currency basis rate swaps at the date of termination was a liability of $3 million.
A 1% increase (decrease) in interest rates would result in a loss of $18 million (gain of $5 million) recognized in net earnings and a gain (loss) of $1 million recognized in OCI for the nine months ended September 30, 2025, with all other variables held constant.
Equity price exposures
We use equity forward contracts on BCE’s common shares to hedge economically the cash flow exposure related to the settlement of equity settled share-based compensation plans. The fair value of our equity forward contracts at September 30, 2025 and December 31, 2024 was a net liability of $430 million and $429 million, respectively, recognized in Other current assets, Trade payables and other liabilities, and Other non-current liabilities in the statements of financial position. A gain of $31 million (loss of $11 million) for the three and nine months ended September 30, 2025, respectively, and a gain of $42 million (loss of $71 million) for the three and nine months ended September 30, 2024, respectively, relating to these equity forward contracts is recognized in Other (expense) income in the income statements.
A 5% increase (decrease) in the market price of BCE’s common shares would result in a gain (loss) of $17 million recognized in net earnings at September 30, 2025, with all other variables held constant.
46 BCE Inc. 2025 THIRD QUARTER SHAREHOLDER REPORT
BCE's and Bell Canada's key credit ratings from Moody's Investors Service, Inc. and S&P Global Ratings Canada, a business unit of S&P Global Canada Corp. (S&P), remain unchanged from those described in section 6.6, Credit ratings of the BCE 2024 Annual MD&A.
On May 8, 2025, S&P revised its outlook on BCE and Bell Canada to negative from stable principally as a result of ongoing debt leverage above S&P’s thresholds for the current ratings. However, S&P affirmed all of BCE’s and Bell Canada’s existing ratings.
On May 16, 2025, DBRS Limited (DBRS) downgraded Bell Canada's issuer rating to BBB from BBB (high), senior (unsubordinated) long-term debt rating to BBB from BBB (high), subordinated long-term debt rating to BB (high) from BBB (low), junior subordinated long-term debt rating to BB (high) from BBB (low) and commercial paper rating to R-2 (middle) from R-2 (high). In addition, DBRS downgraded BCE's issuer rating to BBB (low) from BBB. BCE's preferred shares rating was confirmed at Pfd-3. Consequently, DBRS removed the credit ratings from “Under Review with Negative Implications”, where they were placed on November 5, 2024. The outlook associated with the DBRS ratings is stable. The downgrades were principally as a result of ongoing debt leverage above DBRS’ thresholds for the prior ratings. All of the new ratings on Bell Canada’s senior (unsubordinated) long-term debt and commercial paper remain investment grade according to DBRS’ rating scale with DBRS’ BBB (low) rating representing its last investment grade rating rank for long-term debt and R-2 (low) rating representing its last investment grade rating rank for short-term debt. The new BB (high) rating for Bell Canada’s subordinated long-term debt and junior subordinated long-term debt is considered the highest rating below an investment grade rating on DBRS’ rating scale.
This section contains forward-looking statements, including relating to the sources of liquidity we expect to use to meet our 2025 cash requirements, BCE's annualized common share dividend and BCE's common share dividend payout policy target. Refer to the section Caution regarding forward-looking statements at the beginning of this MD&A.
Available liquidity
Total available liquidity(1) at September 30, 2025 was $3.6 billion, comprised of $460 million in cash, $5 million in cash equivalents, $700 million available under our securitized receivables program and $2.5 billion available under our $4.0 billion committed revolving and expansion credit facilities (given $1.5 billion of commercial paper outstanding).
Total available liquidity at December 31, 2024 was $4.5 billion, comprised of $1,572 million in cash, $400 million in short-term investments, $700 million available under our securitized receivables program and $1.8 billion available under our $4.0 billion committed revolving and expansion credit facilities (given $2.2 billion of commercial paper outstanding).
On July 1, 2025, BCE completed the previously announced disposition of its 37.5% ownership stake in MLSE for gross proceeds of $4.7 billion. BCE directed the net proceeds of this disposition towards the acquisition of Ziply Fiber.
We expect that our cash, cash equivalents, short-term investments, amounts available under our securitized receivables program, cash flows from operations and possible capital markets financings will permit us to meet our cash requirements in 2025 for capital expenditures, post-employment benefit plans funding, dividend payments, the payment of contractual obligations, maturing debt, ongoing operations and other cash requirements.
Should our 2025 cash requirements exceed our cash, cash equivalents, short-term investments, cash generated from our operations, and funds raised under capital markets financings and our securitized receivables program, we would expect to cover such a shortfall by drawing under committed credit facilities that are currently in place or through new facilities to the extent available.
We continuously monitor our operations, capital markets and the Canadian economy with the objective of maintaining adequate liquidity.
(1)Available liquidity is a non-GAAP financial measure. Refer to section 8.1, Non-GAAP financial measures in this MD&A for more information on this measure.
Credit facilities
On September 23, 2025, Bell Canada entered into a $500 million in U.S. dollars ($692 million in Canadian dollars) unsecured term loan agreement to finance certain transactions in the U.S. On September 26, 2025, $500 million in U.S. dollars ($697 million in Canadian dollars) was drawn under this loan agreement. The term loan is repayable at maturity in September 2032. The loan agreement has been designated as a net investment hedge of Bell Canada’s investment in Ziply Fiber.
On April 14, 2025, Bell Canada entered into a $700 million in U.S. dollars ($972 million in Canadian dollars) unsecured committed term loan agreement to finance certain purchase obligations. A first loan advance in the amount of $228 million in U.S. dollars ($315 million in Canadian dollars) was made on April 29, 2025. On August 19, 2025, a second loan advance in the amount of $148 million in U.S. dollars ($206 million in Canadian dollars) was made. Subsequent to quarter end, on November 4, 2025, a third loan advance in the amount of $111 million in U.S. dollars ($157 million in Canadian dollars) was made. The term loans are repayable in multiple periodic installments between July 2026 until maturity of the credit facility in April 2029. The loan advances have been hedged for foreign currency fluctuations.
On November 1, 2024, Bell Canada entered into a commitment letter (Commitment Letter) for a $3,700 million unsecured term loan facility (Ziply Term Facility) denominated in U.S. dollars ($5,048 million in Canadian dollars) that was available to be drawn to finance the acquisition of Ziply Fiber. In Q1 2025 and pursuant to the terms and conditions of the Commitment Letter, Bell Canada made reductions of $965 million in U.S. dollars ($1,387 million in Canadian dollars) in the aggregate amount of the Commitment Letter. On April 15, 2025, Bell Canada made further reductions of $225 million in U.S. dollars ($314 million in Canadian dollars) in the aggregate amount of the Commitment Letter. On July 2, 2025, Bell Canada terminated the Ziply Term Facility and canceled the remaining $2,510 million in U.S. dollars ($3,419 million in Canadian dollars) in the aggregate amount of the Commitment Letter as a result of the completion of the previously announced disposition of its minority stake in MLSE for gross proceeds of $4.7 billion.
Cash requirements
Common share dividend
On May 8, 2025, BCE announced that the Board had determined to establish the annualized dividend at $1.75 per BCE common share effective starting from the July 15, 2025 dividend payment date. In addition, BCE’s common share dividend payout(1) policy was updated to target a dividend payout range of 40% to 55% of free cash flow. Please refer to the section 1.2, Key corporate and business developments – Dividend and dividend payout policy in the BCE 2025 First Quarter MD&A for additional information.
The Board declared on November 5, 2025 a quarterly dividend of $0.4375 per common share, payable on January 15, 2026 to shareholders of record at the close of business on December 15, 2025.
Dividend rates and the declaration of dividends by the Board are ultimately dependent on BCE’s operations and financial results, which are in turn subject to various assumptions and risks, including those outlined in the BCE 2024 Annual MD&A, as updated in the BCE 2025 First Quarter MD&A, the BCE 2025 Second Quarter MD&A and in this MD&A.
Commitments (Off-balance sheet)
Subsequent to quarter end, our commitments for property, plant and equipment and intangible assets increased by $358 million, which are payable $33 million in 2026, $33 million in 2027, $33 million in 2028, $33 million in 2029, $33 million in 2030 and $193 million thereafter.
(1)Dividend payout ratio is a non-GAAP ratio. Refer to section 8.2, Non-GAAP ratios in this MD&A for more information on this measure.
48 BCE Inc. 2025 THIRD QUARTER SHAREHOLDER REPORT
5 Quarterly financial information
BCE’s Q3 2025 Financial Statements were prepared in accordance with IFRS® Accounting Standards, as issued by the International Accounting Standards Board (IASB), under International Accounting Standard (IAS) 34, Interim Financial Reporting and were approved by BCE’s board of directors on November 5, 2025.
The following table, which was also prepared in accordance with IFRS Accounting Standards, shows selected consolidated financial data of BCE for the eight most recent completed quarters.
|
|
|
|
|
|
|
|
|
|
|
|
|
|
|
|
|
|
|
|
|
|
|
|
|
|
|
|
|
|
|
|
2025 |
2024 |
2023 |
|
|
Q3 |
Q2 |
Q1 |
Q4 |
Q3 |
Q2 |
Q1 |
Q4 |
|
|
| Operating revenues |
|
|
|
|
|
|
|
|
|
|
|
| Service |
|
5,329 |
|
5,267 |
|
5,172 |
|
5,287 |
|
5,286 |
|
5,308 |
|
5,192 |
|
5,348 |
|
|
|
| Product |
|
720 |
|
818 |
|
758 |
|
1,135 |
|
685 |
|
697 |
|
819 |
|
1,125 |
|
|
|
| Total operating revenues |
|
6,049 |
|
6,085 |
|
5,930 |
|
6,422 |
|
5,971 |
|
6,005 |
|
6,011 |
|
6,473 |
|
|
|
| Adjusted EBITDA |
|
2,762 |
|
2,674 |
|
2,558 |
|
2,605 |
|
2,722 |
|
2,697 |
|
2,565 |
|
2,567 |
|
|
|
| Severance, acquisition and other costs |
|
(82) |
|
(41) |
|
(247) |
|
(154) |
|
(49) |
|
(22) |
|
(229) |
|
(41) |
|
|
|
| Depreciation |
|
(969) |
|
(949) |
|
(941) |
|
(933) |
|
(934) |
|
(945) |
|
(946) |
|
(954) |
|
|
|
| Amortization |
|
(340) |
|
(338) |
|
(331) |
|
(317) |
|
(325) |
|
(325) |
|
(316) |
|
(299) |
|
|
|
| Impairment of assets |
|
(970) |
|
(8) |
|
(9) |
|
(4) |
|
(2,113) |
|
(60) |
|
(13) |
|
(109) |
|
|
|
| Gains (losses) on investments |
|
5,175 |
|
(8) |
|
(2) |
|
(1) |
|
66 |
|
(2) |
|
(6) |
|
2 |
|
|
|
|
|
|
|
|
|
|
|
|
|
|
|
|
|
|
|
|
|
|
|
|
|
|
|
|
|
|
|
|
|
|
|
|
|
|
|
| Net earnings (loss) |
|
4,555 |
|
644 |
|
683 |
|
505 |
|
(1,191) |
|
604 |
|
457 |
|
435 |
|
|
|
| Net earnings (loss) attributable to common shareholders |
|
4,502 |
|
579 |
|
630 |
|
461 |
|
(1,237) |
|
537 |
|
402 |
|
382 |
|
|
|
|
|
|
|
|
|
|
|
|
|
|
|
|
|
|
|
|
|
|
|
|
|
|
|
|
|
|
|
|
|
|
|
|
|
|
|
| EPS - basic and diluted |
|
4.84 |
|
0.63 |
|
0.68 |
|
0.51 |
|
(1.36) |
|
0.59 |
|
0.44 |
|
0.42 |
|
|
|
|
|
|
|
|
|
|
|
|
|
|
|
|
|
|
|
|
|
|
|
|
|
|
|
|
|
|
|
|
|
|
|
|
|
|
|
|
|
|
|
|
|
|
|
|
|
|
|
|
|
|
|
|
|
|
|
|
|
|
|
|
|
|
|
|
|
|
|
|
|
|
|
|
|
|
|
|
|
|
|
|
|
|
|
|
|
|
|
|
|
|
|
|
|
|
|
|
|
|
|
|
|
|
|
|
|
|
|
|
|
|
|
|
|
|
|
|
|
|
|
|
|
|
|
|
|
|
|
|
|
|
|
| Weighted average number of common shares outstanding – basic (millions) |
|
932.5 |
|
930.9 |
|
920.3 |
|
912.3 |
|
912.3 |
|
912.3 |
|
912.3 |
|
912.3 |
|
|
|
|
|
|
|
|
|
|
|
|
|
|
|
|
|
|
|
|
|
|
|
|
|
|
|
|
|
|
|
|
|
|
|
|
|
|
|
|
|
|
|
|
|
|
|
|
|
|
|
6 Regulatory environment
The following is an update to the regulatory initiatives and proceedings described in the BCE 2024 Annual MD&A under section 3.3, Principal business risks and section 8, Regulatory environment, as updated in the BCE 2025 First Quarter MD&A and the BCE 2025 Second Quarter MD&A.
Telecommunications Act
Review of the wholesale high-speed access service framework
On November 6, 2023, in Telecom Decision CRTC 2023-358 (the Interim Decision), the CRTC determined that aggregated access to Bell Canada’s FTTP facilities in Ontario and Québec should be mandated on a temporary and expedited basis, and the CRTC set interim access rates. On August 13, 2024, in Telecom Regulatory Policy CRTC 2024-180 (the Final Decision), the CRTC mandated that the interim obligation to provide wholesale aggregated access to Bell Canada’s FTTP facilities in Ontario and Québec, and to Telus Communications Inc.’s (Telus’) FTTP facilities in Québec, would be made final. Further, the Final Decision expanded the geographic scope of the Interim Decision such that Bell Canada was required to provide wholesale aggregated access to its FTTP facilities in Atlantic Canada and Manitoba by February 13, 2025. Telus and Saskatchewan Telecommunications (SaskTel) were also required to provide aggregated access to their respective FTTP facilities in Alberta, B.C., and Saskatchewan by the same date. This obligation does not apply to any new FTTP networks that Bell Canada, Telus or SaskTel make available at retail during the five-year period between August 13, 2024 and August 12, 2029. However, this five-year period is not a continuously rolling period. Instead, all new FTTP locations, regardless of when they are made available at retail, will be subject to a wholesale aggregated access obligation as of August 12, 2029. Under the Final Decision, cable companies are exempt from wholesale FTTP obligations and, as such, are not required to provide wholesale access to their FTTP networks. Also, under the Final Decision, Bell Canada, SaskTel, Telus, Cogeco Communications Inc. (Cogeco), Bragg Communications Inc. carrying on business as Eastlink (Eastlink), Rogers Communications Canada Inc. (Rogers), Québecor Media Inc., and their respective affiliates are not eligible to buy mandated aggregated wholesale high-speed access, whether over copper, coaxial cable, or FTTP, within their traditional incumbent wireline footprints. As a result, Distributel and other Bell Canada brands were required to, and did, cease reselling wholesale high-speed access over coaxial cable to new customers after September 12, 2024.
In a motion dated September 12, 2024, SaskTel sought leave to appeal the Final Decision to the Federal Court of Appeal, which was granted in October 2025. Several parties, including Competitive Network Operators of Canada (CNOC), Cogeco, Eastlink, Rogers and TekSavvy Solutions Inc. filed Part 1 applications asking the CRTC to review and vary several aspects of the Final Decision. On June 20, 2025, the CRTC issued Telecom Decision CRTC 2025-154 (the R&V Decision) denying all of the review and vary applications. In a motion dated July 18, 2025, Cogeco and Eastlink sought leave to appeal the R&V Decision to the Federal Court of Appeal, which was granted on September 10, 2025. CNOC, Cogeco, Eastlink and SaskTel filed a joint appeal of the Final Decision to the Governor-in-Council. On August 6, 2025, the Governor-in-Council announced that it had declined to alter the Final Decision. In September 2025, Cogeco, Eastlink and SaskTel, Rogers, and CNOC filed appeals of the R&V Decision to the Governor-in-Council.
On October 25, 2024, in Telecom Order CRTC 2024-261, the CRTC updated interim rates for Ontario and Quebec and set interim rates for the other provinces. If final rates are established that are different from the interim rates, there is a risk they will be applied retroactively.
The imposition of an aggregated access to FTTP facilities obligation, and, in particular, making Telus and Rogers eligible to resell services on Bell Canada’s FTTP network, have undermined Bell Canada’s incentives to invest in next-generation wireline networks. As a direct result, Bell Canada has reduced its capital expenditures by $500 million in 2025 alone and by over $1.2 billion since the Interim Decision in November 2023. The financial impact of these regulatory obligations will be determined in part by whether the CRTC establishes final rates that fully compensate Bell Canada for the significant costs and risks Bell Canada assumes in expanding and upgrading its networks.
CRTC review of access to poles
On October 16, 2023, Bell Canada filed Tariff Notice 981 to revise the tariff pages for its National Services Tariff CRTC 7400 Item 901 – Support Structure Service to reflect an updated monthly pole rental rate per unit applicable in its Ontario and Québec serving area and, on March 11, 2025, in Telecom Order CRTC 2025-77, the CRTC made the existing pole rates interim. The CRTC issued its final decision on rates on October 17, 2025, establishing a final rate of $1.32 per billing unit per month for attachment to our poles, an increase from the previous $1.04 which will increase our revenues.
Bill C-8, An Act Respecting Cyber Security
Bill C-8 has passed the second reading stage in the House of Commons and has been referred to the Standing Committee on Public Safety and National Security for study.
50 BCE Inc. 2025 THIRD QUARTER SHAREHOLDER REPORT
CRTC proceedings on outage reporting, consumer protections associated with outages and network resiliency
On September 4, 2025, the CRTC issued a decision and two consultations that could materially impact Bell Canada's operational and compliance costs. Telecom Decision CRTC 2025-225 introduces mandatory outage reporting for telecommunications service providers, including new reporting thresholds tied to user-minutes which would significantly increase the amount of reporting by providers which had previously been set for outages that impact 100,000 users or more. The CRTC agreed to a request from a large group of providers to suspend the application of the new reporting thresholds pending its consideration of an application from that group seeking changes to the notification regime. While implementation is suspended pending review, Bell Canada anticipates incremental compliance costs for enhanced monitoring and reporting systems, as well as potential adverse publicity with respect to outages.
The CRTC also opened a consultation (Telecom Notice of Consultation CRTC 2025-226) on network resiliency standards. The consultation seeks input on measures intended to harden infrastructure, improve outage response, and enhance reliability across Canada’s telecommunications networks. Prescriptive requirements could drive additional capital expenditures to comply with regulatory mandates, particularly in rural and remote markets where construction is particularly cost-intensive.
The CRTC also seeks input on consumer protections during outages (Telecom and Broadcasting Notice of Consultation CRTC 2025-227), including potential compensation and/or notification frameworks. Depending on the outcome, Bell Canada may face new obligations for customer credits and communication protocols, which could increase operating expenses and require system changes, further increasing compliance costs and regulatory burden.
Broadcasting Act
Broadcasting and Telecom Notice of Consultation CRTC 2025-274
On October 17, 2025, the CRTC issued Broadcasting and Telecom Notice of Consultation CRTC 2025-274, Improving customer awareness of the CCTS. This consultation seeks comments on measures to improve customer awareness of the Commission for Complaints for Telecom-television Services Inc. (CCTS). The CRTC’s preliminary view is to amend the Internet Code, Wireless Code and Television Service Provider Code (the Consumer Protection Codes) to standardize how and when customers are advised about their right to take unresolved complaints to the CCTS. The Notice of Consultation set out a deadline for initial submissions of November 17, 2025. A large group of service providers, including Bell Canada, Rogers Communications Canada Inc., Telus Communications Inc., Cogeco Communications Inc., Québecor Media Inc., Bragg Communications Inc. carrying on business as Eastlink, Saskatchewan Telecommunications, and Xplore Inc., have jointly written to the CRTC expressing concern regarding the Notice of Consultation – including that the measures supported in the CRTC’s preliminary view cannot practically be implemented – and asked the CRTC to suspend the current timelines and establish a different process for considering the relevant issues. The timing of any CRTC decision with respect to this proceeding is currently unknown and it is unclear what impact, if any, this proceeding could have on our business and financial results. Any action by the CRTC to require telecom service providers to implement new workflows within their complaint-resolution processes is likely to have a negative impact on our business and financial results as a result of increased operational costs or other negative outcomes.
Other
Bill C-18, the Online News Act
On June 22, 2023, Bill C-18, An Act respecting online communications platforms that make news content available to persons in Canada (the Online News Act), received royal assent. The Online News Act requires digital news intermediaries, such as Google, that share news content produced by other news outlets to negotiate commercial arrangements with those news outlets, compensating them for the news content shared on digital platforms. The legislation entitles Bell Media’s general news services, such as CTV and Noovo, to compensation. Further details regarding the compensation framework have been set out in regulations that were released on December 15, 2023 (the Regulations). The Regulations allow Google to apply to be exempt from parts of the Online News Act if it commits to pay $100 million annually (growing each year by inflation) to a collective (the Collective) which will then distribute it to eligible news outlets. On June 7, 2024, Google submitted an application for exemption to the CRTC and on October 28, 2024, the CRTC approved a five-year exemption for Google, which required Google to provide payment to the Collective by December 27, 2024 for calendar year 2024. Bell Media received an initial payment of $5.3 million in April 2025 which represents approximately 60% of our total payment for 2024, with the remainder expected to follow in the fall of 2025.
Bill C-2, the Strong Borders Act
On June 3, 2025, the federal government introduced Bill C-2, An Act respecting certain measures relating to the security of the border between Canada and the United States and respecting other related security measures (the Strong Borders Act), in response to calls from the U.S. administration for enhanced security along the U.S.-Canada border. On October 8, 2025, the federal government tabled the Strengthening Canada’s Immigration System and Borders Act (Bill C-12) as a streamlined version of Bill C-2 that focuses on border and immigration controls and omits the lawful access provisions that had raised opposition and civil liberties concerns. While it has not been formally withdrawn, the status of Bill C-2 is now unclear.
7 Accounting policies
BCE’s Q3 2025 Financial Statements were prepared in accordance with IFRS Accounting Standards, as issued by the IASB, under IAS 34 - Interim Financial Reporting and were approved by BCE’s board of directors on November 5, 2025. These financial statements were prepared using the same basis of presentation, accounting policies and methods of computation as outlined in Note 2, Material accounting policies in BCE’s consolidated financial statements for the year ended December 31, 2024. BCE's Q3 2025 Financial Statements do not include all of the notes required in the annual financial statements.
Future changes to accounting standards
The following accounting standard and amendments to accounting standards issued by the IASB have not yet been adopted by BCE.
|
|
|
|
|
|
|
|
|
|
|
|
| Standard |
Description |
Impact |
Effective date |
|
|
|
|
|
|
|
|
|
|
|
|
IFRS 18 – Presentation and Disclosure in Financial Statements |
Sets out requirements and guidance on presentation and disclosure in financial statements, including:
•presentation in the income statements of income and expenses within defined categories - operating, investing, financing, income taxes and discontinued operations
•presentation in the income statements of new defined subtotals - operating profit and profit before financing and income taxes
•disclosure of explanations of management-defined performance measures that are related to the income statements
•enhanced guidance on aggregation and disaggregation of information and whether to provide information in the financial statements or in the notes
•disclosure of specified expenses by nature
IFRS 18 replaces IAS 1 - Presentation of Financial Statements but carries forward many of the requirements from IAS 1 unchanged.
|
We are currently assessing the impact of this standard. |
Annual reporting periods beginning on or after January 1, 2027. Early application is permitted. |
| Amendments to the Classification and Measurement of Financial Instruments – Amendments to IFRS 9 and IFRS 7 |
In particular, the amendments clarify:
•the classification of financial assets with ESG and similar features
•the derecognition date for financial liabilities and introduce an accounting policy option for financial liabilities settled using an electronic payment system if certain conditions are met
The amendments also require additional disclosures for financial instruments with contractual terms that reference a contingent event and equity instruments classified at fair value through OCI.
|
We are currently assessing the impact of these amendments. |
Annual reporting periods beginning on or after January 1, 2026. Early application is permitted. |
52 BCE Inc. 2025 THIRD QUARTER SHAREHOLDER REPORT
8 Non-GAAP financial measures, other financial measures and key performance indicators (KPIs)
BCE uses various financial measures to assess its business performance. Certain of these measures are calculated in accordance with IFRS Accounting Standards or GAAP while certain other measures do not have a standardized meaning under GAAP. We believe that our GAAP financial measures, read together with adjusted non-GAAP and other financial measures, provide readers with a better understanding of how management assesses BCE’s performance.
National Instrument 52-112, Non-GAAP and Other Financial Measures Disclosure (NI 52-112), prescribes disclosure requirements that apply to the following specified financial measures:
•Non-GAAP financial measures
•Non-GAAP ratios
•Total of segments measures
•Capital management measures
•Supplementary financial measures
This section provides a description and classification of the specified financial measures contemplated by NI 52-112 that we use to explain our financial results except that, for supplementary financial measures, an explanation of such measures is provided where they are first referred to in this MD&A if the supplementary financial measures’ labelling is not sufficiently descriptive.
8.1 Non-GAAP financial measures
A non-GAAP financial measure is a financial measure used to depict our historical or expected future financial performance, financial position or cash flow and, with respect to its composition, either excludes an amount that is included in, or includes an amount that is excluded from, the composition of the most directly comparable financial measure disclosed in BCE’s consolidated primary financial statements. We believe that non-GAAP financial measures are reflective of our on-going operating results and provide readers with an understanding of management’s perspective on and analysis of our performance.
Below are descriptions of the non-GAAP financial measures that we use to explain our results as well as reconciliations to the most directly comparable financial measure under IFRS Accounting Standards.
The term adjusted net earnings does not have any standardized meaning under IFRS Accounting Standards. Therefore, it is unlikely to be comparable to similar measures presented by other issuers.
We define adjusted net earnings as net earnings (loss) attributable to common shareholders before severance, acquisition and other costs, net mark-to-market losses (gains) on derivatives used to economically hedge equity settled share-based compensation plans, net equity losses (gains) on investments in associates and joint ventures, net losses (gains) on investments, early debt redemption costs (gains), impairment of assets and discontinued operations, net of tax and NCI.
We use adjusted net earnings and we believe that certain investors and analysts use this measure, among other ones, to assess the performance of our businesses without the effects of severance, acquisition and other costs, net mark-to-market losses (gains) on derivatives used to economically hedge equity settled share-based compensation plans, net equity losses (gains) on investments in associates and joint ventures, net losses (gains) on investments, early debt redemption costs (gains), impairment of assets and discontinued operations, net of tax and NCI. We exclude these items because they affect the comparability of our financial results and could potentially distort the analysis of trends in business performance. Excluding these items does not imply they are non-recurring.
The most directly comparable financial measure under IFRS Accounting Standards is net earnings (loss) attributable to common shareholders.
The following table is a reconciliation of net earnings (loss) attributable to common shareholders to adjusted net earnings on a consolidated basis.
|
|
|
|
|
|
|
|
|
|
|
|
|
|
|
|
Q3 2025 |
Q3 2024 |
YTD 2025 |
YTD 2024 |
| Net earnings (loss) attributable to common shareholders |
4,502 |
|
(1,237) |
|
5,711 |
|
(298) |
|
| Reconciling items: |
|
|
|
|
| Severance, acquisition and other costs |
82 |
|
49 |
|
370 |
|
300 |
|
Net mark-to-market (gains) losses on derivatives used to economically
hedge equity settled share-based compensation plans |
(31) |
|
(42) |
|
11 |
|
71 |
|
| Net equity losses on investments in associates and joint ventures |
— |
|
154 |
|
— |
|
247 |
|
| Net gains on investments |
(5,175) |
|
(66) |
|
(5,165) |
|
(58) |
|
| Early debt redemption costs (gains) |
154 |
|
— |
|
(203) |
|
— |
|
| Impairment of assets |
970 |
|
2,113 |
|
987 |
|
2,186 |
|
| Income taxes for the above reconciling items |
239 |
|
(258) |
|
255 |
|
(368) |
|
| NCI for the above reconciling items |
(8) |
|
(25) |
|
(8) |
|
(26) |
|
|
|
|
|
|
| Adjusted net earnings |
733 |
|
688 |
|
1,958 |
|
2,054 |
|
Available liquidity
The term available liquidity does not have any standardized meaning under IFRS Accounting Standards. Therefore, it is unlikely to be comparable to similar measures presented by other issuers.
We define available liquidity as cash, cash equivalents, short-term investments and amounts available under our securitized receivables program and our committed bank credit facilities, excluding credit facilities that are available exclusively for a pre-determined purpose.
We consider available liquidity to be an important indicator of the financial strength and performance of our businesses because it shows the funds available to meet our cash requirements, including for, but not limited to, capital expenditures, post-employment benefit plans funding, dividend payments, the payment of contractual obligations, maturing debt, on going operations, the acquisition of spectrum, and other cash requirements. We believe that certain investors and analysts use available liquidity to evaluate the financial strength and performance of our businesses. The most directly comparable financial measure under IFRS Accounting Standards is cash.
The following table is a reconciliation of cash to available liquidity on a consolidated basis.
|
|
|
|
|
|
|
|
|
|
September 30, 2025 |
December 31, 2024 |
| Cash |
460 |
|
1,572 |
|
| Cash equivalents |
5 |
|
— |
|
| Short-term investments |
— |
|
400 |
|
Amounts available under our securitized receivables program(1) |
700 |
|
700 |
|
Amounts available under our committed bank credit facilities(2) |
2,479 |
|
1,810 |
|
| Available liquidity |
3,644 |
|
4,482 |
|
(1)At September 30, 2025 and December 31, 2024, $700 million was available under our securitized receivables program, under which we borrowed $1,158 million in U.S. dollars ($1,612 million in Canadian dollars) and $1,112 million in U.S. dollars ($1,600 million in Canadian dollars) as at September 30, 2025 and December 31, 2024, respectively. Loans secured by receivables are included in Debt due within one year in our consolidated financial statements.
(2)At September 30, 2025 and December 31, 2024, respectively, $2,479 million and $1,810 million were available under our committed bank credit facilities, given outstanding commercial paper of $1,093 million in U.S. dollars ($1,521 million in Canadian dollars) and $1,522 million in U.S. dollars ($2,190 million in Canadian dollars) as at September 30, 2025 and December 31, 2024, respectively. Commercial paper outstanding is included in Debt due within one year in our consolidated financial statements.
54 BCE Inc. 2025 THIRD QUARTER SHAREHOLDER REPORT
Free cash flow, free cash flow after payment of lease liabilities and excess free cash flow
The terms free cash flow, free cash flow after payment of lease liabilities and excess free cash flow do not have any standardized meaning under IFRS Accounting Standards. Therefore, they are unlikely to be comparable to similar measures presented by other issuers.
We define free cash flow as cash flows from operating activities, excluding cash from discontinued operations, acquisition and other costs paid (which include significant litigation costs) and voluntary pension funding, less capital expenditures, preferred share dividends and dividends paid by subsidiaries to NCI. We exclude cash from discontinued operations, acquisition and other costs paid and voluntary pension funding because they affect the comparability of our financial results and could potentially distort the analysis of trends in business performance. Excluding these items does not imply they are non-recurring.
We define free cash flow after payment of lease liabilities as cash flows from operating activities, excluding cash from discontinued operations, acquisition and other costs paid (which include significant litigation costs) and voluntary pension funding, less principal payment of lease liabilities, capital expenditures, preferred share dividends and dividends paid by subsidiaries to NCI. We exclude cash from discontinued operations, acquisition and other costs paid and voluntary pension funding because they affect the comparability of our financial results and could potentially distort the analysis of trends in business performance. Excluding these items does not imply they are non-recurring.
We define excess free cash flow as free cash flow less dividends paid on common shares.
We consider free cash flow, free cash flow after payment of lease liabilities and excess free cash flow to be important indicators of the financial strength and performance of our businesses. Free cash flow and free cash flow after payment of lease liabilities show how much cash is available to pay dividends on common shares, repay debt and reinvest in our company. Excess free cash flow shows how much cash is available to repay debt and reinvest in our company, after the payment of dividends on common shares. We believe that certain investors and analysts use free cash flow, free cash flow after payment of lease liabilities and excess free cash flow to value a business and its underlying assets and to evaluate the financial strength and performance of our businesses. The most directly comparable financial measure under IFRS Accounting Standards is cash flows from operating activities.
The following tables provide reconciliations of cash flows from operating activities to free cash flow, free cash flow after payment of lease liabilities and excess free cash flow on a consolidated basis.
|
|
|
|
|
|
|
|
|
|
|
|
|
|
|
|
Q3 2025 |
Q3 2024 |
YTD 2025 |
YTD 2024 |
| Cash flows from operating activities |
1,914 |
|
1,842 |
|
5,432 |
|
5,111 |
|
| Capital expenditures |
(891) |
|
(954) |
|
(2,383) |
|
(2,934) |
|
| Cash dividends paid on preferred shares |
(28) |
|
(43) |
|
(105) |
|
(134) |
|
| Cash dividends paid by subsidiaries to NCI |
(25) |
|
(14) |
|
(38) |
|
(56) |
|
| Acquisition and other costs paid |
33 |
1 |
|
47 |
27 |
|
|
|
|
|
|
| Free cash flow |
1,003 |
|
832 |
|
2,953 |
|
2,014 |
|
| Principal payment of lease liabilities |
(297) |
|
(305) |
|
(879) |
|
(872) |
|
| Free cash flow after payment of lease liabilities |
706 |
|
527 |
|
2,074 |
|
1,142 |
|
|
|
|
|
|
|
|
|
|
|
|
|
|
|
|
|
Q3 2025 |
Q3 2024 |
YTD 2025 |
YTD 2024 |
| Cash flows from operating activities |
1,914 |
|
1,842 |
|
5,432 |
|
5,111 |
|
| Capital expenditures |
(891) |
|
(954) |
|
(2,383) |
|
(2,934) |
|
| Cash dividends paid on preferred shares |
(28) |
|
(43) |
|
(105) |
|
(134) |
|
| Cash dividends paid by subsidiaries to NCI |
(25) |
|
(14) |
|
(38) |
|
(56) |
|
| Acquisition and other costs paid |
33 |
1 |
|
47 |
27 |
|
|
|
|
|
|
| Free cash flow |
1,003 |
|
832 |
|
2,953 |
|
2,014 |
|
| Dividends paid on common shares |
(408) |
|
(910) |
|
(1,618) |
|
(2,703) |
|
| Excess free cash flow |
595 |
|
(78) |
|
1,335 |
|
(689) |
|
The term net debt does not have any standardized meaning under IFRS Accounting Standards. Therefore, it is unlikely to be comparable to similar measures presented by other issuers.
We define net debt as debt due within one year plus long-term debt and 50% of outstanding preferred shares, less 50% of junior subordinated debt included within long-term debt, and less cash, cash equivalents and short-term investments, as shown in BCE’s consolidated statements of financial position.
In Q1 2025, we updated our definition of net debt to include 50% of junior subordinated debt. This change does not impact the net debt amounts previously presented. We include 50% of outstanding preferred shares and 50% of junior subordinated debt in our net debt as it is consistent with the treatment by certain credit rating agencies and given structural features including priority of payments.
We, and certain investors and analysts, consider net debt to be an important indicator of the company’s financial leverage.
Net debt is calculated using several asset and liability categories from the statements of financial position. The most directly comparable financial measure under IFRS Accounting Standards is long-term debt. The following table is a reconciliation of long-term debt to net debt on a consolidated basis.
|
|
|
|
|
|
|
|
|
|
September 30, 2025 |
December 31, 2024 |
| Long-term debt |
35,155 |
|
32,835 |
|
| less: 50% of junior subordinated debt |
(2,177) |
|
— |
|
| Debt due within one year |
5,820 |
|
7,669 |
|
| 50% of preferred shares |
1,669 |
|
1,767 |
|
| Cash |
(460) |
|
(1,572) |
|
| Cash equivalents |
(5) |
|
— |
|
| Short-term investments |
— |
|
(400) |
|
| Net debt |
40,002 |
|
40,299 |
|
A non-GAAP ratio is a financial measure disclosed in the form of a ratio, fraction, percentage or similar representation and that has a non-GAAP financial measure as one or more of its components.
The term adjusted EPS does not have any standardized meaning under IFRS Accounting Standards. Therefore, it is unlikely to be comparable to similar measures presented by other issuers.
We define adjusted EPS as adjusted net earnings per BCE common share. Adjusted net earnings is a non-GAAP financial measure. For further details on adjusted net earnings, see section 8.1, Non-GAAP financial measures.
We use adjusted EPS, and we believe that certain investors and analysts use this measure, among other ones, to assess the performance of our businesses without the effects of severance, acquisition and other costs, net mark-to-market losses (gains) on derivatives used to economically hedge equity settled share-based compensation plans, net equity losses (gains) on investments in associates and joint ventures, net losses (gains) on investments, early debt redemption costs (gains), impairment of assets and discontinued operations, net of tax and NCI. We exclude these items because they affect the comparability of our financial results and could potentially distort the analysis of trends in business performance. Excluding these items does not imply they are non-recurring.
Dividend payout ratio and dividend payout ratio after payment of lease liabilities
The terms dividend payout ratio and dividend payout ratio after payment of lease liabilities do not have any standardized meaning under IFRS Accounting Standards. Therefore, they are unlikely to be comparable to similar measures presented by other issuers.
We define dividend payout ratio as dividends paid on common shares divided by free cash flow. We define dividend payout ratio after payment of lease liabilities as dividends paid on common shares divided by free cash flow after payment of lease liabilities. Free cash flow and free cash flow after payment of lease liabilities are non-GAAP financial measures. For further details on free cash flow and free cash flow after payment of lease liabilities, see section 8.1, Non-GAAP financial measures.
We consider dividend payout ratio and dividend payout ratio after payment of lease liabilities to be important indicators of the financial strength and performance of our businesses because they show the sustainability of the company’s dividend payments.
56 BCE Inc. 2025 THIRD QUARTER SHAREHOLDER REPORT
8.3 Total of segments measures
A total of segments measure is a financial measure that is a subtotal or total of 2 or more reportable segments and is disclosed within the Notes to BCE’s consolidated primary financial statements.
Adjusted EBITDA and Bell CTS adjusted EBITDA
We define adjusted EBITDA as operating revenues less operating costs.
We define Bell CTS adjusted EBITDA as BCE adjusted EBITDA less Bell Media adjusted EBITDA.
The most directly comparable financial measure under IFRS Accounting Standards is net earnings (loss). The following tables provide reconciliations of net earnings (loss) to BCE adjusted EBITDA and Bell CTS adjusted EBITDA.
|
|
|
|
|
|
|
|
|
|
|
|
|
|
|
|
YTD 2025 |
Q3 2025 |
Q2 2025 |
Q1 2025 |
| Net earnings |
5,882 |
|
4,555 |
|
644 |
|
683 |
|
| Severance, acquisition and other costs |
|
370 |
|
|
82 |
|
|
41 |
|
|
247 |
|
| Depreciation |
|
2,859 |
|
|
969 |
|
|
949 |
|
|
941 |
|
| Amortization |
|
1,009 |
|
|
340 |
|
|
338 |
|
|
331 |
|
| Finance costs |
|
|
|
|
| Interest expense |
|
1,322 |
|
|
457 |
|
|
442 |
|
|
423 |
|
| Net return on post-employment benefit plans |
|
(77) |
|
|
(26) |
|
|
(26) |
|
|
(25) |
|
| Impairment of assets |
|
987 |
|
|
970 |
|
|
8 |
|
|
9 |
|
| (Gains) losses on investments |
|
(5,165) |
|
|
(5,175) |
|
|
8 |
|
|
2 |
|
| Other (income) expense |
|
(185) |
|
|
95 |
|
|
30 |
|
|
(310) |
|
| Income taxes |
992 |
|
495 |
|
240 |
|
257 |
|
|
|
|
|
|
|
|
|
|
|
|
|
|
|
|
| BCE adjusted EBITDA |
7,994 |
|
2,762 |
|
2,674 |
|
2,558 |
|
| Less: Bell Media adjusted EBITDA |
(631) |
|
(237) |
|
(235) |
|
(159) |
|
| Bell CTS adjusted EBITDA |
7,363 |
|
2,525 |
|
2,439 |
|
2,399 |
|
|
|
|
|
|
|
|
|
|
|
|
|
|
|
|
|
|
|
|
|
|
|
|
Q4 2024 |
YTD 2024 |
Q3 2024 |
Q2 2024 |
Q1 2024 |
Q4 2023 |
|
| Net earnings (loss) |
505 |
|
(130) |
|
(1,191) |
|
604 |
|
457 |
|
435 |
|
|
| Severance, acquisition and other costs |
|
154 |
|
300 |
|
|
49 |
|
|
22 |
|
|
229 |
|
|
41 |
|
|
| Depreciation |
933 |
|
2,825 |
|
|
934 |
|
|
945 |
|
|
946 |
|
954 |
|
|
| Amortization |
317 |
|
966 |
|
|
325 |
|
|
325 |
|
|
316 |
|
299 |
|
|
| Finance costs |
|
|
|
|
|
|
|
| Interest expense |
431 |
|
1,282 |
|
|
440 |
|
|
426 |
|
|
416 |
|
399 |
|
|
| Net return on post-employment benefit plans |
(17) |
|
(49) |
|
|
(16) |
|
|
(17) |
|
|
(16) |
|
(27) |
|
|
| Impairment of assets |
4 |
|
2,186 |
|
|
2,113 |
|
|
60 |
|
|
13 |
|
109 |
|
|
| Losses (gains) on investments |
1 |
|
(58) |
|
|
(66) |
|
|
2 |
|
|
6 |
|
(2) |
|
|
| Other expense |
102 |
|
260 |
|
|
129 |
|
|
99 |
|
|
32 |
|
149 |
|
|
| Income taxes |
175 |
|
402 |
|
5 |
|
231 |
|
166 |
|
210 |
|
|
|
|
|
|
|
|
|
|
|
|
|
|
|
|
|
|
|
|
|
|
|
|
|
|
| BCE adjusted EBITDA |
2,605 |
|
7,984 |
|
2,722 |
|
2,697 |
|
2,565 |
|
2,567 |
|
|
| Less: Bell Media adjusted EBITDA |
(169) |
|
(589) |
|
(254) |
|
(218) |
|
(117) |
|
(148) |
|
|
| Bell CTS adjusted EBITDA |
2,436 |
|
7,395 |
|
2,468 |
|
2,479 |
|
2,448 |
|
2,419 |
|
|
8.4 Capital management measures
A capital management measure is a financial measure that is intended to enable a reader to evaluate our objectives, policies and processes for managing our capital and is disclosed within the Notes to BCE’s consolidated financial statements.
The financial reporting framework used to prepare the financial statements requires disclosure that helps readers assess the company’s capital management objectives, policies, and processes, as set out in IFRS Accounting Standards in IAS 1 – Presentation of Financial Statements. BCE has its own methods for managing capital and liquidity, and IFRS Accounting Standards do not prescribe any particular calculation method.
Net debt leverage ratio
The net debt leverage ratio represents net debt divided by adjusted EBITDA. Net debt used in the calculation of the net debt leverage ratio is a non-GAAP financial measure. For further details on net debt, see section 8.1, Non-GAAP financial measures. For the purposes of calculating our net debt leverage ratio, adjusted EBITDA is twelve-month trailing adjusted EBITDA.
We use, and believe that certain investors and analysts use, the net debt leverage ratio as a measure of financial leverage.
8.5 Supplementary financial measures
A supplementary financial measure is a financial measure that is not reported in BCE’s consolidated financial statements, and is, or is intended to be, reported periodically to represent historical or expected future financial performance, financial position, or cash flows.
An explanation of such measures is provided where they are first referred to in this MD&A if the supplementary financial measures’ labelling is not sufficiently descriptive.
In addition to the non-GAAP financial measures and other financial measures described previously, we use the following KPIs to measure the success of our strategic imperatives. These KPIs are not accounting measures and may not be comparable to similar measures presented by other issuers.
|
|
|
|
|
|
| KPI |
Definition |
| Adjusted EBITDA margin |
Adjusted EBITDA margin is defined as adjusted EBITDA divided by operating revenues. |
| ARPU |
ARPU is defined as Bell CTS Canada wireless external services revenues divided by the average mobile phone subscriber base for the specified period, expressed as a dollar unit per month. |
| Capital intensity |
Capital intensity is defined as capital expenditures divided by operating revenues. |
| Churn |
Mobile phone churn is the rate at which existing mobile phone subscribers cancel their services. It is a measure of our ability to retain our customers. Mobile phone churn is calculated by dividing the number of mobile phone deactivations during a given period by the average number of mobile phone subscribers in the base for the specified period and is expressed as a percentage per month. |
| Subscriber unit |
Mobile phone subscriber unit is comprised of a recurring revenue generating portable unit (e.g. smartphones and feature phones) on an active service plan, that has access to our wireless networks and includes voice, text and/or data connectivity. We report mobile phone subscriber units in two categories: postpaid and prepaid. Prepaid mobile phone subscriber units are considered active for a period of 90 days following the expiry of the subscriber’s prepaid balance.
Mobile connected device subscriber unit is comprised of a recurring revenue generating portable unit (e.g. tablets, wearables, mobile Internet devices and IoT) on an active service plan, that has access to our wireless networks and is intended for limited or no cellular voice capability.
Wireline subscriber unit consists of an active revenue-generating unit with access to our services, including retail Internet, IPTV, and/or residential NAS. A subscriber is included in our subscriber base when the service has been installed and is operational at the customer premise and a billing relationship has been established.
• Retail Internet and IPTV subscribers have access to stand-alone services, and are primarily represented by a dwelling unit or a business location
• Retail residential NAS subscribers are based on a line count and are represented by a unique telephone number
|
58 BCE Inc. 2025 THIRD QUARTER SHAREHOLDER REPORT
9 Controls and procedures
Disclosure controls and procedures and internal control over financial reporting
In accordance with the provisions of National Instrument 52-109 – Certification of Disclosure in Issuers’ Annual and Interim Filings, the Chief Executive Officer and the Chief Financial Officer of BCE Inc. have limited the scope of their design of our disclosure controls and procedures and internal control over financial reporting to exclude the controls, policies and procedures of Ziply Fiber, which we acquired on August 1, 2025. The contribution of the acquired Ziply Fiber operations to our consolidated financial statements for the nine months ended September 30, 2025 was 0.9% of consolidated revenues and (1.9%) of consolidated net earnings. Additionally, at September 30, 2025, the current assets and current liabilities of the acquired Ziply Fiber operations represented approximately 4.5% of consolidated current assets and 2.4% of consolidated current liabilities, respectively, and the non-current assets and non-current liabilities of the acquired Ziply Fiber operations represented approximately 11.2% of consolidated non-current assets and 0.2% of consolidated non-current liabilities, respectively. The design of the disclosure controls and procedures and internal control over financial reporting of the acquired Ziply Fiber operations will be completed for the third quarter of 2026.
Further details related to the acquisition of Ziply Fiber are disclosed in Note 4, Business acquisitions and disposition, in BCE’s Q3 2025 Financial Statements.
Changes in internal control over financial reporting
No changes were made in our internal control over financial reporting during the quarter ended September 30, 2025 that have materially affected, or are reasonably likely to materially affect, our internal control over financial reporting.