Document
Management's discussion and analysis
Table of contents
Management’s discussion and analysis
In this management’s discussion and analysis (MD&A), we, us, our, BCE and the company mean, as the context may require, either BCE Inc. or, collectively, BCE Inc., Bell Canada, their subsidiaries, joint arrangements and associates. Bell means, as the context may require, either Bell Canada or, collectively, Bell Canada, its subsidiaries, joint arrangements and associates.
All amounts in this MD&A are in millions of Canadian dollars, except where noted. Please refer to section 9, Non-GAAP financial measures, other financial measures and key performance indicators (KPIs) for a list of defined non-GAAP financial measures, other financial measures and KPIs.
Please refer to BCE’s unaudited consolidated financial statements for the second quarter of 2025 (Q2 2025 Financial Statements) when reading this MD&A as well as BCE’s news release to be dated August 7, 2025 announcing BCE’s financial results for the three months and six months ended June 30, 2025 and 2024 (BCE 2025 Second Quarter News Release). We also encourage you to read BCE’s MD&A for the year ended December 31, 2024 dated March 6, 2025 (BCE 2024 Annual MD&A) as updated in BCE's MD&A for the first quarter of 2025 dated May 7, 2025 (BCE 2025 First Quarter MD&A). In preparing this MD&A, we have taken into account information available to us up to August 6, 2025, the date of this MD&A, unless otherwise stated.
You will find additional information relating to BCE, including BCE’s annual information form for the year ended December 31, 2024 dated March 6, 2025 (BCE 2024 AIF) and recent financial reports, including the BCE 2024 Annual MD&A, the BCE 2025 First Quarter MD&A, and the BCE 2025 Second Quarter News Release on BCE’s website at BCE.ca, on SEDAR+ at sedarplus.ca and on EDGAR at sec.gov.
Documents and other information contained in BCE’s website including, without limitation, the BCE 2025 Second Quarter News Release, or in any other site referred to in BCE’s website or in this MD&A are not part of this MD&A and are not incorporated by reference herein.
This MD&A comments on our business operations, performance, financial position and other matters for the three months (Q2) and six months (YTD) ended June 30, 2025 and 2024.
Caution regarding forward-looking statements
This MD&A and, in particular, but without limitation, section 1.2, Key corporate and business developments, section 3.1, Bell CTS, section 3.2, Bell Media, the section and sub-sections entitled Assumptions and section 4.7, Liquidity, contain forward-looking statements. These forward-looking statements include, without limitation, statements relating to: the acquisition by Bell Canada of Northwest Fiber Holdco, LLC (doing business as Ziply Fiber (Ziply Fiber)), certain potential benefits expected to result from this acquisition and Bell Canada’s growth prospects and strategic priorities; the proposed disposition of substantially all of BCE’s home security and monitored alarm assets to a.p.i. ALARM Inc., the expected timing and completion thereof and the expected amount of proceeds to result from this proposed disposition; Bell Canada’s launch of Bell AI Fabric intended to create a national initiative to support Canada's artificial intelligence (AI) ecosystem, the benefits expected to result from the launch of Bell AI Fabric, the expected number of AI data centres to be launched by the end of 2026 and Bell Canada’s long-term objective to drive AI innovation and economic growth in Canada; the sources of liquidity we expect to use to meet our 2025 cash requirements, BCE's annualized common share dividend and BCE's common share dividend payout policy target; BCE’s business outlook, objectives, plans and strategic priorities, and other statements that do not refer to historical facts. A statement we make is forward-looking when it uses what we know and expect today to make a statement about the future. Forward-looking statements are typically identified by the words assumption, goal, guidance, objective, outlook, project, strategy, target, commitment and other similar expressions or future or conditional verbs such as aim, anticipate, believe, could, expect, intend, may, plan, seek, should, strive and will. All such forward-looking statements are made pursuant to the safe harbour provisions of applicable Canadian securities laws and of the United States (U.S.) Private Securities Litigation Reform Act of 1995.
Unless otherwise indicated by us, forward-looking statements in this MD&A describe our expectations as at August 6, 2025 and, accordingly, are subject to change after that date. Except as may be required by applicable securities laws, we do not undertake any obligation to update or revise any forward-looking statements, whether as a result of new information, future events or otherwise.
Forward-looking statements, by their very nature, are subject to inherent risks and uncertainties and are based on several assumptions, both general and specific, which give rise to the possibility that actual results or events could differ materially from our expectations expressed in, or implied by, such forward-looking statements and that our business outlook, objectives, plans and strategic priorities may not be achieved. These statements are not guarantees of future performance or events, and we caution you against relying on any of these forward-looking statements. Forward-looking statements are presented in this MD&A for the purpose of assisting investors and others in understanding our objectives, strategic priorities and business outlook as well as our anticipated operating environment. Readers are cautioned, however, that such information may not be appropriate for other purposes.
We have made certain economic, market, operational and other assumptions in preparing the forward-looking statements contained in this MD&A and, in particular, but without limitation, the forward-looking statements contained in the previously
4 BCE Inc. 2025 SECOND QUARTER SHAREHOLDER REPORT
mentioned sections of this MD&A. These assumptions include, without limitation, the assumptions described in the section and sub-sections of this MD&A entitled Assumptions, which section and sub-sections are incorporated by reference in this cautionary statement. Subject to various factors, we believe that our assumptions were reasonable at August 6, 2025. If our assumptions turn out to be inaccurate, our actual results could be materially different from what we expect.
Important risk factors that could cause actual results or events to differ materially from those expressed in, or implied by, the previously-mentioned forward-looking statements and other forward-looking statements contained in this MD&A, include, but are not limited to: the negative effect of adverse economic conditions, including from trade tariffs and other protective government measures, including the imposition of U.S. tariffs on imports from Canada and retaliatory tariffs by the Canadian government on goods coming from the U.S., recessions, inflation, reductions in immigration levels, high housing support costs relative to income, and financial and capital market volatility, and the resulting negative impact on customer spending and the demand for our products and services, higher costs and supply chain disruptions; the negative effect of adverse conditions associated with geopolitical events; the intensity of competitive activity and the failure to effectively respond to evolving competitive dynamics; the level of technological substitution and the presence of alternative service providers contributing to disruptions and disintermediation in each of our business segments; changing customer behaviour and the expansion of cloud-based, over-the-top (OTT) and other alternative solutions; advertising market pressures from economic conditions, fragmentation and non-traditional/global digital services; rising content costs and challenges in our ability to acquire or develop key content; high Canadian Internet and smartphone penetration; regulatory initiatives, proceedings and decisions, government consultations and government positions that negatively affect us and influence our business including, without limitation, concerning mandatory access to networks, spectrum auctions, the imposition of consumer-related codes of conduct, approval of acquisitions, broadcast and spectrum licensing, foreign ownership requirements, privacy and cybersecurity obligations and control of copyright piracy; the inability to implement enhanced compliance frameworks and to comply with legal and regulatory obligations; unfavourable resolution of legal proceedings; the failure to evolve and transform our networks, systems and operations using next-generation technologies while lowering our cost structure, including the failure to meet customer expectations of product and service experience; the inability to drive a positive customer experience; the inability to protect our physical and non-physical assets from events such as information security attacks, unauthorized access or entry, fire and natural disasters; the failure to implement an effective security and data governance framework; the risk that we may need to incur significant capital expenditures to provide additional capacity and reduce network congestion; service interruptions or outages due to network failures or slowdowns; events affecting the functionality of, and our ability to protect, test, maintain, replace and upgrade, our networks, information technology (IT) systems, equipment and other facilities; the failure by other telecommunications carriers on which we rely to provide services to complete planned and sufficient testing, maintenance, replacement or upgrade of their networks, equipment and other facilities, which could disrupt our operations including through network or other infrastructure failures; the complexity of our operations and IT systems and the failure to implement, maintain or manage highly effective processes and IT systems; in-orbit and other operational risks to which the satellites used to provide our satellite television (TV) services are subject; the failure to attract, develop and retain a talented team capable of furthering our strategic imperatives and operational transformation; the potential deterioration in employee morale and engagement resulting from staff reductions, cost reductions or reorganizations and the de-prioritization of transformation initiatives due to staff reductions, cost reductions or reorganizations; the failure to adequately manage health and safety concerns; labour disruptions and shortages; the inability to access adequate sources of capital and generate sufficient cash flows from operating activities to meet our cash requirements, fund capital expenditures and provide for planned growth; uncertainty as to whether our dividend payout policy will be maintained or achieved, or that the dividend on common shares will be maintained or dividends on any of BCE’s outstanding shares will be declared by BCE’s board of directors (the Board); the failure to reduce costs and adequately assess investment priorities, as well as unexpected increases in costs; the inability to manage various credit, liquidity and market risks; the failure to evolve practices to effectively monitor and control fraudulent activities; new or higher taxes due to new tax laws or changes thereto or in the interpretation thereof, and the inability to predict the outcome of government audits; the impact on our financial statements and estimates from a number of factors; pension obligation volatility and increased contributions to post-employment benefit plans; the expected timing and completion of the proposed disposition of Northwestel Inc. (Northwestel) are subject to closing conditions, termination rights and other risks and uncertainties, including, without limitation, the purchaser securing financing and the completion of confirmatory due diligence, which may affect its completion, terms or timing and, as such, there can be no assurance that the proposed disposition will occur, or that it will occur on the terms and conditions, or at the time, currently contemplated, or that the potential benefits expected to result from the proposed disposition will be realized; the expected timing and completion of the transaction relating to the formation of Network FiberCo, a long-term strategic partnership to accelerate the development of fibre infrastructure through Ziply Fiber in underserved markets in the U.S., are subject to customary closing conditions and other risks and uncertainties, which may affect its completion, terms or timing and, as such, there can be no assurance that the transaction relating to the formation of Network FiberCo will occur, or that it will occur on the terms and conditions, or at the time, currently contemplated, or that the potential benefits expected to result therefrom will be realized; reputational risks and the inability to meaningfully integrate environmental, social and governance (ESG) considerations into our business strategy, operations and governance; the adverse impact of various internal and external factors on our ability to achieve our ESG targets including, without limitation, those related to greenhouse gas (GHG) reduction and supplier engagement; the failure to take appropriate actions to adapt to current and emerging environmental impacts, including climate change; the failure to develop and implement sufficient corporate governance practices; the inability to adequately manage social issues; health risks, including pandemics, epidemics and other health concerns, such as radio frequency emissions from wireless communications devices and equipment; our dependence on third-party suppliers, outsourcers and consultants to provide an uninterrupted supply of the products and services we need; the failure of our vendor selection, governance and oversight processes, including our management of supplier risk in the areas of security, data governance and responsible procurement; the quality of our products and services and the extent to which they may be subject to defects or fail to comply with applicable government regulations and standards; the failure to successfully expand Ziply Fiber’s fibre network and optimize its existing copper network; the inability of Ziply Fiber’s current and future initiatives or programs to generate the level of returns, or to occur on the timeline, we anticipate; the intensity of competitive activity in Ziply Fiber’s services market in the U.S., and the failure to effectively respond to fragmented and rapidly evolving competitive dynamics; the failure to successfully integrate Ziply Fiber as a subsidiary of BCE, and to generate the anticipated benefits from the acquisition of Ziply Fiber; the failure to accurately anticipate fluctuations in the exchange rate between the Canadian dollar and U.S. dollar and our inability to successfully implement currency hedging strategies; Ziply Fiber is subject to significant regulation in the U.S. which may reduce the amount of subsidies or revenues it receives, increase its compliance burdens or constrain its ability to compete; the failure to comply with the non-U.S. ownership rules and our regulatory obligations imposed by the Federal Communications Commission (FCC); changes to tax legislation in the U.S., Canada, or other relevant jurisdictions, or to its interpretation or enforcement, may affect Ziply Fiber’s income tax position, as well as our effective tax rate and the after-tax returns we derive from Ziply Fiber’s U.S. operations.
We caution that the foregoing list of risk factors is not exhaustive and other factors could also materially adversely affect us. Please see section 9, Business risks of the BCE 2024 Annual MD&A for a more complete description of the above-mentioned and other risks, which section, and the other sections of the BCE 2024 Annual MD&A referred to therein, are incorporated by reference in this cautionary statement. Please also see section 6, Regulatory environment in the BCE 2025 First Quarter MD&A and in this MD&A for an update to the regulatory initiatives and proceedings described in the BCE 2024 Annual MD&A, which sections 6 are incorporated by reference in this cautionary statement. Please also see section 7, Business risks in this MD&A for a description of the risk factors relating to Ziply Fiber, which section 7 is incorporated by reference in this cautionary statement. Any of those risks could cause actual results or events to differ materially from our expectations expressed in, or implied by, the forward-looking statements set out in this MD&A. Except for the updates set out in section 6, Regulatory environment in the BCE 2025 First Quarter MD&A and in this MD&A, as well as in section 7, Business risks in this MD&A, the risks described in the BCE 2024 Annual MD&A remain substantially unchanged.
Additional risks and uncertainties not currently known to us or that we currently deem to be immaterial may also have a material adverse effect on our business, financial condition, liquidity, financial results or reputation. We regularly consider potential acquisitions, dispositions, mergers, business combinations, investments, monetizations, joint ventures and other transactions, some of which may be significant. Except as otherwise indicated by us, forward-looking statements do not reflect the potential impact of any such transactions or of special items that may be announced or that may occur after August 6, 2025. The financial impact of these transactions and special items can be complex and depends on facts particular to each of them. We therefore cannot describe the expected impact in a meaningful way, or in the same way we present known risks affecting our business.
6 BCE Inc. 2025 SECOND QUARTER SHAREHOLDER REPORT
1 Overview
BCE Q2 2025 selected quarterly information
|
|
|
|
|
|
|
|
|
|
|
|
|
|
|
|
|
|
|
| Operating revenues |
Net earnings |
Adjusted EBITDA(1) |
|
| $6,085 |
$644 |
$2,674 |
|
| million |
million |
million |
|
+1.3% vs. Q2 2024 |
+6.6% vs. Q2 2024 |
(0.9%) vs. Q2 2024 |
|
|
|
|
|
|
|
|
|
|
|
|
|
|
|
| Net earnings attributable to common shareholders |
Adjusted net earnings(1) |
Cash flows from operating activities |
Free cash flow(1) |
|
| $579 |
$592 |
$1,947 |
$1,152 |
|
| million |
million |
million |
million |
|
+7.8% vs. Q2 2024 |
(16.9%) vs. Q2 2024 |
(8.9%) vs. Q2 2024 |
+5.0% vs. Q2 2024 |
|
|
|
|
|
|
|
|
|
|
|
|
|
Total mobile phones(3)(4) |
Retail high-speed Internet(2)(4) |
Retail internet protocol television (IPTV)(2)(5) |
Retail residential network access services (NAS) lines(2) |
| +0.4% |
(2.2%) |
(1.1%) |
(10.2%) |
|
10.4 million subscribers
at June 30, 2025
|
4.4 million subscribers
at June 30, 2025
|
2.1 million subscribers
at June 30, 2025
|
1.7 million subscribers
at June 30, 2025
|
(1)Adjusted EBITDA is a total of segments measure, and adjusted net earnings and free cash flow are non-GAAP financial measures. See section 9.3, Total of segments measures and section 9.1, Non-GAAP financial measures in this MD&A for more information on these measures.
(2)In Q1 2025, we reduced our retail high-speed Internet, retail IPTV and retail residential NAS lines subscriber bases by 80,666, 441 and 14,150 subscribers, respectively, as at March 31, 2025, as we stopped selling new plans for these services under the Distributel, Acanac, Oricom and B2B2C brands. Additionally, at the beginning of Q1 2025, we reduced our retail high-speed Internet subscriber base by 2,783 subscribers to adjust for prior year customer deactivations following a review of customer accounts.
(3)In Q4 2024, we removed 124,216 Bell prepaid mobile phone subscribers from our prepaid mobile phone subscriber base as at December 31, 2024, as we stopped selling new plans for this service as of that date.
(4)In Q3 2024, we removed 77,971 Virgin Plus prepaid mobile phone subscribers from our prepaid mobile phone subscriber base as at September 30, 2024, as we stopped selling new plans for this service as of that date. Additionally, as a result of a recent Canadian Radio-television and Telecommunications Commission (CRTC) decision on wholesale high-speed Internet access services, we are no longer able to resell cable Internet services to new customers in our wireline footprint as of September 12, 2024, and consequently we removed all of the existing 106,259 cable subscribers in our wireline footprint from our retail high-speed Internet subscriber base as of that date.
(5)In Q2 2024, we increased our retail IPTV subscriber base by 40,997 to align the deactivation policy for our Fibe TV streaming services to our traditional Fibe TV service.
BCE income statements - selected information
|
|
|
|
|
|
|
|
|
|
|
|
|
|
|
|
|
|
|
|
|
|
|
|
|
|
|
| |
Q2 2025 |
Q2 2024 |
$ change |
% change |
YTD 2025 |
YTD 2024 |
$ change |
% change |
| Operating revenues |
|
|
|
|
|
|
|
|
| Service |
5,267 |
5,308 |
(41) |
|
(0.8 |
%) |
10,439 |
10,500 |
(61) |
|
(0.6 |
%) |
| Product |
818 |
697 |
121 |
|
17.4 |
% |
1,576 |
1,516 |
60 |
|
4.0 |
% |
| Total operating revenues |
6,085 |
6,005 |
80 |
|
1.3 |
% |
12,015 |
12,016 |
(1) |
|
— |
|
| Operating costs |
(3,411) |
(3,308) |
(103) |
|
(3.1 |
%) |
(6,783) |
(6,754) |
(29) |
|
(0.4 |
%) |
| Adjusted EBITDA |
2,674 |
2,697 |
(23) |
|
(0.9 |
%) |
5,232 |
5,262 |
(30) |
|
(0.6 |
%) |
Adjusted EBITDA margin(1) |
43.9 |
% |
44.9 |
% |
|
(1.0) pts |
43.5 |
% |
43.8 |
% |
|
(0.3) pts |
|
|
|
|
|
|
|
|
|
|
|
|
|
|
|
|
|
|
|
|
|
|
|
|
|
|
|
|
|
|
|
|
|
|
|
|
|
|
|
|
|
|
|
|
|
|
|
|
|
|
|
|
|
|
|
|
|
|
|
|
|
|
|
|
|
|
|
|
|
|
|
|
|
|
|
|
|
|
|
|
|
|
|
|
|
|
|
|
|
|
|
|
|
|
|
|
|
|
|
|
|
|
|
|
|
|
|
|
|
|
|
|
|
|
|
|
|
|
|
|
|
|
|
|
|
|
|
|
|
|
|
|
|
|
|
|
|
|
|
|
|
|
|
|
| Net earnings attributable to: |
|
|
|
|
|
|
|
|
| Common shareholders |
579 |
537 |
42 |
|
7.8 |
% |
1,209 |
939 |
270 |
|
28.8 |
% |
| Preferred shareholders |
40 |
46 |
(6) |
|
(13.0 |
%) |
81 |
93 |
(12) |
|
(12.9 |
%) |
| Non-controlling interest (NCI) |
25 |
21 |
4 |
|
19.0 |
% |
37 |
29 |
8 |
|
27.6 |
% |
| Net earnings |
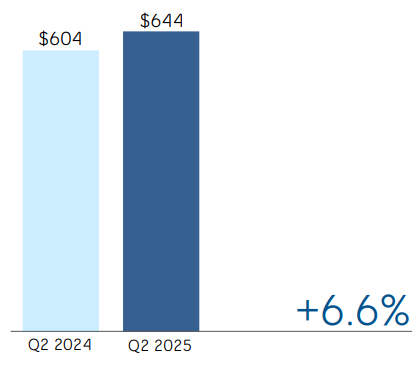
644 |
604 |
40 |
|
6.6 |
% |
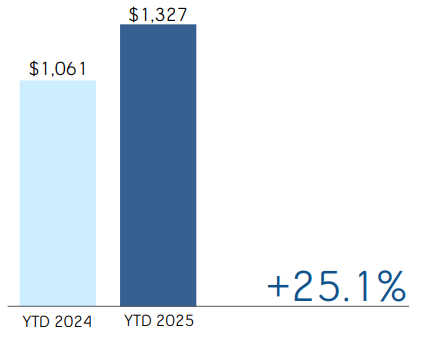
1,327 |
1,061 |
266 |
|
25.1 |
% |
| Adjusted net earnings |
592 |
712 |
(120) |
|
(16.9 |
%) |
1,225 |
1,366 |
(141) |
|
(10.3 |
%) |
|
|
|
|
|
|
|
|
|
|
|
|
|
|
|
|
|
|
| Net earnings per common share (EPS) |
0.63 |
0.59 |
0.04 |
|
6.8 |
% |
1.31 |
1.03 |
0.28 |
|
27.2 |
% |
Adjusted EPS(2) |
0.63 |
0.78 |
(0.15) |
|
(19.2 |
%) |
1.32 |
1.50 |
(0.18) |
|
(12.0 |
%) |
(1)Adjusted EBITDA margin is defined as adjusted EBITDA divided by operating revenues. Refer to section 9.6, KPIs in this MD&A for more information on this measure.
(2)Adjusted EPS is a non-GAAP ratio. Refer to section 9.2, Non-GAAP ratios in this MD&A for more information on this measure.
BCE statements of cash flows – selected information
|
|
|
|
|
|
|
|
|
|
|
|
|
|
|
|
|
|
|
|
|
|
|
|
|
|
|
| |
Q2 2025 |
Q2 2024 |
$ change |
% change |
YTD 2025 |
YTD 2024 |
$ change |
% change |
| Cash flows from operating activities |
1,947 |
|
2,137 |
|
(190) |
|
(8.9 |
%) |
3,518 |
|
3,269 |
|
249 |
|
7.6 |
% |
| Capital expenditures |
(763) |
|
(978) |
|
215 |
|
22.0 |
% |
(1,492) |
|
(1,980) |
|
488 |
|
24.6 |
% |
| Free cash flow |
1,152 |
|
1,097 |
|
55 |
|
5.0 |
% |
1,950 |
|
1,182 |
|
768 |
|
65.0 |
% |
Q2 2025 financial highlights
BCE operating revenues grew by 1.3% in Q2 2025, compared to the same period last year, driven by greater product revenues of 17.4%, moderated by lower service revenues of 0.8%. The increase in product revenues was attributable to Bell AI Fabric, our full-stack sovereign artificial intelligence (AI) platform that combines scalable infrastructure with managed services, resulting from the delivery of our first AI facility in Kamloops, British Columbia (B.C.), along with higher wireless device sales, partly offset by reduced consumer electronics sales at The Source (Bell) Electronics Inc. (The Source) due to permanent store closures and conversion to Best Buy Express as part of our distribution partnership with Best Buy Canada. The decrease in service revenues reflected ongoing erosion in legacy voice, and satellite TV revenues, greater acquisition, retention and bundle discounts on wireline residential services, ongoing elevated wireless competitive pricing pressures and continued lower demand for traditional broadcast TV advertising. This decline in service revenues was moderated by higher wireless and retail Internet average subscriber bases coupled with the flow-through of rate increases, the contribution from various acquisitions, wireless revenues related to the 2025 G7 Leader's Summit, higher Bell Media subscriber revenues, and greater revenues from the Formula 1 (F1) Canadian Grand Prix 2025.
Net earnings of $644 million and net earnings attributable to common shareholders of $579 million in the second quarter of 2025 increased by $40 million and $42 million, respectively, compared to the same period last year, mainly due to lower other expense and lower impairment of assets, partly offset by lower adjusted EBITDA, higher severance, acquisition and other costs, higher depreciation and amortization and higher interest expense.
BCE adjusted EBITDA decreased by 0.9% in Q2 2025, compared to the same period last year, due to a decline in our Bell Communication and Technology Services (Bell CTS) segment, partly offset by growth in our Bell Media segment. This decrease was driven by higher operating costs, partly offset by greater operating revenues. This drove an adjusted EBITDA margin of 43.9% in Q2 2025, down 1.0 pts year over year, attributable to reduced service revenue flow-through, coupled with a higher proportion of lower margin product sales in our total revenue base, moderated by cost reduction initiatives driven by workforce reductions, cost containment, as well as technology and automation-enabled operating efficiencies across the organization.
BCE’s EPS of $0.63 in Q2 2025 increased by $0.04 compared to the same period last year.
In the second quarter of 2025, adjusted net earnings, which excludes the impact of severance, acquisition and other costs, net mark-to-market gains (losses) on derivatives used to economically hedge equity settled share-based compensation
8 BCE Inc. 2025 SECOND QUARTER SHAREHOLDER REPORT
plans, net equity gains (losses) on investments in associates and joint ventures, net gains (losses) on investments, early debt redemption gains (costs) and impairment of assets, net of tax and NCI, was $592 million, or $0.63 per common share, compared to $712 million, or $0.78 per common share, for the same period last year.
Cash flows from operating activities in the second quarter of 2025 decreased by $190 million, compared to the same period last year, mainly due to higher severance and other costs paid and lower cash from working capital, partly offset by lower income taxes paid and lower interest paid.
Free cash flow in the second quarter of 2025 increased by $55 million compared to the same period last year, mainly due to lower capital expenditures and lower cash dividends paid by subsidiaries to NCI, partly offset by lower cash flows from operating activities, excluding cash from acquisition and other costs paid.
1.2 Key corporate and business developments
This section contains forward-looking statements, including relating to the acquisition by Bell Canada of Ziply Fiber, certain potential benefits expected to result from this acquisition, Bell Canada’s growth prospects and strategic priorities, the proposed disposition of substantially all of BCE’s home security and monitored alarm assets to a.p.i. ALARM Inc., the expected timing and completion thereof and the expected amount of proceeds to result from this proposed disposition. Refer to the section Caution regarding forward-looking statements at the beginning of this MD&A.
Completion of Ziply Fiber acquisition
Subsequent to quarter end, on August 1, 2025, Bell Canada completed its previously announced acquisition of Ziply Fiber, the leading fibre internet provider in the Pacific Northwest of the U.S., for cash consideration of $3.65 billion in U.S. dollars ($5.04 billion in Canadian dollars) and the assumption of outstanding net debt(1) of $1.92 billion in U.S. dollars ($2.65 billion in Canadian dollars), following all regulatory approvals. The acquisition expands Bell’s fibre footprint into the U.S. by 1.4 million locations, cementing its position as the third-largest fibre Internet provider in North America.
The acquisition financing was supported by the proceeds of the sale of BCE’s minority stake in Maple Leaf Sports and Entertainment Ltd. (MLSE) on July 1, 2025. This transaction marked the conversion of BCE’s passive interest in MLSE into a core business growth driver.
Ziply Fiber will operate as a separate business unit and will continue to be headquartered in Kirkland, Washington, with its existing management team and highly skilled workforce in alignment with Bell’s strategic priority of building the best fibre Internet networks. Together, Bell Canada and Ziply Fiber will offer enhanced value for existing and new customers in both Canada and the U.S. as demand for faster, more reliable Internet continues to grow. The results of Ziply Fiber will be included in Bell CTS. A news release to be dated August 7, 2025 contains an update to our 2025 financial guidance targets originally provided on February 6, 2025 to incorporate the impact of the acquisition of Ziply Fiber. This news release can be found on SEDAR+ at sedarplus.ca.
Disposition of minority stake in MLSE
On July 1, 2025, BCE completed the previously announced sale of its 37.5% ownership stake in MLSE for $4.7 billion to Rogers Communications Inc. (Rogers). BCE directed the net proceeds of this disposition towards its acquisition of Ziply Fiber. As part of the MLSE transaction, Bell Media has secured access to content rights for the Toronto Maple Leafs and Toronto Raptors on TSN through the 2043/2044 season via a long-term agreement with Rogers.
Disposition of home security and monitored alarm assets
In Q2 2025, BCE entered into an agreement to sell substantially all of its home security and monitored alarm assets to a.p.i. ALARM Inc. as part of its ongoing strategy to focus on its core telecommunications, enterprise solutions and media businesses. Completion of the sale is expected in the second half of 2025, subject to customary closing conditions. Proceeds are expected to be $90 million with additional proceeds of up to $80 million to be received contingent on the achievement of certain performance obligations.
Tender offers for debt securities
On June 12, 2025, Bell Canada repurchased, pursuant to tender offers, for an aggregate cash purchase price of $602 million, an aggregate principal amount of $700 million representing part of the outstanding principal amount of four of its series of medium-term notes (MTN) debentures. In aggregate, these tender offers reduced our net debt by $98 million. Refer to section 4.1, Net debt, of this MD&A for more details.
(1)Net debt is a non-GAAP financial measure. See section 9.1, Non-GAAP financial measures in this MD&A for more information on this measure.
BCE executive team update
On May 20, 2025, Mark McDonald was promoted to the role of Executive Vice President (EVP) and Chief Technology Officer. In his new role, Mark is responsible for Bell’s network strategy and infrastructure, as well as maximizing the potential of key technologies like Fifth Generation (5G) and fibre. Mark has over ten years of experience within Bell’s wireless network team, most recently holding the role of Senior Vice President, Networks.
Also on May 20, 2025, Hadeer Hassaan assumed an expanded role as EVP and Chief Information and Customer Experience Officer. In this role, Hadeer will ensure Bell’s customer-first approach is supported by the right data and information, leveraging technology to create a seamless and positive experience for Bell's customers. She will also lead Bell’s cloud services strategy.
As at the date of this MD&A, our forward-looking statements set out in the BCE 2024 Annual MD&A, as updated or supplemented in the BCE 2025 First Quarter MD&A and in this MD&A, are based on certain assumptions including, without limitation, the following assumptions, as well as the various assumptions referred to under the sub-sections entitled Assumptions set out in section 3, Business segment analysis of this MD&A.
Assumptions about the Canadian economy
Our forward-looking statements are based on certain assumptions concerning the Canadian economy. Given ongoing uncertainty around U.S. trade policy, the economic outlook remains clouded. While the risk of a severe and escalating global trade conflict has diminished and there is some clarity around what tariffs will look like, how U.S. trade policy will unfold remains highly uncertain. It is still too early to confidently project the effects of tariffs on economic growth and inflation. We have assumed current trade policies remain in place. In particular, we have assumed:
•Slowing economic growth, given the Bank of Canada’s most recent estimated growth in Canadian gross domestic product of 1.3% in 2025 under the current tariff scenario, representing a decrease from the earlier estimate of 1.8%
•Slower population growth because of government policies designed to slow immigration
•Slowdown in consumer spending reflecting ongoing trade policy uncertainty
•Slowing business investment, particularly by businesses in sectors most reliant on U.S. markets
•Stable consumer price index (CPI) inflation
•Ongoing labour market softness
•Interest rates expected to remain at or near current levels
•Canadian dollar expected to remain near current levels. Further movements may be impacted by the degree of strength of the U.S. dollar, interest rates and changes in commodity prices
Assumptions about the U.S. economy
In the context of our acquisition of Ziply Fiber, we have made certain assumptions concerning the U.S. economy. In particular, we have assumed:
•Stable consumer spending, but emerging concerns about upward pricing pressure stemming from evolving trade policies
•Slowing business investment due to trade policy uncertainty
•Stable CPI inflation
•Slower population growth than recent historical trends
Canadian market assumptions
•A higher level of wireline and wireless competition in consumer, business and wholesale markets
•Higher, but slowing, wireless industry penetration
•A shrinking data and voice connectivity market as business customers migrate to lower-priced telecommunications solutions or alternative OTT competitors
•The Canadian traditional TV and radio advertising markets are expected to be impacted by audience declines as the advertising market growth continues to shift towards digital
•Declines in broadcasting distribution undertaking (BDU) subscribers driven by increasing competition from the continued rollout of subscription video on demand (SVOD) streaming services together with further scaling of OTT aggregators
U.S. market assumptions
In the context of our acquisition of Ziply Fiber, we have made certain assumptions concerning the U.S. market for our products and services. In particular, we have assumed:
•A higher level of wireline pricing competition in consumer, business and wholesale markets
•Increased demand for colocation and data centre connectivity services
•A shrinking traditional voice services market as customers migrate to wireless or Voice over IP (VoIP) offerings
10 BCE Inc. 2025 SECOND QUARTER SHAREHOLDER REPORT
Assumptions underlying expected continuing contribution holiday in 2025 in the majority of our pension plans
•At the relevant time, our defined benefit (DB) pension plans will remain in funded positions with going concern surpluses and maintain solvency ratios that exceed the minimum legal requirements for a contribution holiday to be taken for applicable DB and defined contribution (DC) components
•No significant declines in our DB pension plans’ financial position due to declines in investment returns or interest rates
•No material experience losses from other events such as through litigation or changes in laws, regulations or actuarial standards
2 Consolidated financial analysis
This section provides detailed information and analysis about BCE’s performance in Q2 and YTD 2025 compared with Q2 and YTD 2024. It focuses on BCE’s consolidated operating results and provides financial information for our Bell CTS and Bell Media business segments. For further discussion and analysis of our business segments, refer to section 3, Business segment analysis.
2.1 BCE consolidated income statements
|
|
|
|
|
|
|
|
|
|
|
|
|
|
|
|
|
|
|
|
|
|
|
|
|
|
|
| |
Q2 2025 |
Q2 2024 |
$ change |
% change |
YTD 2025 |
YTD 2024 |
$ change |
% change |
| Operating revenues |
|
|
|
|
|
|
|
|
| Service |
5,267 |
5,308 |
(41) |
|
(0.8 |
%) |
10,439 |
10,500 |
(61) |
|
(0.6 |
%) |
| Product |
818 |
697 |
121 |
|
17.4 |
% |
1,576 |
1,516 |
60 |
|
4.0 |
% |
| Total operating revenues |
6,085 |
6,005 |
80 |
|
1.3 |
% |
12,015 |
12,016 |
(1) |
|
— |
|
| Operating costs |
(3,411) |
(3,308) |
(103) |
|
(3.1 |
%) |
(6,783) |
(6,754) |
(29) |
|
(0.4 |
%) |
| Adjusted EBITDA |
2,674 |
2,697 |
(23) |
|
(0.9 |
%) |
5,232 |
5,262 |
(30) |
|
(0.6 |
%) |
| Adjusted EBITDA margin |
43.9 |
% |
44.9 |
% |
|
(1.0) pts |
43.5 |
% |
43.8 |
% |
|
(0.3) pts |
| Severance, acquisition and other costs |
(41) |
(22) |
(19) |
|
(86.4 |
%) |
(288) |
(251) |
(37) |
|
(14.7 |
%) |
| Depreciation |
(949) |
(945) |
(4) |
|
(0.4 |
%) |
(1,890) |
(1,891) |
1 |
|
0.1 |
% |
| Amortization |
(338) |
(325) |
(13) |
|
(4.0 |
%) |
(669) |
(641) |
(28) |
|
(4.4 |
%) |
| Finance costs |
|
|
|
|
|
|
|
|
| Interest expense |
(442) |
(426) |
(16) |
|
(3.8 |
%) |
(865) |
(842) |
(23) |
|
(2.7 |
%) |
| Net return on post-employment benefit plans |
26 |
17 |
9 |
|
52.9 |
% |
51 |
33 |
18 |
|
54.5 |
% |
| Impairment of assets |
(8) |
(60) |
52 |
|
86.7 |
% |
(17) |
(73) |
56 |
|
76.7 |
% |
| Other (expense) income |
(38) |
(101) |
63 |
|
62.4 |
% |
270 |
(139) |
409 |
|
n.m. |
| Income taxes |
(240) |
(231) |
(9) |
|
(3.9 |
%) |
(497) |
(397) |
(100) |
|
(25.2 |
%) |
|
|
|
|
|
|
|
|
|
|
|
|
|
|
|
|
|
|
| Net earnings |
644 |
604 |
40 |
|
6.6 |
% |
1,327 |
1,061 |
266 |
|
25.1 |
% |
|
|
|
|
|
|
|
|
|
|
|
|
|
|
|
|
|
|
|
|
|
|
|
|
|
|
|
|
|
|
|
|
|
|
|
|
|
|
|
|
|
|
|
|
|
| Net earnings attributable to: |
|
|
|
|
|
|
|
|
| Common shareholders |
579 |
537 |
42 |
|
7.8 |
% |
1,209 |
939 |
270 |
|
28.8 |
% |
| Preferred shareholders |
40 |
46 |
(6) |
|
(13.0 |
%) |
81 |
93 |
(12) |
|
(12.9 |
%) |
| NCI |
25 |
21 |
4 |
|
19.0 |
% |
37 |
29 |
8 |
|
27.6 |
% |
| Net earnings |
644 |
604 |
40 |
|
6.6 |
% |
1,327 |
1,061 |
266 |
|
25.1 |
% |
| Adjusted net earnings |
592 |
712 |
(120) |
|
(16.9 |
%) |
1,225 |
1,366 |
(141) |
|
(10.3 |
%) |
|
|
|
|
|
|
|
|
|
|
|
|
|
|
|
|
|
|
|
|
|
|
|
|
|
|
|
| EPS |
0.63 |
0.59 |
0.04 |
|
6.8 |
% |
1.31 |
1.03 |
0.28 |
|
27.2 |
% |
| Adjusted EPS |
0.63 |
0.78 |
(0.15) |
|
(19.2 |
%) |
1.32 |
1.50 |
(0.18) |
|
(12.0 |
%) |
n.m.: not meaningful
12 BCE Inc. 2025 SECOND QUARTER SHAREHOLDER REPORT
2.2 Customer connections
BCE net activations
|
|
|
|
|
|
|
|
|
|
|
|
|
|
|
|
|
|
|
|
|
| |
Q2 2025 |
Q2 2024 |
% change |
YTD 2025 |
YTD 2024 |
% change |
| Mobile phone net subscriber activations |
94,479 |
|
131,043 |
|
(27.9 |
%) |
93,883 |
|
156,251 |
|
(39.9 |
%) |
| Postpaid |
44,547 |
|
78,500 |
|
(43.3 |
%) |
34,949 |
|
123,747 |
|
(71.8 |
%) |
| Prepaid |
49,932 |
|
52,543 |
|
(5.0 |
%) |
58,934 |
|
32,504 |
|
81.3 |
% |
| Mobile connected device net subscriber activations |
97,502 |
|
87,917 |
|
10.9 |
% |
133,486 |
|
154,323 |
|
(13.5 |
%) |
| Retail high-speed Internet net subscriber activations |
4,999 |
|
23,841 |
|
(79.0 |
%) |
14,514 |
|
54,919 |
|
(73.6 |
%) |
|
|
|
|
|
|
|
| Retail IPTV net subscriber (losses) activations |
(15,851) |
|
(1,313) |
|
n.m. |
(31,822) |
|
12,861 |
|
n.m. |
|
|
|
|
|
|
|
|
|
|
|
|
|
|
| Retail residential NAS lines net losses |
(44,700) |
|
(53,250) |
|
16.1 |
% |
(92,130) |
|
(97,161) |
|
5.2 |
% |
|
|
|
|
|
|
|
| Total services net activations |
136,429 |
|
188,238 |
|
(27.5 |
%) |
117,931 |
|
281,193 |
|
(58.1 |
%) |
n.m.: not meaningful
Total BCE customer connections
|
|
|
|
|
|
|
|
|
|
|
|
|
|
|
| |
Q2 2025 |
Q2 2024 |
% change |
|
|
|
Mobile phone subscribers(2)(3) |
10,382,457 |
|
10,337,495 |
|
0.4 |
% |
|
|
|
| Postpaid |
9,565,385 |
|
9,440,775 |
|
1.3 |
% |
|
|
|
Prepaid(2)(3) |
817,072 |
|
896,720 |
|
(8.9 |
%) |
|
|
|
| Mobile connected device subscribers |
3,176,916 |
|
2,886,871 |
|
10.0 |
% |
|
|
|
Retail high-speed Internet subscribers(1)(3) |
4,421,961 |
|
4,520,553 |
|
(2.2 |
%) |
|
|
|
|
|
|
|
|
|
|
Retail IPTV subscribers(1)(4) |
2,100,690 |
|
2,124,200 |
|
(1.1 |
%) |
|
|
|
|
|
|
|
|
|
|
|
|
|
|
|
|
|
Retail residential NAS lines(1) |
1,727,911 |
|
1,924,456 |
|
(10.2 |
%) |
|
|
|
|
|
|
|
|
|
|
| Total services subscribers |
21,809,935 |
|
21,793,575 |
|
0.1 |
% |
|
|
|
(1)In Q1 2025, we reduced our retail high-speed Internet, retail IPTV and retail residential NAS lines subscriber bases by 80,666, 441 and 14,150 subscribers, respectively, as at March 31, 2025, as we stopped selling new plans for these services under the Distributel, Acanac, Oricom and B2B2C brands. Additionally, at the beginning of Q1 2025, we reduced our retail high-speed Internet subscriber base by 2,783 subscribers to adjust for prior year customer deactivations following a review of customer accounts.
(2)In Q4 2024, we removed 124,216 Bell prepaid mobile phone subscribers from our prepaid mobile phone subscriber base as at December 31, 2024, as we stopped selling new plans for this service as of that date.
(3)In Q3 2024, we removed 77,971 Virgin Plus prepaid mobile phone subscribers from our prepaid mobile phone subscriber base as at September 30, 2024, as we stopped selling new plans for this service as of that date. Additionally, as a result of a recent CRTC decision on wholesale high-speed Internet access services, we are no longer able to resell cable Internet services to new customers in our wireline footprint as of September 12, 2024, and consequently we removed all of the existing 106,259 cable subscribers in our wireline footprint from our retail high-speed Internet subscriber base as of that date.
(4)In Q2 2024, we increased our retail IPTV subscriber base by 40,997 to align the deactivation policy for our Fibe TV streaming services to our traditional Fibe TV service.
BCE total services net subscriber activations were 136,429 in Q2 2025, down 27.5% compared to the same period in 2024. The total services net subscriber activations in Q2 2025 consisted of:
•94,479 mobile phone net subscriber activations and 97,502 mobile connected device net subscriber activations
•4,999 retail high-speed Internet net subscriber activations
•15,851 retail IPTV net subscriber losses
•44,700 retail residential NAS lines net losses
In the first half of the year, BCE added 117,931 total services net subscriber activations, down 58.1% compared to the same period in 2024. The total services net subscriber activations in the first half of 2025 consisted of:
•93,883 mobile phone net subscriber activations and 133,486 mobile connected device net subscriber activations
•14,514 retail high-speed Internet net subscriber activations
•31,822 retail IPTV net subscriber losses
•92,130 retail residential NAS lines net losses
At June 30, 2025, BCE's customer connections totalled 21,809,935, up 0.1% year over year, and consisted of:
•10,382,457 mobile phone subscribers, up 0.4% year over year, and 3,176,916 mobile connected device subscribers, up 10.0% year over year
•4,421,961 retail high-speed Internet subscribers, down 2.2% year over year
•2,100,690 retail IPTV subscribers, down 1.1% year over year
•1,727,911 retail residential NAS lines, down 10.2% year over year
2.3 Operating revenues
|
|
|
|
|
|
|
|
|
| BCE |
|
BCE |
| Revenues |
|
Revenues |
| (in $ millions) |
|
(in $ millions) |
|
|
|
|
|
|
|
|
|
|
|
|
|
|
|
|
|
|
|
|
|
|
|
|
|
|
|
|
|
|
| |
Q2 2025 |
Q2 2024 |
$ change |
% change |
YTD 2025 |
YTD 2024 |
$ change |
% change |
| Bell CTS |
5,334 |
|
5,283 |
|
51 |
|
1.0 |
% |
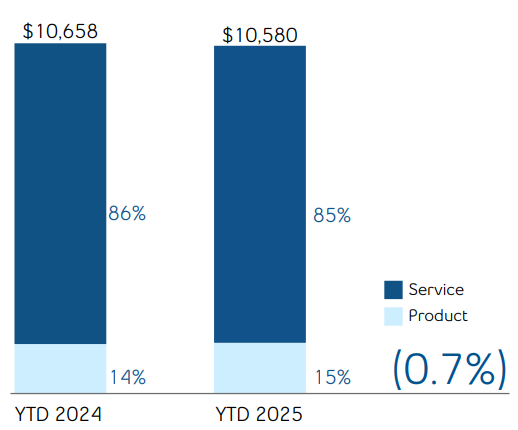
10,580 |
|
10,658 |
|
(78) |
|
(0.7 |
%) |
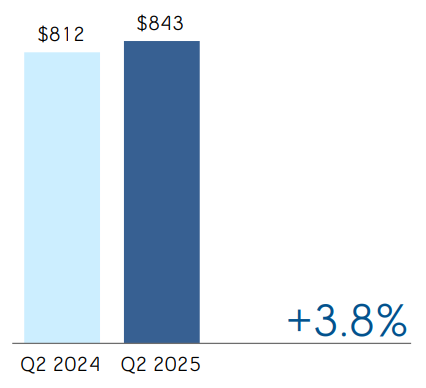
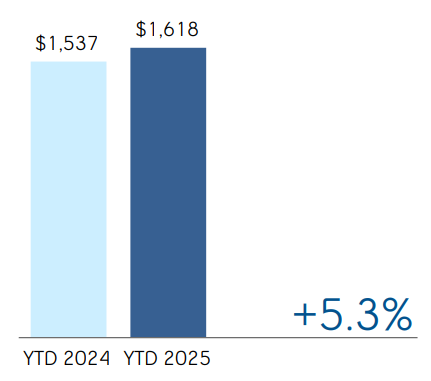
| Bell Media |
843 |
|
812 |
|
31 |
|
3.8 |
% |
1,618 |
|
1,537 |
|
81 |
|
5.3 |
% |
| Inter-segment eliminations |
(92) |
|
(90) |
|
(2) |
|
(2.2 |
%) |
(183) |
|
(179) |
|
(4) |
|
(2.2 |
%) |
| Total BCE operating revenues |
6,085 |
|
6,005 |
|
80 |
|
1.3 |
% |
12,015 |
|
12,016 |
|
(1) |
|
— |
|
BCE
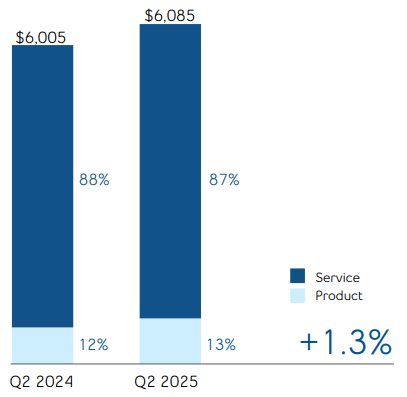
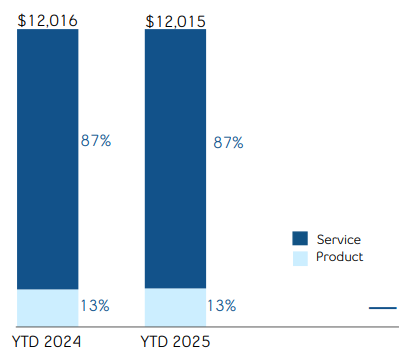
BCE operating revenues increased by 1.3% in Q2 2025, compared to Q2 2024, resulting from greater product revenues, partly offset by lower service revenues. During the first six months of the year, BCE operating revenues were stable year over year, as higher product revenues were offset by lower service revenues. Service revenues of $5,267 million in Q2 2025 and of $10,439 million year to date, declined by 0.8% and 0.6%, respectively, year over year. Product revenues of $818 million in Q2 2025 and $1,576 million year to date, increased by 17.4% and 4.0%, respectively, over the same periods last year.
The year-over-year growth in Q2 2025 operating revenues was driven by an increase from both our Bell CTS and Bell Media segments. Year-to-date revenues were stable year over year, as higher revenues from our Bell Media segment were essentially offset by a decrease in our Bell CTS segment. Bell CTS operating revenues in the quarter grew by 1.0% year over year, due to higher product revenues of 17.4%, moderated by decreased service revenues of 1.5%, from ongoing erosion in wireline voice revenues, along with lower wireline data and wireless revenues. The year-to-date decline in Bell CTS operating revenues of 0.7%, was driven by lower service revenues of 1.5% from reduced wireline voice, wireless and wireline data revenues, moderated by greater product revenues of 4.0%. Bell Media operating revenues increased by 3.8% in Q2 2025, compared to last year, from higher subscriber and F1 Canadian Grand Prix 2025 revenues, partly offset by lower advertising revenues. Bell Media operating revenues during the first half of the year, increased by 5.3% year over year, due to higher subscriber, F1 Canadian Grand Prix 2025 and advertising revenues.
14 BCE Inc. 2025 SECOND QUARTER SHAREHOLDER REPORT
2.4 Operating costs
|
|
|
|
|
|
| BCE |
BCE |
| Operating cost profile |
Operating cost profile |
| Q2 2024 |
Q2 2025 |
|
|
| BCE |
BCE |
| Operating cost profile |
Operating cost profile |
| YTD 2024 |
YTD 2025 |
|
|
|
|
|
|
|
|
|
|
|
|
|
|
|
|
|
|
|
|
|
|
|
|
|
|
|
|
|
| |
Q2 2025 |
Q2 2024 |
$ change |
% change |
YTD 2025 |
YTD 2024 |
$ change |
% change |
| Bell CTS |
(2,895) |
|
(2,804) |
|
(91) |
|
(3.2 |
%) |
(5,742) |
|
(5,731) |
|
(11) |
|
(0.2 |
%) |
| Bell Media |
(608) |
|
(594) |
|
(14) |
|
(2.4 |
%) |
(1,224) |
|
(1,202) |
|
(22) |
|
(1.8 |
%) |
| Inter-segment eliminations |
92 |
|
90 |
|
2 |
|
2.2 |
% |
183 |
|
179 |
|
4 |
|
2.2 |
% |
| Total BCE operating costs |
(3,411) |
|
(3,308) |
|
(103) |
|
(3.1 |
%) |
(6,783) |
|
(6,754) |
|
(29) |
|
(0.4 |
%) |
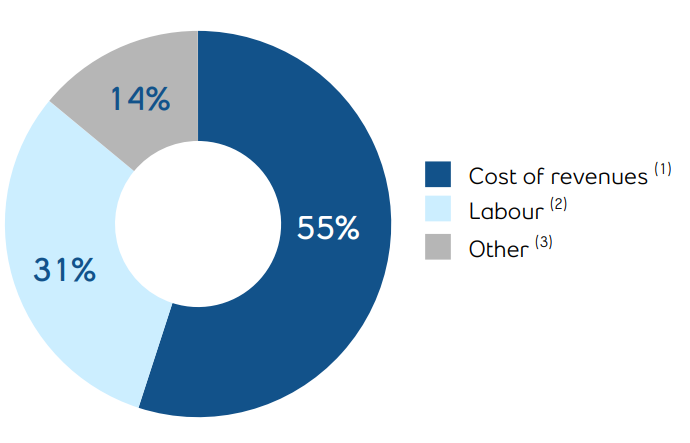
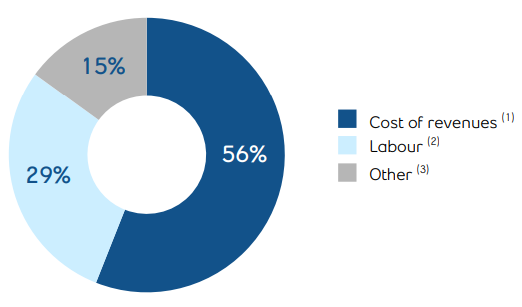
(1)Cost of revenues includes costs of wireless devices and other equipment sold, network and content costs, and payments to other carriers.
(2)Labour costs (net of capitalized costs) include wages, salaries and related taxes and benefits, post-employment benefit plans service cost, and other labour costs, including contractor and outsourcing costs.
(3)Other operating costs include marketing, advertising and sales commission costs, bad debt expense, taxes other than income taxes, IT costs, professional service fees and rent.
BCE
BCE operating costs increased by 3.1% in Q2 2025, and by 0.4% in the first half of the year, compared to the same periods in 2024, driven by higher expenses in Bell CTS of 3.2% and 0.2%, respectively, and in Bell Media of 2.4% and 1.8%, respectively.
2.5 Net earnings
|
|
|
|
|
|
|
|
|
| BCE |
|
BCE |
| Net earnings |
|
Net earnings |
| (in $ millions) |
|
(in $ millions) |
|
|
|
Net earnings in the second quarter of 2025 increased by $40 million, compared to the same period last year, mainly due to lower other expense and lower impairment of assets, partly offset by lower adjusted EBITDA, higher severance, acquisition and other costs, higher depreciation and amortization and higher interest expense.
Net earnings on a year-to-date basis in 2025 increased by $266 million, compared to the same period last year, mainly due to higher other income primarily resulting from early debt redemption gains and lower impairment of assets, partly offset by higher income taxes, higher severance, acquisition and other costs, lower adjusted EBITDA, higher amortization and higher interest expense.
16 BCE Inc. 2025 SECOND QUARTER SHAREHOLDER REPORT
|
|
|
|
|
|
|
|
|
| BCE |
|
BCE |
| Adjusted EBITDA |
|
Adjusted EBITDA |
| (in $ millions) |
|
(in $ millions) |
|
|
|
|
|
|
|
|
|
|
|
|
|
|
|
|
|
|
|
|
|
|
|
|
|
|
|
|
|
|
| |
Q2 2025 |
Q2 2024 |
$ change |
% change |
YTD 2025 |
YTD 2024 |
$ change |
% change |
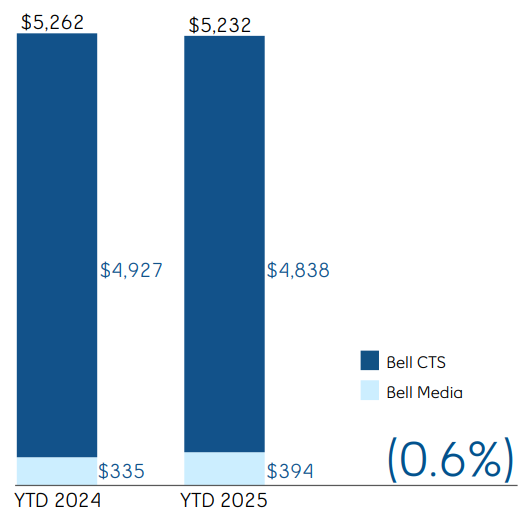
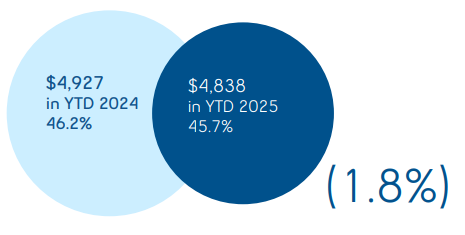
| Bell CTS |
2,439 |
|
2,479 |
|
(40) |
|
(1.6 |
%) |
4,838 |
|
4,927 |
|
(89) |
|
(1.8 |
%) |
| Adjusted EBITDA margin |
45.7 |
% |
46.9 |
% |
|
(1.2) pts |
45.7 |
% |
46.2 |
% |
|
(0.5) pts |
| Bell Media |
235 |
|
218 |
|
17 |
|
7.8 |
% |
394 |
|
335 |
|
59 |
|
17.6 |
% |
| Adjusted EBITDA margin |
27.9 |
% |
26.8 |
% |
|
1.1 pts |
24.4 |
% |
21.8 |
% |
|
2.6 pts |
| Total BCE adjusted EBITDA |
2,674 |
|
2,697 |
|
(23) |
|
(0.9 |
%) |
5,232 |
|
5,262 |
|
(30) |
|
(0.6 |
%) |
| Adjusted EBITDA margin |
43.9 |
% |
44.9 |
% |
|
(1.0) pts |
43.5 |
% |
43.8 |
% |
|
(0.3) pts |
BCE
BCE adjusted EBITDA decreased by 0.9% in Q2 2025, and by 0.6% in the first six months of the year, compared to the same periods last year, driven by a decline in our Bell CTS segment of 1.6% and 1.8%, respectively, moderated by growth in our Bell Media segment of 7.8% and 17.6%, respectively. This drove an adjusted EBITDA margin of 43.9% in Q2 2025, and 43.5% year to date, down 1.0 pts and 0.3 pts, respectively, over the same periods in 2024, resulting from reduced service revenues flow-through, along with a higher proportion of lower margin product sales in our total revenue base, mitigated in part by cost reduction initiatives and operating efficiencies.
2.7 Severance, acquisition and other costs
2025
Severance, acquisition and other costs of $41 million in the second quarter of 2025 and $288 million on a year-to-date basis included:
•Severance costs of $14 million in Q2 2025 and $245 million on a year-to-date basis related to involuntary and voluntary employee terminations
•Acquisition and other costs of $27 million in Q2 2025 and $43 million on a year-to-date basis
2024
Severance, acquisition and other costs of $22 million in the second quarter of 2024 and $251 million on a year-to-date basis included:
•Severance costs recovery of $4 million in Q2 2024
•Severance costs of $230 million on a year-to-date basis related to involuntary and voluntary employee terminations, including the estimated costs of the previously announced workforce reductions incurred up to June 30, 2024
•Acquisition and other costs of $26 million in Q2 2024 and $21 million on a year-to-date basis
2.8 Depreciation and amortization
Depreciation
Depreciation increased by $4 million in the second quarter of 2025 and decreased by $1 million on a year-to-date basis in 2025, compared to the same periods in 2024.
Amortization
Amortization in the second quarter and on a year-to-date basis in 2025 increased by $13 million and $28 million, respectively, compared to the same periods in 2024, mainly due to a higher asset base.
Interest expense
Interest expense in the second quarter and on a year-to-date basis in 2025 increased by $16 million and $23 million, respectively, compared to the same periods in 2024, mainly due to higher average debt balances.
Net return on post-employment benefit plans
Net return on our post-employment benefit plans is based on market conditions that existed at the beginning of the year as well as the net post-employment benefit plan asset (liability). On January 1, 2025, the discount rate was 4.7% compared to 4.6% on January 1, 2024.
In the second quarter and on a year-to-date basis in 2025, net return on post-employment benefit plans increased by $9 million and $18 million, respectively, compared to the same periods last year, as a result of a higher discount rate in 2025 and a higher net asset position.
The impacts of changes in market conditions during the year are recognized in Other comprehensive income (loss) (OCI).
2.10 Impairment of assets
Impairment charges for the second quarter and on a year-to-date basis in 2025 decreased by $52 million and $56 million, respectively, compared to the same periods last year, mainly due to charges in 2024 related to right-of-use assets for certain office spaces we ceased using as part of our real estate optimization strategy as a result of our hybrid work policy.
18 BCE Inc. 2025 SECOND QUARTER SHAREHOLDER REPORT
2.11 Other (expense) income
2025
Other expense of $38 million in the second quarter of 2025 included foreign exchange losses on derivatives used to economically hedge anticipated purchases and the acquisition of Ziply Fiber in foreign currencies and net mark-to-market losses on derivatives used to economically hedge equity settled share-based compensation plans, partly offset by early debt redemption gains due to the repurchase by Bell Canada, as a result of its cash tender offers, of a portion of its Series M-39, M-45, M-51 and M-55 MTN debentures.
Other income of $270 million on a year-to-date basis in 2025 included early debt redemption gains due to the repurchase by Bell Canada, as a result of its cash tender offers, of a portion of its Series M-39, M-45, M-51 and M-55 MTN debentures, and a portion of its Series US-2, US-4, US-5, US-6, and US-7 Notes and interest income, partly offset by foreign exchange losses on derivatives used to economically hedge anticipated purchases and the acquisition of Ziply Fiber in foreign currencies and net mark-to-market losses on derivatives used to economically hedge equity settled share-based compensation plans.
2024
Other expense of $101 million in the second quarter of 2024 included equity losses on our share of an obligation to repurchase at fair value the minority interest in MLSE, net mark-to-market losses on derivatives used to economically hedge equity settled share-based compensation plans and losses on retirements and disposals of property, plant and equipment and intangible assets, partly offset by interest income.
Other expense of $139 million on a year-to-date basis in 2024 included net mark-to-market losses on derivatives used to economically hedge equity settled share-based compensation plans, equity losses on our share of an obligation to repurchase at fair value the minority interest in MLSE and losses on retirements and disposals of property, plant and equipment and intangible assets, partly offset by interest income and income on operations from our equity investments.
Income taxes in the second quarter of 2025 increased by $9 million compared to the same period last year, mainly due to a higher value of favourable tax adjustments in 2024, partly offset by lower taxable income in 2025.
Income taxes on a year-to-date basis in 2025 increased by $100 million compared to the same period last year, mainly due to higher taxable income in 2025 and a higher value of favourable tax adjustments in 2024.
2.13 Net earnings attributable to common shareholders and EPS
Net earnings attributable to common shareholders in the second quarter of 2025 of $579 million, increased by $42 million, compared to the same period last year, mainly due to lower other expense and lower impairment of assets, partly offset by lower adjusted EBITDA, higher severance, acquisition and other costs, higher depreciation and amortization and higher interest expense.
Net earnings attributable to common shareholders on a year-to-date basis in 2025 of $1,209 million, increased by $270 million, compared to the same period last year, mainly due to higher other income primarily resulting from early debt redemption gains and lower impairment of assets, partly offset by higher income taxes, higher severance, acquisition and other costs, lower adjusted EBITDA, higher amortization and higher interest expense.
BCE’s EPS of $0.63 in Q2 2025 increased by $0.04 compared to the same period last year. BCE's EPS of $1.31 on a year-to-date basis in 2025 increased by $0.28 compared to the same period last year.
In the second quarter of 2025, adjusted net earnings, which excludes the impact of severance, acquisition and other costs, net mark-to-market gains (losses) on derivatives used to economically hedge equity settled share-based compensation plans, net equity gains (losses) on investments in associates and joint ventures, net gains (losses) on investments, early debt redemption gains (costs) and impairment of assets, net of tax and NCI, was $592 million, or $0.63 per common share, compared to $712 million, or $0.78 per common share, for the same period last year. Adjusted net earnings in the first half of 2025 was $1,225 million, or $1.32 per common share, compared to $1,366 million, or $1.50 per common share, for the first six months of 2024.
3 Business segment analysis
This section contains forward-looking statements, including relating to Bell Canada’s launch of Bell AI Fabric intended to create a national initiative to support Canada's AI ecosystem, the benefits expected to result from the launch of Bell AI Fabric, the expected number of AI data centres to be launched by the end of 2026, Bell Canada’s long-term objective to drive AI innovation and economic growth in Canada, BCE's plans and 2025 outlook. Refer to the section Caution regarding forward-looking statements at the beginning of this MD&A.
Key business developments
Launch of Bell AI Fabric
On May 28, 2025, Bell Canada announced Bell AI Fabric, a national initiative to support Canada's AI ecosystem. Bell AI Fabric will create a national network of purpose-built AI data centres starting with a data centre supercluster in B.C. that will aim to provide upwards of 500 Megawatts (MW) of hydroelectric-powered AI compute capacity across six facilities. The first facility came online in June 2025 in partnership with leading AI inference provider, Groq, Inc. (Groq), and the launch of its 7 MW AI inference facility in Kamloops, B.C. Additional data centres will come online by the end of 2026, including a 26 MW AI data centre being built in partnership with Thompson Rivers University, with additional facilities in advanced planning stages with stakeholders. Bell AI Fabric underscores Bell's capabilities as a leading full-stack AI Managed Service Provider that can support Canadian enterprises and governments across their full spectrum of AI needs, from strategy and applications development through infrastructure deployment. This initiative represents Bell's long-term objective to drive AI innovation and economic growth in Canada. With cutting-edge technology and ensuring data sovereignty, Bell is poised to lead the way in delivering secure, reliable, and transformative AI solutions for businesses and communities across the country.
Partnership with Zoom to offer workplace collaboration solutions for Canadian businesses
On May 20, 2025, Bell Canada and Zoom Communications, Inc. (Zoom), a global leader in workplace communications, announced a partnership to launch Workplace from Bell and Zoom, a collaboration tool available exclusively through Bell for Canadian enterprises. The open collaboration platform integrates advanced communication tools including video conferencing, messaging, file sharing, and external calling into a seamless experience across devices. With enterprise-grade security and AI-first capabilities included as a standard feature, Workplace from Bell and Zoom enhances productivity with AI-powered task automation. The partnership reinforces Bell’s commitment to deliver services and solutions that meet the productivity and collaboration needs of all Canadian businesses.
20 BCE Inc. 2025 SECOND QUARTER SHAREHOLDER REPORT
Financial performance analysis
Q2 2025 performance highlights
|
|
|
|
|
|
|
|
|
|
|
|
|
|
|
|
|
|
|
|
|
|
|
|
| Bell CTS |
Bell CTS |
| Revenues |
Adjusted EBITDA |
| (in $ millions) |
(in $ millions) |
|
|
|
|
(% adjusted EBITDA margin) |
|
|
|
|
|
|
|
|
|
|
|
|
|
|
| Bell CTS |
Bell CTS |
| Revenues |
Adjusted EBITDA |
| (in $ millions) |
(in $ millions) |
|
|
|
|
(% adjusted EBITDA margin) |
|
|
|
|
|
|
|
|
|
|
|
|
|
|
|
|
|
|
|
|
|
|
|
|
|
|
|
Total mobile phone subscriber growth(2)(3) |
Mobile phone postpaid net subscriber activations in Q2 2025 |
Mobile phone prepaid net subscriber activations in
Q2 2025
|
Mobile phone postpaid churn in Q2 2025(5) |
Mobile phone blended average revenue per user (ARPU)(2)(3)(6) |
| per month |
|
| +0.4% |
44,547 |
49,932 |
1.06% |
(0.7%) |
|
Q2 2025 vs. Q2 2024 |
vs. net activations of 78,500 in Q2 2024 |
vs. net activations of 52,543 in Q2 2024 |
Decreased 0.12 pts vs. Q2 2024 |
Q2 2025:
Q2 2024:
|
$57.61
$58.04
|
|
Retail high-speed Internet subscriber decline(1)(3) |
Retail high-speed Internet net subscriber activations in Q2 2025 |
Retail IPTV subscriber decline(1)(4) |
| (2.2%) |
4,999 |
(1.1%) |
| Q2 2025 vs. Q2 2024 |
Decreased (79.0%) vs. Q2 2024 |
Q2 2025 vs. Q2 2024 |
Retail IPTV net subscriber losses in Q2 2025 |
Retail residential NAS lines subscriber decline(1) |
| (15,851) |
(10.2%) |
vs. net losses of (1,313) in Q2 2024 |
Q2 2025 vs. Q2 2024 |
(1)In Q1 2025, we reduced our retail high-speed Internet, retail IPTV and retail residential NAS lines subscriber bases by 80,666, 441 and 14,150 subscribers, respectively, as at March 31, 2025, as we stopped selling new plans for these services under the Distributel, Acanac, Oricom and B2B2C brands. Additionally, at the beginning of Q1 2025, we reduced our retail high-speed Internet subscriber base by 2,783 subscribers to adjust for prior year customer deactivations following a review of customer accounts.
(2)In Q4 2024, we removed 124,216 Bell prepaid mobile phone subscribers from our prepaid mobile phone subscriber base as at December 31, 2024, as we stopped selling new plans for this service as of that date.
(3)In Q3 2024, we removed 77,971 Virgin Plus prepaid mobile phone subscribers from our prepaid mobile phone subscriber base as at September 30, 2024, as we stopped selling new plans for this service as of that date. Additionally, as a result of a recent CRTC decision on wholesale high-speed Internet access services, we are no longer able to resell cable Internet services to new customers in our wireline footprint as of September 12, 2024, and consequently we removed all of the existing 106,259 cable subscribers in our wireline footprint from our retail high-speed Internet subscriber base as of that date.
(4)In Q2 2024, we increased our retail IPTV subscriber base by 40,997 to align the deactivation policy for our Fibe TV streaming services to our traditional Fibe TV service.
(5)Mobile phone churn is defined as the rate at which existing mobile phone subscribers cancel their services. Refer to section 9.6, KPIs in this MD&A for more information on this measure.
(6)Mobile phone blended ARPU is defined as Bell CTS wireless external services revenues divided by the average mobile phone subscriber base for the specified period, expressed as a dollar unit per month. Refer to section 9.6, KPIs in this MD&A for more information on this measure.
Bell CTS results
Revenues
|
|
|
|
|
|
|
|
|
|
|
|
|
|
|
|
|
|
|
|
|
|
|
|
|
|
|
| |
Q2 2025 |
Q2 2024 |
$ change |
% change |
YTD 2025 |
YTD 2024 |
$ change |
% change |
| Wireless |
1,783 |
|
1,788 |
|
(5) |
|
(0.3 |
%) |
3,542 |
|
3,562 |
|
(20) |
|
(0.6 |
%) |
| Wireline data |
2,025 |
|
2,034 |
|
(9) |
|
(0.4 |
%) |
4,039 |
|
4,046 |
|
(7) |
|
(0.2 |
%) |
| Wireline voice |
624 |
|
677 |
|
(53) |
|
(7.8 |
%) |
1,253 |
|
1,360 |
|
(107) |
|
(7.9 |
%) |
| Other wireline services |
77 |
|
79 |
|
(2) |
|
(2.5 |
%) |
156 |
|
160 |
|
(4) |
|
(2.5 |
%) |
| External service revenues |
4,509 |
|
4,578 |
|
(69) |
|
(1.5 |
%) |
8,990 |
|
9,128 |
|
(138) |
|
(1.5 |
%) |
| Inter-segment service revenues |
7 |
|
8 |
|
(1) |
|
(12.5 |
%) |
14 |
|
14 |
|
— |
|
— |
|
| Operating service revenues |
4,516 |
|
4,586 |
|
(70) |
|
(1.5 |
%) |
9,004 |
|
9,142 |
|
(138) |
|
(1.5 |
%) |
| Wireless |
594 |
|
568 |
|
26 |
|
4.6 |
% |
1,218 |
|
1,252 |
|
(34) |
|
(2.7 |
%) |
| Wireline |
224 |
|
129 |
|
95 |
|
73.6 |
% |
358 |
|
264 |
|
94 |
|
35.6 |
% |
|
|
|
|
|
|
|
|
|
|
|
|
|
|
|
|
|
|
|
|
|
|
|
|
|
|
|
| External/Operating product revenues |
818 |
|
697 |
|
121 |
|
17.4 |
% |
1,576 |
|
1,516 |
|
60 |
|
4.0 |
% |
| Total external revenues |
5,327 |
|
5,275 |
|
52 |
|
1.0 |
% |
10,566 |
|
10,644 |
|
(78) |
|
(0.7 |
%) |
| Total operating revenues |
5,334 |
|
5,283 |
|
51 |
|
1.0 |
% |
10,580 |
|
10,658 |
|
(78) |
|
(0.7 |
%) |
22 BCE Inc. 2025 SECOND QUARTER SHAREHOLDER REPORT
Bell CTS operating revenues increased by 1.0% in Q2 2025, compared to Q2 2024, from higher product revenues, moderated by lower service revenues, whereas in the first half of the year, operating revenues decreased by 0.7%, year over year, attributable to lower service revenues, partly offset by higher product revenues. The service revenues decline in both the quarter and year to date was driven by lower wireline voice, wireline data and wireless revenues.
Bell CTS operating service revenues declined by 1.5% in Q2 2025 and in the first six months of the year, compared to the same periods in 2024.
•Wireless revenues decreased by 0.3% in Q2 2025 and by 0.6% in the first six months of the year, compared to the same periods last year, driven by:
•Ongoing elevated competitive pricing pressures on rate plans and greater impact of discounting
•Reduced data overages driven by increased customer adoption of monthly plans with higher data thresholds, including unlimited plans
•Lower roaming revenues mainly from reduced travel to the U.S.
These factors were partly offset by:
•Continued growth in our mobile phone and connected device average subscriber bases coupled with the flow-through of rate increases
•Revenues related to the 2025 G7 Leader's Summit
•Wireline data revenues declined by 0.4% in Q2 2025 and by 0.2% year to date, compared to the same periods in 2024, mainly driven by:
•Higher acquisition, retention and bundle discounts on residential services
•Continued erosion in our satellite TV subscriber base
•Lower internet protocol (IP) broadband and legacy data revenues
These factors were partly offset by:
•Higher retail Internet average subscriber base, along with the flow-through of residential rate increases
•Greater managed services revenues from Ateko, our Systems Integrator/Managed Services practice, and from our cybersecurity business, including the contribution from small acquisitions made in 2024
•Wireline voice revenues decreased by 7.8% in Q2 2025 and by 7.9% in the first half of the year, compared to the same periods in 2024, primarily due to:
•Greater retail residential NAS lines erosion, combined with business voice declines, driven by technological substitution to wireless and Internet-based services
•Increased acquisition, retention and bundle discounts on residential services
These factors were partly offset by:
•Flow-through of residential rate increases
•Revenues from the 2025 Canadian federal election
Bell CTS operating product revenues increased by 17.4% in Q2 2025 and by 4.0% in the first half of the year, compared to the same periods last year.
•Wireless operating product revenues increased by 4.6% in Q2 2025, compared to the same period last year, due to higher wireless device sales to consumers from greater upgrade volumes and contracted activations, moderated by mix shift to lower value handsets and greater discounting, partly offset by reduced consumer electronics sales due to permanent store closures of The Source. Conversely, during the first half of the year, operating product revenues declined by 2.7%, as lower device sales in Q1 2025 to the government sector more than offset the impact of the items described above.
•Wireline operating product revenues grew by 73.6% in the quarter and by 35.6% year to date, compared to the same periods last year, driven by Bell AI Fabric, from the delivery of our first AI facility in Kamloops, B.C.
Operating costs and adjusted EBITDA
|
|
|
|
|
|
|
|
|
|
|
|
|
|
|
|
|
|
|
|
|
|
|
|
|
|
|
| |
Q2 2025 |
Q2 2024 |
$ change |
% change |
YTD 2025 |
YTD 2024 |
$ change |
% change |
| Operating costs |
(2,895) |
(2,804) |
(91) |
|
(3.2 |
%) |
(5,742) |
(5,731) |
(11) |
|
(0.2 |
%) |
| Adjusted EBITDA |
2,439 |
2,479 |
(40) |
|
(1.6 |
%) |
4,838 |
4,927 |
(89) |
|
(1.8 |
%) |
| Adjusted EBITDA margin |
45.7 |
% |
46.9 |
% |
|
(1.2) pts |
45.7 |
% |
46.2 |
% |
|
(0.5) pts |
Bell CTS operating costs increased by 3.2% in Q2 2025 and by 0.2% in the first half of the year, compared to the same periods last year, due to:
•Higher cost of goods sold and commission expenses, associated with the product revenue growth
•Greater costs associated with the 2025 G7 Leader's Summit, along with higher managed services costs and payments to other carriers due to the growth in related revenues
•Higher costs from the small acquisitions made in 2024
These factors were partly offset by:
•Cost reduction initiatives attributable to workforce reductions, savings from our customer service centres driven by improved call placement and reduced call volumes, permanent closures of The Source stores, as well as technology and automation-enabled operating efficiencies across the organization
•Lower TV programming costs relating to the lower TV revenues
Bell CTS adjusted EBITDA decreased by 1.6% in Q2 2025, compared to Q2 2024, due to higher operating costs, moderated by increased operating revenues. In the first half of the year, adjusted EBITDA declined by 1.8% driven by lower operating revenues and higher operating costs. Adjusted EBITDA margin of 45.7% in both Q2 2025 and in the first six months of the year, decreased by 1.2 pts and 0.5 pts, respectively, year over year, due to lower service revenues flow-through, along with a higher proportion of lower margin product sales in our total revenue base, partly offset by cost reduction initiatives and operating efficiencies.
Bell CTS operating metrics
Wireless
|
|
|
|
|
|
|
|
|
|
|
|
|
|
|
|
|
|
|
|
|
|
|
|
|
|
|
| |
Q2 2025 |
Q2 2024 |
Change |
% change |
YTD 2025 |
YTD 2024 |
Change |
% change |
| Mobile phones |
|
|
|
|
|
|
|
|
Blended ARPU(1)(2) ($/month) |
57.61 |
58.04 |
(0.43) |
(0.7 |
%) |
57.35 |
58.09 |
(0.74) |
(1.3 |
%) |
|
|
|
|
|
|
|
|
|
| Gross subscriber activations |
510,597 |
575,334 |
(64,737) |
(11.3 |
%) |
979,182 |
1,082,773 |
(103,591) |
(9.6 |
%) |
| Postpaid |
331,438 |
389,213 |
(57,775) |
(14.8 |
%) |
651,688 |
756,087 |
(104,399) |
(13.8 |
%) |
| Prepaid |
179,159 |
186,121 |
(6,962) |
(3.7 |
%) |
327,494 |
326,686 |
808 |
0.2 |
% |
| Net subscriber activations |
94,479 |
131,043 |
(36,564) |
(27.9 |
%) |
93,883 |
156,251 |
(62,368) |
(39.9 |
%) |
| Postpaid |
44,547 |
78,500 |
(33,953) |
(43.3 |
%) |
34,949 |
123,747 |
(88,798) |
(71.8 |
%) |
| Prepaid |
49,932 |
52,543 |
(2,611) |
(5.0 |
%) |
58,934 |
32,504 |
26,430 |
81.3 |
% |
| Blended churn % (average per month) |
1.36 |
% |
1.47 |
% |
|
0.11 pts |
1.45 |
% |
1.53 |
% |
|
0.08 pts |
| Postpaid |
1.06 |
% |
1.18 |
% |
|
0.12 pts |
1.13 |
% |
1.20 |
% |
|
0.07 pts |
| Prepaid |
5.06 |
% |
4.60 |
% |
|
(0.46) pts |
5.41 |
% |
5.16 |
% |
|
(0.25) pts |
Subscribers(1)(2) |
10,382,457 |
10,337,495 |
44,962 |
0.4 |
% |
10,382,457 |
10,337,495 |
44,962 |
0.4 |
% |
| Postpaid |
9,565,385 |
9,440,775 |
124,610 |
1.3 |
% |
9,565,385 |
9,440,775 |
124,610 |
1.3 |
% |
Prepaid(1)(2) |
817,072 |
896,720 |
(79,648) |
(8.9 |
%) |
817,072 |
896,720 |
(79,648) |
(8.9 |
%) |
| Mobile connected devices |
|
|
|
|
|
|
|
|
| Net subscriber activations |
97,502 |
87,917 |
9,585 |
10.9 |
% |
133,486 |
154,323 |
(20,837) |
(13.5 |
%) |
| Subscribers |
3,176,916 |
2,886,871 |
290,045 |
10.0 |
% |
3,176,916 |
2,886,871 |
290,045 |
10.0 |
% |
(1)In Q4 2024, we removed 124,216 Bell prepaid mobile phone subscribers from our prepaid mobile phone subscriber base as at December 31, 2024, as we stopped selling new plans for this service as of that date.
(2)In Q3 2024, we removed 77,971 Virgin Plus prepaid mobile phone subscribers from our prepaid mobile phone subscriber base as at September 30, 2024, as we stopped selling new plans for this service as of that date.
Mobile phone blended ARPU of $57.61 in Q2 2025 and $57.35 in the first six months of the year, decreased by 0.7% and 1.3%, respectively, compared to the same periods last year, driven by:
•Ongoing elevated competitive pricing pressures on rate plans and greater impact of discounting
•Lower data overages due to greater customer adoption of monthly plans with higher data thresholds, including unlimited plans
•Decrease in roaming revenues mainly due to reduced travel to the U.S.
24 BCE Inc. 2025 SECOND QUARTER SHAREHOLDER REPORT
These factors were partly offset by:
•Revenues related to the 2025 G7 Leader's Summit
•Flow-through of rate increases
•The favourable impact from 2024 adjustments to our mobile phone prepaid subscriber base to remove 202,187 subscribers
Mobile phone gross subscriber activations declined by 11.3% in Q2 2025, compared to the same period last year, due to lower postpaid and prepaid gross subscriber activations. In the first six months of the year, gross subscriber activations declined by 9.6% year over year, due to lower postpaid gross subscriber activations.
•Mobile phone postpaid gross subscriber activations decreased by 14.8% in the quarter and by 13.8% in the first half of the year, compared to the same periods last year, driven by lower market activity, slowing population growth attributable to government immigration policies and fewer lower-valued bring-your-own-device activations reflecting our focus on higher-value subscriber activations, partly offset by higher contracted activations
•Mobile phone prepaid gross subscriber activations declined by 3.7% in Q2 2025, compared to the same period last year, due to strong performance in Q2 2024 and slowing population growth, mainly lower immigration. In the first half of the year, mobile phone prepaid gross subscriber activations remained essentially stable, improving 0.2% year over year.
Mobile phone net subscriber activations decreased by 27.9% in Q2 2025, compared to Q2 2024, reflecting lower postpaid and prepaid net subscriber activations. In the first six months of the year, mobile phone net subscriber activations decreased by 39.9% due to lower postpaid net subscriber activations, partly offset by higher prepaid net subscriber activations.
•Mobile phone postpaid net subscriber activations decreased year over year by 43.3% in Q2 2025 and by 71.8% in the first six months of the year, compared to the same periods last year, mainly due to lower gross subscriber activations and fewer migrations from prepaid subscribers, partly offset by lower subscriber deactivations
•Mobile phone prepaid net subscriber activations decreased by 5.0% in Q2 2025, compared to Q2 2024, due to lower gross activations, partly offset by fewer migrations to postpaid subscribers. In the first half of the year, prepaid net subscriber activations increased by 81.3%, compared to last year, due to lower subscriber deactivations and fewer migrations to postpaid subscribers.
Mobile phone blended churn of 1.36% in Q2 2025 and 1.45% year to date, decreased by 0.11 pts and 0.08 pts, respectively, compared to the same periods in 2024.
•Mobile phone postpaid churn of 1.06% in Q2 2025 and 1.13% year to date, decreased by 0.12 pts and 0.07 pts, respectively, compared to the same periods last year, due to the benefit from our greater investment in customer retention
•Mobile phone prepaid churn of 5.06% in Q2 2025 and 5.41% in the first six months of the year, increased by 0.46 pts and 0.25 pts, respectively, compared to the same periods in 2024, due to greater market activity, as well as the impact of the 2024 adjustments to our mobile phone prepaid subscriber base to remove 202,187 subscribers, moderated by successful retention offers on Lucky Mobile
Mobile phone subscribers at June 30, 2025 totalled 10,382,457, an increase of 0.4%, from 10,337,495 subscribers reported at the end of Q2 2024. This consisted of 9,565,385 postpaid subscribers, an increase of 1.3% from 9,440,775 subscribers reported at the end of Q2 2024, and 817,072 prepaid subscribers, a decrease of 8.9% from 896,720 subscribers reported at the end of Q2 2024.
Mobile connected device net subscriber activations increased by 10.9% in Q2 2025, compared to the same period last year, mainly due to greater Connected Car net activations and fewer data devices net losses, partly offset by lower business Internet of Things (IoT) net activations. In the first six months of the year, mobile connected device net subscriber activations decreased by 13.5% year over year, due to lower business IoT net activations, partly offset by fewer data devices net losses and greater Connected Car net activations.
Mobile connected device subscribers at June 30, 2025 totalled 3,176,916 up 10.0% from 2,886,871 subscribers reported at the end of Q2 2024.
Wireline data
Retail high-speed Internet
|
|
|
|
|
|
|
|
|
|
|
|
|
|
|
|
|
|
|
|
|
|
|
|
|
|
|
| |
Q2 2025 |
Q2 2024 |
Change |
% change |
YTD 2025 |
YTD 2024 |
Change |
% change |
| Retail high-speed Internet net subscriber activations |
4,999 |
|
23,841 |
|
(18,842) |
|
(79.0 |
%) |
14,514 |
|
54,919 |
|
(40,405) |
|
(73.6 |
%) |
|
|
|
|
|
|
|
|
|
Retail high-speed Internet subscribers(1)(2) |
4,421,961 |
|
4,520,553 |
|
(98,592) |
|
(2.2 |
%) |
4,421,961 |
|
4,520,553 |
|
(98,592) |
|
(2.2 |
%) |
|
|
|
|
|
|
|
|
|
(1)In Q1 2025, we reduced our retail high-speed Internet subscriber base by 80,666 subscribers, as at March 31, 2025, as we stopped selling new plans for this service under the Distributel, Acanac, Oricom and B2B2C brands. Additionally, at the beginning of Q1 2025, we reduced our retail high-speed Internet subscriber base by 2,783 subscribers to adjust for prior year customer deactivations following a review of customer accounts.
(2)As a result of a recent CRTC decision on wholesale high-speed Internet access services, we are no longer able to resell cable Internet services to new customers in our wireline footprint as of September 12, 2024, and consequently we removed all of the existing 106,259 cable subscribers in our wireline footprint from our retail high-speed Internet subscriber base as of that date.
Retail high-speed Internet net subscriber activations decreased by 79.0% in Q2 2025 and by 73.6% in the first six months of the year, compared to the same periods last year, attributable to ongoing aggressive promotional offers by competitors, an increased number of customers coming off of promotional offers, reduced new fibre footprint expansion and slowing market growth, reflecting lower immigration and slower housing starts.
Retail high-speed Internet subscribers totalled 4,421,961 at June 30, 2025, down 2.2% from 4,520,553 subscribers reported at the end of Q2 2024.
Retail IPTV
|
|
|
|
|
|
|
|
|
|
|
|
|
|
|
|
|
|
|
|
|
|
|
|
|
|
|
| |
Q2 2025 |
Q2 2024 |
Change |
% change |
YTD 2025 |
YTD 2024 |
Change |
% change |
| Retail IPTV net subscriber (losses) activations |
(15,851) |
|
(1,313) |
|
(14,538) |
|
n.m. |
(31,822) |
|
12,861 |
|
(44,683) |
|
n.m. |
|
|
|
|
|
|
|
|
|
|
|
|
|
|
|
|
|
|
Retail IPTV subscribers(1)(2) |
2,100,690 |
|
2,124,200 |
|
(23,510) |
|
(1.1 |
%) |
2,100,690 |
|
2,124,200 |
|
(23,510) |
|
(1.1 |
%) |
|
|
|
|
|
|
|
|
|
|
|
|
|
|
|
|
|
|
n.m.: not meaningful
(1)In Q1 2025, we reduced our retail IPTV subscriber base by 441 subscribers, as at March 31, 2025, as we stopped selling new plans for this service under the Distributel, Acanac, Oricom and B2B2C brands.
(2)In Q2 2024, we increased our retail IPTV subscriber base by 40,997 to align the deactivation policy for our Fibe TV streaming services to our traditional Fibe TV service.
Retail IPTV net subscriber losses increased by 14,538 in Q2 2025 and by 44,683 in the first six months of the year, compared to the same periods in 2024, driven by less pull-through on lower Internet activations, reduced gross activations from our Fibe TV streaming services due to our focus on growing higher-valued subscribers, increased competitive intensity and greater substitution with OTT services.
Retail IPTV subscribers at June 30, 2025 totalled 2,100,690, down 1.1% from 2,124,200 subscribers reported at the end of Q2 2024.
Wireline voice
|
|
|
|
|
|
|
|
|
|
|
|
|
|
|
|
|
|
|
|
|
|
|
|
|
|
|
| |
Q2 2025 |
Q2 2024 |
Change |
% change |
YTD 2025 |
YTD 2024 |
Change |
% change |
| Retail residential NAS lines net losses |
(44,700) |
|
(53,250) |
|
8,550 |
|
16.1 |
% |
(92,130) |
|
(97,161) |
|
5,031 |
|
5.2 |
% |
|
|
|
|
|
|
|
|
|
Retail residential NAS lines(1) |
1,727,911 |
|
1,924,456 |
|
(196,545) |
|
(10.2 |
%) |
1,727,911 |
|
1,924,456 |
|
(196,545) |
|
(10.2 |
%) |
|
|
|
|
|
|
|
|
|
(1)In Q1 2025, we reduced our retail residential NAS lines subscriber base by 14,150 subscribers, as at March 31, 2025, as we stopped selling new plans for this service under the Distributel, Acanac, Oricom and B2B2C brands.
Retail residential NAS lines net losses decreased by 16.1% in Q2 2025 and by 5.2% in the first half of the year, compared to the same periods last year, from fewer customer deactivations, moderated by lower gross activations attributable to ongoing substitution to wireless and Internet-based technologies, coupled with less pull-through on reduced Internet activations.
Retail residential NAS lines of 1,727,911 at June 30, 2025, declined by 10.2% from 1,924,456 lines reported at the end of Q2 2024.
26 BCE Inc. 2025 SECOND QUARTER SHAREHOLDER REPORT
Assumptions
As at the date of this MD&A, our forward-looking statements set out in the BCE 2024 Annual MD&A, as updated or supplemented in the BCE 2025 First Quarter MD&A and in this MD&A, are based on certain assumptions including, without limitation, the following assumptions, the assumptions referred to in the Bell Media business segment discussion set out in section 3.2, Bell Media, of this MD&A, as well as the economic, market and other assumptions referred to in section 1.3, Assumptions of this MD&A.
Assumptions applicable to our Bell CTS segment (excluding Ziply Fiber)
•Stable or slight decrease in our market share of national operators’ wireless mobile phone net additions as we manage increased competitive intensity and promotional activity across all regions and market segments
•Ongoing expansion and deployment of 5G and 5G+ wireless networks, offering competitive coverage and quality
•Continued diversification of our distribution strategy with a focus on expanding direct-to-consumer (DTC) and online transactions
•Slightly declining mobile phone blended ARPU due to competitive pricing pressure
•Continuing business customer adoption of advanced 5G, 5G+ and IoT solutions
•Continued scaling of technology services from recent acquisitions made in the enterprise market through leveraging our sales channels with the acquired businesses’ technical expertise
•Improving wireless handset device availability in addition to stable device pricing and margins
•Moderating deployment of direct fibre to incremental homes and businesses within our wireline footprint
•Continued growth in retail Internet subscribers
•Increasing wireless and Internet-based technological substitution
•Continued focus on the consumer household and bundled service offers for mobility, Internet and content services
•Continued large business customer migration to IP-based systems
•Ongoing competitive repricing pressures in our business and wholesale markets
•Traditional high-margin product categories challenged by large global cloud and OTT providers of business voice and data solutions expanding into Canada with on-demand services, which, in many cases, are also sold as a service by Bell Business Markets (BBM) to ensure continuity of customer relationships and adjacent revenue growth opportunities
•Increasing customer adoption of OTT services resulting in downsizing of TV packages and fewer consumers purchasing BDU subscriptions services
•Realization of cost savings related to operating efficiencies enabled by our direct fibre footprint, changes in consumer behaviour and product innovation, digital and AI adoption, product and service enhancements, expanding self-serve capabilities, new call centre and digital investments, other improvements to the customer service experience, management workforce reductions including attrition and retirements, and lower contracted rates from our suppliers
•No adverse material financial, operational or competitive consequences of changes in or implementation of regulations affecting our communication and technology services business
Assumptions applicable to Ziply Fiber
•Continued growth in retail Internet customers with continued deployment of direct fibre to incremental homes and businesses within our footprint
•Increasing retail Internet ARPU through continued migration of customers to higher speed tiers and rate increases
•Ongoing competitive repricing pressures in our business and wholesale markets
•Realization of cost savings related to operational efficiencies enabled by our direct fibre footprint, digital and AI adoption, expanding self service capabilities, and other improvements to the customer service experience
This section contains forward-looking statements, including relating to BCE's strategic priorities, plans and 2025 outlook. Refer to the section Caution regarding forward-looking statements at the beginning of this MD&A.
Key business developments
Expansion of Crave streaming service
On June 5, 2025, Bell Media announced the expansion of its Crave streaming platform to offer CTV and Noovo, content from Bell Media’s extensive entertainment portfolio, news, select sports, and a larger kids collection, growing Crave’s content portfolio by 30%. Scheduled to launch by the end of 2025, the enhanced Crave platform will also feature numerous improvements to the user experience (UX) and interface.
New Disney+, Crave, and TSN streaming bundles
On June 5, 2025, Bell Media and Disney Entertainment announced new streaming bundle offers for the Canadian market that include Disney+, Crave, and TSN, slated to launch later this year. The new bundles will provide savings for viewers when they combine services together, giving customers access to a vast selection of premium content, including HBO and Max Originals, Crave Originals, Disney, Pixar, Marvel, Star Wars, National Geographic, and TSN.
Strategic Investment in Blink49 Studios
On June 9, 2025, Bell Media announced a strategic investment in independent production company, Blink49 Studios. Based in Toronto, Vancouver, and Los Angeles, Blink49 is known for its robust production pipeline and partnership capabilities within Canada, U.S., and Europe. The investment includes a production and global distribution partnership and is expected to enhance Blink49’s capabilities as it continues to grow its slate of scripted and unscripted content. The investment is made through Bell Ventures and is expected to close in the second half of 2025, subject to closing conditions.
Extension of media rights with PGA TOUR and F1
Bell Media and the PGA TOUR announced a multi-year broadcast extension that maintains coverage of the PGA TOUR’s marquee golf events across TSN, RDS, and CTV. The extended agreement complements TSN’s existing live coverage of all four golf Majors. Bell Media and F1 announced a long-term extension to Bell Media's F1 media rights agreement, in conjunction with our agreement to keep the F1 Canadian Grand Prix in Montréal through 2035.
Integration of Bell Marketing Platform into The Trade Desk
On June 5, 2025, Bell Media and The Trade Desk announced the integration of the Bell Marketing Platform into The Trade Desk’s Kokai platform. The integration provides advertisers with access to Bell’s first-party data, tools and intelligence within The Trade Desk’s platform when purchasing advertisements in order to optimize their campaigns.
Innovative Advertising Pilot
On June 5, 2025, Bell Media announced a collaboration with Magna, a global leader in mobility technology, on innovative out-of-home (OOH) advertising opportunities. Astral will offer exclusive advertising placements on vehicles used in Magna’s recently launched City Delivery pilot program in Toronto.
28 BCE Inc. 2025 SECOND QUARTER SHAREHOLDER REPORT
Financial performance analysis
Q2 2025 performance highlights
|
|
|
|
|
|
| Bell Media |
Bell Media |
| Revenues |
Adjusted EBITDA |
| (in $ millions) |
(in $ millions) |
|
|
| Bell Media |
Bell Media |
| Revenues |
Adjusted EBITDA |
| (in $ millions) |
(in $ millions) |
|
|
Bell Media results
Revenues
|
|
|
|
|
|
|
|
|
|
|
|
|
|
|
|
|
|
|
|
|
|
|
|
|
|
|
|
Q2 2025 |
Q2 2024 |
$ change |
% change |
YTD 2025 |
YTD 2024 |
$ change |
% change |
| External revenues |
758 |
|
730 |
|
28 |
|
3.8 |
% |
1,449 |
|
1,372 |
|
77 |
|
5.6 |
% |
| Inter-segment revenues |
85 |
|
82 |
|
3 |
|
3.7 |
% |
169 |
|
165 |
|
4 |
|
2.4 |
% |
| Bell Media operating revenues |
843 |
|
812 |
|
31 |
|
3.8 |
% |
1,618 |
|
1,537 |
|
81 |
|
5.3 |
% |
Bell Media operating revenues increased by 3.8% in Q2 2025, compared to the same period last year, driven by higher subscriber and other revenues, partly offset by lower advertising revenues. In the first half of the year, operating revenues increased by 5.3% year over year, due to higher subscriber, other and advertising revenues. The growth in operating revenues reflects higher digital revenues(1) of 8.7% in the quarter and 10.3% year to date, compared to the same periods last year.
•Advertising revenues decreased by 3.1% in Q2 2025, compared to last year, due to continued lower demand for traditional broadcast TV advertising, primarily impacting conventional and entertainment specialty TV, along with lower year-over-year audio advertising revenues attributable to the previously announced divestiture of 45 radio stations. The year-over-year decline in Q2 2025 advertising revenues was moderated by greater OOH revenues mainly from the acquisition of OUTEDGE Media Canada (OUTEDGE), as well as reflecting higher digital video advertising revenues from growth in Connected TV and ad-supported subscription tiers on Crave. In the first half of the year, advertising revenues increased by 0.4%, impacted by the above items, along with the benefit from higher year-over-year revenues from the broadcast of Super Bowl LIX and the 97th Oscars, and greater advertising spend related to the Canadian Federal election.
•Subscriber revenues increased by 8.1% in Q2 2025 and by 7.9% in the first half of the year, compared to the same periods last year, driven by growth in DTC streaming revenues, primarily from higher Crave and sports subscribers
•Other revenues increased in Q2 2025 and in the first six months of the year, compared to the same periods last year, due to higher year-over-year revenues from the F1 Canadian Grand Prix 2025, and the acquisitions of Sphere Abacus, a content distributor, and OUTEDGE, partly offset by lower program sales
Operating costs and adjusted EBITDA
|
|
|
|
|
|
|
|
|
|
|
|
|
|
|
|
|
|
|
|
|
|
|
|
|
|
|
|
Q2 2025 |
Q2 2024 |
$ change |
% change |
YTD 2025 |
YTD 2024 |
$ change |
% change |
| Operating costs |
(608) |
(594) |
(14) |
|
(2.4%) |
(1,224) |
(1,202) |
(22) |
|
(1.8%) |
| Adjusted EBITDA |
235 |
218 |
17 |
|
7.8% |
394 |
335 |
59 |
|
17.6% |
| Adjusted EBITDA margin |
27.9 |
% |
26.8 |
% |
|
1.1 |
pts |
24.4 |
% |
21.8 |
% |
|
2.6 |
pts |
Bell Media operating costs increased by 2.4% in Q2 2025 and by 1.8% in the first half of the year, compared to the same periods last year, due to:
•Greater costs related to acquisitions
•Higher costs associated with the revenue growth from the F1 Canadian Grand Prix 2025
These factors were partly offset by:
•Cost reduction initiatives from workforce reductions and other operating efficiencies
•Lower costs related to the radio station divestitures
Bell Media adjusted EBITDA grew by 7.8% in Q2 2025 and 17.6% in the first half of the year, compared to the same periods last year, driven by higher operating revenues, partly offset by greater operating costs.
Assumptions
As at the date of this MD&A, our forward-looking statements set out in the BCE 2024 Annual MD&A, as updated or supplemented in the BCE 2025 First Quarter MD&A and in this MD&A, are based on certain assumptions including, without limitation, the following assumptions, the assumptions referred to in the Bell CTS business segment discussion set out in section 3.1, Bell CTS, of this MD&A, as well as the economic, market and other assumptions referred to in section 1.3, Assumptions, of this MD&A.
•Overall digital revenue expected to reflect scaling of Connected TV, DTC advertising and subscriber growth, as well as digital growth in our OOH business contributing towards the advancement of our digital-first media strategy
•Leveraging of first-party data to improve targeting, advertisement delivery including personalized viewing experience and attribution
•Continued escalation of media content costs to secure quality content
•Continued scaling of Crave, TSN, TSN+ and RDS through expanded distribution, optimized content offering and UX improvements
•Continued support in original French content with a focus on digital platforms such as Crave, Noovo.ca and iHeartRadio Canada, to better serve our French-language customers through a personalized digital experience
•Ability to successfully acquire and produce highly-rated programming and differentiated content
•Building and maintaining strategic supply arrangements for content across all screens and platforms
•No adverse material financial, operational or competitive consequences of changes in or implementation of regulations affecting our media business
(1)Digital revenues are comprised of advertising revenue from digital platforms including websites, mobile apps, Connected TV apps and OOH digital assets/platforms, as well as advertising procured through Bell digital buying platforms and subscription revenue from DTC services and video on demand services.
30 BCE Inc. 2025 SECOND QUARTER SHAREHOLDER REPORT
4 Financial and capital management
This section tells you how we manage our cash and capital resources to carry out our strategy and deliver financial results. It provides an analysis of our financial condition, cash flows and liquidity on a consolidated basis.
|
|
|
|
|
|
|
|
|
|
|
|
|
|
|
|
June 30, 2025 |
December 31, 2024 |
$ change |
% change |
| Long-term debt |
32,522 |
|
32,835 |
|
(313) |
|
(1.0 |
%) |
less: 50% of junior subordinated debt(1) |
(2,146) |
|
— |
|
(2,146) |
|
n.m. |
| Debt due within one year |
5,037 |
|
7,669 |
|
(2,632) |
|
(34.3 |
%) |
50% of preferred shares(2) |
1,712 |
|
1,767 |
|
(55) |
|
(3.1 |
%) |
| Cash |
(507) |
|
(1,572) |
|
1,065 |
|
67.7 |
% |
| Cash equivalents |
(3) |
|
— |
|
(3) |
|
n.m. |
| Short-term investments |
— |
|
(400) |
|
400 |
|
100.0 |
% |
| Net debt |
36,615 |
|
40,299 |
|
(3,684) |
|
(9.1 |
%) |
n.m.: not meaningful
(1)50% of junior subordinated debt at June 30, 2025 is excluded as it has been afforded equity treatment by certain credit rating agencies.
(2)50% of outstanding preferred shares of $3,424 million and $3,533 million at June 30, 2025 and December 31, 2024, respectively, are classified as debt consistent with the treatment by certain credit rating agencies.
The decrease of $2,632 million in debt due within one year and the decrease of $313 million in long-term debt were due to:
•the repayment at maturity of Series M-47 MTN debentures, with a total principal amount of $1,500 million
•the repayment at maturity of Series M-49 MTN debentures, with a total principal amount of $600 million
•the repurchase by Bell Canada, pursuant to tender offers, for an aggregate cash purchase price of $633 million in U.S. dollars ($903 million in Canadian dollars) of:
•a principal amount of $174 million in U.S. dollars ($249 million in Canadian dollars) of its Series US-2 Notes, that had an outstanding principal amount of $600 million in U.S. dollars ($856 million in Canadian dollars)
•a principal amount of $79 million in U.S. dollars ($112 million in Canadian dollars) of its Series US-4 Notes, that had an outstanding principal amount of $500 million in U.S. dollars ($713 million in Canadian dollars)
•a principal amount of $183 million in U.S. dollars ($261 million in Canadian dollars) of its Series US-5 Notes, that had an outstanding principal amount of $600 million in U.S. dollars ($856 million in Canadian dollars)
•a principal amount of $191 million in U.S. dollars ($273 million in Canadian dollars) of its Series US-6 Notes, that had an outstanding principal amount of $650 million in U.S. dollars ($927 million in Canadian dollars)
•a principal amount of $217 million in U.S. dollars ($310 million in Canadian dollars) of its Series US-7 Notes, that had an outstanding principal amount of $750 million in U.S. dollars ($1,070 million in Canadian dollars)
•the repurchase by Bell Canada, pursuant to tender offers, for an aggregate cash purchase price of $1,498 million of:
•a principal amount of $105 million of its Series M-39 MTN debentures, that had an outstanding principal amount of $500 million
•a principal amount of $100 million of its Series M-45 MTN debentures, that had an outstanding principal amount of $500 million
•a principal amount of $1,166 million of its Series M-51 MTN debentures, that had an original outstanding principal amount of $1,250 million
•a principal amount of $460 million of its Series M-55 MTN debentures, that had an outstanding principal amount of $550 million
•a decrease in debt of $636 million due to an early debt redemption gain as a result of the tender offers described above
•the repayment of the outstanding loan of $600 million in U.S. dollars ($814 million in Canadian dollars) under the Bell Mobility Inc. (Bell Mobility) trade loan agreement
•a decrease in notes payable (net of issuances) of $726 million
•a net decrease of $1,020 million mainly due to lower lease liabilities and other debt and foreign exchange fluctuations on U.S. debt for which we have entered into hedges. Refer to section 4.5, Financial risk management, of this MD&A for more details.
Partly offset by:
•the issuance by Bell Canada of Series A Fixed-to-Fixed Rate Junior Subordinated Notes (Series A Notes), with a total principal amount of $1,000 million in U.S. dollars ($1,416 million in Canadian dollars)
•the issuance by Bell Canada of Series B Fixed-to-Fixed Rate Junior Subordinated Notes (Series B Notes), with a total principal amount of $1,250 million in U.S. dollars ($1,771 million in Canadian dollars)
•the issuance by Bell Canada of Series C Fixed-to-Fixed Rate Junior Subordinated Notes (Series C Notes), with a total principal amount of $1,250 million
•an increase in outstanding loans of $228 million in U.S. dollars ($315 million in Canadian dollars) under the Bell Canada unsecured committed term loan agreement The decrease in cash of $1,065 million, the decrease in short-term investments of $400 million and the increase in cash equivalents of $3 million were mainly due to:
•$5,399 million repayment of long-term debt, excluding principal payment of lease liabilities
•$1,492 million of capital expenditures
•$1,210 million of dividends paid on BCE common shares
•$726 million decrease in notes payable (net of issuances)
•$582 million principal payment of lease liabilities
•$96 million paid for the purchase on the open market of BCE common shares for the settlement of share-based payments
•$77 million of dividends paid on BCE preferred shares
•$76 million paid for the repurchase of BCE preferred shares
•$13 million of cash dividends paid by subsidiaries to NCI
Partly offset by:
•$4,755 million of issuance of long-term debt
•$3,518 million of cash flows from operating activities
4.2 Outstanding share data
|
|
|
|
|
|
| Common shares outstanding |
Number of shares |
| Outstanding, January 1, 2025 |
912,283,103 |
|
| Shares issued under deferred share plan |
715 |
|
| Shares issued under BCE's Shareholder Dividend Reinvestment and Stock Purchase Plan (DRP) |
20,241,999 |
|
|
|
|
|
Outstanding, June 30, 2025 |
932,525,817 |
|
On May 7, 2025, the Board determined that common shares distributed under BCE's DRP will no longer be issued from treasury at a 2% discount to the average market price and will rather be purchased by BCE's agent, TSX Trust Company, on the secondary market with cash provided by BCE. The modifications became effective commencing with the dividend payable on July 15, 2025 to eligible holders of common shares as of the June 16, 2025 record date, and subsequently until further notice.
|
|
|
|
|
|
|
|
|
| Stock options outstanding |
Number of options |
Weighted average
exercise price ($) |
| Outstanding, January 1, 2025 |
6,545,819 |
|
61 |
|
|
|
|
|
|
|
| Forfeited or expired |
(1,042,645) |
|
57 |
|
|
|
|
| Outstanding and exercisable, June 30, 2025 |
5,503,174 |
|
62 |
|
|
|
|
32 BCE Inc. 2025 SECOND QUARTER SHAREHOLDER REPORT
|
|
|
|
|
|
|
|
|
|
|
|
|
|
|
|
|
|
|
|
|
|
|
|
|
|
|
|
Q2 2025 |
Q2 2024 |
$ change |
% change |
YTD 2025 |
YTD 2024 |
$ change |
% change |
| Cash flows from operating activities |
1,947 |
|
2,137 |
|
(190) |
|
(8.9 |
%) |
3,518 |
|
3,269 |
|
249 |
|
7.6 |
% |
| Capital expenditures |
(763) |
|
(978) |
|
215 |
|
22.0 |
% |
(1,492) |
|
(1,980) |
|
488 |
|
24.6 |
% |
| Cash dividends paid on preferred shares |
(38) |
|
(45) |
|
7 |
|
15.6 |
% |
(77) |
|
(91) |
|
14 |
|
15.4 |
% |
| Cash dividends paid by subsidiaries to NCI |
— |
|
(28) |
|
28 |
|
100.0 |
% |
(13) |
|
(42) |
|
29 |
|
69.0 |
% |
| Acquisition and other costs paid |
6 |
|
11 |
|
(5) |
|
(45.5 |
%) |
14 |
|
26 |
|
(12) |
|
(46.2 |
%) |
|
|
|
|
|
|
|
|
|
|
|
|
|
|
|
|
|
|
| Free cash flow |
1,152 |
|
1,097 |
|
55 |
|
5.0 |
% |
1,950 |
|
1,182 |
|
768 |
|
65.0 |
% |
| Principal payment of lease liabilities |
(278) |
|
(270) |
|
(8) |
|
(3.0 |
%) |
(582) |
|
(567) |
|
(15) |
|
(2.6 |
%) |
Free cash flow after payment of lease liabilities(1) |
874 |
|
827 |
|
47 |
|
5.7 |
% |
1,368 |
|
615 |
|
753 |
|
n.m. |
|
|
|
|
|
|
|
|
|
| Business acquisitions |
(24) |
|
(435) |
|
411 |
|
94.5 |
% |
(23) |
|
(517) |
|
494 |
|
95.6 |
% |
| Business dispositions |
36 |
|
— |
|
36 |
|
n.m. |
38 |
|
— |
|
38 |
|
n.m. |
| Acquisition and other costs paid |
(6) |
|
(11) |
|
5 |
|
45.5 |
% |
(14) |
|
(26) |
|
12 |
|
46.2 |
% |
| (Increase) decrease in short-term investments |
— |
|
(50) |
|
50 |
|
100.0 |
% |
400 |
|
250 |
|
150 |
|
60.0 |
% |
| Spectrum licences |
— |
|
(414) |
|
414 |
|
100.0 |
% |
— |
|
(518) |
|
518 |
|
100.0 |
% |
|
|
|
|
|
|
|
|
|
|
|
|
|
|
|
|
|
|
|
|
|
|
|
|
|
|
|
| Other investing activities |
1 |
|
(11) |
|
12 |
|
n.m. |
(12) |
|
(21) |
|
9 |
|
42.9 |
% |
|
|
|
|
|
|
|
|
|
| Increase (decrease) in notes payable |
405 |
|
404 |
|
1 |
|
0.2 |
% |
(726) |
|
1,383 |
|
(2,109) |
|
n.m. |
|
|
|
|
|
|
|
|
|
| Issue of long-term debt |
318 |
|
1,617 |
|
(1,299) |
|
(80.3 |
%) |
4,755 |
|
3,808 |
|
947 |
|
24.9 |
% |
| Repayment of long-term debt, excluding principal payment of lease liabilities |
(1,447) |
|
(255) |
|
(1,192) |
|
n.m. |
(5,399) |
|
(2,071) |
|
(3,328) |
|
n.m. |
|
|
|
|
|
|
|
|
|
|
|
|
|
|
|
|
|
|
|
|
|
|
|
|
|
|
|
|
|
|
|
|
|
|
|
|
| Purchase of shares for settlement of share-based payments |
(32) |
|
(40) |
|
8 |
|
20.0 |
% |
(96) |
|
(144) |
|
48 |
|
33.3 |
% |
| Repurchase of preferred shares |
(39) |
|
(38) |
|
(1) |
|
(2.6 |
%) |
(76) |
|
(76) |
|
— |
|
— |
|
| Cash dividends paid on common shares |
(608) |
|
(910) |
|
302 |
|
33.2 |
% |
(1,210) |
|
(1,793) |
|
583 |
|
32.5 |
% |
|
|
|
|
|
|
|
|
|
|
|
|
|
|
|
|
|
|
|
|
|
|
|
|
|
|
|
|
|
|
|
|
|
|
|
|
|
|
|
|
|
|
|
|
|
| Other financing activities |
(20) |
|
4 |
|
(24) |
|
n.m. |
(67) |
|
(14) |
|
(53) |
|
n.m. |
|
|
|
|
|
|
|
|
|
| Net (decrease) increase in cash |
(542) |
|
609 |
|
(1,151) |
|
n.m. |
(1,065) |
|
851 |
|
(1,916) |
|
n.m. |
| Net increase in cash equivalents |
— |
|
79 |
|
(79) |
|
(100.0 |
%) |
3 |
|
25 |
|
(22) |
|
(88.0 |
%) |
n.m.: not meaningful
(1) Free cash flow after payment of lease liabilities is a non-GAAP financial measure. See section 9.1, Non-GAAP financial measures in this MD&A for more information on this measure.
Cash flows from operating activities and free cash flow
Cash flows from operating activities in the second quarter of 2025 decreased by $190 million, compared to the same period last year, mainly due to higher severance and other costs paid and lower cash from working capital, partly offset by lower income taxes paid and lower interest paid.
Cash flows from operating activities in the first half of 2025 increased by $249 million, compared to the same period last year, mainly due to lower income taxes paid and higher cash from working capital, partly offset by higher severance and other costs paid.
Free cash flow in the second quarter of 2025 increased by $55 million compared to the same period last year, mainly due to lower capital expenditures and lower cash dividends paid by subsidiaries to NCI, partly offset by lower cash flows from operating activities, excluding cash from acquisition and other costs paid.
Free cash flow in the first half of 2025 increased by $768 million compared to the same period last year, mainly due to lower capital expenditures and higher cash flows from operating activities, excluding cash from acquisition and other costs paid.
Capital expenditures
|
|
|
|
|
|
|
|
|
|
|
|
|
|
|
|
|
|
|
|
|
|
|
|
|
|
|
|
Q2 2025 |
Q2 2024 |
$ change |
% change |
YTD 2025 |
YTD 2024 |
$ change |
% change |
| Bell CTS |
727 |
945 |
218 |
|
23.1 |
% |
1,431 |
1,920 |
489 |
|
25.5 |
% |
Capital intensity(1) |
13.6 |
% |
17.9 |
% |
|
4.3 |
pts |
13.5 |
% |
18.0 |
% |
|
4.5 |
pts |
| Bell Media |
36 |
33 |
(3) |
|
(9.1 |
%) |
61 |
60 |
(1) |
|
(1.7 |
%) |
| Capital intensity |
4.3 |
% |
4.1 |
% |
|
(0.2) |
pts |
3.8 |
% |
3.9 |
% |
|
0.1 |
pts |
| BCE |
763 |
978 |
215 |
|
22.0 |
% |
1,492 |
1,980 |
488 |
|
24.6 |
% |
| Capital intensity |
12.5 |
% |
16.3 |
% |
|
3.8 |
pts |
12.4 |
% |
16.5 |
% |
|
4.1 |
pts |
(1)Capital intensity is defined as capital expenditures divided by operating revenues. Refer to section 9.6, KPIs in this MD&A for more information on this measure.
BCE capital expenditures of $763 million in Q2 2025 and $1,492 million in the first half of the year, declined by $215 million and $488 million, respectively, over the same periods last year. This represented a capital intensity ratio of 12.5% in Q2 2025 and 12.4% year to date, down 3.8 pts and 4.1 pts, respectively, over the same periods last year. The year-over-year decline was driven by lower capital investments in our Bell CTS segment of $218 million in Q2 2025 and $489 million year to date, consistent with a planned reduction in capital spending, primarily attributable to slower fibre-to-the-premise (FTTP) footprint expansion, in part due to regulatory decisions that discourage network investment.
Business acquisitions
On June 7, 2024, Bell Media completed the acquisition of OUTFRONT Media Inc.’s Canadian OOH media business, OUTEDGE, for cash consideration of $429 million ($418 million net of cash acquired). Pursuant to a consent agreement negotiated with the Competition Bureau, in April 2025, Bell Media disposed of 669 advertising displays in Québec and Ontario for proceeds of $14 million.
Spectrum licences
On November 30, 2023, Bell Mobility secured the right to acquire 939 licences of 3800 Megahertz (MHz) spectrum across Canada for $518 million. On January 17, 2024, Bell made a first payment of $104 million to Innovation, Science and Economic Development Canada (ISED). The remaining balance of $414 million was paid on May 29, 2024, at which time Bell acquired the 3800 MHz spectrum licences.
Debt instruments
2025
In the second quarter of 2025, we repaid debt, net of issuances. This included:
•$1,725 million repayment of long-term debt comprised of:
•the repurchase by Bell Canada, pursuant to tender offers, for an aggregate cash purchase price of $602 million, of an aggregate principal amount of $700 million, representing part of the outstanding principal amount of four of its series of MTN debentures. Refer to section 4.1, Net debt, of this MD&A for more details.
•the repayment of the outstanding loan of $600 million in U.S. dollars ($814 million in Canadian dollars) under the Bell Mobility trade loan agreement
•principal payment of lease liabilities of $278 million
•net payments of other debt of $31 million
Partly offset by:
•$318 million issuance of long-term debt comprised of an increase in outstanding loans of $228 million in U.S. dollars ($315 million in Canadian dollars) under the Bell Canada unsecured committed term loan agreement and $3 million issuance of other debt
•$405 million issuance (net of repayments) of notes payable
34 BCE Inc. 2025 SECOND QUARTER SHAREHOLDER REPORT In the first half of 2025, we repaid debt, net of issuances. This included:
•$5,981 million repayment of long-term debt comprised of:
•the repayment at maturity of Series M-47 MTN debentures with a total principal amount of $1,500 million
•the repayment at maturity of Series M-49 MTN debentures with a total principal amount of $600 million
•the repurchase by Bell Canada, pursuant to tender offers, for an aggregate cash purchase price of $633 million in U.S. dollars ($903 million in Canadian dollars), of an aggregate principal amount of $844 million in U.S. dollars ($1,205 million in Canadian dollars), representing part of the outstanding principal amount of five of its series of U.S. notes. Refer to section 4.1, Net debt, of this MD&A for more details.
•the repurchase by Bell Canada, pursuant to tender offers, for an aggregate cash purchase price of $1,498 million, of an aggregate principal amount of $1,831 million representing part of the outstanding principal amount of four of its series of MTN debentures. Refer to section 4.1, Net Debt, of this MD&A for more details.
•the repayment of the outstanding loan of $600 million in U.S. dollars ($814 million in Canadian dollars) under the Bell Mobility trade loan agreement
•principal payment of lease liabilities of $582 million
•net payments of other debt of $84 million
•$726 million repayment (net of issuances) of notes payable
Partly offset by:
•$4,755 million issuance of long-term debt comprised of:
•the issuance of Series A Notes with a total principal amount of $1,000 million U.S. dollars ($1,416 million in Canadian dollars)
•the issuance of Series B Notes with a total principal amount of $1,250 million U.S. dollars ($1,771 million in Canadian dollars)
•the issuance of Series C Notes with a total principal amount of $1,250 million
•an increase in outstanding loans of $228 million in U.S. dollars ($315 million in Canadian dollars) under the Bell Canada unsecured committed term loan agreement
•$3 million issuance of other debt
2024
In the second quarter of 2024, we issued debt, net of repayments. This included:
•$1,617 million issuance of long-term debt comprised of:
•the issuance of Series M-61 MTN debentures with a total principal amount of $400 million
•the issuance of Series M-63 MTN debentures with a total principal amount of $1,100 million
•the increase of $81 million in outstanding loans under the Bell Mobility uncommitted trade loan agreement
•the issuance of other debt of $40 million, partly offset by $4 million of discounts on our debt issuances
•$404 million issuance (net of repayments) of notes payable
Partly offset by:
•$525 million repayment of long-term debt comprised of:
•the repayment of Series 10 Notes with a total principal amount of $225 million
•principal payment of lease liabilities of $270 million
•net payments of other debt of $30 million
In the first half of 2024, we issued debt, net of repayments. This included:
•$3,808 million issuance of long-term debt comprised of:
•the issuance of Series US-9 Notes with a total principal amount of $700 million in U.S. dollars ($942 million in Canadian dollars)
•the issuance of Series US-10 Notes with a total principal amount of $750 million in U.S. dollars ($1,009 million in Canadian dollars)
•the issuance of Series M-61 MTN debentures with a total principal amount of $400 million
•the issuance of Series M-63 MTN debentures with a total principal amount of $1,100 million
•the increase of $324 million in outstanding loans under the Bell Mobility uncommitted trade loan agreement
•the issuance of other debt of $40 million, partly offset by $7 million of discounts on our debt issuances
•$1,383 million issuance (net of repayments) of notes payable
Partly offset by:
•$2,638 million repayment of long-term debt comprised of:
•the repayment of Series M-44 MTN debentures with a total principal amount of $1,000 million
•the repayment of Series US-3 Notes with a total principal amount of $600 million in U.S. dollars ($748 million in Canadian dollars)
•the repayment of Series 10 Notes with a total principal amount of $225 million
•principal payment of lease liabilities of $567 million
•net payments of other debt of $98 million
Repurchase of preferred shares
2025
For the three and six months ended June 30, 2025, BCE repurchased and canceled 2,275,526 and 4,362,531 First Preferred Shares under its normal course issuer bid (NCIB) for a total cost of $39 million and $76 million, respectively.
Subsequent to quarter end, BCE repurchased and canceled 1,128,138 First Preferred Shares under its NCIB for a total cost of $21 million.
2024
For the three and six months ended June 30, 2024, BCE repurchased and canceled 2,187,900 and 4,301,488 First Preferred Shares under its NCIB for a total cost of $38 million and $76 million, respectively.
Cash dividends paid on common shares
In the second quarter of 2025, cash dividends paid on common shares decreased by $302 million compared to Q2 2024, as 10,701,213 common shares were issued from treasury under the DRP, for $319 million.
In the first half of 2025, cash dividends paid on common shares decreased by $583 million compared to 2024, as 20,241,999 common shares were issued from treasury under the DRP, for $633 million, partly offset by a higher dividend paid in the first half of 2025 of $1.995 per common share compared to $1.965 per common share for the same period last year.
4.4 Post-employment benefit plans
For the three months ended June 30, 2025, we recorded an increase in our post-employment benefit plans and a gain, before taxes, in OCI of $108 million, due to an increase in the discount rate of 4.8% at June 30, 2025, compared to 4.7% at March 31, 2025, partly offset by a lower-than-expected return on plan assets.
For the six months ended June 30, 2025, we recorded an increase in our post-employment benefit plans and a gain, before taxes, in OCI of $207 million, due to an increase in the discount rate of 4.8% at June 30, 2025, compared to 4.7% at December 31, 2025, partly offset by an increase in the effect of the asset limit.
For the three months ended June 30, 2024, we recorded an increase in our post-employment benefit plans and a gain, before taxes, in OCI of $152 million, due to an increase in the discount rate of 5.0% at June 30, 2024, compared to 4.9% at March 31, 2024, partly offset by a lower-than-expected return on plan assets and an increase in the effect of the asset limit.
For the six months ended June 30, 2024, we recorded an increase in our post-employment benefit plans and a gain, before taxes, in OCI of $581 million, due to an increase in the discount rate of 5.0% at June 30, 2024, compared to 4.6% at December 31, 2023, partly offset by a lower-than-expected return on plan assets and an increase in the effect of the asset limit.
4.5 Financial risk management
The following table provides the fair value details of certain financial instruments measured at amortized cost in the consolidated statements of financial position (statements of financial position).
|
|
|
|
|
|
|
|
|
|
|
|
|
|
|
|
|
|
|
|
|
| |
|
|
June 30, 2025 |
December 31, 2024 |
|
|
|
|
|
|
|
|
Classification |
Fair value methodology |
Carrying value |
Fair value |
Carrying value |
Fair value (1) |
|
|
|
|
|
|
|
|
|
|
|
|
|
|
|
|
|
|
|
|
|
Debt securities
and other debt |
Debt due within one year and long-term debt |
Quoted market price of debt |
30,259 |
|
30,098 |
|
31,247 |
|
30,022 |
|
(1)We have reclassified amounts from the previous period to make them consistent with the presentation of the current period.
36 BCE Inc. 2025 SECOND QUARTER SHAREHOLDER REPORT
The following table provides the fair value details of financial instruments measured at fair value in the statements of financial position.
|
|
|
|
|
|
|
|
|
|
|
|
|
|
|
|
|
|
|
Classification |
Fair value |
| Carrying value of asset (liability) |
Quoted prices in active markets for identical assets (level 1) |
Observable market data (level 2)(1) |
Non-observable market inputs (level 3)(2) |
| June 30, 2025 |
|
|
|
|
|
Publicly-traded and privately-held investments(3) |
Other non-current assets |
922 |
|
69 |
|
— |
|
853 |
|
| Derivative financial instruments |
Other current assets, trade payables and other liabilities, other non-current assets and liabilities |
(968) |
|
— |
|
(962) |
|
(6) |
|
|
|
|
|
|
|
| Other |
Other non-current assets |
236 |
|
— |
|
236 |
|
— |
|
| December 31, 2024 |
|
|
|
|
|
Publicly-traded and privately-held investments(3) |
Other non-current assets |
877 |
|
35 |
|
— |
|
842 |
|
| Derivative financial instruments |
Other current assets, trade payables and other liabilities, other non-current assets and liabilities |
(368) |
|
— |
|
(368) |
|
— |
|
|
|
|
|
|
|
| Other |
Other non-current assets |
225 |
|
— |
|
225 |
|
— |
|
(1)Observable market data such as equity prices, interest rates, swap rate curves and foreign currency exchange rates.
(2)Non-observable market inputs such as discounted cash flows and revenue and earnings multiples. For certain privately-held investments, changes in our valuation assumptions may result in a significant change in the fair value of our level 3 financial instruments.
(3)Unrealized gains and losses are recorded in OCI in the consolidated statements of comprehensive income and are reclassified from Accumulated OCI to the Deficit in the statements of financial position when realized.
Market risk
Currency exposures
In 2025, we entered into an amortizing cross currency interest rate swap with a notional amount of $228 million in U.S. dollars ($315 million in Canadian dollars), to hedge the interest rate exposure on other debt maturing in 2029. The fair value of the amortizing cross currency interest rate swap at June 30, 2025 was a net liability of $6 million recognized in Other current assets and Other non-current liabilities in the statements of financial position.
In 2025, we terminated cross currency interest rate swaps expiring in 2025 and 2026 with a notional amount of $600 million in U.S. dollars ($814 million in Canadian dollars) used to hedge the U.S. currency exposure of loans maturing in 2025 and 2026 under our Bell Mobility trade loan agreement. The fair value of the cross currency interest rate swaps at the date of termination was $4 million.
In 2025, following the repurchase of a portion of certain debt prior to maturity, we proportionately terminated the corresponding cross currency interest rate swaps used to hedge the U.S. currency exposure of this debt. Specifically, we terminated cross currency interest rate swaps with a notional amount of $174 million in U.S. dollars ($235 million in Canadian dollars) relating to our Series US-2 Notes, $79 million in U.S. dollars ($100 million in Canadian dollars) relating to our Series US-4 Notes, $183 million in U.S. dollars ($230 million in Canadian dollars) relating to our Series US-5 Notes, $191 million in U.S. dollars ($241 million in Canadian dollars) relating to our Series US-6 Notes and $217 million in U.S. dollars ($276 million in Canadian dollars) relating to our Series US-7 Notes. The fair value of the cross currency interest rate swaps at the date of termination was a net liability of $110 million, reflected in the initial fair value of the cross currency interest rate swaps relating to our Series A Notes and Series B Notes described below.
In 2025, we entered into foreign exchange swaps with a notional amount of $1,000 million in U.S. dollars ($1,398 million in Canadian dollars), maturing in 2025, to hedge the U.S. currency exposure of our Series A Notes maturing in 2055. In 2025, we terminated a portion of these foreign exchange swaps with a notional amount $628 million in U.S. dollars ($878 million in Canadian dollars). The fair value of the foreign exchange swaps at the dates of termination was a net liability of $3 million, of which a liability of $8 million is reflected in the initial fair value of the cross currency interest rate swaps relating to our Series A Notes described below. The fair value of the remaining foreign exchange swaps with a notional amount of $372 million in U.S. dollars ($520 million in Canadian dollars) at June 30, 2025 was a net liability of $16 million recognized in Other current assets and Trade payables and other liabilities in the statements of financial position.
In 2025, we entered into foreign exchange swaps with a notional amount of $1,250 million in U.S. dollars ($1,769 million in Canadian dollars) to hedge the U.S. currency exposure of our Series B Notes maturing in 2055. The foreign exchange swaps matured in 2025. The fair value of the foreign exchange swaps at maturity was $13 million. Subsequently, we entered into foreign exchange swaps with a notional amount of $828 million in U.S. dollars ($1,167 million in Canadian dollars), maturing in 2025, to hedge the U.S. currency exposure of our Series B Notes. In 2025, we terminated a portion of these foreign exchange swaps with a notional amount of $456 million in U.S. dollars ($643 million in Canadian dollars). The fair value of the foreign exchange swaps at the date of termination was a liability of $24 million, of which $14 million is reflected in the initial fair value of the cross currency interest rate swaps relating to our Series B Notes described below. The fair value of the remaining foreign exchange swaps with a notional amount of $372 million in U.S. dollars ($524 million in Canadian dollars) at June 30, 2025 was a net liability of $20 million recognized in Other current assets and Trade payables and other liabilities in the statements of financial position.
In 2025, we entered into cross currency interest rate swaps with a notional amount of $628 million in U.S. dollars ($942 million in Canadian dollars), maturing in 2030, to hedge the U.S. currency exposure of our Series A Notes maturing in 2055. The fair value of the cross currency interest rate swaps at June 30, 2025 was a net liability of $79 million recognized in Other current assets, Other non-current assets, Trade payables and other liabilities and Other non-current liabilities in the statements of financial position. This fair value reflects an initial net liability of $55 million on termination of the cross currency swaps noted above and an initial liability of $8 million related to the terminated foreign exchange swaps also noted above.
In 2025, we entered into cross currency interest rate swaps with a notional amount of $878 million in U.S. dollars ($1,288 million in Canadian dollars), maturing in 2035 to hedge the U.S. currency exposure of our Series B Notes maturing in 2055. The fair value of the cross currency interest rate swaps at June 30, 2025 was a net liability of $78 million recognized in Other current assets, Other non-current assets, Trade payables and other liabilities and Other non-current liabilities in the statements of financial position. This fair value reflects an initial net liability of $55 million on termination of the cross currency swaps noted above and an initial liability of $14 million related to the terminated foreign exchange swaps also noted above.
The following table provides details on our outstanding foreign currency forward contracts and options at June 30, 2025.
|
|
|
|
|
|
|
|
|
|
|
|
|
|
|
|
|
|
|
|
|
| Type of hedge |
Buy
currency |
Amount to receive |
Sell
currency |
Amount
to pay |
Maturity |
Hedged item |
Cash flow(1) |
USD |
1,166 |
|
CAD |
1,604 |
|
2025 |
Loans |
| Cash flow |
USD |
1,035 |
|
CAD |
1,416 |
|
2025 |
Commercial paper |
Cash flow(2) |
USD |
905 |
|
CAD |
1,241 |
|
2025 |
Business acquisition |
| Cash flow |
USD |
378 |
|
CAD |
491 |
|
2025 |
|
Anticipated purchases |
| Cash flow |
PHP |
1,623 |
|
CAD |
38 |
|
2025 |
|
Anticipated purchases |
| Cash flow |
USD |
641 |
|
CAD |
852 |
|
2026 |
|
Anticipated purchases |
| Cash flow |
USD |
120 |
|
CAD |
158 |
|
2027 |
|
Anticipated purchases |
| Economic |
USD |
1,626 |
|
CAD |
2,233 |
|
2025 |
|
Business acquisition |
Economic - options (3) |
USD |
200 |
|
CAD |
277 |
|
2025 |
|
Business acquisition |
| Economic - call options |
USD |
261 |
|
CAD |
353 |
|
2025 |
Business acquisition |
| Economic - put options |
USD |
261 |
|
CAD |
353 |
|
2025 |
Business acquisition |
| Economic - swaps |
CAD |
280 |
|
USD |
200 |
|
2025 |
Anticipated purchases |
| Economic - put options |
USD |
190 |
|
CAD |
251 |
|
2025 |
Anticipated purchases |
| Economic - call options |
USD |
120 |
|
CAD |
158 |
|
2026 |
Anticipated purchases |
| Economic - call options |
CAD |
348 |
|
USD |
240 |
|
2026 |
Anticipated purchases |
| Economic - put options |
USD |
150 |
|
CAD |
197 |
|
2026 |
Anticipated purchases |
| Economic - swaps |
USD |
200 |
|
CAD |
275 |
|
2027 |
Anticipated purchases |
| Economic - call options |
USD |
150 |
|
CAD |
197 |
|
2027 |
Anticipated purchases |
| Economic - put options |
USD |
120 |
|
CAD |
158 |
|
2027 |
Anticipated purchases |
| Economic - call options |
CAD |
360 |
|
USD |
240 |
|
2028 |
Anticipated purchases |
|
|
|
|
|
|
|
|
|
|
|
|
|
|
|
|
|
|
|
|
|
|
|
|
|
|
|
|
|
|
|
|
|
|
|
|
|
|
|
|
|
|
|
|
|
|
|
|
|
|
|
|
|
|
|
|
|
|
|
|
|
|
|
|
|
|
|
|
|
|
|
|
|
|
|
|
|
|
|
|
|
|
|
|
(1)Forward contracts to hedge loans secured by receivables under our securitization program.
(2)Deal contingent foreign exchange forwards.
(3)Foreign currency options with a leverage provision and a profit cap limitation.
A 10% depreciation (appreciation) in the value of the Canadian dollar relative to the U.S. dollar would result in a gain of $133 million (loss of $269 million recognized in net earnings at June 30, 2025 and a gain of $238 million (loss of $227 million) recognized in OCI at June 30, 2025, with all other variables held constant.
38 BCE Inc. 2025 SECOND QUARTER SHAREHOLDER REPORT
Interest rate exposures
In 2025, we sold interest rate swaptions with a total notional amount of $345 million expiring in 2025 having maturity dates in 2030 and 2035 to hedge economically the fair value of our Series A Notes and Series B Notes maturing in 2055 for $2 million. The fair value of the swaptions at June 30, 2025 was a liability of $2 million recognized in Trade payables and other liabilities in the statements of financial position.
In 2025, we entered into bond forwards with a notional amount of $300 million, maturing in 2025, to hedge economically the cost to repurchase a portion of our Series M-55 MTN debentures maturing in 2051. The fair value of the bond forwards at the date of maturity was a loss of $3 million.
In 2025, we entered into interest rate swaps with a notional amount of $372 million in U.S. dollars ($531 million in Canadian dollars), maturing in 2030, to hedge the fair value of our Series A Notes maturing in 2055. The fair value of the interest rate swaps at June 30, 2025 was a net asset of $7 million recognized in Other non-current assets and Trade payables and other liabilities in the statements of financial position.
In 2025, we entered into interest rate swaps with a notional amount of $372 million in U.S. dollars ($531 million in Canadian dollars), maturing in 2035, to hedge the fair value of our Series B Notes maturing in 2055. The fair value of the interest rate swaps at June 30, 2025 was a net asset of $7 million recognized in Other non-current assets and Trade payables and other liabilities in the statements of financial position.
In 2025, we terminated interest rate floors expiring in 2029 with a notional amount of $350 million used to hedge economically the interest cost of our Series M-62 MTN debentures maturing in 2029. In 2025, we also terminated interest rate swaps expiring in 2029 with a notional amount of $105 million used to hedge the fair value of our Series M-62 MTN debentures. The fair value of the interest rate floors and interest rate swaps at the date of termination was nil.
In 2025, we entered into forward starting interest rate swaps, effective from 2025, with a notional amount of $423 million, maturing in 2055, to hedge the interest rate exposure on future debt issuances. The fair value of the forward starting interest rate swaps at June 30, 2025 was an asset of $13 million recognized in Other current assets in the statements of financial position.
In 2025, we entered into and subsequently terminated forward starting cross currency basis rate swaps with a notional amount of $350 million in U.S. dollars ($500 million in Canadian dollars) to hedge economically the basis rate on the termination of the cross currency interest rate swaps noted above. The fair value of the forward starting cross currency basis rate swaps at the date of termination was a liability of $3 million.
A 1% increase (decrease) in interest rates would result in a loss of $7 million (loss of $10 million) recognized in net earnings and a gain of $51 million (loss of $67 million) recognized in OCI for the six months ended June 30, 2025, with all other variables held constant.
Equity price exposures
We use equity forward contracts on BCE’s common shares to hedge economically the cash flow exposure related to the settlement of equity settled share-based compensation plans. The fair value of our equity forward contracts at June 30, 2025 and December 31, 2024 was a net liability of $465 million and $429 million, respectively, recognized in Other current assets, Trade payables and other liabilities, and Other non-current liabilities in the statements of financial position. A loss of $43 million and $42 million for the three and six months ended June 30, 2025, respectively, and a loss of $23 million and $113 million for the three and six months ended June 30, 2024, respectively, relating to these equity forward contracts is recognized in Other (expense) income in the consolidated income statements (income statements).
A 5% increase (decrease) in the market price of BCE’s common shares would result in a gain (loss) of $16 million recognized in net earnings at June 30, 2025, with all other variables held constant.
BCE's and Bell Canada's key credit ratings from Moody's Investors Service, Inc. and S&P Global Ratings Canada, a business unit of S&P Global Canada Corp. (S&P), remain unchanged from those described in section 6.6, Credit ratings of the BCE 2024 Annual MD&A.
On May 8, 2025, S&P revised its outlook on BCE and Bell Canada to negative from stable principally as a result of ongoing debt leverage above S&P’s thresholds for the current ratings. However, S&P affirmed all of BCE’s and Bell Canada’s existing ratings.
On May 16, 2025, DBRS Limited (DBRS) downgraded Bell Canada's issuer rating to BBB from BBB (high), senior (unsubordinated) long-term debt rating to BBB from BBB (high), subordinated long-term debt rating to BB (high) from BBB (low), junior subordinated long-term debt rating to BB (high) from BBB (low) and commercial paper rating to R-2 (middle) from R-2 (high). In addition, DBRS downgraded BCE's issuer rating to BBB (low) from BBB. BCE's preferred shares rating was confirmed at Pfd-3. Consequently, DBRS removed the credit ratings from “Under Review with Negative Implications”, where they were placed on November 5, 2024. The outlook associated with the DBRS ratings is stable. The downgrades were principally as a result of ongoing debt leverage above DBRS’ thresholds for the prior ratings. All of the new ratings on Bell Canada’s senior (unsubordinated) long-term debt and commercial paper remain investment grade according to DBRS’ rating scale with DBRS’ BBB (low) rating representing its last investment grade rating rank for long-term debt and R-2 (low) rating representing its last investment grade rating rank for short-term debt. The new BB (high) rating for Bell Canada’s subordinated long-term debt and junior subordinated long-term debt is considered the highest rating below an investment grade rating on DBRS’ rating scale.
This section contains forward-looking statements, including relating to the sources of liquidity we expect to use to meet our 2025 cash requirements, BCE's annualized common share dividend and BCE's common share dividend payout policy target. Refer to the section Caution regarding forward-looking statements at the beginning of this MD&A.
Available liquidity
Total available liquidity(1) at June 30, 2025 was $3.8 billion, comprised of $507 million in cash, $3 million in cash equivalents, $696 million available under our securitized receivables program and $2.6 billion available under our $4.0 billion committed revolving and expansion credit facilities (given $1.4 billion of commercial paper outstanding).
Total available liquidity at December 31, 2024 was $4.5 billion, comprised of $1,572 million in cash, $400 million in short-term investments, $700 million available under our securitized receivables program and $1.8 billion available under our $4.0 billion committed revolving and expansion credit facilities (given $2.2 billion of commercial paper outstanding).
Subsequent to quarter end, on July 1, 2025, BCE completed the previously announced disposition of its 37.5% ownership stake in MLSE for gross proceeds of $4.7 billion. BCE directed the net proceeds of this disposition towards its acquisition of Ziply Fiber.
We expect that our cash, cash equivalents, short-term investments, amounts available under our securitized receivables program, cash flows from operations and possible capital markets financings will permit us to meet our cash requirements in 2025 for capital expenditures, post-employment benefit plans funding, dividend payments, the payment of contractual obligations, maturing debt, ongoing operations and other cash requirements.
Should our 2025 cash requirements exceed our cash, cash equivalents, short-term investments, cash generated from our operations, and funds raised under capital markets financings and our securitized receivables program, we would expect to cover such a shortfall by drawing under committed credit facilities that are currently in place or through new facilities to the extent available.
We continuously monitor our operations, capital markets and the Canadian economy with the objective of maintaining adequate liquidity.
(1)Available liquidity is a non-GAAP financial measure. Refer to section 9.1, Non-GAAP financial measures in this MD&A for more information on this measure.
40 BCE Inc. 2025 SECOND QUARTER SHAREHOLDER REPORT
Credit facilities
On April 14, 2025, Bell Canada entered into a $700 million in U.S. dollars ($972 million in Canadian dollars) unsecured committed term loan agreement to finance certain purchase obligations. A first loan advance in the amount of $228 million in U.S. dollars ($315 million in Canadian dollars) was made on April 29, 2025. The term loans are repayable in multiple periodic installments between July 2026 until maturity of the credit facility in April 2029. The loan advance made on April 29, 2025 has been hedged for foreign currency fluctuations.
On November 1, 2024, Bell Canada entered into a commitment letter (Commitment Letter) for a $3,700 million unsecured term loan facility (Ziply Term Facility) denominated in U.S. dollars ($5,048 million in Canadian dollars) that was available to be drawn to finance the acquisition of Ziply Fiber. In Q1 2025 and pursuant to the terms and conditions of the Commitment Letter, Bell Canada made reductions of $965 million in U.S. dollars ($1,387 million in Canadian dollars) in the aggregate amount of the Commitment Letter. On April 15, 2025, Bell Canada made further reductions of $225 million in U.S. dollars ($314 million in Canadian dollars) in the aggregate amount of the Commitment Letter. Subsequent to quarter end, on July 2, 2025, Bell Canada terminated the Ziply Term Facility and canceled the remaining $2,510 million in U.S. dollars ($3,419 million in Canadian dollars) in the aggregate amount of the Commitment Letter as a result of the completion of the previously announced disposition of its minority stake in MLSE for gross proceeds of $4.7 billion.
Cash requirements
Common share dividend
On May 8, 2025, BCE announced that the Board had determined to establish the annualized dividend at $1.75 per BCE common share effective starting from the July 15, 2025 dividend payment date. In addition, BCE’s common share dividend payout(1) policy was updated to target a dividend payout range of 40% to 55% of free cash flow. Please refer to the section 1.2, Key corporate and business developments – Dividend and dividend payout policy in the BCE 2025 First Quarter MD&A for additional information.
The Board declared on August 6, 2025 a quarterly dividend of $0.4375 per common share, payable on October 15, 2025 to shareholders of record at the close of business on September 15, 2025.
Dividend rates and the declaration of dividends by the Board are ultimately dependent on BCE’s operations and financial results, which are in turn subject to various assumptions and risks, including those outlined in the BCE 2024 Annual MD&A, as updated in the BCE 2025 First Quarter MD&A and in this MD&A.
(1)Dividend payout ratio is a non-GAAP ratio. Refer to section 9.1, Non-GAAP financial measures in this MD&A for more information on this measure.
5 Quarterly financial information
BCE’s Q2 2025 Financial Statements were prepared in accordance with IFRS® Accounting Standards, as issued by the International Accounting Standards Board (IASB), under International Accounting Standard (IAS) 34, Interim Financial Reporting and were approved by BCE’s board of directors on August 6, 2025.
The following table, which was also prepared in accordance with IFRS Accounting Standards, shows selected consolidated financial data of BCE for the eight most recent completed quarters.
|
|
|
|
|
|
|
|
|
|
|
|
|
|
|
|
|
|
|
|
|
|
|
|
|
|
|
|
|
|
|
2025 |
2024 |
2023 |
|
|
Q2 |
Q1 |
Q4 |
Q3 |
Q2 |
Q1 |
Q4 |
Q3 |
|
| Operating revenues |
|
|
|
|
|
|
|
|
|
|
| Service |
|
5,267 |
|
5,172 |
|
5,287 |
|
5,286 |
|
5,308 |
|
5,192 |
|
5,348 |
|
5,281 |
|
|
| Product |
|
818 |
|
758 |
|
1,135 |
|
685 |
|
697 |
|
819 |
|
1,125 |
|
799 |
|
|
| Total operating revenues |
|
6,085 |
|
5,930 |
|
6,422 |
|
5,971 |
|
6,005 |
|
6,011 |
|
6,473 |
|
6,080 |
|
|
| Adjusted EBITDA |
|
2,674 |
|
2,558 |
|
2,605 |
|
2,722 |
|
2,697 |
|
2,565 |
|
2,567 |
|
2,667 |
|
|
| Severance, acquisition and other costs |
|
(41) |
|
(247) |
|
(154) |
|
(49) |
|
(22) |
|
(229) |
|
(41) |
|
(10) |
|
|
| Depreciation |
|
(949) |
|
(941) |
|
(933) |
|
(934) |
|
(945) |
|
(946) |
|
(954) |
|
(937) |
|
|
| Amortization |
|
(338) |
|
(331) |
|
(317) |
|
(325) |
|
(325) |
|
(316) |
|
(299) |
|
(295) |
|
|
| Impairment of assets |
|
(8) |
|
(9) |
|
(4) |
|
(2,113) |
|
(60) |
|
(13) |
|
(109) |
|
— |
|
|
|
|
|
|
|
|
|
|
|
|
|
|
|
|
|
|
|
|
|
|
|
|
| Net earnings (loss) |
|
644 |
|
683 |
|
505 |
|
(1,191) |
|
604 |
|
457 |
|
435 |
|
707 |
|
|
| Net earnings (loss) attributable to common shareholders |
|
579 |
|
630 |
|
461 |
|
(1,237) |
|
537 |
|
402 |
|
382 |
|
640 |
|
|
|
|
|
|
|
|
|
|
|
|
|
|
|
|
|
|
|
|
|
|
|
|
|
|
|
|
|
|
|
|
|
|
|
| EPS - basic and diluted |
|
0.63 |
|
0.68 |
|
0.51 |
|
(1.36) |
|
0.59 |
|
0.44 |
|
0.42 |
|
0.70 |
|
|
|
|
|
|
|
|
|
|
|
|
|
|
|
|
|
|
|
|
|
|
|
|
|
|
|
|
|
|
|
|
|
|
|
|
|
|
|
|
|
|
|
|
|
|
|
|
|
|
|
|
|
|
|
|
|
|
|
|
|
|
|
|
|
|
|
|
|
|
|
|
|
|
|
|
|
|
|
|
|
|
|
|
|
|
|
|
|
|
|
|
|
|
|
|
|
|
|
|
|
|
|
|
|
|
|
|
|
|
|
|
|
|
|
|
|
|
|
|
|
|
|
| Weighted average number of common shares outstanding – basic (millions) |
|
930.9 |
|
920.3 |
|
912.3 |
|
912.3 |
|
912.3 |
|
912.3 |
|
912.3 |
|
912.3 |
|
|
|
|
|
|
|
|
|
|
|
|
|
|
|
|
|
|
|
|
|
|
|
|
|
|
|
|
|
|
|
|
|
|
|
|
|
|
|
|
|
|
|
|
|
|
42 BCE Inc. 2025 SECOND QUARTER SHAREHOLDER REPORT
6 Regulatory environment
The following is an update to the regulatory initiatives and proceedings described in the BCE 2024 Annual MD&A under section 3.3, Principal business risks and section 8, Regulatory environment, as updated in the BCE 2025 First Quarter MD&A.
Telecommunications Act
Review of mobile wireless services
The CRTC previously accepted a request for Final Offer Arbitration (FOA) from Rogers Communications Canada Inc. and Québecor Media Inc. (Québecor) in respect of rates for mobile virtual network operator (MVNO) access service from Rogers Communications Canada Inc. On July 24, 2023, the CRTC selected the rate proposed by Québecor, making several findings downplaying the importance of incentives for investment in Canadian telecommunications networks. Rogers Communications Canada Inc. subsequently appealed the CRTC’s decision with the Federal Court of Appeal. On May 28, 2025, the Federal Court of Appeal upheld the CRTC’s decision, finding no errors in their selection of Québecor’s proposed rate. While the CRTC’s subsequent determination in Bell Mobility’s FOA with Québecor appears to have moderated this approach by highlighting the importance of providing a return on investment to facilities-based carriers, adverse regulatory decisions such as the Rogers Communications Canada Inc. and Québecor FOA decision are expected to impact how, where and when we invest in our future wireless and wireline networks.
CRTC review of access to poles
On February 15, 2023, the CRTC issued a decision which included a number of determinations to facilitate access by third-parties to poles owned by Canadian carriers or poles to which Canadian carriers control access. On February 5, 2024, the CRTC initiated a new consultation, as anticipated in its February 15, 2023 decision, to consider the deployment of wireless facilities, such as small cells, on incumbent local exchange carrier (ILEC)-owned or -controlled support structures. On May 14, 2025, the CRTC ruled that access to support structures owned or controlled by ILECs, such as Bell Canada, for the installation of small cell equipment is subject to the ILECs’ support structure service tariffs on the same terms and conditions as for other attachments on poles. Since carriers pay a per pole fee for access, this decision means that a carrier with fibre on a pole will not pay any additional fees to establish a small cell on that pole. In turn, this reduced any potential increase in our revenue associated with small cells. However, the CRTC also maintained our right to reserve capacity on our poles for our future use requirements, minimizing the risk that access seekers will delay or increase costs with respect to our own deployment activities.
Review of the wholesale high-speed access framework
On November 6, 2023, in Telecom Decision CRTC 2023-358 (the Interim Decision), the CRTC determined that aggregated access to Bell Canada’s FTTP facilities in Ontario and Québec should be mandated on a temporary and expedited basis, and the CRTC set interim access rates.
On August 13, 2024, in Telecom Regulatory Policy CRTC 2024-180 (the Final Decision), the CRTC mandated that the interim obligation to provide wholesale aggregated access to Bell Canada’s FTTP facilities in Ontario and Québec, and to Telus Communications Inc.’s (Telus’) FTTP facilities in Québec, would be made final. Further, the Final Decision expanded the geographic scope of the Interim Decision such that Bell Canada was required to provide wholesale aggregated access to its FTTP facilities in Atlantic Canada and Manitoba by February 13, 2025. Telus and Saskatchewan Telecommunications (SaskTel) were also required to provide aggregated access to their respective FTTP facilities in Alberta, B.C., and Saskatchewan by the same date. This obligation does not apply to any new FTTP networks that Bell Canada, Telus or SaskTel make available at retail during the five-year period between August 13, 2024 and August 12, 2029. However, this five-year period is not a continuously rolling period. Instead, all new FTTP locations, regardless of when they are made available at retail, will be subject to a wholesale aggregated access obligation as of August 12, 2029. Under the Final Decision, cable companies are exempt from wholesale FTTP obligations and, as such, are not required to provide wholesale access to their FTTP networks. Also, under the Final Decision, Bell Canada, SaskTel, Telus, Cogeco Communications Inc. (Cogeco), Bragg Communications Inc. carrying on business as Eastlink (Eastlink), Rogers Communications Canada Inc., Québecor, and their respective affiliates are not eligible to buy mandated aggregated wholesale high-speed access, whether over copper, coaxial cable, or FTTP, within their traditional incumbent wireline footprints. As a result, Distributel and other Bell Canada brands were required to, and did, cease reselling wholesale high-speed access over coaxial cable to new customers after September 12, 2024.
Several parties, including Competitive Network Operators of Canada (CNOC), Cogeco, Eastlink, Rogers Communications Canada Inc. and TekSavvy Solutions Inc. filed Part 1 applications asking the CRTC to review and vary several aspects of the Final Decision. On June 20, 2025, the CRTC issued Telecom Decision CRTC 2025-154 (the R&V Decision) denying all of the review and vary applications. In a motion dated July 18, 2025, Cogeco and Eastlink have sought leave to appeal the R&V Decision to the Federal Court of Appeal.
CNOC, Cogeco, Eastlink and SaskTel have filed a joint appeal of the Final Decision to the Governor-in-Council. If the Governor-in-Council is to decide on this appeal, it must do so on or before August 13, 2025. In a motion dated September 12, 2024, SaskTel also sought leave to appeal the Final Decision to the Federal Court of Appeal.
On October 25, 2024, in Telecom Order CRTC 2024-261, the CRTC updated interim rates for Ontario and Quebec and set interim rates for the other provinces. If final rates are established that are different from the interim rates, there is a risk they will be applied retroactively.
The imposition of an aggregated access to FTTP facilities obligation, and, in particular, making Telus and Rogers Communications Canada Inc. eligible to resell services on Bell Canada’s FTTP network, have undermined Bell Canada’s incentives to invest in next-generation wireline networks. As a direct result, Bell Canada has reduced its capital expenditures by $500 million in 2025 alone and by over $1.2 billion since the Interim Decision in November 2023. The maintenance of these obligations would continue to undermine our incentive to invest in next-generation wireline networks and would be expected to adversely impact our financial results.
Bill C-8, An Act Respecting Cyber Security
On June 18, 2025, the federal government introduced Bill C-8, An Act respecting cyber security, amending the Telecommunications Act and making consequential amendments to other Acts (Bill C-8). Excepting a few minor changes, Bill C-8 mirrors the language of Bill C-26, An Act Respecting Cyber Security, which died on the Order Paper with the call of the 2025 Federal election. Bill C-8 would enact the Critical Cyber Systems Protection Act, which would establish a regulatory framework requiring designated operators in the finance, telecommunications, energy and transportation sectors to protect their critical cyber systems. Bill C-8 also includes proposed changes to the Telecommunications Act that would establish new authorities that would enable the federal government to take action to promote the security of the Canadian telecommunications system, which could include measures with respect to high-risk suppliers, such as Huawei and ZTE. If enacted, Bill C-8 would give the federal cabinet and the ISED Minister additional order-making powers and establish greater supply chain scrutiny, incidence reporting and response, annual reviews and an enforcement regime under which the Minister responsible for ISED could impose administrative monetary penalties, among other actions. It is unclear at this time what impact the legislative changes could have on our business and financial results. As Bill C-26 had the support of all parties prior to the election, it is expected that Bill C-8 will be considered a priority bill by the federal government when Parliament resumes on September 18, 2025.
Other
Bill C-18, the Online News Act
On June 22, 2023, Bill C-18, An Act respecting online communications platforms that make news content available to persons in Canada (the Online News Act), received royal assent. The Online News Act requires digital news intermediaries, such as Google, that share news content produced by other news outlets to negotiate commercial arrangements with those news outlets, compensating them for the news content shared on digital platforms. The legislation entitles Bell Media’s general news services, such as CTV and Noovo, to compensation. Further details regarding the compensation framework have been set out in regulations that were released on December 15, 2023 (the Regulations). The Regulations allow Google to apply to be exempt from parts of the Online News Act if it commits to pay $100 million annually (growing each year by inflation) to a collective (the Collective) which will then distribute it to eligible news outlets. On June 7, 2024, Google submitted an application for exemption to the CRTC and on October 28, 2024, the CRTC approved a five-year exemption for Google, which required Google to provide payment to the Collective by December 27, 2024 for calendar year 2024. Pursuant to the Regulations, of the $100 million to be paid by Google, news outlets that are also private broadcasters, such as CTV and Noovo, cannot receive more than 30% of the overall compensation available (with other news outlets, such as those associated with newspapers and public broadcasters, receiving the rest). Bell Media received an initial payment of $5.3 million in April 2025 which represents approximately 60% of our total payment for 2024, with the remainder expected to follow in August 2025.
Bill C-2, the Strong Borders Act
On June 3, 2025, the federal government introduced Bill C-2, An Act respecting certain measures relating to the security of the border between Canada and the United States and respecting other related security measures (the Strong Borders Act), in response to calls from the U.S. administration for enhanced security along the U.S.-Canada border. Bill C-2 proposes the creation of a new Supporting Authorized Access to Information Act, as well as amendments to the Criminal Code and Canadian Security Intelligence Service Act, which would grant law enforcement and other government bodies broader authority to demand information – including a wider range of subscriber data – from service providers such as Bell Canada. In urgent situations, these demands could be made without a warrant. Additionally, Bill C-2 would require service providers to proactively develop, test, and maintain systems that enable the extraction and provision of information to law enforcement. Service providers would be obligated to facilitate access, support system testing, and comply with inspections/audits, significantly expanding our obligations beyond simply responding to requests. The legislation establishes a general framework for compensating service providers but leaves key details to future regulations and indicates compensation for Ministerial orders is discretionary. The expanded scope of lawful access requests will require us to increase staffing and incur new costs to meet the information demands. The legislation also includes fines and administrative monetary penalties for non-compliance. At this time, it is unclear how these legislative changes might affect our business operations and financial results. Currently, Bill C-2 is at the second reading stage in the House of Commons and will resume debate and consideration in the fall. It is considered a priority bill by the federal government as it continues to negotiate with the U.S. on matters related to strengthening border security and national security issues.
44 BCE Inc. 2025 SECOND QUARTER SHAREHOLDER REPORT
7 Business risks
The following is an update to the risk factors described in the BCE 2024 Annual MD&A under section 9, Business risks and the other sections of the BCE 2024 Annual MD&A referred to therein.
Update to the description of business risks
On August 1, 2025, we completed our previously announced acquisition of Ziply Fiber (the Ziply Fiber Acquisition). We are therefore subject to the following additional risks as a result of this acquisition.
Ziply Fiber's fibre expansion plan
Under Ziply Fiber’s fibre expansion plan, we intend to grow Ziply Fiber’s fibre network and optimize its existing copper network to increase Ziply Fiber’s revenues and number of customers, and in turn increase its profitability and cash flows. These programs and initiatives require significant investment and other resources and may divert attention from ongoing operations and other strategic initiatives. There can be no assurance that Ziply Fiber’s current and future initiatives and programs will be successful, or that the actual returns from these programs and initiatives will not be lower than anticipated or take longer to realize than we anticipate. For example, we may not reach our targets to expand and penetrate Ziply Fiber’s existing fibre network on the timelines we anticipate, or at all. If Ziply Fiber’s current and future programs and initiatives are unsuccessful, result in lower returns than we anticipate, or take longer than we anticipate, it could have a material adverse effect on Ziply Fiber’s results of operations and consequently, adversely affect our financial performance.
The competitiveness of the U.S. communications industry
Ziply Fiber’s services market in the U.S. is highly competitive, rapidly evolving and fragmented, and subject to changing technology, shifting customer needs and frequent introductions of new products and services. Customers have alternatives in obtaining products and services from other providers, including competitive local exchange carriers, local telephone companies, Internet service providers, wireless companies, satellite companies, VoIP providers and cable companies such as Verizon, Lumen, AT&T, Comcast and Charter Communications. Some of these competitors may have market presence, engineering, technical and marketing capabilities and financial, personnel and other resources, in each case greater than those of Ziply Fiber. Additionally, some of Ziply Fiber’s competitors offer wireless services which may place them at a competitive advantage to Ziply Fiber as a result of their ability to offer bundled services and discounts. Our ability to innovate our own technology may also affect our ability to compete. Ziply Fiber’s ability to compete successfully may be affected by various competitive factors affecting the U.S. industry, including a changing regulatory environment that may affect our business and that of our competitors differently. See the risks related to U.S. federal and state regulations below for further details. Loss of customers due to competition or renewal of customer agreements at lower rates could have a material adverse effect on Ziply Fiber’s business and consequently, adversely affect our financial performance.
The integration of Ziply Fiber as a subsidiary of BCE may not be as successful as anticipated and disruptions from the transaction could harm our business
The Ziply Fiber Acquisition involves strategic, financial, accounting, legal, tax and other functions that must be integrated. Difficulties in integrating Ziply Fiber as a subsidiary of BCE may result in the combined company performing differently than expected. Our other businesses could also be negatively impacted by the Ziply Fiber Acquisition. More specifically, potential difficulties that may be encountered in the integration process include, among other factors:
•the inability to successfully integrate Ziply Fiber as a BCE subsidiary in a manner that permits us to achieve the anticipated benefits from the Ziply Fiber Acquisition
•performance shortfalls at Ziply Fiber or BCE resulting from the diversion of management’s attention caused by the Ziply Fiber Acquisition
•challenges related to the alignment and incentives of Ziply Fiber’s management team and the potential impact on the efficiency of decision-making
•funding the operations and planned capital expenditures of Ziply Fiber
•loss of key employees
•potential unknown liabilities and unforeseen expenses, delays or regulatory conditions associated with the Ziply Fiber Acquisition
•the disruption of, or loss of momentum in, our business or inconsistencies in standards, controls, procedures and policies
•integrating relationships with customers, vendors and business partners
Fluctuations in the exchange rate between the Canadian dollar and U.S. dollar may adversely affect our operating results
Our sales have been historically denominated in Canadian dollars. However, as a result of the Ziply Fiber Acquisition, a portion of our revenues, assets, liabilities, and cost structure is now exposed to U.S. dollars. As a result, an increase in the value of the Canadian dollar relative to the U.S dollar may adversely affect our revenue and business.
Selling products, providing services or purchasing inventory or equipment in U.S. dollars could result in our exposure to foreign currency risk becoming more significant. In addition, Ziply Fiber’s employees are located in the U.S. Therefore, a portion of our payroll as well as certain other operating expenses are paid in U.S. dollars. Our operating results are denominated in Canadian dollars and the difference in exchange rates in one period compared to another may directly impact period-to-period comparisons of our operating results. Furthermore, exchange rate fluctuations may make it difficult for us to predict our operating results. We may implement hedging strategies from time to time to mitigate risks related to the impact of fluctuations in exchange rates. However, not every exposure can be hedged and, where hedges are put in place based on expected foreign exchange exposure, they are based on forecasts which may vary or which may later prove to have been inaccurate. Failure to hedge successfully or anticipate currency risks accurately could adversely affect our operating results.
Ziply Fiber is subject to significant U.S. federal and state regulations, which may have a material effect on Ziply Fiber’s business
Some of the services we offer through Ziply Fiber are subject to significant regulation from U.S. federal, state, and local authorities, including by the FCC and state regulatory agencies. As a result, Ziply Fiber faces numerous risks that may have a material adverse effect on its business and operations and consequently, adversely affect our financial performance, including:
•the cost of compliance with these laws can be expensive and these costs could increase substantially
•regulations could impact our ability to change Ziply Fiber’s rates and changes in regulation may reduce the allowable fees that Ziply Fiber may charge, impose additional compliance costs, reduce the amount of subsidies or revenues Ziply Fiber receives, or otherwise change the nature of Ziply Fiber’s operations and the competition in Ziply Fiber’s markets
•a portion of Ziply Fiber’s total revenues are derived from U.S. federal and state subsidies for rural and high-cost support, and changes in the requirements or funding available could impact the ongoing funding it receives
•the withdrawal of U.S. state certifications and U.S. state and local franchise authority to provide common carrier services, or a delay in receiving other similar certifications, could limit or delay Ziply Fiber’s ability to deploy further infrastructure in that state and potentially also require it to remove existing infrastructure, and we cannot predict whether any specific U.S. state regulatory authority may take action in the future to withdraw a given certification or franchise or to delay the granting of certifications or franchises in the future
•certain U.S. federal and state agencies, including state attorneys general, monitor and exercise oversight related to consumer protection matters, including those affecting the communications industry, and such agencies have in the past, and may in the future, choose to launch an inquiry or investigation of Ziply Fiber’s business practices in response to customer complaints or other publicized customer service issues or disruptions, including regarding the failure to meet technological needs or expectations of Ziply Fiber’s customers or related to public safety services
Further, we will be required to comply with the U.S. legal and regulatory requirements to which Ziply Fiber is subject and which requirements differ, in some cases substantially, from those to which we are subject to in Canada. The failure to monitor and comply with these new legal or regulatory obligations could expose us to litigation, significant fines and penalties, and operational restrictions, as well as result in reputational harm.
Ziply Fiber is subject to specific regulatory obligations associated with its ownership by a non-U.S. entity
Under FCC rules and associated executive branch policies associated with FCC authorizations held by Ziply Fiber, proposed non-U.S. ownership of Ziply Fiber triggered certain special filing requirements, together with review of the transaction by The Committee for the Assessment of Foreign Participation in the United States Telecommunications Services Sector (the Committee). To conclude that process, Ziply Fiber, BCE Holding Corporation, and BCE entered into a Letter of Agreement (LOA) under which they made certain commitments intended to ensure that the transaction would be consistent with U.S. national security, law enforcement, and similar interests. As is standard with such agreements involving foreign-owned U.S. carriers, the FCC made compliance with the LOA a condition of Ziply Fiber’s FCC authorizations. FCC rules also require Ziply Fiber to seek further approvals if any previously unapproved non-U.S. investor obtains, or seeks to obtain, direct or indirect interests in Ziply Fiber that exceed certain thresholds. If any new Ziply Fiber foreign ownership were to exceed such levels without further FCC authorization and/or if Ziply Fiber, BCE Holding Corporation, or BCE were to fail to meet their obligations under the LOA, the FCC could subject Ziply Fiber to a range of monetary and other penalties, which could (in extreme cases) include license revocation proceedings. Any such penalties could have a material adverse effect on Ziply Fiber’s business, financial condition and results of operations and consequently, adversely affect our financial performance.
Changes in U.S. tax legislation may adversely affect Ziply Fiber’s business and financial condition and our operating results
The determination of the benefit from (or provision for) income taxes requires complex estimations and significant judgments concerning the applicable U.S. tax laws. If in the future any element of U.S. tax legislation changes the U.S. tax code for income taxes, it could affect Ziply Fiber’s income tax position and we may need to adjust the benefit from (or provision for) income taxes accordingly.
46 BCE Inc. 2025 SECOND QUARTER SHAREHOLDER REPORT
Changes in U.S. tax legislation may adversely affect our effective tax rate and the after-tax returns from Ziply Fiber’s U.S. operations
Our tax position could be adversely affected by changes in tax rates, tax laws, tax treaties, or tax regulations, as well as by changes in their interpretation or enforcement by tax authorities in the U.S., Canada, or other relevant jurisdictions. In particular, the broader U.S. tax reform landscape remains unsettled and significant amendments to the Internal Revenue Code of 1986, as amended, and the Treasury Regulations promulgated thereunder may be proposed or enacted that could negatively impact our effective tax rate, financial condition, or results of operations with respect to Ziply Fiber’s U.S. business. We cannot predict whether any such amendments will ultimately be enacted, or in what form.
8 Accounting policies
BCE’s Q2 2025 Financial Statements were prepared in accordance with IFRS Accounting Standards, as issued by the IASB, under IAS 34 - Interim Financial Reporting and were approved by BCE’s board of directors on August 6, 2025. These financial statements were prepared using the same basis of presentation, accounting policies and methods of computation as outlined in Note 2, Material accounting policies in BCE’s consolidated financial statements for the year ended December 31, 2024. BCE's Q2 2025 Financial Statements do not include all of the notes required in the annual financial statements.
Future changes to accounting standards
The following accounting standard and amendments to accounting standards issued by the IASB have not yet been adopted by BCE.
|
|
|
|
|
|
|
|
|
|
|
|
| Standard |
Description |
Impact |
Effective date |
|
|
|
|
|
|
|
|
|
|
|
|
IFRS 18 – Presentation and Disclosure in Financial Statements |
Sets out requirements and guidance on presentation and disclosure in financial statements, including:
•presentation in the income statements of income and expenses within defined categories - operating, investing, financing, income taxes and discontinued operations
•presentation in the income statements of new defined subtotals - operating profit and profit before financing and income taxes
•disclosure of explanations of management-defined performance measures that are related to the income statements
•enhanced guidance on aggregation and disaggregation of information and whether to provide information in the financial statements or in the notes
•disclosure of specified expenses by nature
IFRS 18 replaces IAS 1 - Presentation of Financial Statements but carries forward many of the requirements from IAS 1 unchanged.
|
We are currently assessing the impact of this standard. |
Annual reporting periods beginning on or after January 1, 2027. Early application is permitted. |
| Amendments to the Classification and Measurement of Financial Instruments – Amendments to IFRS 9 and IFRS 7 |
In particular, the amendments clarify:
•the classification of financial assets with ESG and similar features
•the derecognition date for financial liabilities and introduce an accounting policy option for financial liabilities settled using an electronic payment system if certain conditions are met
The amendments also require additional disclosures for financial instruments with contractual terms that reference a contingent event and equity instruments classified at fair value through OCI.
|
We are currently assessing the impact of these amendments. |
Annual reporting periods beginning on or after January 1, 2026. Early application is permitted. |
48 BCE Inc. 2025 SECOND QUARTER SHAREHOLDER REPORT
9 Non-GAAP financial measures, other financial measures and key performance indicators (KPIs)
BCE uses various financial measures to assess its business performance. Certain of these measures are calculated in accordance with IFRS Accounting Standards or GAAP while certain other measures do not have a standardized meaning under GAAP. We believe that our GAAP financial measures, read together with adjusted non-GAAP and other financial measures, provide readers with a better understanding of how management assesses BCE’s performance.
National Instrument 52-112, Non-GAAP and Other Financial Measures Disclosure (NI 52-112), prescribes disclosure requirements that apply to the following specified financial measures:
•Non-GAAP financial measures
•Non-GAAP ratios
•Total of segments measures
•Capital management measures
•Supplementary financial measures
This section provides a description and classification of the specified financial measures contemplated by NI 52-112 that we use to explain our financial results except that, for supplementary financial measures, an explanation of such measures is provided where they are first referred to in this MD&A if the supplementary financial measures’ labelling is not sufficiently descriptive.
9.1 Non-GAAP financial measures
A non-GAAP financial measure is a financial measure used to depict our historical or expected future financial performance, financial position or cash flow and, with respect to its composition, either excludes an amount that is included in, or includes an amount that is excluded from, the composition of the most directly comparable financial measure disclosed in BCE’s consolidated primary financial statements. We believe that non-GAAP financial measures are reflective of our on-going operating results and provide readers with an understanding of management’s perspective on and analysis of our performance.
Below are descriptions of the non-GAAP financial measures that we use to explain our results as well as reconciliations to the most directly comparable financial measure under IFRS Accounting Standards.
The term adjusted net earnings does not have any standardized meaning under IFRS Accounting Standards. Therefore, it is unlikely to be comparable to similar measures presented by other issuers.
We define adjusted net earnings as net earnings (loss) attributable to common shareholders before severance, acquisition and other costs, net mark-to-market losses (gains) on derivatives used to economically hedge equity settled share-based compensation plans, net equity losses (gains) on investments in associates and joint ventures, net losses (gains) on investments, early debt redemption costs (gains), impairment of assets and discontinued operations, net of tax and NCI.
We use adjusted net earnings and we believe that certain investors and analysts use this measure, among other ones, to assess the performance of our businesses without the effects of severance, acquisition and other costs, net mark-to-market losses (gains) on derivatives used to economically hedge equity settled share-based compensation plans, net equity losses (gains) on investments in associates and joint ventures, net losses (gains) on investments, early debt redemption costs (gains), impairment of assets and discontinued operations, net of tax and NCI. We exclude these items because they affect the comparability of our financial results and could potentially distort the analysis of trends in business performance. Excluding these items does not imply they are non-recurring.
The most directly comparable financial measure under IFRS Accounting Standards is net earnings (loss) attributable to common shareholders.
The following table is a reconciliation of net earnings attributable to common shareholders to adjusted net earnings on a consolidated basis.
|
|
|
|
|
|
|
|
|
|
|
|
|
|
|
|
Q2 2025 |
Q2 2024 |
YTD 2025 |
YTD 2024 |
| Net earnings attributable to common shareholders |
579 |
|
537 |
|
1,209 |
|
939 |
|
| Reconciling items: |
|
|
|
|
| Severance, acquisition and other costs |
41 |
|
22 |
|
288 |
|
251 |
|
Net mark-to-market losses on derivatives used to economically
hedge equity settled share-based compensation plans |
43 |
|
23 |
|
42 |
|
113 |
|
| Net equity losses on investments in associates and joint ventures |
— |
|
93 |
|
— |
|
93 |
|
| Net losses on investments |
8 |
|
2 |
|
10 |
|
8 |
|
| Early debt redemption gains |
(91) |
|
— |
|
(357) |
|
— |
|
| Impairment of assets |
8 |
|
60 |
|
17 |
|
73 |
|
| Income taxes for the above reconciling items |
4 |
|
(25) |
|
16 |
|
(110) |
|
| NCI for the above reconciling items |
— |
|
— |
|
— |
|
(1) |
|
|
|
|
|
|
| Adjusted net earnings |
592 |
|
712 |
|
1,225 |
|
1,366 |
|
Available liquidity
The term available liquidity does not have any standardized meaning under IFRS Accounting Standards. Therefore, it is unlikely to be comparable to similar measures presented by other issuers.
We define available liquidity as cash, cash equivalents, short-term investments and amounts available under our securitized receivables program and our committed bank credit facilities, excluding credit facilities that are available exclusively for a pre-determined purpose.
We consider available liquidity to be an important indicator of the financial strength and performance of our businesses because it shows the funds available to meet our cash requirements, including for, but not limited to, capital expenditures, post-employment benefit plans funding, dividend payments, the payment of contractual obligations, maturing debt, on going operations, the acquisition of spectrum, and other cash requirements. We believe that certain investors and analysts use available liquidity to evaluate the financial strength and performance of our businesses. The most directly comparable financial measure under IFRS Accounting Standards is cash.
The following table is a reconciliation of cash to available liquidity on a consolidated basis.
|
|
|
|
|
|
|
|
|
|
June 30, 2025 |
December 31, 2024 |
| Cash |
507 |
|
1,572 |
|
| Cash equivalents |
3 |
|
— |
|
| Short-term investments |
— |
|
400 |
|
Amounts available under our securitized receivables program(1) |
696 |
|
700 |
|
Amounts available under our committed bank credit facilities(2) |
2,590 |
|
1,810 |
|
| Available liquidity |
3,796 |
|
4,482 |
|
(1)At June 30, 2025 and December 31, 2024, respectively, $696 million and $700 million were available under our securitized receivables program, under which we borrowed $1,161 million in U.S. dollars ($1,584 million in Canadian dollars) and $1,112 million in U.S. dollars ($1,600 million in Canadian dollars) as at June 30, 2025 and December 31, 2024, respectively. Loans secured by receivables are included in Debt due within one year in our consolidated financial statements.
(2)At June 30, 2025 and December 31, 2024, respectively, $2,590 million and $1,810 million were available under our committed bank credit facilities, given outstanding commercial paper of $1,033 million in U.S. dollars ($1,410 million in Canadian dollars) and $1,522 million in U.S. dollars ($2,190 million in Canadian dollars) as at June 30, 2025 and December 31, 2024, respectively. Commercial paper outstanding is included in Debt due within one year in our consolidated financial statements.
50 BCE Inc. 2025 SECOND QUARTER SHAREHOLDER REPORT
Free cash flow, free cash flow after payment of lease liabilities and excess free cash flow
The terms free cash flow, free cash flow after payment of lease liabilities and excess free cash flow do not have any standardized meaning under IFRS Accounting Standards. Therefore, they are unlikely to be comparable to similar measures presented by other issuers.
We define free cash flow as cash flows from operating activities, excluding cash from discontinued operations, acquisition and other costs paid (which include significant litigation costs) and voluntary pension funding, less capital expenditures, preferred share dividends and dividends paid by subsidiaries to NCI. We exclude cash from discontinued operations, acquisition and other costs paid and voluntary pension funding because they affect the comparability of our financial results and could potentially distort the analysis of trends in business performance. Excluding these items does not imply they are non-recurring.
We define free cash flow after payment of lease liabilities as cash flows from operating activities, excluding cash from discontinued operations, acquisition and other costs paid (which include significant litigation costs) and voluntary pension funding, less principal payment of lease liabilities, capital expenditures, preferred share dividends and dividends paid by subsidiaries to NCI. We exclude cash from discontinued operations, acquisition and other costs paid and voluntary pension funding because they affect the comparability of our financial results and could potentially distort the analysis of trends in business performance. Excluding these items does not imply they are non-recurring.
We define excess free cash flow as free cash flow less dividends paid on common shares.
We consider free cash flow, free cash flow after payment of lease liabilities and excess free cash flow to be important indicators of the financial strength and performance of our businesses. Free cash flow and free cash flow after payment of lease liabilities show how much cash is available to pay dividends on common shares, repay debt and reinvest in our company. Excess free cash flow shows how much cash is available to repay debt and reinvest in our company, after the payment of dividends on common shares. We believe that certain investors and analysts use free cash flow, free cash flow after payment of lease liabilities and excess free cash flow to value a business and its underlying assets and to evaluate the financial strength and performance of our businesses. The most directly comparable financial measure under IFRS Accounting Standards is cash flows from operating activities.
The following tables provide reconciliations of cash flows from operating activities to free cash flow, free cash flow after payment of lease liabilities and excess free cash flow on a consolidated basis.
|
|
|
|
|
|
|
|
|
|
|
|
|
|
|
|
Q2 2025 |
Q2 2024 |
YTD 2025 |
YTD 2024 |
| Cash flows from operating activities |
1,947 |
|
2,137 |
|
3,518 |
|
3,269 |
|
| Capital expenditures |
(763) |
|
(978) |
|
(1,492) |
|
(1,980) |
|
| Cash dividends paid on preferred shares |
(38) |
|
(45) |
|
(77) |
|
(91) |
|
| Cash dividends paid by subsidiaries to NCI |
— |
|
(28) |
|
(13) |
|
(42) |
|
| Acquisition and other costs paid |
6 |
11 |
|
14 |
26 |
|
|
|
|
|
|
| Free cash flow |
1,152 |
|
1,097 |
|
1,950 |
|
1,182 |
|
| Principal payment of lease liabilities |
(278) |
|
(270) |
|
(582) |
|
(567) |
|
| Free cash flow after payment of lease liabilities |
874 |
|
827 |
|
1,368 |
|
615 |
|
|
|
|
|
|
|
|
|
|
|
|
|
|
|
|
|
Q2 2025 |
Q2 2024 |
YTD 2025 |
YTD 2024 |
| Cash flows from operating activities |
1,947 |
|
2,137 |
|
3,518 |
|
3,269 |
|
| Capital expenditures |
(763) |
|
(978) |
|
(1,492) |
|
(1,980) |
|
| Cash dividends paid on preferred shares |
(38) |
|
(45) |
|
(77) |
|
(91) |
|
| Cash dividends paid by subsidiaries to NCI |
— |
|
(28) |
|
(13) |
|
(42) |
|
| Acquisition and other costs paid |
6 |
11 |
|
14 |
26 |
|
|
|
|
|
|
| Free cash flow |
1,152 |
|
1,097 |
|
1,950 |
|
1,182 |
|
| Dividends paid on common shares |
(608) |
|
(910) |
|
(1,210) |
|
(1,793) |
|
| Excess free cash flow |
544 |
|
187 |
|
740 |
|
(611) |
|
The term net debt does not have any standardized meaning under IFRS Accounting Standards. Therefore, it is unlikely to be comparable to similar measures presented by other issuers.
We define net debt as debt due within one year plus long-term debt and 50% of outstanding preferred shares, less 50% of junior subordinated debt included within long-term debt, and less cash, cash equivalents and short-term investments, as shown in BCE’s consolidated statements of financial position.
In Q1 2025, we updated our definition of net debt to include 50% of junior subordinated debt. This change does not impact the net debt amounts previously presented. We include 50% of outstanding preferred shares and 50% of junior subordinated debt in our net debt as it is consistent with the treatment by certain credit rating agencies and given structural features including priority of payments.
We, and certain investors and analysts, consider net debt to be an important indicator of the company’s financial leverage.
Net debt is calculated using several asset and liability categories from the statements of financial position. The most directly comparable financial measure under IFRS Accounting Standards is long-term debt. The following table is a reconciliation of long-term debt to net debt on a consolidated basis.
|
|
|
|
|
|
|
|
|
|
June 30, 2025 |
December 31, 2024 |
| Long-term debt |
32,522 |
|
32,835 |
|
| less: 50% of junior subordinated debt |
(2,146) |
|
— |
|
| Debt due within one year |
5,037 |
|
7,669 |
|
| 50% of preferred shares |
1,712 |
|
1,767 |
|
| Cash |
(507) |
|
(1,572) |
|
| Cash equivalents |
(3) |
|
— |
|
| Short-term investments |
— |
|
(400) |
|
| Net debt |
36,615 |
|
40,299 |
|
A non-GAAP ratio is a financial measure disclosed in the form of a ratio, fraction, percentage or similar representation and that has a non-GAAP financial measure as one or more of its components.
The term adjusted EPS does not have any standardized meaning under IFRS Accounting Standards. Therefore, it is unlikely to be comparable to similar measures presented by other issuers.
We define adjusted EPS as adjusted net earnings per BCE common share. Adjusted net earnings is a non-GAAP financial measure. For further details on adjusted net earnings, see section 9.1, Non-GAAP financial measures.
We use adjusted EPS, and we believe that certain investors and analysts use this measure, among other ones, to assess the performance of our businesses without the effects of severance, acquisition and other costs, net mark-to-market losses (gains) on derivatives used to economically hedge equity settled share-based compensation plans, net equity losses (gains) on investments in associates and joint ventures, net losses (gains) on investments, early debt redemption costs (gains), impairment of assets and discontinued operations, net of tax and NCI. We exclude these items because they affect the comparability of our financial results and could potentially distort the analysis of trends in business performance. Excluding these items does not imply they are non-recurring.
Dividend payout ratio and dividend payout ratio after payment of lease liabilities
The terms dividend payout ratio and dividend payout ratio after payment of lease liabilities do not have any standardized meaning under IFRS Accounting Standards. Therefore, they are unlikely to be comparable to similar measures presented by other issuers.
We define dividend payout ratio as dividends paid on common shares divided by free cash flow. We define dividend payout ratio after payment of lease liabilities as dividends paid on common shares divided by free cash flow after payment of lease liabilities. Free cash flow and free cash flow after payment of lease liabilities are non-GAAP financial measures. For further details on free cash flow and free cash flow after payment of lease liabilities, see section 9.1, Non-GAAP financial measures.
We consider dividend payout ratio and dividend payout ratio after payment of lease liabilities to be important indicators of the financial strength and performance of our businesses because they show the sustainability of the company’s dividend payments.
52 BCE Inc. 2025 SECOND QUARTER SHAREHOLDER REPORT
9.3 Total of segments measures
A total of segments measure is a financial measure that is a subtotal or total of 2 or more reportable segments and is disclosed within the Notes to BCE’s consolidated primary financial statements.
Adjusted EBITDA
We define adjusted EBITDA as operating revenues less operating costs as shown in BCE’s consolidated income statements.
The most directly comparable financial measure under IFRS Accounting Standards is net earnings (loss). The following tables provide a reconciliation of net earnings (loss) to adjusted EBITDA on a consolidated basis.
|
|
|
|
|
|
|
|
|
|
|
|
|
YTD 2025 |
Q2 2025 |
Q1 2025 |
| Net earnings |
1,327 |
|
644 |
|
683 |
|
| Severance, acquisition and other costs |
|
288 |
|
|
41 |
|
|
247 |
|
| Depreciation |
|
1,890 |
|
|
949 |
|
|
941 |
|
| Amortization |
|
669 |
|
|
338 |
|
|
331 |
|
| Finance costs |
|
|
|
| Interest expense |
|
865 |
|
|
442 |
|
|
423 |
|
| Net return on post-employment benefit plans |
|
(51) |
|
|
(26) |
|
|
(25) |
|
| Impairment of assets |
|
17 |
|
|
8 |
|
|
9 |
|
| Other (income) expense |
|
(270) |
|
|
38 |
|
|
(308) |
|
| Income taxes |
497 |
|
240 |
|
257 |
|
|
|
|
|
|
|
|
|
|
|
|
|
| Adjusted EBITDA |
5,232 |
|
2,674 |
|
2,558 |
|
|
|
|
|
|
|
|
|
|
|
|
|
|
|
|
|
|
|
|
Q4 2024 |
Q3 2024 |
YTD 2024 |
Q2 2024 |
Q1 2024 |
| Net earnings (loss) |
505 |
|
(1,191) |
|
1,061 |
|
604 |
|
457 |
|
| Severance, acquisition and other costs |
|
154 |
|
|
49 |
|
251 |
|
|
22 |
|
|
229 |
|
| Depreciation |
933 |
|
934 |
|
1,891 |
|
|
945 |
|
|
946 |
|
| Amortization |
317 |
|
325 |
|
641 |
|
|
325 |
|
|
316 |
|
| Finance costs |
|
|
|
|
|
| Interest expense |
431 |
|
440 |
|
842 |
|
|
426 |
|
|
416 |
|
| Net return on post-employment benefit plans |
(17) |
|
(16) |
|
(33) |
|
|
(17) |
|
|
(16) |
|
| Impairment of assets |
4 |
|
2,113 |
|
73 |
|
|
60 |
|
|
13 |
|
| Other expense |
103 |
|
63 |
|
139 |
|
|
101 |
|
|
38 |
|
| Income taxes |
175 |
|
5 |
|
397 |
|
231 |
|
166 |
|
|
|
|
|
|
|
|
|
|
|
|
|
|
|
|
|
|
|
| Adjusted EBITDA |
2,605 |
|
2,722 |
|
5,262 |
|
2,697 |
|
2,565 |
|
|
|
|
|
|
|
|
|
|
|
|
|
|
|
|
Q4 2023 |
Q3 2023 |
|
|
|
|
|
| Net earnings |
435 |
|
707 |
|
|
|
|
|
|
| Severance, acquisition and other costs |
|
41 |
|
|
10 |
|
|
|
|
|
|
| Depreciation |
954 |
|
937 |
|
|
|
|
|
|
| Amortization |
299 |
|
295 |
|
|
|
|
|
|
| Finance costs |
|
|
|
|
|
|
|
| Interest expense |
399 |
|
373 |
|
|
|
|
|
|
| Net return on post-employment benefit plans |
(27) |
|
(27) |
|
|
|
|
|
|
| Impairment of assets |
109 |
|
— |
|
|
|
|
|
|
| Other expense |
147 |
|
129 |
|
|
|
|
|
|
| Income taxes |
210 |
|
243 |
|
|
|
|
|
|
|
|
|
|
|
|
|
|
|
|
|
|
|
|
|
|
|
|
|
|
|
|
|
|
| Adjusted EBITDA |
2,567 |
|
2,667 |
|
|
|
|
|
|
9.4 Capital management measures
A capital management measure is a financial measure that is intended to enable a reader to evaluate our objectives, policies and processes for managing our capital and is disclosed within the Notes to BCE’s consolidated financial statements.
The financial reporting framework used to prepare the financial statements requires disclosure that helps readers assess the company’s capital management objectives, policies, and processes, as set out in IFRS Accounting Standards in IAS 1 – Presentation of Financial Statements. BCE has its own methods for managing capital and liquidity, and IFRS Accounting Standards do not prescribe any particular calculation method.
Net debt leverage ratio
The net debt leverage ratio represents net debt divided by adjusted EBITDA. Net debt used in the calculation of the net debt leverage ratio is a non-GAAP financial measure. For further details on net debt, see section 9.1, Non-GAAP financial measures. For the purposes of calculating our net debt leverage ratio, adjusted EBITDA is twelve-month trailing adjusted EBITDA.
We use, and believe that certain investors and analysts use, the net debt leverage ratio as a measure of financial leverage.
9.5 Supplementary financial measures
A supplementary financial measure is a financial measure that is not reported in BCE’s consolidated financial statements, and is, or is intended to be, reported periodically to represent historical or expected future financial performance, financial position, or cash flows.
An explanation of such measures is provided where they are first referred to in this MD&A if the supplementary financial measures’ labelling is not sufficiently descriptive.
In addition to the non-GAAP financial measures and other financial measures described previously, we use the following KPIs to measure the success of our strategic imperatives. These KPIs are not accounting measures and may not be comparable to similar measures presented by other issuers.
|
|
|
|
|
|
| KPI |
Definition |
| Adjusted EBITDA margin |
Adjusted EBITDA margin is defined as adjusted EBITDA divided by operating revenues. |
| ARPU |
ARPU is defined as Bell CTS wireless external services revenues divided by the average mobile phone subscriber base for the specified period, expressed as a dollar unit per month. |
| Capital intensity |
Capital intensity is defined as capital expenditures divided by operating revenues. |
| Churn |
Mobile phone churn is the rate at which existing mobile phone subscribers cancel their services. It is a measure of our ability to retain our customers. Mobile phone churn is calculated by dividing the number of mobile phone deactivations during a given period by the average number of mobile phone subscribers in the base for the specified period and is expressed as a percentage per month. |
| Subscriber unit |
Mobile phone subscriber unit is comprised of a recurring revenue generating portable unit (e.g. smartphones and feature phones) on an active service plan, that has access to our wireless networks and includes voice, text and/or data connectivity. We report mobile phone subscriber units in two categories: postpaid and prepaid. Prepaid mobile phone subscriber units are considered active for a period of 90 days following the expiry of the subscriber’s prepaid balance.
Mobile connected device subscriber unit is comprised of a recurring revenue generating portable unit (e.g. tablets, wearables, mobile Internet devices and IoT) on an active service plan, that has access to our wireless networks and is intended for limited or no cellular voice capability.
Wireline subscriber unit consists of an active revenue-generating unit with access to our services, including retail Internet, IPTV, and/or residential NAS. A subscriber is included in our subscriber base when the service has been installed and is operational at the customer premise and a billing relationship has been established.
• Retail Internet and IPTV subscribers have access to stand-alone services, and are primarily represented by a dwelling unit or a business location
• Retail residential NAS subscribers are based on a line count and are represented by a unique telephone number
|
54 BCE Inc. 2025 SECOND QUARTER SHAREHOLDER REPORT
10 Controls and procedures
Changes in internal control over financial reporting
No changes were made in our internal control over financial reporting during the quarter ended June 30, 2025 that have materially affected, or are reasonably likely to materially affect, our internal control over financial reporting.