Document
Management's discussion and analysis
Table of contents
Management’s discussion and analysis
In this management’s discussion and analysis (MD&A), we, us, our, BCE and the company mean, as the context may require, either BCE Inc. or, collectively, BCE Inc., Bell Canada, their subsidiaries, joint arrangements and associates. Bell means, as the context may require, either Bell Canada or, collectively, Bell Canada, its subsidiaries, joint arrangements and associates.
All amounts in this MD&A are in millions of Canadian dollars, except where noted. Please refer to section 8, Non-GAAP financial measures, other financial measures and key performance indicators (KPIs) for a list of defined non-GAAP financial measures, other financial measures and KPIs.
Please refer to BCE’s unaudited consolidated financial statements for the third quarter of 2024 (Q3 2024 Financial Statements) when reading this MD&A as well as BCE’s news release to be dated November 7, 2024 announcing BCE’s financial results for the three months and nine months ended September 30, 2024 and 2023 (BCE 2024 Third Quarter News Release). We also encourage you to read BCE’s MD&A for the year ended December 31, 2023 dated March 7, 2024 (BCE 2023 Annual MD&A) as updated in BCE's MD&A for the first quarter of 2024 dated May 1, 2024 (BCE 2024 First Quarter MD&A) and BCE's MD&A for the second quarter of 2024 dated July 31, 2024 (BCE 2024 Second Quarter MD&A). In preparing this MD&A, we have taken into account information available to us up to November 6, 2024, the date of this MD&A, unless otherwise stated. You will find additional information relating to BCE, including BCE’s annual information form for the year ended December 31, 2023 dated March 7, 2024 (BCE 2023 AIF) and recent financial reports, including the BCE 2023 Annual MD&A, the BCE 2024 First Quarter MD&A and the BCE 2024 Second Quarter MD&A, and the BCE 2024 Third Quarter News Release on BCE’s website at BCE.ca, on SEDAR+ at sedarplus.ca and on EDGAR at sec.gov.
Documents and other information contained in BCE’s website including, without limitation, the BCE 2024 Third Quarter News Release, or in any other site referred to in BCE’s website or in this MD&A are not part of this MD&A and are not incorporated by reference herein.
This MD&A comments on our business operations, performance, financial position and other matters for the three months (Q3) and nine months (YTD) ended September 30, 2024 and 2023.
Caution regarding forward-looking statements
This MD&A and, in particular, but without limitation, section 1.2, Key corporate and business developments, section 3.1, Bell CTS, section 3.2, Bell Media, the section and sub-sections entitled Assumptions and section 4.7, Liquidity, contain forward-looking statements. These forward-looking statements include, without limitation, statements relating to the proposed acquisition by Bell Canada of Northwest Fiber Holdco, LLC (doing business as Ziply Fiber (Ziply Fiber)), the expected timing and completion thereof, the sources of liquidity we expect to use to fund the proposed acquisition, certain potential benefits expected to result from the proposed acquisition including the expected expansion of Bell’s fibre footprint by the end of 2028, Bell's growth prospects and strategic positioning, the proposed disposition of BCE’s ownership stake in Maple Leaf Sports and Entertainment Ltd. (MLSE), the expected timing and completion thereof, the intended use by BCE of the proceeds from the proposed disposition and the planned access for Bell Media to content rights for the Toronto Maple Leafs and Toronto Raptors for the next 20 years through a long-term agreement with Rogers Communications Inc. (Rogers), BCE's common share dividend growth strategy, its intention to maintain its annual common share dividend at the current level during 2025 and the potential future resumption of common share dividend growth, potential future purchases by BCE of its preferred shares pursuant to a normal course issuer bid (NCIB), potential future issuances by BCE of new common shares pursuant to its intended discounted treasury shareholder dividend reinvestment and stock purchase plan (DRP), the expected timing of commencement thereof and the anticipated benefits expected to result from such equity issuances, certain benefits expected to result from the acquisition of HGC Technologies Inc. (HGC Technologies), FX Innovation’s growth prospects and strategic plans, the sources of liquidity we expect to use to meet our 2024 cash requirements, BCE’s business outlook, objectives, plans and strategic priorities, and other statements that do not refer to historical facts. A statement we make is forward-looking when it uses what we know and expect today to make a statement about the future. Forward-looking statements are typically identified by the words assumption, goal, guidance, objective, outlook, project, strategy, target, commitment and other similar expressions or future or conditional verbs such as aim, anticipate, believe, could, expect, intend, may, plan, seek, should, strive and will. All such forward-looking statements are made pursuant to the safe harbour provisions of applicable Canadian securities laws and of the United States (U.S.) Private Securities Litigation Reform Act of 1995.
Unless otherwise indicated by us, forward-looking statements in this MD&A describe our expectations as at November 6, 2024 and, accordingly, are subject to change after that date. Except as may be required by applicable securities laws, we do not undertake any obligation to update or revise any forward-looking statements, whether as a result of new information, future events or otherwise.
Forward-looking statements, by their very nature, are subject to inherent risks and uncertainties and are based on several assumptions, both general and specific, which give rise to the possibility that actual results or events could differ materially from our expectations expressed in, or implied by, such forward-looking statements and that our business outlook, objectives, plans and strategic priorities may not be achieved. These statements are not guarantees of future performance or events, and we caution you against relying on any of these forward-looking statements. Forward-looking statements are presented
4 BCE Inc. 2024 THIRD QUARTER SHAREHOLDER REPORT
in this MD&A for the purpose of assisting investors and others in understanding our objectives, strategic priorities and business outlook as well as our anticipated operating environment. Readers are cautioned, however, that such information may not be appropriate for other purposes.
We have made certain economic, market, operational and other assumptions in preparing the forward-looking statements contained in this MD&A and, in particular, but without limitation, the forward-looking statements contained in the previously mentioned sections of this MD&A. These assumptions include, without limitation, the assumptions described in the section and sub-sections of this MD&A entitled Assumptions, which section and sub-sections are incorporated by reference in this cautionary statement. Subject to various factors, we believe that our assumptions were reasonable at November 6, 2024. If our assumptions turn out to be inaccurate, our actual results could be materially different from what we expect.
Important risk factors that could cause actual results or events to differ materially from those expressed in, or implied by, the previously-mentioned forward-looking statements and other forward-looking statements contained in this MD&A, include, but are not limited to: the negative effect of adverse economic conditions, including a potential recession, elevated inflation, high interest rates and financial and capital market volatility, and the resulting negative impact on business and customer spending and the demand for our products and services; the negative effect of adverse conditions associated with geopolitical events; regulatory initiatives, proceedings and decisions, government consultations and government positions that negatively affect us and influence our business including, without limitation, concerning mandatory access to networks, spectrum auctions, the imposition of consumer-related codes of conduct, approval of acquisitions, broadcast and spectrum licensing, foreign ownership requirements, privacy and cybersecurity obligations and control of copyright piracy; the inability to implement enhanced compliance frameworks and to comply with legal and regulatory obligations; unfavourable resolution of legal proceedings; the intensity of competitive activity and the failure to effectively respond to evolving competitive dynamics; the level of technological substitution and the presence of alternative service providers contributing to disruptions and disintermediation in each of our business segments; changing customer behaviour and the expansion of cloud-based, over-the-top (OTT) and other alternative solutions; advertising market pressures from economic conditions, fragmentation and non-traditional/global digital services; rising content costs and challenges in our ability to acquire or develop key content; high Canadian Internet and smartphone penetration; the failure to evolve and transform our networks, systems and operations using next-generation technologies while lowering our cost structure, including the failure to transition from a traditional telecommunications company to a tech services and digital media company and meet customer expectations of product and service experience; the inability to drive a positive customer experience; the inability to protect our physical and non-physical assets from events such as information security attacks, unauthorized access or entry, fire and natural disasters; the failure to implement an effective data governance framework; the failure to attract, develop and retain a diverse and talented team capable of furthering our strategic imperatives and high-tech transformation; the potential deterioration in employee morale and engagement resulting from staff reductions, cost reductions or reorganizations and the de-prioritization of transformation initiatives due to staff reductions, cost reductions or reorganizations; the failure to adequately manage health and safety concerns; labour disruptions and shortages; the risk that we may need to incur significant capital expenditures to provide additional capacity and reduce network congestion; service interruptions or outages due to network failures or slowdowns; events affecting the functionality of, and our ability to protect, test, maintain, replace and upgrade, our networks, information technology (IT) systems, equipment and other facilities; the failure by other telecommunications carriers on which we rely to provide services to complete planned and sufficient testing, maintenance, replacement or upgrade of their networks, equipment and other facilities, which could disrupt our operations including through network or other infrastructure failures; the complexity of our operations and IT systems and the failure to implement or maintain highly effective processes and IT systems; in-orbit and other operational risks to which the satellites used to provide our satellite television (TV) services are subject; the inability to access adequate sources of capital and generate sufficient cash flows from operating activities to meet our cash requirements, fund capital expenditures and provide for planned growth; uncertainty as to whether dividends will be declared or the dividend on common shares will be maintained or increased by BCE’s board of directors; the failure to reduce costs and adequately assess investment priorities, as well as unexpected increases in costs; the inability to manage various credit, liquidity and market risks; the failure to evolve practices to effectively monitor and control fraudulent activities; new or higher taxes due to new tax laws or changes thereto or in the interpretation thereof, and the inability to predict the outcome of government audits; the impact on our financial statements and estimates from a number of factors; pension obligation volatility and increased contributions to post-employment benefit plans; our dependence on third-party suppliers, outsourcers and consultants to provide an uninterrupted supply of the products and services we need; the failure of our vendor selection, governance and oversight processes, including our management of supplier risk in the areas of security, data governance and responsible procurement; the quality of our products and services and the extent to which they may be subject to defects or fail to comply with applicable government regulations and standards; reputational risks and the inability to meaningfully integrate environmental, social and governance (ESG) considerations into our business strategy and operations; the failure to take appropriate actions to adapt to current and emerging environmental impacts, including climate change; pandemics, epidemics and other health risks, including health concerns about radio frequency emissions from wireless communications devices and equipment; the inability to adequately manage social issues; the failure to develop and implement sufficient corporate governance practices; the adverse impact of various internal and external factors on our ability to achieve our ESG targets including, without limitation, those related to greenhouse gas emissions reduction and diversity, equity, inclusion and belonging; the completion of the proposed disposition of Northwestel Inc.
is subject to closing conditions, including the purchaser securing financing and the completion of confirmatory due diligence and, as such, there can be no assurances that the proposed disposition will ultimately be consummated or that it will be consummated on the terms and conditions currently contemplated; the expected timing and completion of the proposed disposition of BCE’s ownership stake in MLSE and the planned access for Bell Media to content rights for the Toronto Maple Leafs and Toronto Raptors for the next 20 years through a long-term agreement with Rogers are subject to closing conditions, including relevant sports league and other customary approvals, and the intended use of proceeds by BCE from the proposed disposition may vary based on timing of closing of the disposition and other factors and, as such, there can be no assurances that the proposed disposition, the anticipated use of proceeds and anticipated benefits from the proposed disposition will occur, or that they will occur on the terms and conditions, or at the time, currently contemplated; and the expected timing and completion of the proposed acquisition of Ziply Fiber are subject to customary closing conditions, including relevant regulatory approvals, such as approval by the Federal Communications Commission (FCC) and approvals by state Public Utilities Commissions (PUCs) and, as such, there can be no assurances that the proposed acquisition and the potential benefits expected to result from the proposed acquisition will occur, or that they will occur on the terms and conditions, or at the time, currently contemplated.
We caution that the foregoing list of risk factors is not exhaustive and other factors could also materially adversely affect us. Please see section 9, Business risks of the BCE 2023 Annual MD&A for a more complete description of the above-mentioned and other risks, which section, and the other sections of the BCE 2023 Annual MD&A referred to therein, are incorporated by reference in this cautionary statement. In addition, please see section 4.8, Litigation in this MD&A for an update to the legal proceedings described in the BCE 2023 AIF, which section 4.8 is incorporated by reference in this cautionary statement. Please also see section 6, Regulatory environment in the BCE 2024 First Quarter MD&A, in the BCE 2024 Second Quarter MD&A and in this MD&A for an update to the regulatory initiatives and proceedings described in the BCE 2023 Annual MD&A, which sections 6 are incorporated by reference in this cautionary statement. Any of those risks could cause actual results or events to differ materially from our expectations expressed in, or implied by, the forward-looking statements set out in this MD&A. Except for the updates set out in section 6, Regulatory environment of the BCE 2024 First Quarter MD&A; in section 6, Regulatory environment of the BCE 2024 Second Quarter MD&A; as well as in section 4.8, Litigation and in section 6, Regulatory environment in this MD&A, the risks described in the BCE 2023 Annual MD&A remain substantially unchanged.
Additional risks and uncertainties not currently known to us or that we currently deem to be immaterial may also have a material adverse effect on our business, financial condition, liquidity, financial results or reputation. We regularly consider potential acquisitions, dispositions, mergers, business combinations, investments, monetizations, joint ventures and other transactions, some of which may be significant. Except as otherwise indicated by us, forward-looking statements do not reflect the potential impact of any such transactions or of special items that may be announced or that may occur after November 6, 2024. The financial impact of these transactions and special items can be complex and depends on facts particular to each of them. We therefore cannot describe the expected impact in a meaningful way, or in the same way we present known risks affecting our business.
6 BCE Inc. 2024 THIRD QUARTER SHAREHOLDER REPORT
1 Overview
BCE Q3 2024 selected quarterly information
|
|
|
|
|
|
|
|
|
|
|
|
|
|
|
|
|
|
|
| Operating revenues |
Net (loss) earnings |
Adjusted EBITDA(1) |
|
| $5,971 |
($1,191) |
$2,722 |
|
| million |
million |
million |
|
(1.8%) vs. Q3 2023 |
vs. $707 million in Q3 2023 |
2.1% vs. Q3 2023 |
|
|
|
|
|
|
|
|
|
|
|
|
|
|
|
| Net (loss) earnings attributable to common shareholders |
Adjusted net earnings(1) |
Cash flows from operating activities |
Free cash flow(1) |
|
| ($1,237) |
$688 |
$1,842 |
$832 |
|
| million |
million |
million |
million |
|
vs. $640 million in Q3 2023 |
(7.2%) vs. Q3 2023 |
(6.1%) vs. Q3 2023 |
10.3% vs. Q3 2023 |
|
|
|
|
BCE customer connections(4) |
|
|
|
|
|
|
|
|
|
|
|
|
Total mobile phones(2)(4) |
Retail high-speed Internet(2)(3)(4) |
Retail internet protocol television (IPTV)(3) |
Retail residential network access services (NAS) lines(3) |
| +1.6% |
+0.9% |
+4.2% |
(8.9%) |
|
10.4 million subscribers
at September 30, 2024
|
4.5 million subscribers
at September 30, 2024
|
2.1 million subscribers
at September 30, 2024
|
1.9 million subscribers
at September 30, 2024
|
(1)Adjusted EBITDA is a total of segments measure, and adjusted net earnings and free cash flow are non-GAAP financial measures. See section 8.3, Total of segments measures and section 8.1, Non-GAAP financial measures in this MD&A for more information on these measures.
(2)In Q3 2024, we removed 77,971 Virgin Plus prepaid mobile phone subscribers from our prepaid mobile phone subscriber base as at September 30, 2024, as we stopped selling new plans for this service as of that date. Additionally, as a result of a recent Canadian Radio-television and Telecommunications Commission (CRTC) decision on wholesale high-speed Internet access services, we are no longer able to resell cable Internet services to new customers in our wireline footprint as of September 12, 2024, and consequently we removed all of the existing 106,259 cable subscribers in our wireline footprint from our retail high-speed Internet subscriber base as of that date.
(3)In Q2 2024, we increased our retail IPTV subscriber base by 40,997 to align the deactivation policy for our Fibe TV streaming services to our traditional Fibe TV service. While in Q2 2023, our retail high-speed Internet, retail IPTV and retail residential NAS lines subscriber bases increased by 35,080, 243 and 7,458 subscribers, respectively, as a result of small acquisitions.
(4)In Q1 2024, we adjusted our mobile phone postpaid subscriber base to remove very low to non-revenue generating business market subscribers of 105,802. Additionally, in Q1 2024 our retail high-speed Internet subscriber base increased by 3,850 business subscribers as a result of a small acquisition. We also removed 11,645 turbo hubs subscribers from our retail high-speed Internet subscriber base in Q1 2024, as we are no longer actively marketing this product in our wireless-to-the-home footprint. Lastly, as of Q1 2024, we are no longer reporting retail satellite TV subscribers as this no longer represents a significant proportion of our revenues. As a result, satellite TV subscribers have been removed from our retail TV subscriber base, and we now report exclusively retail IPTV subscribers.
BCE income statements - selected information
|
|
|
|
|
|
|
|
|
|
|
|
|
|
|
|
|
|
|
|
|
|
|
|
|
|
|
| |
Q3 2024 |
Q3 2023 |
$ change |
% change |
YTD 2024 |
YTD 2023 |
$ change |
% change |
| Operating revenues |
|
|
|
|
|
|
|
|
| Service |
5,286 |
5,281 |
5 |
|
0.1 |
% |
15,786 |
15,806 |
(20) |
|
(0.1 |
%) |
| Product |
685 |
799 |
(114) |
|
(14.3 |
%) |
2,201 |
2,394 |
(193) |
|
(8.1 |
%) |
| Total operating revenues |
5,971 |
6,080 |
(109) |
|
(1.8 |
%) |
17,987 |
18,200 |
(213) |
|
(1.2 |
%) |
| Operating costs |
(3,249) |
(3,413) |
164 |
|
4.8 |
% |
(10,003) |
(10,350) |
347 |
|
3.4 |
% |
| Adjusted EBITDA |
2,722 |
2,667 |
55 |
|
2.1 |
% |
7,984 |
7,850 |
134 |
|
1.7 |
% |
Adjusted EBITDA margin(1) |
45.6 |
% |
43.9 |
% |
|
1.7 pts |
44.4 |
% |
43.1 |
% |
|
1.3 pts |
|
|
|
|
|
|
|
|
|
|
|
|
|
|
|
|
|
|
|
|
|
|
|
|
|
|
|
|
|
|
|
|
|
|
|
|
|
|
|
|
|
|
|
|
|
|
|
|
|
|
|
|
|
|
|
|
|
|
|
|
|
|
|
|
|
|
|
|
|
|
|
|
|
|
|
|
|
|
|
|
|
|
|
|
|
|
|
|
|
|
|
|
|
|
|
|
|
|
|
|
|
|
|
|
|
|
|
|
|
|
|
|
|
|
|
|
|
|
|
|
|
|
|
|
|
|
|
|
|
|
|
|
|
|
|
|
|
|
|
|
|
|
|
|
| Net (loss) earnings attributable to: |
|
|
|
|
|
|
|
|
| Common shareholders |
(1,237) |
640 |
(1,877) |
|
n.m. |
(298) |
1,694 |
(1,992) |
|
n.m. |
| Preferred shareholders |
45 |
47 |
(2) |
|
(4.3 |
%) |
138 |
139 |
(1) |
|
(0.7 |
%) |
| Non-controlling interest |
1 |
20 |
(19) |
|
(95.0 |
%) |
30 |
59 |
(29) |
|
(49.2 |
%) |
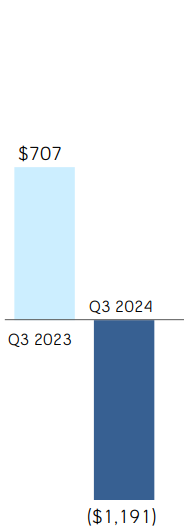
| Net (loss) earnings |
(1,191) |
707 |
(1,898) |
|
n.m. |
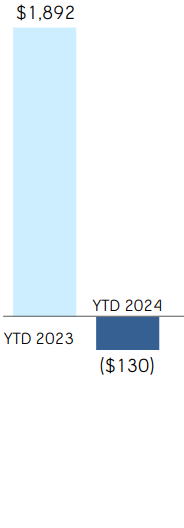
(130) |
1,892 |
(2,022) |
|
n.m. |
| Adjusted net earnings |
688 |
741 |
(53) |
|
(7.2 |
%) |
2,054 |
2,235 |
(181) |
|
(8.1 |
%) |
|
|
|
|
|
|
|
|
|
|
|
|
|
|
|
|
|
|
| Net (loss) earnings per common share (EPS) |
(1.36) |
0.70 |
(2.06) |
|
n.m. |
(0.33) |
1.86 |
(2.19) |
|
n.m. |
Adjusted EPS(2) |
0.75 |
0.81 |
(0.06) |
|
(7.4 |
%) |
2.25 |
2.45 |
(0.20) |
|
(8.2 |
%) |
n.m.: not meaningful
(1)Adjusted EBITDA margin is defined as adjusted EBITDA divided by operating revenues. Refer to section 8.6, KPIs in this MD&A for more information on this measure.
(2)Adjusted EPS is a non-GAAP ratio. Refer to section 8.2, Non-GAAP ratios in this MD&A for more information on this measure.
BCE statements of cash flows – selected information
|
|
|
|
|
|
|
|
|
|
|
|
|
|
|
|
|
|
|
|
|
|
|
|
|
|
|
| |
Q3 2024 |
Q3 2023 |
$ change |
% change |
YTD 2024 |
YTD 2023 |
$ change |
% change |
| Cash flows from operating activities |
1,842 |
|
1,961 |
|
(119) |
|
(6.1 |
%) |
5,111 |
|
5,573 |
|
(462) |
|
(8.3 |
%) |
| Capital expenditures |
(954) |
|
(1,159) |
|
205 |
|
17.7 |
% |
(2,934) |
|
(3,552) |
|
618 |
|
17.4 |
% |
| Free cash flow |
832 |
|
754 |
|
78 |
|
10.3 |
% |
2,014 |
|
1,855 |
|
159 |
|
8.6 |
% |
Q3 2024 financial highlights
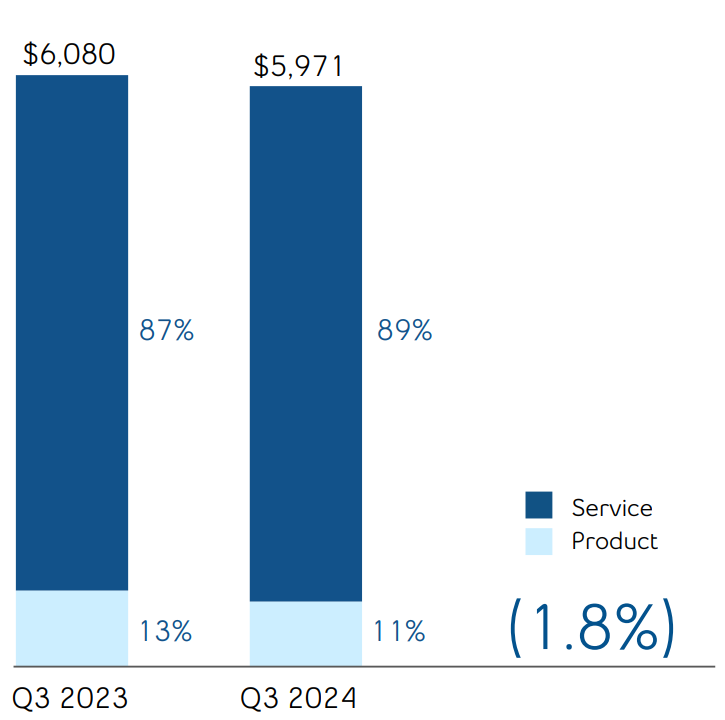
In Q3 2024 BCE operating revenues declined by 1.8%, compared to the same period last year, mainly driven by a 14.3% reduction in product revenues, attributable to reduced consumer electronic sales at The Source (Bell) Electronics Inc. (The Source) due to permanent store closures and conversion to Best Buy Express as part of our distribution partnership with Best Buy Canada, and lower contracted sales of mobile devices. Service revenues were essentially stable year over year, increasing by 0.1%, driven by higher Bell Media subscriber revenues, increased digital media revenues, higher Internet and business solutions services revenue and the contribution from acquisitions made during the past year. This was mostly offset by ongoing erosion in legacy voice, data and satellite TV revenues, combined with lower wireless service revenues mainly due to sustained competitive pricing pressures, and continued lower demand for traditional broadcast TV and radio advertising.
Net loss of $1,191 million and net loss attributable to common shareholders of $1,237 million in the third quarter of 2024 increased by $1,898 million and $1,877 million, respectively, compared to net earnings of $707 million and net earnings attributable to common shareholders of $640 million for the same period last year, mainly due to higher impairment of assets of $2,113 million primarily at our Bell Media segment due to a further decline in advertising demand and spending in the linear advertising market, as well as higher interest expense, partly offset by lower income taxes, lower other expense and higher adjusted EBITDA.
BCE's adjusted EBITDA grew by 2.1% in Q3 2024, compared to the same period last year, driven by growth from our Bell Media and Bell Communication and Technology Services (Bell CTS) segments, reflecting disciplined subscriber acquisition and various cost reduction initiatives, including workforce reductions, cost containment and other operating efficiencies, which more than offset the flow-through impact of the revenue pressures. This drove a corresponding adjusted EBITDA margin of 45.6% in Q3 2024, up 1.7 pts over Q3 2023, from lower operating costs, along with a reduced proportion of low-margin product sales in our total revenue base.
BCE's EPS of ($1.36) in Q3 2024 decreased by $2.06 compared to the same period last year.
8 BCE Inc. 2024 THIRD QUARTER SHAREHOLDER REPORT
In the third quarter of 2024, adjusted net earnings, which excludes the impact of severance, acquisition and other costs, net mark-to-market gains (losses) on derivatives used to economically hedge equity settled share-based compensation plans, net equity gains (losses) on investments in associates and joint ventures, net gains (losses) on investments, early debt redemption costs and impairment of assets, net of tax and NCI, was $688 million, or $0.75 per common share, compared to $741 million, or $0.81 per common share, for the same period last year.
Cash flows from operating activities in the third quarter of 2024 decreased by $119 million, compared to the same period last year, mainly due to lower cash from working capital due in part to timing of supplier payments, higher interest paid and higher severance and other costs paid, partly offset by lower income taxes paid and higher adjusted EBITDA.
Free cash flow in Q3 2024 increased by $78 million, compared to the same period last year, due to lower capital expenditures, partly offset by lower cash flows from operating activities, excluding cash from acquisition and other costs paid.
1.2 Key corporate and business developments
This section contains forward-looking statements, including relating to the proposed acquisition by Bell Canada of Ziply Fiber, the expected timing and completion thereof, the sources of liquidity we expect to use to fund the proposed acquisition, certain potential benefits expected to result from the proposed acquisition including the expected expansion of Bell’s fibre footprint by the end of 2028, Bell's growth prospects and strategic positioning, the proposed disposition of BCE’s ownership stake in MLSE, the expected timing and completion thereof, the intended use by BCE of the proceeds from the proposed disposition and the planned access for Bell Media to content rights for the Toronto Maple Leafs and Toronto Raptors for the next 20 years, BCE's common share dividend growth strategy, its intention to maintain its annual common share dividend at the current level during 2025 and the potential future resumption of common share dividend growth, potential future purchases by BCE of its preferred shares pursuant to an NCIB, and potential future issuances by BCE of new common shares pursuant to its intended discounted treasury DRP, the expected timing of commencement thereof and the anticipated benefits expected to result from such equity issuances. Refer to the section Caution regarding forward-looking statements at the beginning of this MD&A.
Proposed acquisition of Ziply Fiber
On November 4, 2024, BCE announced that Bell Canada had entered into a definitive agreement to acquire Ziply Fiber, the leading fibre Internet provider in the Pacific Northwest of the United States, for approximately $5.0 billion in Canadian dollars in cash and the assumption of outstanding net debt of approximately $2.0 billion in Canadian dollars to be rolled over at transaction close, representing a transaction value of approximately $7.0 billion in Canadian dollars. This transaction is expected to enhance Bell Canada's growth profile and strategic position by giving it a foothold in the large, underpenetrated U.S. fibre market, while increasing its scale, diversifying its operating footprint and unlocking significant growth opportunities. Upon closing of this acquisition, Bell will be poised to expand its fibre footprint to over 12 million locations across North America by the end of 2028, reinforcing its position as the third-largest fibre Internet provider in North America. The transaction is expected to close in the second half of 2025, subject to certain customary closing conditions and the receipt of certain regulatory approvals including the FCC and approvals by state PUCs. Once the transaction has closed, Ziply Fiber will operate as a separate business unit and will continue to be headquartered in Kirkland, Washington.
Disposition of minority stake in MLSE
On September 18, 2024, BCE announced that it had reached an agreement to dispose of its 37.5% ownership stake in MLSE for $4.7 billion to Rogers, subject to relevant sports league and other customary approvals. The transaction is expected to close in mid-2025. BCE intends to direct the net proceeds of this disposition towards the proposed acquisition of Ziply Fiber. In addition, Bell Media has secured access to content rights for the Toronto Maple Leafs and Toronto Raptors on TSN for the next 20 years through a long-term agreement with Rogers, also subject to league approvals. TSN will also continue to broadcast Toronto Argonauts and Toronto FC games through independent agreements with the respective leagues.
BCE's common share dividend
On November 4, 2024, BCE announced that it intends to maintain its annual common share dividend at the current level of $3.99 per share during the financial year ending December 31, 2025. In the context of the strategic acquisition of Ziply Fiber, BCE's focus is on long-term value creation for shareholders and BCE intends to pause dividend growth until BCE's dividend payout and net debt leverage ratios are tracking towards our target policy ranges, subject to review annually by the BCE board of directors.
Discounted Treasury Dividend Reinvestment Plan
On November 4, 2024, BCE also announced that it intends to amend its Shareholder Dividend Reinvestment and Stock Purchase Plan (DRP) to provide, at the BCE board of directors' discretion, for the issuance of new common shares from treasury at a discount to the average market price of the common shares preceding the applicable dividend payment date (the Average Market Price). The equity issuance anticipated from implementing a discounted DRP is expected to enable BCE to retain cash to help fund strategic growth initiatives and strengthen the balance sheet. BCE anticipates that commencing with the dividend payable on January 15, 2025 to eligible shareholders as of the December 16, 2024 record date, and subsequently until further notice, common shares will be issued from treasury at a discount of 2% to the Average Market Price.
The amendment is subject to the finalization of terms and approval of the Toronto Stock Exchange (TSX). The announcement of BCE’s intention to amend its existing DRP does not constitute an offer to sell or the solicitation to buy securities.
Renewal of NCIB for BCE first preferred shares
On November 6, 2024, BCE’s board of directors authorized the company to renew its NCIB to purchase for cancellation up to 10% of the public float of each series of BCE’s outstanding First Preferred Shares (Preferred Shares) that are listed on the TSX. The NCIB will extend from November 11, 2024 to November 10, 2025, or an earlier date should BCE complete its purchases under the NCIB. Under the NCIB, BCE is authorized to repurchase up to 762,020 Series R Preferred Shares, 201,386 Series S Preferred Shares, 519,303 Series T Preferred Shares, 600,765 Series Y Preferred Shares, 266,583 Series Z Preferred Shares, 1,120,233 Series AA Preferred Shares, 643,213 Series AB Preferred Shares, 633,067 Series AC Preferred Shares, 1,188,083 Series AD Preferred Shares, 586,351 Series AE Preferred Shares, 900,538 Series AF Preferred Shares, 841,363 Series AG Preferred Shares, 466,957 Series AH Preferred Shares, 905,824 Series AI Preferred Shares, 389,596 Series AJ Preferred Shares, 2,154,571 Series AK Preferred Shares, 173,088 Series AL Preferred Shares, 998,627 Series AM Preferred Shares, 101,182 Series AN Preferred Shares and 812,151 Series AQ Preferred Shares, representing approximately 10% of the public float in respect of each series of Preferred Shares. The actual number of Preferred Shares to be repurchased under the NCIB and the timing of such repurchases will be at BCE’s discretion and shall be subject to the limitations set out by the TSX. BCE is making this NCIB because it believes that, from time to time, the Preferred Shares may trade in price ranges that do not fully reflect their value. BCE believes that, in such circumstances, the repurchase of its Preferred Shares represents an appropriate use of its available funds. Since the beginning of BCE’s previous NCIB for Preferred Shares on November 9, 2023 until October 31, 2024, BCE repurchased and cancelled 5,599,285 Preferred Shares with a stated capital of $140 million for a total of cost of $97 million. A copy of BCE’s Notice of Intention to Make a Normal Course Issuer Bid through the facilities of the TSX may be obtained, without charge, by contacting BCE’s Investor Relations department at investor.relations@bce.ca or by phone at 1-800-339-6353.
Hadeer Hassaan appointed Bell’s first Chief Customer Experience Officer
In October 2024, Hadeer Hassaan was promoted to the new role of Executive Vice President, Chief Customer Experience Officer. Hadeer leads Bell’s Customer Operations, Field Services, Digital, Channel Design and Delivery business units with a focus on Bell's strategic imperative to champion customer experience. With nearly 25 years of telecommunications and tech experience, including user experience (UX) design, Hadeer has a strong background in creating customer-centric solutions, having led many of Bell’s recent digitization initiatives to deliver meaningful, best-in-class experiences across all channels. Hadeer joined Bell in 2013 as Director, Product Management, and held a number of increasingly senior roles before becoming Senior Vice President, Customer Operations in 2022.
10 BCE Inc. 2024 THIRD QUARTER SHAREHOLDER REPORT
As at the date of this MD&A, our forward-looking statements set out in the BCE 2023 Annual MD&A, as updated or supplemented in the BCE 2024 First Quarter MD&A, in the BCE 2024 Second Quarter MD&A and in this MD&A, are based on certain assumptions including, without limitation, the following assumptions, as well as the various assumptions referred to under the sub-sections entitled Assumptions set out in section 3, Business segment analysis of this MD&A.
Assumptions about the Canadian economy
We have made certain assumptions concerning the Canadian economy. In particular, we have assumed:
•Modest economic growth, given the Bank of Canada’s most recent estimated growth in Canadian gross domestic product of 1.2% in 2024, unchanged from the earlier estimate
•Easing consumer price index (CPI) inflation reflecting weakening pressures
•Softening labour market
•Growth in consumer spending supported by decreases in interest rates
•Business investment growth underpinned by lower interest rates and higher demand
•Interest rates expected to remain at or near current levels
•Slowdown in population growth due to changes to government immigration policy
•Canadian dollar expected to remain near current levels. Further movements may be impacted by the degree of strength of the U.S. dollar, interest rates and changes in commodity prices.
Market assumptions
•A higher level of wireline and wireless competition in consumer, business and wholesale markets
•Higher, but slowing, wireless industry penetration
•A shrinking data and voice connectivity market as business customers migrate to lower-priced telecommunications solutions or alternative OTT competitors
•The Canadian traditional broadcast TV and radio advertising market is experiencing an ongoing slowdown with no improvement expected in the medium term, and visibility into the specific timing and pace of improvement remains limited
•Declines in broadcasting distribution undertaking (BDU) subscribers driven by increasing competition from the continued rollout of subscription video on demand (SVOD) streaming services together with further scaling of OTT aggregators
Assumptions underlying expected continuing contribution holiday in 2024 in the majority of our pension plans
•At the relevant time, our defined benefit (DB) pension plans will remain in funded positions with going concern surpluses and maintain solvency ratios that exceed the minimum legal requirements for a contribution holiday to be taken for applicable DB and defined contribution (DC) components
•No significant declines in our DB pension plans’ financial position due to declines in investment returns or interest rates
•No material experience losses from other events such as through litigation or changes in laws, regulations or actuarial standards
2 Consolidated financial analysis
This section provides detailed information and analysis about BCE’s performance in Q3 and YTD 2024 compared with Q3 and YTD 2023. It focuses on BCE’s consolidated operating results and provides financial information for our Bell CTS and Bell Media business segments. For further discussion and analysis of our business segments, refer to section 3, Business segment analysis.
2.1 BCE consolidated income statements
|
|
|
|
|
|
|
|
|
|
|
|
|
|
|
|
|
|
|
|
|
|
|
|
|
|
|
| |
Q3 2024 |
Q3 2023 |
$ change |
% change |
YTD 2024 |
YTD 2023 |
$ change |
% change |
| Operating revenues |
|
|
|
|
|
|
|
|
| Service |
5,286 |
5,281 |
5 |
|
0.1 |
% |
15,786 |
15,806 |
(20) |
|
(0.1 |
%) |
| Product |
685 |
799 |
(114) |
|
(14.3 |
%) |
2,201 |
2,394 |
(193) |
|
(8.1 |
%) |
| Total operating revenues |
5,971 |
6,080 |
(109) |
|
(1.8 |
%) |
17,987 |
18,200 |
(213) |
|
(1.2 |
%) |
| Operating costs |
(3,249) |
(3,413) |
164 |
|
4.8 |
% |
(10,003) |
(10,350) |
347 |
|
3.4 |
% |
| Adjusted EBITDA |
2,722 |
2,667 |
55 |
|
2.1 |
% |
7,984 |
7,850 |
134 |
|
1.7 |
% |
| Adjusted EBITDA margin |
45.6 |
% |
43.9 |
% |
|
1.7 pts |
44.4 |
% |
43.1 |
% |
|
1.3 pts |
| Severance, acquisition and other costs |
(49) |
(10) |
(39) |
|
n.m. |
(300) |
(159) |
(141) |
|
(88.7 |
%) |
| Depreciation |
(934) |
(937) |
3 |
|
0.3 |
% |
(2,825) |
(2,791) |
(34) |
|
(1.2 |
%) |
| Amortization |
(325) |
(295) |
(30) |
|
(10.2 |
%) |
(966) |
(874) |
(92) |
|
(10.5 |
%) |
| Finance costs |
|
|
|
|
|
|
|
|
| Interest expense |
(440) |
(373) |
(67) |
|
(18.0 |
%) |
(1,282) |
(1,076) |
(206) |
|
(19.1 |
%) |
| Net return on post-employment benefit plans |
16 |
27 |
(11) |
|
(40.7 |
%) |
49 |
81 |
(32) |
|
(39.5 |
%) |
| Impairment of assets |
(2,113) |
— |
(2,113) |
|
n.m. |
(2,186) |
(34) |
(2,152) |
|
n.m. |
| Other expense |
(63) |
(129) |
66 |
|
51.2 |
% |
(202) |
(319) |
117 |
|
36.7 |
% |
| Income taxes |
(5) |
(243) |
238 |
|
97.9 |
% |
(402) |
(786) |
384 |
|
48.9 |
% |
|
|
|
|
|
|
|
|
|
|
|
|
|
|
|
|
|
|
| Net (loss) earnings |
(1,191) |
707 |
(1,898) |
|
n.m. |
(130) |
1,892 |
(2,022) |
|
n.m. |
|
|
|
|
|
|
|
|
|
|
|
|
|
|
|
|
|
|
|
|
|
|
|
|
|
|
|
|
|
|
|
|
|
|
|
|
|
|
|
|
|
|
|
|
|
| Net (loss) earnings attributable to: |
|
|
|
|
|
|
|
|
| Common shareholders |
(1,237) |
640 |
(1,877) |
|
n.m. |
(298) |
1,694 |
(1,992) |
|
n.m. |
| Preferred shareholders |
45 |
47 |
(2) |
|
(4.3 |
%) |
138 |
139 |
(1) |
|
(0.7 |
%) |
| Non-controlling interest |
1 |
20 |
(19) |
|
(95.0 |
%) |
30 |
59 |
(29) |
|
(49.2 |
%) |
| Net (loss) earnings |
(1,191) |
707 |
(1,898) |
|
n.m. |
(130) |
1,892 |
(2,022) |
|
n.m. |
| Adjusted net earnings |
688 |
741 |
(53) |
|
(7.2 |
%) |
2,054 |
2,235 |
(181) |
|
(8.1 |
%) |
|
|
|
|
|
|
|
|
|
|
|
|
|
|
|
|
|
|
|
|
|
|
|
|
|
|
|
| EPS |
(1.36) |
0.70 |
(2.06) |
|
n.m. |
(0.33) |
1.86 |
(2.19) |
|
n.m. |
| Adjusted EPS |
0.75 |
0.81 |
(0.06) |
|
(7.4 |
%) |
2.25 |
2.45 |
(0.20) |
|
(8.2 |
%) |
n.m.: not meaningful
12 BCE Inc. 2024 THIRD QUARTER SHAREHOLDER REPORT
2.2 Customer connections
BCE net activations (losses)
|
|
|
|
|
|
|
|
|
|
|
|
|
|
|
|
|
|
|
|
|
| |
Q3 2024 |
Q3 2023 |
% change |
YTD 2024 |
YTD 2023 |
% change |
| Mobile phone net subscriber activations |
102,196 |
|
166,930 |
|
(38.8 |
%) |
258,447 |
|
319,104 |
|
(19.0 |
%) |
| Postpaid |
33,111 |
|
142,886 |
|
(76.8 |
%) |
156,858 |
|
297,457 |
|
(47.3 |
%) |
| Prepaid |
69,085 |
|
24,044 |
|
n.m. |
101,589 |
|
21,647 |
|
n.m. |
| Mobile connected devices net subscriber activations |
56,216 |
|
64,282 |
|
(12.5 |
%) |
210,539 |
|
214,561 |
|
(1.9 |
%) |
| Retail high-speed Internet net subscriber activations |
42,415 |
|
79,327 |
|
(46.5 |
%) |
97,334 |
|
131,535 |
|
(26.0 |
%) |
|
|
|
|
|
|
|
| Retail IPTV net subscriber activations |
9,197 |
|
35,976 |
|
(74.4 |
%) |
22,058 |
|
58,381 |
|
(62.2 |
%) |
|
|
|
|
|
|
|
|
|
|
|
|
|
|
| Retail residential NAS lines net losses |
(47,674) |
|
(41,776) |
|
(14.1 |
%) |
(144,835) |
|
(138,265) |
|
(4.8 |
%) |
|
|
|
|
|
|
|
| Total services net activations |
162,350 |
|
304,739 |
|
(46.7 |
%) |
443,543 |
|
585,316 |
|
(24.2 |
%) |
n.m.: not meaningful
Total BCE customer connections
|
|
|
|
|
|
|
|
|
|
|
|
|
|
|
| |
Q3 2024 |
Q3 2023 |
% change |
|
|
|
Mobile phone subscribers(1)(3) |
10,361,720 |
|
10,194,961 |
|
1.6 |
% |
|
|
|
Postpaid(3) |
9,473,886 |
|
9,294,115 |
|
1.9 |
% |
|
|
|
Prepaid(1) |
887,834 |
|
900,846 |
|
(1.4 |
%) |
|
|
|
| Mobile connected devices subscribers |
2,943,087 |
|
2,653,802 |
|
10.9 |
% |
|
|
|
Retail high-speed Internet subscribers(1)(2)(3) |
4,456,709 |
|
4,417,838 |
|
0.9 |
% |
|
|
|
|
|
|
|
|
|
|
Retail IPTV subscribers(2) |
2,133,397 |
|
2,046,805 |
|
4.2 |
% |
|
|
|
|
|
|
|
|
|
|
|
|
|
|
|
|
|
Retail residential NAS lines(2) |
1,876,782 |
|
2,059,964 |
|
(8.9 |
%) |
|
|
|
|
|
|
|
|
|
|
Total services subscribers(3) |
21,771,695 |
|
21,373,370 |
|
1.9 |
% |
|
|
|
(1)In Q3 2024, we removed 77,971 Virgin Plus prepaid mobile phone subscribers from our prepaid mobile phone subscriber base as at September 30, 2024, as we stopped selling new plans for this service as of that date. Additionally, as a result of a recent CRTC decision on wholesale high-speed Internet access services, we are no longer able to resell cable Internet services to new customers in our wireline footprint as of September 12, 2024, and consequently we removed all of the existing 106,259 cable subscribers in our wireline footprint from our retail high-speed Internet subscriber base as of that date.
(2)In Q2 2024, we increased our retail IPTV subscriber base by 40,997 to align the deactivation policy for our Fibe TV streaming services to our traditional Fibe TV service. While in Q2 2023, our retail high-speed Internet, retail IPTV and retail residential NAS lines subscriber bases increased by 35,080, 243 and 7,458 subscribers, respectively, as a result of small acquisitions.
(3)In Q1 2024, we adjusted our mobile phone postpaid subscriber base to remove very low to non-revenue generating business market subscribers of 105,802. Additionally, in Q1 2024 our retail high-speed Internet subscriber base increased by 3,850 business subscribers as a result of a small acquisition. We also removed 11,645 turbo hubs subscribers from our retail high-speed Internet subscriber base in Q1 2024, as we are no longer actively marketing this product in our wireless-to-the-home footprint. Lastly, as of Q1 2024, we are no longer reporting retail satellite TV subscribers as this no longer represents a significant proportion of our revenues. As a result, satellite TV subscribers have been removed from our retail TV subscriber base, and we now report exclusively retail IPTV subscribers.
BCE added 162,350 net retail subscriber activations in Q3 2024, down 46.7% compared to the same period last year. The net retail subscriber activations in Q3 2024 consisted of:
•102,196 mobile phone net subscriber activations, along with 56,216 mobile connected device net subscriber activations
•42,415 retail high-speed Internet net subscriber activations
•9,197 retail IPTV net subscriber activations
•47,674 retail residential NAS lines net losses
In the first nine months of the year, BCE added 443,543 net retail subscriber activations, down 24.2% compared to the same period in 2023. The net retail subscriber activations in the first nine months of 2024 consisted of:
•258,447 mobile phone net subscriber activations, along with 210,539 mobile connected device net subscriber activations
•97,334 retail high-speed Internet net subscriber activations
•22,058 retail IPTV net subscriber activations
•144,835 retail residential NAS lines net losses
At September 30, 2024, BCE's retail subscriber connections totalled 21,771,695, up 1.9% year over year, and consisted of:
•10,361,720 mobile phone subscribers, up 1.6% year over year, and 2,943,087 mobile connected device subscribers, up 10.9% year over year
•4,456,709 retail high-speed Internet subscribers, 0.9% higher year over year
•2,133,397 retail IPTV subscribers, up 4.2% year over year
•1,876,782 retail residential NAS lines, down 8.9% year over year
2.3 Operating revenues
|
|
|
|
|
|
|
|
|
| BCE |
|
BCE |
| Revenues |
|
Revenues |
| (in $ millions) |
|
(in $ millions) |
|
|
|
|
|
|
|
|
|
|
|
|
|
|
|
|
|
|
|
|
|
|
|
|
|
|
|
|
|
|
| |
Q3 2024 |
Q3 2023 |
$ change |
% change |
YTD 2024 |
YTD 2023 |
$ change |
% change |
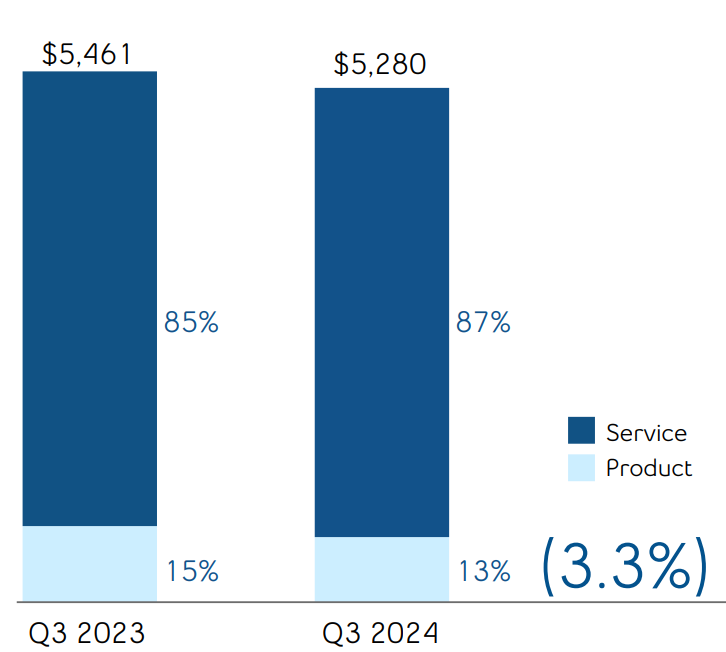
| Bell CTS |
5,280 |
|
5,461 |
|
(181) |
|
(3.3 |
%) |
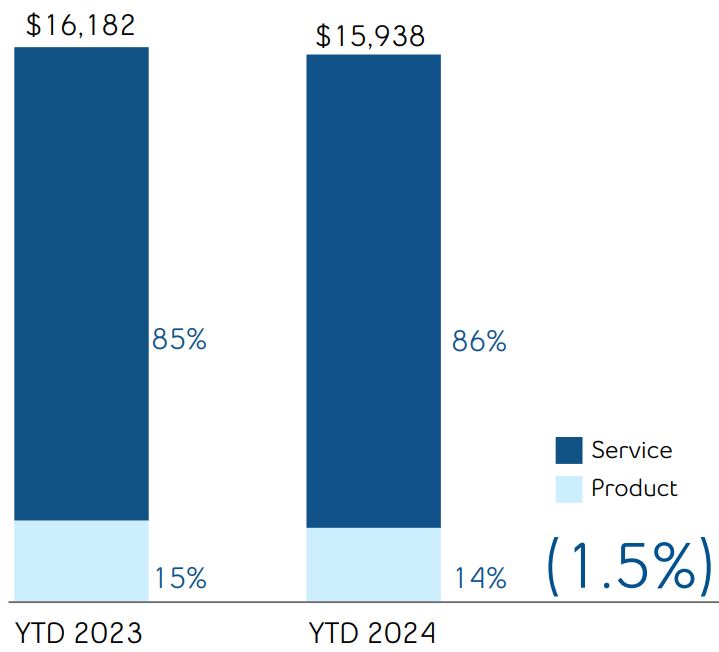
15,938 |
|
16,182 |
|
(244) |
|
(1.5 |
%) |
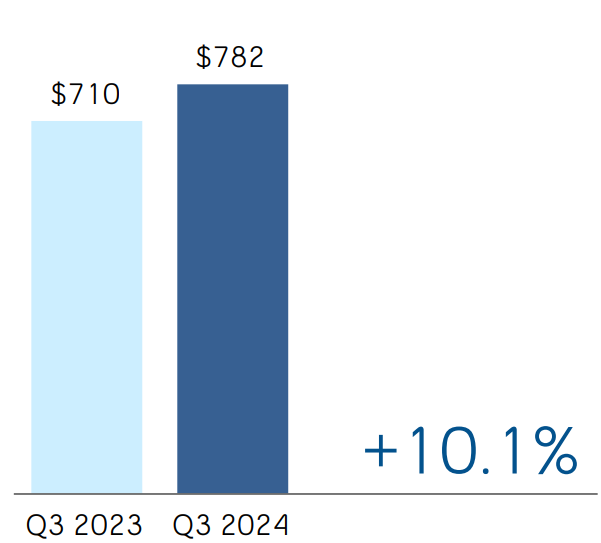
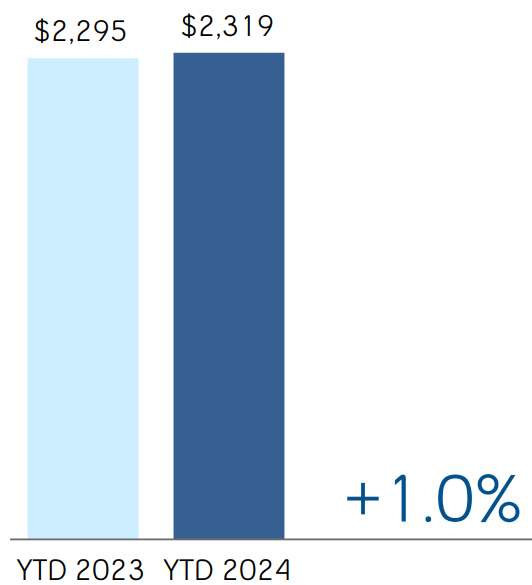
| Bell Media |
782 |
|
710 |
|
72 |
|
10.1 |
% |
2,319 |
|
2,295 |
|
24 |
|
1.0 |
% |
| Inter-segment eliminations |
(91) |
|
(91) |
|
— |
|
— |
|
(270) |
|
(277) |
|
7 |
|
2.5 |
% |
| Total BCE operating revenues |
5,971 |
|
6,080 |
|
(109) |
|
(1.8 |
%) |
17,987 |
|
18,200 |
|
(213) |
|
(1.2 |
%) |
BCE
BCE operating revenues decreased by 1.8% in the quarter, compared to Q3 2023, driven by lower product revenues, partly offset by higher service revenues. During the first nine months of the year, operating revenues declined by 1.2% year over year, driven by lower product and service revenues. Product revenues of $685 million in Q3 2024 and $2,201 million year to date, decreased by 14.3% and 8.1%, respectively, over the same periods last year. Service revenues of $5,286 million in Q3 2024 increased by 0.1% year over year, whereas year-to-date service revenues of $15,786 million declined by 0.1% year over year.
The year-over-year decrease in operating revenues in Q3 2024 and the first nine months of the year, reflected a decline in our Bell CTS segment, partly offset by an increase in our Bell Media segment. Bell CTS operating revenues in the quarter declined by 3.3% year over year, due to lower product revenues of 14.3%, including The Source retail store closures, and reduced service revenues of 1.4%, from ongoing erosion in wireline voice revenues, and lower wireless revenues, moderated by wireline data revenues growth. The year-to-date decline in Bell CTS operating revenues of 1.5%, was due to lower product revenues of 8.1%, along with service revenues decline of 0.4% from continued wireline voice revenue erosion, partly offset by higher wireless and wireline data revenues. Bell Media operating revenues increased by 10.1% in Q3 2024, compared to Q3 2023, from higher subscriber revenues, reflecting retroactive adjustments related to contracts with Canadian TV distributors, and increased advertising revenues, including the impact from the acquisition of OUTEDGE Media Canada (OUTEDGE) in June 2024. Bell Media operating revenues during the first nine months of the year, increased by 1.0% year over year, due to higher advertising revenues, partly offset by lower subscriber revenues.
14 BCE Inc. 2024 THIRD QUARTER SHAREHOLDER REPORT
2.4 Operating costs
|
|
|
|
|
|
| BCE |
BCE |
| Operating cost profile |
Operating cost profile |
| Q3 2023 |
Q3 2024 |
|
|
| BCE |
BCE |
| Operating cost profile |
Operating cost profile |
| YTD 2023 |
YTD 2024 |
|
|
|
|
|
|
|
|
|
|
|
|
|
|
|
|
|
|
|
|
|
|
|
|
|
|
|
|
|
| |
Q3 2024 |
Q3 2023 |
$ change |
% change |
YTD 2024 |
YTD 2023 |
$ change |
% change |
| Bell CTS |
(2,812) |
|
(2,997) |
|
185 |
|
6.2 |
% |
(8,543) |
|
(8,881) |
|
338 |
|
3.8 |
% |
| Bell Media |
(528) |
|
(507) |
|
(21) |
|
(4.1 |
%) |
(1,730) |
|
(1,746) |
|
16 |
|
0.9 |
% |
| Inter-segment eliminations |
91 |
|
91 |
|
— |
|
— |
|
270 |
|
277 |
|
(7) |
|
(2.5 |
%) |
| Total BCE operating costs |
(3,249) |
|
(3,413) |
|
164 |
|
4.8 |
% |
(10,003) |
|
(10,350) |
|
347 |
|
3.4 |
% |
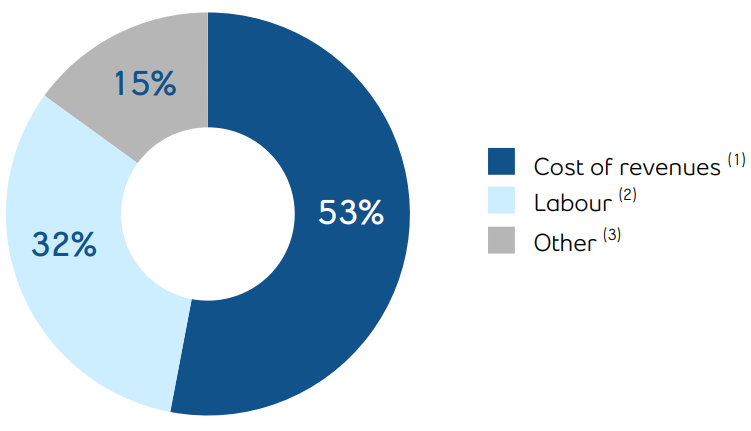
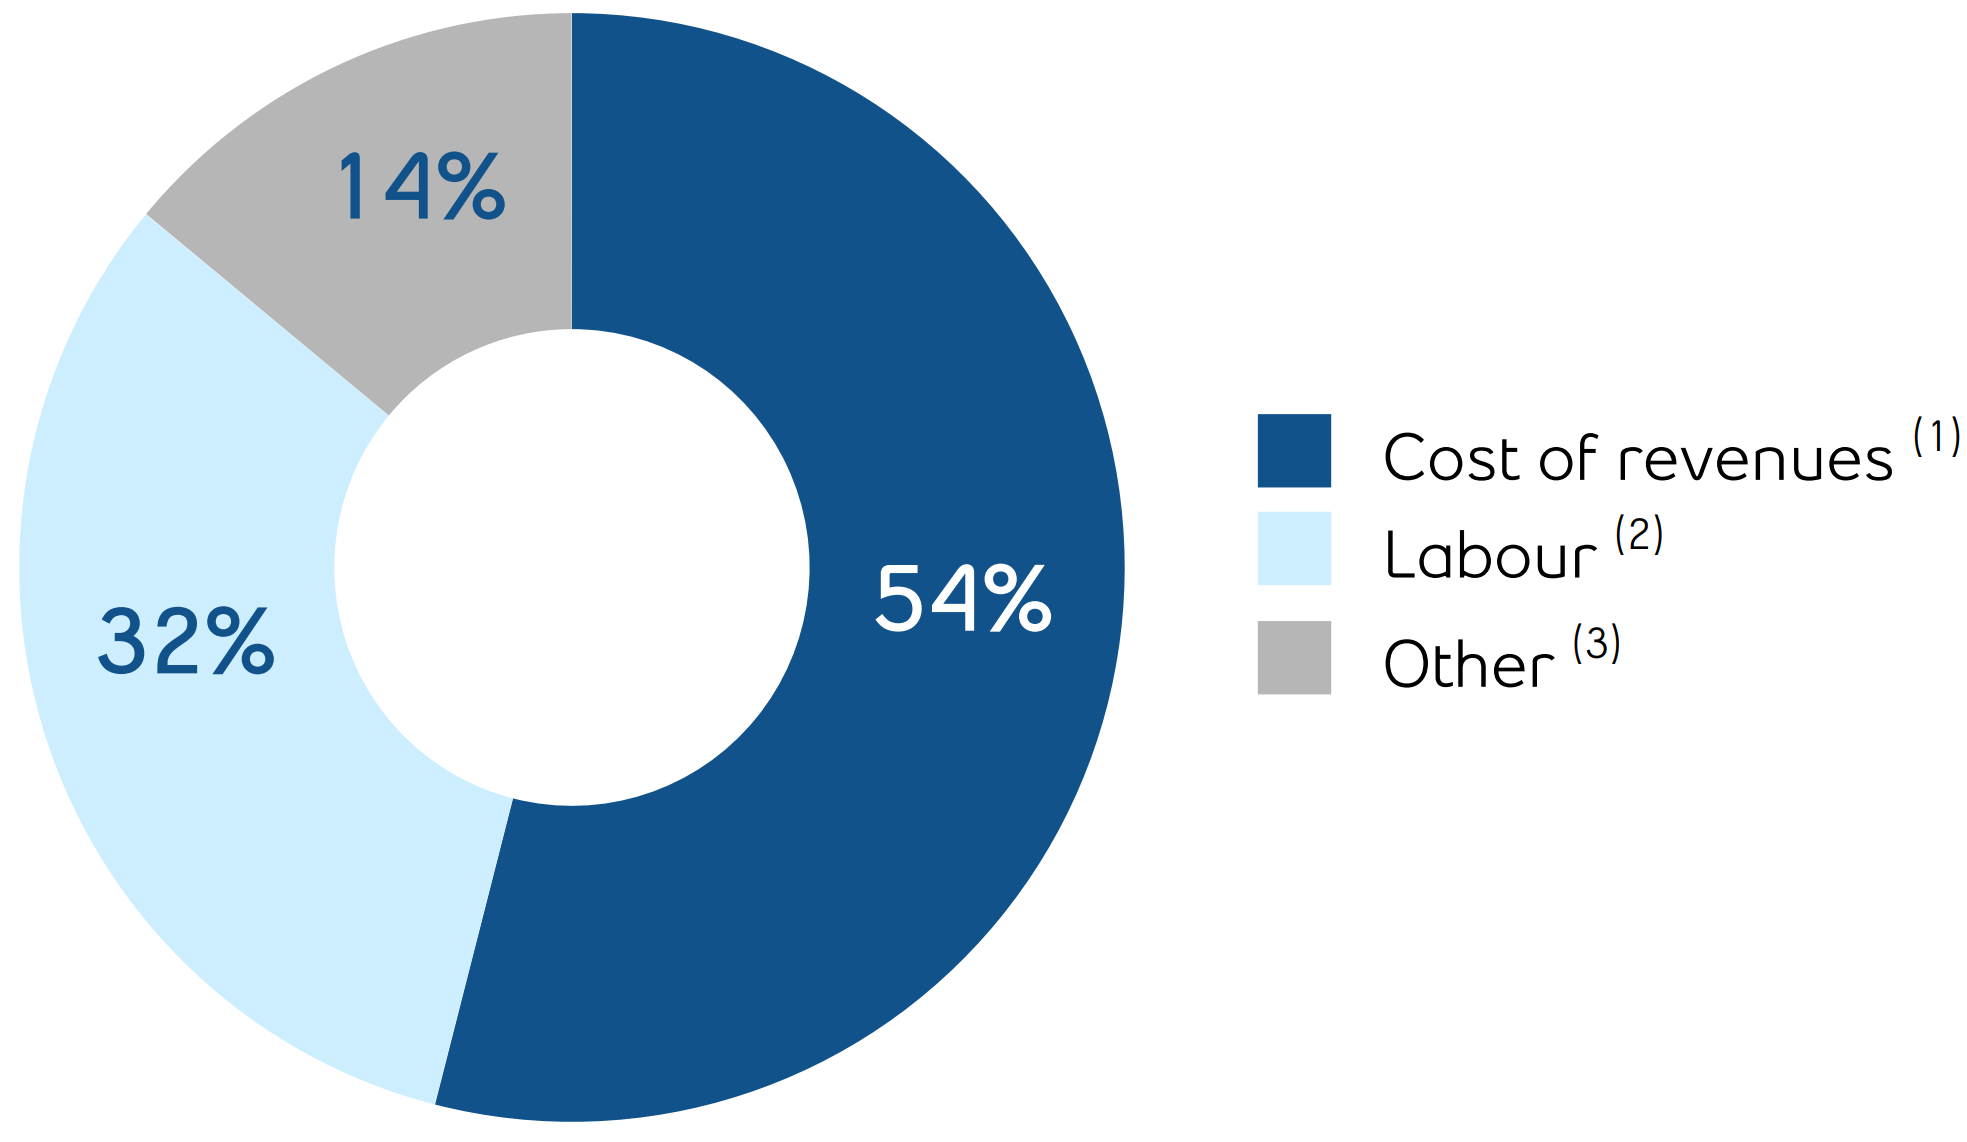
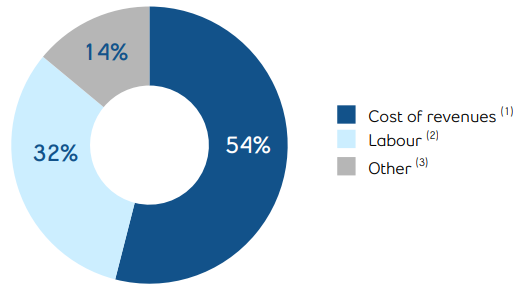
(1)Cost of revenues includes costs of wireless devices and other equipment sold, network and content costs, and payments to other carriers.
(2)Labour costs (net of capitalized costs) include wages, salaries and related taxes and benefits, post-employment benefit plans service cost, and other labour costs, including contractor and outsourcing costs.
(3)Other operating costs include marketing, advertising and sales commission costs, bad debt expense, taxes other than income taxes, IT costs, professional service fees and rent.
BCE
BCE operating costs decreased by 4.8% in Q3 2024, compared to Q3 2023, from lower expenses in Bell CTS of 6.2%, partly offset by an increase in Bell Media costs of 4.1%. During the first nine months of the year, operating expenses declined by 3.4%, compared to the same period last year, due to lower expenses in Bell CTS of 3.8% and Bell Media of 0.9%. The decrease in BCE operating expenses reflected lower cost of goods sold, associated with the decline in product revenues, as well as the favourable impact of various cost reduction initiatives including workforce reductions, cost containment and other operating efficiencies.
2.5 Net (loss) earnings
|
|
|
|
|
|
|
|
|
| BCE |
|
BCE |
| Net (loss) earnings |
|
Net (loss) earnings |
| (in $ millions) |
|
(in $ millions) |
|
|
|
Net loss of $1,191 million in the third quarter of 2024 increased by $1,898 million, compared to net earnings of $707 million for the same period last year, mainly due to higher impairment of assets primarily at our Bell Media segment and higher interest expense, partly offset by lower income taxes, lower other expense and higher adjusted EBITDA.
Net loss of $130 million on a year-to-date basis in 2024 increased by $2,022 million, compared to net earnings of $1,892 million for the same period last year, mainly due to higher impairment of assets primarily at our Bell Media segment, higher interest expense, higher severance, acquisition and other costs and higher depreciation and amortization, partly offset by lower income taxes, higher adjusted EBITDA and lower other expense.
16 BCE Inc. 2024 THIRD QUARTER SHAREHOLDER REPORT
|
|
|
|
|
|
|
|
|
| BCE |
|
BCE |
| Adjusted EBITDA |
|
Adjusted EBITDA |
| (in $ millions) |
|
(in $ millions) |
|
|
|
|
|
|
|
|
|
|
|
|
|
|
|
|
|
|
|
|
|
|
|
|
|
|
|
|
|
|
| |
Q3 2024 |
Q3 2023 |
$ change |
% change |
YTD 2024 |
YTD 2023 |
$ change |
% change |
| Bell CTS |
2,468 |
|
2,464 |
|
4 |
|
0.2 |
% |
7,395 |
|
7,301 |
|
94 |
|
1.3 |
% |
| Adjusted EBITDA margin |
46.7 |
% |
45.1 |
% |
|
1.6 pts |
46.4 |
% |
45.1 |
% |
|
1.3 pts |
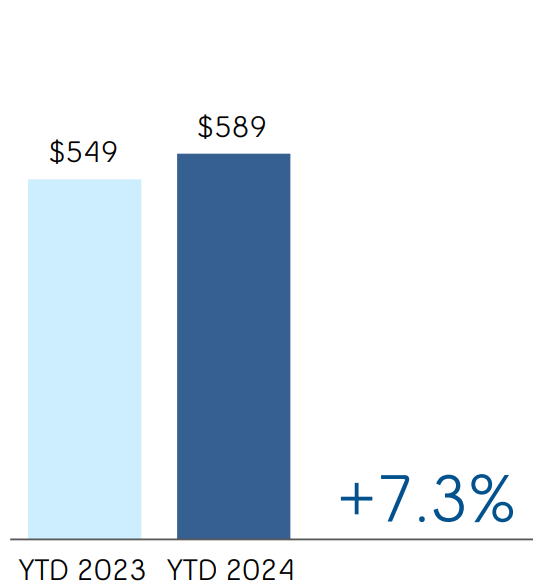
| Bell Media |
254 |
|
203 |
|
51 |
|
25.1 |
% |
589 |
|
549 |
|
40 |
|
7.3 |
% |
| Adjusted EBITDA margin |
32.5 |
% |
28.6 |
% |
|
3.9 pts |
25.4 |
% |
23.9 |
% |
|
1.5 pts |
| Total BCE adjusted EBITDA |
2,722 |
|
2,667 |
|
55 |
|
2.1 |
% |
7,984 |
|
7,850 |
|
134 |
|
1.7 |
% |
| Adjusted EBITDA margin |
45.6 |
% |
43.9 |
% |
|
1.7 pts |
44.4 |
% |
43.1 |
% |
|
1.3 pts |
BCE
BCE adjusted EBITDA grew by 2.1% in Q3 2024, and by 1.7% during the first nine months of the year, compared to the same periods in 2023, due to growth in Bell Media of 25.1% and 7.3%, respectively, as well as an increase in Bell CTS of 0.2% and 1.3%, respectively. The year-over-year increase in BCE adjusted EBITDA in Q3 2024 and year to date was driven by lower operating costs, partly offset by reduced operating revenues. Adjusted EBITDA margin of 45.6% in Q3 2024 and 44.4% year to date, increased by 1.7 pts and 1.3 pts, respectively, over the same periods last year, due to lower operating costs, coupled with a reduced proportion of low-margin product sales in our total revenue base.
2.7 Severance, acquisition and other costs
2024
Severance, acquisition and other costs of $49 million in the third quarter of 2024 and $300 million on a year-to-date basis included:
•Severance costs of $16 million in Q3 2024 and $246 million on a year-to-date basis related to involuntary and voluntary employee terminations
•Acquisition and other costs of $33 million in Q3 2024 and $54 million on a year-to-date basis
2023
Severance, acquisition and other costs of $10 million in the third quarter of 2023 and $159 million on a year-to-date basis included:
•Severance costs of $12 million in Q3 2023 and $121 million on a year-to-date basis related to involuntary and voluntary employee terminations
•Acquisition and other costs recovery of $2 million in Q3 2023 and acquisition and other costs of $38 million on a year-to-date basis
2.8 Depreciation and amortization
Depreciation
Depreciation in the third quarter of 2024 decreased by $3 million, compared to the same period in 2023.
Depreciation on a year-to-date basis in 2024 increased by $34 million, compared to the same period in 2023, mainly due to a higher asset base as we continued to invest in our broadband and wireless networks.
Amortization
Amortization in the third quarter and on a year-to-date basis in 2024 increased by $30 million and $92 million, respectively, compared to the same periods in 2023, mainly due to a higher asset base.
Interest expense
Interest expense in the third quarter and on a year-to-date basis in 2024 increased by $67 million and $206 million, respectively, compared to the same periods in 2023, mainly due to higher average debt balances and higher interest rates.
Net return on post-employment benefit plans
Net return on our post-employment benefit plans is based on market conditions that existed at the beginning of the year as well as the net post-employment benefit plan asset (liability). On January 1, 2024, the discount rate was 4.6% compared to 5.3% on January 1, 2023.
In the third quarter and on a year-to-date basis in 2024, net return on post-employment benefit decreased by $11 million and $32 million, respectively, compared to the same periods last year, as a result of a lower discount rate in 2024 and a lower net asset position.
The impacts of changes in market conditions during the year are recognized in Other comprehensive income (loss) (OCI).
18 BCE Inc. 2024 THIRD QUARTER SHAREHOLDER REPORT
2.10 Impairment of assets
2024
During the third quarter of 2024, we identified indicators of impairment for our Bell Media TV services and radio markets, due to a further decline in advertising demand and spending in the linear advertising market. Accordingly, impairment testing was required for certain groups of cash-generating units (CGUs) as well as for goodwill for the Bell Media group of CGUs.
We recognized $958 million of impairment charges for English and French TV services and radio markets within our Bell Media segment. These charges included $627 million allocated to indefinite-life intangible assets for broadcast licences and brands, $144 million allocated to program and feature film rights, $85 million allocated to property, plant and equipment for network and infrastructure and equipment, $85 million allocated to software, $10 million allocated to finite-life intangible assets mainly for trademarks, and $7 million allocated to prepaid expenses.
We recorded $1,132 million of impairment charges for goodwill.
Additionally, for the three and nine months ended September 30, 2024, impairment charges of $23 million and $96 million, respectively, relate mainly to right-of-use assets for certain office spaces we ceased using as part of our real estate optimization strategy as a result of our hybrid work policy.
2023
Impairment charges for the nine months ended September 30, 2023 of $34 million relate mainly to right-of-use assets for certain office spaces we ceased using as part of our real estate optimization strategy as a result of our hybrid work policy.
2024
Other expense of $63 million in the third quarter of 2024 included losses on our equity investments in associates and joint ventures, which included a loss on BCE's share of an obligation to repurchase at fair value the minority interest in MLSE, partly offset by gains on our investments mainly related to an obligation to repurchase at fair value the minority interest in one of our subsidiaries and net mark-to-market gains on derivatives used to economically hedge equity settled share-based compensation plans.
Other expense of $202 million on a year-to-date basis in 2024 included losses on our equity investments in associates and joint ventures, which included a loss on BCE's share of an obligation to repurchase at fair value the minority interest in MLSE, net mark-to-market losses on derivatives used to economically hedge equity settled share-based compensation plans and losses on retirements and disposals of property, plant and equipment and intangible assets, partly offset by interest income and gains on our investments mainly related to an obligation to repurchase at fair value the minority interest in one of our subsidiaries.
2023
Other expense of $129 million in the third quarter of 2023 mainly included net mark-to-market losses on derivatives used to economically hedge equity settled share-based compensation plans.
Other expense of $319 million on a year-to-date basis in 2023 related mainly to losses on our equity investments in associates and joint ventures, which included a loss on BCE's share of an obligation to repurchase at fair value the minority interest in MLSE, and net mark-to-market losses on derivatives used to economically hedge equity settled share-based compensation plans, partly offset by gains on our investments as a result of the sale of our 63% ownership in certain production studios and higher interest income.
Income taxes in the third quarter and on a year-to-date basis in 2024 decreased by $238 million and $384 million, respectively, compared to the same periods last year, mainly due to lower taxable income.
2.13 Net (loss) earnings attributable to common shareholders and EPS
Net loss attributable to common shareholders in the third quarter of 2024 of $1,237 million, increased by $1,877 million, compared to net earnings attributable to common shareholders of $640 million for the same period last year, mainly due to higher impairment of assets primarily at our Bell Media segment and higher interest expense, partly offset by lower income taxes, lower other expense and higher adjusted EBITDA.
Net loss attributable to common shareholders on a year-to-date basis in 2024 of $298 million, increased by $1,992 million, compared to net earnings attributable to common shareholders of $1,694 million for the same period last year, mainly due to higher impairment of assets primarily at our Bell Media segment, higher interest expense, higher severance, acquisition and other costs and higher depreciation and amortization, partly offset by lower income taxes, higher adjusted EBITDA and lower other expense.
BCE’s EPS of ($1.36) in Q3 2024 decreased by $2.06 compared to the same period last year. BCE's EPS of ($0.33) on a year-to-date basis in 2024 decreased by $2.19 compared to the same period last year.
In the third quarter of 2024, adjusted net earnings, which excludes the impact of severance, acquisition and other costs, net mark-to-market gains (losses) on derivatives used to economically hedge equity settled share-based compensation plans, net equity gains (losses) on investments in associates and joint ventures, net gains (losses) on investments, early debt redemption costs and impairment of assets, net of tax and NCI, was $688 million, or $0.75 per common share, compared to $741 million, or $0.81 per common share, for the same period last year. Adjusted net earnings in the first nine months of 2024 was $2,054 million, or $2.25 per common share, compared to $2,235 million, or $2.45 per common share, for the first nine months of 2023.
20 BCE Inc. 2024 THIRD QUARTER SHAREHOLDER REPORT
3 Business segment analysis
This section contains forward-looking statements, including relating to certain benefits expected to result from the acquisition of HGC Technologies, FX Innovation’s growth prospects and strategic plans, as well as BCE's plans and 2024 outlook. Refer to the section Caution regarding forward-looking statements at the beginning of this MD&A.
Key business developments
Acquisition of HGC Technologies by FX Innovation
On October 9, 2024, FX Innovation, a Bell Canada company, acquired HGC Technologies (HGC), an Elite ServiceNow partner. Based in Montréal, with Canadian and American operations, HGC focuses on helping clients maximize their business impact with the ServiceNow digital workflow platform. HGC strengthens FX Innovation's expertise in process automation, cloud technologies, and digital transformation, bringing strengths in business application development, HR and customer service delivery, and a strong North American talent base to support growth. HGC's existing U.S. customer base aligns with FX Innovation's strategic plans for expansion into the U.S. market, providing immediate access to a new and growing customer segment. This acquisition marks another significant step in Bell's transformation journey from traditional telco to technology services leader. Combined with Bell's reliable connectivity and advanced cybersecurity services, with HGC on board, FX Innovation can now offer clients across a wide range of industries end-to-end ServiceNow-related services, Artificial Intelligence (AI)-driven automation and insights, and expertise to help drive business transformation.
Partnership with Hyundai Motor Group for in-car infotainment services
On July 25, 2024, Bell announced a multi-year extension of its strategic partnership with Hyundai Motor Group (Hyundai) to provide Canadian customers with advanced in-car connected infotainment services. Through Bell's Internet of Things (IoT) connectivity, Hyundai, Kia and Genesis customers in Canada will benefit from fast and reliable access to infotainment features, with the partnership also exploring additional services such as over-the-air software updates, music/video streaming, casual gaming and eventually Wi-Fi hotspots, providing seamless connectivity on the go.
Collaboration with MacLean to advance the next generation of mining operations in Canada
On September 17, 2024, Bell announced a technology collaboration with MacLean Engineering (MacLean), the world's largest Canadian-based manufacturer of underground mining equipment, to better support the evolving needs of mining customers. Bell's Private Mobile Network at the MacLean Research & Training Facility will transform the test facility into a centre of excellence, leveraging Bell's secure 5G/Long-term evolution (LTE) network that delivers persistent, dedicated bandwidth and signal stability from the surface shop to the underground environment. This will improve equipment interoperability, enhancing safety for workers and driving sustainable practices and reduced vehicle emissions.
Financial performance analysis
Q3 2024 performance highlights
|
|
|
|
|
|
|
|
|
|
|
|
|
|
|
|
|
|
|
|
|
|
|
|
| Bell CTS |
Bell CTS |
| Revenues |
Adjusted EBITDA |
| (in $ millions) |
(in $ millions) |
|
|
|
|
(% adjusted EBITDA margin) |
|
|
|
|
|
|
|
|
|
|
|
|
|
|
| Bell CTS |
Bell CTS |
| Revenues |
Adjusted EBITDA |
| (in $ millions) |
(in $ millions) |
|
|
|
|
(% adjusted EBITDA margin) |
|
|
|
|
|
|
22 BCE Inc. 2024 THIRD QUARTER SHAREHOLDER REPORT
|
|
|
|
|
|
|
|
|
|
|
|
|
|
|
|
|
|
|
|
|
Total mobile phone subscriber growth(1)(3) |
Mobile phone postpaid net subscriber activations in Q3 2024 |
Mobile phone prepaid net subscriber activations in Q3 2024 |
Mobile phone postpaid churn in Q3 2024(4) |
Mobile phone blended average revenue per user (ARPU)(1)(3)(5) |
| per month |
|
| +1.6% |
33,111 |
69,085 |
1.28% |
(3.4%) |
|
| Q3 2024 vs. Q3 2023 |
Decreased (76.8%) vs. Q3 2023 |
vs. net activations of 24,044 in Q3 2023 |
Increased 0.18 pts vs. Q3 2023 |
Q3 2024:
Q3 2023:
|
$58.26
$60.28
|
|
Retail high-speed Internet subscriber growth(1)(2)(3) |
Retail high-speed Internet net subscriber activations in Q3 2024 |
Retail IPTV subscriber growth(2) |
| +0.9% |
42,415 |
+4.2% |
| Q3 2024 vs. Q3 2023 |
Decreased (46.5%) vs. Q3 2023 |
Q3 2024 vs. Q3 2023 |
Retail IPTV net subscriber activations in Q3 2024 |
Retail residential NAS lines subscriber decline(2) |
| 9,197 |
(8.9%) |
Decreased (74.4%) vs. Q3 2023 |
Q3 2024 vs. Q3 2023 |
(1)In Q3 2024, we removed 77,971 Virgin Plus prepaid mobile phone subscribers from our prepaid mobile phone subscriber base as at September 30, 2024, as we stopped selling new plans for this service as of that date. Additionally, as a result of a recent CRTC decision on wholesale high-speed Internet access services, we are no longer able to resell cable Internet services to new customers in our wireline footprint as of September 12, 2024, and consequently we removed all of the existing 106,259 cable subscribers in our wireline footprint from our retail high-speed Internet subscriber base as of that date.
(2)In Q2 2024, we increased our retail IPTV subscriber base by 40,997 to align the deactivation policy for our Fibe TV streaming services to our traditional Fibe TV service. While in Q2 2023, our retail high-speed Internet, retail IPTV and retail residential NAS lines subscriber bases increased by 35,080, 243 and 7,458 subscribers, respectively, as a result of small acquisitions.
(3)In Q1 2024, we adjusted our mobile phone postpaid subscriber base to remove very low to non-revenue generating business market subscribers of 105,802. Additionally, in Q1 2024 our retail high-speed Internet subscriber base increased by 3,850 business subscribers as a result of a small acquisition. We also removed 11,645 turbo hubs subscribers from our retail high-speed Internet subscriber base in Q1 2024, as we are no longer actively marketing this product in our wireless-to-the-home footprint.
(4)Mobile phone churn is defined as the rate at which existing mobile phone subscribers cancel their services. Refer to section 8.6, KPIs in this MD&A for more information on this measure.
(5)Mobile phone blended ARPU is defined as Bell CTS wireless external services revenues divided by the average mobile phone subscriber base for the specified period, expressed as a dollar unit per month.
Bell CTS results
Revenues
|
|
|
|
|
|
|
|
|
|
|
|
|
|
|
|
|
|
|
|
|
|
|
|
|
|
|
| |
Q3 2024 |
Q3 2023 |
$ change |
% change |
YTD 2024 |
YTD 2023 |
$ change |
% change |
| Wireless |
1,811 |
|
1,828 |
|
(17) |
|
(0.9 |
%) |
5,373 |
|
5,317 |
|
56 |
|
1.1 |
% |
| Wireline data |
2,038 |
|
2,032 |
|
6 |
|
0.3 |
% |
6,084 |
|
6,054 |
|
30 |
|
0.5 |
% |
| Wireline voice |
663 |
|
717 |
|
(54) |
|
(7.5 |
%) |
2,023 |
|
2,165 |
|
(142) |
|
(6.6 |
%) |
| Other wireline services |
76 |
|
78 |
|
(2) |
|
(2.6 |
%) |
236 |
|
231 |
|
5 |
|
2.2 |
% |
| External service revenues |
4,588 |
|
4,655 |
|
(67) |
|
(1.4 |
%) |
13,716 |
|
13,767 |
|
(51) |
|
(0.4 |
%) |
| Inter-segment service revenues |
7 |
|
7 |
|
— |
|
— |
|
21 |
|
21 |
|
— |
|
— |
|
| Operating service revenues |
4,595 |
|
4,662 |
|
(67) |
|
(1.4 |
%) |
13,737 |
|
13,788 |
|
(51) |
|
(0.4 |
%) |
| Wireless |
569 |
|
672 |
|
(103) |
|
(15.3 |
%) |
1,821 |
|
1,924 |
|
(103) |
|
(5.4 |
%) |
| Wireline |
116 |
|
127 |
|
(11) |
|
(8.7 |
%) |
380 |
|
470 |
|
(90) |
|
(19.1 |
%) |
|
|
|
|
|
|
|
|
|
|
|
|
|
|
|
|
|
|
|
|
|
|
|
|
|
|
|
| External/Operating product revenues |
685 |
|
799 |
|
(114) |
|
(14.3 |
%) |
2,201 |
|
2,394 |
|
(193) |
|
(8.1 |
%) |
| Total external revenues |
5,273 |
|
5,454 |
|
(181) |
|
(3.3 |
%) |
15,917 |
|
16,161 |
|
(244) |
|
(1.5 |
%) |
| Total operating revenues |
5,280 |
|
5,461 |
|
(181) |
|
(3.3 |
%) |
15,938 |
|
16,182 |
|
(244) |
|
(1.5 |
%) |
Bell CTS operating revenues decreased by 3.3% in Q3 2024, and by 1.5% in the first nine months of the year, compared to the same periods in 2023, due to both lower product and service revenues. The Q3 year-over-year service revenue decline was driven by continued erosion in wireline voice revenues and lower wireless revenues, moderated by higher wireline data revenues. The year-over-year decline in the first nine months of the year, resulted from ongoing erosion in wireline voice revenues, partly offset by higher wireless and wireline data revenues.
Bell CTS operating service revenues decreased by 1.4% in Q3 2024, and by 0.4% in the first nine months of the year, compared to the same periods last year.
•Wireless revenues decreased by 0.9% in Q3 2024, compared to the same period last year, driven by:
•Continued greater year-over-year competitive pricing pressures on rate plans
•Lower data overages driven by increased customer adoption of monthly plans with higher data thresholds, including unlimited plans
These factors were partly offset by:
•Continued growth in our mobile phone and connected device subscriber bases coupled with the flow-through of rate increases
Conversely, in the first nine months of the year, wireless service revenues increased by 1.1%, compared to the same period last year, as the growth in our mobile phone and connected device subscriber bases and the flow-through of rate increases more than offset the decreases described above.
•Wireline data revenues grew by 0.3% in Q3 2024 and by 0.5% in the first nine months of the year, compared to the same periods in 2023, mainly driven by:
•Higher retail Internet and IPTV subscriber bases, along with the flow-through of residential rate increases
•The contribution from small acquisitions made over the past year
•Higher business solutions services sales, to enterprise customers, mainly security and cloud growth
These factors were partly offset by:
•Increased acquisition, retention and bundle discounts on residential services
•Continued erosion in our satellite TV subscriber base and Internet Protocol (IP) broadband and legacy data revenue declines
Additionally, year over year data revenues in the first nine months of the year were favourably impacted by the acquisition of FX Innovation in June 2023.
•Wireline voice revenues declined by 7.5% in Q3 2024 and by 6.6% in the first nine months of the year, compared to the same periods last year, primarily due to:
•Ongoing retail residential NAS lines erosion, combined with business voice declines, driven by technological substitution to wireless and Internet-based services
•Greater acquisition, retention and bundle discounts on residential services
These factors were partly offset by:
•Flow-through of residential rate increases
Bell CTS operating product revenues decreased by 14.3% in Q3 2024 and by 8.1% in the first nine months of the year, compared to the same periods last year.
•Wireless operating product revenues declined by 15.3% in Q3 2024 and by 5.4% in the first nine months of the year, compared to the same periods last year, due to lower consumer electronics sales from The Source as a result of permanent store closures and conversion to Best Buy Express as part of our distribution partnership with Best Buy Canada, and reduced wireless product revenues from lower contracted sales volumes of mobile devices, partly offset by a greater sales mix of premium mobile phones.
•Wireline operating product revenues declined by 8.7% in Q3 2024 and by 19.1% in the first nine months of the year, compared to the same periods last year, attributable to timing of equipment sales to large business customers. Additionally, in the first nine months of the year, the decrease in product revenues, were unfavourably impacted by exceptionally strong sales in 2023 to large enterprise customers, mainly due to the recovery from global supply chain disruptions experienced in 2022.
Operating costs and adjusted EBITDA
|
|
|
|
|
|
|
|
|
|
|
|
|
|
|
|
|
|
|
|
|
|
|
|
|
|
|
| |
Q3 2024 |
Q3 2023 |
$ change |
% change |
YTD 2024 |
YTD 2023 |
$ change |
% change |
| Operating costs |
(2,812) |
(2,997) |
185 |
|
6.2 |
% |
(8,543) |
(8,881) |
338 |
|
3.8 |
% |
| Adjusted EBITDA |
2,468 |
2,464 |
4 |
|
0.2 |
% |
7,395 |
7,301 |
94 |
|
1.3 |
% |
| Adjusted EBITDA margin |
46.7 |
% |
45.1 |
% |
|
1.6 pts |
46.4 |
% |
45.1 |
% |
|
1.3 pts |
24 BCE Inc. 2024 THIRD QUARTER SHAREHOLDER REPORT Bell CTS operating costs decreased by 6.2% in Q3 2024 and by 3.8% in the first nine months of the year, compared to the same periods in 2023, due to:
•Lower cost of goods sold associated with the decline in product revenues
•Cost reduction initiatives, mainly attributable to workforce reductions, cost containment and other operating efficiencies
•Savings from fewer call volumes to our customer service centres
These factors were partly offset by:
•Greater costs from small acquisitions made during the past year
•Higher expenses related to the growth in business solutions services revenue
•Increased bad debt expense
Additionally, year over year expenses for the first nine months of the year were unfavourably impacted by higher costs from the acquisition of FX Innovation in June 2023.
Bell CTS adjusted EBITDA increased by 0.2% in Q3 2024 and by 1.3% in the first nine months of the year, compared to the same periods in 2023, driven by lower operating costs, partly offset by a decrease in operating revenues. Adjusted EBITDA margin of 46.7% in Q3 2024, and 46.4% in the first nine months of the year, increased by 1.6 pts and 1.3 pts, respectively, over the same periods in 2023, due to lower costs, driven by various cost reduction initiatives and other operating efficiencies, along with a reduced proportion of low-margin product sales in our total revenue base.
Bell CTS operating metrics
Wireless
|
|
|
|
|
|
|
|
|
|
|
|
|
|
|
|
|
|
|
|
|
|
|
|
|
|
|
| |
Q3 2024 |
Q3 2023 |
Change |
% change |
YTD 2024 |
YTD 2023 |
Change |
% change |
| Mobile phones |
|
|
|
|
|
|
|
|
Blended ARPU(1)(2) ($/month) |
58.26 |
60.28 |
(2.02) |
(3.4 |
%) |
58.15 |
59.21 |
(1.06) |
(1.8 |
%) |
|
|
|
|
|
|
|
|
|
| Gross subscriber activations |
588,263 |
603,770 |
(15,507) |
(2.6 |
%) |
1,671,036 |
1,512,245 |
158,791 |
10.5 |
% |
| Postpaid |
374,116 |
423,364 |
(49,248) |
(11.6 |
%) |
1,130,203 |
1,043,719 |
86,484 |
8.3 |
% |
| Prepaid |
214,147 |
180,406 |
33,741 |
18.7 |
% |
540,833 |
468,526 |
72,307 |
15.4 |
% |
| Net subscriber activations |
102,196 |
166,930 |
(64,734) |
(38.8 |
%) |
258,447 |
319,104 |
(60,657) |
(19.0 |
%) |
| Postpaid |
33,111 |
142,886 |
(109,775) |
(76.8 |
%) |
156,858 |
297,457 |
(140,599) |
(47.3 |
%) |
| Prepaid |
69,085 |
24,044 |
45,041 |
n.m. |
101,589 |
21,647 |
79,942 |
n.m. |
| Blended churn % (average per month) |
1.58 |
% |
1.45 |
% |
|
(0.13) pts |
1.55 |
% |
1.34 |
% |
|
(0.21) pts |
| Postpaid |
1.28 |
% |
1.10 |
% |
|
(0.18) pts |
1.23 |
% |
0.98 |
% |
|
(0.25) pts |
| Prepaid |
4.66 |
% |
5.10 |
% |
|
0.44 pts |
4.99 |
% |
5.02 |
% |
|
0.03 pts |
Subscribers(1)(2) |
10,361,720 |
10,194,961 |
166,759 |
1.6 |
% |
10,361,720 |
10,194,961 |
166,759 |
1.6 |
% |
Postpaid(2) |
9,473,886 |
9,294,115 |
179,771 |
1.9 |
% |
9,473,886 |
9,294,115 |
179,771 |
1.9 |
% |
Prepaid(1) |
887,834 |
900,846 |
(13,012) |
(1.4 |
%) |
887,834 |
900,846 |
(13,012) |
(1.4 |
%) |
| Mobile connected devices |
|
|
|
|
|
|
|
|
| Net subscriber activations |
56,216 |
64,282 |
(8,066) |
(12.5 |
%) |
210,539 |
214,561 |
(4,022) |
(1.9 |
%) |
| Subscribers |
2,943,087 |
2,653,802 |
289,285 |
10.9 |
% |
2,943,087 |
2,653,802 |
289,285 |
10.9 |
% |
n.m.: not meaningful
(1)As at September 30, 2024, we removed 77,971 Virgin Plus prepaid mobile phone subscribers from our prepaid mobile phone subscriber base as we stopped selling new plans for this service as of that date.
(2)In Q1 2024, we adjusted our mobile phone postpaid subscriber base to remove very low to non-revenue generating business market subscribers of 105,802.
Mobile phone blended ARPU of $58.26 in Q3 2024 and $58.15 year to date, declined by 3.4% and 1.8%, respectively, compared to the same periods last year, driven by:
•Continued greater year-over-year competitive pricing pressures on rate plans
•Lower data overages due to greater customer adoption of monthly plans with higher data thresholds, including unlimited plans
These factors were partly offset by:
•Flow-through of rate increases
•The favourable impact from the Q1 2024 adjustment to our mobile phone postpaid subscriber base to remove very low to non-revenue generating business market subscribers of 105,802.
Mobile phone gross subscriber activations decreased by 2.6% in Q3 2024, compared to the same period last year, due to lower postpaid gross subscriber activations, partly offset by higher prepaid gross subscriber activations. In the first nine months of the year, mobile phone gross subscriber activations increased by 10.5% year over year, due to both higher postpaid and prepaid gross subscriber activations.
•Mobile phone postpaid gross subscriber activations decreased by 11.6% in Q3 2024, compared to the same period last year, driven by greater competitive intensity along with our focus on growing higher-valued mobile phone subscribers, a decline in foreign student volumes reflecting government-imposed student visa caps and lower business customer demand. In the first nine months of the year, mobile phone postpaid gross subscriber activations increased by 8.3% year over year, as the favourable impact from population growth, and 5G momentum more than offset the factors pressuring postpaid gross activations discussed above.
•Mobile phone prepaid gross subscriber activations increased by 18.7% in Q3 2024 and by 15.4% in the first nine months of the year, compared to the same periods last year, driven by expanded retail distribution and effective Lucky Mobile promotional offers
Mobile phone net subscriber activations decreased by 38.8% in Q3 2024 and by 19.0% in the first nine months of the year, compared to the same periods last year, due to lower postpaid net subscriber activations, partly offset by greater prepaid net subscriber activations.
•Mobile phone postpaid net subscriber activations decreased by 76.8% in Q3 2024, compared to the same period last year, due to greater subscriber deactivations and lower gross activations. In the first nine months of the year, mobile phone postpaid net subscriber activations decreased by 47.3% year over year, driven by greater subscriber deactivations, partly offset by higher subscriber gross activations.
•Mobile phone prepaid net subscriber activations increased year over year by 45,041 in Q3 2024 and by 79,942 year to date, due to higher gross activations and fewer subscriber deactivations.
Mobile phone blended churn of 1.58% in Q3 2024 and 1.55% year to date, increased by 0.13 pts and 0.21 pts, respectively, compared to the same periods in 2023.
•Mobile phone postpaid churn of 1.28% in the quarter and 1.23% year to date, increased by 0.18 pts and 0.25 pts, respectively, compared to the same periods last year, due to higher subscriber deactivations driven by greater overall competitive market activity and promotional offer intensity
•Mobile phone prepaid churn of 4.66% in the quarter and 4.99% in the first nine months of the year, decreased by 0.44 pts and 0.03 pts, respectively, compared to the same periods last year, due to lower subscriber deactivations driven by successful retention offers on Lucky Mobile. Additionally, the year-to-date decline in prepaid churn was moderated by the impact of more attractive promotional offers on postpaid discount brands, particularly in the early part of the year.
Mobile phone subscribers at September 30, 2024 totalled 10,361,720, an increase of 1.6%, from 10,194,961 subscribers reported at the end of Q3 2023. This consisted of 9,473,886 postpaid subscribers, an increase of 1.9% from 9,294,115 subscribers reported at the end of Q3 2023, and 887,834 prepaid subscribers, a decrease of 1.4% from 900,846 subscribers reported at the end of Q3 2023. As at September 30, 2024, we removed 77,971 Virgin Plus prepaid mobile phone subscribers from our prepaid mobile phone subscriber base as we stopped selling new plans for this service as of that date.
Mobile connected device net subscriber activations decreased by 12.5% in Q3 2024, compared to the same period last year, due to lower consumer IoT net activations and higher net losses from data devices, partly offset by higher connected car subscriptions. In the first nine months of the year, mobile connected device net subscriber activations decreased by 1.9%, year over year, driven by greater net losses from data devices, partly offset by higher IoT net activations.
Mobile connected device subscribers at September 30, 2024 totalled 2,943,087, up 10.9% from 2,653,802 subscribers reported at the end of Q3 2023.
Wireline data
Retail high-speed Internet
|
|
|
|
|
|
|
|
|
|
|
|
|
|
|
|
|
|
|
|
|
|
|
|
|
|
|
| |
Q3 2024 |
Q3 2023 |
Change |
% change |
YTD 2024 |
YTD 2023 |
Change |
% change |
| Retail net subscriber activations |
42,415 |
|
79,327 |
|
(36,912) |
|
(46.5 |
%) |
97,334 |
|
131,535 |
|
(34,201) |
|
(26.0 |
%) |
|
|
|
|
|
|
|
|
|
Retail subscribers(1)(2)(3)(4) |
4,456,709 |
|
4,417,838 |
|
38,871 |
|
0.9 |
% |
4,456,709 |
|
4,417,838 |
|
38,871 |
|
0.9 |
% |
|
|
|
|
|
|
|
|
|
(1)As a result of a recent CRTC decision on wholesale high-speed Internet access services, we are no longer able to resell cable Internet services to new customers in our wireline footprint as of September 12, 2024, and consequently we removed all of the existing 106,259 cable subscribers in our wireline footprint from our retail high-speed Internet subscriber base as of that date.
(2)In Q1 2024, we removed 11,645 turbo hubs subscribers from our retail high-speed Internet subscriber base as we are no longer actively marketing this product in our wireless-to-the-home footprint.
(3)In Q1 2024, our retail high-speed Internet subscriber base increased by 3,850 business subscribers as a result of a small acquisition.
(4)In Q2 2023, our retail high-speed Internet subscriber base increased by 35,080 as a result of small acquisitions.
26 BCE Inc. 2024 THIRD QUARTER SHAREHOLDER REPORT
Retail high-speed Internet net subscriber activations decreased by 46.5% in Q3 2024, and by 26.0% in the first nine months of the year, compared to the same periods last year, mainly due to aggressive promotional offers by competitors, less new fibre footprint expansion and slowing market growth.
Retail high-speed Internet subscribers totalled 4,456,709 at September 30, 2024, up 0.9% from 4,417,838 subscribers reported at the end of Q3 2023. As a result of a recent CRTC decision on wholesale high-speed Internet access services, we are no longer able to resell cable Internet services to new customers in our wireline footprint as of September 12, 2024, and consequently we removed all of the existing 106,259 cable subscribers in our wireline footprint from our retail high-speed Internet subscriber base as of that date.
Retail IPTV
|
|
|
|
|
|
|
|
|
|
|
|
|
|
|
|
|
|
|
|
|
|
|
|
|
|
|
| |
Q3 2024 |
Q3 2023 |
Change |
% change |
YTD 2024 |
YTD 2023 |
Change |
% change |
| Retail IPTV net subscriber activations |
9,197 |
|
35,976 |
|
(26,779) |
|
(74.4 |
%) |
22,058 |
|
58,381 |
|
(36,323) |
|
(62.2 |
%) |
|
|
|
|
|
|
|
|
|
|
|
|
|
|
|
|
|
|
Retail IPTV subscribers(1)(2) |
2,133,397 |
|
2,046,805 |
|
86,592 |
|
4.2 |
% |
2,133,397 |
|
2,046,805 |
|
86,592 |
|
4.2 |
% |
|
|
|
|
|
|
|
|
|
|
|
|
|
|
|
|
|
|
(1)In Q2 2024, we increased our retail IPTV subscriber base by 40,997 to align the deactivation policy for our Fibe TV streaming services to our traditional Fibe TV service.
(2)In Q2 2023, our retail IPTV subscriber base increased by 243 as a result of small acquisitions.
Retail IPTV net subscriber activations decreased by 74.4% in Q3 2024 and by 62.2% in the first nine months of the year, compared to the same periods in 2023, driven by reduced gross activations from our Fibe TV streaming services due to our focus on growing higher-valued subscribers, along with lower Internet pull-through, greater competitive intensity and higher substitution with OTT services.
Retail IPTV subscribers at September 30, 2024 totalled 2,133,397, up 4.2% from 2,046,805 subscribers reported at the end of Q3 2023.
Wireline voice
|
|
|
|
|
|
|
|
|
|
|
|
|
|
|
|
|
|
|
|
|
|
|
|
|
|
|
| |
Q3 2024 |
Q3 2023 |
Change |
% change |
YTD 2024 |
YTD 2023 |
Change |
% change |
| Retail residential NAS lines net losses |
(47,674) |
|
(41,776) |
|
(5,898) |
|
(14.1 |
%) |
(144,835) |
|
(138,265) |
|
(6,570) |
|
(4.8 |
%) |
|
|
|
|
|
|
|
|
|
Retail residential NAS lines(1) |
1,876,782 |
|
2,059,964 |
|
(183,182) |
|
(8.9 |
%) |
1,876,782 |
|
2,059,964 |
|
(183,182) |
|
(8.9 |
%) |
|
|
|
|
|
|
|
|
|
(1)In Q2 2023, our retail residential NAS lines subscriber base increased by 7,458 subscribers as a result of small acquisitions.
Retail residential NAS lines net losses increased by 14.1% in Q3 2024 and by 4.8% year to date, compared to the same periods last year, from fewer gross activations attributable to the continued substitution to wireless and Internet-based technologies and less pull-through on lower Internet volumes, mitigated in part by lower customer deactivations.
Retail residential NAS lines of 1,876,782 at September 30, 2024, declined by 8.9% from 2,059,964 lines reported at the end of Q3 2023. The Q3 2024 rate of erosion of 8.9% has deteriorated over the 4.8% experienced in Q3 2023, mainly due to the impact of the acquisition of Distributel Communications Limited (Distributel) in Q4 2022 and other small acquisitions made in Q2 2023.
Update to 2024 Outlook
As at the date of the BCE 2023 Annual MD&A, we were targeting growth in Bell CTS segment revenue in 2024 driven by continued subscriber base expansion. We are now expecting Bell CTS segment revenue to decline in 2024 due to the cumulative impact of wireless pricing pressures on mobile phone blended ARPU, lower-than-forecasted wireless product revenue attributable to reduced mobile device sales volumes and the timing of business wireline equipment sales.
Assumptions
As at the date of this MD&A, our forward-looking statements set out in the BCE 2023 Annual MD&A, as updated or supplemented in the BCE 2024 First Quarter MD&A, the BCE 2024 Second Quarter MD&A and in this MD&A, are based on certain assumptions including, without limitation, the following assumptions, the assumptions referred to in the Bell Media business segment discussion set out in section 3.2, Bell Media, of this MD&A, as well as the economic, market and other assumptions referred to in section 1.3, Assumptions of this MD&A.
•In the BCE 2023 Annual MD&A, we disclosed our assumption of increase in our market share of national operators’ wireless mobile phone net additions. We are now assuming that our market share of national operators' wireless mobile phone net additions will remain stable or decrease slightly as we shift our focus from increasing market share to focus instead on economic and financial outcomes.
•Increased competitive intensity and promotional activity across all regions and market segments
•Ongoing expansion and deployment of 5G and 5G+ wireless networks, offering competitive coverage and quality
•Continued diversification of our distribution strategy with a focus on expanding direct-to-consumer (DTC) and online transactions
•In the BCE 2023 Annual MD&A, we disclosed our assumption of moderating growth in mobile phone blended ARPU. We are now assuming declining mobile phone blended ARPU, due to a higher-than-anticipated level of competitive pricing pressure which intensified progressively in the first quarter of 2024, that has carried over from the seasonally more intense Q4 2023 selling period.
•Continuing business customer adoption of advanced 5G, 5G+ and IoT solutions
•Improving wireless handset device availability in addition to stable device pricing and margins
•Further deployment of direct fibre to more homes and businesses within our wireline footprint, but at a slower pace than during any of 2020 to 2023
•Continued growth in retail Internet and IPTV subscribers
•Increasing wireless and Internet-based technological substitution
•Continued focus on the consumer household and bundled service offers for mobility and Internet customers
•Continued large business customer migration to IP-based systems
•Ongoing competitive repricing pressures in our business and wholesale markets
•Continued competitive intensity in our small and medium-sized business markets as cable operators and other telecommunications competitors continue to intensify their focus on business customers
•Traditional high-margin product categories challenged by large global cloud and OTT providers of business voice and data solutions expanding into Canada with on-demand services
•Increasing customer adoption of OTT services resulting in downsizing of TV packages
•Growing consumption of OTT TV services and on-demand video streaming, as well as the proliferation of devices, such as tablets, that consume large quantities of bandwidth, will require ongoing capital investment
•Realization of cost savings related to operating efficiencies enabled by our direct fibre footprint, changes in consumer behaviour and product innovation, digital adoption, product and service enhancements, expanding self-serve capabilities, new call centre and digital investments, other improvements to the customer service experience, management workforce reductions including attrition and retirements, and lower contracted rates from our suppliers
•No adverse material financial, operational or competitive consequences of changes in or implementation of regulations affecting our communication and technology services business
28 BCE Inc. 2024 THIRD QUARTER SHAREHOLDER REPORT
This section contains forward-looking statements, including relating to BCE's plans and 2024 outlook. Refer to the section Caution regarding forward-looking statements at the beginning of this MD&A.
Key business developments
Expansion of partnership with Warner Bros. Discovery
On October 8, 2024, Bell Media announced the expansion of its partnership with Warner Bros. Discovery for the Canadian market, extending Crave for multiple years as the exclusive home of HBO and Max content. The expansion of Bell Media's existing licensing agreement with Warner Bros. Discovery, announced in 2023, ensures Crave subscribers have continued access to a vast library of premium content for the foreseeable future. The new agreement also includes a co-production commitment for original Canadian content with global appeal, licensing of Bell Media original content for use on Warner Bros. Discovery platforms outside of Canada, and extended access to French-language content for use on Bell Media platforms. Bell Media and Warner Bros. Discovery also confirmed that they have settled all matters in their recent dispute regarding Bell Media's suite of Discovery-branded channels.
Agreement with NBCUniversal to bring USA Network and Oxygen True Crime channels to Canada
On October 17, 2024, Bell Media announced it secured a content and licensing agreement with NBCUniversal Global TV Distribution that brings cable channels USA Network and Oxygen True Crime to Canada for the first time ever, beginning January 1, 2025, at which time existing specialty channels Discovery and Investigation Discovery rebrand to USA Network and Oxygen True Crime. A selection of popular shows from USA Network, such as SUITS, and Oxygen True Crime, along with all new series from both channels, will also be available for streaming on Crave. Also on January 1, existing specialty channels Animal Planet, Discovery Science, and Discovery Velocity, rebrand to CTV Wild, CTV Nature, and CTV Speed, respectively, completing the revitalization of Bell Media’s suite of Discovery channels.
Launch of TSN and RDS on Prime Video Channels in Canada
On September 6, 2024, Bell Media’s TSN service, featuring live sports, became available on Prime Video Channels in Canada, followed by RDS in October. The linear feeds and on demand content from TSN and RDS can be added by Prime members to their Prime Video account. TSN and RDS join Bell Media’s streaming service Crave, which became part of Prime Video Channels in Canada in February. With the addition of Prime Video Channels in Canada, Bell Media gives subscribers even more choice and access to TSN and RDS. The networks also continue to be available on a variety of platforms, including the TSN and RDS apps, TSN.ca, RDS.ca, digital media players such as Android TV, Apple TV, Samsung Smart TV, LG Smart TV, Roku, and Amazon Fire TV Stick, and television service providers.
Financial performance analysis
Q3 2024 performance highlights
|
|
|
|
|
|
| Bell Media |
Bell Media |
| Revenues |
Adjusted EBITDA |
| (in $ millions) |
(in $ millions) |
|
|
| Bell Media |
Bell Media |
| Revenues |
Adjusted EBITDA |
| (in $ millions) |
(in $ millions) |
|
|
Bell Media results
Revenues
|
|
|
|
|
|
|
|
|
|
|
|
|
|
|
|
|
|
|
|
|
|
|
|
|
|
|
|
Q3 2024 |
Q3 2023 |
$ change |
% change |
YTD 2024 |
YTD 2023 |
$ change |
% change |
| External revenues |
698 |
|
626 |
|
72 |
|
11.5 |
% |
2,070 |
|
2,039 |
|
31 |
|
1.5 |
% |
| Inter-segment revenues |
84 |
|
84 |
|
— |
|
— |
|
249 |
|
256 |
|
(7) |
|
(2.7 |
%) |
| Bell Media operating revenues |
782 |
|
710 |
|
72 |
|
10.1 |
% |
2,319 |
|
2,295 |
|
24 |
|
1.0 |
% |
30 BCE Inc. 2024 THIRD QUARTER SHAREHOLDER REPORT Bell Media operating revenues increased by 10.1% in Q3 2024, compared to the same period in 2023, driven by higher subscriber and advertising revenues. In the first nine months of the year, operating revenues increased by 1.0% year over year, driven by higher advertising revenues, along with the favourable impact of Formula 1 revenues in Q2 2024, partly offset by lower subscriber revenues. Digital revenues(1) continued to contribute to the growth in operating revenues, up 19% in Q3 2024 and 24.9% year to date, compared to the same periods last year.
•Advertising revenues increased by 7.9% in Q3 2024 and by 3.7% in the first nine months of the year, compared to the same periods last year, driven by continued growth in digital advertising revenues, mainly attributable to increased bookings from Bell Media's strategic audience management (SAM) TV media sales tool, as well as growth in Addressable TV and ad-supported subscription tiers on Crave. The growth in advertising revenues also reflected higher out-of-home (OOH) revenues from the acquisition of OUTEDGE in June 2024, along with stronger sports specialty TV performance, partly offset by lower demand for traditional broadcast TV advertising, including the shift in advertising dollars to the principal broadcaster of the Olympic Games Paris 2024. In the first nine months of the year, content delays driven by the Writers Guild of America (WGA) and the Screen Actors Guild and American Federation of Television and Radio Artists (SAG-AFTRA) strikes in 2023 also unfavourably impacted advertising revenues.
•Subscriber revenues increased by 13.5% in Q3 2024, compared to the same period in 2023, due to retroactive adjustments related to contracts with Canadian TV distributors, along with growth in Crave and sports streaming subscribers, partly offset by lower year-over-year BDU subscribers. In the first nine months of the year, subscriber revenues decreased by 2.1%, compared to the same period last year, as the pressure from lower BDU subscribers more than offset the growth in Crave and sports streaming revenues and the year-over-year net benefit from retroactive adjustments related to contracts with Canadian TV distributors.
Operating costs and adjusted EBITDA
|
|
|
|
|
|
|
|
|
|
|
|
|
|
|
|
|
|
|
|
|
|
|
|
|
|
|
|
Q3 2024 |
Q3 2023 |
$ change |
% change |
YTD 2024 |
YTD 2023 |
$ change |
% change |
| Operating costs |
(528) |
(507) |
(21) |
|
(4.1%) |
(1,730) |
(1,746) |
16 |
|
0.9% |
| Adjusted EBITDA |
254 |
203 |
51 |
|
25.1% |
589 |
549 |
40 |
|
7.3% |
| Adjusted EBITDA margin |
32.5 |
% |
28.6 |
% |
|
3.9 |
pts |
25.4 |
% |
23.9 |
% |
|
1.5 |
pts |
Bell Media operating costs increased by 4.1% in Q3 2024, compared to the same period last year, due to:
•Higher content costs, primarily sports broadcasting rights and programming
•Greater costs related to the acquisition of OUTEDGE
These factors were partly offset by:
•Restructuring initiatives undertaken over the past year as a result of the unfavourable economic and broadcasting regulatory environments
In the first nine months of the year, operating costs decreased by 0.9% year over year, due to restructuring initiatives and lower content costs driven by content delays due to the WGA and SAG-AFTRA strikes, partly offset by the higher costs as described above, as well as the higher expenses associated with the revenue growth from Formula 1.
Bell Media adjusted EBITDA grew by 25.1% in Q3 2024, compared to the same period last year, driven by higher operating revenues, partly offset by greater operating costs. In the first nine months of the year, adjusted EBITDA grew by 7.3% year over year, due to higher operating revenues and lower operating costs.
(1)Digital revenues are comprised of advertising revenue from digital platforms including websites, mobile apps, connected TV apps and OOH digital assets/platforms, as well as advertising procured through Bell digital buying platforms and subscription revenue from DTC services and video on demand services.
Update to 2024 Outlook
As at the date of the BCE 2023 Annual MD&A, our expectation was that, while the advertising market continued to be adversely affected by economic uncertainty, a recovery was expected to occur in the course of 2024, although visibility as to the timing and pace thereof remained limited. From the date of the BCE 2024 First Quarter MD&A, our expectation was that an improvement in the Canadian traditional broadcast TV and radio advertising market was expected in the medium term, although visibility to the specific timing and pace thereof remained limited. As at the date of this MD&A, we no longer expect such improvement to take place in the medium term and visibility into the specific timing and pace of such improvement remains limited. The platforms by which Bell Media generates advertising revenue are now experiencing a mix shift from traditional broadcast TV and radio to significant digital growth as well as growth in our OOH business. We expect this shift to continue into the future and to mitigate declines in the traditional advertising market.
Assumptions
As at the date of this MD&A, our forward-looking statements set out in the BCE 2023 Annual MD&A, as updated or supplemented in the BCE 2024 First Quarter MD&A, in the BCE 2024 Second Quarter MD&A and in this MD&A, are based on certain assumptions including, without limitation, the following assumptions, the assumptions referred to in the Bell CTS business segment discussion set out in section 3.1, Bell CTS, of this MD&A, as well as the economic, market and other assumptions referred to in section 1.3, Assumptions, of this MD&A.
•Overall digital revenue expected to reflect continued scaling of our SAM TV and demand-side platform buying platforms, expansion of Addressable TV, as well as DTC subscriber growth, contributing towards the advancement of our digital-first media strategy
•Leveraging of first-party data to improve targeting, advertisement delivery including personalized viewing experience and attribution
•Continued escalation of media costs to secure quality content
•Continued scaling of Crave through optimized content offering, user experience improvements and expanded distribution
•Continued support in original French content with a focus on digital platforms such as Crave, Noovo.ca and iHeartRadio Canada, to better serve our French-language customers through a personalized digital experience
•Ability to successfully acquire and produce highly-rated and differentiated content
•Building and maintaining strategic supply arrangements for content across all screens and platforms
•No adverse material financial, operational or competitive consequences of changes in or implementation of regulations affecting our media business
32 BCE Inc. 2024 THIRD QUARTER SHAREHOLDER REPORT
4 Financial and capital management
This section tells you how we manage our cash and capital resources to carry out our strategy and deliver financial results. It provides an analysis of our financial condition, cash flows and liquidity on a consolidated basis.
|
|
|
|
|
|
|
|
|
|
|
|
|
|
|
|
September 30, 2024 |
December 31, 2023 |
$ change |
% change |
| Long-term debt |
32,606 |
|
31,135 |
|
1,471 |
|
4.7 |
% |
| Debt due within one year |
7,475 |
|
5,042 |
|
2,433 |
|
48.3 |
% |
50% of preferred shares(1) |
1,780 |
|
1,834 |
|
(54) |
|
(2.9 |
%) |
| Cash |
(1,860) |
|
(547) |
|
(1,313) |
|
n.m. |
| Cash equivalents |
— |
|
(225) |
|
225 |
|
100.0 |
% |
| Short-term investments |
(750) |
|
(1,000) |
|
250 |
|
25.0 |
% |
Net debt(2) |
39,251 |
|
36,239 |
|
3,012 |
|
8.3 |
% |
n.m.: not meaningful
(1)50% of outstanding preferred shares of $3,559 million and $3,667 million at September 30, 2024 and December 31, 2023, respectively, are classified as debt consistent with the treatment by some credit rating agencies.
(2)Net debt is a non-GAAP financial measure. See section 8.1, Non-GAAP financial measures in this MD&A for more information on this measure.
The increase of $2,433 million in debt due within one year and the increase of $1,471 million in long-term debt were due to:
•the issuance by Bell Canada of Series US-9 Notes, with a total principal amount of $700 million in U.S. dollars ($942 million in Canadian dollars)
•the issuance by Bell Canada of Series US-10 Notes, with a total principal amount of $750 million in U.S. dollars ($1,009 million in Canadian dollars)
•the issuance by Bell Canada of Series M-61 medium-term note (MTN) debentures, with a total principal amount of $400 million
•the issuance by Bell Canada of Series M-63 MTN debentures, with a total principal amount of $1,100 million
•an increase in notes payable (net of repayments) of $2,146 million
•an increase in outstanding loans of $324 million under the Bell Mobility Inc. (Bell Mobility) uncommitted trade loan agreement
Partly offset by:
•the repayment at maturity of Series M-44 MTN debentures, with a total principal amount of $1,000 million
•the repayment at maturity of Series US-3 Notes, with a total principal amount of $600 million in U.S. dollars ($748 million in Canadian dollars)
•the repayment at maturity of Series 10 Notes, with a total principal amount of $225 million
•a net decrease of $44 million due to lower lease liabilities and other debt
The increase in cash of $1,313 million, the decrease in short-term investments of $250 million and the decrease in cash equivalents of $225 million were mainly due to:
•$5,111 million of cash flows from operating activities
•$3,818 million of issuance of long-term debt
•$2,146 million increase in notes payable (net of repayments)
Partly offset by:
•$2,981 million repayment of long-term debt
•$2,934 million of capital expenditures
•$2,703 million of dividends paid on BCE common shares
•$590 million for business acquisitions
•$531 million for spectrum licences
•$186 million paid for the purchase on the open market of BCE common shares for the settlement of share-based payments
•$134 million of dividends paid on BCE preferred shares
•$76 million paid for the repurchase of BCE preferred shares
•$56 million of dividends paid by subsidiaries to NCI
4.2 Outstanding share data
|
|
|
|
|
|
| Common shares outstanding |
Number of shares |
| Outstanding, January 1, 2024 |
912,274,545 |
|
| Shares issued under deferred share plan |
8,558 |
|
|
|
|
|
Outstanding, September 30, 2024 |
912,283,103 |
|
|
|
|
|
|
|
|
|
|
| Stock options outstanding |
Number of options |
Weighted average
exercise price ($) |
| Outstanding, January 1, 2024 |
7,484,561 |
|
61 |
|
|
|
|
|
|
|
| Forfeited or expired |
(930,211) |
|
59 |
|
|
|
|
| Outstanding and exercisable, September 30, 2024 |
6,554,350 |
|
61 |
|
|
|
|
|
|
|
|
|
|
|
|
|
|
|
|
|
|
|
|
|
|
|
|
|
|
|
|
|
|
|
|
|
|
|
|
|
Q3 2024 |
|
Q3 2023 |
|
$ change |
% change |
|
YTD 2024 |
|
YTD 2023 |
|
$ change |
% change |
| Cash flows from operating activities |
1,842 |
|
|
1,961 |
|
|
(119) |
|
(6.1 |
%) |
|
5,111 |
|
|
5,573 |
|
|
(462) |
|
(8.3 |
%) |
| Capital expenditures |
(954) |
|
|
(1,159) |
|
|
205 |
|
17.7 |
% |
|
(2,934) |
|
|
(3,552) |
|
|
618 |
|
17.4 |
% |
| Cash dividends paid on preferred shares |
(43) |
|
|
(35) |
|
|
(8) |
|
(22.9 |
%) |
|
(134) |
|
|
(136) |
|
|
2 |
|
1.5 |
% |
| Cash dividends paid by subsidiaries to non-controlling interest |
(14) |
|
|
(13) |
|
|
(1) |
|
(7.7 |
%) |
|
(56) |
|
|
(35) |
|
|
(21) |
|
(60.0 |
%) |
| Acquisition and other costs paid |
1 |
|
|
— |
|
|
1 |
|
n.m. |
|
27 |
|
|
5 |
|
|
22 |
|
n.m. |
|
|
|
|
|
|
|
|
|
|
|
|
|
|
|
|
|
|
|
|
|
|
|
|
|
|
|
|
| Free cash flow |
832 |
|
|
754 |
|
|
78 |
|
10.3 |
% |
|
2,014 |
|
|
1,855 |
|
|
159 |
|
8.6 |
% |
|
|
|
|
|
|
|
|
|
|
|
|
|
|
| Business acquisitions |
(73) |
|
|
1 |
|
|
(74) |
|
n.m. |
|
(590) |
|
|
(220) |
|
|
(370) |
|
n.m. |
| Business dispositions |
— |
|
|
1 |
|
|
(1) |
|
(100.0 |
%) |
|
— |
|
|
209 |
|
|
(209) |
|
(100.0 |
%) |
| Acquisition and other costs paid |
(1) |
|
|
— |
|
|
(1) |
|
n.m. |
|
(27) |
|
|
(5) |
|
|
(22) |
|
n.m. |
| Short-term investments |
— |
|
|
— |
|
|
— |
|
— |
|
|
250 |
|
|
— |
|
|
250 |
|
n.m. |
| Spectrum licences |
(13) |
|
|
(3) |
|
|
(10) |
|
n.m. |
|
(531) |
|
|
(159) |
|
|
(372) |
|
n.m. |
|
|
|
|
|
|
|
|
|
|
|
|
|
|
|
|
|
|
|
|
|
|
|
|
|
|
|
|
|
|
|
|
|
|
|
|
|
|
|
|
|
|
| Other investing activities |
(8) |
|
|
(16) |
|
|
8 |
|
50.0 |
% |
|
(29) |
|
|
(1) |
|
|
(28) |
|
n.m. |
|
|
|
|
|
|
|
|
|
|
|
|
|
|
| Increase (decrease) in notes payable |
763 |
|
|
(300) |
|
|
1,063 |
|
n.m. |
|
2,146 |
|
|
(484) |
|
|
2,630 |
|
n.m. |
|
|
|
|
|
|
|
|
|
|
|
|
|
|
| Issue of long-term debt |
10 |
|
|
1,161 |
|
|
(1,151) |
|
(99.1 |
%) |
|
3,818 |
|
|
3,864 |
|
|
(46) |
|
(1.2 |
%) |
| Repayment of long-term debt |
(343) |
|
|
(920) |
|
|
577 |
|
62.7 |
% |
|
(2,981) |
|
|
(1,565) |
|
|
(1,416) |
|
(90.5 |
%) |
| Repurchase of a financial liability |
— |
|
|
— |
|
|
— |
|
— |
|
|
— |
|
|
(149) |
|
|
149 |
|
100.0 |
% |
| Issue of common shares |
— |
|
|
— |
|
|
— |
|
— |
|
|
— |
|
|
18 |
|
|
(18) |
|
(100.0 |
%) |
|
|
|
|
|
|
|
|
|
|
|
|
|
|
|
|
|
|
|
|
|
|
|
|
|
|
|
|
| Purchase of shares for settlement of share-based payments |
(42) |
|
|
(44) |
|
|
2 |
|
4.5 |
% |
|
(186) |
|
|
(179) |
|
|
(7) |
|
(3.9 |
%) |
| Repurchase of preferred shares |
— |
|
|
(27) |
|
|
27 |
|
100.0 |
% |
|
(76) |
|
|
(90) |
|
|
14 |
|
15.6 |
% |
| Cash dividends paid on common shares |
(910) |
|
|
(883) |
|
|
(27) |
|
(3.1 |
%) |
|
(2,703) |
|
|
(2,604) |
|
|
(99) |
|
(3.8 |
%) |
|
|
|
|
|
|
|
|
|
|
|
|
|
|
|
|
|
|
|
|
|
|
|
|
|
|
|
|
|
|
|
|
|
|
|
|
|
|
|
|
|
|
|
|
|
|
|
|
|
|
|
|
|
|
|
|
|
|
|
|
|
|
|
|
|
|
|
|
|
|
| Other financing activities |
(3) |
|
|
(5) |
|
|
2 |
|
40.0 |
% |
|
(17) |
|
|
(20) |
|
|
3 |
|
15.0 |
% |
|
|
|
|
|
|
|
|
|
|
|
|
|
|
| Net increase in cash |
462 |
|
|
119 |
|
|
343 |
|
n.m. |
|
1,313 |
|
|
470 |
|
|
843 |
|
n.m. |
| Net decrease in cash equivalents |
(250) |
|
|
(400) |
|
|
150 |
|
37.5 |
% |
|
(225) |
|
|
— |
|
|
(225) |
|
n.m. |
n.m.: not meaningful
Cash flows from operating activities and free cash flow
Cash flows from operating activities in the third quarter of 2024 decreased by $119 million, compared to the same period last year, mainly due to lower cash from working capital due in part to timing of supplier payments, higher interest paid and higher severance and other costs paid, partly offset by lower income taxes paid and higher adjusted EBITDA.
Cash flows from operating activities in the first nine months of 2024 decreased by $462 million, compared to the same period last year, mainly due to lower cash from working capital, higher interest paid and higher severance and other costs paid, partly offset by higher adjusted EBITDA.
34 BCE Inc. 2024 THIRD QUARTER SHAREHOLDER REPORT
Free cash flow in the third quarter and the first nine months of 2024 increased by $78 million and $159 million, respectively, compared to the same periods last year, due to lower capital expenditures, partly offset by lower cash flows from operating activities, excluding cash from acquisition and other costs paid.
Capital expenditures
|
|
|
|
|
|
|
|
|
|
|
|
|
|
|
|
|
|
|
|
|
|
|
|
|
|
|
|
Q3 2024 |
Q3 2023 |
$ change |
% change |
YTD 2024 |
YTD 2023 |
$ change |
% change |
| Bell CTS |
919 |
1,123 |
204 |
|
18.2 |
% |
2,839 |
3,446 |
607 |
|
17.6 |
% |
Capital intensity(1) |
17.4 |
% |
20.6 |
% |
|
3.2 |
pts |
17.8 |
% |
21.3 |
% |
|
3.5 |
pts |
| Bell Media |
35 |
36 |
1 |
|
2.8 |
% |
95 |
106 |
11 |
|
10.4 |
% |
| Capital intensity |
4.5 |
% |
5.1 |
% |
|
0.6 |
pts |
4.1 |
% |
4.6 |
% |
|
0.5 |
pts |
| BCE |
954 |
1,159 |
205 |
|
17.7 |
% |
2,934 |
3,552 |
618 |
|
17.4 |
% |
| Capital intensity |
16.0 |
% |
19.1 |
% |
|
3.1 |
pts |
16.3 |
% |
19.5 |
% |
|
3.2 |
pts |
(1)Capital intensity is defined as capital expenditures divided by operating revenues.
BCE capital expenditures of $954 million in Q3 2024 and $2,934 million in the first nine months of the year, decreased by $205 million and $618 million, respectively, compared to the same periods in 2023. This corresponded to a capital intensity ratio of 16.0% in Q3 2024 and 16.3% year to date, down 3.1 pts and 3.2 pts, respectively, over the same periods last year. The year-over-year declines reflected:
•Lower capital expenditures in Bell CTS of $204 million in Q3 2024 and $607 million year to date, compared to same periods last year, consistent with a planned reduction in capital spending, primarily driven by a slowdown in our fibre-to-the-premise (FTTP) rollout and reflects efficiencies realized from prior investments in digital transformation initiatives
•Stable year-over-year capital spending at Bell Media in Q3 2024, down $1 million over Q3 2023. Year-to-date capital expenditures declined by $11 million, mainly due to lower spending on Addressable TV and studio expansions, partly offset by higher investments to support digital growth.
On July 2, 2024, Bell Canada acquired Stratejm Inc. (Stratejm) for cash consideration of $78 million ($73 million net of cash acquired) and $11 million of estimated additional cash consideration contingent on the achievement of certain performance objectives. This contingent consideration is expected to be settled by 2027 and the maximum amount payable is $20 million. Stratejm leverages AI through end-to-end Security-as-a-Service solutions, real-time threat detection and response, and streamlining incident management processes.
On June 7, 2024, Bell Media completed the acquisition of OUTFRONT Media Inc.’s Canadian OOH media business, OUTEDGE, for cash consideration of $429 million ($418 million net of cash acquired). The acquisition of OUTEDGE supports Bell Media’s digital media strategy and delivers multi-channel marketing solutions across Canada. Pursuant to a consent agreement negotiated with the Competition Bureau, Bell Media must dispose of 669 advertising displays in Québec and Ontario. On October 4, 2024, we entered into an agreement to dispose of these advertising displays for estimated proceeds of $14 million, subject to adjustments. Completion of the sale is expected in the first quarter of 2025, subject to receipt of the Competition Bureau’s approval and other customary closing conditions.
On June 1, 2023, Bell acquired FX Innovation, a Montréal-based provider of cloud-focused managed and professional services and workflow automation solutions for business clients, for cash consideration of $157 million, of which $12 million is payable within two years and an estimated $6 million of additional cash consideration contingent on the achievement of certain performance objectives. This contingent consideration is expected to be settled by 2027 and the maximum amount payable is $7 million. The acquisition of FX Innovation aims to position Bell as a technology services leader for our enterprise customers.
Business dispositions
On May 3, 2023, we completed the previously announced sale of our 63% ownership in certain production studios, which were included in our Bell Media segment, for net cash proceeds of $211 million.
Spectrum licences
On November 30, 2023, Bell Mobility secured the right to acquire 939 licences of 3800 Megahertz (MHz) spectrum across Canada for $518 million. On January 17, 2024, Bell made a first payment of $104 million to Innovation, Science and Economic Development Canada (ISED). The remaining balance of $414 million was paid on May 29, 2024, at which time Bell acquired the 3800 MHz spectrum licences.
On May 19, 2023, after approval from ISED, Bell Mobility obtained the right to use, through subordination, certain of Xplore Inc.'s 3500 MHz spectrum licences in Québec, for $145 million.
Debt instruments
2024
In the third quarter of 2024, we issued debt, net of repayments. This included:
•$763 million issuance (net of repayments) of notes payable
•$10 million issuance of long-term debt
Partly offset by:
•$343 million repayment of long-term debt comprised of net payments of leases and other debt
In the first nine months of 2024, we issued debt, net of repayments. This included:
•$3,818 million issuance of long-term debt comprised of the issuance of Series US-9 Notes with a total principal amount of $700 million in U.S. dollars ($942 million in Canadian dollars), the issuance of Series US-10 Notes with a total principal amount of $750 million in U.S. dollars ($1,009 million in Canadian dollars), the issuance of Series M-61 MTN debentures with a total principal amount of $400 million, the issuance of Series M-63 MTN debentures with a total principal amount of $1,100 million, the increase of $324 million in outstanding loans under the Bell Mobility uncommitted trade loan agreement and the issuance of other debt of $50 million, partly offset by $7 million of discounts on our debt issuances
•$2,146 million issuance (net of repayments) of notes payable
Partly offset by:
•$2,981 million repayment of long-term debt comprised of the repayment of Series M-44 MTN debentures with a total principal amount of $1,000 million, the repayment of Series US-3 Notes with a total principal amount of $600 million in U.S. dollars ($748 million in Canadian dollars), the repayment of Series 10 Notes with a total principal amount of $225 million and net payments of leases and other debt of $1,008 million
2023
In the third quarter of 2023, we repaid debt, net of issuances. This included:
•$920 million repayment of long-term debt comprised of the repayment of Series M-29 MTN debentures with a total principal amount of $600 million and net payments of leases and other debt of $320 million
•$300 million repayment (net of issuances) of notes payable
Partly offset by:
•$1,161 million issuance of long-term debt comprised of the issuance of Series M-60 MTN debentures with a total principal amount of $600 million, the issuance of Series M-61 MTN debentures with a total principal amount of $400 million and other debt of $162 million, partly offset by $1 million of discounts on our debt issuances
In the first nine months of 2023, we issued debt, net of repayments. This included:
•$3,864 million issuance of long-term debt comprised of the issuance of Series M-58 MTN debentures with a total principal amount of $1,050 million, the issuance of Series M-59 MTN debentures with a total principal amount of $450 million, the issuance of Series M-60 MTN debentures with a total principal amount of $600 million, the issuance of Series M-61 MTN debentures with a total principal amount of $400 million, the issuance of Series US-8 Notes, with a total principal amount of $850 million in U.S. dollars ($1,138 million in Canadian dollars) and the issuance of other debt of $232 million, partly offset by $6 million of discounts on our debt issuances
Partly offset by:
•$1,565 million repayment of long-term debt comprised of net payments of leases and other debt of $965 million and the repayment of Series M-29 MTN debentures with a total principal amount of $600 million
•$484 million repayment (net of issuances) of notes payable
Consolidation of MLSE ownership under BCE (repurchase of a financial liability)
In January 2023, BCE repurchased the 9% interest held by the BCE Master Trust Fund (Master Trust Fund), a trust fund that holds pension fund investments serving the pension obligations of the BCE group pension plan participants, in MLSE for a cash consideration of $149 million, as a result of BCE’s obligation to repurchase the Master Trust Fund’s interest in MLSE at that price.
Issuance of common shares
The issuance of common shares in the first nine months of 2024 decreased by $18 million, compared to the same period in 2023, due to no stock options having been exercised in the first nine months of 2024.
36 BCE Inc. 2024 THIRD QUARTER SHAREHOLDER REPORT
Repurchase of preferred shares
2024
For the nine months ended September 30, 2024, BCE repurchased and canceled 4,301,488 First Preferred Shares under its normal course issuer bid for a total cost of $76 million.
2023
For the three and nine months ended September 30, 2023, BCE repurchased and canceled 1,574,700 and 5,135,650 First Preferred Shares under its normal course issuer bid for a total cost of $27 million and $90 million, respectively.
Cash dividends paid on common shares
In the third quarter of 2024, cash dividends paid on common shares increased by $27 million compared to Q3 2023, due to a higher dividend paid in Q3 2024 of $0.9975 per common share compared to $0.9675 per common share in Q3 2023.
In the first nine months of 2024, cash dividends paid on common shares increased by $99 million compared to 2023, due to a higher dividend paid in the first nine months of 2024 of $2.9625 per common share compared to $2.855 per common share for the same period last year.
4.4 Post-employment benefit plans
For the three months ended September 30, 2024, we recorded an increase in our post-employment benefit plans and a gain, before taxes, in OCI of $125 million, due to a higher-than-expected return on plan assets, partly offset by a decrease in the discount rate to 4.7% at September 30, 2024, compared to 5.0% at June 30, 2024 and an increase in the effect of the asset limit.
For the nine months ended September 30, 2024, we recorded an increase in our post-employment benefit plans and a gain, before taxes, in OCI of $706 million, due to a higher-than-expected return on plan assets, and an increase in the discount rate to 4.7% at September 30, 2024, compared to 4.6% at December 31, 2023, partly offset by an increase in the effect of the asset limit.
For the three months ended September 30, 2023, we recorded an increase in our post-employment benefit plans and a gain, before taxes, in OCI of $217 million, due to an increase in the discount rate to 5.7% at September 30, 2023, compared to 5.0% at June 30, 2023 and a decrease in the effect of the asset limit, partly offset by a loss on plan assets.
For the nine months ended September 30, 2023, we recorded a decrease in our post-employment benefit plans and a loss, before taxes, in OCI of $144 million, due to a loss on plan assets, partly offset by an increase in the discount rate to 5.7% at September 30, 2023, compared to 5.3% at December 31, 2022 and a decrease in the effect of the asset limit.
4.5 Financial risk management
The following table provides the fair value details of certain financial instruments measured at amortized cost in the consolidated statements of financial position (statements of financial position).
|
|
|
|
|
|
|
|
|
|
|
|
|
|
|
|
|
|
|
|
|
| |
|
|
September 30, 2024 |
December 31, 2023 |
|
|
|
|
|
|
|
|
Classification |
Fair value methodology |
Carrying value |
Fair value |
Carrying value |
Fair value |
|
|
|
|
|
|
|
|
|
|
|
|
|
|
|
|
|
|
|
|
|
Debt securities
and other debt |
Debt due within one year and long-term debt |
Quoted market price of debt |
31,494 |
|
31,148 |
|
29,049 |
|
28,225 |
|
The following table provides the fair value details of financial instruments measured at fair value in the statements of financial position.
|
|
|
|
|
|
|
|
|
|
|
|
|
|
|
|
|
|
|
Classification |
Fair value |
| Carrying value of asset (liability) |
Quoted prices in active markets for identical assets (level 1) |
Observable market data (level 2)(1) |
Non-observable market inputs (level 3)(2) |
| September 30, 2024 |
|
|
|
|
|
Publicly-traded and privately-held investments(3) |
Other non-current assets |
623 |
|
40 |
|
— |
|
583 |
|
| Derivative financial instruments |
Other current assets, trade payables and other liabilities, other non-current assets and liabilities |
(358) |
|
— |
|
(358) |
|
— |
|
|
|
|
|
|
|
| Other |
Other non-current assets |
224 |
|
— |
|
224 |
|
— |
|
| December 31, 2023 |
|
|
|
|
|
Publicly-traded and privately-held investments(3) |
Other non-current assets |
587 |
|
10 |
|
— |
|
577 |
|
| Derivative financial instruments |
Other current assets, trade payables and other liabilities, other non-current assets and liabilities |
(488) |
|
— |
|
(488) |
|
— |
|
|
|
|
|
|
|
| Other |
Other non-current assets and liabilities |
147 |
|
— |
|
216 |
|
(69) |
|
(1)Observable market data such as equity prices, interest rates, swap rate curves and foreign currency exchange rates.
(2)Non-observable market inputs such as discounted cash flows and revenue and earnings multiples. For certain privately-held investments, changes in our valuation assumptions may result in a significant increase (decrease) in the fair value of our level 3 financial instruments.
(3)Unrealized gains and losses are recorded in Other comprehensive income (loss) in the statements of comprehensive income and are reclassified from Accumulated other comprehensive loss to the Deficit in the statements of financial position when realized.
Market risk
Currency exposures
In 2024, we entered into cross currency interest rate swaps with a notional amount of $700 million in U.S. dollars ($942 million in Canadian dollars) to hedge the U.S. currency exposure of our US-9 Notes maturing in 2034. The fair value of the cross currency interest rate swaps at September 30, 2024 was a net liability of $14 million recognized in Other current assets and Other non-current liabilities in the statements of financial position.
In 2024, we entered into cross currency interest rate swaps with a notional amount of $750 million in U.S. dollars ($1,009 million in Canadian dollars) to hedge the U.S. currency exposure of our US-10 Notes maturing in 2054. In connection with these swaps, cross currency basis rate swaps outstanding at December 31, 2023 with a notional amount of $644 million were settled. The fair value of the cross currency interest rate swaps at September 30, 2024 was a net liability of $17 million recognized in Other current assets and Other non-current liabilities in the statements of financial position.
38 BCE Inc. 2024 THIRD QUARTER SHAREHOLDER REPORT
In 2024, we entered into cross currency interest rate swaps with a notional amount of $240 million in U.S. dollars ($324 million in Canadian dollars) to hedge the U.S. currency exposure of outstanding loans maturing in 2026 under our Bell Mobility uncommitted trade loan agreement. The fair value of the cross currency interest rate swaps at September 30, 2024 was nil.
The following table provides further details on our outstanding foreign currency forward contracts and options at September 30, 2024.
|
|
|
|
|
|
|
|
|
|
|
|
|
|
|
|
|
|
|
|
|
| Type of hedge |
Buy
currency |
Amount to receive |
Sell
currency |
Amount
to pay |
Maturity |
Hedged item |
Cash flow (1) |
USD |
1,189 |
|
CAD |
1,607 |
|
2024 |
Loans |
| Cash flow |
USD |
1,740 |
|
CAD |
2,353 |
|
2024 |
Commercial paper |
| Cash flow |
USD |
195 |
|
CAD |
251 |
|
2024 |
Anticipated purchases |
| Cash flow |
PHP |
744 |
|
CAD |
18 |
|
2024 |
|
Anticipated purchases |
| Cash flow |
USD |
639 |
|
CAD |
832 |
|
2025 |
|
Anticipated purchases |
| Cash flow |
PHP |
3,193 |
|
CAD |
75 |
|
2025 |
|
Anticipated purchases |
| Cash flow |
USD |
420 |
|
CAD |
562 |
|
2026 |
|
Anticipated purchases |
| Economic |
USD |
45 |
|
CAD |
59 |
|
2024 |
|
Anticipated purchases |
Economic - options(2) |
USD |
100 |
|
CAD |
131 |
|
2024 |
|
Anticipated purchases |
|
|
|
|
|
|
|
| Economic - call options |
USD |
314 |
|
CAD |
420 |
|
2024 |
Anticipated purchases |
| Economic - call options |
CAD |
56 |
|
USD |
39 |
|
2024 |
Anticipated purchases |
| Economic - put options |
USD |
669 |
|
CAD |
884 |
|
2024 |
Anticipated purchases |
| Economic |
USD |
120 |
|
CAD |
158 |
|
2025 |
Anticipated purchases |
Economic - options (2) |
USD |
390 |
|
CAD |
512 |
|
2025 |
Anticipated purchases |
| Economic - call options |
USD |
370 |
|
CAD |
481 |
|
2025 |
Anticipated purchases |
| Economic - call options |
CAD |
141 |
|
USD |
100 |
|
2025 |
Anticipated purchases |
| Economic - put options |
USD |
460 |
|
CAD |
697 |
|
2025 |
Anticipated purchases |
| Economic - call options |
USD |
120 |
|
CAD |
158 |
|
2026 |
Anticipated purchases |
| Economic - call options |
CAD |
348 |
|
USD |
240 |
|
2026 |
Anticipated purchases |
| Economic - put options |
USD |
150 |
|
CAD |
197 |
|
2026 |
Anticipated purchases |
|
|
|
|
|
|
|
|
|
|
|
|
|
|
|
|
|
|
|
|
|
|
|
|
|
|
|
|
|
|
|
|
|
|
|
|
|
|
|
|
|
|
(1)Forward contracts to hedge loans secured by receivables under our securitization program.
(2)Foreign currency options with a leverage provision and a profit cap limitation.
A 10% depreciation (appreciation) in the value of the Canadian dollar relative to the U.S. dollar would result in a gain of $47 million (loss of $163 million) recognized in net (loss) earnings at September 30, 2024 and a gain of $173 million (loss of $158 million) recognized in Other comprehensive income (loss) at September 30, 2024, with all other variables held constant.
Interest rate exposures
In 2024, we entered into, and subsequently terminated, forward starting interest rate swaps, effective from 2026, with a notional amount of $336 million to hedge the fair value of our US-10 Notes maturing in 2054. The fair value of the forward starting interest rate swaps at the date of termination was an asset of $20 million.
In 2024, we terminated forward starting interest rate swaps with a notional amount of $250 million used to hedge the fair value of our Series M-52 MTN debentures maturing in 2030. The fair value of the forward starting interest rate swaps at the date of termination was an asset of $6 million.
In 2024, we terminated a series of interest rate swaps with a notional amount of $50 million maturing in 2025 and $150 million maturing in 2032. These interest rate swaps were used to hedge the fair value of our M-57 MTN debentures maturing in 2032. The fair value of the interest rate swaps at the date of termination was an asset of $6 million.
In 2024, we entered into forward starting interest rate swaps, effective from 2025, with a notional amount of $800 million in U.S. dollars ($1,080 million in Canadian dollars), of which $400 million in U.S. dollars matures in each of 2030 and 2035, to hedge the interest rate exposure on future U.S. dollar debt issuances. The fair value of the forward starting interest rate swaps at September 30, 2024 was a liability of $3 million recognized in Other non-current liabilities in the statements of financial position.
In 2024, we sold U.S. dollar interest rate swaptions with a notional amount of $214 million in U.S. dollars ($289 million in Canadian dollars) expiring in 2024 to hedge economically the fair value of future U.S. dollar debt issuances. The fair value of the swaptions at September 30, 2024 was a liability of $4 million recognized in Trade payables and other liabilities in the statements of financial position.
In 2024, we sold interest rate swaptions, expiring in 2024, with a notional amount of $300 million to hedge economically the fair value of our M-17 MTN debentures maturing in 2035. The fair value of the interest rate swaptions at September 30, 2024 was nil.
In 2024, we sold interest rate swaptions, expiring in 2024, with a notional amount of $750 million for $3 million to hedge economically the fair value of our M-53 MTN debentures maturing in 2027. The fair value of the interest rate swaptions at September 30, 2024 was a liability of $9 million recognized in Trade payables and other liabilities in the statements of financial position.
In 2024, we sold interest rate floors, expiring in 2029, with a notional amount of $350 million and purchased interest rate options, expiring in 2026, with a notional amount of $440 million to hedge economically the interest cost of our M-62 MTN debentures maturing in 2029. The fair value of the interest rate floors and interest rate options at September 30, 2024 was a net asset of $1 million recognized in Other current assets, Other non-current assets, Trade payables and other liabilities and Other non-current liabilities in the statements of financial position.
A 1% increase (decrease) in interest rates would result in a loss of $12 million (loss of $6 million) recognized in net (loss) earnings for the nine months ended September 30, 2024, with all other variables held constant.
Equity price exposures
We use equity forward contracts on BCE’s common shares to hedge economically the cash flow exposure related to the settlement of equity settled share-based compensation plans. The fair value of our equity forward contracts at September 30, 2024 and December 31, 2023 was a net liability of $225 million and $162 million, respectively, recognized in Other current assets, Trade payables and other liabilities and Other non-current liabilities in the statements of financial position. A gain of $42 million and a loss of $71 million for the three and nine months ended September 30, 2024, respectively, relating to these equity forward contracts is recognized in Other expense in the income statements.
A 5% increase (decrease) in the market price of BCE’s common shares would result in a gain (loss) of $25 million recognized in net (loss) earnings at September 30, 2024, with all other variables held constant.
BCE's and Bell Canada's key credit ratings from DBRS Limited remain unchanged from those described in the BCE 2023 Annual MD&A.
On August 30, 2024, Moody's Canada Inc. (Moody’s) downgraded Bell Canada's issuer rating to Baa2 from Baa1, long-term debt rating to Baa2 from Baa1 and subordinated long-term debt rating to Baa3 from Baa2. Bell Canada's commercial paper rating was affirmed at P-2. In addition, Moody’s downgraded BCE's issuer rating to Baa3 from Baa2. The outlook associated with the Moody’s ratings was changed to stable from negative. The downgrades were principally as a result of ongoing debt leverage above Moody’s thresholds for the prior ratings. All of the new ratings remain investment grade according to Moody’s rating scale with Moody’s Baa3 rating representing its last investment grade rating rank.
On September 12, 2024, S&P Global Ratings Canada (S&P), a business unit of S&P Global Canada Corp., downgraded the issuer-credit ratings on BCE and its subsidiaries to BBB from BBB+. At the same time, S&P lowered Bell Canada's long-term debt rating to BBB from BBB+ and subordinated long-term debt rating to BBB- from BBB. Although Bell Canada’s commercial paper rating was affirmed at A-2 on a Global scale, it was downgraded to A-2 from A-1 (Low) on a Canadian national scale. S&P also lowered the ratings on BCE's preferred shares to P3 (High) from P2 (Low), on a Canadian national scale, and to BB+ from BBB-, on a Global scale. The outlook associated with the S&P ratings was changed to stable from negative. The downgrades were principally as a result of ongoing debt leverage above S&P’s thresholds for the prior ratings. All of the new ratings on Bell Canada’s debt remain investment grade according to S&P’s rating scale with S&P’s BBB- rating representing its last investment grade rating rank. Notwithstanding that preferred shares are not debt or credit instruments, the new P3 (High) and BB+ ratings on BCE’s preferred shares are considered below an investment grade rating on S&P’s rating scale.
40 BCE Inc. 2024 THIRD QUARTER SHAREHOLDER REPORT
This section contains forward-looking statements, including relating to the sources of liquidity we expect to use to meet our 2024 cash requirements and to fund the proposed acquisition by Bell Canada of Ziply Fiber. Refer to the section Caution regarding forward-looking statements at the beginning of this MD&A.
The purchase price for the acquisition of the Ziply Fiber equity is anticipated to be approximately $5.0 billion Canadian dollars ($3.65 billion U.S. dollars), approximately $4.2 billion Canadian dollars of which is expected to be funded from the net proceeds of the divestiture of MLSE. BCE expects to fund the balance of the purchase price from a discounted treasury DRP program. In the event that the close of BCE's ownership stake in MLSE occurs after the close of this acquisition, Bell has entered into a $3.7 billion U.S. dollars fully committed delayed-draw term loan facility to finance the proposed acquisition.
Available liquidity
Total available liquidity(1) at September 30, 2024 was $4.4 billion, comprised of $1,860 million in cash, $750 million in short-term investments, $639 million available under our securitized receivables program and $1.2 billion available under our $3.5 billion committed revolving and expansion credit facilities (given $2.3 billion of commercial paper outstanding).
Total available liquidity at December 31, 2023 was $5.8 billion, comprised of $547 million in cash, $225 million in cash equivalents, $1,000 million in short-term investments, $700 million available under our securitized receivables program and $3.3 billion available under our $3.5 billion committed revolving and expansion credit facilities (given $197 million of commercial paper outstanding).
In Q2 2024, Bell Canada extended the term of its $2.5 billion committed revolving credit facility from May 2028 to May 2029 and the term of its $1 billion committed expansion credit facility from May 2026 to May 2027.
We expect that our cash, cash equivalents, short-term investments, amounts available under our securitized receivables program, cash flows from operations and possible capital markets financings will permit us to meet our cash requirements in 2024 for capital expenditures, post-employment benefit plans funding, dividend payments, the payment of contractual obligations, maturing debt, ongoing operations and other cash requirements.
Should our 2024 cash requirements exceed our cash, cash equivalents, short-term investments, cash generated from our operations, and funds raised under capital markets financings and our securitized receivables program, we would expect to cover such a shortfall by drawing under committed credit facilities that are currently in place or through new facilities to the extent available.
We continuously monitor our operations, capital markets and the Canadian economy with the objective of maintaining adequate liquidity.
Recent developments in legal proceedings
The following is an update to the legal proceedings described in the BCE 2023 AIF under section 8, Legal proceedings.
Intellectual property infringement lawsuits concerning IPTV, satellite TV and/or Crave systems
On January 19, 2018, a patent infringement claim was filed in the Federal Court against BCE, Bell Canada, Bell Aliant Regional Communications Inc., Bell MTS Inc. and NorthernTel, Limited Partnership by Rovi Guides, Inc. (Rovi) and Tivo Solutions Inc. On October 7, 2022, the trial judge delivered a judgment completely in the defendants’ favour, dismissing all of the plaintiffs’ claims and invalidating all four of the remaining patents. Rovi’s appeal from that judgment was dismissed by the Federal Court of Appeal on August 6, 2024.
(1)Available liquidity is a non-GAAP financial measure. Refer to section 8.1, Non-GAAP financial measures in this MD&A for more information on this measure.
5 Quarterly financial information
BCE’s Q3 2024 Financial Statements were prepared in accordance with International Financial Reporting Standards (IFRS), as issued by the International Accounting Standards Board (IASB), under International Accounting Standard (IAS) 34, Interim Financial Reporting and were approved by BCE’s board of directors on November 6, 2024.
The following table, which was also prepared in accordance with IFRS, shows selected consolidated financial data of BCE for the eight most recent completed quarters.
|
|
|
|
|
|
|
|
|
|
|
|
|
|
|
|
|
|
|
|
|
|
|
|
|
|
|
|
2024 |
2023 |
2022 |
|
Q3 |
Q2 |
Q1 |
Q4 |
Q3 |
Q2 |
Q1 |
Q4 |
| Operating revenues |
|
|
|
|
|
|
|
|
| Service |
5,286 |
|
5,308 |
|
5,192 |
|
5,348 |
|
5,281 |
|
5,303 |
|
5,222 |
|
5,353 |
|
| Product |
685 |
|
697 |
|
819 |
|
1,125 |
|
799 |
|
763 |
|
832 |
|
1,086 |
|
| Total operating revenues |
5,971 |
|
6,005 |
|
6,011 |
|
6,473 |
|
6,080 |
|
6,066 |
|
6,054 |
|
6,439 |
|
| Adjusted EBITDA |
2,722 |
|
2,697 |
|
2,565 |
|
2,567 |
|
2,667 |
|
2,645 |
|
2,538 |
|
2,437 |
|
| Severance, acquisition and other costs |
(49) |
|
(22) |
|
(229) |
|
(41) |
|
(10) |
|
(100) |
|
(49) |
|
(19) |
|
| Depreciation |
(934) |
|
(945) |
|
(946) |
|
(954) |
|
(937) |
|
(936) |
|
(918) |
|
(922) |
|
| Amortization |
(325) |
|
(325) |
|
(316) |
|
(299) |
|
(295) |
|
(296) |
|
(283) |
|
(270) |
|
| Impairment of assets |
(2,113) |
|
(60) |
|
(13) |
|
(109) |
|
— |
|
— |
|
(34) |
|
(150) |
|
|
|
|
|
|
|
|
|
|
|
|
|
|
|
|
|
|
|
| Net (loss) earnings |
(1,191) |
|
604 |
|
457 |
|
435 |
|
707 |
|
397 |
|
788 |
|
567 |
|
| Net (loss) earnings attributable to common shareholders |
(1,237) |
|
537 |
|
402 |
|
382 |
|
640 |
|
329 |
|
725 |
|
528 |
|
|
|
|
|
|
|
|
|
|
|
|
|
|
|
|
|
|
|
|
|
|
|
|
|
|
|
|
| EPS - basic and diluted |
(1.36) |
|
0.59 |
|
0.44 |
|
0.42 |
|
0.70 |
|
0.37 |
|
0.79 |
|
0.58 |
|
|
|
|
|
|
|
|
|
|
|
|
|
|
|
|
|
|
|
|
|
|
|
|
|
|
|
|
|
|
|
|
|
|
|
|
|
|
|
|
|
|
|
|
|
|
|
|
|
|
|
|
|
|
|
|
|
|
|
|
|
|
|
|
|
|
|
|
|
|
|
|
|
|
|
|
|
|
|
|
|
|
|
|
|
|
|
|
|
|
|
|
|
|
|
|
|
|
|
|
| Weighted average number of common shares outstanding – basic (millions) |
912.3 |
|
912.3 |
|
912.3 |
|
912.3 |
|
912.3 |
|
912.2 |
|
912.1 |
|
912.0 |
|
|
|
|
|
|
|
|
|
|
|
|
|
|
|
|
|
|
|
|
|
|
|
|
|
|
|
|
|
|
|
|
|
|
|
|
|
42 BCE Inc. 2024 THIRD QUARTER SHAREHOLDER REPORT
6 Regulatory environment
The following is an update to the regulatory initiatives and proceedings described in the BCE 2023 Annual MD&A under section 3.3, Principal business risks and section 8, Regulatory environment, as updated in the BCE 2024 First Quarter MD&A and the BCE 2024 Second Quarter MD&A.
Telecommunications Act
Review of Mobile Wireless Services
On July 13, 2023, the CRTC accepted a request from Quebecor Media Inc. (Quebecor) to initiate final offer arbitration (FOA) in respect of rates for mobile virtual network operator (MVNO) access service from Bell Mobility. On October 10, 2023, the CRTC issued a decision selecting the rate proposed by Bell Mobility. On December 15, 2023, Quebecor filed a Part 1 application seeking the CRTC’s intervention in determining the start date for the MVNO access service from Bell Mobility, alleging Bell Mobility had improperly denied Quebecor access subsequent to the release of the CRTC’s FOA decision. On August 29, 2024, the CRTC denied Quebecor’s application and set September 12, 2024 as the start date for Bell Mobility’s MVNO access service, directing the parties to enter into an MVNO access agreement by such date. Consistent with the CRTC’s decision, the parties entered into an MVNO access agreement as of September 12, 2024 under which Quebecor is now receiving MVNO access from Bell Mobility.
The CRTC previously accepted a joint request for FOA from Rogers Communications Canada Inc. (Rogers) and Quebecor. On July 24, 2023, the CRTC issued a decision selecting the rate proposed by Quebecor. On August 23, 2023, Rogers sought leave to appeal the CRTC’s FOA decision with the Federal Court of Appeal. On August 16, 2024, the Federal Court of Appeal granted Rogers' application.
Review of wholesale fibre-to-the-node high-speed access service rates
On July 22, 2024, the Federal Court of Appeal issued a decision rejecting TekSavvy Solutions Inc.’s (TekSavvy) appeal of Decision 2021-181. On September 30, 2024, TekSavvy sought leave to appeal that decision to the Supreme Court of Canada.
Review of wholesale high-speed access service framework
On November 6, 2023, in Telecom Decision CRTC 2023-358 (the Interim Decision), the CRTC determined that aggregated access to Bell Canada’s fibre-to-the-premises (FTTP) facilities in Ontario and Québec should be mandated on a temporary and expedited basis, and the CRTC set interim access rates.
On February 2, 2024, Bell Canada had filed an appeal of the Interim Decision to the Governor-in-Council. On November 6, 2024, the Governor-in-Council released an order referring the Interim Decision back to the CRTC to reconsider, no later than 90 days after November 6, 2024, whether Bell Canada, Rogers and Telus Communications Inc. (Telus) and their affiliates should be prohibited from using aggregated FTTP services in Ontario and Quebec further to tariffs approved by the CRTC.
On August 13, 2024, in Telecom Regulatory Policy CRTC 2024-180 (the Final Decision), the CRTC mandated that the interim obligation to provide wholesale aggregated access to Bell Canada’s FTTP facilities in Ontario and Québec, and to Telus' FTTP facilities in Québec, would be made final. Further, the Final Decision expanded the geographic scope of the Interim Decision such that Bell Canada is required to provide wholesale aggregated access to its FTTP facilities in Atlantic Canada and Manitoba by February 13, 2025. Telus and Saskatchewan Telecommunications (SaskTel) are also required to provide aggregated access to their respective FTTP facilities in Alberta, British Columbia, and Saskatchewan by the same date. This obligation does not apply to any new FTTP networks that Bell Canada, Telus, or SaskTel make available at retail during the five-year period between August 13, 2024 and August 12, 2029. However, this five-year period is not a continuously rolling period. Instead, all new FTTP locations, regardless of when they are made available at retail, will be subject to a wholesale aggregated access obligation as of August 12, 2029. Under the Final Decision, cable companies are exempt from wholesale FTTP obligations and, as such, are not required to provide wholesale access to their FTTP networks. Also, under the Final Decision, Bell Canada, SaskTel, Telus, Cogeco Communications Inc., Bragg Communications Inc. (Eastlink), Rogers, Quebecor, and their respective affiliates are not eligible to buy mandated aggregated wholesale high-speed access, whether over copper, coaxial cable, or FTTP, within their traditional incumbent wireline footprints. As a result, Distributel and other Bell Canada brands were required to, and did, cease reselling wholesale high-speed access over coaxial cable to new customers after September 12, 2024.
Following the issuance of the Final Decision, Bell Canada filed, on August 28, 2024, a notice of discontinuance with the Federal Court of Appeal, wholly discontinuing its appeal of Telecom Decision CRTC 2023-358.
Bell Canada is currently assessing the impact of the Final Decision since final rates have yet to be determined. If final rates are established that are different from the interim rates, there is a risk they will be applied retroactively. In a motion dated September 12, 2024, SaskTel has sought leave to appeal the Final Decision to the Federal Court of Appeal.
CRTC examination of retail rates for international roaming
On October 7, 2024, the CRTC issued a letter to each of Bell Mobility, Rogers and Telus indicating that following a review it had conducted of fees that Canadians pay when they travel internationally, it had certain concerns with respect to the choice available to Canadians when roaming and roaming rates. The CRTC indicated that it expected Bell Mobility, Rogers and Telus to report back to the CRTC by November 4, 2024 on the steps they are taking to respond to these concerns and that if it determines that sufficient action is not taken, it will launch a formal proceeding. Each of the three carriers filed their responses on November 4, 2024 setting out their plans to the CRTC. While the timing and outcome of any further CRTC process regarding our international roaming rates is currently unknown and it is unclear what impact, if any, such a process could have, any action by the CRTC to regulate the rates or attributes of the international roaming offerings of wireless carriers is likely to have a negative impact on our business and financial results.
Other
Bill C-18, An Act respecting online communications platforms that make news content available to persons in Canada (the Online News Act)
On October 28, 2024, the CRTC approved a five-year exemption for Google, which requires Google to provide payment within 60 days to a collective (the Collective) which will then distribute it to eligible news outlets. Of the $100 million to be paid by Google, under the regulations that were released on December 15, 2023, news outlets that are also private broadcasters, such as CTV and Noovo, cannot receive more than 30% of the overall compensation available (with other news outlets, such as those associated with newspapers and public broadcasters, receiving the rest). Given the above, the amount of compensation that Bell Media may receive from Google is unclear, as is the timing of such compensation as the Collective in charge of distributing the funding, once received from Google, does not itself have a deadline to distribute compensation to eligible news outlets.
44 BCE Inc. 2024 THIRD QUARTER SHAREHOLDER REPORT
7 Accounting policies
BCE’s Q3 2024 Financial Statements were prepared in accordance with IFRS, as issued by the IASB, under IAS 34 - Interim Financial Reporting and were approved by BCE’s board of directors on November 6, 2024. These financial statements were prepared using the same basis of presentation, accounting policies and methods of computation as outlined in Note 2, Material accounting policies in BCE’s consolidated financial statements for the year ended December 31, 2023. BCE's Q3 2024 Financial Statements do not include all of the notes required in the annual financial statements.
Future changes to accounting standards
The following accounting standard and amendments to accounting standards issued by the IASB have not yet been adopted by BCE.
|
|
|
|
|
|
|
|
|
|
|
|
| Standard |
Description |
Impact |
Effective date |
|
|
|
|
|
|
|
|
| IFRS 18 – Presentation and Disclosure in Financial Statements |
Sets out requirements and guidance on presentation and disclosure in financial statements, including:
•presentation in the income statements of income and expenses within defined categories - operating, investing, financing, income taxes and discontinued operations
•presentation in the income statements of new defined subtotals - operating profit and profit before financing and income taxes
•disclosure of explanations of management-defined performance measures that are related to the income statements
•enhanced guidance on aggregation and disaggregation of information and whether to provide information in the financial statements or in the notes
•disclosure of specified expenses by nature
IFRS 18 replaces IAS 1 - Presentation of Financial Statements but carries forward many of the requirements from IAS 1 unchanged.
|
We are currently assessing the impact of this standard. |
Annual reporting periods beginning on or after January 1, 2027. Early application is permitted. |
| Amendments to the Classification and Measurement of Financial Instruments – Amendments to IFRS 9 and IFRS 7 |
In particular, the amendments clarify:
•the classification of financial assets with ESG and similar features
•the derecognition date for financial liabilities and introduce an accounting policy option for financial liabilities settled using an electronic payment system if certain conditions are met
The amendments also require additional disclosures for financial instruments with contractual terms that reference a contingent event and equity instruments classified at fair value through other comprehensive income.
|
We are currently assessing the impact of these amendments. |
Annual reporting periods beginning on or after January 1, 2026. Early application is permitted. |
8 Non-GAAP financial measures, other financial measures and key performance indicators (KPIs)
BCE uses various financial measures to assess its business performance. Certain of these measures are calculated in accordance with International Financial Reporting Standards (IFRS or GAAP) while certain other measures do not have a standardized meaning under GAAP. We believe that our GAAP financial measures, read together with adjusted non-GAAP and other financial measures, provide readers with a better understanding of how management assesses BCE’s performance.
National Instrument 52-112, Non-GAAP and Other Financial Measures Disclosure (NI 52-112), prescribes disclosure requirements that apply to the following specified financial measures:
•Non-GAAP financial measures;
•Non-GAAP ratios;
•Total of segments measures;
•Capital management measures; and
•Supplementary financial measures.
This section provides a description and classification of the specified financial measures contemplated by NI 52-112 that we use to explain our financial results except that, for supplementary financial measures, an explanation of such measures is provided where they are first referred to if the supplementary financial measures’ labelling is not sufficiently descriptive.
8.1 Non-GAAP financial measures
A non-GAAP financial measure is a financial measure used to depict our historical or expected future financial performance, financial position or cash flow and, with respect to its composition, either excludes an amount that is included in, or includes an amount that is excluded from, the composition of the most directly comparable financial measure disclosed in BCE’s consolidated primary financial statements. We believe that non-GAAP financial measures are reflective of our on-going operating results and provide readers with an understanding of management’s perspective on and analysis of our performance.
Below are descriptions of the non-GAAP financial measures that we use to explain our results as well as reconciliations to the most directly comparable IFRS financial measures.
The term adjusted net earnings does not have any standardized meaning under IFRS. Therefore, it is unlikely to be comparable to similar measures presented by other issuers.
We define adjusted net earnings as net (loss) earnings attributable to common shareholders before severance, acquisition and other costs, net mark-to-market losses (gains) on derivatives used to economically hedge equity settled share-based compensation plans, net equity losses (gains) on investments in associates and joint ventures, net losses (gains) on investments, early debt redemption costs, impairment of assets and discontinued operations, net of tax and NCI.
We use adjusted net earnings and we believe that certain investors and analysts use this measure, among other ones, to assess the performance of our businesses without the effects of severance, acquisition and other costs, net mark-to-market losses (gains) on derivatives used to economically hedge equity settled share-based compensation plans, net equity losses (gains) on investments in associates and joint ventures, net losses (gains) on investments, early debt redemption costs, impairment of assets and discontinued operations, net of tax and NCI. We exclude these items because they affect the comparability of our financial results and could potentially distort the analysis of trends in business performance. Excluding these items does not imply they are non-recurring.
The most directly comparable IFRS financial measure is net (loss) earnings attributable to common shareholders.
46 BCE Inc. 2024 THIRD QUARTER SHAREHOLDER REPORT
The following table is a reconciliation of net (loss) earnings attributable to common shareholders to adjusted net earnings on a consolidated basis.
|
|
|
|
|
|
|
|
|
|
|
|
|
|
|
|
Q3 2024 |
Q3 2023 |
YTD 2024 |
YTD 2023 |
| Net (loss) earnings attributable to common shareholders |
(1,237) |
|
640 |
|
(298) |
|
1,694 |
|
| Reconciling items: |
|
|
|
|
| Severance, acquisition and other costs |
49 |
|
10 |
|
300 |
|
159 |
|
Net mark-to-market (gains) losses on derivatives used to economically
hedge equity settled share-based compensation plans |
(42) |
|
128 |
|
71 |
|
109 |
|
| Net equity losses on investments in associates and joint ventures |
154 |
|
— |
|
247 |
|
377 |
|
| Net (gains) losses on investments |
(66) |
|
1 |
|
(58) |
|
(78) |
|
| Early debt redemption costs |
— |
|
— |
|
— |
|
1 |
|
| Impairment of assets |
2,113 |
|
— |
|
2,186 |
|
34 |
|
| Income taxes for the above reconciling items |
(258) |
|
(38) |
|
(368) |
|
(61) |
|
| NCI for the above reconciling items |
(25) |
|
— |
|
(26) |
|
— |
|
|
|
|
|
|
| Adjusted net earnings |
688 |
|
741 |
|
2,054 |
|
2,235 |
|
Available liquidity
The term available liquidity does not have any standardized meaning under IFRS. Therefore, it is unlikely to be comparable to similar measures presented by other issuers.
We define available liquidity as cash, cash equivalents, short-term investments and amounts available under our securitized receivables program and our committed bank credit facilities, excluding credit facilities that are available exclusively for a pre-determined purpose.
We consider available liquidity to be an important indicator of the financial strength and performance of our businesses because it shows the funds available to meet our cash requirements, including for, but not limited to, capital expenditures, post-employment benefit plans funding, dividend payments, the payment of contractual obligations, maturing debt, on going operations, the acquisition of spectrum, and other cash requirements. We believe that certain investors and analysts use available liquidity to evaluate the financial strength and performance of our businesses. The most directly comparable IFRS financial measure is cash.
The following table is a reconciliation of cash to available liquidity on a consolidated basis.
|
|
|
|
|
|
|
|
|
|
September 30, 2024 |
December 31, 2023 |
| Cash |
1,860 |
|
547 |
|
| Cash equivalents |
— |
|
225 |
|
| Short-term investments |
750 |
|
1,000 |
|
Amounts available under our securitized receivables program(1) |
639 |
|
700 |
|
Amounts available under our committed bank credit facilities(2) |
1,162 |
|
3,303 |
|
| Available liquidity |
4,411 |
|
5,775 |
|
(1)At September 30, 2024 and December 31, 2023, respectively, $639 million and $700 million were available under our securitized receivables program, under which we borrowed $1,183 million in U.S. dollars ($1,597 million in Canadian dollars) and $1,200 million in U.S. dollars ($1,588 million in Canadian dollars) as at September 30, 2024 and December 31, 2023, respectively. Loans secured by receivables are included in Debt due within one year in our consolidated financial statements.
(2)At September 30, 2024 and December 31, 2023, respectively, $1,162 million and $3,303 million were available under our committed bank credit facilities, given outstanding commercial paper of $1,732 million in U.S. dollars ($2,338 million in Canadian dollars) and $149 million in U.S. dollars ($197 million in Canadian dollars) as at September 30, 2024 and December 31, 2023, respectively. Commercial paper outstanding is included in Debt due within one year in our consolidated financial statements.
Free cash flow and excess free cash flow
The terms free cash flow and excess free cash flow do not have any standardized meaning under IFRS. Therefore, they are unlikely to be comparable to similar measures presented by other issuers.
We define free cash flow as cash flows from operating activities, excluding cash from discontinued operations, acquisition and other costs paid (which include significant litigation costs) and voluntary pension funding, less capital expenditures, preferred share dividends and dividends paid by subsidiaries to NCI. We exclude cash from discontinued operations, acquisition and other costs paid and voluntary pension funding because they affect the comparability of our financial results and could potentially distort the analysis of trends in business performance. Excluding these items does not imply they are non-recurring.
We define excess free cash flow as free cash flow less dividends paid on common shares.
We consider free cash flow and excess free cash flow to be important indicators of the financial strength and performance of our businesses. Free cash flow shows how much cash is available to pay dividends on common shares, repay debt and reinvest in our company. Excess free cash flow shows how much cash is available to repay debt and reinvest in our company, after the payment of dividends on common shares. We believe that certain investors and analysts use free cash flow and excess free cash flow to value a business and its underlying assets and to evaluate the financial strength and performance of our businesses. The most directly comparable IFRS financial measure is cash flows from operating activities.
The following table is a reconciliation of cash flows from operating activities to free cash flow and excess free cash flow on a consolidated basis.
|
|
|
|
|
|
|
|
|
|
|
|
|
|
|
|
Q3 2024 |
Q3 2023 |
YTD 2024 |
YTD 2023 |
| Cash flows from operating activities |
1,842 |
|
1,961 |
|
5,111 |
|
5,573 |
|
| Capital expenditures |
(954) |
|
(1,159) |
|
(2,934) |
|
(3,552) |
|
| Cash dividends paid on preferred shares |
(43) |
|
(35) |
|
(134) |
|
(136) |
|
| Cash dividends paid by subsidiaries to NCI |
(14) |
|
(13) |
|
(56) |
|
(35) |
|
| Acquisition and other costs paid |
1 |
— |
|
27 |
5 |
|
|
|
|
|
|
| Free cash flow |
832 |
|
754 |
|
2,014 |
|
1,855 |
|
| Dividends paid on common shares |
(910) |
|
(883) |
|
(2,703) |
|
(2,604) |
|
| Excess free cash flow |
(78) |
|
(129) |
|
(689) |
|
(749) |
|
The term net debt does not have any standardized meaning under IFRS. Therefore, it is unlikely to be comparable to similar measures presented by other issuers.
We define net debt as debt due within one year plus long-term debt and 50% of preferred shares, less cash, cash equivalents and short-term investments, as shown in BCE’s consolidated statements of financial position. We include 50% of outstanding preferred shares in our net debt as it is consistent with the treatment by certain credit rating agencies.
We consider net debt to be an important indicator of the company’s financial leverage because it represents the amount of debt that is not covered by available cash, cash equivalents and short-term investments. We believe that certain investors and analysts use net debt to determine a company’s financial leverage.
Net debt is calculated using several asset and liability categories from the statements of financial position. The most directly comparable IFRS financial measure is long-term debt. The following table is a reconciliation of long-term debt to net debt on a consolidated basis.
|
|
|
|
|
|
|
|
|
|
September 30, 2024 |
December 31, 2023 |
| Long-term debt |
32,606 |
|
31,135 |
|
| Debt due within one year |
7,475 |
|
5,042 |
|
| 50% of preferred shares |
1,780 |
|
1,834 |
|
| Cash |
(1,860) |
|
(547) |
|
| Cash equivalents |
— |
|
(225) |
|
| Short-term investments |
(750) |
|
(1,000) |
|
| Net debt |
39,251 |
|
36,239 |
|
48 BCE Inc. 2024 THIRD QUARTER SHAREHOLDER REPORT
A non-GAAP ratio is a financial measure disclosed in the form of a ratio, fraction, percentage or similar representation and that has a non-GAAP financial measure as one or more of its components.
The term adjusted EPS does not have any standardized meaning under IFRS. Therefore, it is unlikely to be comparable to similar measures presented by other issuers.
We define adjusted EPS as adjusted net earnings per BCE common share. Adjusted net earnings is a non-GAAP financial measure. For further details on adjusted net earnings, see section 8.1, Non-GAAP financial measures.
We use adjusted EPS, and we believe that certain investors and analysts use this measure, among other ones, to assess the performance of our businesses without the effects of severance, acquisition and other costs, net mark-to-market losses (gains) on derivatives used to economically hedge equity settled share-based compensation plans, net equity losses (gains) on investments in associates and joint ventures, net losses (gains) on investments, early debt redemption costs, impairment of assets and discontinued operations, net of tax and NCI. We exclude these items because they affect the comparability of our financial results and could potentially distort the analysis of trends in business performance. Excluding these items does not imply they are non-recurring.
Dividend payout ratio
The term dividend payout ratio does not have any standardized meaning under IFRS. Therefore, it is unlikely to be comparable to similar measures presented by other issuers.
We define dividend payout ratio as dividends paid on common shares divided by free cash flow. Free cash flow is a non-GAAP financial measure. For further details on free cash flow, see section 8.1, Non-GAAP financial measures.
We consider dividend payout ratio to be an important indicator of the financial strength and performance of our businesses because it shows the sustainability of the company’s dividend payments.
8.3 Total of segments measures
A total of segments measure is a financial measure that is a subtotal or total of 2 or more reportable segments and is disclosed within the Notes to BCE’s consolidated primary financial statements.
Adjusted EBITDA
We define adjusted EBITDA as operating revenues less operating costs as shown in BCE’s consolidated income statements.
The most directly comparable IFRS financial measure is net (loss) earnings. The following tables provide a reconciliation of net (loss) earnings to adjusted EBITDA on a consolidated basis.
|
|
|
|
|
|
|
|
|
|
|
|
|
|
|
|
|
YTD 2024 |
Q3 2024 |
|
Q2 2024 |
Q1 2024 |
| Net (loss) earnings |
(130) |
|
(1,191) |
|
|
604 |
|
457 |
|
| Severance, acquisition and other costs |
|
300 |
|
|
49 |
|
|
|
22 |
|
229 |
|
| Depreciation |
|
2,825 |
|
|
934 |
|
|
|
945 |
|
946 |
|
| Amortization |
|
966 |
|
|
325 |
|
|
|
325 |
|
316 |
|
| Finance costs |
|
|
|
|
|
| Interest expense |
|
1,282 |
|
|
440 |
|
|
|
426 |
|
416 |
|
| Net return on post-employment benefit plans |
|
(49) |
|
|
(16) |
|
|
|
(17) |
|
(16) |
|
| Impairment of assets |
|
2,186 |
|
|
2,113 |
|
|
|
60 |
|
13 |
|
| Other expense |
|
202 |
|
|
63 |
|
|
|
101 |
|
38 |
|
| Income taxes |
402 |
|
5 |
|
|
231 |
|
166 |
|
|
|
|
|
|
|
|
|
|
|
|
|
|
|
|
|
|
|
| Adjusted EBITDA |
7,984 |
|
2,722 |
|
|
2,697 |
|
2,565 |
|
|
|
|
|
|
|
|
|
|
|
|
|
|
|
|
|
|
|
|
|
|
|
|
Q4 2023 |
YTD 2023 |
Q3 2023 |
|
Q2 2023 |
Q1 2023 |
Q4 2022 |
| Net earnings |
435 |
|
1,892 |
|
707 |
|
|
397 |
|
788 |
|
567 |
|
| Severance, acquisition and other costs |
|
41 |
|
|
159 |
|
|
10 |
|
|
|
100 |
|
49 |
|
19 |
|
| Depreciation |
954 |
|
|
2,791 |
|
|
937 |
|
|
|
936 |
|
918 |
|
922 |
|
| Amortization |
299 |
|
|
874 |
|
|
295 |
|
|
|
296 |
|
283 |
|
270 |
|
| Finance costs |
|
|
|
|
|
|
|
| Interest expense |
399 |
|
|
1,076 |
|
|
373 |
|
|
|
359 |
|
344 |
|
319 |
|
| Net return on post-employment benefit plans |
(27) |
|
|
(81) |
|
|
(27) |
|
|
|
(27) |
|
(27) |
|
(13) |
|
| Impairment of assets |
109 |
|
|
34 |
|
|
— |
|
|
|
— |
|
34 |
|
150 |
|
| Other expense (income) |
147 |
|
|
319 |
|
|
129 |
|
|
|
311 |
|
(121) |
|
(19) |
|
| Income taxes |
210 |
|
786 |
|
243 |
|
|
273 |
|
270 |
|
222 |
|
|
|
|
|
|
|
|
|
|
|
|
|
|
|
|
|
|
|
|
|
|
|
|
|
| Adjusted EBITDA |
2,567 |
|
7,850 |
|
2,667 |
|
|
2,645 |
|
2,538 |
|
2,437 |
|
8.4 Capital management measures
A capital management measure is a financial measure that is intended to enable a reader to evaluate our objectives, policies and processes for managing our capital and is disclosed within the Notes to BCE’s consolidated financial statements.
The financial reporting framework used to prepare the financial statements requires disclosure that helps readers assess the company’s capital management objectives, policies, and processes, as set out in IFRS in IAS 1 – Presentation of Financial Statements. BCE has its own methods for managing capital and liquidity, and IFRS does not prescribe any particular calculation method.
Net debt leverage ratio
The net debt leverage ratio represents net debt divided by adjusted EBITDA. Net debt used in the calculation of the net debt leverage ratio is a non-GAAP financial measure. For further details on net debt, see section 8.1, Non-GAAP financial measures. For the purposes of calculating our net debt leverage ratio, adjusted EBITDA is twelve-month trailing adjusted EBITDA.
We use, and believe that certain investors and analysts use, the net debt leverage ratio as a measure of financial leverage.
50 BCE Inc. 2024 THIRD QUARTER SHAREHOLDER REPORT
8.5 Supplementary financial measures
A supplementary financial measure is a financial measure that is not reported in BCE’s consolidated financial statements, and is, or is intended to be, reported periodically to represent historical or expected future financial performance, financial position, or cash flows.
An explanation of such measures is provided where they are first referred to in this MD&A if the supplementary financial measures’ labelling is not sufficiently descriptive.
In addition to the non-GAAP financial measures and other financial measures described previously, we use the following KPIs to measure the success of our strategic imperatives. These KPIs are not accounting measures and may not be comparable to similar measures presented by other issuers.
|
|
|
|
|
|
| KPI |
Definition |
| Adjusted EBITDA margin |
Adjusted EBITDA margin is defined as adjusted EBITDA divided by operating revenues. |
| ARPU |
ARPU is defined as Bell CTS wireless external services revenues divided by the average mobile phone subscriber base for the specified period, expressed as a dollar unit per month. |
| Capital intensity |
Capital intensity is defined as capital expenditures divided by operating revenues. |
| Churn |
Mobile phone churn is the rate at which existing mobile phone subscribers cancel their services. It is a measure of our ability to retain our customers. Mobile phone churn is calculated by dividing the number of mobile phone deactivations during a given period by the average number of mobile phone subscribers in the base for the specified period and is expressed as a percentage per month. |
Subscriber unit(1) |
Mobile phone subscriber unit is comprised of a recurring revenue generating portable unit (e.g. smartphones and feature phones) on an active service plan, that has access to our wireless networks and includes voice, text and/or data connectivity. We report mobile phone subscriber units in two categories: postpaid and prepaid. Prepaid mobile phone subscriber units are considered active for a period of 90 days following the expiry of the subscriber’s prepaid balance.
Mobile connected device subscriber unit is comprised of a recurring revenue generating portable unit (e.g. tablets, wearables, mobile Internet devices and IoT) on an active service plan, that has access to our wireless networks and is intended for limited or no cellular voice capability.
Wireline subscriber unit consists of an active revenue-generating unit with access to our services, including retail Internet, IPTV, and/or residential NAS. A subscriber is included in our subscriber base when the service has been installed and is operational at the customer premise and a billing relationship has been established.
• Retail Internet and IPTV subscribers have access to stand-alone services, and are primarily represented by a dwelling unit or a business location
• Retail residential NAS subscribers are based on a line count and are represented by a unique telephone number
|
(1)As of Q1 2024, we are no longer reporting retail satellite TV subscribers as this no longer represents a significant proportion of our revenues. As a result, satellite TV subscribers have been removed from our retail TV subscriber base, and we now report exclusively retail IPTV subscribers.
9 Controls and procedures
Changes in internal control over financial reporting
No changes were made in our internal control over financial reporting during the quarter ended September 30, 2024 that have materially affected, or are reasonably likely to materially affect, our internal control over financial reporting.
52 BCE Inc. 2024 THIRD QUARTER SHAREHOLDER REPORT